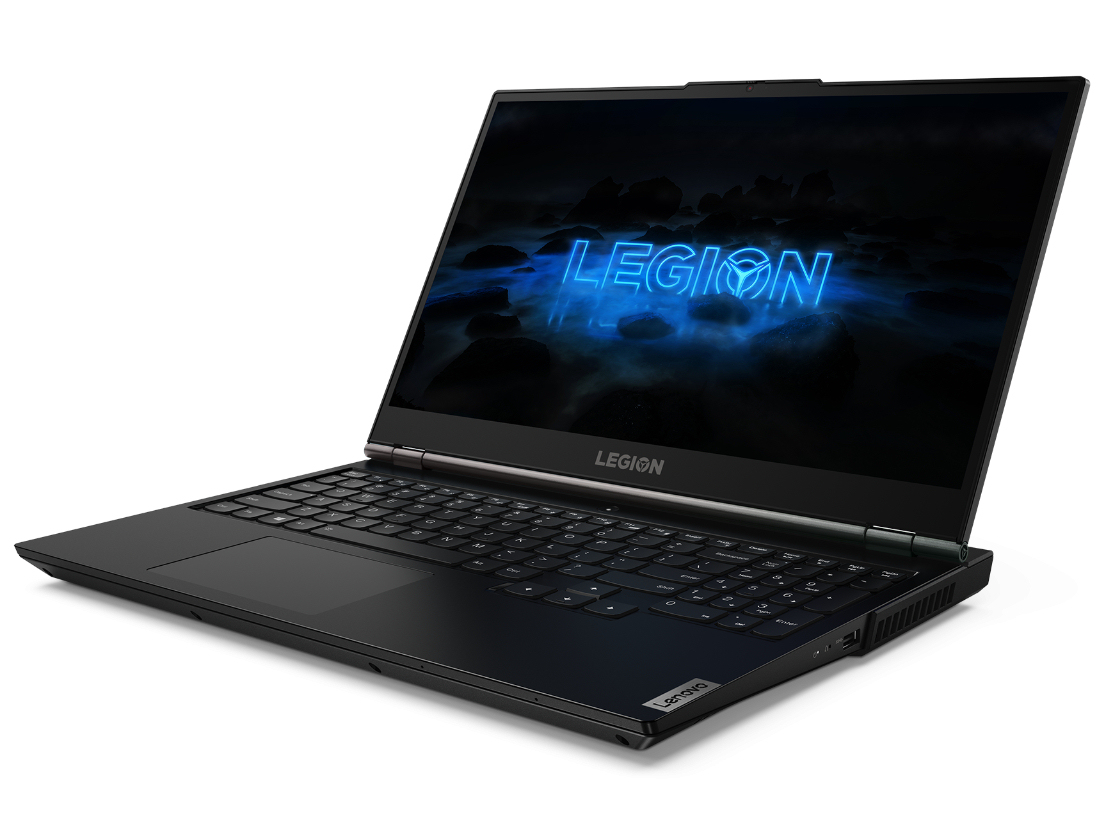
Lenovo Legion 5 15IMH05H Review: Excellent power delivery and good battery life

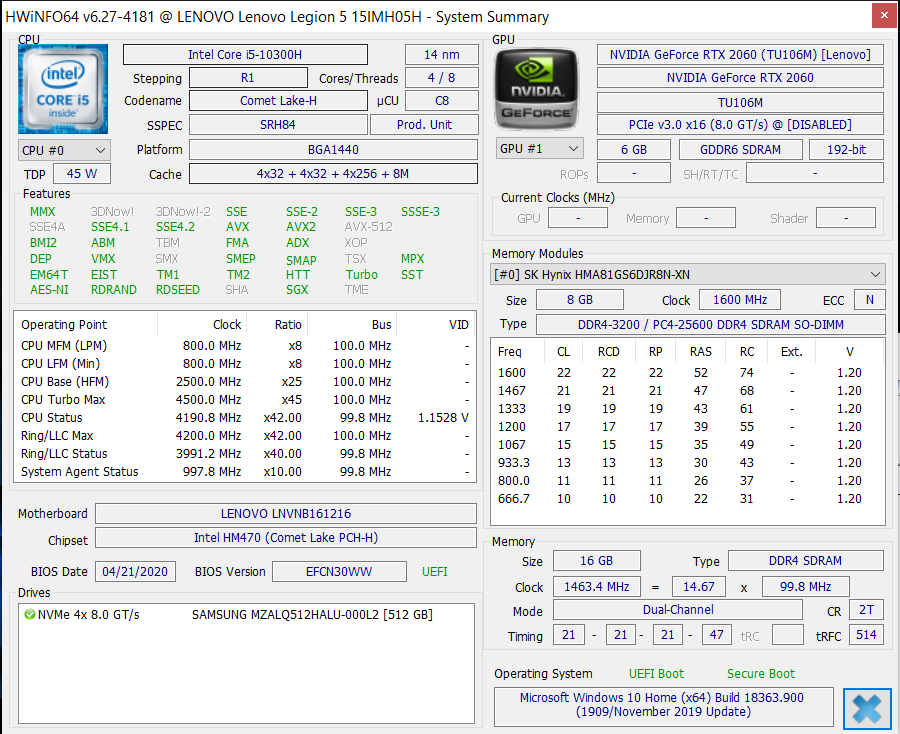
The Lenovo Legion 5 15IMH05H is an upper mid-range 15.6-inch gaming notebook. It is the successor of theLenovo Legion Y540-15IRH Laptop Review: A good gaming laptop with a GeForce GTX 1660 Ti GPU Legion Y540-15IRH and still resembles this device, although the build is not exactly the same. Our test configuration is equipped with a Core-i5-10300H and a GeForce-RTX-2060. Among its competitors are devices such as the Dell G5 15 SE, the Asus TUF A15 FA506IV and the MSI Alpha 15 A3DDK-034.
Rating | Date | Model | Weight | Height | Size | Resolution | Price |
|---|---|---|---|---|---|---|---|
| 83.3 % v7 (old) | 07 / 2020 | Lenovo Legion 5 15IMH05H i5-10300H, GeForce RTX 2060 Mobile | 2.5 kg | 26.1 mm | 15.60" | 1920x1080 | |
| 82.7 % v7 (old) | 06 / 2020 | Asus TUF Gaming A15 FA506IV-HN172 R7 4800H, GeForce RTX 2060 Mobile | 2.2 kg | 24.9 mm | 15.60" | 1920x1080 | |
| 83.7 % v7 (old) | 06 / 2020 | Dell G5 15 SE 5505 P89F R7 4800H, Radeon RX 5600M | 2.4 kg | 21.6 mm | 15.60" | 1920x1080 | |
| 78.8 % v7 (old) | 02 / 2020 | MSI Alpha 15 A3DDK-034 R7 3750H, Radeon RX 5500M | 2.3 kg | 27.5 mm | 15.60" | 1920x1080 |
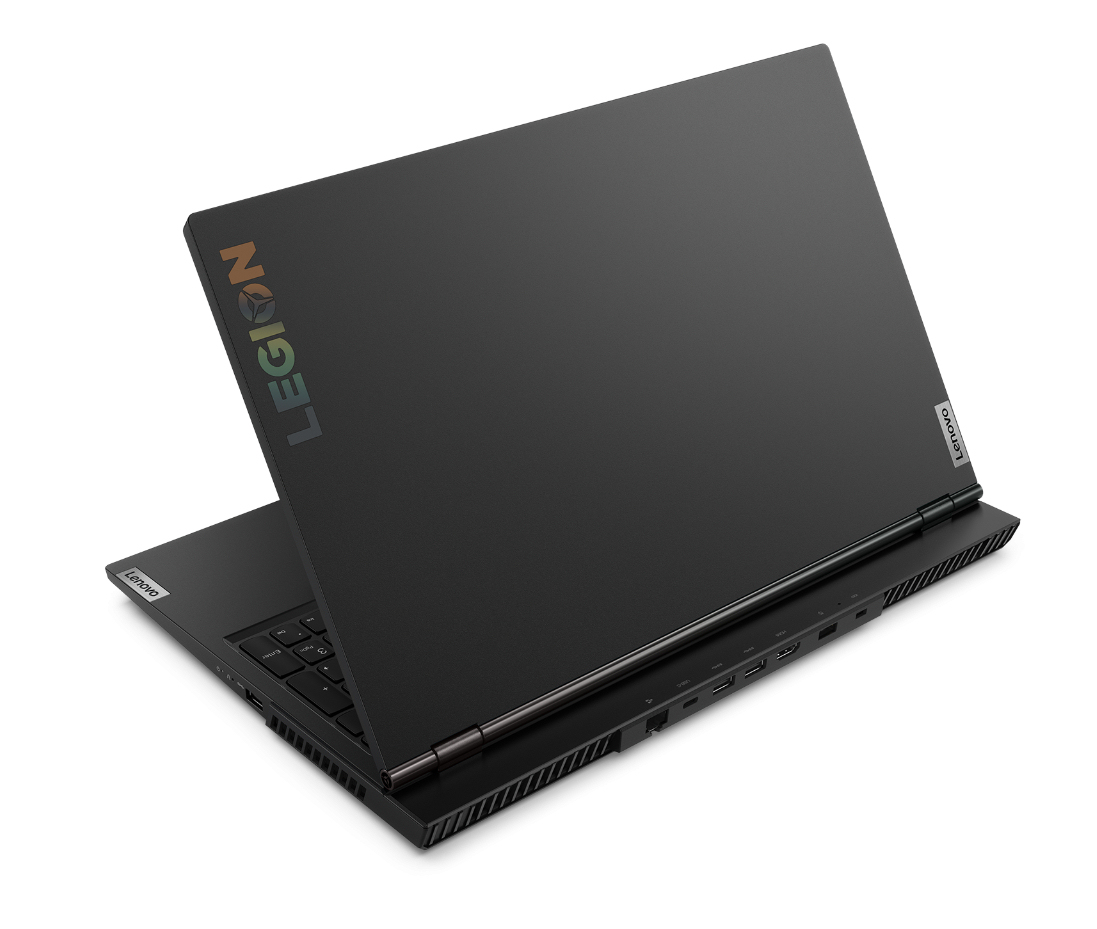
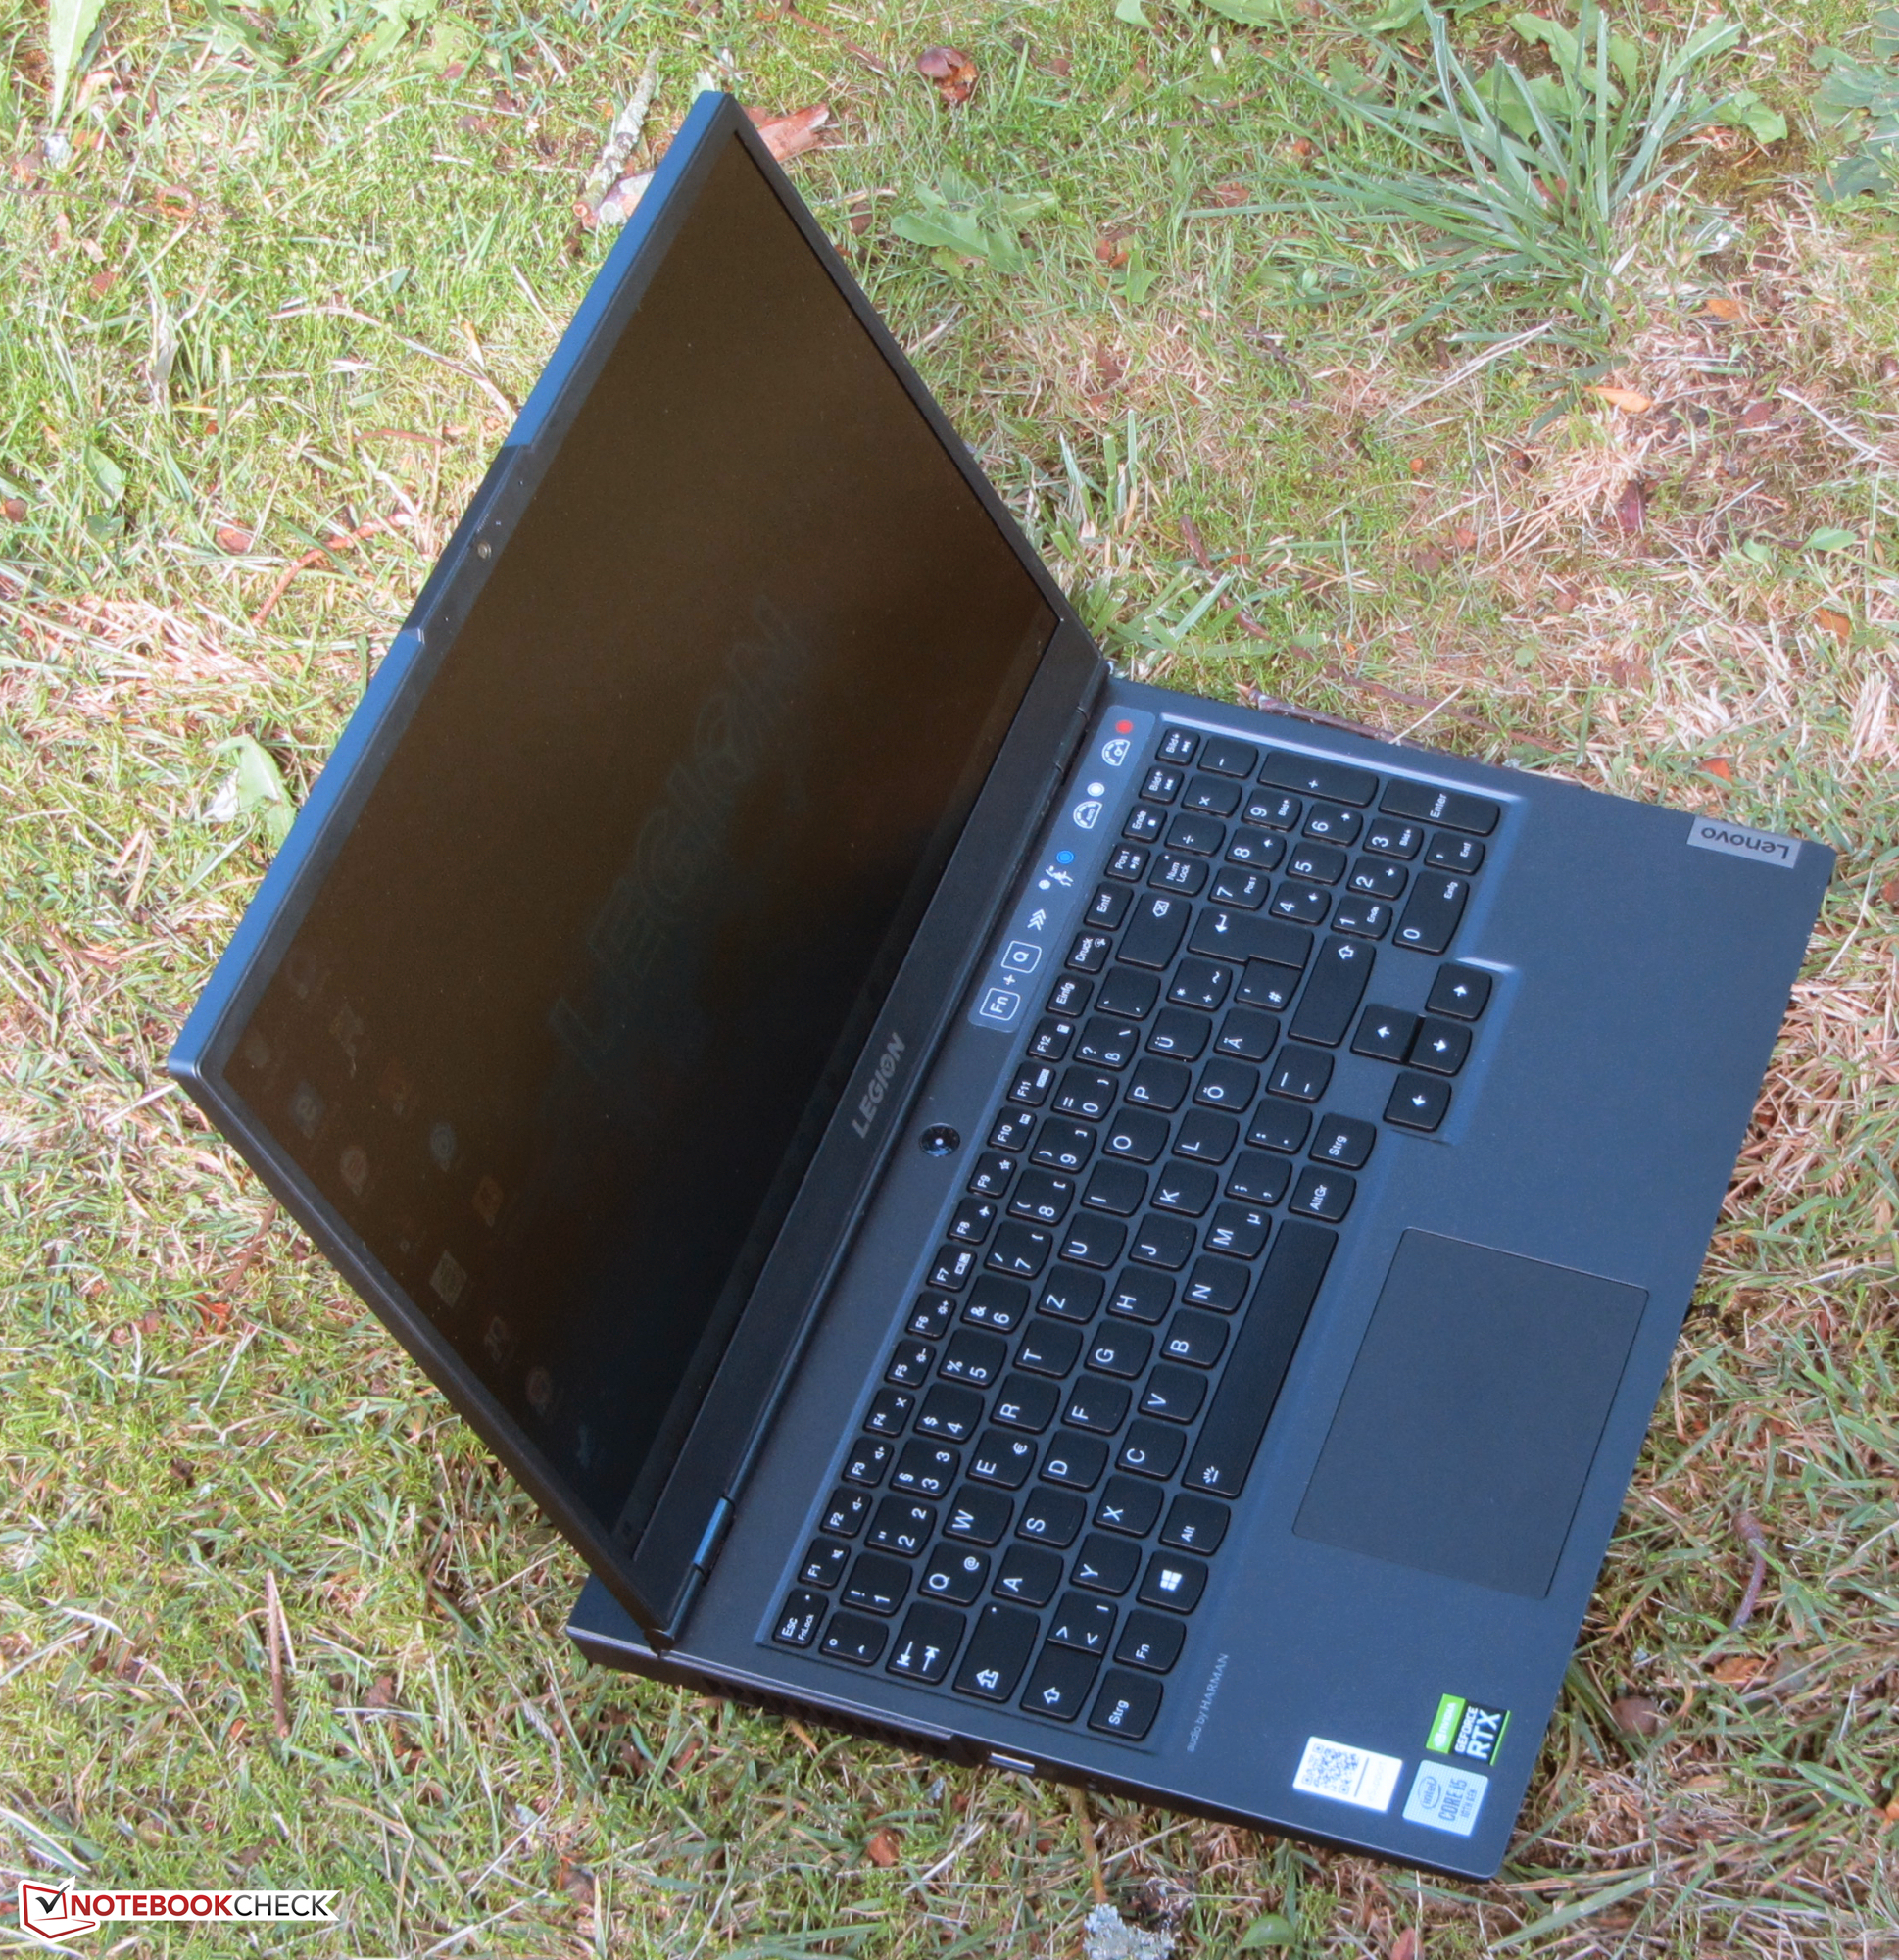
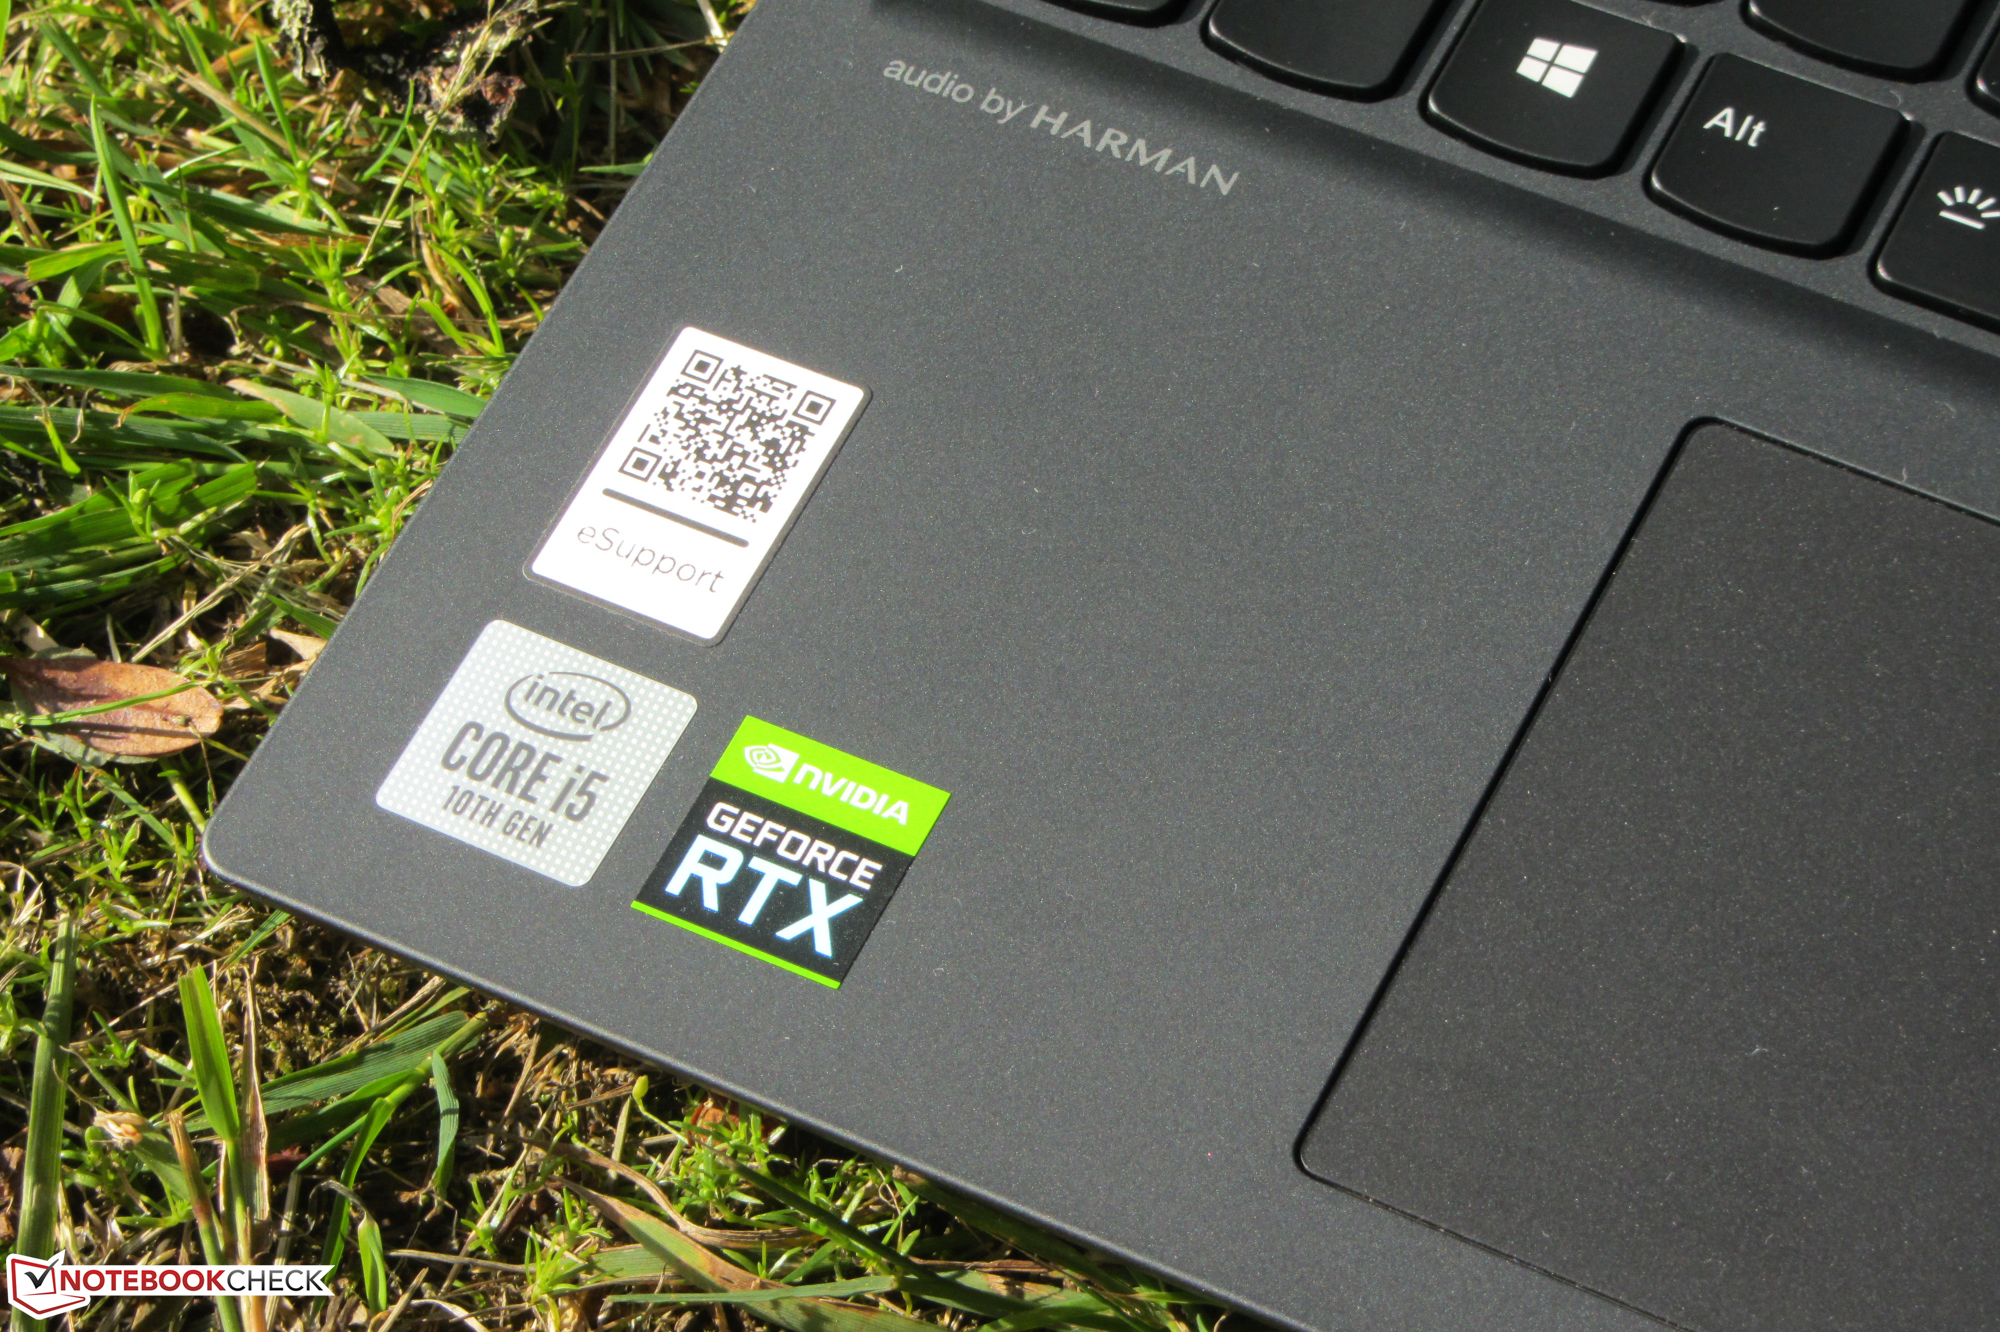
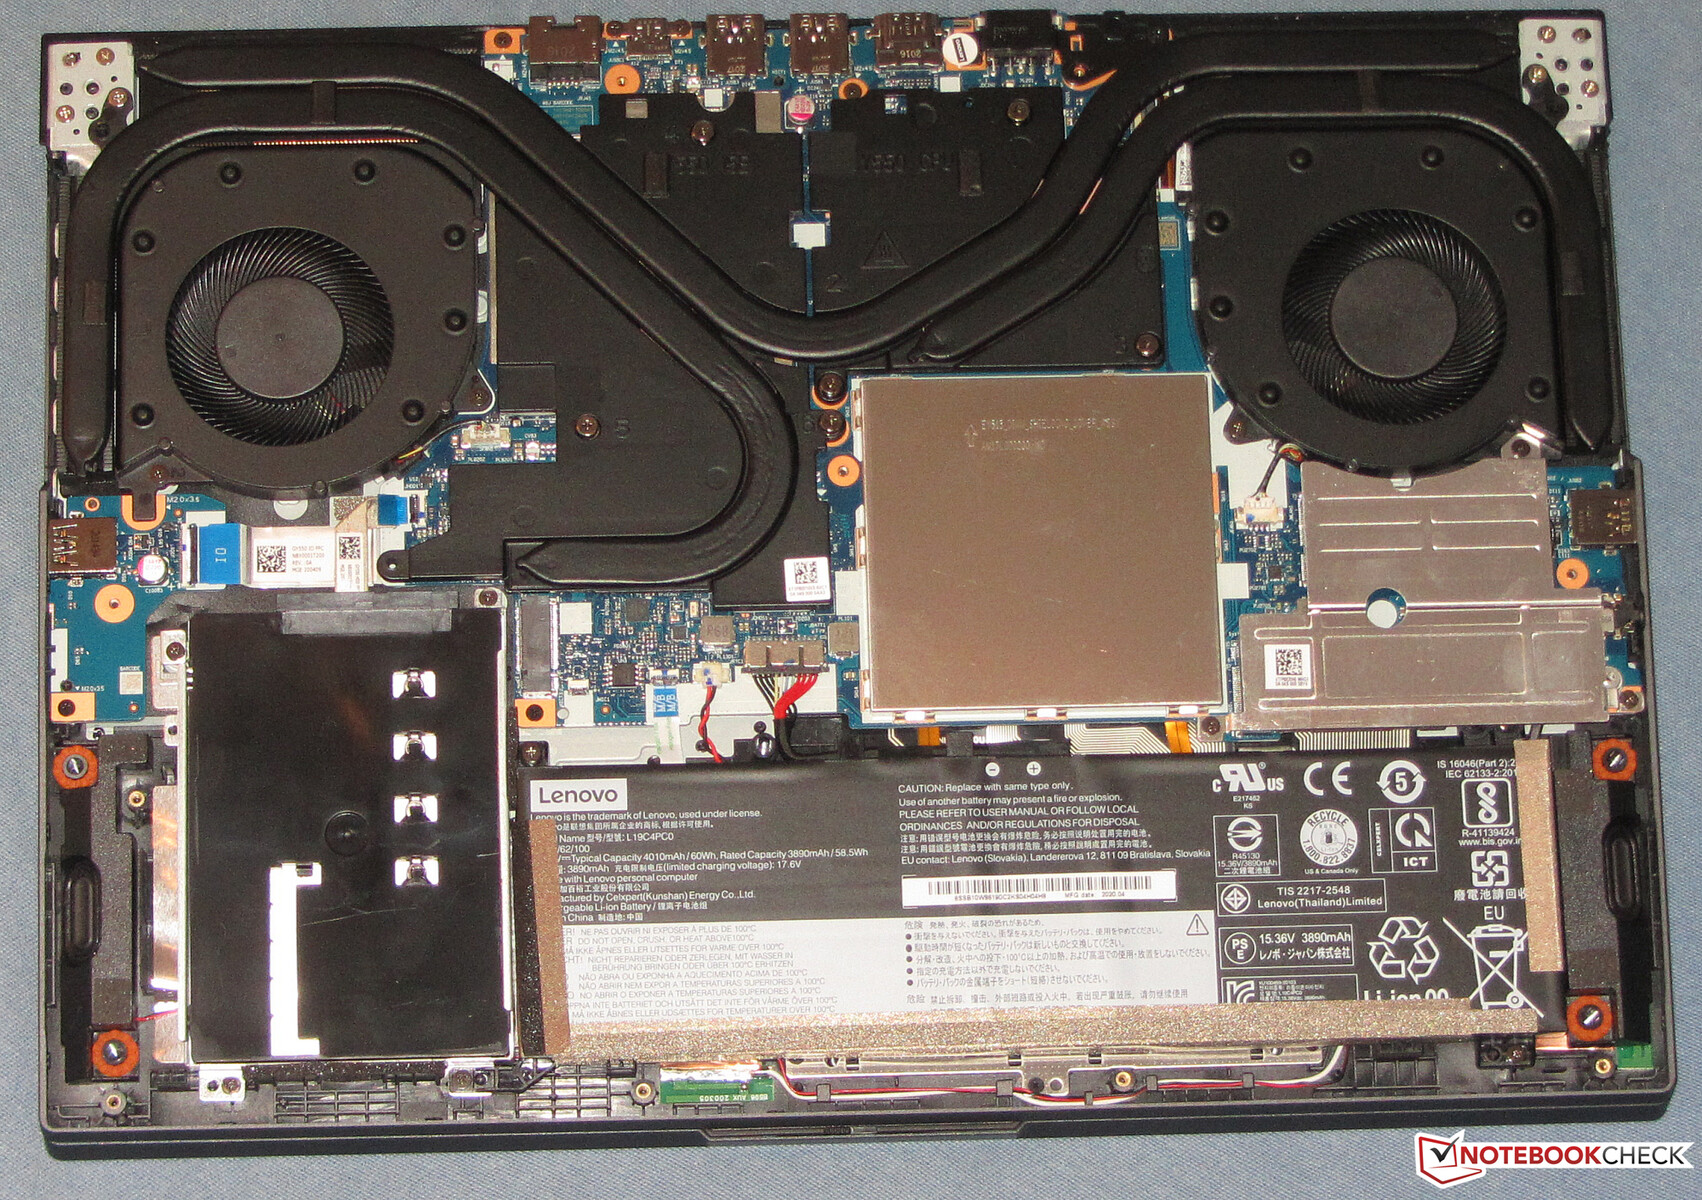
Case - Lenovo uses black plastic
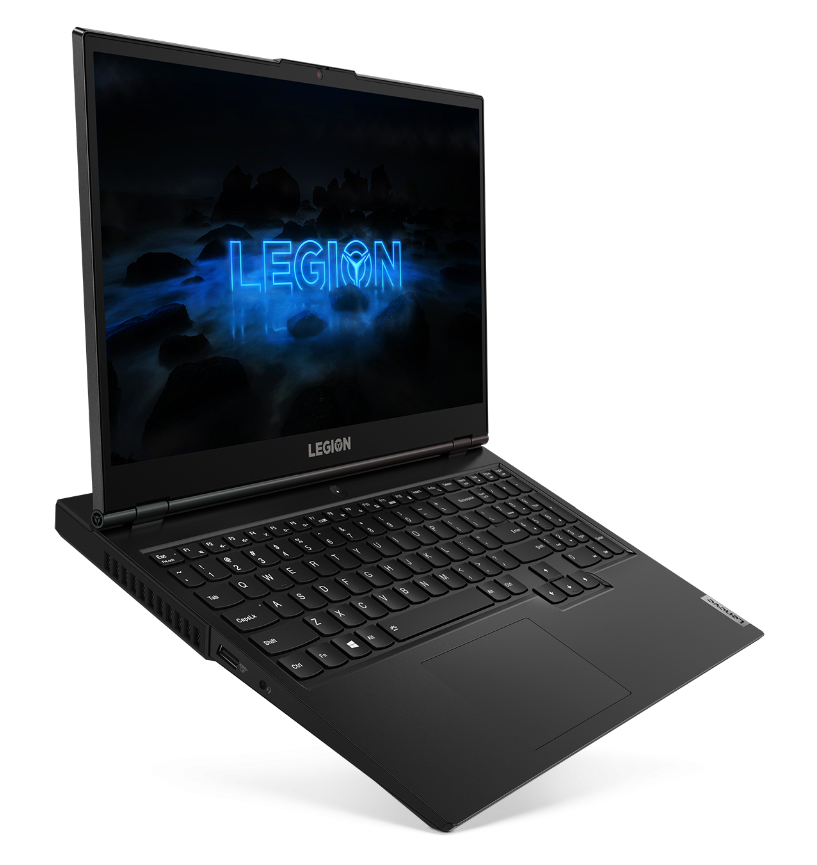
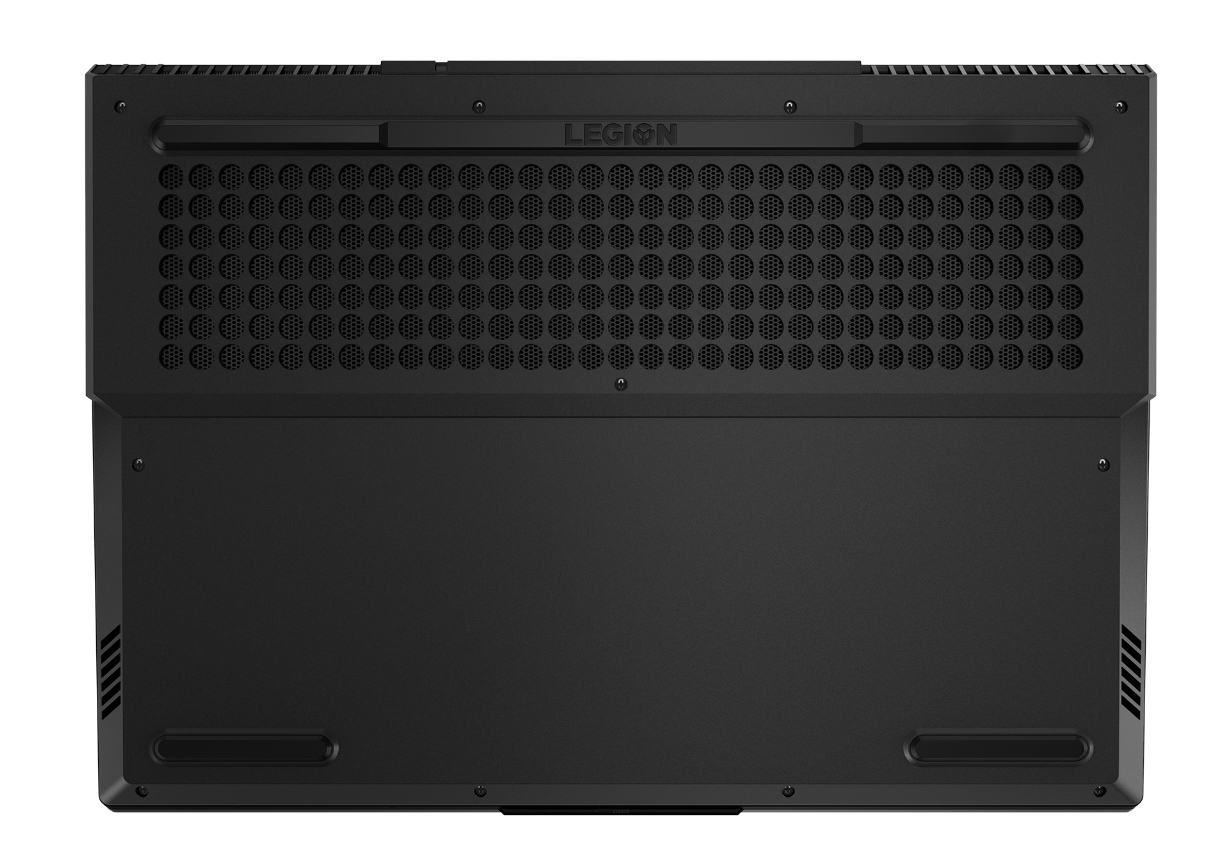
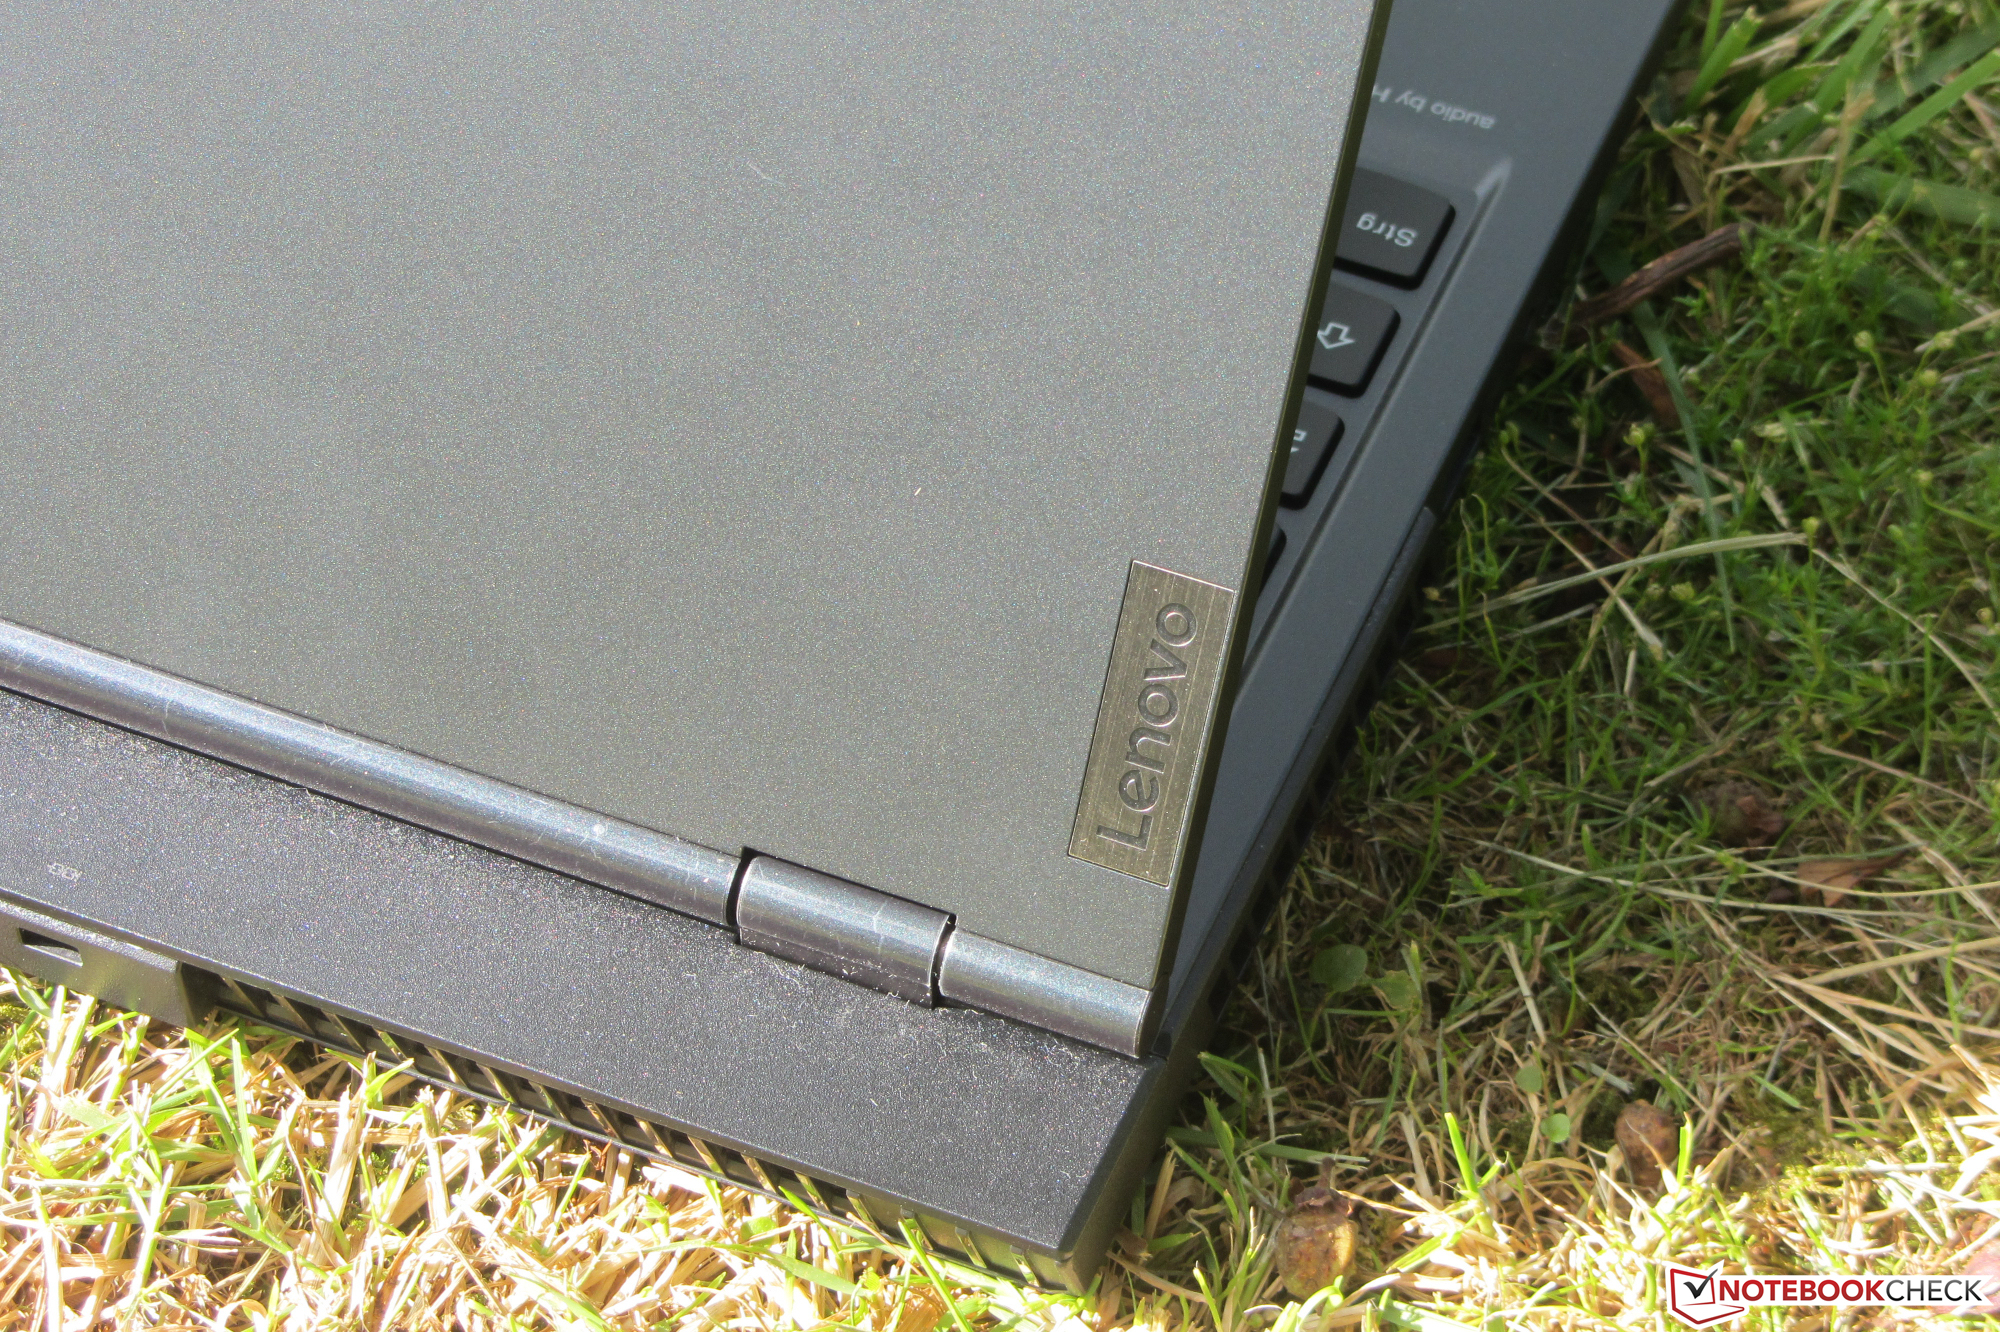
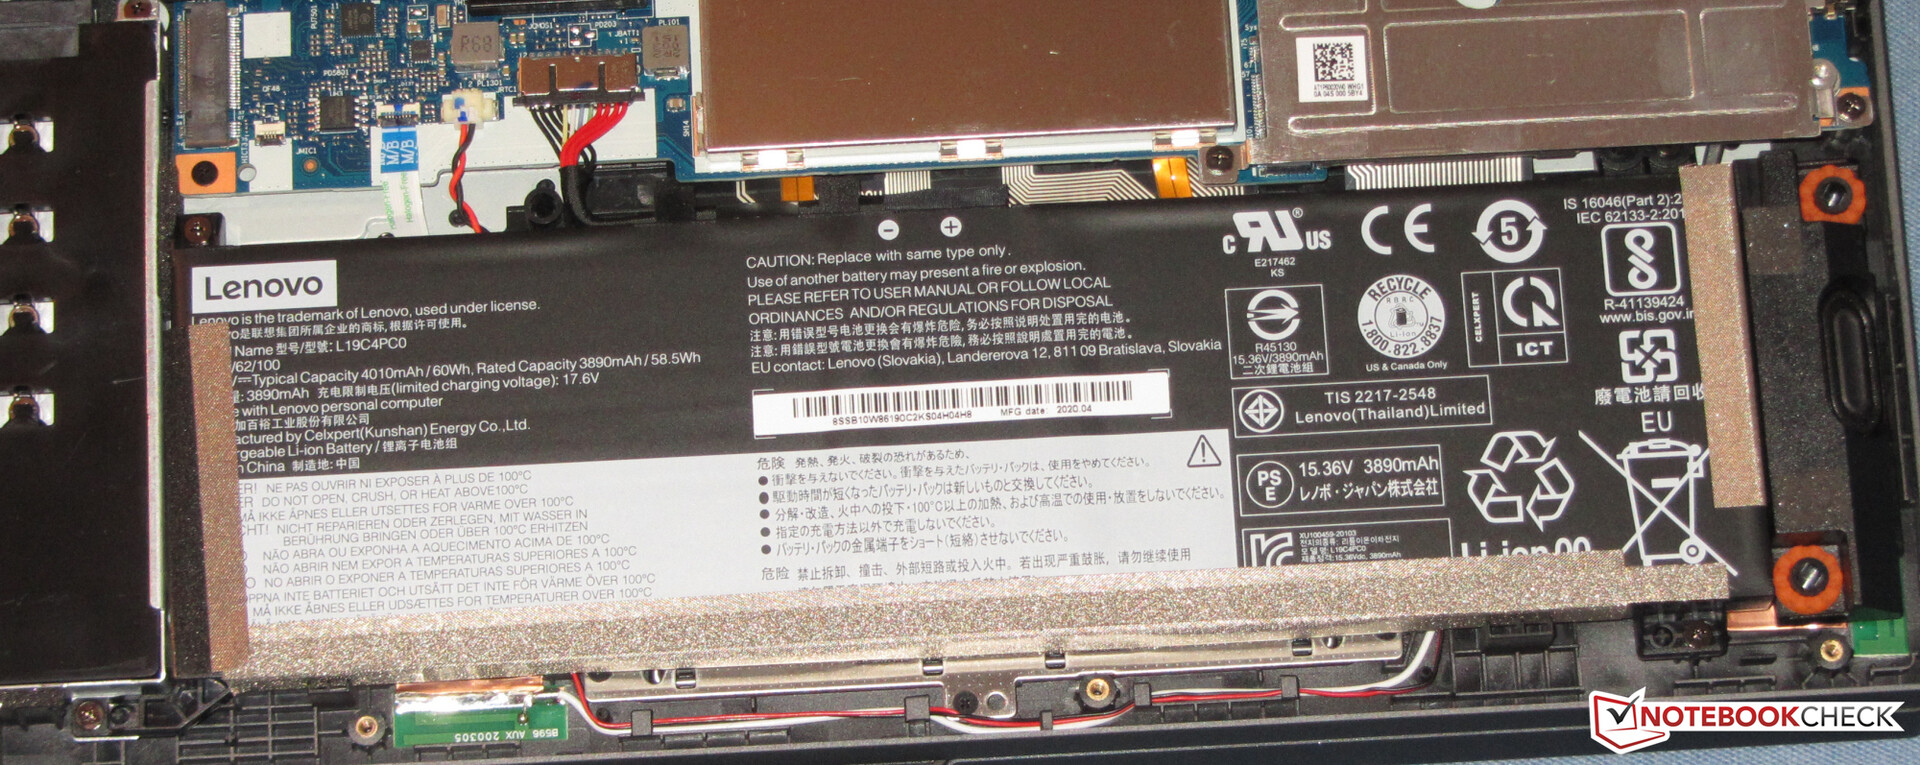
The case of the Legion is entirely made of black plastic (Phantom Black), with a rubberized surface on the top of the base unit. The most noticeable aspect of the device is the way the lid is connected to the base unit, as the hinges have been shifted towards the front by 25 mm (~0.98 in). The battery is firmly built in and there is no maintenance hatch. The notebook will look familiar to users who know the Lenovo gaming series - although there are some differences to the predecessor Legion Y540-15IRH.
The workmanship of the notebook is good. The gap dimensions are regular and we did not notice any overhanging material. Unfortunately, the device is not quite as sturdy as we would have hoped. The base unit can only be warped slightly, but it can be compressed on the right and left side of the keyboard without a lot of pressure. The lid can be warped considerably, which we are rather disappointed by. Pressure on the back of the display causes the image to change in a few areas. The hinges are tight and keep the lid in position while still enabling users to open the device with one hand.

There is not a big difference between the dimensions of the various devices, although the Legion is the heaviest notebook with a weight of 2.5 kg (~5.5 lb).
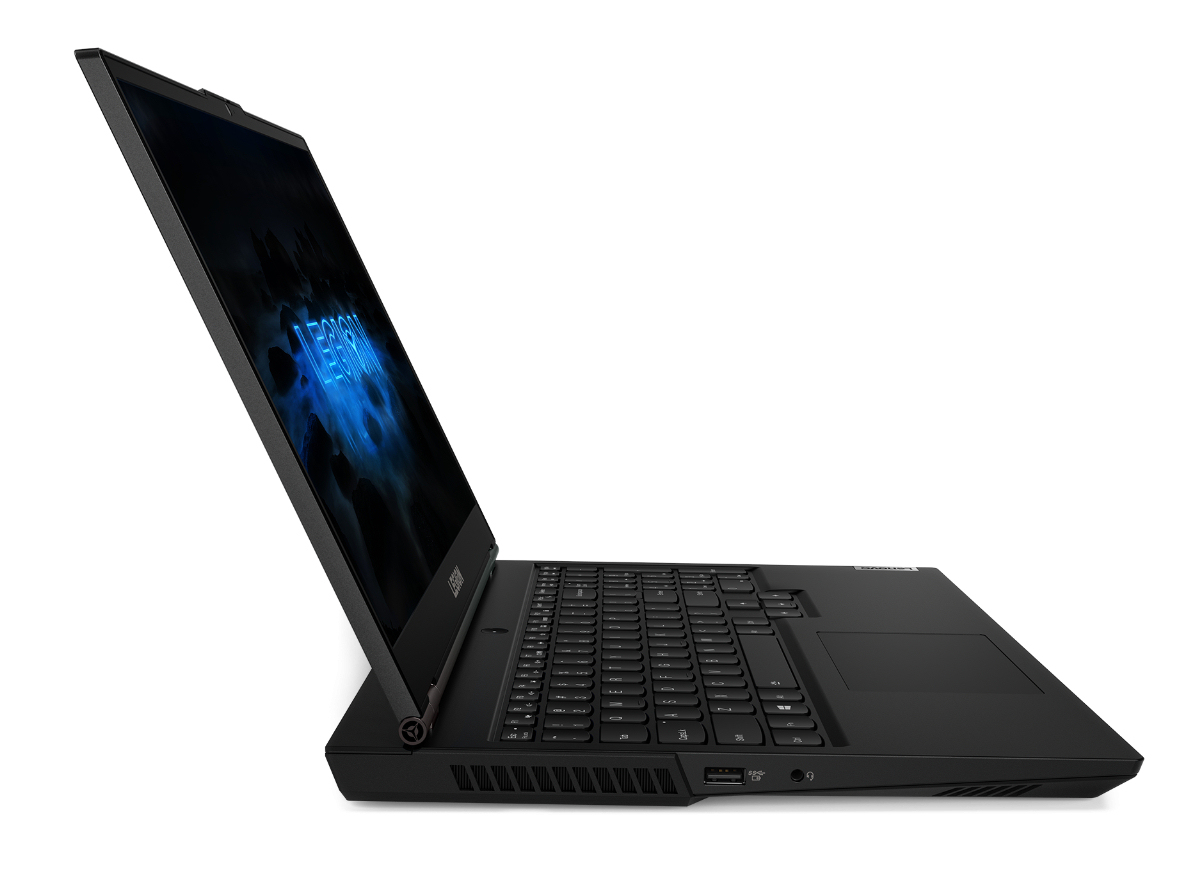
Connectivity - No Thunderbolt 3 for this Lenovo
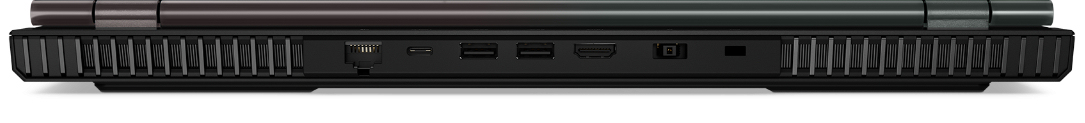
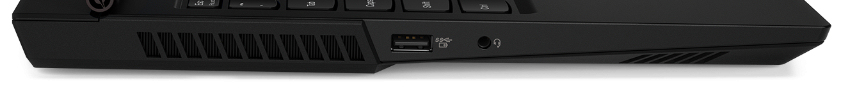
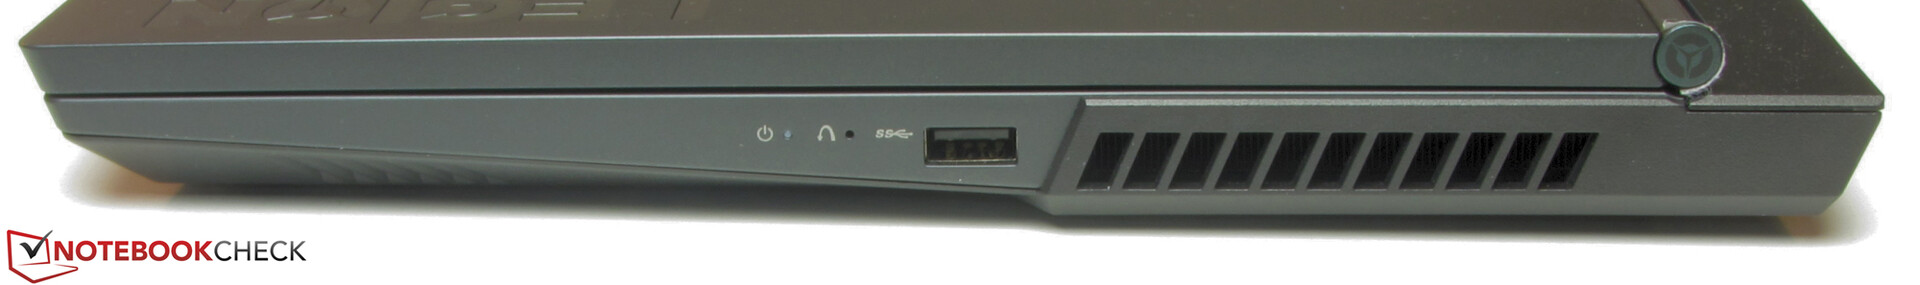
The Lenovo offers no surprises in terms of port selection. The device has four USB ports (3x Type A, 1x Type C), which all support the USB 3.2 Gen 1 standard. In addition, the Type C port supports the DisplayPort via USB-C function (although users will have to buy a separate adapter to make use of it). We would have appreciated a Thunderbolt 3 port and also noticed that the Legion doesn't offer an SD card reader.
The ports are spread across three sides. The ports on the left and right are positioned in the middle, which leaves sufficient free space around the wrist rests.
Communication
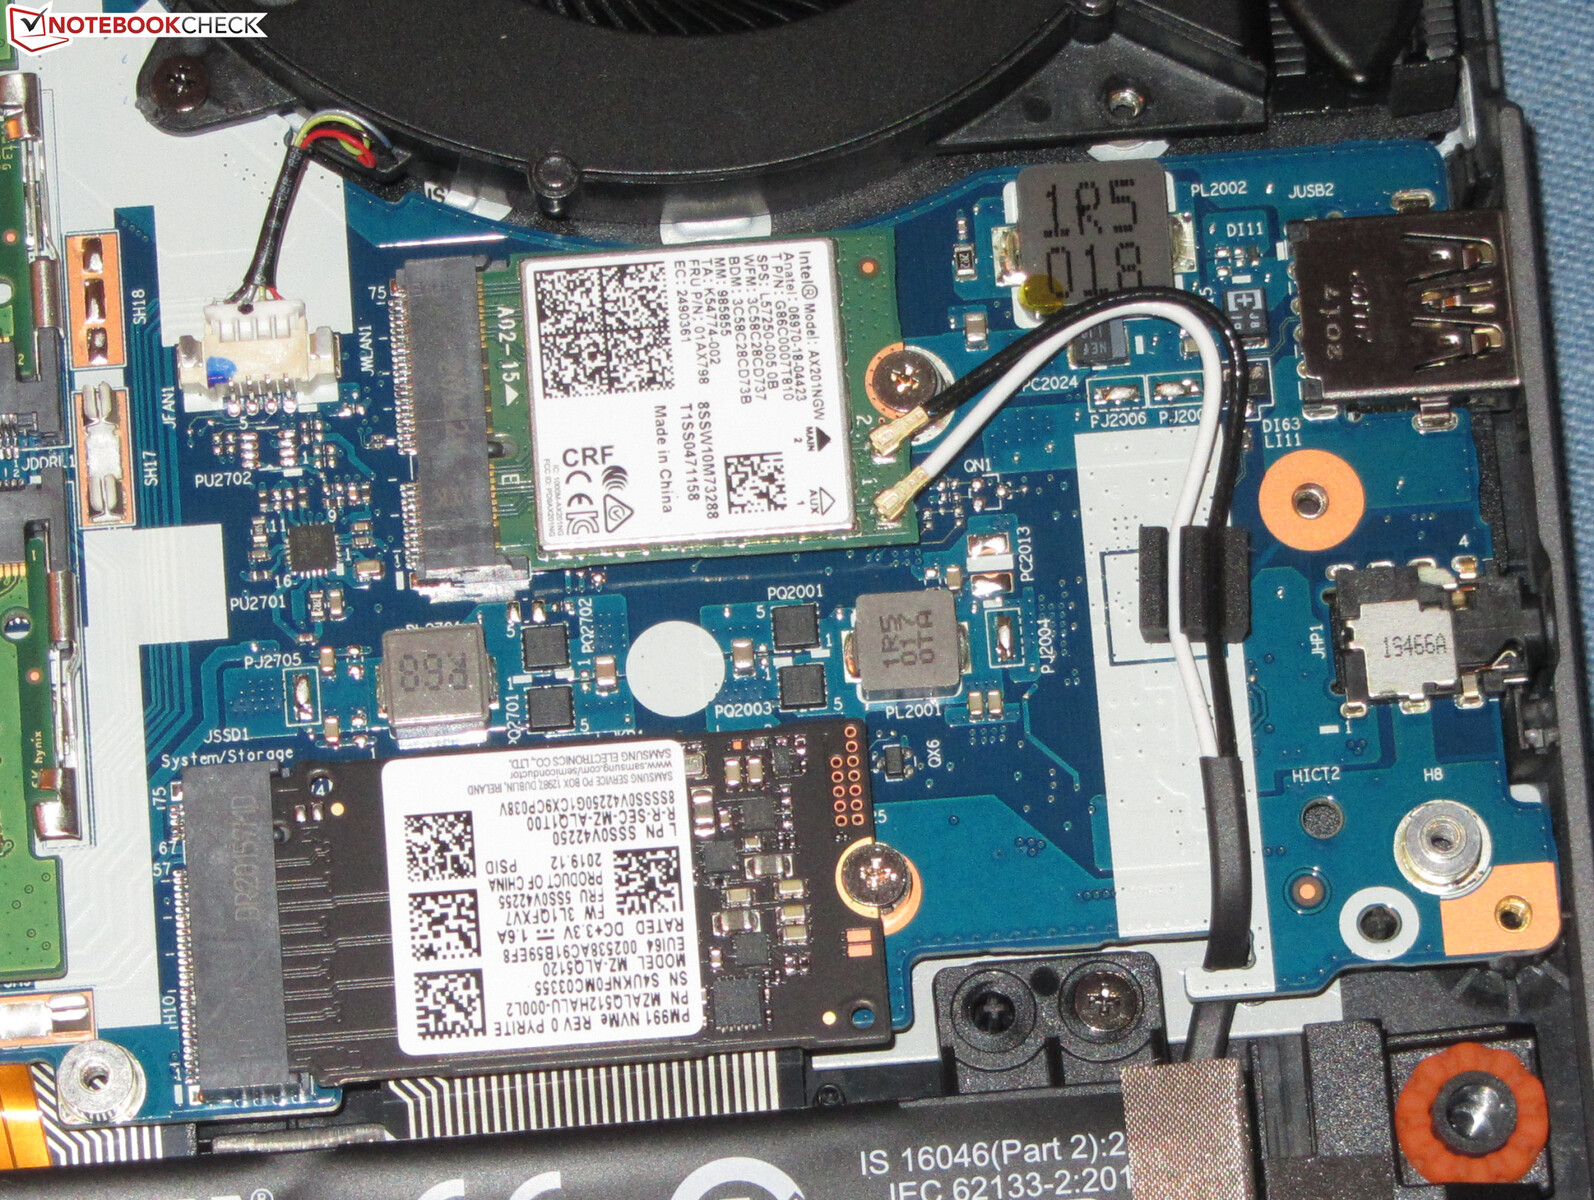
The included Wi-Fi module (Intel Wi-Fi 6 AX201) supports the fast ax standard. We tested it under ideal conditions (no other Wi-Fi devices in the vicinity, short distance between notebook and server PC) and the transfer rates were very good. The Legion also has a Gigabit Ethernet controller from Realtek's RTL 8168/8111 series, which works reliably.
Webcam
The webcam (0.9 MP) of the Legion 5 creates washed-out images with a maximum resolution of 1280x720 pixels. Colors are not displayed particularly accurately either - we measured a Delta E deviation of 25, which is very far from the ideal of below 3.


Accessories
The notebook is delivered with the usual paperwork: a quick start guide and warranty information.
Maintenance
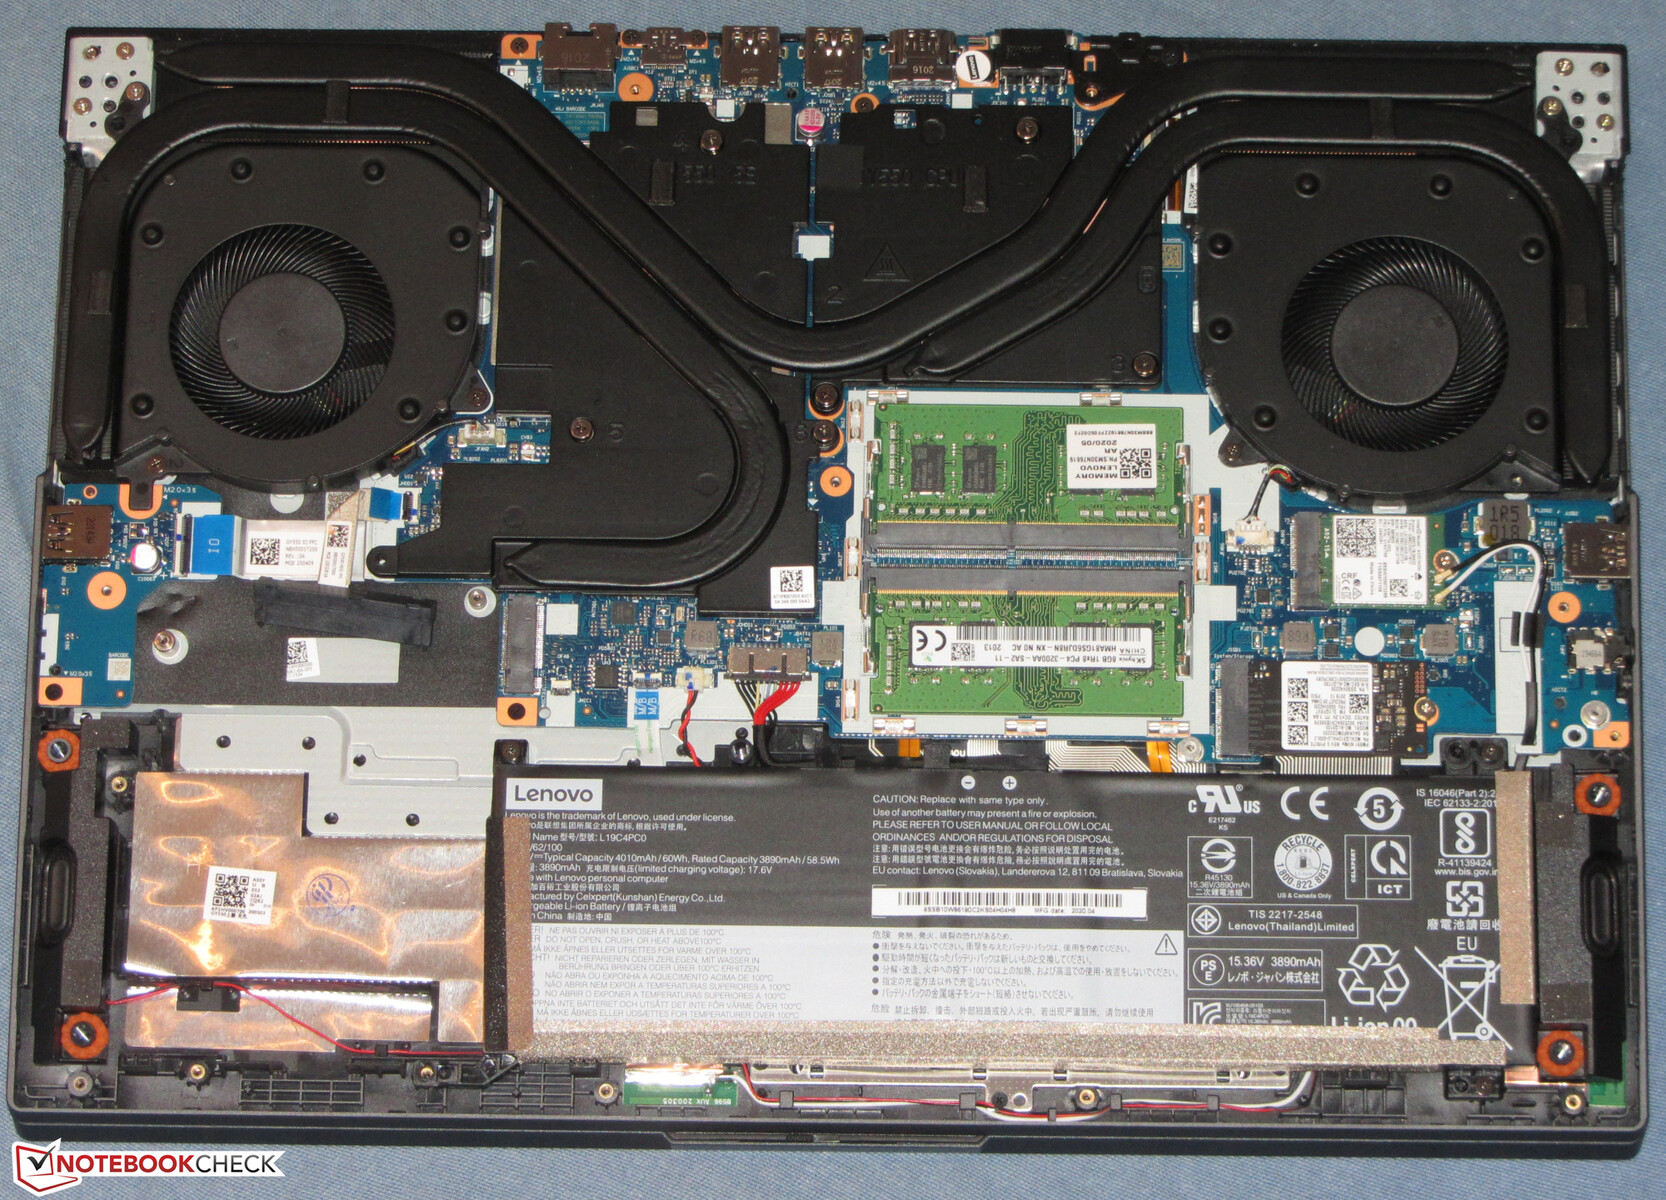
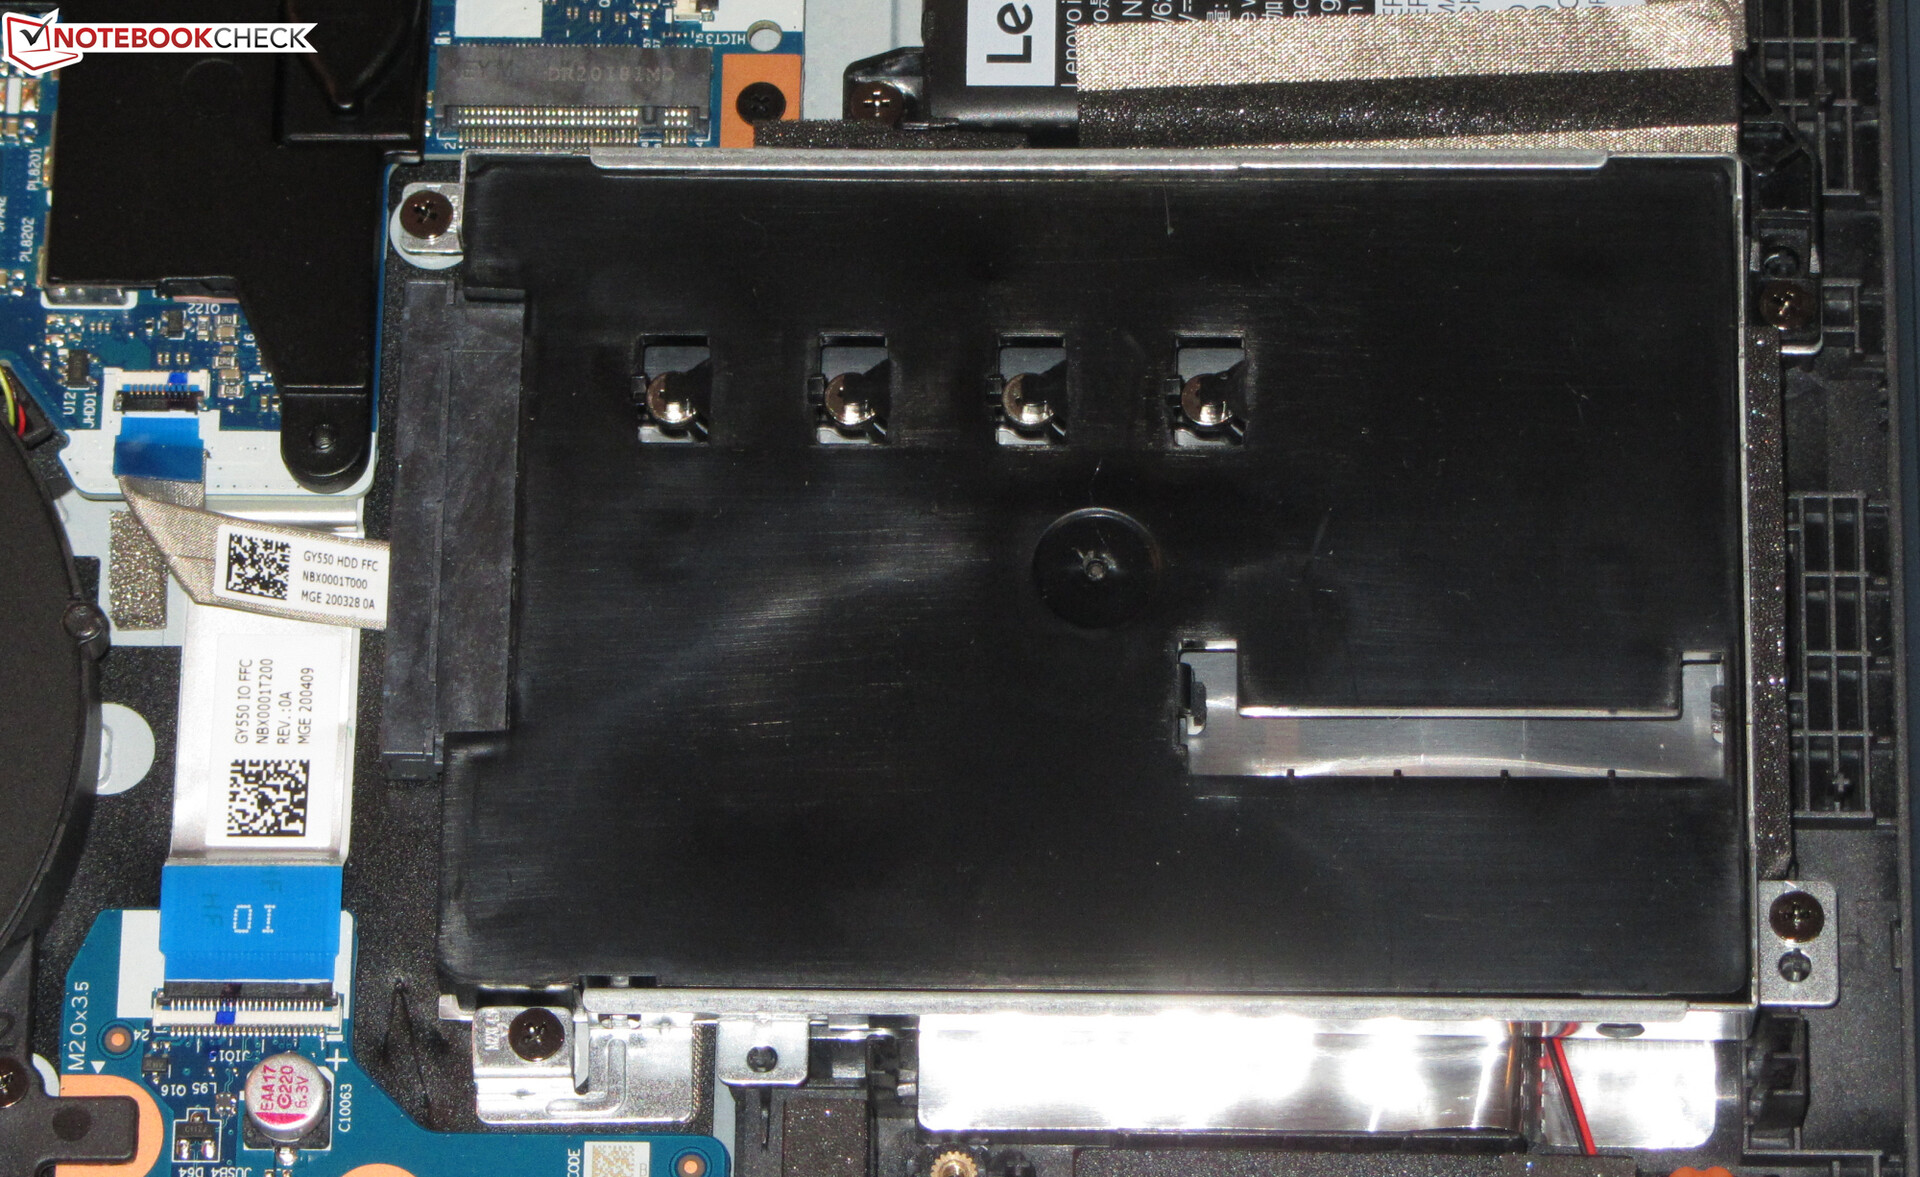
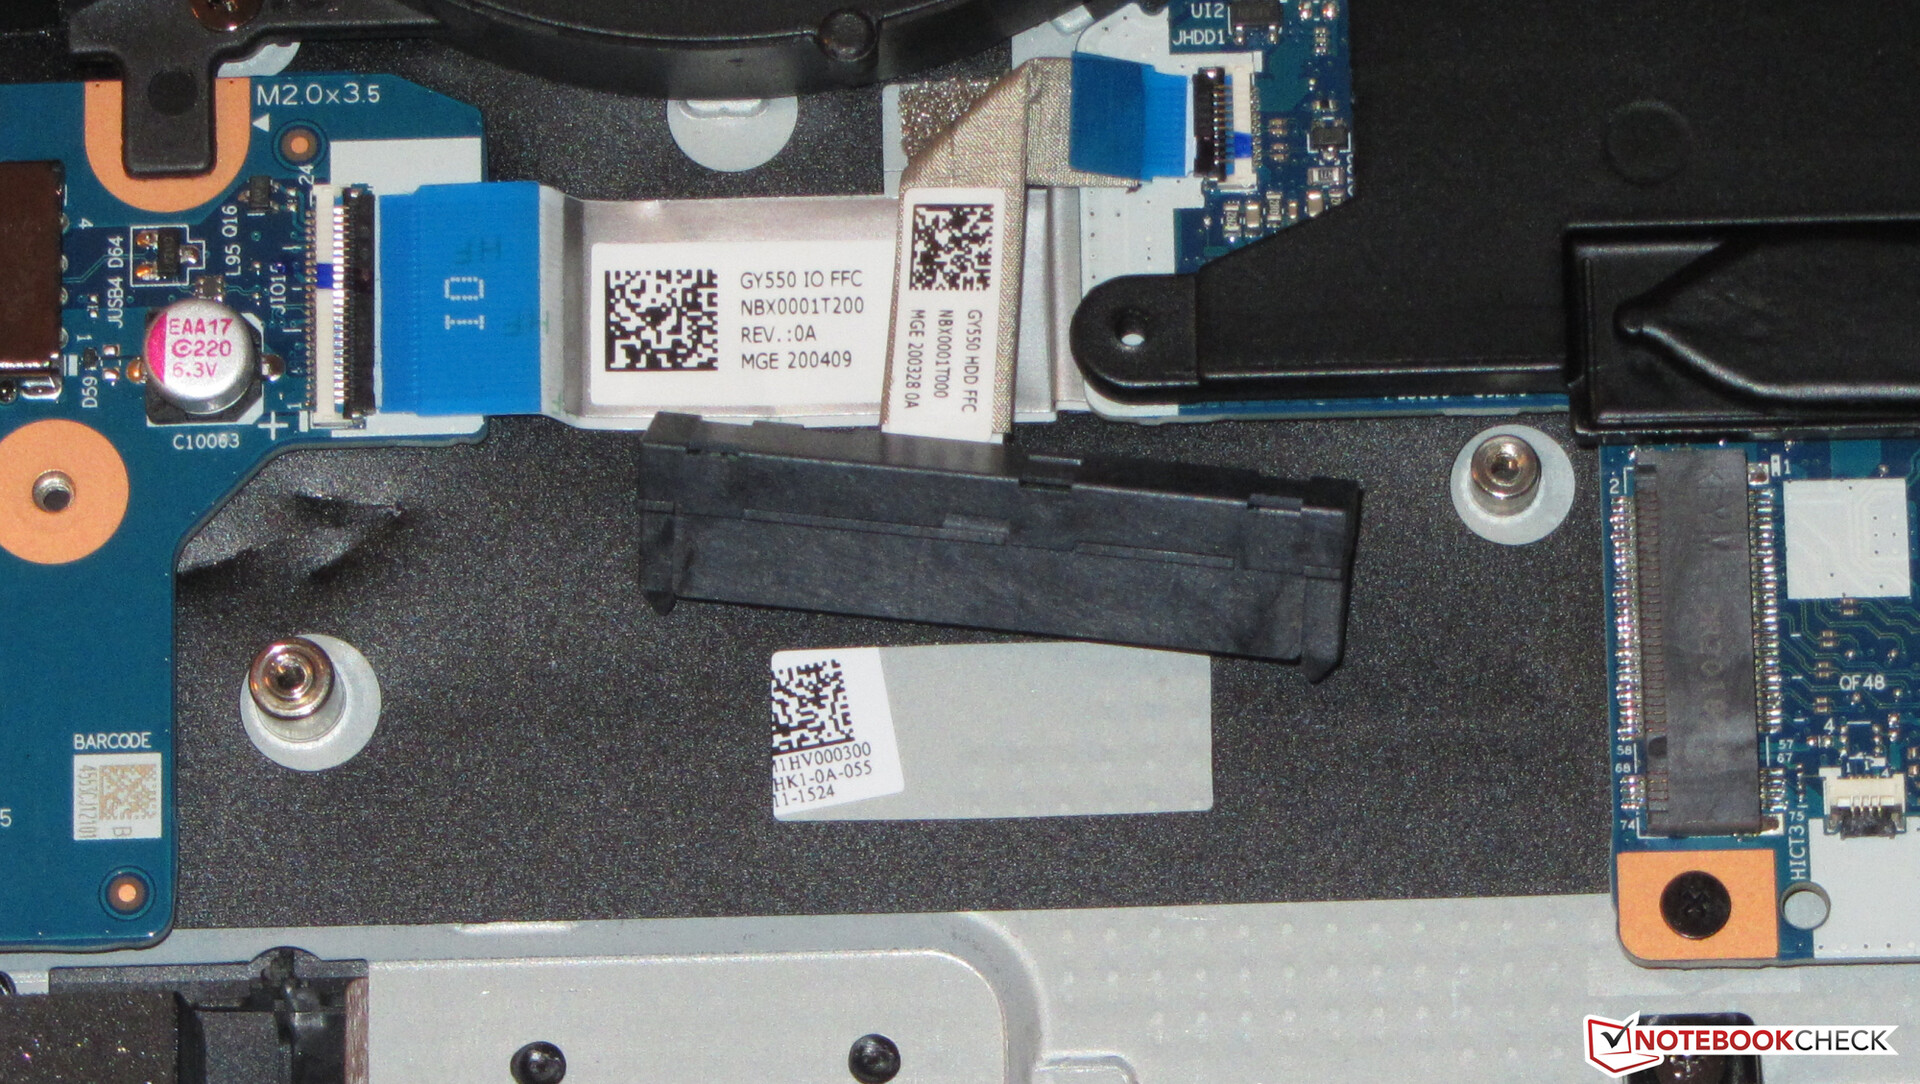
The Lenovo notebook does not have a maintenance hatch. Users will have to remove the base cover to get to the insides, which can be done by removing all the screws and lifting the cover off with the help of a spatula or a similar flat tool. This is more difficult on the back of the base unit - you will have to work carefully.
Warranty
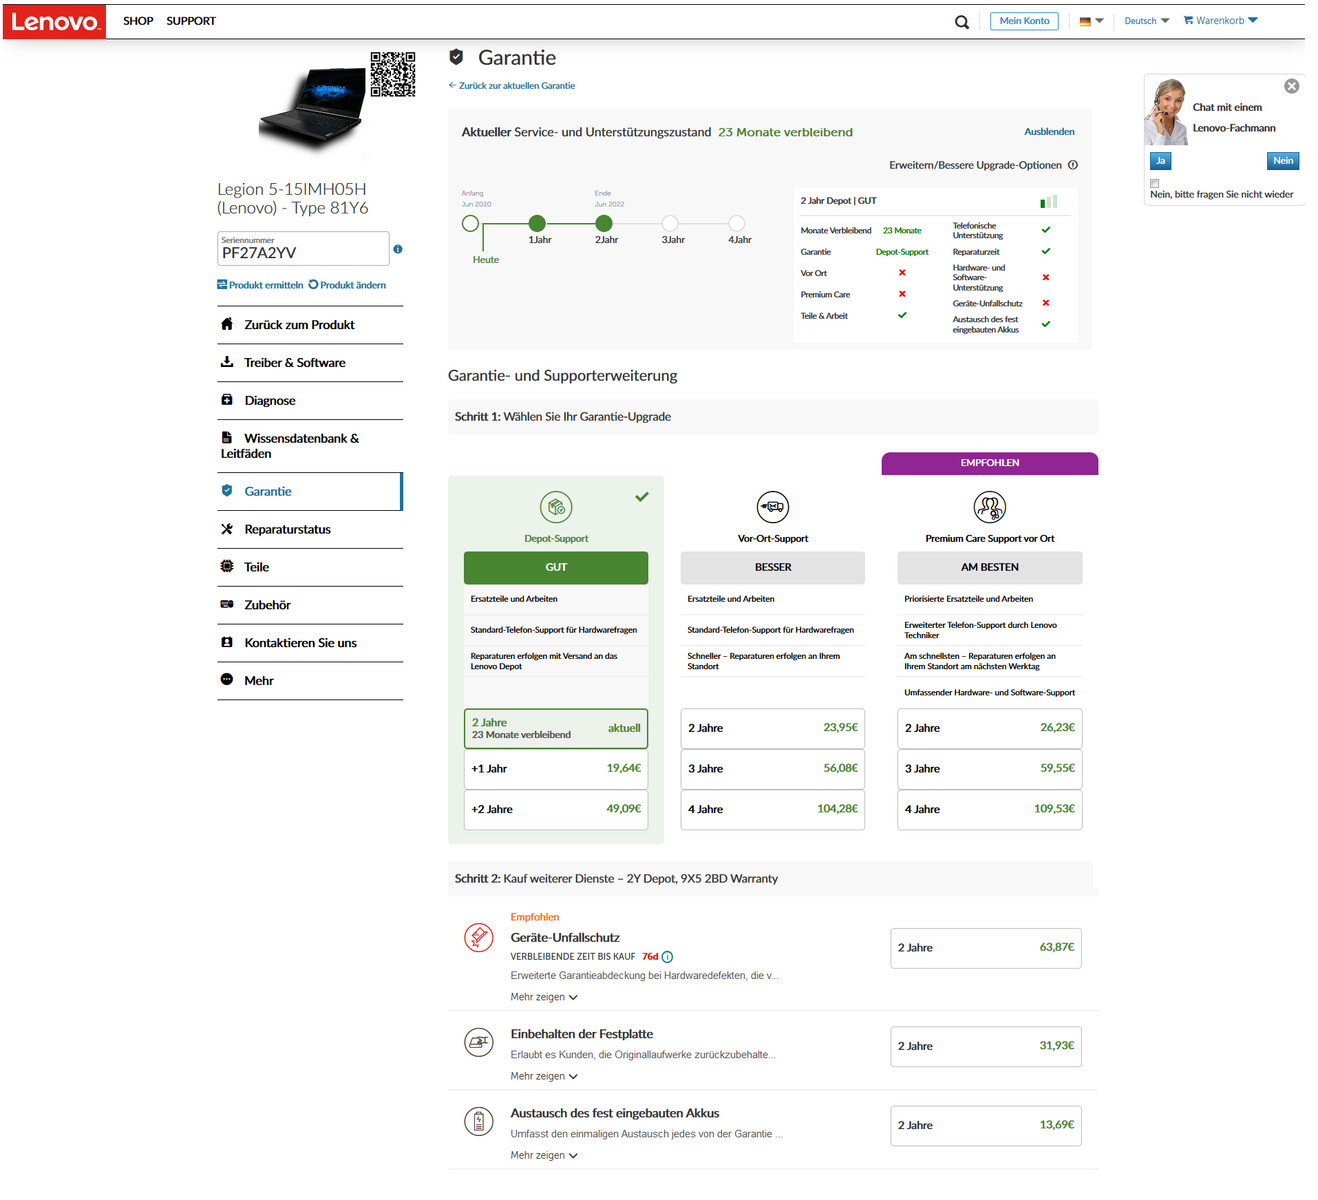
Lenovo has equipped its 15.6-inch device with a two-year warranty. There are various warranty extensions available. A four year on-site warranty costs $101, for example.
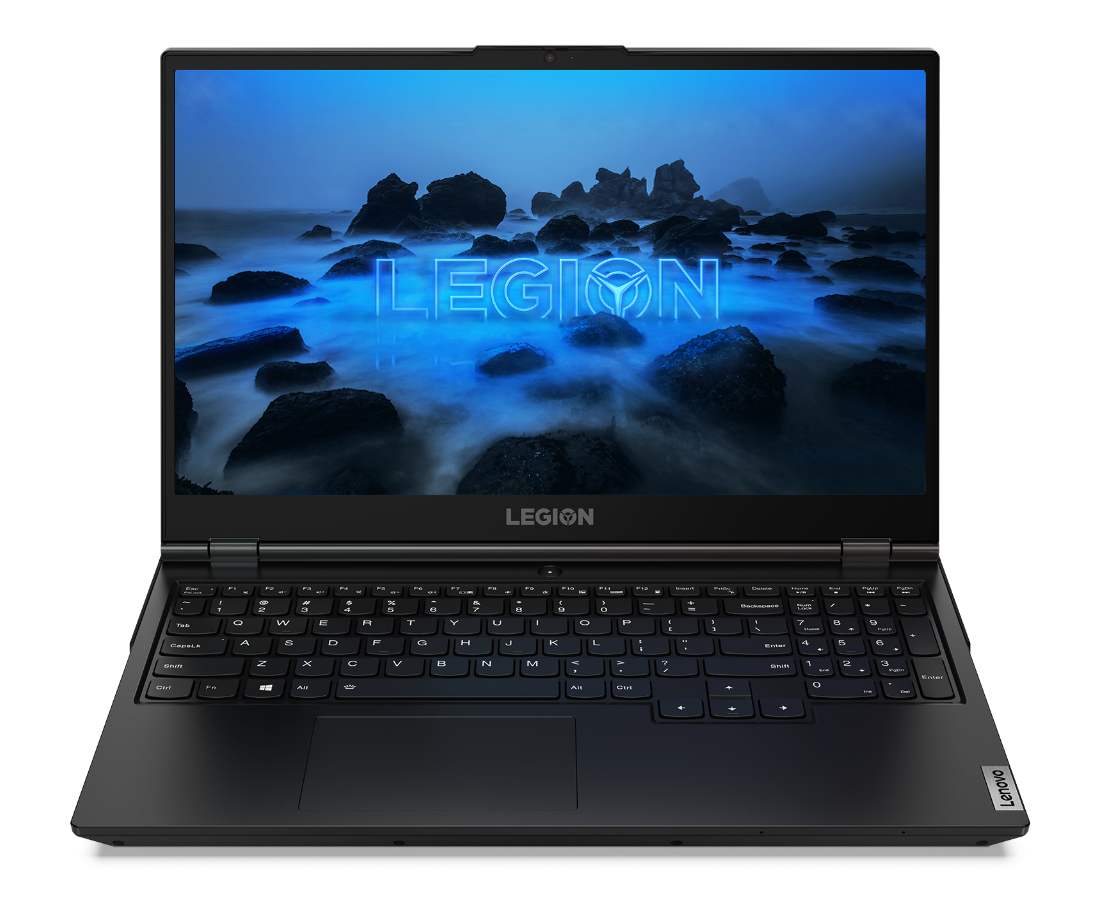
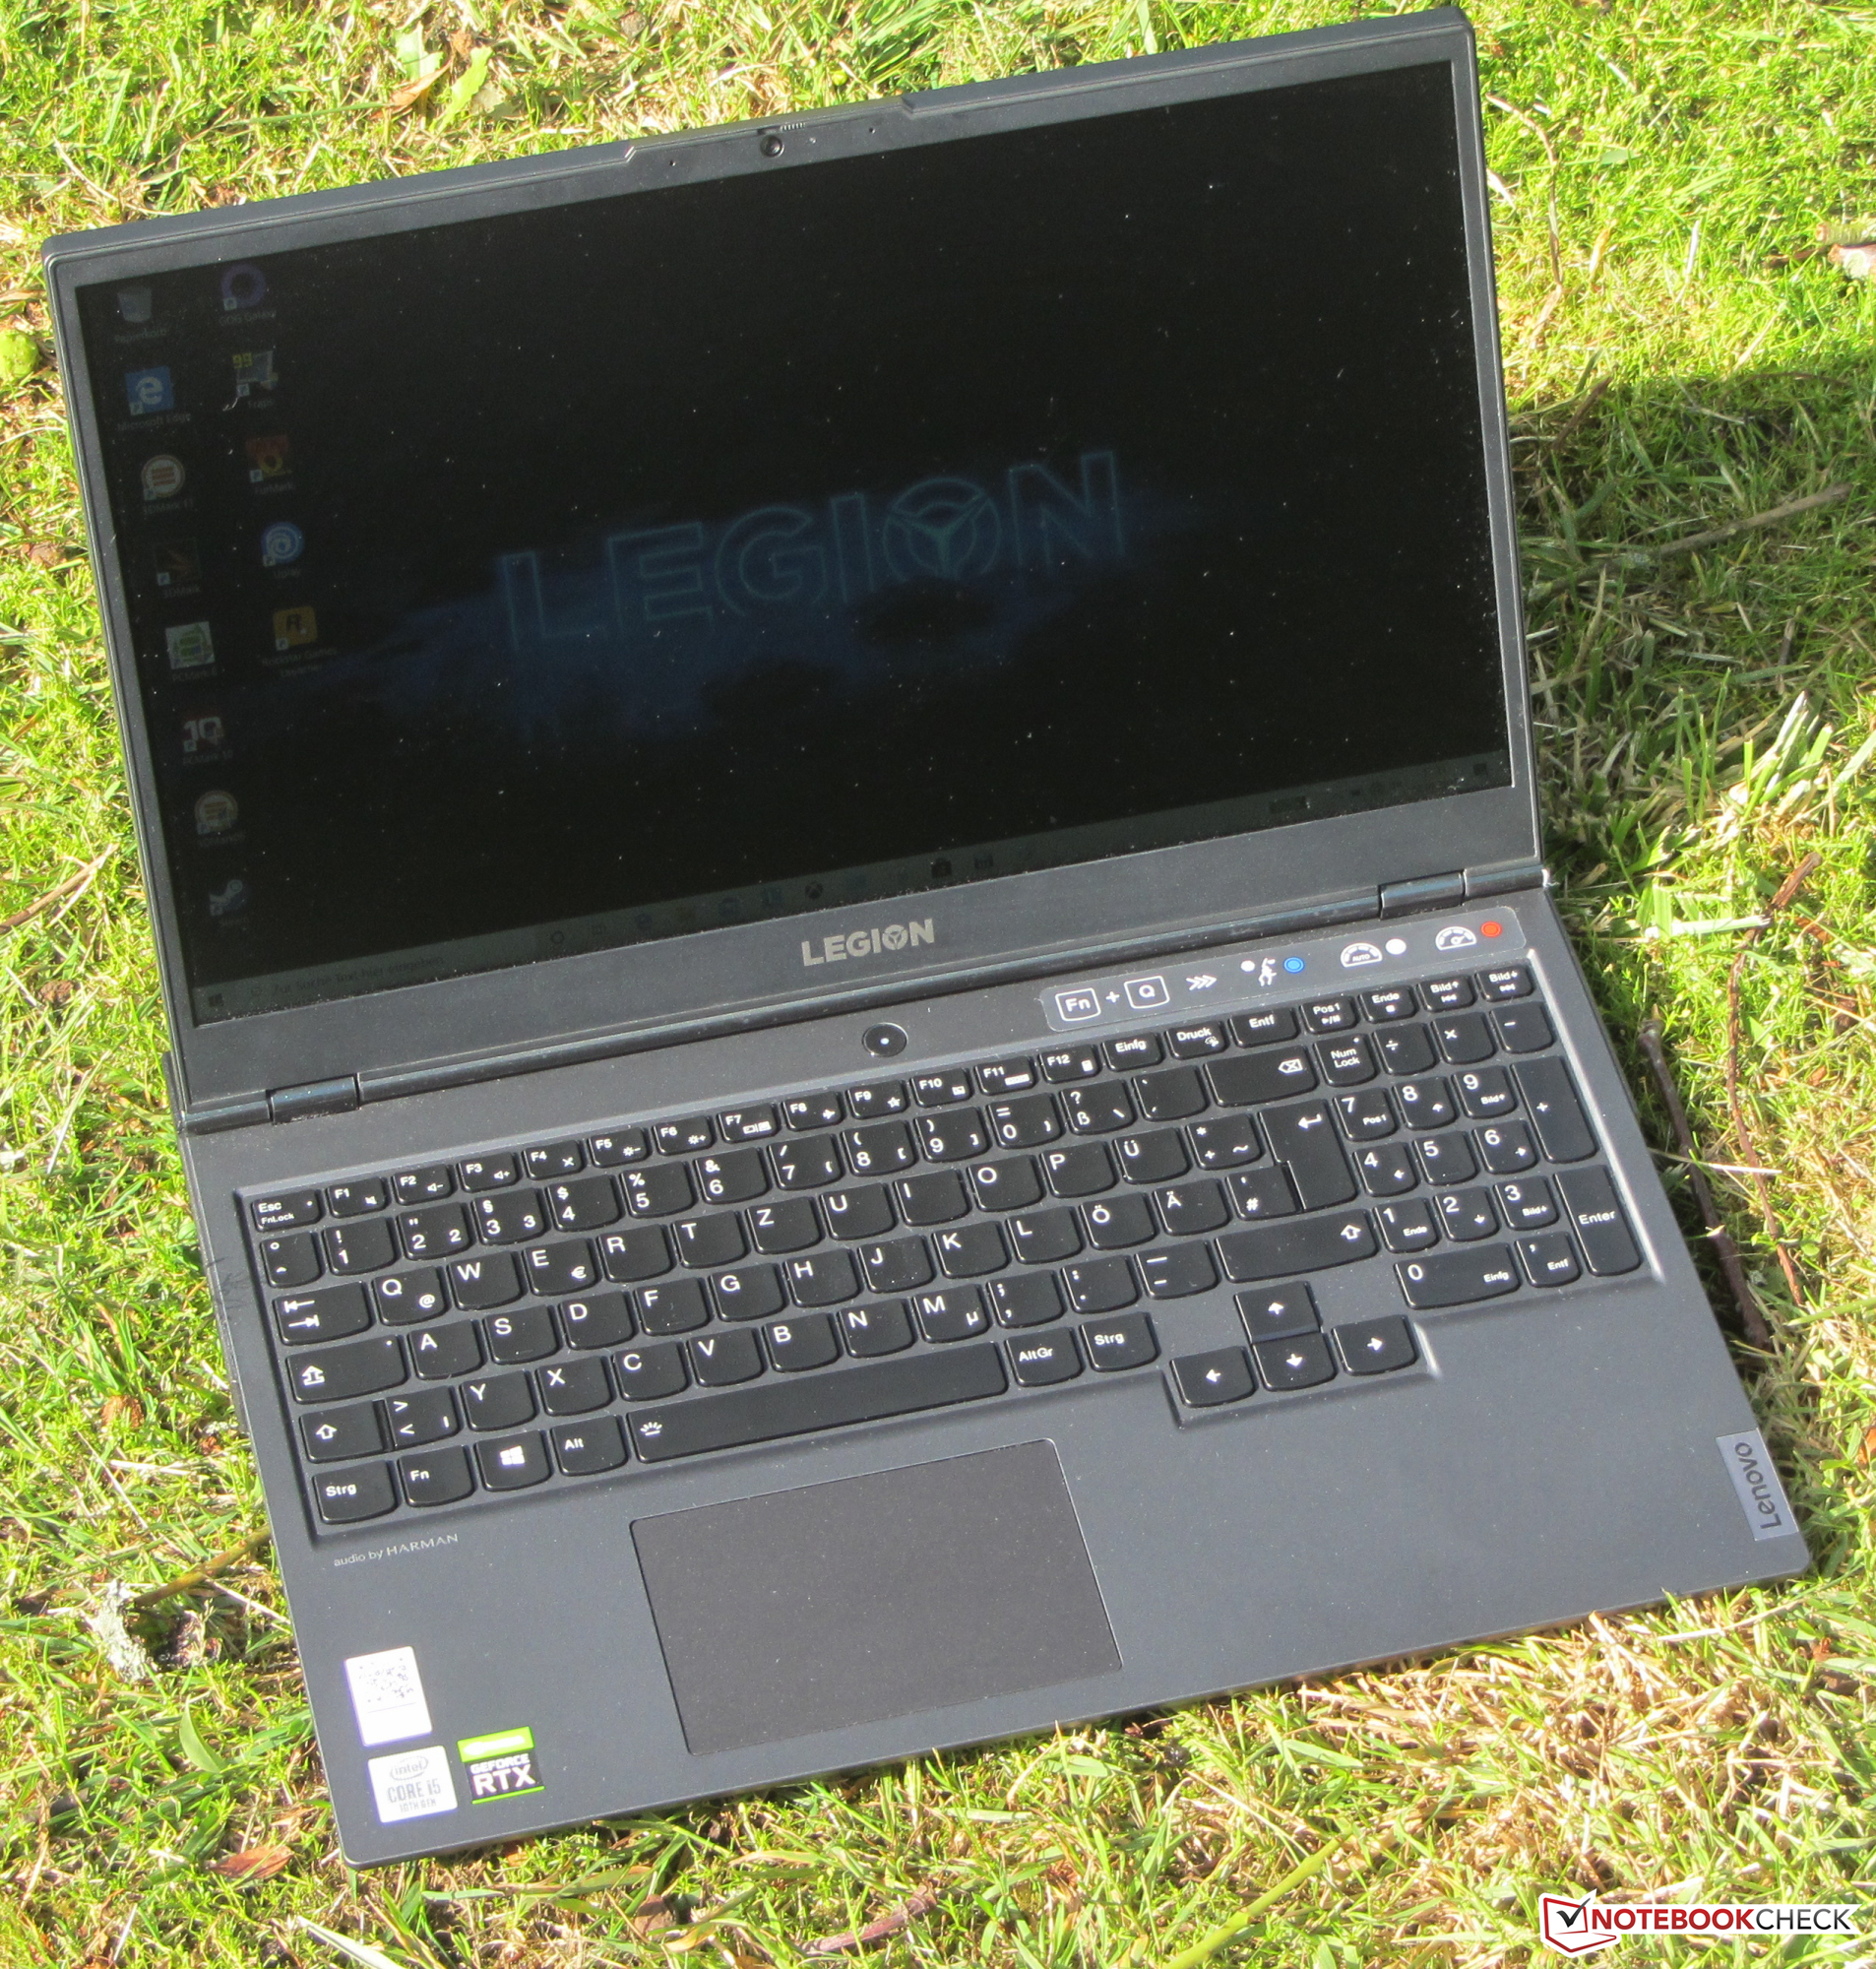
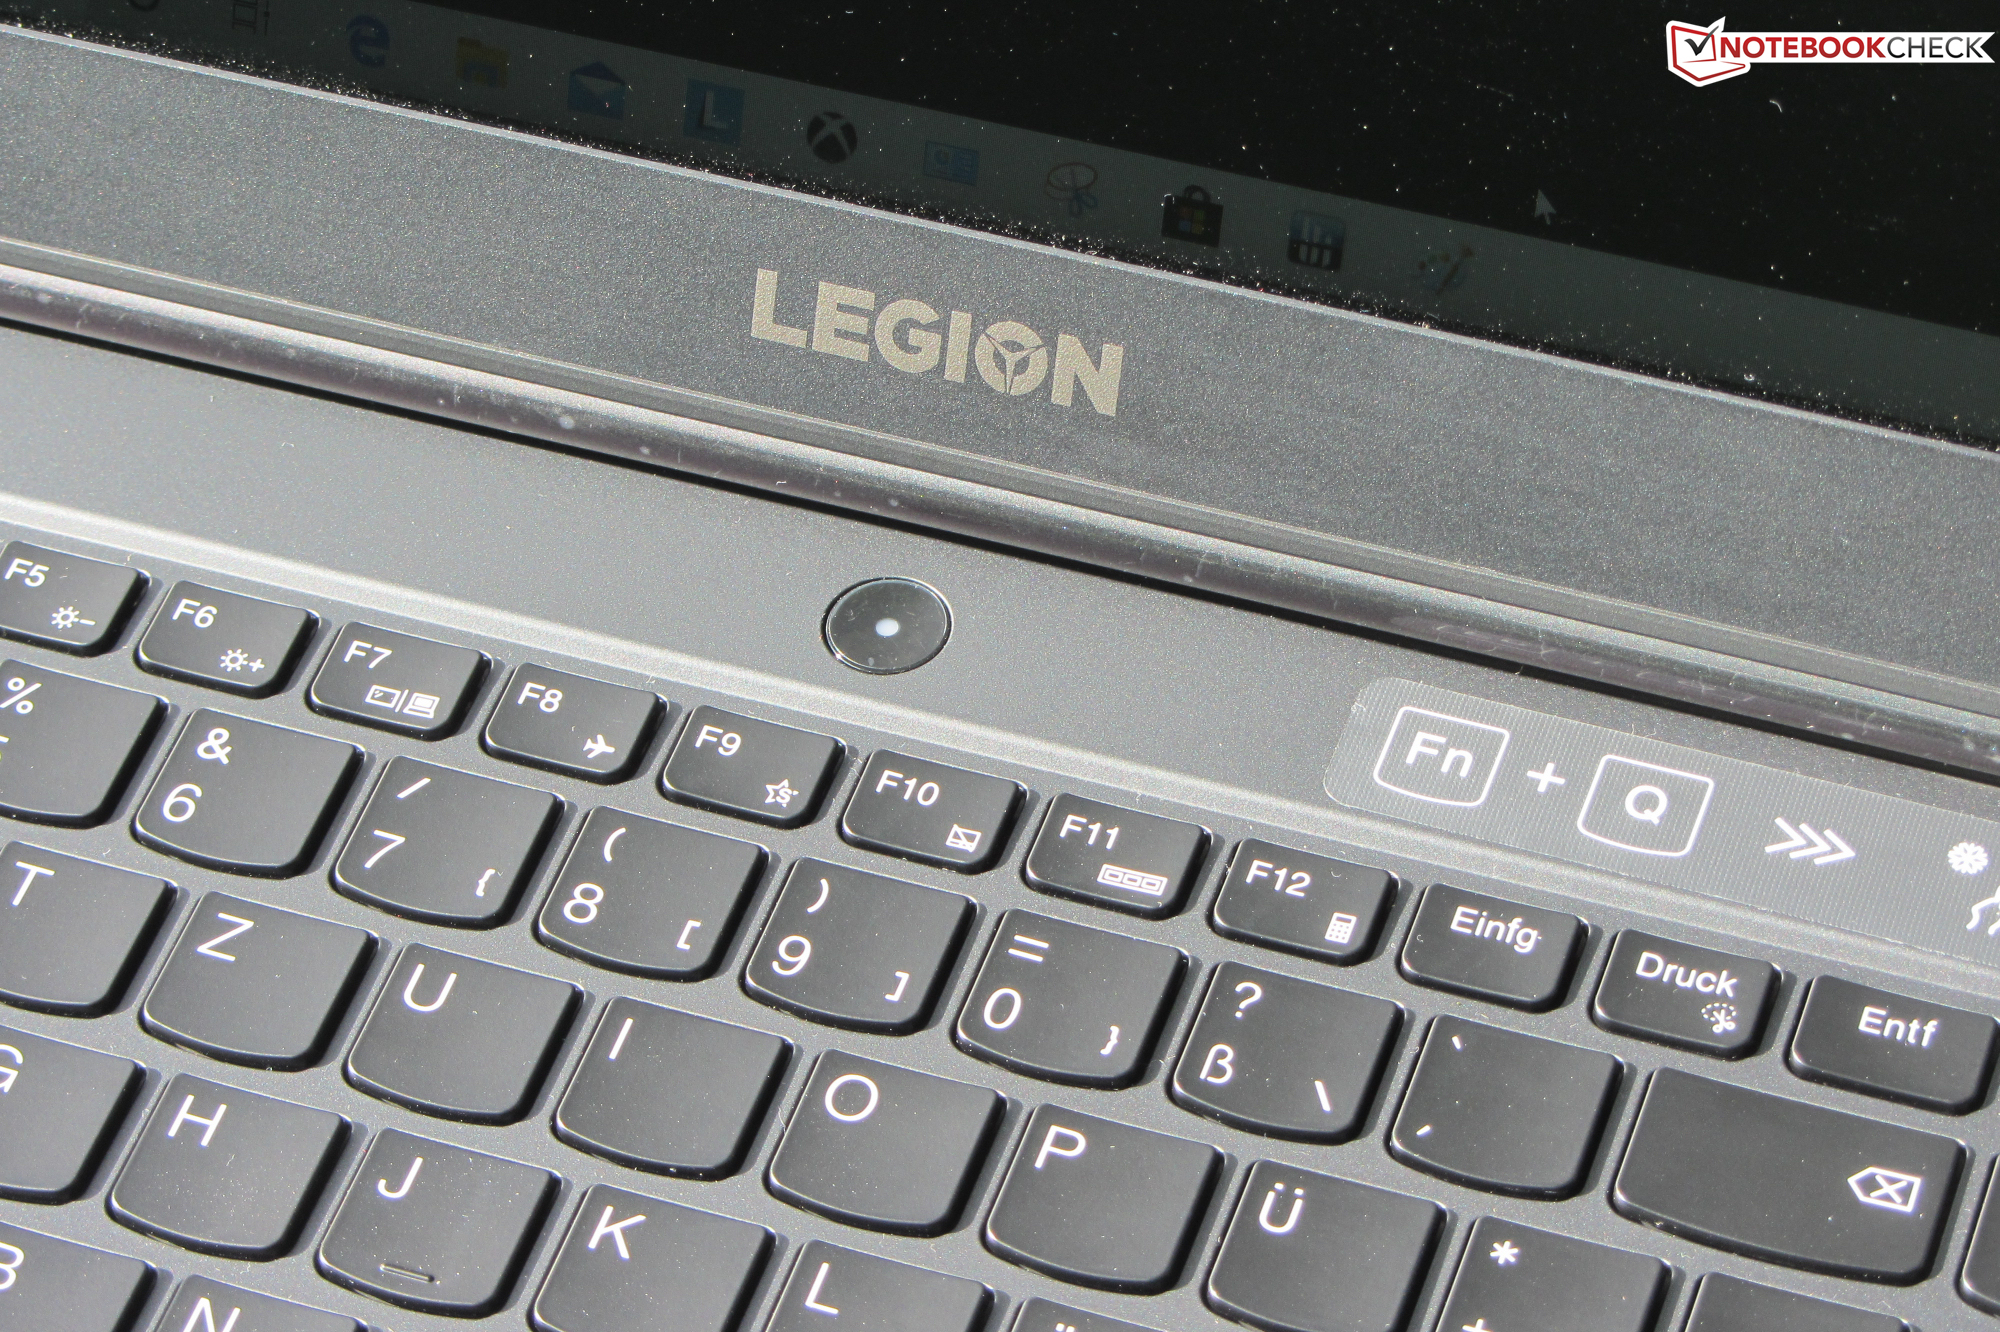
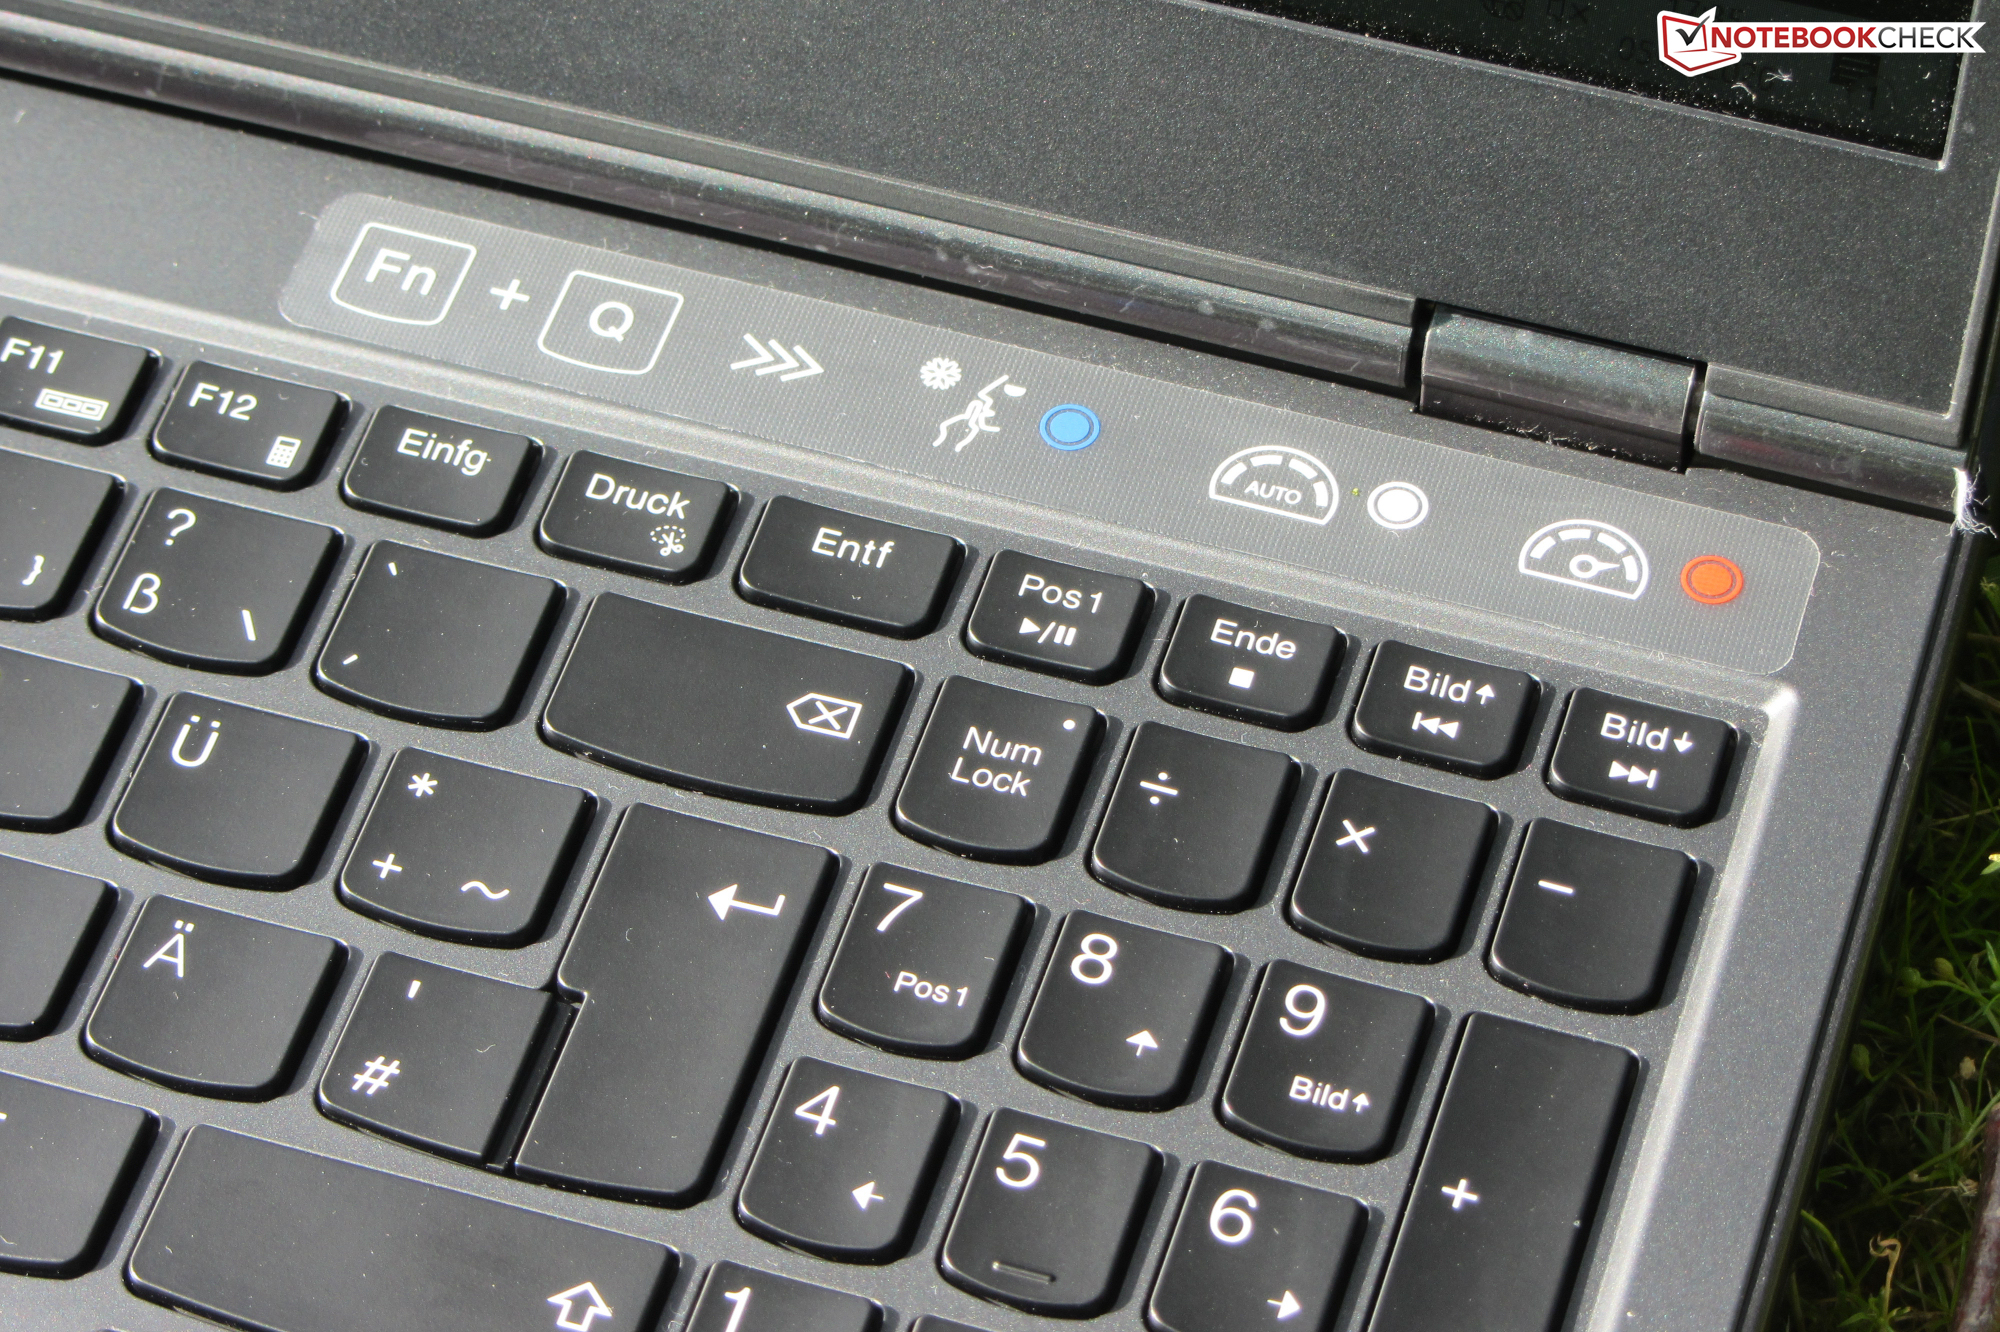
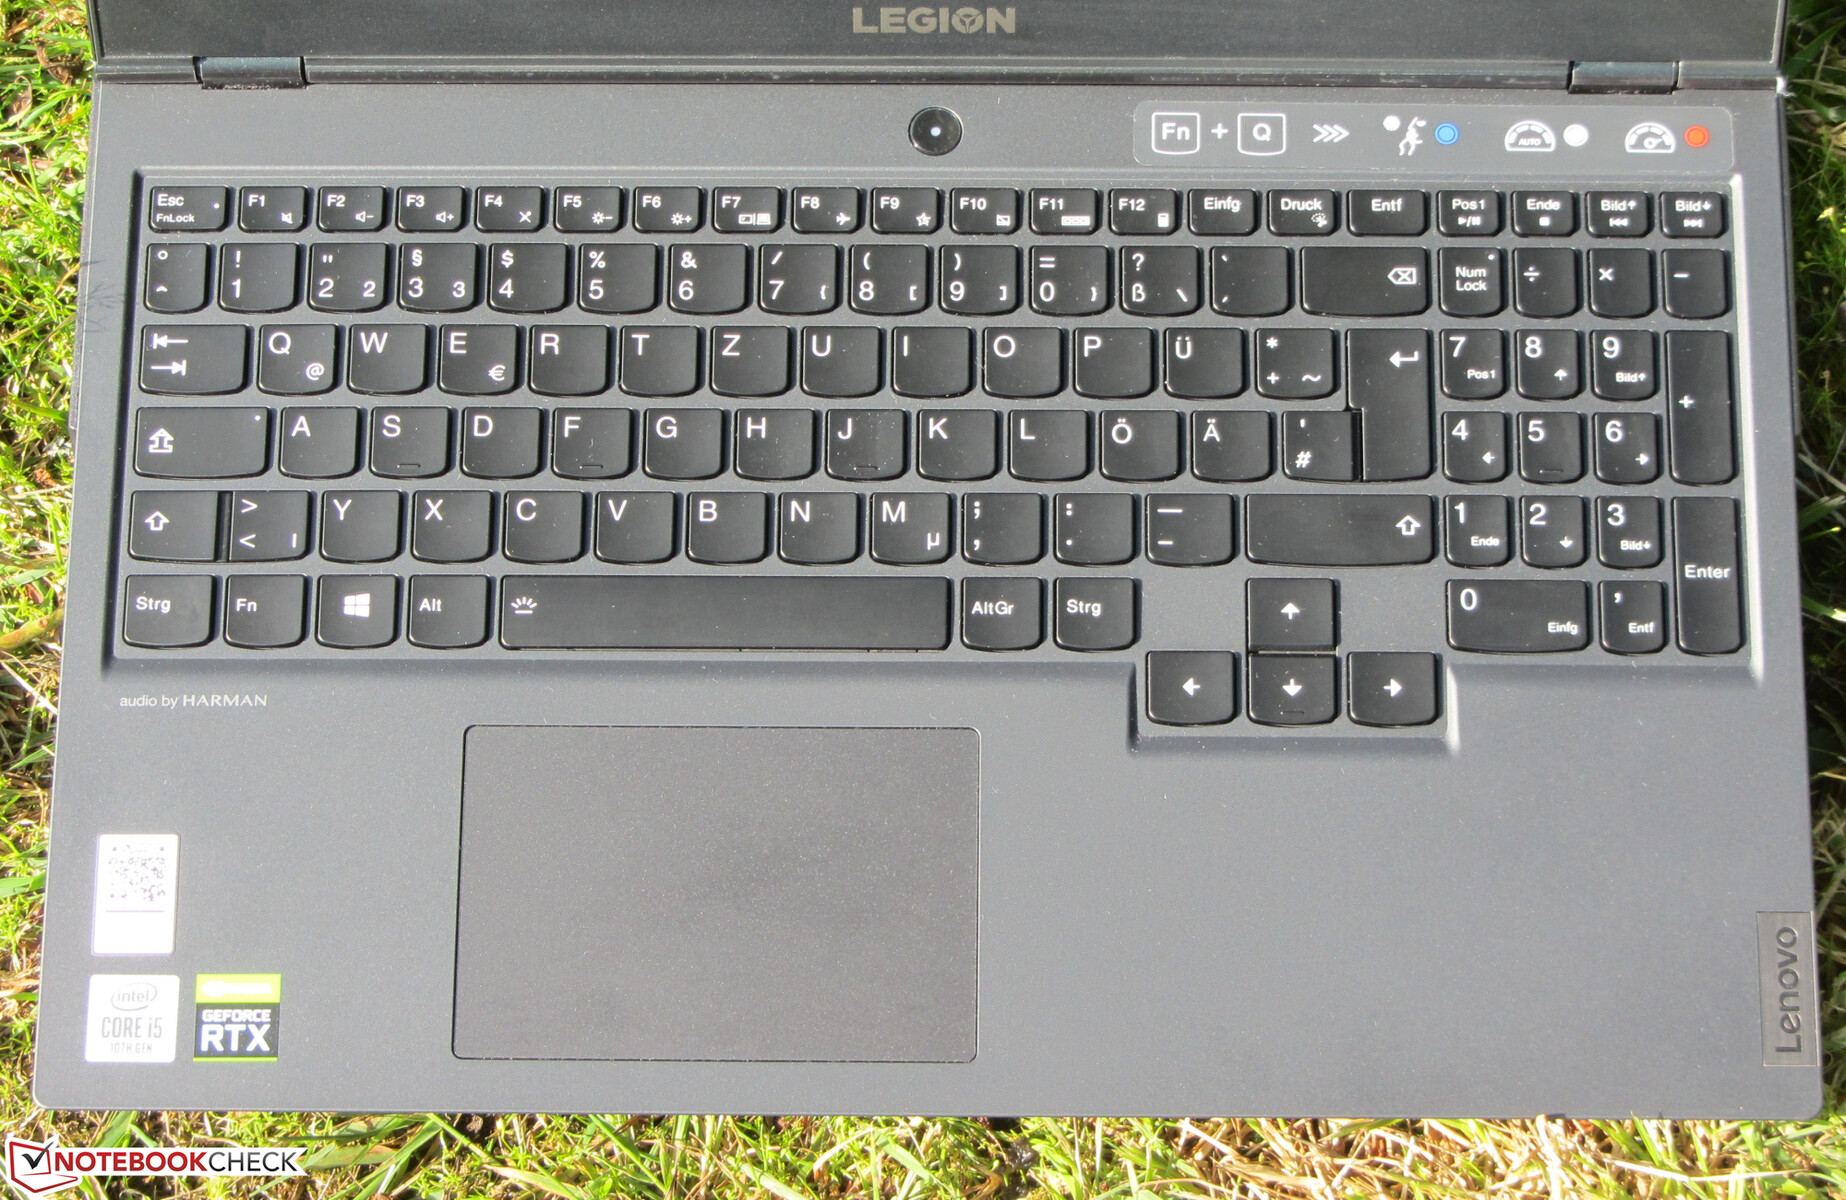
Input Devices - crisp keyboard with backlighting
Keyboard
The Legion is equipped with a backlit chicklet keyboard. Its concave keys have short travel and a clear pressure point. We were also pleased with the crisp actuation. The keyboard hardly gives way while typing and this certainly wasn't an issue. The backlighting (two brightness levels) can be controlled via a function key. Overall, this is a good keyboard suitable for everyday use.
Touchpad
The multi-touch ClickPad takes up around 10.6 x 7 cm (~4.17 x 2.75 in). It therefore offers sufficient space for gesture control. The smooth surface of the pad makes it easy for fingers to glide over. It responds to inputs nicely - even in the corners - has short travel and a clear (and audible) pressure point.
Display - 120-Hz IPS
The 15.6-inch panel in the Legion has a native resolution of 1920x1080 pixels. While it has a good contrast ratio (1158:1), its maximum brightness is too low at 277.3 cd/m². We usually consider values above 300 cd/m² and 1000:1 as good. The response rate is fine for a 120-Hz panel. We were pleased to see no PWM on this screen.


| |||||||||||||||||||||||||
Brightness Distribution: 77 %
Center on Battery: 299 cd/m²
Contrast: 1158:1 (Black: 0.26 cd/m²)
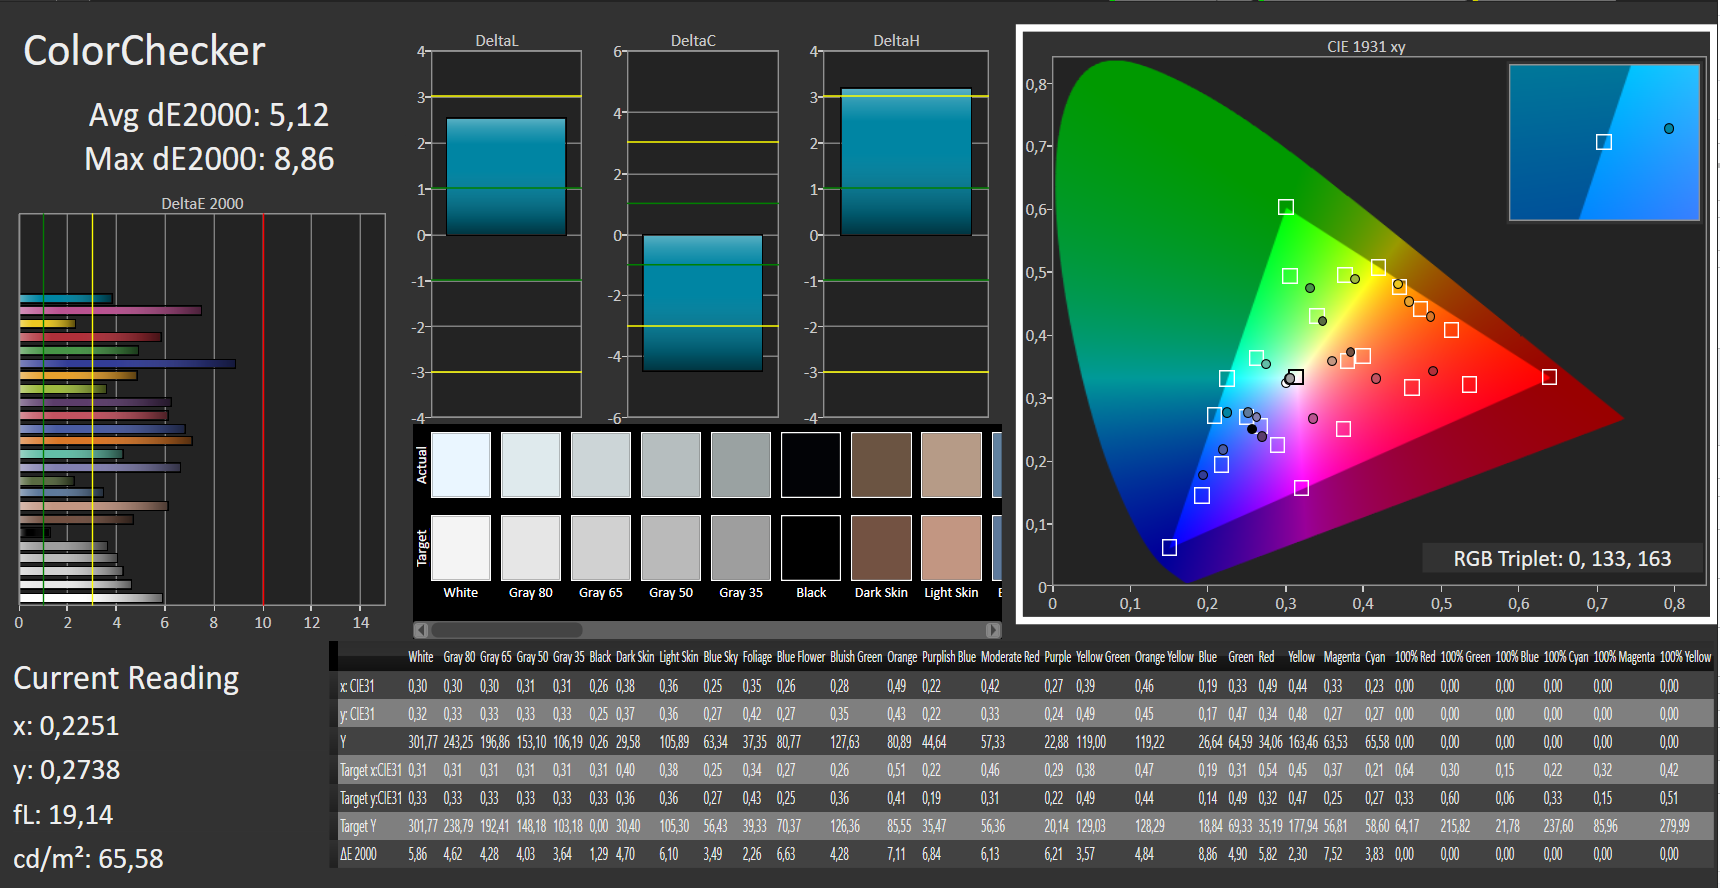
ΔE ColorChecker Calman: 5.12 | ∀{0.5-29.43 Ø4.71}
calibrated: 4.88
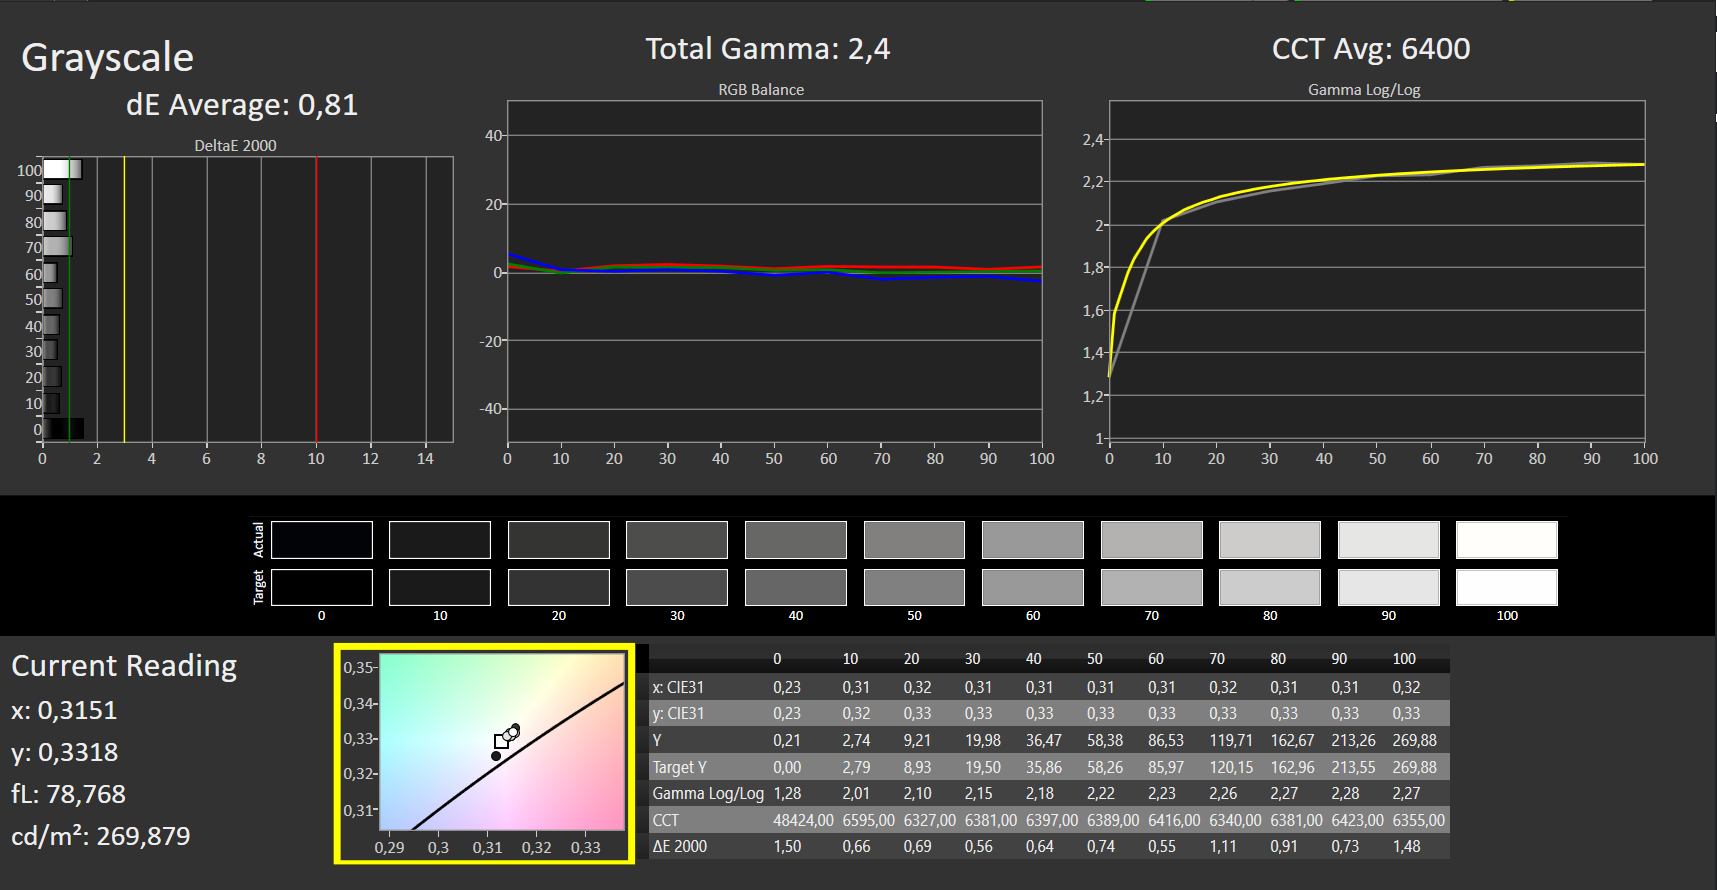
ΔE Greyscale Calman: 3.47 | ∀{0.09-98 Ø4.96}
57% sRGB (Argyll 1.6.3 3D)
37% AdobeRGB 1998 (Argyll 1.6.3 3D)
40.09% AdobeRGB 1998 (Argyll 3D)
57.8% sRGB (Argyll 3D)
38.8% Display P3 (Argyll 3D)
Gamma: 2.37
CCT: 7062 K
| Lenovo Legion 5 15IMH05H BOE CQ NV156FHM-NX1, IPS, 1920x1080, 15.6" | Asus TUF Gaming A15 FA506IV-HN172 LM156LF-2F01, IPS, 1920x1080, 15.6" | Dell G5 15 SE 5505 P89F BOE NV156FH, WVA, 1920x1080, 15.6" | MSI Alpha 15 A3DDK-034 AU Optronics B156HAN08.0 (AUO80ED), IPS, 1920x1080, 15.6" | Lenovo Legion Y540-15IRH BOE NV156FHM-N4G (BOE084D), IPS, 1920x1080, 15.6" | |
|---|---|---|---|---|---|
| Display | 0% | 59% | 65% | 63% | |
| Display P3 Coverage (%) | 38.8 | 38.92 0% | 63 62% | 66.4 71% | 64.5 66% |
| sRGB Coverage (%) | 57.8 | 58.5 1% | 90.1 56% | 91 57% | 91.6 58% |
| AdobeRGB 1998 Coverage (%) | 40.09 | 40.22 0% | 64.1 60% | 66.6 66% | 65.9 64% |
| Response Times | -36% | 29% | 56% | 54% | |
| Response Time Grey 50% / Grey 80% * (ms) | 26 ? | 34 ? -31% | 20.4 ? 22% | 7 ? 73% | 8.8 ? 66% |
| Response Time Black / White * (ms) | 17 ? | 24 ? -41% | 10.8 ? 36% | 10.4 ? 39% | 10 ? 41% |
| PWM Frequency (Hz) | 198.4 ? | ||||
| Screen | -4% | 18% | 14% | 20% | |
| Brightness middle (cd/m²) | 301 | 280 -7% | 292 -3% | 310 3% | 284 -6% |
| Brightness (cd/m²) | 277 | 254 -8% | 290 5% | 310 12% | 277 0% |
| Brightness Distribution (%) | 77 | 88 14% | 77 0% | 86 12% | 87 13% |
| Black Level * (cd/m²) | 0.26 | 0.15 42% | 0.27 -4% | 0.29 -12% | 0.3 -15% |
| Contrast (:1) | 1158 | 1867 61% | 1081 -7% | 1069 -8% | 947 -18% |
| Colorchecker dE 2000 * | 5.12 | 5.89 -15% | 3.99 22% | 4.78 7% | 3.53 31% |
| Colorchecker dE 2000 max. * | 8.86 | 19 -114% | 6.11 31% | 8.1 9% | 6.11 31% |
| Colorchecker dE 2000 calibrated * | 4.88 | 4.79 2% | 3.02 38% | 2.36 52% | 1.81 63% |
| Greyscale dE 2000 * | 3.47 | 4.08 -18% | 3.3 5% | 4.78 -38% | 3.56 -3% |
| Gamma | 2.37 93% | 2.33 94% | 2.25 98% | 2.43 91% | 2.47 89% |
| CCT | 7062 92% | 7303 89% | 7047 92% | 7739 84% | 7257 90% |
| Color Space (Percent of AdobeRGB 1998) (%) | 37 | 37 0% | 58.1 57% | 59 59% | 59 59% |
| Color Space (Percent of sRGB) (%) | 57 | 58 2% | 89.7 57% | 91 60% | 91 60% |
| Total Average (Program / Settings) | -13% /
-7% | 35% /
27% | 45% /
29% | 46% /
32% |
* ... smaller is better
The screen has decent colors ex-works, although its DeltaE 2000 deviation of around 5 isn't within the ideal range (DeltaE below 3). The display does not suffer from a blue cast. Our calibration improves color display slightly, but the color spaces AdobeRGB and sRGB aren't covered entirely (37 and 57 percent, respectively).


Display Response Times
| ↔ Response Time Black to White | ||
|---|---|---|
| 17 ms ... rise ↗ and fall ↘ combined | ↗ 8 ms rise | 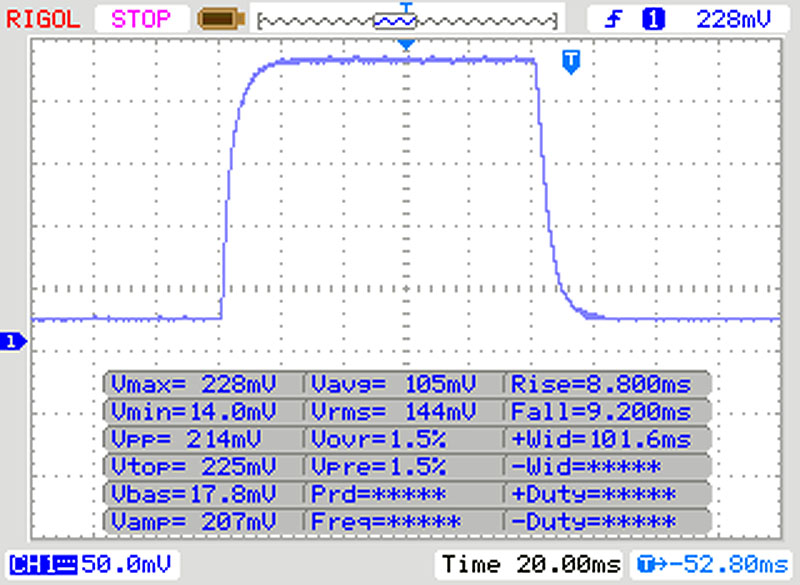 |
| ↘ 9 ms fall | ||
| The screen shows good response rates in our tests, but may be too slow for competitive gamers. In comparison, all tested devices range from 0.1 (minimum) to 240 (maximum) ms. » 39 % of all devices are better. This means that the measured response time is better than the average of all tested devices (19.8 ms). | ||
| ↔ Response Time 50% Grey to 80% Grey | ||
| 26 ms ... rise ↗ and fall ↘ combined | ↗ 12 ms rise | 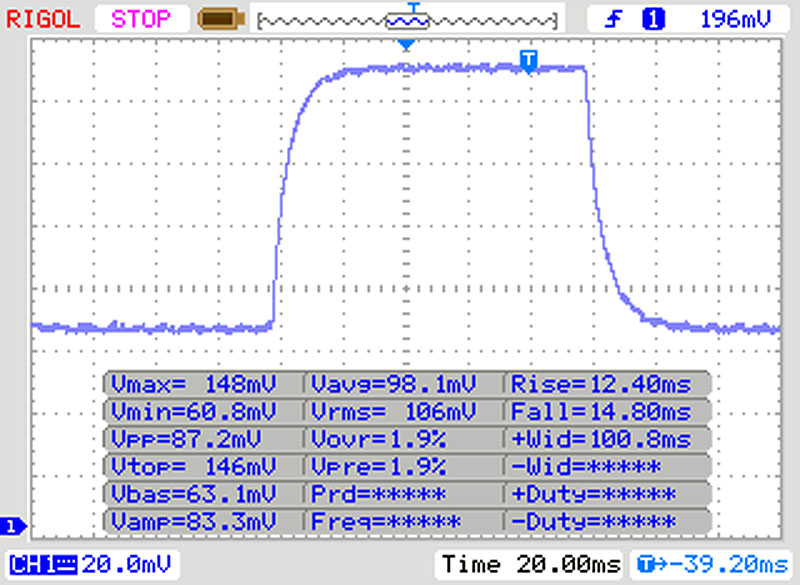 |
| ↘ 14 ms fall | ||
| The screen shows relatively slow response rates in our tests and may be too slow for gamers. In comparison, all tested devices range from 0.165 (minimum) to 636 (maximum) ms. » 36 % of all devices are better. This means that the measured response time is better than the average of all tested devices (31 ms). | ||
Screen Flickering / PWM (Pulse-Width Modulation)
| Screen flickering / PWM not detected | 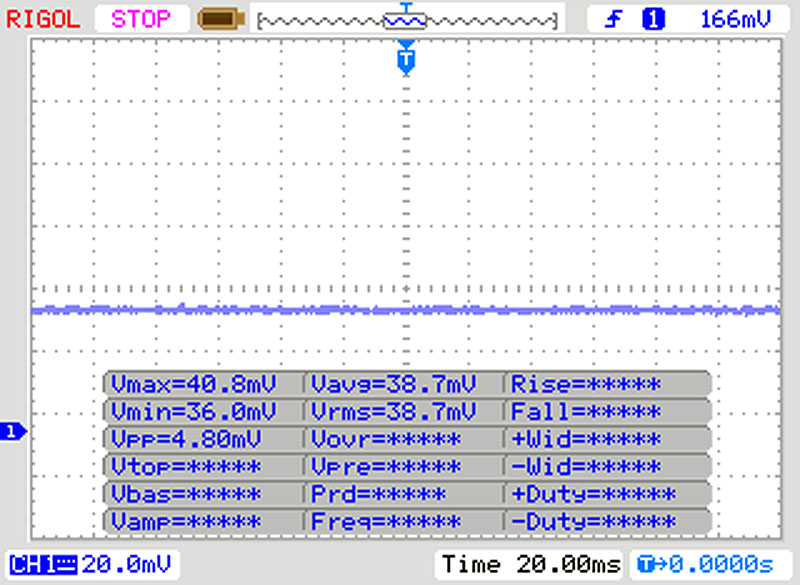 | ||
In comparison: 52 % of all tested devices do not use PWM to dim the display. If PWM was detected, an average of 7754 (minimum: 5 - maximum: 343500) Hz was measured. | |||
The notebook is equipped with an IPS panel with stable viewing angles. This means that the screen can be read from any angle. Using the device outside is only possible if the sun isn't shining too bright.

Performance - The Legion 5 makes full use of its hardware
Lenovo has created a 15.6-inch gaming notebook that can display every current game smoothly while also doing a good job in other areas of application. Our test unit is available for around $1250. There are other configurations available as well.


Testing Conditions
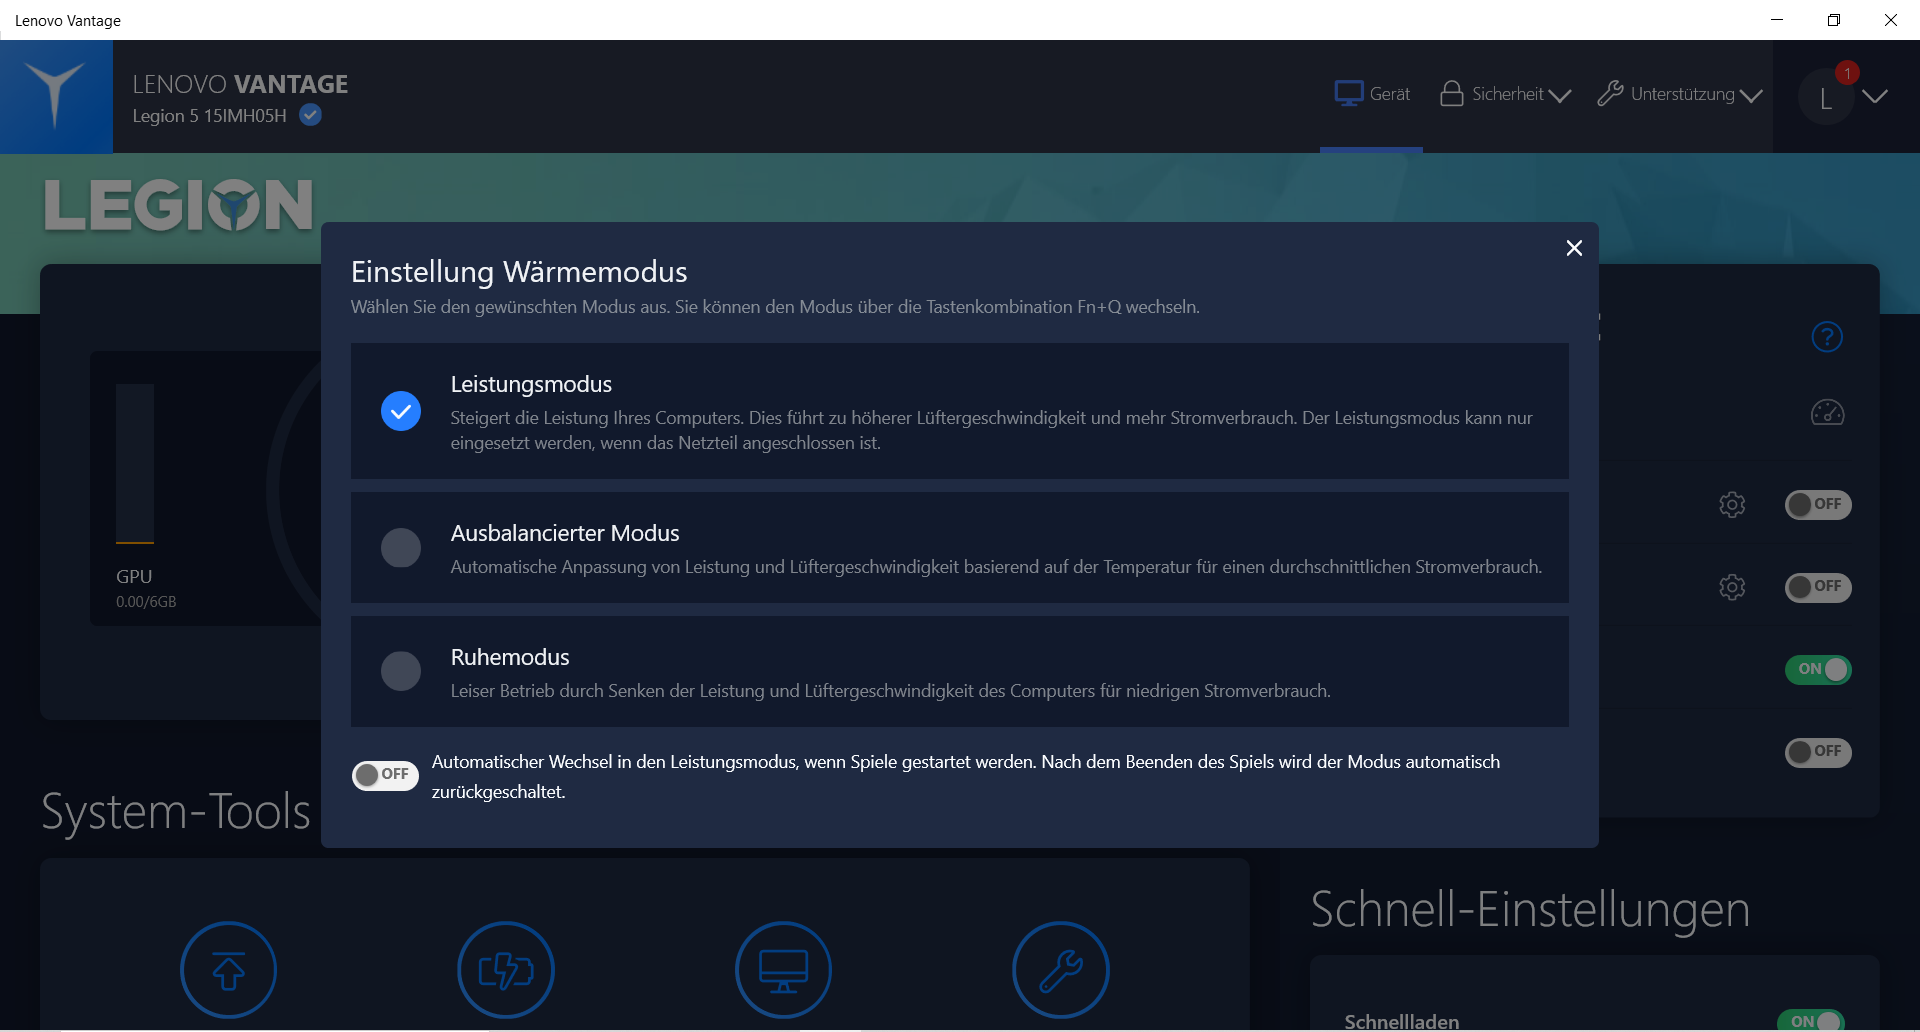
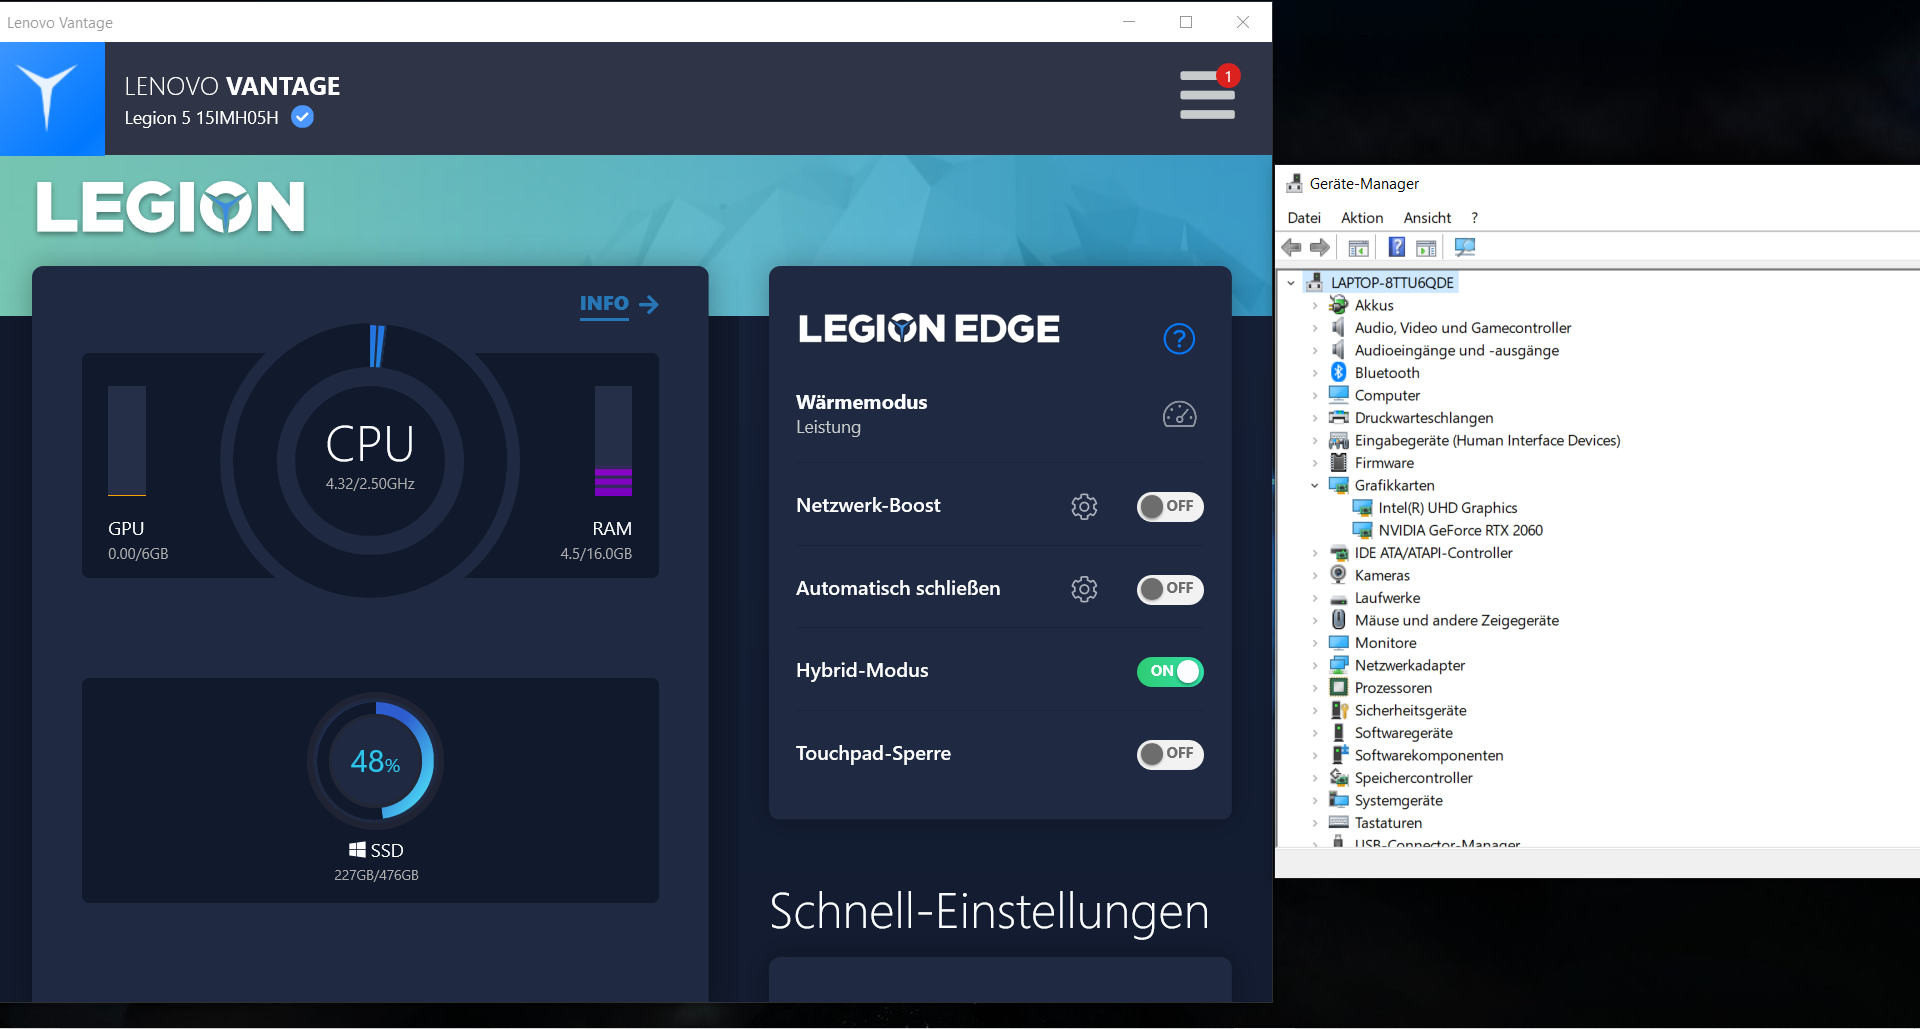
The preinstalled Lenovo Vantage software enables users to set a temperature mode. There are three modes available: performance mode, balanced mode and calm mode. We ran all benchmarks in performance mode.
In order to get an idea of how these settings influence performance, we also ran some benchmarks in all three modes, in which case we mention these results explicitly.

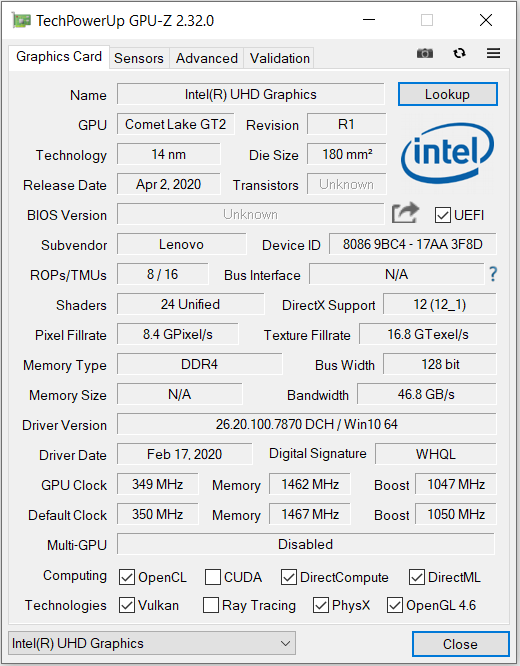
Users can switch the integrated UHD Graphics 630 on and off within the BIOS or using the Lenovo Vantage software (Hybrid mode). As the GPU is activated ex-works, we ran our tests with the iGPU (and therefore the graphics switching function Optimus) activated.

Processor
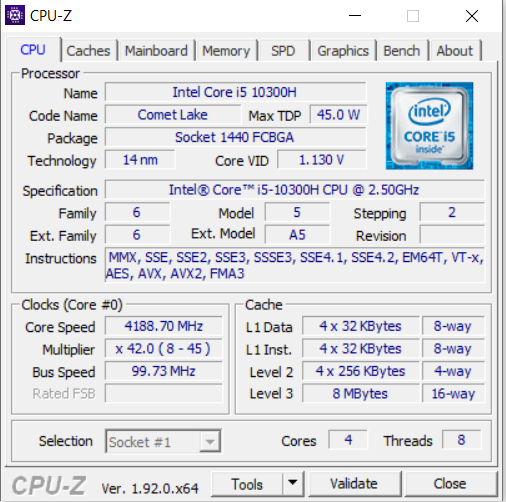
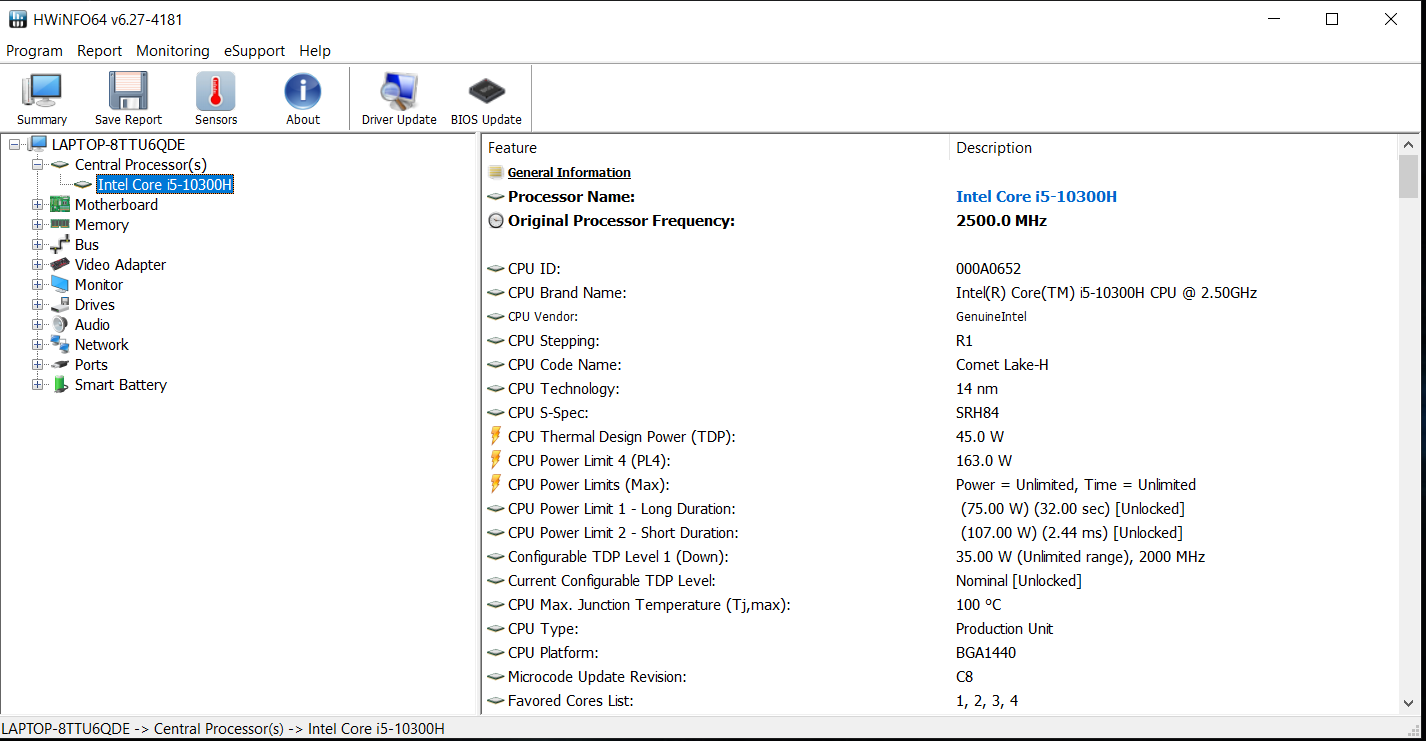
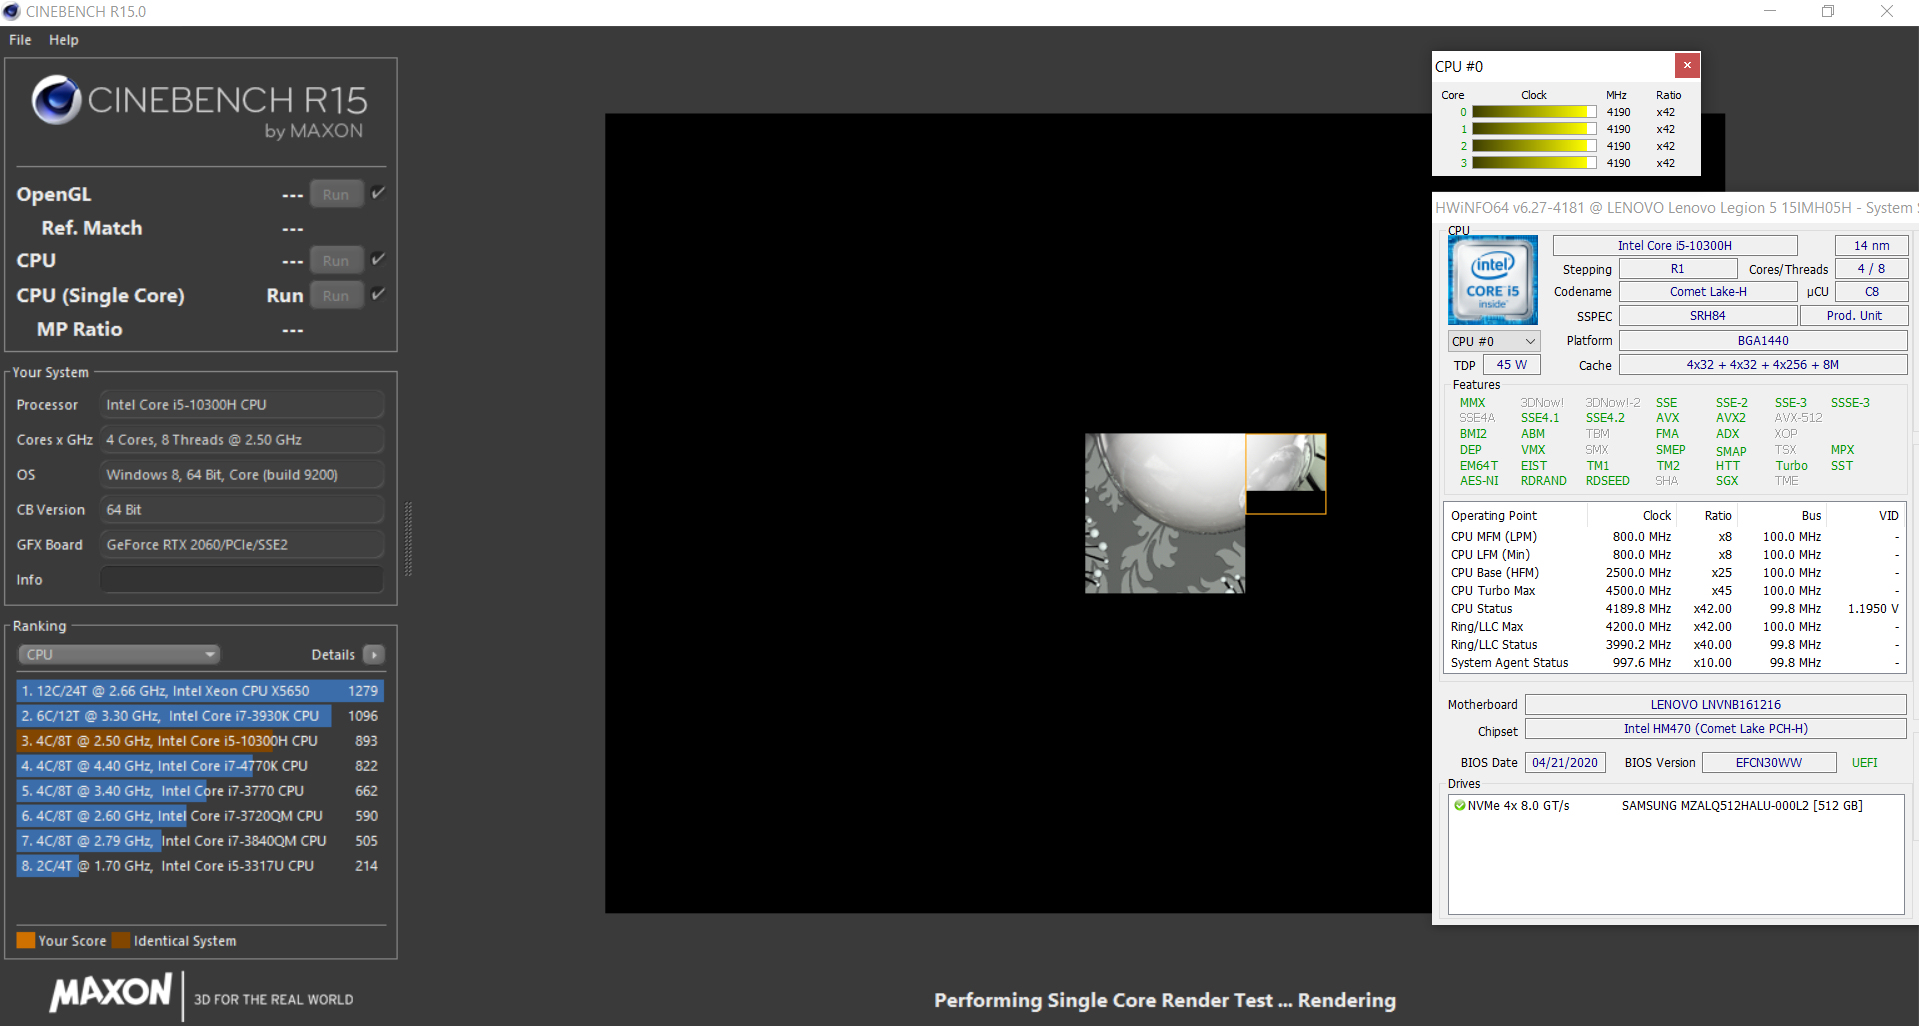
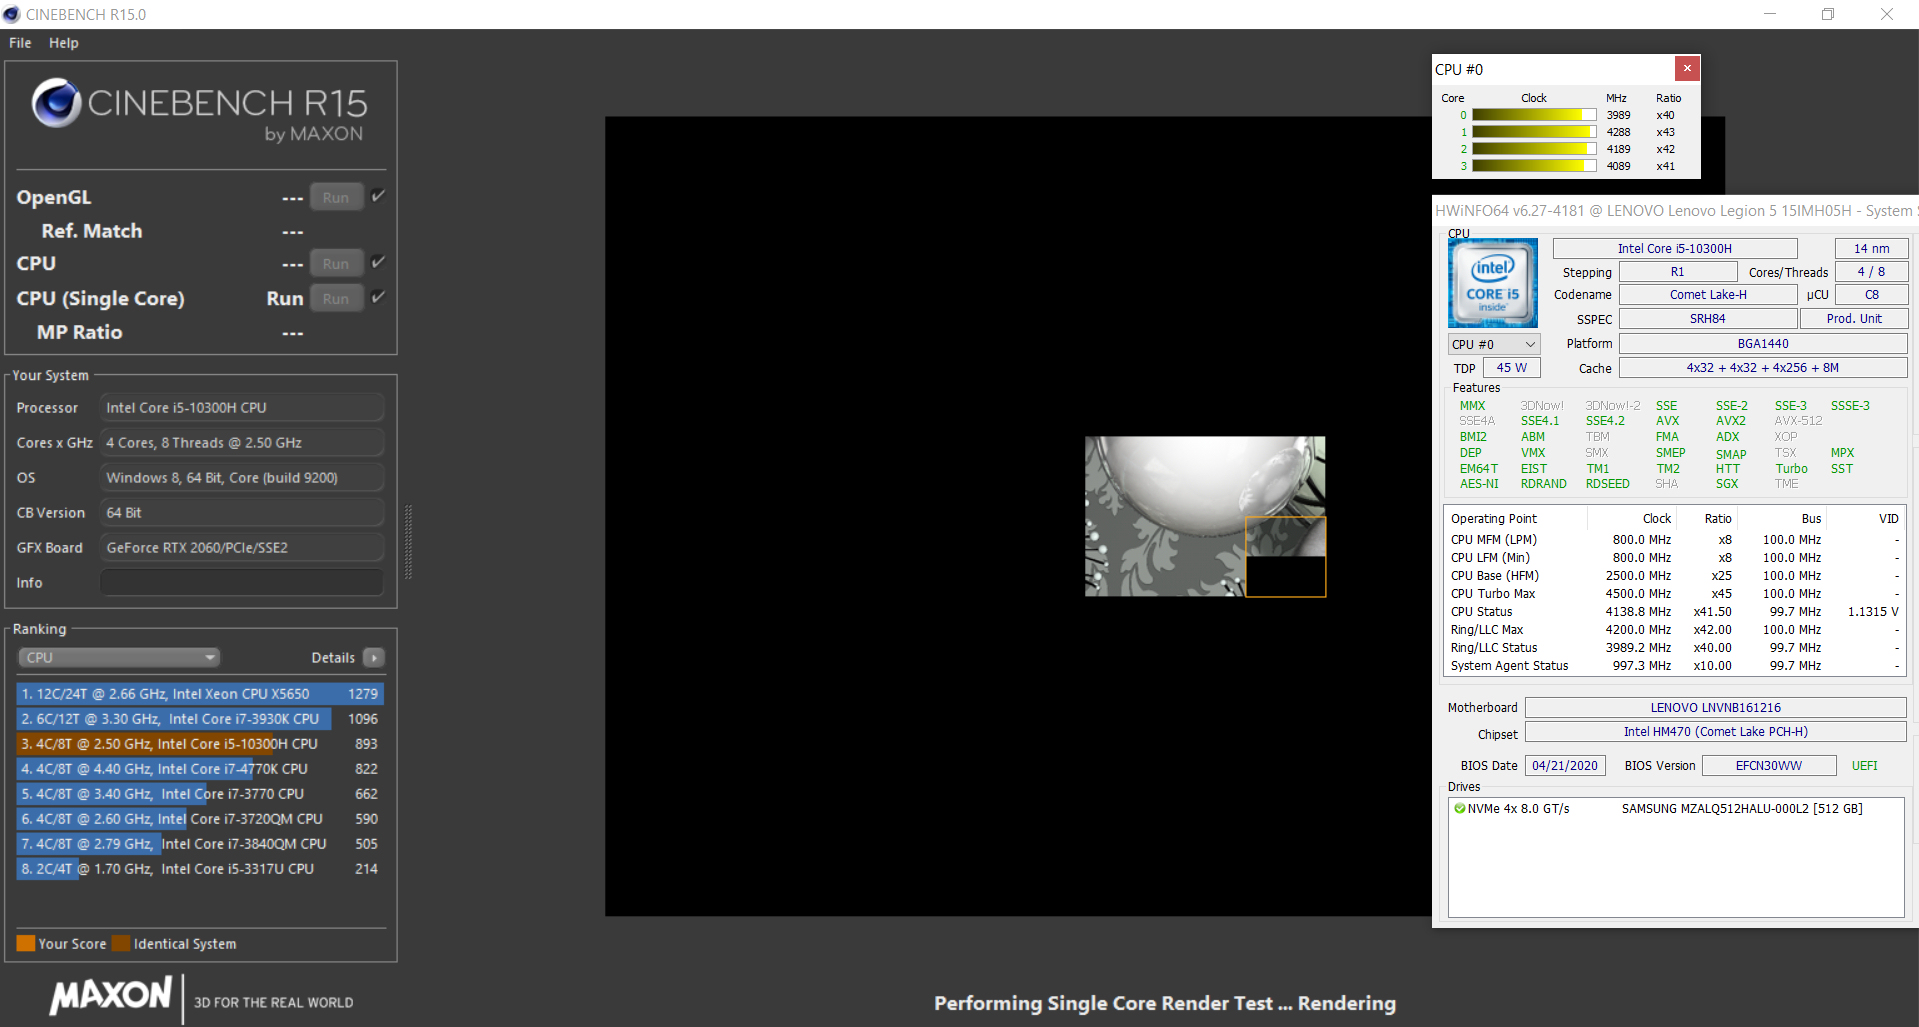
Lenovo has equipped the Legion with a quad-core Core-i5-10300H processor (Comet Lake). The CPU clocks at a base rate of 2.5 GHz. The clock rate can be boosted to 4.2 GHz (four cores) and up to 4.5 GHz (one core). Hyperthreading (working two threads per core) is supported.
The multi-thread tests of the Cinebench benchmarks are processed at 4.2 GHz (on mains) and 2.5 GHz (on battery). The single thread tests are worked at 4.2 - 4.5 GHz (mains) and 3.5 - 4.2 GHz (battery).Intel Core i5-10300H SoC - Benchmarks and Specs
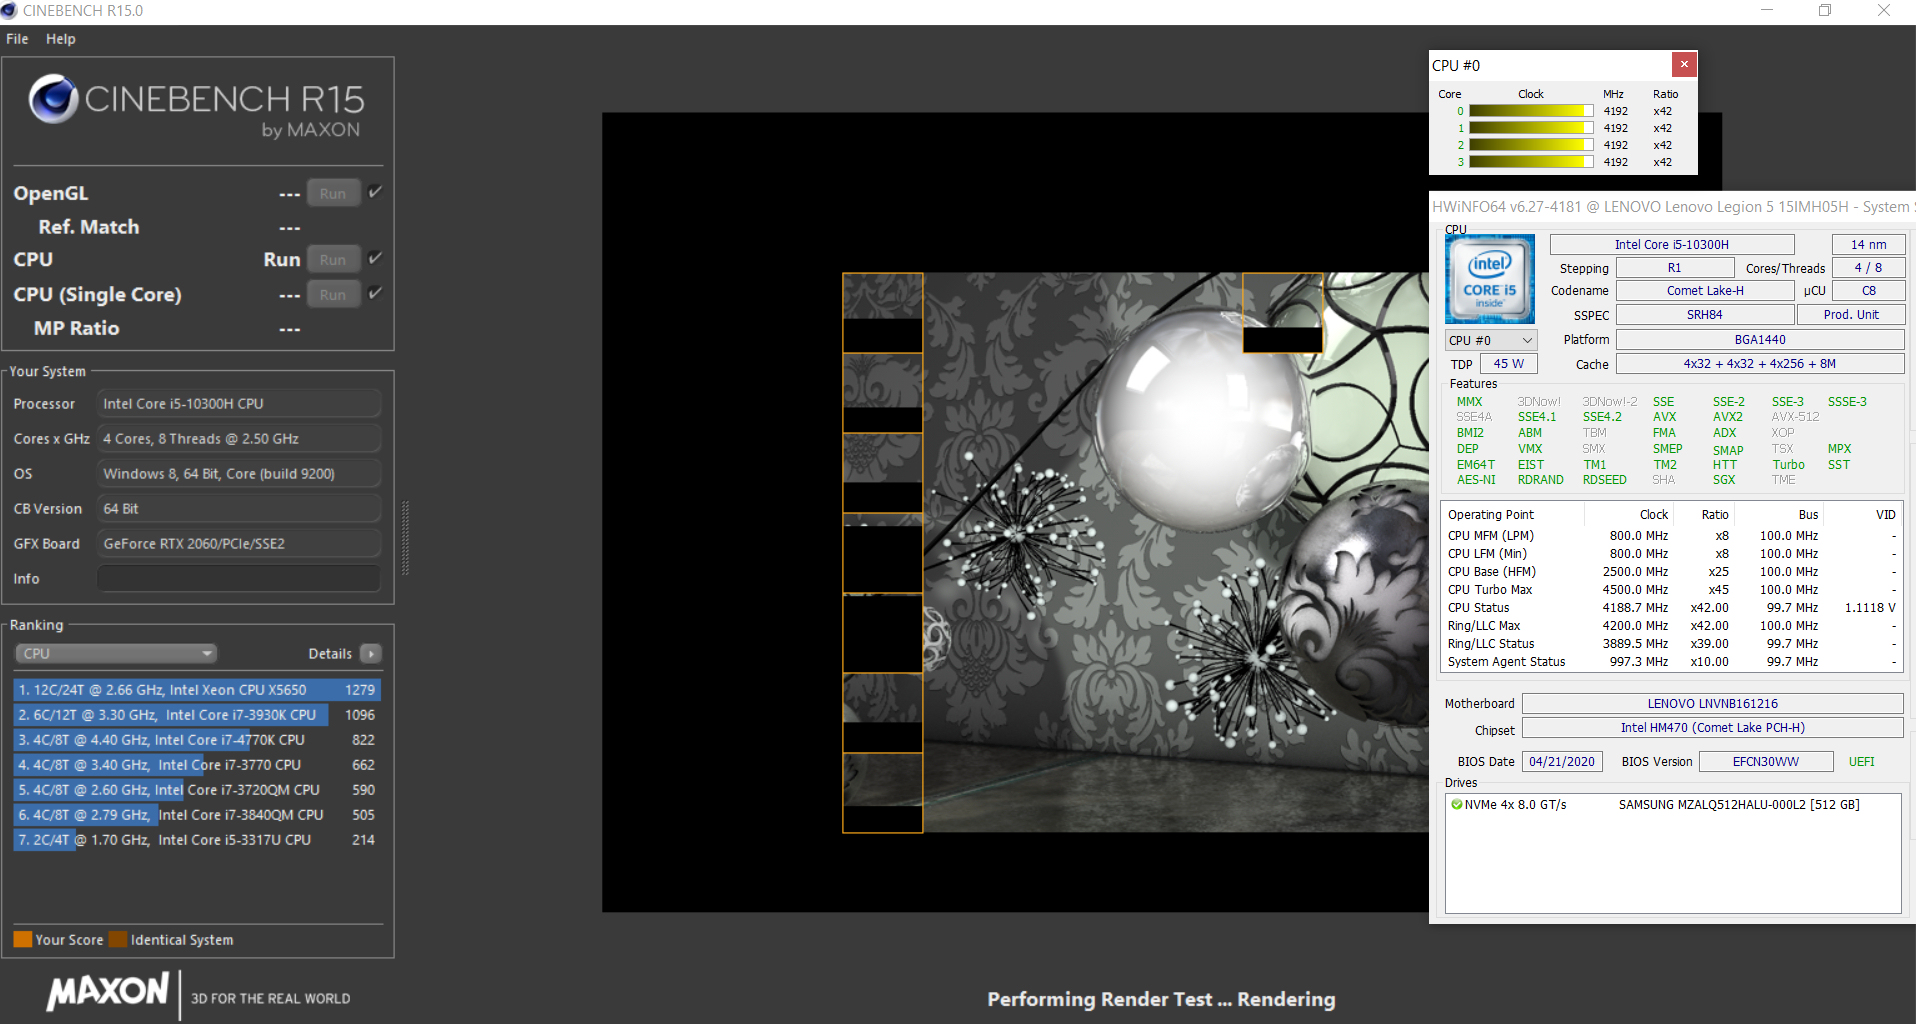
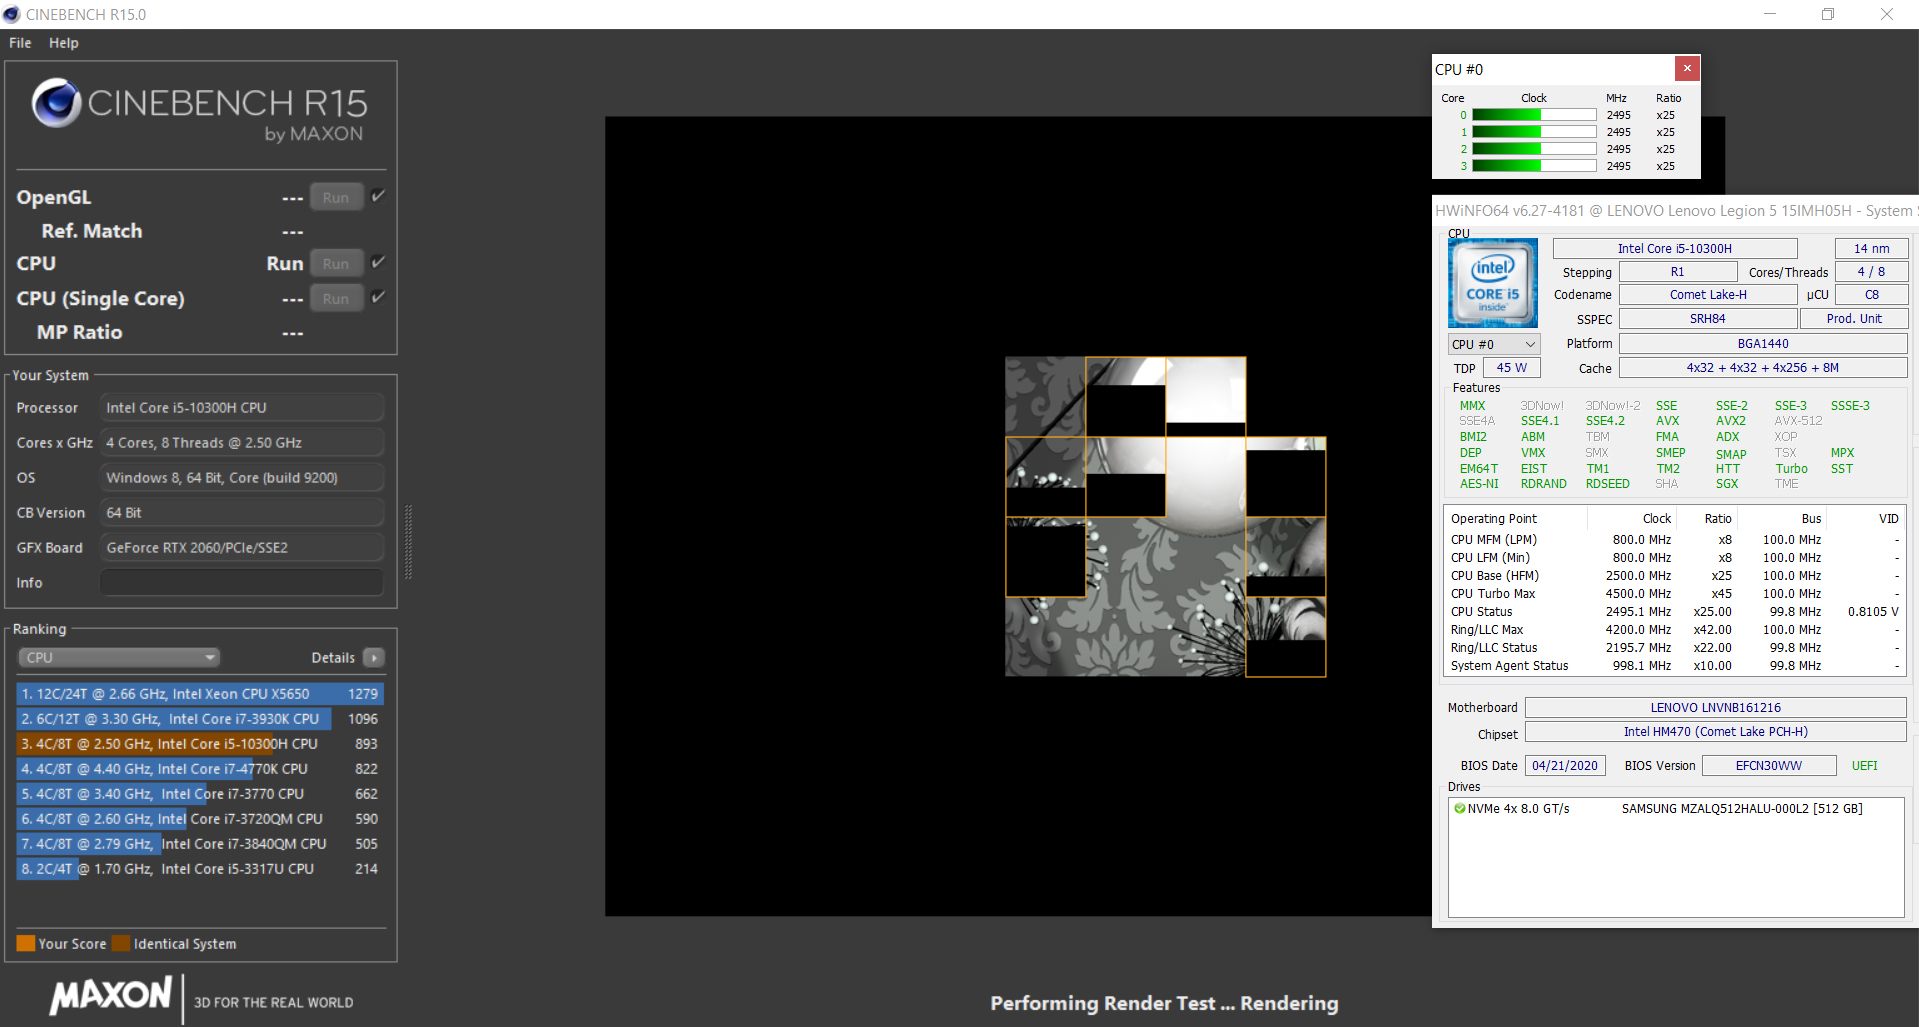
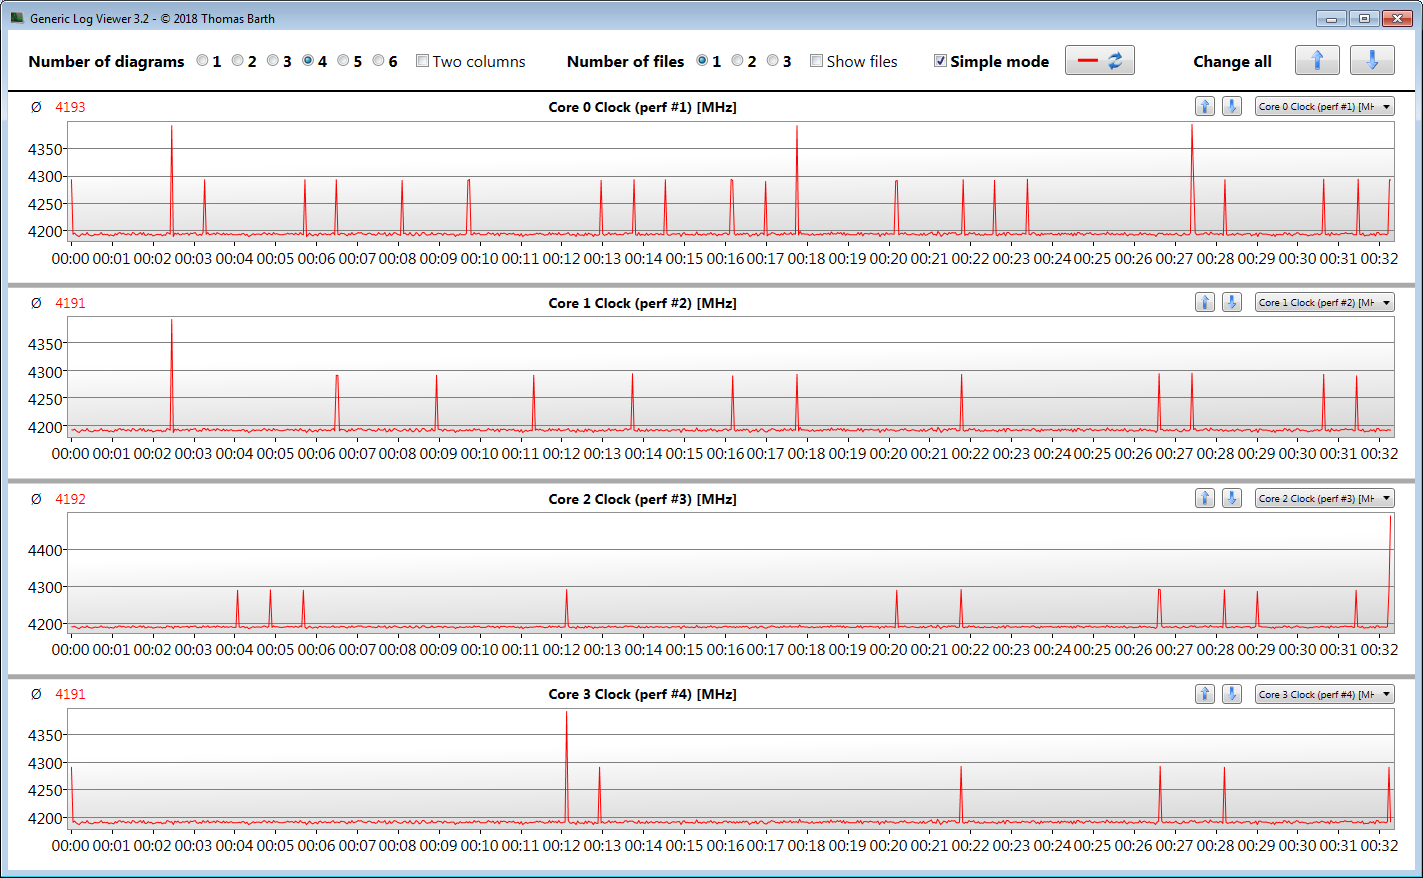
To find out whether the CPU turbo is available for a prolonged period on mains, we run the multi thread Cinebench R15 benchmark in a loop for at least 30 minutes. The results remain constant throughout the test, which means that the turbo continues to be used to the maximum.
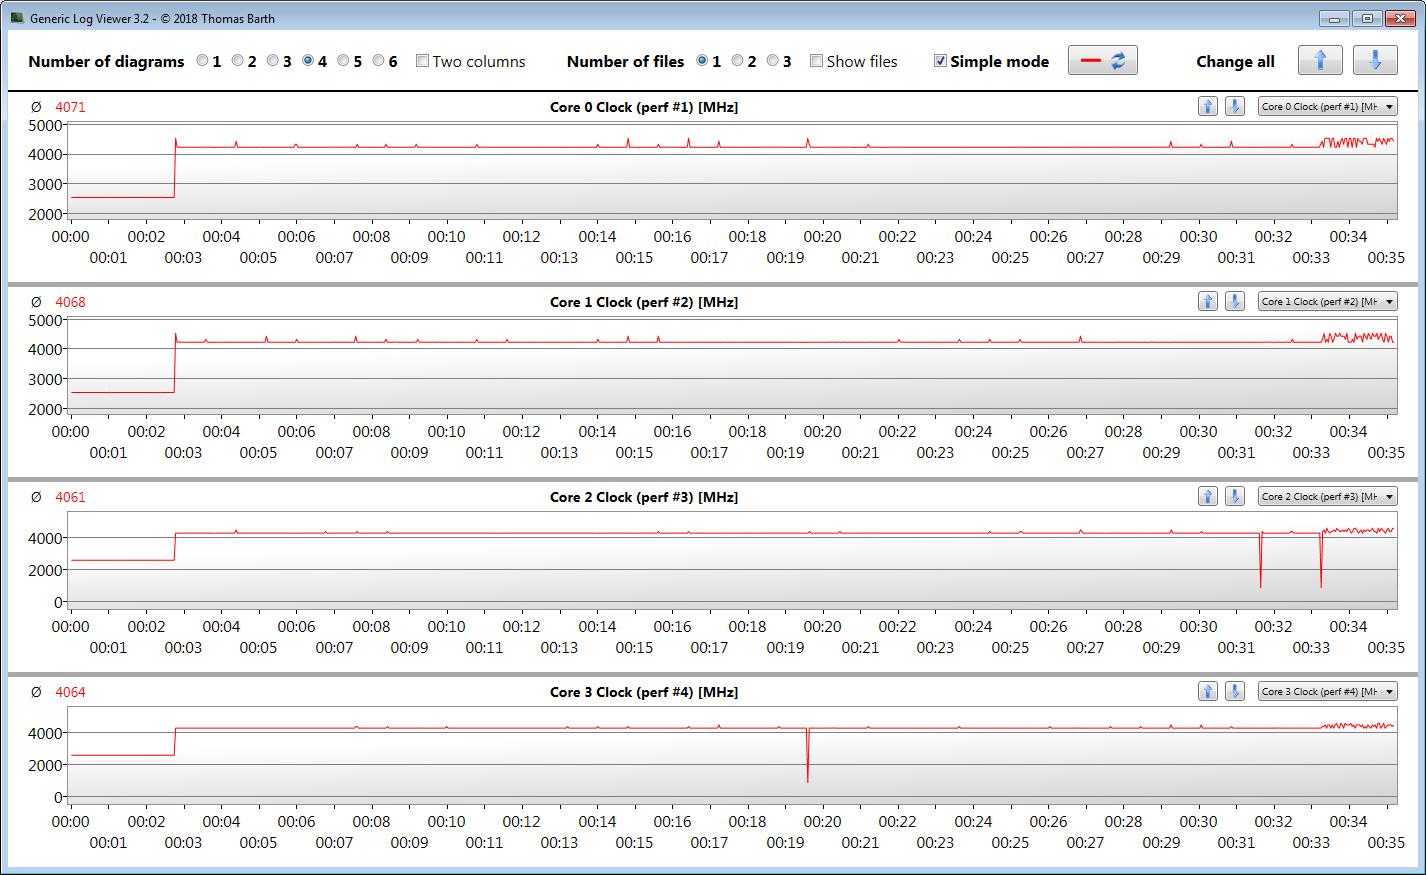
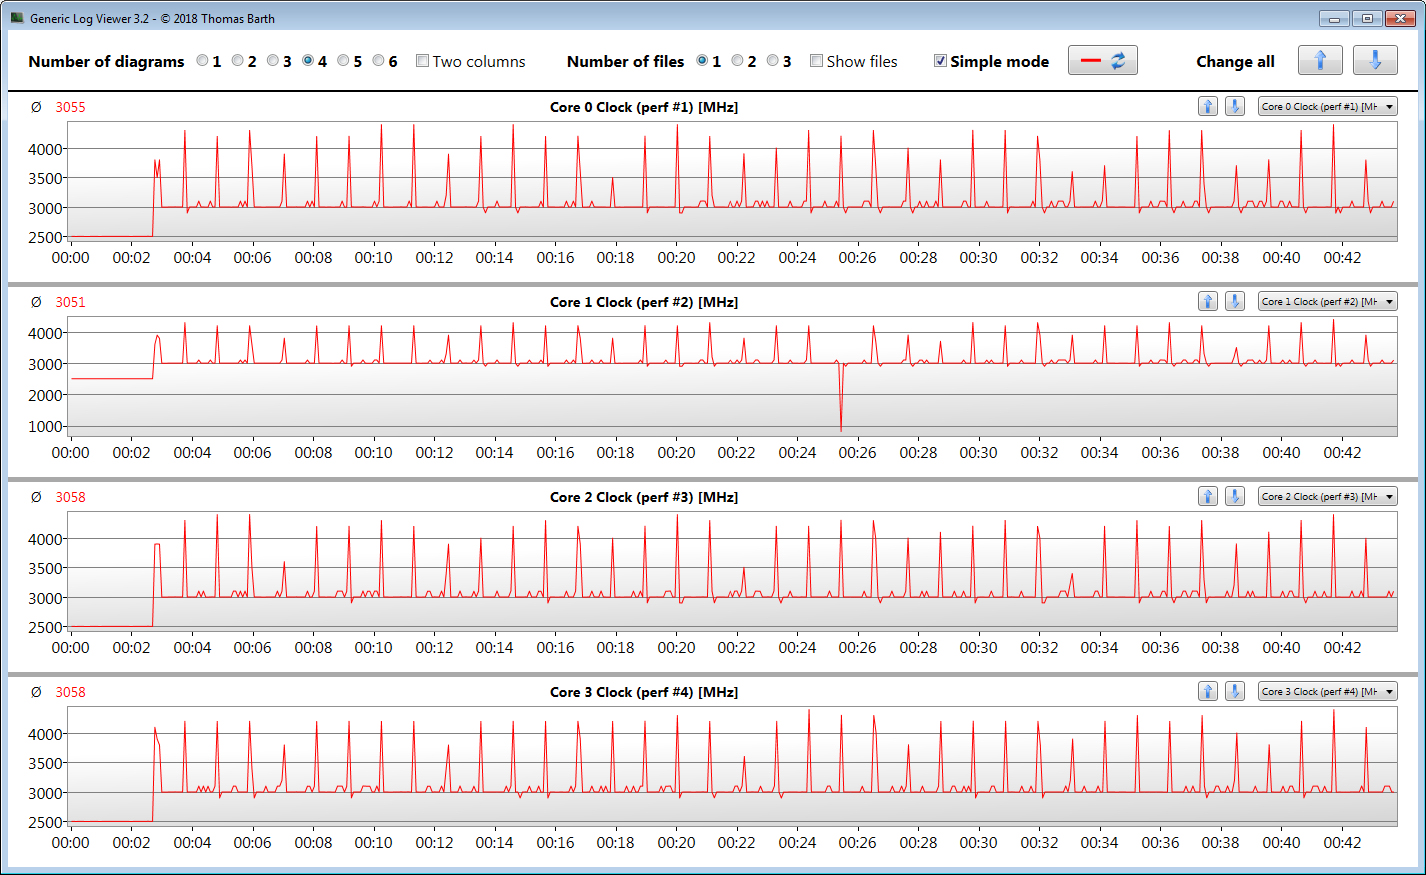
The temperature modes that can be set within Lenovo Vantage have a strong influence on performance. The CB15 loop in balanced or calm mode results in 530 and 540 points in the first two rounds, but the results subsequently drop significantly in calm mode. The balanced results are more or less on par with those recorded in performance mode.
The modes influence single thread performance as well with the single thread test of the CB15 benchmark resulting in 131 points (balanced mode) and 108 points (calm mode).
* ... smaller is better
System Performance
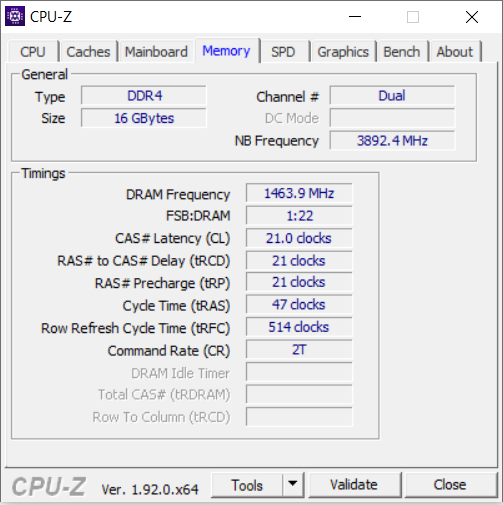
The combination of a quad-core processor, RAM running in dual channel mode and an NVMe SSD results in a fast, smooth-running system. The very good PCMark results confirm that the Lenovo notebook is also suitable for applications beyond gaming.
| PCMark 8 Home Score Accelerated v2 | 3984 points | |
| PCMark 8 Creative Score Accelerated v2 | 3770 points | |
| PCMark 8 Work Score Accelerated v2 | 5319 points | |
| PCMark 10 Score | 4887 points | |
Help | ||
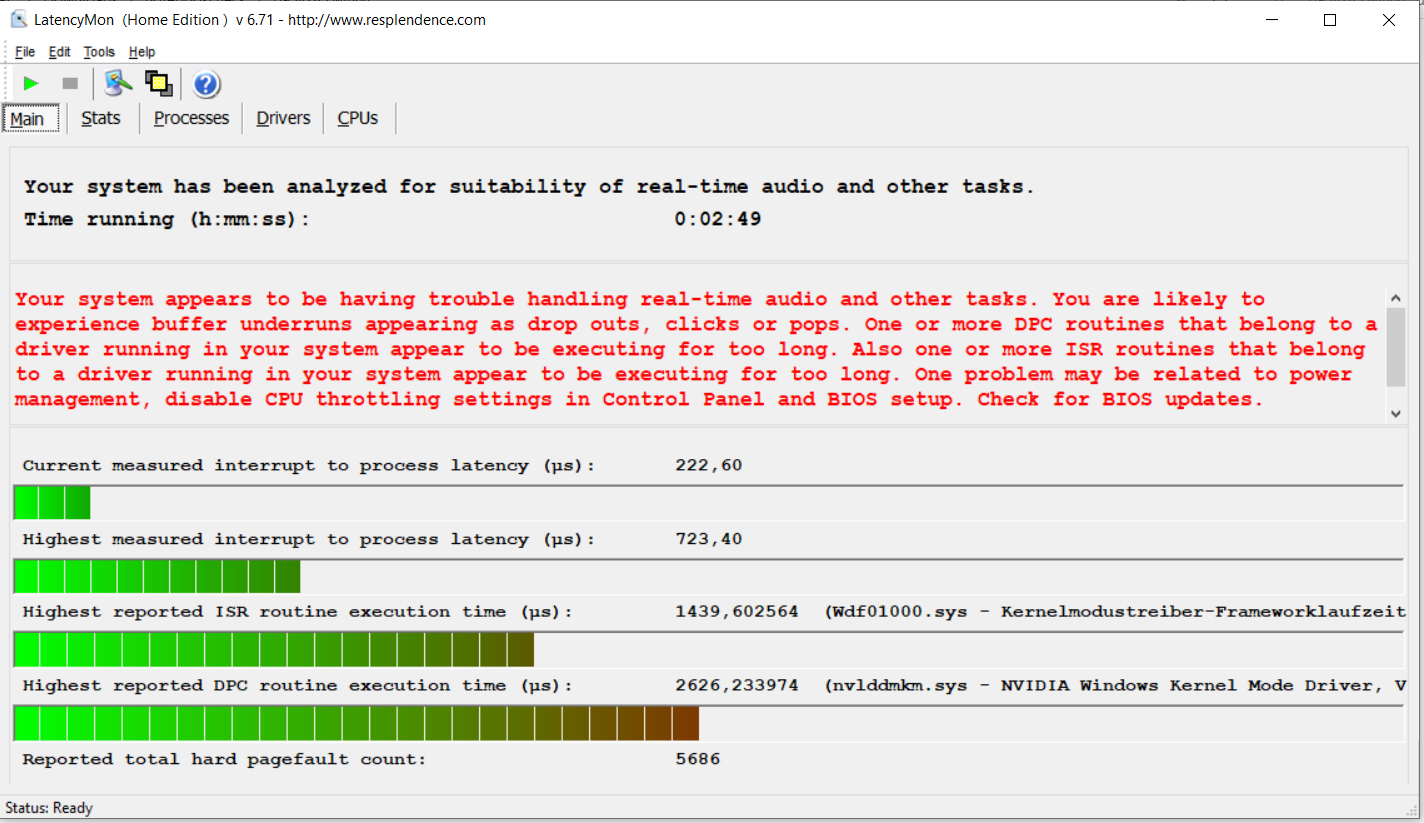
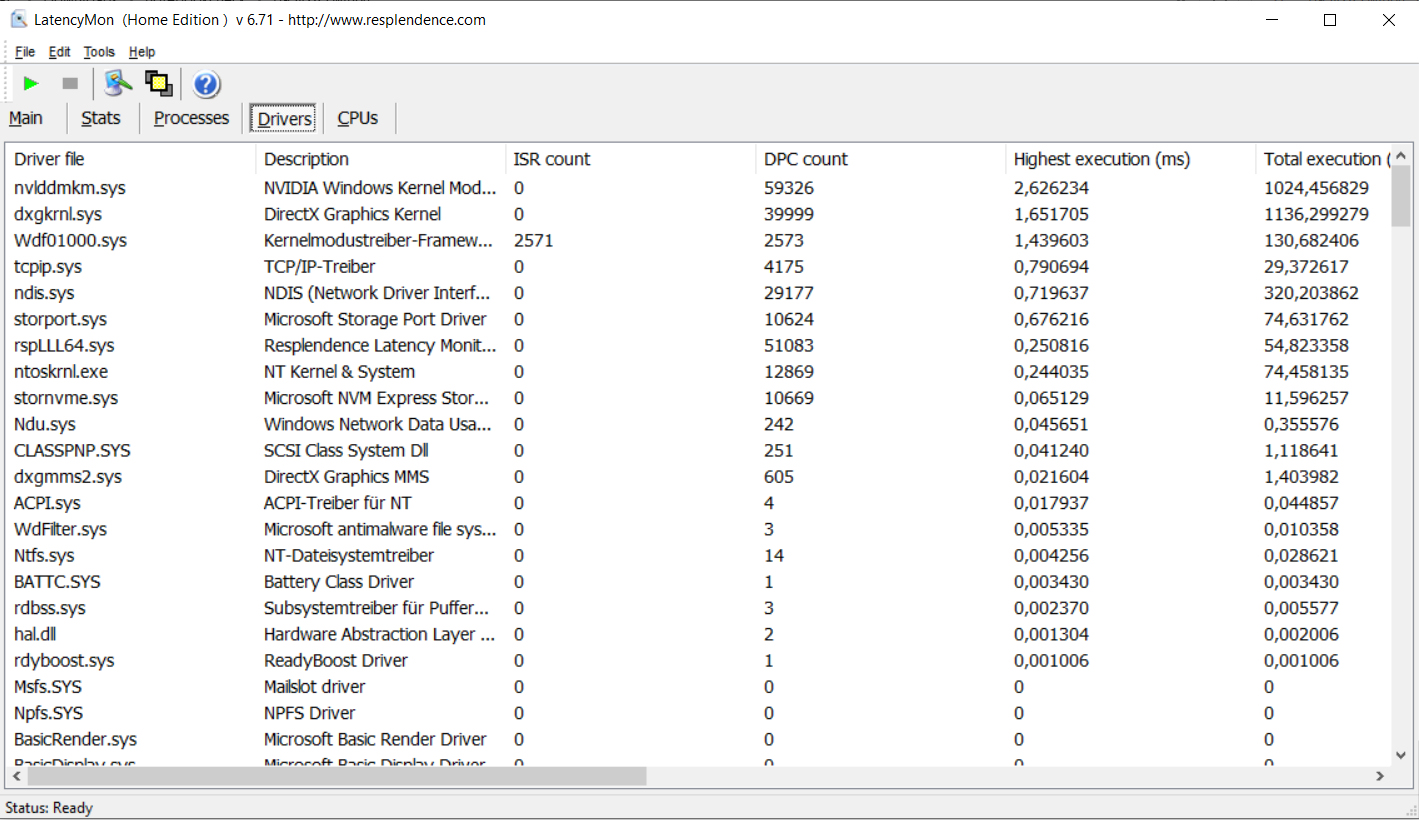
DPC latencies
Our standardized Latency Monitor test (browsing, watching 4K videos, Prime95 high load) showed that the device has high DPC latencies. This means that the system is not suitable for real-time video and audio processing.
| DPC Latencies / LatencyMon - interrupt to process latency (max), Web, Youtube, Prime95 | |
| Dell G5 15 SE 5505 P89F | |
| Asus TUF Gaming A15 FA506IV-HN172 | |
| Lenovo Legion 5 15IMH05H | |
| Acer Nitro 5 AN517-52-77DS | |
* ... smaller is better
Storage Devices
Our test unit is equipped with an NVMe SSD (M.2 2242) from Samsung, with a capacity of 512 GB. The transfer rates are very good.
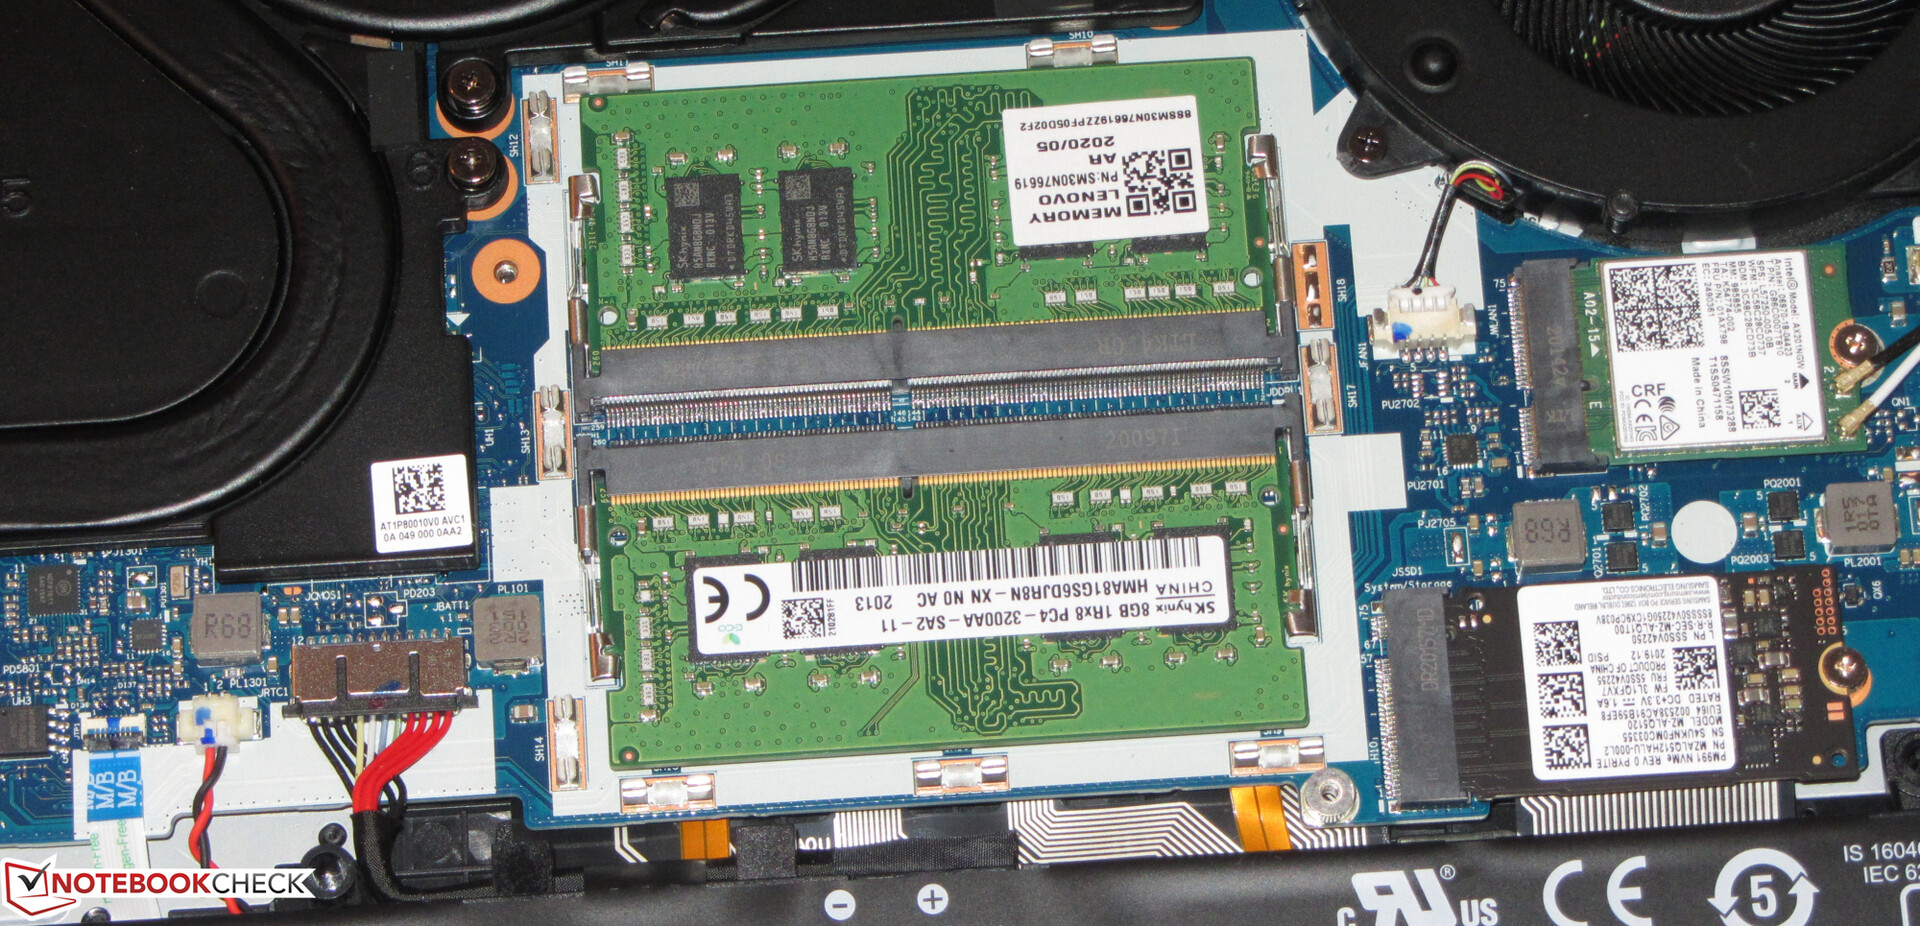
The notebook also has a slot available for a 2.5-inch storage device (SATA slot plus caddy included) or a second NVMe SSD (M.2-2280). Both devices cannot be operated simultaneously as you will need to remove the 2.5-inch caddy to insert the second NVMe SSD.

| Lenovo Legion 5 15IMH05H Samsung PM991 MZALQ512HALU | Asus TUF Gaming A15 FA506IV-HN172 Kingston OM8PCP3512F-AB | Dell G5 15 SE 5505 P89F Samsung PM991 MZ9LQ512HALU | MSI Alpha 15 A3DDK-034 Kingston RBUSNS8154P3512GJ | Average Samsung PM991 MZALQ512HALU | |
|---|---|---|---|---|---|
| CrystalDiskMark 5.2 / 6 | 5% | 3% | -23% | 0% | |
| Write 4K (MB/s) | 145.4 | 219.8 51% | 142.1 -2% | 105.4 -28% | 129.5 ? -11% |
| Read 4K (MB/s) | 51.6 | 50.2 -3% | 46.43 -10% | 33.24 -36% | 45.1 ? -13% |
| Write Seq (MB/s) | 1007 | 979 -3% | 1108 10% | 1029 2% | 1172 ? 16% |
| Read Seq (MB/s) | 1145 | 1990 74% | 1622 42% | 1098 -4% | 1496 ? 31% |
| Write 4K Q32T1 (MB/s) | 468.4 | 516 10% | 467 0% | 322.1 -31% | 448 ? -4% |
| Read 4K Q32T1 (MB/s) | 528 | 298.3 -44% | 525 -1% | 352 -33% | 415 ? -21% |
| Write Seq Q32T1 (MB/s) | 1381 | 982 -29% | 1203 -13% | 1036 -25% | 1397 ? 1% |
| Read Seq Q32T1 (MB/s) | 2291 | 1907 -17% | 2288 0% | 1606 -30% | 2307 ? 1% |
| Write 4K Q8T8 (MB/s) | 981 | ||||
| Read 4K Q8T8 (MB/s) | 300.9 | ||||
| AS SSD | -7% | -13% | -20% | 3% | |
| Seq Read (MB/s) | 2012 | 1682 -16% | 1386 -31% | 1423 -29% | 1917 ? -5% |
| Seq Write (MB/s) | 1261 | 904 -28% | 1234 -2% | 958 -24% | 1061 ? -16% |
| 4K Read (MB/s) | 43.66 | 60.2 38% | 41.32 -5% | 33.2 -24% | 45.7 ? 5% |
| 4K Write (MB/s) | 109.3 | 164.8 51% | 128 17% | 80.7 -26% | 140.1 ? 28% |
| 4K-64 Read (MB/s) | 851 | 472.5 -44% | 854 0% | 816 -4% | 854 ? 0% |
| 4K-64 Write (MB/s) | 780 | 845 8% | 721 -8% | 708 -9% | 780 ? 0% |
| Access Time Read * (ms) | 0.117 | 0.087 26% | 0.098 16% | 0.1 15% | 0.1031 ? 12% |
| Access Time Write * (ms) | 0.036 | 0.02 44% | 0.095 -164% | 0.047 -31% | 0.03488 ? 3% |
| Score Read (Points) | 1096 | 701 -36% | 1034 -6% | 991 -10% | 1091 ? 0% |
| Score Write (Points) | 1016 | 1101 8% | 973 -4% | 885 -13% | 1027 ? 1% |
| Score Total (Points) | 2643 | 2143 -19% | 2536 -4% | 2365 -11% | 2643 ? 0% |
| Copy ISO MB/s (MB/s) | 1481 | 675 -54% | 1284 -13% | 1043 -30% | 1310 ? -12% |
| Copy Program MB/s (MB/s) | 467.5 | 248.4 -47% | 401.9 -14% | 252.7 -46% | 453 ? -3% |
| Copy Game MB/s (MB/s) | 734 | 535 -27% | 1013 38% | 483.6 -34% | 924 ? 26% |
| Total Average (Program / Settings) | -1% /
-3% | -5% /
-7% | -22% /
-21% | 2% /
2% |
* ... smaller is better
Dauerleistung Lesen: DiskSpd Read Loop, Queue Depth 8
GPU Performance
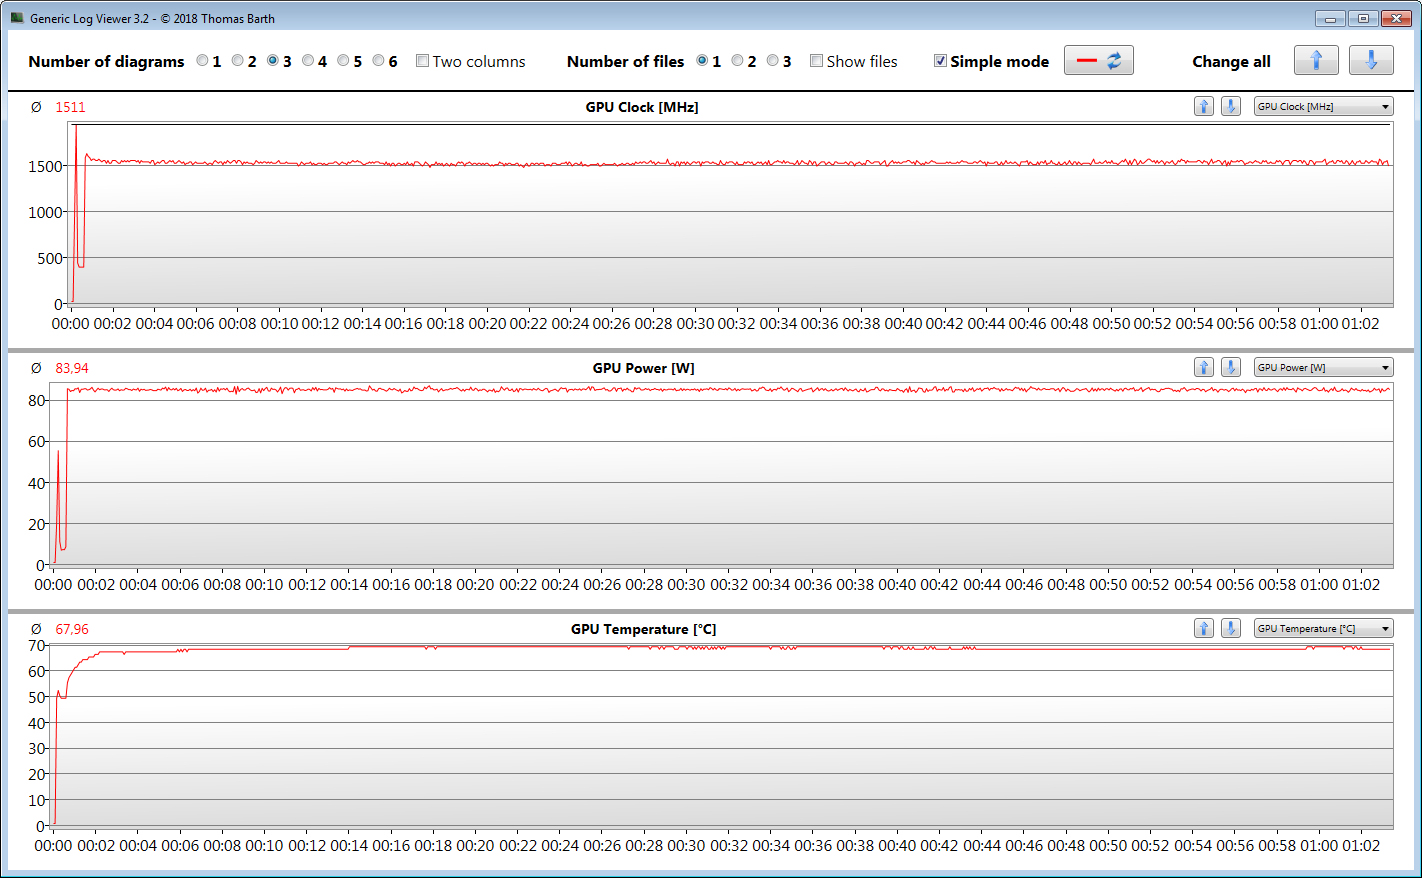
The GeForce RTX-2060 (Turing) is a top-range GPU that supports DirectX 12 and clocks at a base rate of 960 MHz, which can be increased to up to 1200 MHz via the turbo boost. Provided the GPU does not reach a certain temperature or energy limit, it can reach even higher speeds. We actually measured a maximum clock rate of 1931 MHz. The Witcher 3 test was completed with an average speed of 1511 MHz. The GPU can make use of fast GDDR6 storage (6144 MB).
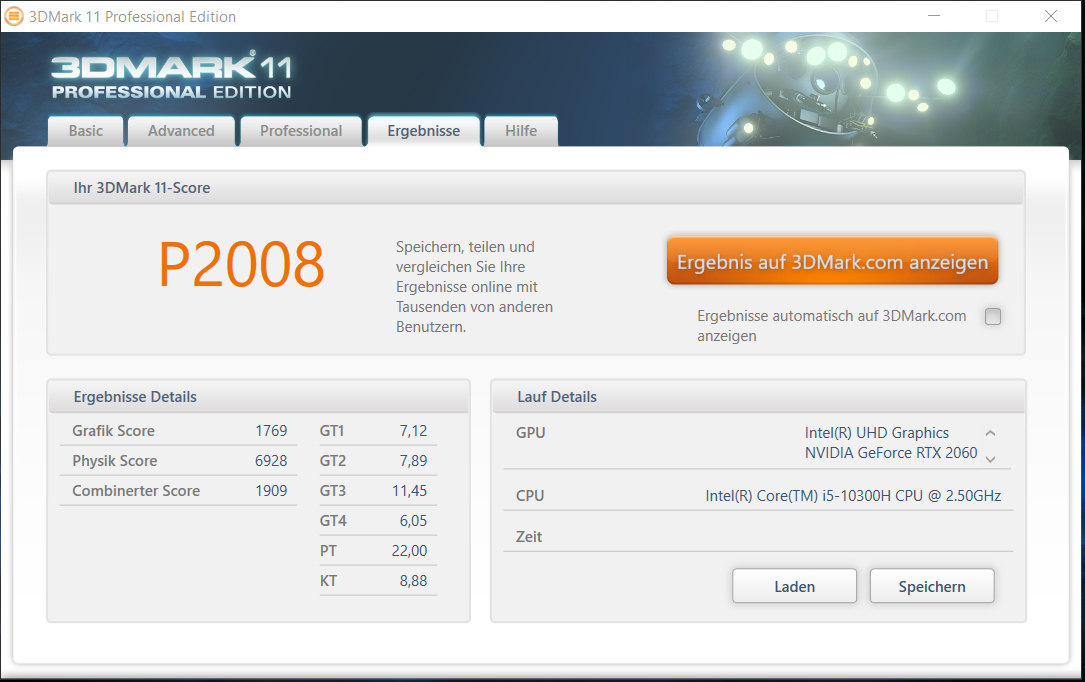
The results of the various 3DMark benchmarks are as expected for this GPU. The integrated Intel GPU UHD-Graphics-G1 is active and the notebook uses Nvidia Optimus to switch between the two. As mentioned earlier, the iGPU can be deactivated in the BIOS or using Lenovo Vantage.
The temperature modes of the Lenovo Vantage software have an influence on the graphics performance. While the 3DMark results in performance and balanced mode are very similar, the graphics performance drops significantly when calm mode is active.
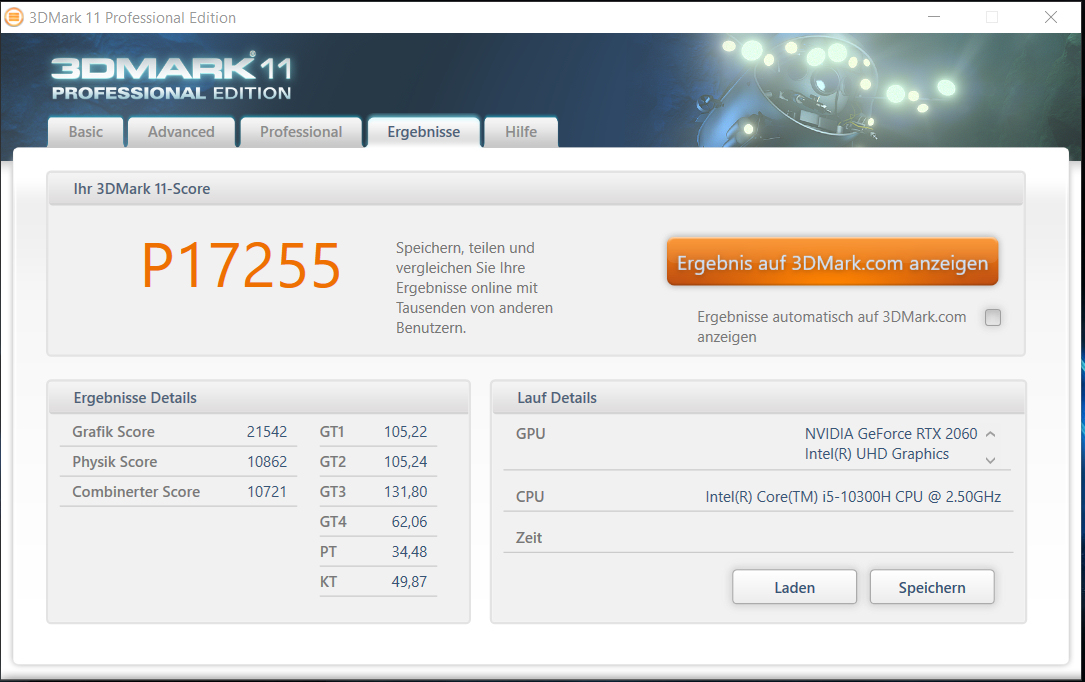
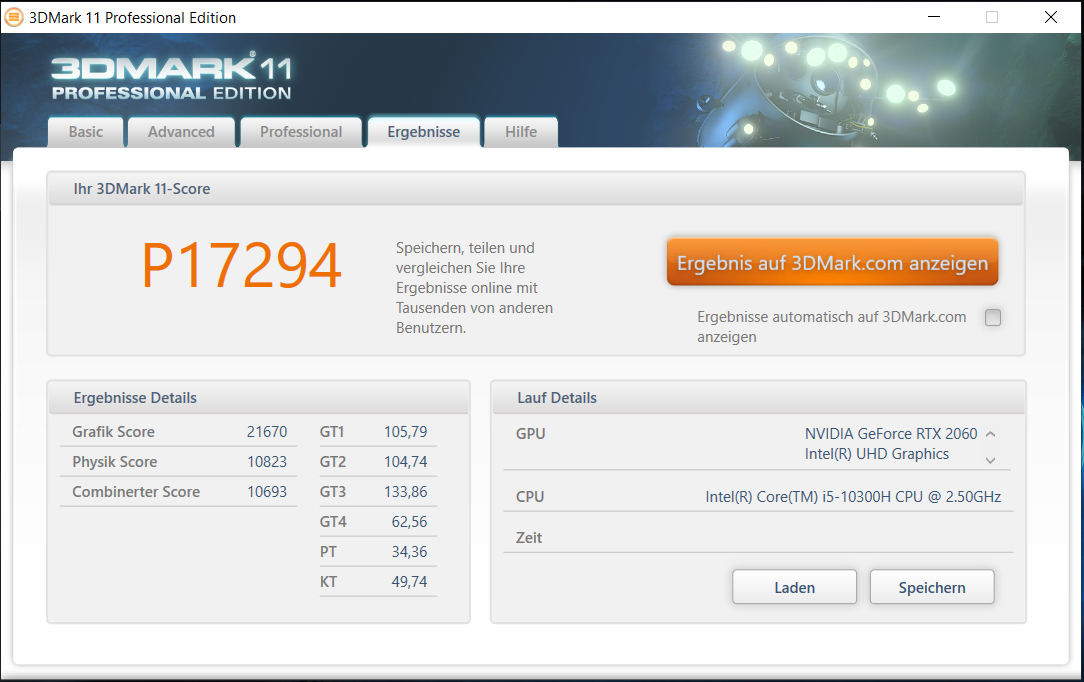
| 3DMark 11 Performance | 17255 points | |
| 3DMark Ice Storm Standard Score | 178912 points | |
| 3DMark Cloud Gate Standard Score | 30548 points | |
| 3DMark Fire Strike Score | 13745 points | |
| 3DMark Time Spy Score | 5980 points | |
Help | ||
Gaming Performance
The CPU/GPU combination of the Legion 5 displays all games smoothly at Full-HD resolution and high to maximum quality settings. The GPU even manages some resolutions above Full-HD (this would require a suitable external monitor), although you would have to lower the quality settings slightly to get there.
| The Witcher 3 - 1920x1080 Ultra Graphics & Postprocessing (HBAO+) | |
| Average of class Gaming (104.7 - 240, n=7, last 2 years) | |
| Lenovo Legion 5 15IMH05H | |
| Dell G5 15 SE 5505 P89F | |
| Acer Nitro 5 AN517-52-77DS | |
| Average NVIDIA GeForce RTX 2060 Mobile (50.6 - 74, n=40) | |
| Asus TUF Gaming A15 FA506IV-HN172 | |
| Lenovo Legion Y540-15IRH | |
| MSI Alpha 15 A3DDK-034 | |
| BioShock Infinite - 1920x1080 Ultra Preset, DX11 (DDOF) | |
| Lenovo Legion 5 15IMH05H | |
| Average NVIDIA GeForce RTX 2060 Mobile (119 - 156, n=17) | |
| Acer Nitro 5 AN517-52-77DS | |
| Asus TUF Gaming A15 FA506IV-HN172 | |
| MSI Alpha 15 A3DDK-034 | |
| Shadow of the Tomb Raider - 1920x1080 Highest Preset AA:T | |
| Average of class Gaming (96 - 116, n=2, last 2 years) | |
| Lenovo Legion 5 15IMH05H | |
| Average NVIDIA GeForce RTX 2060 Mobile (54 - 86, n=22) | |
| Acer Nitro 5 AN517-52-77DS | |
| Dell G5 15 SE 5505 P89F | |
| Red Dead Redemption 2 - 1920x1080 High Settings | |
| Lenovo Legion 5 15IMH05H | |
| Average NVIDIA GeForce RTX 2060 Mobile (50.7 - 56.2, n=5) | |
| Acer Nitro 5 AN517-52-77DS | |
| Far Cry 5 - 1920x1080 Ultra Preset AA:T | |
| Average of class Gaming (70 - 151, n=6, last 2 years) | |
| Lenovo Legion 5 15IMH05H | |
| Average NVIDIA GeForce RTX 2060 Mobile (76 - 90, n=9) | |
| Gears Tactics - 1920x1080 Ultra Preset | |
| Dell G5 15 SE 5505 P89F | |
| Lenovo Legion 5 15IMH05H | |
| Average NVIDIA GeForce RTX 2060 Mobile (60.7 - 71.3, n=7) | |
| Acer Nitro 5 AN517-52-77DS | |
To find out whether the refresh rates remain the same over a long period, we ran the game "The Witcher 3" for around 60 minutes in Full-HD resolution and maximum quality settings. The character played by the player did not move throughout the test. We did not observe a drop in frame rates.
| low | med. | high | ultra | |
|---|---|---|---|---|
| BioShock Infinite (2013) | 349.9 | 315.9 | 288.8 | 144.4 |
| The Witcher 3 (2015) | 275.4 | 204.8 | 124.8 | 68.3 |
| Dota 2 Reborn (2015) | 140.9 | 128.9 | 118.8 | 113.1 |
| X-Plane 11.11 (2018) | 85.6 | 78.5 | 68.1 | |
| Far Cry 5 (2018) | 114 | 97 | 91 | 85 |
| Shadow of the Tomb Raider (2018) | 125 | 97 | 90 | 81 |
| Total War: Three Kingdoms (2019) | 215.3 | 108.3 | 71.7 | 50.6 |
| F1 2019 (2019) | 185 | 166 | 137 | 127 |
| Red Dead Redemption 2 (2019) | 117.9 | 81.6 | 55.1 | 35.1 |
| Doom Eternal (2020) | 204.9 | 140 | 126.9 | 126.1 |
| Gears Tactics (2020) | 228.8 | 151.8 | 99.3 | 68.1 |
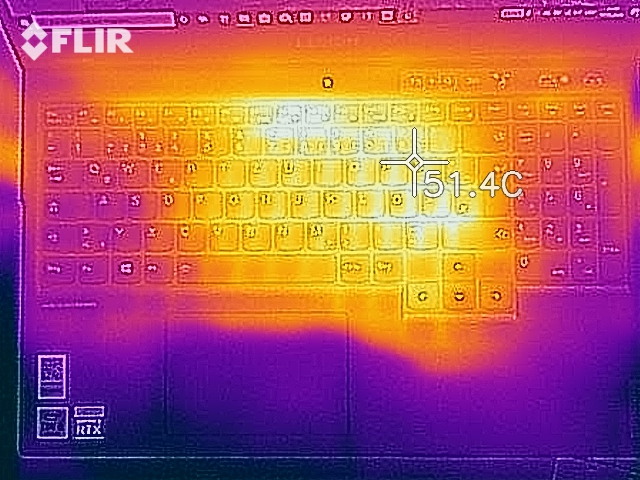
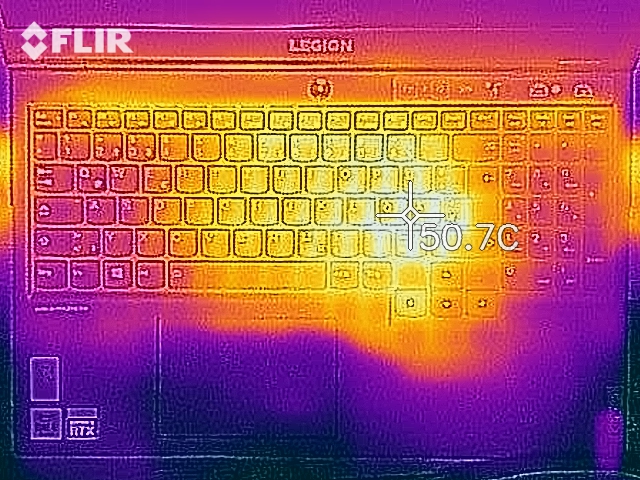
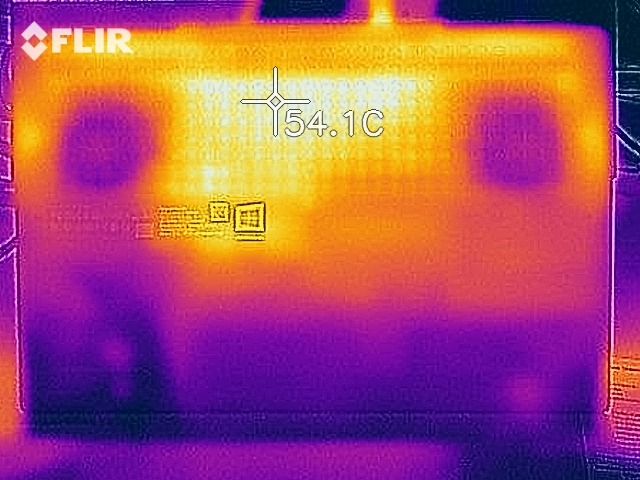
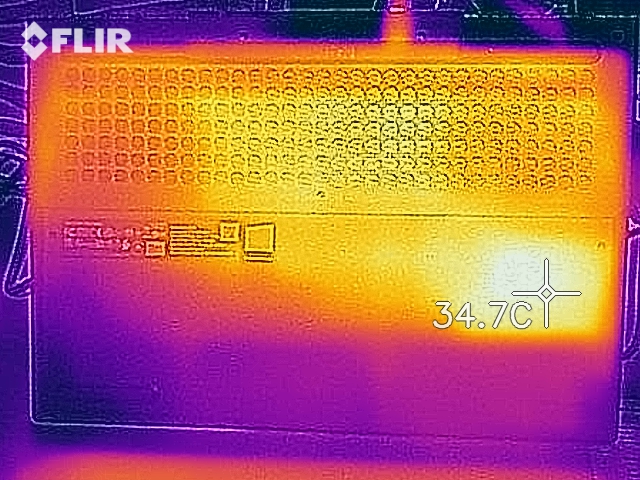
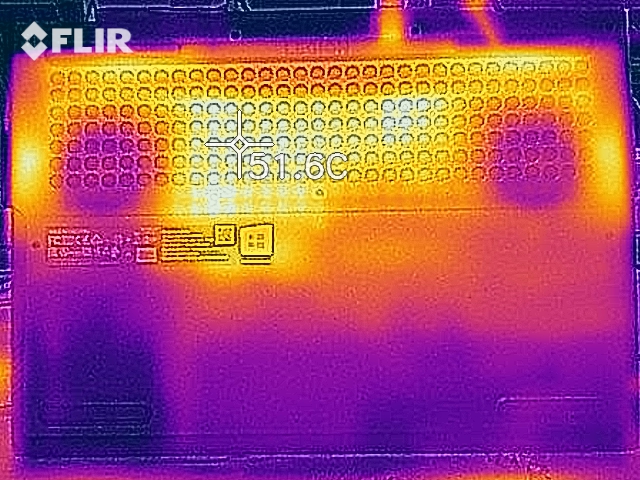
Emissions - The Lenovo Legion only heats up moderately
System Noise
The fact that gaming notebooks produce a lot of noise should not be surprising. After all, powerful hardware needs to be cooled down. In this case, we measured a noise level of 50.9 dB(A) (stress test) and 47 dB(A) (Witcher 3). The cooling fans are a lot less noticeable while idling and often don't turn on at all, in which case the device is silent.
If users want their device to remain quiet, they will have to turn on calm mode within Lenovo Vantage. This has an effect on computing power.
Noise level
| Idle |
| 30.7 / 30.7 / 30.7 dB(A) |
| Load |
| 36.6 / 50.9 dB(A) |
 | ||
30 dB silent 40 dB(A) audible 50 dB(A) loud |
||
min: | ||
| Lenovo Legion 5 15IMH05H i5-10300H, GeForce RTX 2060 Mobile | Asus TUF Gaming A15 FA506IV-HN172 R7 4800H, GeForce RTX 2060 Mobile | Dell G5 15 SE 5505 P89F R7 4800H, Radeon RX 5600M | MSI Alpha 15 A3DDK-034 R7 3750H, Radeon RX 5500M | Lenovo Legion Y540-15IRH i7-9750H, GeForce RTX 2060 Mobile | Average NVIDIA GeForce RTX 2060 Mobile | Average of class Gaming | |
|---|---|---|---|---|---|---|---|
| Noise | -0% | 7% | -20% | -5% | -2% | 4% | |
| off / environment * (dB) | 30.7 | 30.2 2% | 28 9% | 29 6% | 30 2% | 27.9 ? 9% | 24.1 ? 21% |
| Idle Minimum * (dB) | 30.7 | 30.2 2% | 28 9% | 36 -17% | 30 2% | 29 ? 6% | 26 ? 15% |
| Idle Average * (dB) | 30.7 | 30.2 2% | 28 9% | 37 -21% | 32 -4% | 30 ? 2% | 27.4 ? 11% |
| Idle Maximum * (dB) | 30.7 | 30.2 2% | 28 9% | 46 -50% | 34 -11% | 33 ? -7% | 30.1 ? 2% |
| Load Average * (dB) | 36.6 | 40 -9% | 28 23% | 50 -37% | 44 -20% | 44 ? -20% | 43.6 ? -19% |
| Witcher 3 ultra * (dB) | 47 | 49 -4% | 50.6 -8% | 51 -9% | 48 -2% | ||
| Load Maximum * (dB) | 50.9 | 49 4% | 50.6 1% | 57 -12% | 52 -2% | 51.6 ? -1% | 54.2 ? -6% |
* ... smaller is better
Temperature
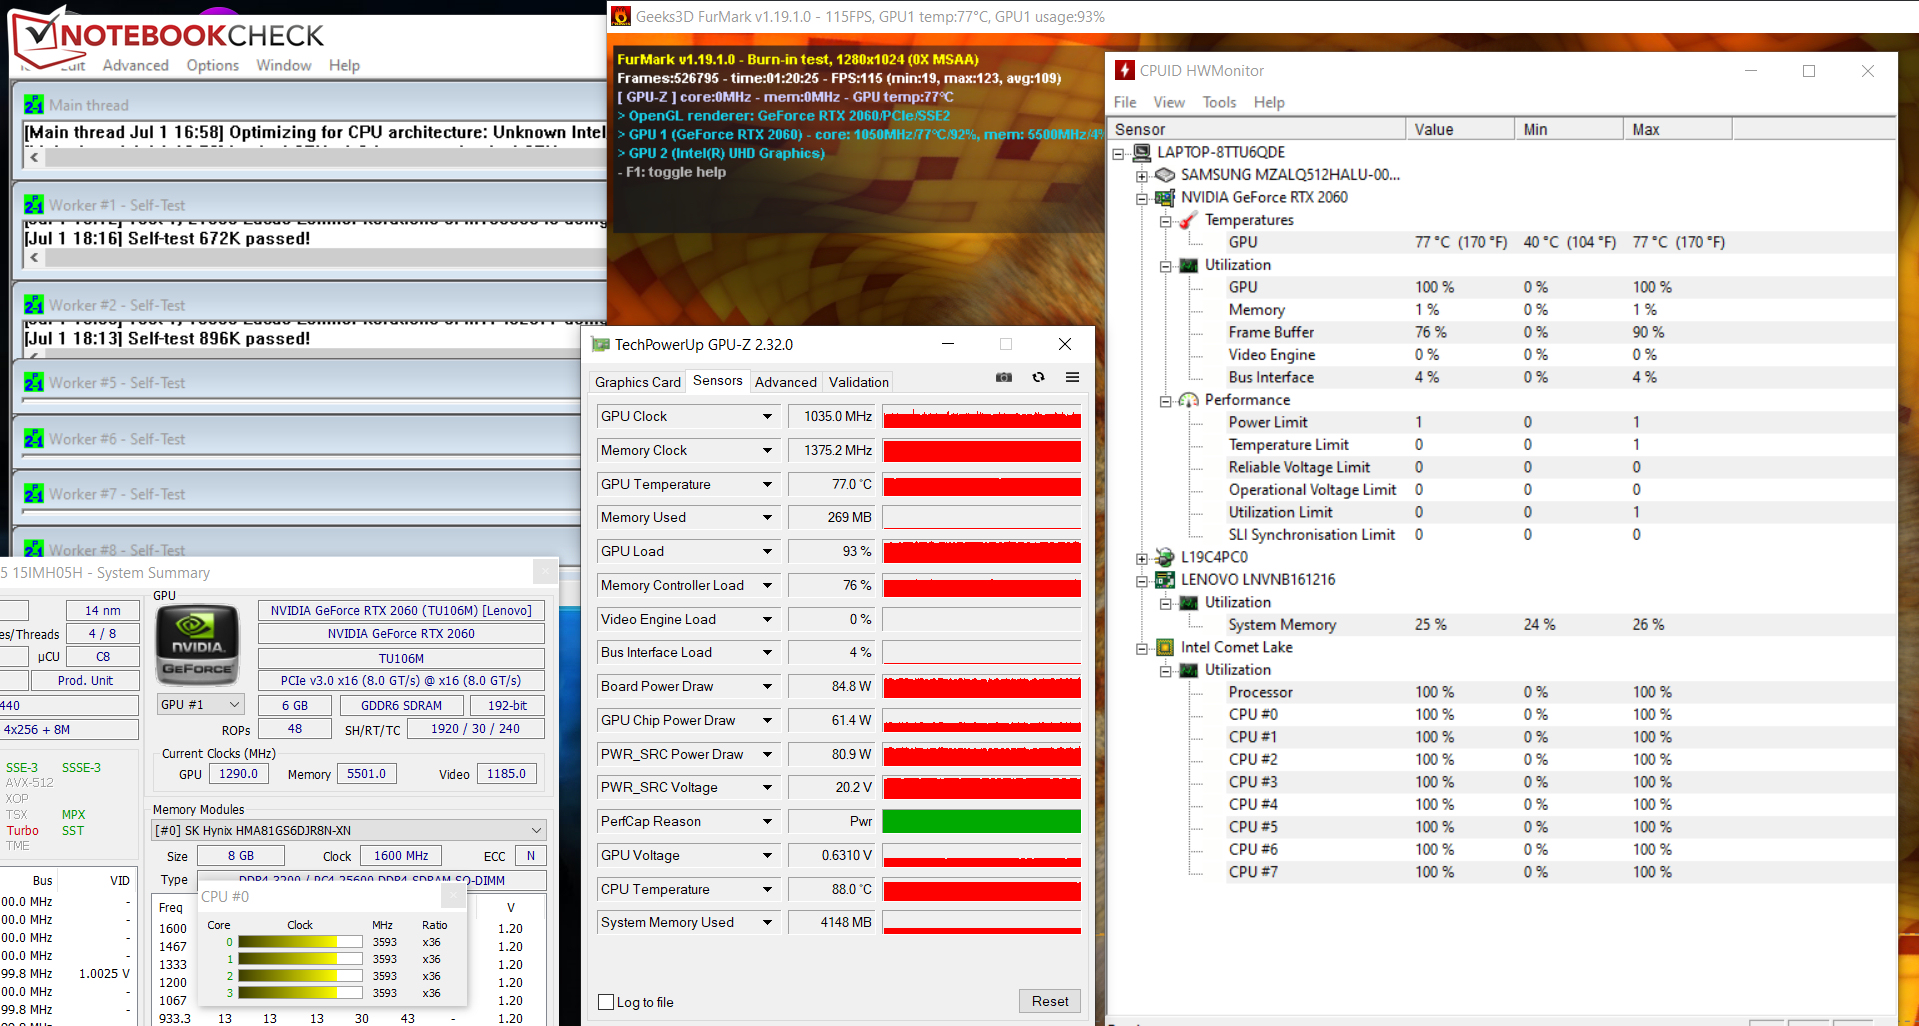
Our stress test (Prime95 and FurMark running for one hour) has different results depending on whether the device is running on mains or on battery. The clock rate of the processor drops from 4 - 4.1 GHz at first to around 3.3 - 3.6 GHz, where it remains. The GPU clock rate, on the other hand, drops from around 1200 MHz to 1050 MHz. The clock rates on battery are 2.5 GHz (CPU) and 1500 MHz (GPU). The stress test is an extreme scenario that does not occur as such during everyday use. We use it to find our whether the system remains stable even under maximum load.
The Lenovo Legion does not heat up particularly. While we did measure temperatures above 40 °C (104 °F) in some areas during our stress test, the temperatures were a little lower during our Witcher 3 test and perfectly normal during everyday use.
(-) The maximum temperature on the upper side is 46.3 °C / 115 F, compared to the average of 40.4 °C / 105 F, ranging from 21.2 to 68.8 °C for the class Gaming.
(±) The bottom heats up to a maximum of 44.4 °C / 112 F, compared to the average of 43.2 °C / 110 F
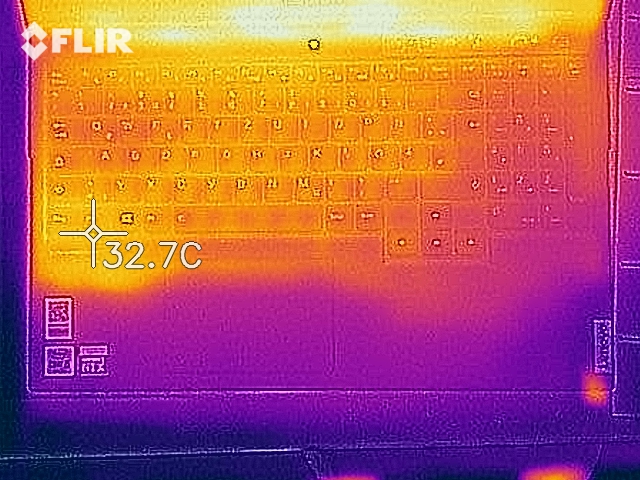
(+) In idle usage, the average temperature for the upper side is 26.6 °C / 80 F, compared to the device average of 33.9 °C / 93 F.
(±) Playing The Witcher 3, the average temperature for the upper side is 34.6 °C / 94 F, compared to the device average of 33.9 °C / 93 F.
(+) The palmrests and touchpad are cooler than skin temperature with a maximum of 27 °C / 80.6 F and are therefore cool to the touch.
(±) The average temperature of the palmrest area of similar devices was 28.8 °C / 83.8 F (+1.8 °C / 3.2 F).
| Lenovo Legion 5 15IMH05H i5-10300H, GeForce RTX 2060 Mobile | Asus TUF Gaming A15 FA506IV-HN172 R7 4800H, GeForce RTX 2060 Mobile | Dell G5 15 SE 5505 P89F R7 4800H, Radeon RX 5600M | MSI Alpha 15 A3DDK-034 R7 3750H, Radeon RX 5500M | Lenovo Legion Y540-15IRH i7-9750H, GeForce RTX 2060 Mobile | Average NVIDIA GeForce RTX 2060 Mobile | Average of class Gaming | |
|---|---|---|---|---|---|---|---|
| Heat | 1% | -12% | 2% | -27% | -11% | -8% | |
| Maximum Upper Side * (°C) | 46.3 | 42.9 7% | 53 -14% | 44 5% | 47 -2% | 47.2 ? -2% | 45.2 ? 2% |
| Maximum Bottom * (°C) | 44.4 | 49.9 -12% | 57.6 -30% | 49 -10% | 60 -35% | 52.7 ? -19% | 48.1 ? -8% |
| Idle Upper Side * (°C) | 28.1 | 27.8 1% | 27.4 2% | 26 7% | 37 -32% | 31 ? -10% | 31 ? -10% |
| Idle Bottom * (°C) | 29.4 | 27 8% | 31 -5% | 28 5% | 41 -39% | 32.9 ? -12% | 34.2 ? -16% |
* ... smaller is better
Speakers
The stereo speakers are positioned towards the front at the bottom of the base unit. They produce a decent sound, although there is hardly any bass. The speakers don't reach a very high volume either.
Lenovo Legion 5 15IMH05H audio analysis
(-) | not very loud speakers (65.2 dB)
Bass 100 - 315 Hz
(-) | nearly no bass - on average 15.8% lower than median
(±) | linearity of bass is average (13.4% delta to prev. frequency)
Mids 400 - 2000 Hz
(+) | balanced mids - only 3.9% away from median
(+) | mids are linear (3.4% delta to prev. frequency)
Highs 2 - 16 kHz
(+) | balanced highs - only 2.2% away from median
(+) | highs are linear (6.5% delta to prev. frequency)
Overall 100 - 16.000 Hz
(±) | linearity of overall sound is average (19.1% difference to median)
Compared to same class
» 64% of all tested devices in this class were better, 7% similar, 28% worse
» The best had a delta of 6%, average was 18%, worst was 132%
Compared to all devices tested
» 46% of all tested devices were better, 7% similar, 47% worse
» The best had a delta of 4%, average was 23%, worst was 134%
Energy Management - The gaming notebook is very enduring
Power Consumption
We did not notice any particularly surprising consumption rates on the Lenovo notebook. We measured a maximum consumption of 8.7 Watt while idling and up to 195 Watt during our stress test. The power consumption was an average of 151 Watt (147 - 156 Watt) during our Witcher 3 test. The rated output of the power supply is 230 Watt.
| Off / Standby | |
| Idle | |
| Load |
|
Key:
min: | |
| Lenovo Legion 5 15IMH05H i5-10300H, GeForce RTX 2060 Mobile | Asus TUF Gaming A15 FA506IV-HN172 R7 4800H, GeForce RTX 2060 Mobile | Dell G5 15 SE 5505 P89F R7 4800H, Radeon RX 5600M | MSI Alpha 15 A3DDK-034 R7 3750H, Radeon RX 5500M | Lenovo Legion Y540-15IRH i7-9750H, GeForce RTX 2060 Mobile | Average NVIDIA GeForce RTX 2060 Mobile | Average of class Gaming | |
|---|---|---|---|---|---|---|---|
| Power Consumption | -24% | -26% | -114% | -132% | -113% | -137% | |
| Idle Minimum * (Watt) | 3.2 | 5.4 -69% | 6.5 -103% | 14 -338% | 15 -369% | 11.5 ? -259% | 13 ? -306% |
| Idle Average * (Watt) | 8.3 | 10 -20% | 10.6 -28% | 18 -117% | 20 -141% | 16.5 ? -99% | 19 ? -129% |
| Idle Maximum * (Watt) | 8.7 | 10.5 -21% | 11 -26% | 32 -268% | 33 -279% | 23.7 ? -172% | 24.6 ? -183% |
| Load Average * (Watt) | 82 | 135 -65% | 84.1 -3% | 64 22% | 88 -7% | 107.5 ? -31% | 110.7 ? -35% |
| Witcher 3 ultra * (Watt) | 151 | 144 5% | 152.9 -1% | 123 19% | 128 15% | ||
| Load Maximum * (Watt) | 195 | 147 25% | 180.4 7% | 193 1% | 213 -9% | 199.7 ? -2% | 259 ? -33% |
* ... smaller is better
Battery Life
The gaming notebook manages a battery life of 7:12 h during our practical Wi-Fi test (browsing the web via a script, energy profile set to balanced). It lasts even longer during our video test (energy profile set to balanced), which it displays for 9:14 h before turning off. This test involves running the short film Big Buck Bunny (H.264 encoding, 1920x1080 pixels) in a loop. Power saving was deactivated and display brightness set to around 150 cd/m² for both of these tests. We also turned off the wireless modules for the video test.
| Lenovo Legion 5 15IMH05H i5-10300H, GeForce RTX 2060 Mobile, 60 Wh | Asus TUF Gaming A15 FA506IV-HN172 R7 4800H, GeForce RTX 2060 Mobile, 48 Wh | Dell G5 15 SE 5505 P89F R7 4800H, Radeon RX 5600M, 51 Wh | MSI Alpha 15 A3DDK-034 R7 3750H, Radeon RX 5500M, 51 Wh | Lenovo Legion Y540-15IRH i7-9750H, GeForce RTX 2060 Mobile, 57 Wh | Acer Nitro 5 AN517-52-77DS i7-10750H, GeForce RTX 2060 Mobile, 57.48 Wh | Average of class Gaming | |
|---|---|---|---|---|---|---|---|
| Battery runtime | -12% | -9% | -51% | -50% | -2% | -11% | |
| Reader / Idle (h) | 14.1 | 9.8 -30% | 11.2 -21% | 5.8 -59% | 3.9 -72% | 11 -22% | 8.27 ? -41% |
| H.264 (h) | 9.2 | 5.4 -41% | 3.9 -58% | 7.3 -21% | 8.32 ? -10% | ||
| WiFi v1.3 (h) | 7.2 | 6.2 -14% | 6.2 -14% | 4.1 -43% | 3.2 -56% | 6.6 -8% | 7.11 ? -1% |
| Load (h) | 1.4 | 1.9 36% | 1.5 7% | 0.8 -43% | 1.1 -21% | 2 43% | 1.502 ? 7% |
Pros
Cons
Verdict
The Lenovo Legion 5 with its combination of a Core-i5-10300H processor with a GeForce-RTX-2060 graphics chip display all current computer games smoothly onto its 120-Hz display. Most games can be played in Full-HD resolution and high to maximum quality settings. The CPU and GPU also manage to keep up their high clock rates over a long time.
The Legion 5 allows users to activate and deactivate the integrated GPU.
The integrated UHD Graphics 630 can be activated and deactivated with the click of a button. Battery life is very good when the iGPU is activated, but doesn't last quite as long if the demanding GeForce RTX 2060 is at work.
Should the storage in the 512-GB SSD run out, users can expand the device either with a 2.5-inch drive or a second NVMe SSD (M.2 2280). Inserting the storage device requires opening the device, which doesn't have a maintenance hatch.
The Full-HD IPS display offers stable viewing angles, a matte surface, acceptable response times, a good contrast ratio and decent colors. The maximum brightness and color space coverage are too low, however. We expect more from a $1250 notebook.
The port selection is good for the most part, although we do miss a Thunderbolt 3 port. This would enable users to connect external GPUs, for example. The Legion only has one Type C USB 3.2 Gen 1 port which supports DisplayPort via USB C.
Lenovo Legion 5 15IMH05H
- 07/08/2020 v7 (old)
Sascha Mölck
Price comparison

