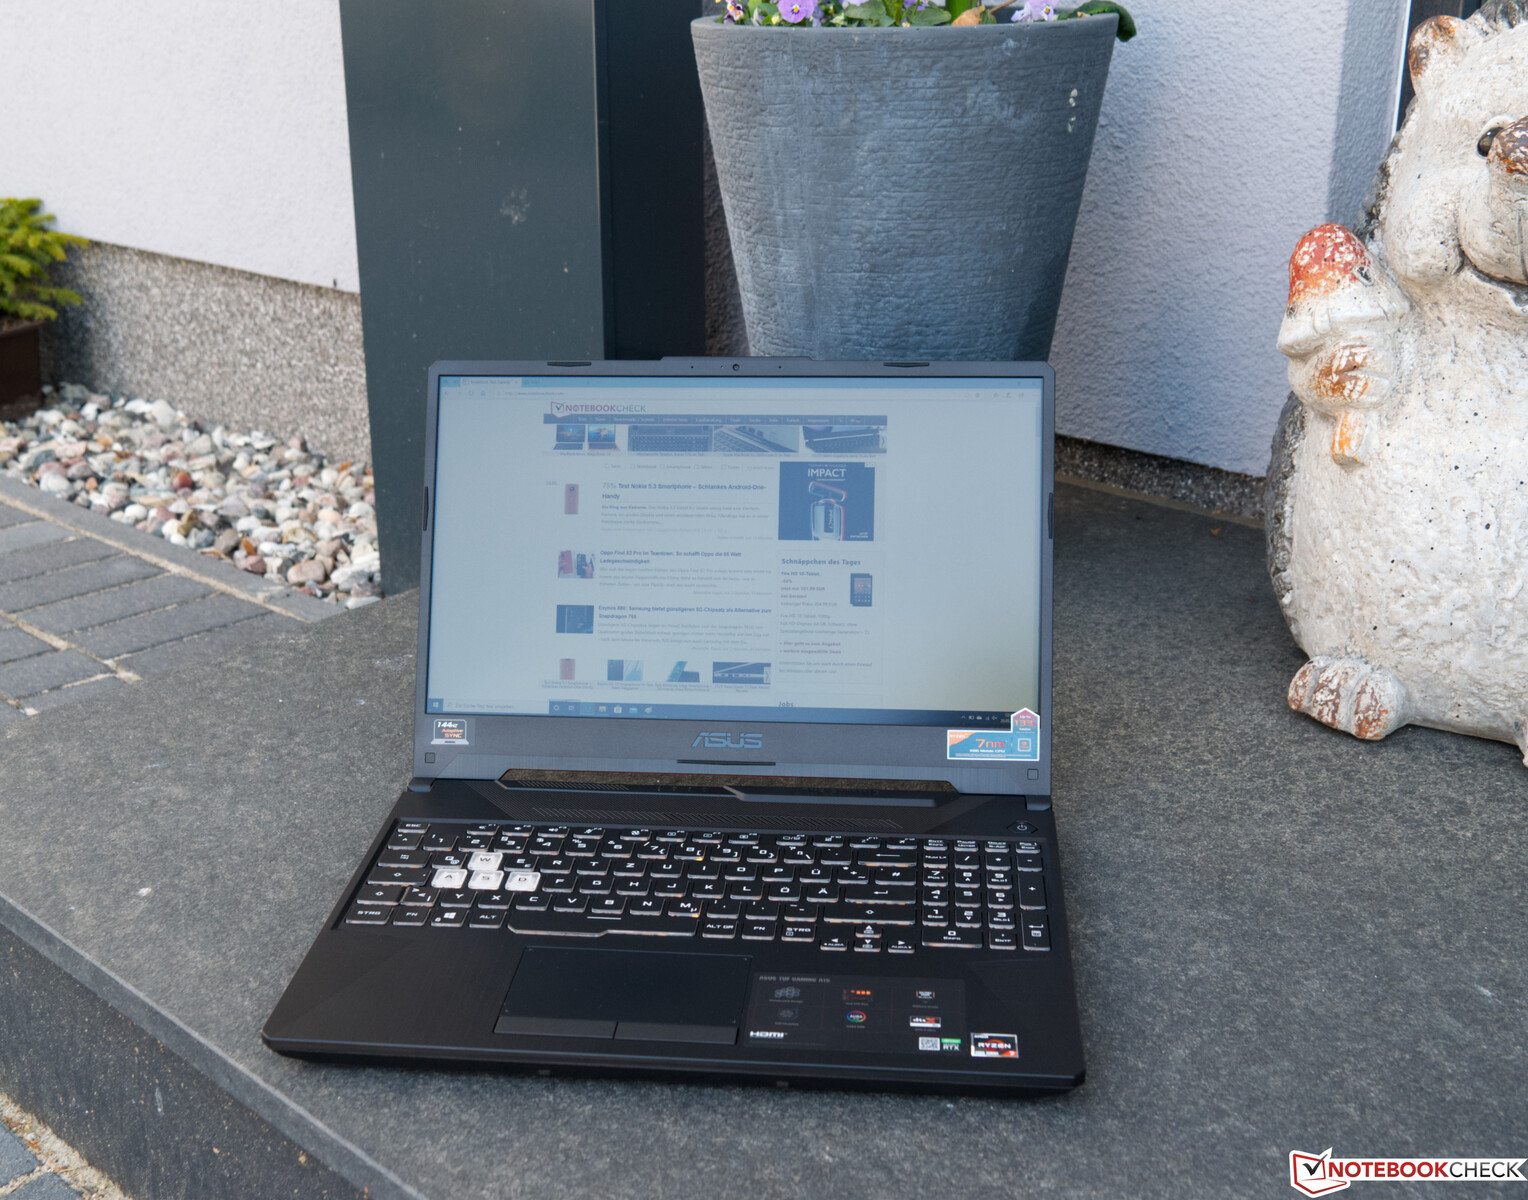
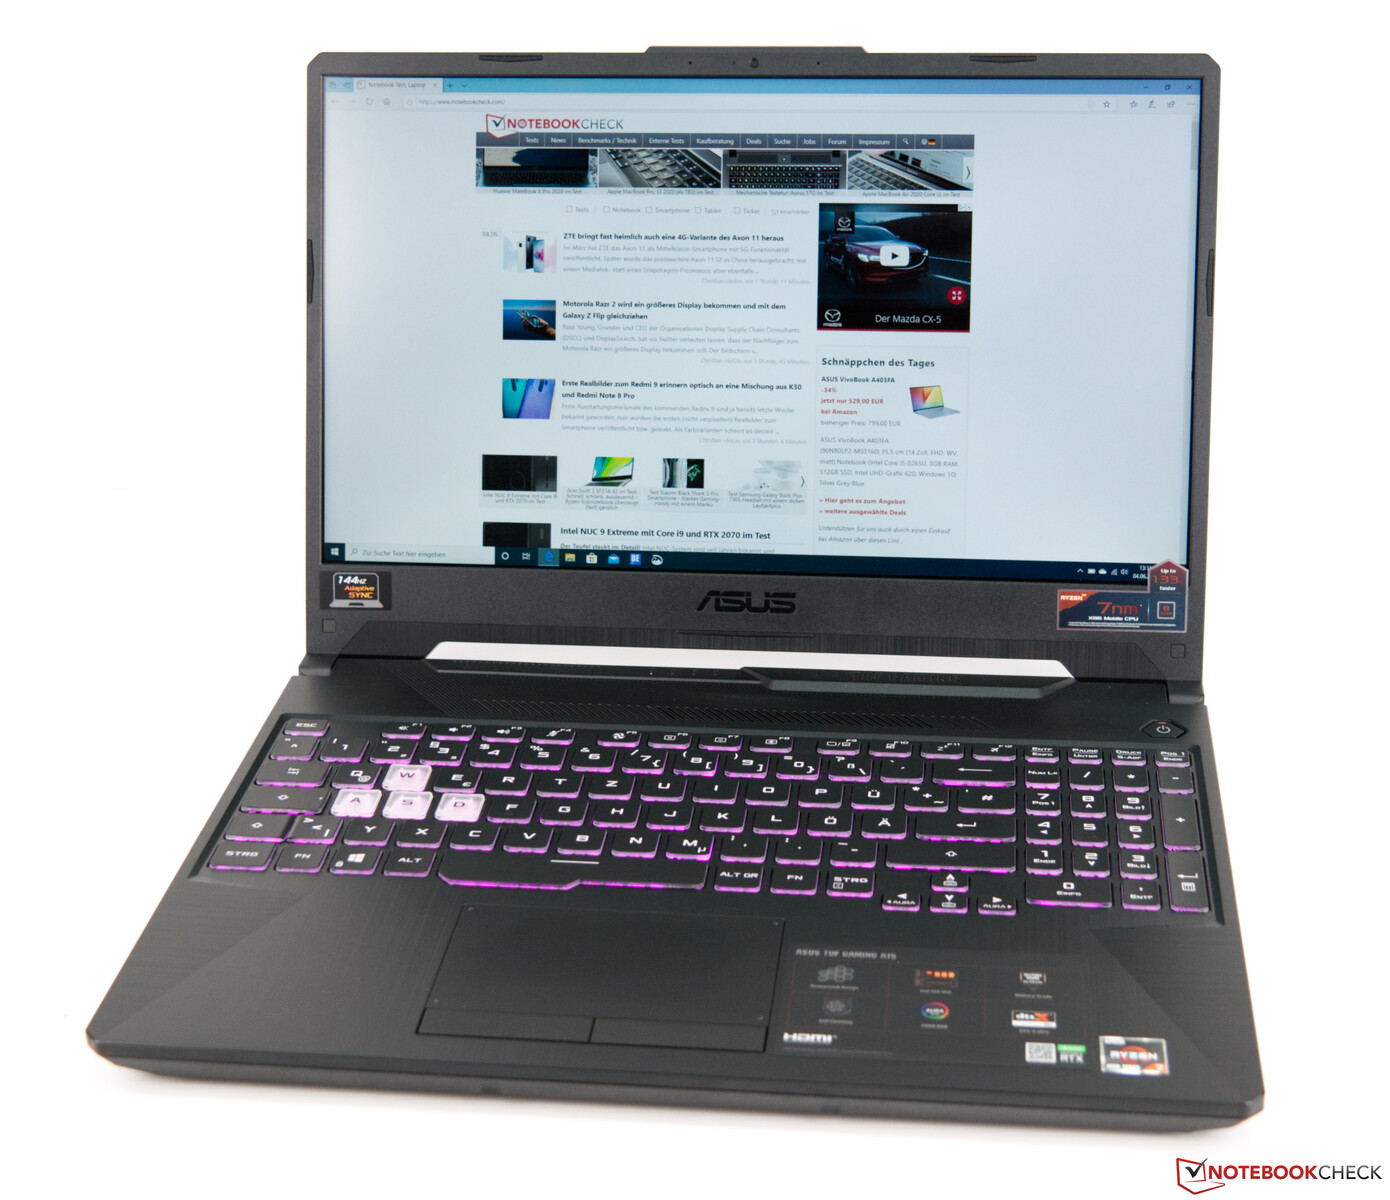
Asus TUF A15 with AMD Renoir and Nvidia Graphics in Review

The Asus TUF Gaming A15 is an entry-level gaming laptop. The relatively low price of 1299 Euros (~$1469) also reflects this, particularly in light of the device's fast raw gaming performance. For its current generation, Asus relies on AMD's brand-new Renoir processors.
With eight physical cores, the AMD Ryzen 7 4800H is a solid foundation for modern games and video-editing. In conjunction with the Nvidia GeForce RTX 2060, the device does not struggle with the latest games at the native resolution. However, this already represents the highest-end GPU option for the Asus TUF A15 FA506. For more price-conscious buyers, alternative configurations with a GeForce GTX 1660 Ti or GeForce GTX 1650 Ti are also available.
We chose 15-inch laptops with similar specifications for comparison. They are listed in the following table.
Rating | Date | Model | Weight | Height | Size | Resolution | Price |
|---|---|---|---|---|---|---|---|
| 82.7 % v7 (old) | 06 / 2020 | Asus TUF Gaming A15 FA506IV-HN172 R7 4800H, GeForce RTX 2060 Mobile | 2.2 kg | 24.9 mm | 15.60" | 1920x1080 | |
| 82.3 % v7 (old) | 08 / 2019 | Lenovo Legion Y540-15IRH-81SX00B2GE i7-9750H, GeForce GTX 1660 Ti Mobile | 2.2 kg | 26 mm | 15.60" | 1920x1080 | |
| 78.8 % v7 (old) | 02 / 2020 | MSI Alpha 15 A3DDK-034 R7 3750H, Radeon RX 5500M | 2.3 kg | 27.5 mm | 15.60" | 1920x1080 | |
| 80.8 % v7 (old) | 10 / 2019 | MSI GL65 9SEK i7-9750H, GeForce RTX 2060 Mobile | 2.3 kg | 27.5 mm | 15.60" | 1920x1080 | |
| 81.5 % v7 (old) | 07 / 2019 | HP Omen 15-dc1020ng i5-9300H, GeForce GTX 1650 Mobile | 2.3 kg | 25 mm | 15.60" | 1920x1080 | |
| 83.3 % v6 (old) | 05 / 2019 | Asus ROG Zephyrus G15 GA502DU R7 3750H, GeForce GTX 1660 Ti Max-Q | 2.1 kg | 20.4 mm | 15.60" | 1920x1080 |
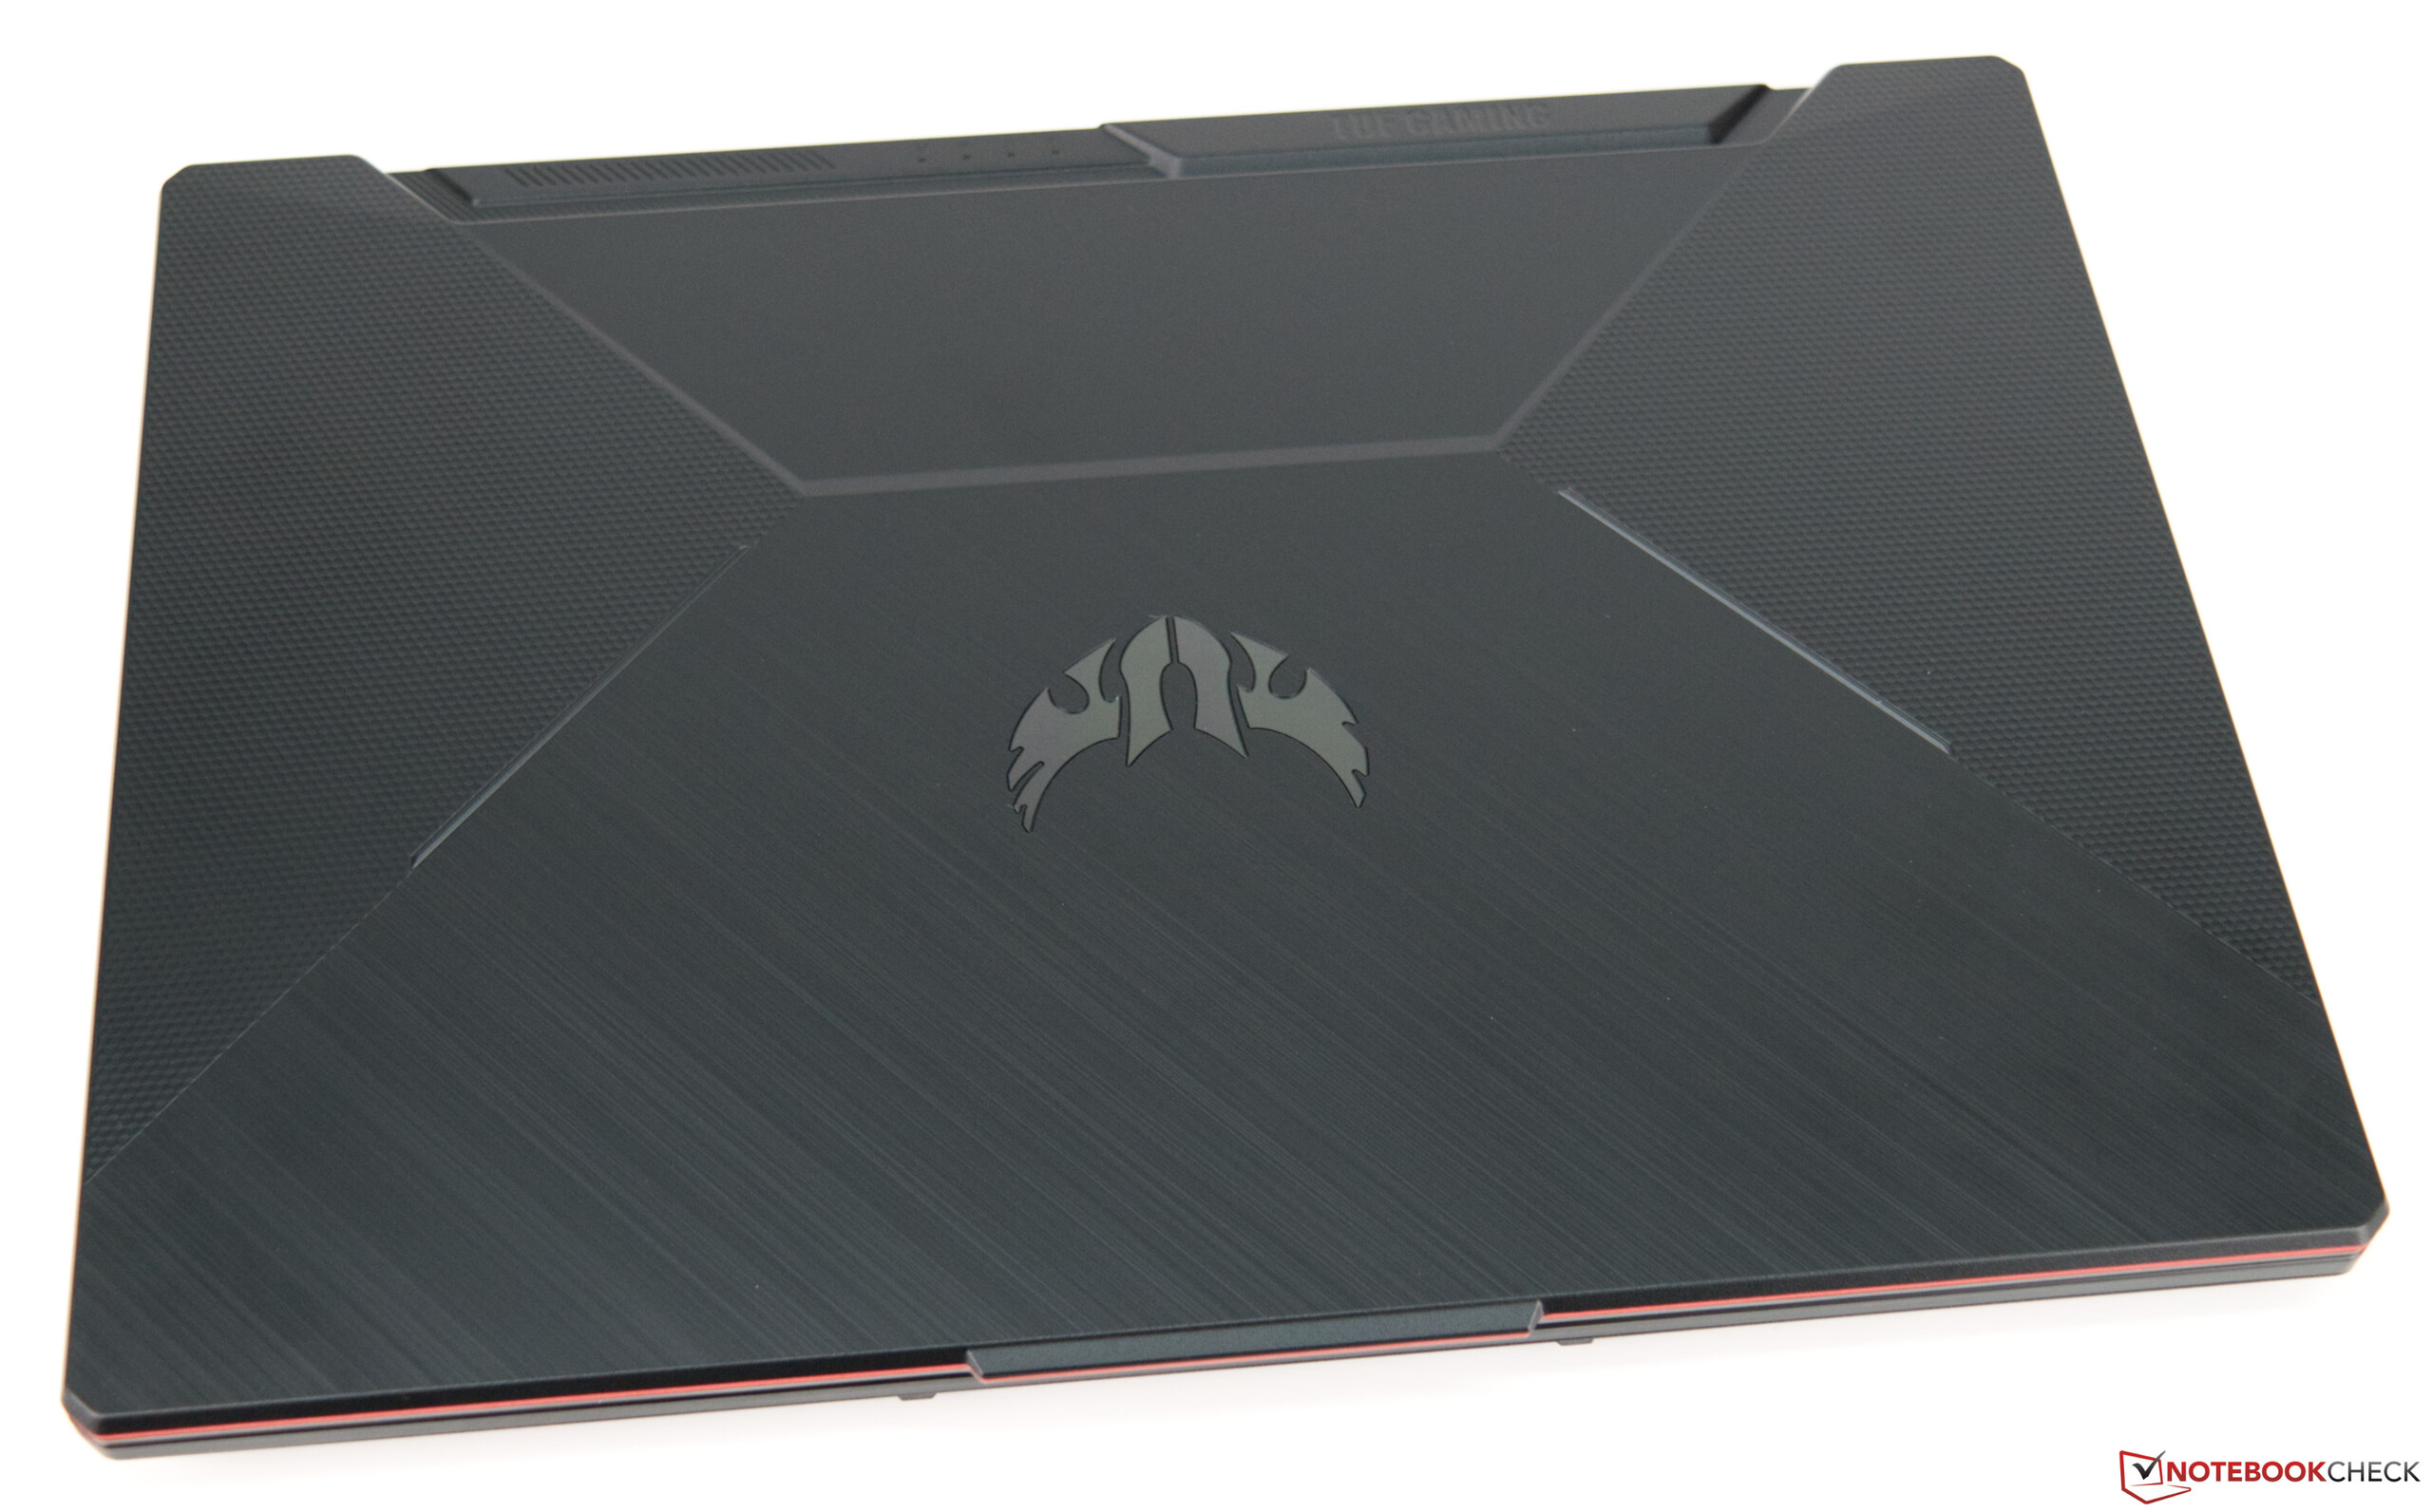
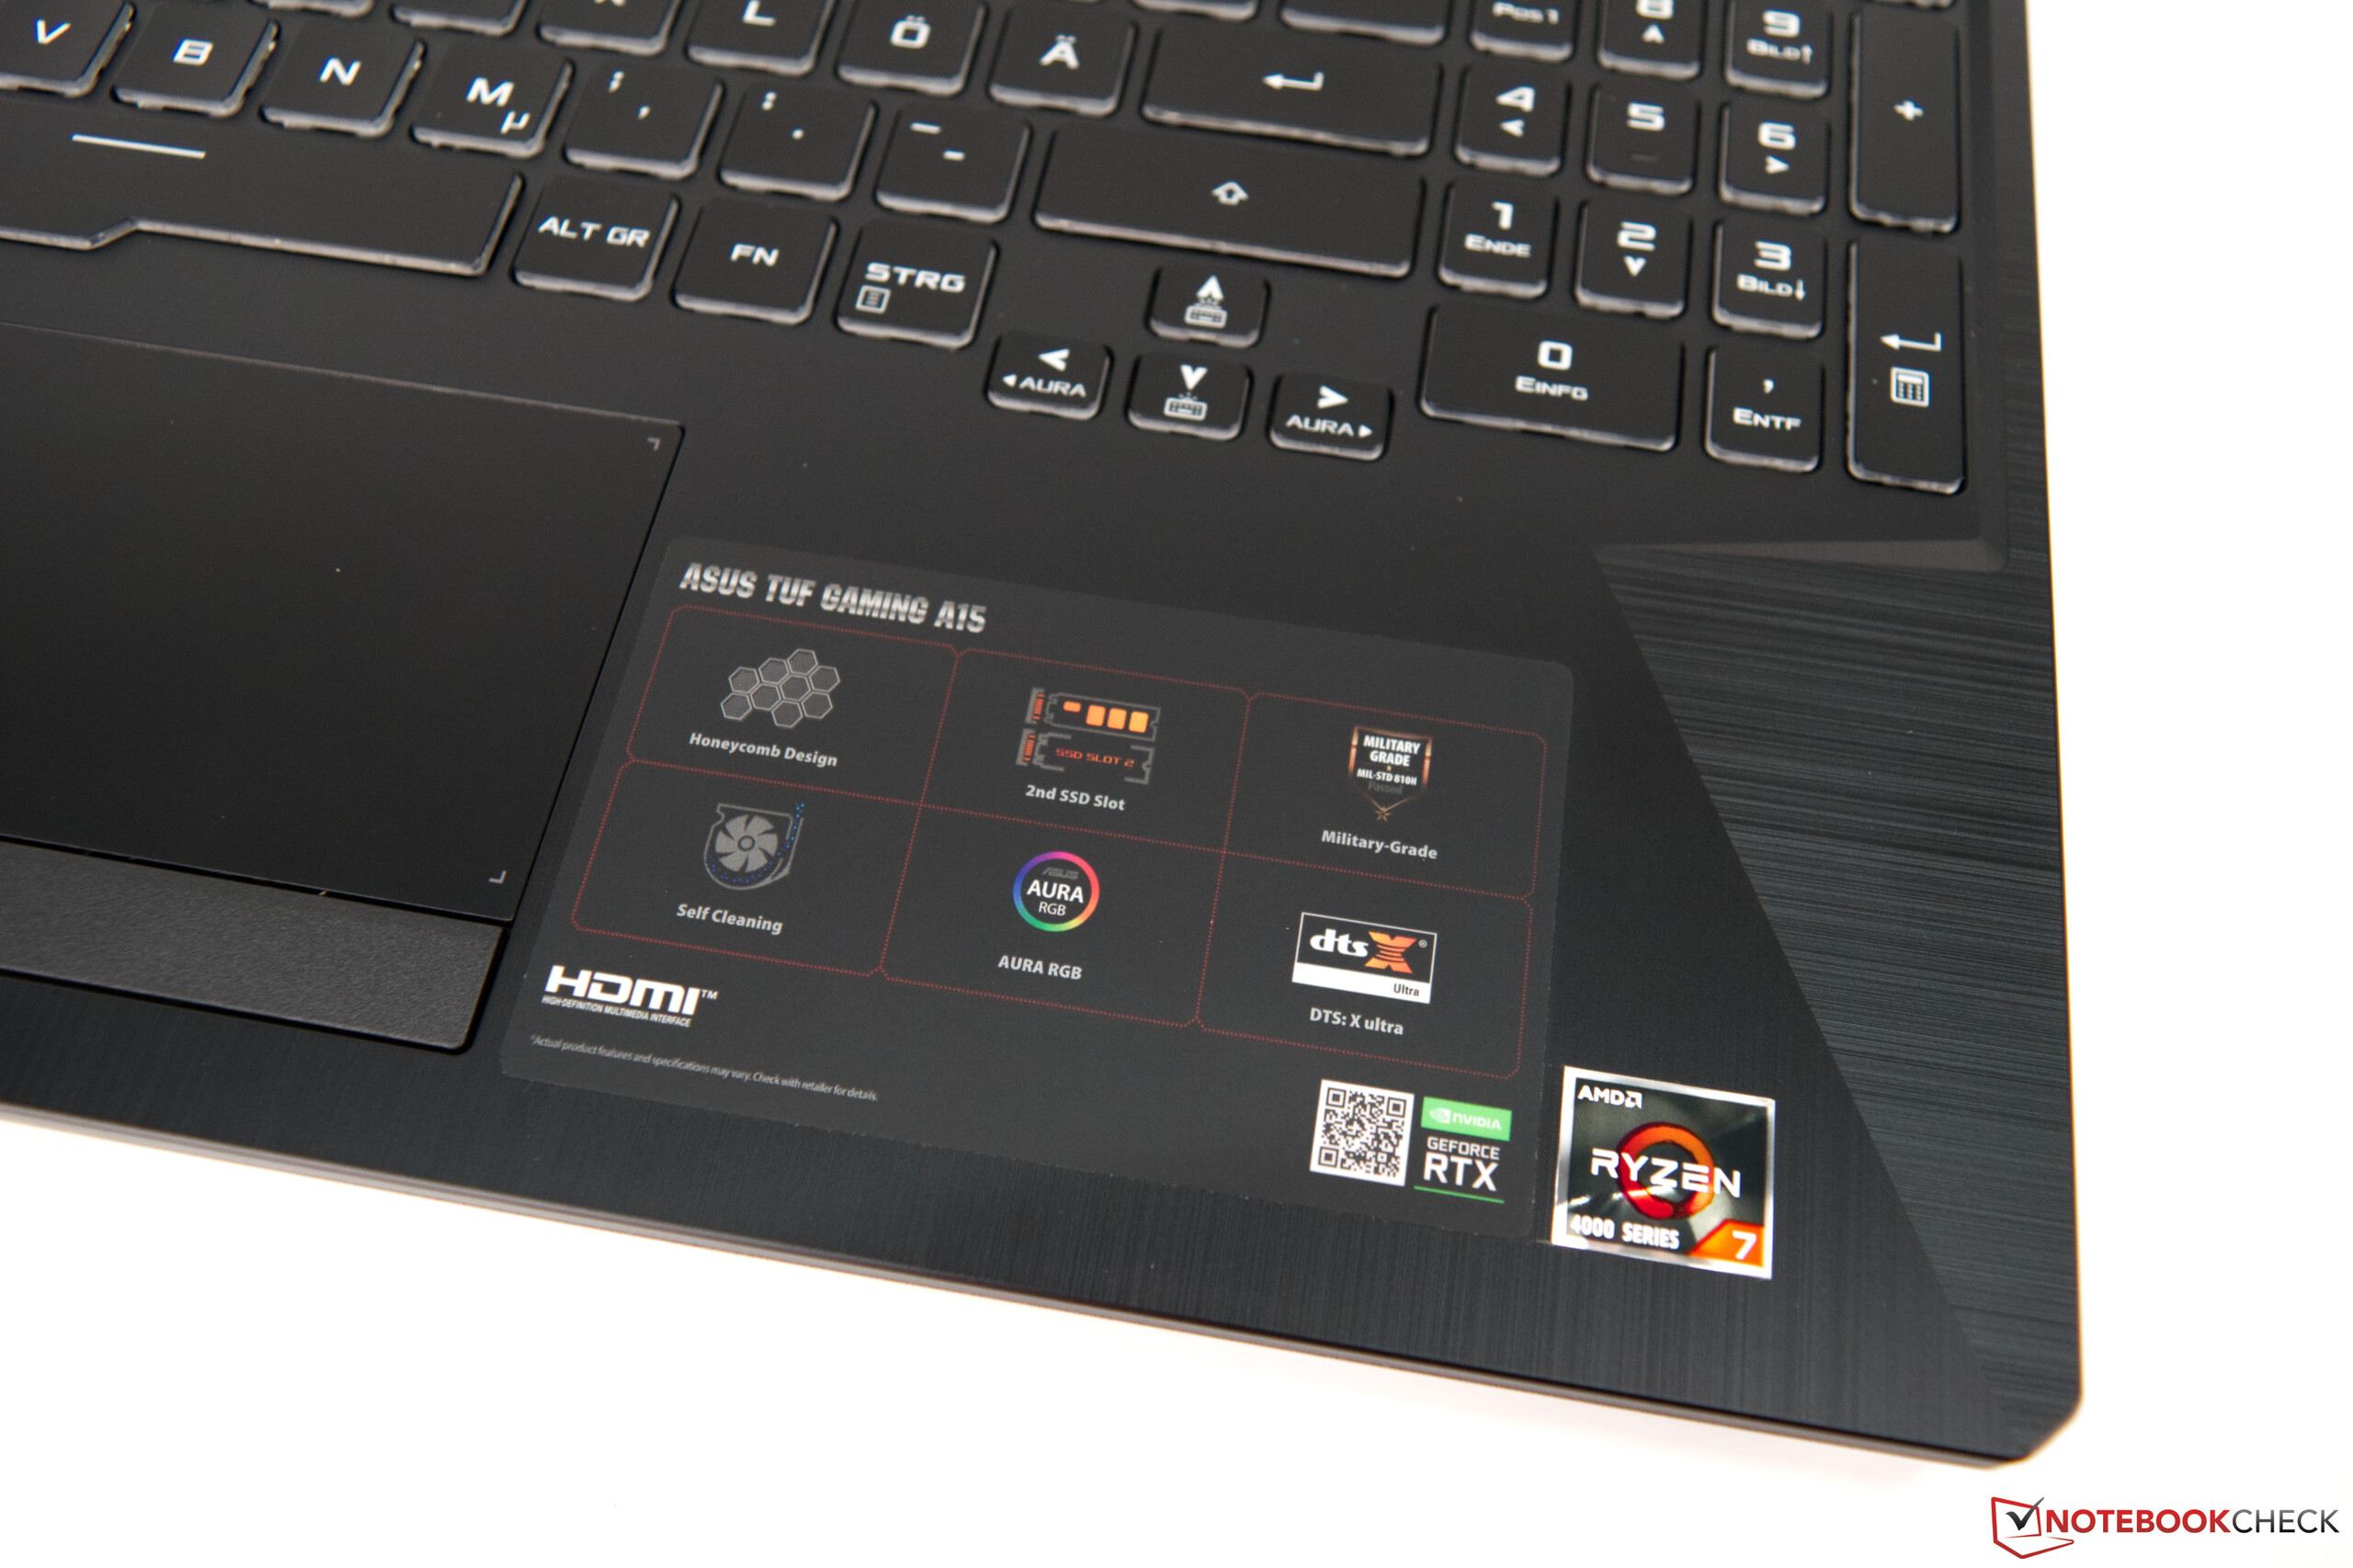
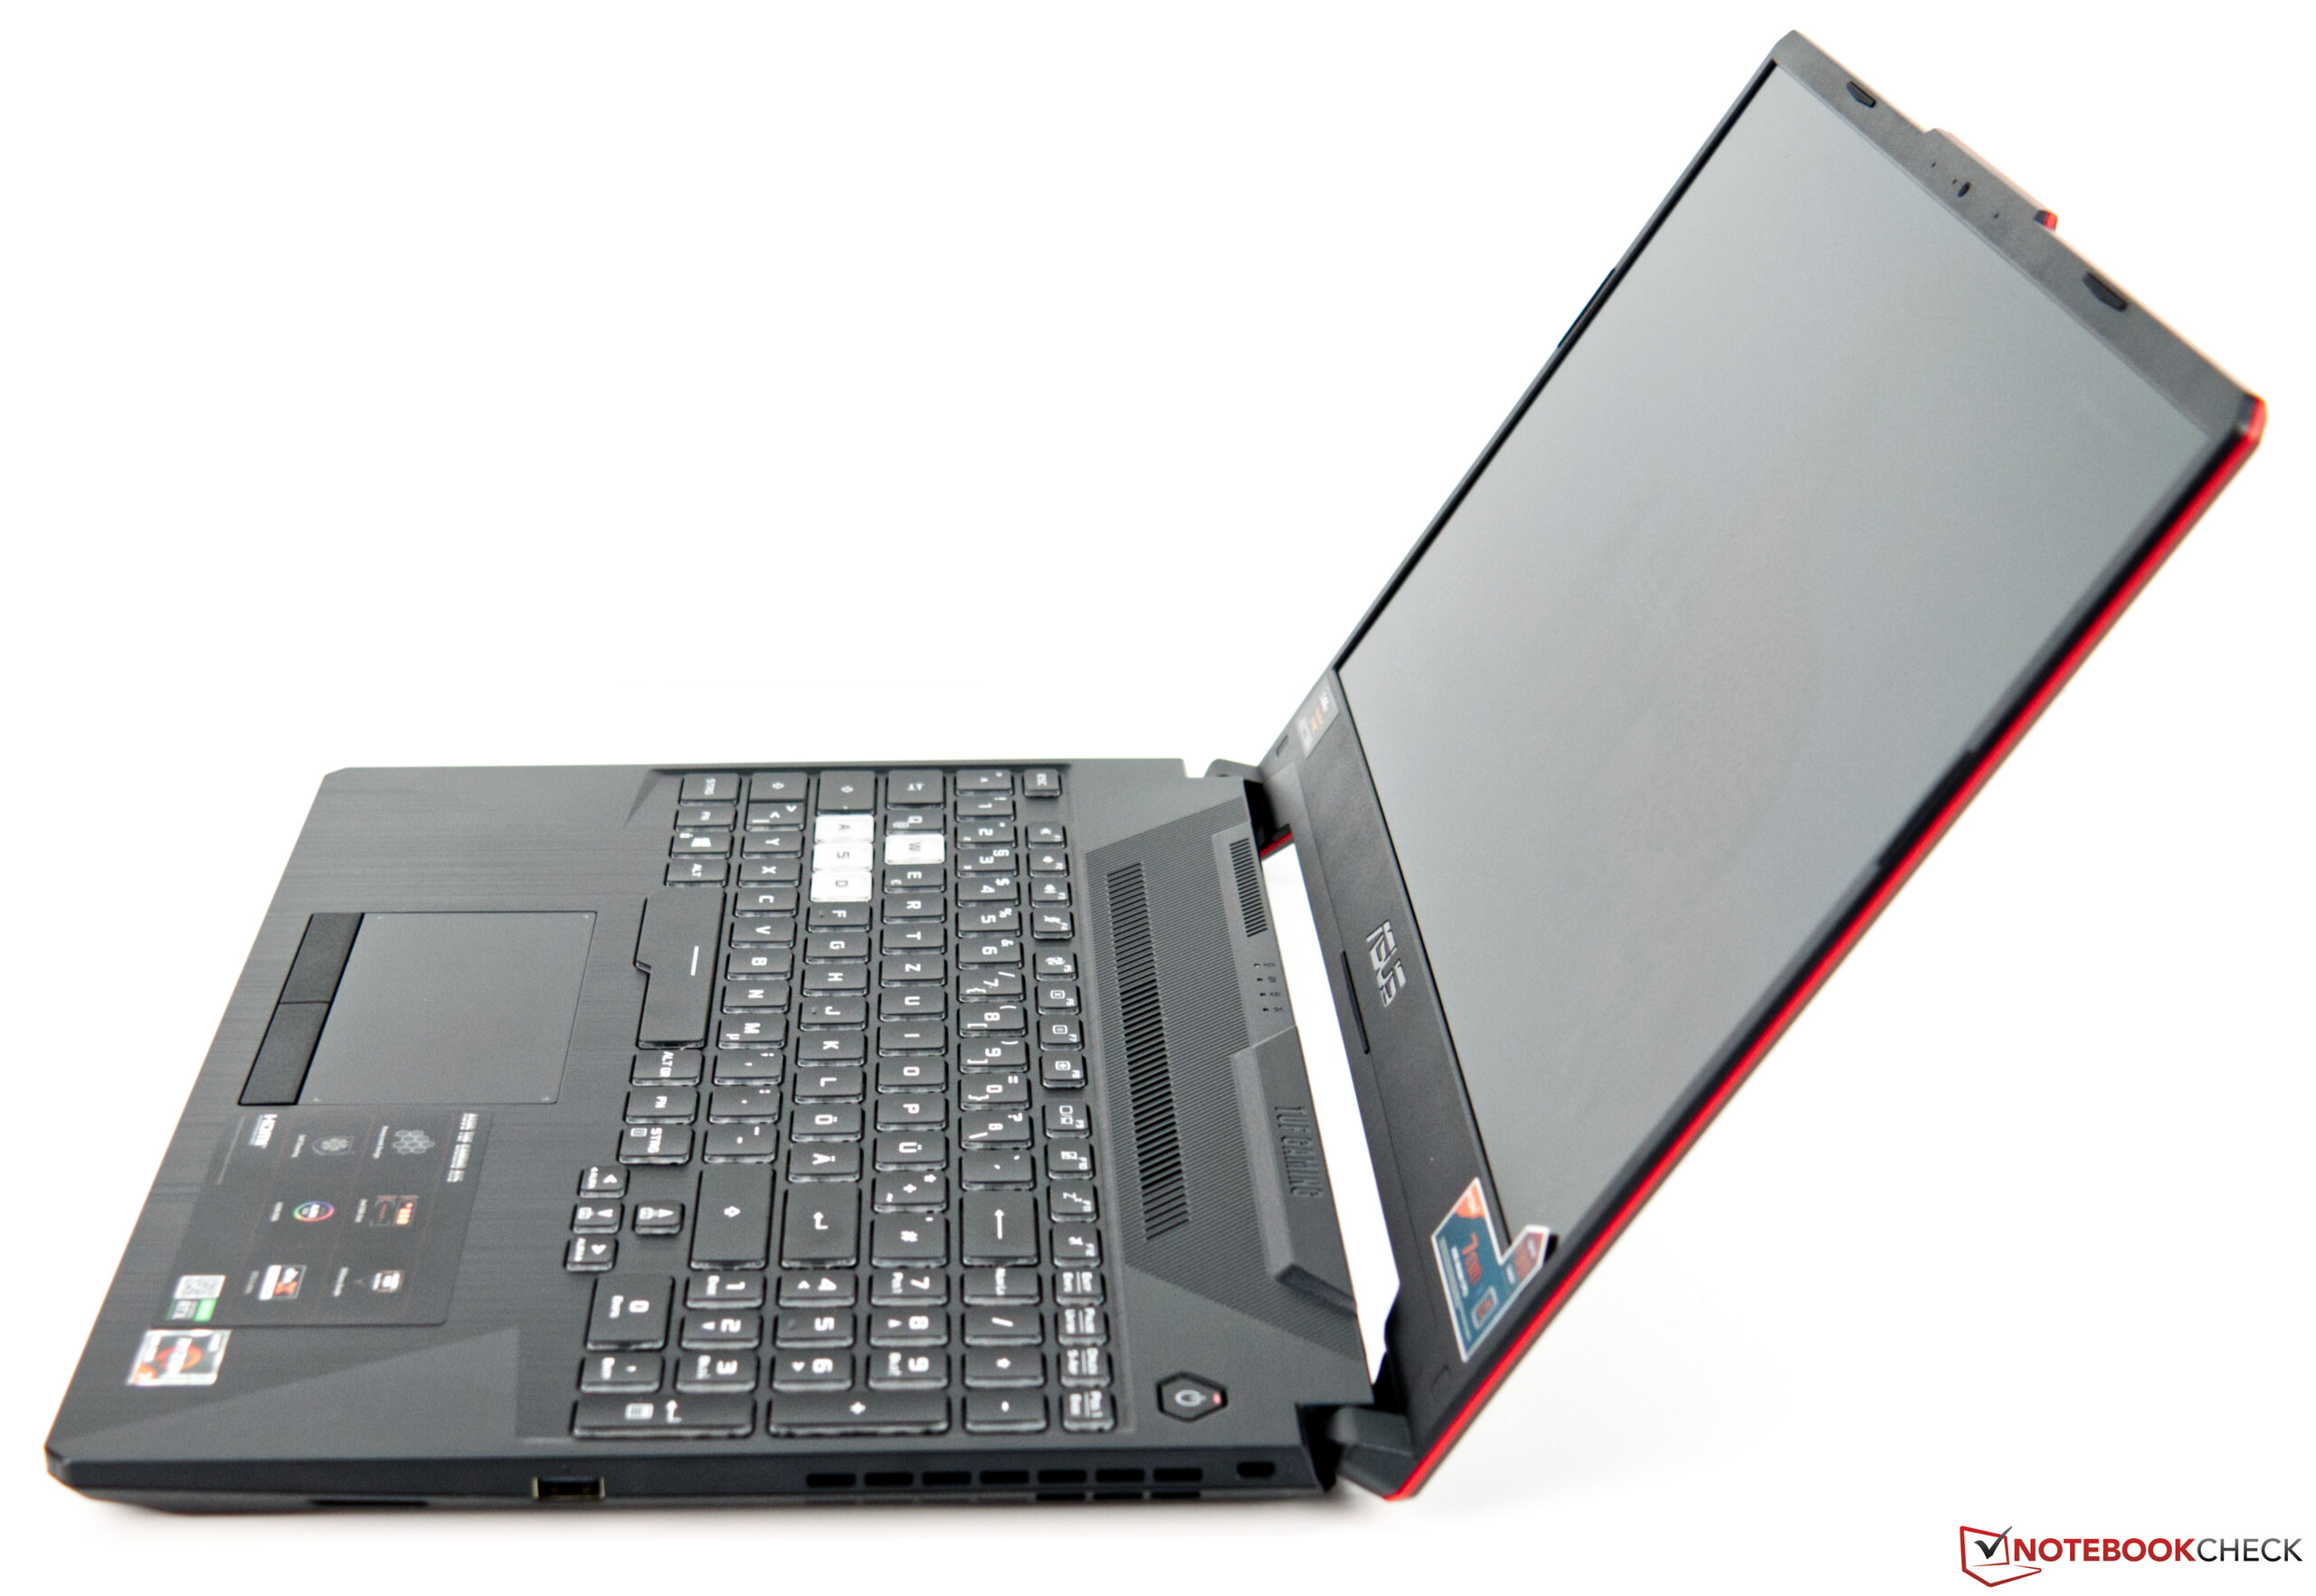
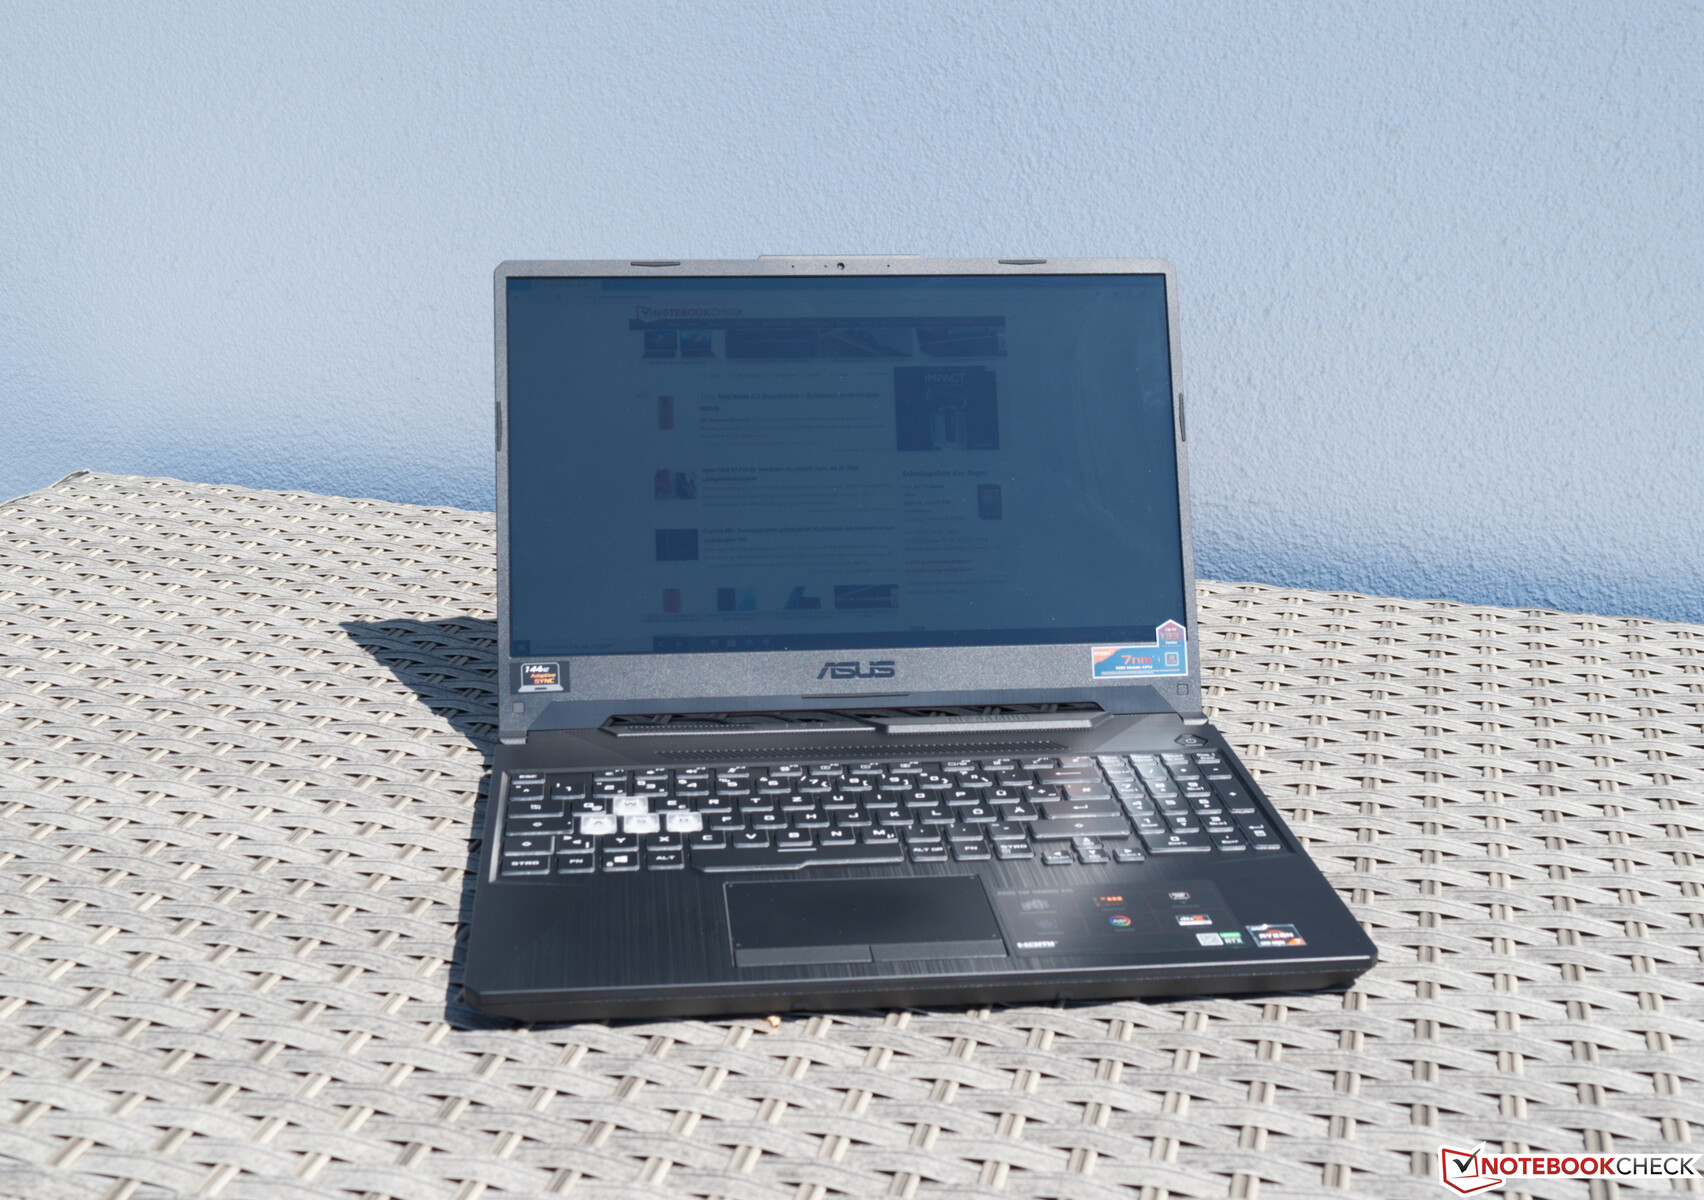
Case - Plastic Everywhere
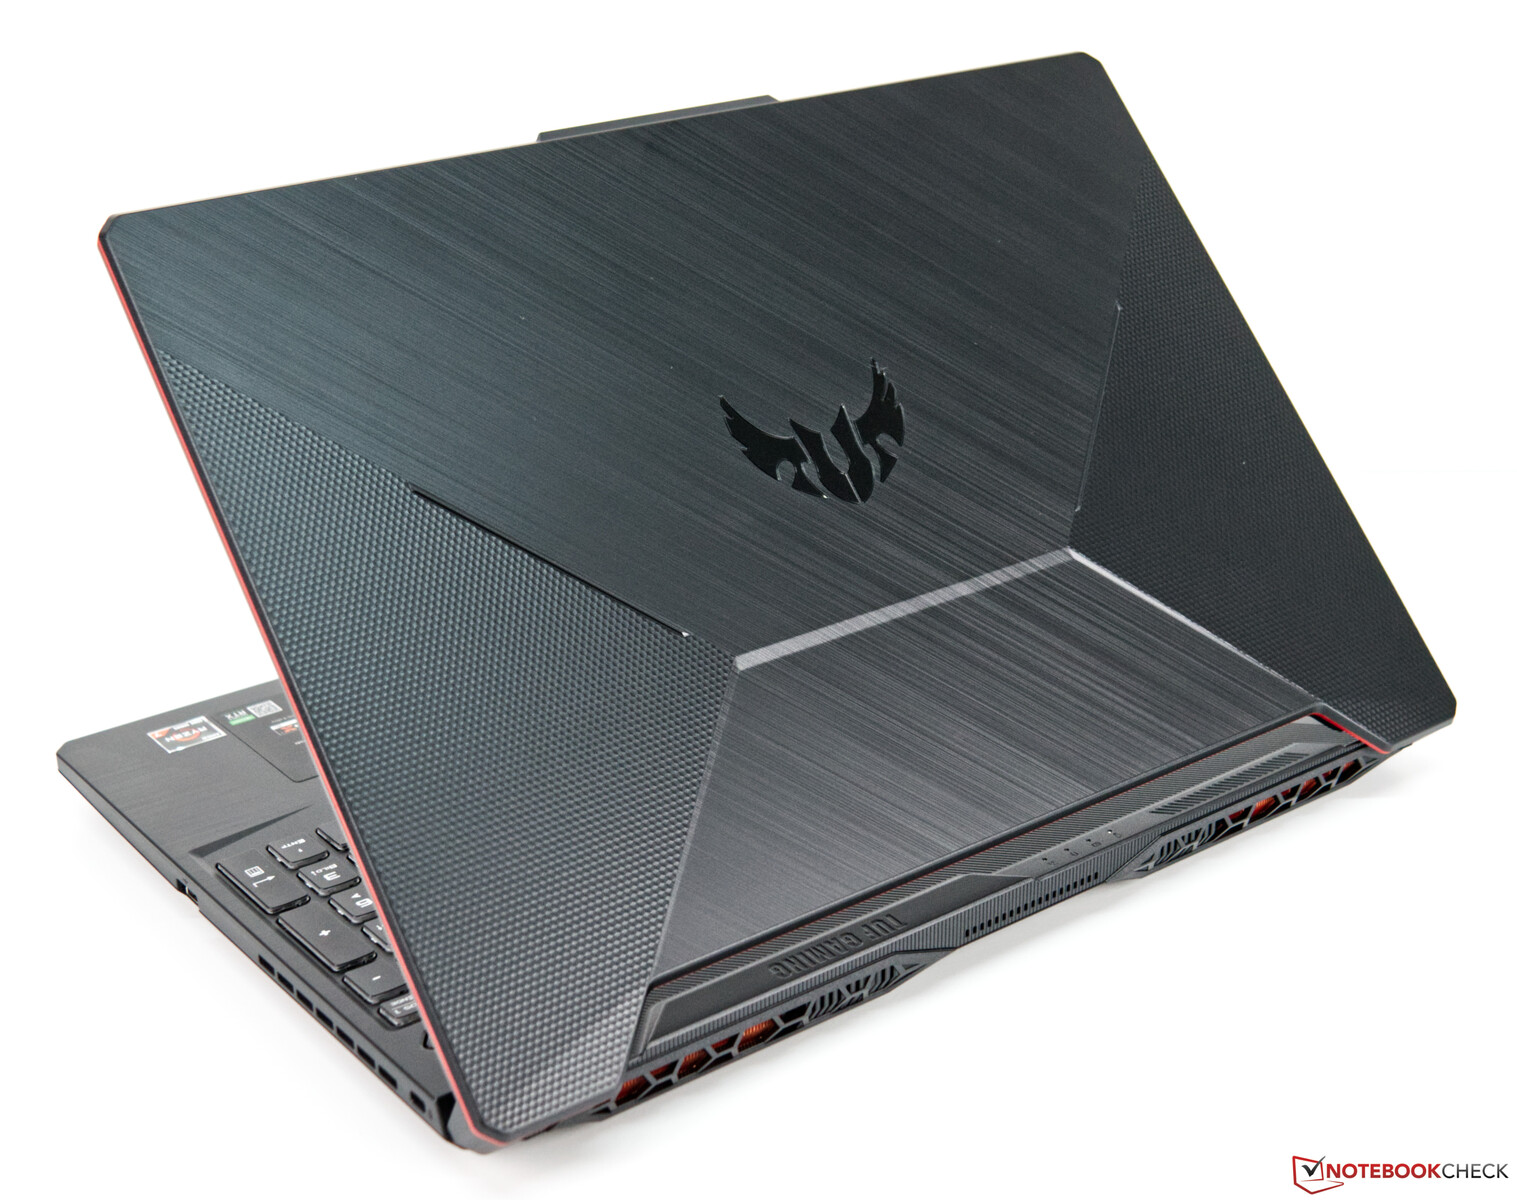
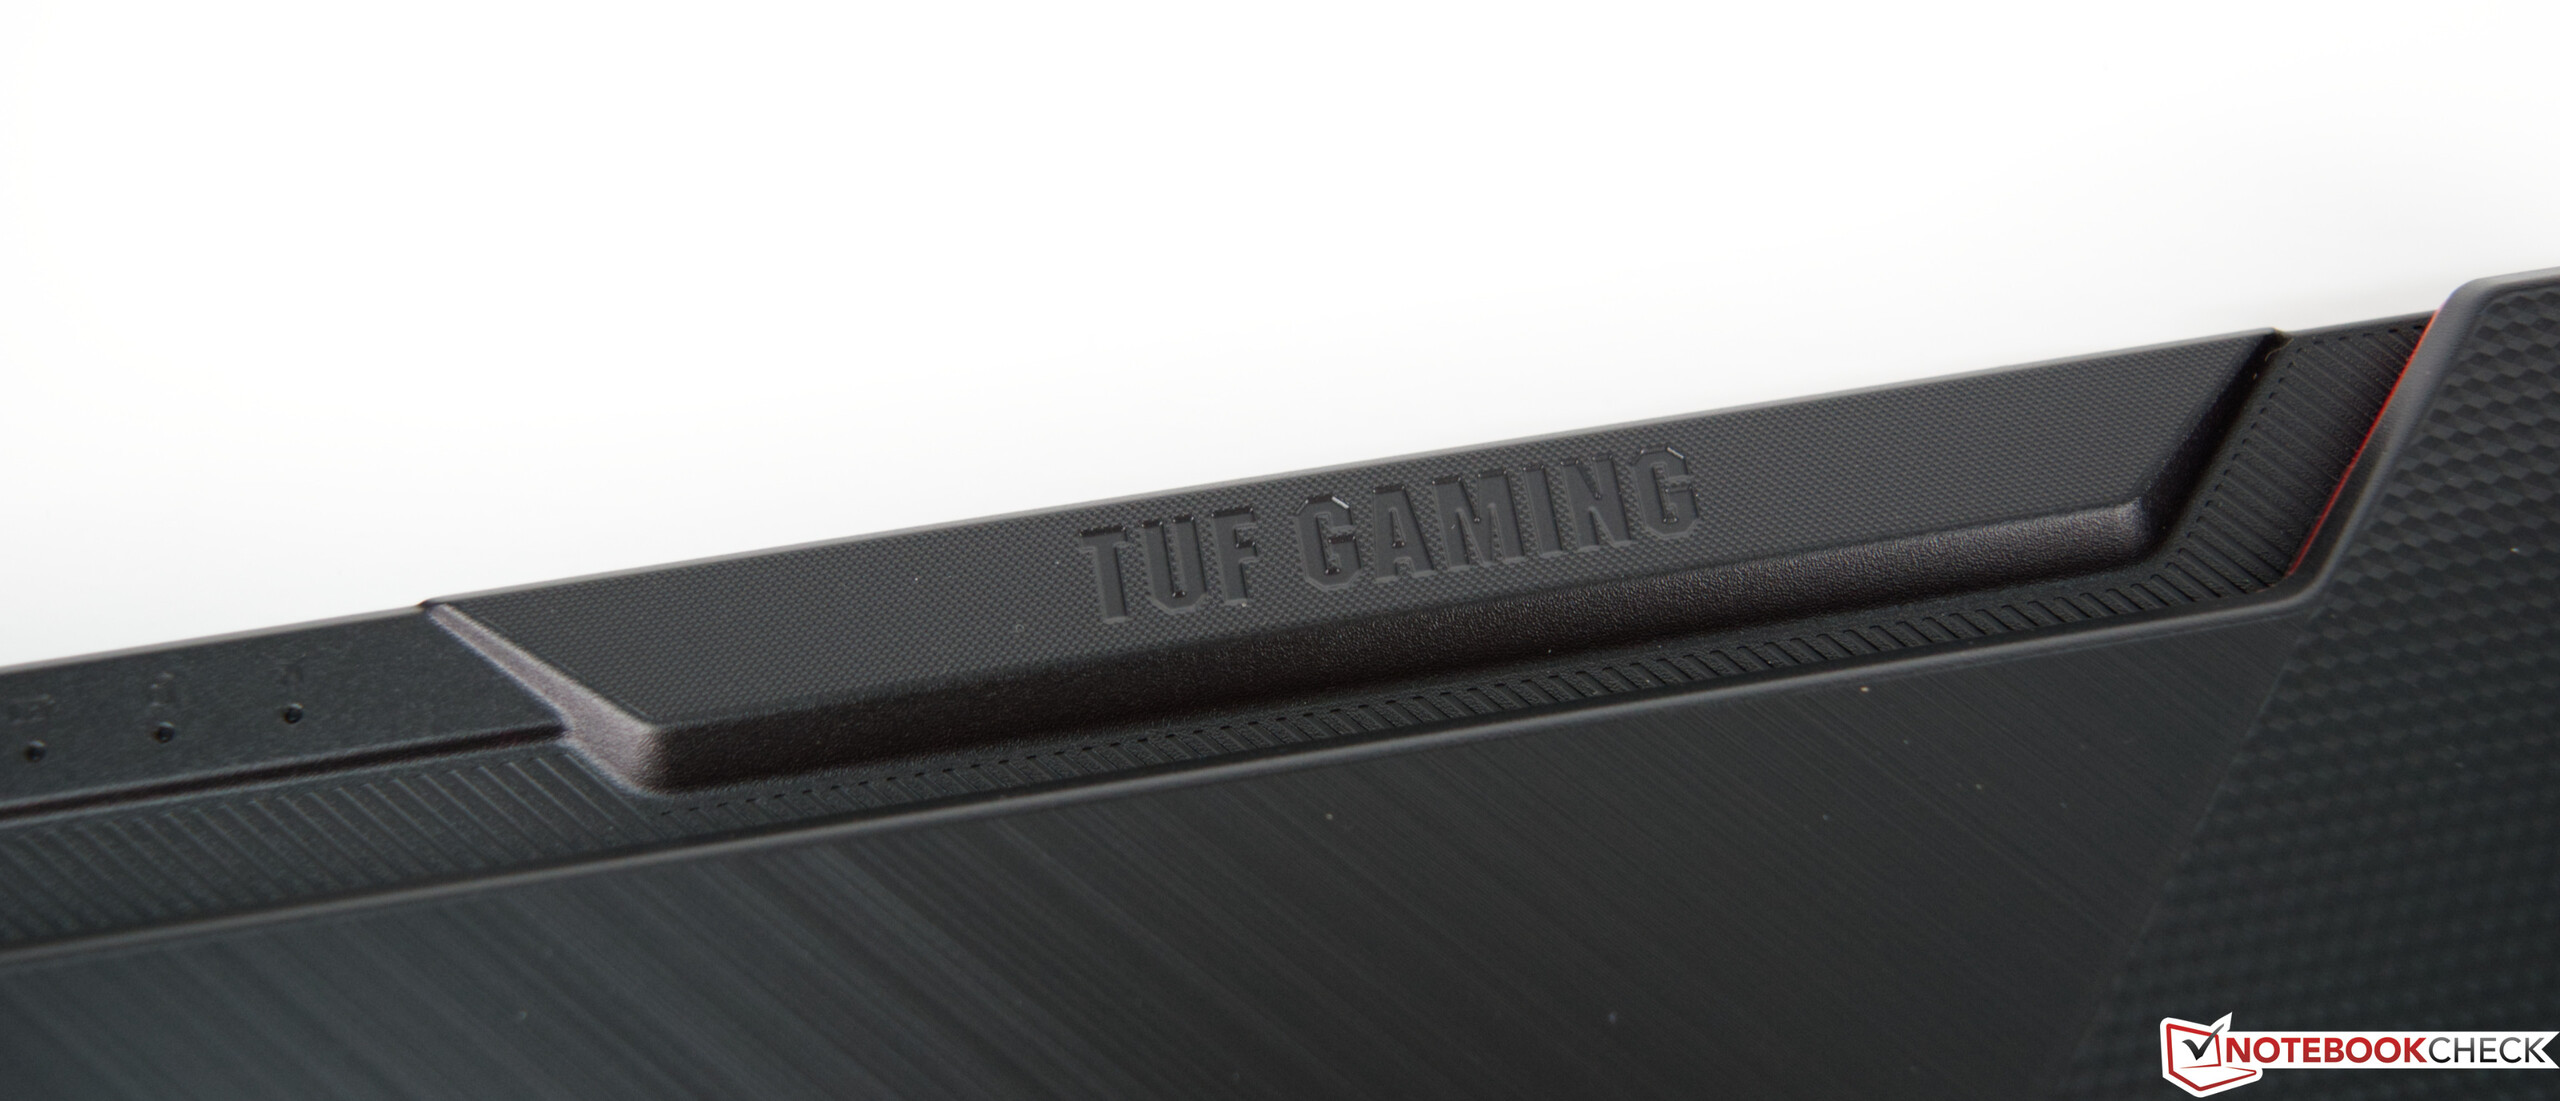
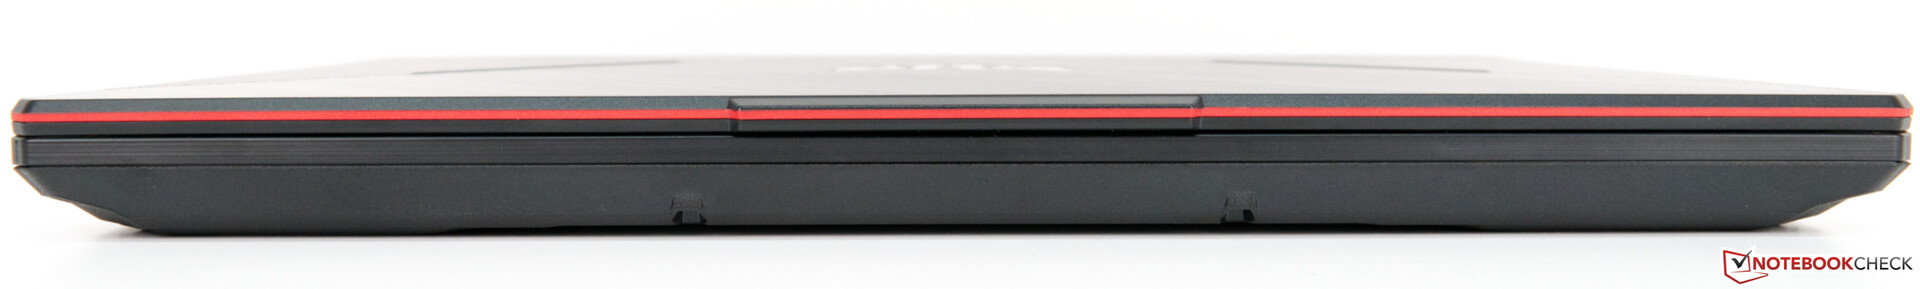
The chassis of the Asus TUF A15 FA506 primarily consists of plastic. The color scheme is mostly black. The lid is adorned with a single red stripe. Additionally, the designers seem to have texturized the surface to enhance the appearance of the laptop. There are no metal surfaces, which likely stems from price constraints. The laptop still looks quite attractive and the rigidity of the base unit matches our expectations. Since the lid is somewhat flimsy, it can be twisted with little effort. The bezels on the sides are only 7 mm wide, making them very small. This reinforces the modern look, which Asus has successfully created regardless of the plastic construction.
The two hinges hold the display firmly in place. It is possible to open the display with one hand, and even though there is some teetering it is fairly minor.

All the devices in our comparison share the approximate same dimensions. This should not come as a big surprise, since we only included 15-inch devices. In terms of thickness, there is no clear winner, either. The laptops in our comparison do not differ too much from one another, and this also includes their weight. At 2.2 kg (~4.85 lbs), the Asus TUF A15 F506's weight is identical to that of the Lenovo Legion Y540. The AC adapter weighs an additional 754 g (~1.66 lbs).
Features - The Basics
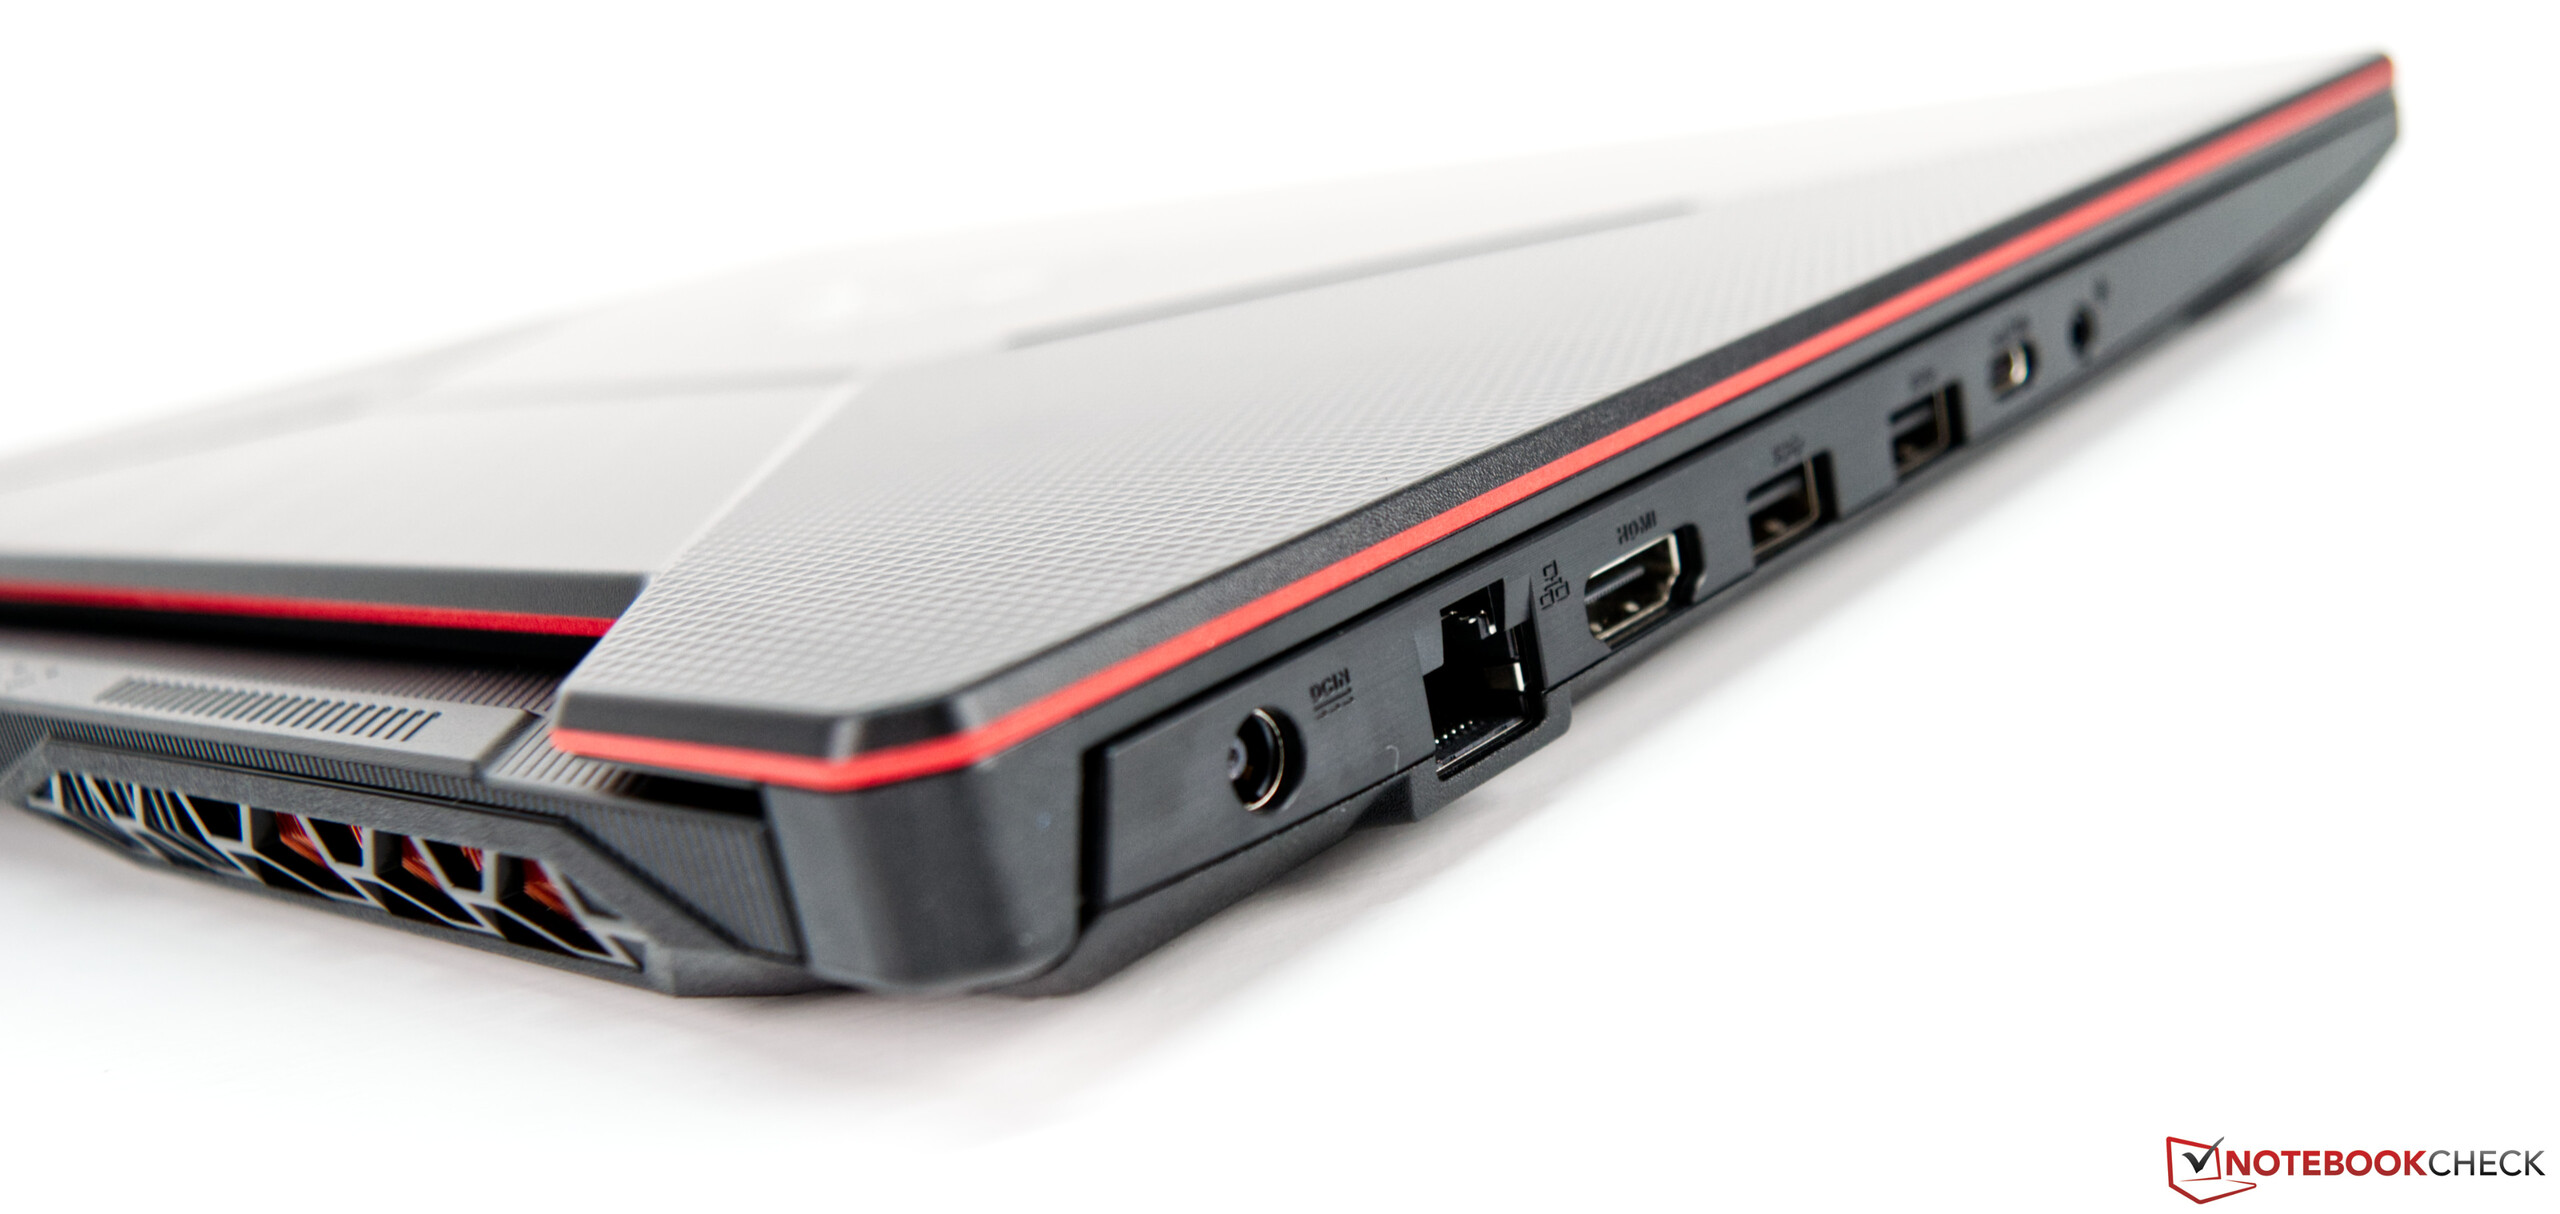
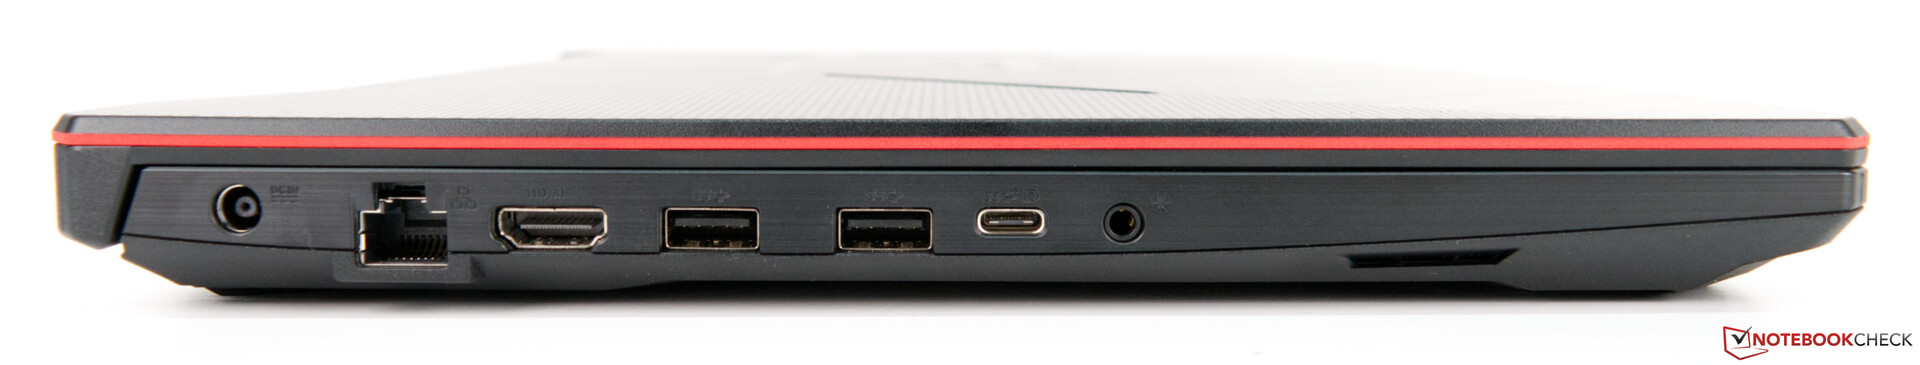
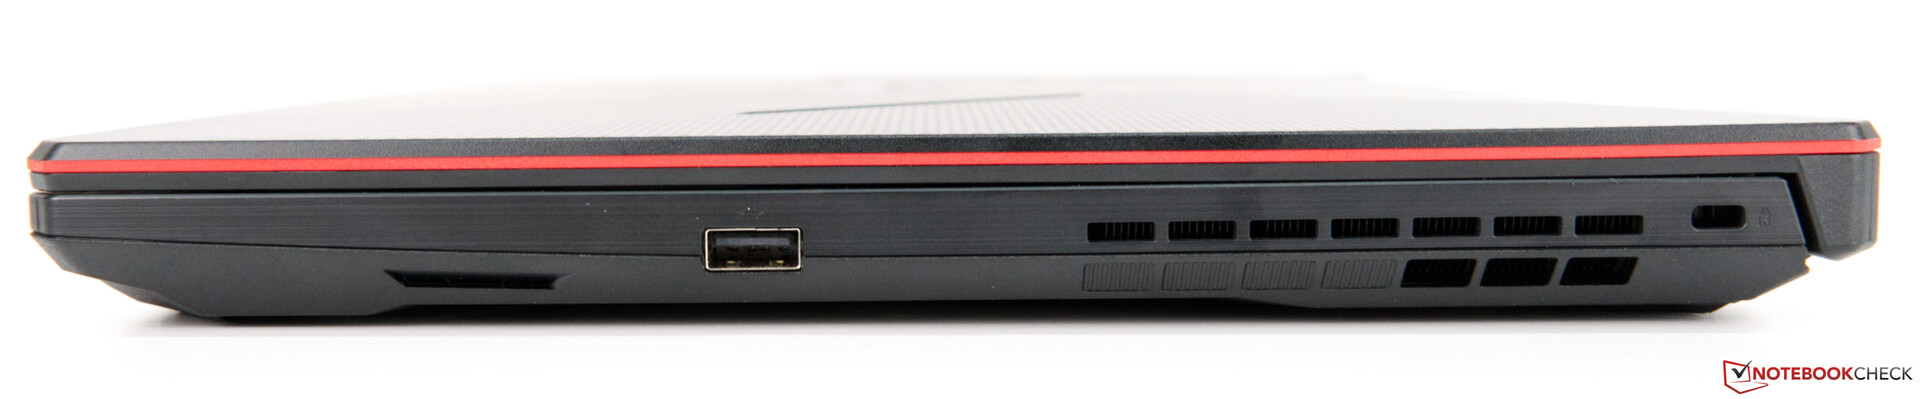
The port selection of the Asus TUF A15 FA506 is relatively bare-bones, and the most important connectivity has been included. There are three USB Type-A ports in total. Since only two of them support USB 3.0 speeds, they are the preferred choice for external drives. By contrast, the single USB port on the right only supports USB 2.0, which makes it better suited to peripherals. Furthermore, there is LAN, HDMI, and a USB Type-C port that can be used to connect external displays. The port layout is asymmetrical. Almost all ports are located on the left. Since the spacing is sufficiently wide, cables will not block adjacent ports.
However, we regret the absence of an SD card reader. In our opinion, there is enough space available on the right for one.
Communication
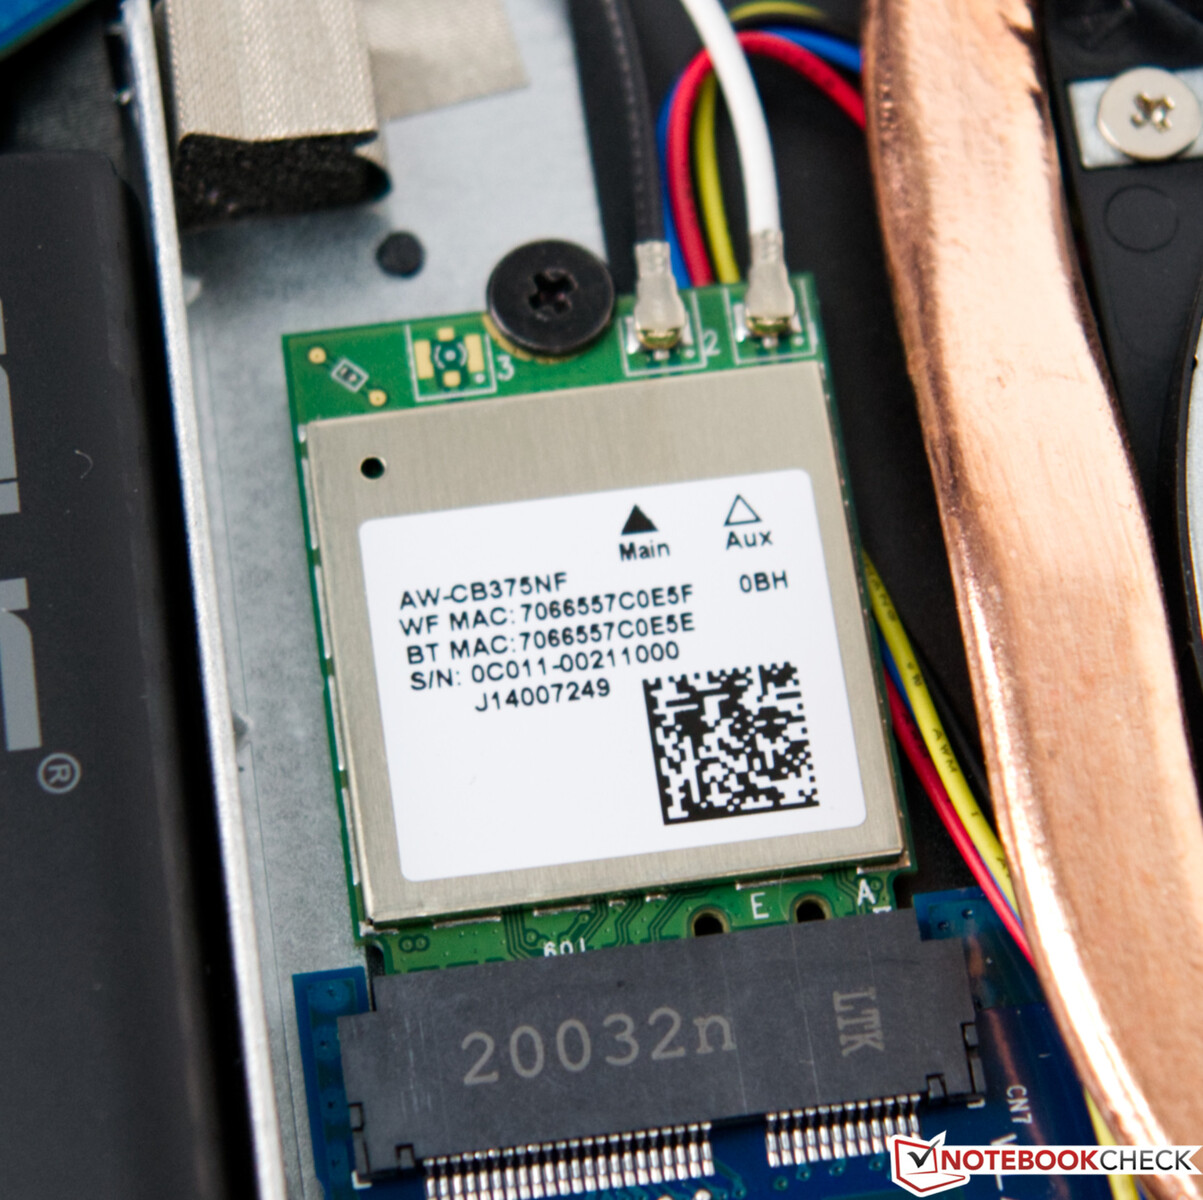
For local networks, users have the choice between Wi-Fi and LAN. The Asus TUF A15 FA506 offers both. The user-replaceable Realtek Wi-Fi module is hidden directly below the internal M.2 SSD. In addition to Wi-Fi, it also provides Bluetooth 5.0 support. The results of our performance measurements put the Wi-Fi module on par with the Intel Wireless AC 9560 module. There were no noteworthy performance dips in terms of sending or receiving data.
Webcam
The installed webcam (0.9 MP) has a maximum resolution of 1280x720 pixels. The resulting pictures look somewhat washed-out and slightly blurry. Unfortunately, the color deviation of 13.44 is far too high. Unfortunately, the webcam misses the ideal DeltaE of less than 3 by a large margin.


Accessories
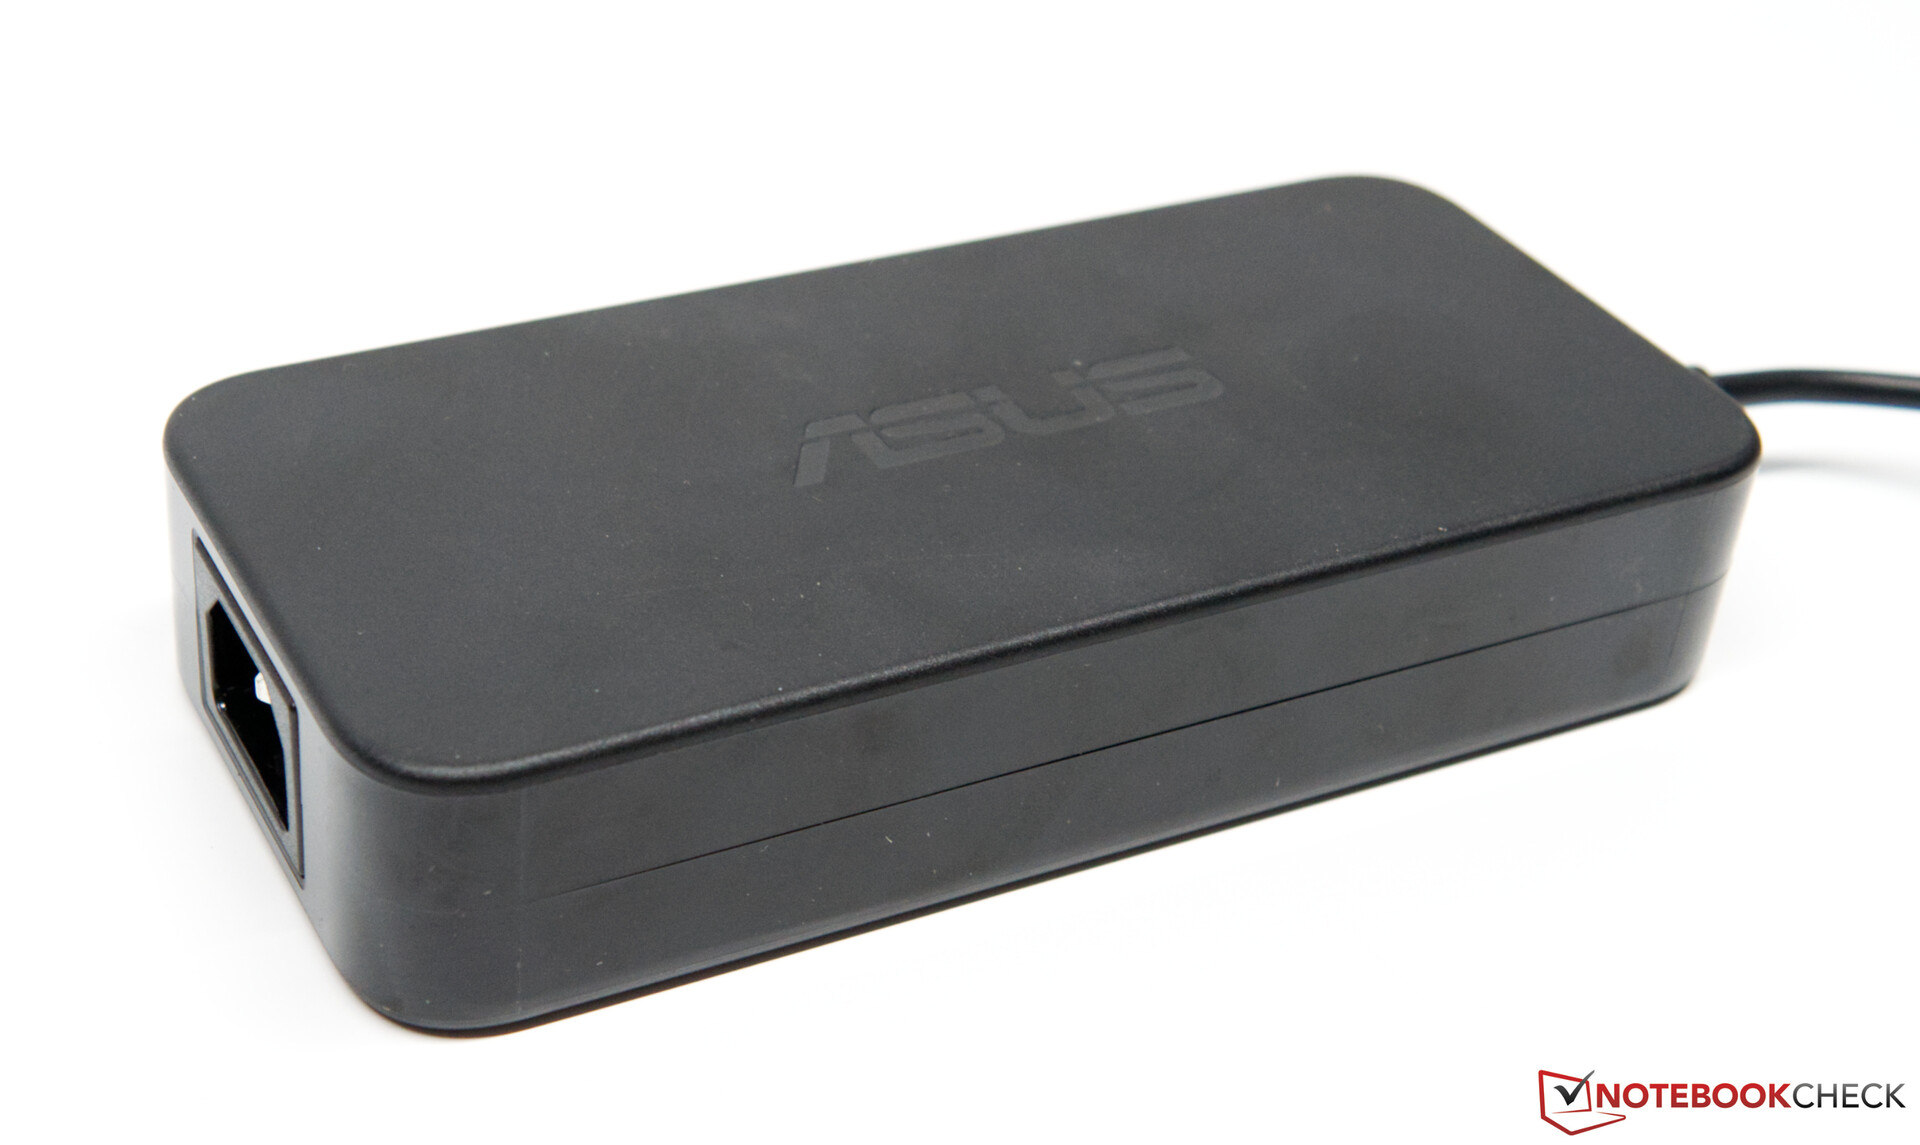
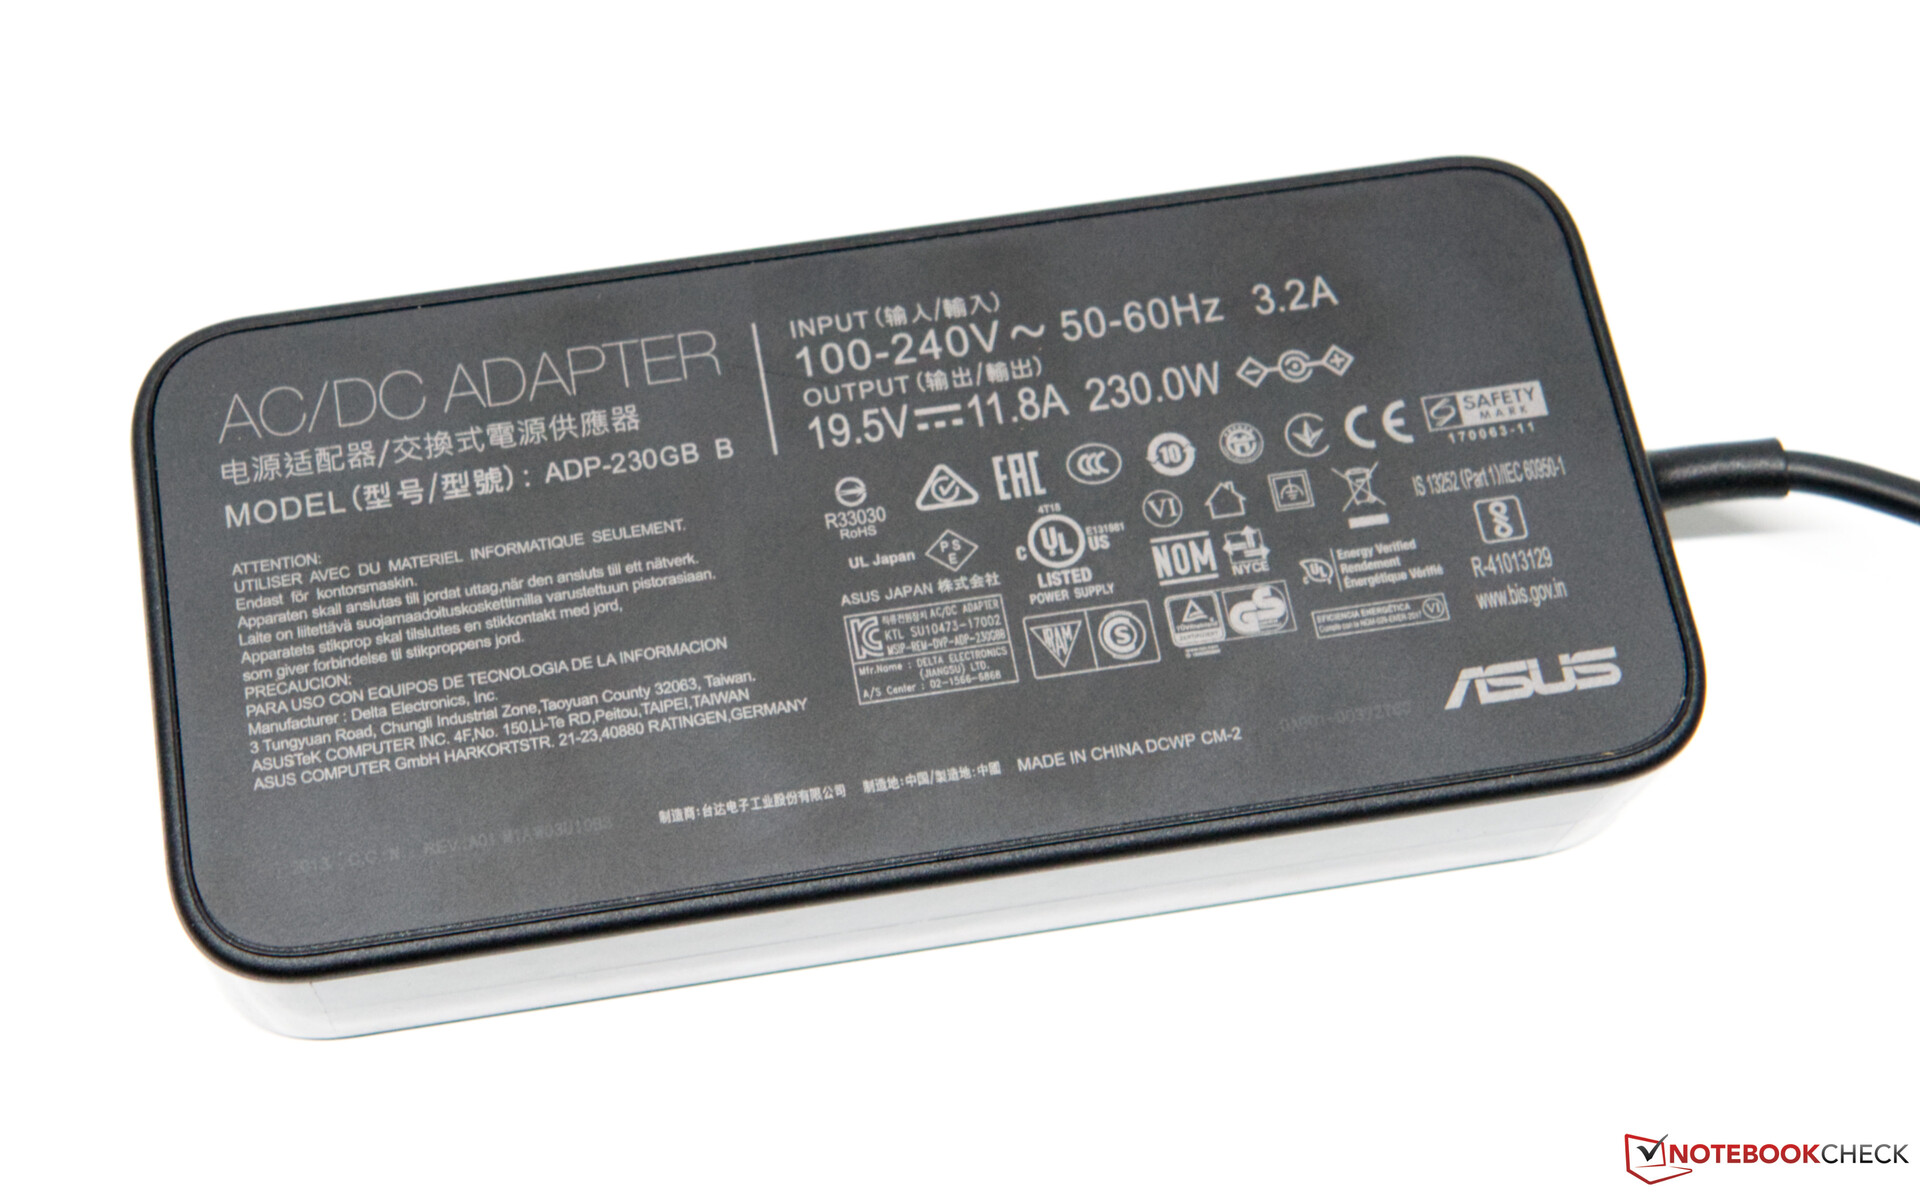
Apart from the laptop itself, the package of the Asus TUF A15 FA506 includes a 230-Watt AC adapter and the usual paperwork. Additionally, there is a cable for installing a 2.5-inch drive.
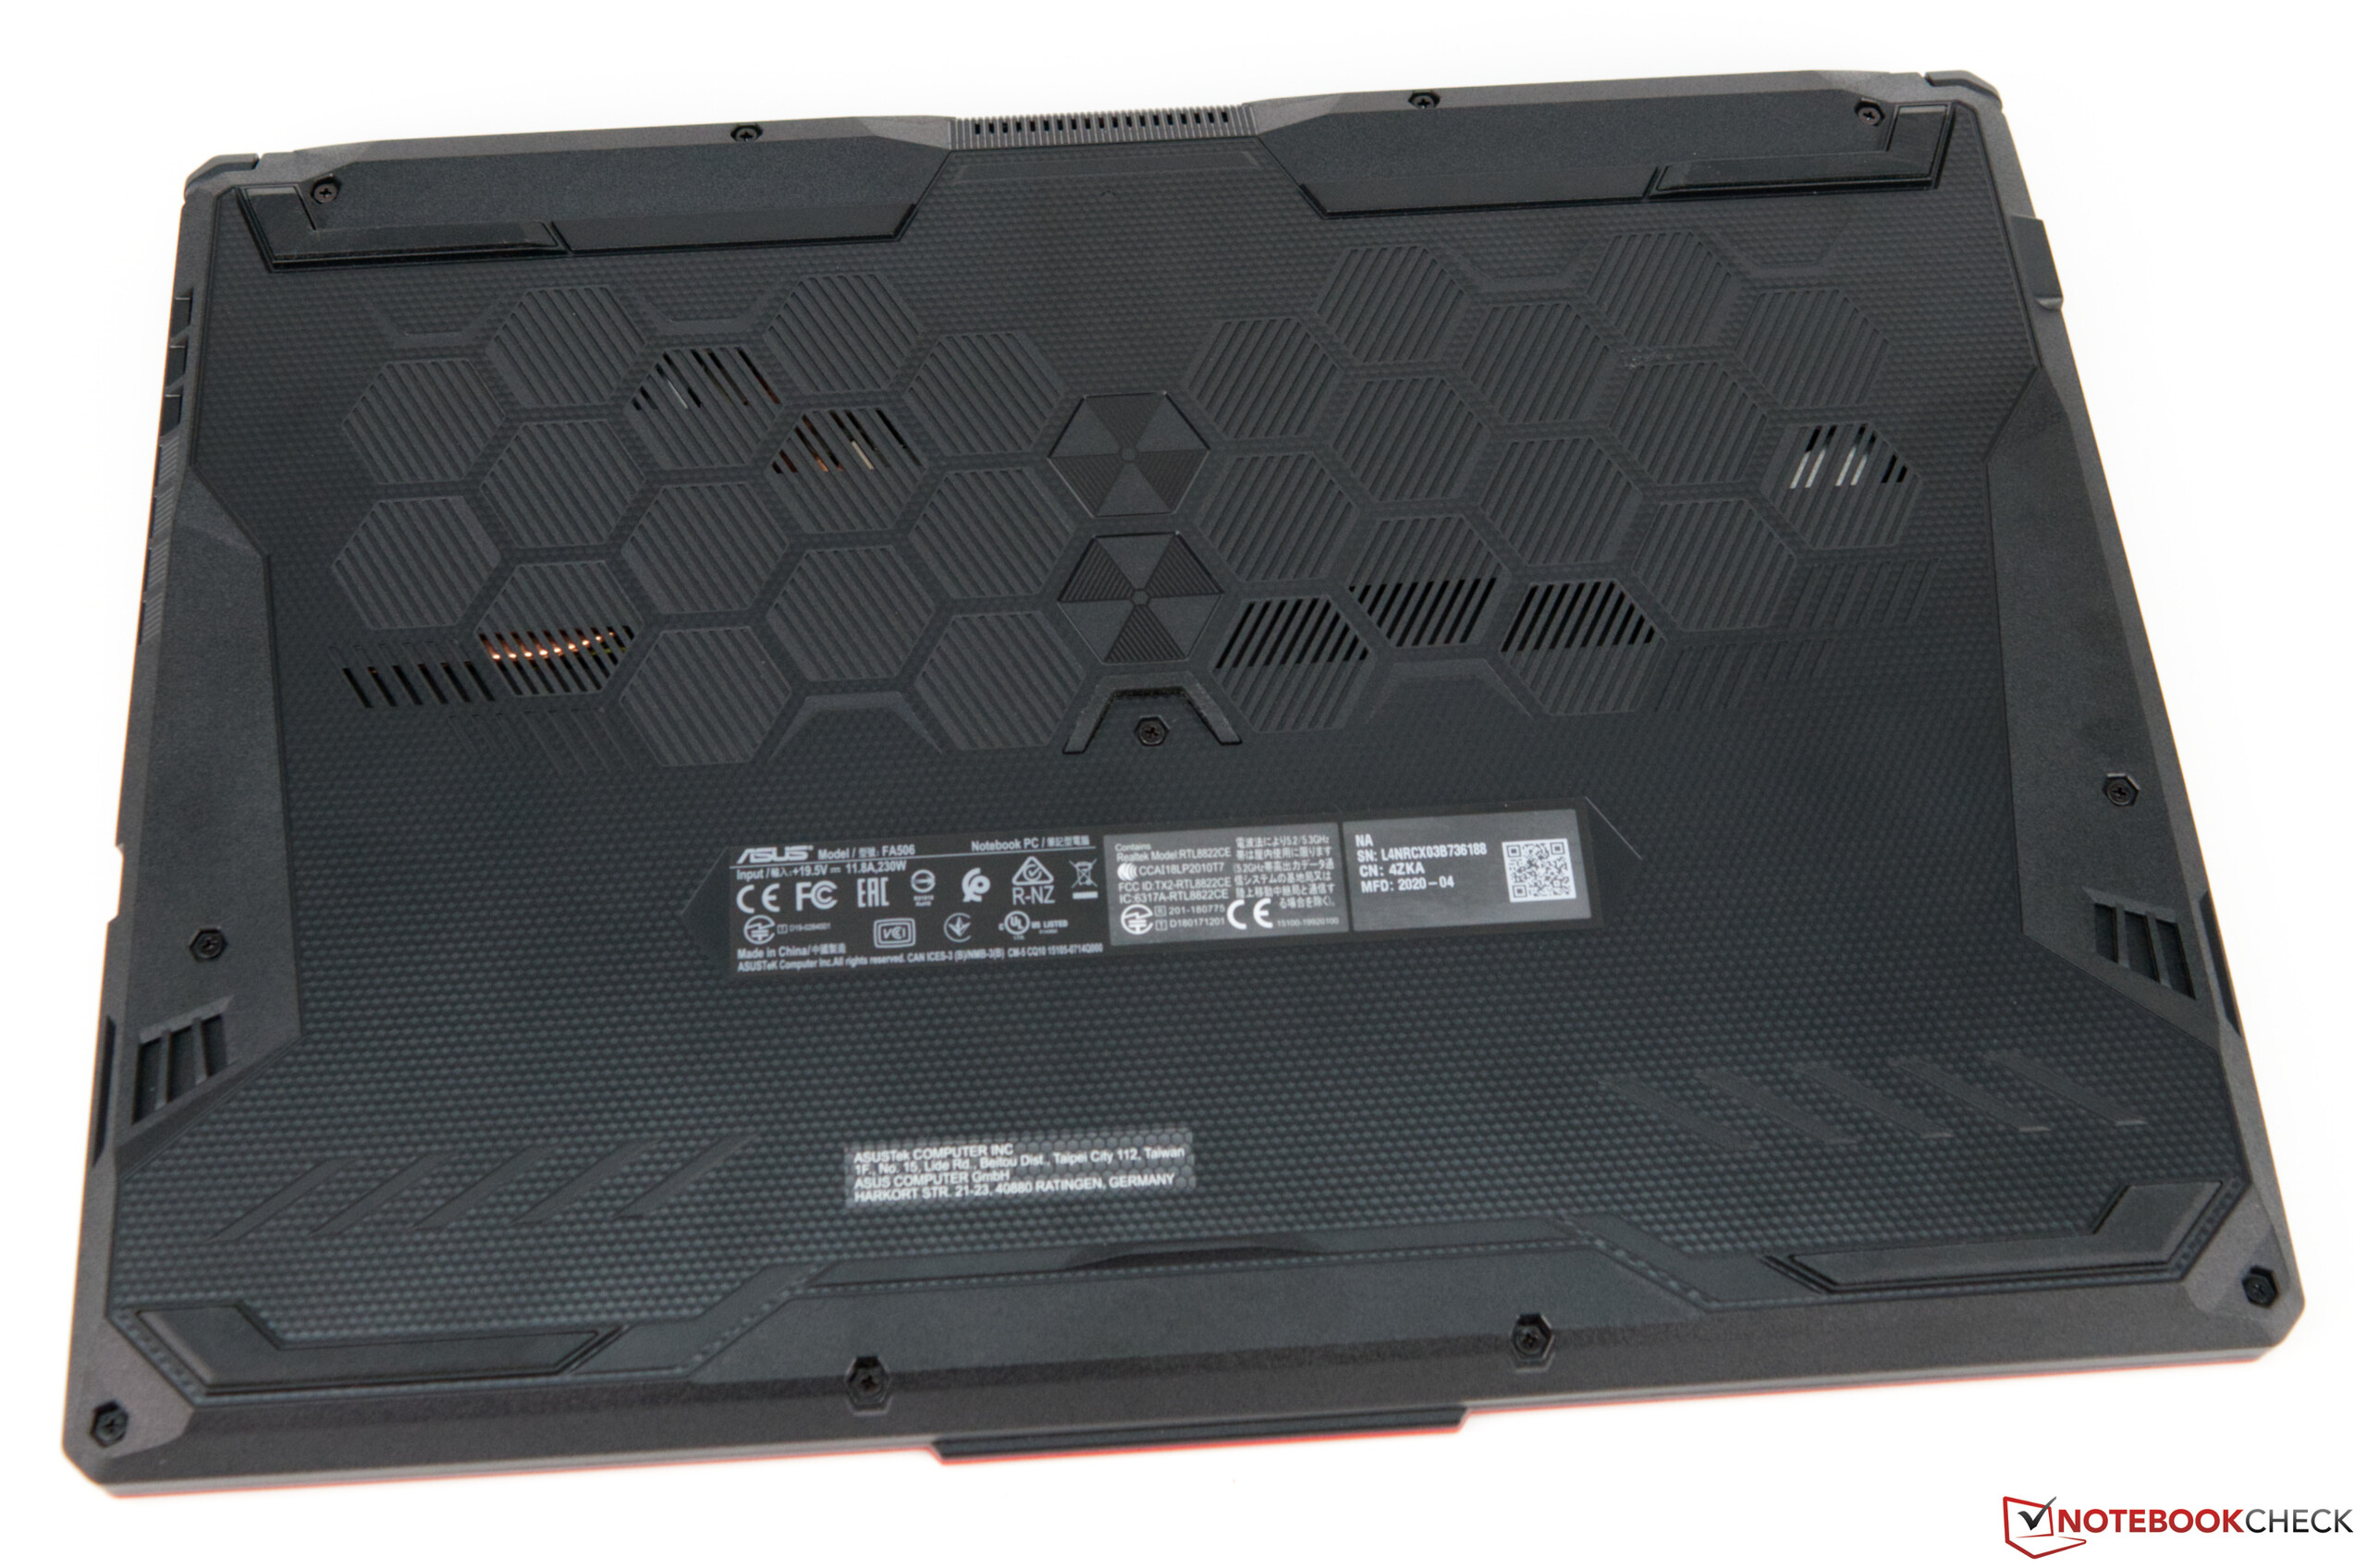
Maintenance
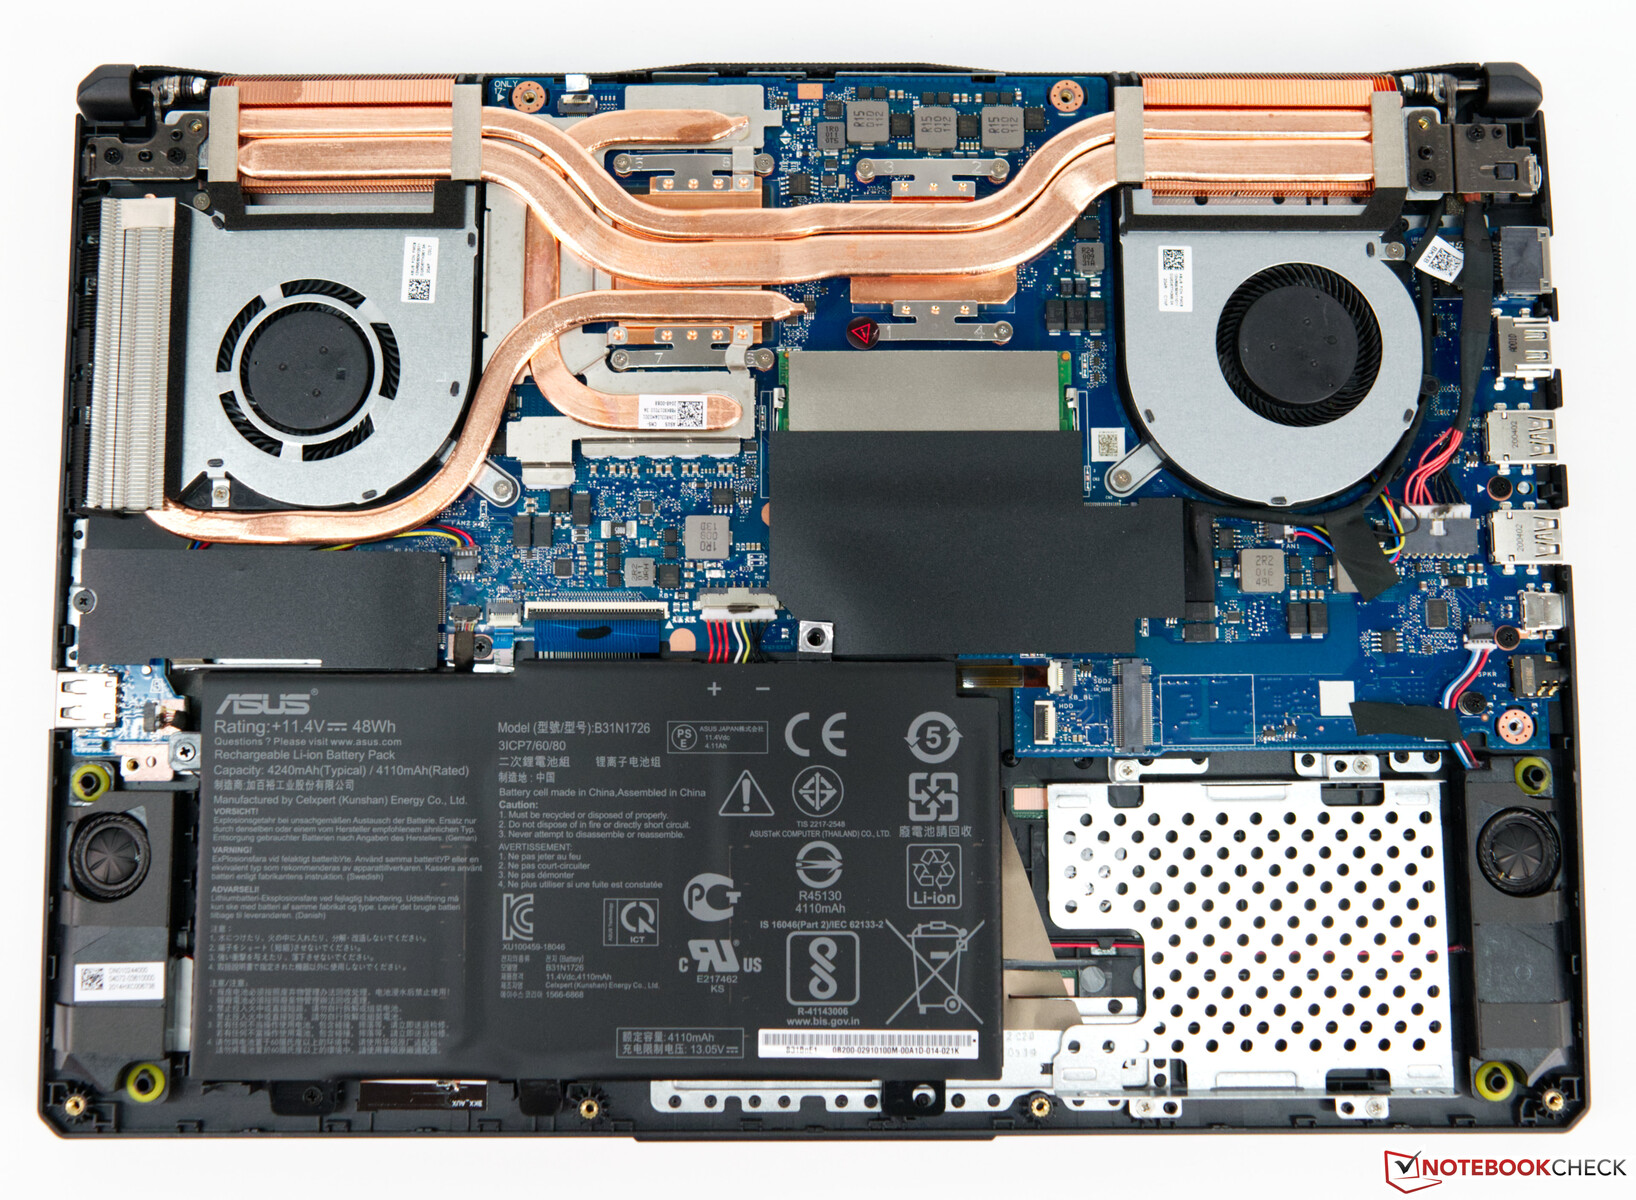
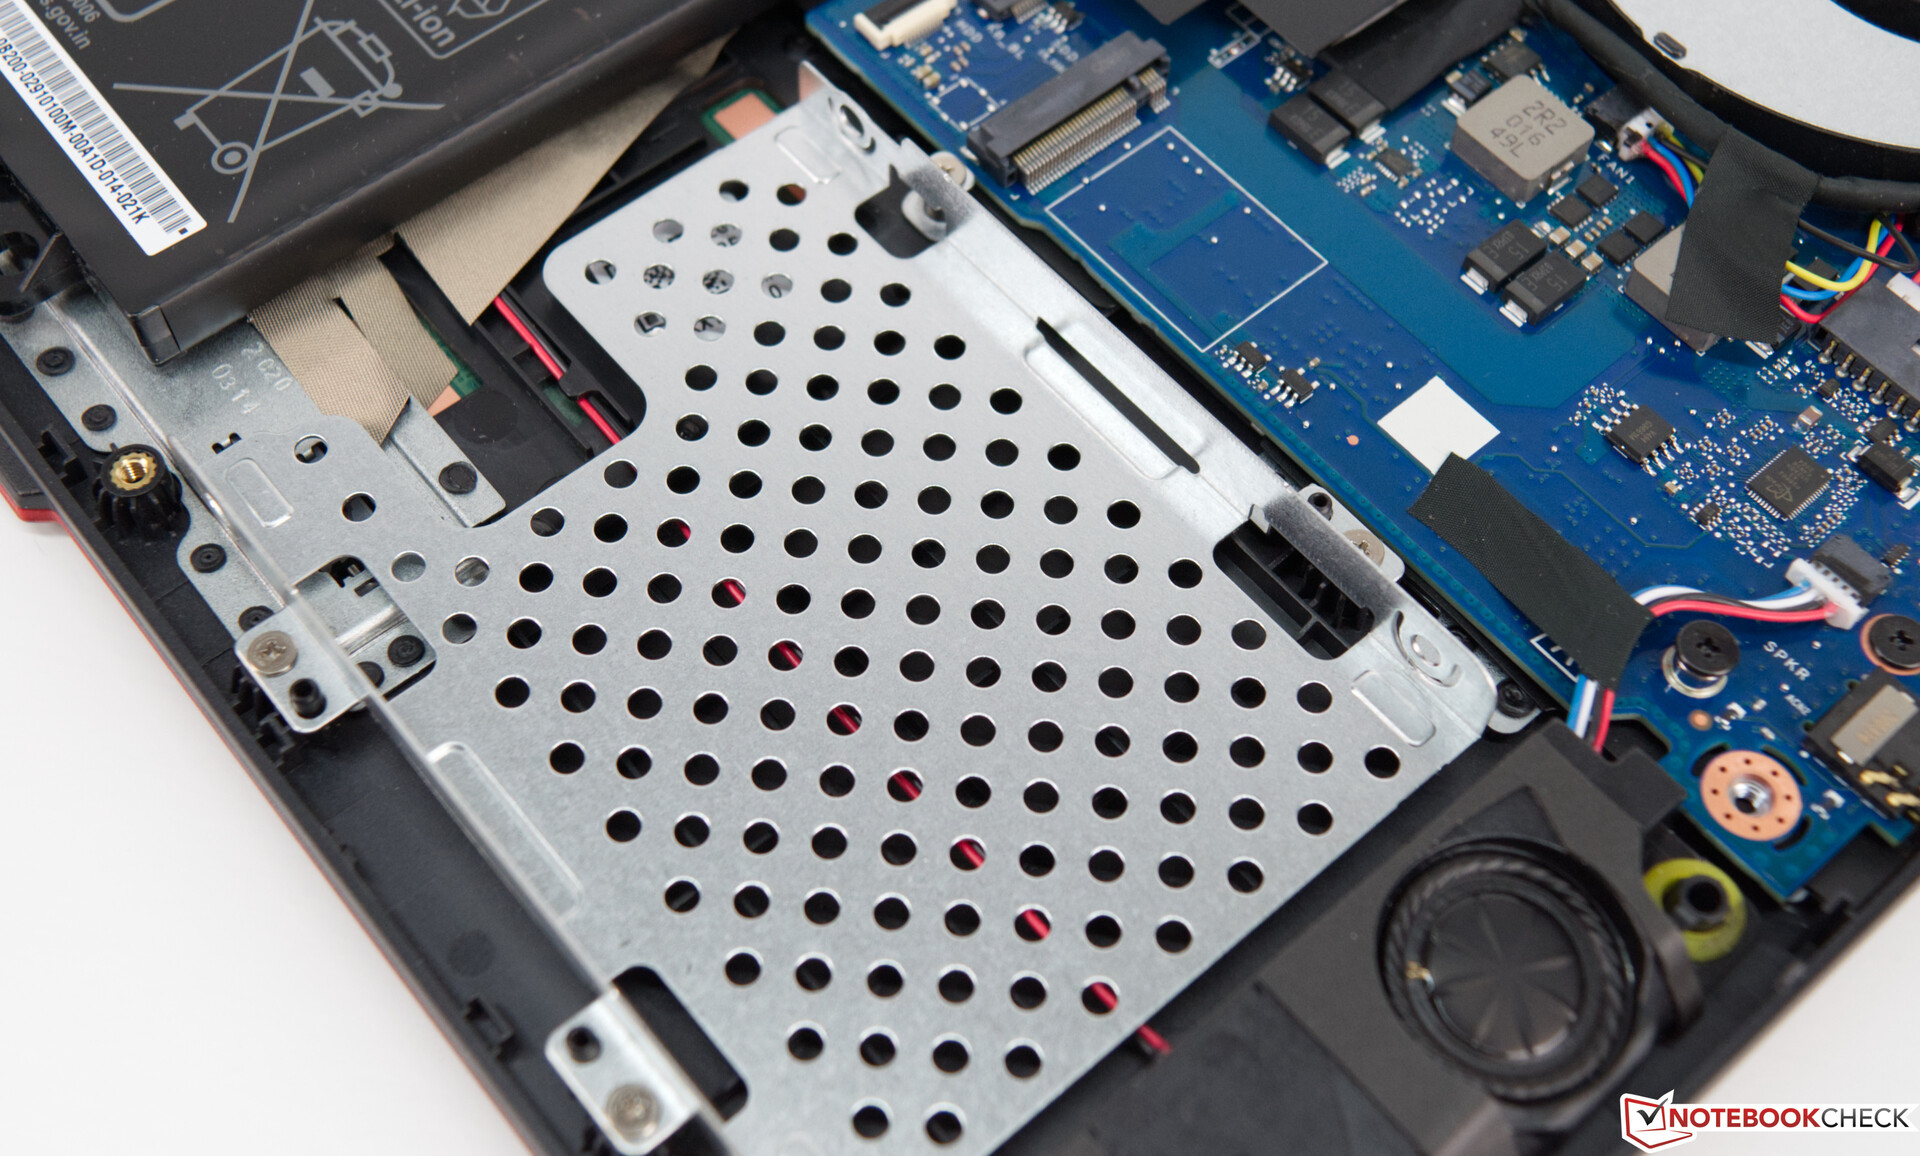
Performing maintenance on the Asus TUF A15 FA506 is fairly simple. Note: In order to safely remove the bottom plate without permanent scratches, it should be disconnected from the base unit with a special tool. On the inside, all of the internal components are easy to reach. For example, the RAM can be swapped or expanded. Similarly, the storage drives can be upgraded without any issues. In our case, there is space for a secondary M.2 SSD and a 2.5-inch drive. Ideally, we would have liked to see one or two small maintenance hatches to make this process even easier.
Warranty
Asus offers buyers of the TUF A15 FA506 a two-year warranty - including pick-up and delivery service.
Input Devices
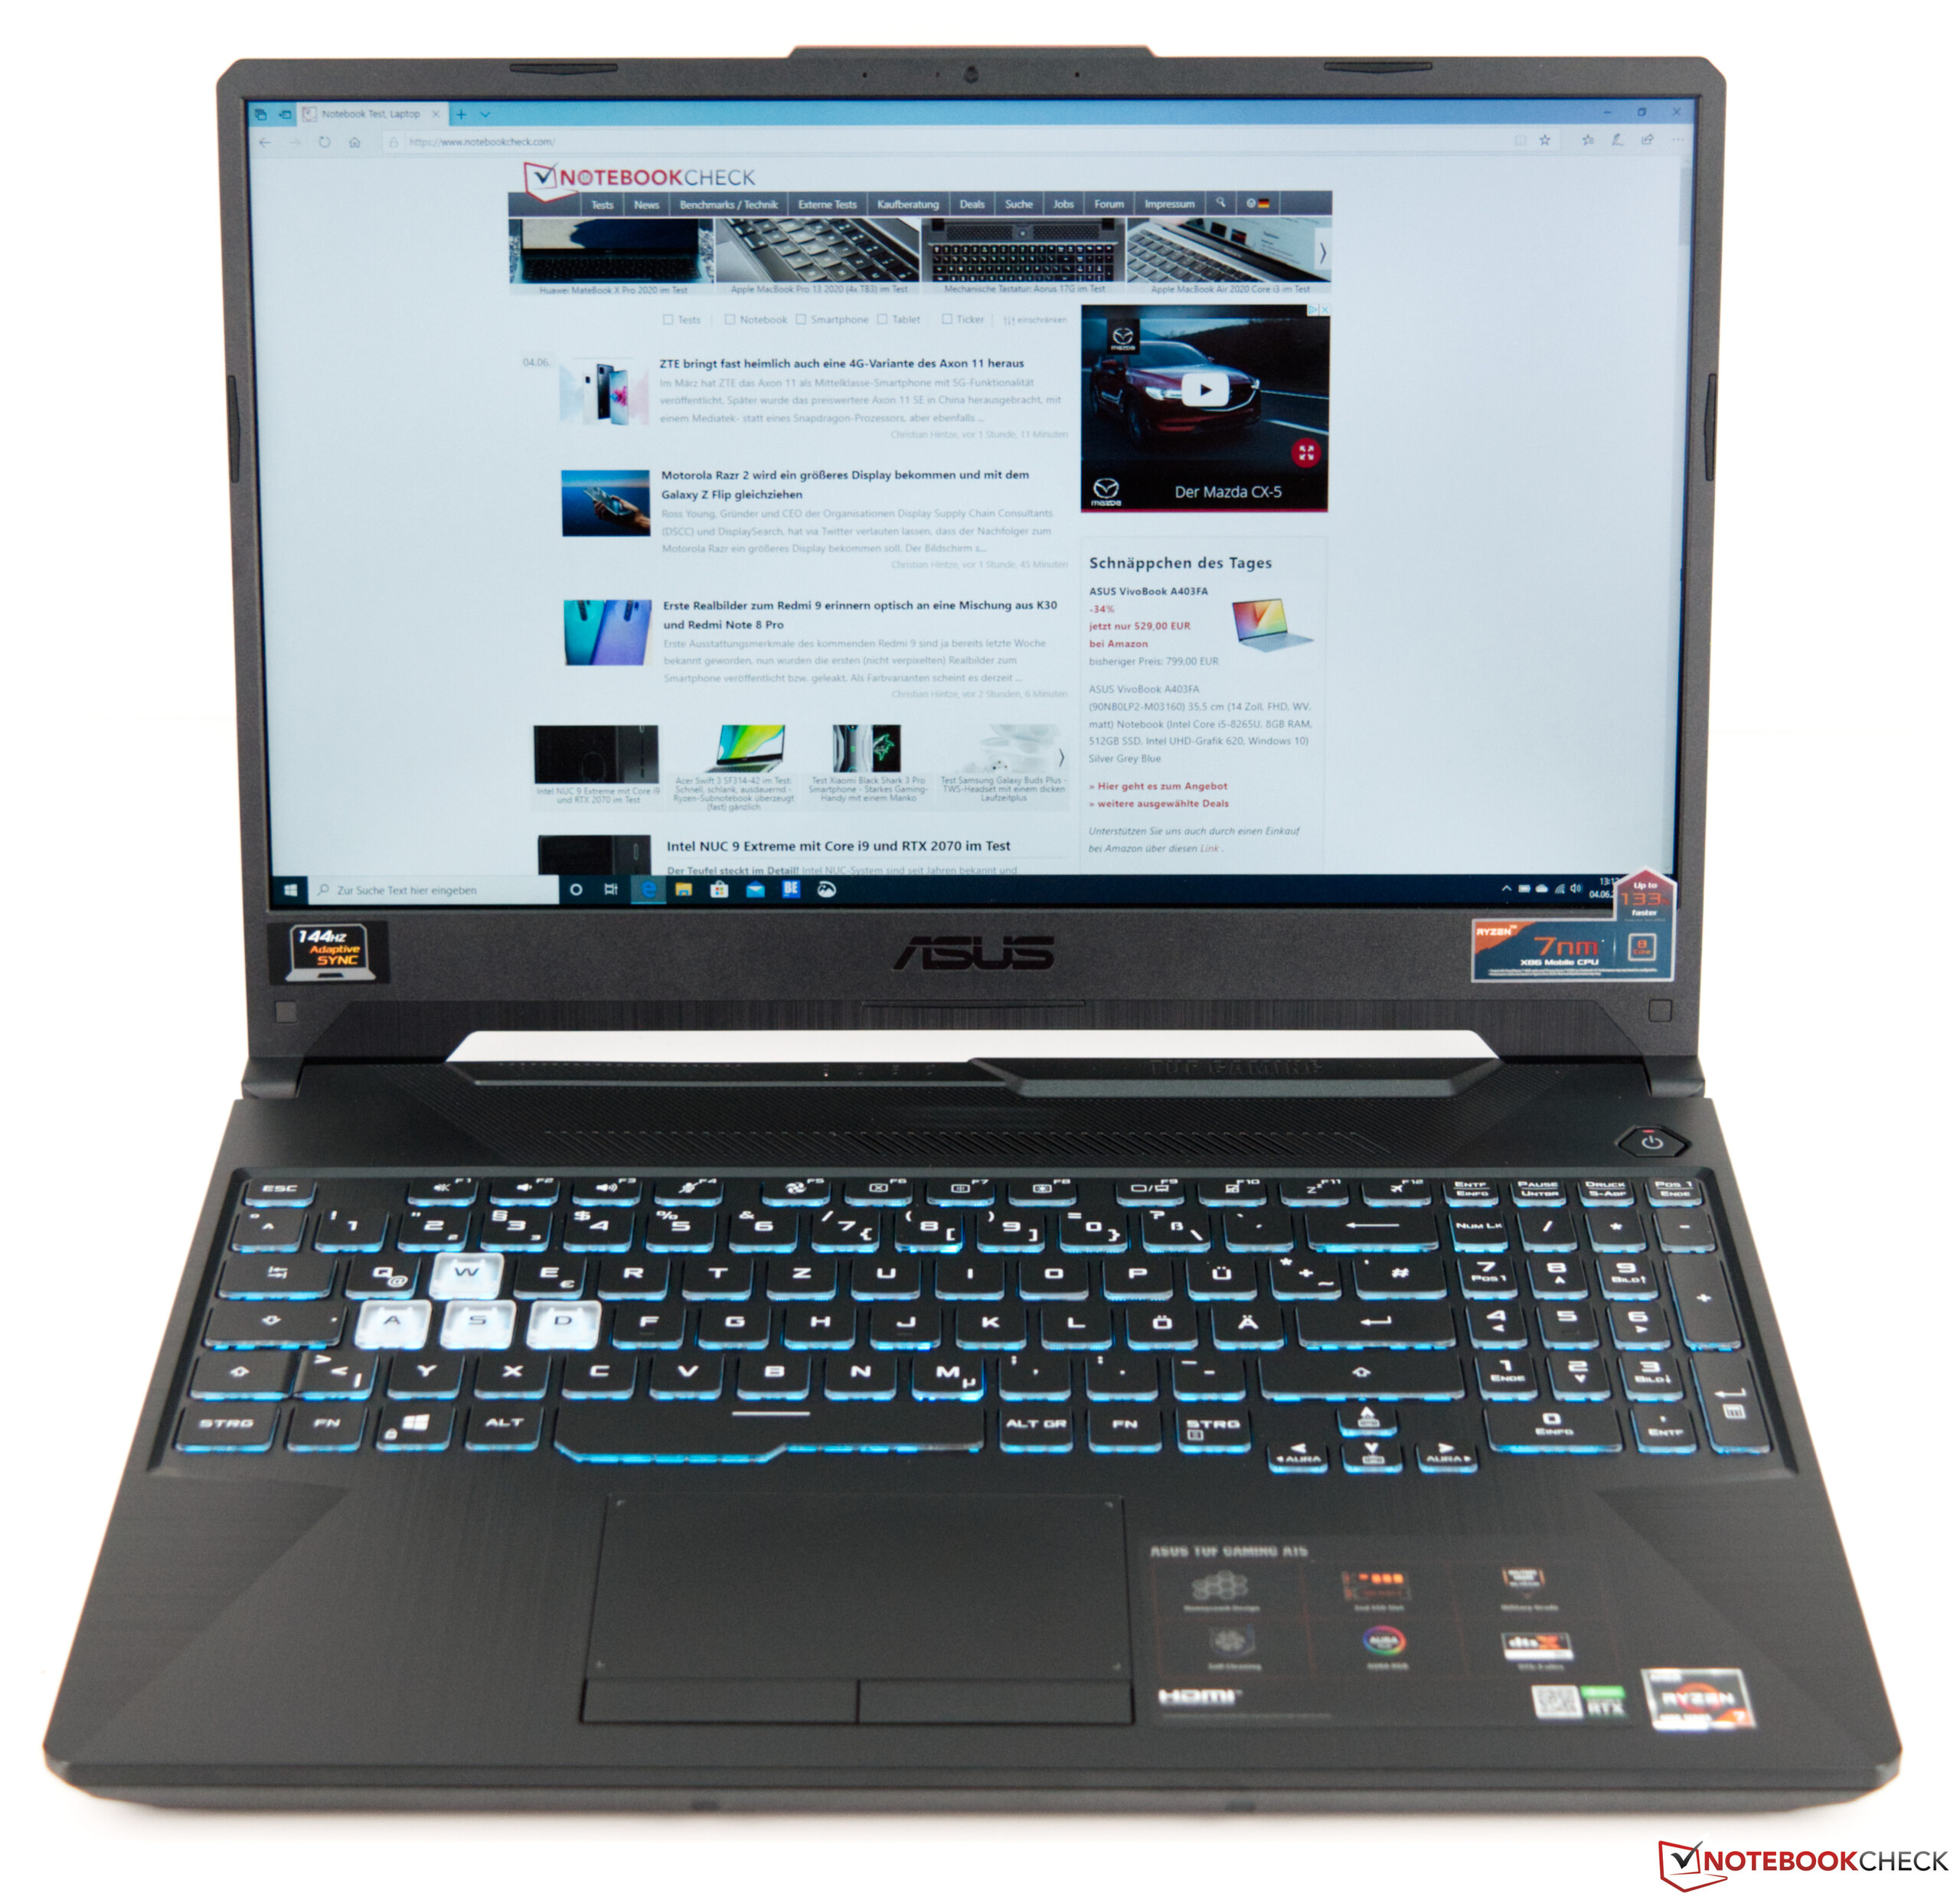
Keyboard
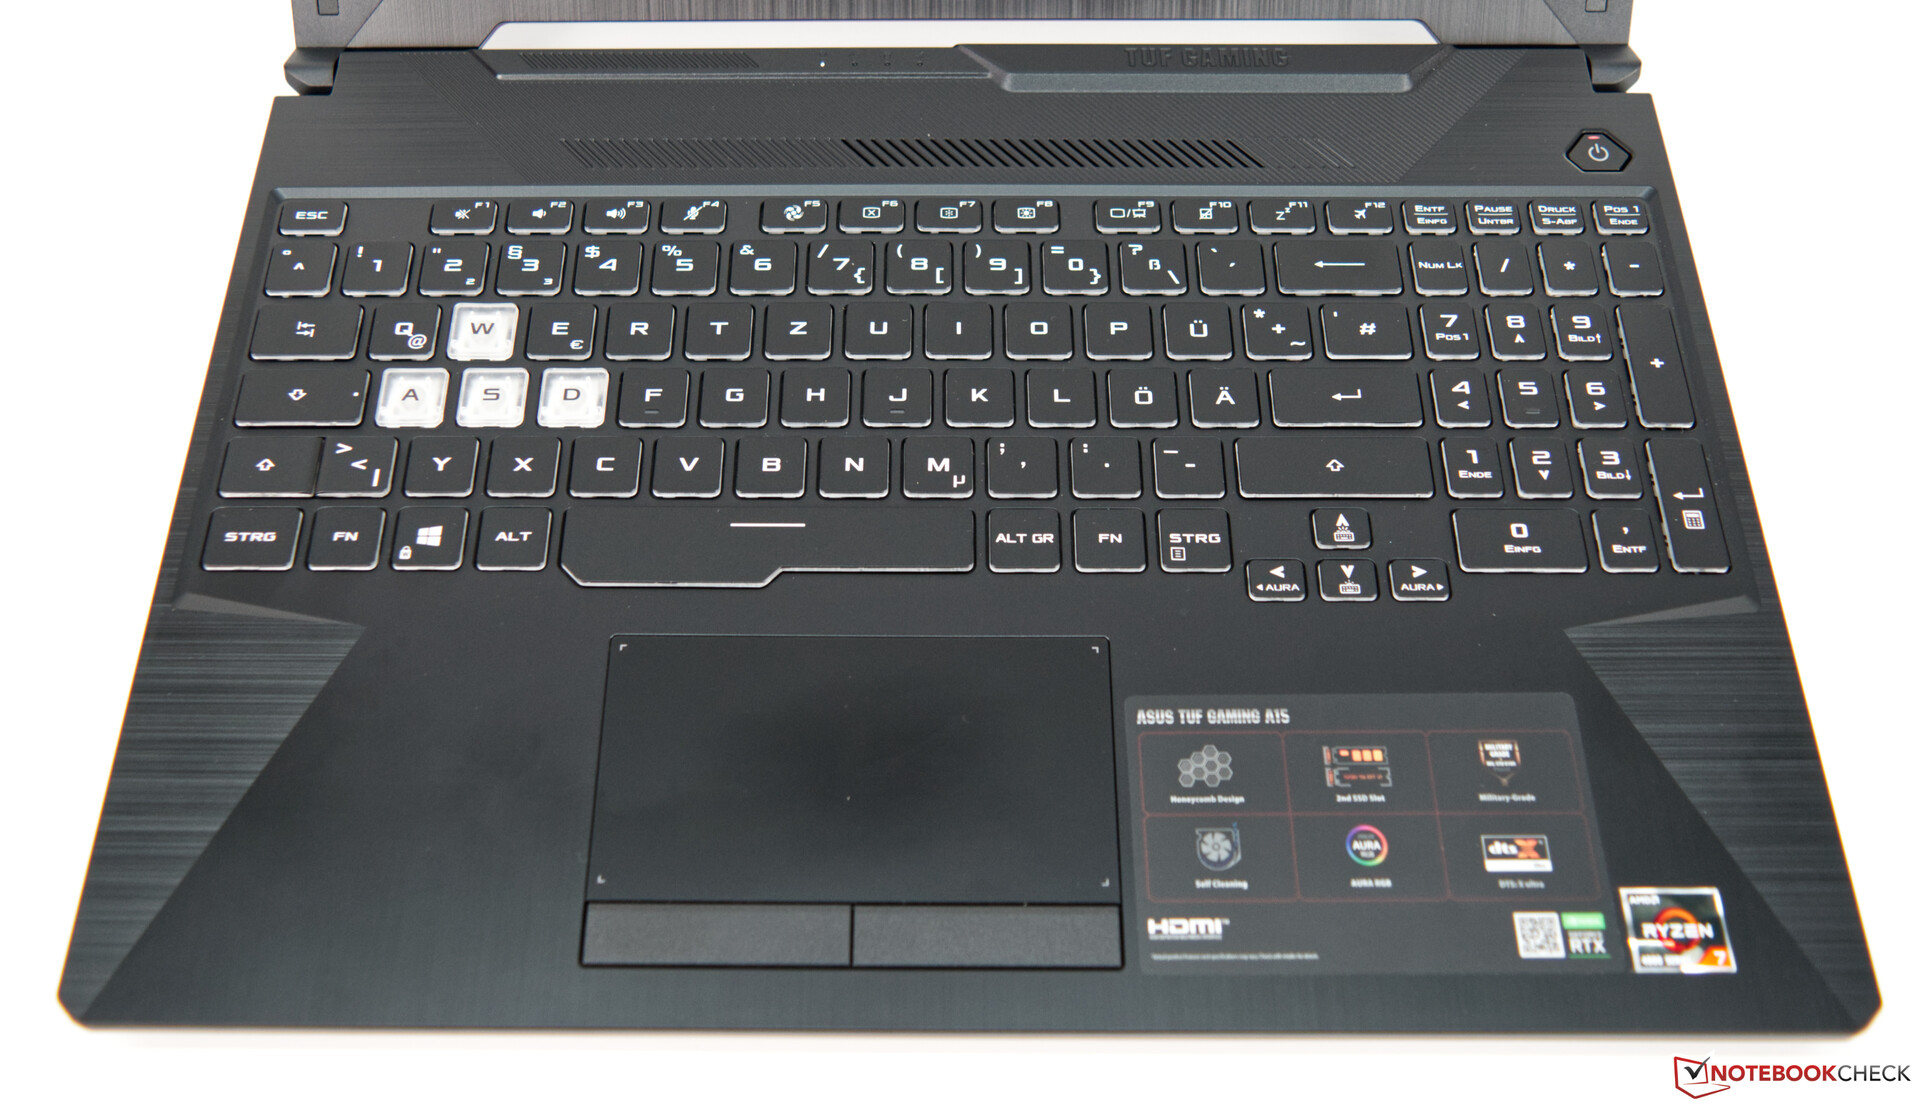
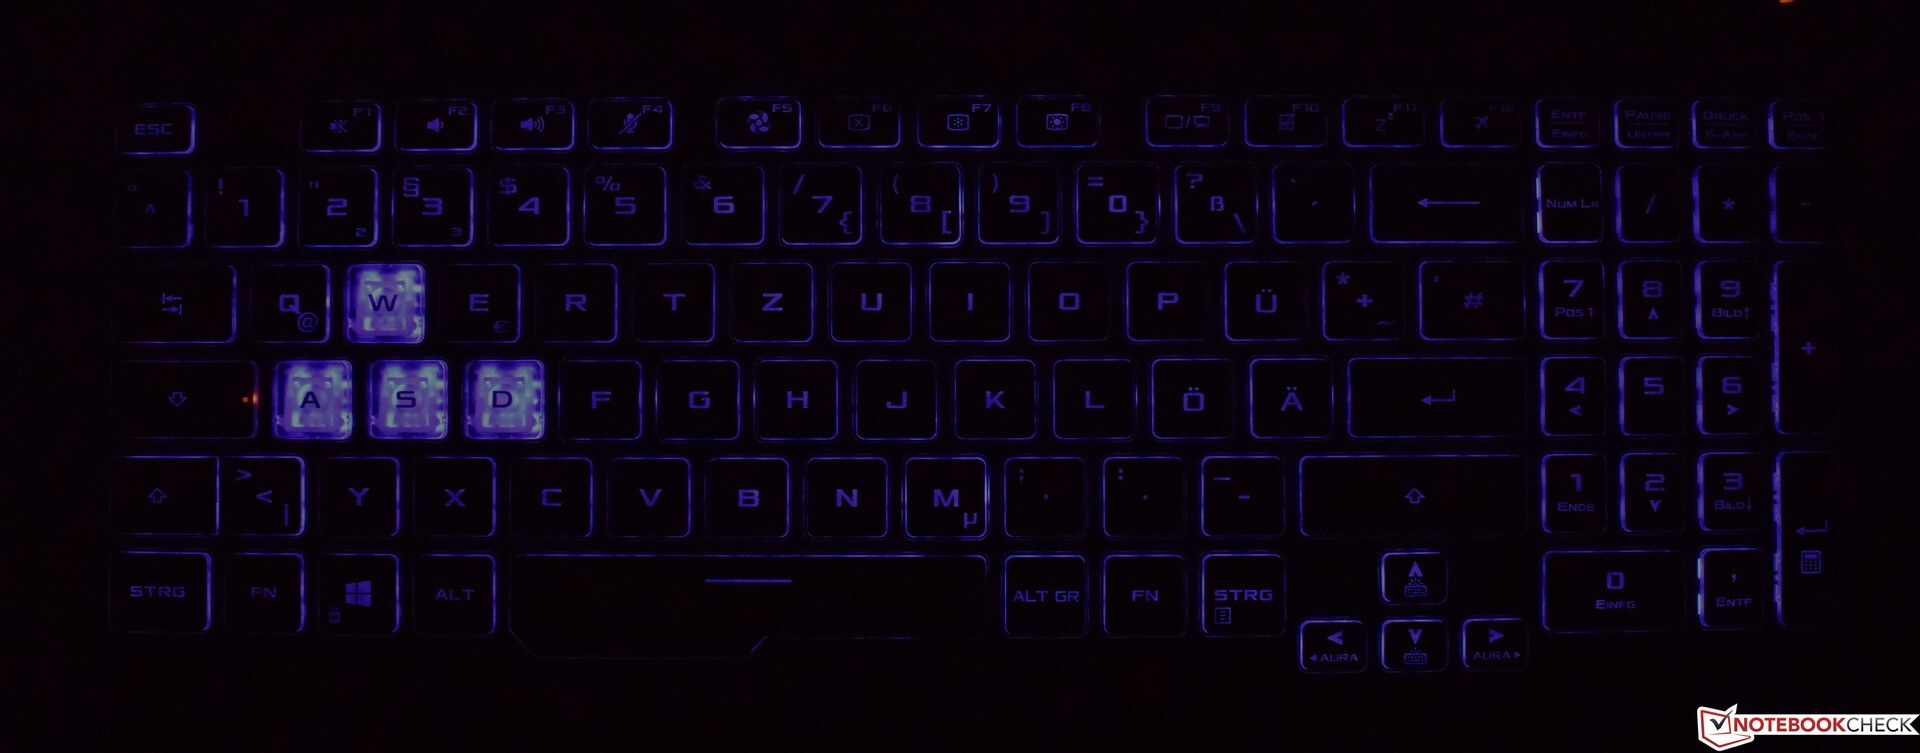
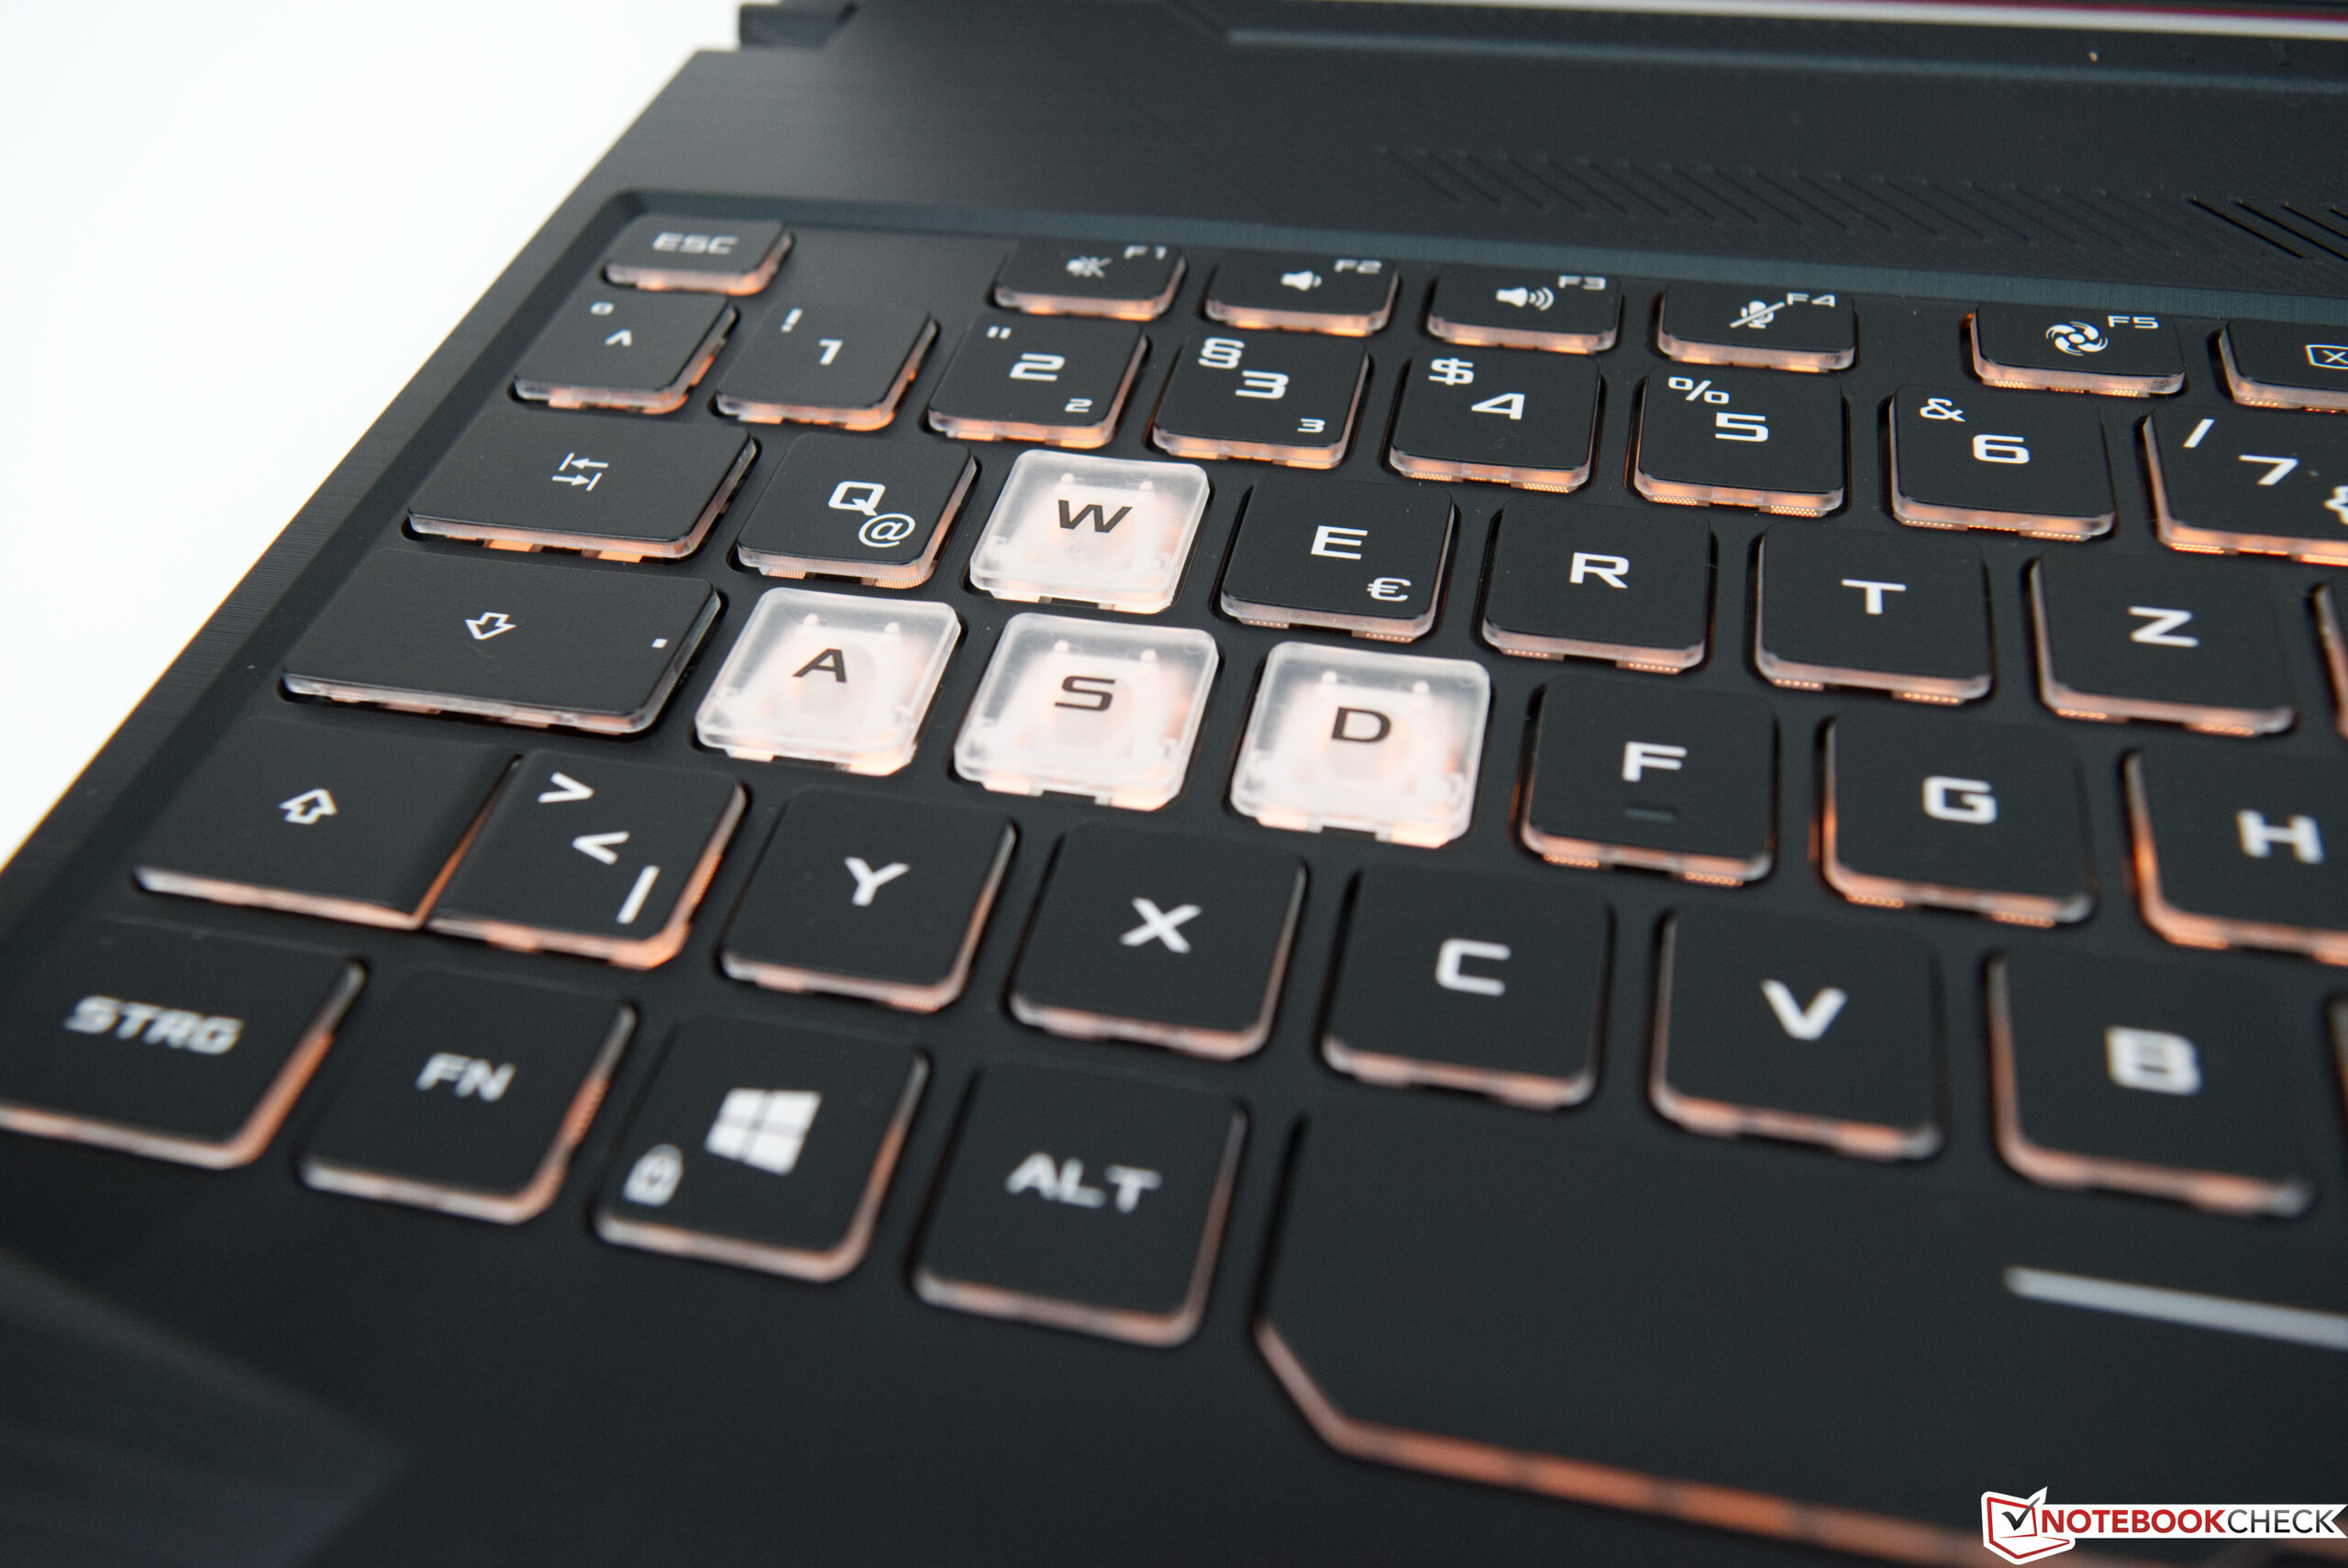
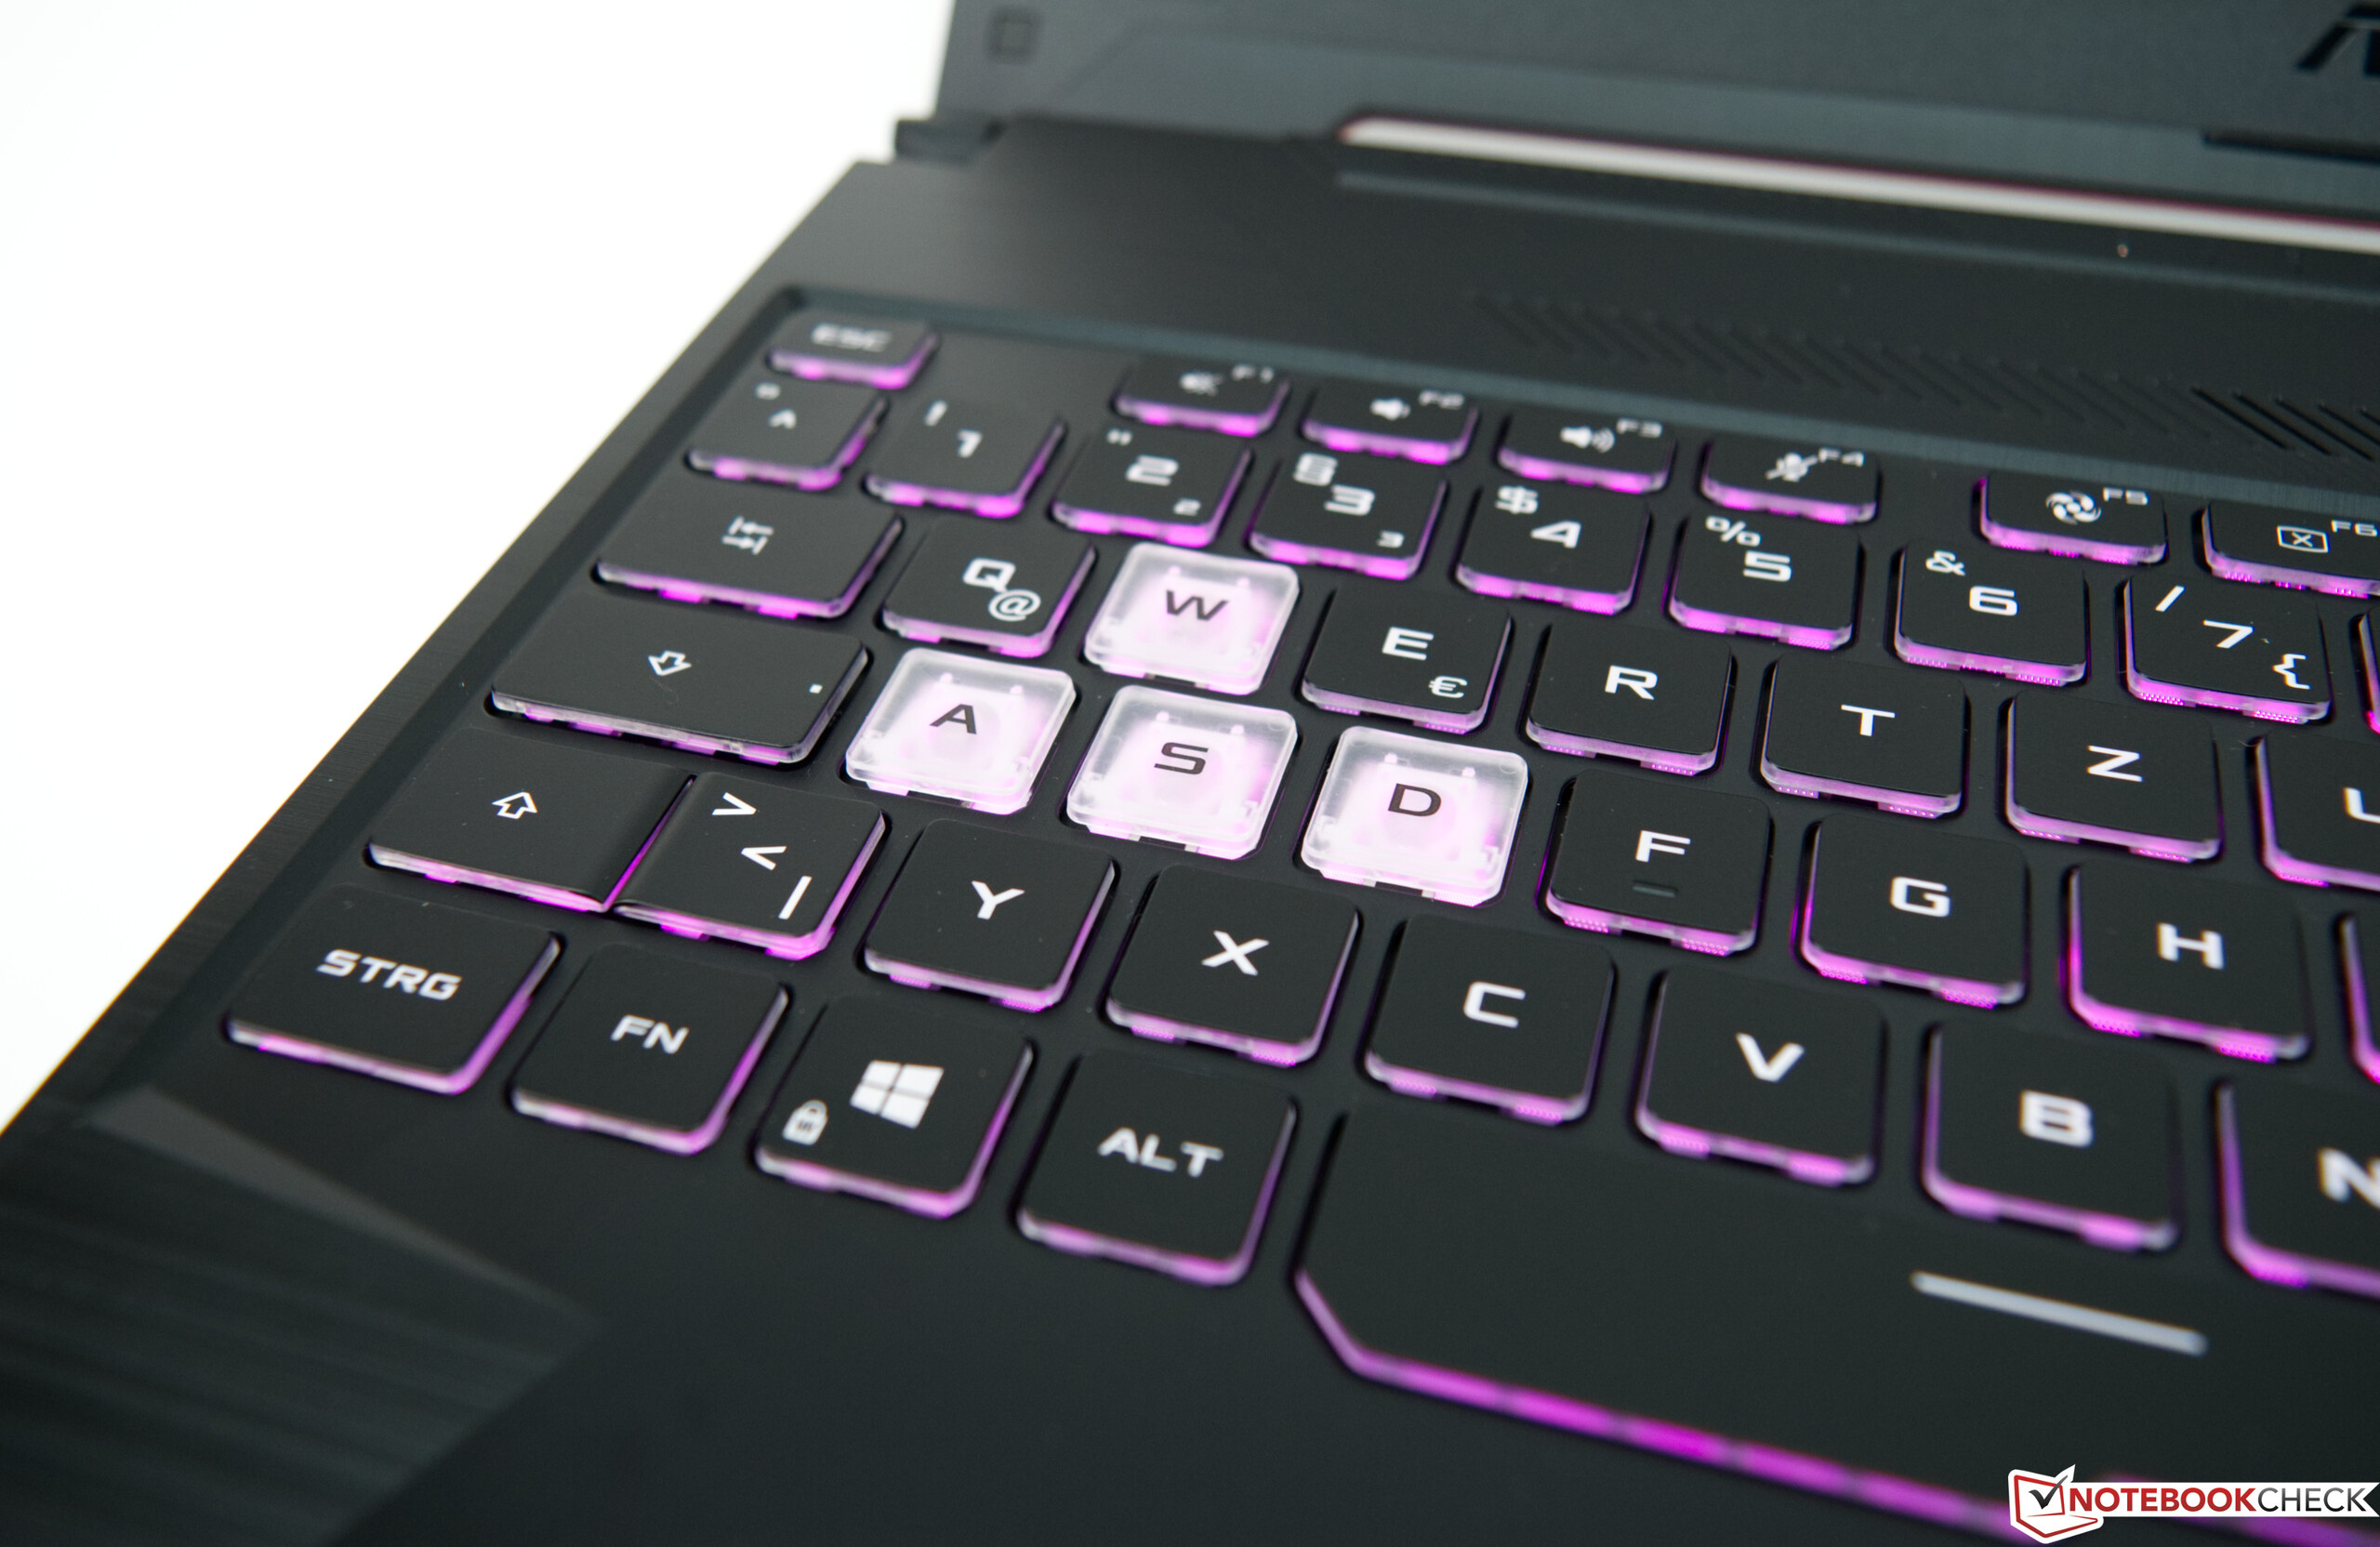
Asus has equipped the TUF A15 FA506 with a 6-row chiclet keyboard that comes with RGB lighting. As with the base unit and the majority of the chassis, almost all the keys are black. Only the WASD keys are visually distinct and further highlighted by the RGB backlighting. The keys offer shallow travel and a distinct actuation point. However, they cannot be pressed down linearly. The manufacturer has omitted noticeable dampening, in order to prevent a spongy typing experience. The keyboard is good overall, although the arrow keys could have been slightly larger.
Touchpad
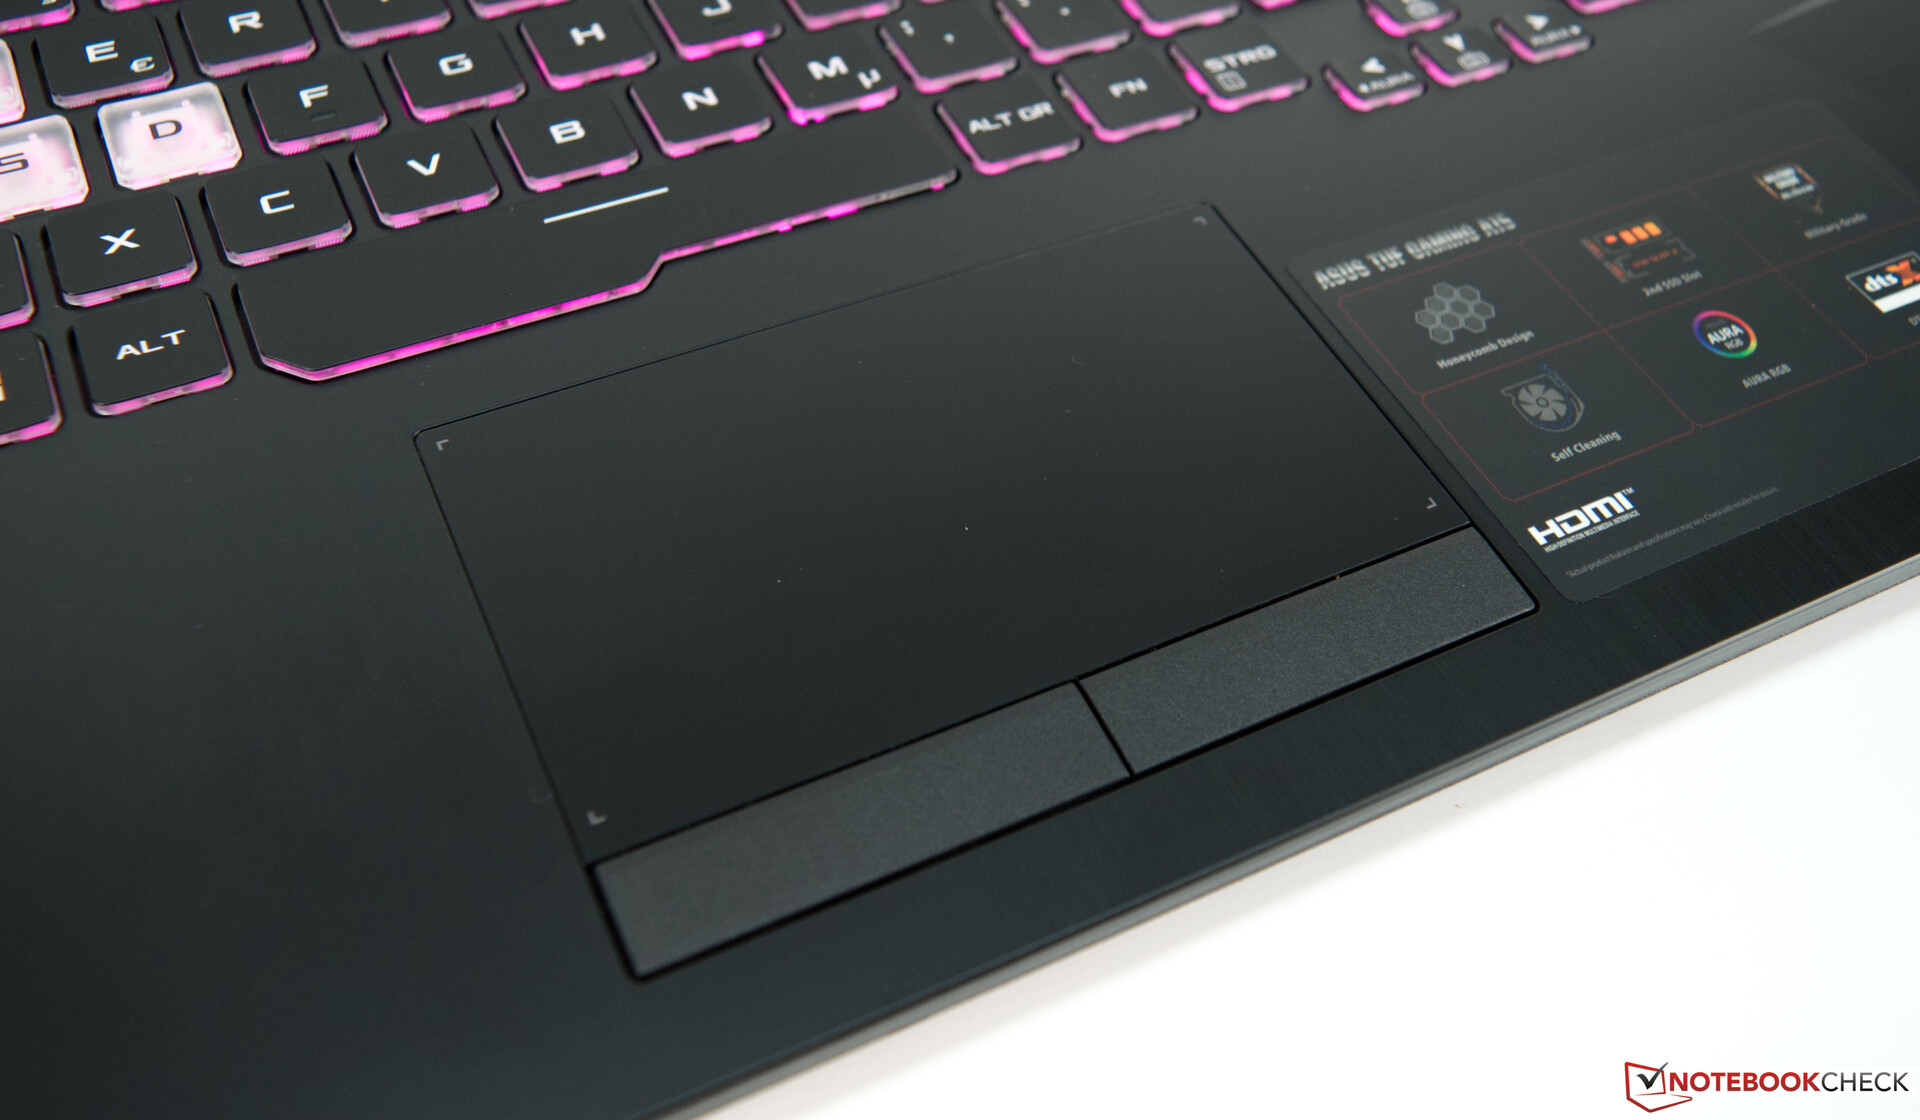
With a surface area of 10.8 x 5.9 centimeters (~4.25 x 2.32 in), the touchpad is sufficiently large enough for occasional use. Unfortunately, some areas in the corners of the touchpad can respond somewhat imprecisely. Regardless, accurately controlling the cursor did not prove to be an issue. Additionally, multi-touch gestures were recognized and executed. Unlike with ClickPads, the bottom area of the touchpad contains two buttons that are separate from the input area. Their fairly deep travel is the only feedback they provide. There is no distinct acoustic feedback.
Display - 144 Hz and No PWM


Asus has equipped our test device with a matte 15.6-inch Full HD IPS panel that supports a refresh rate of 144 Hz. The display resolution of 1920x1080 pixels amounts to a pixel density of 141 PPI. Alternatively, a 60-Hz version of the IPS panel is also available.
We observed an average display brightness of 254 cd/m². With 88%, the display's illumination is good and there are no noticeable halos. The installed panel has a black value of 0.15, which is very low for an excellent contrast ratio of 1867:1. No other device in our comparison even comes close to this result.
Thankfully, users of the Asus TUF A15 FA506 should not experience PWM-related eyestrain. PWM is not used to control the display's brightness. The only issue we encountered on our test device was slight backlight bleeding. In our case, it manifests on the top of the screen.
| |||||||||||||||||||||||||
Brightness Distribution: 88 %
Center on Battery: 280 cd/m²
Contrast: 1867:1 (Black: 0.15 cd/m²)
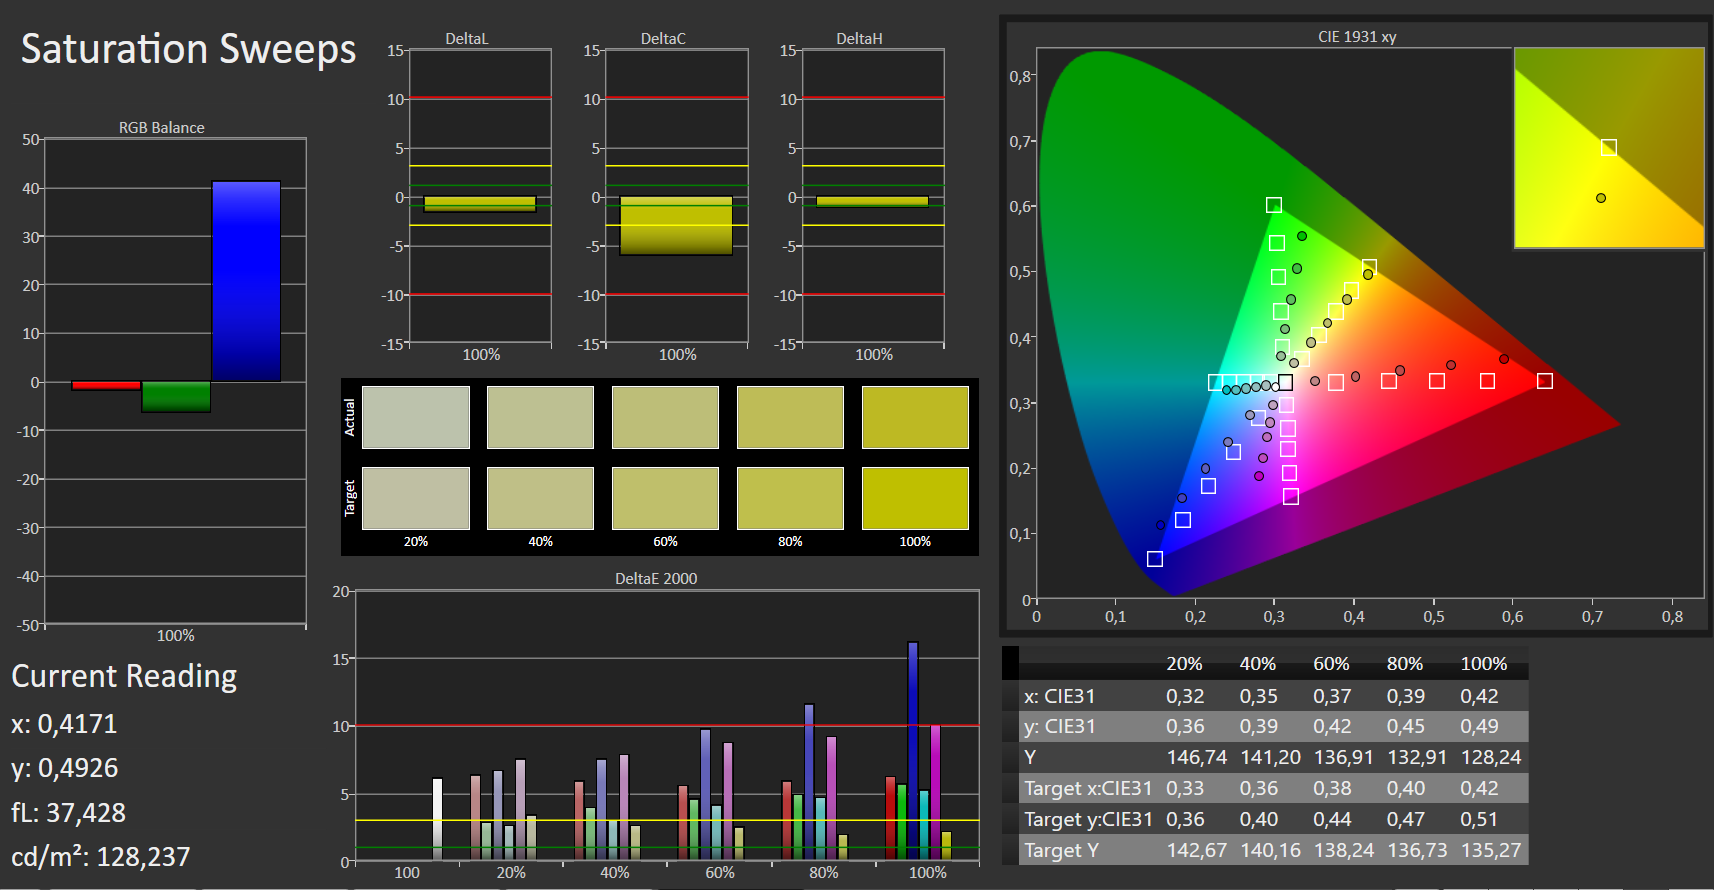
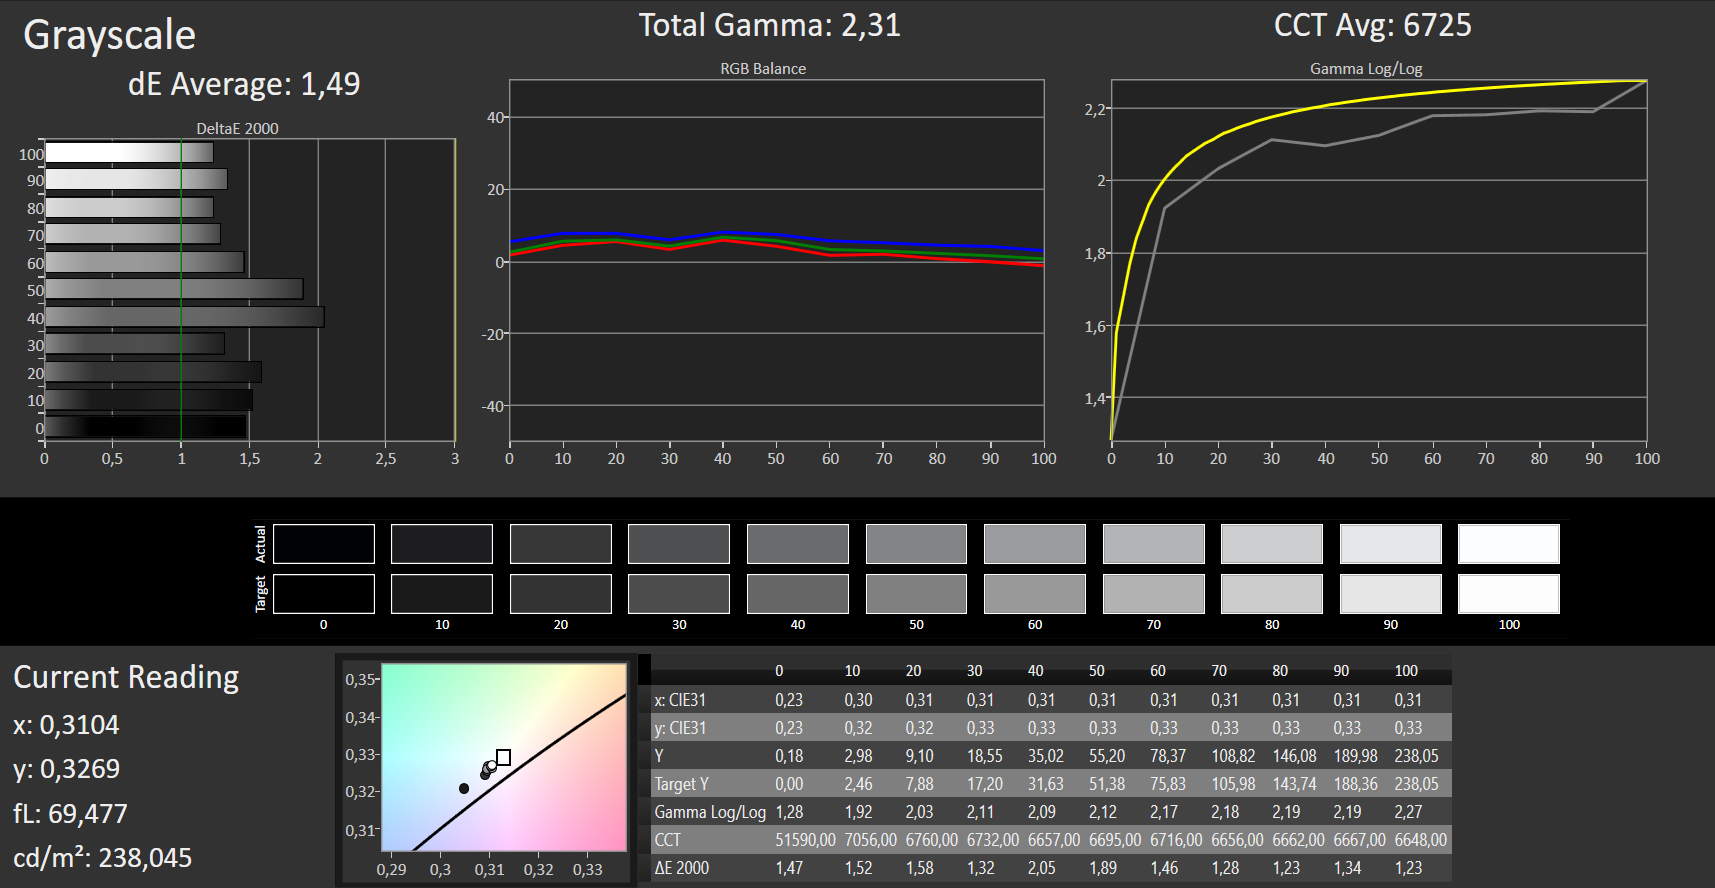
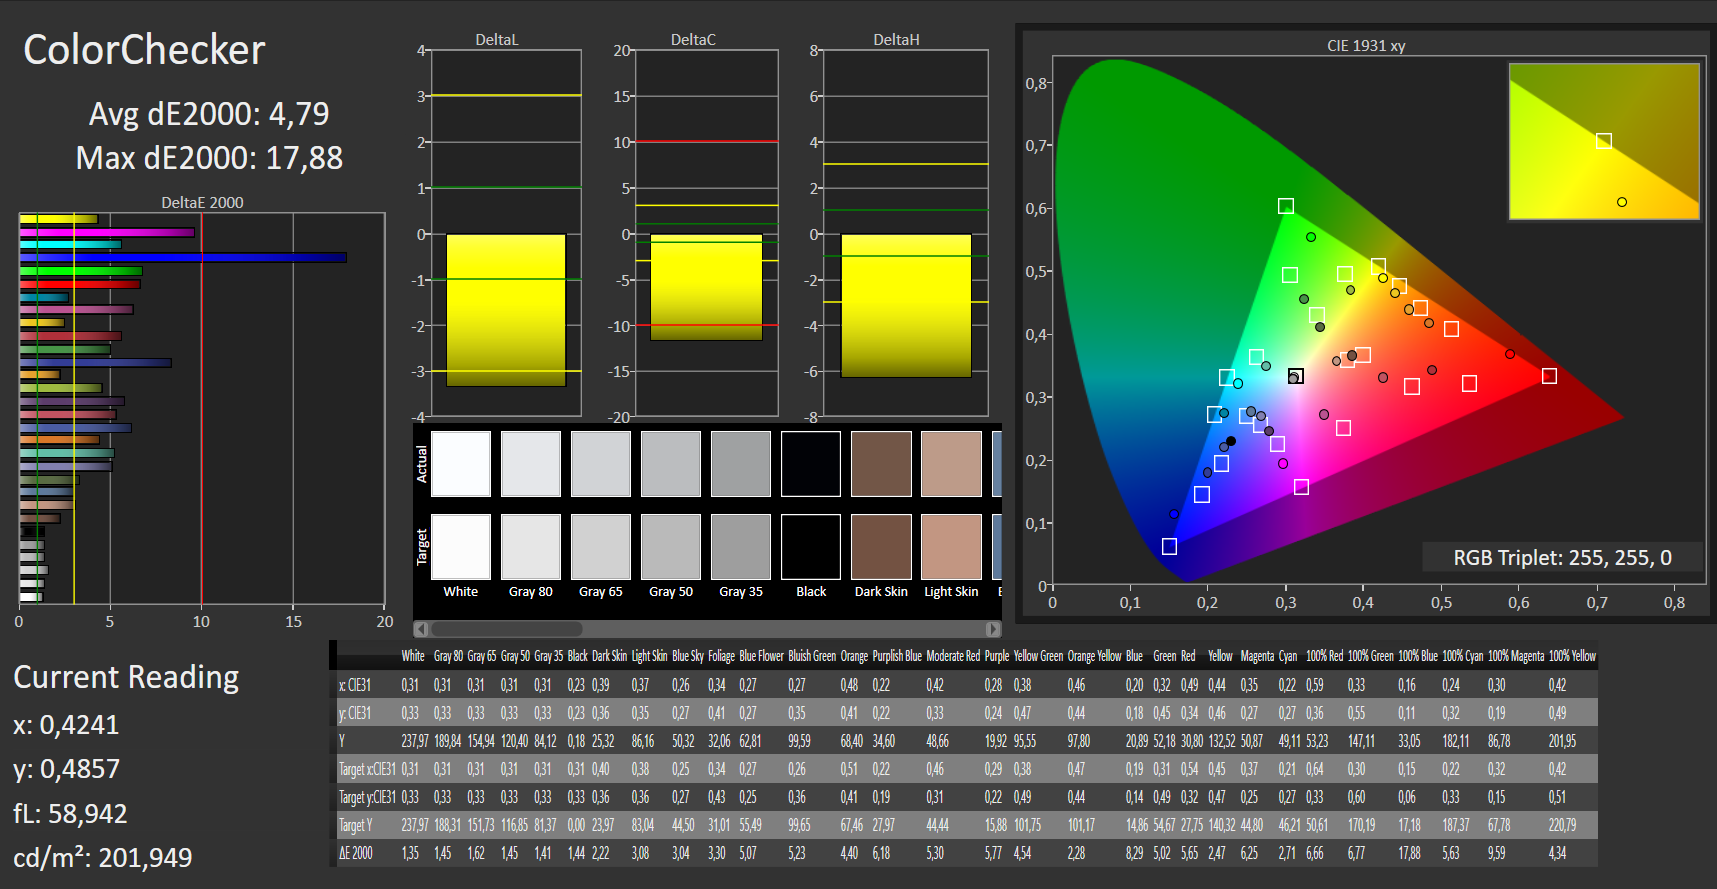
ΔE ColorChecker Calman: 5.89 | ∀{0.5-29.43 Ø4.71}
calibrated: 4.79
ΔE Greyscale Calman: 4.08 | ∀{0.09-98 Ø4.96}
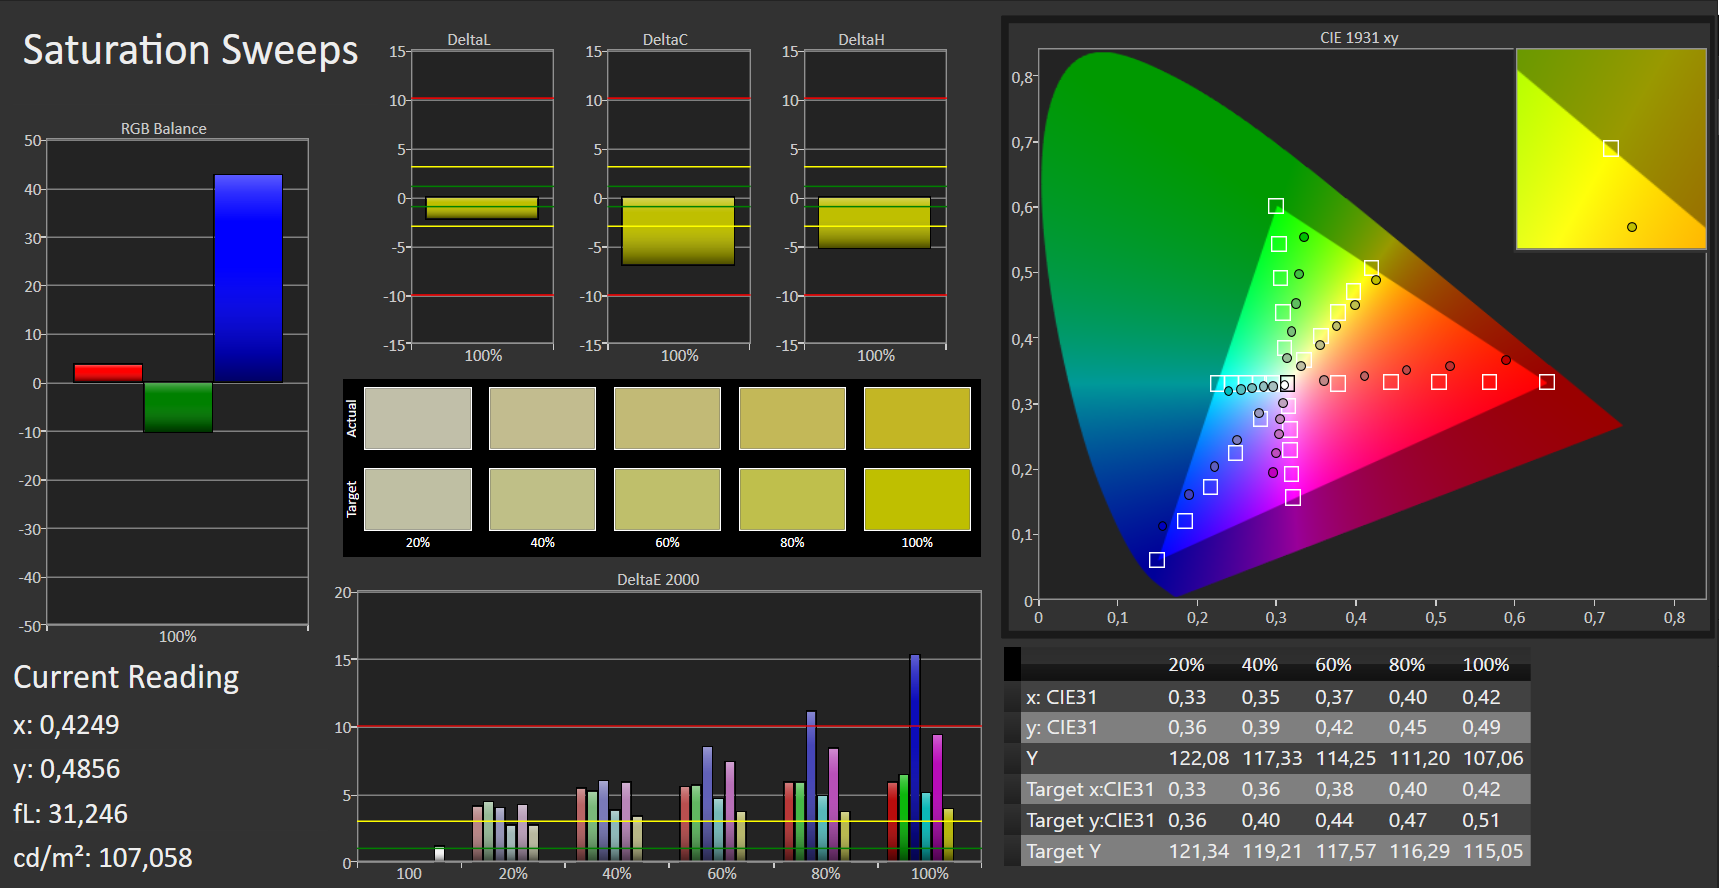
58% sRGB (Argyll 1.6.3 3D)
37% AdobeRGB 1998 (Argyll 1.6.3 3D)
40.22% AdobeRGB 1998 (Argyll 3D)
58.5% sRGB (Argyll 3D)
38.92% Display P3 (Argyll 3D)
Gamma: 2.33
CCT: 7303 K
| Asus TUF Gaming A15 FA506IV-HN172 LM156LF-2F01, IPS, 1920x1080, 15.6" | Lenovo Legion Y540-15IRH-81SX00B2GE BOE 084D, IPS, 1920x1080, 15.6" | MSI Alpha 15 A3DDK-034 AU Optronics B156HAN08.0 (AUO80ED), IPS, 1920x1080, 15.6" | MSI GL65 9SEK AU Optronics B156HAN13.0, IPS, 1920x1080, 15.6" | HP Omen 15-dc1020ng LGD05CE, IPS, 1920x1080, 15.6" | Asus ROG Zephyrus G15 GA502DU Panda LM156LF-CL03, IPS, 1920x1080, 15.6" | |
|---|---|---|---|---|---|---|
| Display | 61% | 64% | -6% | -1% | 4% | |
| Display P3 Coverage (%) | 38.92 | 63.6 63% | 66.4 71% | 36.63 -6% | 38.37 -1% | 40.33 4% |
| sRGB Coverage (%) | 58.5 | 91.7 57% | 91 56% | 55 -6% | 57.6 -2% | 60.6 4% |
| AdobeRGB 1998 Coverage (%) | 40.22 | 65.2 62% | 66.6 66% | 37.85 -6% | 39.69 -1% | 41.69 4% |
| Response Times | 62% | 68% | -2% | -21% | -9% | |
| Response Time Grey 50% / Grey 80% * (ms) | 34 ? | 8.8 ? 74% | 7 ? 79% | 26.4 ? 22% | 40 ? -18% | 34 ? -0% |
| Response Time Black / White * (ms) | 24 ? | 12 ? 50% | 10.4 ? 57% | 30 ? -25% | 29.6 ? -23% | 28 ? -17% |
| PWM Frequency (Hz) | 21280 ? | |||||
| Screen | 15% | 11% | -4% | -7% | -11% | |
| Brightness middle (cd/m²) | 280 | 299 7% | 310 11% | 277.3 -1% | 251 -10% | 240.1 -14% |
| Brightness (cd/m²) | 254 | 290 14% | 310 22% | 256 1% | 232 -9% | 231 -9% |
| Brightness Distribution (%) | 88 | 89 1% | 86 -2% | 86 -2% | 76 -14% | 85 -3% |
| Black Level * (cd/m²) | 0.15 | 0.29 -93% | 0.29 -93% | 0.2 -33% | 0.17 -13% | 0.34 -127% |
| Contrast (:1) | 1867 | 1031 -45% | 1069 -43% | 1387 -26% | 1476 -21% | 706 -62% |
| Colorchecker dE 2000 * | 5.89 | 3.7 37% | 4.78 19% | 5.25 11% | 6.2 -5% | 4.2 29% |
| Colorchecker dE 2000 max. * | 19 | 7 63% | 8.1 57% | 19.43 -2% | 18.6 2% | 17.8 6% |
| Colorchecker dE 2000 calibrated * | 4.79 | 2 58% | 2.36 51% | 4.39 8% | 4.8 -0% | 4.09 15% |
| Greyscale dE 2000 * | 4.08 | 4.1 -0% | 4.78 -17% | 3.5 14% | 4.2 -3% | 2.8 31% |
| Gamma | 2.33 94% | 2.19 100% | 2.43 91% | 2.1 105% | 2.32 95% | 2.2 100% |
| CCT | 7303 89% | 7166 91% | 7739 84% | 6895 94% | 7454 87% | 6925 94% |
| Color Space (Percent of AdobeRGB 1998) (%) | 37 | 59.3 60% | 59 59% | 35 -5% | 36.5 -1% | 38.4 4% |
| Color Space (Percent of sRGB) (%) | 58 | 91.5 58% | 91 57% | 55 -5% | 57.4 -1% | 60.4 4% |
| Total Average (Program / Settings) | 46% /
29% | 48% /
28% | -4% /
-4% | -10% /
-8% | -5% /
-8% |
* ... smaller is better
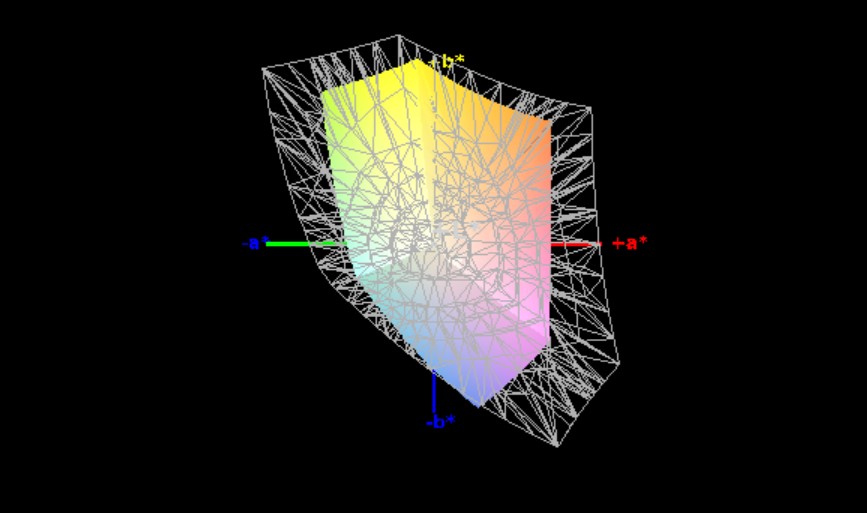
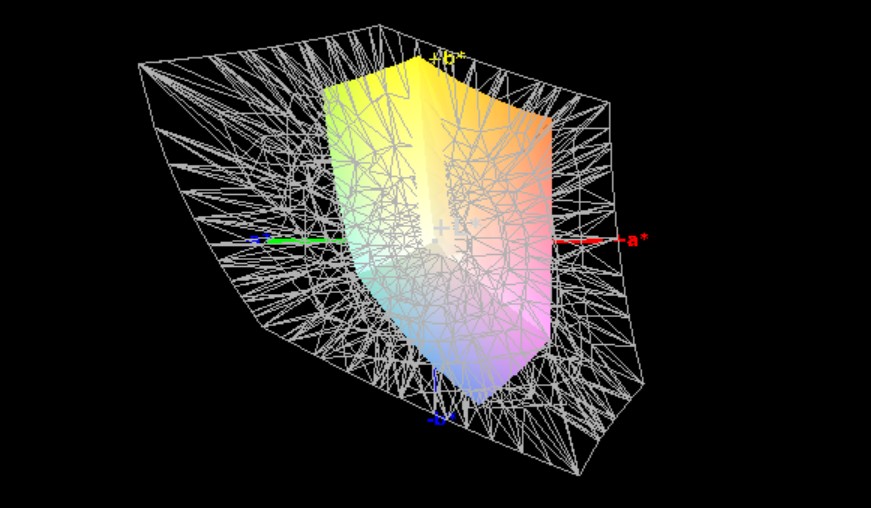
The display's quality is decent overall. Relative to the laptop's price class and intended purpose, the installed panel offers a good visual experience. There is still room for improvement, since the panel suffers from slightly increased grayscale and color DeltaE-2000 values ex-factory with the sRGB color space as a reference. Here, the Lenovo Legion Y540 and the MSI Alpha 15 achieve better results. Our calibration attempt significantly improves the grayscale (1.49). Regrettably, the colors were barely improved. As such, the device is a relatively poor choice for professional video and photo-editing.


The matte layer prevents distracting reflections, which often occur during outdoor use. We still recommend working in the shade whenever possible. A look at the viewing angles shows a result that is typical for IPS panels. There are no significant color distortions at any of the angles we tested.

Display Response Times
| ↔ Response Time Black to White | ||
|---|---|---|
| 24 ms ... rise ↗ and fall ↘ combined | ↗ 13 ms rise | 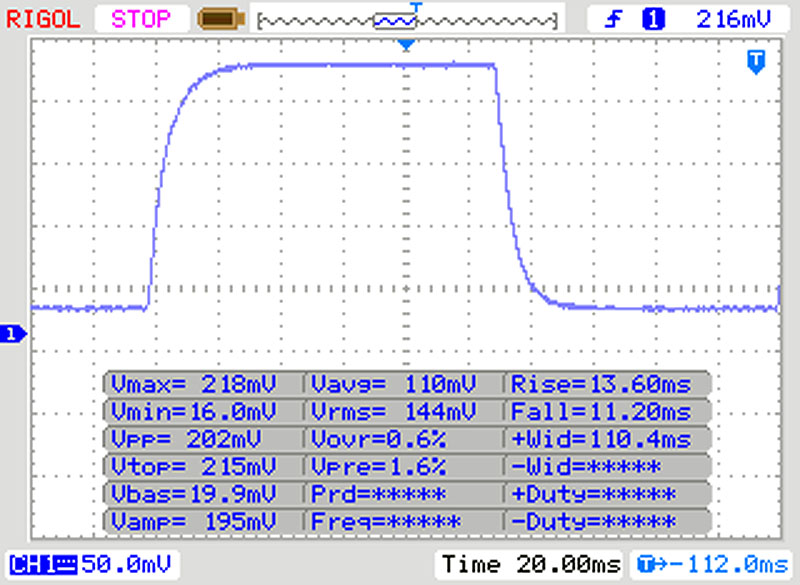 |
| ↘ 11 ms fall | ||
| The screen shows good response rates in our tests, but may be too slow for competitive gamers. In comparison, all tested devices range from 0.1 (minimum) to 240 (maximum) ms. » 54 % of all devices are better. This means that the measured response time is worse than the average of all tested devices (19.8 ms). | ||
| ↔ Response Time 50% Grey to 80% Grey | ||
| 34 ms ... rise ↗ and fall ↘ combined | ↗ 16 ms rise | 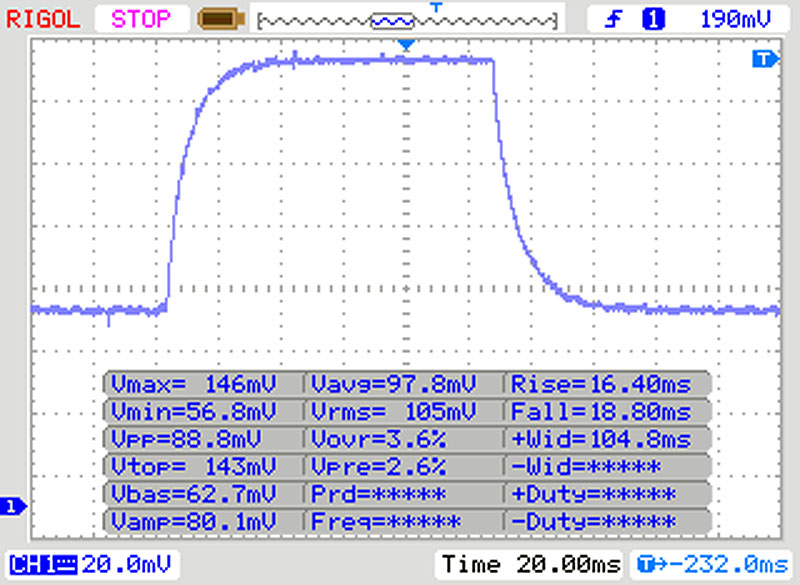 |
| ↘ 18 ms fall | ||
| The screen shows slow response rates in our tests and will be unsatisfactory for gamers. In comparison, all tested devices range from 0.165 (minimum) to 636 (maximum) ms. » 47 % of all devices are better. This means that the measured response time is similar to the average of all tested devices (31 ms). | ||
Screen Flickering / PWM (Pulse-Width Modulation)
| Screen flickering / PWM not detected | 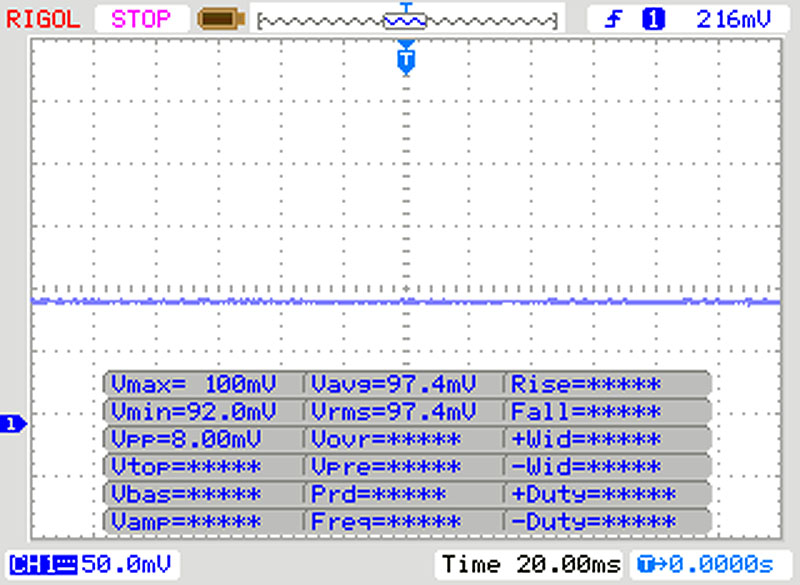 | ||
In comparison: 52 % of all tested devices do not use PWM to dim the display. If PWM was detected, an average of 7757 (minimum: 5 - maximum: 343500) Hz was measured. | |||
Performance
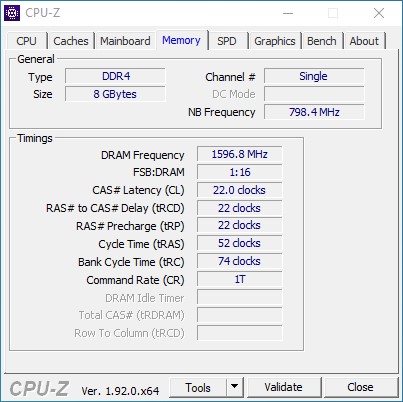
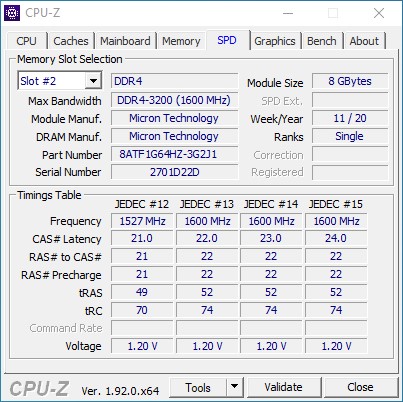
Based on the latest AMD Renoir SoCs, the Asus TUF A15 FA506, which features an Nvidia GeForce RTX 2060, achieves a respectable level of gaming performance. A total of eight cores are nice to have and hold the promise of being somewhat future-proof. Conversely, our device is equipped with just 8 GB of RAM, which is not a lot for today's standards. Modern games are still playable on this setup and the RAM can easily be upgraded without any issues.
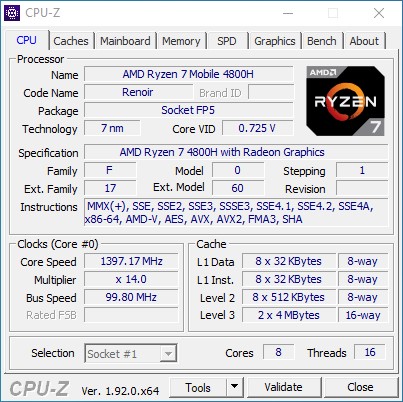
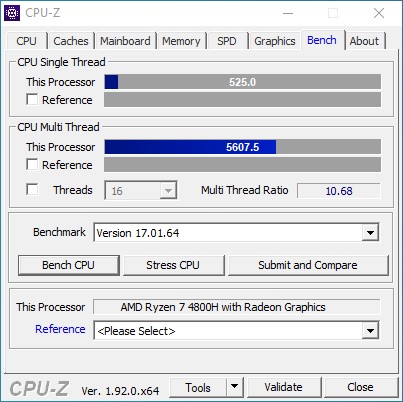
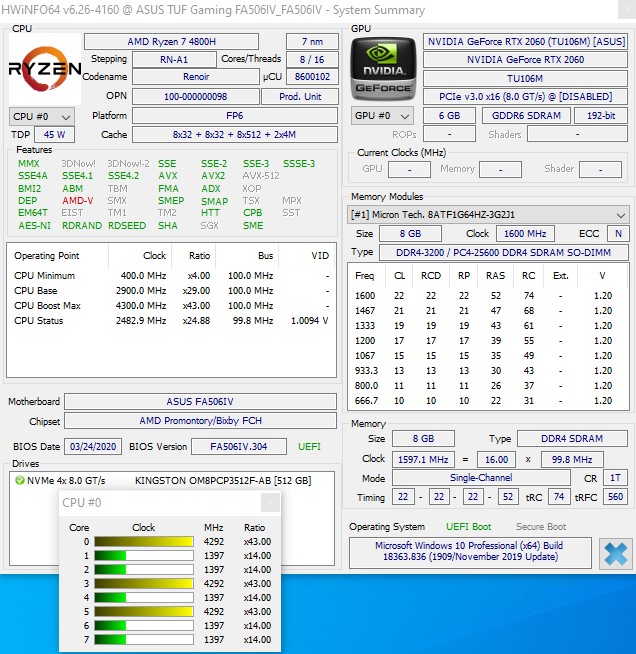
Processor
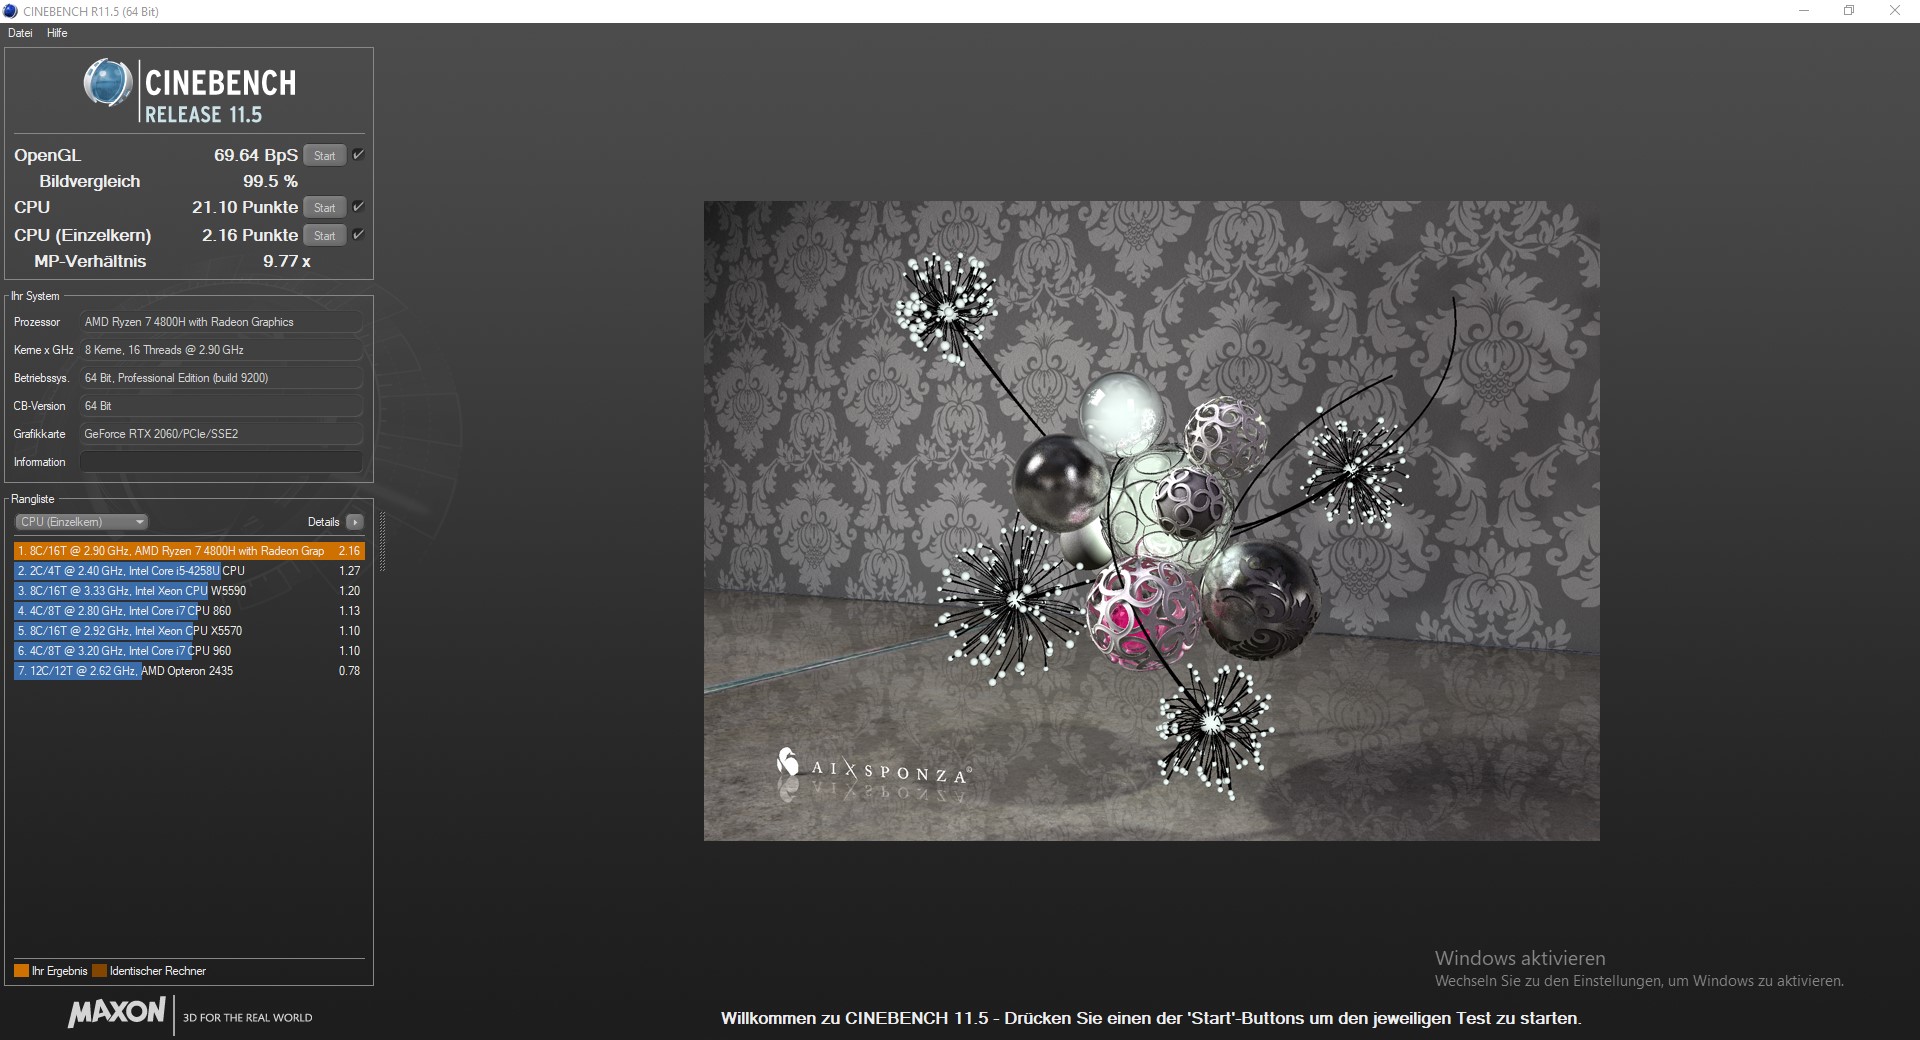
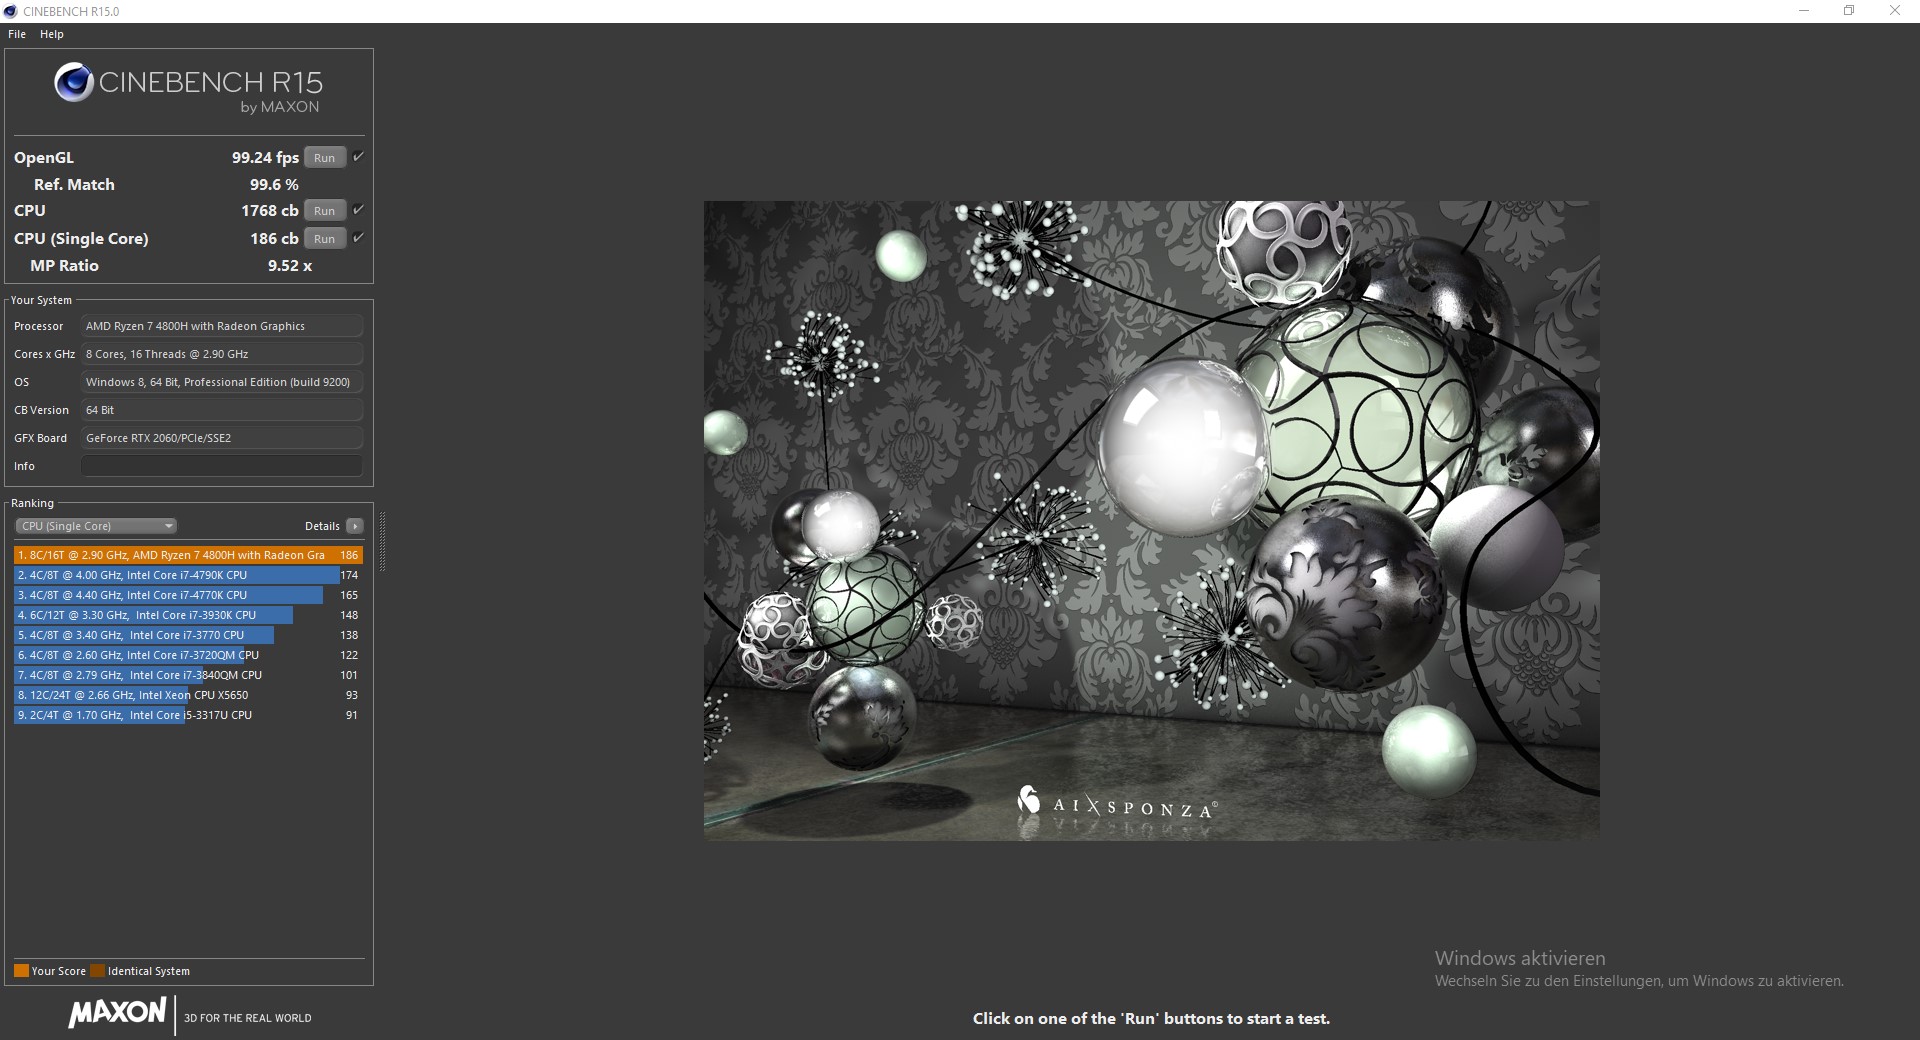
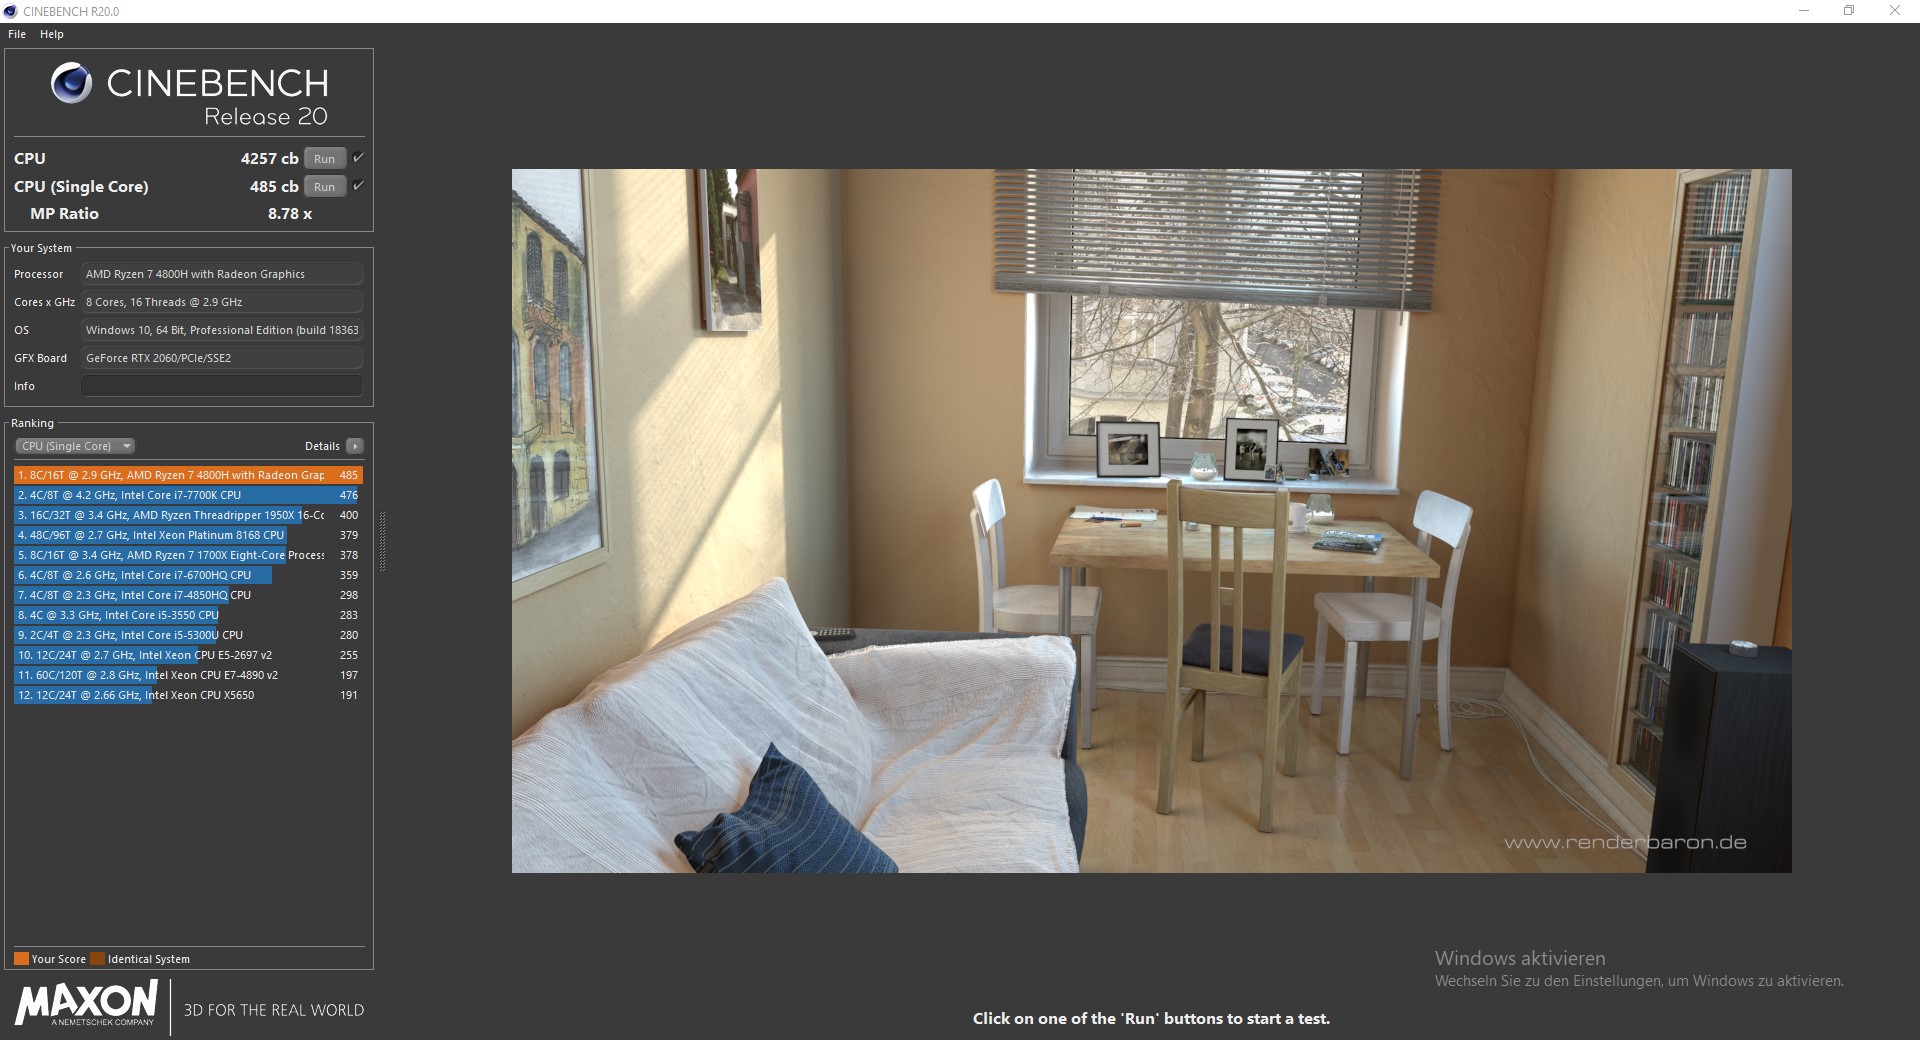
The AMD Ryzen 7 4800H is an octa-core CPU and a direct competitor of Intel's 10th generation Comet Lake-H SoCs. The latest Renoir AMD SoC performs particularly well in multithreaded workloads. Compared to the 3000 series, the single-core performance of the AMD chip has been improved dramatically as well, which puts the Ryzen 7 4800H on par with an Intel Core i7-9750H.
During the Cinebench R15 multithread loop test, we did not observe a performance drop-off after stressing the CPU for a prolonged period of time. All the scores range from 1850 to 1601, which results in a fair average score of 1753 points.
More comparisons and benchmarks can be found in our CPU table.
Cinebench R15: CPU Single 64Bit | CPU Multi 64Bit
Blender: v2.79 BMW27 CPU
7-Zip 18.03: 7z b 4 -mmt1 | 7z b 4
Geekbench 5.5: Single-Core | Multi-Core
HWBOT x265 Benchmark v2.2: 4k Preset
LibreOffice : 20 Documents To PDF
R Benchmark 2.5: Overall mean
| Cinebench R20 / CPU (Single Core) | |
| Average of class Gaming (442 - 913, n=106, last 2 years) | |
| Average Intel Core i7-10875H (430 - 524, n=32) | |
| Asus TUF Gaming A15 FA506IV-HN172 | |
| MSI GL65 9SEK | |
| Lenovo Legion Y540-15IRH-81SX00B2GE | |
| HP Omen 15-dc1020ng | |
| MSI Alpha 15 A3DDK-034 | |
| Asus ROG Zephyrus G15 GA502DU | |
| Cinebench R20 / CPU (Multi Core) | |
| Average of class Gaming (4029 - 16433, n=106, last 2 years) | |
| Asus TUF Gaming A15 FA506IV-HN172 | |
| Average Intel Core i7-10875H (1986 - 4176, n=32) | |
| MSI GL65 9SEK | |
| Lenovo Legion Y540-15IRH-81SX00B2GE | |
| Asus ROG Zephyrus G15 GA502DU | |
| HP Omen 15-dc1020ng | |
| MSI Alpha 15 A3DDK-034 | |
| Cinebench R15 / CPU Single 64Bit | |
| Average of class Gaming (188.8 - 350, n=106, last 2 years) | |
| Average Intel Core i7-10875H (190 - 220, n=37) | |
| MSI GL65 9SEK | |
| Lenovo Legion Y540-15IRH-81SX00B2GE | |
| Asus TUF Gaming A15 FA506IV-HN172 | |
| HP Omen 15-dc1020ng | |
| Asus ROG Zephyrus G15 GA502DU | |
| MSI Alpha 15 A3DDK-034 | |
| Cinebench R15 / CPU Multi 64Bit | |
| Average of class Gaming (1578 - 6330, n=105, last 2 years) | |
| Asus TUF Gaming A15 FA506IV-HN172 | |
| Average Intel Core i7-10875H (1003 - 1833, n=38) | |
| MSI GL65 9SEK | |
| Lenovo Legion Y540-15IRH-81SX00B2GE | |
| Asus ROG Zephyrus G15 GA502DU | |
| HP Omen 15-dc1020ng | |
| MSI Alpha 15 A3DDK-034 | |
| Blender / v2.79 BMW27 CPU | |
| HP Omen 15-dc1020ng | |
| Asus ROG Zephyrus G15 GA502DU | |
| Lenovo Legion Y540-15IRH-81SX00B2GE | |
| Average Intel Core i7-10875H (259 - 535, n=30) | |
| Asus TUF Gaming A15 FA506IV-HN172 | |
| Average of class Gaming (79 - 330, n=104, last 2 years) | |
| 7-Zip 18.03 / 7z b 4 -mmt1 | |
| Average of class Gaming (4199 - 7436, n=105, last 2 years) | |
| Average Intel Core i7-10875H (5071 - 5780, n=31) | |
| Lenovo Legion Y540-15IRH-81SX00B2GE | |
| Asus TUF Gaming A15 FA506IV-HN172 | |
| HP Omen 15-dc1020ng | |
| Asus ROG Zephyrus G15 GA502DU | |
| 7-Zip 18.03 / 7z b 4 | |
| Average of class Gaming (33491 - 148086, n=105, last 2 years) | |
| Asus TUF Gaming A15 FA506IV-HN172 | |
| Average Intel Core i7-10875H (29844 - 49562, n=31) | |
| Lenovo Legion Y540-15IRH-81SX00B2GE | |
| HP Omen 15-dc1020ng | |
| Asus ROG Zephyrus G15 GA502DU | |
| Geekbench 5.5 / Single-Core | |
| Average of class Gaming (986 - 2474, n=105, last 2 years) | |
| Average Intel Core i7-10875H (1233 - 1371, n=29) | |
| Asus TUF Gaming A15 FA506IV-HN172 | |
| MSI Alpha 15 A3DDK-034 | |
| Geekbench 5.5 / Multi-Core | |
| Average of class Gaming (6460 - 28263, n=105, last 2 years) | |
| Average Intel Core i7-10875H (5715 - 8620, n=29) | |
| Asus TUF Gaming A15 FA506IV-HN172 | |
| MSI Alpha 15 A3DDK-034 | |
| HWBOT x265 Benchmark v2.2 / 4k Preset | |
| Average of class Gaming (11.5 - 44.4, n=105, last 2 years) | |
| Average Intel Core i7-10875H (7.27 - 14.1, n=27) | |
| Asus TUF Gaming A15 FA506IV-HN172 | |
| Lenovo Legion Y540-15IRH-81SX00B2GE | |
| HP Omen 15-dc1020ng | |
| Asus ROG Zephyrus G15 GA502DU | |
| LibreOffice / 20 Documents To PDF | |
| Average Intel Core i7-10875H (30.2 - 84.3, n=30) | |
| Average of class Gaming (33.2 - 88.8, n=105, last 2 years) | |
| Asus TUF Gaming A15 FA506IV-HN172 | |
| R Benchmark 2.5 / Overall mean | |
| Asus TUF Gaming A15 FA506IV-HN172 | |
| Average Intel Core i7-10875H (0.546 - 0.662, n=29) | |
| Average of class Gaming (0.3439 - 0.759, n=106, last 2 years) | |
* ... smaller is better
Cinebench R15 Multi-Thread Loop
System Performance
The PCMark 10 benchmark results are slightly worse than those of other devices equipped with the same CPU. During our testing, we did not encounter any software or hardware issues. The system always remained smooth and responsive.
| PCMark 8 Home Score Accelerated v2 | 4698 points | |
| PCMark 8 Creative Score Accelerated v2 | 7841 points | |
| PCMark 8 Work Score Accelerated v2 | 5773 points | |
| PCMark 10 Score | 5095 points | |
Help | ||
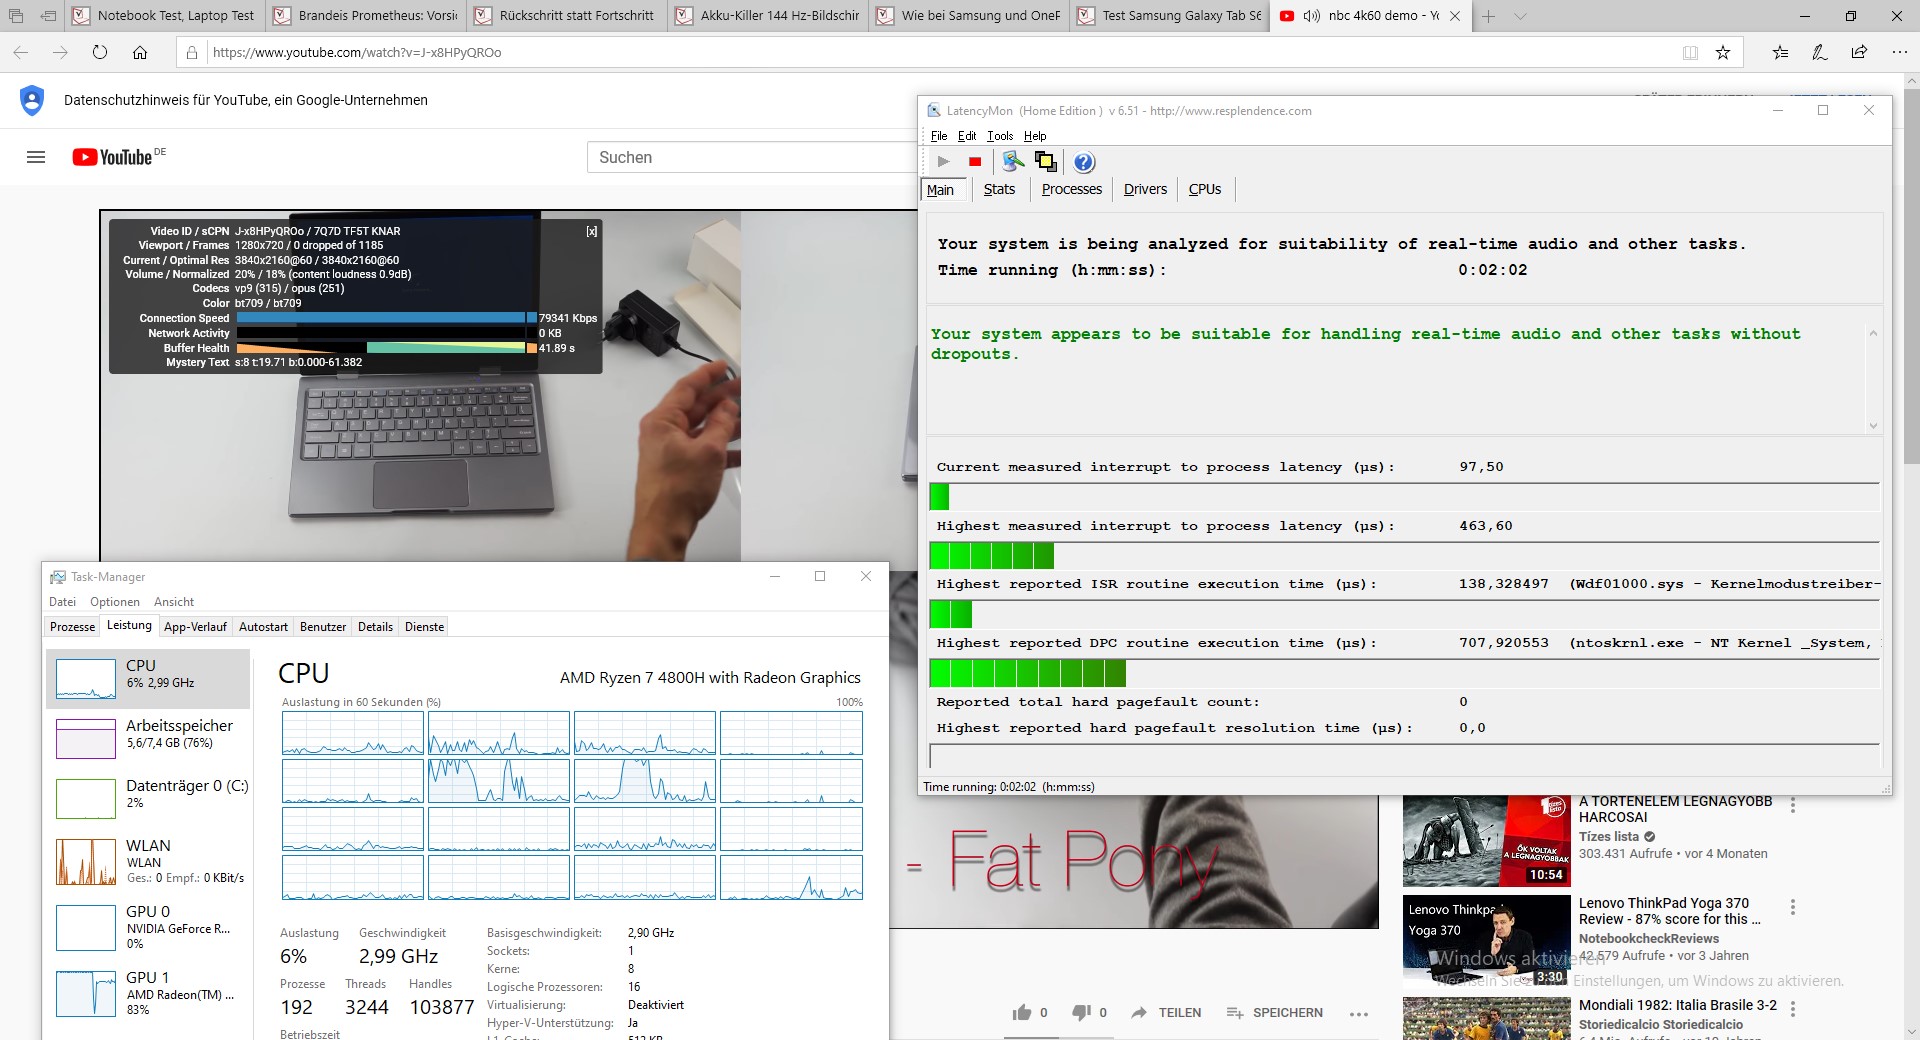
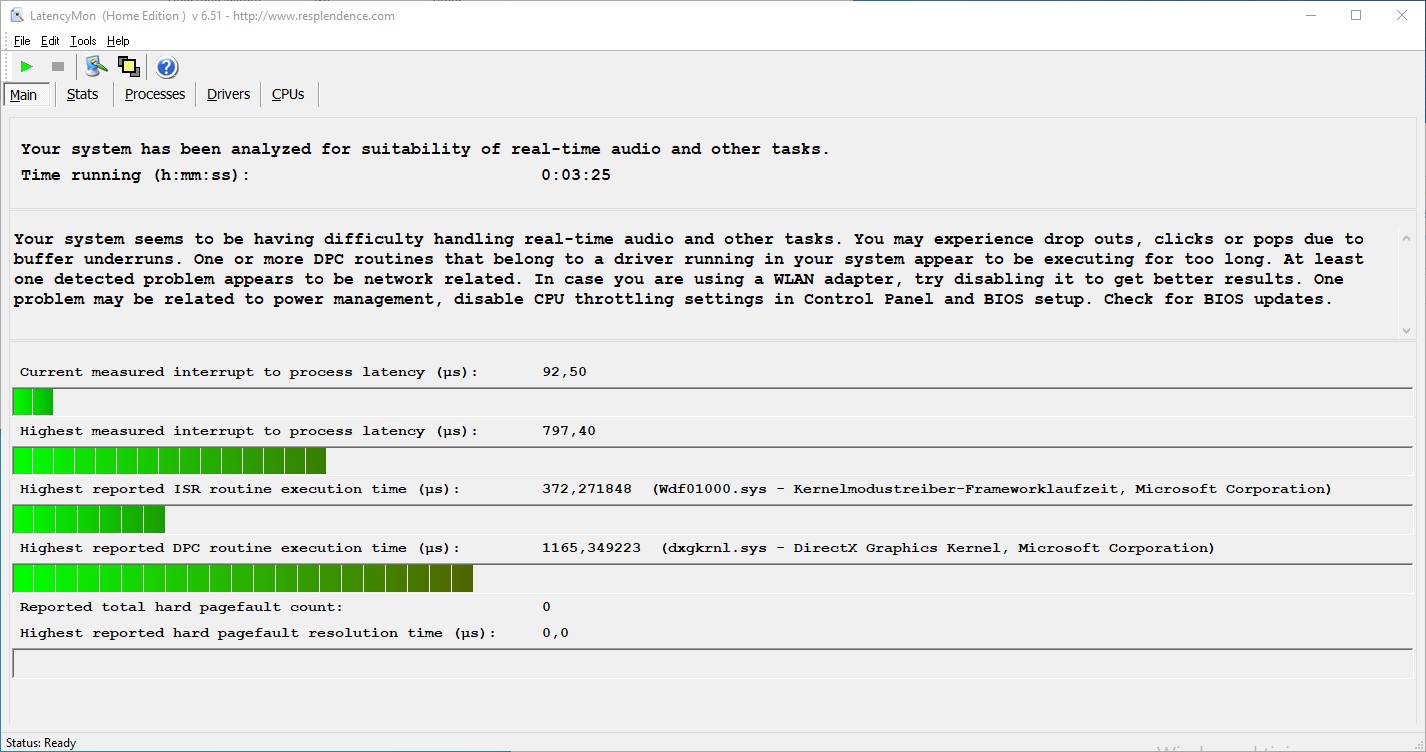
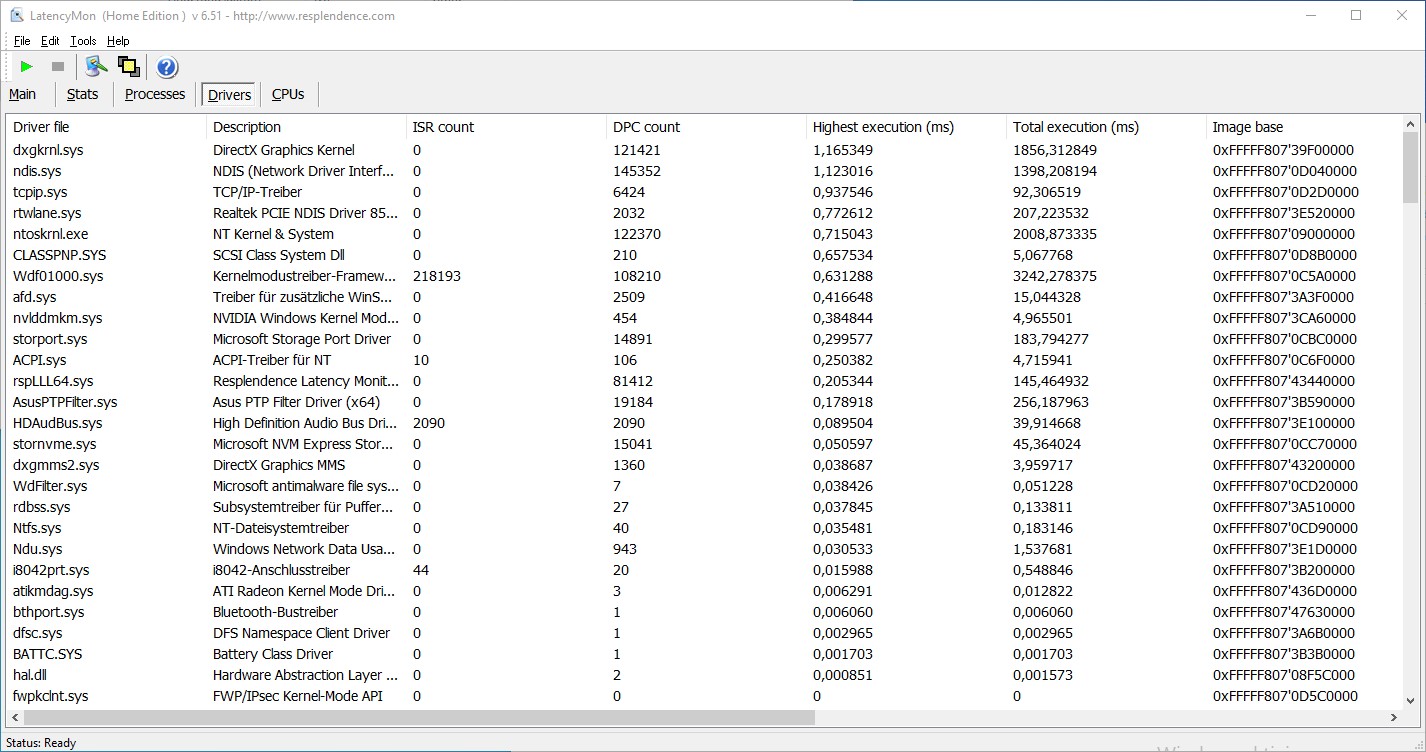
DPC Latencies
According to LatencyMon, the DPC latencies do not reach critical levels when opening multiple browser tabs in Edge, and regardless of 81% GPU usage there are no problems with 4K video playback. LatencyMon only starts to report issues with real-time audio and video playback when running Prime95 with large FFTs.
| DPC Latencies / LatencyMon - interrupt to process latency (max), Web, Youtube, Prime95 | |
| Asus TUF Gaming A15 FA506IV-HN172 | |
* ... smaller is better
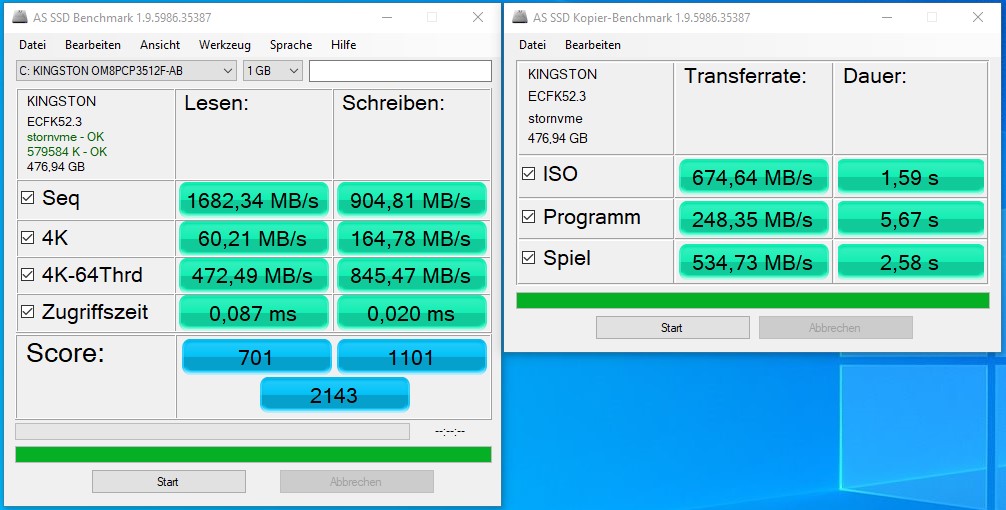
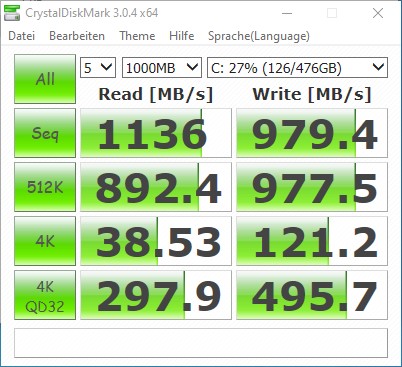
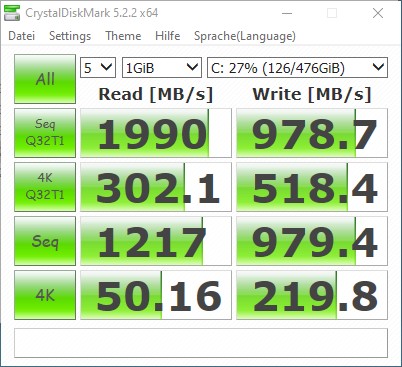
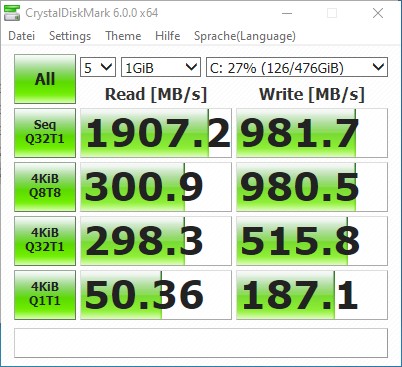
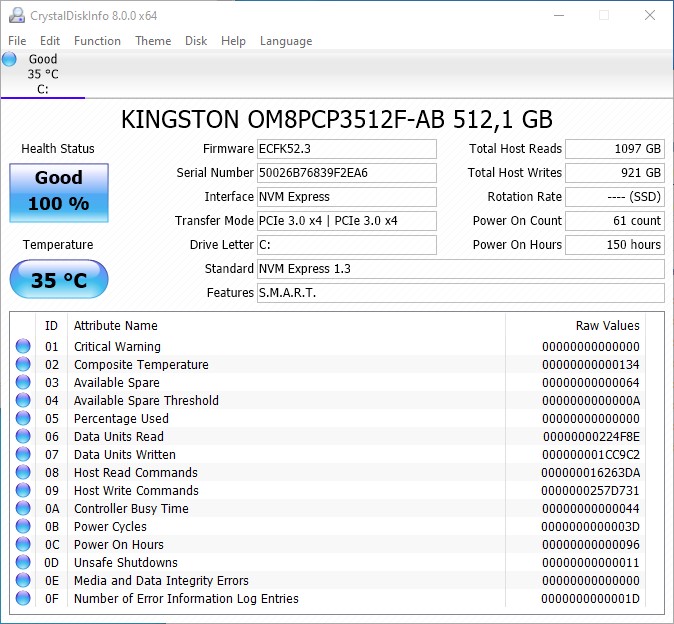
Storage Solution
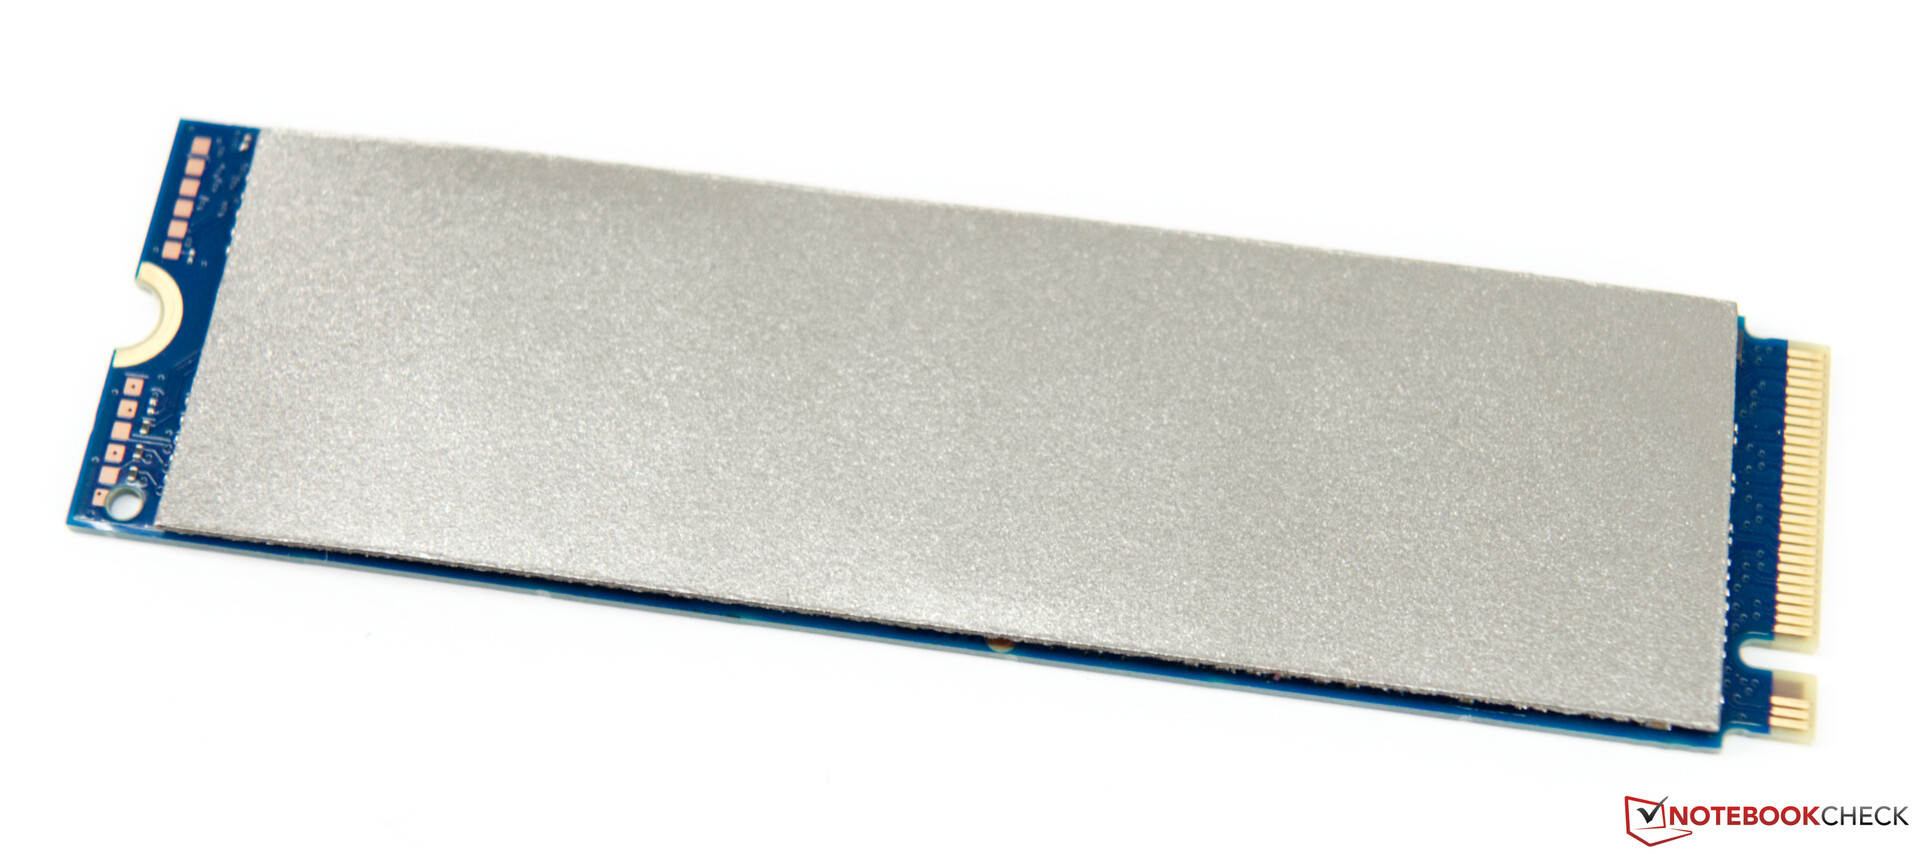
Asus has installed a fast Kingston NVMe SSD inside the TUF A15 FA506. It offers 512 GB of storage space and uses the M.2-PCIe interface for data transfer. In our tests, it achieves good transfer rates when reading and writing data. Its 4K read performance of just above 60 MB/s is exceptional and thus noteworthy. The TUF A15 FA506 can be fitted with a total of three mass-storage devices. There is a secondary M.2 slot and a 2.5-inch drive bay. The cables required to connect the 2.5-inch drive to the motherboard are included.
More comparisons and benchmarks can be found in our comparison table.
| Asus TUF Gaming A15 FA506IV-HN172 Kingston OM8PCP3512F-AB | Lenovo Legion Y540-15IRH-81SX00B2GE WDC PC SN720 SDAPNTW-512G | MSI Alpha 15 A3DDK-034 Kingston RBUSNS8154P3512GJ | MSI GL65 9SEK WDC PC SN520 SDAPNUW-512G | HP Omen 15-dc1020ng WDC PC SN720 SDAQNTW-512G | Asus ROG Zephyrus G15 GA502DU Intel SSD 660p SSDPEKNW512G8 | Average Kingston OM8PCP3512F-AB | |
|---|---|---|---|---|---|---|---|
| CrystalDiskMark 5.2 / 6 | 30% | -20% | 10% | 35% | -17% | -5% | |
| Write 4K (MB/s) | 219.8 | 158.8 -28% | 105.4 -52% | 150.2 -32% | 112.1 -49% | 132.2 -40% | 194.5 ? -12% |
| Read 4K (MB/s) | 50.2 | 29.11 -42% | 33.24 -34% | 43.46 -13% | 42.01 -16% | 55.5 11% | 47.3 ? -6% |
| Write Seq (MB/s) | 979 | 1584 62% | 1029 5% | 1412 44% | 1964 101% | 986 1% | 978 ? 0% |
| Read Seq (MB/s) | 1990 | 1694 -15% | 1098 -45% | 1340 -33% | 2065 4% | 1318 -34% | 1299 ? -35% |
| Write 4K Q32T1 (MB/s) | 516 | 536 4% | 322.1 -38% | 482.2 -7% | 318.2 -38% | 220.3 -57% | 505 ? -2% |
| Read 4K Q32T1 (MB/s) | 298.3 | 363.9 22% | 352 18% | 535 79% | 406.7 36% | 315.5 6% | 301 ? 1% |
| Write Seq Q32T1 (MB/s) | 982 | 2536 158% | 1036 5% | 1454 48% | 2534 158% | 987 1% | 978 ? 0% |
| Read Seq Q32T1 (MB/s) | 1907 | 3458 81% | 1606 -16% | 1744 -9% | 3438 80% | 1416 -26% | 1930 ? 1% |
| Write 4K Q8T8 (MB/s) | 981 | 981 ? 0% | |||||
| Read 4K Q8T8 (MB/s) | 300.9 | 301 ? 0% | |||||
| AS SSD | 63% | -9% | 10% | 66% | -10% | -9% | |
| Seq Read (MB/s) | 1682 | 2927 74% | 1423 -15% | 1315 -22% | 2955 76% | 907 -46% | 1570 ? -7% |
| Seq Write (MB/s) | 904 | 2149 138% | 958 6% | 1378 52% | 2440 170% | 926 2% | 904 ? 0% |
| 4K Read (MB/s) | 60.2 | 42.43 -30% | 33.2 -45% | 25.31 -58% | 40.56 -33% | 47.26 -21% | 48.2 ? -20% |
| 4K Write (MB/s) | 164.8 | 147.1 -11% | 80.7 -51% | 118.2 -28% | 118.6 -28% | 98.7 -40% | 118.9 ? -28% |
| 4K-64 Read (MB/s) | 472.5 | 1286 172% | 816 73% | 839 78% | 1283 172% | 321.5 -32% | 415 ? -12% |
| 4K-64 Write (MB/s) | 845 | 1432 69% | 708 -16% | 720 -15% | 1538 82% | 736 -13% | 829 ? -2% |
| Access Time Read * (ms) | 0.087 | 0.065 25% | 0.1 -15% | 0.116 -33% | 0.084 3% | 0.064 26% | 0.1294 ? -49% |
| Access Time Write * (ms) | 0.02 | 0.026 -30% | 0.047 -135% | 0.091 -355% | 0.032 -60% | 0.045 -125% | 0.0371 ? -86% |
| Score Read (Points) | 701 | 1621 131% | 991 41% | 996 42% | 1619 131% | 459 -35% | 619 ? -12% |
| Score Write (Points) | 1101 | 1794 63% | 885 -20% | 976 -11% | 1901 73% | 927 -16% | 1036 ? -6% |
| Score Total (Points) | 2143 | 4208 96% | 2365 10% | 2485 16% | 4323 102% | 1641 -23% | 1955 ? -9% |
| Copy ISO MB/s (MB/s) | 675 | 1043 55% | 1279 89% | 1418 110% | 905 34% | 977 ? 45% | |
| Copy Program MB/s (MB/s) | 248.4 | 252.7 2% | 889 258% | 392.5 58% | 496.9 100% | 373 ? 50% | |
| Copy Game MB/s (MB/s) | 535 | 483.6 -10% | 1218 128% | 907 70% | 819 53% | 610 ? 14% | |
| Total Average (Program / Settings) | 47% /
49% | -15% /
-13% | 10% /
10% | 51% /
55% | -14% /
-12% | -7% /
-7% |
* ... smaller is better

Continuous read performance: DiskSpd Read Loop, Queue Depth 8
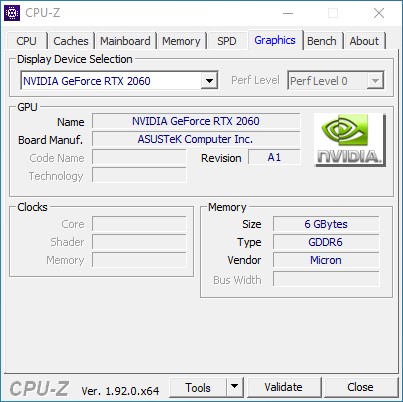
GPU Performance
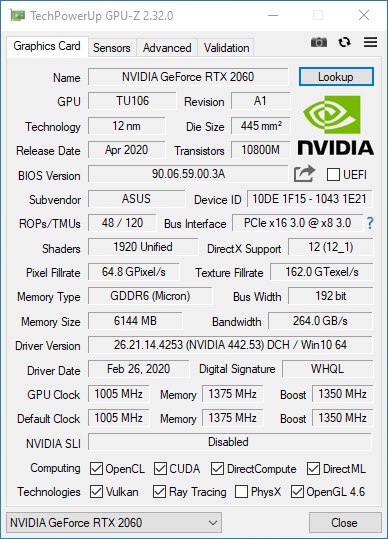
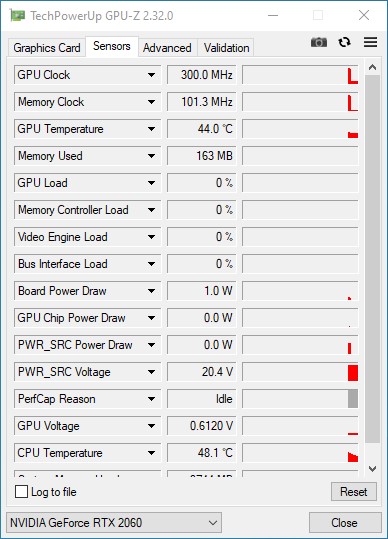
The Nvidia GeForce RTX 2060 model represents the highest-end GPU configuration of the TUF A15 F506 that Asus is currently offering. In synthetic benchmarks, the results of our test device and the MSI GL65 are neck-and-neck. In order to access the full performance of the GeForce RTX 2060, users will have to connect their AC adapter. In battery mode, the performance is fairly heavily throttled.
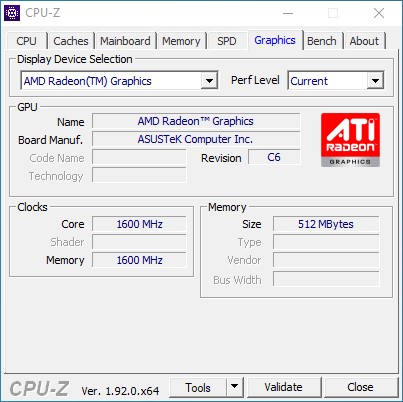
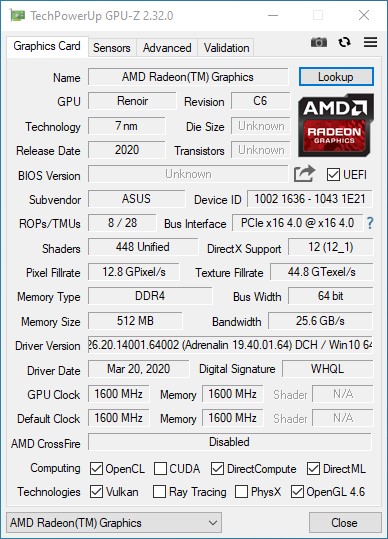
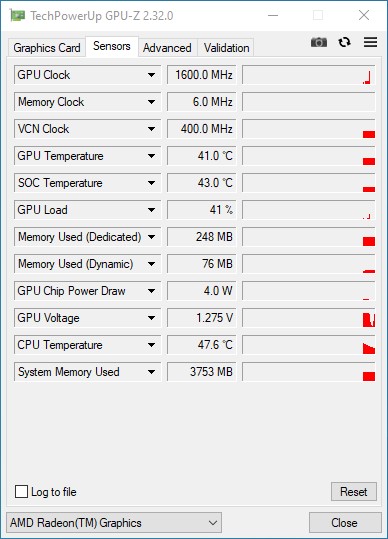
During 2D use, AMD's Radeon Vega is responsible for video output, which improves the battery life due to the iGPU's lower energy consumption.
More comparisons and benchmarks can be found in our GPU table.
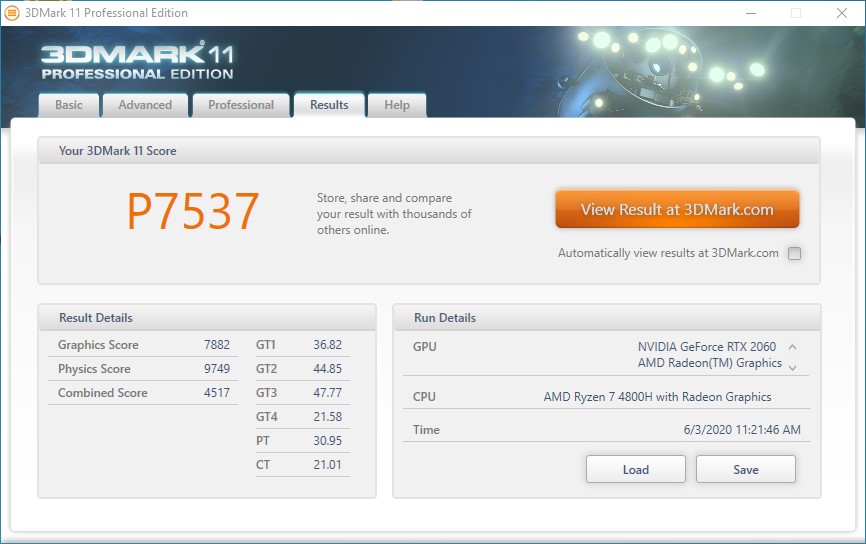
| 3DMark 11 Performance | 17390 points | |
| 3DMark Ice Storm Standard Score | 72466 points | |
| 3DMark Cloud Gate Standard Score | 34649 points | |
| 3DMark Fire Strike Score | 14757 points | |
| 3DMark Fire Strike Extreme Score | 7382 points | |
| 3DMark Time Spy Score | 6256 points | |
Help | ||
Gaming Performance
The Nvidia GeForce RTX 2060 combined with the AMD Ryzen 7 4800H reaches good frame rates. Even more-demanding modern games can be played smoothly at the native resolution with maximum details. Here, our test device has to compete with the MSI GL65 once more, although both devices tend to perform about the same as the resolution and quality settings increase.
Even under prolonged load the performance level does not drop. As the graph shows, the frame rates remain very consistent when running The Witcher 3 for one hour.
| low | med. | high | ultra | |
|---|---|---|---|---|
| BioShock Infinite (2013) | 232 | 209 | 189 | 119 |
| The Witcher 3 (2015) | 191 | 160 | 105 | 60.5 |
| Dota 2 Reborn (2015) | 103.8 | 94.7 | 85.4 | 81.3 |
| Rise of the Tomb Raider (2016) | 99.7 | 124 | 85.2 | |
| X-Plane 11.11 (2018) | 69.9 | 63.9 | 55.6 |
Emissions
System Noise
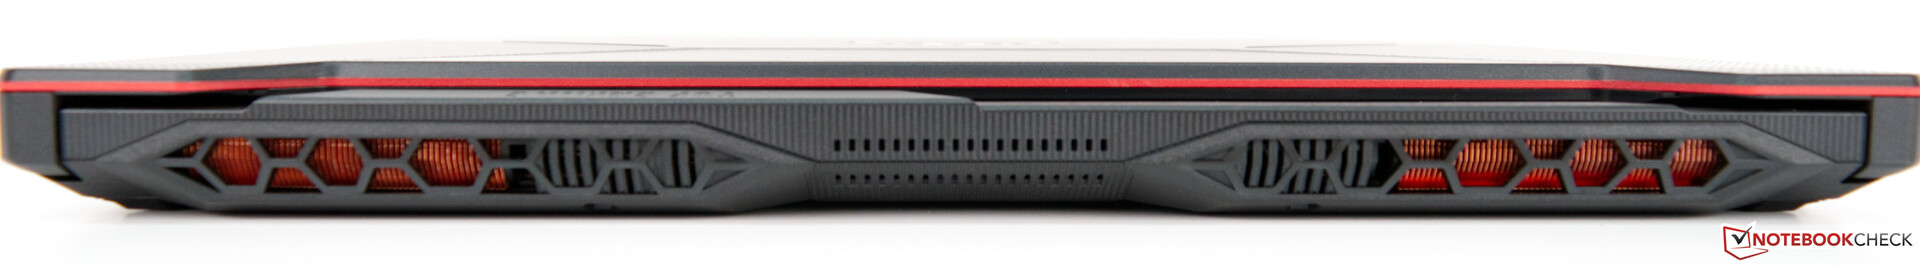
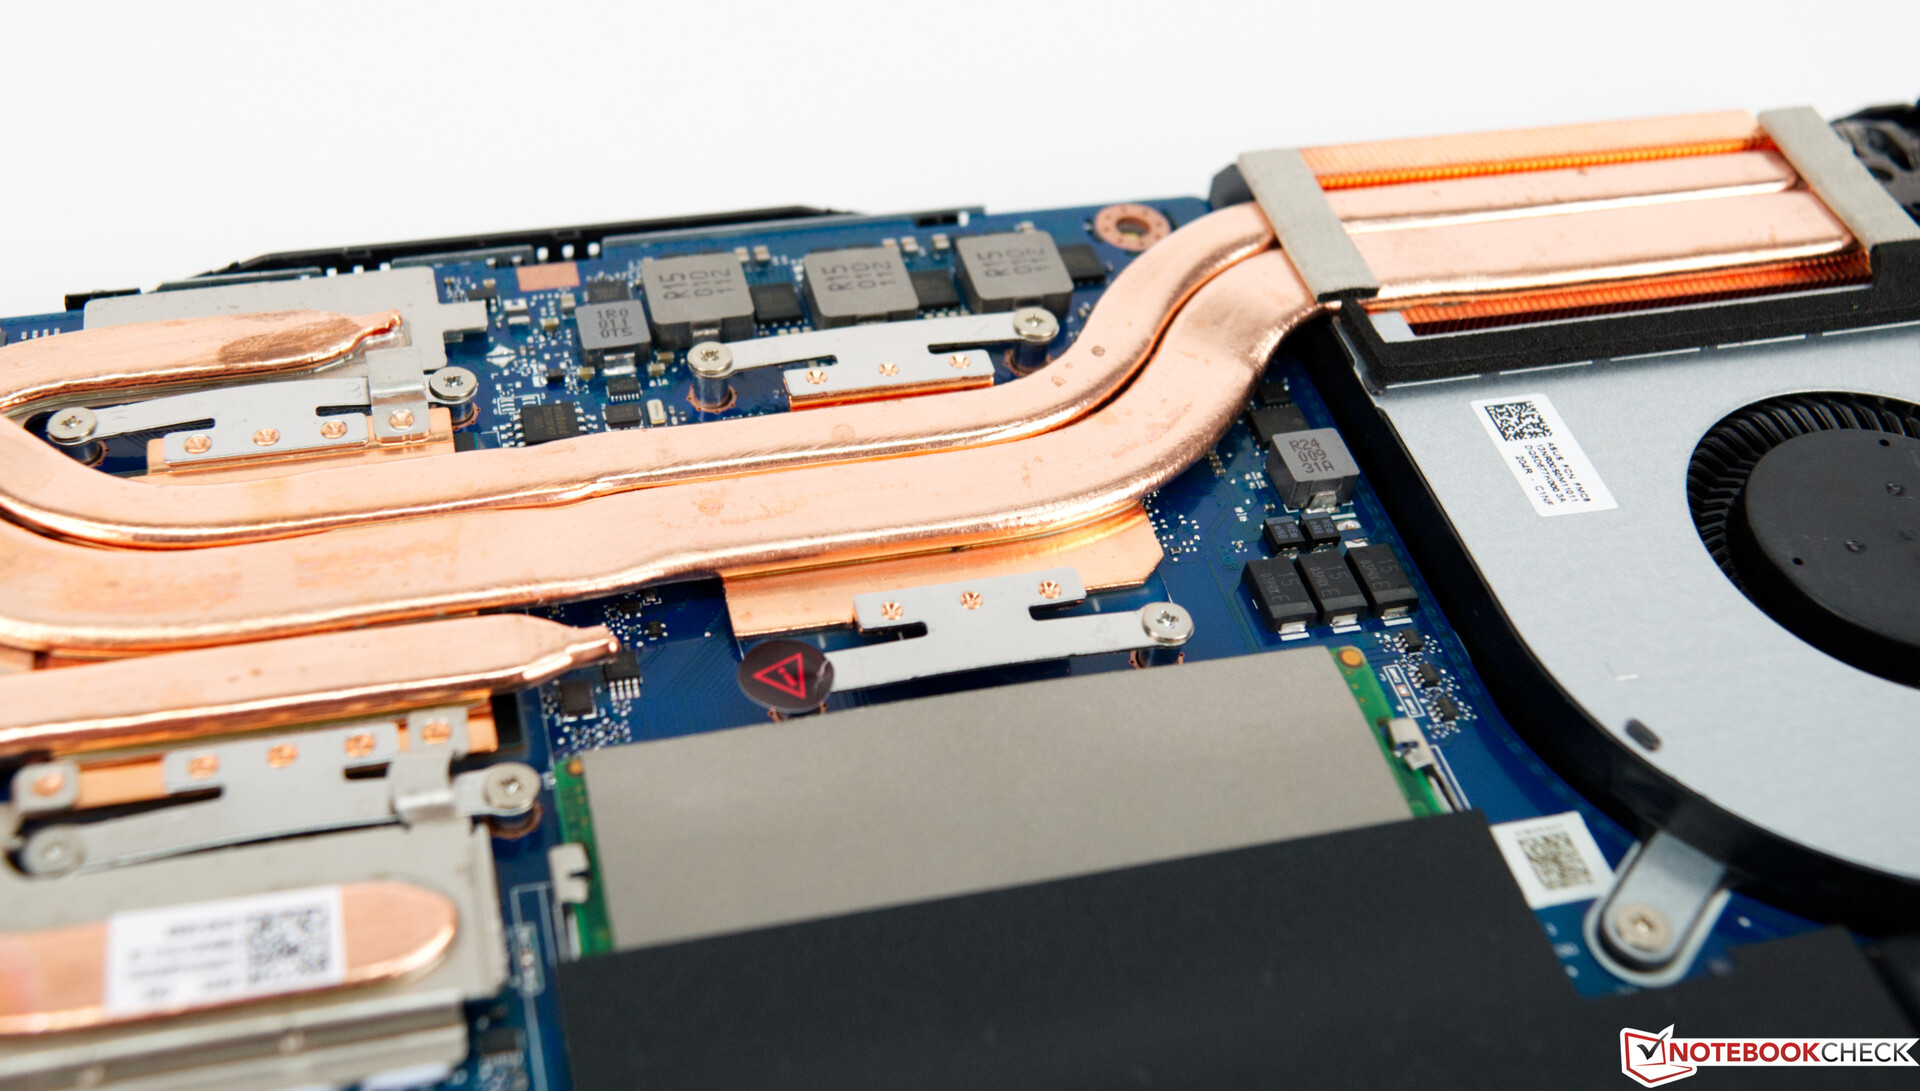
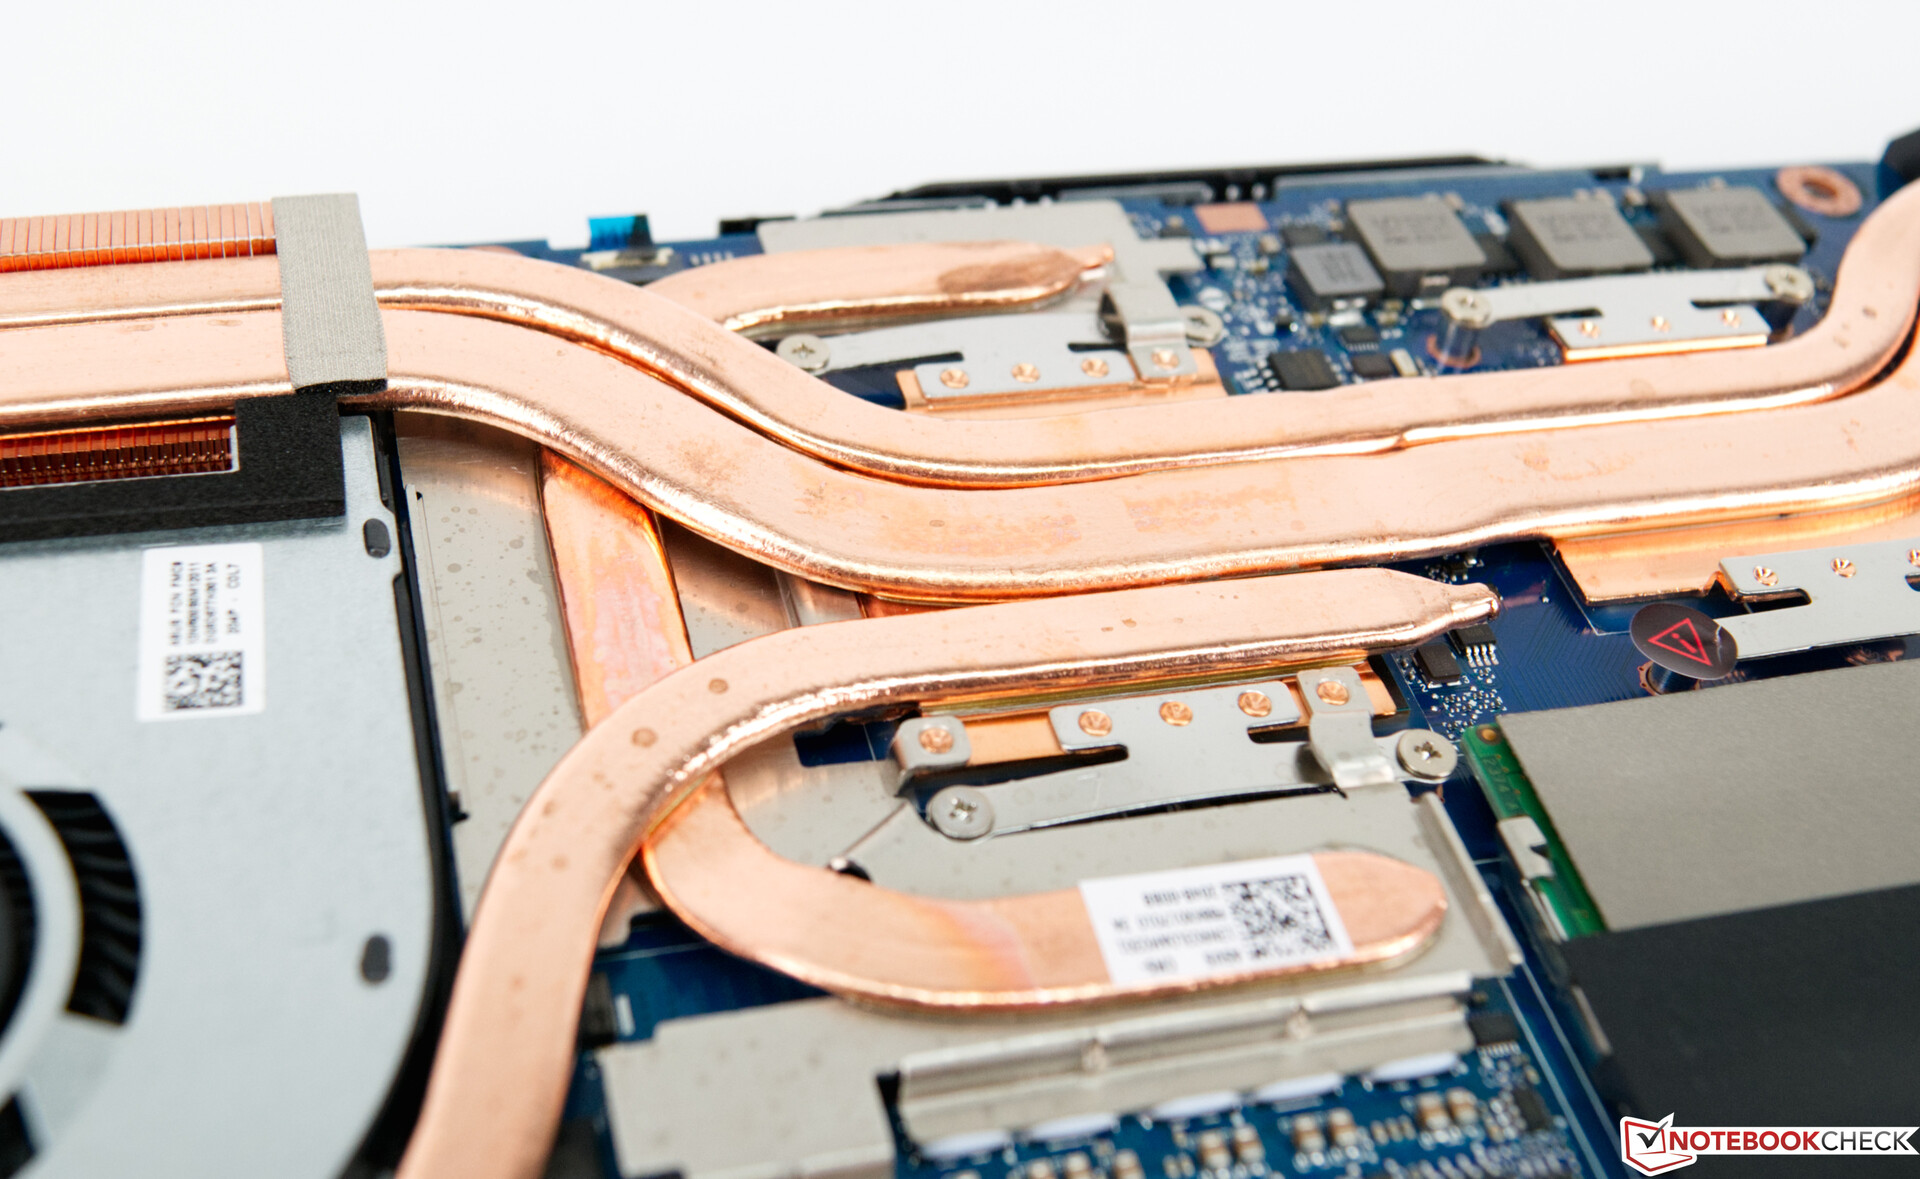
In terms of cooling, gaming laptops tend to be on the louder side due to their high-performance components. The Asus TUF A15 FA506, which is equipped with one large heatpipe cooler and two fans, continues this trend. However, the device is pleasantly quiet and often even completely silent at times when the fans do not spin at all.
Noise level
| Idle |
| 30.2 / 30.2 / 30.2 dB(A) |
| Load |
| 40 / 49 dB(A) |
 | ||
30 dB silent 40 dB(A) audible 50 dB(A) loud |
||
min: | ||
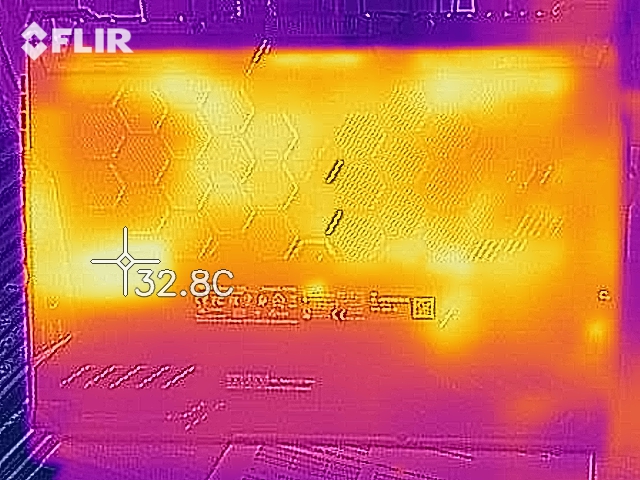
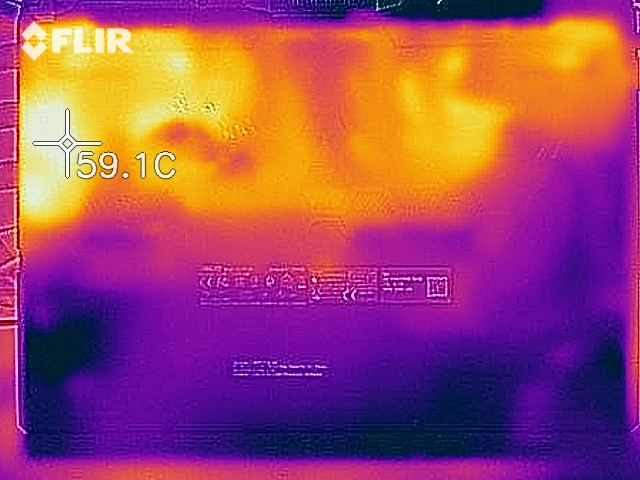
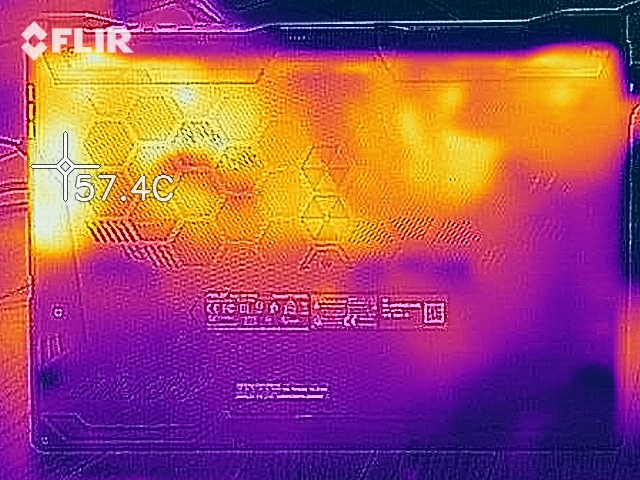
Temperature
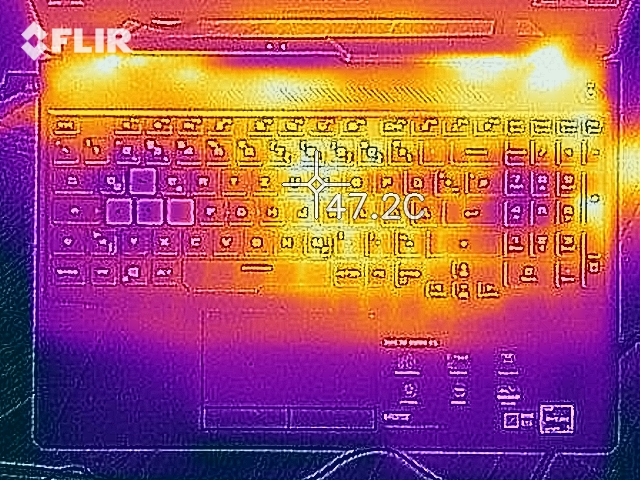
Generally, the surface temperatures of the Asus device do not leave much room for criticism. The high maximum temperature of 49.9 °C is the only real downside, although thankfully, it was recorded towards the back on the bottom of the laptop. While gaming, this value slightly increased to 50.4 °C, since the adjacent GPU adds to the heat development.
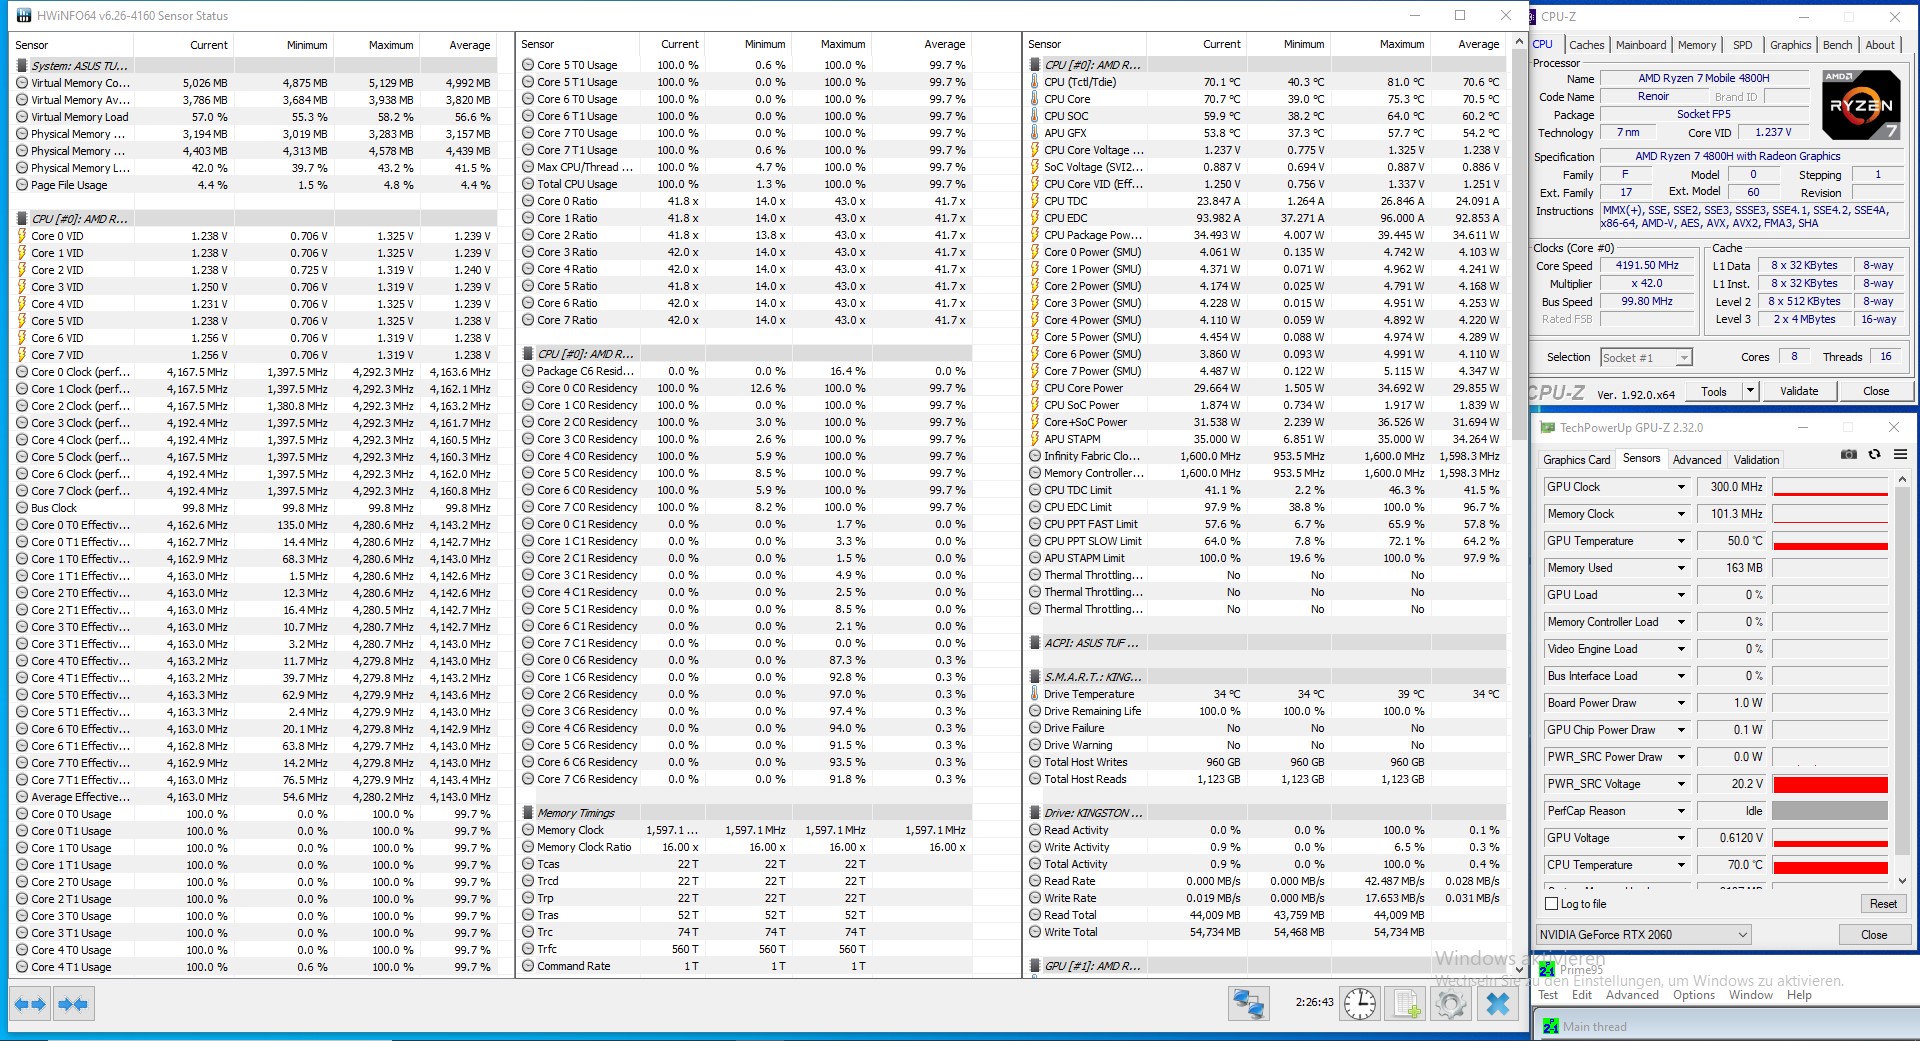
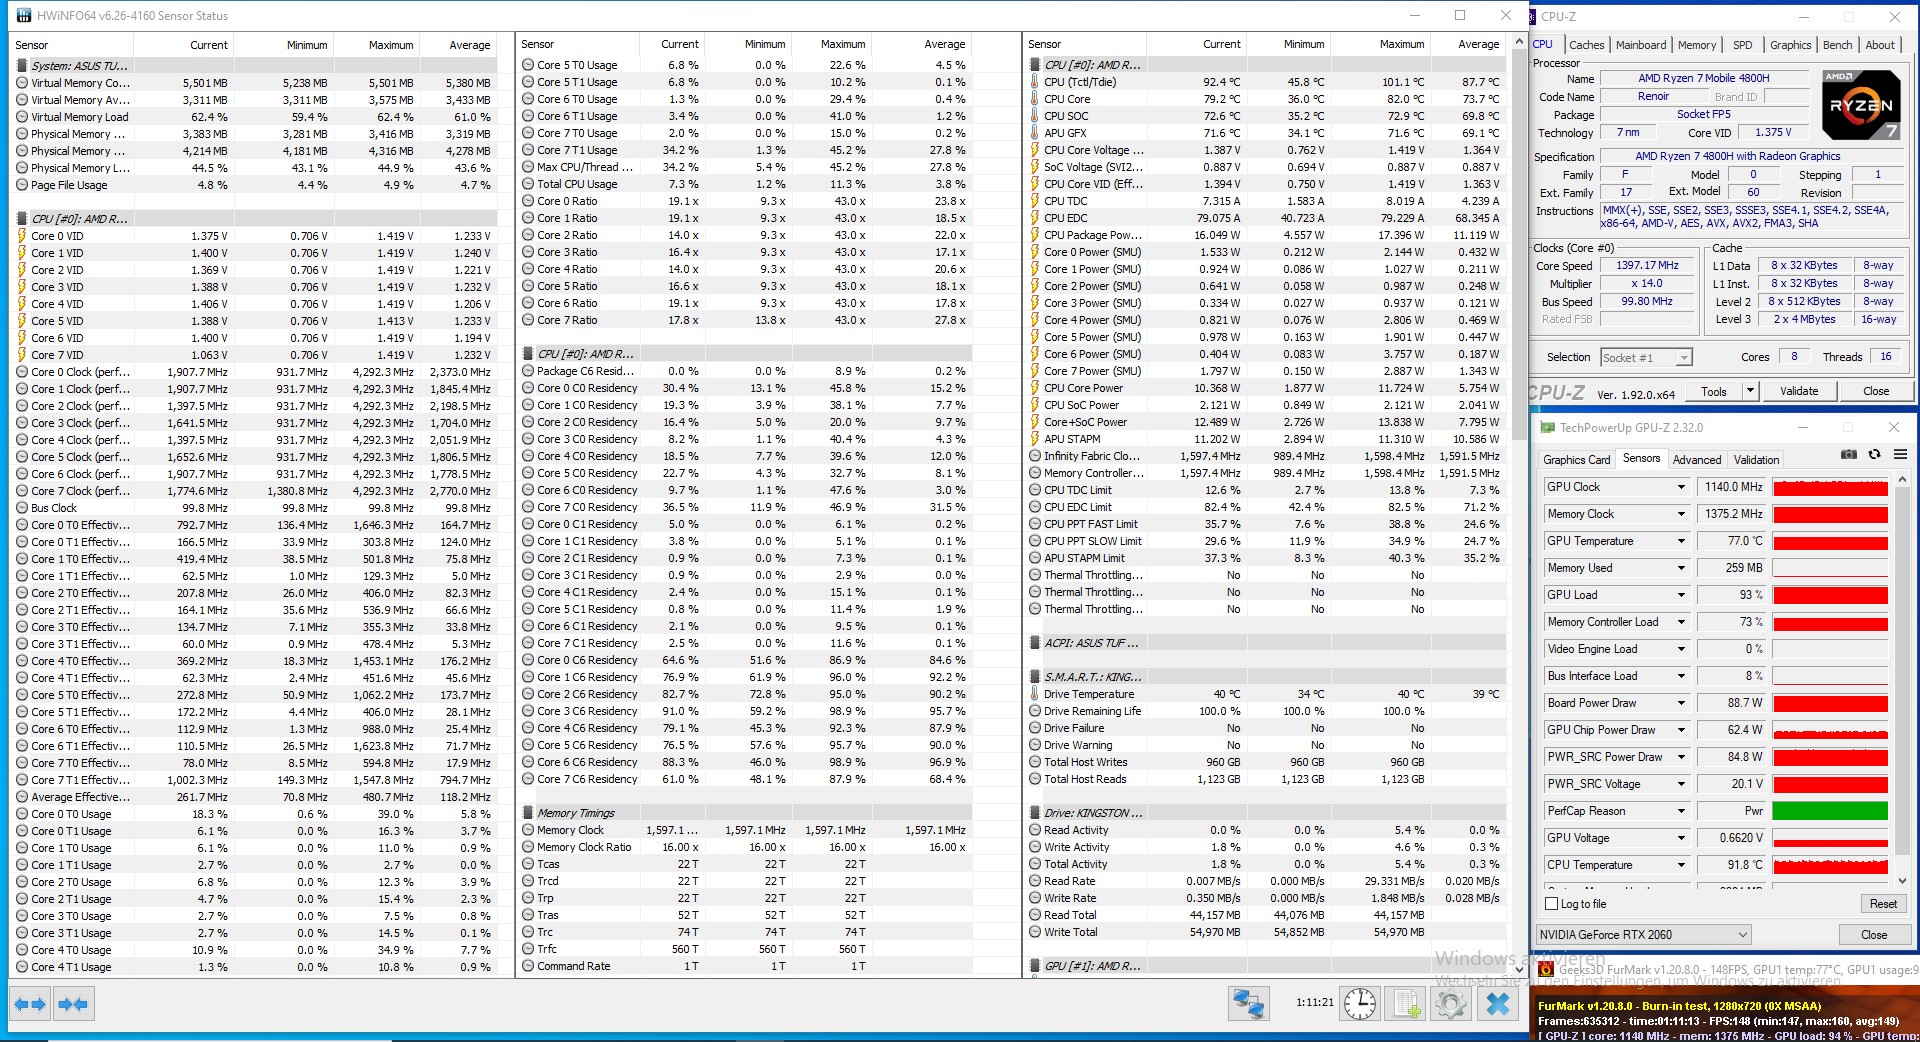
A closer look at the components during our stress test quickly shows that the capabilities of the cooling solution are fully exhausted in order to keep the CPU and GPU cool. During our CPU stress test with only Prime95, we recorded a peak core temperature of 81 °C. When stressing both the CPU and the GPU, the temperatures rise even further, since the CPU and GPU are connected via the same heatpipe. This results in temperature measurements of 94.5 °C for the Ryzen 7 4800H and up to 84 °C for the GeForce RTX 2060. The continuous stress scenario had no sustained impact on the 3D performance.
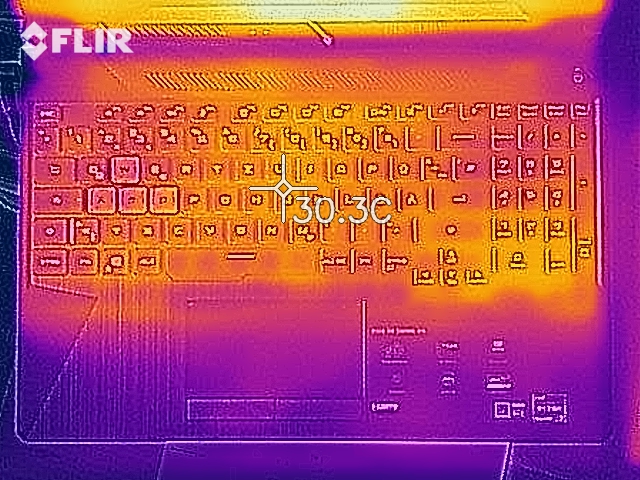
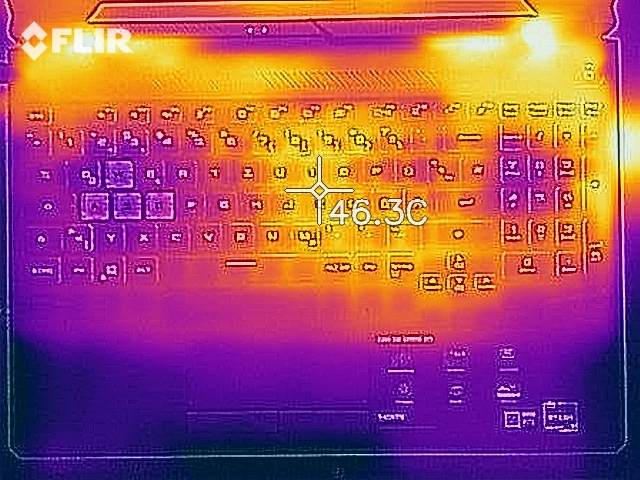
(±) The maximum temperature on the upper side is 42.9 °C / 109 F, compared to the average of 40.4 °C / 105 F, ranging from 21.2 to 68.8 °C for the class Gaming.
(-) The bottom heats up to a maximum of 49.9 °C / 122 F, compared to the average of 43.2 °C / 110 F
(+) In idle usage, the average temperature for the upper side is 26.4 °C / 80 F, compared to the device average of 33.9 °C / 93 F.
(±) Playing The Witcher 3, the average temperature for the upper side is 32.9 °C / 91 F, compared to the device average of 33.9 °C / 93 F.
(+) The palmrests and touchpad are cooler than skin temperature with a maximum of 26.9 °C / 80.4 F and are therefore cool to the touch.
(±) The average temperature of the palmrest area of similar devices was 28.8 °C / 83.8 F (+1.9 °C / 3.4 F).
Speakers
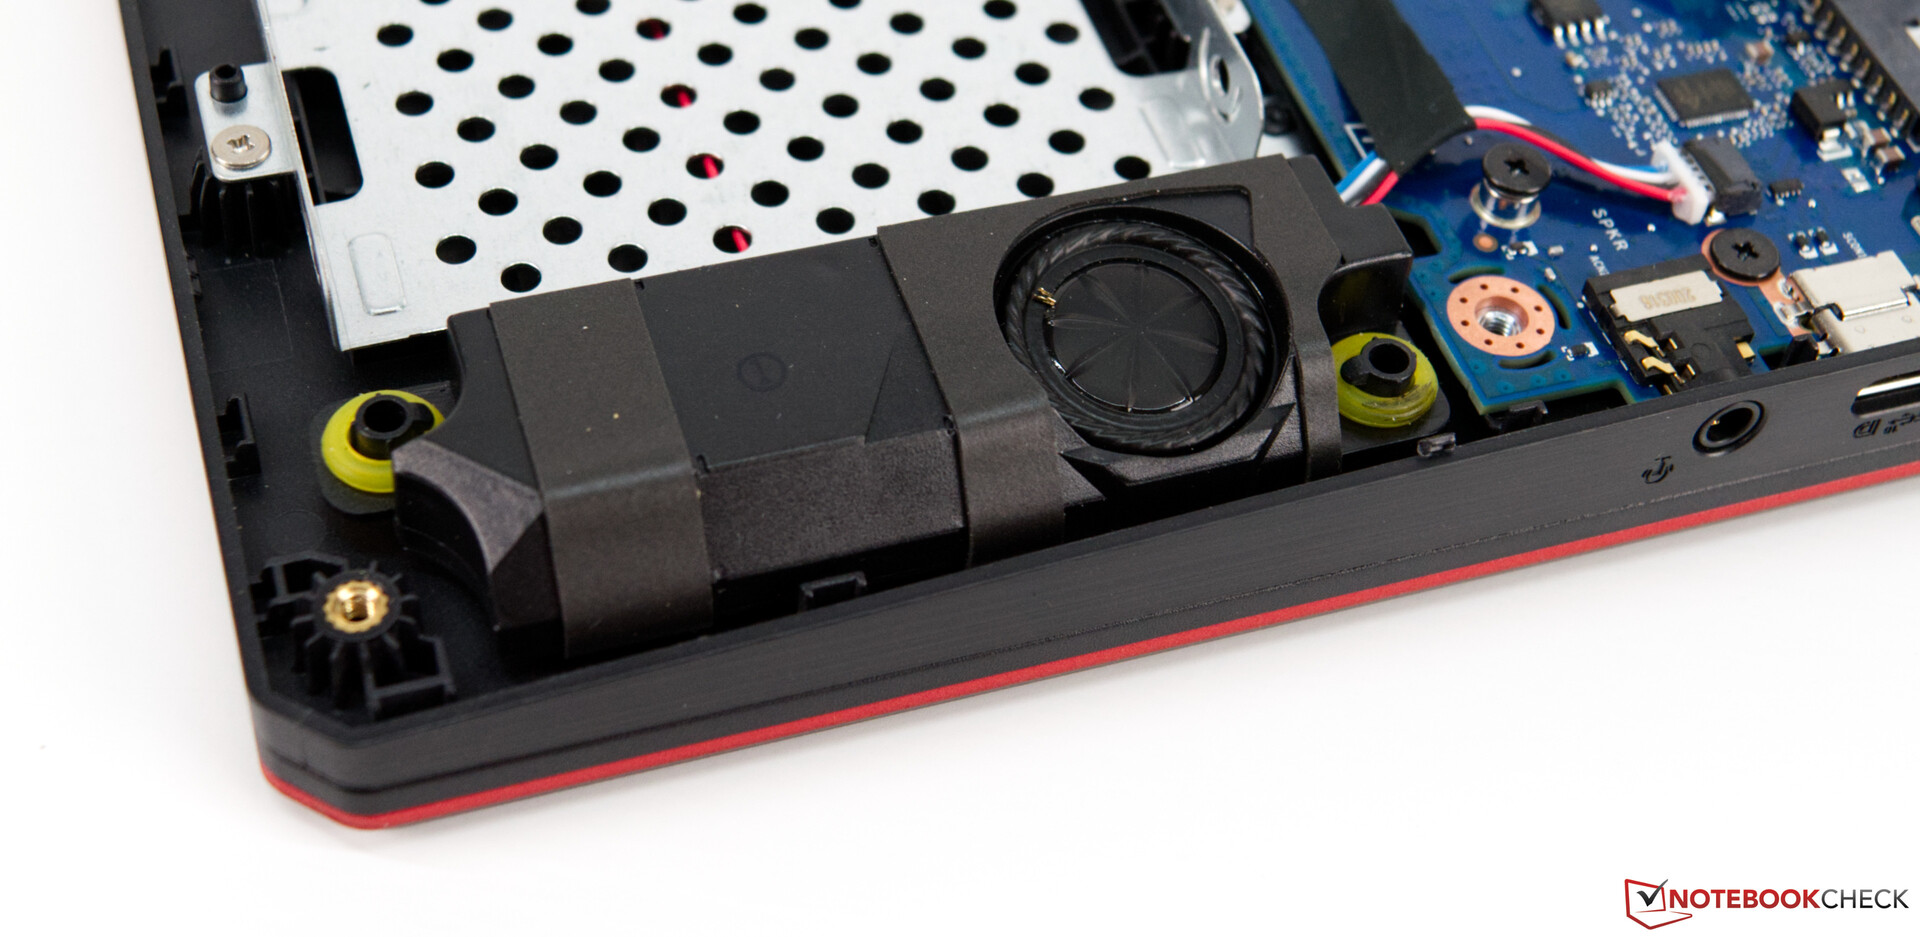
The audio system is comprised of two simple stereo speakers, which unfortunately lack a complementary subwoofer for lower frequencies. Thus, the sound stage is characterized mainly by the treble and mids, which is acceptable for a gaming laptop in this price segment. However, we recommend using a headset for a better audio experience. It can be connected to the laptop via 3.5 mm jack or USB.
Lenovo Legion Y540-15IRH-81SX00B2GE audio analysis
(±) | speaker loudness is average but good (77.4 dB)
Bass 100 - 315 Hz
(-) | nearly no bass - on average 17.7% lower than median
(±) | linearity of bass is average (11.6% delta to prev. frequency)
Mids 400 - 2000 Hz
(+) | balanced mids - only 3.7% away from median
(+) | mids are linear (4.5% delta to prev. frequency)
Highs 2 - 16 kHz
(+) | balanced highs - only 3.3% away from median
(+) | highs are linear (5.9% delta to prev. frequency)
Overall 100 - 16.000 Hz
(±) | linearity of overall sound is average (18.1% difference to median)
Compared to same class
» 57% of all tested devices in this class were better, 8% similar, 35% worse
» The best had a delta of 6%, average was 18%, worst was 132%
Compared to all devices tested
» 39% of all tested devices were better, 8% similar, 54% worse
» The best had a delta of 4%, average was 23%, worst was 134%
Energy Management
Energy Consumption
Our configuration of the Asus TUF A15 FA506 consumes only 5.4 to 10.5 watts while idling. During gaming use, this value increases to an average of 144 watts. This amount approximately matches that of the MSI GL65, which is also equipped with a GeForce RTX 2060. Our test device comes with a 230-watt AC adapter. It is sufficiently powerful enough for the battery not to be drained during our stress test.
| Off / Standby | |
| Idle | |
| Load |
|
Key:
min: | |
| Asus TUF Gaming A15 FA506IV-HN172 R7 4800H, GeForce RTX 2060 Mobile, Kingston OM8PCP3512F-AB, IPS, 1920x1080, 15.6" | Lenovo Legion Y540-15IRH-81SX00B2GE i7-9750H, GeForce GTX 1660 Ti Mobile, WDC PC SN720 SDAPNTW-512G, IPS, 1920x1080, 15.6" | MSI Alpha 15 A3DDK-034 R7 3750H, Radeon RX 5500M, Kingston RBUSNS8154P3512GJ, IPS, 1920x1080, 15.6" | MSI GL65 9SEK i7-9750H, GeForce RTX 2060 Mobile, WDC PC SN520 SDAPNUW-512G, IPS, 1920x1080, 15.6" | HP Omen 15-dc1020ng i5-9300H, GeForce GTX 1650 Mobile, WDC PC SN720 SDAQNTW-512G, IPS, 1920x1080, 15.6" | Asus ROG Zephyrus G15 GA502DU R7 3750H, GeForce GTX 1660 Ti Max-Q, Intel SSD 660p SSDPEKNW512G8, IPS, 1920x1080, 15.6" | Average NVIDIA GeForce RTX 2060 Mobile | Average of class Gaming | |
|---|---|---|---|---|---|---|---|---|
| Power Consumption | -56% | -68% | -230% | 20% | -36% | -64% | -83% | |
| Idle Minimum * (Watt) | 5.4 | 14.5 -169% | 14 -159% | 41 -659% | 4.04 25% | 7.4 -37% | 11.5 ? -113% | 13 ? -141% |
| Idle Average * (Watt) | 10 | 18.5 -85% | 18 -80% | 45.3 -353% | 7.2 28% | 8.6 14% | 16.5 ? -65% | 18.7 ? -87% |
| Idle Maximum * (Watt) | 10.5 | 20 -90% | 32 -205% | 47.1 -349% | 11.4 -9% | 39.1 -272% | 23.7 ? -126% | 24.3 ? -131% |
| Load Average * (Watt) | 135 | 81.6 40% | 64 53% | 94.9 30% | 80.8 40% | 65.9 51% | 107.5 ? 20% | 110.2 ? 18% |
| Witcher 3 ultra * (Watt) | 144 | 132 8% | 123 15% | 149.4 -4% | 93.6 35% | 106.9 26% | ||
| Load Maximum * (Watt) | 147 | 208.1 -42% | 193 -31% | 214.2 -46% | 144.5 2% | 141.3 4% | 199.7 ? -36% | 258 ? -76% |
* ... smaller is better
Battery Life

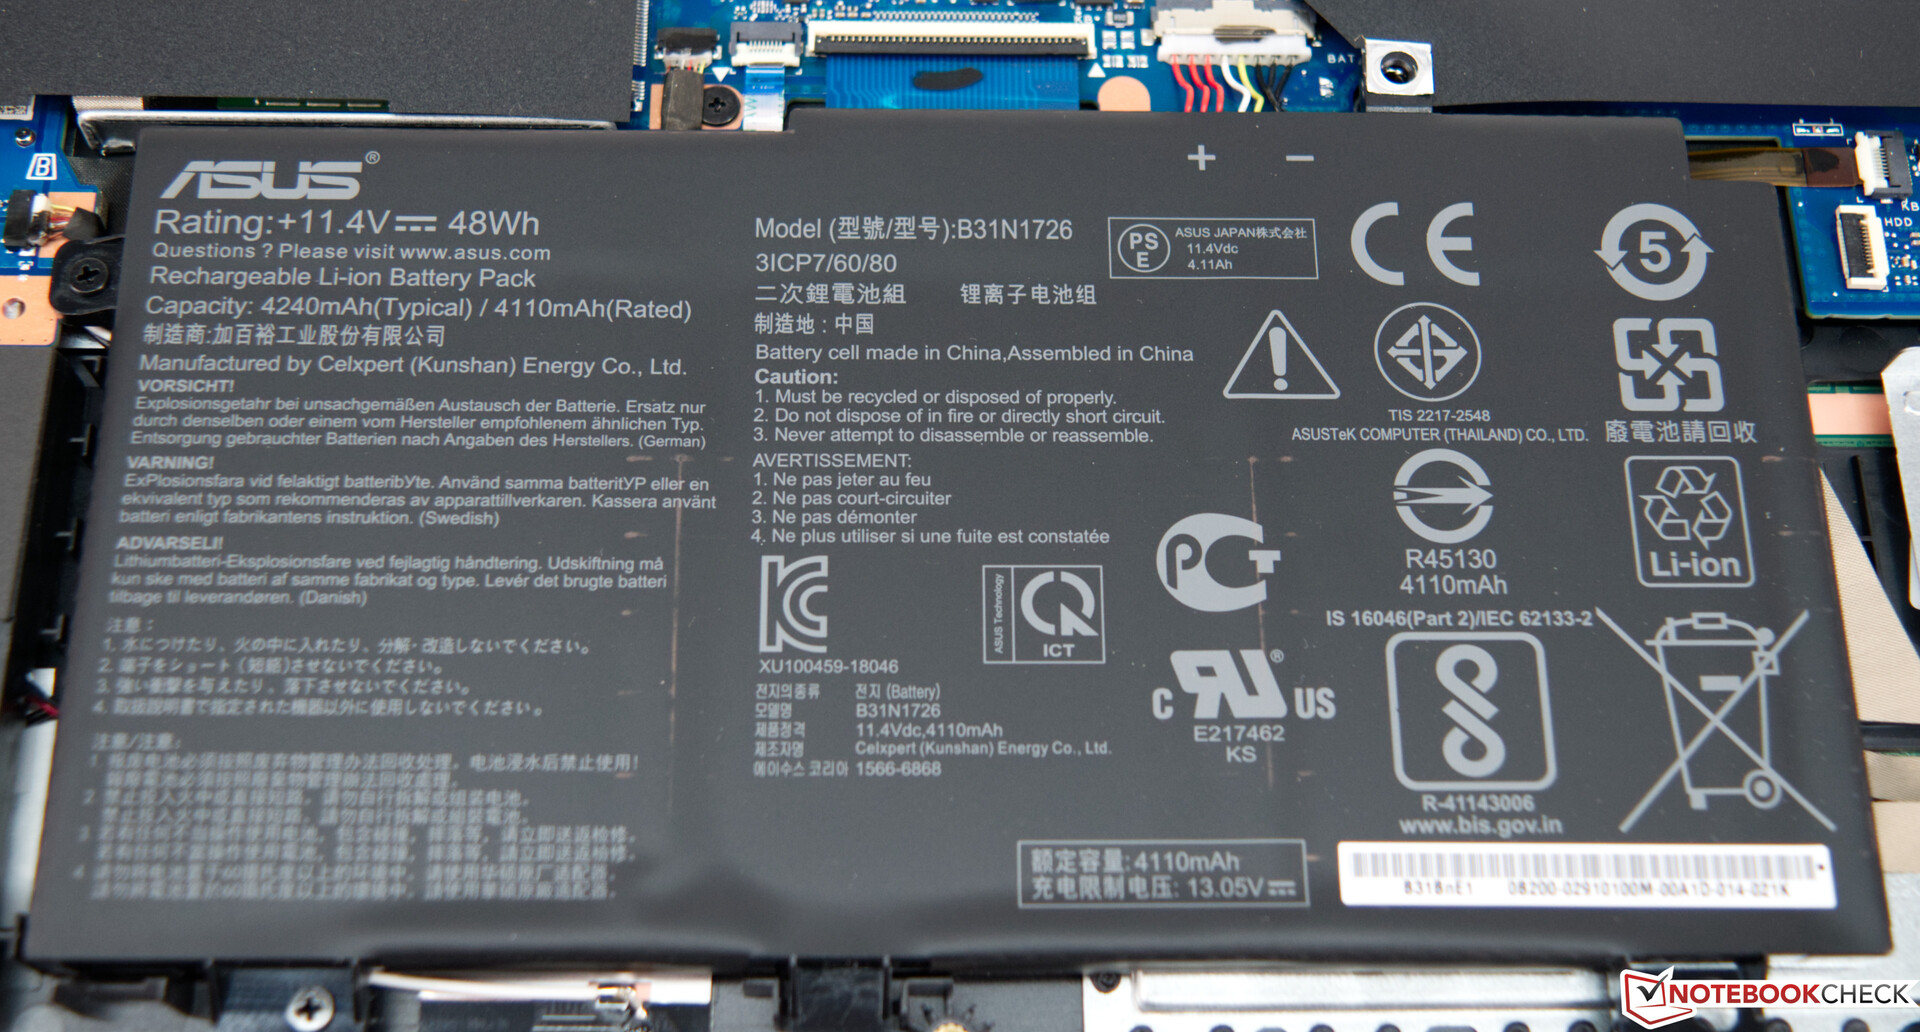
The 48Wh battery is able to power the Asus TUF A15 FA506 for just above six hours in our real-world Wi-Fi test before the laptop has to be recharged. For this test, we reduced the display's brightness by three steps, which results in a brightness of 150 cd/m². At full brightness, the runtime decreases by 40 minutes in the same test. In spite of the small battery, the runtimes are relatively good for a gaming laptop.
In this category, competitors fall short or they owe their longer battery life to their larger batteries. Users can expect to fully charge the battery within two hours.
As mentioned before, we want to point out once more that the CPU and GPU performance is significantly reduced in battery mode.
| Asus TUF Gaming A15 FA506IV-HN172 R7 4800H, GeForce RTX 2060 Mobile, 48 Wh | Lenovo Legion Y540-15IRH-81SX00B2GE i7-9750H, GeForce GTX 1660 Ti Mobile, 57 Wh | MSI Alpha 15 A3DDK-034 R7 3750H, Radeon RX 5500M, 51 Wh | MSI GL65 9SEK i7-9750H, GeForce RTX 2060 Mobile, 51 Wh | HP Omen 15-dc1020ng i5-9300H, GeForce GTX 1650 Mobile, 52.5 Wh | Asus ROG Zephyrus G15 GA502DU R7 3750H, GeForce GTX 1660 Ti Max-Q, 76 Wh | Average of class Gaming | |
|---|---|---|---|---|---|---|---|
| Battery runtime | -51% | -40% | -47% | 19% | 32% | 8% | |
| Reader / Idle (h) | 9.8 | 4 -59% | 5.8 -41% | 4.4 -55% | 15.9 62% | 15.3 56% | 8.16 ? -17% |
| H.264 (h) | 5.4 | 3.9 -28% | 8 48% | 8.32 ? 54% | |||
| WiFi v1.3 (h) | 6.2 | 2.4 -61% | 4.1 -34% | 3.8 -39% | 6.4 3% | 8 29% | 7.11 ? 15% |
| Load (h) | 1.9 | 1.3 -32% | 0.8 -58% | 1 -47% | 1.2 -37% | 2.1 11% | 1.502 ? -21% |
| Witcher 3 ultra (h) | 1 |


Pros
Cons
Verdict - Competitive Price and Solid Performance
The Asus TUF A15 FA506 is a gaming laptop with great hardware for a fair price. The device can be purchased from various online retailers for below 1300 Euros (~$1470), and it comes with the brand-new AMD Ryzen 7 4800H CPU, which outperforms its Intel counterpart thanks to its eight cores. The former is a solid gaming CPU and suitable as a foundation for a gaming machine, which runs even very demanding games at maximum details when paired with the Nvidia GeForce RTX 2060.
Speaking of visuals, the installed display offers a great contrast ratio and a fast 144-Hz refresh rate. Furthermore, there is no PWM and thus, no additional eyestrain during prolonged use. That being said, we were disappointed with the small color gamut. Meanwhile, the case is decent, although its feel did not entirely convince us due to the full plastic construction. By contrast, we have no complaints at all when it comes to raw performance, which can be partially attributed to the AMD SoC. Similar devices in this price class tend to be limited to 6-core processors. It is hard to complain about two additional cores for the same price.
With good performance and a competitive price, the Asus TUF A15 FA506 is definitely worth considering if you are looking for an inexpensive gaming laptop.
Furthermore, the battery life is surprisingly good, which cannot be taken for granted, particularly on a gaming device. If you are interested in this system, RAM and storage upgrade options are worth taking a look at. Unfortunately, our model is only equipped with the bare minimum memory configuration for a gaming laptop. That being said, 8 GB of RAM and 512 GB of SSD storage are still sufficient for many tasks and applications.
Asus TUF Gaming A15 FA506IV-HN172
- 06/09/2020 v7 (old)
Sebastian Bade
Price comparison

