Asus ROG Strix G15 G512LI Laptop Review: $1000 USD for GeForce GTX 1650 Ti Graphics is Too Much
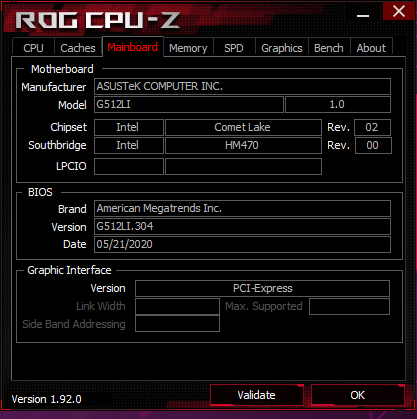
Asus has been be adding G14, G15, and G17 suffixes to many of its gaming laptops this year so buyers can more easily identify the 14-inch, 15.6-inch, and 17.3-inch screen sizes, respectively. The new ROG Strix G15 G512 series is essentially the more inexpensive version of the ROG Strix GL531/G531 series available since 2019.
SKUs range from the Core i5-10300H CPU with GeForce GTX 1650 Ti graphics and a 144 Hz 1080p display up to the Core i7-10875H with RTX 2070 Super graphics and a 240 Hz 1080p display. Our unit in review is a lower-end configuration with the Core i7-10750H, GTX 1650 Ti, and 144 Hz panel for approximately $1000 to $1100 USD retail. The official specifications for the 15.6-inch G512 series and 17.3-inch G712 series can be found here.
Competitors are plentiful as the 15.6-inch budget-midrange segment is filled with options like the Gigabyte Aorus 15G, MSI GP65 or GF65, HP Pavilion Gaming 15, Lenovo Legion Y540-15, and the Dell G5 15 series.
More Asus reviews:
Rating | Date | Model | Weight | Height | Size | Resolution | Price |
|---|---|---|---|---|---|---|---|
| 80.8 % v7 (old) | 07 / 2020 | Asus ROG Strix G15 G512LI i7-10750H, GeForce GTX 1650 Ti Mobile | 2.3 kg | 25.8 mm | 15.60" | 1920x1080 | |
| 82.7 % v7 (old) | 06 / 2020 | Asus TUF Gaming A15 FA506IV-HN172 R7 4800H, GeForce RTX 2060 Mobile | 2.2 kg | 24.9 mm | 15.60" | 1920x1080 | |
| 82.1 % v7 (old) | 10 / 2019 | Asus Strix Scar III G531GW-AZ062T i7-9750H, GeForce RTX 2070 Mobile | 2.4 kg | 25 mm | 15.60" | 1920x1080 | |
| 83.2 % v7 (old) | 05 / 2020 | MSI GP65 10SFK-047US i7-10750H, GeForce RTX 2070 Mobile | 2.3 kg | 27.5 mm | 15.60" | 1920x1080 | |
| 83.7 % v7 (old) | 06 / 2020 | Dell G5 15 SE 5505 P89F R7 4800H, Radeon RX 5600M | 2.4 kg | 21.6 mm | 15.60" | 1920x1080 | |
| 81.5 % v7 (old) | 07 / 2019 | HP Omen 15-dc1020ng i5-9300H, GeForce GTX 1650 Mobile | 2.3 kg | 25 mm | 15.60" | 1920x1080 |
Case
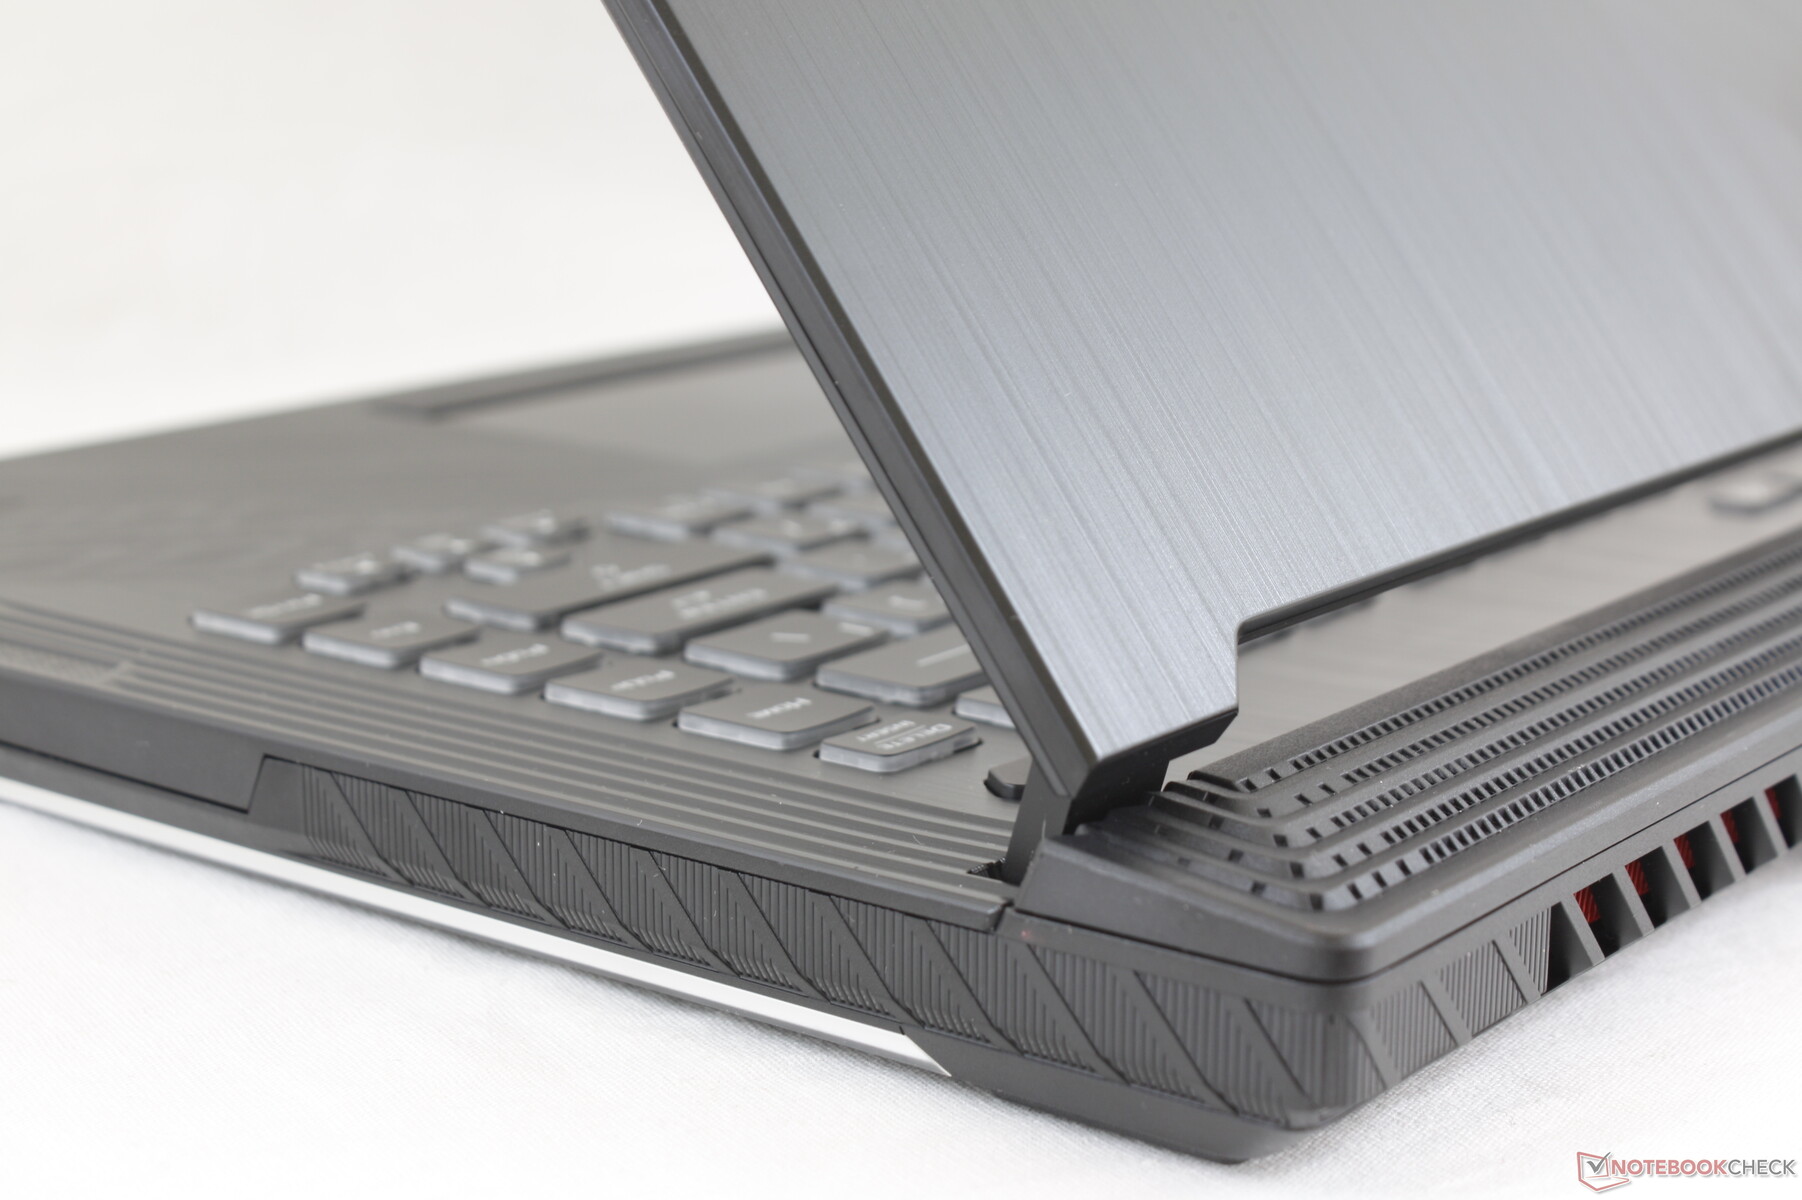
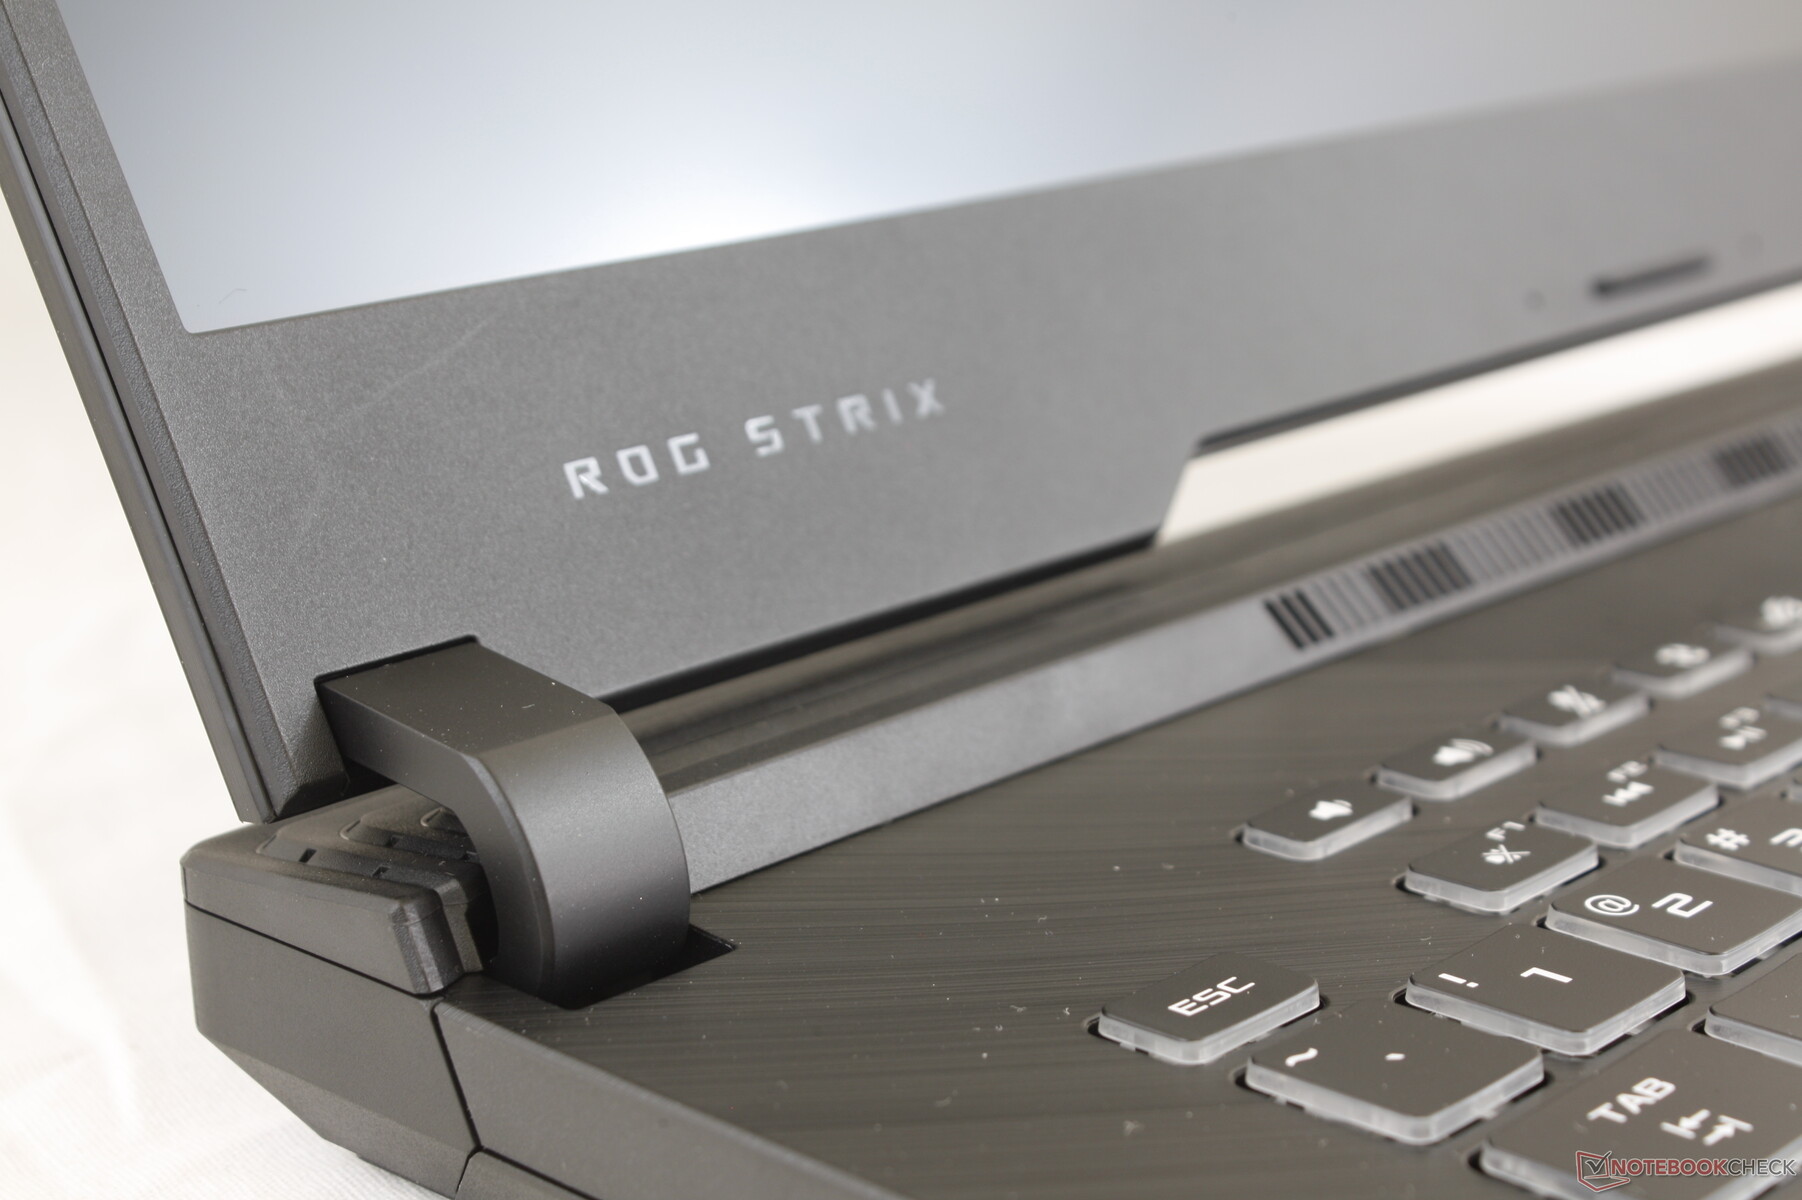
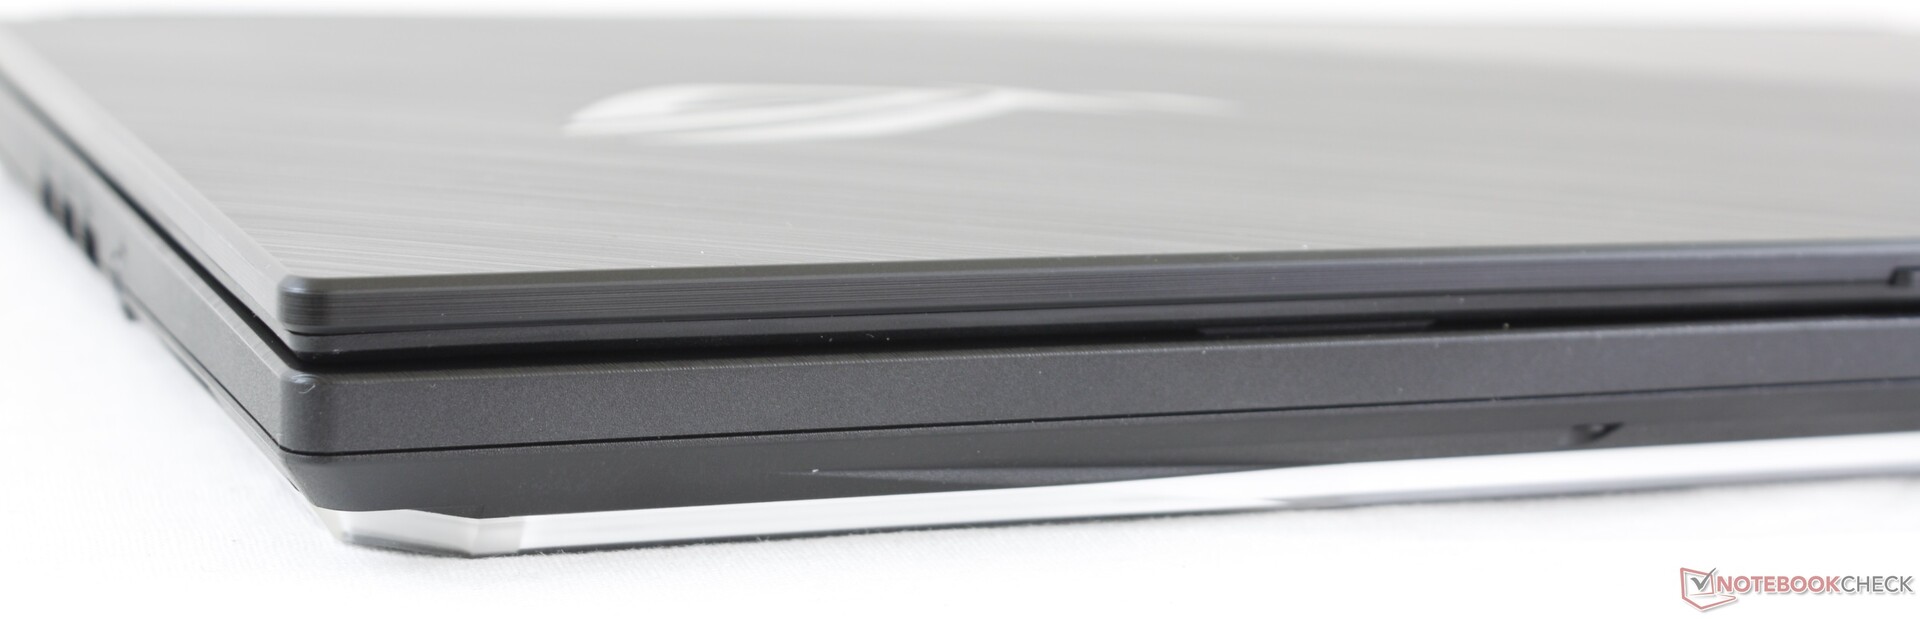
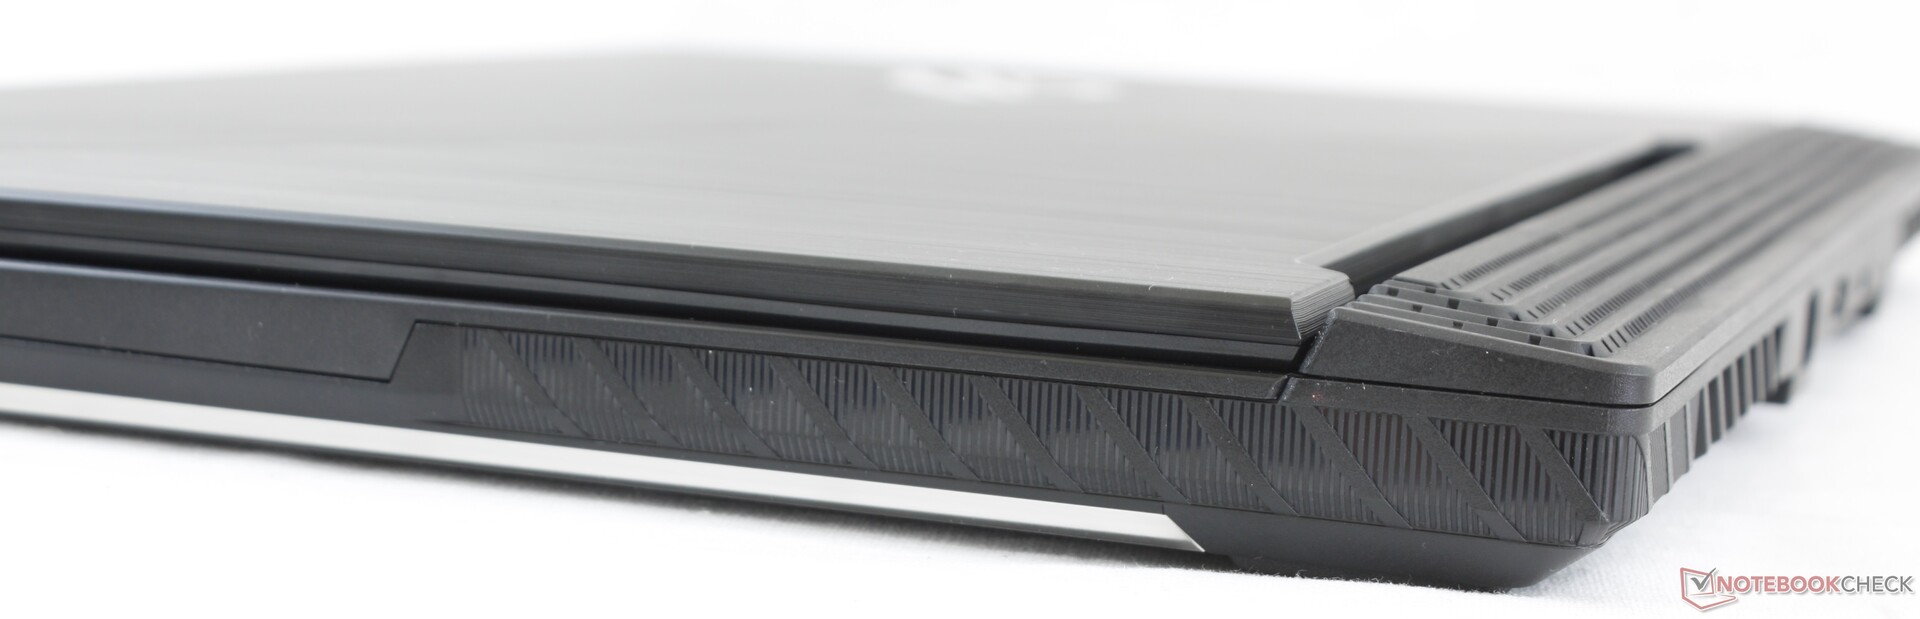
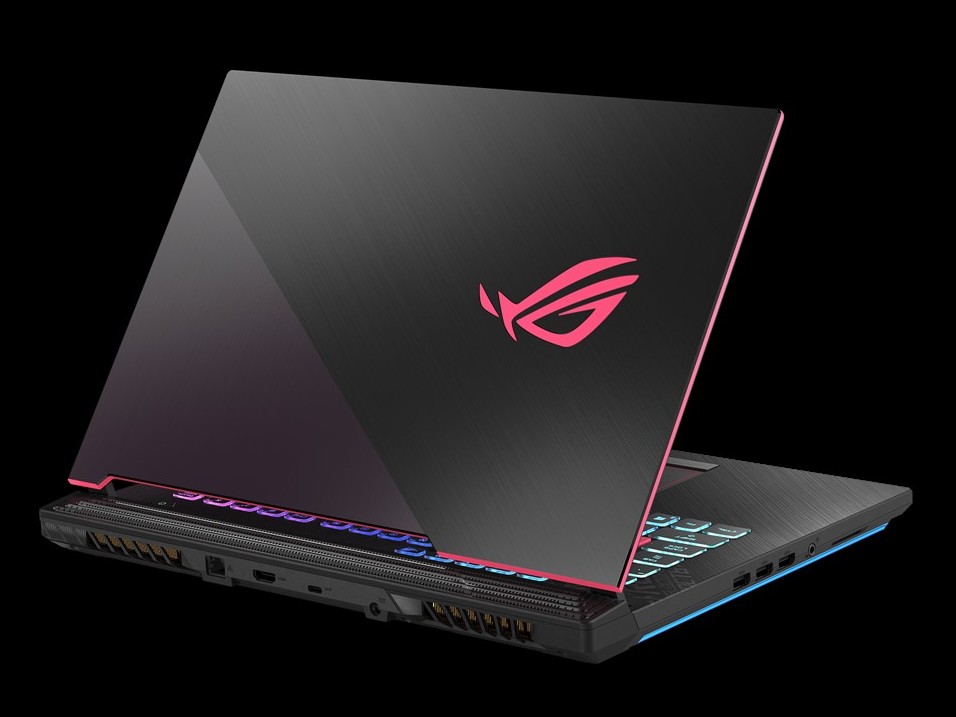
Take the ROG G531, replace its metal materials with plastic, and you'll have yourself the ROG G15 G512. The G512 looks and feels cheaper to the touch when compared to the G531 even though it carries almost the exact same visual design. Chassis rigidity, however, doesn't seem all that much worse than the G531. The base remains relatively strong while the lid is still more flexible than we would like.
Asus Keystone is not compatible with this machine as Asus is adamant about this lesser-known feature appearing on higher-end ROG laptops only.
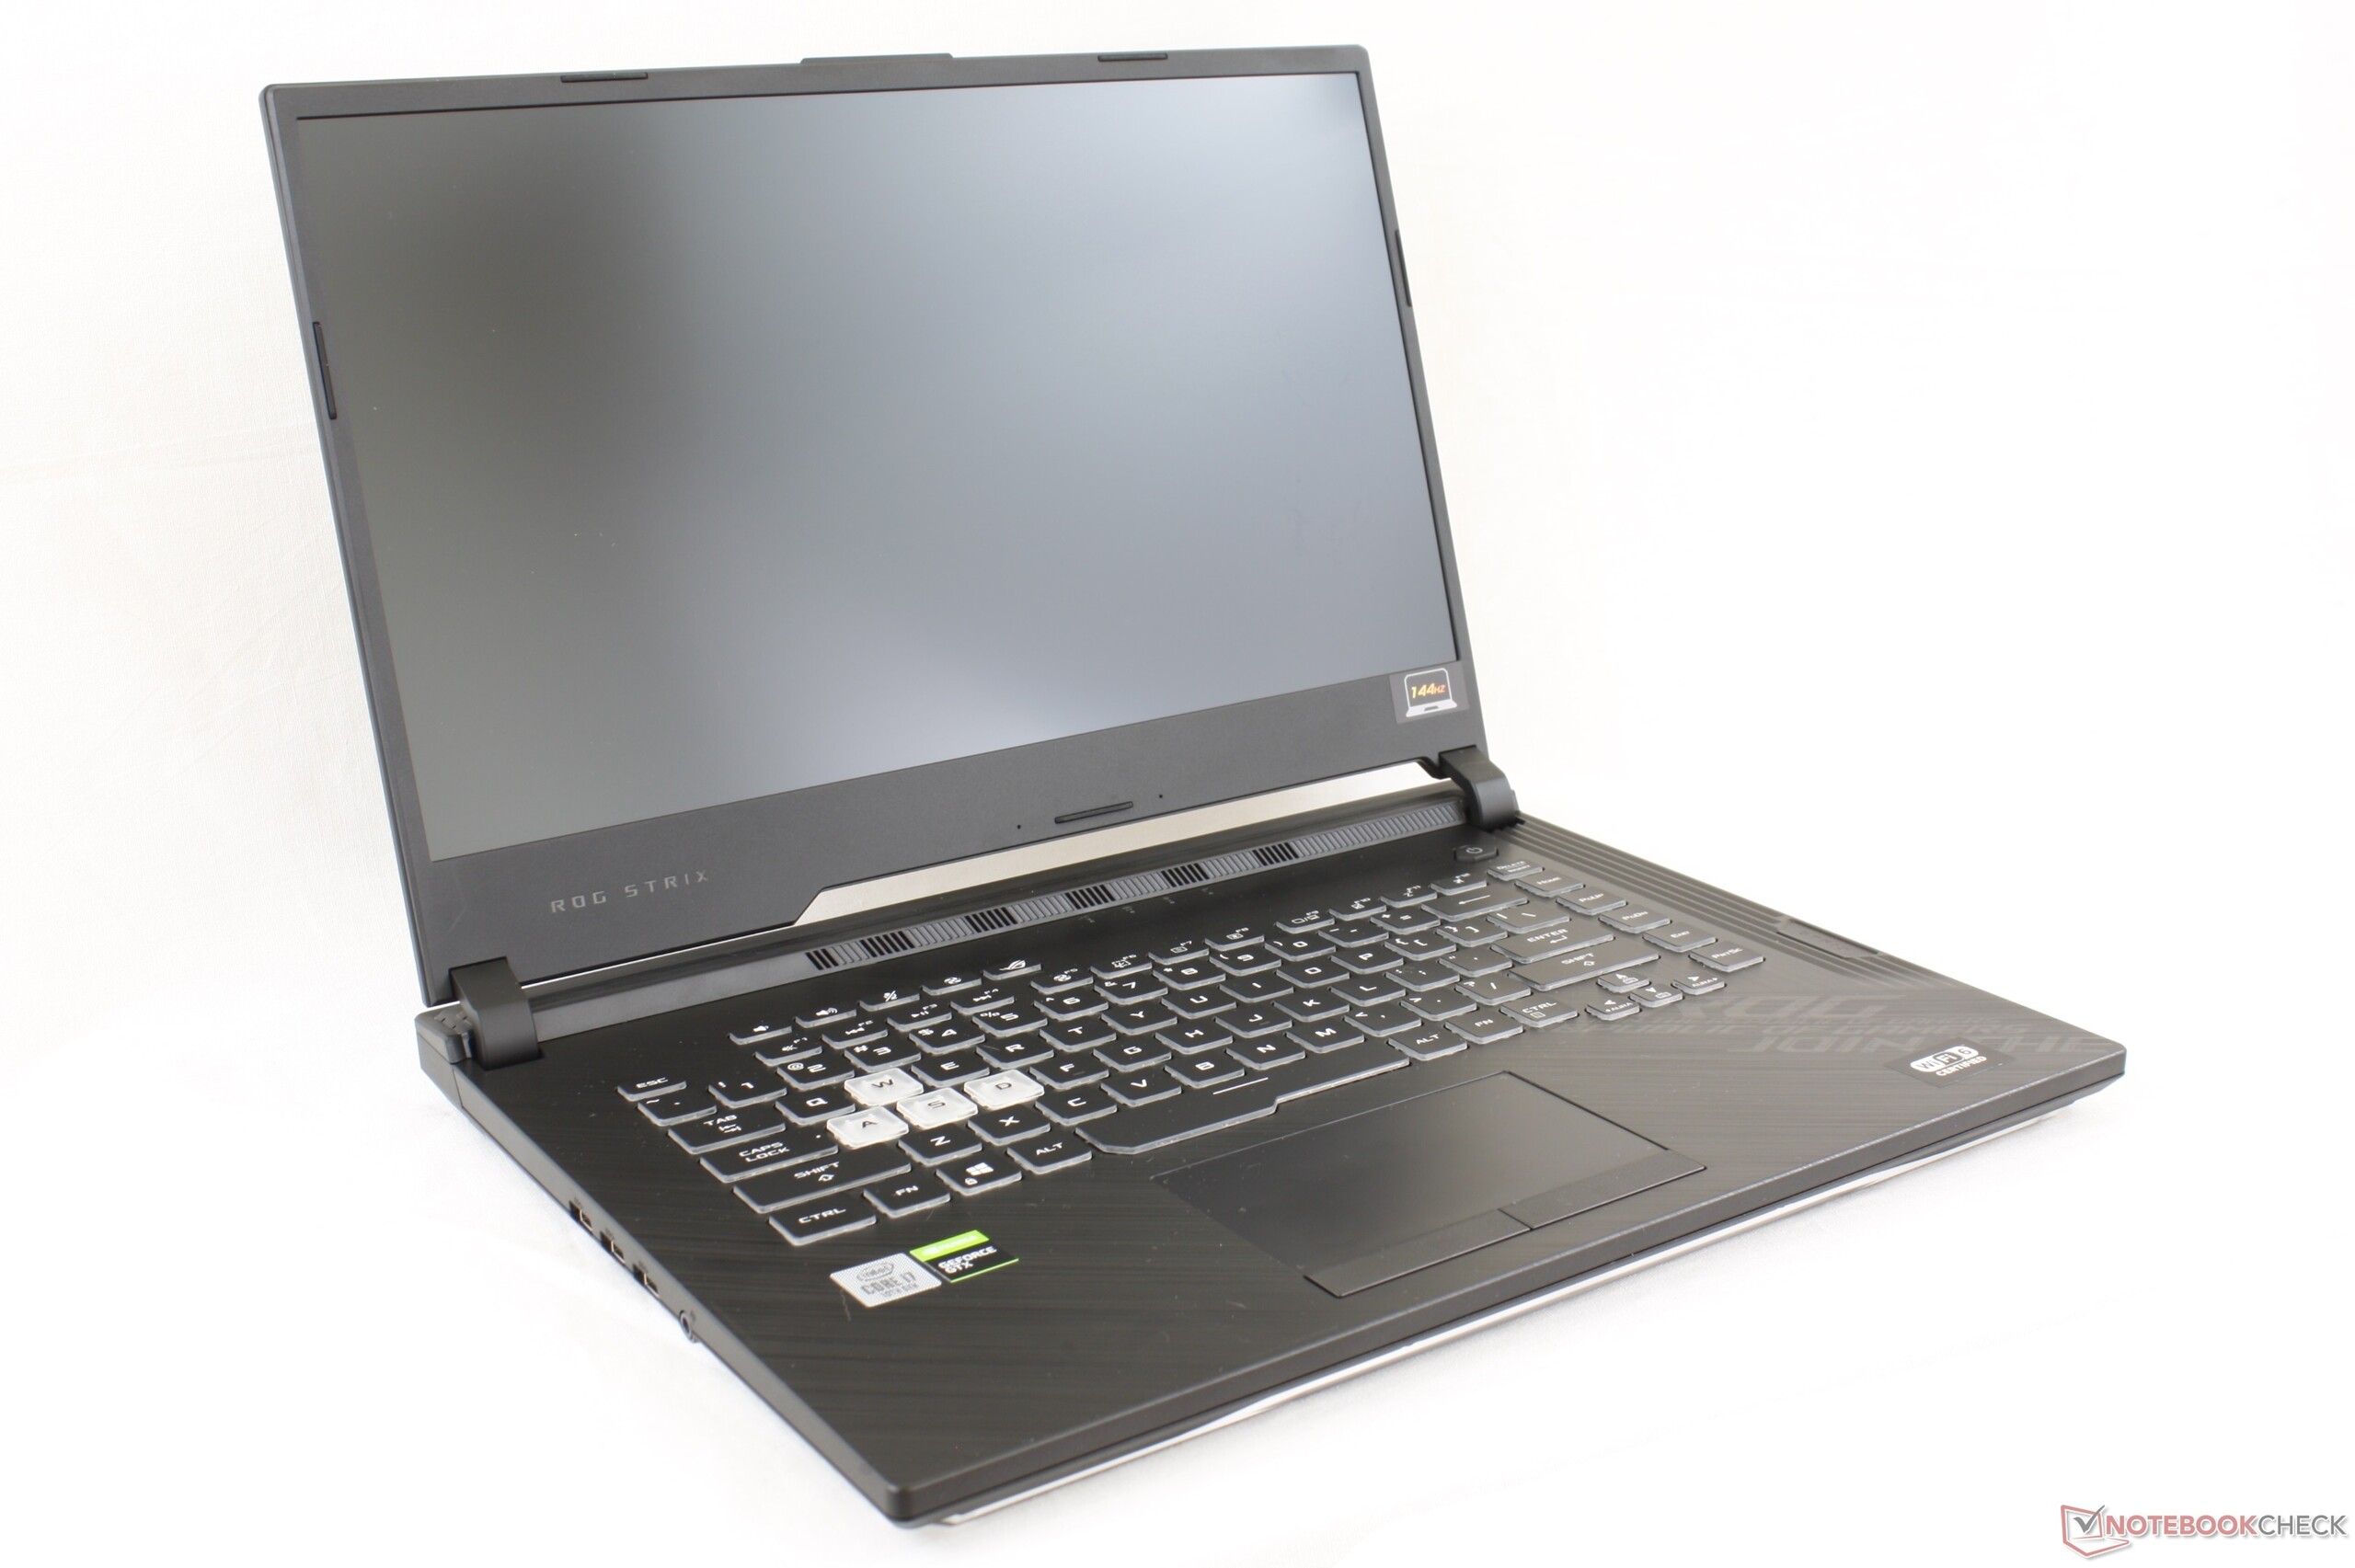
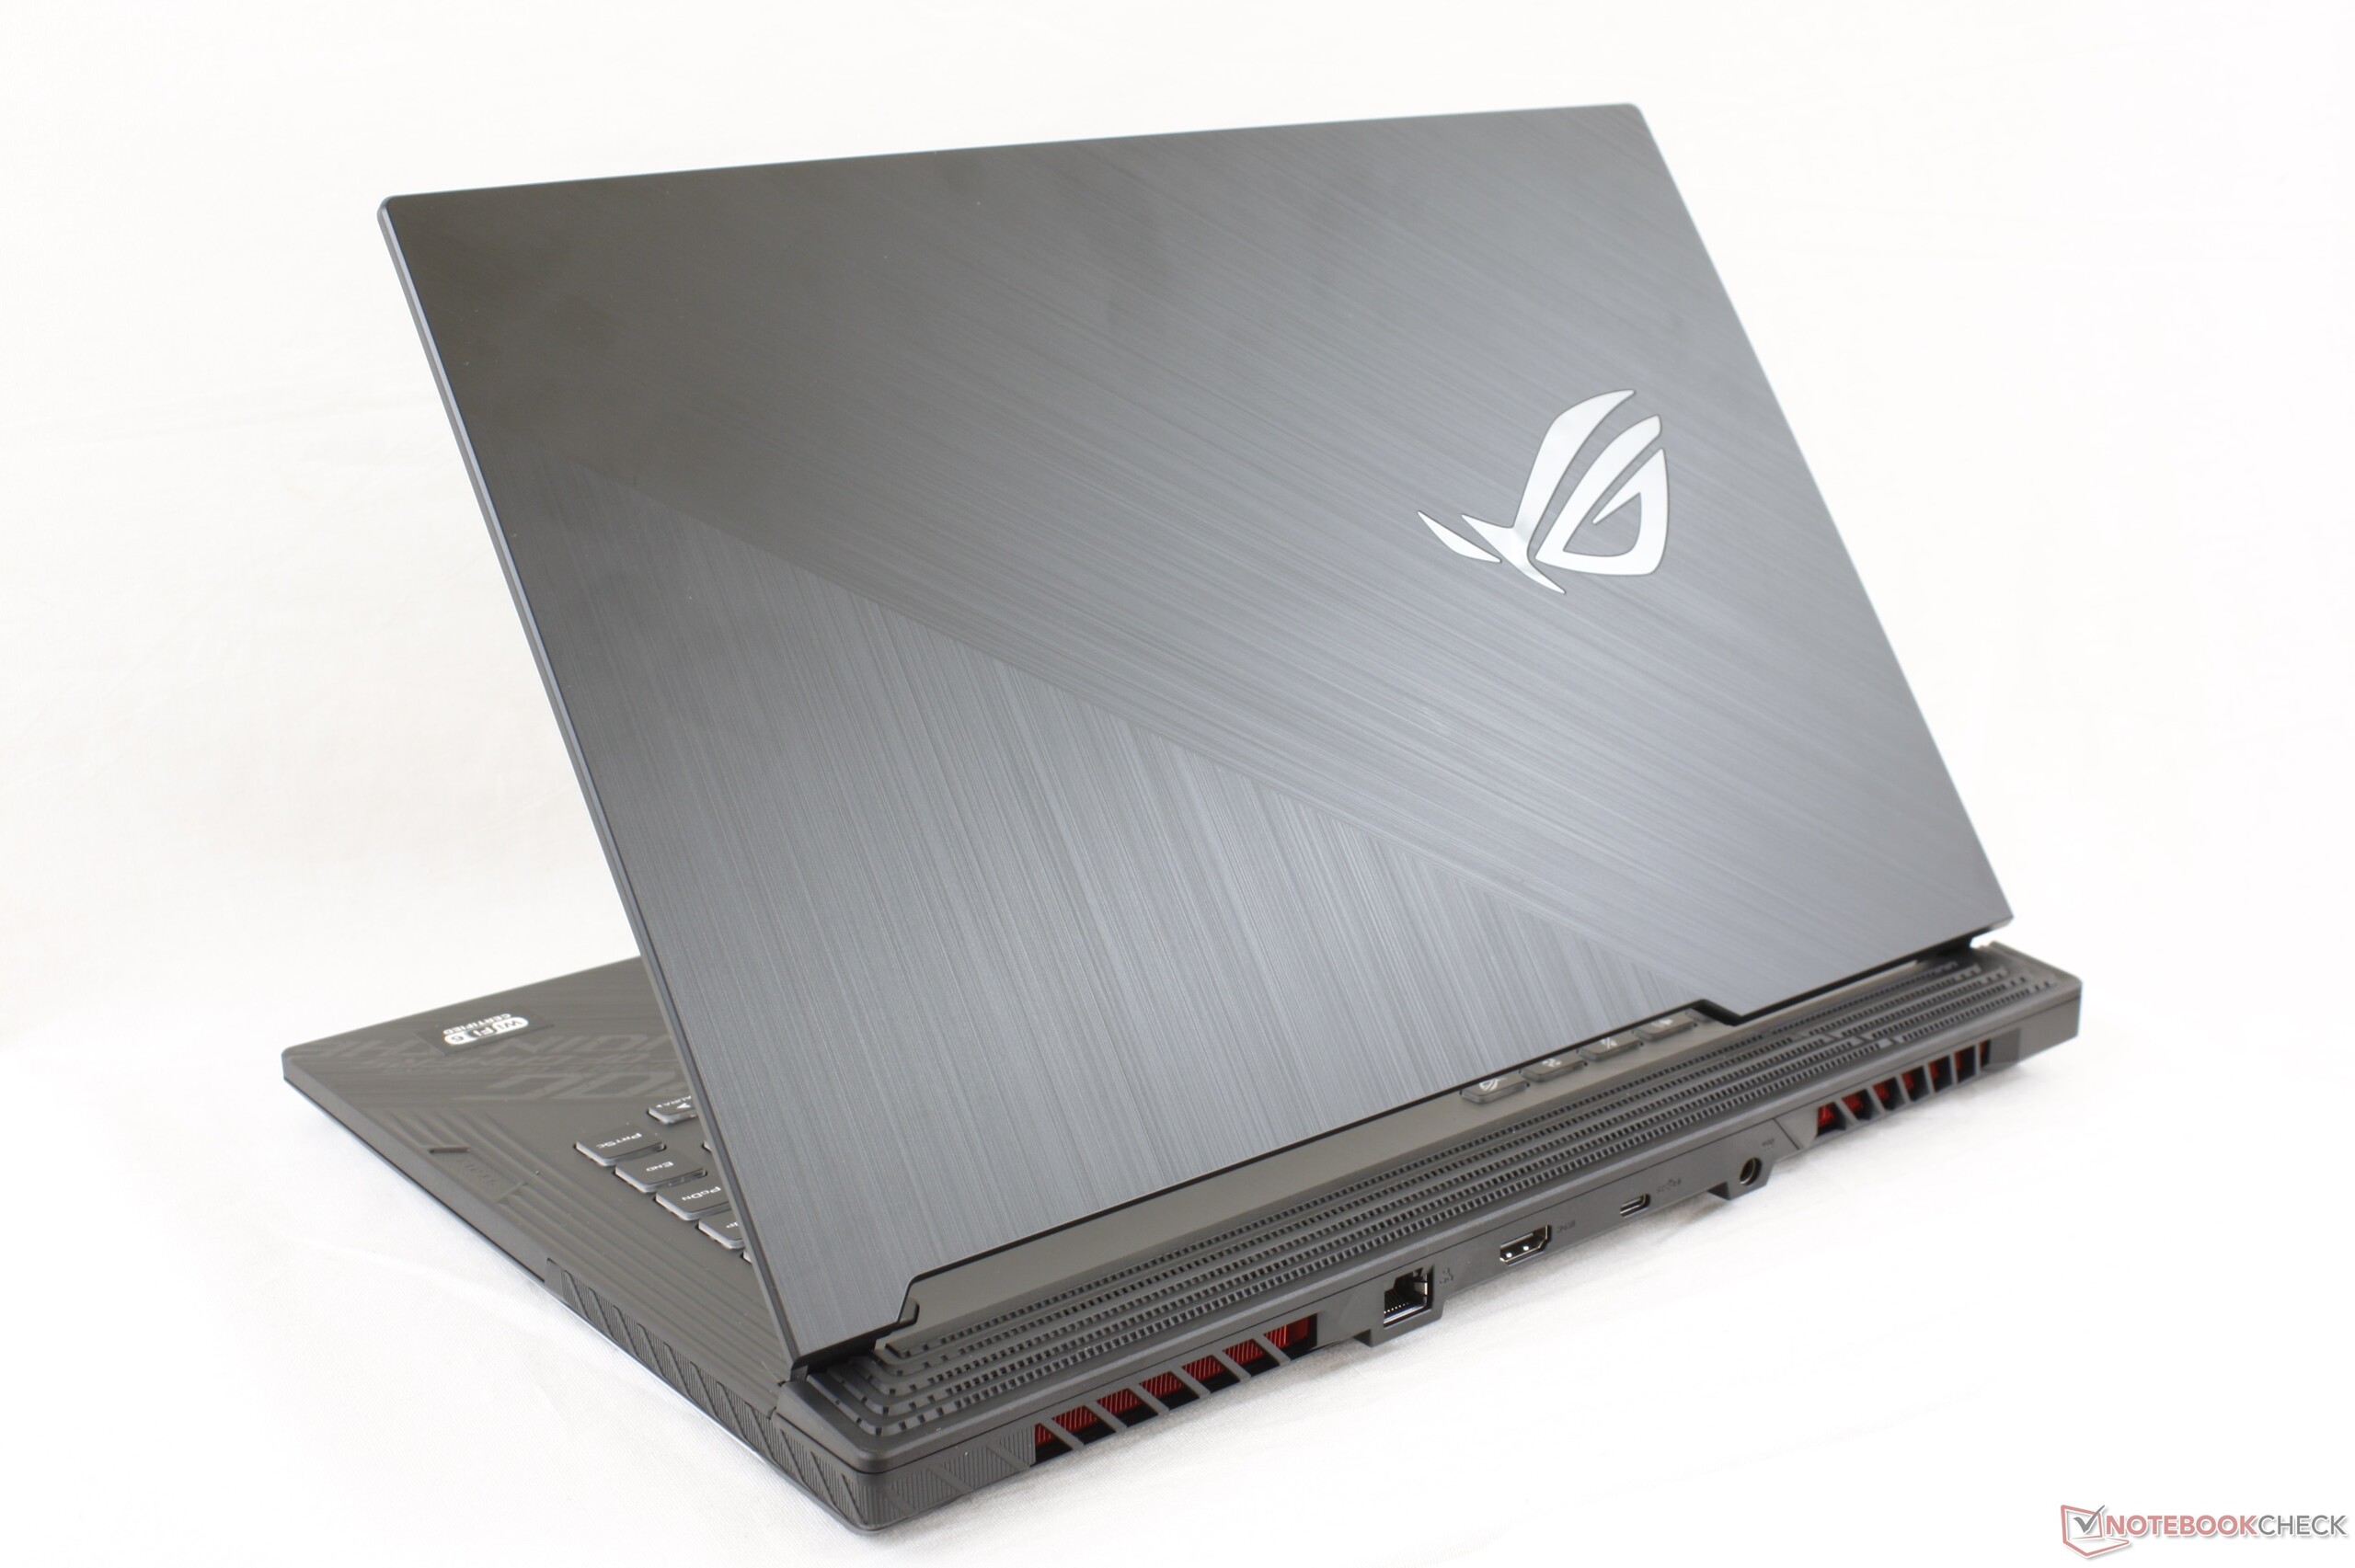
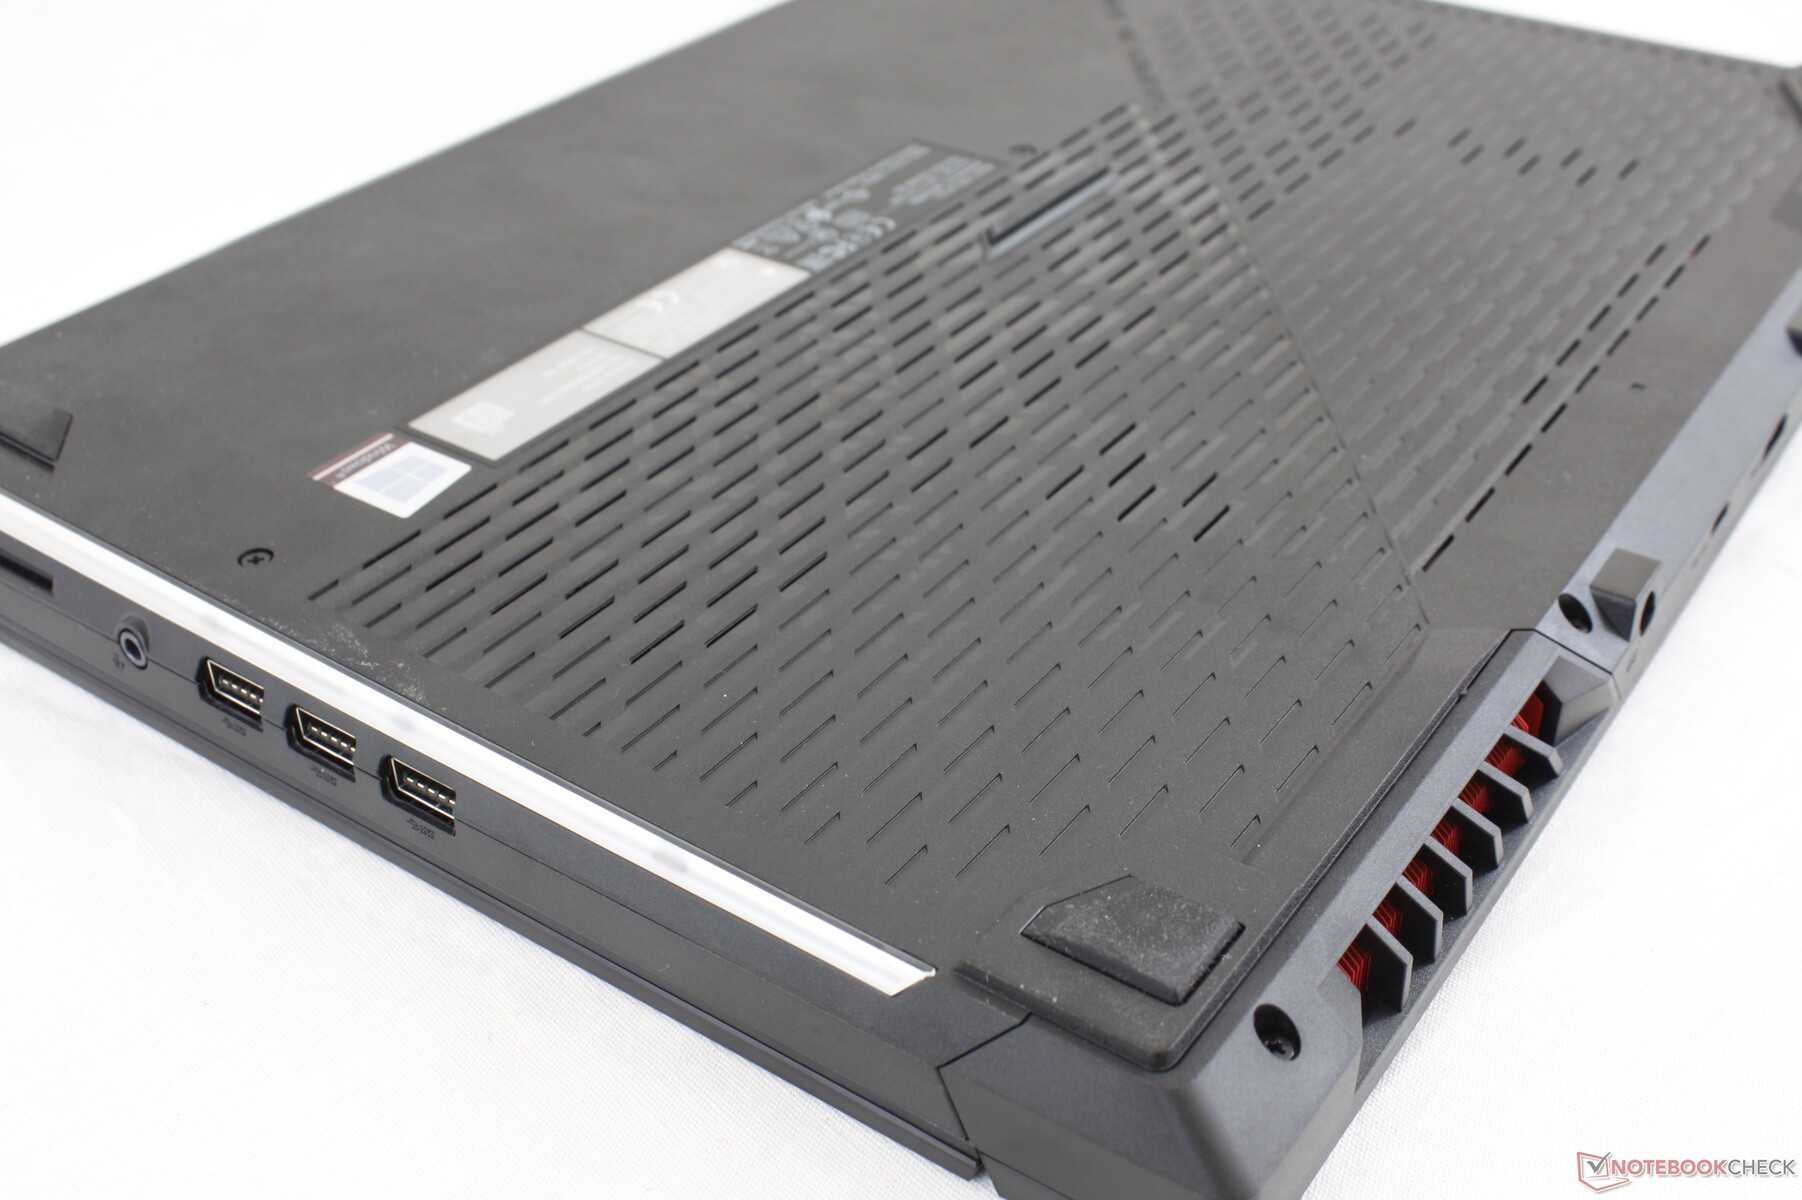
Because of its extended rear, the Strix G15 G512 is larger than many other gaming laptops including the Dell G5 15 SE, MSI GP65, and even's Asus' own TUF A15. Thankfully, the system isn't necessarily all that heavier at 2.3 kg to be about average for its price range and category.
Connectivity
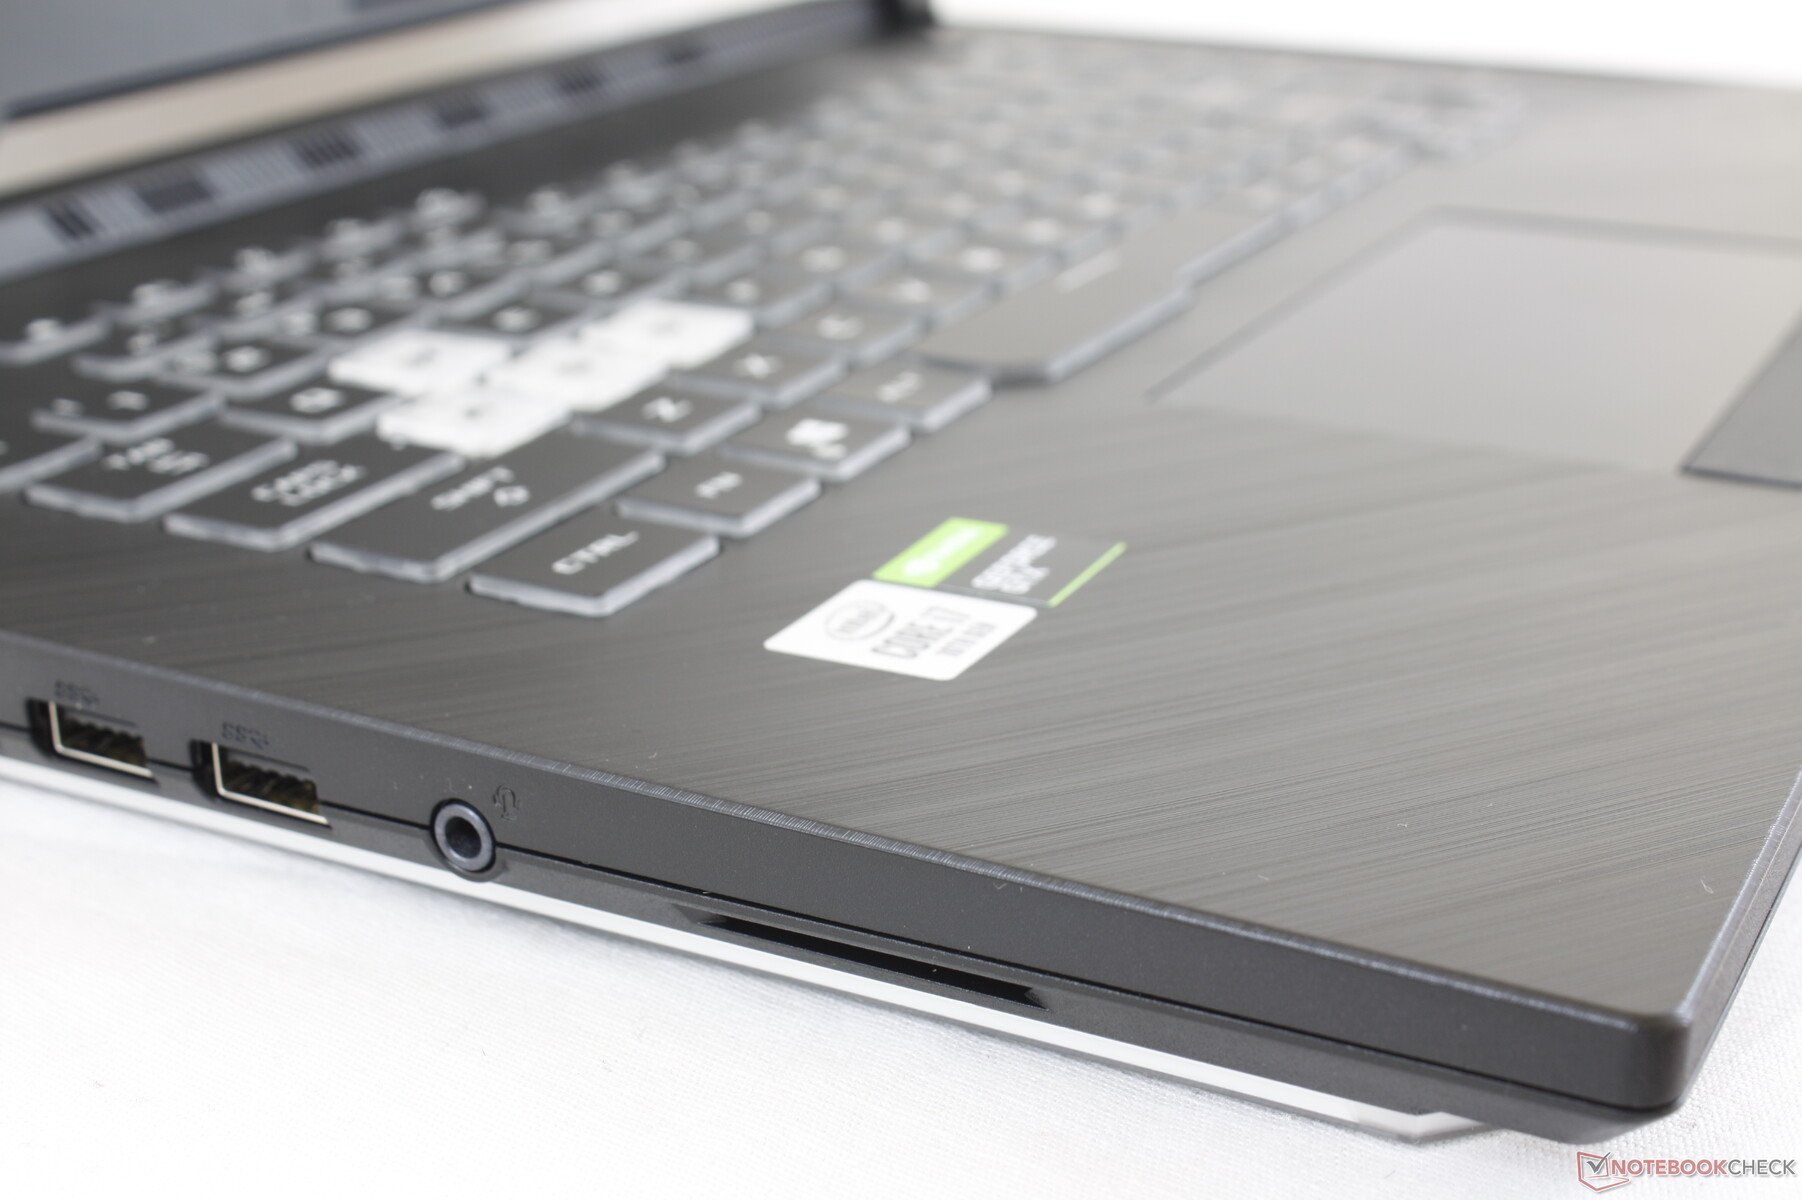
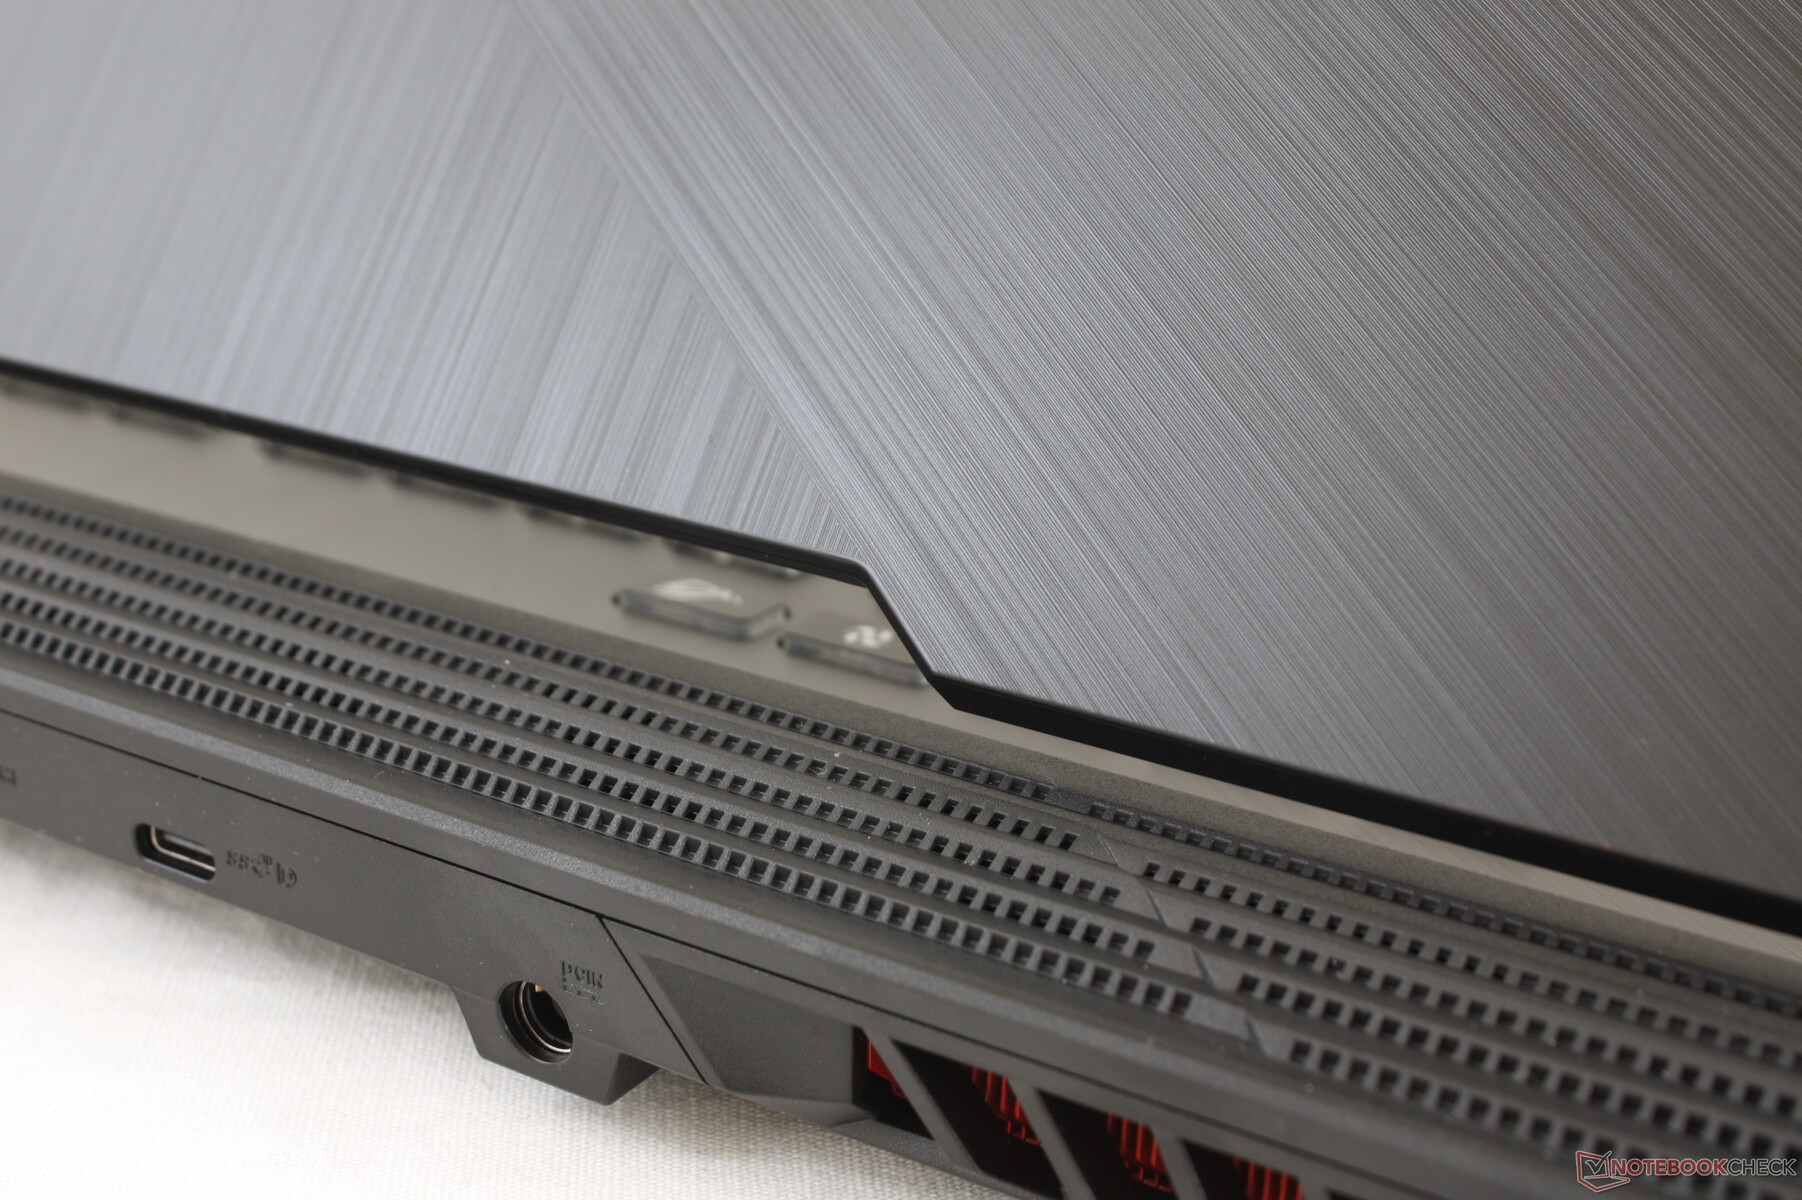
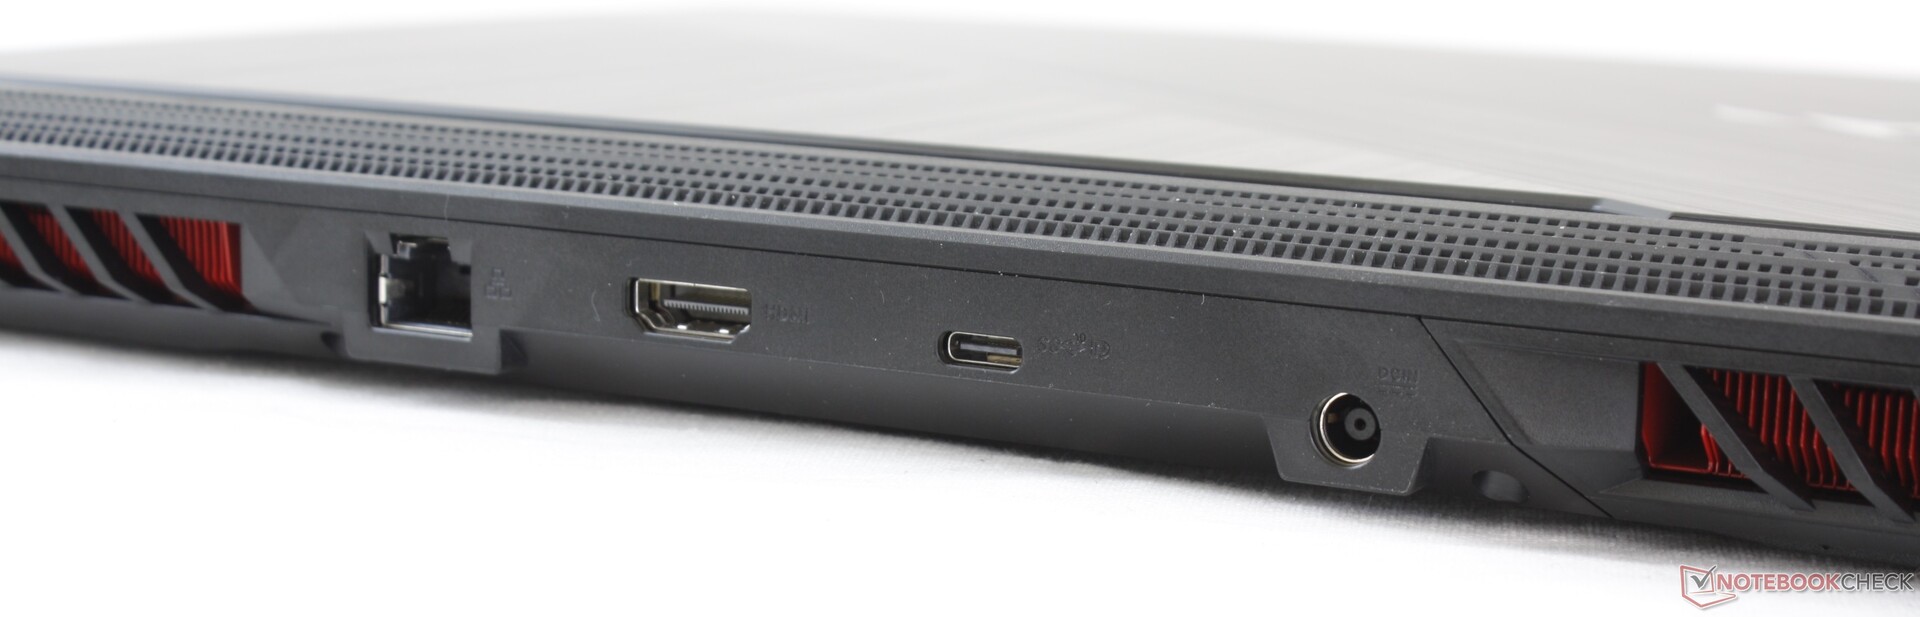
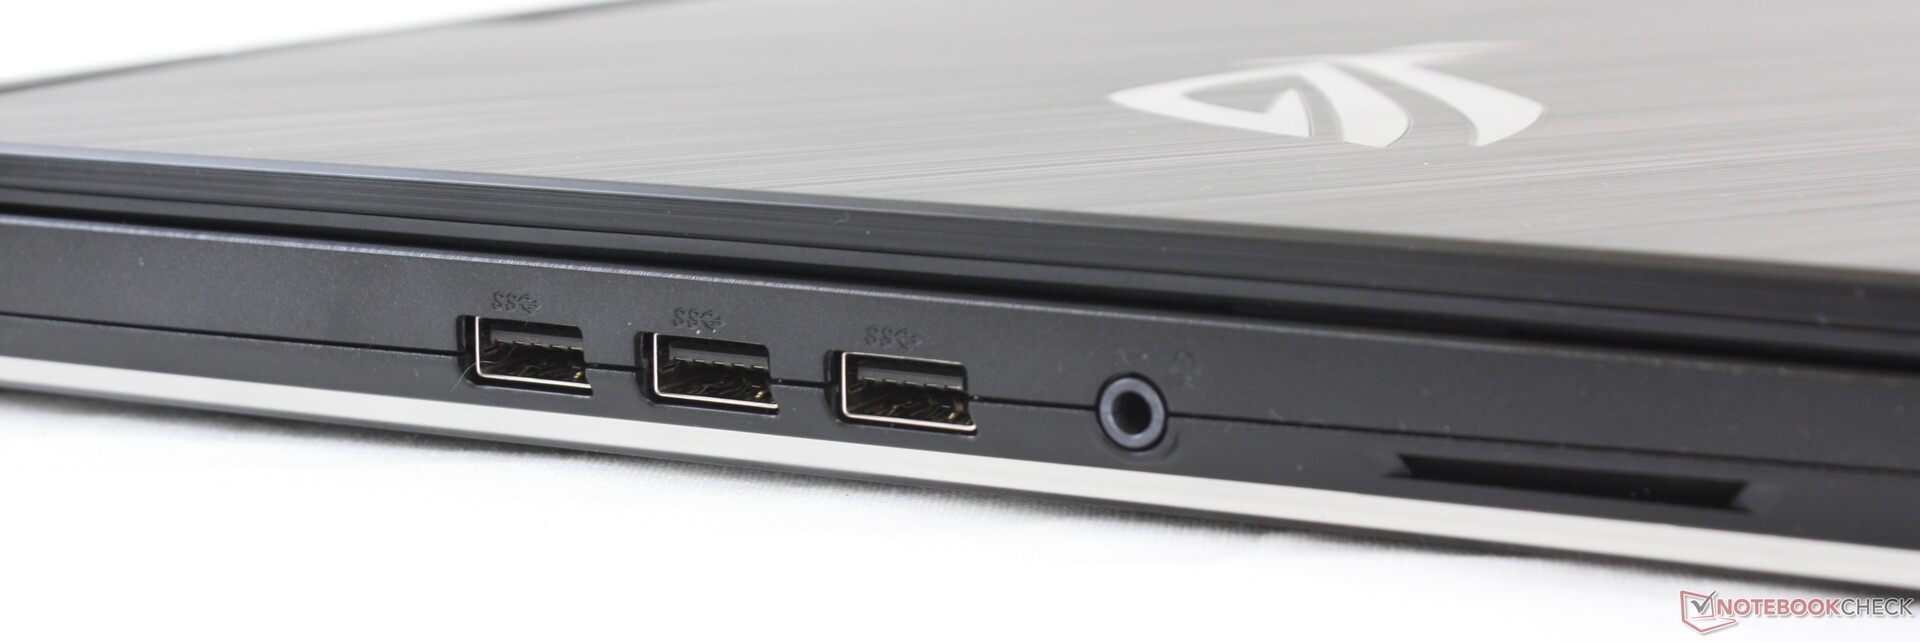
Port positioning is odd for a laptop as there are none along the right edge while all the USB-A ports are along the left edge only. This was probably done to appease gamers who are more likely to want desk space for a mouse and mousepad on the right side of the laptop. Thunderbolt 3 is not supported.
Communication
The Intel AX201 comes standard on all SKUs for Wi-Fi 6 compatibility. We experienced no connectivity issues when paired to our Netgear RAX200 test router.
| Networking | |
| iperf3 transmit AX12 | |
| Asus ROG Strix G15 G512LI | |
| MSI GP65 10SFK-047US | |
| Dell G5 15 SE 5505 P89F | |
| Asus TUF Gaming A15 FA506IV-HN172 | |
| iperf3 receive AX12 | |
| Dell G5 15 SE 5505 P89F | |
| MSI GP65 10SFK-047US | |
| Asus ROG Strix G15 G512LI | |
| Asus TUF Gaming A15 FA506IV-HN172 | |
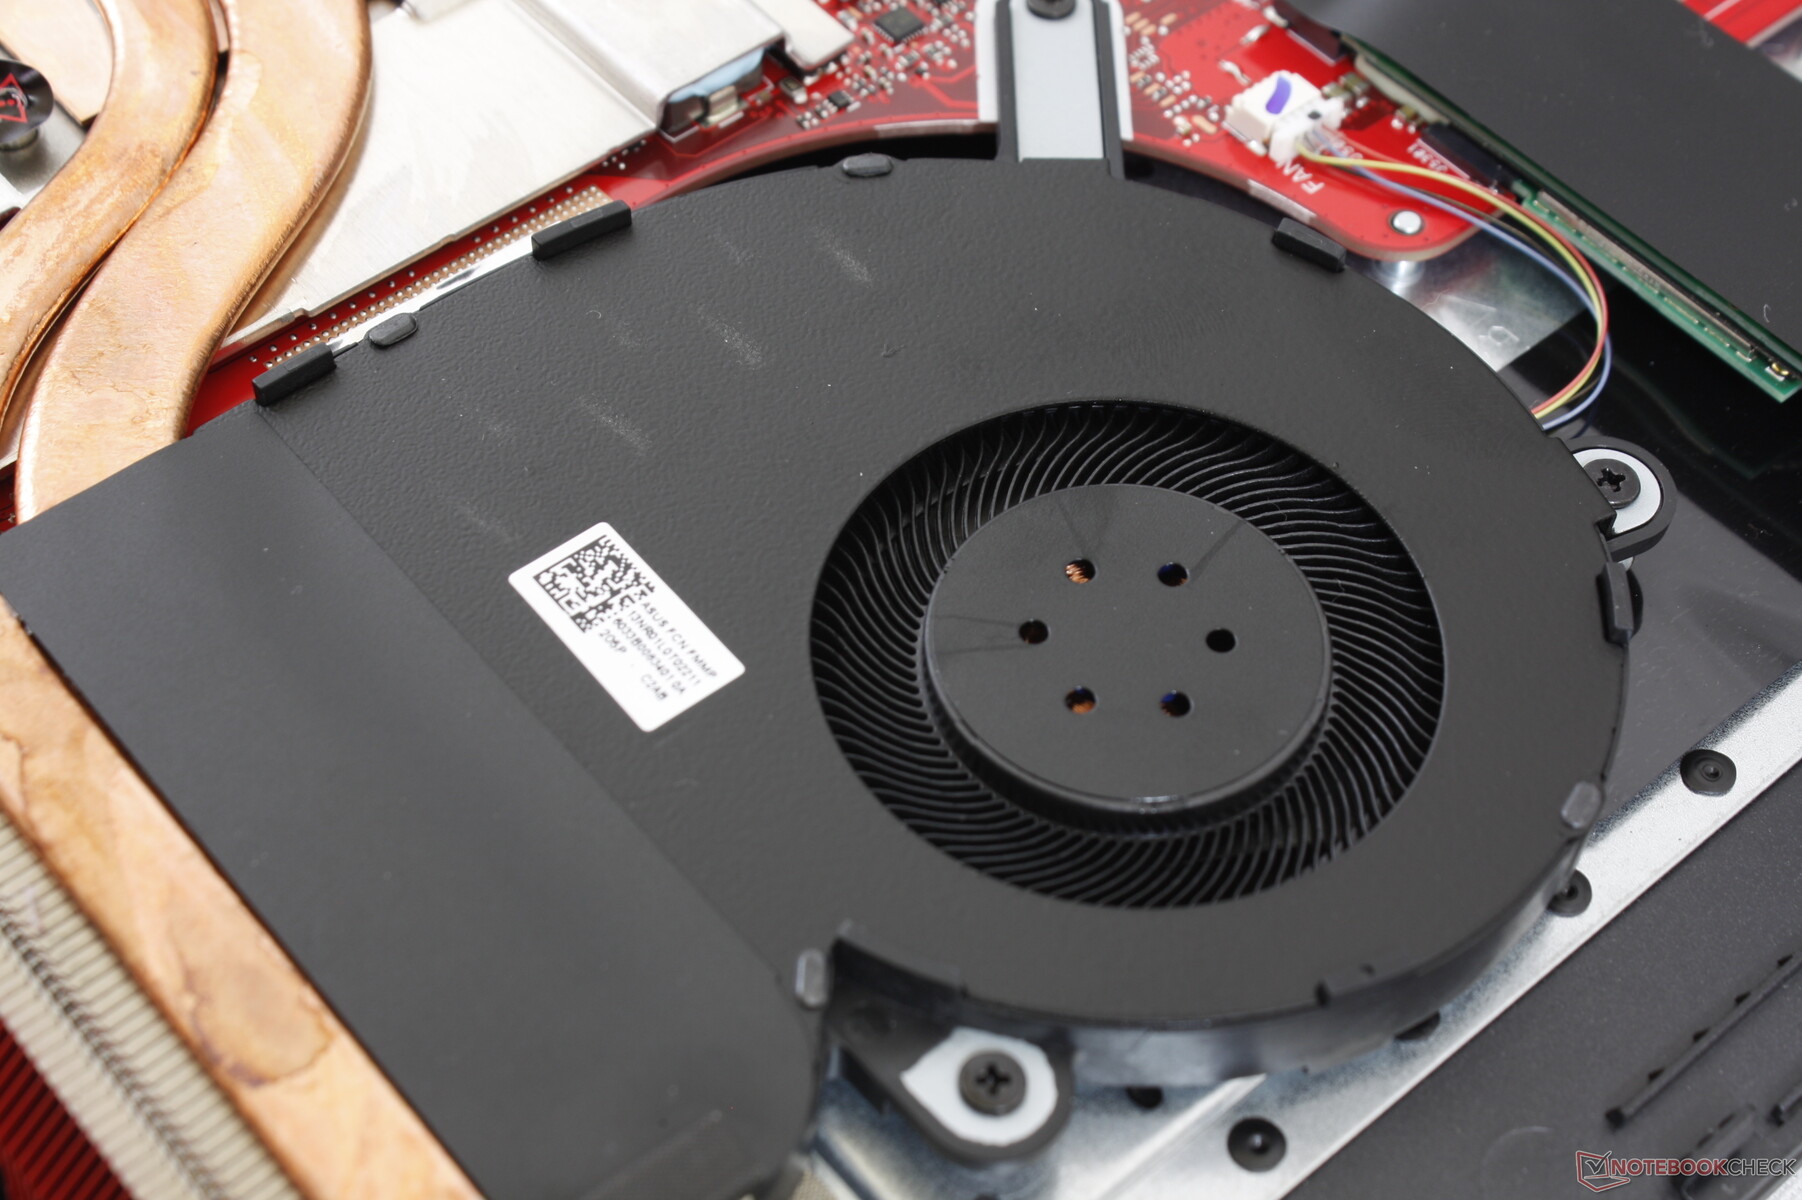
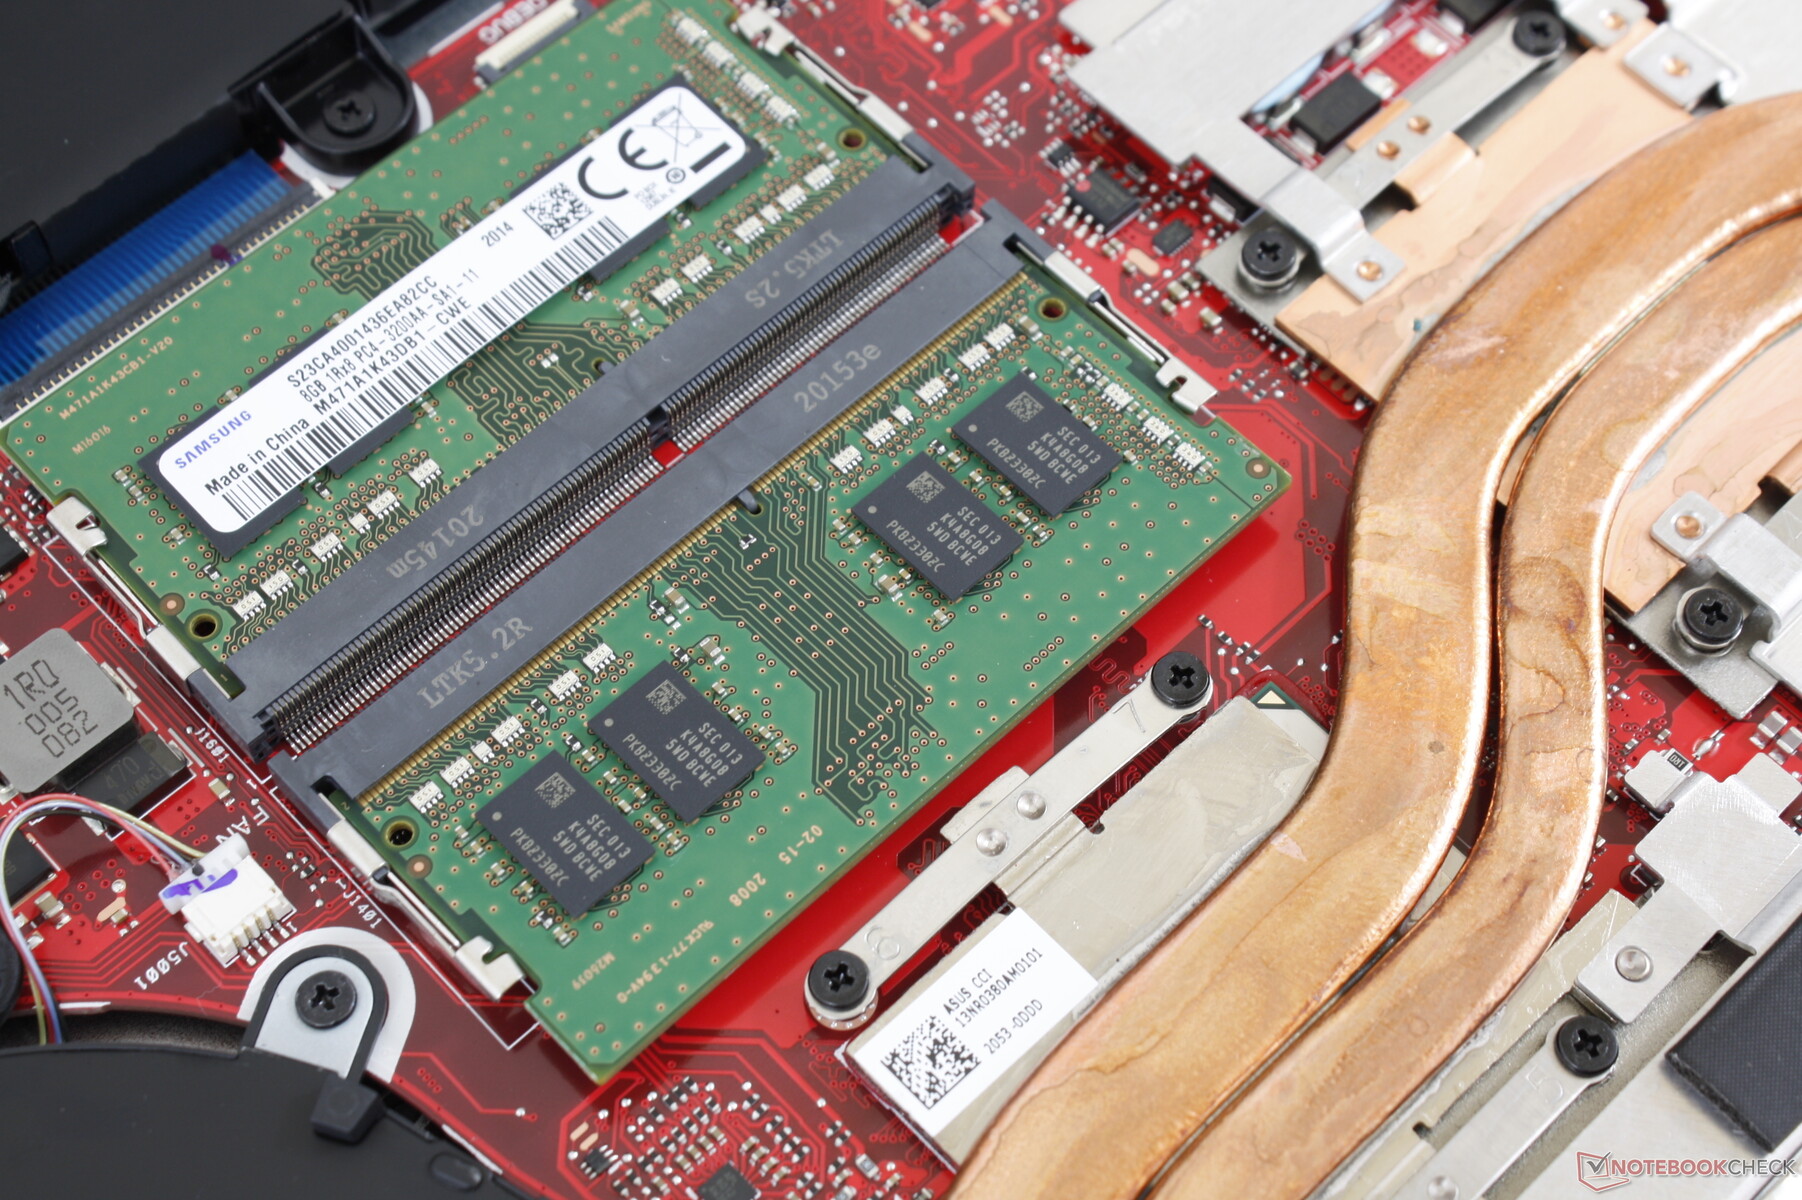
Maintenance
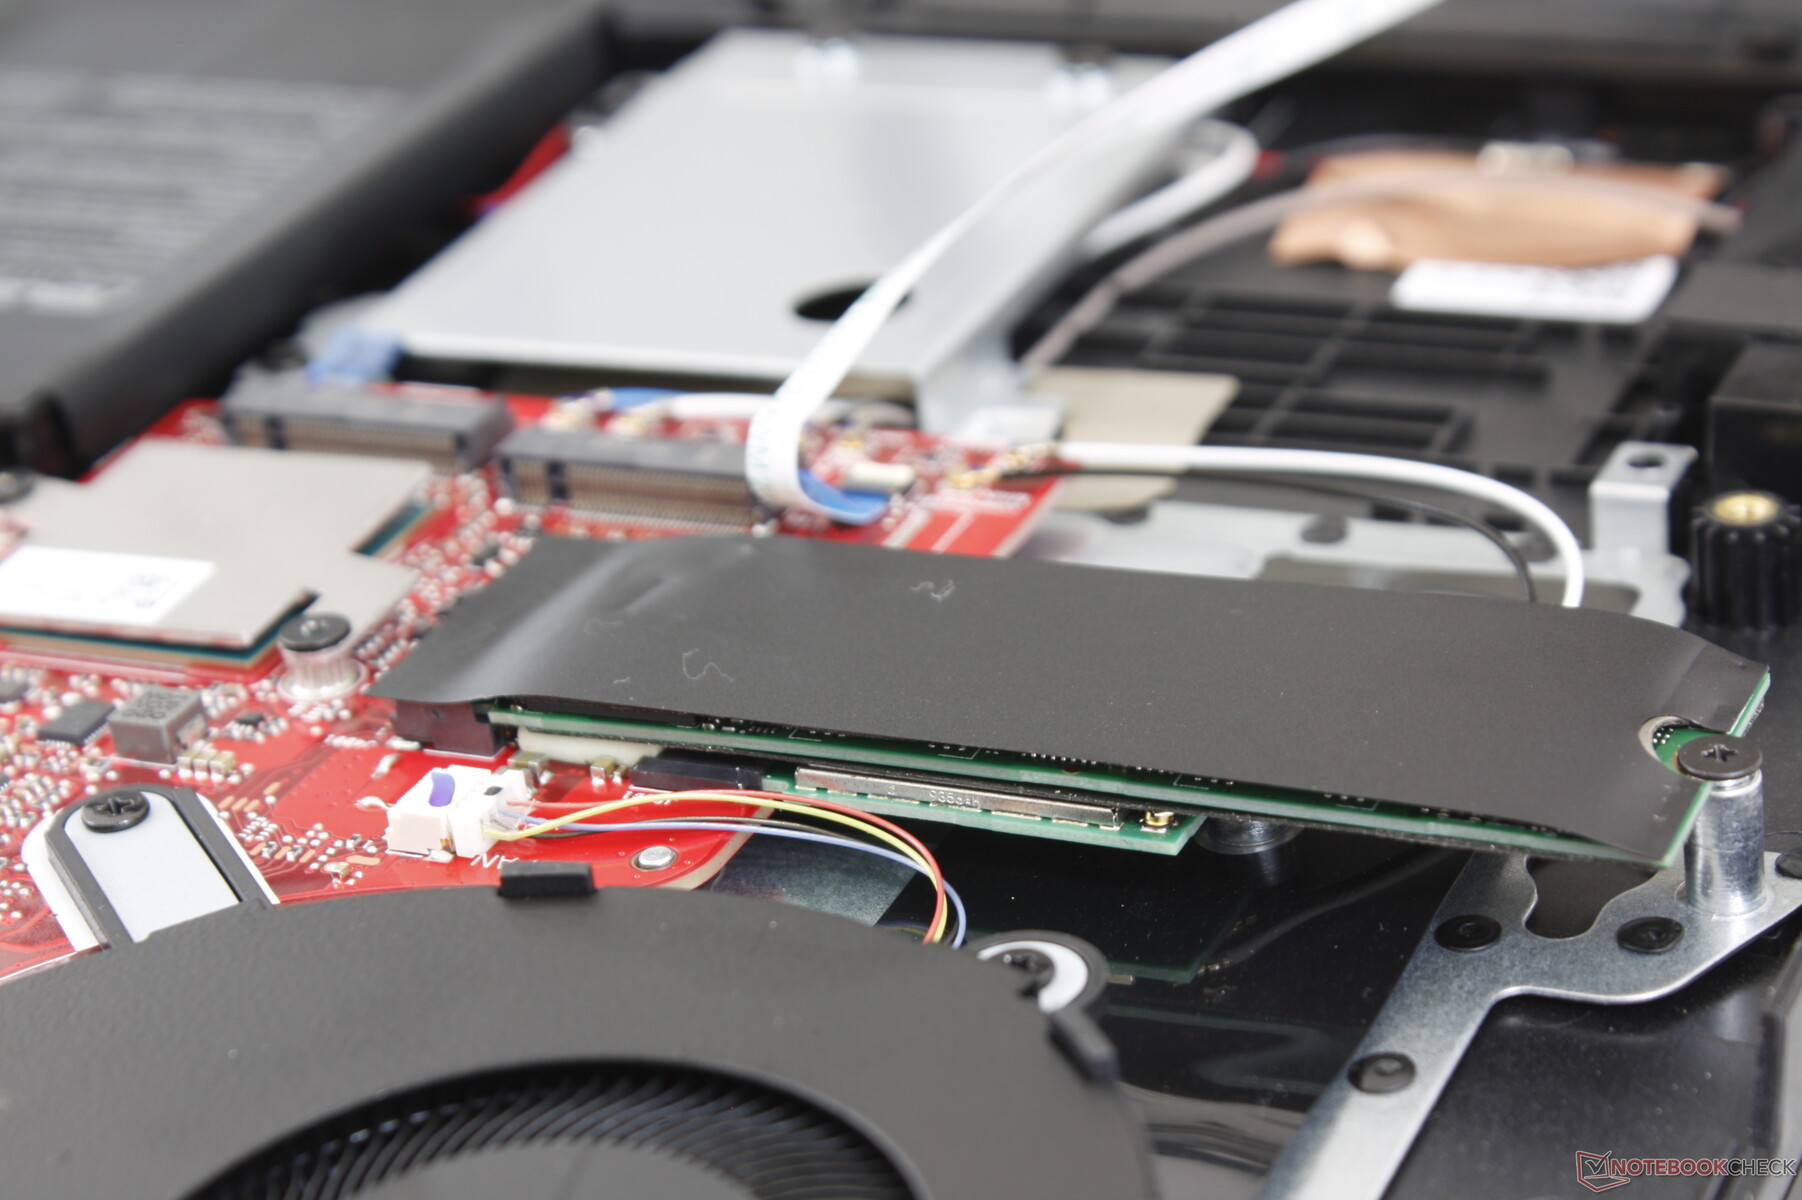
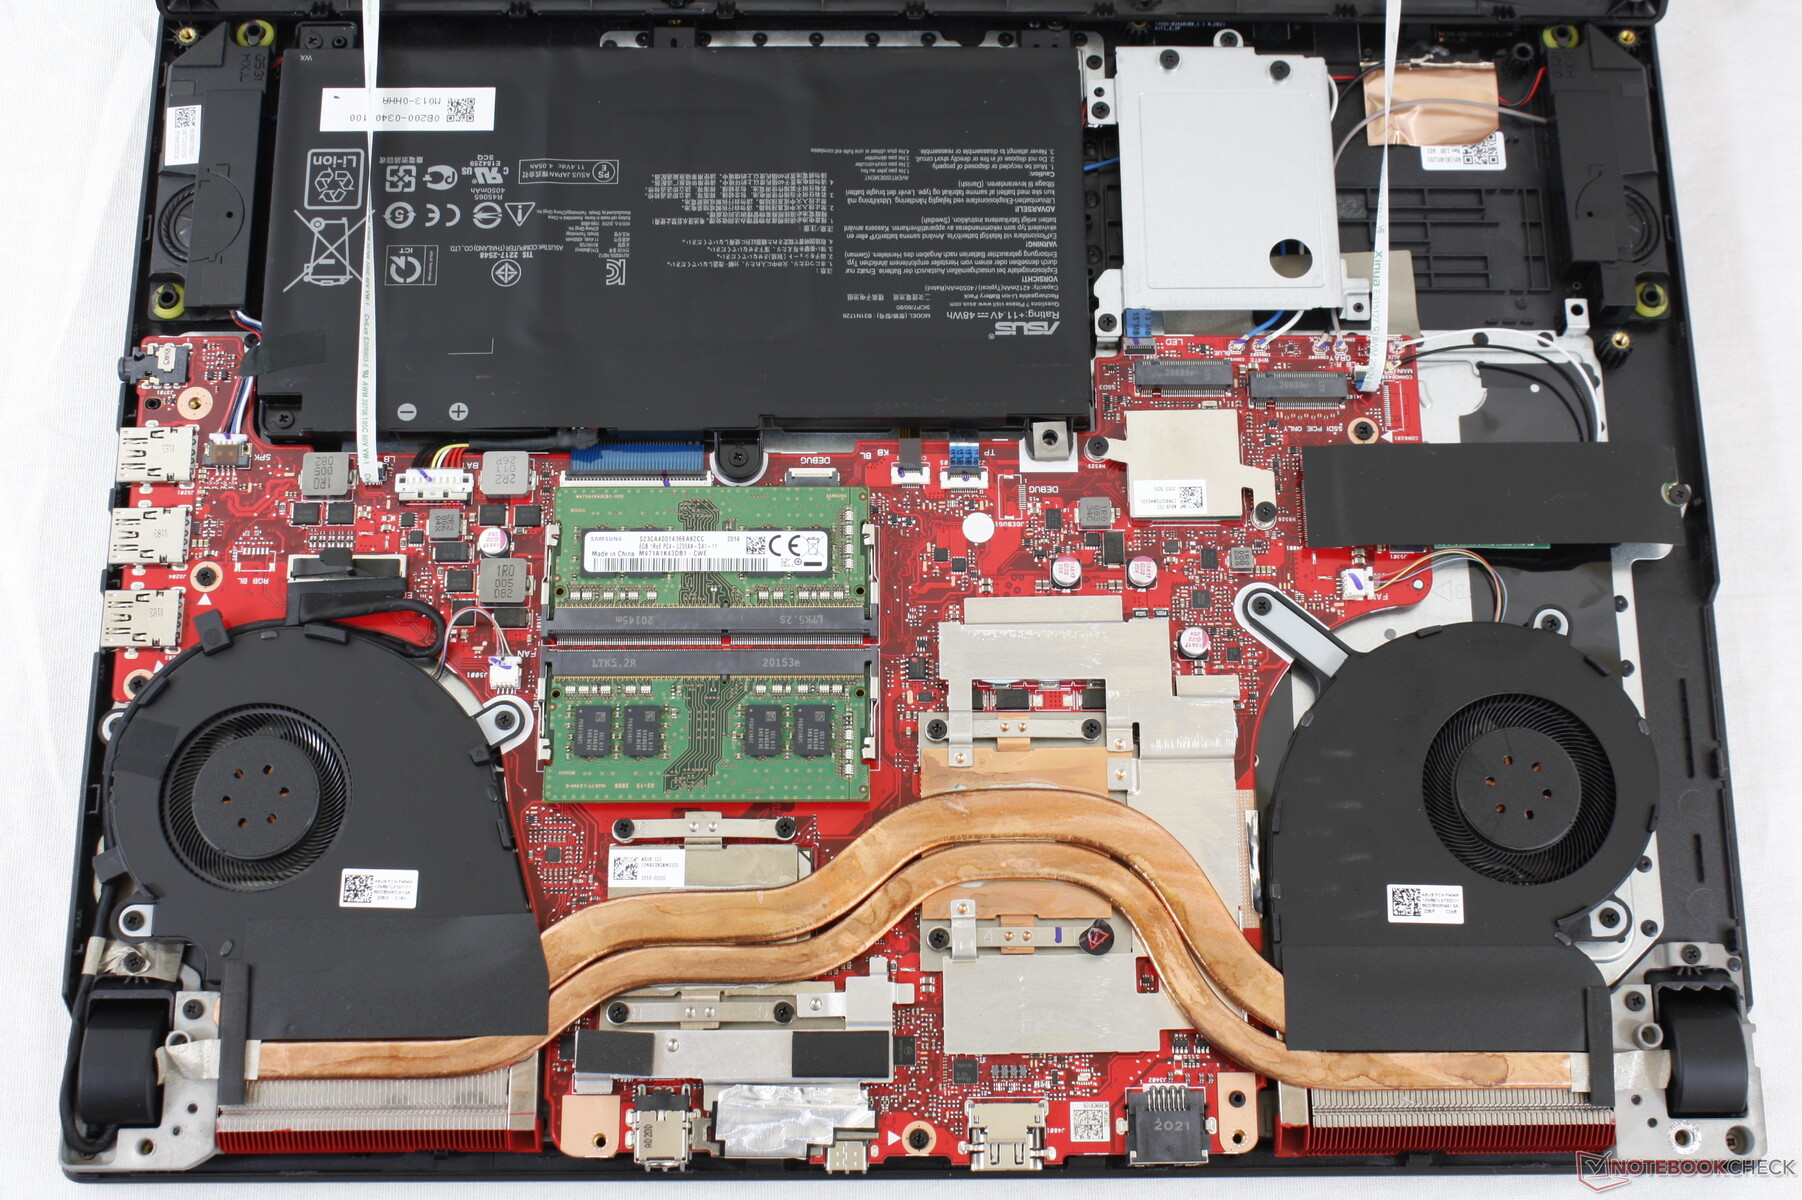
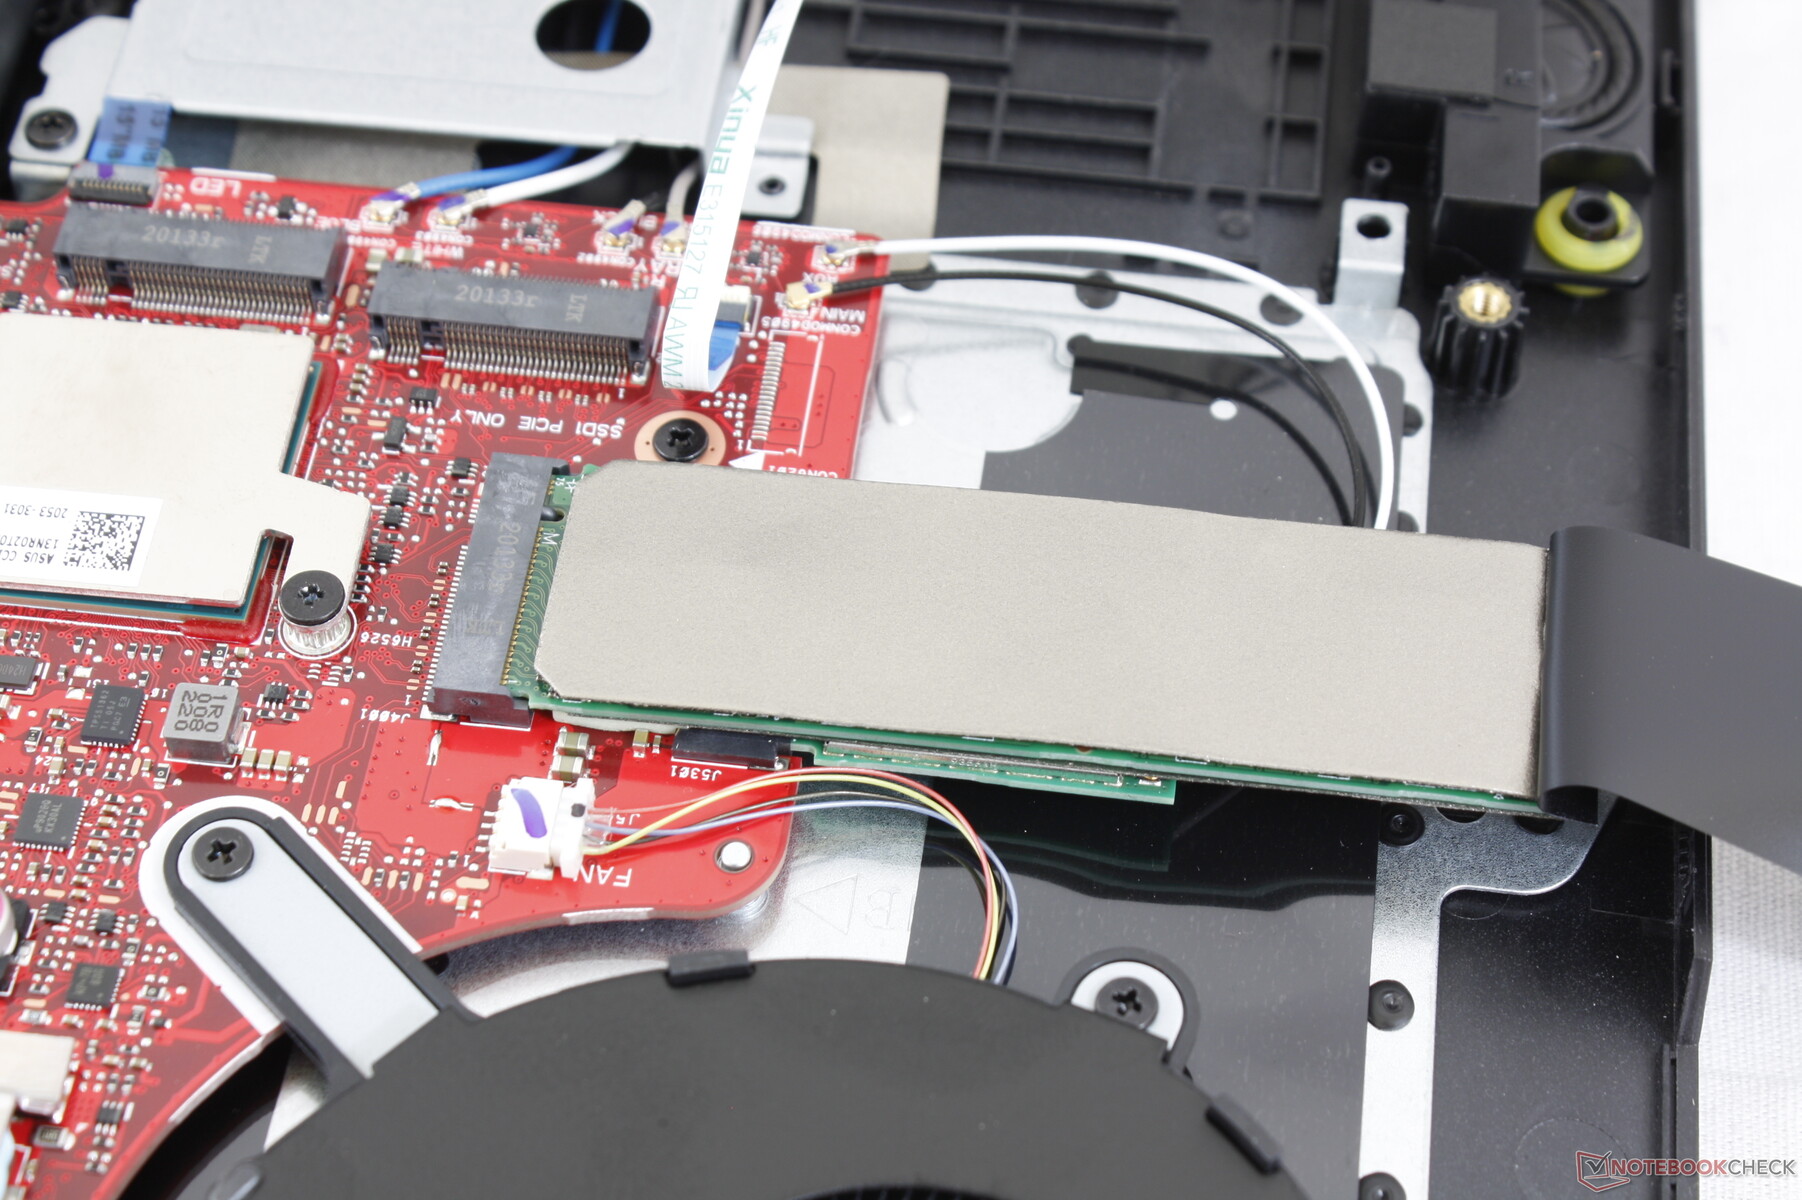
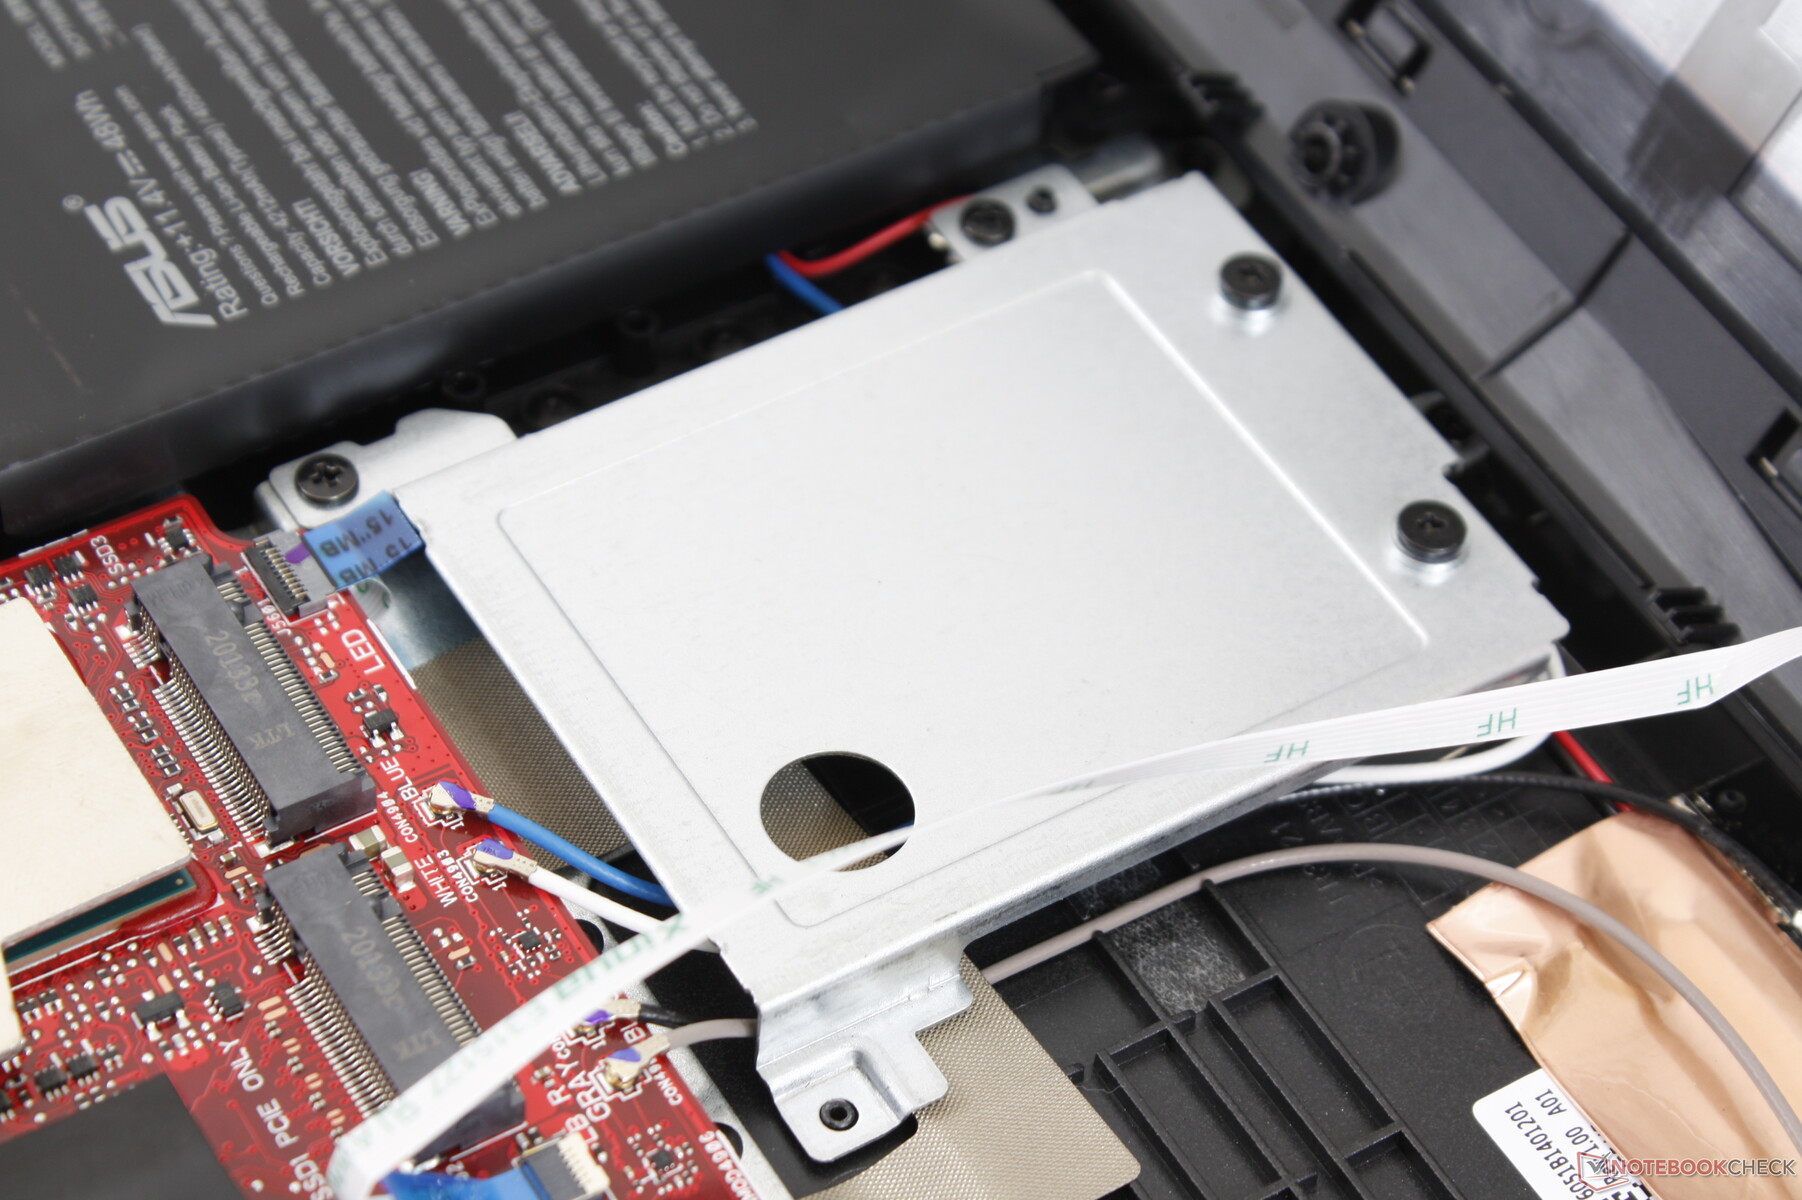
The bottom panel is easy to remove with a simple Phillips screwdriver. However, the panel is attached to the motherboard via two delicate ribbon cables that should be handled with care. Upgrading RAM, storage, or WLAN is a simple process.
Accessories and Warranty
There are no included extras in the box other than the AC adapter and usual paperwork. The standard one-year limited warranty applies.
Input Devices
Keyboard
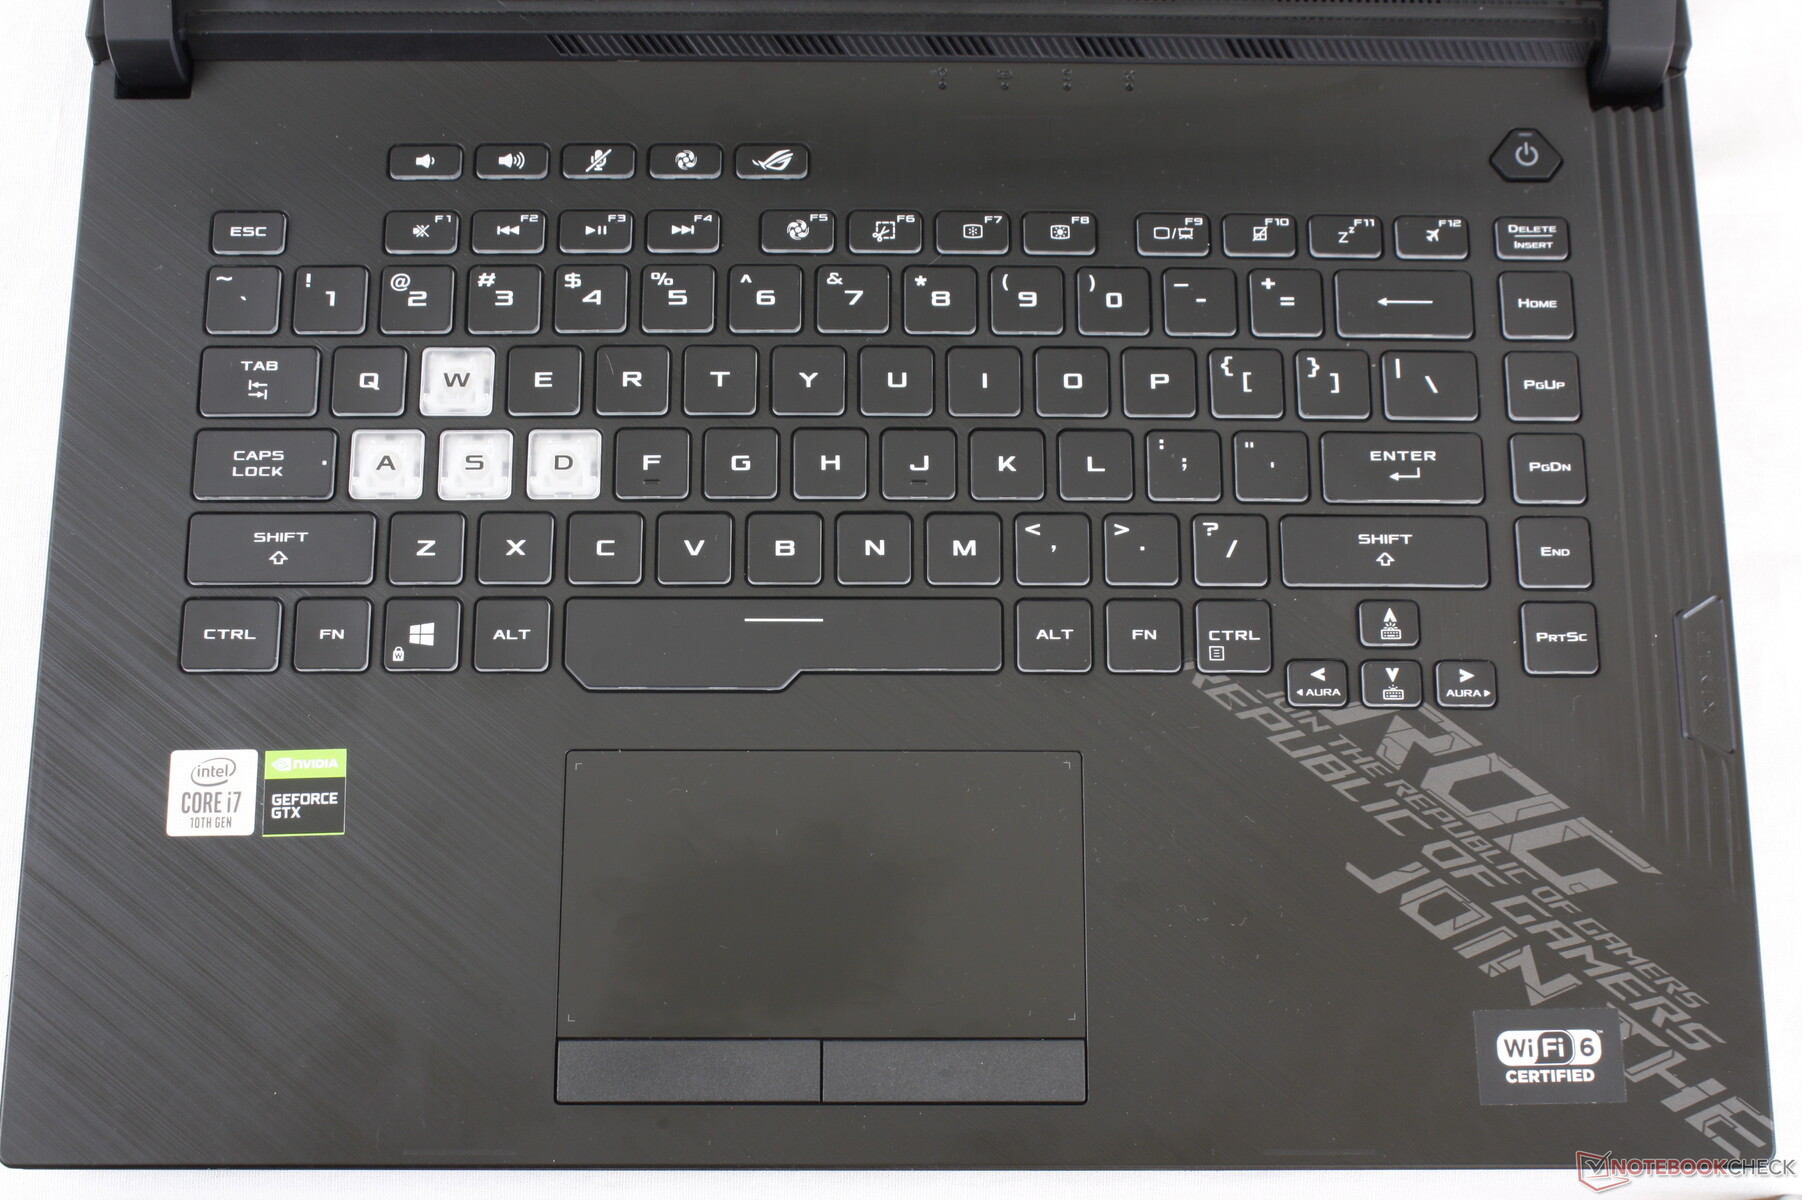
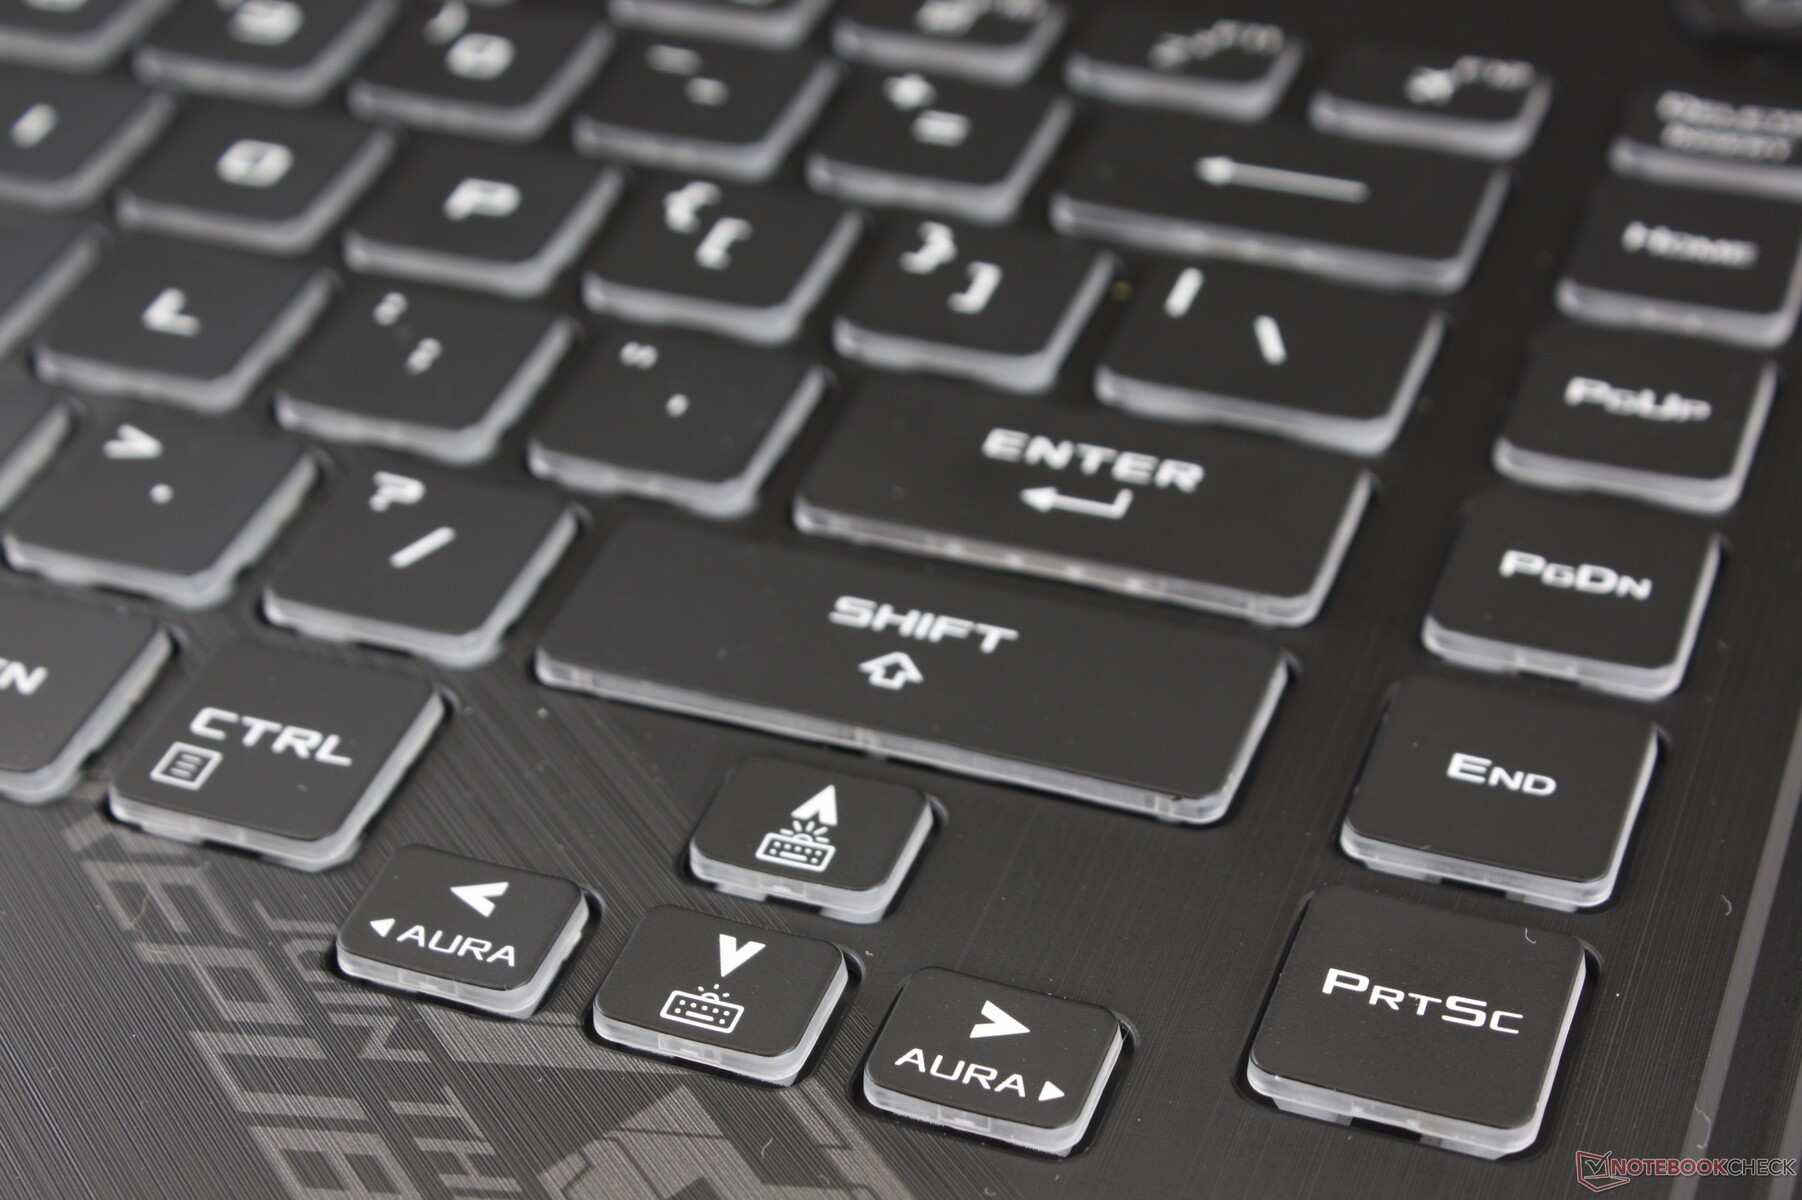
Layout and feedback are identical to the keyboard on the GL531 and so our existing comments apply here. We especially like that the system features a row of dedicated multimedia keys along the top and a dedicated column of PgUp and PgDn keys along the right edge as many other laptops tend to ignore these keys.
Touchpad
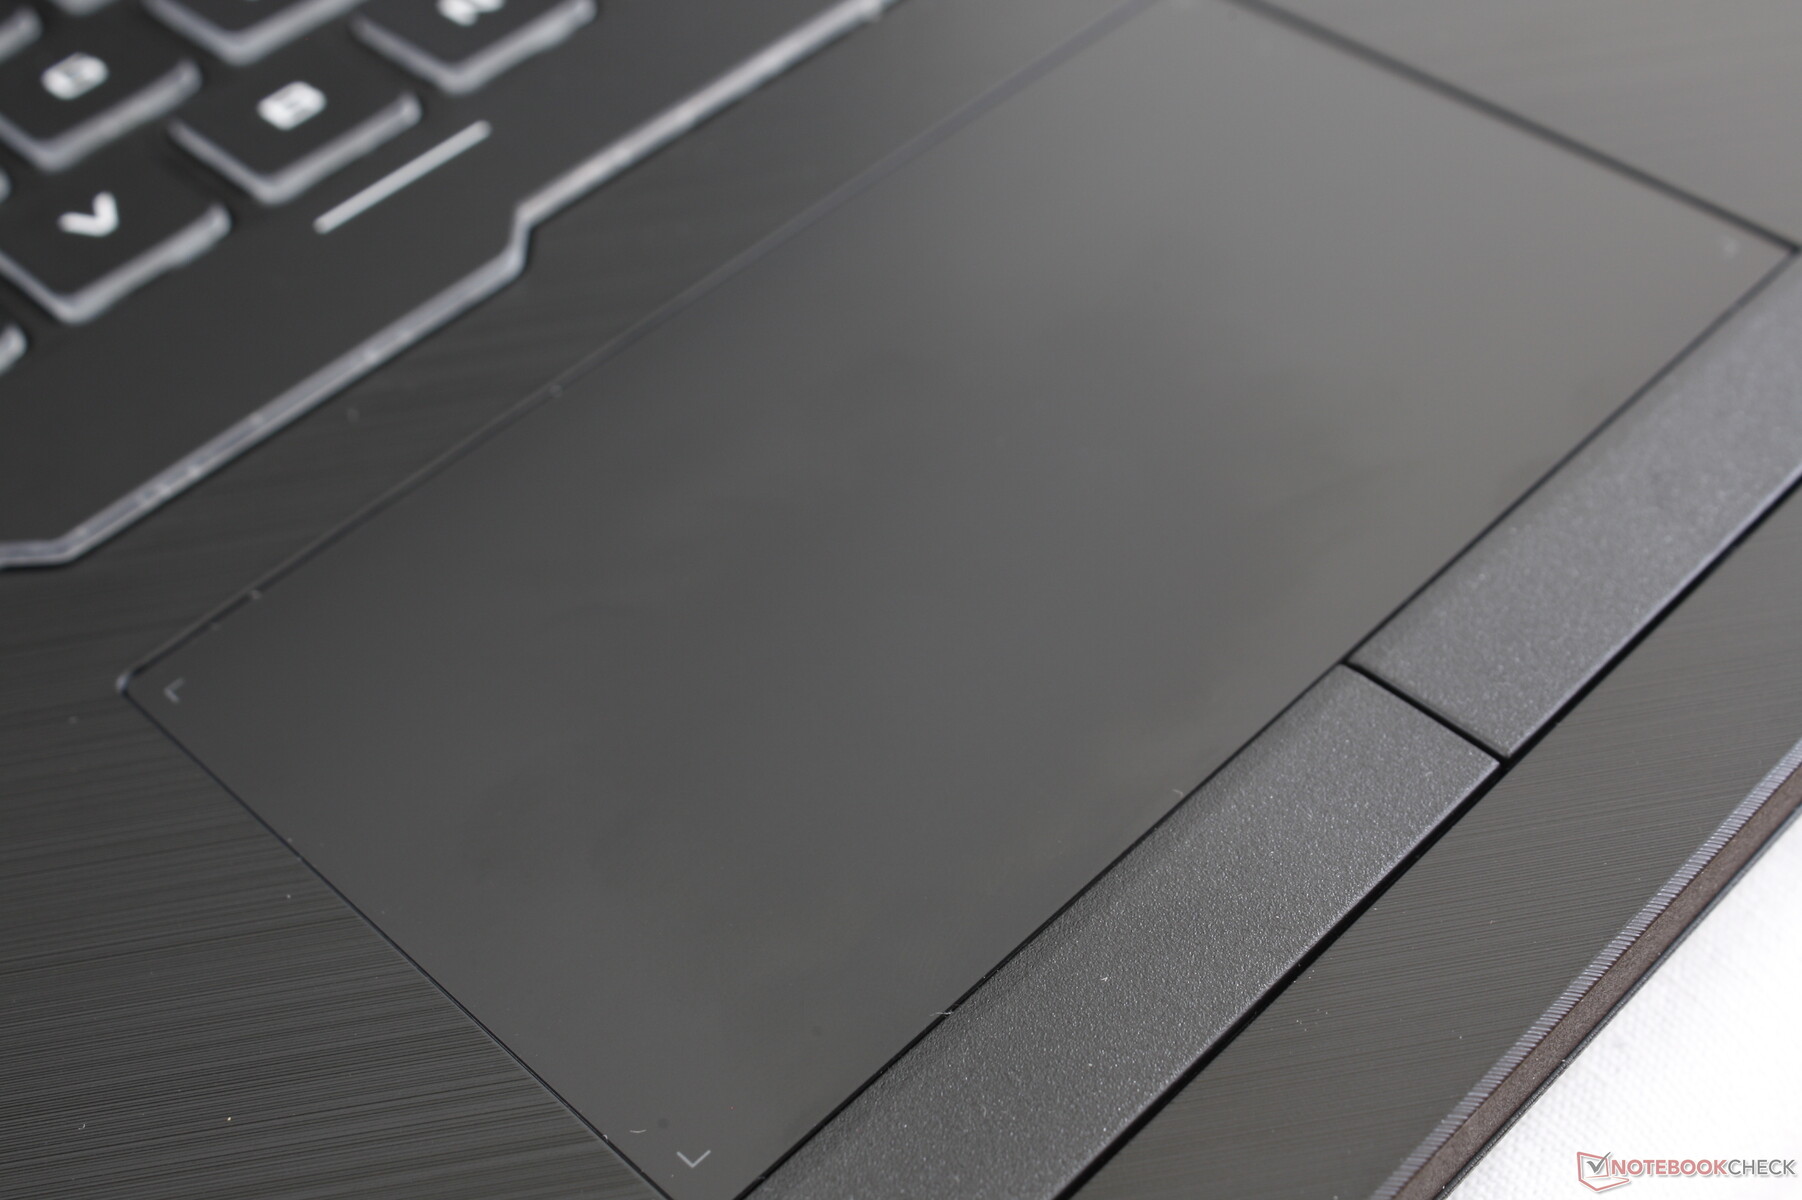
The touchpad is slightly smaller than the one of the MSI GE65 (11 x 6.3 cm vs. 10.9 x 6 cm). Cursor control is reliable with no issues, but gliding is stickier than we would like especially at low-medium speeds. Meanwhile, the dedicated mouse buttons are some of the quietest we've seen on any gaming laptop in contrast to the louder and "clickier" keys on the MSI GE65.

Display
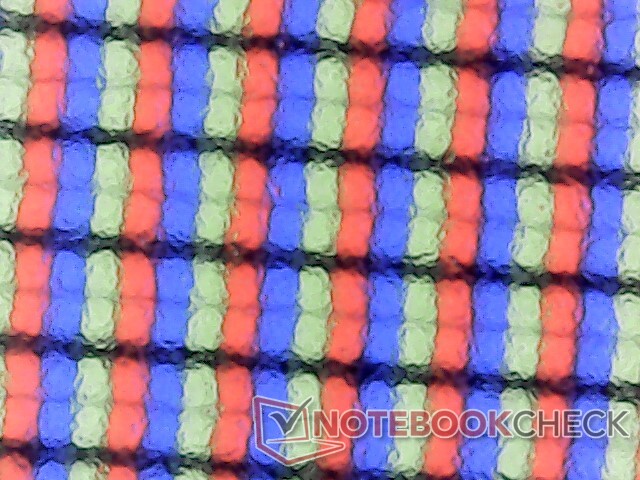
Asus deploys the same Panda LM156LF-2F01 IPS panel for both the TUF A15 FA506IV and our ROG Strix G15 G512LI. Although the native 144 Hz refresh rate is notable, response times are average and contrast is middling at only about 500:1 with below-average color reproduction for shallow colors overall. This is a budget gaming panel when compared to the Sharp panels used on the Strix Scar III G531GW. Fortunately, Asus offers a higher-end 240 Hz/3 ms option for this chassis.

| |||||||||||||||||||||||||
Brightness Distribution: 79 %
Center on Battery: 271.2 cd/m²
Contrast: 512:1 (Black: 0.53 cd/m²)
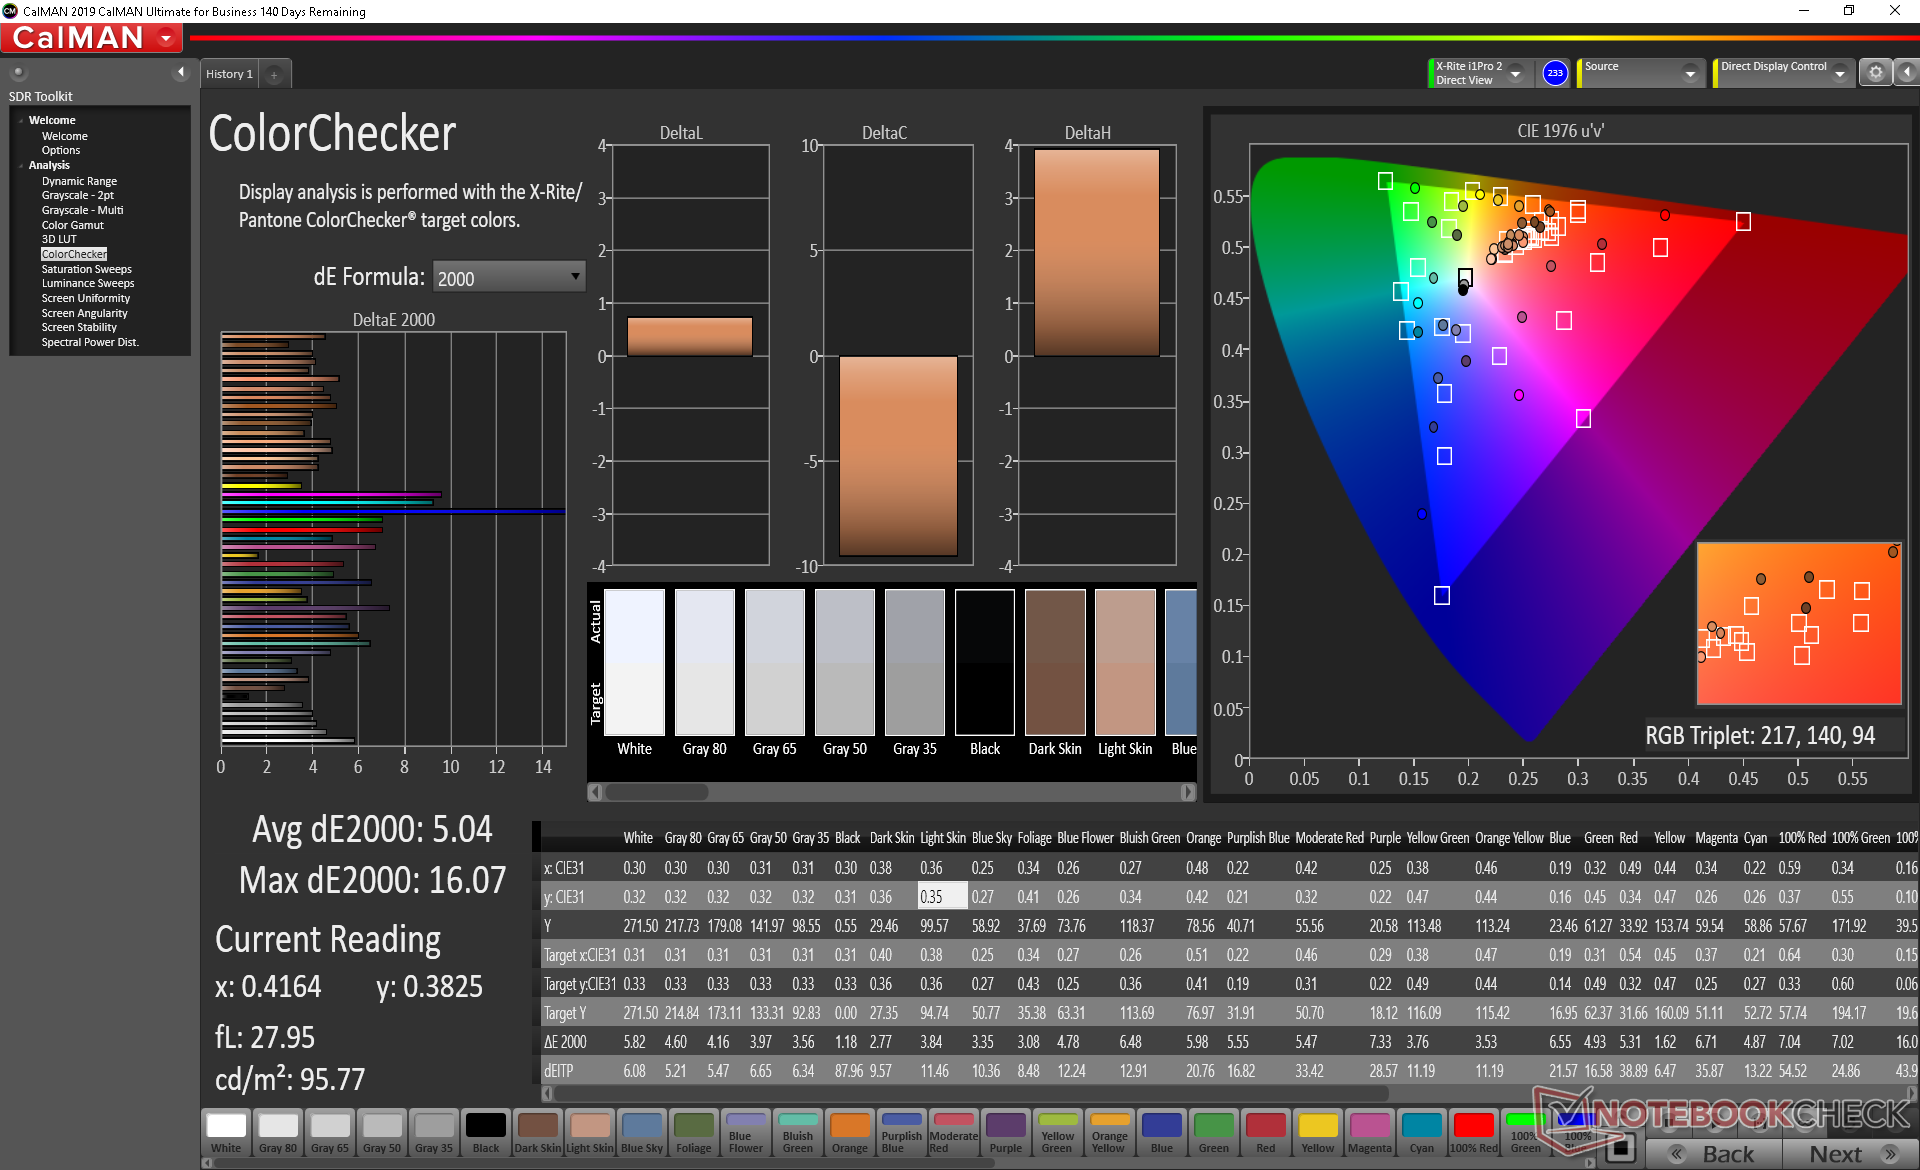
ΔE ColorChecker Calman: 5.04 | ∀{0.5-29.43 Ø4.71}
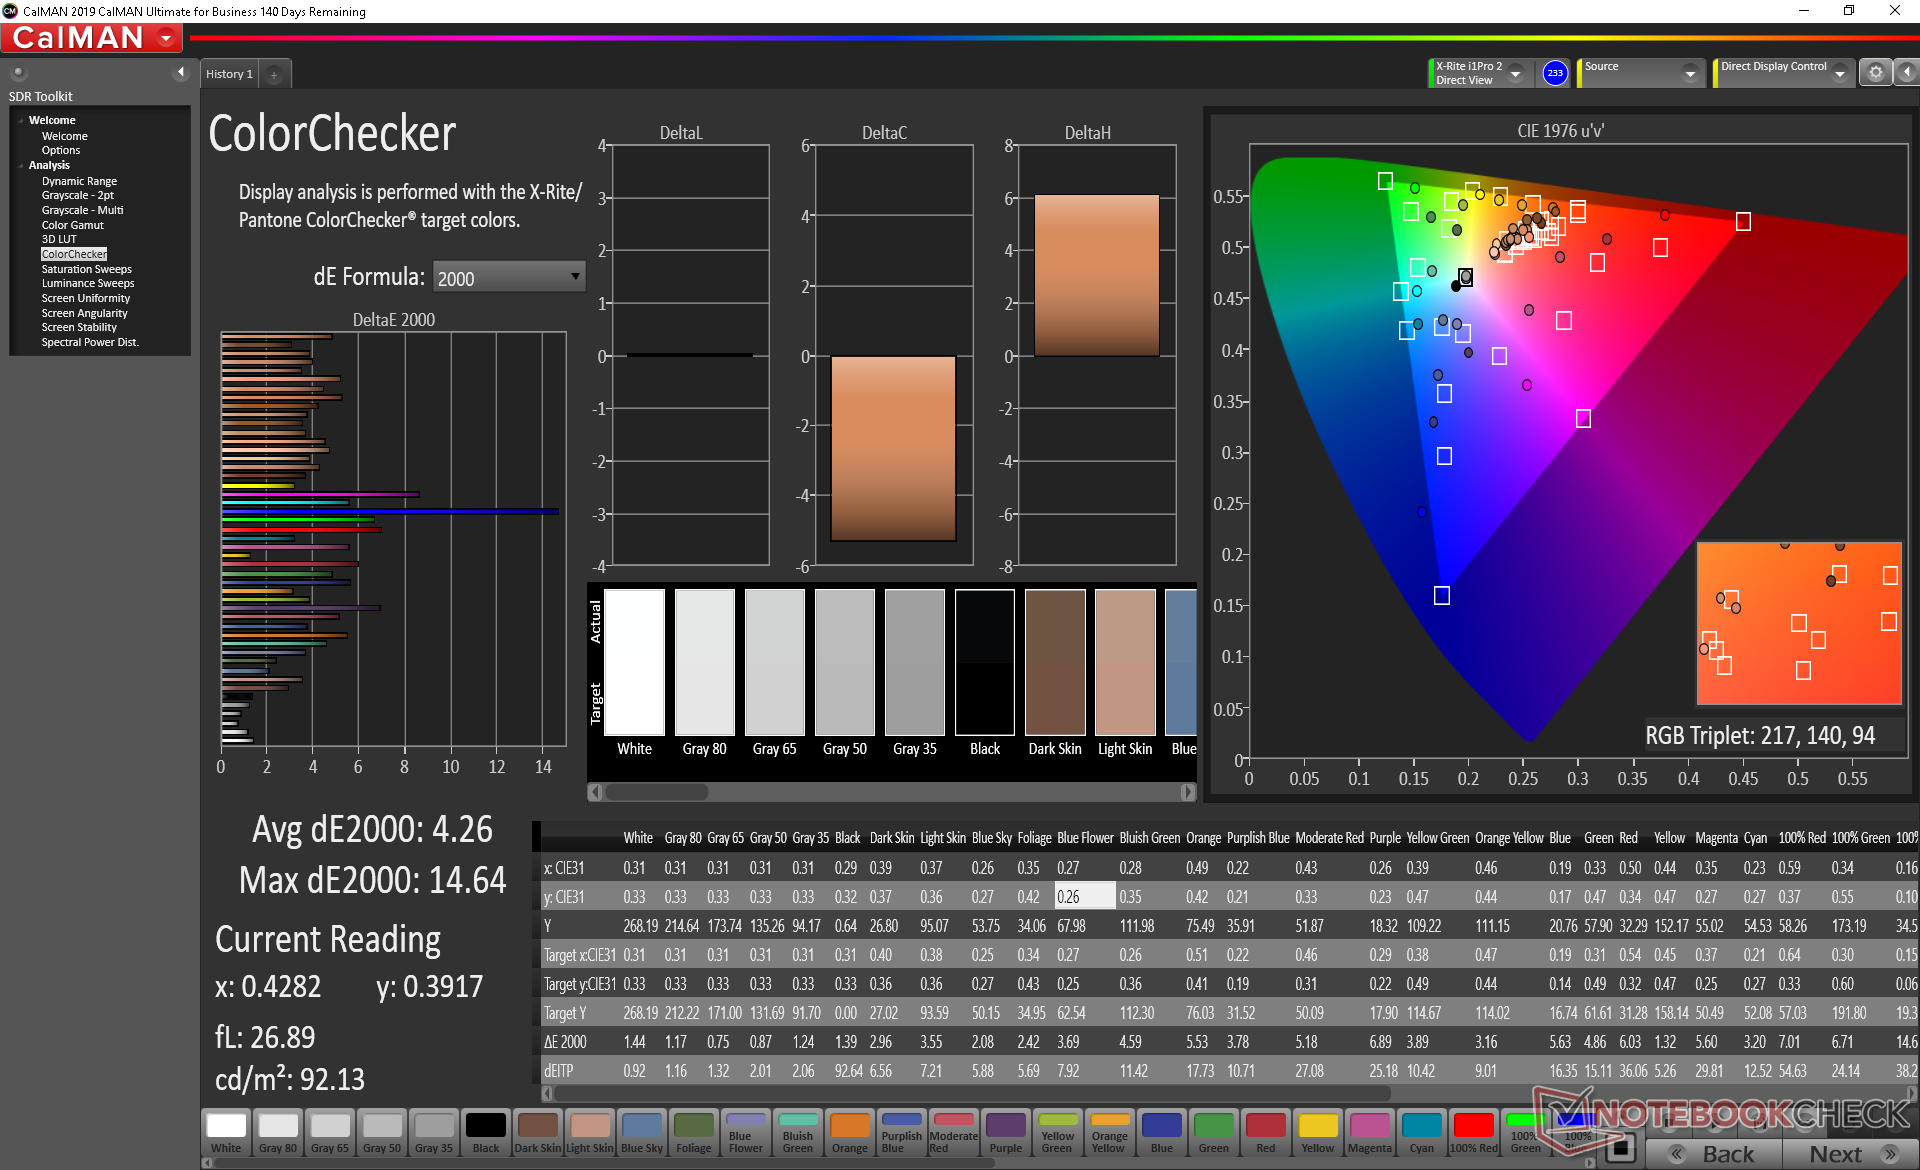
calibrated: 4.26
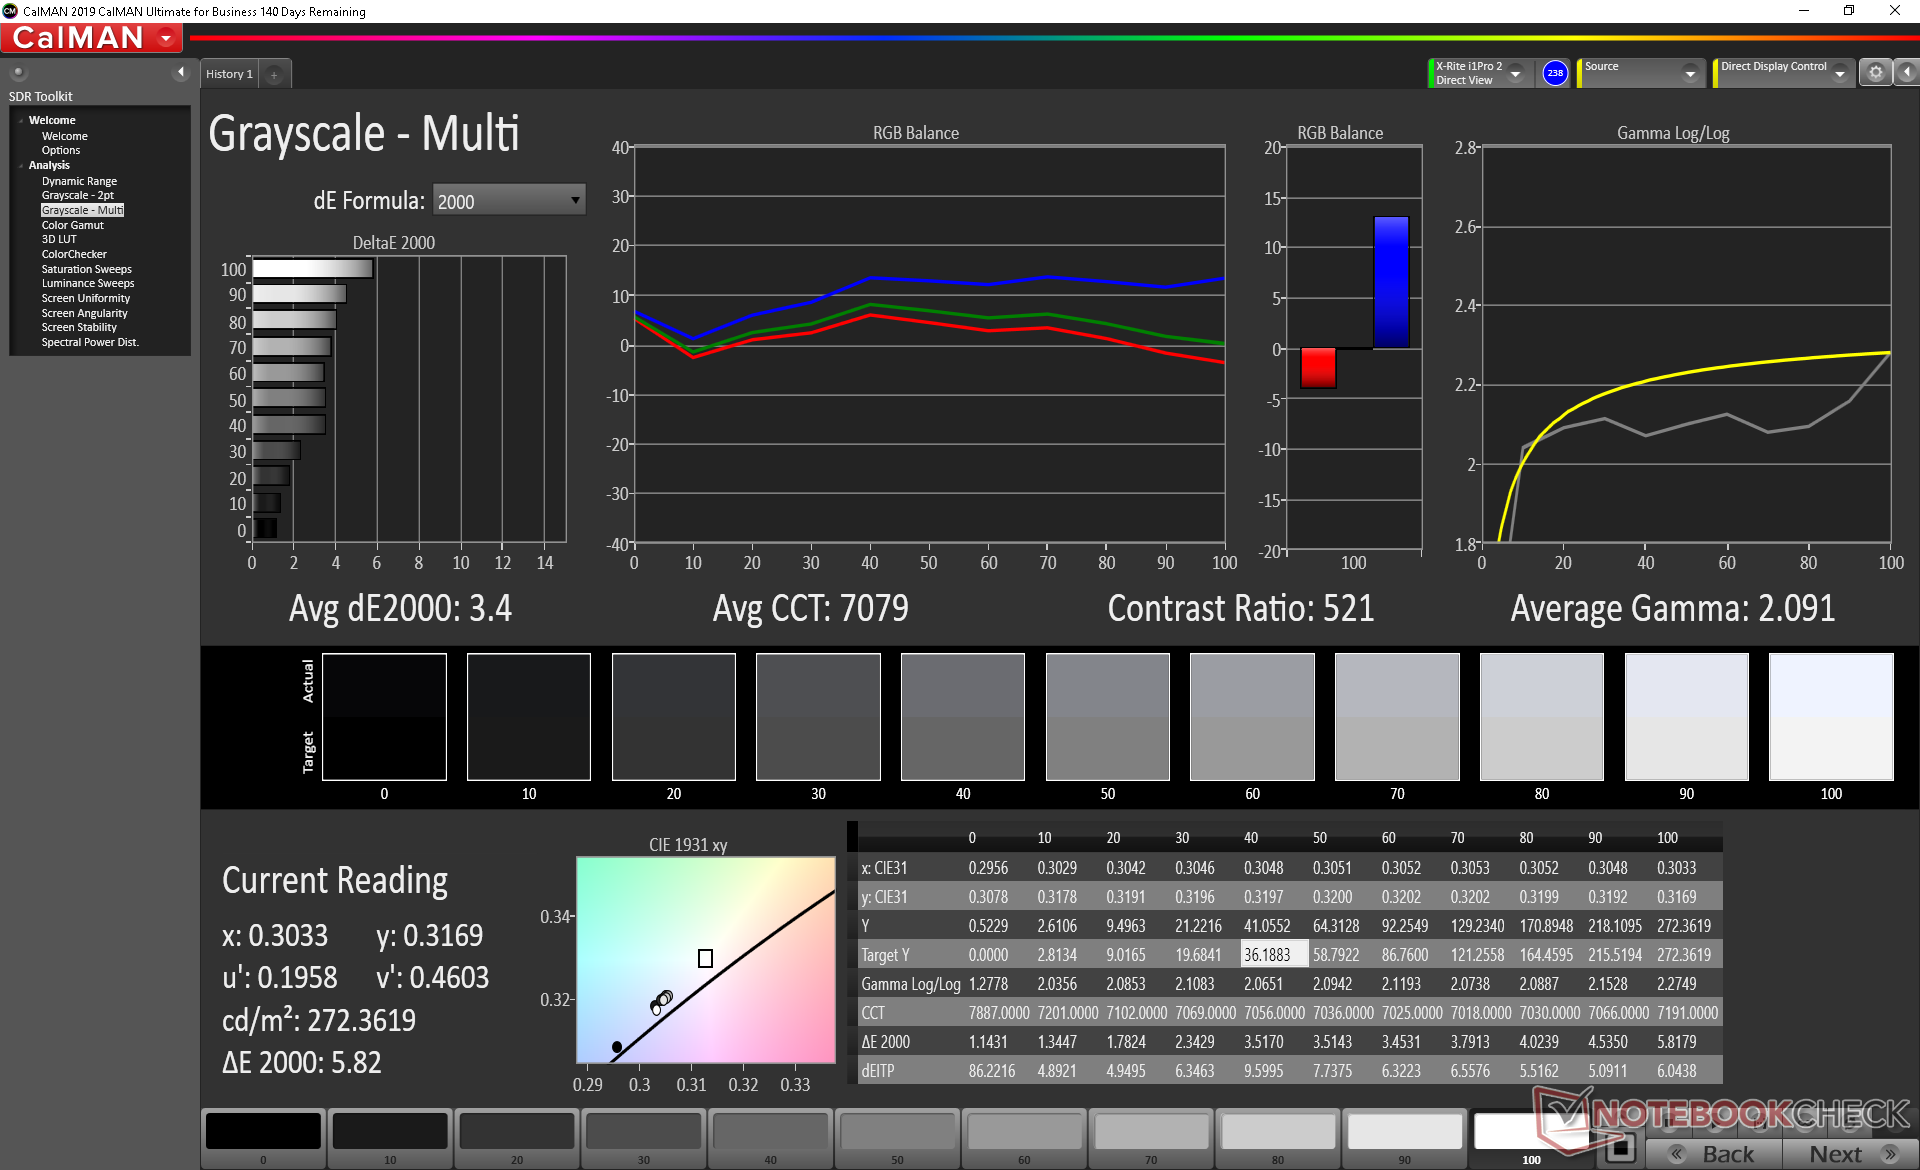
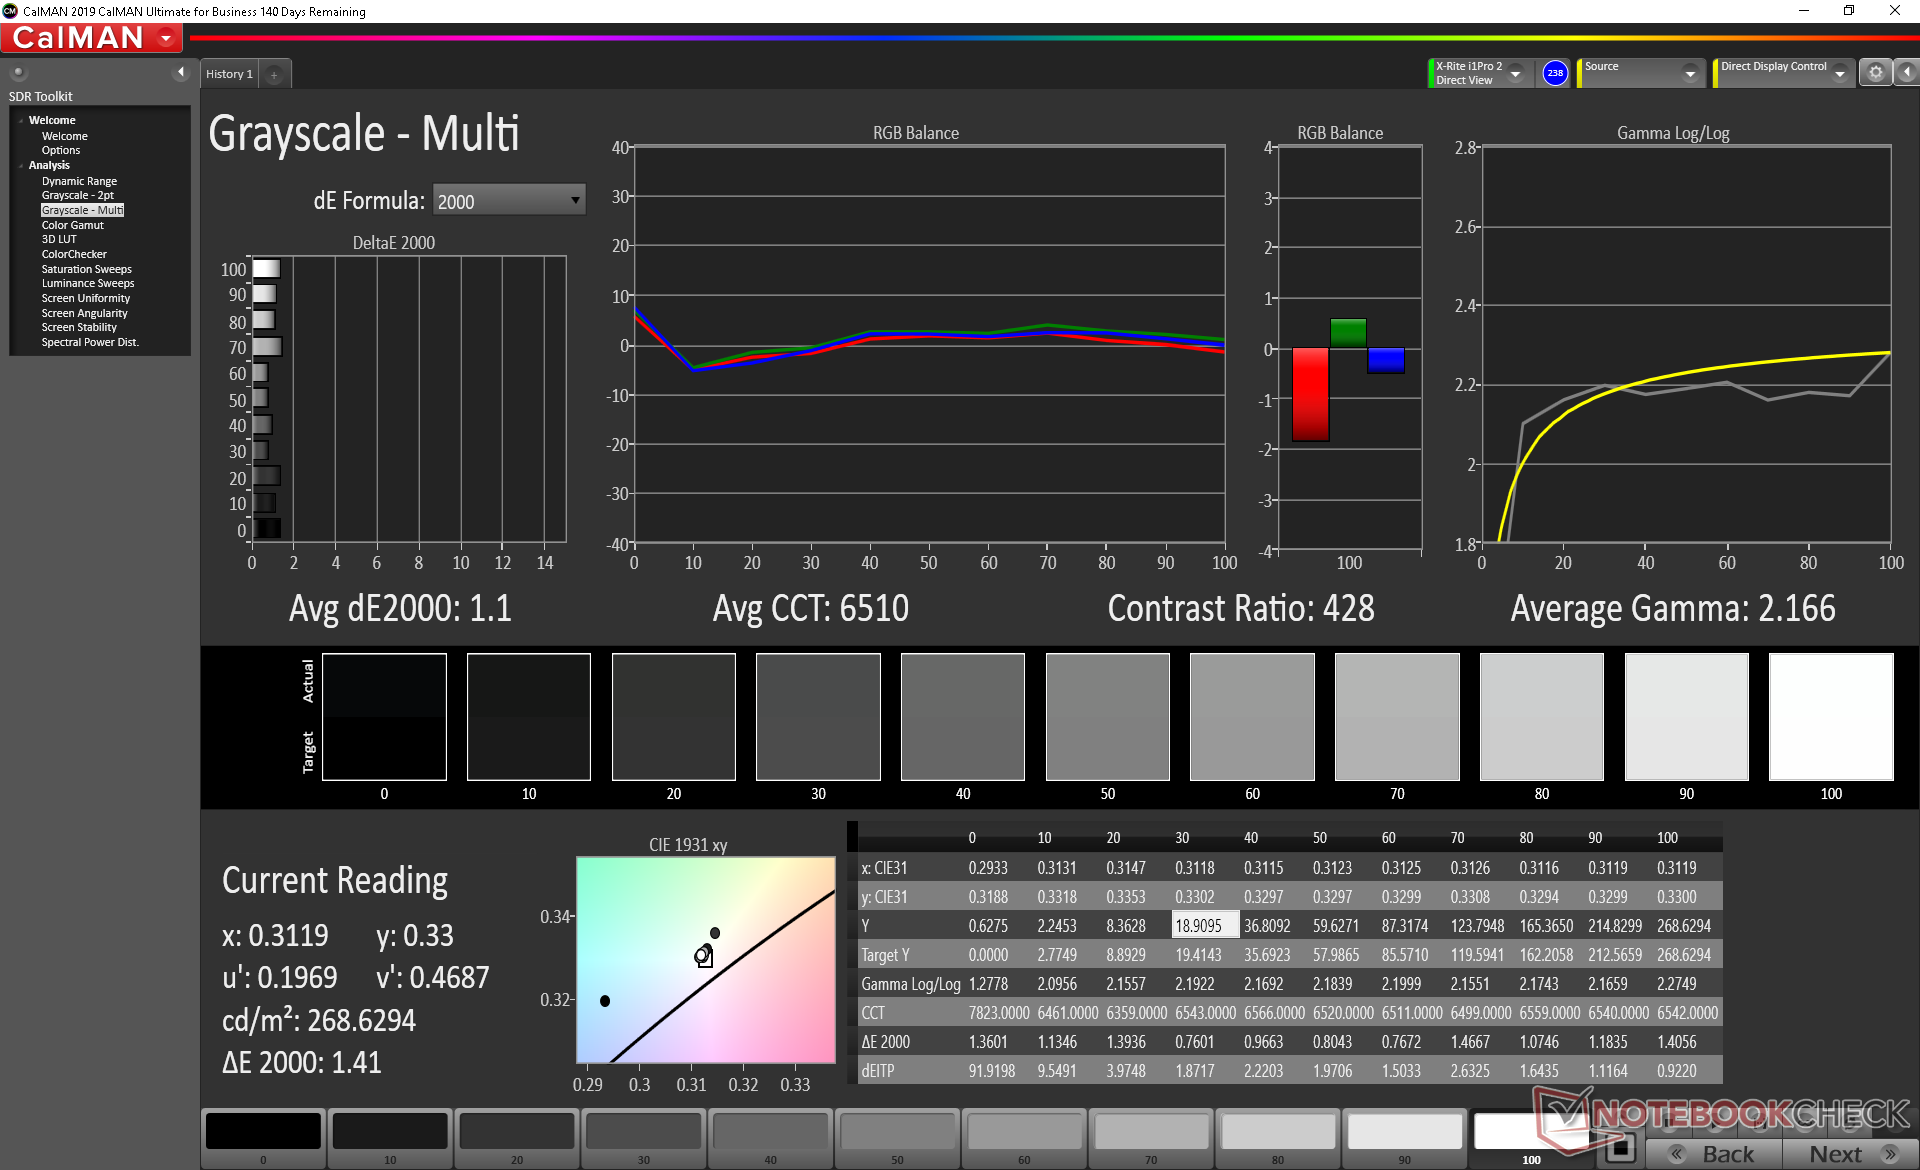
ΔE Greyscale Calman: 3.4 | ∀{0.09-98 Ø4.96}
59.5% sRGB (Argyll 1.6.3 3D)
37.8% AdobeRGB 1998 (Argyll 1.6.3 3D)
41.06% AdobeRGB 1998 (Argyll 3D)
59.8% sRGB (Argyll 3D)
39.73% Display P3 (Argyll 3D)
Gamma: 2.09
CCT: 7079 K
| Asus ROG Strix G15 G512LI Panda LM156LF-2F01, IPS, 15.6", 1920x1080 | Asus TUF Gaming A15 FA506IV-HN172 LM156LF-2F01, IPS, 15.6", 1920x1080 | Asus Strix Scar III G531GW-AZ062T Sharp LQ156M1JW09 (SHP14D3), IPS, 15.6", 1920x1080 | MSI GP65 10SFK-047US LG Philips LP156WFG-SPB3, IPS, 15.6", 1920x1080 | Dell G5 15 SE 5505 P89F BOE NV156FH, WVA, 15.6", 1920x1080 | HP Omen 15-dc1020ng LGD05CE, IPS, 15.6", 1920x1080 | |
|---|---|---|---|---|---|---|
| Display | -2% | 65% | 59% | 55% | -3% | |
| Display P3 Coverage (%) | 39.73 | 38.92 -2% | 66.2 67% | 63.5 60% | 63 59% | 38.37 -3% |
| sRGB Coverage (%) | 59.8 | 58.5 -2% | 97.1 62% | 94.4 58% | 90.1 51% | 57.6 -4% |
| AdobeRGB 1998 Coverage (%) | 41.06 | 40.22 -2% | 67.6 65% | 65.1 59% | 64.1 56% | 39.69 -3% |
| Response Times | 6% | 61% | 63% | 50% | -13% | |
| Response Time Grey 50% / Grey 80% * (ms) | 33.6 ? | 34 ? -1% | 15 ? 55% | 10.4 ? 69% | 20.4 ? 39% | 40 ? -19% |
| Response Time Black / White * (ms) | 27.6 ? | 24 ? 13% | 9 ? 67% | 12 ? 57% | 10.8 ? 61% | 29.6 ? -7% |
| PWM Frequency (Hz) | 250 ? | 198.4 ? | ||||
| Screen | 25% | 29% | 36% | 36% | 14% | |
| Brightness middle (cd/m²) | 271.2 | 280 3% | 309 14% | 384.9 42% | 292 8% | 251 -7% |
| Brightness (cd/m²) | 252 | 254 1% | 284 13% | 358 42% | 290 15% | 232 -8% |
| Brightness Distribution (%) | 79 | 88 11% | 88 11% | 87 10% | 77 -3% | 76 -4% |
| Black Level * (cd/m²) | 0.53 | 0.15 72% | 0.42 21% | 0.67 -26% | 0.27 49% | 0.17 68% |
| Contrast (:1) | 512 | 1867 265% | 736 44% | 574 12% | 1081 111% | 1476 188% |
| Colorchecker dE 2000 * | 5.04 | 5.89 -17% | 3.99 21% | 2.43 52% | 3.99 21% | 6.2 -23% |
| Colorchecker dE 2000 max. * | 16.07 | 19 -18% | 8.3 48% | 4.58 71% | 6.11 62% | 18.6 -16% |
| Colorchecker dE 2000 calibrated * | 4.26 | 4.79 -12% | 1.12 74% | 2.03 52% | 3.02 29% | 4.8 -13% |
| Greyscale dE 2000 * | 3.4 | 4.08 -20% | 5.43 -60% | 2.6 24% | 3.3 3% | 4.2 -24% |
| Gamma | 2.09 105% | 2.33 94% | 2.57 86% | 2.2 100% | 2.25 98% | 2.32 95% |
| CCT | 7079 92% | 7303 89% | 7767 84% | 6981 93% | 7047 92% | 7454 87% |
| Color Space (Percent of AdobeRGB 1998) (%) | 37.8 | 37 -2% | 63 67% | 59.7 58% | 58.1 54% | 36.5 -3% |
| Color Space (Percent of sRGB) (%) | 59.5 | 58 -3% | 97 63% | 93.9 58% | 89.7 51% | 57.4 -4% |
| Total Average (Program / Settings) | 10% /
18% | 52% /
40% | 53% /
44% | 47% /
42% | -1% /
7% |
* ... smaller is better
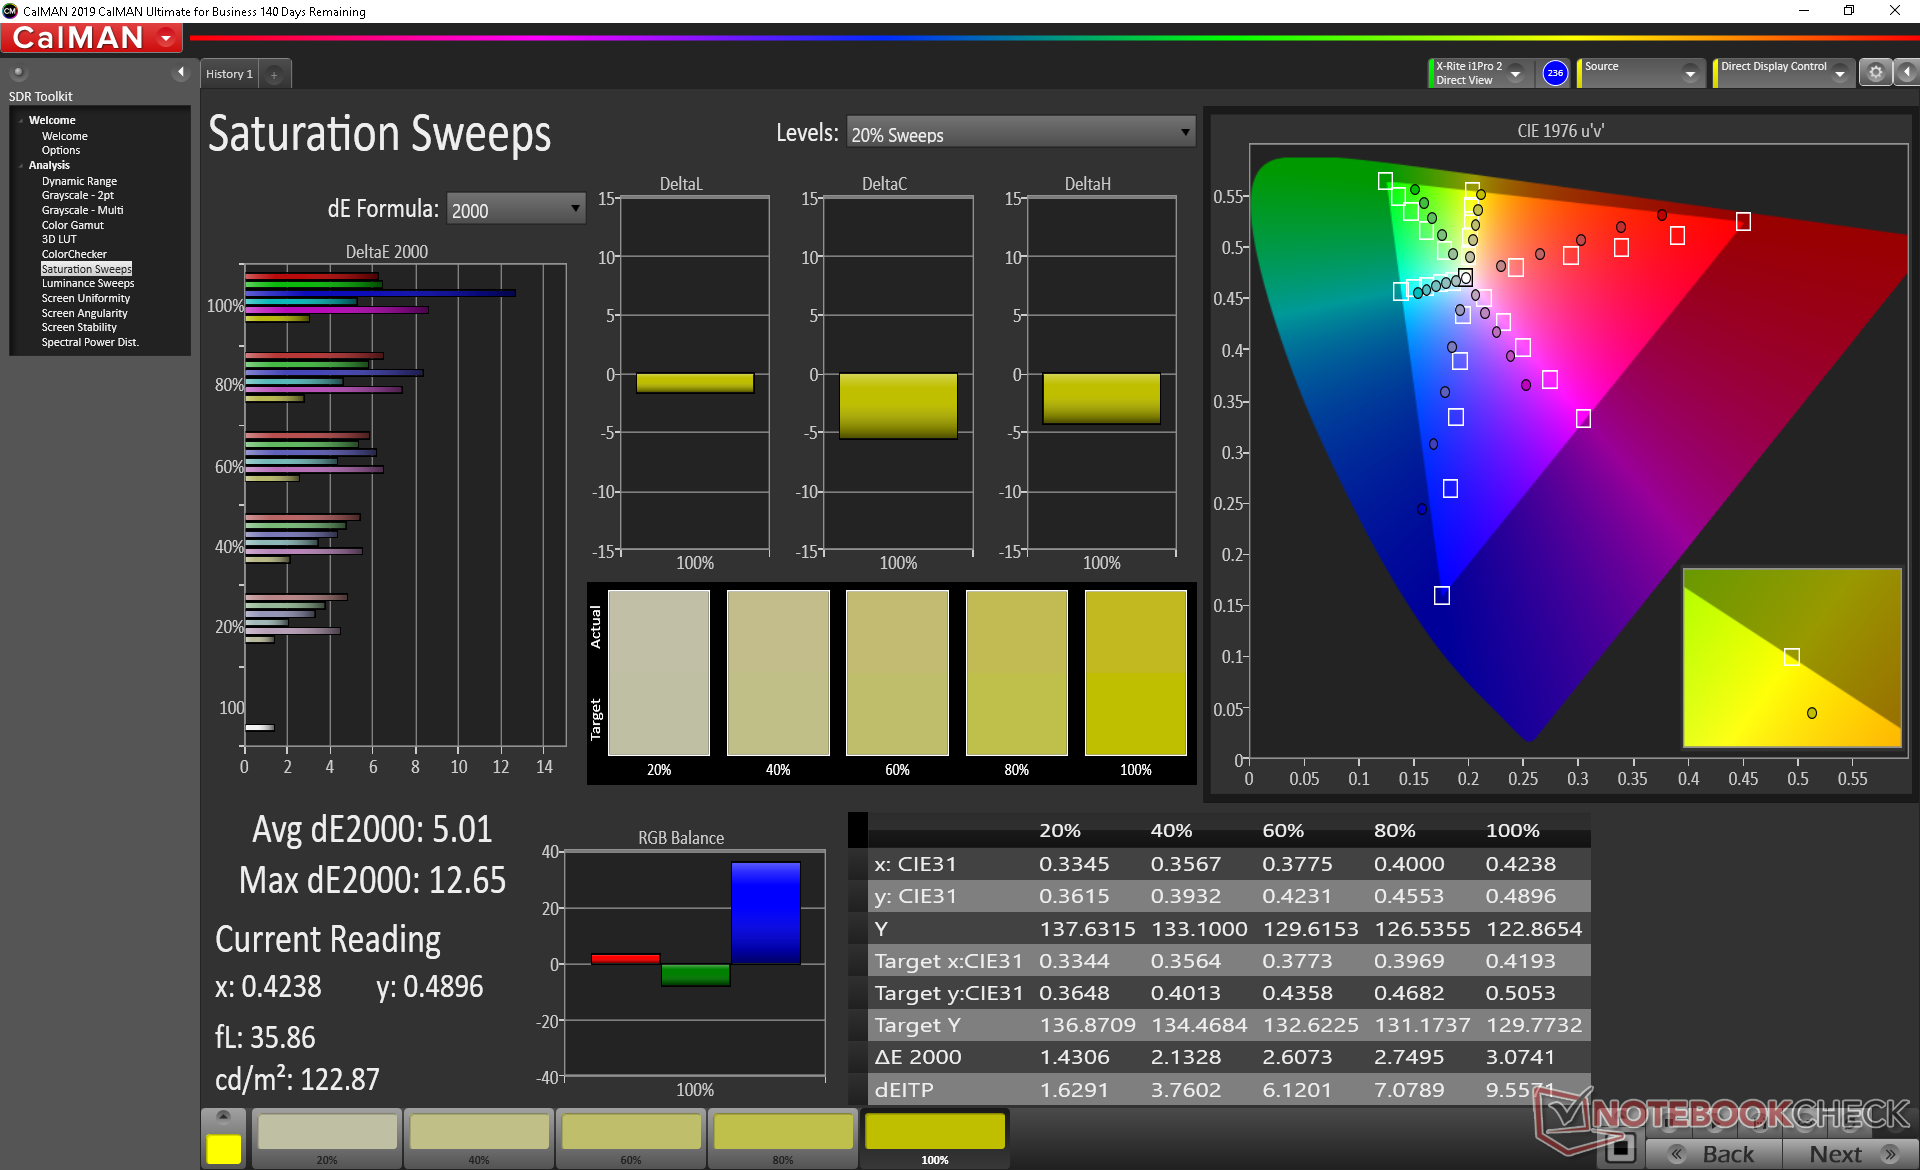
Color space is narrow at just 60 percent of sRGB to be indicative of a budget display. These results are in line with what we recorded on the Asus TUF A15 FA506IV while pricier gaming models like the ROG G531 tend to cover sRGB almost completely for deeper and more accurate colors.
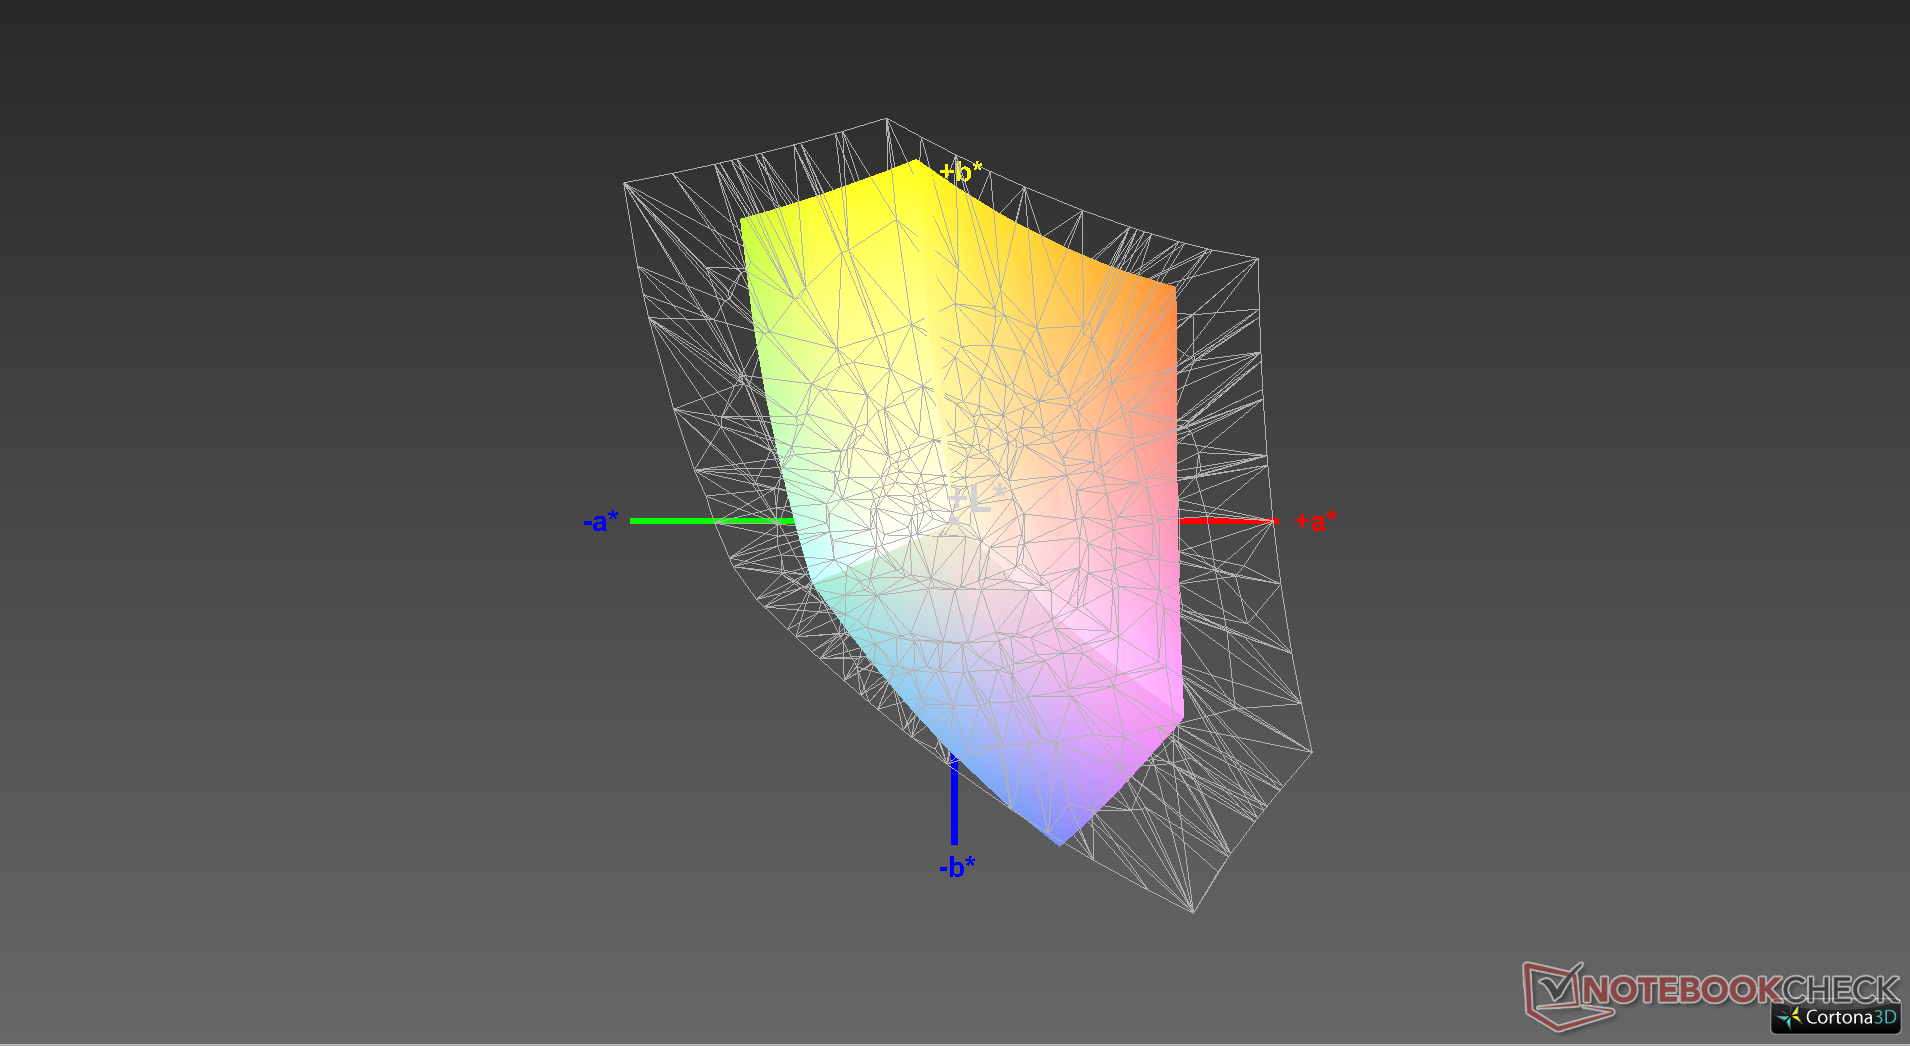
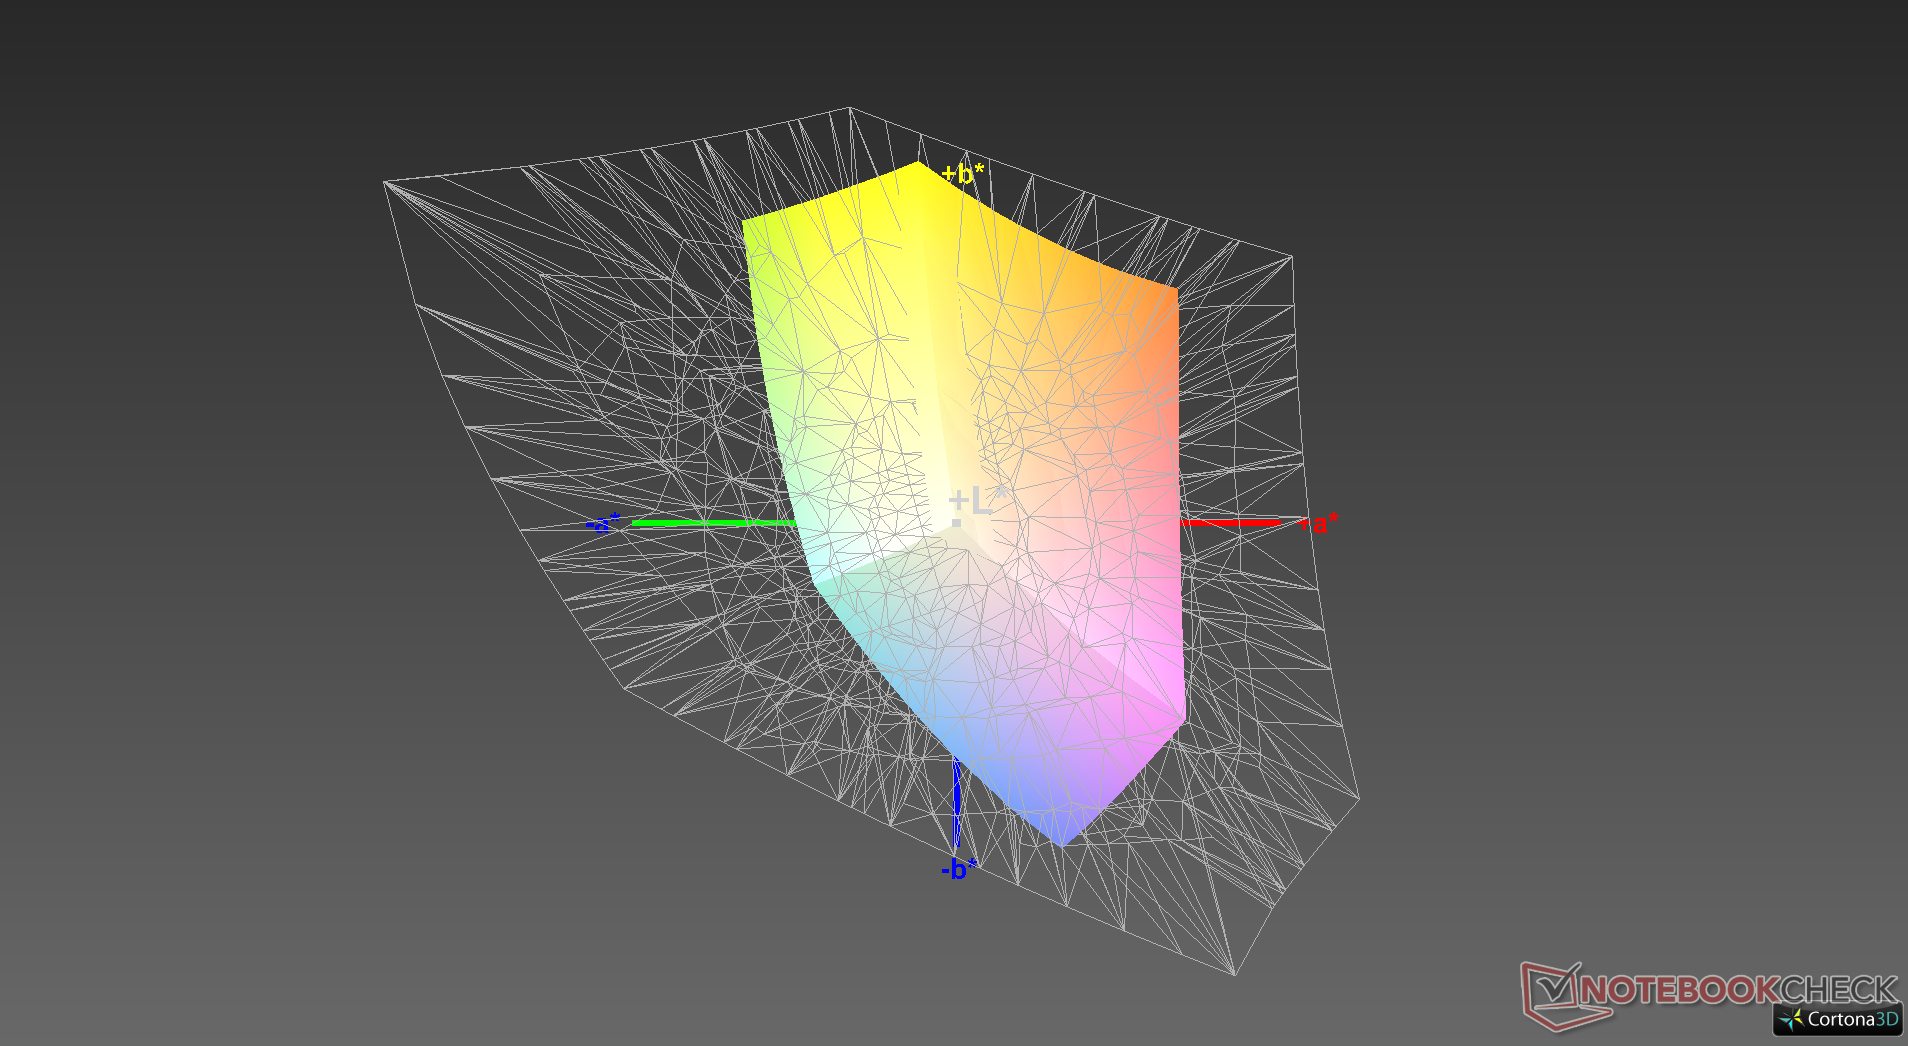
Further measurements with a colorimeter reveal an overly cool color temperature out of the box. Calibrating the display ourselves addresses the issue, but color accuracy would remain almost the same due to the limited color space mentioned above.

Display Response Times
| ↔ Response Time Black to White | ||
|---|---|---|
| 27.6 ms ... rise ↗ and fall ↘ combined | ↗ 15.6 ms rise | 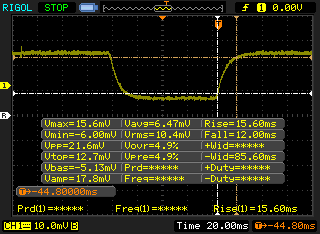 |
| ↘ 12 ms fall | ||
| The screen shows relatively slow response rates in our tests and may be too slow for gamers. In comparison, all tested devices range from 0.1 (minimum) to 240 (maximum) ms. » 70 % of all devices are better. This means that the measured response time is worse than the average of all tested devices (19.8 ms). | ||
| ↔ Response Time 50% Grey to 80% Grey | ||
| 33.6 ms ... rise ↗ and fall ↘ combined | ↗ 18.4 ms rise | 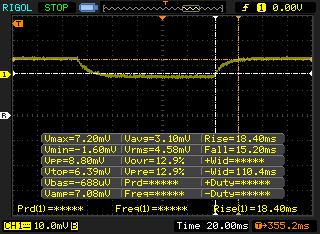 |
| ↘ 15.2 ms fall | ||
| The screen shows slow response rates in our tests and will be unsatisfactory for gamers. In comparison, all tested devices range from 0.165 (minimum) to 636 (maximum) ms. » 46 % of all devices are better. This means that the measured response time is similar to the average of all tested devices (30.9 ms). | ||
Screen Flickering / PWM (Pulse-Width Modulation)
| Screen flickering / PWM not detected | 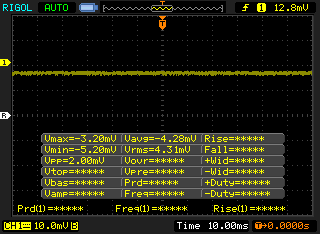 | ||
In comparison: 52 % of all tested devices do not use PWM to dim the display. If PWM was detected, an average of 7744 (minimum: 5 - maximum: 343500) Hz was measured. | |||
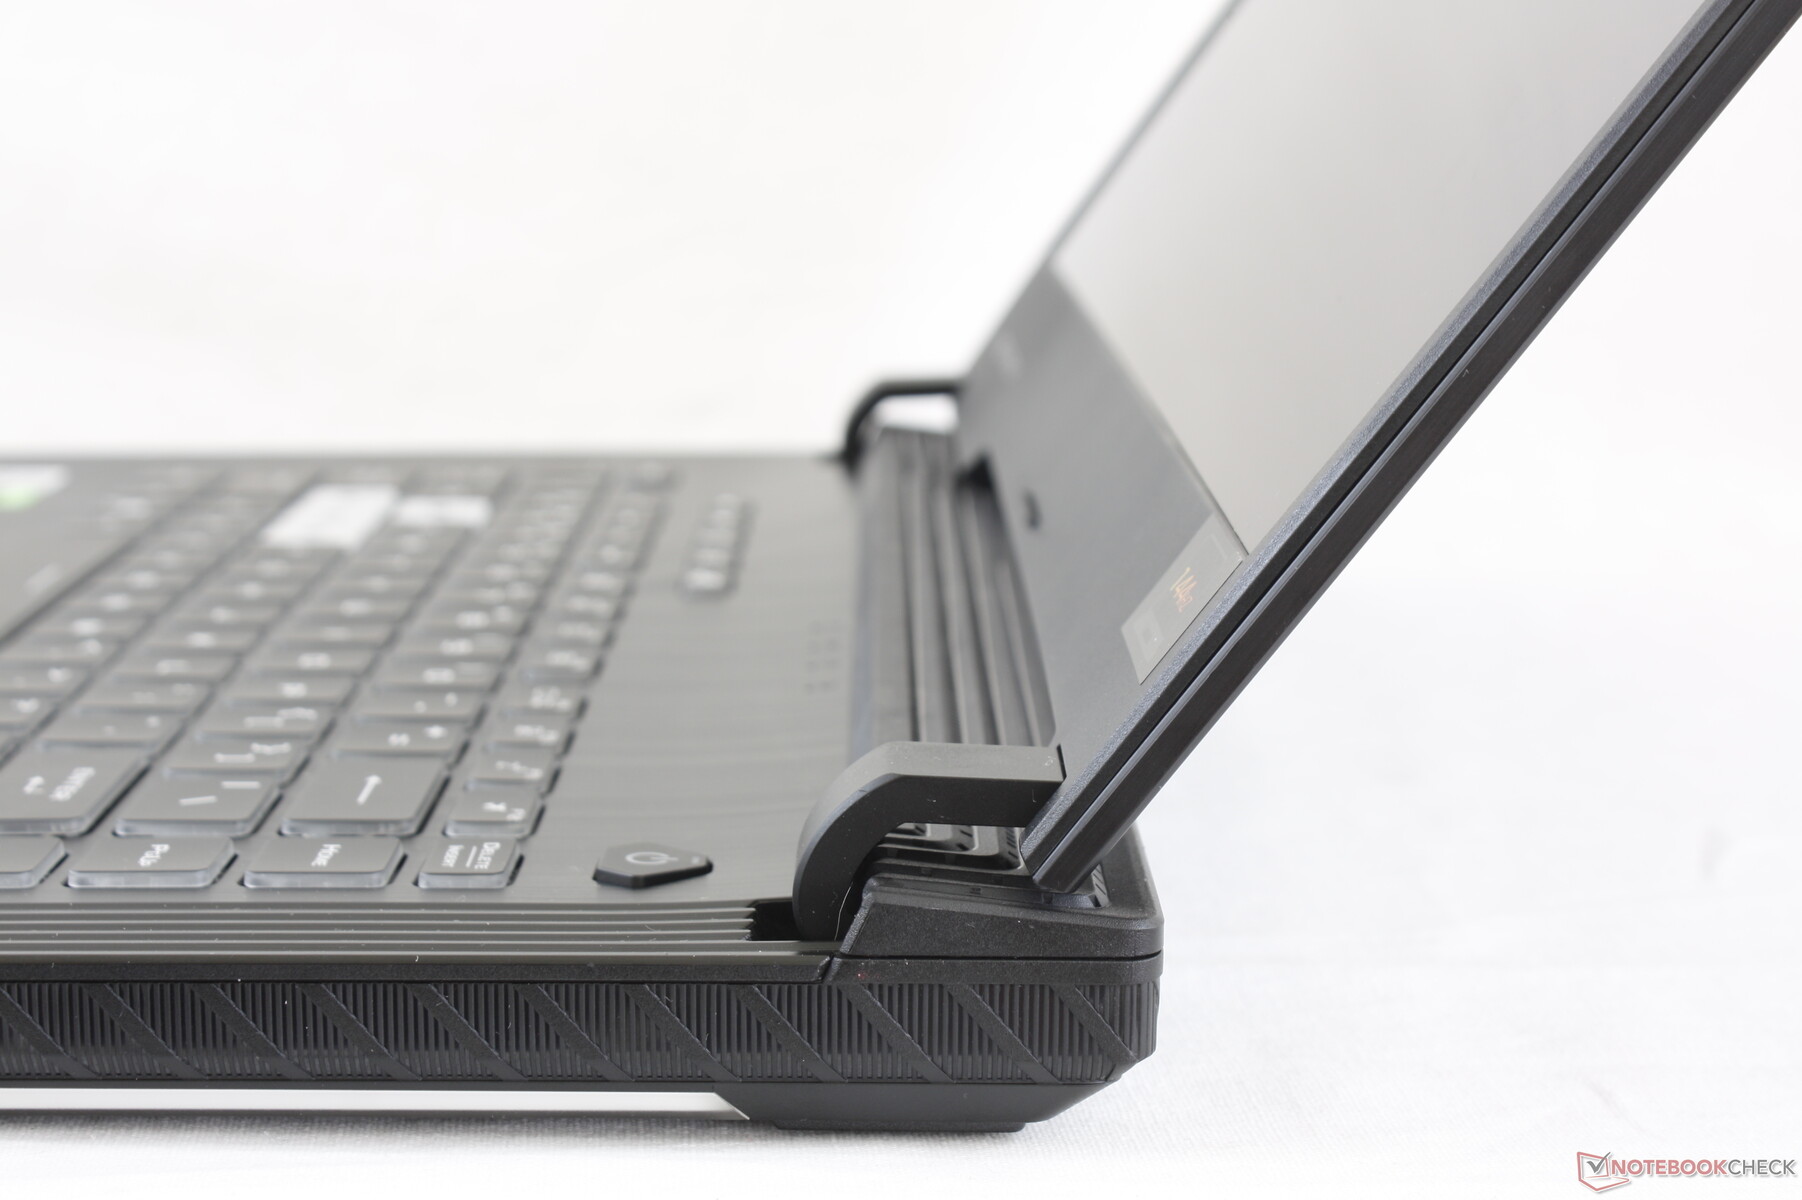
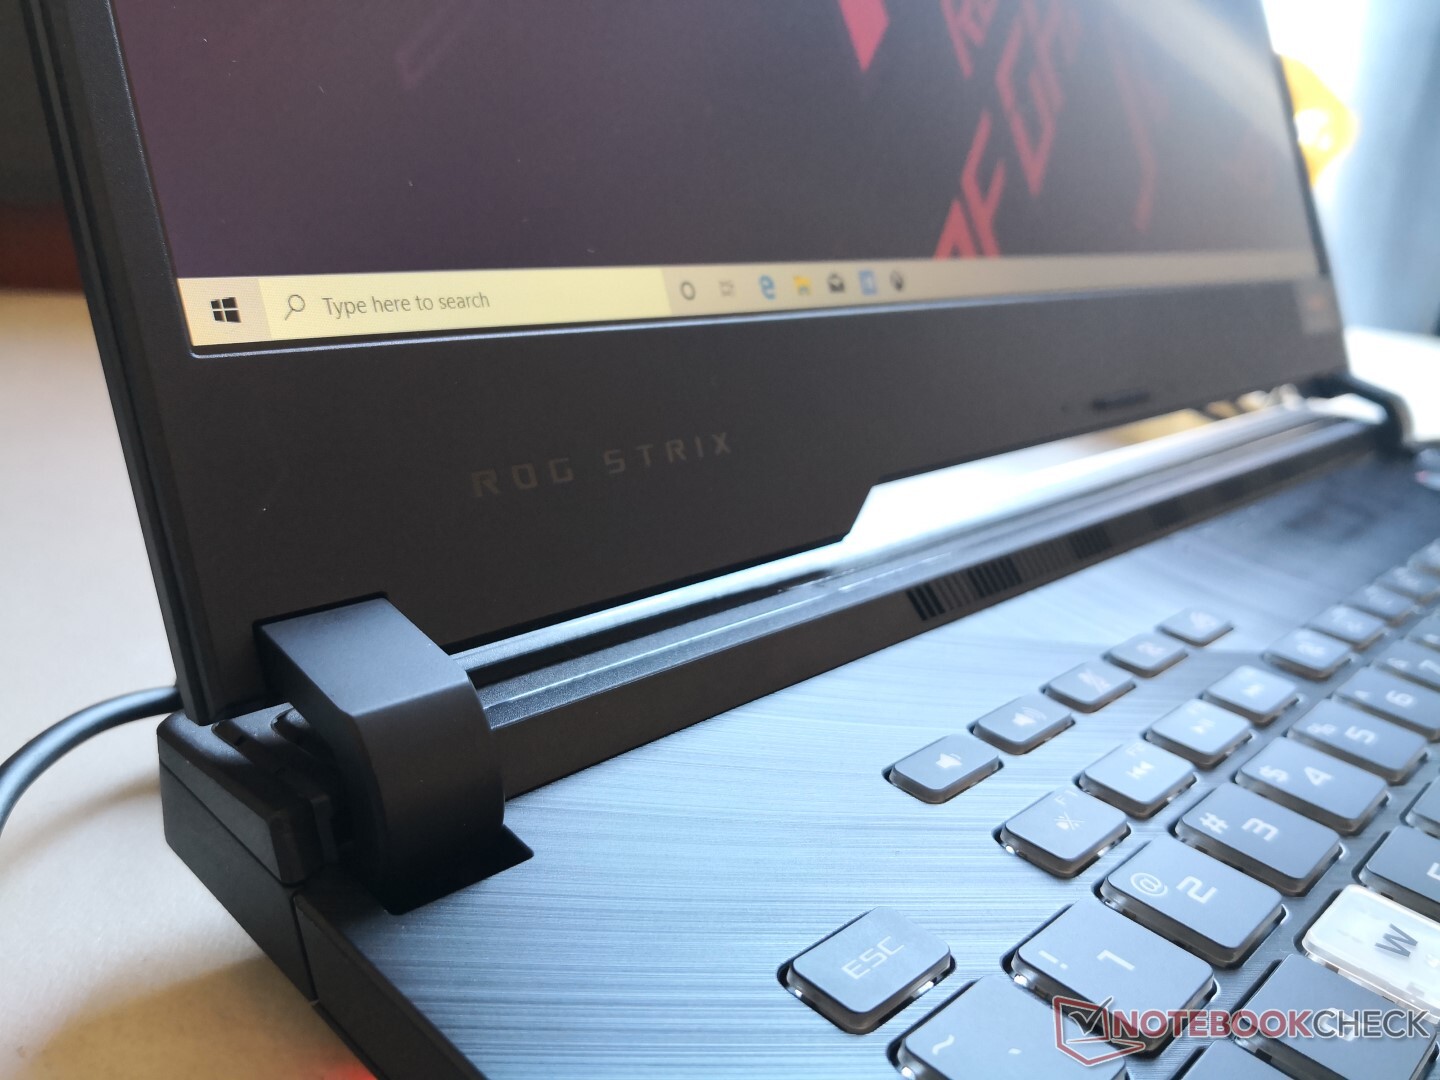
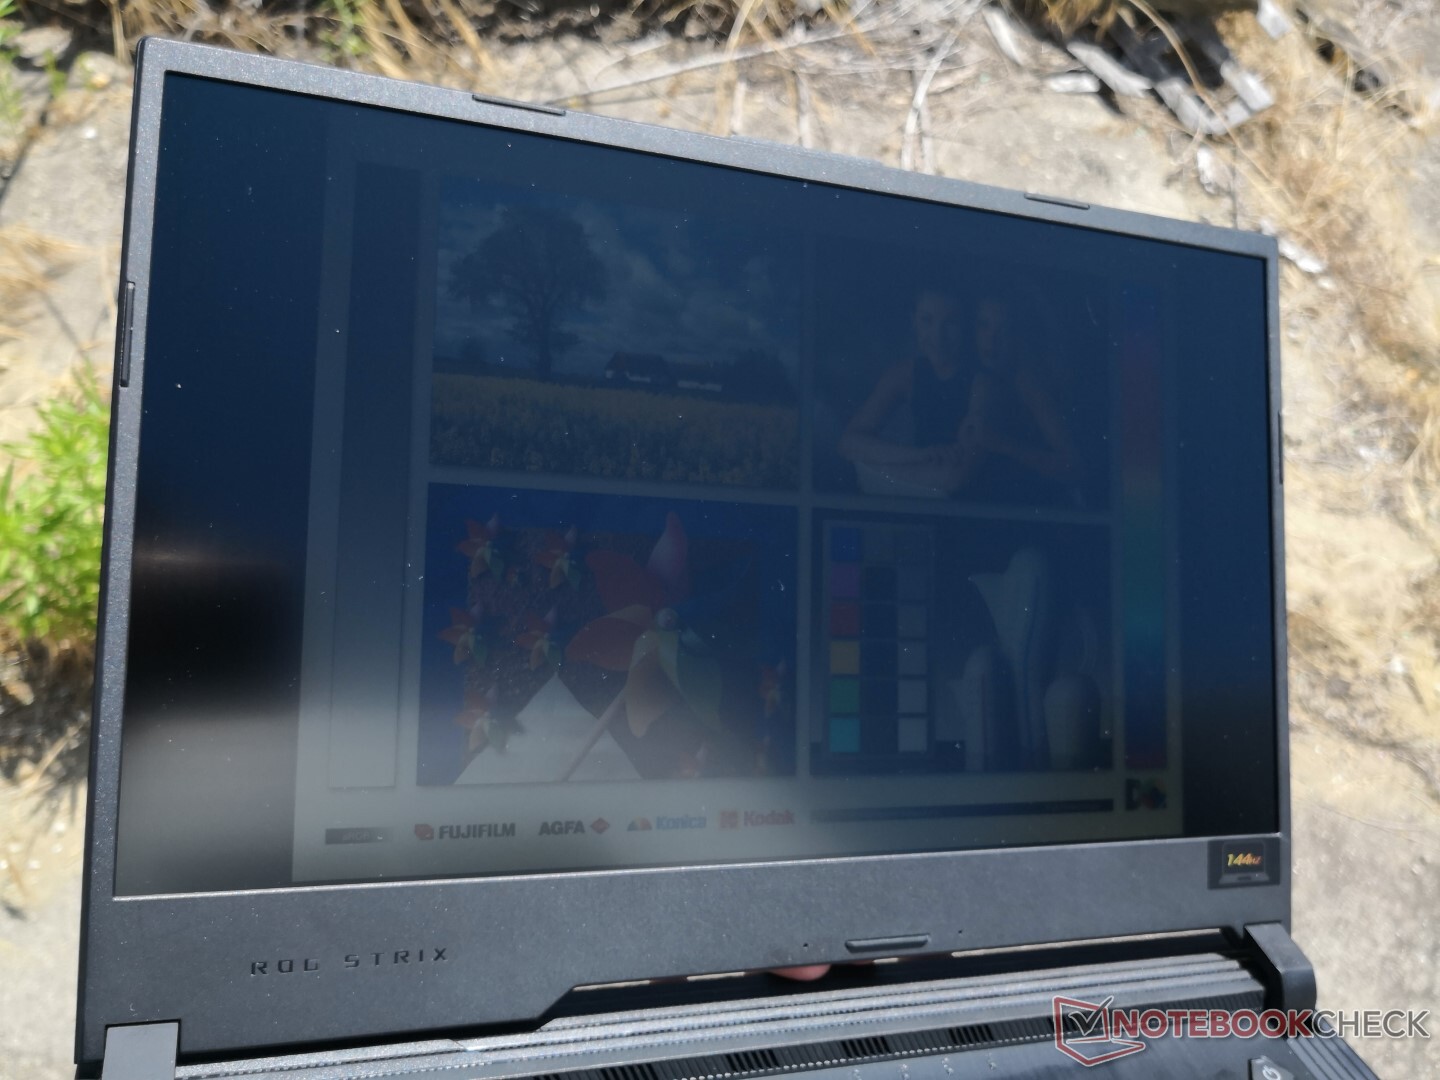
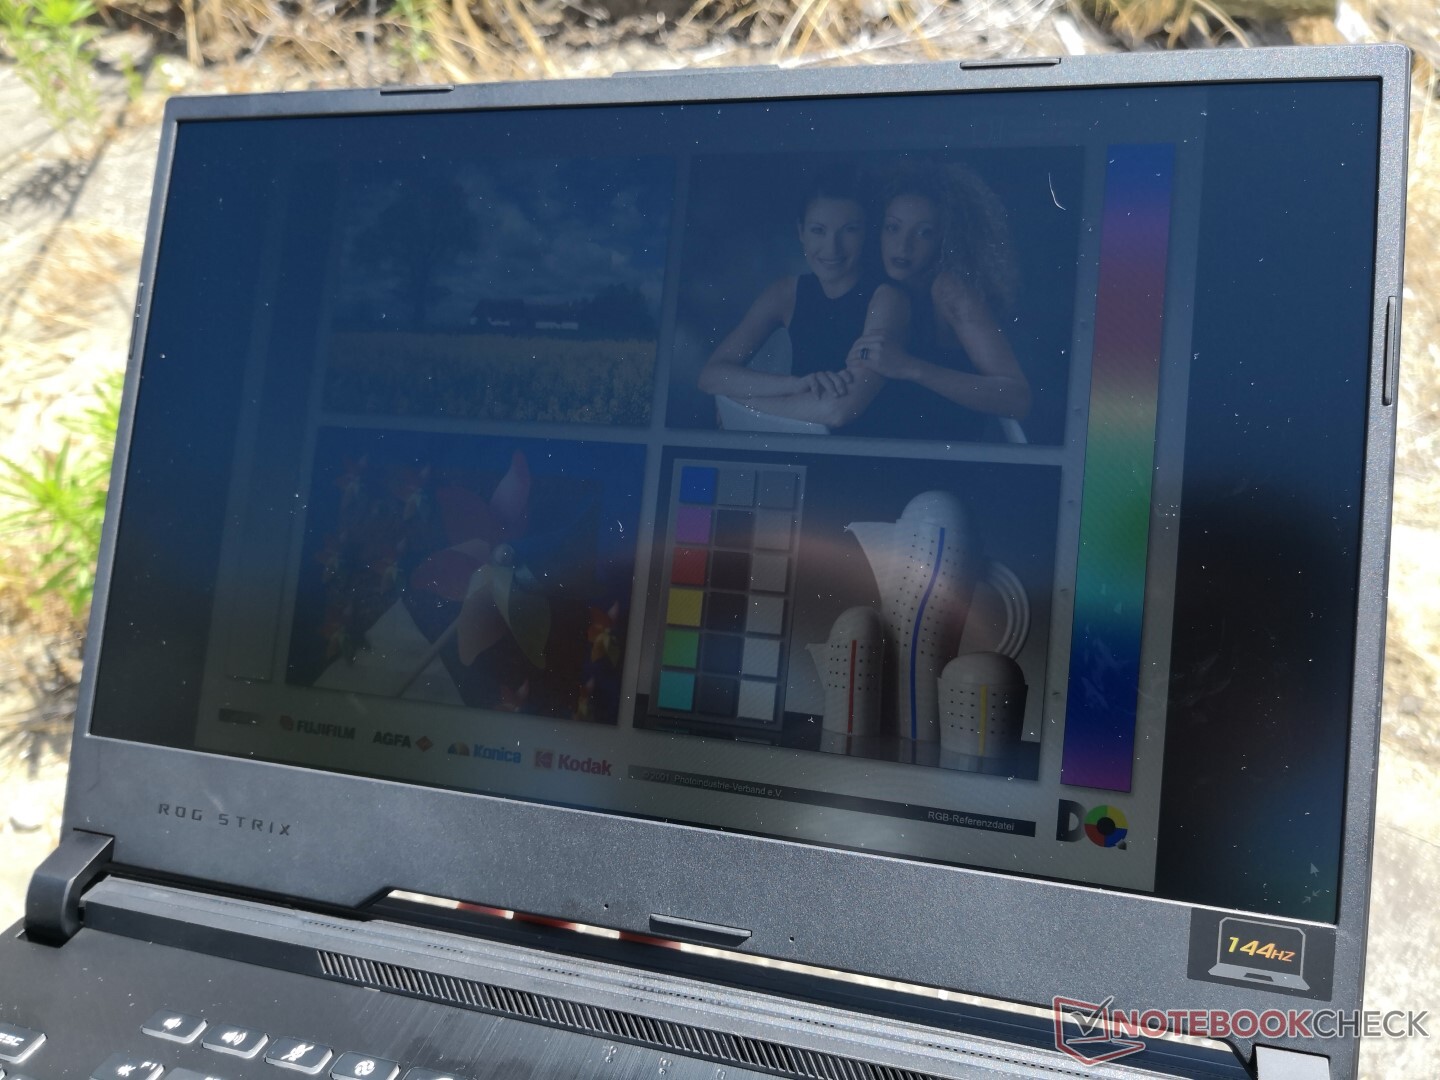
Outdoor visibility is average at best when under shade since this laptop was not designed to be used outdoors frequently. The narrow hinge angle discourages outdoor use as well.

Performance
Asus offers surprisingly high GPU options of up to the RTX 2070 Super for what is ultimately a mid-range chassis at best. Users looking for Core i9, AMD Ryzen, or RTX 2080 options will have to look outside of the G512 series and into the TUF series or mothership ROG series.
Keep in mind that our measurements and numbers below reflect only our configuration in review. Higher-end SKUs with the more powerful RTX 2060 or RTX 2070 Super will likely run louder and/or warmer than what we've recorded here.
Nvidia Optimus comes standard with no G-Sync options.
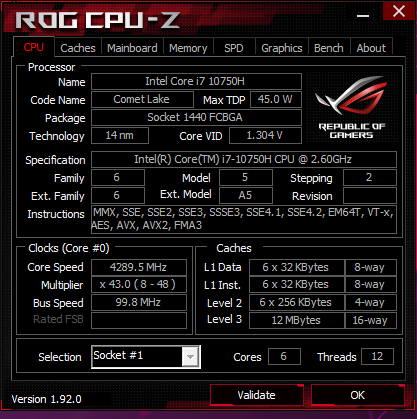
Processor
The Core i7-10750H is performing where we expect it to be relative to other laptops in our database with the same processor. Multi-thread performance will be about 10 to 30 percent faster than the last generation Core i7-9750H depending on the laptop in question while being slightly slower than the competing Ryzen 5 4600H. Upgrading to the octa-core Core i7-10875H will net about 25 percent faster performance.
See our dedicated page on the Core i7-10750H for more technical information and benchmark comparisons.
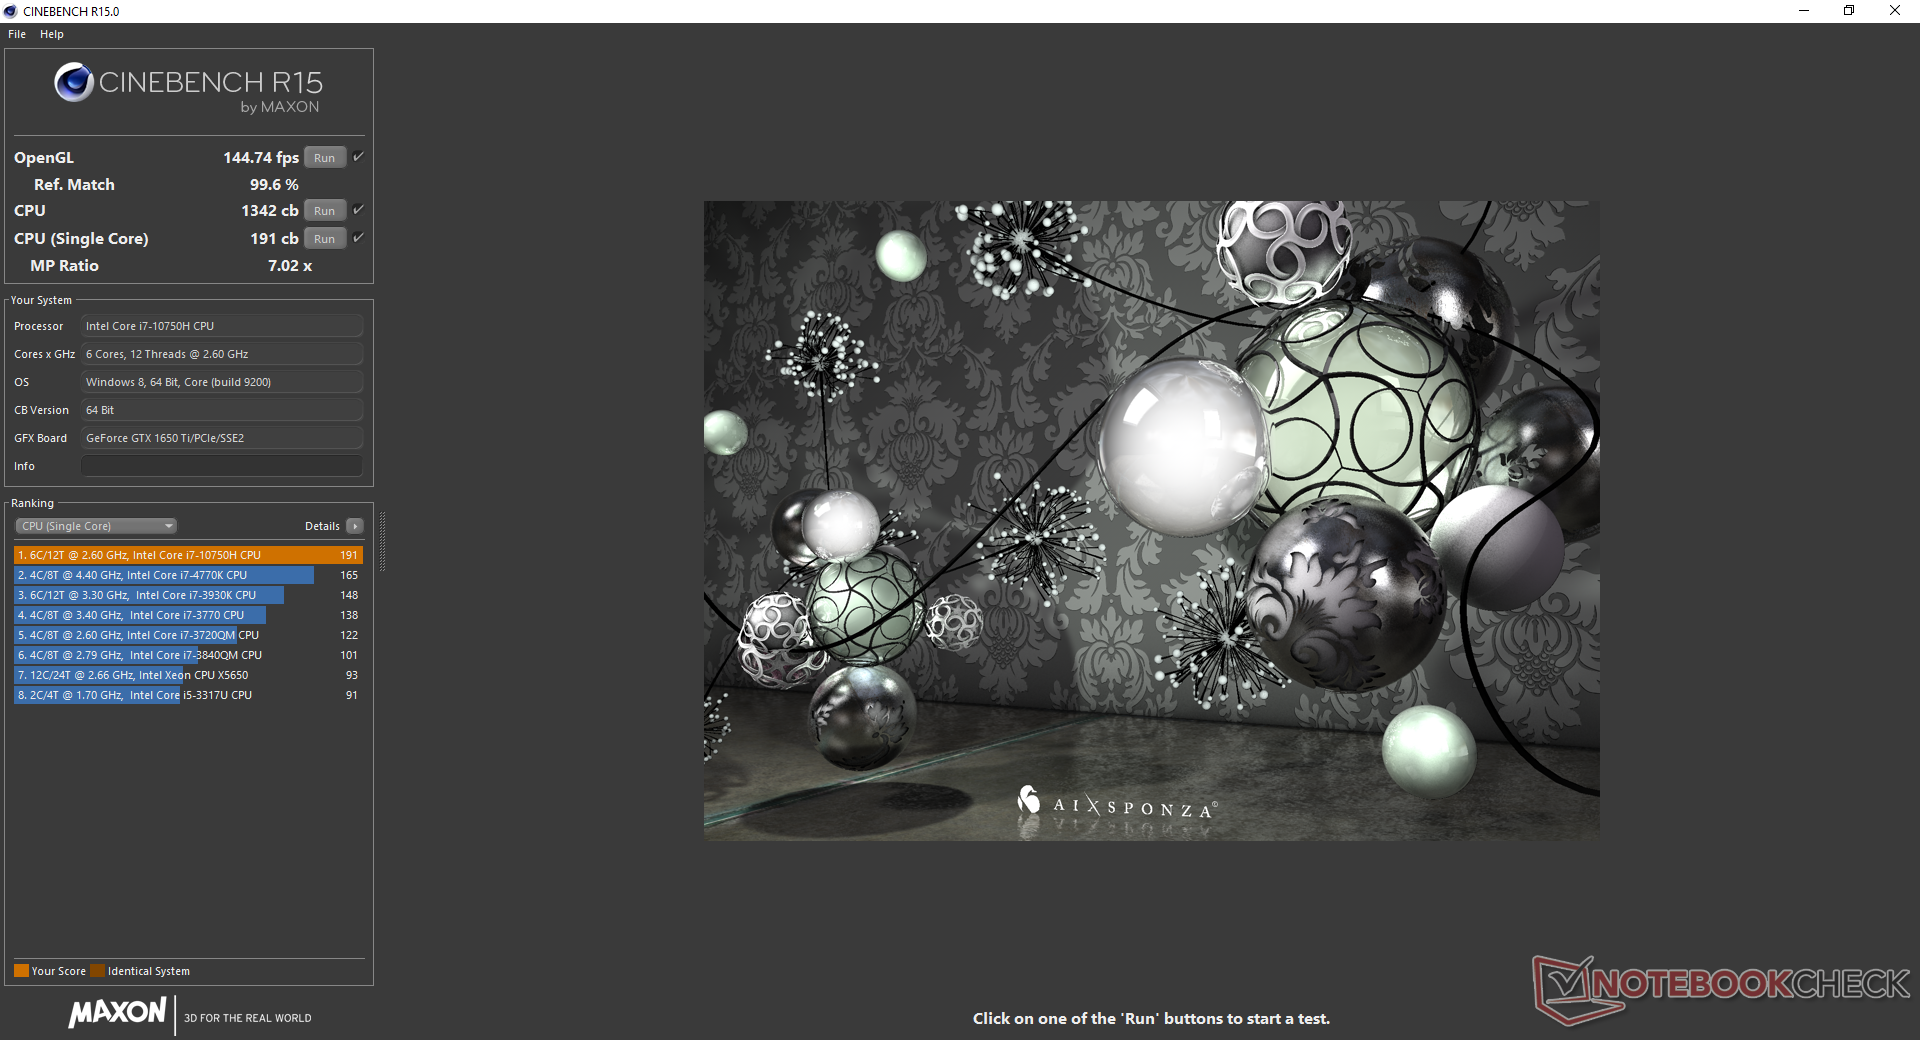
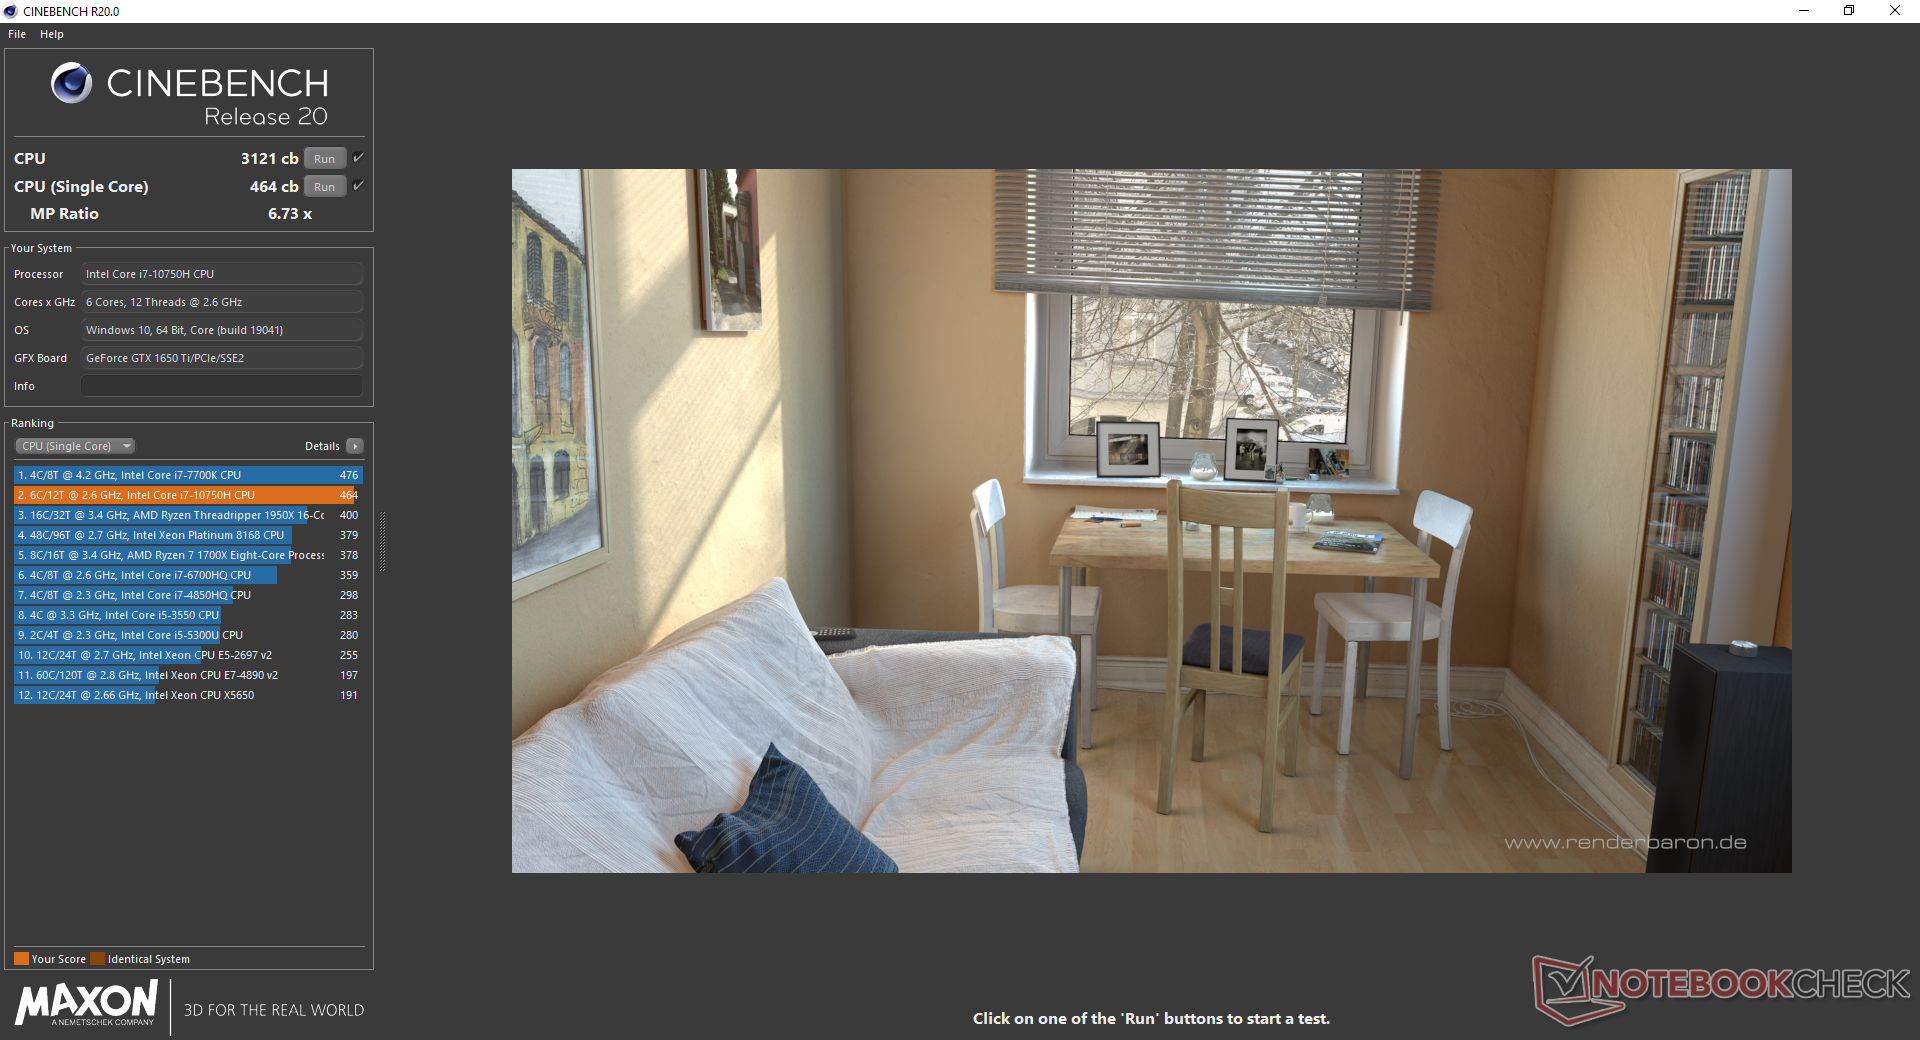
Cinebench R15: CPU Multi 64Bit | CPU Single 64Bit
Blender: v2.79 BMW27 CPU
7-Zip 18.03: 7z b 4 -mmt1 | 7z b 4
Geekbench 5.5: Single-Core | Multi-Core
HWBOT x265 Benchmark v2.2: 4k Preset
LibreOffice : 20 Documents To PDF
R Benchmark 2.5: Overall mean
| Geekbench 5.5 / Single-Core | |
| MSI GE66 Raider 10SFS | |
| Gigabyte Aero 15 OLED XB-8DE51B0SP | |
| Average Intel Core i7-10750H (1114 - 1333, n=43) | |
| Lenovo Legion 5 15IMH05H | |
| Asus Zephyrus G14 GA401IV | |
| Dell G5 15 SE 5505 P89F | |
| Schenker XMG Pro 15 | |
| Asus ROG Strix G15 G512LI | |
| Acer Nitro 5 AN515-44-R5FT | |
| Geekbench 5.5 / Multi-Core | |
| MSI GE66 Raider 10SFS | |
| Gigabyte Aero 15 OLED XB-8DE51B0SP | |
| Dell G5 15 SE 5505 P89F | |
| Asus Zephyrus G14 GA401IV | |
| Asus ROG Strix G15 G512LI | |
| Average Intel Core i7-10750H (4443 - 6674, n=43) | |
| Schenker XMG Pro 15 | |
| Acer Nitro 5 AN515-44-R5FT | |
| Lenovo Legion 5 15IMH05H | |
| HWBOT x265 Benchmark v2.2 / 4k Preset | |
| Gigabyte Aero 15 OLED XB-8DE51B0SP | |
| MSI GE66 Raider 10SFS | |
| Dell G5 15 SE 5505 P89F | |
| Asus Zephyrus G14 GA401IV | |
| Asus ROG Strix G15 G512LI | |
| Average Intel Core i7-10750H (5.54 - 11.6, n=43) | |
| Acer Nitro 5 AN515-44-R5FT | |
| Schenker XMG Pro 15 | |
| Lenovo Legion 5 15IMH05H | |
| Asus ROG Zephyrus G15 GA502DU | |
| LibreOffice / 20 Documents To PDF | |
| Dell G5 15 SE 5505 P89F | |
| Acer Nitro 5 AN515-44-R5FT | |
| MSI GE66 Raider 10SFS | |
| Average Intel Core i7-10750H (43.1 - 99.2, n=43) | |
| Lenovo Legion 5 15IMH05H | |
| Gigabyte Aero 15 OLED XB-8DE51B0SP | |
| Asus ROG Strix G15 G512LI | |
| R Benchmark 2.5 / Overall mean | |
| Schenker XMG Pro 15 | |
| Lenovo Legion 5 15IMH05H | |
| Acer Nitro 5 AN515-44-R5FT | |
| Asus ROG Strix G15 G512LI | |
| Average Intel Core i7-10750H (0.578 - 0.708, n=42) | |
| Dell G5 15 SE 5505 P89F | |
| MSI GE66 Raider 10SFS | |
| Gigabyte Aero 15 OLED XB-8DE51B0SP | |
* ... smaller is better
System Performance
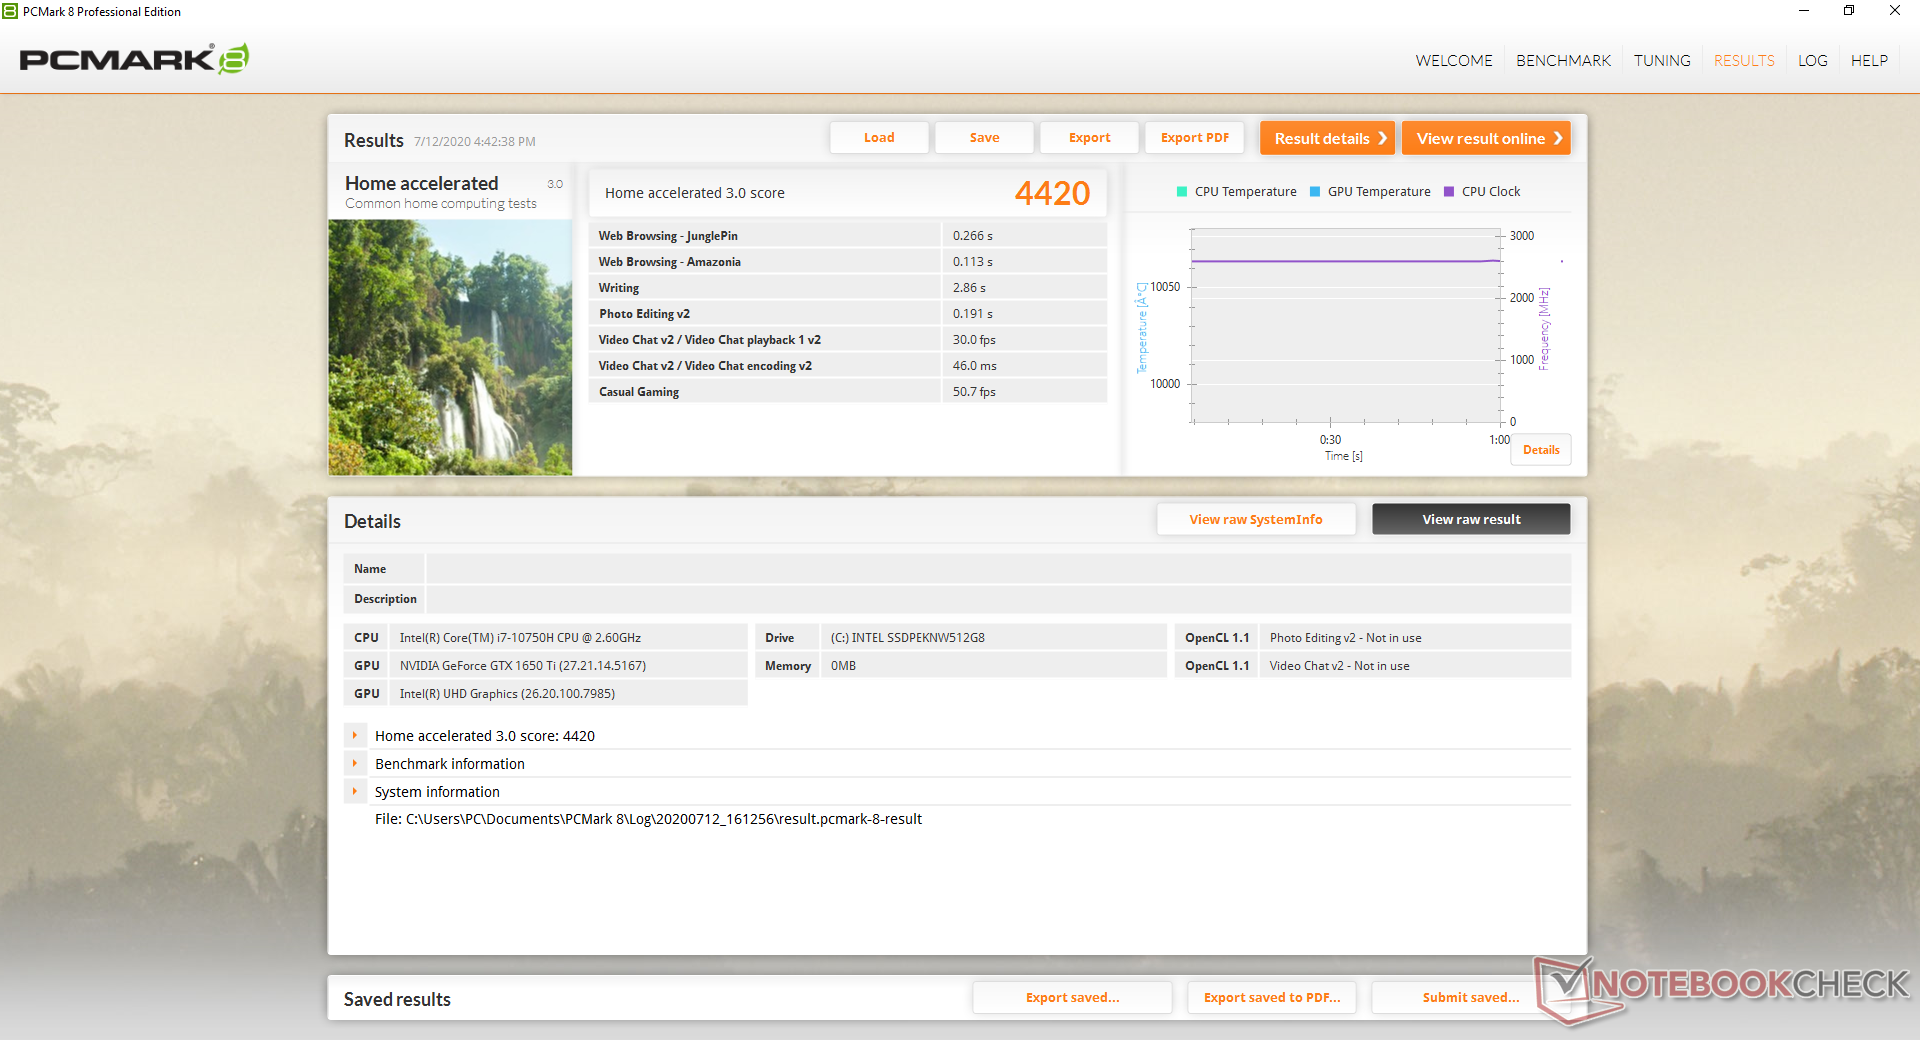
| PCMark 8 Home Score Accelerated v2 | 4420 points | |
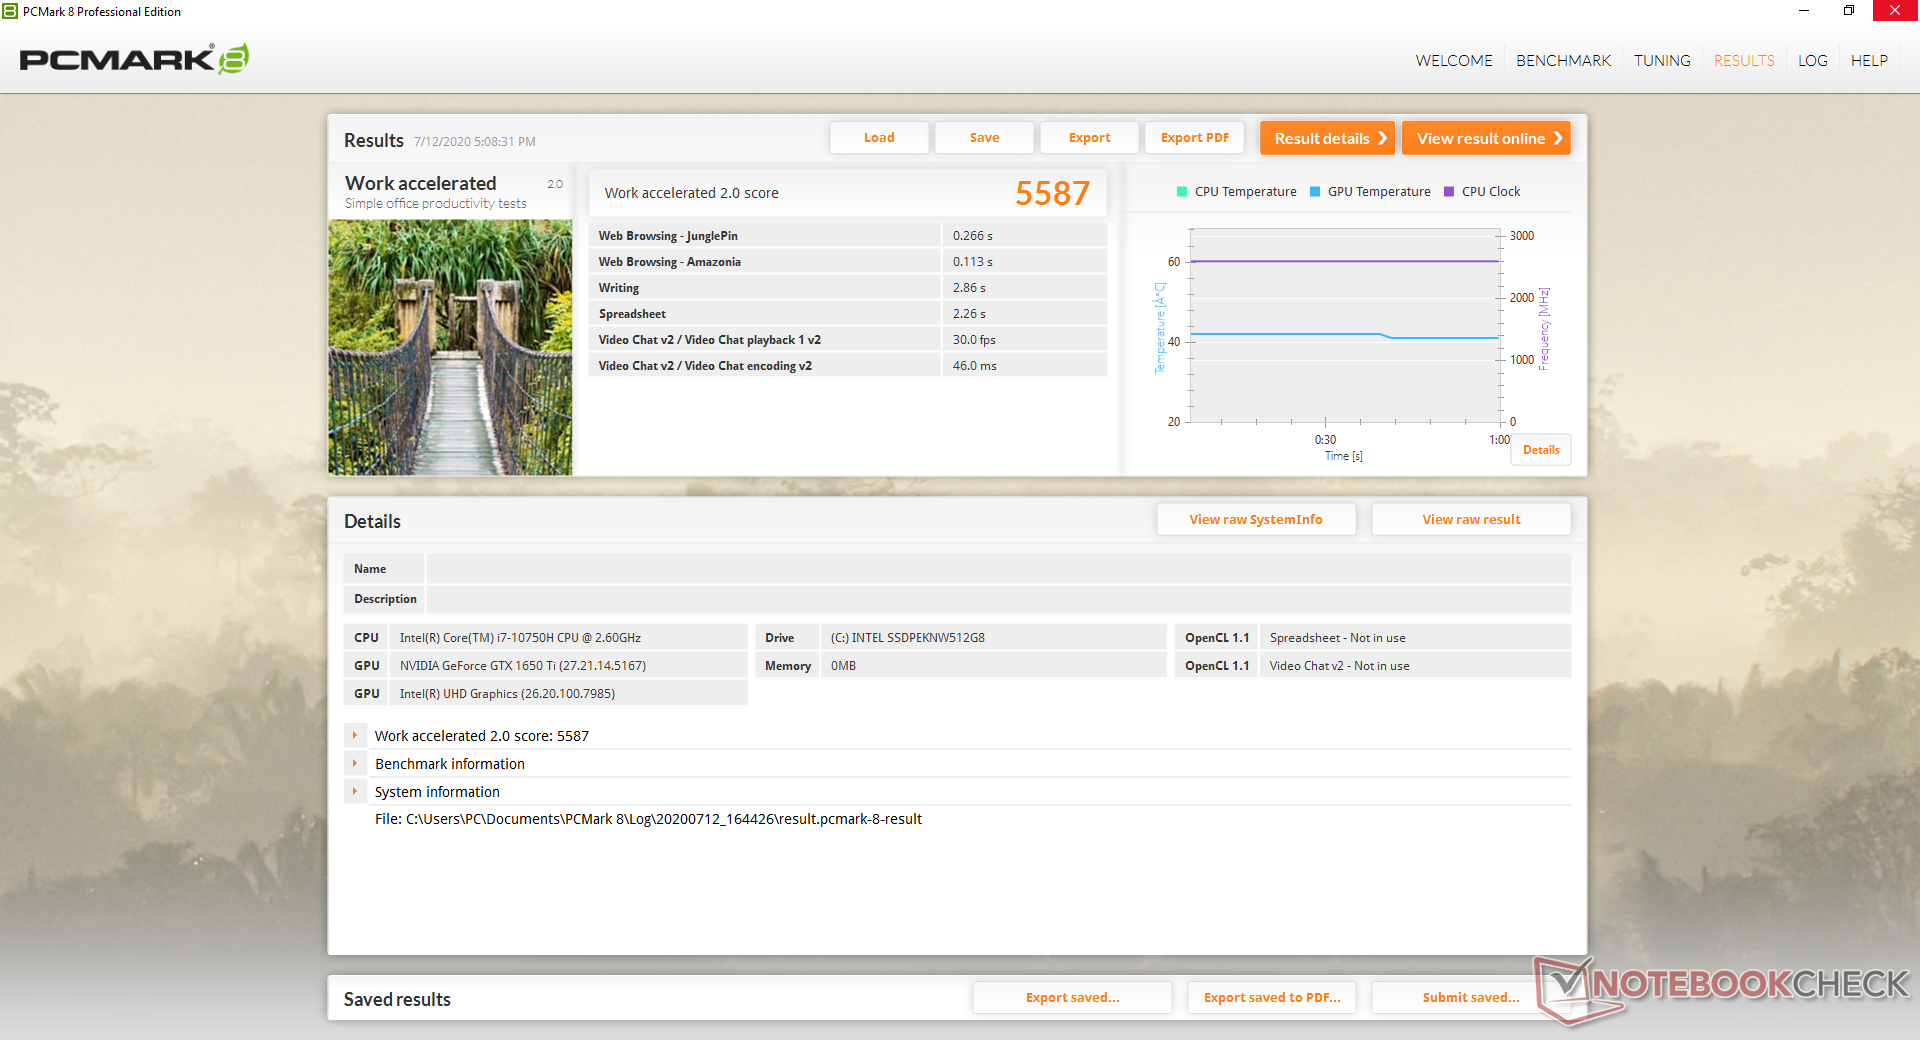
| PCMark 8 Work Score Accelerated v2 | 5587 points | |
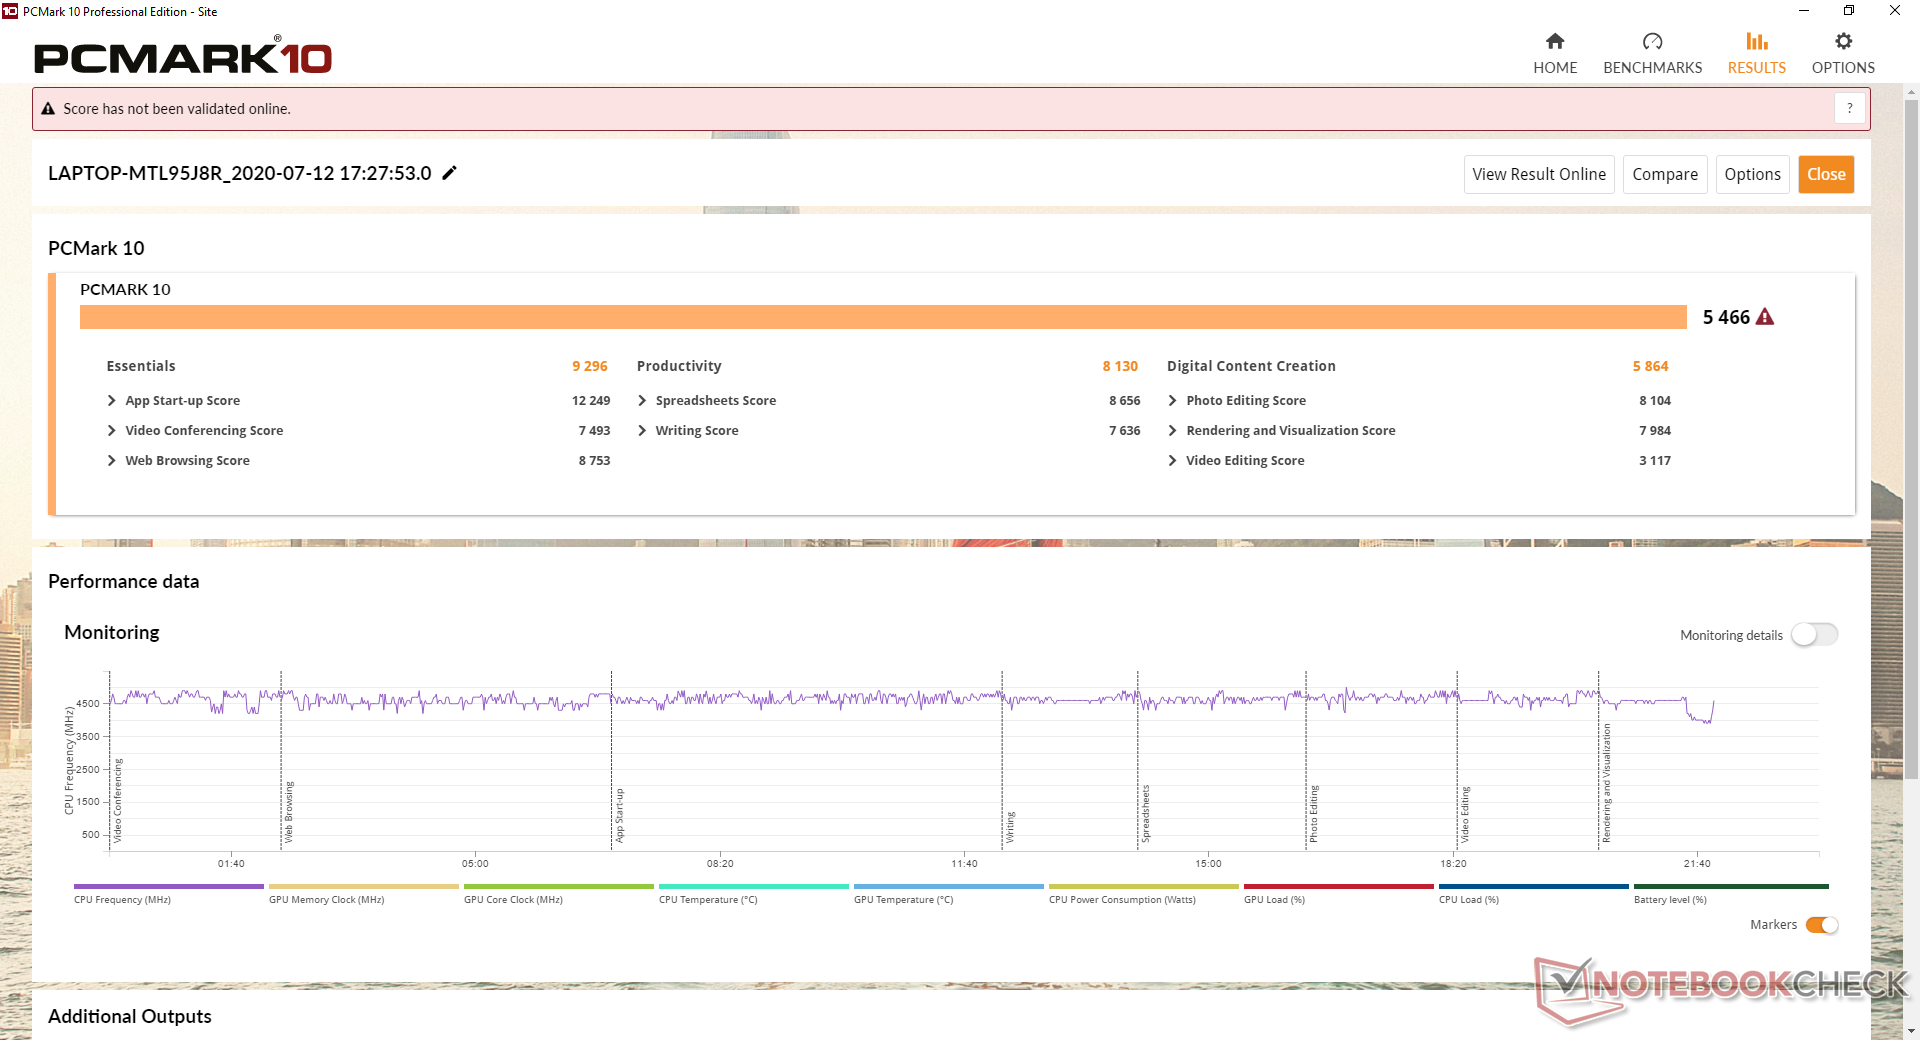
| PCMark 10 Score | 5466 points | |
Help | ||
DPC Latency
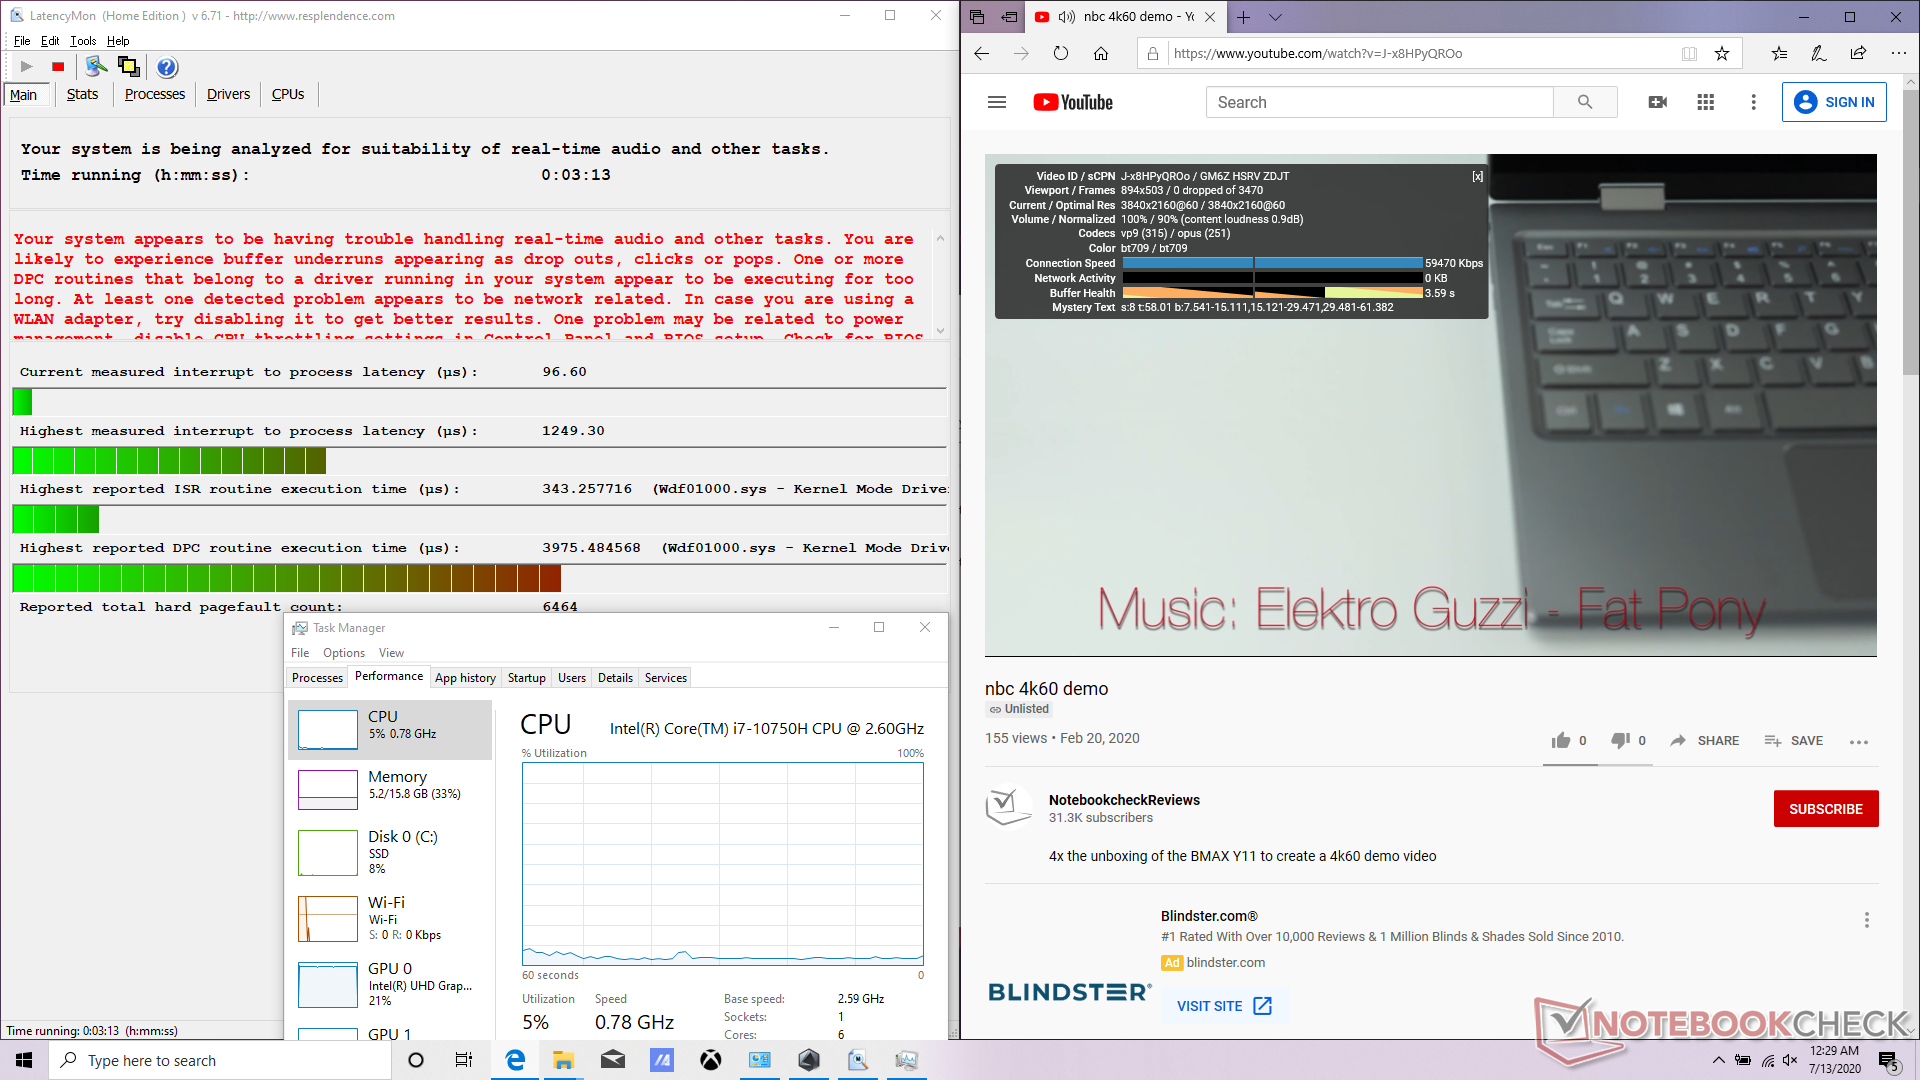
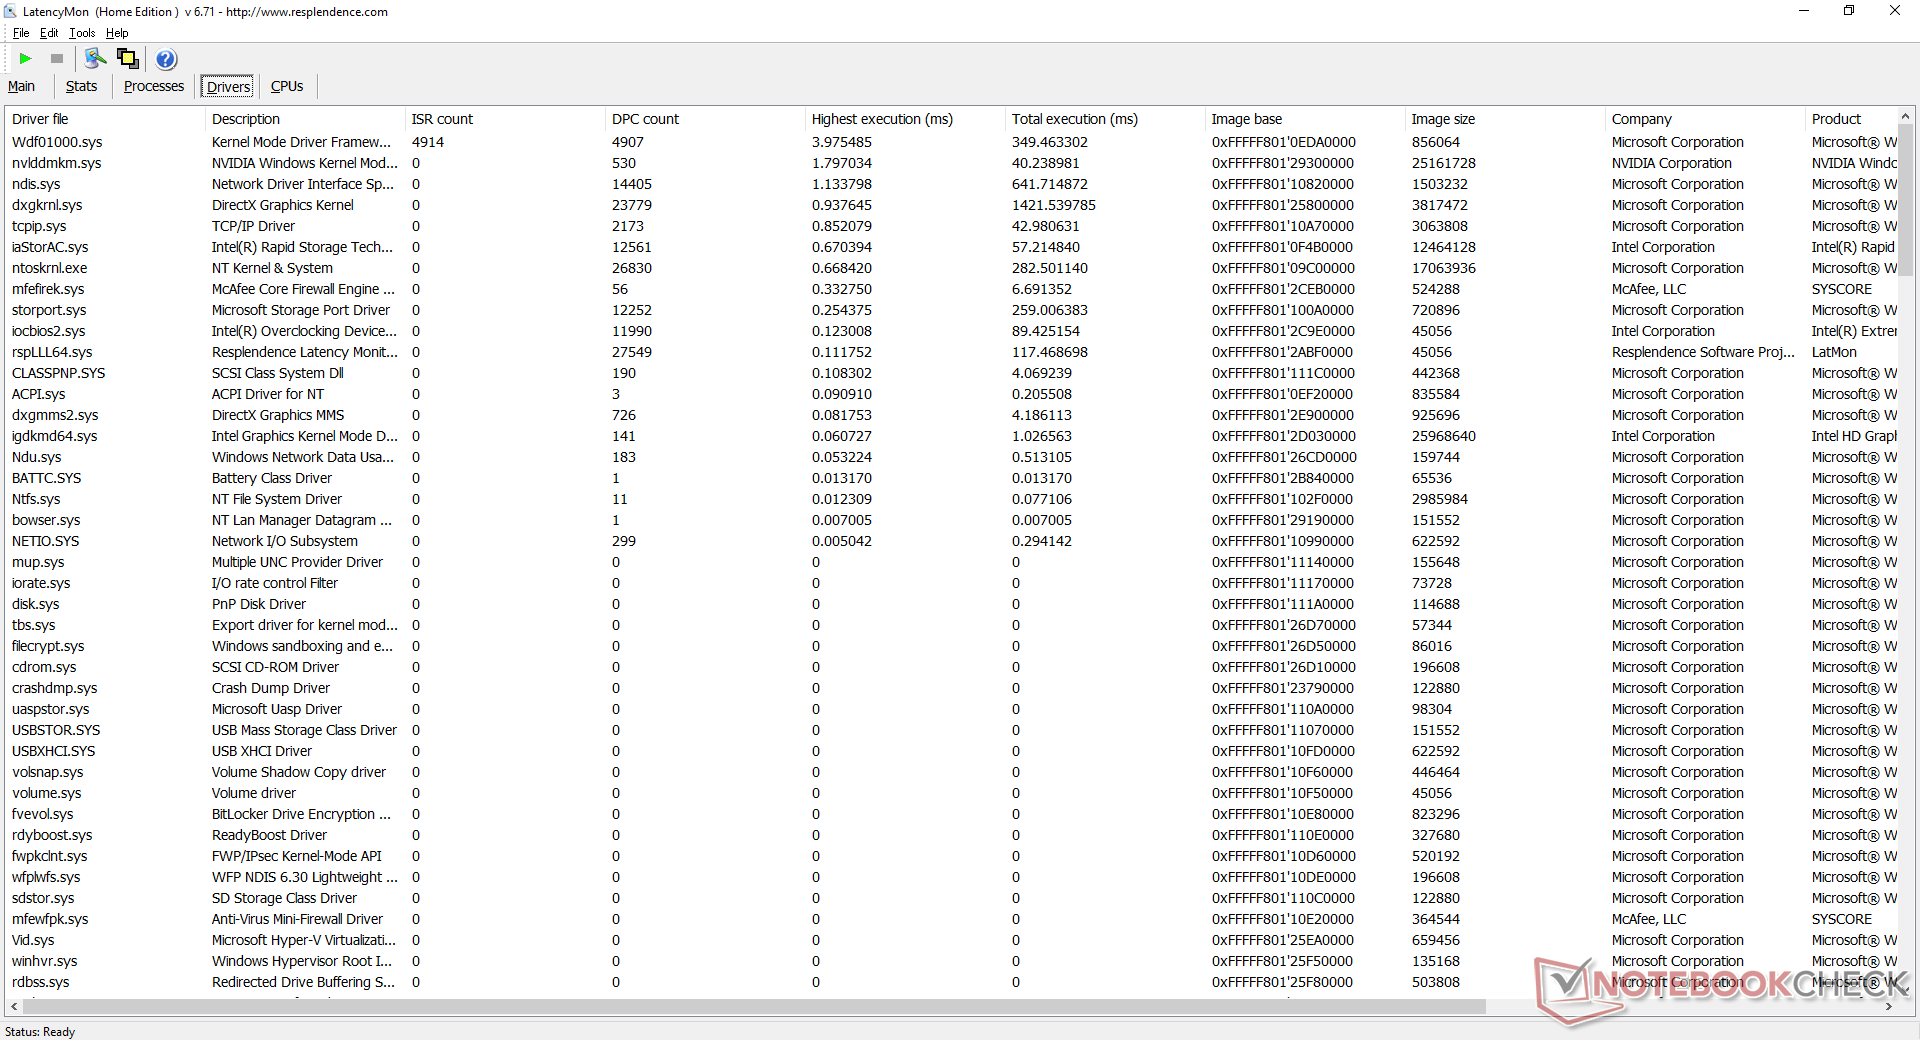
Our unit exhibits DPC latency issues with high execution times from Wdf01000.sys. 4K video playback on YouTube is otherwise smooth and with no dropped frames.
| DPC Latencies / LatencyMon - interrupt to process latency (max), Web, Youtube, Prime95 | |
| Dell G5 15 SE 5505 P89F | |
| Gigabyte Aero 15 OLED XB-8DE51B0SP | |
| MSI Bravo 15 A4DCR | |
| Asus ROG Strix G15 G512LI | |
| Acer Nitro 5 AN515-44-R5FT | |
| MSI GE66 Raider 10SFS | |
| Razer Blade 15 RZ09-0328 | |
| Asus TUF Gaming A15 FA506IV-HN172 | |
| Lenovo Legion 5 15IMH05H | |
| Eluktronics RP-15 | |
* ... smaller is better
Storage Devices
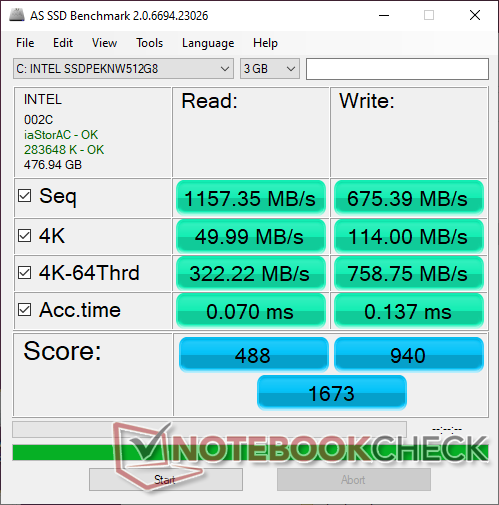
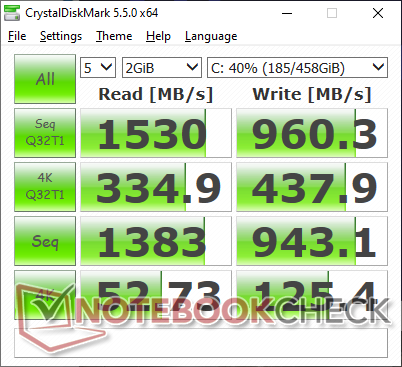
The Strix G15 supports up to three M.2 SSDs which is more than what most other budget gaming laptops have to offer. The Intel 660p in our unit is a budget NVMe drive with mediocre transfer rates when compared to the more expensive Samsung PM981 series. Even so, it's still leagues faster than any SATA III alternatives.
See our table of HDDs and SSDs for more benchmark comparisons.
| Asus ROG Strix G15 G512LI Intel SSD 660p SSDPEKNW512G8 | Asus TUF Gaming A15 FA506IV-HN172 Kingston OM8PCP3512F-AB | Asus Strix Scar III G531GW-AZ062T Intel SSD 660p SSDPEKNW512G8 | MSI GP65 10SFK-047US Samsung SSD PM981 MZVLB1T0HALR | Dell G5 15 SE 5505 P89F Samsung PM991 MZ9LQ512HALU | HP Omen 15-dc1020ng WDC PC SN720 SDAQNTW-512G | |
|---|---|---|---|---|---|---|
| AS SSD | 17% | -18% | 150% | 32% | 99% | |
| Seq Read (MB/s) | 1157 | 1682 45% | 1163 1% | 2066 79% | 1386 20% | 2955 155% |
| Seq Write (MB/s) | 675 | 904 34% | 919 36% | 2418 258% | 1234 83% | 2440 261% |
| 4K Read (MB/s) | 49.99 | 60.2 20% | 48.88 -2% | 54.2 8% | 41.32 -17% | 40.56 -19% |
| 4K Write (MB/s) | 114 | 164.8 45% | 90.1 -21% | 129 13% | 128 12% | 118.6 4% |
| 4K-64 Read (MB/s) | 322.2 | 472.5 47% | 323.8 0% | 1865 479% | 854 165% | 1283 298% |
| 4K-64 Write (MB/s) | 759 | 845 11% | 403.8 -47% | 1878 147% | 721 -5% | 1538 103% |
| Access Time Read * (ms) | 0.07 | 0.087 -24% | 0.24 -243% | 0.042 40% | 0.098 -40% | 0.084 -20% |
| Access Time Write * (ms) | 0.137 | 0.02 85% | 0.046 66% | 0.091 34% | 0.095 31% | 0.032 77% |
| Score Read (Points) | 488 | 701 44% | 489 0% | 2126 336% | 1034 112% | 1619 232% |
| Score Write (Points) | 940 | 1101 17% | 586 -38% | 2249 139% | 973 4% | 1901 102% |
| Score Total (Points) | 1673 | 2143 28% | 1332 -20% | 5482 228% | 2536 52% | 4323 158% |
| Copy ISO MB/s (MB/s) | 939 | 675 -28% | 1269 35% | 2927 212% | 1284 37% | 1418 51% |
| Copy Program MB/s (MB/s) | 489.9 | 248.4 -49% | 452.8 -8% | 728 49% | 401.9 -18% | 392.5 -20% |
| Copy Game MB/s (MB/s) | 895 | 535 -40% | 755 -16% | 1614 80% | 1013 13% | 907 1% |
| CrystalDiskMark 5.2 / 6 | 19% | -2% | 69% | 22% | 51% | |
| Write 4K (MB/s) | 125.4 | 219.8 75% | 133.3 6% | 145 16% | 142.1 13% | 112.1 -11% |
| Read 4K (MB/s) | 52.7 | 50.2 -5% | 55.3 5% | 46.84 -11% | 46.43 -12% | 42.01 -20% |
| Write Seq (MB/s) | 943 | 979 4% | 980 4% | 2377 152% | 1108 17% | 1964 108% |
| Read Seq (MB/s) | 1383 | 1990 44% | 1406 2% | 2185 58% | 1622 17% | 2065 49% |
| Write 4K Q32T1 (MB/s) | 437.9 | 516 18% | 286.3 -35% | 463.5 6% | 467 7% | 318.2 -27% |
| Read 4K Q32T1 (MB/s) | 334.9 | 298.3 -11% | 331.5 -1% | 527 57% | 525 57% | 406.7 21% |
| Write Seq Q32T1 (MB/s) | 960 | 982 2% | 976 2% | 2395 149% | 1203 25% | 2534 164% |
| Read Seq Q32T1 (MB/s) | 1530 | 1907 25% | 1520 -1% | 3470 127% | 2288 50% | 3438 125% |
| Write 4K Q8T8 (MB/s) | 981 | 748 | ||||
| Read 4K Q8T8 (MB/s) | 300.9 | 344.6 | ||||
| Total Average (Program / Settings) | 18% /
18% | -10% /
-13% | 110% /
121% | 27% /
28% | 75% /
81% |
* ... smaller is better

Disk Throttling: DiskSpd Read Loop, Queue Depth 8
GPU Performance
The GeForce GTX 1650 Ti is most comparable to the last generation mobile GTX 1060. Upgrading to the GTX 1660 Ti, RTX 2060, or RTX 2070 Super SKUs will net users approximately 45 percent, 60 percent, and 110 percent faster graphics performance, respectively.
See our dedicated page on the GTX 1650 Ti for more technical information and benchmark comparisons. The GTX 1650 Ti is generally not fast enough to run most games at 144 FPS, but you don't need to run games at 144 FPS to exploit the advantages of a 144 Hz monitor.
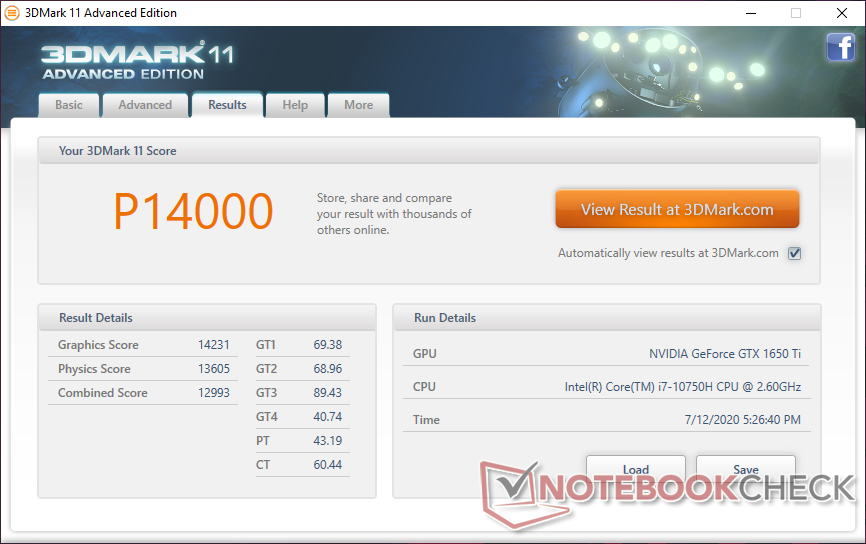
| 3DMark 11 Performance | 14000 points | |
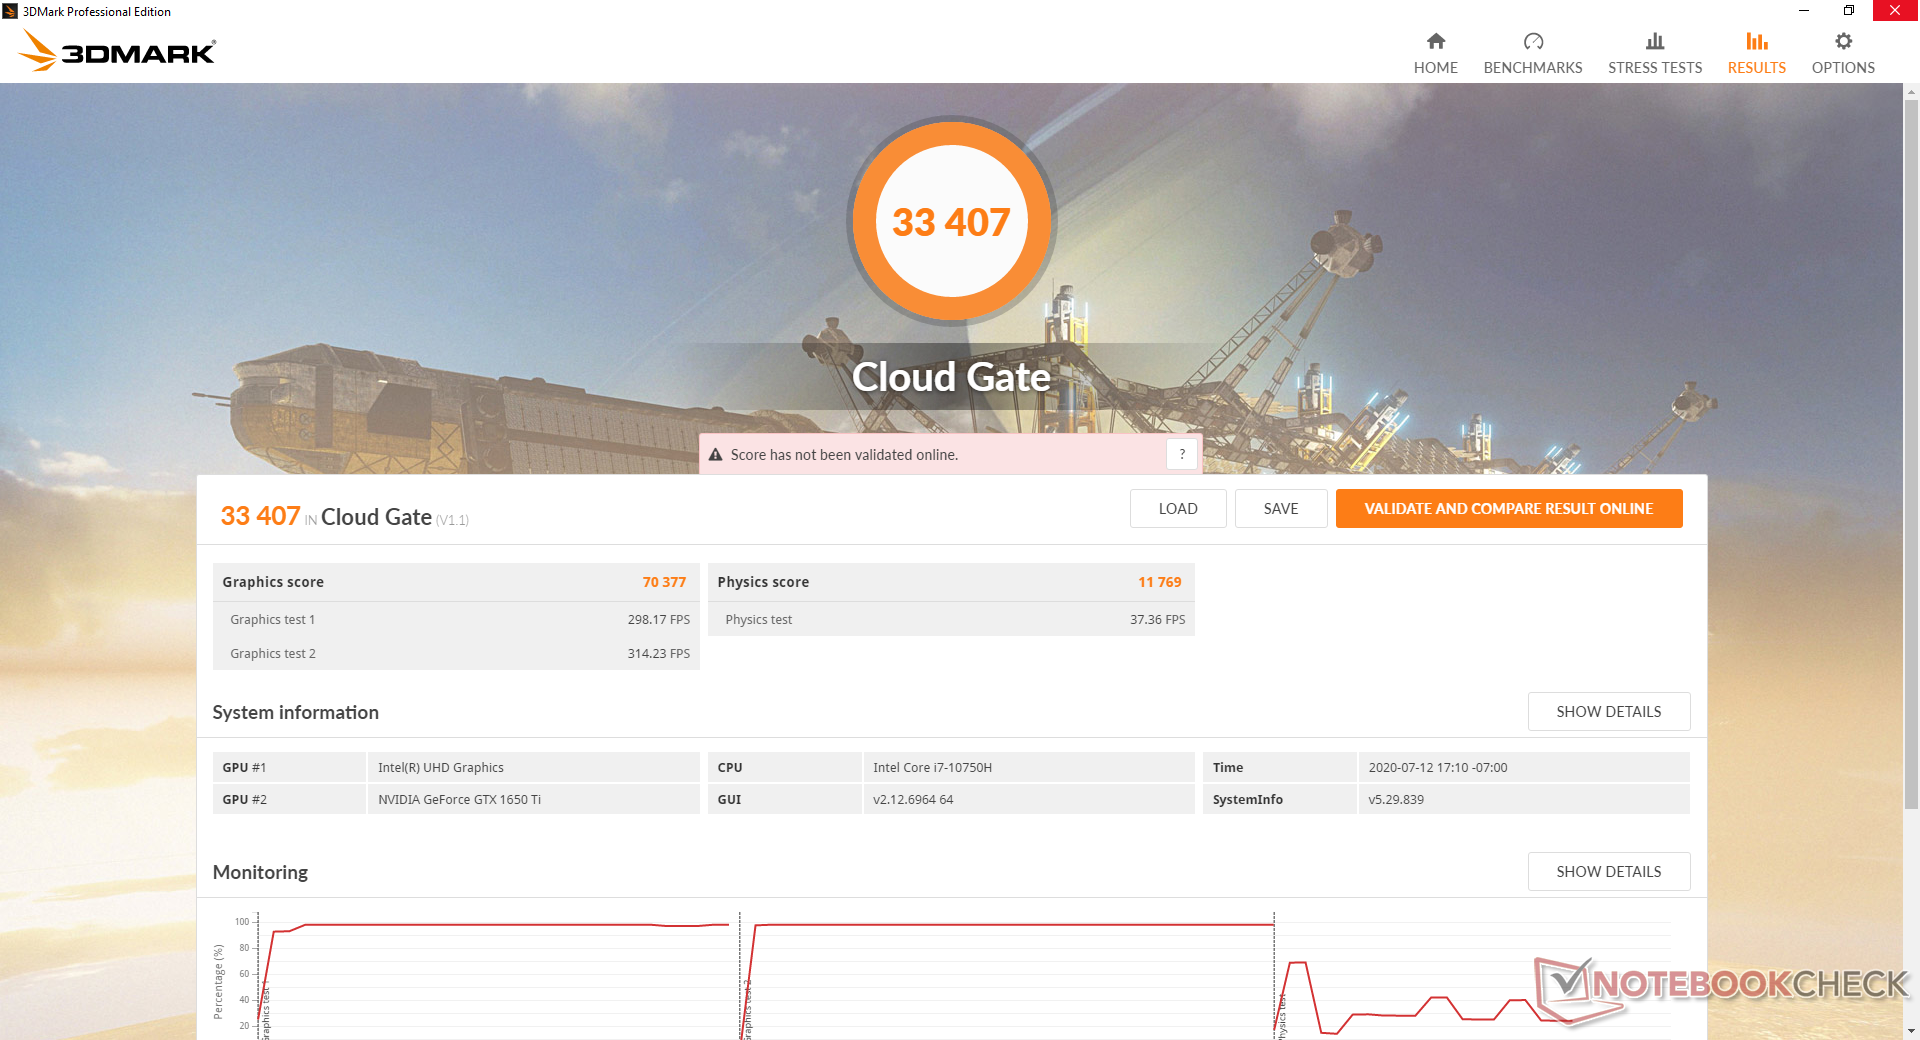
| 3DMark Cloud Gate Standard Score | 33407 points | |
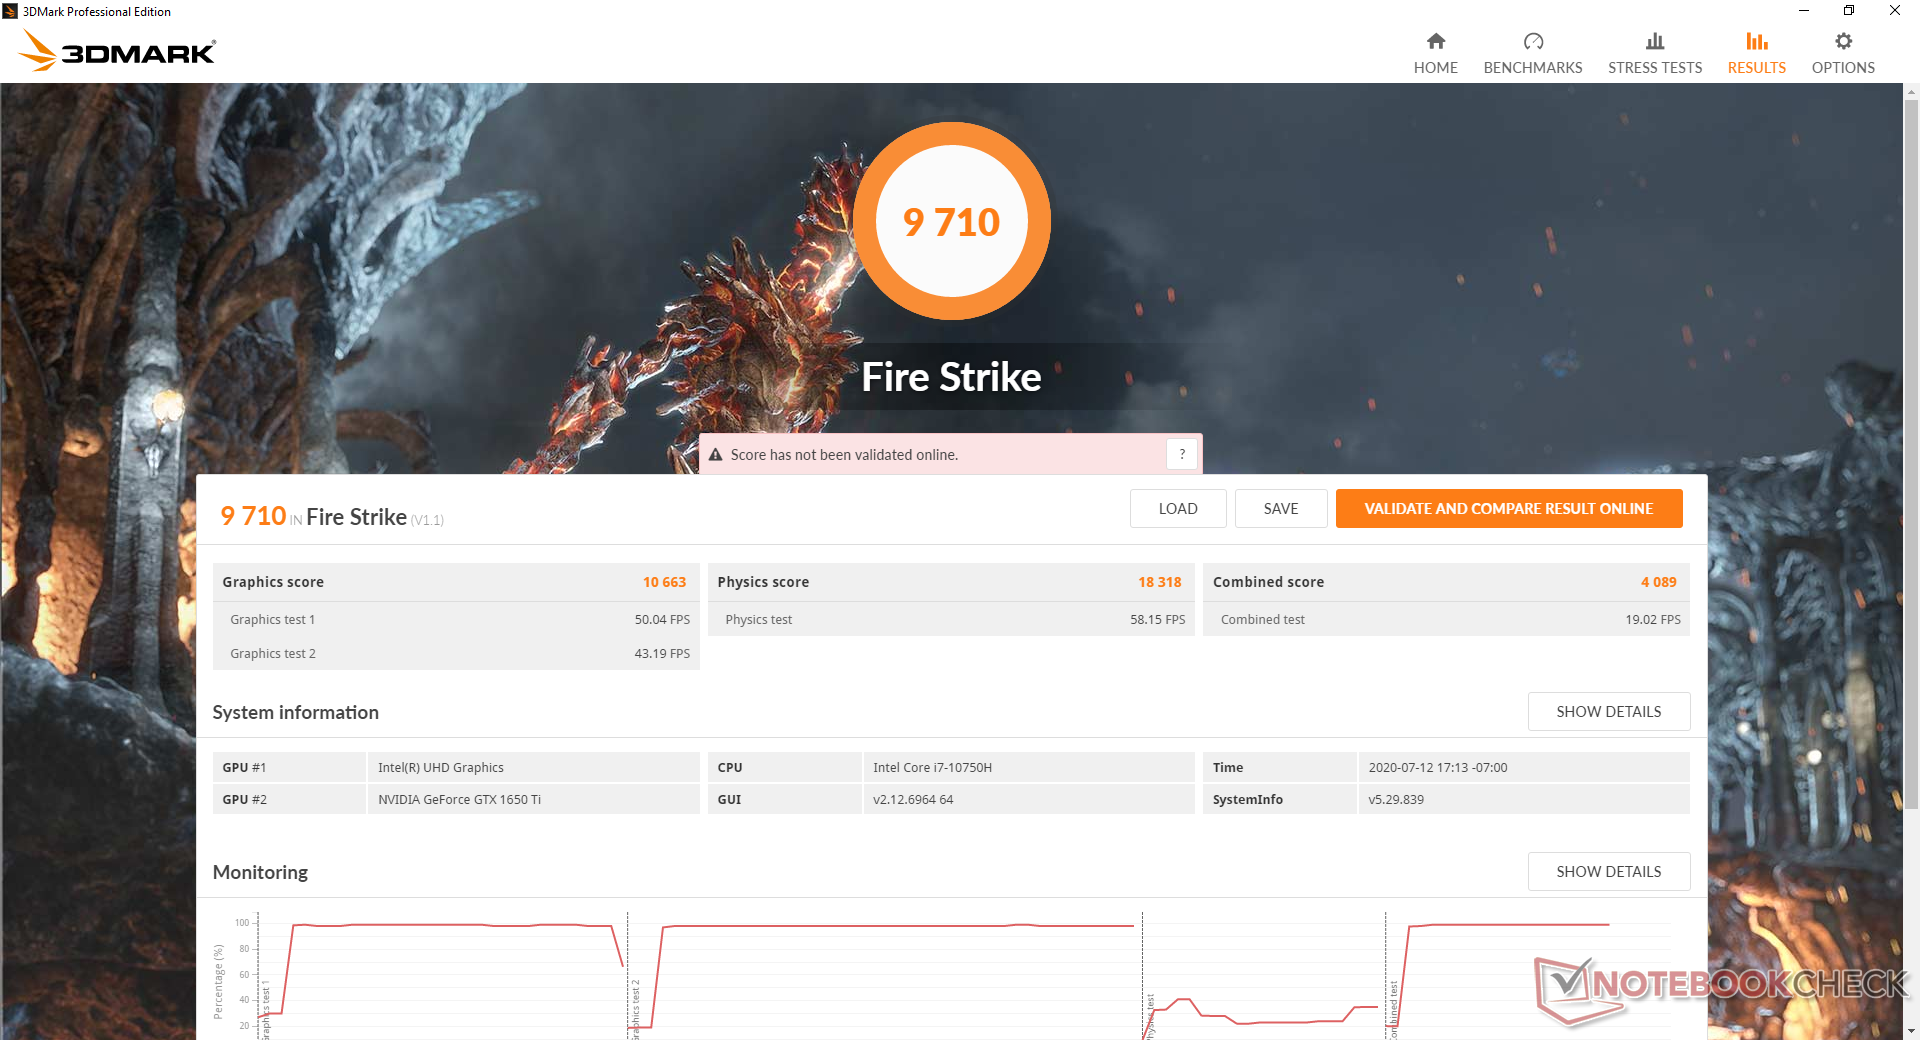
| 3DMark Fire Strike Score | 9710 points | |
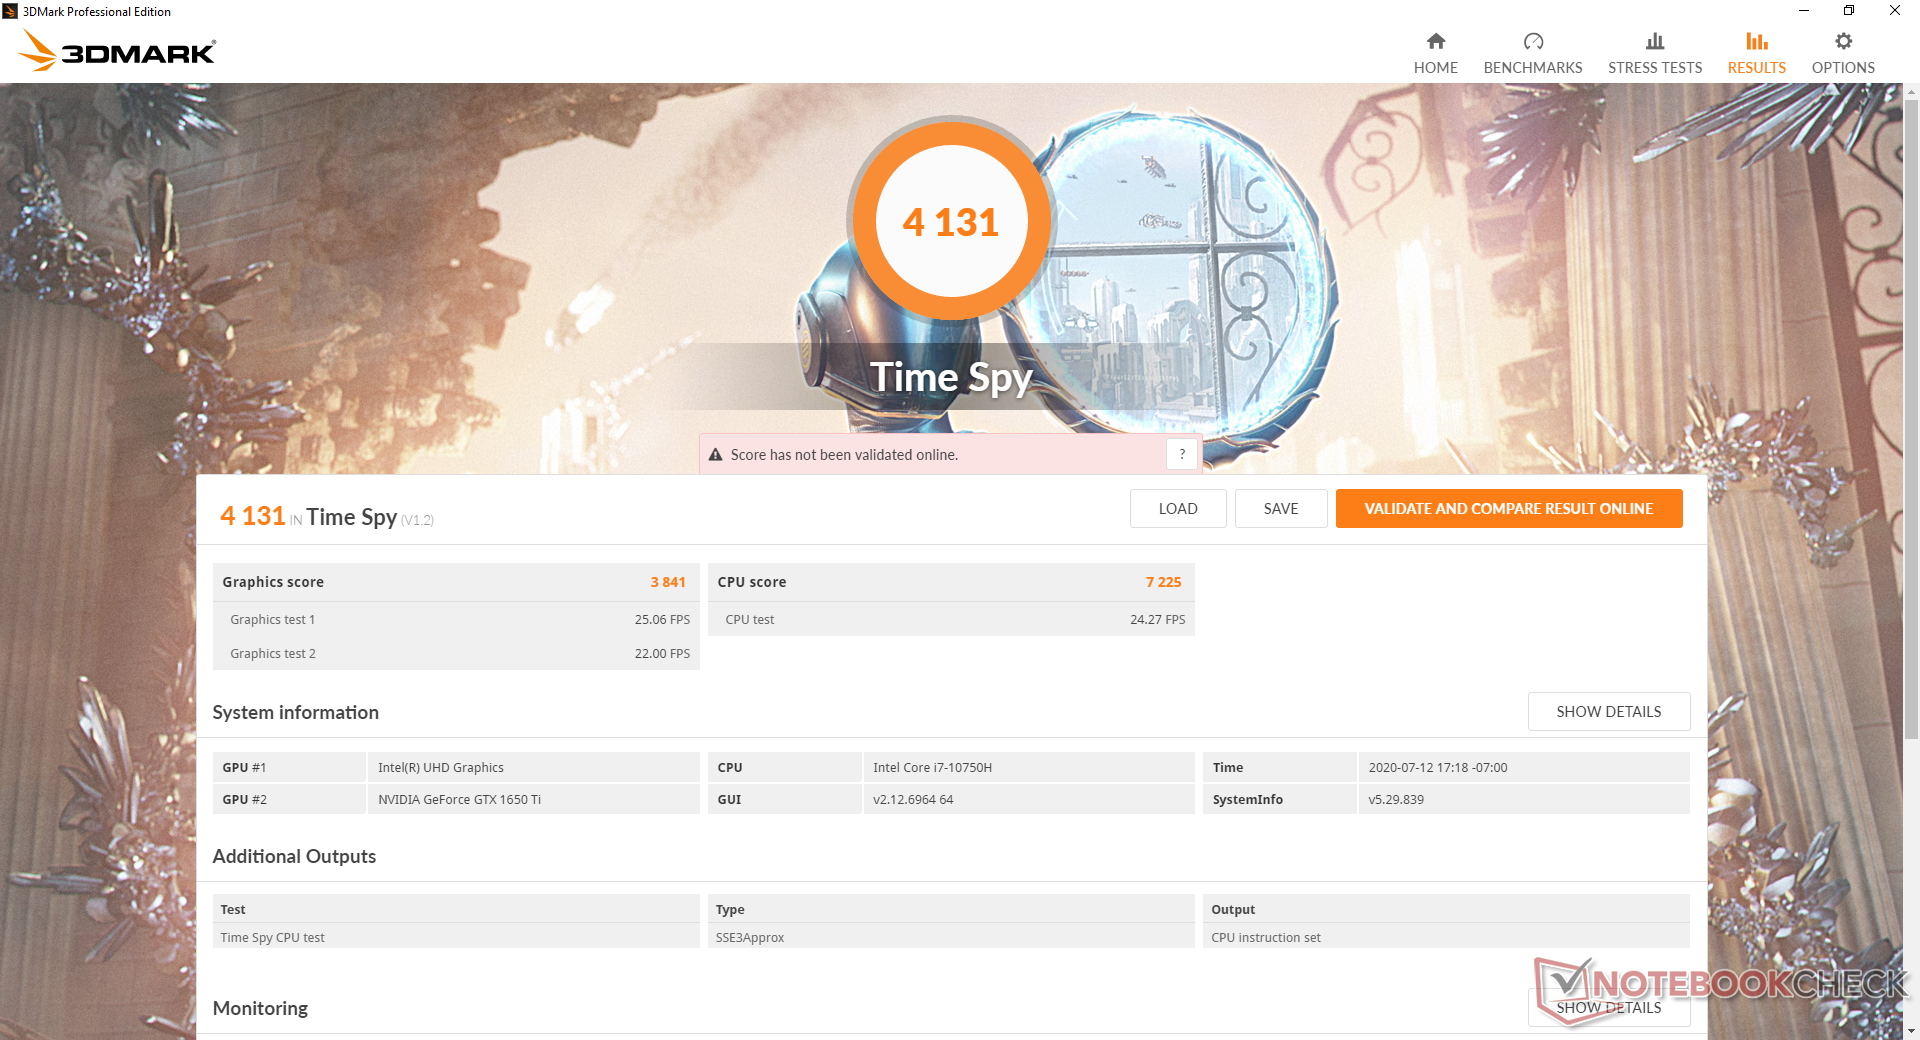
| 3DMark Time Spy Score | 4131 points | |
Help | ||
| low | med. | high | ultra | |
|---|---|---|---|---|
| The Witcher 3 (2015) | 223.5 | 135.5 | 76.1 | 40.1 |
| Dota 2 Reborn (2015) | 148 | 132 | 122 | 115 |
| X-Plane 11.11 (2018) | 98.9 | 82.7 | 71.8 |
Emissions
System Noise
Much like what we discovered on some other Asus gaming laptops, fan noise is never actually silent even when set to "silent" mode. We're able to record a fan noise of 34 dB(A) against a background of 27.7 dB(A) despite having no applications running. Most other gaming laptops are able able to remain quieter for longer than our Asus as shown by the comparison table below.
Fan noise tops out at 48 to 49 dB(A) when running high loads like gaming on Turbo mode. If on Performance mode, fan noise becomes just slightly quieter at 46.2 dB(A). These results are about normal for a gaming laptop of this size.
| Asus ROG Strix G15 G512LI GeForce GTX 1650 Ti Mobile, i7-10750H, Intel SSD 660p SSDPEKNW512G8 | Asus TUF Gaming A15 FA506IV-HN172 GeForce RTX 2060 Mobile, R7 4800H, Kingston OM8PCP3512F-AB | Asus Strix Scar III G531GW-AZ062T GeForce RTX 2070 Mobile, i7-9750H, Intel SSD 660p SSDPEKNW512G8 | MSI GP65 10SFK-047US GeForce RTX 2070 Mobile, i7-10750H, Samsung SSD PM981 MZVLB1T0HALR | Dell G5 15 SE 5505 P89F Radeon RX 5600M, R7 4800H, Samsung PM991 MZ9LQ512HALU | HP Omen 15-dc1020ng GeForce GTX 1650 Mobile, i5-9300H, WDC PC SN720 SDAQNTW-512G | |
|---|---|---|---|---|---|---|
| Noise | 6% | 4% | -2% | 13% | 16% | |
| off / environment * (dB) | 27.7 | 30.2 -9% | 30 -8% | 29.3 -6% | 28 -1% | 28.8 -4% |
| Idle Minimum * (dB) | 34.2 | 30.2 12% | 30.6 11% | 31.9 7% | 28 18% | 28.8 16% |
| Idle Average * (dB) | 36 | 30.2 16% | 30.6 15% | 31.9 11% | 28 22% | 29.5 18% |
| Idle Maximum * (dB) | 36.6 | 30.2 17% | 37.7 -3% | 33.5 8% | 28 23% | 31.1 15% |
| Load Average * (dB) | 44.3 | 40 10% | 36.5 18% | 47 -6% | 28 37% | 35.2 21% |
| Witcher 3 ultra * (dB) | 47.9 | 49 -2% | 52.1 -9% | 53.8 -12% | 50.6 -6% | 35.2 27% |
| Load Maximum * (dB) | 49.3 | 49 1% | 48.1 2% | 56.7 -15% | 50.6 -3% | 41 17% |
* ... smaller is better
Noise level
| Idle |
| 34.2 / 36 / 36.6 dB(A) |
| Load |
| 44.3 / 49.3 dB(A) |
 | ||
30 dB silent 40 dB(A) audible 50 dB(A) loud |
||
min: | ||
Temperature
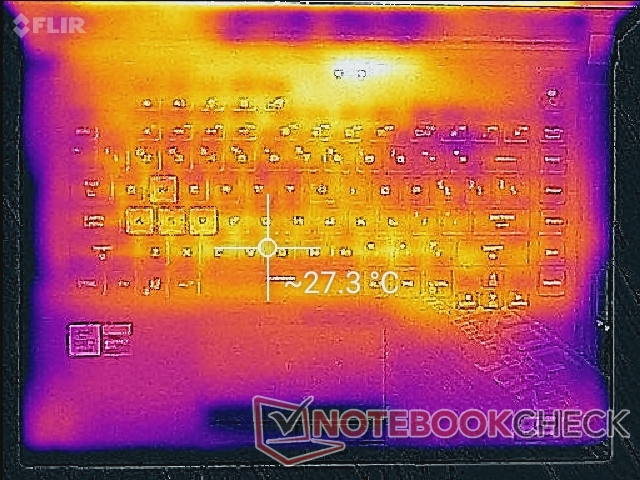
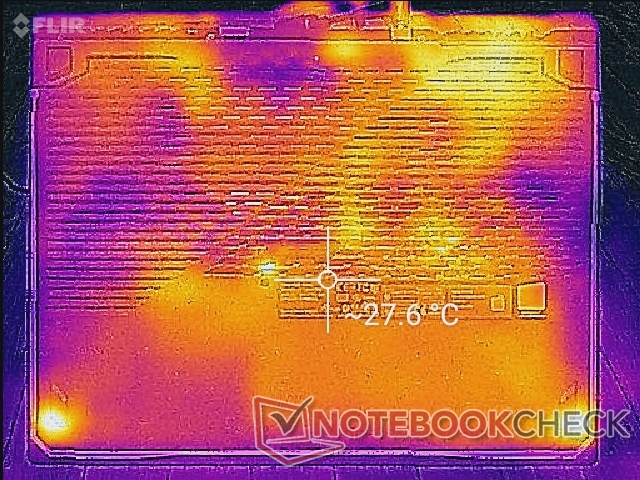
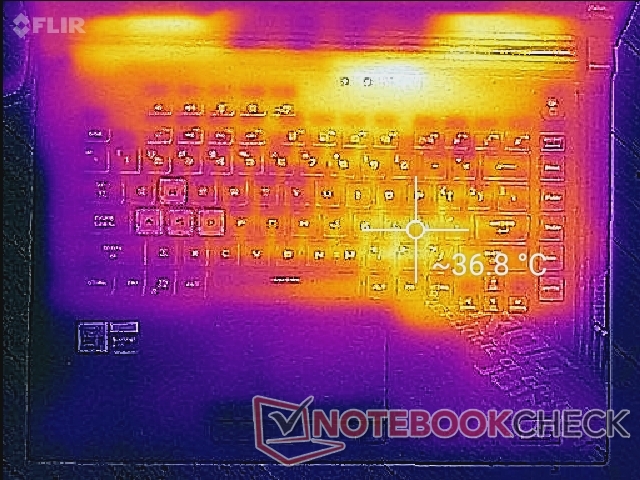
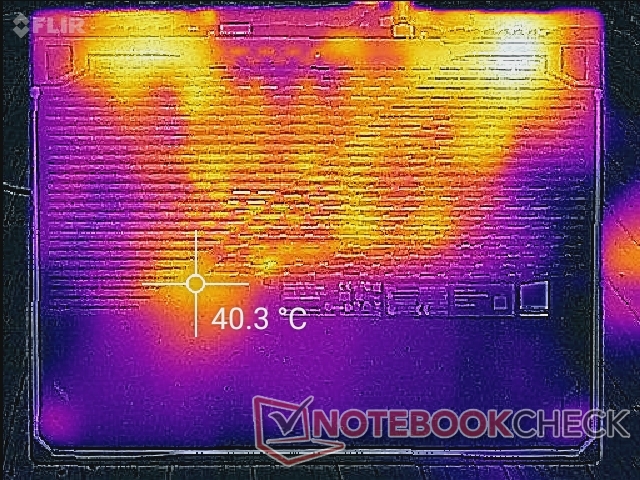
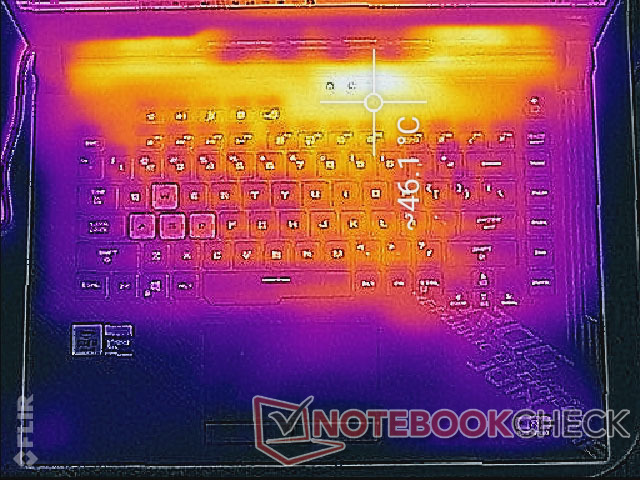
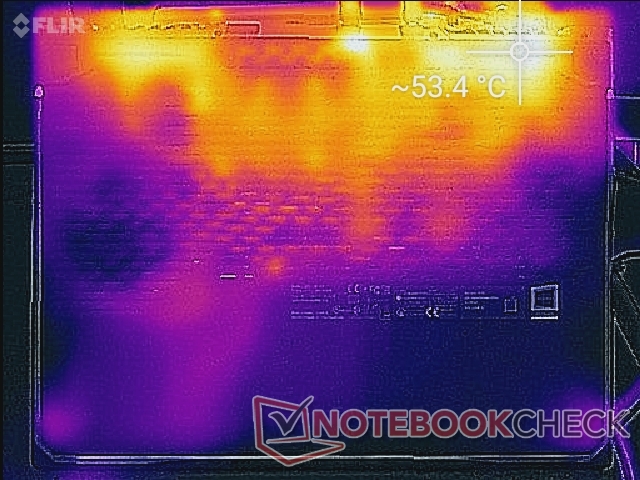
Surface temperatures never become uncomfortably warm no matter the onscreen load. Though hot spots can be as warm as 46 C to 53 C when gaming, these areas are towards the rear away from the keyboard keys and palm rests.
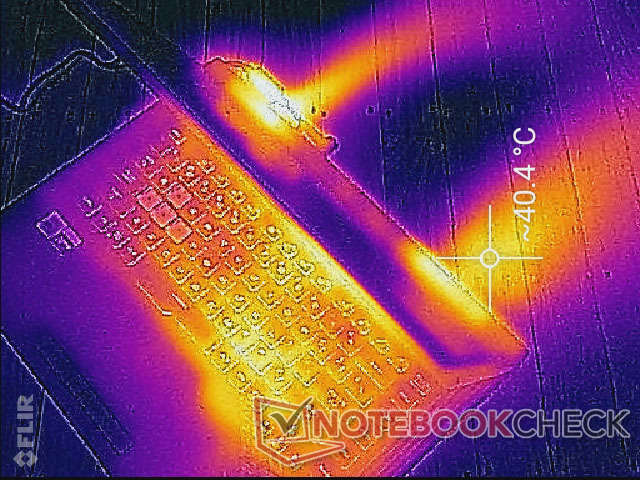
(-) The maximum temperature on the upper side is 46.2 °C / 115 F, compared to the average of 40.4 °C / 105 F, ranging from 21.2 to 68.8 °C for the class Gaming.
(-) The bottom heats up to a maximum of 53.6 °C / 128 F, compared to the average of 43.2 °C / 110 F
(+) In idle usage, the average temperature for the upper side is 26 °C / 79 F, compared to the device average of 33.9 °C / 93 F.
(+) Playing The Witcher 3, the average temperature for the upper side is 31.8 °C / 89 F, compared to the device average of 33.9 °C / 93 F.
(+) The palmrests and touchpad are cooler than skin temperature with a maximum of 25.8 °C / 78.4 F and are therefore cool to the touch.
(+) The average temperature of the palmrest area of similar devices was 28.8 °C / 83.8 F (+3 °C / 5.4 F).
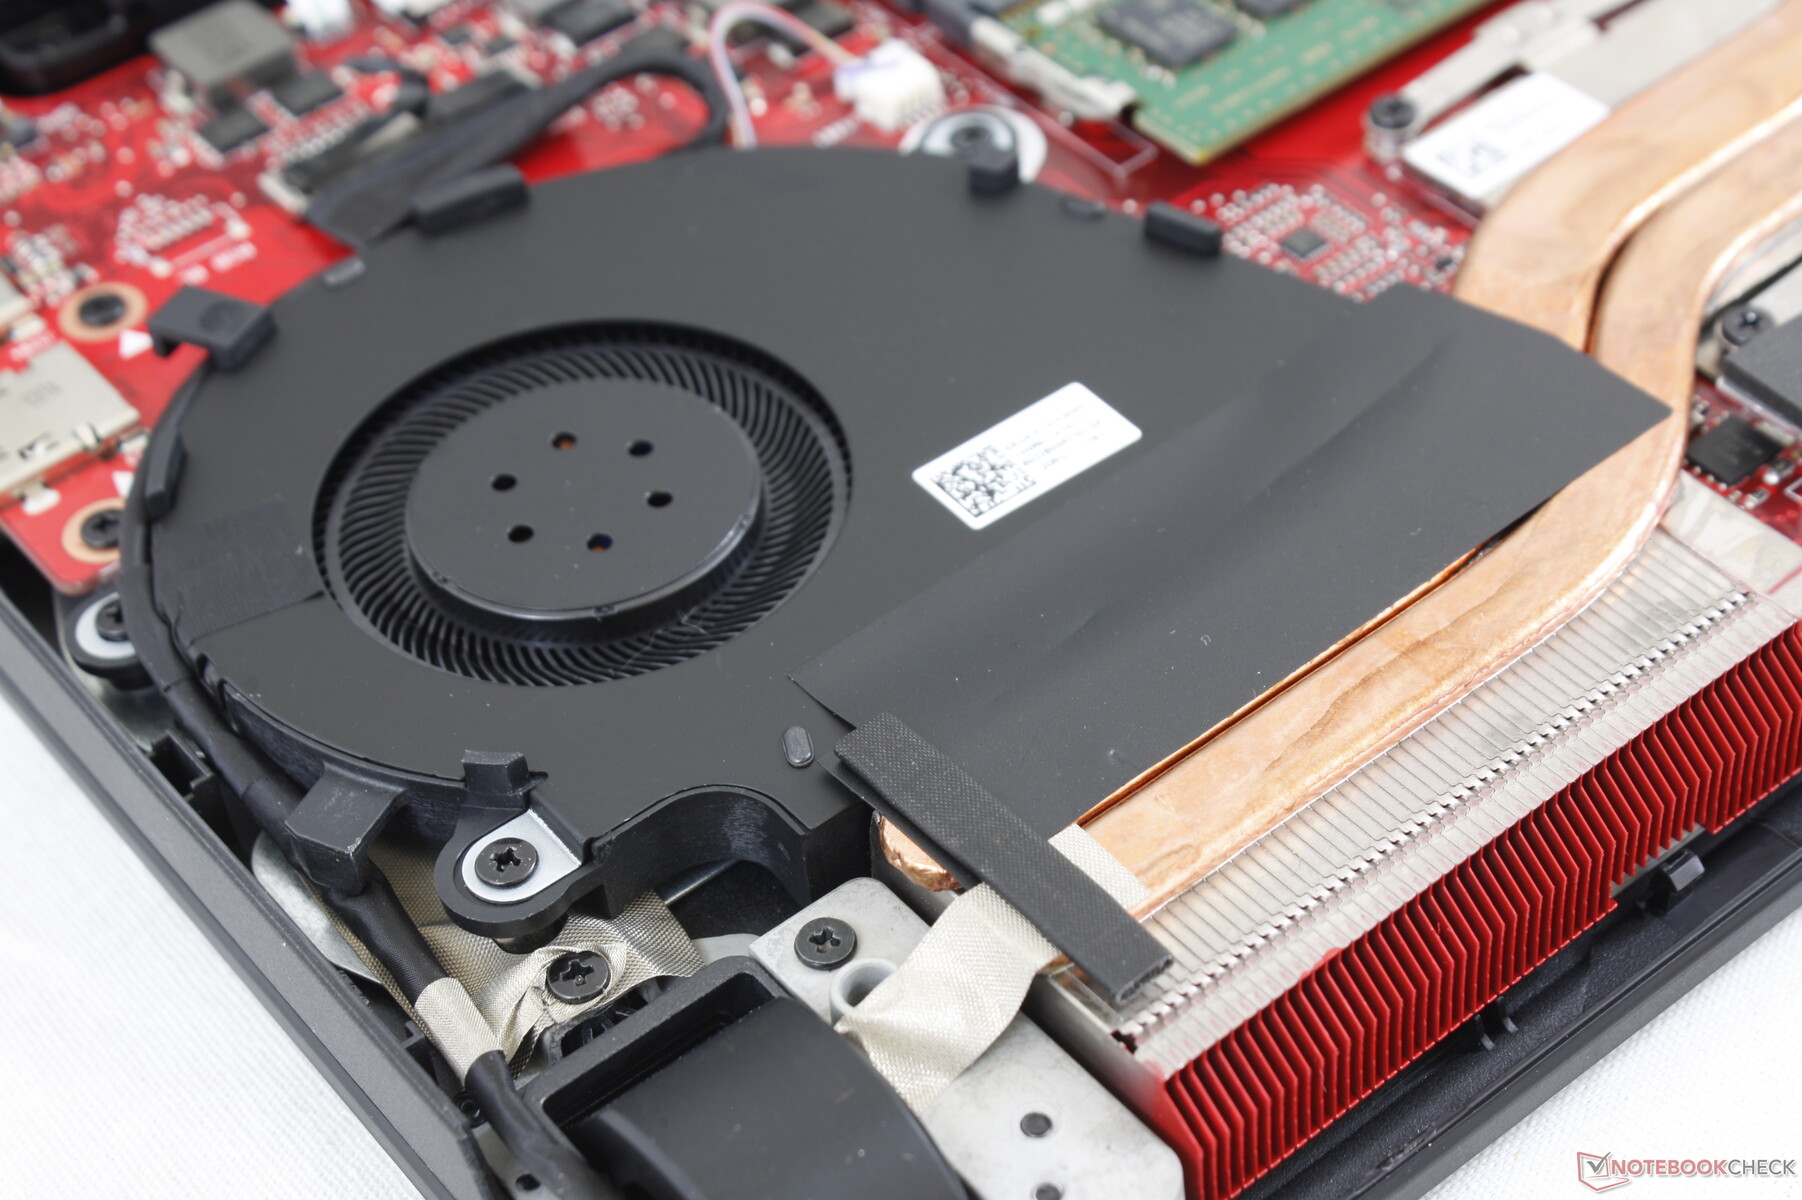
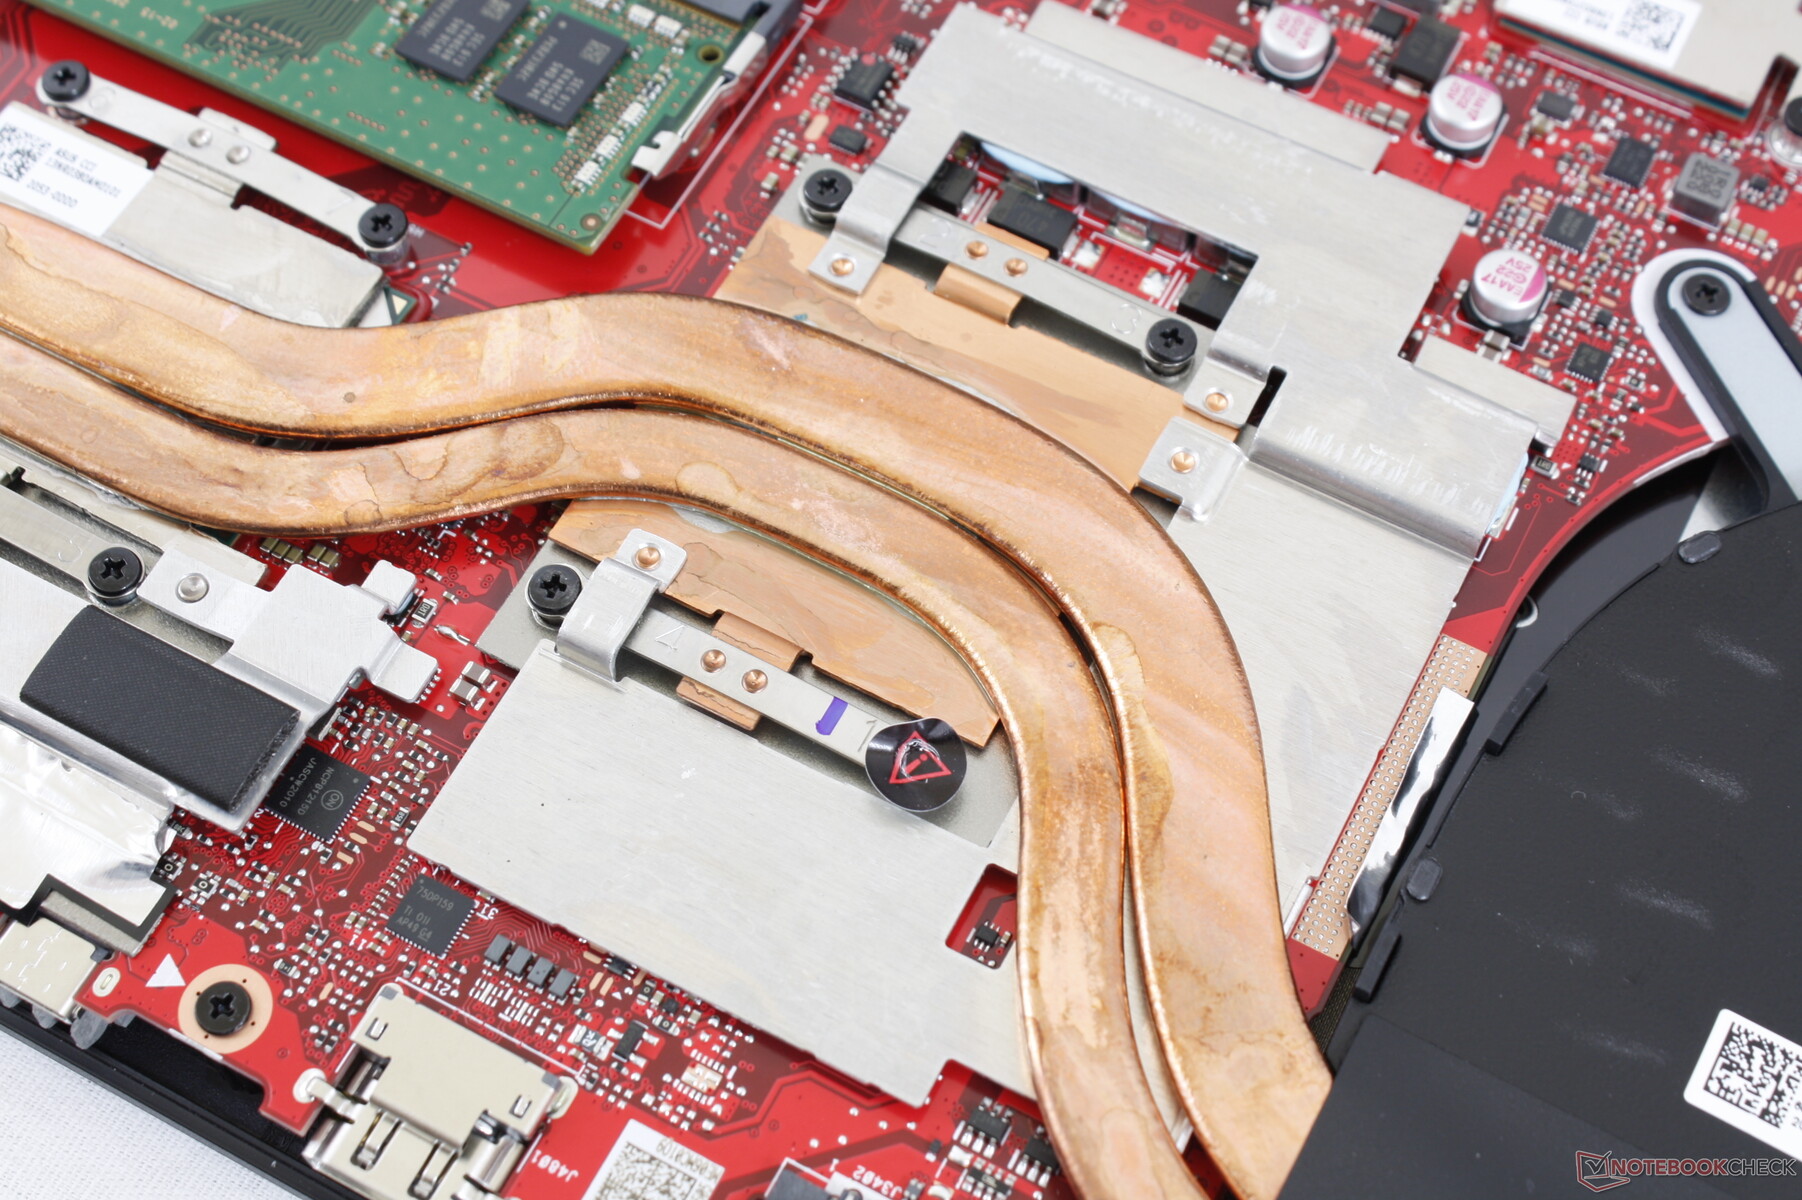
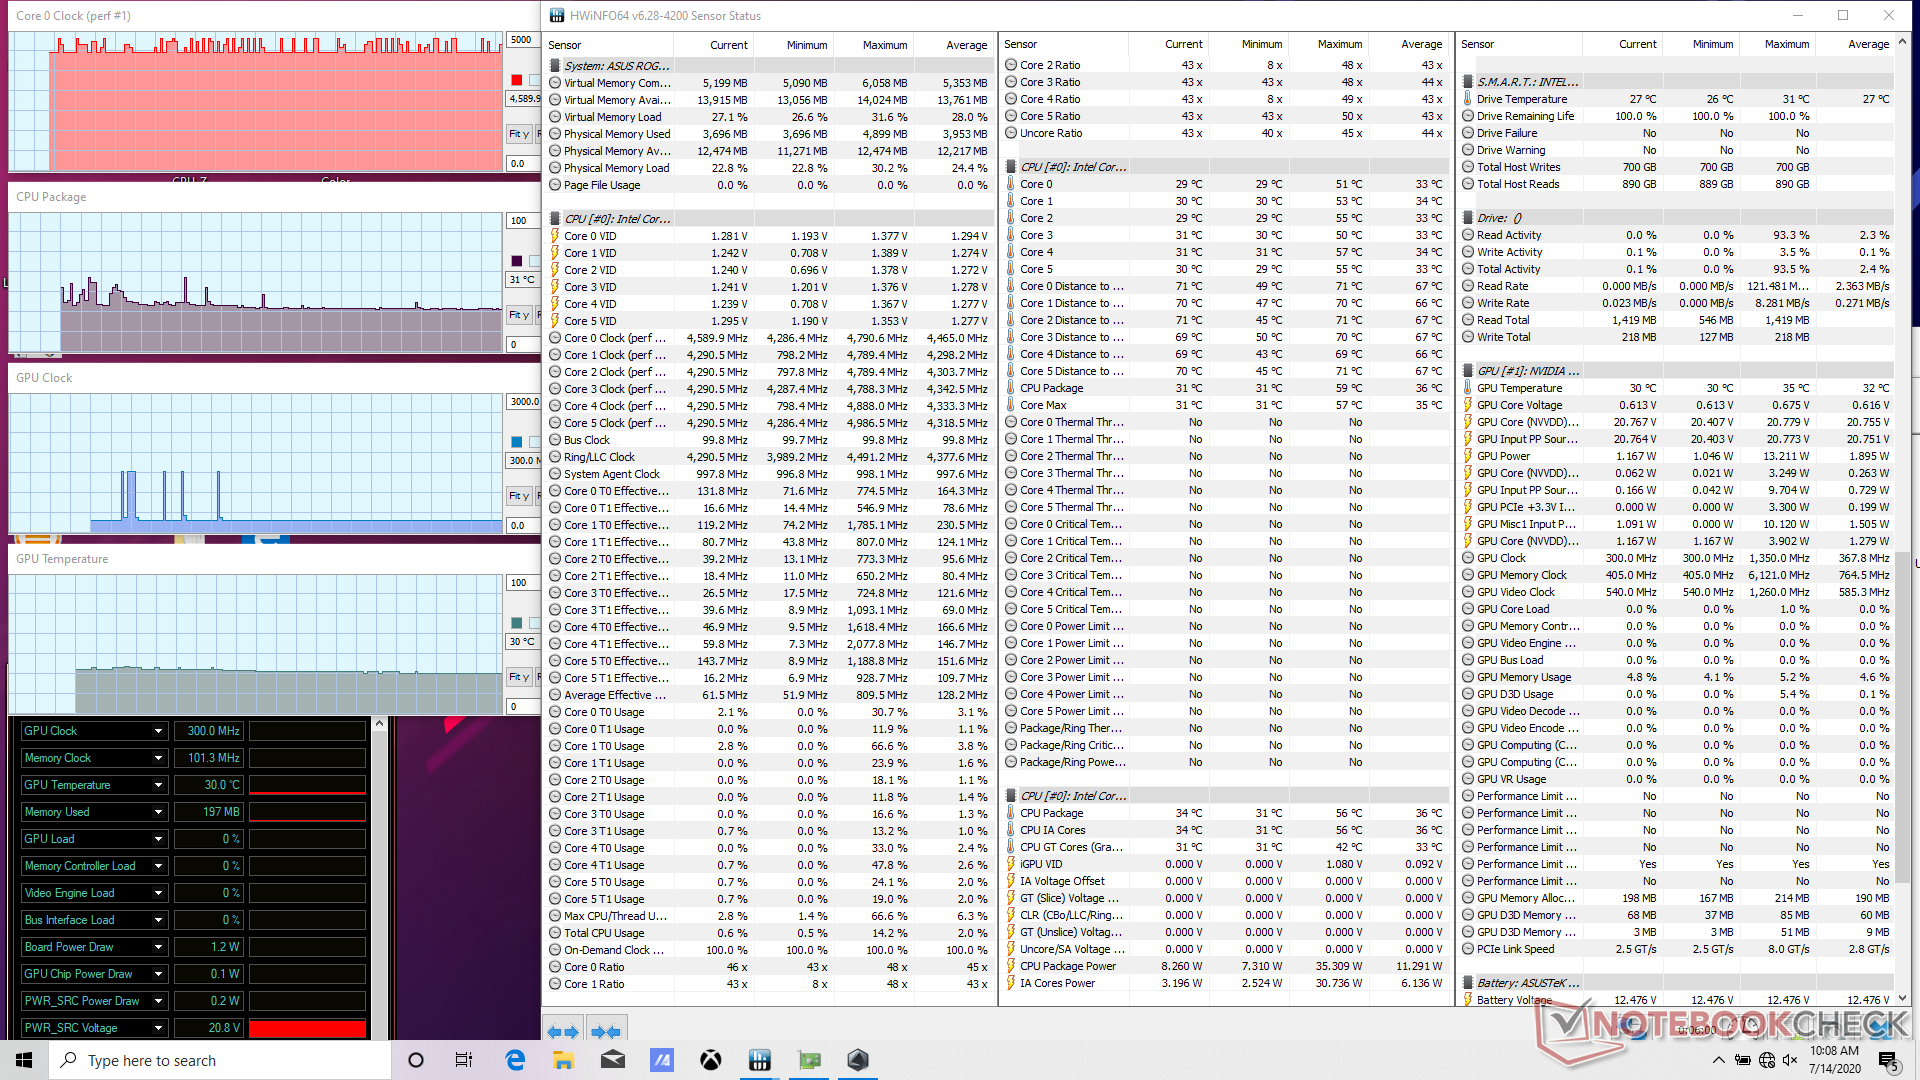
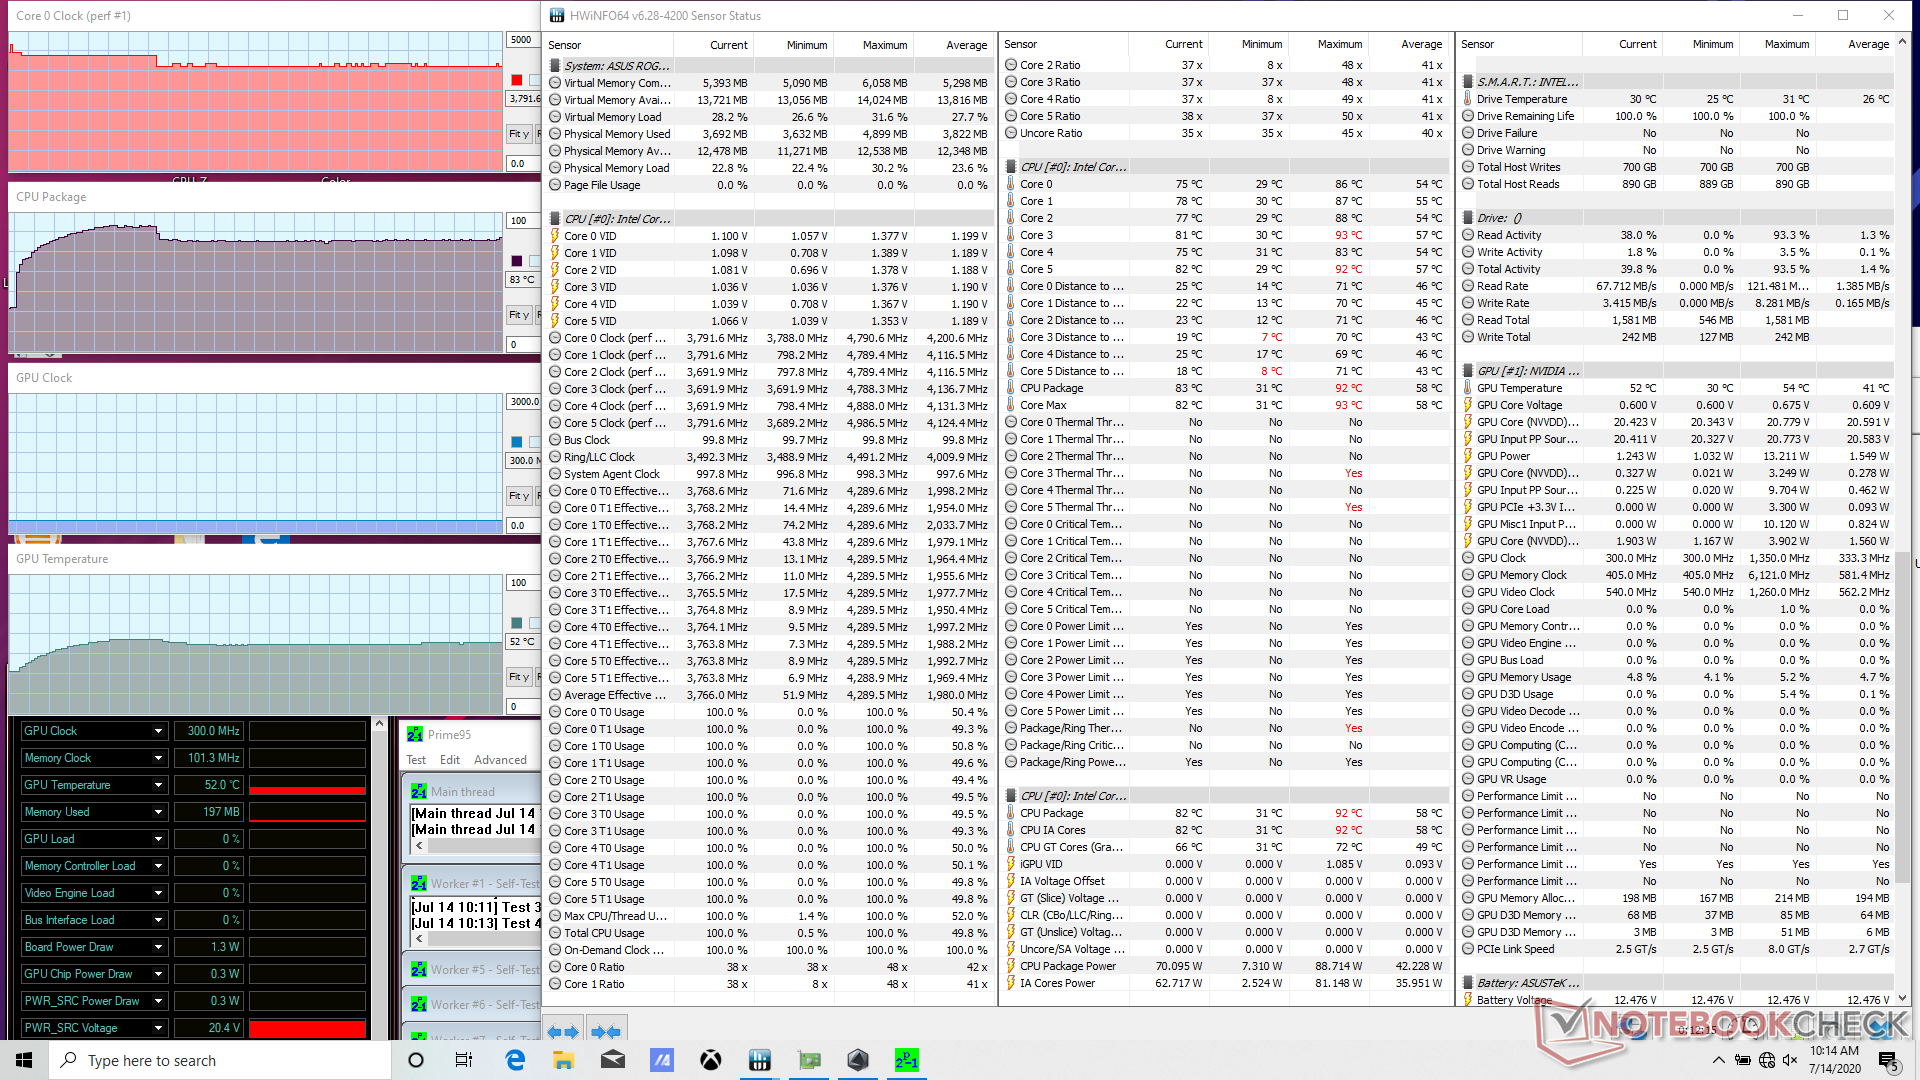
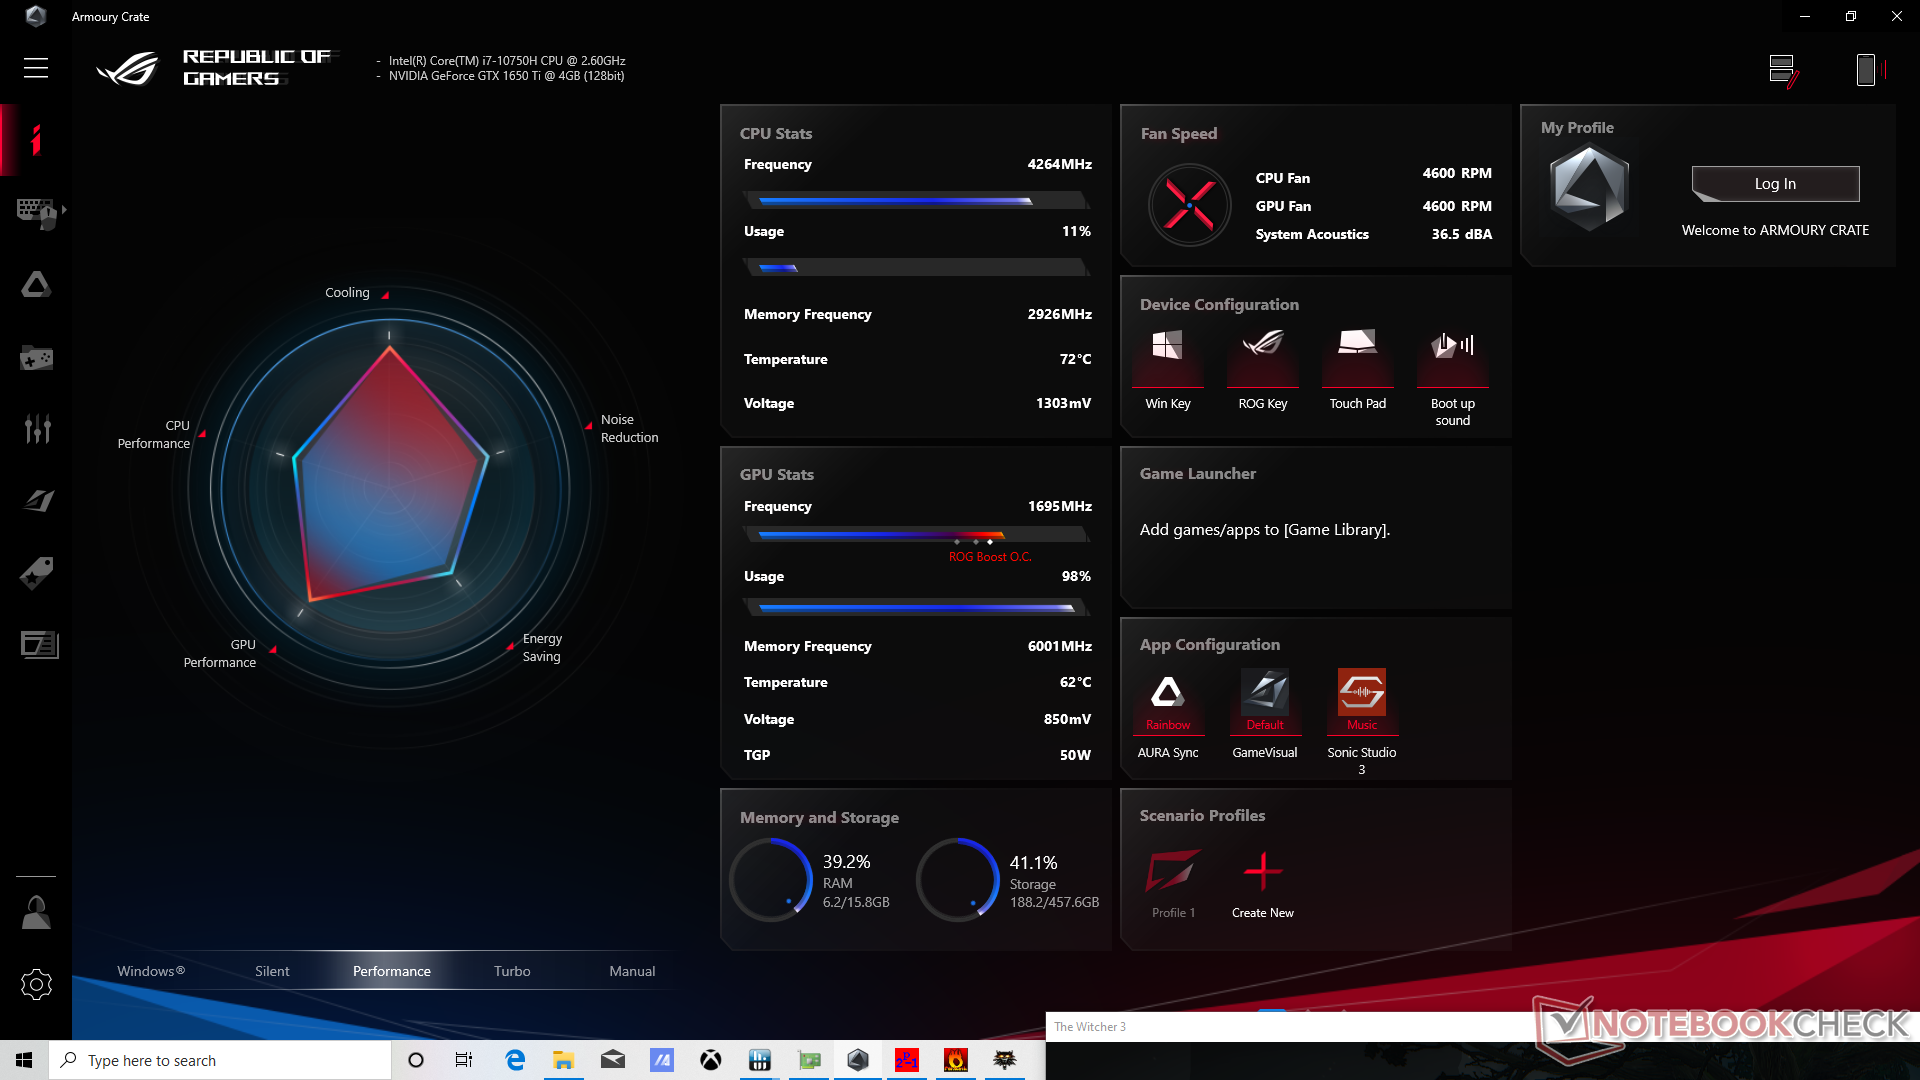
Stress Test
When running Prime95, the CPU can be observed boosting up to 4.2 GHz for about 90 seconds until hitting a core temperature of 91 C. After reaching this temperature ceiling, clock rates would drop to 3.8 GHz in order to maintain a cooler core temperature of 83 C.
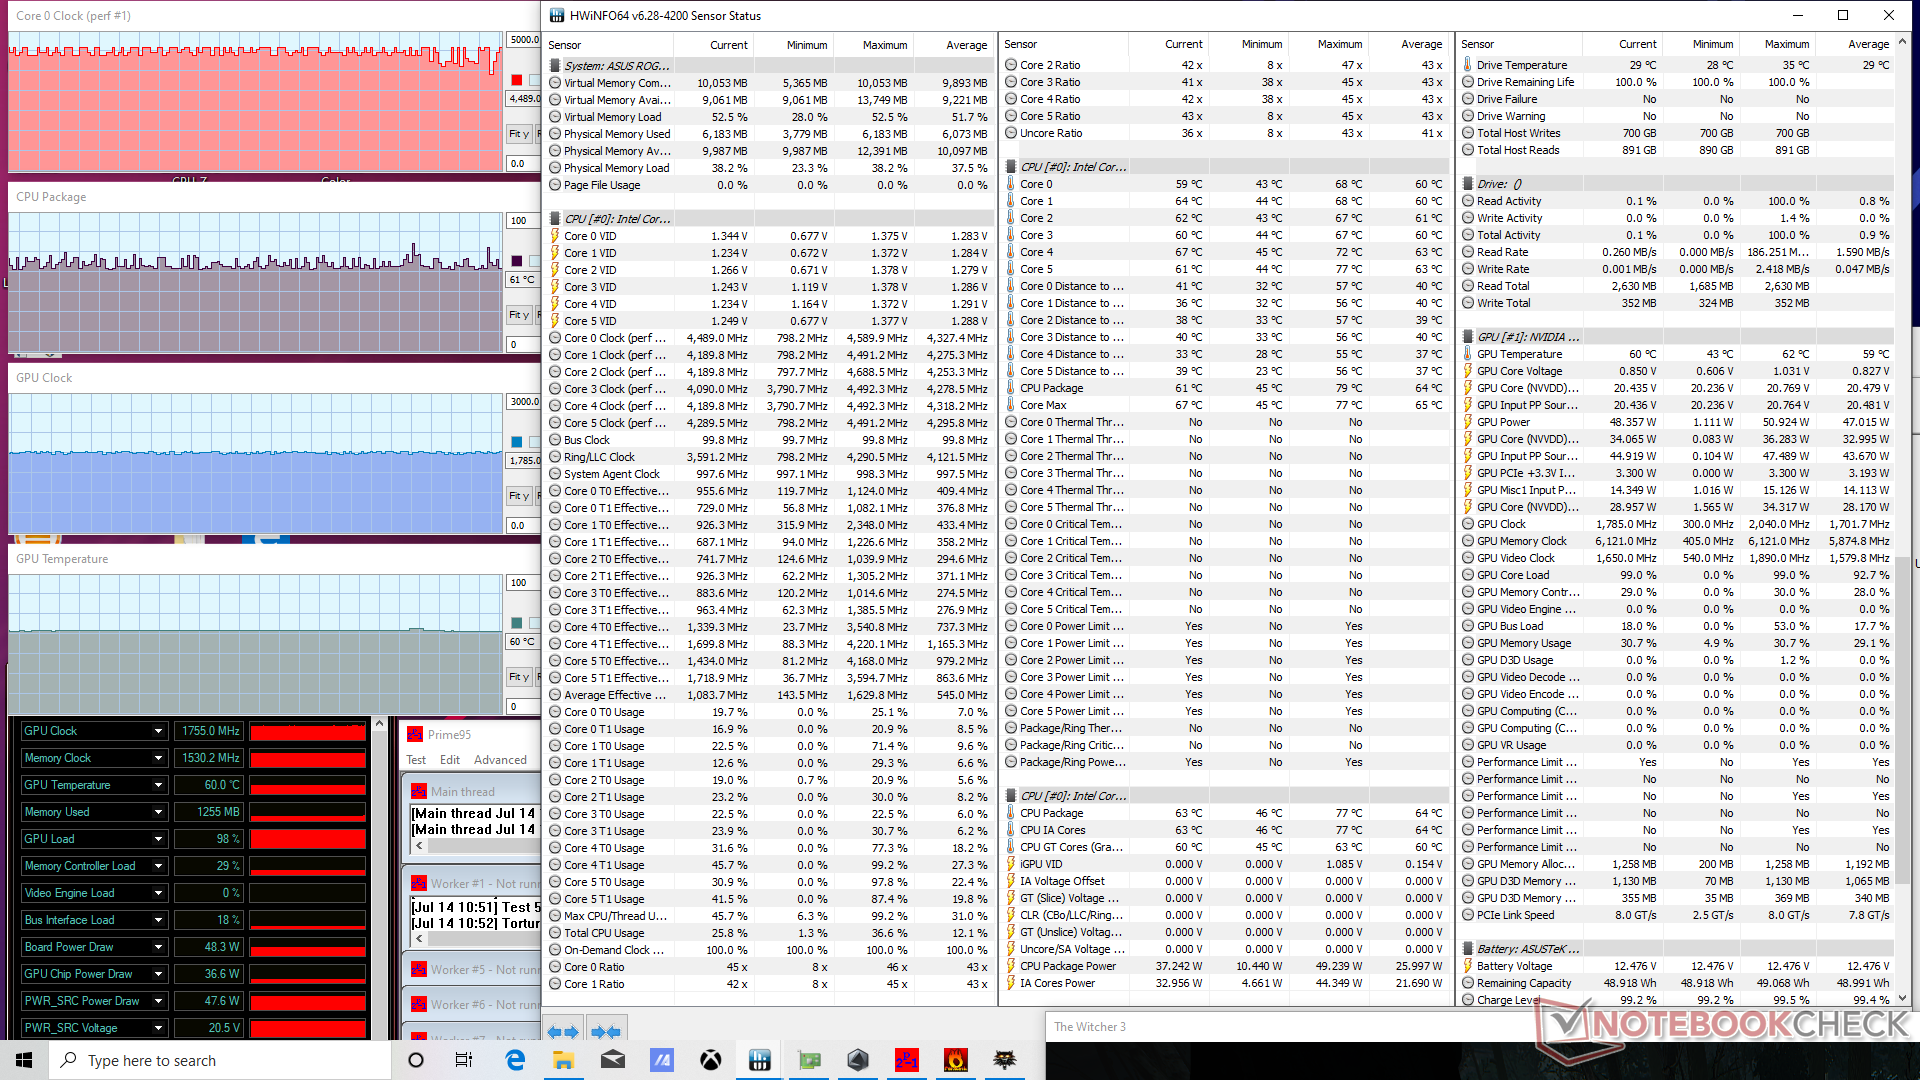
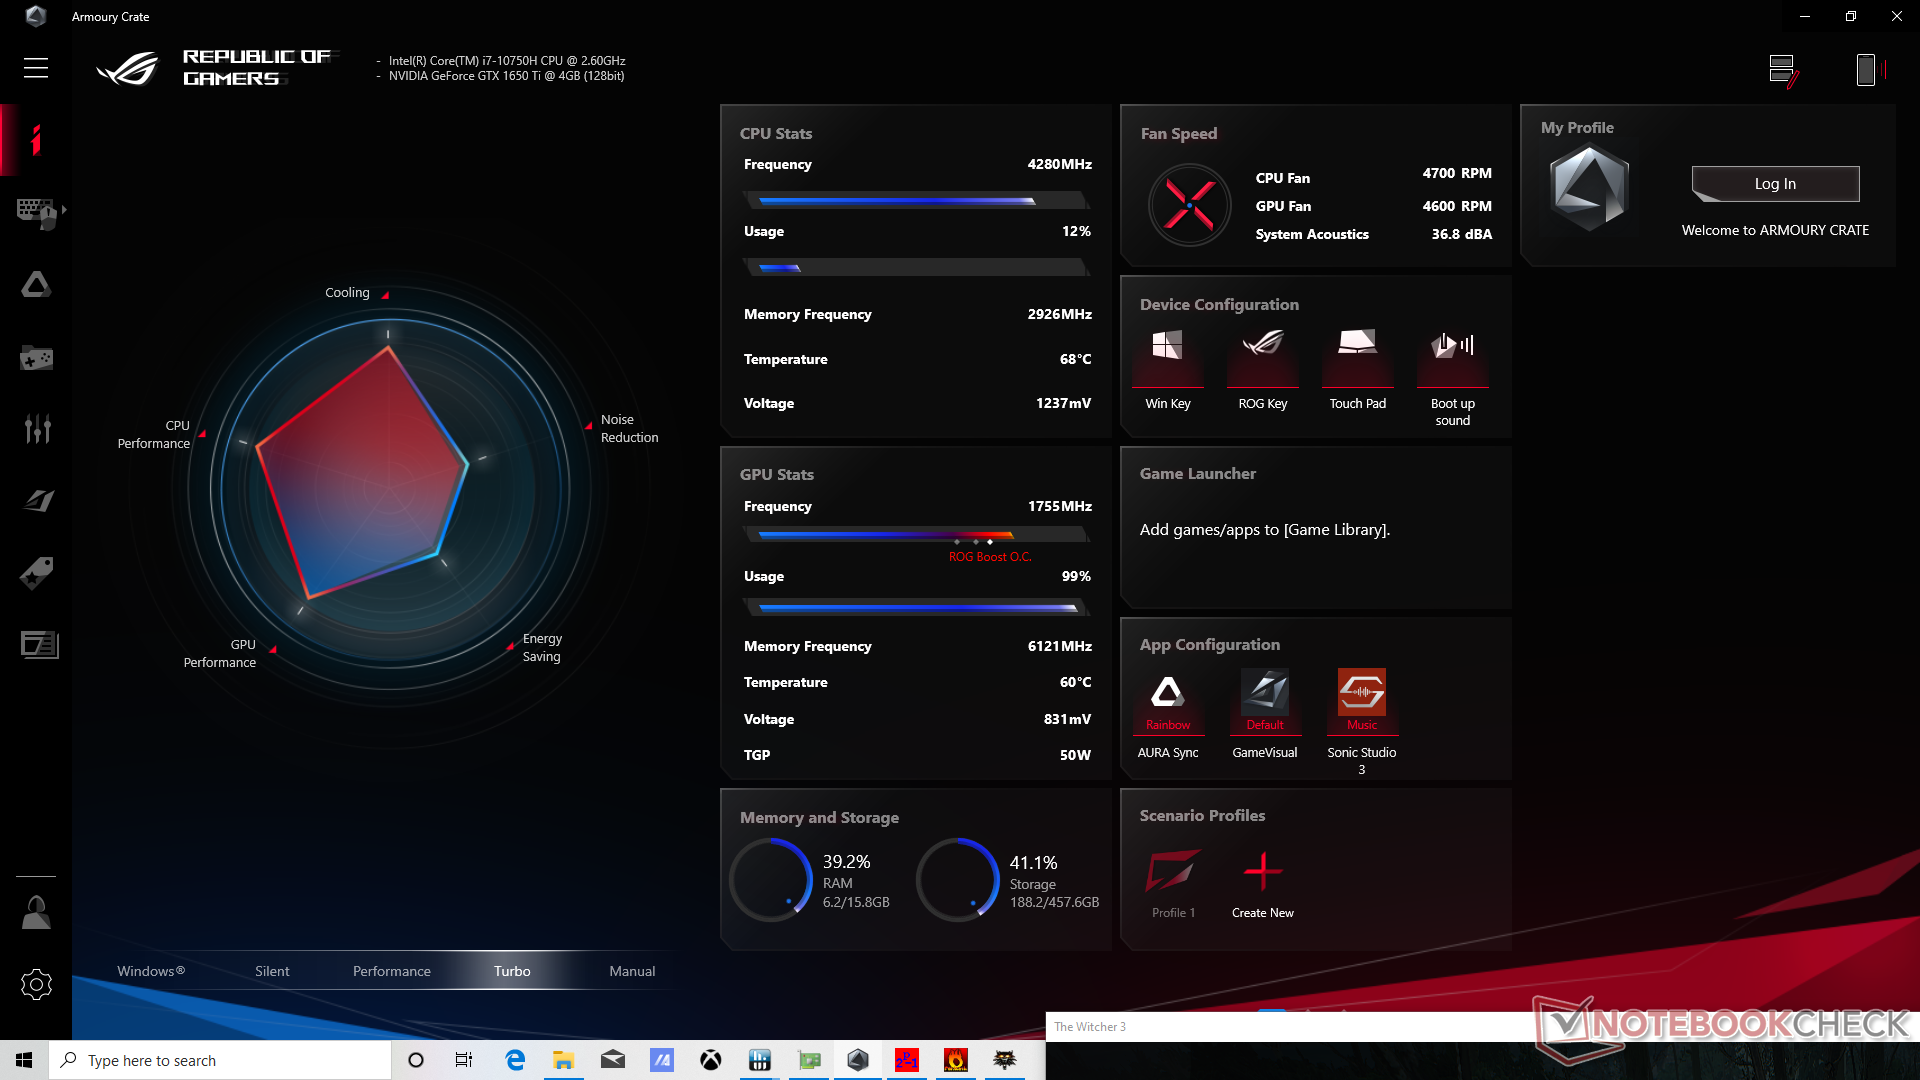
Running Witcher 3 on Asus' Turbo mode results in the CPU and GPU stabilizing at 61 C and 60 C, respectively, with a GPU clock rate of 1755 MHz. GPU clock rate drops just slightly to 1695 MHz when running in performance mode without much of a change in fan noise so users may as well game on Turbo mode whenever possible. These running temperatures are relatively low since this particular chassis was built to handle faster GPU options up to the RTX 2070 Super.
Running on battery power will limit performance. A Fire Strike run on batteries would return Physics and Graphics scores of 12489 and 7647 points, respectively, compared to 18318 and 10663 points when on mains.
| CPU Clock (GHz) | GPU Clock (MHz) | Average CPU Temperature (°C) | Average GPU Temperature (°C) | |
| System Idle | -- | -- | 31 | 30 |
| Prime95 Stress | 3.8 | -- | 83 | 52 |
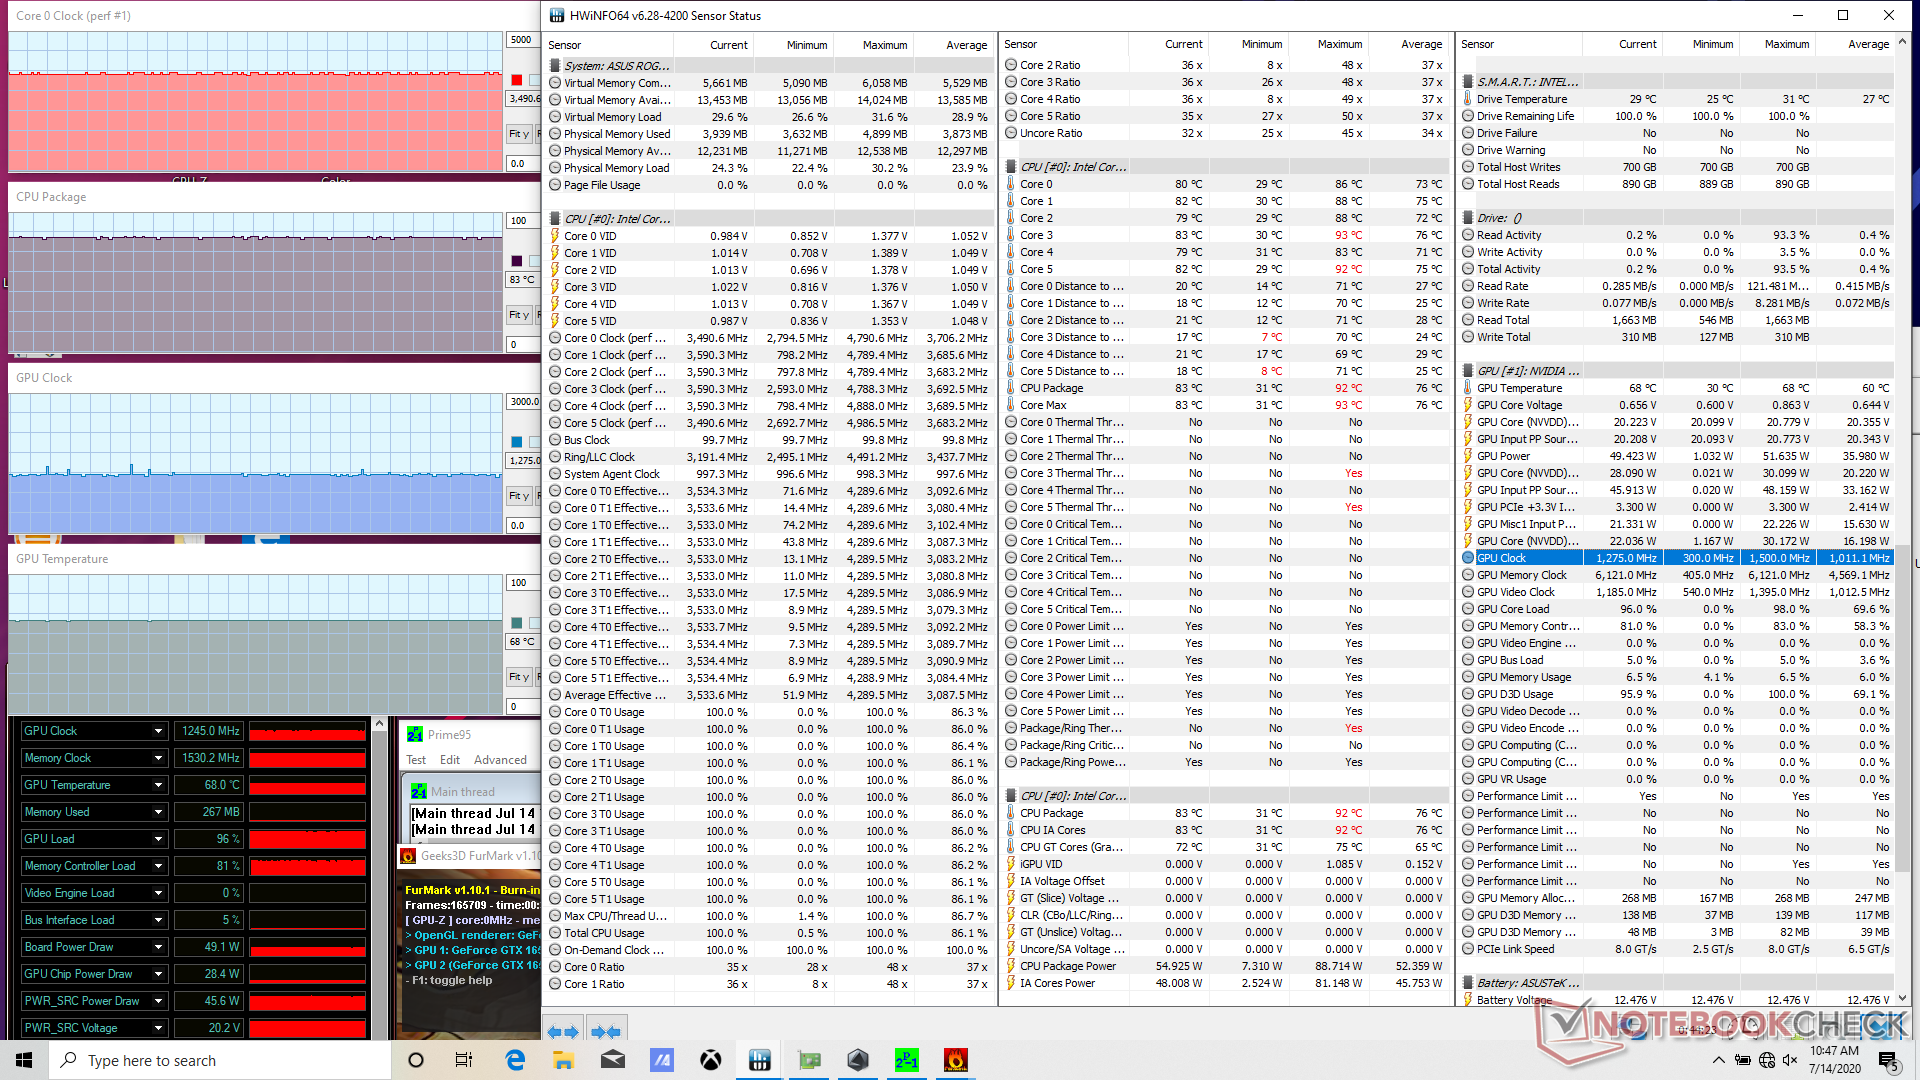
| Prime95 + FurMark Stress | 3.5 | 1245 | 83 | 68 |
| Witcher 3 Stress (Turbo Mode) | ~4.4 | 1755 | 61 | 60 |
Speakers


Asus ROG Strix G15 G512LI audio analysis
(+) | speakers can play relatively loud (85.8 dB)
Bass 100 - 315 Hz
(±) | reduced bass - on average 14.3% lower than median
(±) | linearity of bass is average (12.3% delta to prev. frequency)
Mids 400 - 2000 Hz
(±) | higher mids - on average 8.2% higher than median
(+) | mids are linear (5.1% delta to prev. frequency)
Highs 2 - 16 kHz
(+) | balanced highs - only 3.4% away from median
(±) | linearity of highs is average (9.5% delta to prev. frequency)
Overall 100 - 16.000 Hz
(±) | linearity of overall sound is average (18.9% difference to median)
Compared to same class
» 63% of all tested devices in this class were better, 8% similar, 29% worse
» The best had a delta of 6%, average was 18%, worst was 132%
Compared to all devices tested
» 44% of all tested devices were better, 8% similar, 48% worse
» The best had a delta of 4%, average was 23%, worst was 134%
Apple MacBook 12 (Early 2016) 1.1 GHz audio analysis
(+) | speakers can play relatively loud (83.6 dB)
Bass 100 - 315 Hz
(±) | reduced bass - on average 11.3% lower than median
(±) | linearity of bass is average (14.2% delta to prev. frequency)
Mids 400 - 2000 Hz
(+) | balanced mids - only 2.4% away from median
(+) | mids are linear (5.5% delta to prev. frequency)
Highs 2 - 16 kHz
(+) | balanced highs - only 2% away from median
(+) | highs are linear (4.5% delta to prev. frequency)
Overall 100 - 16.000 Hz
(+) | overall sound is linear (10.2% difference to median)
Compared to same class
» 7% of all tested devices in this class were better, 2% similar, 90% worse
» The best had a delta of 5%, average was 18%, worst was 53%
Compared to all devices tested
» 5% of all tested devices were better, 1% similar, 94% worse
» The best had a delta of 4%, average was 23%, worst was 134%
Energy Management
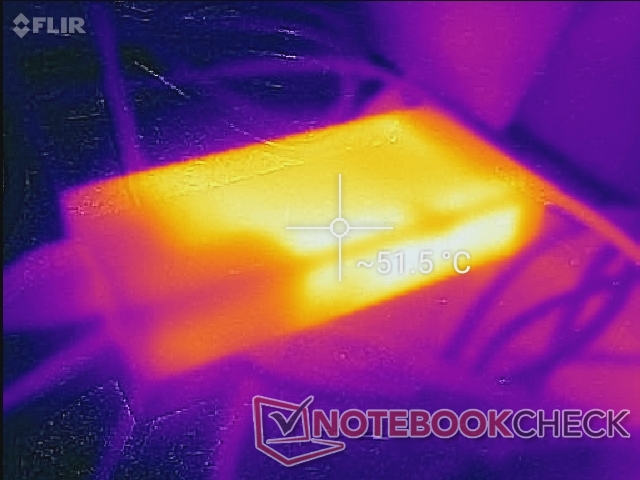
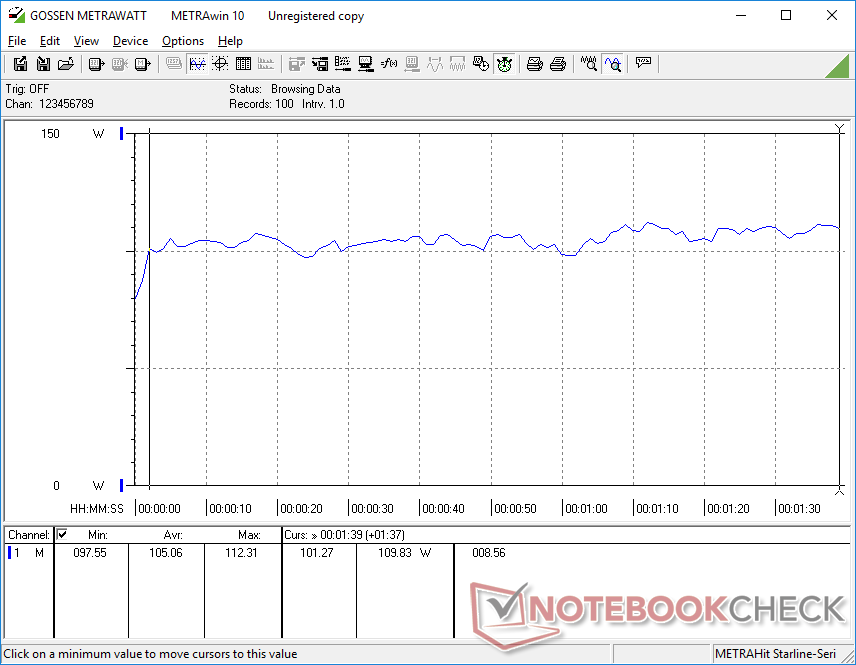
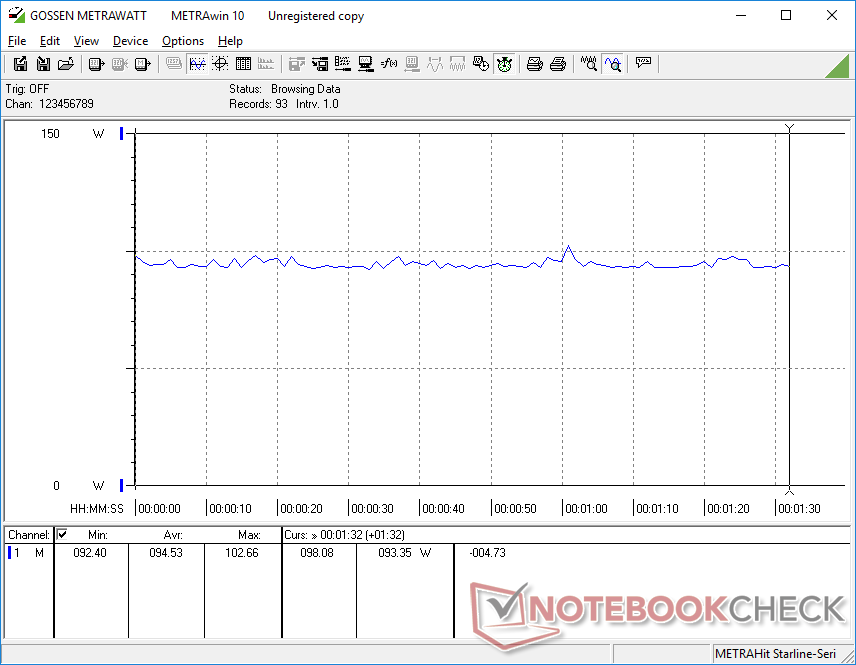
Power Consumption
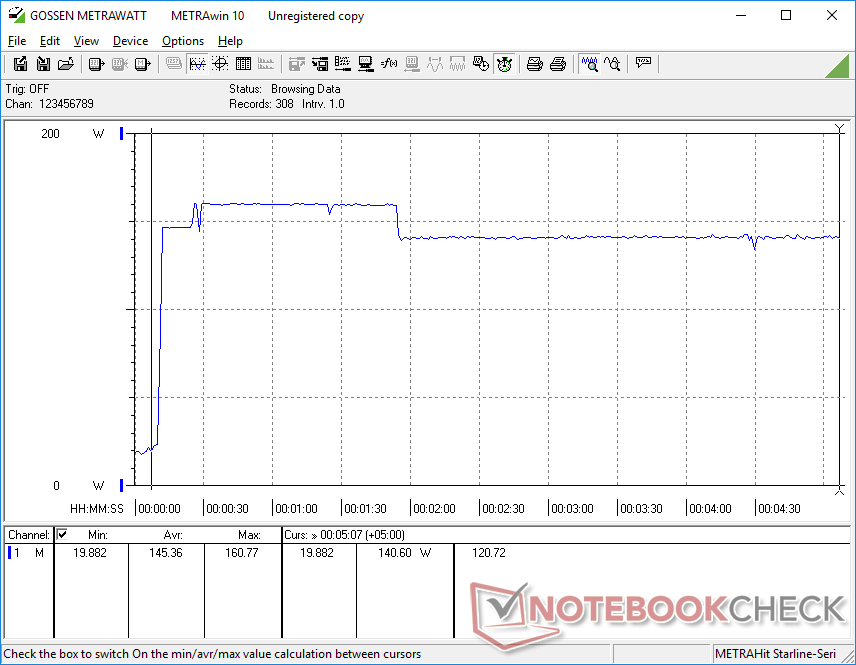
Idling on desktop demands between 5 W and 21 W depending on the brightness level and power profile. Running Witcher 3 consumes about 95 W compared to 125 W to 130 W on most GTX 1060-powered laptops. Thus, the GTX 1650 Ti is able to offer similar graphics performance at a much higher performance-per-watt than the last generation Pascal GPU.
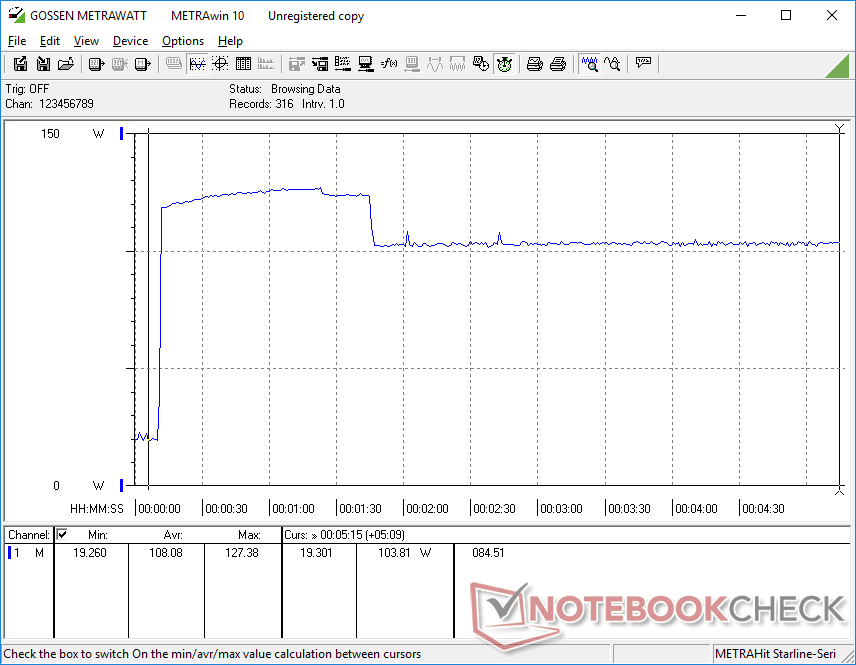
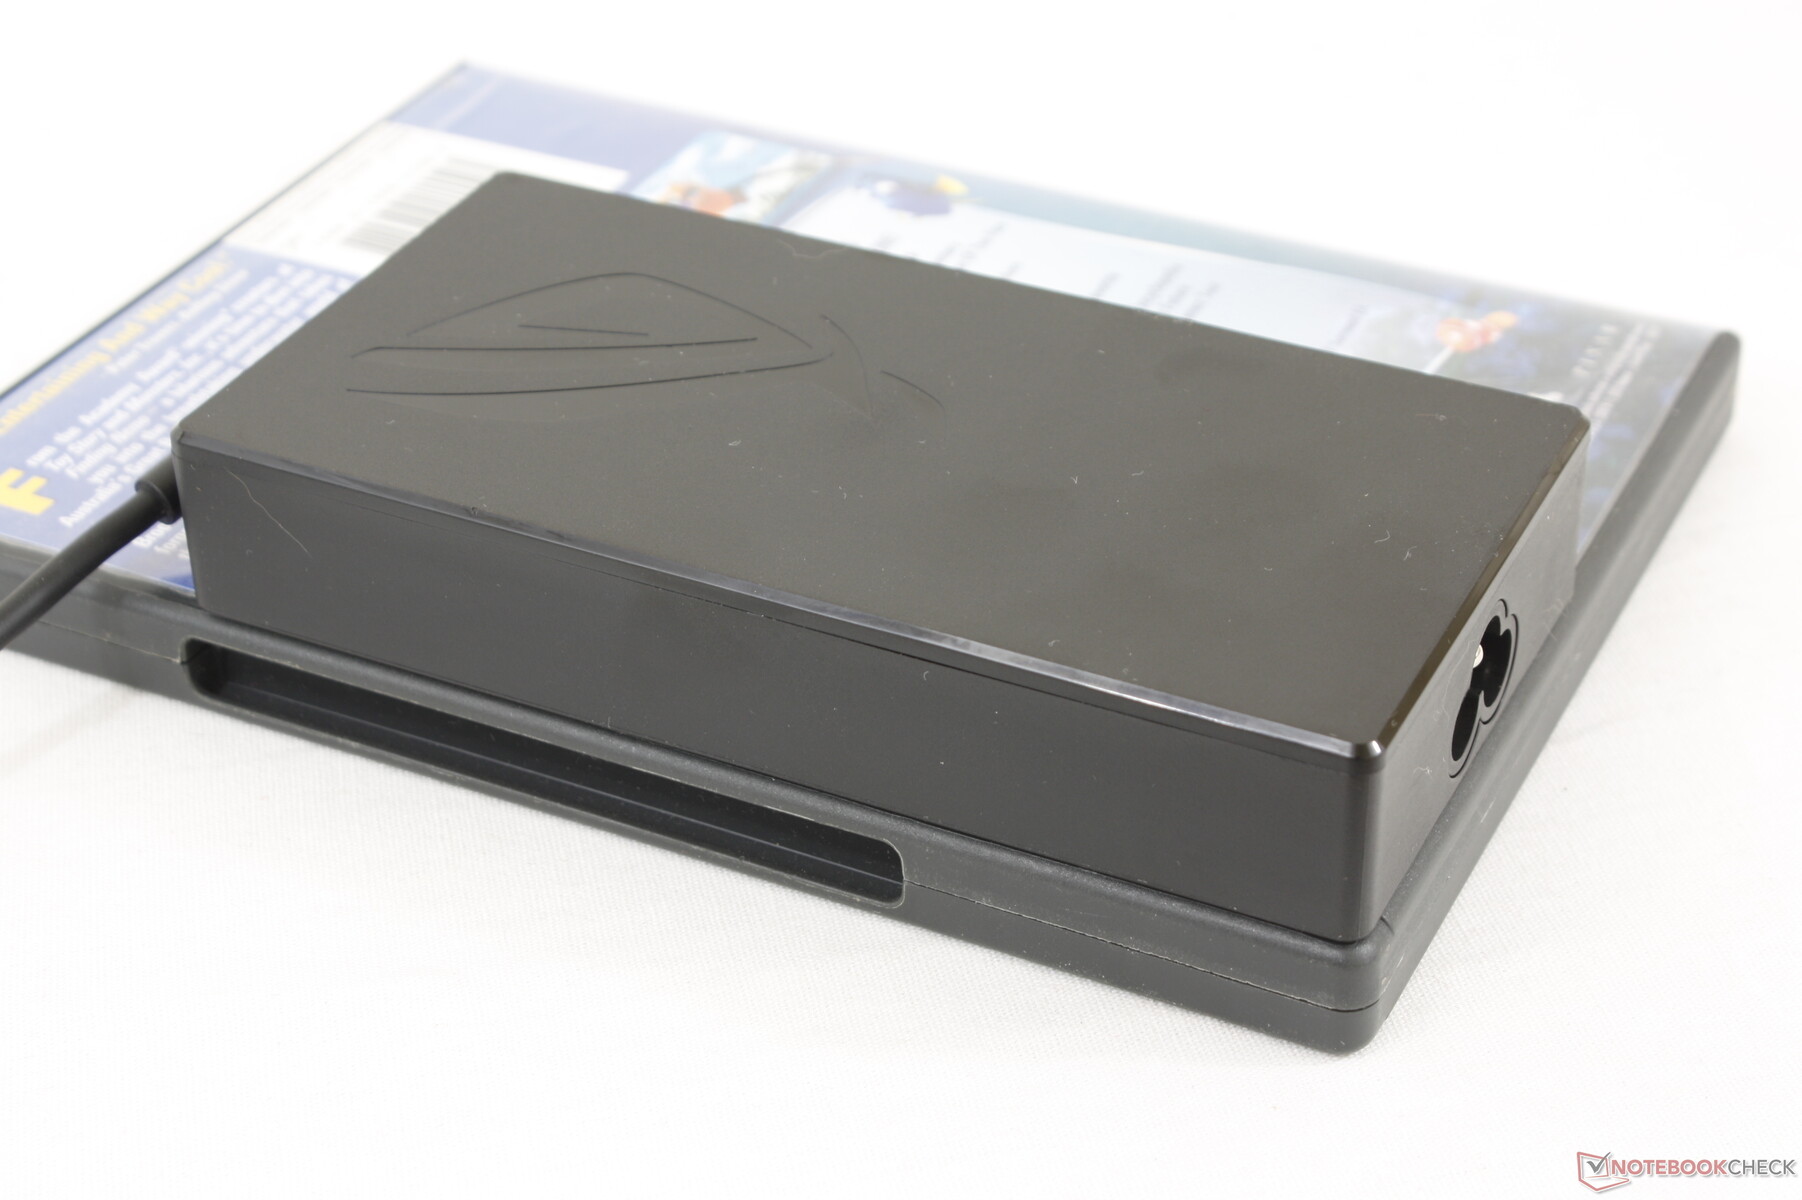
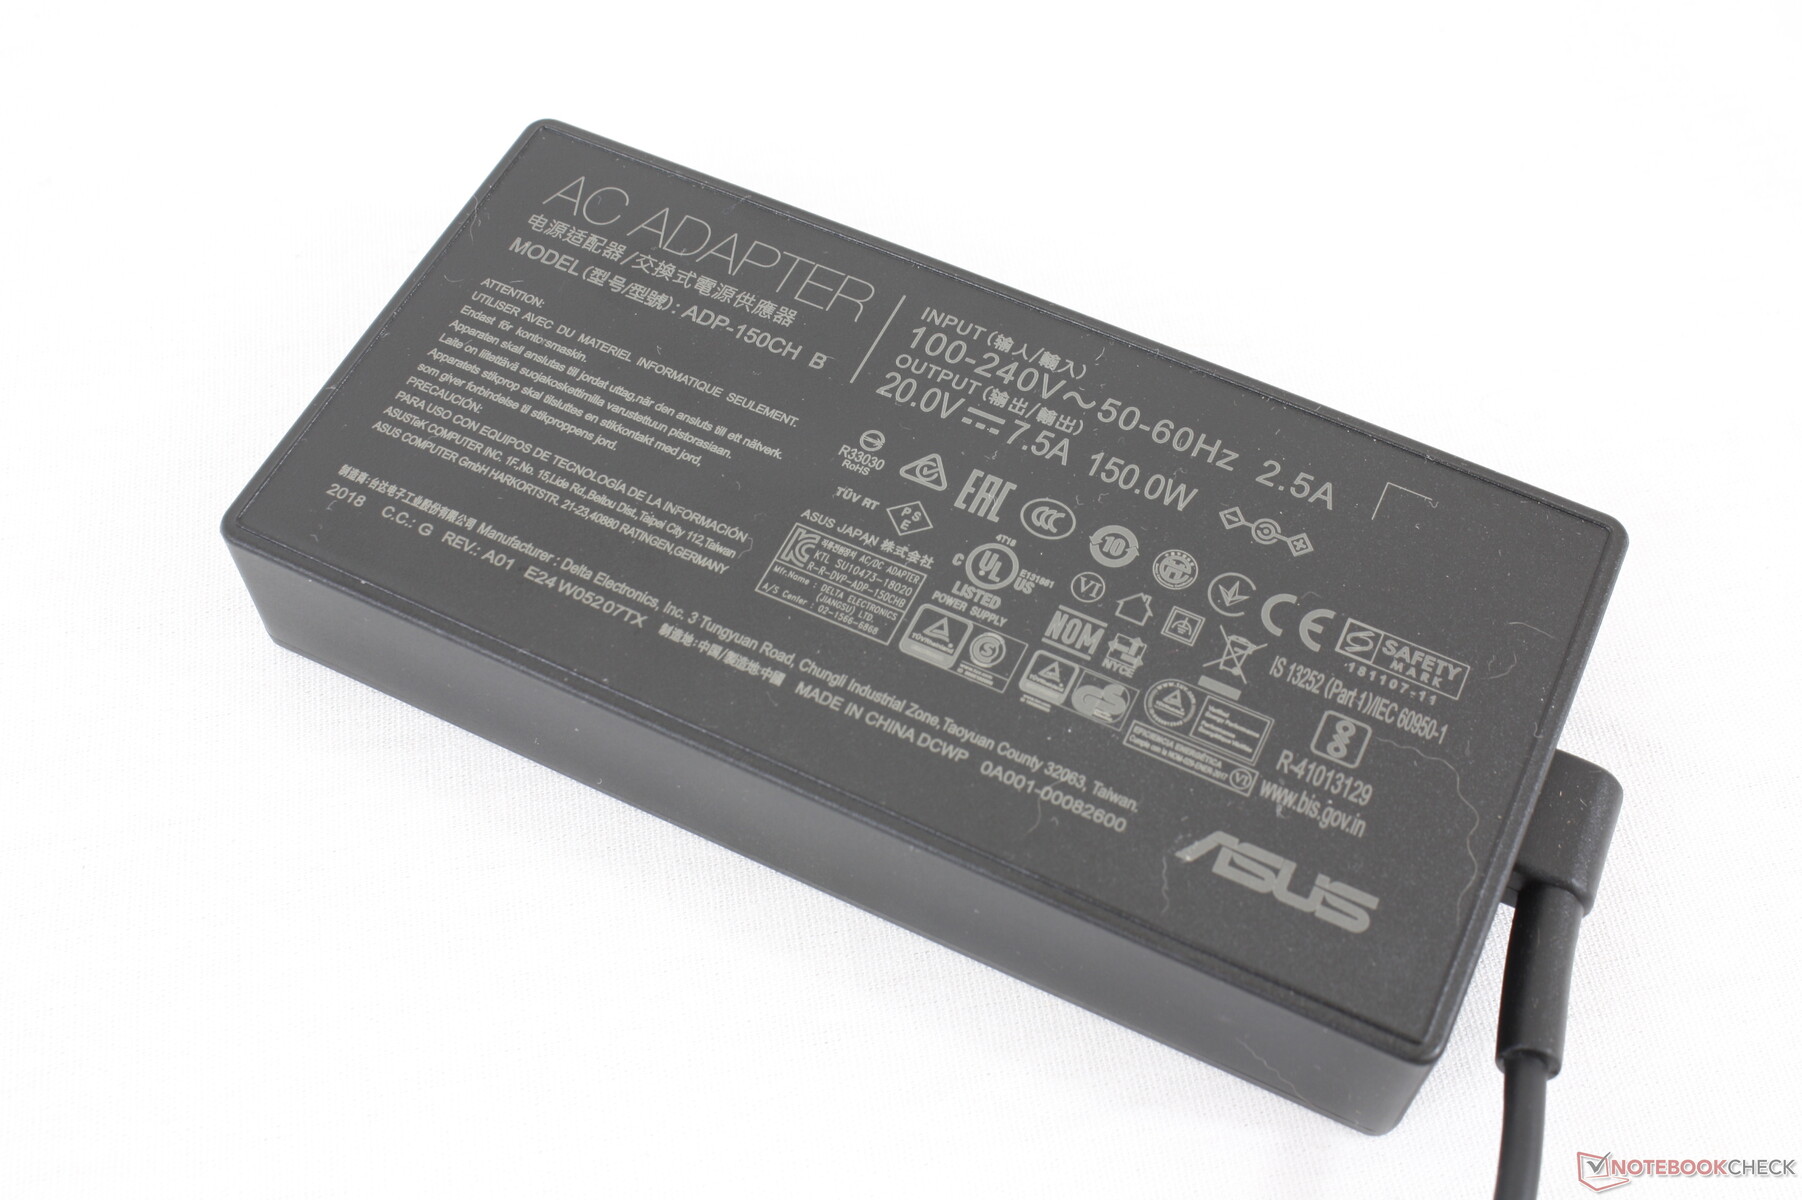
We're able to record a maximum draw of 161 W from the medium-sized 150 W AC adapter. This maximum is only temporary as shown by our graphs below. Configurations with the GTX 1660 Ti GPU or higher will ship with a larger 230 W AC adapter instead.
| Off / Standby | |
| Idle | |
| Load |
|
Key:
min: | |
| Asus ROG Strix G15 G512LI i7-10750H, GeForce GTX 1650 Ti Mobile, Intel SSD 660p SSDPEKNW512G8, IPS, 1920x1080, 15.6" | Asus TUF Gaming A15 FA506IV-HN172 R7 4800H, GeForce RTX 2060 Mobile, Kingston OM8PCP3512F-AB, IPS, 1920x1080, 15.6" | MSI GP65 10SFK-047US i7-10750H, GeForce RTX 2070 Mobile, Samsung SSD PM981 MZVLB1T0HALR, IPS, 1920x1080, 15.6" | Dell G5 15 SE 5505 P89F R7 4800H, Radeon RX 5600M, Samsung PM991 MZ9LQ512HALU, WVA, 1920x1080, 15.6" | HP Omen 15-dc1020ng i5-9300H, GeForce GTX 1650 Mobile, WDC PC SN720 SDAQNTW-512G, IPS, 1920x1080, 15.6" | HP Pavilion Gaming 15-cx0003ng i7-8750H, GeForce GTX 1050 Ti Mobile, Intel Optane 16 GB MEMPEK1J016GAH + HGST HTS721010A9E630 1 TB HDD, IPS, 1920x1080, 15.6" | |
|---|---|---|---|---|---|---|
| Power Consumption | -4% | -66% | -6% | 22% | 14% | |
| Idle Minimum * (Watt) | 5.7 | 5.4 5% | 14.2 -149% | 6.5 -14% | 4.04 29% | 5.5 4% |
| Idle Average * (Watt) | 9.3 | 10 -8% | 18.8 -102% | 10.6 -14% | 7.2 23% | 8.5 9% |
| Idle Maximum * (Watt) | 20.9 | 10.5 50% | 23.9 -14% | 11 47% | 11.4 45% | 11.9 43% |
| Load Average * (Watt) | 105.1 | 135 -28% | 96.9 8% | 84.1 20% | 80.8 23% | 94 11% |
| Witcher 3 ultra * (Watt) | 94.5 | 144 -52% | 185 -96% | 152.9 -62% | 93.6 1% | 86 9% |
| Load Maximum * (Watt) | 160.8 | 147 9% | 233.4 -45% | 180.4 -12% | 144.5 10% | 144 10% |
* ... smaller is better
Battery Life
At 4.5 hours of real-world WLAN use, battery life is about average for its category and size class. Battery capacity is quite small at just 48 Wh compared to 99 Wh on something like the MSI GS66.
Recharging from empty to full capacity takes about 1.5 hours. The system cannot be recharged via USB-C unlike on the Asus Zephyrus M GU502.
| Asus ROG Strix G15 G512LI i7-10750H, GeForce GTX 1650 Ti Mobile, 48 Wh | Asus TUF Gaming A15 FA506IV-HN172 R7 4800H, GeForce RTX 2060 Mobile, 48 Wh | Asus Strix Scar III G531GW-AZ062T i7-9750H, GeForce RTX 2070 Mobile, 66 Wh | MSI GP65 10SFK-047US i7-10750H, GeForce RTX 2070 Mobile, 51 Wh | Dell G5 15 SE 5505 P89F R7 4800H, Radeon RX 5600M, 51 Wh | HP Omen 15-dc1020ng i5-9300H, GeForce GTX 1650 Mobile, 52.5 Wh | |
|---|---|---|---|---|---|---|
| Battery runtime | 16% | 24% | -18% | 10% | 16% | |
| Reader / Idle (h) | 13.3 | 9.8 -26% | 11.2 -16% | 15.9 20% | ||
| WiFi v1.3 (h) | 4.5 | 6.2 38% | 5.6 24% | 3.7 -18% | 6.2 38% | 6.4 42% |
| Load (h) | 1.4 | 1.9 36% | 1.5 7% | 1.2 -14% | ||
| Witcher 3 ultra (h) | 1 |
Pros
Cons
Verdict
The features that stick out the most are the support for 3x M.2 2280 SSDs, baseline 144 Hz display option, and the LED bar around the bottom edges of the chassis for visual flair. Most other laptops in this size class can house just two storage drives only. Otherwise, performance is somewhat disappointing for a $1000 gaming machine because users can get pretty much the same graphics performance out of an older and cheaper GTX 1060 laptop or even almost 50 percent faster performance from systems running on the GTX 1660 Ti by spending just $100 to $200 more.
Additionally, the 144 Hz display here sounds good on paper, but this particular Panda panel has major trade-offs including its more limited color space, more noticeable ghosting, and low contrast ratio. The gaming experience is therefore not as smooth or colorful as it could have been unless if users are willing to spend more on the 240 Hz option.
For $1000 USD, the Asus ROG Strix G15 G512LI doesn't offer a compelling enough GPU to make it worthwhile especially now that gaming laptops with AMD Ryzen are taking off. Users are going to be happier with the performance of an Asus TUF model or GTX 1660 Ti alternative for around this same price.
Asus ROG Strix G15 G512LI
- 11/04/2020 v7 (old)
Allen Ngo
Price comparison
