MSI GS66 Stealth 10SGS Laptop Review: Core i7 or Core i9?
It takes more than just one configuration to get a feel for the whole series. After having just checked out the MSI GS66 10SFS with the Core i9-10980HK CPU and GeForce RTX 2070 Super Max-Q GPU, we're now ready to tackle the GS66 10SGS configured with the Core i7-10750H and GeForce RTX 2080 Super Max-Q instead. What differences can users expect between the two SKUs and is one more recommendable than the other?
The configuration as tested below can be found on Xotic PC for $2700 USD. The GS66 directly succeeds the GS65 and it competes directly with other high-end ultra-thin gaming laptops like the Razer Blade 15, Asus Zephyrus S GX531, Dell Alienware m15 R2, Gigabyte Aorus series, Lenovo Legion Y740-15, and the Acer Predator Triton.
More MSI reviews:
Rating | Date | Model | Weight | Height | Size | Resolution | Price |
|---|---|---|---|---|---|---|---|
| 84 % v7 (old) | 05 / 2020 | MSI GS66 10SGS i7-10750H, GeForce RTX 2080 Super Max-Q | 2.2 kg | 20 mm | 15.60" | 1920x1080 | |
| 81.3 % v7 (old) | 05 / 2019 | Asus Zephyrus S GX502GW i7-9750H, GeForce RTX 2070 Mobile | 2.1 kg | 19 mm | 15.60" | 1920x1080 | |
| 88.8 % v6 (old) | 05 / 2019 | Razer Blade 15 RTX 2080 Max-Q i7-9750H, GeForce RTX 2080 Max-Q | 2.2 kg | 17.8 mm | 15.60" | 1920x1080 | |
| 84.8 % v7 (old) | 10 / 2019 | Lenovo Legion Y740-15ICHg i7-9750H, GeForce RTX 2070 Max-Q | 2.3 kg | 25 mm | 15.60" | 1920x1080 | |
| 83.3 % v7 (old) | 02 / 2020 | Schenker XMG Pro 15 i7-9750H, GeForce RTX 2070 Mobile | 2.5 kg | 30 mm | 15.60" | 1920x1080 |
Case
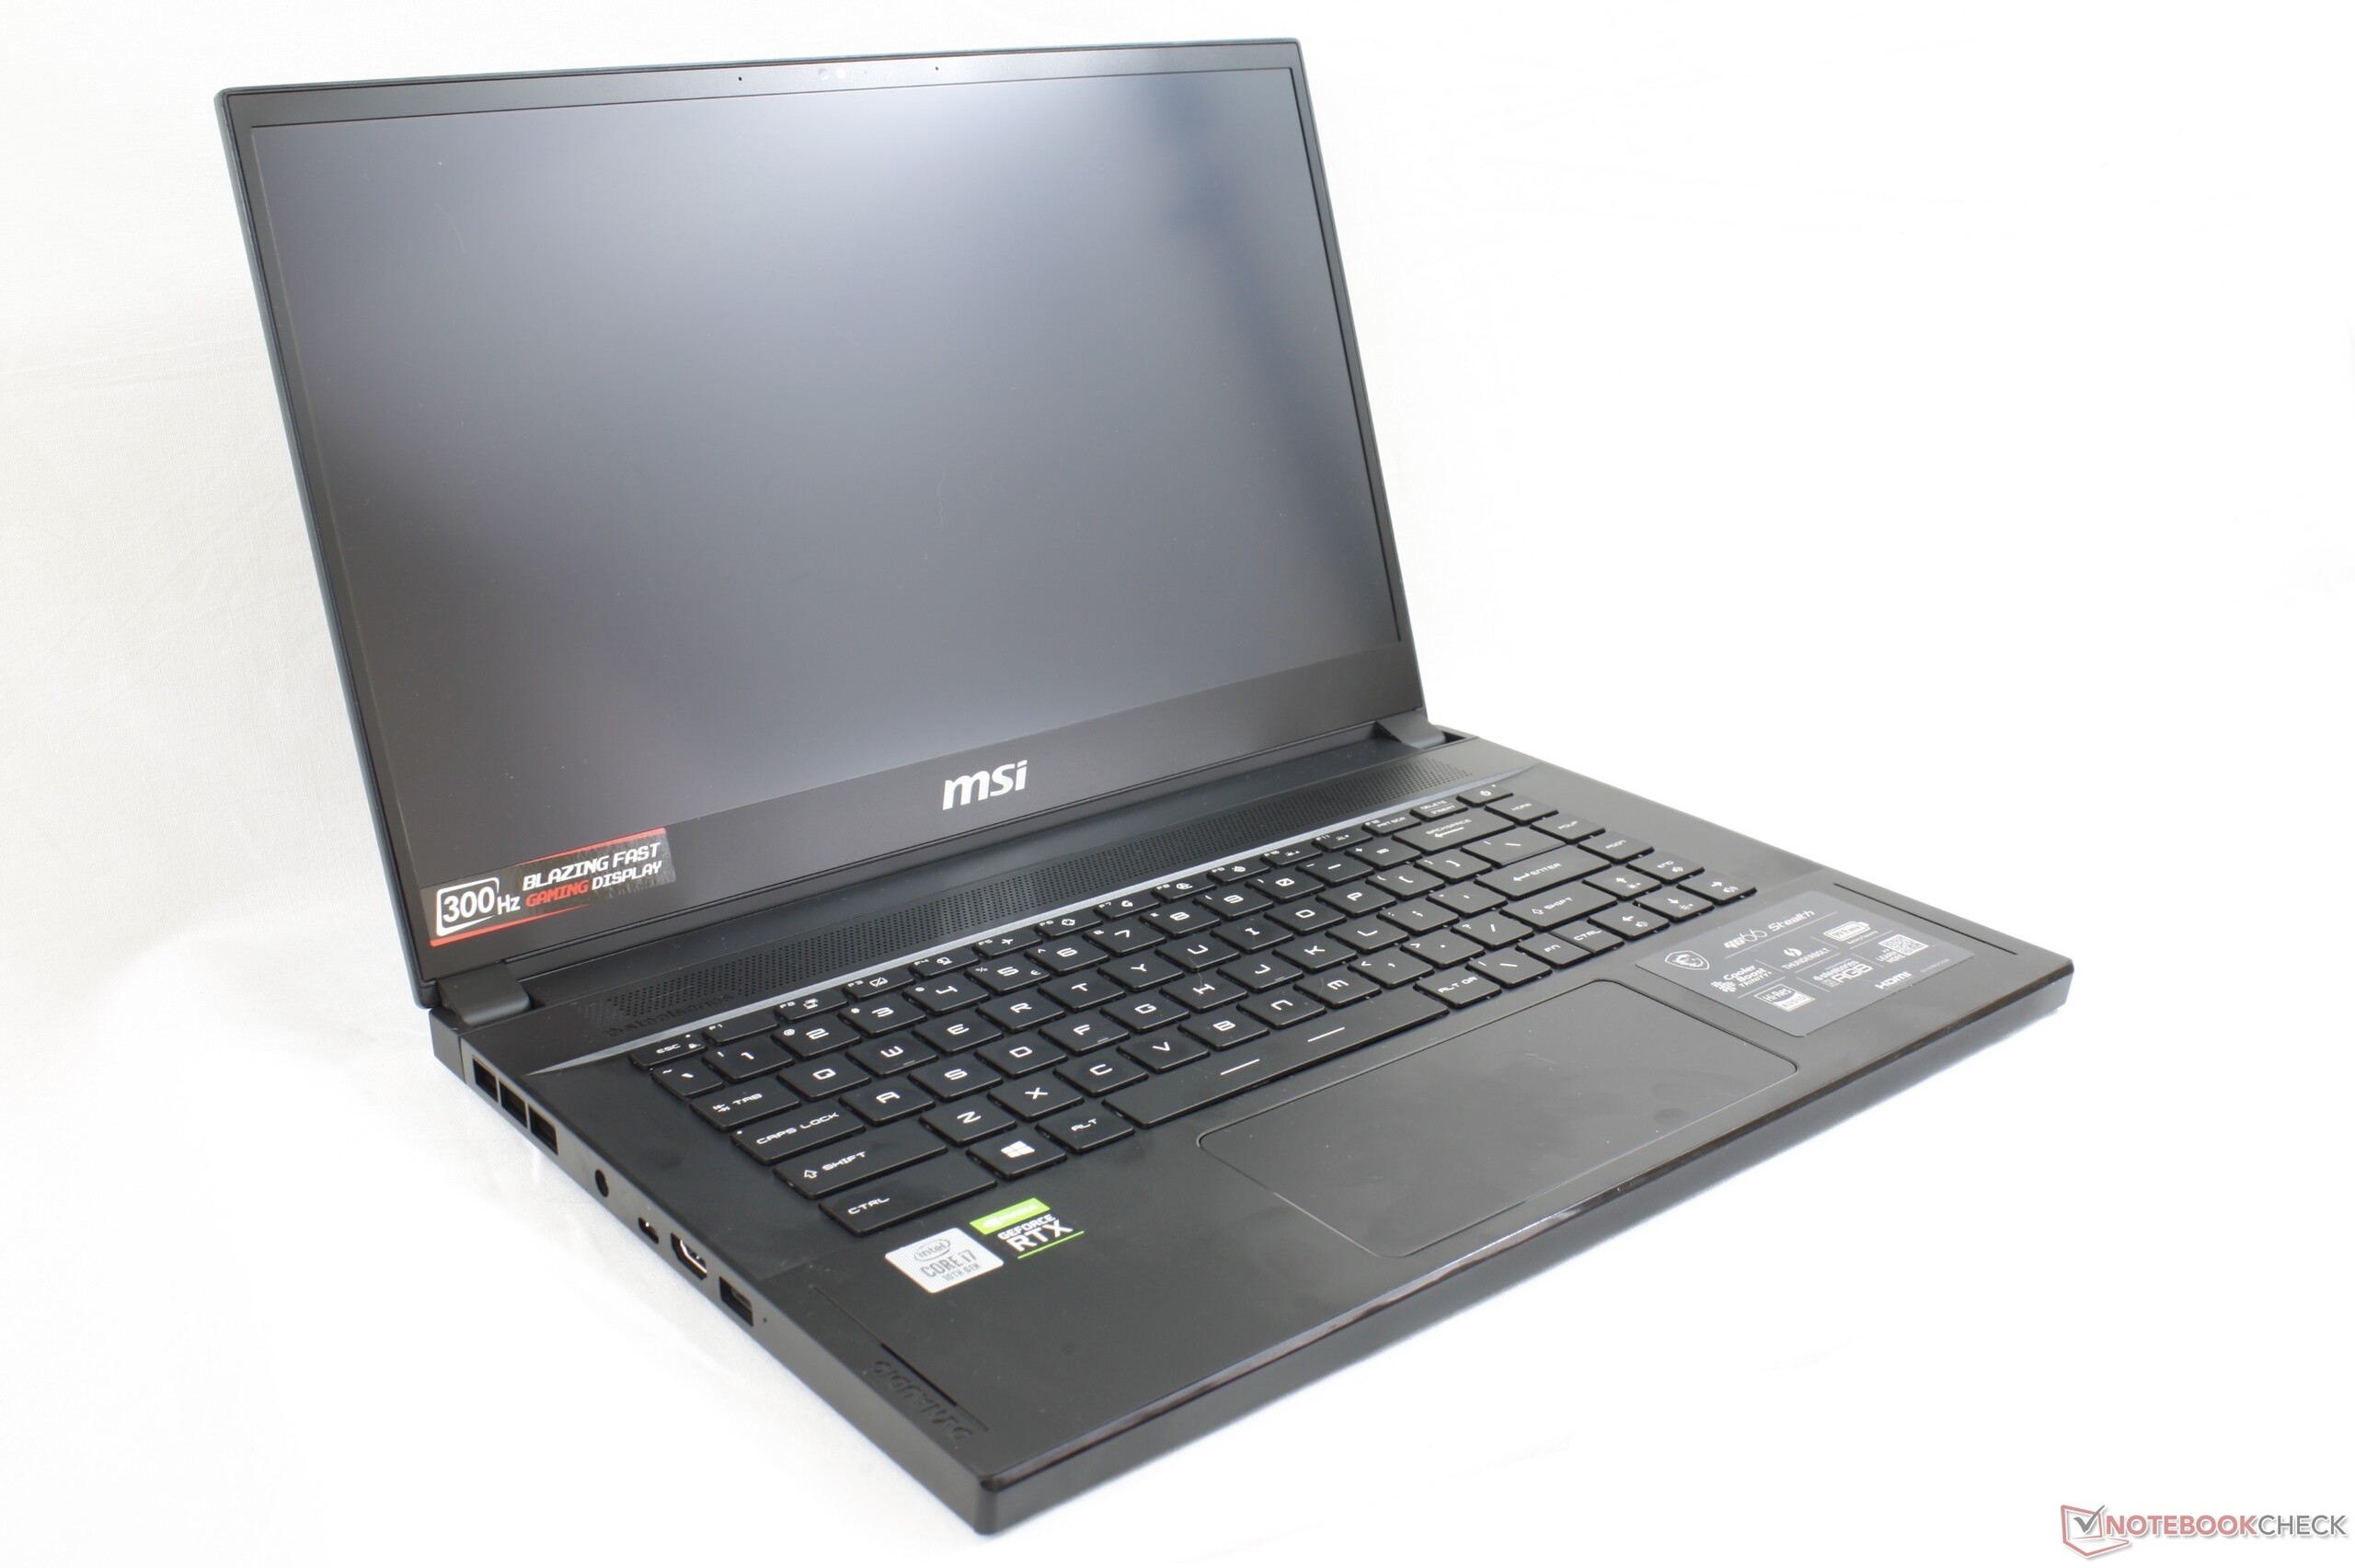
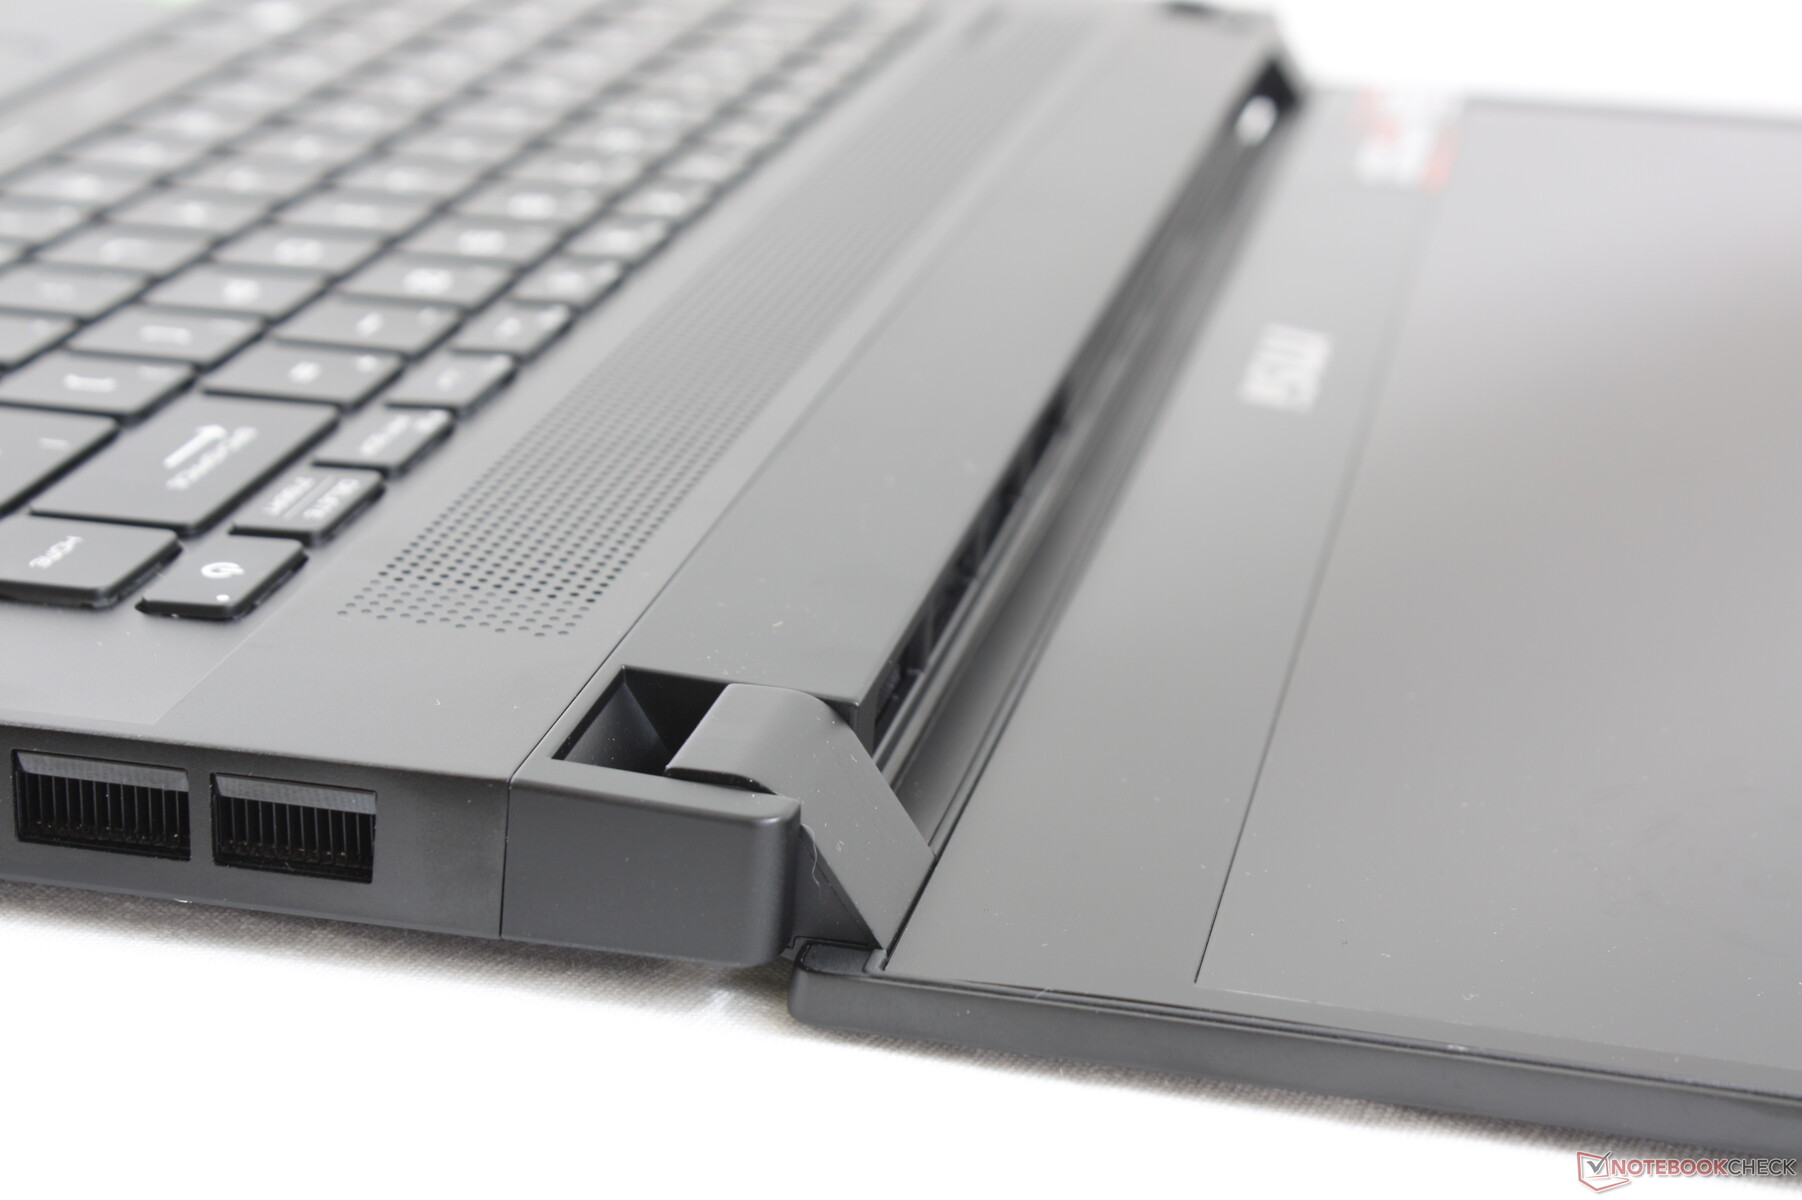
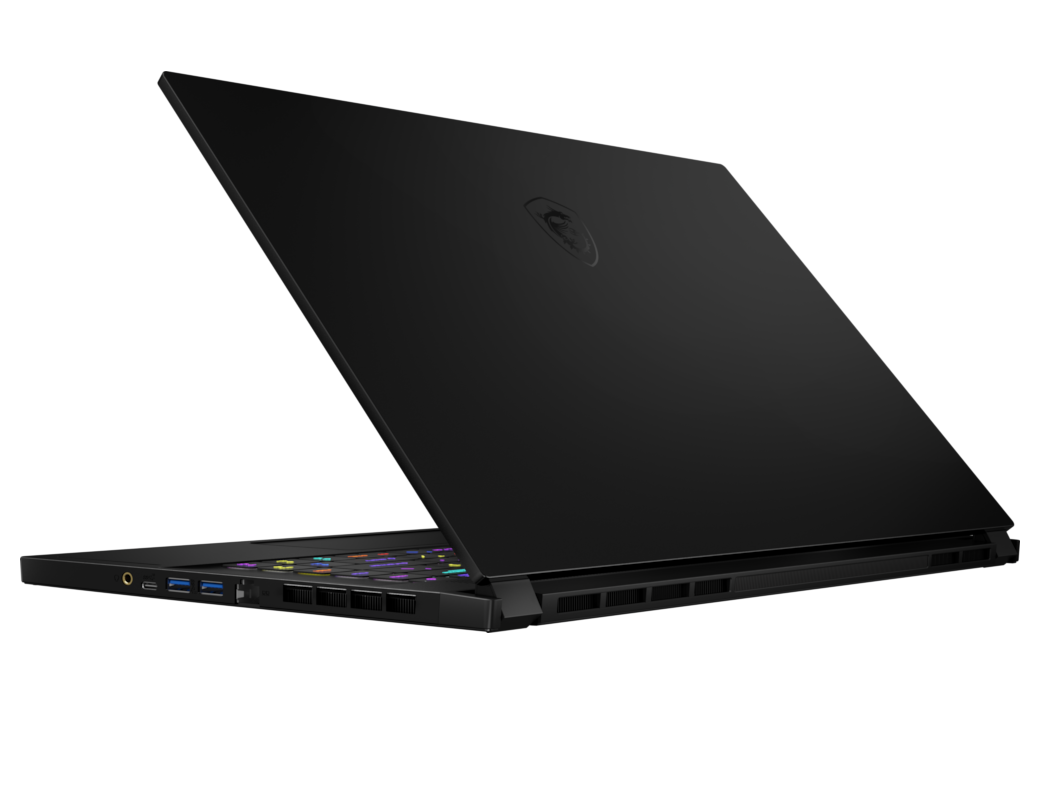
One of the main criticisms of the GS65 was its pliable build compared to sturdier and more rigid alternatives like the Razer Blade 15. The GS66 addresses this by overhauling the chassis to be firmer and less likely to bend. It's definitely one of the biggest and most noticeable improvements over the GS65.
There are still a couple of drawbacks to the new metal design. Firstly, the chassis still bends and creaks a bit more than the Razer when twisting it from its corners. Secondly, it's not a unibody skeleton despite its sleek all-black demeanor; the front edge and rear, for example, are made of separate pieces meaning that there is room for uneven gaps and crevices between materials.
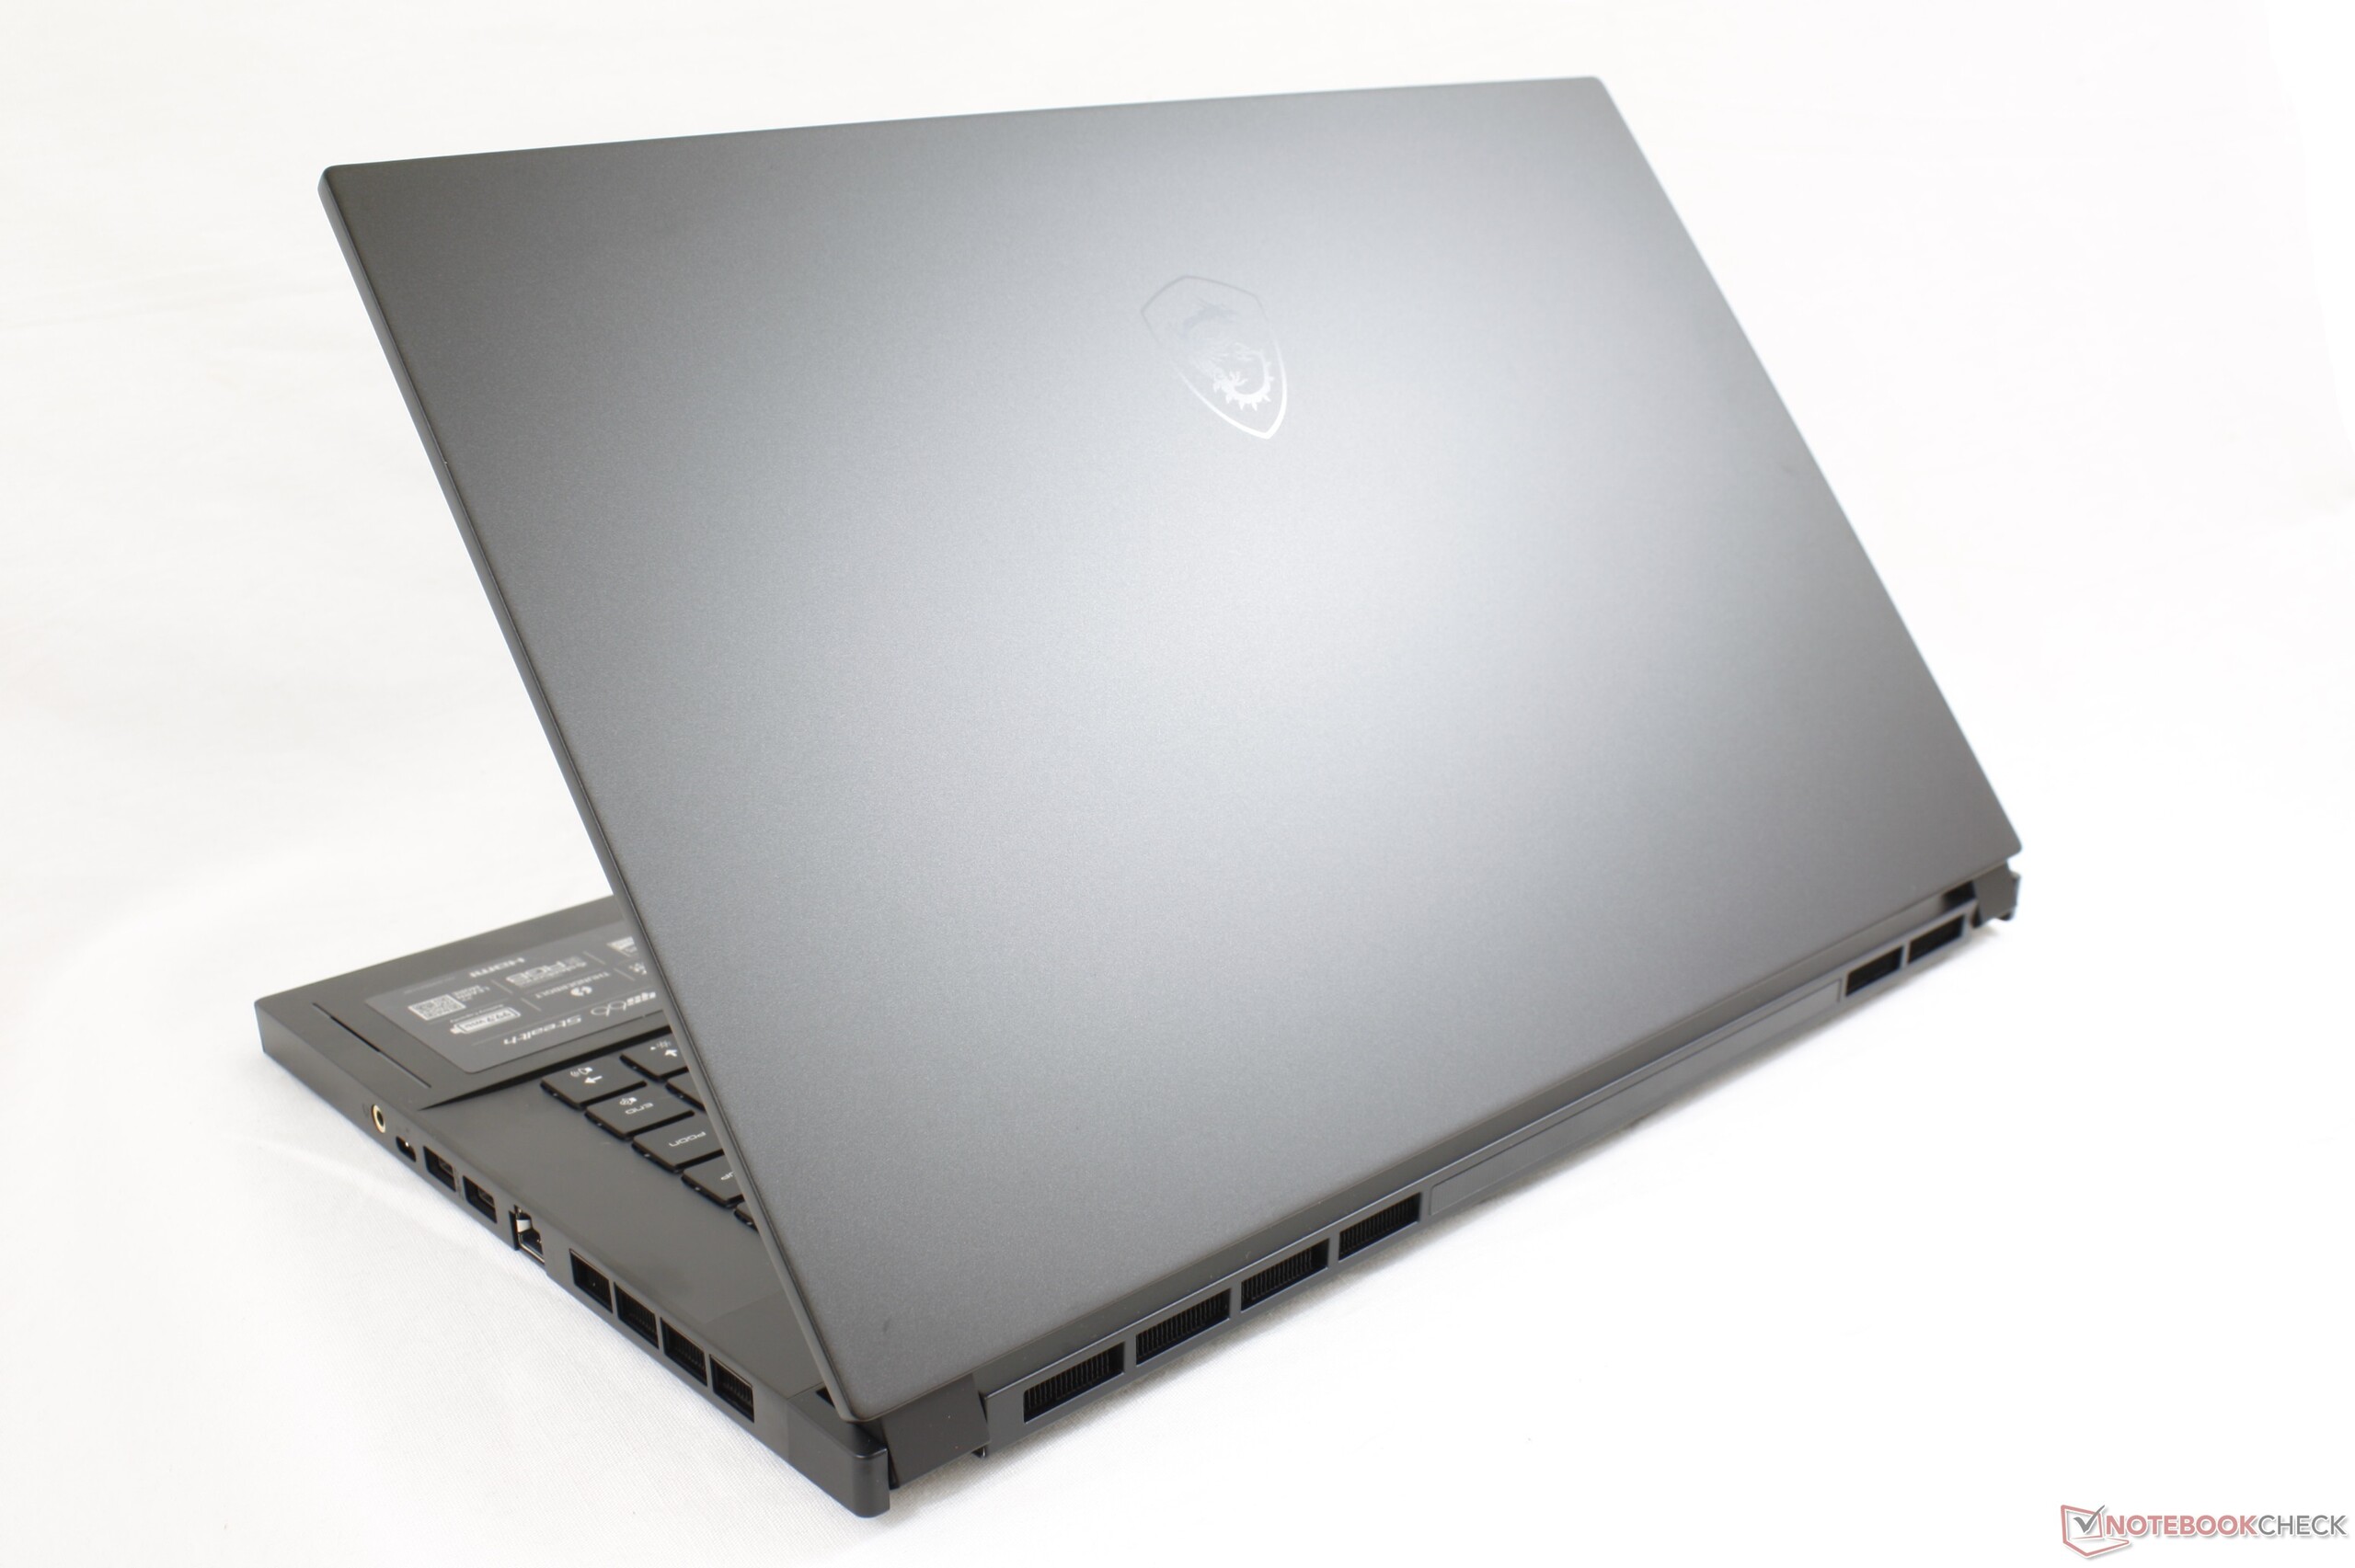
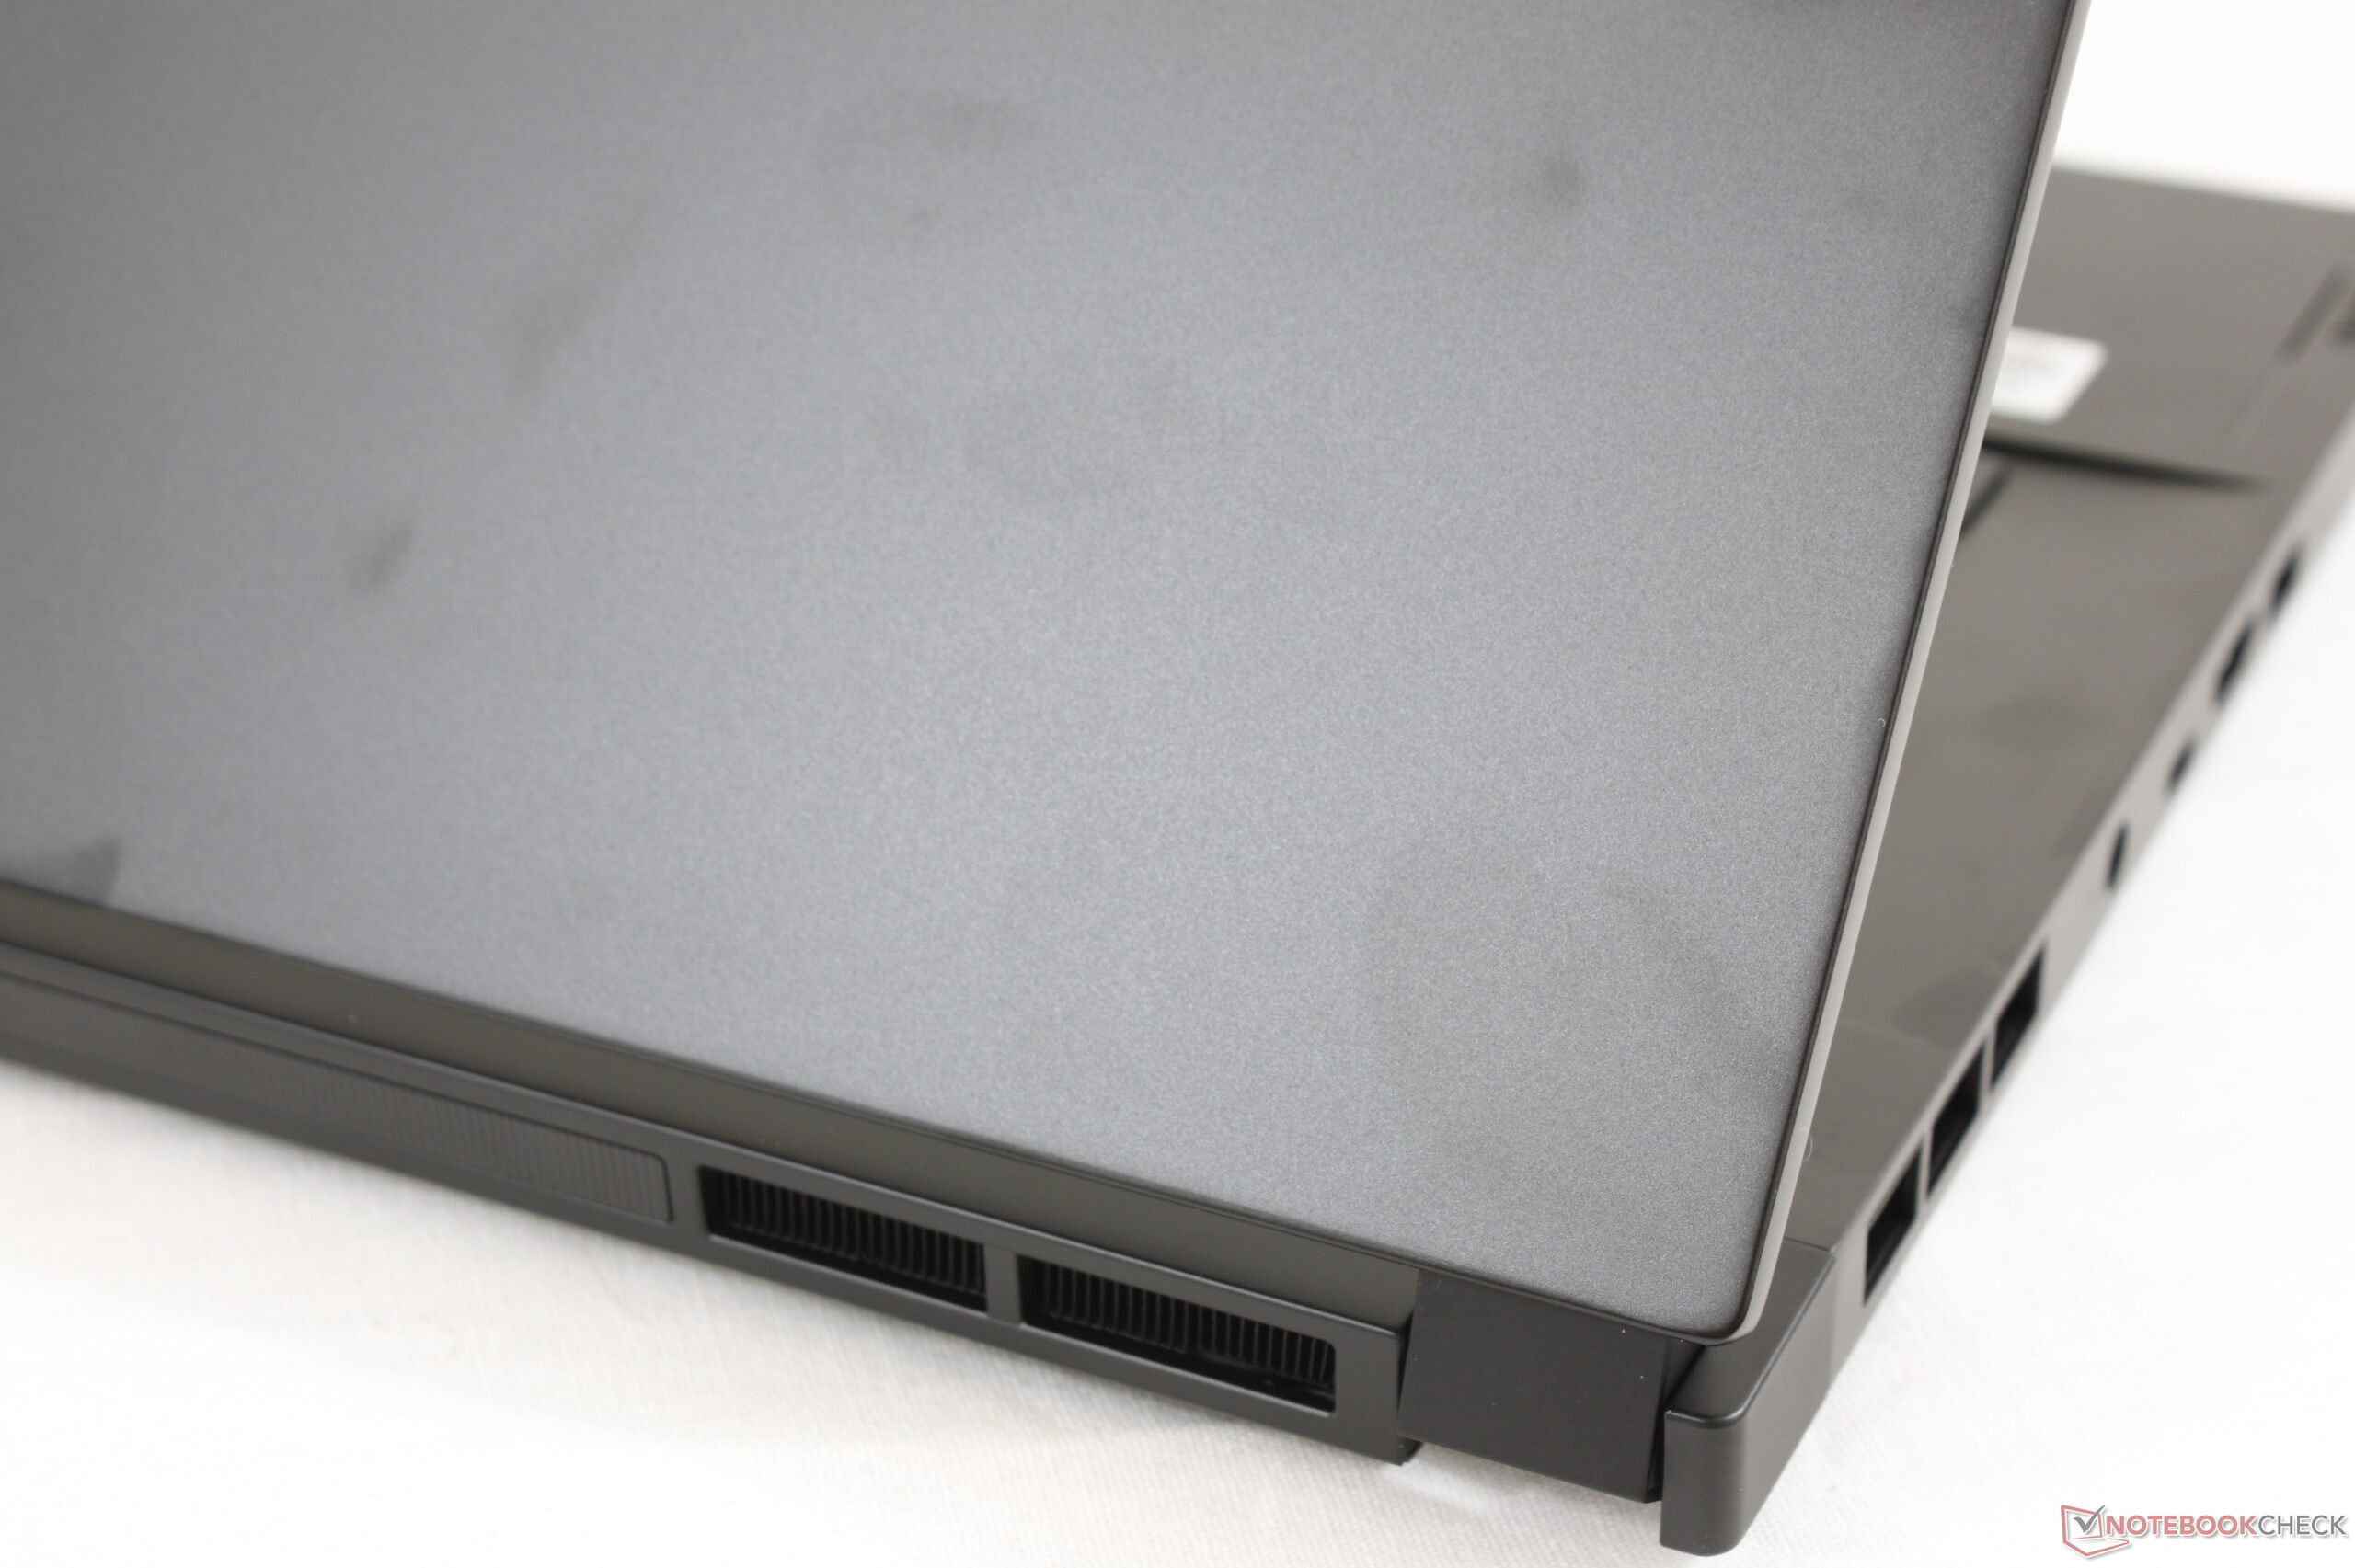
In order to strengthen the chassis and add a larger battery, MSI had to increase both the thickness and weight by about 2 mm and 200 g, respectively, over the older GS65 design. MSI had one of the lightest 15.6-inch gaming laptops in the market with the GS65 and so it's a bit of a bummer that the newer model is noticeably heavier. However, the move is probably for the best as the system feels better and longer-lasting than its predecessor.
Connectivity
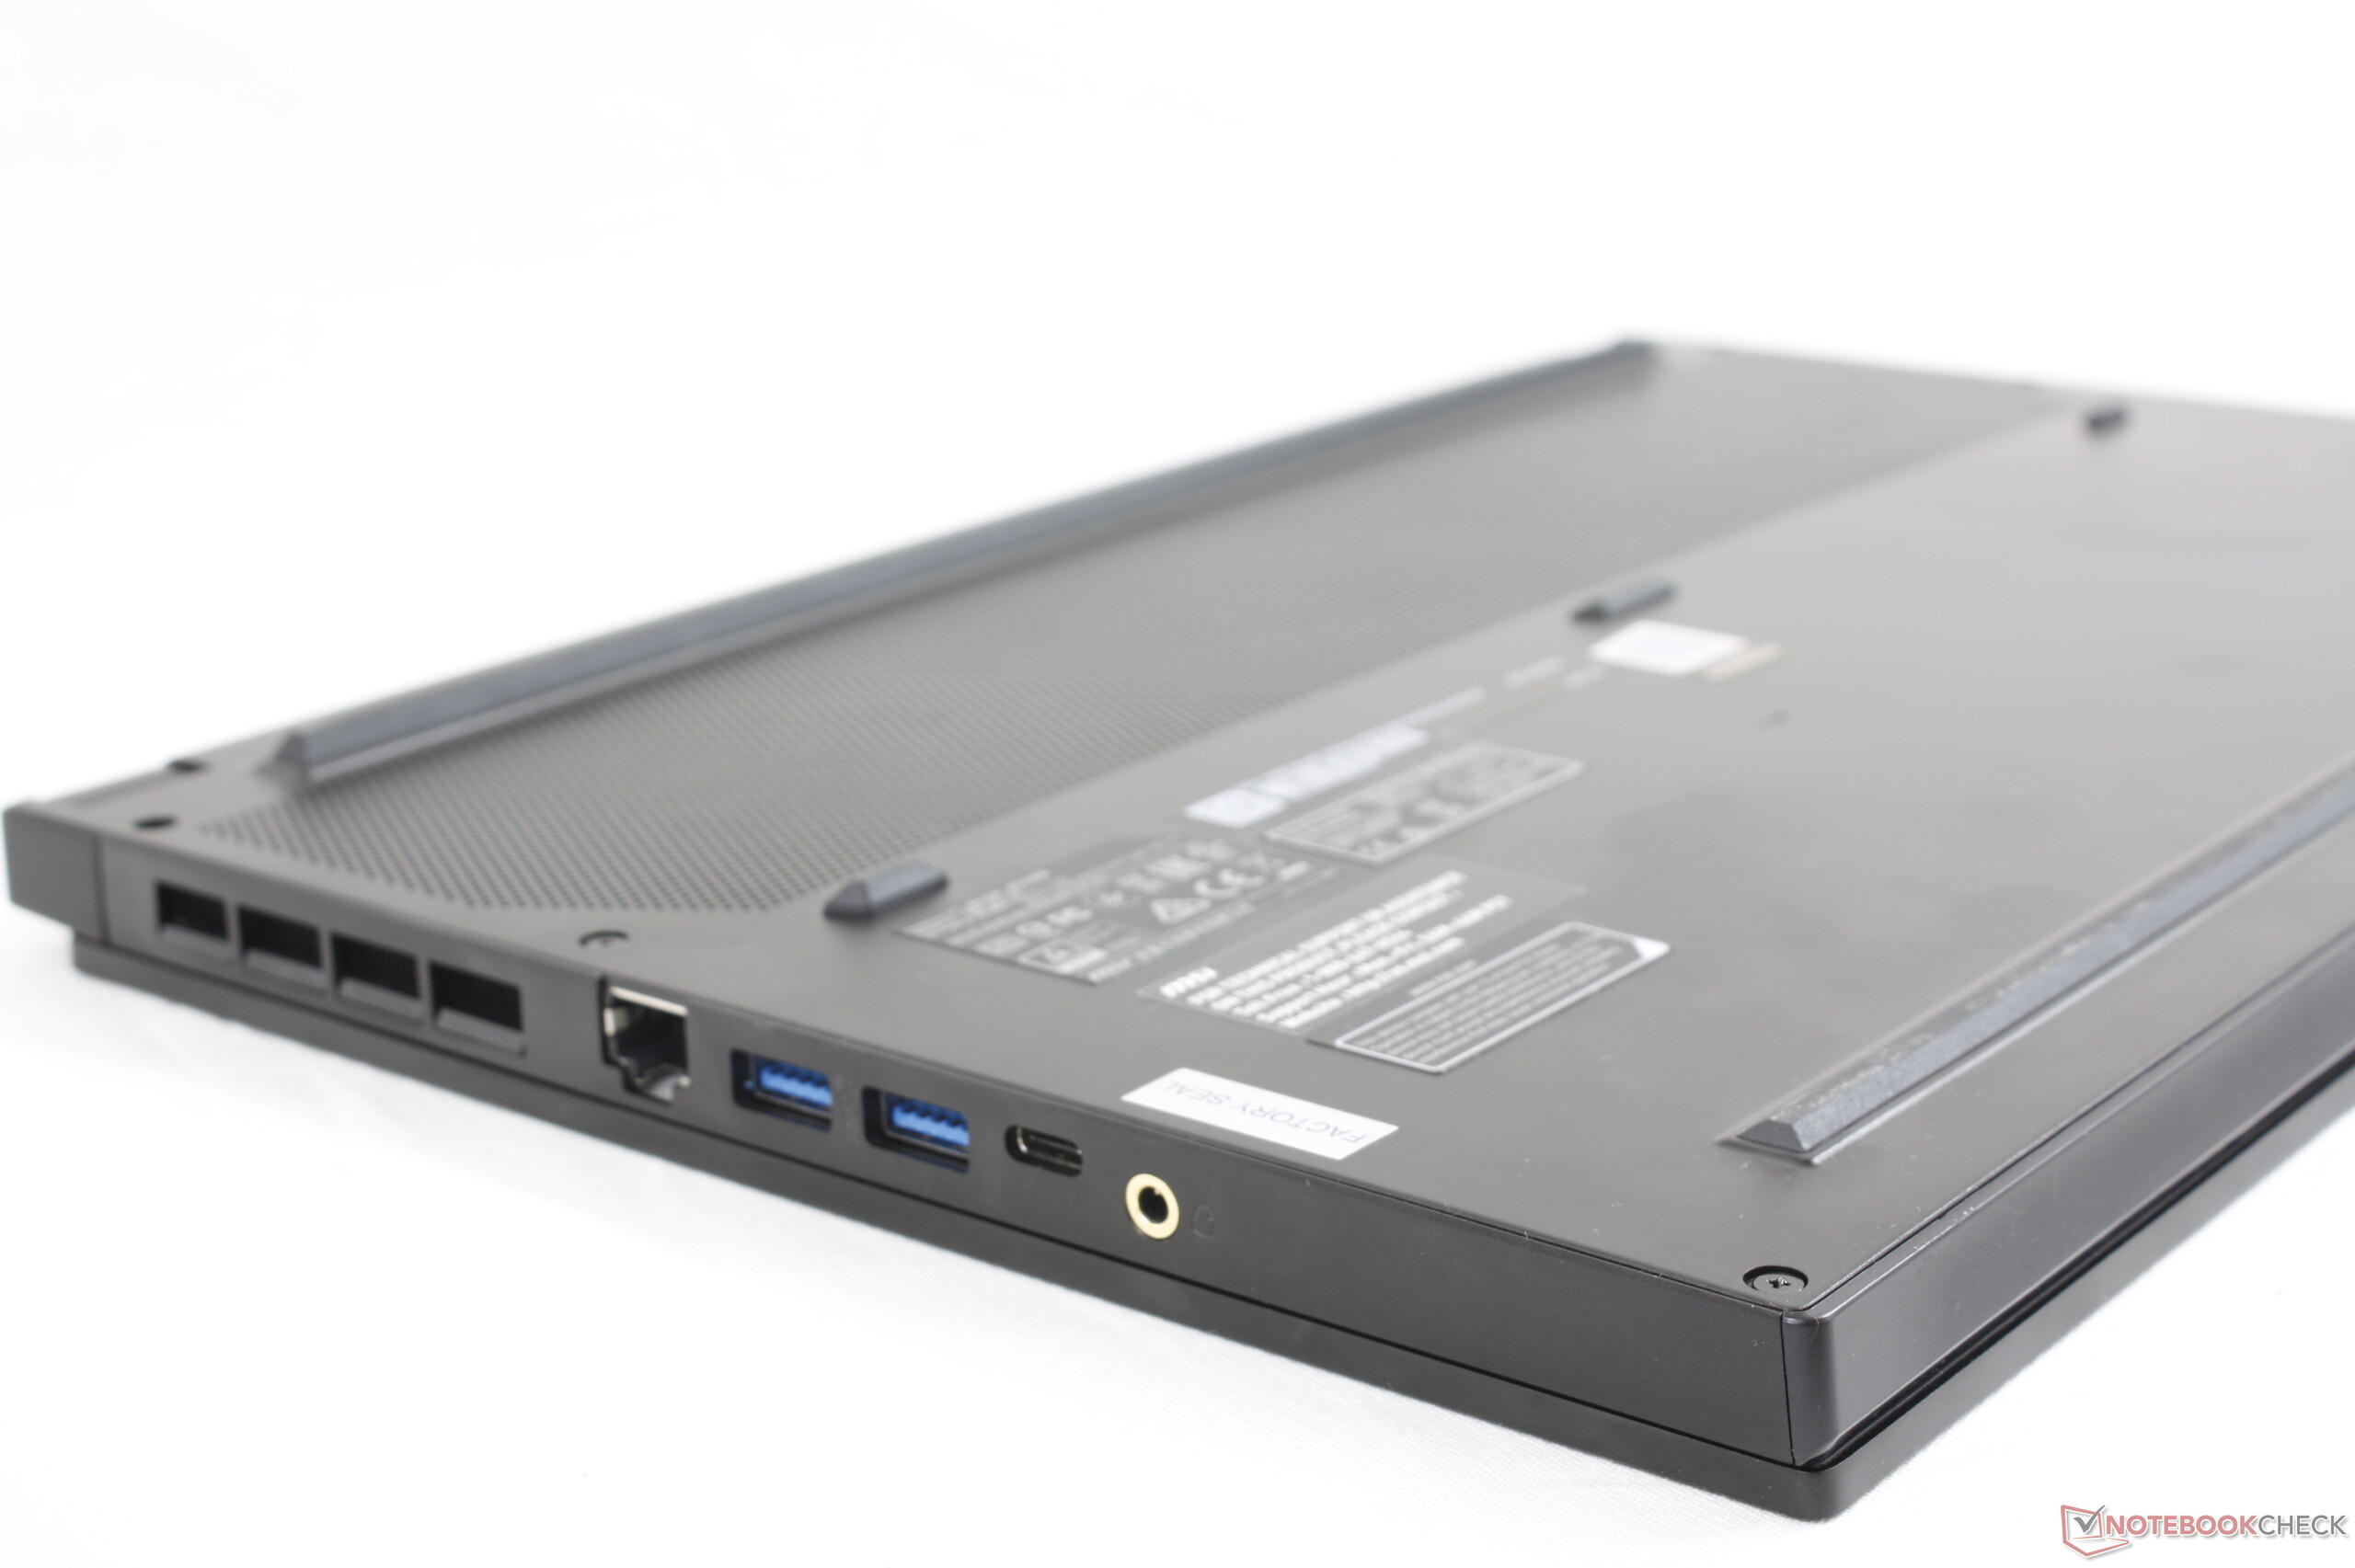
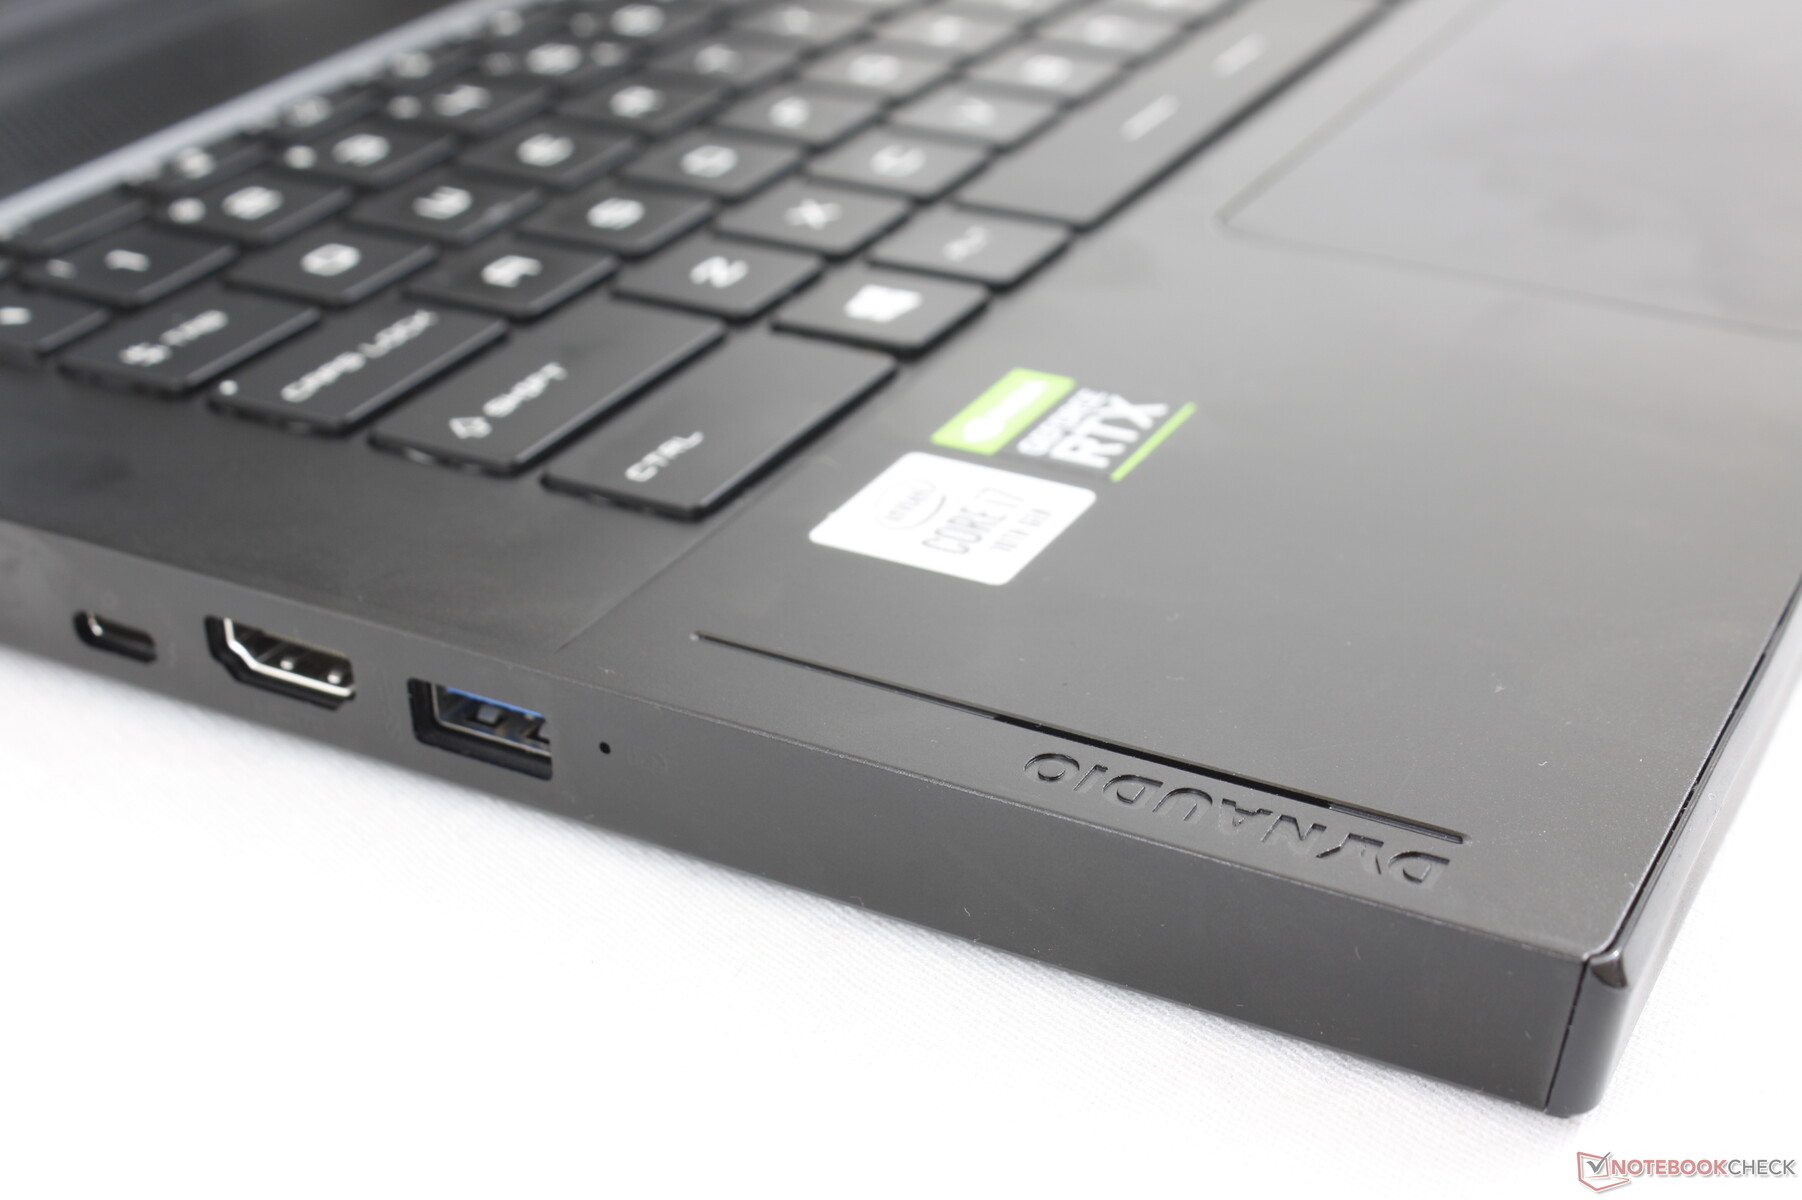
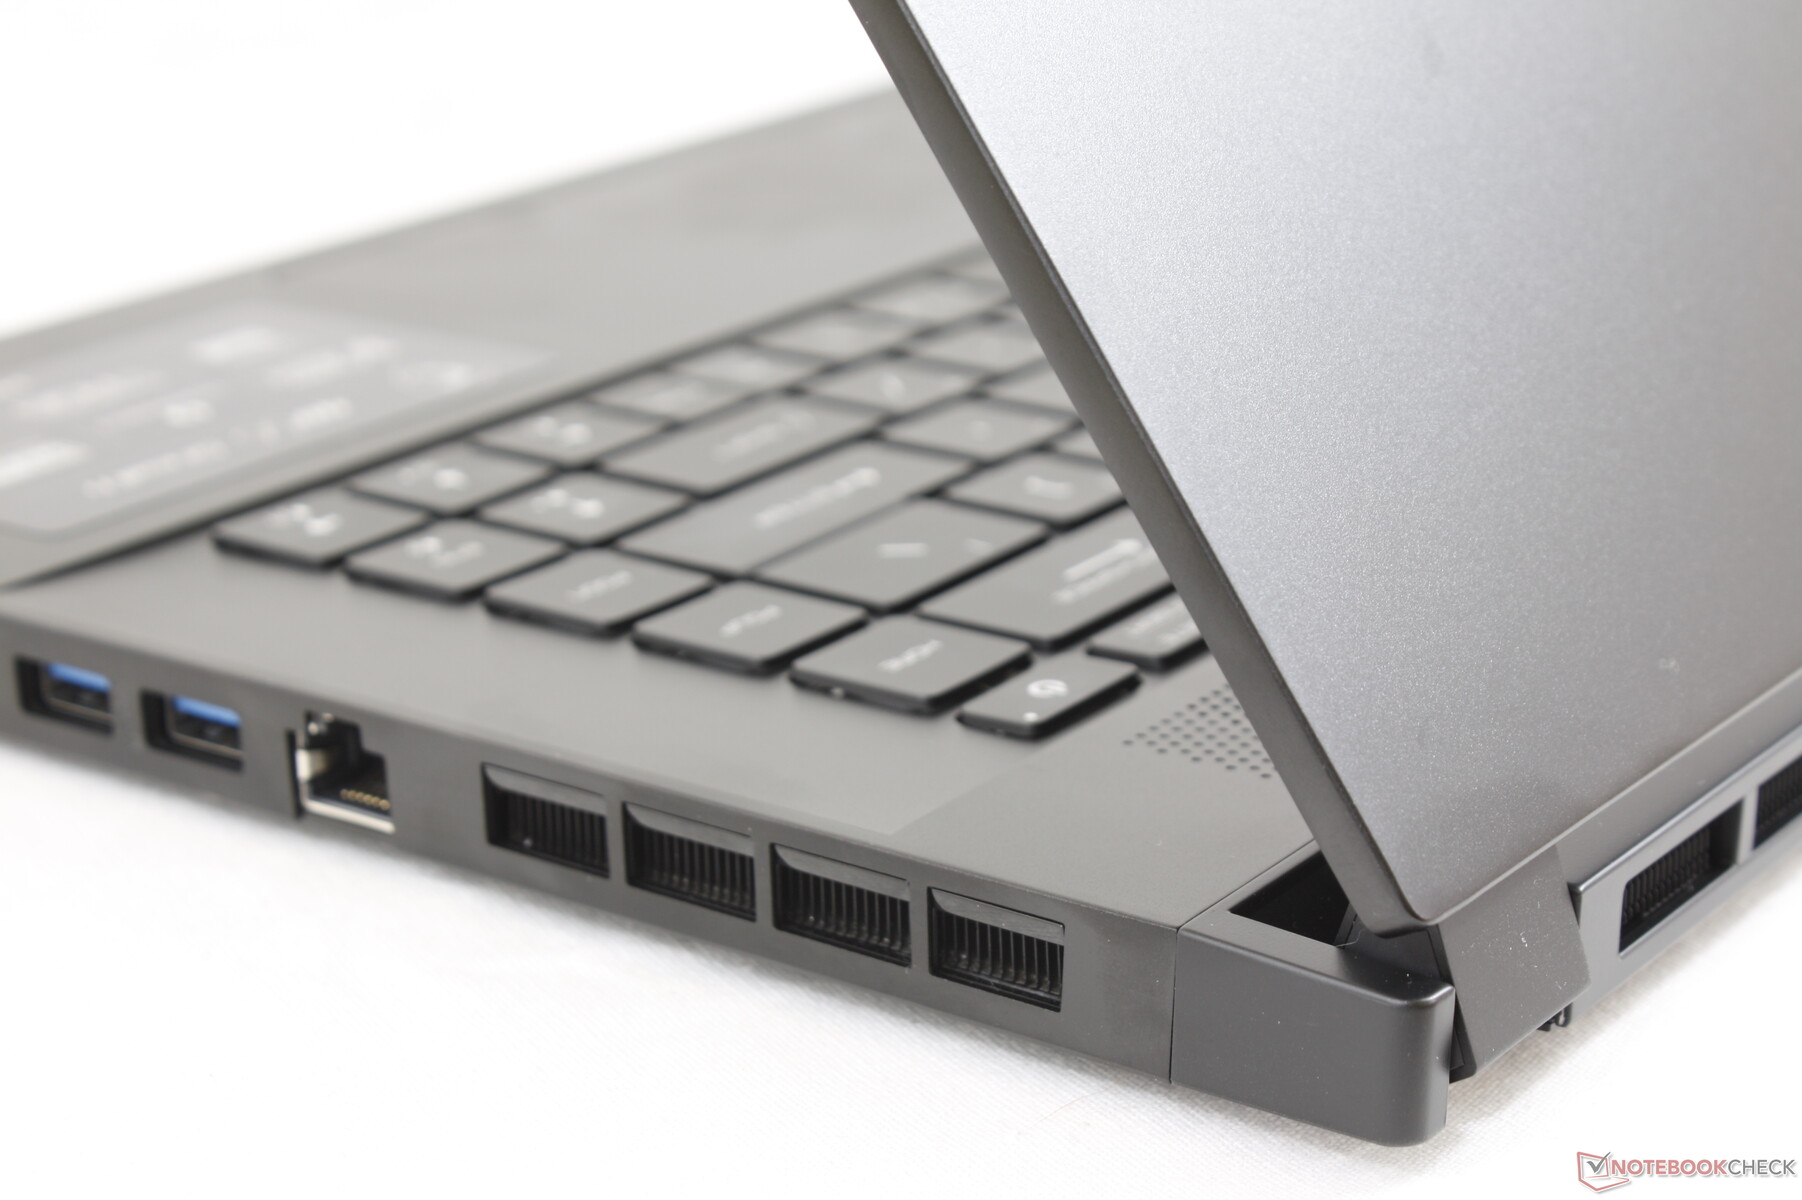
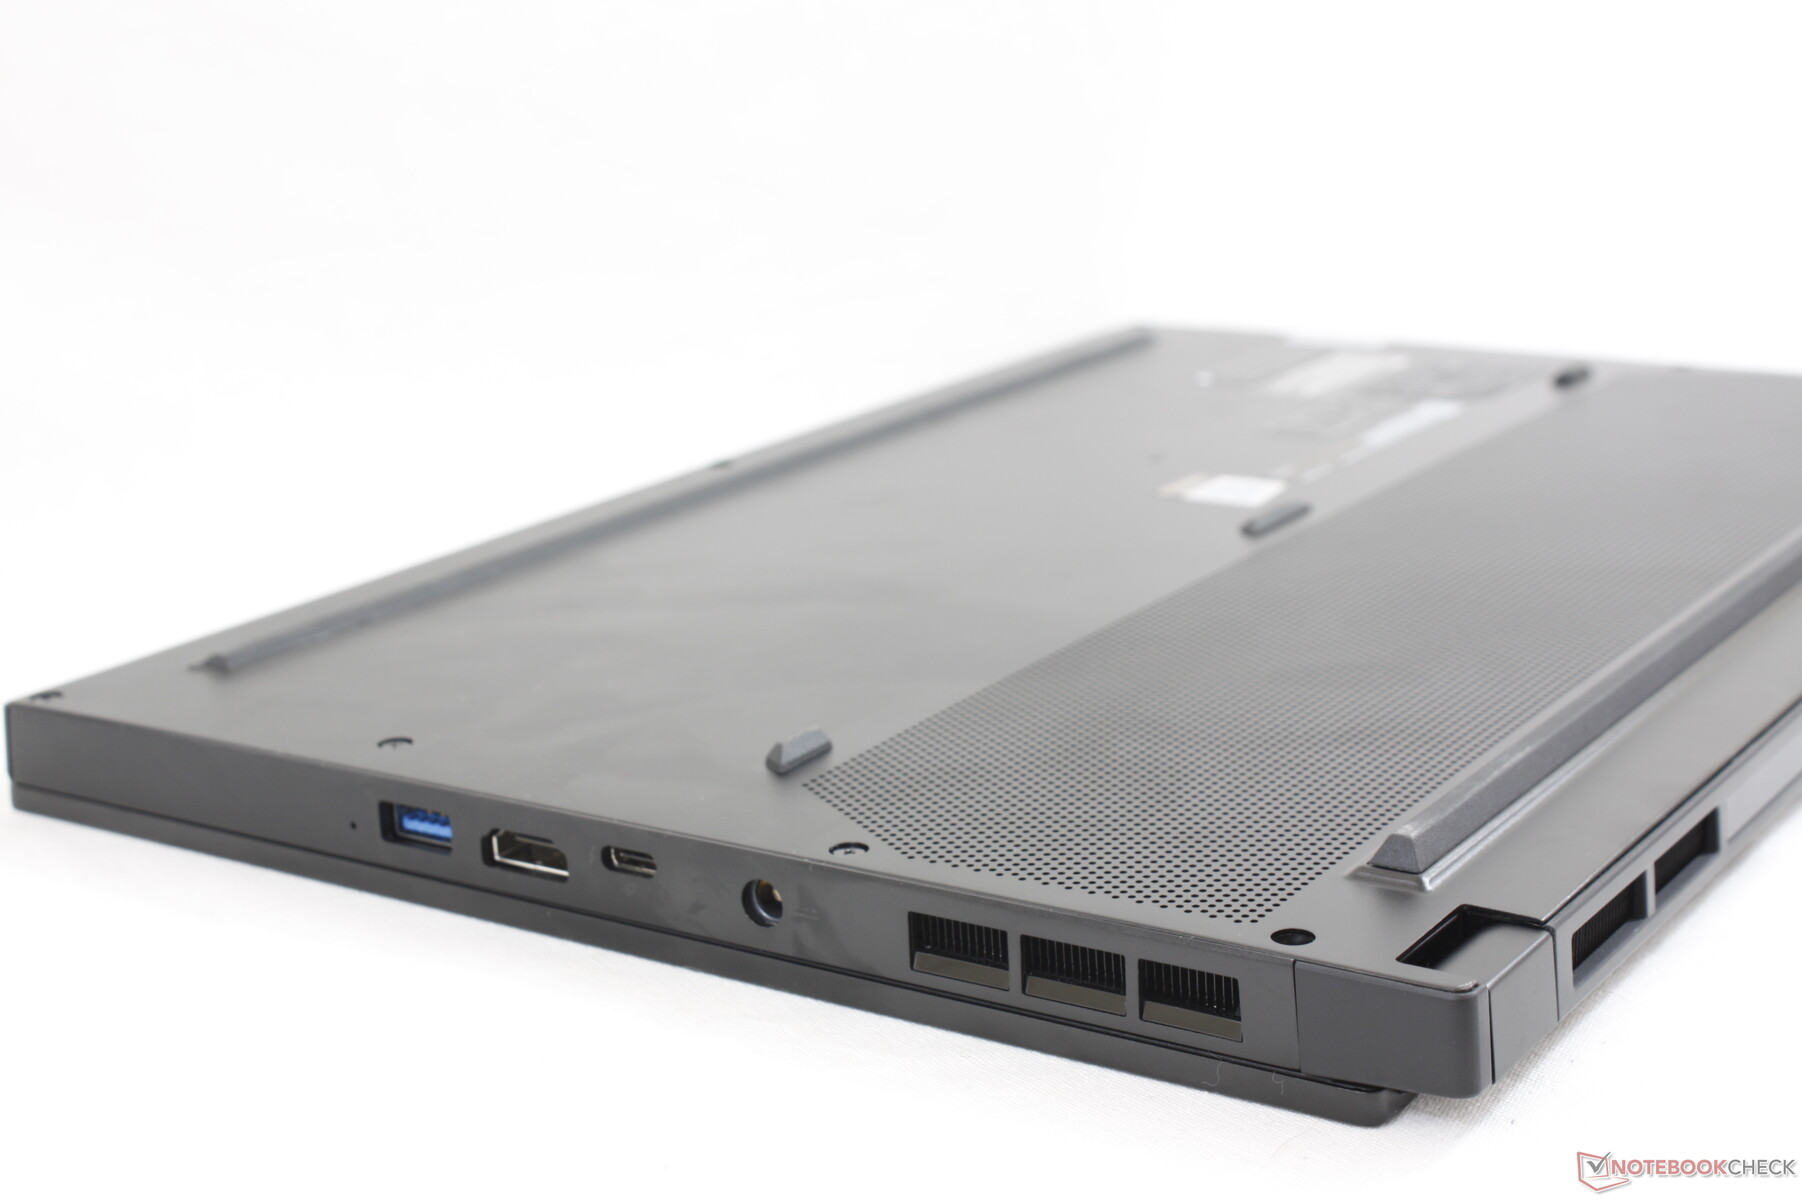
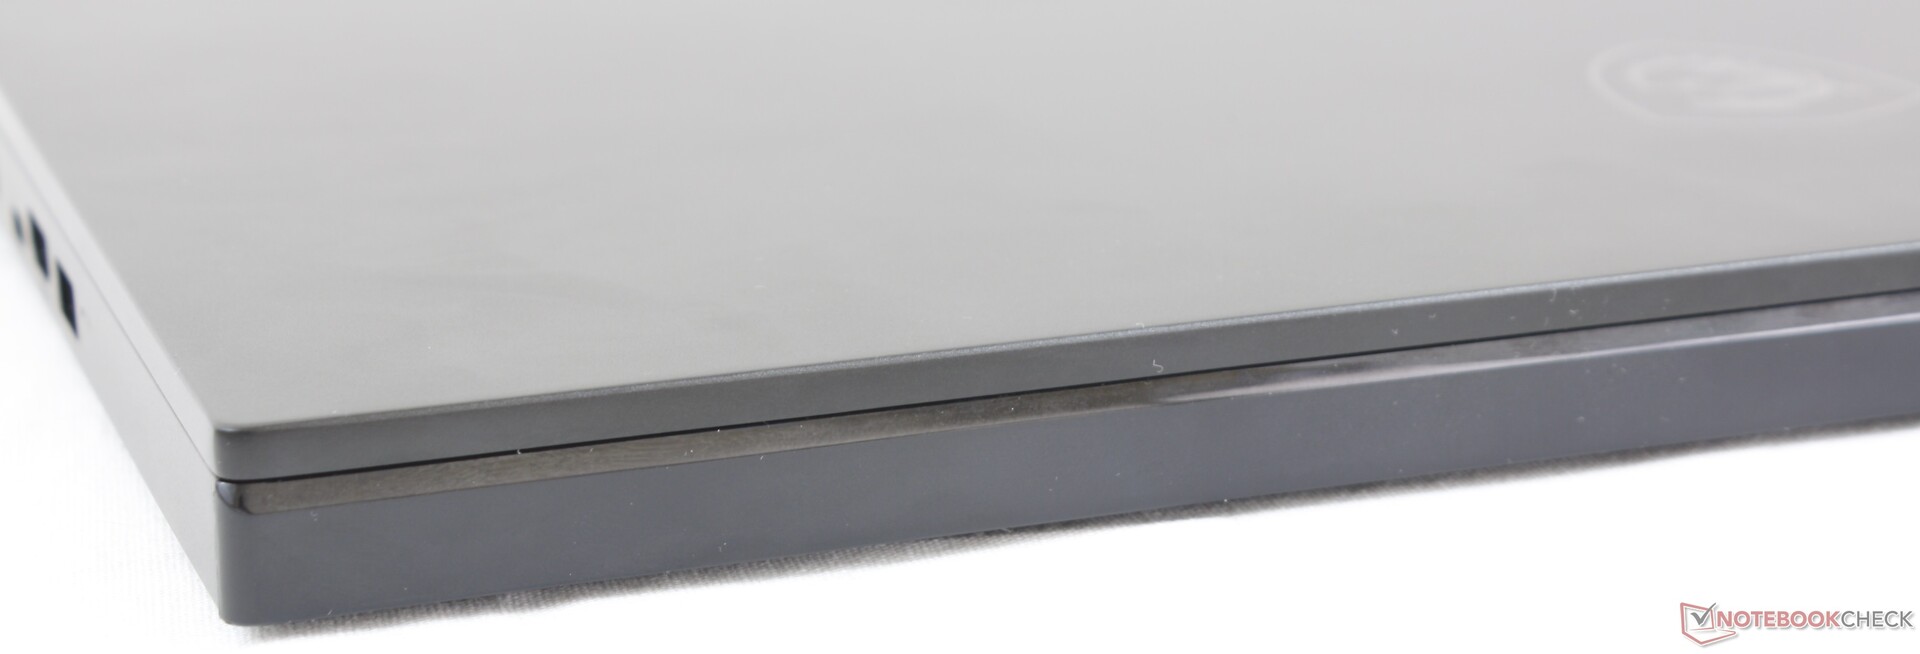
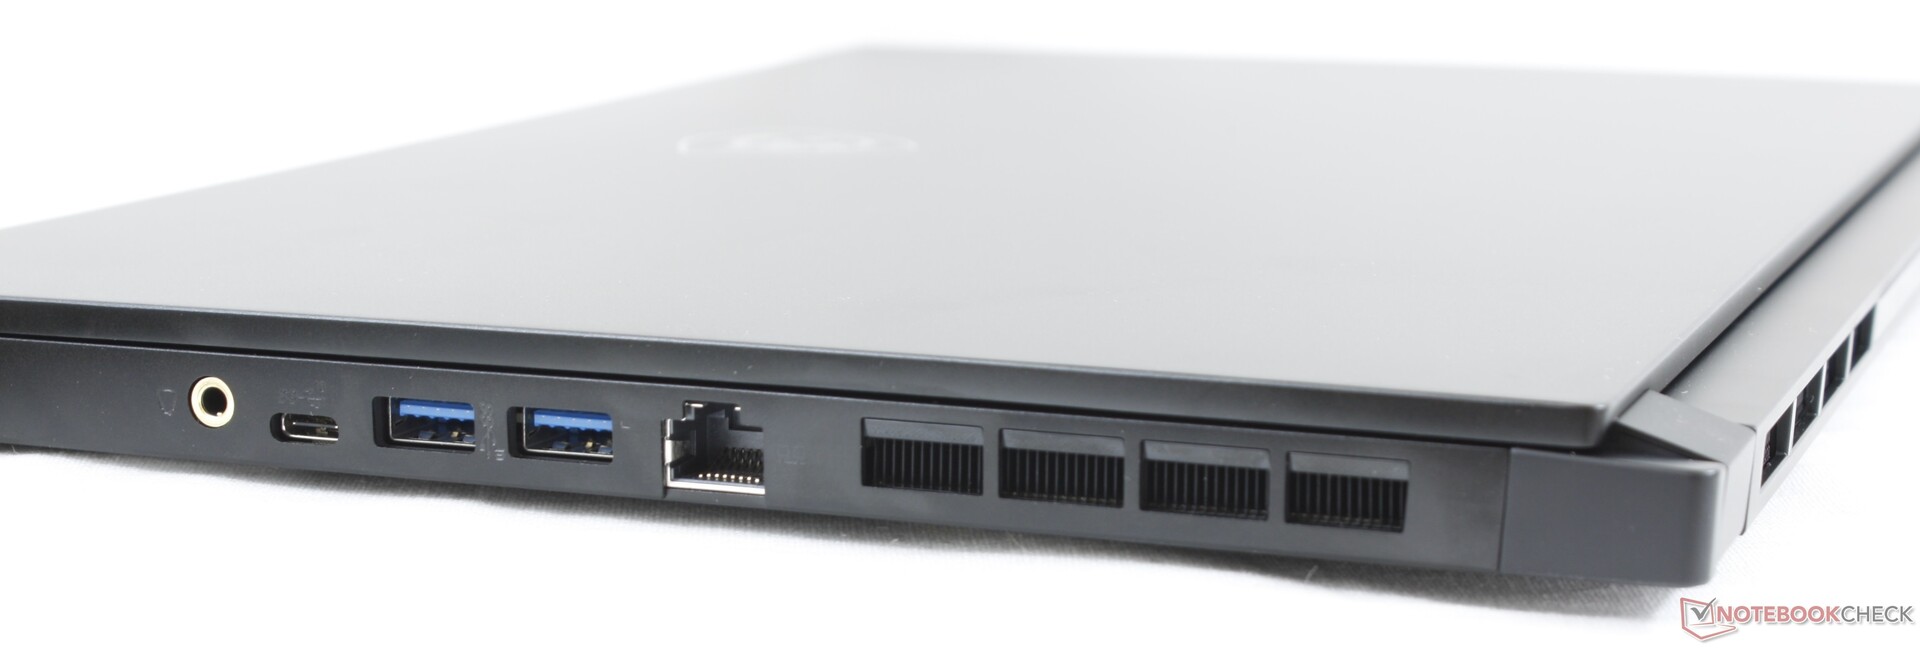
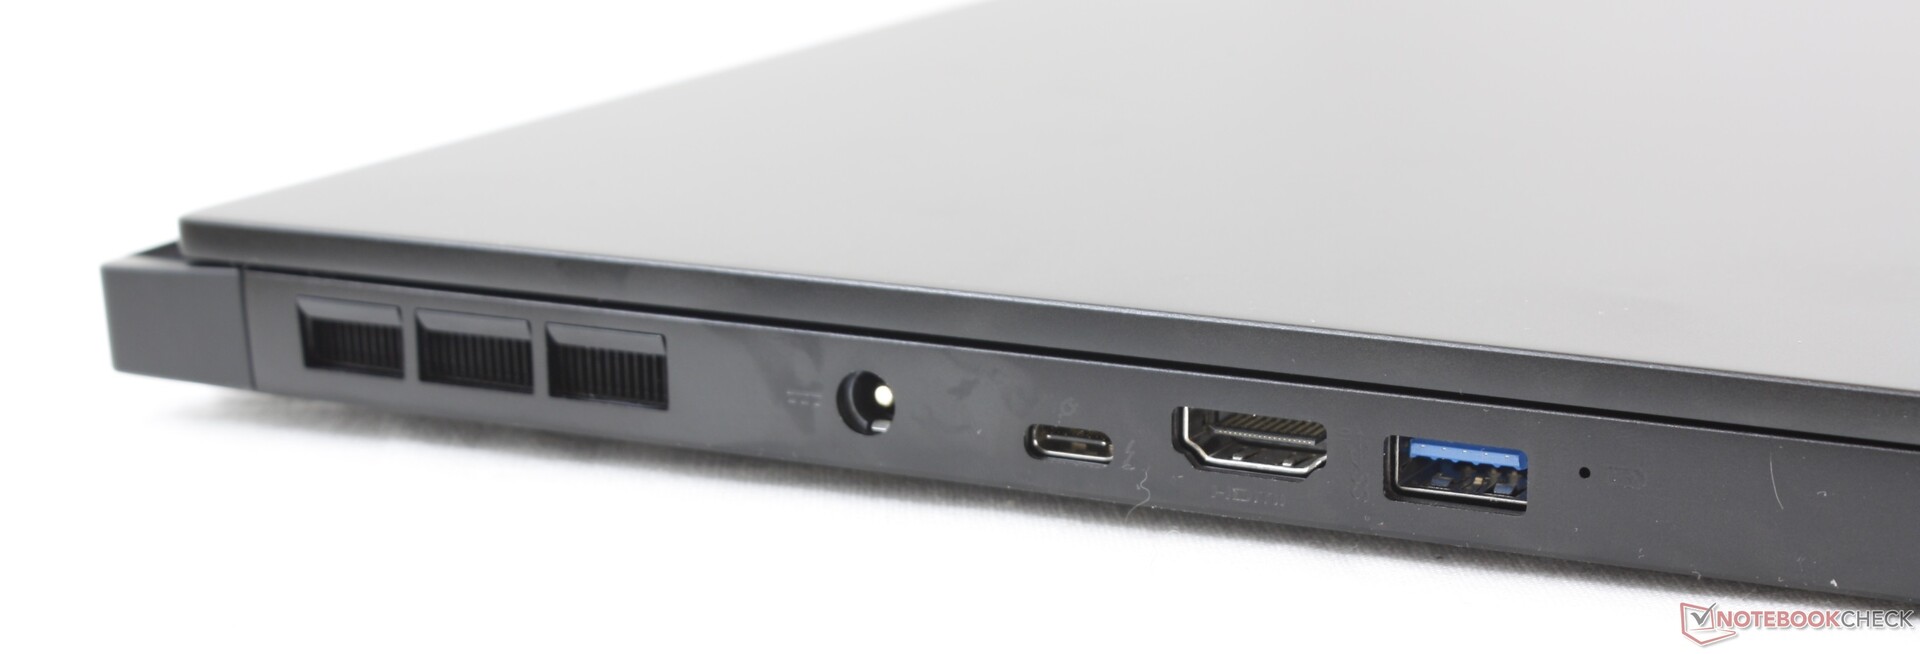
Port options have changed from the last generation GS65. Most notably, MSI has swapped out the mini-DisplayPort in favor of a second USB Type-C port while the dedicated microphone port is now nowhere to be found. We suspect that most users don't even utilize these ports which had prompted MSI to drop them.
Port positioning continues to be a mixed bag because the ports are tightly packed and close to the front edge. In comparison, the Blade 15 has its ports further towards the rear where cables are less likely to get in the way.
Communication
The Intel AX201 comes standard for Wi-Fi 6 connectivity and Buetooth 5.1. We experienced no issues when connected to our Netgear RAX200 test router. Users can upgrade to the Killer 1650s for additional software features, but raw throughout will otherwise be almost the same.
| Networking | |
| iperf3 transmit AX12 | |
| Asus ZenBook Duo UX481FL | |
| MSI GP65 10SFK-047US | |
| MSI GS66 Stealth 10SFS | |
| MSI GS66 10SGS | |
| MSI GF75 Thin 10SCXR | |
| iperf3 receive AX12 | |
| Asus ZenBook Duo UX481FL | |
| MSI GS66 10SGS | |
| MSI GS66 Stealth 10SFS | |
| MSI GP65 10SFK-047US | |
| MSI GF75 Thin 10SCXR | |
Webcam


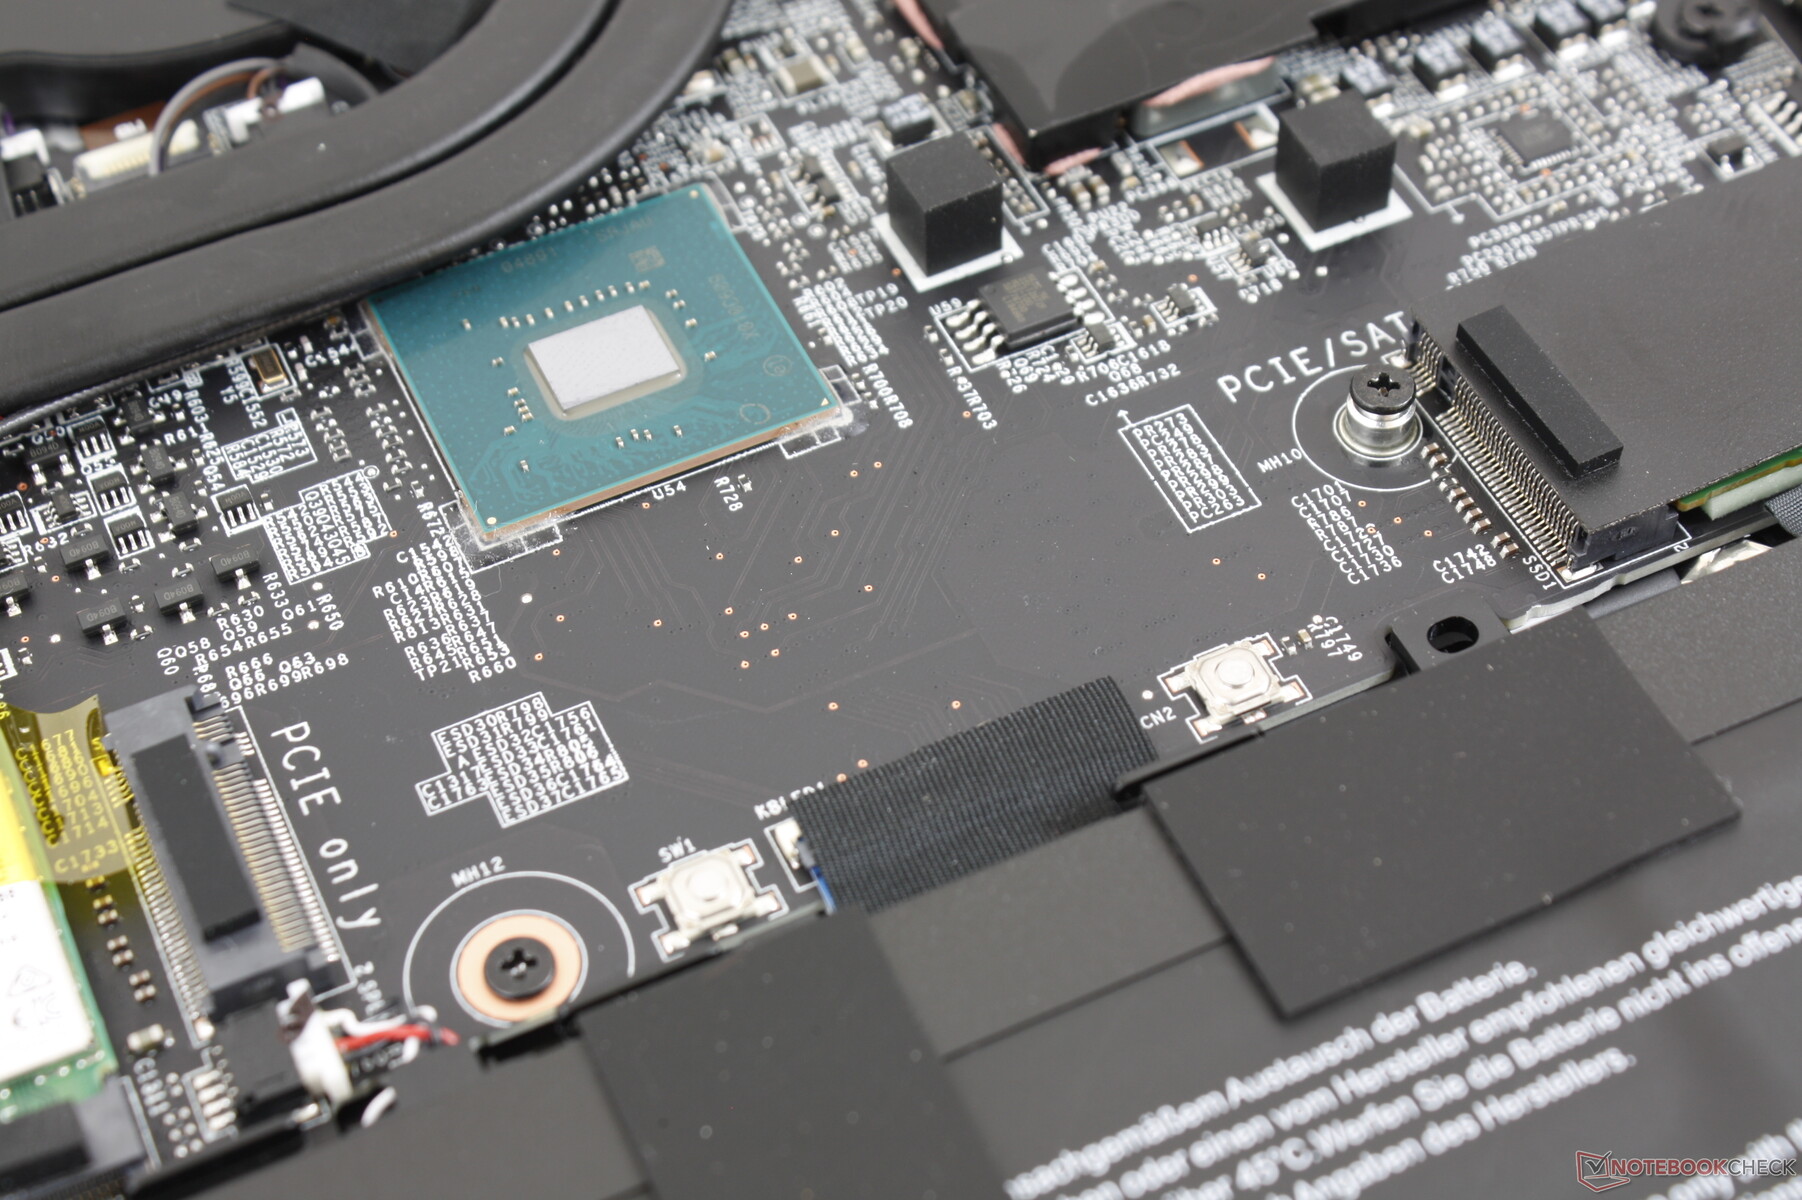
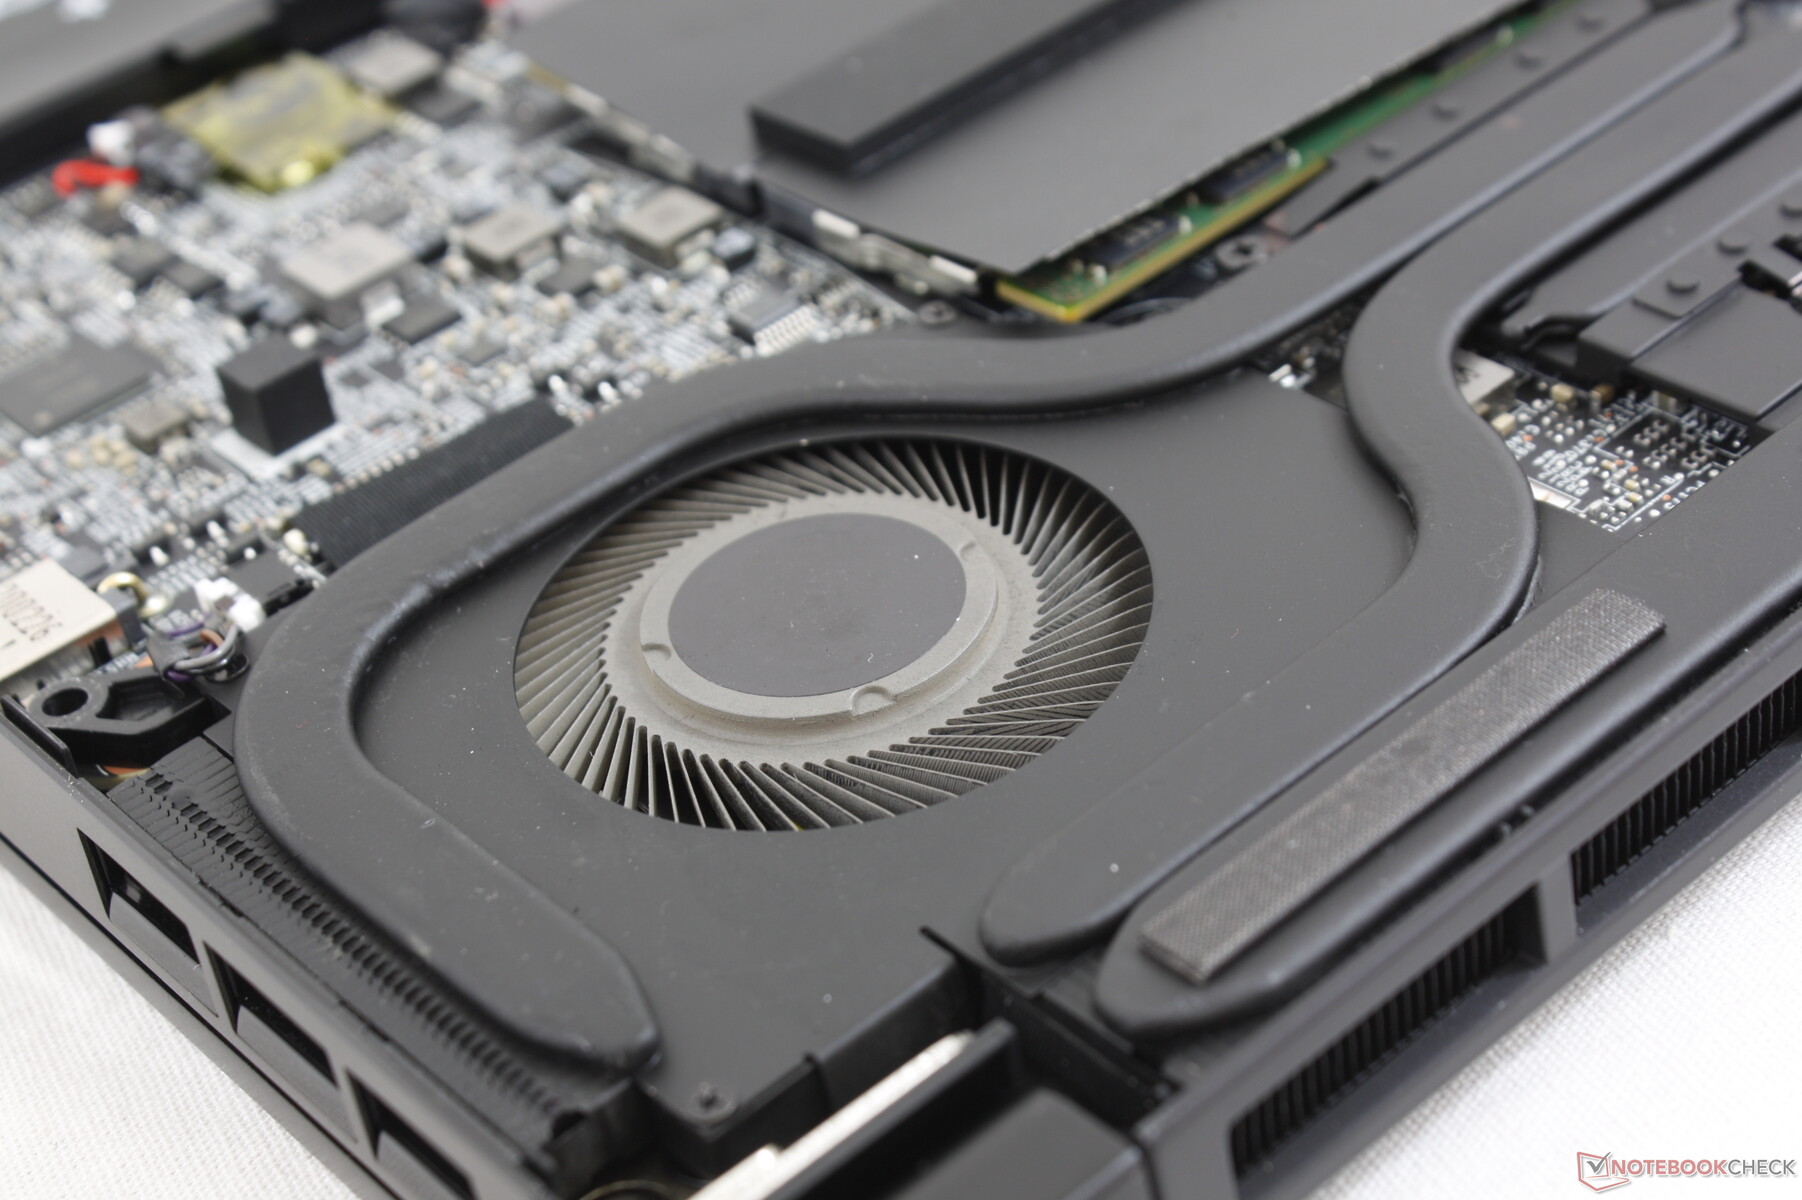
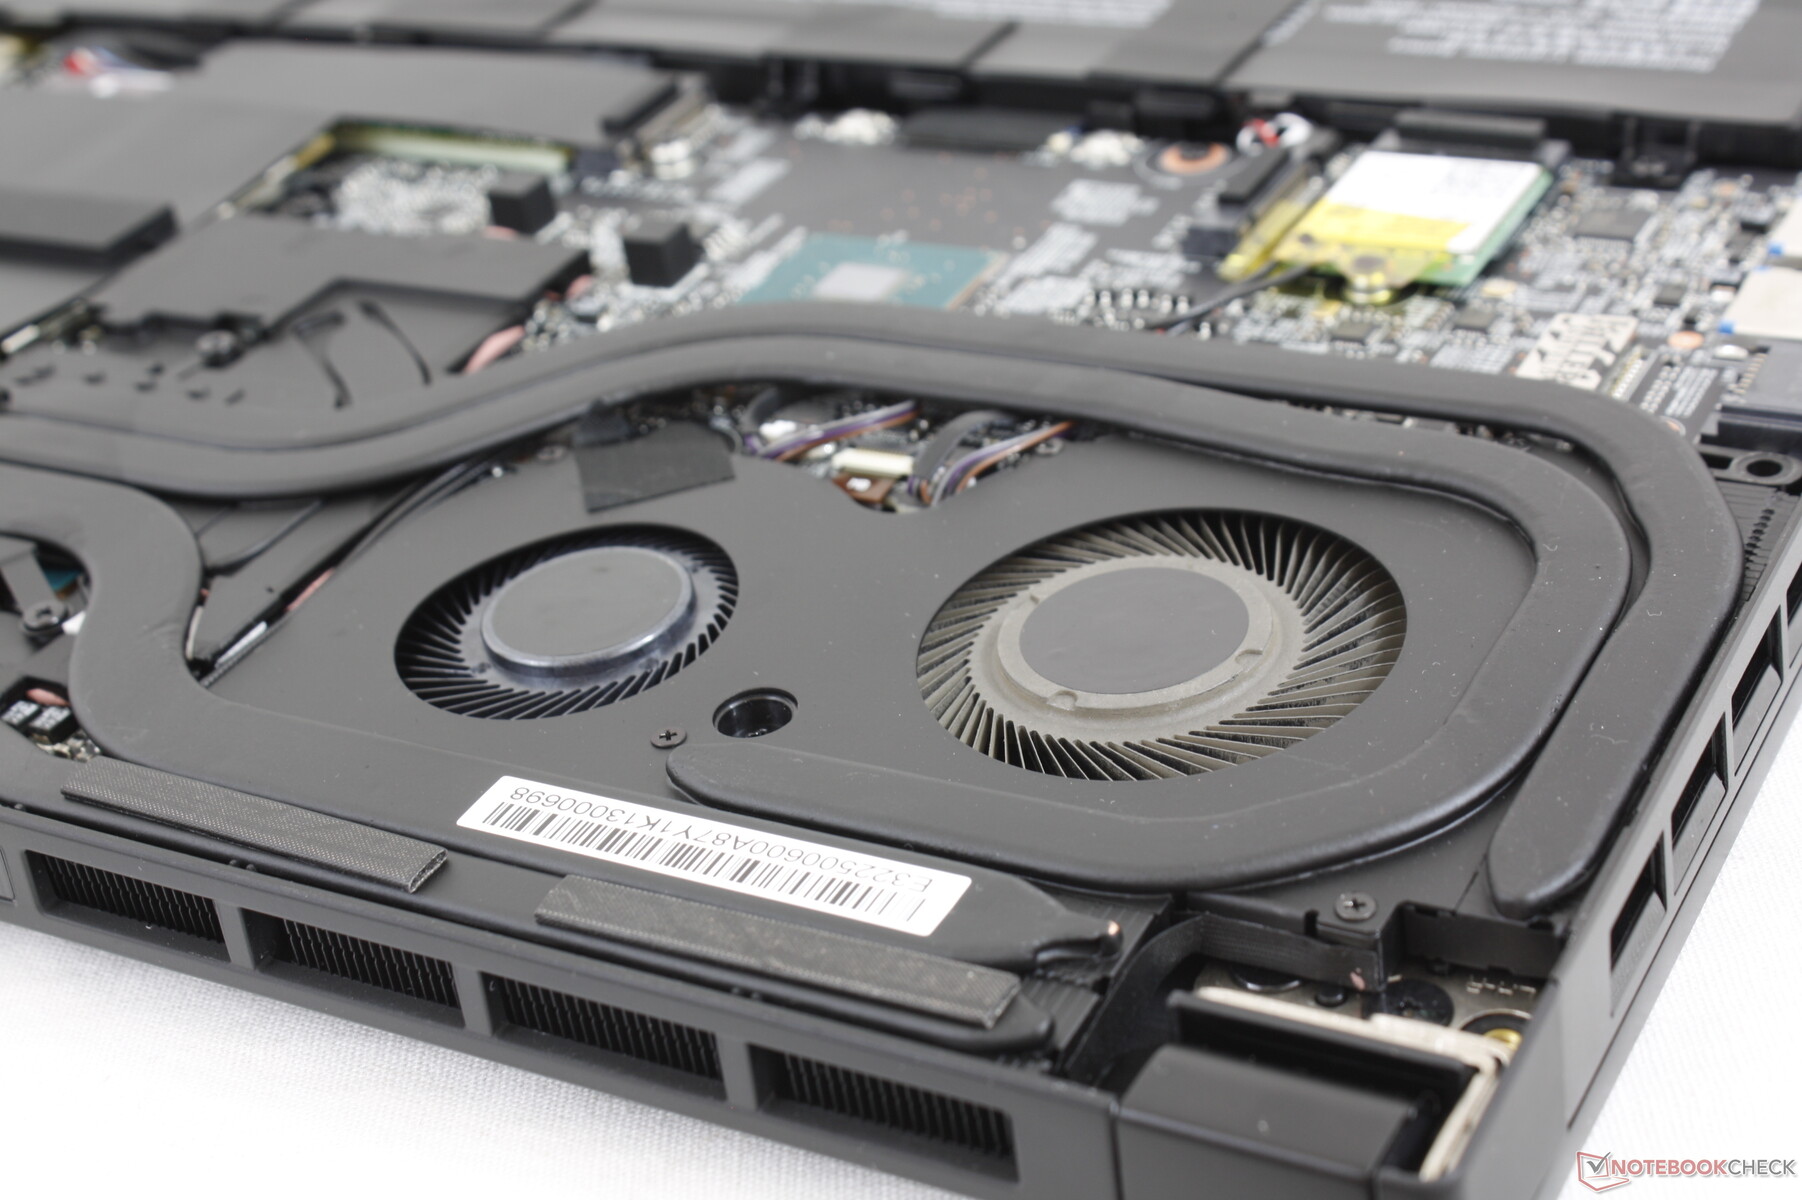
Maintenance
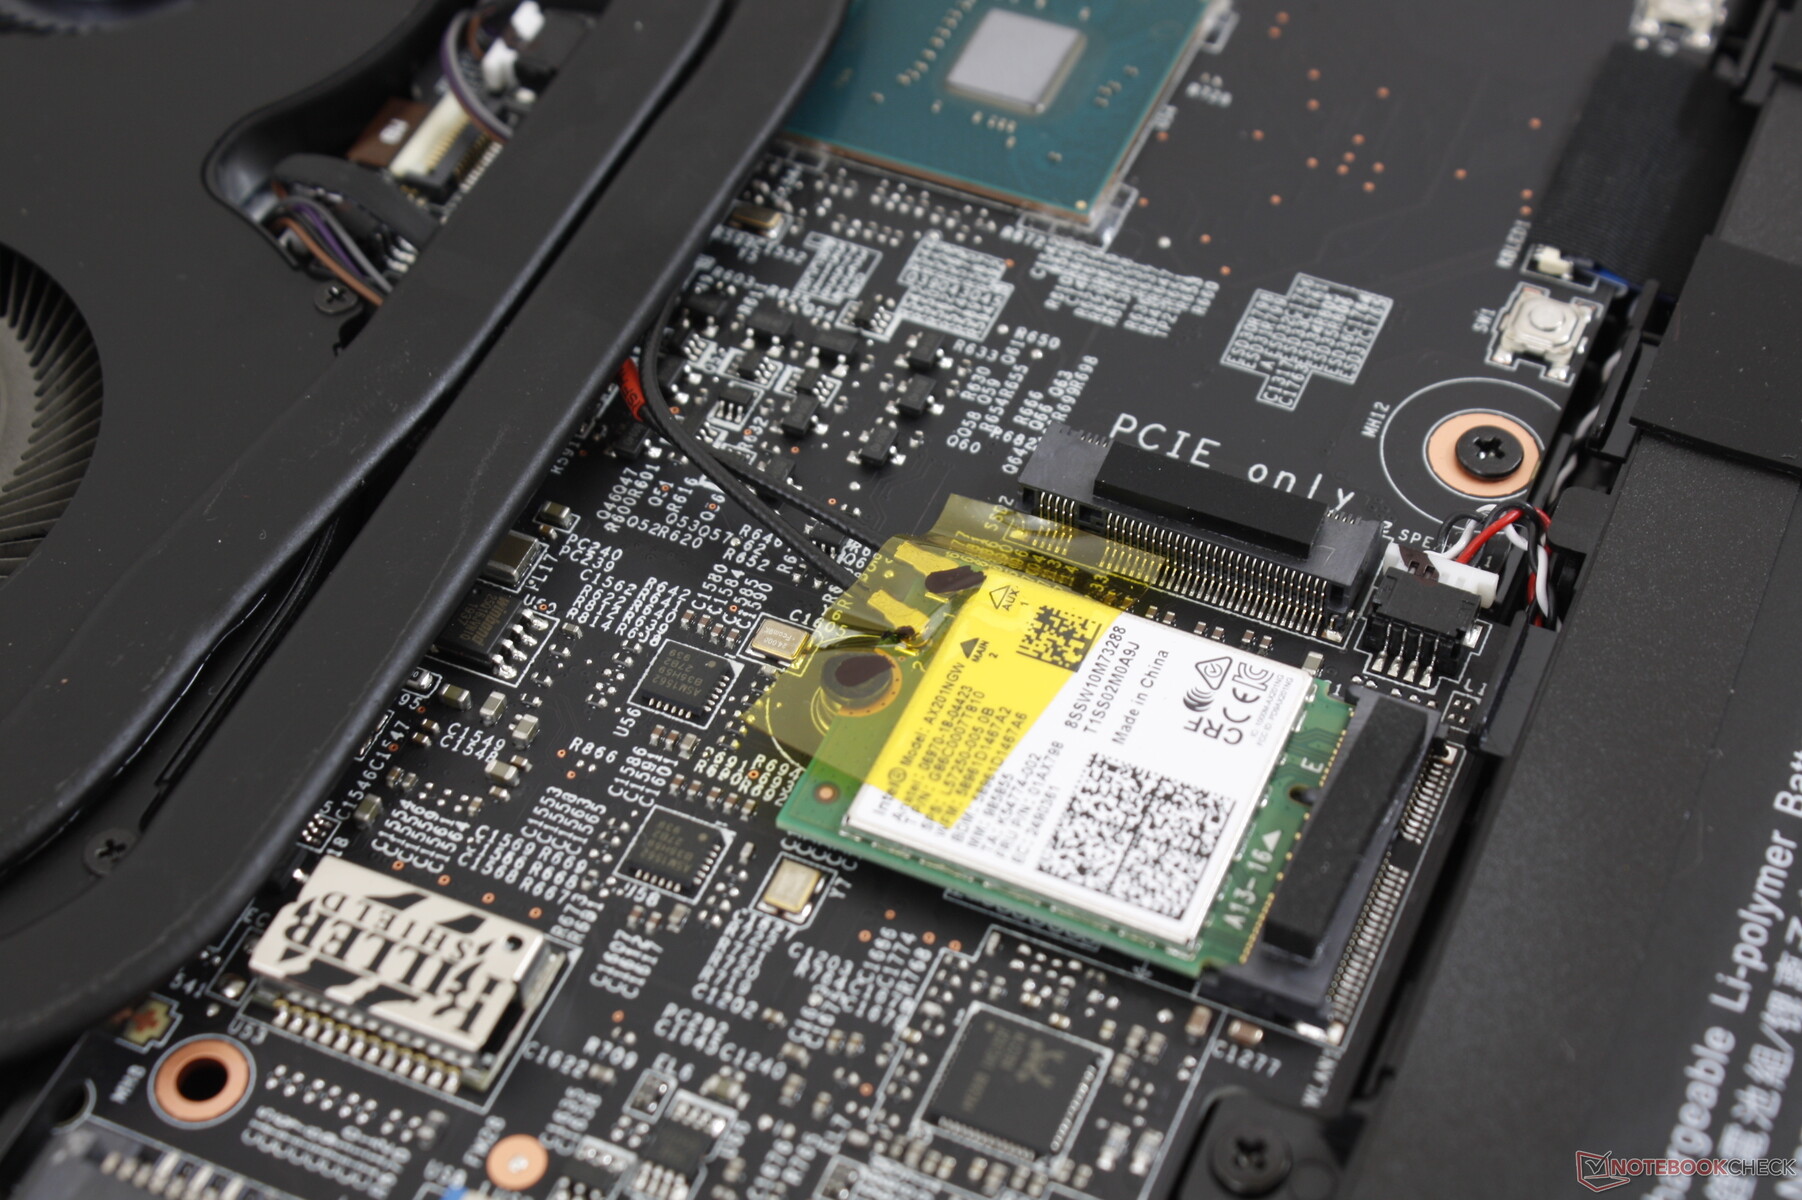
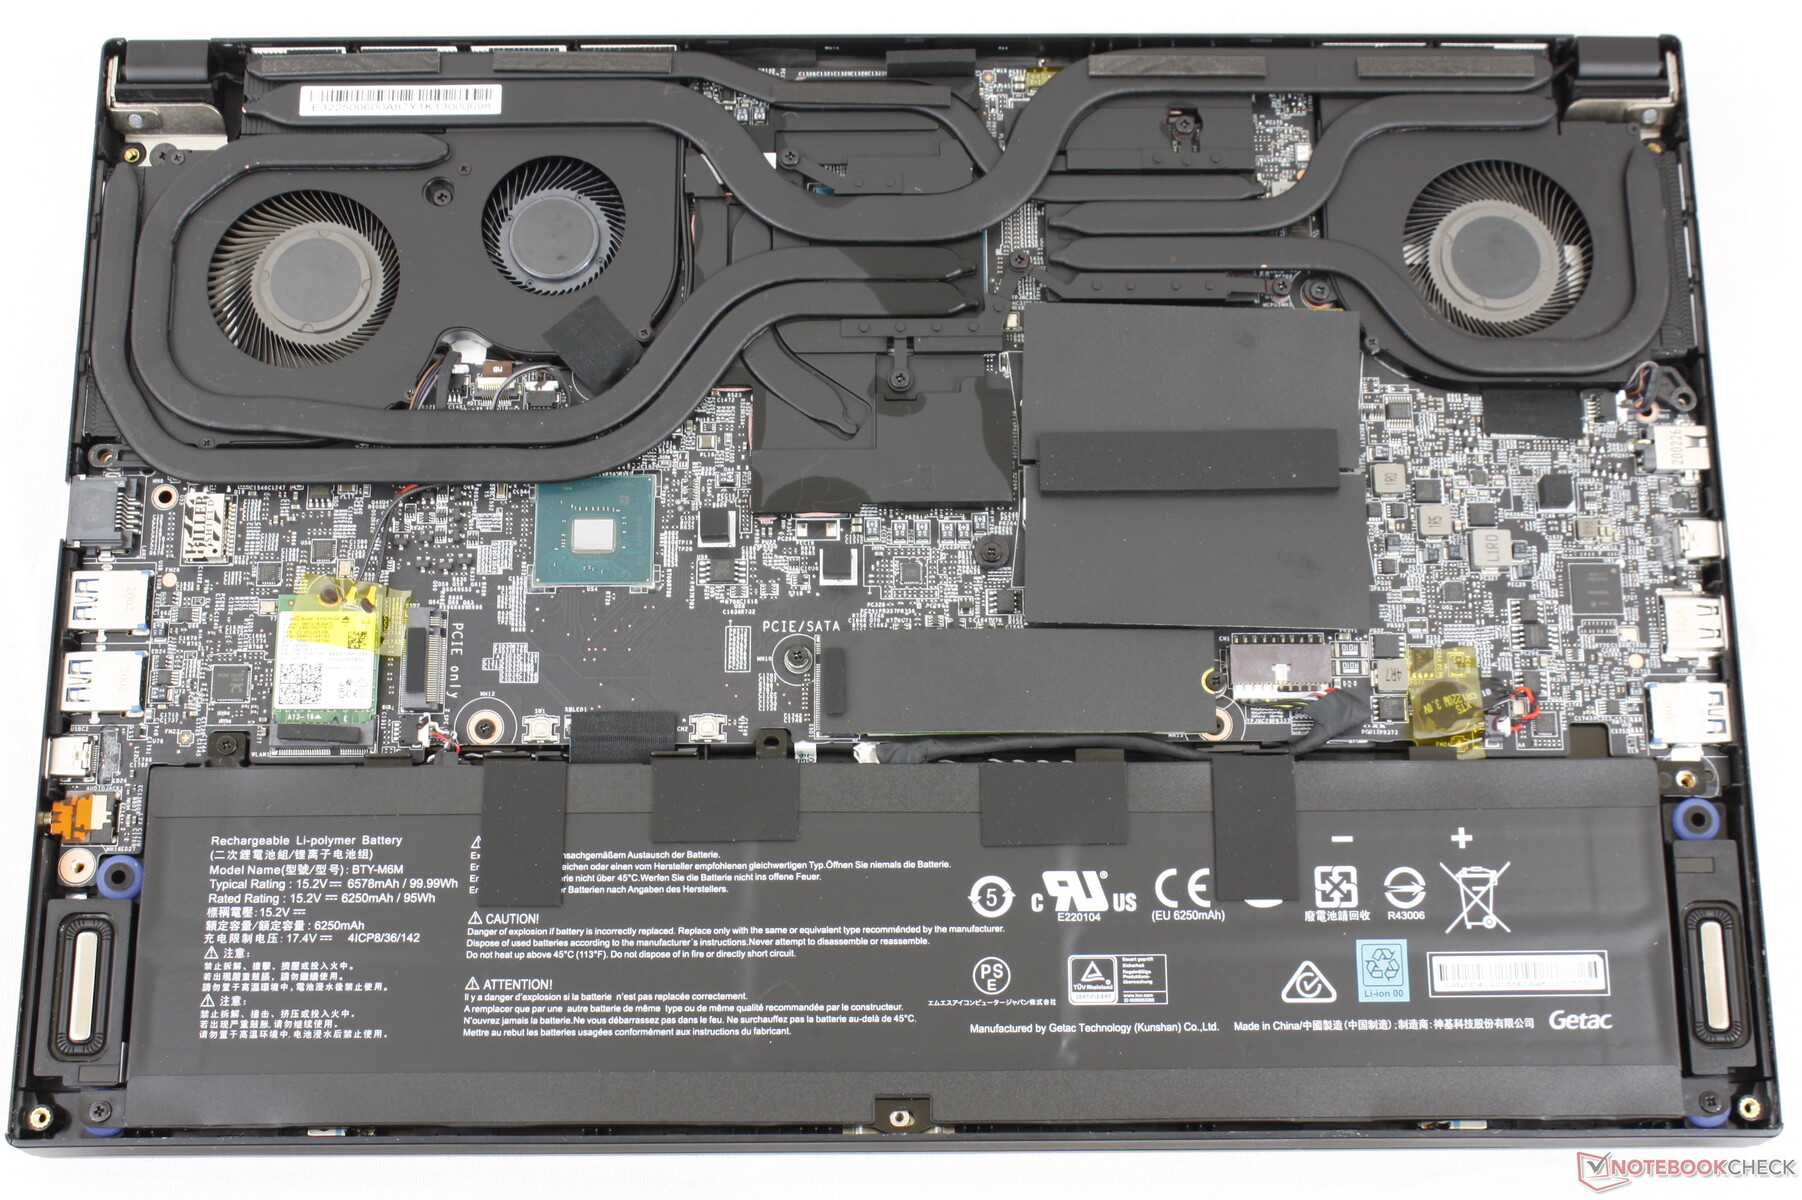
The bottom panel is secured by 9 Philips screws and owners will have to tear a 'Factory Seal' sticker to get inside. The bottom panel is more difficult to remove than the bottom panels of the GS65 or Razer Blade 15 and so we recommend both careful hands and a sharp edge to get the job done.
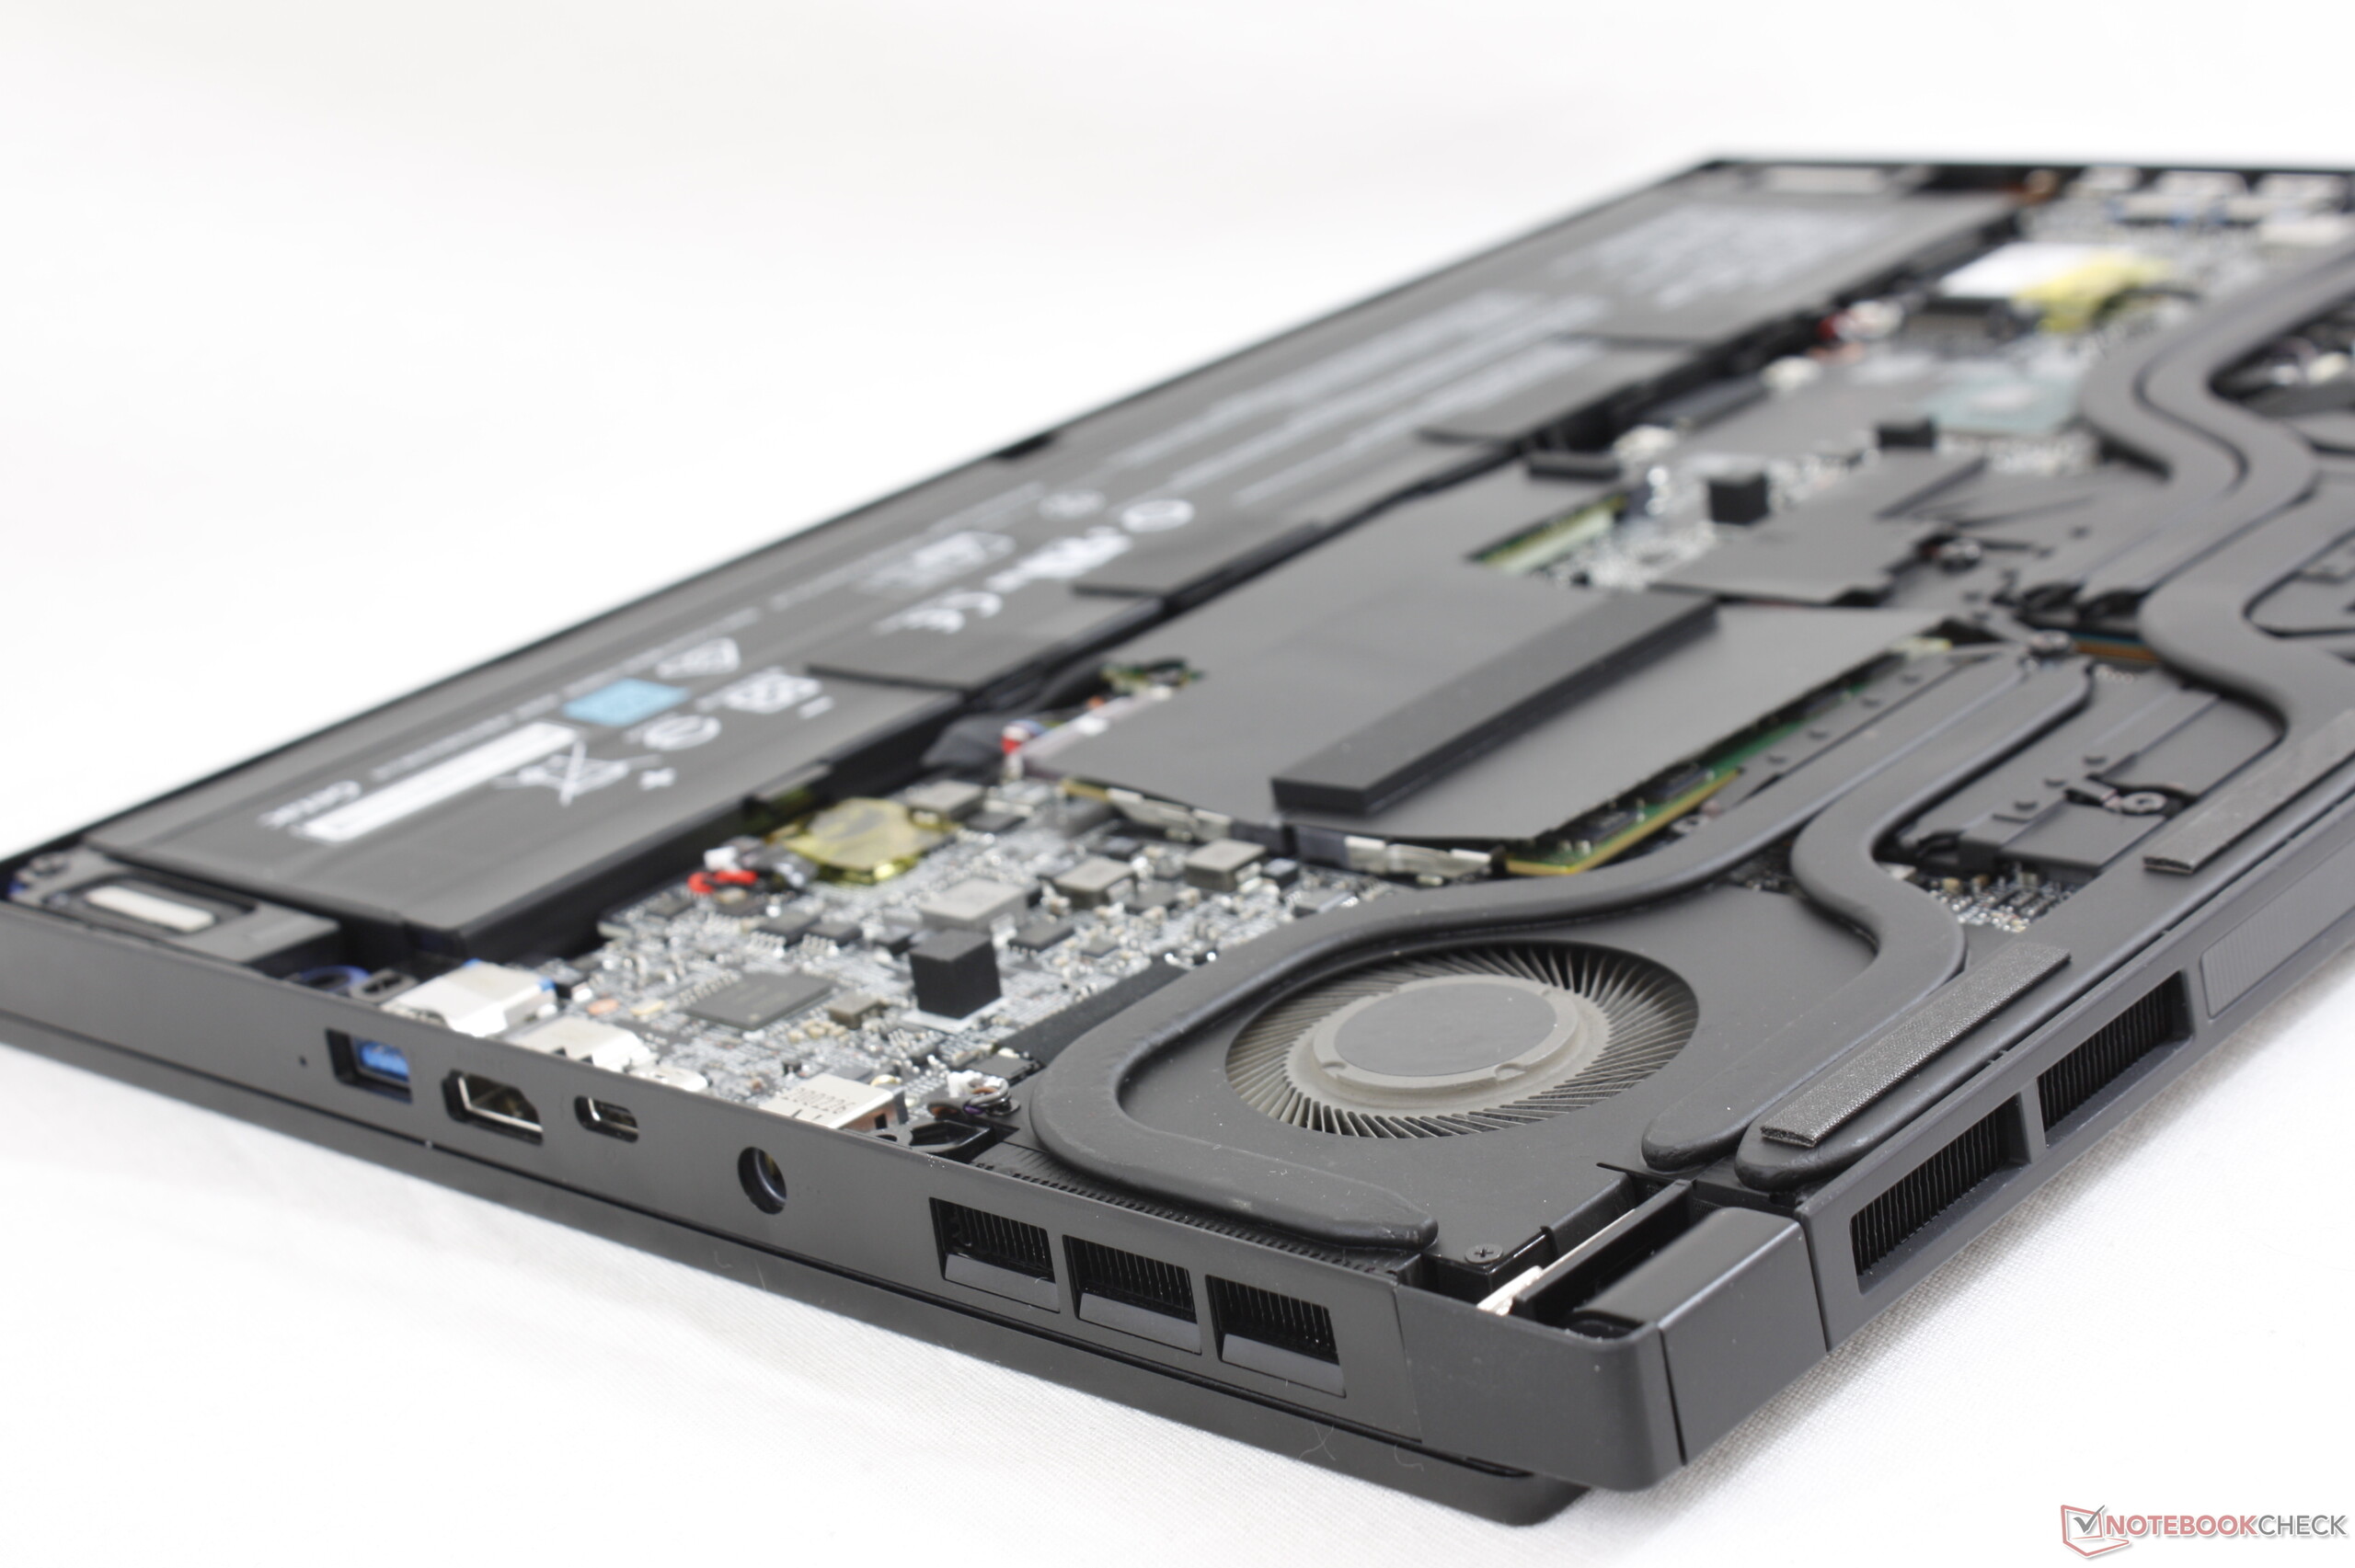
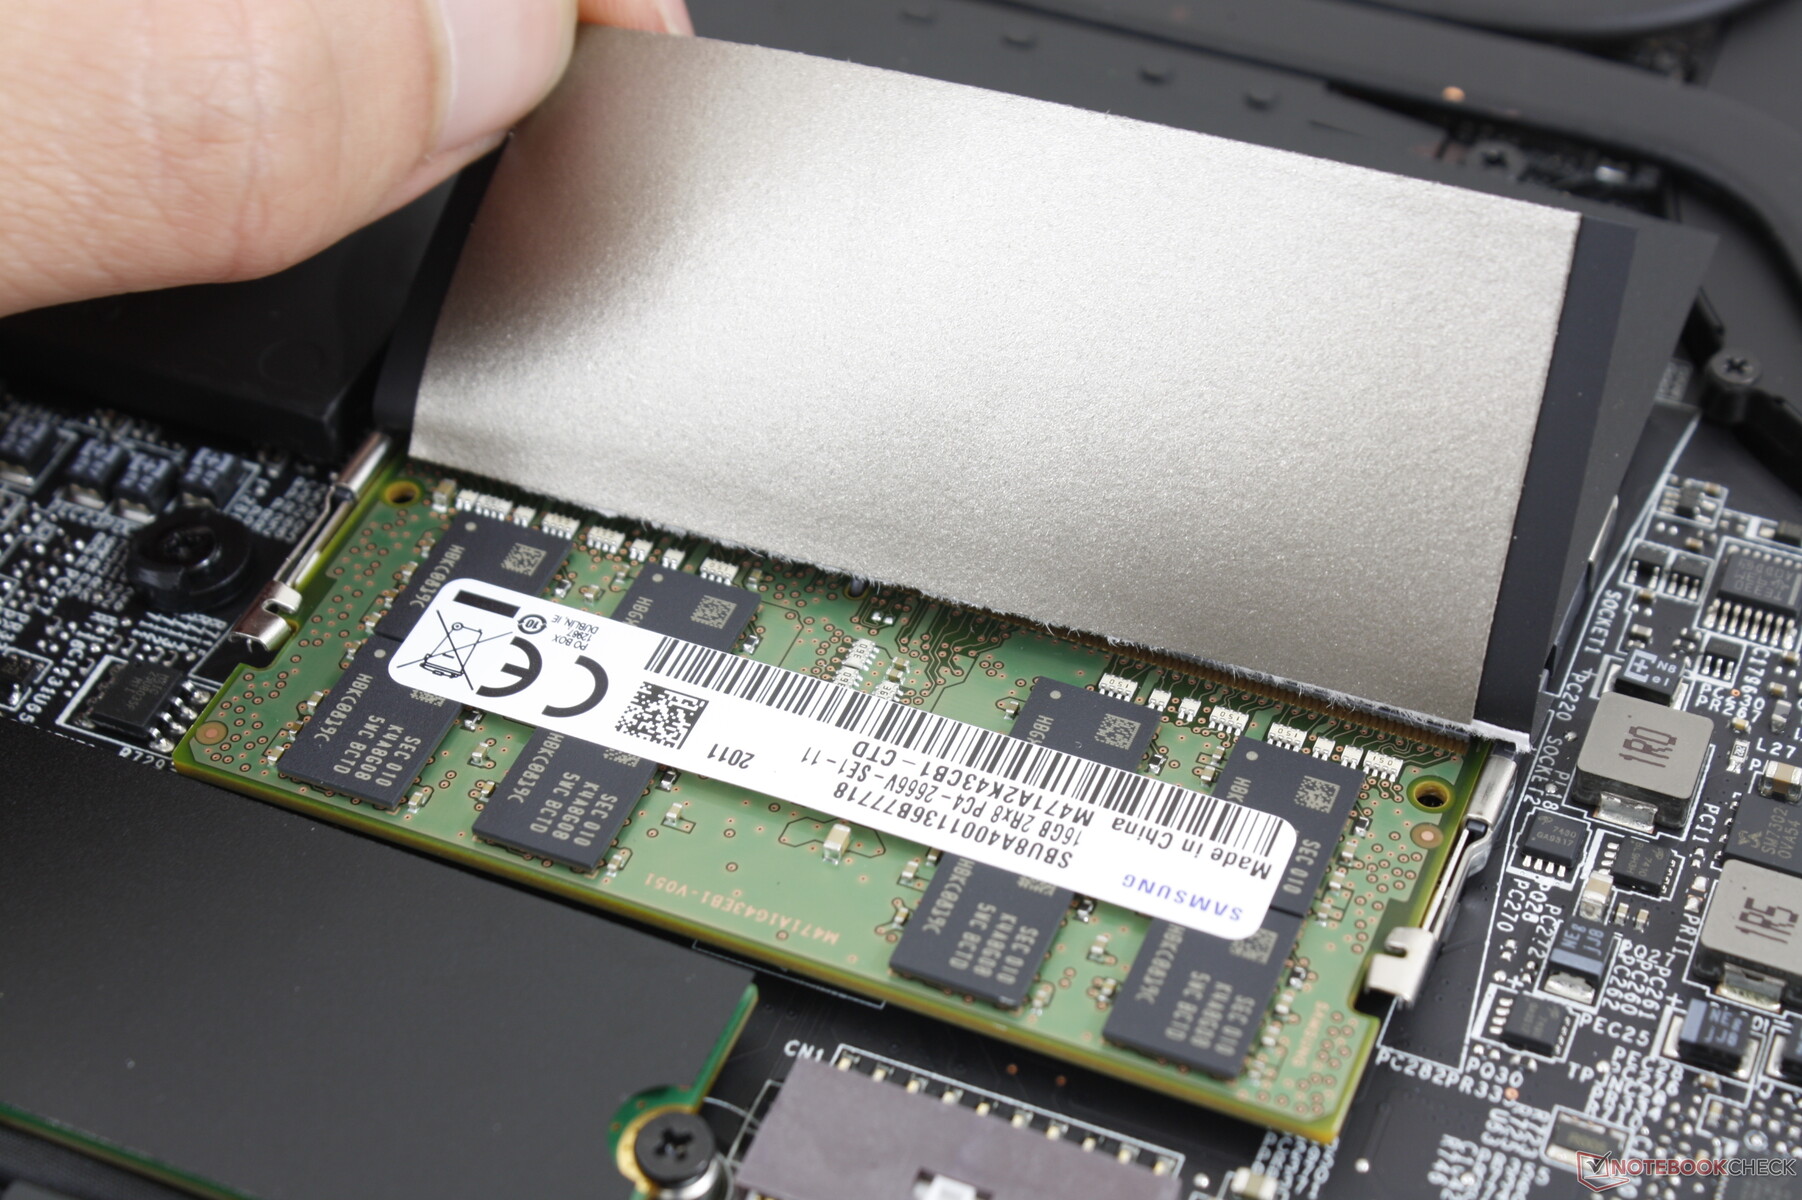
Thankfully, MSI has ditched the upside-down motherboard layout that made upgrades on the GS65 more difficult than it needed to be. Owners get direct access to two storage bays, two SODIMM slots, the WLAN module, and the internal battery.
Accessories and Warranty
There are no notable extras in the box which is a bit disappointing because the GS65 would ship with a handy velvet cleaning cloth. The standard one-year manufacturer warranty applies with additional options if purchased from resellers like Xotic PC.
Input Devices
Keyboard and Touchpad
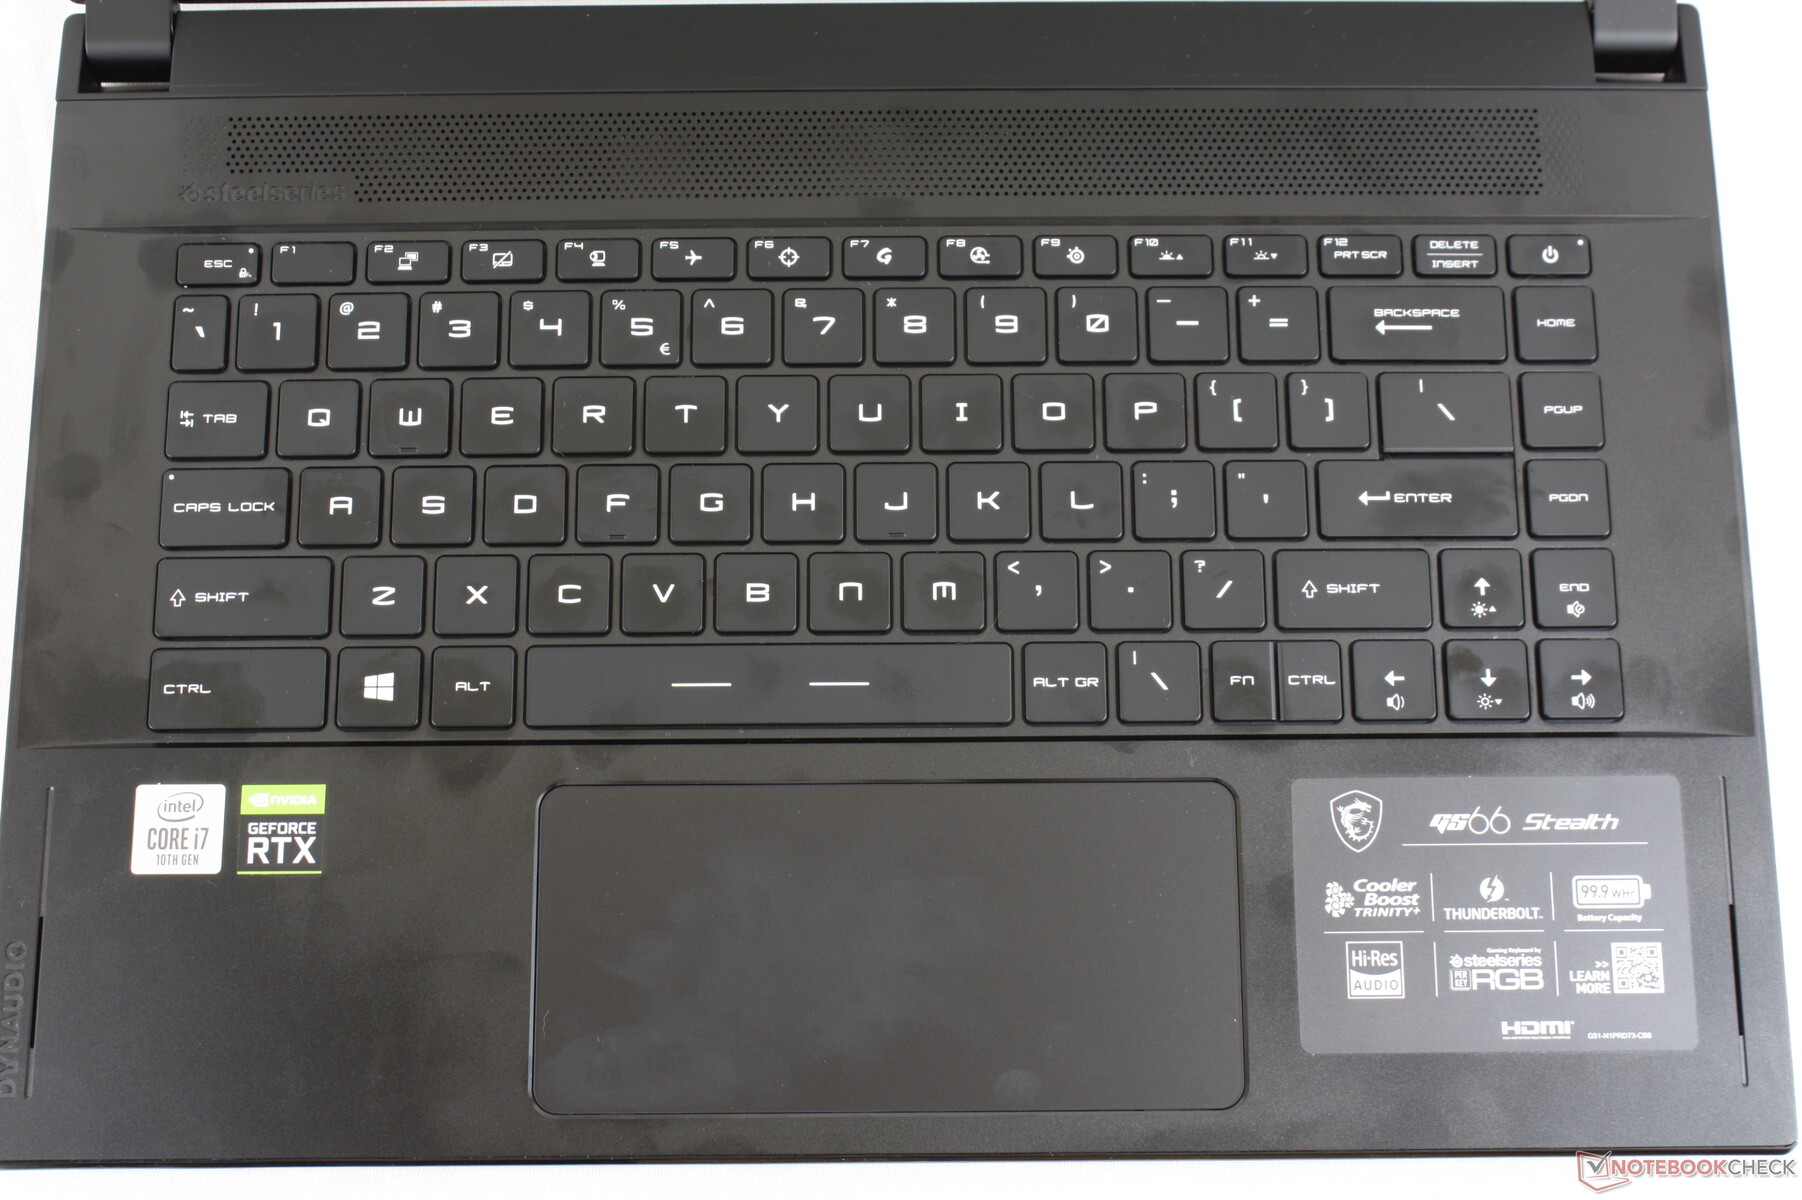
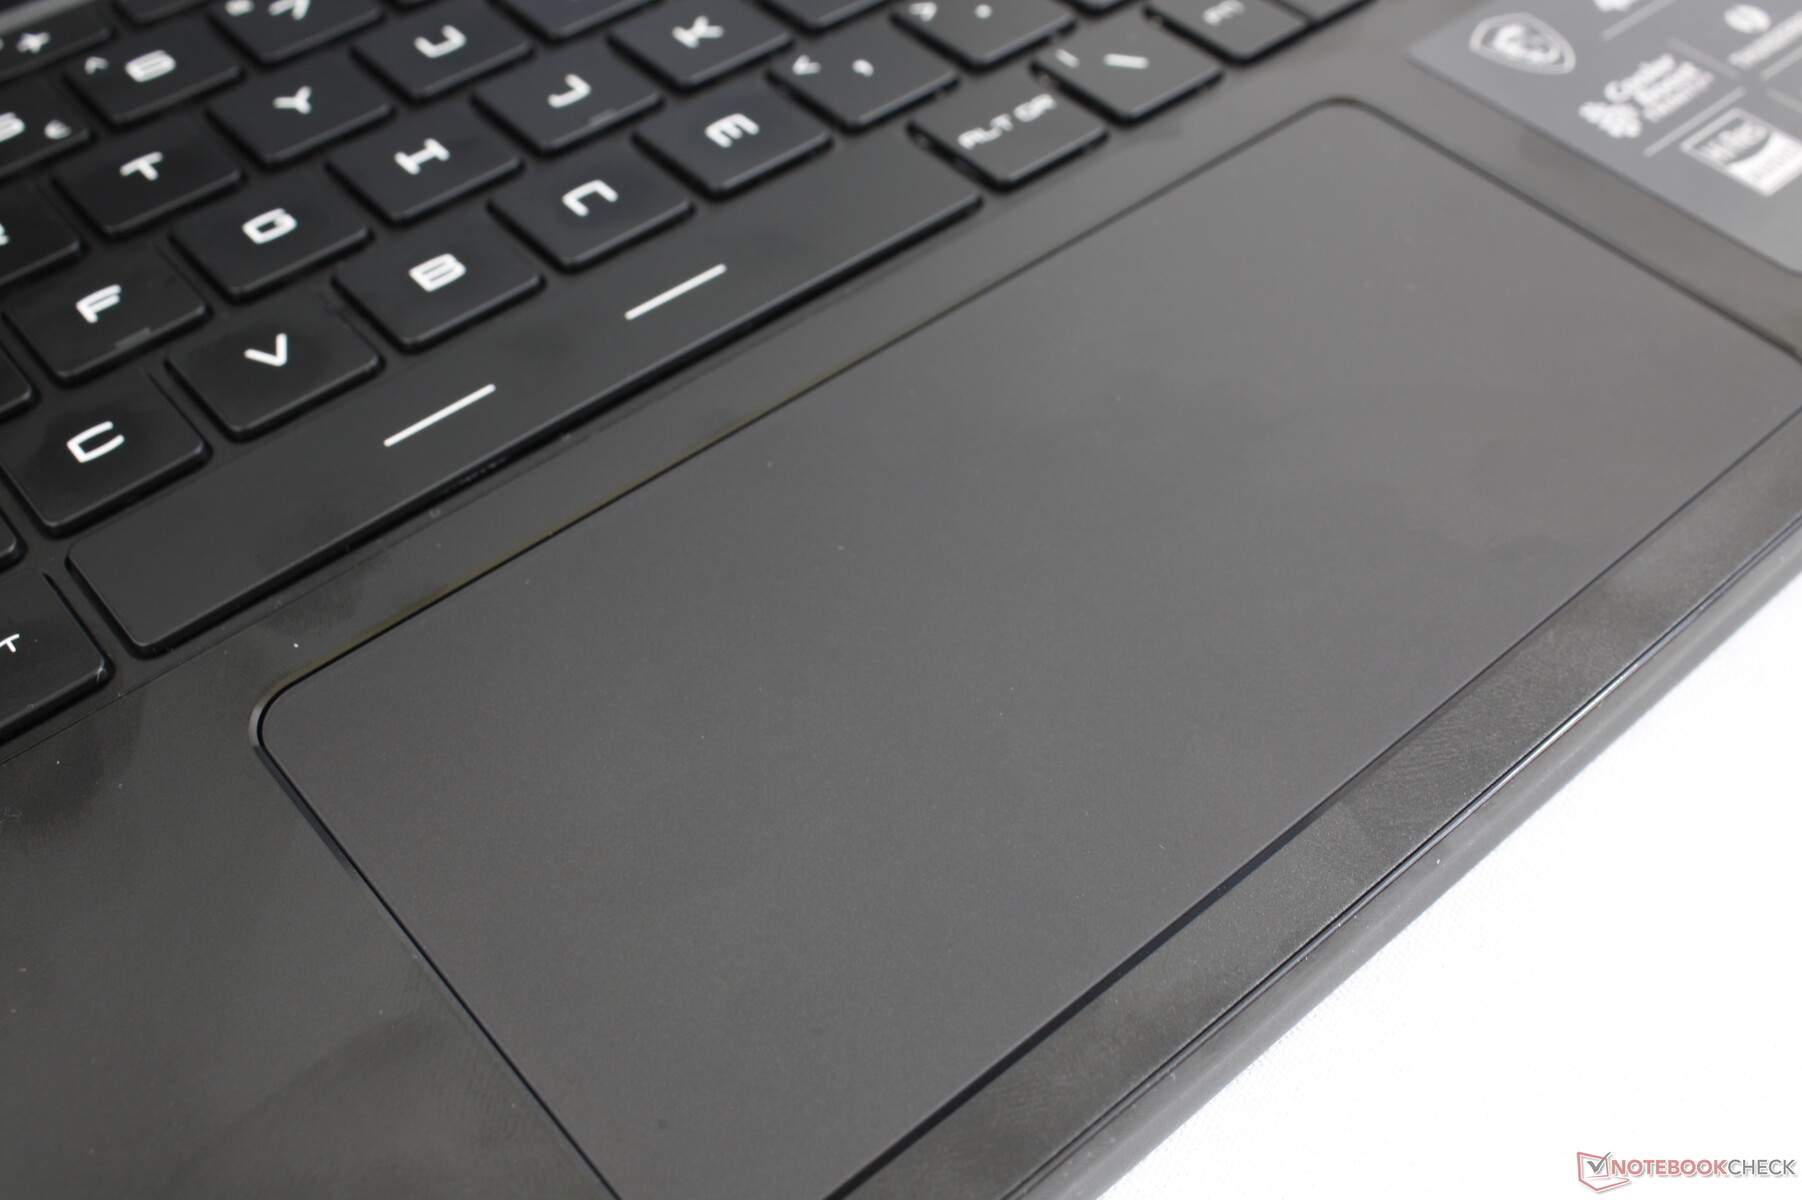
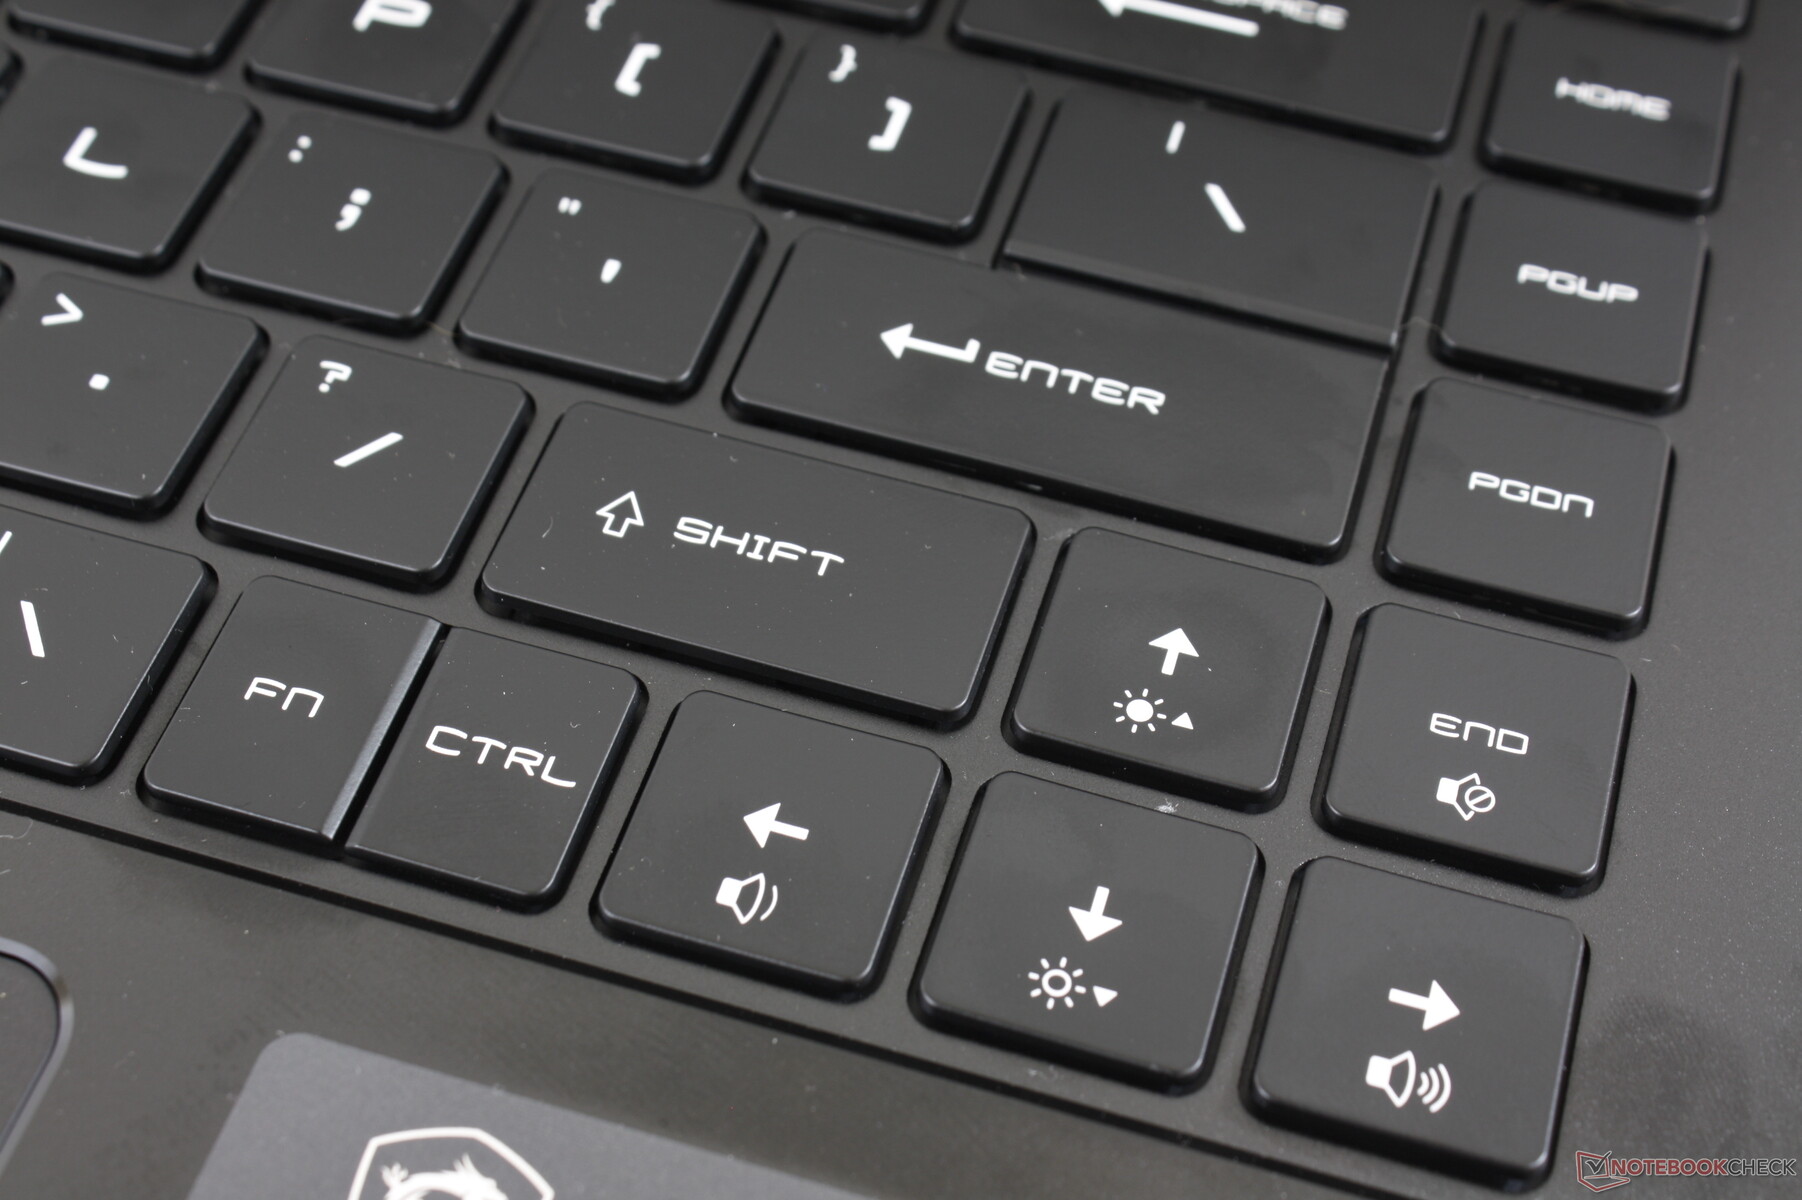
See our review here on our take on the keyboard and touchpad. In general, we don't find the typing experience to be any better or worse than last year's GS65 even though MSI has revised the layout and design. The clickpad, however, is larger and firmer this time around to be easier to use.
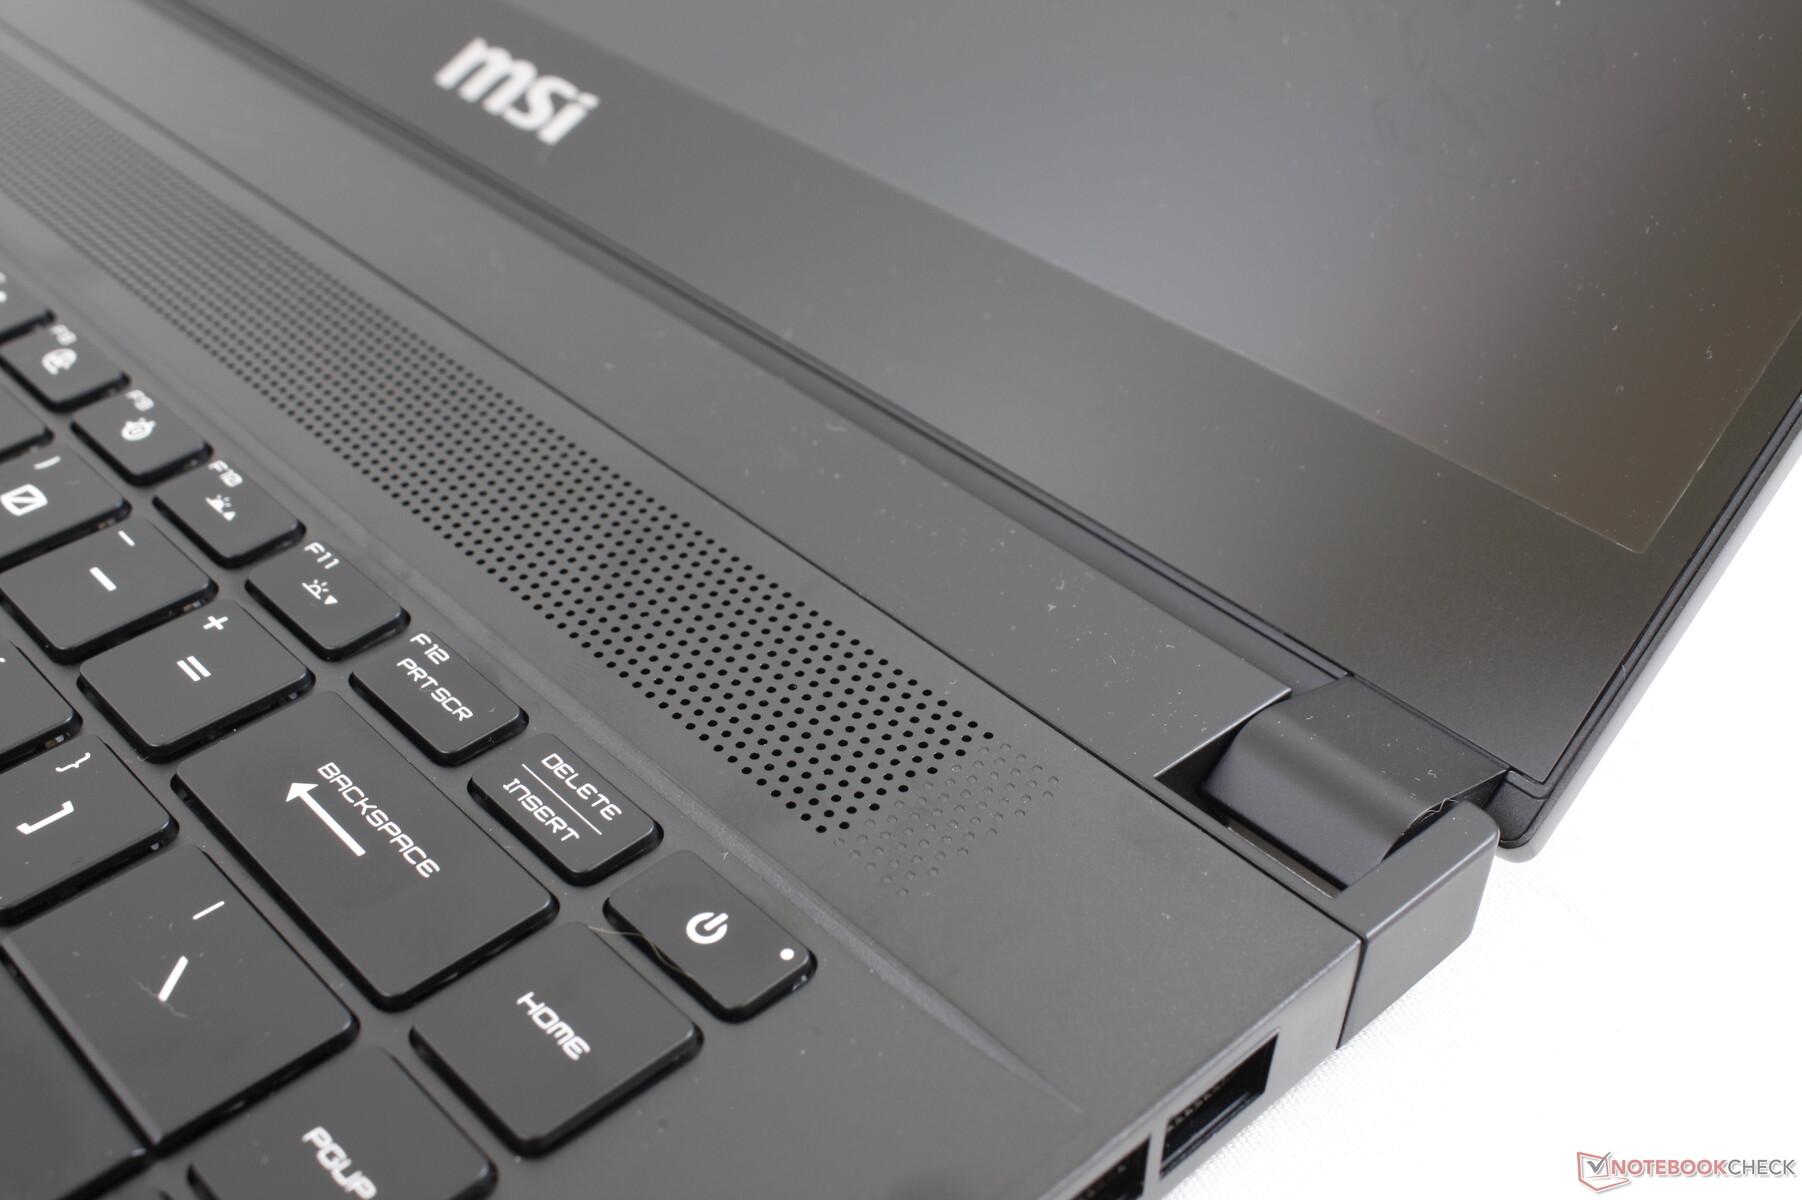
Annoyingly, the brightness controls are inexplicably swapped on the keyboard.

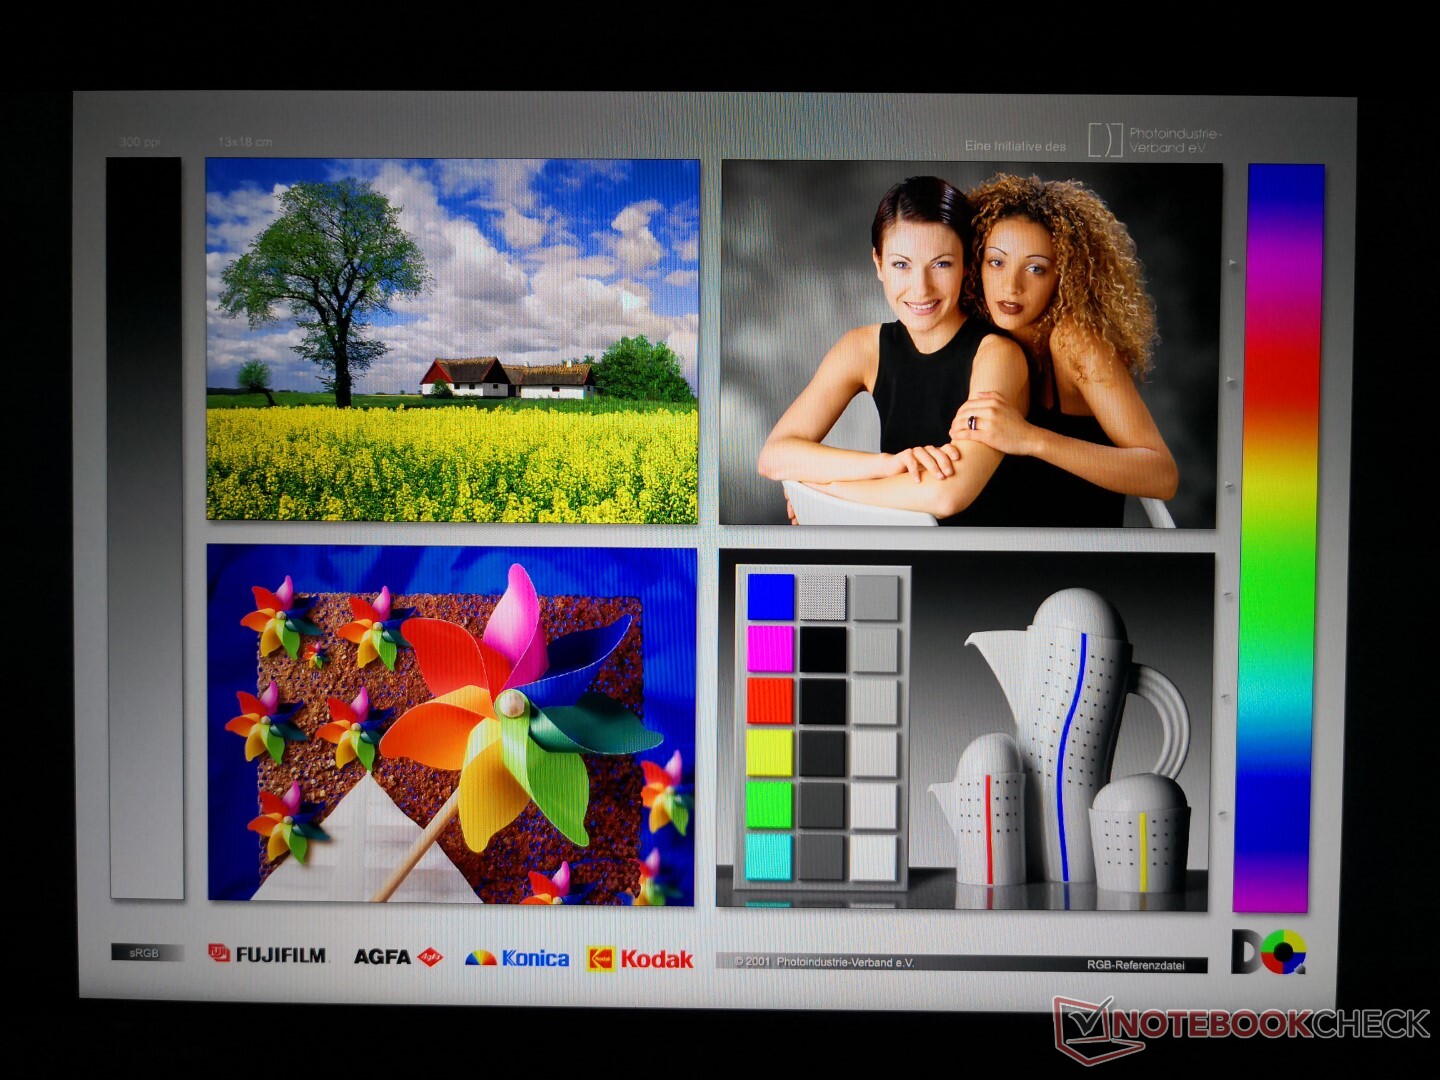
Display
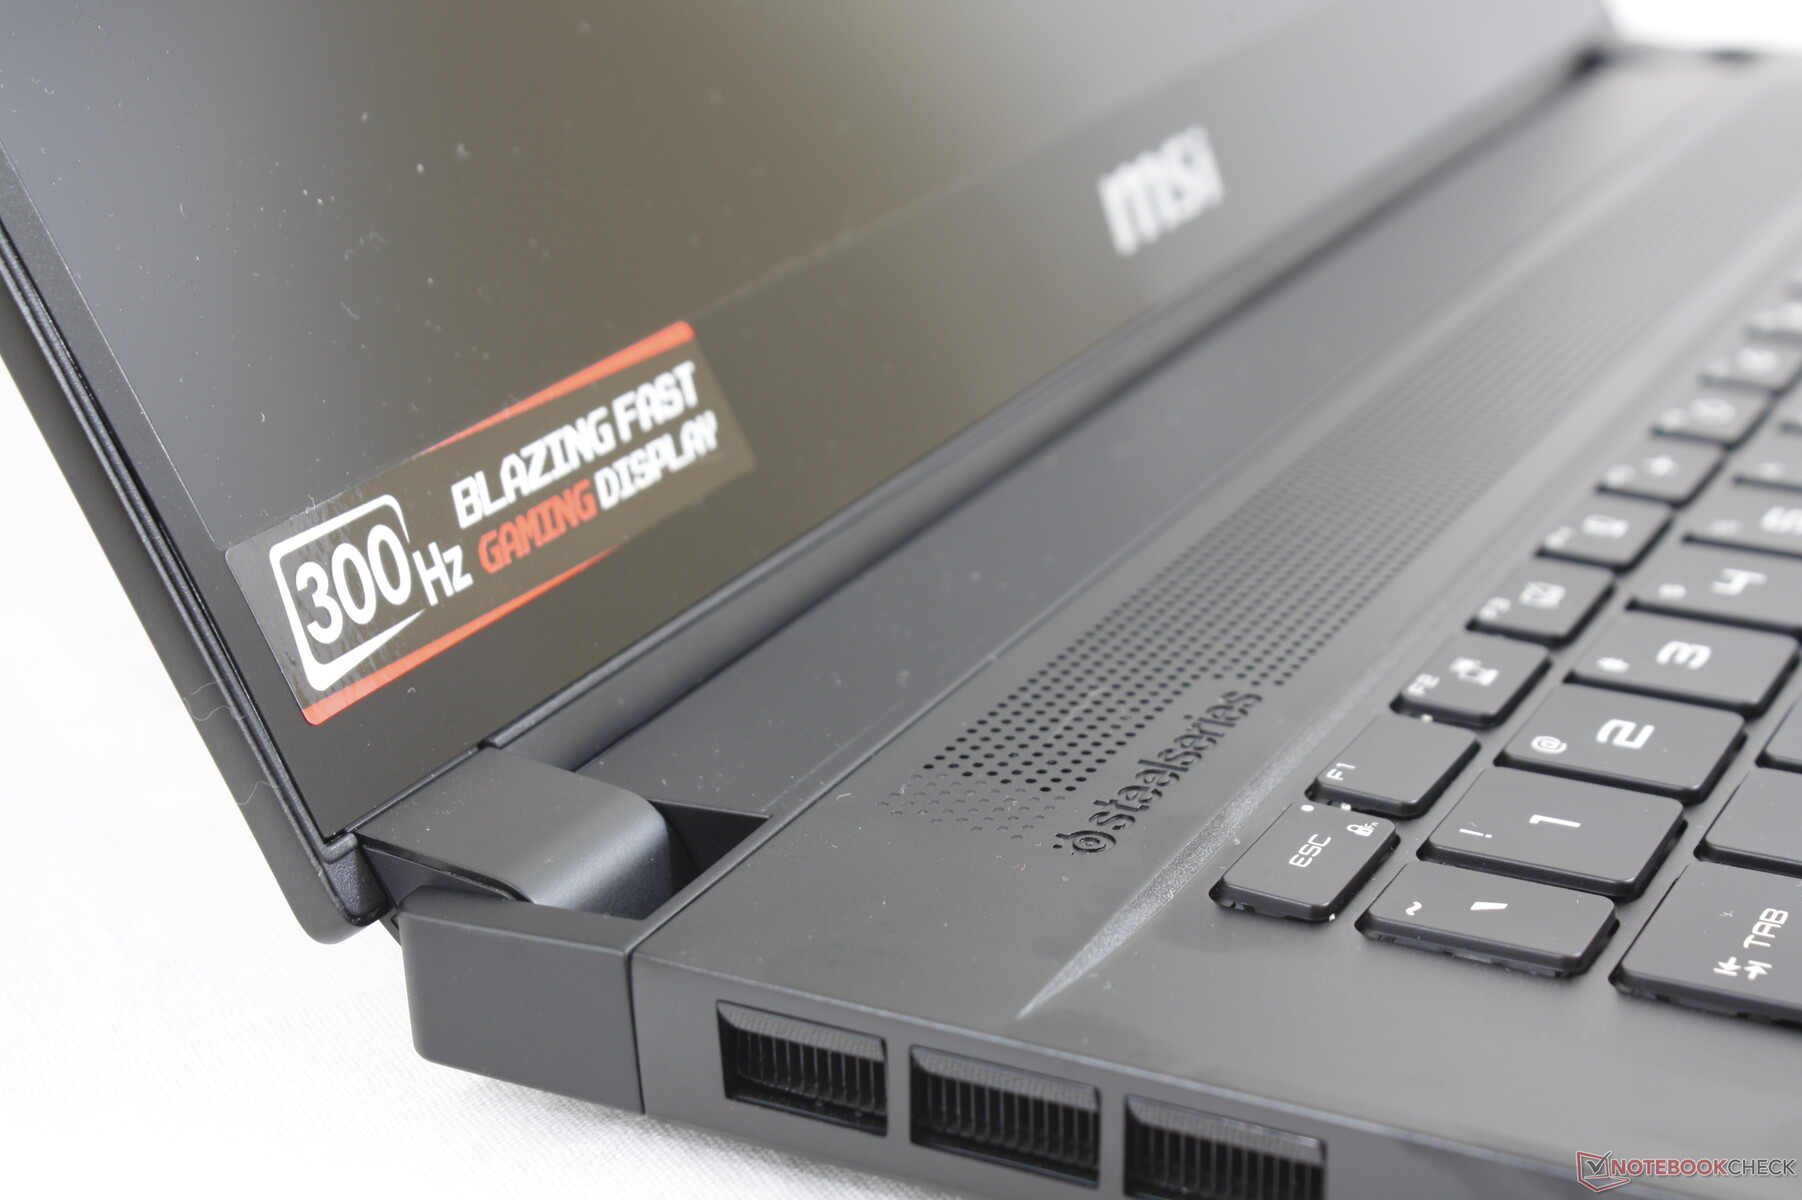
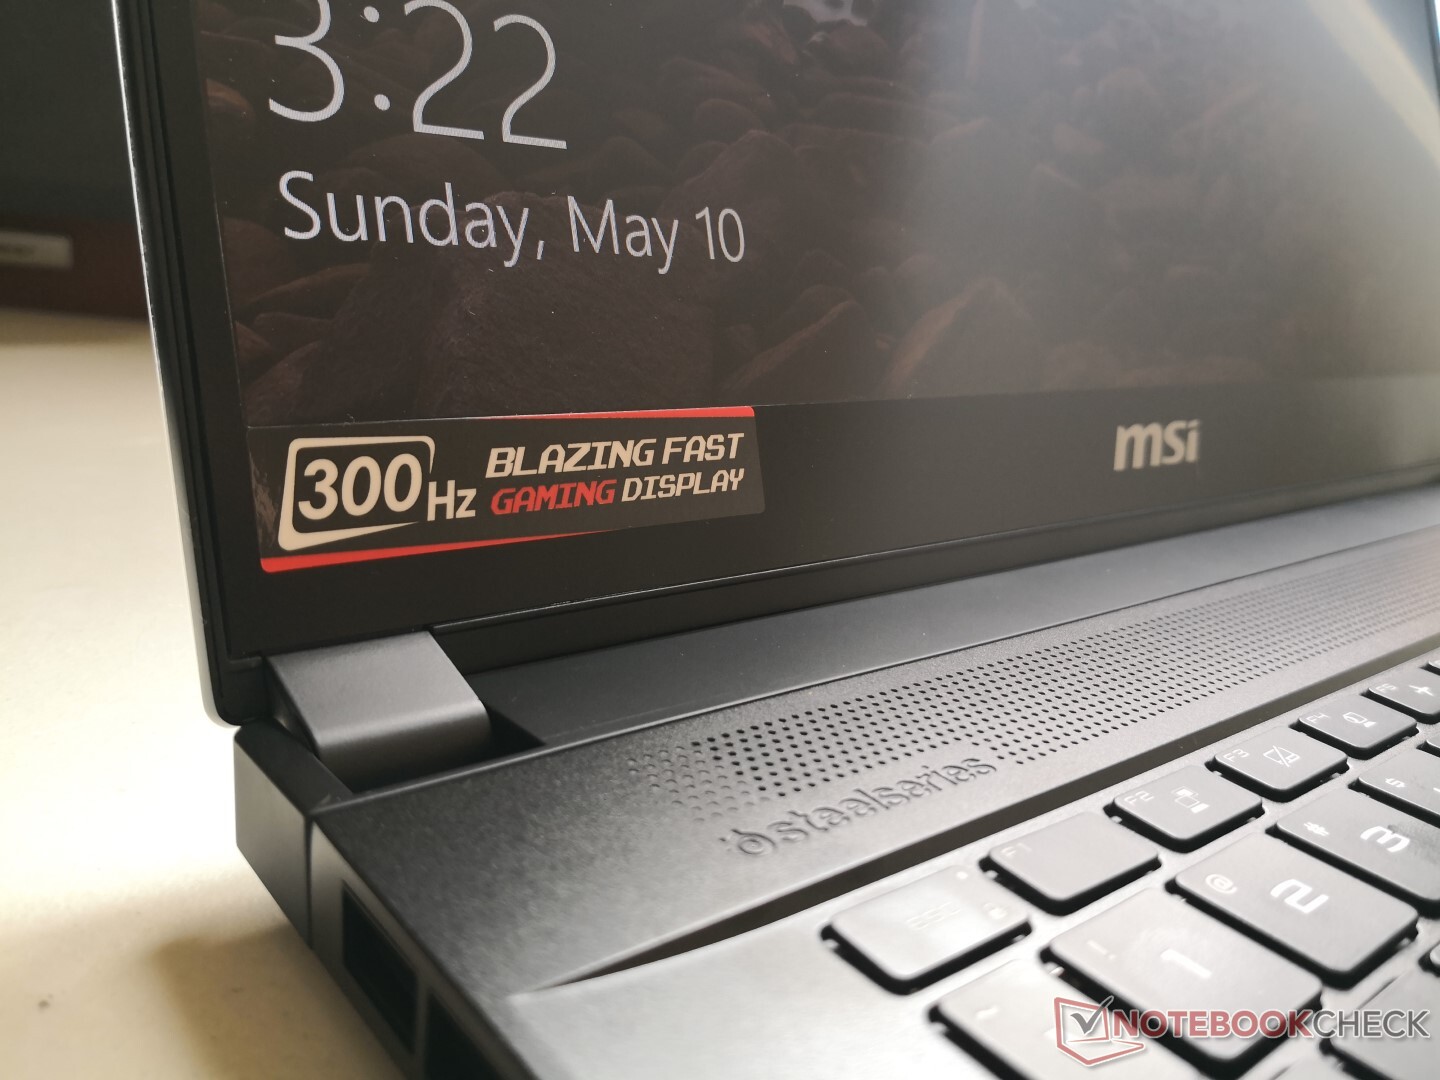
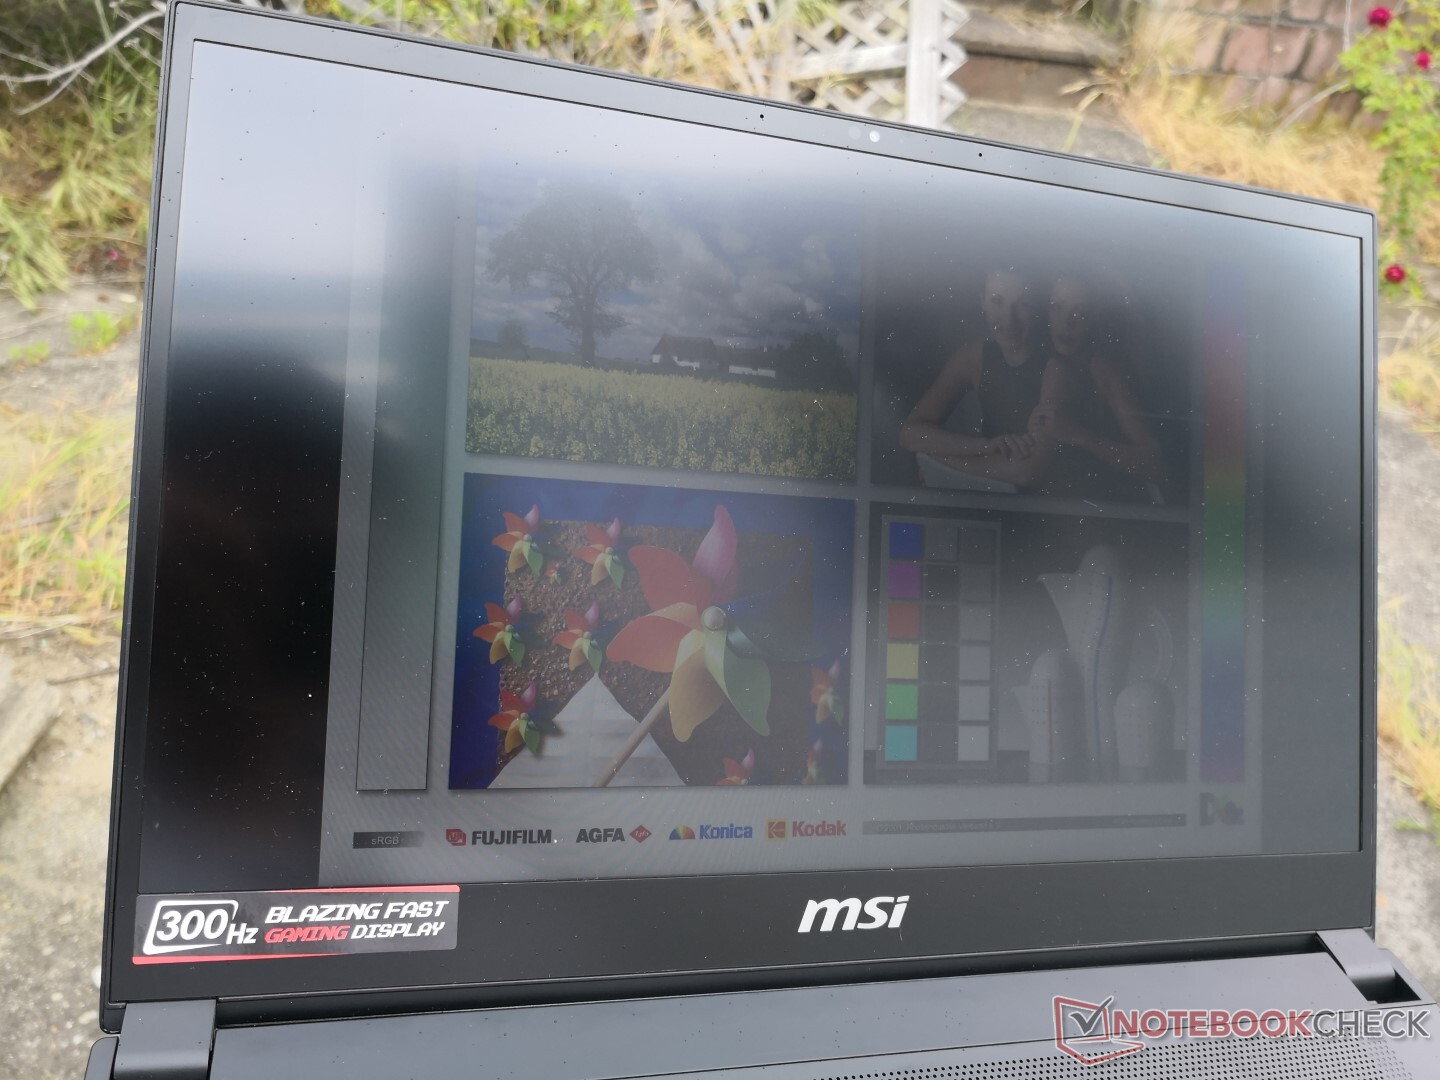
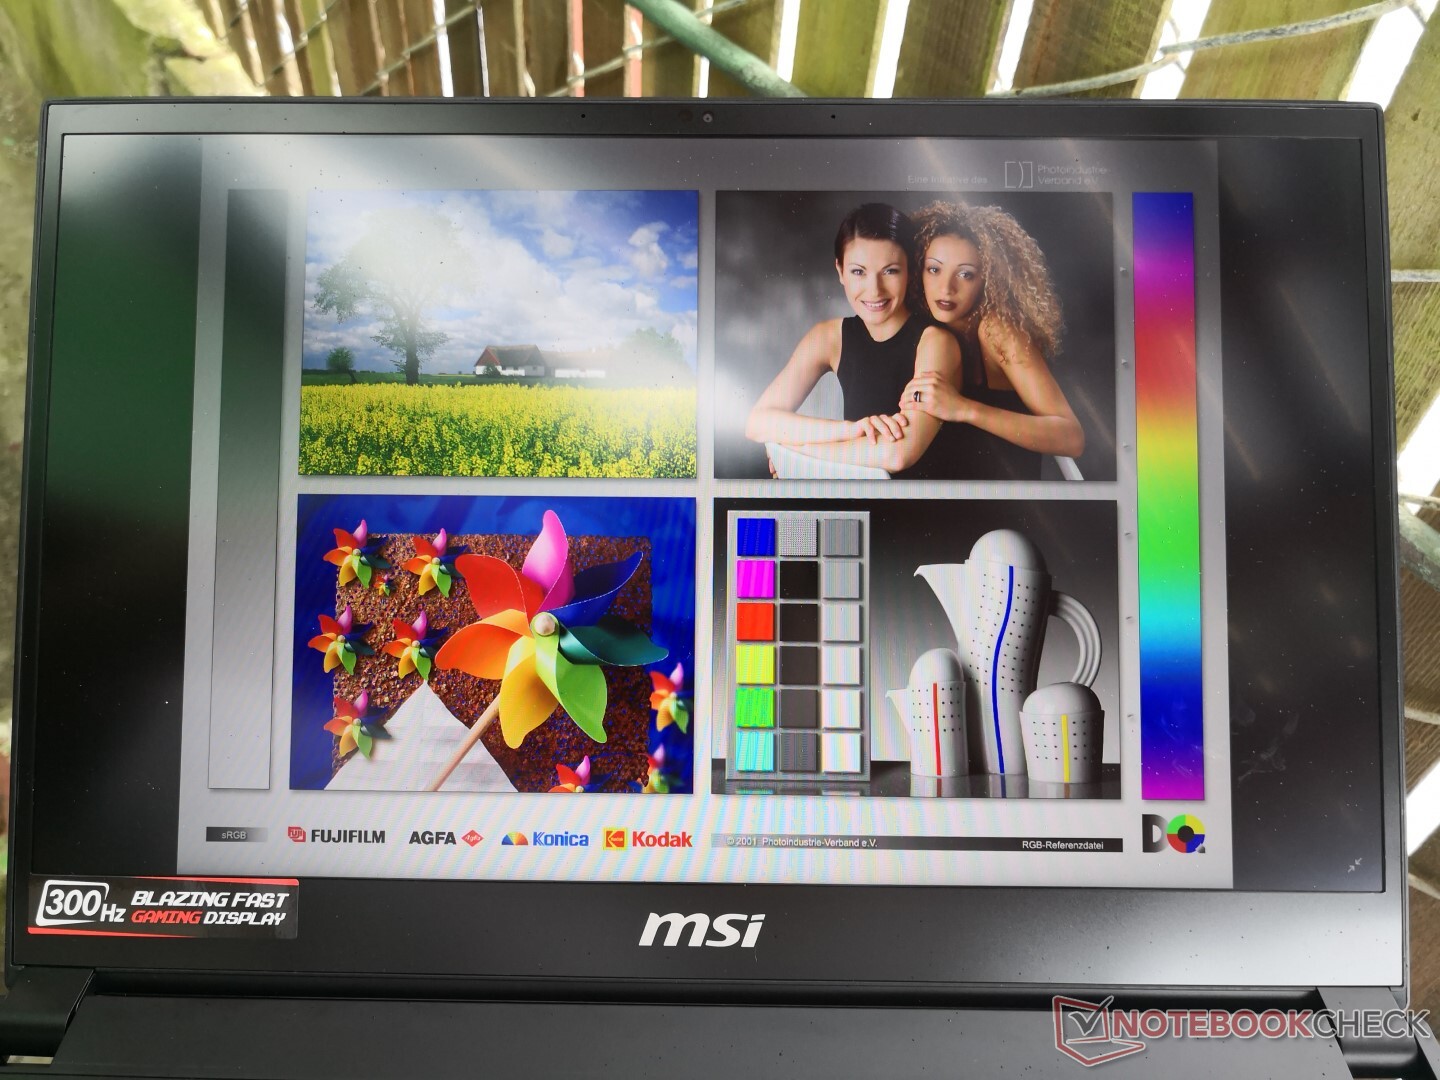
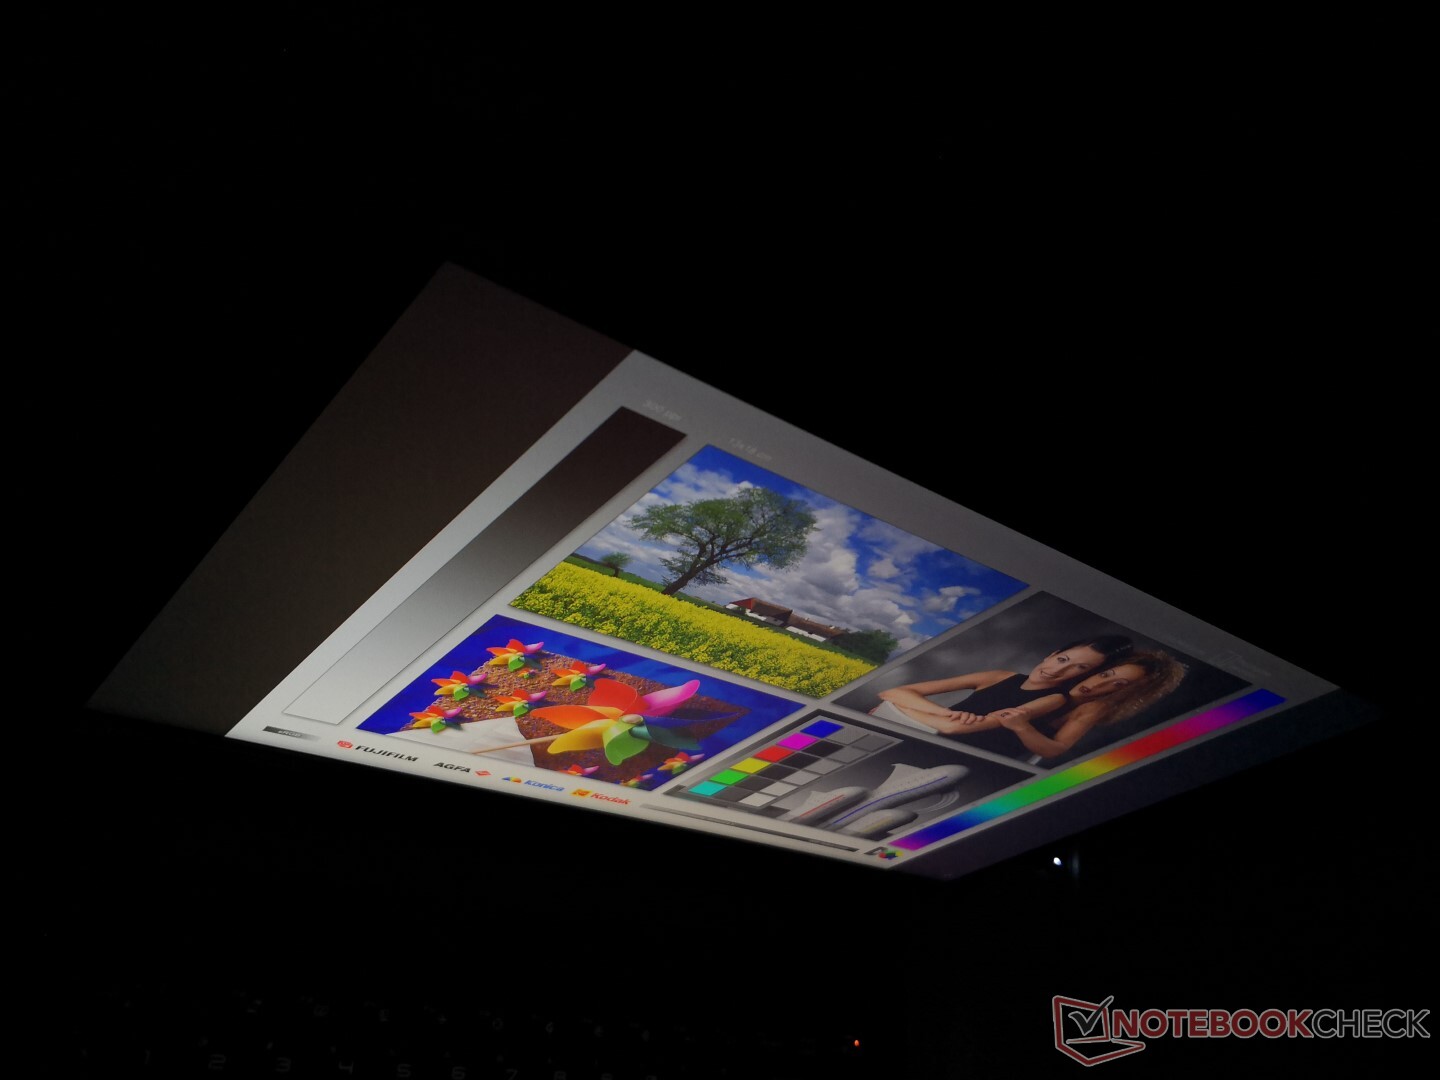
All current SKUs come with 1080p displays at either 240 Hz or 300 Hz. Our second GS66 test unit uses the same 300 Hz AUO B156HAN12.0 IPS panel as found on our first test unit. The deep contrast ratio (~1500:1), wide color space (~100 percent sRGB), and very fast response times (3 ms to 5 ms) remain intact to represent a high quality display fit for a flagship gaming laptop. Razer is about to launch its own 300 Hz display option for the Blade 15 as well that will likely utilize this same AU Optronics panel.
Keep in mind that you don't have to reach 300 FPS in games to take advantage of a 300 Hz display. Even so, we'd love to see QHD or 4K UHD options in the future.


| |||||||||||||||||||||||||
Brightness Distribution: 92 %
Center on Battery: 339.4 cd/m²
Contrast: 1414:1 (Black: 0.24 cd/m²)
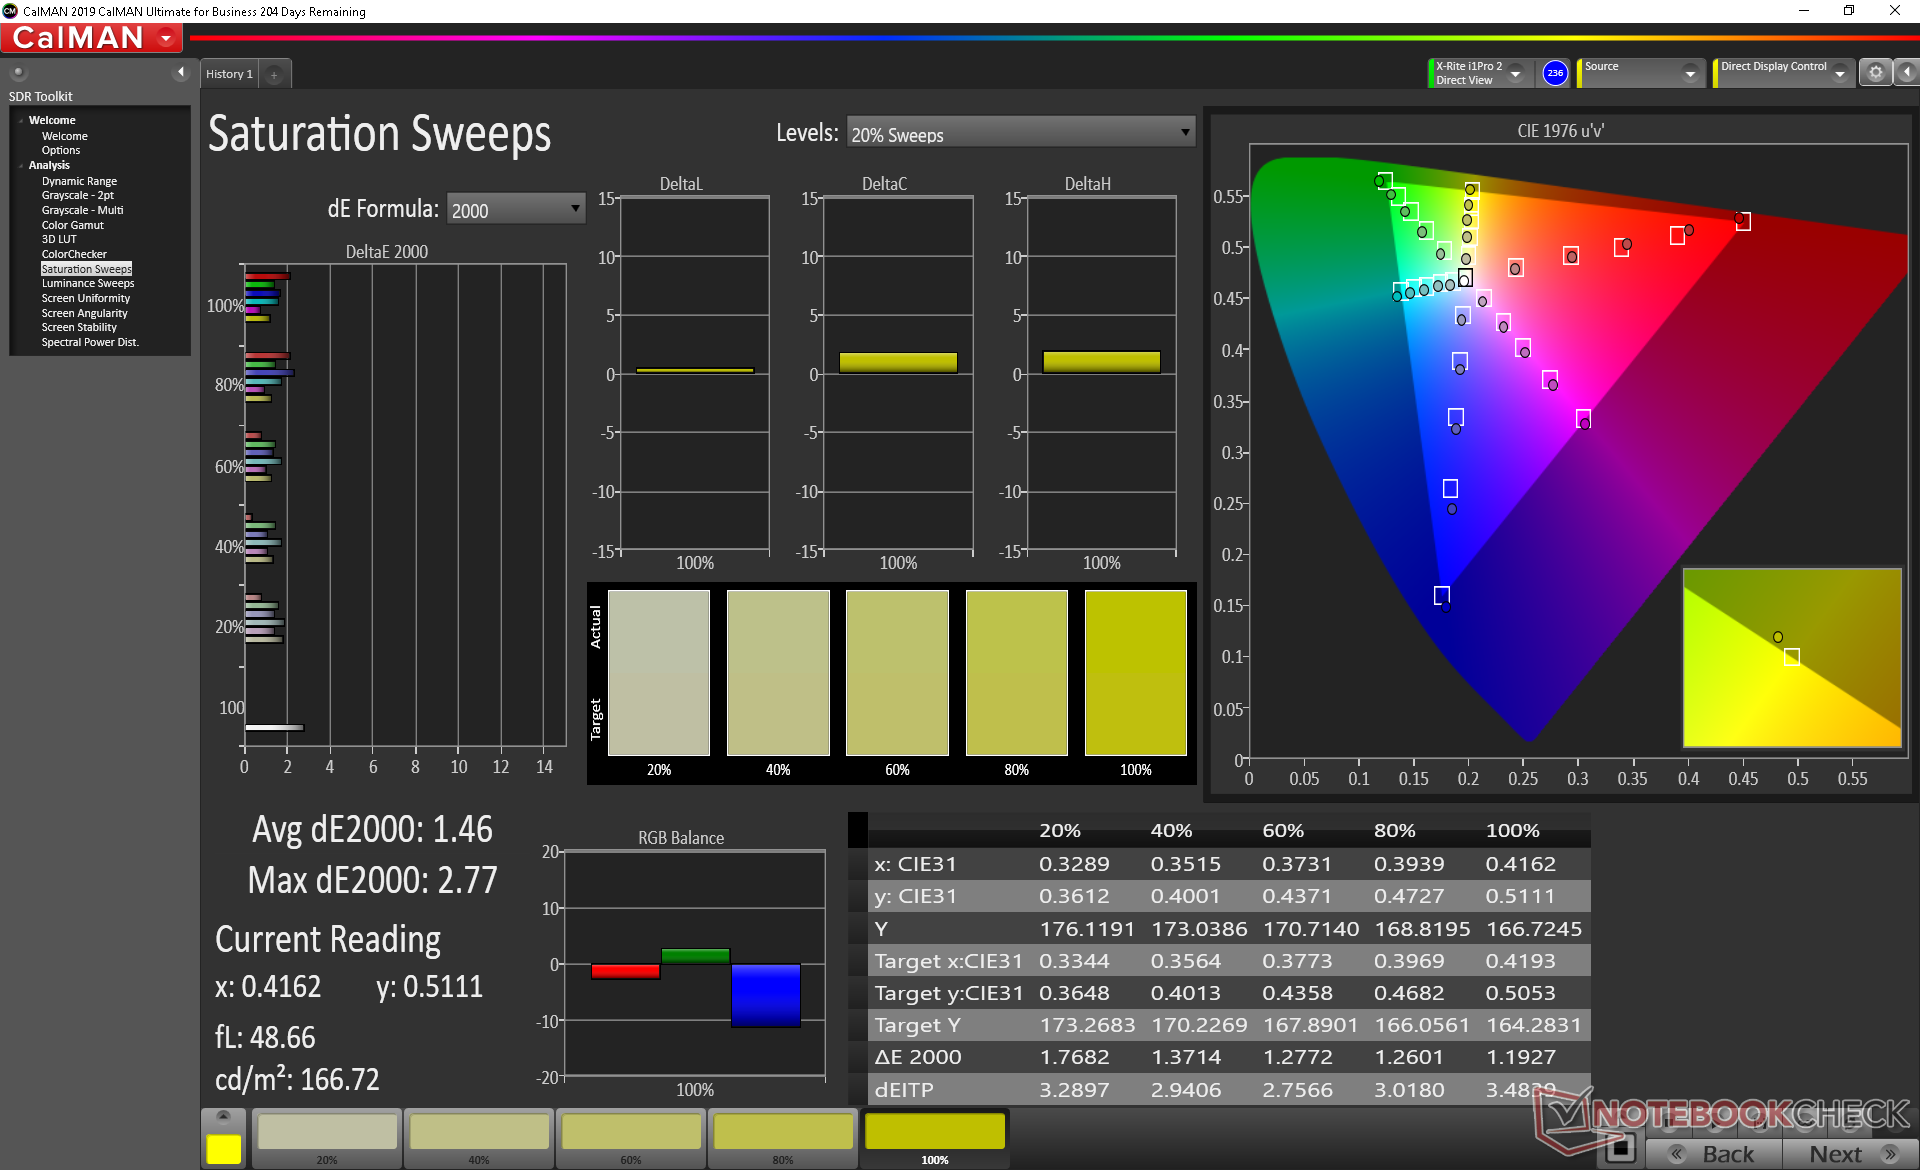
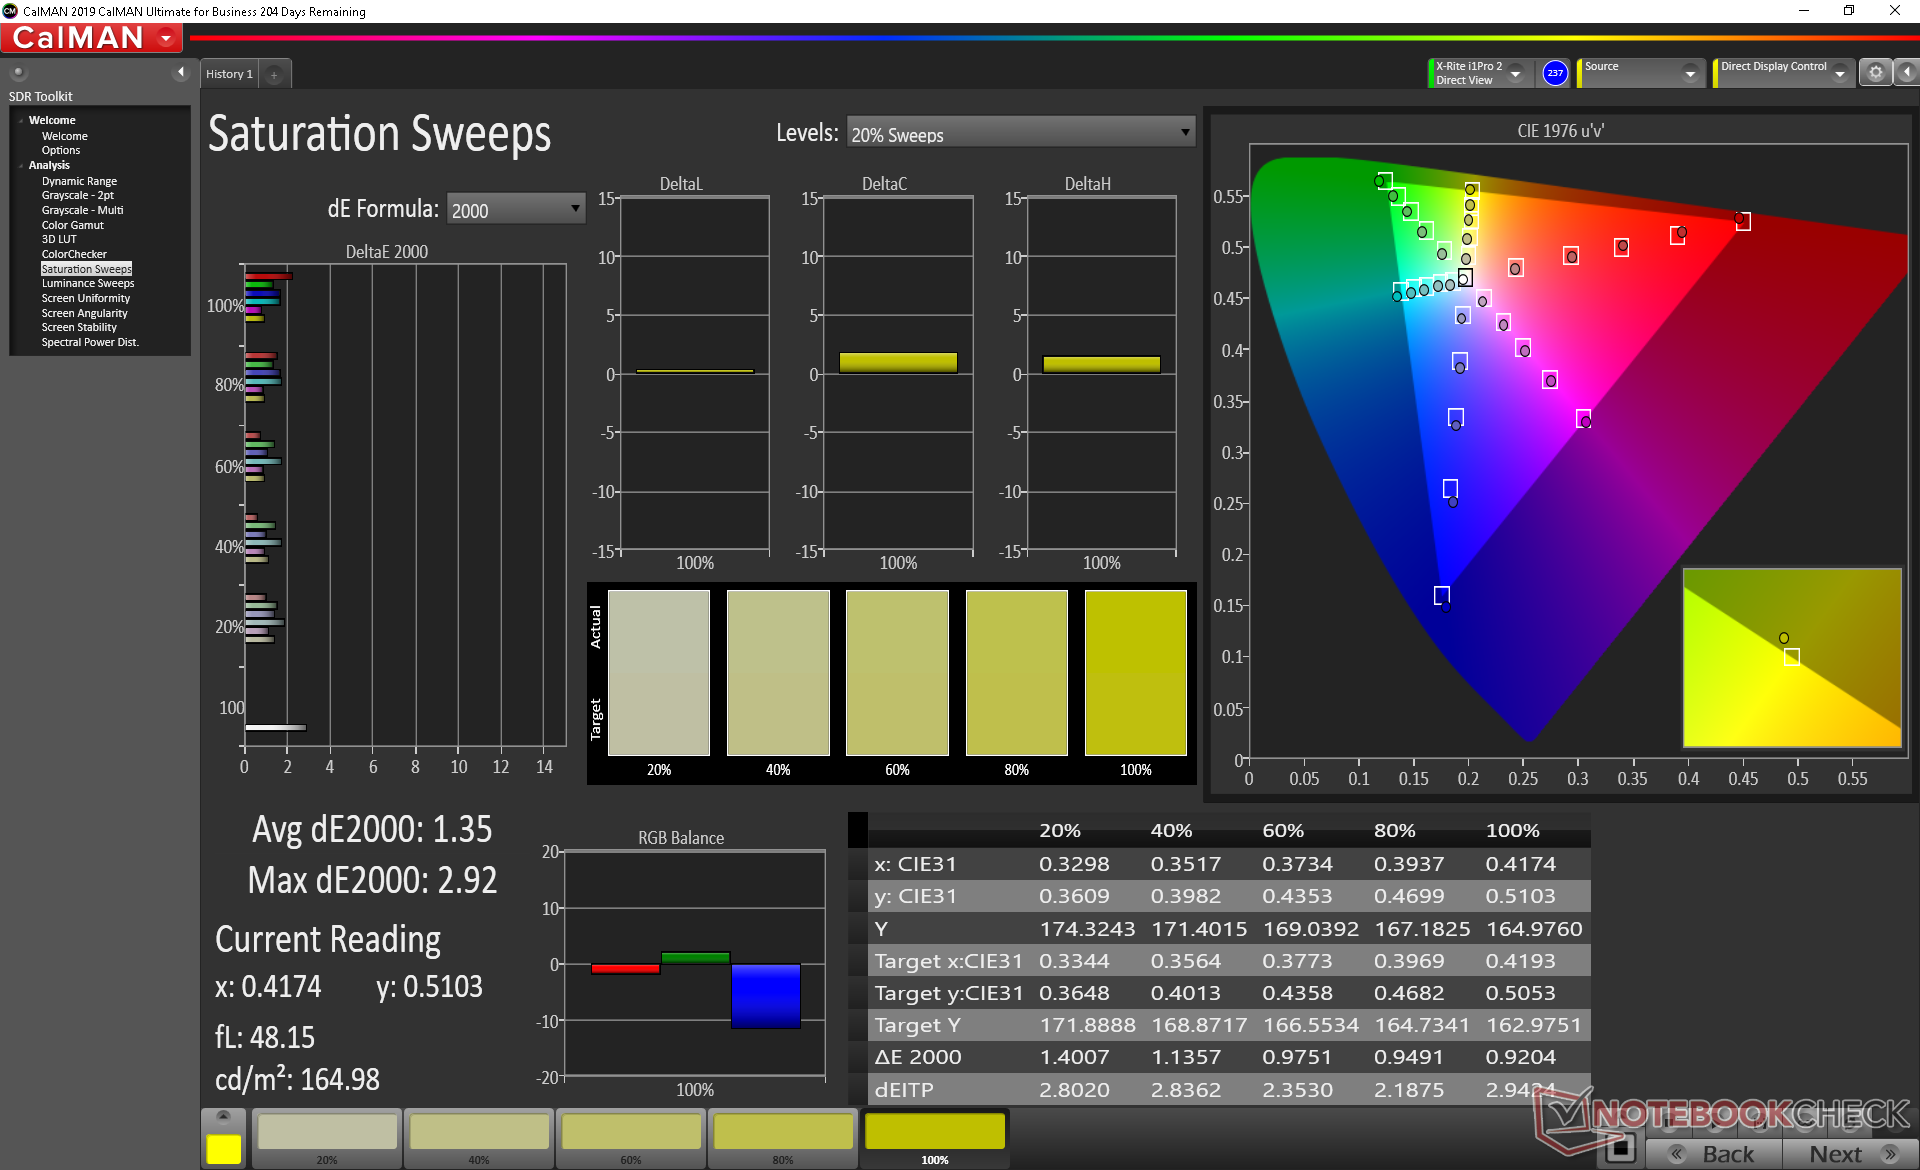
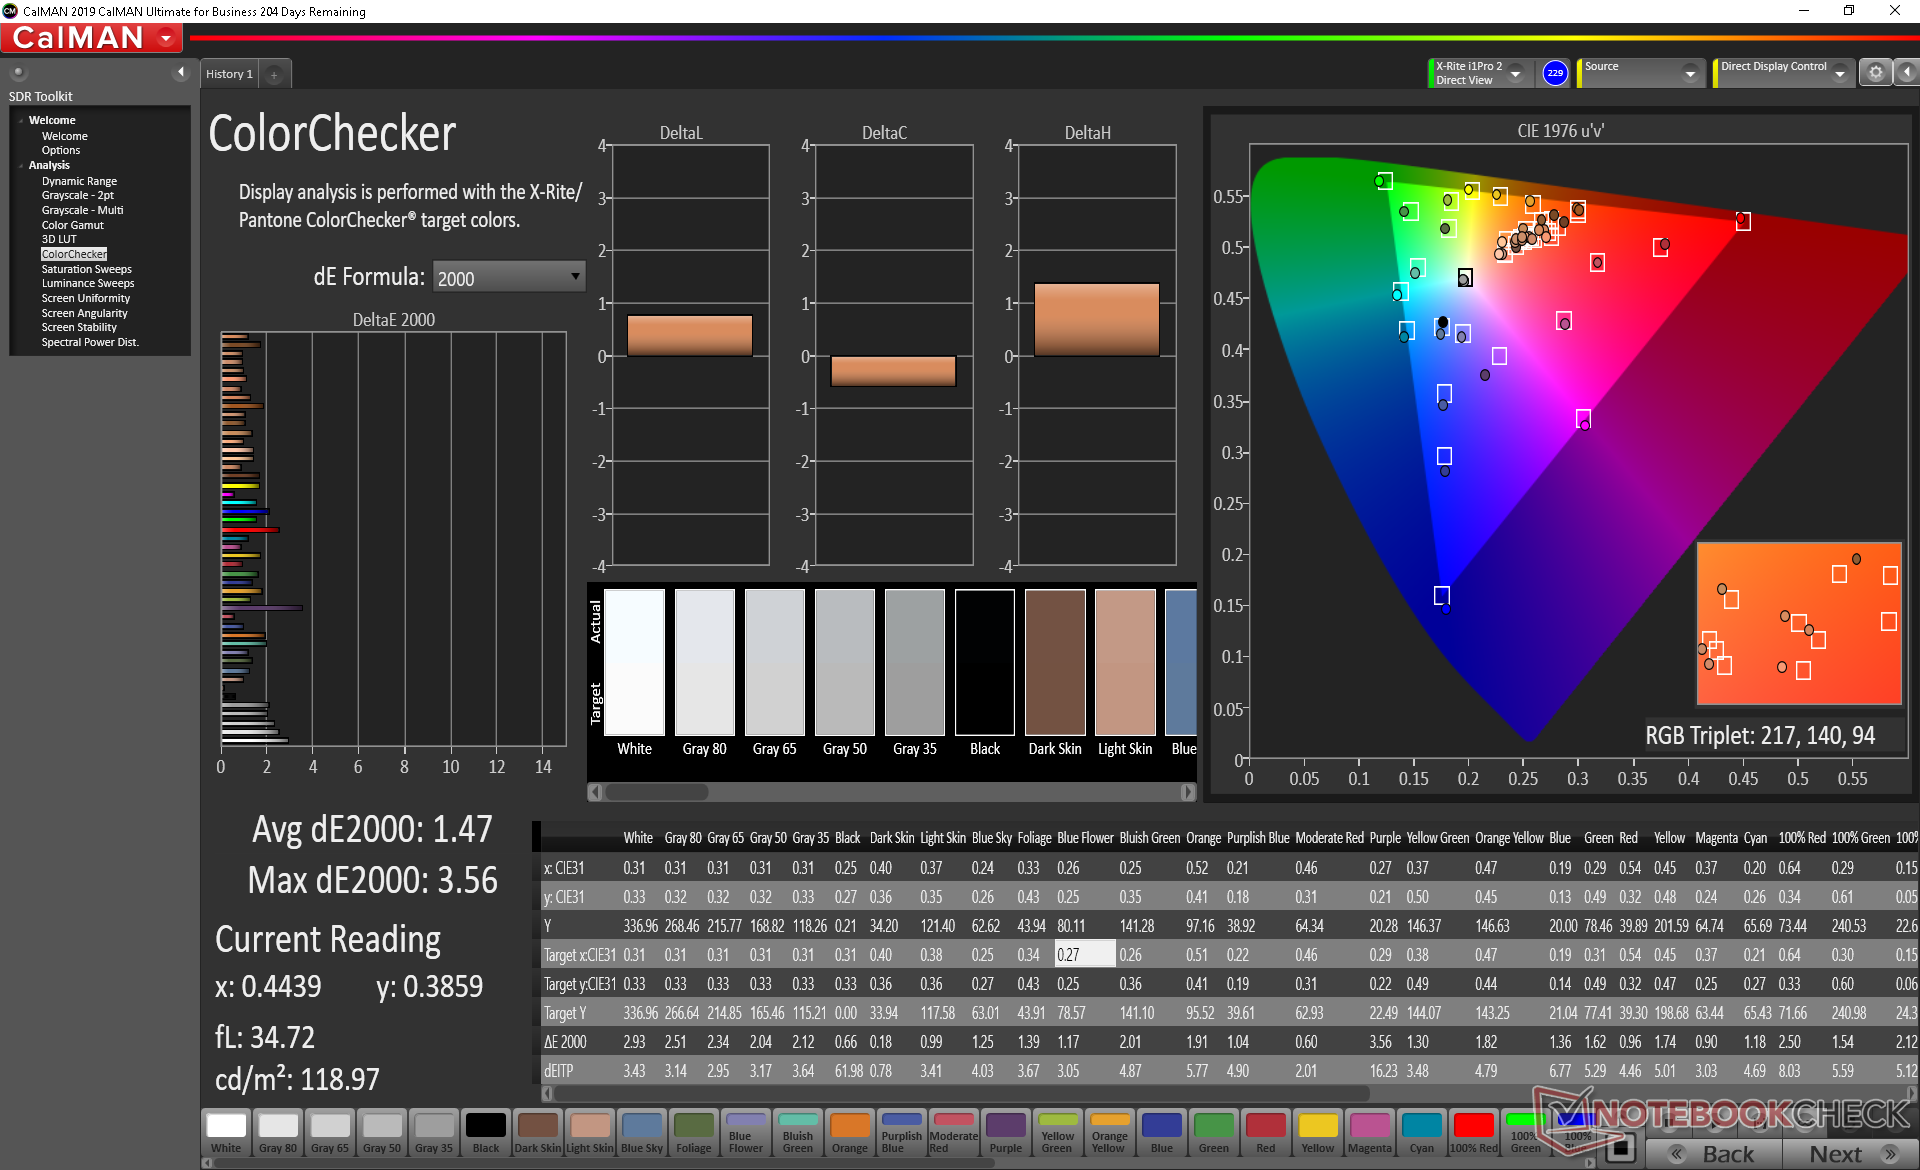
ΔE ColorChecker Calman: 1.58 | ∀{0.5-29.43 Ø4.73}
calibrated: 1.47
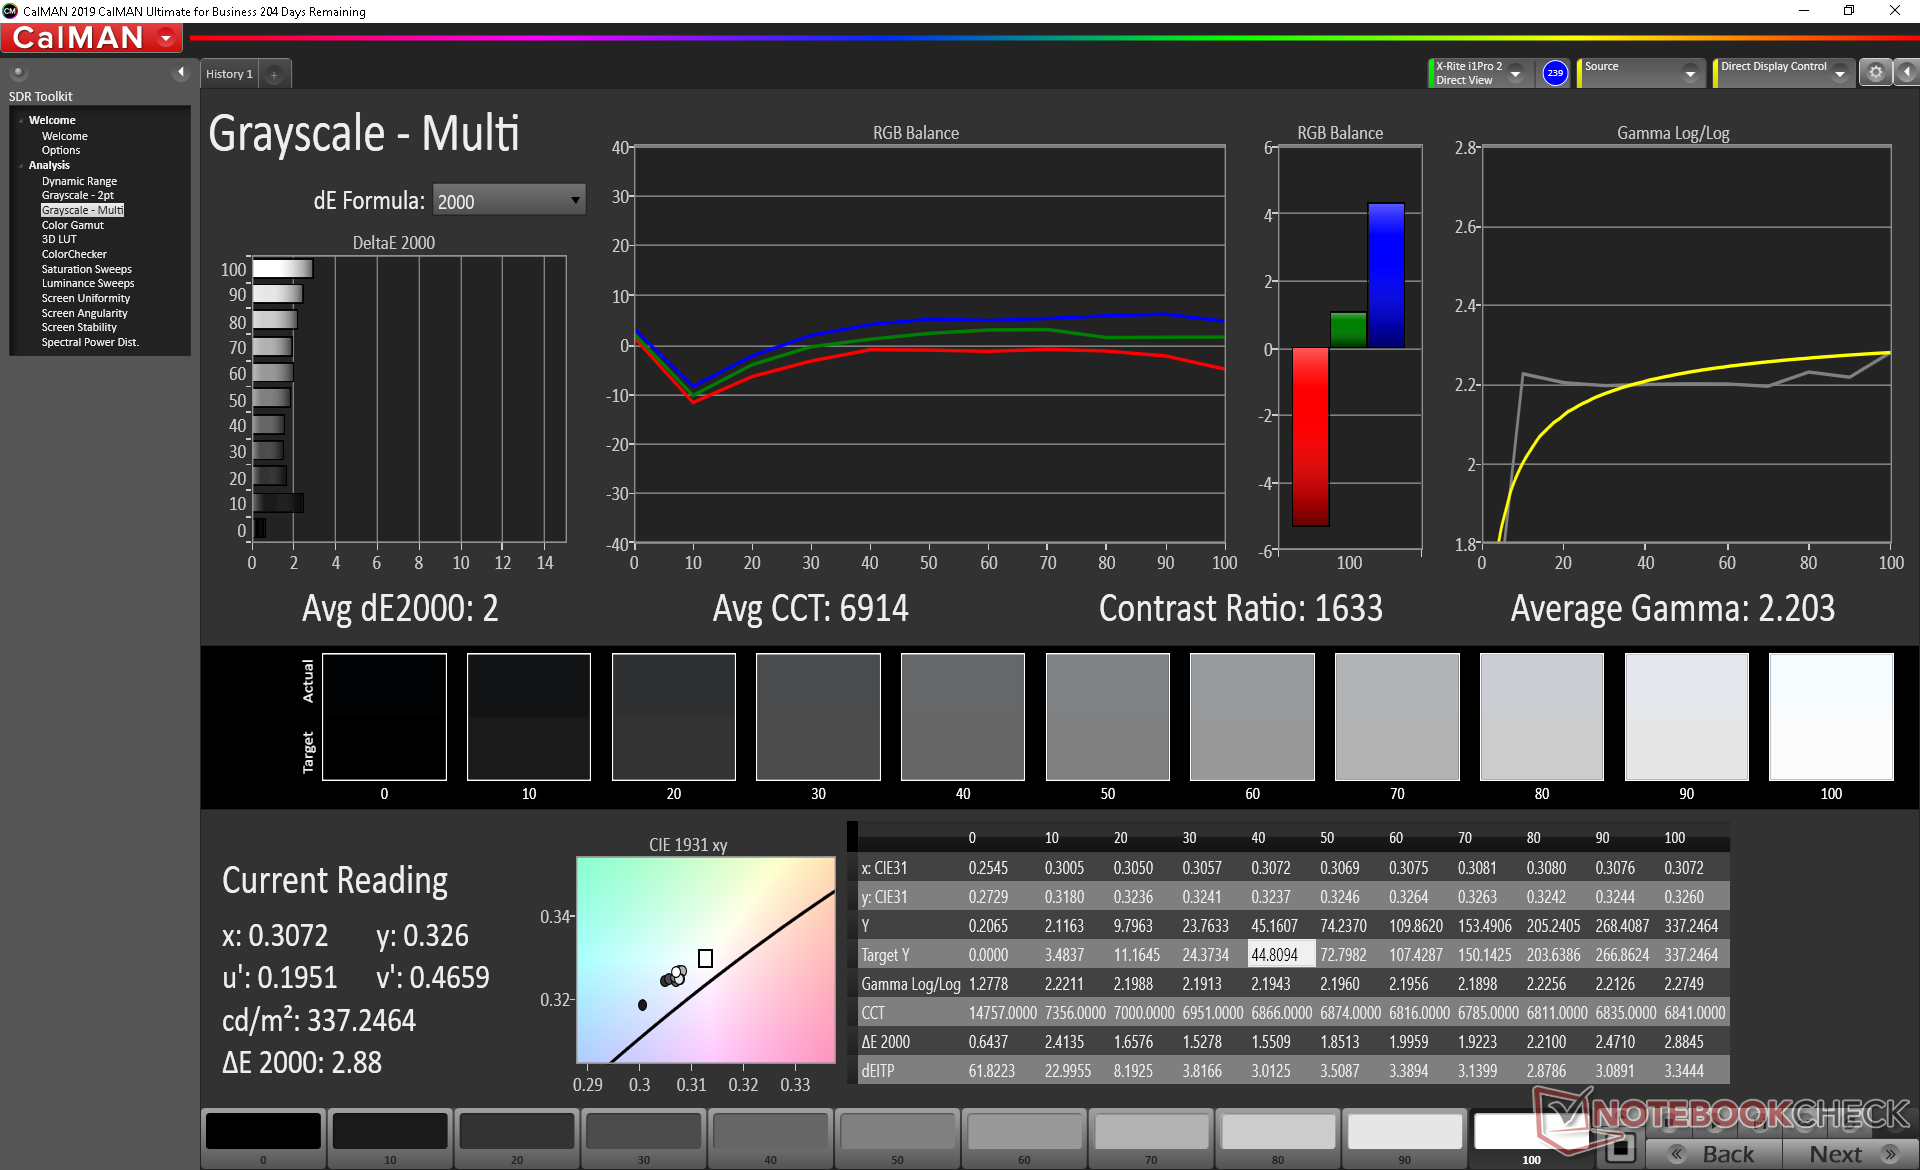
ΔE Greyscale Calman: 2.3 | ∀{0.09-98 Ø4.97}
99.4% sRGB (Argyll 1.6.3 3D)
64.8% AdobeRGB 1998 (Argyll 1.6.3 3D)
71.1% AdobeRGB 1998 (Argyll 3D)
99.1% sRGB (Argyll 3D)
69.9% Display P3 (Argyll 3D)
Gamma: 2.24
CCT: 6952 K
| MSI GS66 10SGS AU Optronics B156HAN12.0, IPS, 15.6", 1920x1080 | MSI GS65 Stealth 9SG Sharp LQ156M1JW03 (SHP14C5), IPS, 15.6", 1920x1080 | Asus Zephyrus S GX502GW AU Optronics B156HAN08.2 (AUO82ED), IPS, 15.6", 1920x1080 | Razer Blade 15 RTX 2080 Max-Q Sharp LQ156M1JW03 (SHP14C5), IPS, 15.6", 1920x1080 | HP Omen X 2S 15-dg0075cl AU Optronics AUO82ED, IPS, 15.6", 1920x1080 | Lenovo Legion Y740-15ICHg BOE NV156FHM-N4J, IPS, 15.6", 1920x1080 | |
|---|---|---|---|---|---|---|
| Display | -3% | -7% | -3% | -6% | -6% | |
| Display P3 Coverage (%) | 69.9 | 67.6 -3% | 64.9 -7% | 66.9 -4% | 66.2 -5% | 67.7 -3% |
| sRGB Coverage (%) | 99.1 | 97.5 -2% | 91 -8% | 98.1 -1% | 92.3 -7% | 91.6 -8% |
| AdobeRGB 1998 Coverage (%) | 71.1 | 68.9 -3% | 65.9 -7% | 68.5 -4% | 67.2 -5% | 67.1 -6% |
| Response Times | -21% | 24% | -9% | -22% | -35% | |
| Response Time Grey 50% / Grey 80% * (ms) | 11.2 ? | 13.6 ? -21% | 7.2 ? 36% | 12.8 ? -14% | 15.2 ? -36% | 19 ? -70% |
| Response Time Black / White * (ms) | 10 ? | 12 ? -20% | 8.8 ? 12% | 10.4 ? -4% | 10.8 ? -8% | 10 ? -0% |
| PWM Frequency (Hz) | 23260 ? | 23810 ? | ||||
| Screen | -0% | -23% | -6% | -58% | -18% | |
| Brightness middle (cd/m²) | 339.4 | 282.3 -17% | 286 -16% | 293 -14% | 324.8 -4% | 477 41% |
| Brightness (cd/m²) | 331 | 269 -19% | 275 -17% | 270 -18% | 316 -5% | 431 30% |
| Brightness Distribution (%) | 92 | 90 -2% | 90 -2% | 87 -5% | 84 -9% | 84 -9% |
| Black Level * (cd/m²) | 0.24 | 0.32 -33% | 0.37 -54% | 0.29 -21% | 0.26 -8% | 0.175 27% |
| Contrast (:1) | 1414 | 882 -38% | 773 -45% | 1010 -29% | 1249 -12% | 2726 93% |
| Colorchecker dE 2000 * | 1.58 | 1.17 26% | 2.19 -39% | 1.69 -7% | 4.96 -214% | 4.17 -164% |
| Colorchecker dE 2000 max. * | 3.8 | 3.29 13% | 4.4 -16% | 3.37 11% | 8.95 -136% | 6.97 -83% |
| Colorchecker dE 2000 calibrated * | 1.47 | 1.06 28% | 2.27 -54% | 1.24 16% | 3.23 -120% | 2.51 -71% |
| Greyscale dE 2000 * | 2.3 | 1.3 43% | 2.2 4% | 2.3 -0% | 5 -117% | 3.49 -52% |
| Gamma | 2.24 98% | 2.2 100% | 2.41 91% | 2.3 96% | 2.21 100% | 2.5 88% |
| CCT | 6952 93% | 6643 98% | 6405 101% | 6758 96% | 7742 84% | 7076 92% |
| Color Space (Percent of AdobeRGB 1998) (%) | 64.8 | 63.8 -2% | 59 -9% | 63 -3% | 59.8 -8% | 60 -7% |
| Color Space (Percent of sRGB) (%) | 99.4 | 97.5 -2% | 91 -8% | 98.5 -1% | 91.8 -8% | 91 -8% |
| Total Average (Program / Settings) | -8% /
-3% | -2% /
-14% | -6% /
-6% | -29% /
-44% | -20% /
-18% |
* ... smaller is better
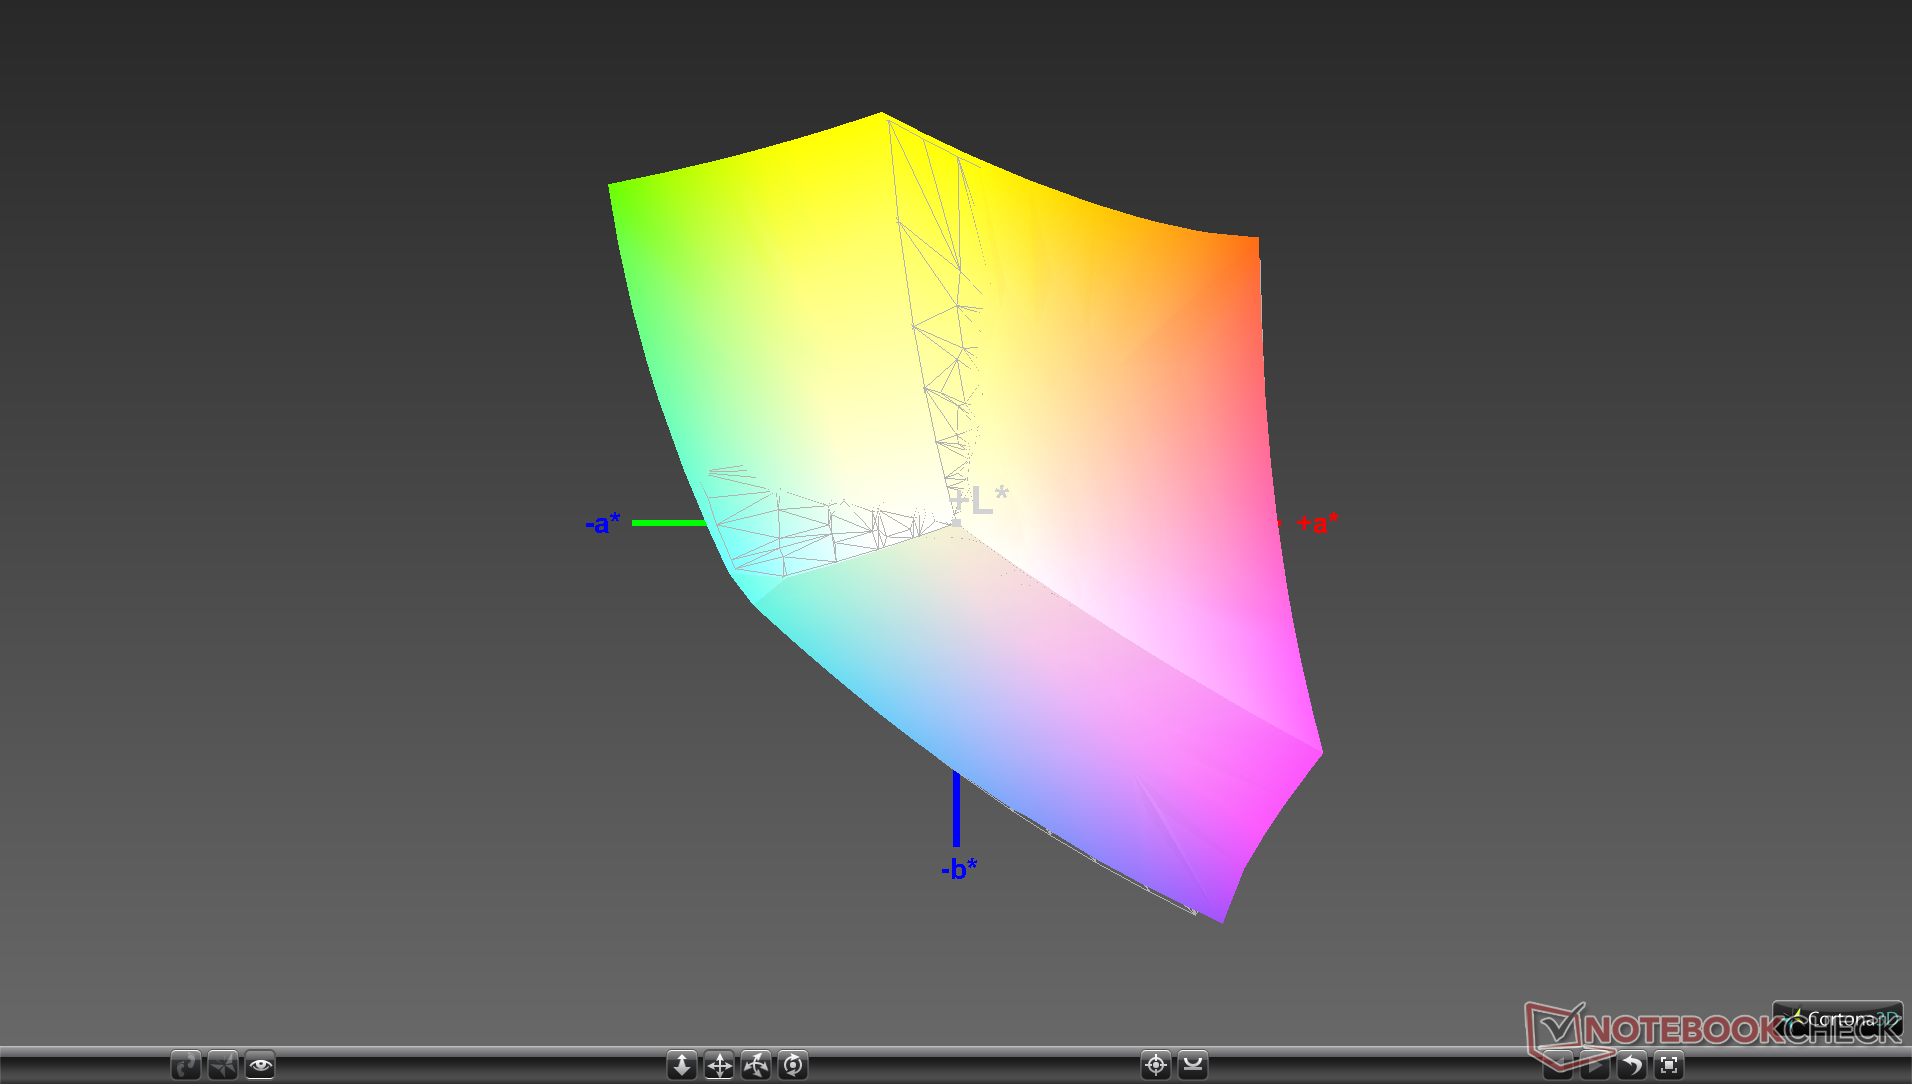
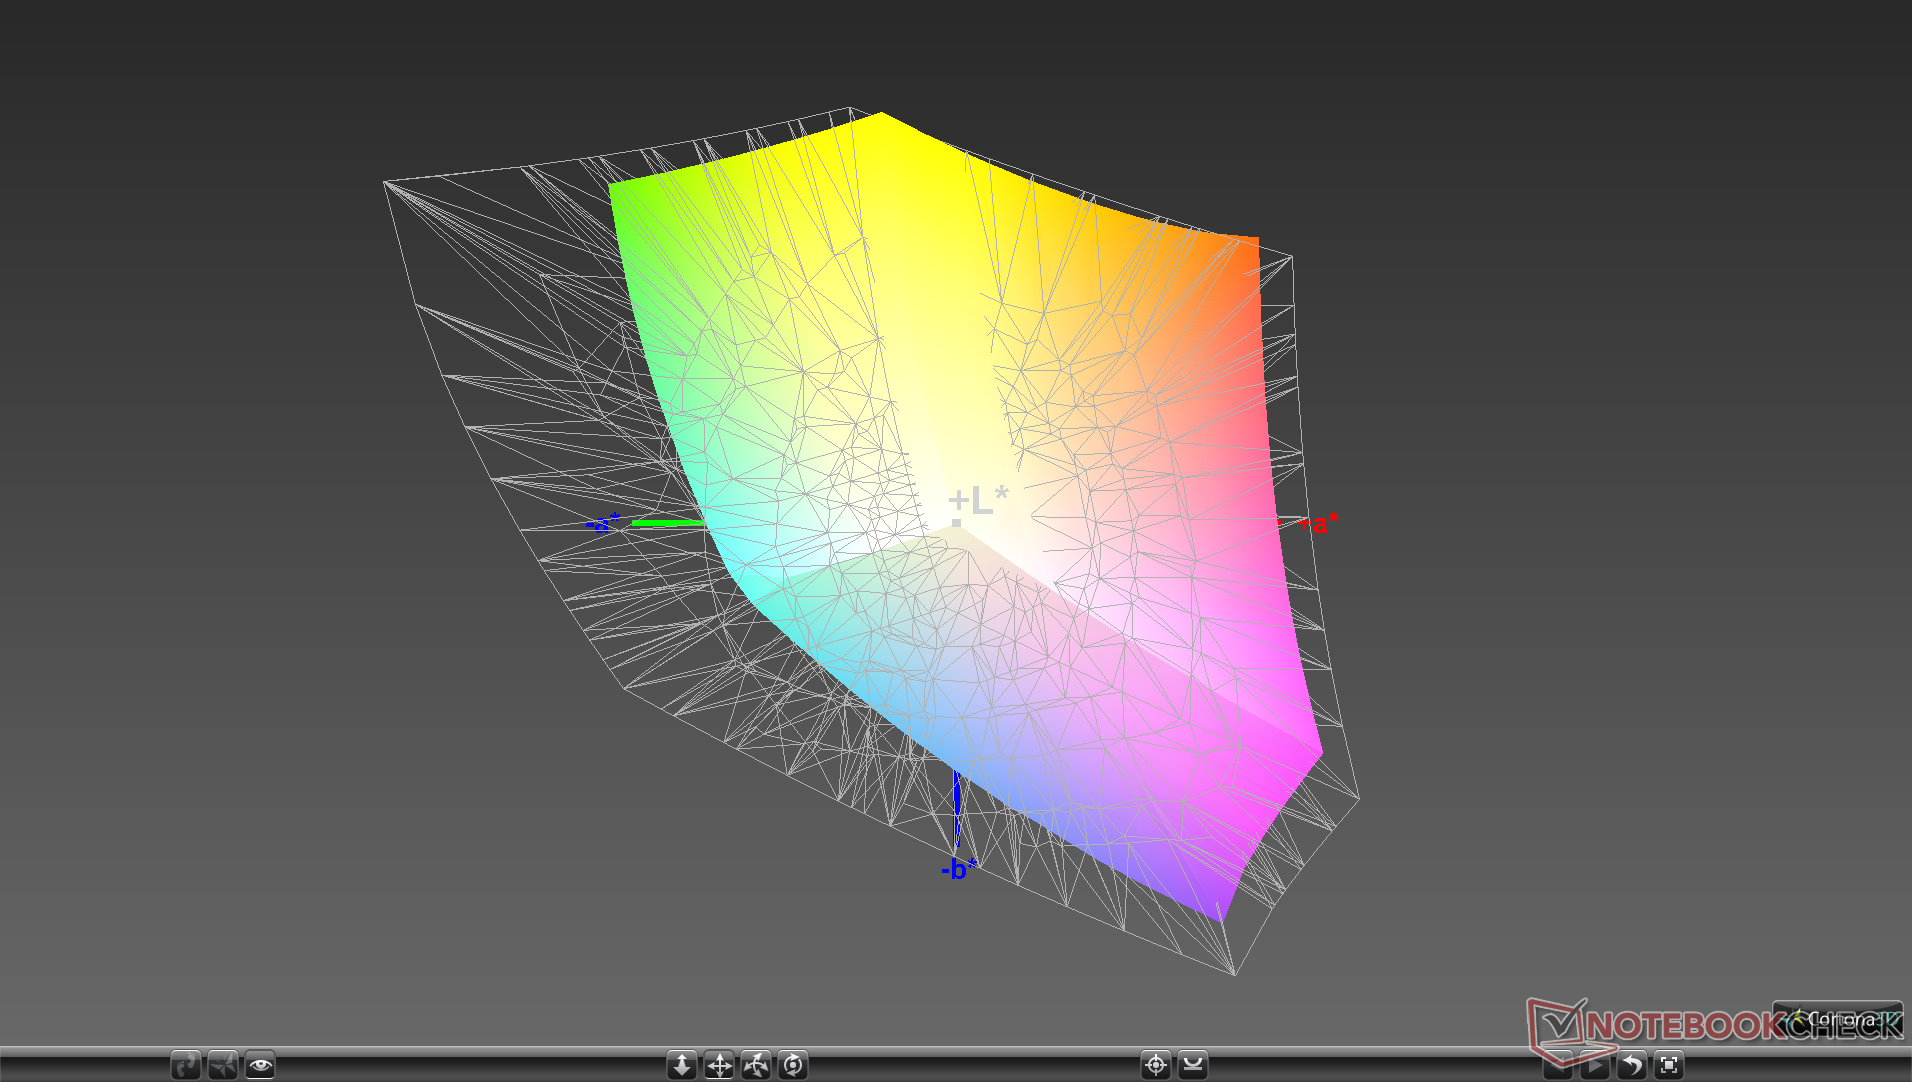
X-Rite colorimeter measurements show a well-calibrated display out of the box and our own attempt to calibrate the display even further would not result in any major improvements. Average DeltaE grayscale and ColorChecker values are already excellent at 2.3 and 1.58, respectively. The pre-installed MSI True Color software allows for easy fine-tuning of colors and color temperature.


Display Response Times
| ↔ Response Time Black to White | ||
|---|---|---|
| 10 ms ... rise ↗ and fall ↘ combined | ↗ 5.2 ms rise | 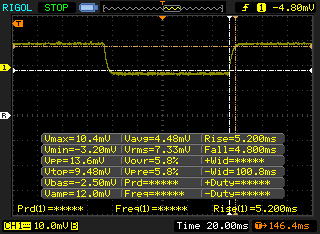 |
| ↘ 4.8 ms fall | ||
| The screen shows good response rates in our tests, but may be too slow for competitive gamers. In comparison, all tested devices range from 0.1 (minimum) to 240 (maximum) ms. » 27 % of all devices are better. This means that the measured response time is better than the average of all tested devices (19.9 ms). | ||
| ↔ Response Time 50% Grey to 80% Grey | ||
| 11.2 ms ... rise ↗ and fall ↘ combined | ↗ 6 ms rise | 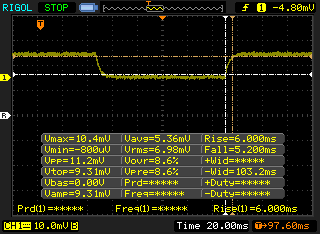 |
| ↘ 5.2 ms fall | ||
| The screen shows good response rates in our tests, but may be too slow for competitive gamers. In comparison, all tested devices range from 0.165 (minimum) to 636 (maximum) ms. » 25 % of all devices are better. This means that the measured response time is better than the average of all tested devices (31.1 ms). | ||
Screen Flickering / PWM (Pulse-Width Modulation)
| Screen flickering / PWM not detected | 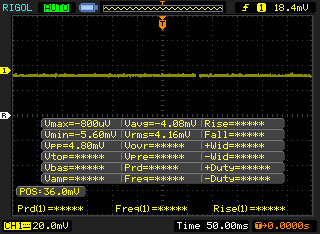 | ||
In comparison: 52 % of all tested devices do not use PWM to dim the display. If PWM was detected, an average of 7784 (minimum: 5 - maximum: 343500) Hz was measured. | |||
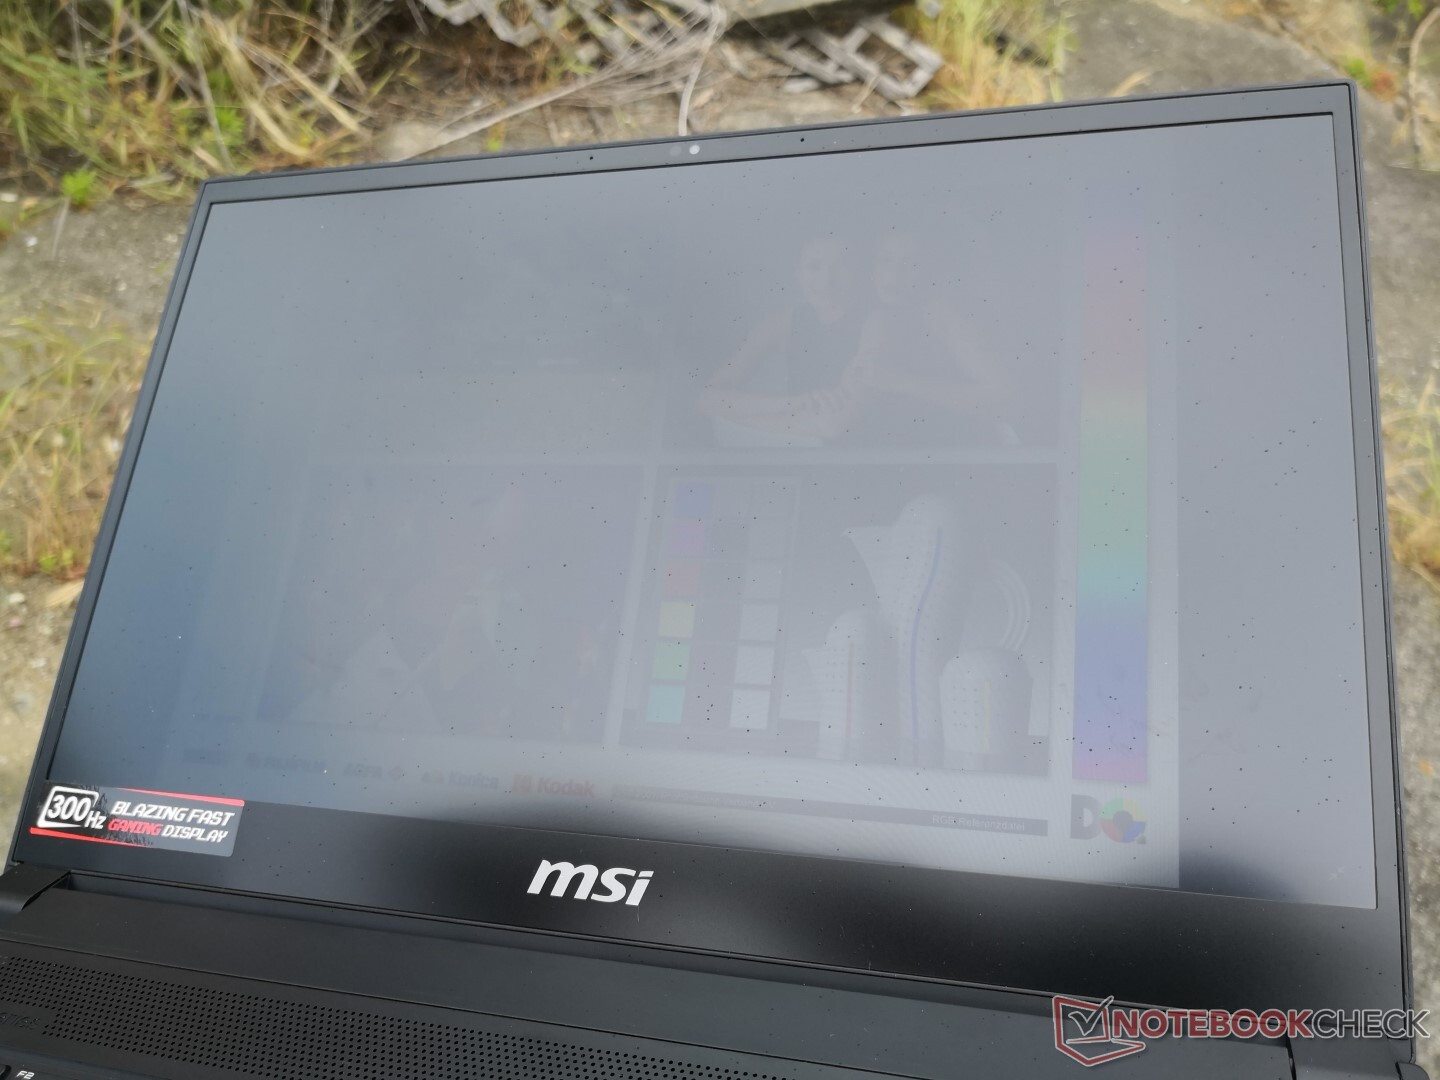
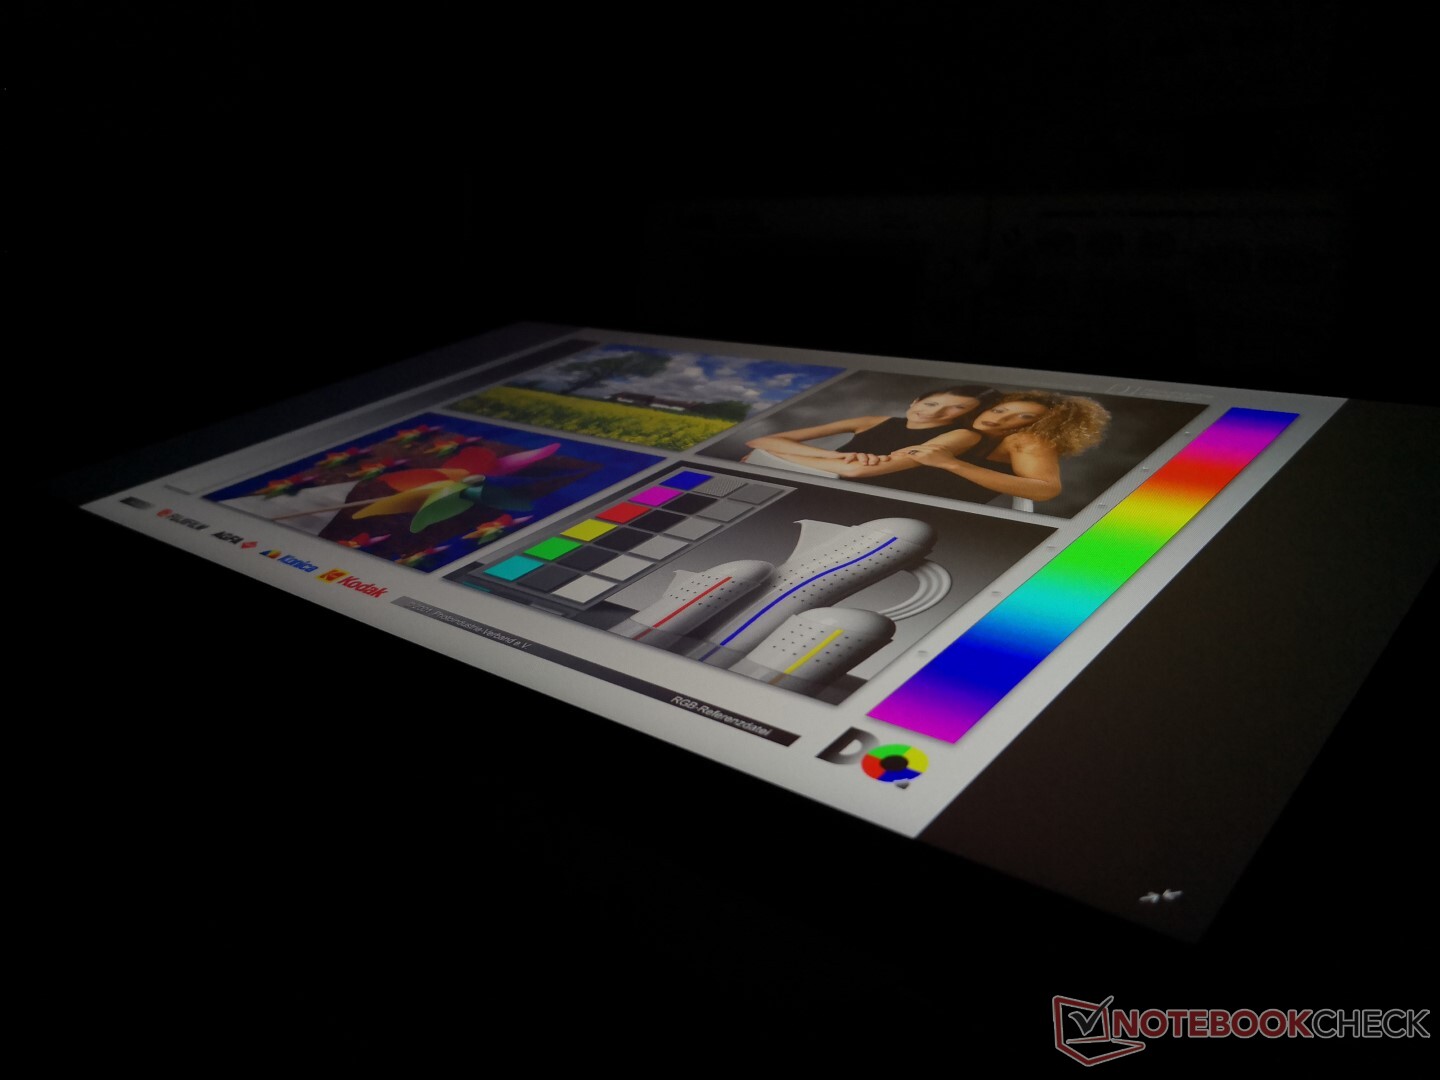
Outdoor visibility is not any better or worse than most gaming laptops out there as the display brightness of 300 nits is typical for the category. MSI still has the slight advantage here due to the 180-degree hinges for easier mitigation or glare.
Performance
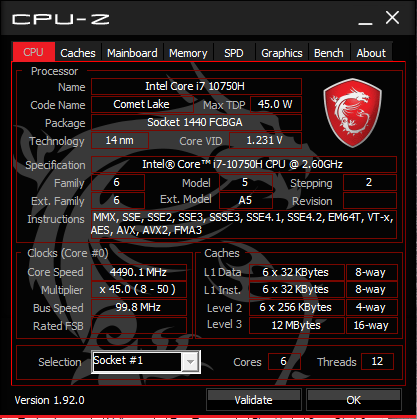
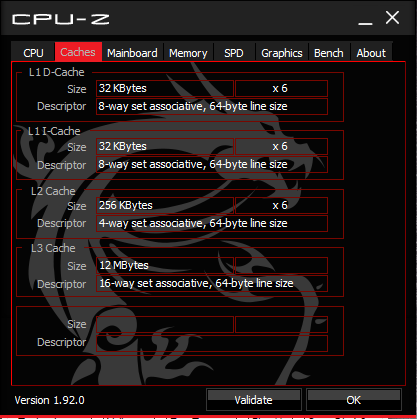
Processor
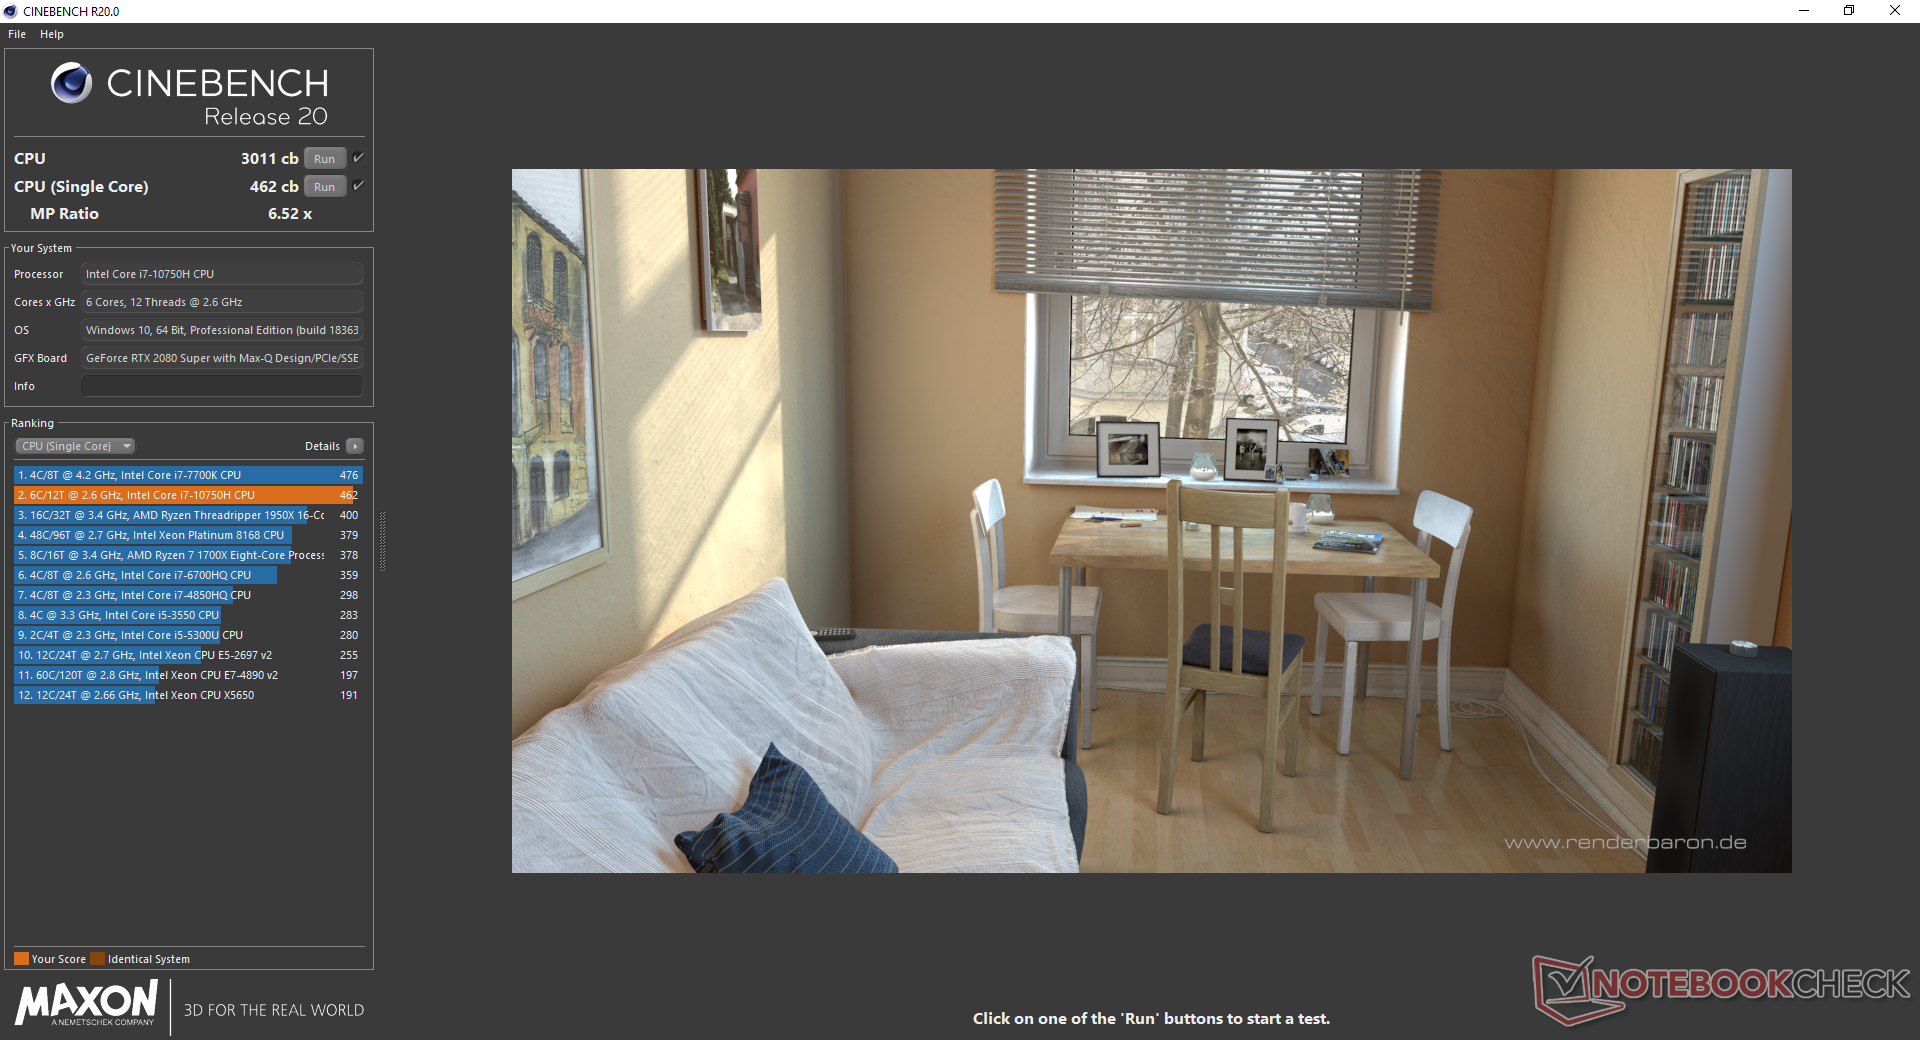
The 10th gen hexa-core Core i7-10750H replaces the 9th gen Core i7-9750H as found on almost all gaming laptops of 2019. Overall performance is most similar to the Core i9-8950HK or roughly 15 percent faster than the average Core i7-9750H laptop. Users upgrading from the much older Core i7-7700HQ or Core i7-8750H series will see the most benefit. Of course, octa-core solutions like the Core i9-9880H, Core i7-10875H, or Core i9-10980HK will still outperform the Core i7-10750H. MSI offers the latter for approximately 27 to 34 percent faster multi-thread performance.
Running CineBench R15 Multi-Thread in a loop shows an initial score of 1271 points before falling 4 to 5 percent over time due to thermal limitations much like what we observed on the MSI GP65 10SFK.
See our dedicated page on the Core i7-10750H for more technical information and benchmark comparisons.

Cinebench R15: CPU Multi 64Bit | CPU Single 64Bit
Blender: v2.79 BMW27 CPU
7-Zip 18.03: 7z b 4 -mmt1 | 7z b 4
Geekbench 5.5: Single-Core | Multi-Core
HWBOT x265 Benchmark v2.2: 4k Preset
LibreOffice : 20 Documents To PDF
R Benchmark 2.5: Overall mean
| Cinebench R20 / CPU (Multi Core) | |
| Asus Zephyrus G14 GA401IV | |
| Gigabyte Aero 15 OLED XB-8DE51B0SP | |
| MSI GS66 Stealth 10SFS | |
| MSI GE65 Raider 9SF-049US | |
| MSI GS66 10SGS | |
| Medion Erazer X15805 | |
| Average Intel Core i7-10750H (1749 - 3325, n=43) | |
| Average Intel Core i7-9750H (2017 - 3133, n=55) | |
| Schenker XMG Pro 15 | |
| MSI GE63 Raider 8SG | |
| MSI GF75 Thin 10SCXR | |
| MSI GF63 Thin 9SC | |
| Cinebench R20 / CPU (Single Core) | |
| Gigabyte Aero 15 OLED XB-8DE51B0SP | |
| Medion Erazer X15805 | |
| Asus Zephyrus G14 GA401IV | |
| MSI GS66 Stealth 10SFS | |
| MSI GE65 Raider 9SF-049US | |
| Average Intel Core i7-10750H (431 - 504, n=43) | |
| MSI GS66 10SGS | |
| Average Intel Core i7-9750H (416 - 486, n=55) | |
| MSI GF75 Thin 10SCXR | |
| Schenker XMG Pro 15 | |
| MSI GF63 Thin 9SC | |
| MSI GE63 Raider 8SG | |
| Cinebench R15 / CPU Multi 64Bit | |
| Asus Zephyrus G14 GA401IV | |
| Gigabyte Aero 15 OLED XB-8DE51B0SP | |
| MSI GS66 Stealth 10SFS | |
| MSI GE65 Raider 9SF-049US | |
| MSI GS66 10SGS | |
| Average Intel Core i7-10750H (804 - 1418, n=50) | |
| Medion Erazer X15805 | |
| Average Intel Core i7-9750H (952 - 1306, n=85) | |
| Schenker XMG Pro 15 | |
| MSI GE63 Raider 8SG | |
| MSI GF75 Thin 10SCXR | |
| MSI GF63 Thin 9SC | |
| Cinebench R15 / CPU Single 64Bit | |
| Gigabyte Aero 15 OLED XB-8DE51B0SP | |
| Medion Erazer X15805 | |
| MSI GS66 Stealth 10SFS | |
| MSI GE65 Raider 9SF-049US | |
| Average Intel Core i7-10750H (184 - 213, n=45) | |
| Asus Zephyrus G14 GA401IV | |
| MSI GS66 10SGS | |
| Average Intel Core i7-9750H (170 - 194, n=82) | |
| MSI GF75 Thin 10SCXR | |
| Schenker XMG Pro 15 | |
| MSI GF63 Thin 9SC | |
| MSI GE63 Raider 8SG | |
| Blender / v2.79 BMW27 CPU | |
| MSI GF75 Thin 10SCXR | |
| Schenker XMG Pro 15 | |
| Average Intel Core i7-9750H (342 - 495, n=21) | |
| Average Intel Core i7-10750H (322 - 587, n=43) | |
| MSI GS66 10SGS | |
| Asus Zephyrus G14 GA401IV | |
| MSI GS66 Stealth 10SFS | |
| Gigabyte Aero 15 OLED XB-8DE51B0SP | |
| 7-Zip 18.03 / 7z b 4 -mmt1 | |
| Gigabyte Aero 15 OLED XB-8DE51B0SP | |
| MSI GS66 Stealth 10SFS | |
| Average Intel Core i7-10750H (4504 - 5470, n=43) | |
| MSI GS66 10SGS | |
| Average Intel Core i7-9750H (4580 - 5090, n=21) | |
| MSI GF75 Thin 10SCXR | |
| Asus Zephyrus G14 GA401IV | |
| Schenker XMG Pro 15 | |
| 7-Zip 18.03 / 7z b 4 | |
| Asus Zephyrus G14 GA401IV | |
| Gigabyte Aero 15 OLED XB-8DE51B0SP | |
| MSI GS66 Stealth 10SFS | |
| MSI GS66 10SGS | |
| Average Intel Core i7-10750H (26040 - 37345, n=43) | |
| Schenker XMG Pro 15 | |
| Average Intel Core i7-9750H (28512 - 35174, n=21) | |
| MSI GF75 Thin 10SCXR | |
| Geekbench 5.5 / Single-Core | |
| Gigabyte Aero 15 OLED XB-8DE51B0SP | |
| MSI GS66 Stealth 10SFS | |
| Average Intel Core i7-10750H (1114 - 1333, n=43) | |
| Asus Zephyrus G14 GA401IV | |
| MSI GS66 10SGS | |
| Average Intel Core i7-9750H (1117 - 1251, n=13) | |
| MSI GF75 Thin 10SCXR | |
| Schenker XMG Pro 15 | |
| Geekbench 5.5 / Multi-Core | |
| Gigabyte Aero 15 OLED XB-8DE51B0SP | |
| Asus Zephyrus G14 GA401IV | |
| MSI GS66 Stealth 10SFS | |
| MSI GS66 10SGS | |
| Average Intel Core i7-10750H (4443 - 6674, n=43) | |
| Schenker XMG Pro 15 | |
| Average Intel Core i7-9750H (4859 - 6262, n=13) | |
| MSI GF75 Thin 10SCXR | |
| HWBOT x265 Benchmark v2.2 / 4k Preset | |
| Gigabyte Aero 15 OLED XB-8DE51B0SP | |
| MSI GS66 Stealth 10SFS | |
| Asus Zephyrus G14 GA401IV | |
| MSI GS66 10SGS | |
| Average Intel Core i7-10750H (5.54 - 11.6, n=43) | |
| Schenker XMG Pro 15 | |
| Average Intel Core i7-9750H (7.1 - 10.7, n=21) | |
| MSI GF75 Thin 10SCXR | |
| LibreOffice / 20 Documents To PDF | |
| Average Intel Core i7-9750H (54.5 - 64.7, n=9) | |
| MSI GF75 Thin 10SCXR | |
| MSI GS66 10SGS | |
| Average Intel Core i7-10750H (43.1 - 99.2, n=43) | |
| MSI GS66 Stealth 10SFS | |
| Gigabyte Aero 15 OLED XB-8DE51B0SP | |
| R Benchmark 2.5 / Overall mean | |
| MSI GF75 Thin 10SCXR | |
| Schenker XMG Pro 15 | |
| Average Intel Core i7-9750H (0.608 - 0.695, n=14) | |
| MSI GS66 10SGS | |
| Average Intel Core i7-10750H (0.578 - 0.708, n=42) | |
| MSI GS66 Stealth 10SFS | |
| Gigabyte Aero 15 OLED XB-8DE51B0SP | |
* ... smaller is better
System Performance
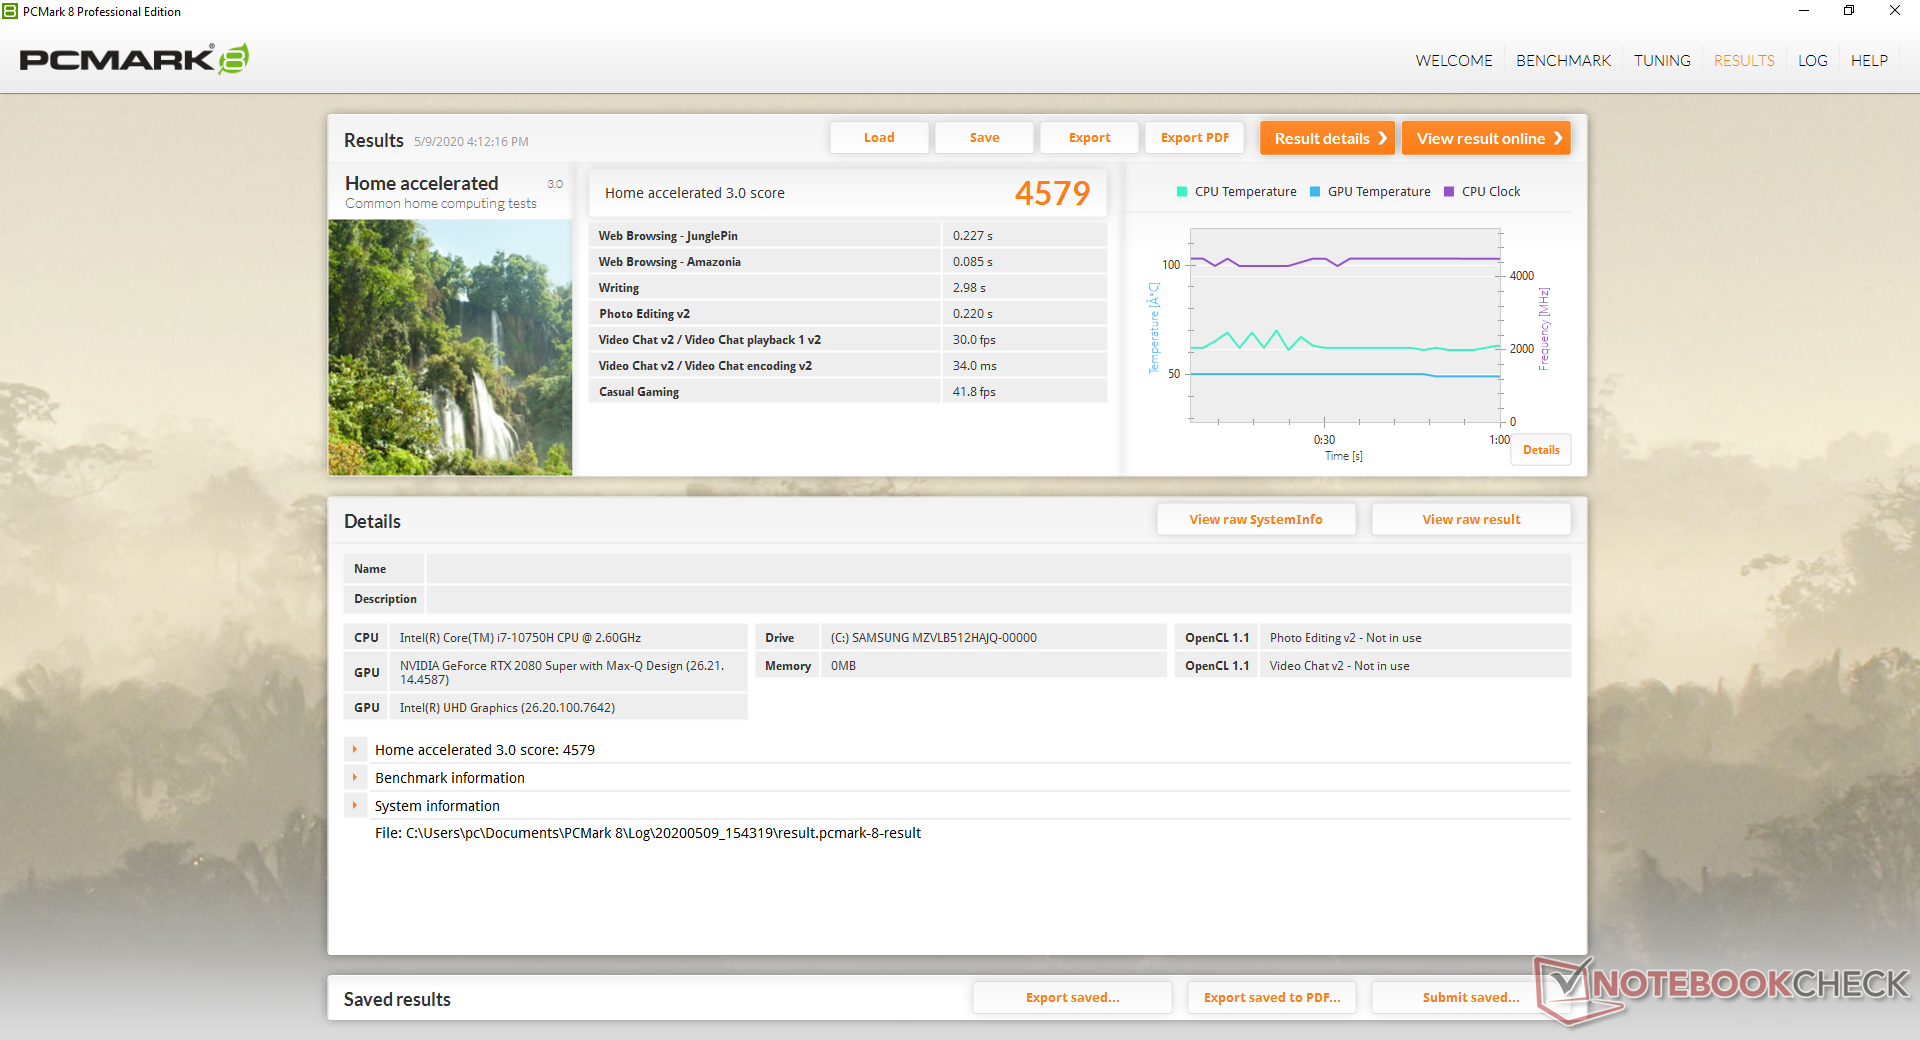
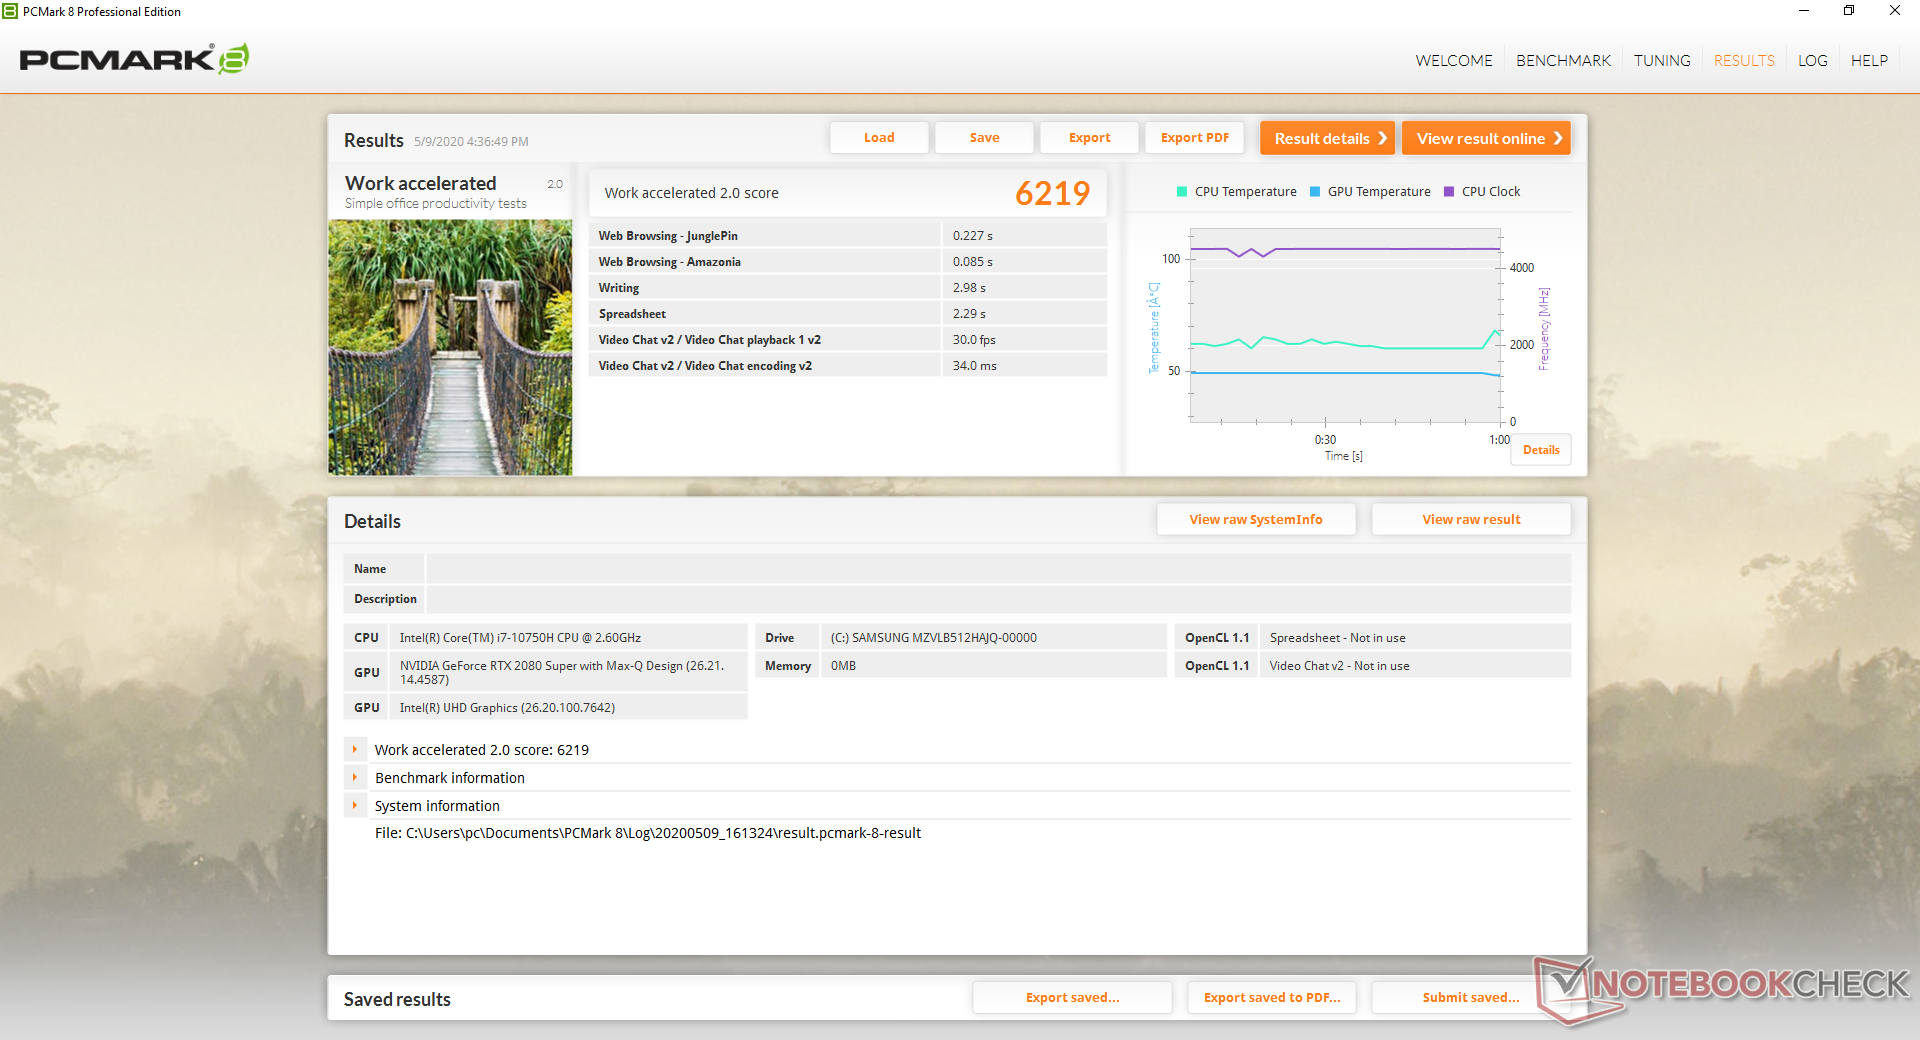
PCMark benchmarks are consistently below the GS66 10SFS with the higher-end Core i9-10980HK but slower GeForce RTX 2070 Super Max-Q GPU. Thus, the faster RTX 2080 Super Max-Q in our GS66 10SGS is not enough to make up for the CPU deficit at least for these types of scenarios.

| PCMark 8 | |
| Home Score Accelerated v2 | |
| Lenovo Legion Y740-15ICHg | |
| MSI GS66 10SGS | |
| MSI GS65 Stealth 9SG | |
| Razer Blade 15 RTX 2080 Max-Q | |
| Work Score Accelerated v2 | |
| MSI GS66 10SGS | |
| Lenovo Legion Y740-15ICHg | |
| MSI GS65 Stealth 9SG | |
| Razer Blade 15 RTX 2080 Max-Q | |
| PCMark 8 Home Score Accelerated v2 | 4579 points | |
| PCMark 8 Work Score Accelerated v2 | 6219 points | |
| PCMark 10 Score | 6154 points | |
Help | ||
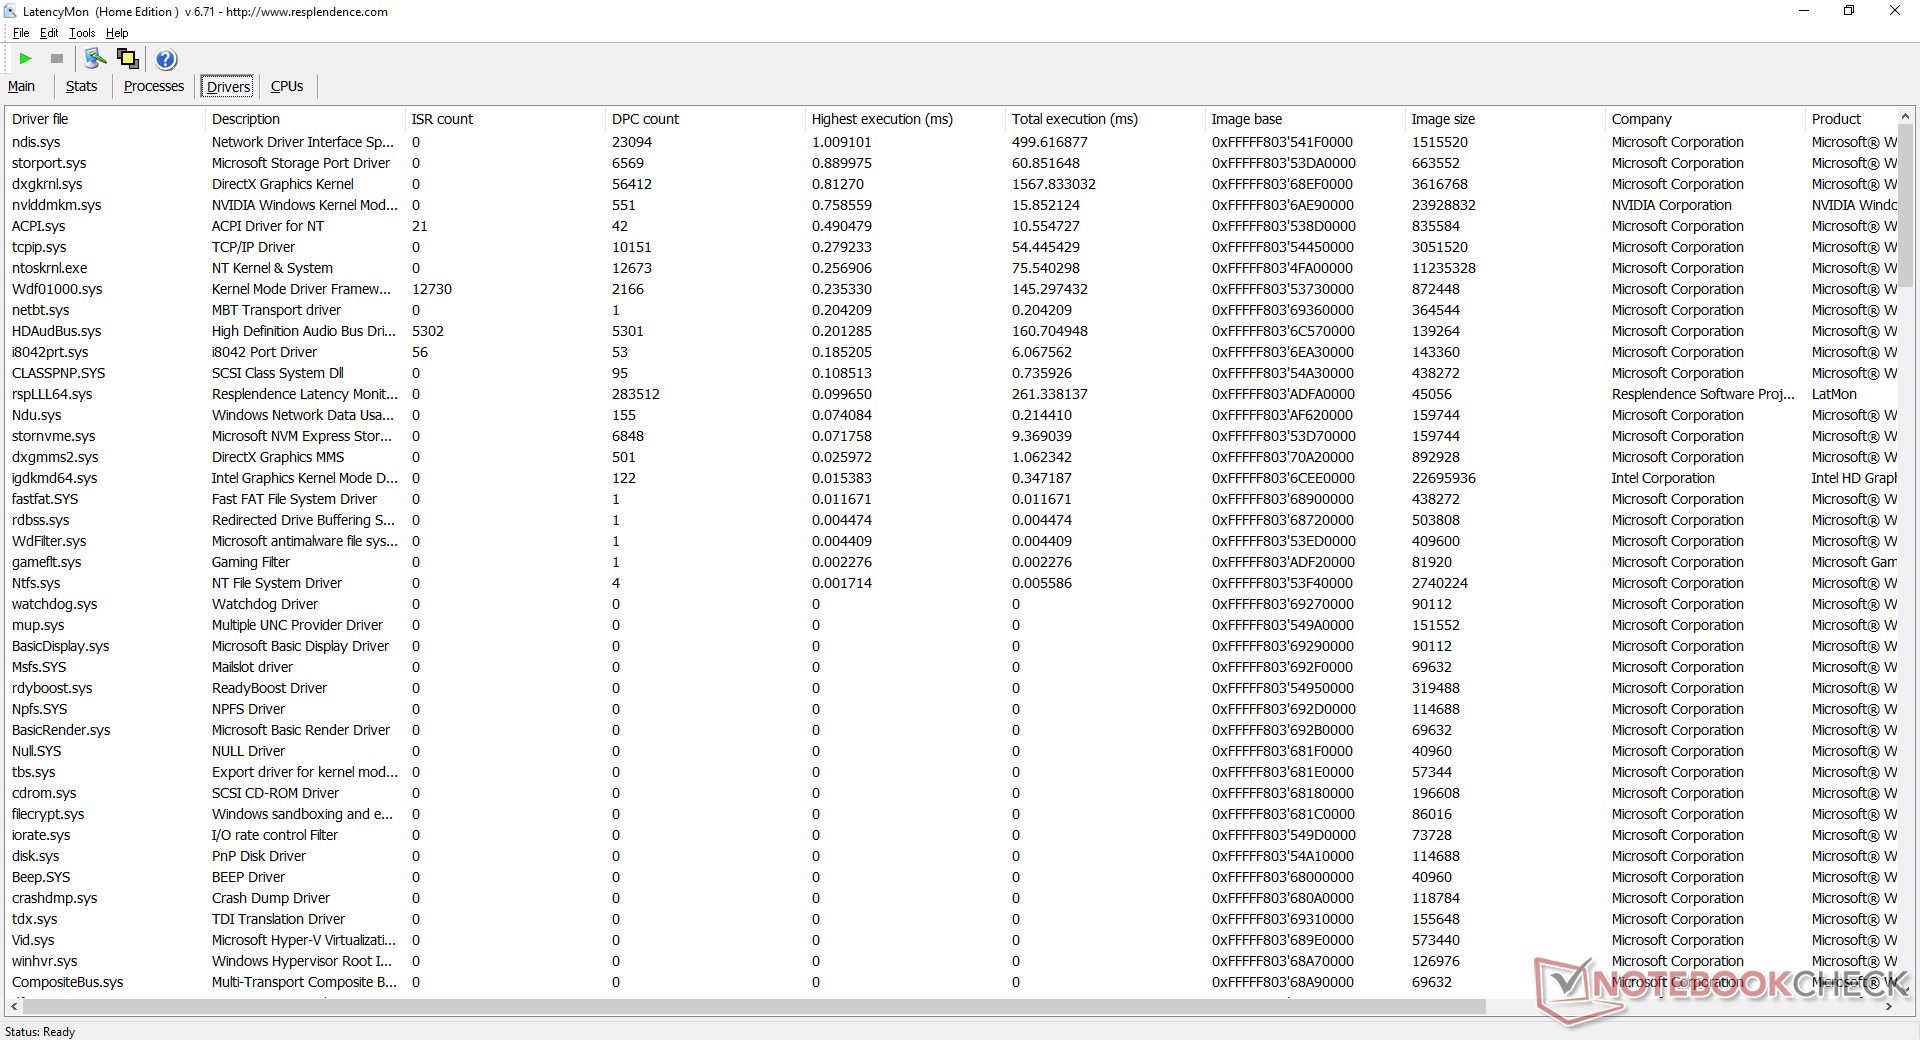
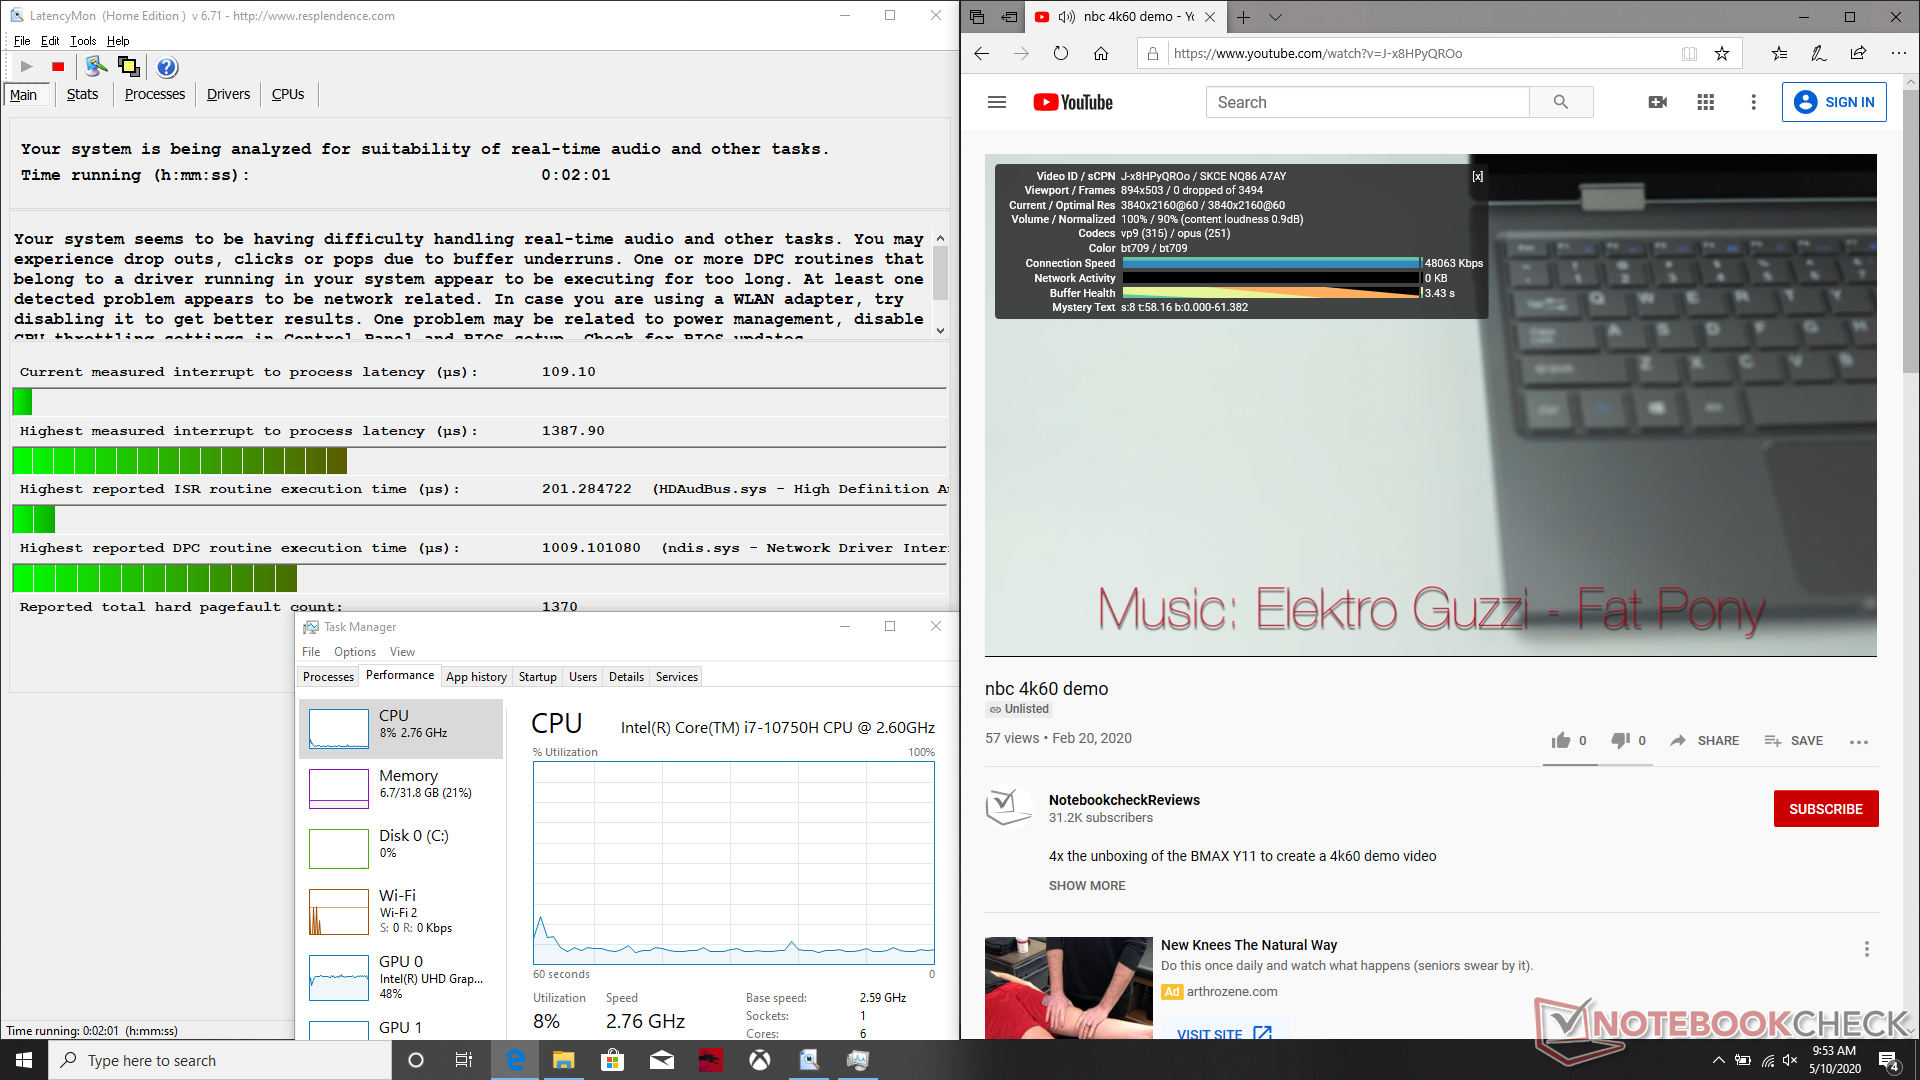
DPC Latency
LatencyMon shows DPC latency issues when opening multiple browser tabs. 4K video playback is otherwise smooth with no frame drops.
| DPC Latencies / LatencyMon - interrupt to process latency (max), Web, Youtube, Prime95 | |
| MSI GS66 10SGS | |
* ... smaller is better
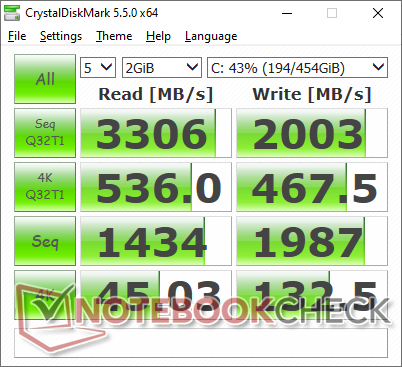
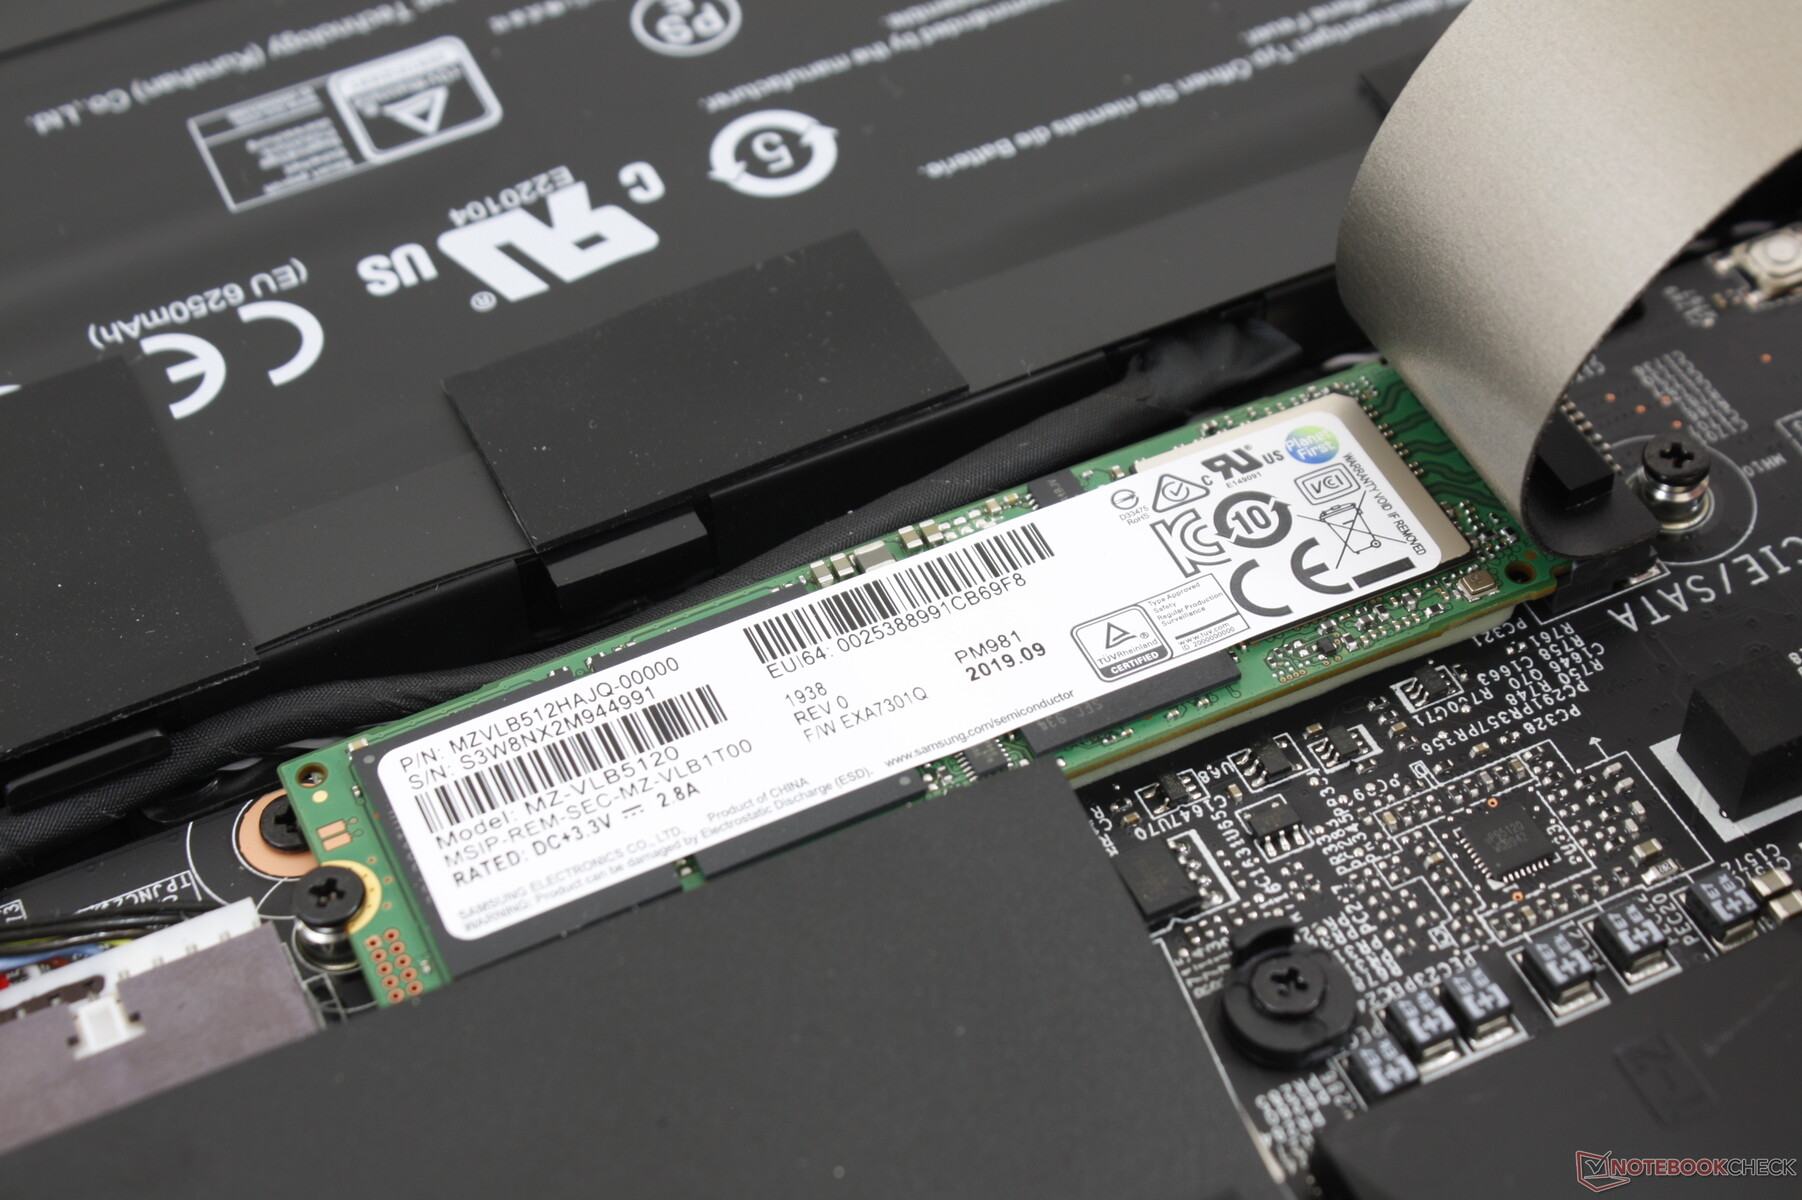
Storage Devices
Our GS66 still uses the same Samsung PM981 MZVLB512HAJQ NVMe SSD as found on last year's GS65. An important gen-to-gen change, however, is that the two M.2 bays are now easier to access whereas they were hidden underneath the motherboard on the GS65 design.
See our table of HDDs and SSDs for more benchmark comparisons. Different drives may be possible depending on the reseller or retailer.

| MSI GS66 10SGS Samsung SSD PM981 MZVLB512HAJQ | MSI GS65 Stealth 9SG Samsung SSD PM981 MZVLB512HAJQ | Asus Zephyrus S GX502GW 2x Intel SSD 660p SSDPEKNW512G8 (RAID 0) | Razer Blade 15 RTX 2080 Max-Q Samsung SSD PM981 MZVLB512HAJQ | Lenovo Legion Y740-15ICHg WDC PC SN520 SDAPMUW-128G | MSI GS66 Stealth 10SFS Samsung SSD PM981 MZVLB1T0HALR | |
|---|---|---|---|---|---|---|
| AS SSD | 9% | -6% | 3% | -49% | 9% | |
| Seq Read (MB/s) | 1086 | 2005 85% | 2506 131% | 1832 69% | 1372 26% | 1065 -2% |
| Seq Write (MB/s) | 1901 | 1580 -17% | 1712 -10% | 1864 -2% | 746 -61% | 2360 24% |
| 4K Read (MB/s) | 51 | 49.33 -3% | 48.32 -5% | 52.1 2% | 35.42 -31% | 48.09 -6% |
| 4K Write (MB/s) | 117.3 | 103.8 -12% | 103.6 -12% | 108.3 -8% | 99.9 -15% | 110.7 -6% |
| 4K-64 Read (MB/s) | 1503 | 1241 -17% | 624 -58% | 1159 -23% | 302.1 -80% | 1635 9% |
| 4K-64 Write (MB/s) | 1721 | 1730 1% | 1253 -27% | 1807 5% | 191.4 -89% | 1829 6% |
| Access Time Read * (ms) | 0.059 | 0.054 8% | 0.08 -36% | 0.05 15% | 0.132 -124% | 0.071 -20% |
| Access Time Write * (ms) | 0.1 | 0.036 64% | 0.04 60% | 0.034 66% | 0.037 63% | 0.034 66% |
| Score Read (Points) | 1662 | 1490 -10% | 923 -44% | 1394 -16% | 475 -71% | 1790 8% |
| Score Write (Points) | 2029 | 1991 -2% | 1528 -25% | 2102 4% | 366 -82% | 2176 7% |
| Score Total (Points) | 4588 | 4230 -8% | 2896 -37% | 4221 -8% | 1065 -77% | 4950 8% |
| Copy ISO MB/s (MB/s) | 2155 | 3025 40% | 2083 -3% | 1062 -51% | ||
| Copy Program MB/s (MB/s) | 715 | 713 0% | 496.5 -31% | 426 -40% | ||
| Copy Game MB/s (MB/s) | 1506 | 1554 3% | 977 -35% | 650 -57% | ||
| CrystalDiskMark 5.2 / 6 | -7% | -4% | -3% | -41% | 6% | |
| Write 4K (MB/s) | 132.5 | 91.3 -31% | 97 -27% | 137.2 4% | 134.2 1% | 131.3 -1% |
| Read 4K (MB/s) | 45.03 | 40.73 -10% | 49.58 10% | 46.82 4% | 37.72 -16% | 45.84 2% |
| Write Seq (MB/s) | 1987 | 1915 -4% | 1838 -7% | 1221 -39% | 389.2 -80% | 2370 19% |
| Read Seq (MB/s) | 1434 | 2051 43% | 2421 69% | 1217 -15% | 1030 -28% | 1509 5% |
| Write 4K Q32T1 (MB/s) | 467.5 | 308.3 -34% | 326.9 -30% | 527 13% | 238.9 -49% | 481.5 3% |
| Read 4K Q32T1 (MB/s) | 536 | 417.4 -22% | 372.9 -30% | 614 15% | 343.9 -36% | 560 4% |
| Write Seq Q32T1 (MB/s) | 2003 | 1922 -4% | 1894 -5% | 1986 -1% | 789 -61% | 2392 19% |
| Read Seq Q32T1 (MB/s) | 3306 | 3395 3% | 2828 -14% | 3234 -2% | 1502 -55% | 3232 -2% |
| Write 4K Q8T8 (MB/s) | 293.4 | |||||
| Read 4K Q8T8 (MB/s) | 405.8 | |||||
| Total Average (Program / Settings) | 1% /
3% | -5% /
-5% | 0% /
1% | -45% /
-46% | 8% /
8% |
* ... smaller is better

Disk Throttling: DiskSpd Read Loop, Queue Depth 8
GPU Performance
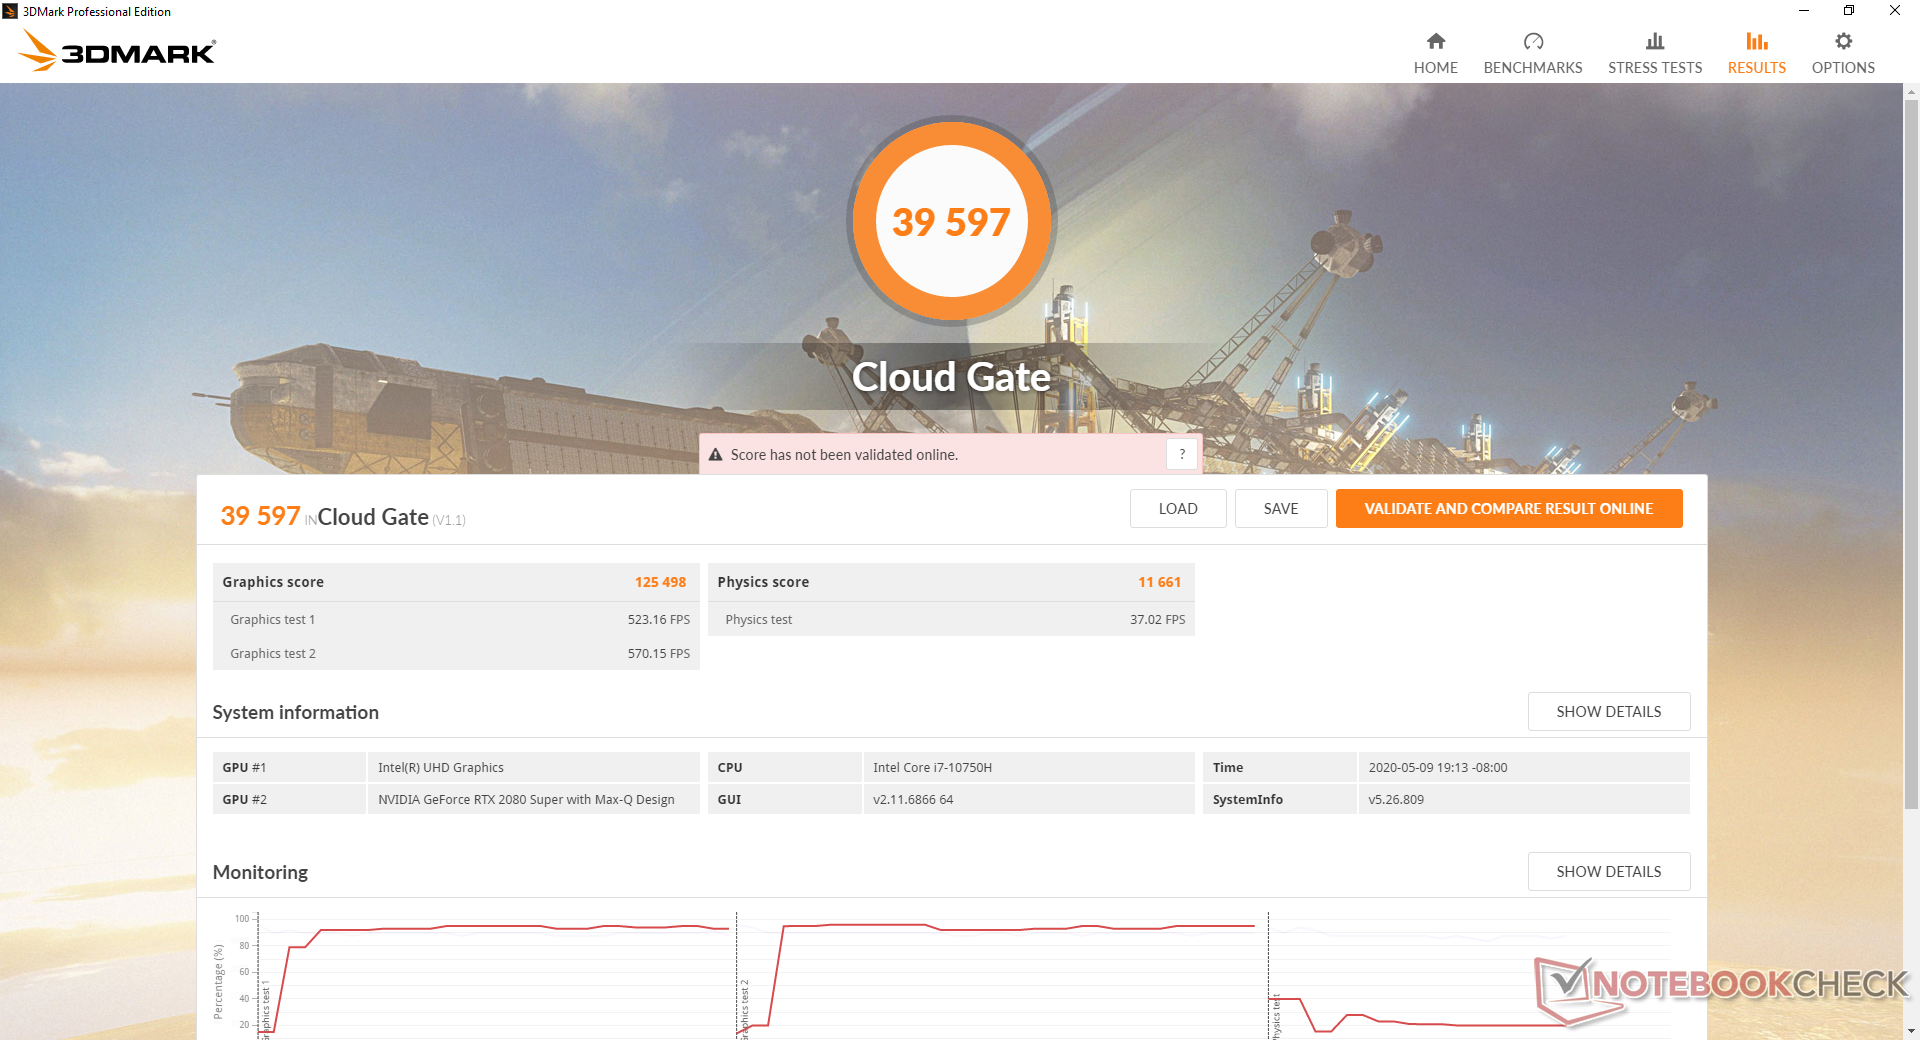
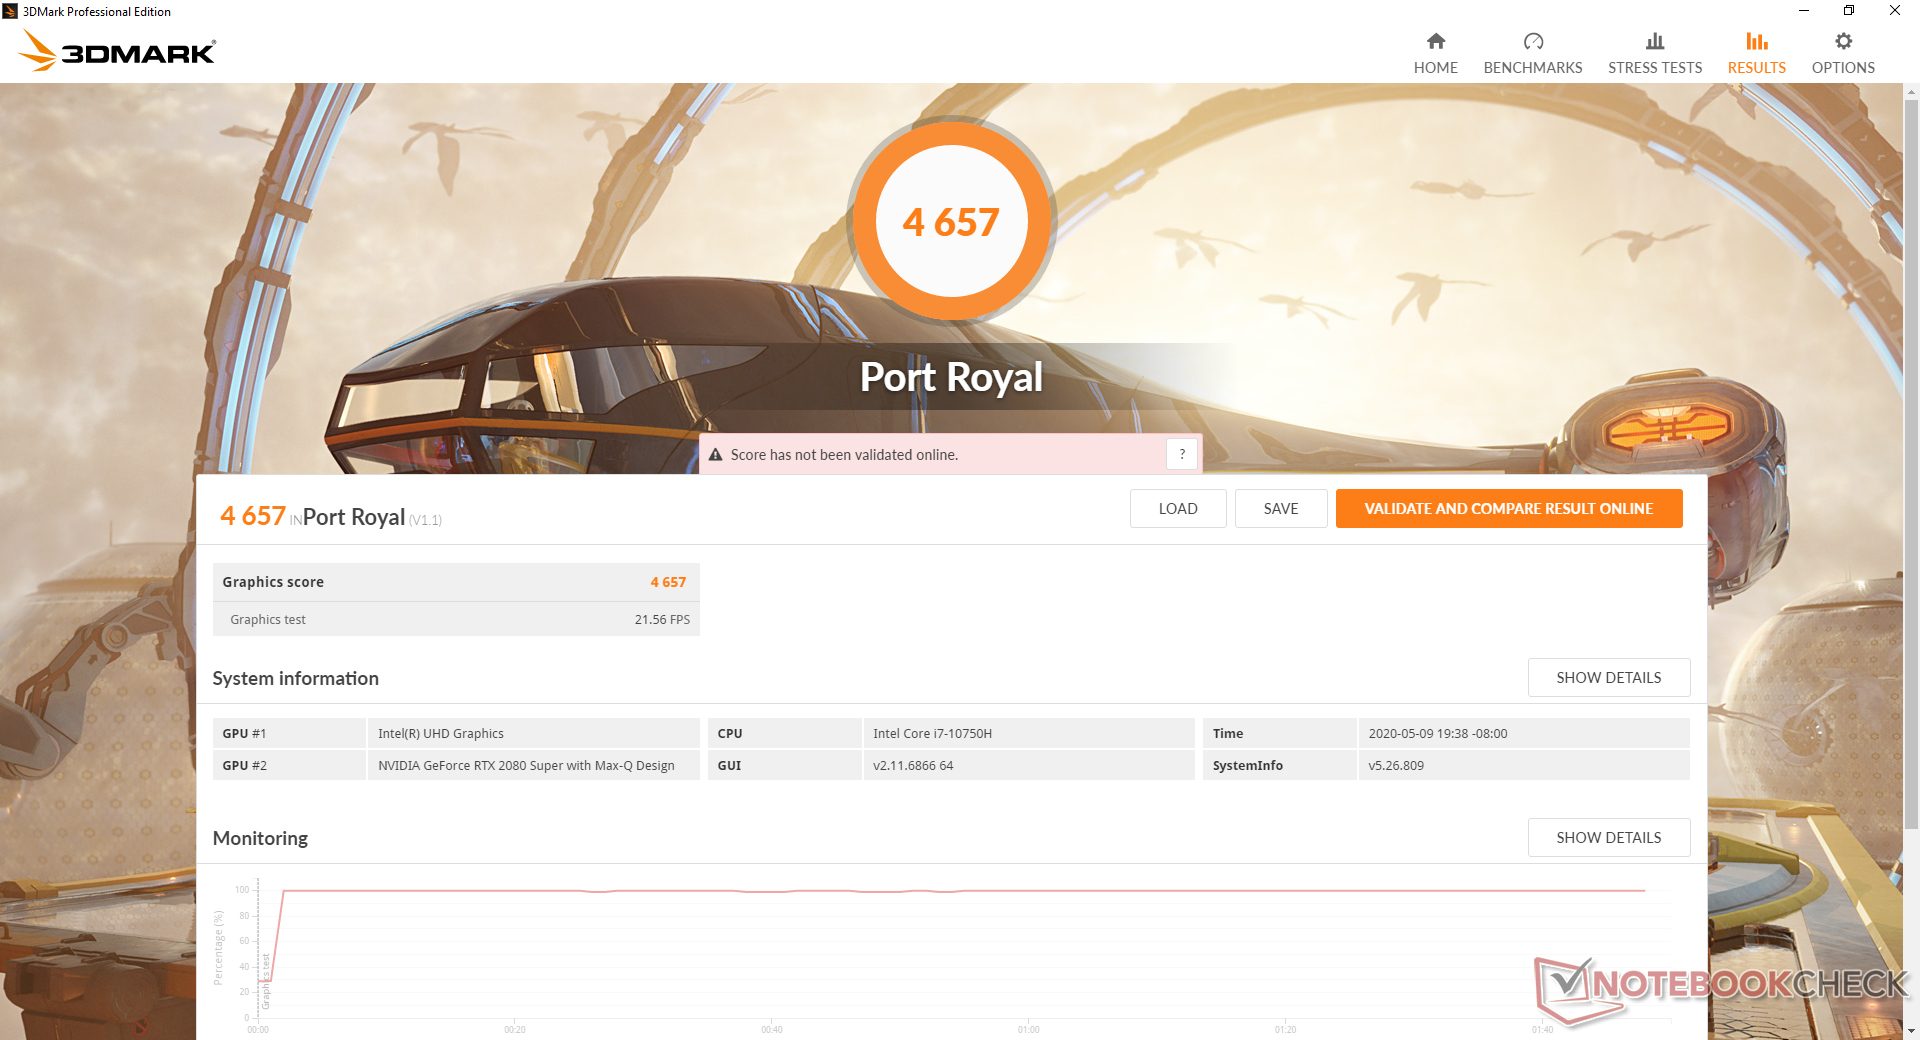
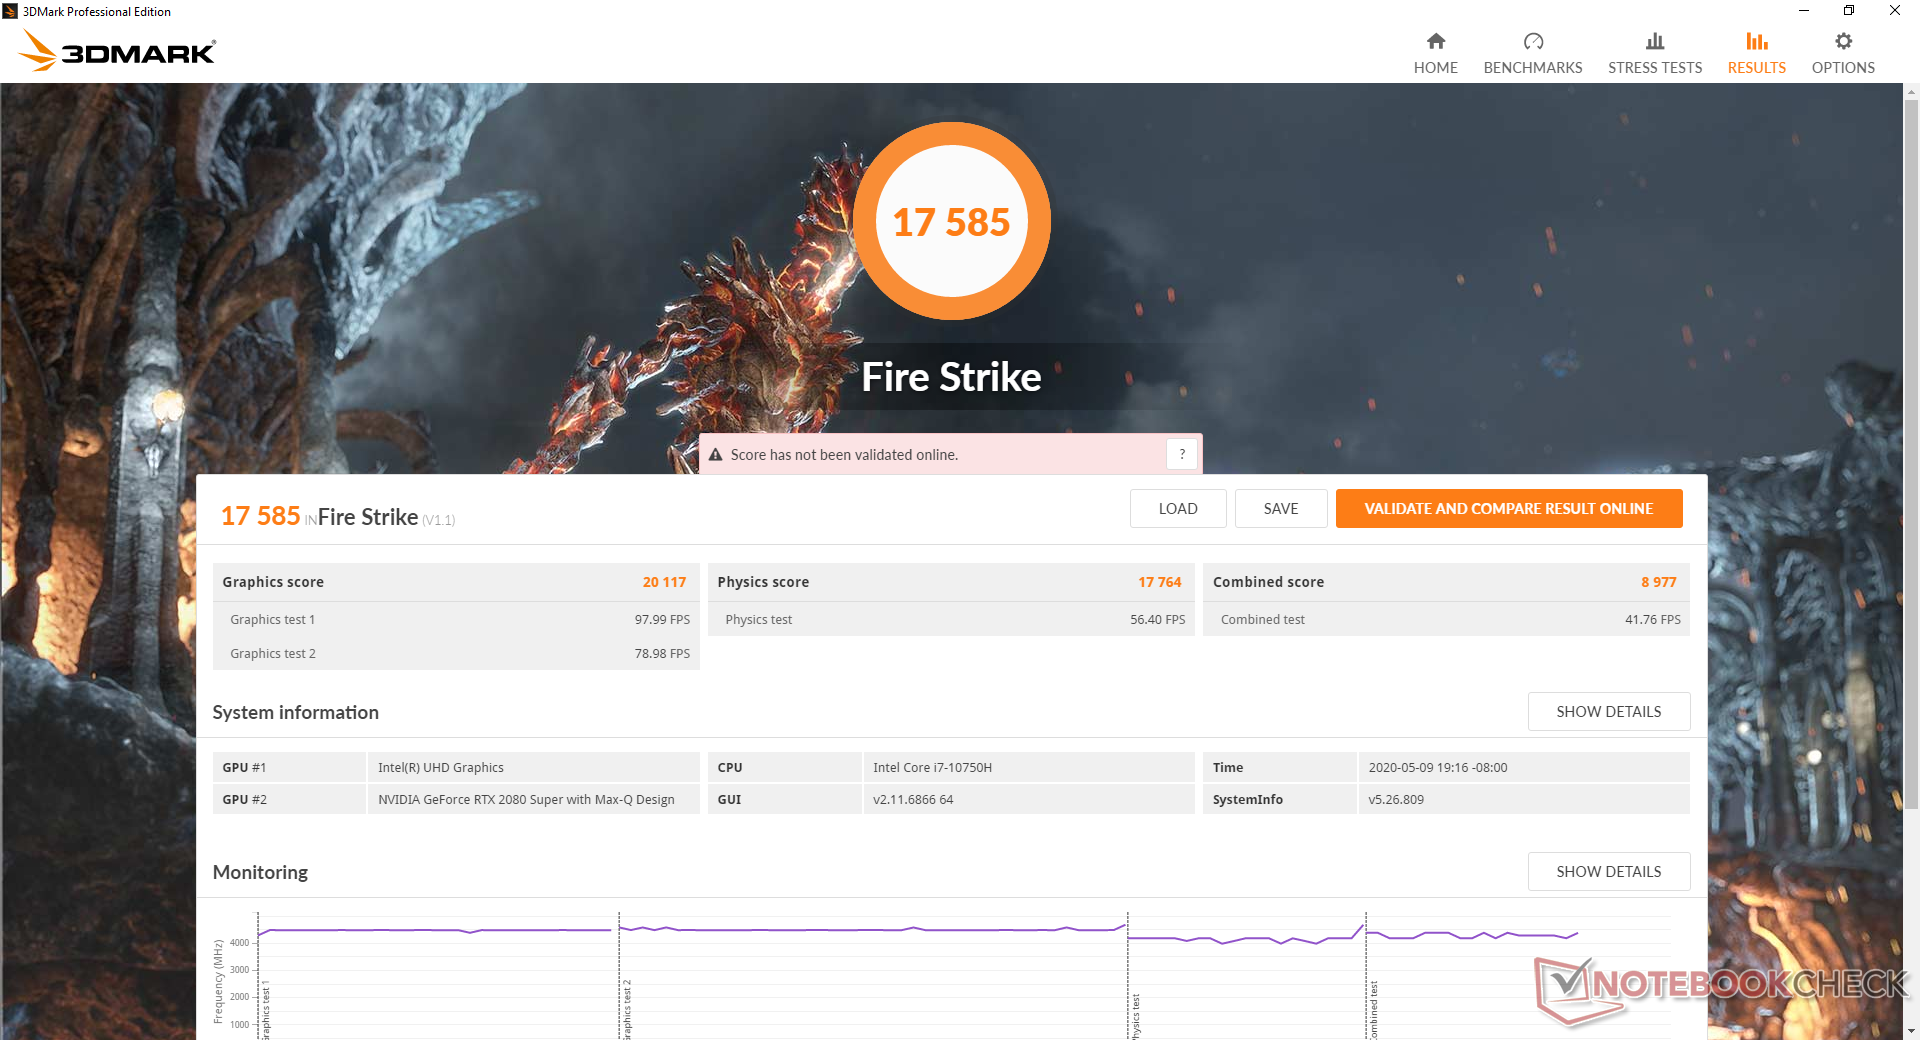
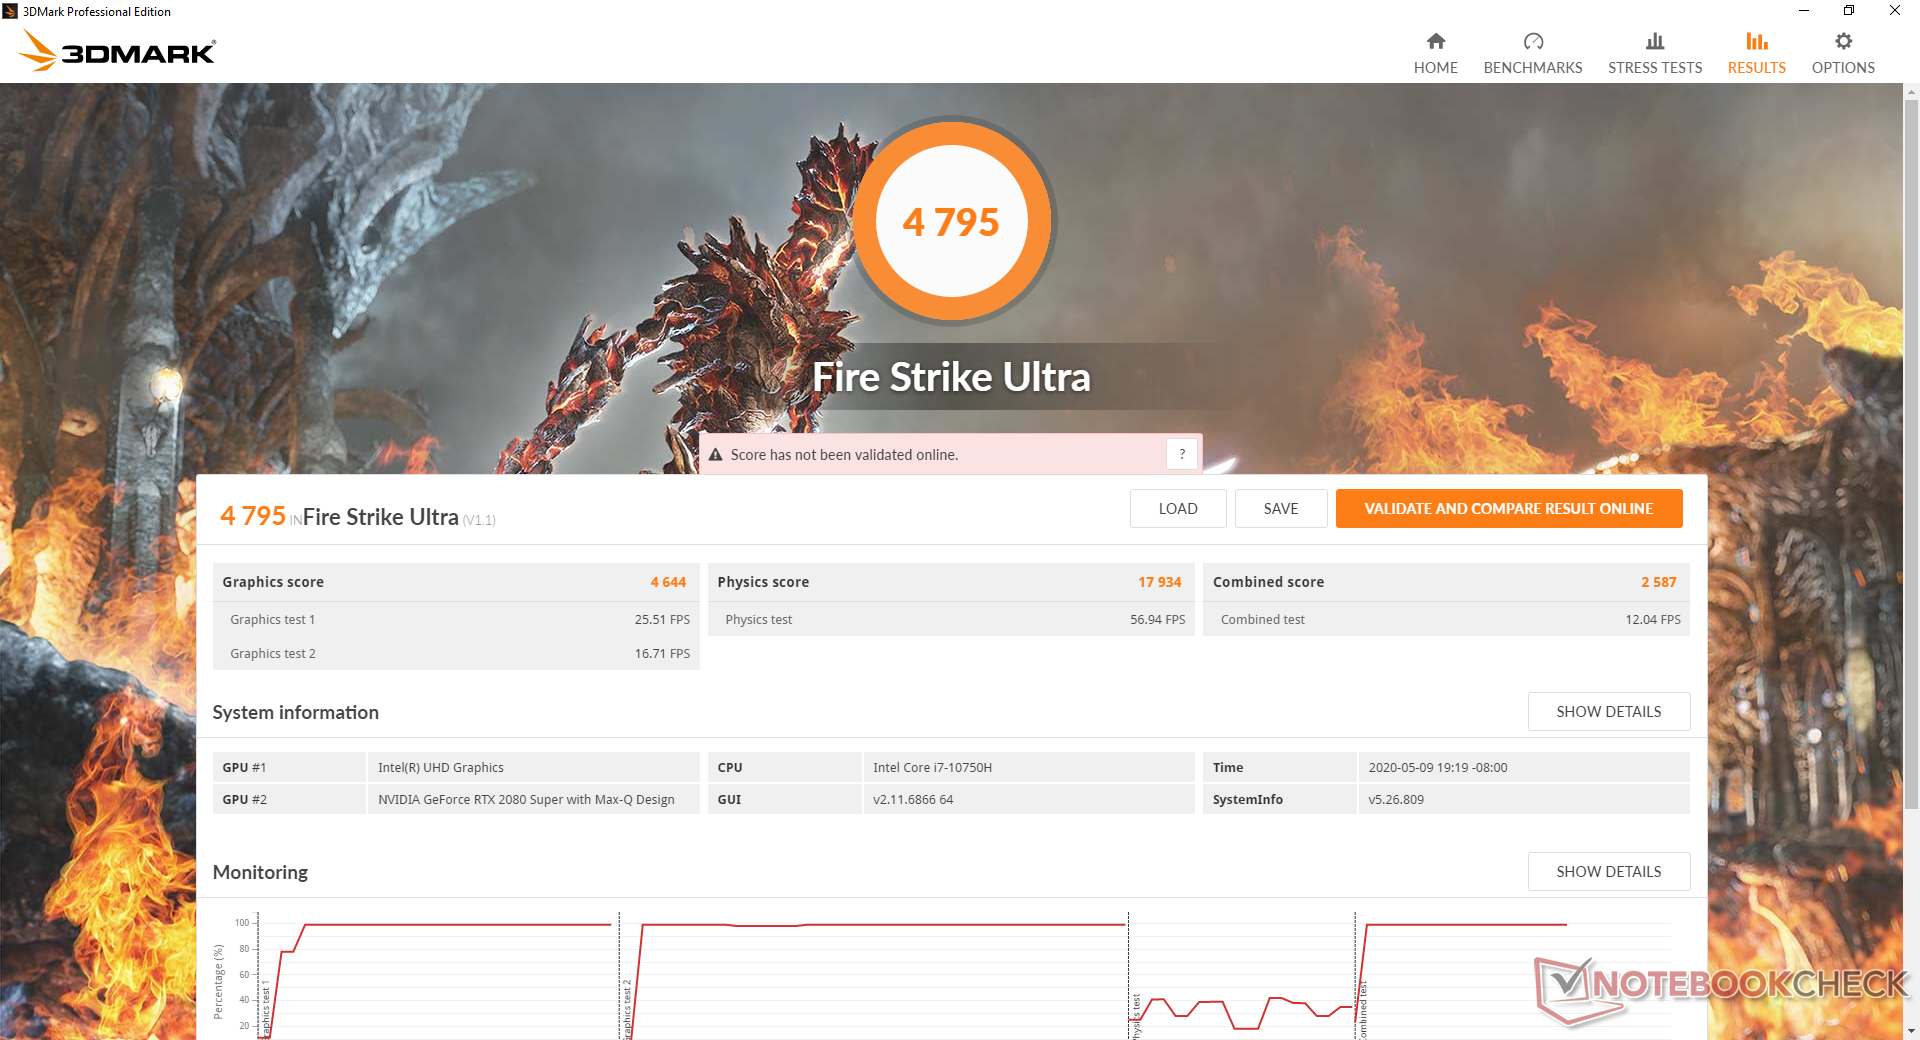
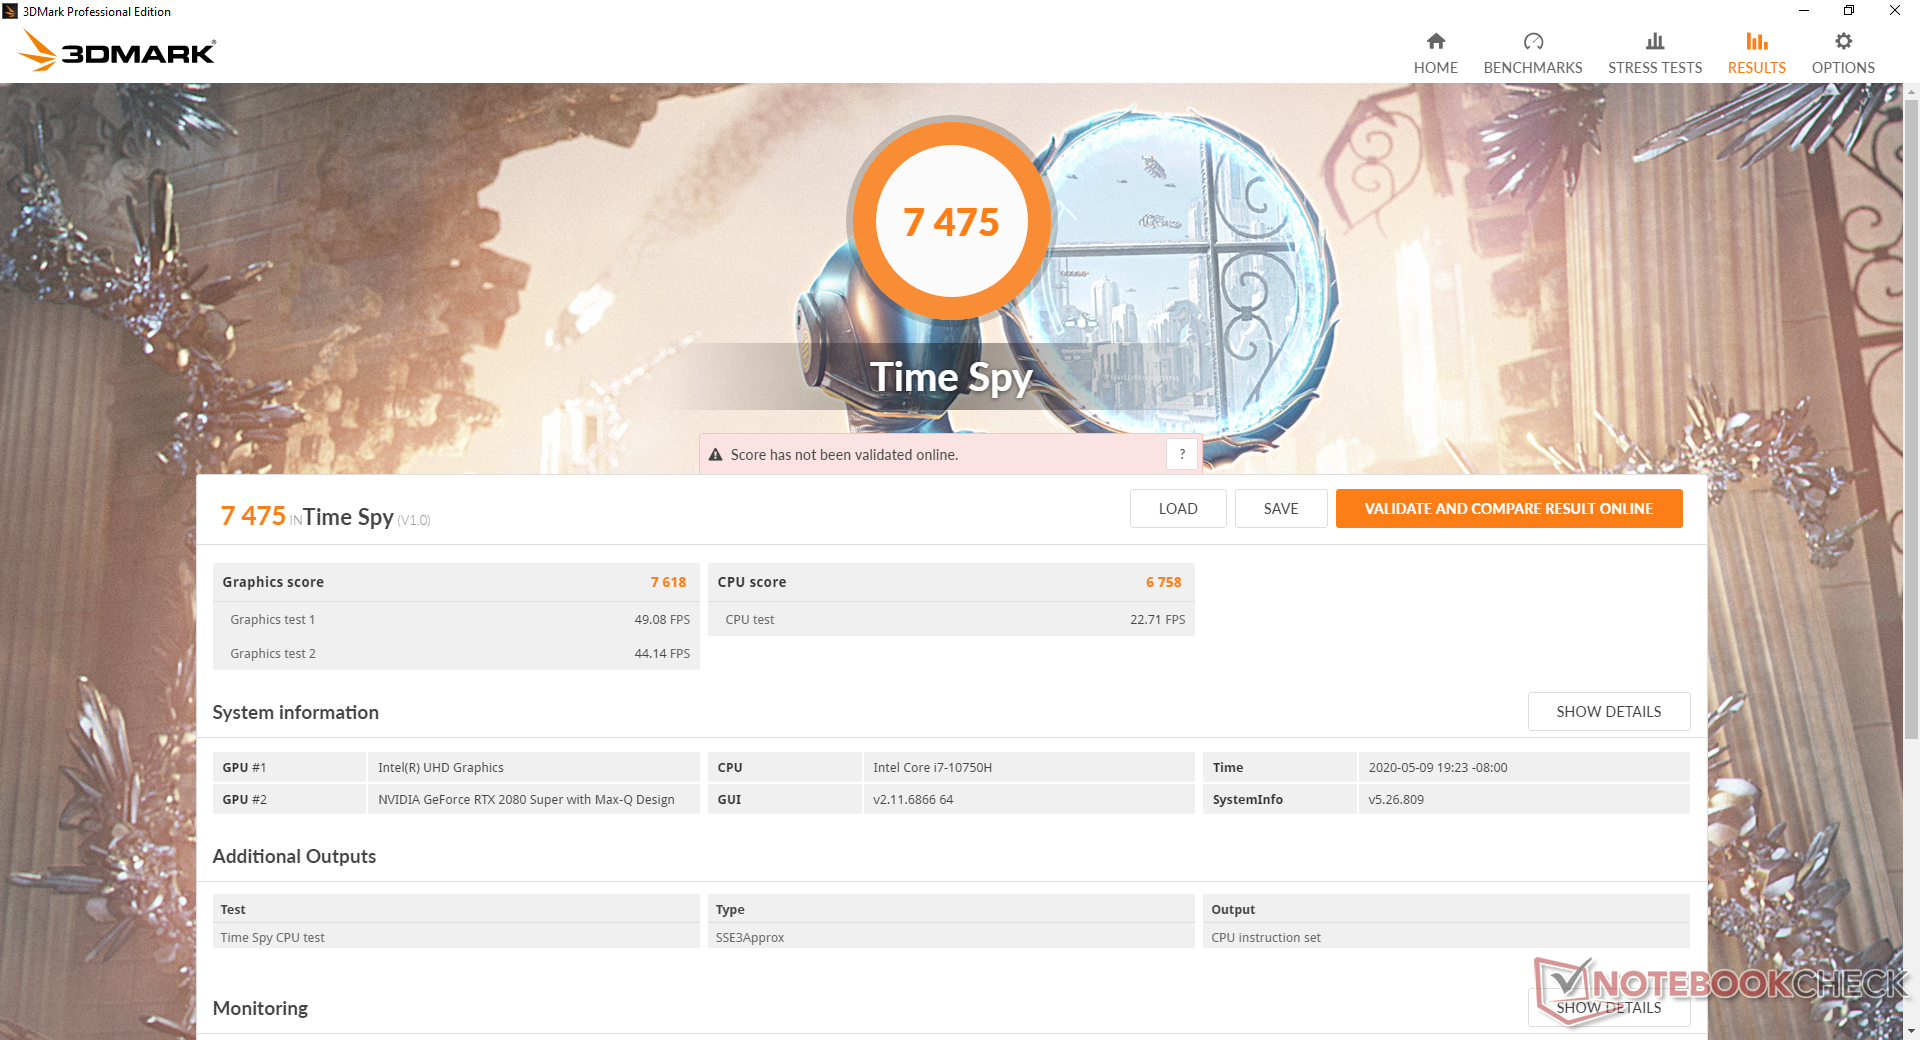
3DMark benchmarks are slightly below the Acer Triton 500 with the same GeForce RTX 2080 Super Max-Q GPU. When looking at the bigger picture, some older laptops with the GeForce RTX 2080 Max-Q are able to outscore our MSI by about 10 percent including the Dell Alienware m17 R2 and Asus ROG Zephyrus S GX701GXR. Users should therefore expect nearly the same gaming performance as the year old GeForce RTX 2080 Max-Q. In fact, upgrading from the GeForce RTX 2070 Super Max-Q configuration will only bring 5 to 10 percent more graphics horsepower.
Enabling Cooler Boost will increase GPU performance by only a hair. A 3DMark Fire Strike run with Cooler Boost active returns a Graphics score of 20784 points compared to 20117 points when the feature is off.
Note that G-Sync is not supported as the laptop uses Optimus instead. We can't say we miss the feature since the 300 Hz display will naturally cut down on screen tearing.
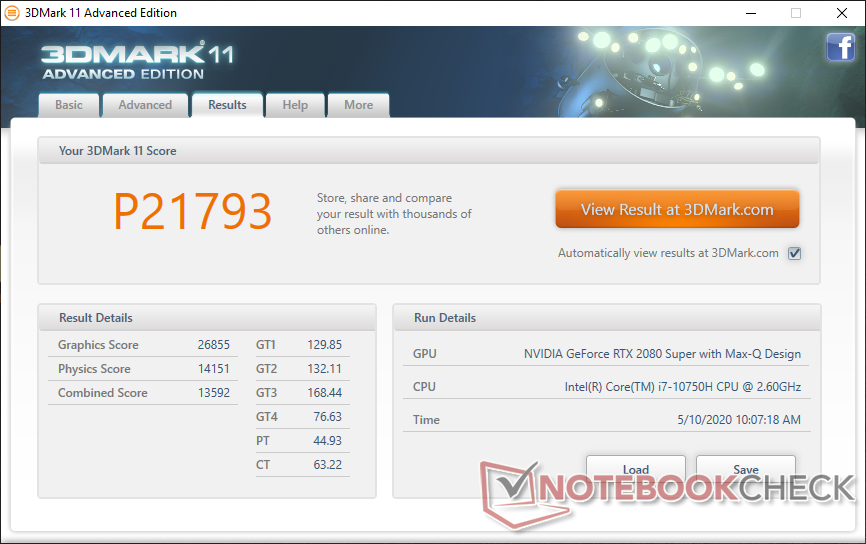
| 3DMark 11 Performance | 21793 points | |
| 3DMark Cloud Gate Standard Score | 39597 points | |
| 3DMark Fire Strike Score | 17585 points | |
| 3DMark Time Spy Score | 7475 points | |
Help | ||
Gaming Performance
Frame rates are consistently higher than the GS66 10SFS when playing at High or Extreme settings where games are more likely to be GPU bound. Differences are minor at 10 percent or less as predicted by the 3DMark results above.
Interestingly, there are cases where the GeForce RTX 2070 Super Max-Q can outperform our MSI. The Aorus 17G XB, for example, slightly edges out our system on Shadow of the Tomb Raider while it falls behind our system when running Borderlands 3. The faster Core i7-10875H CPU in the Gigabyte laptop is likely responsible for the discrepancy.
See our dedicated page on the GeForce RTX 2080 Super Max-Q for more technical information and benchmarks comparisons.
| The Witcher 3 | |
| 1920x1080 Ultra Graphics & Postprocessing (HBAO+) | |
| Nvidia GeForce RTX 2080 Super | |
| MSI GE75 9SG | |
| Average NVIDIA GeForce RTX 2080 Super Max-Q (74.3 - 96, n=11) | |
| MSI GP65 10SFK-047US | |
| Alienware m17 R2 P41E | |
| MSI GS66 10SGS | |
| Aorus 17G XB | |
| MSI GS66 Stealth 10SFS | |
| Walmart EVOO Gaming 17 | |
| Asus Zephyrus G14 GA401IV | |
| 1920x1080 High Graphics & Postprocessing (Nvidia HairWorks Off) | |
| Nvidia GeForce RTX 2080 Super | |
| MSI GE75 9SG | |
| MSI GP65 10SFK-047US | |
| Alienware m17 R2 P41E | |
| Average NVIDIA GeForce RTX 2080 Super Max-Q (138 - 160, n=7) | |
| MSI GS66 10SGS | |
| Aorus 17G XB | |
| Walmart EVOO Gaming 17 | |
| MSI GS66 Stealth 10SFS | |
| Asus Zephyrus G14 GA401IV | |
| Borderlands 3 | |
| 1920x1080 Badass Overall Quality (DX11) | |
| Average NVIDIA GeForce RTX 2080 Super Max-Q (62.5 - 71.6, n=4) | |
| MSI GS66 10SGS | |
| MSI GS66 Stealth 10SFS | |
| Aorus 17G XB | |
| Asus Zephyrus G14 GA401IV | |
| 1920x1080 High Overall Quality (DX11) | |
| MSI GS66 10SGS | |
| Average NVIDIA GeForce RTX 2080 Super Max-Q (78.2 - 84.3, n=4) | |
| Aorus 17G XB | |
| MSI GS66 Stealth 10SFS | |
| Asus Zephyrus G14 GA401IV | |
| low | med. | high | ultra | |
|---|---|---|---|---|
| The Witcher 3 (2015) | 310.3 | 239.5 | 142.7 | 74.3 |
| Dota 2 Reborn (2015) | 147 | 132 | 122 | 116 |
| X-Plane 11.11 (2018) | 102 | 90.9 | 76.8 | |
| Shadow of the Tomb Raider (2018) | 138 | 109 | 104 | 96 |
| Assassin´s Creed Odyssey (2018) | 102 | 87 | 75 | 54 |
| Apex Legends (2019) | 299 | 196 | 148.8 | 147.6 |
| Metro Exodus (2019) | 143.3 | 96.2 | 74.4 | 59 |
| Dirt Rally 2.0 (2019) | 252 | 168.4 | 158.5 | 90 |
| The Division 2 (2019) | 165 | 117 | 96 | 73 |
| Anno 1800 (2019) | 159 | 98.2 | 76.7 | 44.4 |
| Total War: Three Kingdoms (2019) | 233 | 127.8 | 88.5 | 64.1 |
| F1 2019 (2019) | 205 | 168 | 147 | 142 |
| Borderlands 3 (2019) | 132.5 | 105.7 | 81.1 | 63.5 |
| Ghost Recon Breakpoint (2019) | 117 | 96 | 86 | 65 |
| GRID 2019 (2019) | 174.8 | 125 | 111 | 74 |
| Need for Speed Heat (2019) | 101.9 | 92 | 84 | 76.9 |
| Escape from Tarkov (2020) | 121 | 121 | 120 | 120 |
| Hunt Showdown (2020) | 207.4 | 121.4 | 102 | |
| Doom Eternal (2020) | 256 | 167.6 | 147.1 | 140 |
Emissions
System Noise
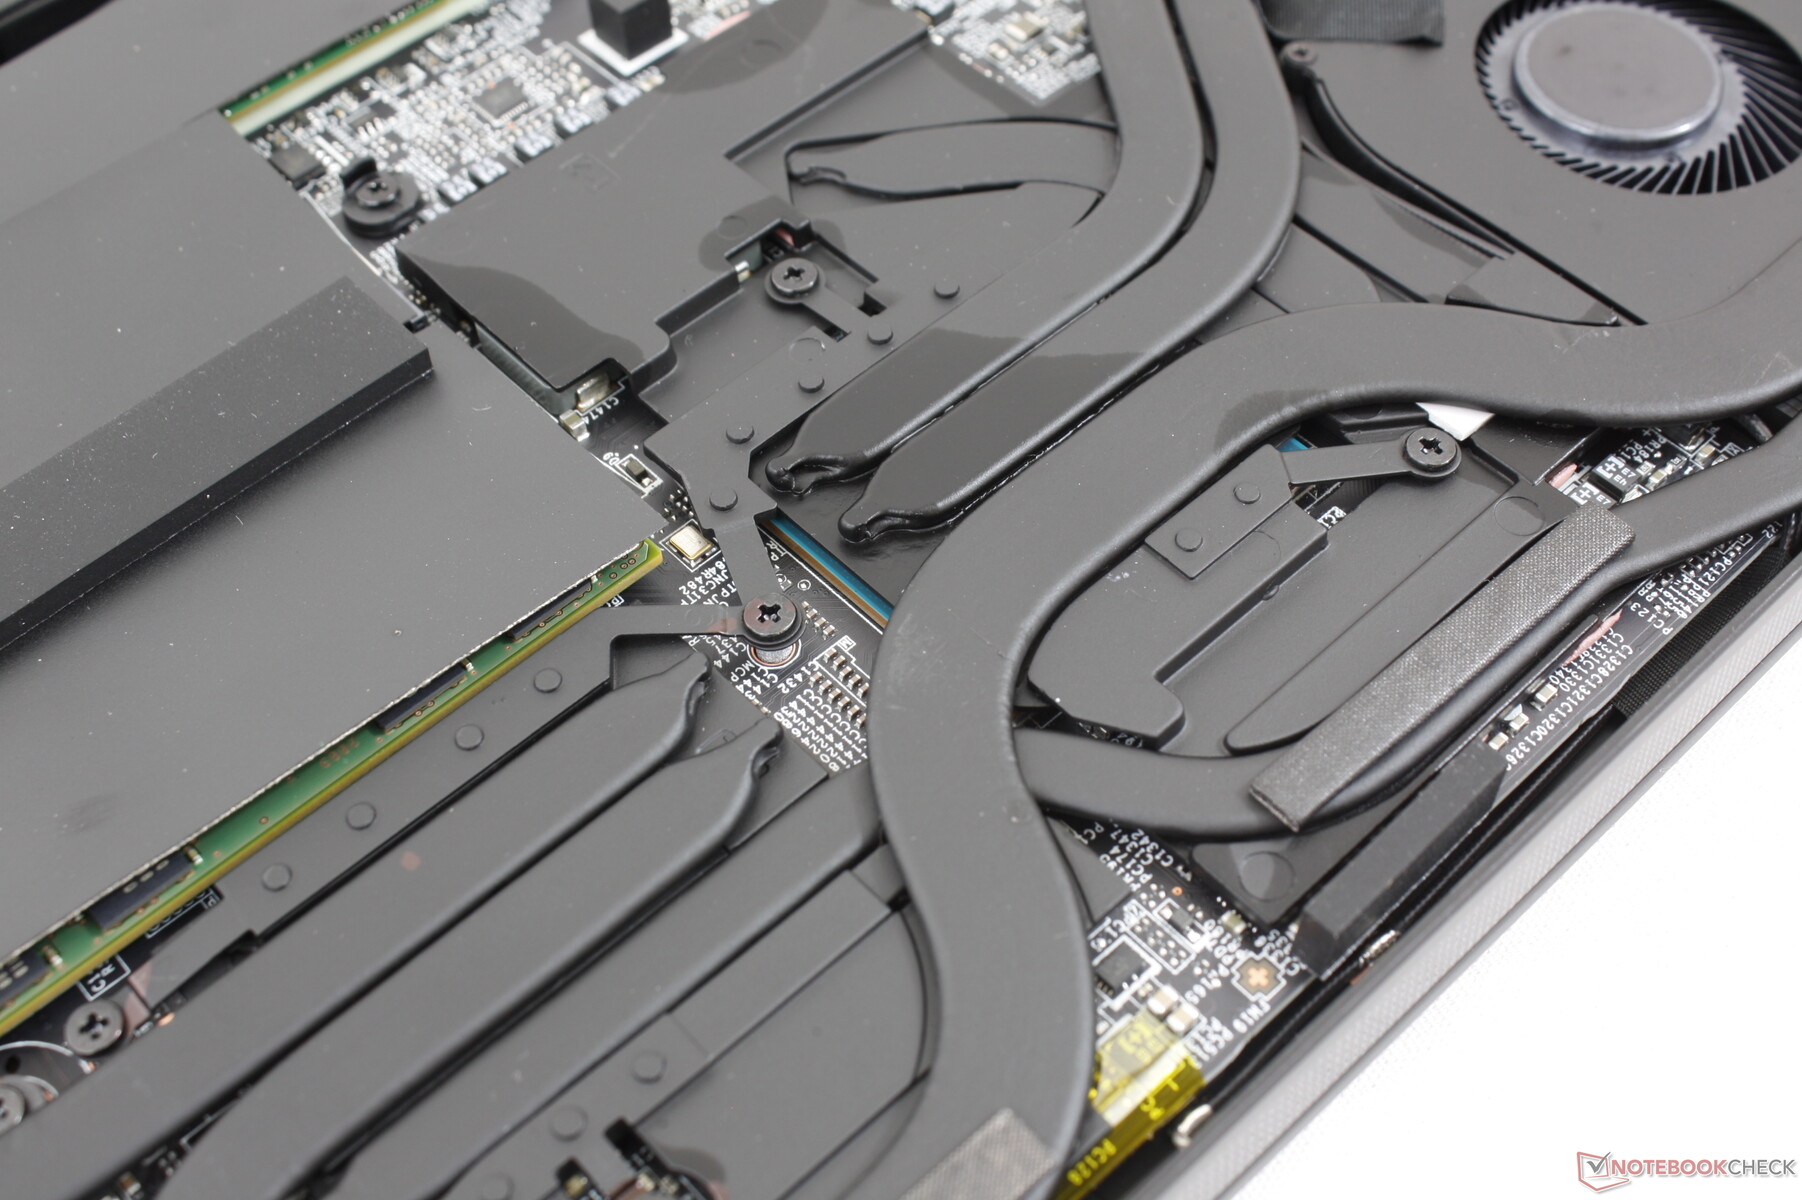
The cooling solution consists of two ~50 mm fans and a smaller ~40 mm one with seven heat pipes between them. Fan noise will always be present at about 30 to 30.9 dB(A) no matter the setting or onscreen load even if on the preset MSI "Silent" power profile. Though audible, we don't find this to be bothersome when browsing or video streaming. Still, we recommend using the laptop in Power Saver or Silent mode if not gaming or else the fans will pulse frequently.
Speaking of fan pulse, our GS66 10SGS is able to remain quieter for longer than the GS66 10SFS before plateauing at the same final decibel reading. For example, fan noise when running the first benchmark scene of 3DMark 06 would top out at 53 dB(A) on the 10SFS while the 10SGS would return a lower fan noise of 39.5 dB(A). When considering the higher Turbo Boost potential of the Core i9 in the 10SGS, the results make sense. When running Witcher 3, fan noise would stabilize at 48 dB(A) on both laptops. Overall results are on par with the GS66 despite the thicker and heavier build of the GS66.
Fan noise tops out at about 53 dB(A) when under more extreme loads like Prime95 and FurMark. If Cooler Boost is enabled, fan noise will increase to a steady 59.4 dB(A). We prefer to keep Cooler Boost off when gaming as it will not boost performance by all that much relative to the extreme increase in fan noise.
| MSI GS66 10SGS GeForce RTX 2080 Super Max-Q, i7-10750H, Samsung SSD PM981 MZVLB512HAJQ | MSI GS65 Stealth 9SG GeForce RTX 2080 Max-Q, i7-9750H, Samsung SSD PM981 MZVLB512HAJQ | Asus Zephyrus S GX502GW GeForce RTX 2070 Mobile, i7-9750H, 2x Intel SSD 660p SSDPEKNW512G8 (RAID 0) | Razer Blade 15 RTX 2080 Max-Q GeForce RTX 2080 Max-Q, i7-9750H, Samsung SSD PM981 MZVLB512HAJQ | HP Omen X 2S 15-dg0075cl GeForce RTX 2070 Max-Q, i7-9750H, WDC PC SN720 SDAPNTW-1T00 | Lenovo Legion Y740-15ICHg GeForce RTX 2070 Max-Q, i7-9750H, WDC PC SN520 SDAPMUW-128G | MSI GS66 Stealth 10SFS GeForce RTX 2070 Super Max-Q, i9-10980HK, Samsung SSD PM981 MZVLB1T0HALR | |
|---|---|---|---|---|---|---|---|
| Noise | 2% | -10% | 9% | -1% | 2% | -11% | |
| off / environment * (dB) | 28.5 | 28.3 1% | 30 -5% | 28.3 1% | 29 -2% | 30 -5% | 30 -5% |
| Idle Minimum * (dB) | 30 | 30.4 -1% | 31 -3% | 28.8 4% | 30.5 -2% | 31.3 -4% | 32 -7% |
| Idle Average * (dB) | 30 | 30.5 -2% | 33 -10% | 28.8 4% | 31.5 -5% | 31.3 -4% | 34 -13% |
| Idle Maximum * (dB) | 30.9 | 30.6 1% | 38 -23% | 29 6% | 31.5 -2% | 31.3 -1% | 39 -26% |
| Load Average * (dB) | 39.5 | 37.6 5% | 50 -27% | 33.5 15% | 40.6 -3% | 42 -6% | 53 -34% |
| Witcher 3 ultra * (dB) | 48 | 46 4% | 53 -10% | 45 6% | 49.5 -3% | 42.1 12% | 48 -0% |
| Load Maximum * (dB) | 59.4 | 55.1 7% | 56 6% | 45.2 24% | 53.4 10% | 46.5 22% | 53 11% |
* ... smaller is better
Noise level
| Idle |
| 30 / 30 / 30.9 dB(A) |
| Load |
| 39.5 / 59.4 dB(A) |
 | ||
30 dB silent 40 dB(A) audible 50 dB(A) loud |
||
min: | ||
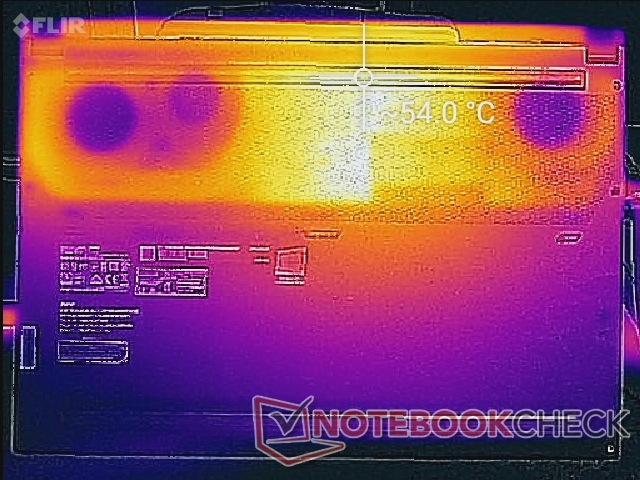
Temperature
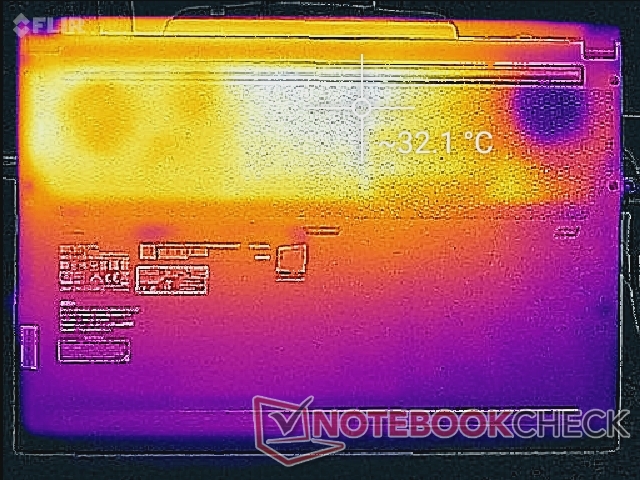
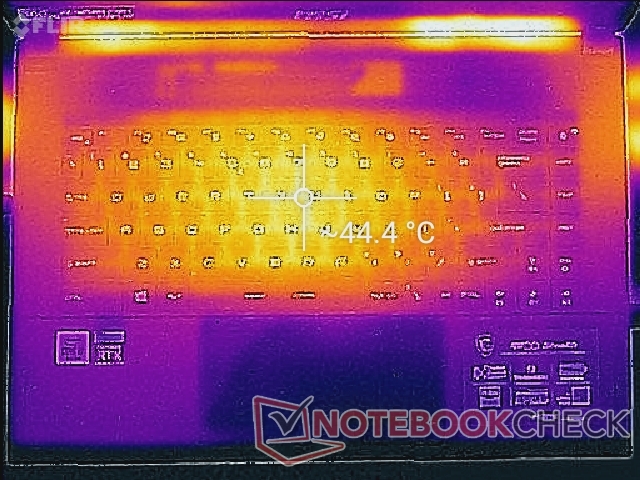
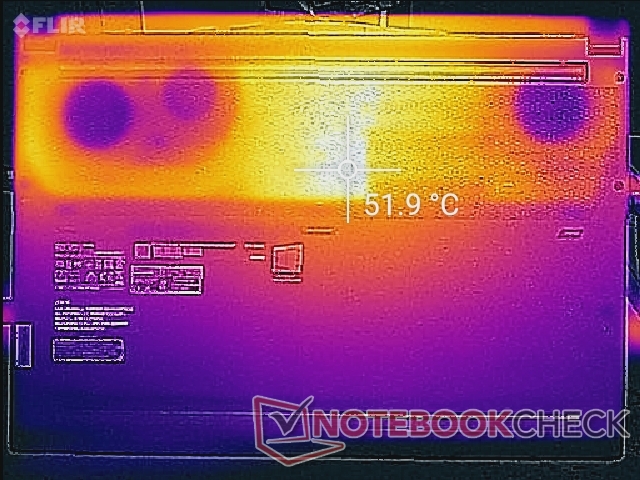
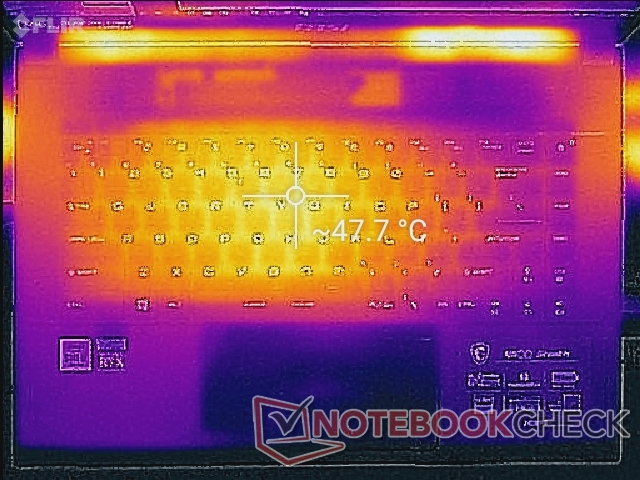
Surface temperatures are similar to what we recorded on last year's MSI GS65. The hot spot continues to be on the very center of the keyboard in contrast to the Asus Zephyrus S GX531 where the hot spot is above the keyboard and away from the keys. If gaming, expect the WASD keys to be about 40 C.
The front half of the laptop will always be much cooler than the back half since the battery occupies most of the front.
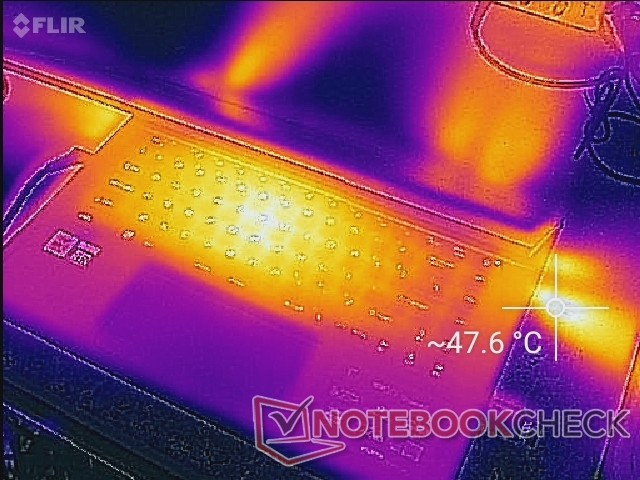
(-) The maximum temperature on the upper side is 47.8 °C / 118 F, compared to the average of 40.4 °C / 105 F, ranging from 21.2 to 68.8 °C for the class Gaming.
(-) The bottom heats up to a maximum of 54.4 °C / 130 F, compared to the average of 43.2 °C / 110 F
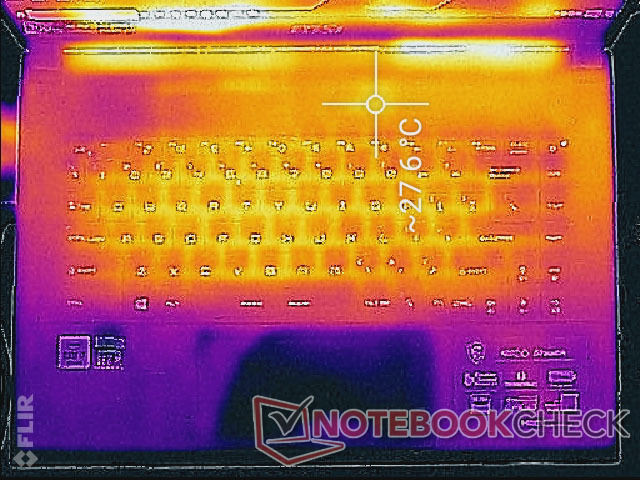
(+) In idle usage, the average temperature for the upper side is 25.9 °C / 79 F, compared to the device average of 33.9 °C / 93 F.
(±) Playing The Witcher 3, the average temperature for the upper side is 33.3 °C / 92 F, compared to the device average of 33.9 °C / 93 F.
(+) The palmrests and touchpad are cooler than skin temperature with a maximum of 28.6 °C / 83.5 F and are therefore cool to the touch.
(±) The average temperature of the palmrest area of similar devices was 28.8 °C / 83.8 F (+0.2 °C / 0.3 F).
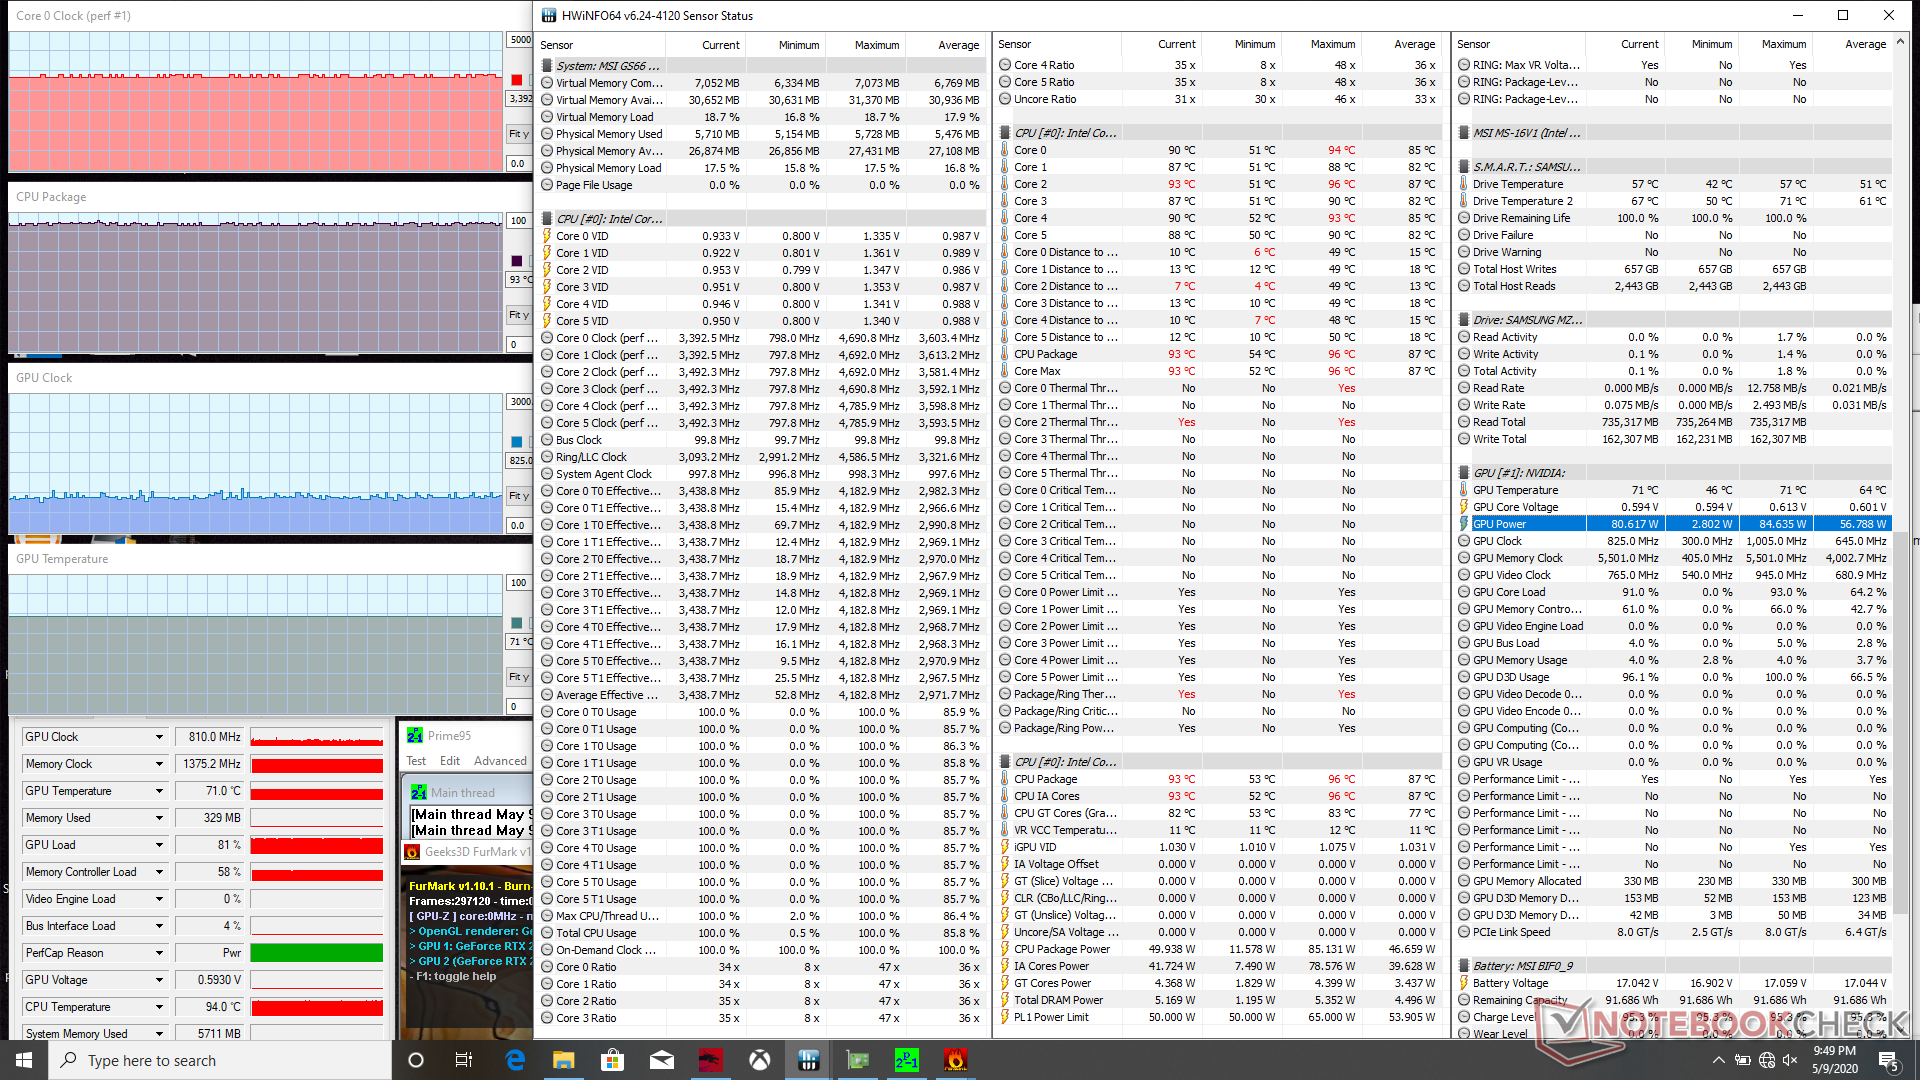
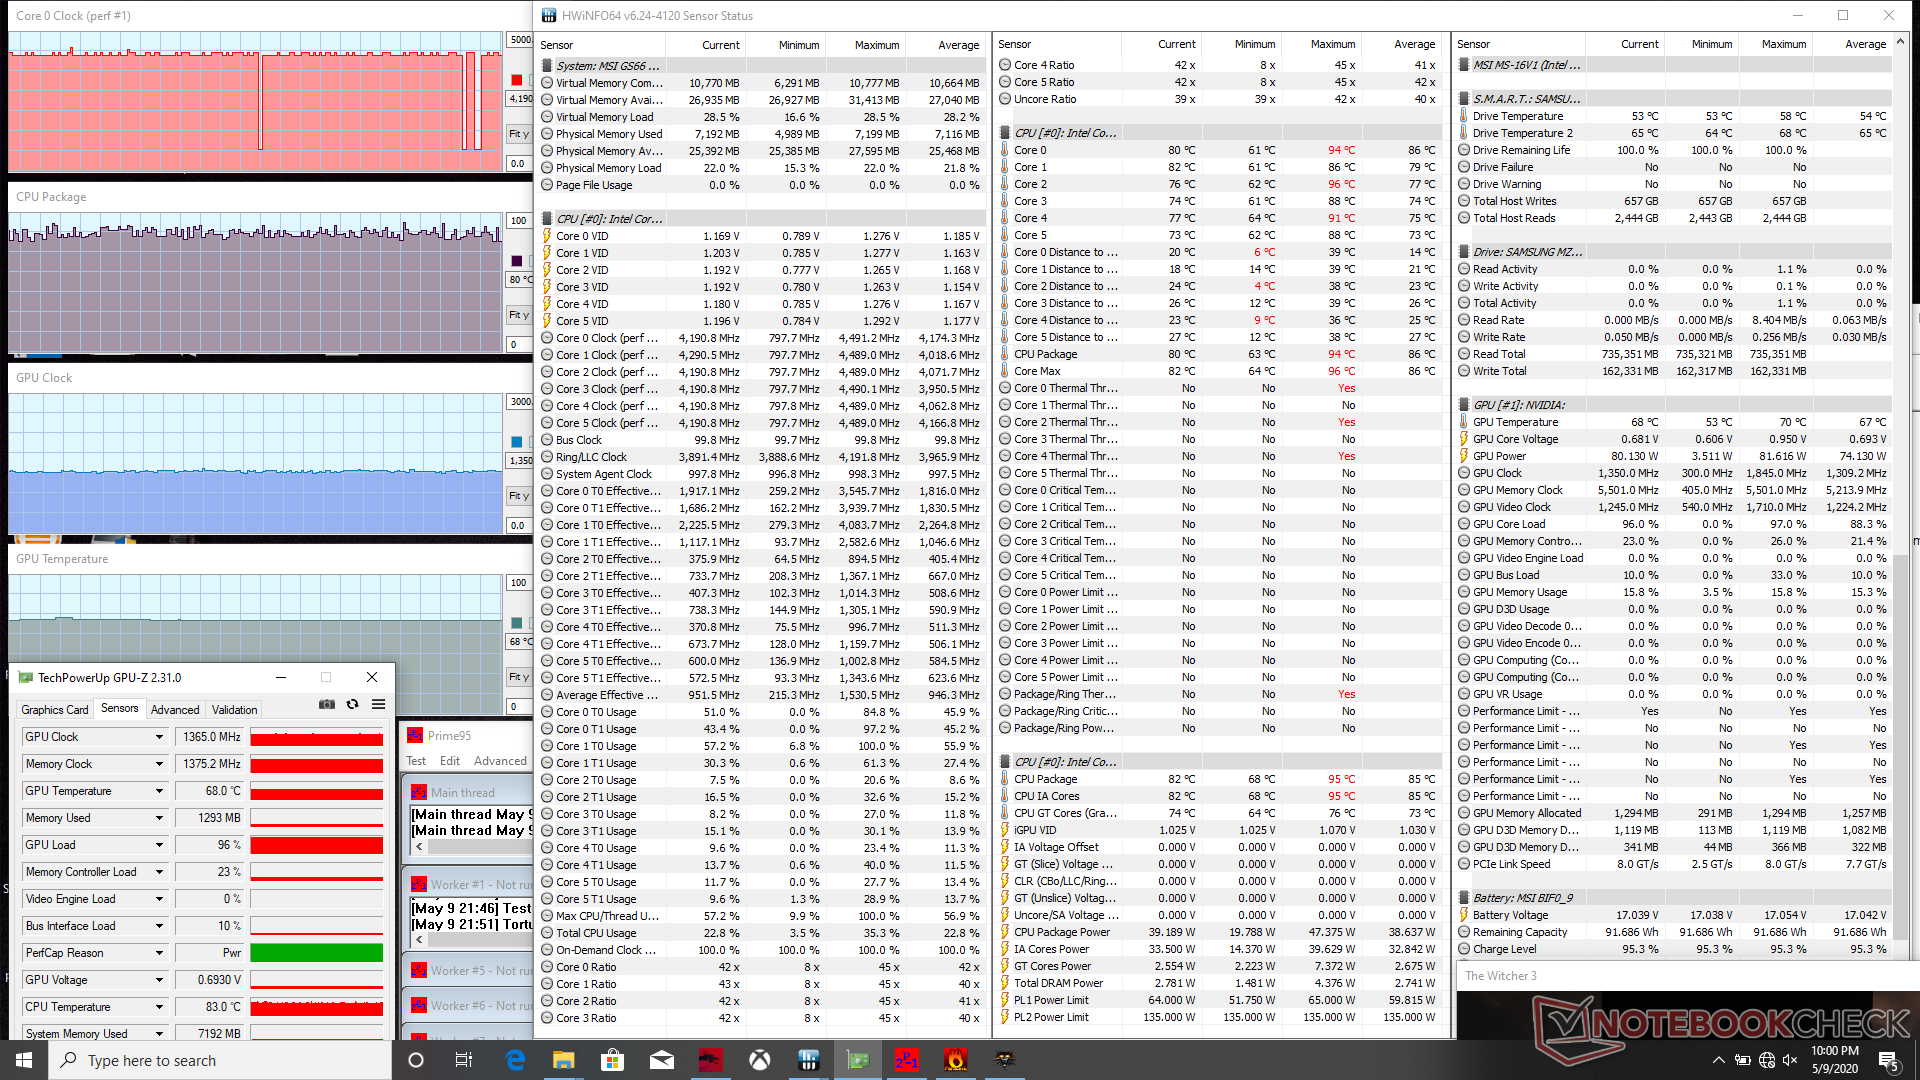
Stress Test
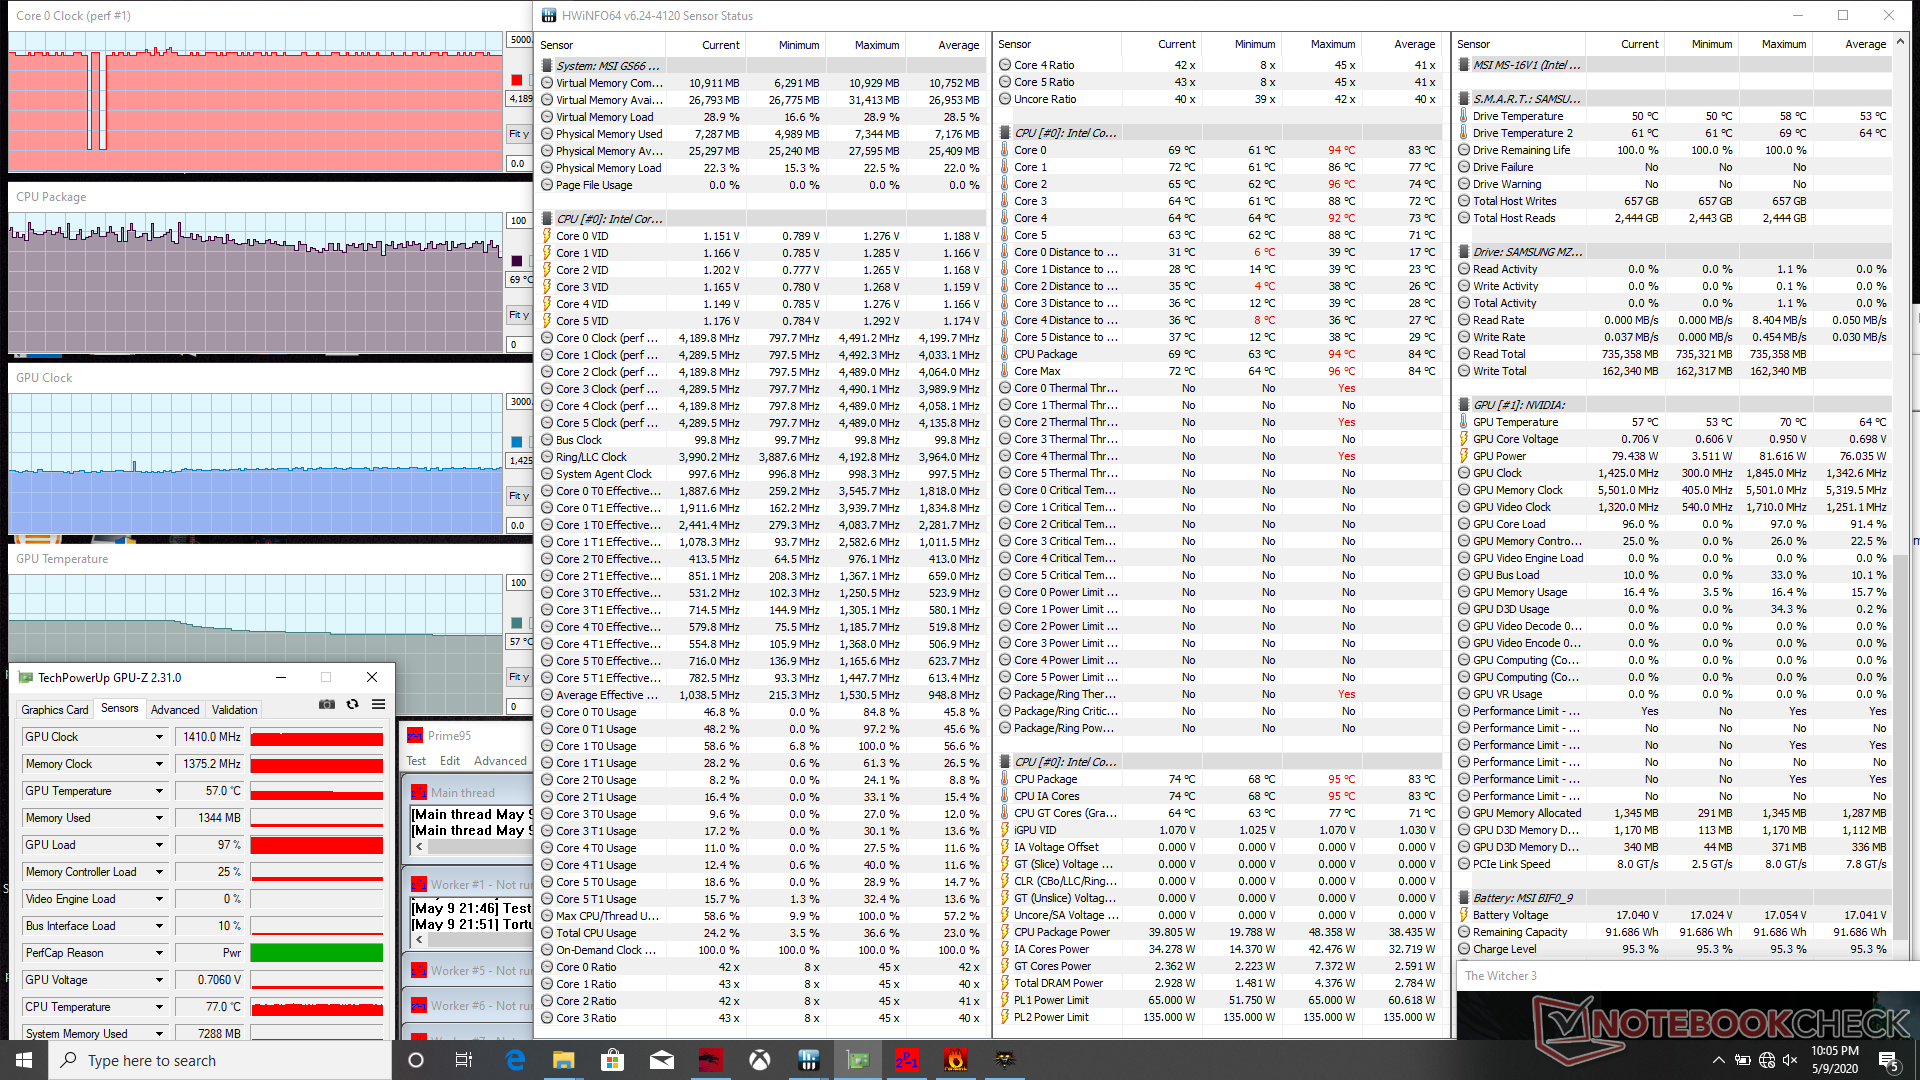
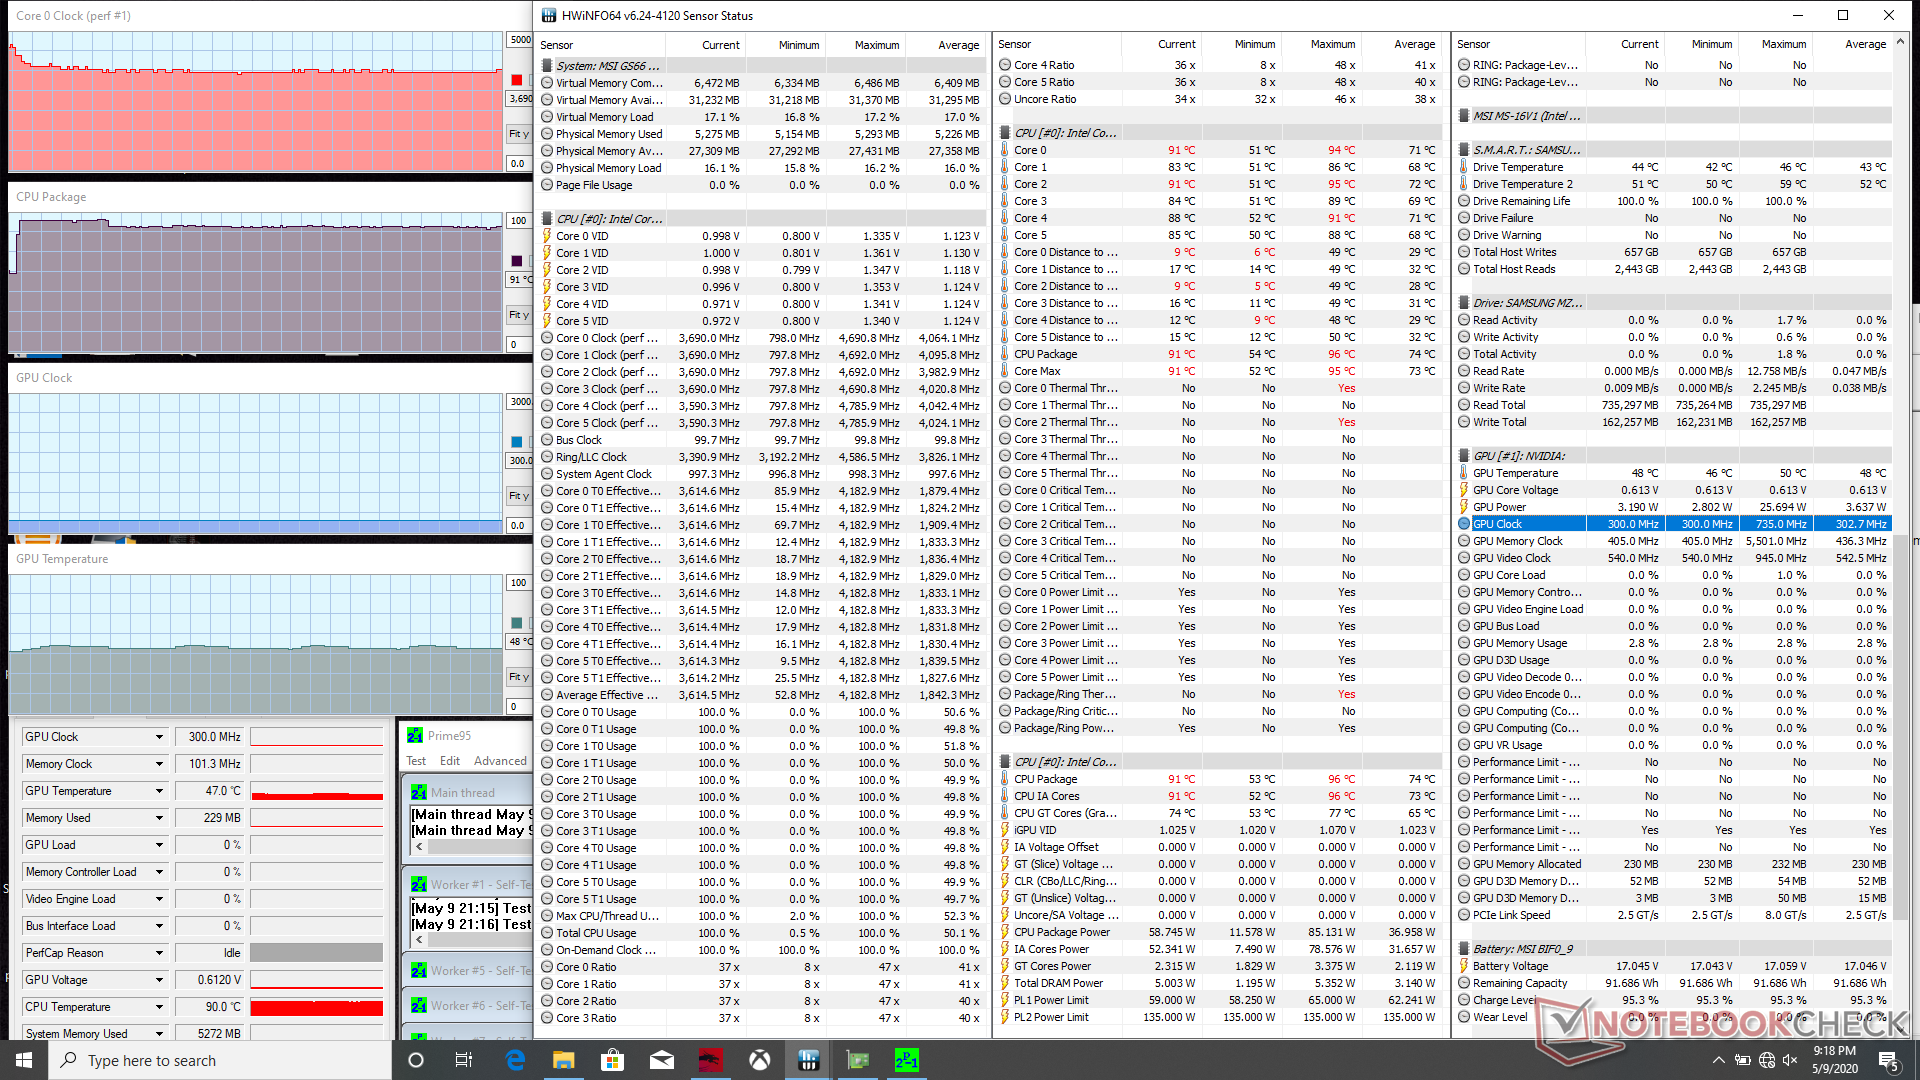
We stress the system with synthetic loads to identify for any potential throttling issues. When running Prime95, the CPU would boost up to 4.2 GHz for only a couple of seconds before dropping to 3.8 - 3.9 GHz for the next 30 to 40 seconds. Afterwards, clock rates and core temperature would stabilize at 3.6 to 3.7 GHz and a toasty 91 C, respectively. Running Prime95 and FurMark simultaneously causes the CPU and GPU to stabilize at 93 C and 71 C, respectively.
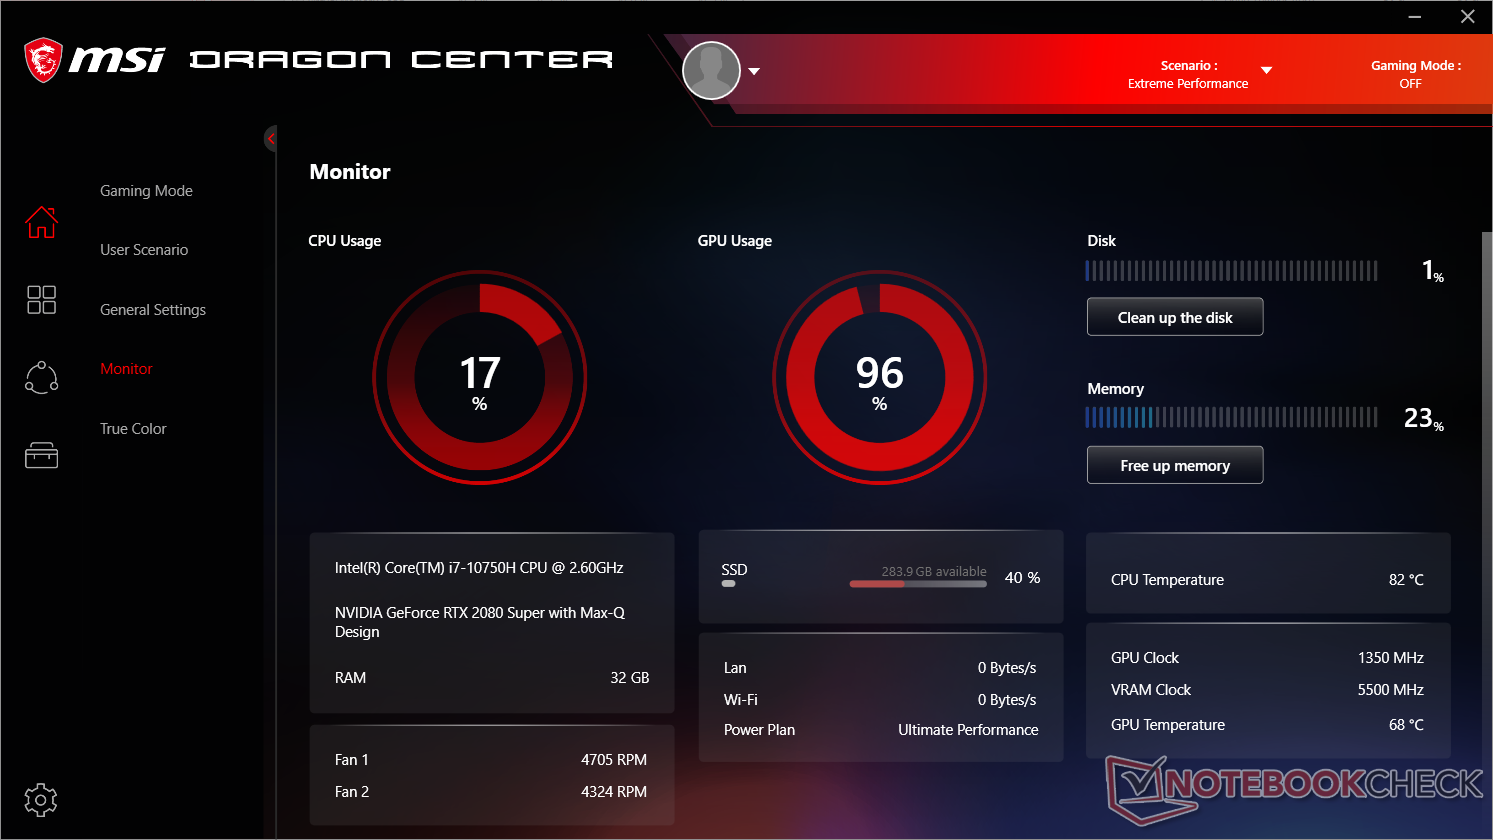
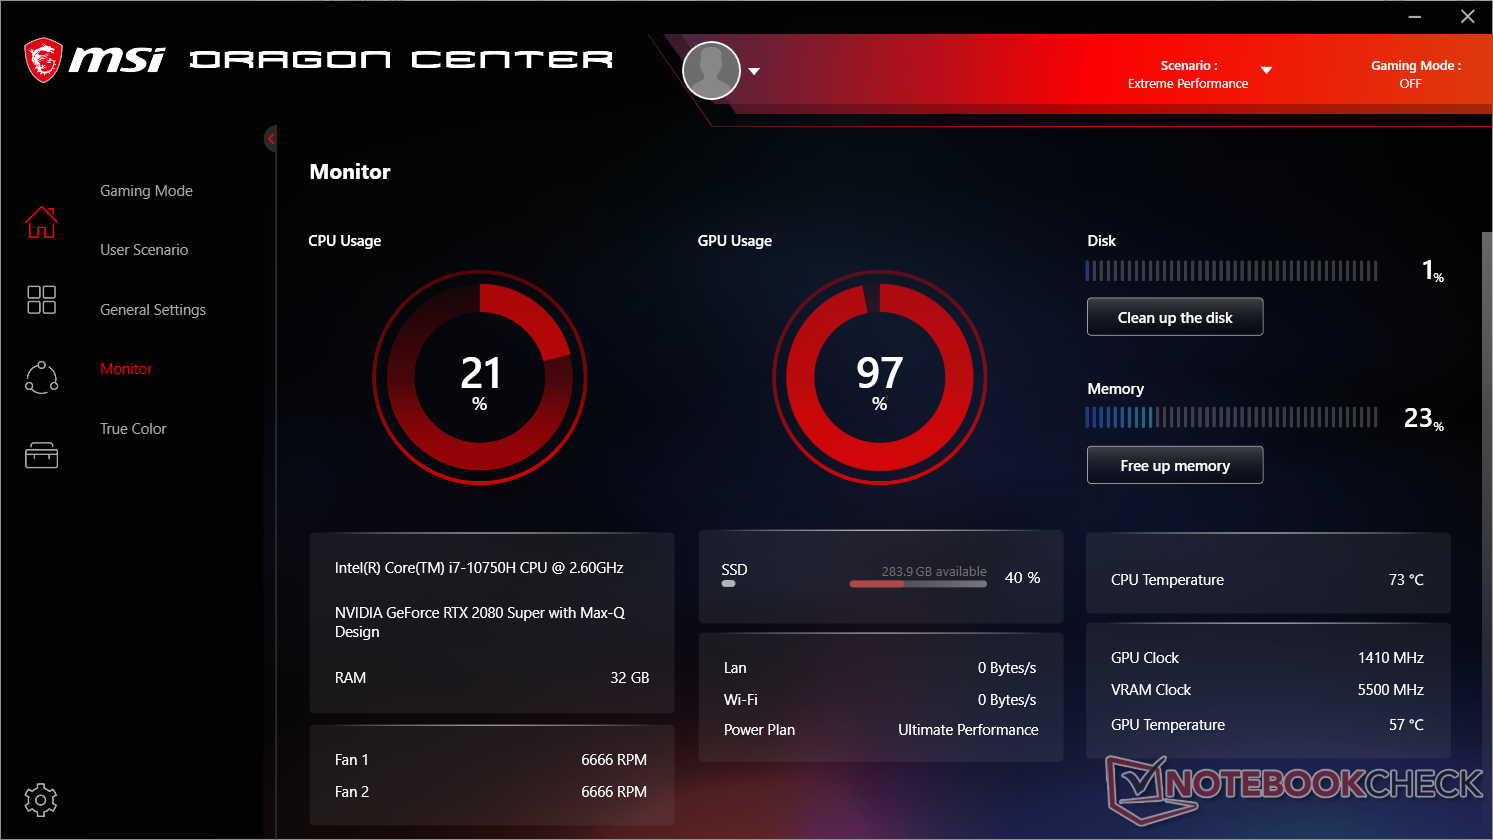
Running Witcher 3 is more representative of real-world gaming loads. The CPU and GPU would stabilize at 82 C and 68 C, respectively, compared to 81 C and 71 C on the older GS65 with the Core i7-9750H and RTX 2080 Max-Q. Enabling Cooler Boost would reduce CPU and GPU temperatures by about 10 C each while boosting GPU clock rate ever so slightly (1365 MHz vs. 1410 MHz).
Running on battery power will impact performance. A Fire Strike run on batteries returns Physics and Graphics scores of 12931 and 5667 points, respectively, compared to 17764 and 20117 points when on mains.
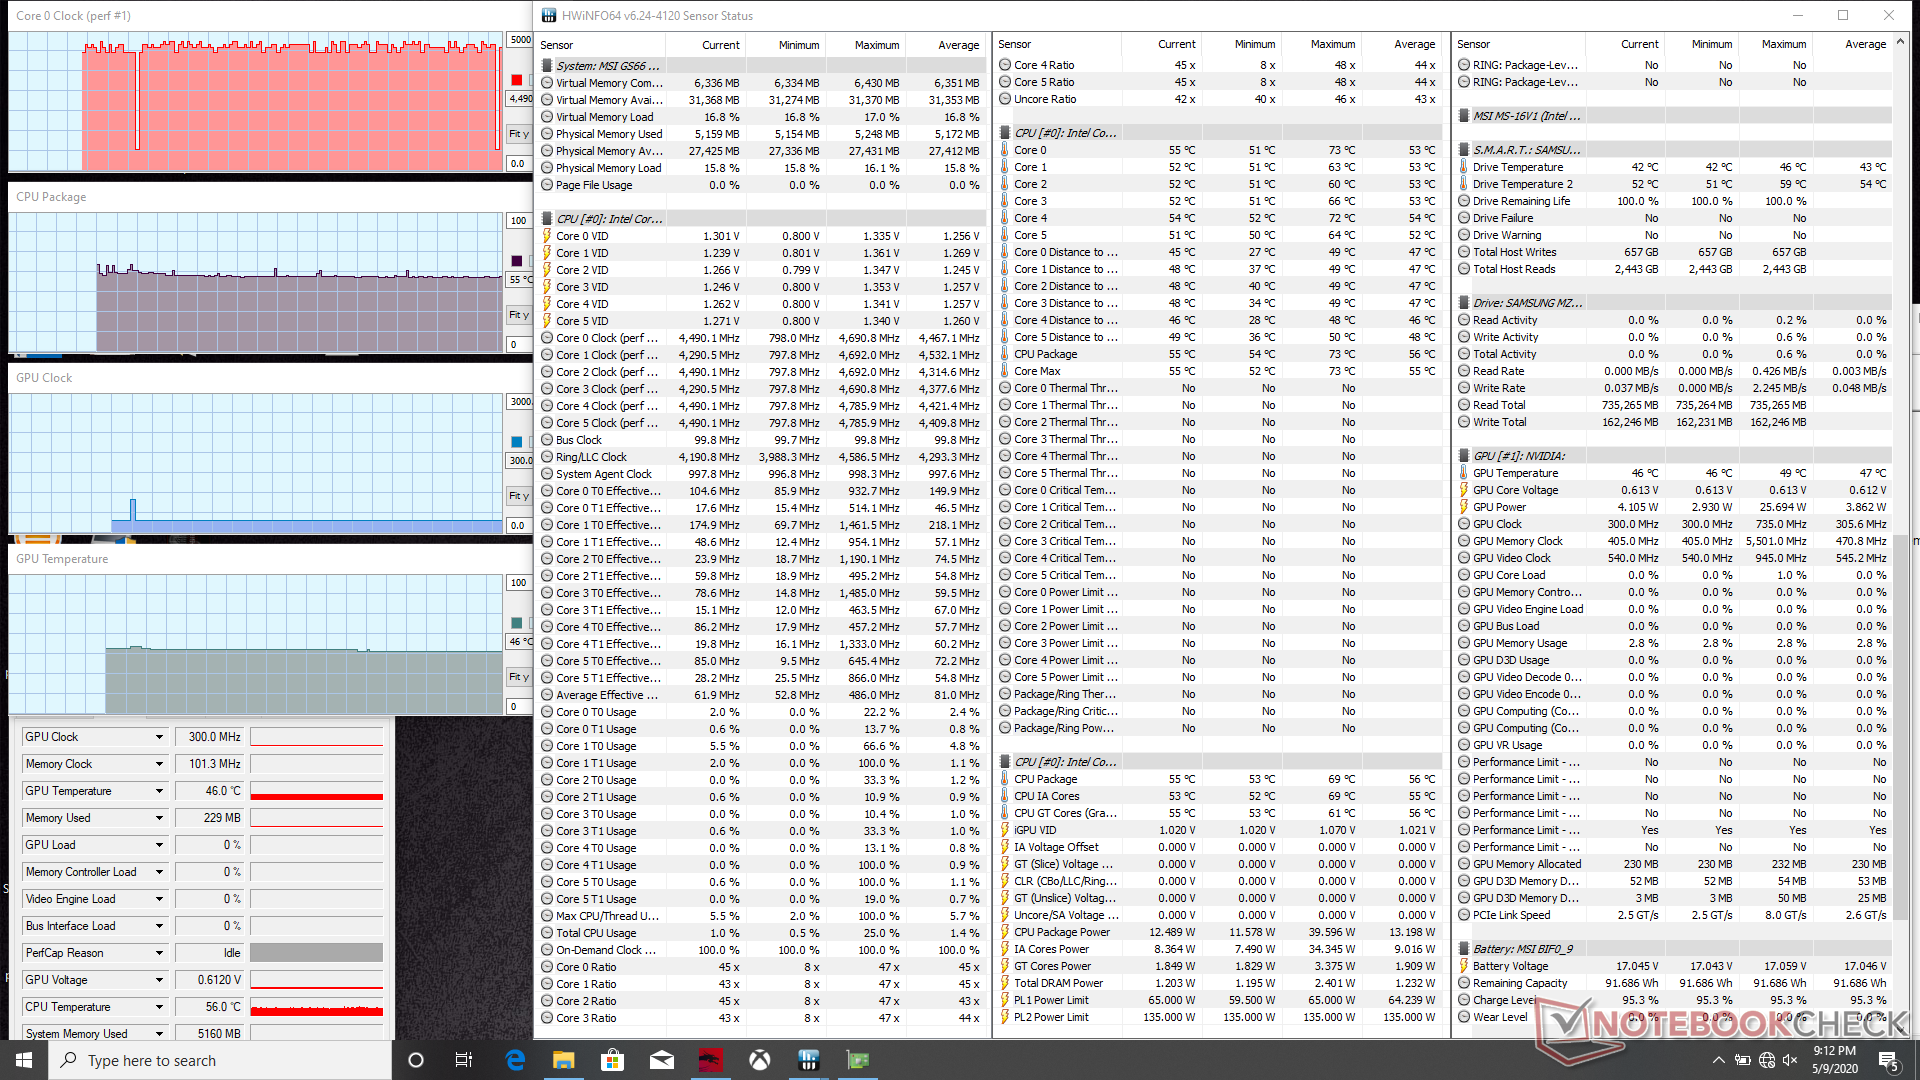
| CPU Clock (GHz) | GPU Clock (MHz) | Average CPU Temperature (°C) | Average GPU Temperature (°C) | |
| System Idle | -- | -- | 55 | 46 |
| Prime95 Stress | 3.6 - 3.7 | -- | 91 | 48 |
| Prime95 + FurMark Stress | 3.3 - 3.4 | 810 | 93 | 71 |
| Witcher 3 Stress (Cooler Boost off) | 4.2 - 4.3 | 1365 | ~82 | 68 |
| Witcher 3 Stress (Cooler Boost on) | 4.2 - 4.3 | 1410 | 71 | 57 |
Speakers


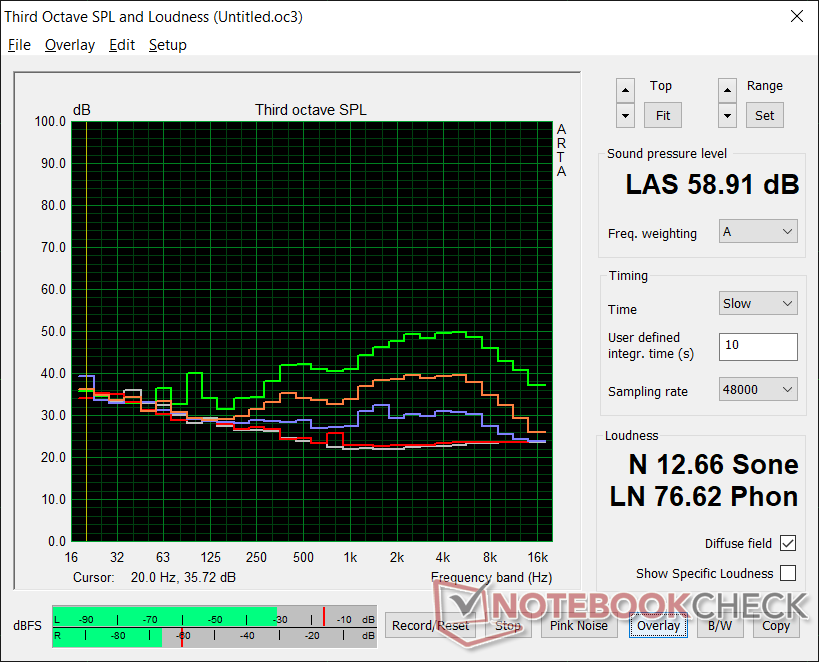
MSI GS66 10SGS audio analysis
(+) | speakers can play relatively loud (92.3 dB)
Bass 100 - 315 Hz
(-) | nearly no bass - on average 29.8% lower than median
(±) | linearity of bass is average (7.5% delta to prev. frequency)
Mids 400 - 2000 Hz
(±) | higher mids - on average 9.3% higher than median
(±) | linearity of mids is average (9.2% delta to prev. frequency)
Highs 2 - 16 kHz
(±) | reduced highs - on average 6.1% lower than median
(±) | linearity of highs is average (7.5% delta to prev. frequency)
Overall 100 - 16.000 Hz
(±) | linearity of overall sound is average (29.4% difference to median)
Compared to same class
» 95% of all tested devices in this class were better, 2% similar, 3% worse
» The best had a delta of 6%, average was 18%, worst was 132%
Compared to all devices tested
» 87% of all tested devices were better, 2% similar, 10% worse
» The best had a delta of 4%, average was 24%, worst was 134%
Apple MacBook 12 (Early 2016) 1.1 GHz audio analysis
(+) | speakers can play relatively loud (83.6 dB)
Bass 100 - 315 Hz
(±) | reduced bass - on average 11.3% lower than median
(±) | linearity of bass is average (14.2% delta to prev. frequency)
Mids 400 - 2000 Hz
(+) | balanced mids - only 2.4% away from median
(+) | mids are linear (5.5% delta to prev. frequency)
Highs 2 - 16 kHz
(+) | balanced highs - only 2% away from median
(+) | highs are linear (4.5% delta to prev. frequency)
Overall 100 - 16.000 Hz
(+) | overall sound is linear (10.2% difference to median)
Compared to same class
» 7% of all tested devices in this class were better, 2% similar, 91% worse
» The best had a delta of 5%, average was 18%, worst was 53%
Compared to all devices tested
» 5% of all tested devices were better, 1% similar, 94% worse
» The best had a delta of 4%, average was 24%, worst was 134%
Energy Management
Power Consumption
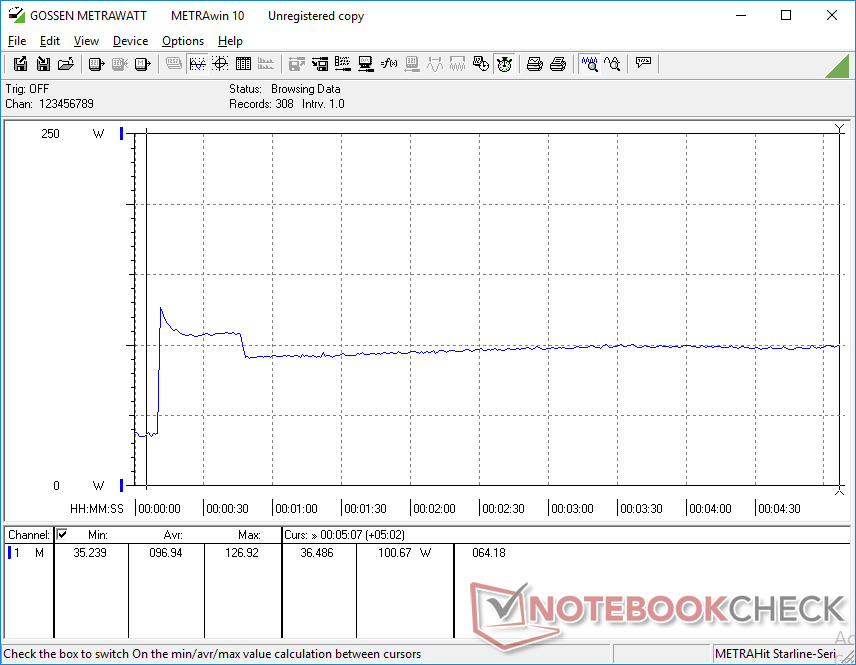
Idling on desktop on Power Saver mode at the minimum brightness setting and with the iGPU active will consume about 15 W. Bumping brightness up to maximum will draw about 2.5 W more. If set to High Performance mode, consumption jumps to almost 30 W meaning it's worth changing the power profile manually to prolong battery life if simply browsing, video streaming, or emailing.
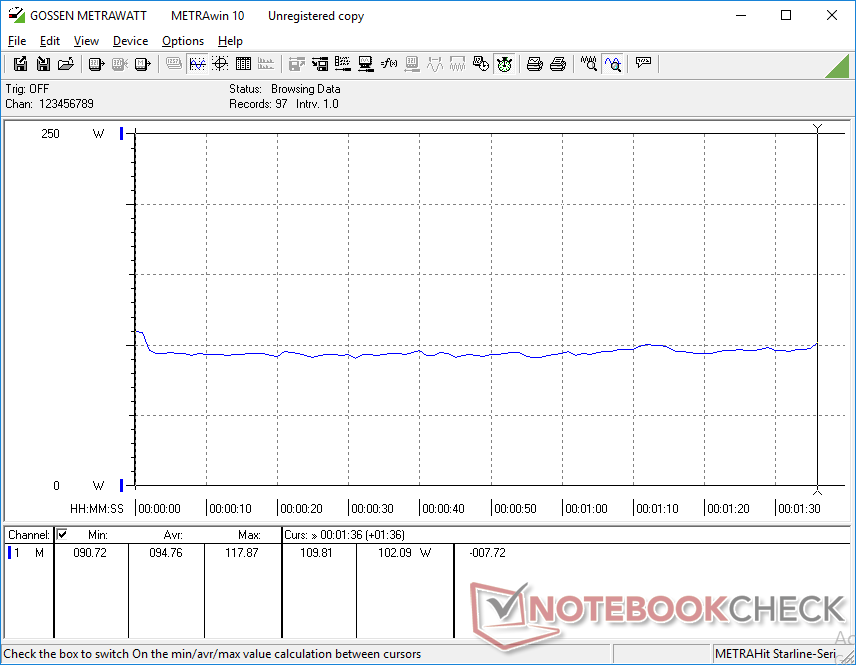
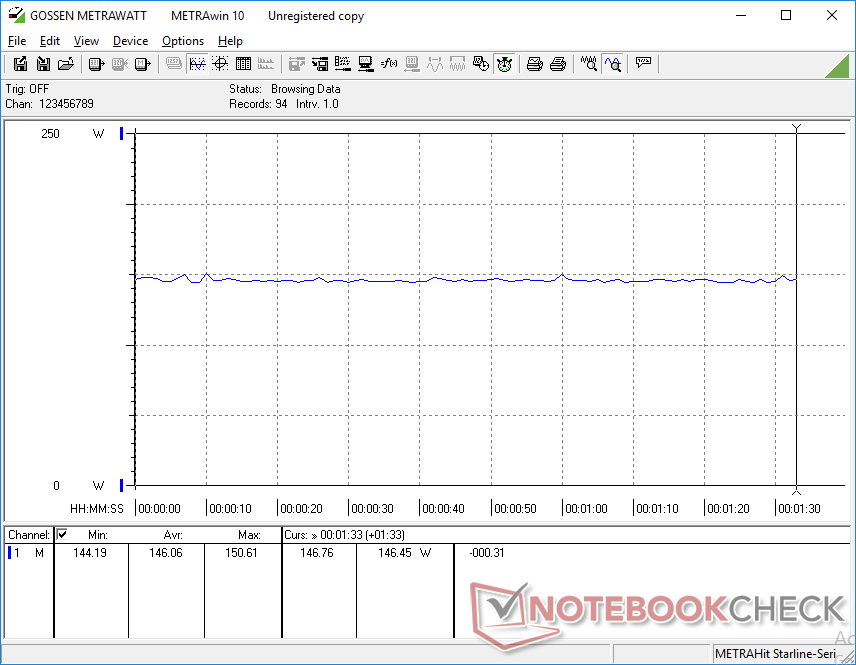
When under higher loads, power consumption trails behind the GS65 10SGS with the Core i9-10980HK even though the latter uses the slower GeForce RTX 2070 Super Max-Q GPU. This makes sense because the RTX 2070 Super Max-Q and RTX 2080 Super Max-Q share nearly the same TDP while the octa-core Core i9 has a cTDP of up to 65 W compared to just 35 W to 45 W on our hexa-core Core i7. Running Witcher 3 draws an average of 146 W to be about 6 percent less than the GS65 10SGS.
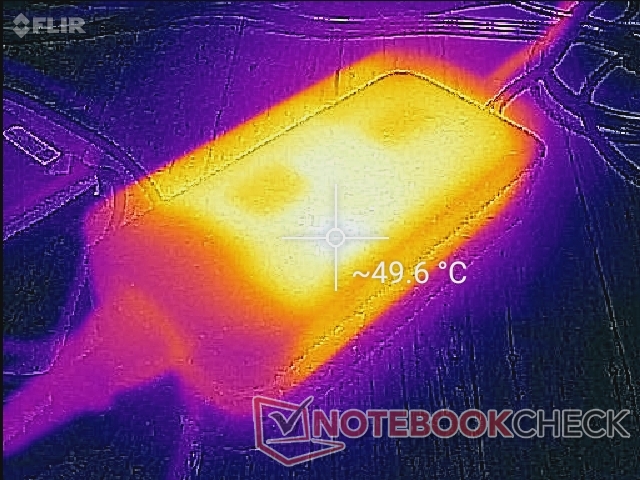
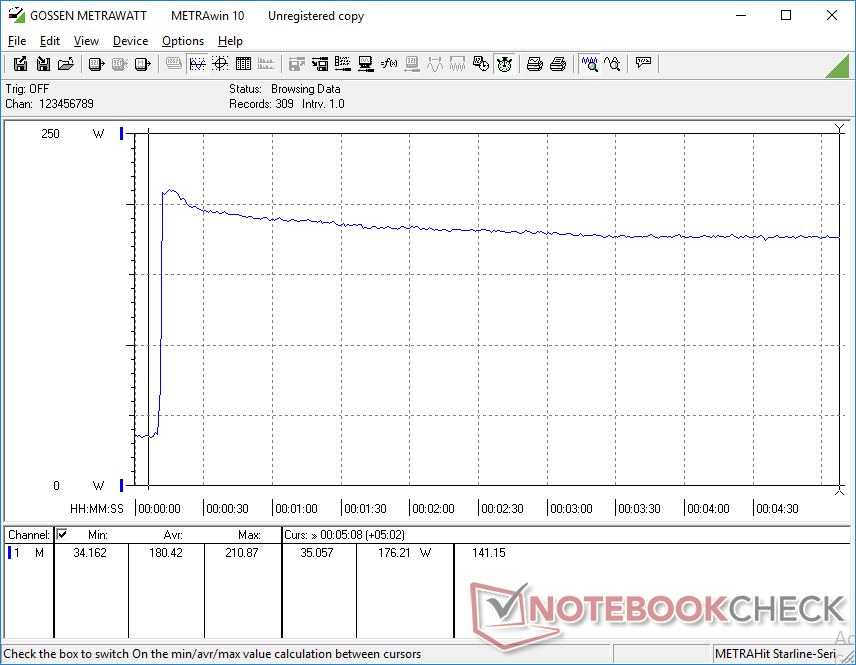
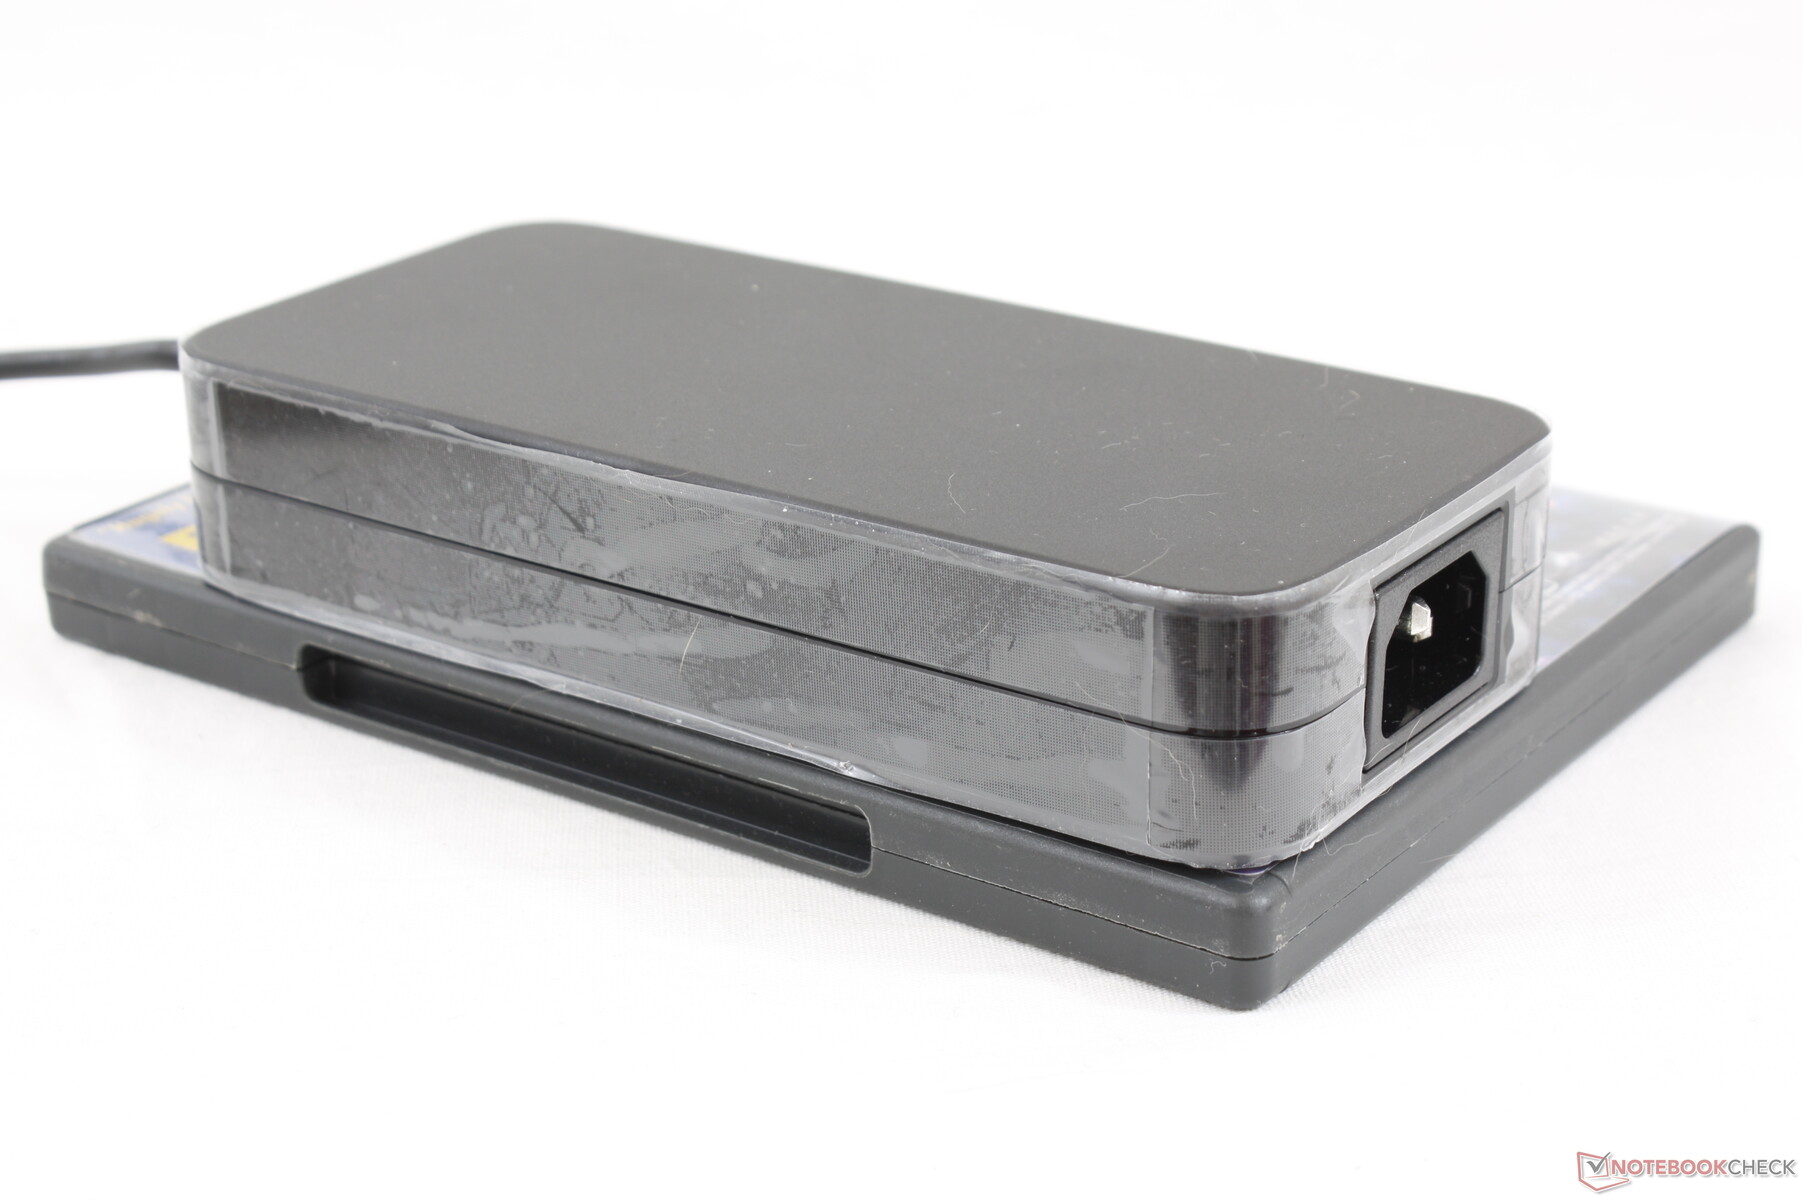
We're able to record a maximum of 210.9 W from the relatively large (~16.5 x 7.5 x 3.3 cm) 230 W AC adapter when running Prime95 and FurMark simultaneously. This peak is only temporary as shown by the graphs below.
| Off / Standby | |
| Idle | |
| Load |
|
Key:
min: | |
| MSI GS66 10SGS i7-10750H, GeForce RTX 2080 Super Max-Q, Samsung SSD PM981 MZVLB512HAJQ, IPS, 1920x1080, 15.6" | MSI GS65 Stealth 9SG i7-9750H, GeForce RTX 2080 Max-Q, Samsung SSD PM981 MZVLB512HAJQ, IPS, 1920x1080, 15.6" | Asus Zephyrus S GX502GW i7-9750H, GeForce RTX 2070 Mobile, 2x Intel SSD 660p SSDPEKNW512G8 (RAID 0), IPS, 1920x1080, 15.6" | Razer Blade 15 RTX 2080 Max-Q i7-9750H, GeForce RTX 2080 Max-Q, Samsung SSD PM981 MZVLB512HAJQ, IPS, 1920x1080, 15.6" | HP Omen X 2S 15-dg0075cl i7-9750H, GeForce RTX 2070 Max-Q, WDC PC SN720 SDAPNTW-1T00, IPS, 1920x1080, 15.6" | Lenovo Legion Y740-15ICHg i7-9750H, GeForce RTX 2070 Max-Q, WDC PC SN520 SDAPMUW-128G, IPS, 1920x1080, 15.6" | MSI GS66 Stealth 10SFS i9-10980HK, GeForce RTX 2070 Super Max-Q, Samsung SSD PM981 MZVLB1T0HALR, IPS, 1920x1080, 15.6" | |
|---|---|---|---|---|---|---|---|
| Power Consumption | -8% | -31% | 9% | -97% | -15% | -1% | |
| Idle Minimum * (Watt) | 14.9 | 18.3 -23% | 24 -61% | 12.5 16% | 46 -209% | 22.2 -49% | 13 13% |
| Idle Average * (Watt) | 17.5 | 22 -26% | 27 -54% | 15.3 13% | 59 -237% | 24.9 -42% | 16 9% |
| Idle Maximum * (Watt) | 29.5 | 28.8 2% | 33 -12% | 20.7 30% | 65.5 -122% | 30.6 -4% | 27 8% |
| Load Average * (Watt) | 94.8 | 93 2% | 129 -36% | 90.2 5% | 99.8 -5% | 101 -7% | 109 -15% |
| Witcher 3 ultra * (Watt) | 146.1 | 142.6 2% | 176 -20% | 162 -11% | 154.1 -5% | 143 2% | 155 -6% |
| Load Maximum * (Watt) | 210.9 | 215.9 -2% | 216 -2% | 209.3 1% | 222.7 -6% | 186 12% | 236 -12% |
* ... smaller is better
Battery Life
One of the major differences between the GS65 and newer GS66 is the increase in battery capacity from 82 Wh to 99 Wh. There is no consumer laptop with an integrated battery pack larger than 99 Wh since the FAA does not allow batteries higher than 100 Wh onboard commercial aircraft. The result is a long battery life especially for a gaming laptop with RTX 2080 graphics at almost 7 hours of real-world WLAN use. Be sure to set the system to Power Saver or Balanced mode to reduce power consumption as mentioned above.
A drawback to the large battery capacity is the slower charging rate. Expect to wait around 2.5 to 3 hours for a full charge compared to 1.5 to 2 hours on most other laptops. The system cannot be recharged via USB Type-C unlike on the Asus Zephyrus M.
| MSI GS66 10SGS i7-10750H, GeForce RTX 2080 Super Max-Q, 99.99 Wh | MSI GS65 Stealth 9SG i7-9750H, GeForce RTX 2080 Max-Q, 82 Wh | Asus Zephyrus S GX502GW i7-9750H, GeForce RTX 2070 Mobile, 76 Wh | Razer Blade 15 RTX 2080 Max-Q i7-9750H, GeForce RTX 2080 Max-Q, 80 Wh | Lenovo Legion Y740-15ICHg i7-9750H, GeForce RTX 2070 Max-Q, 57 Wh | MSI GS66 Stealth 10SFS i9-10980HK, GeForce RTX 2070 Super Max-Q, 99.99 Wh | |
|---|---|---|---|---|---|---|
| Battery runtime | -13% | -42% | 19% | -57% | -8% | |
| Reader / Idle (h) | 10.2 | 5.9 -42% | 15.9 56% | 8.4 -18% | ||
| WiFi v1.3 (h) | 6.9 | 6 -13% | 3.7 -46% | 6.6 -4% | 3 -57% | 6.1 -12% |
| Load (h) | 1.6 | 1 -37% | 1.7 6% | 1.7 6% |
Pros
Cons
Verdict

The MSI GS66 comes in several SKUs with two CPU options (Core i7-10750H, Core i9-10980HK) and three GPU options (GeForce RTX 2060, RTX 2070 Super Max-Q, RTX 2080 Super Max-Q). The two SKUs we've tested so far are the GS66 10SGS (Core i7-10750H, RTX 2080 Super Max-Q) and GS66 10SFS (Core i9-10980HK, RTX 2070 Super Max-Q). If we had to choose between the faster CPU with slower GPU or slower CPU with faster GPU for gaming purposes, it would definitely be the latter as games will still run marginally faster overall with this configuration.
If you intend to use the GS66 for CPU heavy tasks outside of gaming, then the octa-core Core i9 SKU might make more sense because of its 25 to 35 percent faster multi-thread performance advantage over the hexa-core Core i7. Otherwise, any differences would be too marginal when gaming where the faster GPU option often takes precedence. Users who want the best of both worlds can always go with the ultra high-end GS66 10SGS-031 configuration.
Impressive new chassis with not-as-impressive gaming upgrades. The GeForce RTX 2080 Super Max-Q in the GS66 offers just 5 to 10 percent faster graphics performance than the older MSI GS65 with the GeForce RTX 2080 Max-Q. The best reasons to purchase the GS66 over the GS65 are therefore for its stronger chassis design and upgradeability rather than the minor performance gains when gaming.
MSI GS66 10SGS
- 05/17/2020 v7 (old)
Allen Ngo
Price comparison
