Asus ROG Mothership GZ700GX Laptop Review: Out of this world
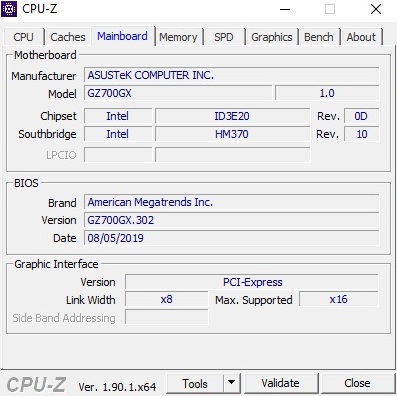
One year ago, we took a closer look at a prototype of the GZ700. Now, at the end of 2019 and although barely any suppliers list the ROG Mothership, the time for the final product has come. The 17-inch device is unlikely to be well-received by the mass market, where it presumably only attracts few buyers. With its lofty price of $6,500, the GZ7000GX is among the most expensive gaming laptops ever (as far as we know, only the Acer Predator 21 X featuring a giant curved display is even more expensive).
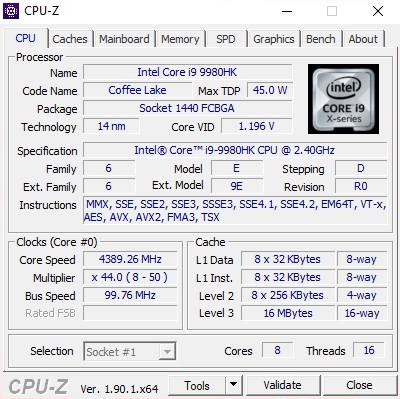
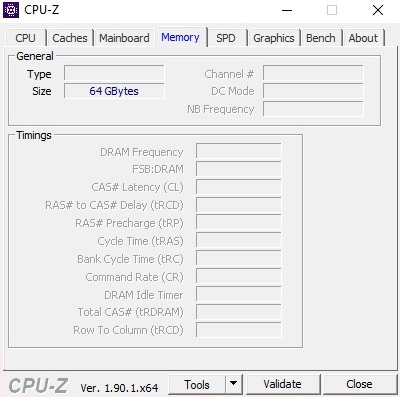
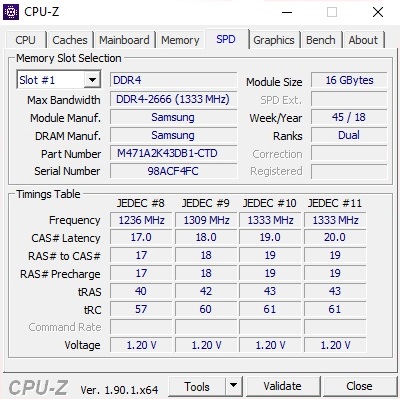
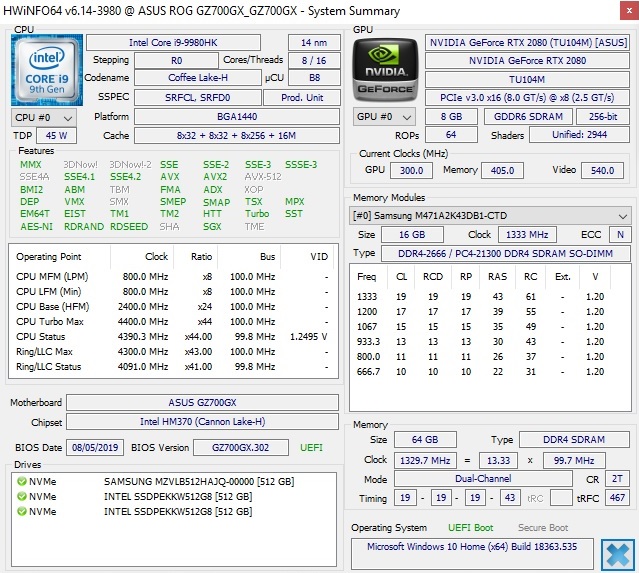
In order to somewhat justify the incredibly high price, Asus integrates a lot of technology into the 2-in-1. The processor is the strongest laptop model from Intel's Coffee Lake generation, the Core i9-9980HK. Similarly, the highest-end model from Nvidia's Turing series, the GeForce RTX 2080, is also on board. This package is rounded-off by 64 GB of DDR4-RAM (4x 16 GB @2,666 MHz) and an SSD RAID that consists of three NVMe SSDs with 512 GB each. Finally, a G-Sync capable IPS panel with 144 Hz produces the image.
Competitors of the GZ700GX include other 17-inch gaming laptops with the RTX 2080 such as the MSI GE75 9SG, HP Omen 17, MSI GT76 9SG, Alienware Area 51m and Asus' own Asus ROG G703GXR. We've included the results from these competitors in the following tables for comparison purposes.
Rating | Date | Model | Weight | Height | Size | Resolution | Price |
|---|---|---|---|---|---|---|---|
| 84.7 % v7 (old) | 12 / 2019 | Asus ROG Mothership GZ700GX i9-9980HK, GeForce RTX 2080 Mobile | 4.8 kg | 30 mm | 17.30" | 1920x1080 | |
| 85.8 % v7 (old) | 10 / 2019 | Asus ROG G703GXR i7-9750H, GeForce RTX 2080 Mobile | 4.7 kg | 48 mm | 17.30" | 1920x1080 | |
| 85.1 % v7 (old) | 08 / 2019 | HP Omen 17-cb0020ng i9-9880H, GeForce RTX 2080 Mobile | 3.3 kg | 27 mm | 17.30" | 1920x1080 | |
| 86.1 % v7 (old) | 05 / 2019 | MSI GE75 9SG i9-9880H, GeForce RTX 2080 Mobile | 2.7 kg | 27.5 mm | 17.30" | 1920x1080 | |
| 85.5 % v7 (old) | 06 / 2019 | MSI GT76 Titan DT 9SG i9-9900K, GeForce RTX 2080 Mobile | 4.2 kg | 42 mm | 17.30" | 1920x1080 | |
| 85.8 % v7 (old) | 03 / 2019 | Alienware Area-51m i9-9900K RTX 2080 i9-9900K, GeForce RTX 2080 Mobile | 3.9 kg | 42 mm | 17.30" | 1920x1080 |
Case
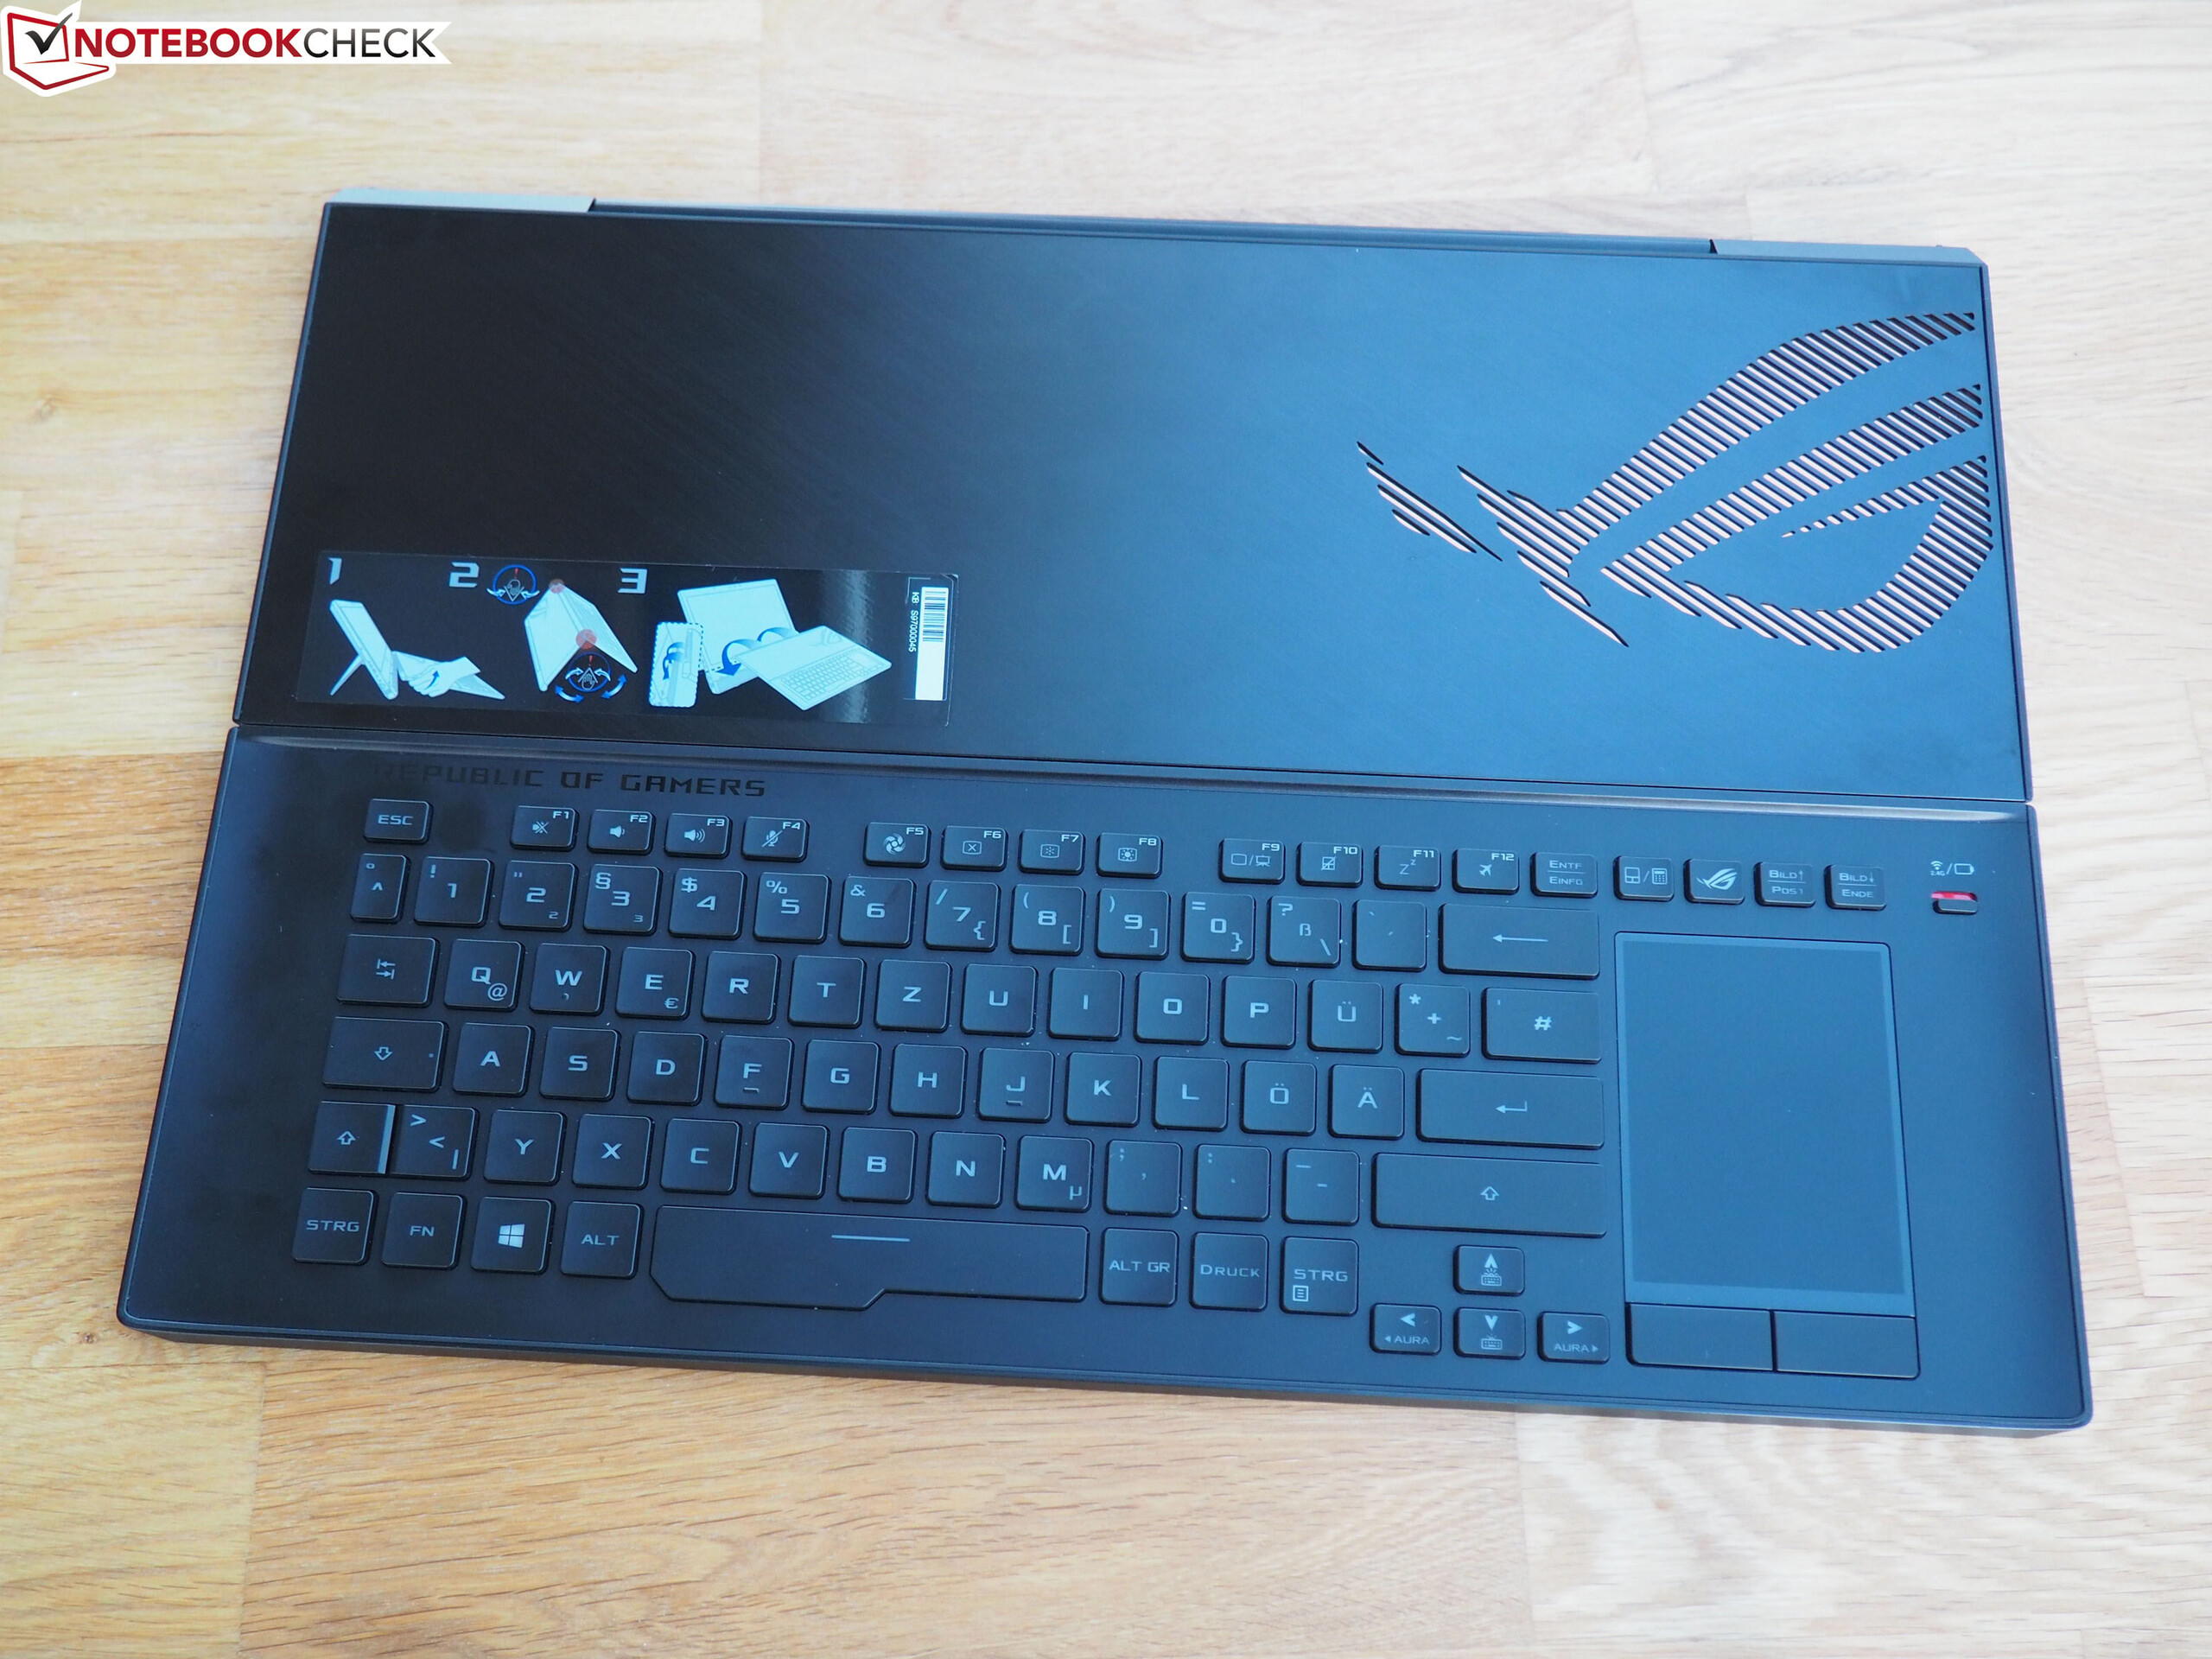
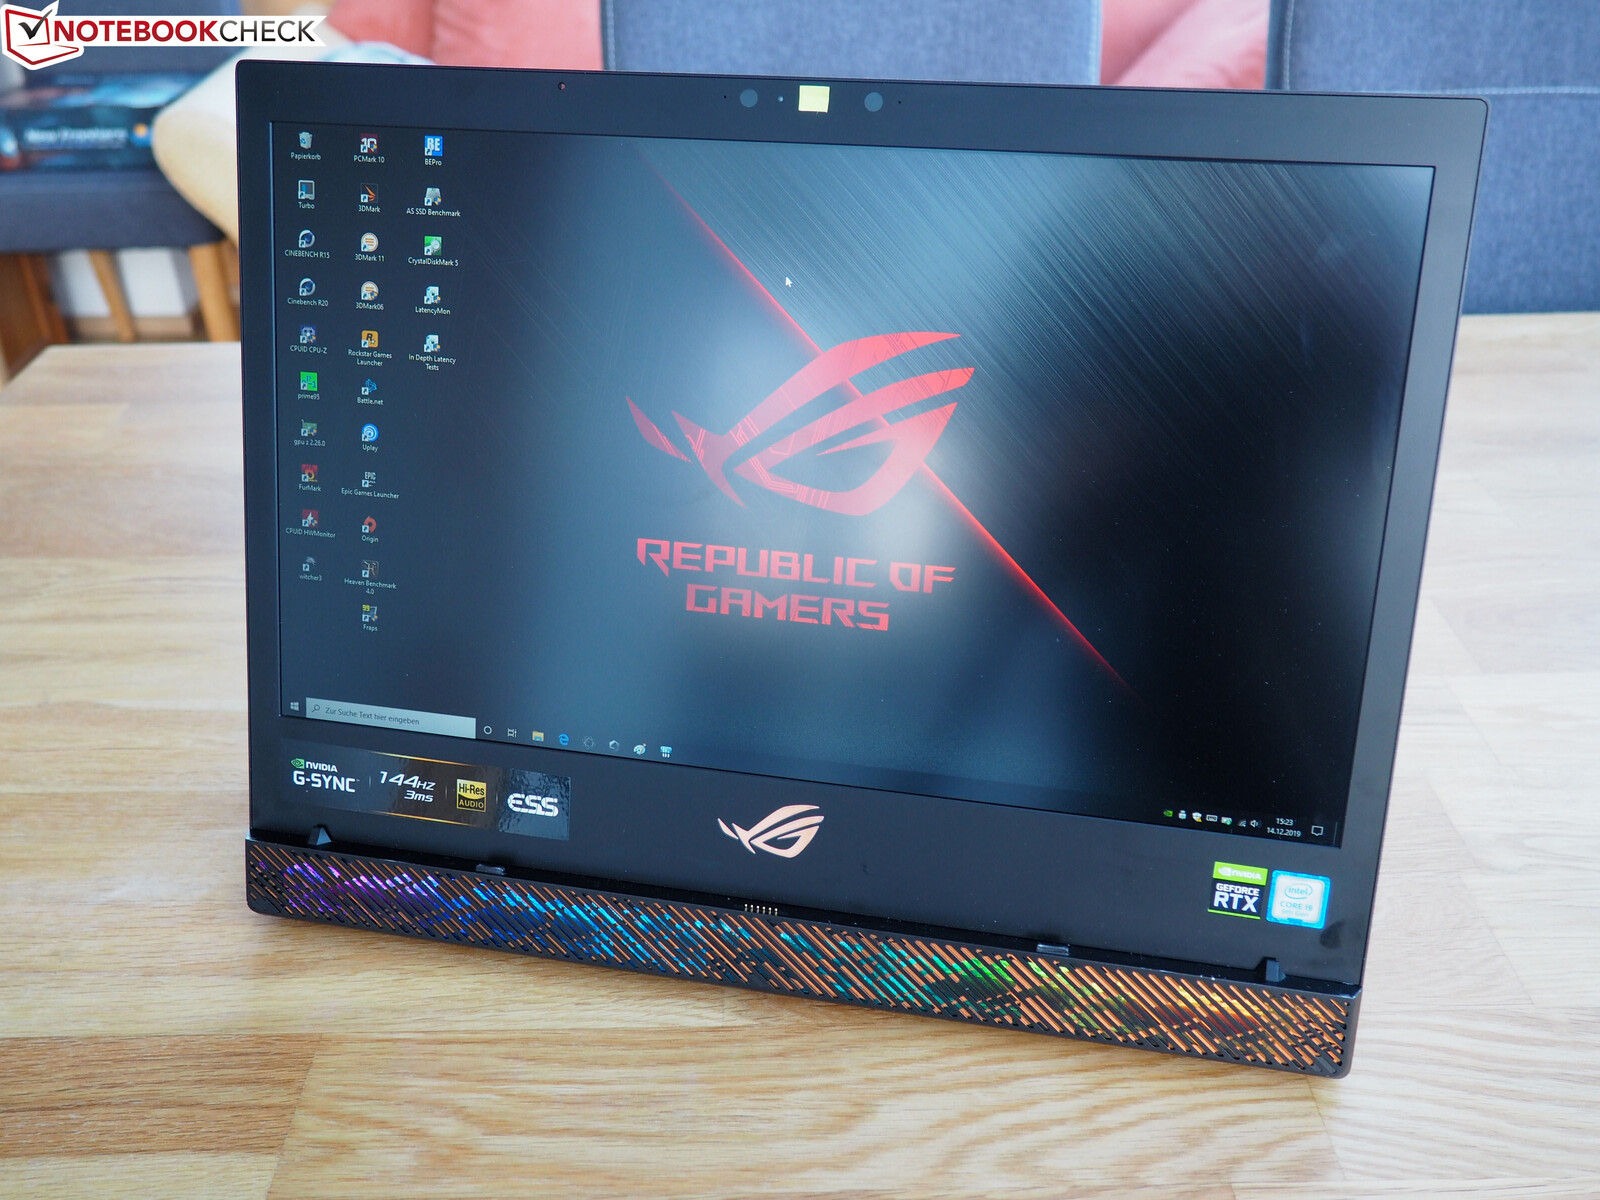
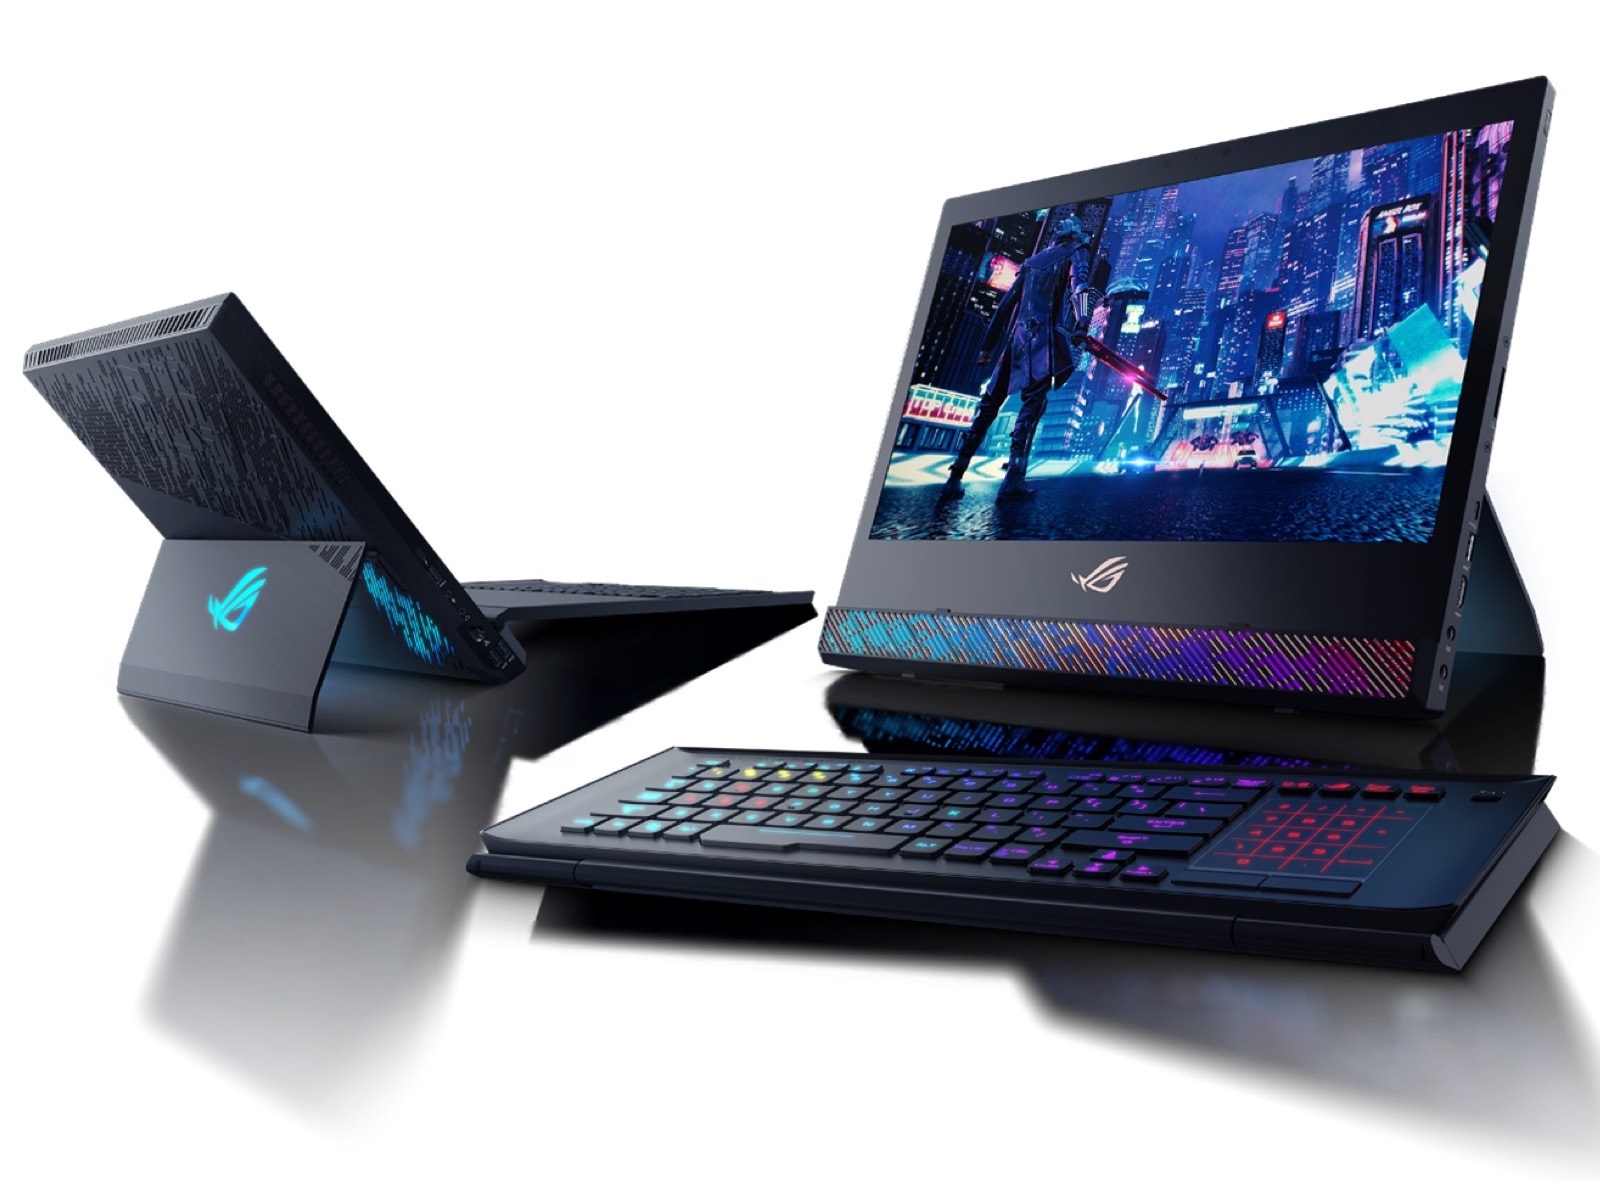
As mentioned before, the ROG Mothership is a 2-in-1 laptop. The keyboard can be detached and folded up for a more flexible user experience, leaving the display standing independently (like a normal monitor). While the mechanism for attaching the keyboard works relatively well thanks to the magnets, it can feel somewhat clunky at times.
The display hinge warrants no criticism. Similarly, the stand showed itself to be surprisingly stable throughout our tests. The same cannot be said for the keyboard, however. While attached, the center area is particularly susceptible to flexing.
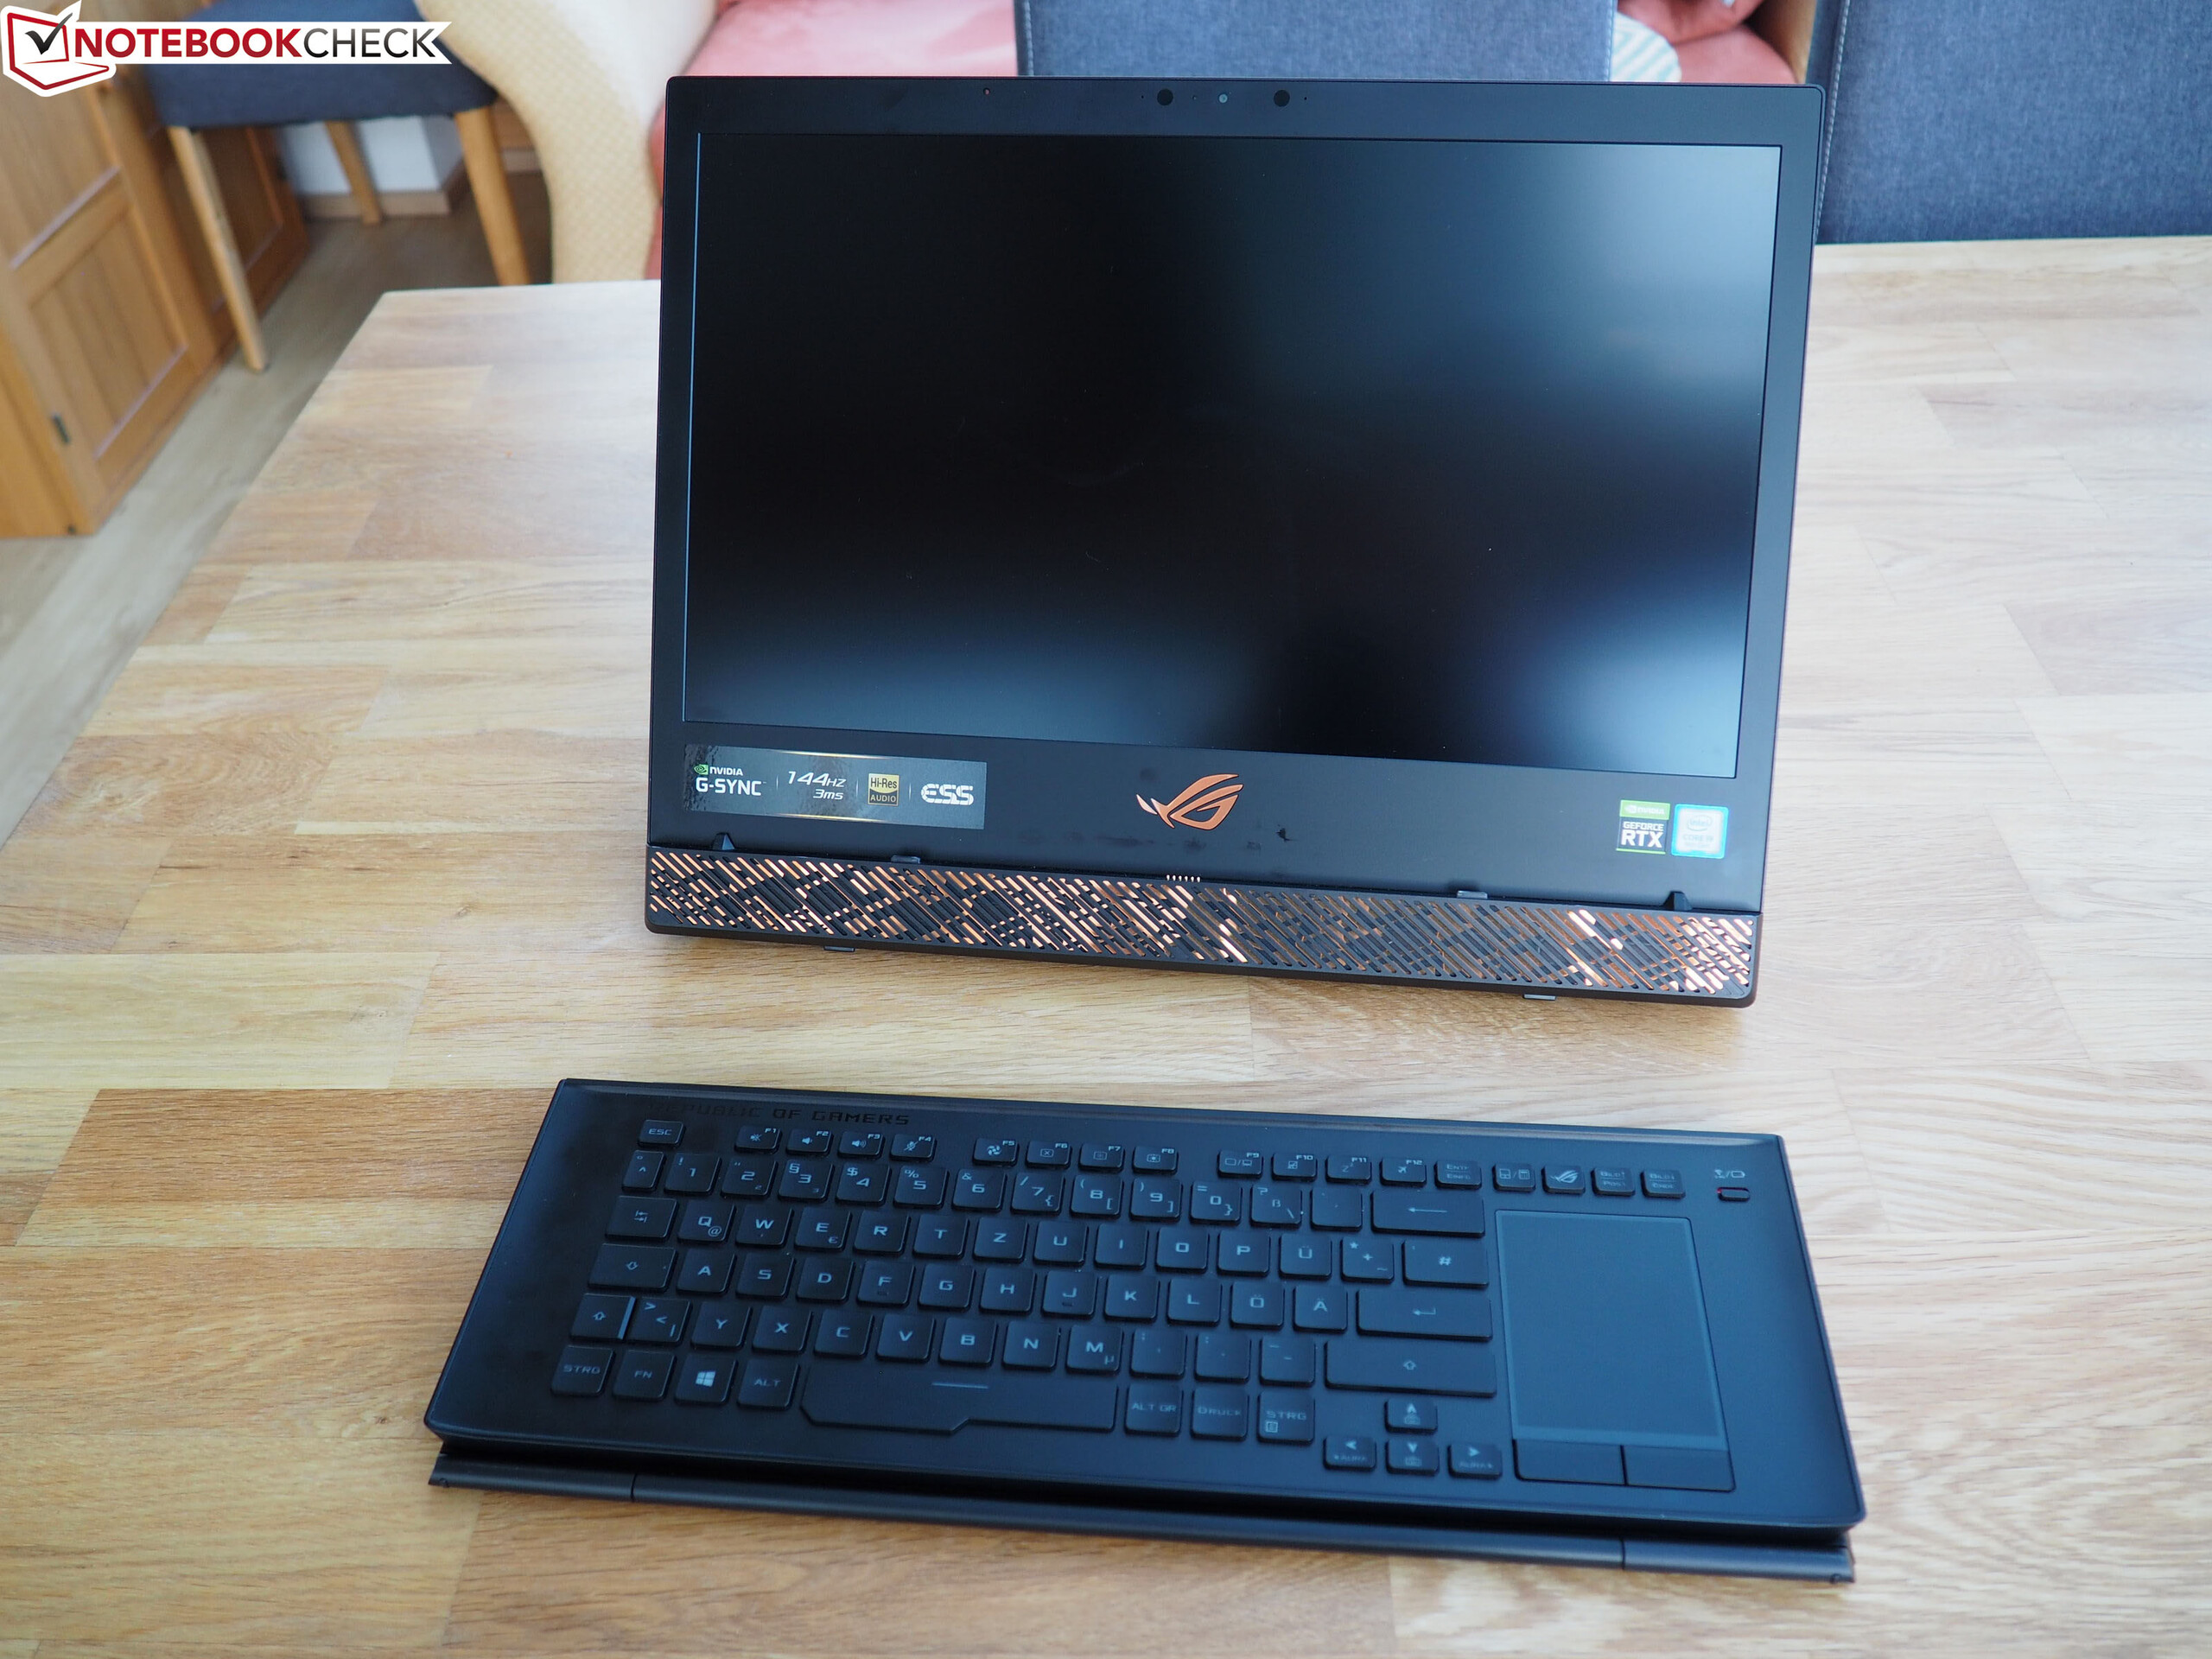
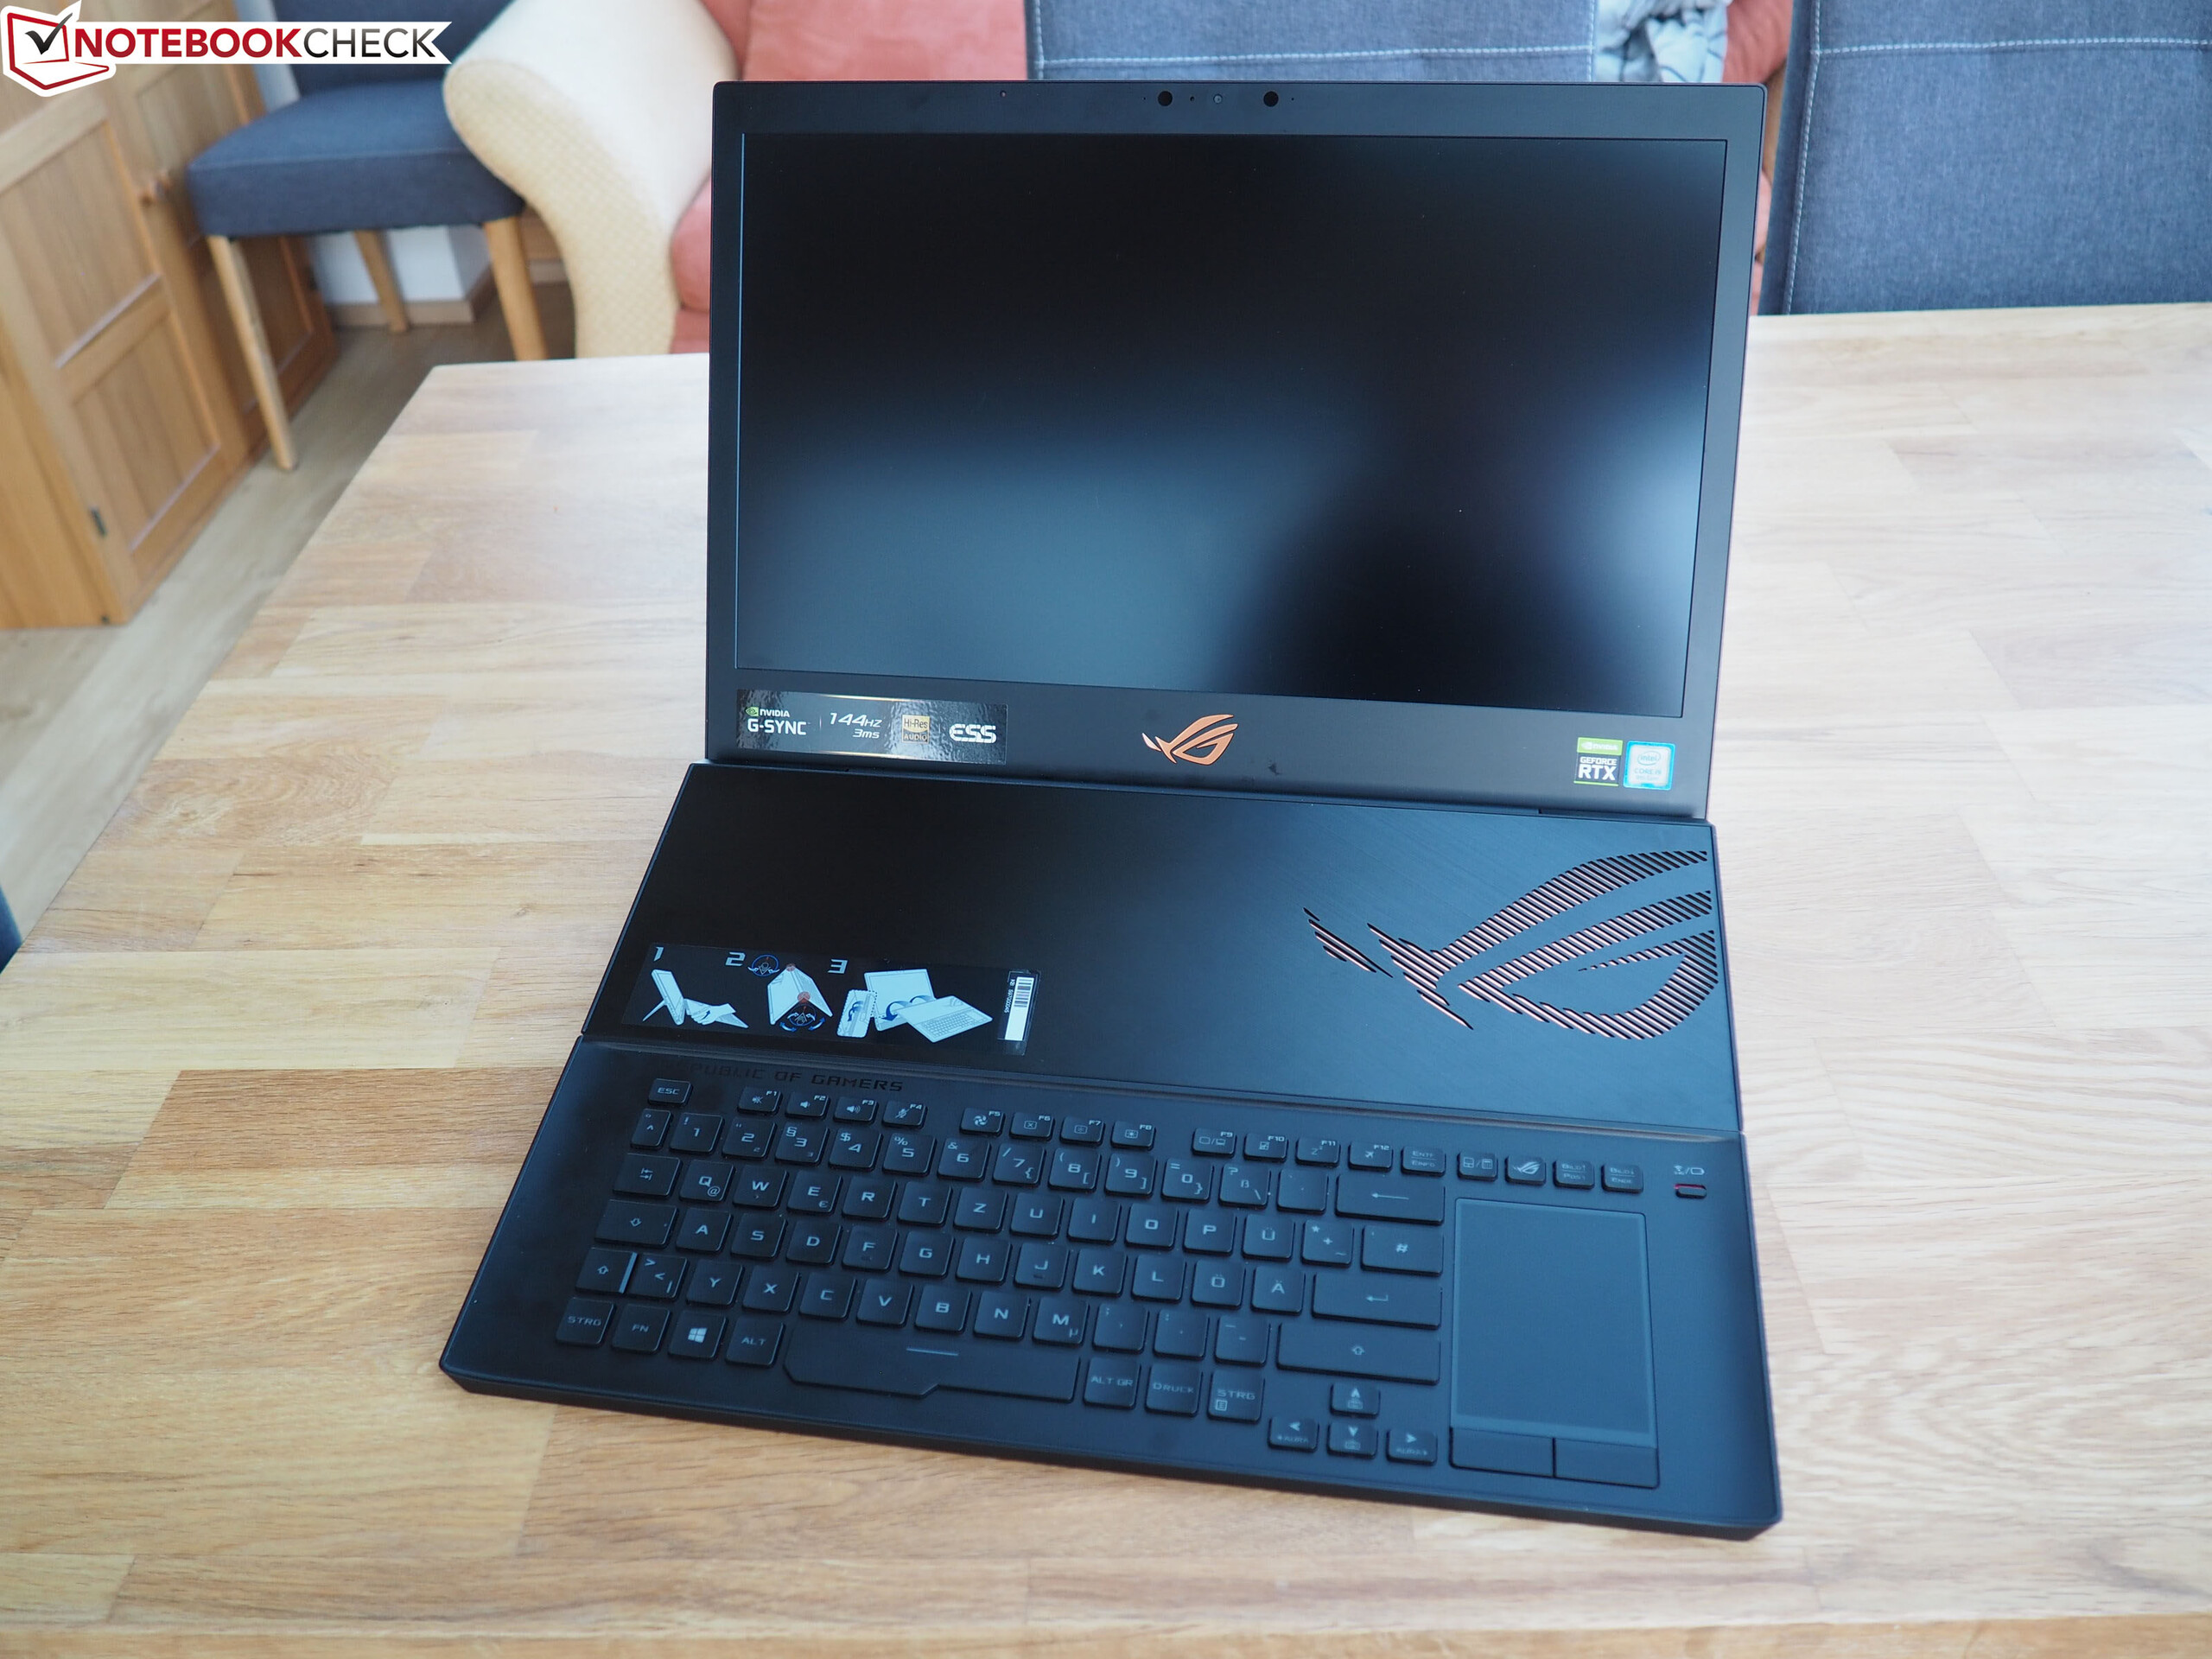
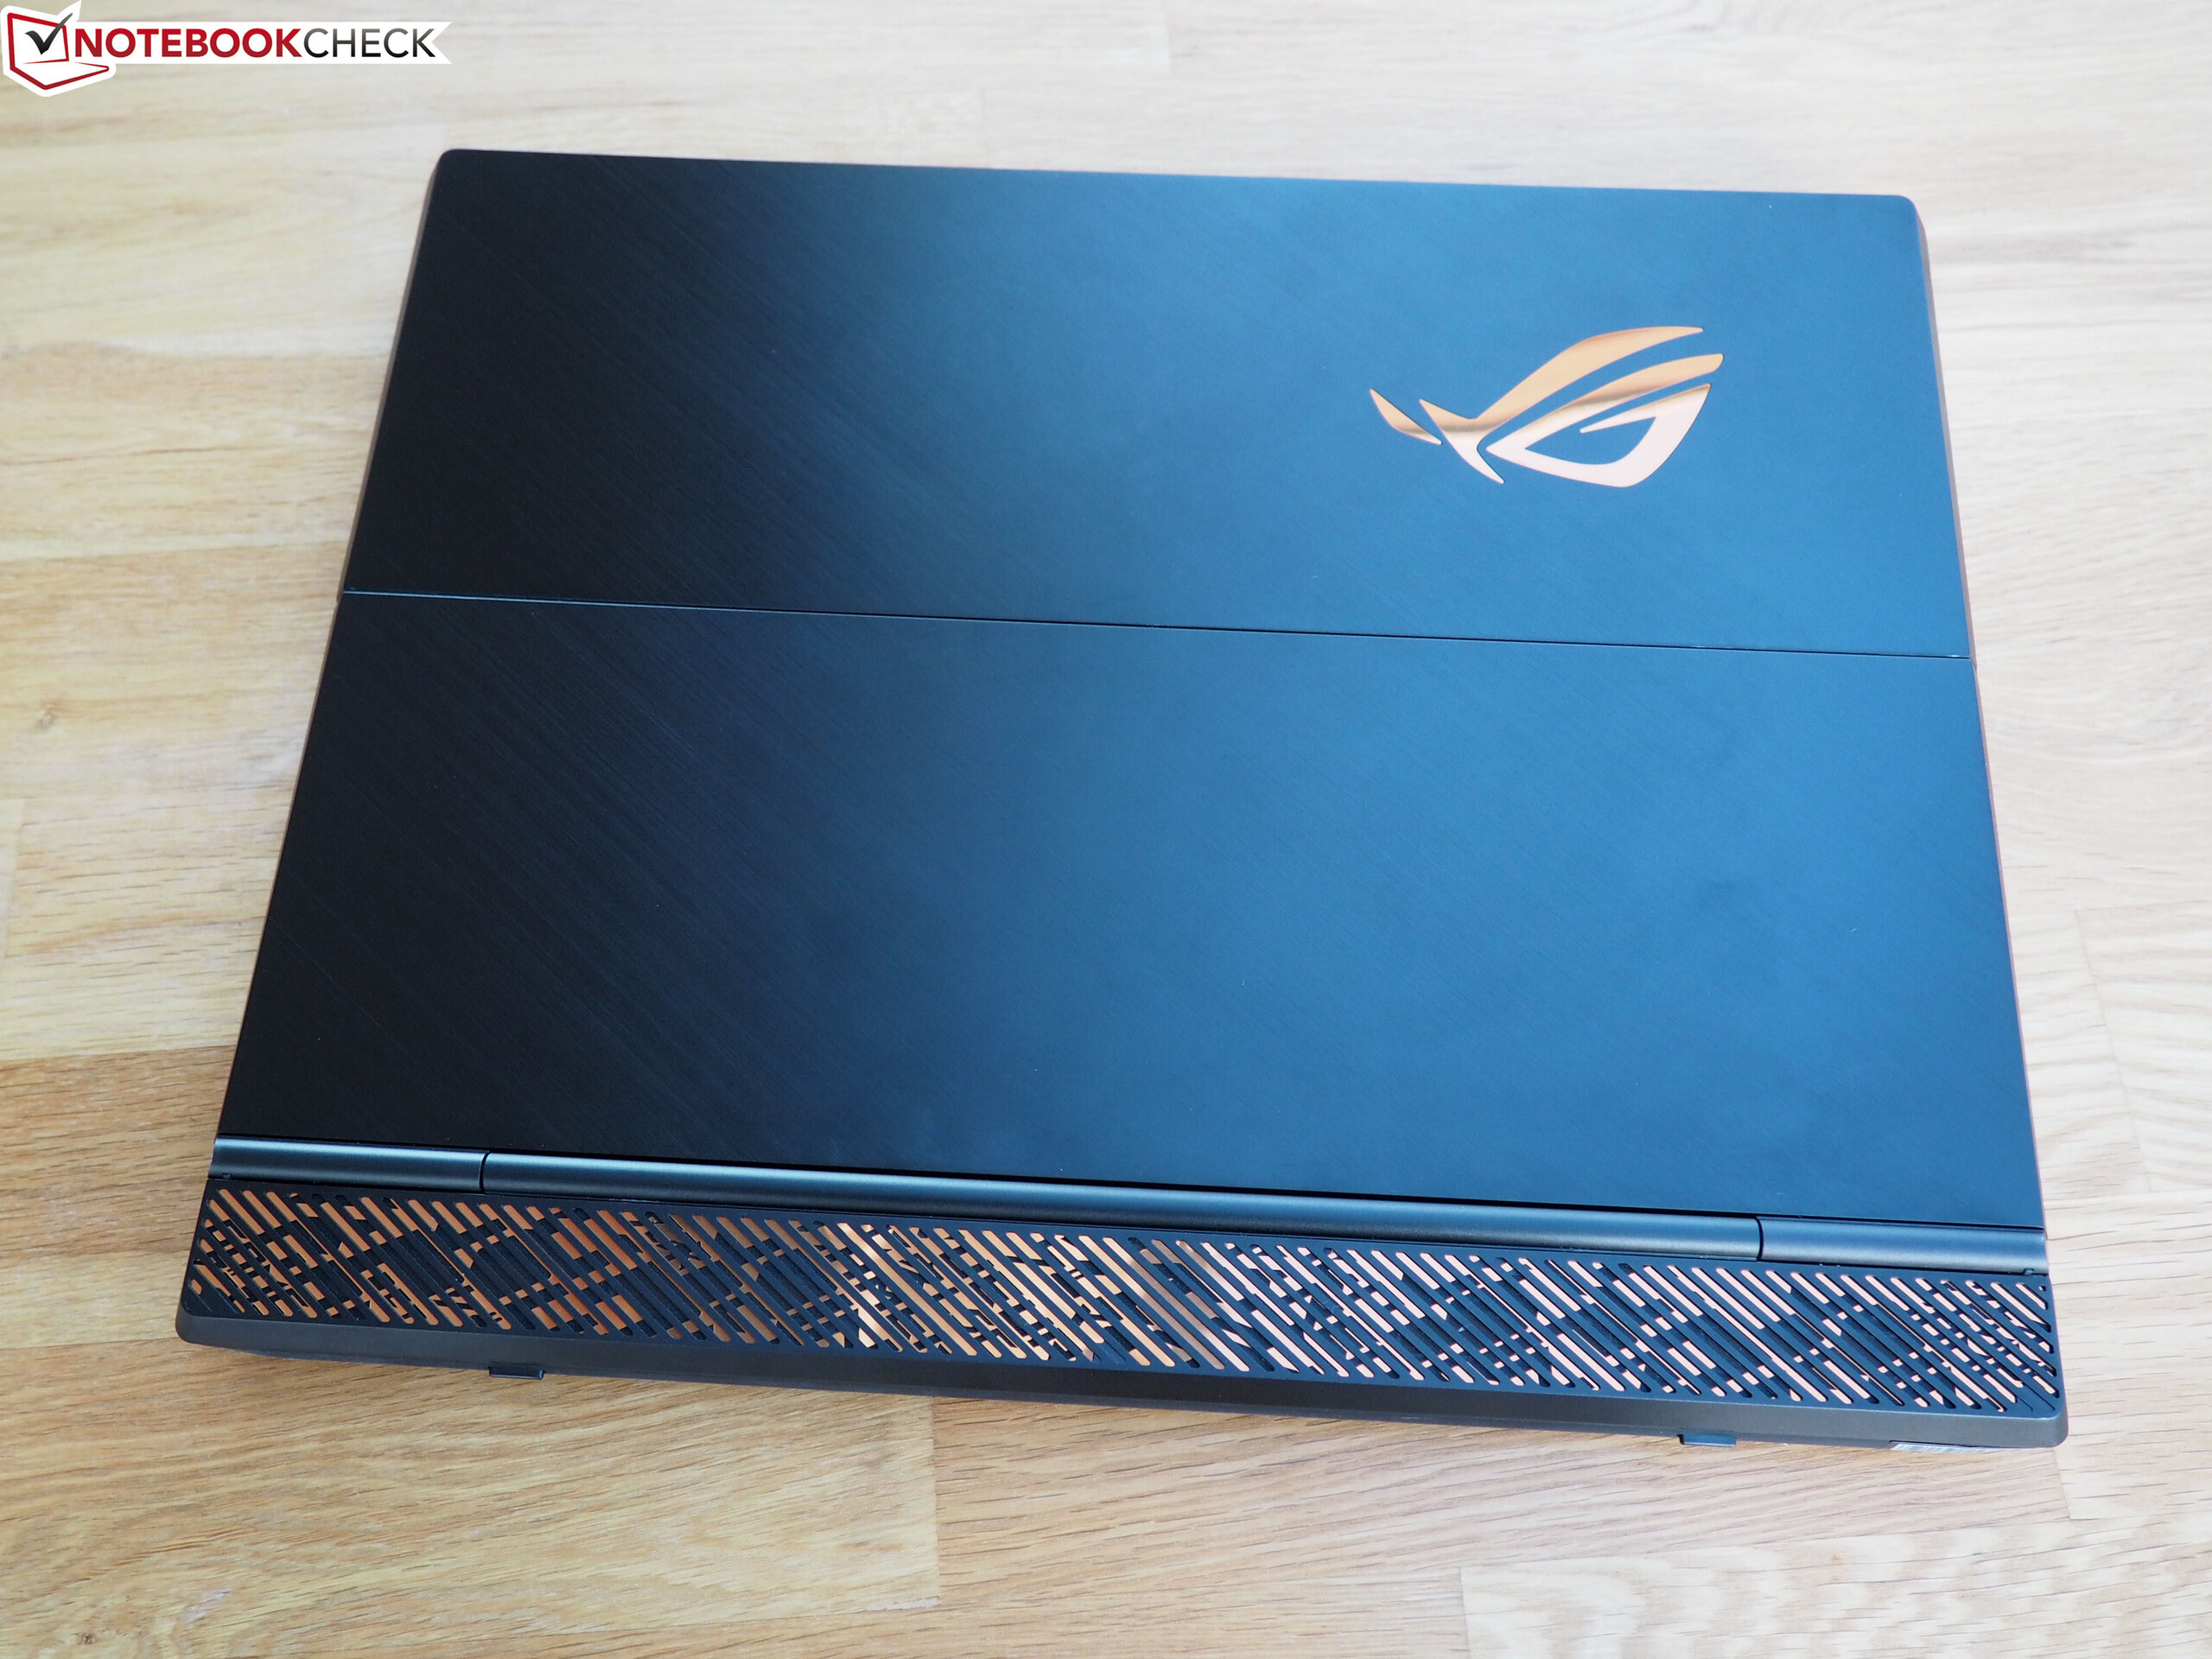
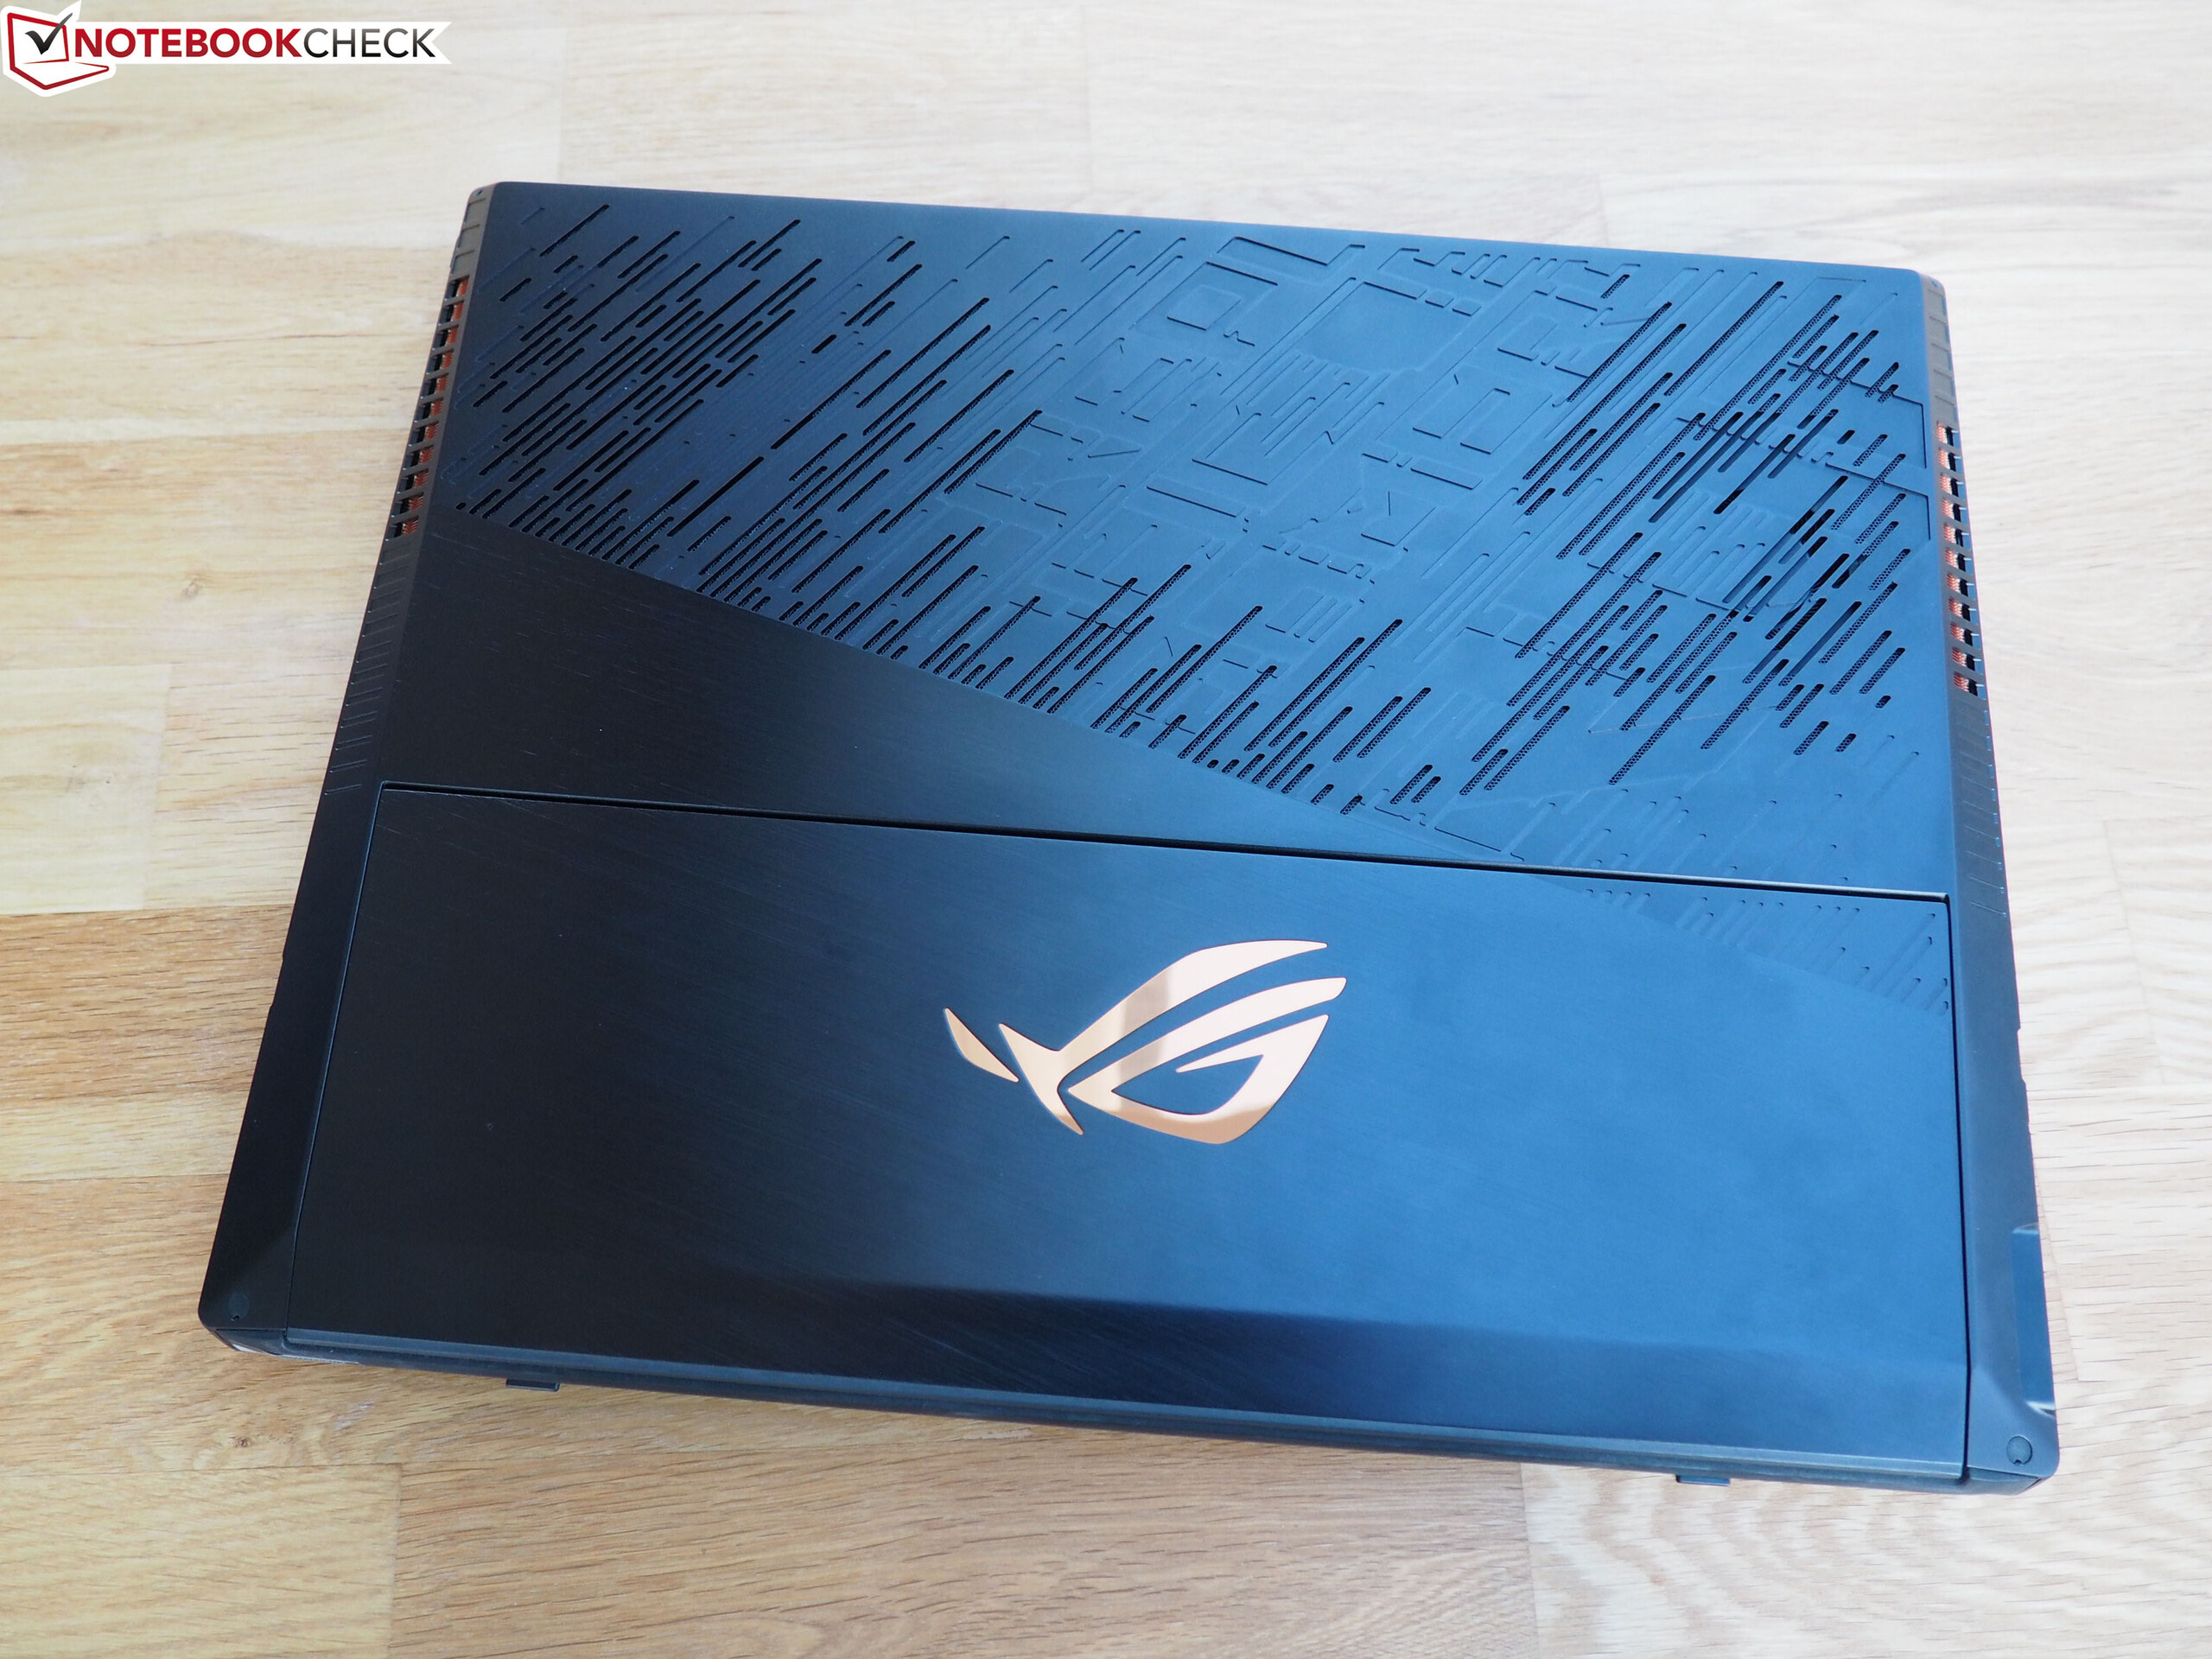
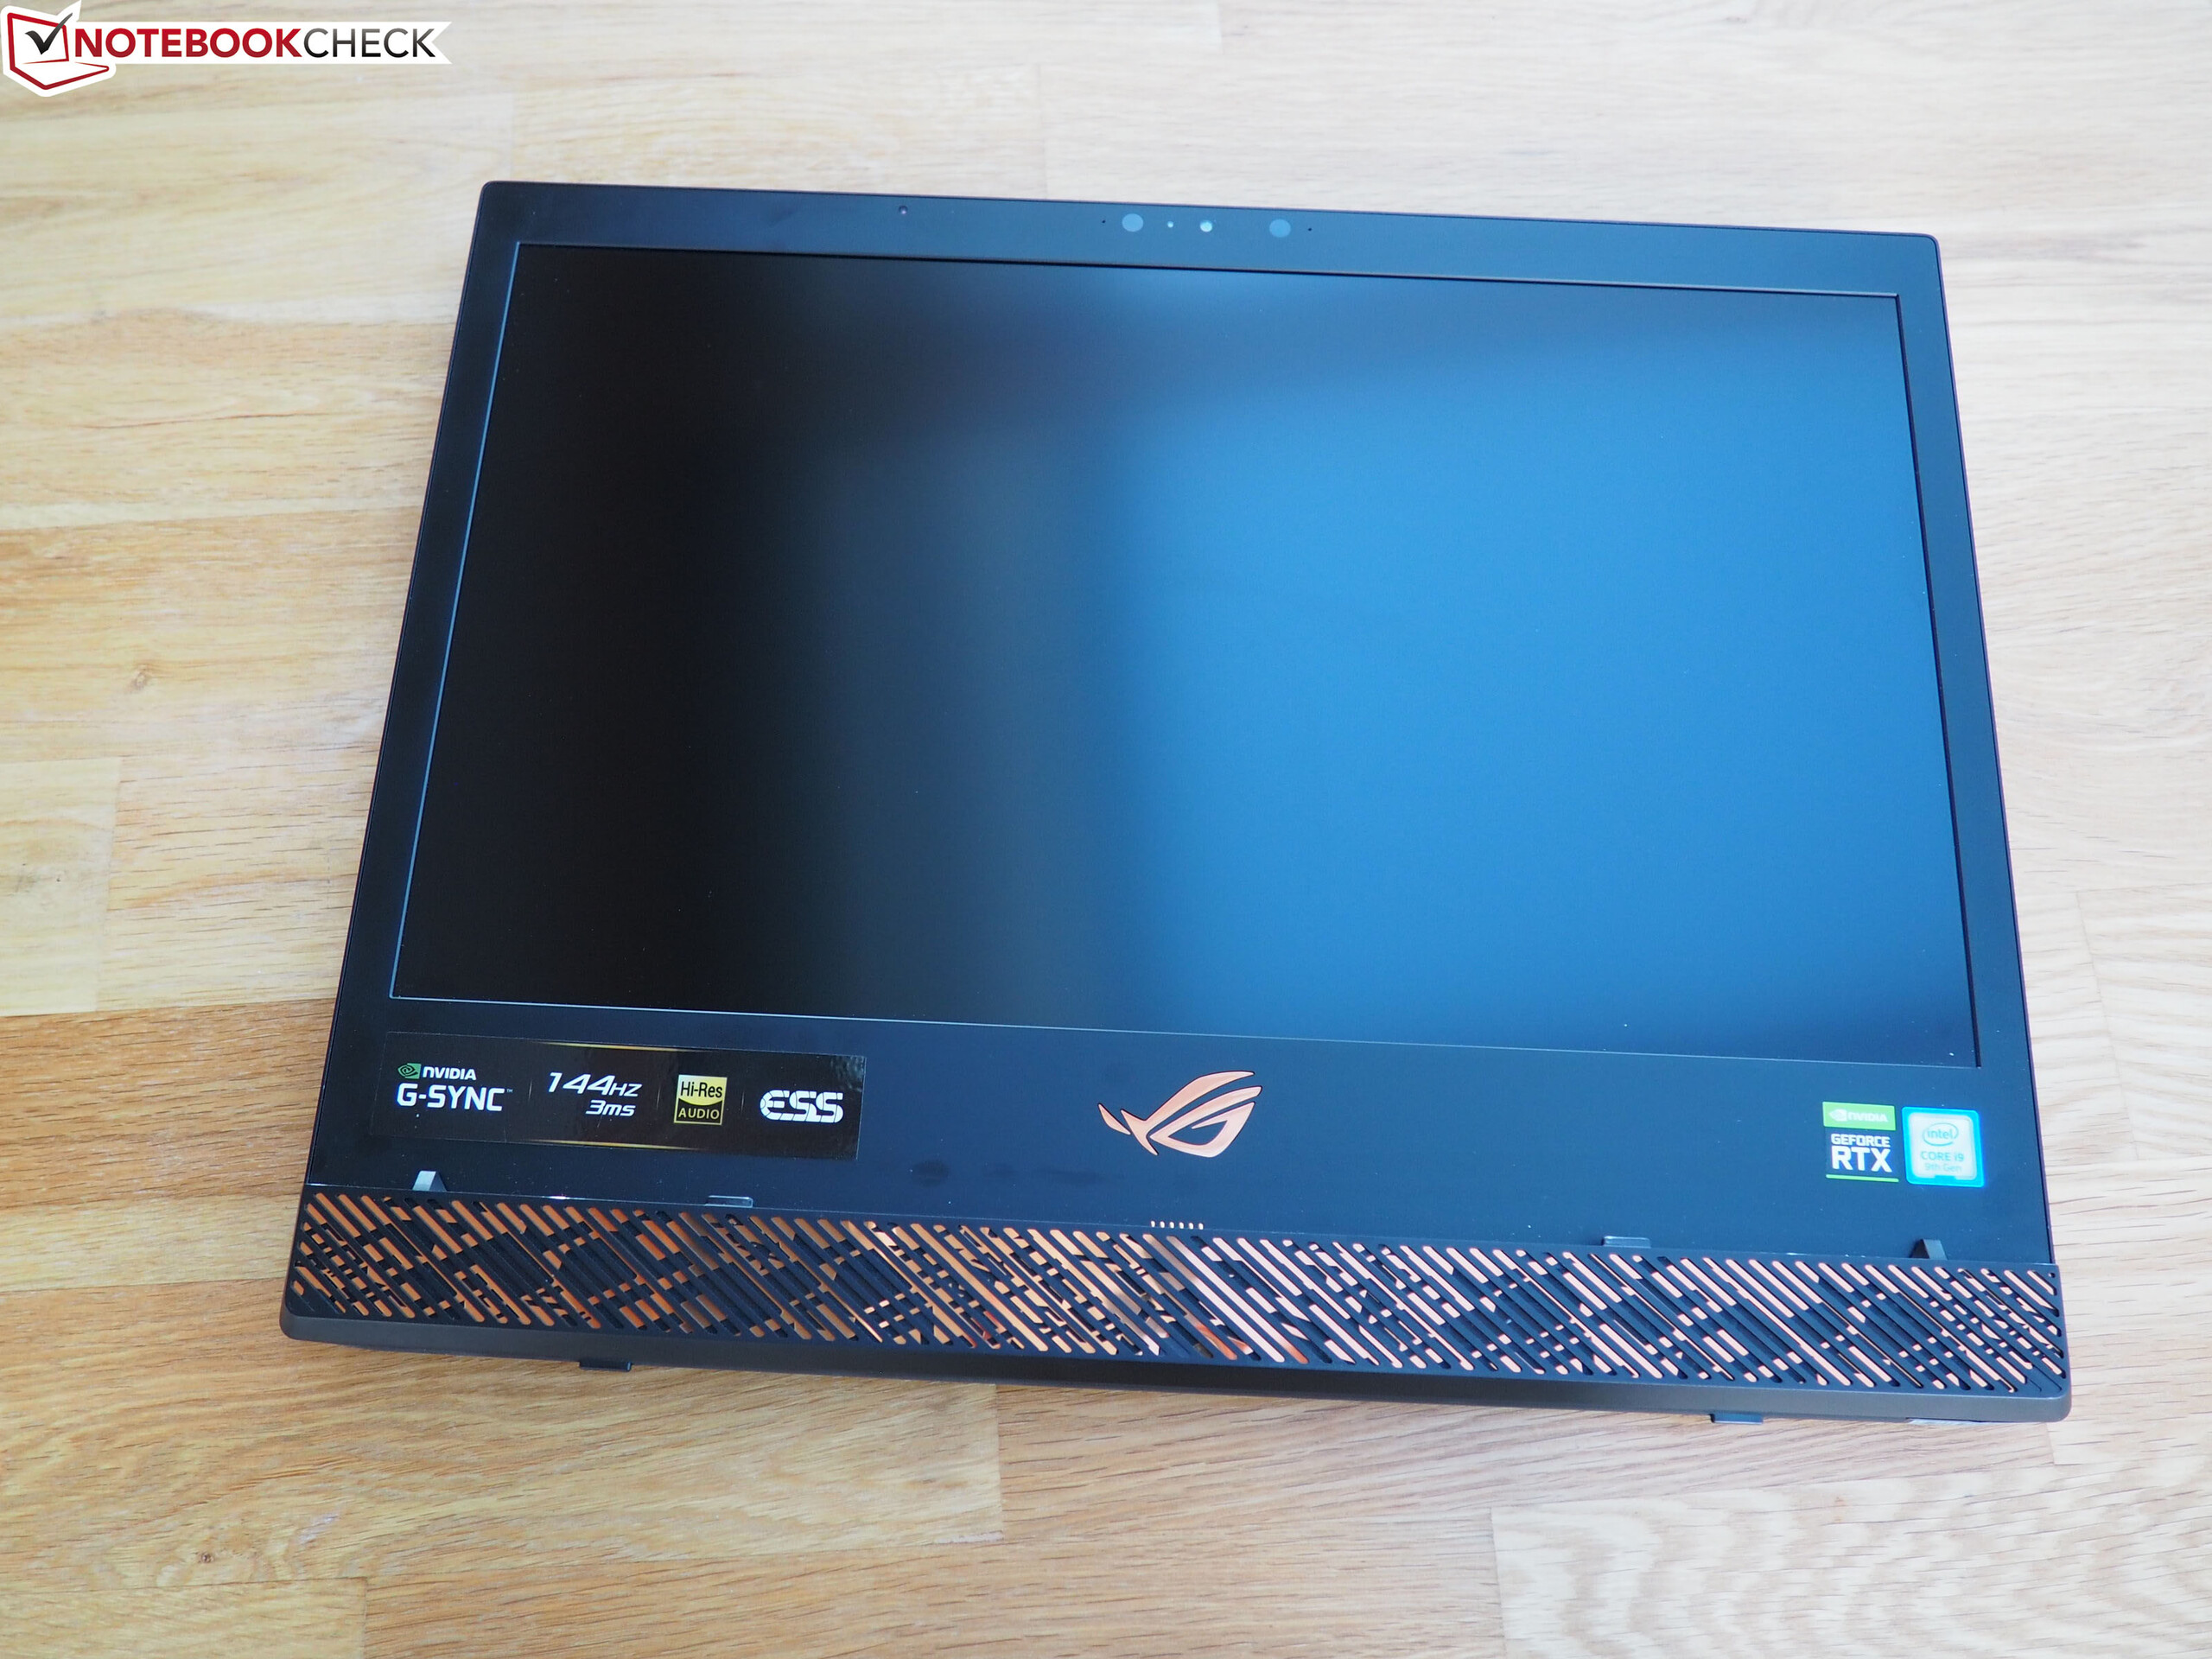
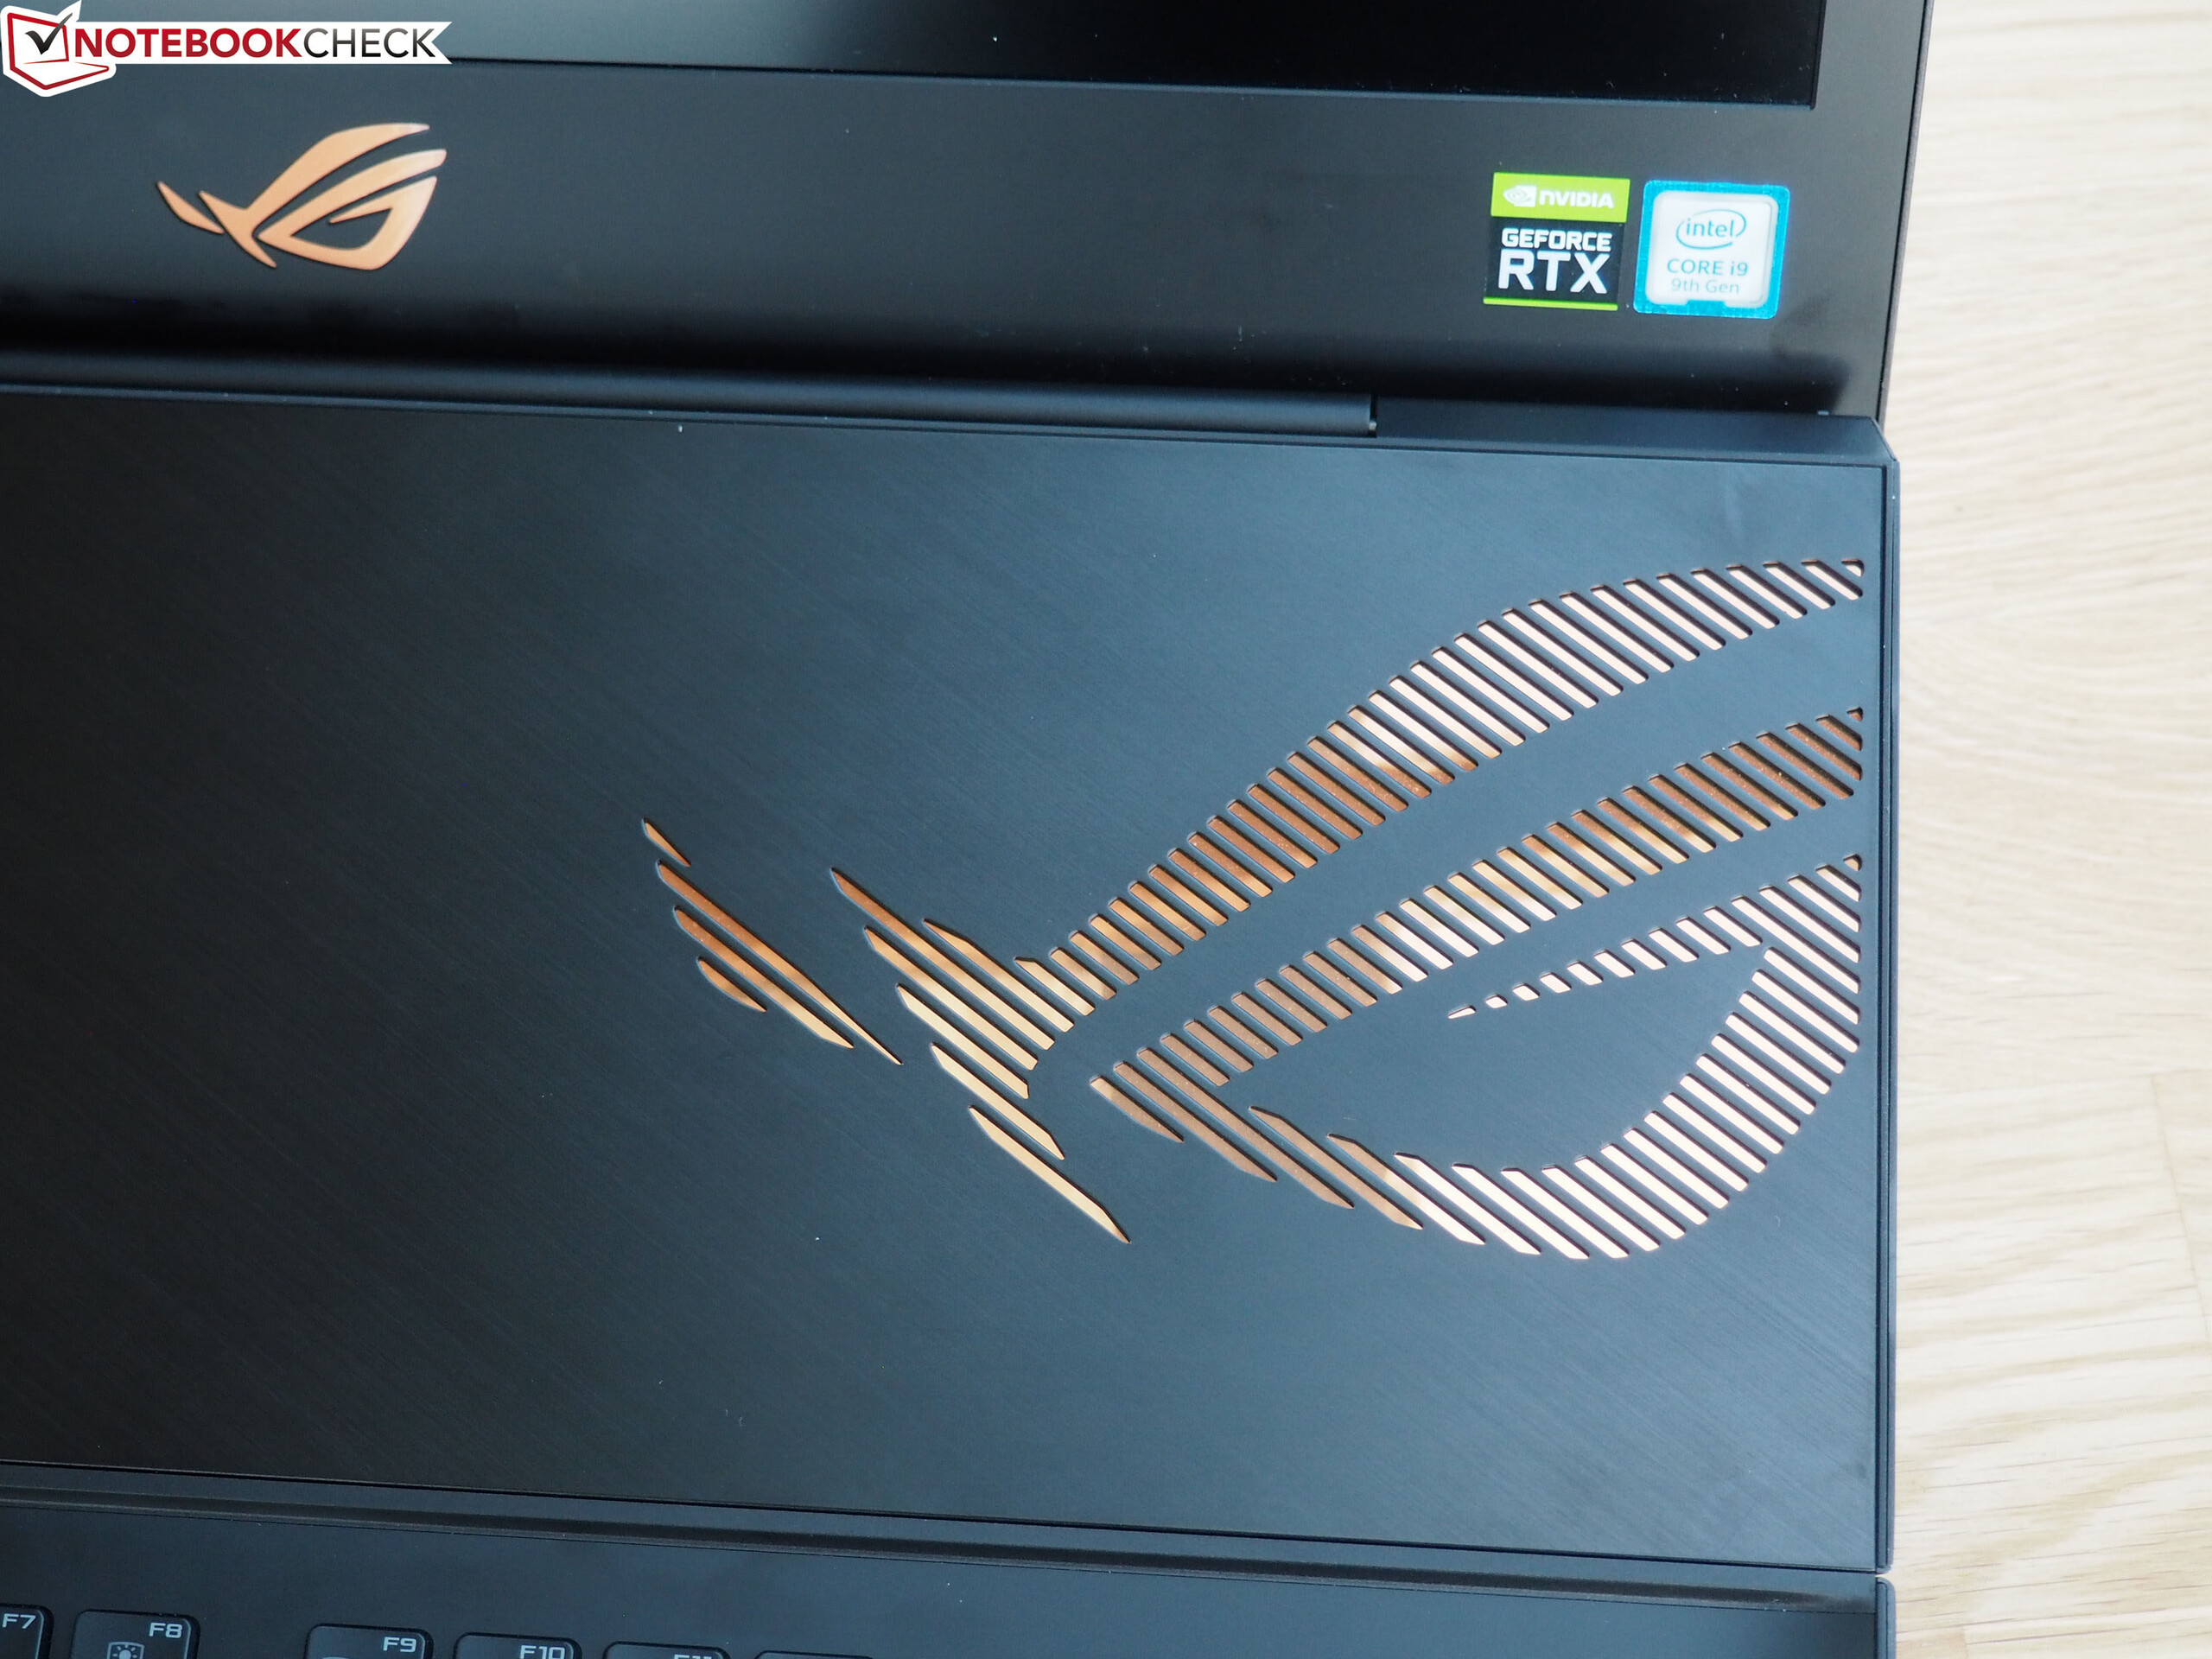
The design looks quite futuristic, which is typical for Asus devices. Not only the keyboard but also the bottom edge of the display border are illuminated. The build quality of the GZ700 is on a very high level. All elements of our test device smoothly transition into one another. The quality of the materials leaves nothing to be desired either. The metal surfaces gives the laptop a premium look and feel.
At 4.8 kg (~10.6 lb), the GZ700 is very heavy. Some of the competing devices are more than 1 kg (~2.2 lb) lighter. In terms of thickness, the Asus laptop falls between the HP Omen 17 or MSI GE75 9SG (2.7 cm/~1.1 in) and the Alienware Area 51m or MSI GT76 9SG (4.2 cm/~1.65 in).
Connectivity
Ports
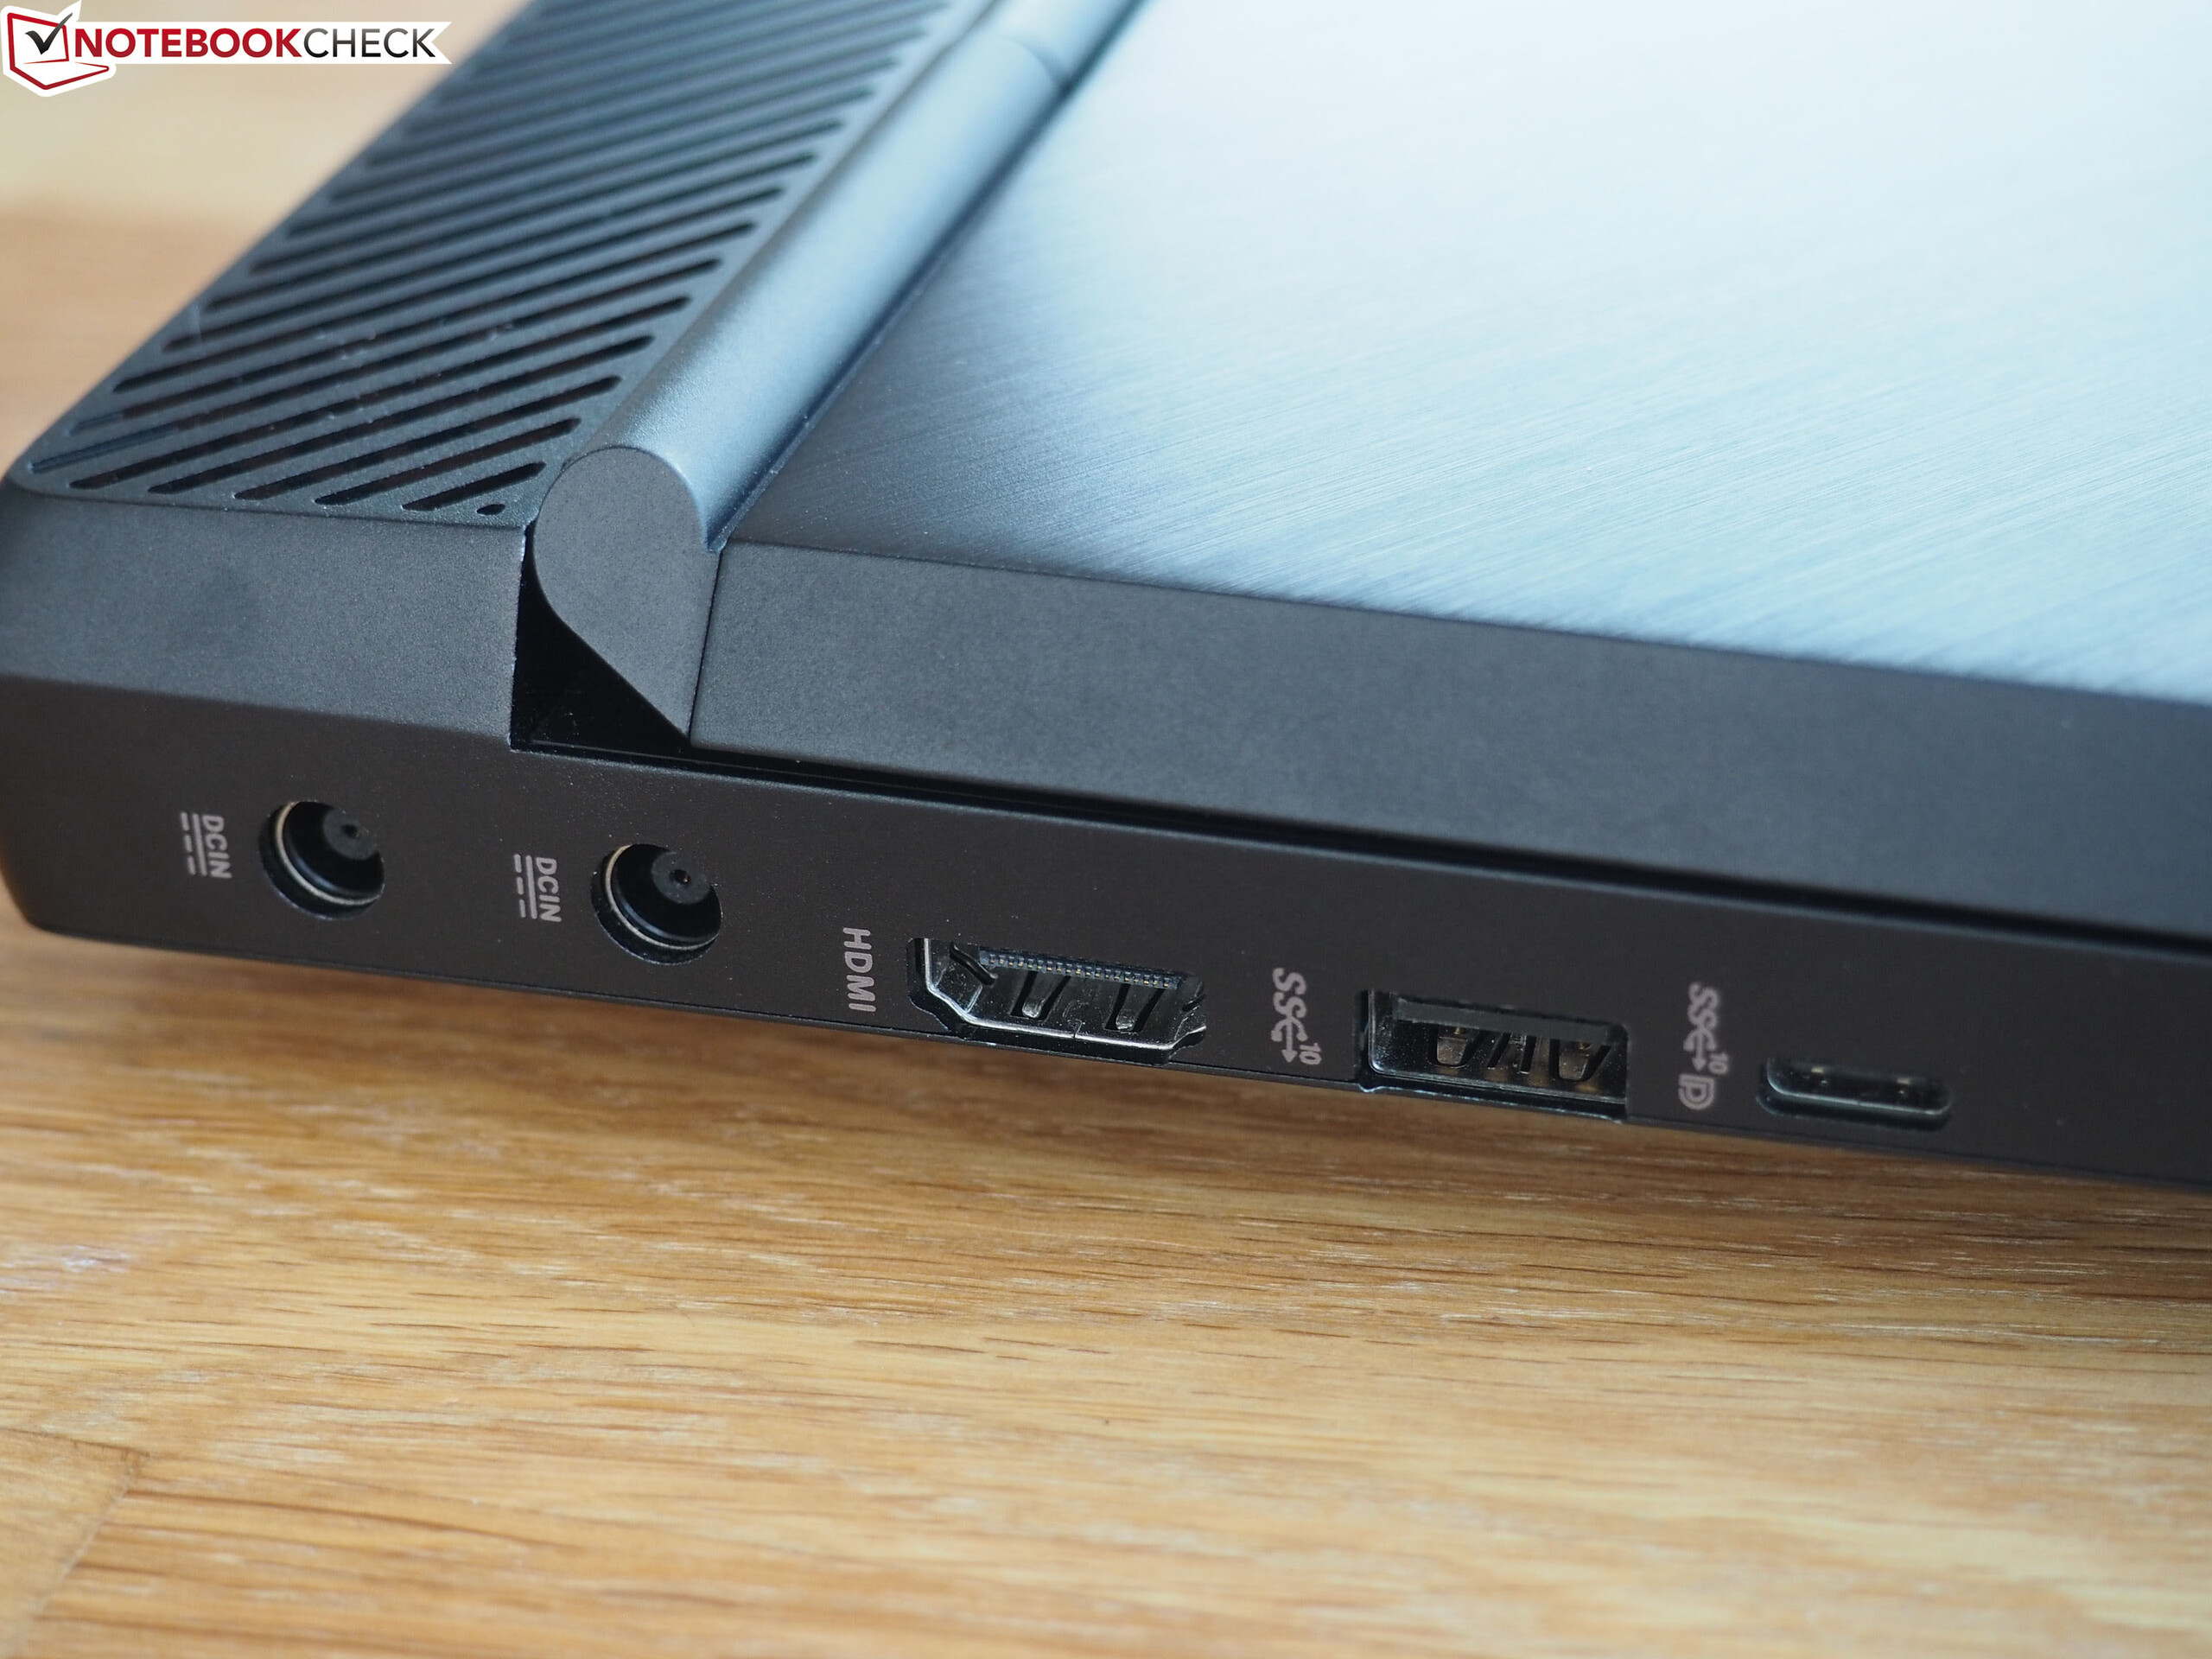
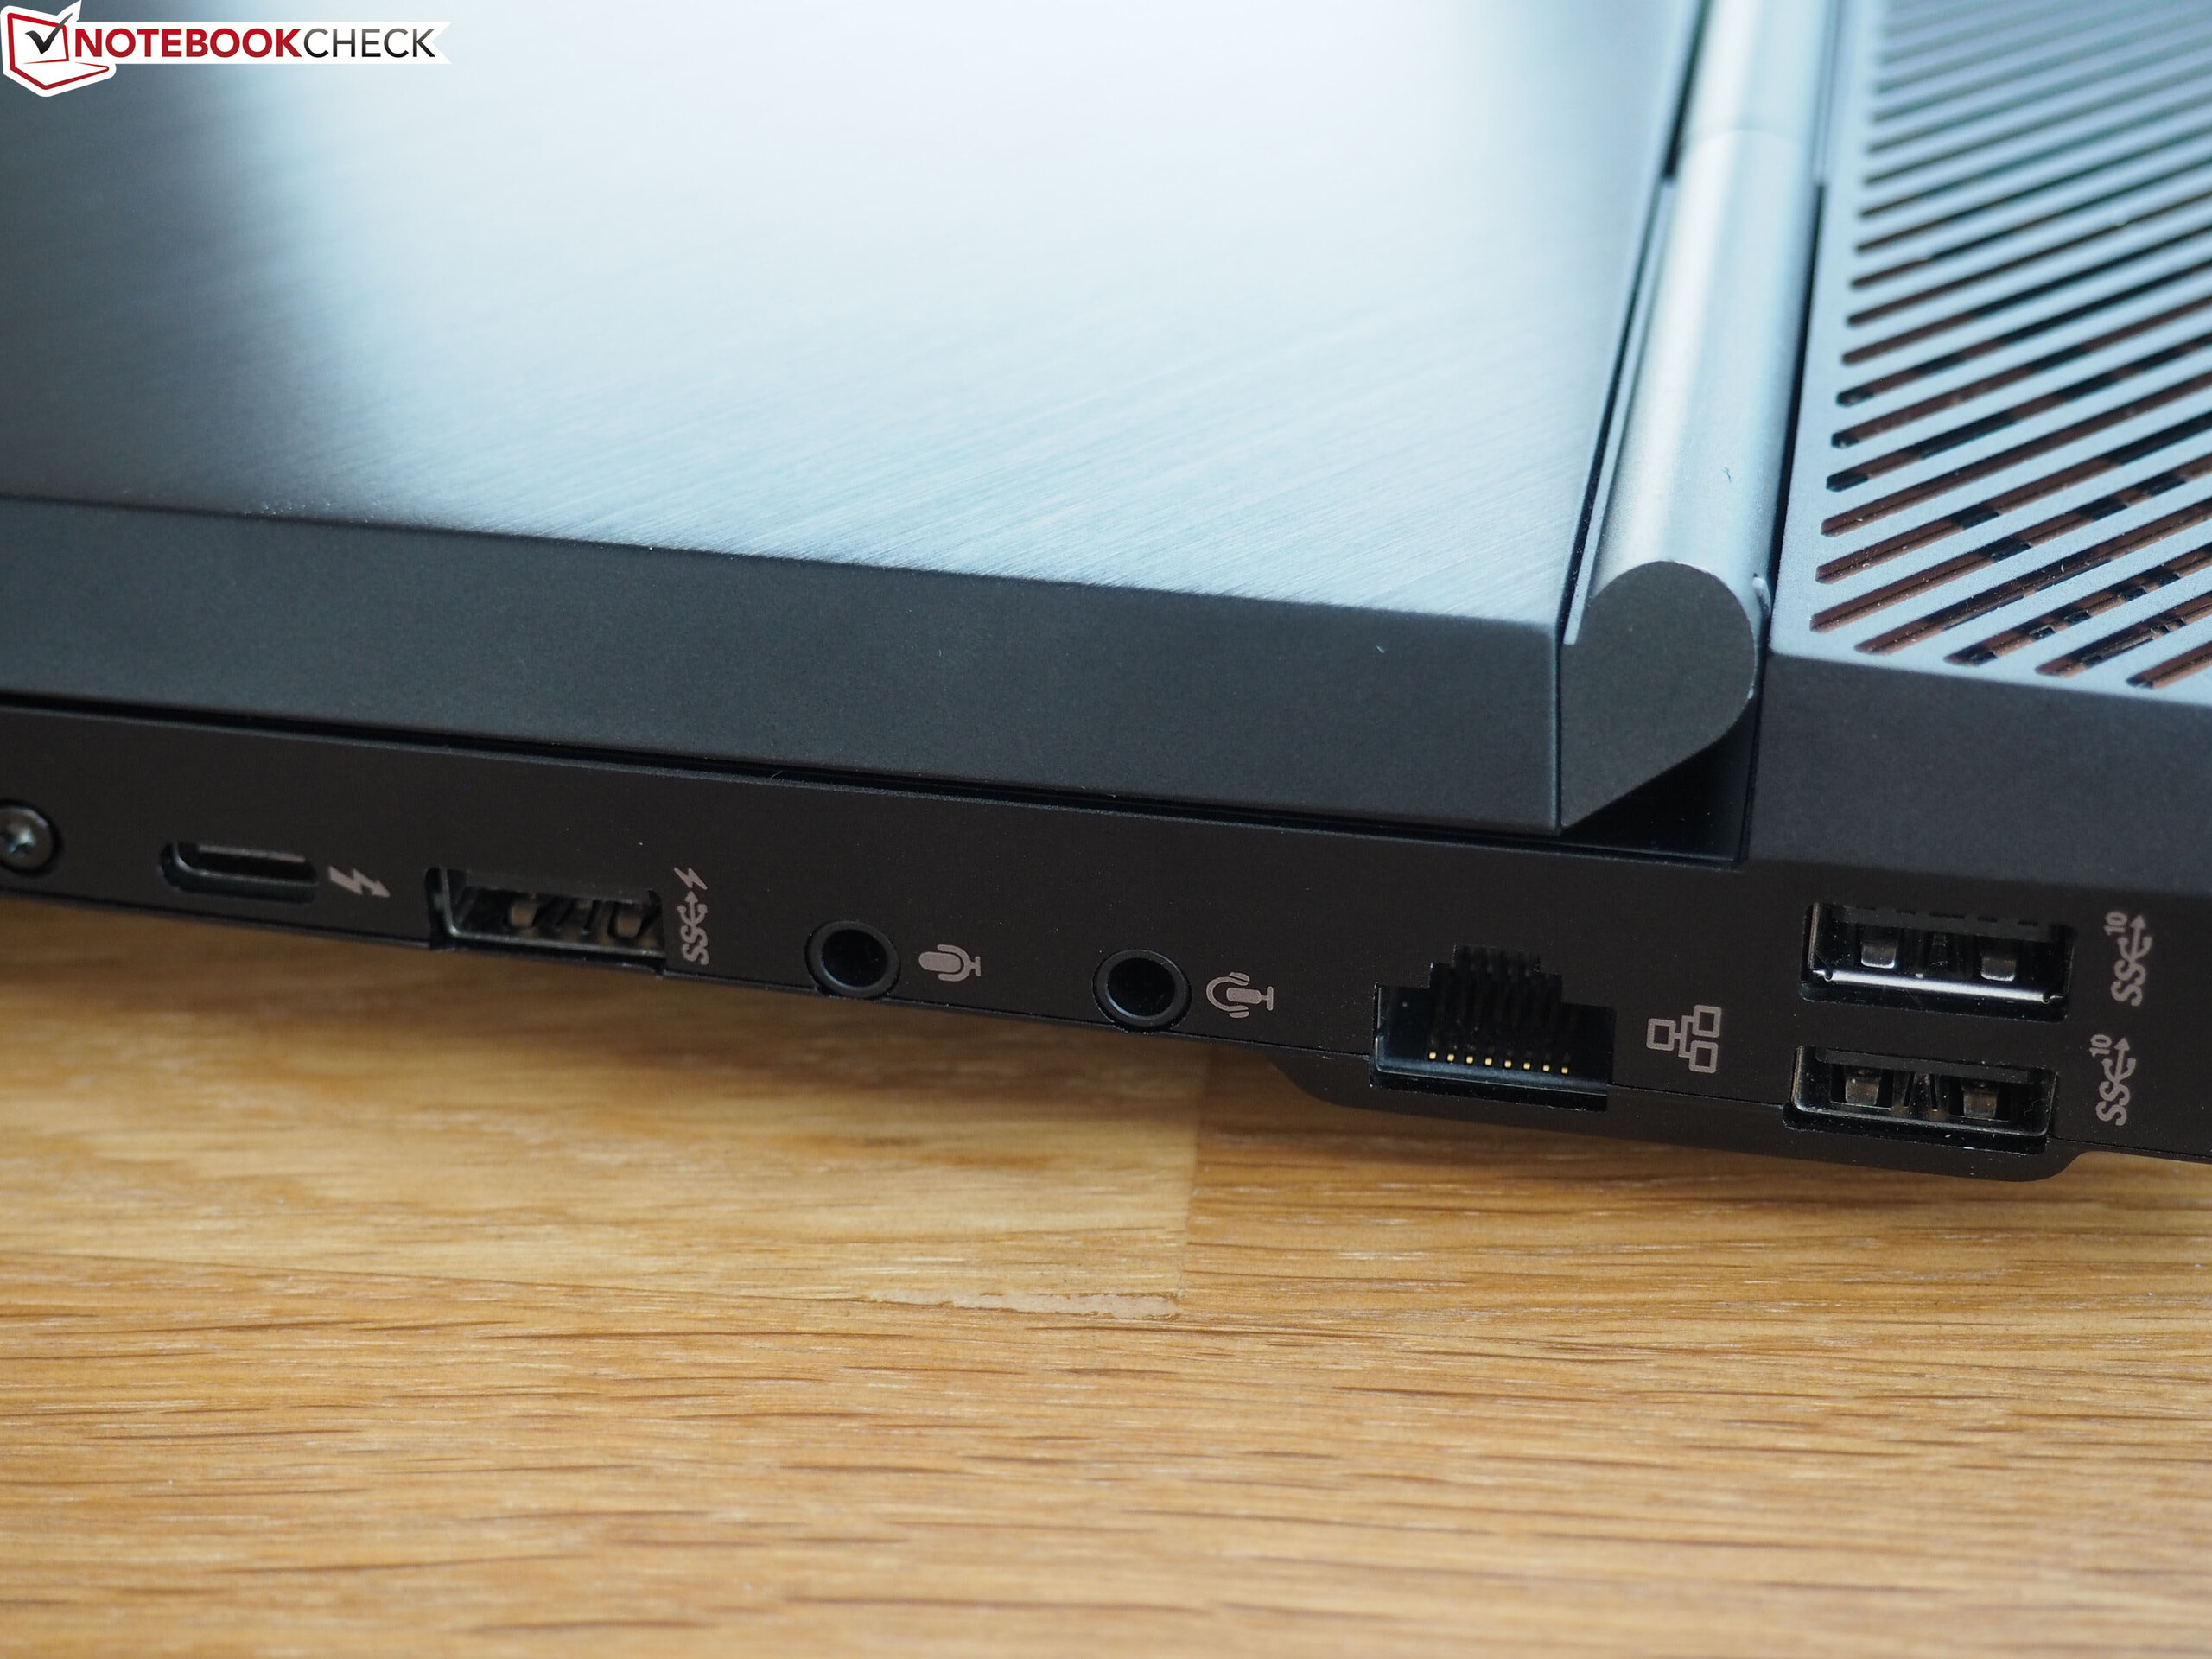
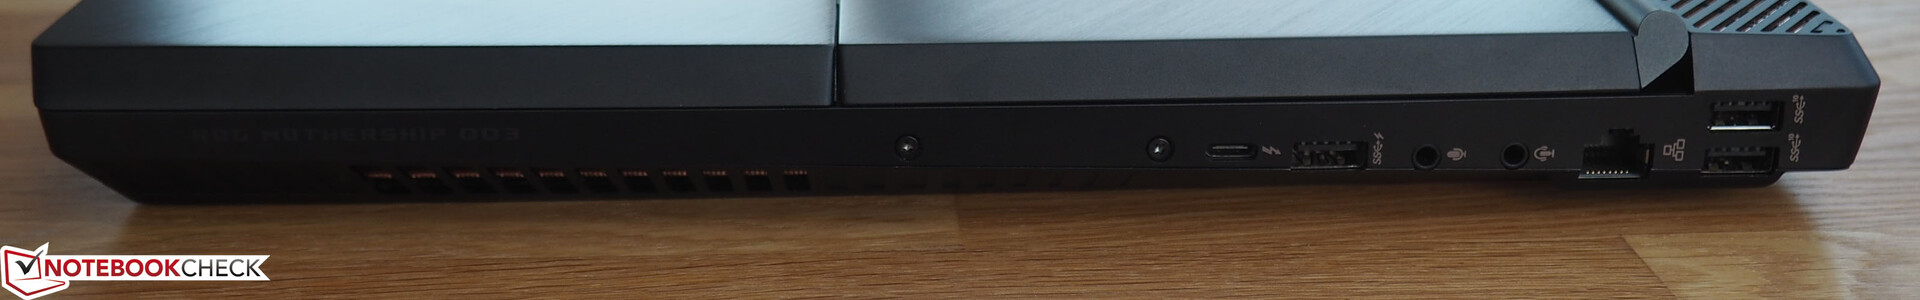
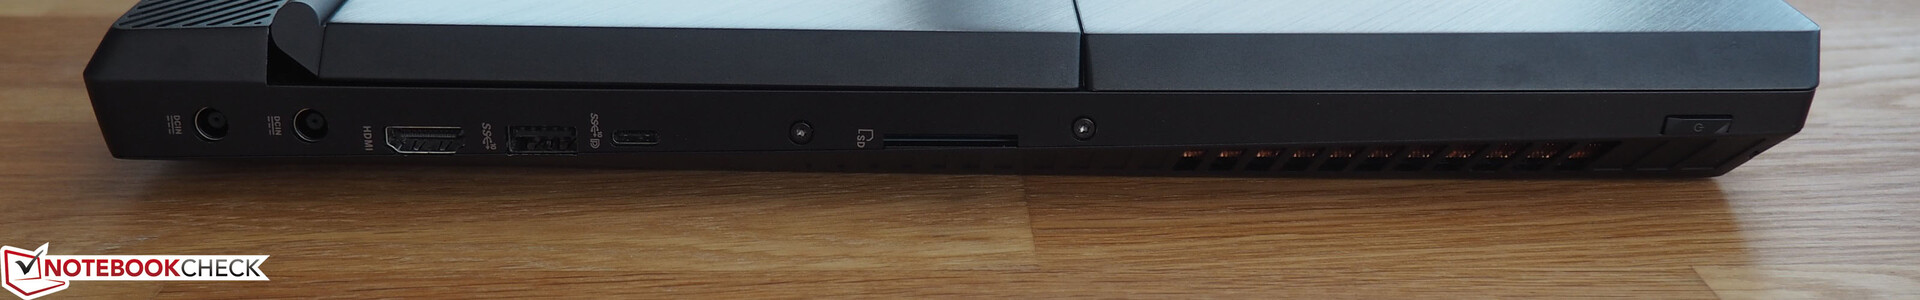
The port selection matches the price. There is a total of 6 USB ports, 5 of which support the 3.1 Gen 2 standard. 2 of the USB ports have the Type-C form factor (1x with DisplayPort support and 1x with Thunderbolt 3 support). Additionally, there is an HDMI output, two audio jacks (headphone + microphone), a card reader and a Kensington Lock port. There is also a blazing-fast 2.5-GB/s LAN port.
Since all ports reside on the display unit, there is enough space for an external mouse in front or to the sides of the device. Here, unlike on many other laptops, there are few ways for connected cables to get in the way.
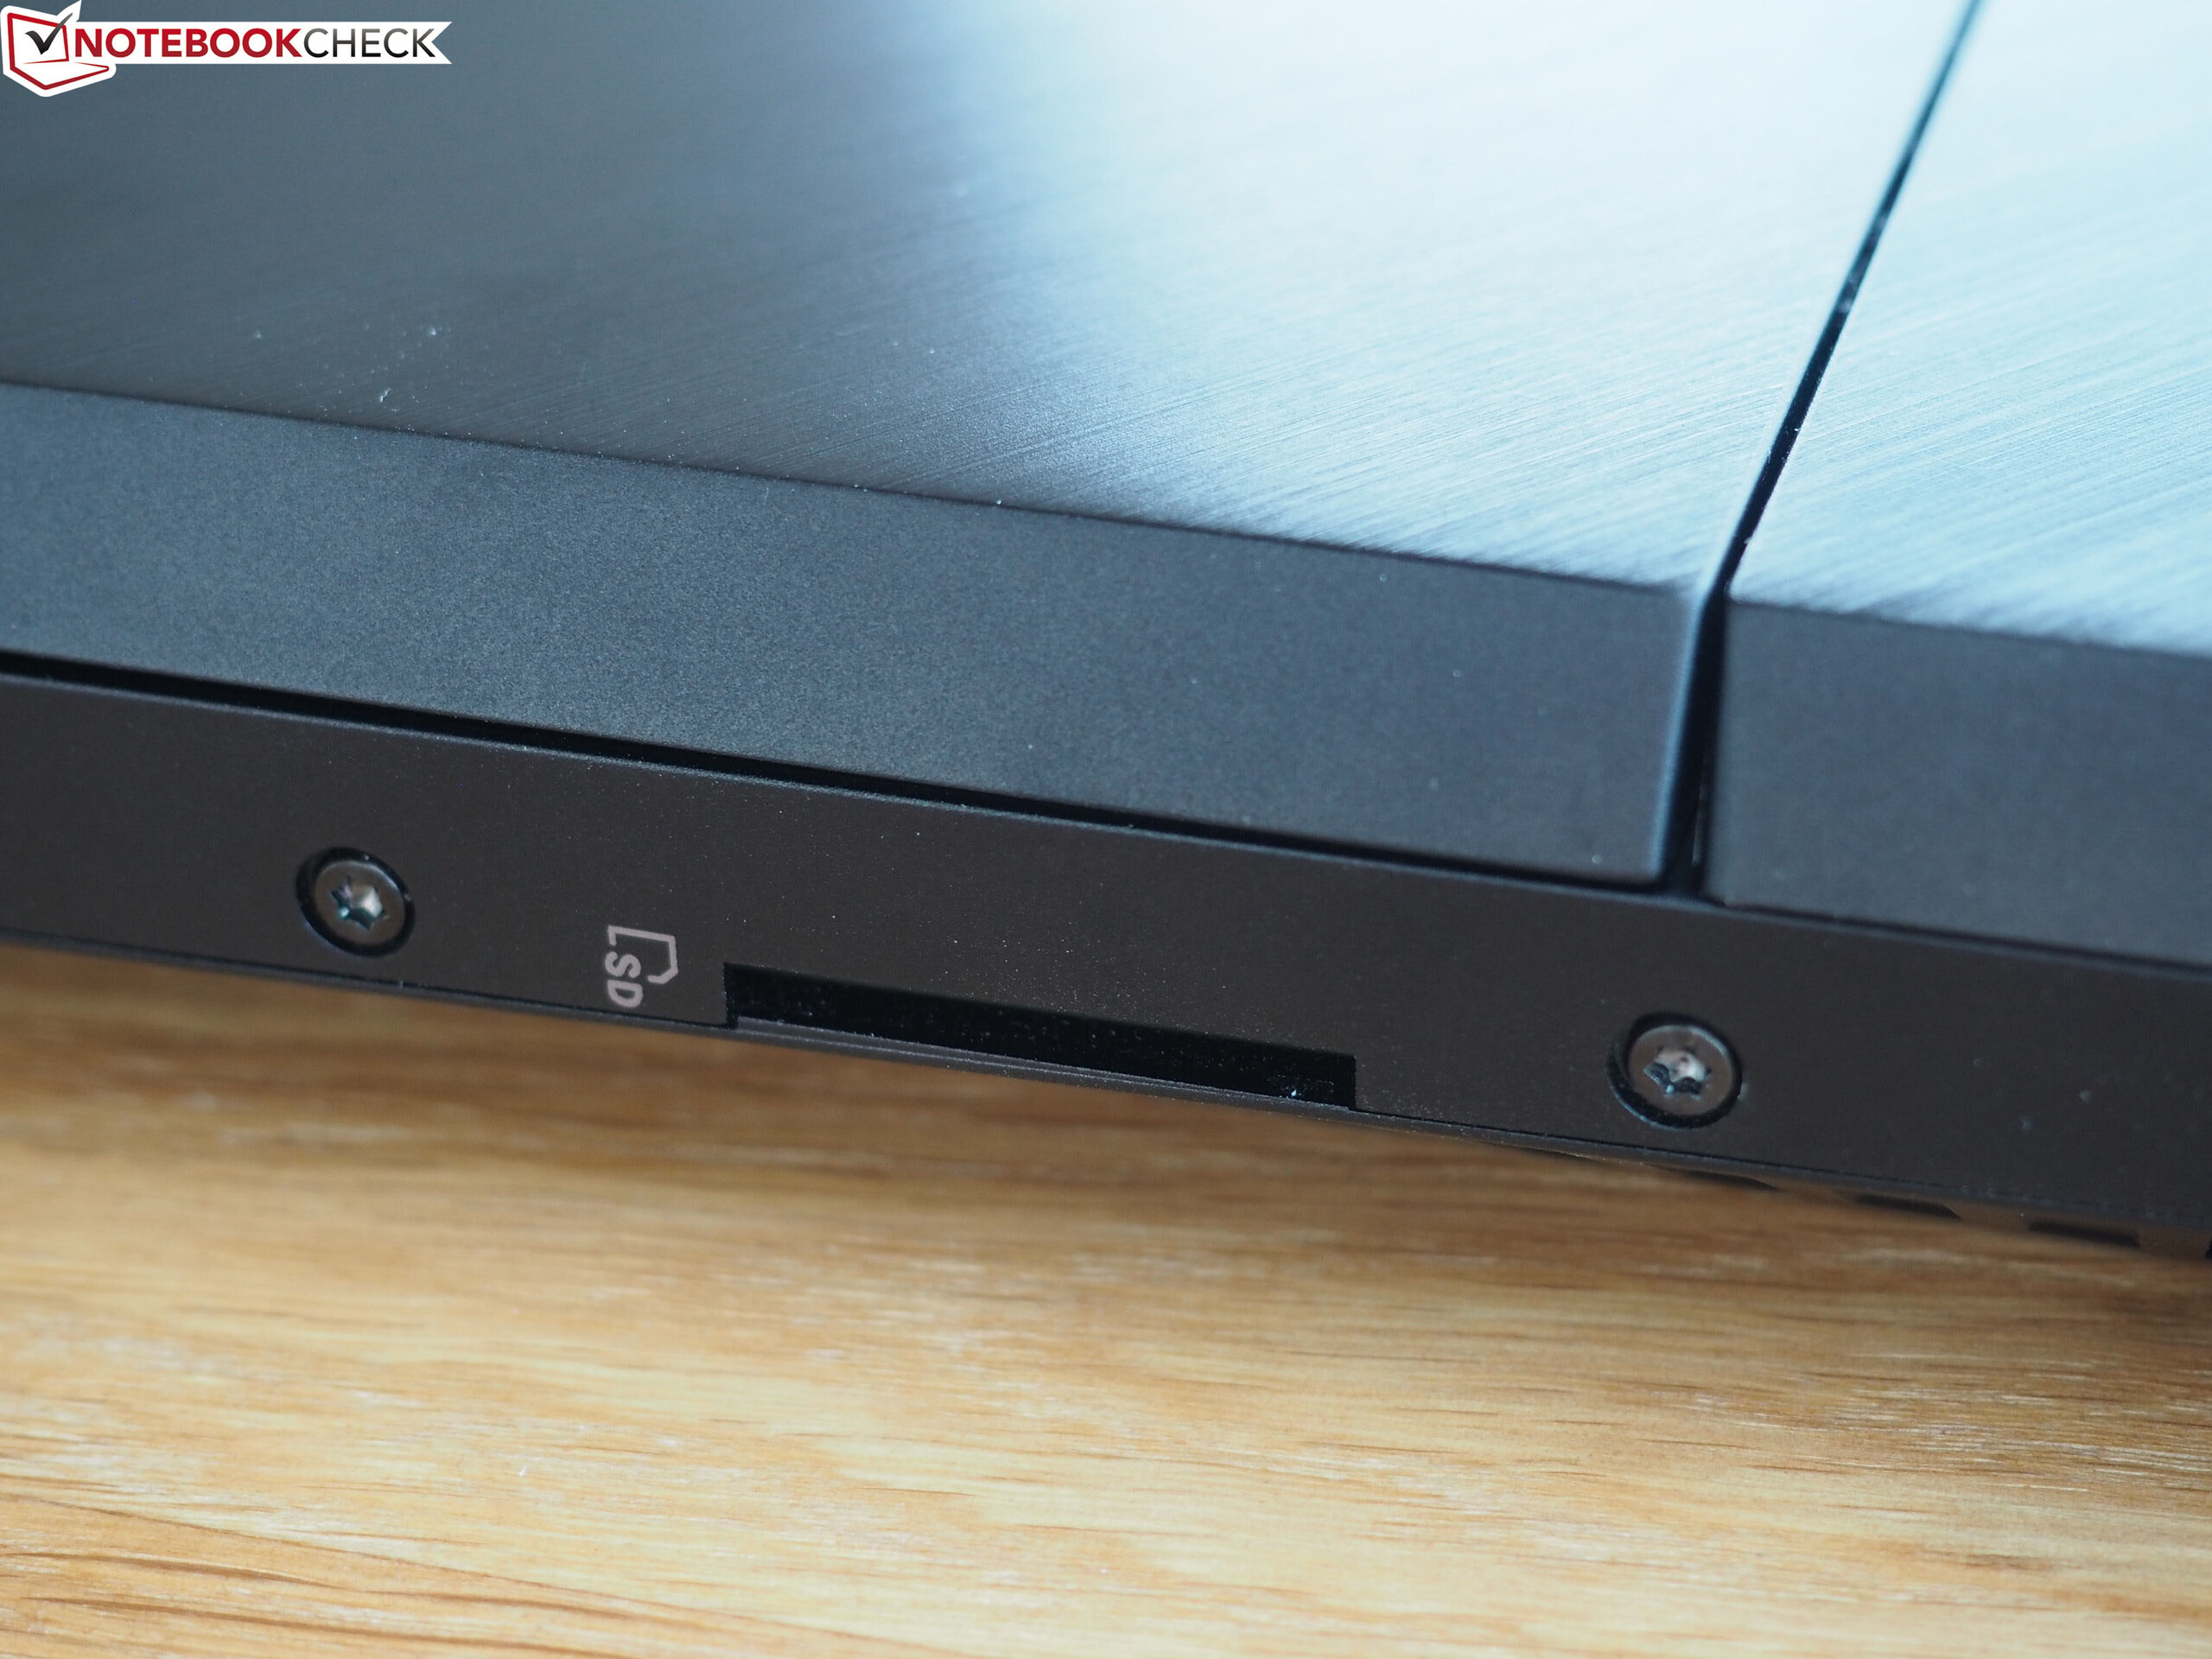
SD Card Reader
Unfortunately, the installed card reader is not one of the fastest models. At around 80 to 90 MB/s for sequential read and write operations on images, it only achieves an average result (in the same ballpark as the HP Omen 17) compared to the competition. With the ROG G703GXR, Asus shows the right way to do it, since its card reader almost fully exhausts the capabilities of our reference card. Meanwhile, the MSI GE75 is the slowest and only reaches USB 2.0 speeds.
| SD Card Reader | |
| average JPG Copy Test (av. of 3 runs) | |
| Asus ROG G703GXR (Toshiba Exceria Pro SDXC 64 GB UHS-II) | |
| Average of class Gaming (20.9 - 210, n=54, last 2 years) | |
| Asus ROG Mothership GZ700GX (Toshiba Exceria Pro SDXC 64 GB UHS-II) | |
| HP Omen 17-cb0020ng (Toshiba Exceria Pro SDXC 64 GB UHS-II) | |
| MSI GE75 9SG (Toshiba Exceria Pro SDXC 64 GB UHS-II) | |
| maximum AS SSD Seq Read Test (1GB) | |
| Asus ROG G703GXR (Toshiba Exceria Pro SDXC 64 GB UHS-II) | |
| Average of class Gaming (25.5 - 261, n=51, last 2 years) | |
| Asus ROG Mothership GZ700GX (Toshiba Exceria Pro SDXC 64 GB UHS-II) | |
| HP Omen 17-cb0020ng (Toshiba Exceria Pro SDXC 64 GB UHS-II) | |
| MSI GE75 9SG (Toshiba Exceria Pro SDXC 64 GB UHS-II) | |
Communication
Intel's brand-new AX200 chip serves as the wireless module. The results listed in the table are not quite directly comparable with those of competing devices. We recently upgraded our test setup from an ac router (Linksys EA8500) to an ax router (Netgear Nighthawk AX12). The latter causes the speed in our range test to approximately double. Transfer rates in excess of 1,400 MB/s is an excellent result.
Accessories
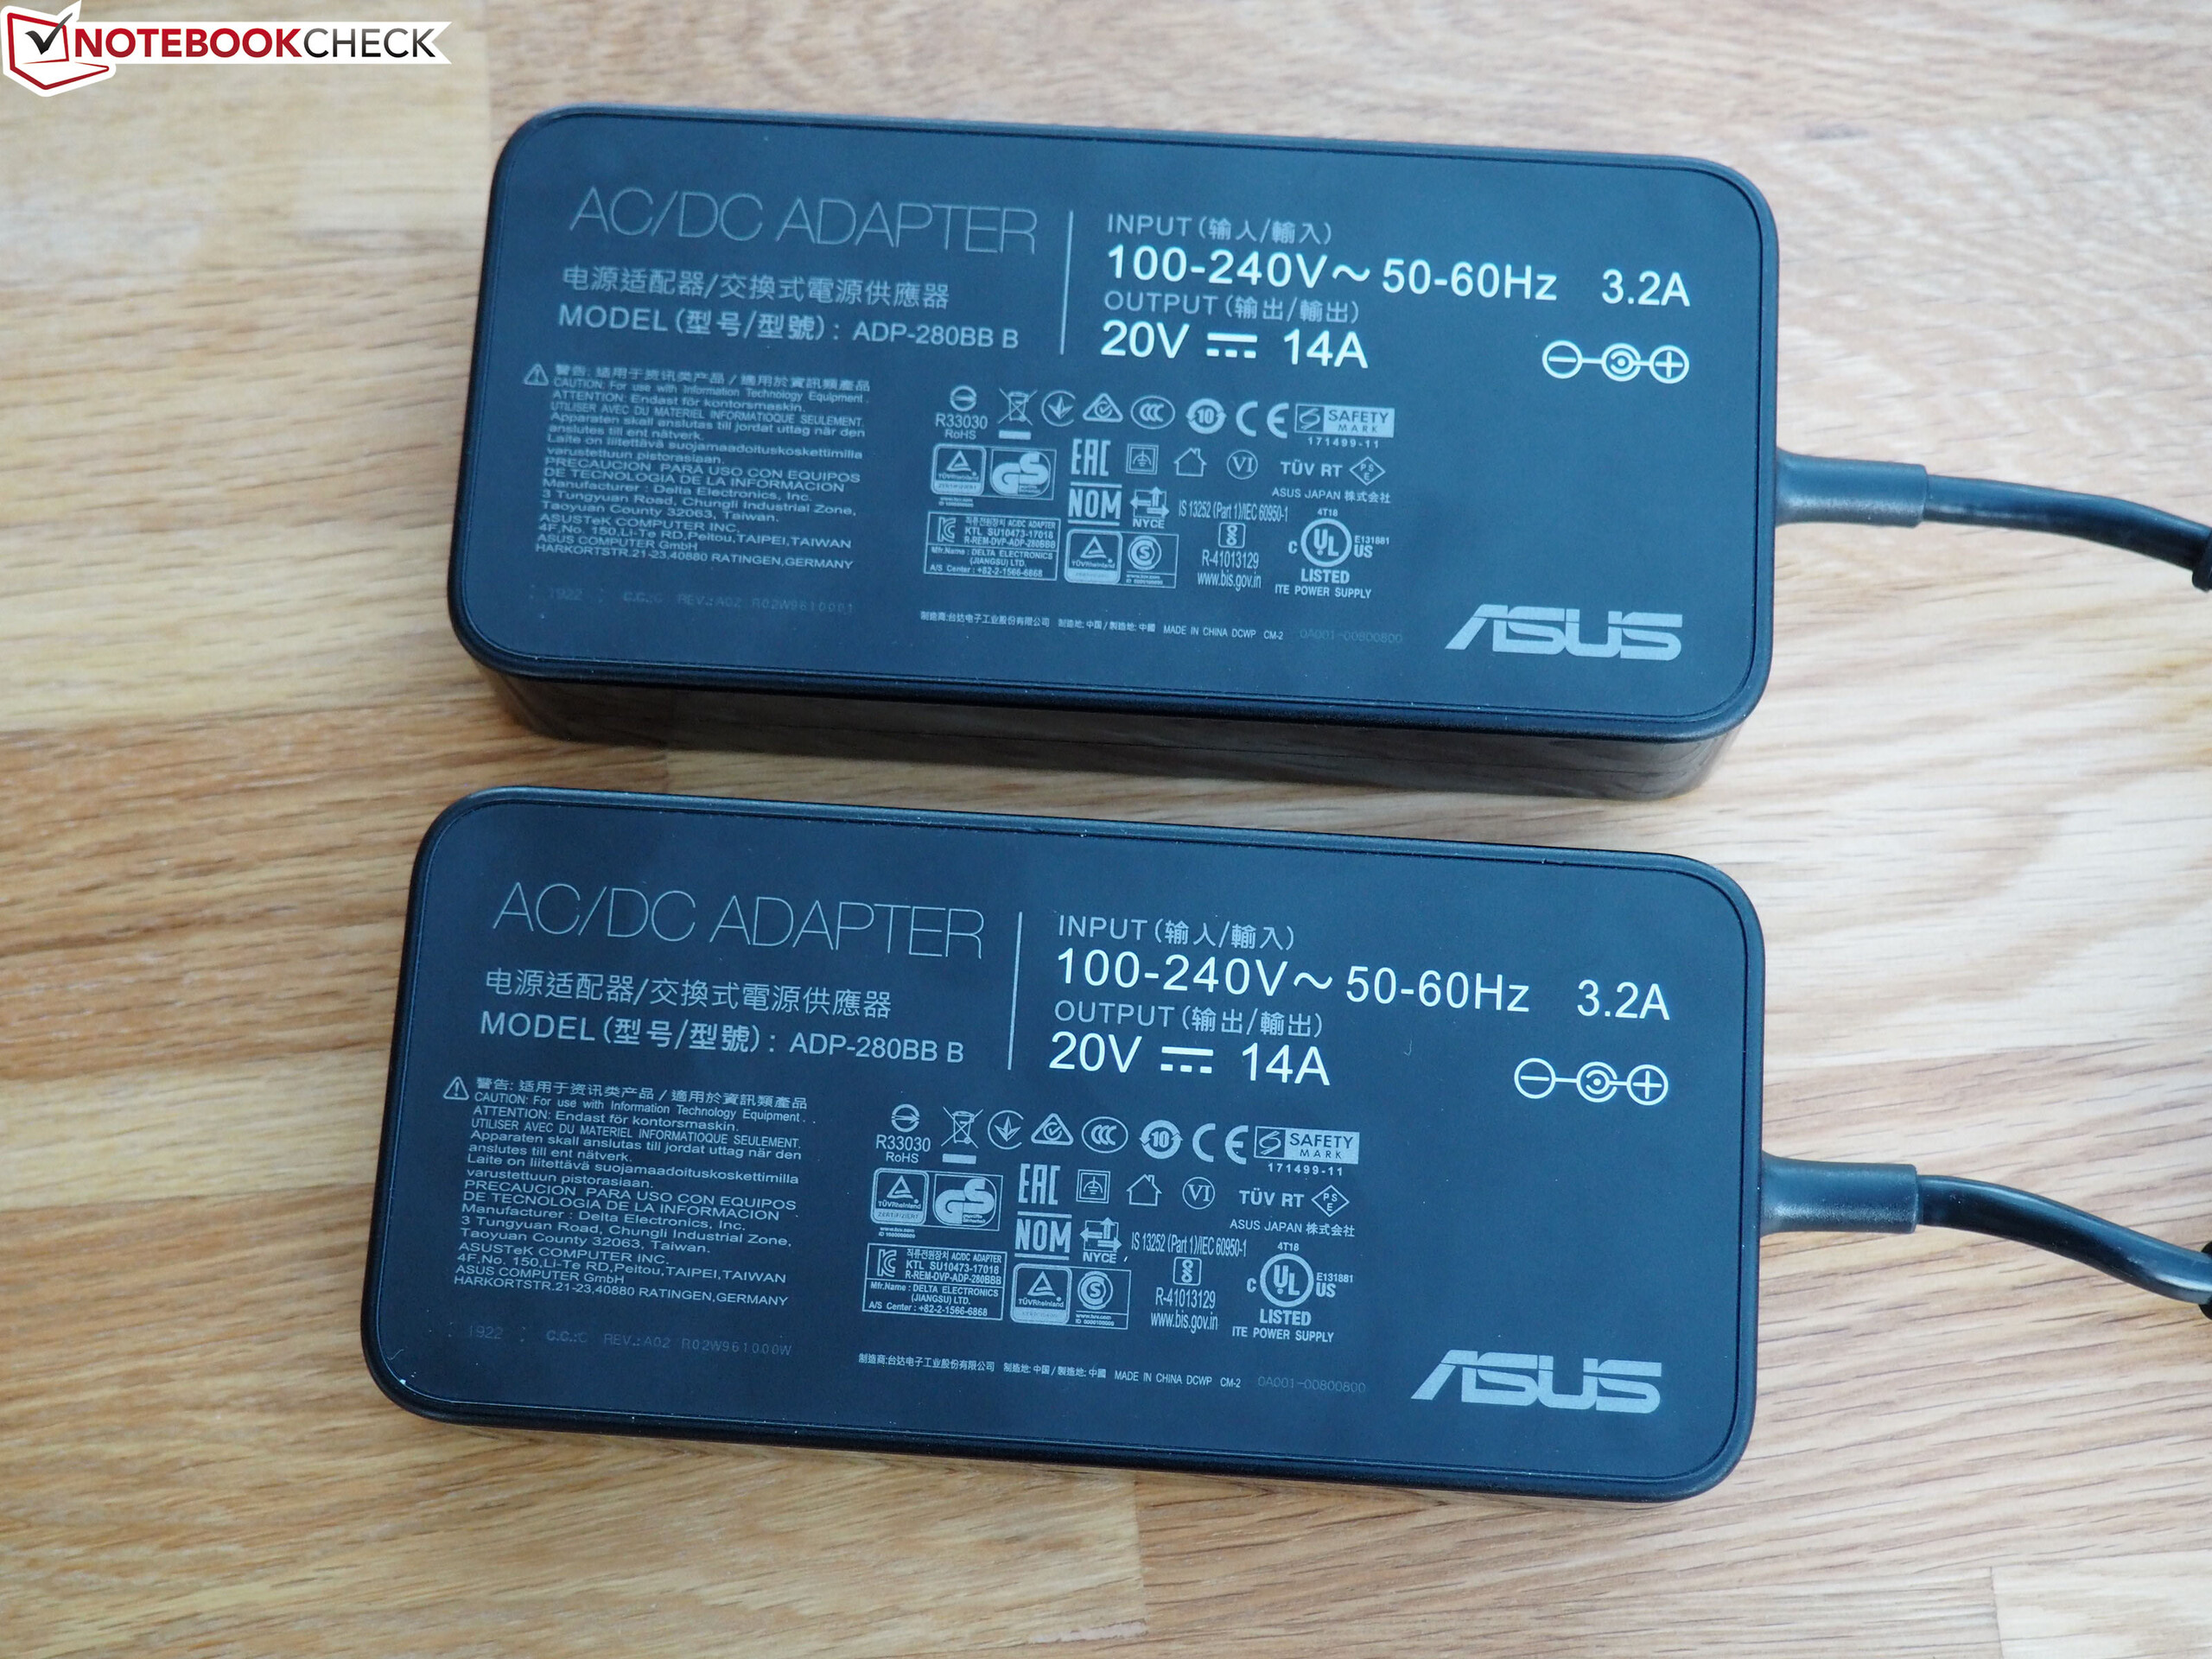
Aside from the ports and components, the scope of delivery is generous as well. With a gaming mouse (Gladius II) and a gaming headset (Cerberus) included in the giant package, gamers can get started right away. When travelling, the laptop and accessories can be stowed away in the included backpack. Not one, but two 280-Watt AC adapters, which have a combined weight of 1.7 kg (~3.7 lb), are used to power the GZ700.
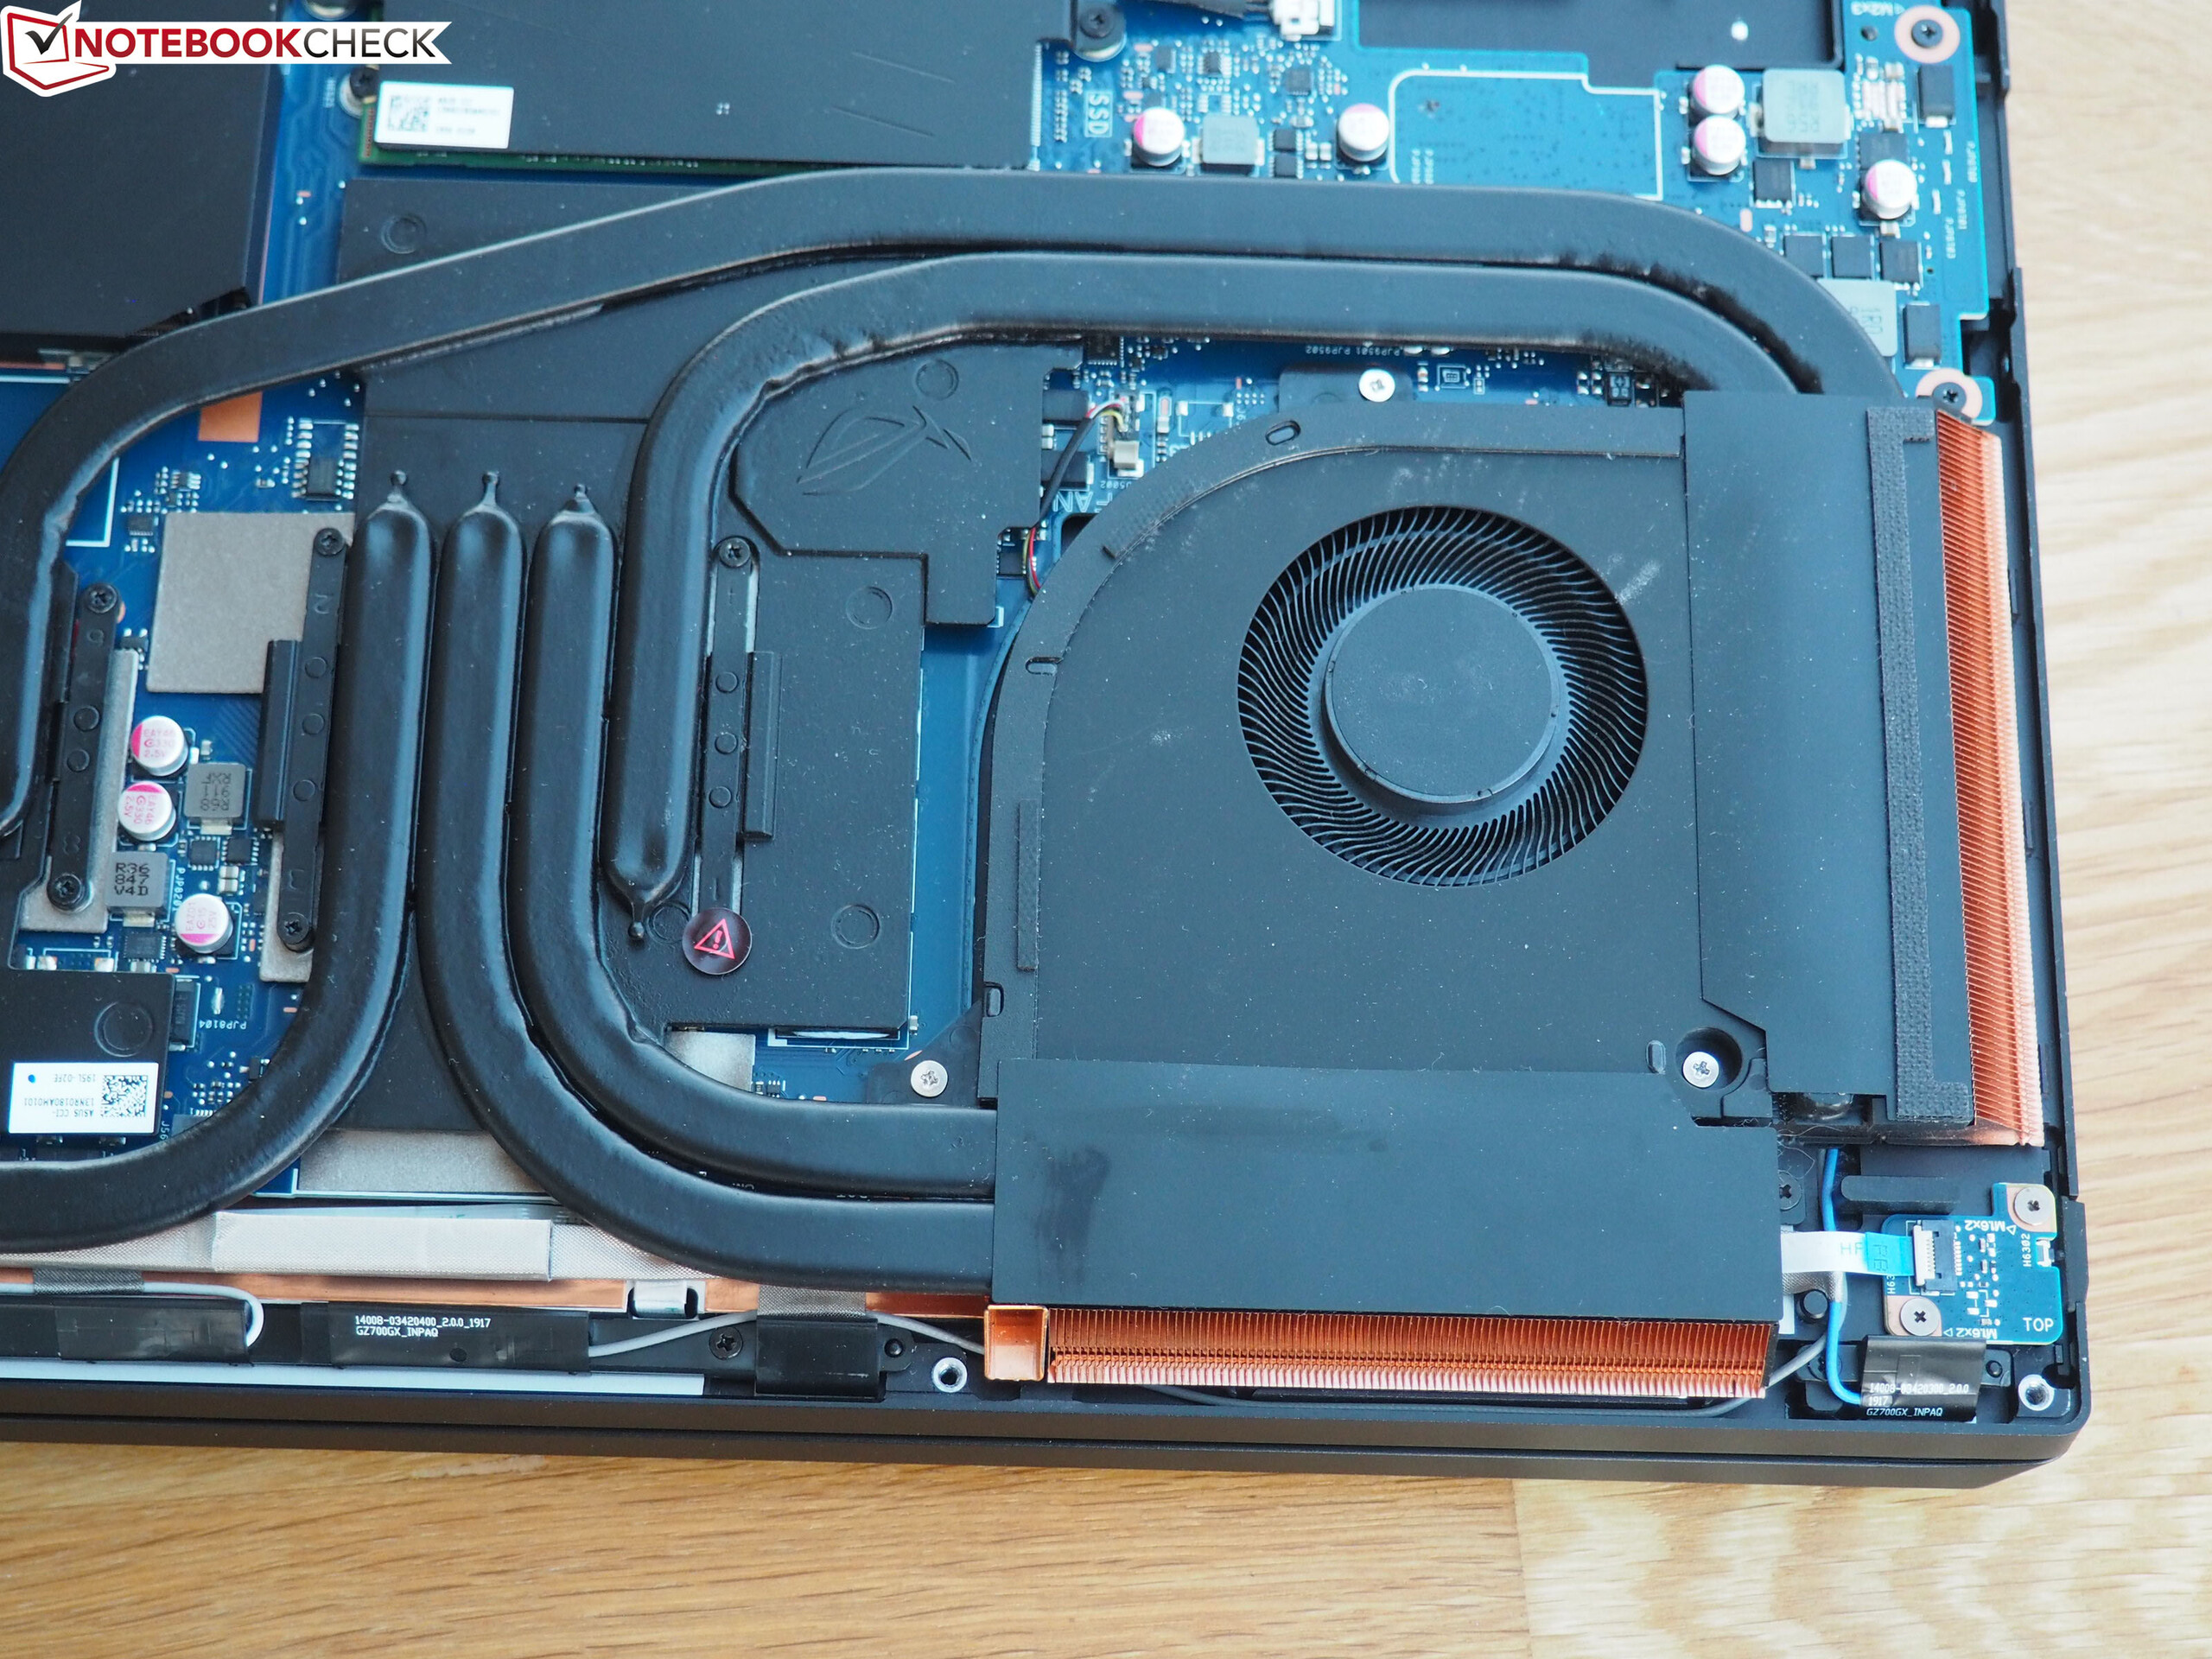
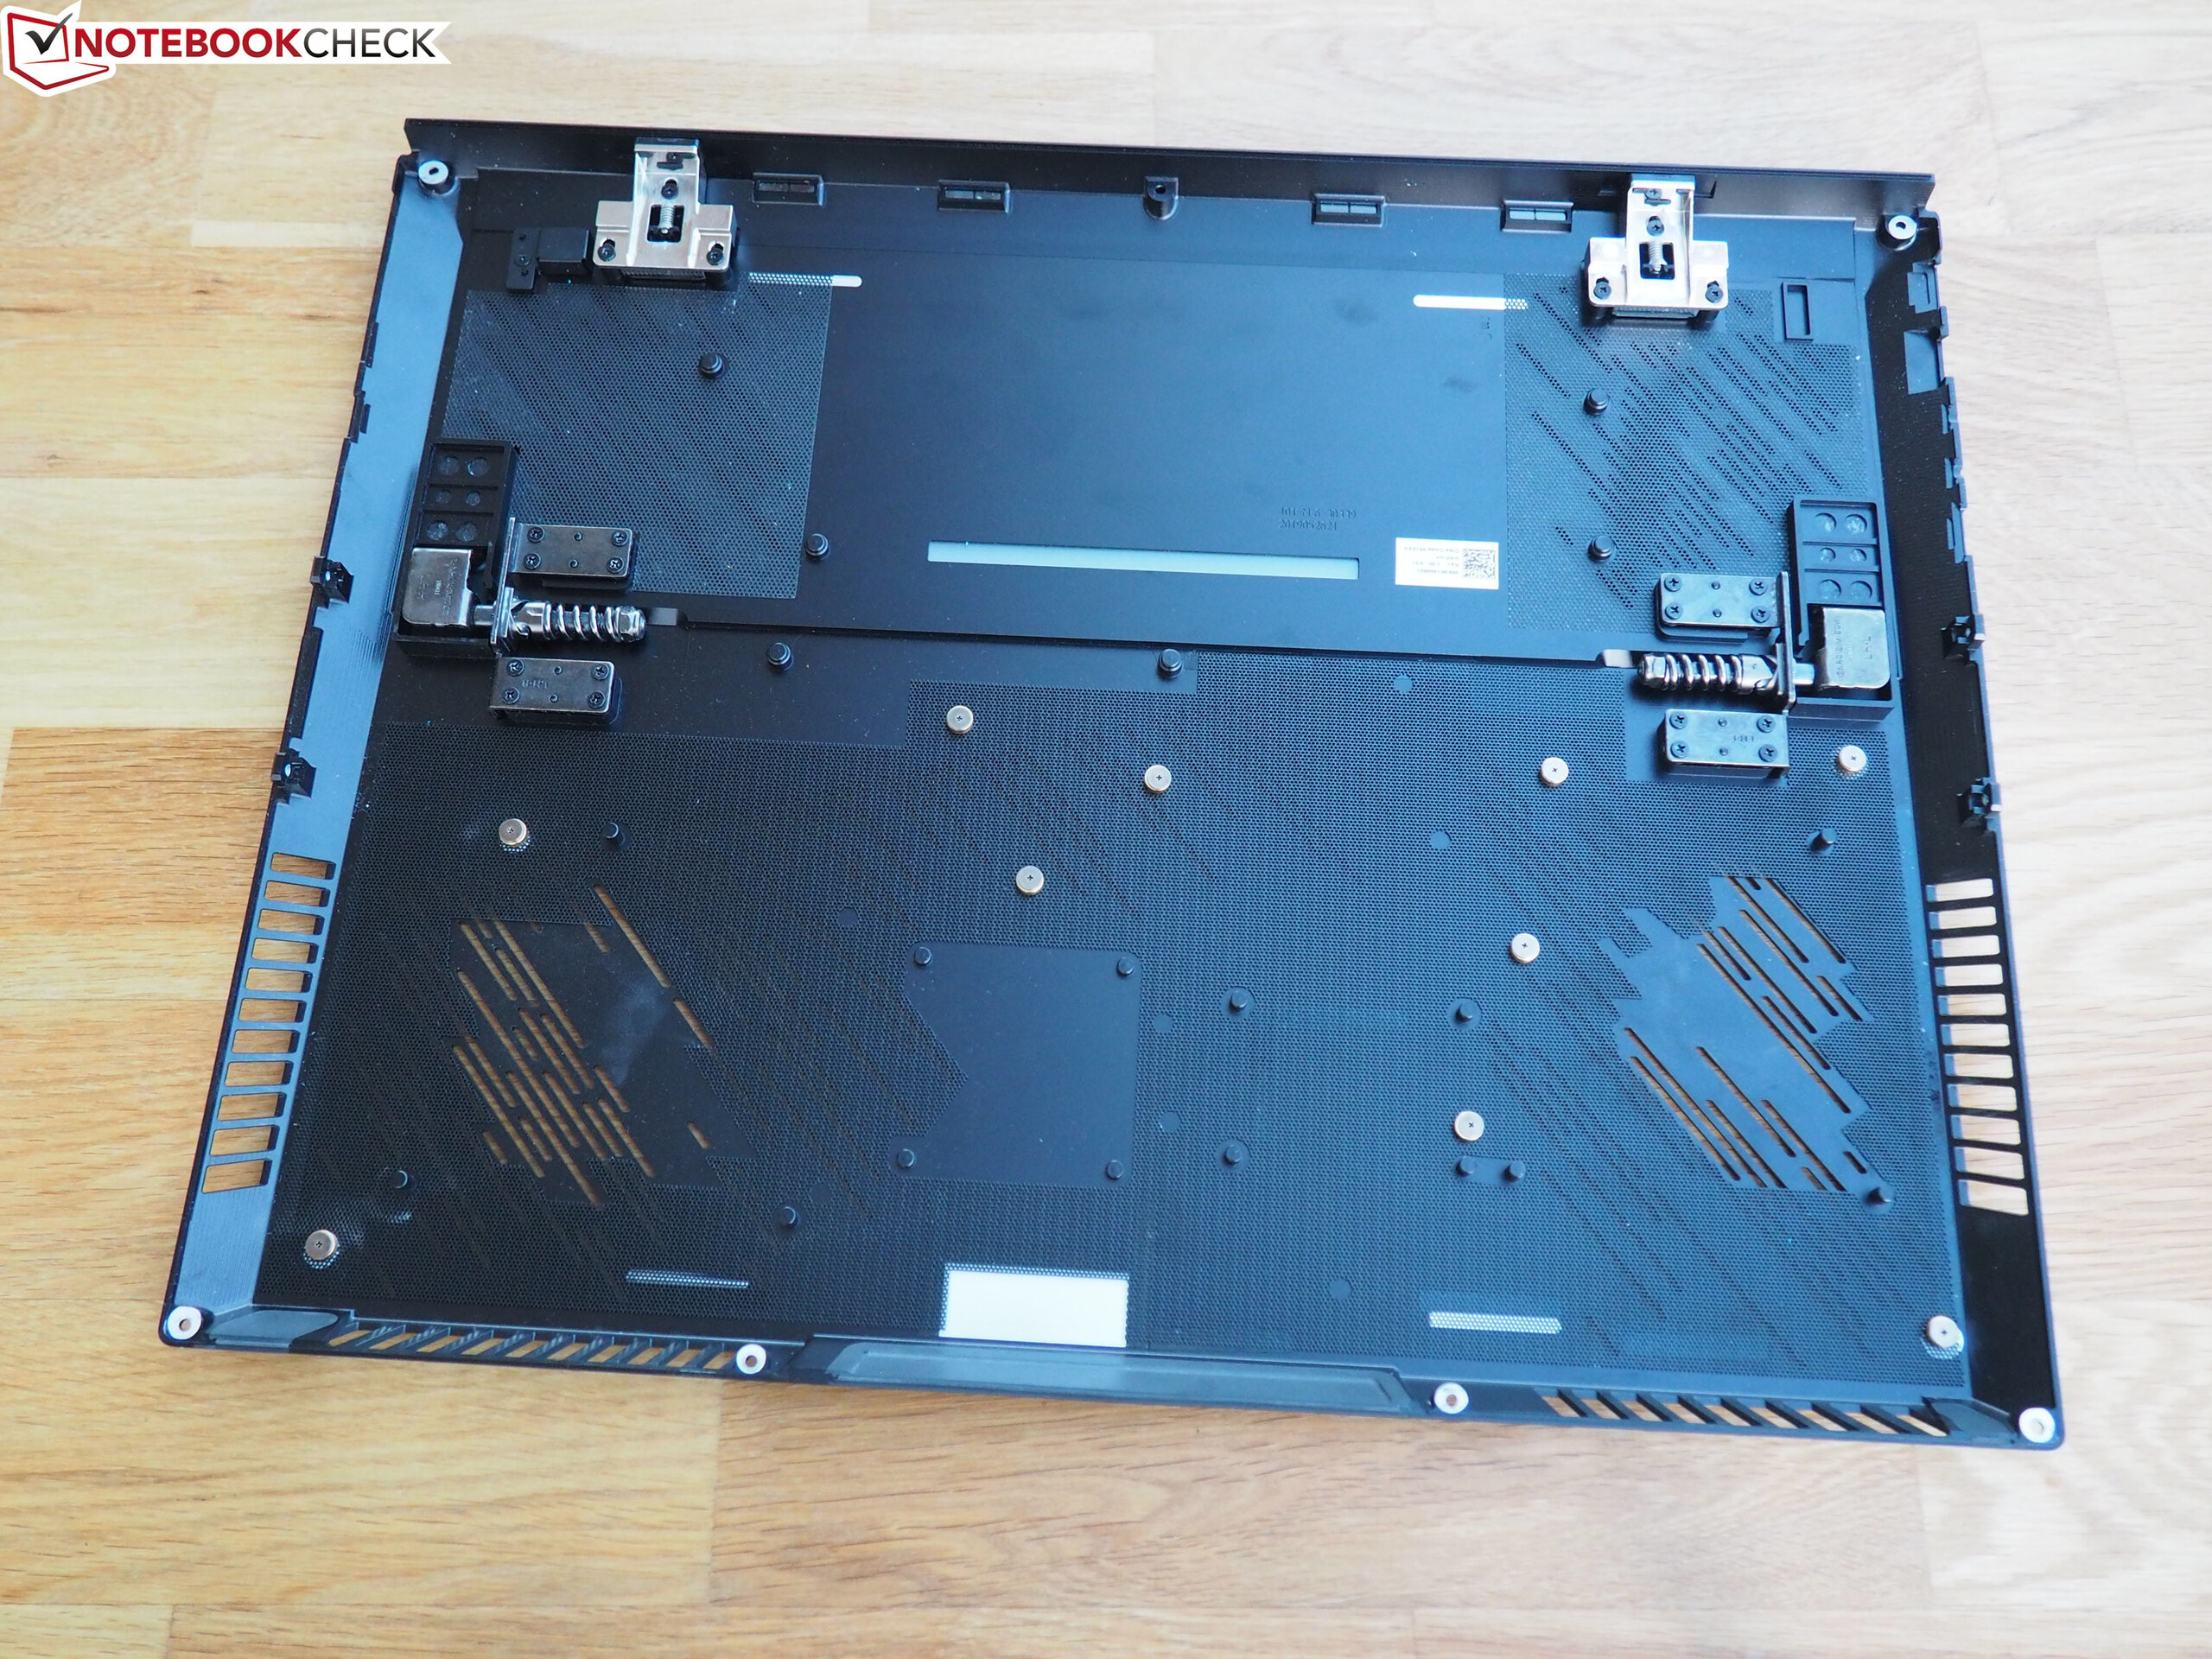
Maintenance
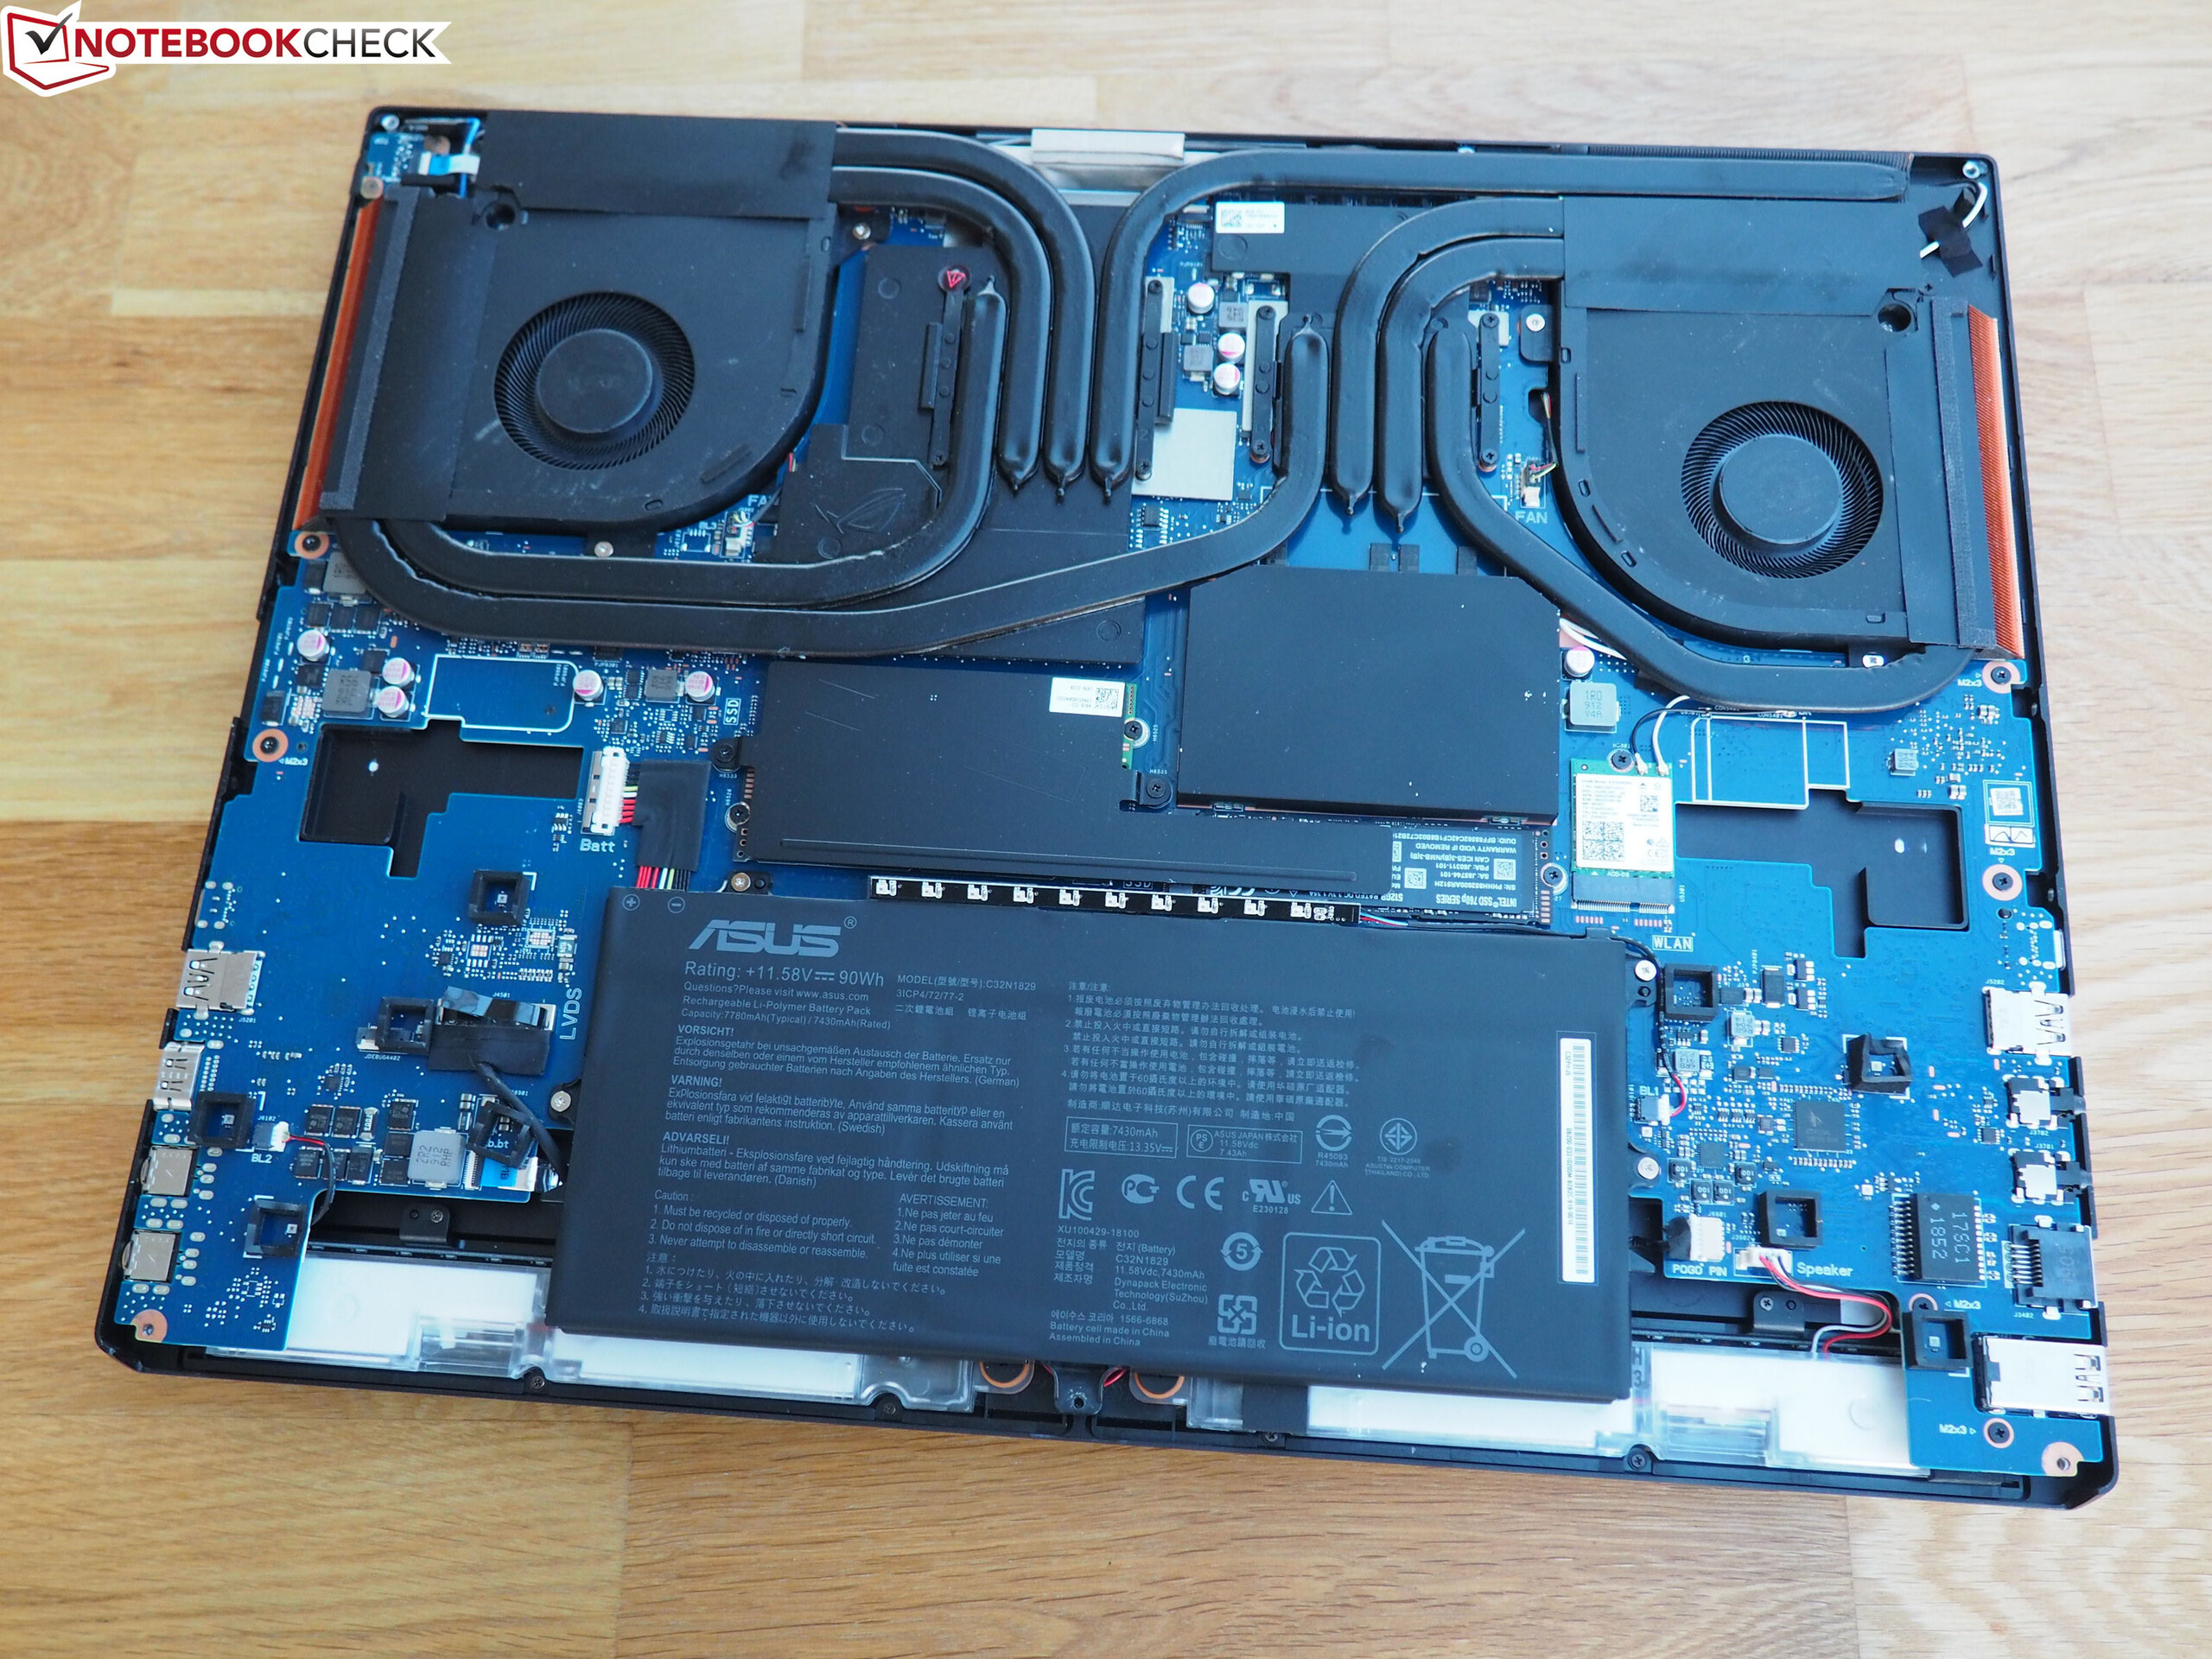
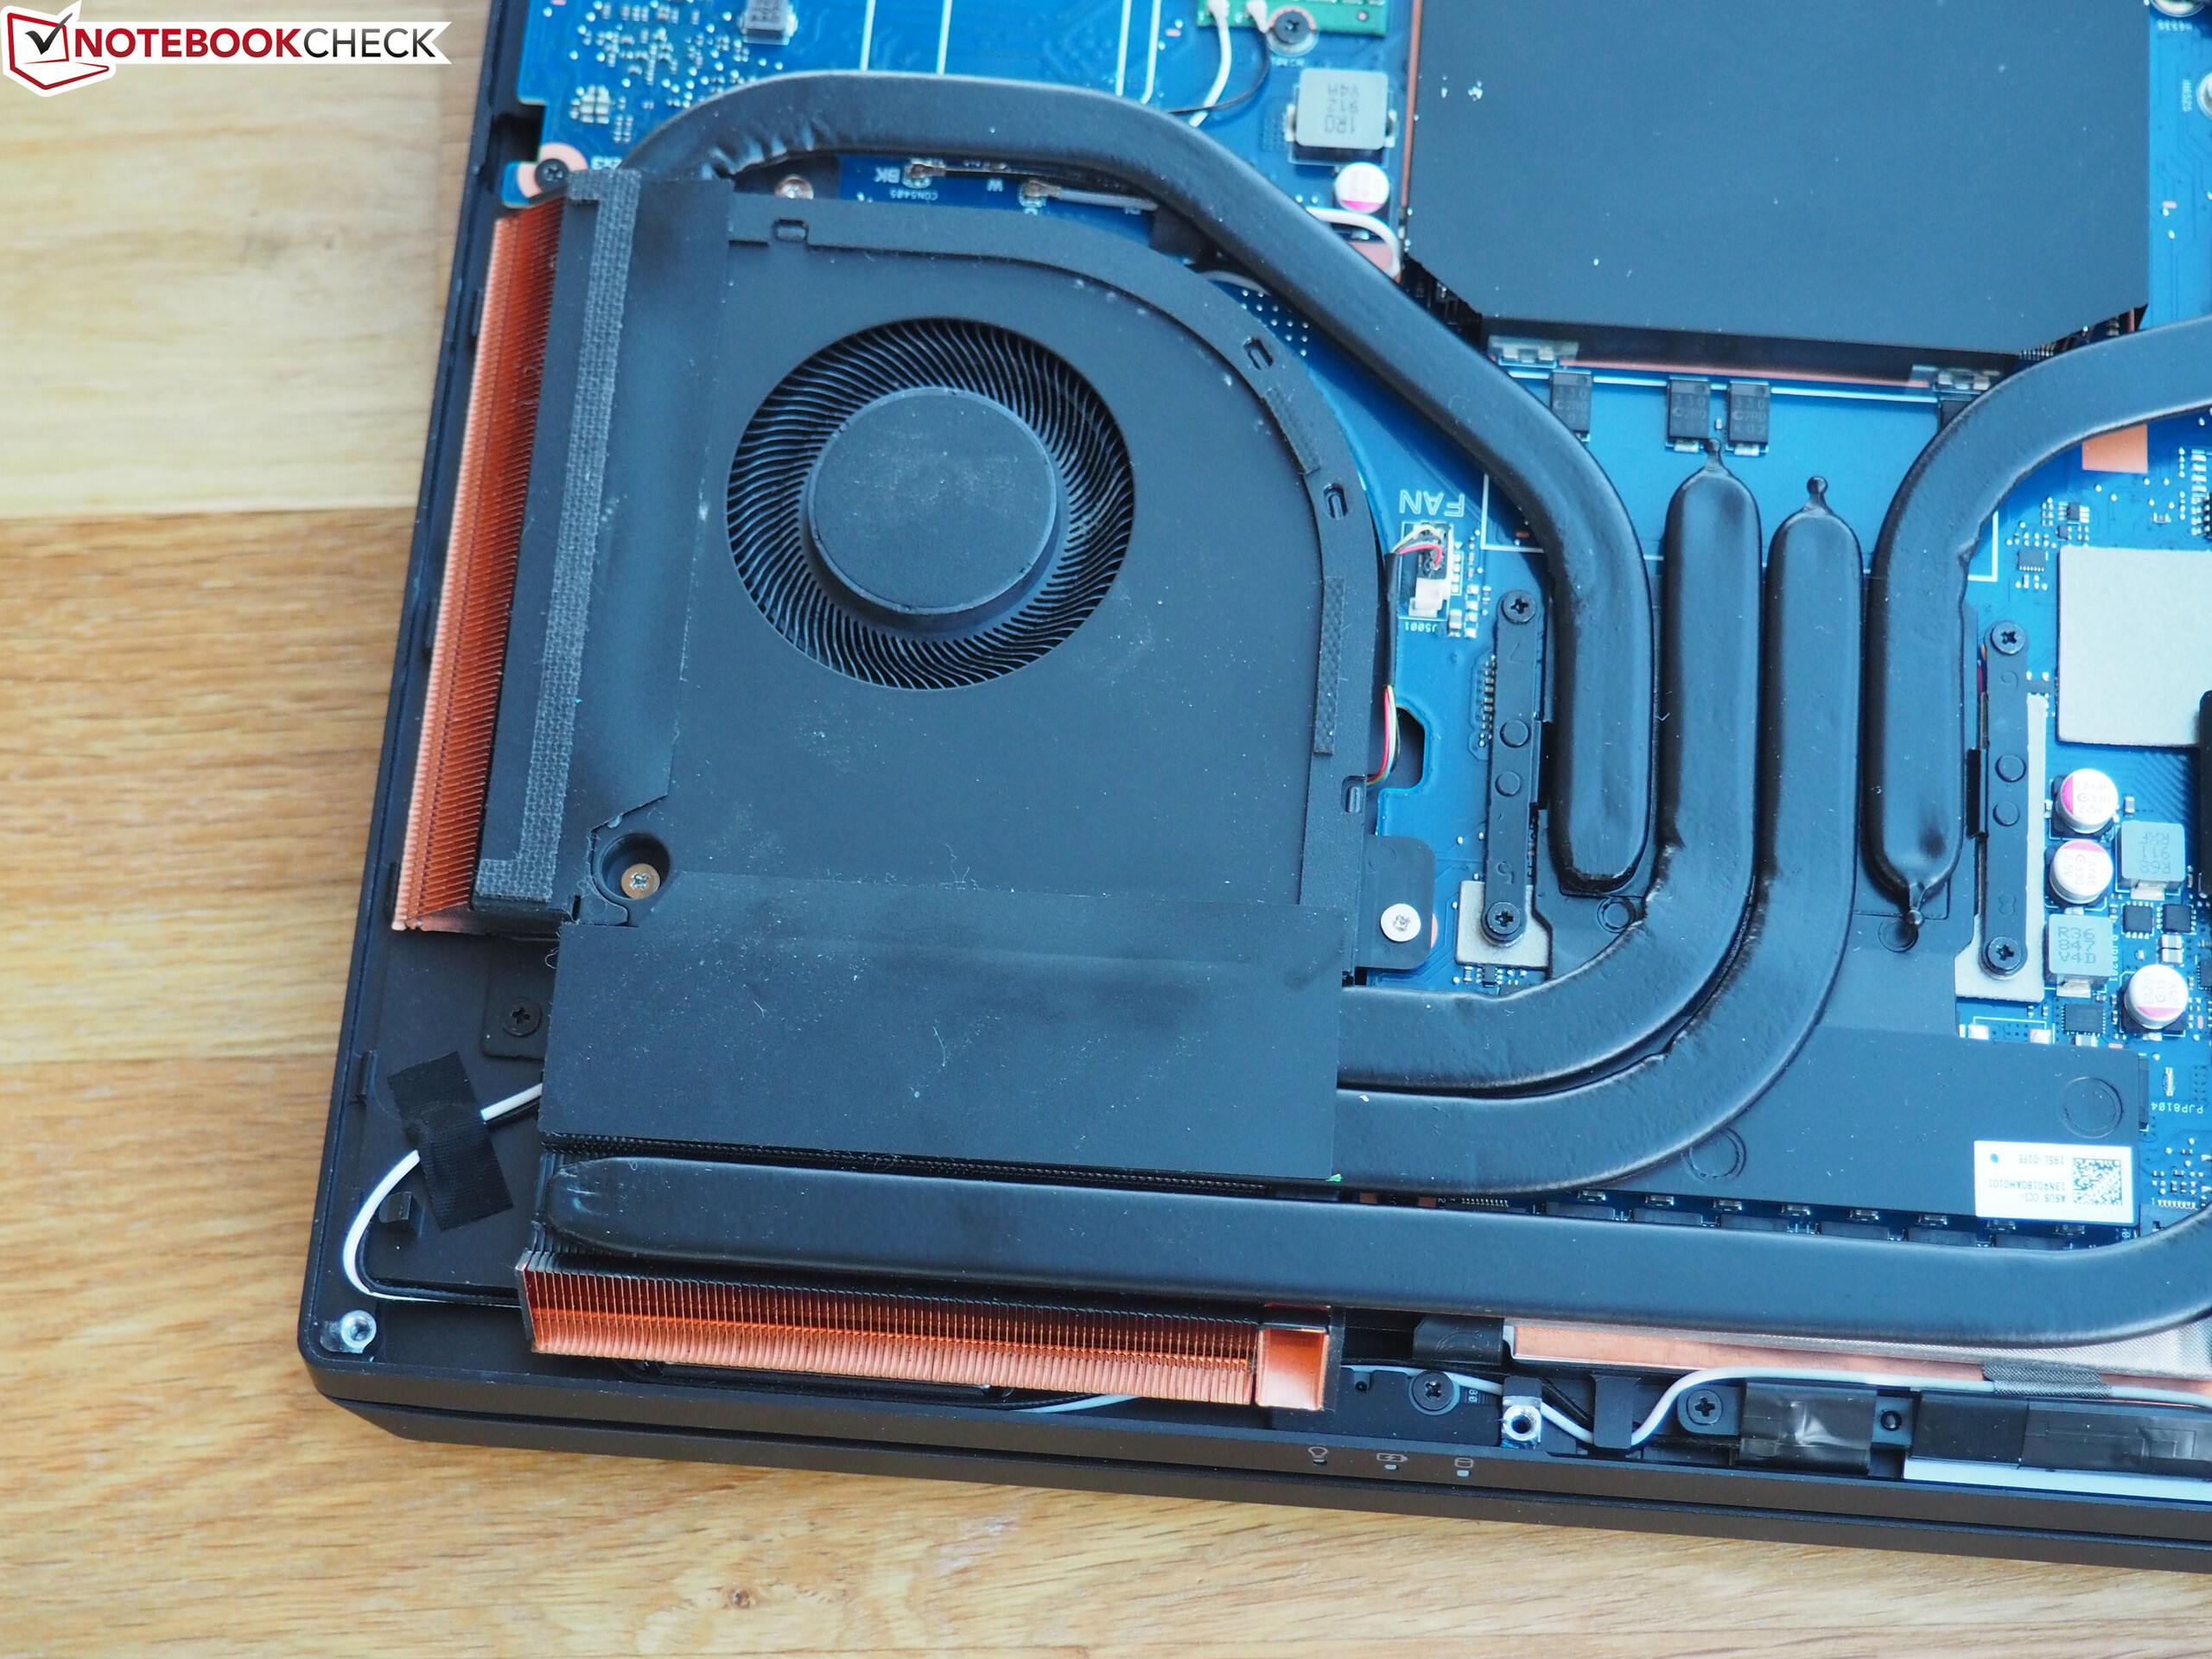
Unlike on most laptops, the majority of the hardware is not installed within the base unit, but rather behind/below the display. In order to access the hardware on the inside, the back plate of the display has to be removed (7 Philips screws and 4 Torx screws). Subsequently, almost all of the components are accessible, as you can see in our photos. This includes storage (3x M.2 slots with cover), the wireless module, the battery and the cooling solution. There are two fans and multiple heatpipes, which stretch themselves across CPU and GPU. Unfortunately, only 2 of the 4 RAM slots can be accessed.
Input Devices
Keyboard
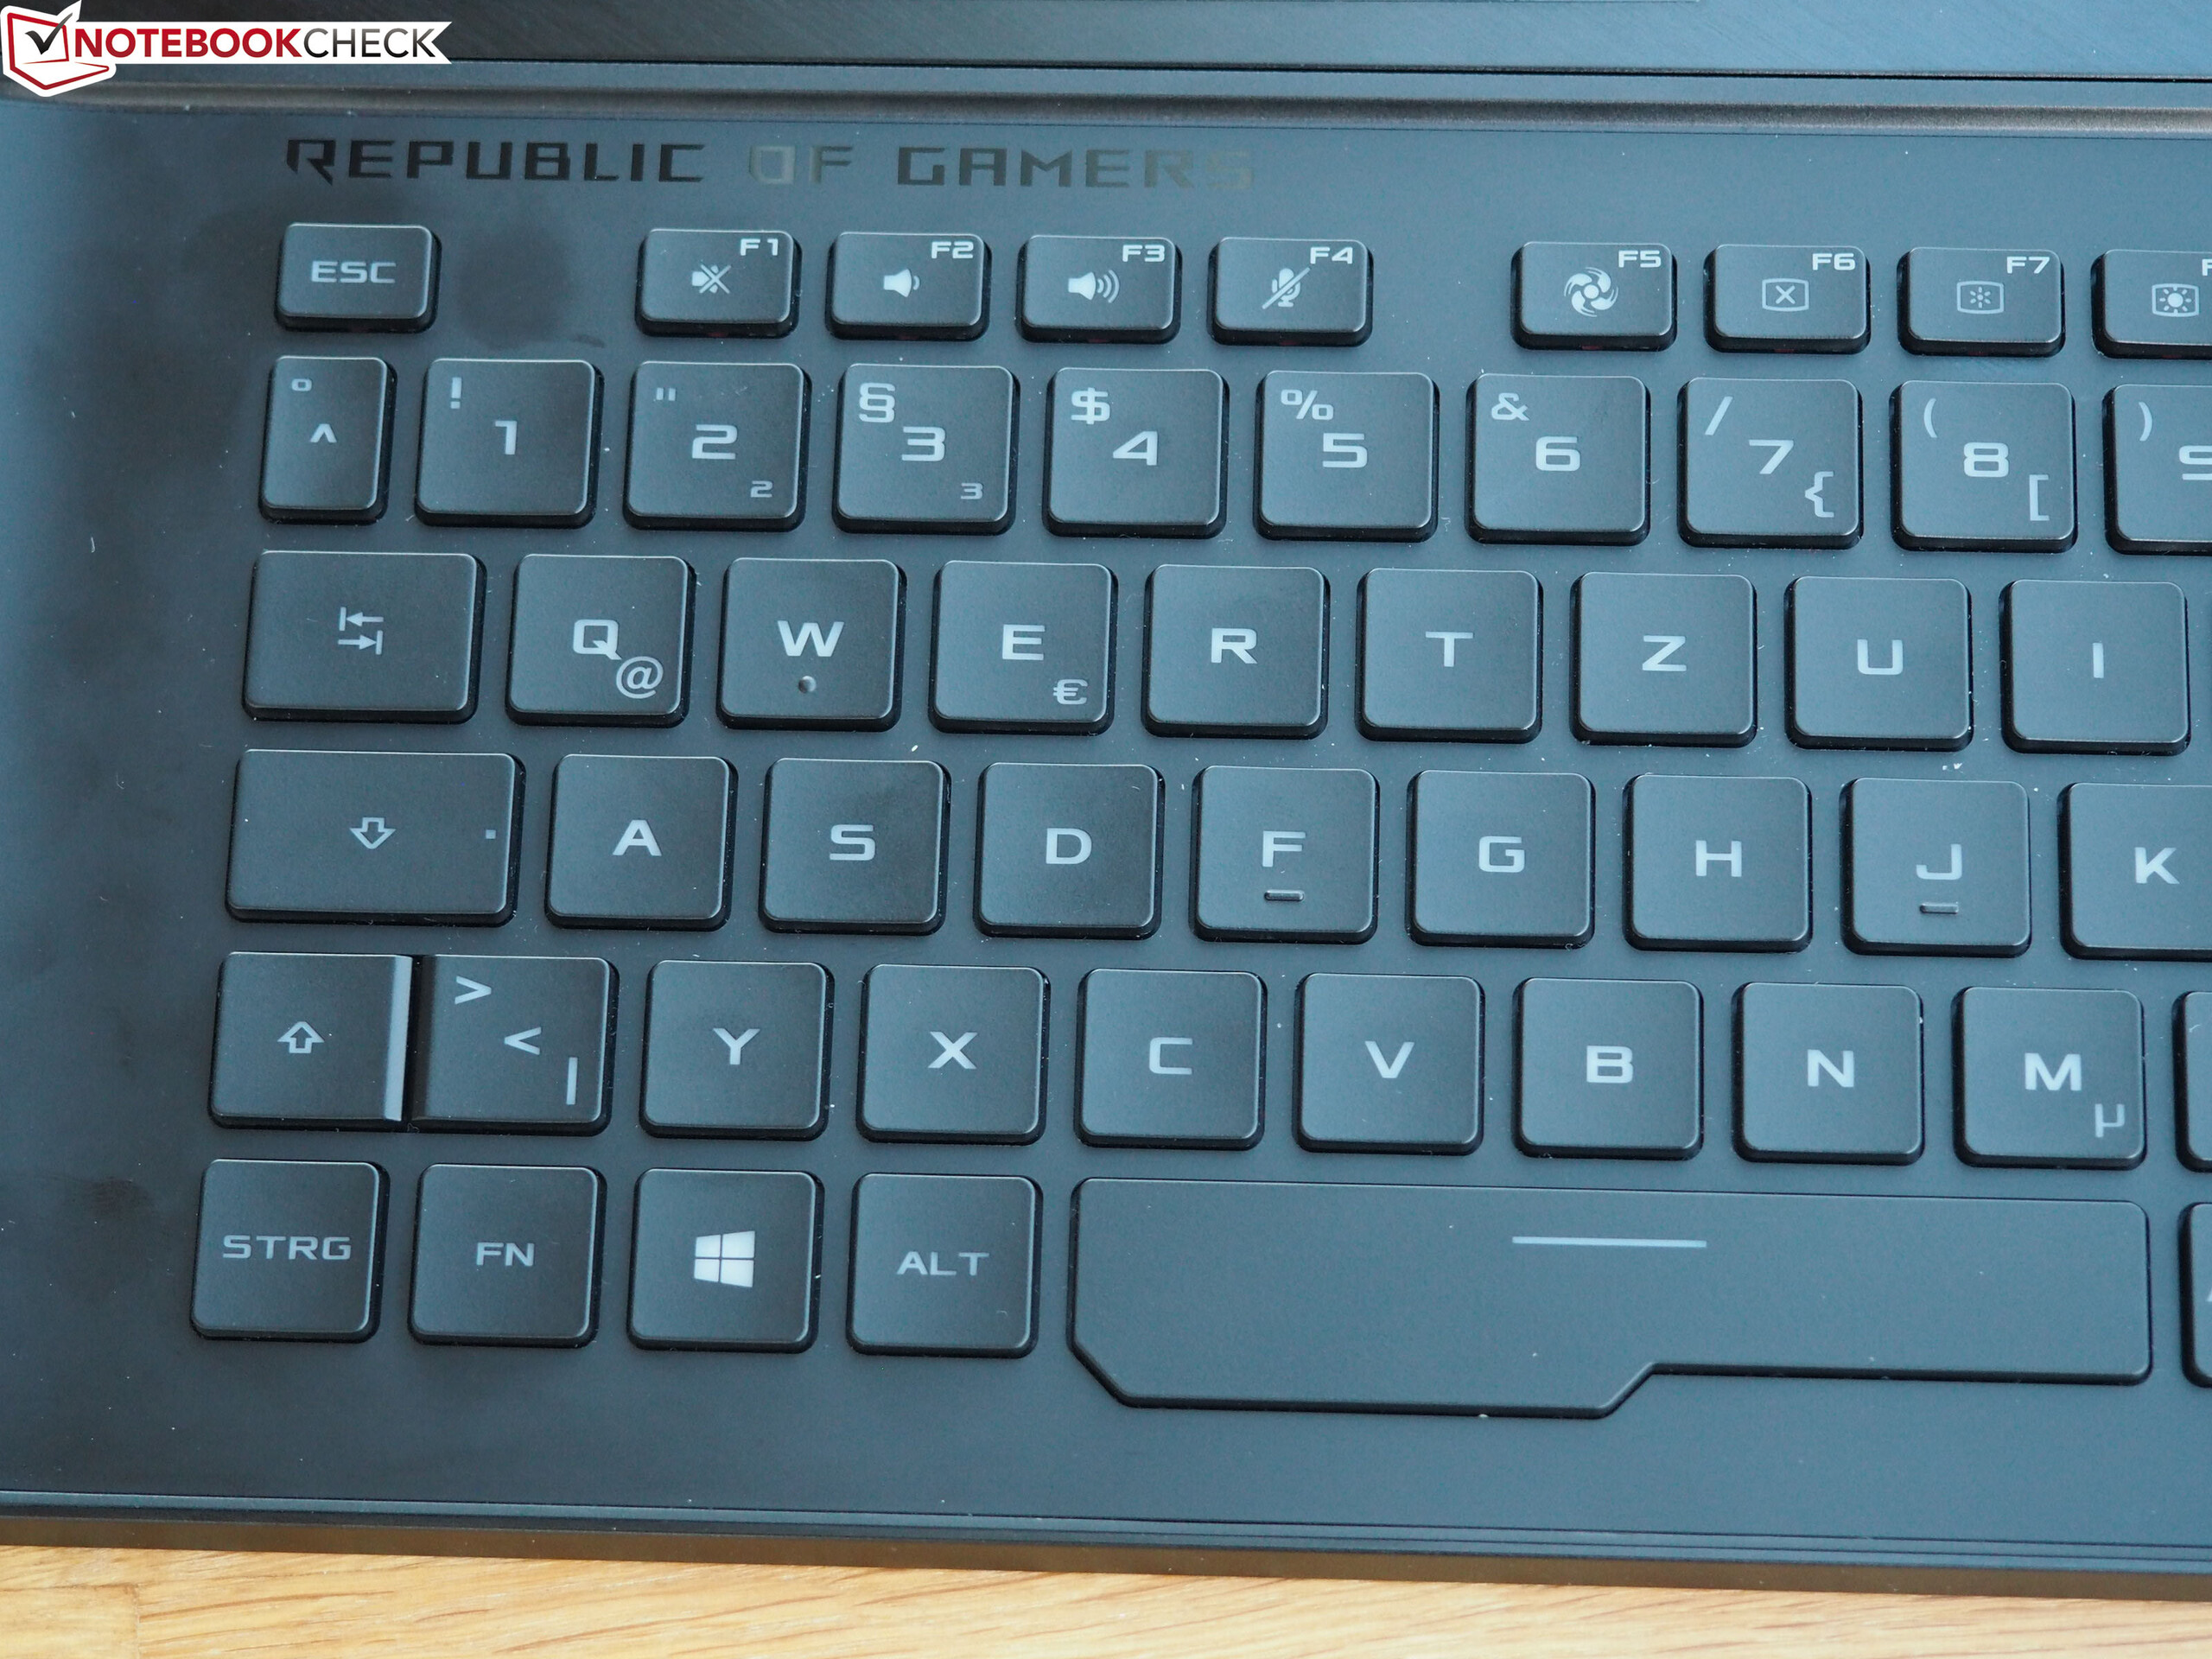
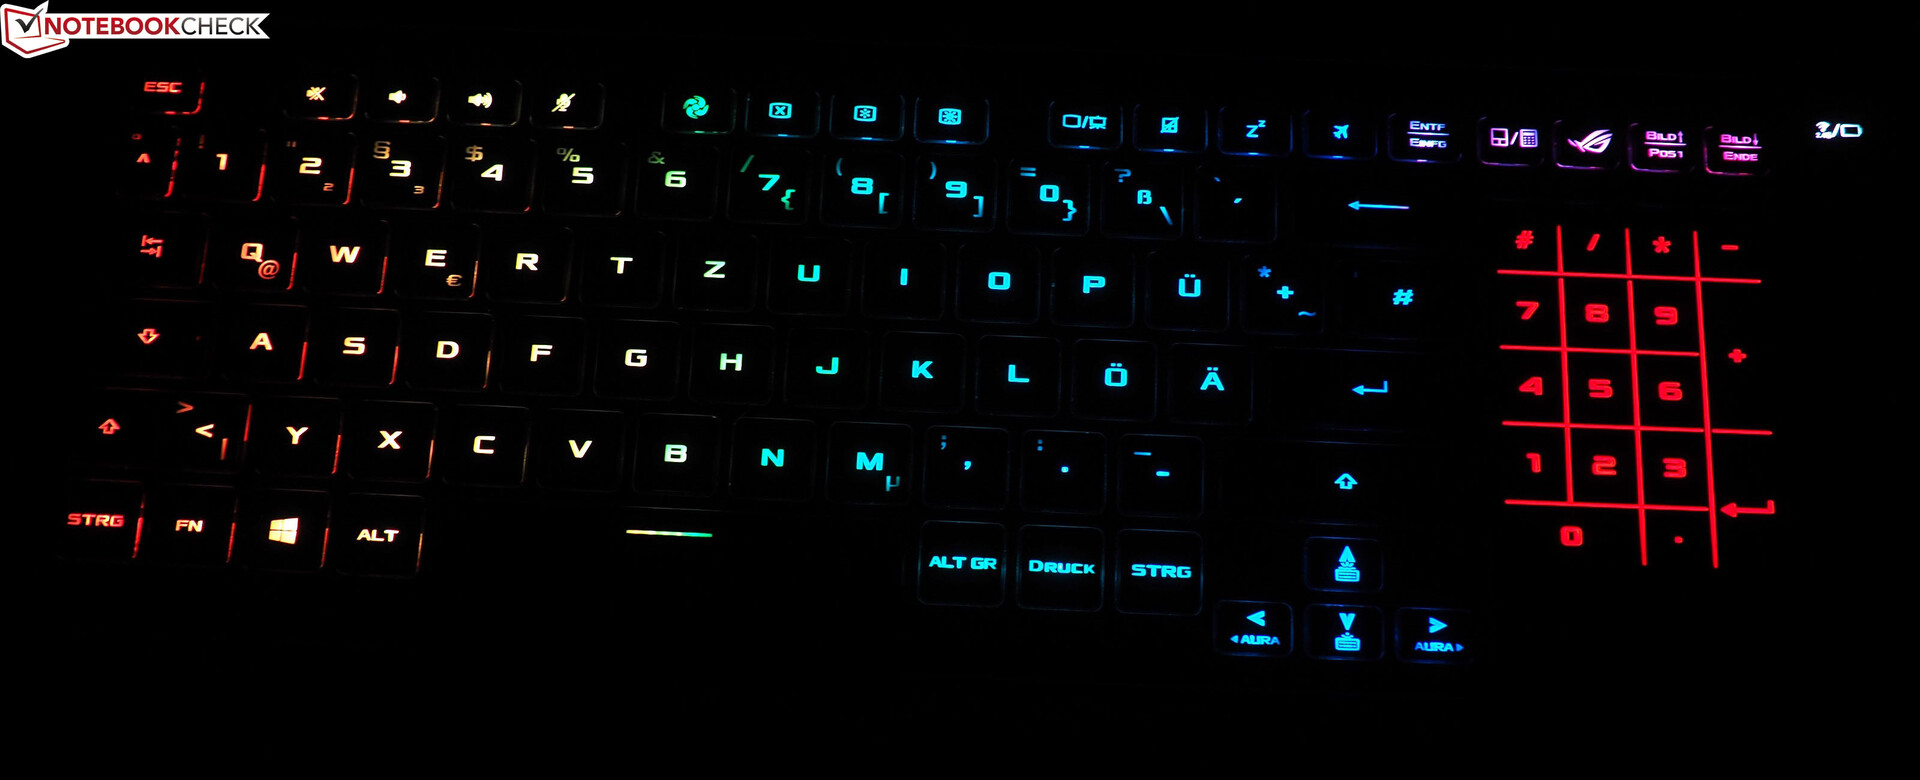
As with some relatives from the GX series, the keyboard sits at the front. There are no palm rests, which is unusual for laptops. Despite not being a mechanical model, the keyboard makes a good impression. Positive aspects include RGB lighting with multiple settings (various modes) and an all around crisp typing experience.
We were less pleased with the size of the keys, however. The arrow keys and the F key row are particularly small. Good: Thanks to the integrated battery, the keyboard unit is powered even when detached and does not require a cable.
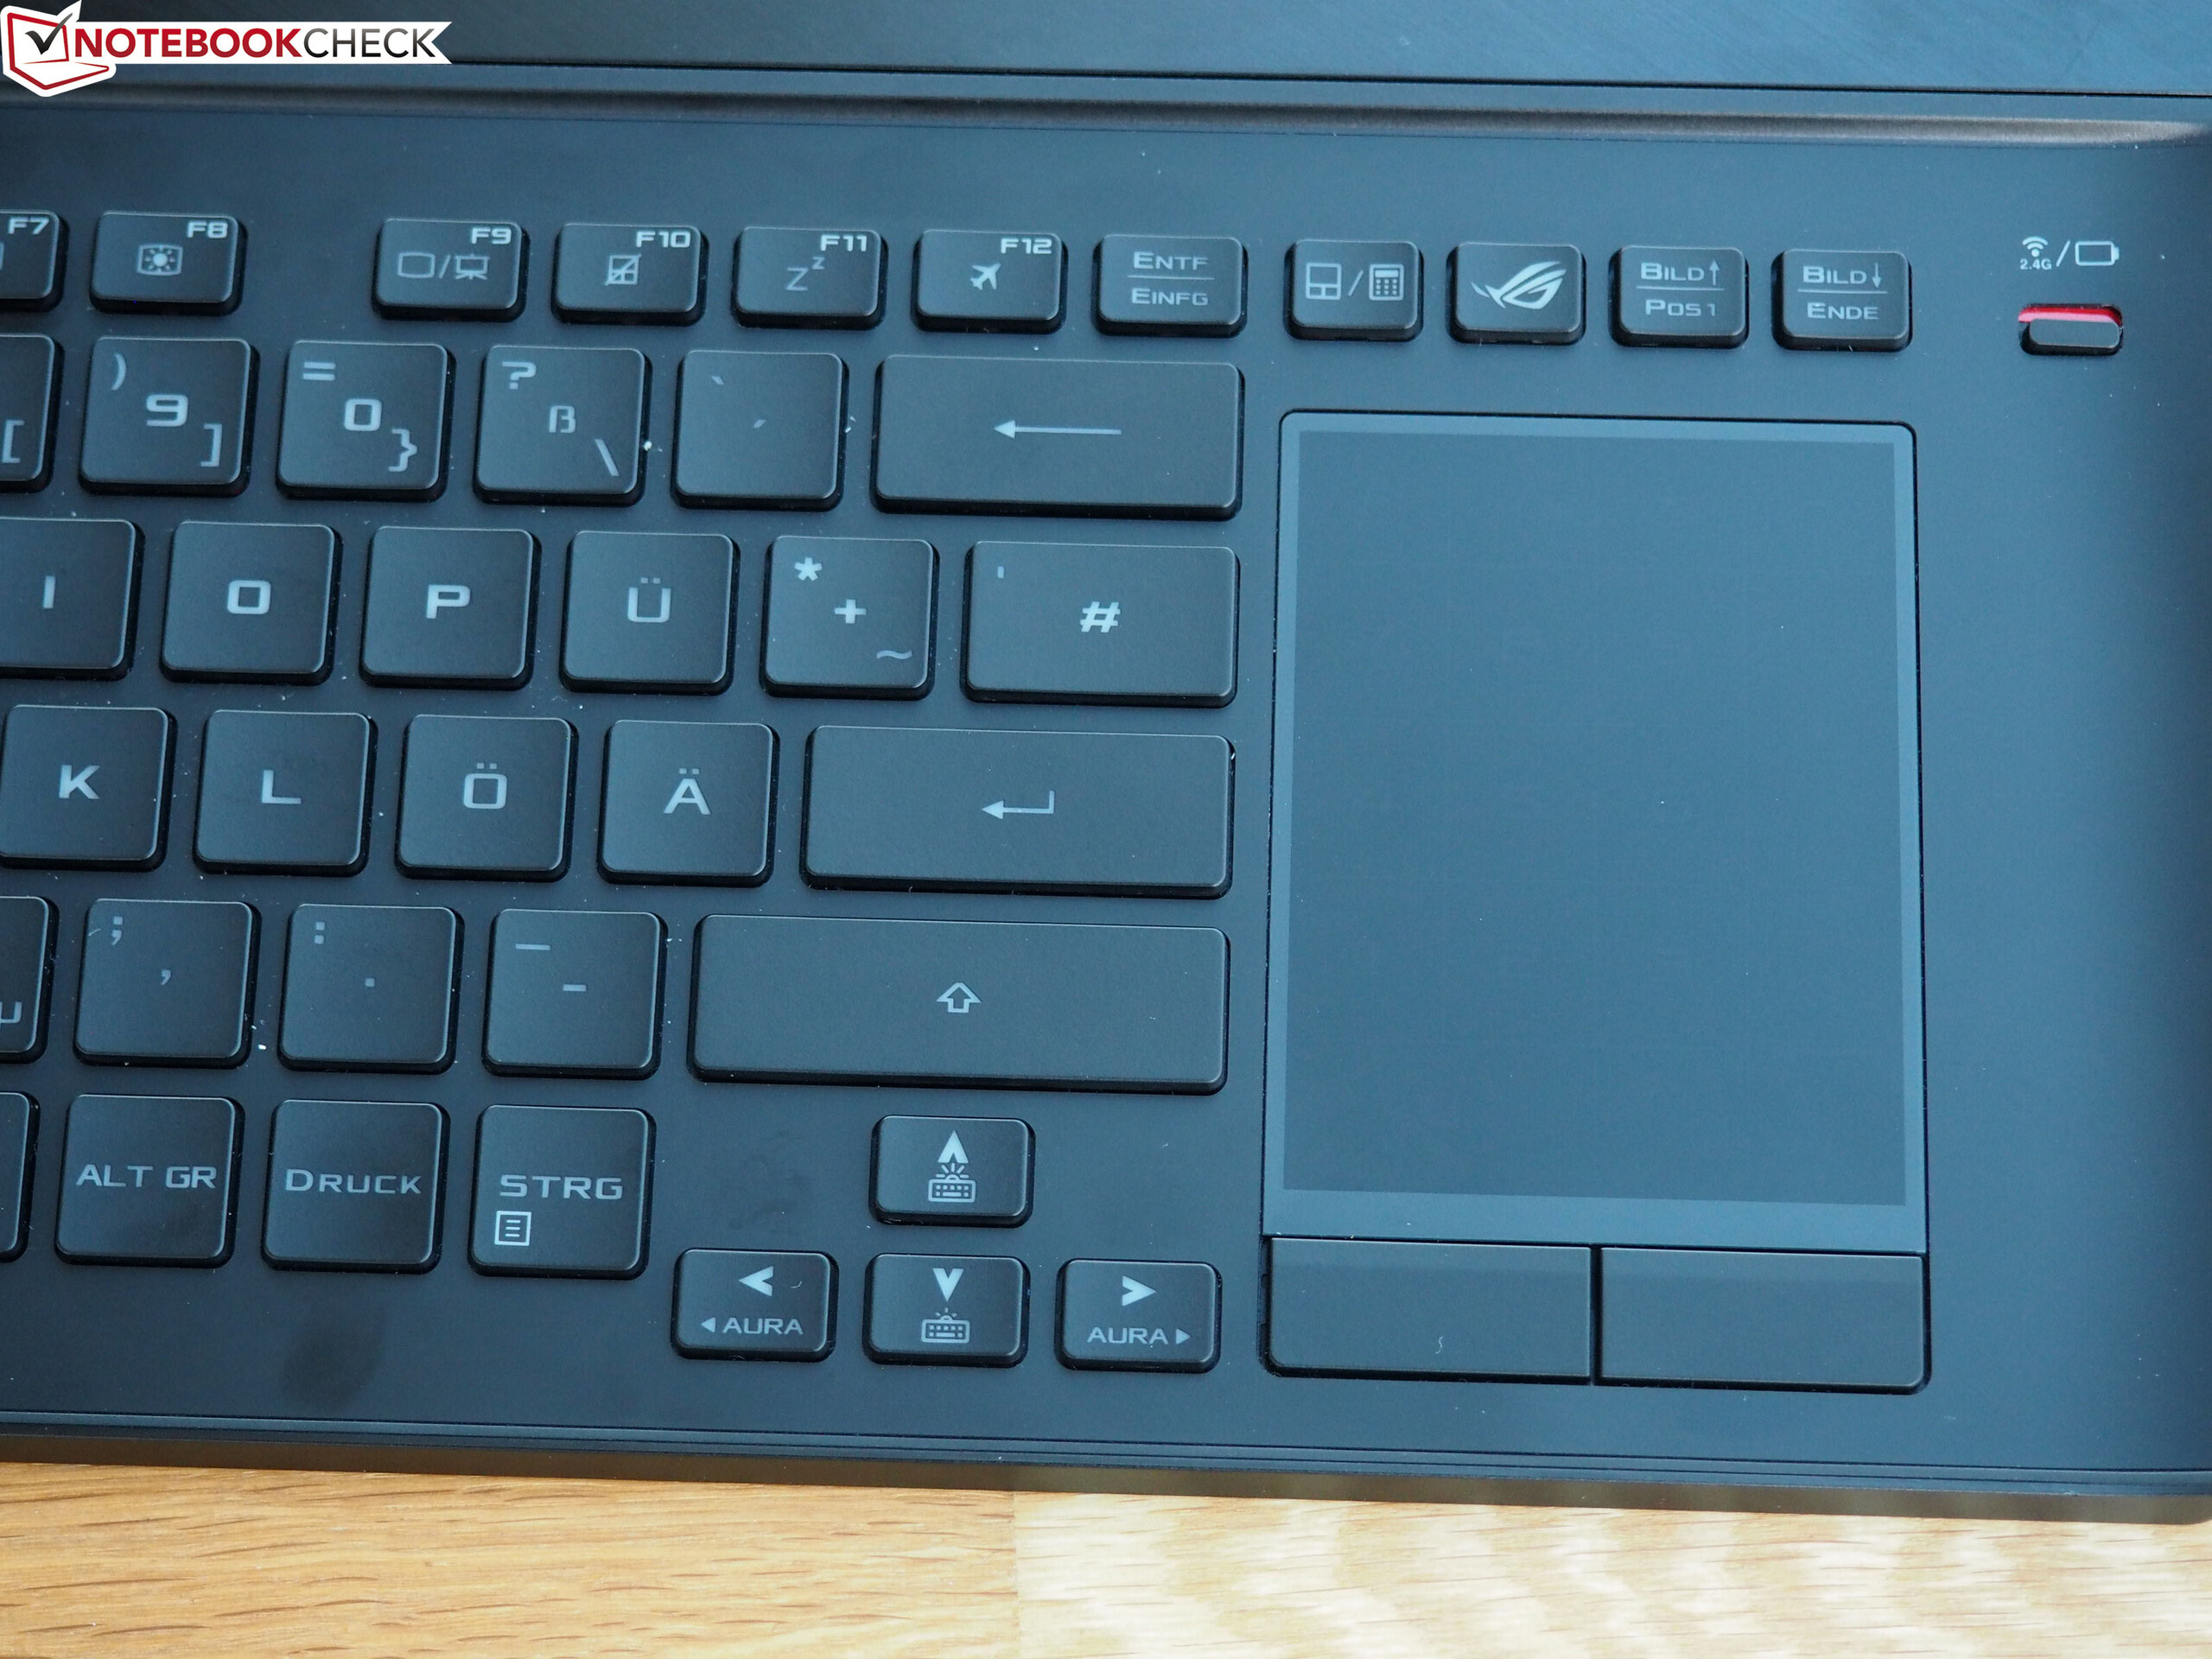
Touchpad
The touchpad is a mixed bag. While at 8 cm (~3.15 in), the length is more than sufficient, the width of only 6 cm (~2.36 in) is very small. Users will need to readjust their finger when it comes to longer distances or drag-and-drop operations. However, we were impressed with the feature that allows the touchpad to transform into a numpad at the press of a button (see picture). The dedicated mouse buttons are nothing out of the ordinary. The same holds true for the precision, the gliding properties and the multitouch support (as in gestures).
Display
Although more and more laptops are featuring 240- or even 300-Hz displays, 144-Hz screens continue to be a good choice for gamers.
| |||||||||||||||||||||||||
Brightness Distribution: 90 %
Center on Battery: 283 cd/m²
Contrast: 1230:1 (Black: 0.23 cd/m²)
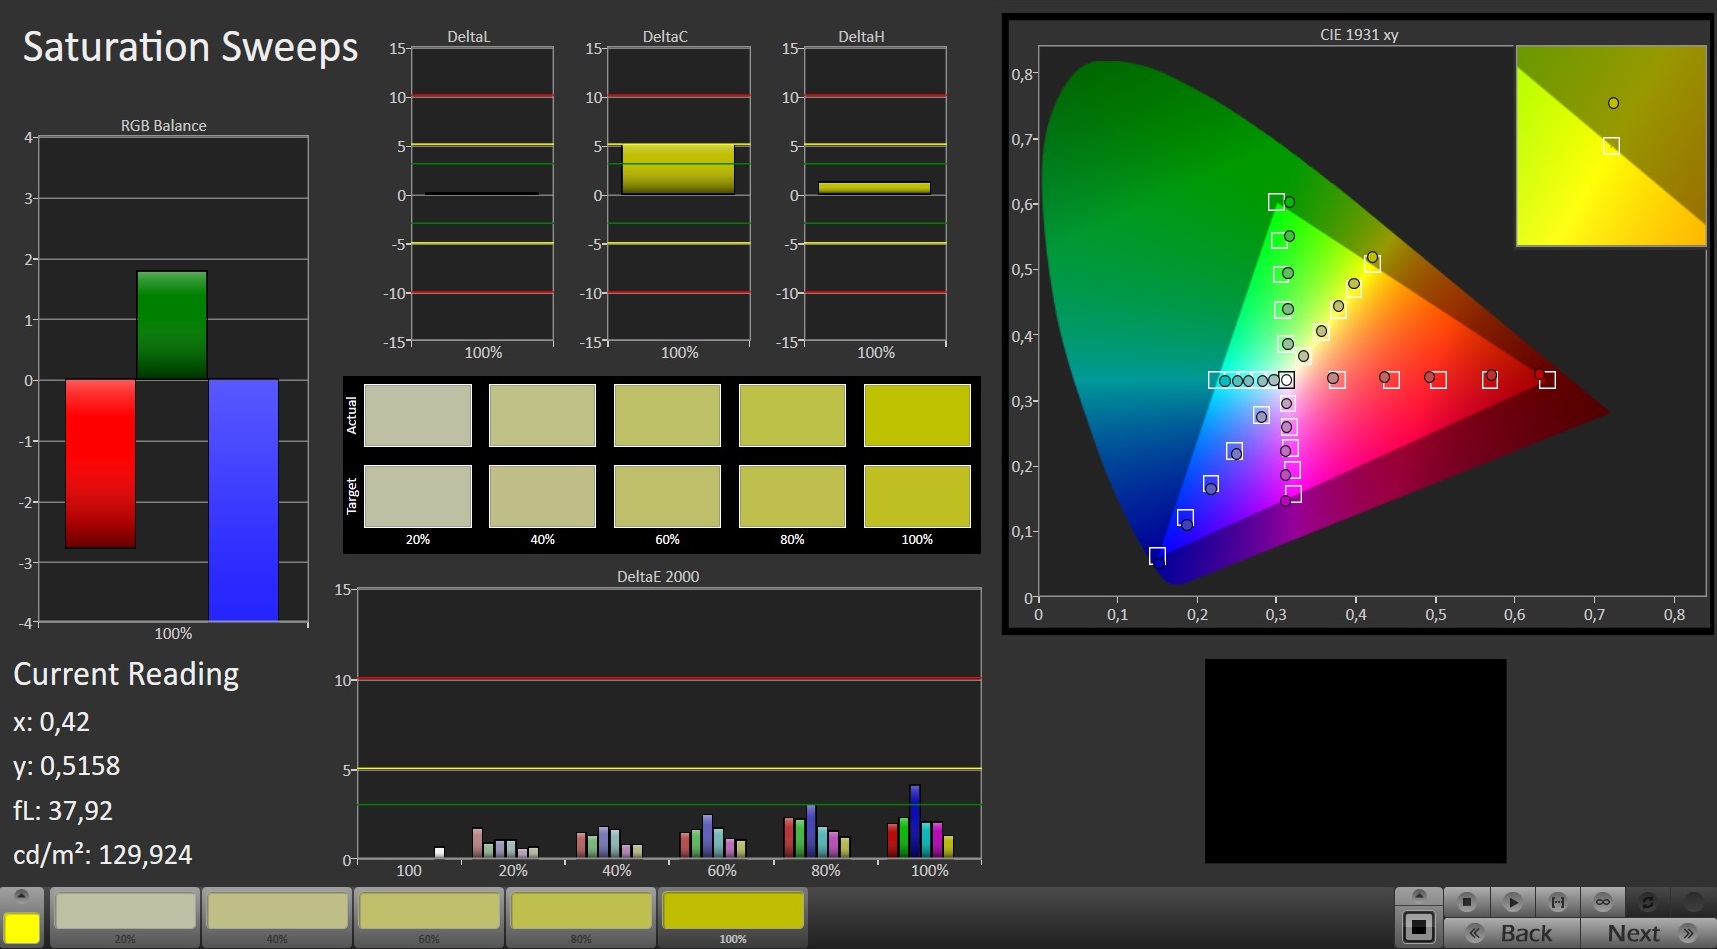
ΔE ColorChecker Calman: 5.87 | ∀{0.5-29.43 Ø4.71}
calibrated: 1.82
ΔE Greyscale Calman: 7.19 | ∀{0.09-98 Ø4.96}
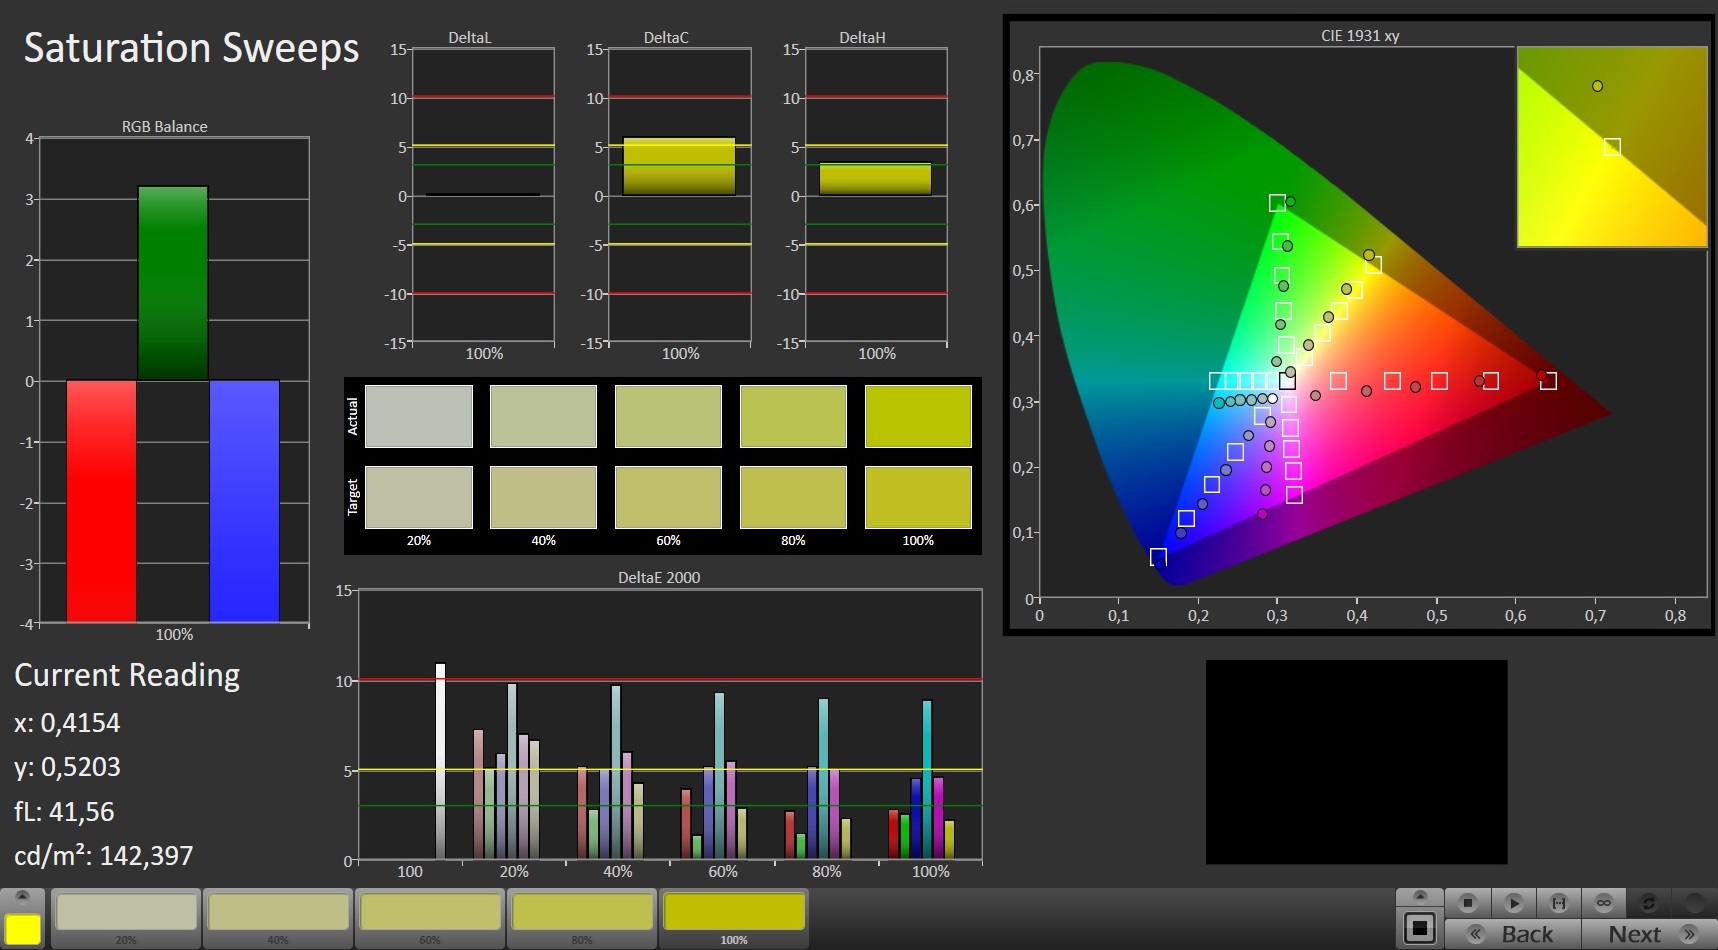
90% sRGB (Argyll 1.6.3 3D)
58% AdobeRGB 1998 (Argyll 1.6.3 3D)
63.7% AdobeRGB 1998 (Argyll 3D)
90.4% sRGB (Argyll 3D)
62.3% Display P3 (Argyll 3D)
Gamma: 2.41
CCT: 8239 K
| Asus ROG Mothership GZ700GX AU Optronics B173HAN04.0 (AUO409D), IPS, 1920x1080 | Asus ROG G703GXR AU Optronics B173HAN04.0 (AUO409D), IPS, 1920x1080 | HP Omen 17-cb0020ng CMN175D, IPS, 1920x1080 | MSI GE75 9SG Chi Mei N173HCE-G33, AHVA, 1920x1080 | MSI GT76 Titan DT 9SG Chi Mei N173HCE-G33 (CMN175C), IPS, 1920x1080 | Alienware Area-51m i9-9900K RTX 2080 LG Philips 173WFG, IPS, 1920x1080 | |
|---|---|---|---|---|---|---|
| Display | 2% | 4% | 0% | 1% | 6% | |
| Display P3 Coverage (%) | 62.3 | 63.2 1% | 63.7 2% | 61.5 -1% | 62.3 0% | 66.3 6% |
| sRGB Coverage (%) | 90.4 | 92 2% | 96 6% | 92 2% | 93.4 3% | 96.9 7% |
| AdobeRGB 1998 Coverage (%) | 63.7 | 64.7 2% | 65.8 3% | 63.5 0% | 64.3 1% | 66.5 4% |
| Response Times | -15% | -101% | 9% | -15% | -62% | |
| Response Time Grey 50% / Grey 80% * (ms) | 6 ? | 6.4 ? -7% | 17.6 ? -193% | 7.2 ? -20% | 8 ? -33% | 13.2 ? -120% |
| Response Time Black / White * (ms) | 10.4 ? | 12.8 ? -23% | 11.2 ? -8% | 6.6 ? 37% | 10 ? 4% | 10.8 ? -4% |
| PWM Frequency (Hz) | 25510 ? | 26040 ? | 26040 ? | |||
| Screen | 10% | 28% | 25% | 25% | -3% | |
| Brightness middle (cd/m²) | 283 | 290 2% | 360 27% | 400.7 42% | 396 40% | 335.2 18% |
| Brightness (cd/m²) | 285 | 281 -1% | 342 20% | 372 31% | 373 31% | 297 4% |
| Brightness Distribution (%) | 90 | 91 1% | 91 1% | 89 -1% | 89 -1% | 82 -9% |
| Black Level * (cd/m²) | 0.23 | 0.2 13% | 0.26 -13% | 0.34 -48% | 0.33 -43% | 0.66 -187% |
| Contrast (:1) | 1230 | 1450 18% | 1385 13% | 1179 -4% | 1200 -2% | 508 -59% |
| Colorchecker dE 2000 * | 5.87 | 4.77 19% | 1.91 67% | 1.33 77% | 2.04 65% | 2.02 66% |
| Colorchecker dE 2000 max. * | 11.01 | 9.08 18% | 4.08 63% | 3.51 68% | 3.85 65% | 7.23 34% |
| Colorchecker dE 2000 calibrated * | 1.82 | 1.46 20% | 0.78 57% | 1.39 24% | 0.82 55% | 1.17 36% |
| Greyscale dE 2000 * | 7.19 | 5.83 19% | 2.72 62% | 1.3 82% | 2.83 61% | 3.2 55% |
| Gamma | 2.41 91% | 2.47 89% | 2.37 93% | 2.24 98% | 2.49 88% | 2.16 102% |
| CCT | 8239 79% | 8076 80% | 6692 97% | 6735 97% | 7113 91% | 6746 96% |
| Color Space (Percent of AdobeRGB 1998) (%) | 58 | 59 2% | 60 3% | 58.2 0% | 59 2% | 61.3 6% |
| Color Space (Percent of sRGB) (%) | 90 | 92 2% | 96 7% | 92.1 2% | 94 4% | 96.9 8% |
| Total Average (Program / Settings) | -1% /
6% | -23% /
7% | 11% /
18% | 4% /
16% | -20% /
-8% |
* ... smaller is better
The GZ700 comes with a 17-inch AU Optronics IPS panel with the model number B173HAN04.0. The Asus G703GXR uses the same panel. For the most part, the panel performs well in our tests.
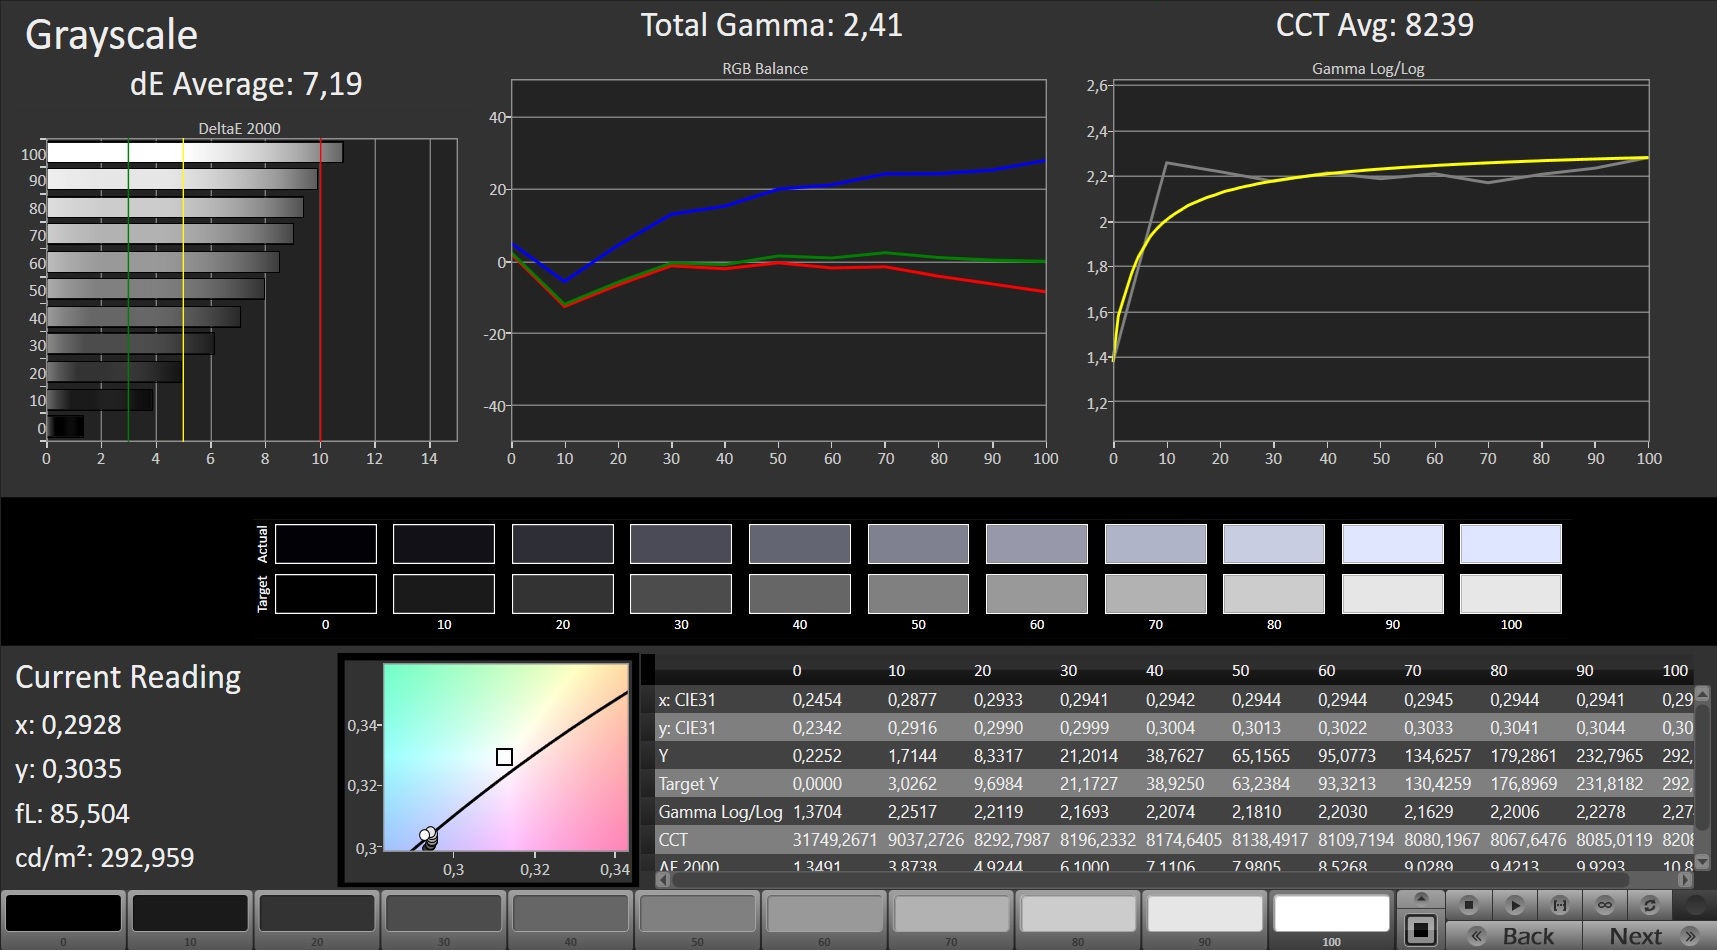
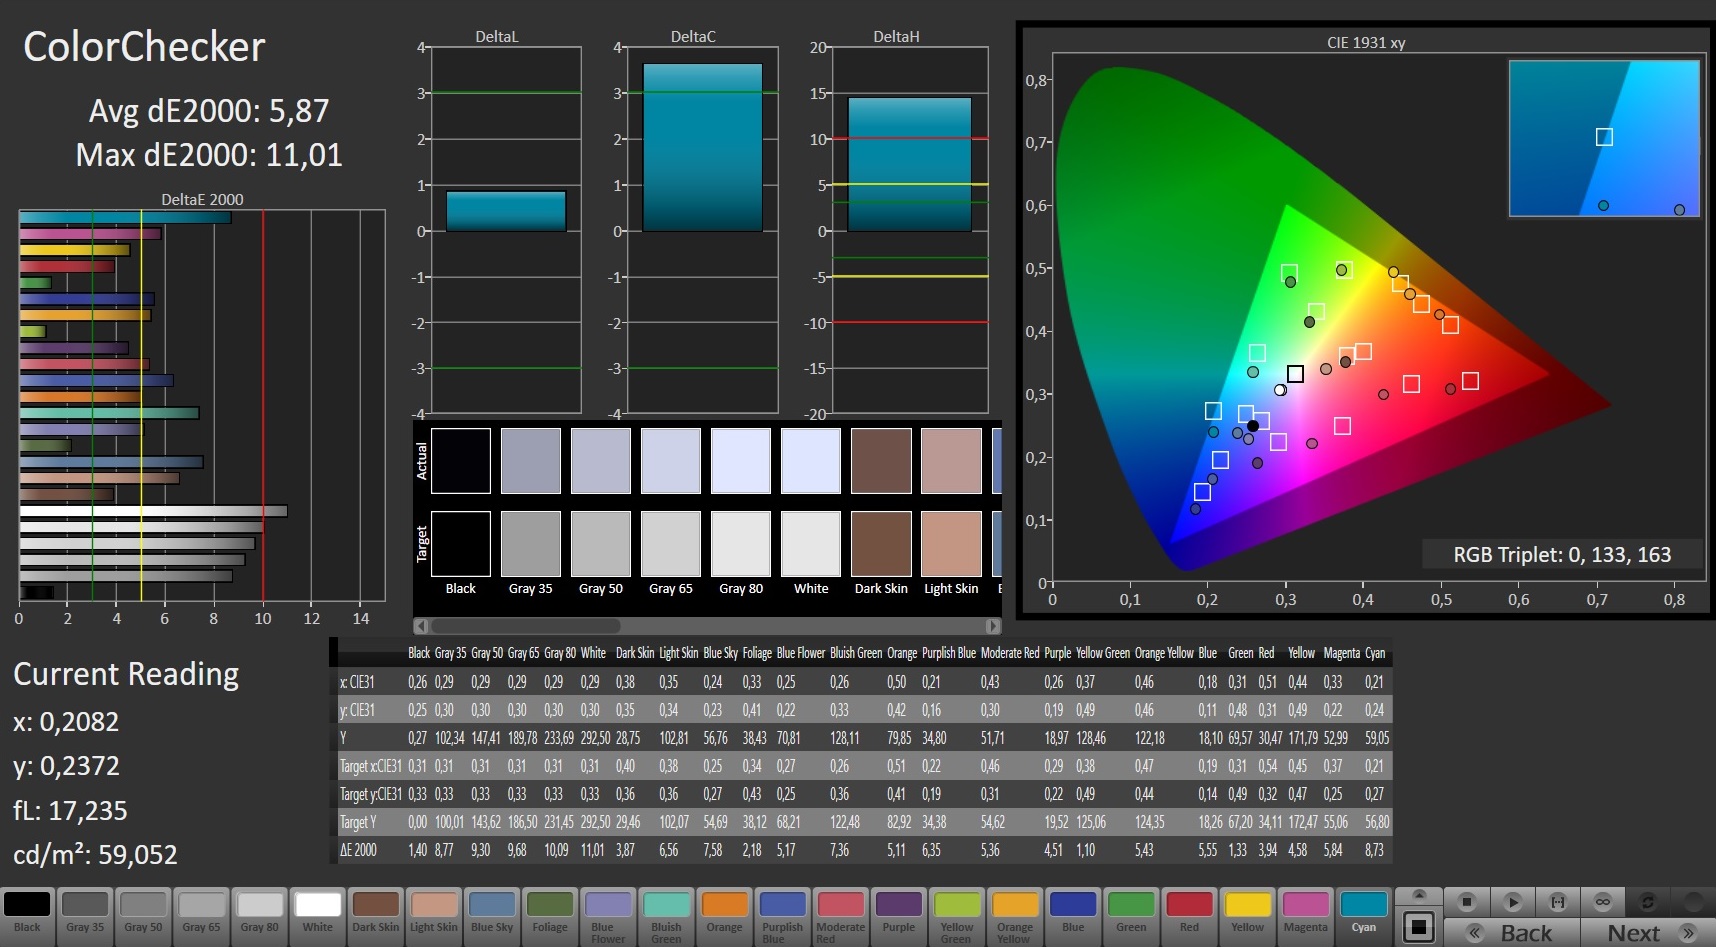
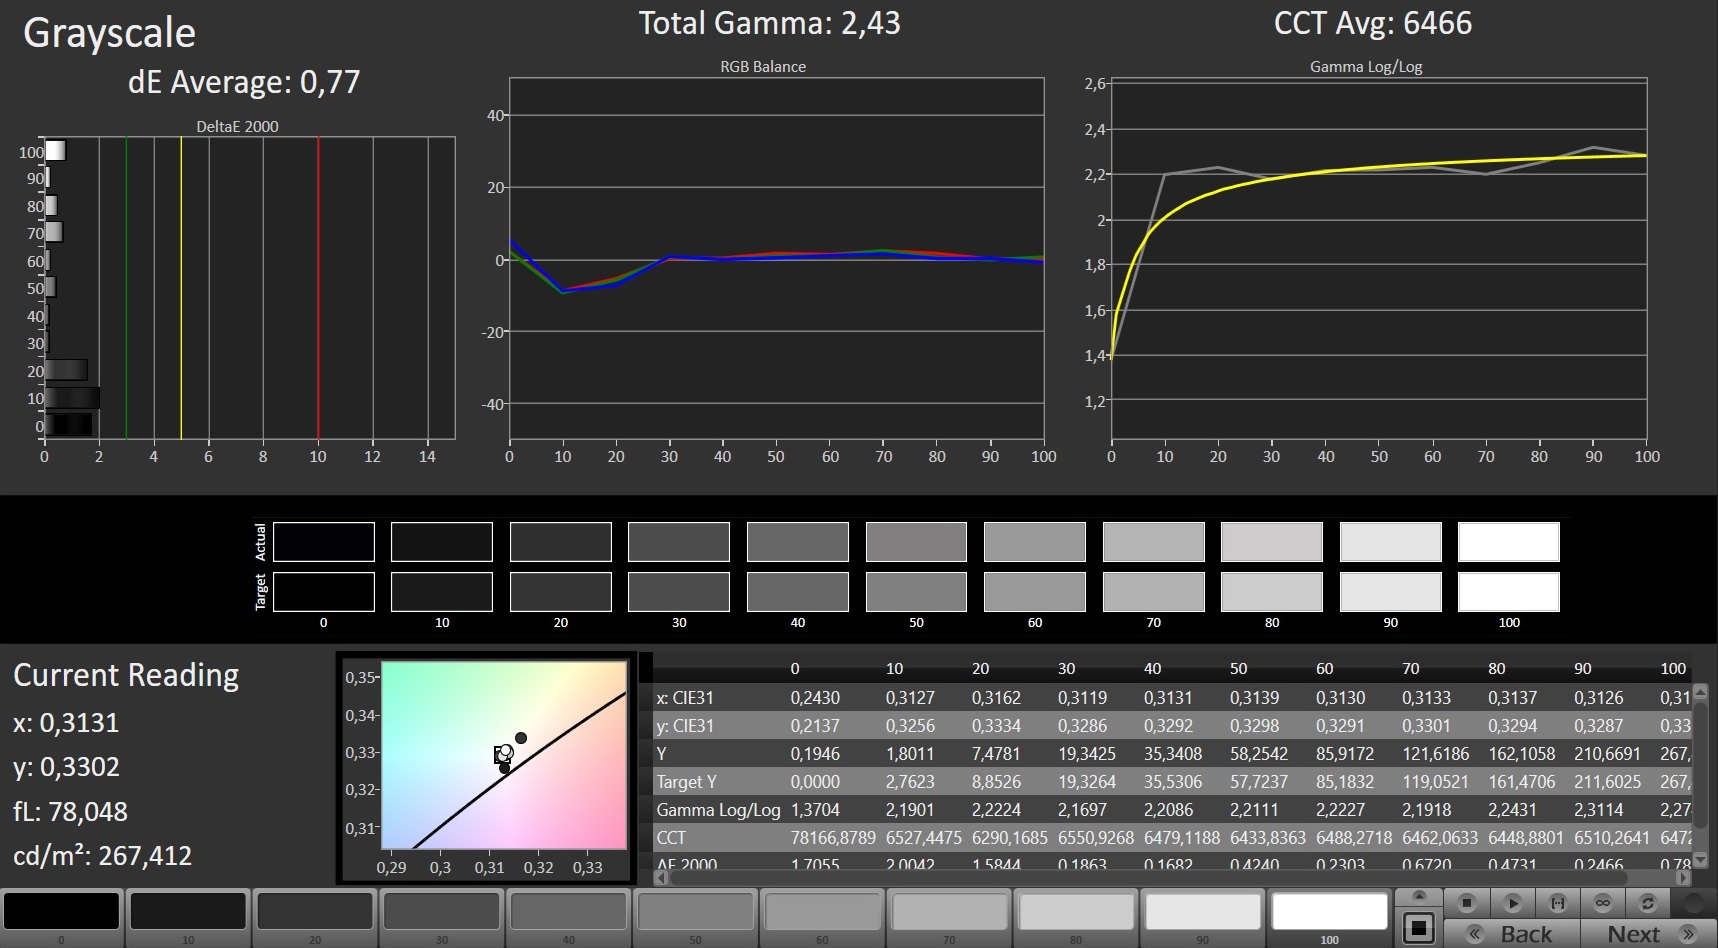
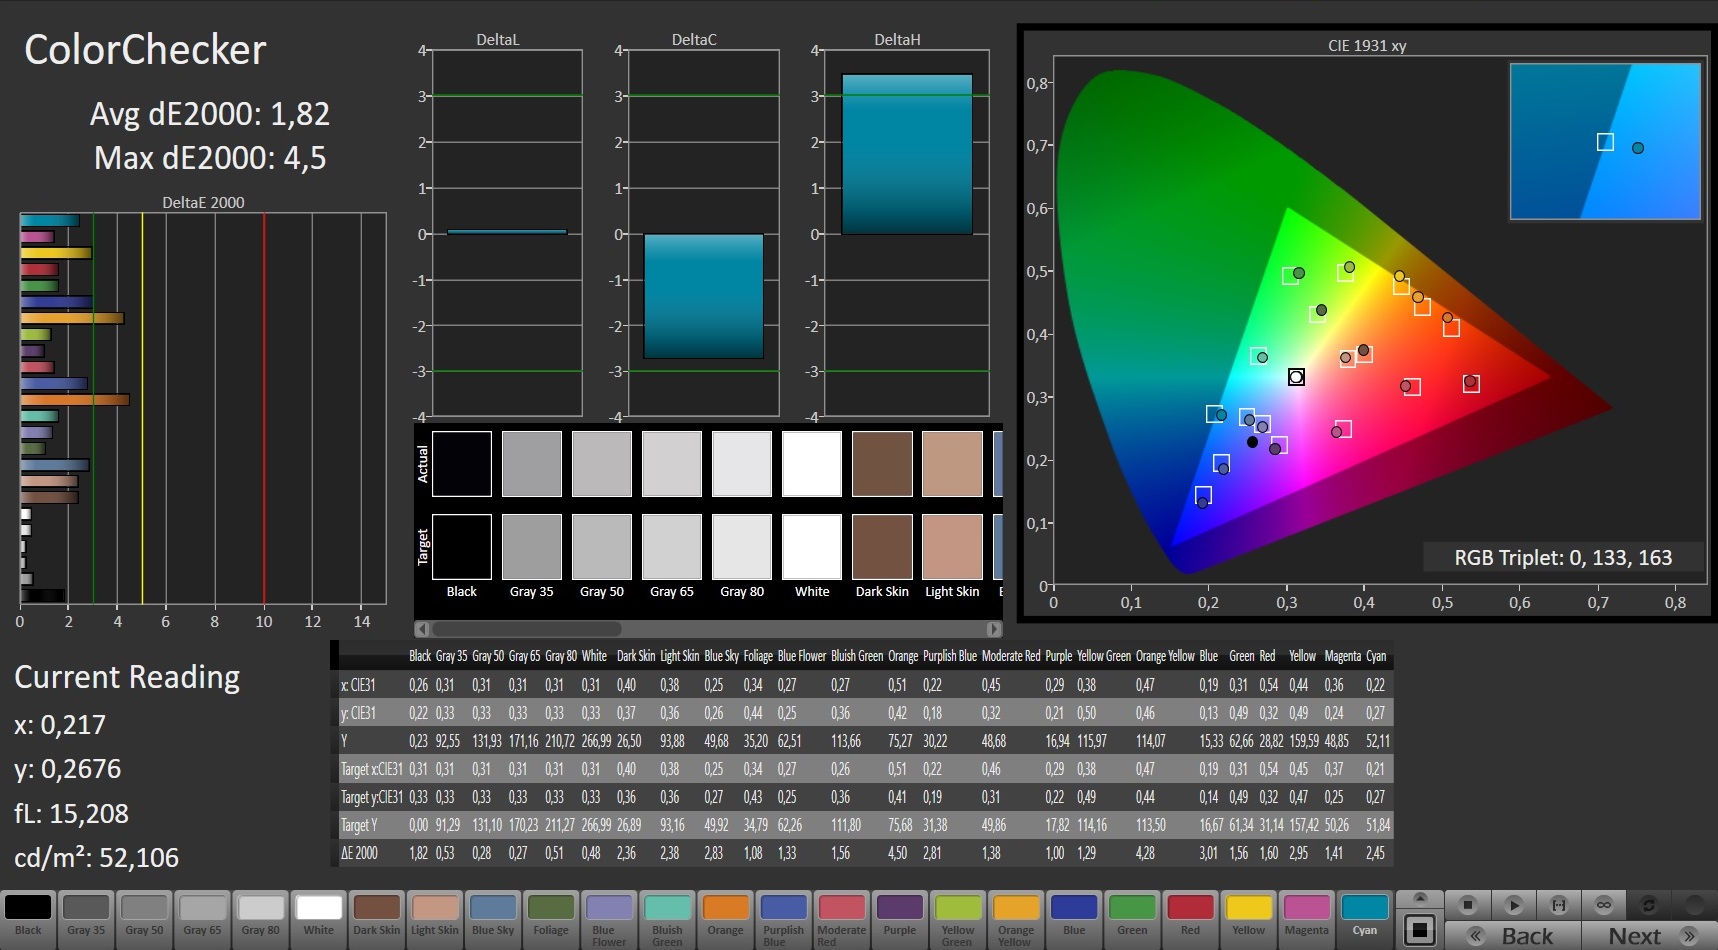
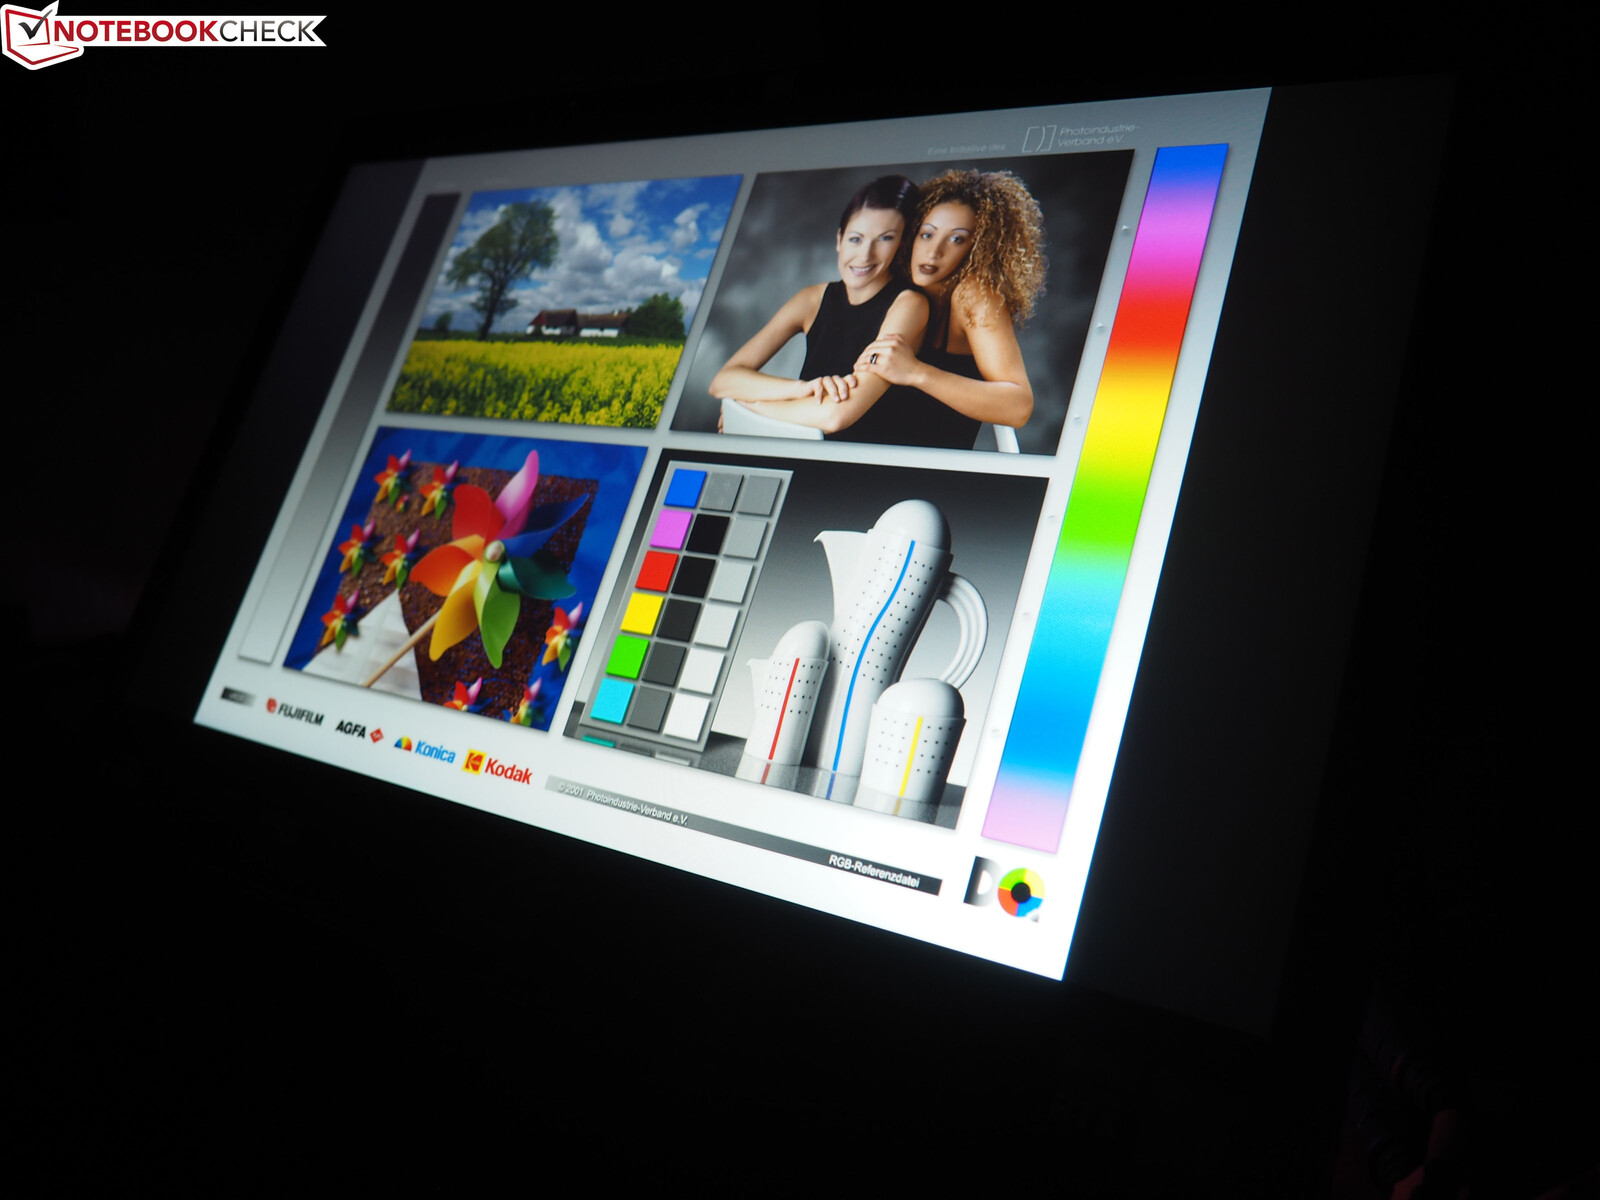
Apart from the mediocre brightness value (approximately 285 cd/m²) and a relatively poor color accuracy (blue tint) the visual experience is good. A black value of 0.23 cd/m² and a contrast ratio of 1,230:1 are respectable. With these values, the GZ700 is on par with its competition.
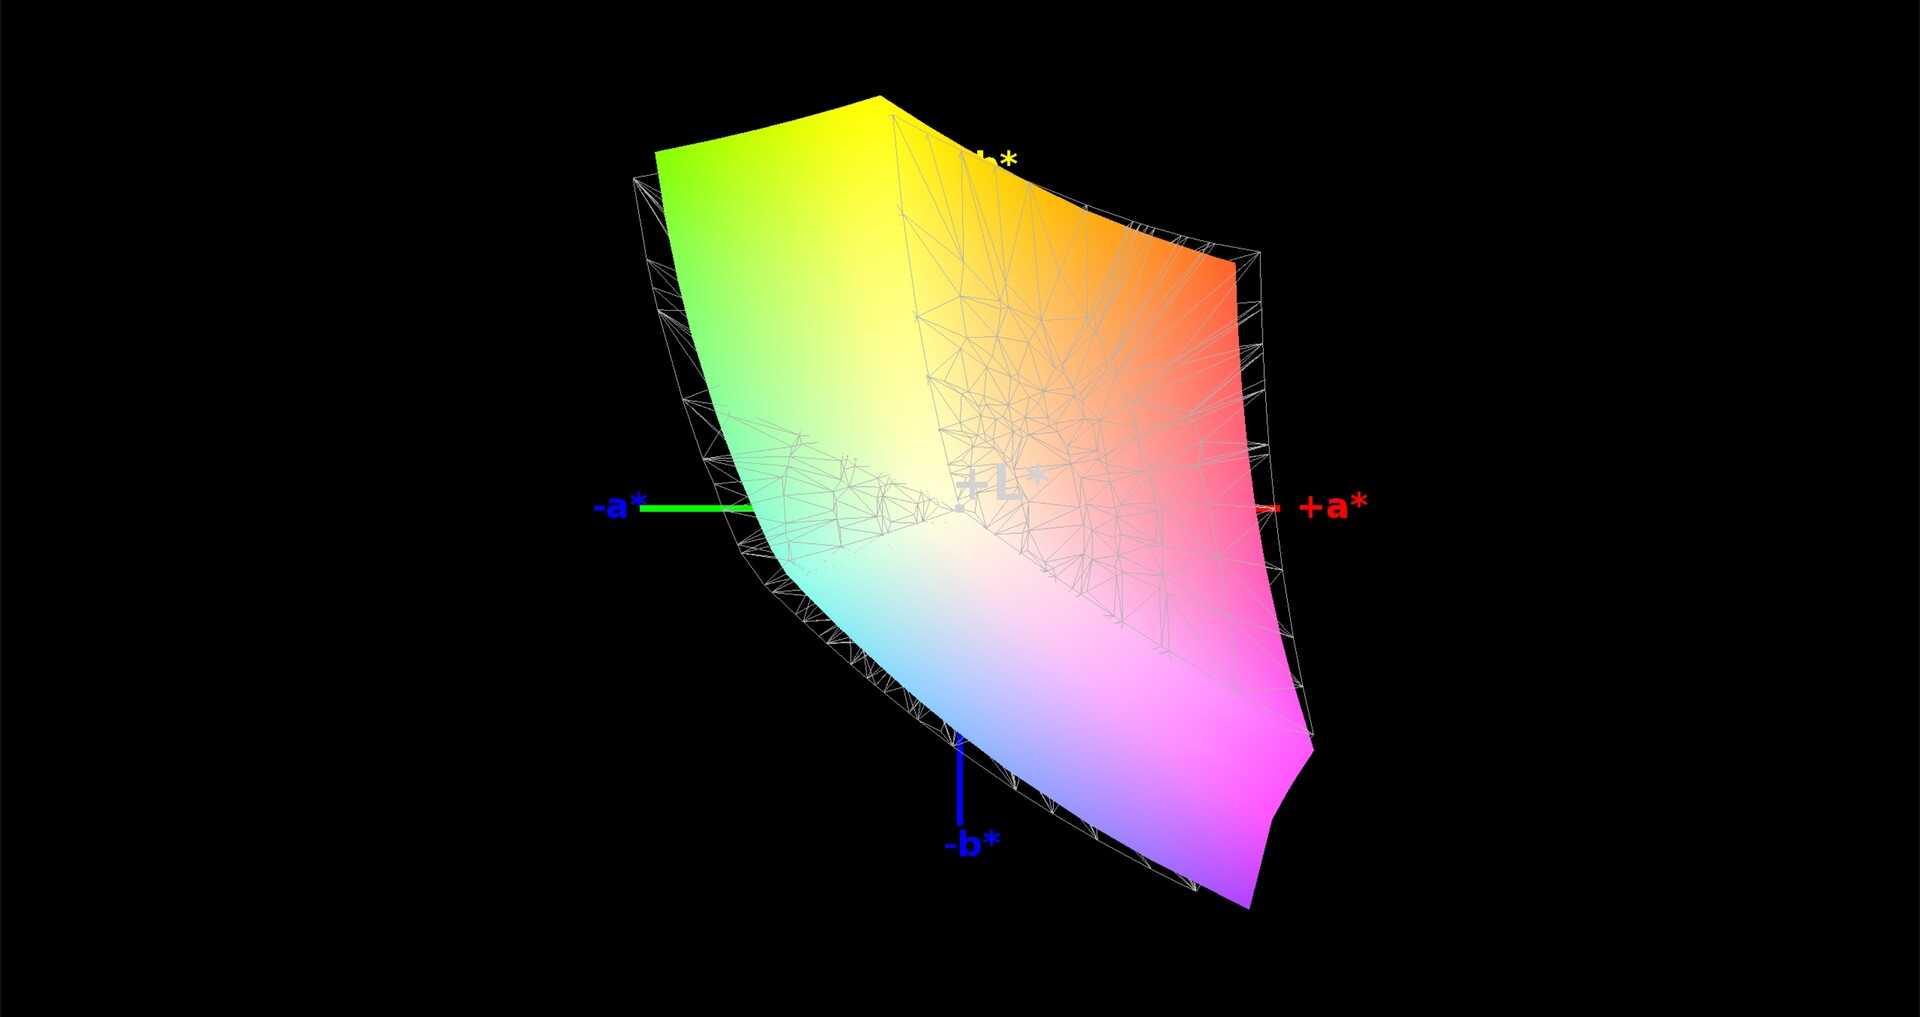
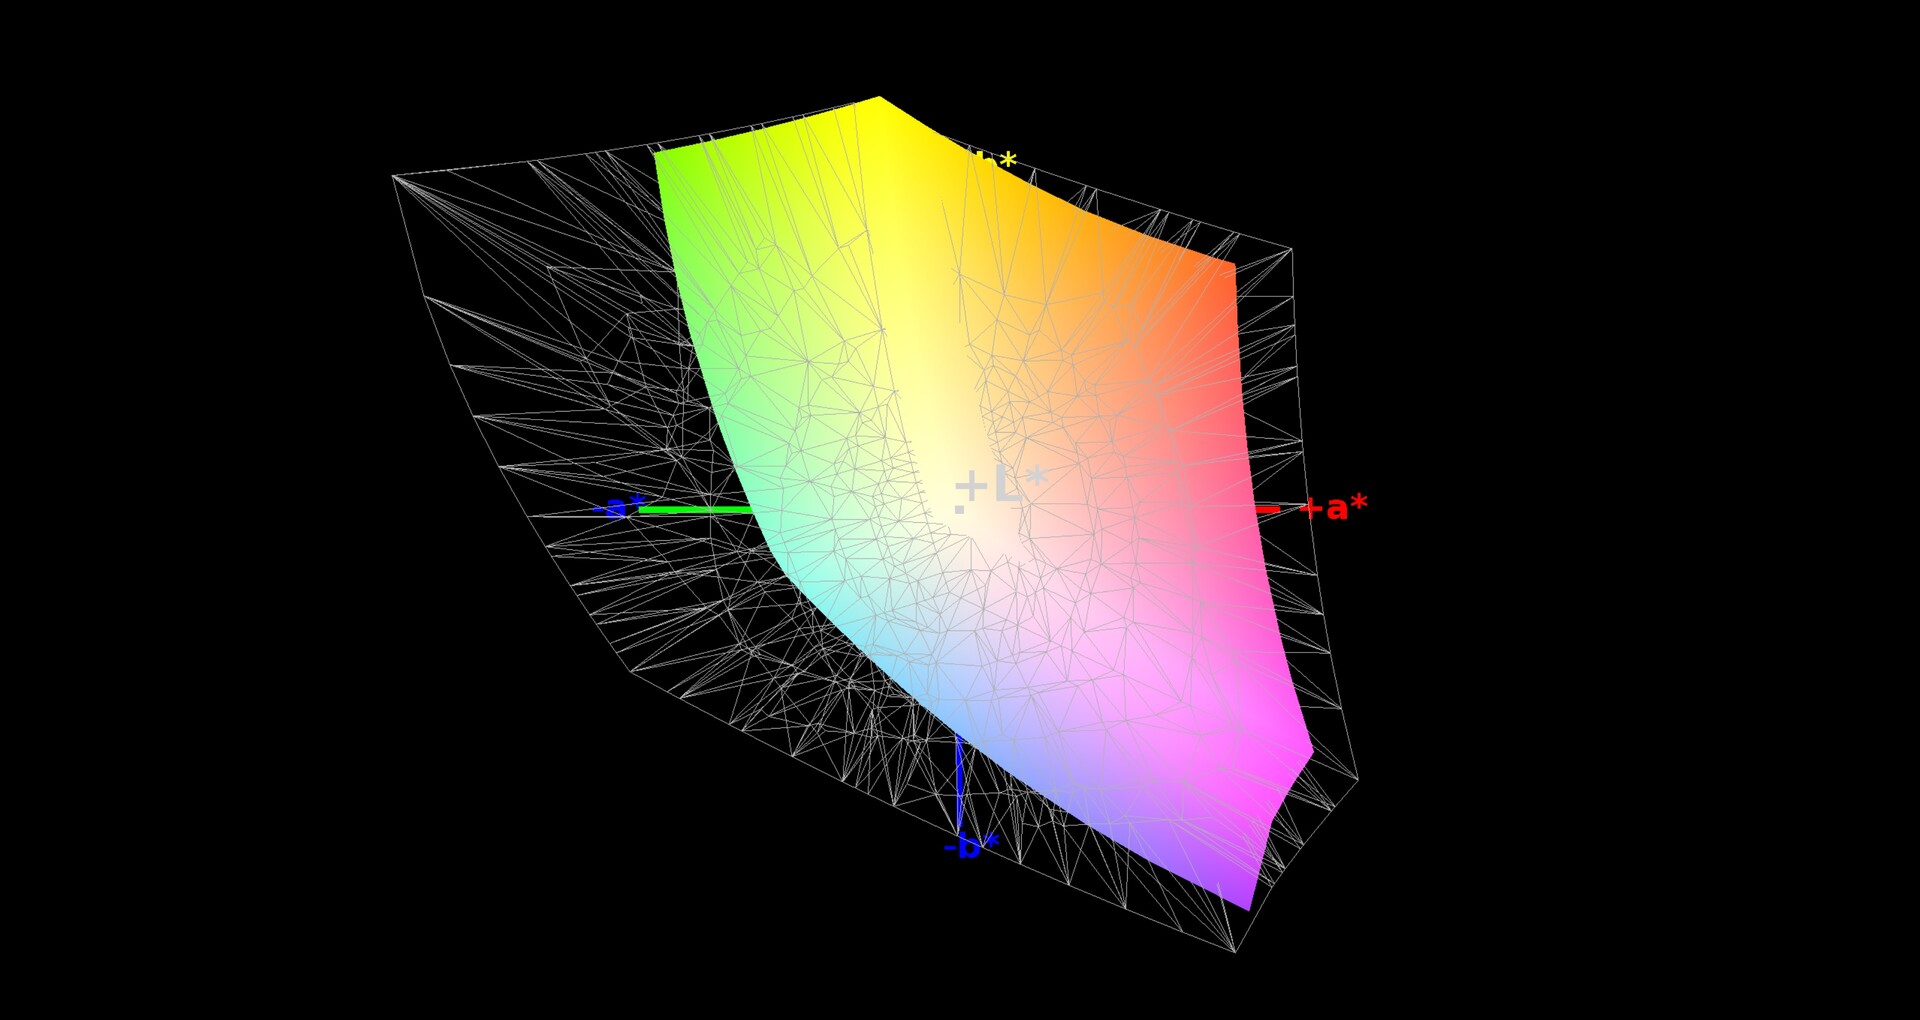
There are no anomalies in terms of the color space (90% sRGB), the viewing angles or the illumination. For an IPS panel, the response times are surprisingly low. With 6 to 10 ms, even fast-paced games should remain largely unaffected by ghosting.
Display Response Times
| ↔ Response Time Black to White | ||
|---|---|---|
| 10.4 ms ... rise ↗ and fall ↘ combined | ↗ 6 ms rise | 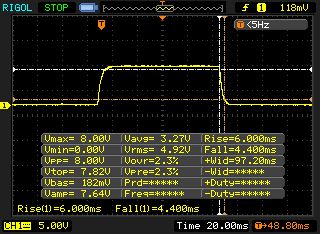 |
| ↘ 4.4 ms fall | ||
| The screen shows good response rates in our tests, but may be too slow for competitive gamers. In comparison, all tested devices range from 0.1 (minimum) to 240 (maximum) ms. » 28 % of all devices are better. This means that the measured response time is better than the average of all tested devices (19.8 ms). | ||
| ↔ Response Time 50% Grey to 80% Grey | ||
| 6 ms ... rise ↗ and fall ↘ combined | ↗ 3 ms rise | 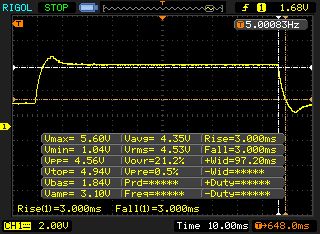 |
| ↘ 3 ms fall | ||
| The screen shows very fast response rates in our tests and should be very well suited for fast-paced gaming. In comparison, all tested devices range from 0.165 (minimum) to 636 (maximum) ms. » 19 % of all devices are better. This means that the measured response time is better than the average of all tested devices (30.9 ms). | ||
Screen Flickering / PWM (Pulse-Width Modulation)
| Screen flickering / PWM not detected | 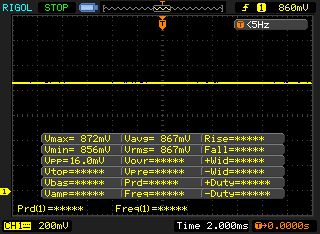 | ||
In comparison: 52 % of all tested devices do not use PWM to dim the display. If PWM was detected, an average of 7741 (minimum: 5 - maximum: 343500) Hz was measured. | |||
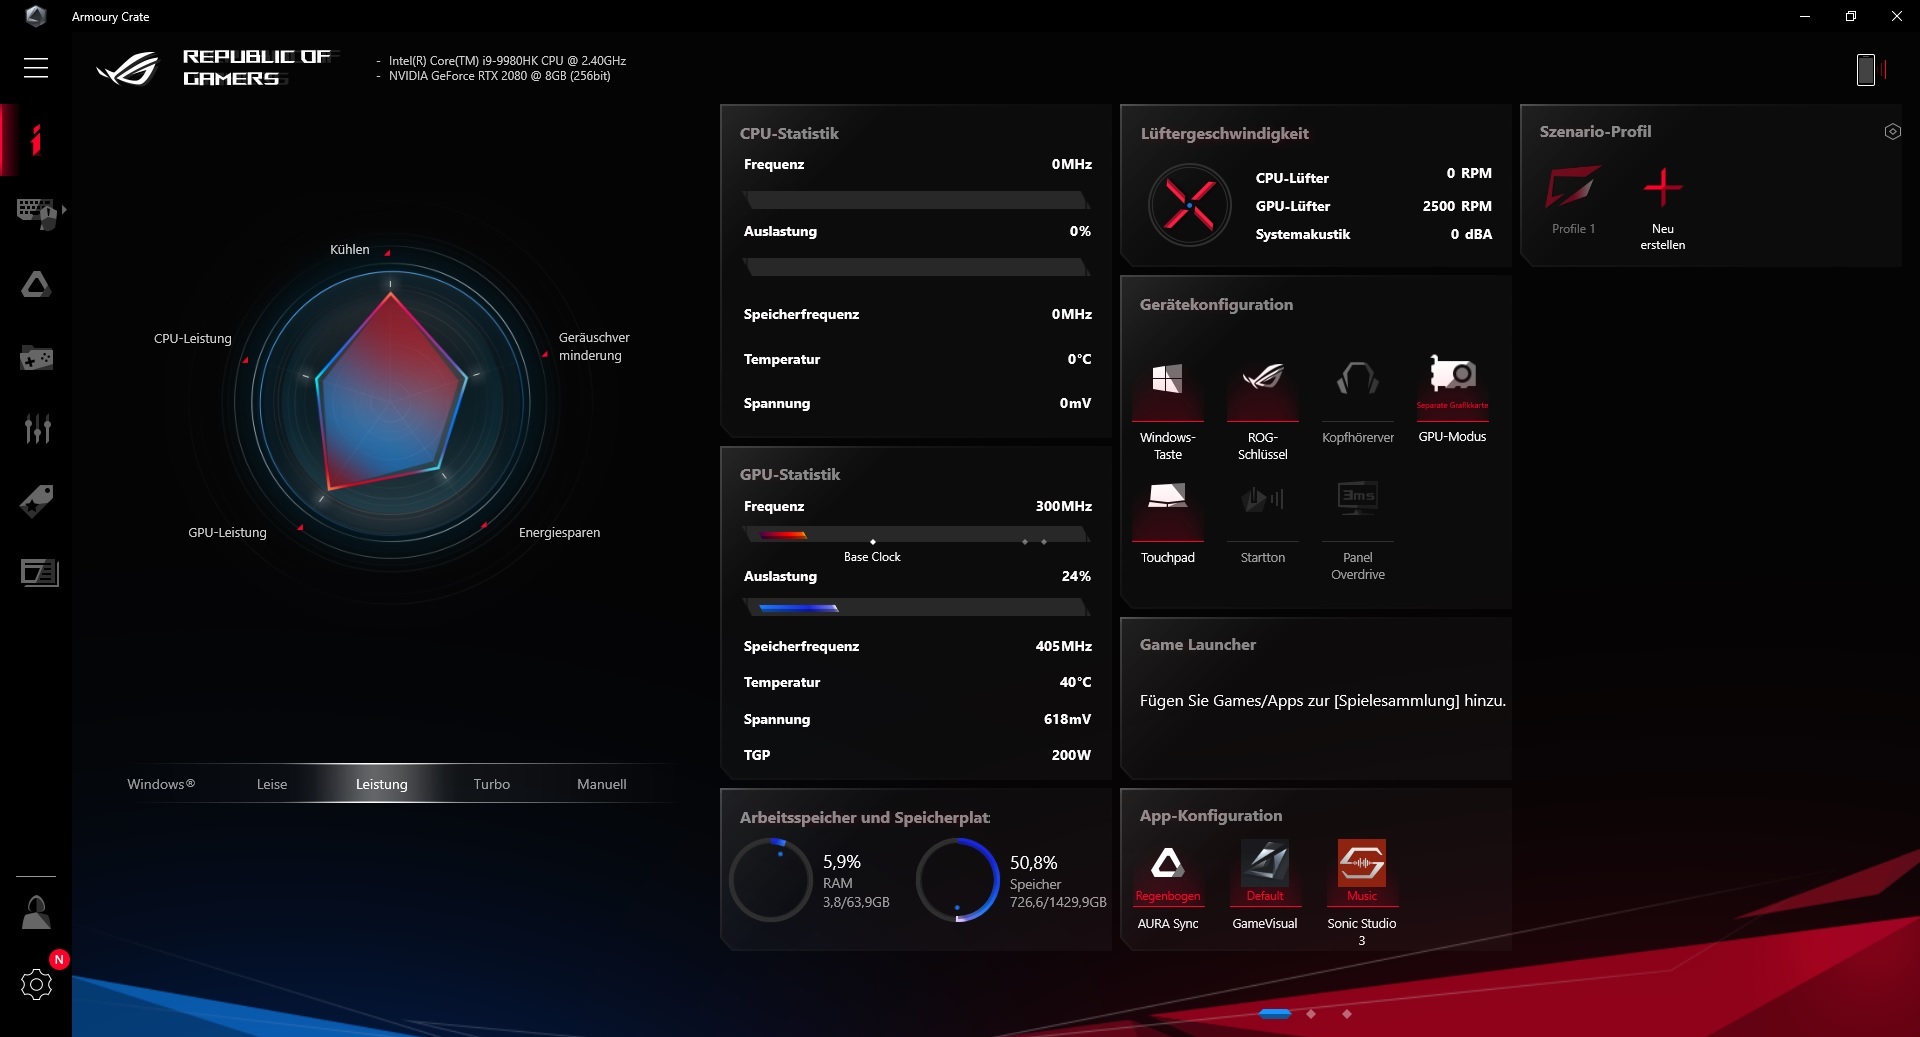
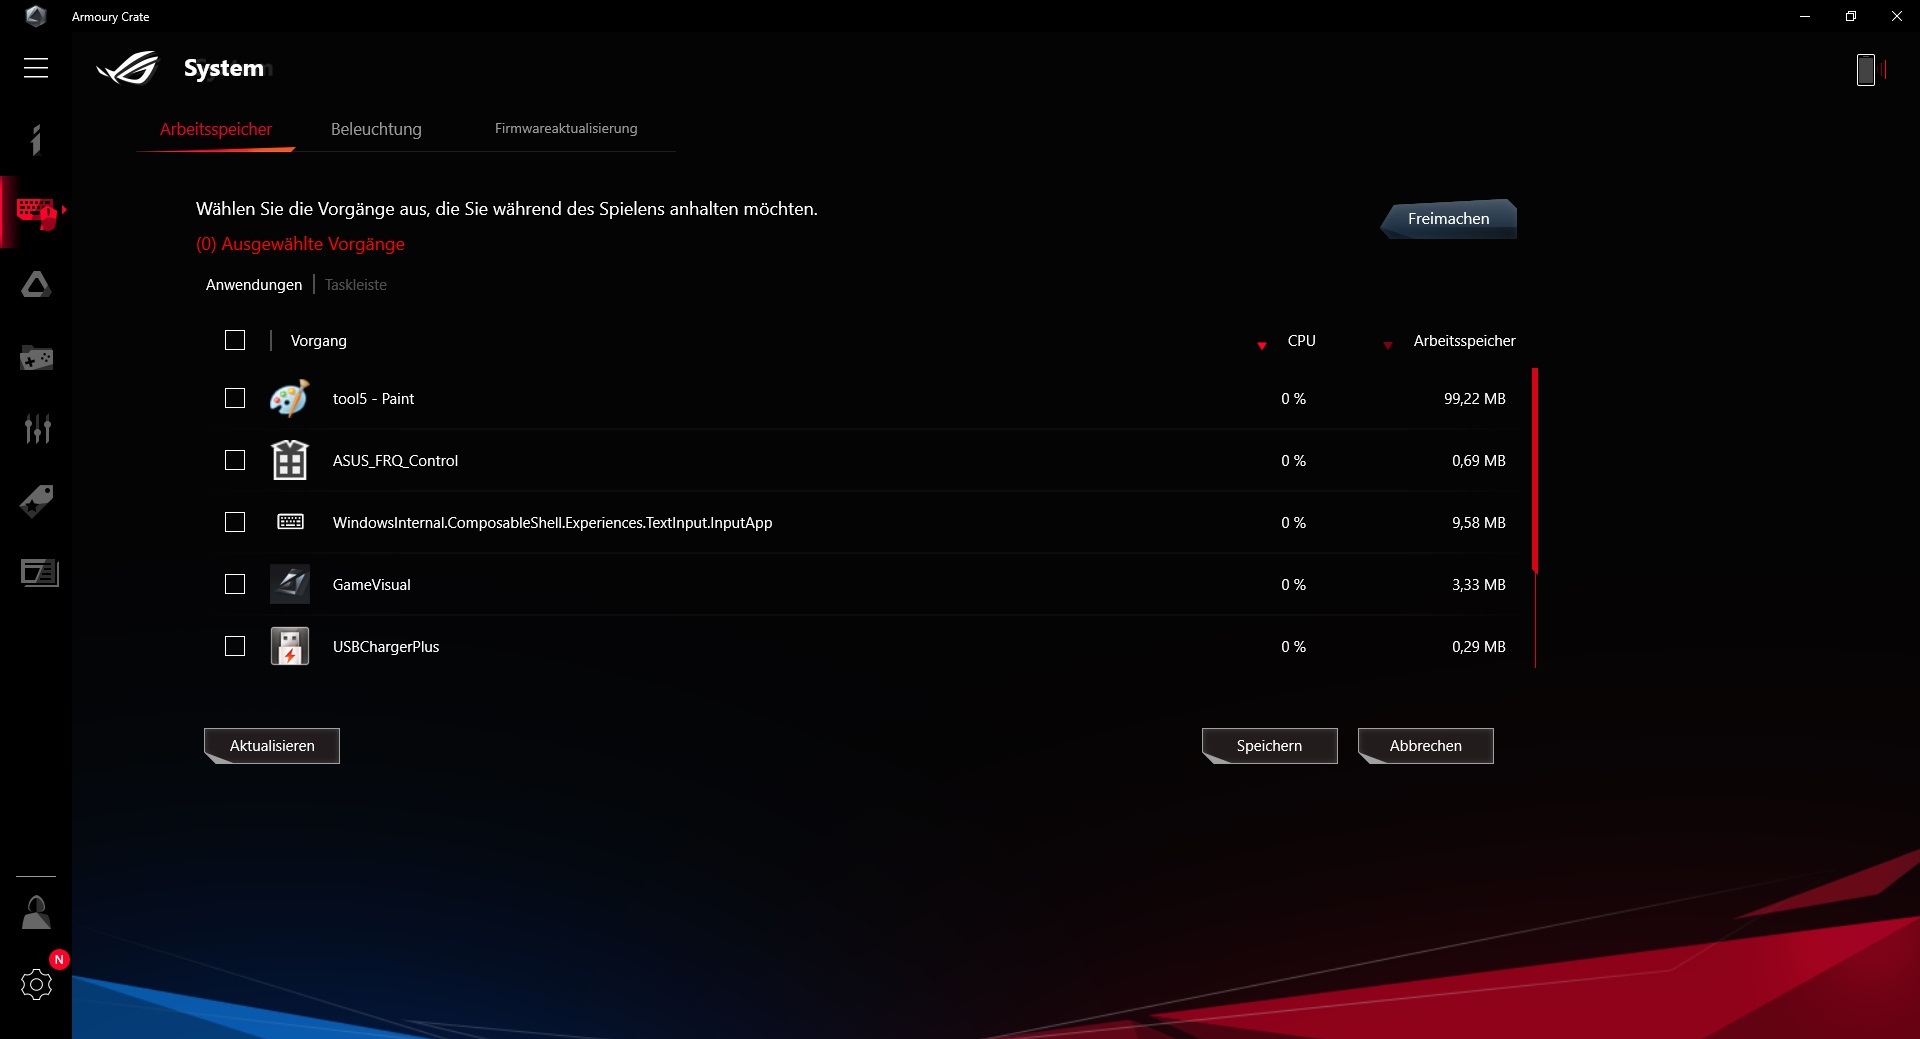
Test Conditions
The preinstalled tool Armoury Crate gives users the opportunity to adjust the system in various different ways. For example, users can switch between the power profiles (quiet, performance & turbo) and choose either the graphics switching technology Optimus or the anti-tearing technology G-Sync. Unless stated otherwise, all of our tests were performed using the performance mode with G-Sync active. Performing the tests on other settings may produce very different results.
Performance
The ROG Mothership is a pure-blooded desktop replacement that effortlessly handles even demanding applications and presumably offers enough performance for years to come.
Processor
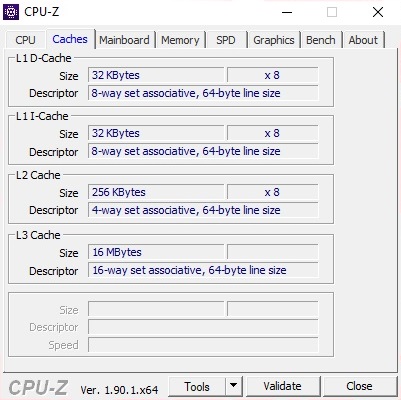
No half-measures: That is the approach Asus has taken with the hardware of the GZ700. The Core i9-9980HK from Intel is one of the best examples of this. The eight-core model not only features an unlocked multiplier, but also 16 MB of L3 cache as well as a very high maximum frequency of 5.0 GHz.
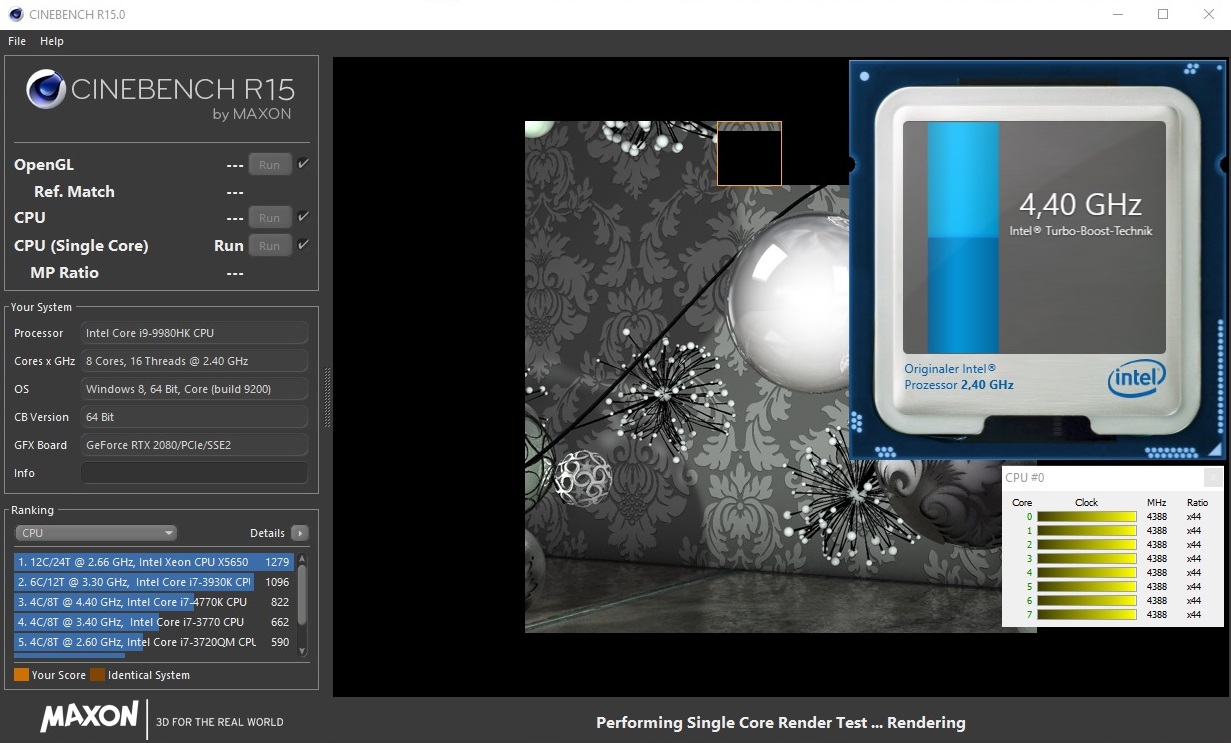
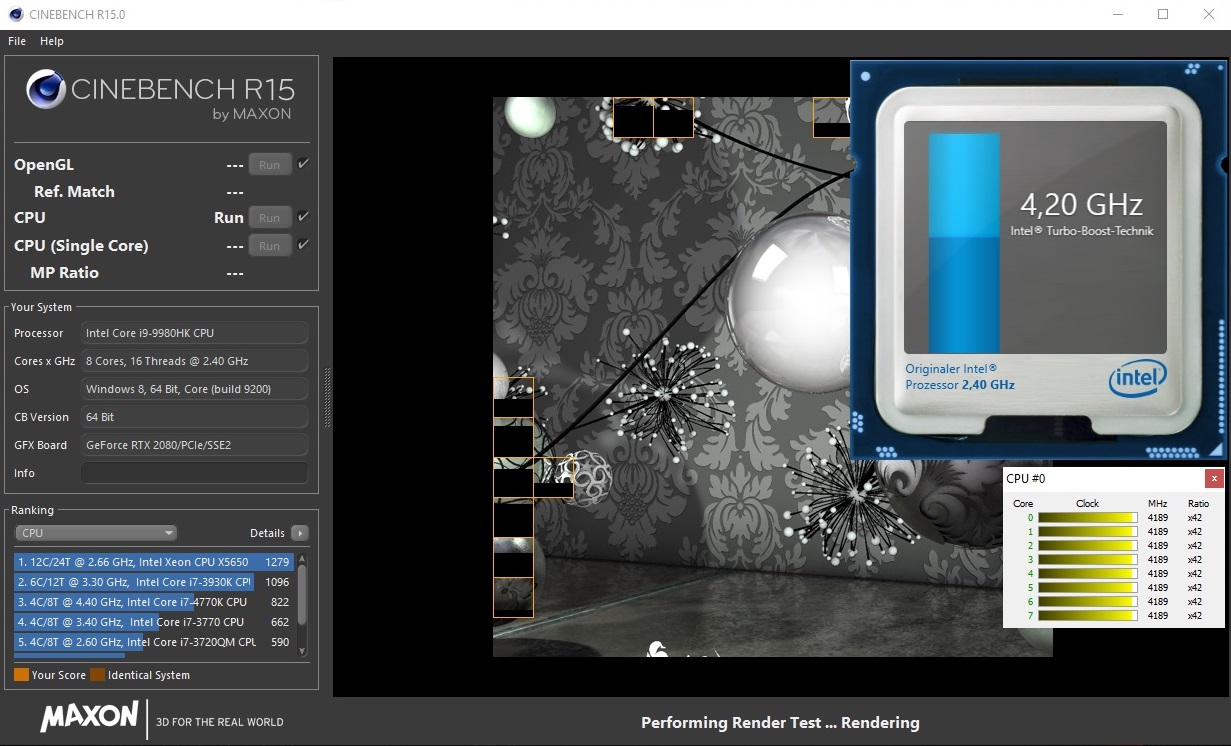
Good: The ROG Mothership makes fairly good use of its Turbo Boost potential. In Cinebench R15, we measured a clock speed of between 4.2 and 4.5 GHz for a single-core load or 4.2 GHz exactly with all cores active.
These clock speeds put the GZ700 ahead of the 9880H competitors HP Omen 17 and MSI GE75 9SG. Only desktop processor based gaming laptops achieve even better results. The Core i9-9980HK cannot quite keep up with the Core i9-9900K inside of the Alienware Area 51m and MSI GT76 9SG. Meanwhile, the current "default" laptop CPU choice, the six-core model Core i7-9750H, can slower by as much as 30%.
System Performance
The system performance is sublime. 6,789 points in PCMark 10 is a result that commands respect; only the Alienware 51m achieves a slightly higher score. Subjectively, Windows 10 is very responsive and boots within a few seconds. Loading times are pleasantly short as well.
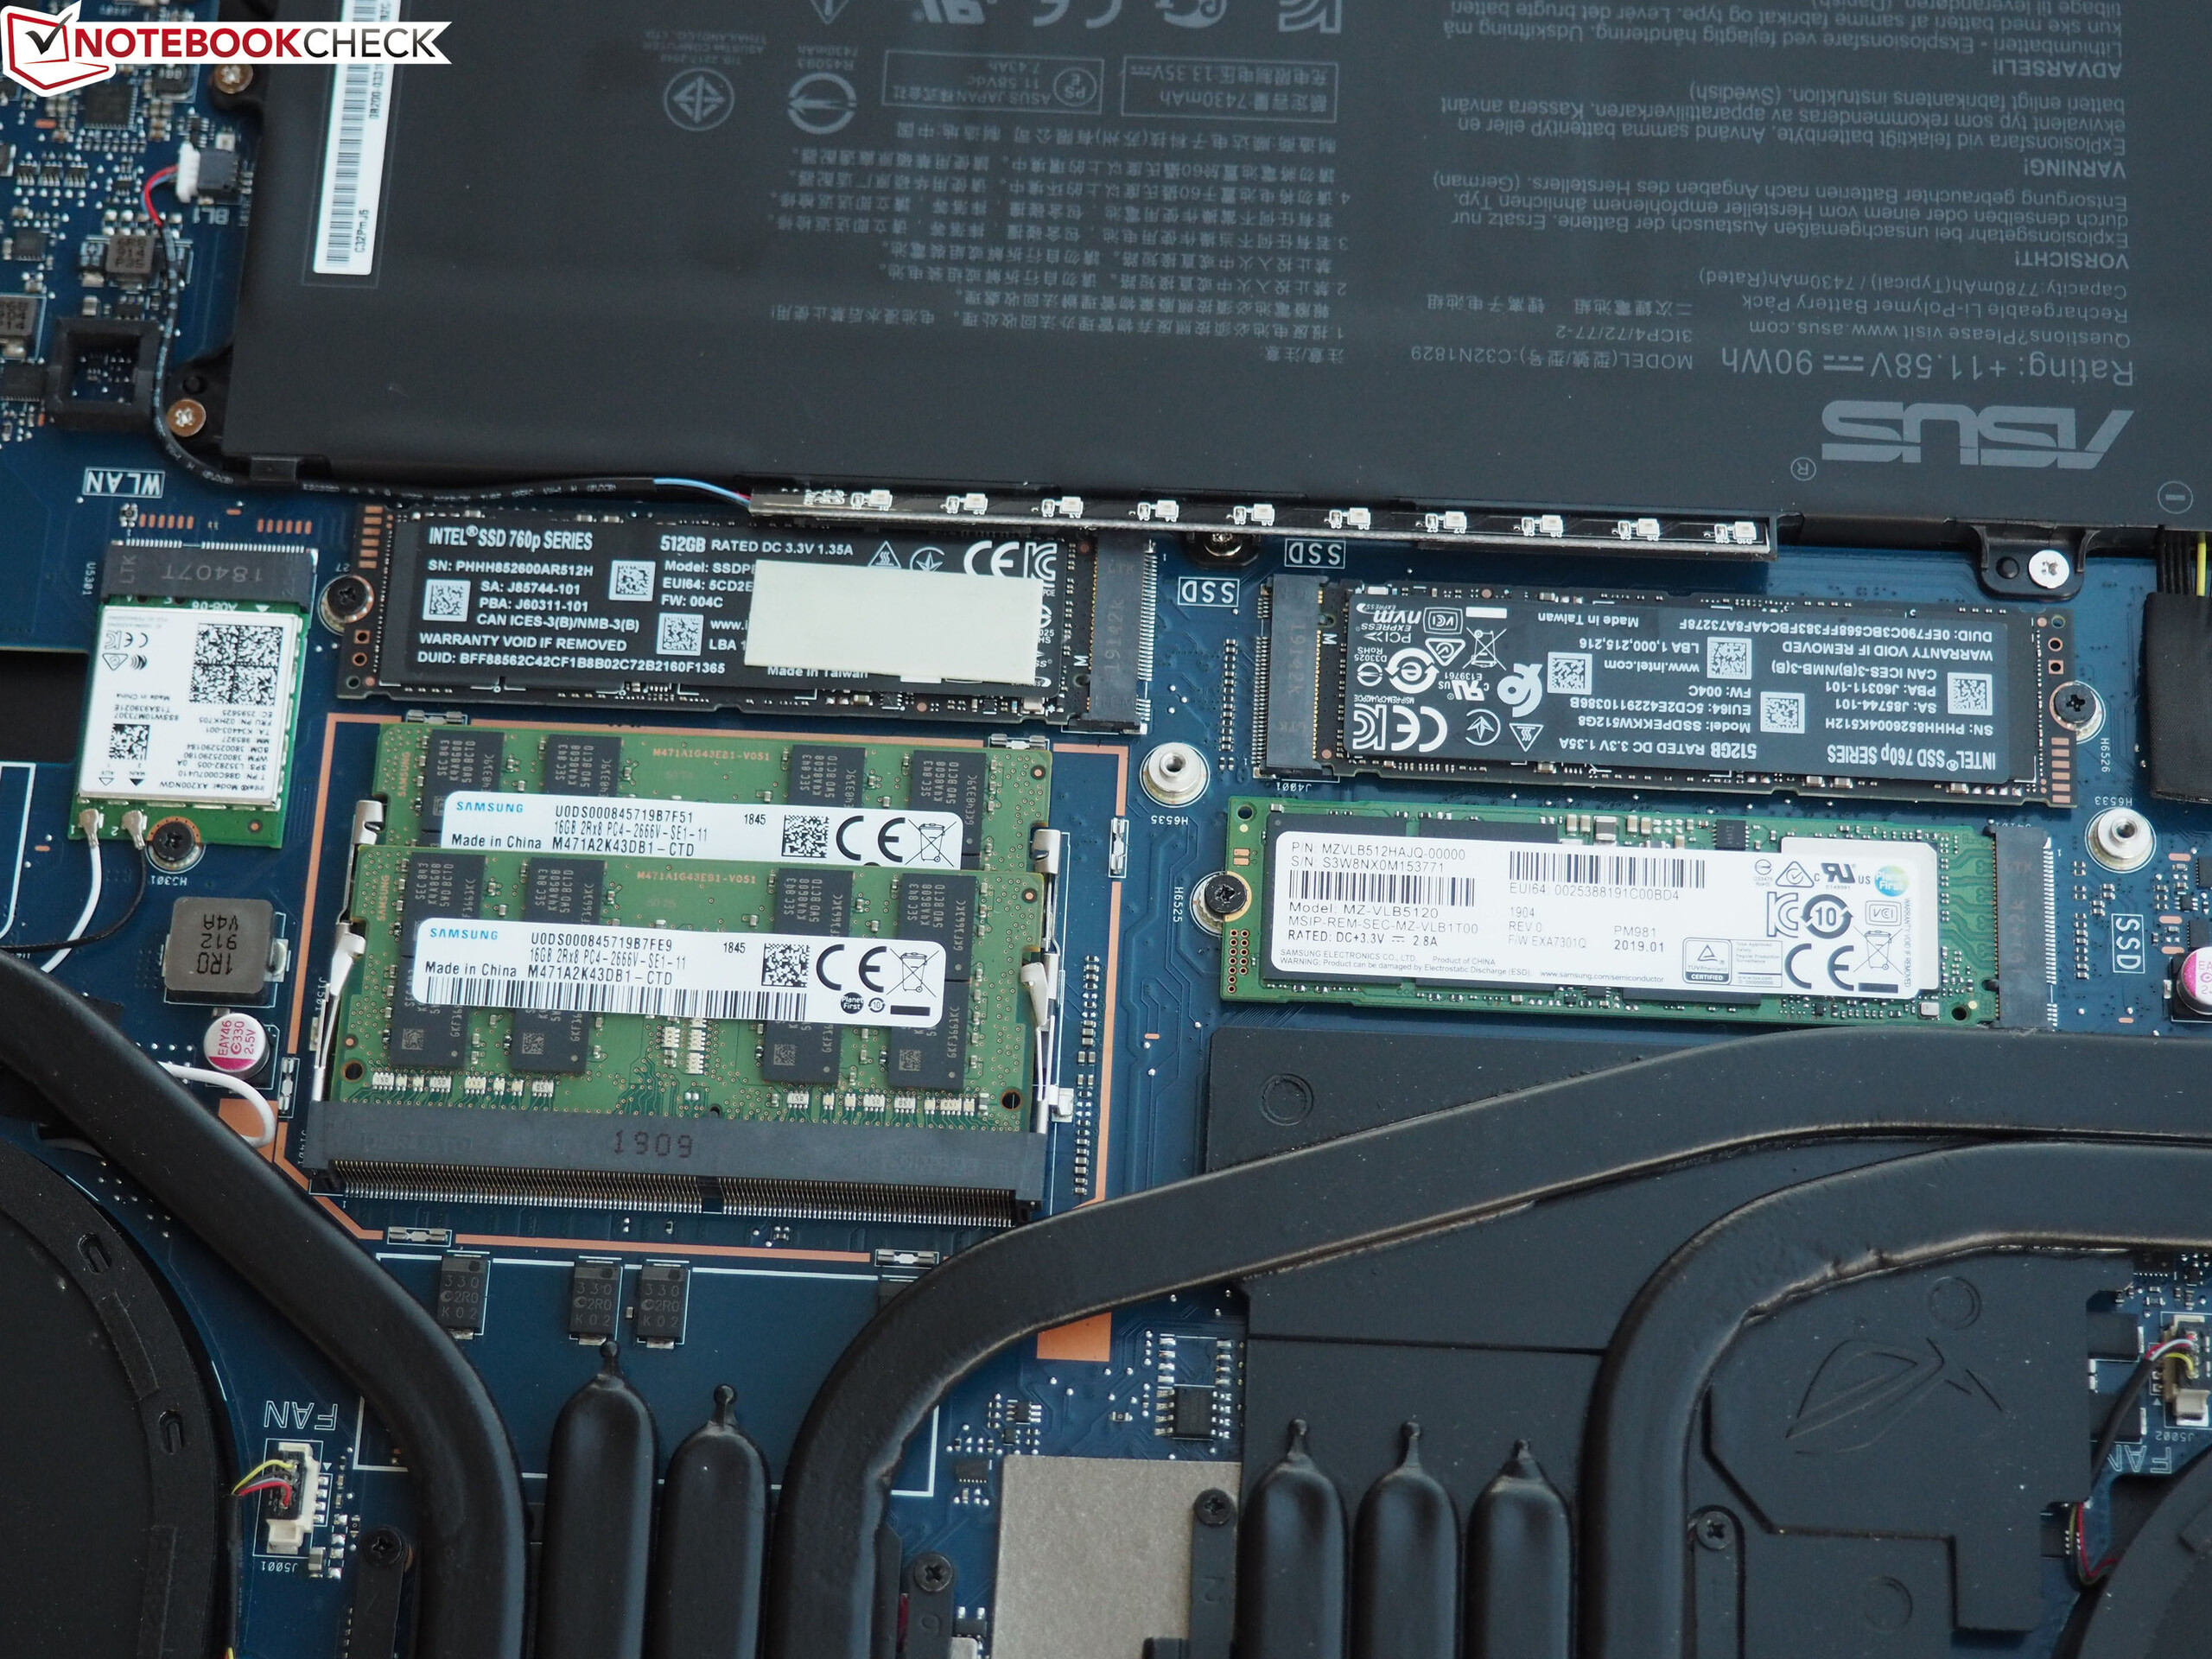
Storage Solution
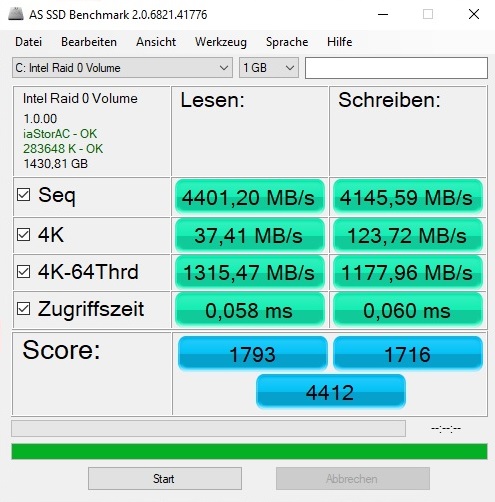
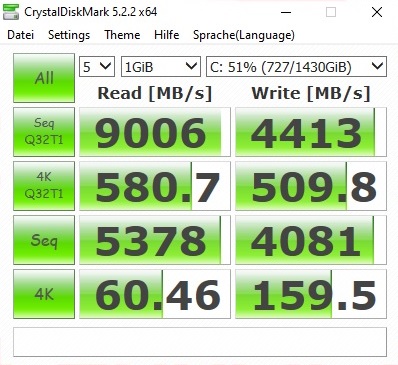
In terms of storage performance, the ROG Mothership also chases records. Asus fits the 17-inch device with a total of three NVMe SSDs with the M.2 form factor (1x Samsung PM981 + 2x Intel 760p), which run in RAID 0 and have a total capacity of 1.5 TB. With sequential read and write speeds of 4,000 MB/s (AS SSD benchmark), it leaves the remainder of the comparison in the dust.
| Asus ROG Mothership GZ700GX 1x Samsung SSD PM981 MZVLB512HAJQ + 2x Intel SSD 760p SSDPEKKW512G8 (RAID 0) | Asus ROG G703GXR Samsung SSD PM981 MZVLB512HAJQ | HP Omen 17-cb0020ng 2x Samsung SSD PM981 MZVLB512HAJQ (RAID 0) | MSI GE75 9SG Samsung SSD PM981 MZVLB1T0HALR | MSI GT76 Titan DT 9SG 2x Samsung PM961 MZVLW256HEHP (RAID 0) | Alienware Area-51m i9-9900K RTX 2080 2x SK Hynix PC400 512GB (RAID 0) | |
|---|---|---|---|---|---|---|
| AS SSD | -18% | -14% | -11% | -9% | -18% | |
| Seq Read (MB/s) | 4401 | 1030 -77% | 2568 -42% | 1358 -69% | 2646 -40% | 2082 -53% |
| Seq Write (MB/s) | 4146 | 1888 -54% | 2608 -37% | 2381 -43% | 2214 -47% | 2335 -44% |
| 4K Read (MB/s) | 37.41 | 43.83 17% | 41.2 10% | 27.02 -28% | 30.42 -19% | 24.14 -35% |
| 4K Write (MB/s) | 123.7 | 97.1 -22% | 98 -21% | 89.2 -28% | 95.9 -22% | 91.8 -26% |
| 4K-64 Read (MB/s) | 1315 | 1092 -17% | 1352 3% | 1642 25% | 1609 22% | 1561 19% |
| 4K-64 Write (MB/s) | 1178 | 1647 40% | 1138 -3% | 1799 53% | 1573 34% | 1350 15% |
| Score Total (Points) | 4412 | 3856 -13% | 3994 -9% | 4899 11% | 4740 7% | 4390 0% |

GPU Performance
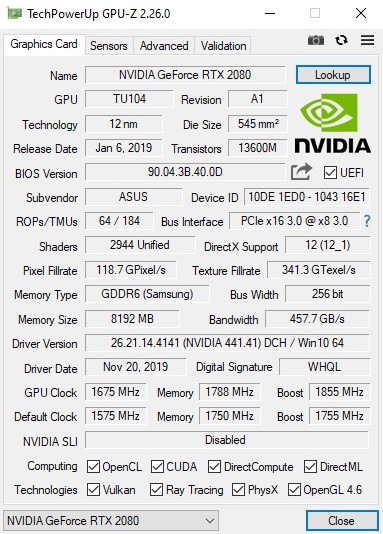
In order to be able to capitalize on the 144-Hz refresh rate of the Full-HD display, the extremely high-performance DirectX 12 model Nvidia GeForce RTX 2080 is installed in the laptop. 2,944 shader units and 8 GB GDDR6-VRAM (256-bit interface) is a statement.
| 3DMark 11 Performance | 28126 points | |
| 3DMark Cloud Gate Standard Score | 55579 points | |
| 3DMark Fire Strike Score | 22005 points | |
| 3DMark Time Spy Score | 10150 points | |
Help | ||
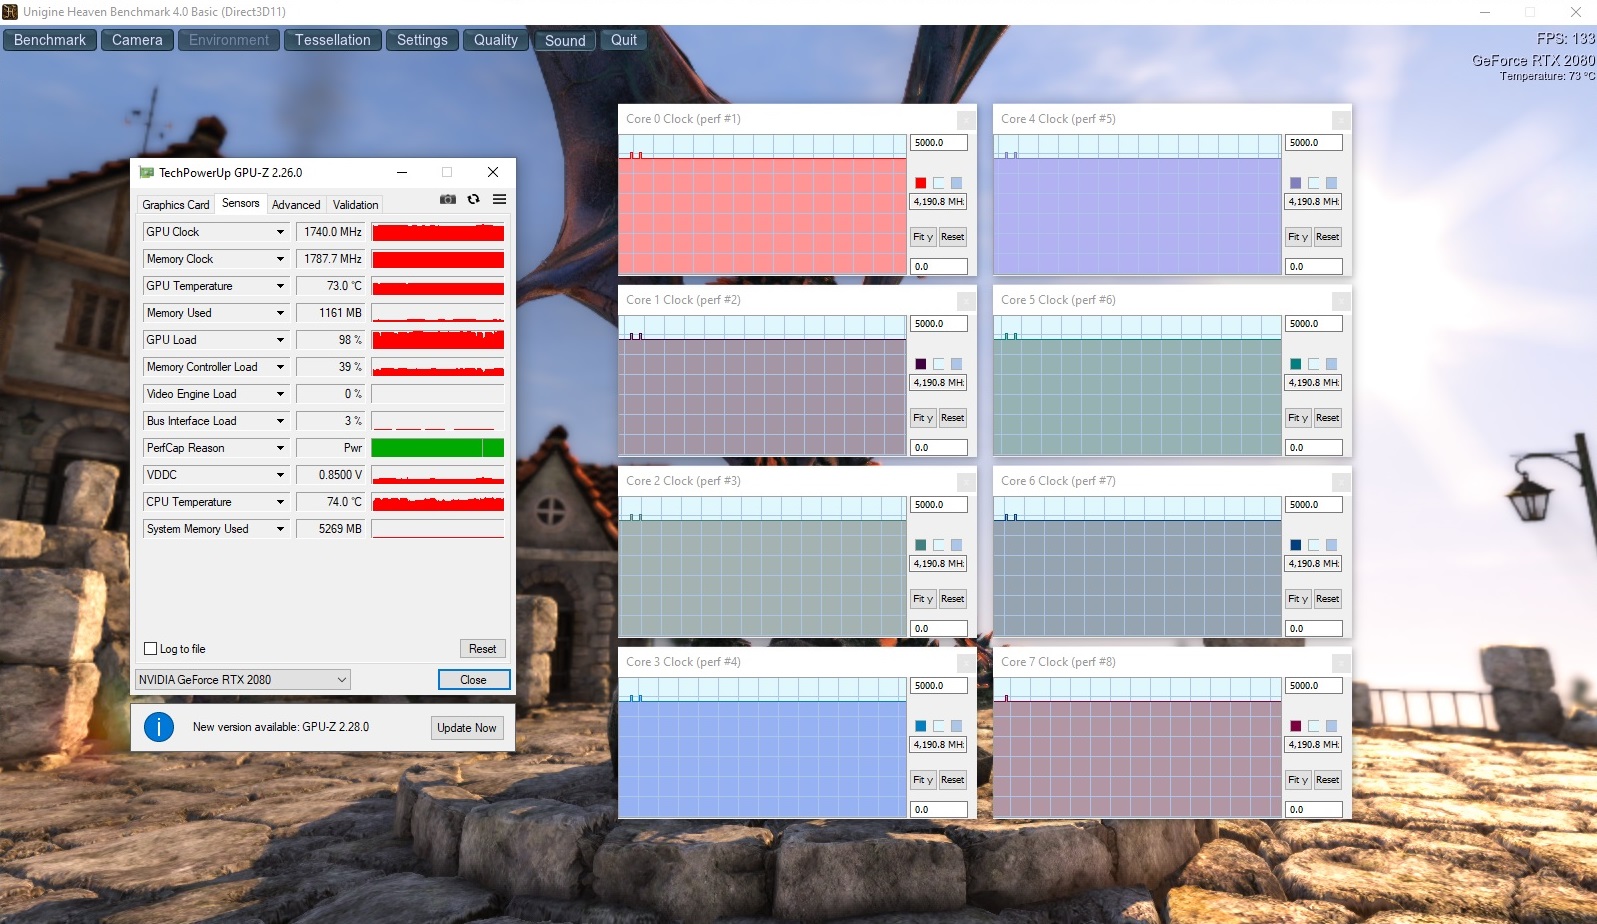
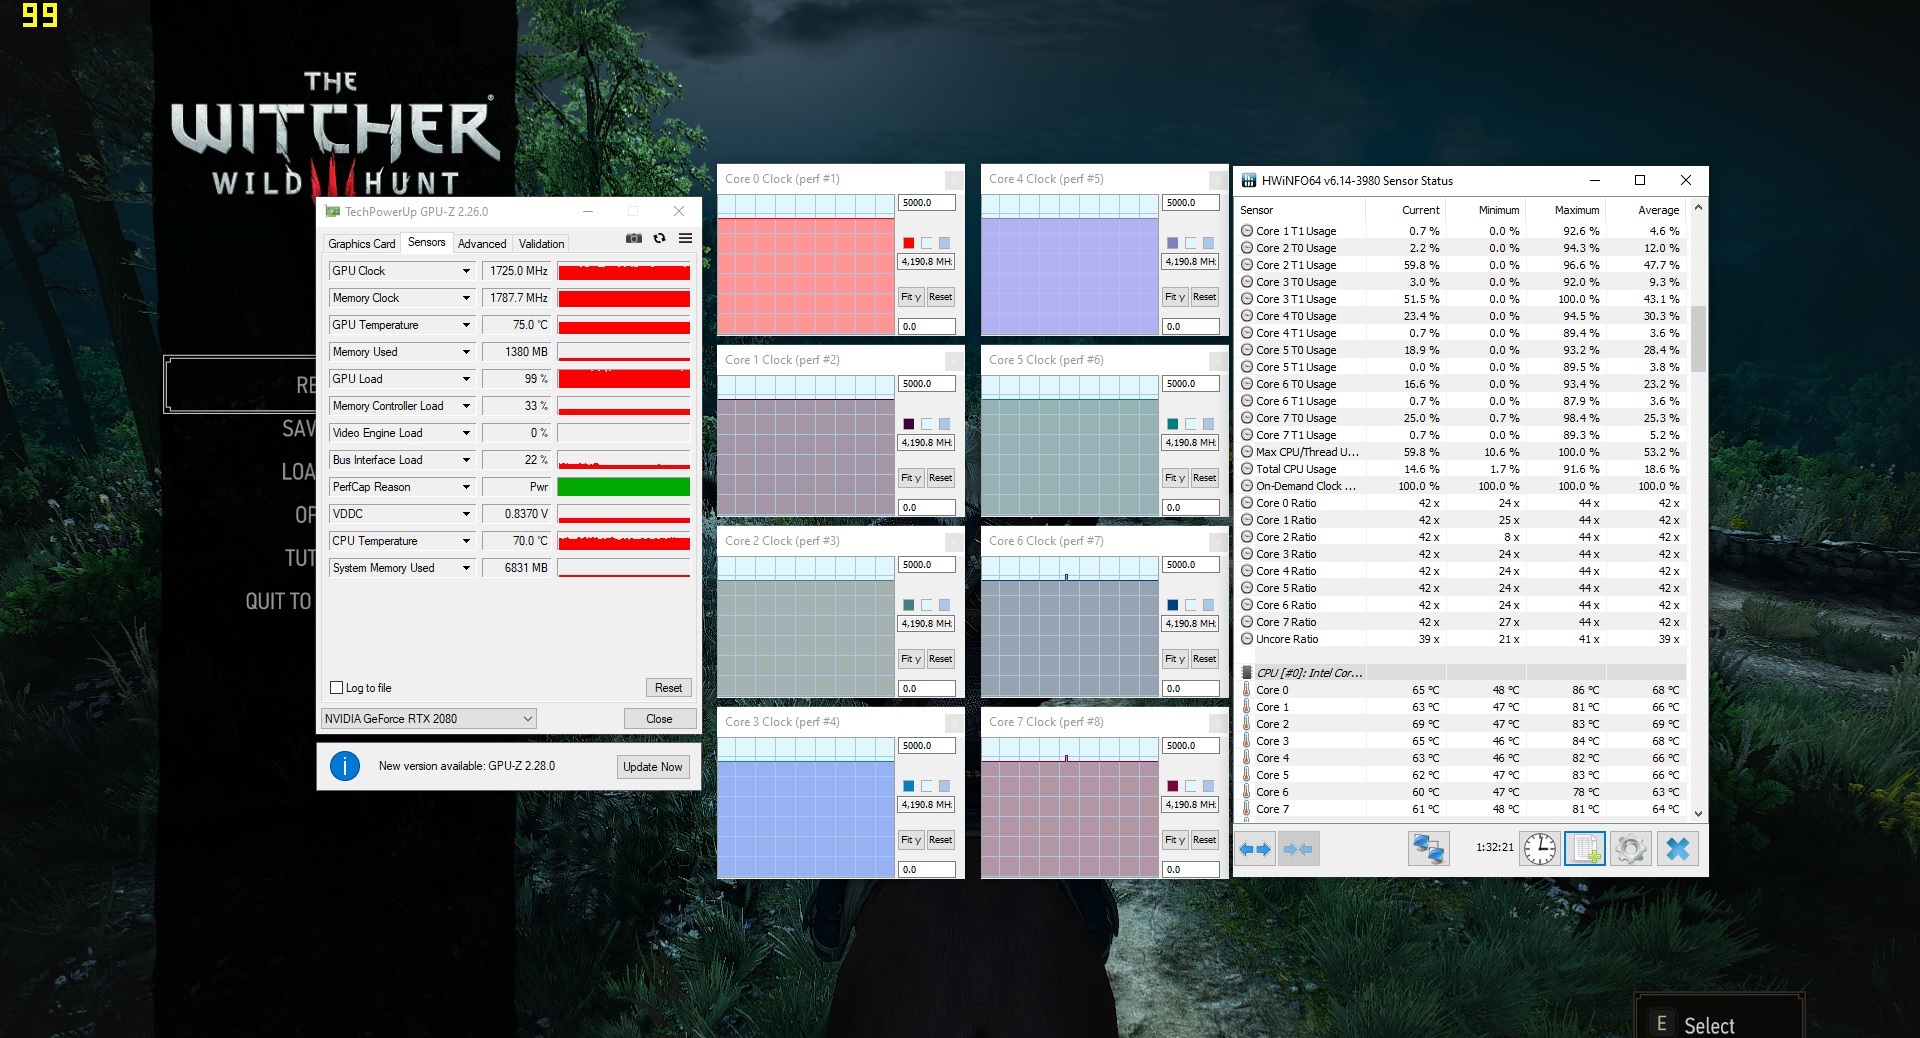
According to the tool GPU-Z, Asus has increased the memory speed from the base value of 1,750 to 1,788 MHz and the core clock from 1,575 to 1,675 MHz. Thanks to GPU boost, even higher frequencies are possible. As our Unigine Heaven 4.0 benchmark (one run) and our "The Witcher 3" tests (60 minutes @FHD/Ultra) show, users can expect a clock speed of about 1,720 to 1,740 MHz - a good result for an RTX 2080 laptop.
The 3DMark 13 and 3DMark 11 benchmark scores put the 17-inch device at the top spot or close to it.
Gaming Performance
The GeForce RTX 2080 does not break a sweat at 1,920x1,080 pixels. Almost all the titles we tested ran at above 80 FPS with maximum details. Only in extremely demanding games, such as "Red Dead Redemption 2", the 60-FPS mark is not reached.
| The Witcher 3 - 1920x1080 Ultra Graphics & Postprocessing (HBAO+) | |
| Average of class Gaming (104.7 - 240, n=7, last 2 years) | |
| Alienware Area-51m i9-9900K RTX 2080 | |
| MSI GT76 Titan DT 9SG | |
| Asus ROG Mothership GZ700GX | |
| Asus ROG G703GXR | |
| MSI GE75 9SG | |
| HP Omen 17-cb0020ng | |
| low | med. | high | ultra | |
|---|---|---|---|---|
| The Witcher 3 (2015) | 181 | 98.3 | ||
| Control (2019) | 92.1 | |||
| Borderlands 3 (2019) | 104 | 89.4 | ||
| FIFA 20 (2019) | 267 | 262 | ||
| Ghost Recon Breakpoint (2019) | 111 | 83 | ||
| GRID 2019 (2019) | 127 | 89.7 | ||
| Call of Duty Modern Warfare 2019 (2019) | 159 | 136 | ||
| Need for Speed Heat (2019) | 99.2 | 90.1 | ||
| Star Wars Jedi Fallen Order (2019) | 111 | 108 | ||
| Red Dead Redemption 2 (2019) | 88.9 | 56.8 |
Emissions
Noise Emissions
Usually, a high performance level goes hand in hand with high fan noise. The GZ700 falls into the same category. 37 to 39 dB(A) during idle mark the worst resullt in our comparison. The fans are very noticeable even during harmless tasks such as office work, playing videos and web browsing.
While gaming, the fans increase their speed significantly and reach up to 52 dB(A) - a distractingly loud noise level. For noise sensitive users, an average of 48 dB(A) while playing "The Witcher 3" is not a good result either. As a result, a headset is almost a necessity for gaming.
Noise level
| Idle |
| 37 / 38 / 39 dB(A) |
| Load |
| 40 / 52 dB(A) |
 | ||
30 dB silent 40 dB(A) audible 50 dB(A) loud |
||
min: | ||
| Asus ROG Mothership GZ700GX i9-9980HK, GeForce RTX 2080 Mobile | Asus ROG G703GXR i7-9750H, GeForce RTX 2080 Mobile | HP Omen 17-cb0020ng i9-9880H, GeForce RTX 2080 Mobile | MSI GE75 9SG i9-9880H, GeForce RTX 2080 Mobile | MSI GT76 Titan DT 9SG i9-9900K, GeForce RTX 2080 Mobile | Alienware Area-51m i9-9900K RTX 2080 i9-9900K, GeForce RTX 2080 Mobile | Average of class Gaming | |
|---|---|---|---|---|---|---|---|
| Noise | 4% | 0% | 6% | -5% | -1% | 15% | |
| off / environment * (dB) | 30 | 30 -0% | 30 -0% | 28.2 6% | 30 -0% | 28.1 6% | 24.1 ? 20% |
| Idle Minimum * (dB) | 37 | 33 11% | 34 8% | 30.4 18% | 33 11% | 28.1 24% | 25.9 ? 30% |
| Idle Average * (dB) | 38 | 34 11% | 35 8% | 30.4 20% | 34 11% | 28.6 25% | 27.4 ? 28% |
| Idle Maximum * (dB) | 39 | 35 10% | 36 8% | 33.4 14% | 44 -13% | 51 -31% | 30.1 ? 23% |
| Load Average * (dB) | 40 | 38 5% | 51 -27% | 37.1 7% | 47 -18% | 51 -27% | 43.7 ? -9% |
| Witcher 3 ultra * (dB) | 48 | 50 -4% | 47 2% | 54.2 -13% | 53 -10% | 51 -6% | |
| Load Maximum * (dB) | 52 | 54 -4% | 51 2% | 56.4 -8% | 59 -13% | 51 2% | 54.3 ? -4% |
* ... smaller is better
Temperature
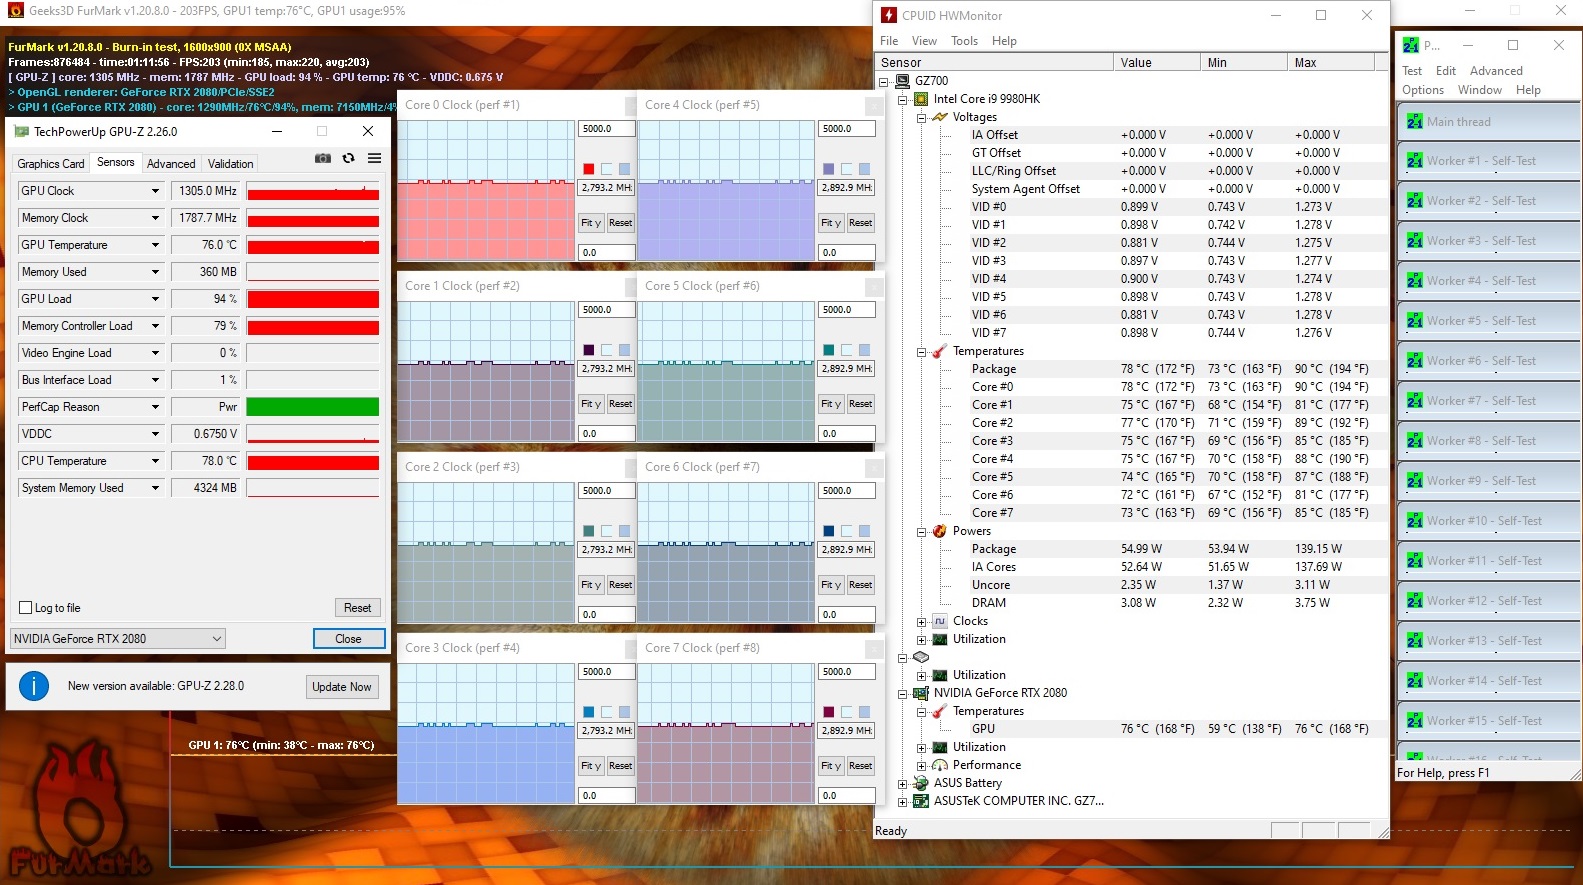
The heat development remains modest. Even under full load with FurMark & Prime95, the CPU temperature does not climb higher than 90 °C (~194 °F; around 60/~140 °F to 70 °C/~158 °F @The Witcher 3). During the stress test, the GPU stabilizes at a moderate temperature of 76 °C (~169 °F).
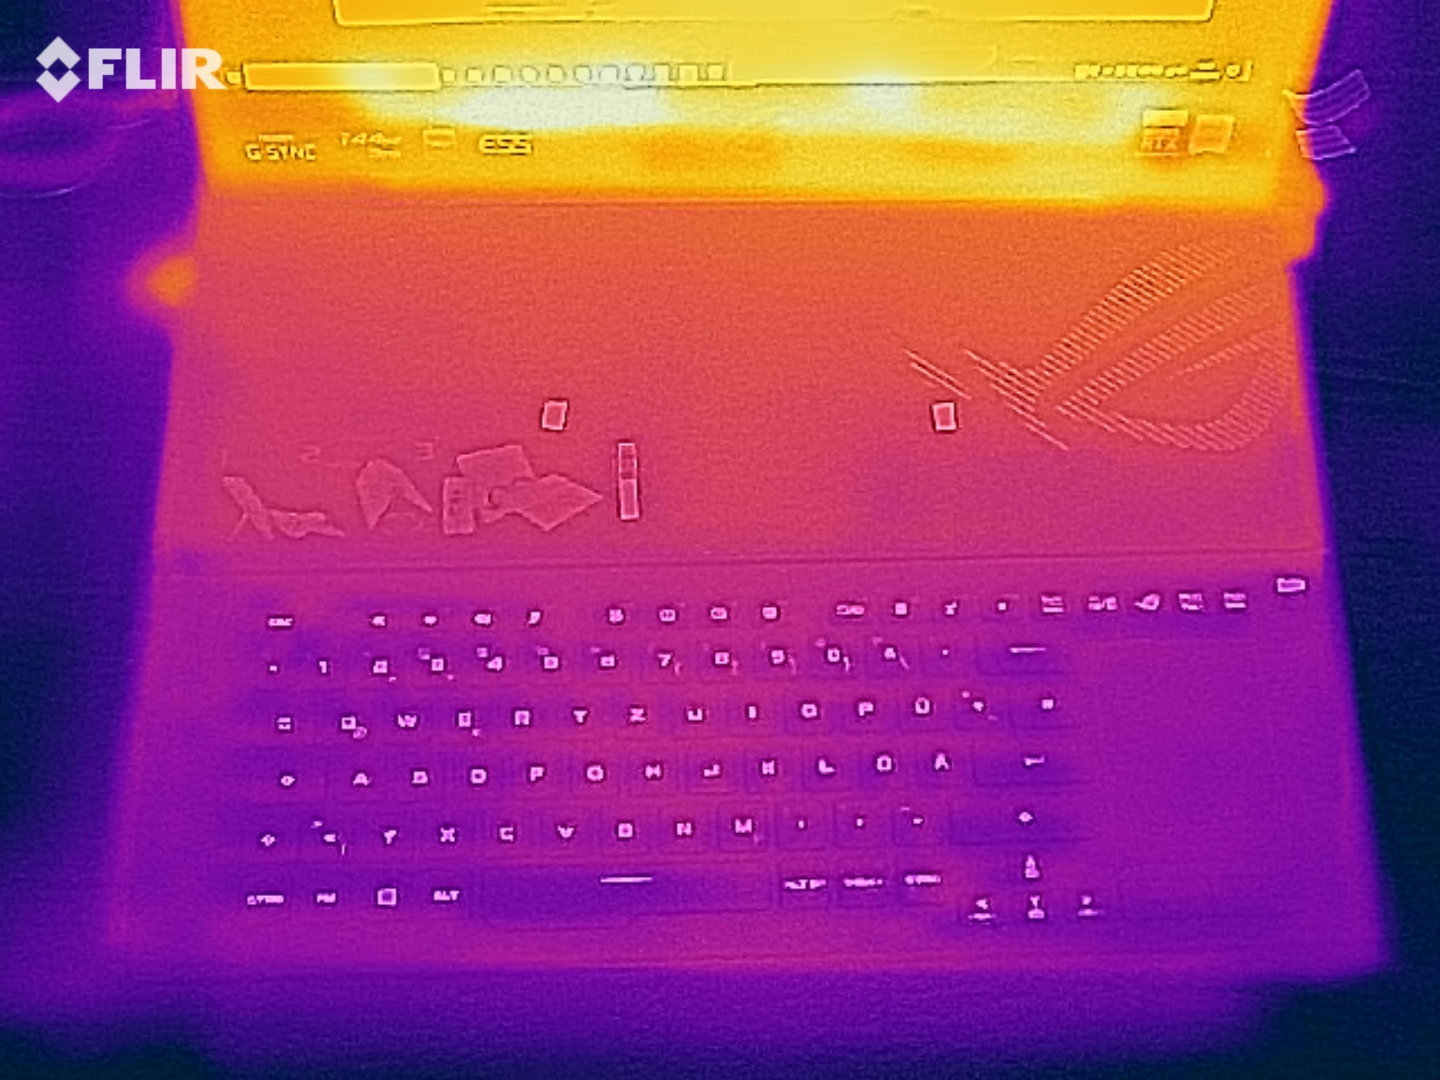
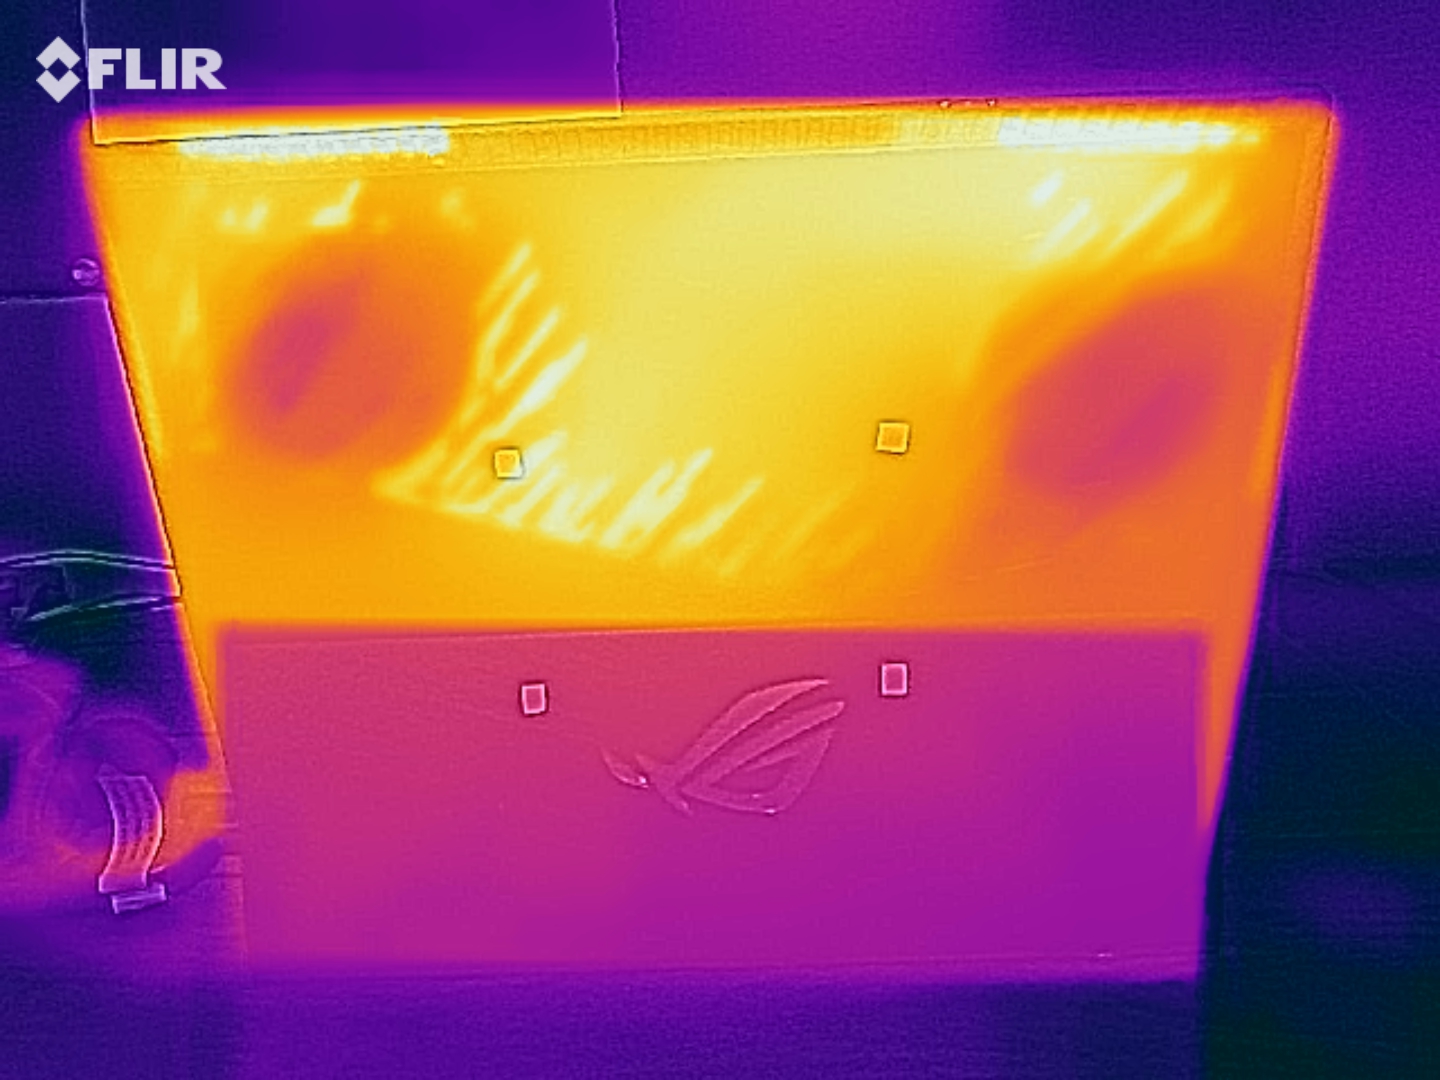
The surface temperatures of the case vary significantly. While the keyboard unit remains comfortably cool in any situation, the back of the display can reach up to 51 °C (~124 °F).
(+) The maximum temperature on the upper side is 39 °C / 102 F, compared to the average of 40.4 °C / 105 F, ranging from 21.2 to 68.8 °C for the class Gaming.
(-) The bottom heats up to a maximum of 51 °C / 124 F, compared to the average of 43.2 °C / 110 F
(+) In idle usage, the average temperature for the upper side is 25 °C / 77 F, compared to the device average of 33.9 °C / 93 F.
(+) Playing The Witcher 3, the average temperature for the upper side is 28.2 °C / 83 F, compared to the device average of 33.9 °C / 93 F.
(+) The palmrests and touchpad are cooler than skin temperature with a maximum of 27 °C / 80.6 F and are therefore cool to the touch.
(±) The average temperature of the palmrest area of similar devices was 28.8 °C / 83.8 F (+1.8 °C / 3.2 F).
| Asus ROG Mothership GZ700GX i9-9980HK, GeForce RTX 2080 Mobile | Asus ROG G703GXR i7-9750H, GeForce RTX 2080 Mobile | HP Omen 17-cb0020ng i9-9880H, GeForce RTX 2080 Mobile | MSI GE75 9SG i9-9880H, GeForce RTX 2080 Mobile | MSI GT76 Titan DT 9SG i9-9900K, GeForce RTX 2080 Mobile | Alienware Area-51m i9-9900K RTX 2080 i9-9900K, GeForce RTX 2080 Mobile | Average of class Gaming | |
|---|---|---|---|---|---|---|---|
| Heat | -9% | -12% | -27% | -8% | -17% | -10% | |
| Maximum Upper Side * (°C) | 39 | 46 -18% | 47 -21% | 48.8 -25% | 51 -31% | 47 -21% | 45.1 ? -16% |
| Maximum Bottom * (°C) | 51 | 49 4% | 54 -6% | 52 -2% | 57 -12% | 58.8 -15% | 48.1 ? 6% |
| Idle Upper Side * (°C) | 25 | 31 -24% | 32 -28% | 36.2 -45% | 26 -4% | 31 -24% | 31 ? -24% |
| Idle Bottom * (°C) | 33 | 32 3% | 30 9% | 44.4 -35% | 28 15% | 35 -6% | 34.2 ? -4% |
* ... smaller is better
Speaker
In terms of our audio analysis, the GZ700 produces the best sound of all gaming laptops we have tested. According to the data sheet, the ROG Mothership includes 4 speakers with 4 watts each. They produce a fairly powerful, clear and balanced sound, although it sounds somewhat dull in the author's opinion.
Asus ROG Mothership GZ700GX audio analysis
(+) | speakers can play relatively loud (85 dB)
Bass 100 - 315 Hz
(±) | reduced bass - on average 5.6% lower than median
(±) | linearity of bass is average (13.1% delta to prev. frequency)
Mids 400 - 2000 Hz
(+) | balanced mids - only 3% away from median
(+) | mids are linear (5.8% delta to prev. frequency)
Highs 2 - 16 kHz
(+) | balanced highs - only 3% away from median
(+) | highs are linear (5.9% delta to prev. frequency)
Overall 100 - 16.000 Hz
(+) | overall sound is linear (8.1% difference to median)
Compared to same class
» 1% of all tested devices in this class were better, 1% similar, 98% worse
» The best had a delta of 6%, average was 18%, worst was 132%
Compared to all devices tested
» 2% of all tested devices were better, 1% similar, 98% worse
» The best had a delta of 4%, average was 23%, worst was 134%
Asus ROG G703GXR audio analysis
(+) | speakers can play relatively loud (92 dB)
Bass 100 - 315 Hz
(±) | reduced bass - on average 13.2% lower than median
(±) | linearity of bass is average (8.9% delta to prev. frequency)
Mids 400 - 2000 Hz
(+) | balanced mids - only 3.1% away from median
(+) | mids are linear (3.1% delta to prev. frequency)
Highs 2 - 16 kHz
(±) | reduced highs - on average 5.4% lower than median
(+) | highs are linear (4.2% delta to prev. frequency)
Overall 100 - 16.000 Hz
(+) | overall sound is linear (14.8% difference to median)
Compared to same class
» 29% of all tested devices in this class were better, 7% similar, 63% worse
» The best had a delta of 6%, average was 18%, worst was 132%
Compared to all devices tested
» 20% of all tested devices were better, 4% similar, 76% worse
» The best had a delta of 4%, average was 23%, worst was 134%
Energy Management
Energy Consumption
The 17-inch laptop consumes a lot of power with the graphics switching disabled, even while idling. The idle test demanded between 37 and 59 watts. Under load, the consumption increases to between 105 and 349 watts. Thus, the two AC adapters (560 watts total) are well dimensioned and even offer some headroom.
| Off / Standby | |
| Idle | |
| Load |
|
Key:
min: | |
| Asus ROG Mothership GZ700GX i9-9980HK, GeForce RTX 2080 Mobile | Asus ROG G703GXR i7-9750H, GeForce RTX 2080 Mobile | HP Omen 17-cb0020ng i9-9880H, GeForce RTX 2080 Mobile | MSI GE75 9SG i9-9880H, GeForce RTX 2080 Mobile | MSI GT76 Titan DT 9SG i9-9900K, GeForce RTX 2080 Mobile | Alienware Area-51m i9-9900K RTX 2080 i9-9900K, GeForce RTX 2080 Mobile | Average of class Gaming | |
|---|---|---|---|---|---|---|---|
| Power Consumption | 10% | 21% | 32% | 21% | 1% | 41% | |
| Idle Minimum * (Watt) | 37 | 27 27% | 26 30% | 13.9 62% | 14 62% | 23.3 37% | 13.1 ? 65% |
| Idle Average * (Watt) | 48 | 32 33% | 29 40% | 18.8 61% | 18 62% | 33.5 30% | 19 ? 60% |
| Idle Maximum * (Watt) | 59 | 39 34% | 38 36% | 23.1 61% | 23 61% | 38.4 35% | 24.6 ? 58% |
| Load Average * (Watt) | 105 | 124 -18% | 106 -1% | 112.3 -7% | 114 -9% | 114.1 -9% | 111.3 ? -6% |
| Witcher 3 ultra * (Watt) | 233 | 274 -18% | 228 2% | 231 1% | 283 -21% | 339.5 -46% | |
| Load Maximum * (Watt) | 349 | 338 3% | 287 18% | 291.5 16% | 443 -27% | 485.1 -39% | 260 ? 26% |
* ... smaller is better
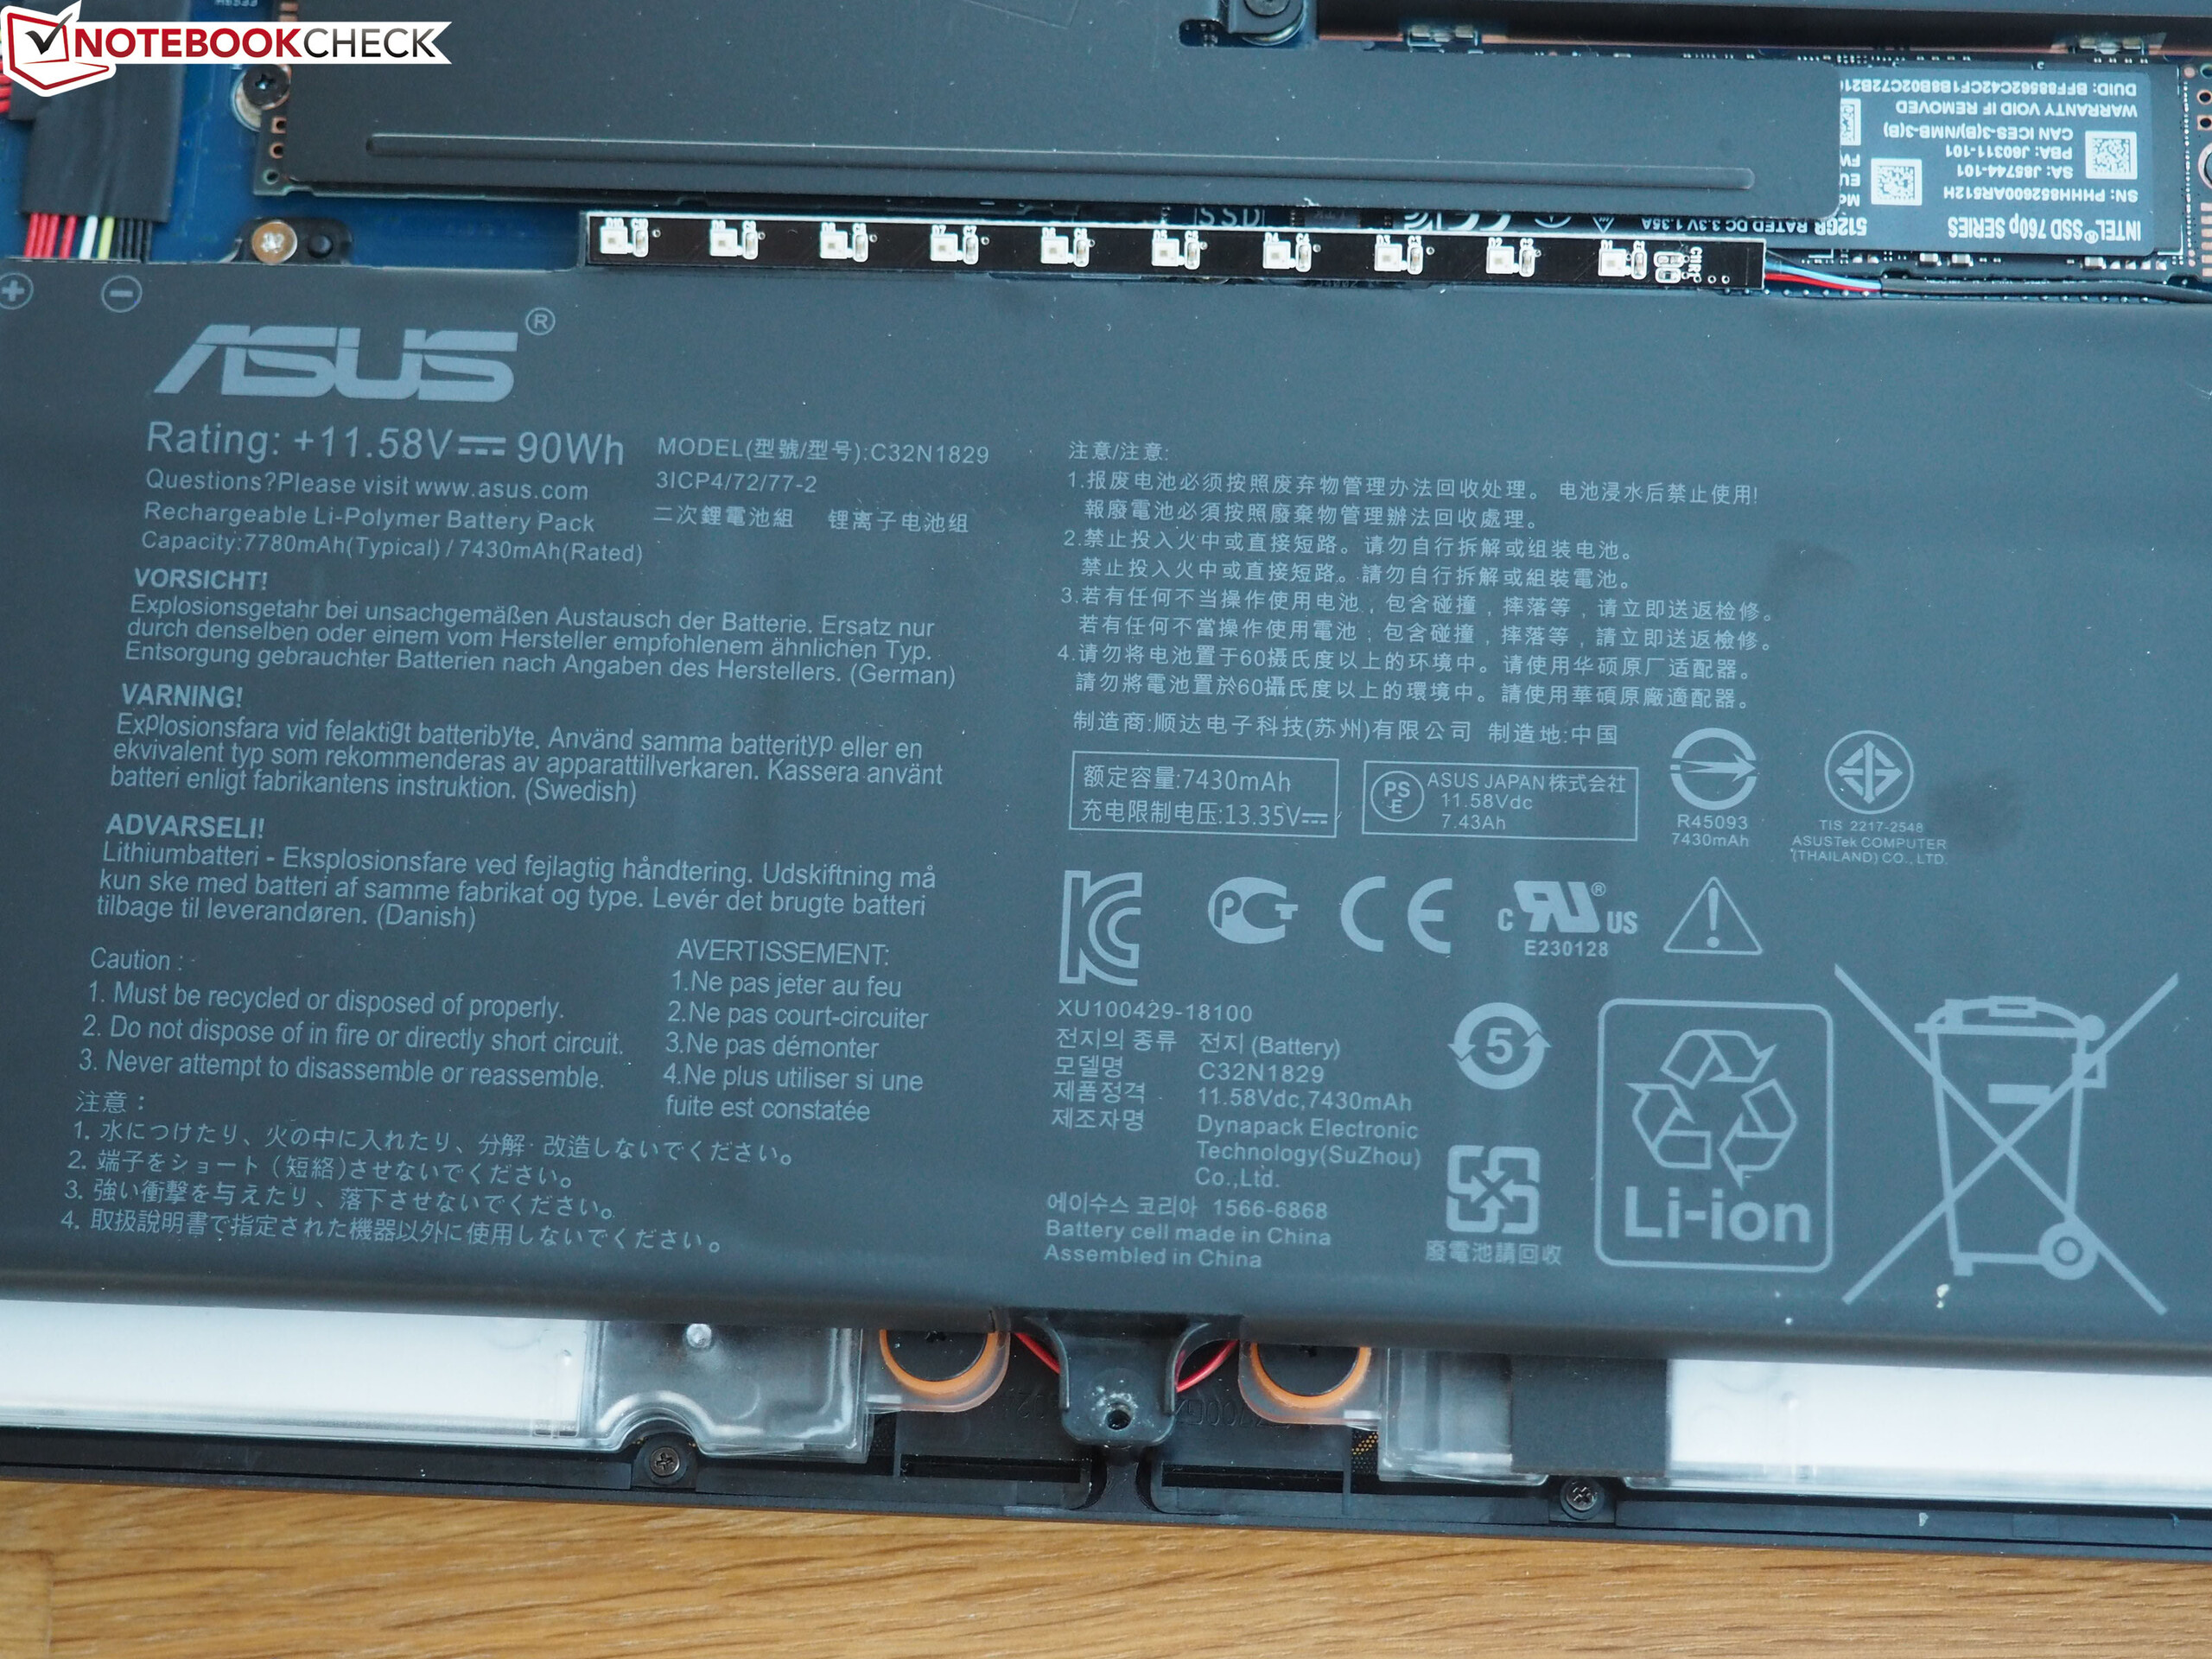
Battery Life
Aside from the MSI GE75 9SG (65 Wh) and the HP Omen 17 (70 Wh), all competitors come with a battery capacity of 90 Wh or more. The GZ700 manages to get a maximum runtime of 3 hours out of its battery. In our Wi-Fi test, the 17-inch lasts about 2.5 hours at medium brightness. When using Optimus instead of G-Sync, users can expect to be able to browse the web for around 4.5 hours.
| Asus ROG Mothership GZ700GX i9-9980HK, GeForce RTX 2080 Mobile, 90 Wh | Asus ROG G703GXR i7-9750H, GeForce RTX 2080 Mobile, 96 Wh | HP Omen 17-cb0020ng i9-9880H, GeForce RTX 2080 Mobile, 70 Wh | MSI GE75 9SG i9-9880H, GeForce RTX 2080 Mobile, 65 Wh | MSI GT76 Titan DT 9SG i9-9900K, GeForce RTX 2080 Mobile, 90 Wh | Alienware Area-51m i9-9900K RTX 2080 i9-9900K, GeForce RTX 2080 Mobile, 90 Wh | Average of class Gaming | |
|---|---|---|---|---|---|---|---|
| Battery runtime | 87% | 9% | 88% | 56% | -24% | 105% | |
| Reader / Idle (h) | 3 | 8.1 170% | 4.2 40% | 6.8 127% | 2.6 -13% | 7.84 ? 161% | |
| WiFi v1.3 (h) | 2.6 | 6.1 135% | 3.3 27% | 4.9 88% | 5 92% | 2.1 -19% | 7.08 ? 172% |
| Load (h) | 1.8 | 1 -44% | 1.1 -39% | 0.9 -50% | 1.1 -39% | 1.496 ? -17% |
Pros
Cons
Verdict
In terms of technology and quality, the ROG Mothership GZ700GX is an excellent high-end laptop. The premium metal chassis not only houses a lot of ports, but a 144-Hz display with a good contrast ratio, good viewing angles and great response times as well.
The performance is stellar. Intel's Core i9-9980HK and Nvidia's GeForce RTX 2080 form an extraodinarily fast duo that is complemented by 64 GB of DDR4-RAM and three SSDs in RAID 0. Furthermore, we were impressed by the good sound and the option to choose between G-Sync and Optimus.
The main problem of the GZ700GX is its ridiculous price. Asus charges a pretty penny for the 2-in-1 design, the practicality of which remains in question. The ROG Mothership costs almost twice as much as other RTX 2080 laptops.
Asus ROG Mothership GZ700GX
- 05/14/2020 v7 (old)
Florian Glaser
Price comparison

