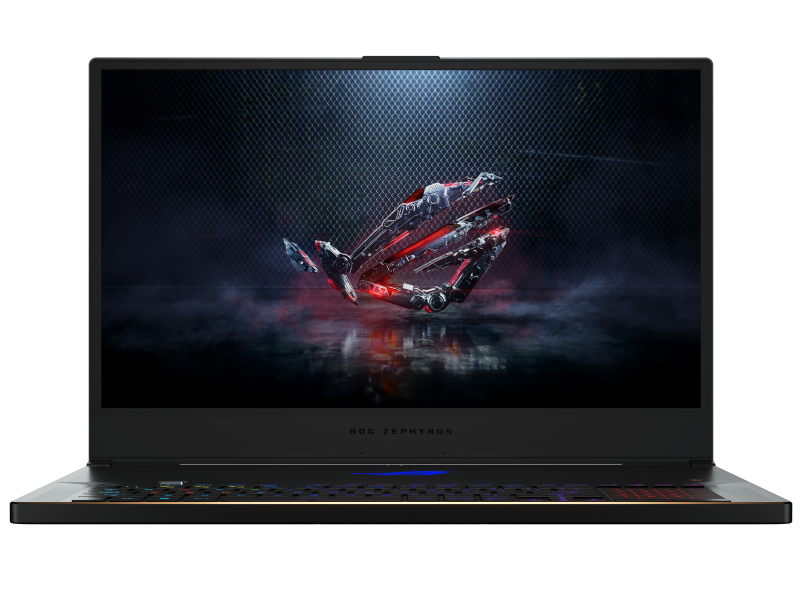
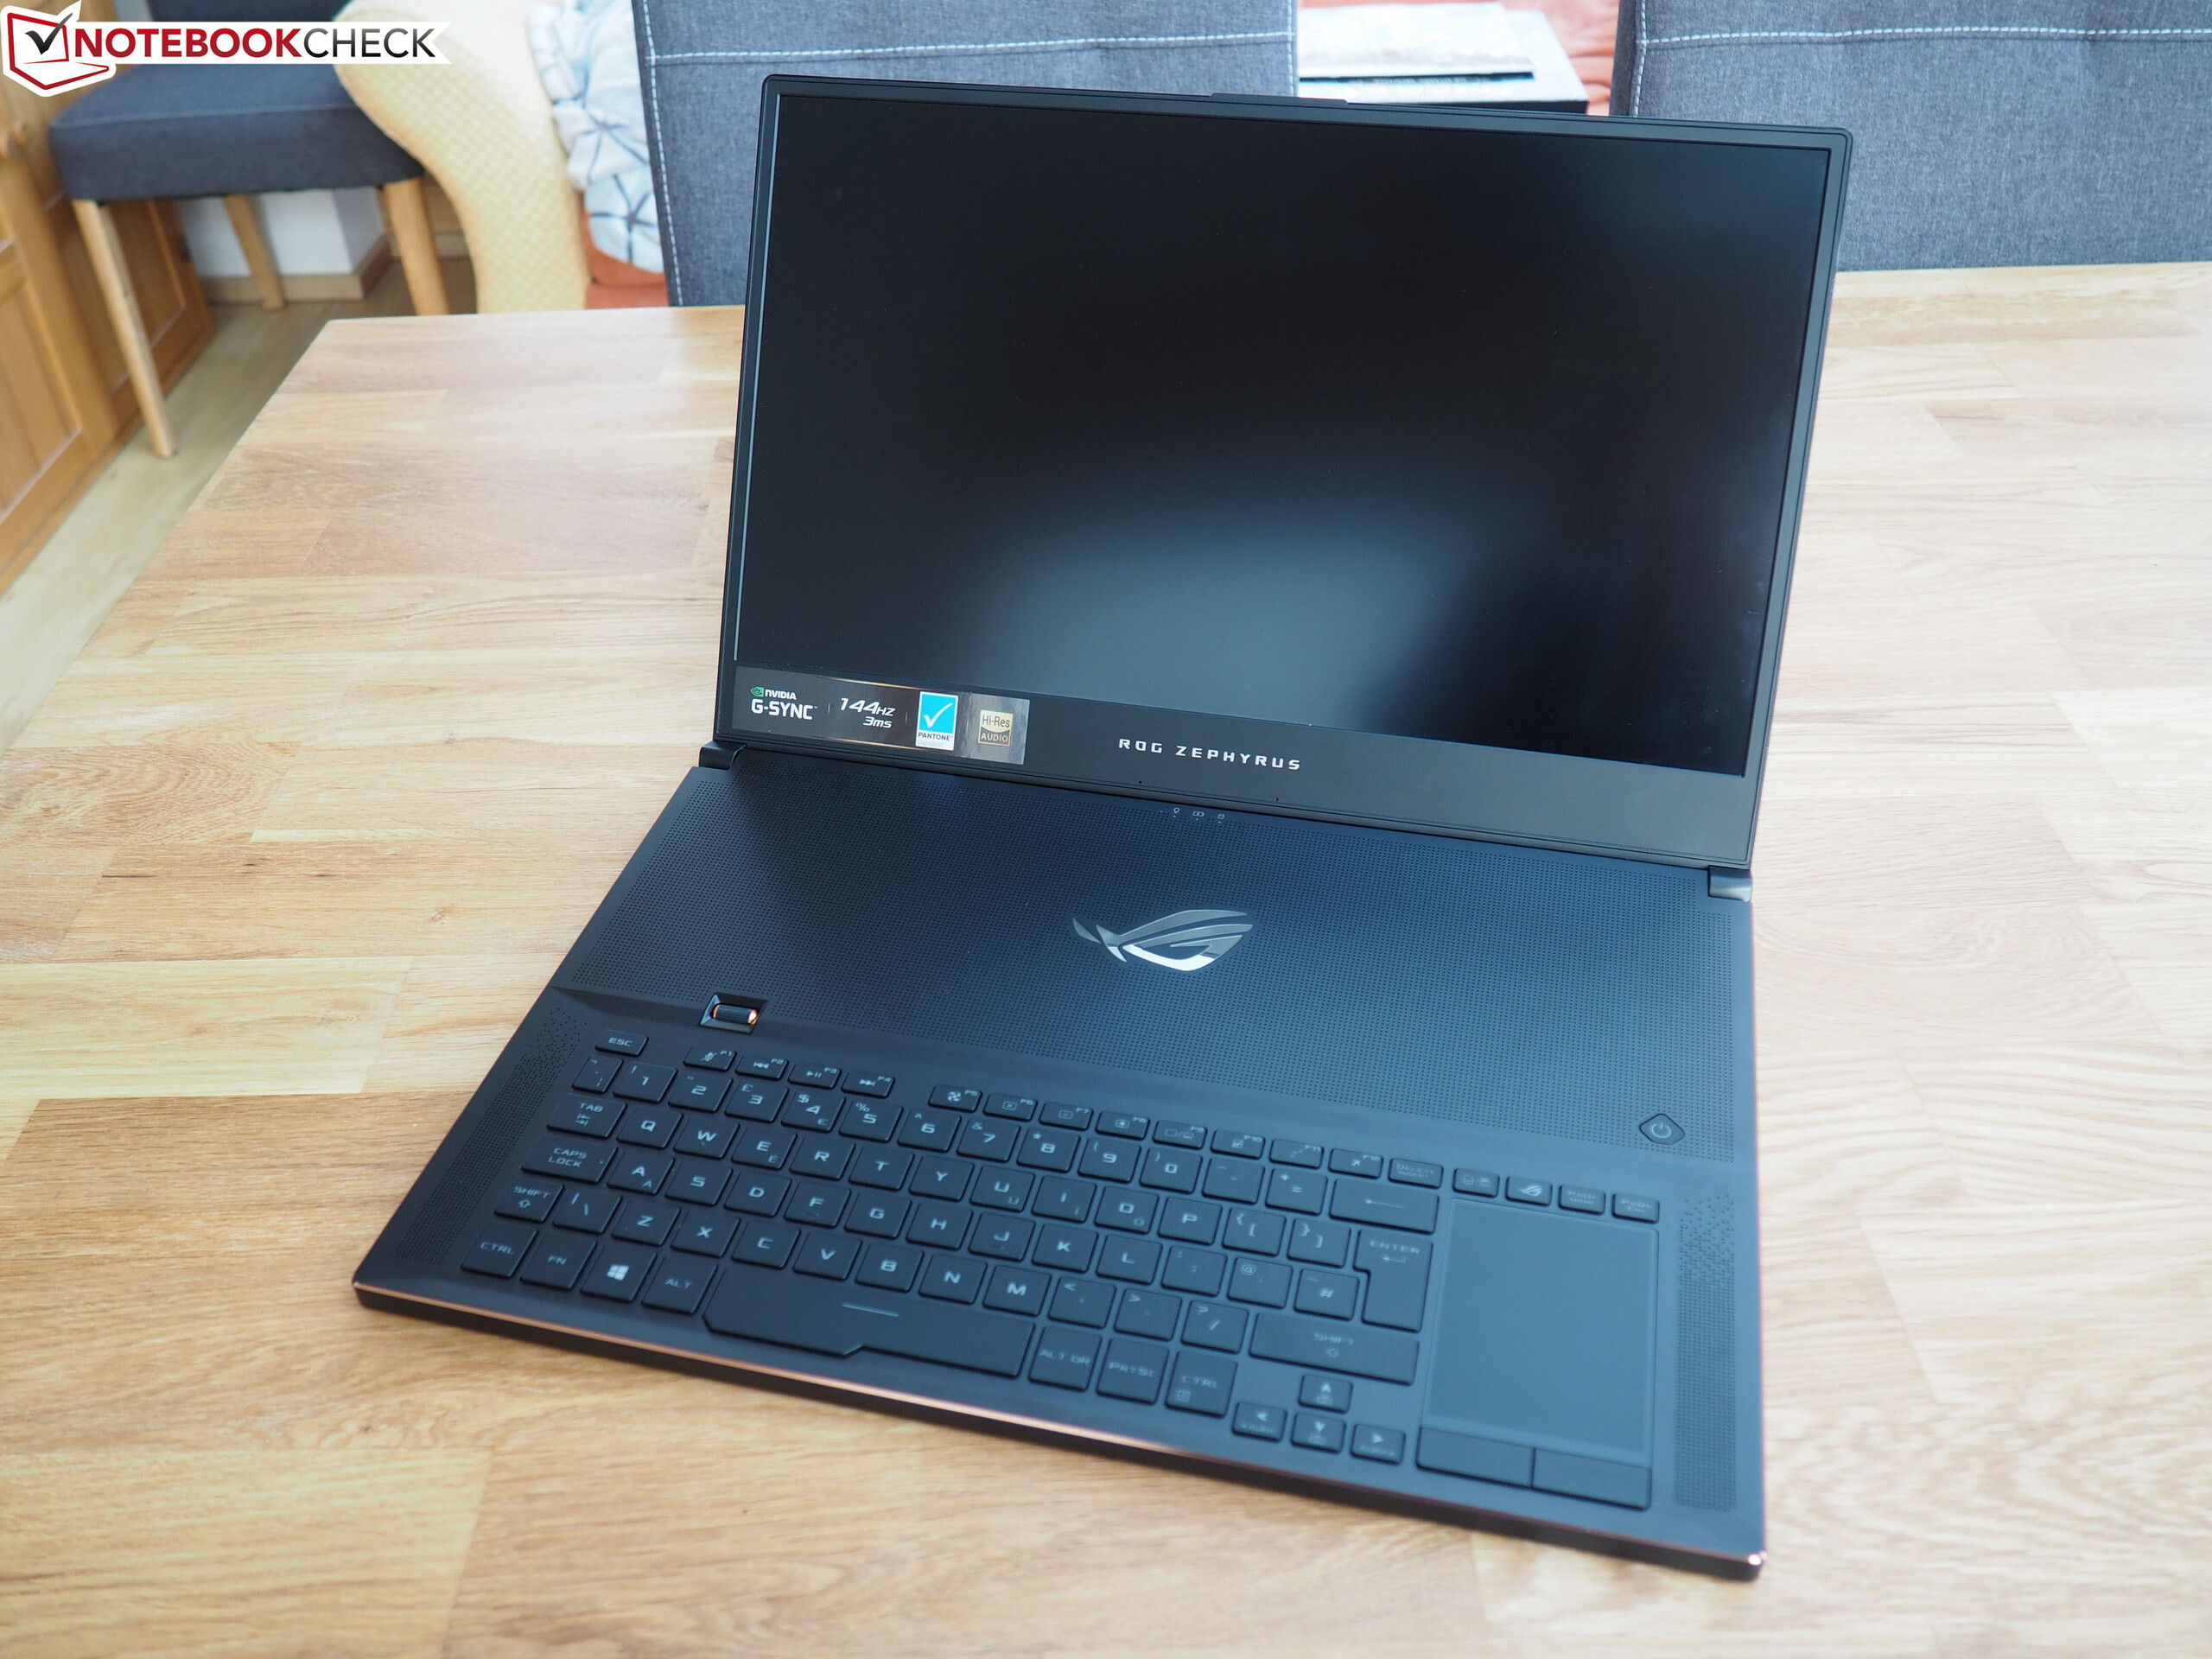
Asus ROG Zephyrus S GX701GXR laptop review: Slim gaming laptop scores points with a fast 300 Hz display
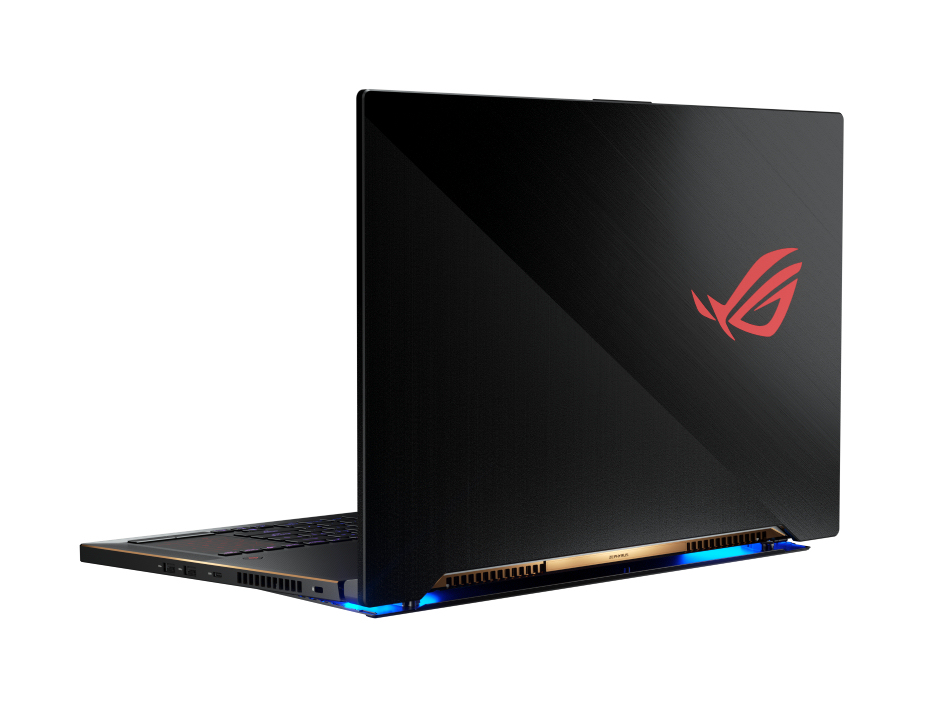
The Zephyrus S GX701GXR is one of the slim, compact gaming laptops in the 17.3-inch format. This is the identically built sister model of the Asus ROG Zephyrus S GX701GX that we already reviewed. The test device before us is powered by a Core i7-9750H processor and a GeForce RTX 2080 Max-Q GPU. Competitors include devices such as the Razer Blade Pro 17, the Gigabyte Aero 17 XA, the Alienware m17 and the Lenovo Legion Y740-17ICH.
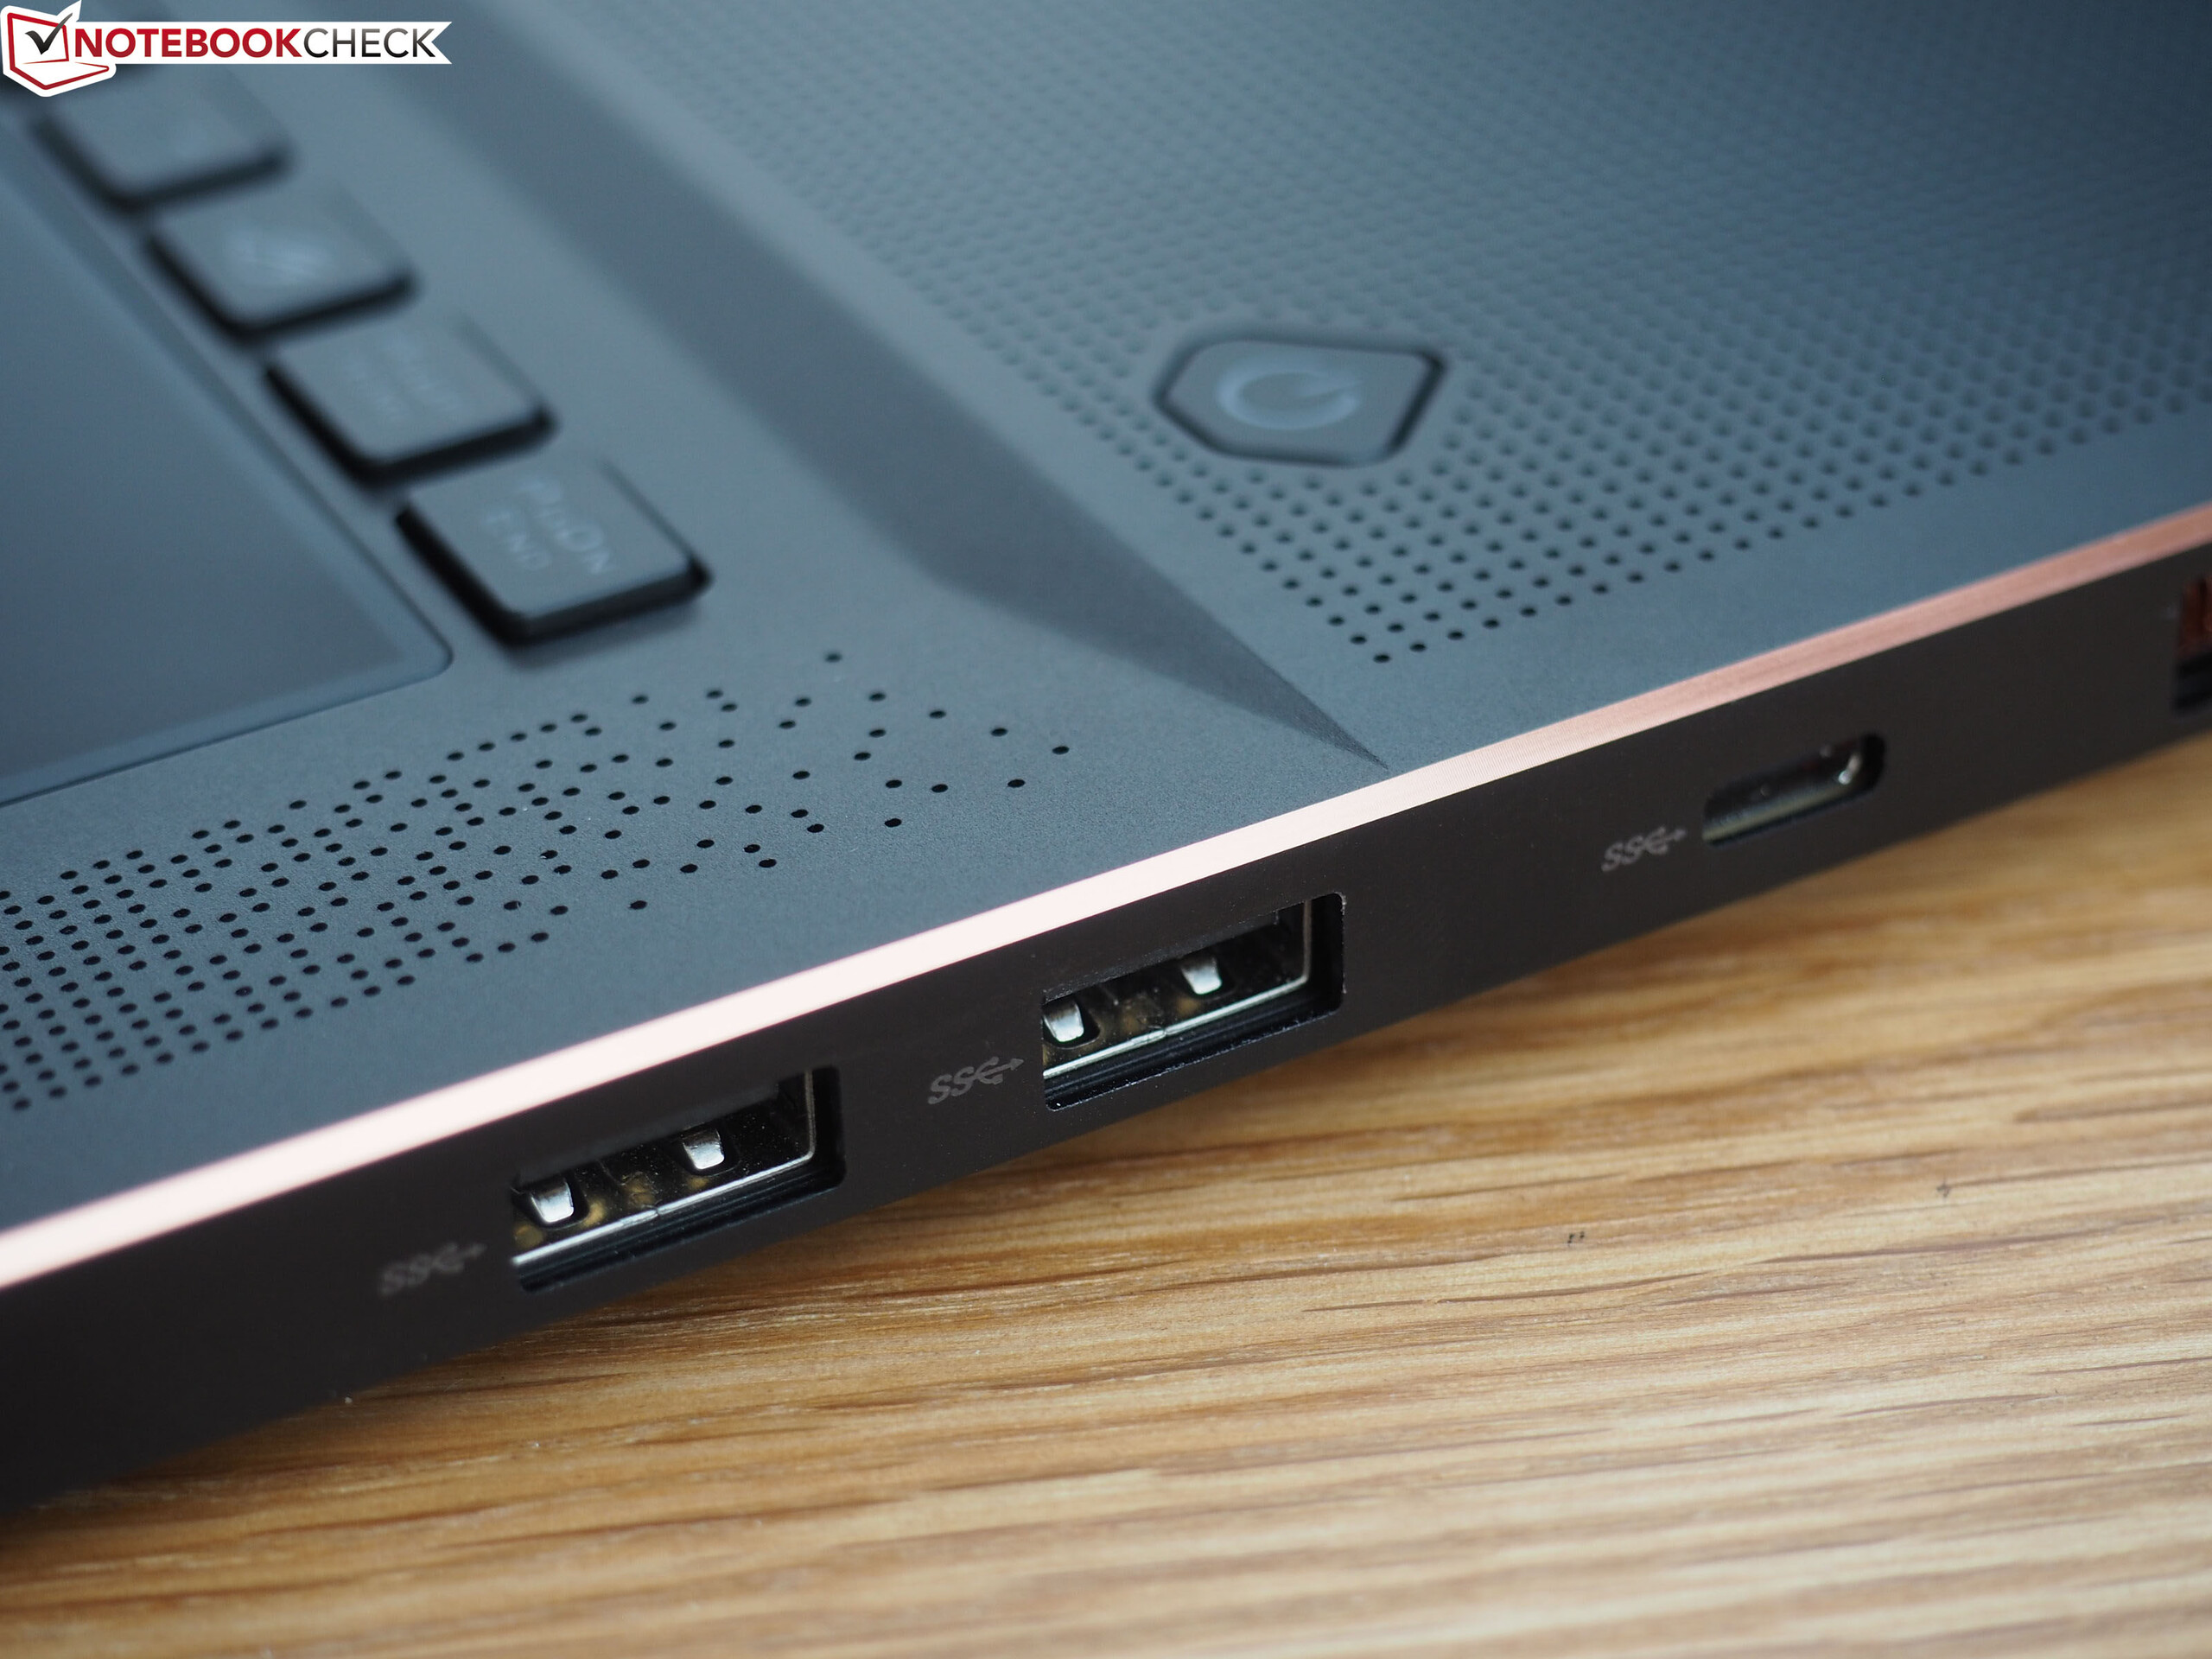
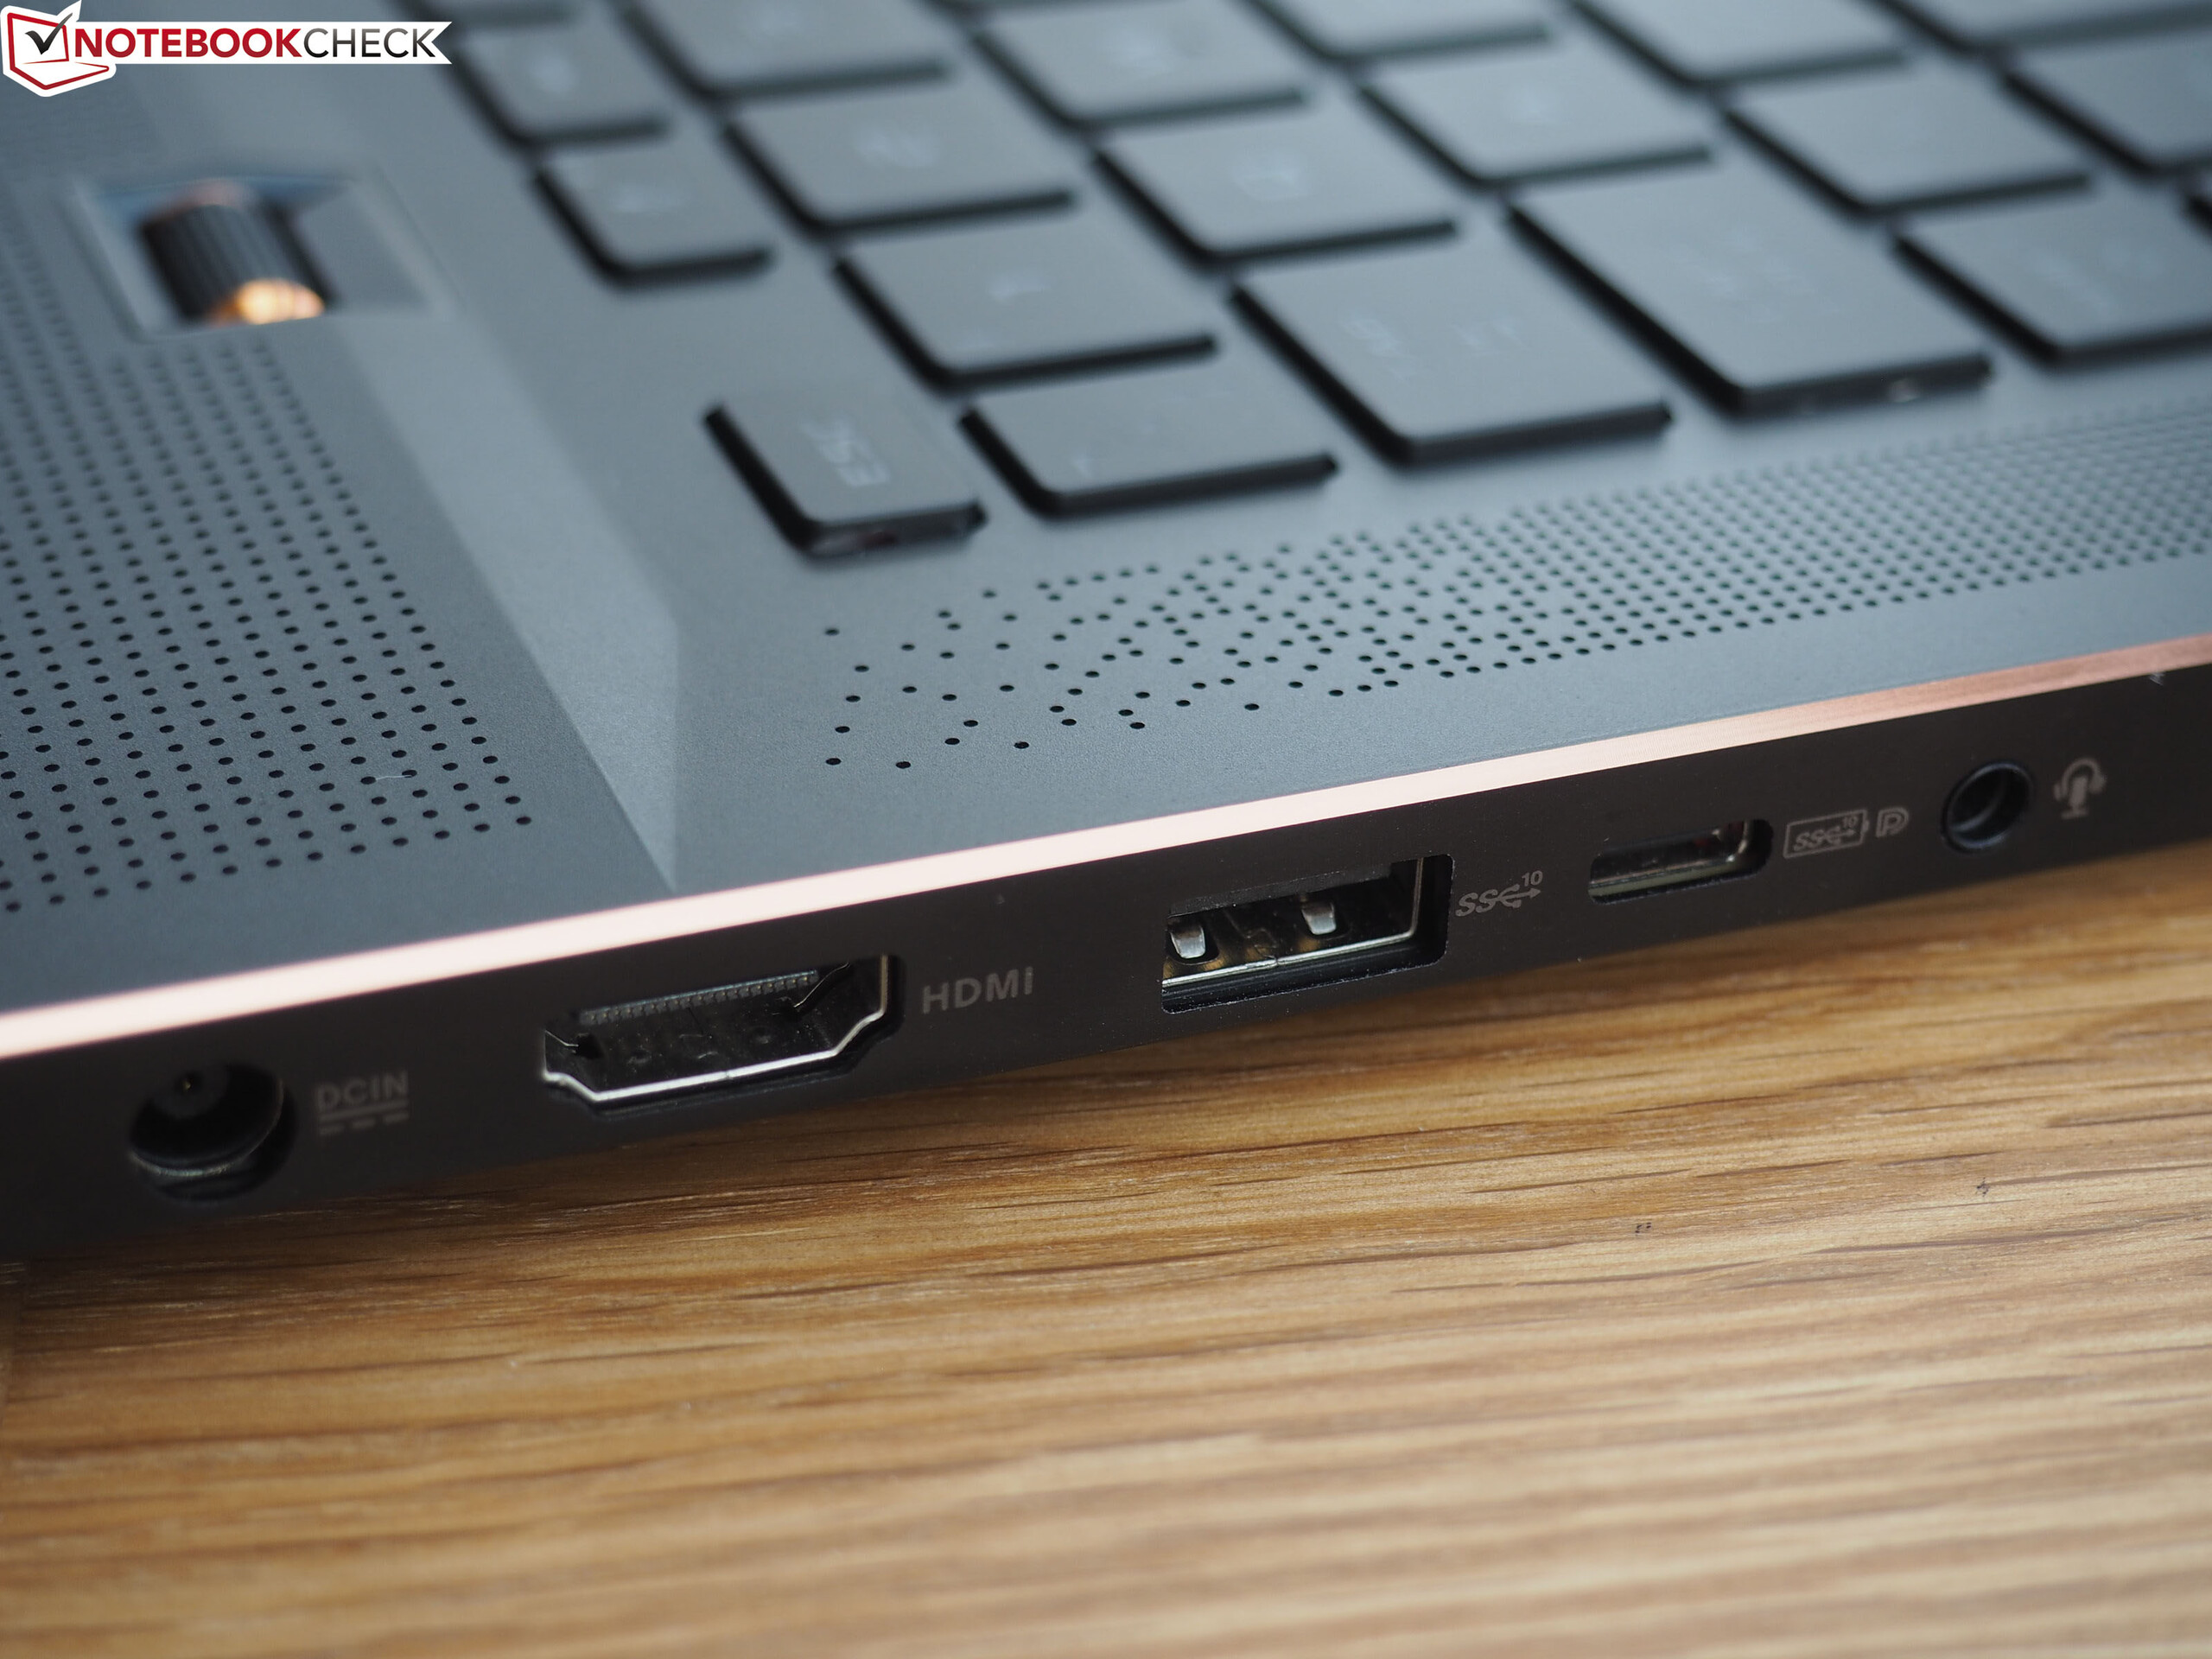
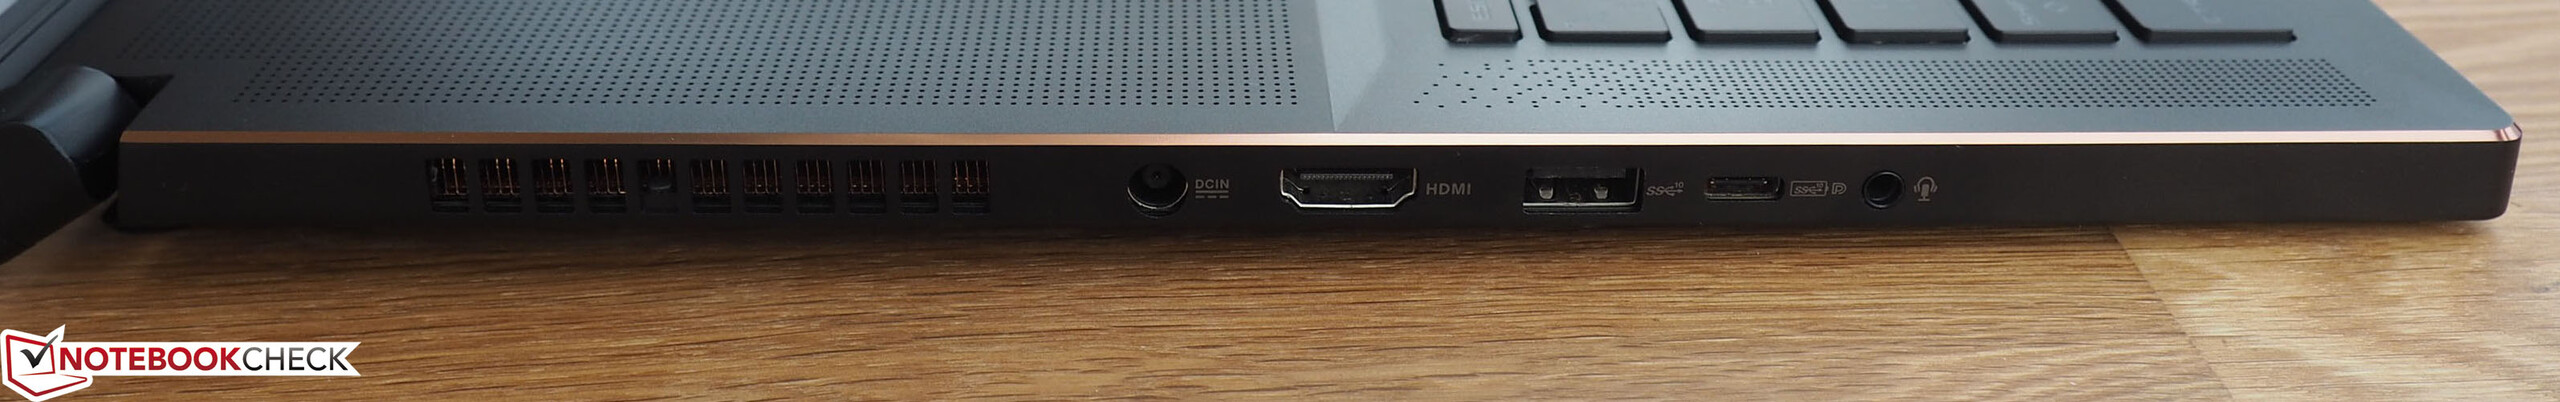
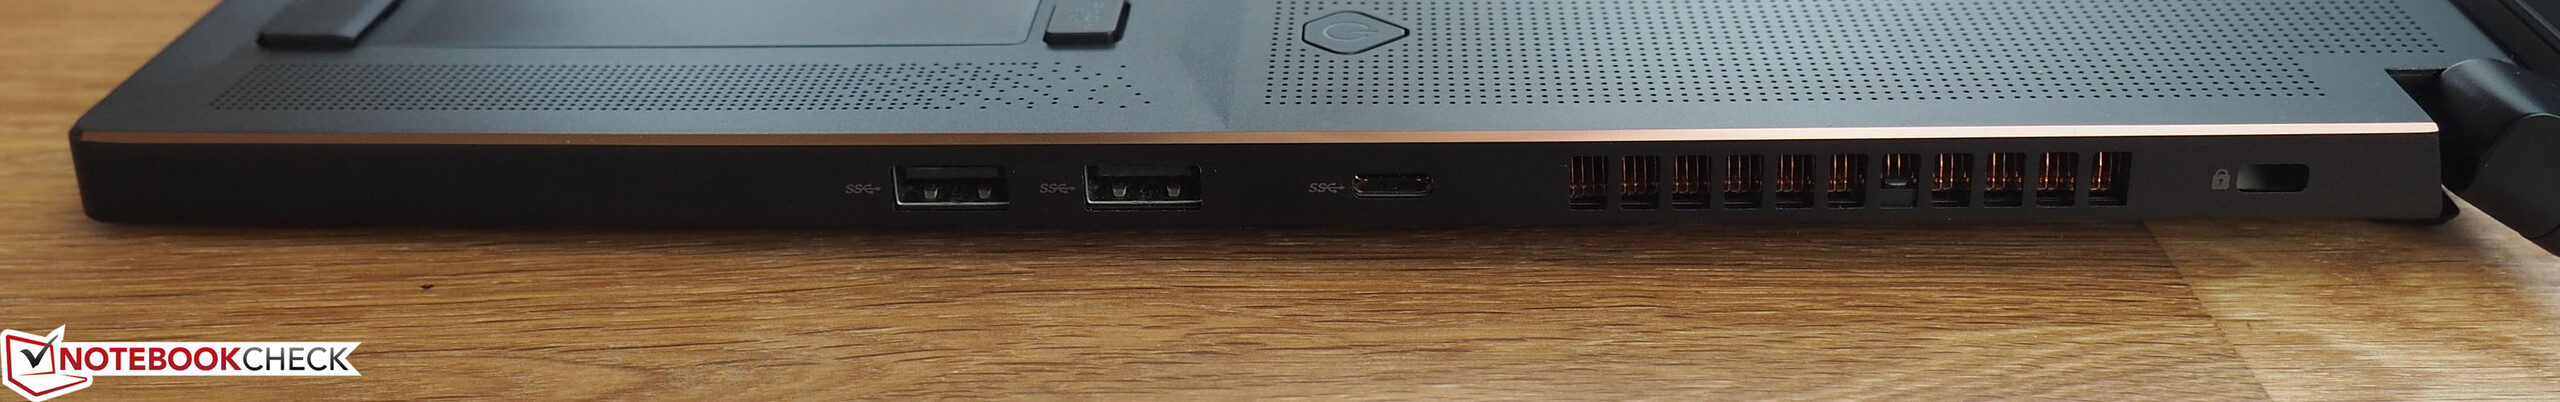
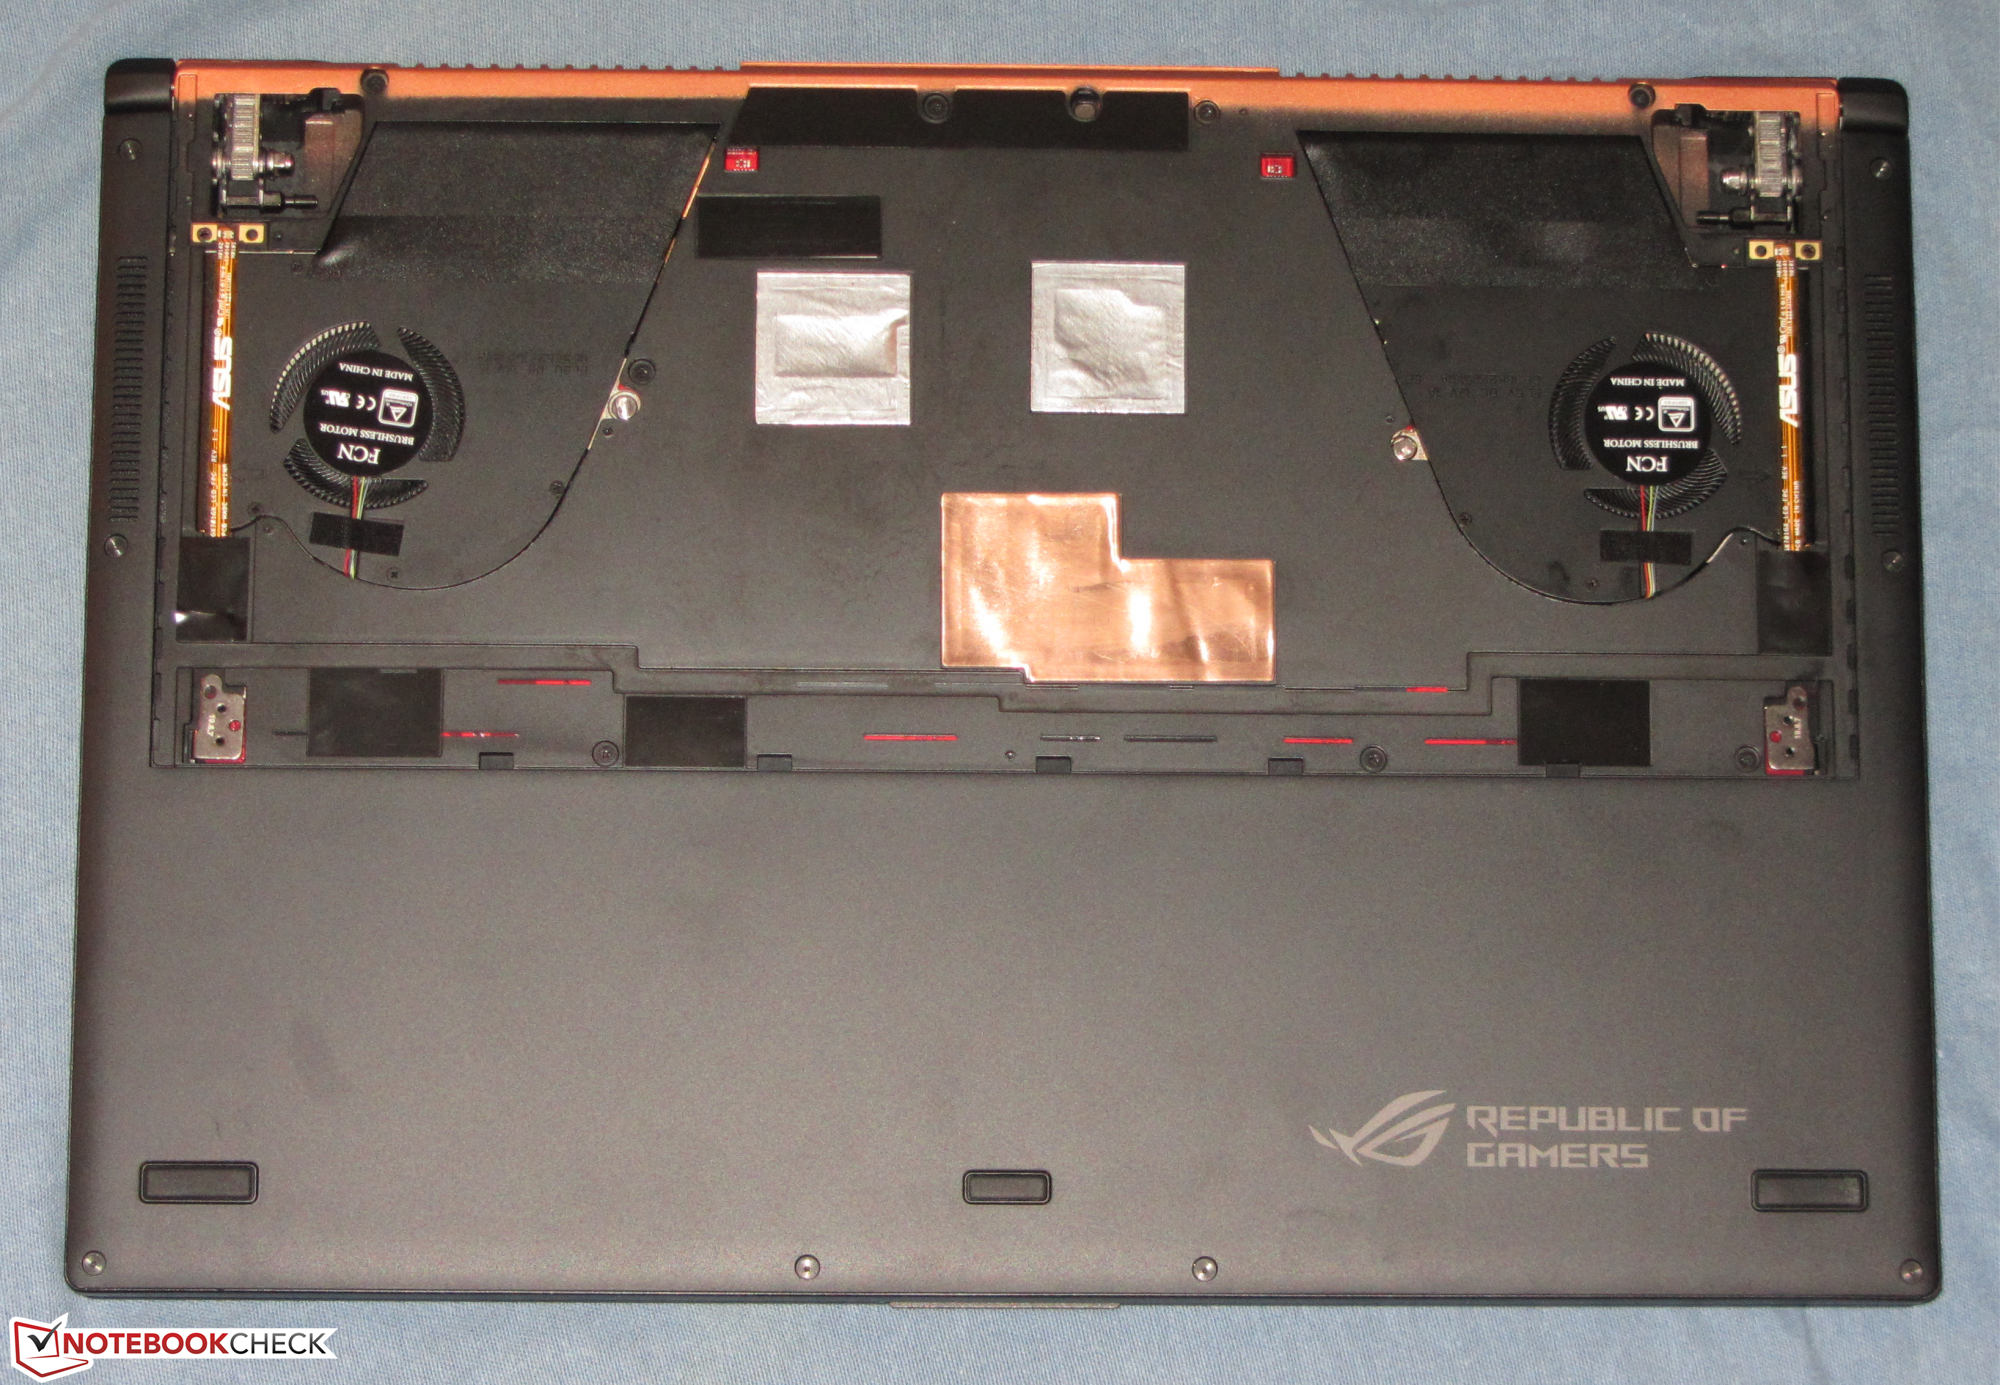
Since the two Zephyrus models are identical in construction, we won't go into the case, the connectivity, the input devices and the speakers. The corresponding information can be found in our review of the Zephyrus S GX701GX.
Rating | Date | Model | Weight | Height | Size | Resolution | Price |
|---|---|---|---|---|---|---|---|
| 81.2 % v7 (old) | 12 / 2019 | Asus ROG Zephyrus S GX701GXR i7-9750H, GeForce RTX 2080 Max-Q | 2.7 kg | 18.7 mm | 17.30" | 1920x1080 | |
| 87.7 % v7 (old) | 06 / 2019 | Razer Blade Pro 17 RTX 2080 Max-Q i7-9750H, GeForce RTX 2080 Max-Q | 2.8 kg | 19.9 mm | 17.30" | 1920x1080 | |
| 86.1 % v7 (old) | 09 / 2019 | Gigabyte Aero 17 XA RP77 i9-9980HK, GeForce RTX 2070 Max-Q | 2.5 kg | 21.4 mm | 17.30" | 3840x2160 | |
| 87.4 % v6 (old) | 04 / 2019 | Alienware m17 P37E i9-8950HK, GeForce RTX 2080 Max-Q | 2.6 kg | 23 mm | 17.30" | 3840x2160 | |
| 85.6 % v6 (old) | 03 / 2019 | Lenovo Legion Y740-17ICH i7-8750H, GeForce RTX 2080 Max-Q | 2.8 kg | 23 mm | 17.30" | 1920x1080 |


| Networking | |
| iperf3 transmit AX12 | |
| Asus ROG Zephyrus S GX701GXR | |
| iperf3 receive AX12 | |
| Asus ROG Zephyrus S GX701GXR | |
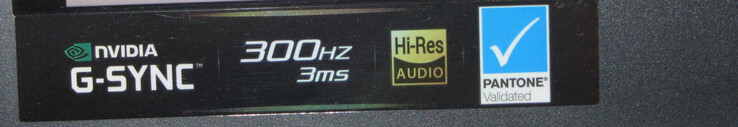
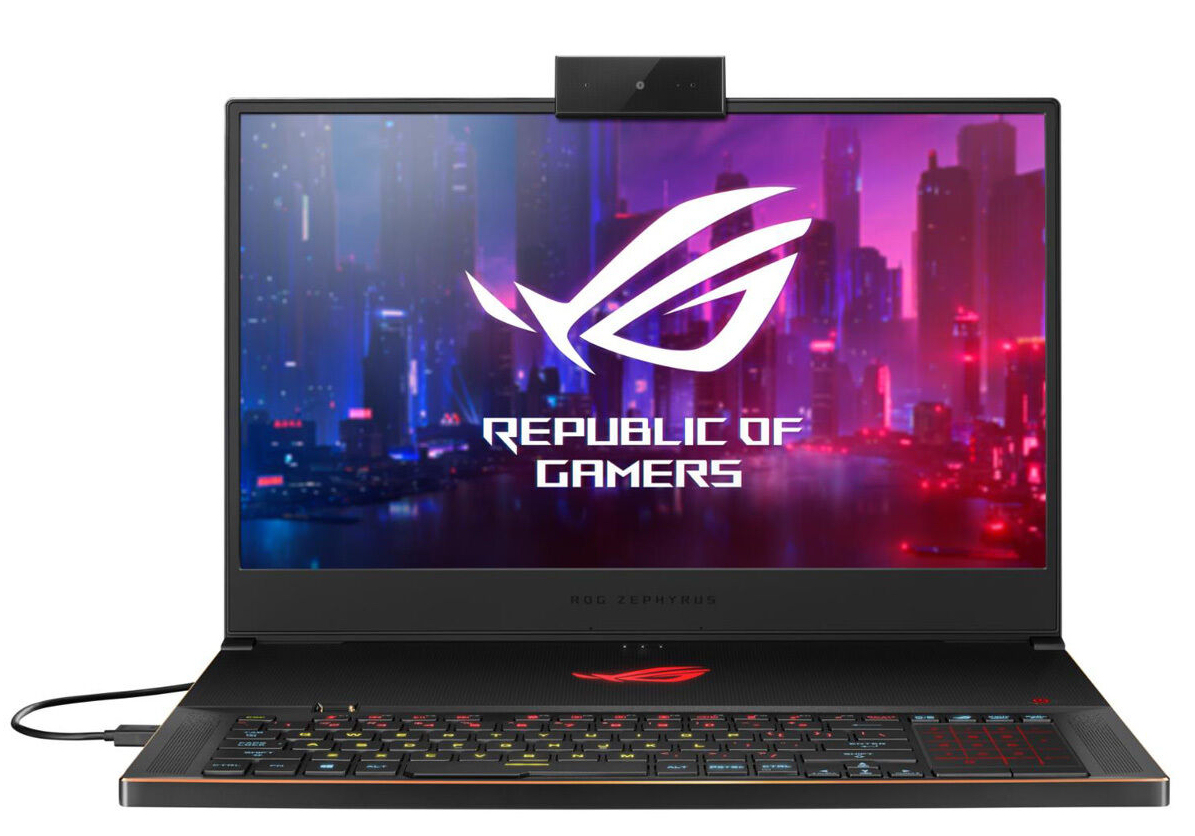
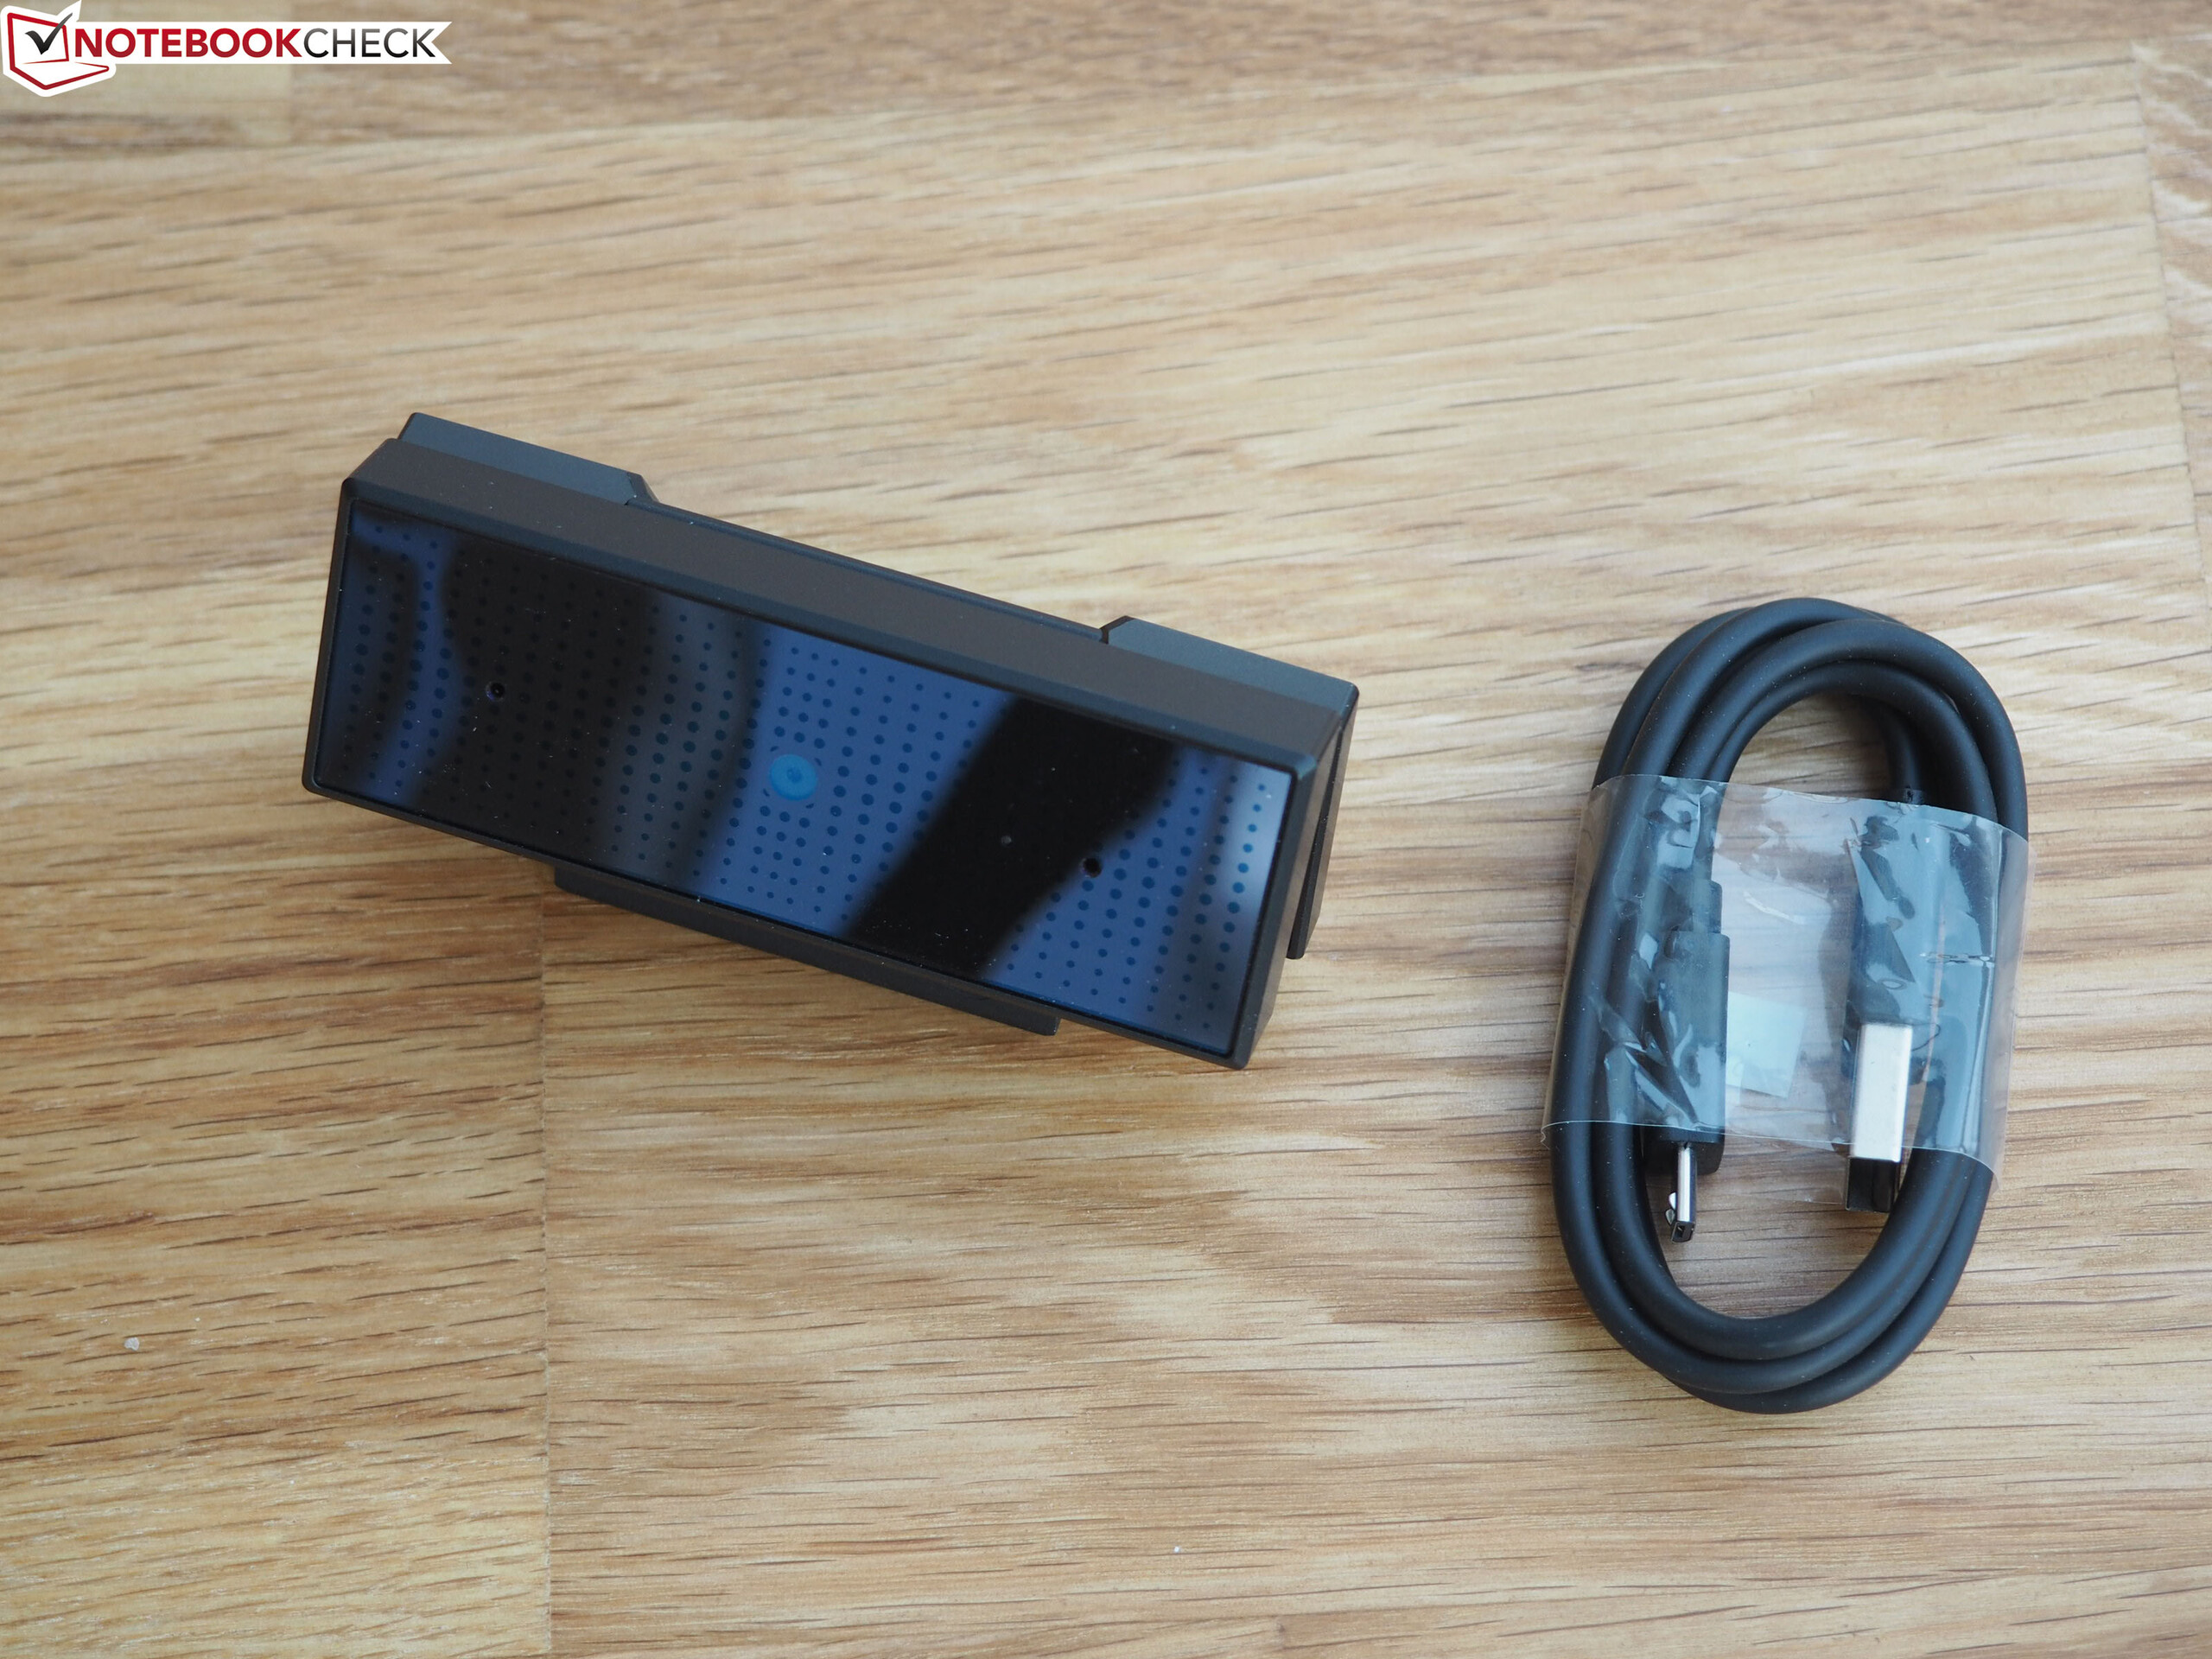
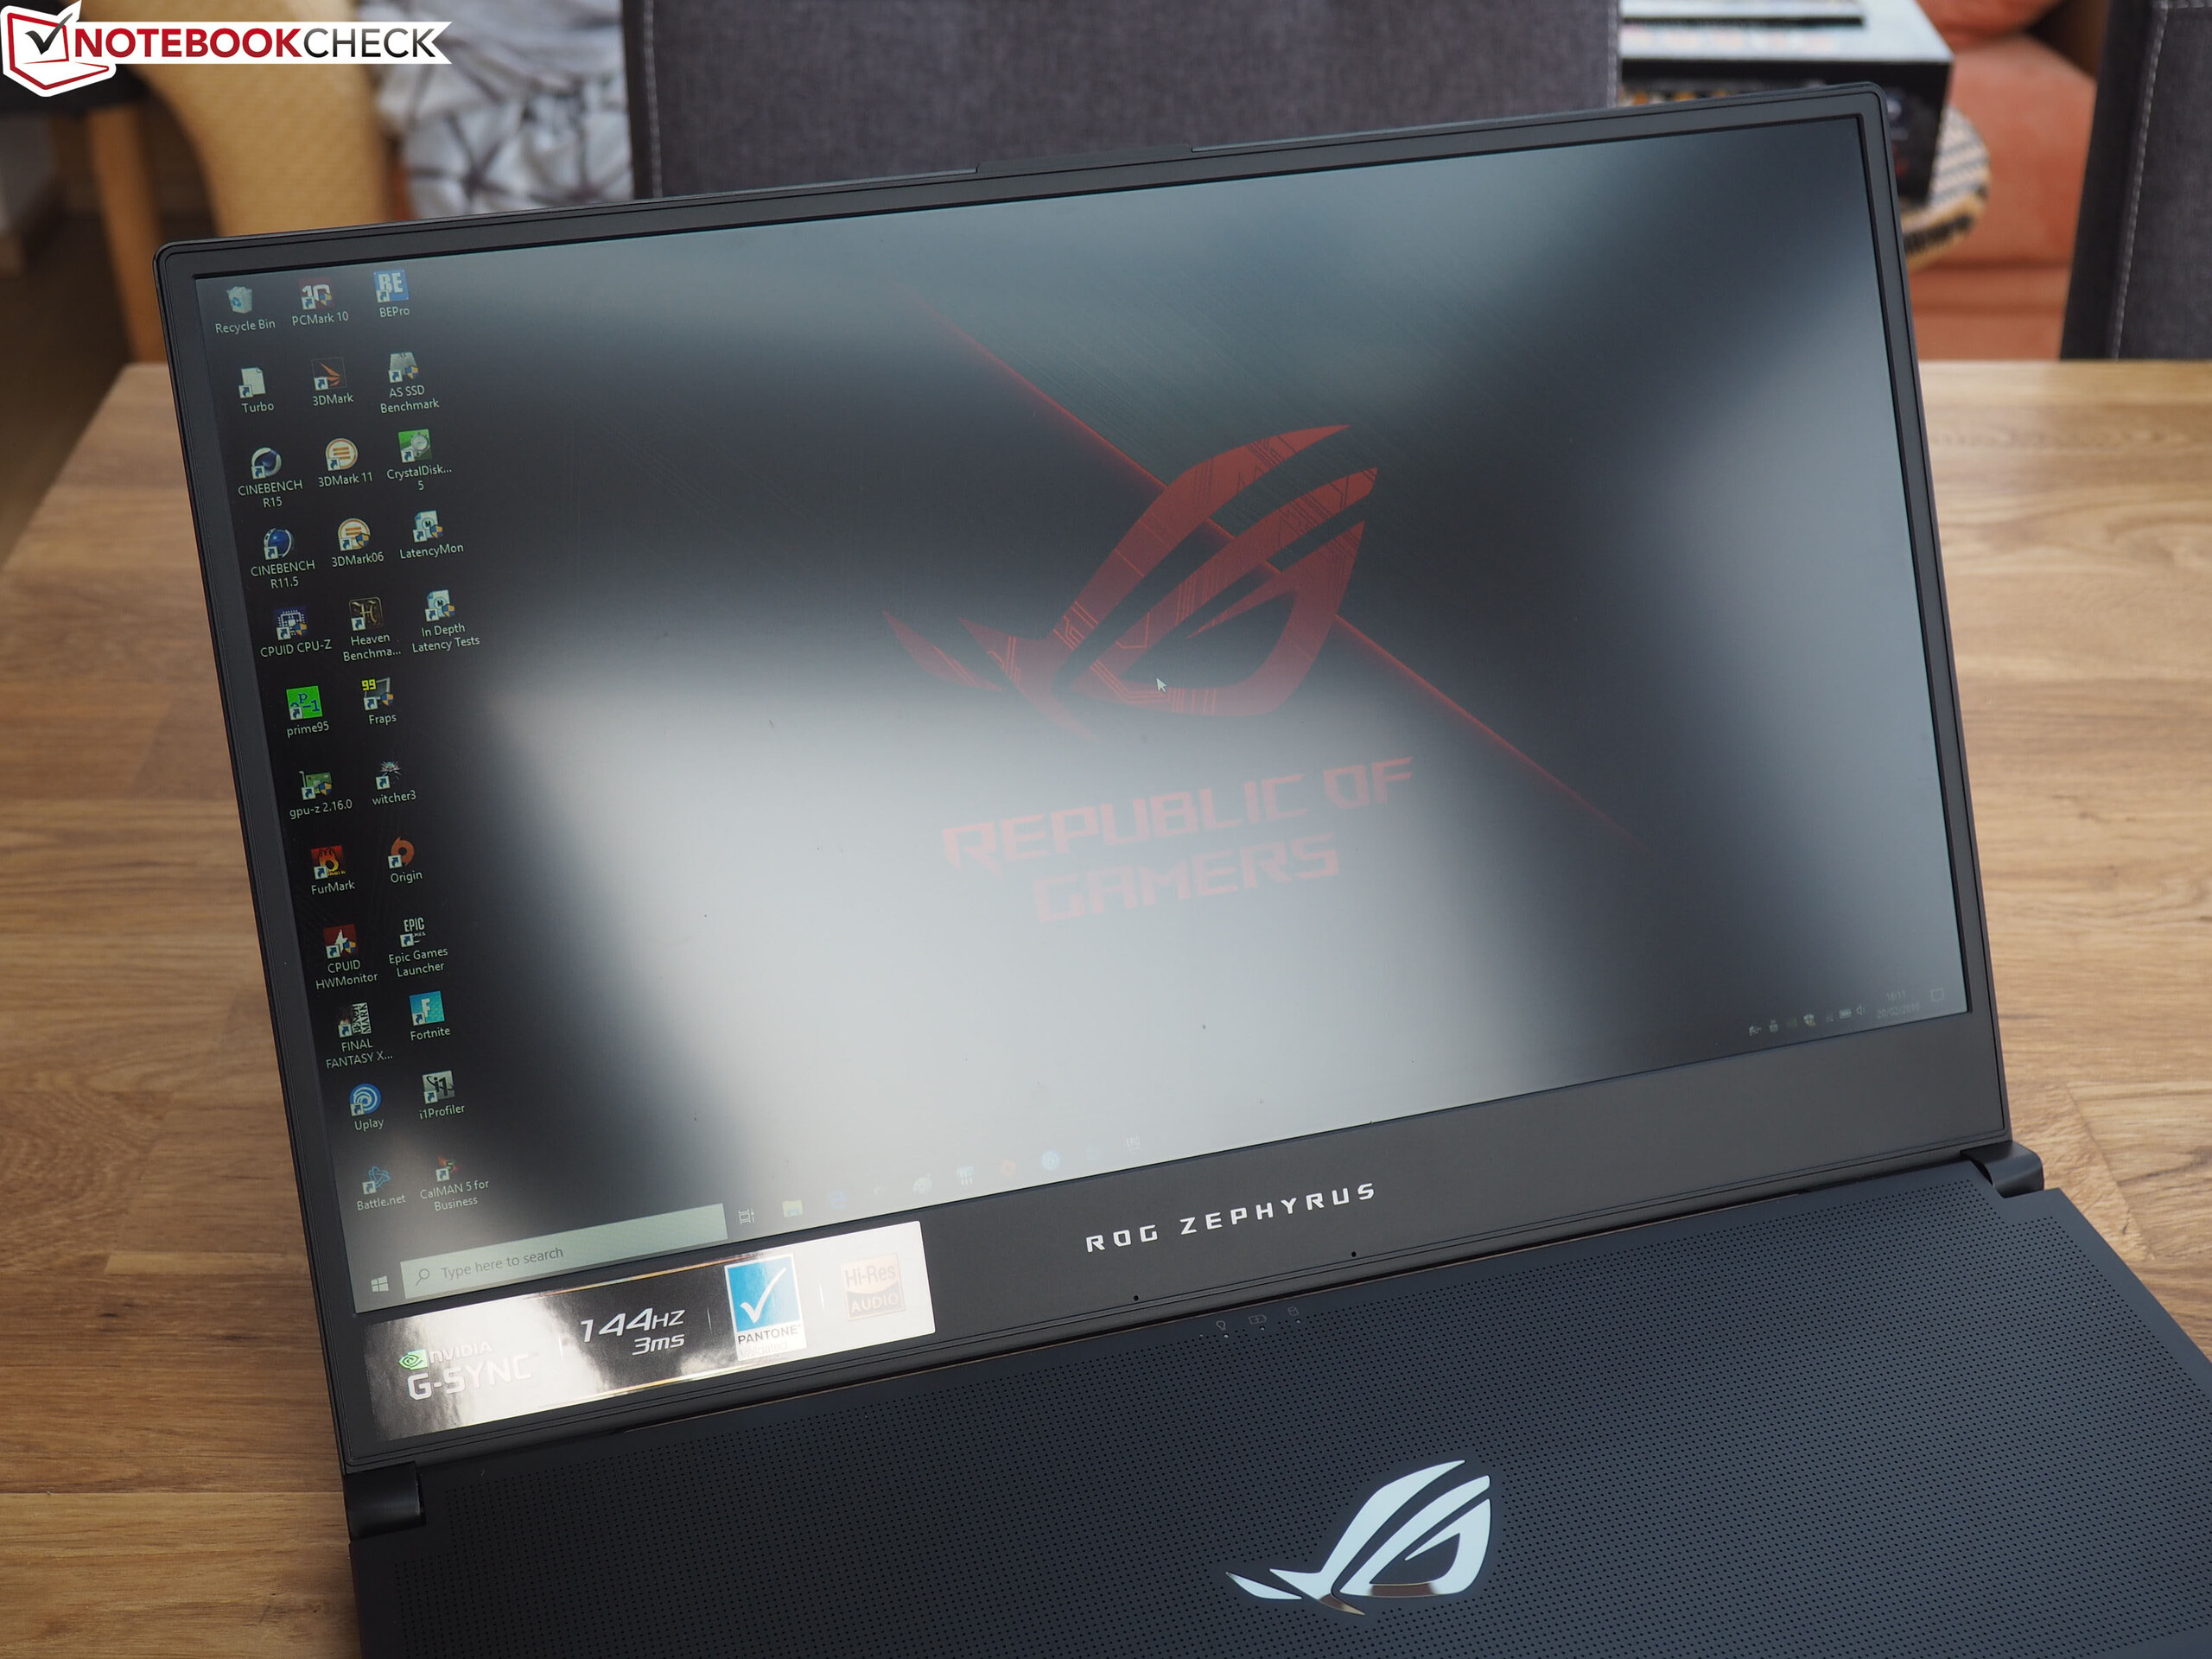
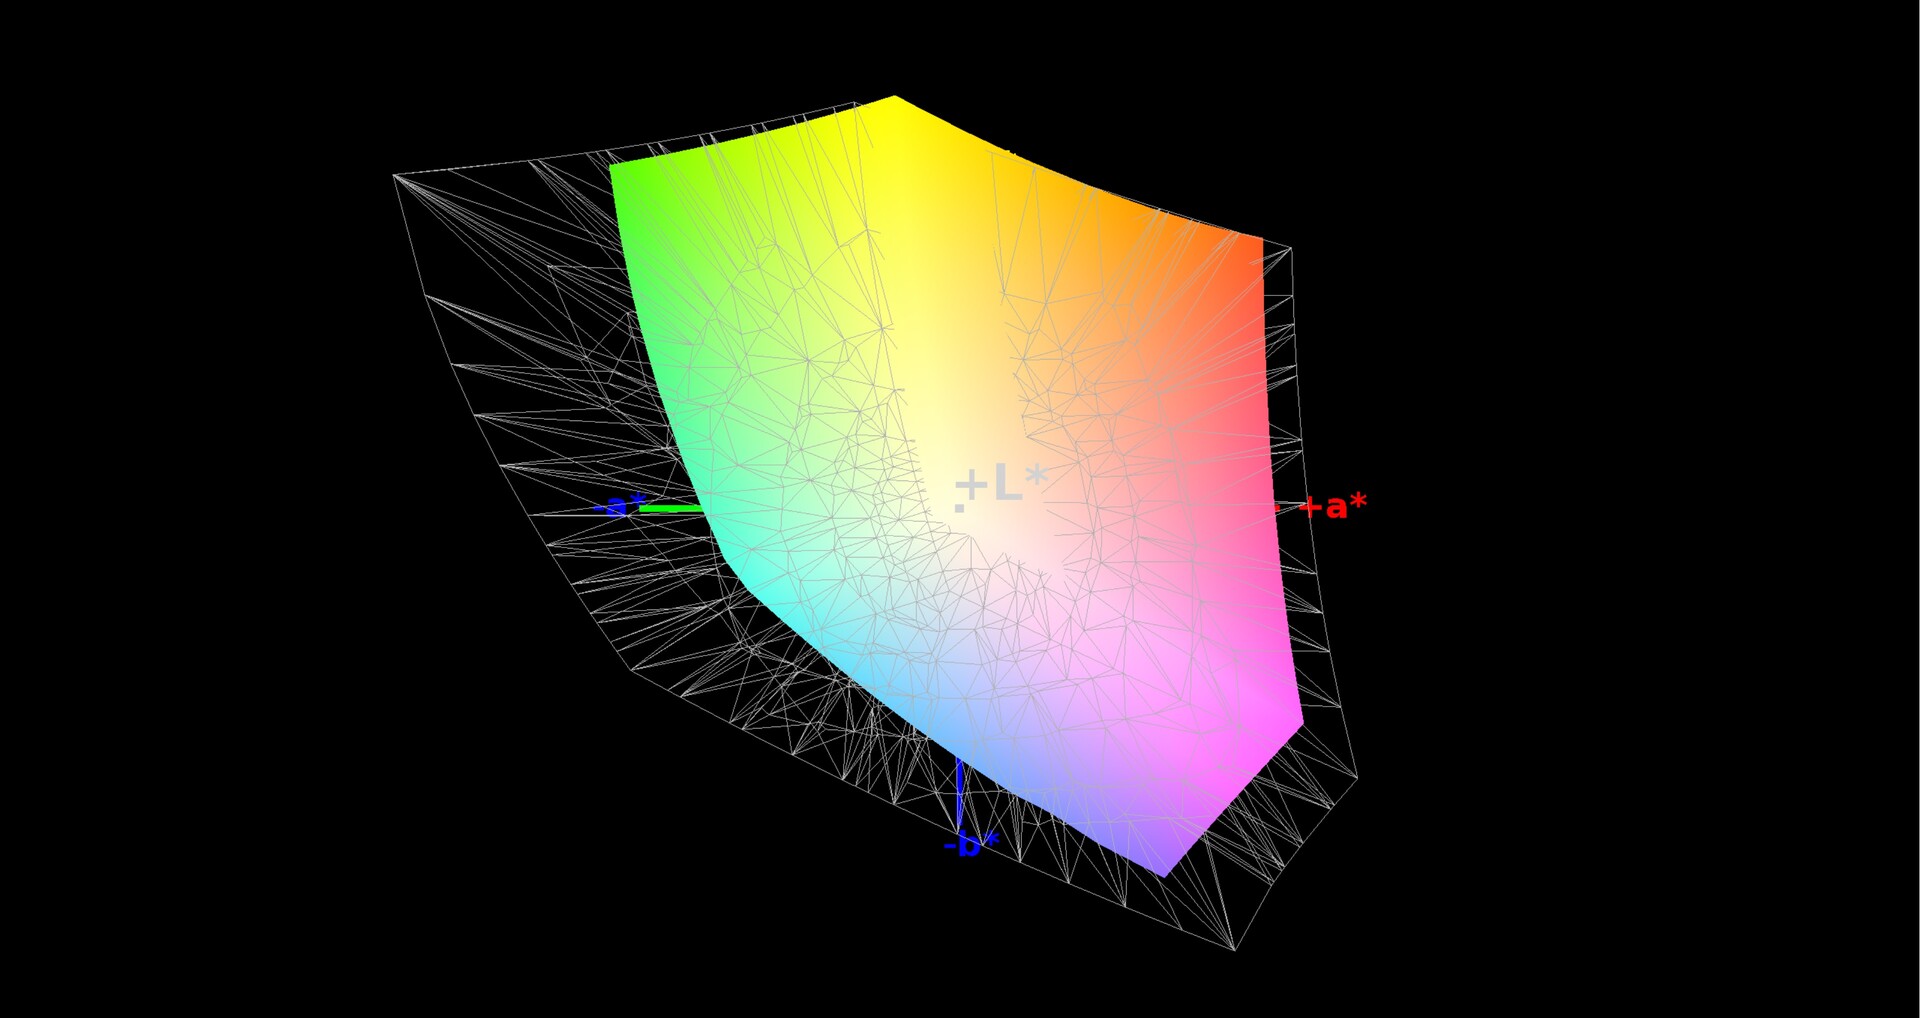
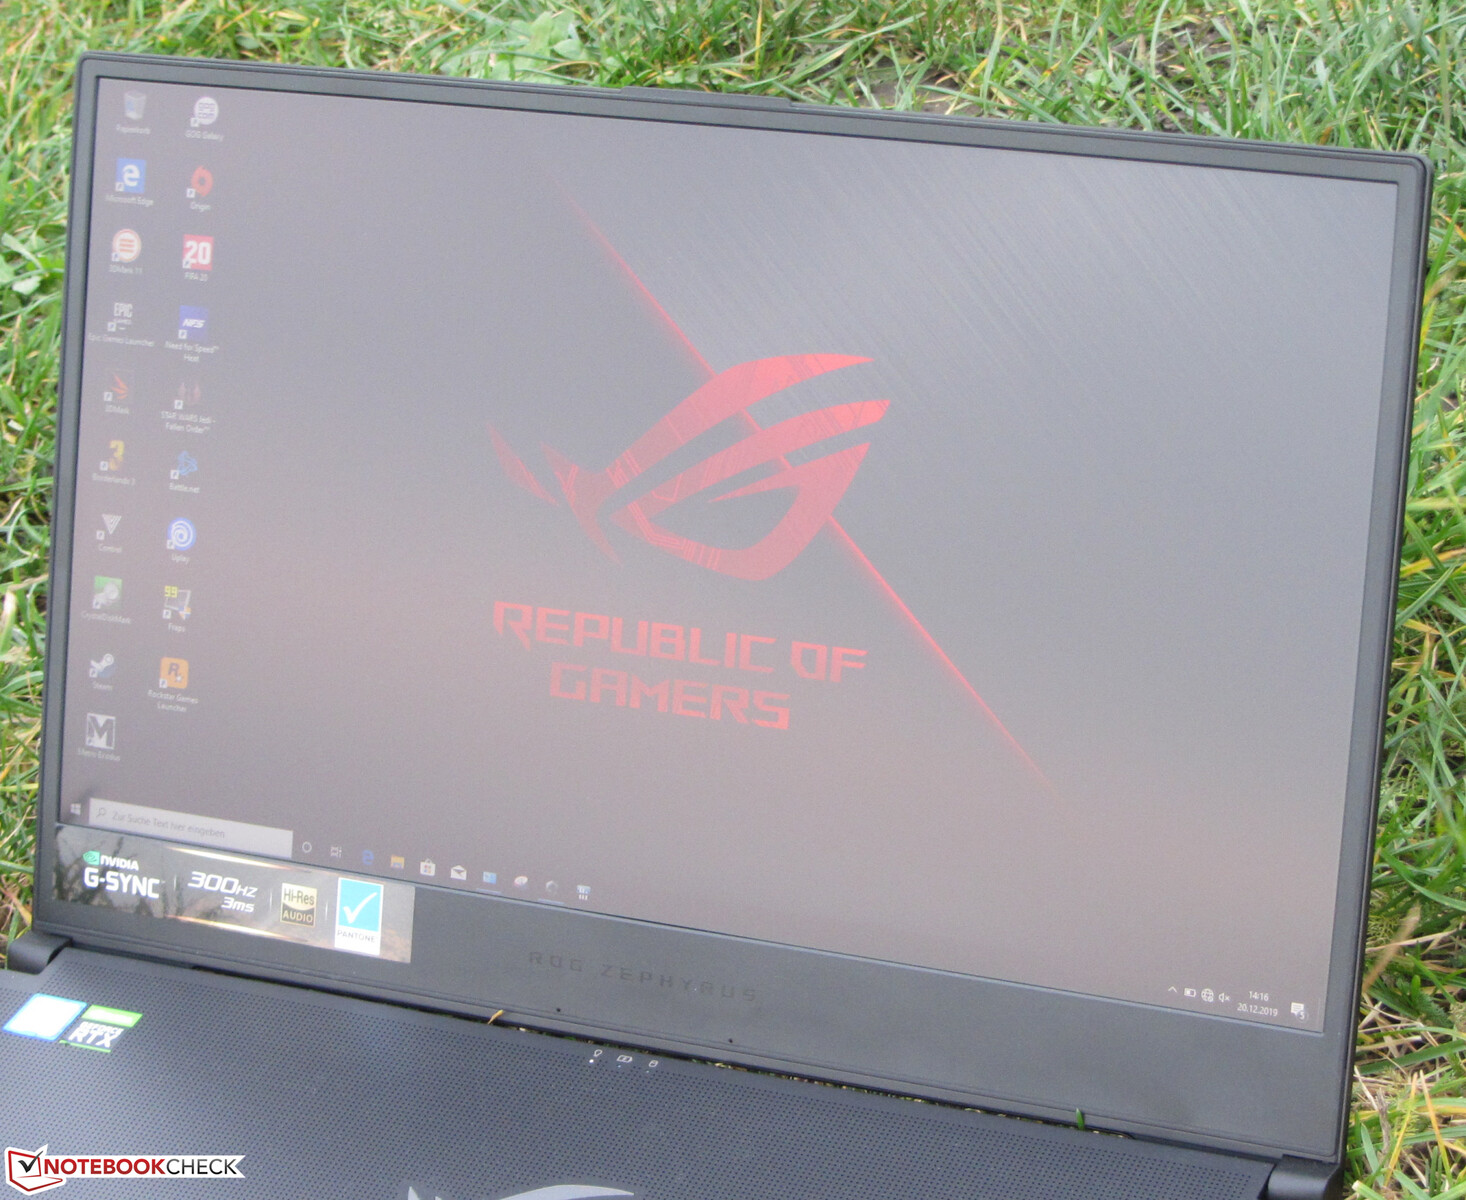
Display - 300 Hz IPS
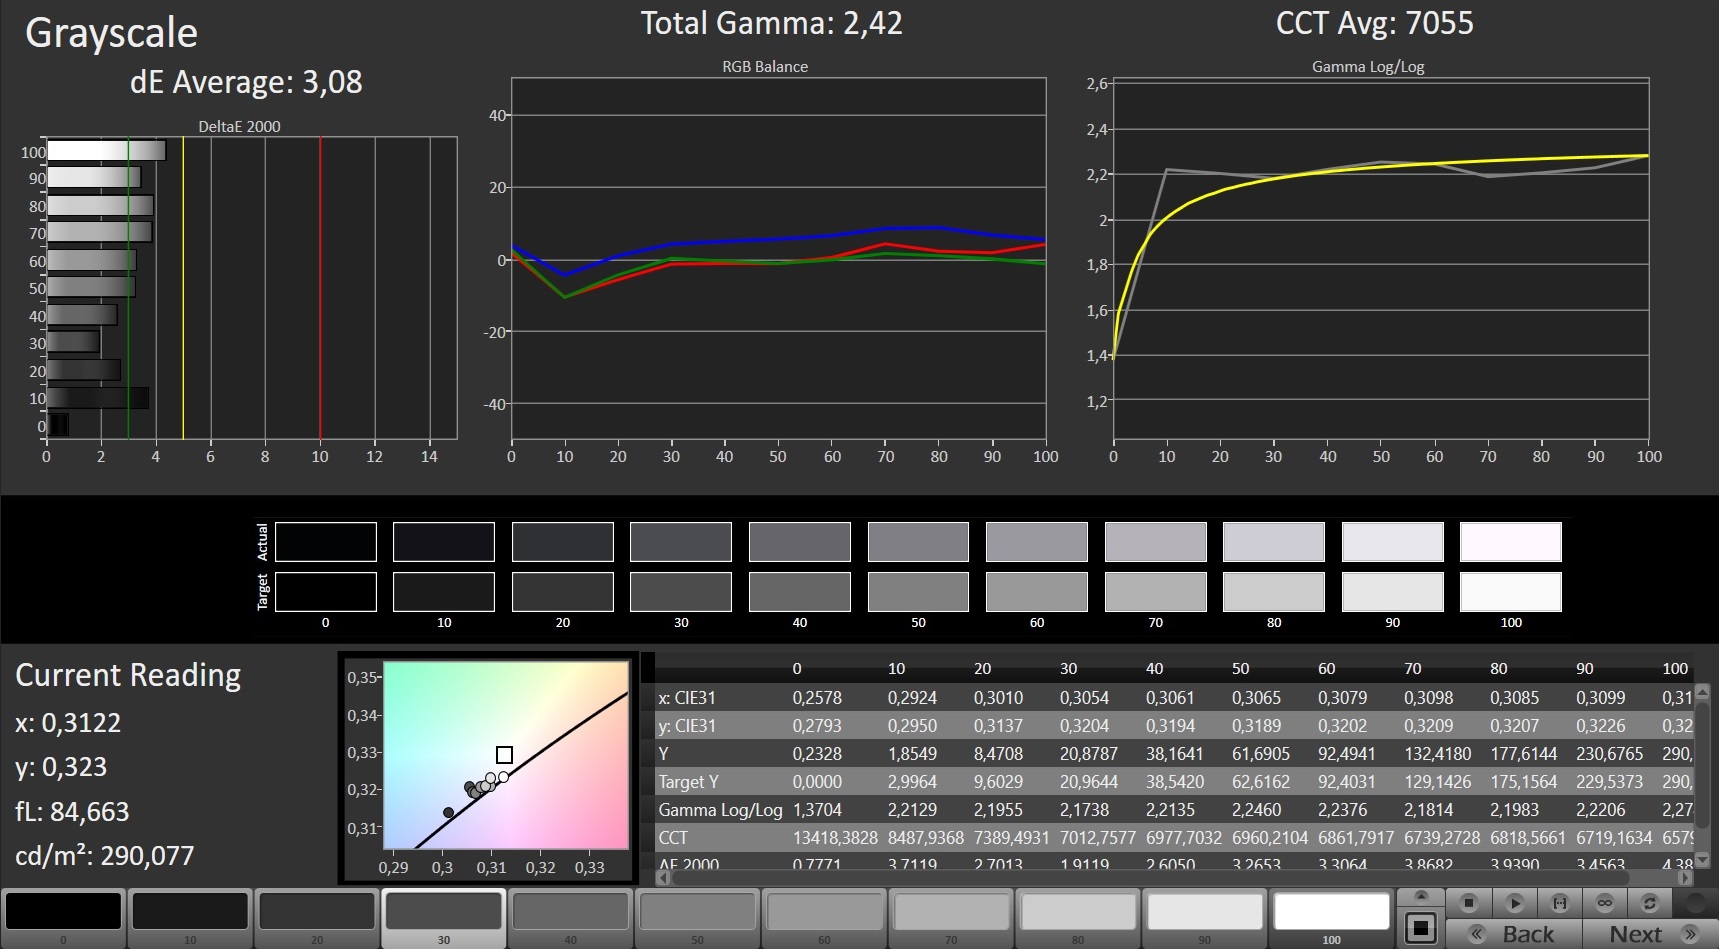
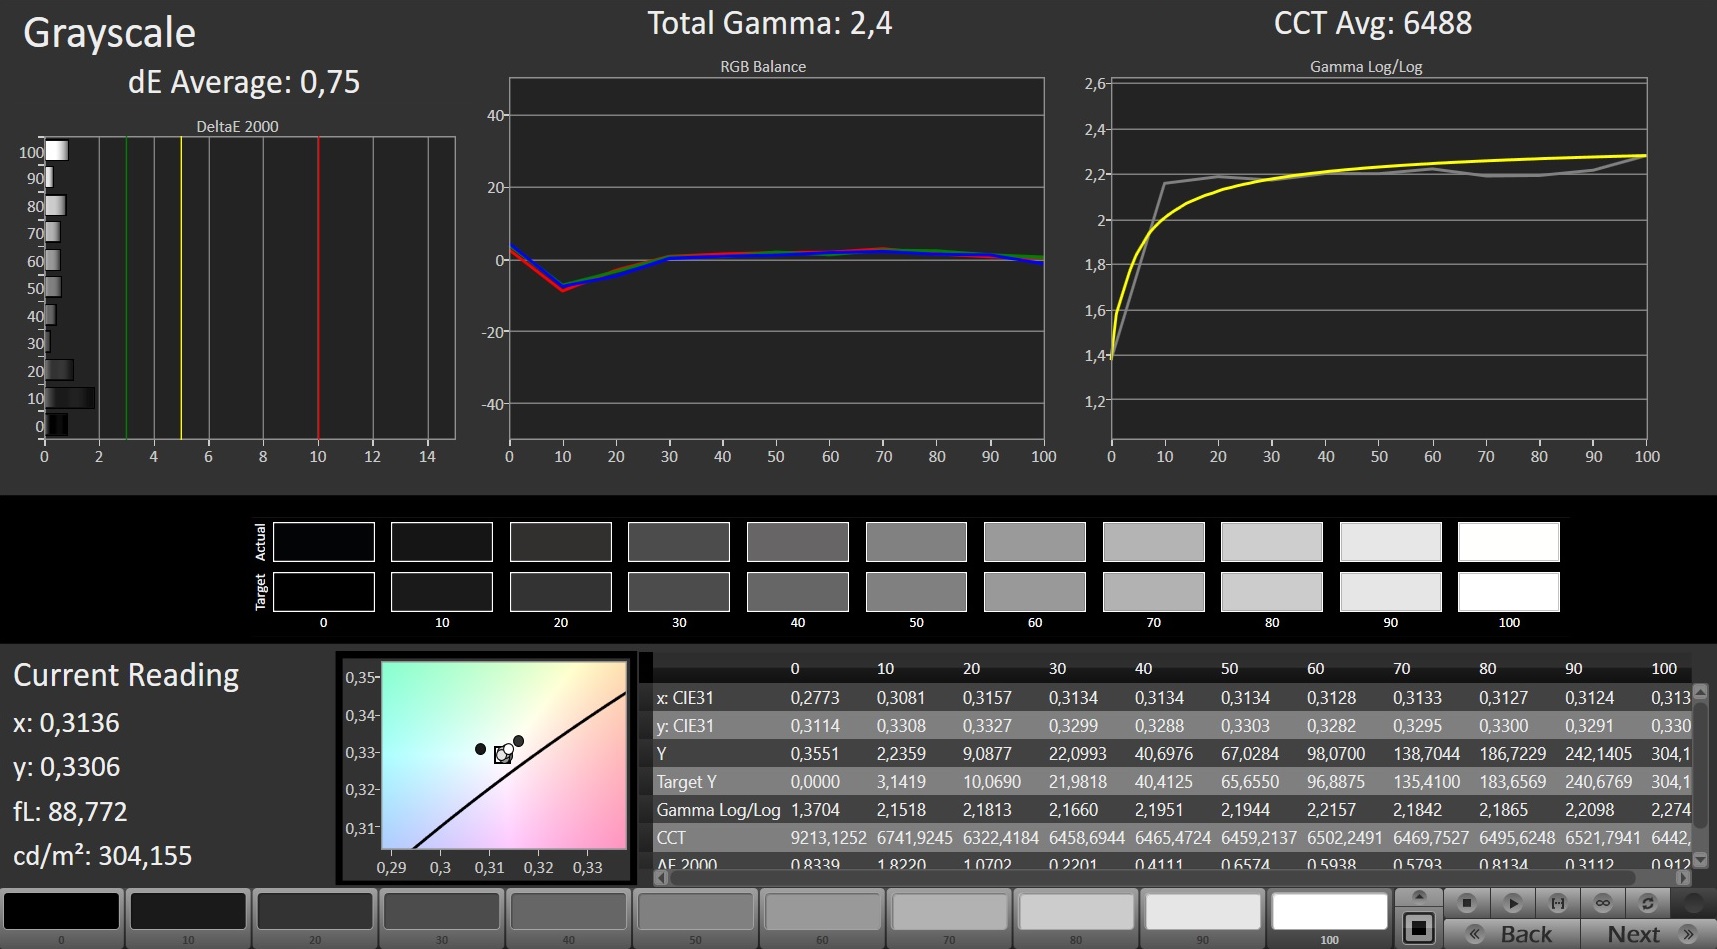
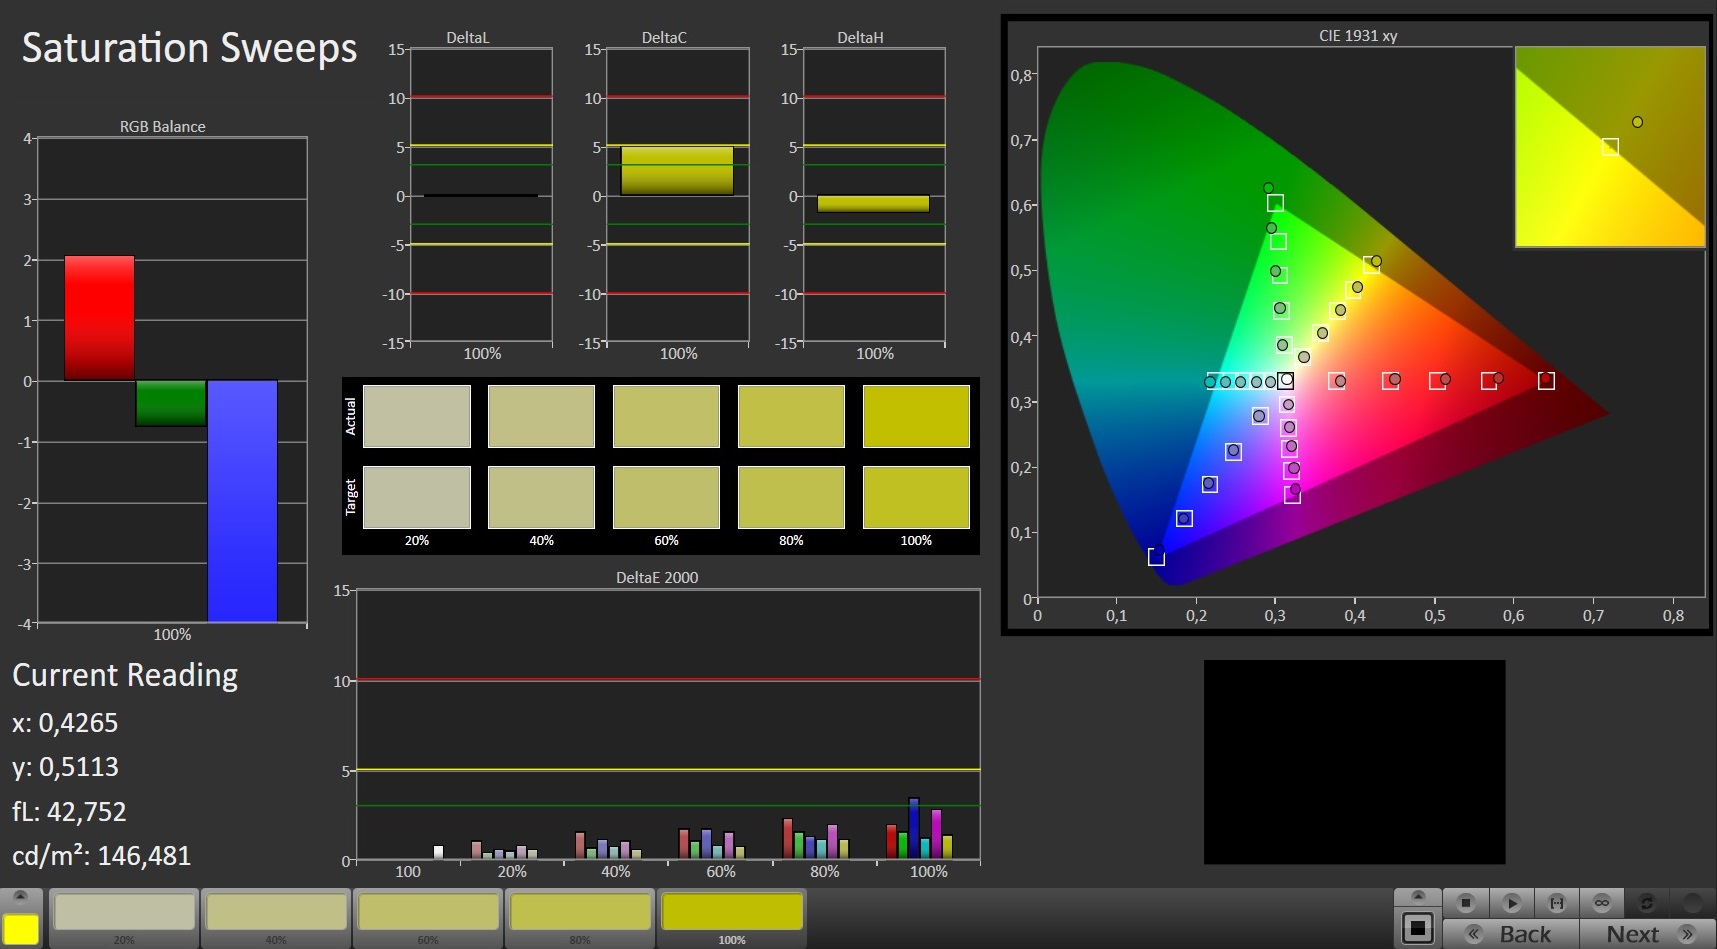
The Zephyrus' 17.3-inch display has a native resolution of 1920x1080 pixels. While the display provides good contrast (1,200:1), the brightness (276 cd/m²) is slightly too low for the price. We consider a value beyond 300 cd/m² to be good. Pros: The screen doesn't show PWM flickering. The built-in 300 Hz panel pleases with short response times. It also supports Nvidia's G-Sync technology.
| |||||||||||||||||||||||||
Brightness Distribution: 93 %
Center on Battery: 288 cd/m²
Contrast: 1200:1 (Black: 0.24 cd/m²)
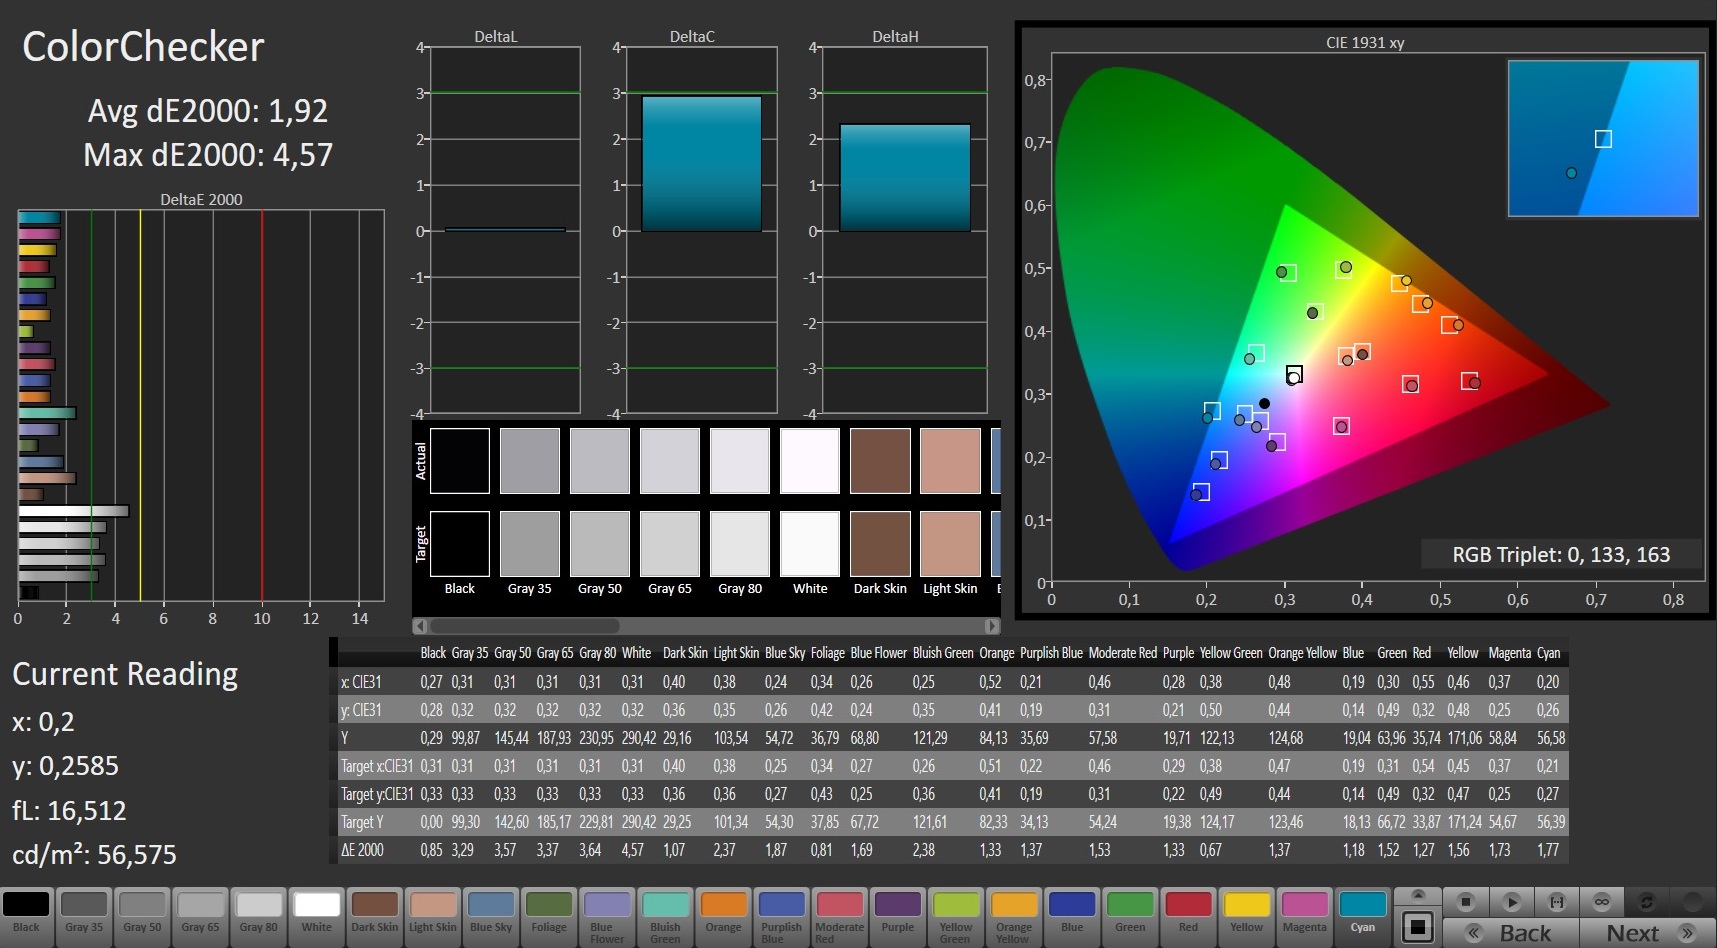
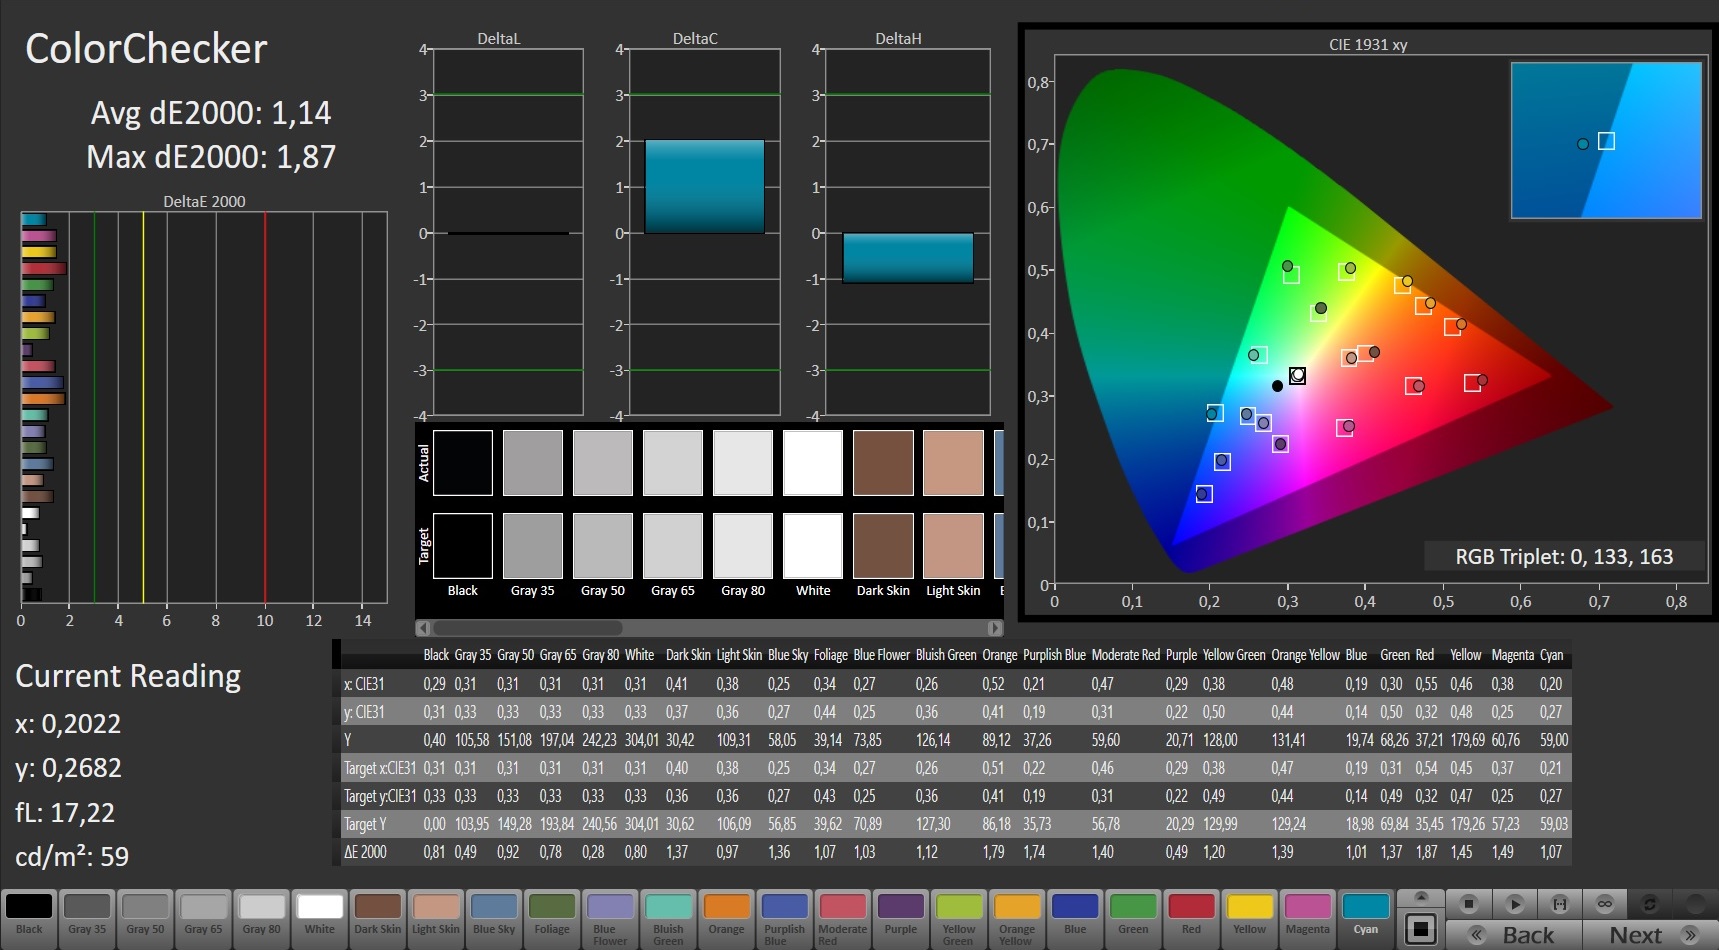
ΔE ColorChecker Calman: 1.92 | ∀{0.5-29.43 Ø4.72}
calibrated: 1.14
ΔE Greyscale Calman: 3.08 | ∀{0.09-98 Ø4.97}
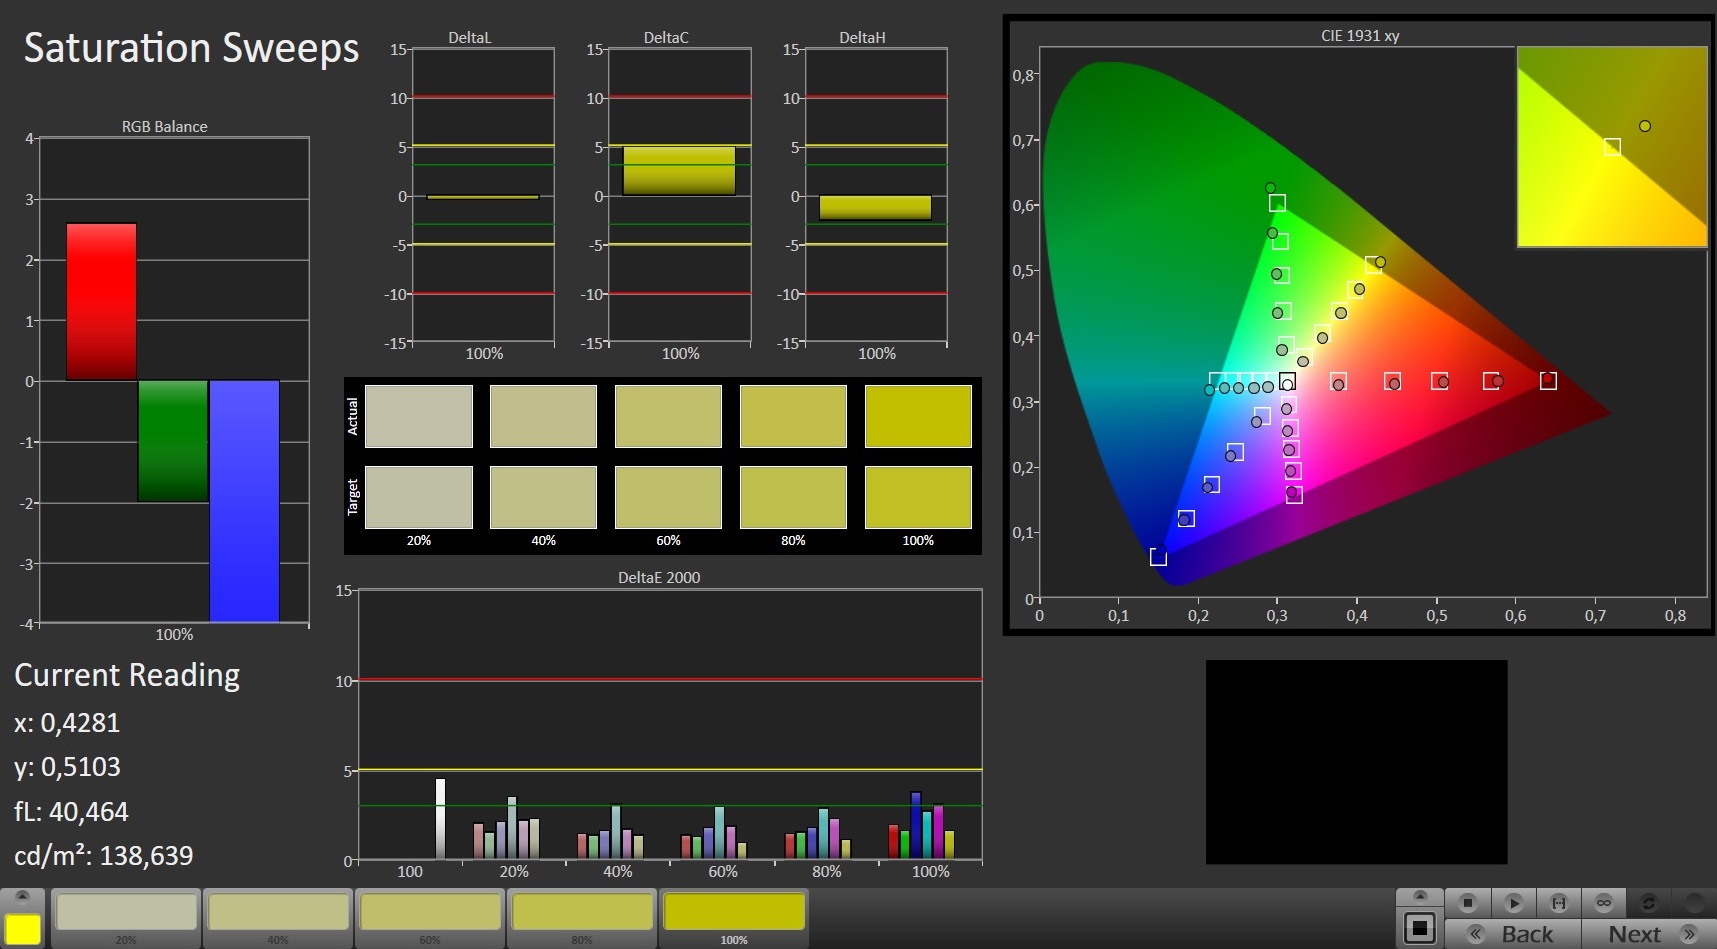
96% sRGB (Argyll 1.6.3 3D)
65% AdobeRGB 1998 (Argyll 1.6.3 3D)
72.3% AdobeRGB 1998 (Argyll 3D)
96.6% sRGB (Argyll 3D)
70% Display P3 (Argyll 3D)
Gamma: 2.42
CCT: 7055 K
| Asus ROG Zephyrus S GX701GXR AU Optronics B173HAN05.1, IPS, 1920x1080 | Asus Zephyrus S GX701GX B173HAN04.0 (AUO409D), IPS, 1920x1080 | Razer Blade Pro 17 RTX 2080 Max-Q AU Optronics B173HAN04.0, IPS, 1920x1080 | Gigabyte Aero 17 XA RP77 AU Optronics B173ZAN03.2, IPS, 3840x2160 | Alienware m17 P37E AU Optronics B173ZAN01.0, IPS, 3840x2160 | Lenovo Legion Y740-17ICH AU Optronics B173HAN03.2, IPS, 1920x1080 | |
|---|---|---|---|---|---|---|
| Display | -10% | -12% | 22% | 21% | -8% | |
| Display P3 Coverage (%) | 70 | 62.9 -10% | 60.6 -13% | 86.8 24% | 86.4 23% | 64 -9% |
| sRGB Coverage (%) | 96.6 | 87.8 -9% | 89 -8% | 100 4% | 99.9 3% | 90.4 -6% |
| AdobeRGB 1998 Coverage (%) | 72.3 | 63.9 -12% | 62.1 -14% | 99.5 38% | 99.1 37% | 64.8 -10% |
| Response Times | -28% | -24% | -507% | -402% | -124% | |
| Response Time Grey 50% / Grey 80% * (ms) | 5.6 ? | 7.2 ? -29% | 6.8 ? -21% | 45.6 ? -714% | 35.6 ? -536% | 15.6 ? -179% |
| Response Time Black / White * (ms) | 7.6 ? | 9.6 ? -26% | 9.6 ? -26% | 30.4 ? -300% | 28 ? -268% | 12.8 ? -68% |
| PWM Frequency (Hz) | ||||||
| Screen | -7% | -23% | -6% | -77% | -59% | |
| Brightness middle (cd/m²) | 288 | 288 0% | 299.3 4% | 667.3 132% | 357.9 24% | 299.1 4% |
| Brightness (cd/m²) | 276 | 287 4% | 294 7% | 633 129% | 347 26% | 273 -1% |
| Brightness Distribution (%) | 93 | 91 -2% | 94 1% | 90 -3% | 94 1% | 81 -13% |
| Black Level * (cd/m²) | 0.24 | 0.2 17% | 0.29 -21% | 0.46 -92% | 0.33 -38% | 0.27 -13% |
| Contrast (:1) | 1200 | 1440 20% | 1032 -14% | 1451 21% | 1085 -10% | 1108 -8% |
| Colorchecker dE 2000 * | 1.92 | 2.33 -21% | 2.55 -33% | 3.53 -84% | 6.57 -242% | 5.07 -164% |
| Colorchecker dE 2000 max. * | 4.57 | 5.34 -17% | 4.73 -4% | 6.88 -51% | 9.86 -116% | 10.55 -131% |
| Colorchecker dE 2000 calibrated * | 1.14 | 2.47 -117% | 2.9 -154% | 3.79 -232% | 6.74 -491% | 3.31 -190% |
| Greyscale dE 2000 * | 3.08 | 1.19 61% | 3.5 -14% | 0.9 71% | 4.3 -40% | 6.8 -121% |
| Gamma | 2.42 91% | 2.41 91% | 2.28 96% | 2.17 101% | 2.6 85% | 2.46 89% |
| CCT | 7055 92% | 6710 97% | 7101 92% | 6533 99% | 6403 102% | 7805 83% |
| Color Space (Percent of AdobeRGB 1998) (%) | 65 | 57 -12% | 57 -12% | 87.1 34% | 88.4 36% | 58.5 -10% |
| Color Space (Percent of sRGB) (%) | 96 | 88 -8% | 88.7 -8% | 100 4% | 100 4% | 89.9 -6% |
| Total Average (Program / Settings) | -15% /
-10% | -20% /
-21% | -164% /
-64% | -153% /
-99% | -64% /
-58% |
* ... smaller is better
The display has an X-Rite Pantone certification, which ensures very natural colors. Therefore, it already shows a good color reproduction out of the box. With a DeltaE 2000 color deviation of 1.92, the target (DeltaE less than 3) is met. Calibration can be used to further improve color reproduction. In this way, the color deviation drops to a value of 1.14, and the grayscales are also shown in a much more balanced way. The AdobeRGB (65%) and sRGB (96%) color spaces aren't fully mapped.
Display Response Times
| ↔ Response Time Black to White | ||
|---|---|---|
| 7.6 ms ... rise ↗ and fall ↘ combined | ↗ 3.4 ms rise | 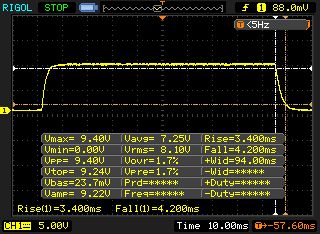 |
| ↘ 4.2 ms fall | ||
| The screen shows very fast response rates in our tests and should be very well suited for fast-paced gaming. In comparison, all tested devices range from 0.1 (minimum) to 240 (maximum) ms. » 22 % of all devices are better. This means that the measured response time is better than the average of all tested devices (19.8 ms). | ||
| ↔ Response Time 50% Grey to 80% Grey | ||
| 5.6 ms ... rise ↗ and fall ↘ combined | ↗ 2.4 ms rise | 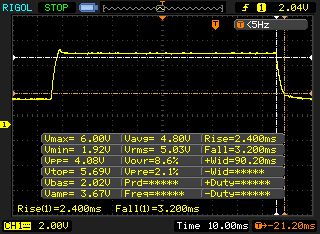 |
| ↘ 3.2 ms fall | ||
| The screen shows very fast response rates in our tests and should be very well suited for fast-paced gaming. In comparison, all tested devices range from 0.165 (minimum) to 636 (maximum) ms. » 18 % of all devices are better. This means that the measured response time is better than the average of all tested devices (31 ms). | ||
Screen Flickering / PWM (Pulse-Width Modulation)
| Screen flickering / PWM not detected | 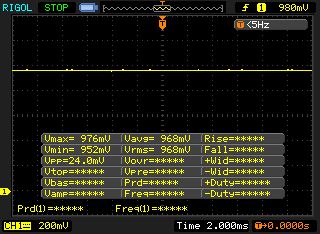 | ||
In comparison: 52 % of all tested devices do not use PWM to dim the display. If PWM was detected, an average of 7763 (minimum: 5 - maximum: 343500) Hz was measured. | |||
The Asus laptop is equipped with a viewing-angle-stable IPS panel. Therefore, the screen can be read from any position. Outdoors, the display can be read when the sun is not shining too brightly.

Performance - Zephyrus S comes with upper-class hardware
With the Zephyrus S, Asus delivers a slim 17.3-inch gaming laptop that can run all the latest computer games smoothly. For our test device, you'll currently have to cough up about 3,500 Euros (~$3,882). Other configuration variants are available, and prices start at 3,080 Euros (~$3,416).


Test conditions
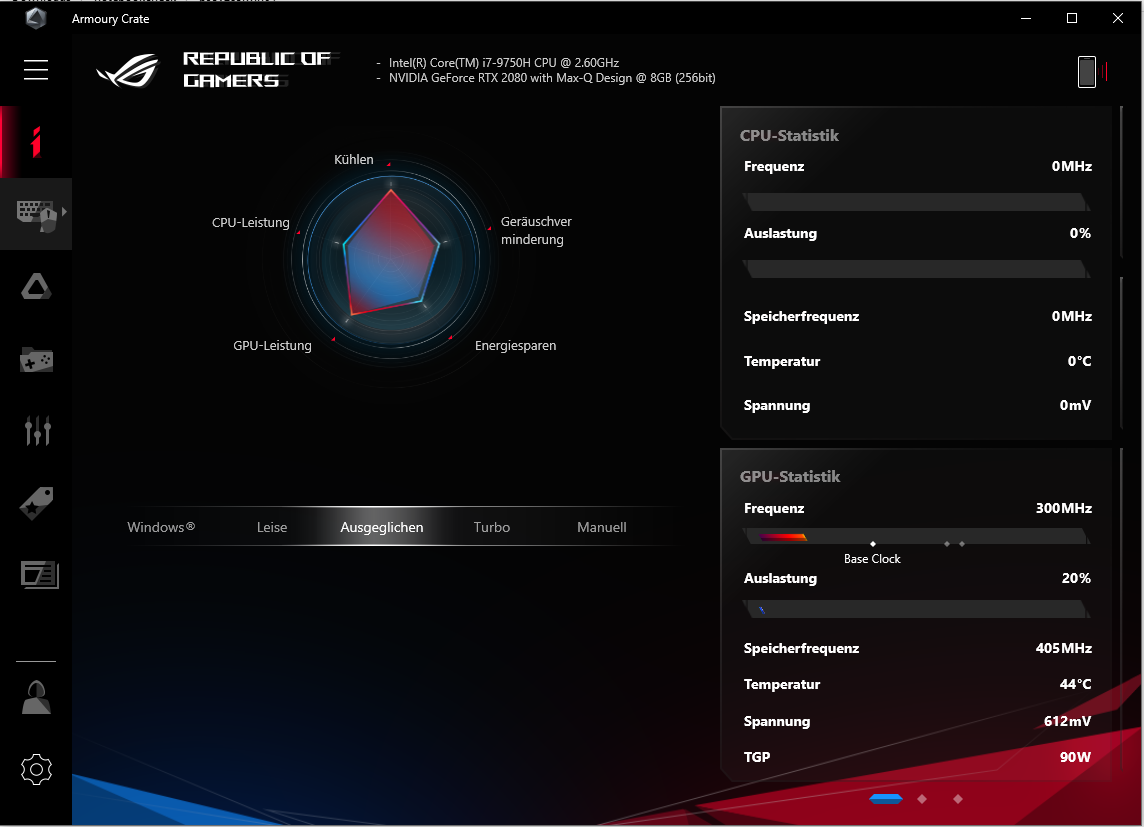
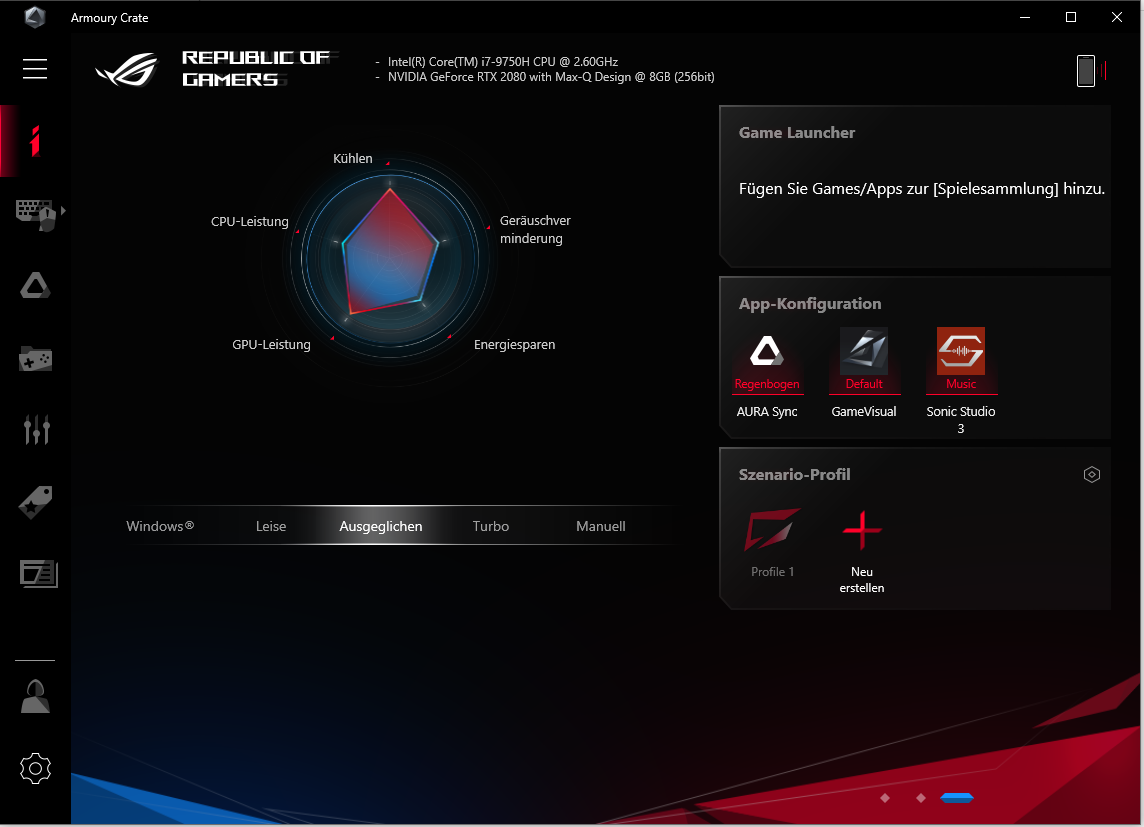
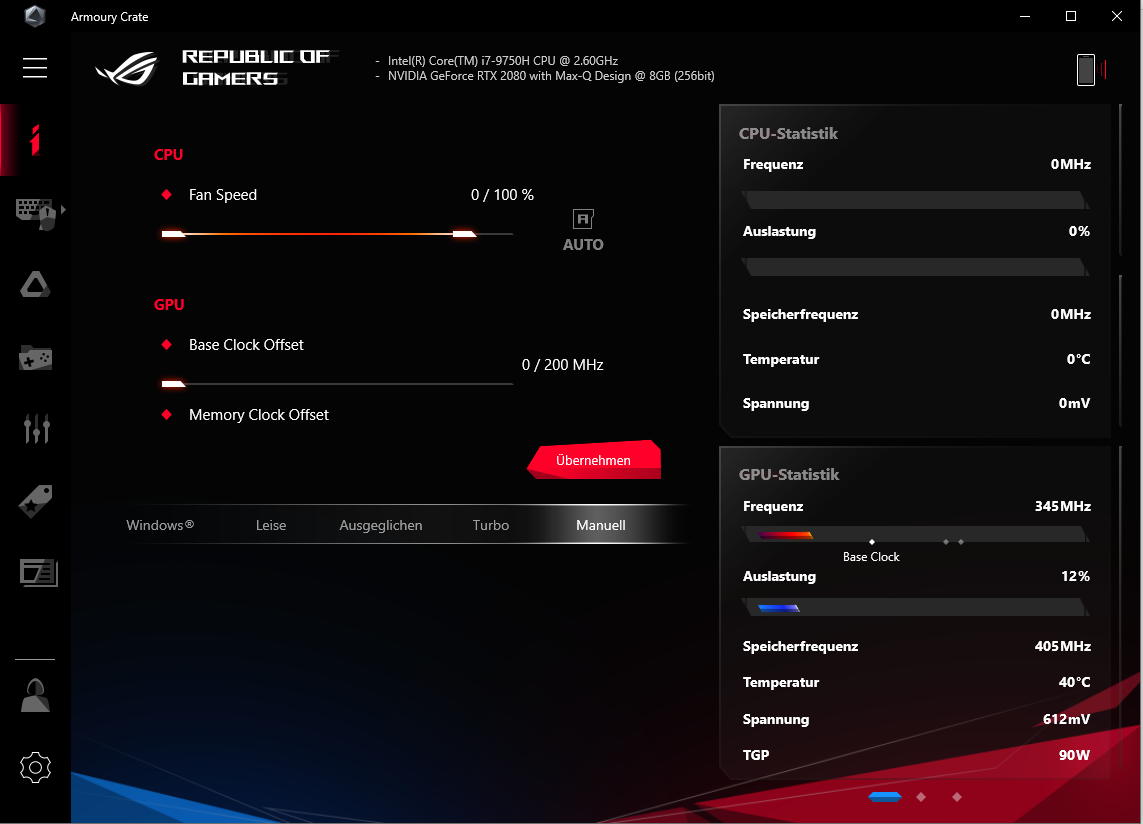
We chose the "Balanced" energy profile within the preinstalled Armoury Crate software (exception: We used the Windows power scheme for the battery tests). In addition, we ran some benchmarks with an active "Turbo" mode. The results can be found in the comparison tables. Furthermore, the integrated GPU was disabled. The latter can be switched on and off with a mouse click and a subsequent system restart.
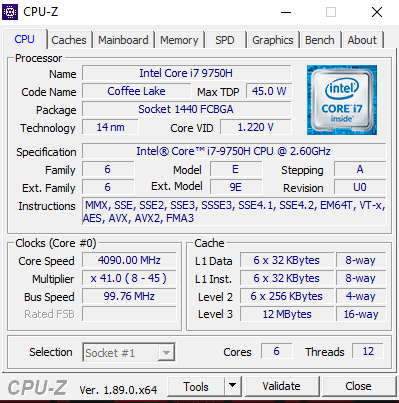
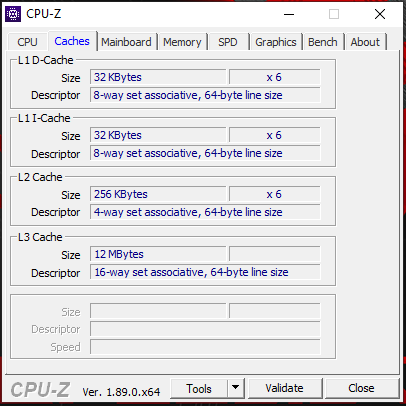
Processor
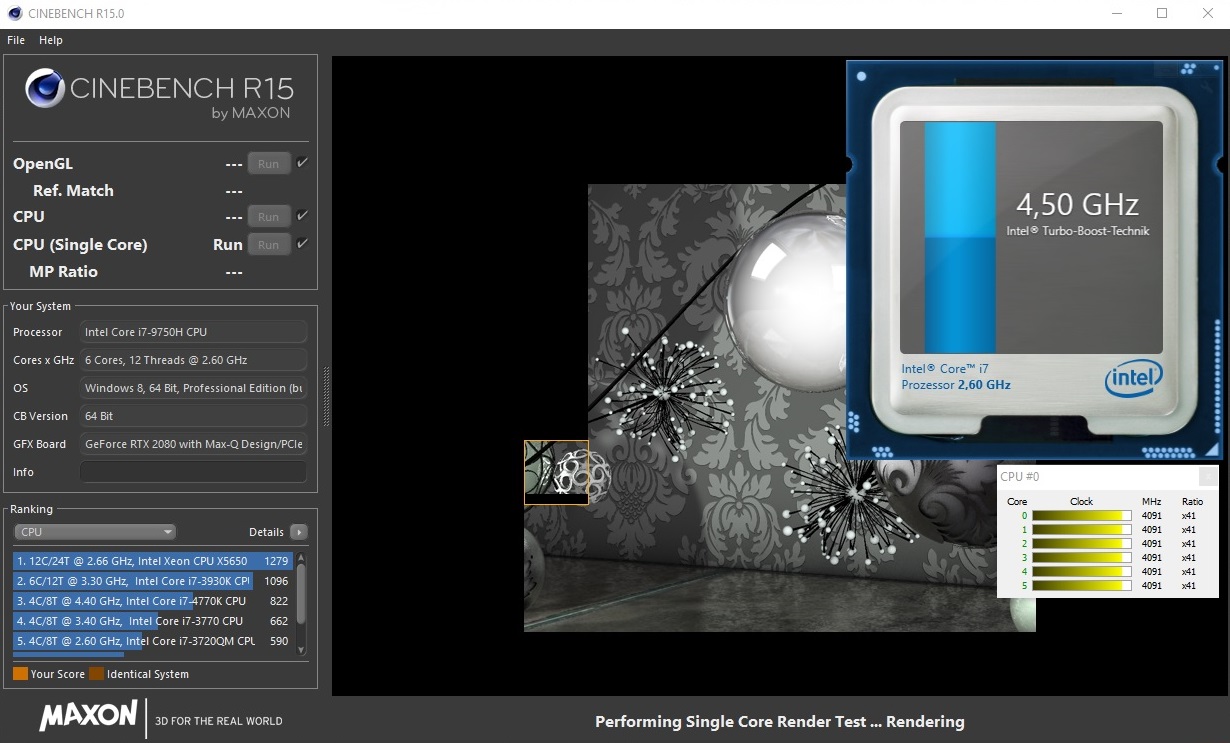
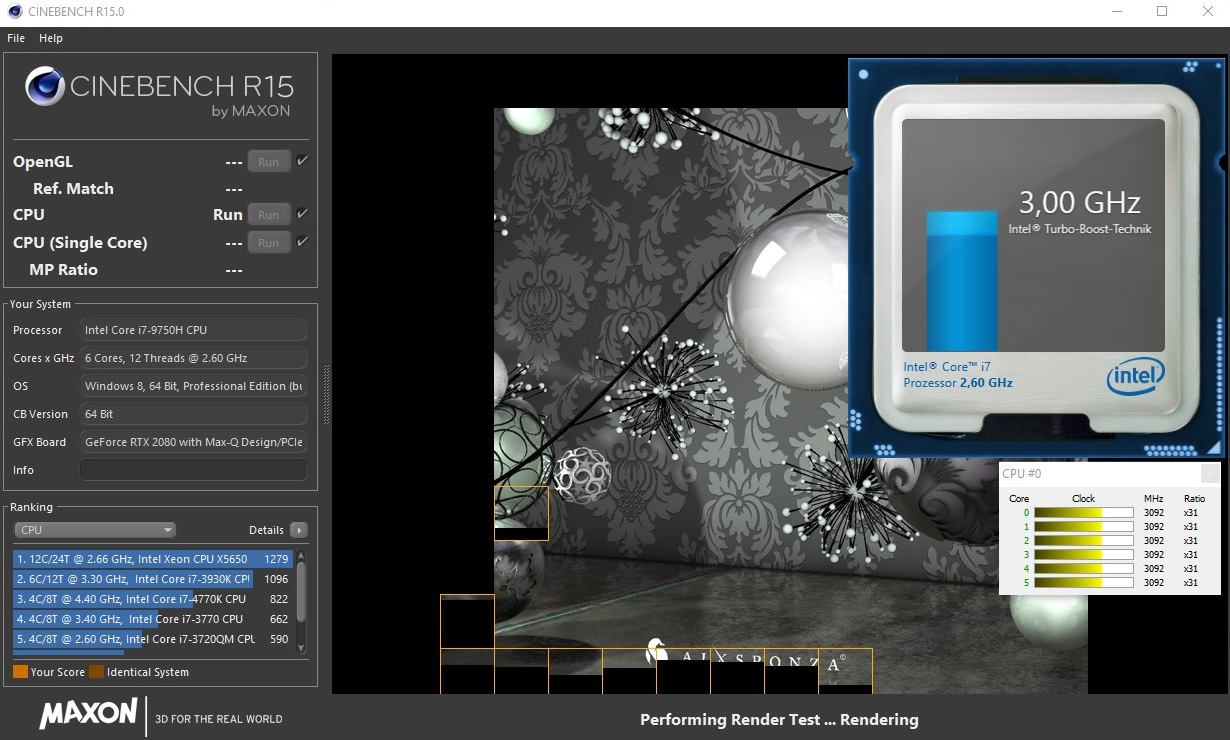
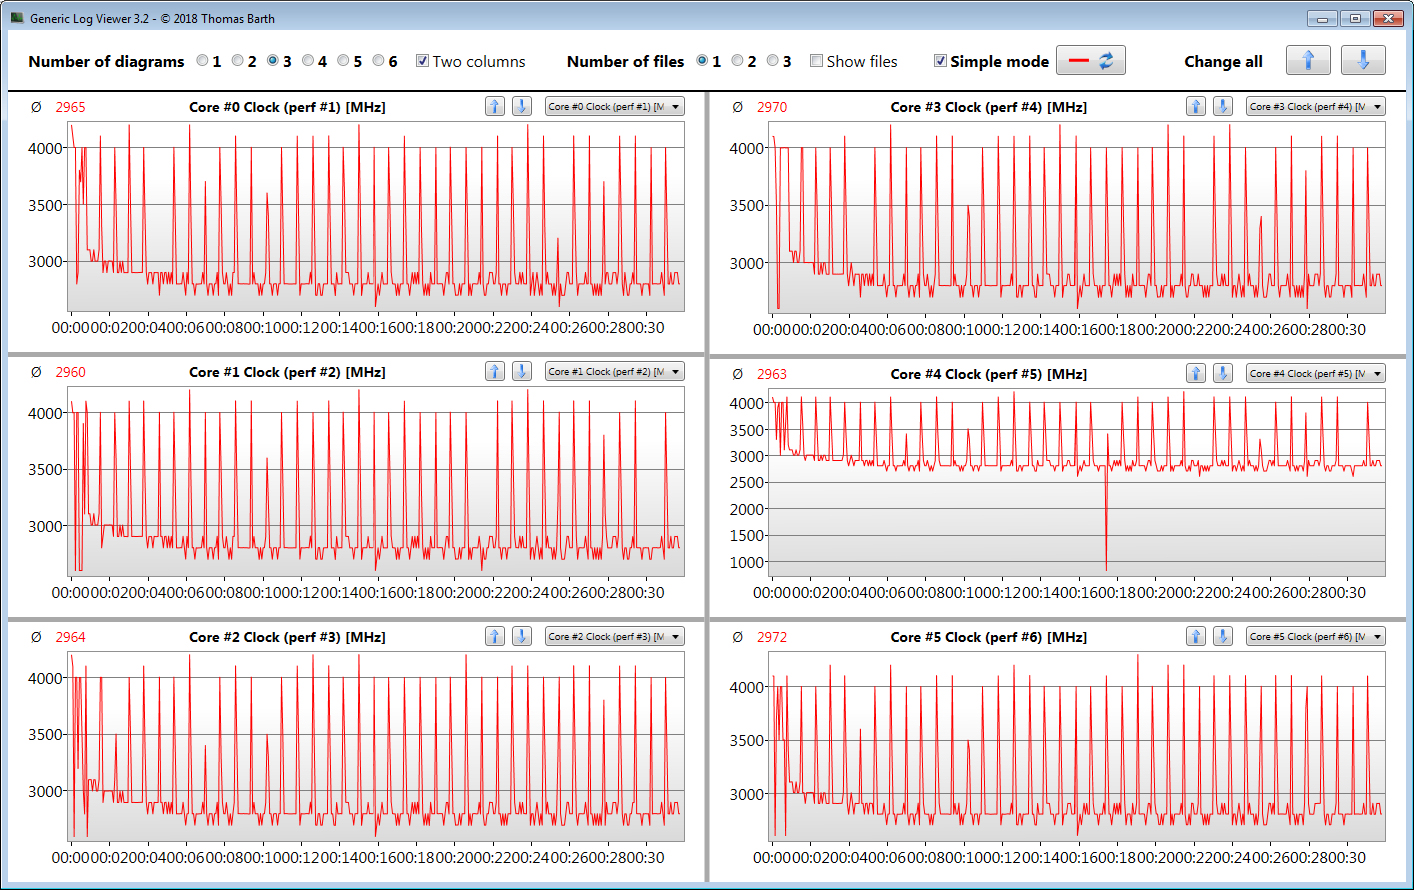
The laptop has a Core i7-9750H hexa-core processor (Coffee Lake Refresh) on board. The CPU operates at a base speed of 2.6 GHz. Turbo Boost can increase the clock speed to 4 GHz (six cores), 4.1 GHz (five cores), 4.2 GHz (four cores), 4.3 GHz (three cores), 4.4 GHz (two cores) and 4.5 GHz (one core), respectively.
The processor runs the multithread test of the Cinebench R15 benchmark at 2.6 to 4 GHz (Turbo mode: 3.7 to 4 GHz). The single-thread test is performed at 4 to 4.5 GHz (the same clock speeds are achieved in Turbo mode). On battery power, the working speed sits at a constant 2.3 GHz.
We check whether the CPU boost is also used consistently when plugged in by running Cinebench's R15 multithread test for a minimum of 30 minutes in a continuous loop. Outcome: The results drop significantly from the first to the eighth run and then stabilize at a fairly constant level. The Boost is only used to a small extent.
The Core i7 clearly lags behind its capabilities. Significantly better results are achieved when Turbo mode is activated within the Armoury Crate software. However, the fans also produce more noise then.

| Cinebench R15 | |
| CPU Single 64Bit | |
| Average of class Gaming (188.8 - 343, n=108, last 2 years) | |
| Gigabyte Aero 17 XA RP77 | |
| Alienware m17 P37E | |
| Razer Blade Pro 17 RTX 2080 Max-Q | |
| Asus ROG Zephyrus S GX701GXR (Turbo) | |
| Asus ROG Zephyrus S GX701GXR | |
| Asus Zephyrus S GX701GX | |
| Lenovo Legion Y740-17ICH | |
| CPU Multi 64Bit | |
| Average of class Gaming (1578 - 6271, n=107, last 2 years) | |
| Gigabyte Aero 17 XA RP77 | |
| Alienware m17 P37E | |
| Lenovo Legion Y740-17ICH | |
| Asus Zephyrus S GX701GX | |
| Asus ROG Zephyrus S GX701GXR (Turbo) | |
| Razer Blade Pro 17 RTX 2080 Max-Q | |
| Asus ROG Zephyrus S GX701GXR | |
| Cinebench R10 | |
| Rendering Multiple CPUs 32Bit | |
| Average of class Gaming (42932 - 81339, n=8, last 2 years) | |
| Asus ROG Zephyrus S GX701GXR | |
| Shading 32Bit | |
| Average of class Gaming (14418 - 24952, n=5, last 2 years) | |
| Asus ROG Zephyrus S GX701GXR | |
| Cinebench R20 | |
| CPU (Single Core) | |
| Average of class Gaming (442 - 895, n=108, last 2 years) | |
| Gigabyte Aero 17 XA RP77 | |
| Asus ROG Zephyrus S GX701GXR | |
| CPU (Multi Core) | |
| Average of class Gaming (4029 - 16108, n=108, last 2 years) | |
| Gigabyte Aero 17 XA RP77 | |
| Asus ROG Zephyrus S GX701GXR | |
| Geekbench 3 | |
| 32 Bit Multi-Core Score | |
| Asus ROG Zephyrus S GX701GXR | |
| 32 Bit Single-Core Score | |
| Asus ROG Zephyrus S GX701GXR | |
| Geekbench 4.4 | |
| 64 Bit Multi-Core Score | |
| Average of class Gaming (89200 - 97490, n=2, last 2 years) | |
| Asus ROG Zephyrus S GX701GXR | |
| 64 Bit Single-Core Score | |
| Average of class Gaming (9335 - 9492, n=2, last 2 years) | |
| Asus ROG Zephyrus S GX701GXR | |
| Geekbench 5.0 | |
| 5.0 Multi-Core | |
| Average of class Gaming (21768 - 23588, n=2, last 2 years) | |
| Asus ROG Zephyrus S GX701GXR | |
| 5.0 Single-Core | |
| Average of class Gaming (2237 - 2270, n=2, last 2 years) | |
| Asus ROG Zephyrus S GX701GXR | |
| Mozilla Kraken 1.1 - Total | |
| Asus ROG Zephyrus S GX701GXR (Edge 44) | |
| Lenovo Legion Y740-17ICH (Edge 44.17763.1.0) | |
| Razer Blade Pro 17 RTX 2080 Max-Q (Edge 44.18362.1.0) | |
| Gigabyte Aero 17 XA RP77 (Edge 44.18362.267.0) | |
| Average of class Gaming (391 - 590, n=103, last 2 years) | |
| Octane V2 - Total Score | |
| Average of class Gaming (93292 - 139447, n=27, last 2 years) | |
| Gigabyte Aero 17 XA RP77 (Edge 44.18362.267.0) | |
| Razer Blade Pro 17 RTX 2080 Max-Q (Edge 44.18362.1.0) | |
| Lenovo Legion Y740-17ICH (Edge 44.17763.1.0) | |
| Asus ROG Zephyrus S GX701GXR (Edge 44) | |
| JetStream 1.1 - 1.1 Total | |
| Average of class Gaming (549 - 647, n=3, last 2 years) | |
| Gigabyte Aero 17 XA RP77 (Edge 44.18362.267.0) | |
| Razer Blade Pro 17 RTX 2080 Max-Q (Edge 44.18362.1.0) | |
| Lenovo Legion Y740-17ICH (Edge 44.17763.1.0) | |
| Asus ROG Zephyrus S GX701GXR (Edge 44) | |
* ... smaller is better
System performance
The GX701GXR does not lack system performance. A powerful hexa-core processor, memory running in dual-channel mode and a fast NVMe SSD provide a fast and smooth system. This is complemented by an upper-class GPU. The results in the PCMark benchmarks are very good.
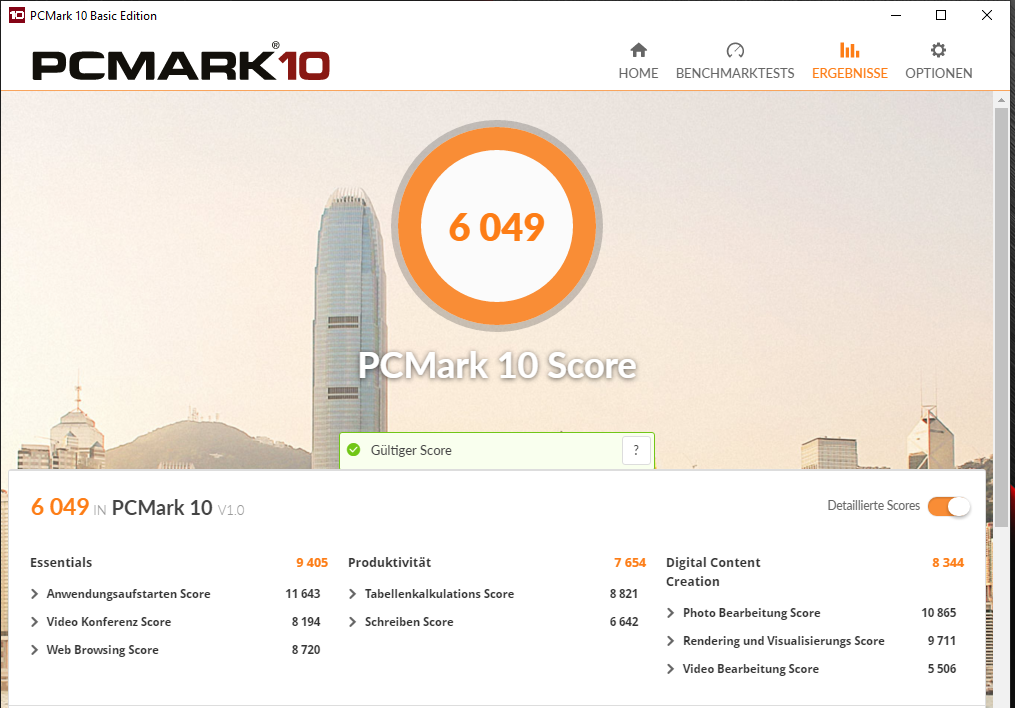
| PCMark 8 Home Score Accelerated v2 | 5319 points | |
| PCMark 8 Creative Score Accelerated v2 | 6716 points | |
| PCMark 8 Work Score Accelerated v2 | 6593 points | |
| PCMark 10 Score | 6049 points | |
Help | ||
Storage
The system drive is an NVMe SSD (M.2 2280 format) from Samsung, which provides 1 TB of storage space. The SSD provides very good transfer rates. The laptop does not have room for additional storage devices.
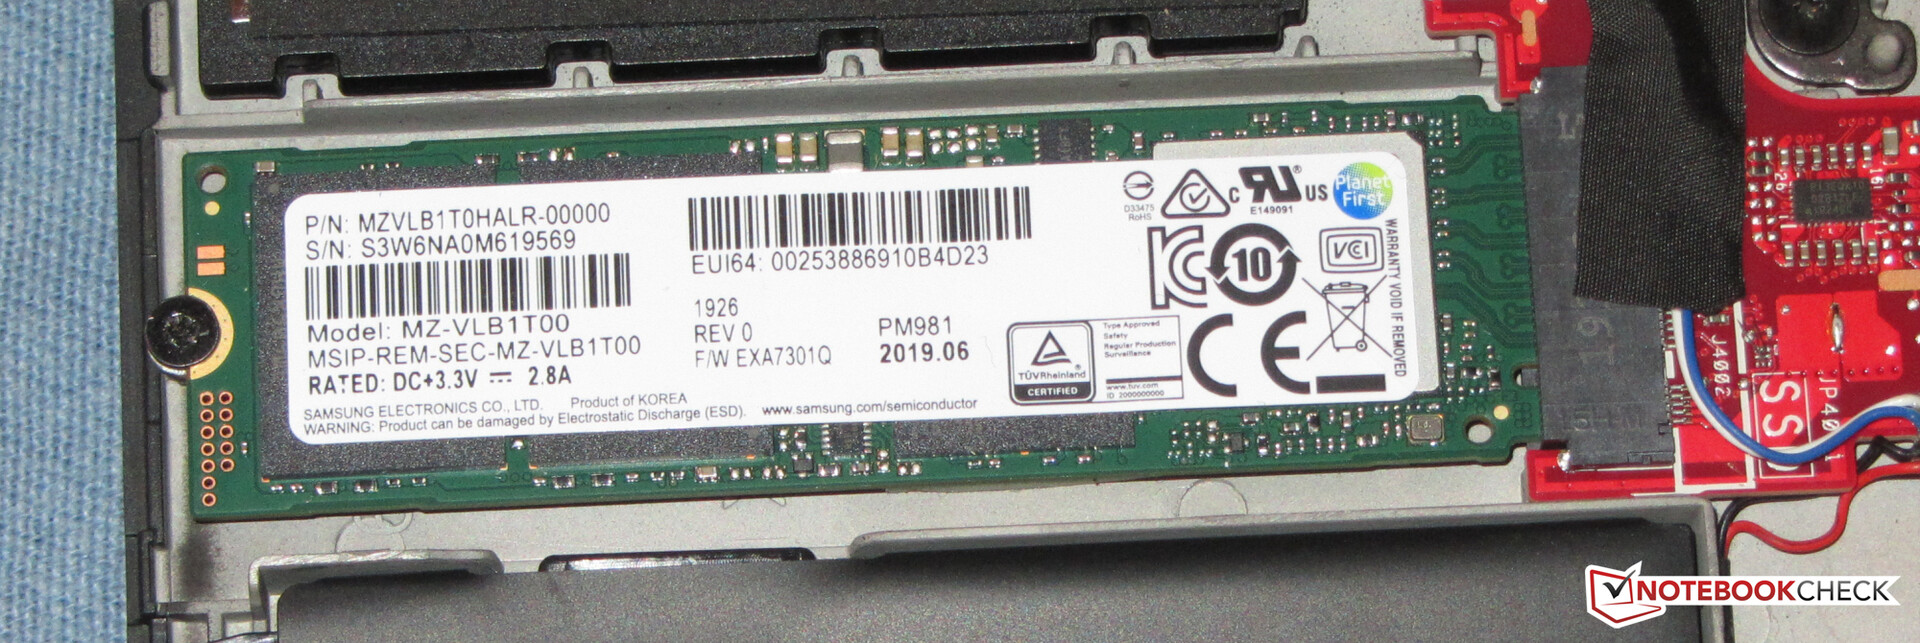

| Asus ROG Zephyrus S GX701GXR Samsung SSD PM981 MZVLB1T0HALR | Razer Blade Pro 17 RTX 2080 Max-Q Samsung SSD PM981 MZVLB512HAJQ | Gigabyte Aero 17 XA RP77 Intel SSD 760p SSDPEKKW512G8 | Alienware m17 P37E SK Hynix PC401 512GB M.2 (HFS512GD9TNG) | Lenovo Legion Y740-17ICH Samsung SSD PM981 MZVLB256HAHQ | Asus Zephyrus S GX701GX Samsung SSD PM981 MZVLB1T0HALR | |
|---|---|---|---|---|---|---|
| CrystalDiskMark 5.2 / 6 | -1% | 34% | 6% | 12% | -6% | |
| Write 4K (MB/s) | 96.1 | 100.7 5% | 169.6 76% | 120.2 25% | 99.8 4% | 92.4 -4% |
| Read 4K (MB/s) | 40.86 | 41.03 0% | 58 42% | 44.3 8% | 40.81 0% | 39.59 -3% |
| Write Seq (MB/s) | 1317 | 1146 -13% | 1516 15% | 1278 -3% | 1385 5% | 1221 -7% |
| Read Seq (MB/s) | 1030 | 1115 8% | 2362 129% | 1389 35% | 2089 103% | 1005 -2% |
| Write 4K Q32T1 (MB/s) | 350.4 | 384.6 10% | 481.8 38% | 436.2 24% | 380 8% | 292.5 -17% |
| Read 4K Q32T1 (MB/s) | 404.1 | 429.5 6% | 506 25% | 515 27% | 445.5 10% | 330.8 -18% |
| Write Seq Q32T1 (MB/s) | 2396 | 1859 -22% | 1530 -36% | 1157 -52% | 1380 -42% | 2385 0% |
| Read Seq Q32T1 (MB/s) | 3194 | 3179 0% | 2645 -17% | 2671 -16% | 3471 9% | 3339 5% |
Graphics card
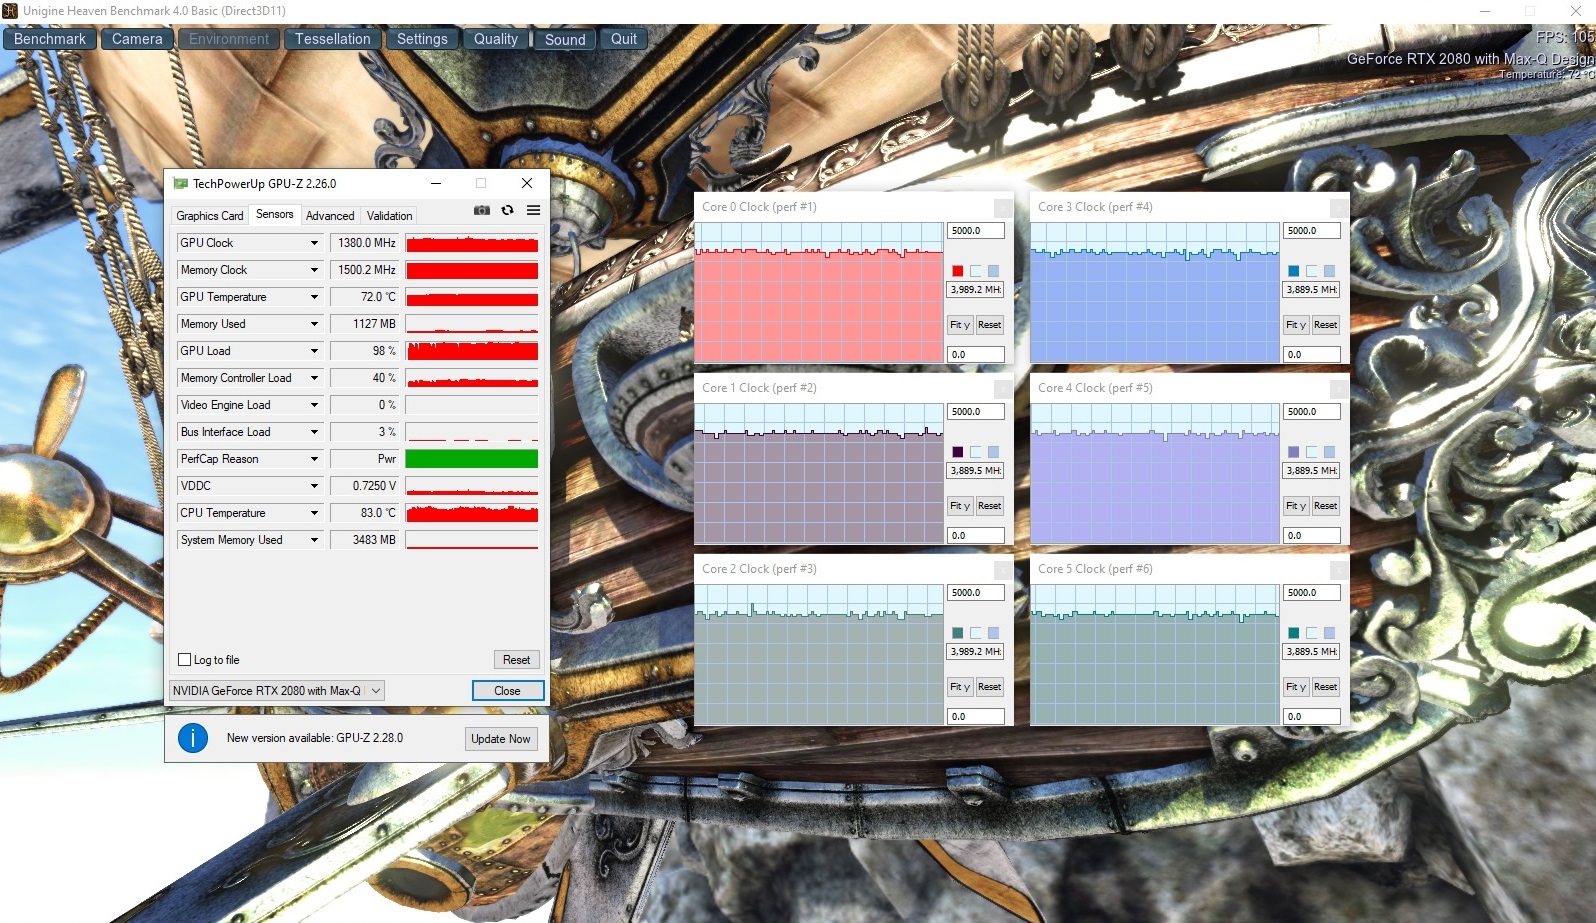
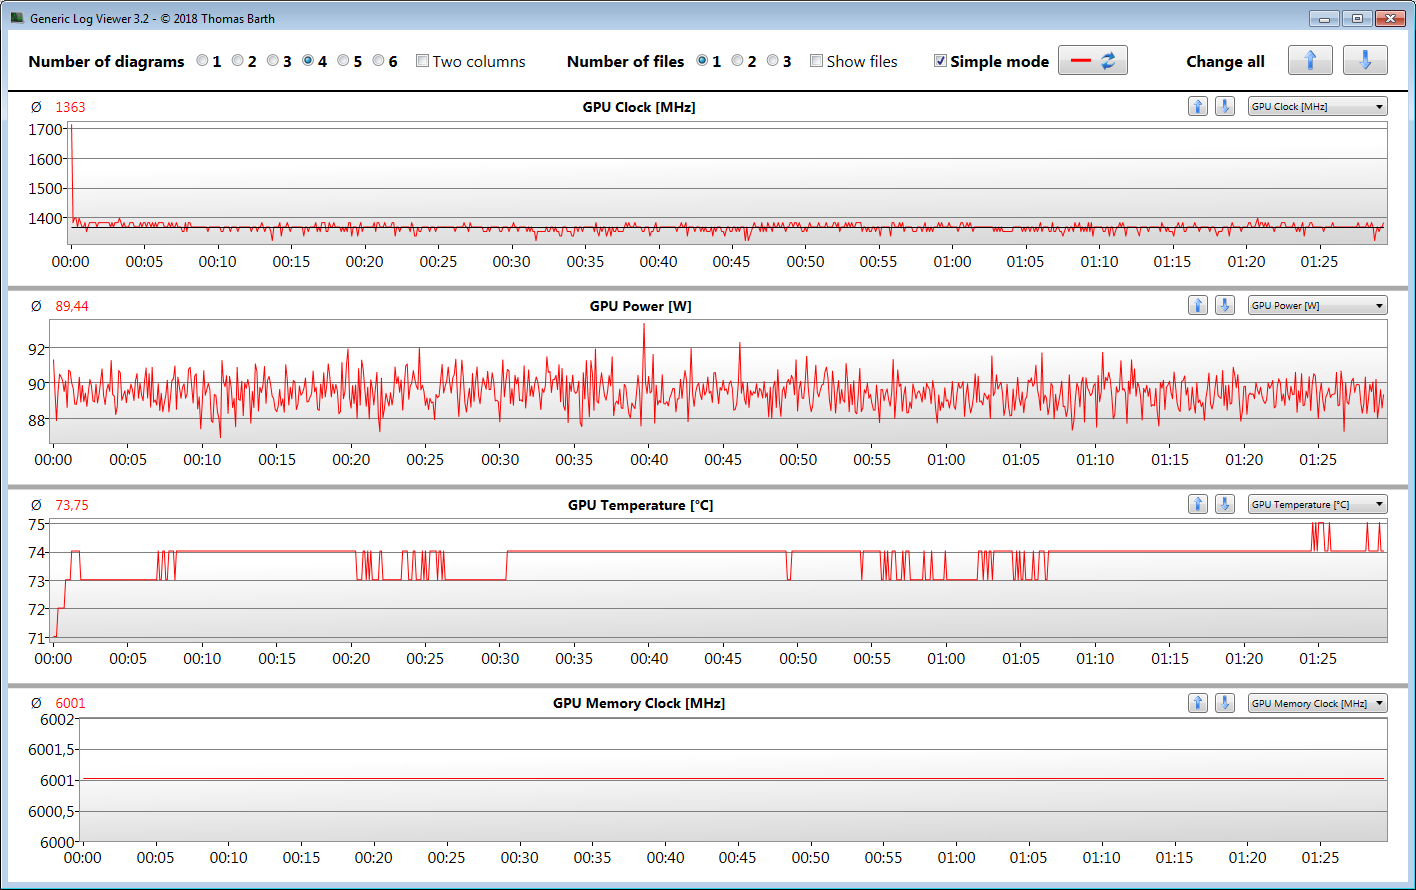
The built-in GeForce RTX 2080 Max Q graphics core supports DirectX 12 and operates at a base speed of 990 MHz. An increase to up to 1,230 MHz is possible through Boost. Higher speeds are feasible if the GPU doesn't reach a set temperature and/or energy threshold. In this way, we register a maximum of 1,815 MHz. The Witcher 3 test is performed at an average speed of 1,365 MHz. The GPU can access fast GDDR6 graphics memory (8,192 MB).
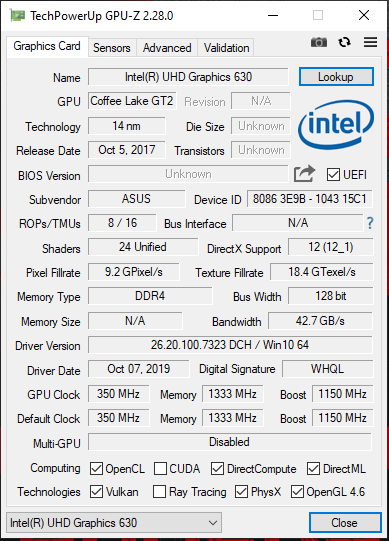
The results in the 3DMark benchmarks are at a normal level for the GPU. The UHD Graphics 630 chip built into the processor is switched off in G-Sync mode, but it can be activated if needed.
| 3DMark 06 Standard Score | 36228 points | |
| 3DMark 11 Performance | 20578 points | |
| 3DMark Ice Storm Standard Score | 171155 points | |
| 3DMark Cloud Gate Standard Score | 32628 points | |
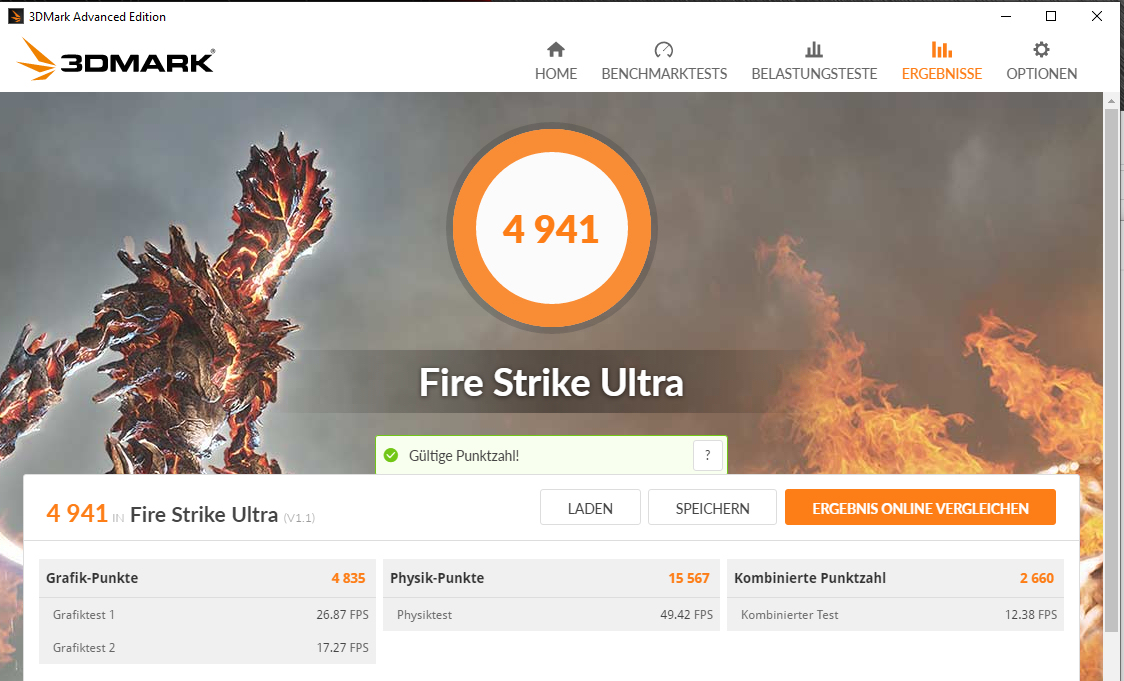
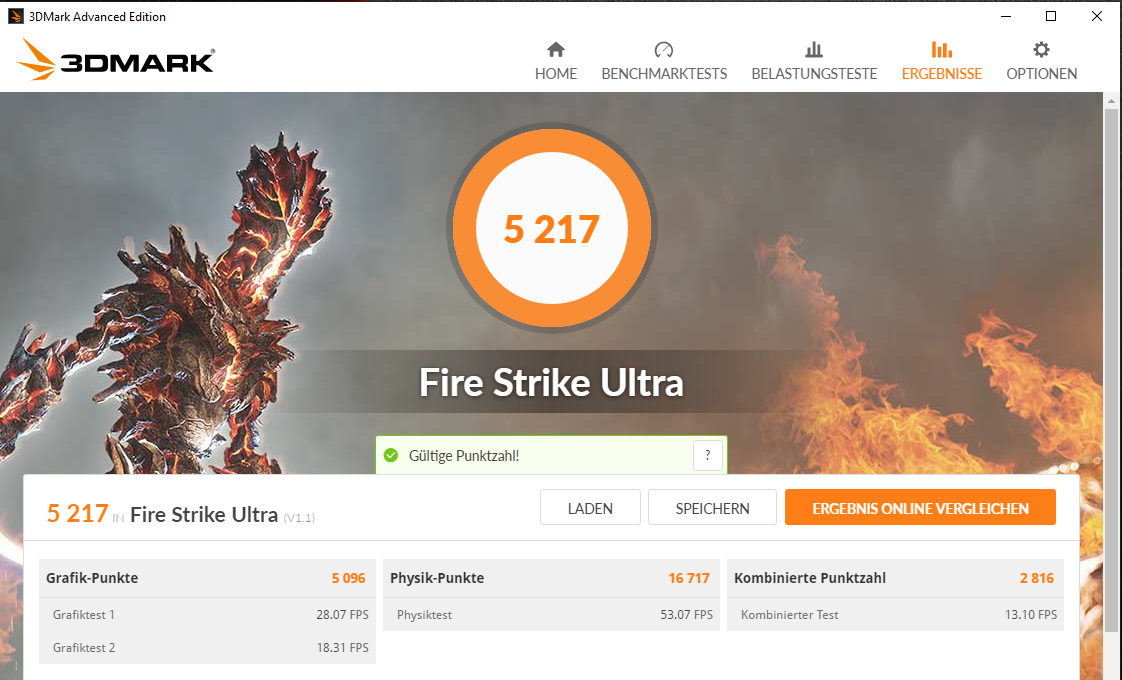
| 3DMark Fire Strike Score | 17374 points | |
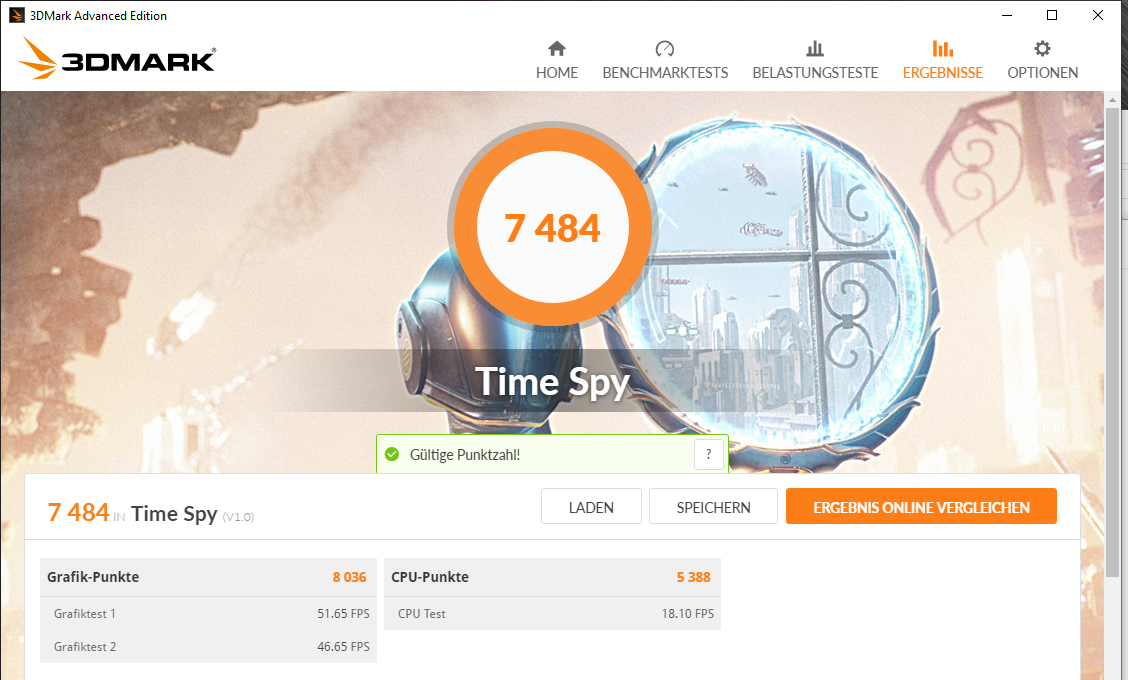
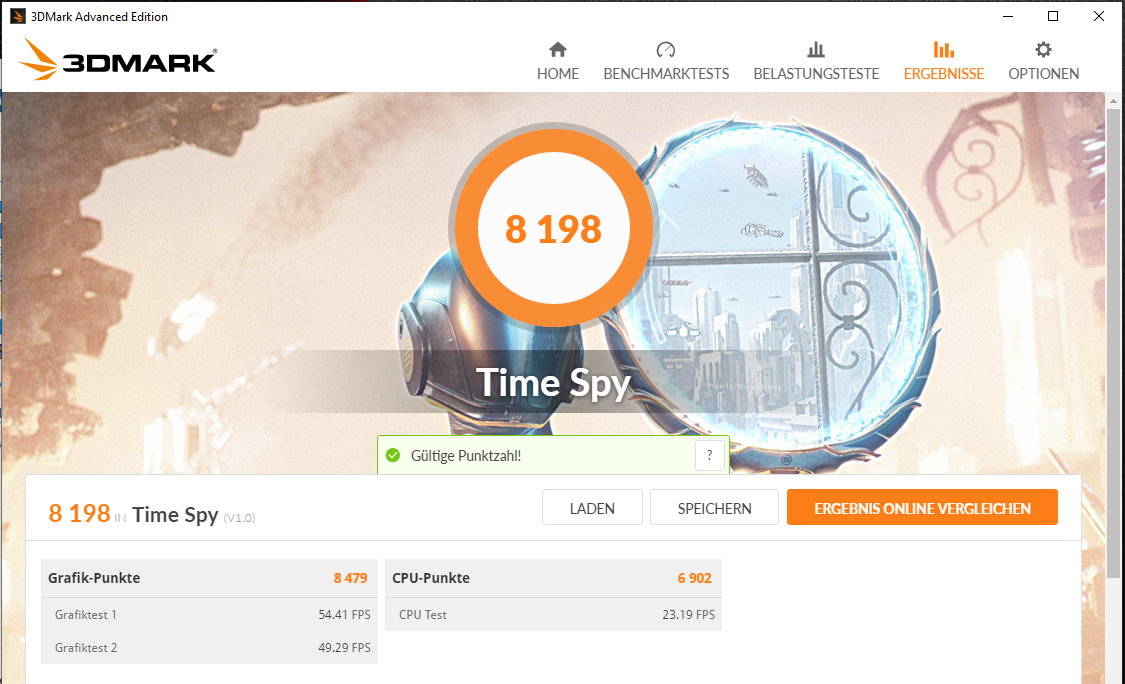
| 3DMark Time Spy Score | 7484 points | |
Help | ||
| 3DMark | |
| 1920x1080 Fire Strike Graphics | |
| Average of class Gaming (12242 - 62849, n=117, last 2 years) | |
| Razer Blade Pro 17 RTX 2080 Max-Q | |
| Asus ROG Zephyrus S GX701GXR (Turbo) | |
| Asus Zephyrus S GX701GX | |
| Asus ROG Zephyrus S GX701GXR | |
| Alienware m17 P37E | |
| Lenovo Legion Y740-17ICH | |
| Gigabyte Aero 17 XA RP77 | |
| 2560x1440 Time Spy Graphics | |
| Average of class Gaming (5012 - 26212, n=117, last 2 years) | |
| Razer Blade Pro 17 RTX 2080 Max-Q | |
| Asus Zephyrus S GX701GX | |
| Asus ROG Zephyrus S GX701GXR (Turbo) | |
| Asus ROG Zephyrus S GX701GXR | |
| Alienware m17 P37E | |
| Lenovo Legion Y740-17ICH | |
| Gigabyte Aero 17 XA RP77 | |
| 3DMark 11 - 1280x720 Performance GPU | |
| Average of class Gaming (21841 - 80022, n=106, last 2 years) | |
| Razer Blade Pro 17 RTX 2080 Max-Q | |
| Asus ROG Zephyrus S GX701GXR (Turbo) | |
| Asus Zephyrus S GX701GX | |
| Asus ROG Zephyrus S GX701GXR | |
| Alienware m17 P37E | |
| Lenovo Legion Y740-17ICH | |
| Gigabyte Aero 17 XA RP77 | |
Gaming performance
The 17.3-incher runs all games found in our database smoothly. Full HD resolution and high to maximum quality settings can normally be selected. The RTX 2080 Max Q GPU can also handle resolutions beyond Full HD (this would require an external monitor). However, the quality settings must then be chosen more conservatively - especially at 4K level.
| The Witcher 3 - 1920x1080 Ultra Graphics & Postprocessing (HBAO+) | |
| Average of class Gaming (95 - 240, n=7, last 2 years) | |
| Razer Blade Pro 17 RTX 2080 Max-Q | |
| Asus Zephyrus S GX701GX | |
| Asus ROG Zephyrus S GX701GXR | |
| Alienware m17 P37E | |
| Lenovo Legion Y740-17ICH | |
| Gigabyte Aero 17 XA RP77 | |
| BioShock Infinite - 1920x1080 Ultra Preset, DX11 (DDOF) | |
| Razer Blade Pro 17 RTX 2080 Max-Q | |
| Asus ROG Zephyrus S GX701GXR | |
| Alienware m17 P37E | |
| Lenovo Legion Y740-17ICH | |
| Gigabyte Aero 17 XA RP77 | |
To check whether the frame rates also remain largely constant over a prolonged period of time, we run the game The Witcher 3 for about 60 minutes at Full HD resolution and maximum quality settings. The character embodied by the player isn't moved over this entire period.
| low | med. | high | ultra | |
|---|---|---|---|---|
| BioShock Infinite (2013) | 350.6 | 306 | 285.9 | 176.5 |
| The Witcher 3 (2015) | 295.5 | 230.3 | 153.2 | 80.7 |
| Metro Exodus (2019) | 121.7 | 94.6 | 72.1 | 59 |
| Control (2019) | 231.9 | 92.8 | 71.9 | |
| Borderlands 3 (2019) | 128.8 | 110.8 | 84.7 | 67.1 |
| FIFA 20 (2019) | 214.6 | 208.1 | 197.7 | 197.1 |
| Ghost Recon Breakpoint (2019) | 105 | 95 | 92 | 71 |
| GRID 2019 (2019) | 213.5 | 187.6 | 120.7 | 81.3 |
| Call of Duty Modern Warfare 2019 (2019) | 171.5 | 126.7 | 104.9 | 90.6 |
| Need for Speed Heat (2019) | 85.6 | 66 | 63.6 | 57.2 |
| Star Wars Jedi Fallen Order (2019) | 94.5 | 84.2 | 82.3 | |
| Red Dead Redemption 2 (2019) | 121 | 102.6 | 72.8 | 45.6 |
| Escape from Tarkov (2020) | 121 | 121 | 120 | 117 |
| Hunt Showdown (2020) | 184 | 134 | 121 | |
| Doom Eternal (2020) | 156 | 140 | 138 | 134 |
Emissions - Heat and noise development are acceptable
Noise emissions
When idle, the fans constantly work at low speeds. The whole thing is reflected in a subtle noise. During the stress test, we measure a sound pressure level of 50 dB(A). It gets similarly loud when playing games: When performing our The Witcher 3 test, the GX701GXR reaches a level of 49 dB(A). The use of the included headset is almost indispensable.
From the inside of the laptop, a relatively loud electronic crackling can be heard in certain situations, which is drowned out by the noise of the fans at higher rotation speeds.
Noise level
| Idle |
| 32 / 33 / 34 dB(A) |
| Load |
| 40 / 50 dB(A) |
 | ||
30 dB silent 40 dB(A) audible 50 dB(A) loud |
||
min: | ||
| Asus ROG Zephyrus S GX701GXR i7-9750H, GeForce RTX 2080 Max-Q | Razer Blade Pro 17 RTX 2080 Max-Q i7-9750H, GeForce RTX 2080 Max-Q | Gigabyte Aero 17 XA RP77 i9-9980HK, GeForce RTX 2070 Max-Q | Alienware m17 P37E i9-8950HK, GeForce RTX 2080 Max-Q | Lenovo Legion Y740-17ICH i7-8750H, GeForce RTX 2080 Max-Q | Asus Zephyrus S GX701GX i7-8750H, GeForce RTX 2080 Max-Q | Average of class Gaming | |
|---|---|---|---|---|---|---|---|
| Noise | 4% | -1% | 1% | 8% | -0% | 9% | |
| off / environment * (dB) | 30 | 28.2 6% | 29.3 2% | 28.2 6% | 28.3 6% | 29 3% | 24.1 ? 20% |
| Idle Minimum * (dB) | 32 | 28.2 12% | 33 -3% | 28.2 12% | 31.5 2% | 29 9% | 25.9 ? 19% |
| Idle Average * (dB) | 33 | 28.2 15% | 33 -0% | 28.2 15% | 31.6 4% | 32 3% | 27.4 ? 17% |
| Idle Maximum * (dB) | 34 | 30.8 9% | 33 3% | 31 9% | 31.6 7% | 33 3% | 29.9 ? 12% |
| Load Average * (dB) | 40 | 42 -5% | 42.5 -6% | 50.8 -27% | 32.3 19% | 47 -18% | 43.3 ? -8% |
| Witcher 3 ultra * (dB) | 49 | 51 -4% | 42 14% | 50.8 -4% | 43 12% | 49 -0% | |
| Load Maximum * (dB) | 50 | 53 -6% | 59.6 -19% | 50.8 -2% | 45.5 9% | 51 -2% | 54.2 ? -8% |
* ... smaller is better
Temperature
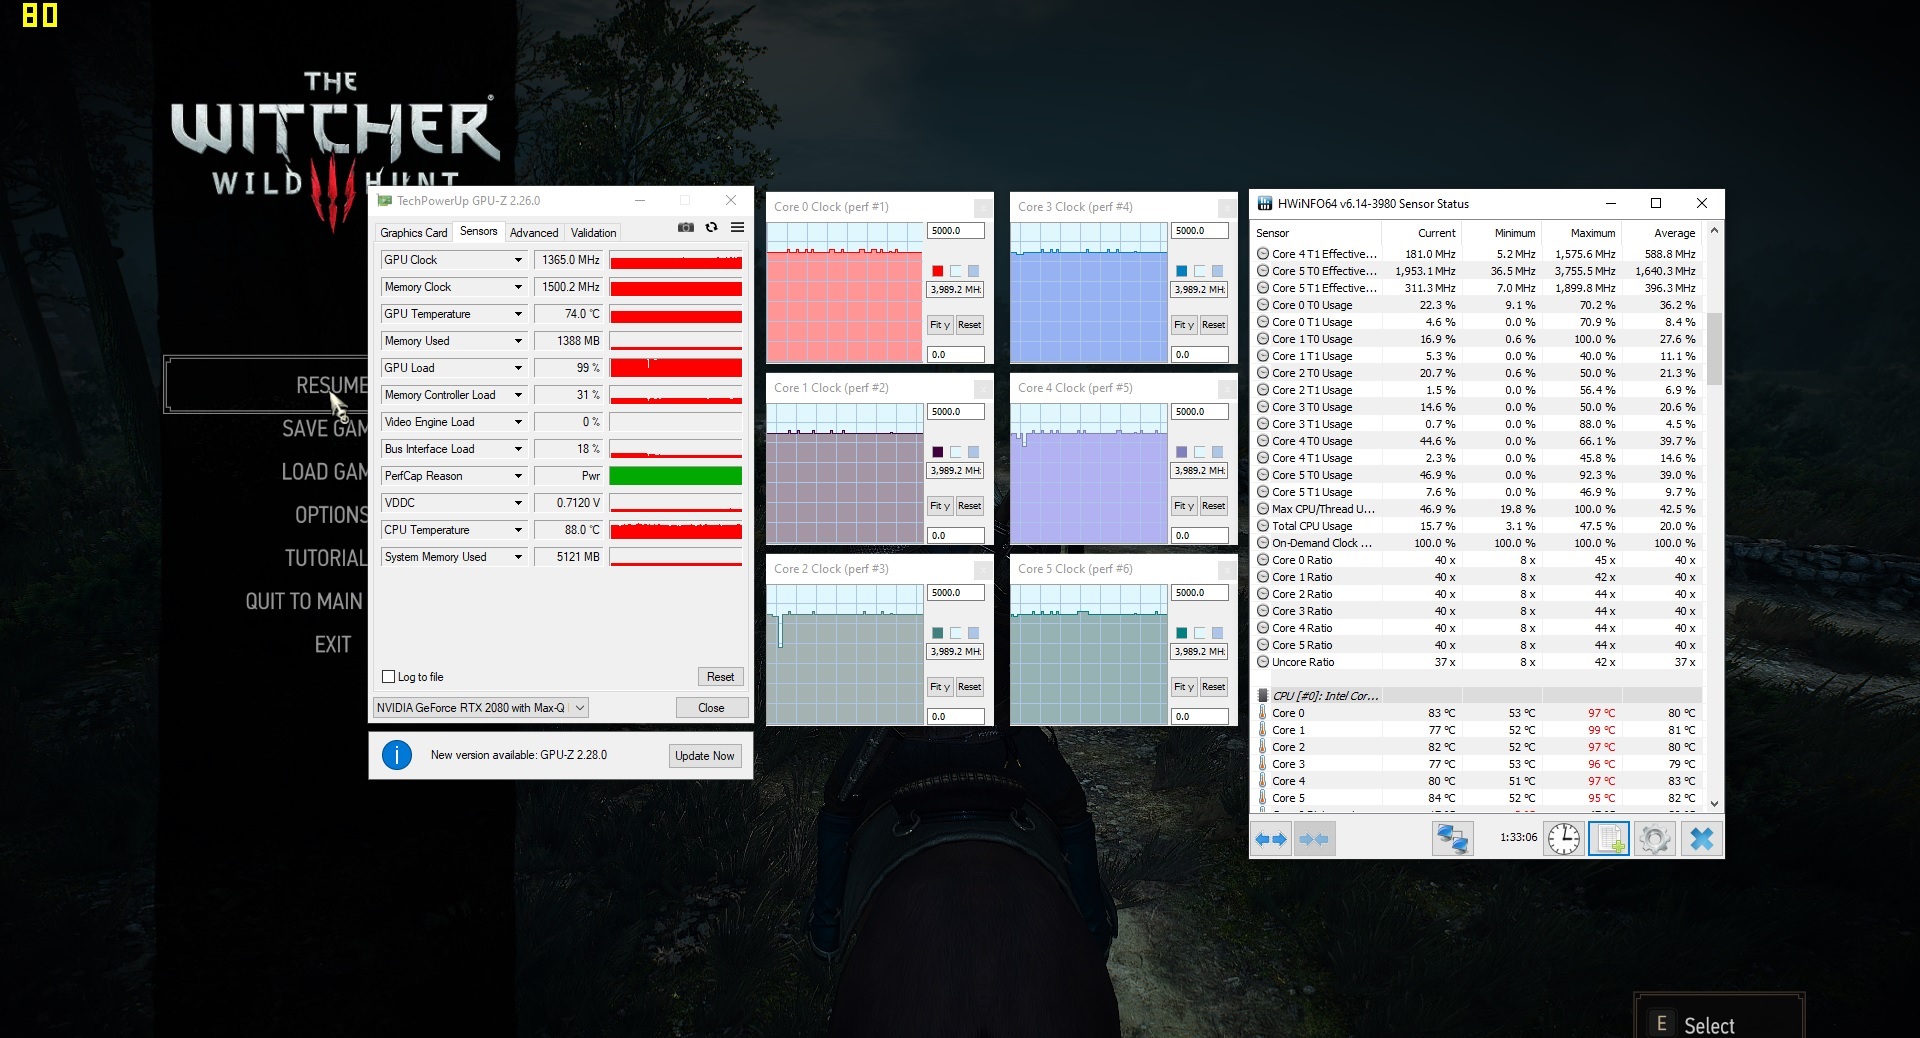
Our stress test (Prime95 and FurMark run for at least an hour) is carried out by the Zephyrus in different ways when plugged in and on battery power. When plugged in, the processor runs at 2 to 2.1 GHz. The graphics core works at 1,455 MHz. On battery power, the CPU clock speed jumps back and forth between 800 MHz and 2.3 GHz. The GPU operates at speeds between 300 and 1,100 MHz. The stress test represents an extreme scenario that doesn't occur in everyday life. With this test, we check whether the system remains stable even under full load.
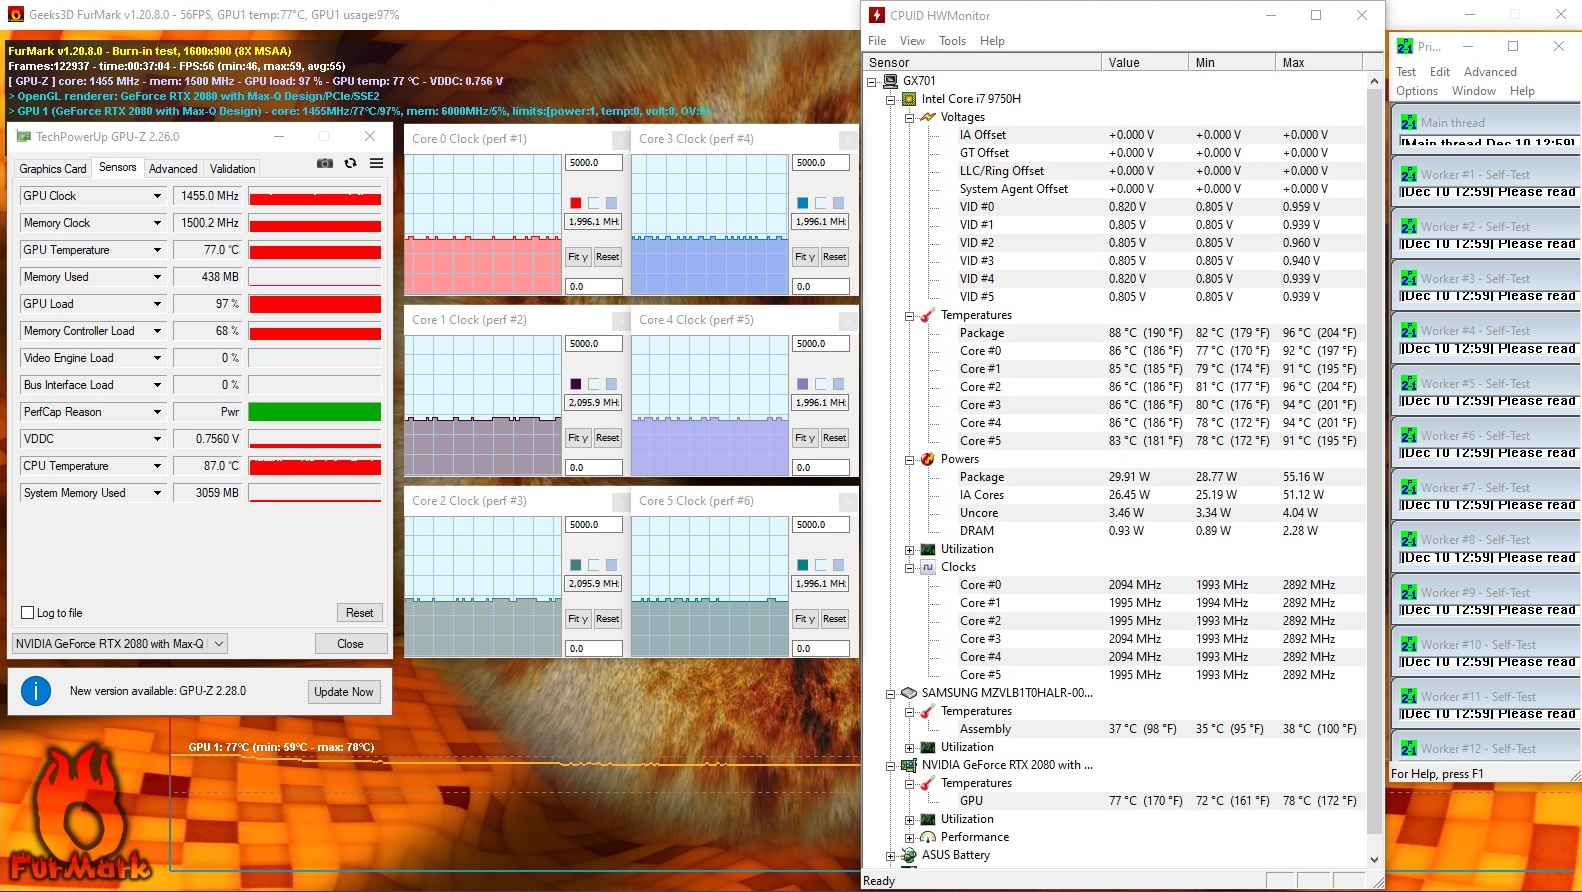
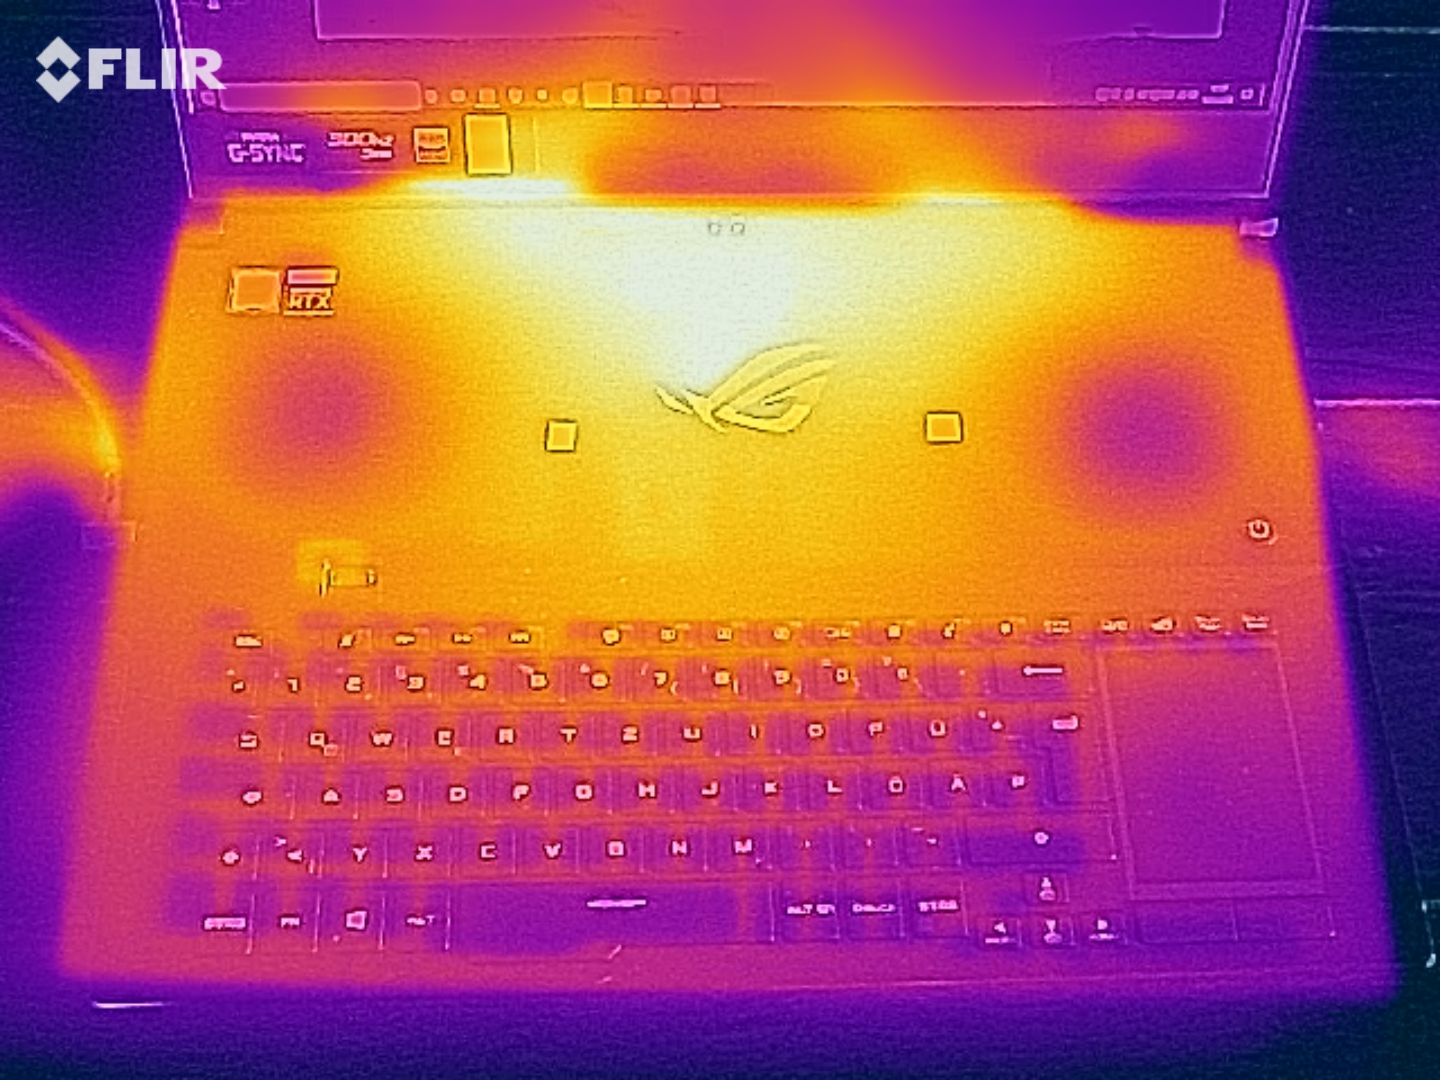
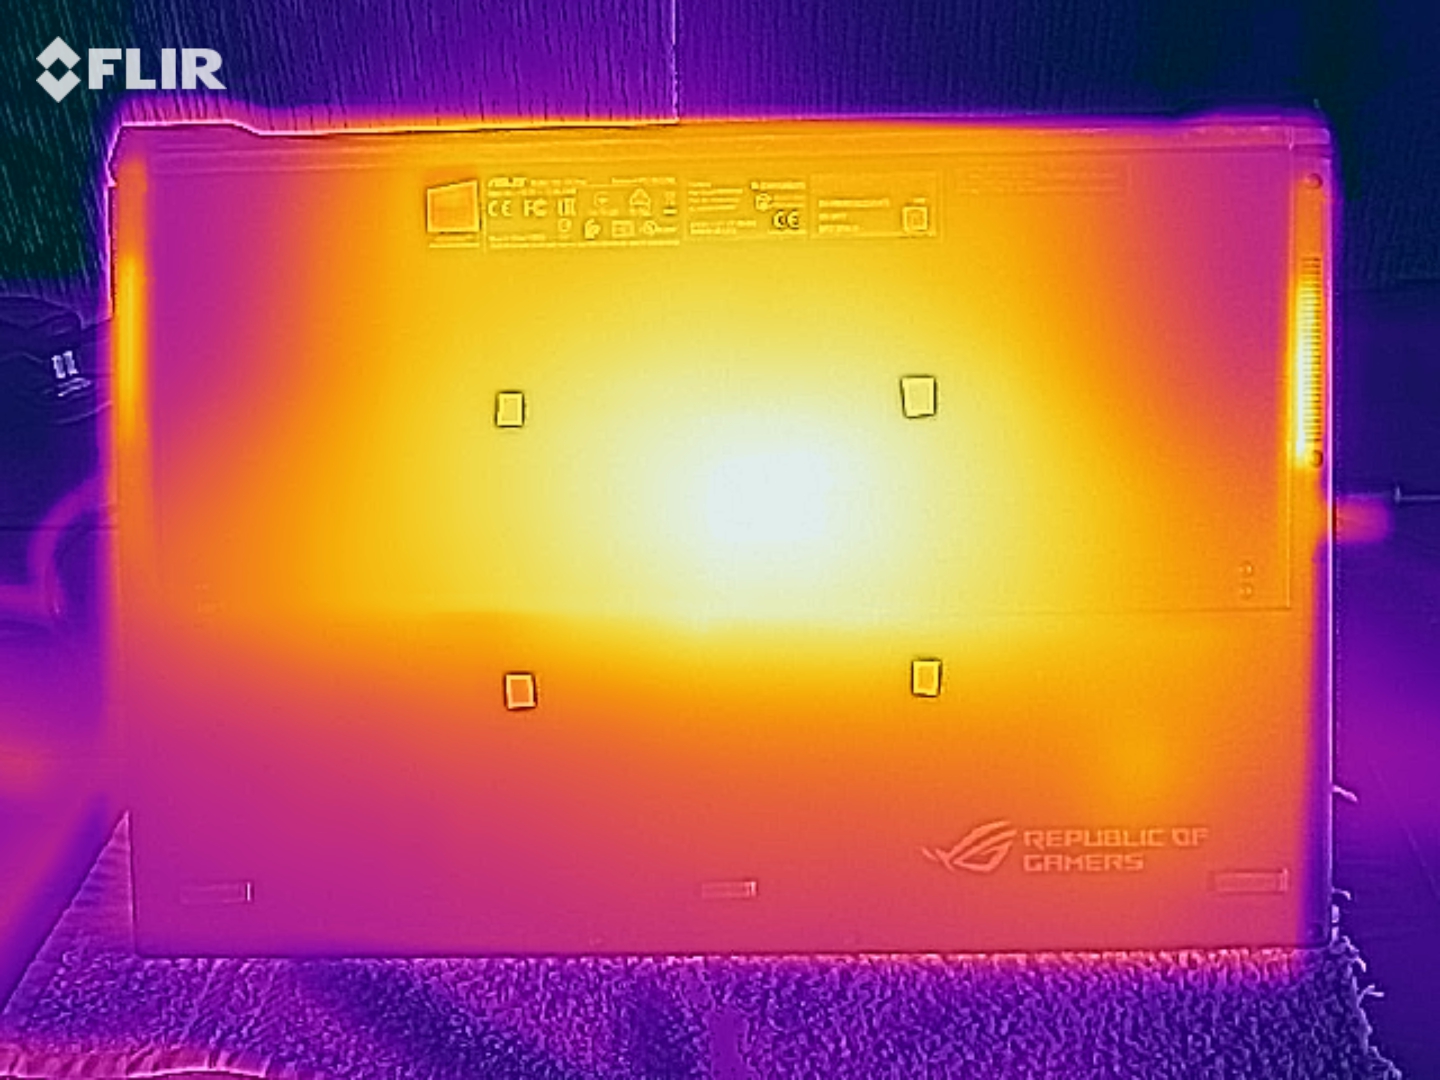
In terms of the computing power in the laptop, heat development is at an acceptable level. Temperatures between 40 °C (~104 °F) and 50 °C (~122 °F) are reached at most measuring points. Heat development is minimally stronger when performing our The Witcher 3 test. Therefore, the device shouldn't be placed on the lap. In everyday use, the values are in the green range.
(-) The maximum temperature on the upper side is 50 °C / 122 F, compared to the average of 40.4 °C / 105 F, ranging from 21.2 to 68.8 °C for the class Gaming.
(-) The bottom heats up to a maximum of 47 °C / 117 F, compared to the average of 43.2 °C / 110 F
(+) In idle usage, the average temperature for the upper side is 31.2 °C / 88 F, compared to the device average of 33.9 °C / 93 F.
(-) Playing The Witcher 3, the average temperature for the upper side is 44.1 °C / 111 F, compared to the device average of 33.9 °C / 93 F.
(±) The palmrests and touchpad can get very hot to the touch with a maximum of 38 °C / 100.4 F.
(-) The average temperature of the palmrest area of similar devices was 28.8 °C / 83.8 F (-9.2 °C / -16.6 F).
| Asus ROG Zephyrus S GX701GXR i7-9750H, GeForce RTX 2080 Max-Q | Razer Blade Pro 17 RTX 2080 Max-Q i7-9750H, GeForce RTX 2080 Max-Q | Gigabyte Aero 17 XA RP77 i9-9980HK, GeForce RTX 2070 Max-Q | Alienware m17 P37E i9-8950HK, GeForce RTX 2080 Max-Q | Lenovo Legion Y740-17ICH i7-8750H, GeForce RTX 2080 Max-Q | Asus Zephyrus S GX701GX i7-8750H, GeForce RTX 2080 Max-Q | Average of class Gaming | |
|---|---|---|---|---|---|---|---|
| Heat | 11% | -4% | -6% | 9% | 5% | 3% | |
| Maximum Upper Side * (°C) | 50 | 43 14% | 46.8 6% | 55 -10% | 38.6 23% | 53 -6% | 45.2 ? 10% |
| Maximum Bottom * (°C) | 47 | 47.2 -0% | 62.2 -32% | 60 -28% | 43.6 7% | 50 -6% | 48.2 ? -3% |
| Idle Upper Side * (°C) | 33 | 27.2 18% | 29 12% | 30.4 8% | 30.2 8% | 27 18% | 31 ? 6% |
| Idle Bottom * (°C) | 34 | 30 12% | 34 -0% | 31.8 6% | 35 -3% | 30 12% | 34.3 ? -1% |
* ... smaller is better
Speakers
Asus ROG Zephyrus S GX701GXR audio analysis
(+) | speakers can play relatively loud (83 dB)
Bass 100 - 315 Hz
(±) | reduced bass - on average 10.3% lower than median
(±) | linearity of bass is average (11.1% delta to prev. frequency)
Mids 400 - 2000 Hz
(+) | balanced mids - only 2.6% away from median
(+) | mids are linear (4.3% delta to prev. frequency)
Highs 2 - 16 kHz
(+) | balanced highs - only 3.3% away from median
(+) | highs are linear (4.1% delta to prev. frequency)
Overall 100 - 16.000 Hz
(+) | overall sound is linear (12.5% difference to median)
Compared to same class
» 15% of all tested devices in this class were better, 3% similar, 81% worse
» The best had a delta of 6%, average was 18%, worst was 132%
Compared to all devices tested
» 11% of all tested devices were better, 2% similar, 87% worse
» The best had a delta of 4%, average was 23%, worst was 134%
Razer Blade Pro 17 RTX 2080 Max-Q audio analysis
(+) | speakers can play relatively loud (83.6 dB)
Bass 100 - 315 Hz
(±) | reduced bass - on average 10.5% lower than median
(±) | linearity of bass is average (14.4% delta to prev. frequency)
Mids 400 - 2000 Hz
(±) | higher mids - on average 5.3% higher than median
(+) | mids are linear (4.6% delta to prev. frequency)
Highs 2 - 16 kHz
(+) | balanced highs - only 3.5% away from median
(±) | linearity of highs is average (10% delta to prev. frequency)
Overall 100 - 16.000 Hz
(±) | linearity of overall sound is average (17.9% difference to median)
Compared to same class
» 54% of all tested devices in this class were better, 9% similar, 37% worse
» The best had a delta of 6%, average was 18%, worst was 132%
Compared to all devices tested
» 37% of all tested devices were better, 8% similar, 55% worse
» The best had a delta of 4%, average was 23%, worst was 134%
Energy management - The Asus laptop doesn't have much endurance
Energy consumption
When idle, we register a maximum power consumption of 36 watts - a fairly high value. If the built-in GPU were active, the value would be significantly lower. The stress test increases the demand to up to 187 watts. During the execution of our The Witcher 3 test, we measure a power consumption of about 155 watts. The output of the power adapter is 230 watts.
| Off / Standby | |
| Idle | |
| Load |
|
Key:
min: | |
| Asus ROG Zephyrus S GX701GXR i7-9750H, GeForce RTX 2080 Max-Q | Razer Blade Pro 17 RTX 2080 Max-Q i7-9750H, GeForce RTX 2080 Max-Q | Gigabyte Aero 17 XA RP77 i9-9980HK, GeForce RTX 2070 Max-Q | Alienware m17 P37E i9-8950HK, GeForce RTX 2080 Max-Q | Lenovo Legion Y740-17ICH i7-8750H, GeForce RTX 2080 Max-Q | Asus Zephyrus S GX701GX i7-8750H, GeForce RTX 2080 Max-Q | Average of class Gaming | |
|---|---|---|---|---|---|---|---|
| Power Consumption | 14% | 4% | -3% | 16% | 11% | 18% | |
| Idle Minimum * (Watt) | 32 | 16.2 49% | 13.9 57% | 21.2 34% | 20.2 37% | 19 41% | 12.8 ? 60% |
| Idle Average * (Watt) | 34 | 20.4 40% | 24.3 29% | 29.6 13% | 27.2 20% | 22 35% | 18.5 ? 46% |
| Idle Maximum * (Watt) | 36 | 26.1 27% | 35.5 1% | 34 6% | 28.7 20% | 30 17% | 24 ? 33% |
| Load Average * (Watt) | 95 | 96.5 -2% | 127.6 -34% | 130.9 -38% | 90.8 4% | 104 -9% | 108.2 ? -14% |
| Witcher 3 ultra * (Watt) | 155 | 182.9 -18% | 158 -2% | 177.5 -15% | 152.1 2% | 167 -8% | |
| Load Maximum * (Watt) | 187 | 214.3 -15% | 237.5 -27% | 219.7 -17% | 165.4 12% | 203 -9% | 254 ? -36% |
* ... smaller is better
Battery life
In our practical Wi-Fi test, the GX701GXR achieves a runtime of 3:02 h (iGPU disabled) and 5:13 h (iGPU switched on), respectively. We use a script to simulate the load caused by accessing websites. The "Balanced" profile is active, and the display brightness is adjusted to about 150 cd/m². The 17.3-incher completes our video test after 2:48 h. We run the short film Big Buck Bunny (H.264 encoding, 1920x1080 pixels) in a continuous loop here. The "Power Saving Mode" profile is active, the radio module is deactivated, and the display brightness is reduced to 150 cd/m².
| Asus ROG Zephyrus S GX701GXR i7-9750H, GeForce RTX 2080 Max-Q, 76 Wh | Razer Blade Pro 17 RTX 2080 Max-Q i7-9750H, GeForce RTX 2080 Max-Q, 70 Wh | Gigabyte Aero 17 XA RP77 i9-9980HK, GeForce RTX 2070 Max-Q, 94.24 Wh | Alienware m17 P37E i9-8950HK, GeForce RTX 2080 Max-Q, 90 Wh | Lenovo Legion Y740-17ICH i7-8750H, GeForce RTX 2080 Max-Q, 76 Wh | Asus Zephyrus S GX701GX i7-8750H, GeForce RTX 2080 Max-Q, 76 Wh | Average of class Gaming | |
|---|---|---|---|---|---|---|---|
| Battery runtime | 31% | 121% | 51% | 7% | 8% | 123% | |
| Reader / Idle (h) | 4.1 | 4.9 20% | 11.9 190% | 9.1 122% | 5 22% | 8.71 ? 112% | |
| H.264 (h) | 2.8 | 8.9 ? 218% | |||||
| WiFi v1.3 (h) | 3 | 4.7 57% | 7.2 140% | 4.9 63% | 3.2 7% | 3.8 27% | 7.09 ? 136% |
| Load (h) | 1.2 | 1.4 17% | 1.6 33% | 0.8 -33% | 0.9 -25% | 1.51 ? 26% |
Pros
Cons
Verdict
With the Zephyrus S GX701GXR, Asus delivers a compact 17.3-inch gaming laptop that brings all current games smoothly to the matte Full HD display thanks to the Core i7-9750H processor and the GeForce RTX 2080 Max Q GPU. Heat and noise development are at an acceptable level. Battery life is hardly worth mentioning, but it can be increased by activating the integrated GPU.
The 300 Hz IPS display scores points with short response times, stable viewing angles, good contrast, an X-Rite Pantone certification and great color reproduction.
The display's maximum brightness is slightly too low. A laptop in this price range should offer more in this respect.
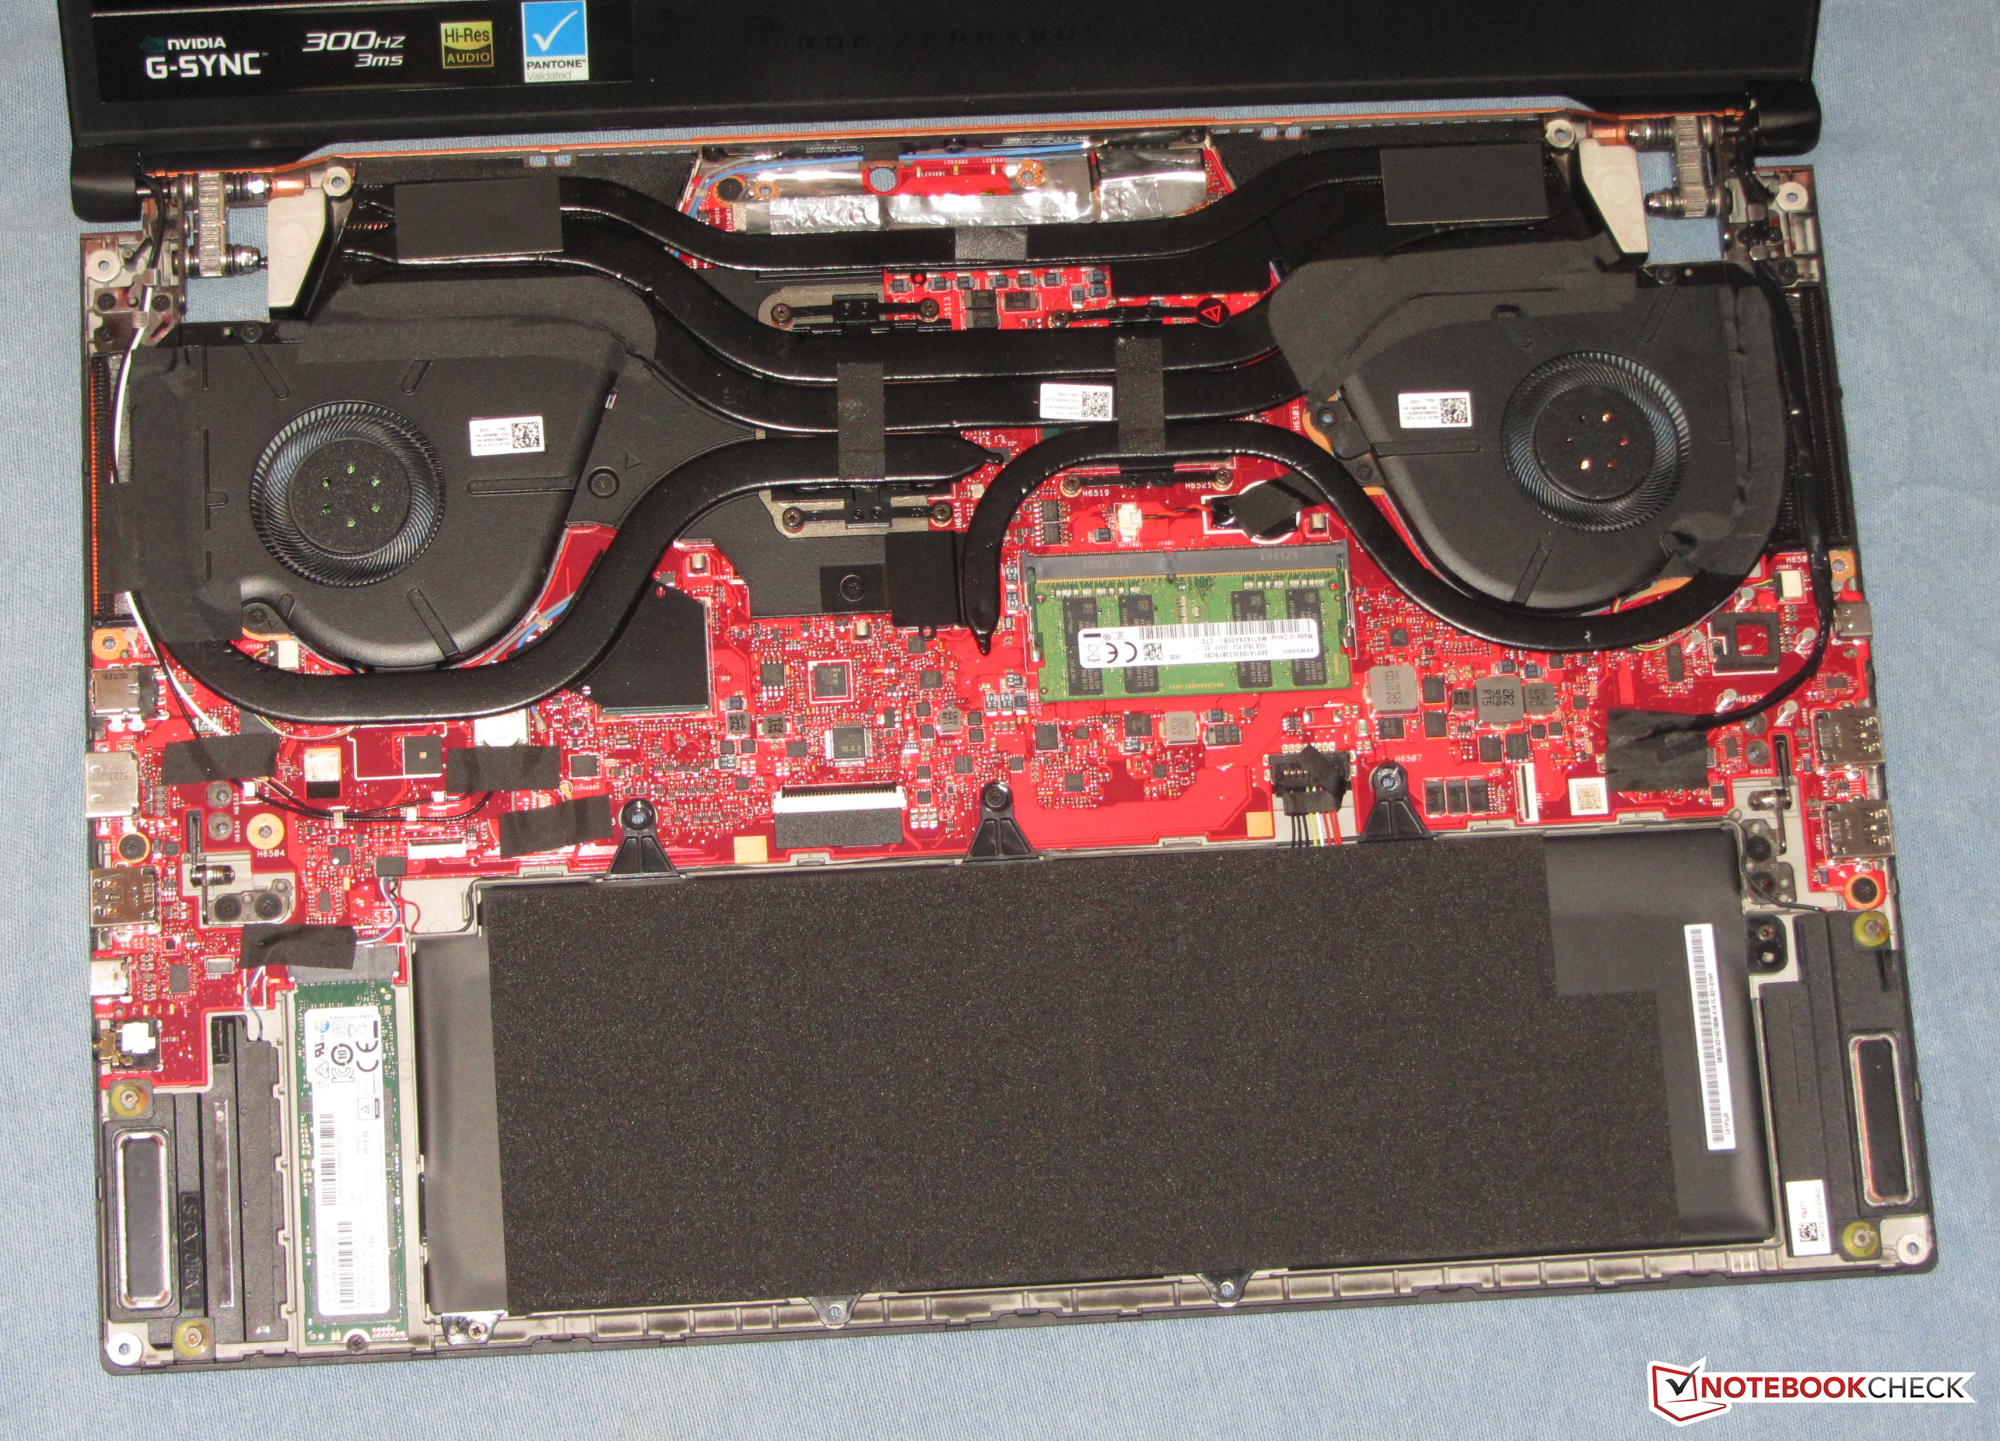
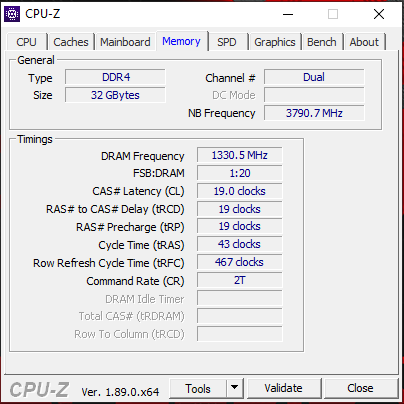
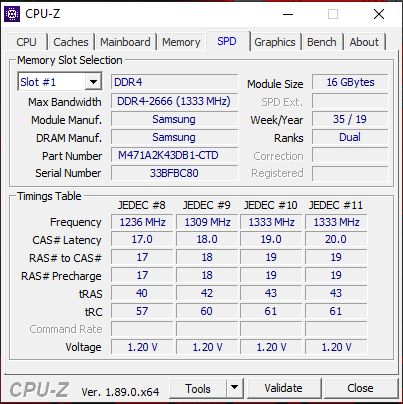
Upgrade options are very limited. Only one storage medium (M.2 SSD) can be installed; there is no space for a 2.5-inch hard drive. In addition, the computer only has one memory slot (16 GB of RAM is soldered). More than the installed 32 GB of memory is not supported. Moreover, opening the case turns out to be more complex than with many competitors.
There's also room for improvement in terms of ports. Asus doesn't equip the laptop with a Thunderbolt 3 port, and only equips it with two USB Type-C 3.1 ports (1x Gen 1, 1x Gen 2). The device doesn't provide a memory card reader or an Ethernet port either. Users who expect more in terms of upgrade/maintenance or port selection must resort to a competitor device - for example, the Razer Blade Pro 17 or the Gigabyte Aero 17 XA.
Asus ROG Zephyrus S GX701GXR
- 05/14/2020 v7 (old)
Sascha Mölck
Price comparison
