Lenovo Legion Y740-17ICH (i7-8750H, RTX 2080 Max-Q) Laptop Review
When we reviewed the 17.3-inch Legion Y730-17ICH late last year, we were baffled as to why Lenovo was not offering any GPU options higher than the GTX 1050 Ti. Both Core temperature and fan noise were relatively low especially for a gaming laptop to suggest that the chassis was capable of housing faster and more demanding GPUs. Fast forward to CES 2019 and now we know why Lenovo was holding back on additional GTX GPUs—it was preparing for GeForce RTX Legion SKUs all along.
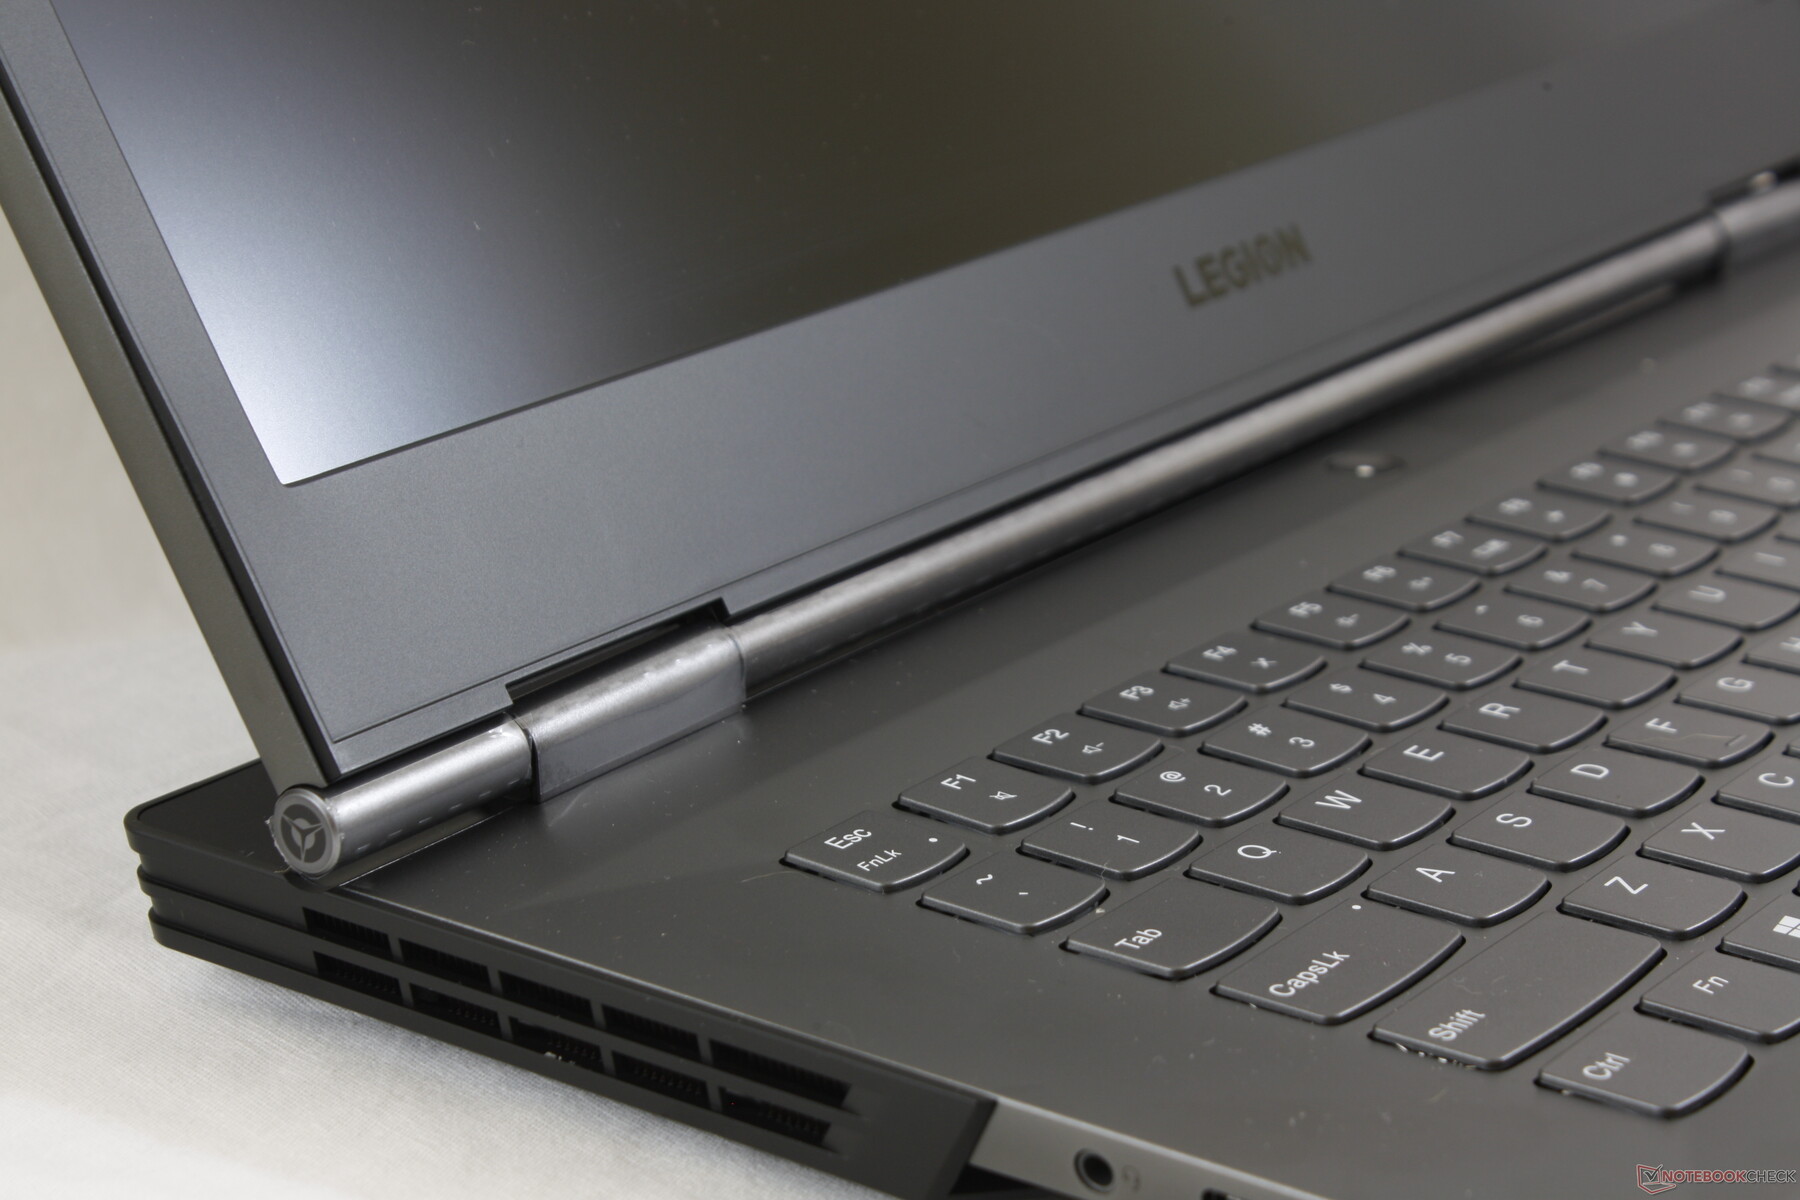
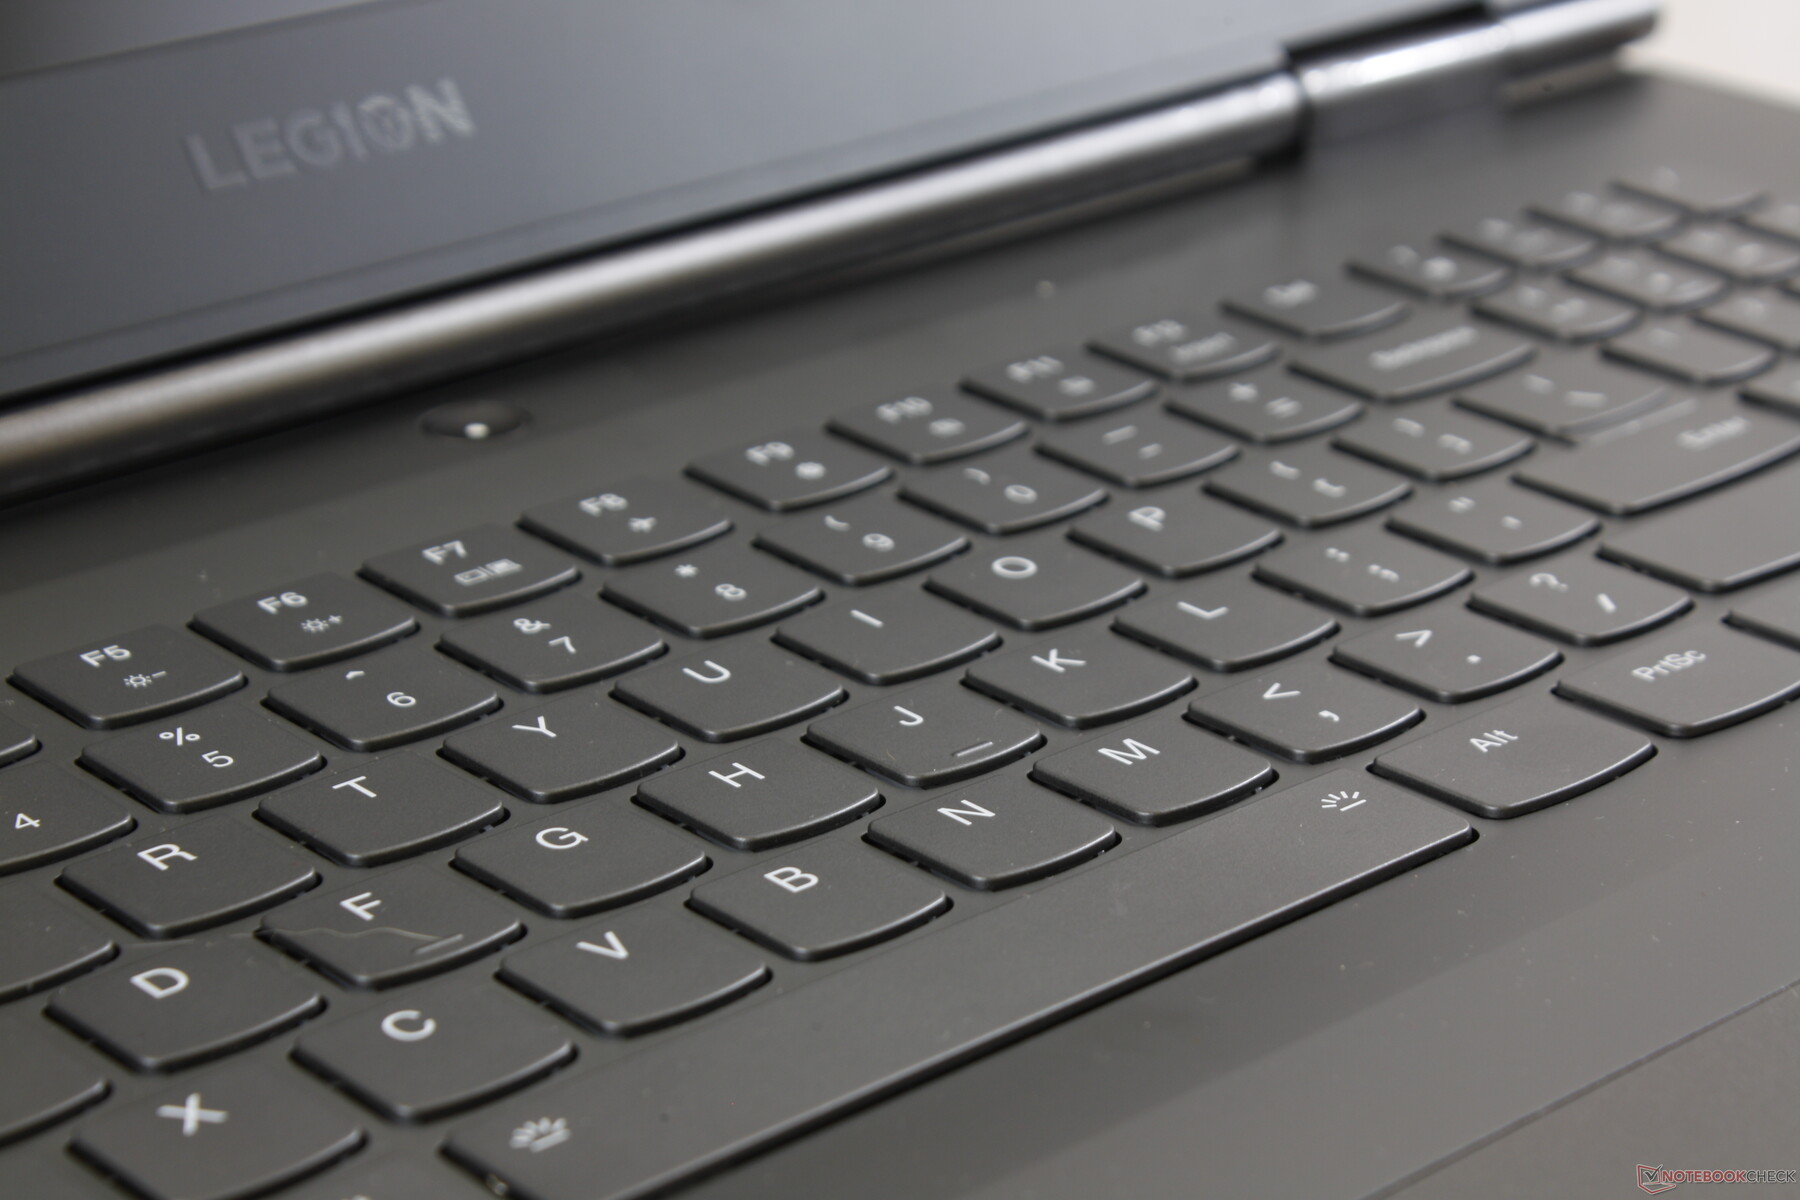
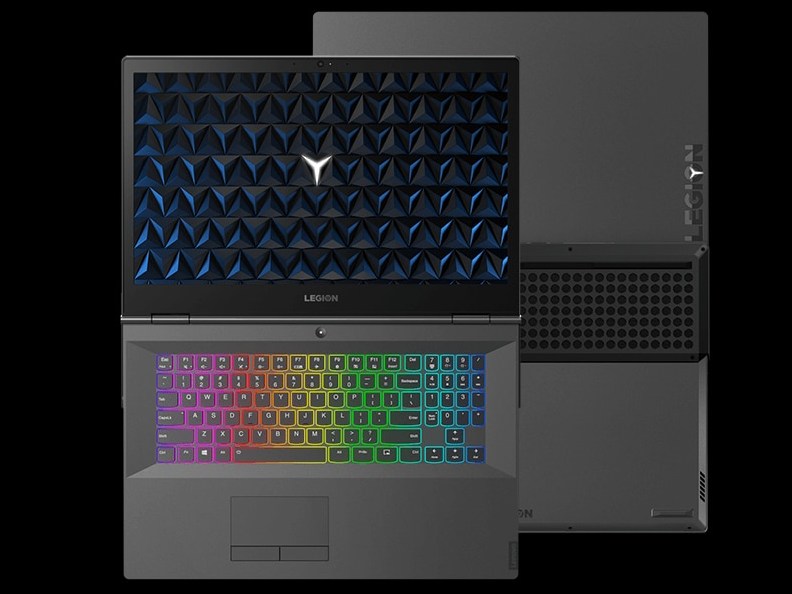
Called the Legion Y740, the system sports RTX graphics compared to the GTX-powered Legion Y730 series. The Y740 is otherwise visually identical to the Legion Y730 and so both models carry the same keyboard, connectivity options, and physical features. We recommend checking out our existing review on the Legion Y730-17ICH for more details on the chassis since many of our comments still apply here for the Legion Y740.
Note that the Legion Y740 series comes in 15.6-inch (Y740-15ICH) and 17.3-inch (Y740-17ICH) SKUs just like on the Legion Y730 series. We will be checking out the 15.6-inch version at a later date.
The unit we have today sports a 17.3-inch 144 Hz IPS display, Core i7-8750H CPU, and a GeForce RTX 2080 Max-Q GPU for around $2400 USD. This is surprisingly inexpensive considering the specifications as many competing RTX 2080 laptops like the Acer Predator Triton 500, MSI GS75, Asus ROG GL704, or Razer Blade 15 can retail for $3000 or more. Did Lenovo cut any corners on its RTX offering?
More Lenovo Legion reviews:
Case
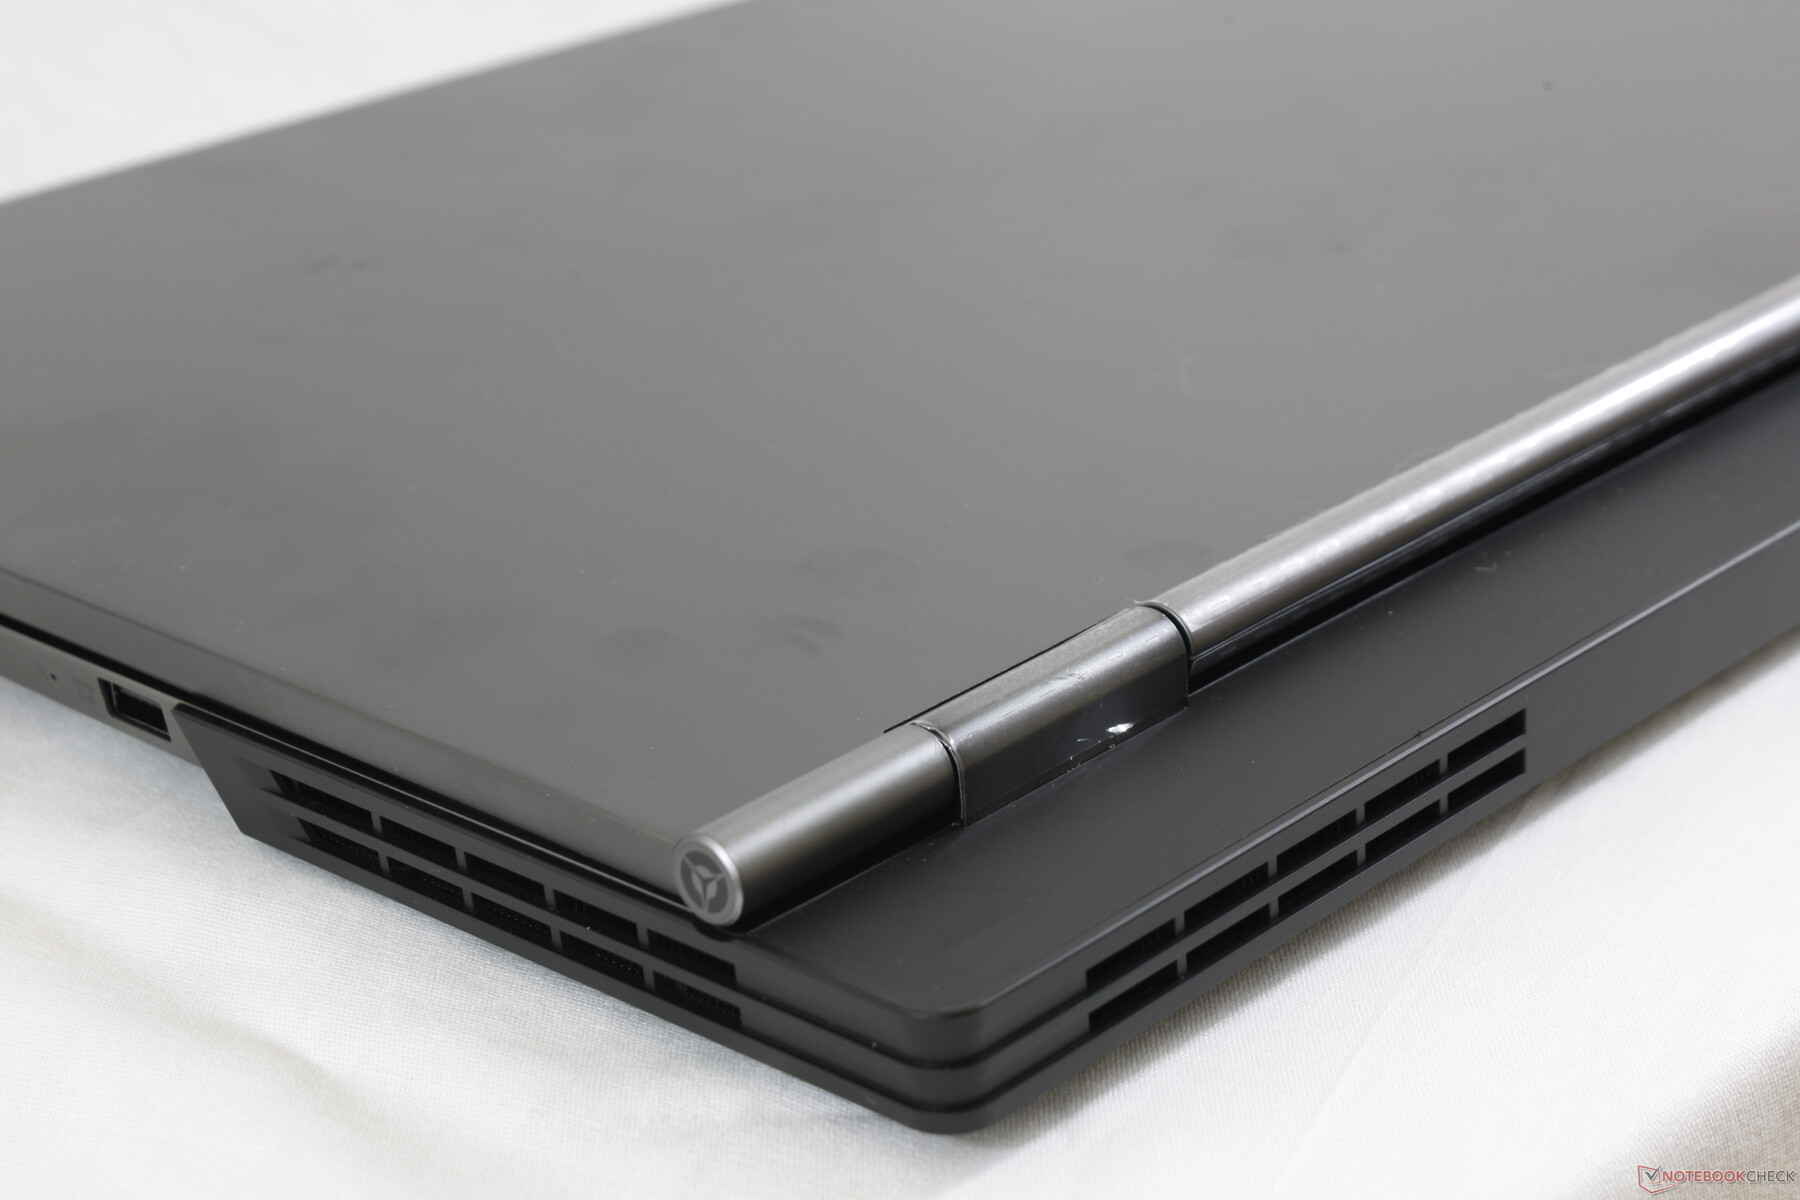
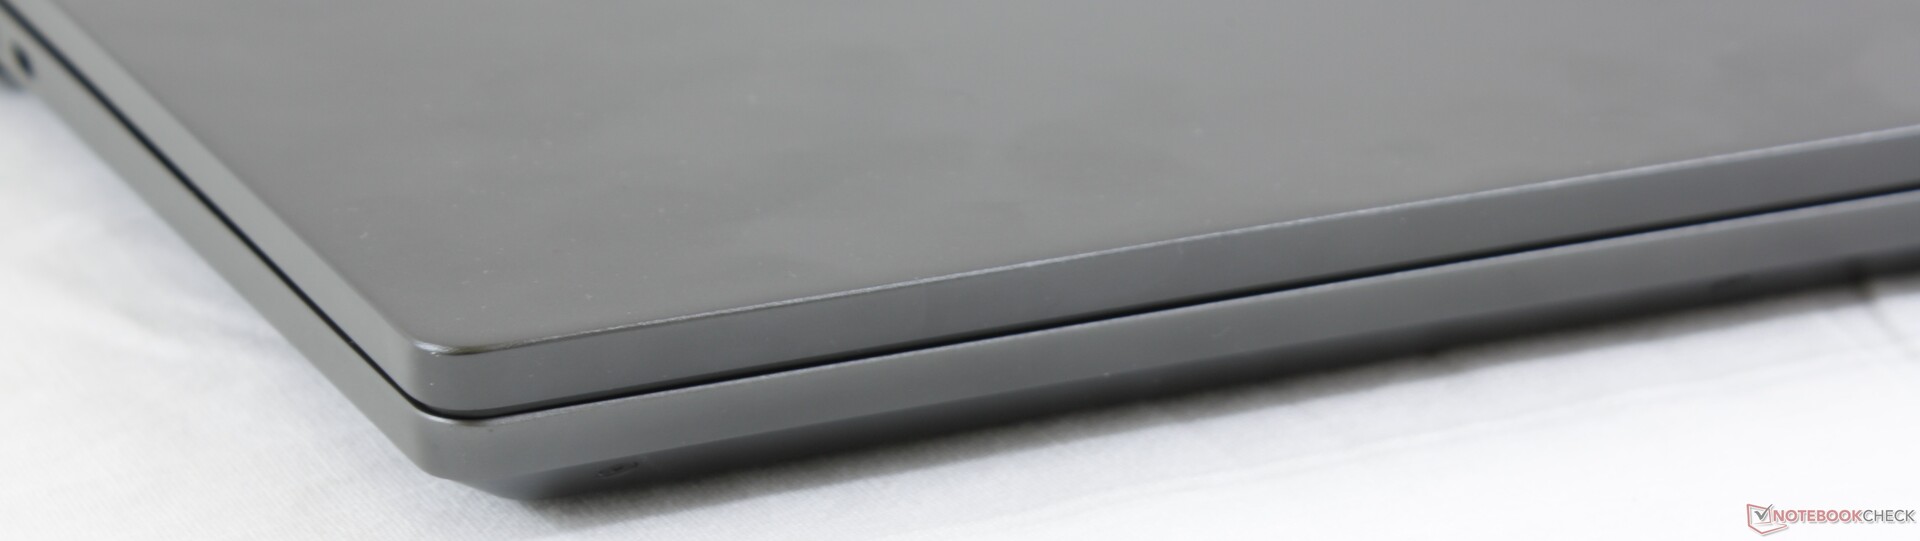
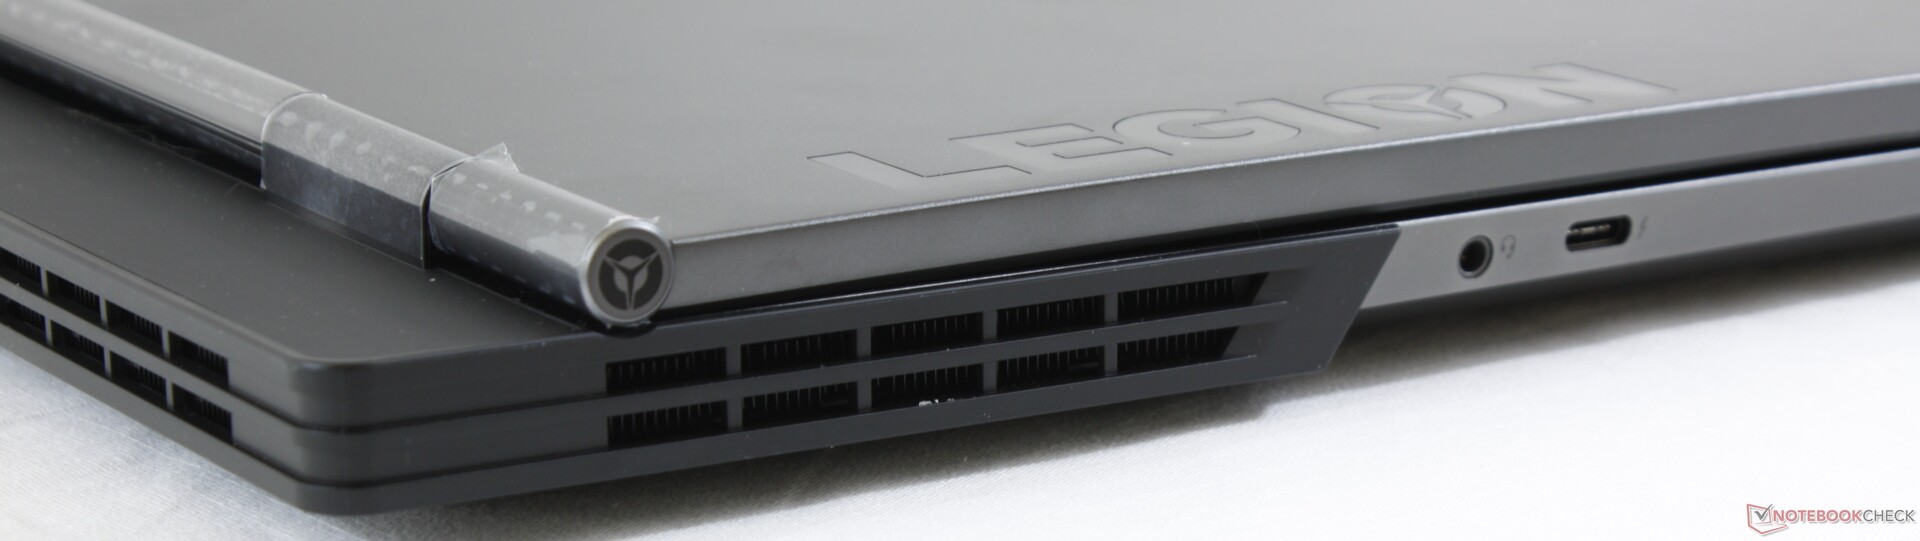
The chassis remains identical to the Legion Y730-17ICH including all the customizeable rear LED lights. Surfaces feel thinner and more flexible than many competing 17-inch gaming laptops including the Asus ROG GL704, Razer Blade Pro, MSI GE75, and Alienware m17. Additionally, the system is lacking the narrow bezels of the 15.6-inch Legion Y740-15ICH and its lid tends to teeter more when adjusting the angle. Thus, chassis rigidity is the weakest aspect of the Y740-17ICH when compared to the competition.
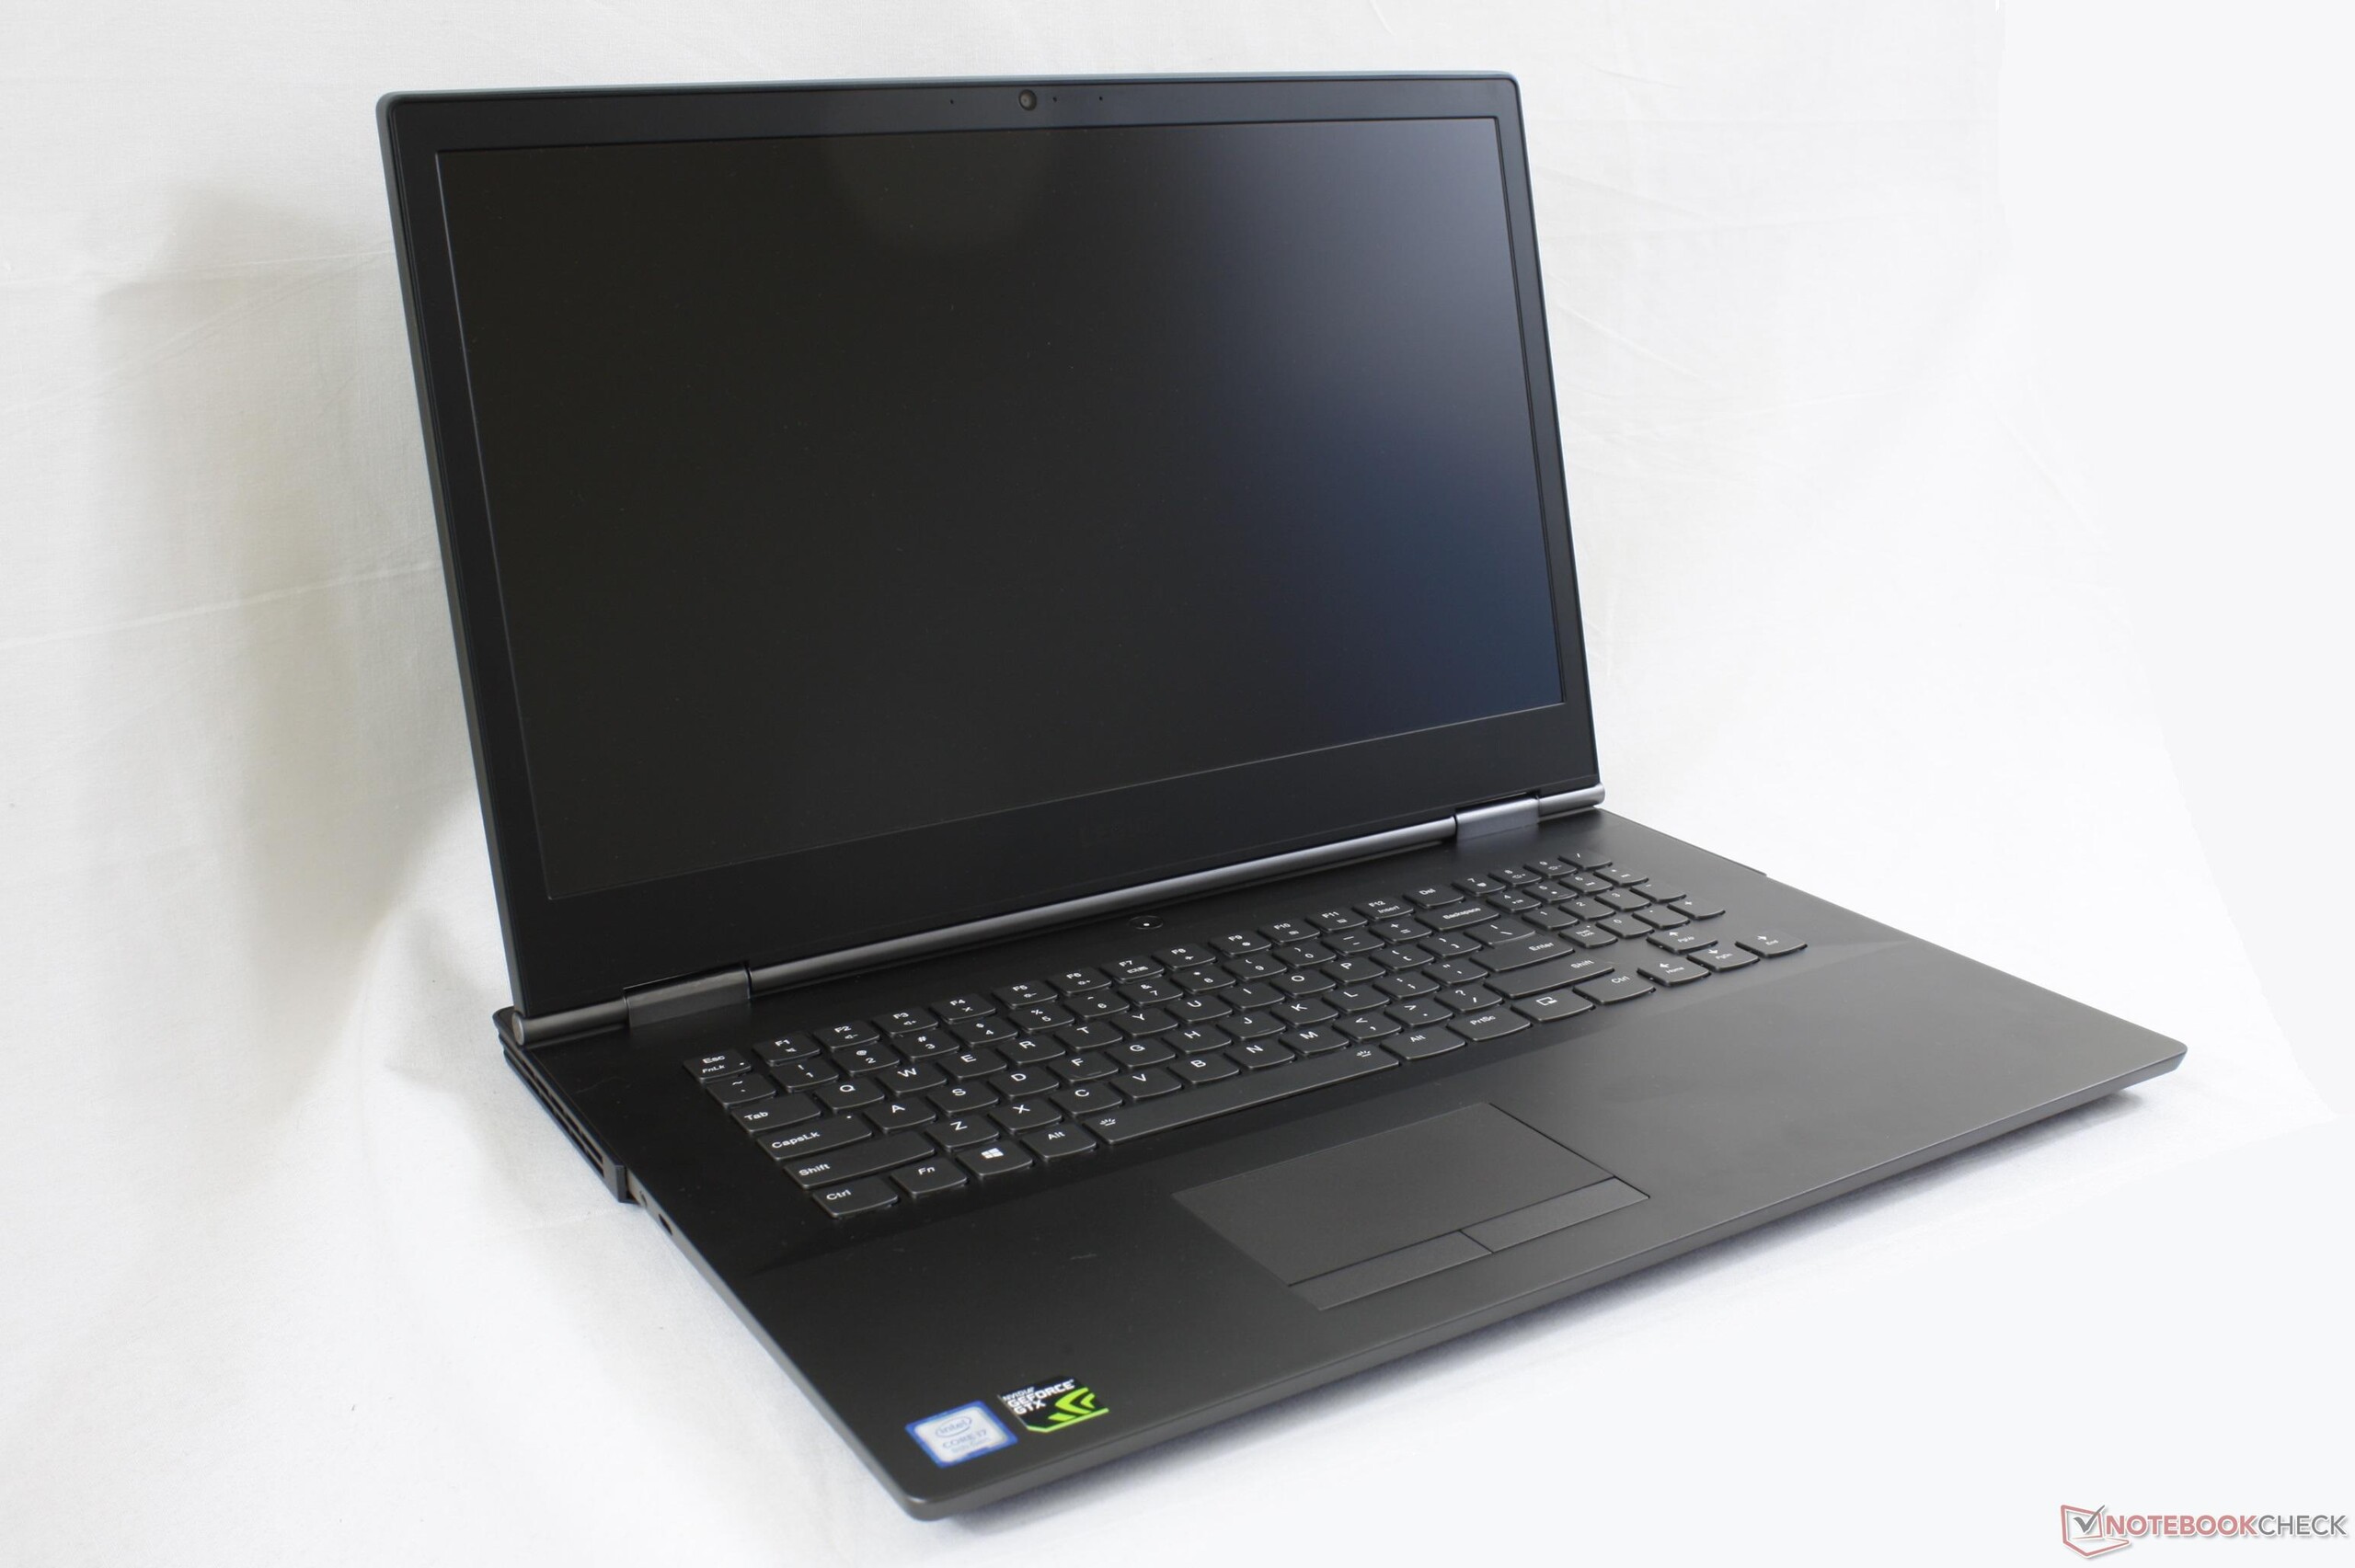
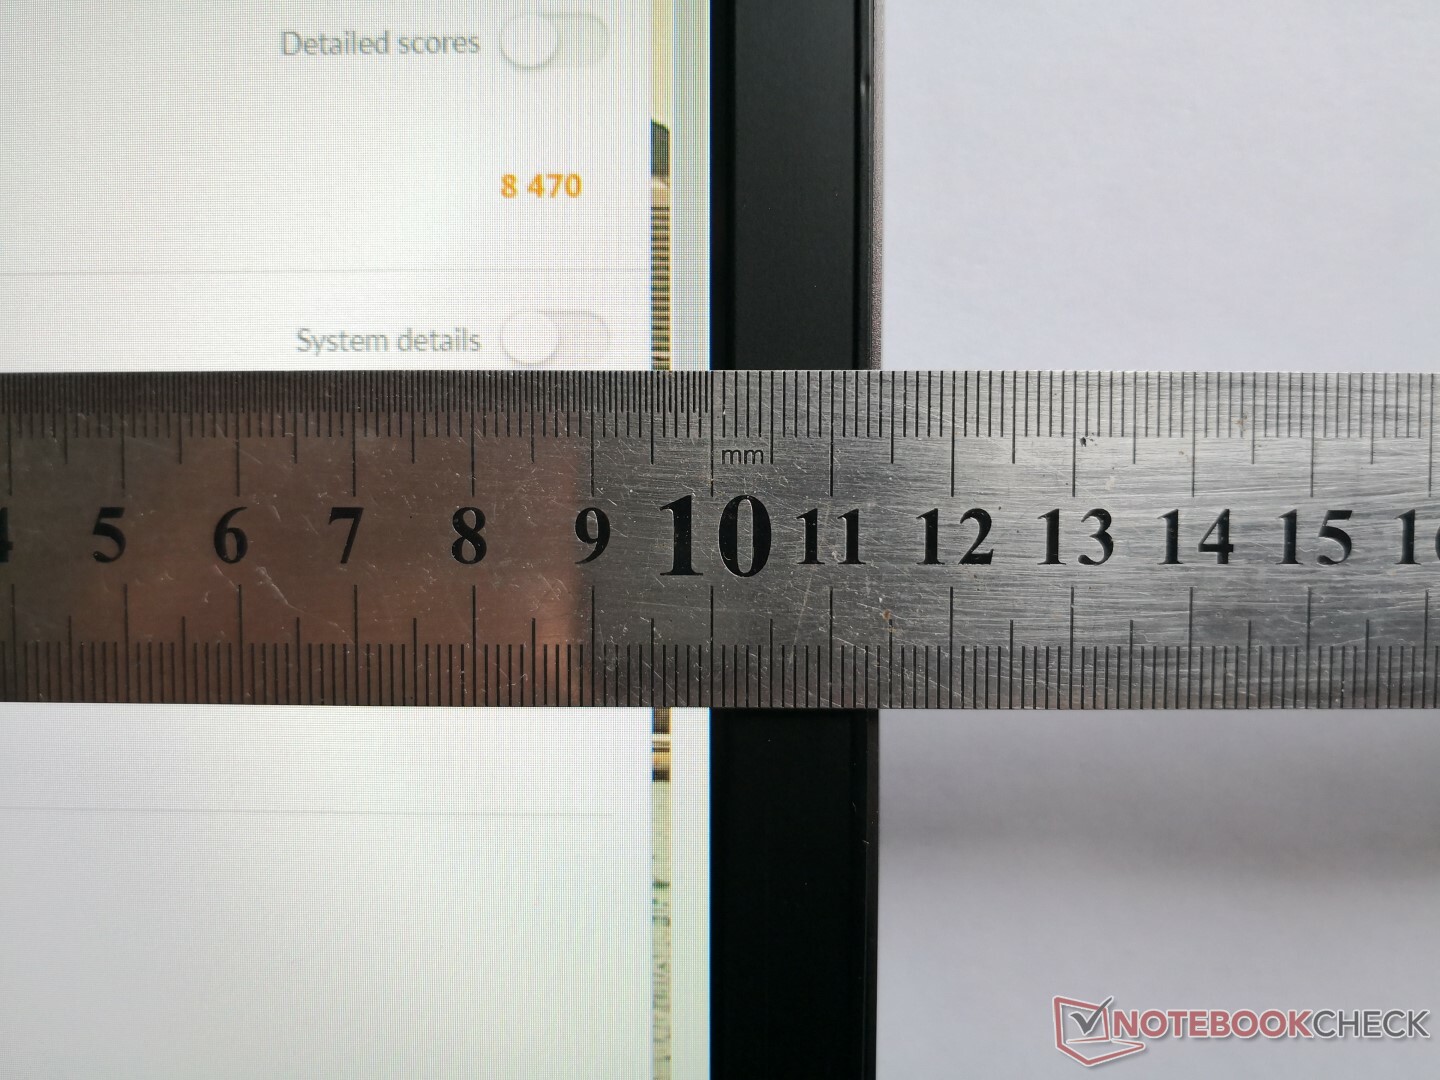
The Lenovo laptop has the notable trait of being relatively thin but with a large footprint. For example, the system is over 30 mm longer and 10 mm wider than the competing Asus ROG GL704 and yet it is 3 mm thinner. The elongated rear and thick bezel design are responsible for the large chassis.
Interestingly, Lenovo is listing the Y740 a hair thicker than the Y730 (23 mm vs. 21.95 mm). This could just be a result from the conversion between inches and SI.
Connectivity
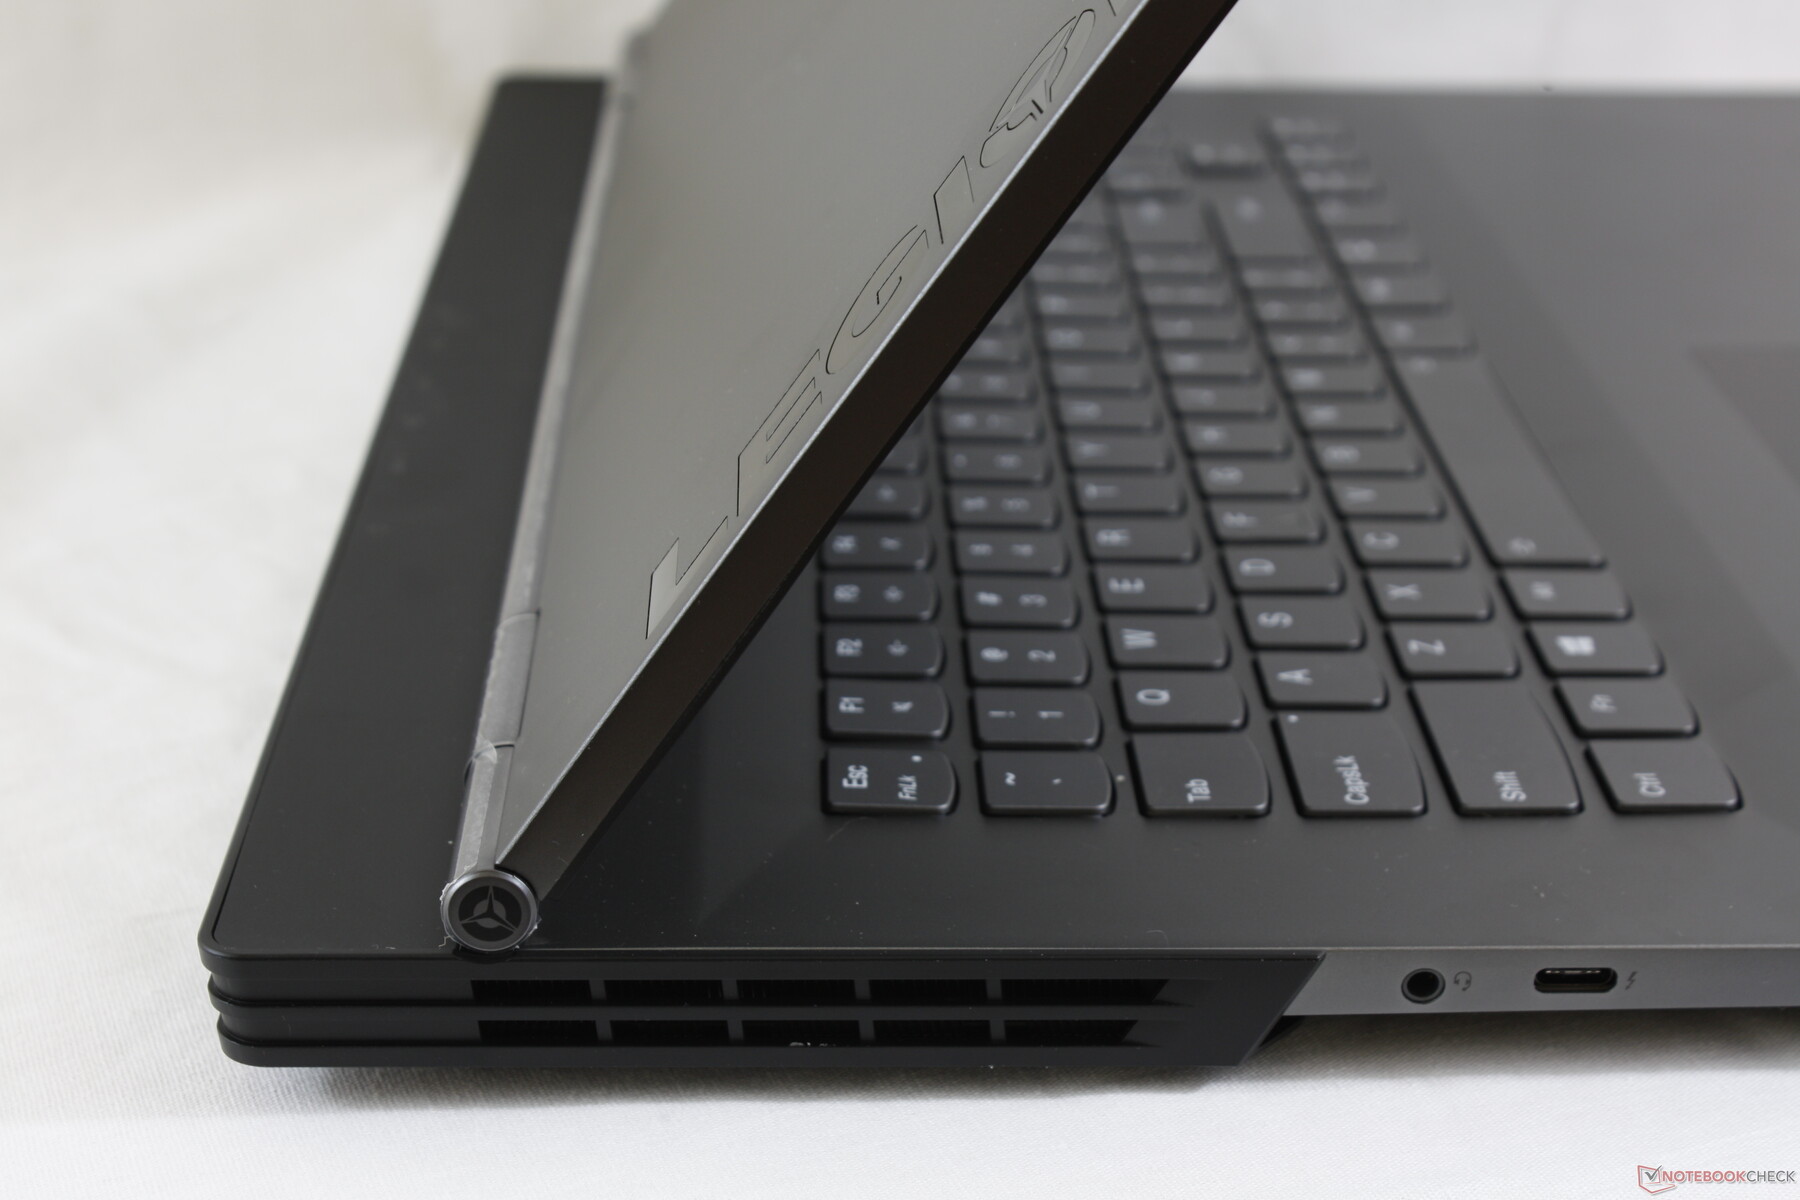
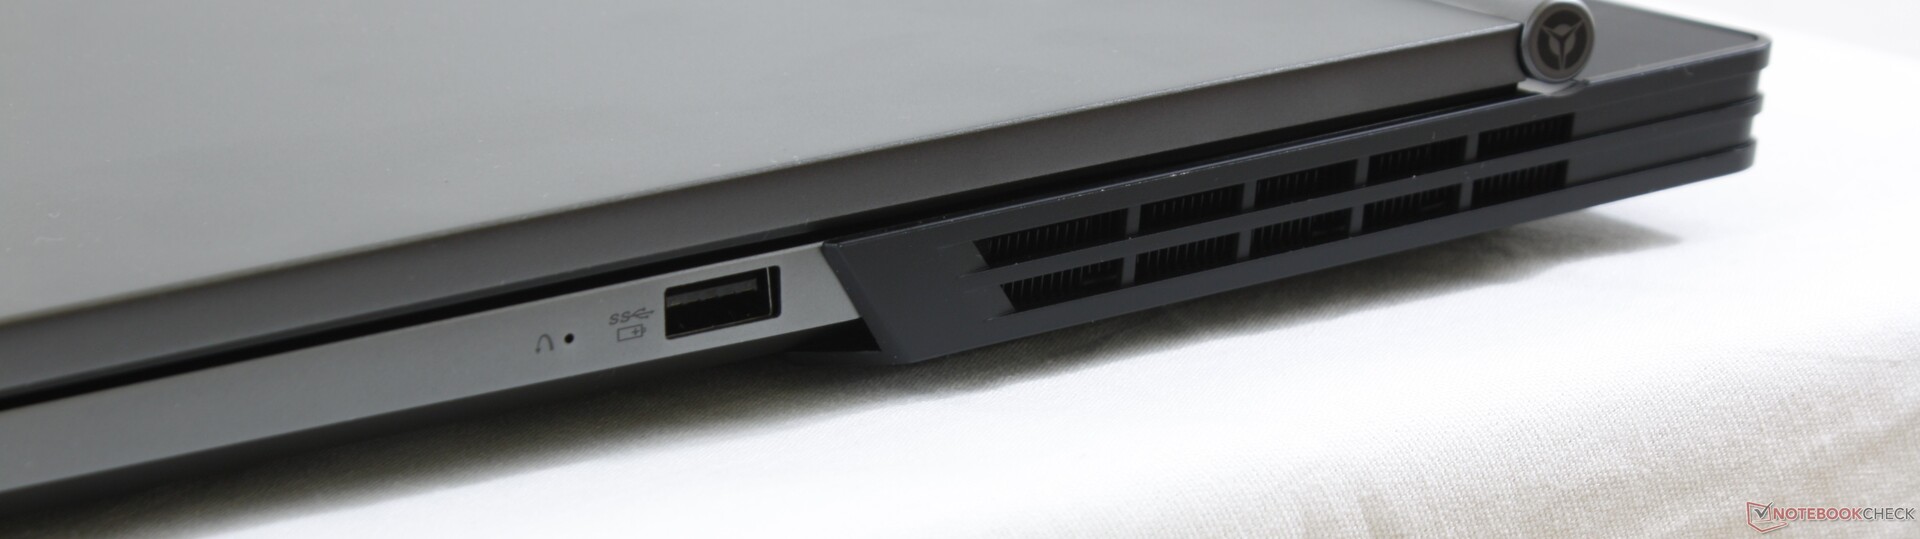
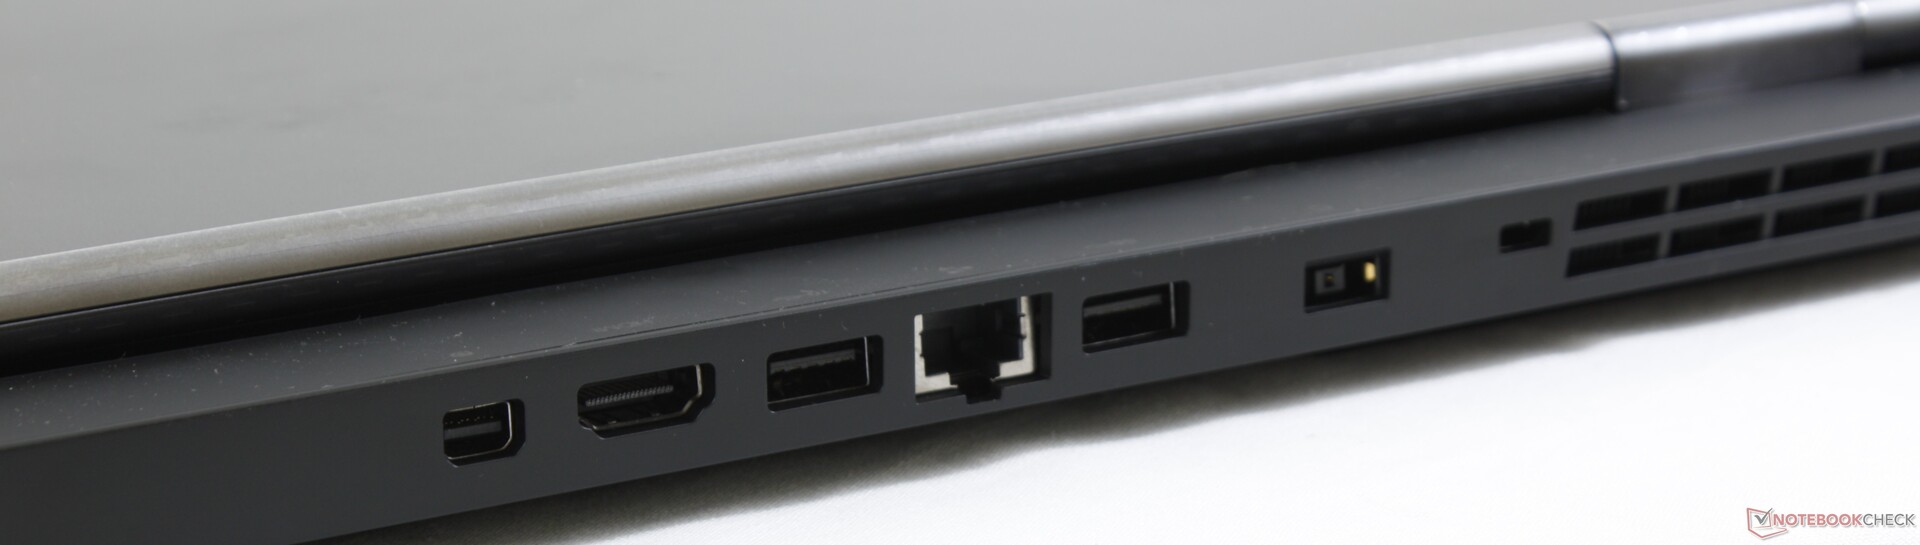
Port positioning will be unusual to many gamers. Whereas other gaming laptops typically have most or all of their ports along the left and right edges, the Legion Y740 has most of its ports along the rear instead. There are certainly pros and cons to this approach that gamers will either love or hate. In our opinion, having to reach around the rear of the laptop whenever we need to access commonly used ports can become bothersome.
The system still lacks an integrated SD reader. Thankfully, both Thunderbolt 3 and mini-DisplayPort are present.
Communication
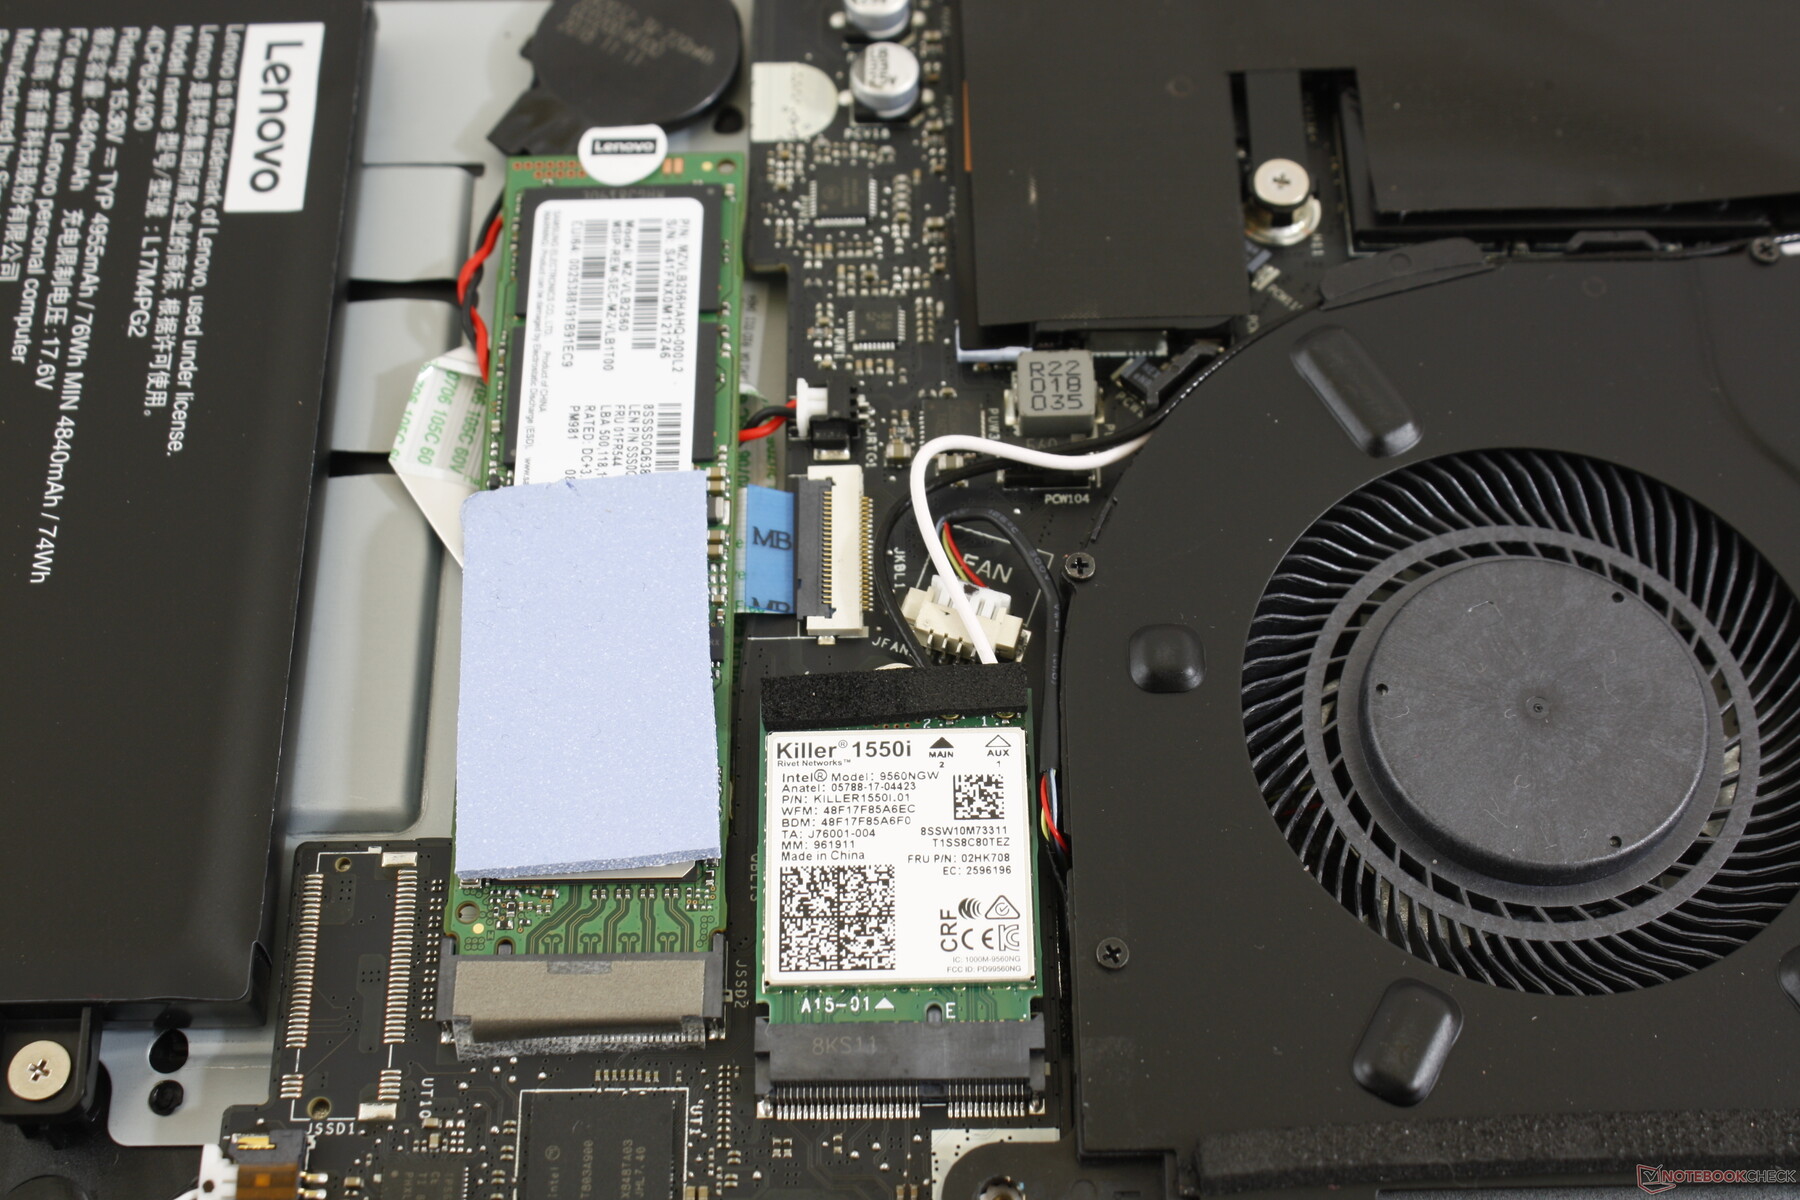
WLAN and Bluetooth 5 are provided by a Killer 1550i which is an upgrade from the RealTek RTL8822BE on last year's Legion Y730. Users with Killer WiFi benefit from gaming-specific features and controls.
Theoretical transfer rates (1.73 Gbps) are faster than what we've recorded below since our server setup is limited by a 1 Gbps line.
Accessories
There are no extras in the box for a barebones unboxing experience.
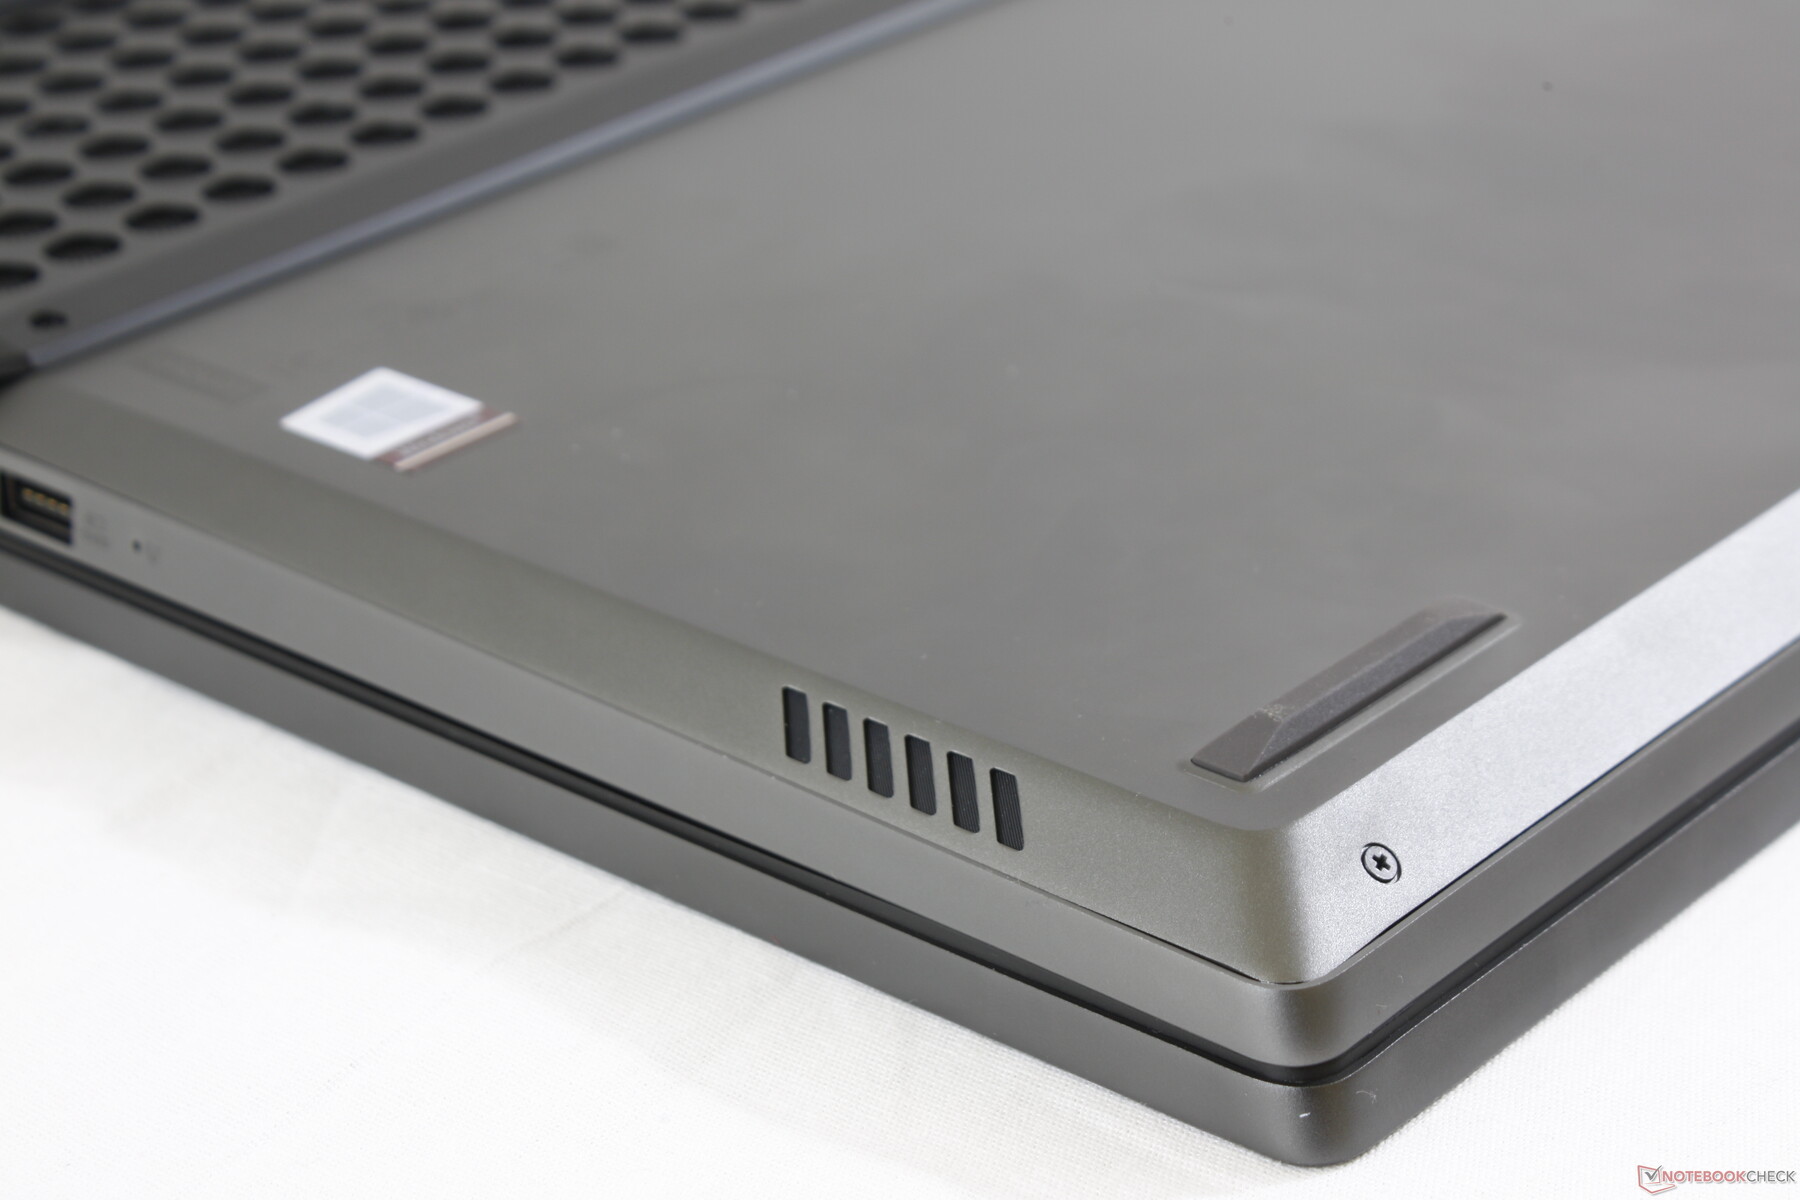
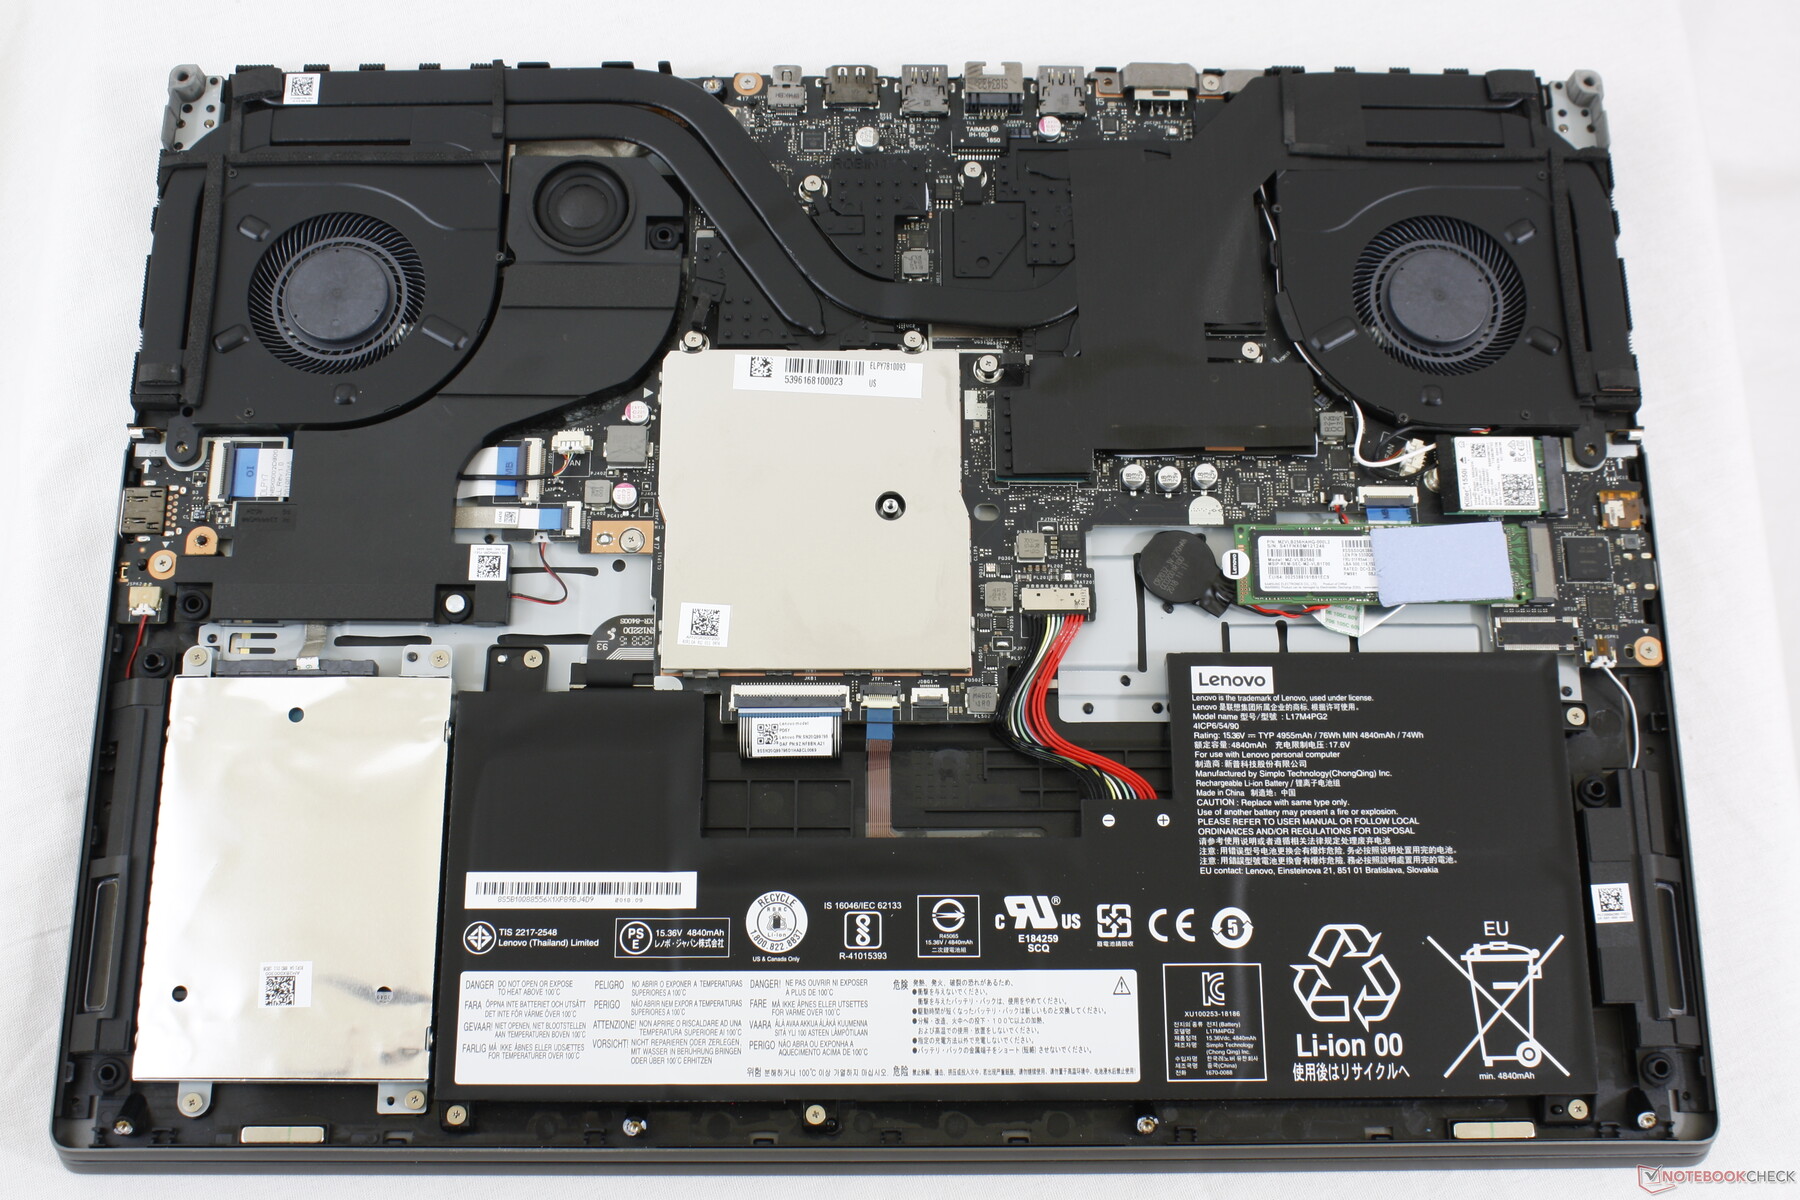
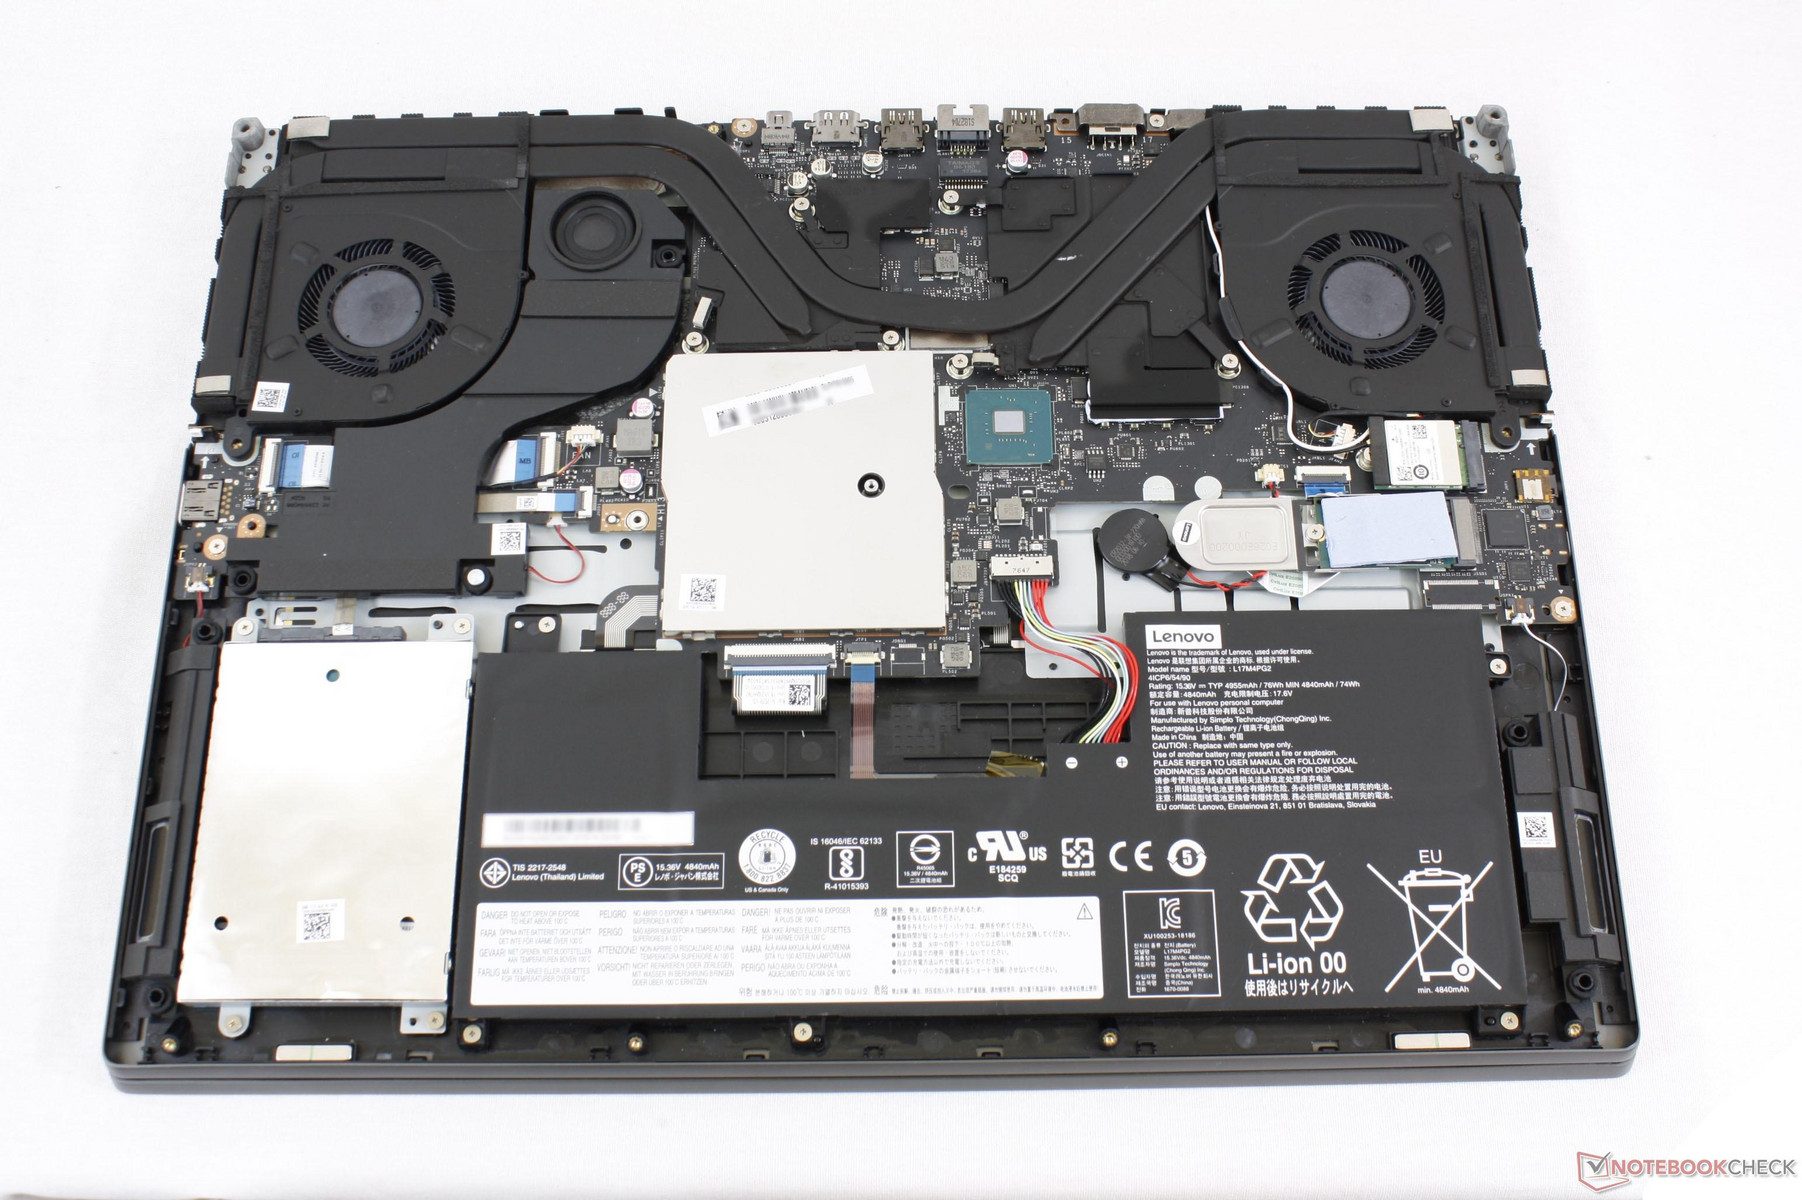
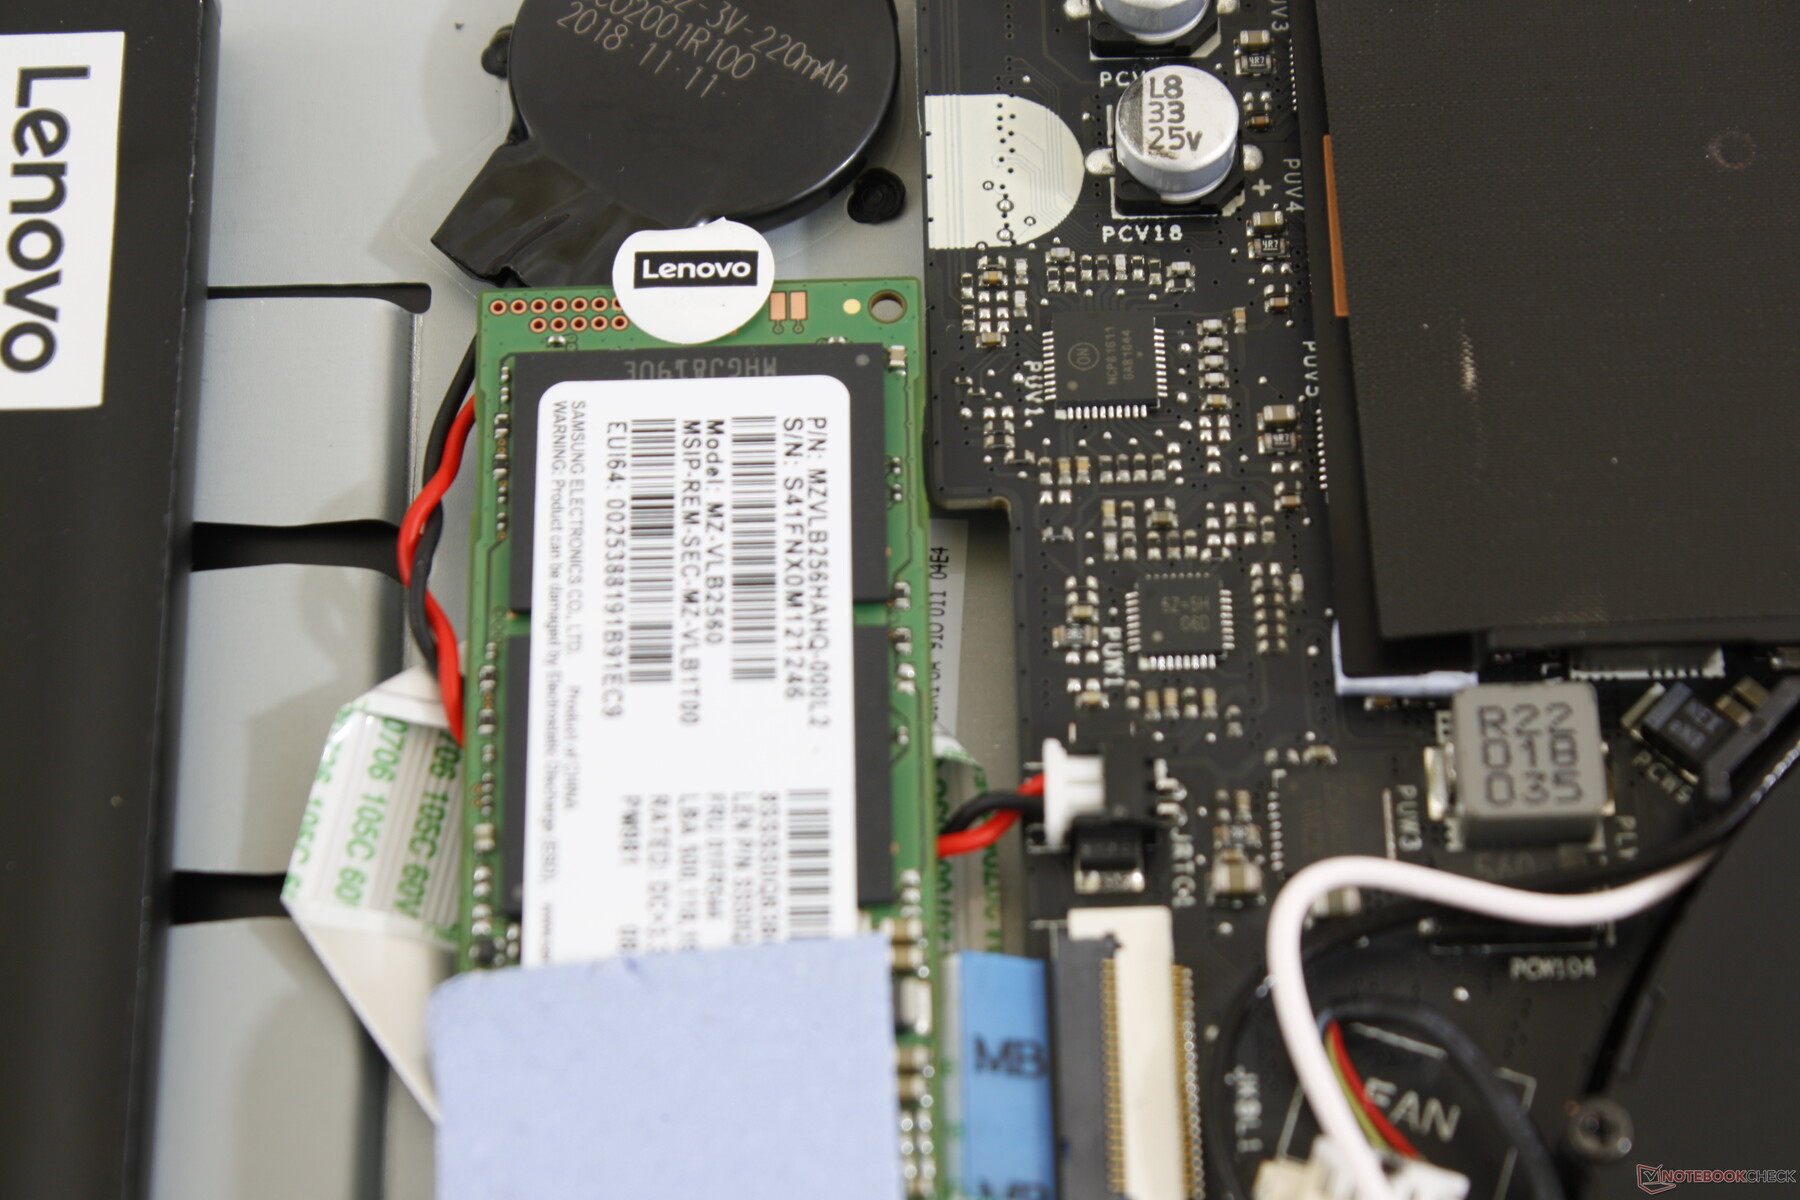
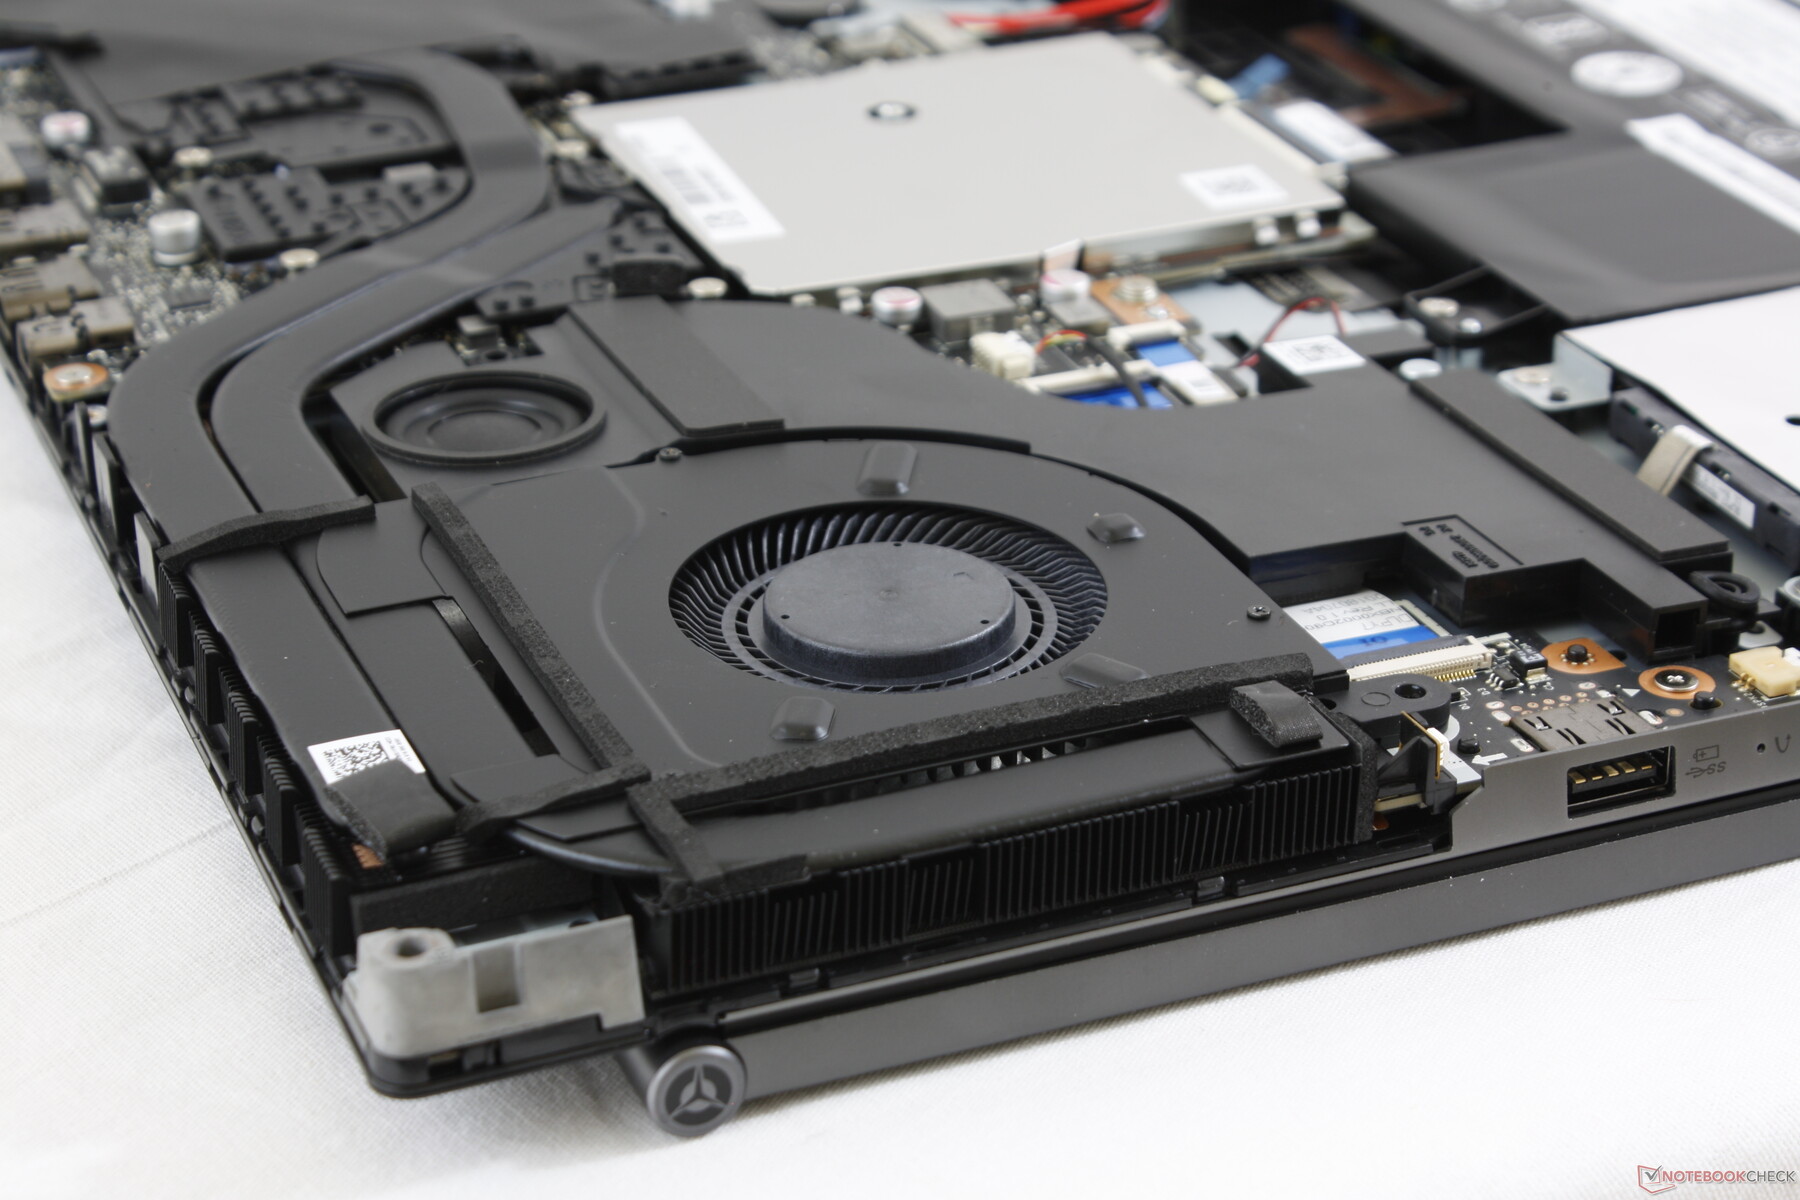
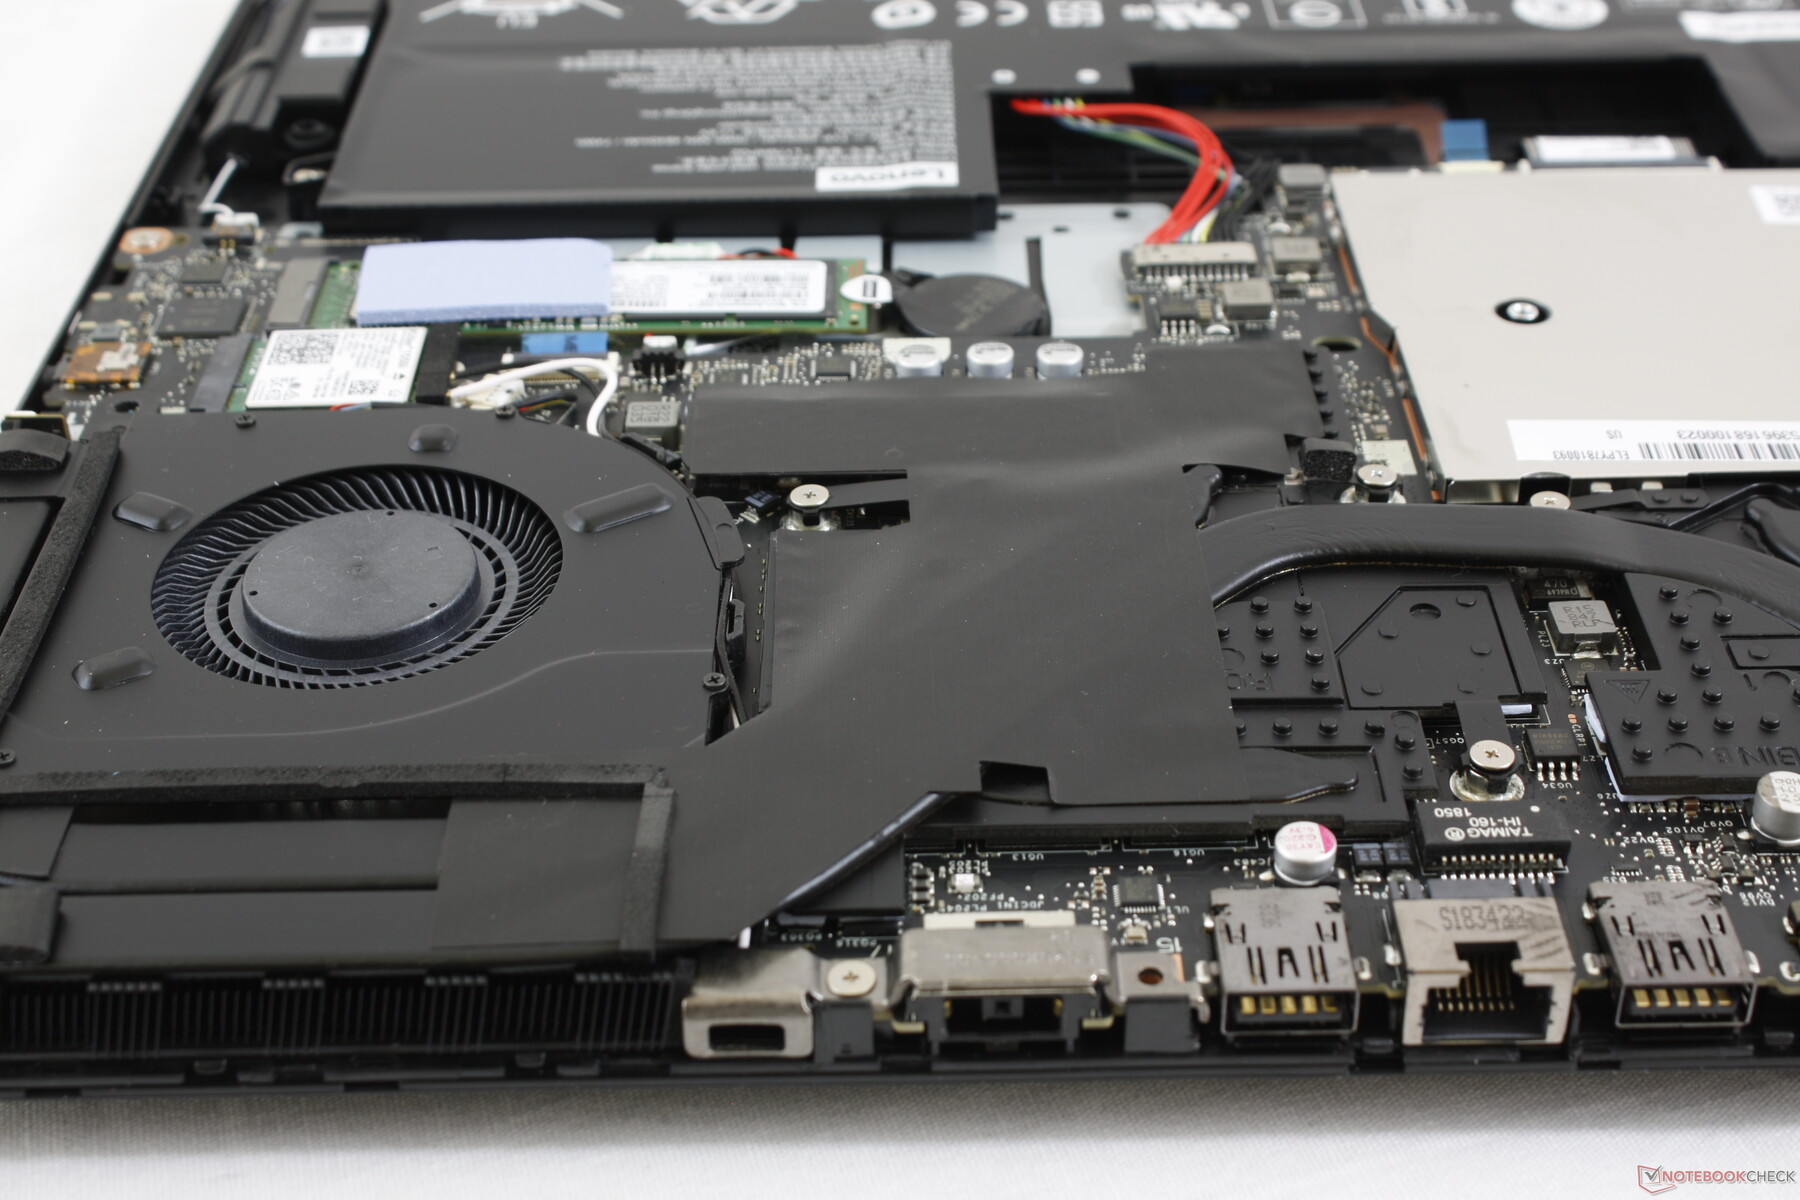
Maintenance
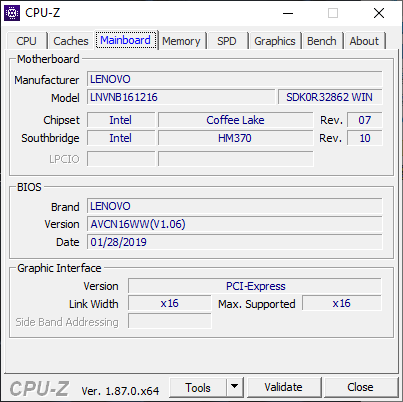
Serviceability is identical to last year's Legion Y730. We can notice no obvious changes to the motherboard layout between the two generations aside from the additional cooling over the chipset adjacent to the covered RAM slots.
Warranty
The standard one-year limited warranty applies. Lenovo offers a wide range of optional extensions including accidental damage protection and onsite support for up to three years.
Input Devices
Keyboard and Touchpad
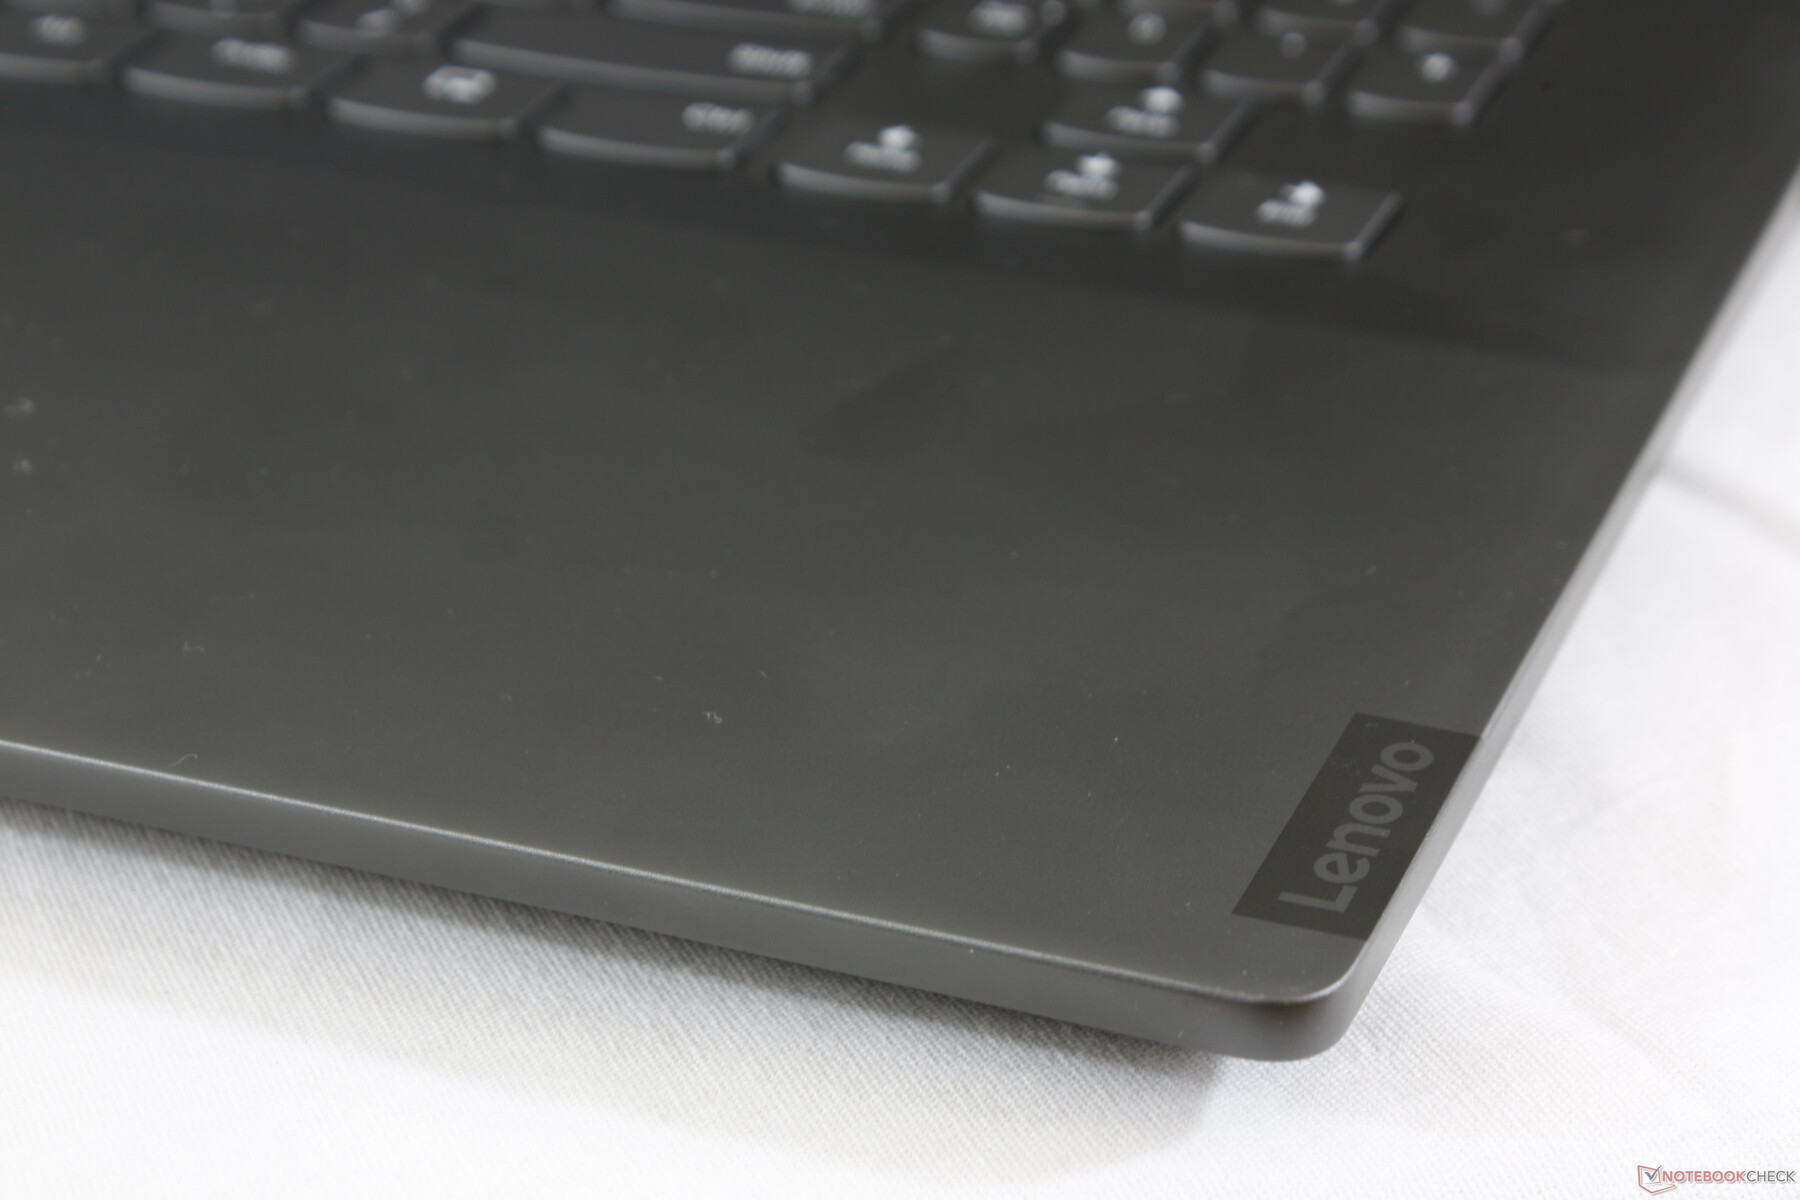
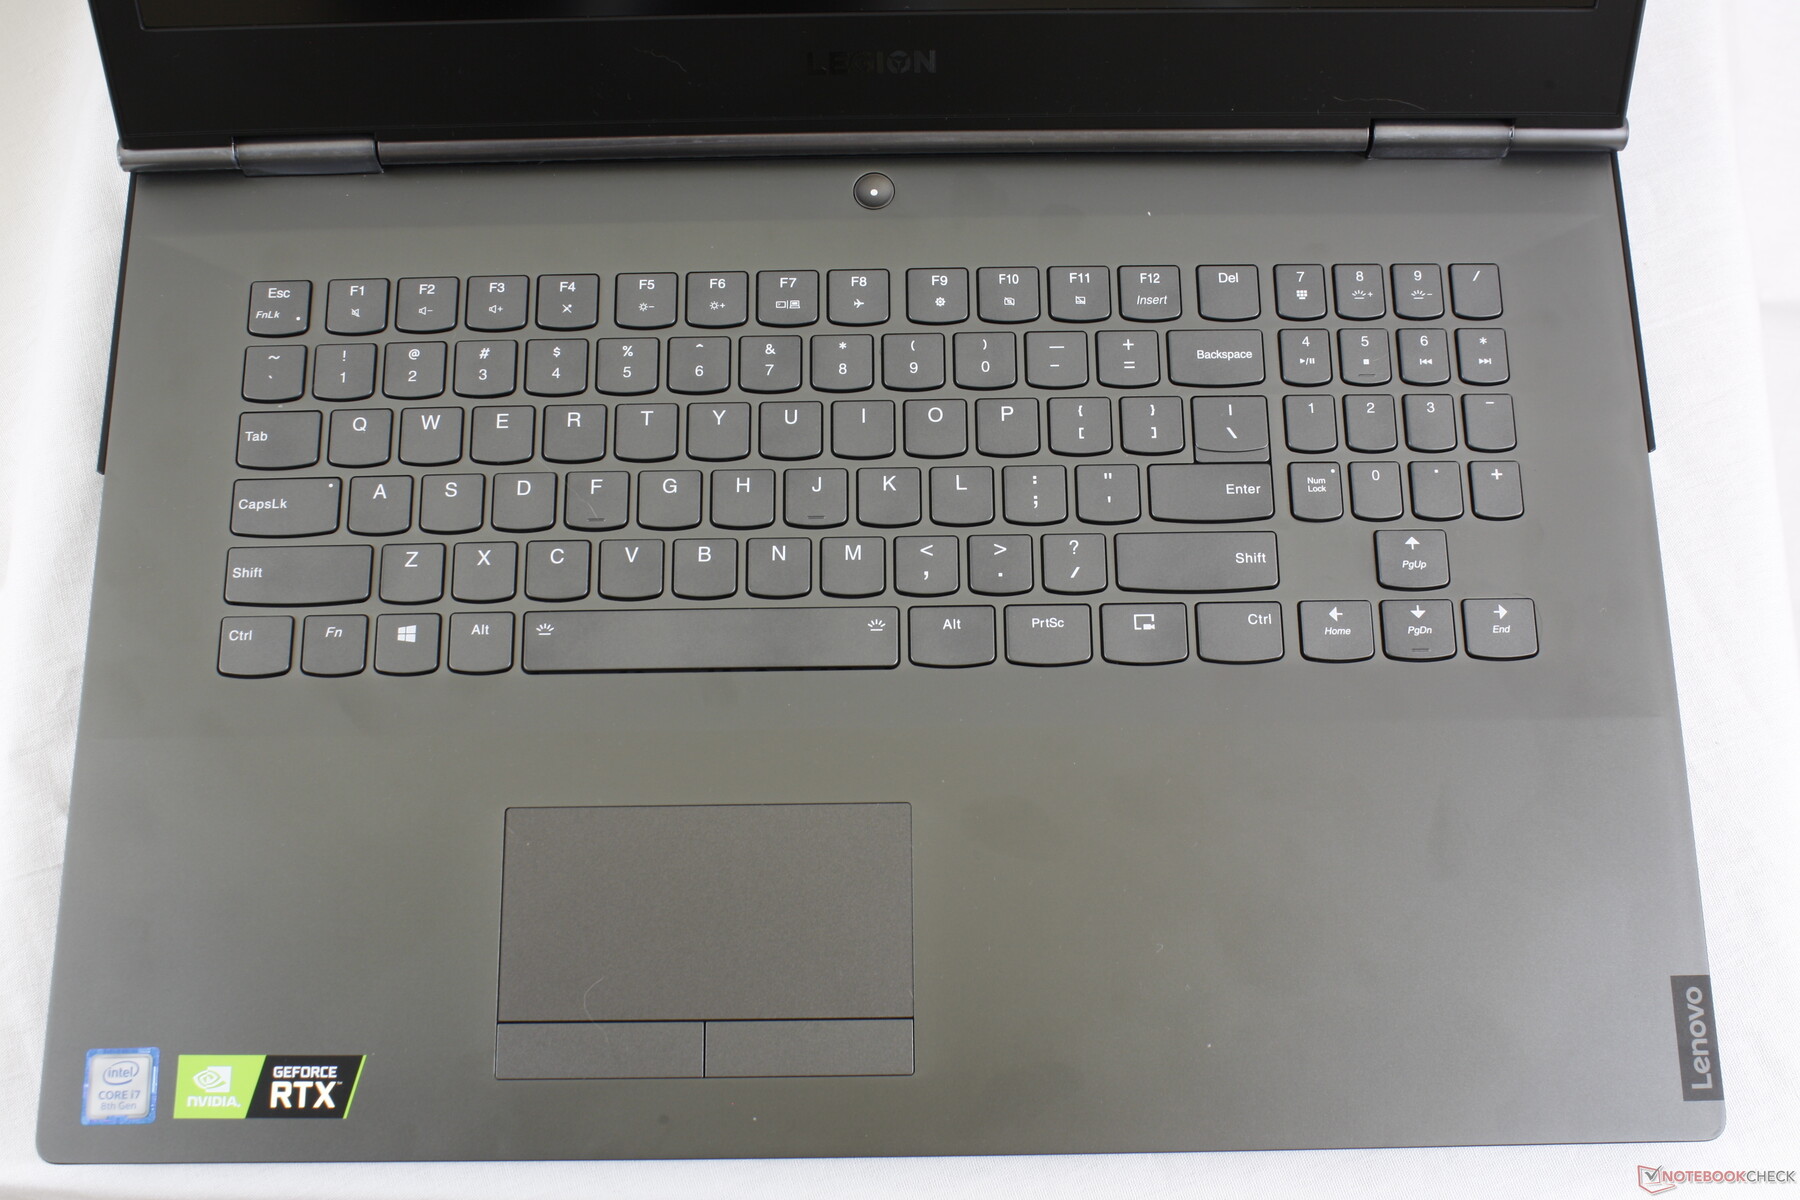
The keyboard and trackpad are identical to the Y730 and so all our existing comments still apply here. In summary, we find key feedback to be too weak and travel too short especially for a gaming laptop. The keyboards of the Gigabyte Aero 15, MSI GS65, and Alienware 17 feel stronger and firmer. On the bright side, clatter is quiet, the directional keys are large, and the numpad is an uncommon feature for its category.
The trackpad is relatively small but accurate nonetheless with no cursor jumping. Responsiveness is very smooth because of the native 144 Hz refresh rate.
Display
Lenovo has upgraded the 60 Hz 1080p IPS panel on the Legion Y730 to the 144 Hz 1080p IPS panel we have here. Both contrast ratio and response times have improved significantly while other characteristics like brightness and color coverage remain largely the same. The high quality AU Optronics B173HAN03.2 panel is common on enthusiast gaming laptops including the Asus ROG G703GI. Note that Lenovo is not offering any 4K UHD or touchscreen options for its Y740 series as of this writing.
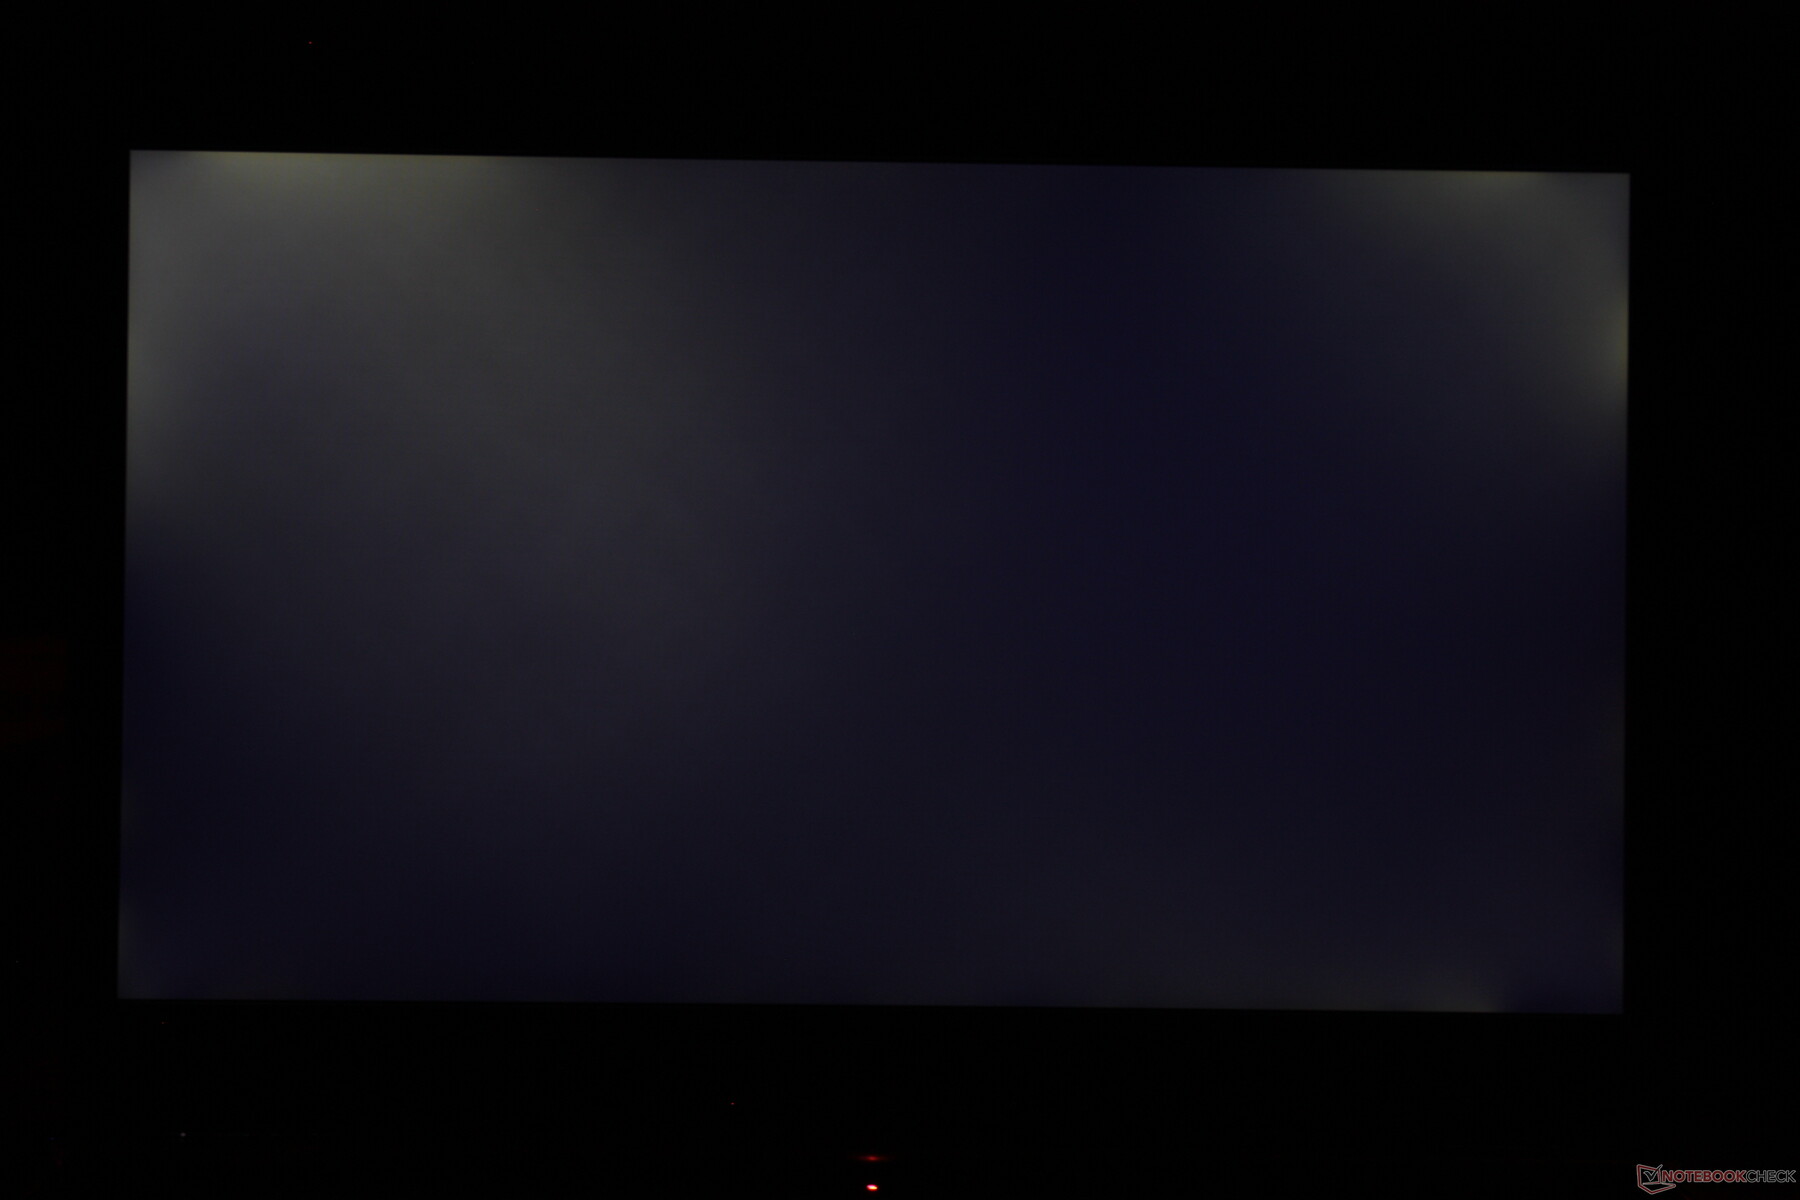
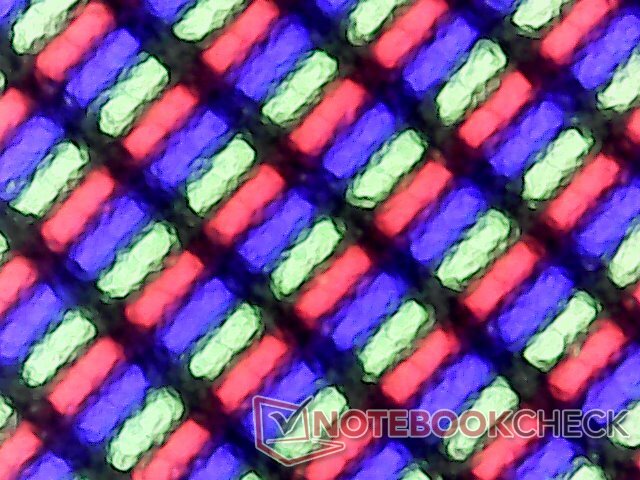
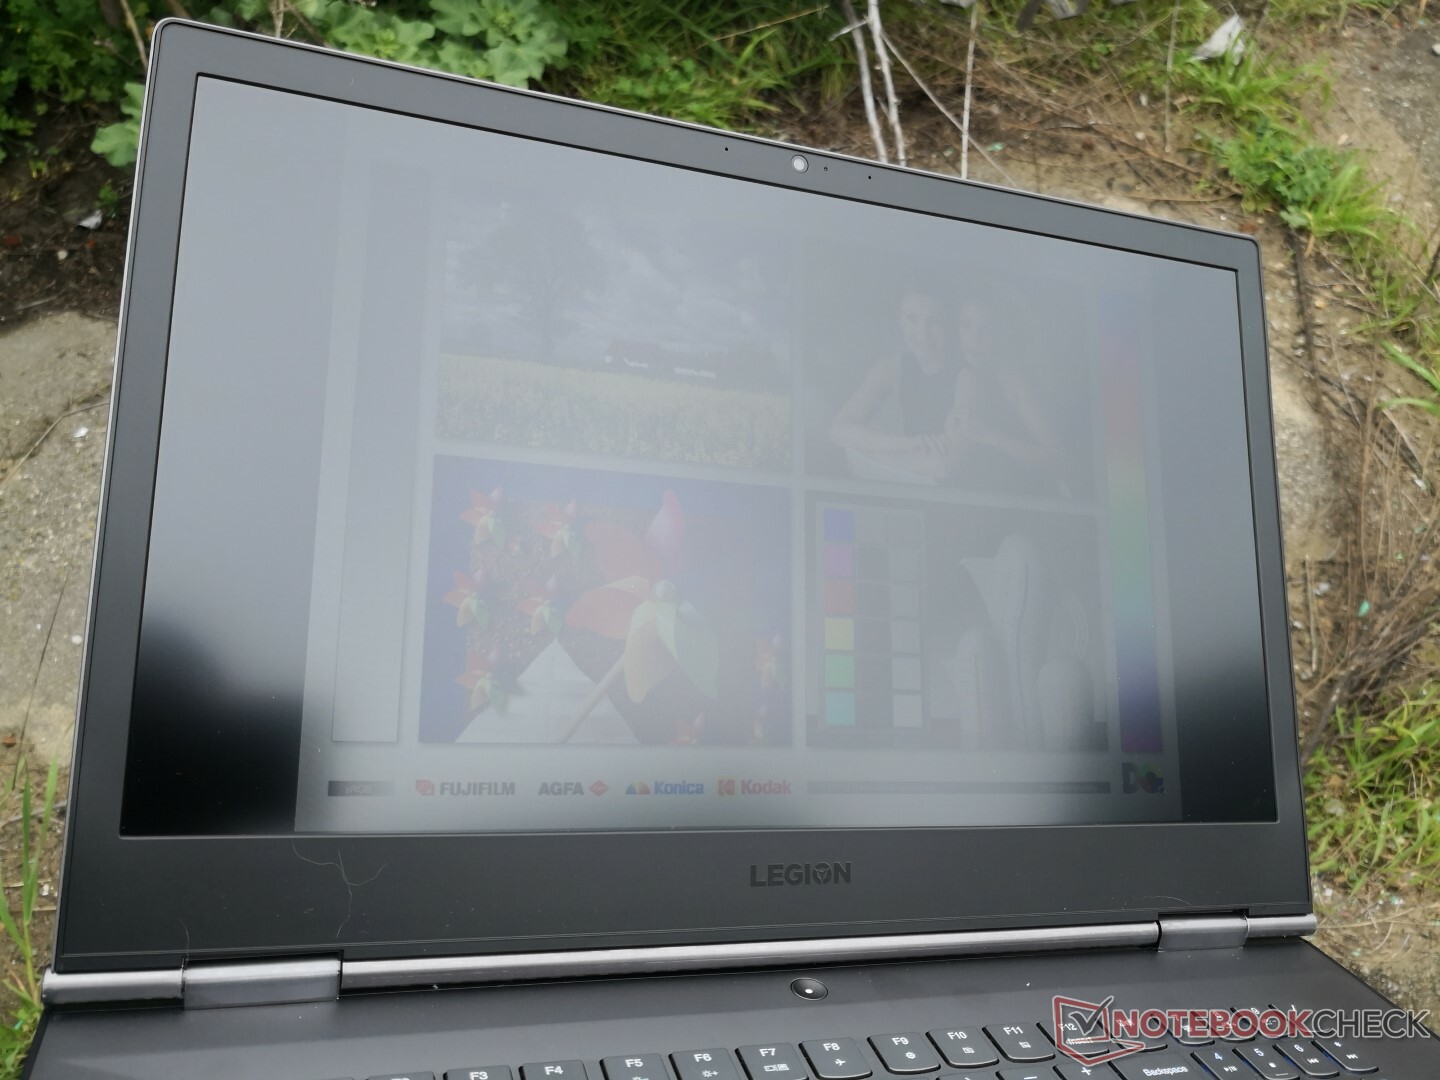
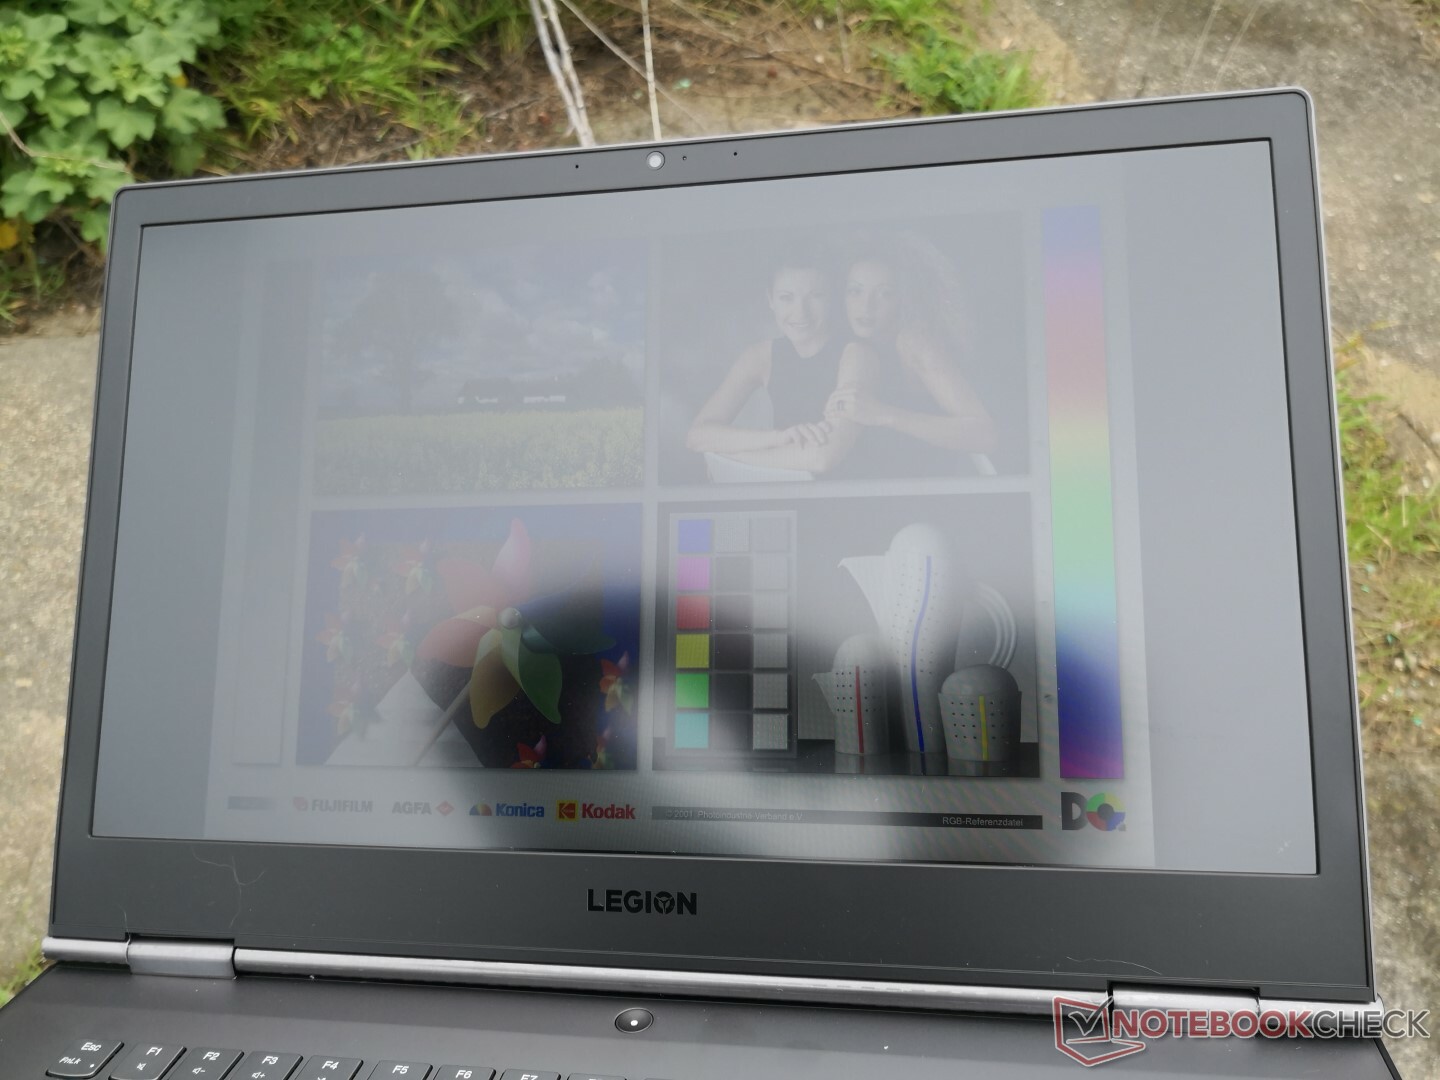
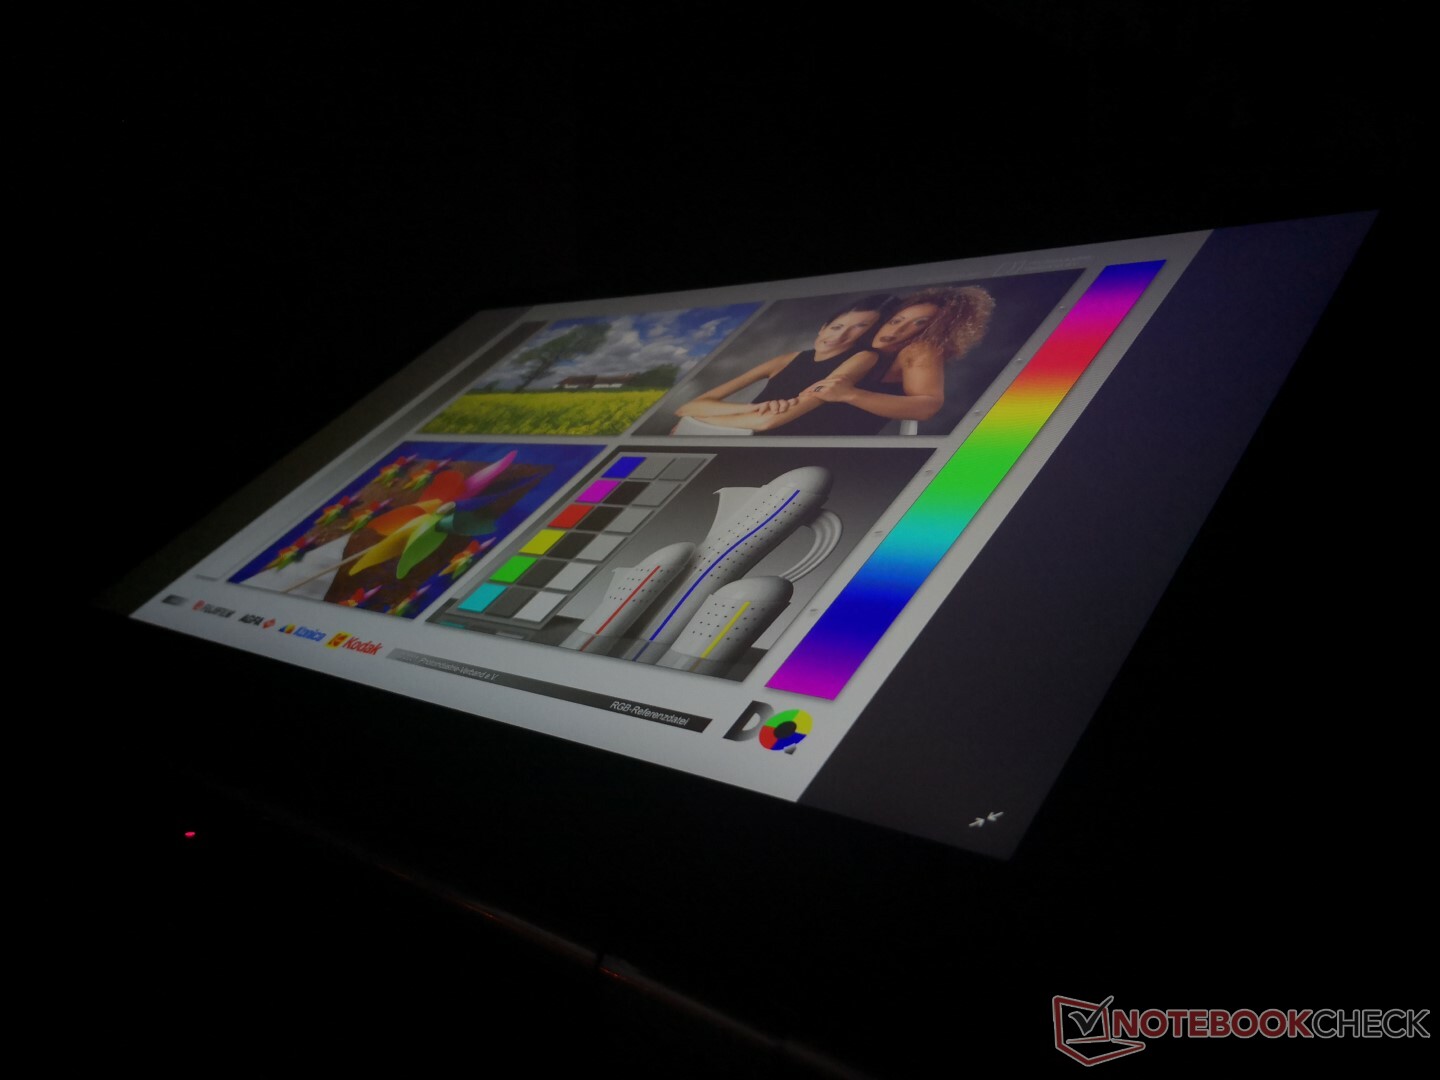
We can notice some minor graininess on the matte panel that would otherwise be absent on a glossy panel. It's not severe enough to be distracting, but it's present nonetheless. Heavy backlight bleeding is present along the edges of our test unit that's even worse than what we saw on the Legion Y730. We're hopeful that this is not a widespread issue.
| |||||||||||||||||||||||||
Brightness Distribution: 81 %
Center on Battery: 299.1 cd/m²
Contrast: 1108:1 (Black: 0.27 cd/m²)
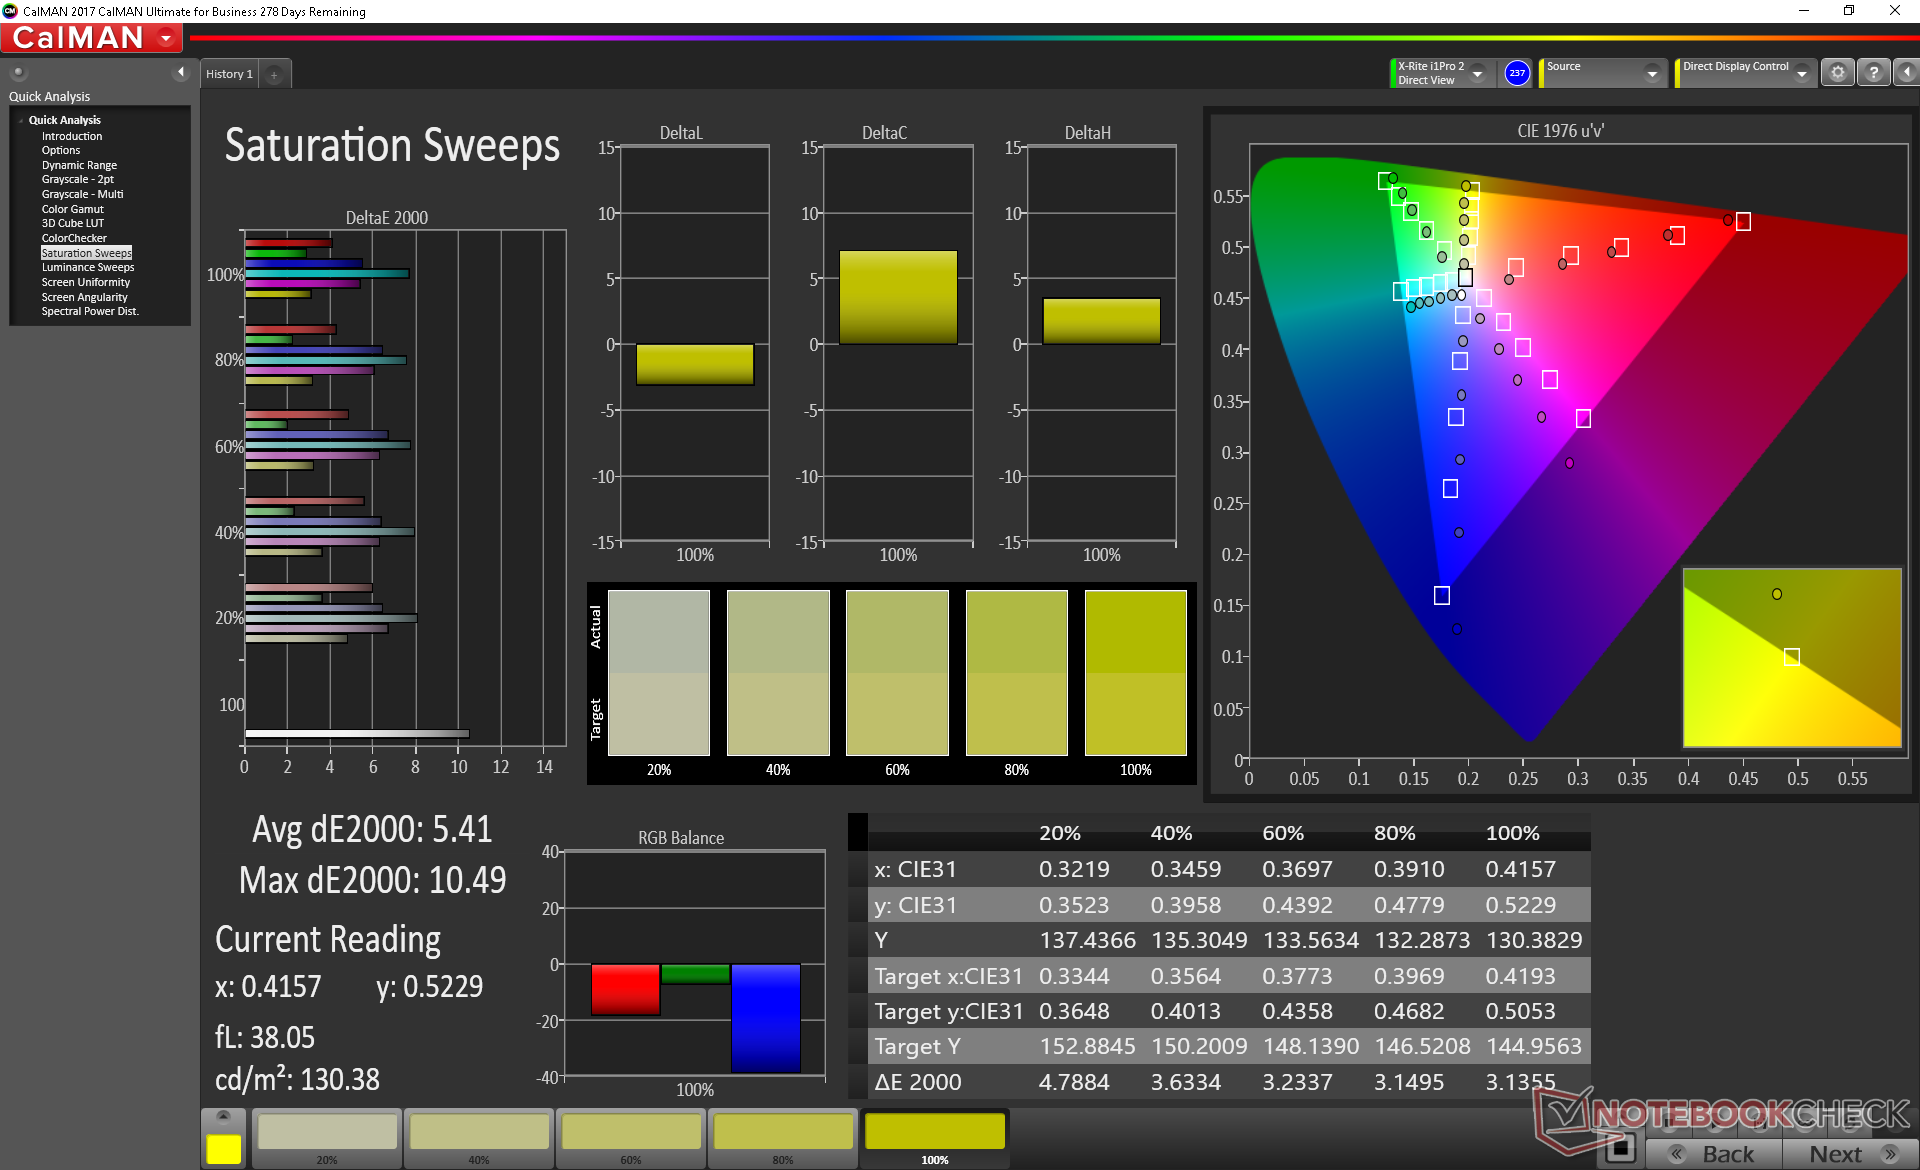
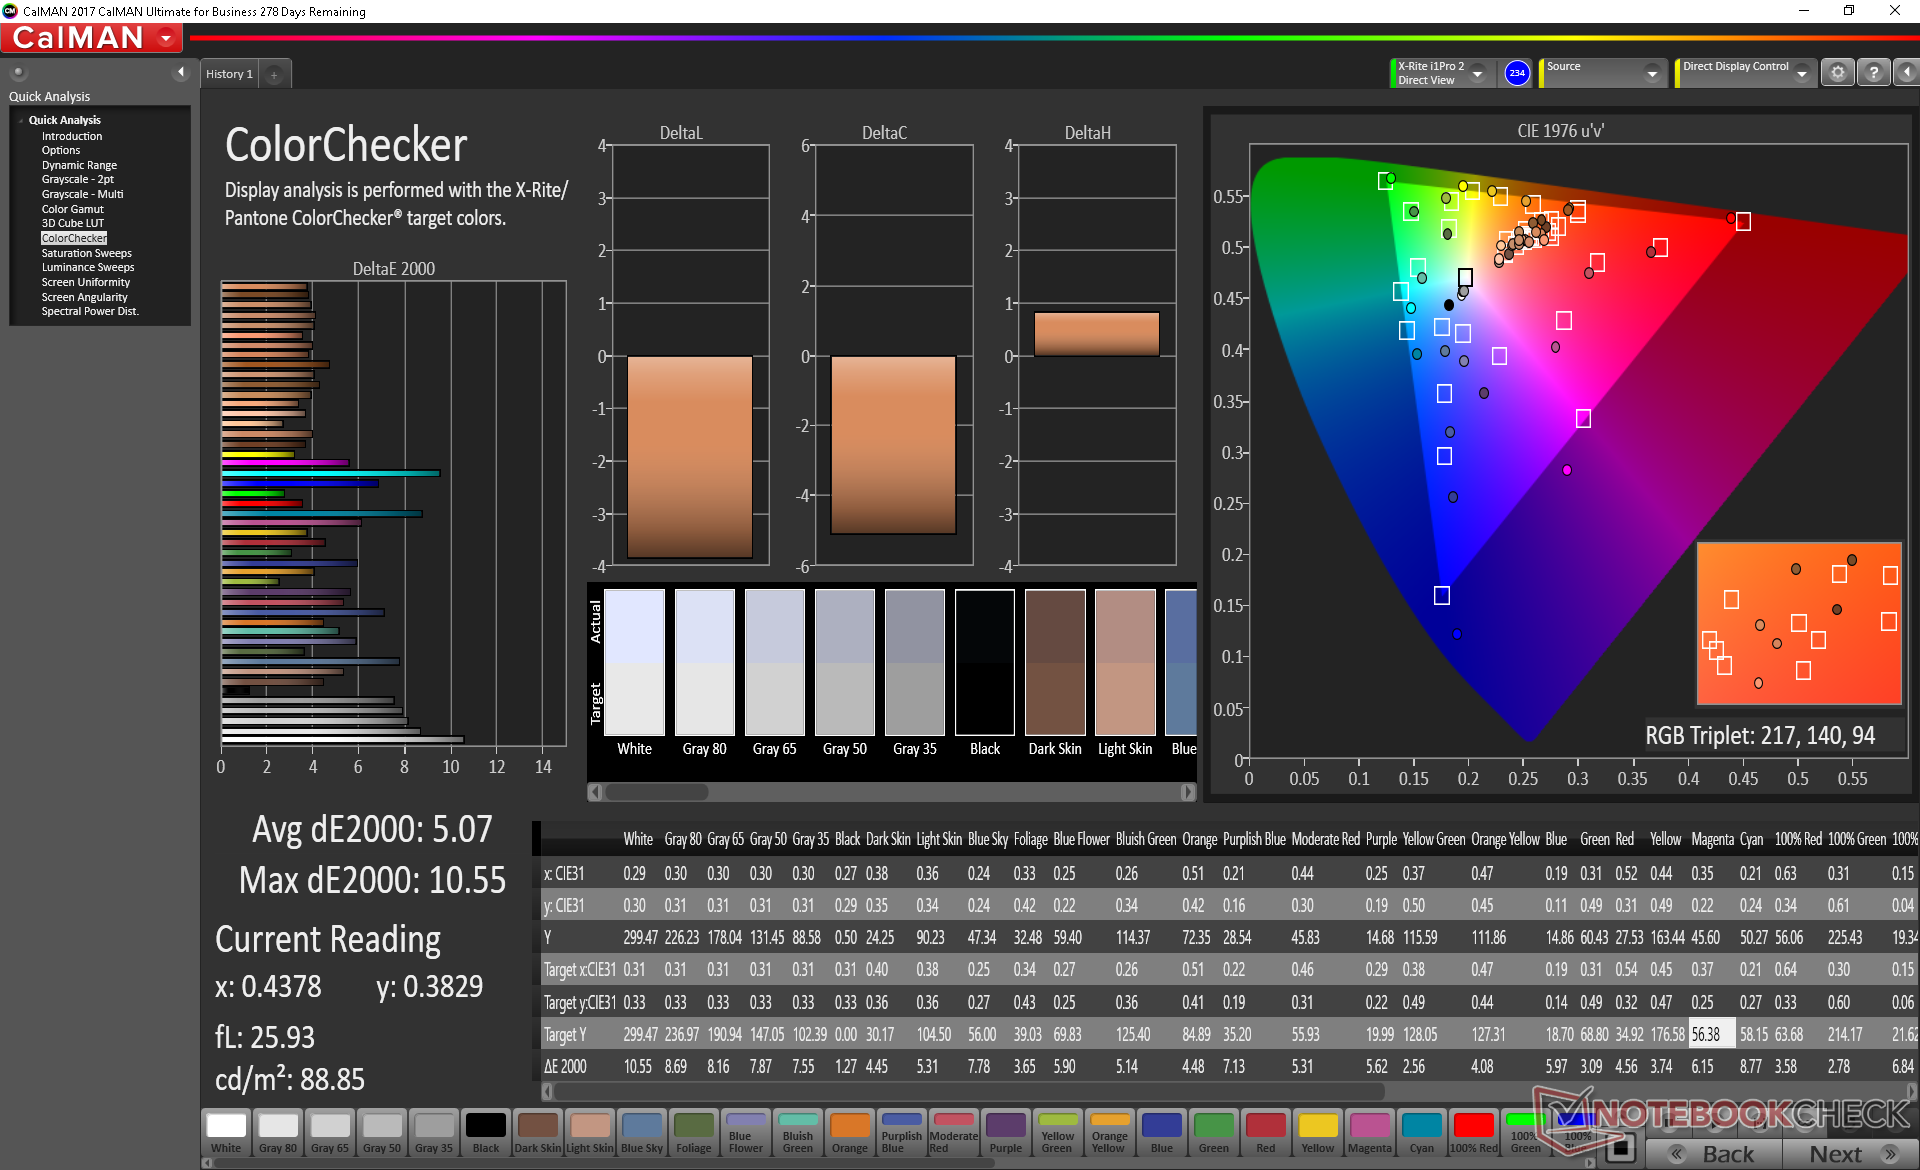
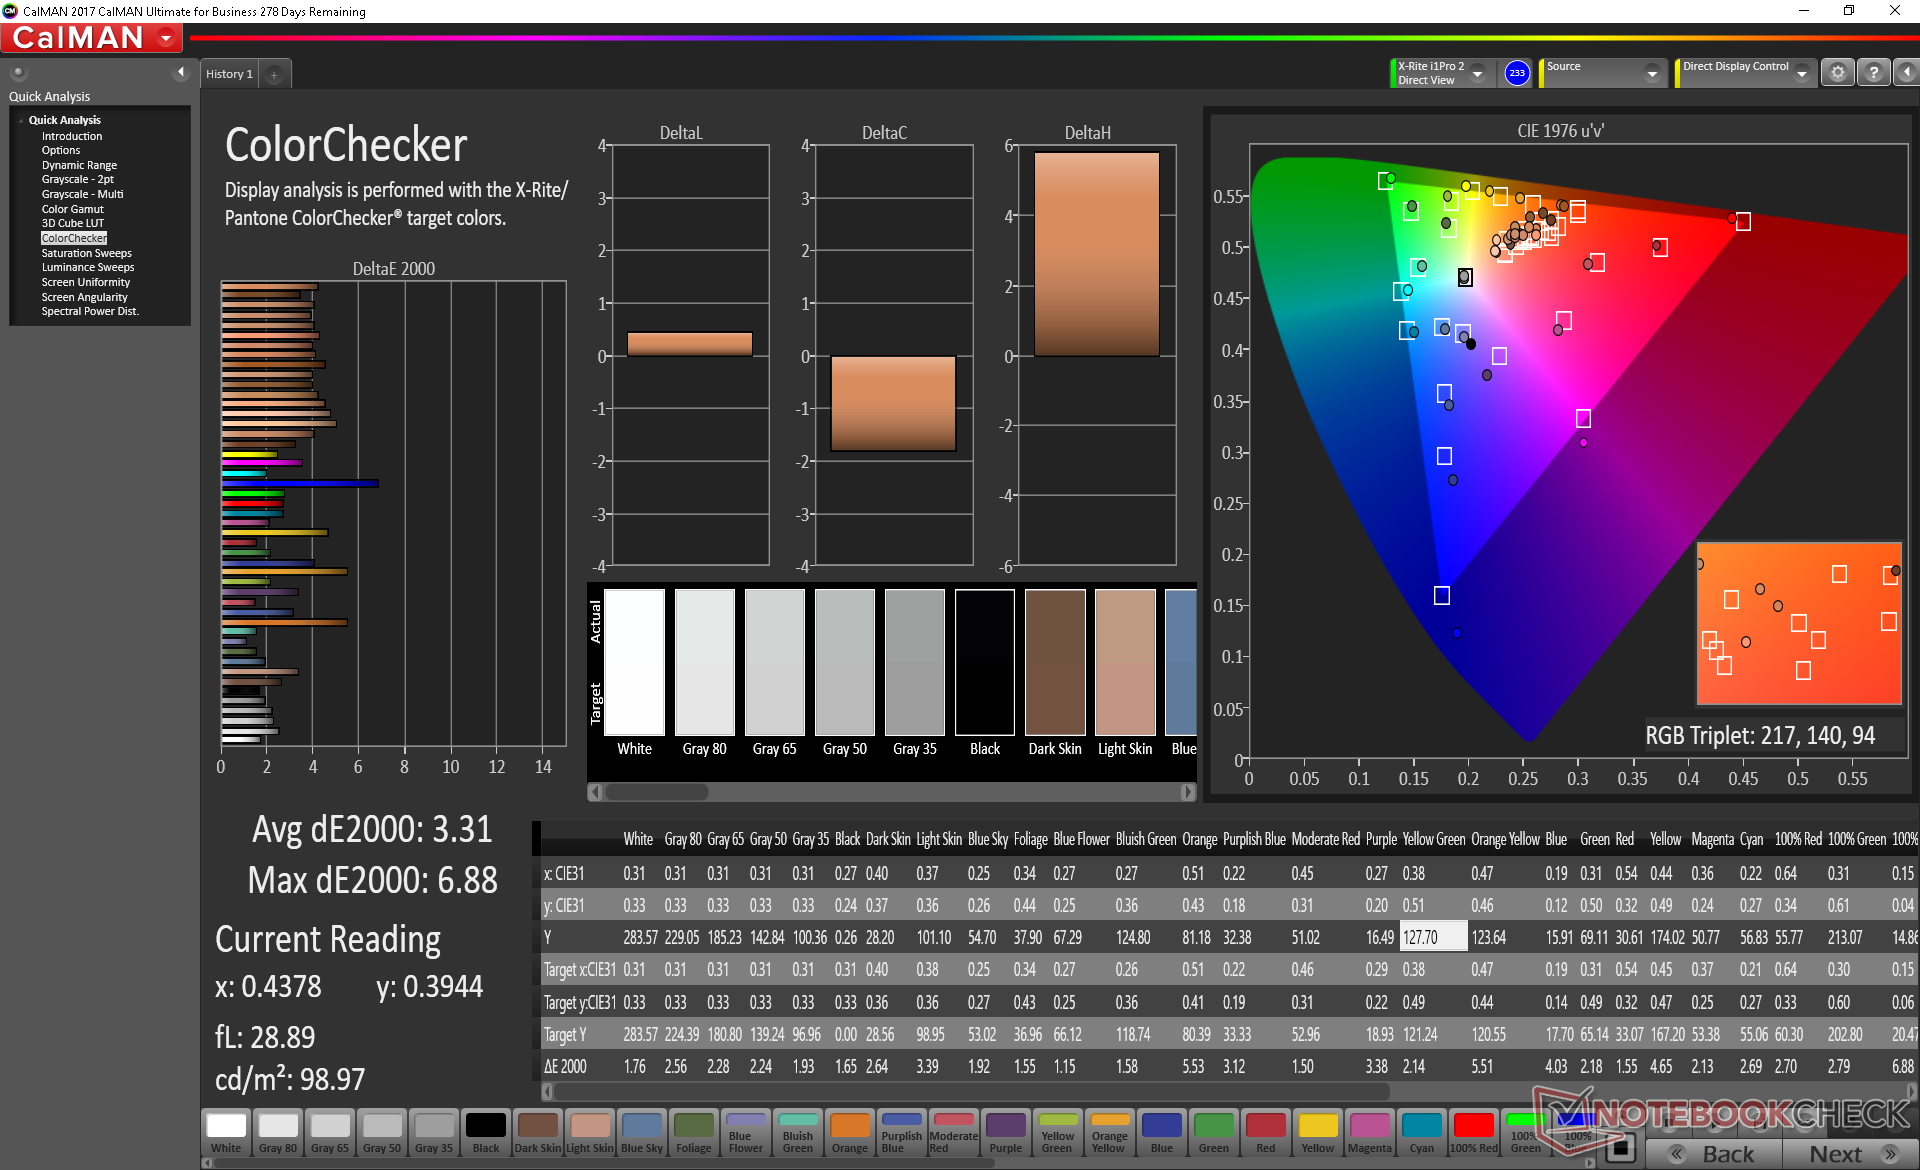
ΔE ColorChecker Calman: 5.07 | ∀{0.5-29.43 Ø4.71}
calibrated: 3.31
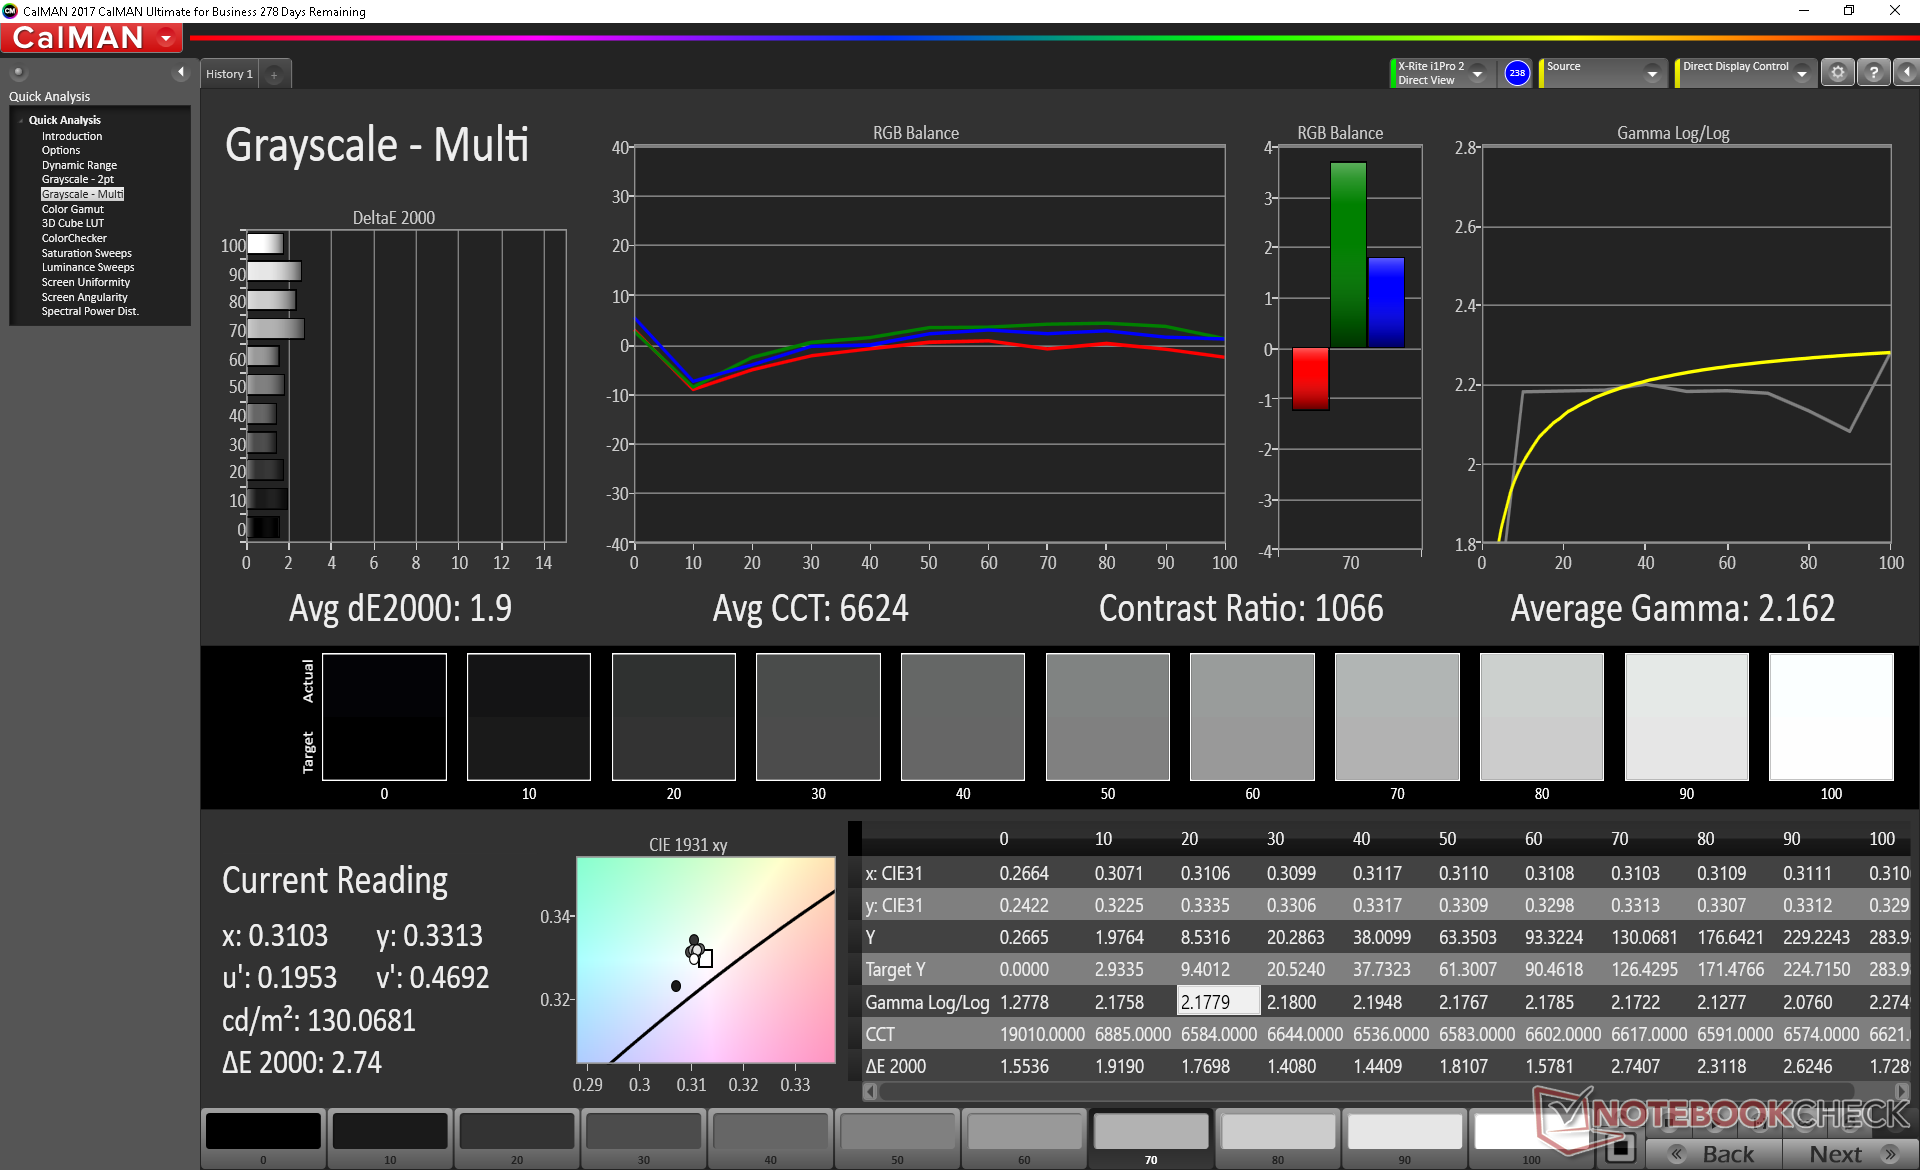
ΔE Greyscale Calman: 6.8 | ∀{0.09-98 Ø4.96}
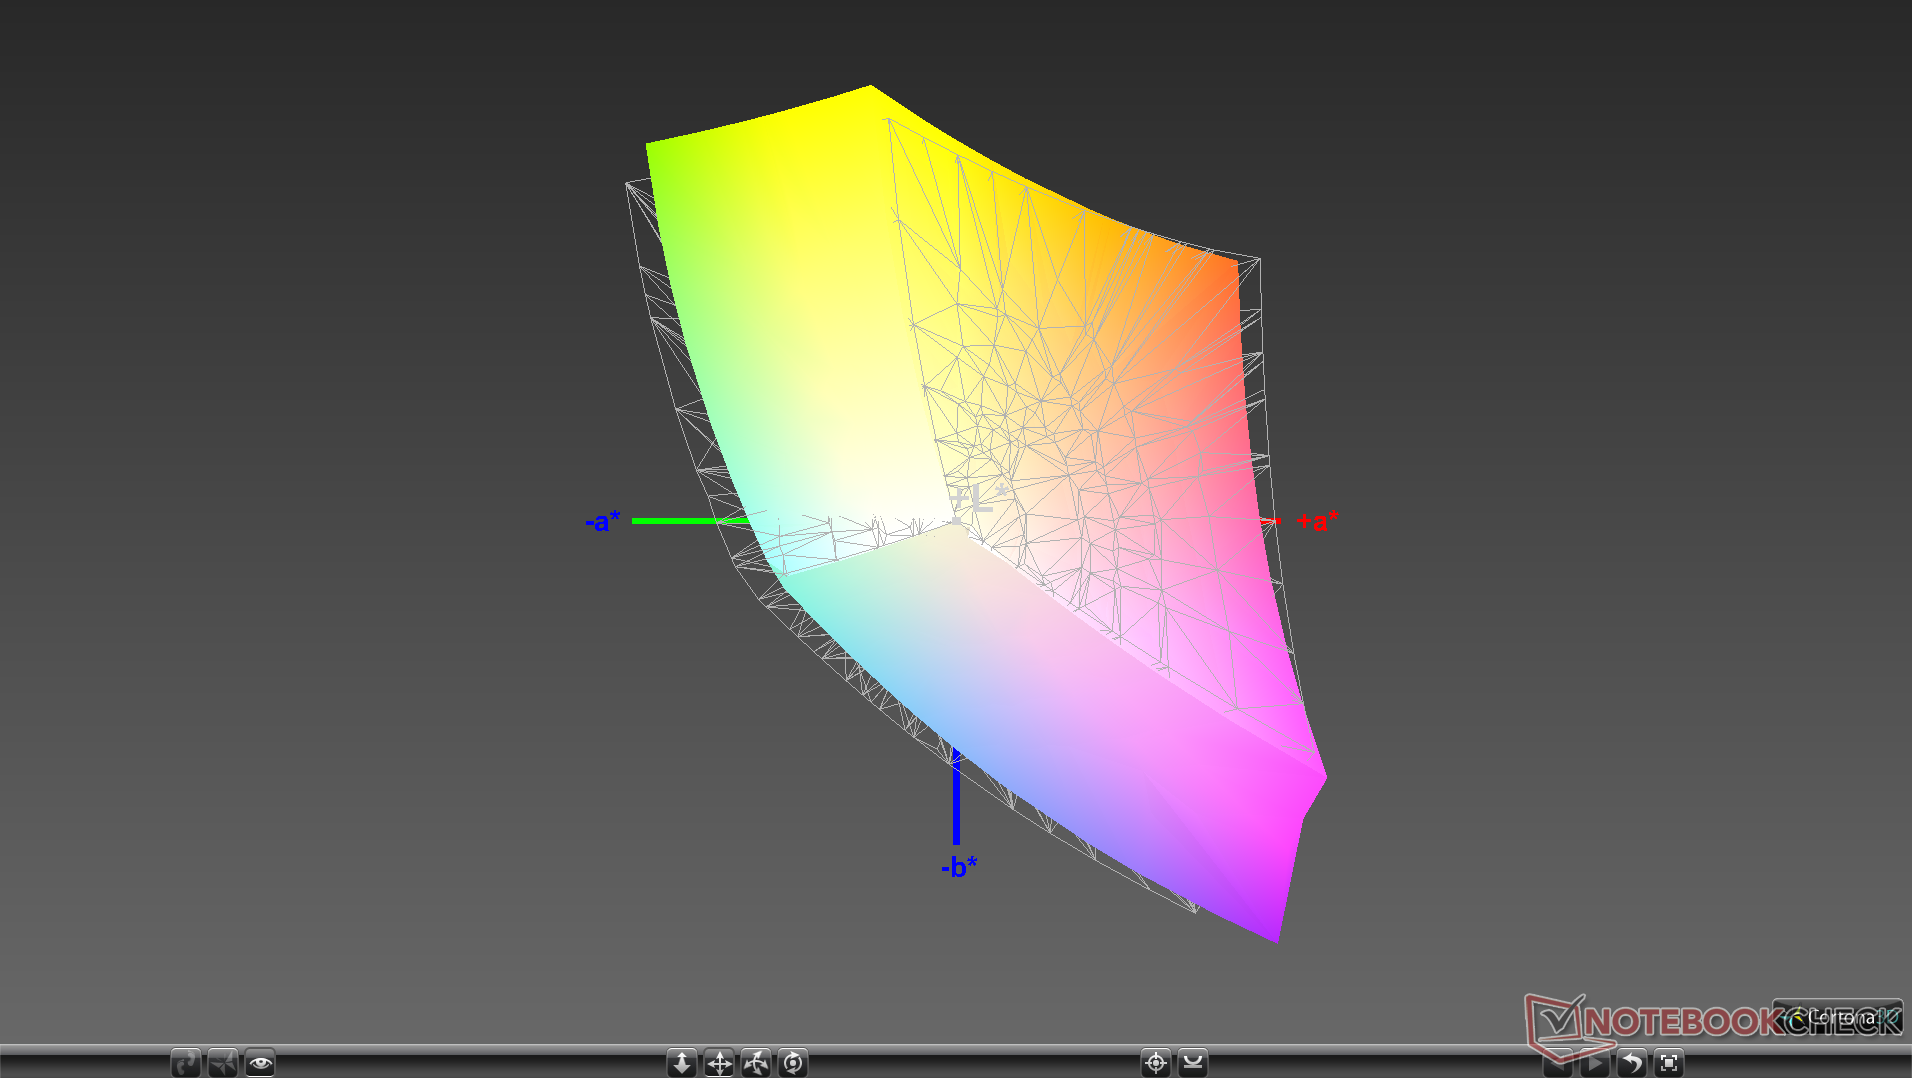
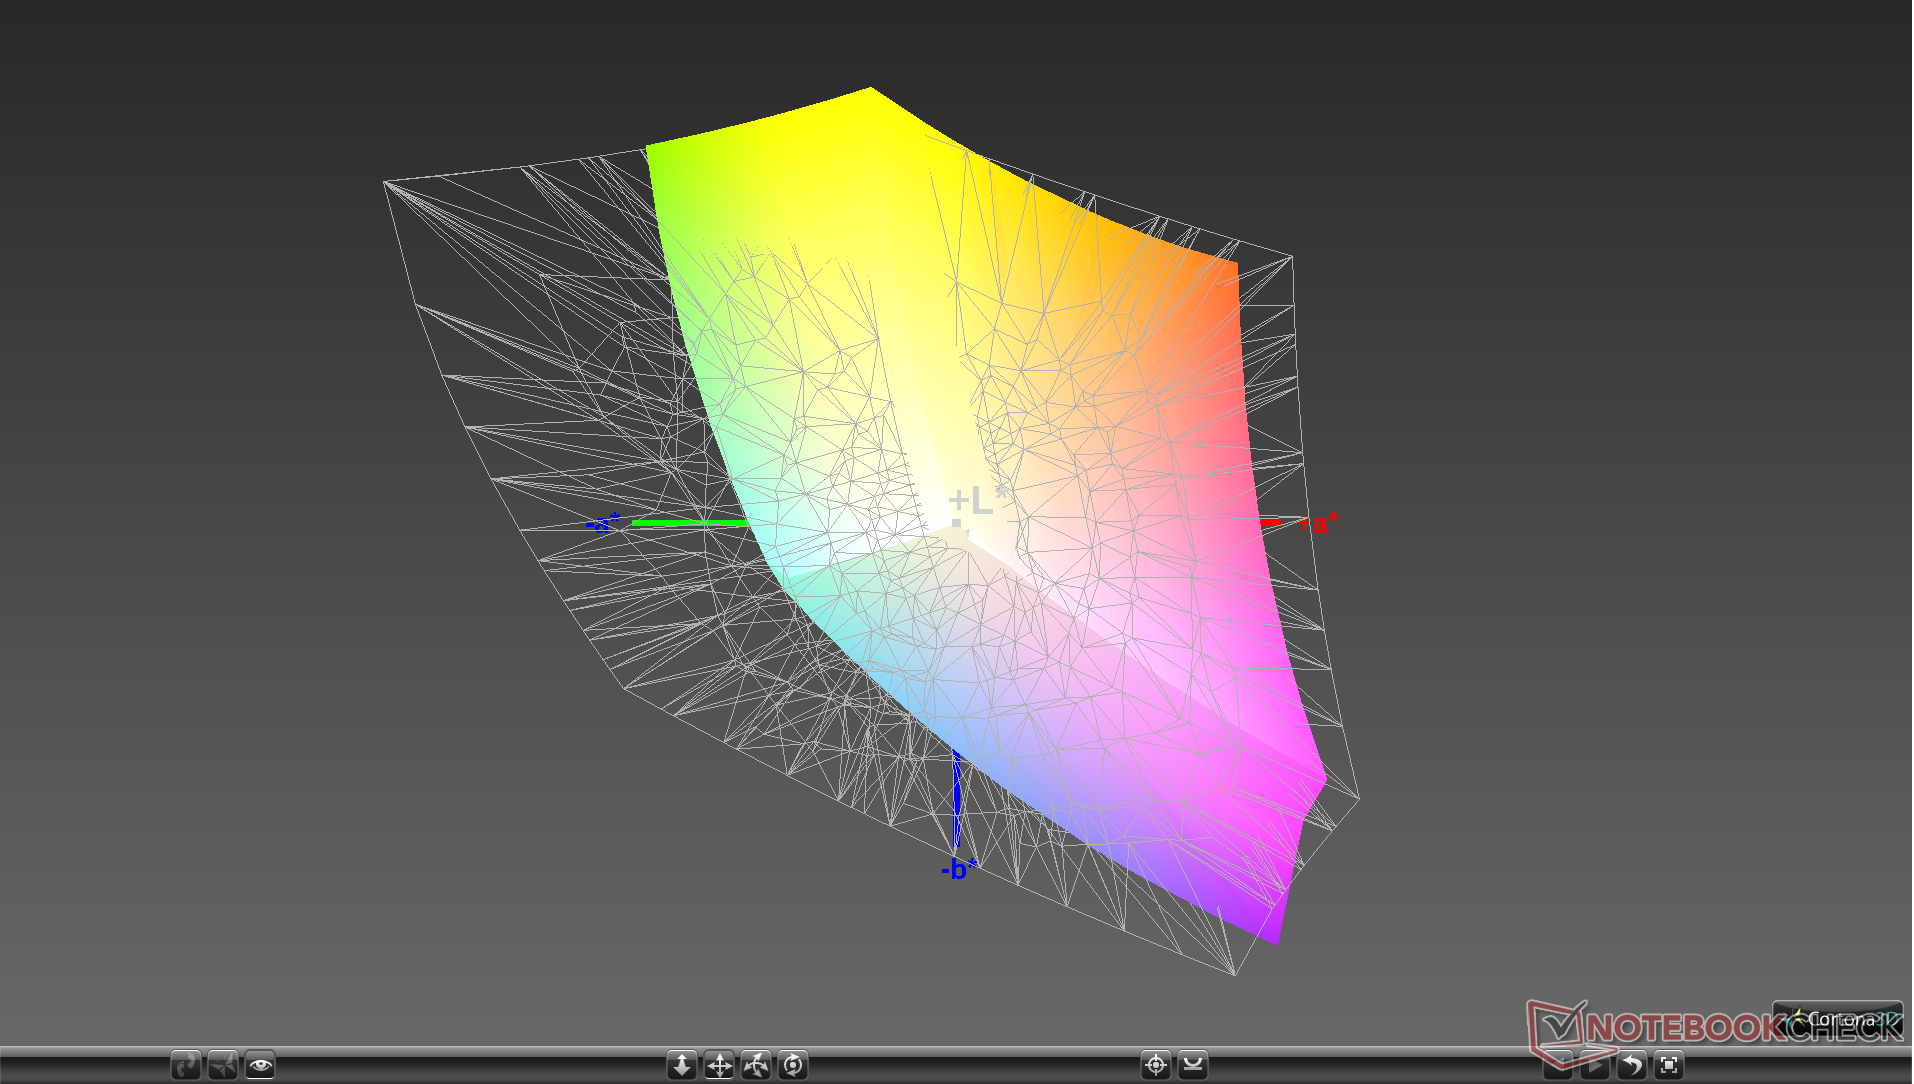
89.9% sRGB (Argyll 1.6.3 3D)
58.5% AdobeRGB 1998 (Argyll 1.6.3 3D)
64.8% AdobeRGB 1998 (Argyll 3D)
90.4% sRGB (Argyll 3D)
64% Display P3 (Argyll 3D)
Gamma: 2.46
CCT: 7805 K
| Lenovo Legion Y740-17ICH AU Optronics B173HAN03.2, IPS, 17.3", 1920x1080 | Asus ROG Strix Scar II GL704GW B173HAN04.0 (AUO409D), AHVA, 17.3", 1920x1080 | Razer Blade Pro 2017 Sharp LQ173D1JW33 (SHP145A), IGZO, 17.3", 3840x2160 | MSI GE75 8SG Raider CMN N173HCE-G33 (CMN175C), AHVA, 17.3", 1920x1080 | Alienware 17 R5 JYWWF_B173QTN (AUO1496), TN, 17.3", 2560x1440 | Lenovo Legion Y730-17ICH, i7-8750H LP173WF4-SPF6, IPS, 17.3", 1920x1080 | |
|---|---|---|---|---|---|---|
| Display | -3% | 35% | -2% | -3% | -2% | |
| Display P3 Coverage (%) | 64 | 62.9 -2% | 88.9 39% | 60.6 -5% | 63.4 -1% | 66.4 4% |
| sRGB Coverage (%) | 90.4 | 87.1 -4% | 100 11% | 91.2 1% | 86.1 -5% | 84.9 -6% |
| AdobeRGB 1998 Coverage (%) | 64.8 | 63.7 -2% | 99.7 54% | 62.6 -3% | 62.9 -3% | 62.1 -4% |
| Response Times | 0% | -245% | 39% | 10% | -112% | |
| Response Time Grey 50% / Grey 80% * (ms) | 15.6 ? | 17.6 ? -13% | 60.8 ? -290% | 8 ? 49% | 20.8 ? -33% | 36.8 ? -136% |
| Response Time Black / White * (ms) | 12.8 ? | 11.2 ? 13% | 38.4 ? -200% | 9.2 ? 28% | 6 ? 53% | 24 ? -88% |
| PWM Frequency (Hz) | 204.9 ? | 26040 ? | ||||
| Screen | 19% | 7% | 24% | -1% | -8% | |
| Brightness middle (cd/m²) | 299.1 | 295 -1% | 230 -23% | 363 21% | 398 33% | 328.7 10% |
| Brightness (cd/m²) | 273 | 291 7% | 207 -24% | 342 25% | 367 34% | 318 16% |
| Brightness Distribution (%) | 81 | 96 19% | 83 2% | 86 6% | 86 6% | 91 12% |
| Black Level * (cd/m²) | 0.27 | 0.24 11% | 0.2 26% | 0.27 -0% | 0.51 -89% | 0.51 -89% |
| Contrast (:1) | 1108 | 1229 11% | 1150 4% | 1344 21% | 780 -30% | 645 -42% |
| Colorchecker dE 2000 * | 5.07 | 3.2 37% | 5.62 -11% | 2.29 55% | 5.45 -7% | 4.91 3% |
| Colorchecker dE 2000 max. * | 10.55 | 6.64 37% | 10.24 3% | 4.54 57% | 10.36 2% | 10.15 4% |
| Colorchecker dE 2000 calibrated * | 3.31 | 2.52 24% | 2.45 26% | 2.56 23% | 4.27 -29% | |
| Greyscale dE 2000 * | 6.8 | 2.16 68% | 4.54 33% | 3.02 56% | 5.4 21% | 3.9 43% |
| Gamma | 2.46 89% | 2.46 89% | 2.36 93% | 2.38 92% | 2.4 92% | 2.13 103% |
| CCT | 7805 83% | 6872 95% | 6625 98% | 7048 92% | 7453 87% | 6911 94% |
| Color Space (Percent of AdobeRGB 1998) (%) | 58.5 | 57 -3% | 88 50% | 58 -1% | 56 -4% | 55.6 -5% |
| Color Space (Percent of sRGB) (%) | 89.9 | 87 -3% | 100 11% | 91 1% | 86 -4% | 84.7 -6% |
| Total Average (Program / Settings) | 5% /
12% | -68% /
-21% | 20% /
21% | 2% /
-0% | -41% /
-20% |
* ... smaller is better
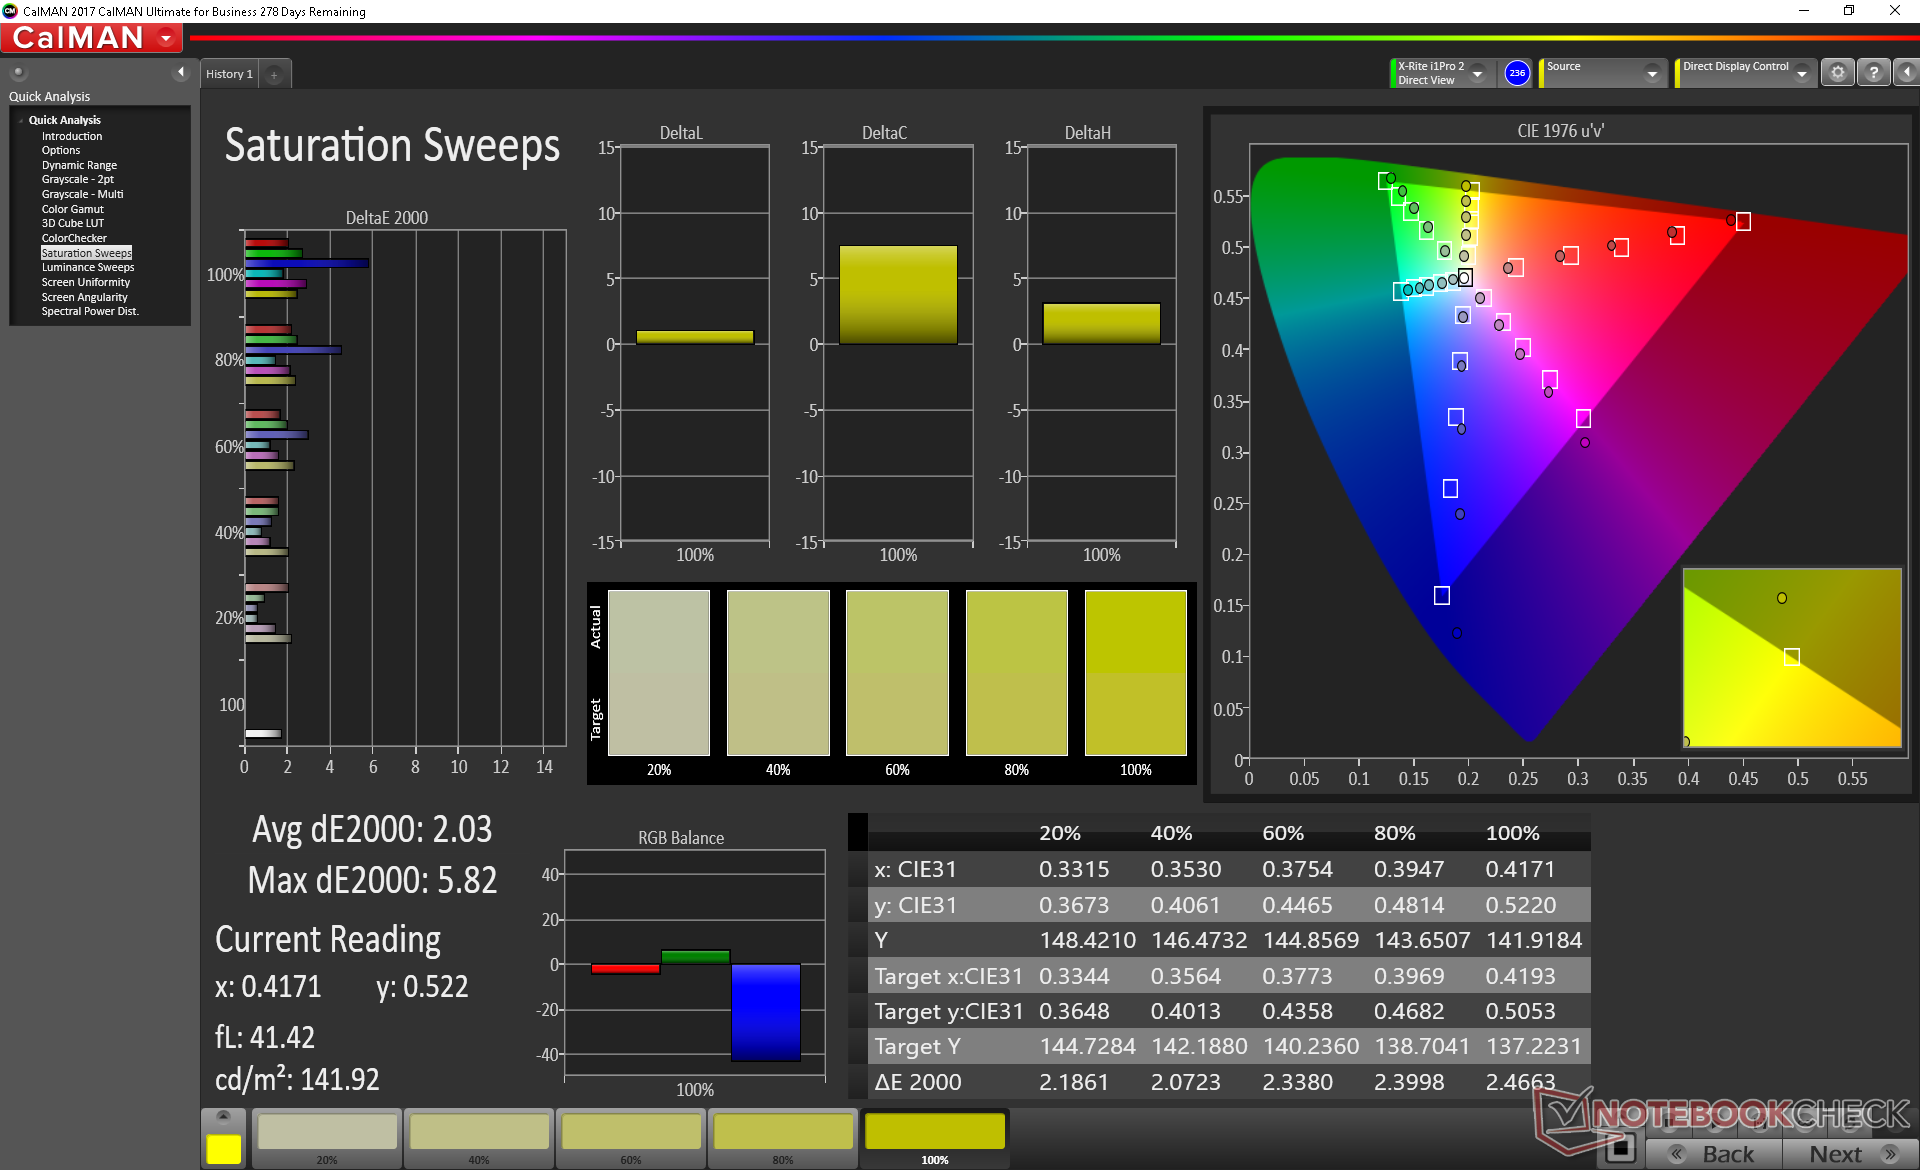
Color space covers approximately 59 percent and 90 percent of AdobeRGB and sRGB standards, respectively. This is narrower than the Sharp IGZO display of the Razer Blade Pro but with significantly less ghosting when playing fast-paced games.
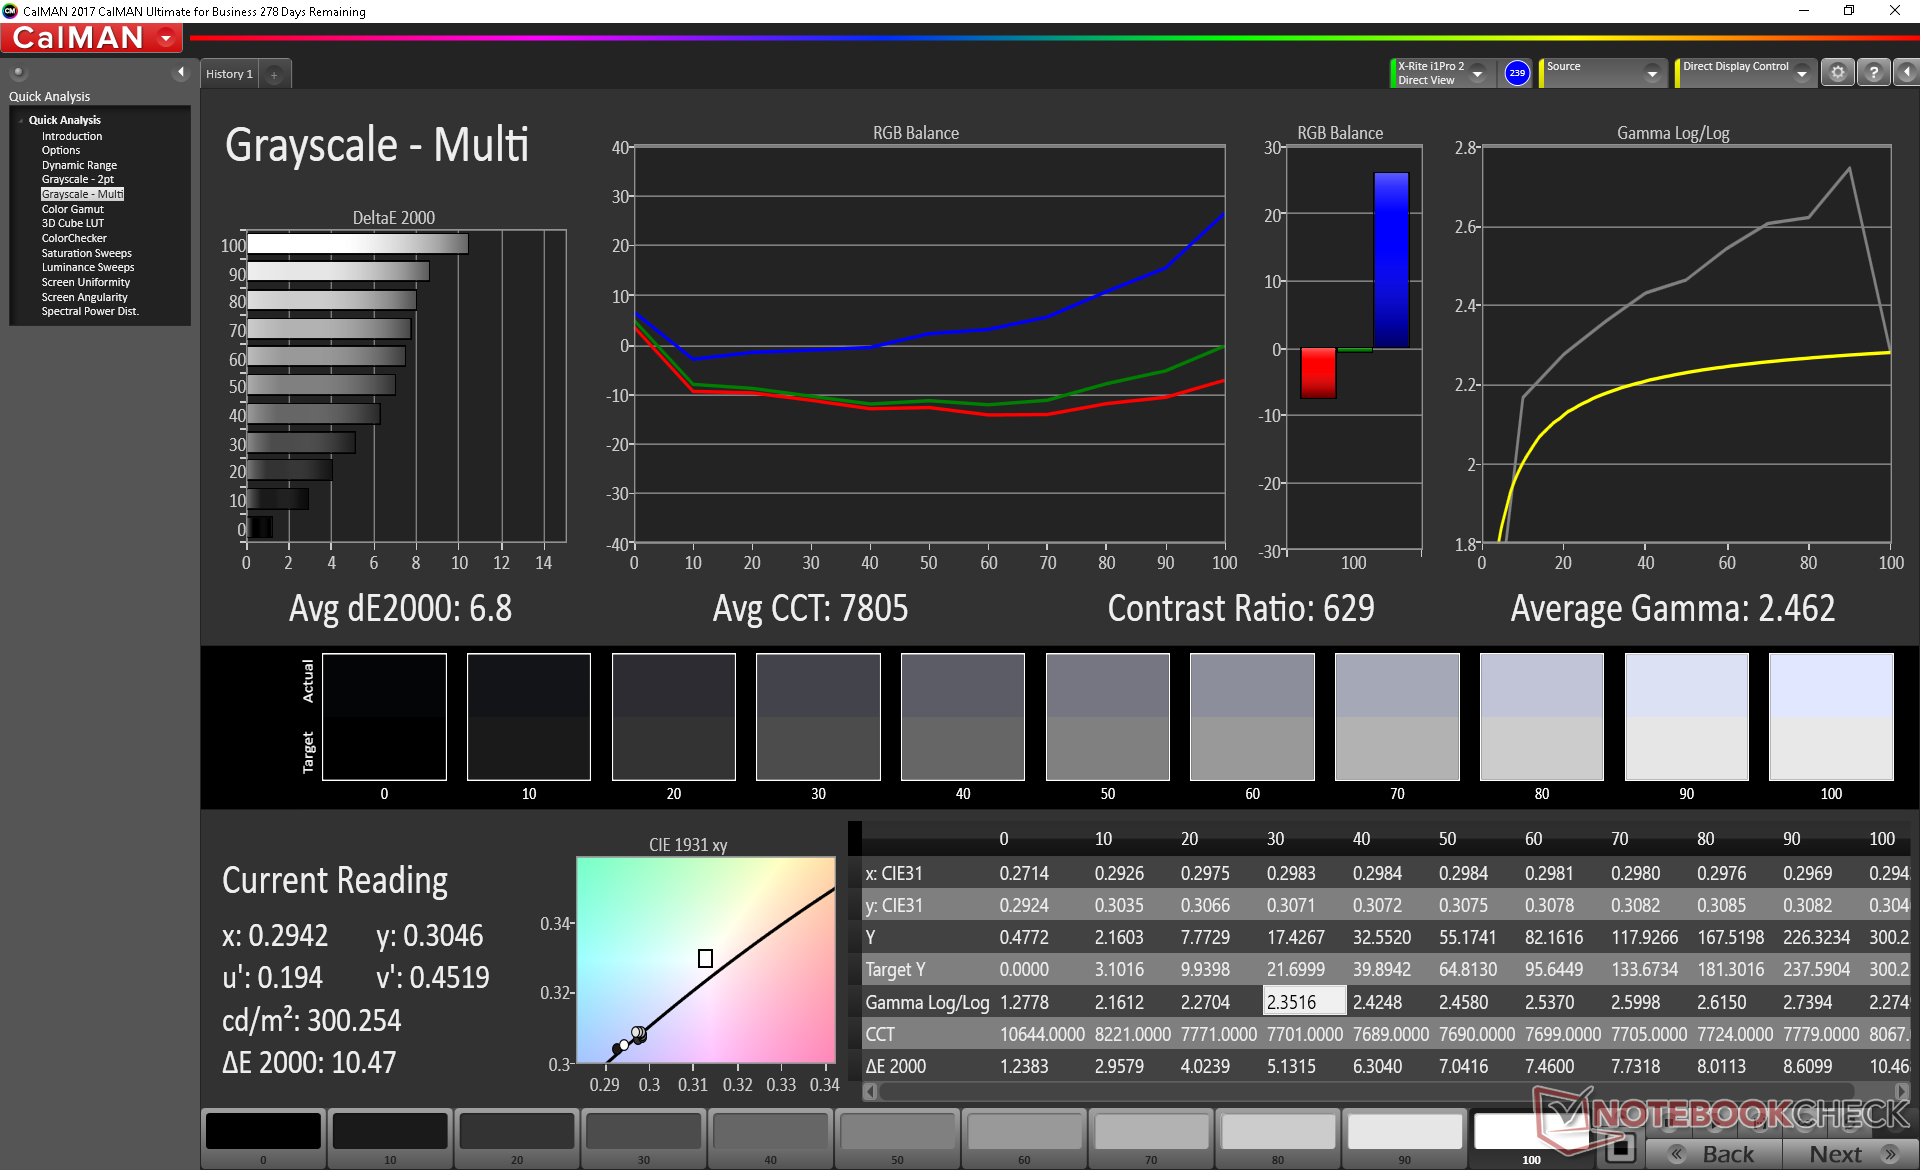
Further measurements with an X-Rite colorimeter reveal inaccurate colors and an overly cool color temperature out of the box. Our calibration directly addresses these shortcomings for a noticeably better picture. Average grayscale DeltaE in particular drops dramatically from 6.8 to 1.9. We recommend an end-user calibration if possible to get the most out of the display.
Display Response Times
| ↔ Response Time Black to White | ||
|---|---|---|
| 12.8 ms ... rise ↗ and fall ↘ combined | ↗ 7.6 ms rise | 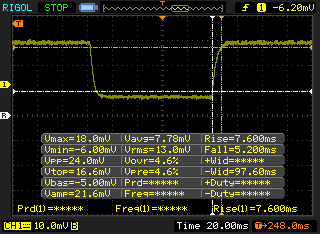 |
| ↘ 5.2 ms fall | ||
| The screen shows good response rates in our tests, but may be too slow for competitive gamers. In comparison, all tested devices range from 0.1 (minimum) to 240 (maximum) ms. » 33 % of all devices are better. This means that the measured response time is better than the average of all tested devices (19.8 ms). | ||
| ↔ Response Time 50% Grey to 80% Grey | ||
| 15.6 ms ... rise ↗ and fall ↘ combined | ↗ 8 ms rise | 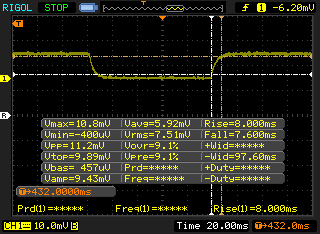 |
| ↘ 7.6 ms fall | ||
| The screen shows good response rates in our tests, but may be too slow for competitive gamers. In comparison, all tested devices range from 0.165 (minimum) to 636 (maximum) ms. » 30 % of all devices are better. This means that the measured response time is better than the average of all tested devices (30.9 ms). | ||
Screen Flickering / PWM (Pulse-Width Modulation)
| Screen flickering / PWM not detected | 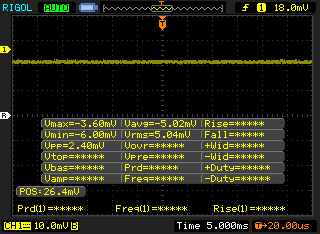 | ||
In comparison: 52 % of all tested devices do not use PWM to dim the display. If PWM was detected, an average of 7741 (minimum: 5 - maximum: 343500) Hz was measured. | |||
The 300-nit backlight is average for a 17-inch gaming laptop and so outdoor visibility is unimpressive. The heavier Alienware 17 R5 has a 33 percent display if outdoor visibility is priority. Even so, these large gaming laptops are not designed to be away from AC outlets for very long.
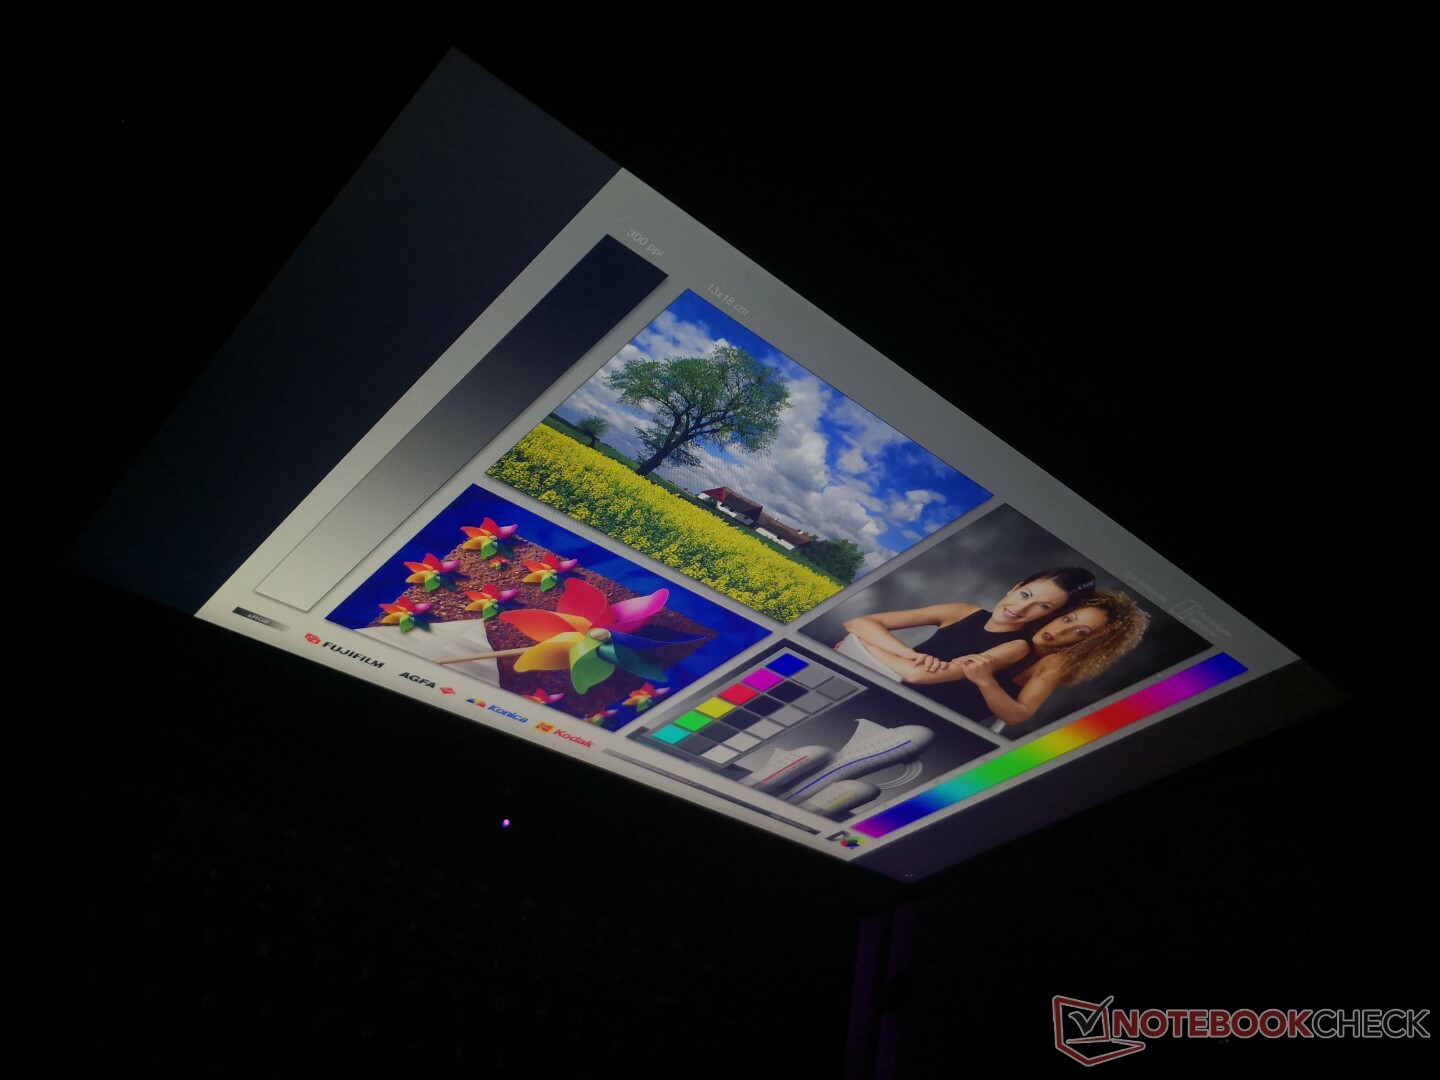
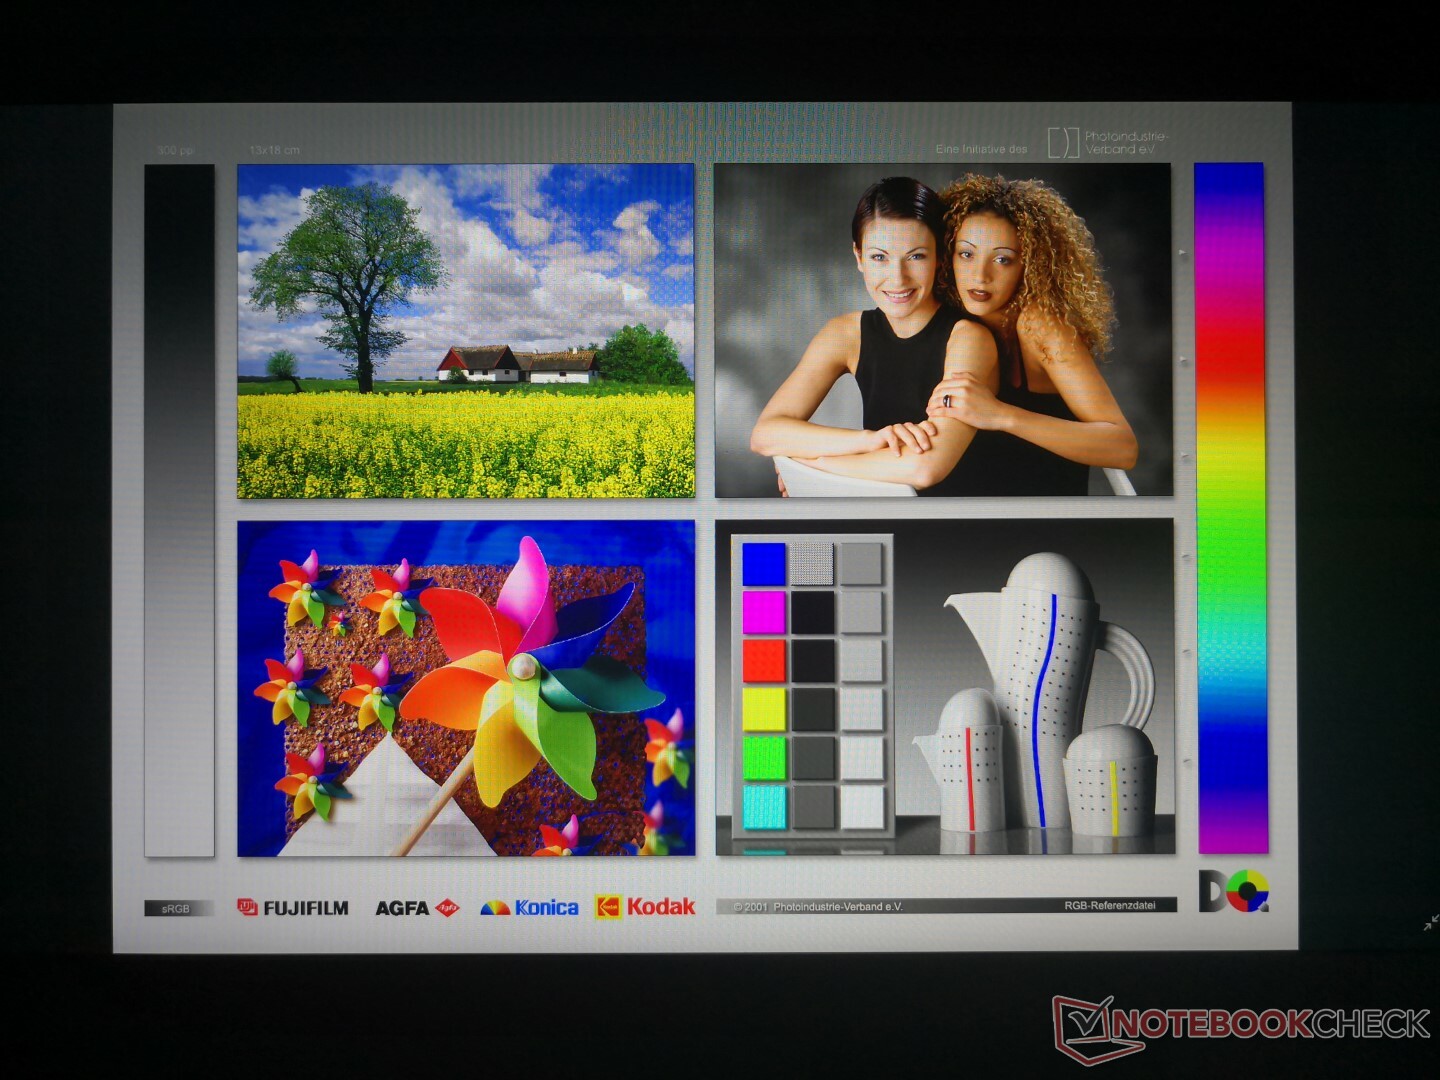
Viewing angles are excellent as expected from an IPS panel. Viewing from extreme and unrealistic angles will impact both contrast and brightness slightly.

Performance
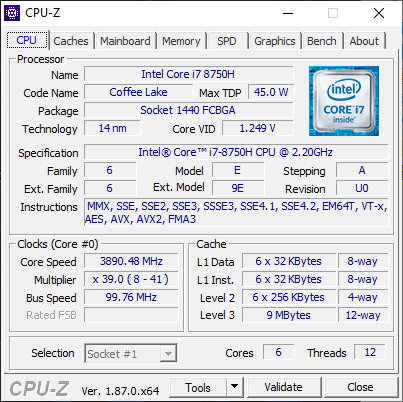
The Legion Y740 can be configured with an RTX 2060, 2070 Max-Q, or 2080 Max-Q in contrast to the GTX options on the Y730 series. Lenovo says future SKUs are ready to support the next generation of Core ix CPUs following Coffee Lake-H whenever Intel is ready to announce it.
Interestingly, the Core i7-8750H CPU comes standard on all current SKUs with no Core i5-8300H option in sight.
Another important difference between the Y730 and Y740 is the lack of Optimus graphics switching on the latter. Lenovo decided to include G-Sync this time instead which we find to be more appropriate for the target hardcore gamer.
Processor
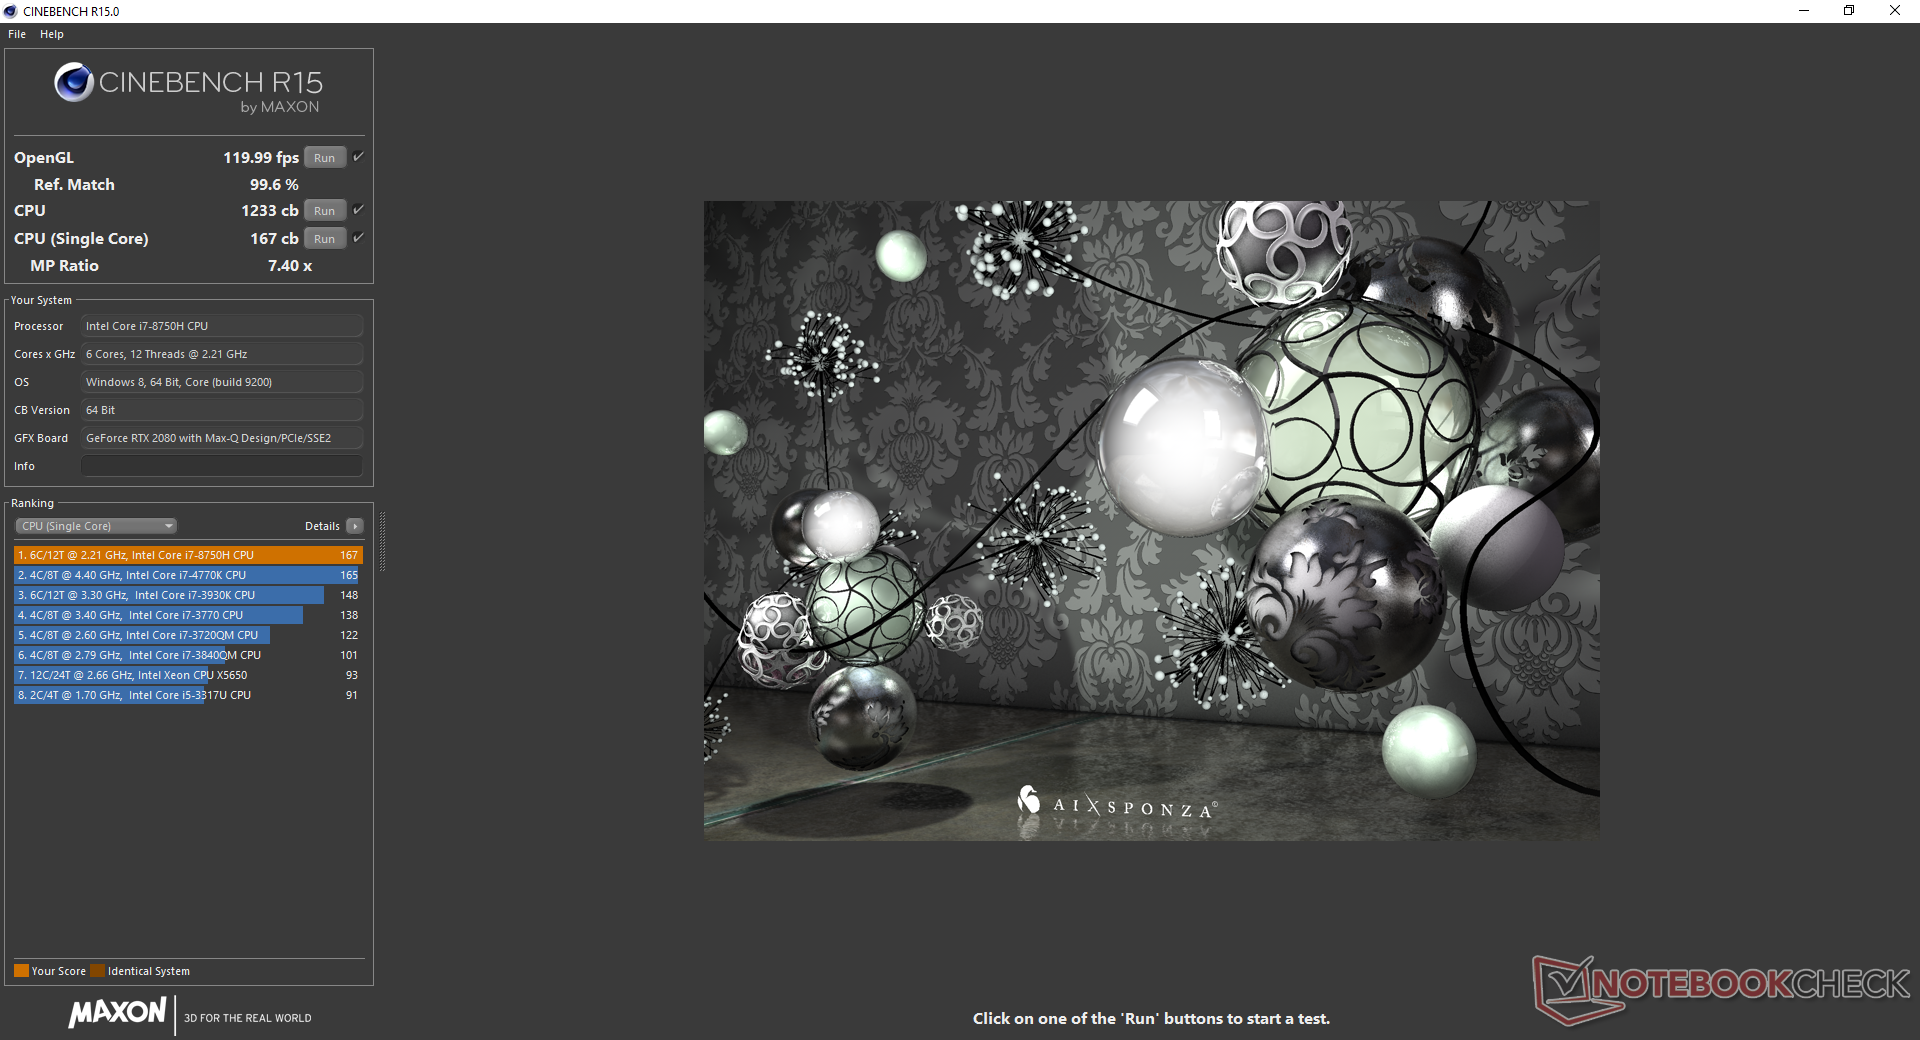
CineBench R15 Multi-Thread results are 11 percent higher than the average Core i7-8750H in our database taken from 70 other laptops. This suggests excellent Turbo Boost performance when under high load much like what we discovered on the Legion Y730. CPU performance is even better than the stock Core i9-8950HK found on the XPS 15 9570.
We can measure performance sustainability by running CineBench R15 in a loop as shown below. The initial high score of 1233 points drops to 1139 points by the second loop to represent a performance dip of only 7.6 percent. Results are consistently faster than the same CPU as found on the Gigabyte Aero 15X and Asus Zephyrus S GX701GX.
See our dedicated page on the Core i7-8750H for more technical information and benchmark comparisons.
System Performance
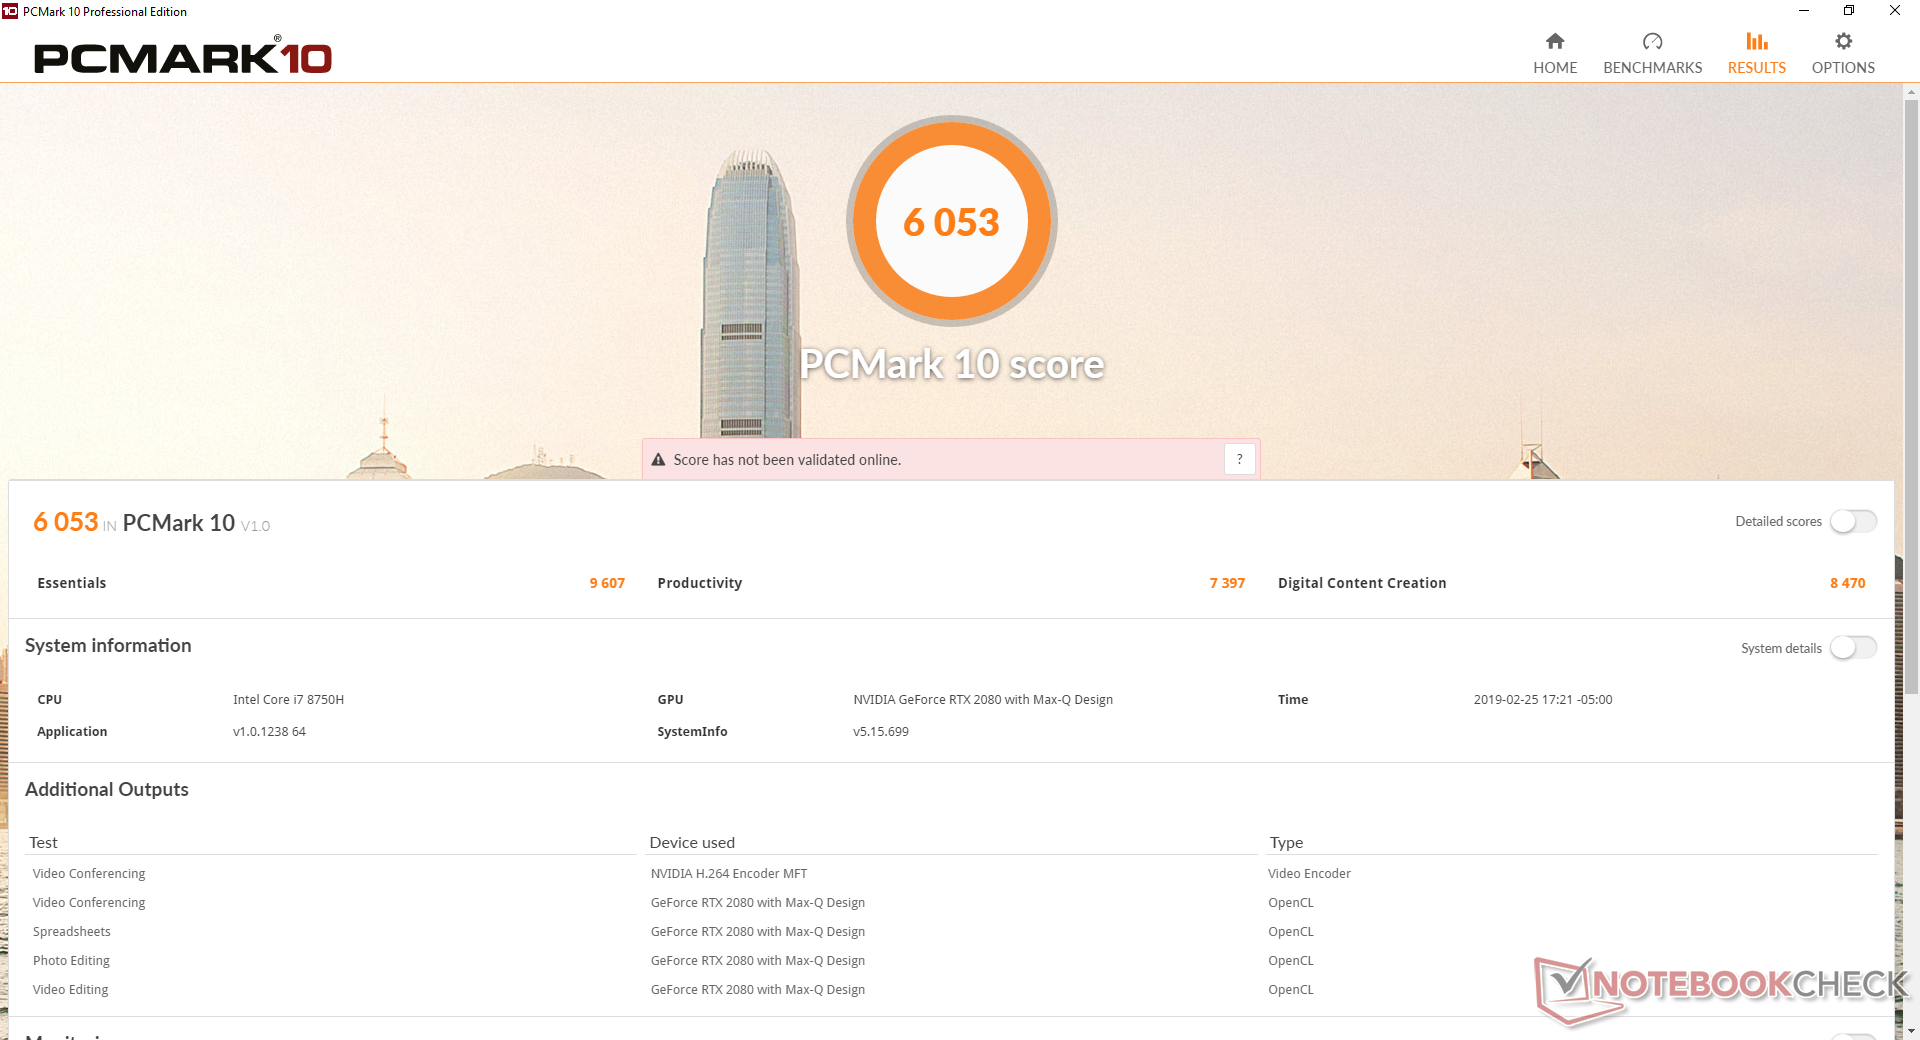
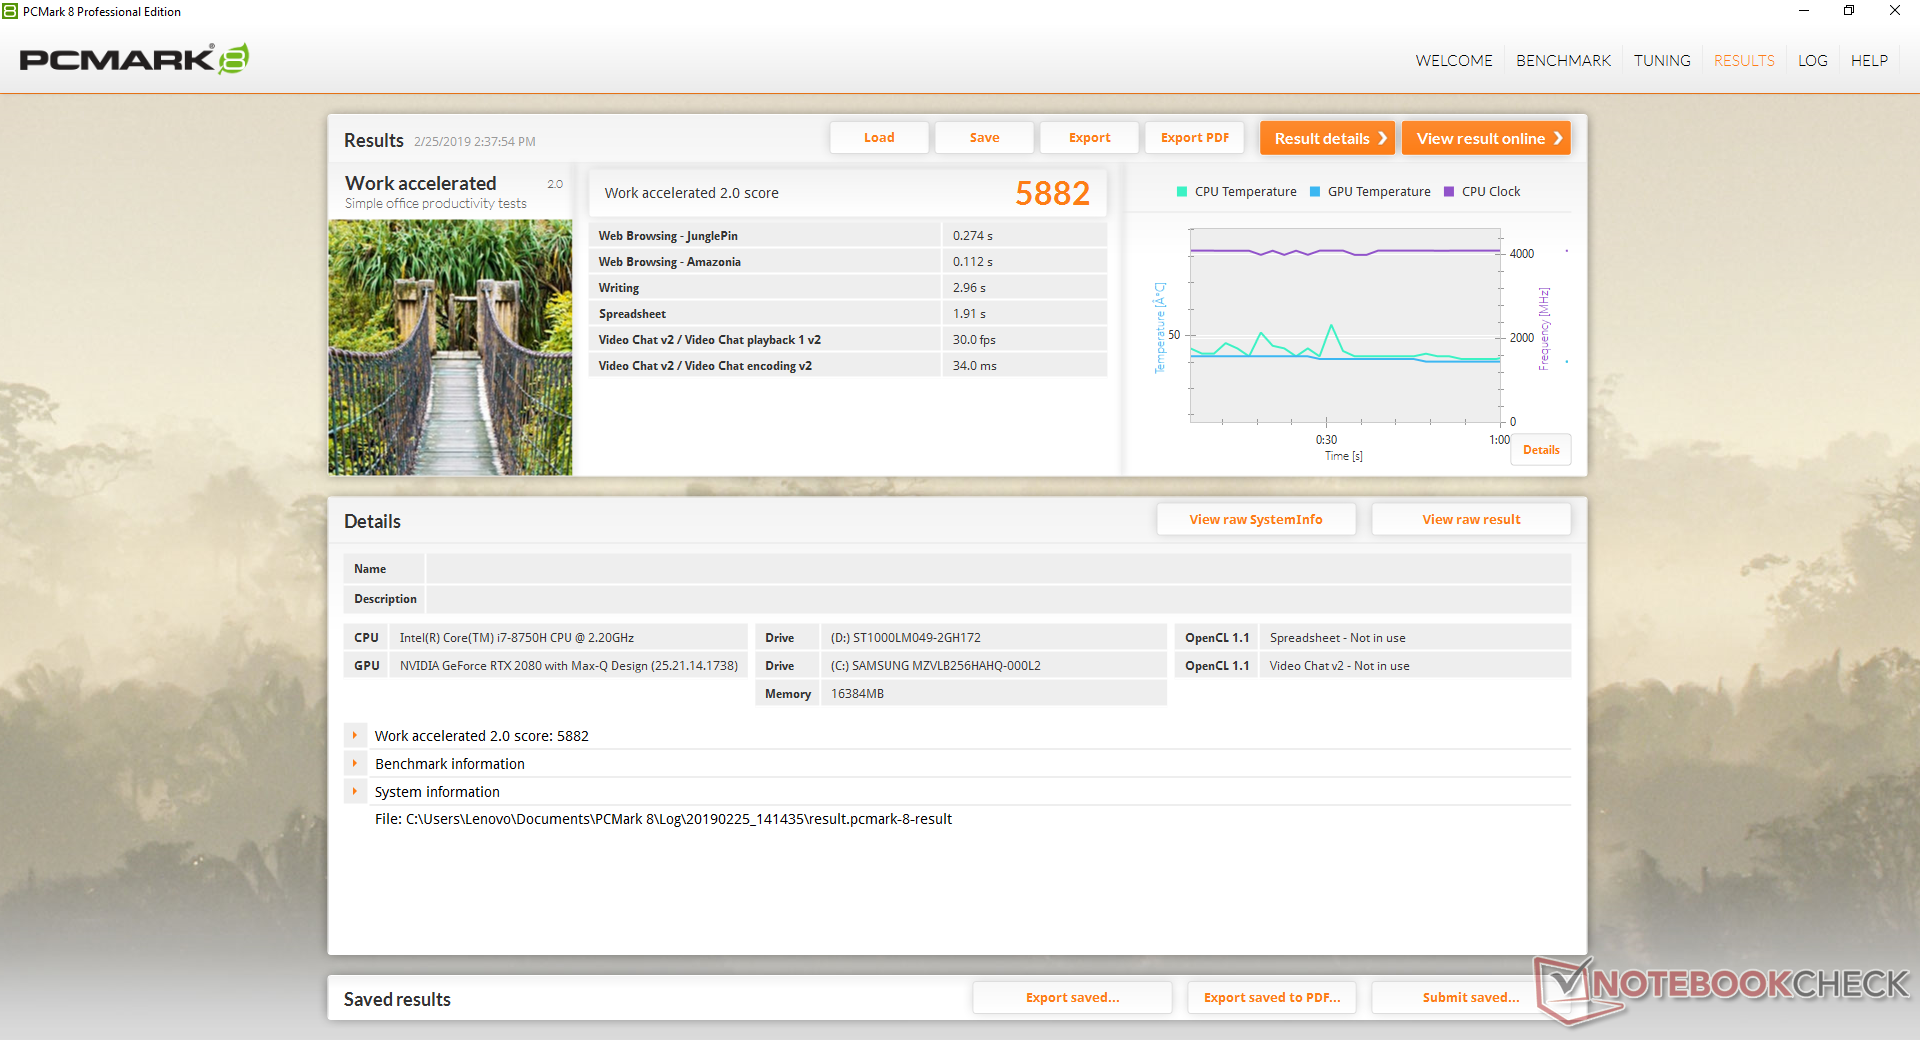
PCMark ranks our Legion Y740 just a few percentage points ahead of last year's Y730 with the exception of the Digital Content Creation test where the Y740 scores significantly higher. This particular benchmark favors PCs with high performance GPUs like our RTX 2080 Max-Q. We experienced no software or hardware issues during our time with the test unit.
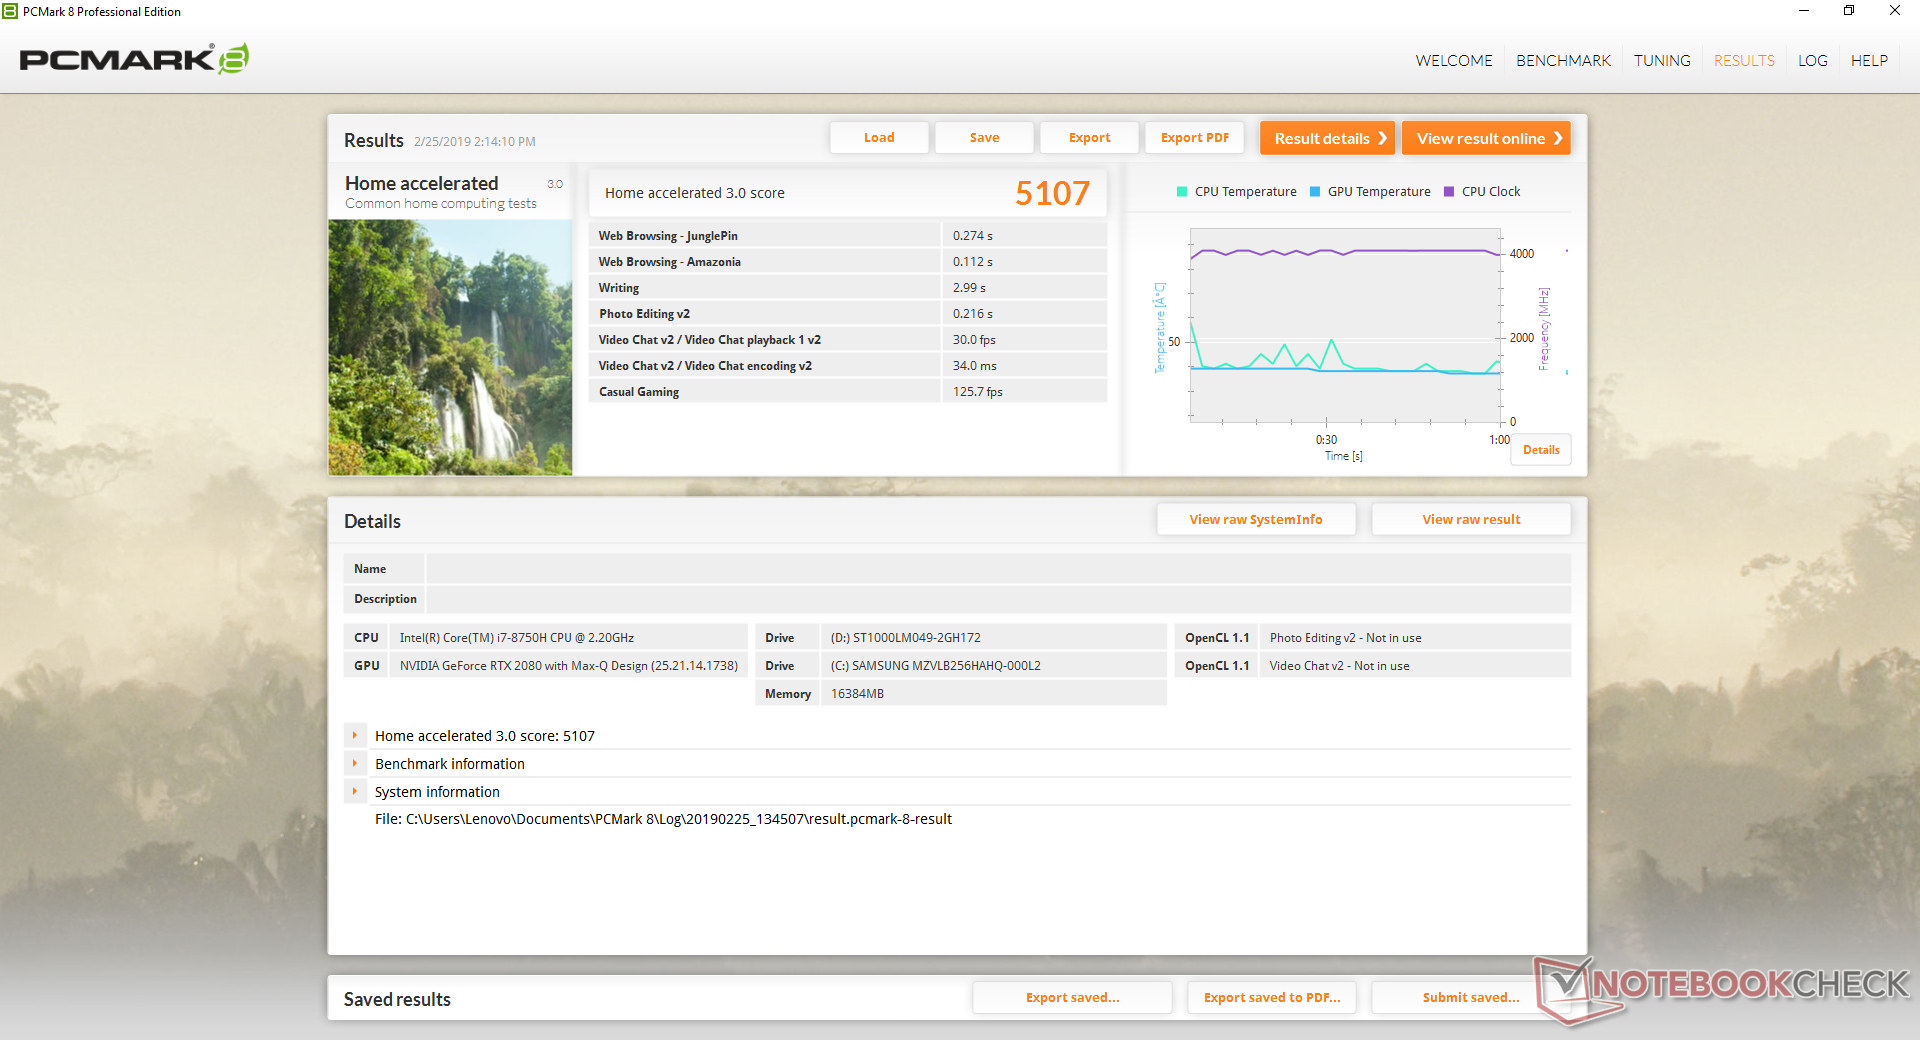
| PCMark 8 Home Score Accelerated v2 | 5107 points | |
| PCMark 8 Work Score Accelerated v2 | 5882 points | |
| PCMark 10 Score | 6053 points | |
Help | ||
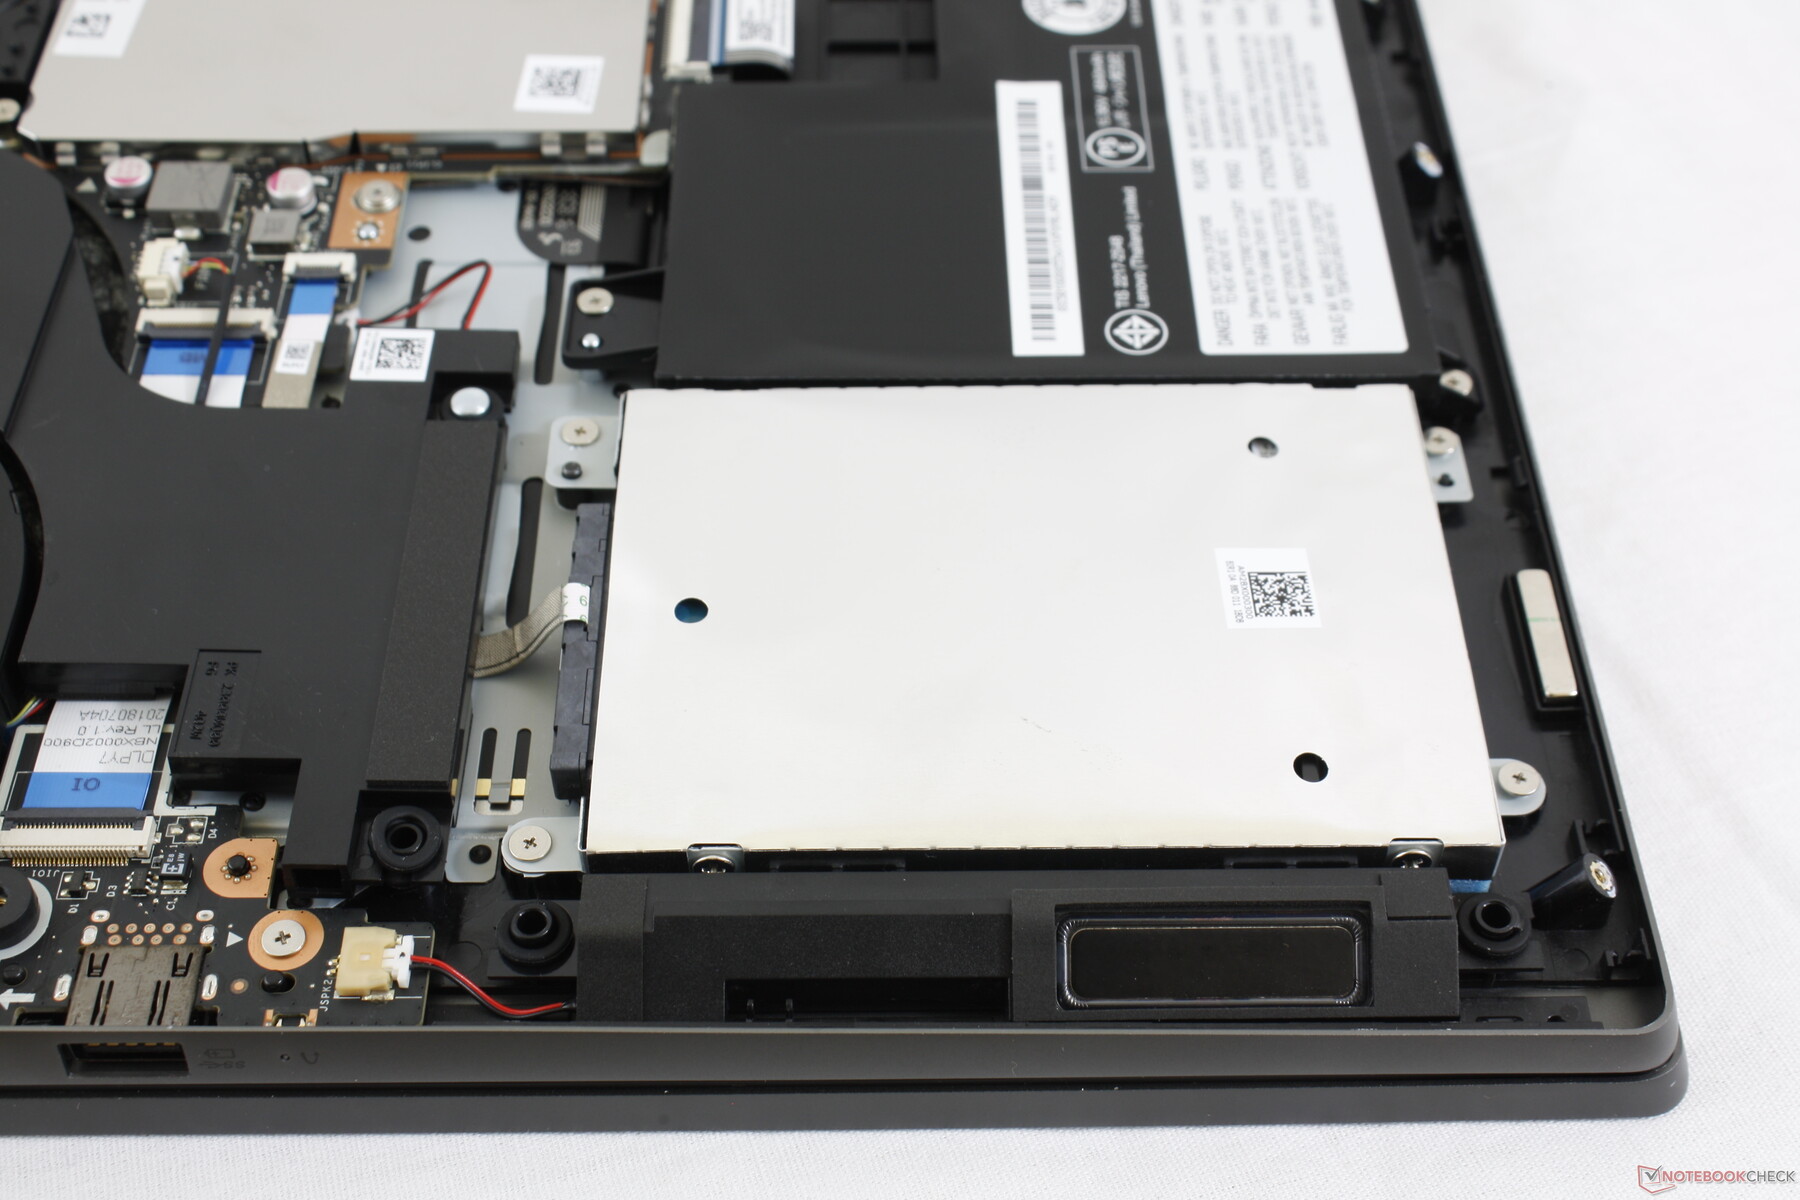
Storage Devices
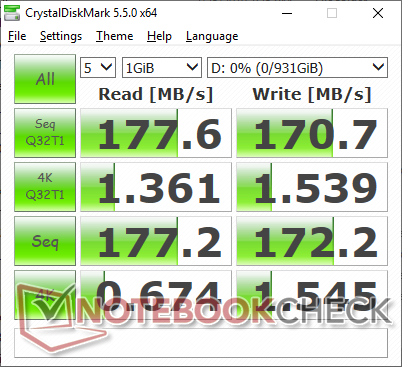
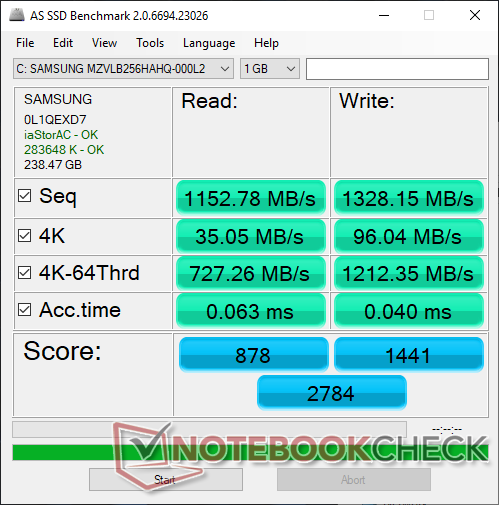
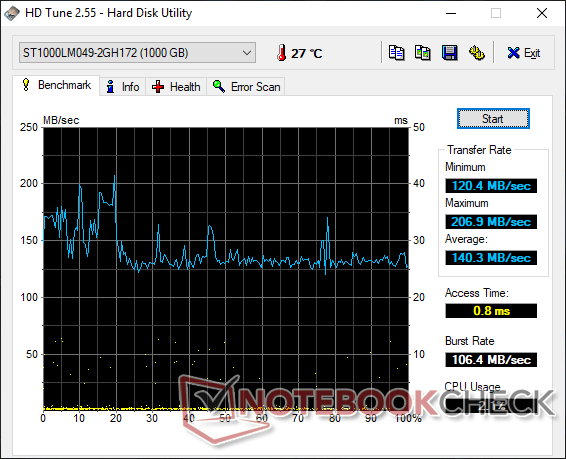
Two internal storage bays are available (1x M.2 2280 + 1x 2.5-inch SATA III). Our specific test unit is equipped with a 256 GB Samsung PM981 NVMe SSD and a secondary 1 TB Seagate ST1000LM049. The SSD in particular is a huge upgrade from the Toshiba in our Legion Y730.
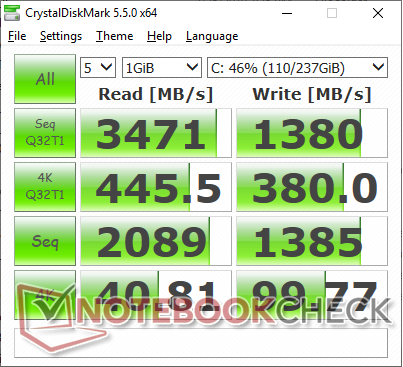
AS SSD returns an unusually slow sequential read rate of 1152.78 MB/s whereas the Lenovo Ideapad 730S equipped with the exact same SSD returns a sequential read rate of 2323.41 MB/s. Meanwhile, CrystalDiskMark 5.5 shows a read rate of 2089 MB/s. We're unsure why this is, but we otherwise didn't experience any drive issues during our time with the test unit.
Competing 17-inch gaming laptops like the Alienware 15 or Asus ROG G703 have more internal storage options than the Legion Y740.
See our table of SSDs and HDDs for more benchmark comparisons.
| Lenovo Legion Y740-17ICH Samsung SSD PM981 MZVLB256HAHQ | Asus ROG Strix Scar II GL704GW Intel SSD 660p SSDPEKNW512G8 | Razer Blade Pro 2017 2x Samsung SSD PM951 MZVLV256HCHP (RAID 0) | Alienware 17 R5 SK hynix PC401 HFS256GD9TNG | HP Omen X 17-ap0xx Samsung PM961 MZVLW256HEHP | |
|---|---|---|---|---|---|
| AS SSD | -21% | 11% | -29% | 13% | |
| Seq Read (MB/s) | 1153 | 1315 14% | 2599 125% | 2203 91% | 2352 104% |
| Seq Write (MB/s) | 1328 | 927 -30% | 588 -56% | 559 -58% | 1145 -14% |
| 4K Read (MB/s) | 35.05 | 52.4 50% | 37.57 7% | 38.74 11% | 44.81 28% |
| 4K Write (MB/s) | 96 | 122.8 28% | 104.4 9% | 92.7 -3% | 116.2 21% |
| 4K-64 Read (MB/s) | 727 | 326.5 -55% | 1116 54% | 447.2 -38% | 967 33% |
| 4K-64 Write (MB/s) | 1212 | 727 -40% | 513 -58% | 279.1 -77% | 798 -34% |
| Access Time Read * (ms) | 0.063 | 0.11 -75% | 0.051 19% | 0.091 -44% | 0.05 21% |
| Access Time Write * (ms) | 0.04 | 0.045 -13% | 0.036 10% | 0.065 -63% | 0.032 20% |
| Score Read (Points) | 878 | 510 -42% | 1414 61% | 706 -20% | 1248 42% |
| Score Write (Points) | 1441 | 942 -35% | 676 -53% | 428 -70% | 1029 -29% |
| Score Total (Points) | 2784 | 1715 -38% | 2715 -2% | 1424 -49% | 2862 3% |
| Copy ISO MB/s (MB/s) | 1487 | 1834 23% | |||
| Copy Program MB/s (MB/s) | 608 | 492.1 -19% | |||
| Copy Game MB/s (MB/s) | 1162 | 983 -15% |
* ... smaller is better

GPU Performance
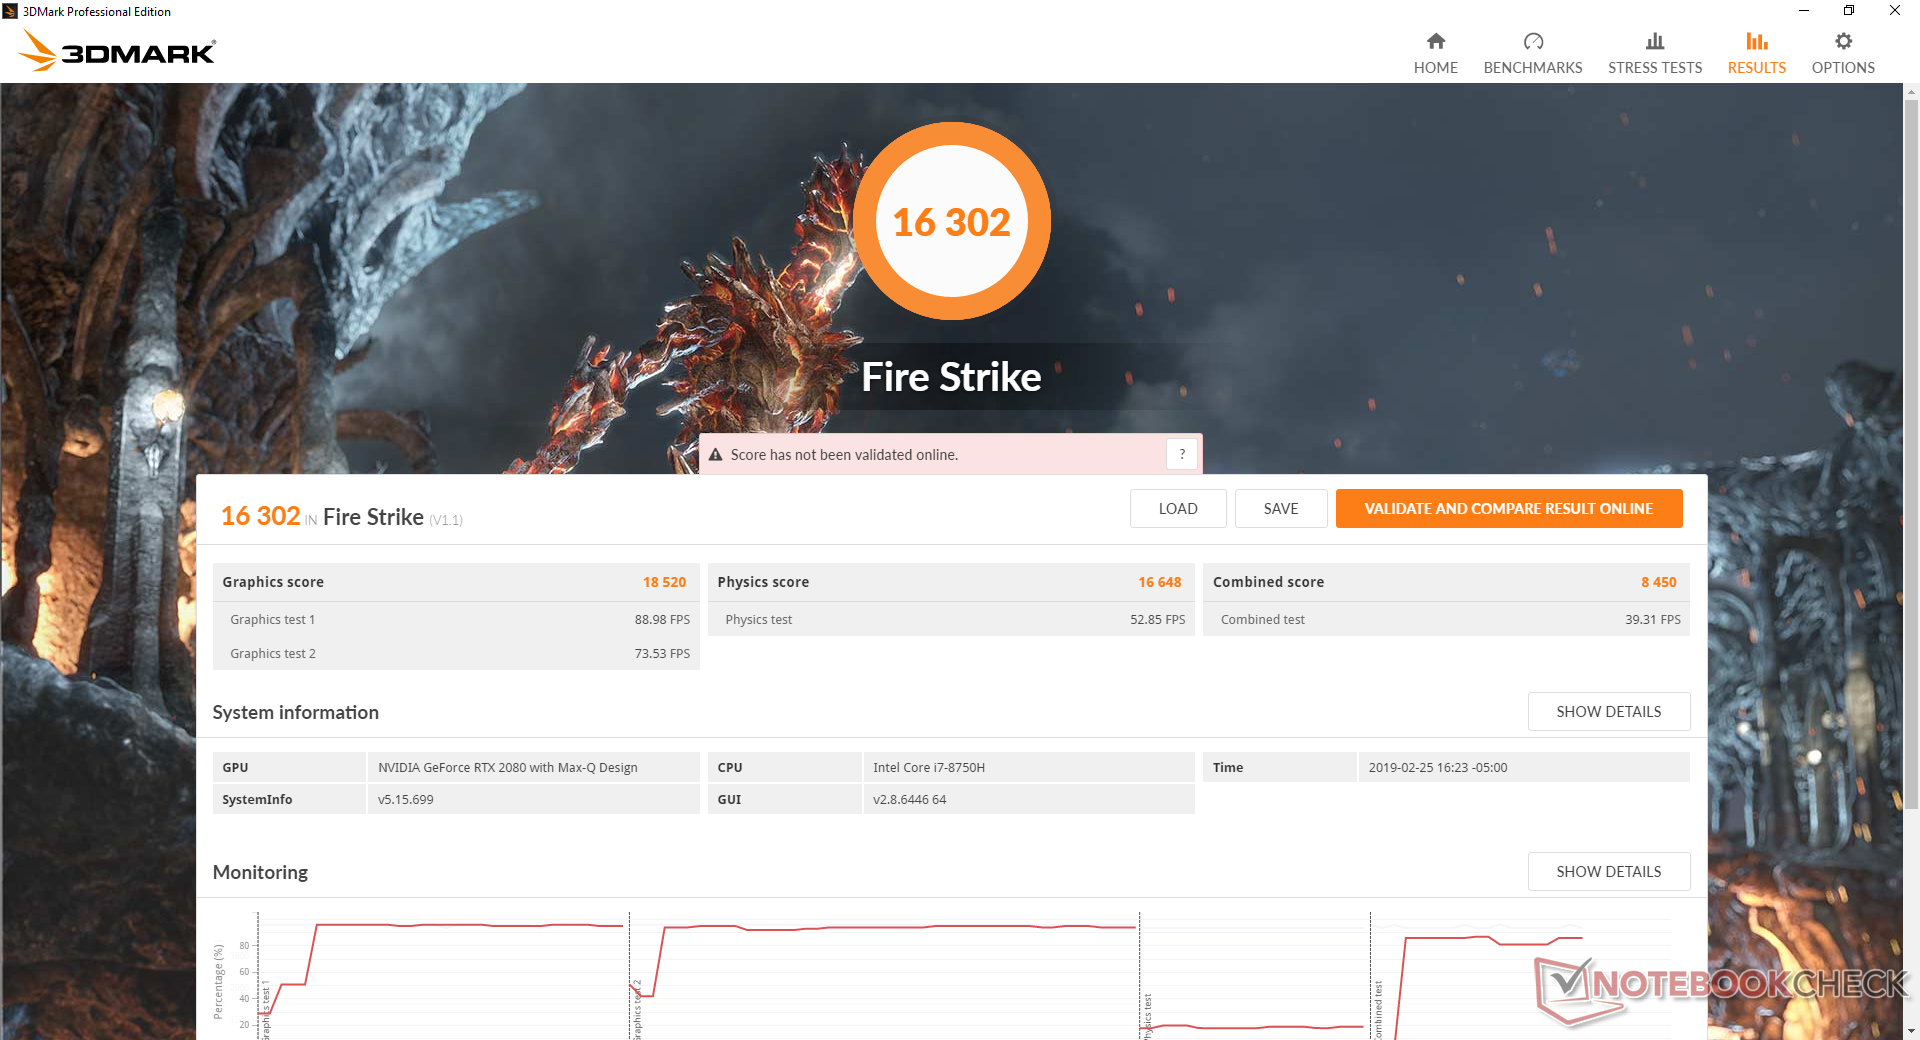
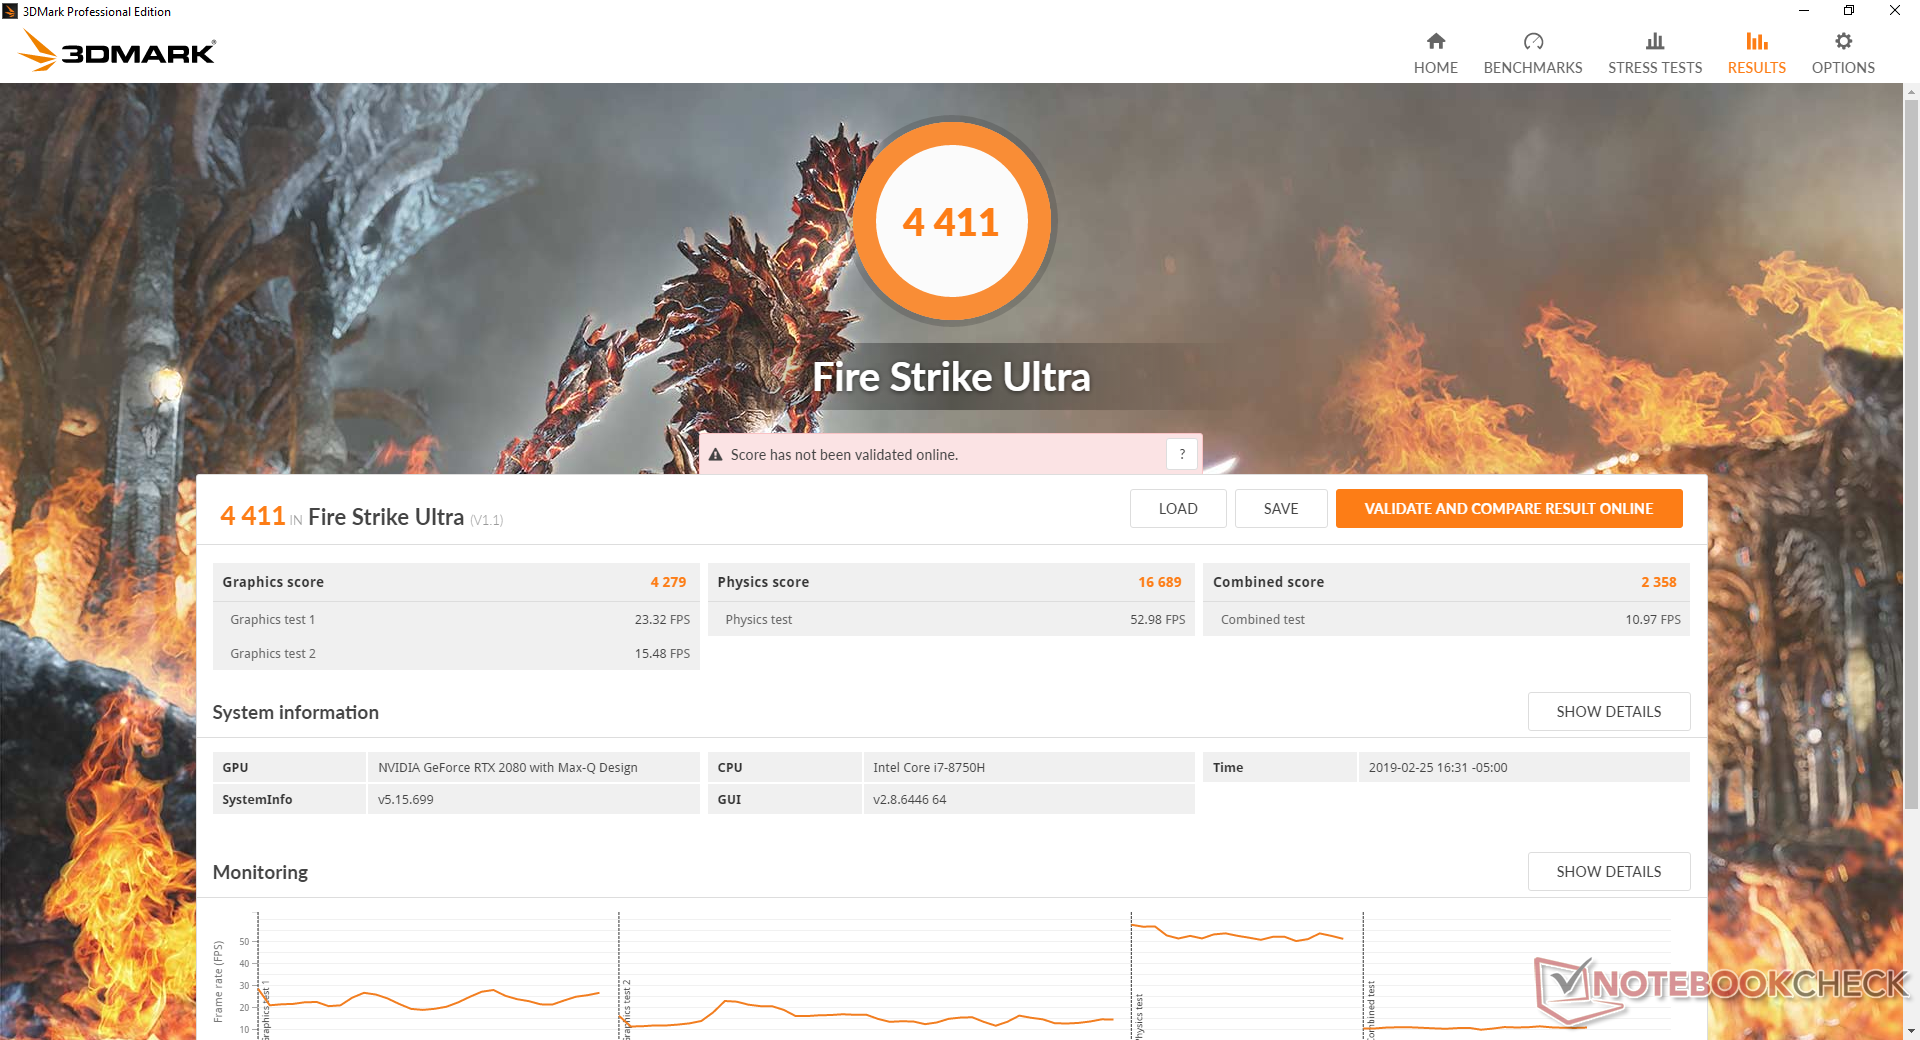
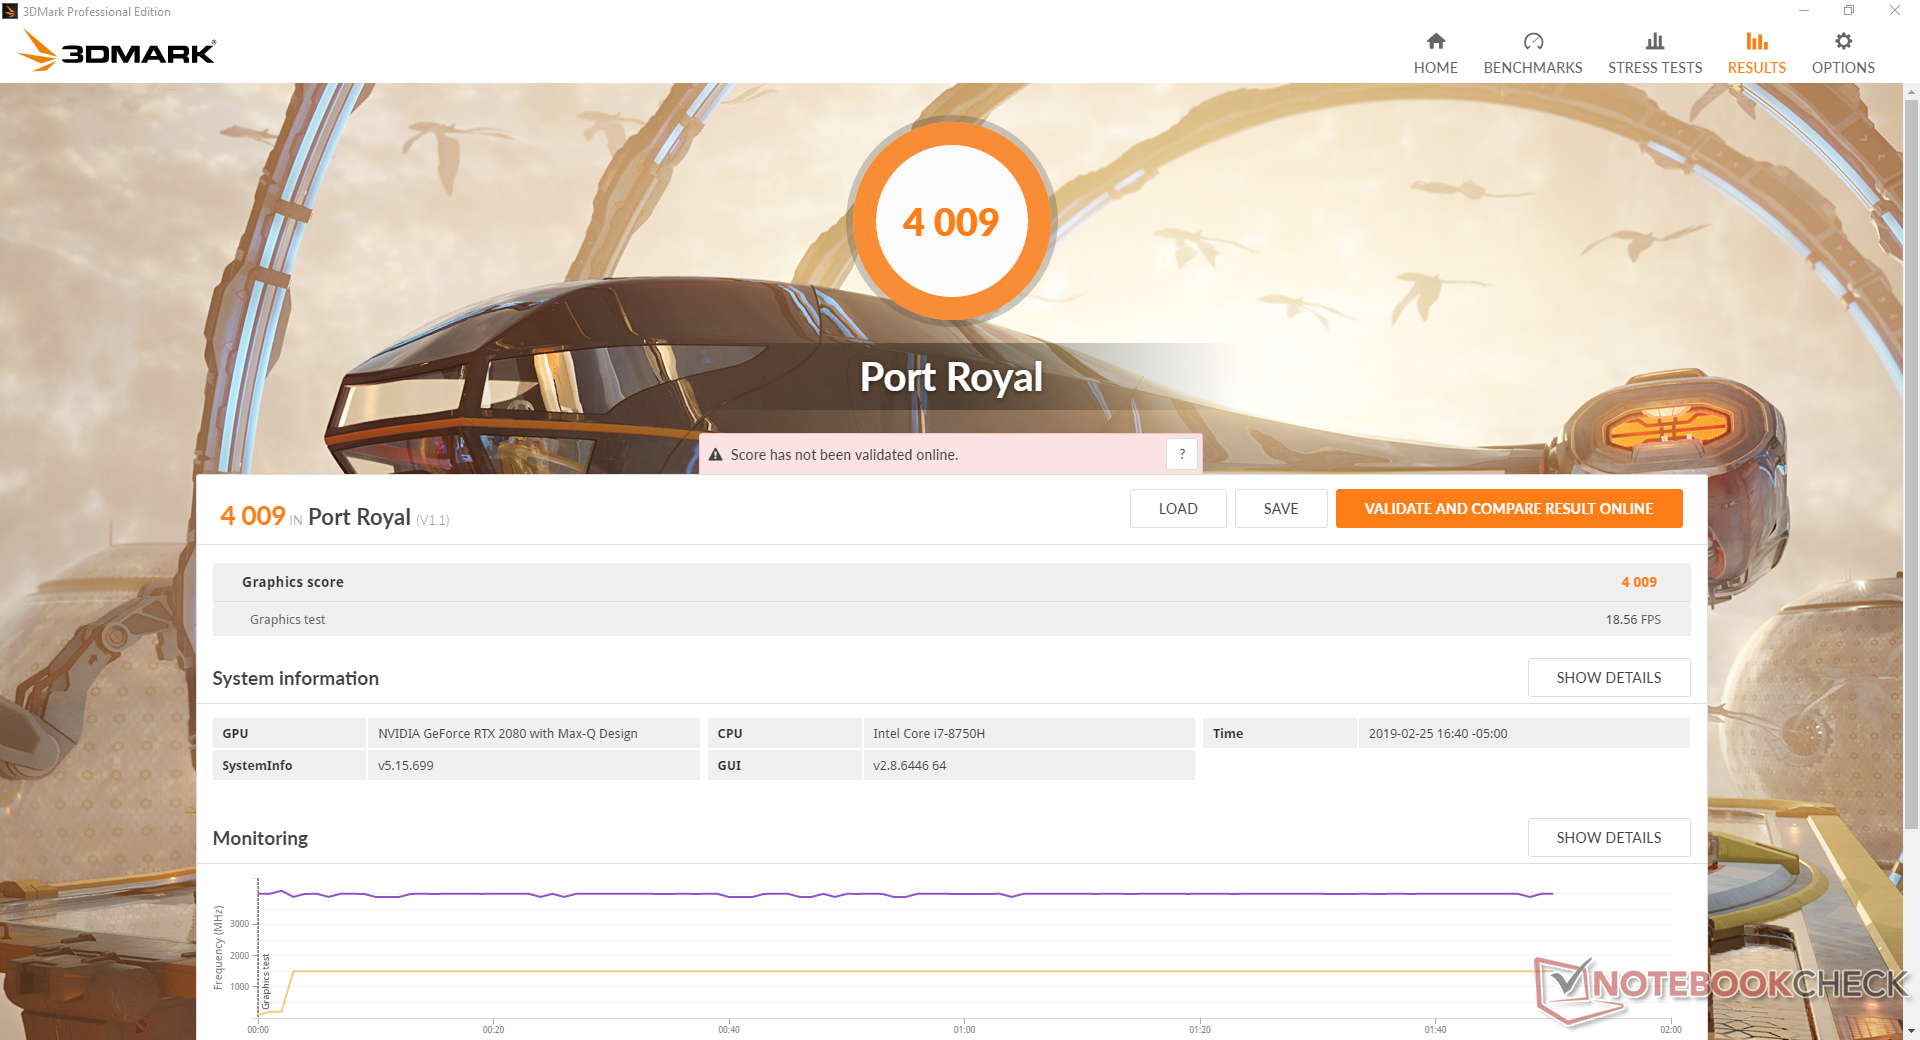
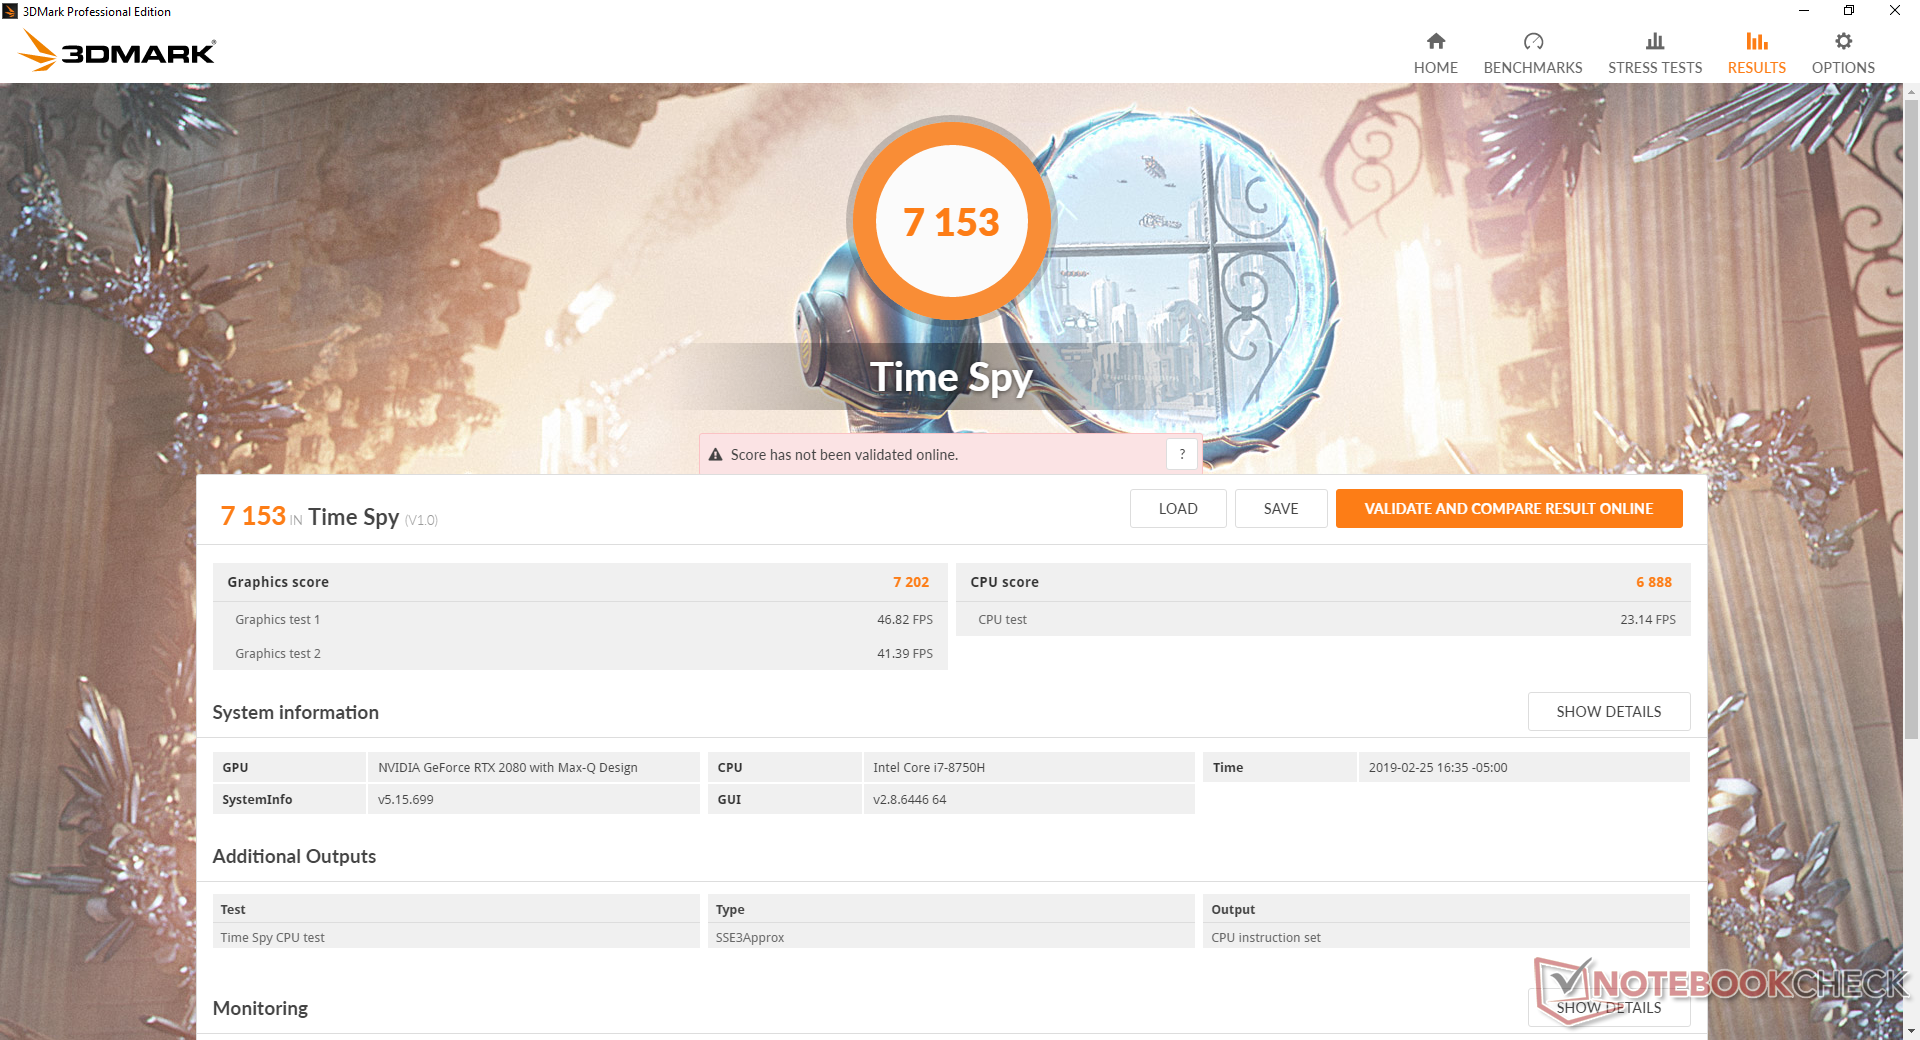
3DMark benchmarks rank our RTX 2080 Max-Q about 9 percent behind the last generation GTX 1080 and just 5 to 10 percent ahead of the RTX 2070 Max-Q. Due to the wide TDP range of the mobile RTX 2080 family, however, some laptops with the same RTX 2080 Max-Q GPU may perform even faster than our Lenovo. The Asus Zephyrus S GX701GX, for example, scores about 15 to 20 percent higher than our Lenovo.
Performance is slower than a standard mobile RTX 2080 by about 30 percent. In comparison, the GTX 1080 Max-Q is just 10 percent behind the standard mobile GTX 1080. It's a bit disappointing to see an even wider performance deficit for this latest generation of Max-Q GPUs.
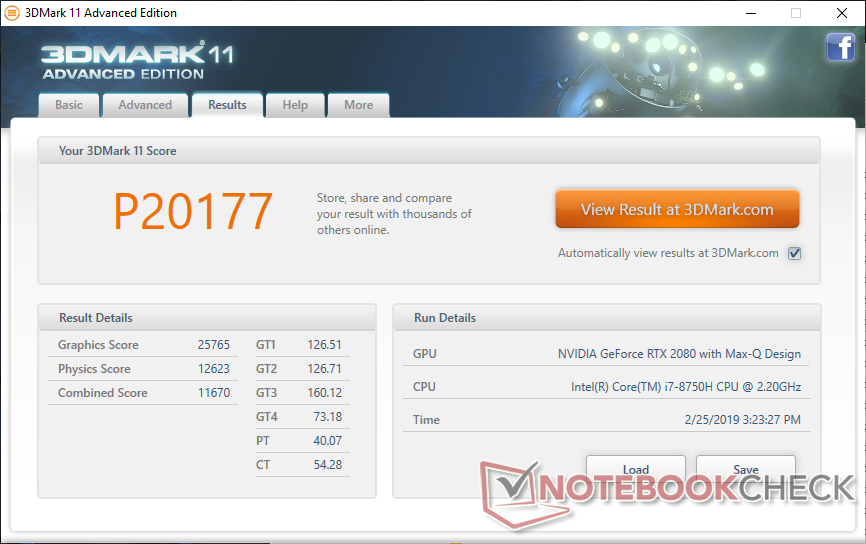

| 3DMark 11 Performance | 20177 points | |
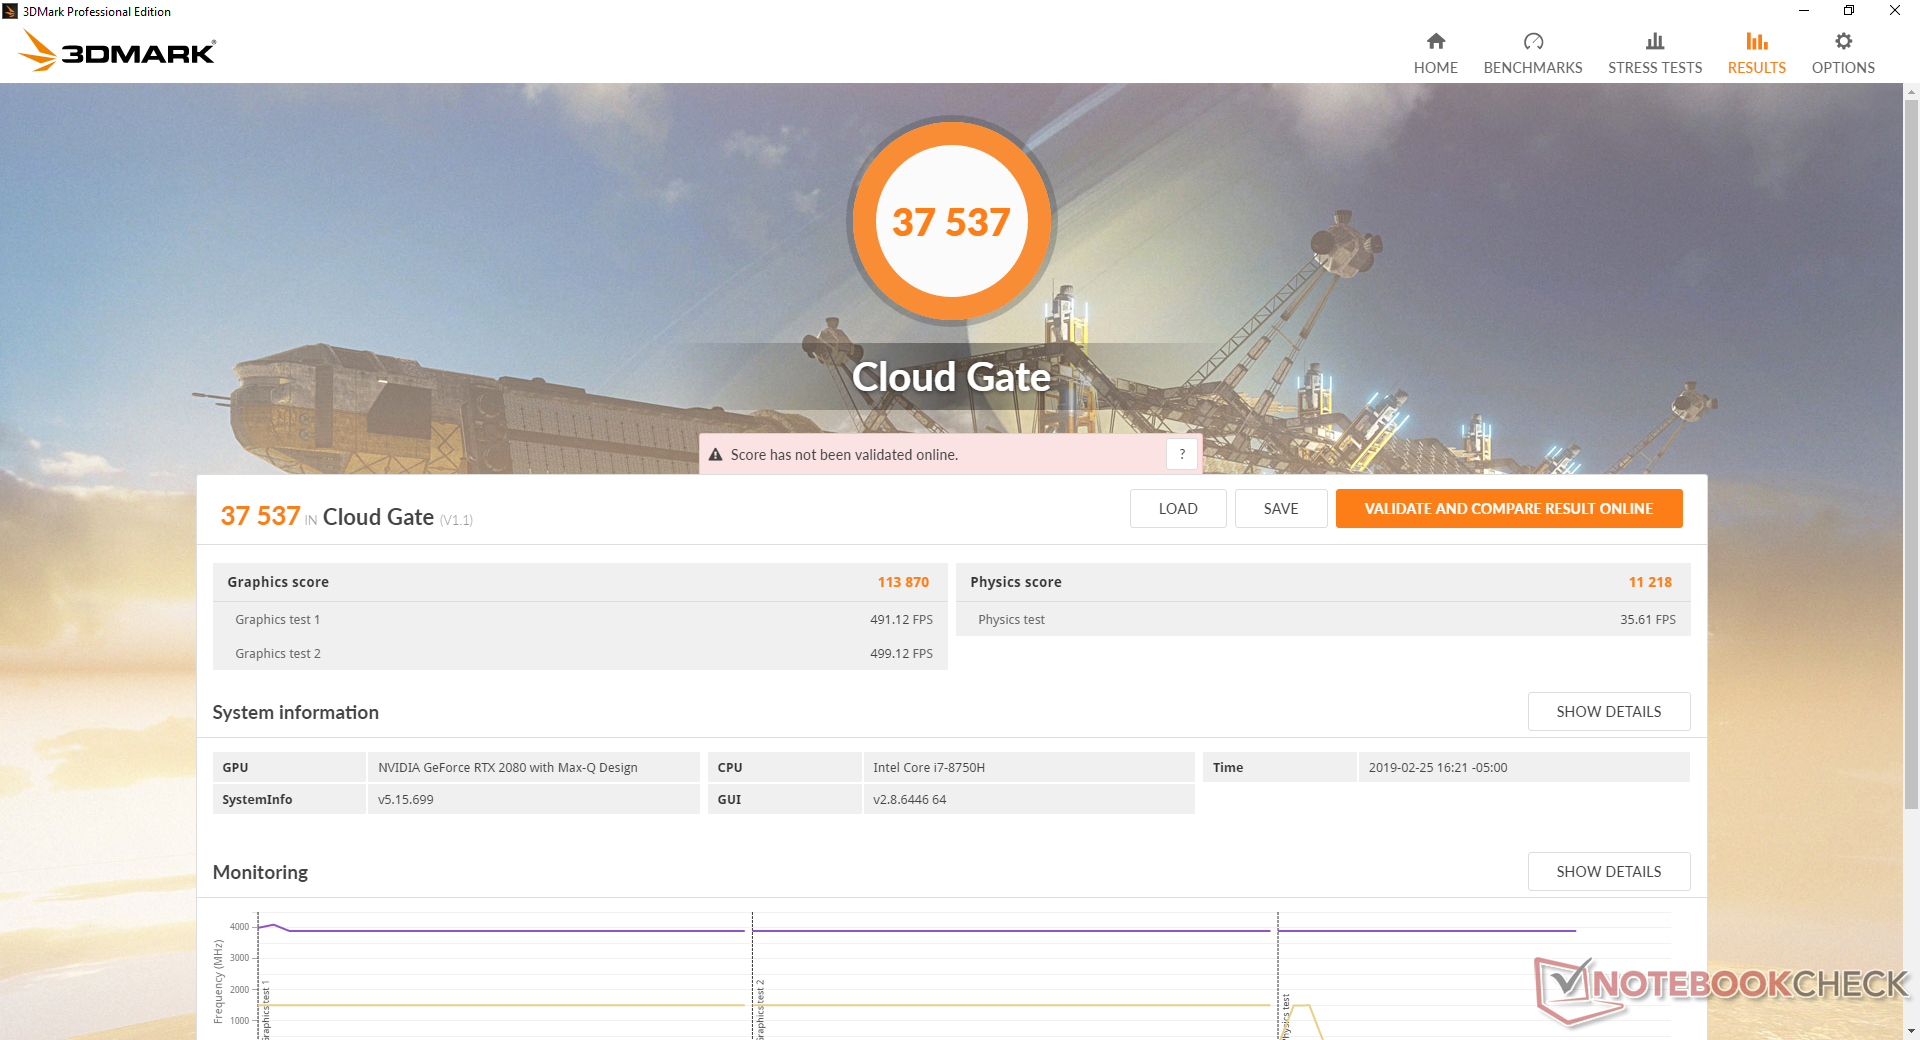
| 3DMark Cloud Gate Standard Score | 37537 points | |
| 3DMark Fire Strike Score | 16302 points | |
| 3DMark Fire Strike Extreme Score | 8104 points | |
| 3DMark Time Spy Score | 7153 points | |
Help | ||
Gaming Performance
Real-world gaming performance is most similar to the the mobile RTX 2070. It's possible to reach a stable 144 FPS at 1080p to take advantage of the native 144 Hz refresh rate with most settings turned to Medium.
Running Witcher 3 results in stable frame rates throughout with no interrupting dips or performance throttling.
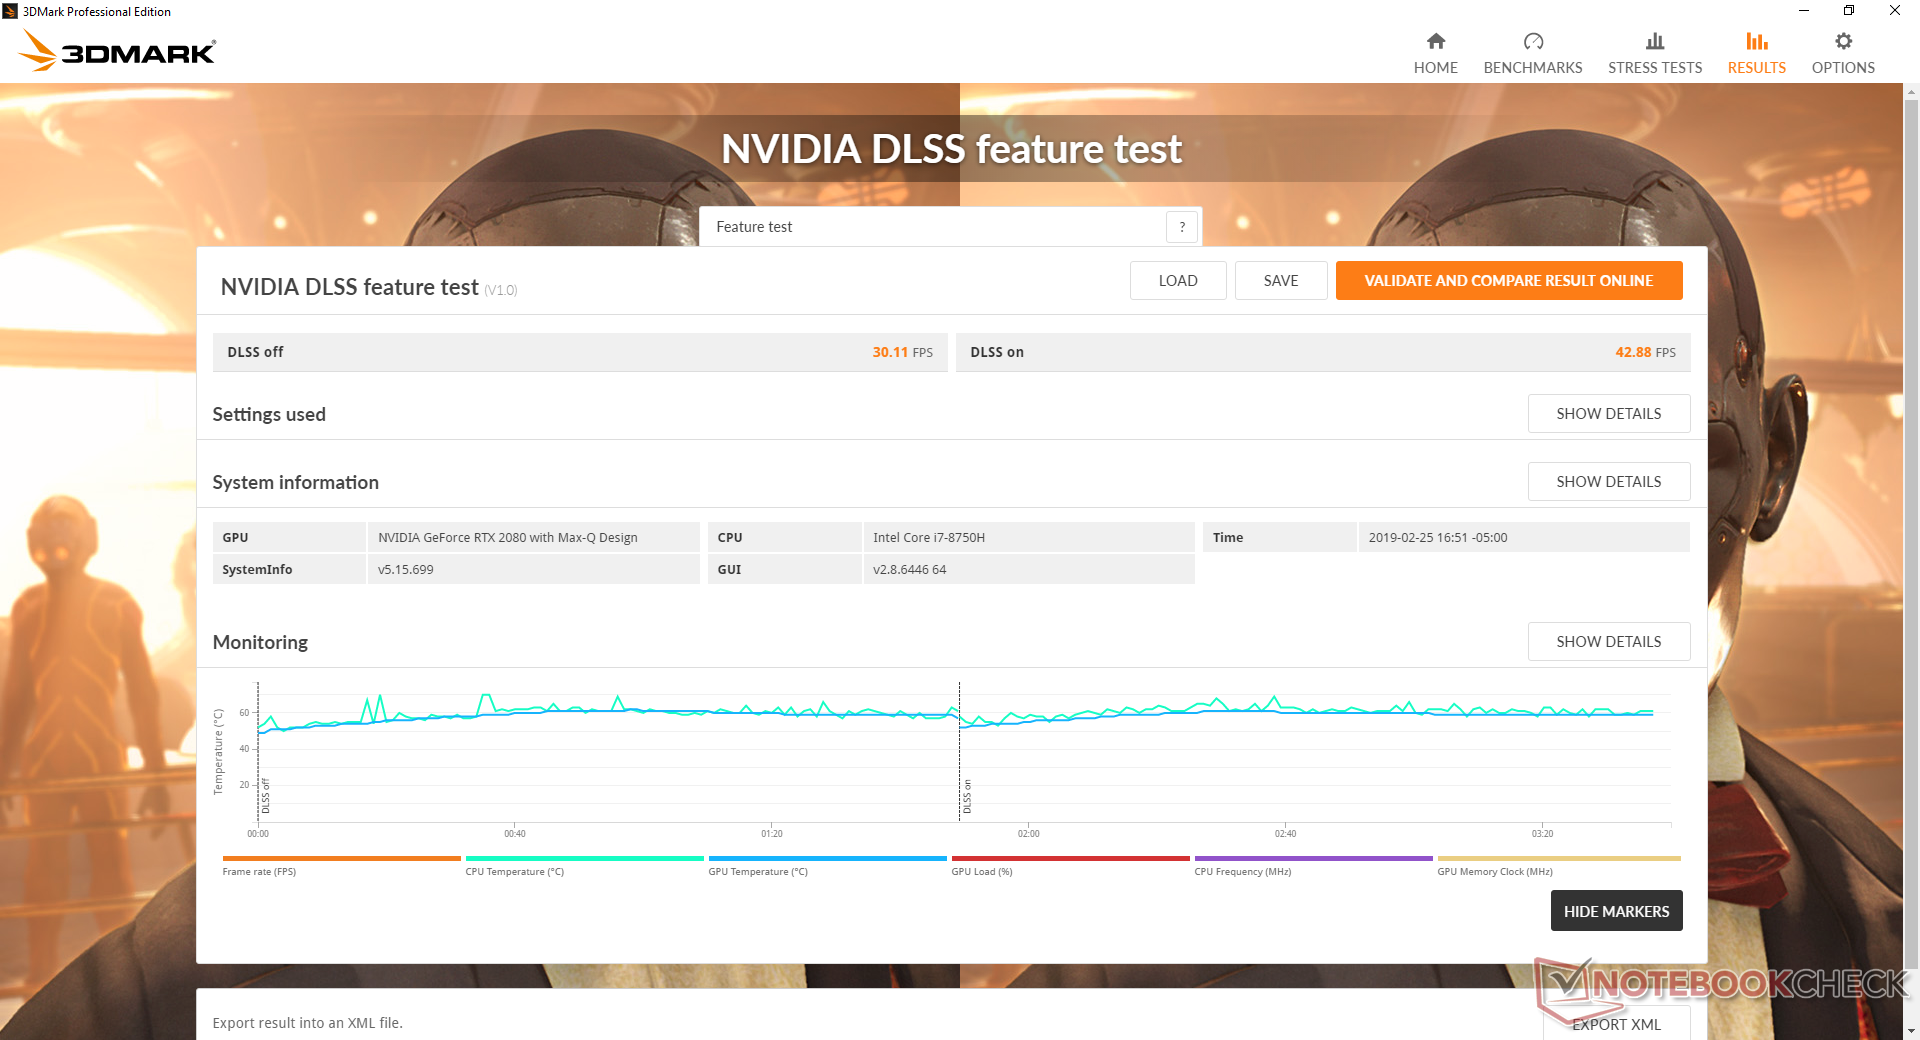
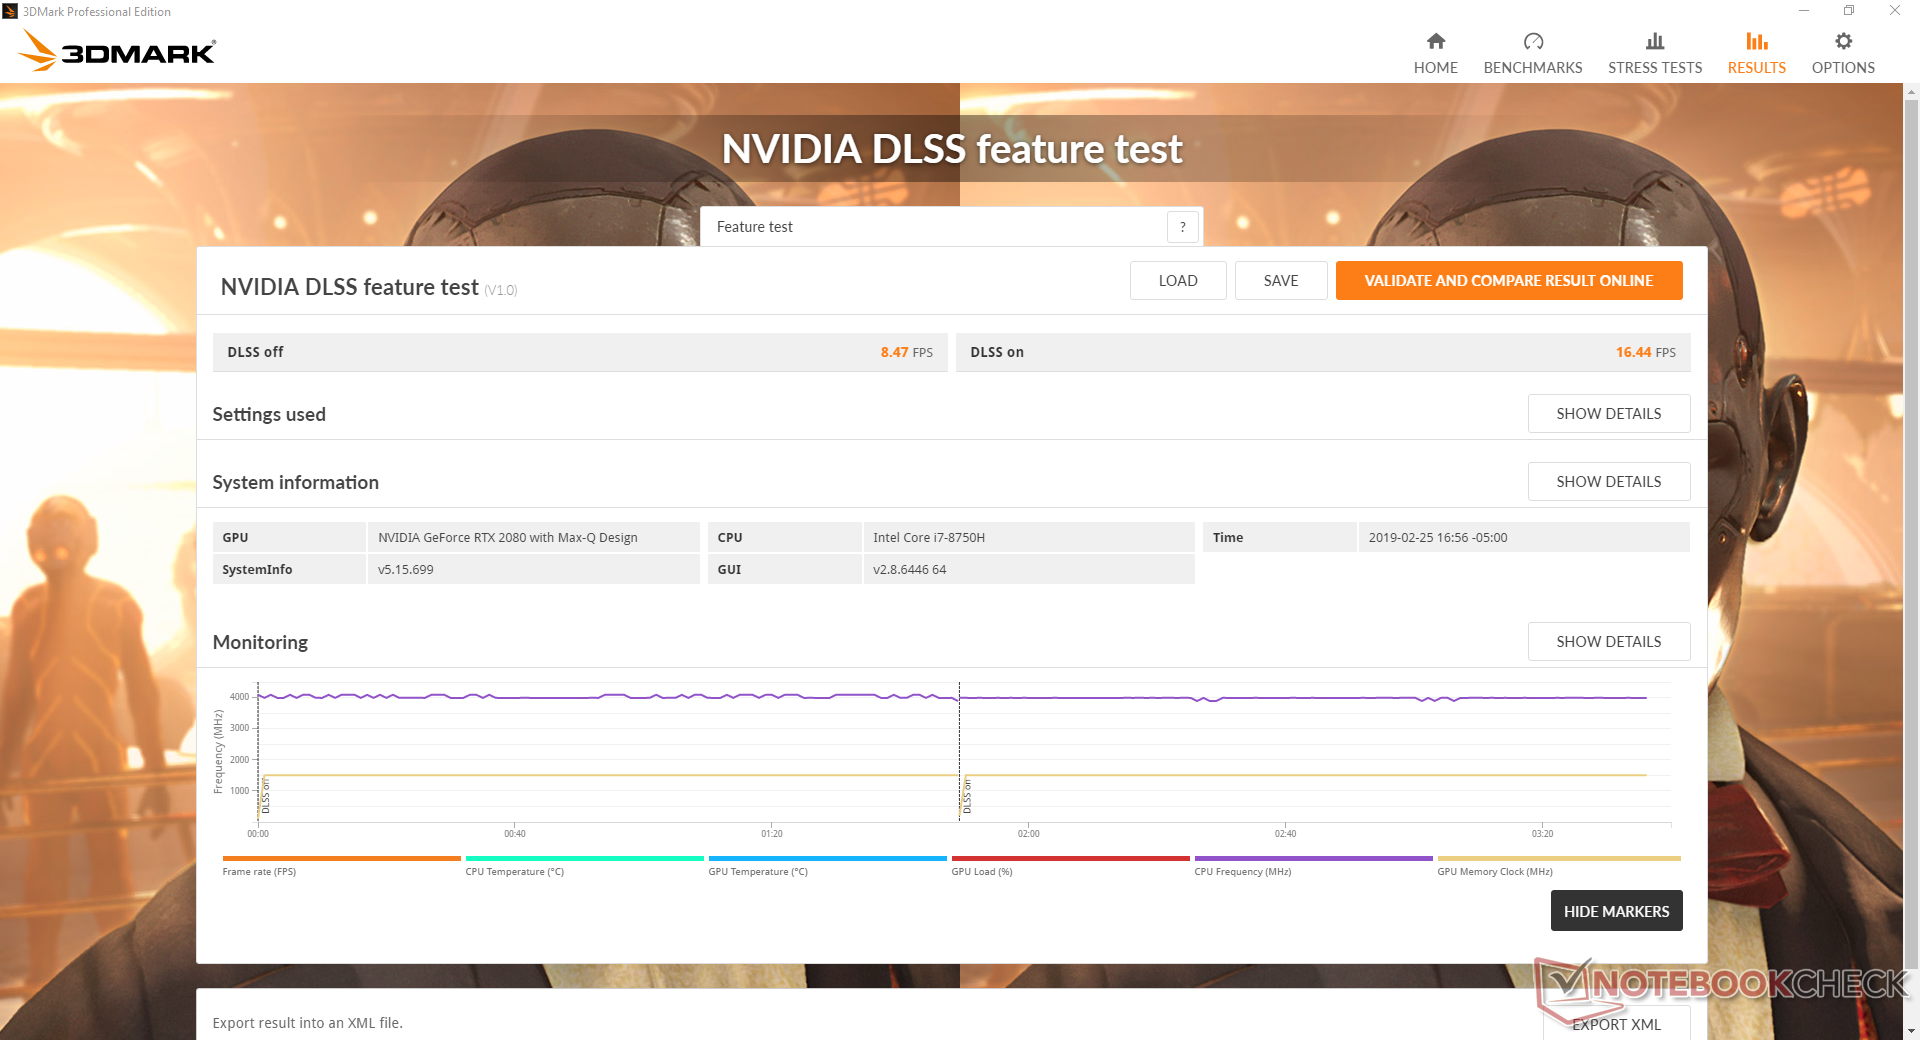
See our dedicated page on the GeForce RTX 2080 Max-Q for more gaming benchmarks and our review on mobile Turing for more technical information.
| The Witcher 3 - 1920x1080 Ultra Graphics & Postprocessing (HBAO+) | |
| Asus ROG G703GX | |
| MSI GS75 8SG Stealth | |
| Lenovo Legion Y740-17ICH | |
| Asus ROG Strix Scar II GL704GW | |
| Razer Blade 15 RTX 2070 Max-Q | |
| HP Omen X 17-ap0xx | |
| Alienware 17 R5 | |
| Alienware m15 GTX 1070 Max-Q | |
| Lenovo Legion Y730-17ICH, i7-8750H | |
| Acer Nitro 5 AN515-42-R6V0 | |
| low | med. | high | ultra | |
|---|---|---|---|---|
| BioShock Infinite (2013) | 316.8 | 283.4 | 239.6 | 161.5 |
| The Witcher 3 (2015) | 305.4 | 222.4 | 144.2 | 73.1 |
| Rise of the Tomb Raider (2016) | 253.4 | 182.8 | 138.8 | 109 |
Emissions
System Noise
We were anticipating the Legion Y740 to run louder than the Legion Y730-17ICH since the RTX 2080 Max-Q is much more powerful than the GTX 1050 Ti. To our surprise, however, fan noise is almost identical. Fan noise is in the low-to-mid 40 dB(A) range when running Witcher 3 compared to over 50 dB(A) on enthusiast gaming laptops like the Alienware 17 or MSI GE75.
The fans are almost always active even during low processing loads, but they thankfully remain relatively quiet with no sudden or acute changes to RPM. System noise will never be truly silent if a secondary HDD is installed much like what we have here.
We can notice no coil whine on our test unit.
| Lenovo Legion Y740-17ICH GeForce RTX 2080 Max-Q, i7-8750H, Samsung SSD PM981 MZVLB256HAHQ | Asus ROG Strix Scar II GL704GW GeForce RTX 2070 Mobile, i7-8750H, Intel SSD 660p SSDPEKNW512G8 | Razer Blade Pro 2017 GeForce GTX 1080 Mobile, i7-7820HK, 2x Samsung SSD PM951 MZVLV256HCHP (RAID 0) | MSI GE75 8SG Raider GeForce RTX 2080 Mobile, i7-8750H, Kingston RBUSNS8154P3512GJ | Alienware 17 R5 GeForce GTX 1070 Mobile, i7-8750H, SK hynix PC401 HFS256GD9TNG | Lenovo Legion Y730-17ICH, i7-8750H GeForce GTX 1050 Ti Mobile, i7-8750H, Toshiba KBG30ZMT128G | |
|---|---|---|---|---|---|---|
| Noise | -14% | -13% | -18% | -12% | 3% | |
| off / environment * (dB) | 28.3 | 29 -2% | 30 -6% | 30 -6% | 30 -6% | 28 1% |
| Idle Minimum * (dB) | 31.5 | 29 8% | 30 5% | 30 5% | 32 -2% | 28 11% |
| Idle Average * (dB) | 31.6 | 32 -1% | 31 2% | 34 -8% | 33 -4% | 28 11% |
| Idle Maximum * (dB) | 31.6 | 40 -27% | 33 -4% | 37 -17% | 34 -8% | 31.3 1% |
| Load Average * (dB) | 32.3 | 46 -42% | 43 -33% | 52 -61% | 43 -33% | 33.4 -3% |
| Witcher 3 ultra * (dB) | 43 | 51 -19% | 55 -28% | 53 -23% | 51 -19% | 42.8 -0% |
| Load Maximum * (dB) | 45.5 | 52 -14% | 58 -27% | 54 -19% | 51 -12% | 46.2 -2% |
* ... smaller is better
Noise level
| Idle |
| 31.5 / 31.6 / 31.6 dB(A) |
| HDD |
| 31.6 dB(A) |
| Load |
| 32.3 / 45.5 dB(A) |
 | ||
30 dB silent 40 dB(A) audible 50 dB(A) loud |
||
min: | ||
Temperature
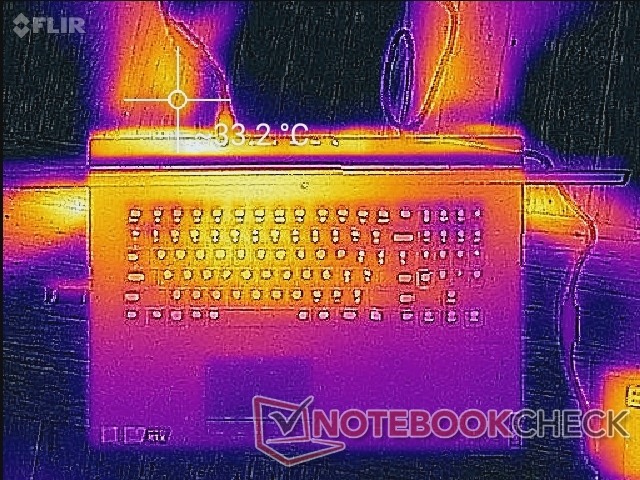
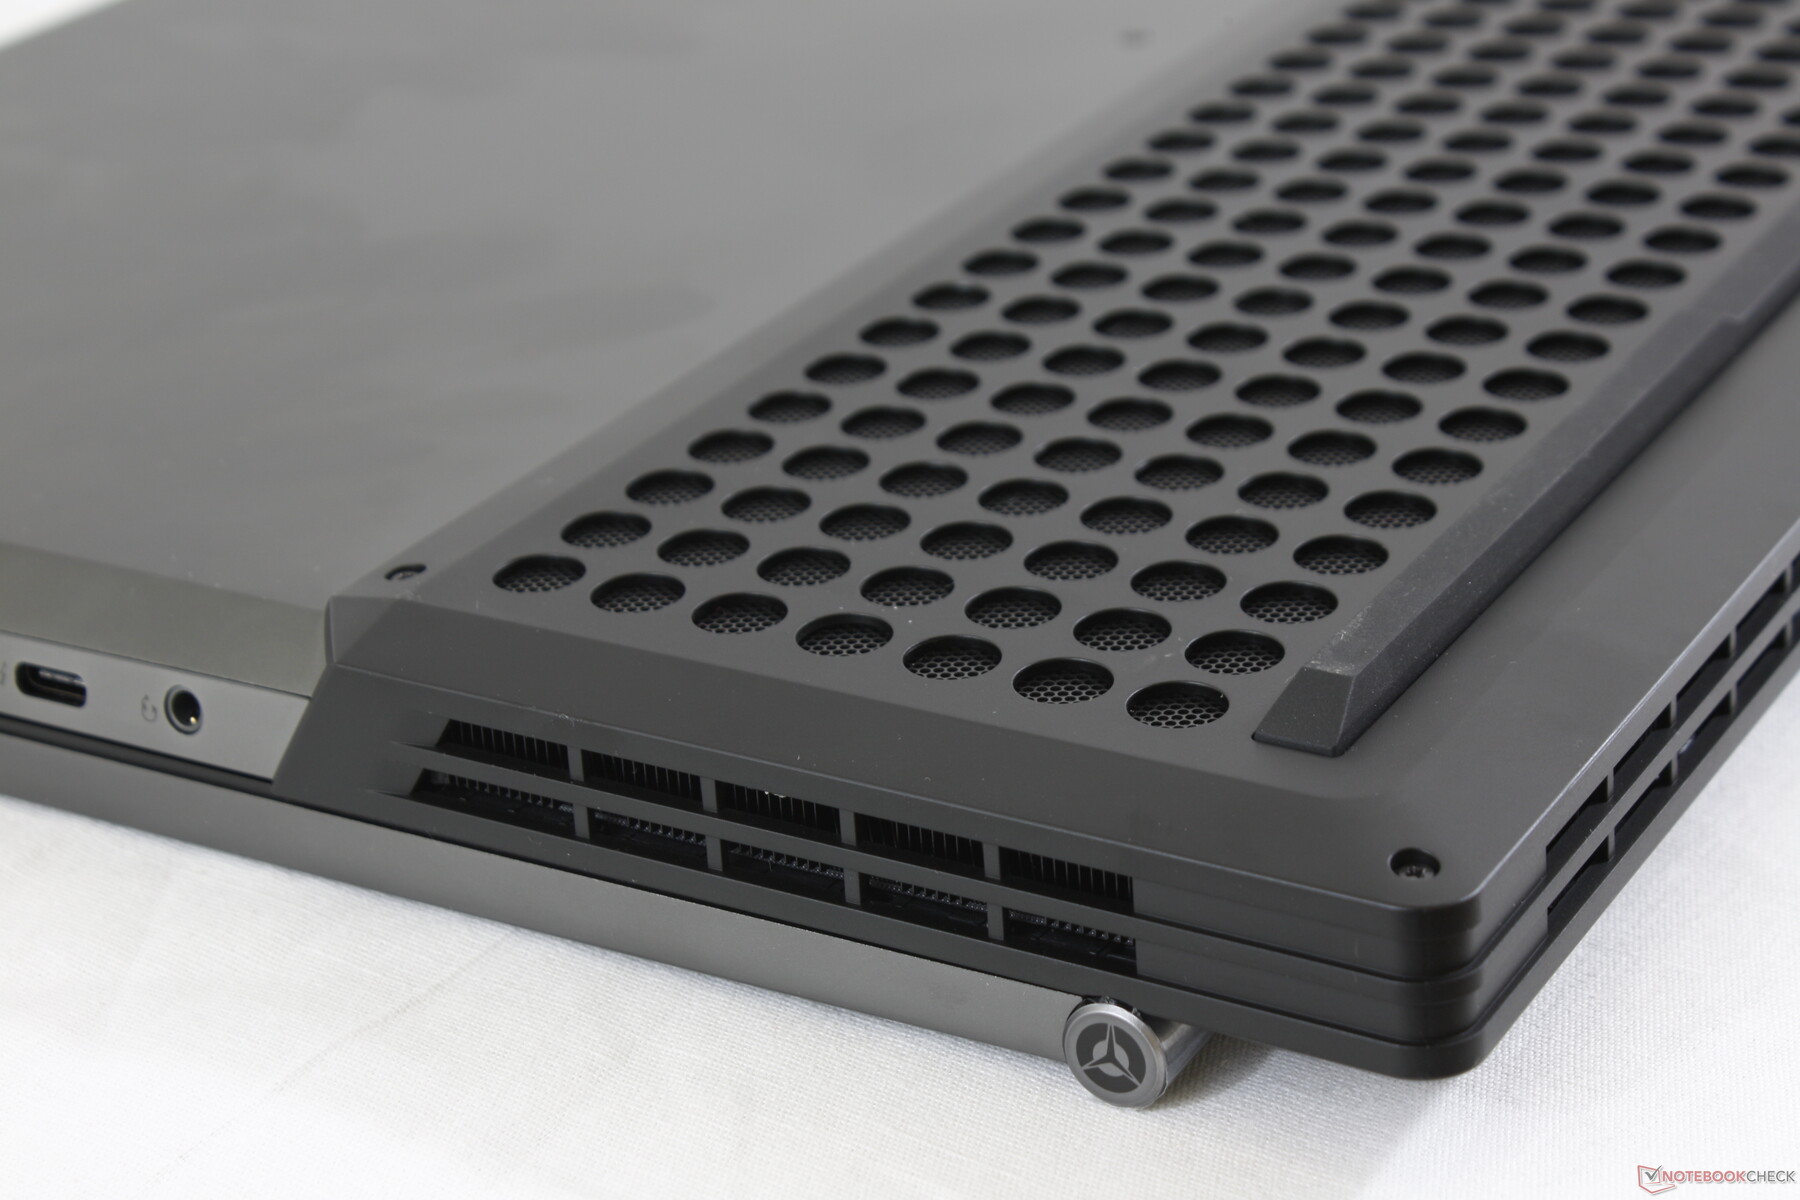
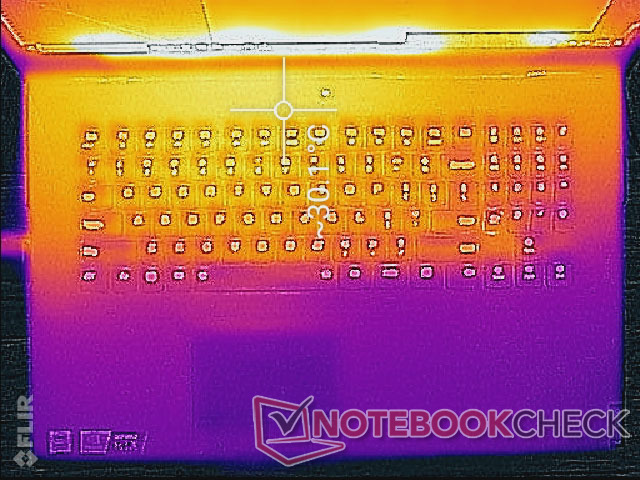
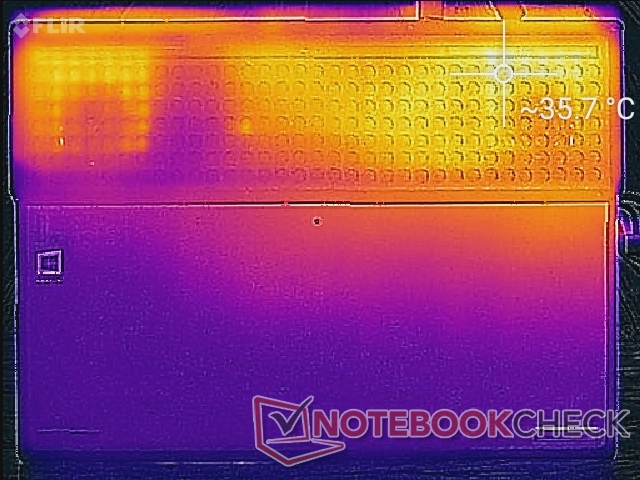
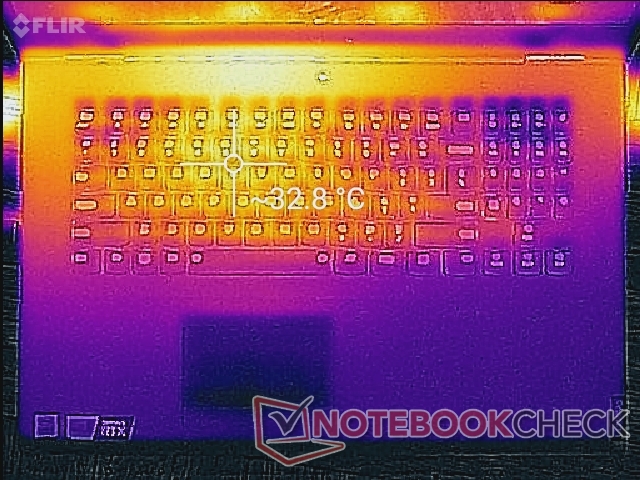
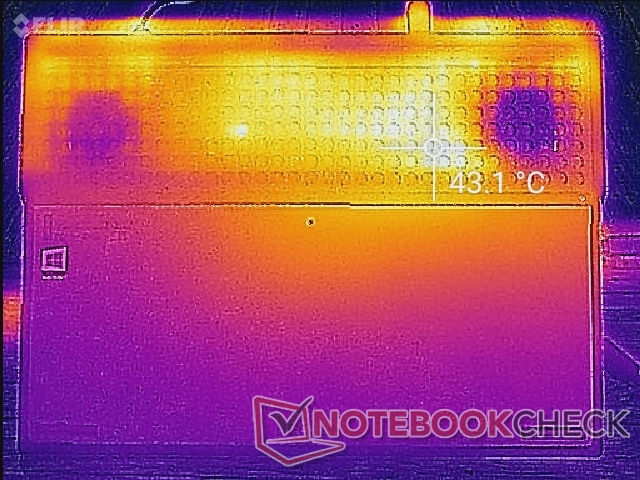
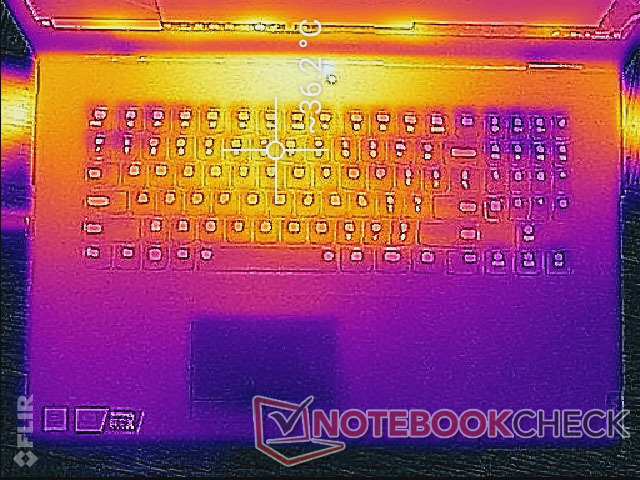
Surface temperatures were relatively cool on the last generation Legion Y730 and this remains true for the Legion Y740. When gaming, the keyboard hotspot is only 33 C to 36 C compared to 40 C on the Asus ROG G703GX equipped with the full-fledged RTX 2080. The wider chassis design and superfluous ventilation along the rear, bottom, and sides make this Lenovo laptop run surprisingly cool considering the hardware inside.
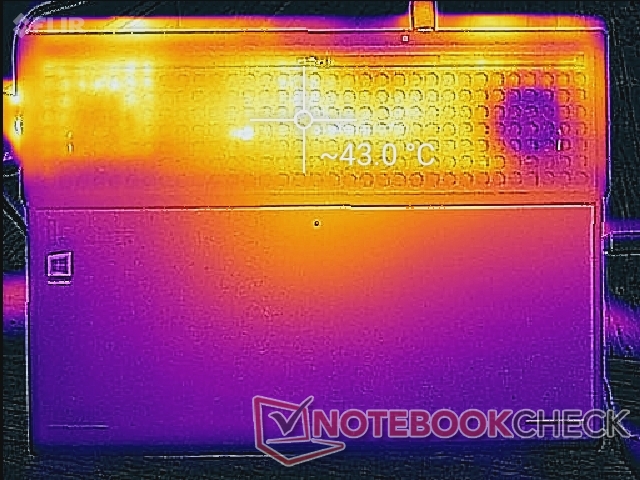
The bottom rear of the notebook can become as warm as 43 C and so it's important to not impede the fans or airflow when gaming.
Stress Test
We stress the system with synthetic loads to identify for any potential throttling or stability issues. When running Prime95, the CPU can be observed operating at 3.9 GHz for the first few seconds until reaching a core temperature of 82 C. Thereafter, the processor stabilizes at 3.4 to 3.5 GHz to maintain a cooler core temperature of 70 C. Since the base clock rate of the Core i7-8750H is 2.2 GHz, the Y740 is able to sustain relatively high levels of Turbo Boost that coincide with our CineBench test results above.
When running Witcher 3, the CPU and GPU stabilize at 71 C and 64 C, respectively, which are warmer than on last year's Legion Y730 but otherwise still relatively cool for a gaming laptop. In comparison, the same CPU and GPU in the Acer Triton 500 stabilize at warmer core temperatures of about 84 C and 78 C, respectively, when running the same game.
Running on batteries will impact CPU and GPU performance even when set to the High Performance and Prefer Maximum Performance power profiles. 3DMark 11 Physics and Graphics scores when running on batteries are only at at 15893 and 8863 points, respectively, compared to 25765 and 12623 points when on mains.
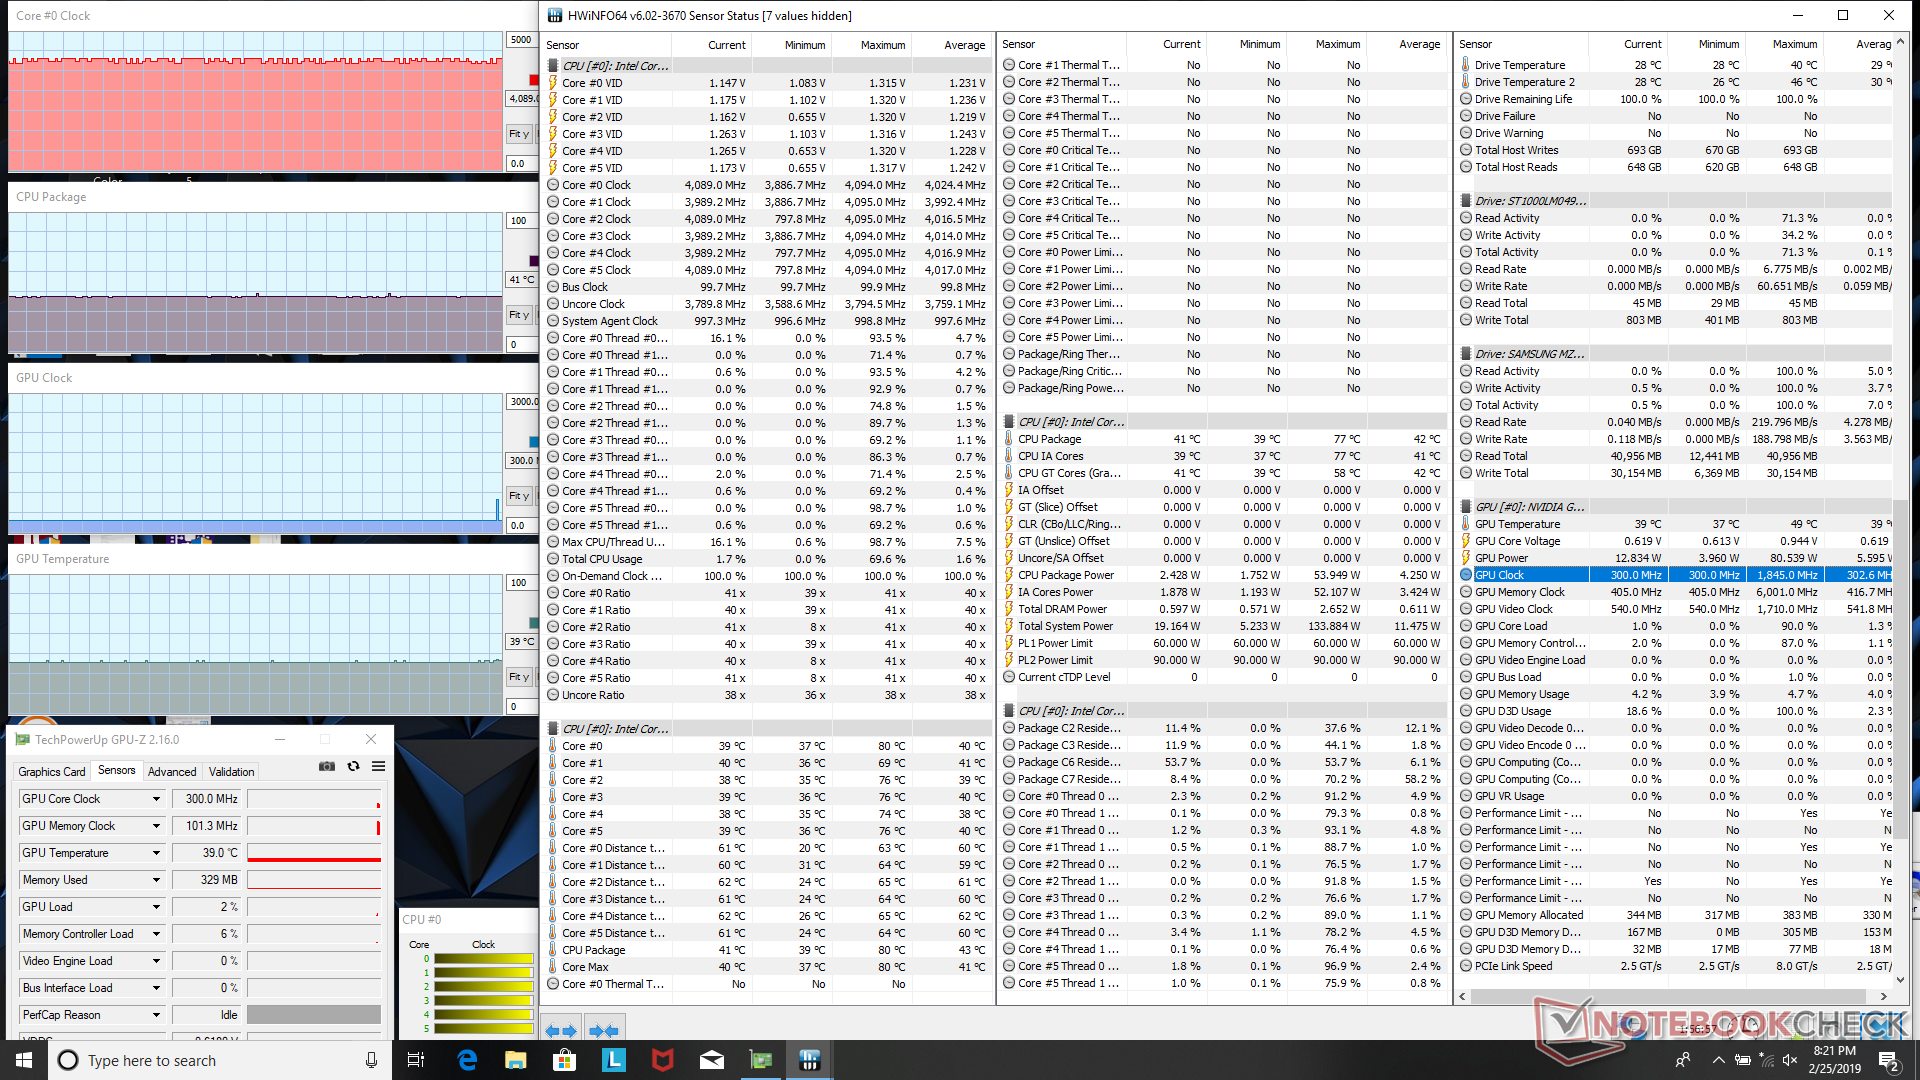
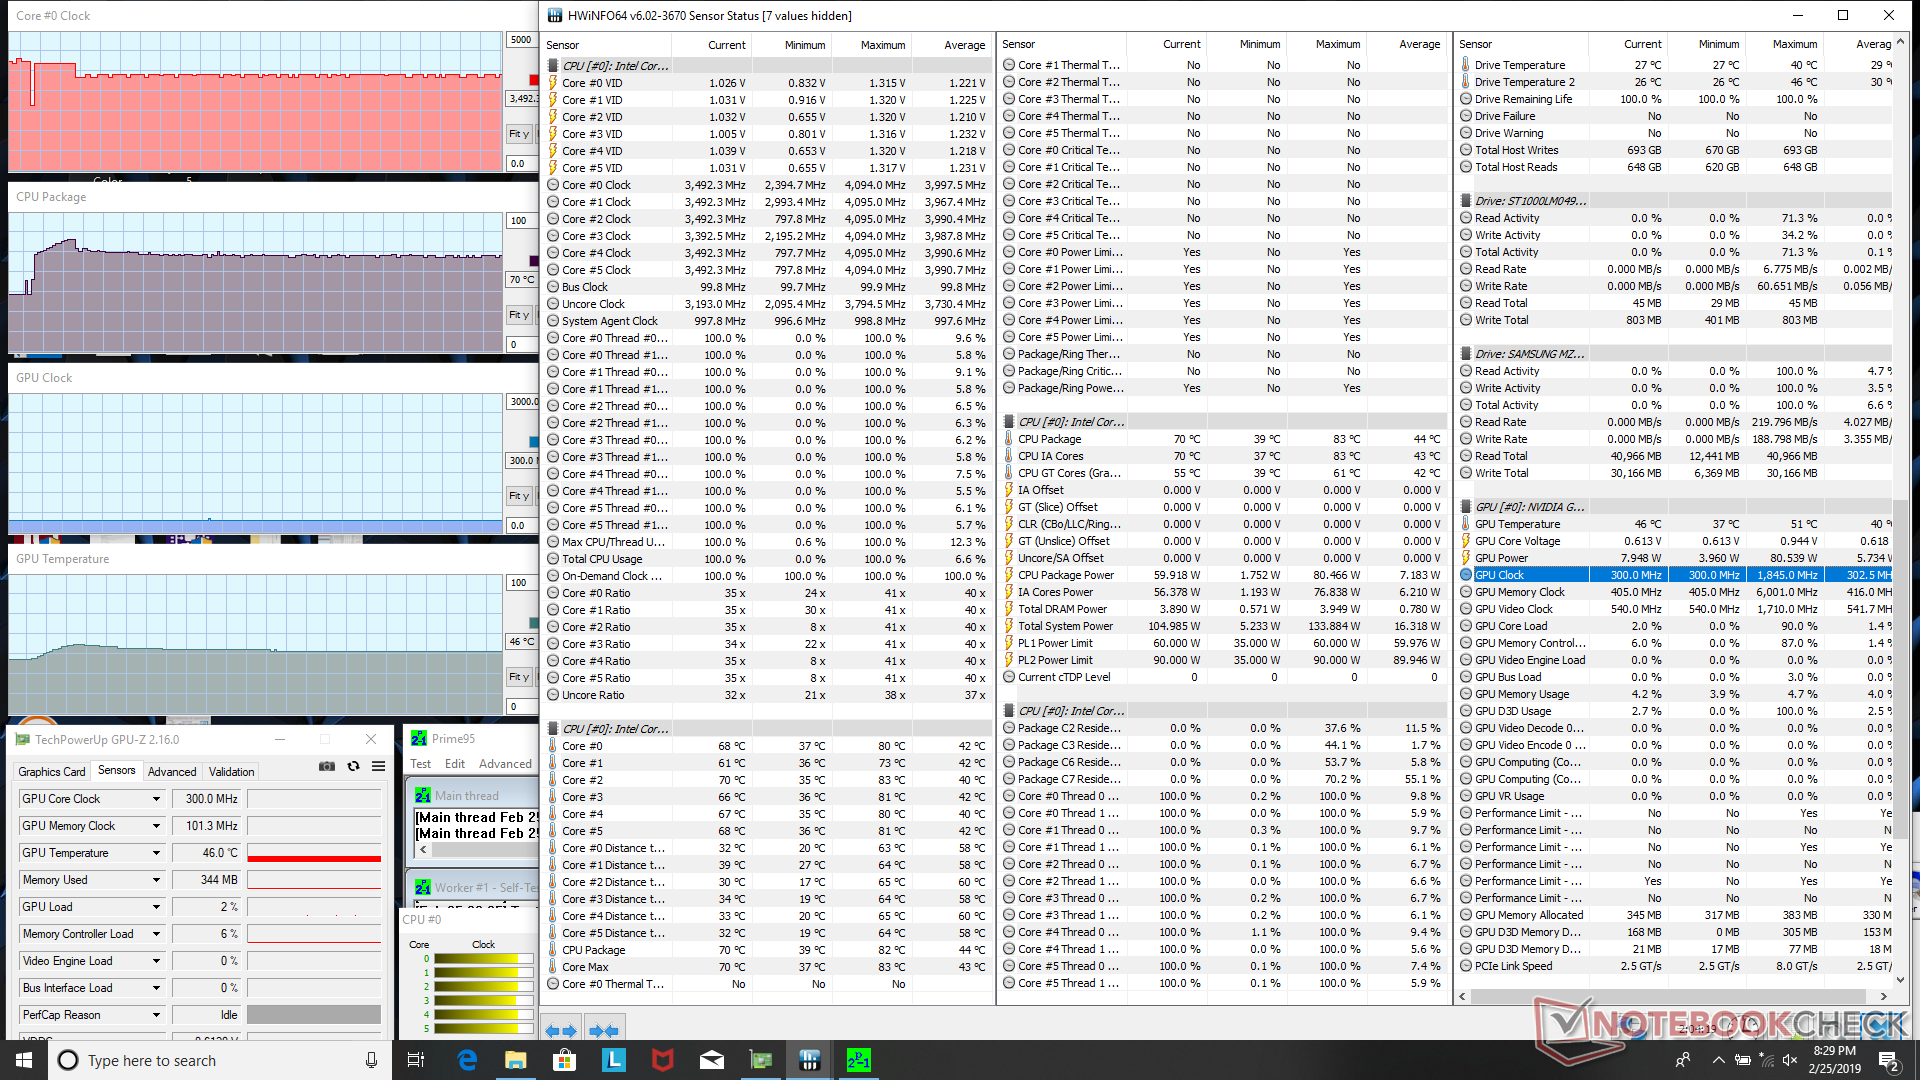
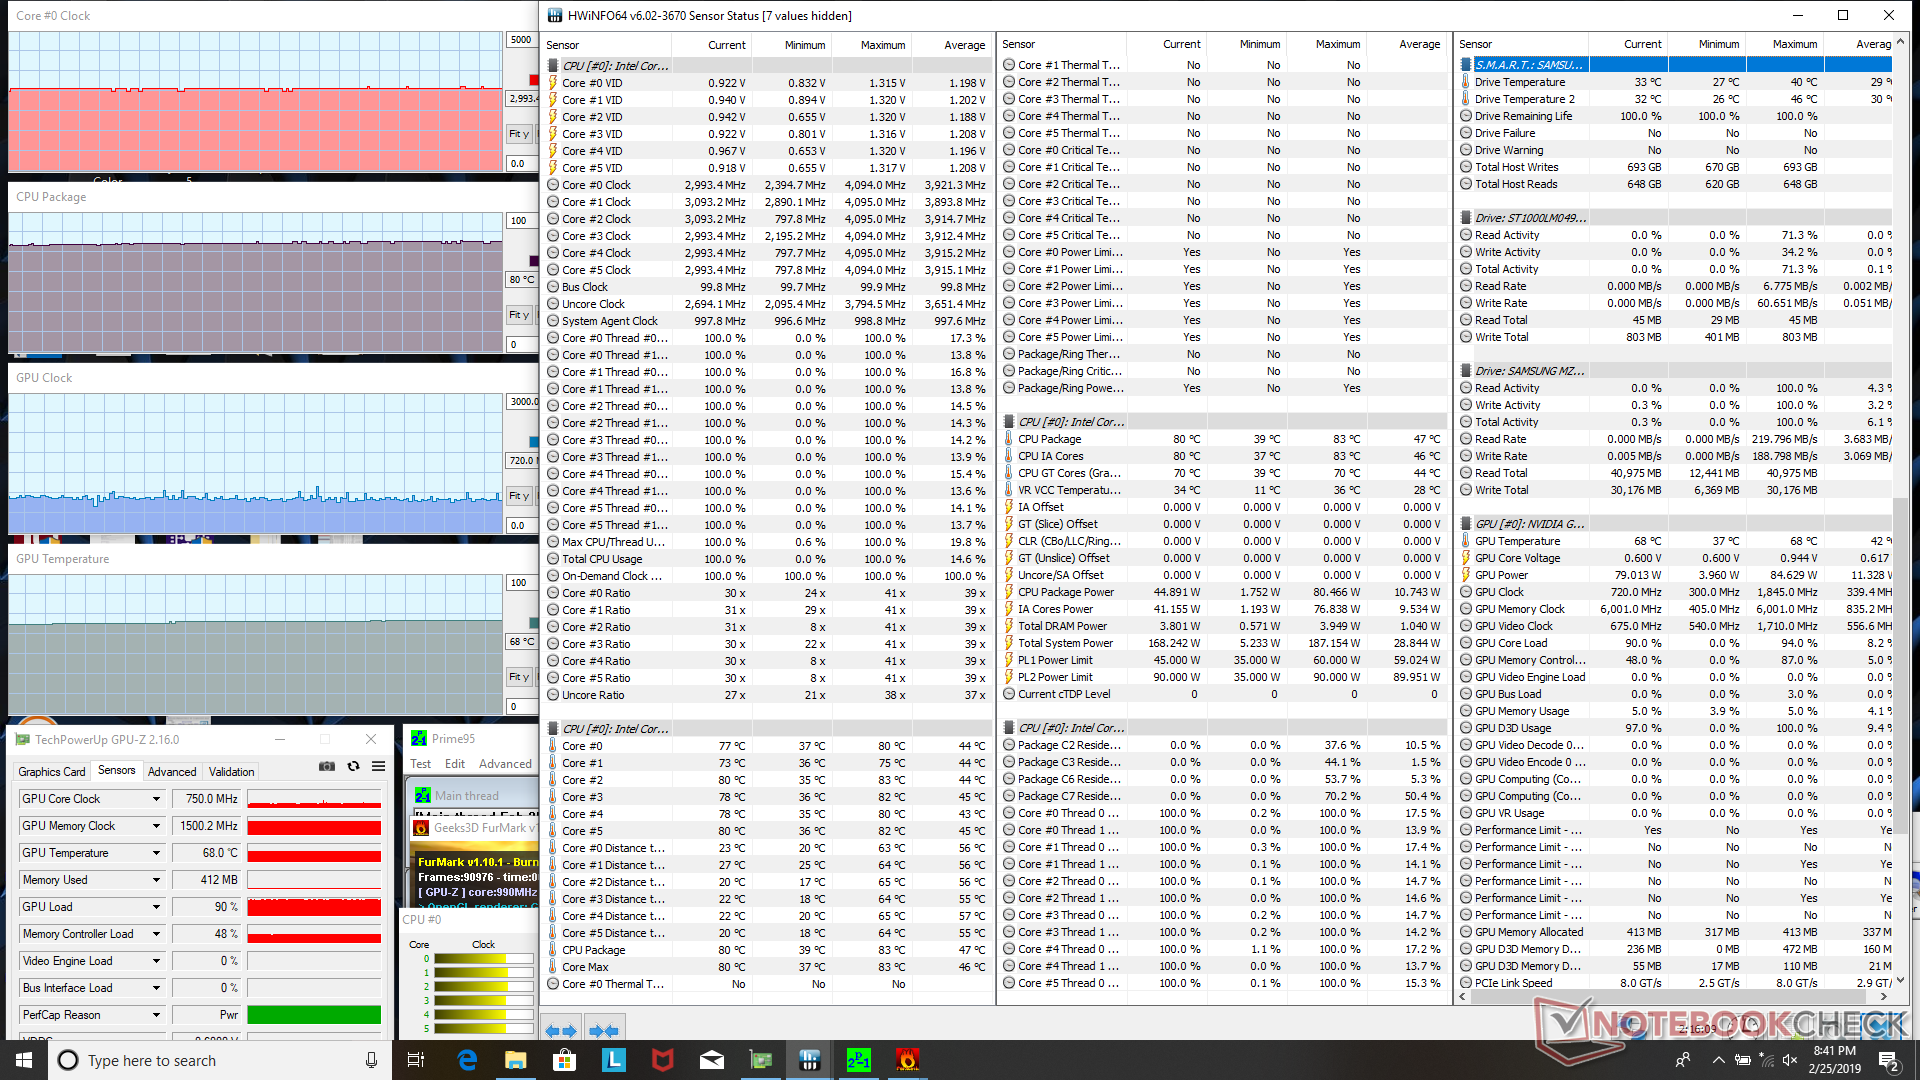
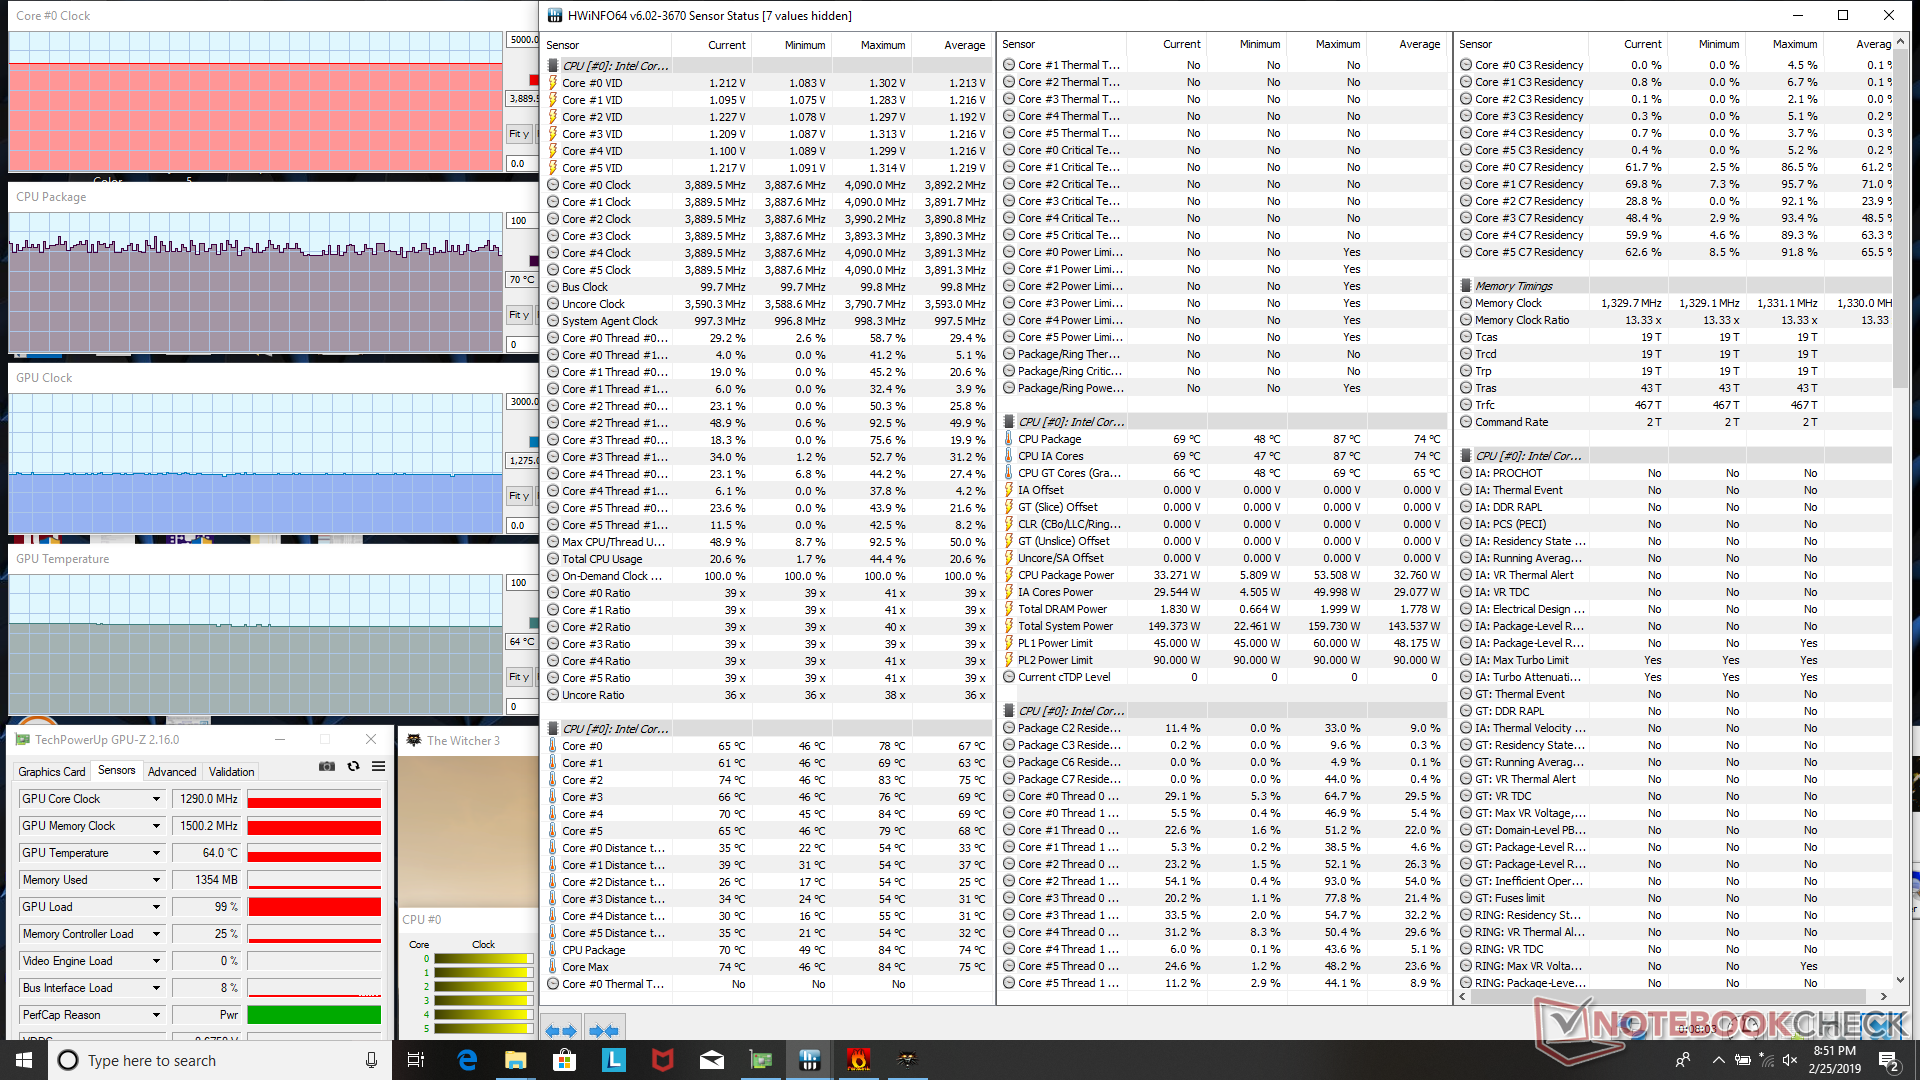
| CPU Clock (GHz) | GPU Clock (MHz) | Average CPU Temperature (°C) | Average GPU Temperature (°C) | |
| System Idle | -- | -- | 41 | 39 |
| Prime95 Stress | 3.4 - 3.5 | -- | 70 | -- |
| Prime95 + FurMark Stress | 3.0 | 750 | 80 | 68 |
| Witcher 3 Stress | 3.9 | 1290 | 71 | 64 |
(+) The maximum temperature on the upper side is 38.6 °C / 101 F, compared to the average of 40.4 °C / 105 F, ranging from 21.2 to 68.8 °C for the class Gaming.
(±) The bottom heats up to a maximum of 43.6 °C / 110 F, compared to the average of 43.2 °C / 110 F
(+) In idle usage, the average temperature for the upper side is 26.1 °C / 79 F, compared to the device average of 33.9 °C / 93 F.
(+) Playing The Witcher 3, the average temperature for the upper side is 29.6 °C / 85 F, compared to the device average of 33.9 °C / 93 F.
(+) The palmrests and touchpad are cooler than skin temperature with a maximum of 27 °C / 80.6 F and are therefore cool to the touch.
(±) The average temperature of the palmrest area of similar devices was 28.8 °C / 83.8 F (+1.8 °C / 3.2 F).
Speakers


Lenovo Legion Y740-17ICH audio analysis
(±) | speaker loudness is average but good (74.3 dB)
Bass 100 - 315 Hz
(-) | nearly no bass - on average 21.1% lower than median
(-) | bass is not linear (16.5% delta to prev. frequency)
Mids 400 - 2000 Hz
(+) | balanced mids - only 3.3% away from median
(±) | linearity of mids is average (9.7% delta to prev. frequency)
Highs 2 - 16 kHz
(+) | balanced highs - only 1.7% away from median
(+) | highs are linear (4.6% delta to prev. frequency)
Overall 100 - 16.000 Hz
(±) | linearity of overall sound is average (23.4% difference to median)
Compared to same class
» 85% of all tested devices in this class were better, 5% similar, 11% worse
» The best had a delta of 6%, average was 18%, worst was 132%
Compared to all devices tested
» 70% of all tested devices were better, 6% similar, 24% worse
» The best had a delta of 4%, average was 23%, worst was 134%
Apple MacBook 12 (Early 2016) 1.1 GHz audio analysis
(+) | speakers can play relatively loud (83.6 dB)
Bass 100 - 315 Hz
(±) | reduced bass - on average 11.3% lower than median
(±) | linearity of bass is average (14.2% delta to prev. frequency)
Mids 400 - 2000 Hz
(+) | balanced mids - only 2.4% away from median
(+) | mids are linear (5.5% delta to prev. frequency)
Highs 2 - 16 kHz
(+) | balanced highs - only 2% away from median
(+) | highs are linear (4.5% delta to prev. frequency)
Overall 100 - 16.000 Hz
(+) | overall sound is linear (10.2% difference to median)
Compared to same class
» 7% of all tested devices in this class were better, 2% similar, 90% worse
» The best had a delta of 5%, average was 18%, worst was 53%
Compared to all devices tested
» 5% of all tested devices were better, 1% similar, 94% worse
» The best had a delta of 4%, average was 23%, worst was 134%
Energy Management
Power Consumption
The system demands anywhere between 20 W to 29 W when idling on desktop compared to just 6 W to 12 W on last year's Legion Y730. This significantly impacts battery life as our next section below will show. Results are not unlike other enthusiast gaming notebooks equipped with GTX 1070/1080 or RTX 2070/2080 level graphics.
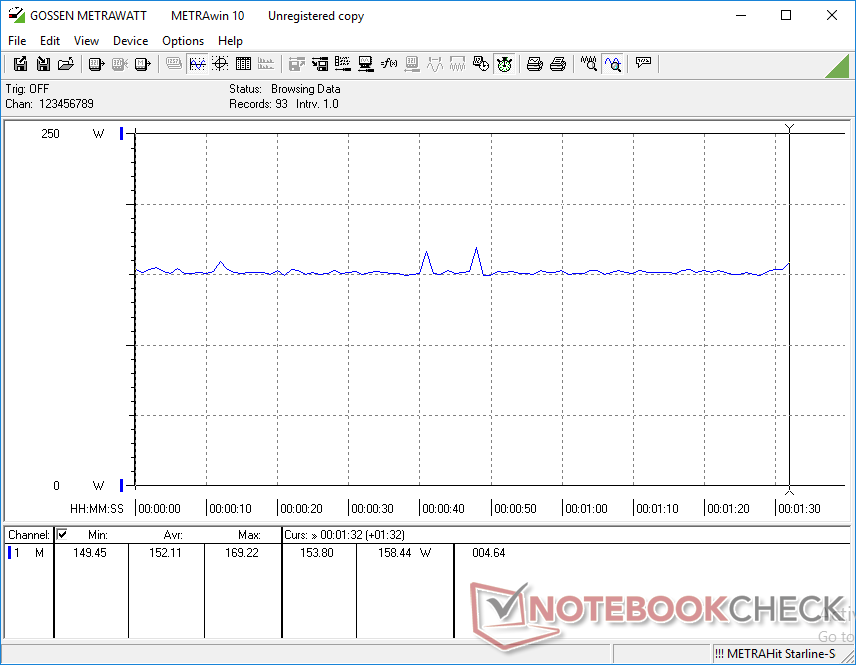
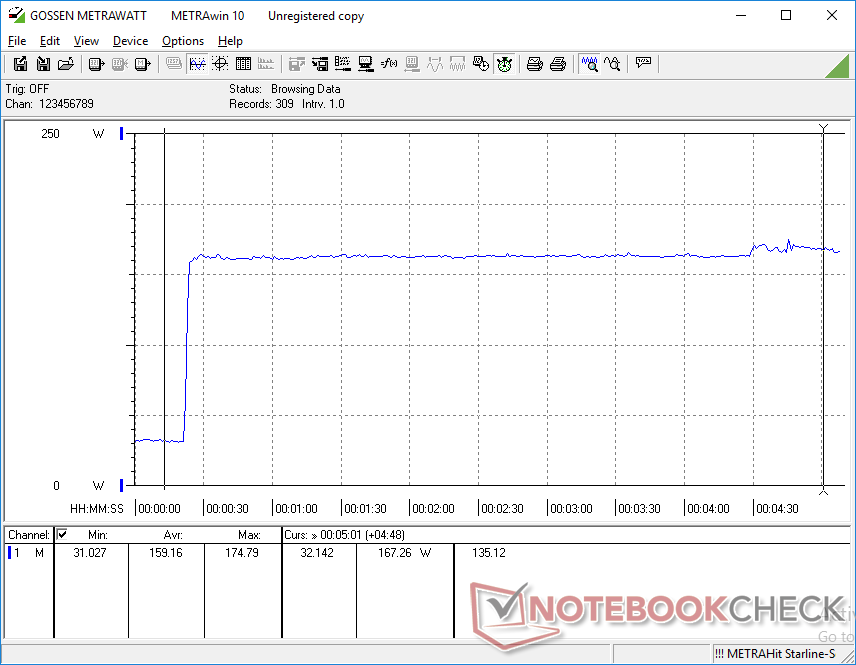
When gaming, the Y740 draws a constant 152 W to be 33 percent more demanding than the Legion Y730 under similar conditions. More impressively, the system is 39 percent more power efficient than the Razer Blade Pro with GTX 1080 graphics while performing up to 13 percent faster in the DX12 Time Spy benchmark. The performance-per-Watt from the RTX 2080 Max-Q is quite impressive when compared to the RTX 2070 as well.
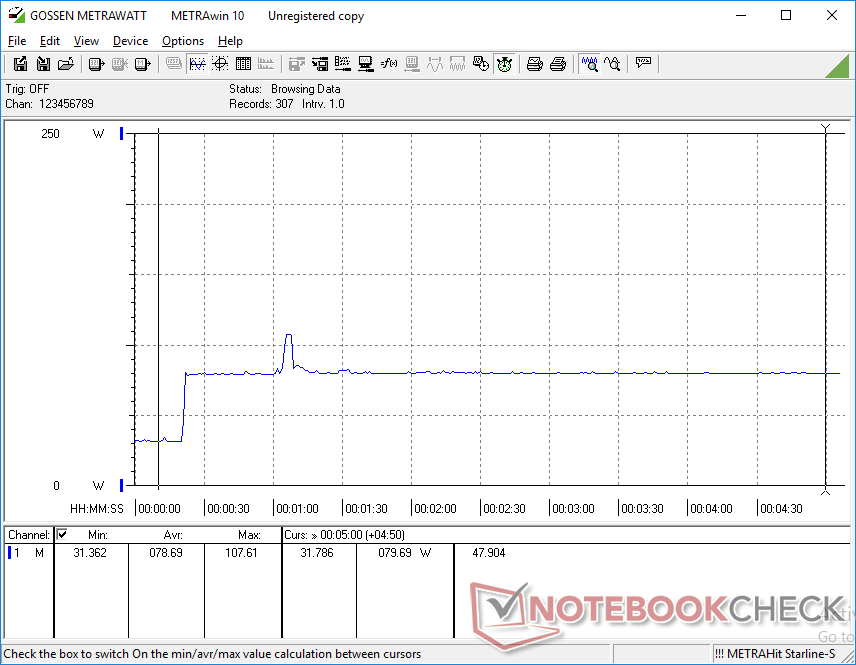
Running Prime95 will demand a constant 80 W without any sharp dips since Turbo Boost performance is relatively stable. We're able to record a maximum draw of 165 W from the large (~20 x 10 x 2.7 cm) 230 W AC adapter. This adapter is noticeably larger than the 135 W adapter that shipped with the Legion Y730.
| Off / Standby | |
| Idle | |
| Load |
|
Key:
min: | |
| Lenovo Legion Y740-17ICH i7-8750H, GeForce RTX 2080 Max-Q, Samsung SSD PM981 MZVLB256HAHQ, IPS, 1920x1080, 17.3" | Asus ROG Strix Scar II GL704GW i7-8750H, GeForce RTX 2070 Mobile, Intel SSD 660p SSDPEKNW512G8, AHVA, 1920x1080, 17.3" | Razer Blade Pro 2017 i7-7820HK, GeForce GTX 1080 Mobile, 2x Samsung SSD PM951 MZVLV256HCHP (RAID 0), IGZO, 3840x2160, 17.3" | MSI GE75 8SG Raider i7-8750H, GeForce RTX 2080 Mobile, Kingston RBUSNS8154P3512GJ, AHVA, 1920x1080, 17.3" | Alienware 17 R5 i7-8750H, GeForce GTX 1070 Mobile, SK hynix PC401 HFS256GD9TNG, TN, 2560x1440, 17.3" | Lenovo Legion Y730-17ICH, i7-8750H i7-8750H, GeForce GTX 1050 Ti Mobile, Toshiba KBG30ZMT128G, IPS, 1920x1080, 17.3" | |
|---|---|---|---|---|---|---|
| Power Consumption | -9% | -42% | 7% | -29% | 41% | |
| Idle Minimum * (Watt) | 20.2 | 19 6% | 31 -53% | 7 65% | 28 -39% | 6.3 69% |
| Idle Average * (Watt) | 27.2 | 22 19% | 36 -32% | 15 45% | 32 -18% | 11 60% |
| Idle Maximum * (Watt) | 28.7 | 29 -1% | 44 -53% | 22 23% | 37 -29% | 11.5 60% |
| Load Average * (Watt) | 90.8 | 102 -12% | 107 -18% | 92 -1% | 112 -23% | 89.8 1% |
| Witcher 3 ultra * (Watt) | 152.1 | 190 -25% | 212 -39% | 207 -36% | 192 -26% | 102 33% |
| Load Maximum * (Watt) | 165.4 | 231 -40% | 258 -56% | 254 -54% | 231 -40% | 130.7 21% |
* ... smaller is better
Battery Life
Runtimes are significantly shorter when compared to last year's Legion Y730. When running the same WLAN stress test, the Y740 lasts for just over 3 hours or less than half the runtime of the Y730. We attribute this to both the 144 Hz panel and RTX 2080 Max-Q graphics which indubitably demand more power than the 60 Hz panel and GTX 1050 Ti GPU on last year's model. The lack of Optimus graphics switching is another hard hit on battery life.
When compared to other enthusiast gaming laptops like the Asus ROG GL704GW or Razer Blade Pro, however, WLAN runtime is where we expect it to be.
Charging from empty to full capacity takes about 1.5 hours.
| Lenovo Legion Y740-17ICH i7-8750H, GeForce RTX 2080 Max-Q, 76 Wh | Asus ROG Strix Scar II GL704GW i7-8750H, GeForce RTX 2070 Mobile, 66 Wh | Razer Blade Pro 2017 i7-7820HK, GeForce GTX 1080 Mobile, 99 Wh | MSI GE75 8SG Raider i7-8750H, GeForce RTX 2080 Mobile, 65 Wh | Alienware 17 R5 i7-8750H, GeForce GTX 1070 Mobile, 99 Wh | Lenovo Legion Y730-17ICH, i7-8750H i7-8750H, GeForce GTX 1050 Ti Mobile, 76 Wh | |
|---|---|---|---|---|---|---|
| Battery runtime | 22% | 3% | 47% | 13% | 109% | |
| WiFi v1.3 (h) | 3.2 | 3.9 22% | 3.3 3% | 4.7 47% | 3.6 13% | 6.7 109% |
| Reader / Idle (h) | 6.2 | 4.2 | 7.8 | 4.5 | 13.2 | |
| Witcher 3 ultra (h) | 0.9 | 0.8 | ||||
| Load (h) | 1.1 | 1.4 | 0.9 | 1.1 | 0.9 |
Pros
Cons
Verdict
Most OEMs normally reserve the high-end GeForce 80-class GPUs for their enthusiast flagship models. This used to be the Legion Y900 family for Lenovo, but the manufacturer has since put that series on hold leaving the mid-range Legion Y700 series as the highest-end offering. The result is a mid-range gaming laptop with a high-end GeForce GPU at much more affordable prices than competing "super" gaming laptops like the Alienware m17, Asus ROG G703, MSI GT75, or Acer Triton 700. The Lenovo laptop offers the same gaming performance as these enthusiast alternatives for hundreds of dollars less largely because its chassis design is simpler and less eccentric.
CPU performance is faster than the average Core i7-8750H due to excellent Turbo Boost sustainability. Both core temperatures and fan noise are lower than expected as well considering the thin form factor and high performance.
Because the Legion Y740 carries a mid-range chassis, however, first impressions are not as strong as the aforementioned high-end alternatives. The Lenovo is more prone to flexing and teetering than the more rigid (and pricier) MSI GT75 or Asus ROG G703. Our specific unit also suffers from moderate-heavy backlight bleeding and inaccurate colors. Its keyboard keys are softer and generally poorer for gaming, too. Gamers won't lose out on performance, but the weaker chassis and keys will put a dent on the overall gaming experience.
The mid-range Legion Y740 retails for much less than a competing enthusiast 17.3-inch gaming laptop while sporting the same high-end CPU and GPU. It has excellent bang-for-the-buck in terms of performance so long as you're ok with its modest design and more flexible chassis.
Lenovo Legion Y740-17ICH
- 03/01/2019 v6 (old)
Allen Ngo
Price comparison
