Lenovo Legion Y530 (Core i5-8300H, GTX 1050 Ti) Laptop Review
Last year’s Lenovo Legion Y520 was met somewhat positively in our review, where we lauded its comfortable input devices, dual storage capability, reasonable price tag, and good overall performance. Apart from objections about its sometimes flimsy plastic construction and subpar display, we didn’t have any major criticisms to offer, either. Especially for the price (some $1,060 at the time), the laptop represented a perfectly respectable alternative to the gaudy and overly expensive gaming PCs decorating the top of the charts.
Today, we’ll have an in-depth look at its successor, the Y530. Continuing the strategy of its predecessor, the Y530 sports a decidedly low-key, almost professional appearance, content with its muted monochromatism and focused solely on the fundamentals of performance, ergonomics, and functionality. And, like before, it’s approachably priced: just $929 (as of this writing).
Our review unit features an Intel Core i5-8300H, NVIDIA GeForce GTX 1050 Ti GPU, matte FHD display, and a dual-storage 128 GB NVMe SSD/1 TB HDD configuration. Is it a worthwhile consideration for those with more low- to mid-range mobile gaming aspirations?
Case
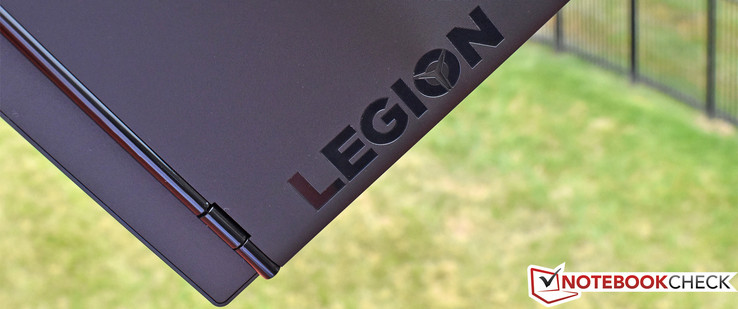
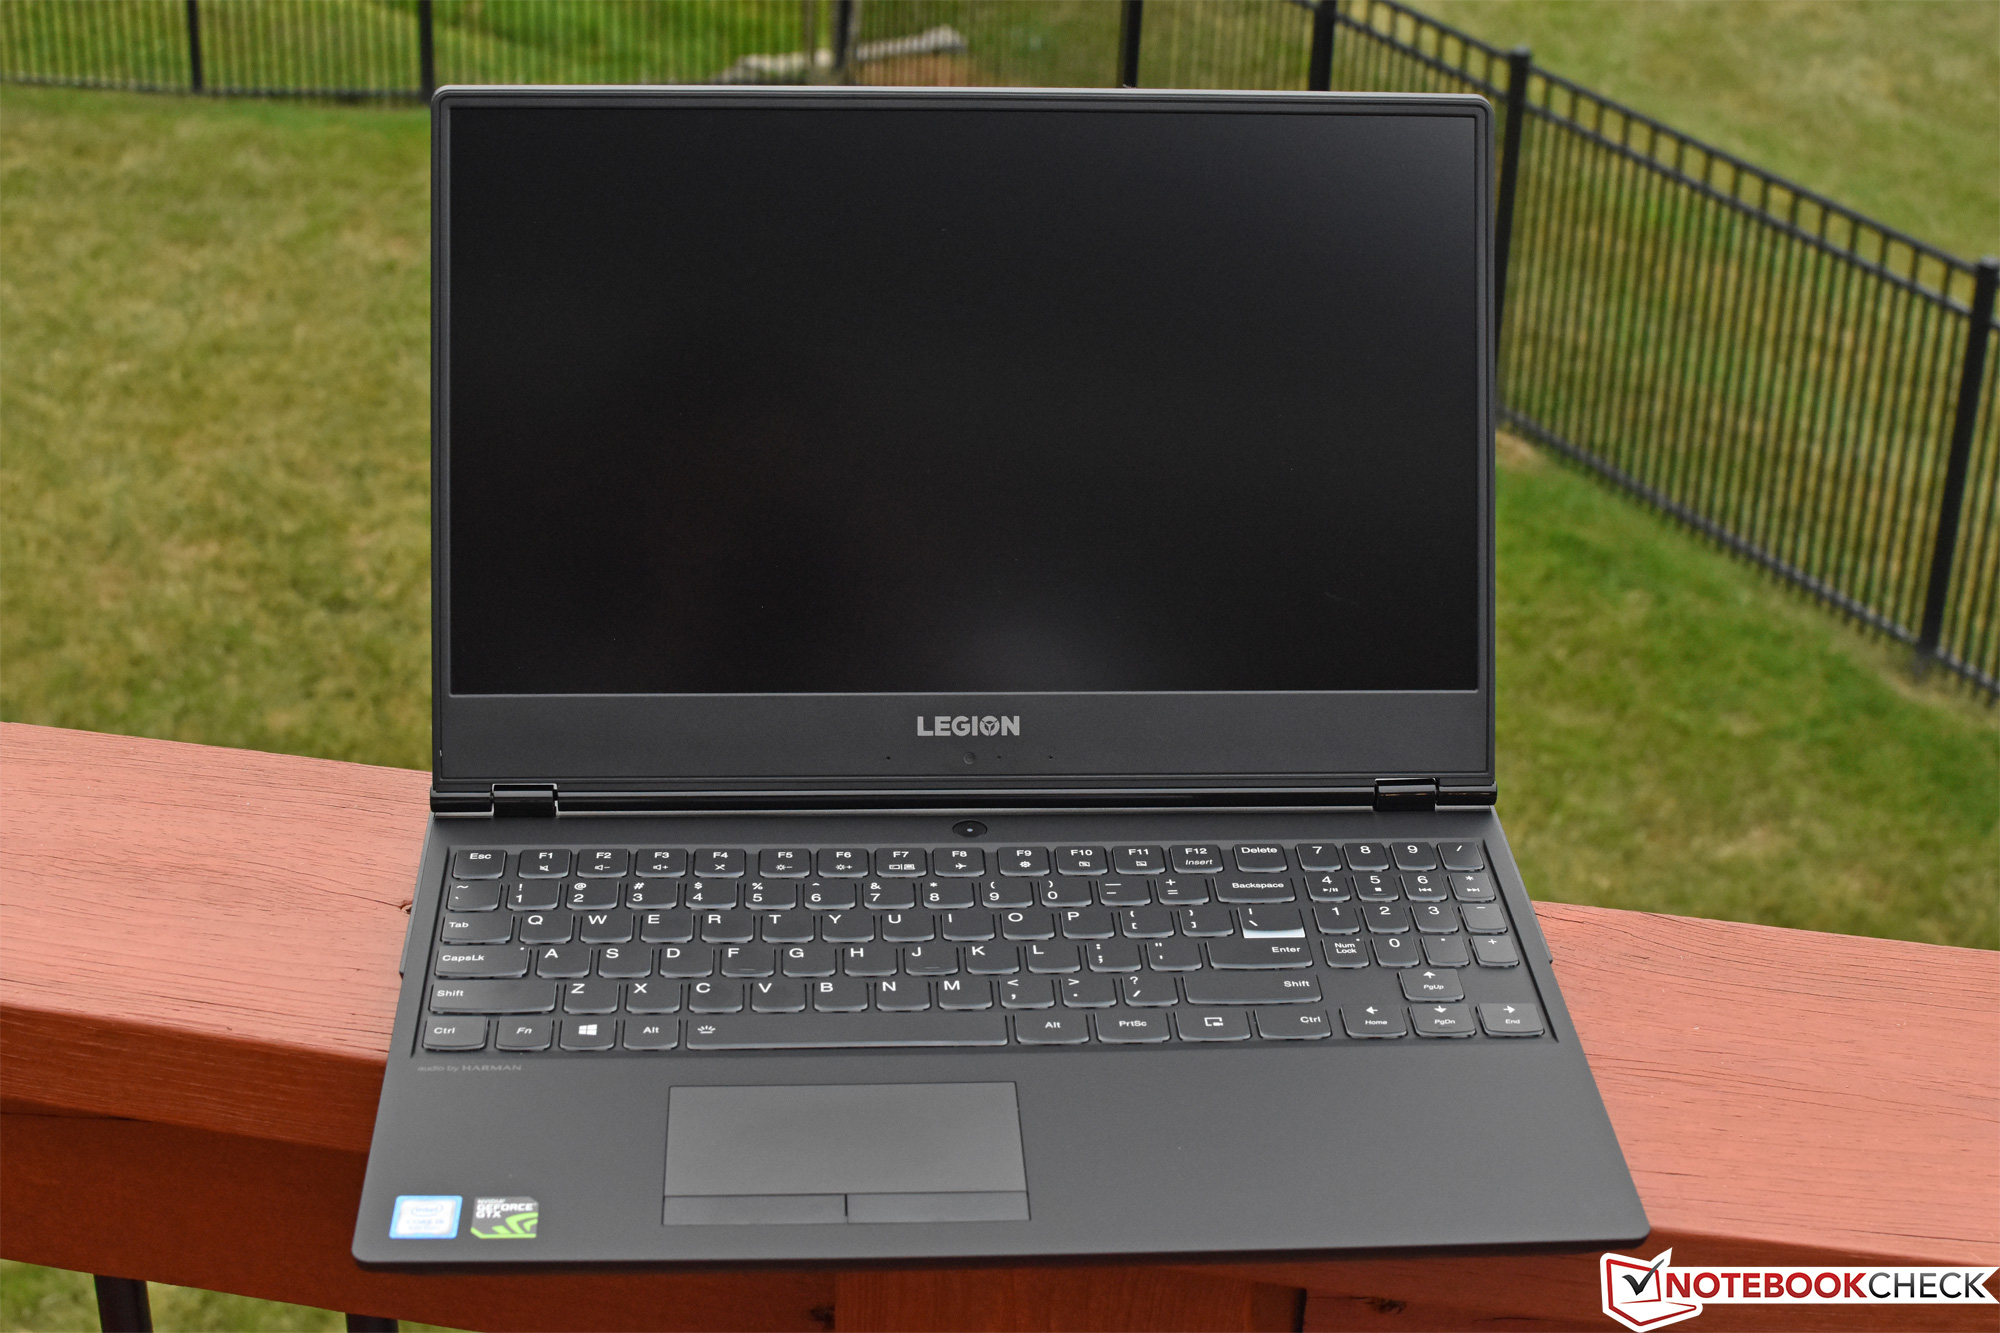
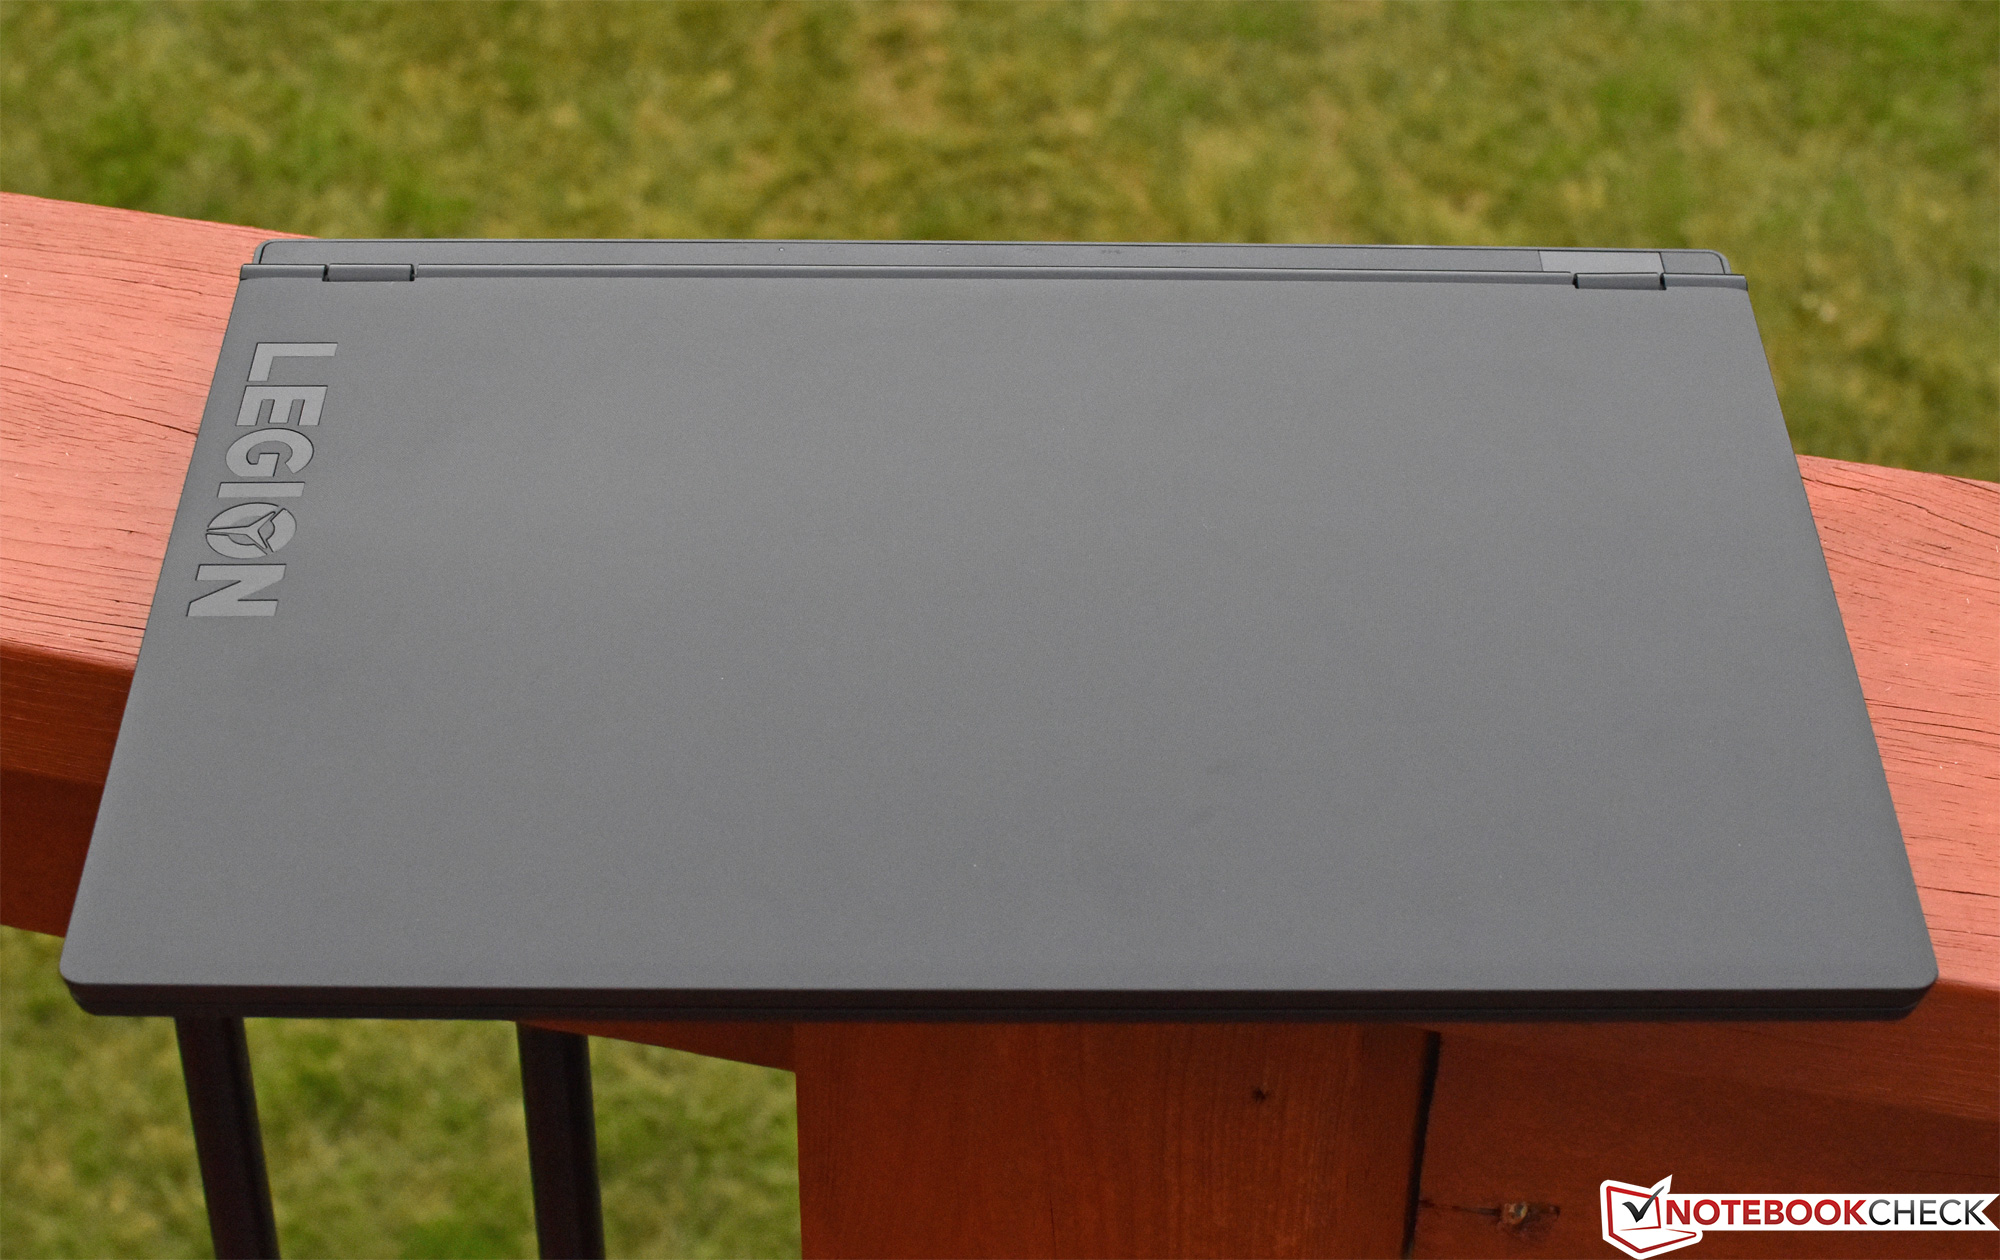
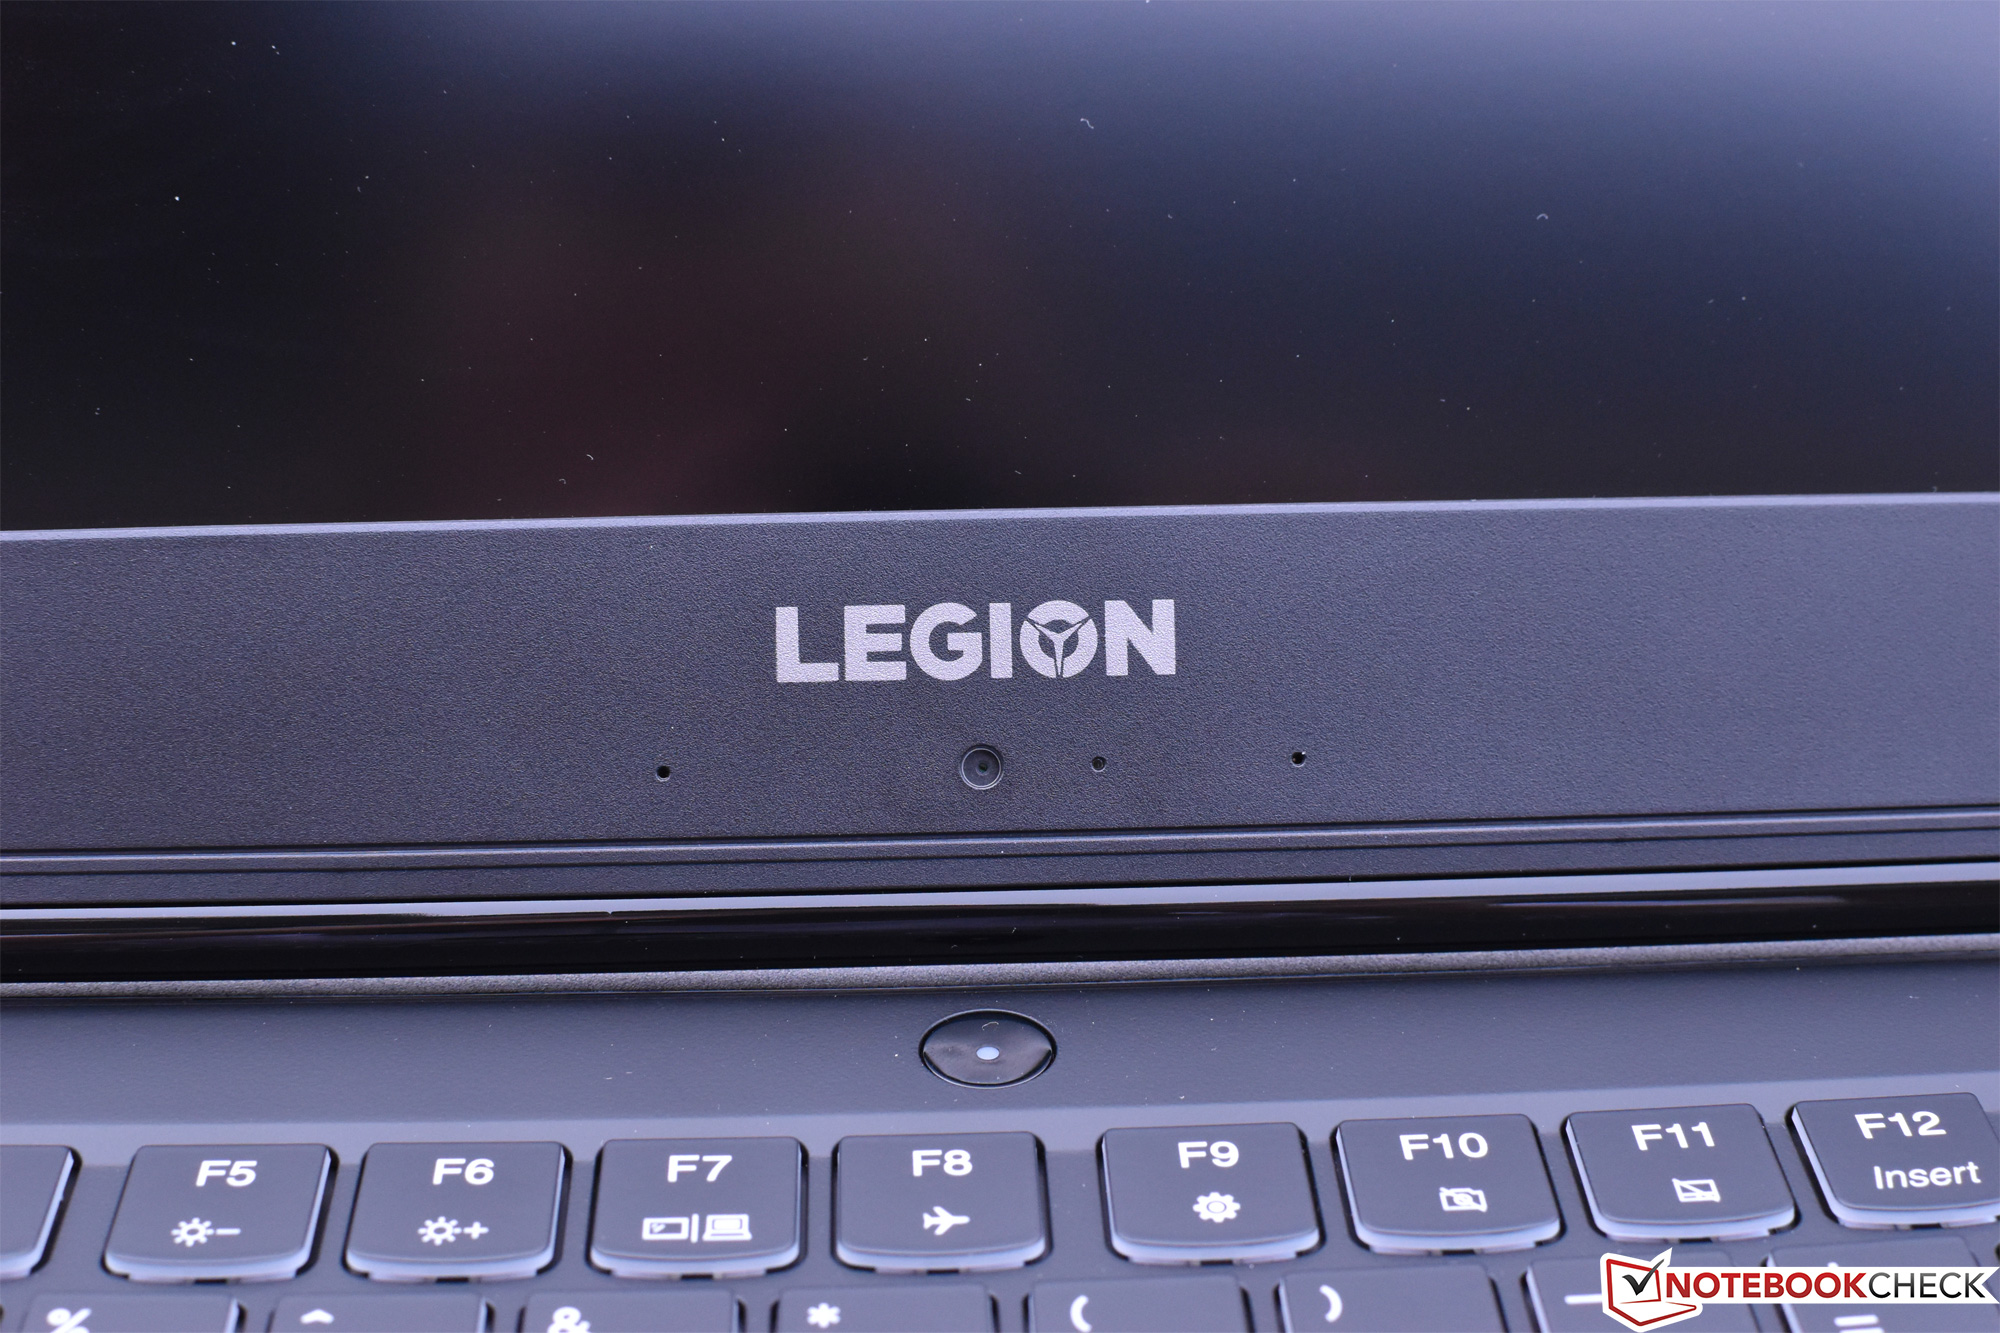
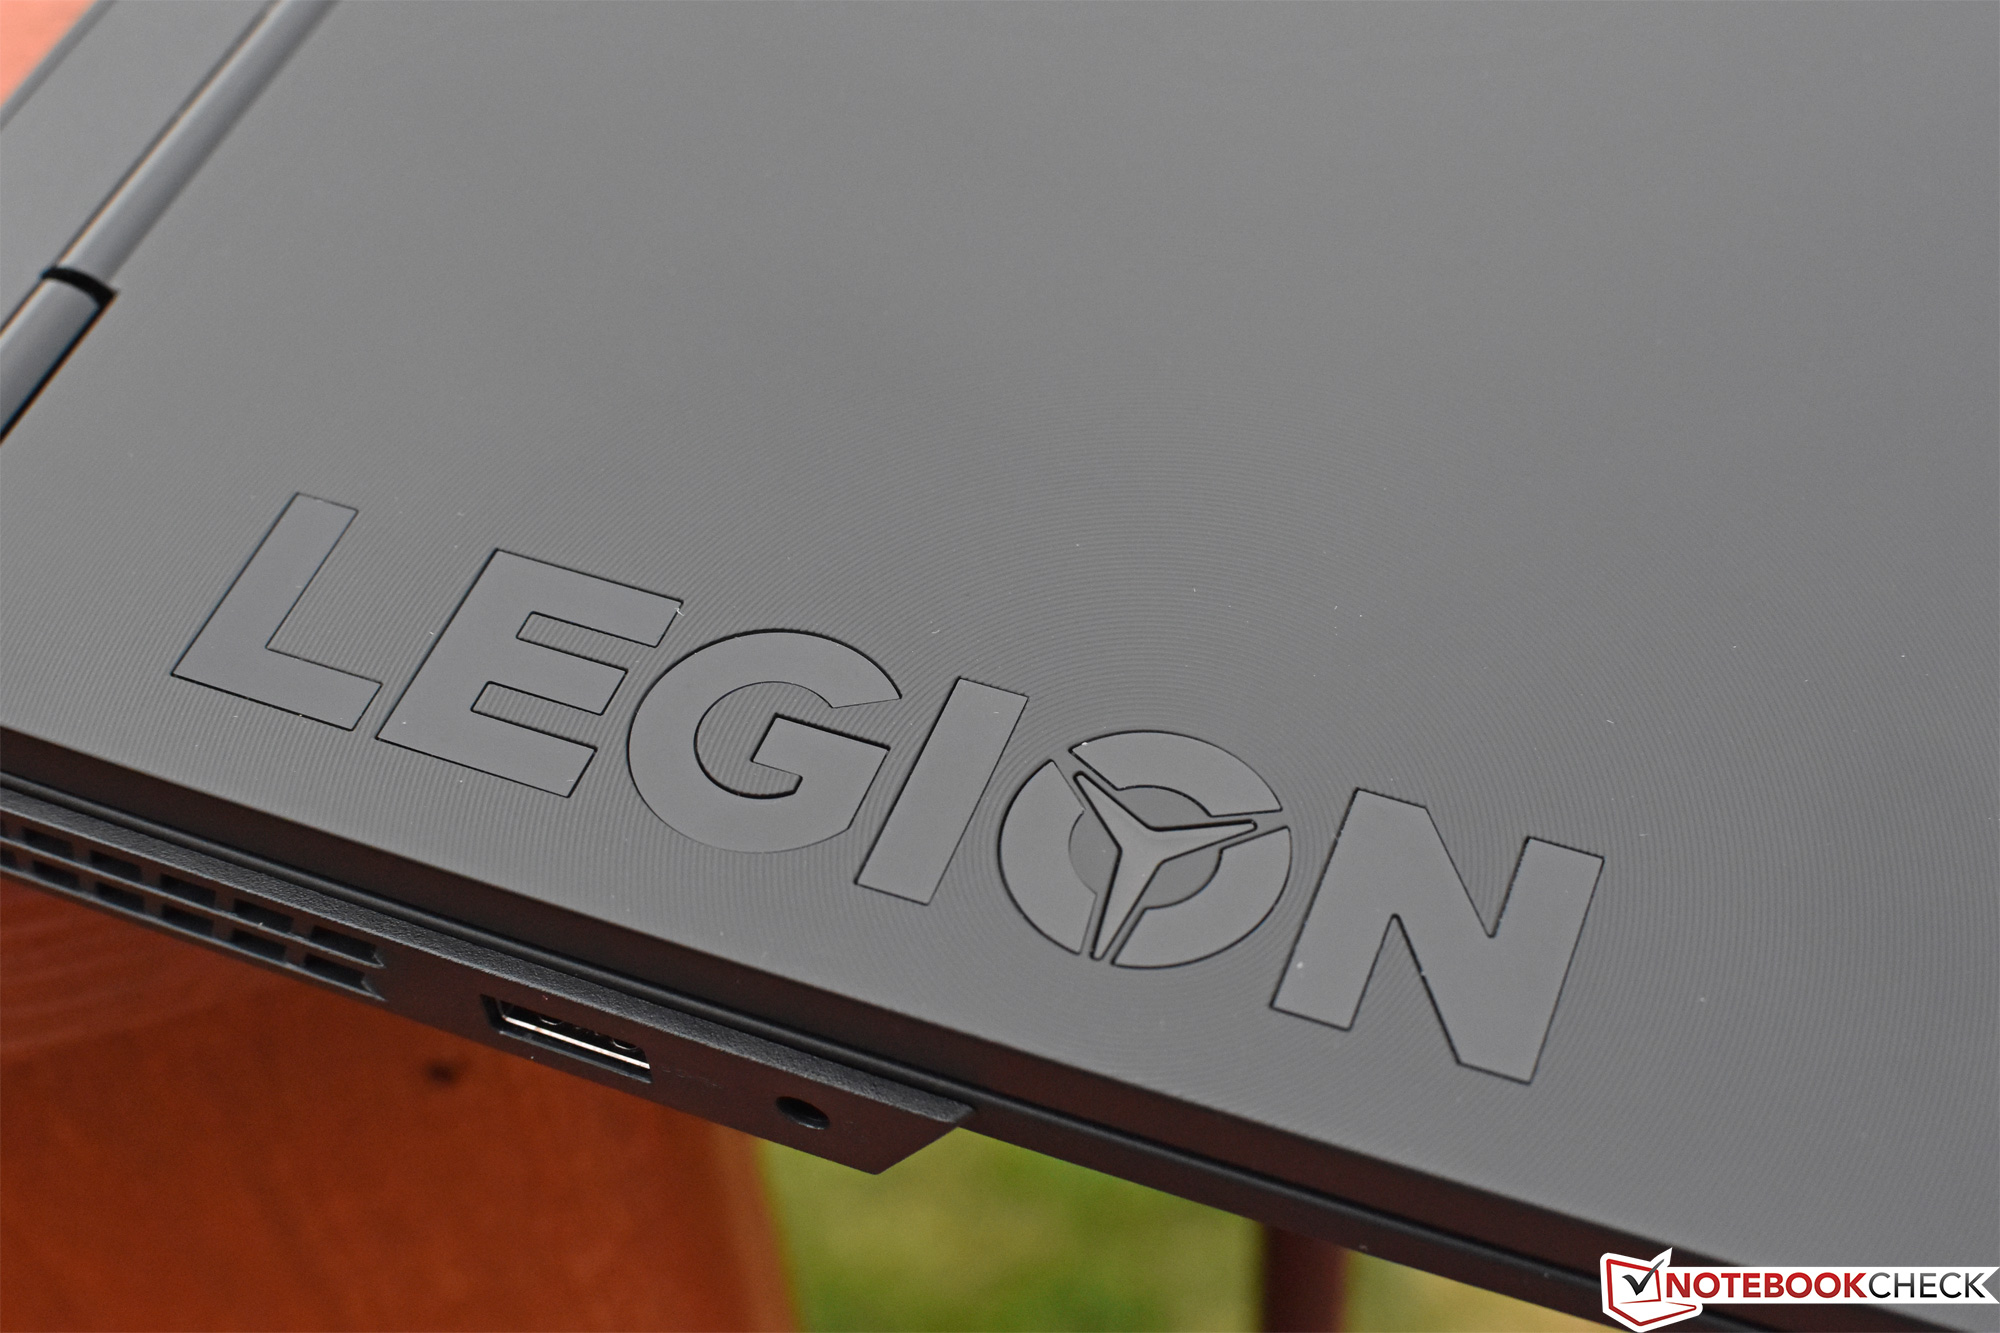
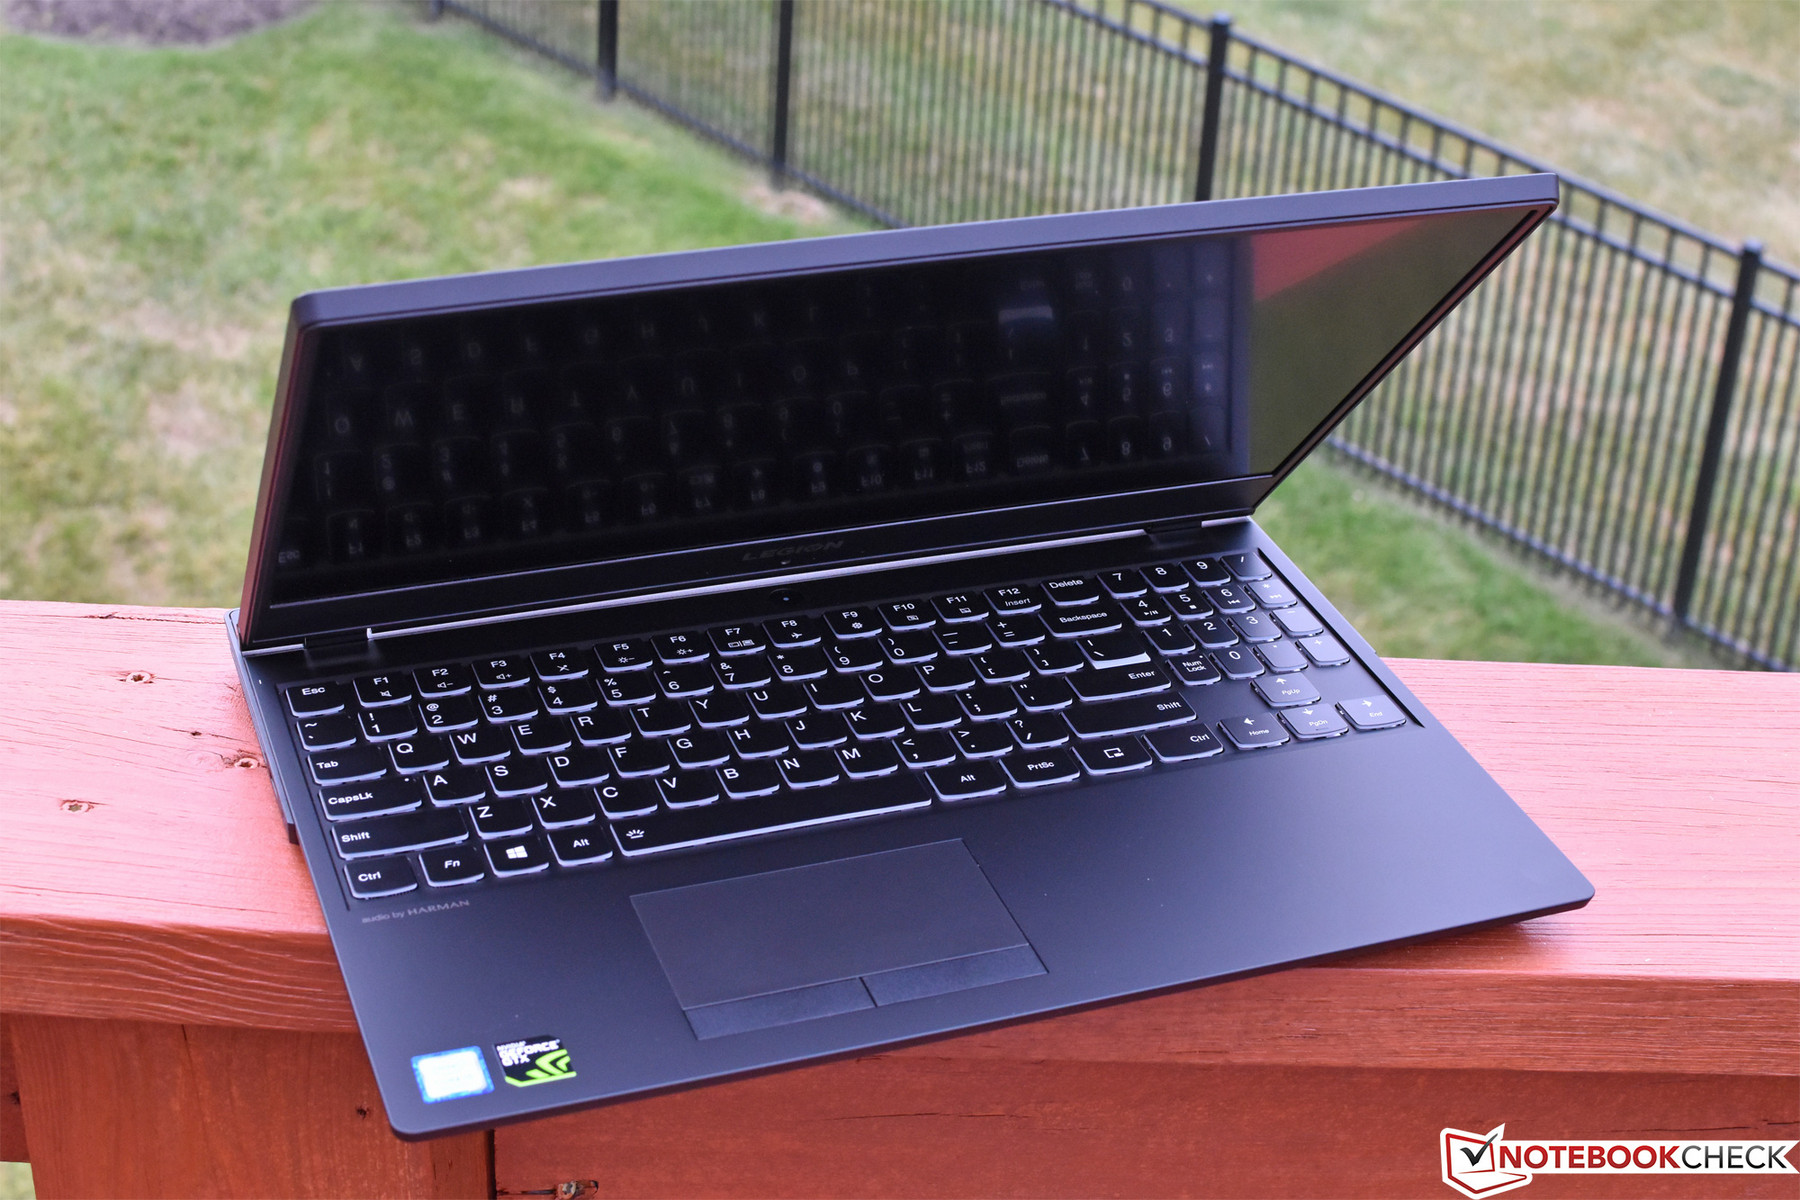
Although it’s only slightly smaller in size and weight as compared to its predecessor, the Legion Y530 has a few aesthetic tricks up its sleeve. To start with, the bezels surrounding the screen have now shrunk to a comparably minute 8 mm (barring the bottom, to where the webcam has now been relocated). Gone are the red accents and keyboard backlight of the previous model—perhaps the last remaining bastions of any sort of conventional gaming pomp exhibited by the otherwise predominantly subdued contraption. The display lid—previously sporting an angled, semi-Alienware/ASUS ROG styling—is now perfectly flat, imbued only by a subtle spiral pattern encircling the “O” in “Legion”, a letter which also exudes the only hint of showmanship to which the device succumbs via a stylish white circumscribed star.
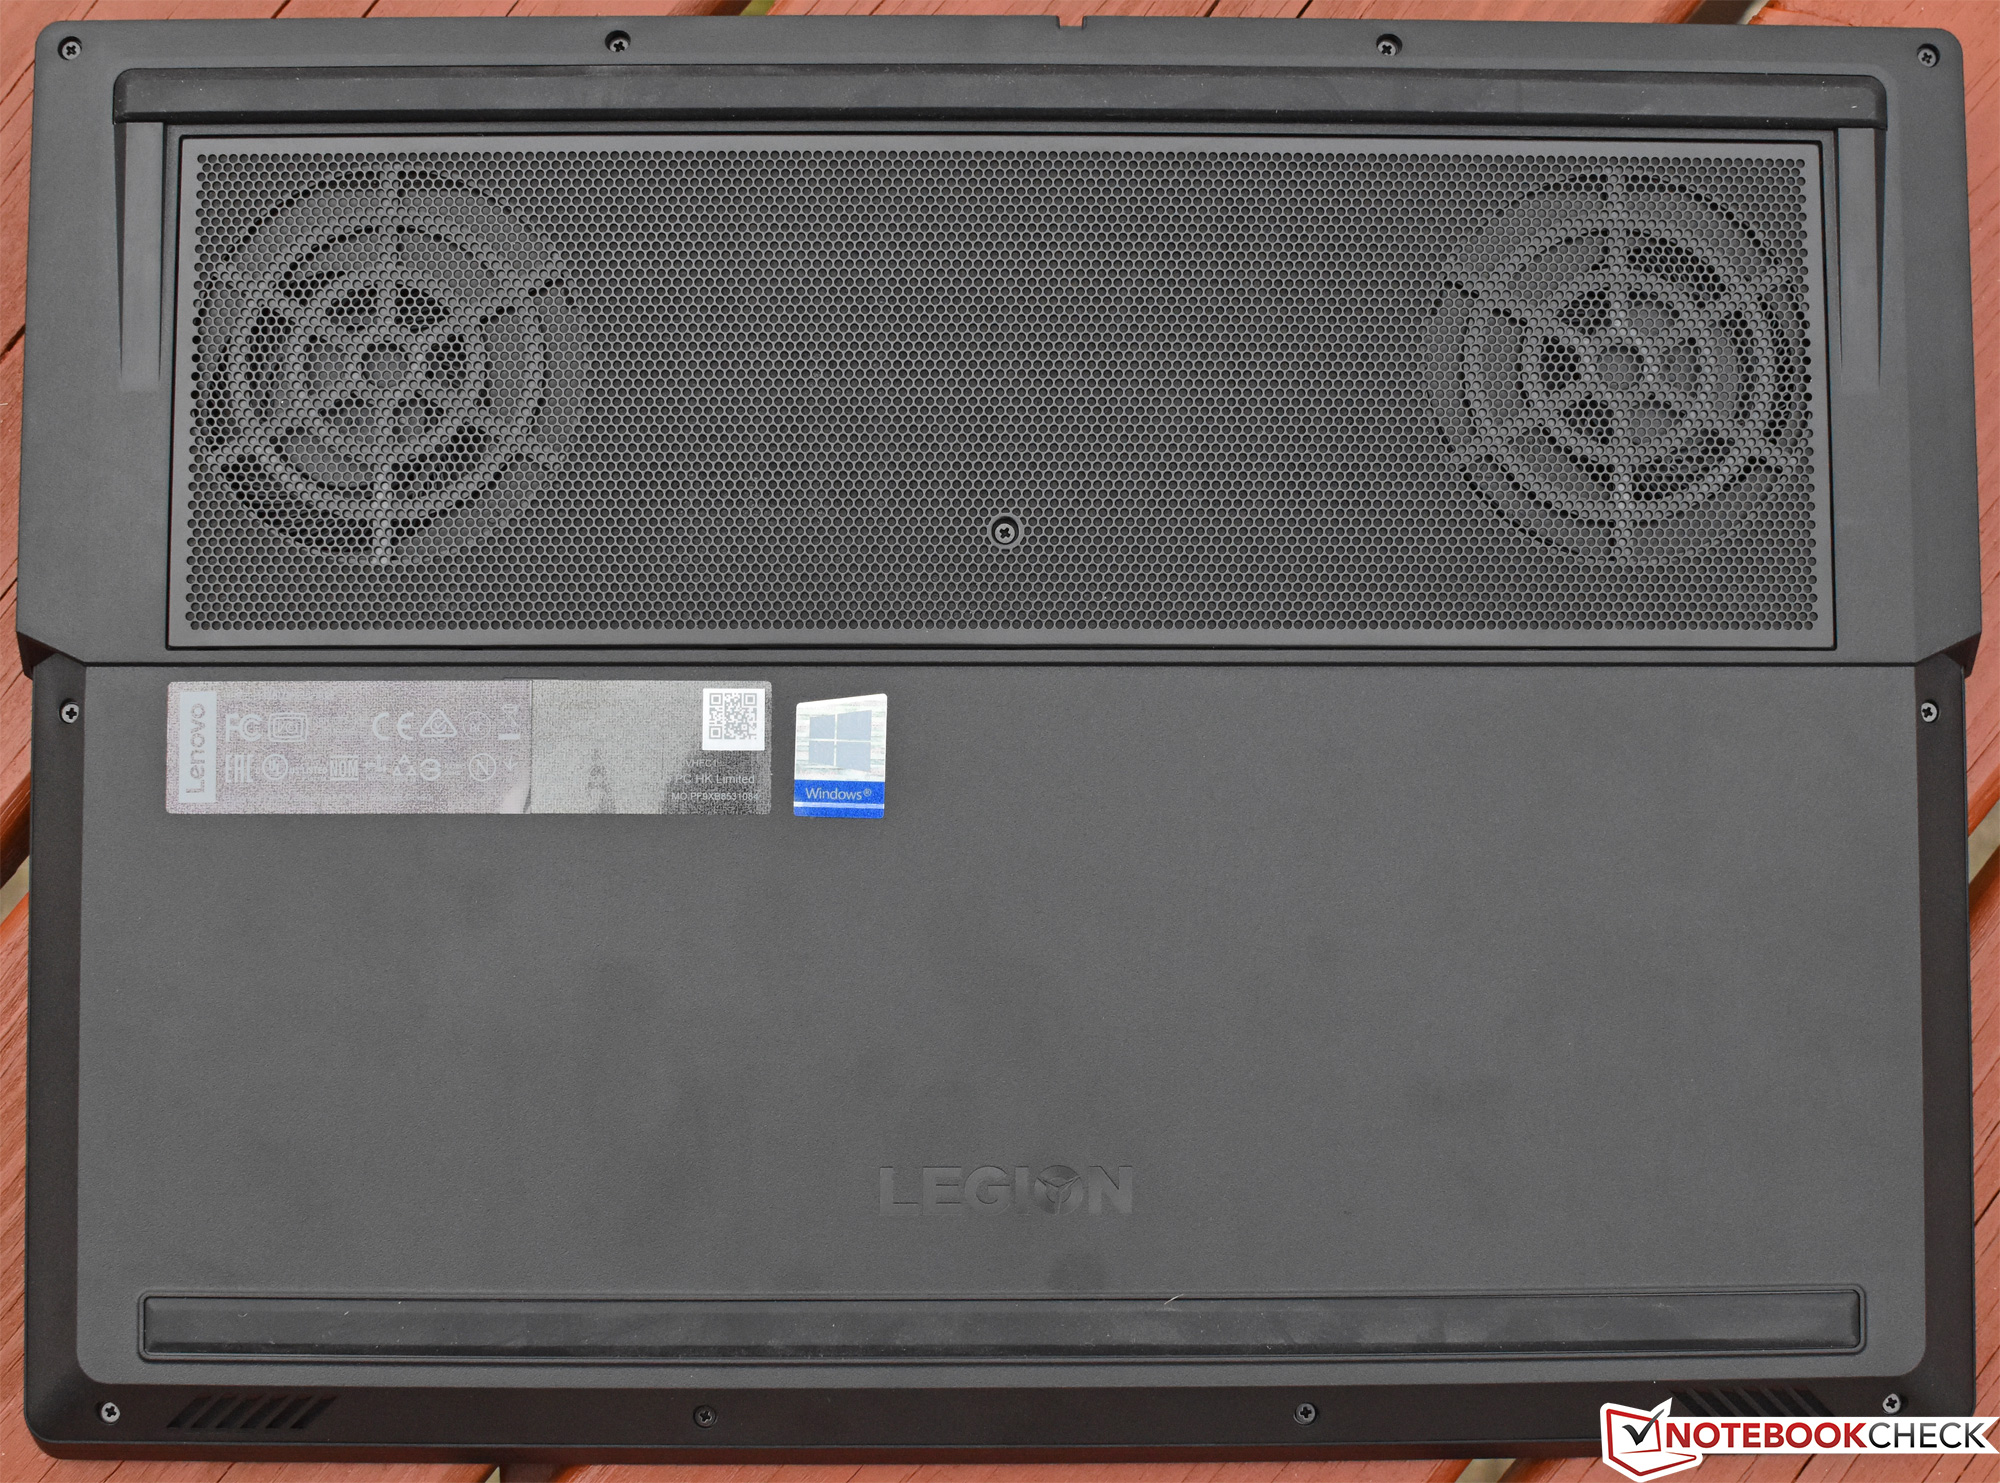
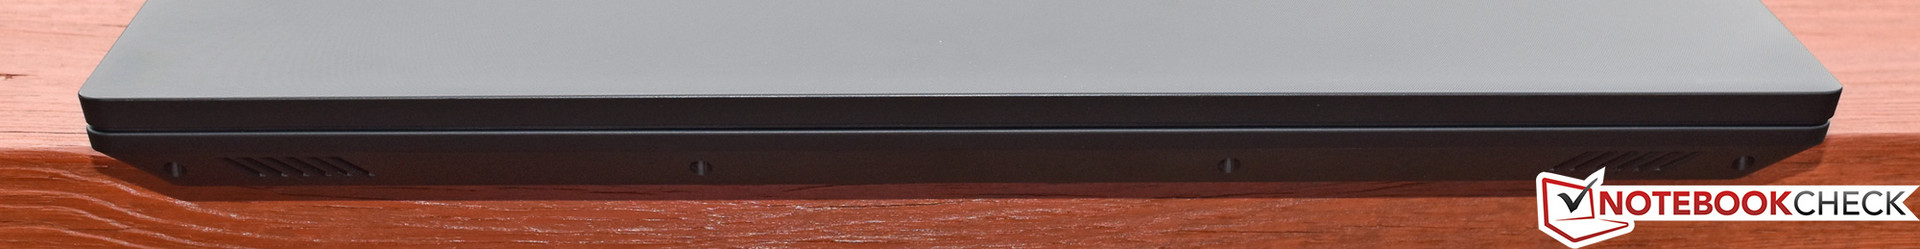
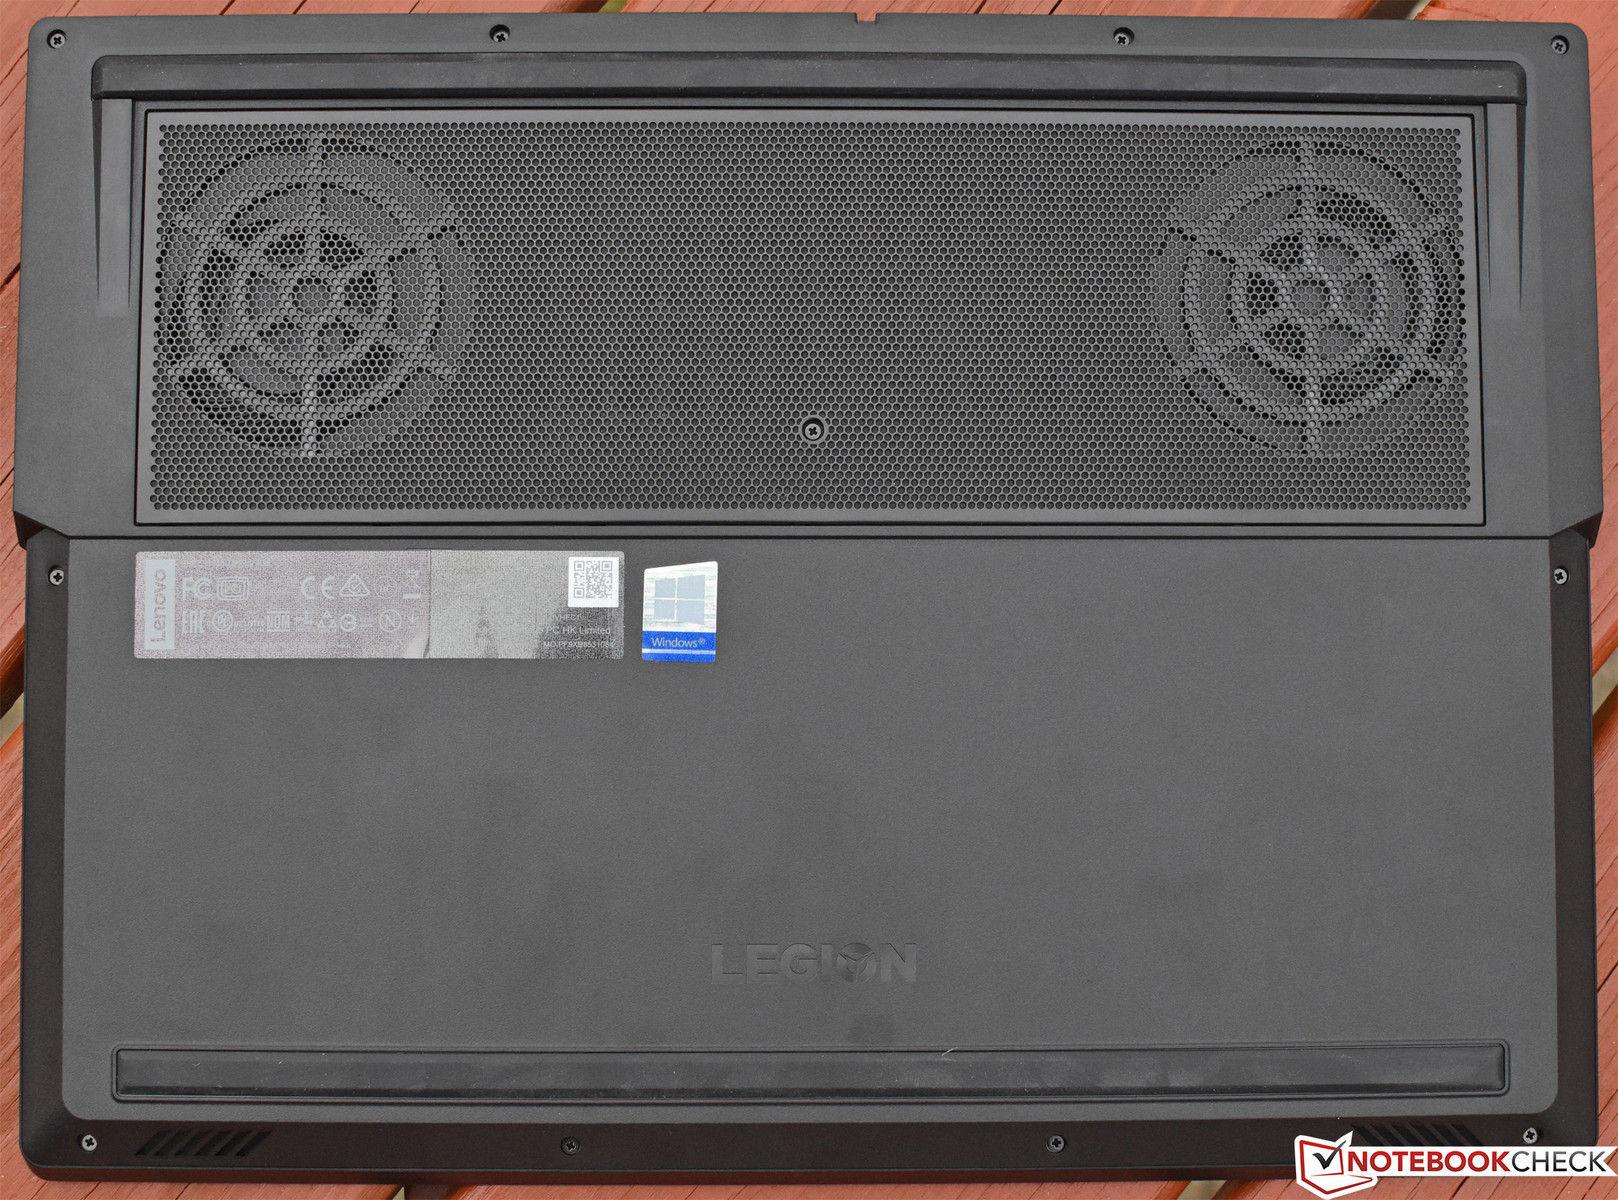
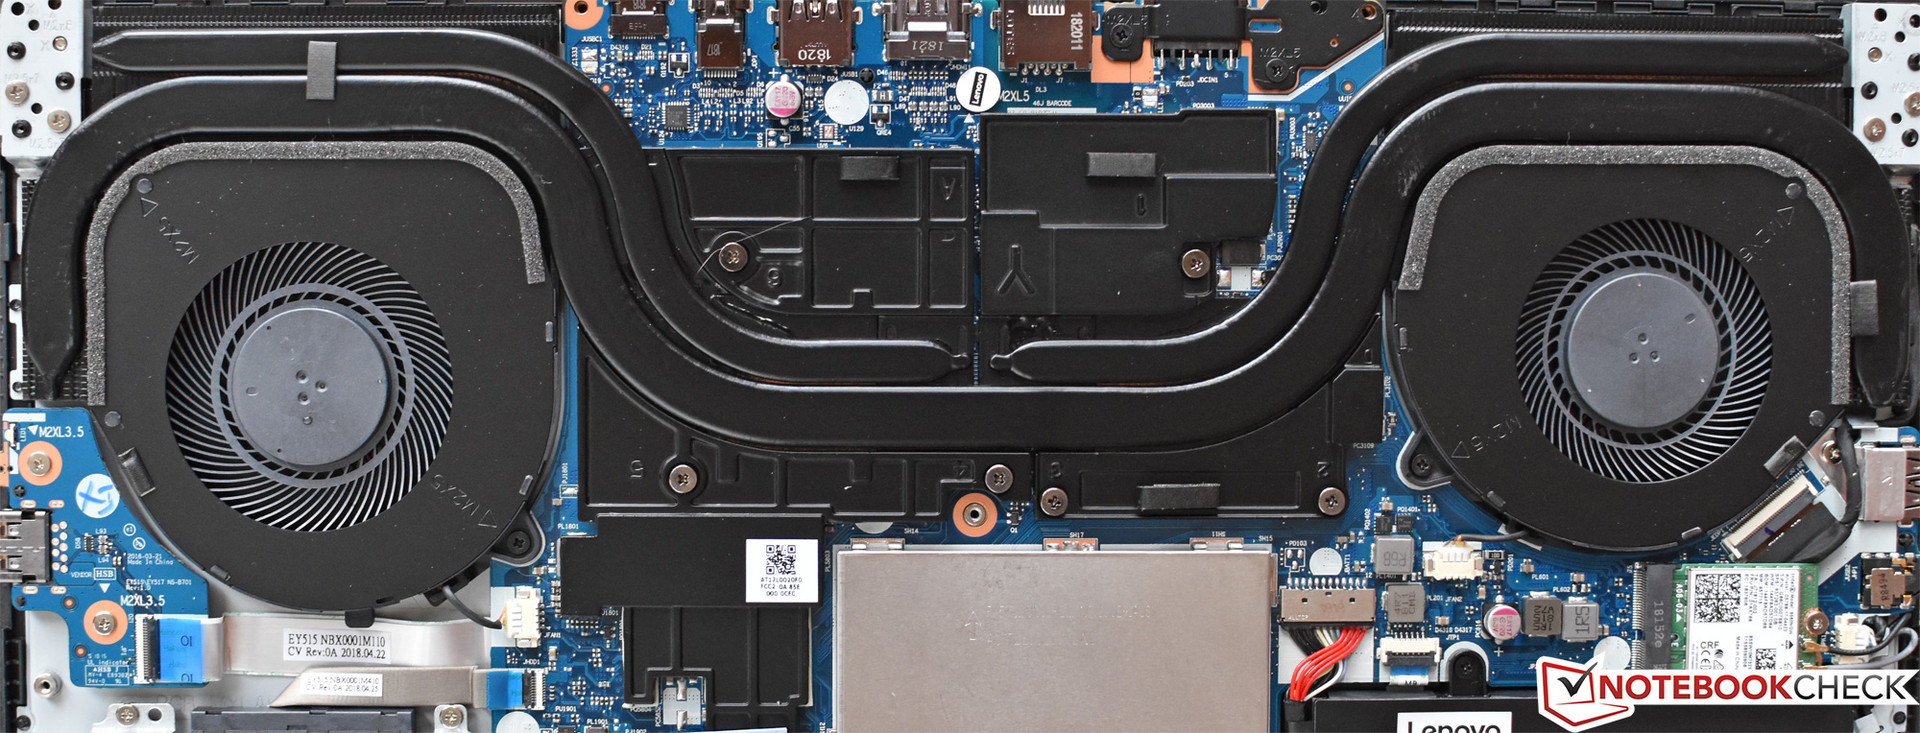
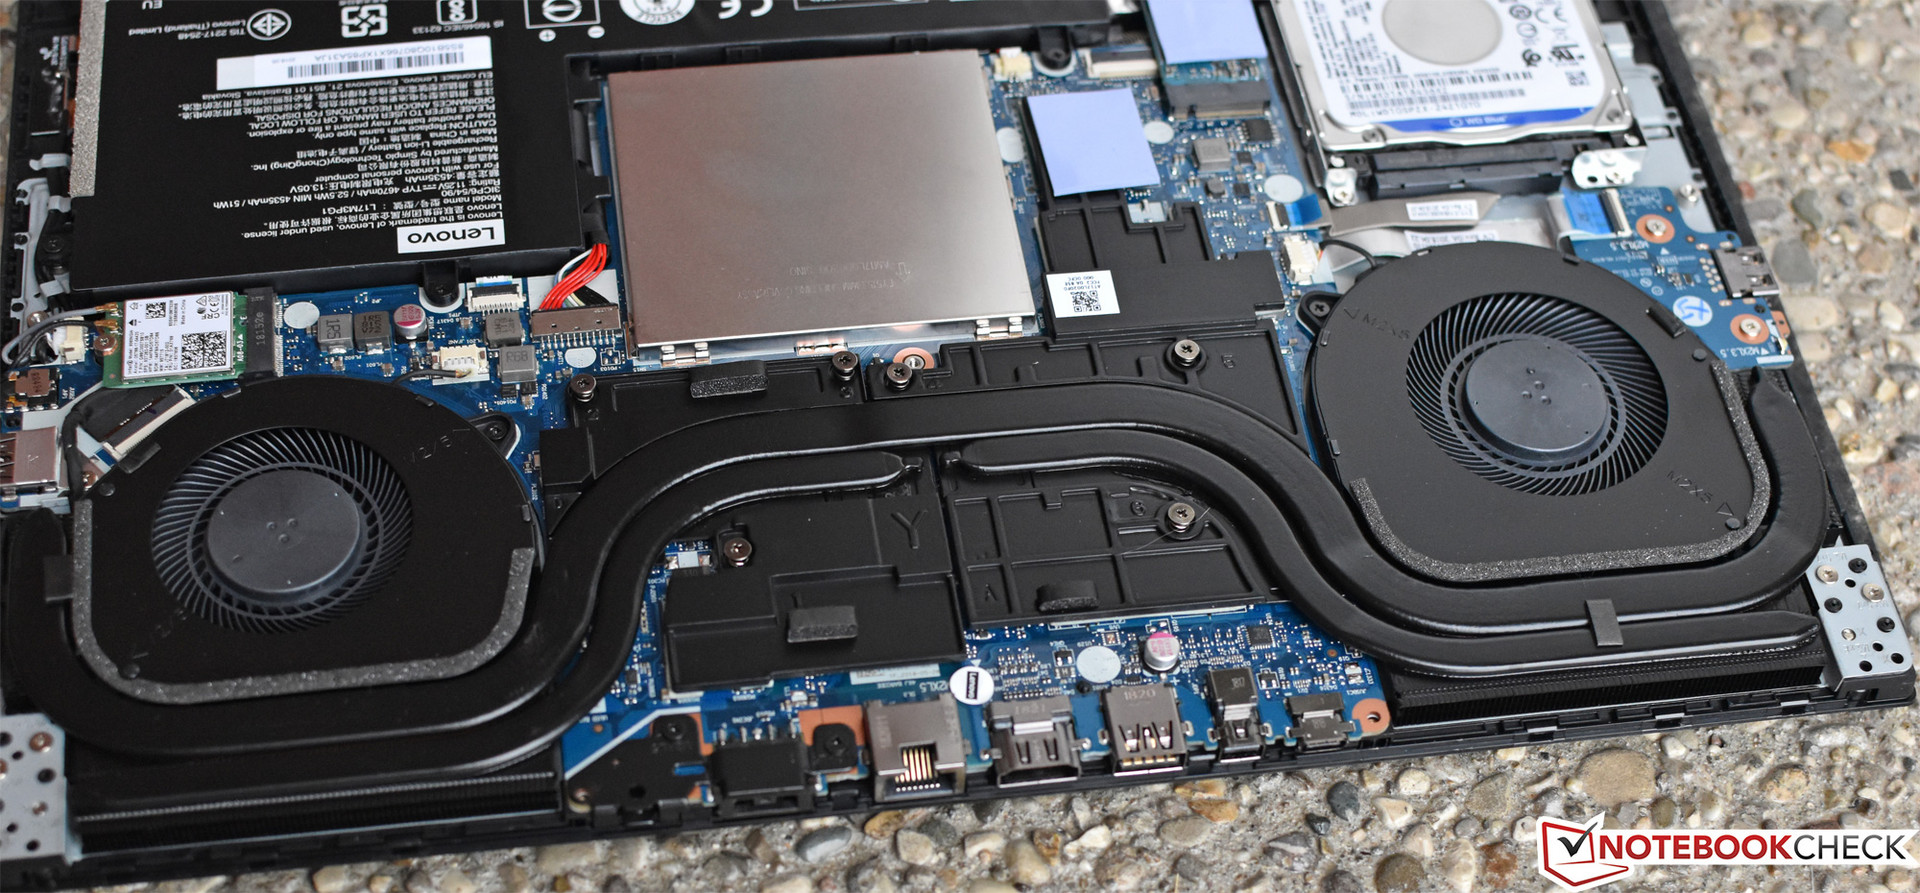
Casing stability hasn’t suffered in the least, and in spite of the principally plastic construction, the Legion Y530 is unmistakably stable on a hard surface, helped considerably by its long horizontal rubber feet (a la the Dell XPS 15). There is very little flex across the breadth of the base unit, with only the center (between the keyboard and touchpad) giving slightly under moderate pressure. Replacing the central large hinge are two smaller hinges out near the edges, and the exhaust vents have been relocated from the center of the rear to the corners, wrapping around to facilitate better cooling. Speaking of which, the bottom also features a much larger intake grate, emphasizing airflow from either side of the machine to be funneled toward the now larger, more horizontally distant fans.
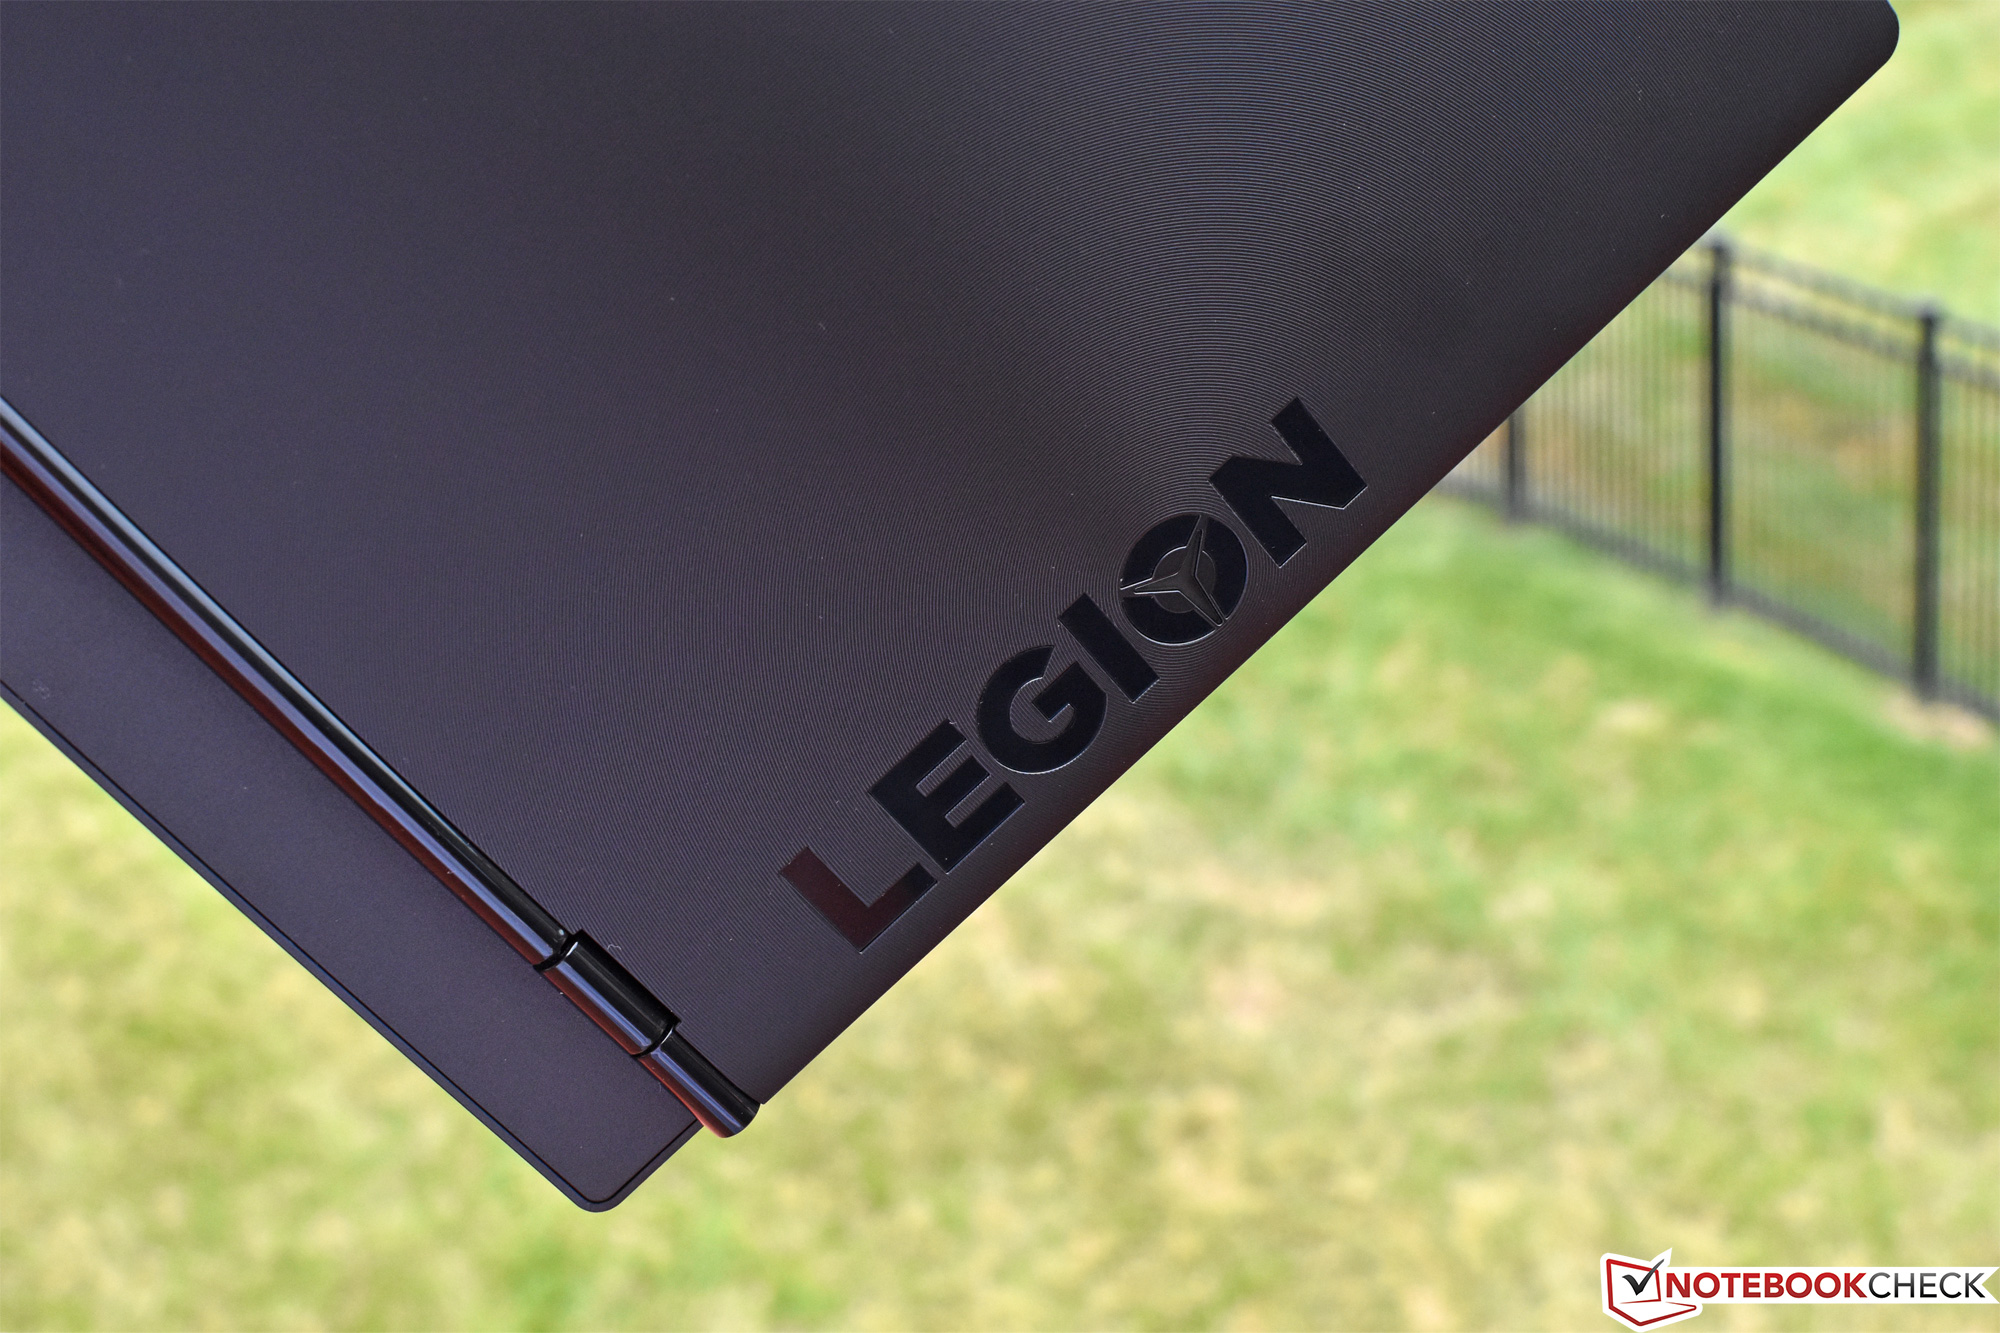
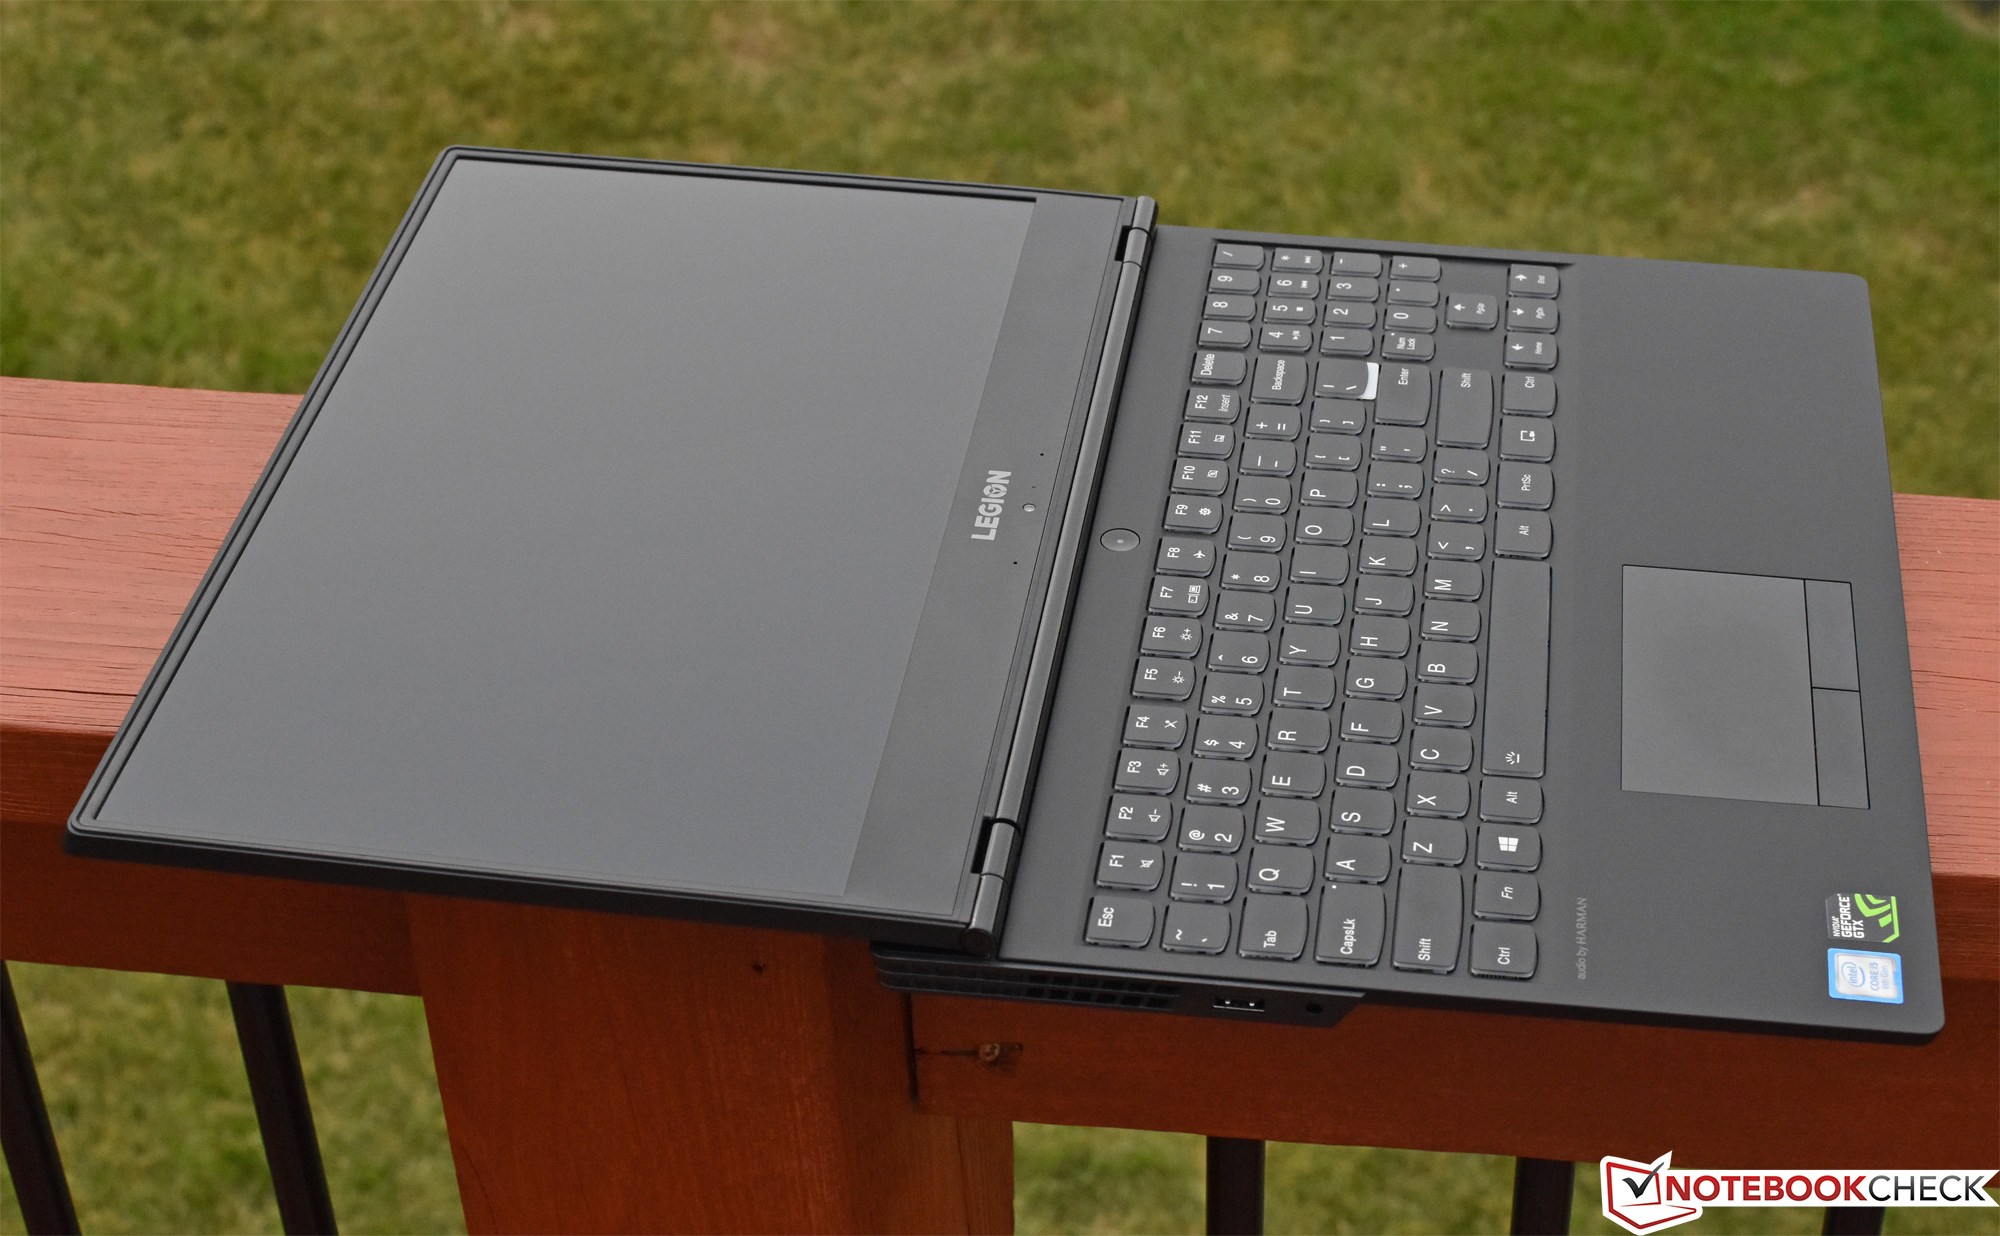
All of these changes are for the better, but one peculiarity of the new design is the 23 mm shelf that resides behind the hinges and display lid, which is why the new design isn’t any smaller in depth than the previous one, even in spite of the shrunken bezels (this modified design does allow for single-handed opening of the display, though, regardless of the tightly-wound hinges). The lid itself can nevertheless still be opened to around 180 degrees if desired. At 360 x 268 x 28 mm, the Y530 isn’t nearly as small as its similarly bezel-less peer, the XPS 15—which steals the show with a depth of just 235 mm and a thickness of only 17 mm. It does borrow the soft-touch silicone finish of the XPS also, however, which feels terrific, but is just as prone to the collection of skin oils and fingerprints as was the XPS palm rest.
Connectivity
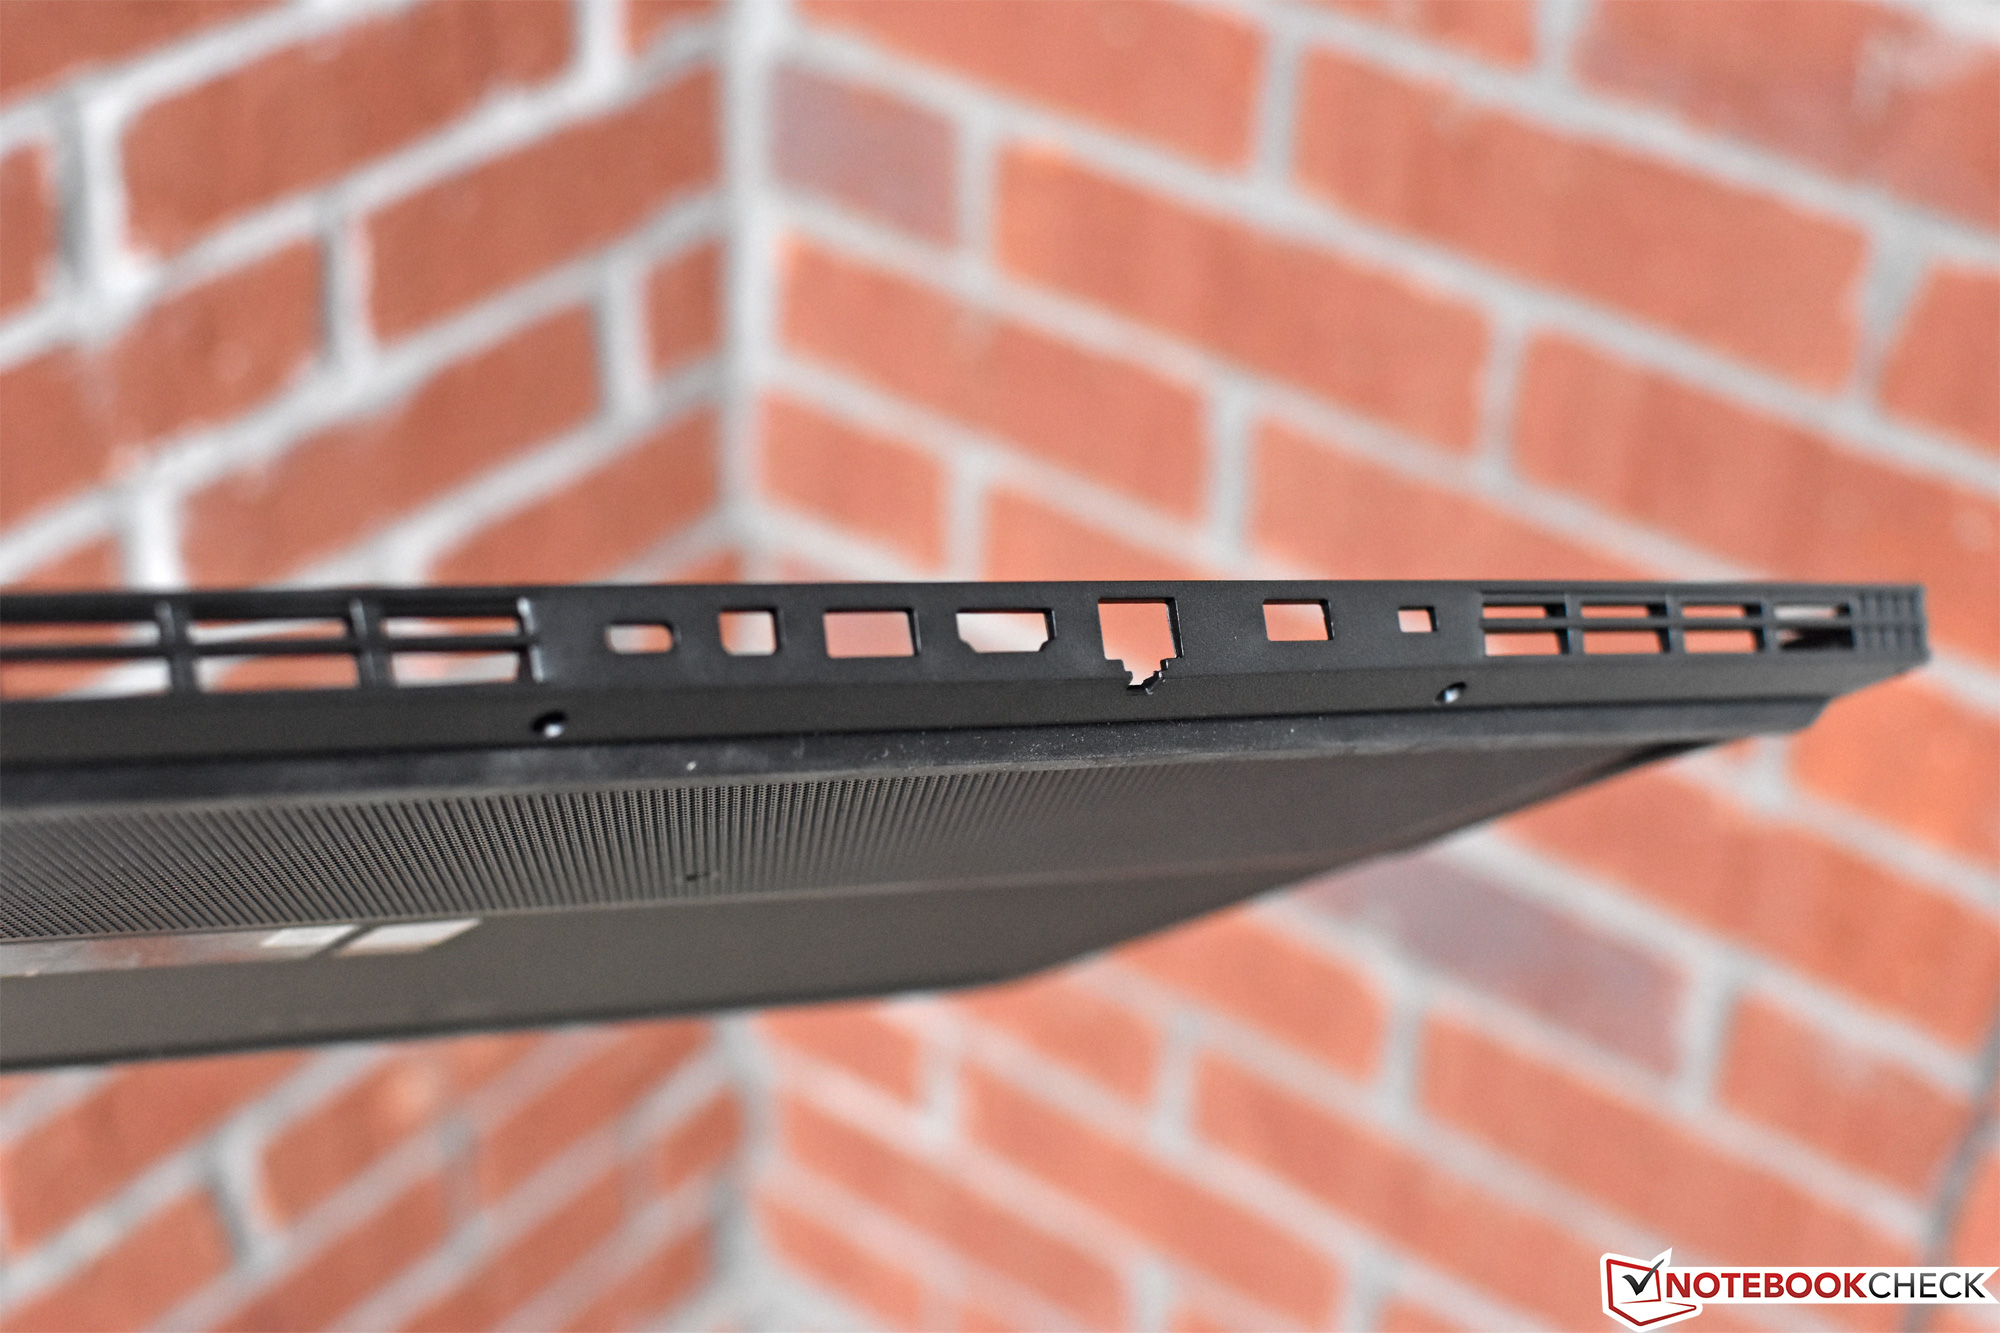
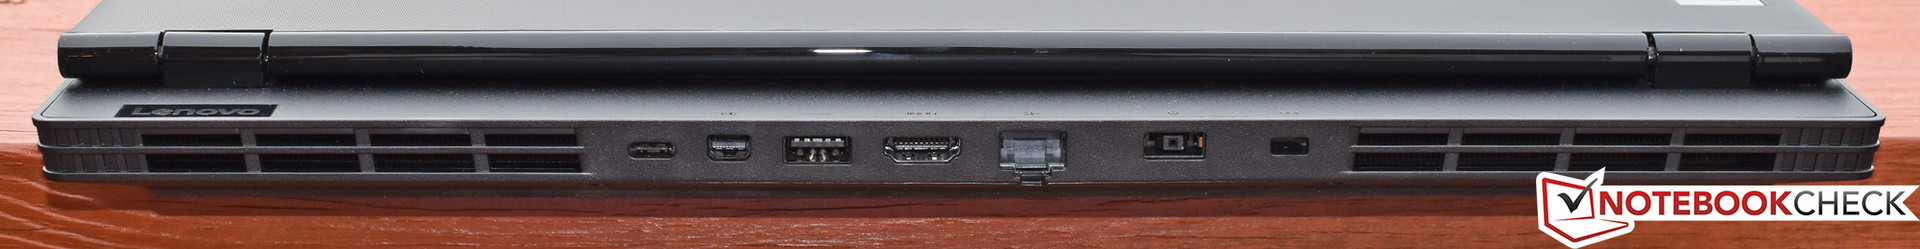
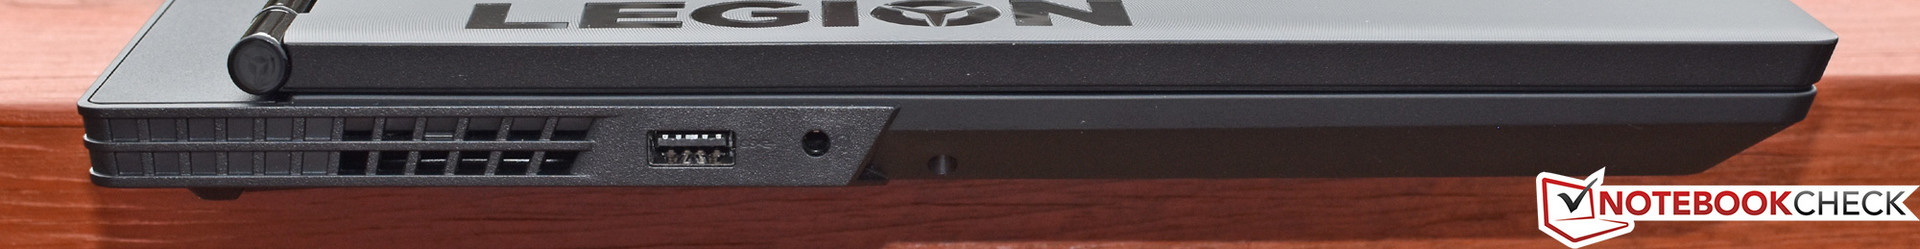
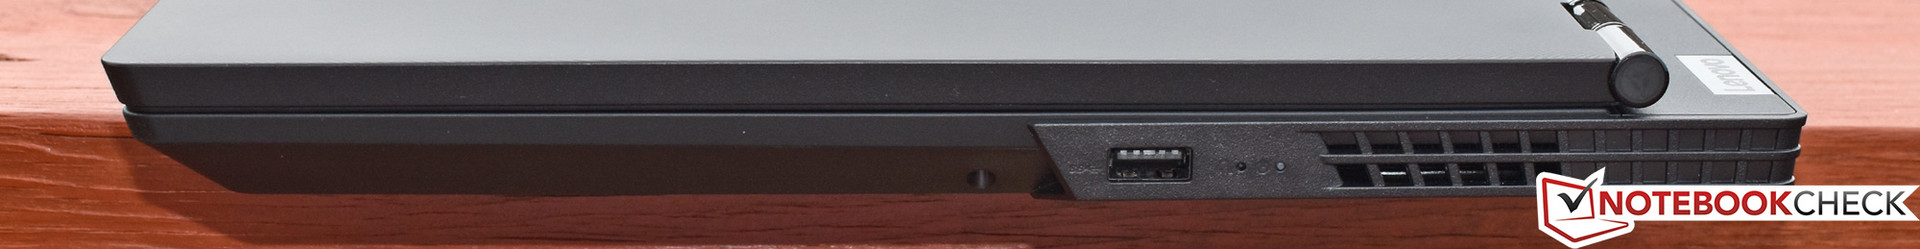
A good variety of ports occupies the edges of the Legion, though only a few remain on the left and right sides (namely, two USB ports and the audio jack). The rest of the connections are on the rear, where you’ll find two more USB ports (one of which is Type-C), HDMI and mini-DisplayPort for video output, and the charging port. While most users are fine with the idea of the majority of the ports being located on the back edge, the large exhaust vents wind up crowding the ports together such that large connectors will not be able to coexist with neighboring plugs. See our photos for a visual explanation of this (admittedly relatively minor) dilemma.
Perhaps slightly more off-putting is the complete lack of a card reader of any sort (SD or microSD).
Communication
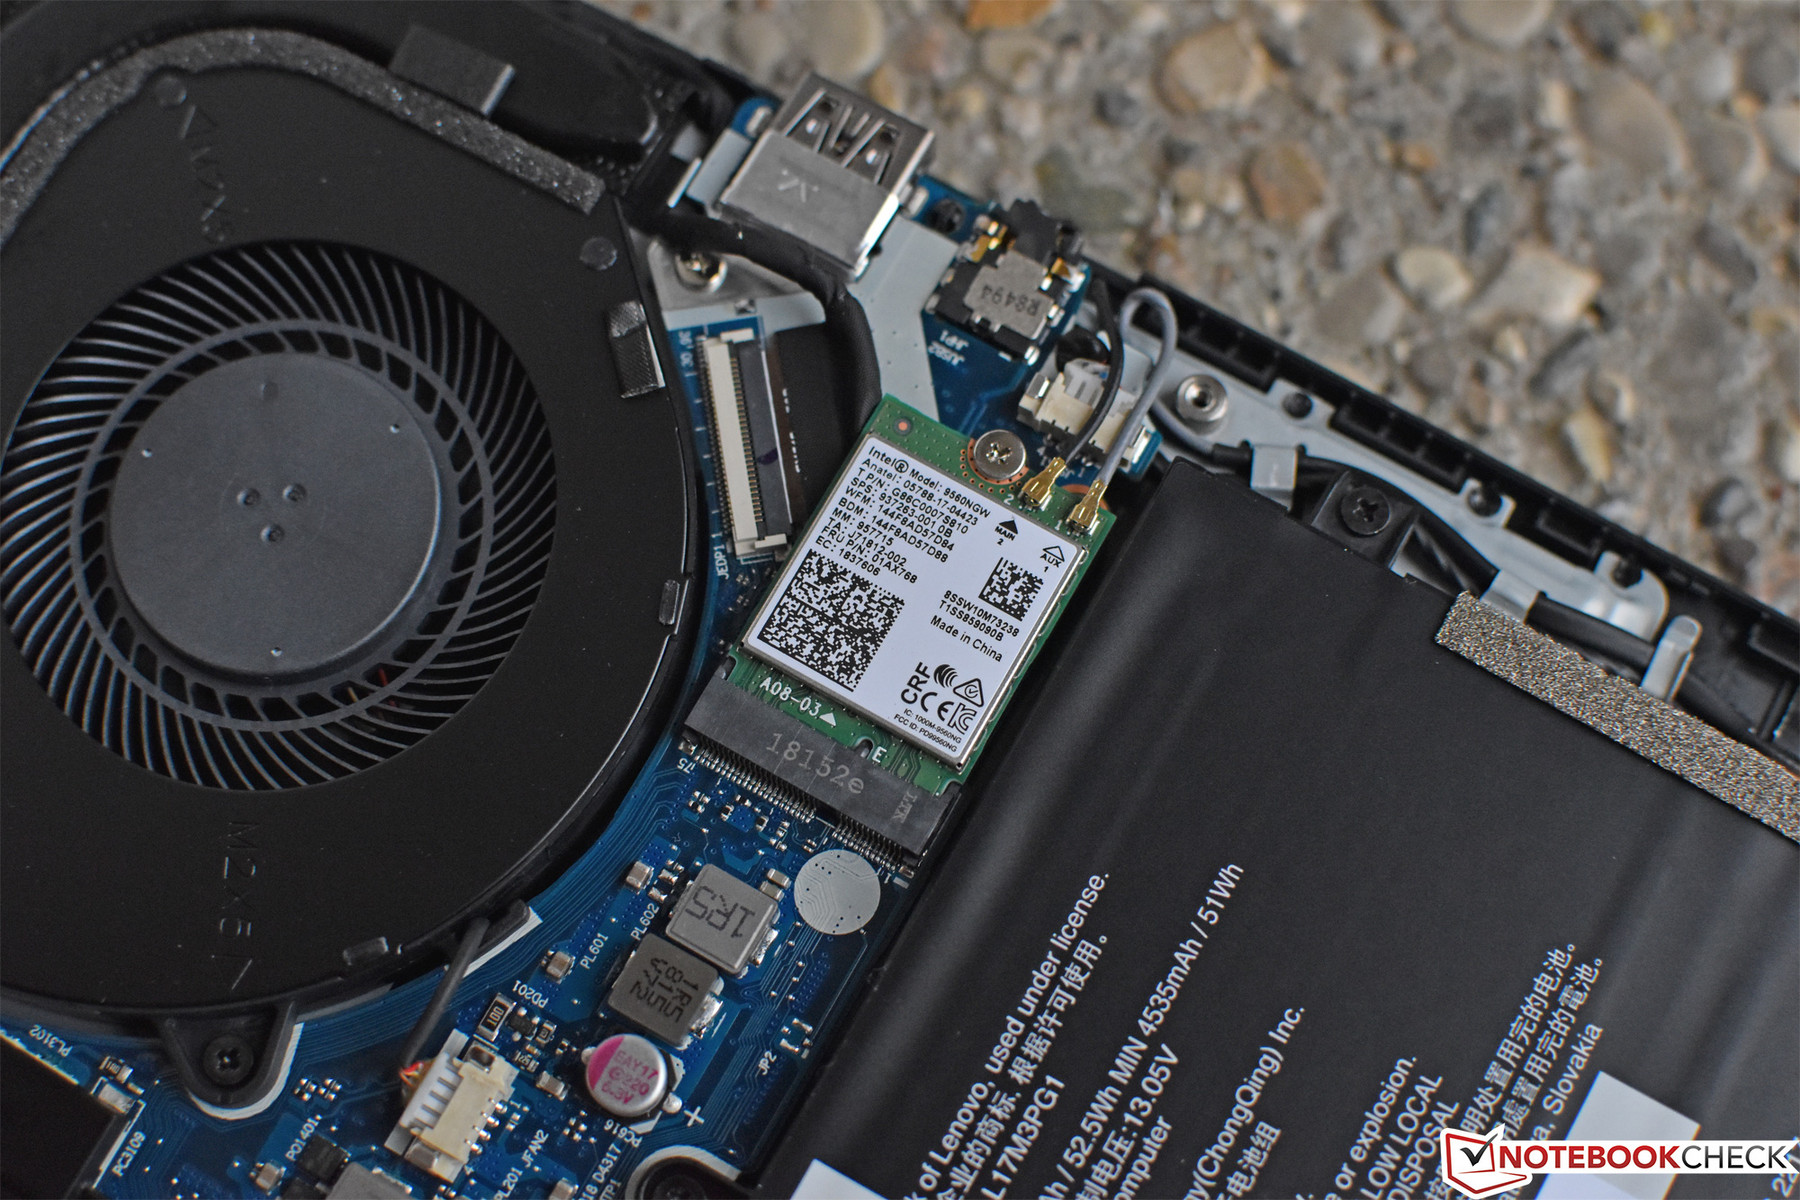
The Legion Y530 is the latest laptop to include the Intel Wireless-AC 9560 adapter, which features 2x2 antenna design and Bluetooth 5.0. Unlike the Dell G5 15 5587, the Y530 shows no signs of struggle in achieving high connection throughput, with results of 663 MB/s and 632 MB/s in our receive/transmit wireless tests respectively. The Intel 9650 adapter can theoretically reach speeds of up to 1.73 Gbps, but our current setup is limited to 1 Gbps.
Gigabit Ethernet is also on board courtesy of the ubiquitous Realtek GBE adapter.
Accessories
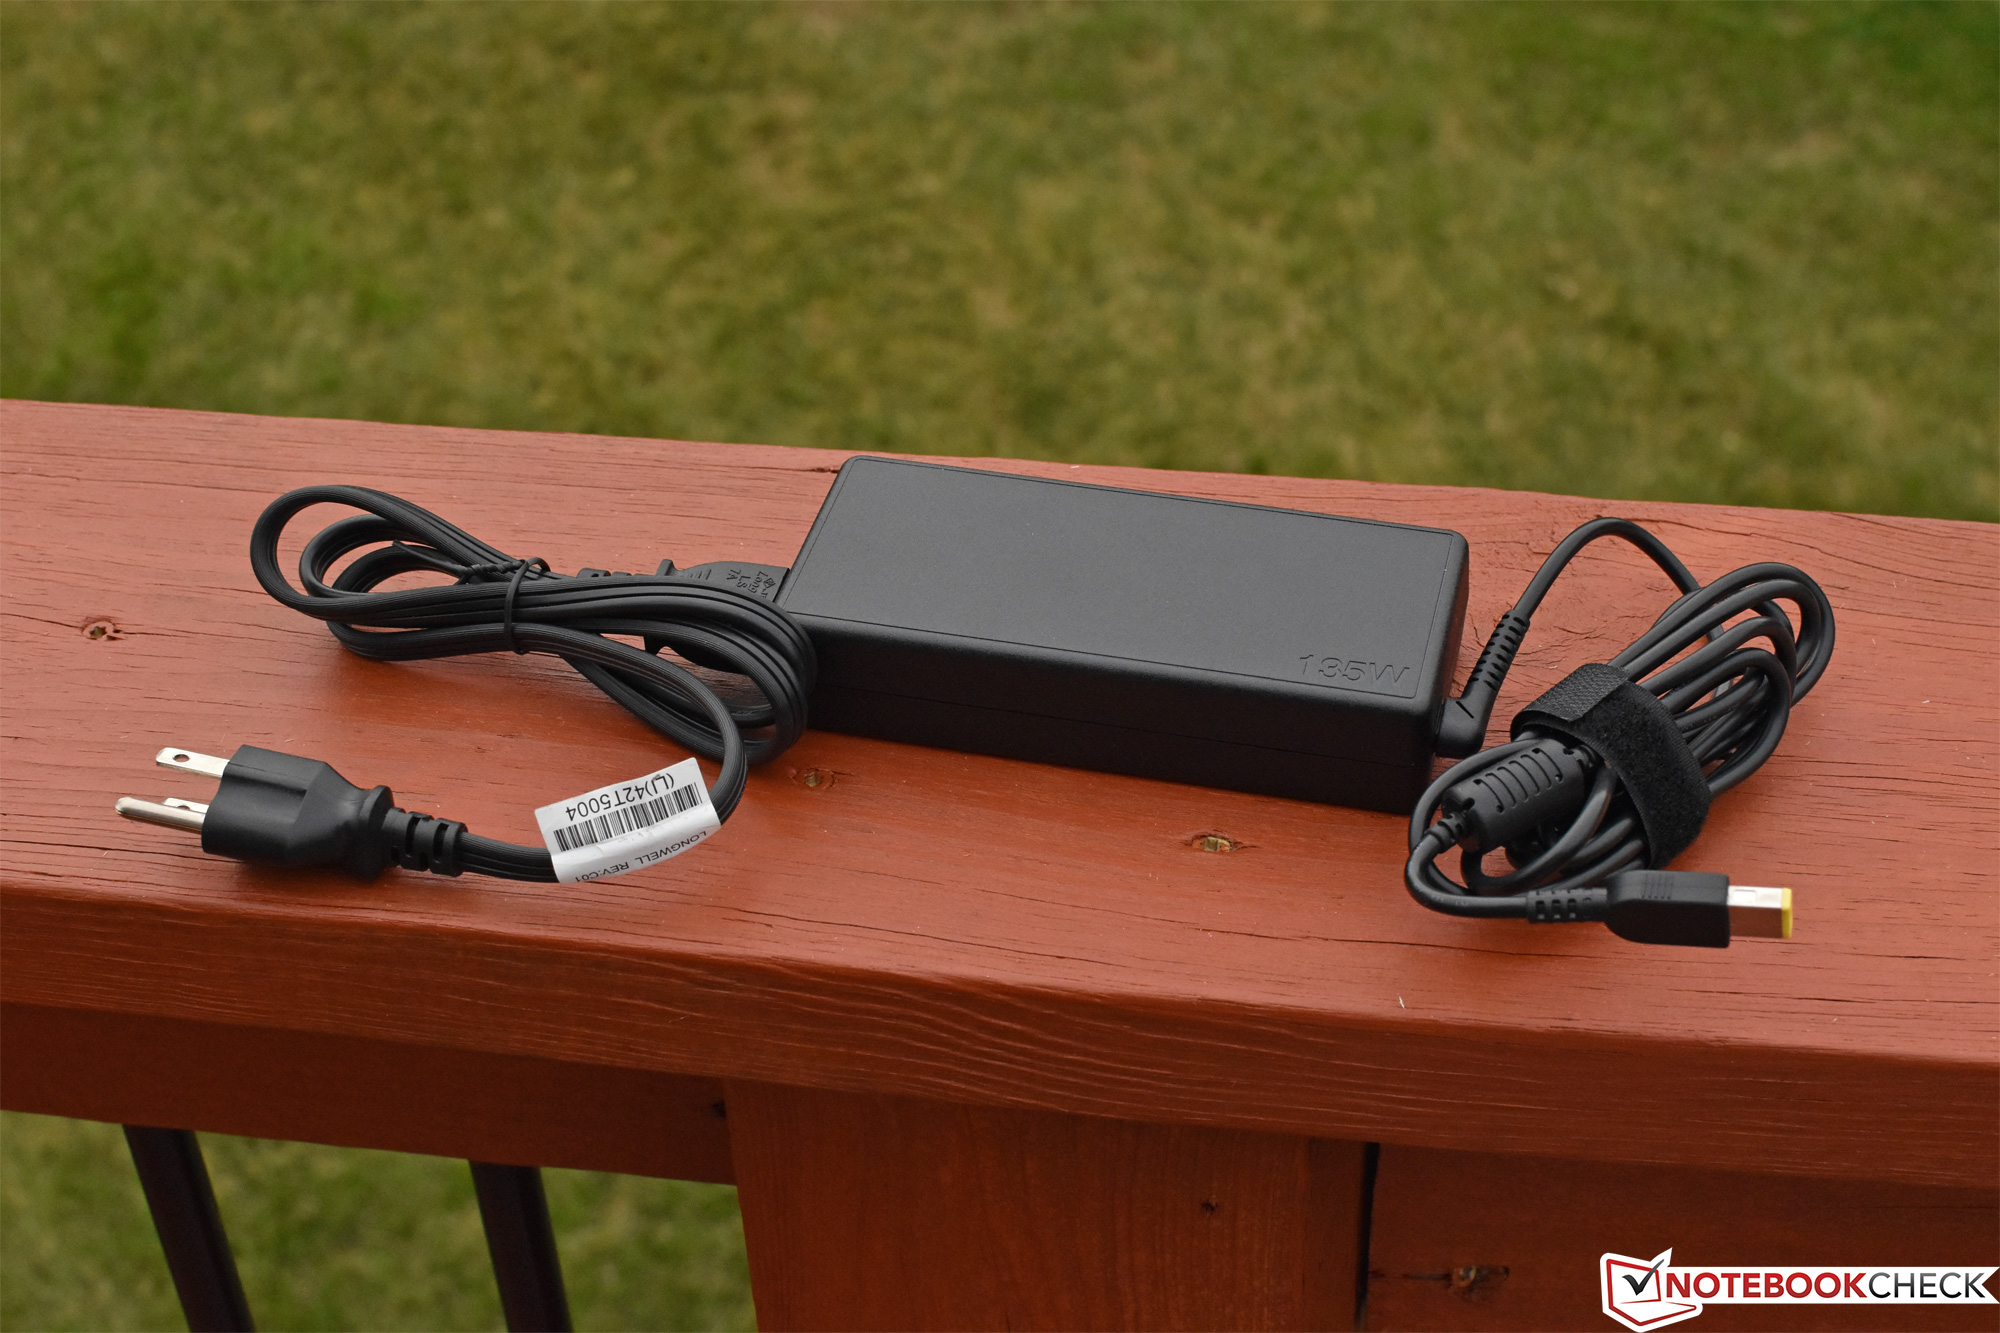
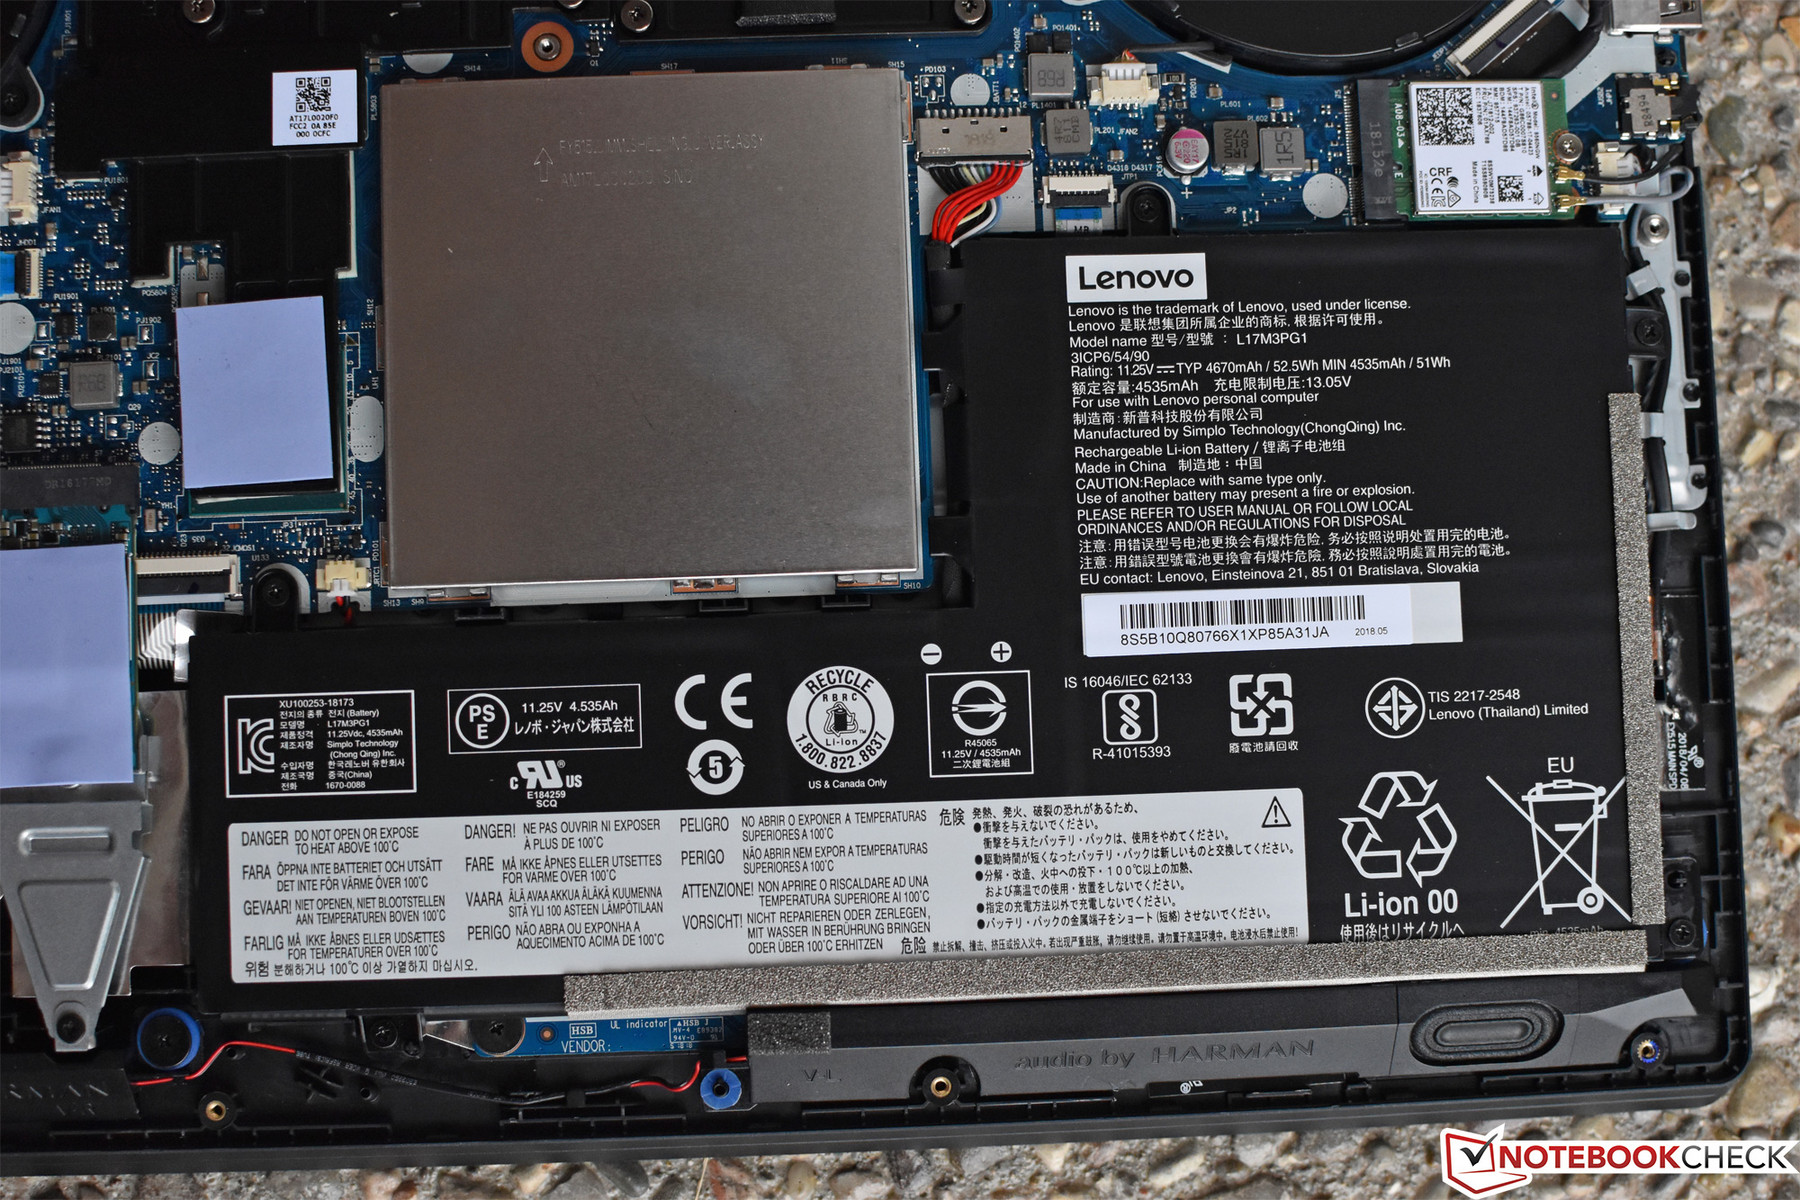
Included with the Y530 is a rather large 135 W AC Adapter weighing in at 582 g. No other accessories are provided.
Software
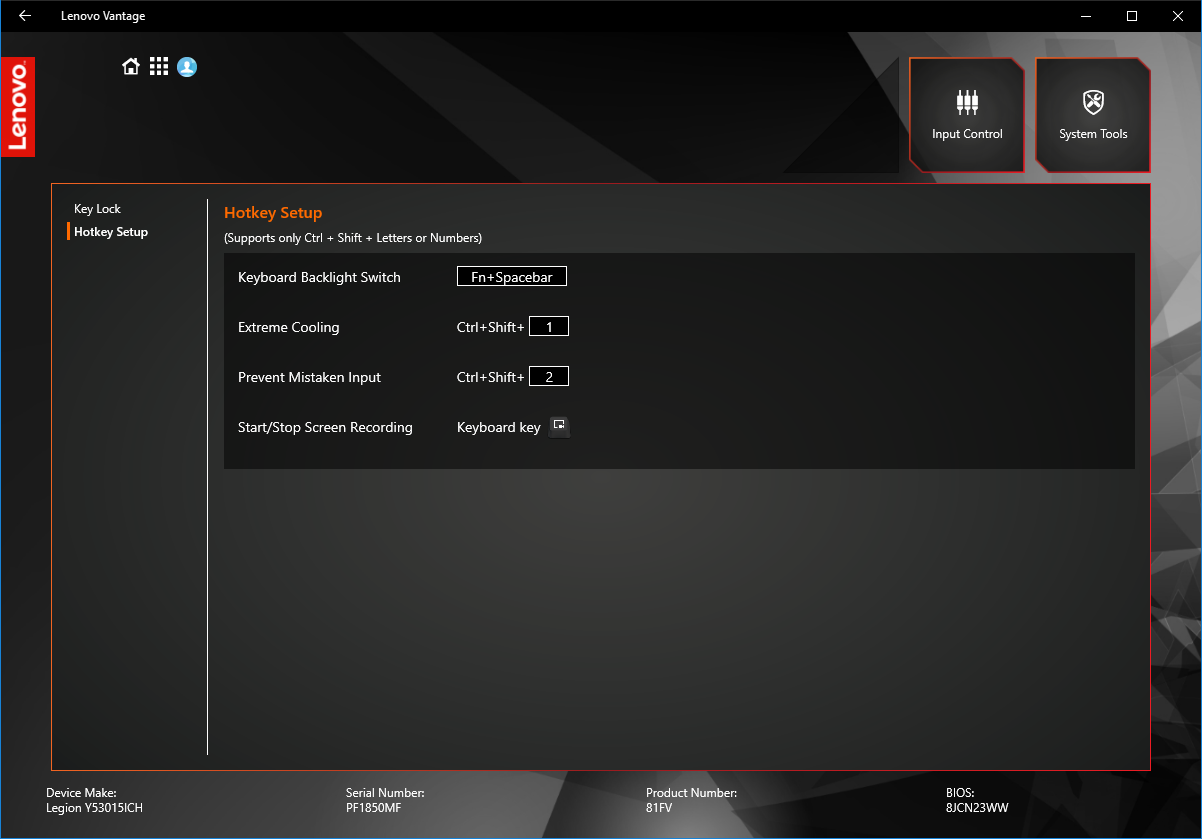
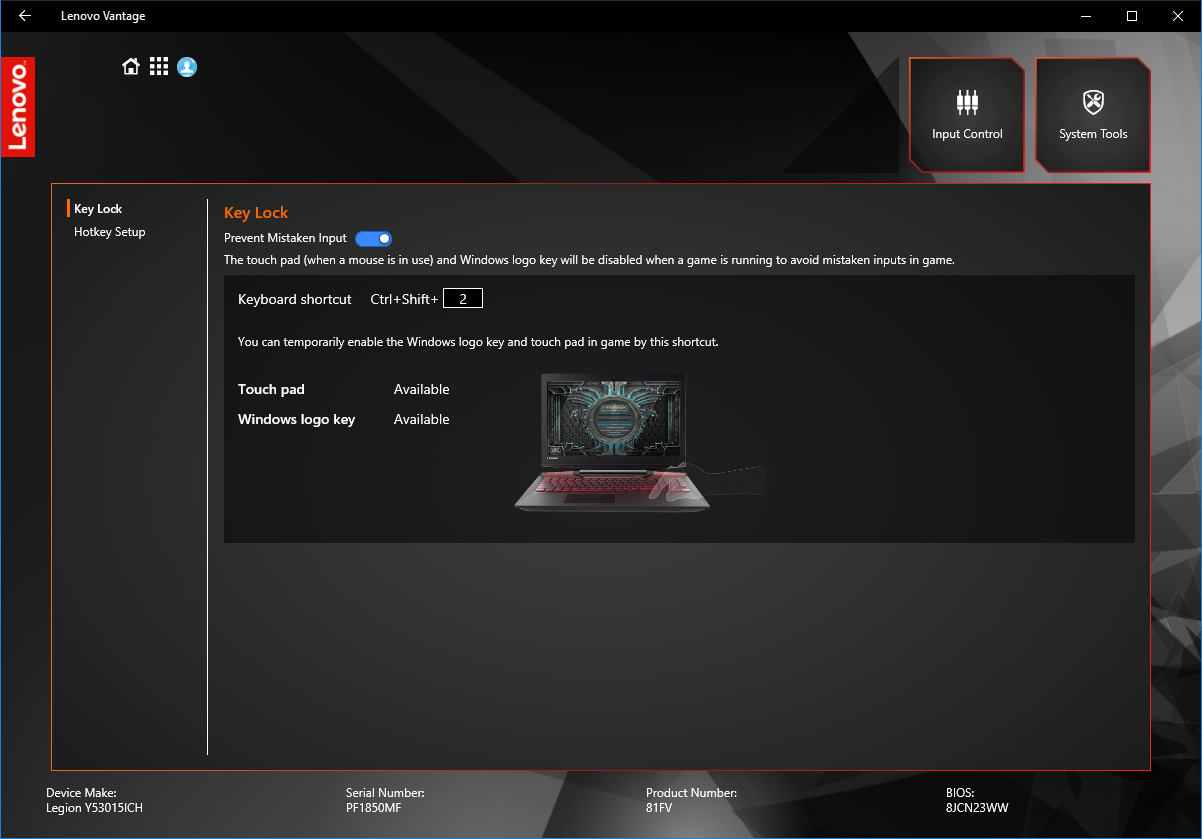
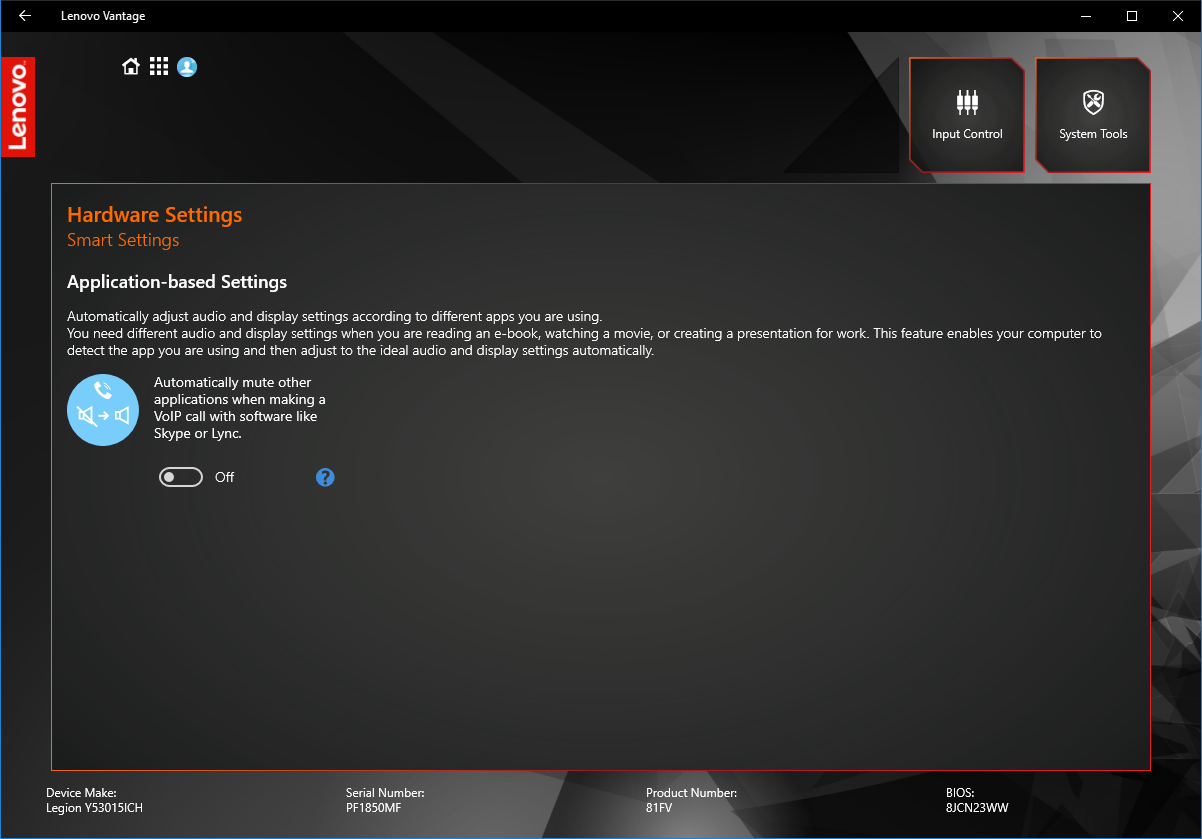
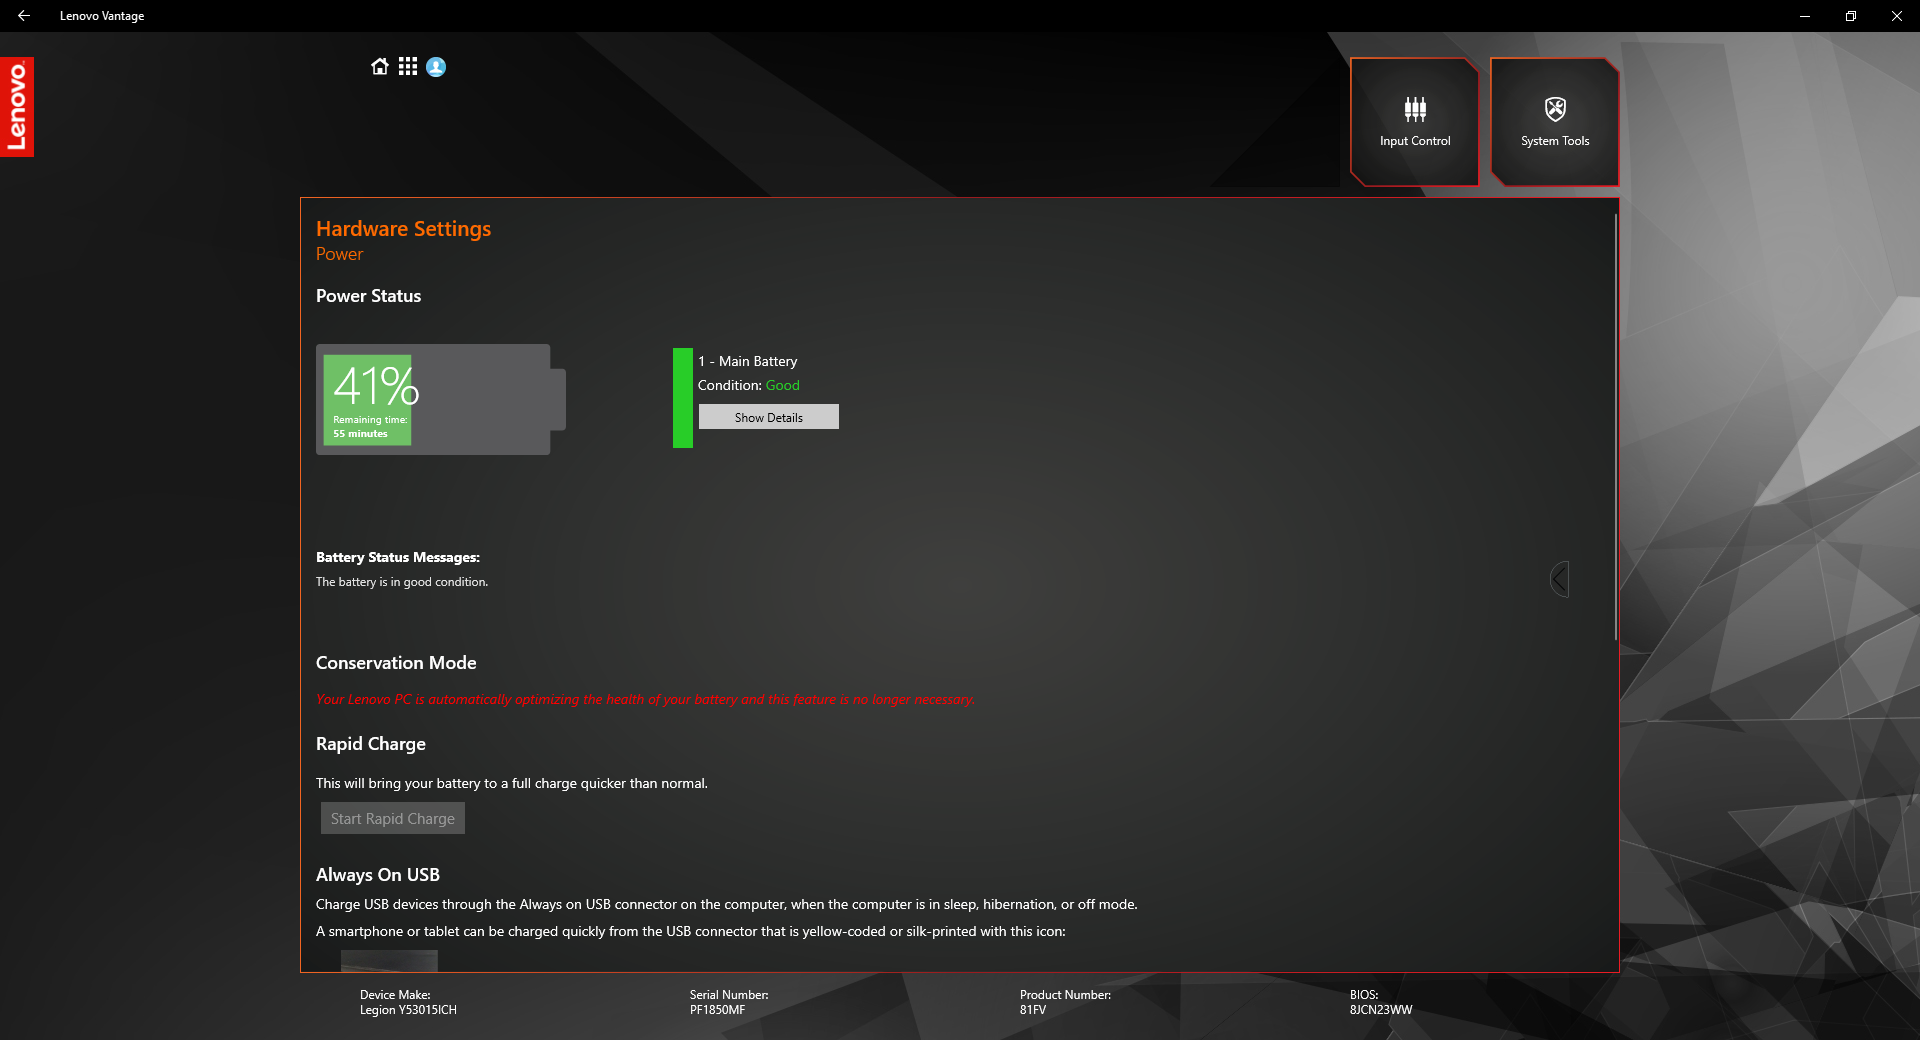
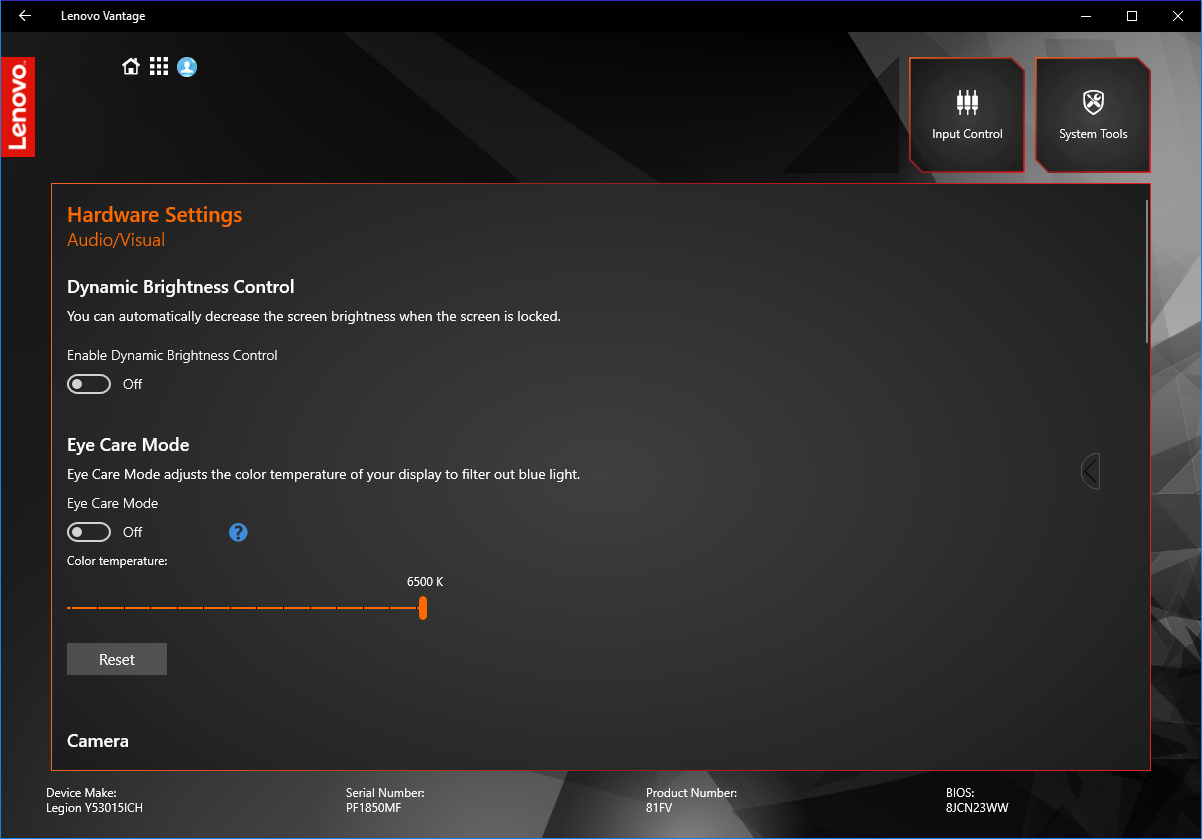
Lenovo preloads their Lenovo Vantage management software, which provides basic control over fundamentals such as fan operation, hotkeys, and system monitoring. Though it lacks a dedicated physical button, the Legion mimics some competitors (such as MSI) with the inclusion of a Cooling Boost feature that forces the fans to high RPM to improve temperatures.
Maintenance
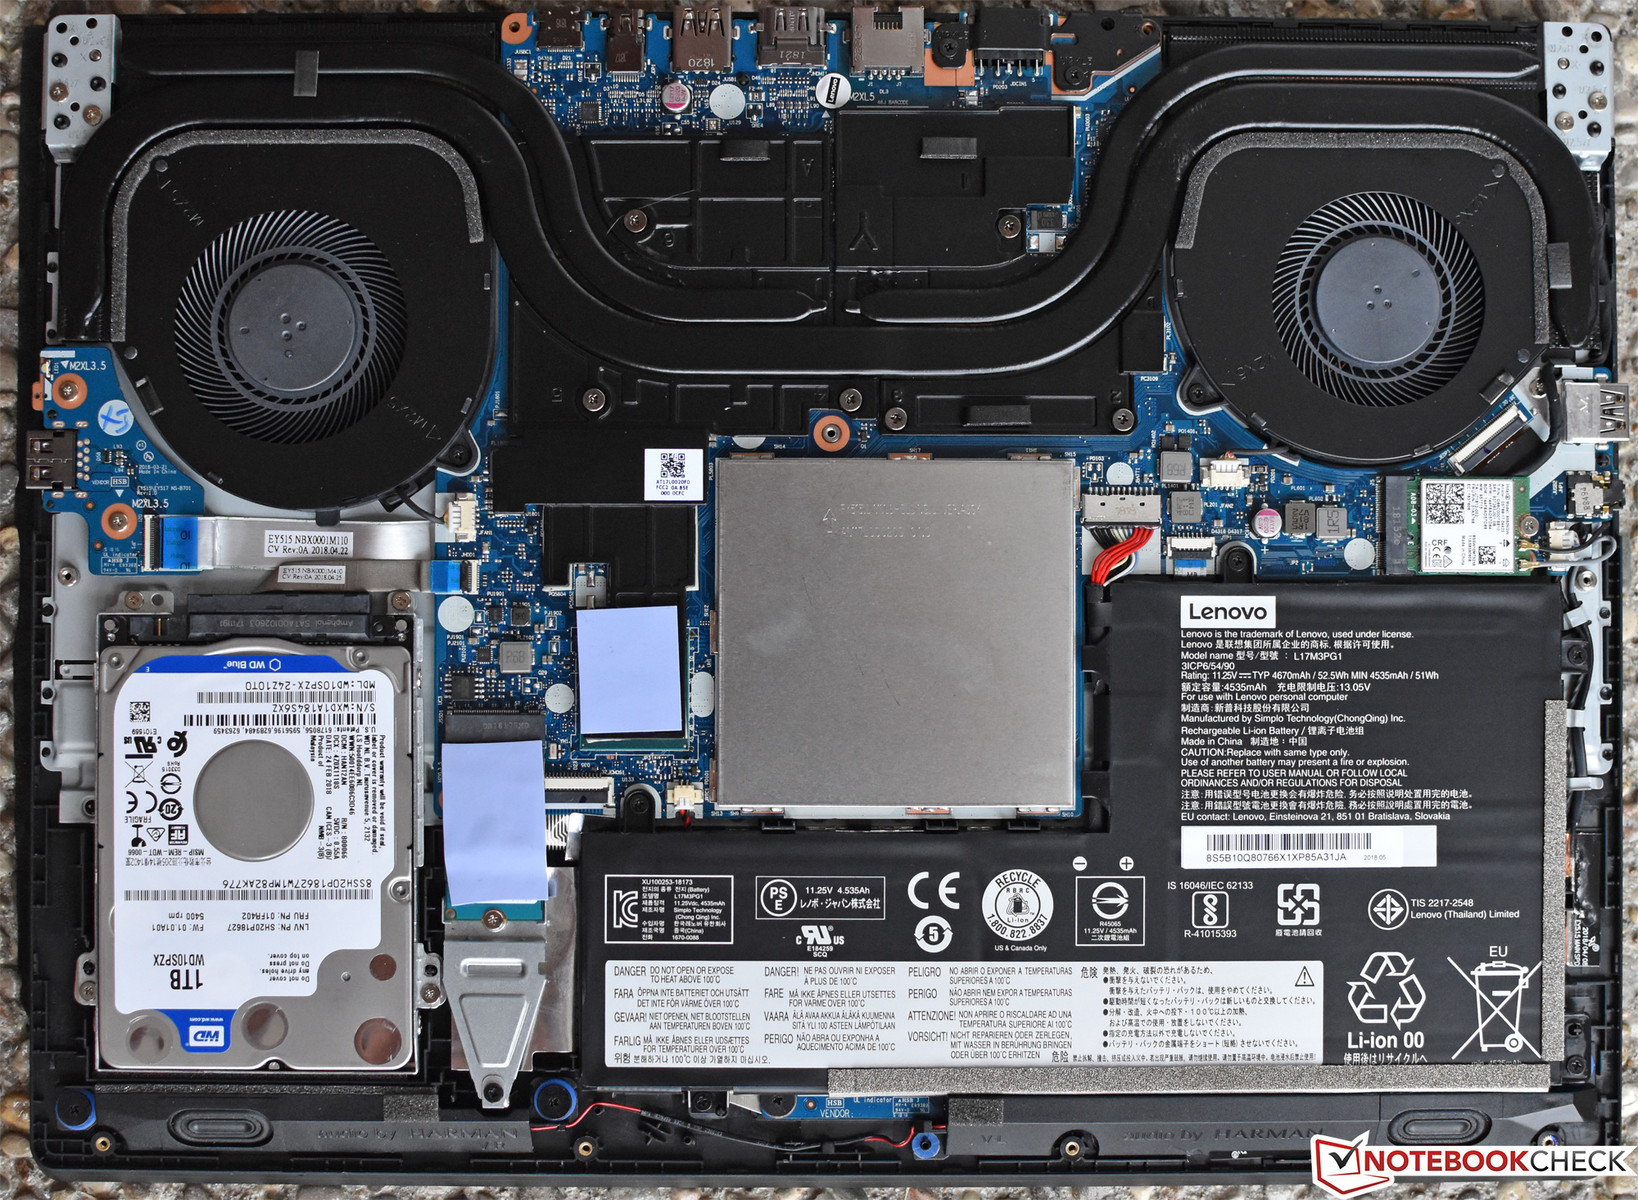
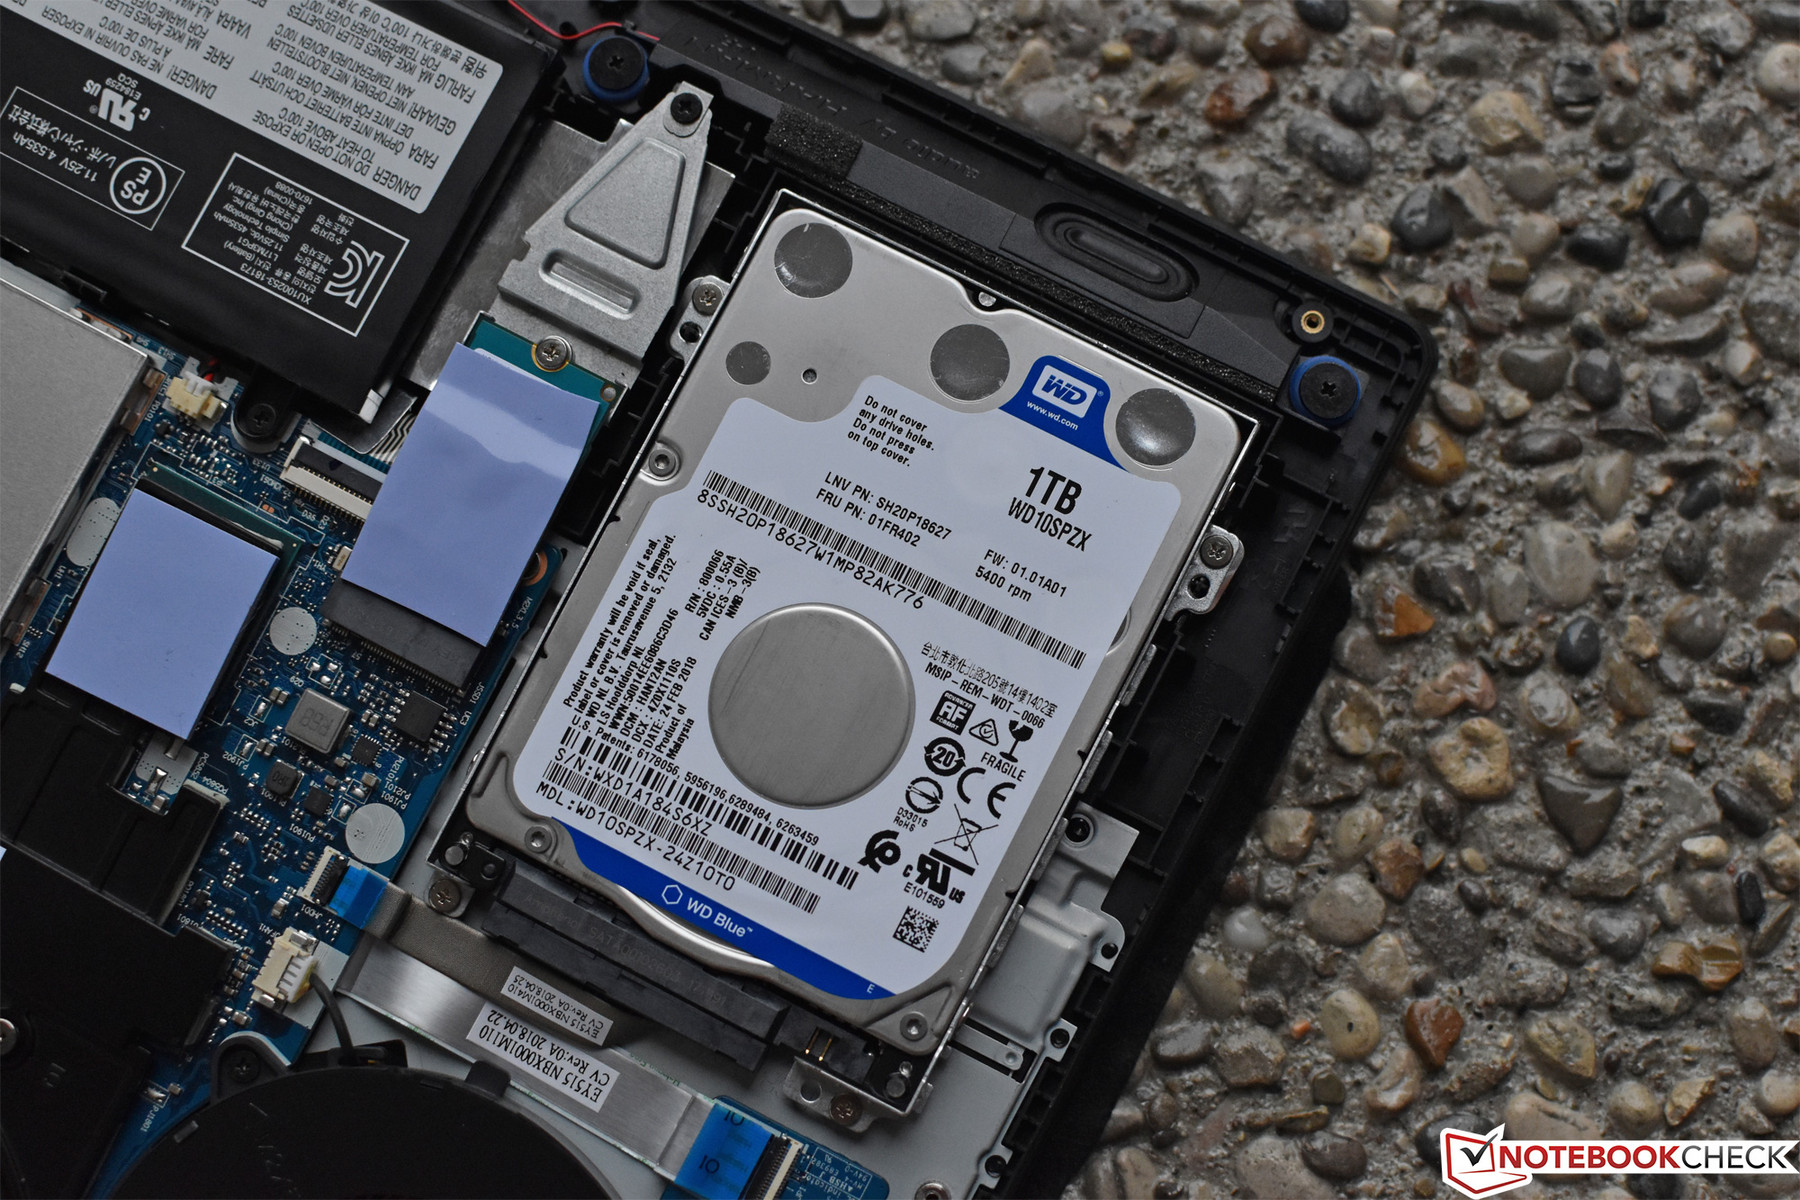
Eleven Phillips-head screws secure the bottom panel to the machine. Once they’re removed, care must be taken not to damage the bottom (plastic) cover while prying around the perimeter—including the top of the rear shelf behind the screen—and carefully separating it from the rest of the base unit. Inside, both storage ports (2.5” SATA + M.2 2280/NVMe), the RAM (2 DIMMs), the WLAN adapter, the battery, the CMOS/RTC battery, and the fans are readily accessible. Well—mostly readily accessible; the RAM is behind a metal shield, which is indeed removable, but which also is very easy to bend if you aren’t careful.
Warranty
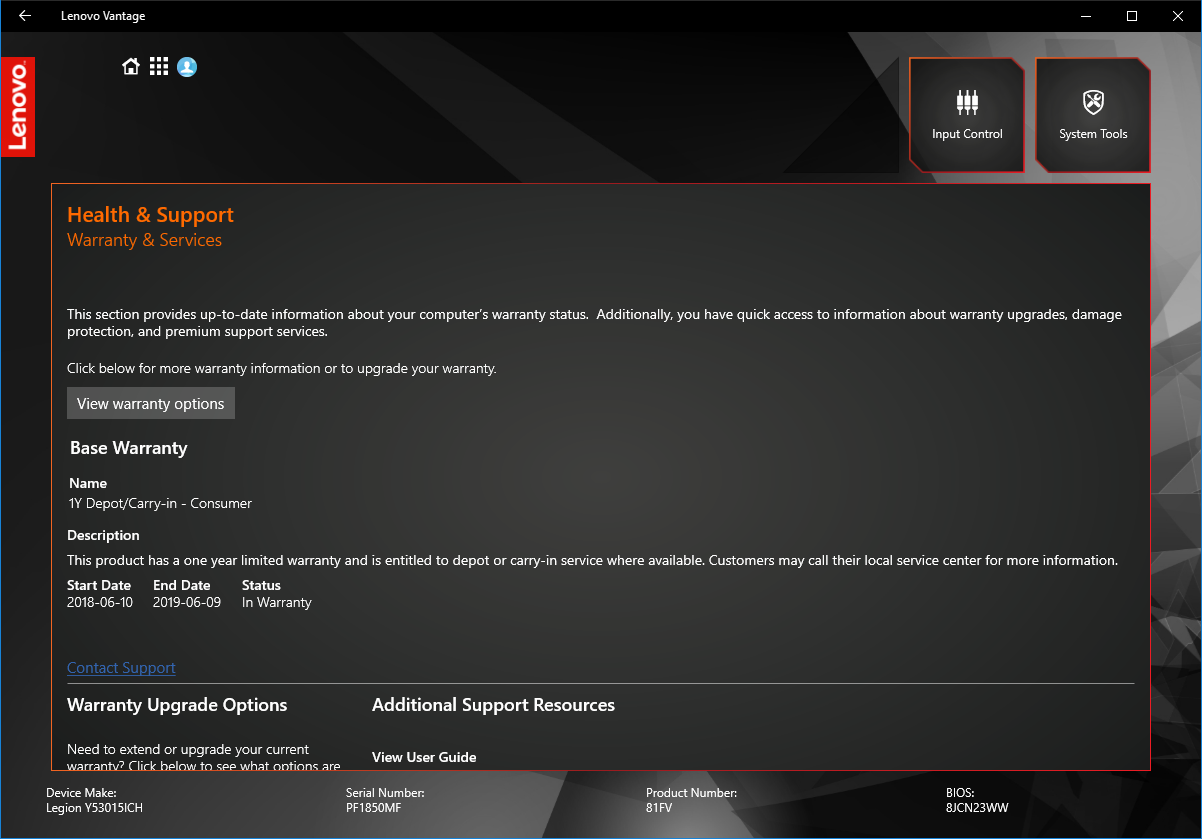
The Lenovo Legion Y530 ships with a 1-year depot warranty. Please see our Guarantees, Return policies and Warranties FAQ for country-specific information.
Input Devices
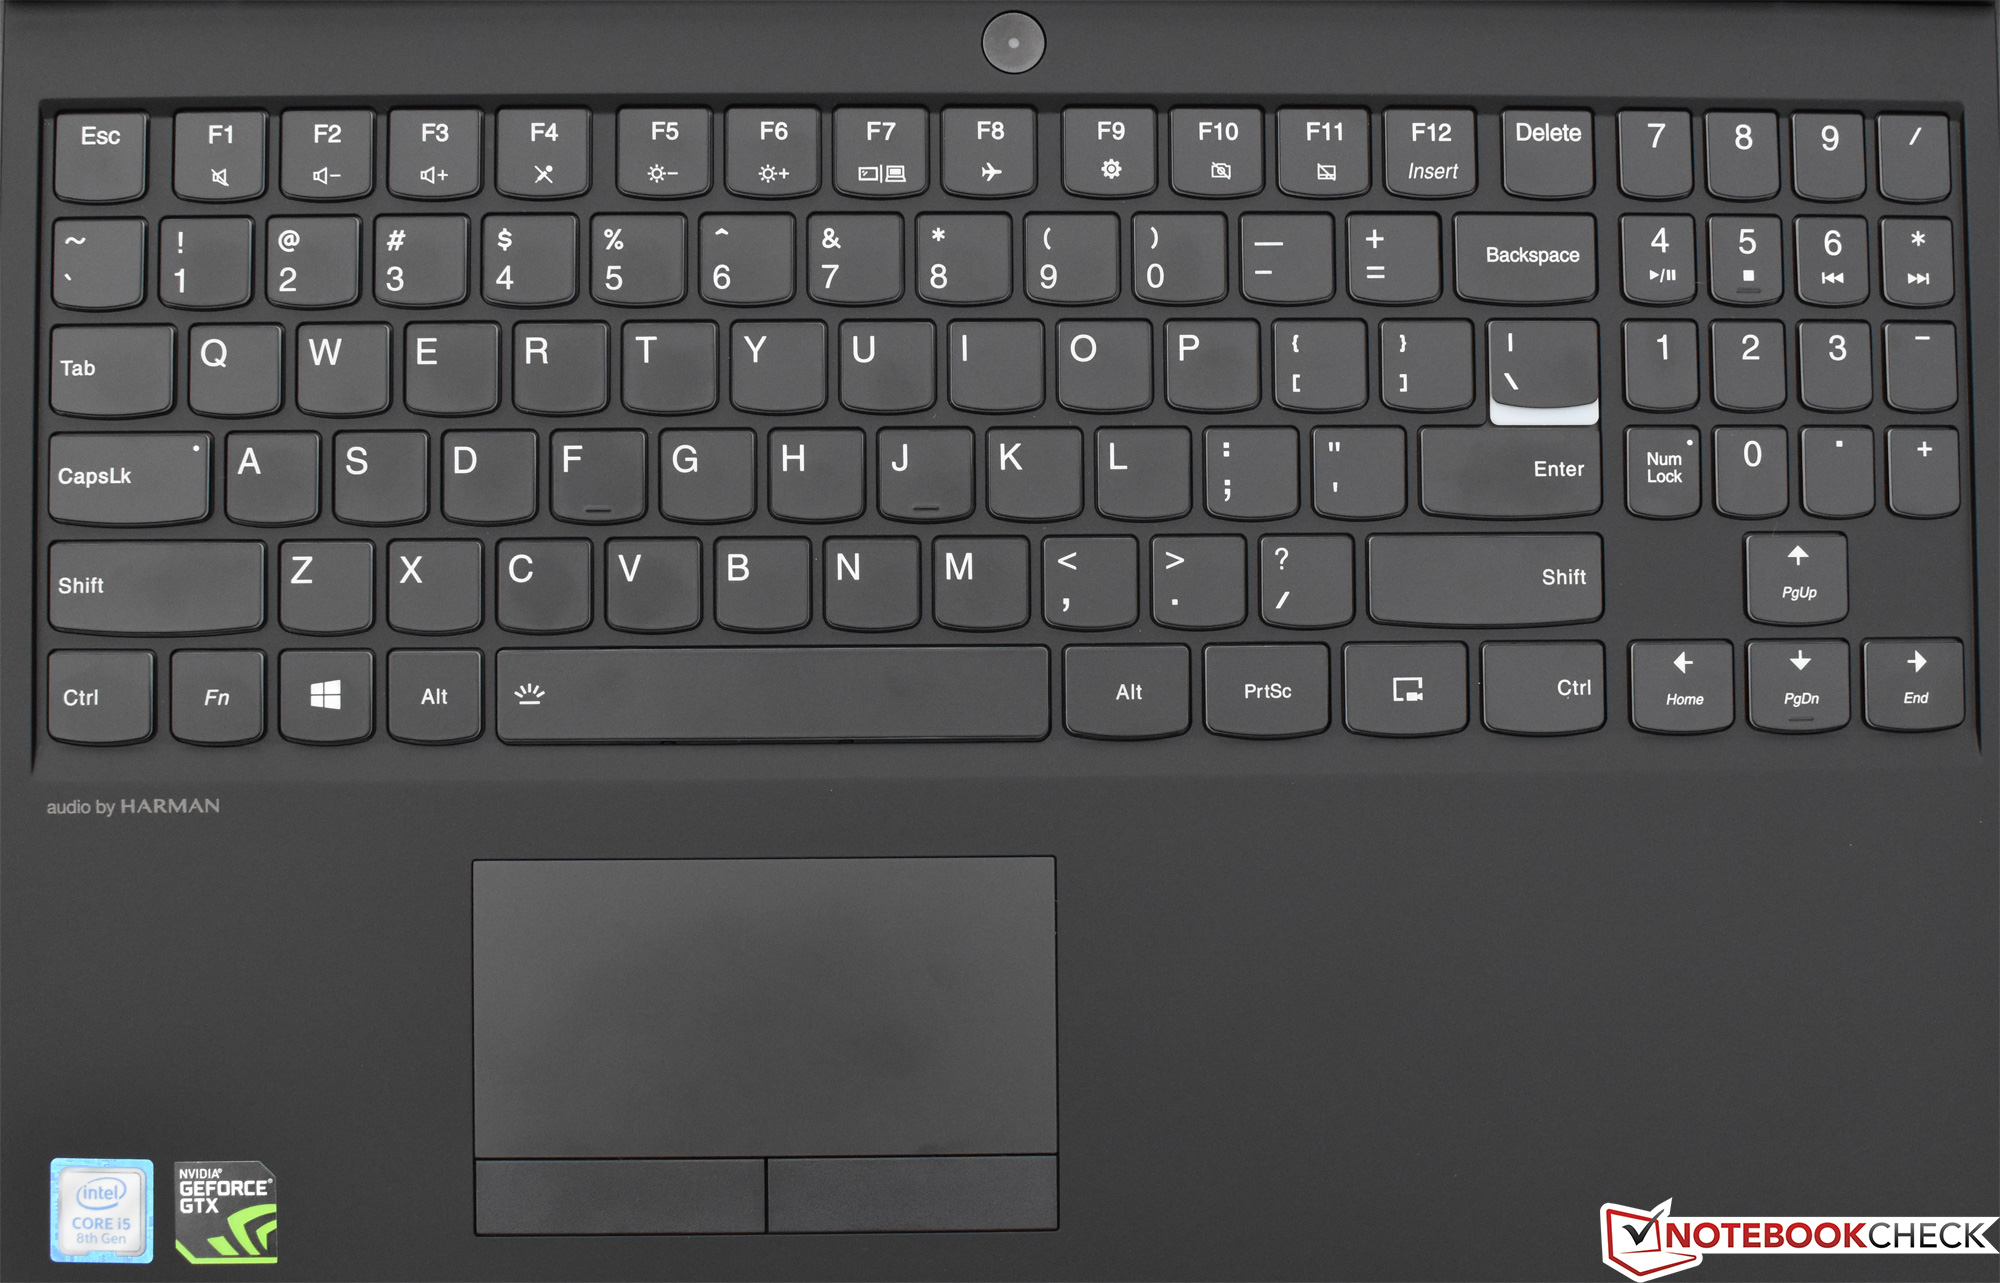
Keyboard
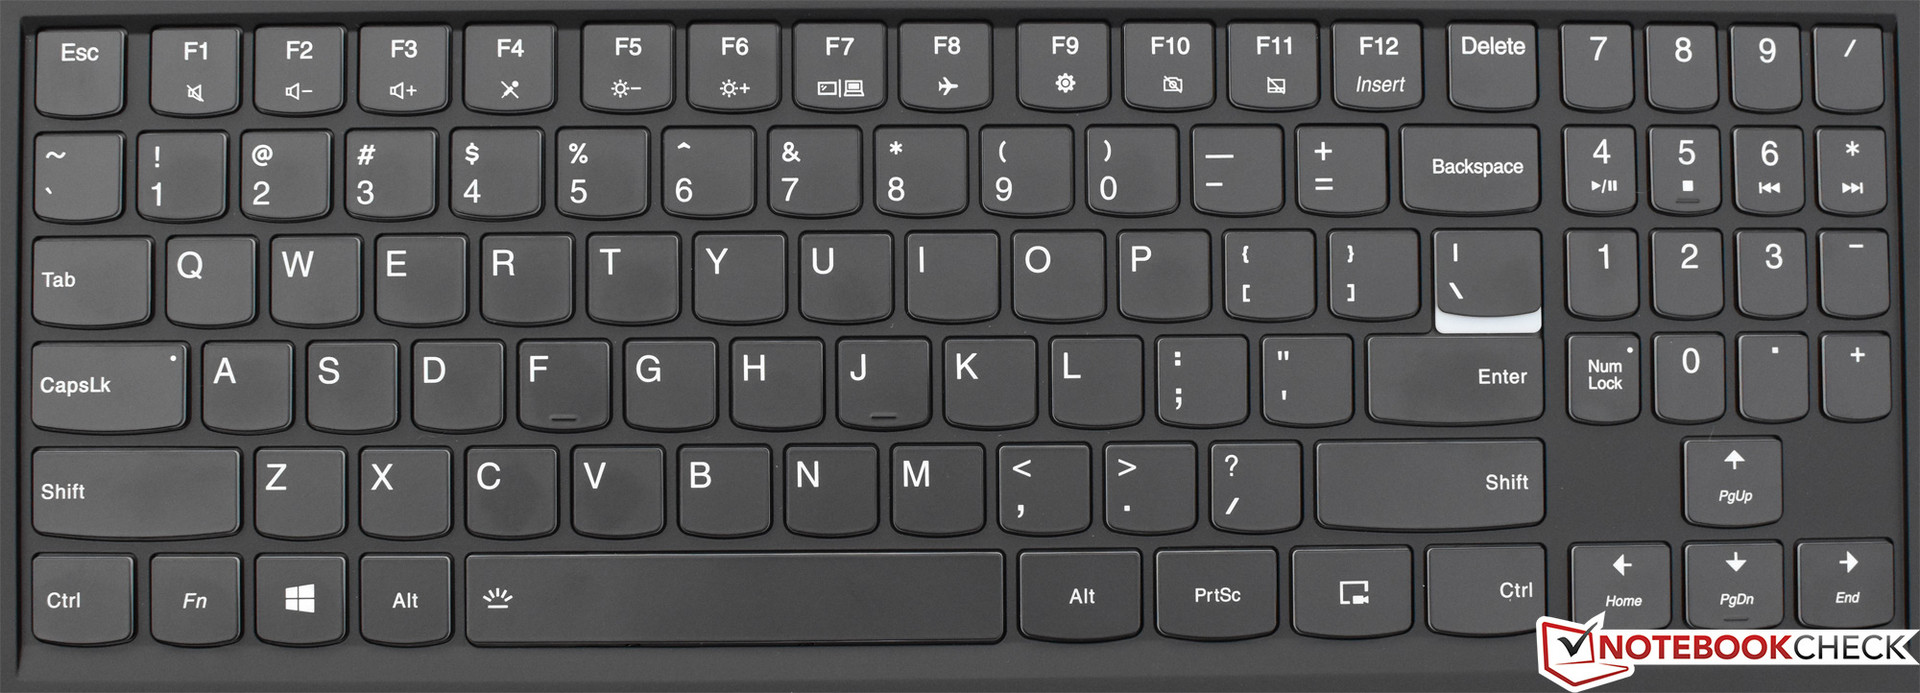
The Legion Y530’s keys feature a comfortable 1.7 mm of travel punctuated by a rather soft stop, the latter of which some people may find requires a bit of adjustment. Spacing and organization is comfortable, however, and visibility is also good (black keys with white lettering and a relatively even backlight). No dedicated hotkeys exist, but the oversized arrow keys will be undoubtedly appreciated. There is also a number pad, though the keys are horizontally compressed.
Touchpad
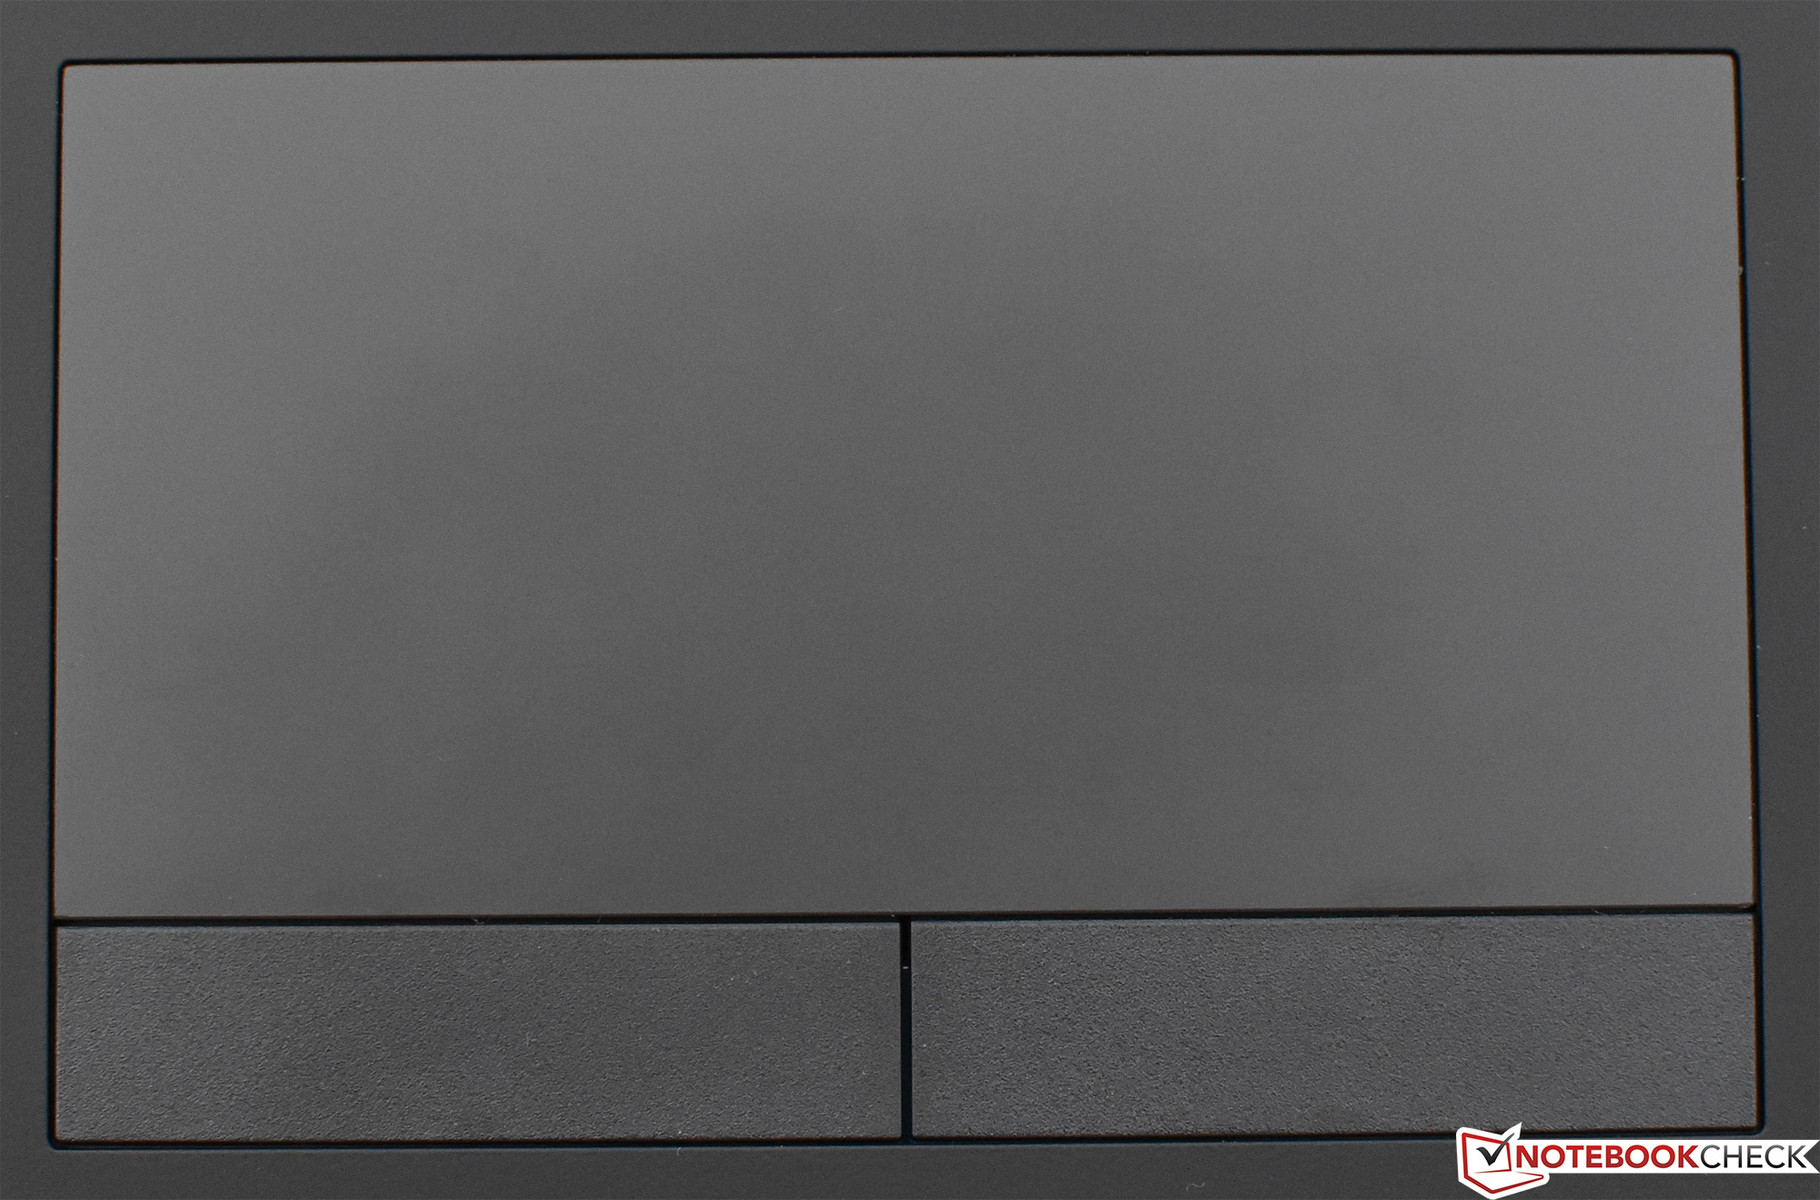
The Legion Y530’s touchpad is on the small side (100 x 51 mm), but operation is responsive and accurate thanks to Precision Touchpad drivers. The two separate physical buttons are loud and feature shallow travel, but they’re still preferable to the integrated clickpad button implementations we find in many modern machines.
Display
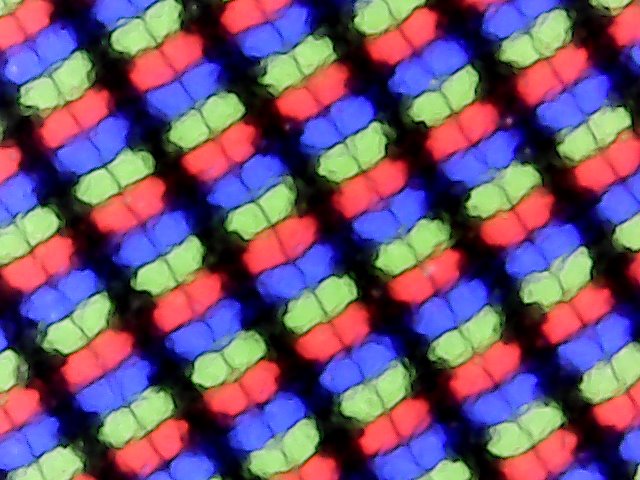
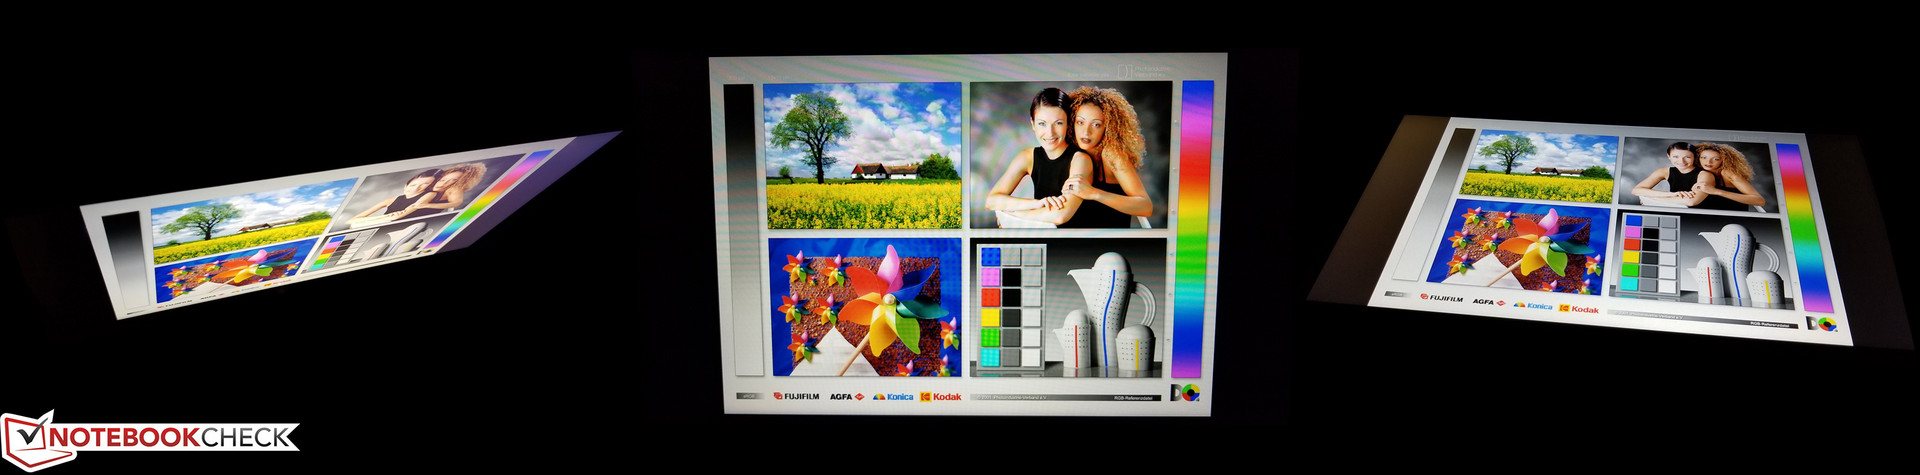
Despite our complaints about the display in last year’s Legion Y520, at first glance, the Y530 version doesn’t seem to be very much improved. The matte, 15.6-inch, FHD (1920x1080) panel yields merely average brightness, and colors are notably washed out. Lenovo is said to be planning a separate, brighter (300 nits) panel option that also features a 144 Hz refresh rate, but that display as of this writing is still listed as Coming Soon. We at least didn’t notice any untoward graininess from the panel in our review unit.
| |||||||||||||||||||||||||
Brightness Distribution: 88 %
Center on Battery: 282.8 cd/m²
Contrast: 673:1 (Black: 0.42 cd/m²)
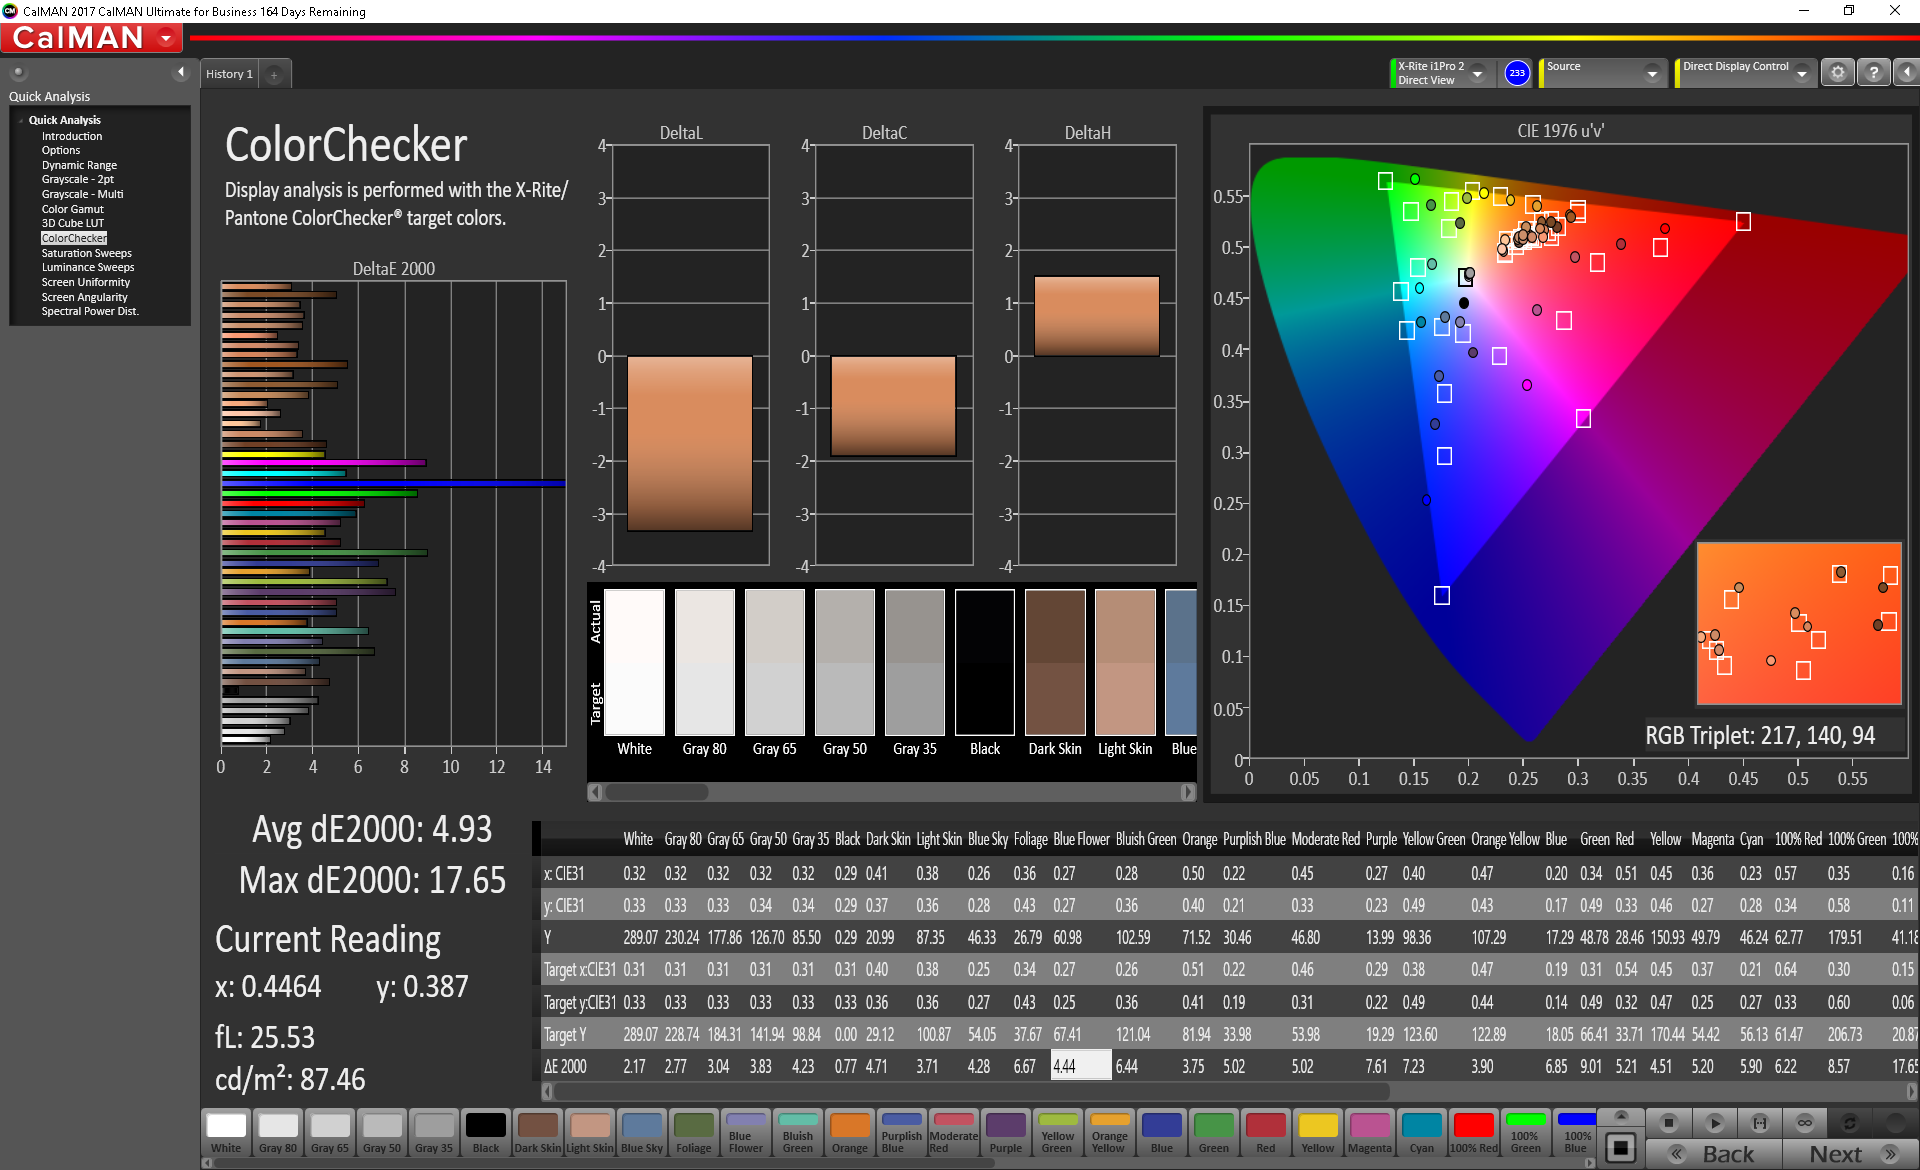
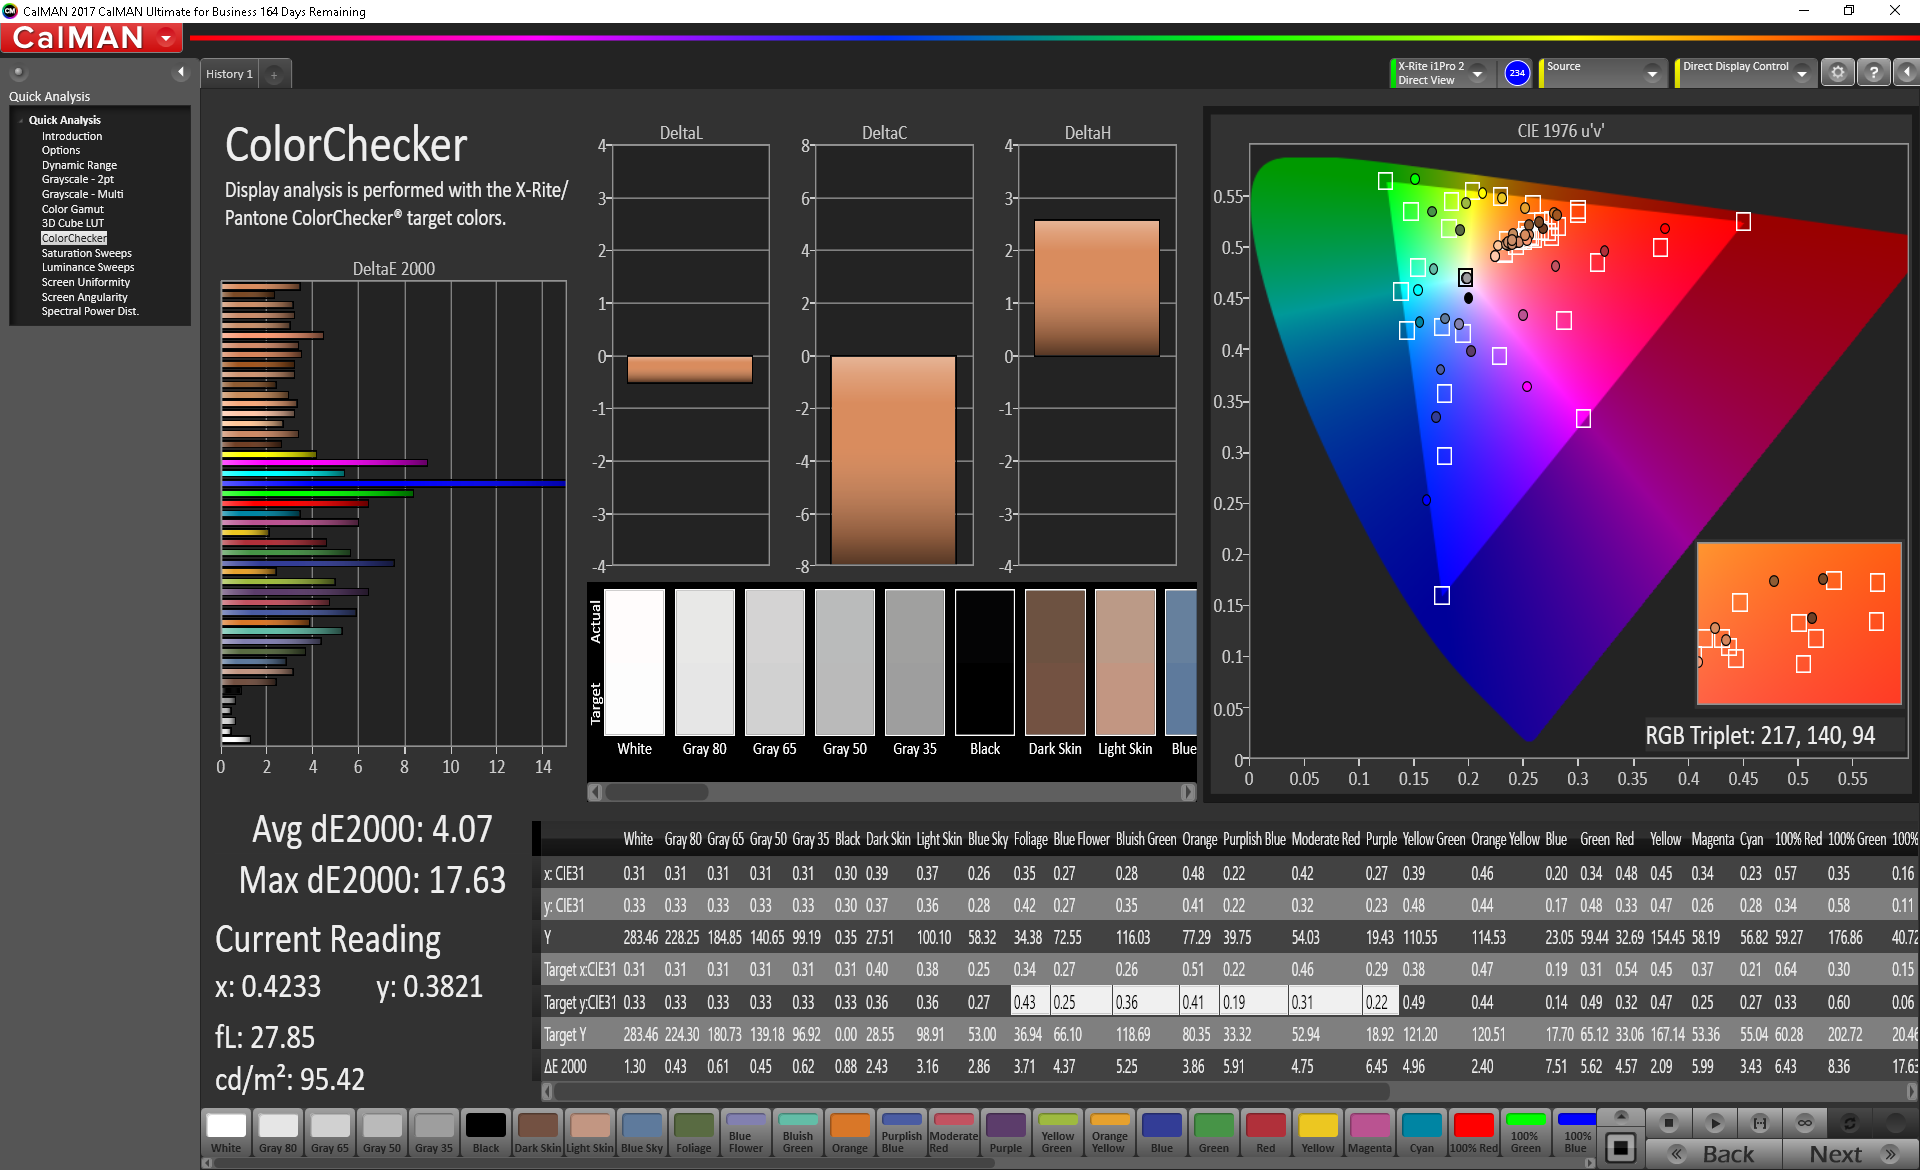
ΔE ColorChecker Calman: 4.93 | ∀{0.5-29.43 Ø4.72}
calibrated: 4.07
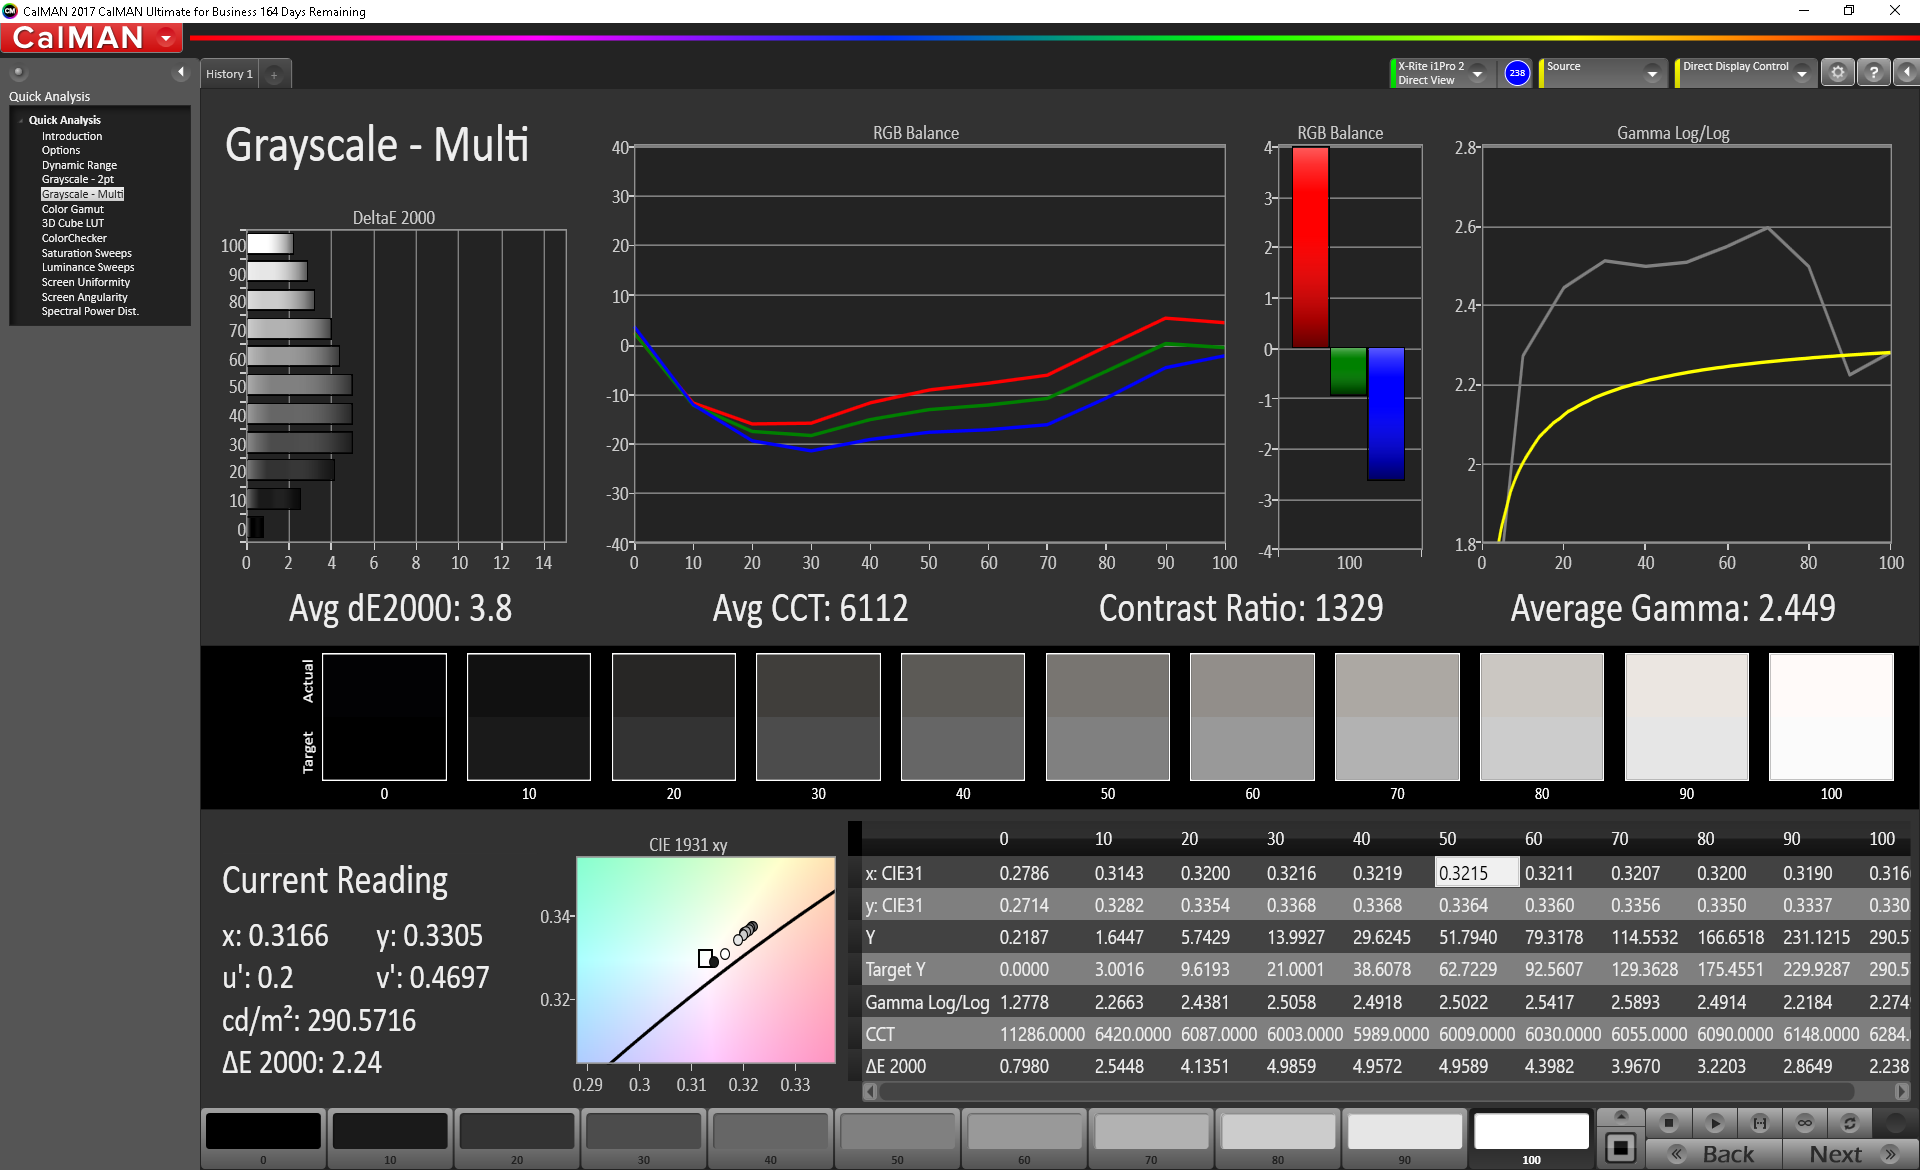
ΔE Greyscale Calman: 3.8 | ∀{0.09-98 Ø4.97}
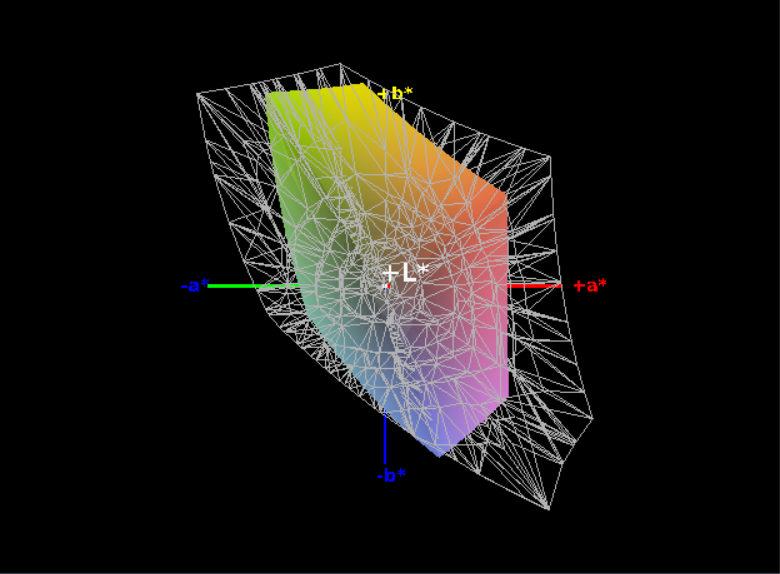
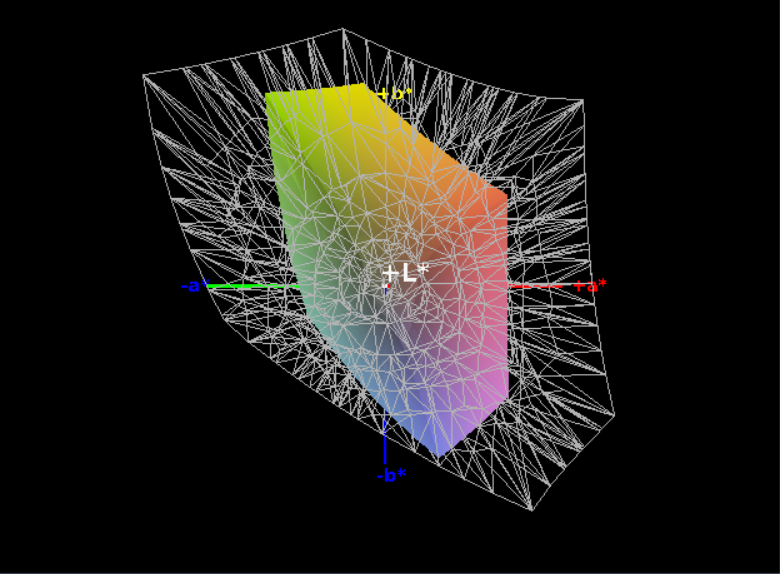
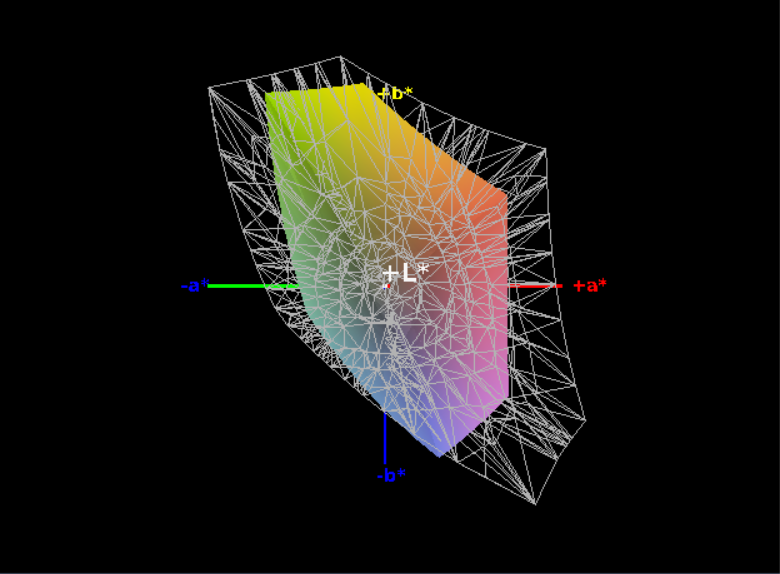
57% sRGB (Argyll 1.6.3 3D)
36% AdobeRGB 1998 (Argyll 1.6.3 3D)
39.58% AdobeRGB 1998 (Argyll 3D)
57.3% sRGB (Argyll 3D)
38.31% Display P3 (Argyll 3D)
Gamma: 2.449
CCT: 6112 K
| Lenovo Legion Y530-15ICH B156HAN02.1, IPS, 15.6", 1920x1080 | Dell XPS 15 2018 i5 FHD 97Wh Sharp SHP149A LQ156M1, LED IGZO IPS InfinityEdge, 15.6", 1920x1080 | Razer Blade 15 GTX 1060 LGD05C0, IPS, 15.6", 1920x1080 | Lenovo Legion Y520-15IKBA-80WY001VGE LG Philips LGD0533, IPS, 15.6", 1920x1080 | Alienware 15 R4 LG Philips LP156WF6 (LGD0540), IPS, 15.6", 1920x1080 | Dell G5 15 5587 LGD053F, 156WF6, IPS, 15.6", 1920x1080 | MSI GS63VR 7RG-005 Chi Mei N156HHE-GA1 (CMN15F4), TN LED, 15.6", 1920x1080 | |
|---|---|---|---|---|---|---|---|
| Display | 70% | 65% | 3% | 60% | -0% | 111% | |
| Display P3 Coverage (%) | 38.31 | 66 72% | 64.4 68% | 39.53 3% | 65.7 71% | 38.13 0% | 91.6 139% |
| sRGB Coverage (%) | 57.3 | 96.5 68% | 93.4 63% | 59.2 3% | 86.4 51% | 56.8 -1% | 100 75% |
| AdobeRGB 1998 Coverage (%) | 39.58 | 66.7 69% | 65.5 65% | 40.86 3% | 63.1 59% | 39.47 0% | 86.6 119% |
| Response Times | -3% | 66% | 11% | 20% | 25% | 78% | |
| Response Time Grey 50% / Grey 80% * (ms) | 43.6 ? | 49 ? -12% | 13.6 ? 69% | 42 ? 4% | 37.6 ? 14% | 33 ? 24% | 10.4 ? 76% |
| Response Time Black / White * (ms) | 32.4 ? | 30 ? 7% | 12 ? 63% | 27 ? 17% | 24 ? 26% | 24 ? 26% | 6.6 ? 80% |
| PWM Frequency (Hz) | 961 ? | 24900 ? | 20830 ? | 25510 ? | |||
| Screen | 52% | 38% | -3% | 23% | -7% | 44% | |
| Brightness middle (cd/m²) | 282.8 | 413 46% | 304.3 8% | 243 -14% | 292 3% | 229 -19% | 269 -5% |
| Brightness (cd/m²) | 264 | 378 43% | 293 11% | 231 -12% | 278 5% | 224 -15% | 254 -4% |
| Brightness Distribution (%) | 88 | 86 -2% | 80 -9% | 87 -1% | 88 0% | 87 -1% | 85 -3% |
| Black Level * (cd/m²) | 0.42 | 0.29 31% | 0.38 10% | 0.24 43% | 0.29 31% | 0.28 33% | 0.21 50% |
| Contrast (:1) | 673 | 1424 112% | 801 19% | 1013 51% | 1007 50% | 818 22% | 1281 90% |
| Colorchecker dE 2000 * | 4.93 | 2.44 51% | 1.79 64% | 6.36 -29% | 4.9 1% | 6.1 -24% | 3 39% |
| Colorchecker dE 2000 max. * | 17.65 | 4.46 75% | 3.69 79% | 12.76 28% | 10.08 43% | 12.2 31% | 5.62 68% |
| Colorchecker dE 2000 calibrated * | 4.07 | 2.48 39% | 6.51 -60% | 2.27 44% | 6.12 -50% | ||
| Greyscale dE 2000 * | 3.8 | 2.48 35% | 1.1 71% | 5.63 -48% | 4.89 -29% | 5.68 -49% | 3.18 16% |
| Gamma | 2.449 90% | 2.43 91% | 2.27 97% | 2.47 89% | 2.36 93% | 2.4 92% | 2.25 98% |
| CCT | 6112 106% | 7006 93% | 6665 98% | 7411 88% | 7598 86% | 6989 93% | 7274 89% |
| Color Space (Percent of AdobeRGB 1998) (%) | 36 | 62 72% | 59.8 66% | 38 6% | 56 56% | 36 0% | 77 114% |
| Color Space (Percent of sRGB) (%) | 57 | 96 68% | 92.8 63% | 59 4% | 86 51% | 57 0% | 100 75% |
| Total Average (Program / Settings) | 40% /
48% | 56% /
47% | 4% /
-0% | 34% /
30% | 6% /
-1% | 78% /
62% |
* ... smaller is better
The average measured brightness of our Y530 display came to 264.1 cd/m², which is just 20 cd/m² brighter than last year’s dim Y520 panel. The contrast ratio has actually been reduced to just 673:1—which isn’t great—due to a rather high measured black value of 0.42 cd/m². A brightness distribution of 87% does make for a relatively consistent luminosity across the panel, however.
Color coverage is indeed poor. Managing just 57% of sRGB and 36% of AdobeRGB, the Y530 matches the Dell G5 15 5587 for worst color reproduction of the bunch. Last year’s Y520 was basically the same as well, though it scores a couple of percentage points higher in our measurements. The rest of the competitors do much better, with the lowest performer (the Alienware 15 R4) still hitting 86% of sRGB.
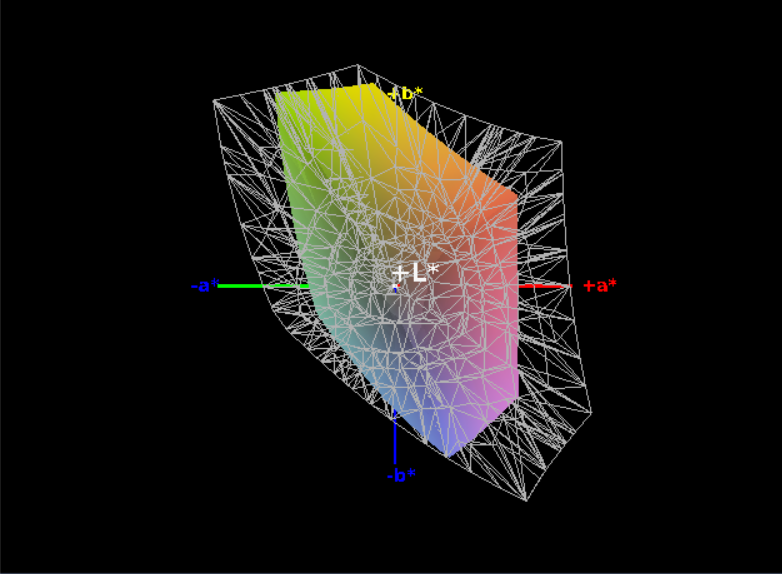

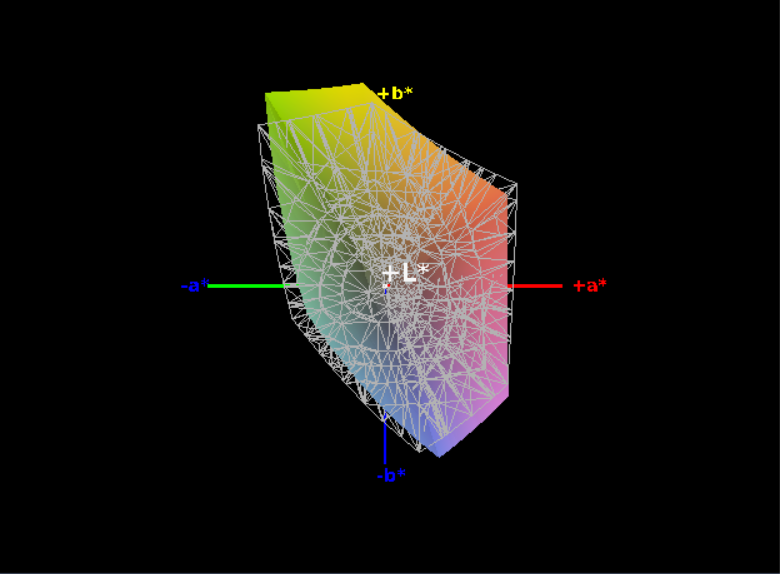
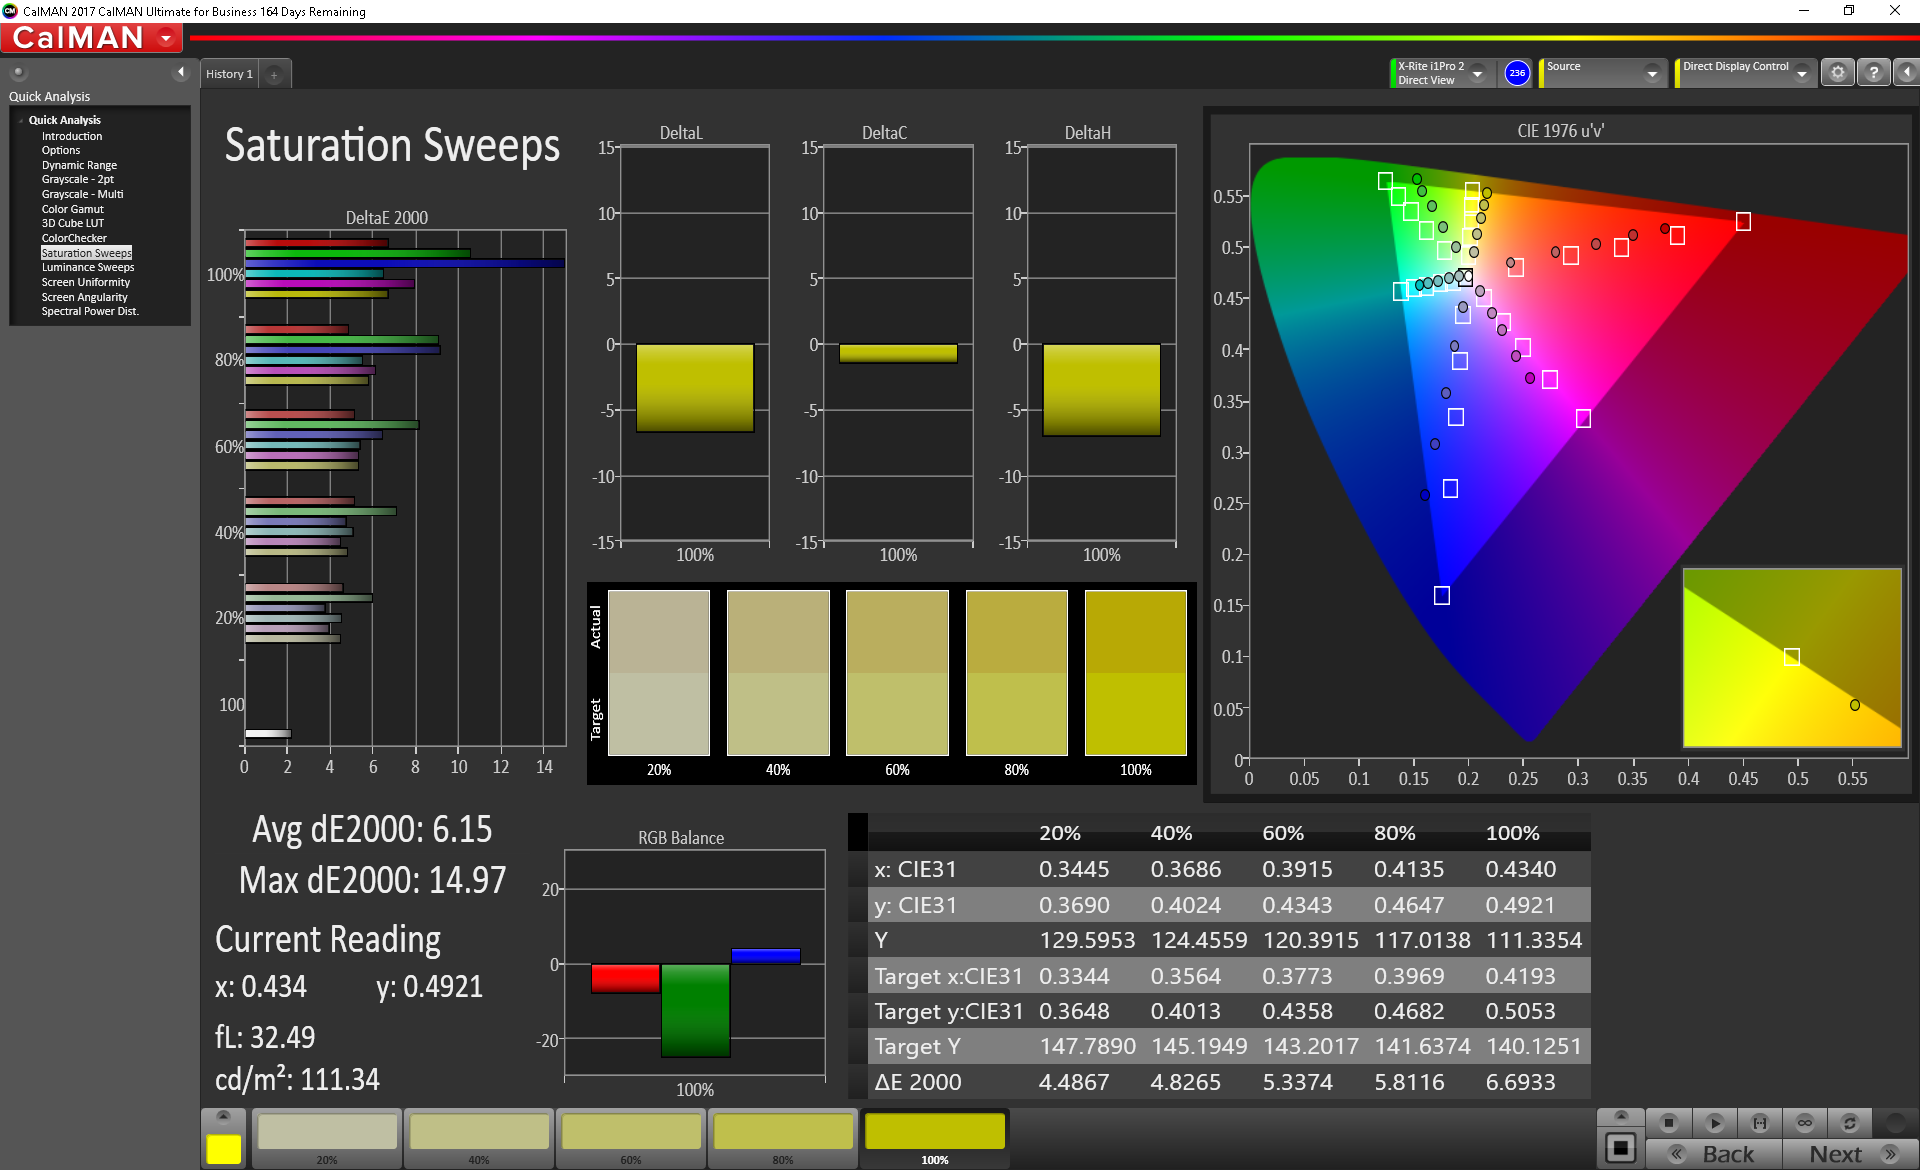
CalMAN’s color accuracy measurements resulted in decent overall DeltaE averages for Greyscale/ColorChecker of just 3.8 and 4.93, respectively, though Blue is particularly off the charts with a reading of 17.65. This doesn’t change much post-calibration, though the average DeltaE values do drop to 0.7 and 4.07. Gamma (2.449) and CCT Average (6112) are both reasonably close to their ideal values without any additional calibration performed.
Display Response Times
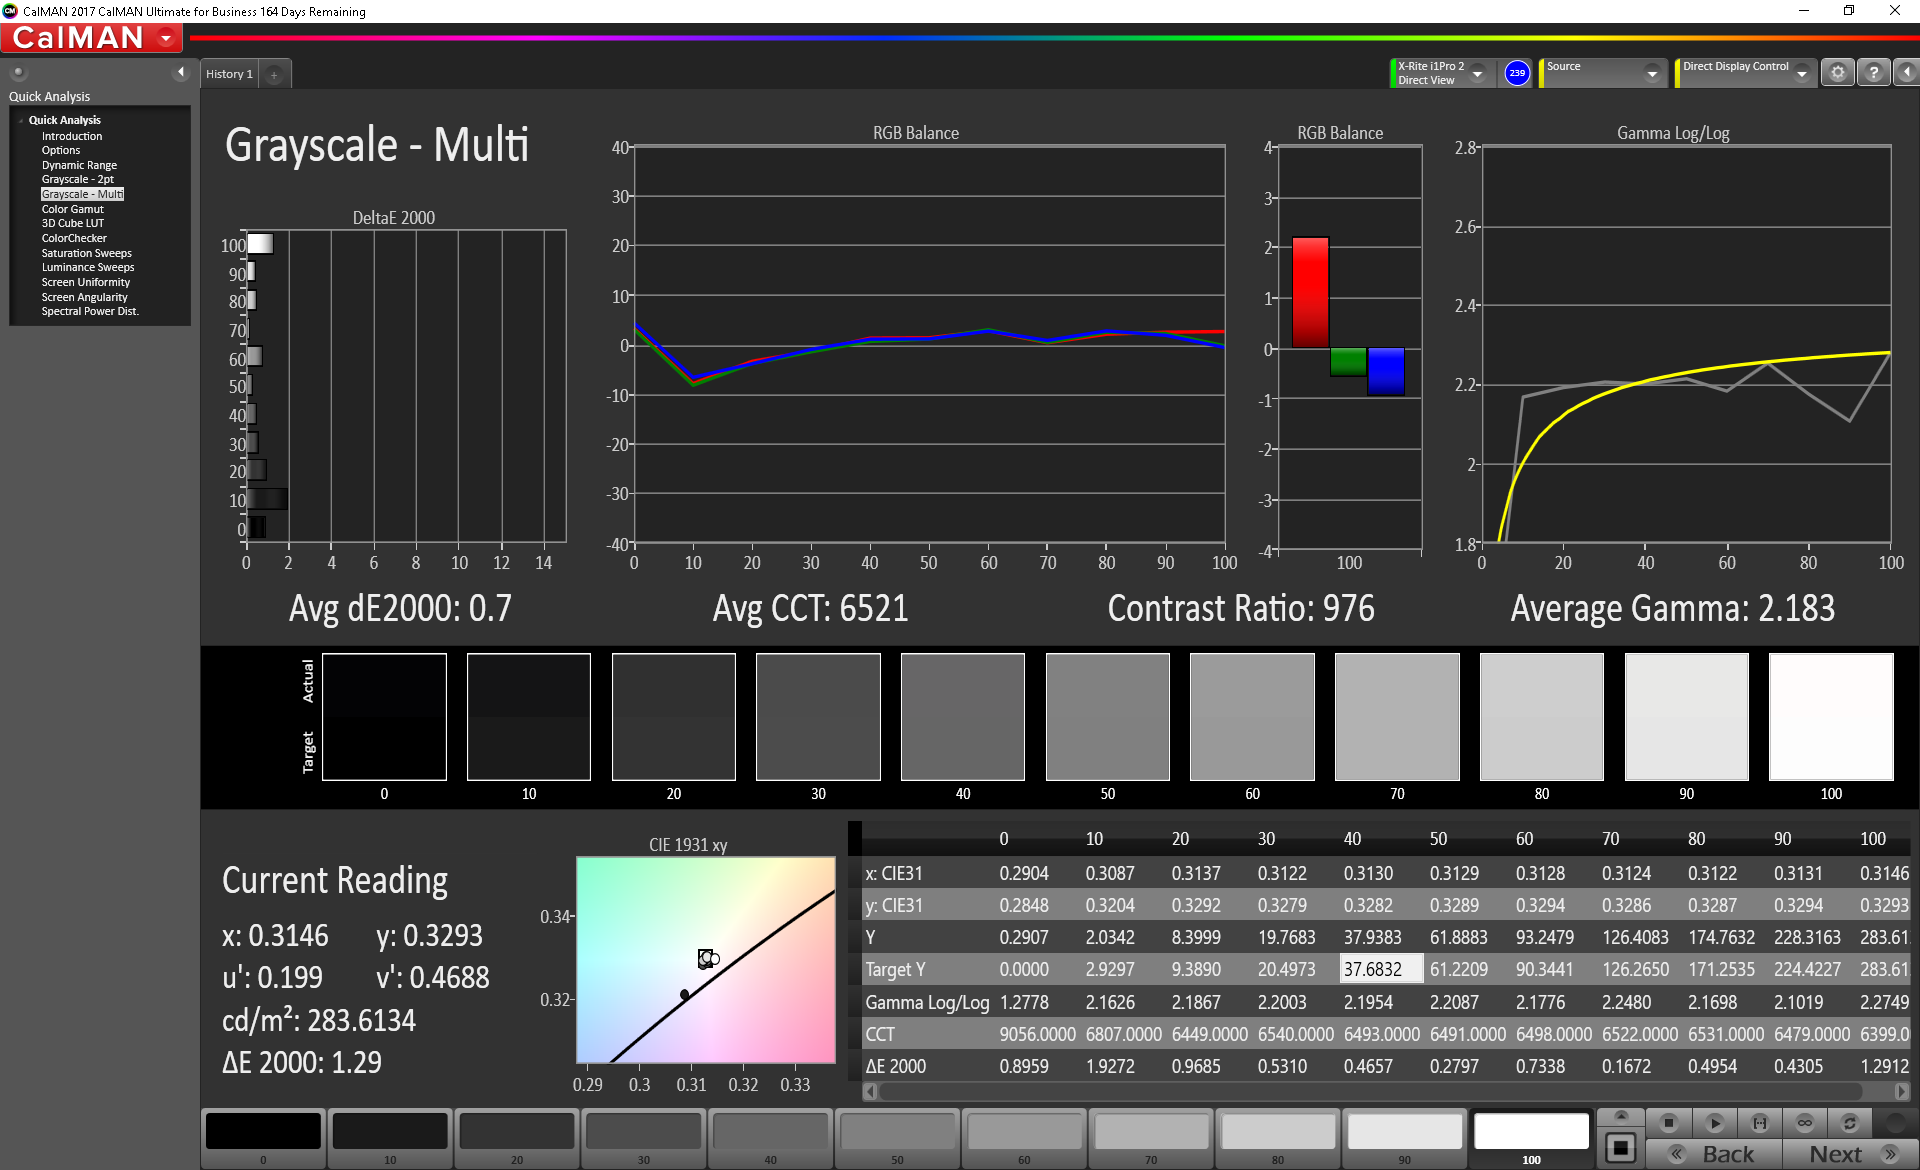
| ↔ Response Time Black to White | ||
|---|---|---|
| 32.4 ms ... rise ↗ and fall ↘ combined | ↗ 18 ms rise | 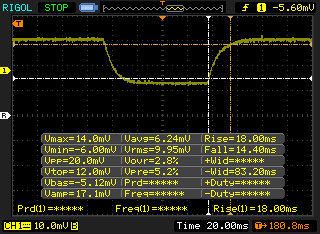 |
| ↘ 14.4 ms fall | ||
| The screen shows slow response rates in our tests and will be unsatisfactory for gamers. In comparison, all tested devices range from 0.1 (minimum) to 240 (maximum) ms. » 88 % of all devices are better. This means that the measured response time is worse than the average of all tested devices (19.8 ms). | ||
| ↔ Response Time 50% Grey to 80% Grey | ||
| 43.6 ms ... rise ↗ and fall ↘ combined | ↗ 19.2 ms rise | 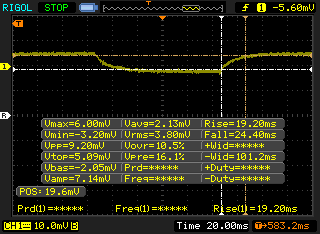 |
| ↘ 24.4 ms fall | ||
| The screen shows slow response rates in our tests and will be unsatisfactory for gamers. In comparison, all tested devices range from 0.165 (minimum) to 636 (maximum) ms. » 73 % of all devices are better. This means that the measured response time is worse than the average of all tested devices (31 ms). | ||
Screen Flickering / PWM (Pulse-Width Modulation)
| Screen flickering / PWM not detected | 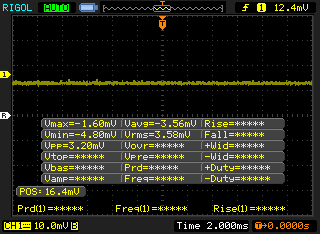 | ||
In comparison: 52 % of all tested devices do not use PWM to dim the display. If PWM was detected, an average of 7747 (minimum: 5 - maximum: 343500) Hz was measured. | |||
Response times from the panel are unfortunately rather slow—among the slowest of the entire bunch, in fact. The Razer Blade and MSI GS63 perform much better here.
Viewing angles are great from any side thanks to the IPS panel. Meanwhile, outdoor use is rarely comfortable (except in the most heavily shaded areas) due to the weak brightness and contrast of the panel. The matte finish does help to reduce obstructive reflections though.
Performance
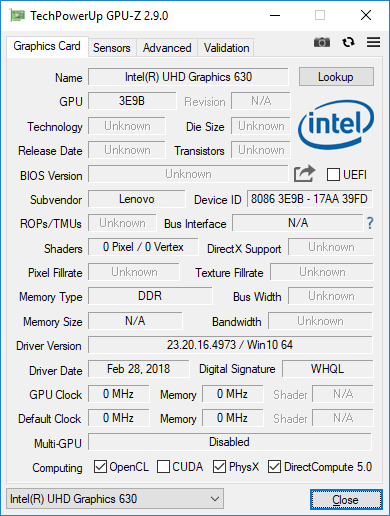
The Lenovo Legion Y530 is available in a variety of different configurations, with processors ranging up to the 6-core Core i7-8750H, up to 16 GB of DDR4 RAM, and the choice of either a GTX 1050 or GTX 1050 Ti for the GPU (both featuring 4 GB of GDDR5 VRAM).
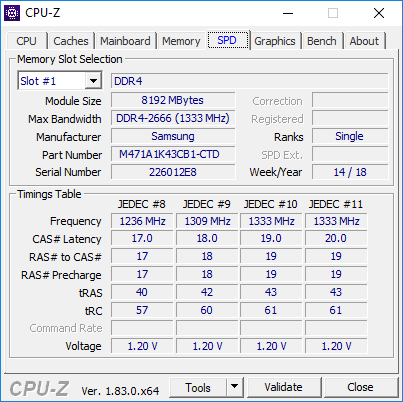
Our review unit arrived with a Core i5-8300H, 8 GB DDR4 RAM, and a GTX 1050 Ti. It seems a sensible mid-range configuration for those interested in some moderate gaming but not willing to splurge for the highest-end components.
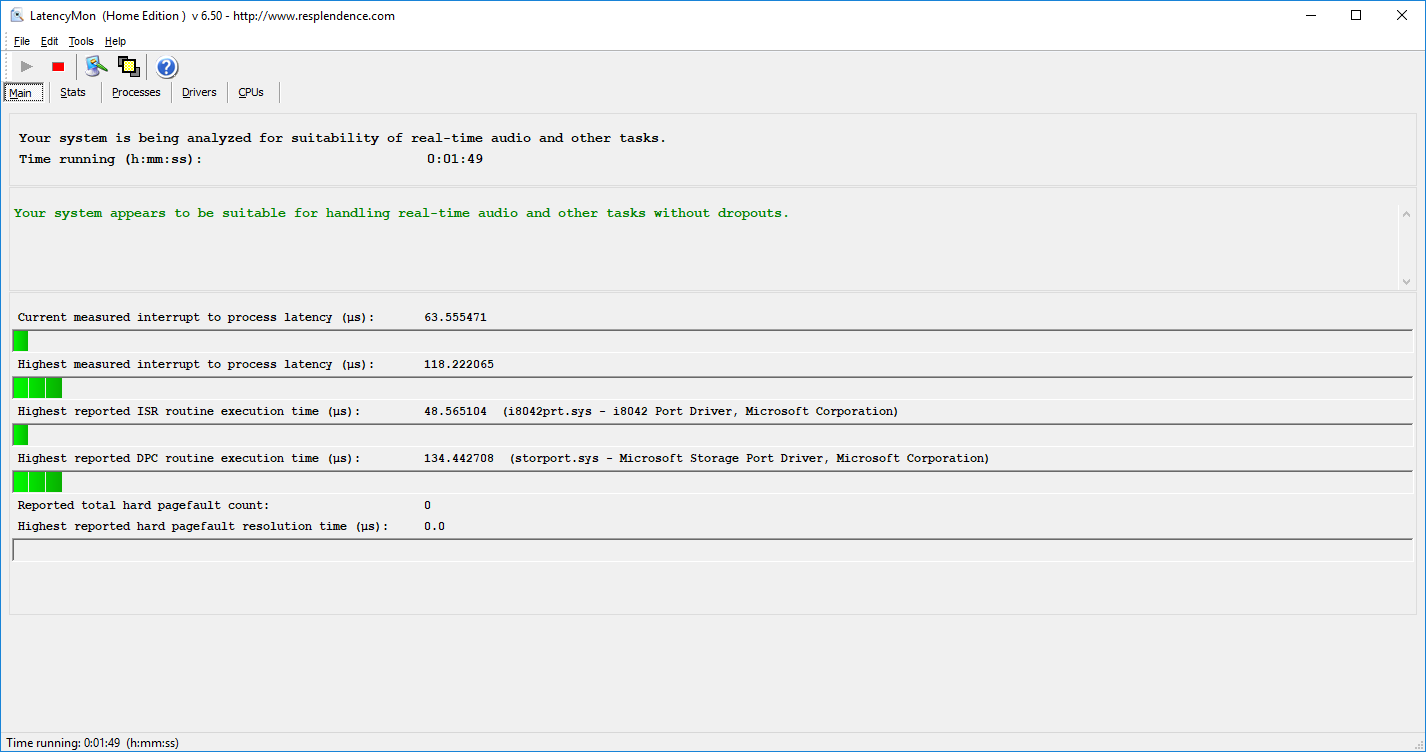
Performance unplugged is, as expected, somewhat below that while operating on AC power: a second run of 3DMark 11 resulted in a Graphics Score of 6245 (versus the 9909 points we recorded during our normal run). On the topic of DPC latencies, LatencyMon revealed no such issues even with all wireless radios active.
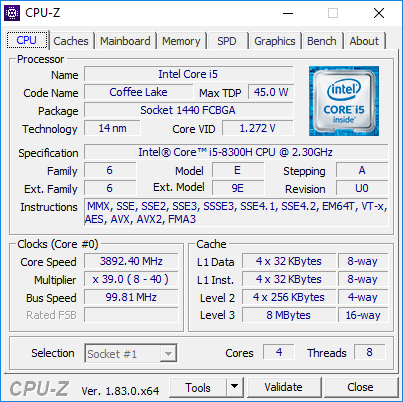
Processor
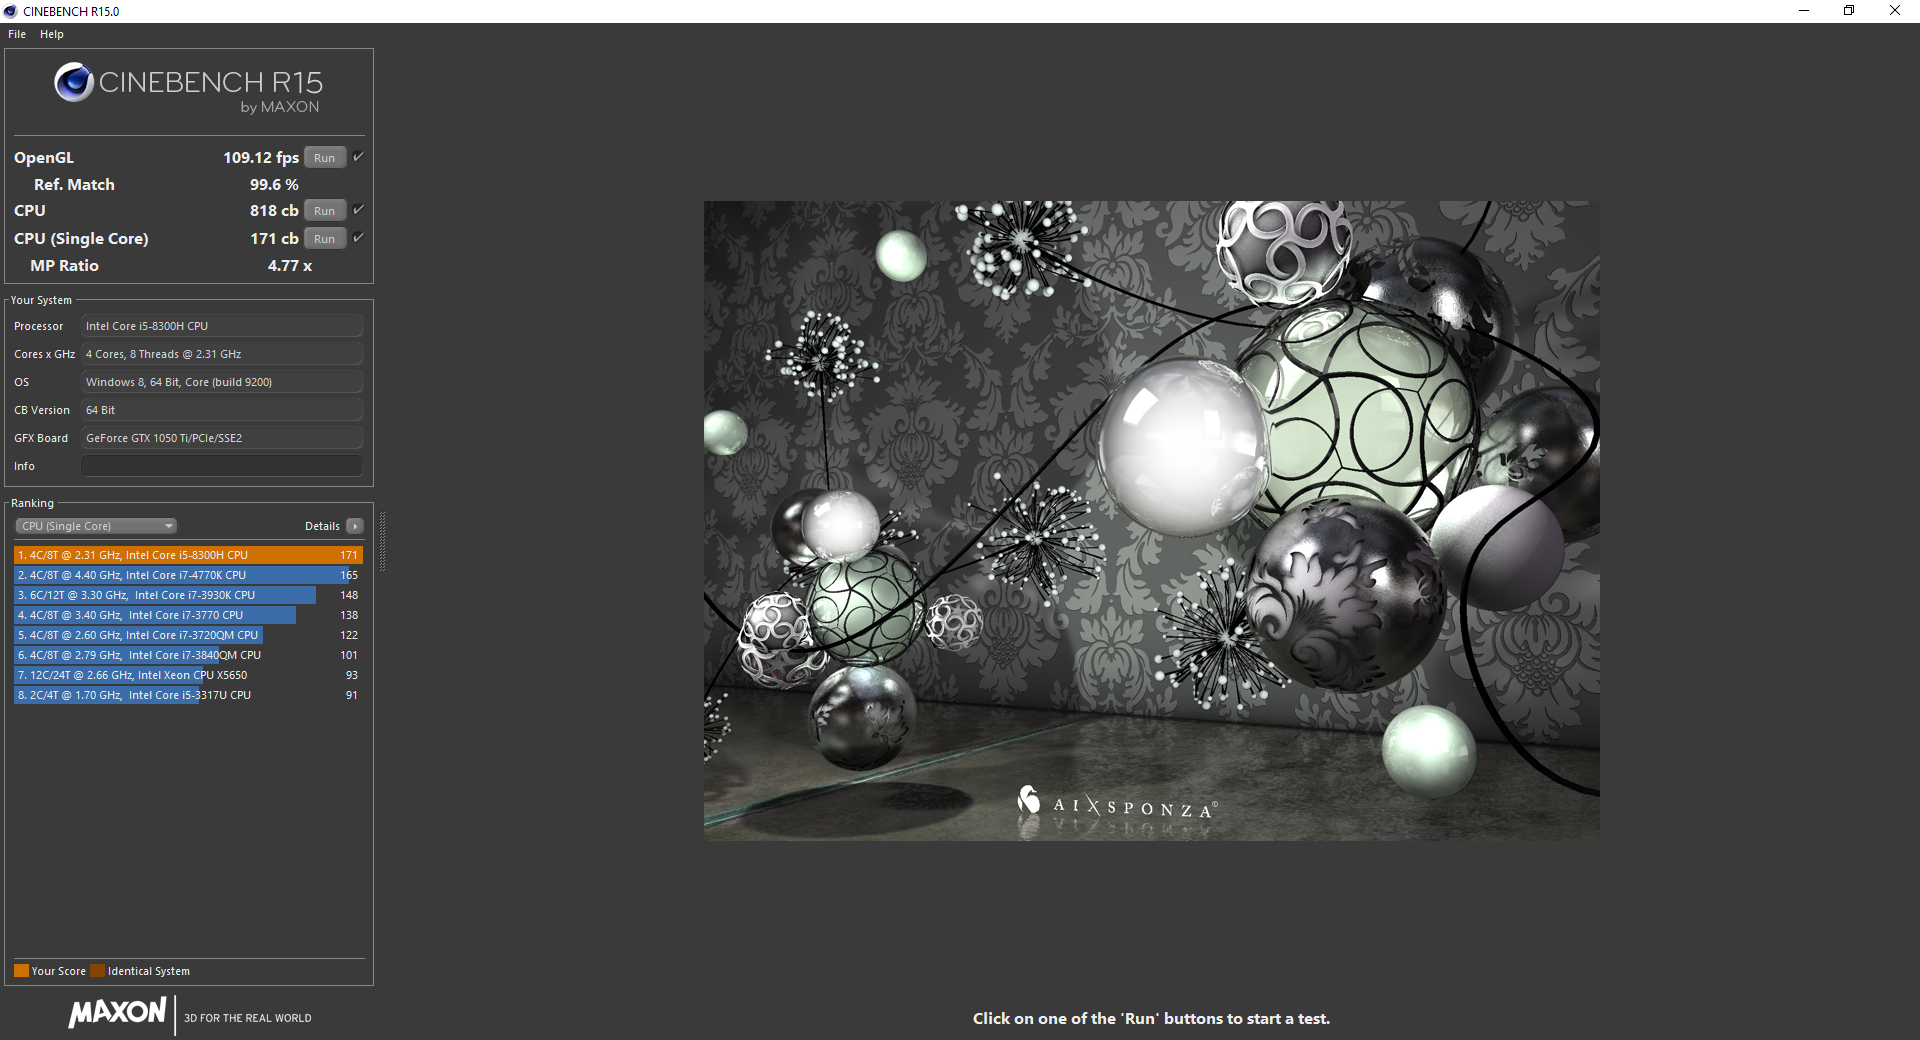
The Core i5-8300H in our Y530 is a quad-core CPU with a 45 W TDP that we’ve covered numerous times before already. Performance is great, though obviously below the six-core CPUs such as the Core i7-8750H (which is an option for the Y530) and Core i9-8950HK. Clock rates range from 2.3 GHz up to 4 GHz (3.9 GHz with 4 cores active) and Hyper-Threading technology is supported.
Our Y530 review unit manages scores which are slightly above the average for this CPU, though not quite as high as those of the XPS 15 (the configuration of which features this same CPU in our tests, as shown in the graphs below). 818 points in Cinebench R15 multi-CPU is a very good result however (versus the i5-8300H CPU average of 788 points), and the score of 171 in single-CPU is exactly what we’d expect to see.
We were pleased to discover that sustained performance also was not a problem in our Cinebench loop test; scores only dropped from 829 down to 804 on the seventh run, after which point they climbed back into the 815 – 817 range semi-permanently—still above average for this CPU.
System Performance
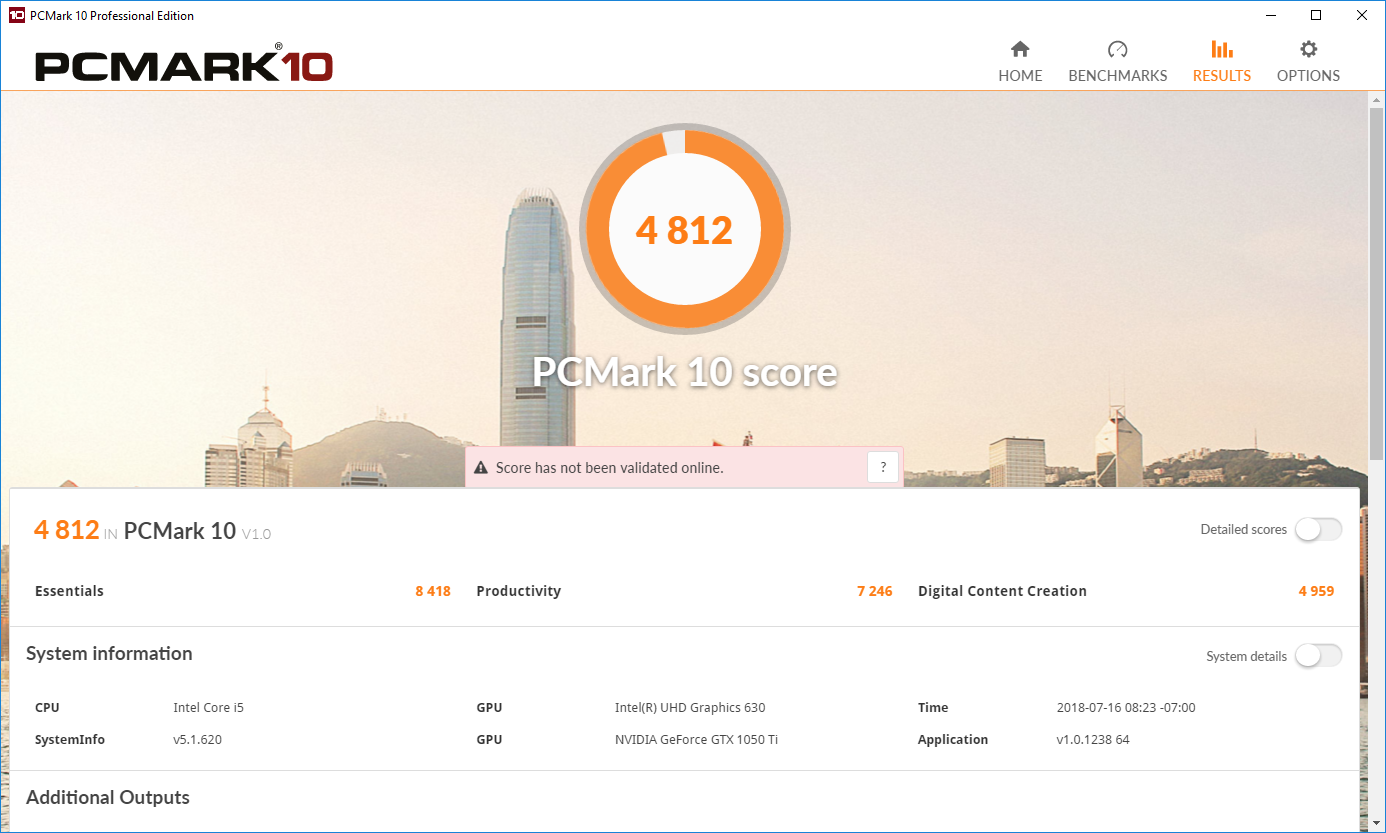
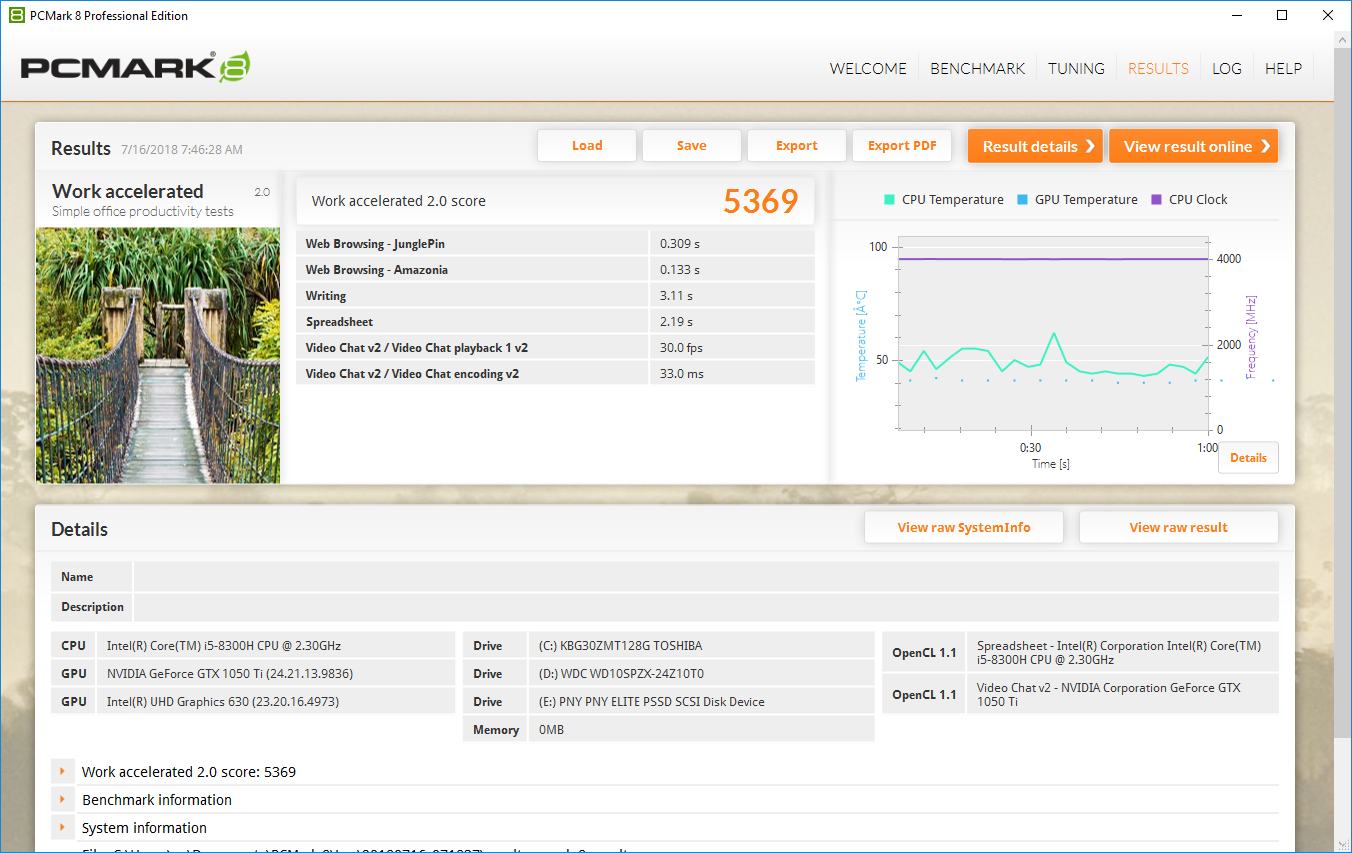
Despite featuring an NVMe SSD, the Y530 can barely keep up with the rest of its NVMe-equipped brethren. We’ll discover in the next section that this is mostly due to the drive’s below-average speeds for its class, but before we get to that, have a quick look at our PCMark results below. In PCMark 10, the score of 4812 isn’t bad, but it’s slightly below the gaming class average and some 25% below the Alienware 15 R4’s 6008. Even the Dell G5 15 (and, to a lesser extent, the Razer Blade 15) fare better here, but in reality it’s rather difficult to notice the difference anyway. Barring some slowdowns during program/game installations, the device wasn’t really ever sluggish during our time with it, though (again) as we’ll see below, the true weakness is in the realm of writing rather than reading from the SSD.
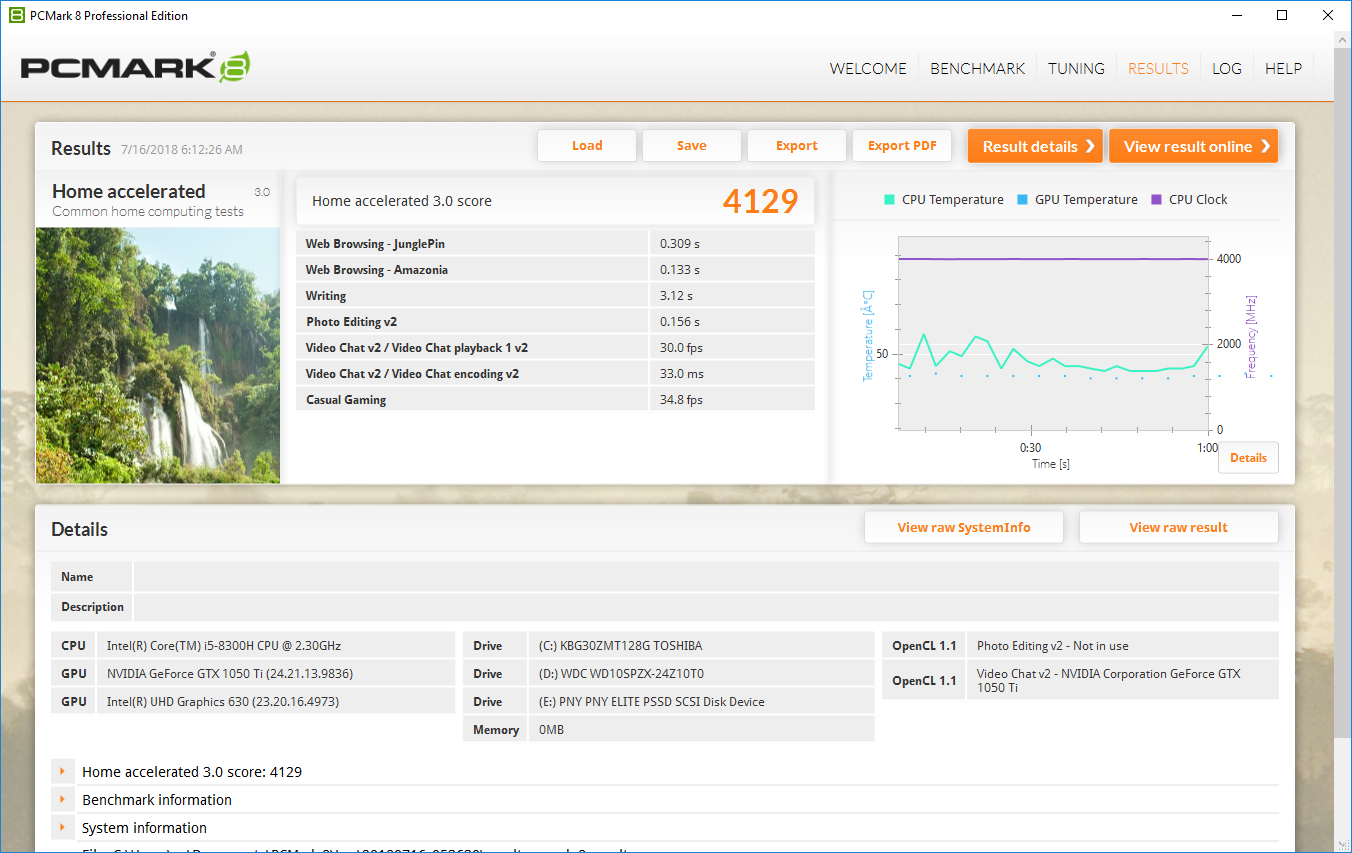
| PCMark 8 Home Score Accelerated v2 | 4129 points | |
| PCMark 8 Work Score Accelerated v2 | 5369 points | |
| PCMark 10 Score | 4812 points | |
Help | ||
Storage Devices
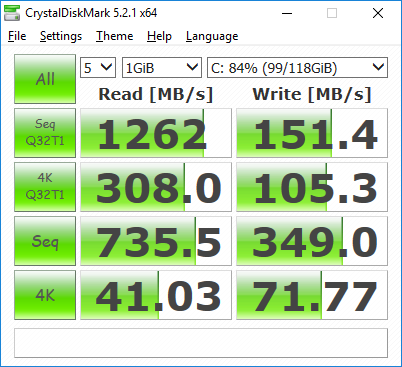
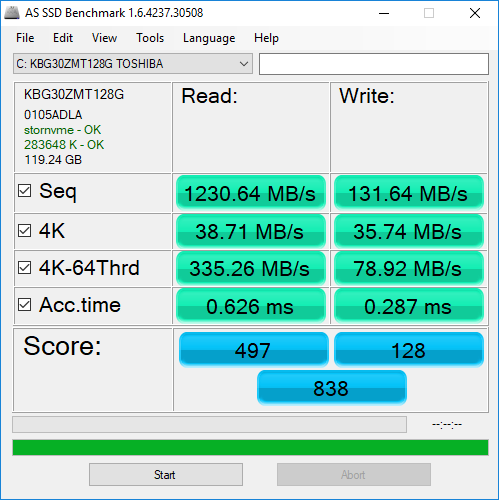
The Toshiba KBG30ZMT128G, a rather unconventional M.2 2242-sized drive, requires an adapter bracket to span the full length of the M.2 2280 slot. It’s also not a very impressive drive in context with its NVMe peers; it’s the slowest of the bunch, with especially poor write speeds. We recorded an AS SSD Score of 838, hampered by very poor sequential/4K-64 write speeds of 131.64 MB/s and 78.92 MB/s respectively. Read speeds are much better, though still below averages for an NVMe drive. Subjectively, the speed discrepancies are really only noticeable during write-heavy activities such as program and game installations—but the drive isn’t too difficult to swap out for a different SSD if the user decides to do so aftermarket anyway.
There is also a mechanical 1 TB 7200 RPM storage drive in our review unit—a Western Digital WD10SPZX—so there’s plenty of room for game downloads on board.
| Lenovo Legion Y530-15ICH Toshiba KBG30ZMT128G | Dell XPS 15 2018 i5 FHD 97Wh Lite-On CA3-8D256-Q11 | Razer Blade 15 GTX 1060 Samsung SSD PM981 MZVLB512HAJQ | Alienware 15 R4 Toshiba XG5 KXG50ZNV256G | Dell G5 15 5587 SK hynix SC311 M.2 | MSI GS63VR 7RG-005 Samsung SM961 MZVPW256HEGL | Lenovo Legion Y520-15IKBN 80WK0042GE Samsung PM961 NVMe MZVLW128HEGR | Average Toshiba KBG30ZMT128G | |
|---|---|---|---|---|---|---|---|---|
| AS SSD | -17% | 550% | 111% | 16% | 392% | 138% | 0% | |
| Copy Game MB/s (MB/s) | 465.9 | 882 | 130.9 | 892 | 197.3 | 122.3 ? | ||
| Copy Program MB/s (MB/s) | 117.2 | 370.7 | 95.7 | 317.5 | 127.3 | 122.6 ? | ||
| Copy ISO MB/s (MB/s) | 632 | 1452 | 146.6 | 1698 | 497.6 | 174.8 ? | ||
| Score Total (Points) | 838 | 750 -11% | 4095 389% | 1416 69% | 557 -34% | 3848 359% | 1434 71% | 656 ? -22% |
| Score Write (Points) | 128 | 58 -55% | 1955 1427% | 435 240% | 199 55% | 1185 826% | 368 188% | 149 ? 16% |
| Score Read (Points) | 497 | 492 -1% | 1407 183% | 714 44% | 240 -52% | 1795 261% | 746 50% | 360 ? -28% |
| Access Time Write * (ms) | 0.287 | 0.889 -210% | 0.037 87% | 0.053 82% | 0.066 77% | 0.03 90% | 0.032 89% | 0.27 ? 6% |
| Access Time Read * (ms) | 0.626 | 0.086 86% | 0.05 92% | 0.116 81% | 0.128 80% | 0.039 94% | 0.07 89% | 0.3803 ? 39% |
| 4K-64 Write (MB/s) | 78.9 | 19.19 -76% | 1664 2009% | 310.5 294% | 112.4 42% | 932 1081% | 158.6 101% | 75.1 ? -5% |
| 4K-64 Read (MB/s) | 335.3 | 301.8 -10% | 1177 251% | 437.4 30% | 164.1 -51% | 1506 349% | 463.2 38% | 222 ? -34% |
| 4K Write (MB/s) | 35.74 | 5.12 -86% | 99.2 178% | 94.8 165% | 62.2 74% | 124.7 249% | 127.9 258% | 60.8 ? 70% |
| 4K Read (MB/s) | 38.71 | 32.5 -16% | 48.56 25% | 32.87 -15% | 24.44 -37% | 51 32% | 46.98 21% | 30.3 ? -22% |
| Seq Write (MB/s) | 131.6 | 340.3 159% | 1917 1357% | 300.4 128% | 243.7 85% | 1281 873% | 814 519% | 122.4 ? -7% |
| Seq Read (MB/s) | 1231 | 1574 28% | 1820 48% | 2441 98% | 511 -58% | 2382 94% | 2362 92% | 1074 ? -13% |
* ... smaller is better

GPU Performance
The GPU in our Legion Y530—the NVIDIA GeForce GTX 1050 Ti 4 GB—has been evaluated dozens of times already at Notebookcheck. The Y530’s performance is roughly in line with the average scores we have in our database for this adapter, so there aren’t any major surprises to explore here. Scores of 7740 in 3DMark Fire Strike and 50387 in Cloud Gate are perfectly reasonable, however, and suggest a machine which can easily handle most games at medium (and some on high) settings. It’s worth noting that these scores are nearly identical to those we received from the GTX 1050 Ti-equipped Y520 from last year, which is what we’d expect to see here if temperatures are kept reliably in check.
Our Witcher 3 Ultra sustained performance analysis shows consistent frame rates (day/night cycles and other factors always provoke some anticipated dips) and temperatures.
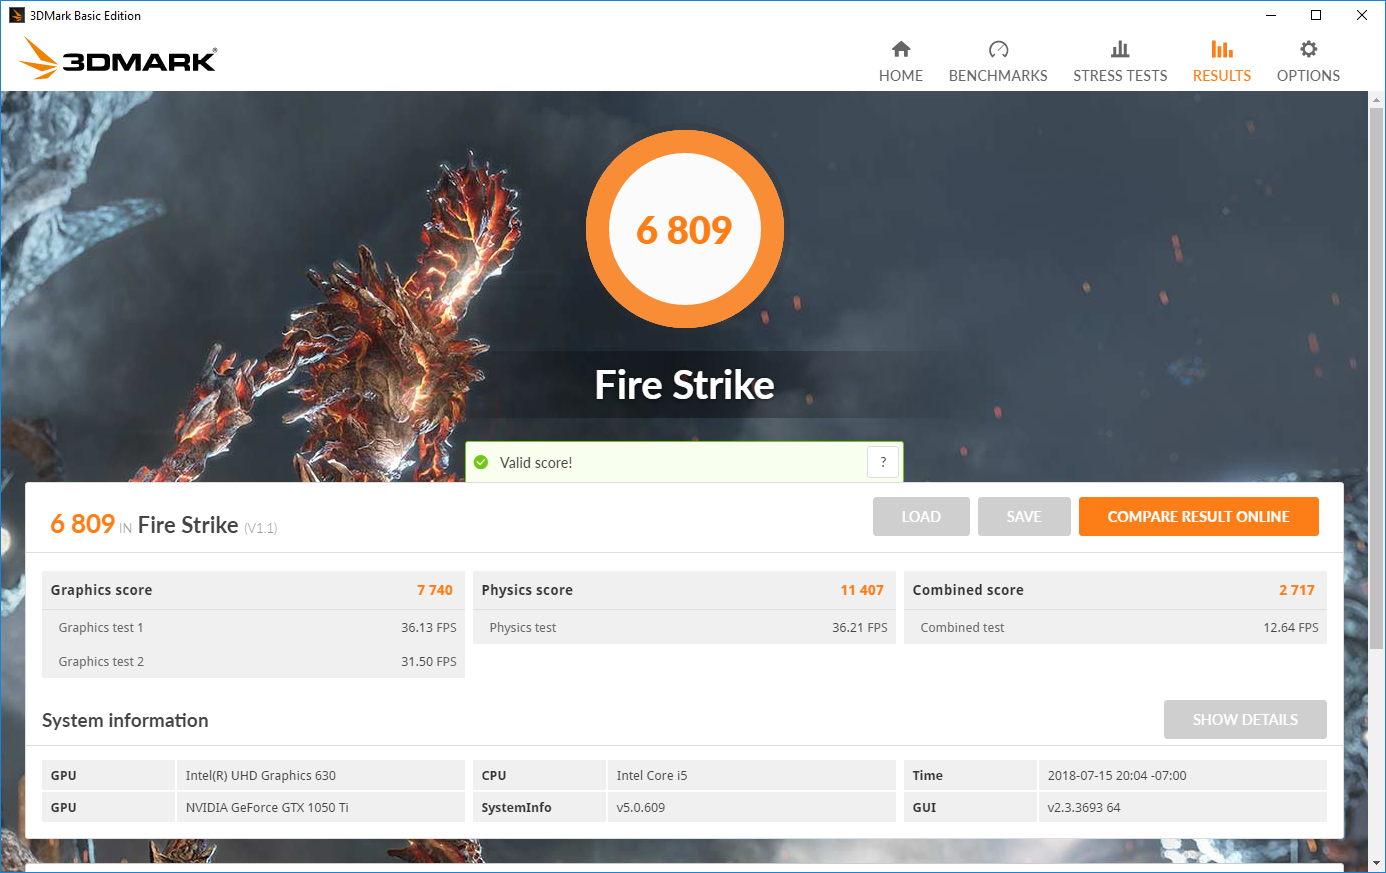
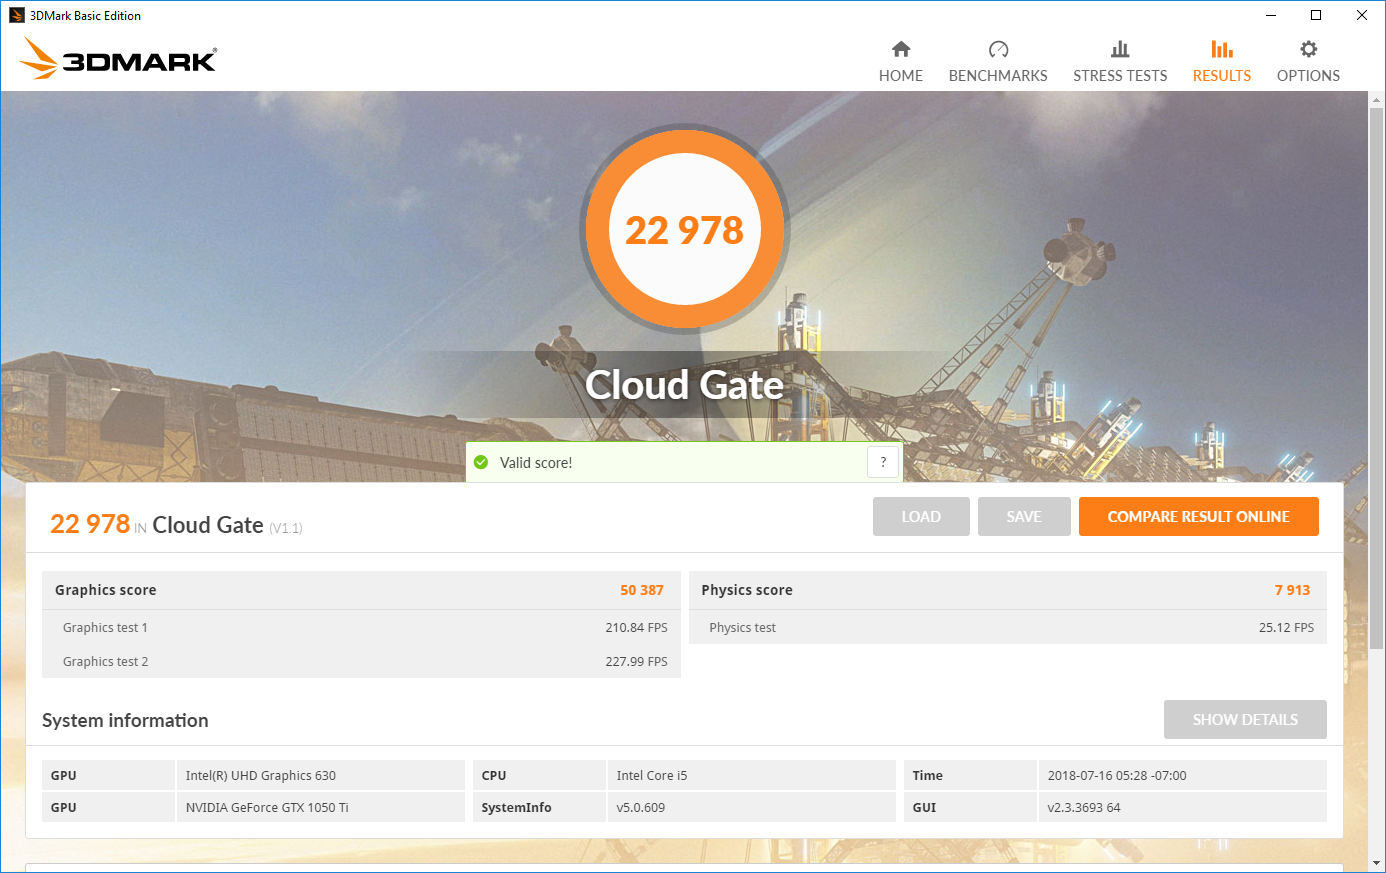
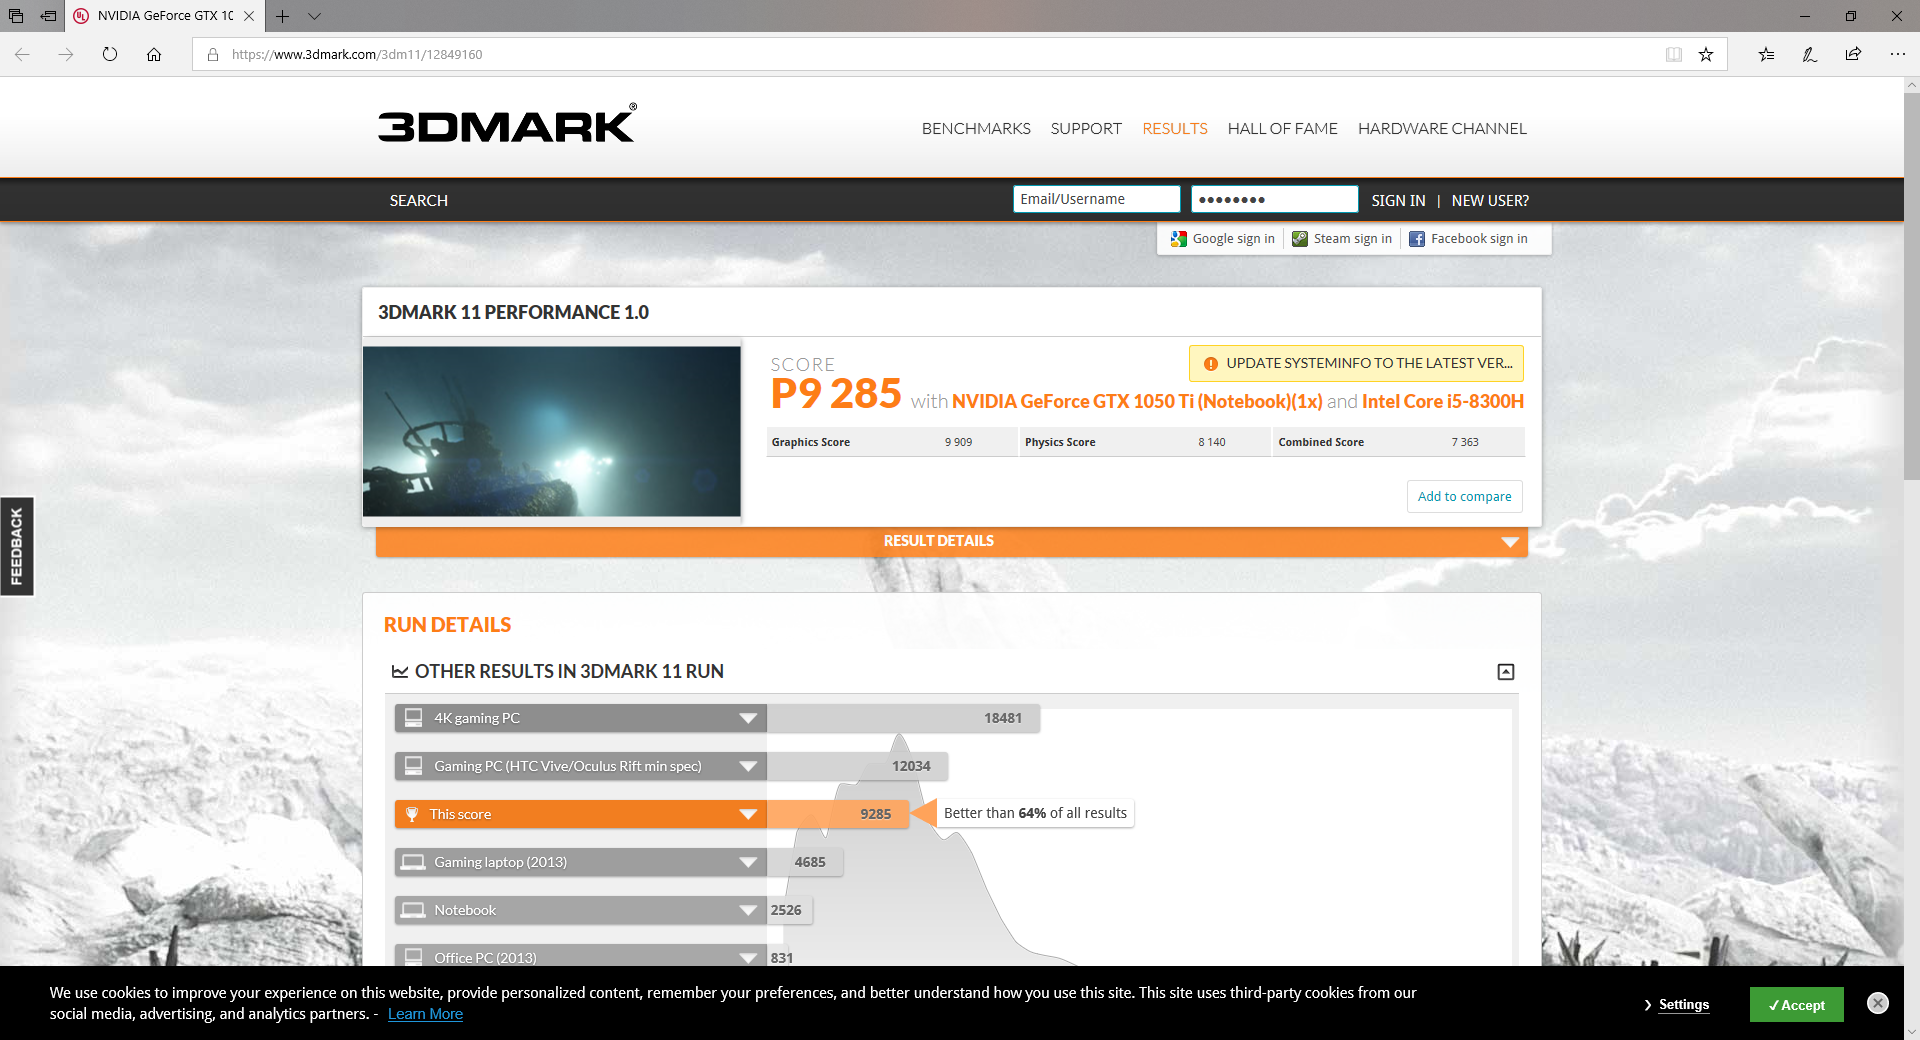
| 3DMark 11 Performance | 9285 points | |
| 3DMark Cloud Gate Standard Score | 22978 points | |
| 3DMark Fire Strike Score | 6809 points | |
Help | ||
Gaming Performance
Just as we’d expect, our game benchmarks reveal that the Y530 can handle most games at least at medium settings with smooth frame rates—though bumping it up to the native resolution in games like Rise of the Tomb Raider and Metro: Last Light does see dips to rates quite a bit lower. Again, this is more of an entry-level gaming machine, so there are no surprises here.
| Metro: Last Light | |
| 1024x768 Low (DX10) AF:4x (sort by value) | |
| Lenovo Legion Y530-15ICH | |
| Average NVIDIA GeForce GTX 1050 Ti Mobile (113 - 115, n=2) | |
| 1366x768 Medium (DX10) AF:4x (sort by value) | |
| Lenovo Legion Y530-15ICH | |
| Average NVIDIA GeForce GTX 1050 Ti Mobile (106 - 108, n=2) | |
| 1366x768 High (DX11) AF:16x (sort by value) | |
| Lenovo Legion Y530-15ICH | |
| Average NVIDIA GeForce GTX 1050 Ti Mobile (87 - 98, n=2) | |
| 1920x1080 Very High (DX11) AF:16x (sort by value) | |
| Lenovo Legion Y530-15ICH | |
| Average NVIDIA GeForce GTX 1050 Ti Mobile (47 - 59, n=3) | |
| The Witcher 3 - 1920x1080 Ultra Graphics & Postprocessing (HBAO+) (sort by value) | |
| Lenovo Legion Y530-15ICH | |
| Dell XPS 15 2018 i5 FHD 97Wh | |
| Razer Blade 15 GTX 1060 | |
| Lenovo Legion Y520-15IKBA-80WY001VGE | |
| Alienware 15 R4 | |
| Dell G5 15 5587 | |
| MSI GS63VR 7RG-005 | |
| Average NVIDIA GeForce GTX 1050 Ti Mobile (14 - 38, n=31) | |
| Average of class Gaming (104.7 - 240, n=6, last 2 years) | |
| low | med. | high | ultra | |
|---|---|---|---|---|
| BioShock Infinite (2013) | 238 | 201 | 155 | 61 |
| Metro: Last Light (2013) | 115 | 108 | 98 | 47 |
| The Witcher 3 (2015) | 37 | |||
| Rise of the Tomb Raider (2016) | 88 | 60 | 33 | 29 |
Stress Test
Full CPU stress sees the CPU at first managing a full 3.9 – 4.0 GHz before eventually settling down to 3.7 GHz, with temperatures stable at 94 – 95 °C. GPU stress using FurMark provokes clock rates of around 1450 – 1500 MHz with temperatures ebbing and flowing in the 60 – 67 °C range.
Combined CPU and GPU stress results in the machine predictably favoring GPU performance, which manages to remain stable at around 1733 MHz (with occasional drops) alongside GPU core temperatures of 67 – 68 °C. CPU, on the other hand, toggles wildly between 2.3 GHz and 3.8 GHz with temperatures in the 90 – 96 °C range.
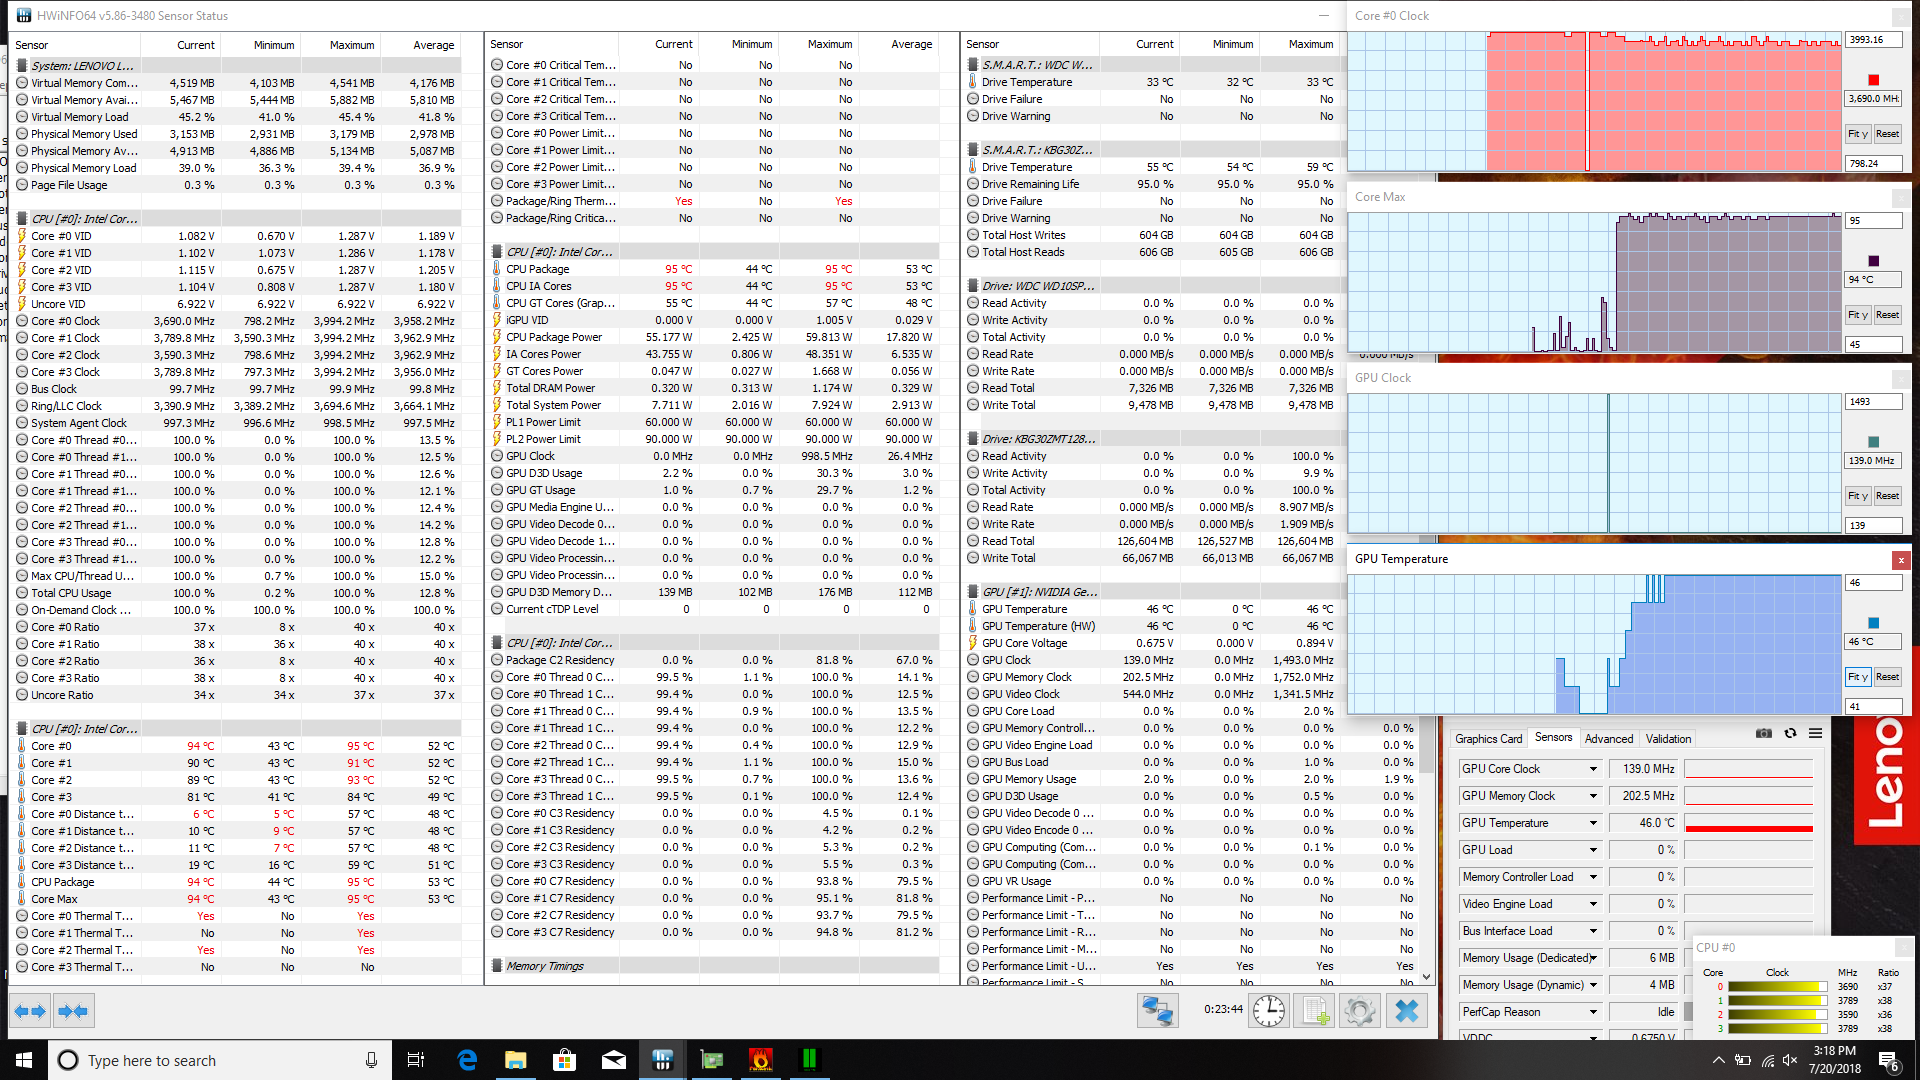
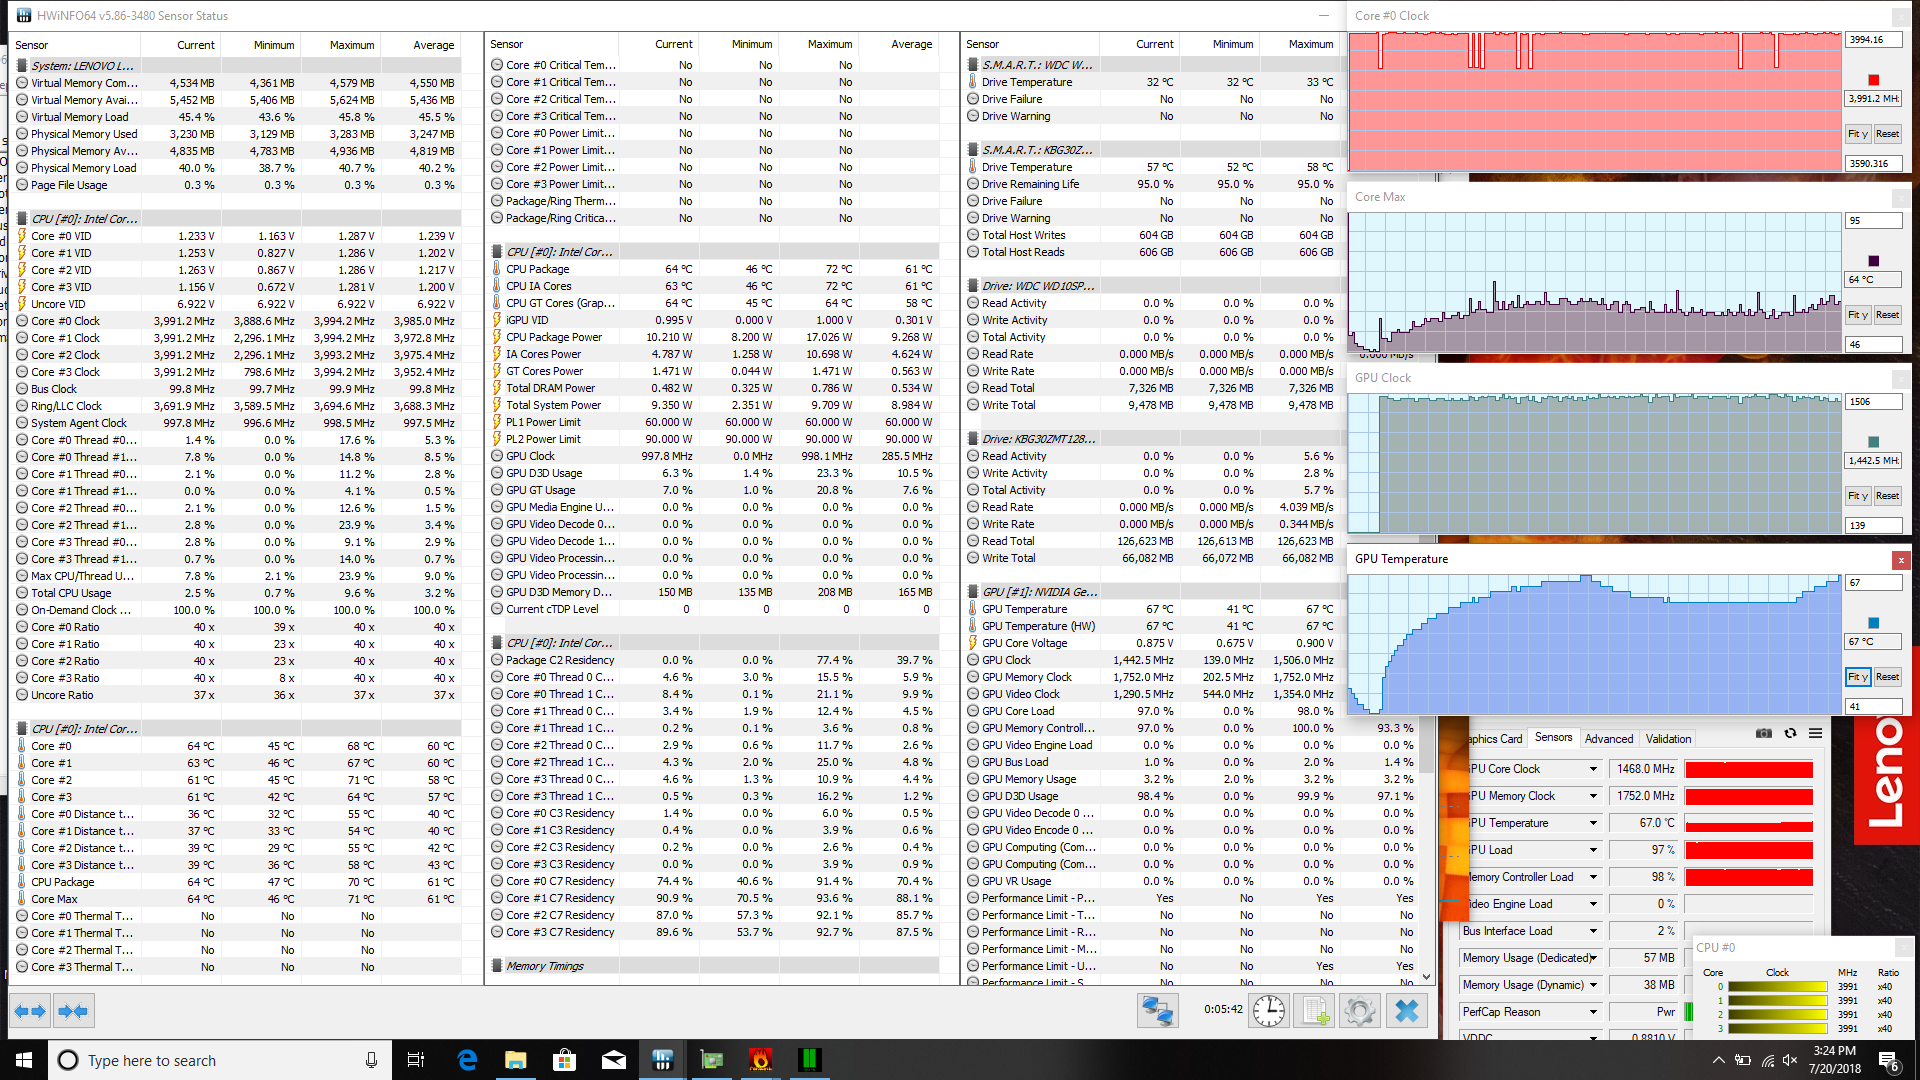
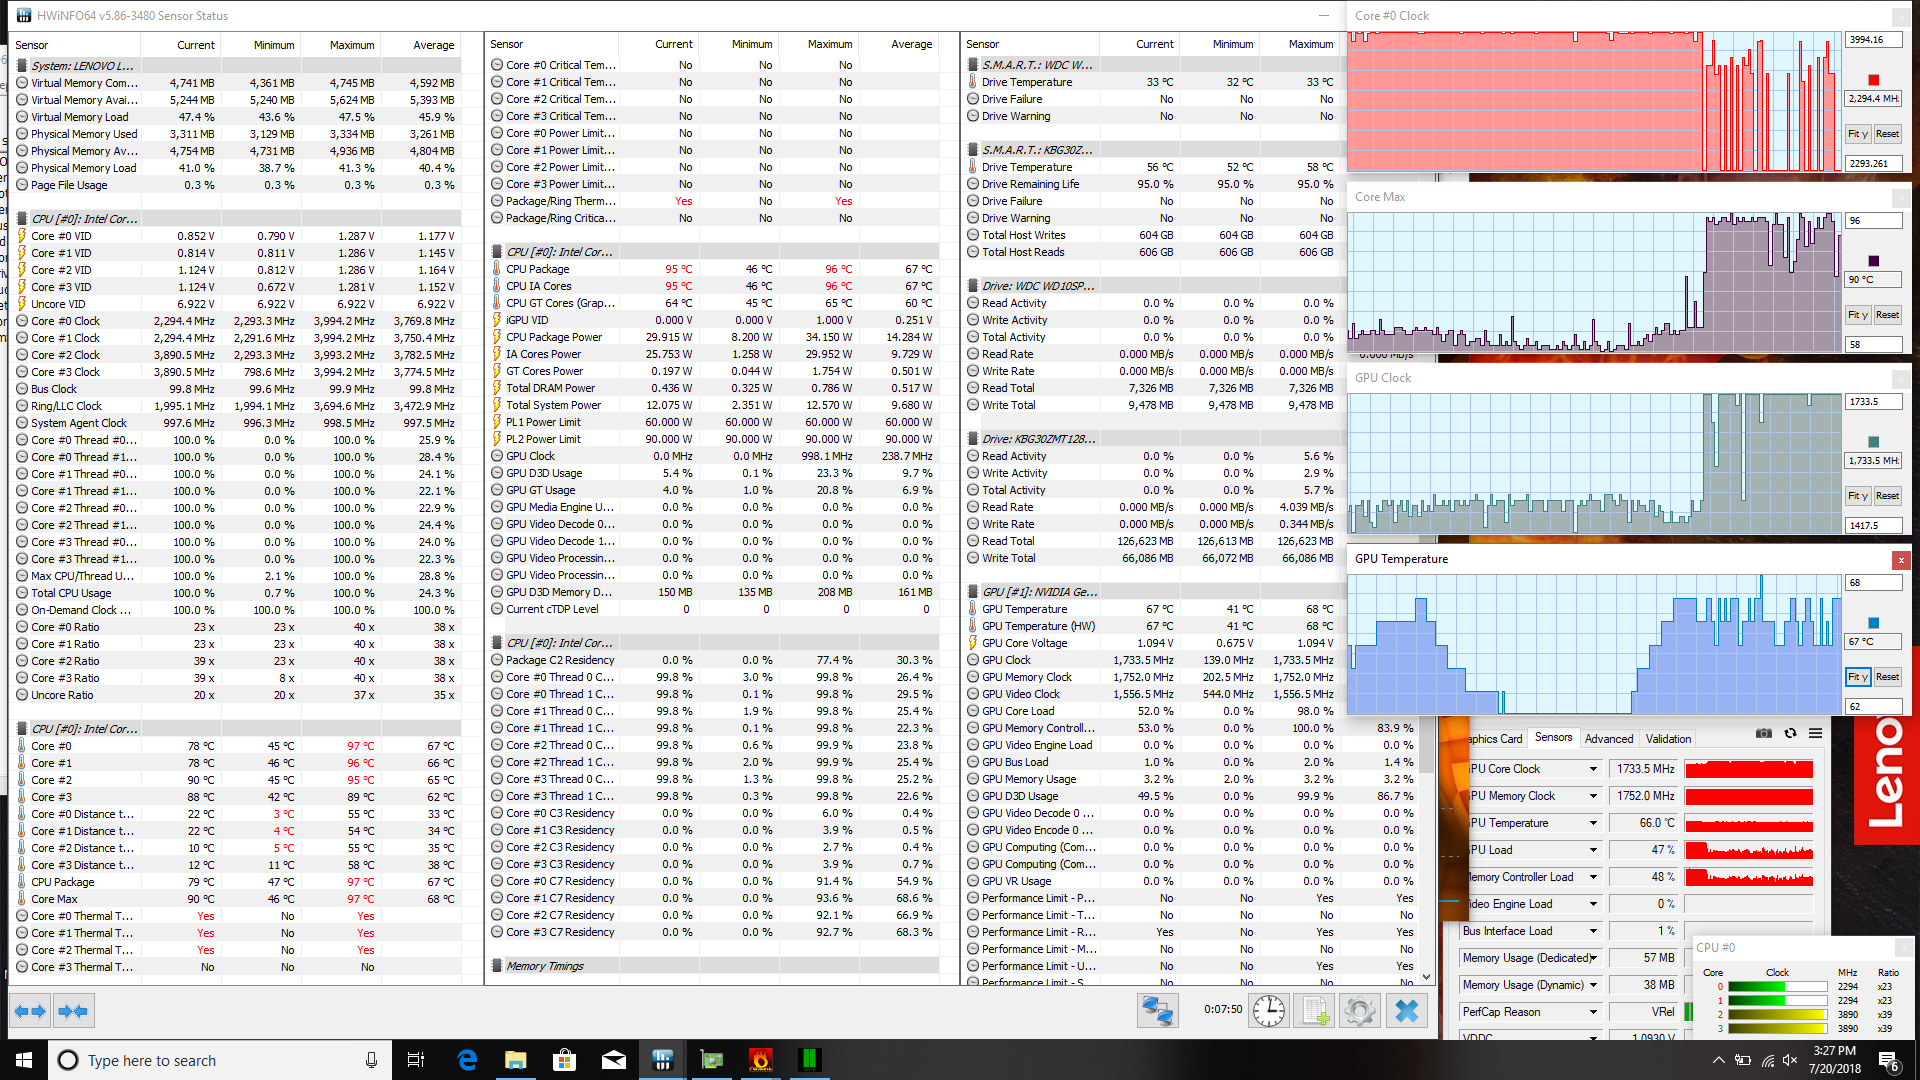
| CPU Clock (GHz) | GPU Clock (MHz) | Average CPU Temperature (°C) | Average GPU Temperature (°C) | |
| Prime95 Stress | 3.7 | - | 94 | - |
| FurMark Stress | - | 1440 | - | 67 |
| Prime95 + FurMark Stress | 3.0 | 1700 | 90 | 67 |
| Witcher 3 Stress | 3.8 | 1600 | 75 | 63 |
Emissions
System Noise
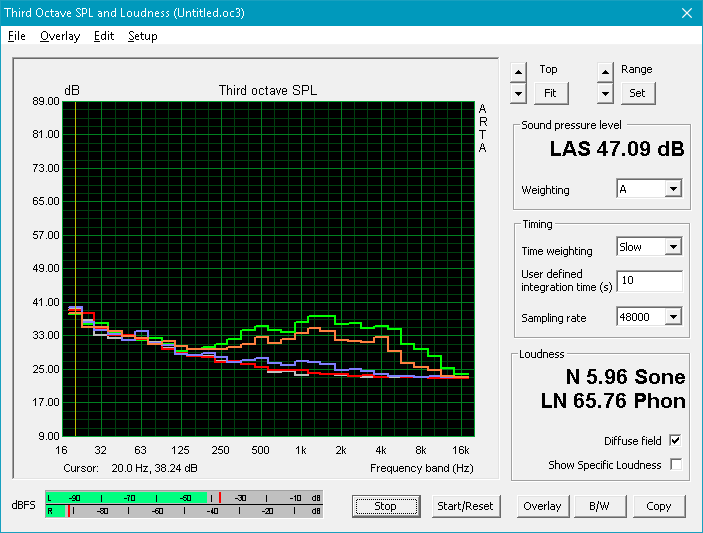
While idling, the Y530 is basically silent—with only a very slight increase in noise—0.5 dB(A)—recorded on the high end. Under load, averages are still quite low—just 34.9 dB(A), which is a mere 6.9 dB(A) above ambient noise levels—though we did record a max value of 49.6 dB(A) while both fans were running at the highest RPM levels.
Noise level
| Idle |
| 28 / 28 / 28.5 dB(A) |
| Load |
| 34.9 / 49.6 dB(A) |
 | ||
30 dB silent 40 dB(A) audible 50 dB(A) loud |
||
min: | ||
| Lenovo Legion Y530-15ICH GeForce GTX 1050 Ti Mobile, i5-8300H, Toshiba KBG30ZMT128G | Dell XPS 15 2018 i5 FHD 97Wh GeForce GTX 1050 Mobile, i5-8300H, Lite-On CA3-8D256-Q11 | Razer Blade 15 GTX 1060 GeForce GTX 1060 Max-Q, i7-8750H, Samsung SSD PM981 MZVLB512HAJQ | Lenovo Legion Y520-15IKBA-80WY001VGE Radeon RX 560 (Laptop), i5-7300HQ, Seagate Mobile HDD 1TB ST1000LM035 | Alienware 15 R4 GeForce GTX 1070 Mobile, i9-8950HK, Toshiba XG5 KXG50ZNV256G | Dell G5 15 5587 GeForce GTX 1060 Max-Q, i5-8300H, SK hynix SC311 M.2 | MSI GS63VR 7RG-005 GeForce GTX 1070 Max-Q, i7-7700HQ, Samsung SM961 MZVPW256HEGL | |
|---|---|---|---|---|---|---|---|
| Noise | -4% | -9% | -3% | -26% | -7% | -12% | |
| off / environment * (dB) | 28 | 30.3 -8% | 28.1 -0% | 30.3 -8% | 29 -4% | 30.3 -8% | 30 -7% |
| Idle Minimum * (dB) | 28 | 30.3 -8% | 28.1 -0% | 31.3 -12% | 32 -14% | 31.1 -11% | 31 -11% |
| Idle Average * (dB) | 28 | 30.3 -8% | 33 -18% | 31.3 -12% | 33 -18% | 31.1 -11% | 34 -21% |
| Idle Maximum * (dB) | 28.5 | 30.3 -6% | 33.5 -18% | 31.3 -10% | 50 -75% | 34.2 -20% | 35 -23% |
| Load Average * (dB) | 34.9 | 37.1 -6% | 42.2 -21% | 32.8 6% | 50 -43% | 34.9 -0% | 42 -20% |
| Witcher 3 ultra * (dB) | 40 | 43.3 -8% | 45.3 -13% | 41.2 -3% | 51 -27% | 42.7 -7% | 44 -10% |
| Load Maximum * (dB) | 49.6 | 43 13% | 45.7 8% | 39 21% | 51 -3% | 44 11% | 46 7% |
* ... smaller is better
Temperature
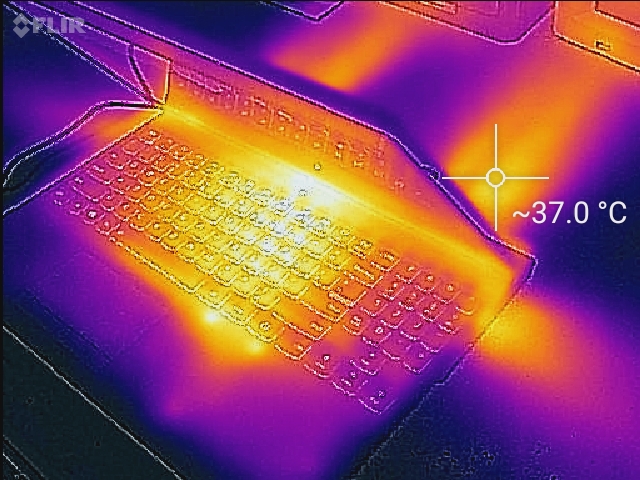
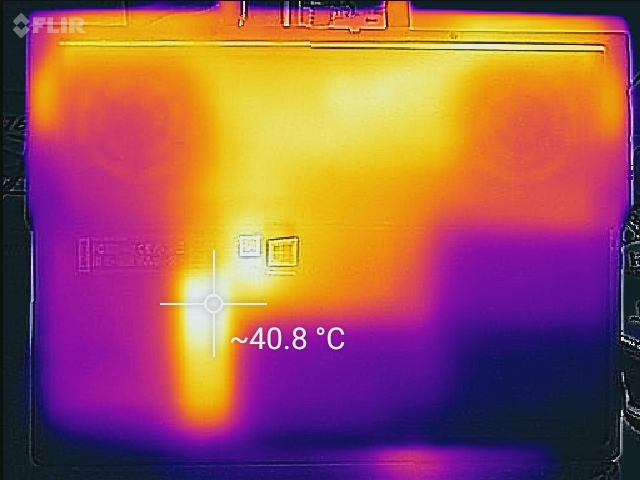
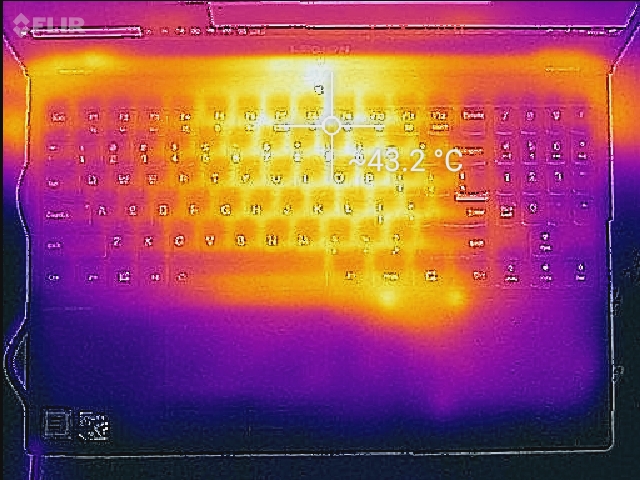
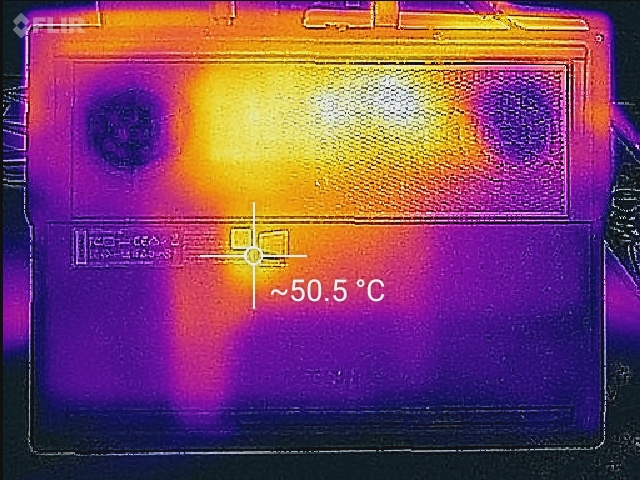
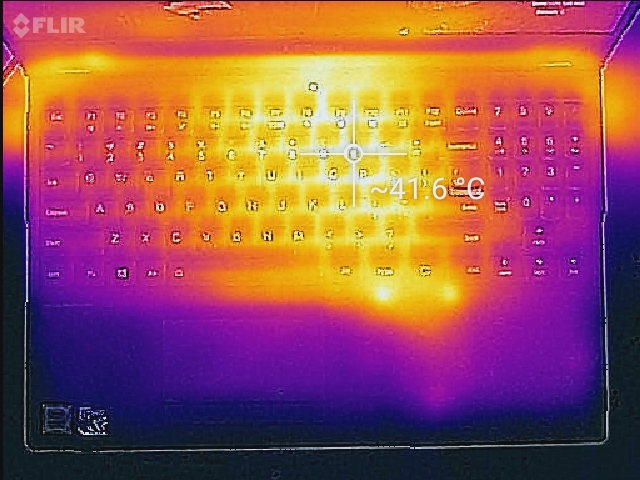
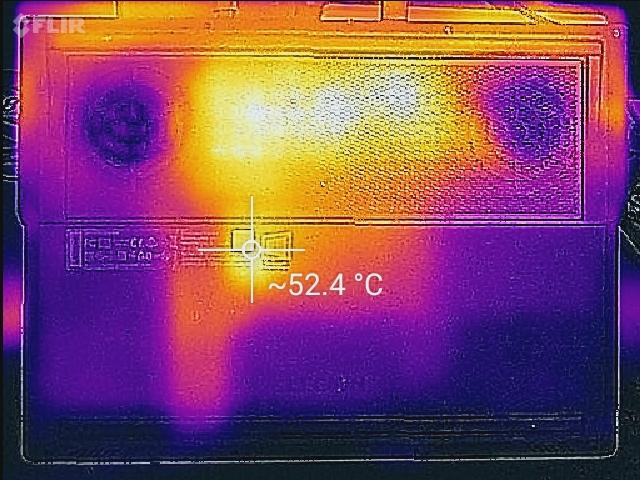
The device also does a good job overall of managing temperatures, though idle values are a bit on the high side at 27.4 °C / 33.2 °C (against an environmental temperature of 20 °C). Under load, it remains cooler than most competitors (thanks in part to its lower-performance GPU, of course). We recorded averages of 31.9 °C / 35.9 °C on top/bottom (environment: 22 °C), with hot spots of 42.8 °C / 52 °C in the rear center of the unit. The upper left quadrant of the underside also heats up rather noticeably to 46 °C, but as usual, gaming with the unit resting on the lap is not recommended.
Cooling is helped by the fact that the dual fans are now larger than before and also more distant, allowing for more effective independent heat displacement for CPU and GPU. The large intake grate spanning nearly half of the bottom of the machine coupled with the spacious corner-mounted exhaust vents also provides for uninhibited airflow.
(±) The maximum temperature on the upper side is 42.8 °C / 109 F, compared to the average of 40.4 °C / 105 F, ranging from 21.2 to 68.8 °C for the class Gaming.
(-) The bottom heats up to a maximum of 52 °C / 126 F, compared to the average of 43.2 °C / 110 F
(+) In idle usage, the average temperature for the upper side is 27.4 °C / 81 F, compared to the device average of 33.9 °C / 93 F.
(+) Playing The Witcher 3, the average temperature for the upper side is 30.9 °C / 88 F, compared to the device average of 33.9 °C / 93 F.
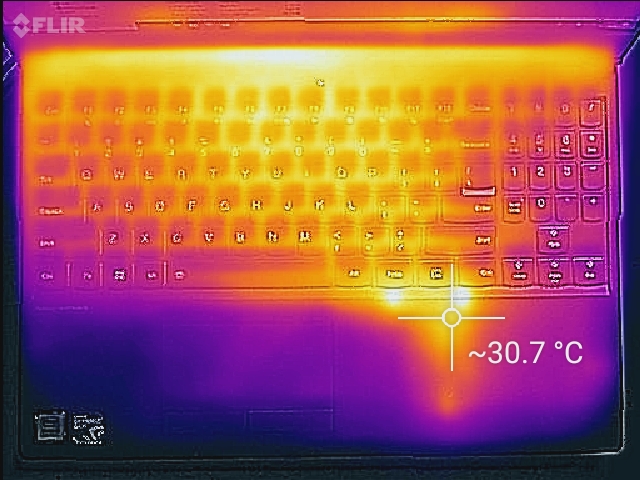
(+) The palmrests and touchpad are cooler than skin temperature with a maximum of 31 °C / 87.8 F and are therefore cool to the touch.
(-) The average temperature of the palmrest area of similar devices was 28.8 °C / 83.8 F (-2.2 °C / -4 F).
Speakers
The Y530’s two front bottom-mounted speakers are reasonably loud with average linearity and balanced highs and mids, but they’re hamstrung by a conspicuous lack of bass (not surprising given the absence of a subwoofer). We noticed a bit of distortion and minor case reverberation at max volume levels, but it was relatively minor. Overall, the results aren’t bad, and for most purposes it will suffice. Headphones are (naturally) always a superior option.


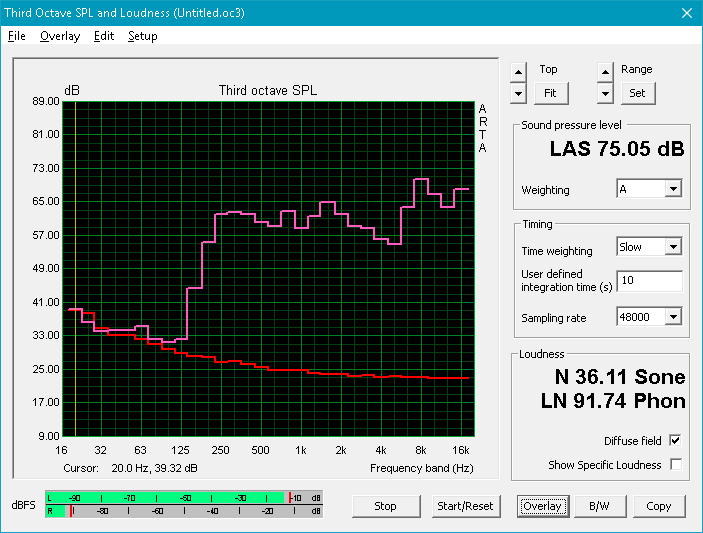
Lenovo Legion Y530-15ICH audio analysis
(±) | speaker loudness is average but good (75.1 dB)
Bass 100 - 315 Hz
(±) | reduced bass - on average 14% lower than median
(±) | linearity of bass is average (14.1% delta to prev. frequency)
Mids 400 - 2000 Hz
(+) | balanced mids - only 1.5% away from median
(+) | mids are linear (6.7% delta to prev. frequency)
Highs 2 - 16 kHz
(+) | balanced highs - only 4.8% away from median
(±) | linearity of highs is average (10% delta to prev. frequency)
Overall 100 - 16.000 Hz
(±) | linearity of overall sound is average (18.9% difference to median)
Compared to same class
» 63% of all tested devices in this class were better, 8% similar, 29% worse
» The best had a delta of 6%, average was 18%, worst was 132%
Compared to all devices tested
» 44% of all tested devices were better, 8% similar, 48% worse
» The best had a delta of 4%, average was 23%, worst was 134%
Dell XPS 15 2018 i5 FHD 97Wh audio analysis
(±) | speaker loudness is average but good (73 dB)
Bass 100 - 315 Hz
(±) | reduced bass - on average 10.9% lower than median
(+) | bass is linear (4.9% delta to prev. frequency)
Mids 400 - 2000 Hz
(±) | higher mids - on average 6.8% higher than median
(+) | mids are linear (6.8% delta to prev. frequency)
Highs 2 - 16 kHz
(+) | balanced highs - only 3.7% away from median
(+) | highs are linear (6.9% delta to prev. frequency)
Overall 100 - 16.000 Hz
(±) | linearity of overall sound is average (16.6% difference to median)
Compared to same class
» 44% of all tested devices in this class were better, 7% similar, 50% worse
» The best had a delta of 5%, average was 17%, worst was 45%
Compared to all devices tested
» 29% of all tested devices were better, 6% similar, 65% worse
» The best had a delta of 4%, average was 23%, worst was 134%
Energy Management
Power Consumption
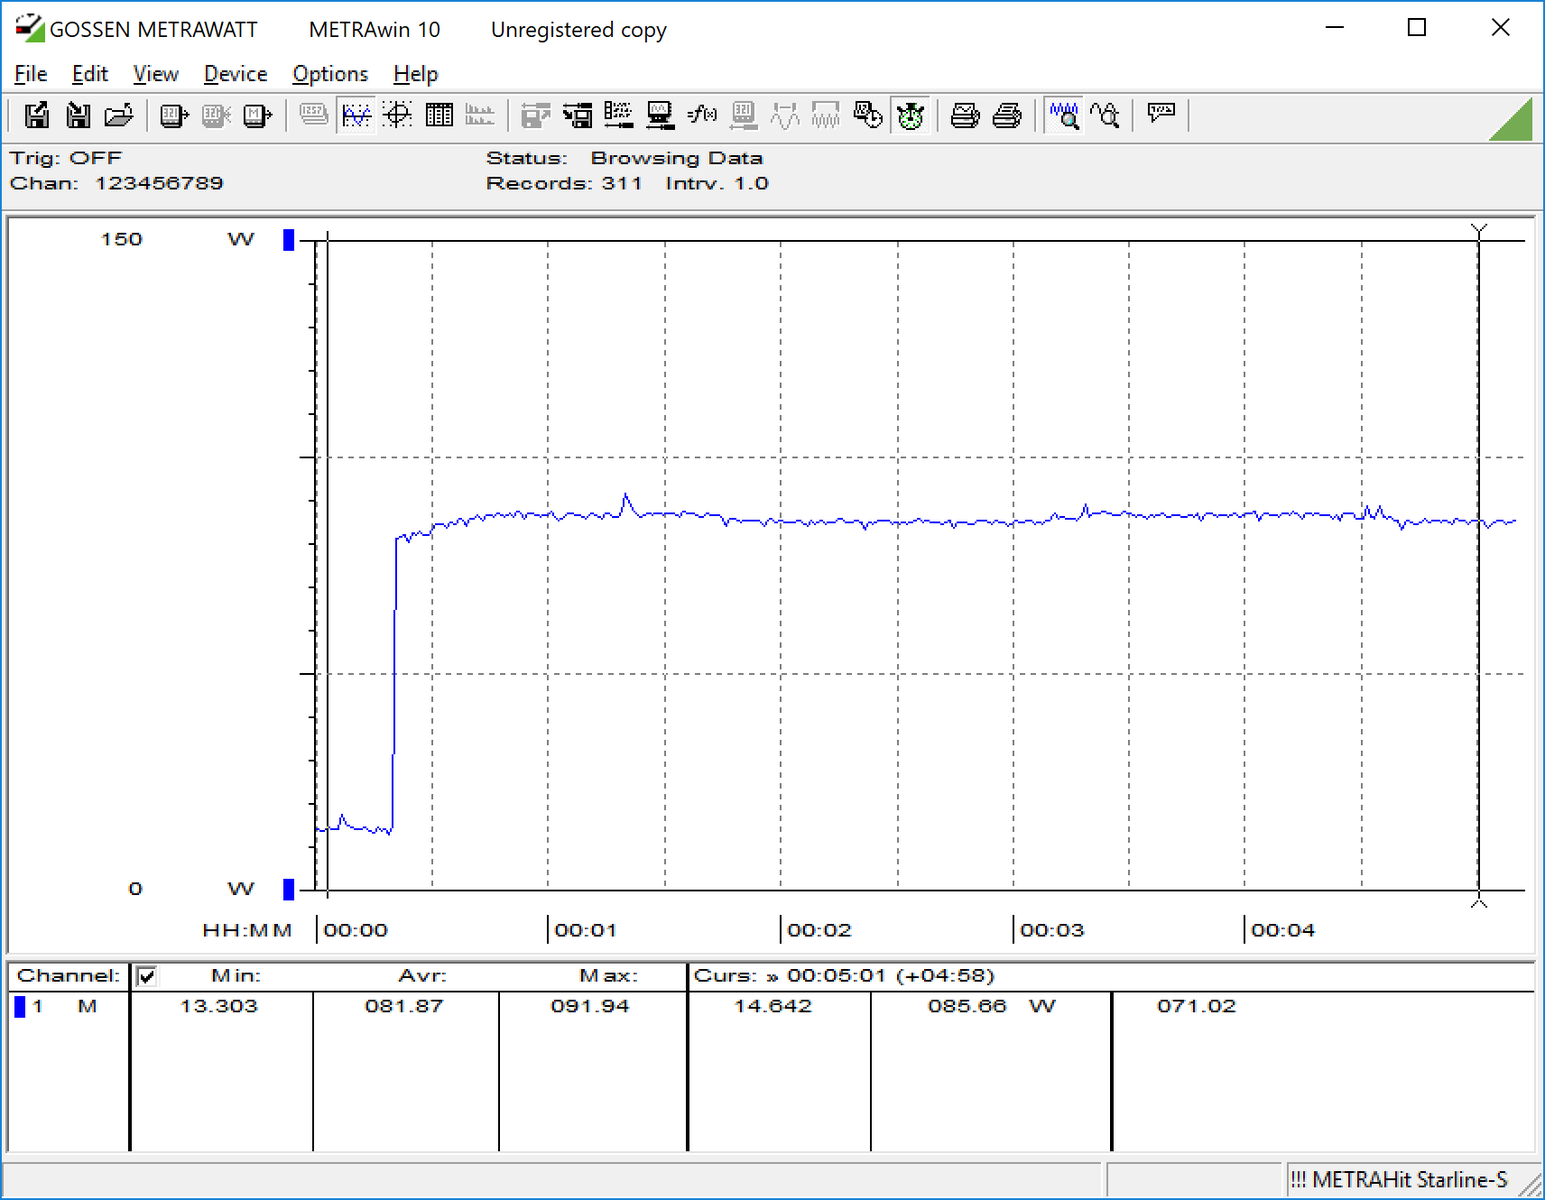
Absolutely nothing surprising arises from our power consumption measurements; the Y530 sits just in between units equipped with a GTX 1050 and GTX 1060, and requires somewhat more power than the RX 560-equipped Legion Y520 configuration. The included AC adapter provides 135 W.
| Off / Standby | |
| Idle | |
| Load |
|
Key:
min: | |
| Lenovo Legion Y530-15ICH i5-8300H, GeForce GTX 1050 Ti Mobile, Toshiba KBG30ZMT128G, IPS, 1920x1080, 15.6" | Dell XPS 15 2018 i5 FHD 97Wh i5-8300H, GeForce GTX 1050 Mobile, Lite-On CA3-8D256-Q11, LED IGZO IPS InfinityEdge, 1920x1080, 15.6" | Razer Blade 15 GTX 1060 i7-8750H, GeForce GTX 1060 Max-Q, Samsung SSD PM981 MZVLB512HAJQ, IPS, 1920x1080, 15.6" | Lenovo Legion Y520-15IKBA-80WY001VGE i5-7300HQ, Radeon RX 560 (Laptop), Seagate Mobile HDD 1TB ST1000LM035, IPS, 1920x1080, 15.6" | Alienware 15 R4 i9-8950HK, GeForce GTX 1070 Mobile, Toshiba XG5 KXG50ZNV256G, IPS, 1920x1080, 15.6" | Dell G5 15 5587 i5-8300H, GeForce GTX 1060 Max-Q, SK hynix SC311 M.2, IPS, 1920x1080, 15.6" | MSI GS63VR 7RG-005 i7-7700HQ, GeForce GTX 1070 Max-Q, Samsung SM961 MZVPW256HEGL, TN LED, 1920x1080, 15.6" | |
|---|---|---|---|---|---|---|---|
| Power Consumption | 29% | -63% | 17% | -143% | 4% | -53% | |
| Idle Minimum * (Watt) | 4.5 | 2.9 36% | 14.9 -231% | 4.7 -4% | 23 -411% | 4.9 -9% | 12 -167% |
| Idle Average * (Watt) | 10 | 5.8 42% | 17.5 -75% | 7.8 22% | 26 -160% | 8.5 15% | 16 -60% |
| Idle Maximum * (Watt) | 13.8 | 7.5 46% | 19.2 -39% | 8.4 39% | 30 -117% | 9.1 34% | 21 -52% |
| Load Average * (Watt) | 92.5 | 77.5 16% | 103.2 -12% | 76.5 17% | 111 -20% | 90.7 2% | 85 8% |
| Witcher 3 ultra * (Watt) | 108.1 | 84 22% | 123.1 -14% | 93 14% | 182 -68% | 110 -2% | 128 -18% |
| Load Maximum * (Watt) | 123.2 | 107 13% | 132.7 -8% | 106 14% | 222 -80% | 144 -17% | 162 -31% |
* ... smaller is better
Battery Life
The 52.5 Wh internal battery in the Y530 provided just 4 hours and 5 minutes of life in our standardized web surfing battery test. This is among the lowest of any of the candidates in today’s comparison field, with only the MSI GS63V (also with a 52 Wh battery) doing worse. The older Y520 equipped with the weaker AMD Radeon RX 560 GPU does manage to last quite a bit longer, but obviously at the sacrifice of graphical capability.
Battery life is of minimal importance on a gaming PC at any rate; 4 hours should be plenty to move around the house from room to room or to commute to and from destinations where the actual gaming presumably will take place.
| Lenovo Legion Y530-15ICH i5-8300H, GeForce GTX 1050 Ti Mobile, 52.5 Wh | Dell XPS 15 2018 i5 FHD 97Wh i5-8300H, GeForce GTX 1050 Mobile, 97 Wh | Razer Blade 15 GTX 1060 i7-8750H, GeForce GTX 1060 Max-Q, 80 Wh | Lenovo Legion Y520-15IKBA-80WY001VGE i5-7300HQ, Radeon RX 560 (Laptop), 45 Wh | Alienware 15 R4 i9-8950HK, GeForce GTX 1070 Mobile, 99 Wh | Dell G5 15 5587 i5-8300H, GeForce GTX 1060 Max-Q, 56 Wh | MSI GS63VR 7RG-005 i7-7700HQ, GeForce GTX 1070 Max-Q, 52.4 Wh | |
|---|---|---|---|---|---|---|---|
| Battery runtime | 283% | 63% | 37% | 24% | 59% | -5% | |
| WiFi v1.3 (h) | 4.1 | 15.7 283% | 6.7 63% | 5.6 37% | 5.1 24% | 6.5 59% | 3.9 -5% |
| Witcher 3 ultra (h) | 1 |
Pros
Cons
Verdict
The Lenovo Legion Y530 is a terrific starting point for consumers in search of a basic gaming laptop that addresses most of the fundamentals without splurging on pomp and luxury. It doubles down on the philosophy of last year’s Y520 by removing the last remnants of any sort of flashy colorful accents and replacing them with a much more professional (or, at least, subdued) white-on-black palette. Although it’s equipped with a relatively low-end GPU (the GeForce GTX 1050 Ti) and “merely” a Core i5-8300H quad-core CPU, performance is uncommonly steady and temperatures (along with, pleasingly, noise levels) never really get out of hand. It can thus easily handle most games at medium settings, and some on high at native resolution.
The Lenovo Legion Y530 is a terrific starting point for consumers in search of a basic gaming laptop that addresses most of the fundamentals without splurging on pomp and luxury.
Speaking of which, the display is the first item on our list of complaints. It offers no real benefits over the previous Y520 panel, with slightly better brightness but lower contrast and the same pitiful washed-out color reproduction. Apart from this, the Toshiba M.2 2242 NVMe SSD offers write speeds which pale in comparison to even many SATA drives, and although this configuration includes dual storage (with a 1 TB 7200 RPM HDD also installed), aftermarket maintenance and upgrades are rendered unnecessarily challenging via a somewhat finicky bottom panel that feels as though it might break if the user is not extremely careful while disengaging the numerous perimeter clips. The plastic construction overall does seem appropriately stable, but it’s unquestionably lower-grade than the sort of thing you’ll find in category leaders, not to mention the ultra-premium Dell XPS 15 and Razer Blade 15.
Those with deeper pockets might also consider those two alternatives as well, though they both come with their own unique limitations: the XPS is quite expensive, and the Razer Blade struggles to maintain turbo frequencies and runs rather hot (among other things). But compromise is the name of the game when it comes to purchasing just about any laptop, especially portable gaming machines. And it just so happens that, provided users can overlook the disappointing display, the Y530’s assortment of strengths emphasizes those traits which are most appealing to anyone either interested in a first-time gaming laptop purchase, or perhaps just a reasonably-capable gaming machine that doesn’t look like a gaming machine.
Lenovo Legion Y530-15ICH
- 11/30/2018 v6 (old)
Steve Schardein
Price comparison
