Dell XPS 15 2018 9570 (8300H, GTX 1050, 97Wh) Laptop Review

Dell's XPS 15 has started into a new year. The 2018 model runs under the name 9570 and offers a quad-core Coffee Lake H CPU, i5-8300H, and Intel's UHD Graphics 630 as well as Nvidia's GeForce GTX 1050.
We have started with the smallest configuration: 8 GB of RAM and a 256-GB NVMe SSD. We will also be taking a closer look at the stronger configurations in the near future. These include the Coffee Lake processors Core i7-8750H and Core i9-8950HK (both six-core) and a GeForce GTX 1050 Ti with increased performance (4 GB GDDR5).
The case has remained unchanged: CNC-milled aluminum with a carbon finish on the wrist rest and some of the slimmest bezels around. The storage offer remains as in 2017: A range of 256 - 1-TB NVMe SSDs is available.
Here are all our XPS 15 reviews from the past years:
Case - a stable & compact XPS
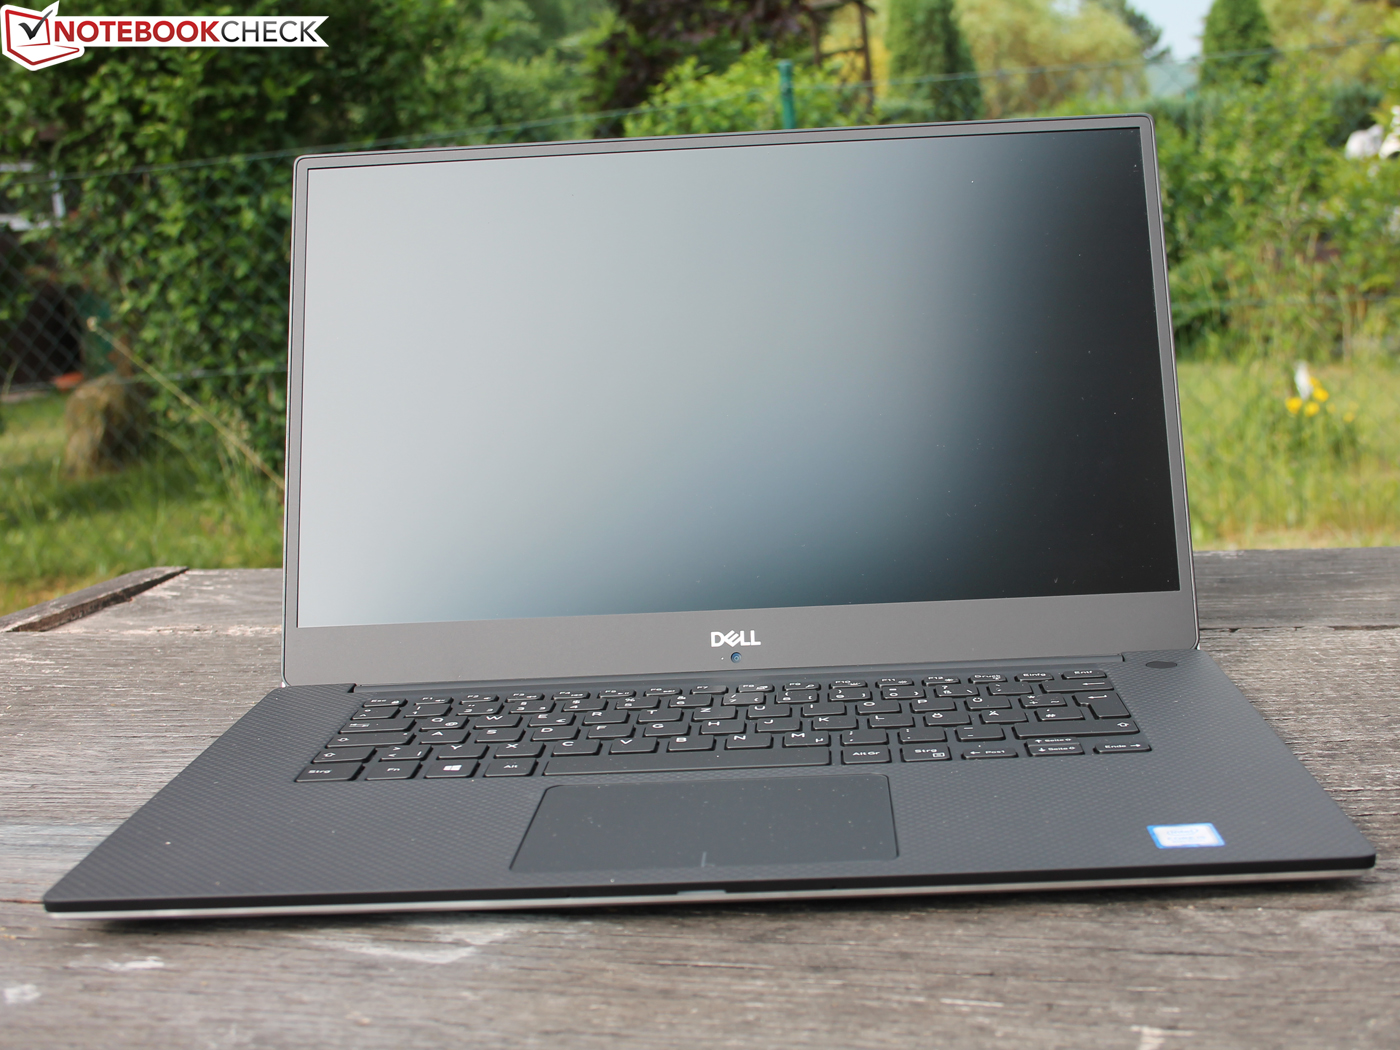
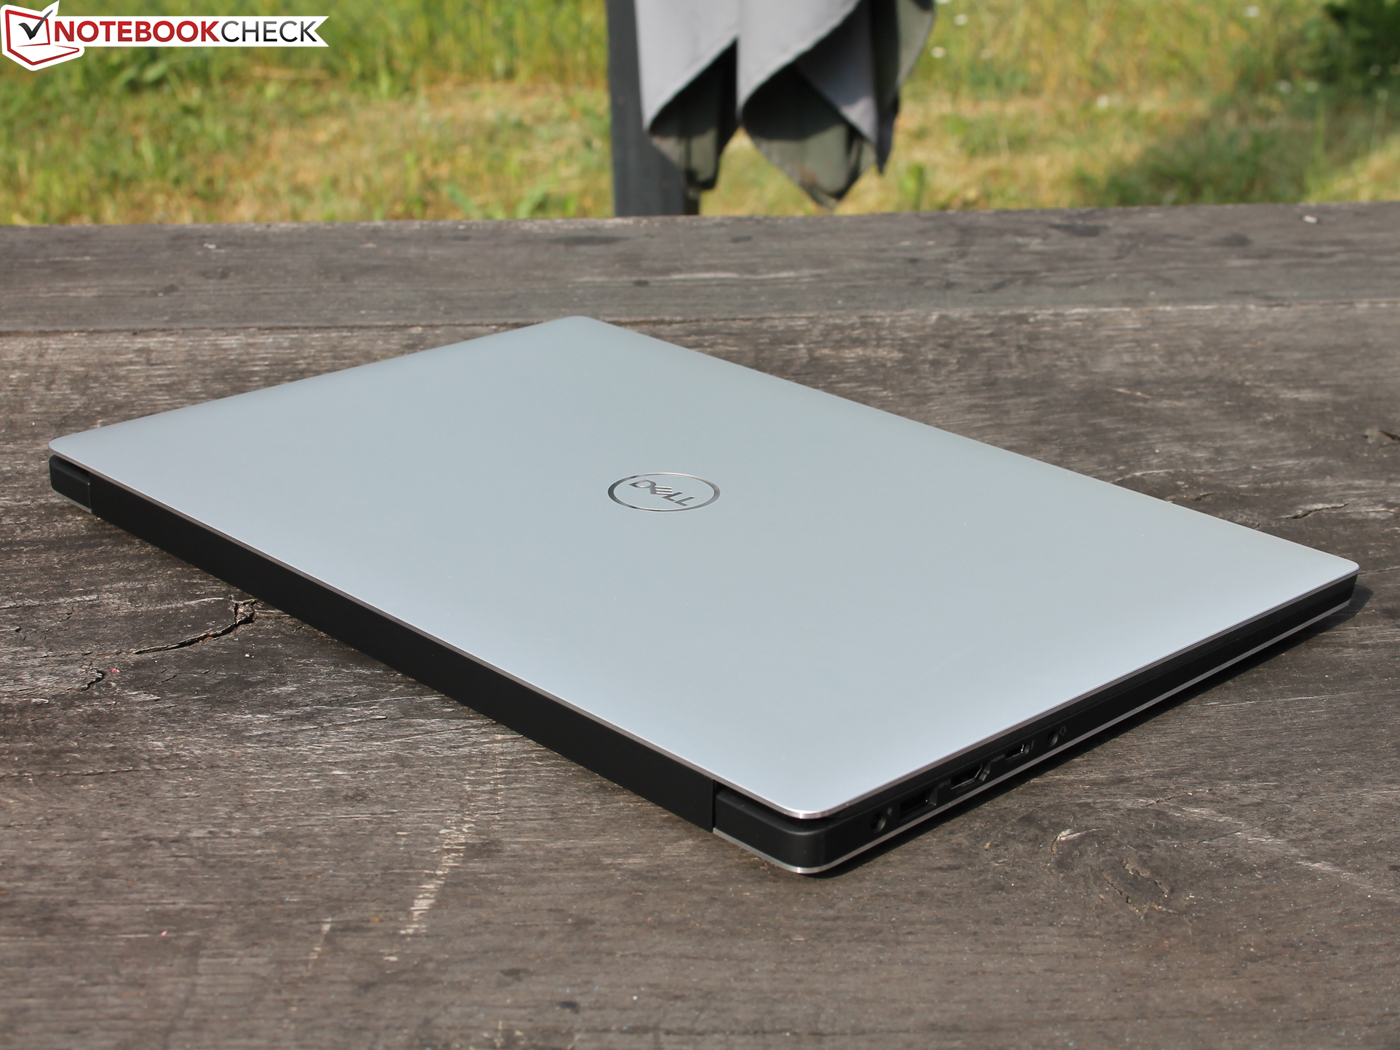
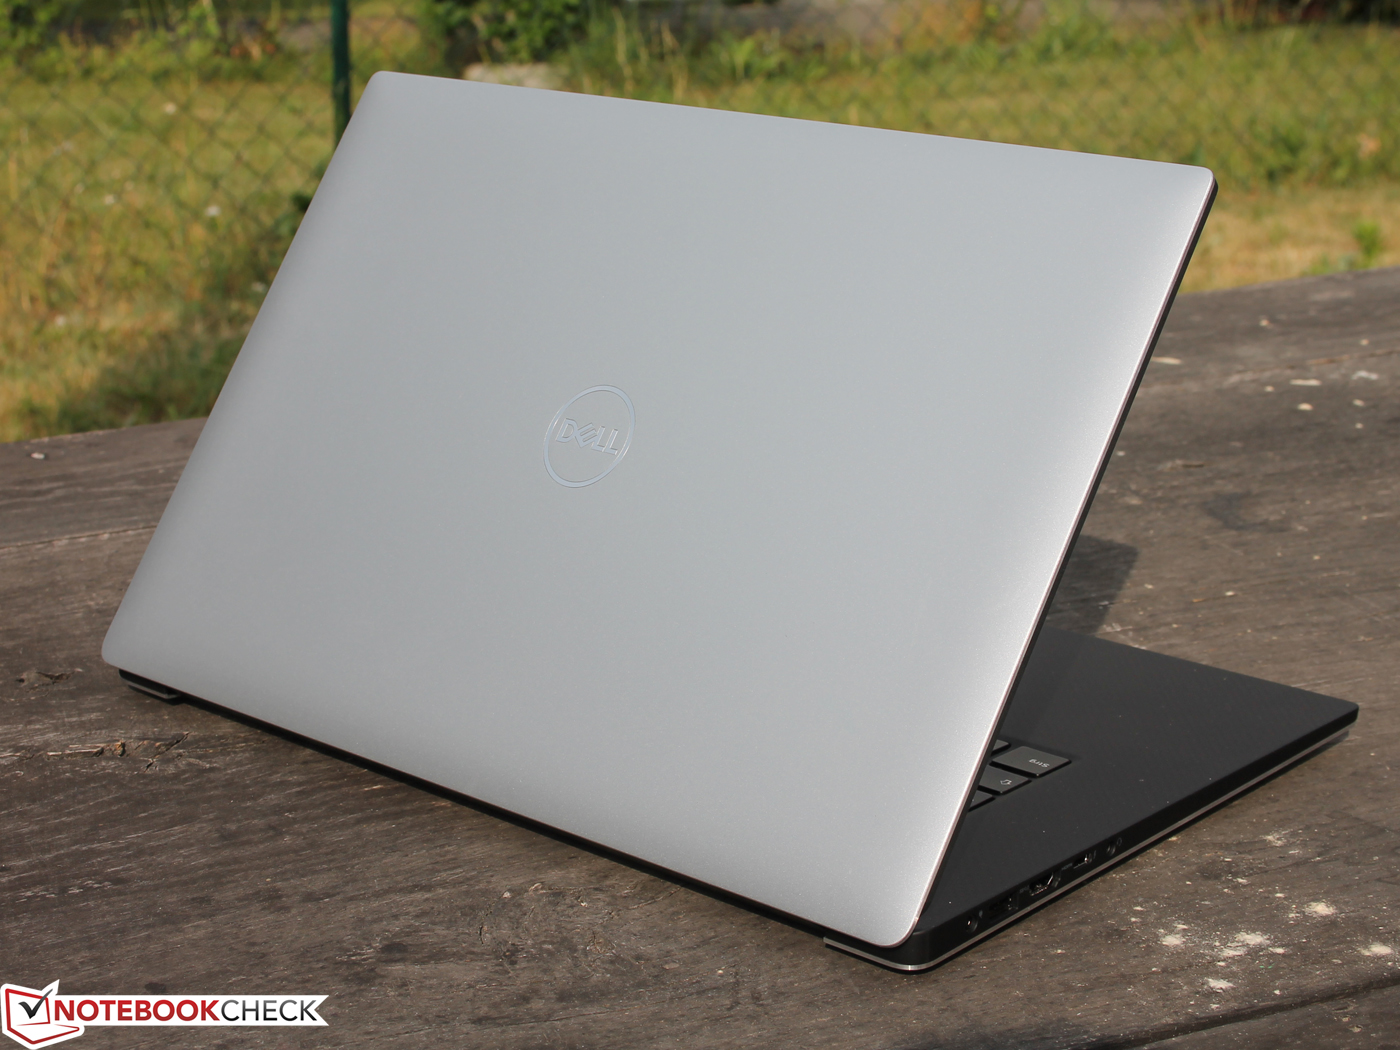
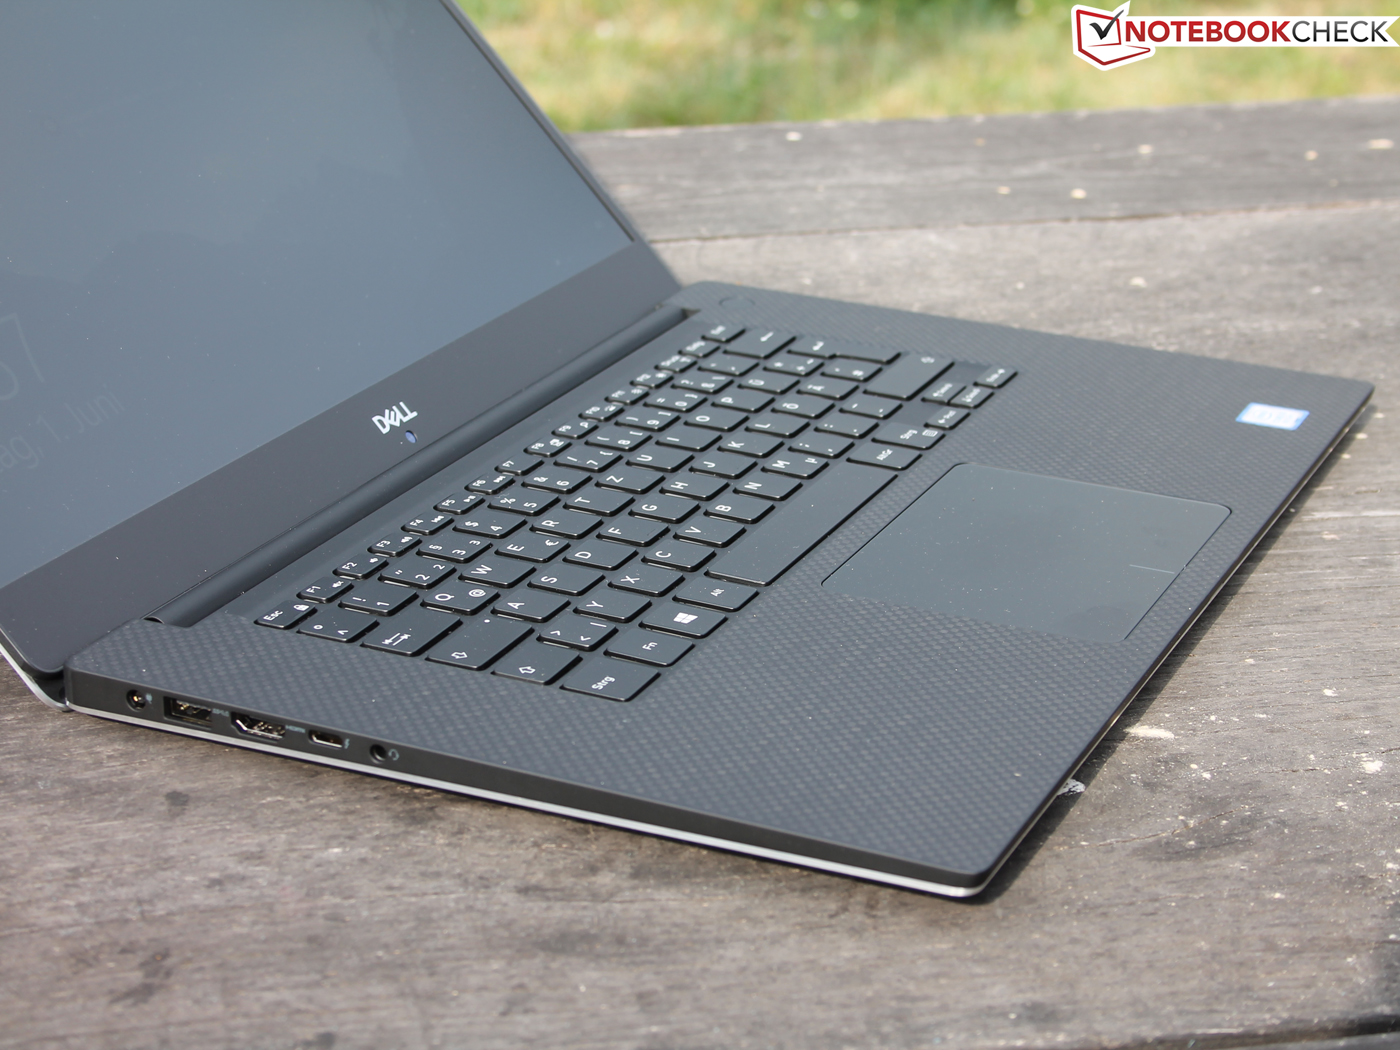
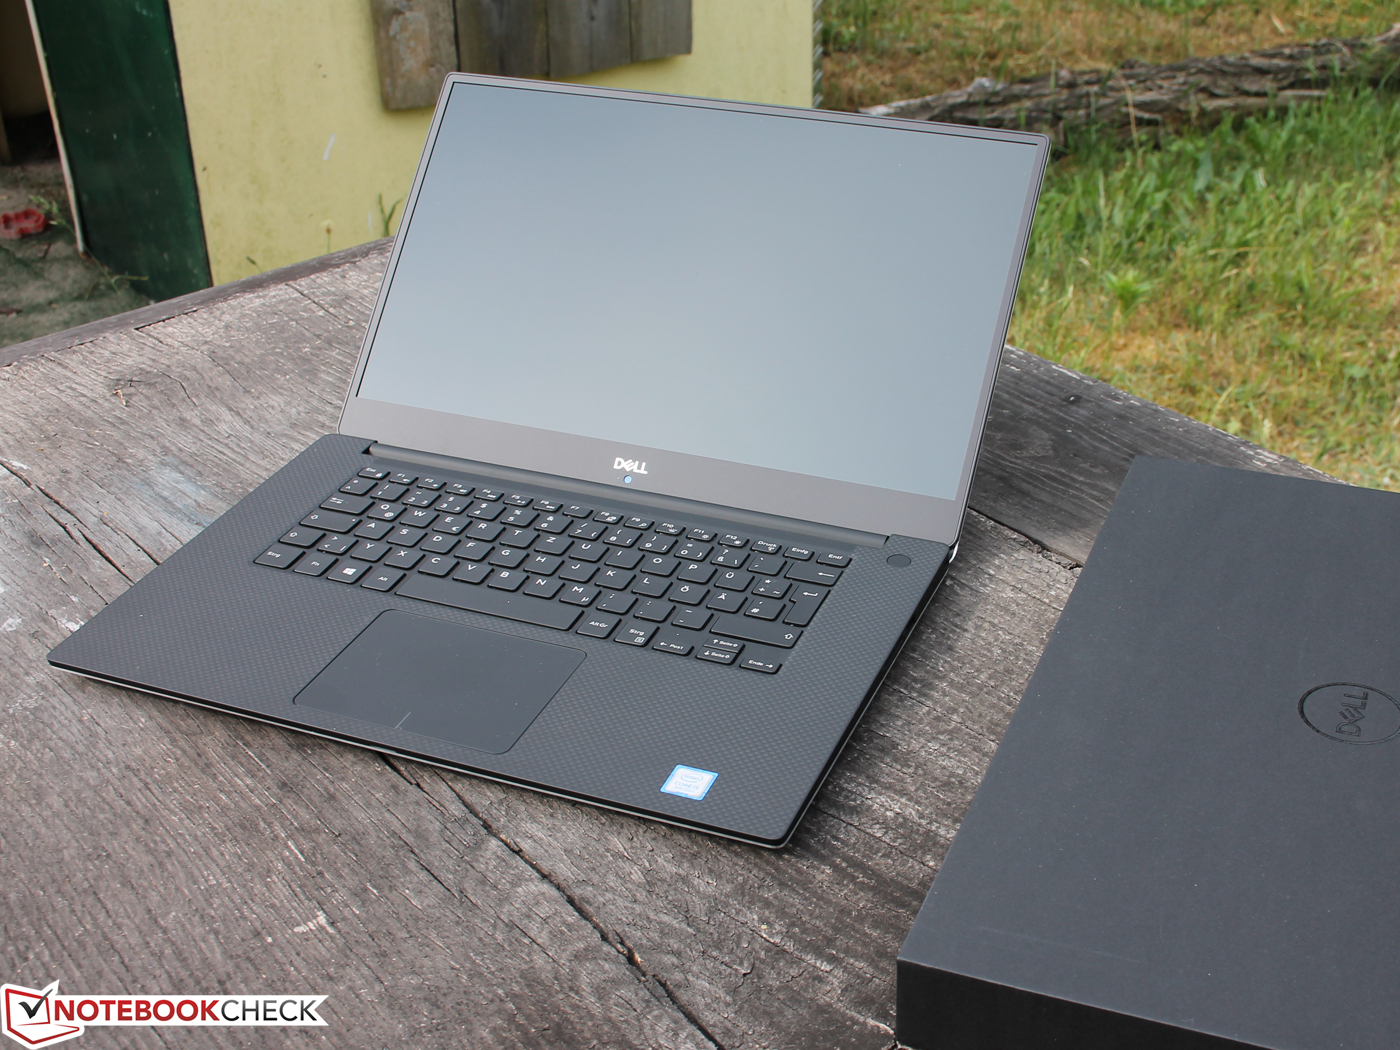
No perceptible changes have been made to the case of the XPS 15. Dell continues to use a mixture of high-quality materials such as aluminum on the display lid and the bottom of the base unit, magnesium on the inside and carbon on the top of the base unit.
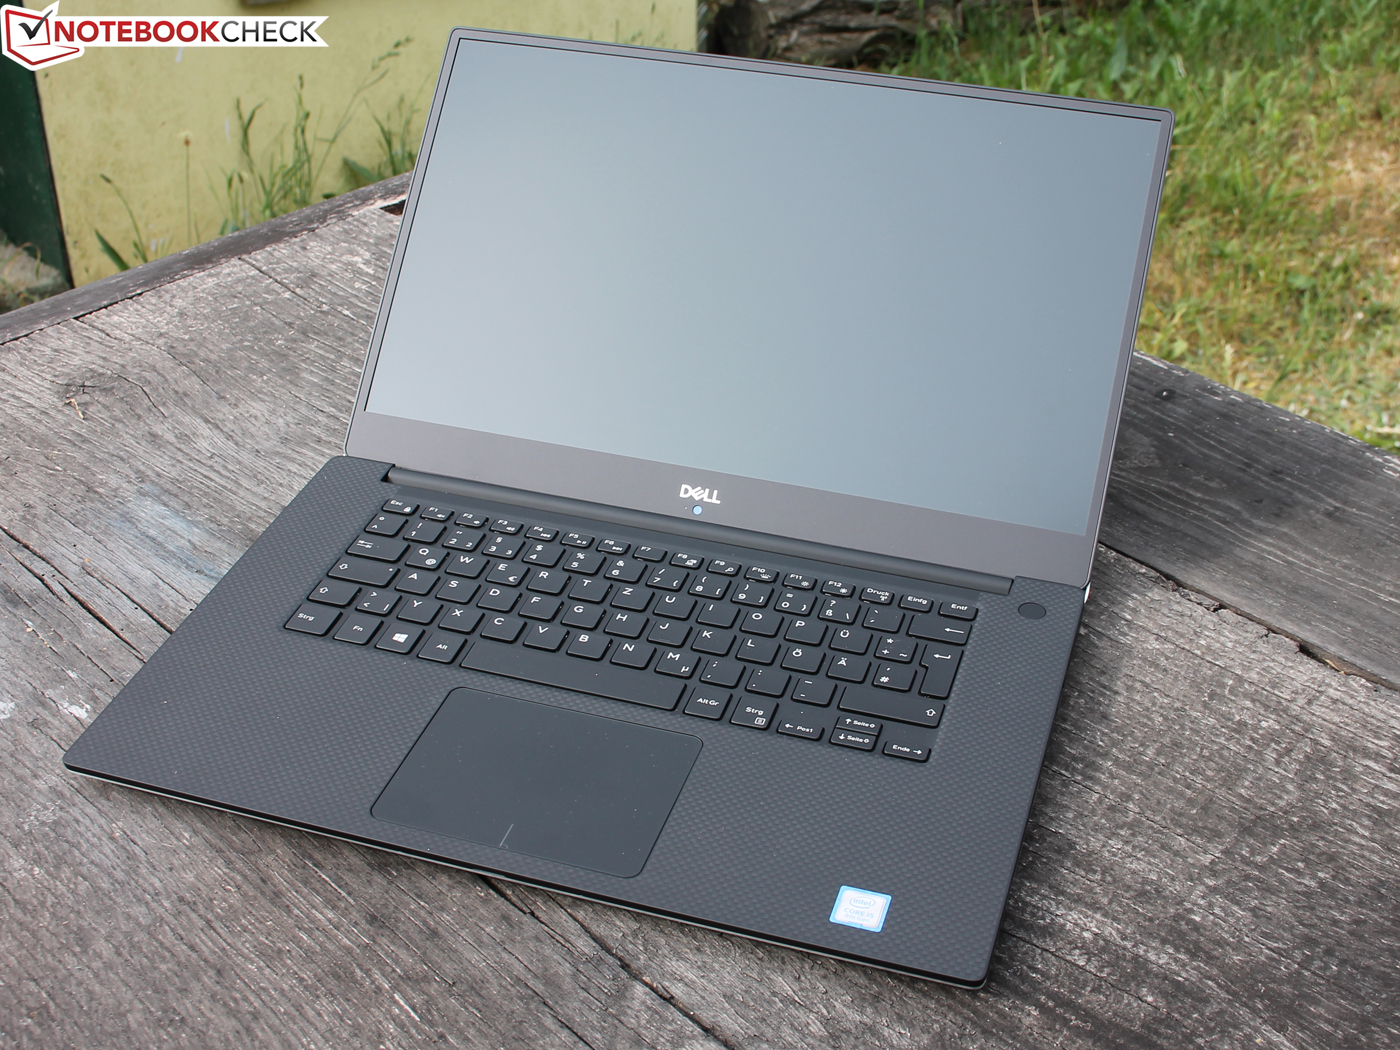
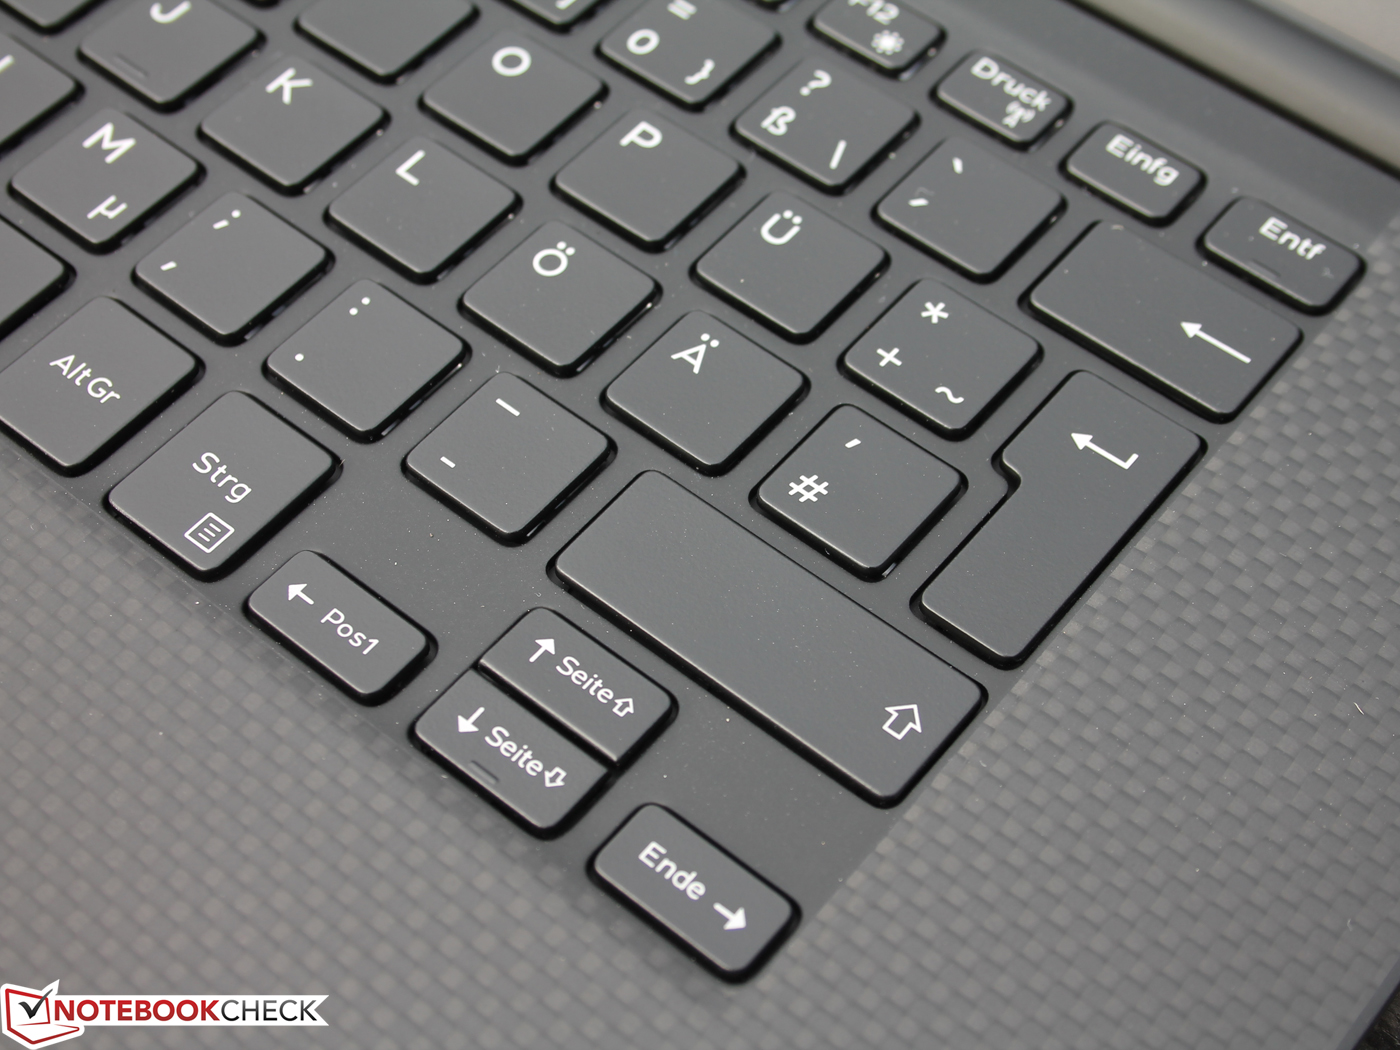
The soft-touch finish around the wrist rest feels nice and offers a good grip, but is not so easy to clean (we would recommend a damp cloth). The matte glass touchpad also seems to attract fingerprints as if by magic.
The display can be opened to around 130°, which should be fully sufficient for most areas of use considering the probably good viewing angles. The hinge is unusually tight, and we needed two hands to open the device. An advantage: The screen does not wobble when carrying it around, no matter in which position it is held. The lid is also unlikely to fall closed by itself due to this tight hinge.
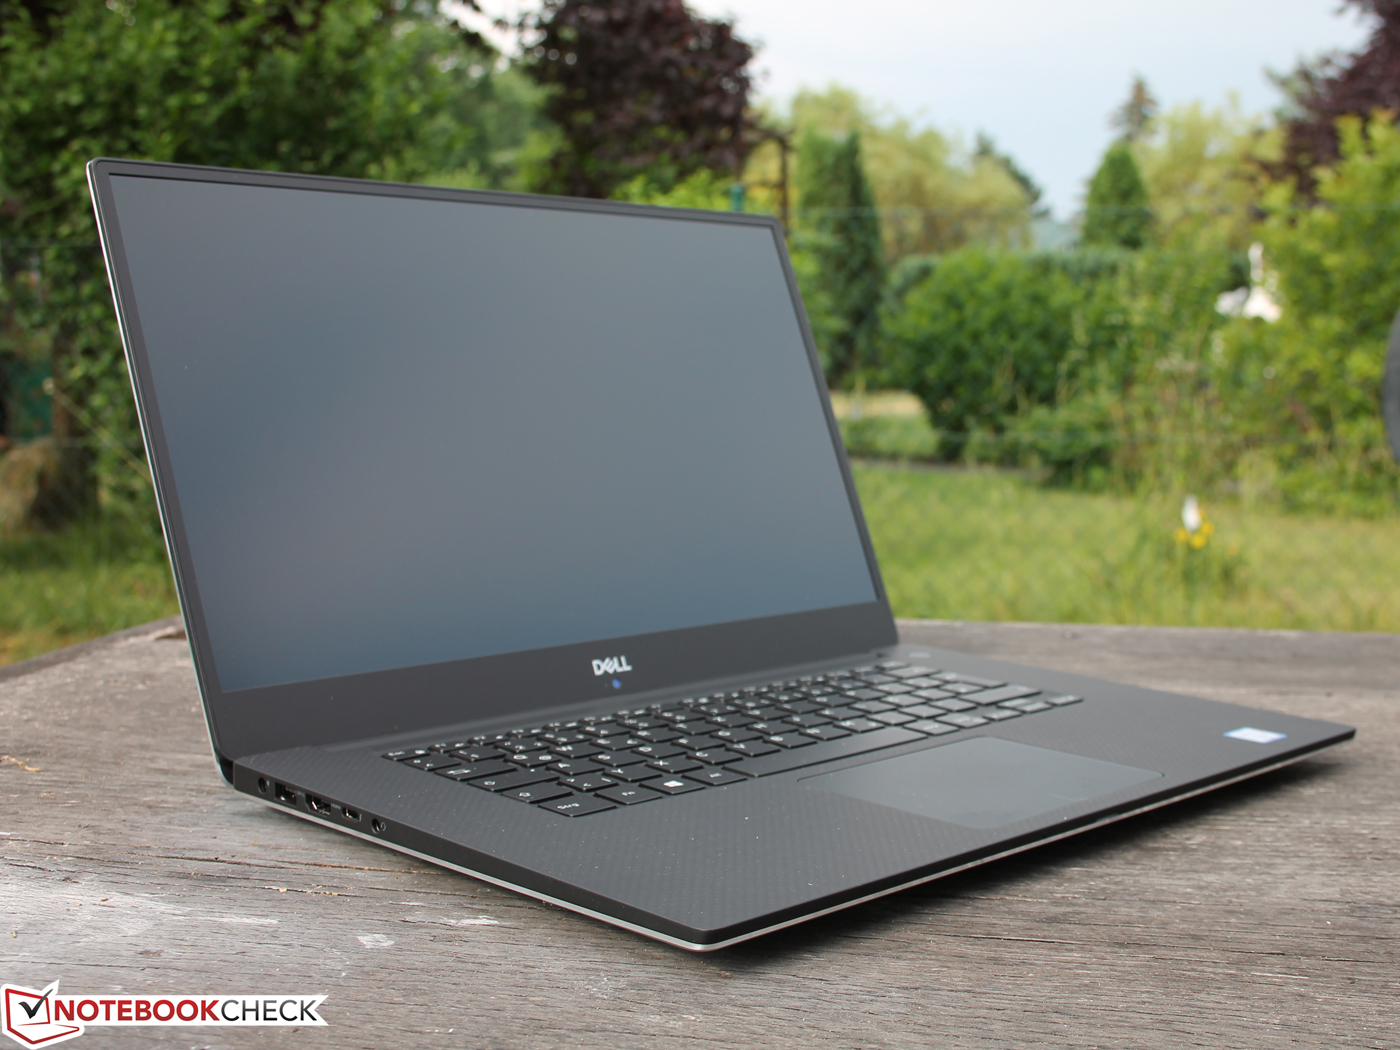
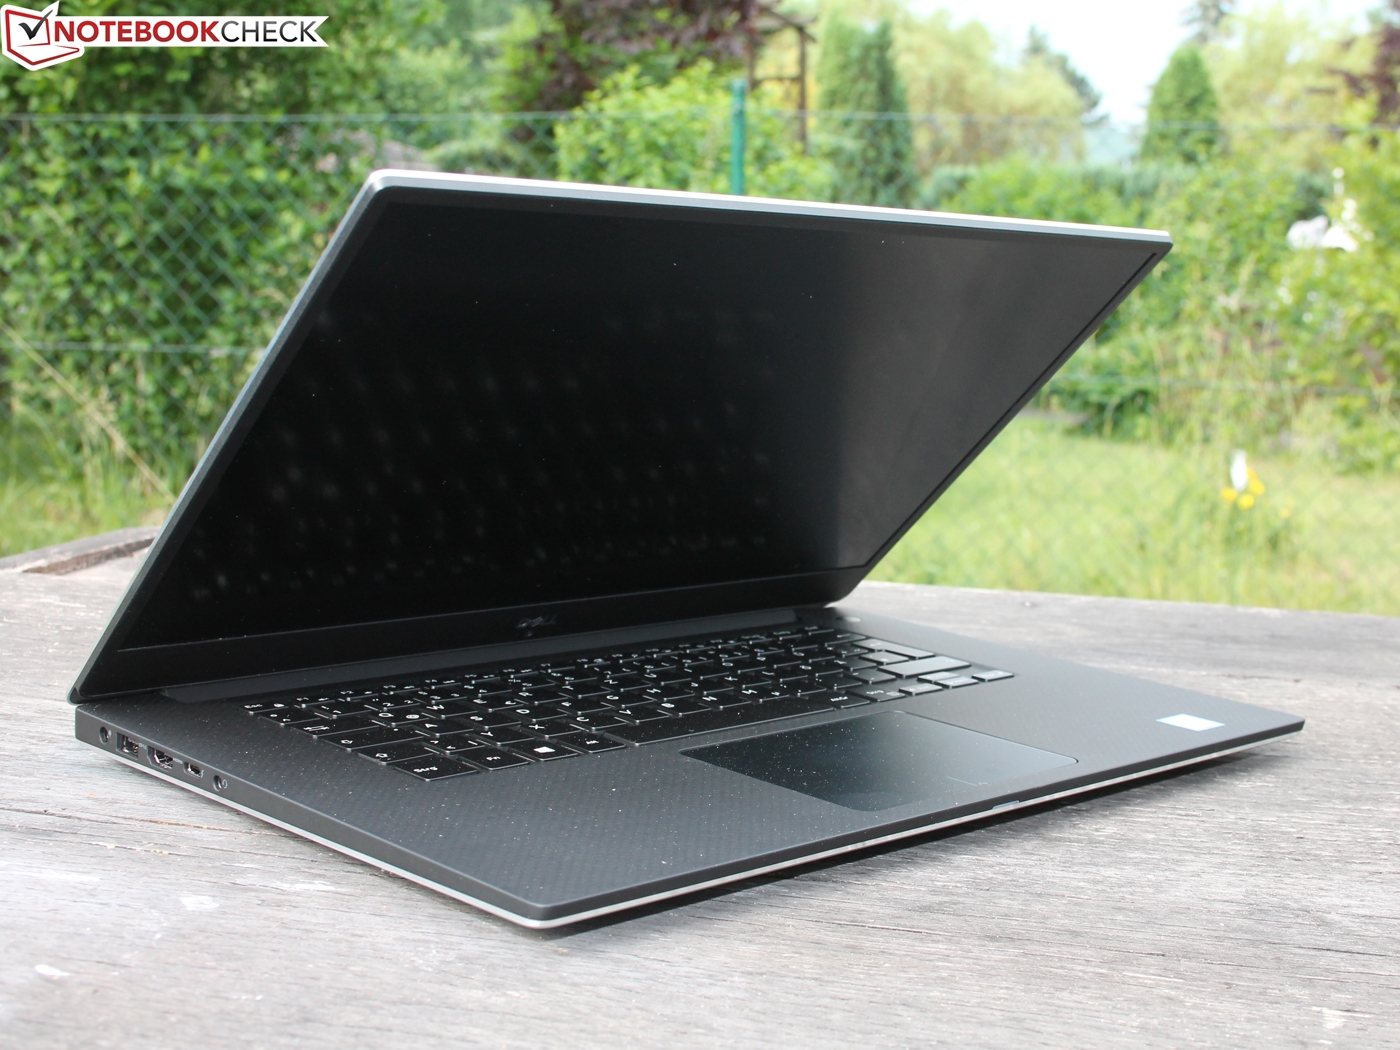
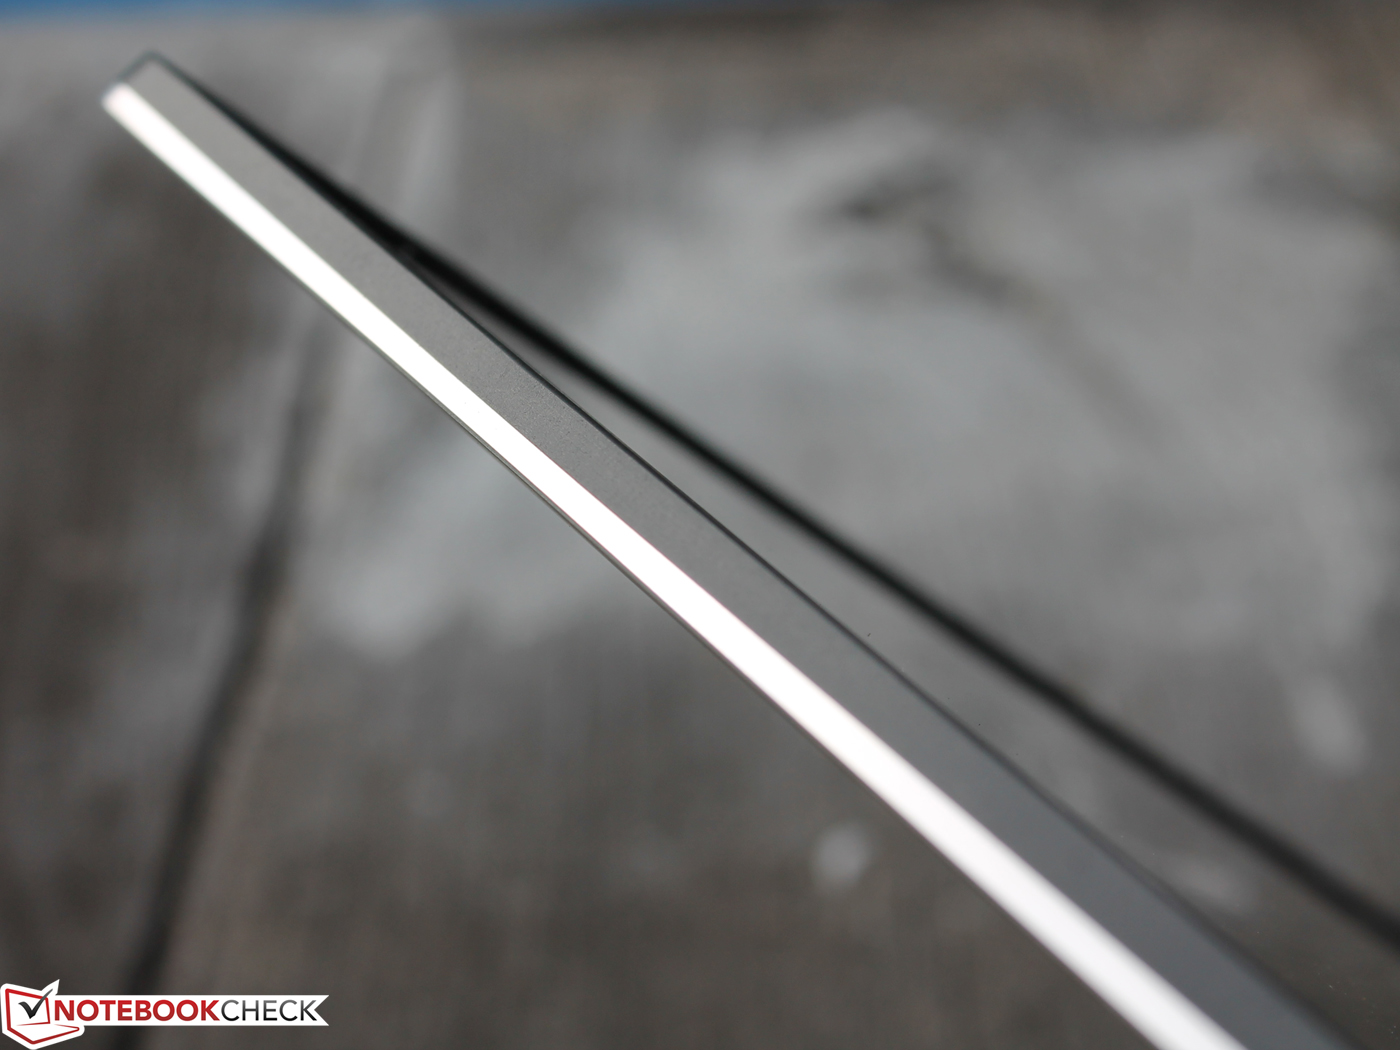
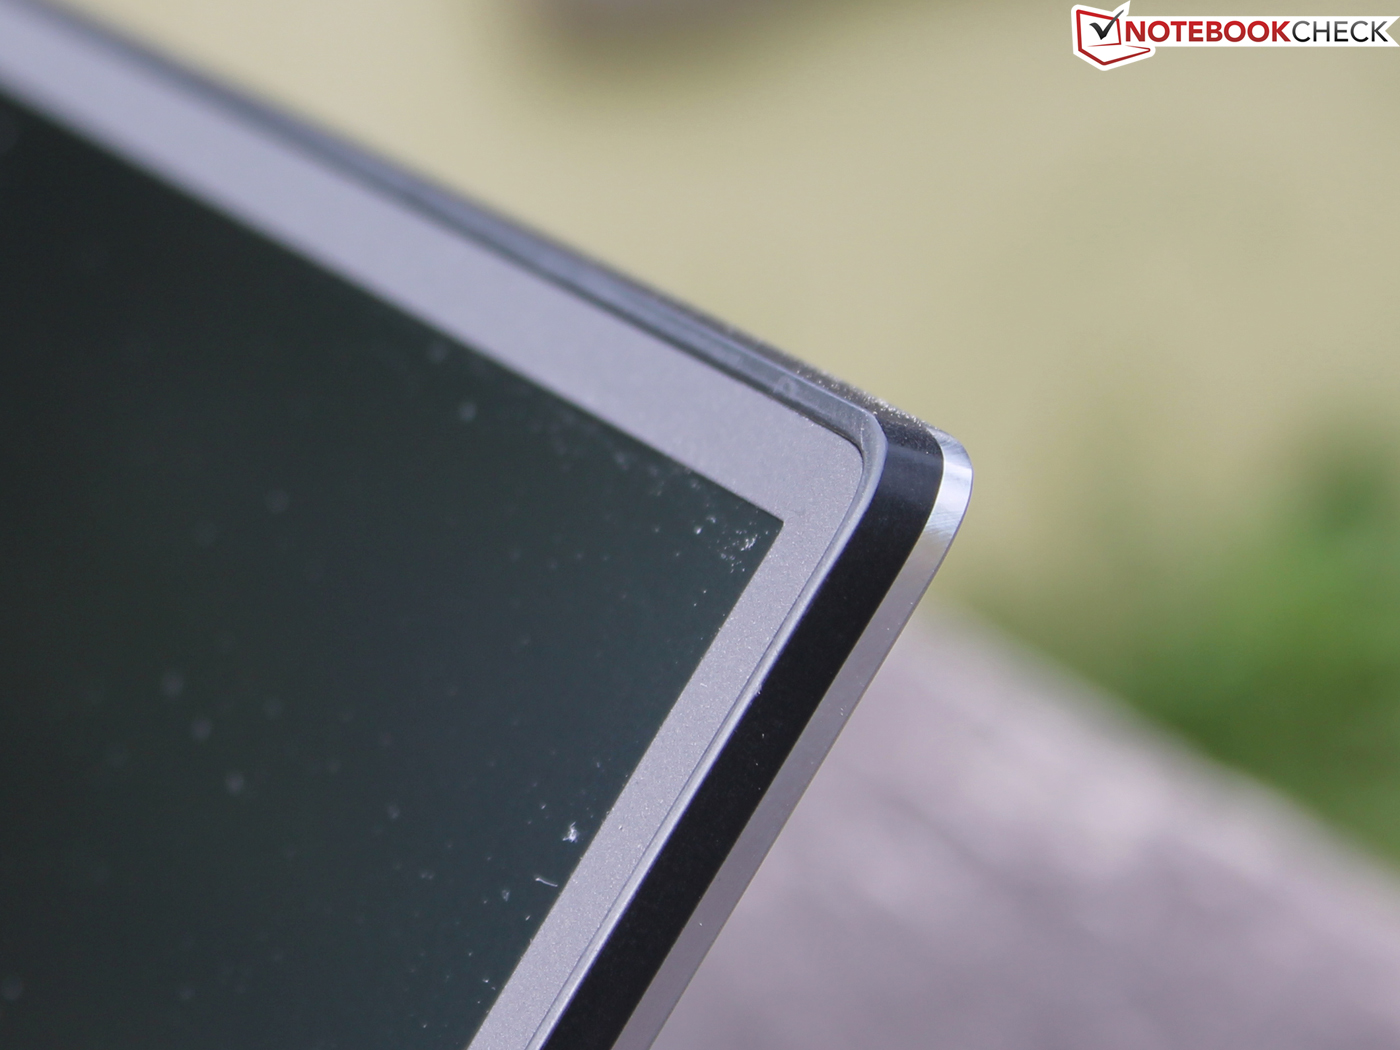
The current Dell XPS 15 9570 is 11 - 17 mm (~0.43 – 0.7 in) high. This only applies to the rims of the front and back edge. Placed on a table, the laptop is 22 mm (~0.87 in) high. The biggest advantage compared to most laptops with 15.6-inch displays is that it still has a very compact size (length x width) thanks to its very slim InfinityEdge bezels.
The weight of our version (FHD with the 97-Wh battery and without a hard drive) is 1932 grams (~4.26 lb). It seems as if the laptop has lost weight - the 2017 FHD version with a smaller 56-Wh battery weighed 1950 grams (~4.3 lb) in our review. The 4K version will, like last year, be a little heavier, which is due to the coating on the touch panel. The 2017 XPS 15 UHD weighed 2070 grams (~4.6 lb).
Connectivity - the XPS has Thunderbolt 3
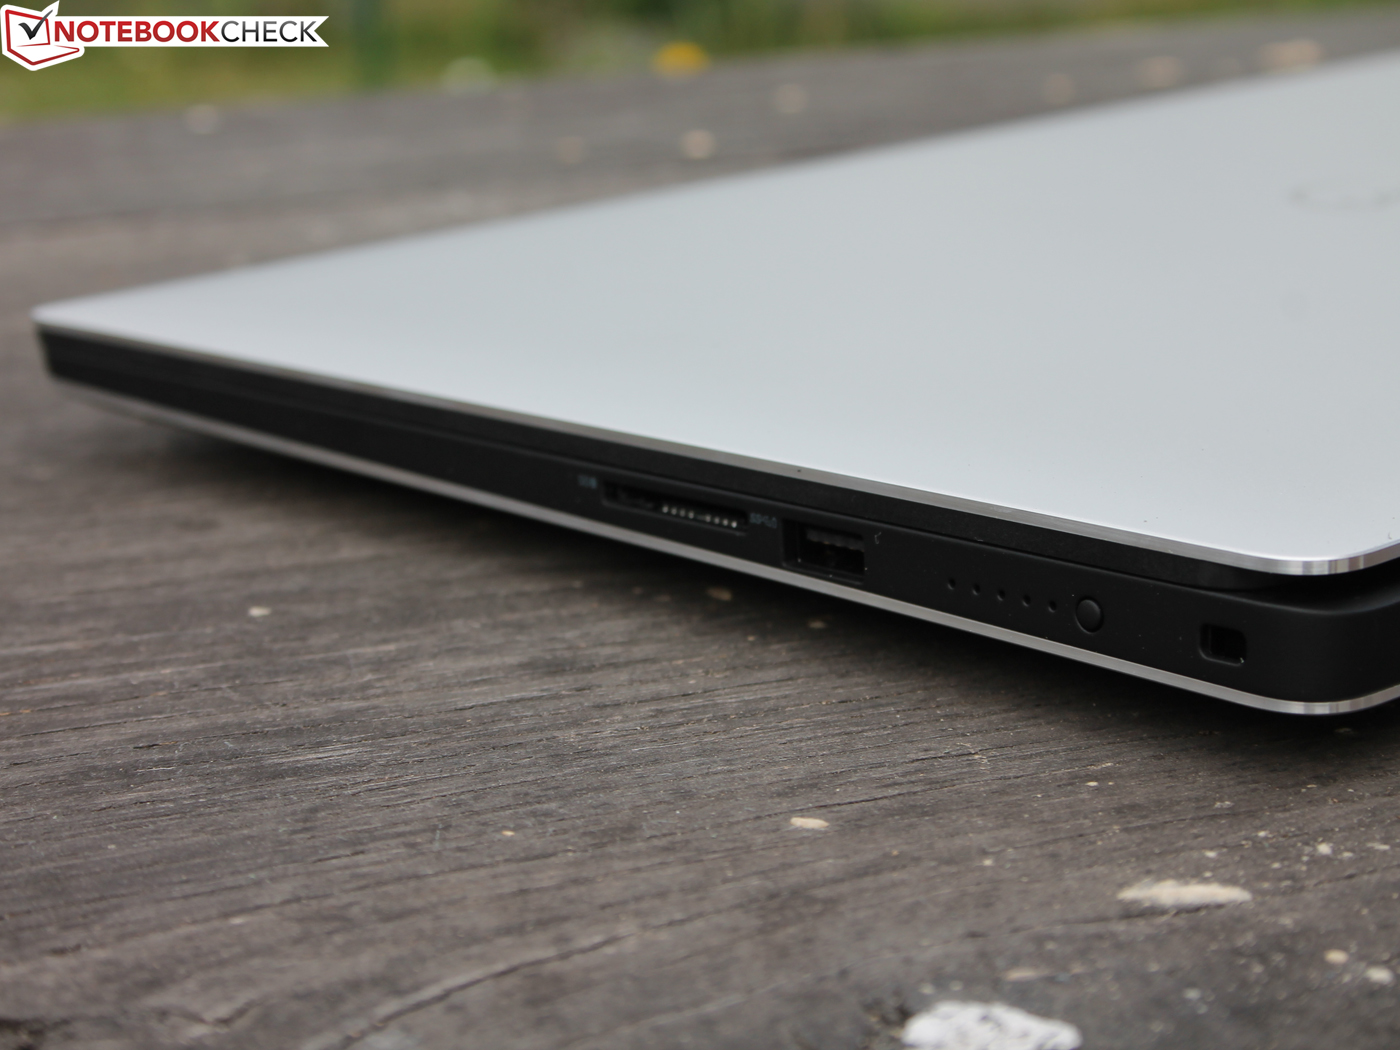
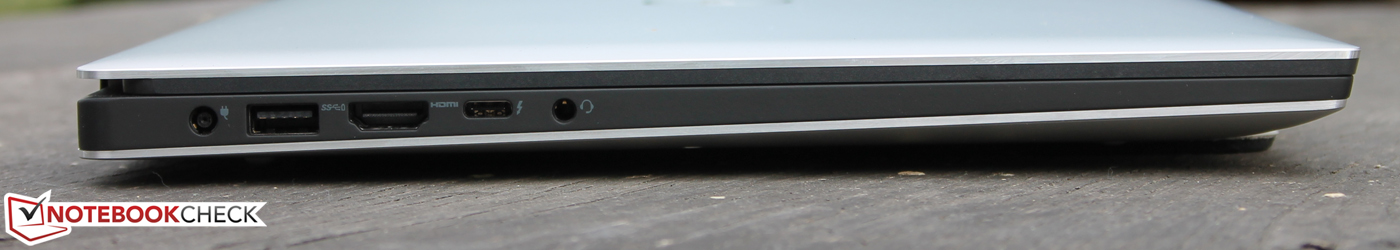
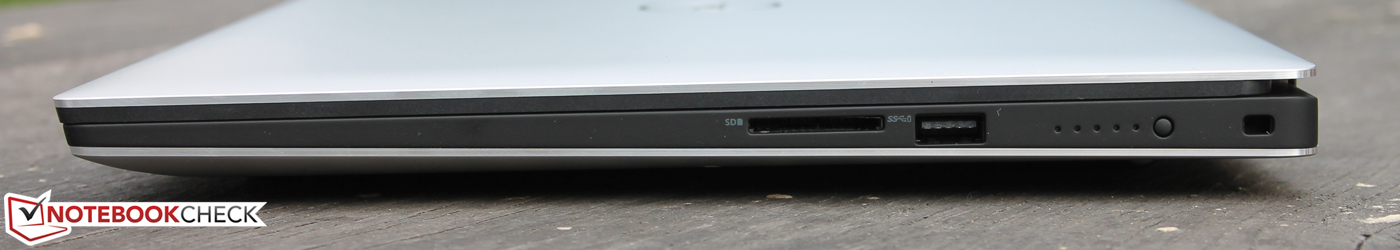
There have been no changes to the available ports. Like on its predecessor, the ports are positioned on the sides of our test unit, always towards the back. There is a full-fledged USB 3.0 port available on either side of the device. Dell has also placed a USB Type-C port on the left side, which supports both Thunderbolt 3 and USB 3.1 Gen 2.
Actually, there is one change: The Thunderbolt 3 (including power supply and DisplayPort) now has four PCIe lanes. Particularly gamers who are planning to connect an external GPU to their XPS 15 will be delighted by this news. The two PCIe lanes of the 2017 model were a real bottleneck for eGPUs.
SD card reader
Dell has again chosen to go with a fast integrated card reader for its new generation of XPS devices. The read transfer rates are excellent. AS SSD measured about 200 MB/s with our reference card from Toshiba (Exceria Pro SCXC UHS-II). This is significantly faster than what many cheaper models can offer (<100 MB/s). Toshiba claims that the maximum transfer rate of its SD card is 260 MB/s. Our test unit is a little slower at the copy test and reaches 123 MB/s, but still manages to beat non-XPS competition with ease. The card cannot be inserted fully into the card reader and one third of the card constantly stands out of the case.
| SD Card Reader | |
| average JPG Copy Test (av. of 3 runs) | |
| Dell XPS 13 9370 FHD i5 (Toshiba Exceria Pro M501 64 GB UHS-II) | |
| Average of class Multimedia (23 - 531, n=37, last 2 years) | |
| Dell XPS 15 2018 i5 FHD 97Wh | |
| Gigabyte Aero 14-K8 (Toshiba Exceria Pro SDXC 64 GB UHS-II) | |
| Gigabyte Aero 15 (Toshiba Exceria Pro SDXC 64 GB UHS-II) | |
| Asus Zenbook Pro UX550VE-DB71T (Toshiba Exceria Pro SDXC 64 GB UHS-II) | |
| Dell XPS 15 2017 9560 (7300HQ, Full-HD) (Toshiba Exceria Pro SDXC 64 GB UHS-II) | |
| maximum AS SSD Seq Read Test (1GB) | |
| Dell XPS 13 9370 FHD i5 (Toshiba Exceria Pro M501 64 GB UHS-II) | |
| Dell XPS 15 2017 9560 (7300HQ, Full-HD) (Toshiba Exceria Pro SDXC 64 GB UHS-II) | |
| Dell XPS 15 2018 i5 FHD 97Wh | |
| Average of class Multimedia (37.3 - 1455, n=36, last 2 years) | |
| Asus Zenbook Pro UX550VE-DB71T (Toshiba Exceria Pro SDXC 64 GB UHS-II) | |
| Gigabyte Aero 15 (Toshiba Exceria Pro SDXC 64 GB UHS-II) | |
| Gigabyte Aero 14-K8 (Toshiba Exceria Pro SDXC 64 GB UHS-II) | |
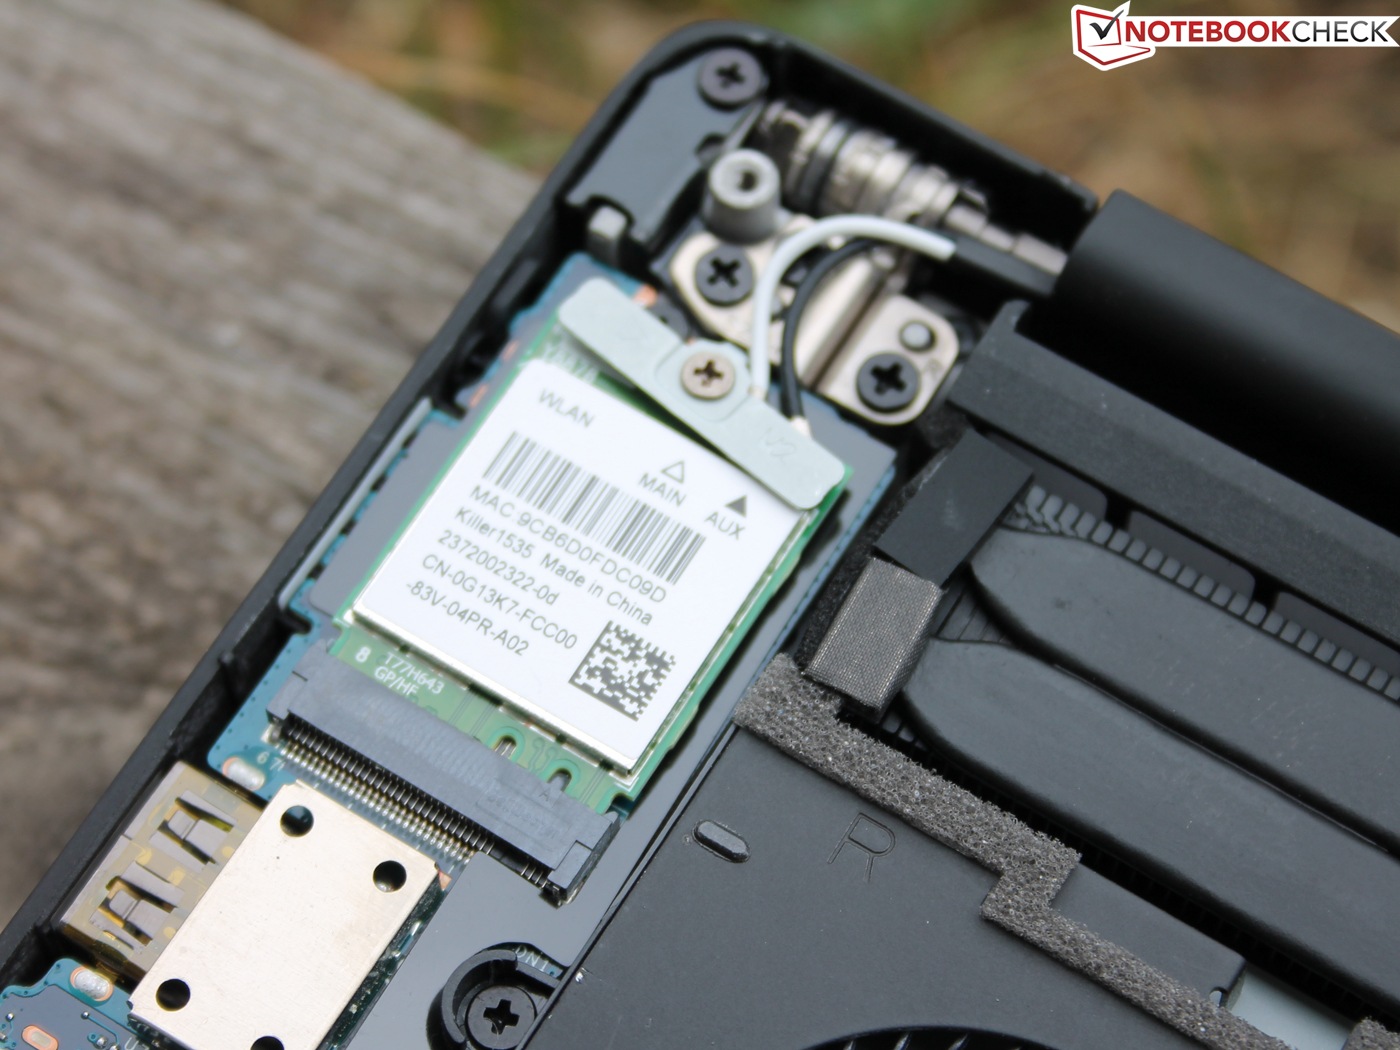
Communication
The Dell XPS 15 9570 has a Wi-Fi module from Killer Networks (Wireless n/a/ac 1535, 2x2). With this, the notebook reached a maximum transfer rate of 675 MBit/s (receiving) and 551 MBit/s (sending) in our Wi-Fi test (Linksys EA8500, at a distance of 1 m/~3 ft). This result is lower than that of the 2017 XPS with the same Wi-Fi module, which could be caused by different drivers or measurement uncertainties.
Webcam
The webcam is still placed below the display and users will have to get used to this position so that their call partners do not need to look up their noses.


Security
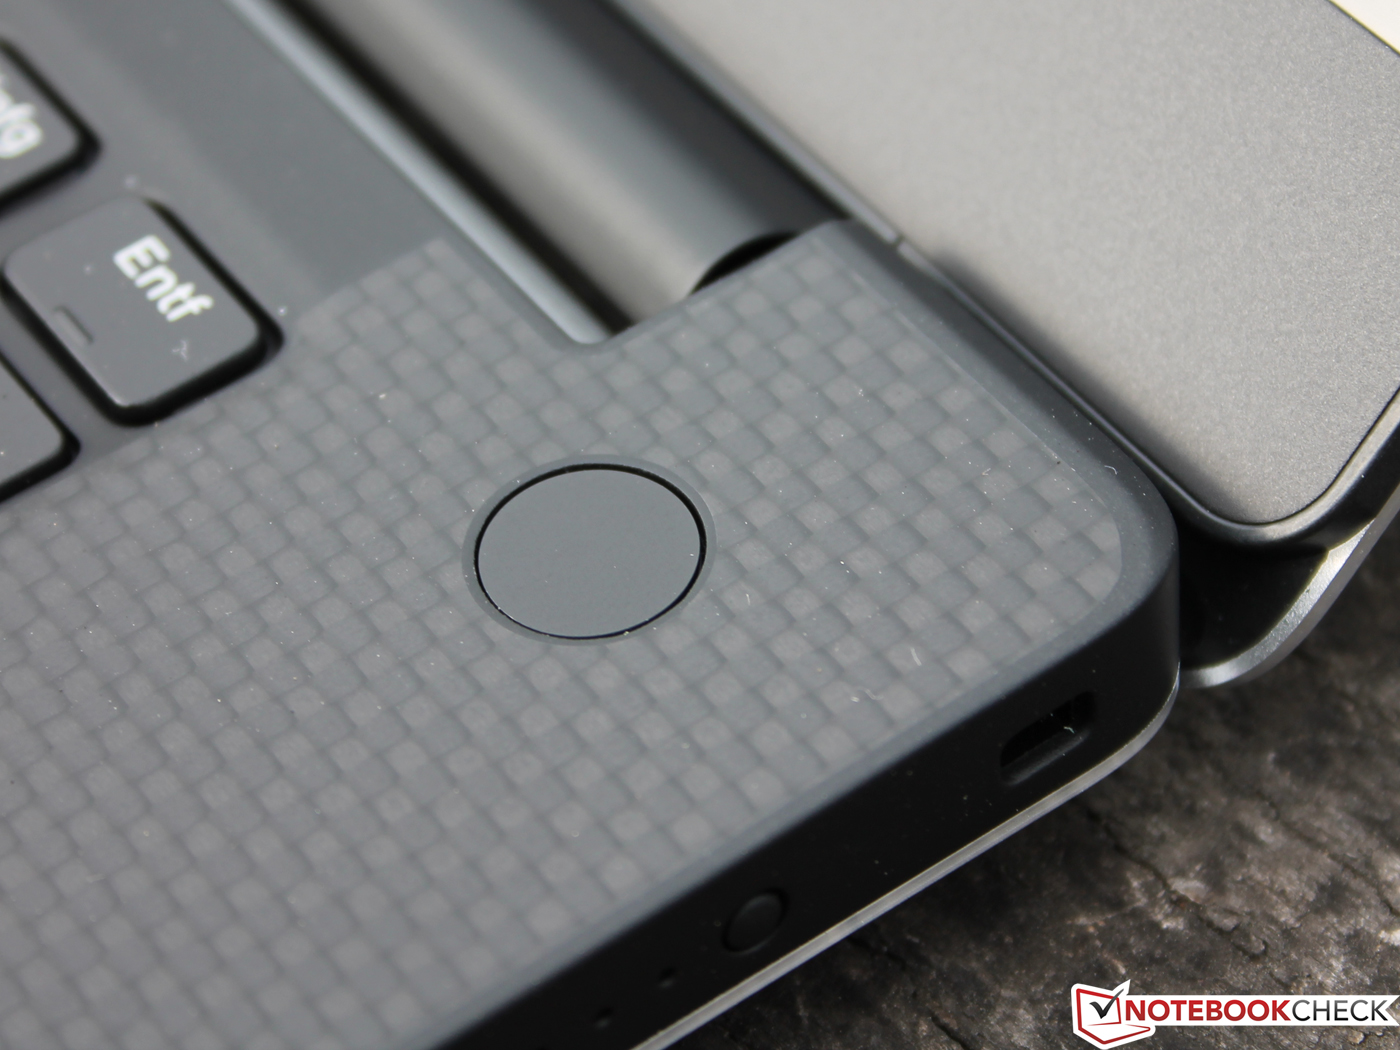
The Dell XPS 15 9570 features a long list of security measures. You will find a good overview of the supported functions in the BIOS - they range from classic passwords on various levels to TPM 2.0 and all the way to Computrace. The XPS 15 also offers a fingerprint reader (touch, not swipe), which is integrated into the Power On button.
Accessories
You will find plenty of accessories available at the end of the online configuration process. The palette ranges from bags and external input devices to adapters and docks. The latter might be quite interesting as the device lacks an RJ45 Ethernet connector, for example. The solution would be the suitable Dell USB-C adapter, which adds HDMI, VGA, Ethernet and USB 3.0 ports.
The available Thunderbolt dock TB16 240W also sounds great. This dock offers a variety of additional ports, but also takes care of the device's power supply, which means that you only ever need to have one cable connected to the device. The price of $240 seems quite appropriate for this accessory.
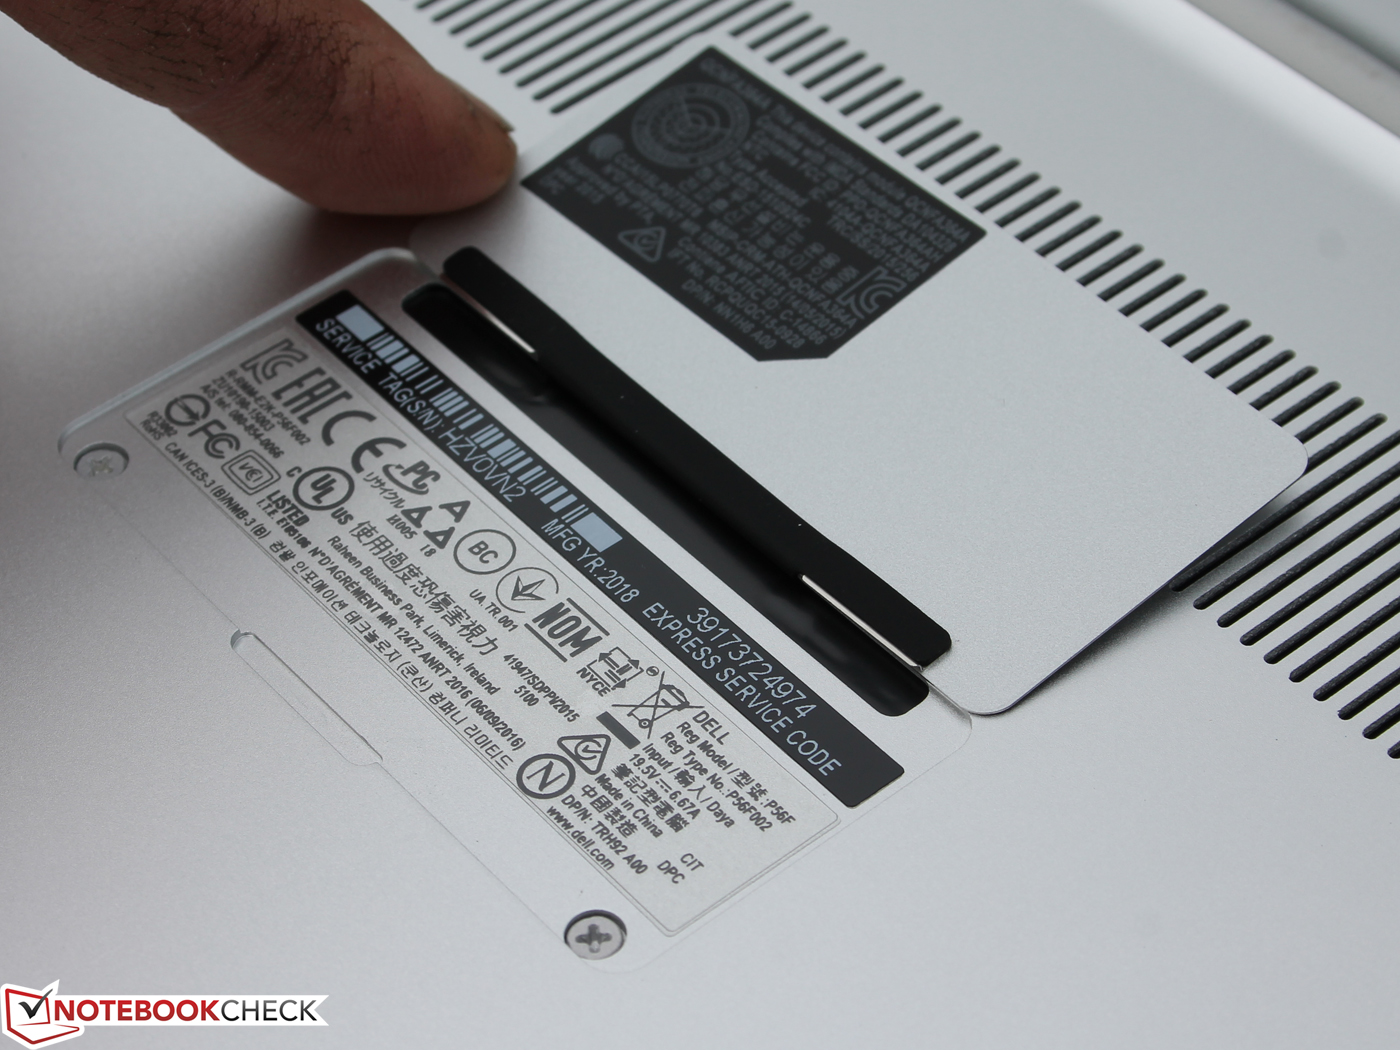
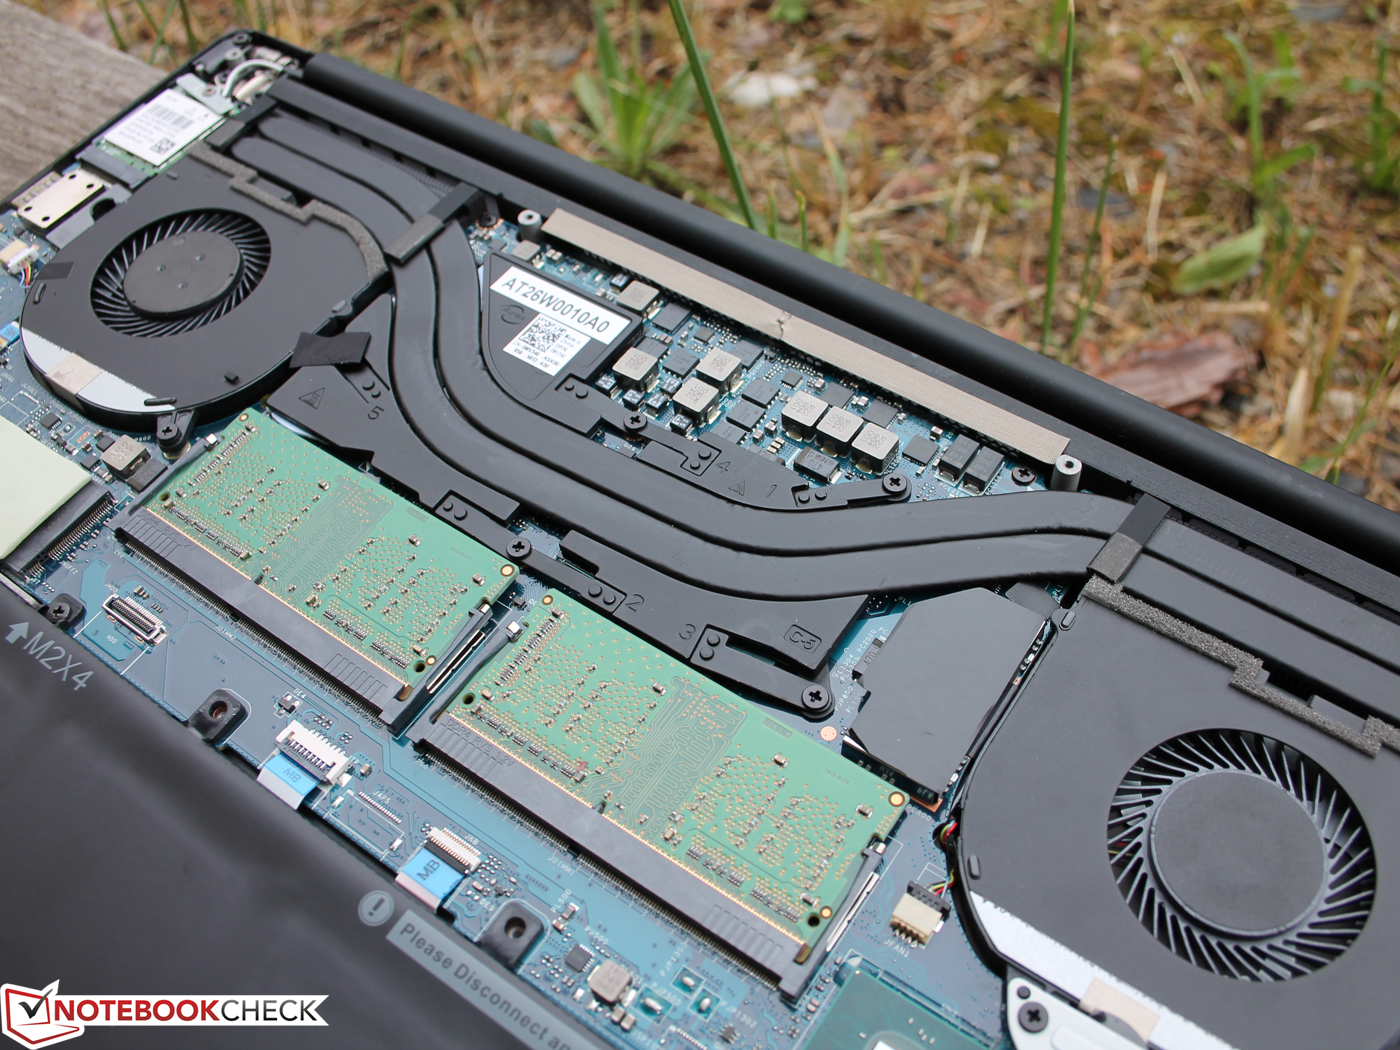
Maintenance
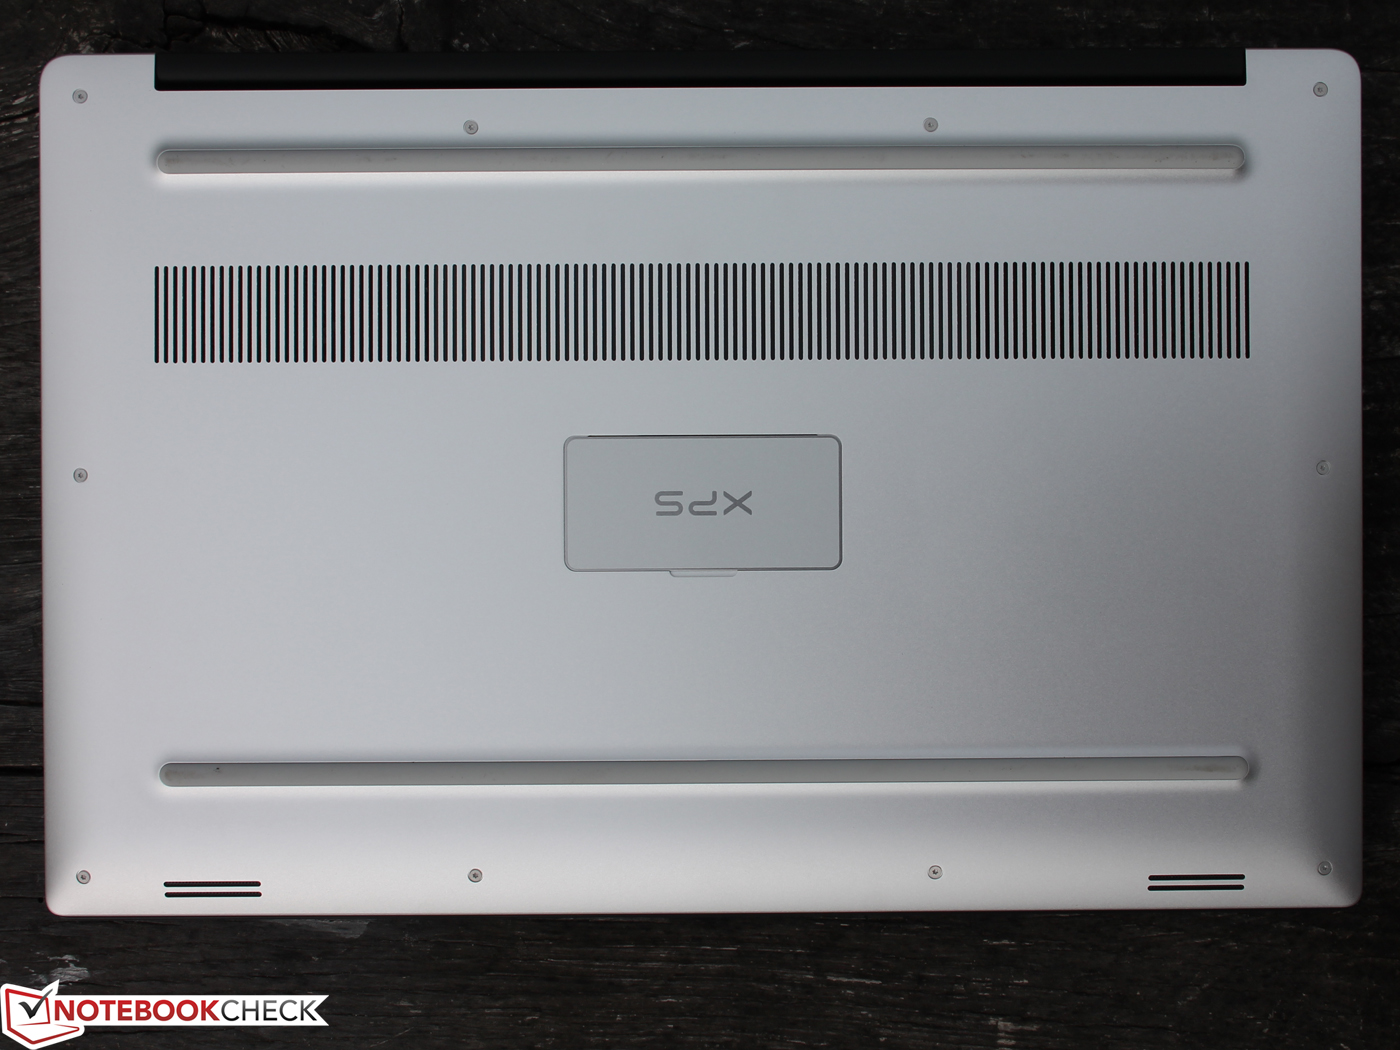
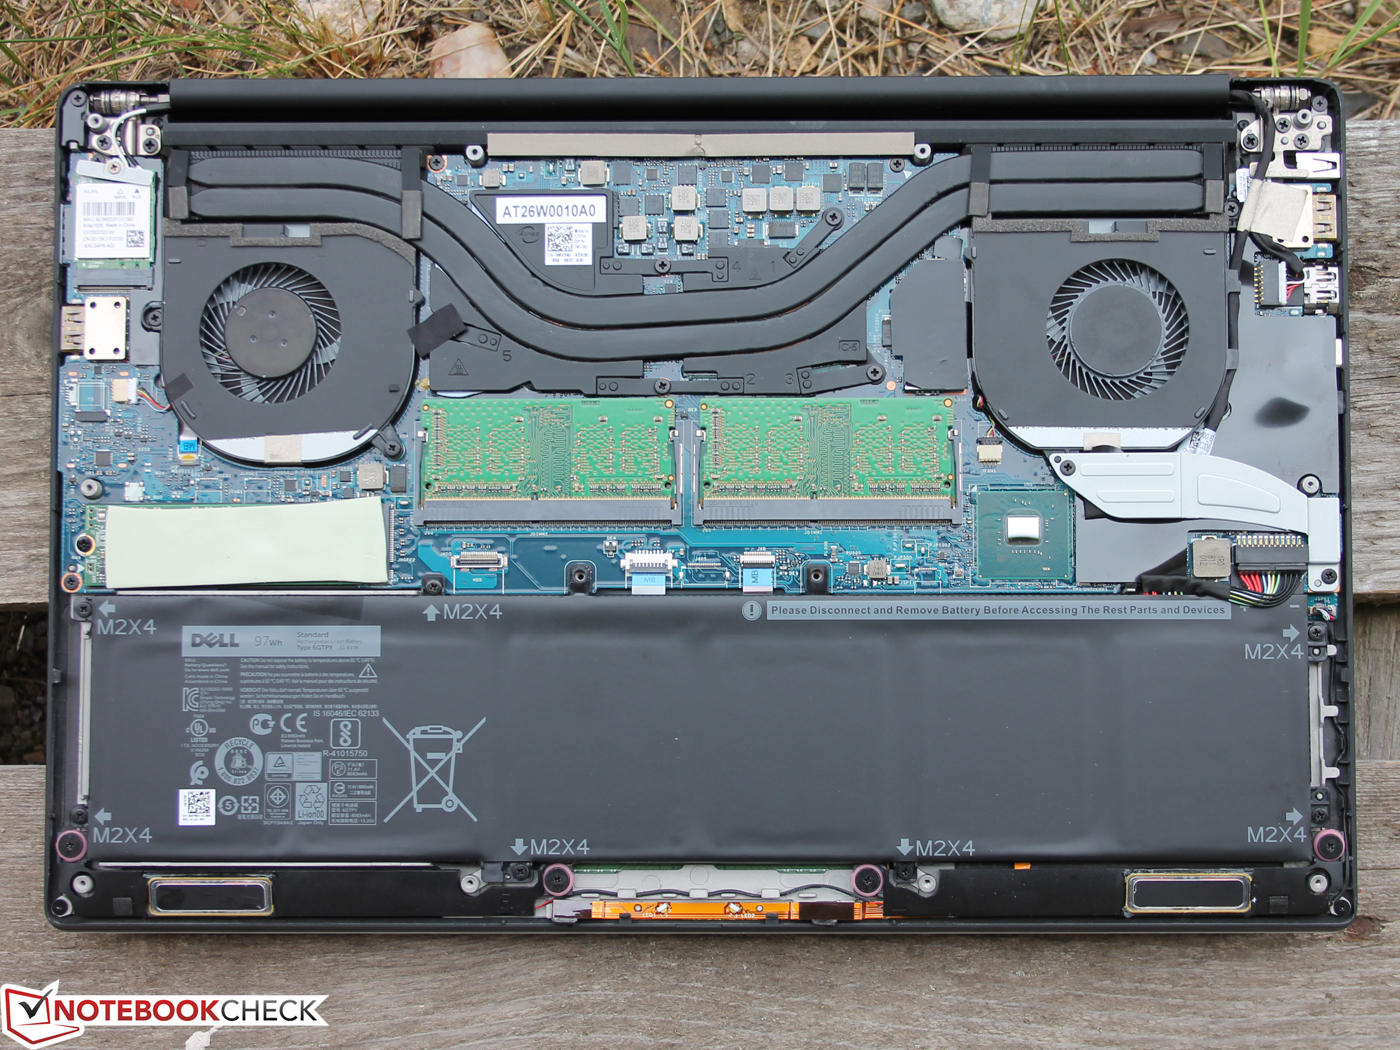
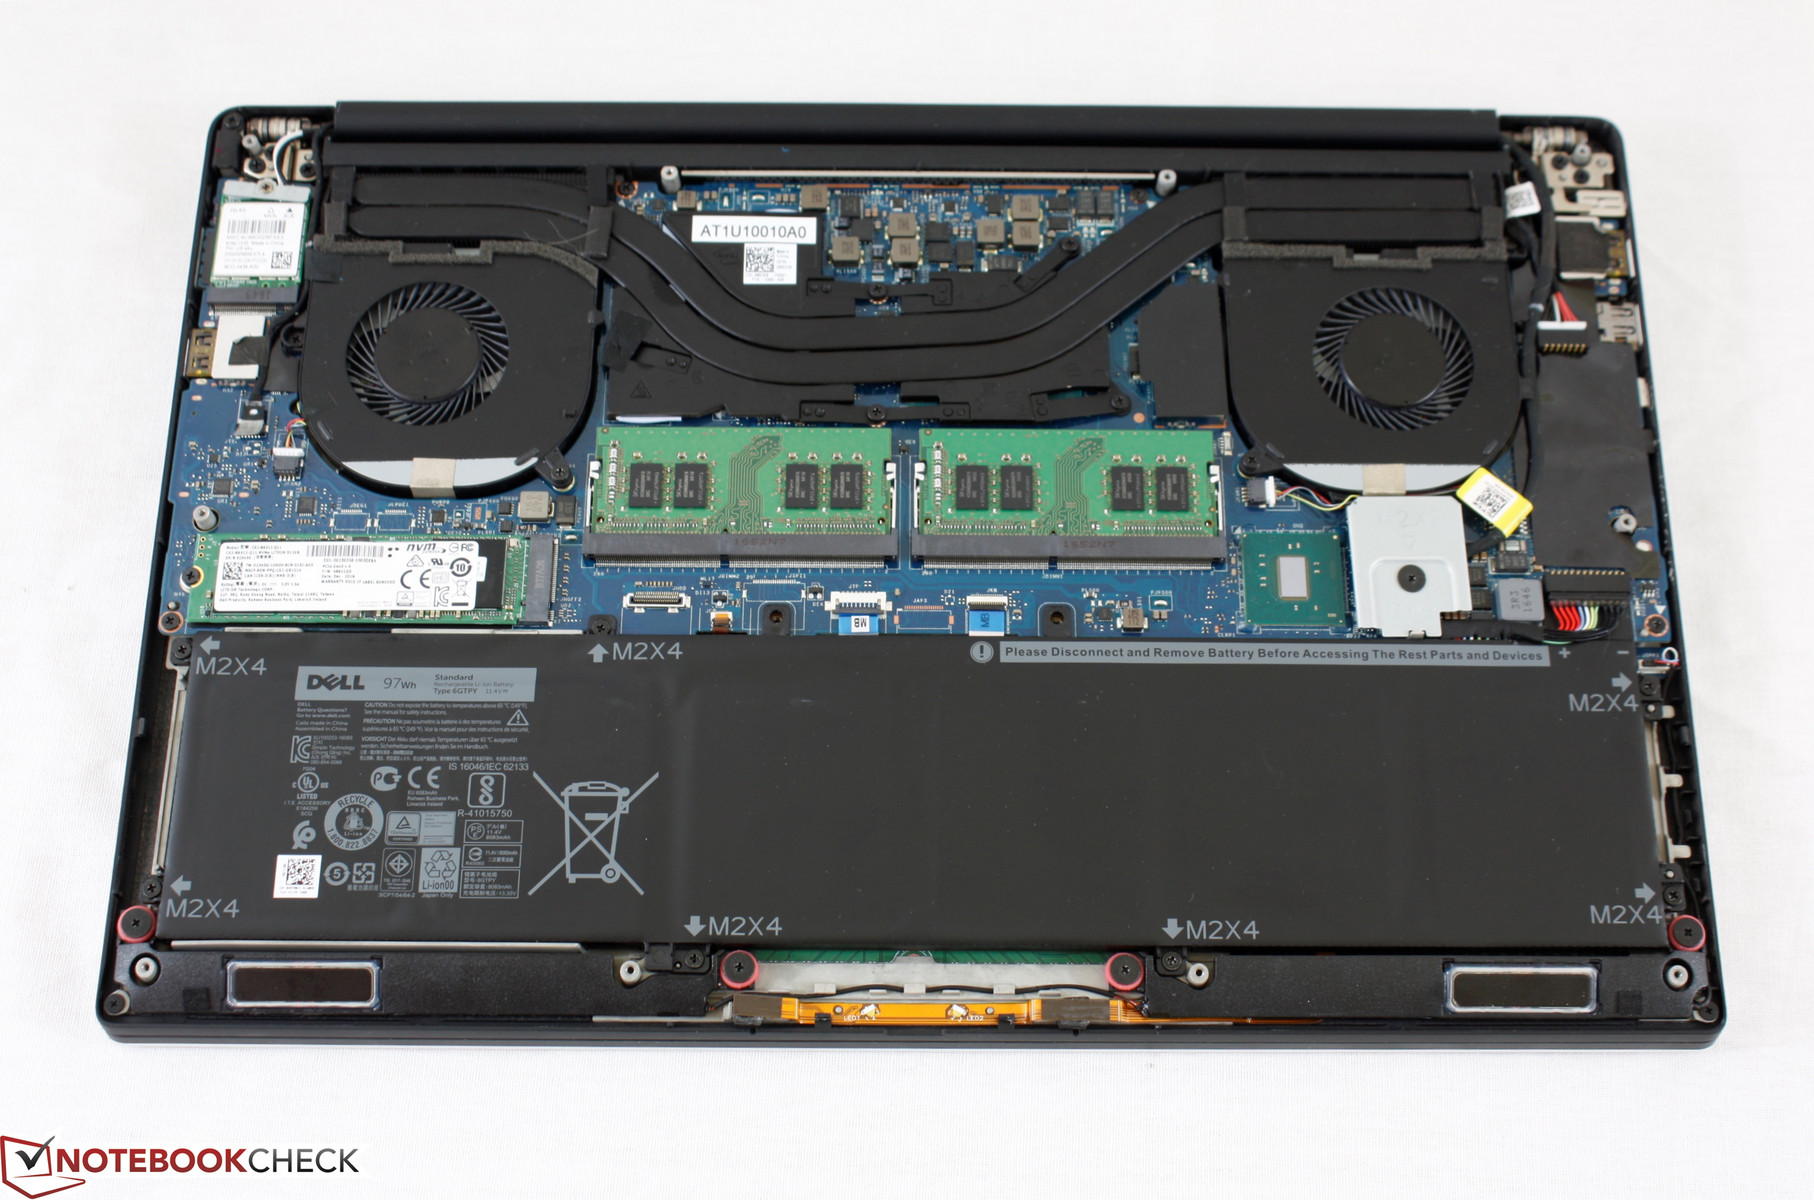
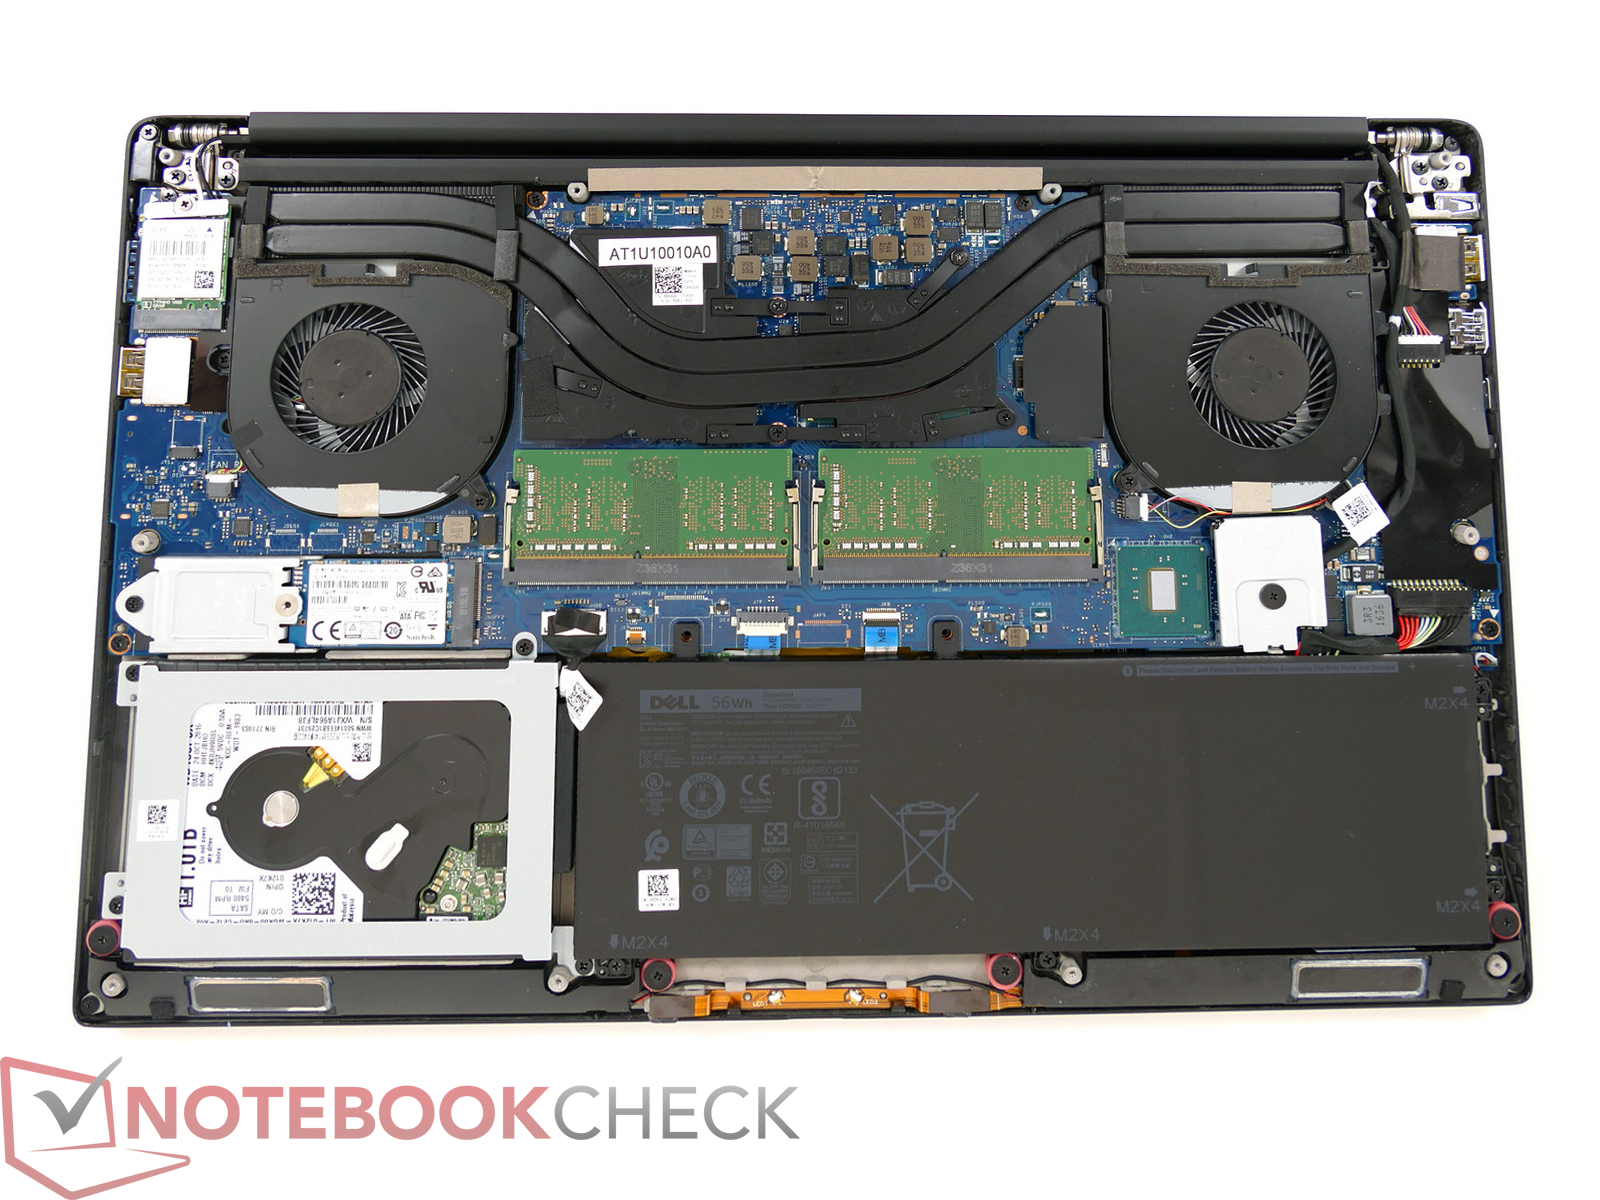
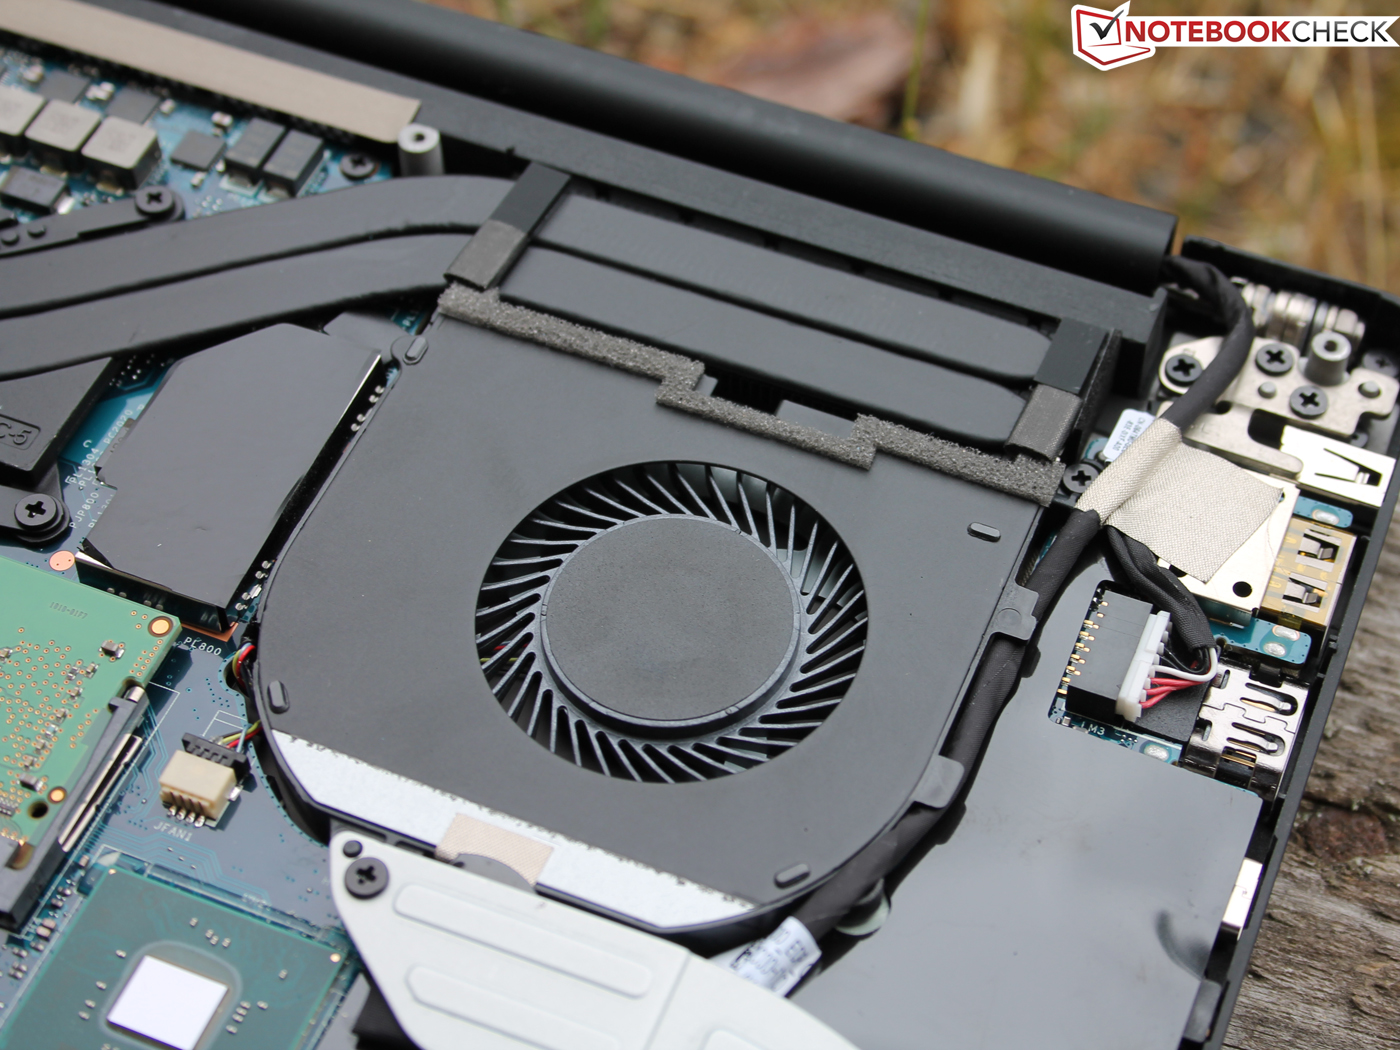
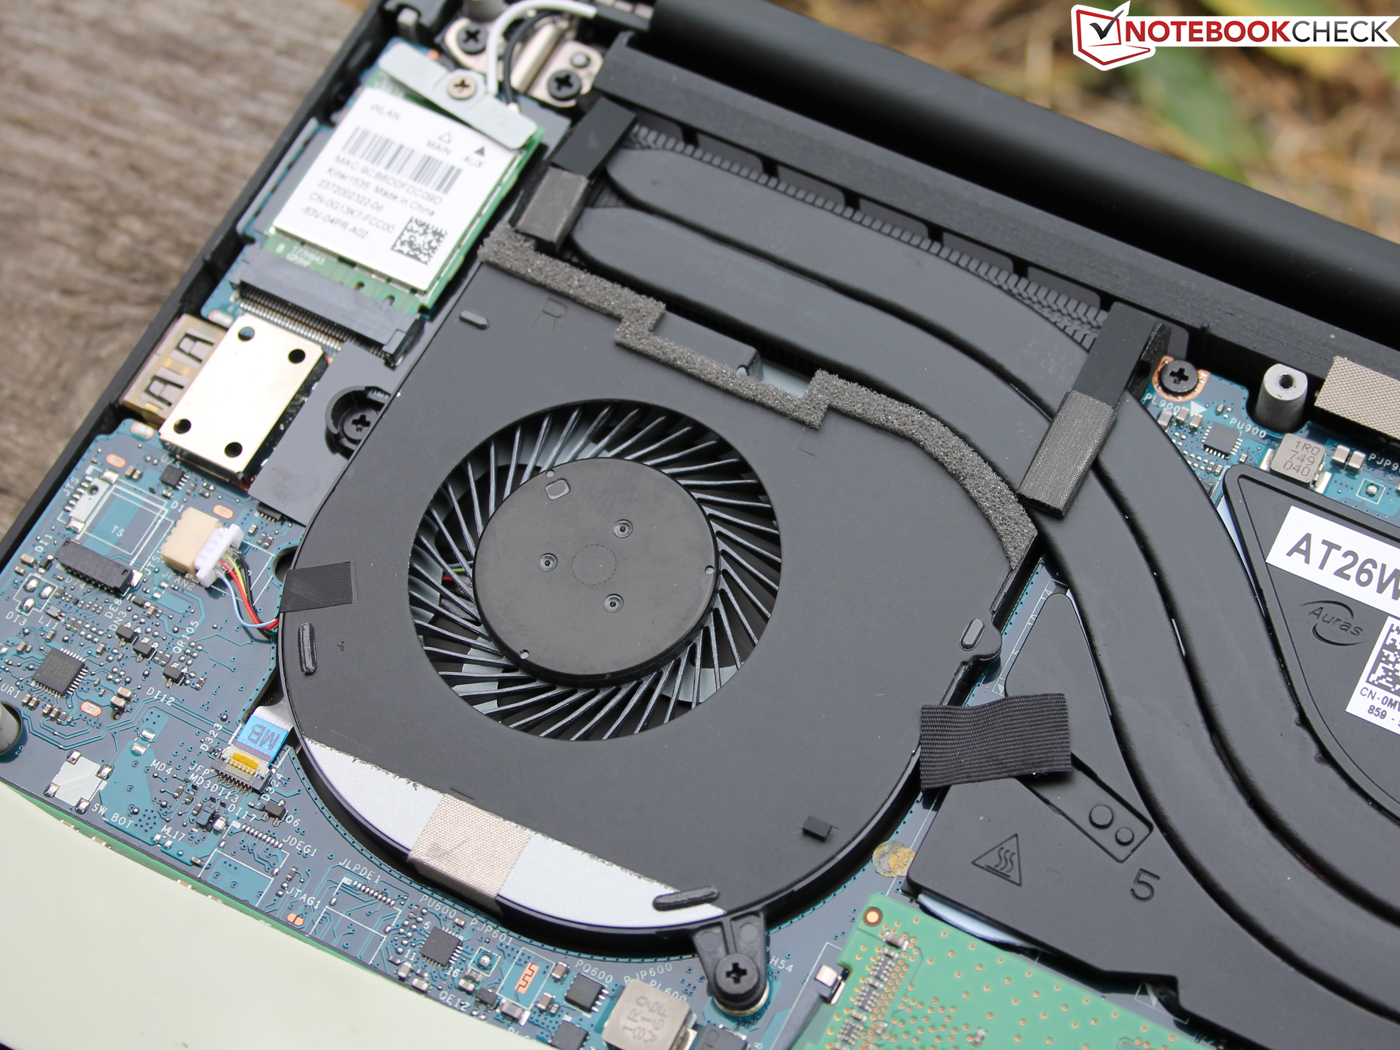
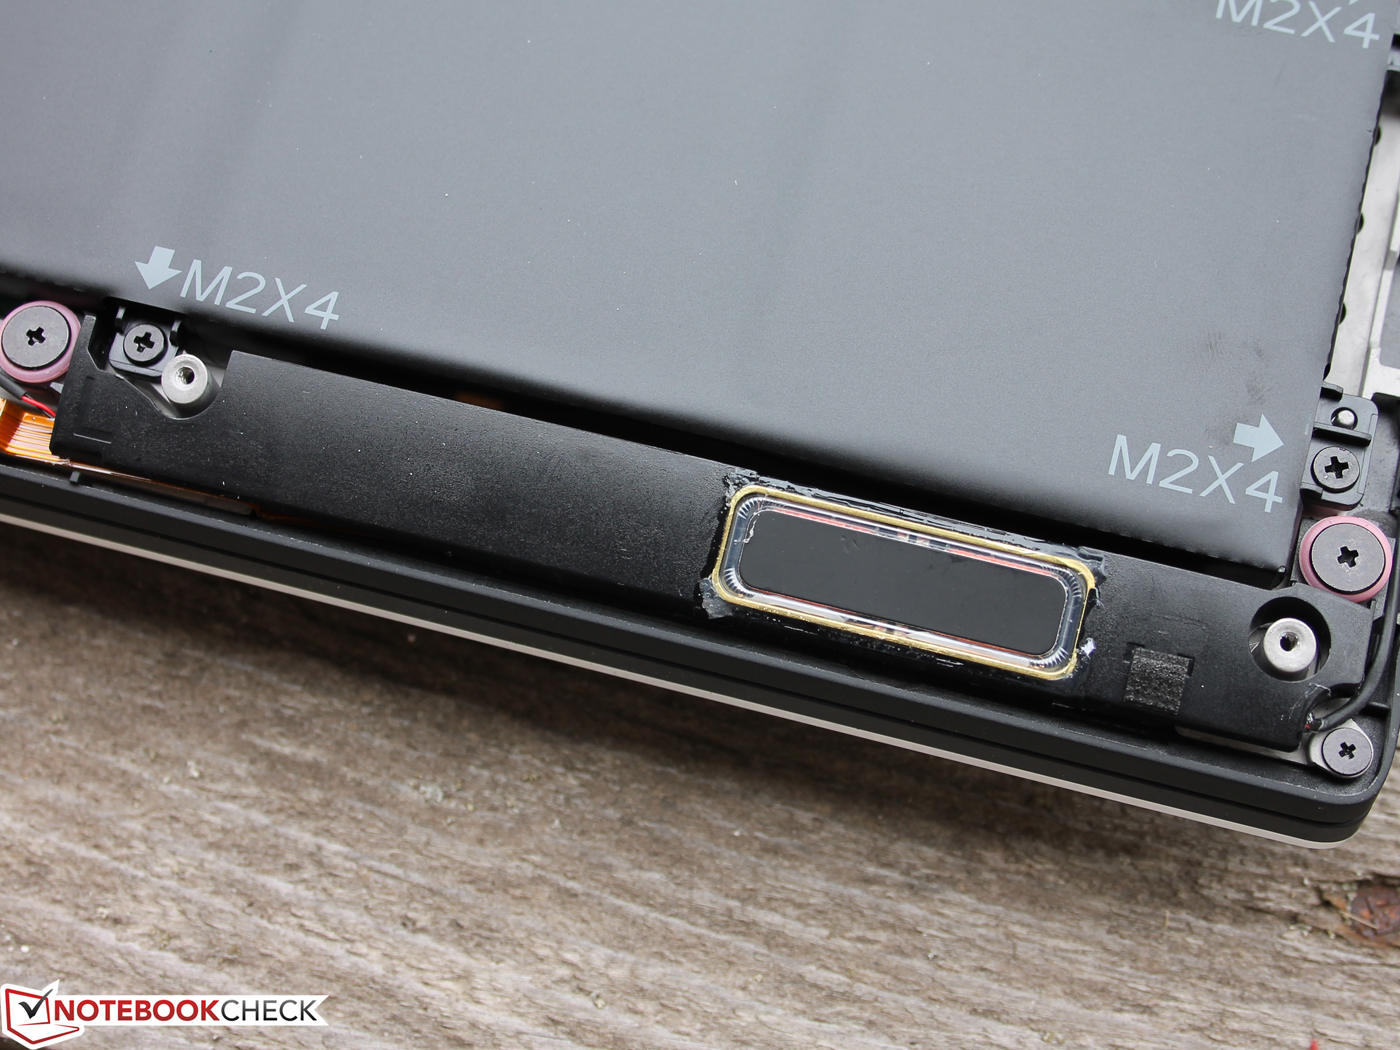
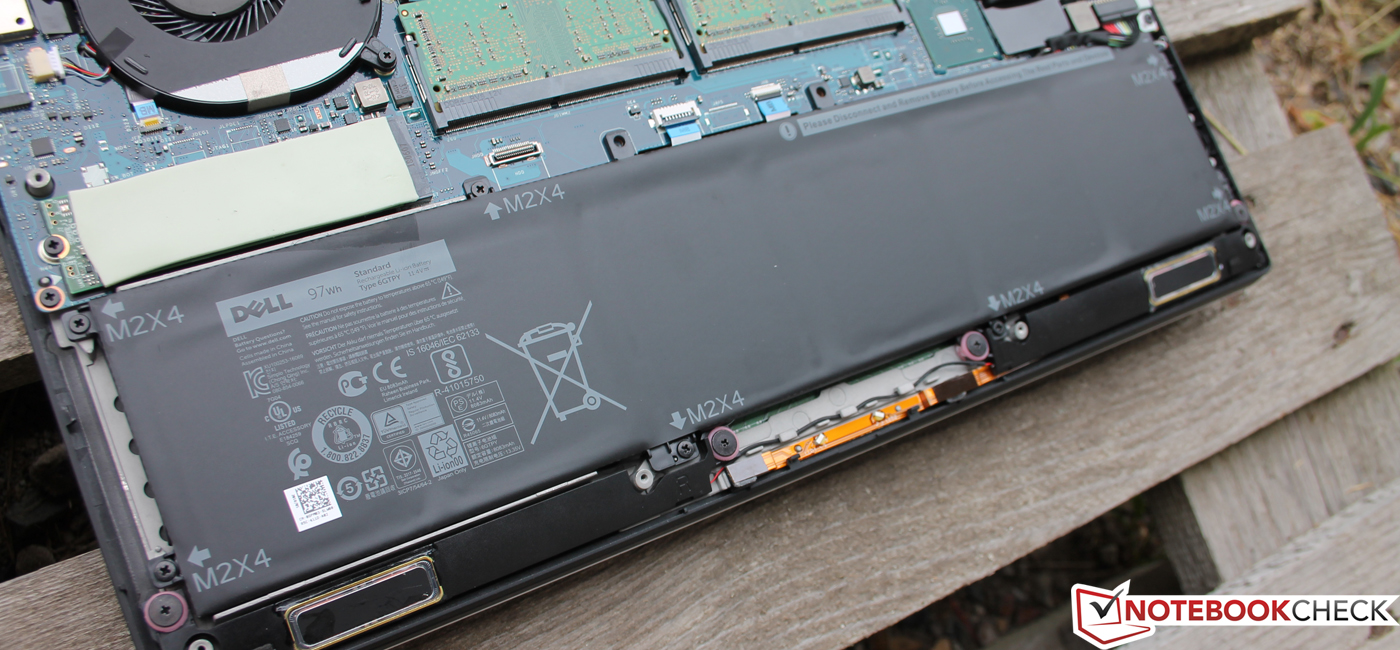
As long as you have a Phillips or Torx T5 screwdriver, you will have no problems opening the XPS 15. Dell has foregone plastic clips to secure the aluminum plate to the base unit. Just be aware that there are two more screws hidden beneath the flap with the type information.
After removing the aluminum cover, users have full access to the main components such as HDD, SSD, RAM, the battery, the Wi-Fi module and, of course, the two fans and heat pipes. It is comparatively easy to exchange the RAM or SSD, for example.
The 57-Wh version has a smaller battery, but offers space for a 2.5-inch SATA storage device.
Warranty
The basic configuration of all XPS 15 versions that Dell offers on its online store come with a one-year Premium Support warranty with on-site service. Should hardware need to be repaired, Dell will send a technician to your home within 1-2 business days after a remote diagnosis.
If you purchase Pro Support for your XPS 15 in the Dell Business shop, the manufacturer promises next business day repair. You can also extend this service agreement for a second year ($240), a third year ($300) or even a total of four years ($340).
Please see our Guarantees, Return policies and Warranties FAQ for country-specific information.
Input devices - the 9570 has first-class input devices
Keyboard
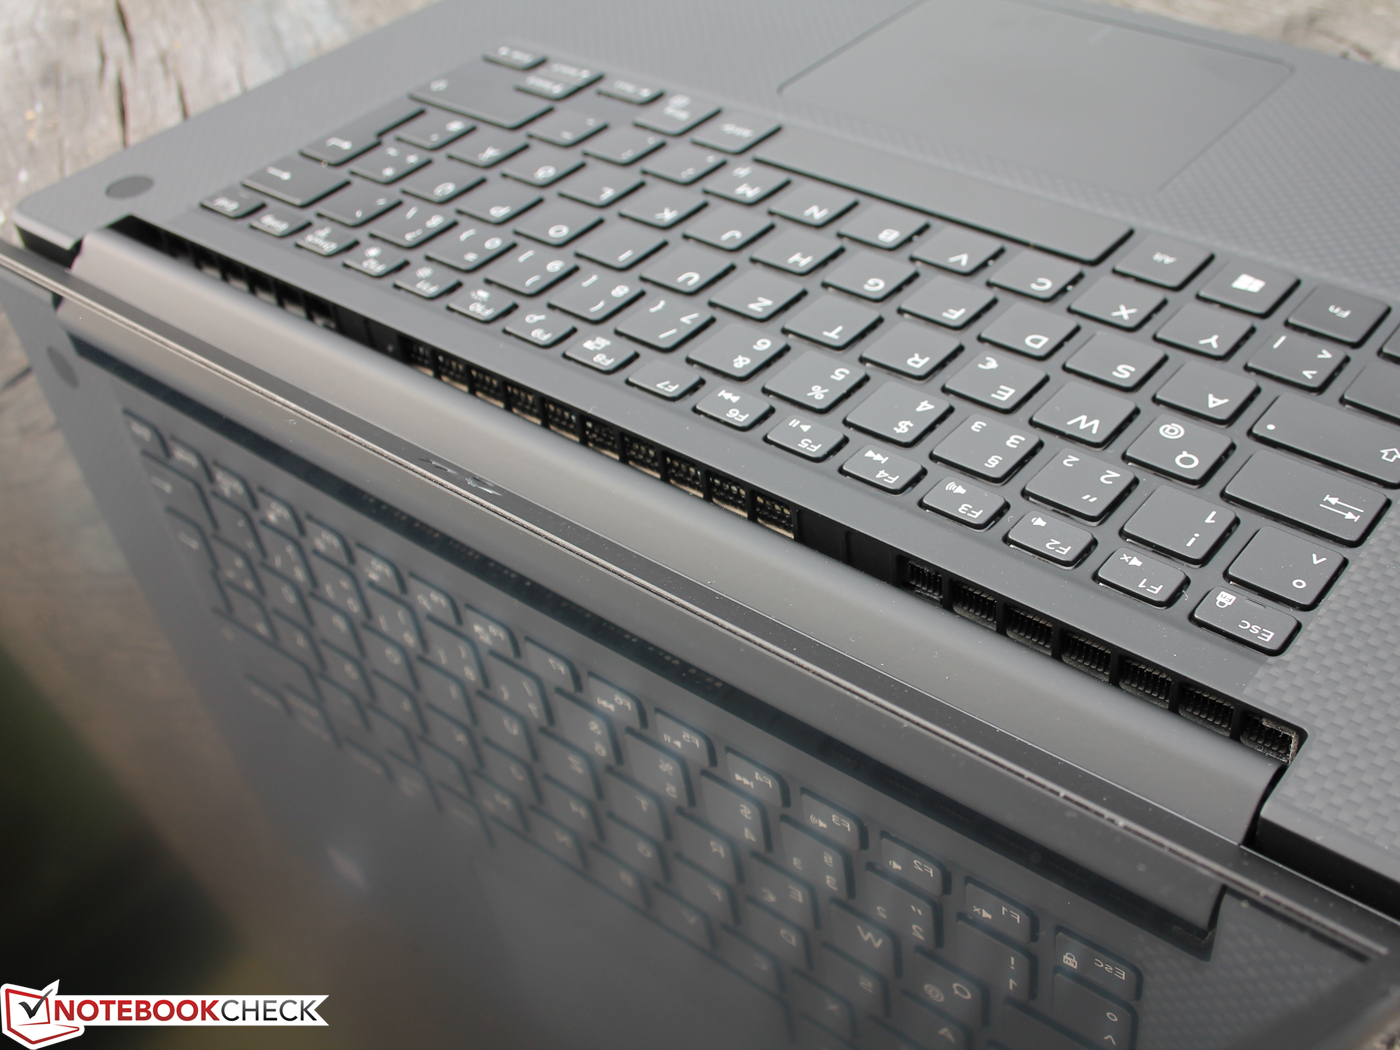
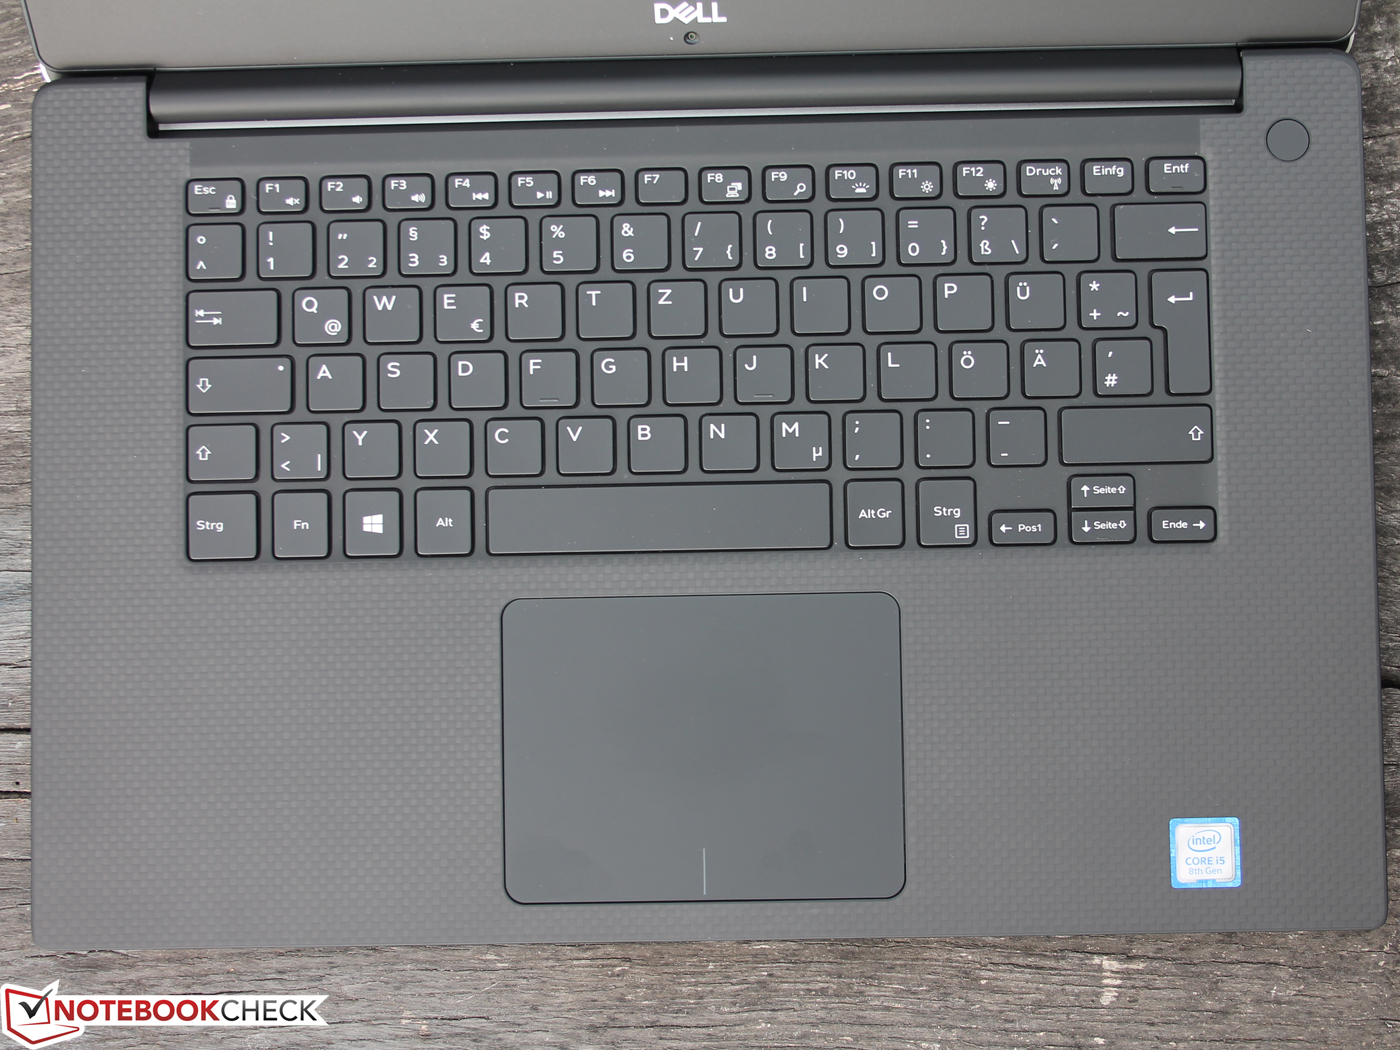
The keyboard is exactly the same as that of the predecessor. The typing experience, sound and travel are still pleasing, the individual keys are tight and respond well even when you hit them at the edges.
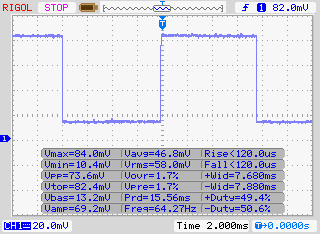
Dell has also included a two-level keyboard backlight that has PWM (pulse-width modulation) at a frequency of 64 Hz on the lower brightness level. The 2017 model also had PWM here. This will not be an issue for most users, but sensitive people might notice it. The flickering is easily observable in a slow-motion recording, which we did in our 2017 review: Dell XPS 15 2017 7300HQ.
The keyboard of the XPS 13 is about 5 mm (~0.2 in) narrower than that of our test unit.
Touchpad
Dell has also made no changes to the touchpad. We had no issues using it to navigate during our test. Gliding is easy and comfortable on the glass surface and the mechanic areas of the ClickPad work very well too. You do not need to apply too much pressure to make a click, but clicks are not too slack either. The touchpad responds with a muffled sound and well-adjusted tactile feedback.
Display - XPS 15 with high contrast
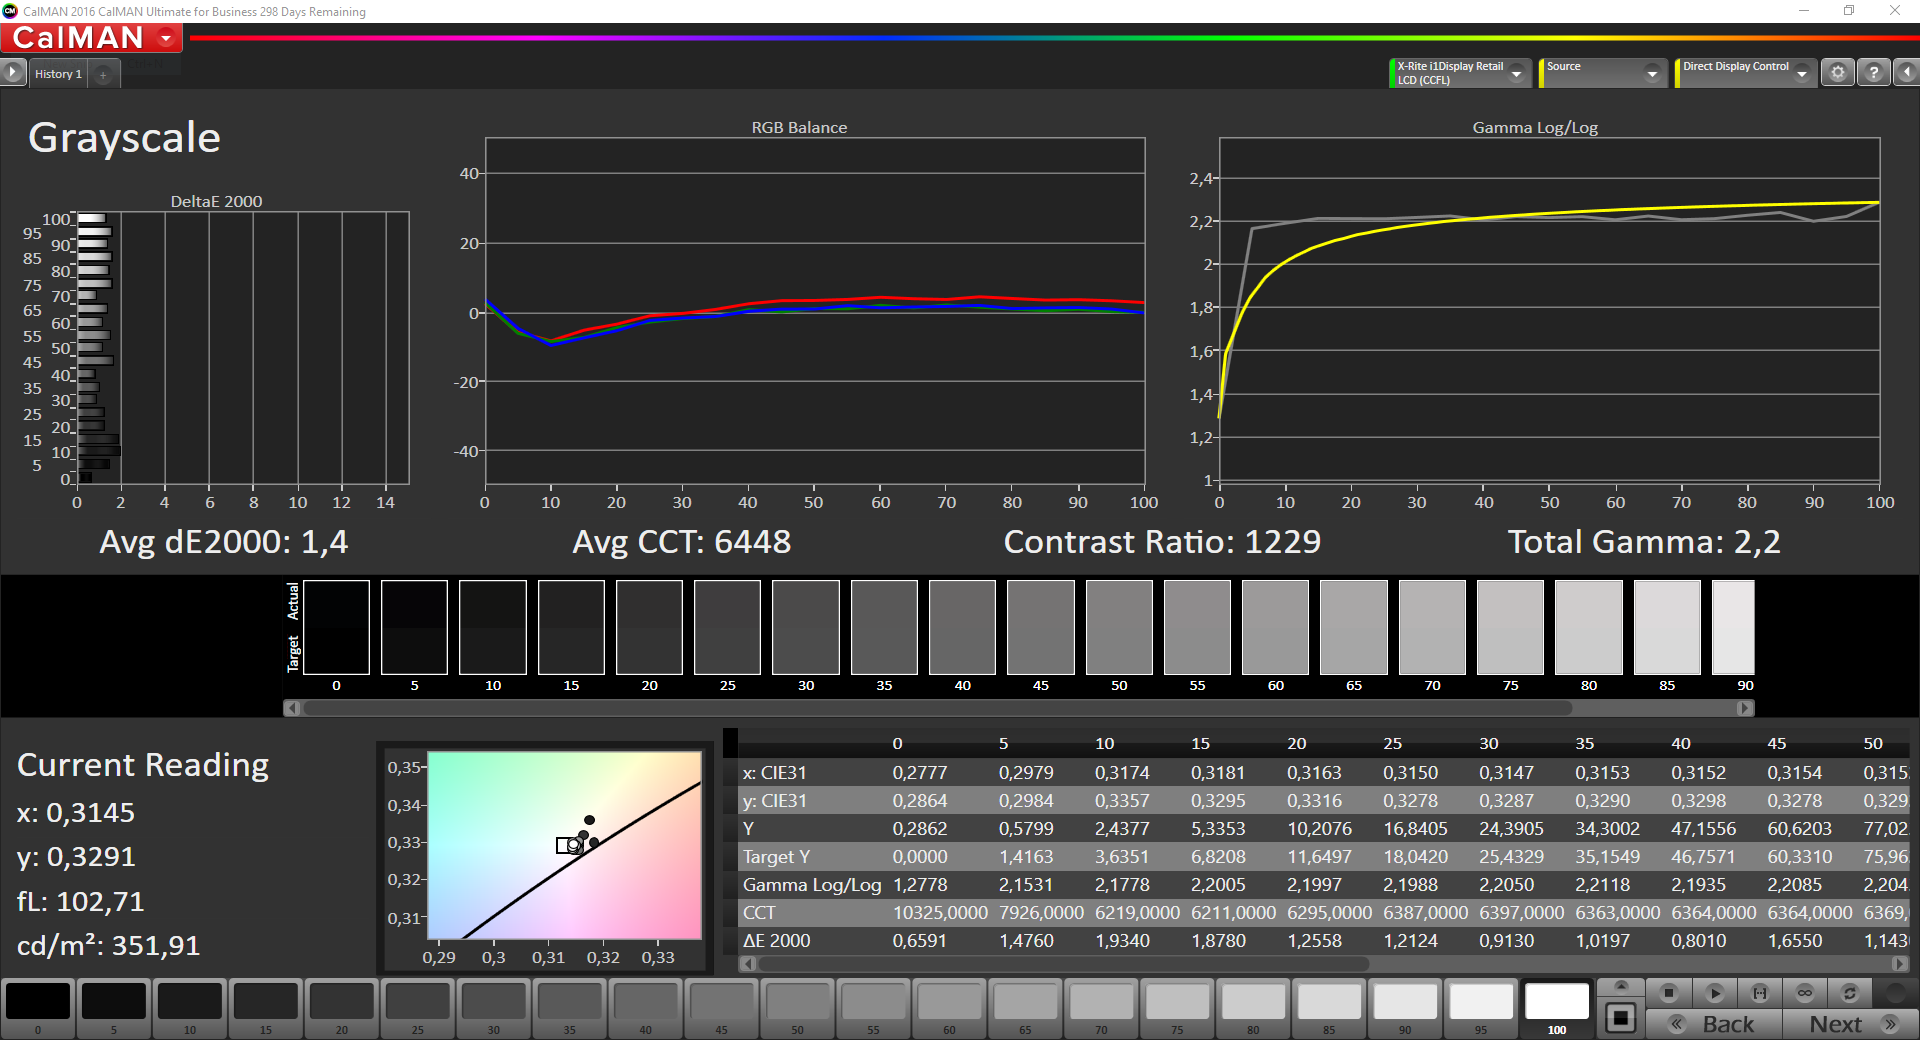
We decided to first test the XPS 15 9570 version with a Full-HD display. The display used in our test unit is called "Sharp SHP1453 LQ156M1", which hints at the fact that this display will be comparable to the ones used in the predecessors 9560/9550. Our measurements of brightness, contrast and color space are very similar. However, Dell has made some changes to the details. We now measured PWM flickering of 961 Hz, which was not the case in the previous version despite having a panel of the same build. But the PWM only occurs at a brightness level of 10% and below, so even sensitive users can avoid having to deal with its effects quite easily.
The display still has good values with a maximum brightness of 413 cd/m² and a low black value of only 0.29 cd/m² (maximum contrast: 1424:1). With these results, the Full-HD display does not need to fear comparison with the 2017 Apple MacBook Pro 15. Only the MacBook has a real advantage when looking at color space coverage and color accuracy (sRGB) ex-works.
The other available display has a 4K resolution and - if the current series continues to use the panel of the 2017 generation - has slightly lower contrast and brightness values. However, it offers an AdobeRGB color space coverage of 88%, which is unusually high. We will also be reviewing the current 4K model in an upcoming review.
The resolution of 1920x1080 pixels on the 15.6-inch screen is suitable for most areas of use. The image is sufficiently sharp, and it is not necessary to increase the size of text and symbols, which also avoids issues displaying content due to scaling.
The alternative 4K display could be particularly interesting for professional graphic designers that are dependent on an AdobeRGB98 color space that is as accurate as possible. Provided, of course, that the measurements we took last year apply to the current version. Programmers and professional office users (large Excel databases, etc.) could also benefit from the high resolution as writing is displayed very clearly even at small font sizes.
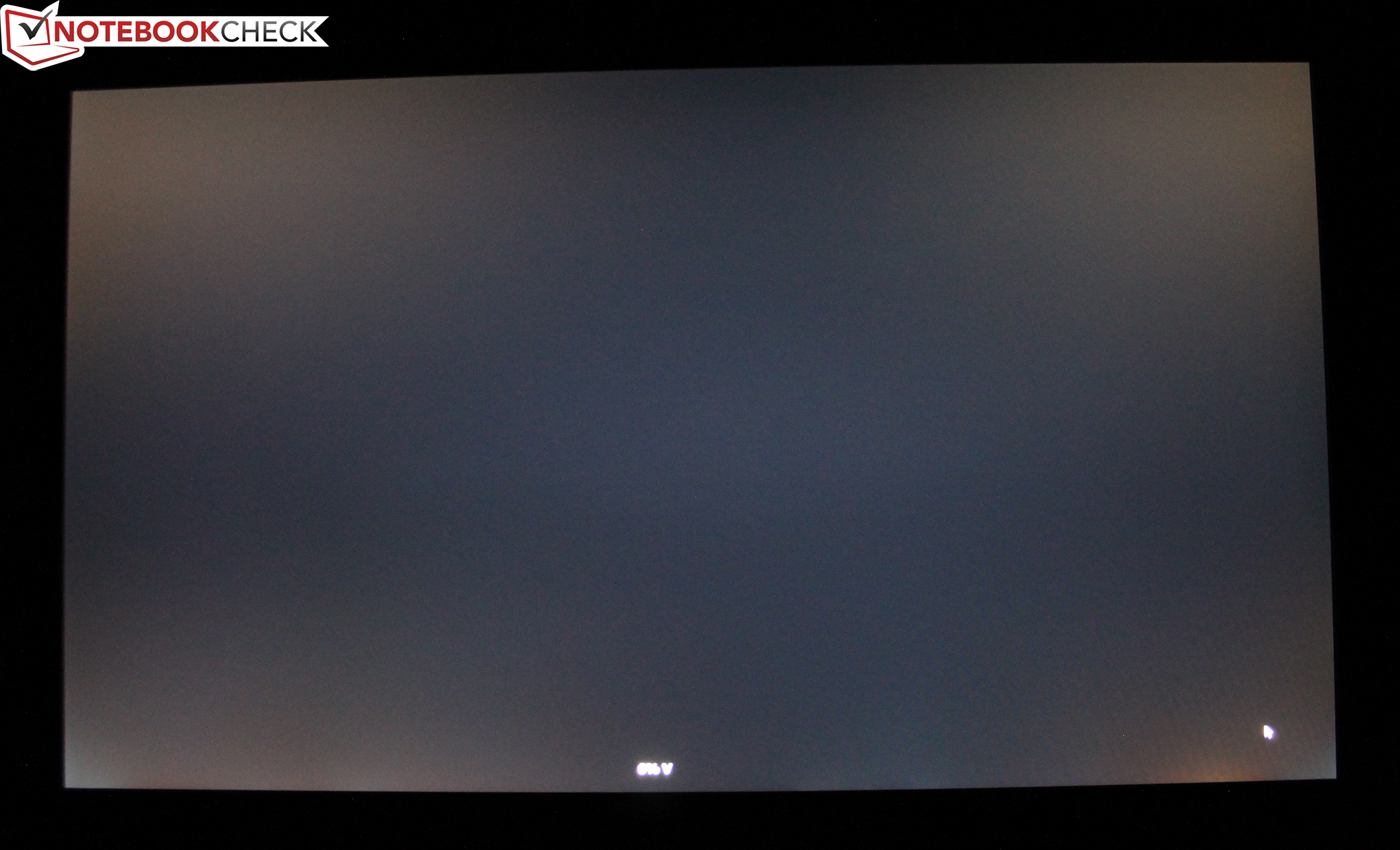
We did notice some backlight bleeding around the edges of our test unit on dark content and in dark surroundings. This will not be particularly bothersome in day-to-day use.
| |||||||||||||||||||||||||
Brightness Distribution: 86 %
Center on Battery: 414 cd/m²
Contrast: 1424:1 (Black: 0.29 cd/m²)
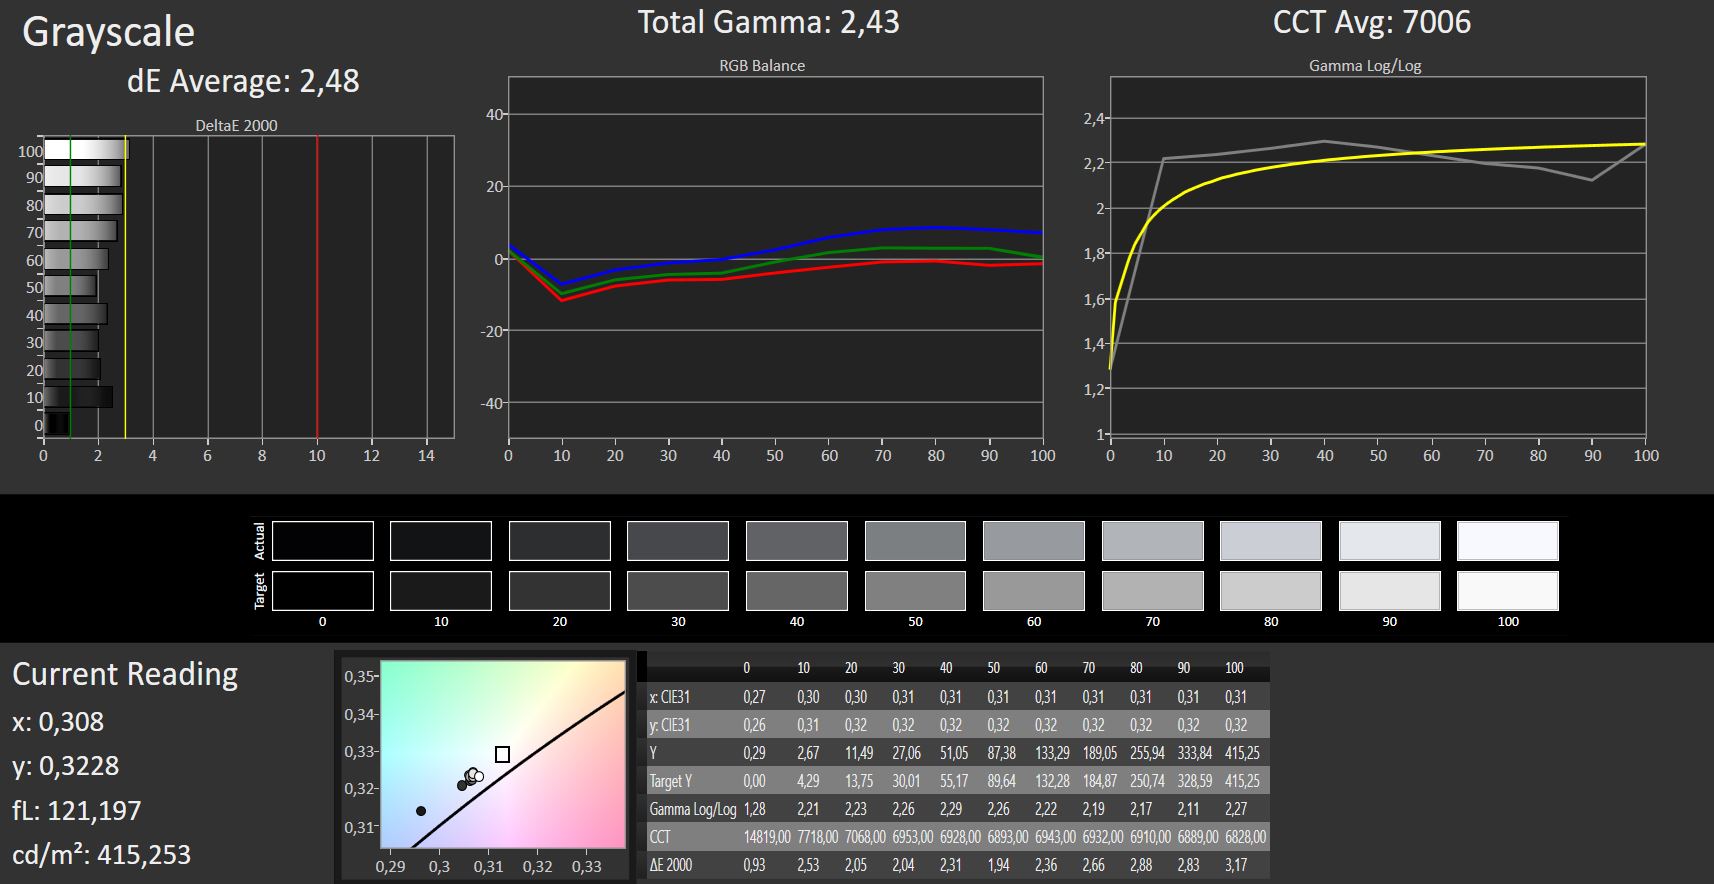
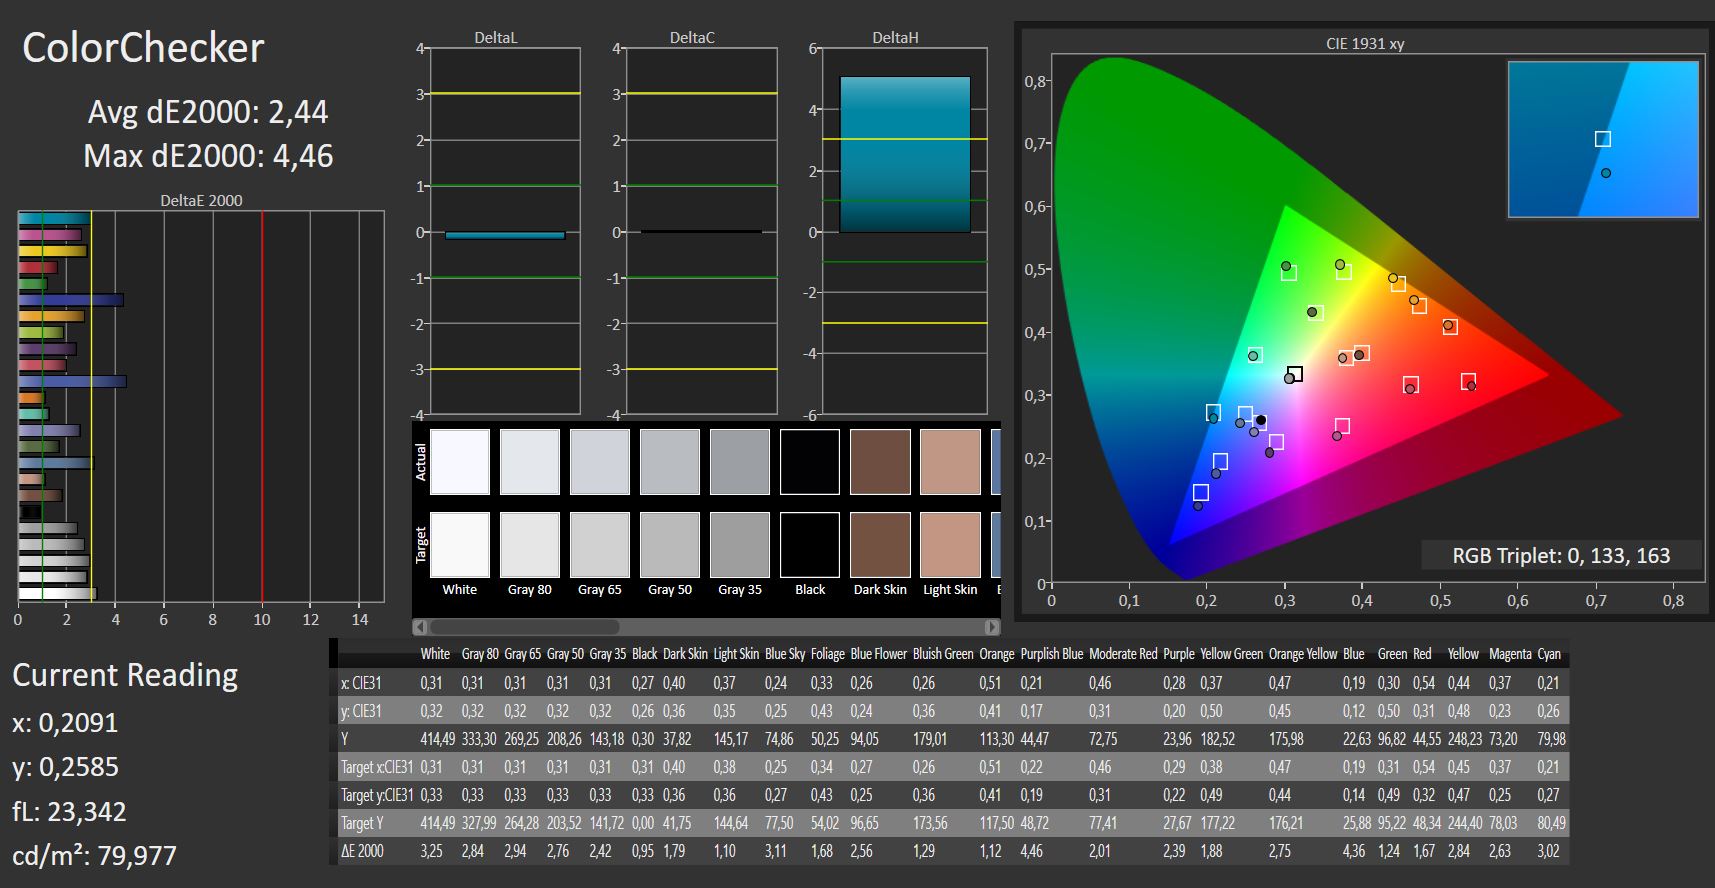
ΔE ColorChecker Calman: 2.44 | ∀{0.5-29.43 Ø4.71}
calibrated: 2.48
ΔE Greyscale Calman: 2.48 | ∀{0.09-98 Ø4.96}
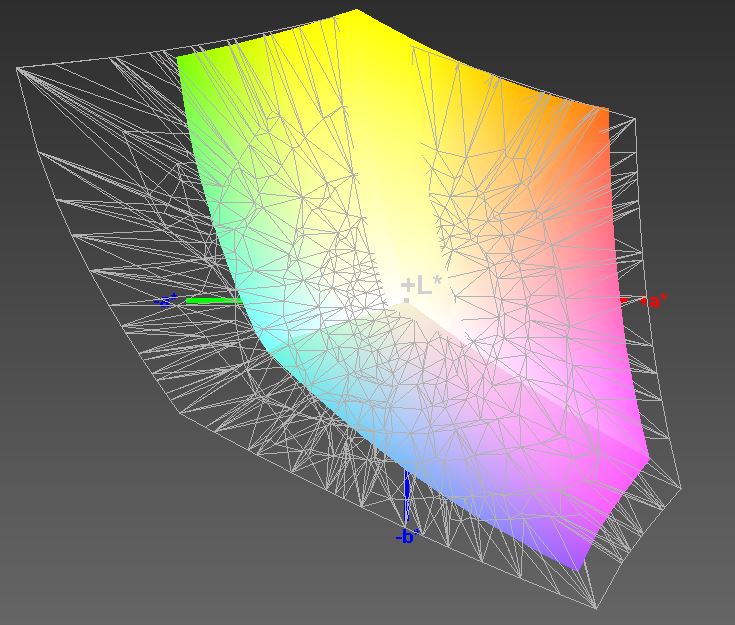
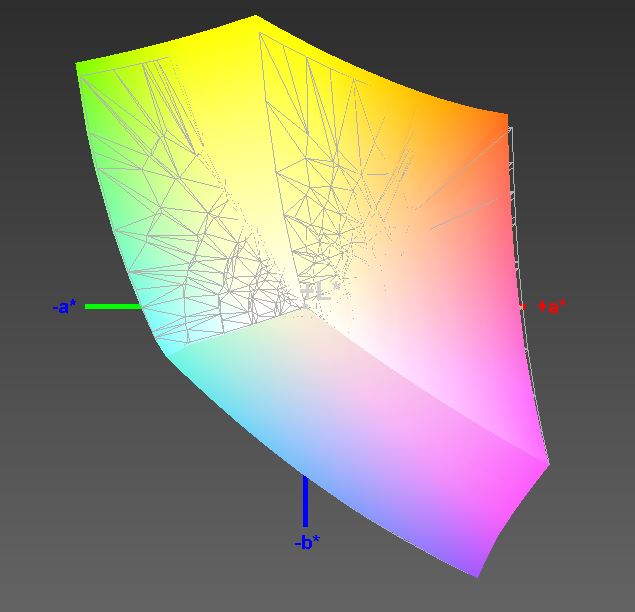
96% sRGB (Argyll 1.6.3 3D)
62% AdobeRGB 1998 (Argyll 1.6.3 3D)
66.7% AdobeRGB 1998 (Argyll 3D)
96.5% sRGB (Argyll 3D)
66% Display P3 (Argyll 3D)
Gamma: 2.43
CCT: 7006 K
| Dell XPS 15 2018 i5 FHD 97Wh Sharp SHP149A LQ156M1, , 1920x1080, 15.6" | Dell XPS 15 9560 (i7-7700HQ, UHD) 3840x2160, 15.6" | Dell XPS 15 2017 9560 (7300HQ, Full-HD) Sharp SHP1453 LQ156M1, , 1920x1080, 15.6" | Dell XPS 13 9370 FHD i5 SHP1484, , 1920x1080, 13.3" | Apple MacBook Pro 15 2017 (2.8 GHz, 555) APPA031, , 2880x1800, 15.4" | Gigabyte Aero 14-K8 AU Optronics B140QAN01.5 (AUO1536), , 2560x1440, 14" | Gigabyte Aero 15 N156HCA-EA1 (CMN15D7), , 1920x1080, 15.6" | Asus Zenbook Pro UX550VE-DB71T N156HCE-EN1 (CMN15E8), , 1920x1080, 15.6" | |
|---|---|---|---|---|---|---|---|---|
| Display | 30% | 4% | 3% | 27% | 3% | -2% | -4% | |
| Display P3 Coverage (%) | 66 | 89.7 36% | 68.9 4% | 68.9 4% | 97.9 48% | 69.1 5% | 65.2 -1% | 64.3 -3% |
| sRGB Coverage (%) | 96.5 | 100 4% | 98.9 2% | 96.6 0% | 99.9 4% | 96 -1% | 92.5 -4% | 90.4 -6% |
| AdobeRGB 1998 Coverage (%) | 66.7 | 100 50% | 70.9 6% | 69.6 4% | 85.9 29% | 70.3 5% | 66.5 0% | 65.3 -2% |
| Response Times | -24% | -43% | -40% | -6% | -5% | 3% | 2% | |
| Response Time Grey 50% / Grey 80% * (ms) | 49 ? | 57.2 ? -17% | 54 ? -10% | 62.4 ? -27% | 48 ? 2% | 47.2 ? 4% | 42.8 ? 13% | 43.2 ? 12% |
| Response Time Black / White * (ms) | 30 ? | 39.2 ? -31% | 52.4 ? -75% | 45.6 ? -52% | 33.8 ? -13% | 34 ? -13% | 32 ? -7% | 32.8 ? -9% |
| PWM Frequency (Hz) | 961 ? | 962 | 1008 ? | 119000 ? | 26000 ? | 25510 ? | ||
| Screen | -35% | -41% | -16% | 10% | 6% | -45% | -62% | |
| Brightness middle (cd/m²) | 413 | 370.1 -10% | 400 -3% | 428 4% | 545 32% | 256 -38% | 320 -23% | 288.2 -30% |
| Brightness (cd/m²) | 378 | 356 -6% | 392 4% | 405 7% | 523 38% | 250 -34% | 316 -16% | 266 -30% |
| Brightness Distribution (%) | 86 | 87 1% | 89 3% | 87 1% | 86 0% | 90 5% | 90 5% | 75 -13% |
| Black Level * (cd/m²) | 0.29 | 0.37 -28% | 0.26 10% | 0.26 10% | 0.44 -52% | 0.28 3% | 0.36 -24% | 0.3 -3% |
| Contrast (:1) | 1424 | 1000 -30% | 1538 8% | 1646 16% | 1239 -13% | 914 -36% | 889 -38% | 961 -33% |
| Colorchecker dE 2000 * | 2.44 | 5.3 -117% | 4.9 -101% | 3.8 -56% | 1.6 34% | 1.21 50% | 4.62 -89% | 5.5 -125% |
| Colorchecker dE 2000 max. * | 4.46 | 9.9 -122% | 11 -147% | 7.2 -61% | 3.8 15% | 2.11 53% | 9.75 -119% | 11.3 -153% |
| Colorchecker dE 2000 calibrated * | 2.48 | |||||||
| Greyscale dE 2000 * | 2.48 | 4.6 -85% | 7.2 -190% | 4.4 -77% | 1.9 23% | 1.13 54% | 6 -142% | 7.9 -219% |
| Gamma | 2.43 91% | 2.31 95% | 2.11 104% | 2.21 100% | 2.26 97% | 2.42 91% | 2.46 89% | 2.09 105% |
| CCT | 7006 93% | 6284 103% | 6911 94% | 7067 92% | 6834 95% | 6422 101% | 6761 96% | 6559 99% |
| Color Space (Percent of AdobeRGB 1998) (%) | 62 | 88.3 42% | 64.2 4% | 62.8 1% | 62 0% | 60 -3% | 58.5 -6% | |
| Color Space (Percent of sRGB) (%) | 96 | 100 4% | 98.9 3% | 96.4 0% | 96 0% | 92 -4% | 90 -6% | |
| Total Average (Program / Settings) | -10% /
-21% | -27% /
-32% | -18% /
-15% | 10% /
11% | 1% /
4% | -15% /
-30% | -21% /
-42% |
* ... smaller is better
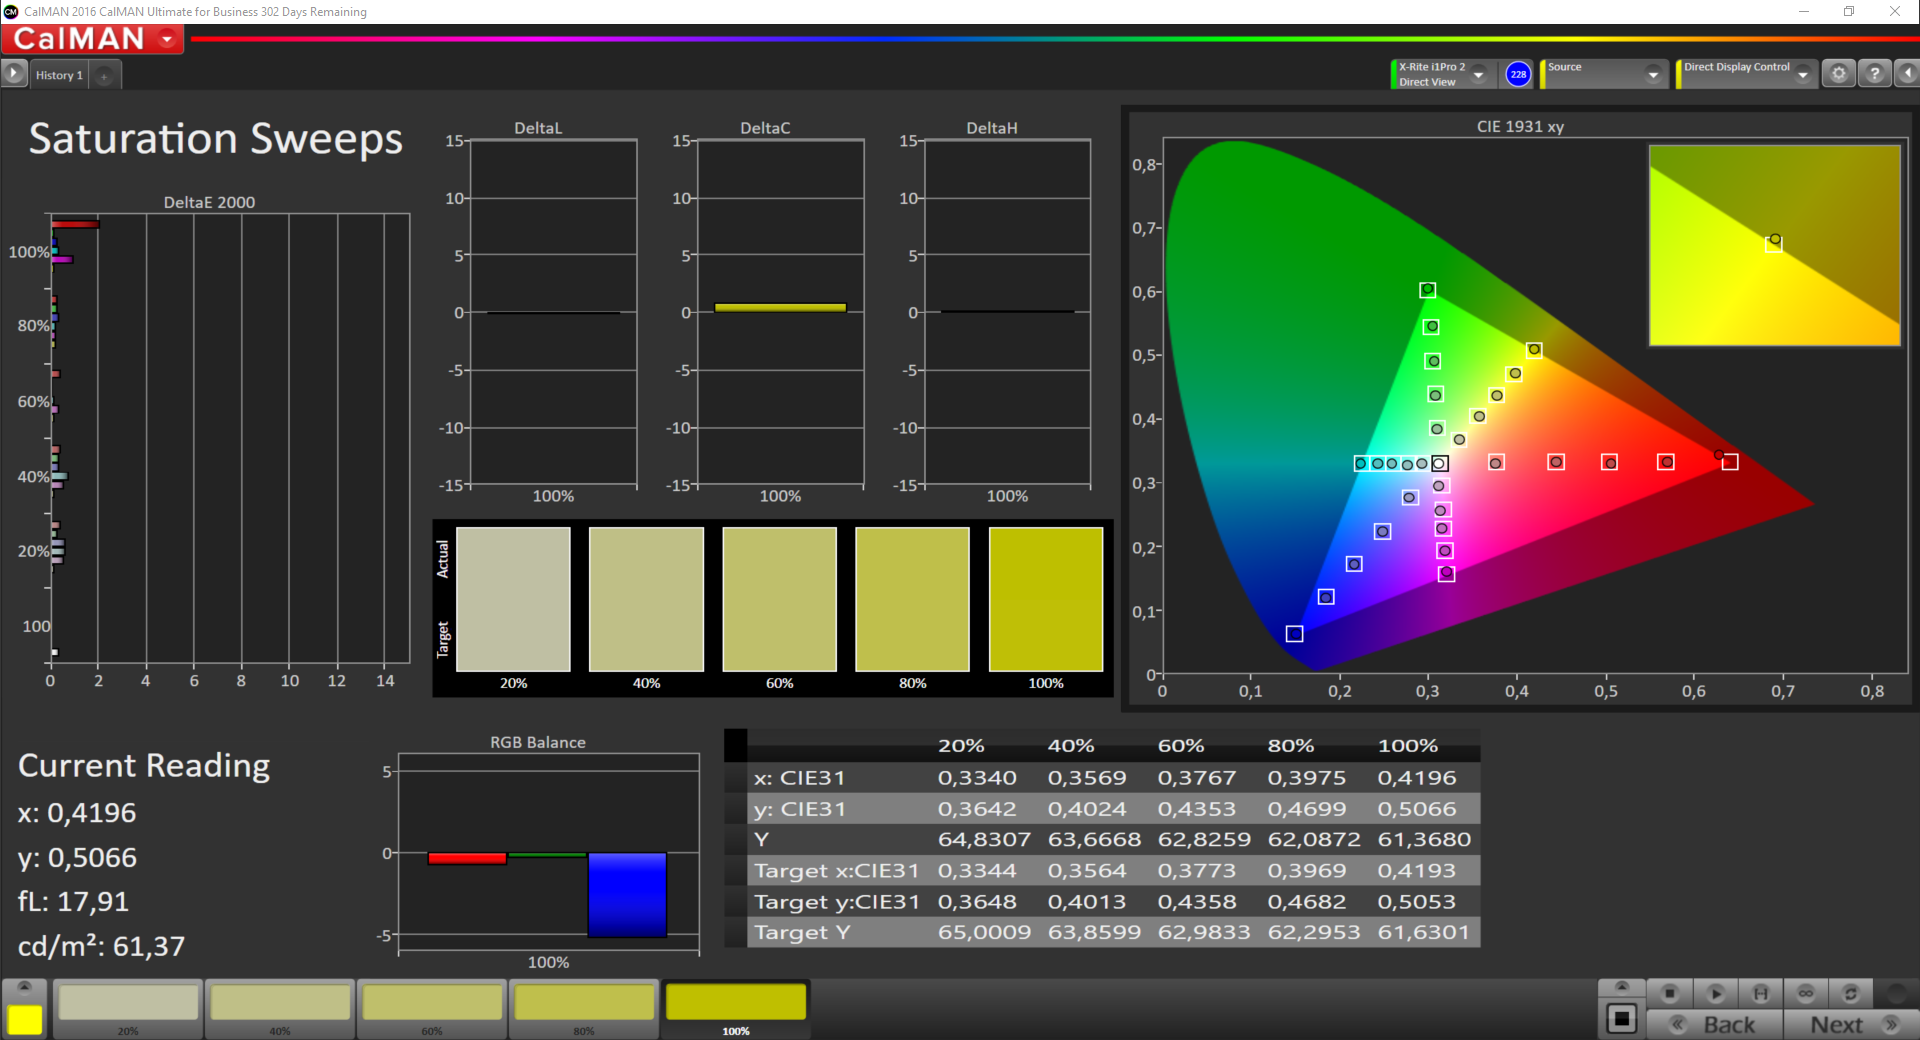
Displaying colors correctly was not one of the 2017 XPS 15 9560's forte. We measured a maximum deviation of 11 and an average deviation of 5 with the CalMAN ColorChecker on the Full-HD screen of last year's XPS 15.
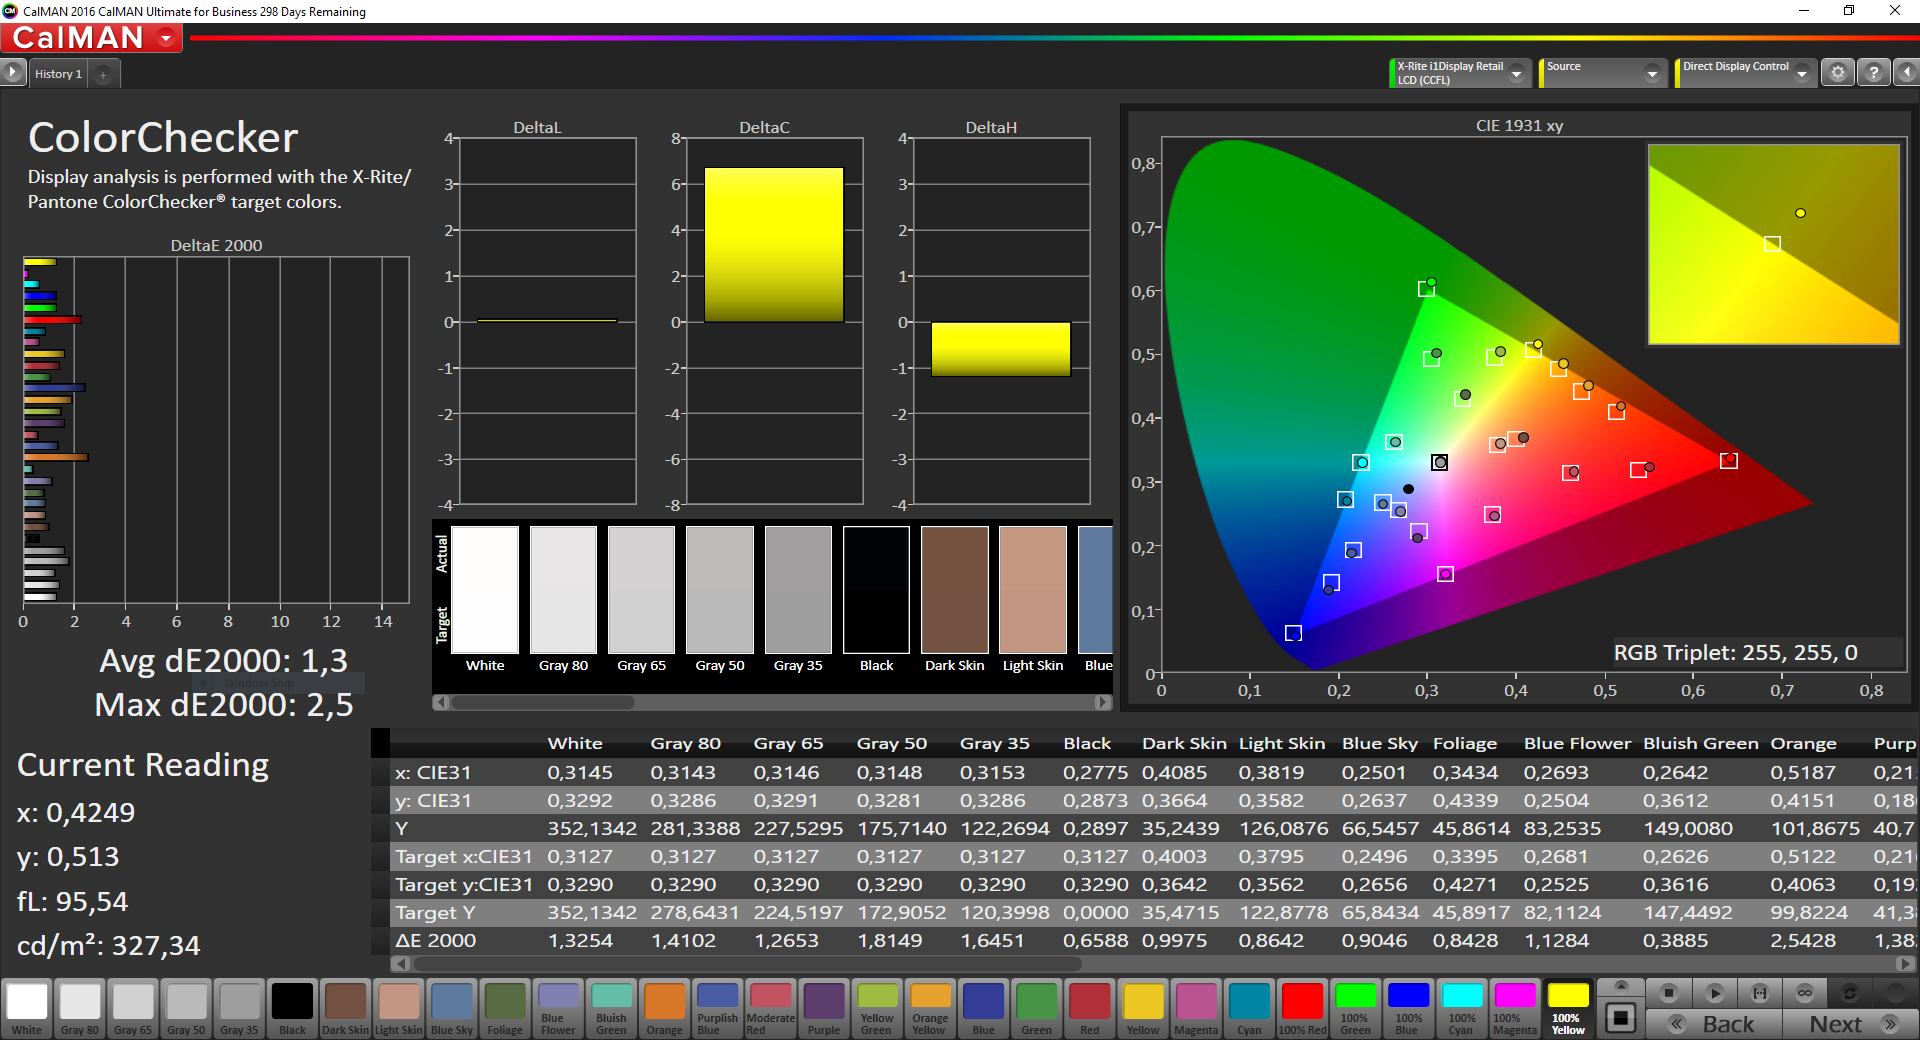
Dell has made some improvements this time and offers better display quality: The DeltaE ColorChecker results have dropped to 2.4 and the maximum deviation is only 4.5. And this ex-works.
Please be aware: At a value of 3 and below it is almost impossible to notice any differences with the naked eye. There is a slight blue cast according to our measurements, but this is only noticeable when you compare the colors directly.
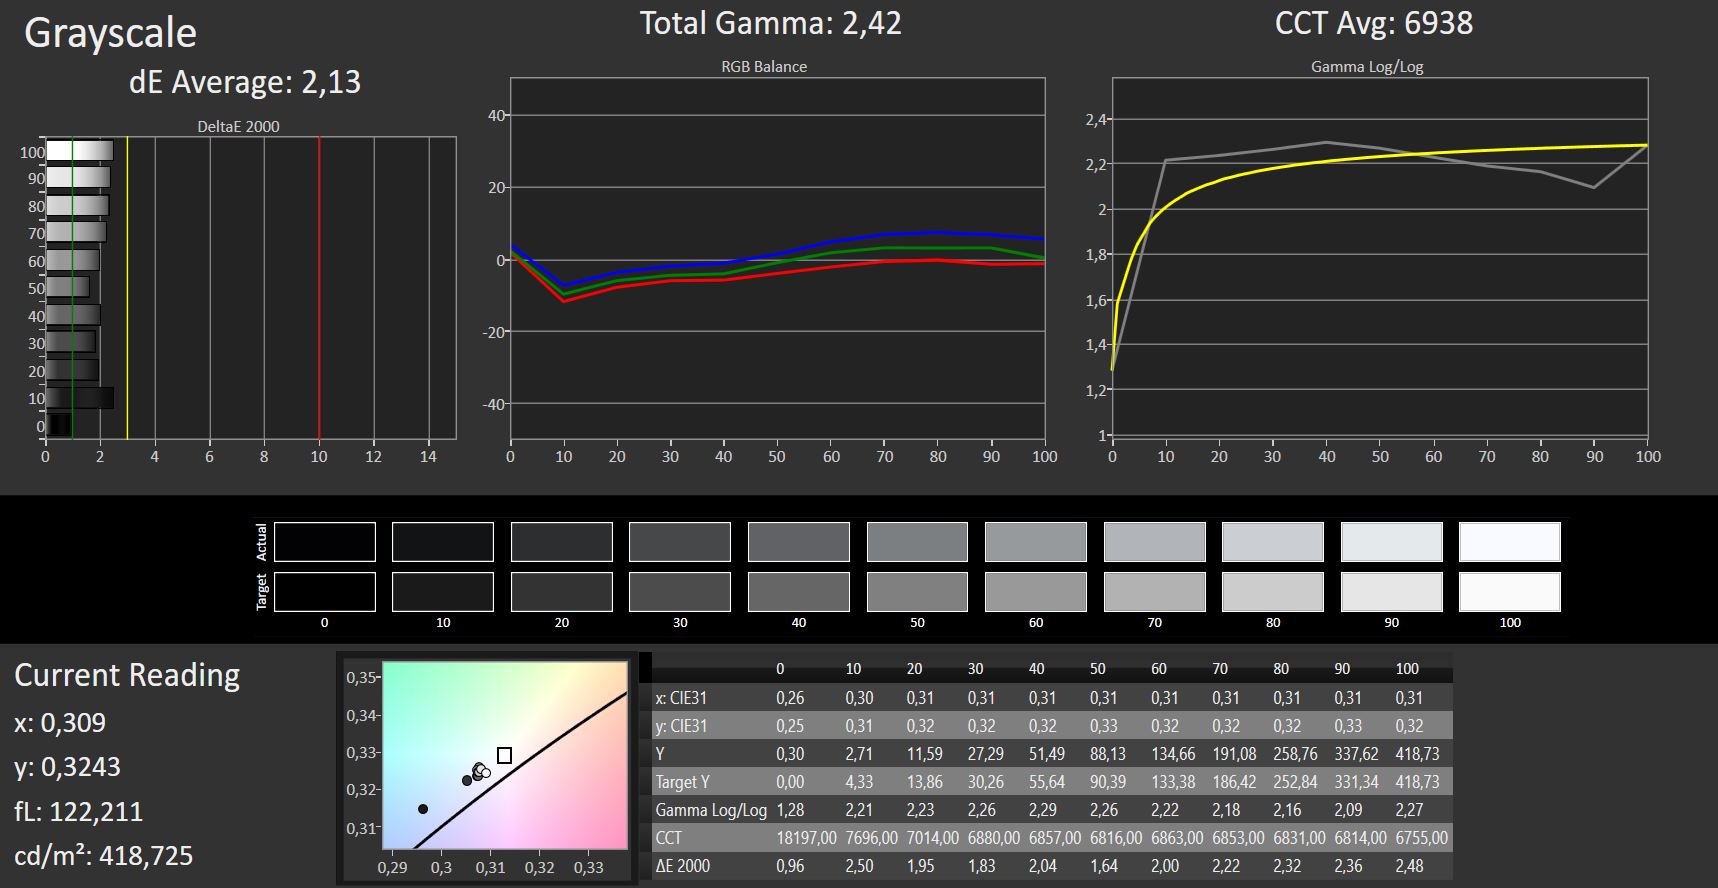
The Full-HD display can be calibrated (sRGB) which improves the results even more: 2.2 / 4.3 in the DeltaE ColorChecker/Max. The DeltaE Grayscale results drop from 2.5 to 2.1. You can download the ICC file for free from above.


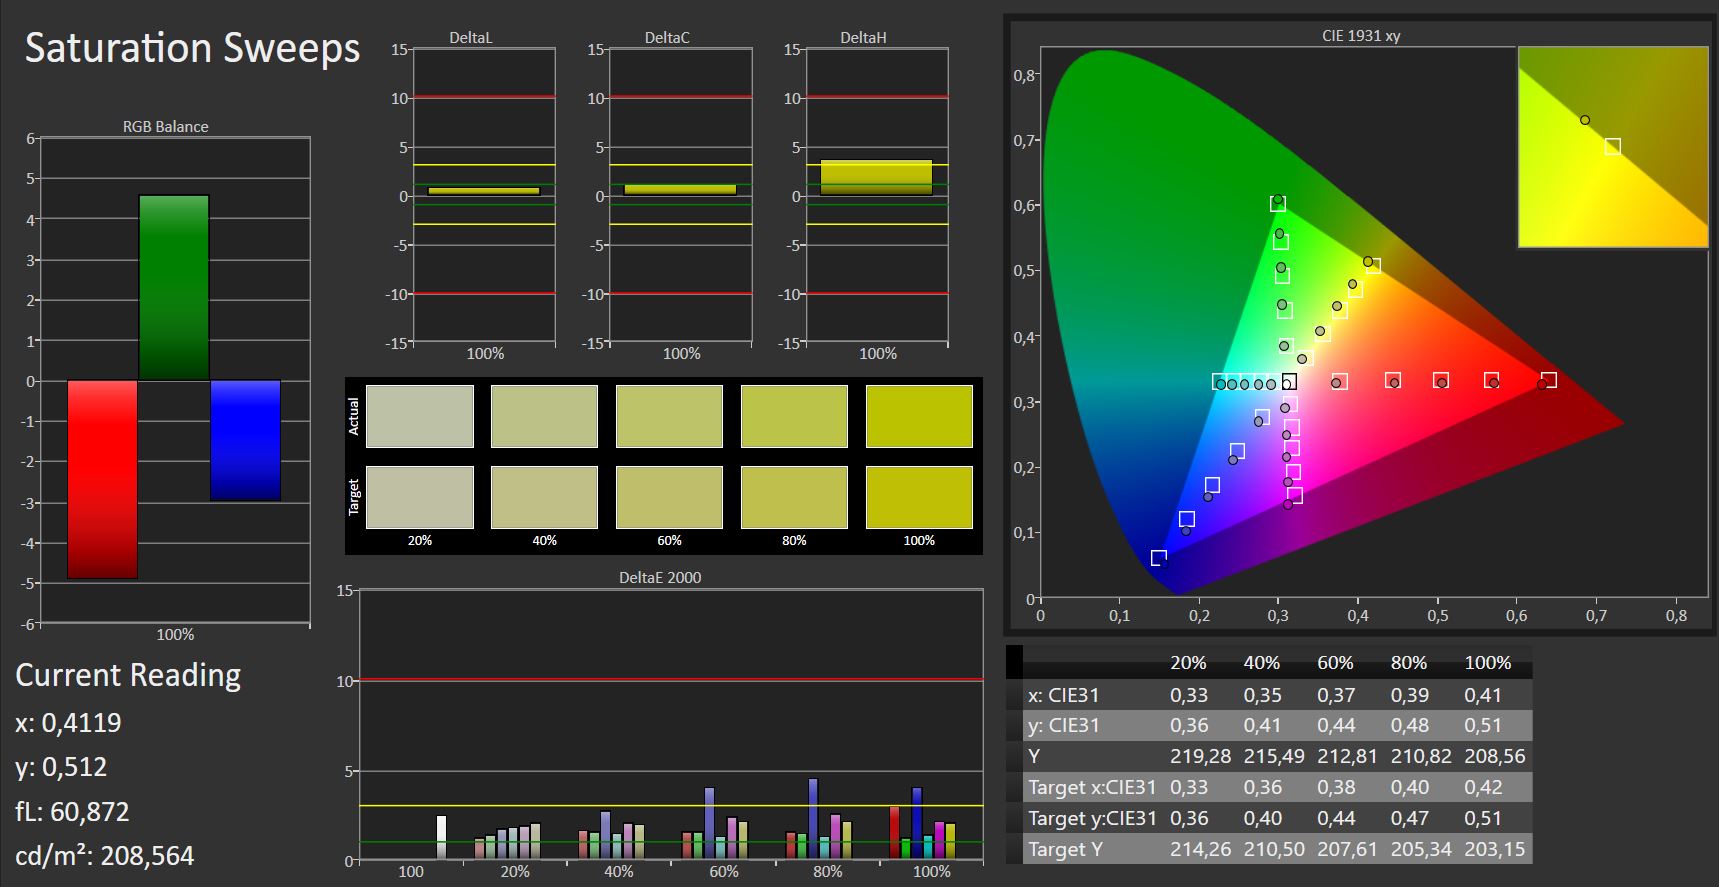
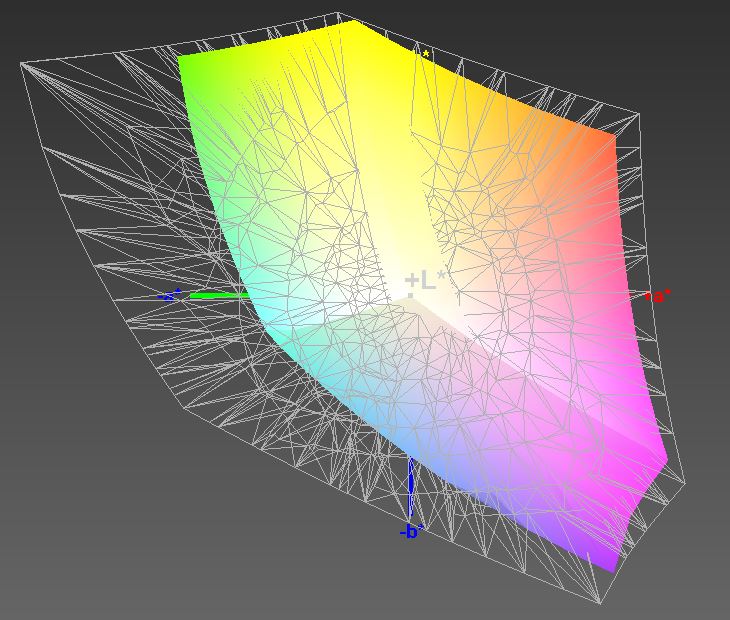
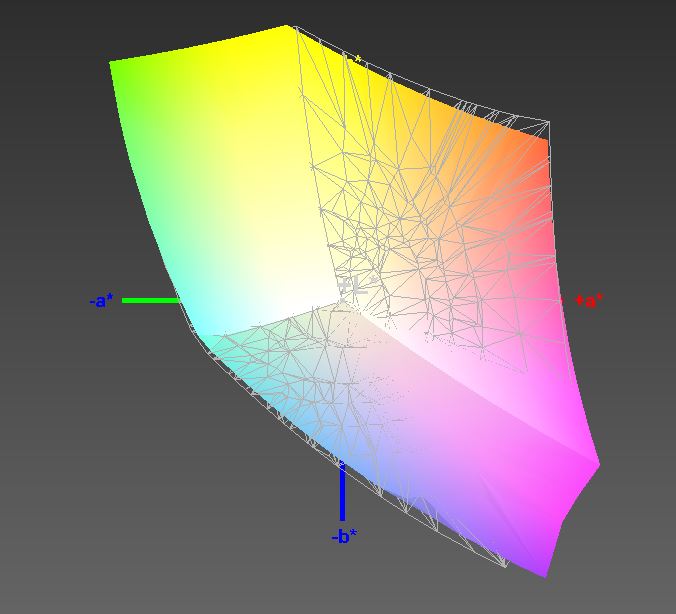
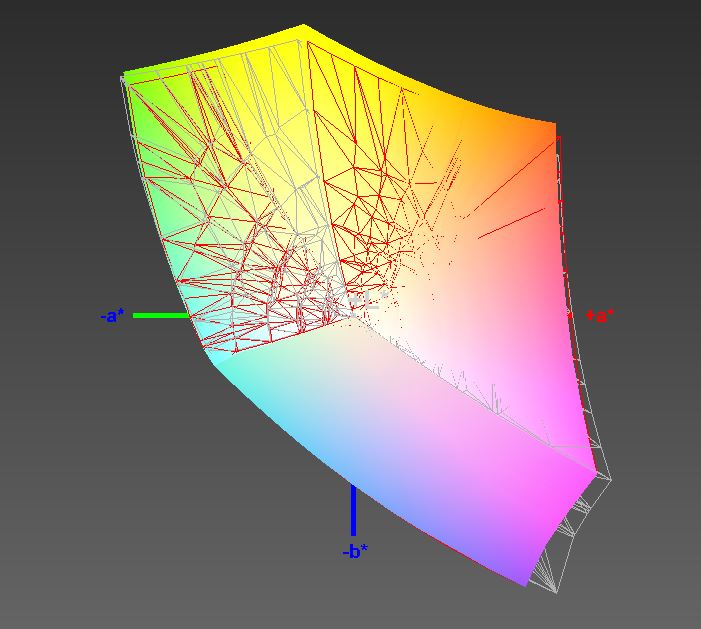
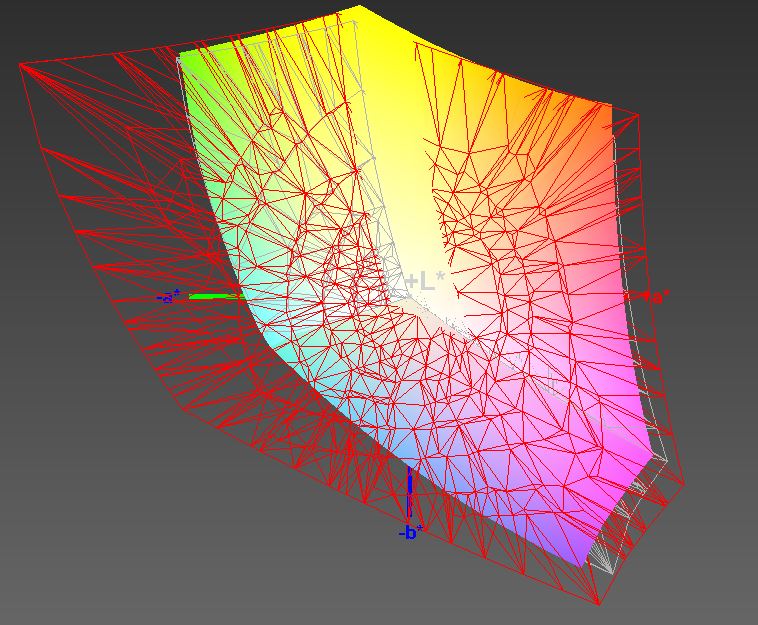
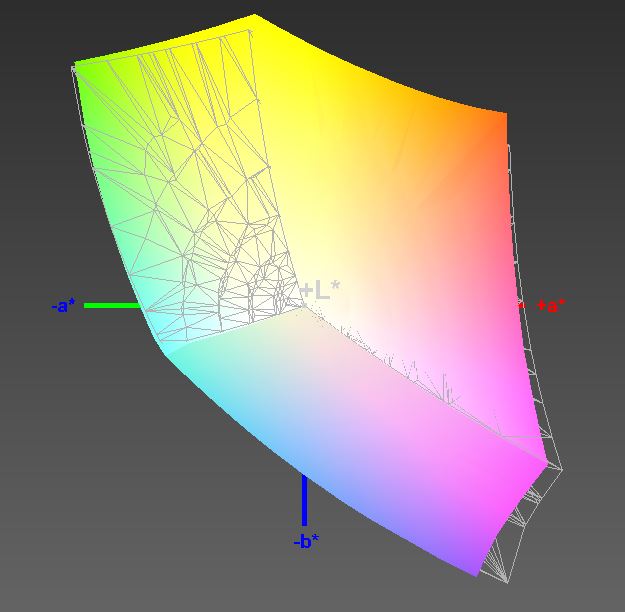
Following our readers' request, here is a comparison of the XPS 15 9560 and 9570 color spaces with one-another as well as with sRGB/AdobeRGB.
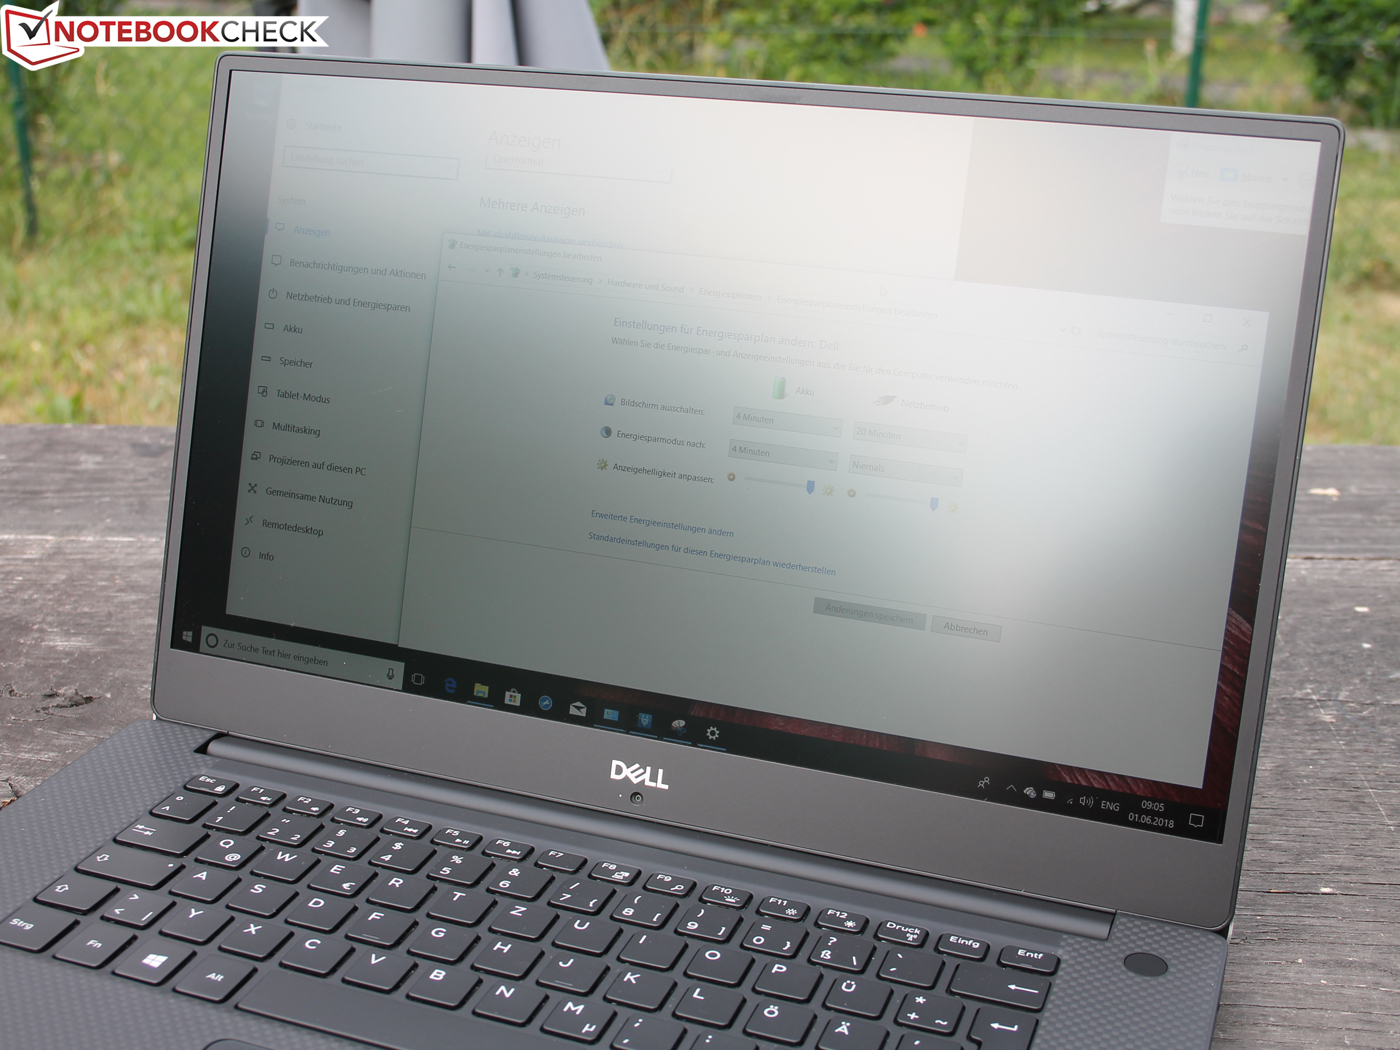
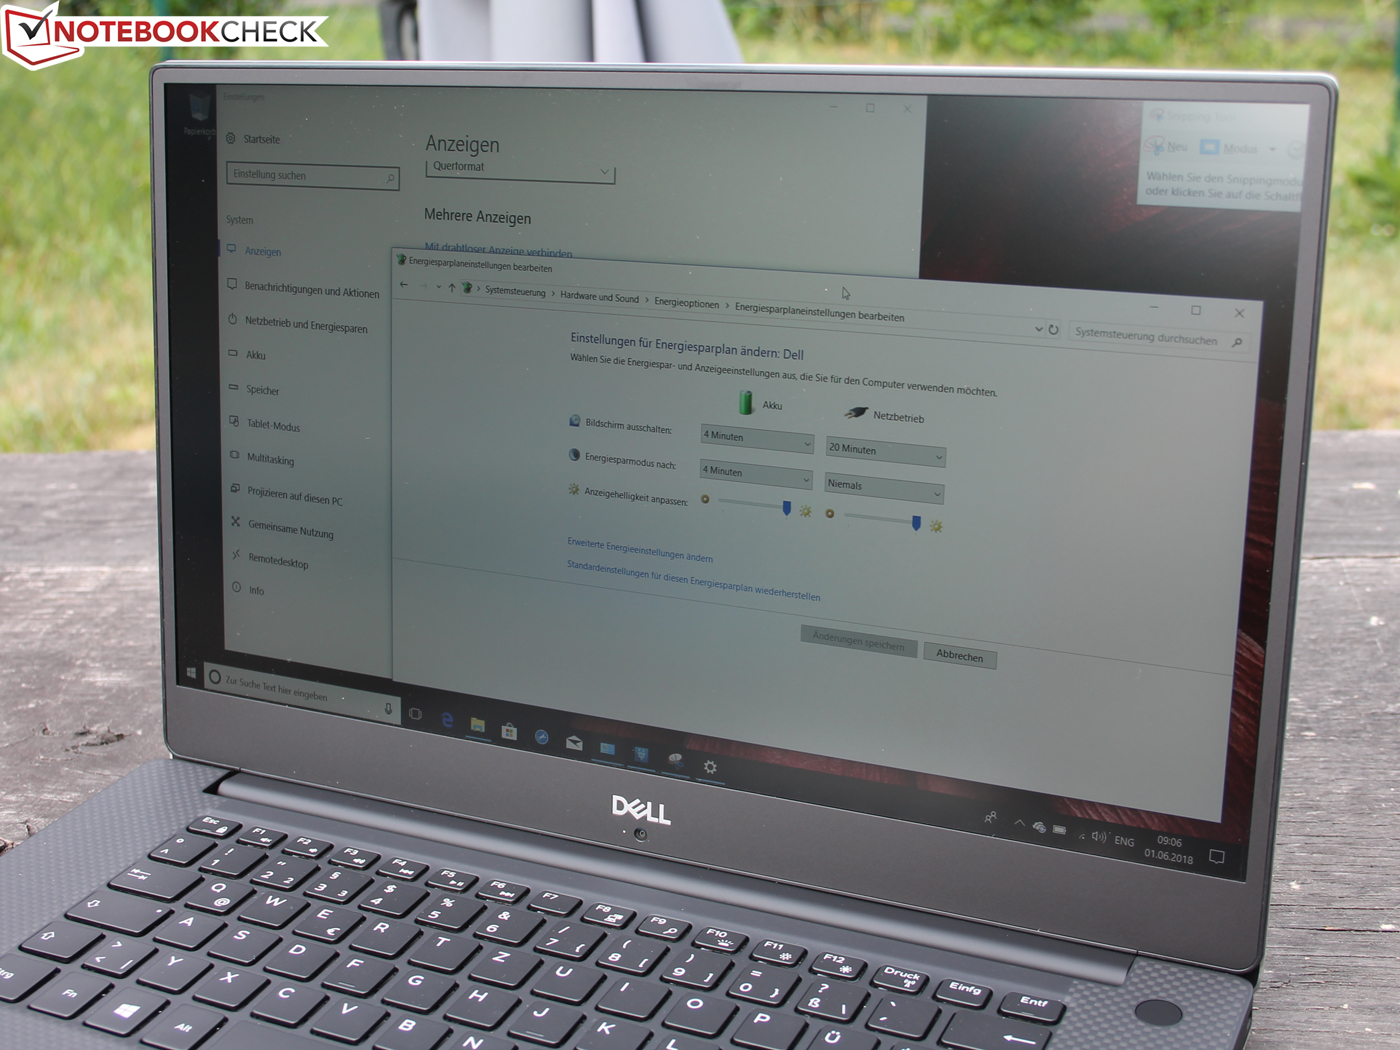
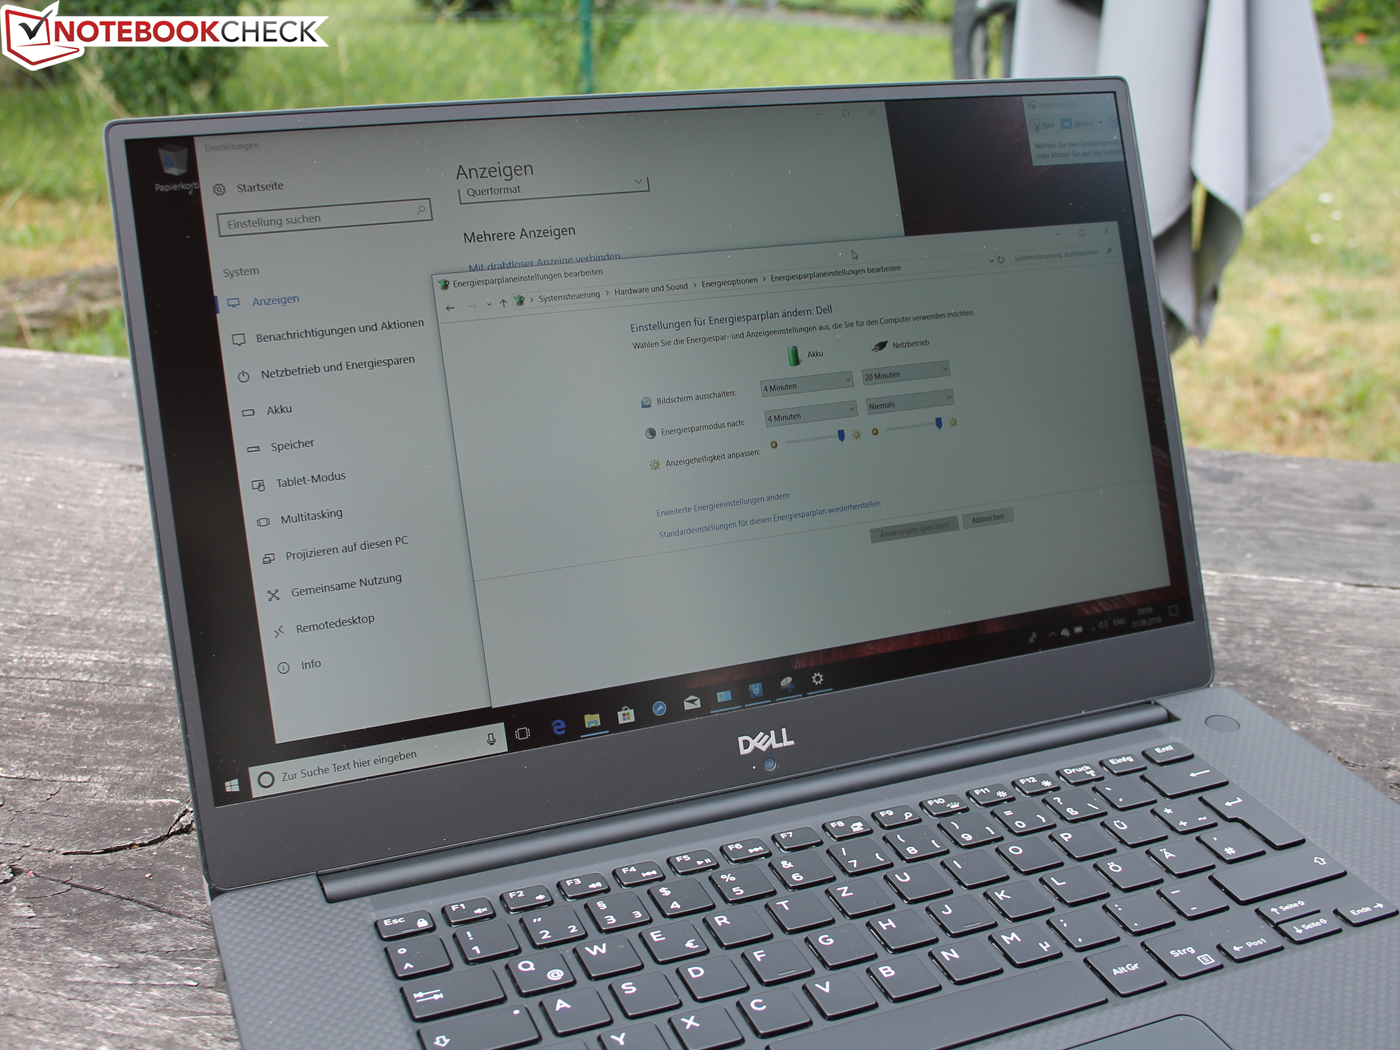
The XPS 15 can be used outdoors thanks to its high brightness combined with a high contrast ratio and a matte display surface.
The response rate of 30/50 milliseconds when changing from black to white/from gray to gray (50/80%) are not the fastest around. However, the screen does achieve better results than the 4K display in last year's XPS 15 and than the current MacBook Pro 15. Gamers might want to take a look at the 120-Hz panels often available nowadays. Other users should not be at any disadvantage with the standard 60-Hz panel.
Display Response Times
| ↔ Response Time Black to White | ||
|---|---|---|
| 30 ms ... rise ↗ and fall ↘ combined | ↗ 16 ms rise | 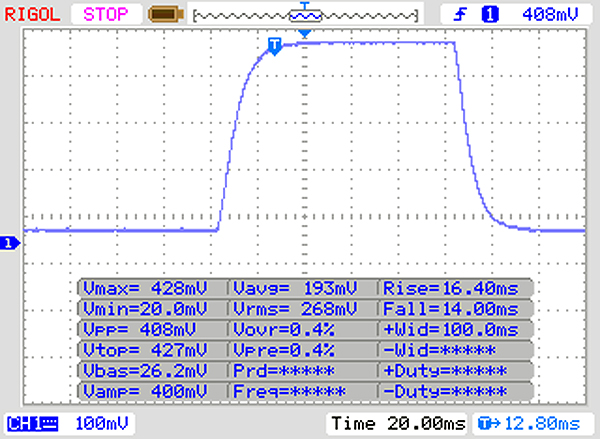 |
| ↘ 14 ms fall | ||
| The screen shows slow response rates in our tests and will be unsatisfactory for gamers. In comparison, all tested devices range from 0.1 (minimum) to 240 (maximum) ms. » 80 % of all devices are better. This means that the measured response time is worse than the average of all tested devices (19.8 ms). | ||
| ↔ Response Time 50% Grey to 80% Grey | ||
| 49 ms ... rise ↗ and fall ↘ combined | ↗ 25 ms rise | 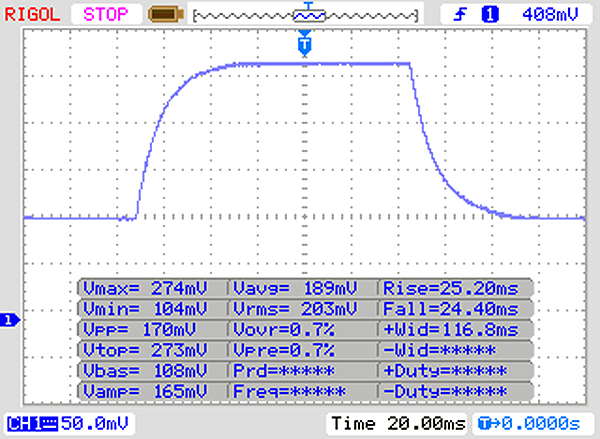 |
| ↘ 40 ms fall | ||
| The screen shows slow response rates in our tests and will be unsatisfactory for gamers. In comparison, all tested devices range from 0.165 (minimum) to 636 (maximum) ms. » 85 % of all devices are better. This means that the measured response time is worse than the average of all tested devices (31 ms). | ||
Screen Flickering / PWM (Pulse-Width Modulation)
| Screen flickering / PWM detected | 961 Hz | ≤ 10 % brightness setting | 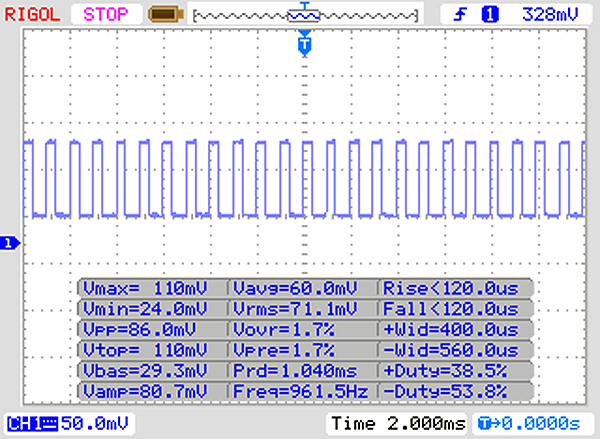 |
The display backlight flickers at 961 Hz (worst case, e.g., utilizing PWM) Flickering detected at a brightness setting of 10 % and below. There should be no flickering or PWM above this brightness setting. The frequency of 961 Hz is quite high, so most users sensitive to PWM should not notice any flickering. In comparison: 52 % of all tested devices do not use PWM to dim the display. If PWM was detected, an average of 7754 (minimum: 5 - maximum: 343500) Hz was measured. | |||
The XPS 15 9570 is equipped with a matte Full-HD display and offers the very good viewing angles that are typical for an IPS screen. Both images and text are displayed accurately even at wide viewing angles.
Again, we noticed a yellowish-reddish cast on pure black content at a horizontal angle of over 45°. But this should not cause any limitations in everyday use.

Performance - the Core i5 makes full use of its cooling system
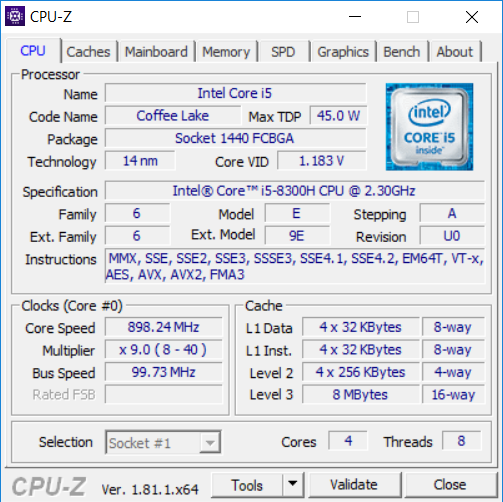
Unlike the six-core i7-8750H, which comes to use in the next highest configuration of the XPS 15 9570, the Core i5-8300H has only four cores and is supposed to replace the quad-core i5-7300HQ. The biggest difference between these is the possibility of hyperthreading 8 threads simultaneously. This alone makes the i5-8300H's performance capacity comparable to that of the Core i7-7700HQ from last year.
The mid-range GPU GTX 1050 is usually used in more affordable gaming notebooks. The XPS 15 supports Optimus and can therefore switch to the integrated UHD Graphics 630 when necessary.
Processor
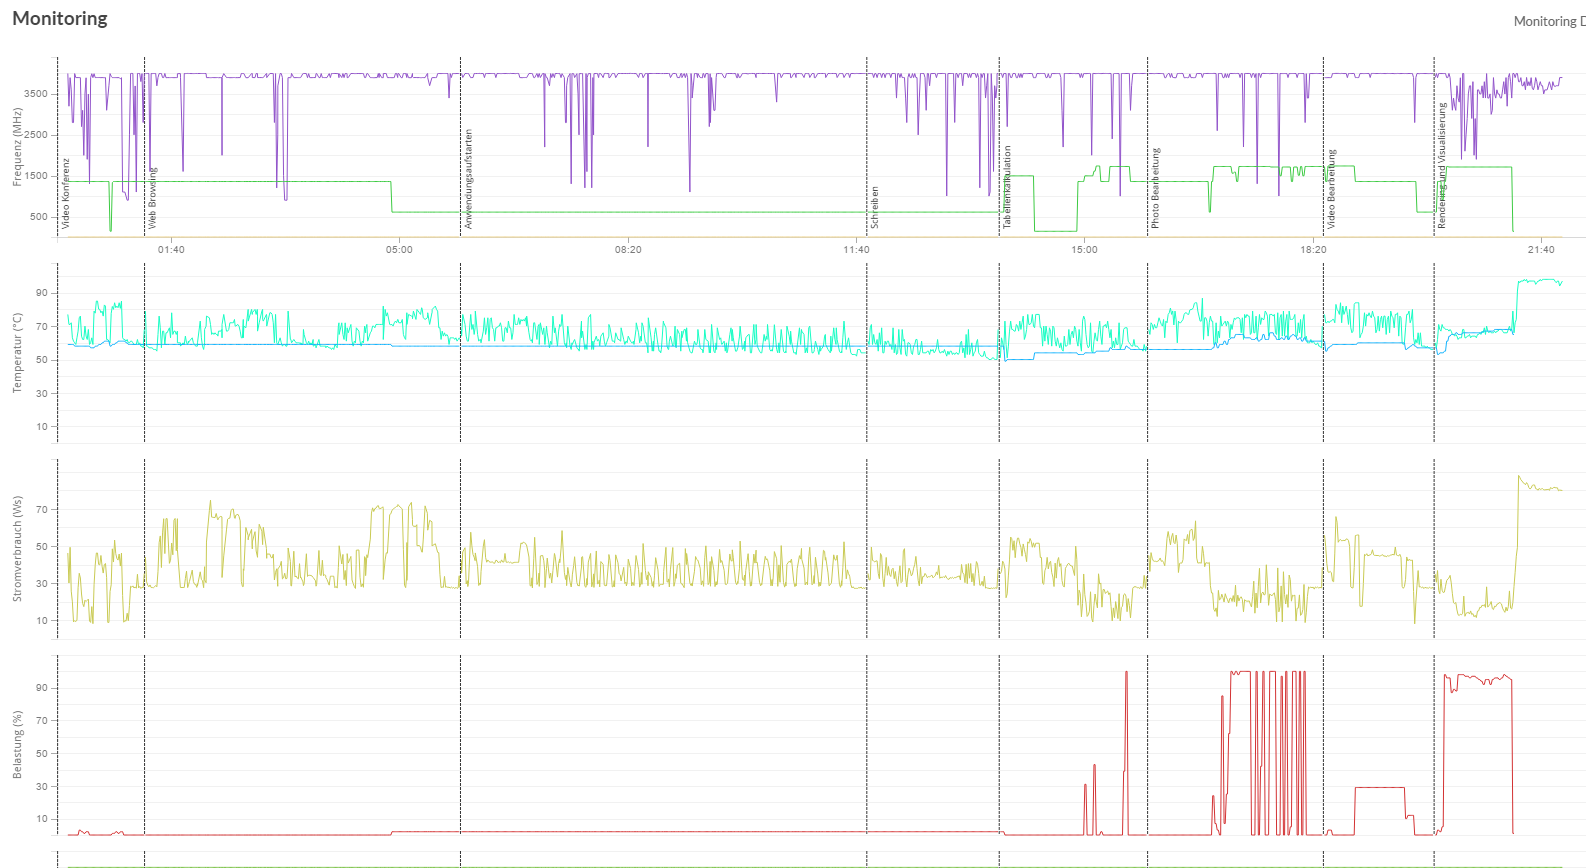
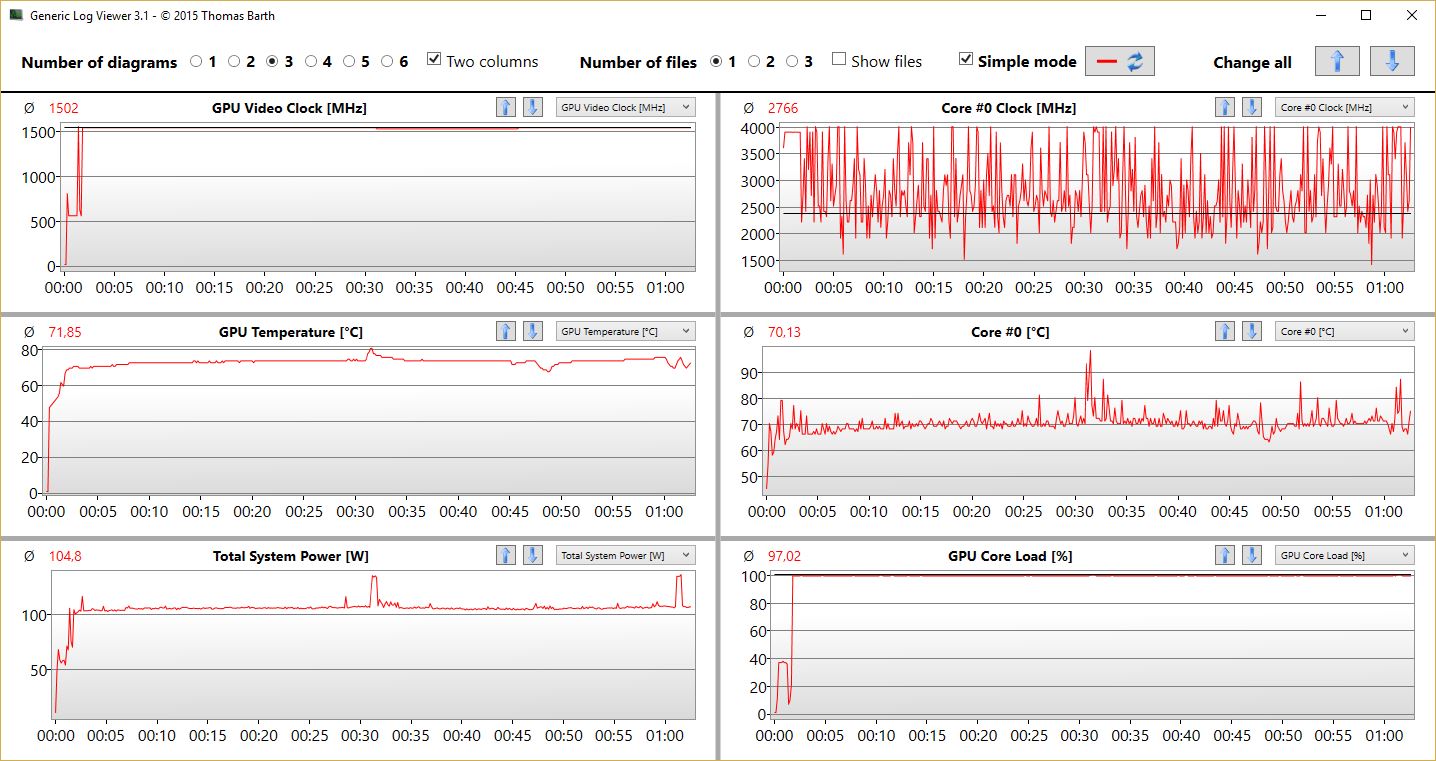
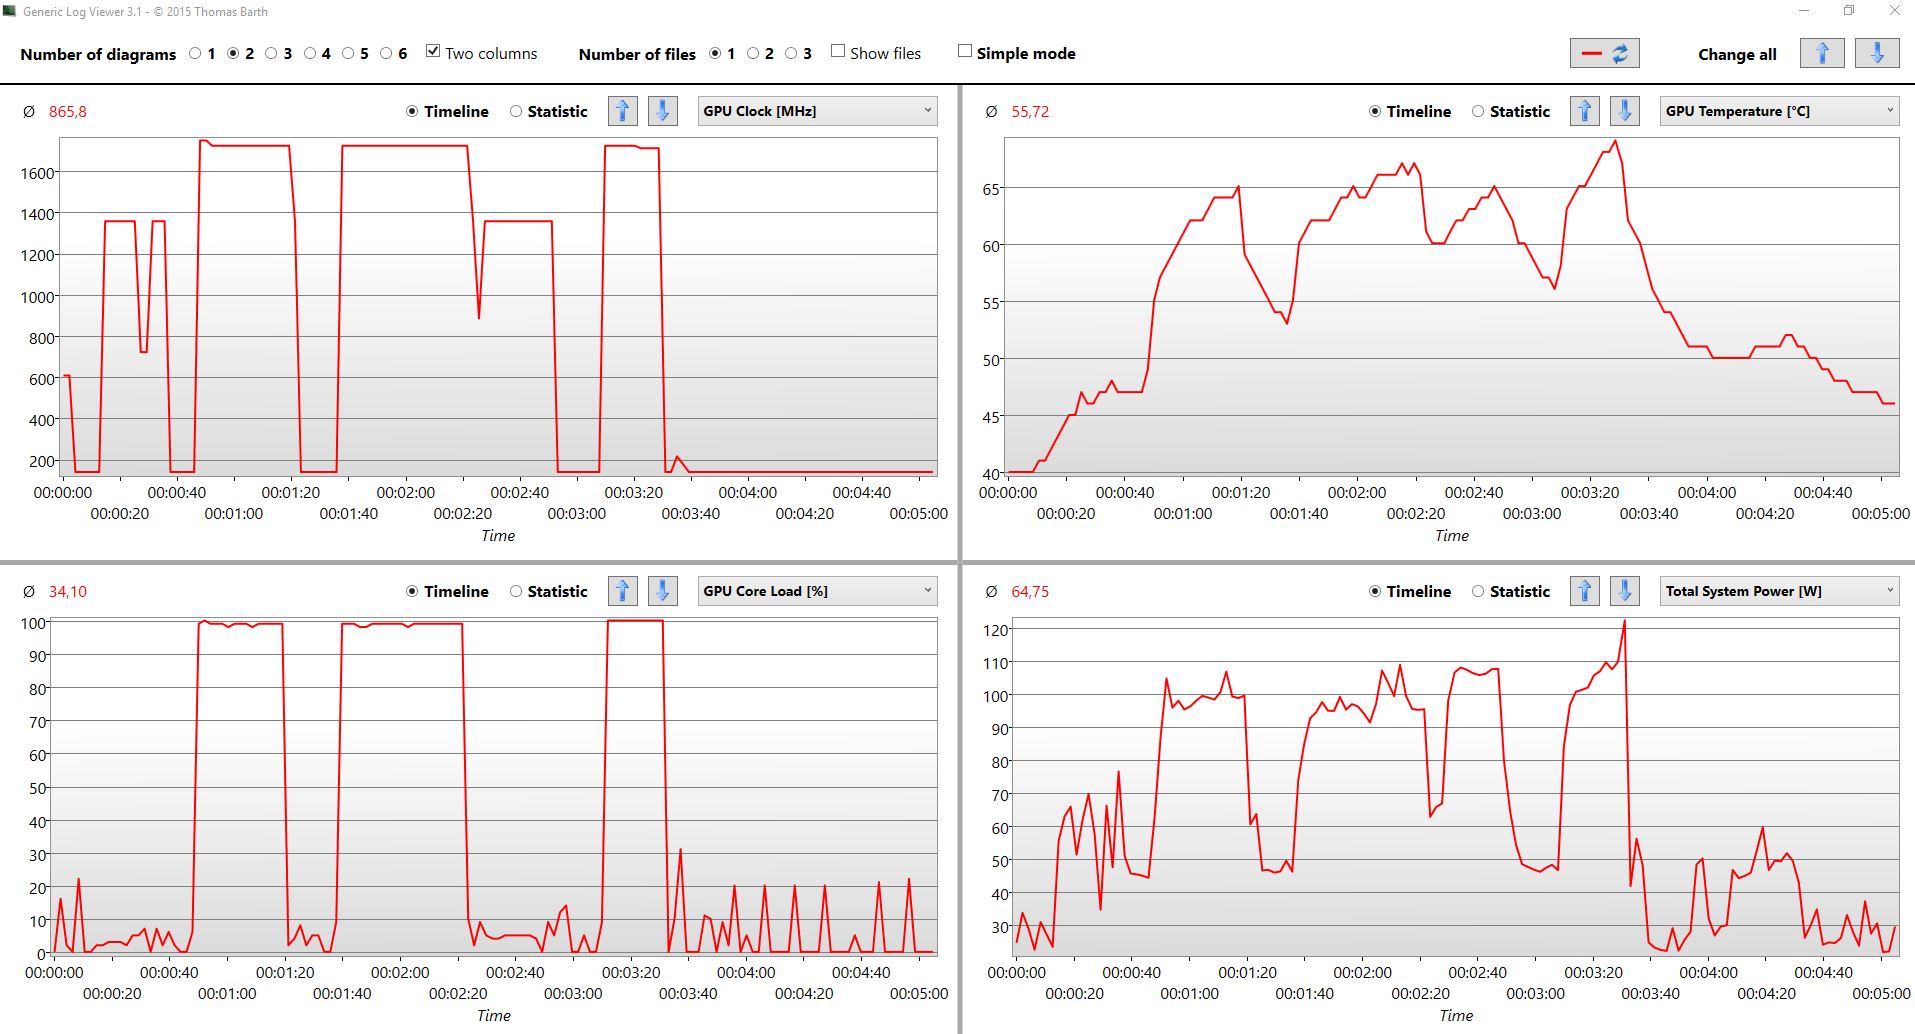
Our test unit only suffers a short drop in performance during the R15 loop. The first round results in 840 points; after that the score settles to around 810 points (-3.5%). The processor works at 3.5 - 3.9 GHz, with the higher clock rates being more frequent. The graph below shows that the performance should remain the same in further rounds.
The temperature increases to up to 97 °C (~207 °F) at the beginning of the loop, then stabilizes at around 93/94 °C (~199/201 °F). The Total System Power lies at around 100 and 112 watts, the Package Power of the SoC around 55 and 70 watts. Again, the system settles down at a lower level during the loop phase, equating to 100 and 55 watts respectively.
We did not notice any signs of heavy throttling of the SoC, but we wonder how the six-core system will deal with this cooling system if we are already reaching temperatures of just under 100 °C (~212 °F) with our quad-core Core i5. The 2017 Dell XPS 15 lost 8% of its performance during the Cinebench loop, which would qualify as throttling. The -3.5% of our i5-8300H is quite acceptable in comparison.

The single thread performance is excellent and can almost be compared with that of a Core i7-8750H (Aero 14). The multi-thread applications are good too: Our device performed 13% better than the Core i7-7700HQ (Aero 15) and was only 27% behind the Core i7-8750H (Aero 14). Users will have to decide for themselves whether the additional price is worth the relatively small increase in performance.
All R15 multi scores displayed here are results of the single round or of the first run in the R15 loop. After that some laptops experience a varying level of throttling - this is the case particularly for slim laptops such as the Gigabyte Aero 14 (-2.5%). But even slim devices can avoid throttling, as you can see from the Aero 15 (0% throttling in the R15 loop).
System Performance
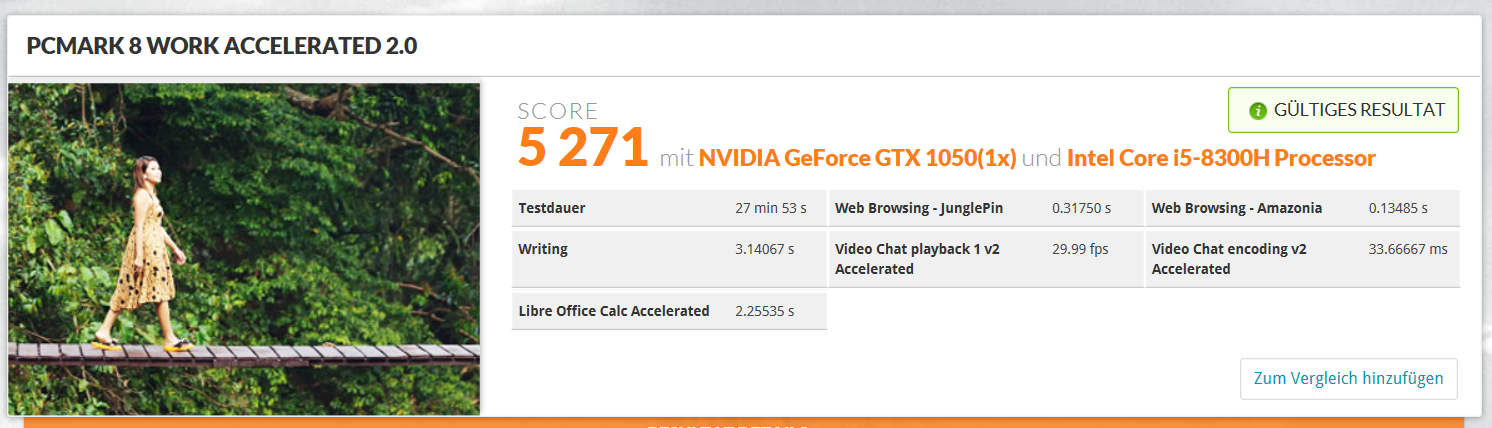
The system performance is above average. It can almost keep up with 7700HQ systems such as the Gigabyte Aero 15, which is equipped with a GTX 1060. In the Home Score of the PCMark 8 its position is average only, but almost all test units have very similar results in this test.
Things are similar in the PCMark 10. Here, Dell gets close to the Asus ZenBook Pro UX550 equipped with a 7700HQ and is only 6% behind the Gigabyte Aero 14-K8 (8750H).


| PCMark 8 Home Score Accelerated v2 | 4030 points | |
| PCMark 8 Work Score Accelerated v2 | 5271 points | |
| PCMark 10 Score | 4479 points | |
Help | ||
Storage Devices

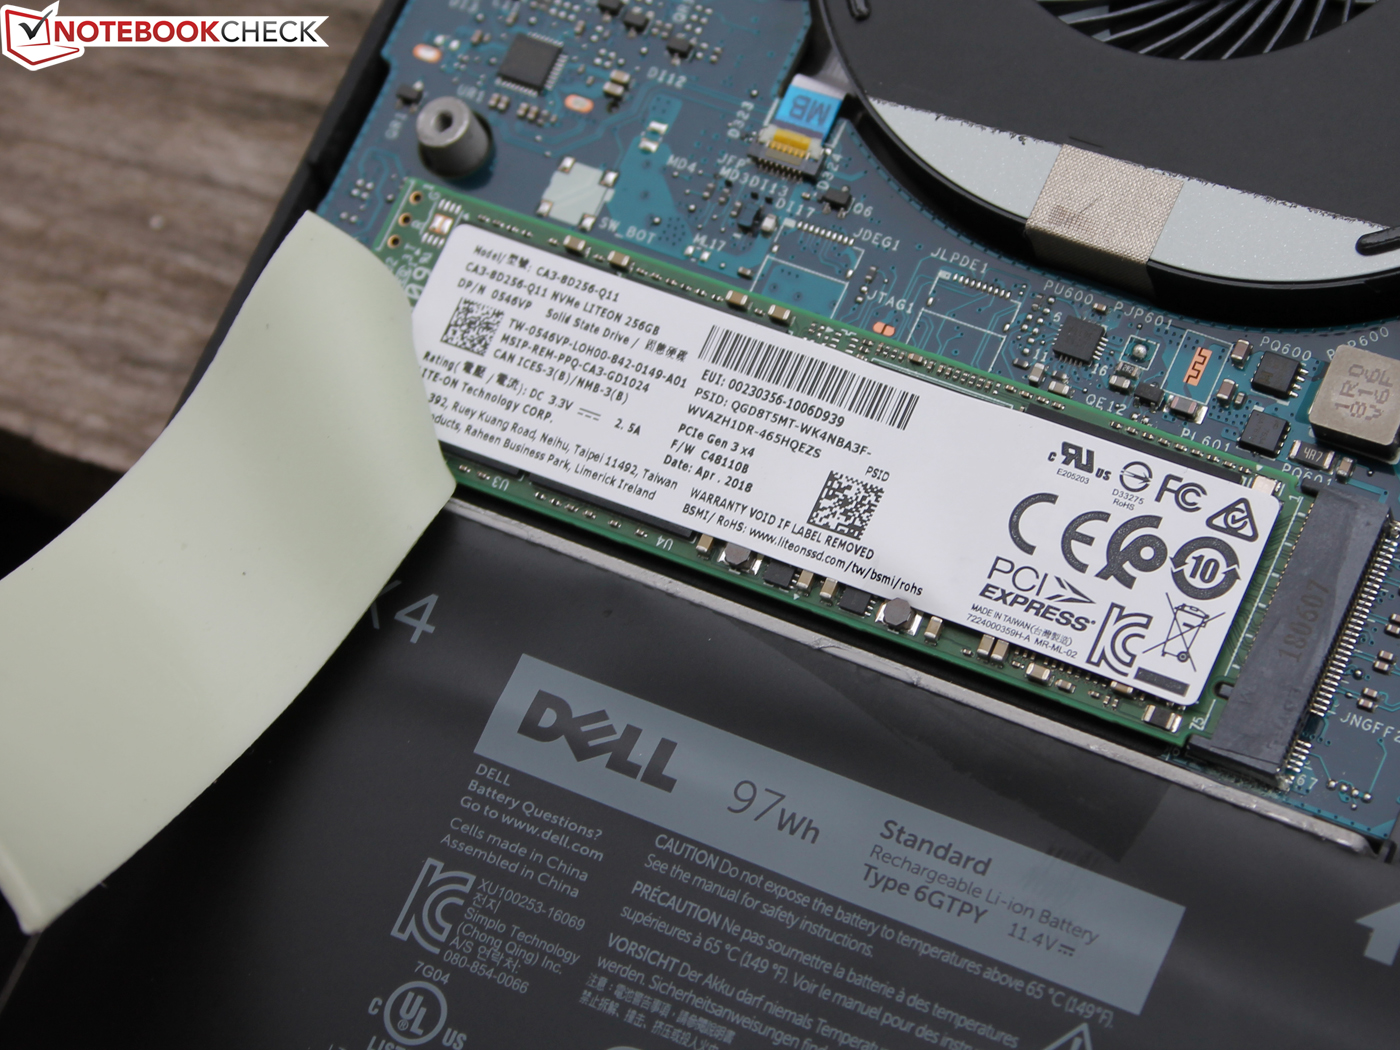
Our test unit is equipped with a PCIe NVMe Lite-On CA3-8D256-Q11 (256 GB). Dell will not offer an entry-level device with a hard drive and SSD cache like the XPS 15 2017 9560 (7300HQ, Full-HD) in all regions this year. In the US, users can purchase a model with a 128-GB SSD plus a 1-TB HDD, a 256-GB PCIe SSD or a 1-TB SSHD as possible alternatives to larger SSD configurations with 512/1024/2048 GB.
The Lite-On cannot keep up with the Lite-On CX2 in the Dell XPS 15 9560 or the Aero 15, which is due to the lower 4K QD32 write/read speeds. When writing large blocks of data (Write 512), the Lite-On CA3 is also on the weak side, but not so during the Read 512.
The Toshiba SSD in the current XPS 13 (9370) can offer slightly better performance in some areas but has the same overall performance as the Lite-On CA3 in our test unit. In any case, the operating system boots very quickly and is extremely responsive as well. The previously mentioned PCMarks confirm our subjective impression.
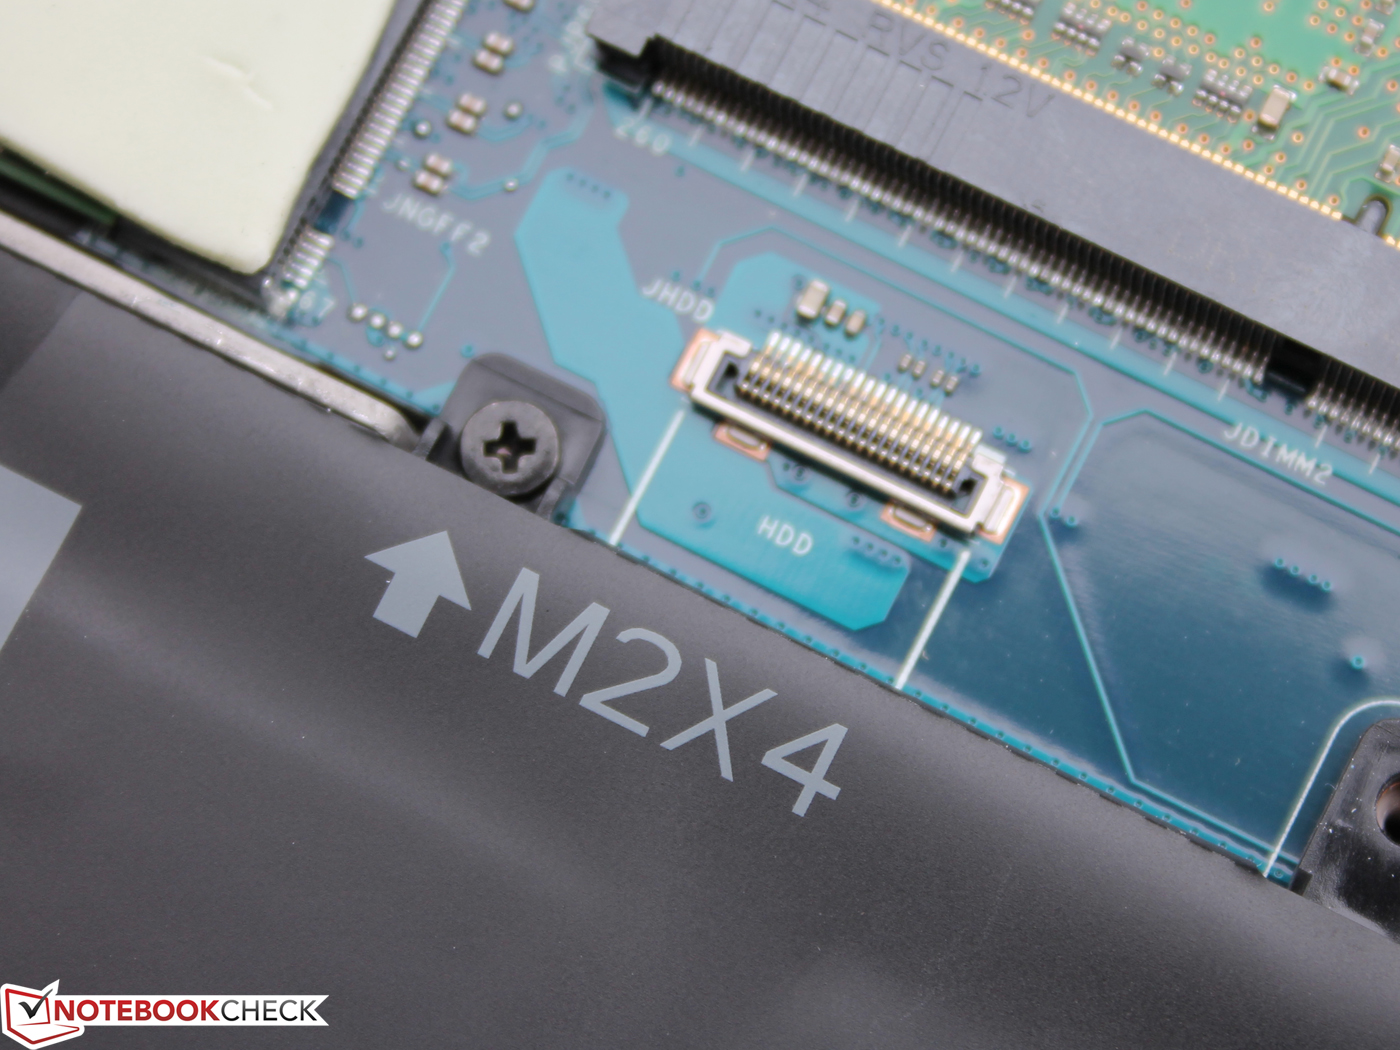
If 256 GB is too small for you in the long run (184 GB available at purchase), you do NOT have the possibility of adding a SATA hard drive or a second PCIe SSD. The 97-Wh model does not offer a second M.2 slot nor space for a 2.5-inch hard drive (7 mm/0.27 in). If you downgrade the battery to a 56-Wh version later on, you should be able to fit in a 2.5-inch hard drive with the suitable caddy.
If you are looking for a model with two storage devices, you had better go for the 56-Wh version. This also includes a 2.5-inch SATA slot. Of course, you will have to trade in the good 15-hour runtimes for this option.
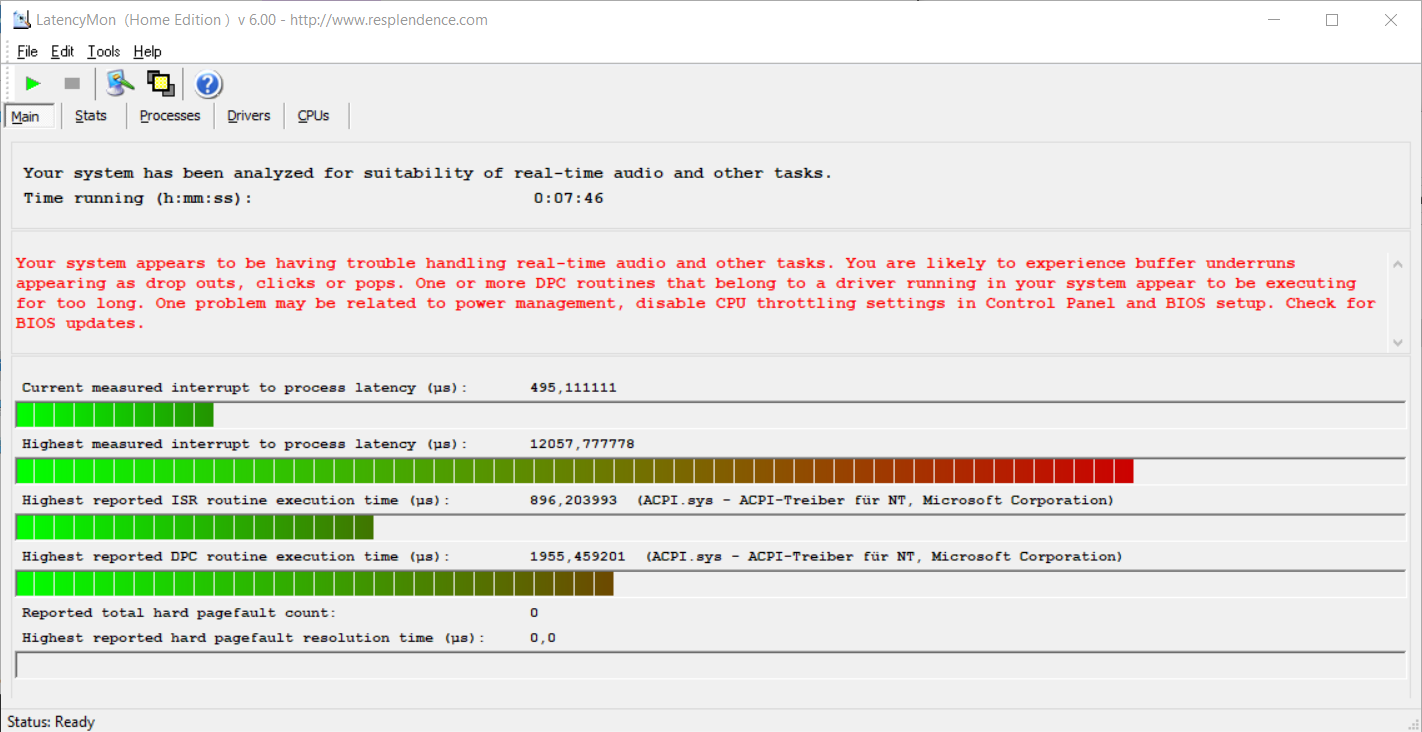
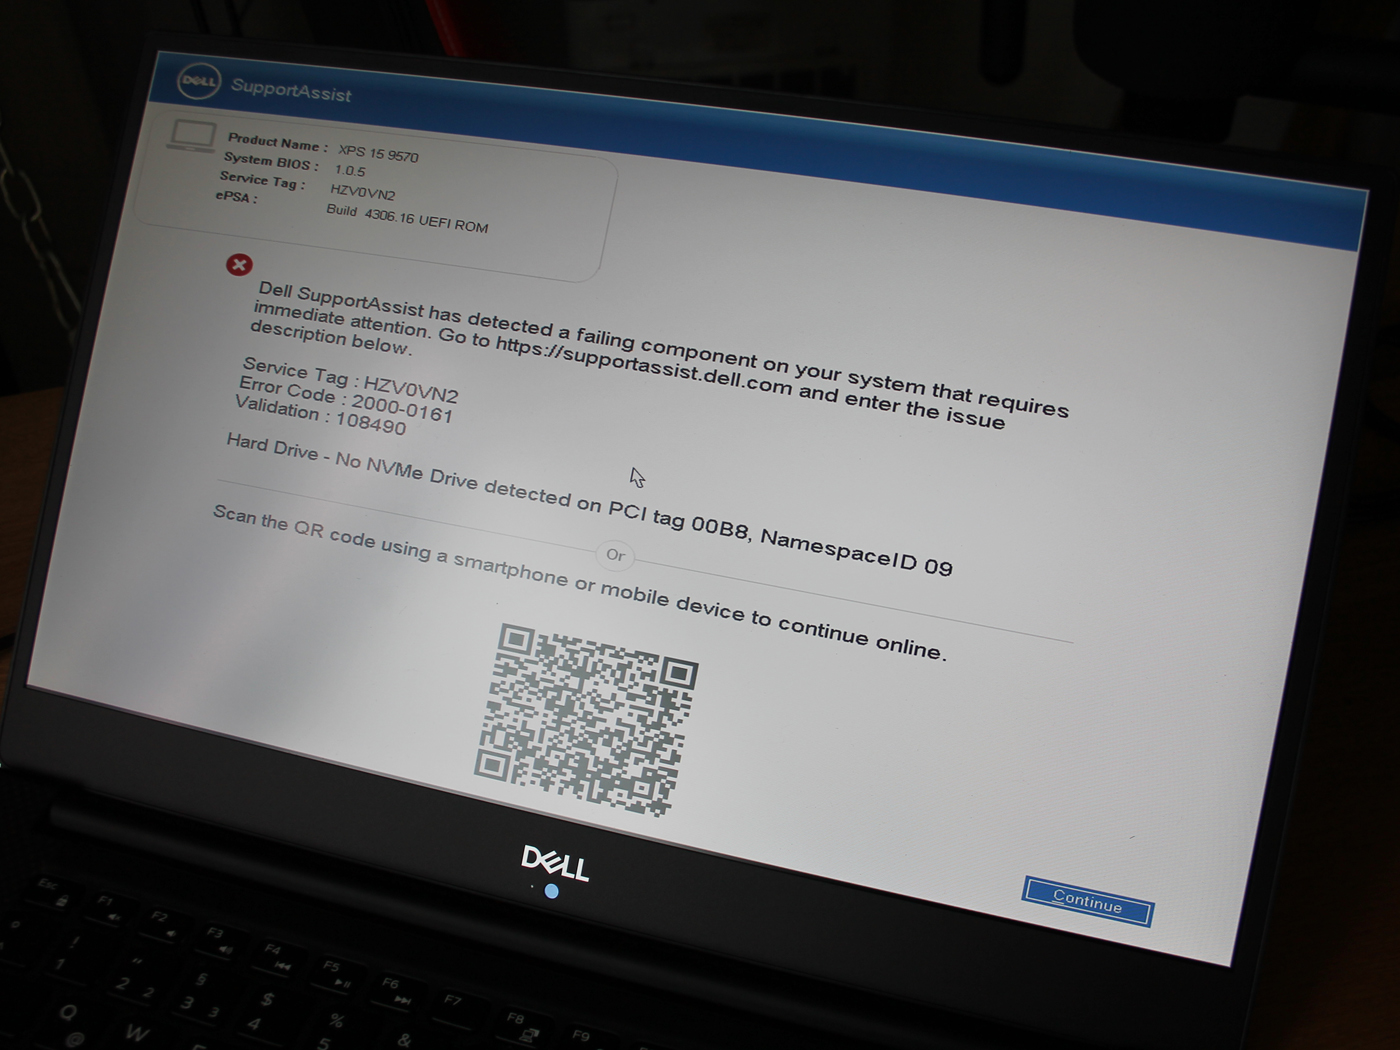
An issue with the SSD (ePSA error "Hard Drive - No NVMe Drive detected on PCI tag 00B8, Namespace ID 09") put a sudden end to our test. Fortunately, we had already done the tests and measurements that are relevant for our rating. The system had already frozen three times during testing and could only be reactivated by doing a hard reset (pressing the power button for a long time). This problem did not have an impact on our rating, however, we believe this is an issue specific to our test unit and does not apply to the entire series.
| Dell XPS 15 2018 i5 FHD 97Wh Lite-On CA3-8D256-Q11 | Apple MacBook Pro 15 2017 (2.8 GHz, 555) Apple SSD SM0256L | Gigabyte Aero 15 Lite-On CX2-8B512-Q11 | Dell XPS 13 9370 FHD i5 Toshiba XG5 KXG50ZNV256G | Dell XPS 15 9560 (i7-7700HQ, UHD) Lite-On CX2-8B512-Q11 | Average Lite-On CA3-8D256-Q11 | |
|---|---|---|---|---|---|---|
| CrystalDiskMark 3.0 | 44% | 63% | 5% | 54% | 0% | |
| Read Seq (MB/s) | 1706 | 1557 -9% | 1769 4% | 1875 10% | 1684 -1% | 1706 ? 0% |
| Write Seq (MB/s) | 613 | 1505 146% | 1133 85% | 352.7 -42% | 1106 80% | 613 ? 0% |
| Read 512 (MB/s) | 1171 | 968 -17% | 891 -24% | 840 -28% | 977 -17% | 1171 ? 0% |
| Write 512 (MB/s) | 483.4 | 1124 133% | 1069 121% | 353.9 -27% | 1119 131% | 483 ? 0% |
| Read 4k (MB/s) | 40.64 | 10.76 -74% | 44.7 10% | 34.18 -16% | 45.14 11% | 40.6 ? 0% |
| Write 4k (MB/s) | 89.4 | 12.87 -86% | 123.3 38% | 127.5 43% | 134.1 50% | 89.4 ? 0% |
| Read 4k QD32 (MB/s) | 233.8 | 631 170% | 645 176% | 381.8 63% | 509 118% | 234 ? 0% |
| Write 4k QD32 (MB/s) | 249.1 | 468.4 88% | 490.5 97% | 339.9 36% | 398.1 60% | 249 ? 0% |

Graphics

The 2017 XPS 15 (every configuration) was equipped with a GTX 1050 - without the Ti. In 2018 Dell users will still receive a GTX 1050 in the lower configuration with the 8300H, but the more expensive i7-8750H versions will be working with a GeForce GTX 1050 Ti.
Our GTX 1050 is up to 20% slower than the Ti version in the 3DMark benchmarks, but only (at the most) 3% behind the normal GTX 1050. See Asus ROG Strix GL703VD or Inspiron 15 7000 7577 in the Firestrike. The Asus FX504GD is particularly interesting as it is equipped with the i5 8300 with the same build and is only 2% faster and sometimes even 8% slower (Firestrike, 3DMark 11).
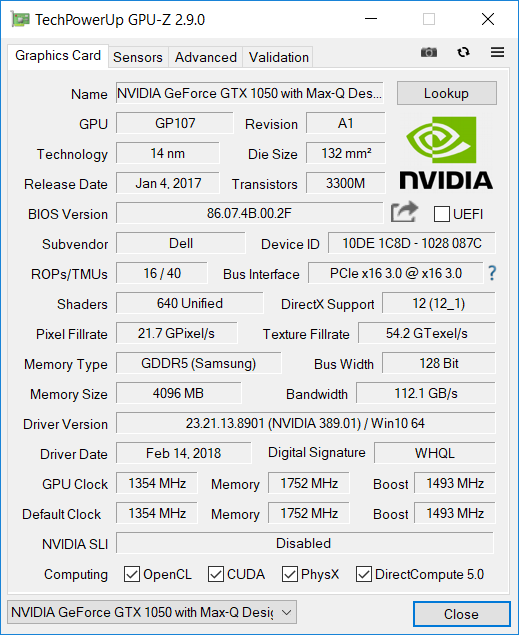
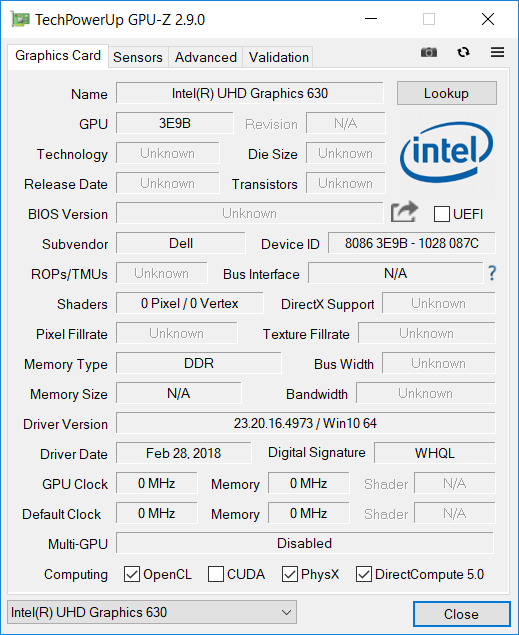
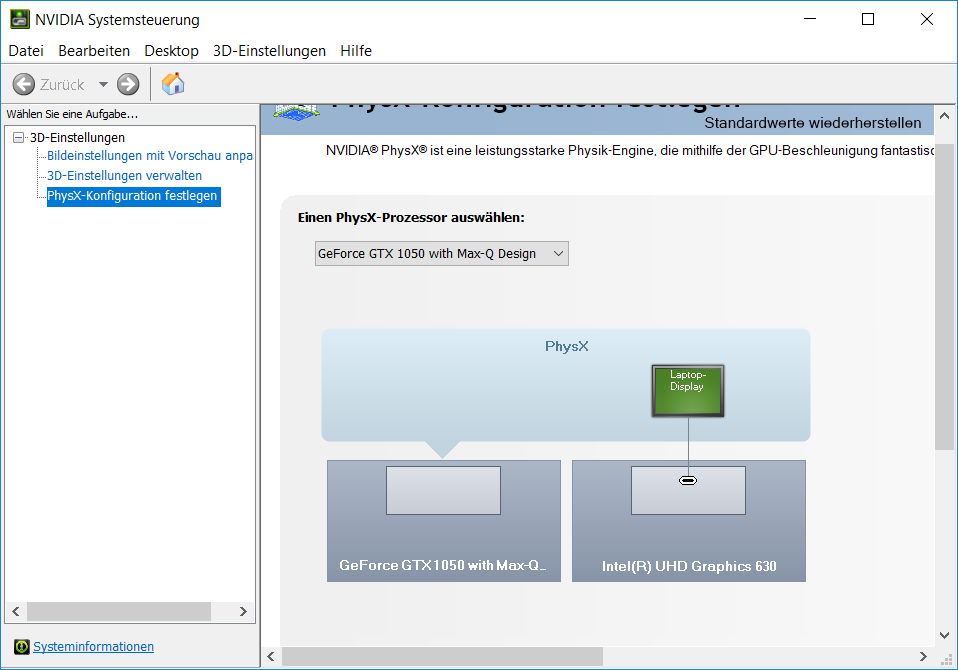
Update 06/04/2018 12:00 - Confusion about Max-Q
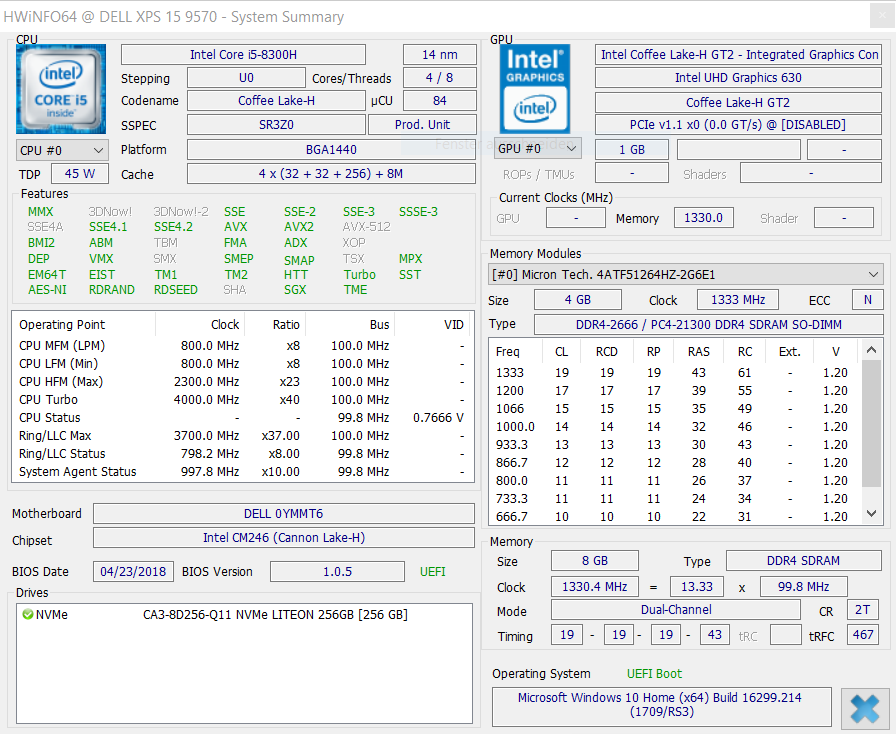
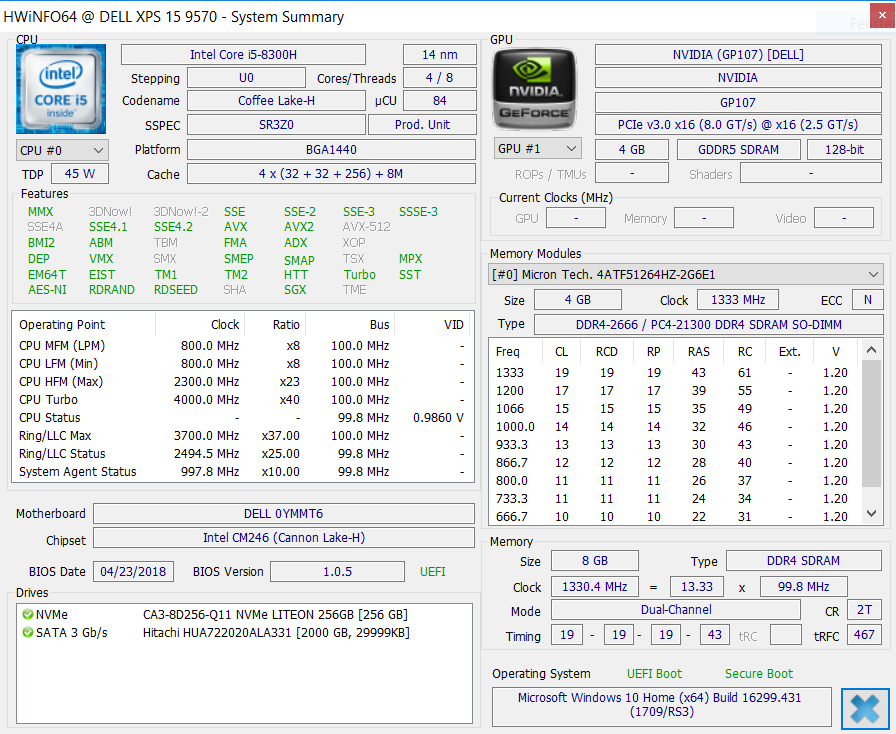
Dell was reading our live review and intervened: Our device is supposed to be equipped with a normal GTX 1050, not with a Max-Q version. But why do GPU-Z and games claim it is a Max-Q version? The most current version of HW-Info cites a Nvidia (GP107) with 128 Bit. The PC and 3DMarks say they found a GTX 1050. The Nvidia control panel - and they should know - reports a Max-Q, as you can see from the screenshots below.
"To our knowledge, the XPS 15 only ships with 1050Ti with Max-Q design and *not* 1050 with Max-Q design. Also, the GPU-Z shot sends conflicting information. Should it have been a Max-Q design GeForce GTX 1050, the clocks would be lower."
Dell argues that the base clock rate would be lower than 1354 MHz in a Max-Q GPU, as would the boost: GeForce GTX 1050 Max-Q (999 - 1189 - 1139 - 1328 MHz (Boost))
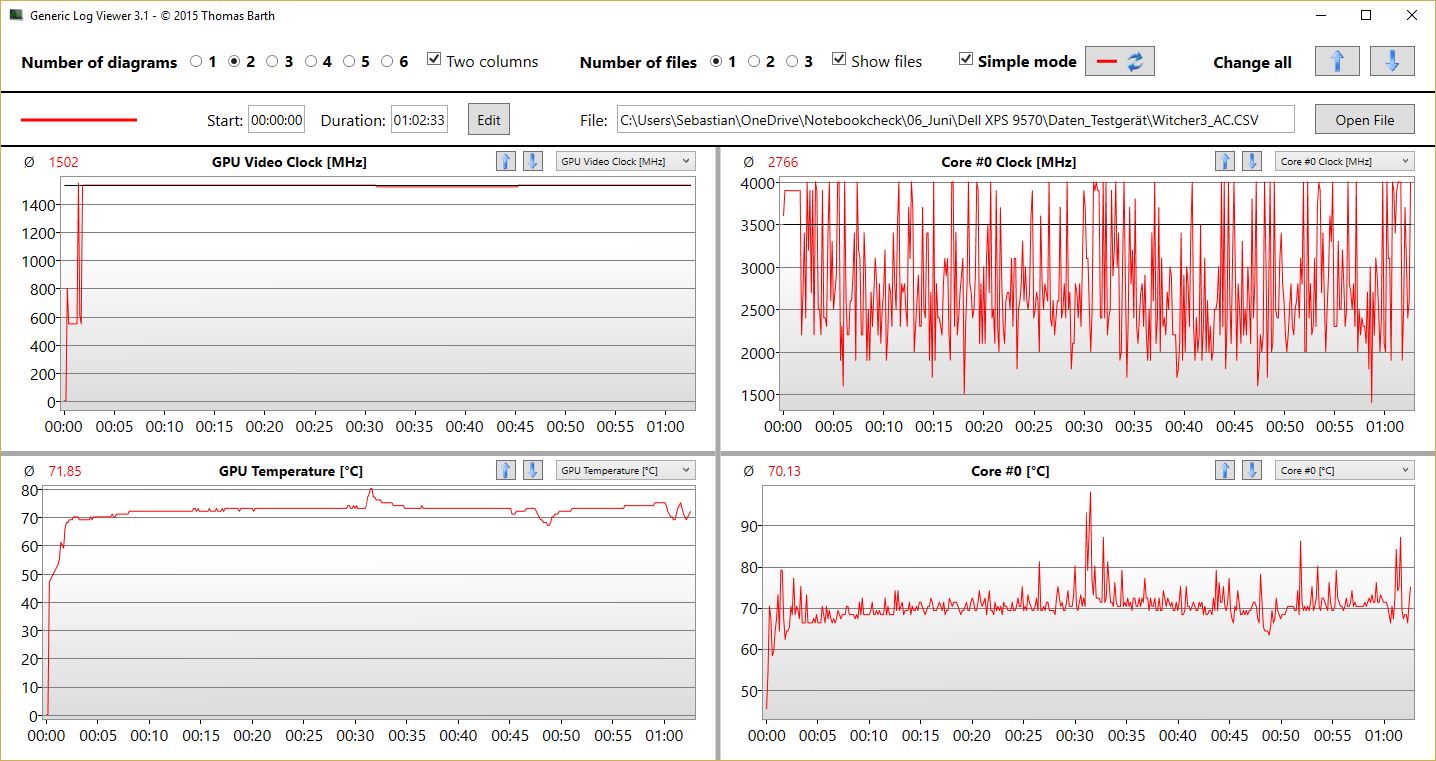
Regardless of the GPU-Z data, our measurements confirm the high clock rates of 1500 MHz, for example in the “Witcher 3” stress test. We have not yet tested a "real" Max-Q 1050 and therefore cannot make any comparisons. Due to these facts, we must assume that the device is equipped with a "normal" GTX 1050 and have adjusted the specification sheet of our test unit accordingly.
Update 06/06/2018
In the meantime, Dell has confirmed a driver issue which caused the graphics card to be identified wrongly. The A01 driver from 05/30/2018 should recognize the GPU correctly. You can download the driver from the Dell website here.
| 3DMark 11 Performance | 7974 points | |
| 3DMark Cloud Gate Standard Score | 21868 points | |
| 3DMark Fire Strike Score | 5687 points | |
Help | ||
Gaming Performance

Games are displayed very well and the GTX 1050 offers the performance that we would have expected from it. Ti models, however, offer a performance increase of 15 - 25%. The test unit's graphics card still performs 6-14% above average. This means that it does a noticeably better job while gaming (2-9 FPS) than the average of all GTX 1050 in our database. The XPS 15 outclasses several powerful multimedia notebooks such as the Asus Strix GL753VD or the Acer Nitro 5 Spin.
Of course, this device cannot be considered a real gamer - this cannot be expected from a GTX 1050. Gaming laptops that can display current games in Full-HD and at high details are equipped with a GTX 1060 or higher. The XPS 15 can be placed in the upper range of multimedia devices and can display a lot of games in high details. The device reaches its limits when trying to display current, demanding games such as “Final Fantasy XV”.
It is possible to play games when the device is running on battery, but the GPU performance of the XPS drops significantly: “Witcher 3” in FHD and high details drops from 39 to 29.7 FPS on battery because the GPU turbo cannot reach 1500 MHz.
| Final Fantasy XV Benchmark - 1280x720 Lite Quality | |
| Average of class Multimedia (21.4 - 232, n=57, last 2 years) | |
| Dell XPS 15 2018 i5 FHD 97Wh | |
| MSI GL62M 7RD-077 | |
| Average NVIDIA GeForce GTX 1050 Mobile (41 - 63.8, n=6) | |
| Asus GL753VD | |
| Acer Nitro 5 Spin NP515-51-86CX | |
| Apple MacBook Pro 15 2017 (2.8 GHz, 555) | |
| Dirt 4 - 1920x1080 High Preset AA:2xMS AF:8x | |
| MSI GL62M 7RD-077 | |
| Dell XPS 15 2018 i5 FHD 97Wh | |
| Acer Nitro 5 AN515-51-788E | |
| Average NVIDIA GeForce GTX 1050 Mobile (46.2 - 63.7, n=4) | |
| Apple MacBook Pro 15 2017 (2.8 GHz, 555) | |
| Fallout 4 - 1920x1080 Ultra Preset AA:T AF:16x | |
| Asus GL503VD-DB74 | |
| Dell XPS 15 2018 i5 FHD 97Wh | |
| Dell XPS 15 9560 (i7-7700HQ, UHD) | |
| Average NVIDIA GeForce GTX 1050 Mobile (31 - 37, n=10) | |
| Asus Strix GL753VD-GC045T | |
| HP Pavilion 15 Power 1GK62AV | |
| low | med. | high | ultra | |
|---|---|---|---|---|
| BioShock Infinite (2013) | 67.5 | |||
| The Witcher 3 (2015) | 46.7 | 39 | 22.7 | |
| Fallout 4 (2015) | 45.4 | 36.7 | ||
| Rise of the Tomb Raider (2016) | 73.2 | 40.6 | 33.2 | |
| Dirt 4 (2017) | 61.9 | 32.6 | ||
| F1 2017 (2017) | 57 | 36 | ||
| Final Fantasy XV Benchmark (2018) | 63.6 | 32.5 | 22.7 |
Emissions - the cooling system can deal with the i5
System Noise
As we are testing a device without a conventional HDD, we are treated to an absolutely silent laptop. The two cooling fans are usually turned off when idling (silent periods of up to 30 minutes). The fans do turn on shortly at some point in order to cool down the SoC (2500 U/min), but this also depends on the ambient temperature: 25 °C (~77 °F) while testing (summer).
In the realistic office scenario, for example, when surfing the web (Wi-Fi script) with the energy profile set to "optimized", the cooling fans remain turned off and CPU temperature lies around 40 - 50 °C (~104 – 122 °F). The same happens when the energy profile is set to "quiet".
Whether the device will remain completely silent when you are using it for office applications (provided you choose a configuration without an HDD) strongly depends on your individual usage pattern. If you do not need CPU performance the Dell energy profiles such as "quiet" or "optimized" can put a real break on the development of CPU temperatures and will probably keep the fans turned off.
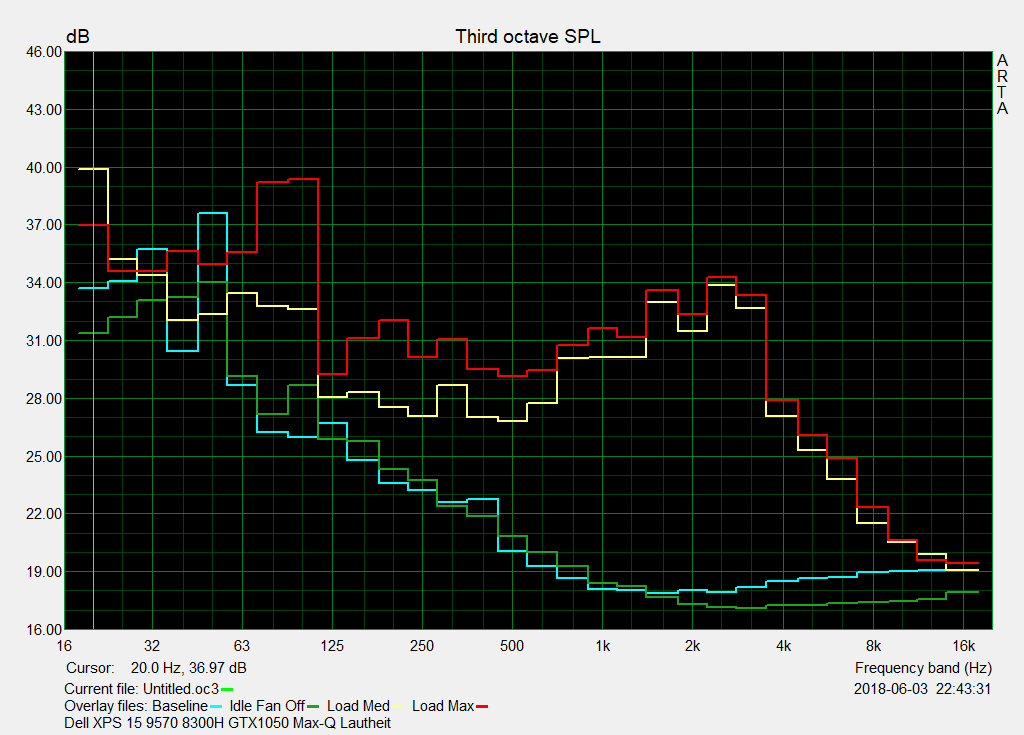
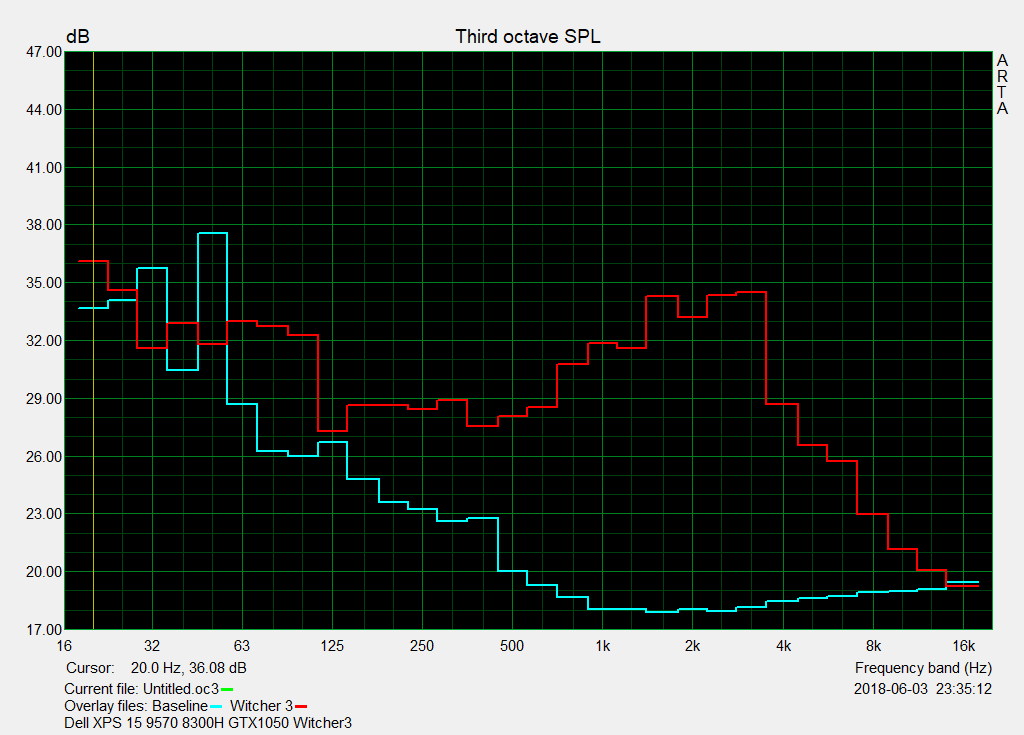
While gaming (Witcher 3 Ultra), the cooling fans turn up quite quickly and our microphone measured a noise level of 43.4 dB(A). The device does seem loud to us, although the fan noise is not too annoying.
We noticed that compared to the XPS 15 from 2017 system noise has improved significantly. The predecessor was about 30% louder under average load and 11% louder under maximum load. Dell has clearly taken the customers' criticism seriously and made the necessary adjustments. In particular, the cooling pattern when using office applications was criticized a lot as the cooling fans turned on too often, which many users were annoyed by. We are happy to say that this no longer happens in our 8300H model. It is really impressive to see how long the XPS can run without turning its fans on.
We could only occasionally hear electronic noises, such as the famous coil whine, when putting our ear very close to the device. We tested this in various scenarios and at different CPU frequencies, on power supply and on battery. Coil whine is not an issue for our test unit. By the way, the BIOS version of our test unit is 3.1.
Noise level
| Idle |
| 30.3 / 30.3 / 30.3 dB(A) |
| Load |
| 37.1 / 43 dB(A) |
 | ||
30 dB silent 40 dB(A) audible 50 dB(A) loud |
||
min: | ||
| Dell XPS 15 2018 i5 FHD 97Wh GeForce GTX 1050 Mobile, i5-8300H, Lite-On CA3-8D256-Q11 | Dell XPS 13 9370 FHD i5 UHD Graphics 620, i5-8250U, Toshiba XG5 KXG50ZNV256G | Apple MacBook Pro 15 2017 (2.8 GHz, 555) Radeon Pro 555, i7-7700HQ, Apple SSD SM0256L | Dell XPS 15 2017 9560 (7300HQ, Full-HD) GeForce GTX 1050 Mobile, i5-7300HQ, WDC WD10SPCX-75KHST0 + SanDisk Z400s M.2 2242 32 GB Cache | Gigabyte Aero 15 GeForce GTX 1060 Mobile, i7-7700HQ, Lite-On CX2-8B512-Q11 | Asus Zenbook Pro UX550VE-DB71T GeForce GTX 1050 Ti Mobile, i7-7700HQ, Samsung PM961 NVMe MZVLW512HMJP | |
|---|---|---|---|---|---|---|
| Noise | 7% | -2% | -10% | -7% | -4% | |
| off / environment * (dB) | 30.3 | 29.1 4% | 30.9 -2% | 30.3 -0% | 31 -2% | 28.3 7% |
| Idle Minimum * (dB) | 30.3 | 29.1 4% | 31.3 -3% | 31.6 -4% | 32 -6% | 30.4 -0% |
| Idle Average * (dB) | 30.3 | 29.1 4% | 31.3 -3% | 31.6 -4% | 33 -9% | 31 -2% |
| Idle Maximum * (dB) | 30.3 | 29.1 4% | 31.7 -5% | 33.4 -10% | 34 -12% | 31.2 -3% |
| Load Average * (dB) | 37.1 | 32.2 13% | 39.7 -7% | 47.8 -29% | 39 -5% | 43.3 -17% |
| Witcher 3 ultra * (dB) | 43.3 | 35.5 18% | 43 1% | 46.2 -7% | ||
| Load Maximum * (dB) | 43 | 37.3 13% | 48.6 -13% | 47.8 -11% | 50 -16% | 46.2 -7% |
* ... smaller is better
Temperature
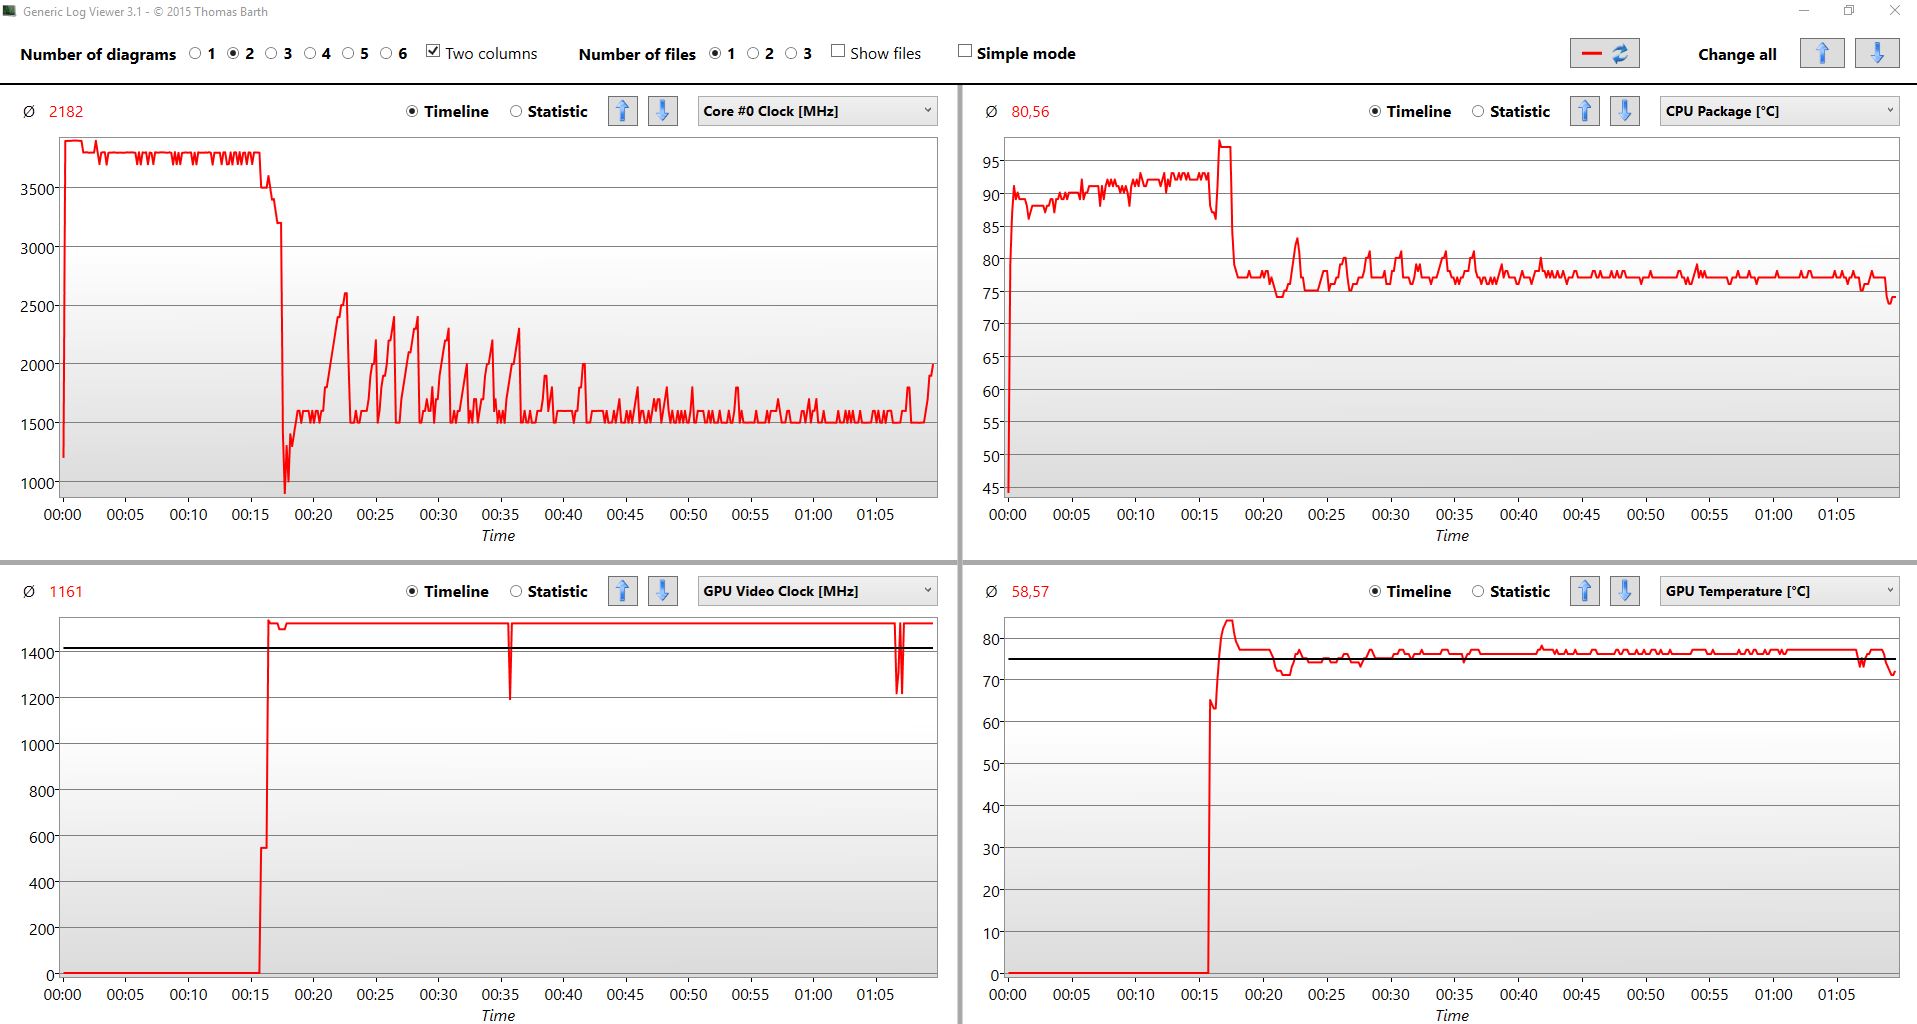
While our XPS 15 (8300H) hardly heated up while idling (average temperature 28.7 °C/~84 °F) and did not produce any noise, it heats up significantly under load, reaching an average of 43 °C (~109 °F). We have already mentioned the reason for this in our section on performance: The SoC heats up to almost 95 °C (~203 °F) in the R15 loop. The combined stress test moves the heat production to the GPU while the CPU is throttled to 1.5 GHz so as not to cross the TDP limit.
We first ran the Prime95 CPU stress test on its own, during which the CPU heated up to over 90 °C (~194 °F) and clocked at 3.7 - 3.8 GHz. It could only reach 3.9 GHz in the first minute of the test.
At minute 17, we added FurMark which also affects the GTX 1050. Quickly, the CPU clock rate dropped to 1.5 GHz and the GPU worked at full power (1500 MHz). The heat created by the GTX 1050 only crossed the 80 °C (~176 °F) mark once for a short time, then settled down around 75 °C (~167 °F). The strong throttling made the temperature of the 8300H drop to around 77 °C (~171 °F).

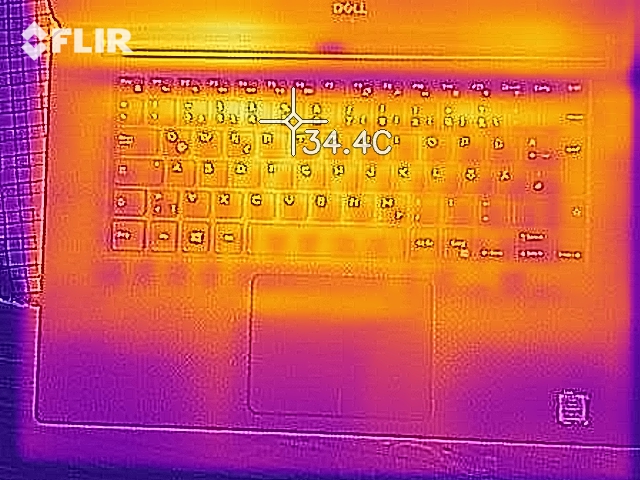
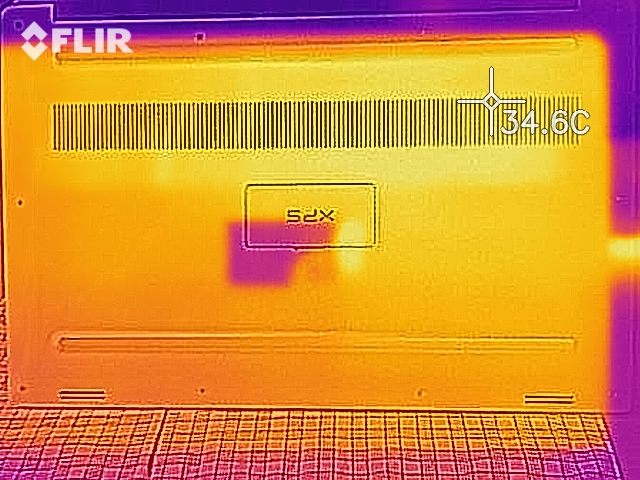
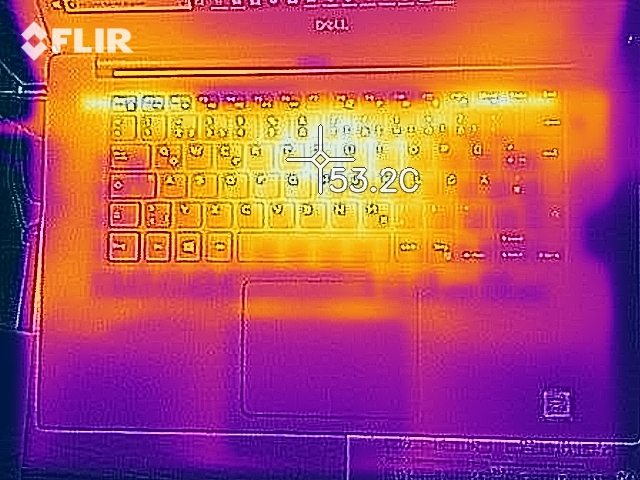
(-) The maximum temperature on the upper side is 55 °C / 131 F, compared to the average of 36.8 °C / 98 F, ranging from 21 to 71 °C for the class Multimedia.
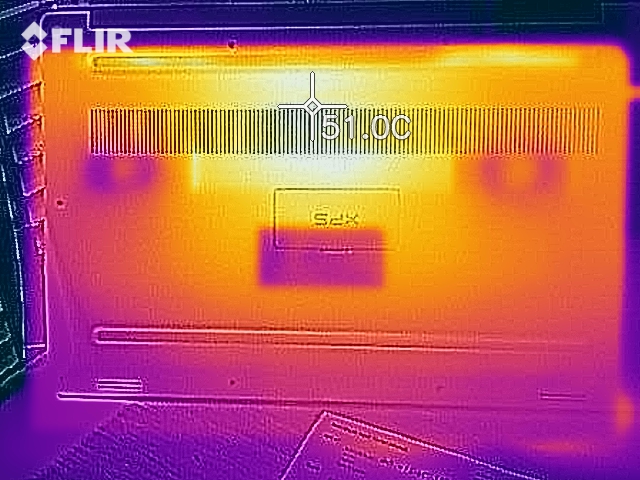
(-) The bottom heats up to a maximum of 49.1 °C / 120 F, compared to the average of 39.1 °C / 102 F
(+) In idle usage, the average temperature for the upper side is 28.7 °C / 84 F, compared to the device average of 31.3 °C / 88 F.
(-) Playing The Witcher 3, the average temperature for the upper side is 40.5 °C / 105 F, compared to the device average of 31.3 °C / 88 F.
(±) The palmrests and touchpad can get very hot to the touch with a maximum of 37.1 °C / 98.8 F.
(-) The average temperature of the palmrest area of similar devices was 28.7 °C / 83.7 F (-8.4 °C / -15.1 F).
Speakers
The Dell XPS 15 has two integrated speakers that are positioned at the front of the device with the sound coming out of openings along the front edge. The sound they produce is well-balanced, clear and sufficiently loud (although not loud enough for a party). The speakers can be used for listening to music.
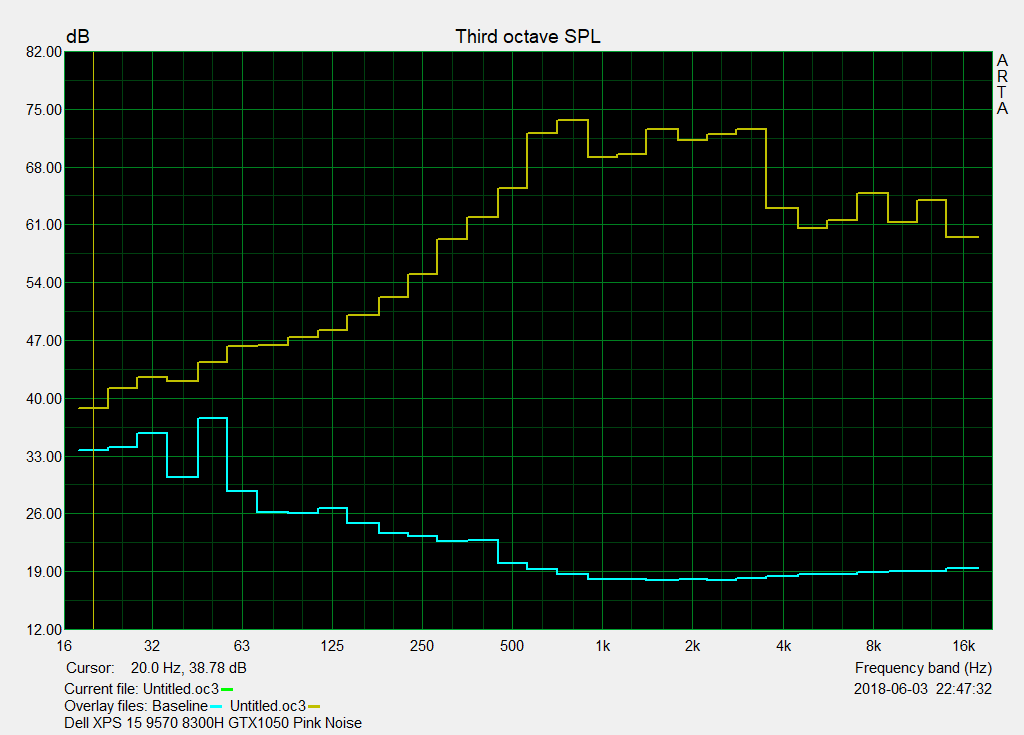
Our frequency diagram comparison confirms our impression. The Apple MacBook Pro 15, currently the best thing notebooks have to offer when it comes to sound quality, offers better results when rendering low frequencies that play an important part in making music sound "full". Apart from that, the two notebooks have very similar sound characteristics.
The XPS has an integrated Dual Array microphone positioned in the center of the front edge. In our skype video call test we did not encounter any issues with the microphone. The video transmission with the webcam was also satisfying.
Dell XPS 15 2018 i5 FHD 97Wh audio analysis
(±) | speaker loudness is average but good (73 dB)
Bass 100 - 315 Hz
(±) | reduced bass - on average 10.9% lower than median
(+) | bass is linear (4.9% delta to prev. frequency)
Mids 400 - 2000 Hz
(±) | higher mids - on average 6.8% higher than median
(+) | mids are linear (6.8% delta to prev. frequency)
Highs 2 - 16 kHz
(+) | balanced highs - only 3.7% away from median
(+) | highs are linear (6.9% delta to prev. frequency)
Overall 100 - 16.000 Hz
(±) | linearity of overall sound is average (16.6% difference to median)
Compared to same class
» 44% of all tested devices in this class were better, 7% similar, 50% worse
» The best had a delta of 5%, average was 17%, worst was 45%
Compared to all devices tested
» 29% of all tested devices were better, 6% similar, 65% worse
» The best had a delta of 4%, average was 23%, worst was 134%
Apple MacBook Pro 15 2017 (2.8 GHz, 555) audio analysis
(+) | speakers can play relatively loud (87 dB)
Bass 100 - 315 Hz
(±) | reduced bass - on average 8.7% lower than median
(±) | linearity of bass is average (11.1% delta to prev. frequency)
Mids 400 - 2000 Hz
(+) | balanced mids - only 2.5% away from median
(±) | linearity of mids is average (7.5% delta to prev. frequency)
Highs 2 - 16 kHz
(+) | balanced highs - only 1.7% away from median
(+) | highs are linear (5% delta to prev. frequency)
Overall 100 - 16.000 Hz
(+) | overall sound is linear (7.9% difference to median)
Compared to same class
» 7% of all tested devices in this class were better, 2% similar, 91% worse
» The best had a delta of 5%, average was 17%, worst was 45%
Compared to all devices tested
» 2% of all tested devices were better, 1% similar, 98% worse
» The best had a delta of 4%, average was 23%, worst was 134%
Dell XPS 15 2017 9560 (7300HQ, Full-HD) audio analysis
(+) | speakers can play relatively loud (87 dB)
Bass 100 - 315 Hz
(-) | nearly no bass - on average 15.8% lower than median
(±) | linearity of bass is average (13.9% delta to prev. frequency)
Mids 400 - 2000 Hz
(+) | balanced mids - only 4.3% away from median
(±) | linearity of mids is average (7.1% delta to prev. frequency)
Highs 2 - 16 kHz
(+) | balanced highs - only 3.1% away from median
(±) | linearity of highs is average (7.9% delta to prev. frequency)
Overall 100 - 16.000 Hz
(+) | overall sound is linear (13.5% difference to median)
Compared to same class
» 29% of all tested devices in this class were better, 4% similar, 67% worse
» The best had a delta of 5%, average was 17%, worst was 45%
Compared to all devices tested
» 14% of all tested devices were better, 4% similar, 82% worse
» The best had a delta of 4%, average was 23%, worst was 134%
Energy Management - 15-hour marathon runner
Power Consumption
The Dell XPS 15 2018 (8300H) is surprisingly energy-efficient while idling with our quad-core FHD model only consuming 3 - 7 watts. The XPS 15 FHD from 2017 was not this frugal and consumed 6 - 11 watts. Last year's UHD version even needed 12 - 17 watts while idling. The test unit is almost as energy-efficient as the current XPS 13 FHD.
Things become more interesting under load where we can see whether the processor works at full capacity. We measured a consumption of 107 watts during the stress test (Prime95+FurMark), although the CPU only clocks at 1.5 GHz here while the GTX 1050 runs at 1500 MHz. The cooling system cannot support both components running at maximum performance and the power supply (130 watts) would also reach its limits as the processor package alone requires 55 watts at full load.
We measured a consumption of 77.5 watts at average load - the first sequence of the 3DMark 2006. This number seems too lenient: The 3DMark Firestrike causes the Total System Power to cross the 100-watt mark, particularly when the GTX 1050 is under full load.
| Off / Standby | |
| Idle | |
| Load |
|
Key:
min: | |
| Dell XPS 15 2018 i5 FHD 97Wh i5-8300H, GeForce GTX 1050 Mobile, Lite-On CA3-8D256-Q11, LED IGZO IPS InfinityEdge, 1920x1080, 15.6" | Apple MacBook Pro 15 2017 (2.8 GHz, 555) i7-7700HQ, Radeon Pro 555, Apple SSD SM0256L, IPS, 2880x1800, 15.4" | Gigabyte Aero 14-K8 i7-8750H, GeForce GTX 1050 Ti Mobile, Crucial MX300 CT525MX300SSD1, IPS, 2560x1440, 14" | Gigabyte Aero 15 i7-7700HQ, GeForce GTX 1060 Mobile, Lite-On CX2-8B512-Q11, IPS, 1920x1080, 15.6" | Asus Zenbook Pro UX550VE-DB71T i7-7700HQ, GeForce GTX 1050 Ti Mobile, Samsung PM961 NVMe MZVLW512HMJP, IPS, 1920x1080, 15.6" | Dell XPS 13 9370 FHD i5 i5-8250U, UHD Graphics 620, Toshiba XG5 KXG50ZNV256G, IPS, 1920x1080, 13.3" | MSI GT75 8RG-090 Titan i9-8950HK, GeForce GTX 1080 Mobile, 2x Samsung PM961 MZVLW256HEHP (RAID 0), TN, 1920x1080, 17.3" | Dell XPS 15 9560 (i7-7700HQ, UHD) i7-7700HQ, GeForce GTX 1050 Mobile, Lite-On CX2-8B512-Q11, IGZO IPS, 3840x2160, 15.6" | Dell XPS 15 2017 9560 (7300HQ, Full-HD) i5-7300HQ, GeForce GTX 1050 Mobile, WDC WD10SPCX-75KHST0 + SanDisk Z400s M.2 2242 32 GB Cache, LED IGZO IPS InfinityEdge, 1920x1080, 15.6" | Average NVIDIA GeForce GTX 1050 Mobile | Average of class Multimedia | |
|---|---|---|---|---|---|---|---|---|---|---|---|
| Power Consumption | -39% | -55% | -121% | -30% | 25% | -418% | -116% | -49% | -62% | -46% | |
| Idle Minimum * (Watt) | 2.9 | 3.4 -17% | 7 -141% | 12 -314% | 6.3 -117% | 3.14 -8% | 31 -969% | 11.9 -310% | 6.6 -128% | 6.99 ? -141% | 5.66 ? -95% |
| Idle Average * (Watt) | 5.8 | 13.9 -140% | 10 -72% | 15 -159% | 7.9 -36% | 5.22 10% | 35 -503% | 17.1 -195% | 9 -55% | 10.7 ? -84% | 10.2 ? -76% |
| Idle Maximum * (Watt) | 7.5 | 17.6 -135% | 13 -73% | 20 -167% | 8.1 -8% | 6 20% | 45 -500% | 17.3 -131% | 10.7 -43% | 12.7 ? -69% | 12.5 ? -67% |
| Load Average * (Watt) | 77.5 | 71.1 8% | 73 6% | 82 -6% | 84.9 -10% | 38.5 50% | 130 -68% | 94.7 -22% | 77.5 -0% | 82.9 ? -7% | 65.2 ? 16% |
| Witcher 3 ultra * (Watt) | 84 | 57.9 31% | 96 -14% | 111 -32% | 96.3 -15% | 268 -219% | 104.8 -25% | ||||
| Load Maximum * (Watt) | 107 | 88.5 17% | 143 -34% | 161 -50% | 102.4 4% | 50.4 53% | 374 -250% | 122 -14% | 130 -21% | 115.3 ? -8% | 113.5 ? -6% |
* ... smaller is better
Battery Runtimes
The runtime on battery is one of the best that an XPS 15 has ever offered in our tests: The lights only go out after 15:42 hours in our Wi-Fi test at 150 cd/m² (dimmed by 6 levels, Dell energy profile set to "quiet"). We ran the test a second time, which confirmed this result. The load test with Battery Eater ended after 114 minutes. The 97-Wh battery requires 2:30 hours at the most to recharge fully, which is incredibly quick considering its long runtime.
| Dell XPS 15 2018 i5 FHD 97Wh i5-8300H, GeForce GTX 1050 Mobile, 97 Wh | Dell XPS 15 2017 9560 (7300HQ, Full-HD) i5-7300HQ, GeForce GTX 1050 Mobile, 56 Wh | Dell XPS 15 9560 (i7-7700HQ, UHD) i7-7700HQ, GeForce GTX 1050 Mobile, 97 Wh | Dell XPS 13 9370 FHD i5 i5-8250U, UHD Graphics 620, 52 Wh | Apple MacBook Pro 15 2017 (2.8 GHz, 555) i7-7700HQ, Radeon Pro 555, 76 Wh | Asus Zenbook Pro UX550VE-DB71T i7-7700HQ, GeForce GTX 1050 Ti Mobile, 73 Wh | Gigabyte Aero 14-K8 i7-8750H, GeForce GTX 1050 Ti Mobile, 94.24 Wh | Gigabyte Aero 15 i7-7700HQ, GeForce GTX 1060 Mobile, 94.24 Wh | Average of class Multimedia | |
|---|---|---|---|---|---|---|---|---|---|
| Battery runtime | -45% | -33% | -14% | -10% | -40% | 19% | -28% | -17% | |
| WiFi v1.3 (h) | 15.7 | 5.6 -64% | 7.2 -54% | 10.7 -32% | 10.7 -32% | 8.9 -43% | 11 -30% | 7 -55% | 12.2 ? -22% |
| Witcher 3 ultra (h) | 1 | 1.5 50% | |||||||
| Load (h) | 1.9 | 1.4 -26% | 1.7 -11% | 2 5% | 1 -47% | 1.2 -37% | 3.2 68% | 1.9 0% | 1.664 ? -12% |
| Reader / Idle (h) | 9.4 | 13.9 | 23.6 | 17.1 | 17.6 | 10.6 | 24.9 ? | ||
| H.264 (h) | 13.9 | 8.5 | 7.7 | 17.1 ? |
Verdict
Pros
Cons
Not much has changed from the outside, but users of the XPS 15 2018 will soon notice: Dell has managed to make an already very good notebook even better. Its emissions, battery runtimes and a detail in the port selection have been improved. The result is a better ranking.
Dell has managed to make an already very good Notebook even better. Its emissions, battery runtimes and a detail in the port selection have been improved.
The performance of the i5-8300H already has a lot to offer users. Compared to the more expensive versions with the Core i7-8750H and Core i9-8950HK (both with six cores), the i5-8300H only has a real disadvantage when it comes to intensive multi tasking.
The i5-8300H makes full use of its cooling system (dual fan, 94 °C/~201 °F) but is only throttled minimally by the temperature limit (-3.5%). We are curious to see how the six-core model fares in this case and whether it can also manage to keep throttling to a minimum. Only the stress test caused the processor to be throttled significantly, as was to be expected. The Nvidia GPU takes precedence. This does not apply to normal processor load, but only to the rather unrealistic combination of CPU and GPU load of 100% each.
Our 8300H device received good results in the PCMark benchmarks and there are only minor differences in performance of 0 - 6% to powerful multimedia devices. The Lite-On SSD cannot quite keep up with the SSDs in the XPS 15 2017 or Aero 15 according to the benchmarks, but this does not seem to have an impact on the PCMark results.
We prefer the FHD screen to that of the 2017 model. Although the panel is of the same build, the new screen offers better color display ex-works (without calibration) and lower response rates. Contrast and color space coverage remain very good. However, this is the first time Dell has chosen to use PWM to reduce brightness, although this does not occur until a brightness level of 10% or below and should not affect everyday use for most users.
The input devices are of high-quality as usual and are suitable for frequent typers, there are no changes here. The keyboard backlighting still has PWM at 64 Hz on the lower brightness level.
Dell continues to offer the basic options of 2 storage devices and 56 Wh or 1 storage device and 97 Wh. This offers a lot of flexibility when configuring your device and it is also possible to combine an i7 with 56 Wh.
The runtime is great: Almost 16 hours during the Wi-Fi test. While gaming, the GTX 1050 Ti has an advantage of about 20%; the GTX 1050 performs above average. We are curious to see what the GTX 1050 Ti can do in the XPS 15. Gamers with an external GPU such as Razer Core will be pleased with the four PCIe lanes of the Thunderbolt 3 port (9560 only had two lanes).
We found nothing to criticize about the device's system noise, which had not been ideal in the 2017 XPS 15. The maximum volume is lower, and the fans remain turned off while idling with a web script. It is therefore possible to work silently when using office applications.
Next, we will be taking a look at the Core i7/i9, GTX 1050 Ti versions of the XPS 15 9570. The test units are already on their way.
Update 06/06/2018
In the meantime, Dell has confirmed a driver issue which causes the graphics card to be identified wrongly. The A01 driver from 05/30/2018 should recognize the GPU correctly. You can download the driver from the Dell website here.
Changelog:
06/01/2018 4pm – Performance processor/applications, photos
06/02/2018 2pm – Storage devices
06/02/2018 3pm – Energy, temperature, stress test
06/02/2018 6pm - Display
06/03/2018 9am - Input devices
06/03/2018 12pm - Connectivity, Maintenance
06/03/2018 2pm - Battery runtime, gaming
06/04/2018 1pm - GPU details, no Max-Q!
06/04/2018 3pm - Fan noise, speakers
06/05/2018 10am - Rating, final verdict
Our test unit comes from the official Dell shop, where we purchased it. It is therefore a series version that we have tested in the condition it came in (ex-works). The performance tests were carried out in the Dell mode "Ultra Performance". An issue with the SSD (ePSA error "Hard Drive - No NVMe Drive detected on CPI tag 00B8, namespace ID 09") put a sudden end to our tests. Fortunately, we had already done the tests and measurements that are relevant for our rating. The system had already frozen three times during testing and could only be reactivated by doing a hard reset (pressing the power button for a long time). This problem did not have an impact on our rating, however, as we believe this is an issue specific to our test unit and does not apply to the entire series.
Dell XPS 15 2018 i5 FHD 97Wh
- 06/05/2018 v6 (old)
Sebastian Jentsch
Price comparison

