2022 Dell XPS 15 9520 3.5K OLED laptop review: Skip or buy?
Dell kicked off the decade with a bang by introducing the fully refreshed XPS 15 9500 to succeed the older generation XPS 15 7590 series. The model shifted the XPS 15 family from 16:9 to 16:10 alongside a brand new chassis design with Intel 10th gen Comet Lake-H CPUs and the GeForce GTX 1650 Ti GPU. The XPS 15 9510 took it a step further with 11th gen Tiger Lake-H CPUs and optional 3.5K OLED panels. Now, the XPS 15 9520 is yet another incremental update with 12th gen Alder Lake-H CPUs and faster DDR5 RAM.
We recommend checking out our existing review on the XPS 15 9500 as the XPS 15 9520 chassis remains identical. This review page will focus on the performance of the XPS 15 9520 and other differences users can expect when compared to previous models.
Alternatives to the Dell XPS 15 9520 include other high-end 15.6-inch multimedia laptops with discrete graphics like the the Asus Zenbook Pro 15 OLED, Lenovo Yoga Creator 7 15, HP Spectre x360 15, HP Envy 15, or the MSI Creator 15.
More Dell reviews:
Potential Competitors in Comparison
Rating | Date | Model | Weight | Height | Size | Resolution | Price |
|---|---|---|---|---|---|---|---|
| 89.5 % v7 (old) | 05 / 2022 | Dell XPS 15 9520 RTX 3050 Ti i7-12700H, GeForce RTX 3050 Ti Laptop GPU | 1.9 kg | 18 mm | 15.60" | 3456x2160 | |
| 88.4 % v7 (old) | 08 / 2021 | Dell XPS 15 9510 11800H RTX 3050 Ti OLED i7-11800H, GeForce RTX 3050 Ti Laptop GPU | 1.9 kg | 18 mm | 15.60" | 3456x2160 | |
| 85 % v7 (old) | 01 / 2020 | HP Spectre X360 15-5ZV31AV i7-10510U, GeForce MX250 | 2.1 kg | 19.3 mm | 15.60" | 3840x2160 | |
| 87.7 % v7 (old) | 05 / 2022 | Asus Zenbook Pro 15 OLED UM535Q R9 5900HX, GeForce RTX 3050 Ti Laptop GPU | 1.9 kg | 18 mm | 15.60" | 1920x1080 | |
| 82.4 % v7 (old) | 02 / 2021 | MSI Stealth 15M A11SEK i7-1185G7, GeForce RTX 2060 Max-Q | 1.7 kg | 16.15 mm | 15.60" | 1920x1080 | |
| 93.2 % v7 (old) | 11 / 2021 | Apple MacBook Pro 16 2021 M1 Pro M1 Pro, M1 Pro 16-Core GPU | 2.2 kg | 16.8 mm | 16.20" | 3456x2234 |
Case
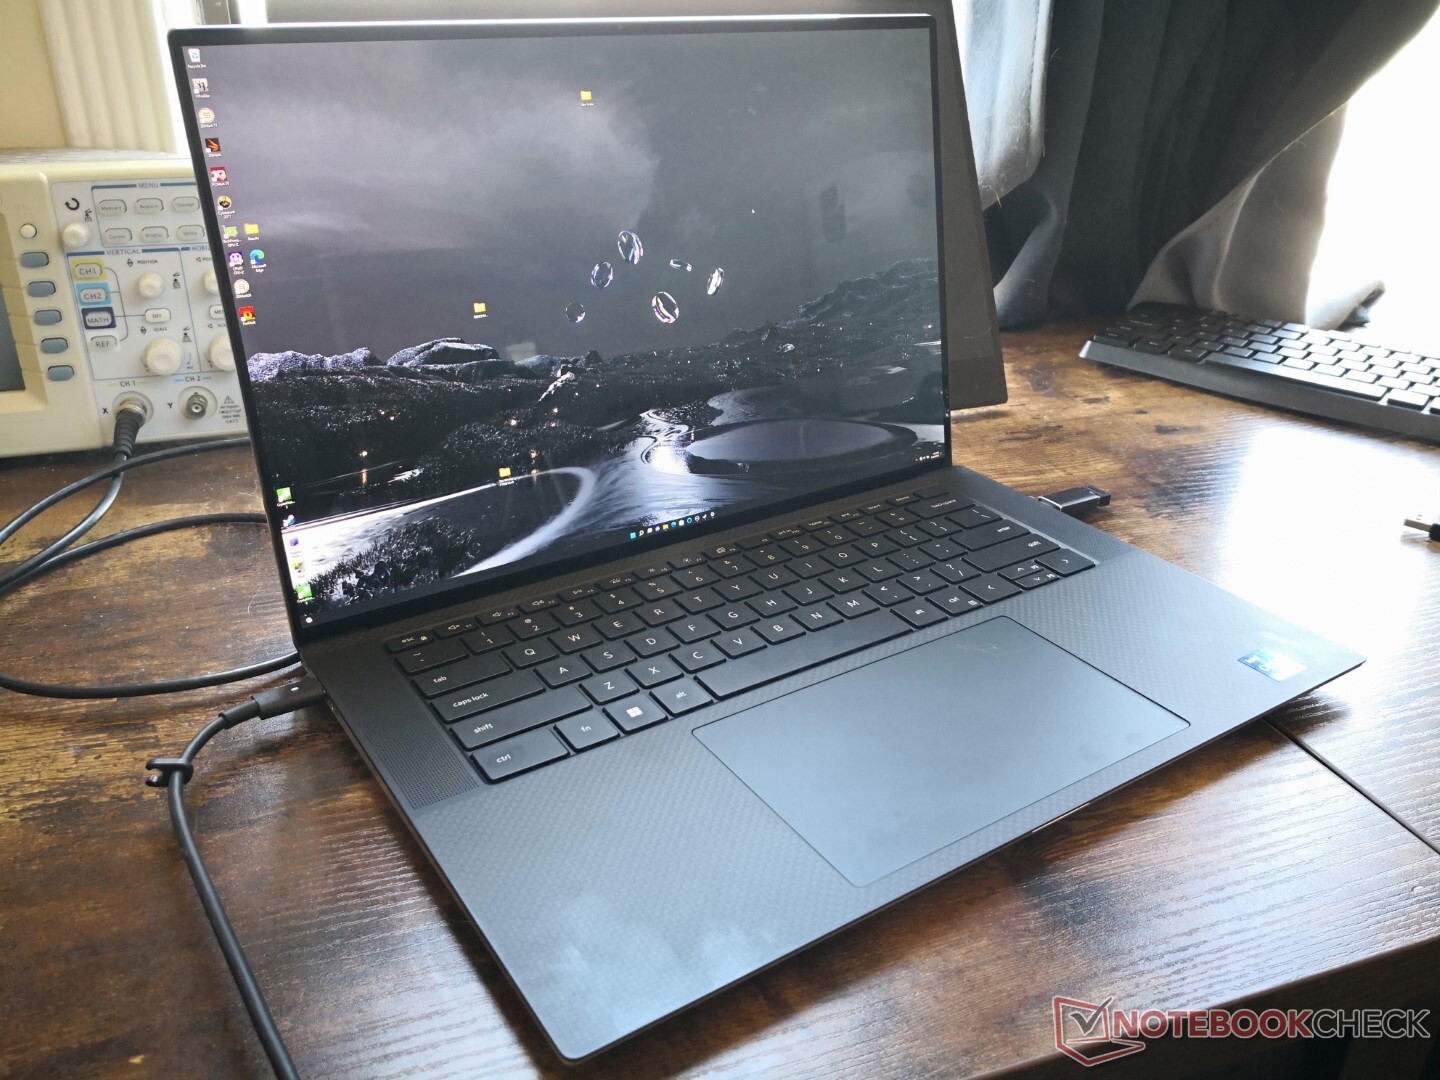
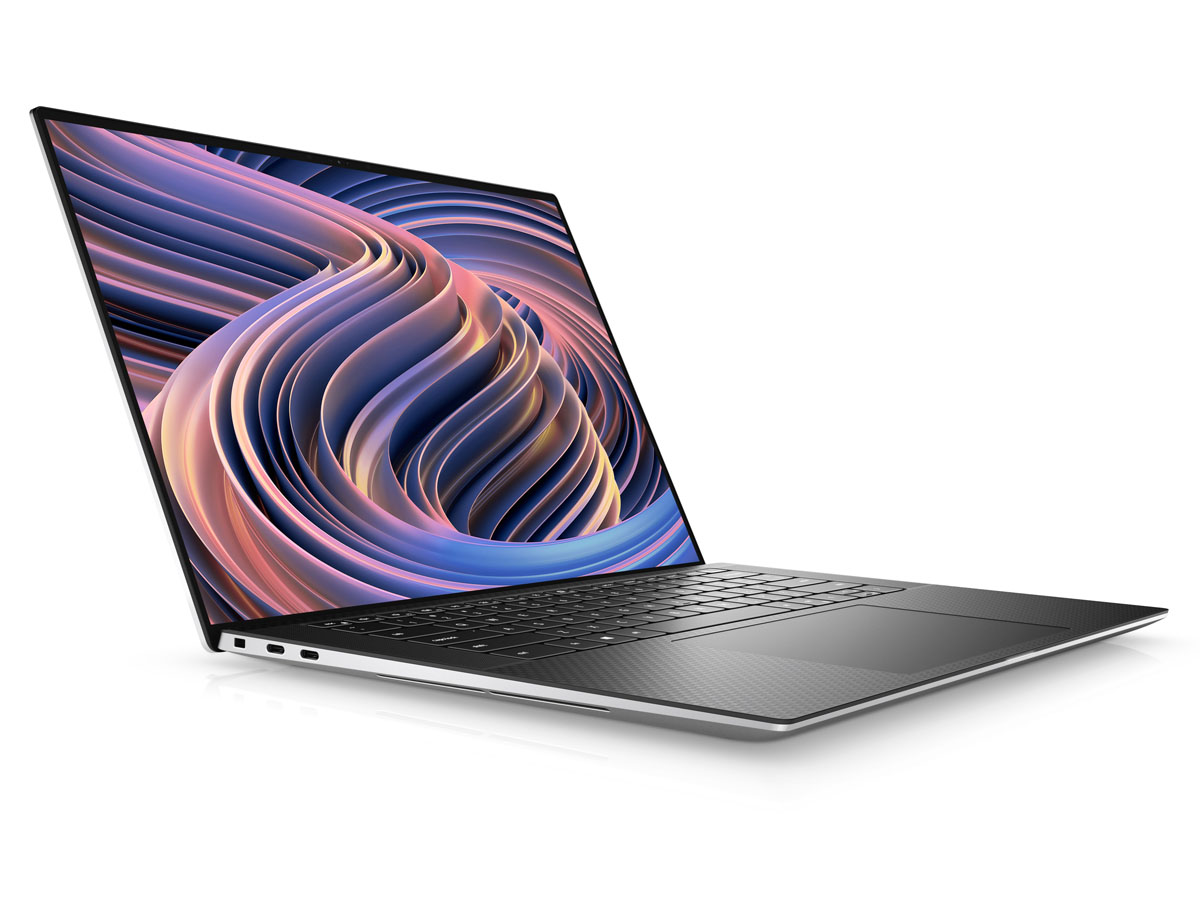
The XPS 15 9520 chassis is still one of the smallest designs in its size category despite being two years old. The very narrow bezels on all four sides including the chin help to reduce footprint by greater margins than say the Zenbook Pro 15 or Spectre x360 15.
SD Card Reader
| SD Card Reader | |
| average JPG Copy Test (av. of 3 runs) | |
| Dell XPS 15 9510 11800H RTX 3050 Ti OLED (AV Pro V60) | |
| Dell XPS 15 9500 Core i7 4K UHD (Toshiba Exceria Pro SDXC 64 GB UHS-II) | |
| MSI Stealth 15M A11SEK (Toshiba Exceria Pro M501 microSDXC 32GB) | |
| Dell XPS 15 9520 RTX 3050 Ti (Toshiba Exceria Pro SDXC 64 GB UHS-II) | |
| HP Spectre X360 15-5ZV31AV (Toshiba Exceria Pro M501 UHS-II) | |
| Asus Zenbook Pro 15 OLED UM535Q (Toshiba Exceria Pro SDXC 64 GB UHS-II) | |
| maximum AS SSD Seq Read Test (1GB) | |
| MSI Stealth 15M A11SEK (Toshiba Exceria Pro M501 microSDXC 32GB) | |
| Dell XPS 15 9510 11800H RTX 3050 Ti OLED (AV Pro V60) | |
| Dell XPS 15 9500 Core i7 4K UHD (Toshiba Exceria Pro SDXC 64 GB UHS-II) | |
| HP Spectre X360 15-5ZV31AV (Toshiba Exceria Pro M501 UHS-II) | |
| Dell XPS 15 9520 RTX 3050 Ti (Toshiba Exceria Pro SDXC 64 GB UHS-II) | |
| Asus Zenbook Pro 15 OLED UM535Q (Toshiba Exceria Pro SDXC 64 GB UHS-II) | |
Communication
An Intel AX211 comes standard for Wi-Fi 6E and Bluetooth 5.2 connectivity. However, Dell has confirmed with us that the XPS 15 9520 was not designed to support 6 GHz Wi-Fi 6E networks despite the fact that the AX211 chip can. Thus, owners of the XPS 15 9520 will only be able to connect to 2.4 GHz and 5 GHz networks up to Wi-Fi 6.
| Networking | |
| iperf3 transmit AX12 | |
| Dell XPS 15 9510 11800H RTX 3050 Ti OLED | |
| Dell XPS 15 9500 Core i7 4K UHD | |
| MSI Stealth 15M A11SEK | |
| Asus Zenbook Pro 15 OLED UM535Q | |
| iperf3 receive AX12 | |
| Dell XPS 15 9500 Core i7 4K UHD | |
| Dell XPS 15 9510 11800H RTX 3050 Ti OLED | |
| MSI Stealth 15M A11SEK | |
| Asus Zenbook Pro 15 OLED UM535Q | |
| iperf3 receive AXE11000 | |
| Dell XPS 15 9520 RTX 3050 Ti | |
| iperf3 transmit AXE11000 | |
| Dell XPS 15 9520 RTX 3050 Ti | |
Webcam
Dell has improved the colors of the webcam by separating the IR and RGB sensors when compared to the XPS 15 9510 or 9500. It remains just 1 MP, however, compared to 2 MP on other flagship 15.6-inch laptops like the Razer Blade 15. Thus, while colors may be a bit better, the picture is still muddy.


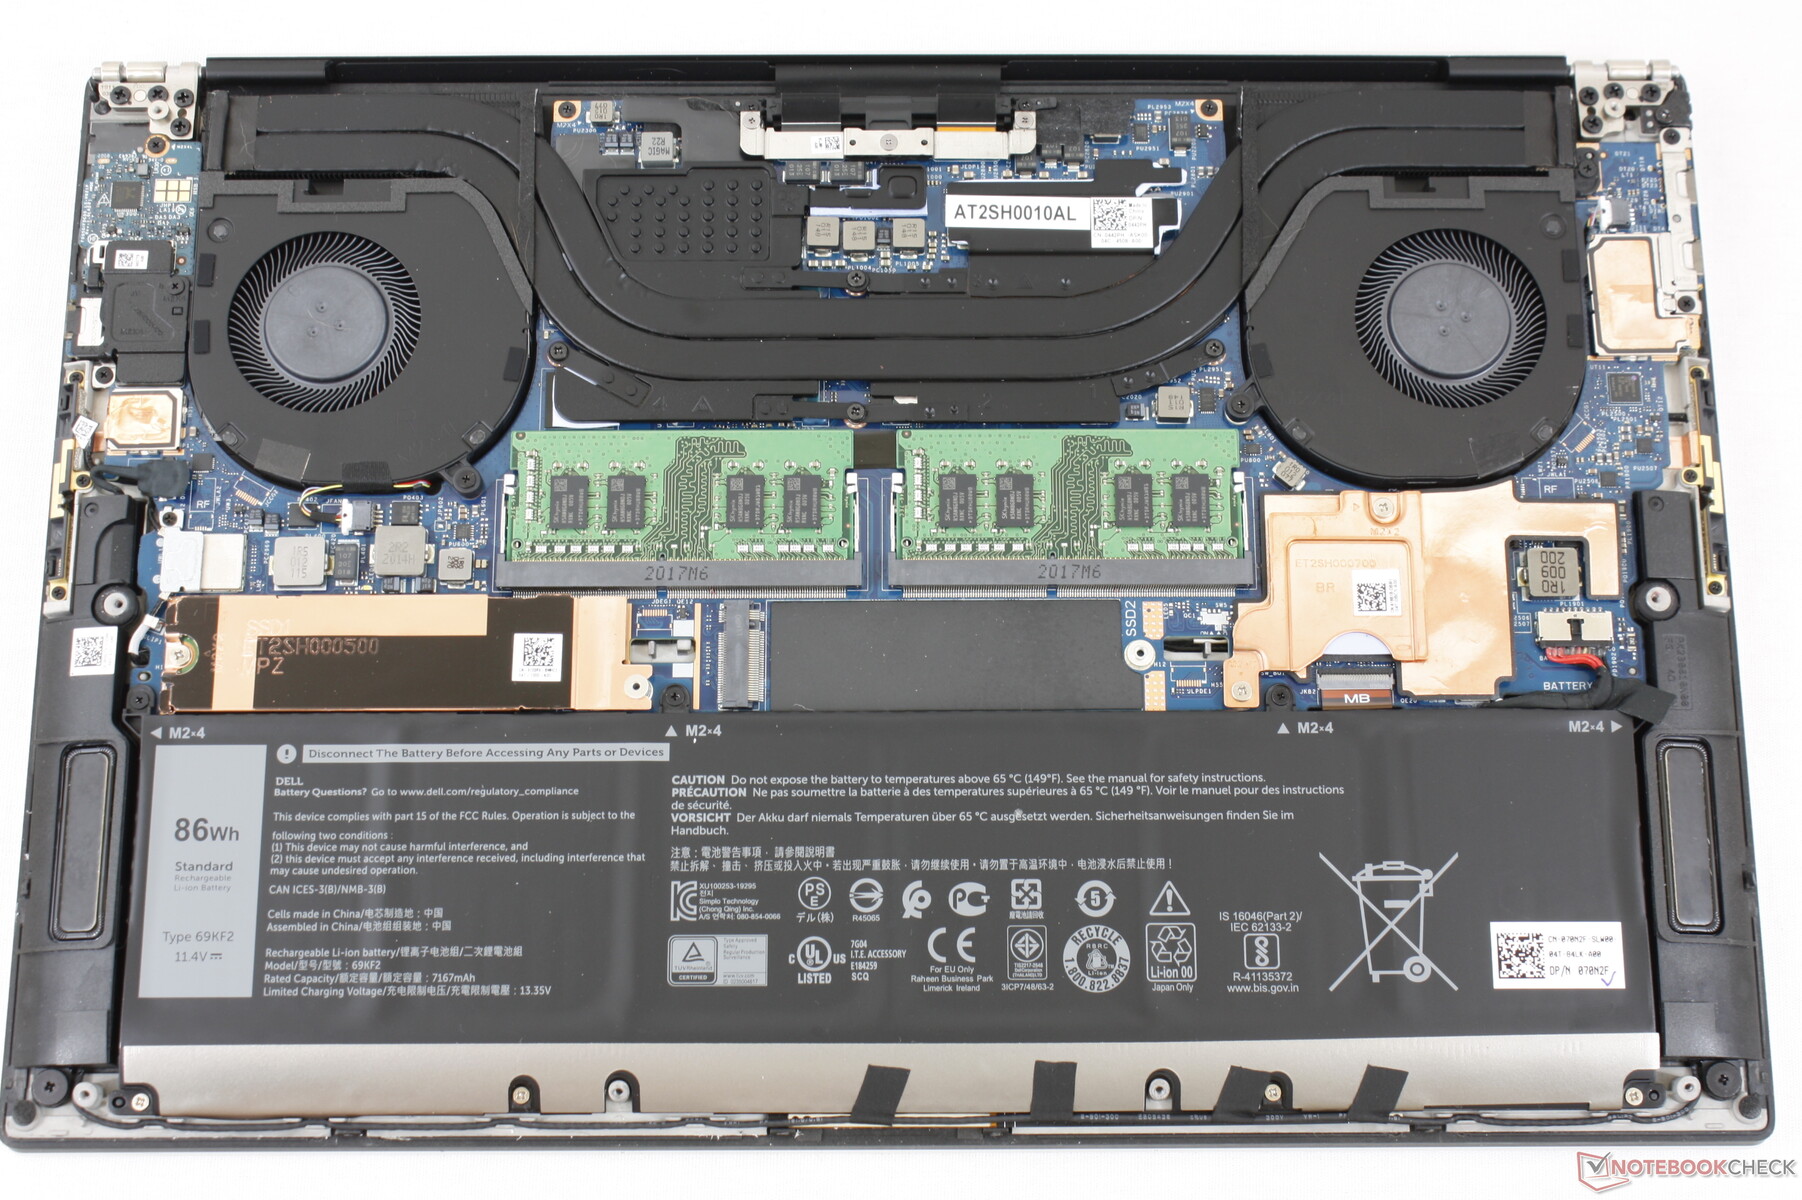
Maintenance
Accessories and Warranty
The retail box includes the USB-C AC adapter, paperwork, and a USB-C to full-size HDMI and USB-A adapter. The latter is particularly helpful as the system integrates only USB-C ports.
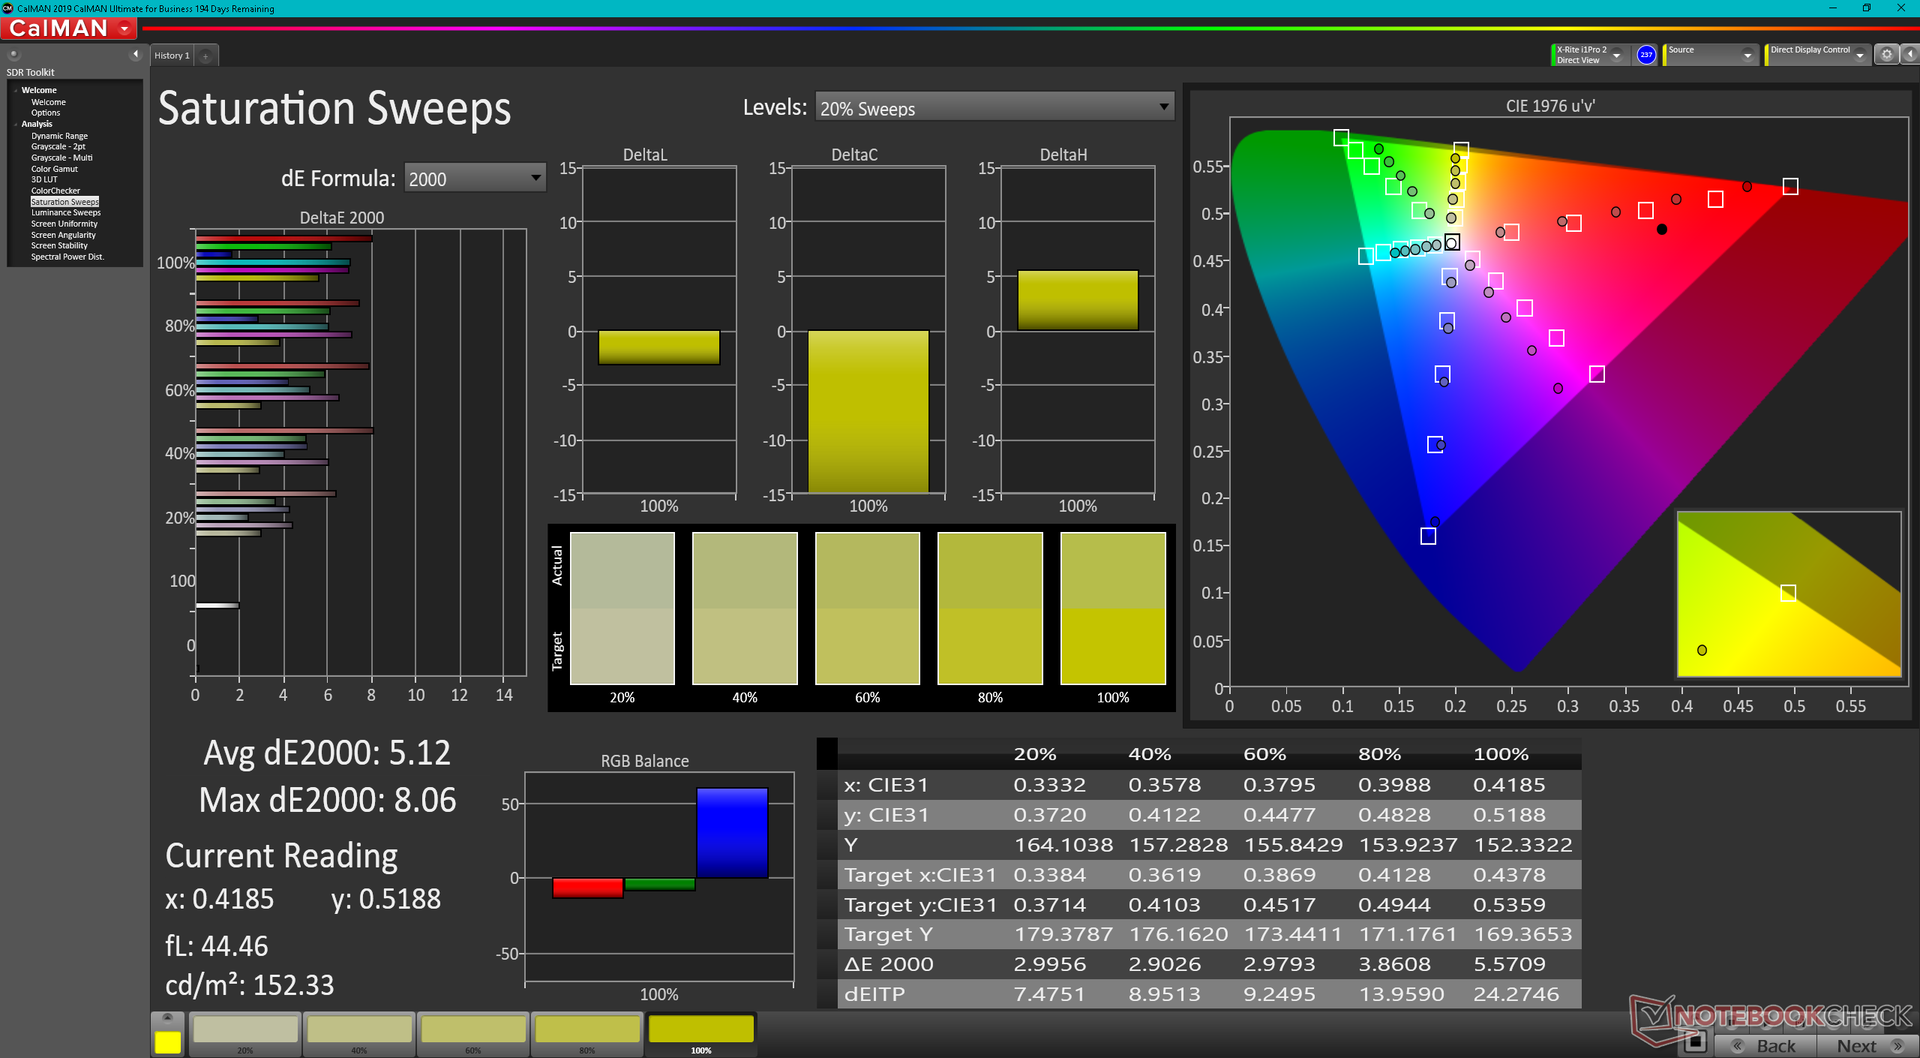
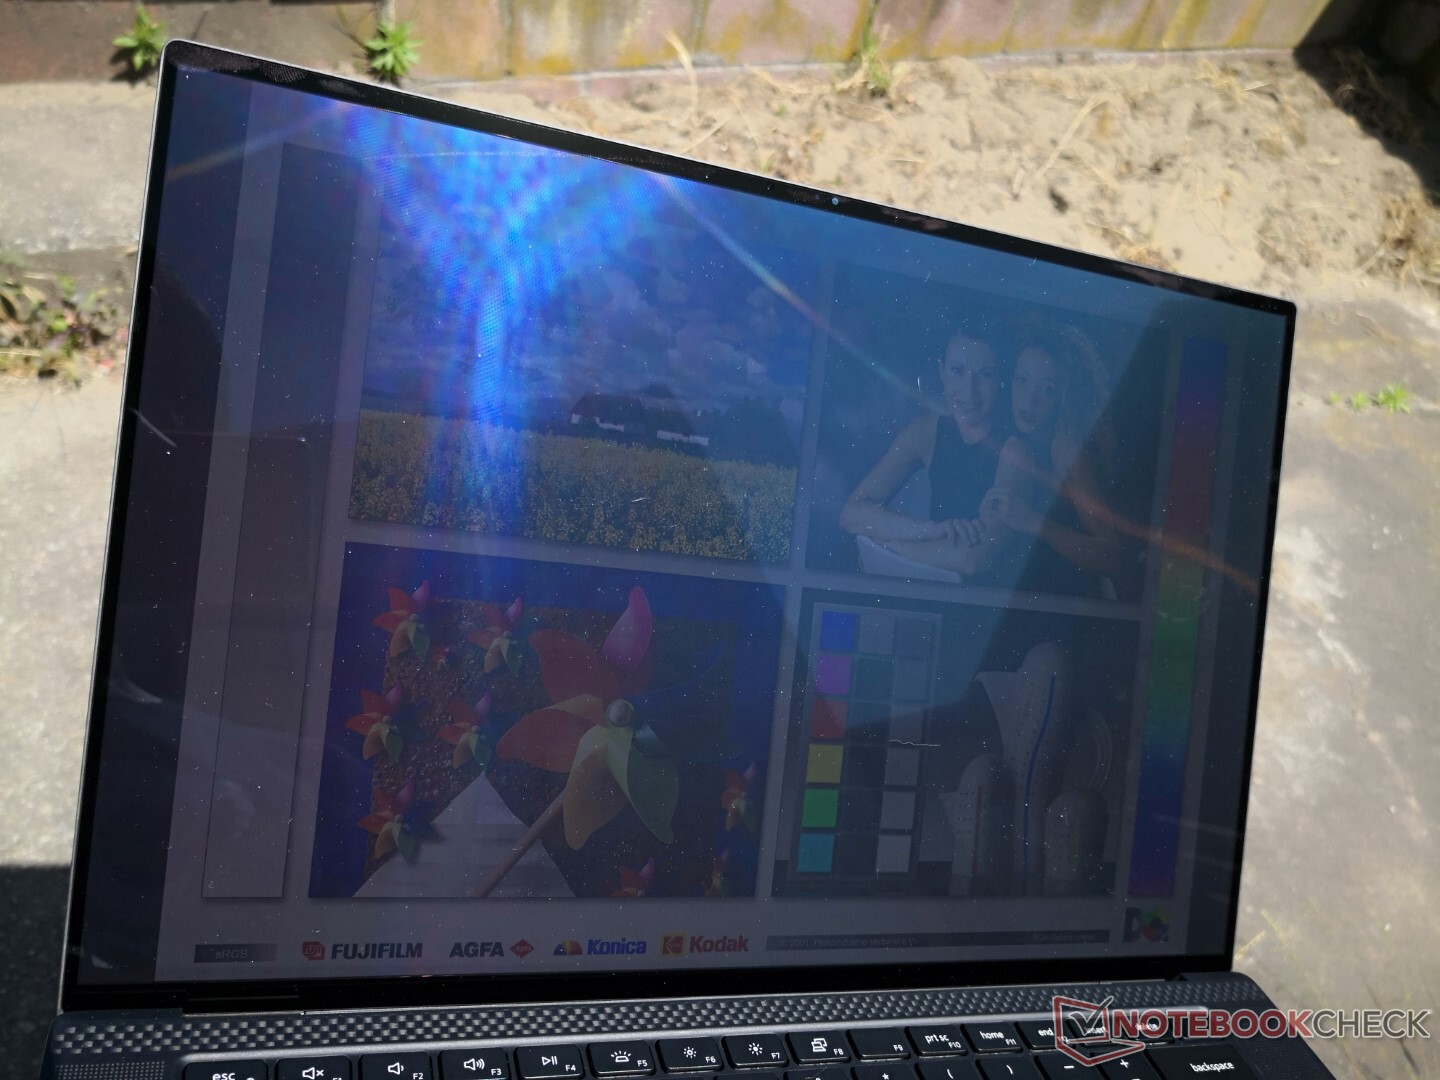
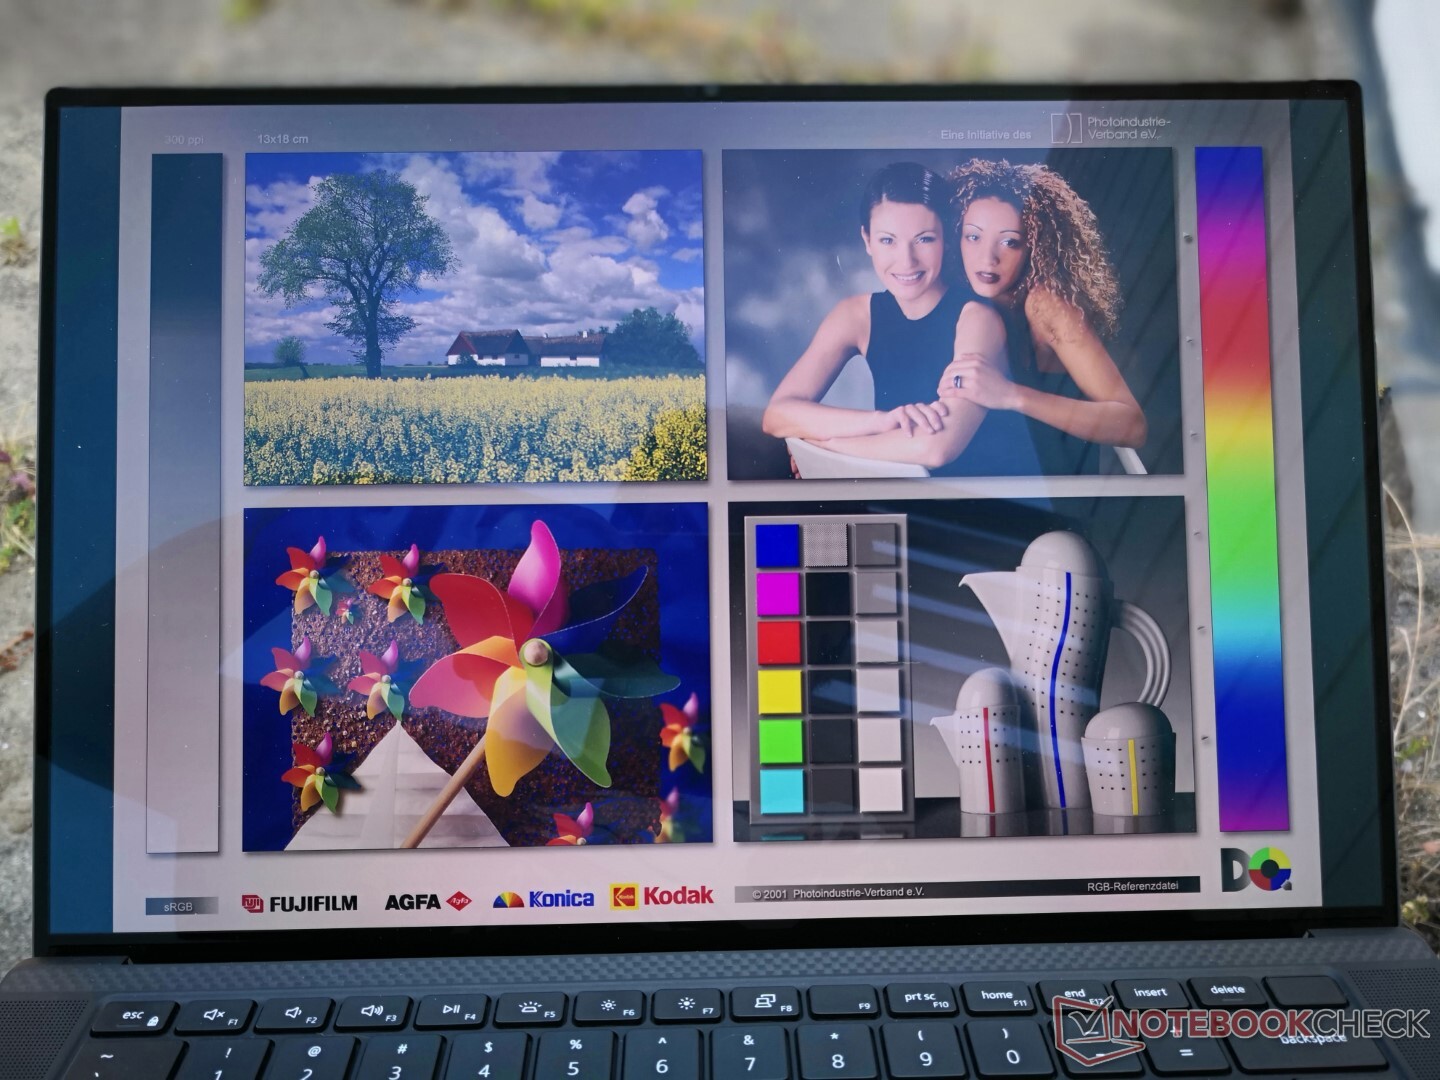
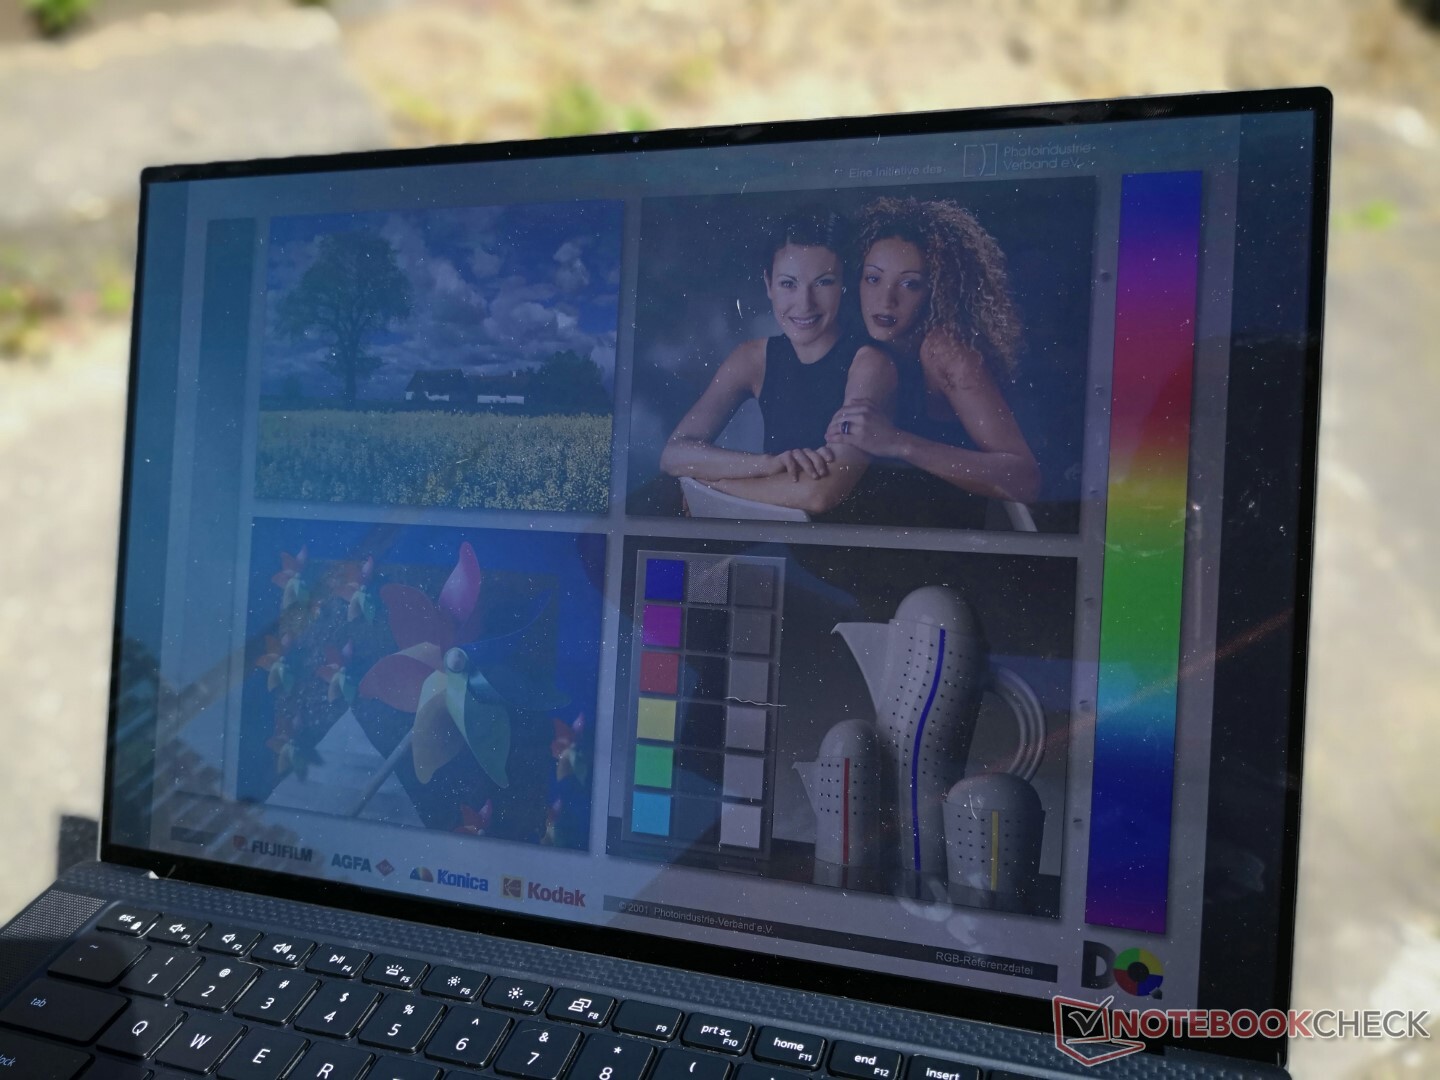
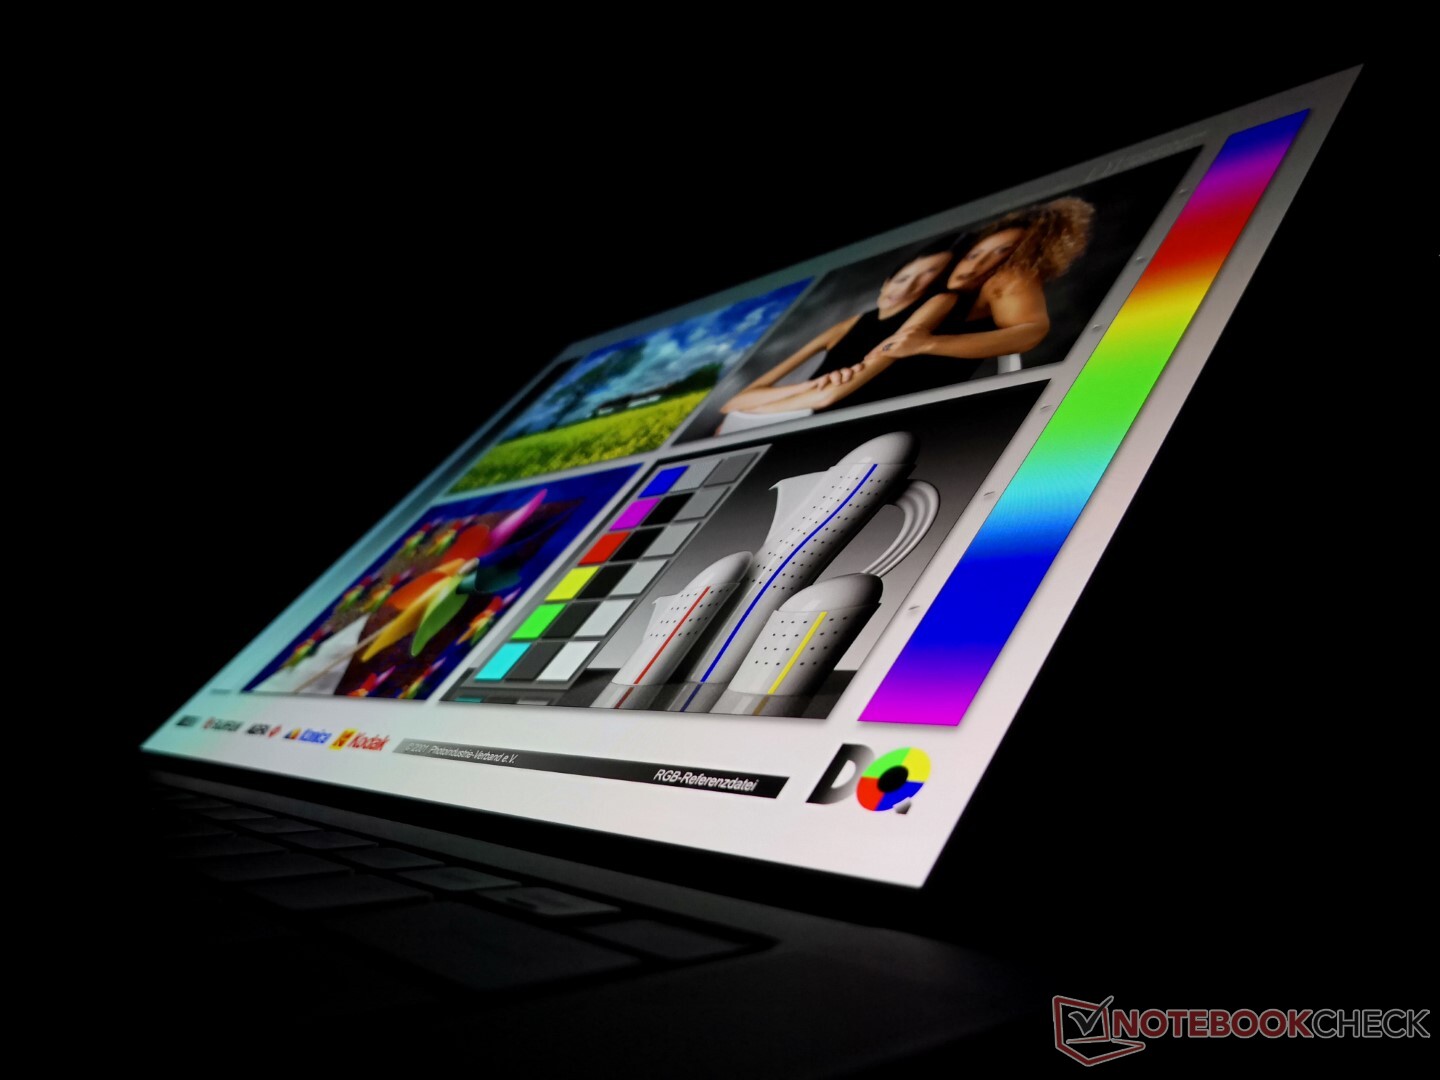
Display — Uncommon 3.5K OLED
Our review unit comes with the same 3.5K OLED touchscreen that was available on last year's XPS 15 9510 meaning that the visual experience hasn't changed year-over-year. A lower-resolution 1920 x 1200 IPS option and higher-resolution 3840 x 2400 IPS option are also available, but all panels are unfortunately limited to a 60 Hz refresh rate. Certain Ultrabooks like the Lenovo IdeaPad Slim 7i Pro or Asus Vivobook Pro 14 are already shipping with faster 90 Hz panels for a noticeably smoother UI experience.
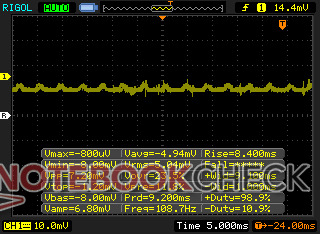
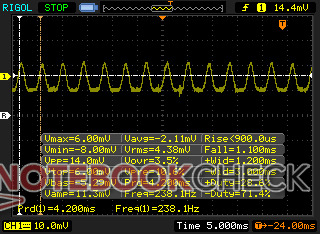
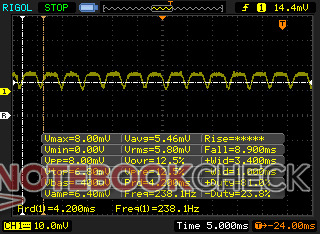
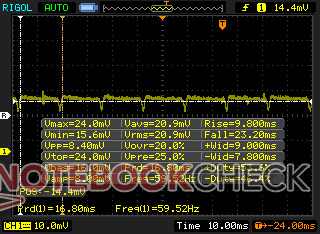
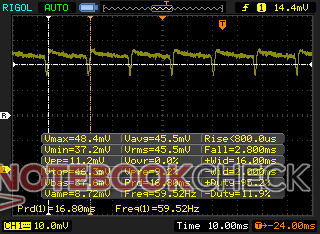
Keep in mind that pulse-width modulation is present on all brightness at 238 Hz from 0 percent to 25 percent brightness and 59 Hz from 26 percent to 100 percent brightness. If screen flickering is an issue, then we recommend configuring with IPS instead.

| |||||||||||||||||||||||||
Brightness Distribution: 95 %
Center on Battery: 381.4 cd/m²
Contrast: ∞:1 (Black: 0 cd/m²)
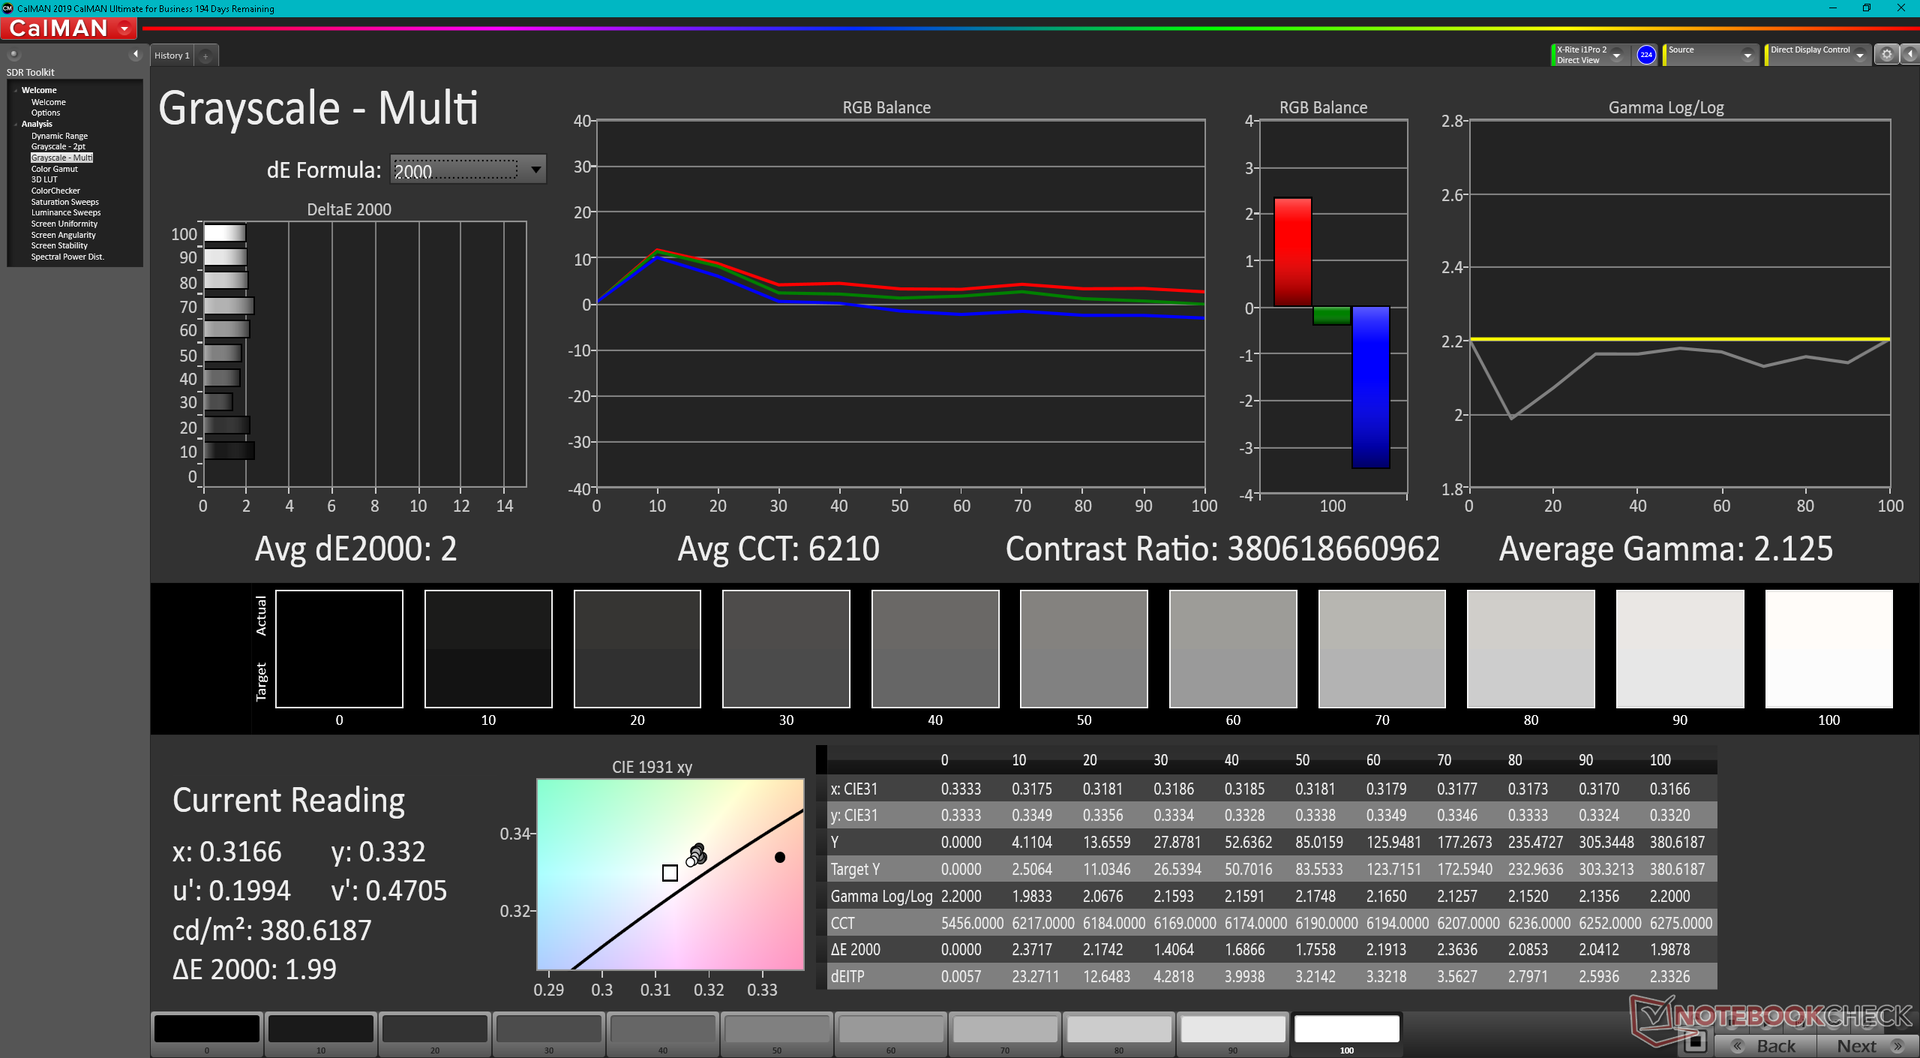
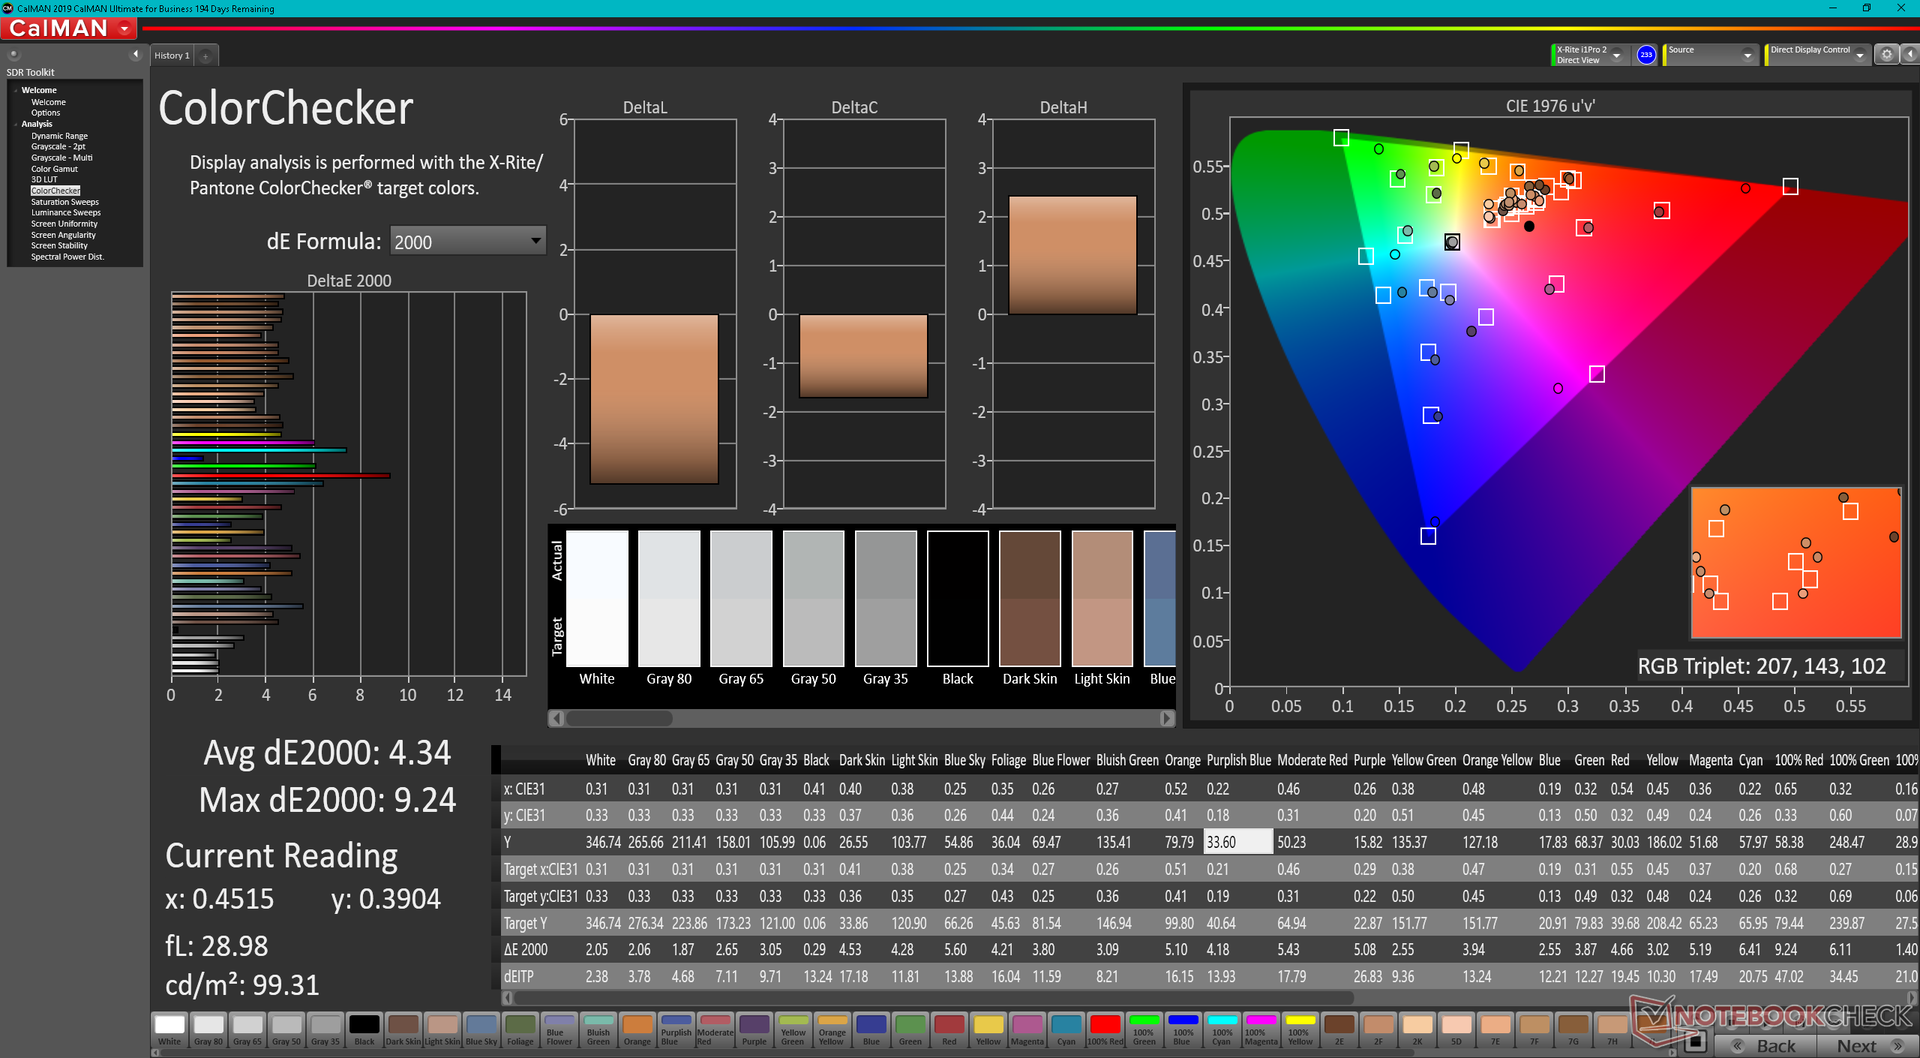
ΔE ColorChecker Calman: 4.34 | ∀{0.5-29.43 Ø4.73}
ΔE Greyscale Calman: 2 | ∀{0.09-98 Ø4.97}
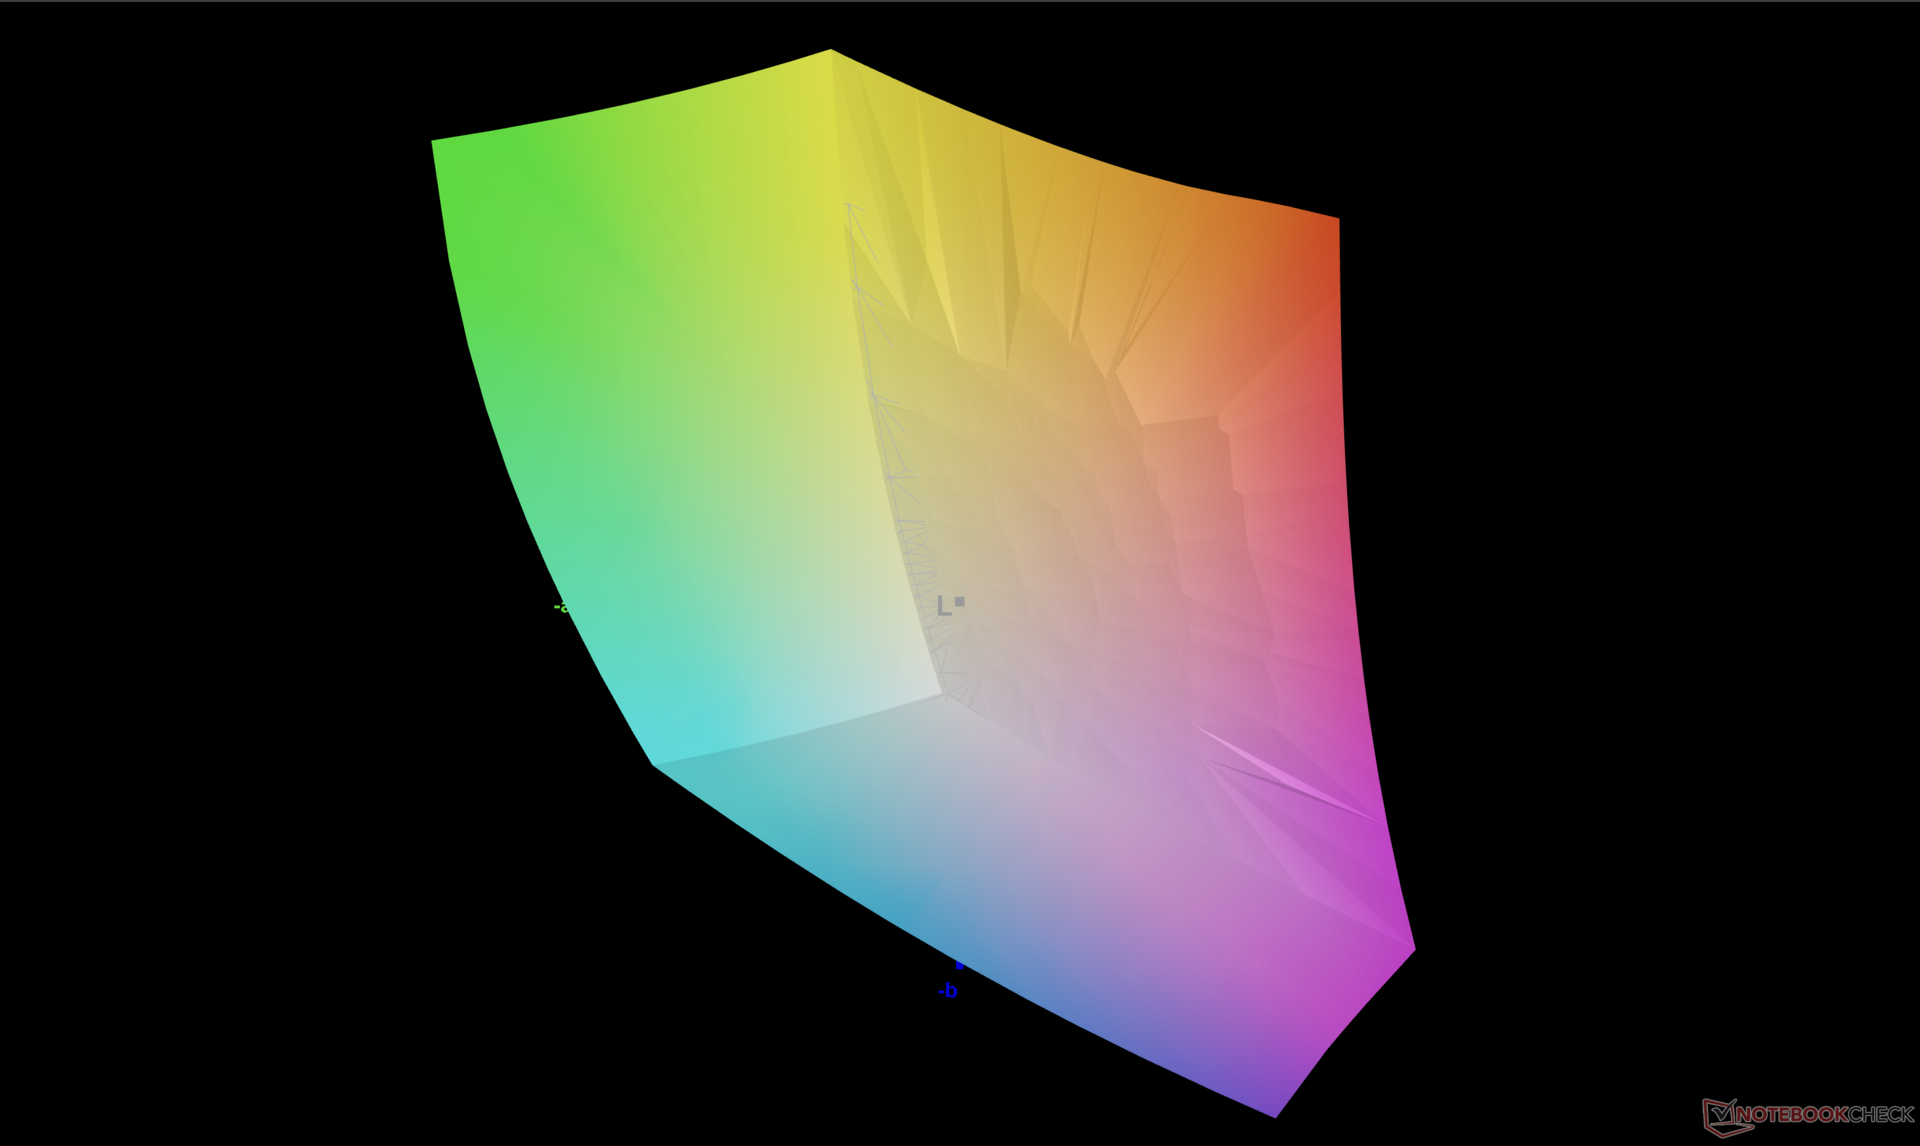
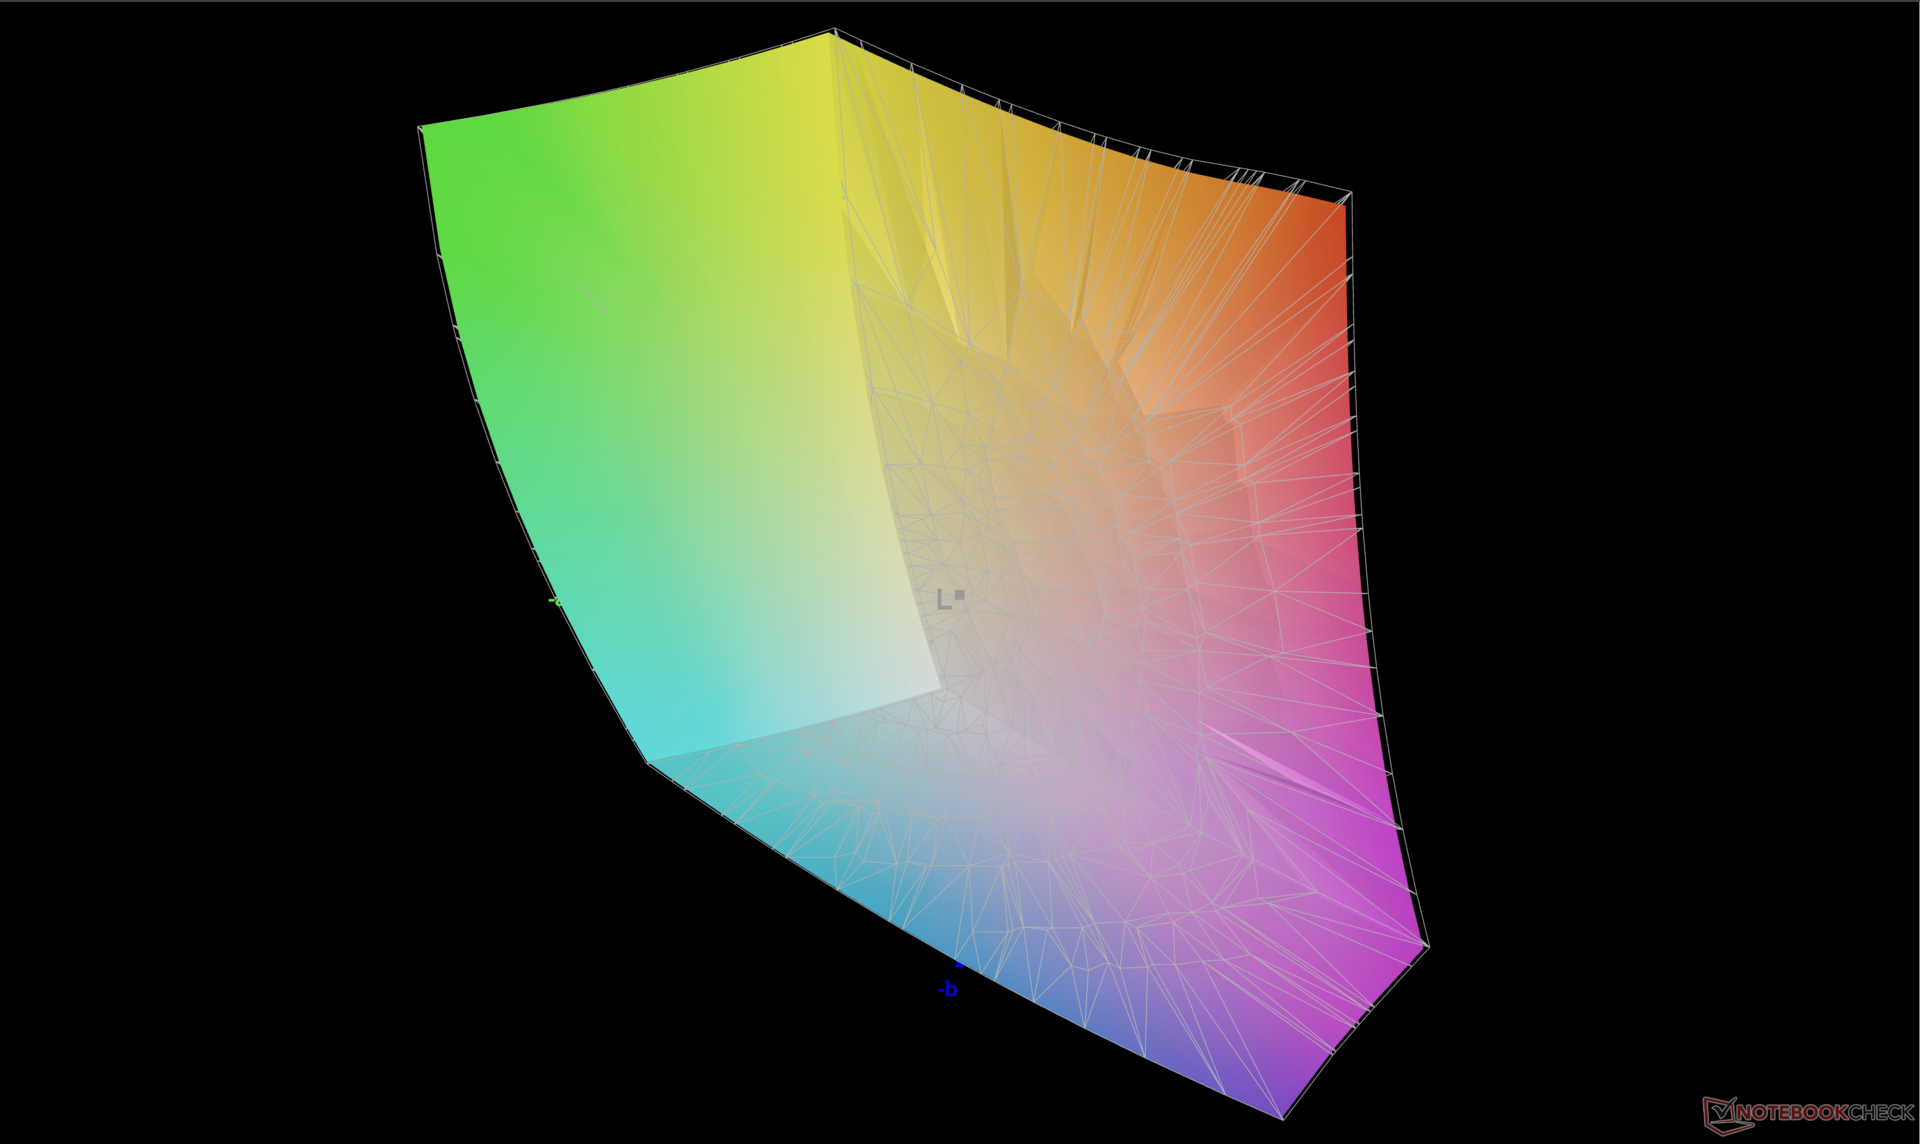
86% AdobeRGB 1998 (Argyll 3D)
99.9% sRGB (Argyll 3D)
97.8% Display P3 (Argyll 3D)
Gamma: 2.13
CCT: 6210 K
| Dell XPS 15 9520 RTX 3050 Ti Samsung 156XG01, OLED, 3456x2160, 15.6" | Dell XPS 15 9510 11800H RTX 3050 Ti OLED SDC414D, OLED, 3456x2160, 15.6" | Dell XPS 15 9500 Core i7 4K UHD Sharp LQ156R1, IPS, 3840x2400, 15.6" | HP Spectre X360 15-5ZV31AV AU Optronics AUO30EB, IPS, 3840x2160, 15.6" | Asus Zenbook Pro 15 OLED UM535Q Samsung ATNA56YX03-0, OLED, 1920x1080, 15.6" | MSI Stealth 15M A11SEK Chi Mei N156HCE-EN1, IPS, 1920x1080, 15.6" | |
|---|---|---|---|---|---|---|
| Display | 5% | 3% | -19% | -7% | -23% | |
| Display P3 Coverage (%) | 97.8 | 99.9 2% | 89.7 -8% | 68.3 -30% | 79.3 -19% | 62 -37% |
| sRGB Coverage (%) | 99.9 | 100 0% | 100 0% | 94.3 -6% | 95.6 -4% | 93.4 -7% |
| AdobeRGB 1998 Coverage (%) | 86 | 98.1 14% | 99.8 16% | 68.4 -20% | 87.3 2% | 64.1 -25% |
| Response Times | -68% | -2195% | -2468% | -16% | -2079% | |
| Response Time Grey 50% / Grey 80% * (ms) | 1.9 ? | 3.6 ? -89% | 54 ? -2742% | 56.8 ? -2889% | 2.1 ? -11% | 47.6 ? -2405% |
| Response Time Black / White * (ms) | 1.9 ? | 2.8 ? -47% | 33.2 ? -1647% | 40.8 ? -2047% | 2.3 ? -21% | 35.2 ? -1753% |
| PWM Frequency (Hz) | 59.52 ? | 59.5 ? | 60.2 | 25000 ? | ||
| Screen | 22% | 5% | -11% | 13% | -4% | |
| Brightness middle (cd/m²) | 381.4 | 362 -5% | 557.9 46% | 284.6 -25% | 342.9 -10% | 279 -27% |
| Brightness (cd/m²) | 384 | 367 -4% | 541 41% | 285 -26% | 346 -10% | 252 -34% |
| Brightness Distribution (%) | 95 | 97 2% | 91 -4% | 85 -11% | 98 3% | 82 -14% |
| Black Level * (cd/m²) | 0.06 | 0.39 | 0.25 | 0.32 | ||
| Colorchecker dE 2000 * | 4.34 | 2.1 52% | 4.54 -5% | 3.52 19% | 2.42 44% | 1.72 60% |
| Colorchecker dE 2000 max. * | 9.24 | 4.1 56% | 7.92 14% | 5.56 40% | 4.05 56% | 5.62 39% |
| Greyscale dE 2000 * | 2 | 1.4 30% | 3.2 -60% | 3.2 -60% | 2.1 -5% | 2.9 -45% |
| Gamma | 2.13 103% | 2.18 101% | 1.99 111% | 2.28 96% | 2.21 100% | 2.3 96% |
| CCT | 6210 105% | 6608 98% | 6451 101% | 7070 92% | 6364 102% | 6700 97% |
| Contrast (:1) | 6033 | 1431 | 1138 | 872 | ||
| Colorchecker dE 2000 calibrated * | 2.5 | 3.82 | 3 | 1.39 | ||
| Color Space (Percent of AdobeRGB 1998) (%) | 89.5 | 61.1 | 59 | |||
| Color Space (Percent of sRGB) (%) | 100 | 93.8 | 93.2 | |||
| Total Average (Program / Settings) | -14% /
1% | -729% /
-395% | -833% /
-460% | -3% /
2% | -702% /
-386% |
* ... smaller is better
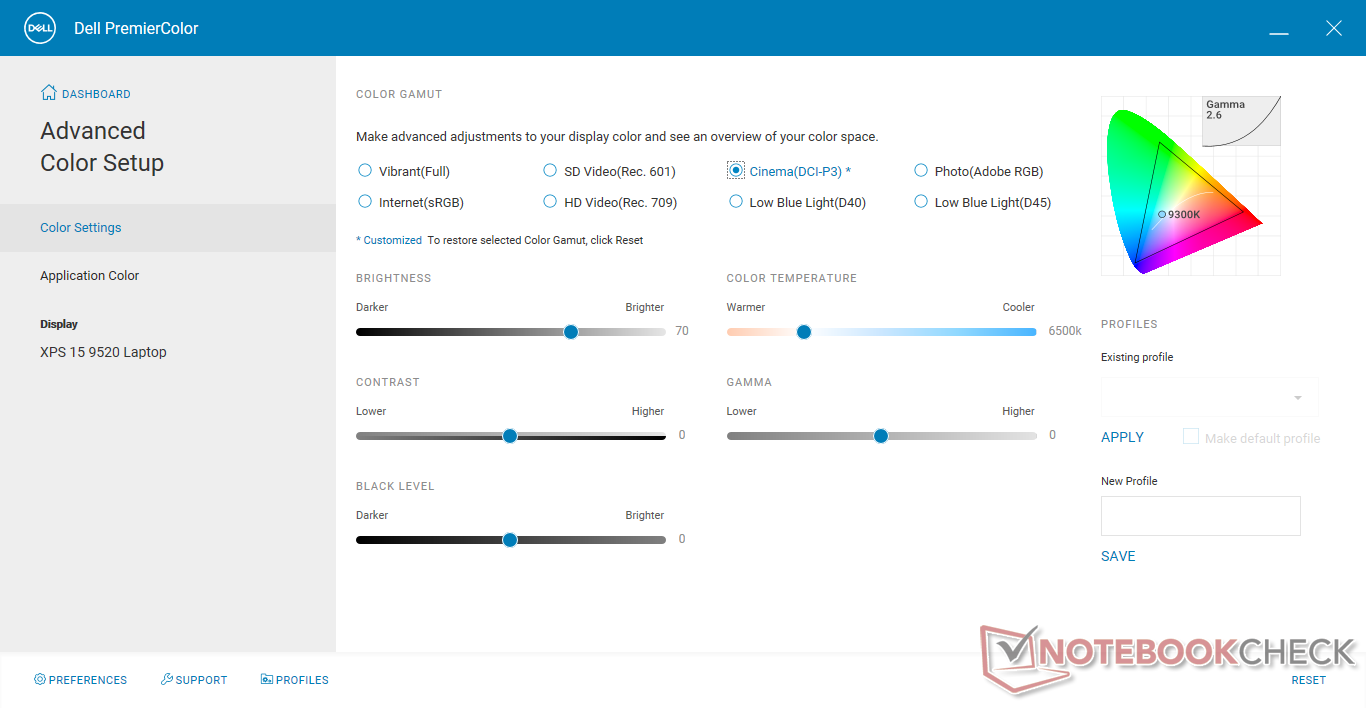
Though we can confirm at least 98 percent DCI-P3 coverage, the colors on our unit have not been calibrated well against the standard even when set to DCI-P3 via the PremierColor software.
Display Response Times
| ↔ Response Time Black to White | ||
|---|---|---|
| 1.9 ms ... rise ↗ and fall ↘ combined | ↗ 1.1 ms rise | 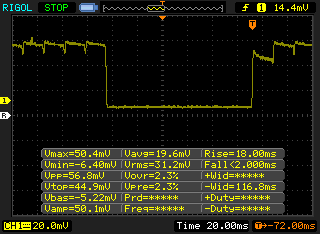 |
| ↘ 0.8 ms fall | ||
| The screen shows very fast response rates in our tests and should be very well suited for fast-paced gaming. In comparison, all tested devices range from 0.1 (minimum) to 240 (maximum) ms. » 11 % of all devices are better. This means that the measured response time is better than the average of all tested devices (19.9 ms). | ||
| ↔ Response Time 50% Grey to 80% Grey | ||
| 1.9 ms ... rise ↗ and fall ↘ combined | ↗ 1.1 ms rise | 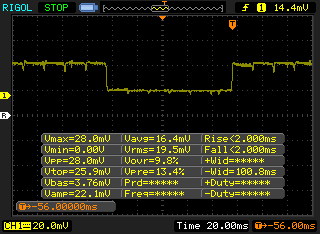 |
| ↘ 0.8 ms fall | ||
| The screen shows very fast response rates in our tests and should be very well suited for fast-paced gaming. In comparison, all tested devices range from 0.165 (minimum) to 636 (maximum) ms. » 9 % of all devices are better. This means that the measured response time is better than the average of all tested devices (31.1 ms). | ||
Screen Flickering / PWM (Pulse-Width Modulation)
| Screen flickering / PWM detected | 59.52 Hz | ≤ 100 % brightness setting | 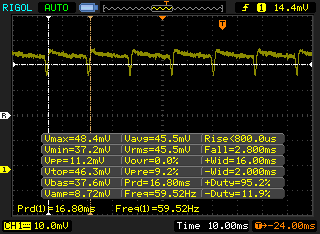 |
The display backlight flickers at 59.52 Hz (worst case, e.g., utilizing PWM) Flickering detected at a brightness setting of 100 % and below. There should be no flickering or PWM above this brightness setting. The frequency of 59.52 Hz is very low, so the flickering may cause eyestrain and headaches after extended use. In comparison: 52 % of all tested devices do not use PWM to dim the display. If PWM was detected, an average of 7784 (minimum: 5 - maximum: 343500) Hz was measured. | |||


Performance — Intel 12th Gen Options
Testing Conditions
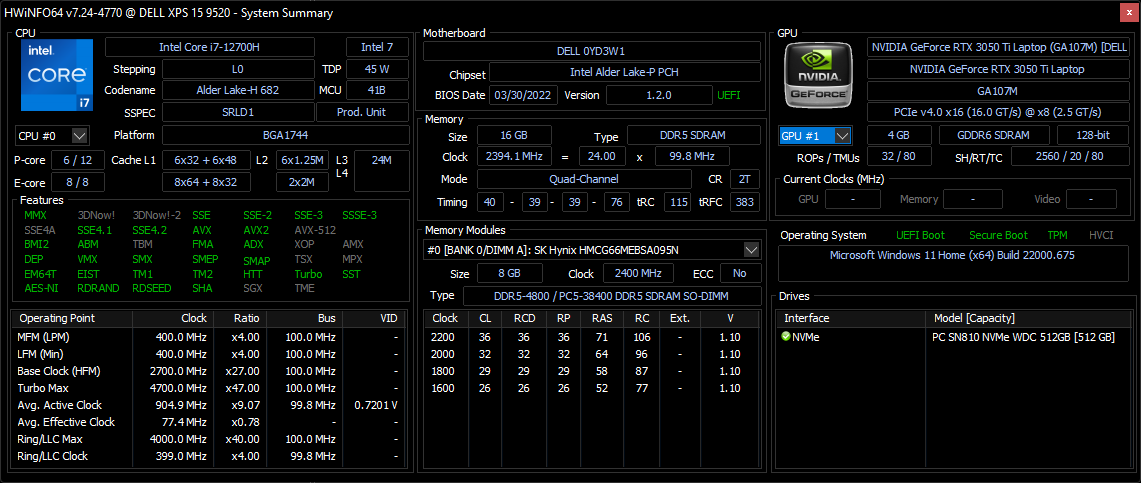
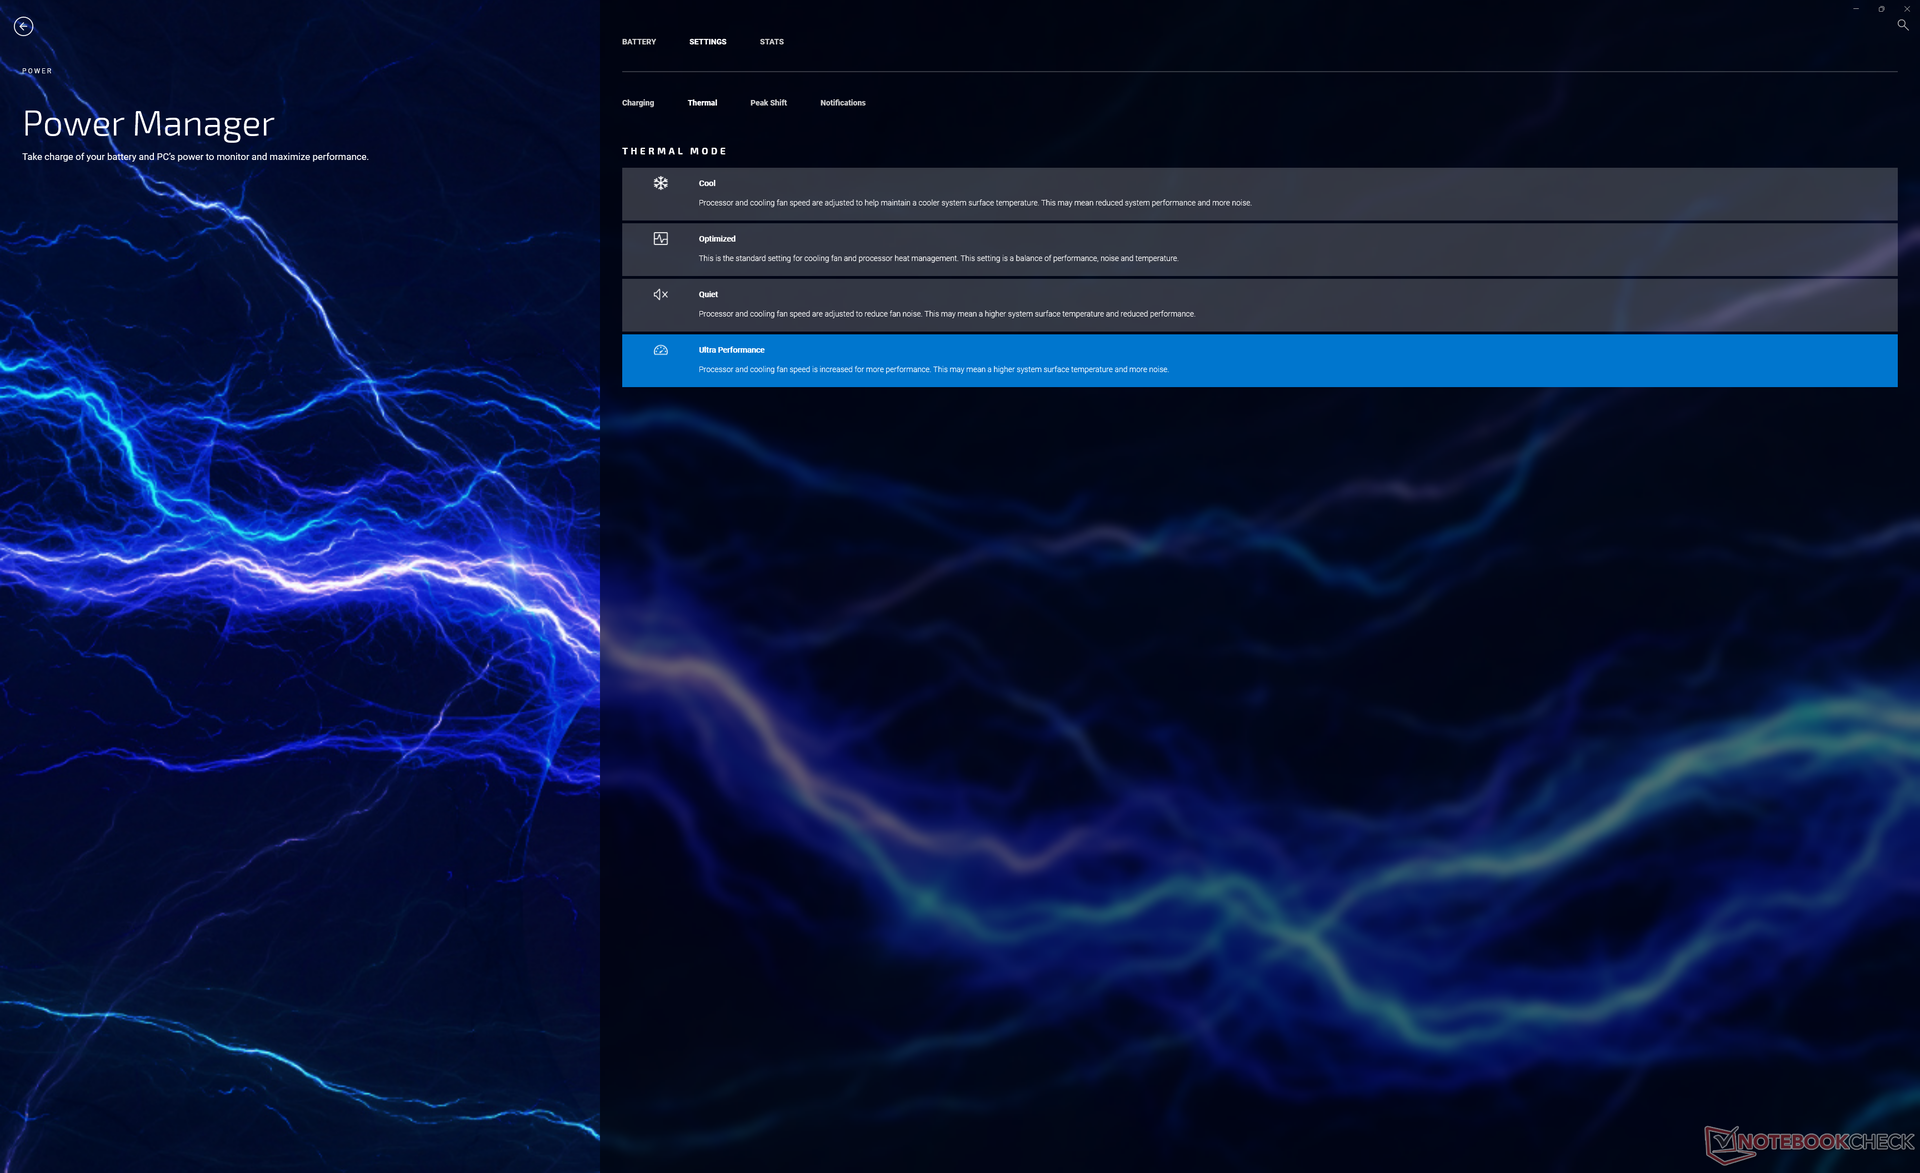
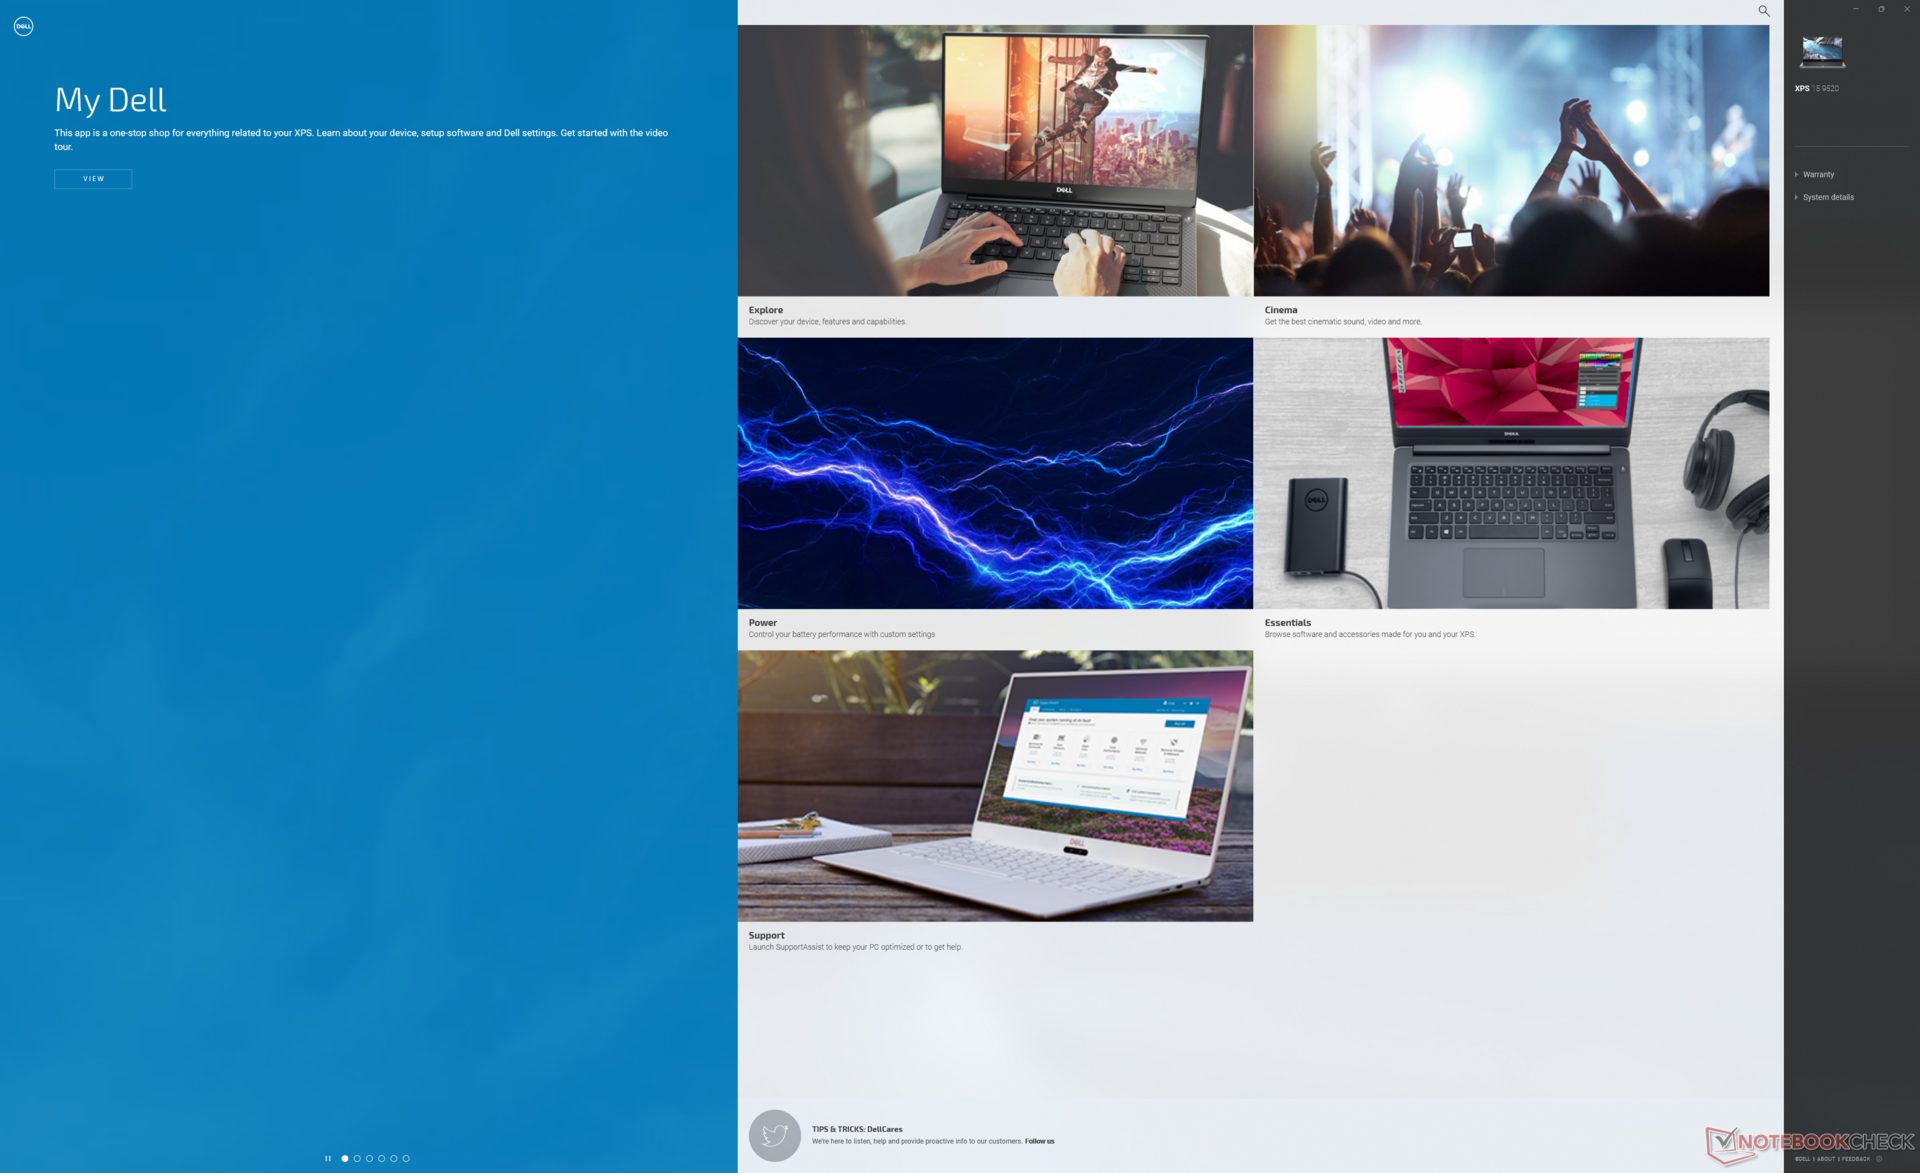
Our unit was set to Performance mode via Windows and Ultra Performance mode via the My Dell application prior to running any benchmarks below for the highest possible scores. Note that My Dell has effectively replaced the older Dell Power Manager software. We recommend users become familiar with the new application as it is the one-stop shop for Dell updates and performance settings.
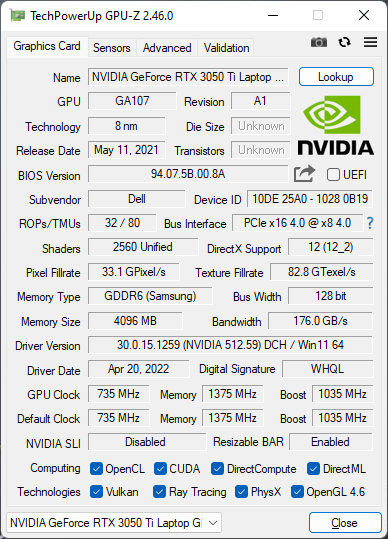
The 45 W TGP GeForce RTX 3050 Ti GPU has not changed from the previous XPS 15 9510. There is expectedly no MUX switch or adaptive sync since the XPS 15 is not designed for gaming.
Processor
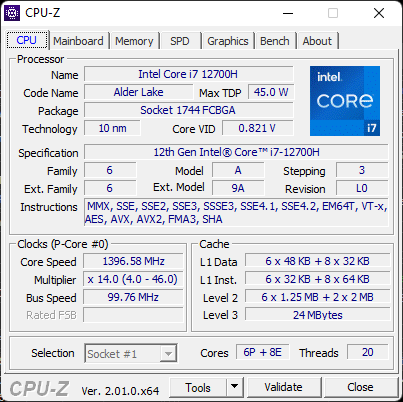
The boost in CPU performance from the XPS 15 9510 to the 9520 is more significant than the boost in CPU performance from the XPS 9500 to the 9510. Jumping from the Core i7-11800H in the XPS 15 9510 to the Core i7-12700H in our 9520 will grant a 35 to 40 percent increase in multi-thread performance and a 15 to 20 percent increase in single-thread performance. The jump is enough to propel the 12th gen Intel CPU slightly ahead of the popular Ryzen 7 5800H that has infamously outperformed most 11th gen Intel Core-H series CPUs in multi-thread workloads.
CPU performance could have been better in spite of the aforementioned year-over-year increase. When compared to the 20+ other laptops we've tested thus far with the same Core i7-12700H CPU, the one in our XPS 15 9520 is slower than the average by about 5 to 15 percent. Running CineBench R15 xT in a loop shows that the CPU in the Dell isn't able to maintain high Turbo Boost clock rates for as long as most other laptops with the same processor. Models like the Asus TUF Gaming F15 FX507ZM can run the same CPU up to 36 percent faster than on our Dell.
Cinebench R15 Multi Loop
Cinebench R23: Multi Core | Single Core
Cinebench R15: CPU Multi 64Bit | CPU Single 64Bit
Blender: v2.79 BMW27 CPU
7-Zip 18.03: 7z b 4 | 7z b 4 -mmt1
Geekbench 5.5: Multi-Core | Single-Core
HWBOT x265 Benchmark v2.2: 4k Preset
LibreOffice : 20 Documents To PDF
R Benchmark 2.5: Overall mean
* ... smaller is better
AIDA64: FP32 Ray-Trace | FPU Julia | CPU SHA3 | CPU Queen | FPU SinJulia | FPU Mandel | CPU AES | CPU ZLib | FP64 Ray-Trace | CPU PhotoWorxx
| Performance rating | |
| Asus Zenbook Pro 15 OLED UM535Q | |
| Average Intel Core i7-12700H | |
| Dell XPS 15 9520 RTX 3050 Ti | |
| Dell XPS 15 9500 Core i7 4K UHD | |
| Dell XPS 15 9510 11800H RTX 3050 Ti OLED -9! | |
| AIDA64 / FP32 Ray-Trace | |
| Asus Zenbook Pro 15 OLED UM535Q | |
| Average Intel Core i7-12700H (2585 - 17957, n=64) | |
| Dell XPS 15 9500 Core i7 4K UHD | |
| Dell XPS 15 9520 RTX 3050 Ti | |
| AIDA64 / FPU Julia | |
| Asus Zenbook Pro 15 OLED UM535Q | |
| Dell XPS 15 9500 Core i7 4K UHD | |
| Average Intel Core i7-12700H (12439 - 90760, n=64) | |
| Dell XPS 15 9520 RTX 3050 Ti | |
| AIDA64 / CPU SHA3 | |
| Asus Zenbook Pro 15 OLED UM535Q | |
| Average Intel Core i7-12700H (833 - 4242, n=64) | |
| Dell XPS 15 9500 Core i7 4K UHD | |
| Dell XPS 15 9520 RTX 3050 Ti | |
| AIDA64 / CPU Queen | |
| Asus Zenbook Pro 15 OLED UM535Q | |
| Dell XPS 15 9520 RTX 3050 Ti | |
| Average Intel Core i7-12700H (57923 - 103202, n=63) | |
| Dell XPS 15 9500 Core i7 4K UHD | |
| AIDA64 / FPU SinJulia | |
| Asus Zenbook Pro 15 OLED UM535Q | |
| Dell XPS 15 9500 Core i7 4K UHD | |
| Average Intel Core i7-12700H (3249 - 9939, n=64) | |
| Dell XPS 15 9520 RTX 3050 Ti | |
| AIDA64 / FPU Mandel | |
| Asus Zenbook Pro 15 OLED UM535Q | |
| Dell XPS 15 9500 Core i7 4K UHD | |
| Average Intel Core i7-12700H (7135 - 44760, n=64) | |
| Dell XPS 15 9520 RTX 3050 Ti | |
| AIDA64 / CPU AES | |
| Asus Zenbook Pro 15 OLED UM535Q | |
| Average Intel Core i7-12700H (31839 - 144360, n=64) | |
| Dell XPS 15 9520 RTX 3050 Ti | |
| Dell XPS 15 9500 Core i7 4K UHD | |
| AIDA64 / CPU ZLib | |
| Average Intel Core i7-12700H (305 - 1171, n=64) | |
| Dell XPS 15 9520 RTX 3050 Ti | |
| Asus Zenbook Pro 15 OLED UM535Q | |
| Dell XPS 15 9500 Core i7 4K UHD | |
| Dell XPS 15 9510 11800H RTX 3050 Ti OLED | |
| AIDA64 / FP64 Ray-Trace | |
| Asus Zenbook Pro 15 OLED UM535Q | |
| Average Intel Core i7-12700H (1437 - 9692, n=64) | |
| Dell XPS 15 9520 RTX 3050 Ti | |
| Dell XPS 15 9500 Core i7 4K UHD | |
| AIDA64 / CPU PhotoWorxx | |
| Dell XPS 15 9520 RTX 3050 Ti | |
| Average Intel Core i7-12700H (12863 - 52207, n=64) | |
| Dell XPS 15 9500 Core i7 4K UHD | |
| Asus Zenbook Pro 15 OLED UM535Q | |
System Performance
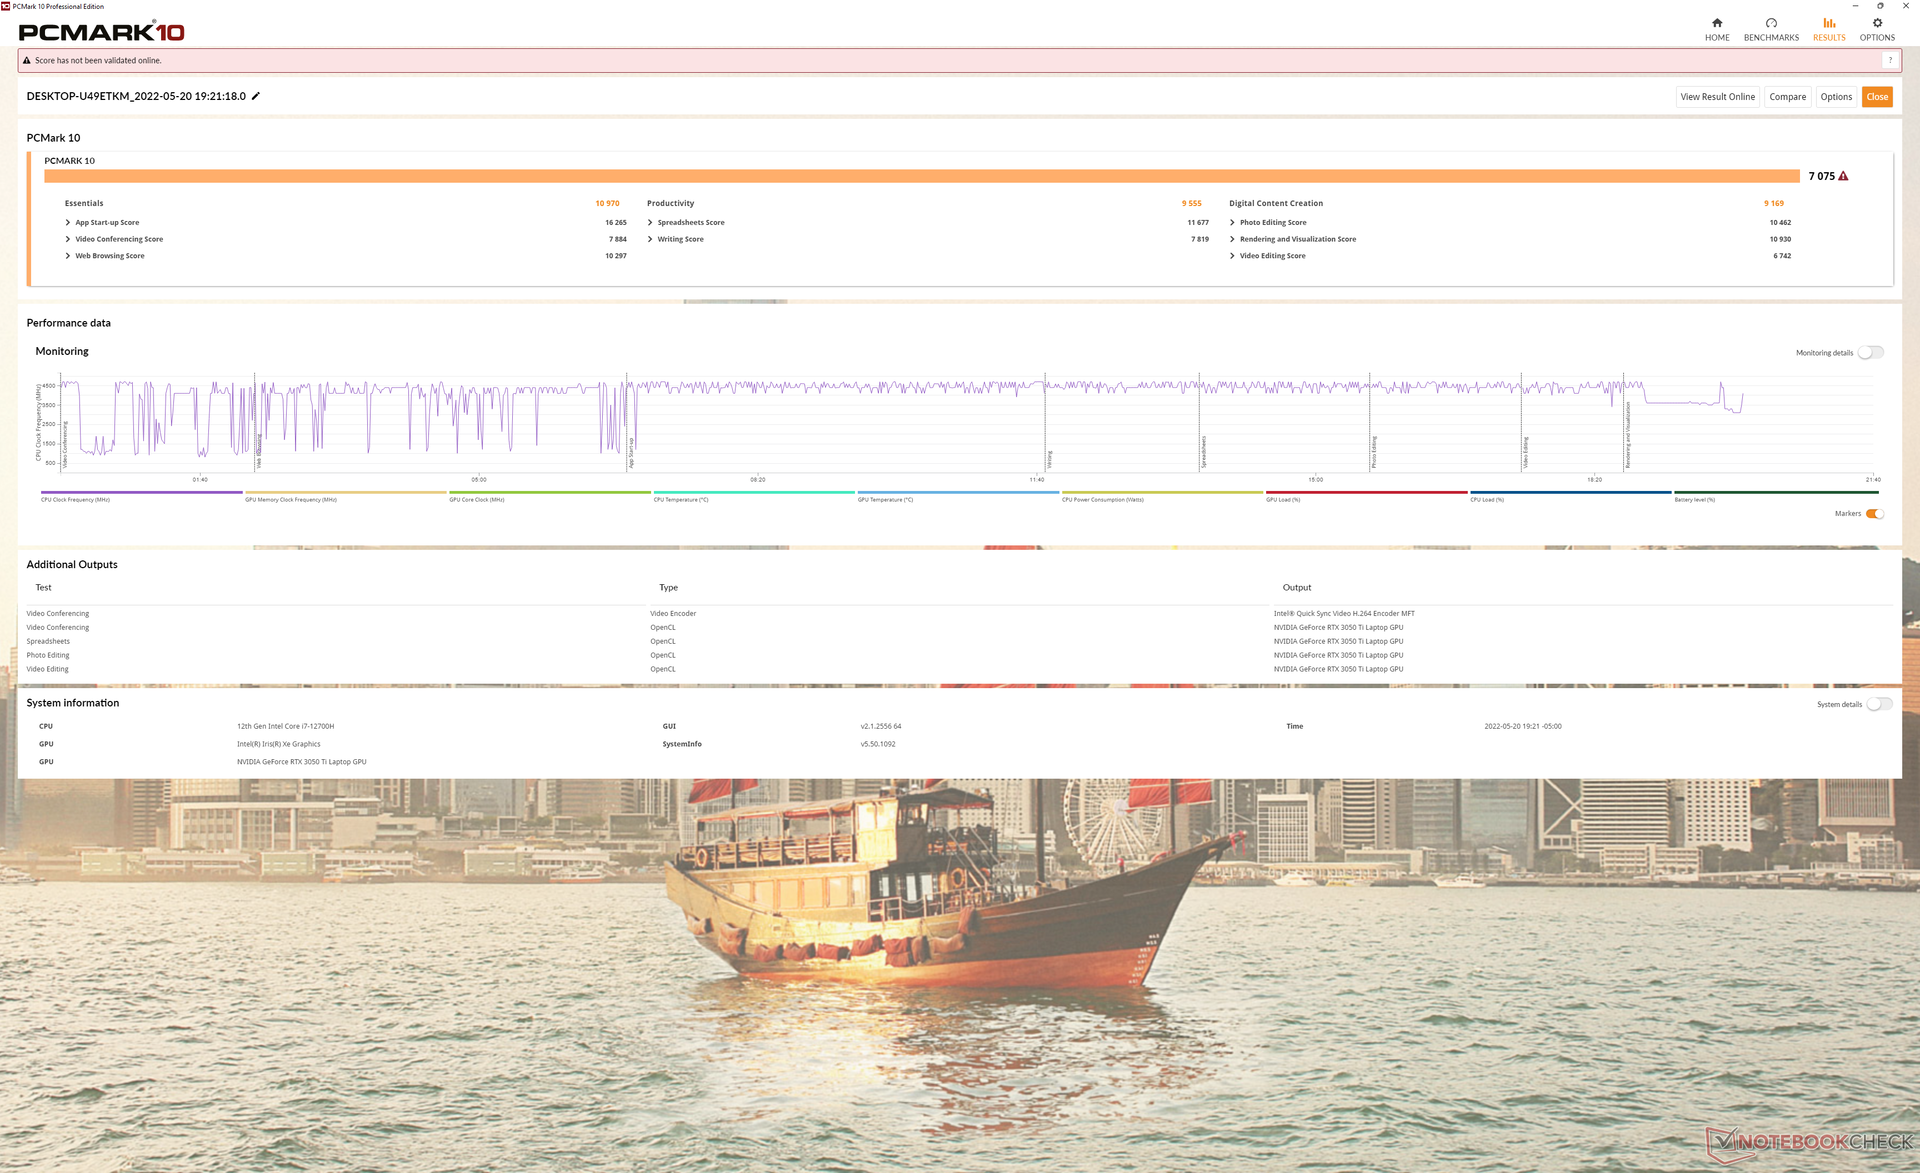
PCMark 10 results are consistently higher than what we recorded on the older XPS 15 9510 and 9500 due largely to the boost in CPU and SSD performance.
CrossMark: Overall | Productivity | Creativity | Responsiveness
| PCMark 10 / Score | |
| Dell XPS 15 9520 RTX 3050 Ti | |
| Average Intel Core i7-12700H, NVIDIA GeForce RTX 3050 Ti Laptop GPU (6623 - 7075, n=5) | |
| Asus Zenbook Pro 15 OLED UM535Q | |
| Dell XPS 15 9510 11800H RTX 3050 Ti OLED | |
| MSI Stealth 15M A11SEK | |
| Dell XPS 15 9500 Core i7 4K UHD | |
| HP Spectre X360 15-5ZV31AV | |
| PCMark 10 / Essentials | |
| Dell XPS 15 9520 RTX 3050 Ti | |
| Asus Zenbook Pro 15 OLED UM535Q | |
| Average Intel Core i7-12700H, NVIDIA GeForce RTX 3050 Ti Laptop GPU (9540 - 10970, n=5) | |
| Dell XPS 15 9500 Core i7 4K UHD | |
| MSI Stealth 15M A11SEK | |
| Dell XPS 15 9510 11800H RTX 3050 Ti OLED | |
| HP Spectre X360 15-5ZV31AV | |
| PCMark 10 / Productivity | |
| Asus Zenbook Pro 15 OLED UM535Q | |
| Dell XPS 15 9520 RTX 3050 Ti | |
| Average Intel Core i7-12700H, NVIDIA GeForce RTX 3050 Ti Laptop GPU (8530 - 9555, n=5) | |
| MSI Stealth 15M A11SEK | |
| Dell XPS 15 9510 11800H RTX 3050 Ti OLED | |
| Dell XPS 15 9500 Core i7 4K UHD | |
| HP Spectre X360 15-5ZV31AV | |
| PCMark 10 / Digital Content Creation | |
| Average Intel Core i7-12700H, NVIDIA GeForce RTX 3050 Ti Laptop GPU (8855 - 9542, n=5) | |
| Dell XPS 15 9520 RTX 3050 Ti | |
| Asus Zenbook Pro 15 OLED UM535Q | |
| Dell XPS 15 9510 11800H RTX 3050 Ti OLED | |
| MSI Stealth 15M A11SEK | |
| Dell XPS 15 9500 Core i7 4K UHD | |
| HP Spectre X360 15-5ZV31AV | |
| CrossMark / Overall | |
| Dell XPS 15 9520 RTX 3050 Ti | |
| Average Intel Core i7-12700H, NVIDIA GeForce RTX 3050 Ti Laptop GPU (1654 - 1872, n=5) | |
| Asus Zenbook Pro 15 OLED UM535Q | |
| CrossMark / Productivity | |
| Dell XPS 15 9520 RTX 3050 Ti | |
| Average Intel Core i7-12700H, NVIDIA GeForce RTX 3050 Ti Laptop GPU (1595 - 1792, n=5) | |
| Asus Zenbook Pro 15 OLED UM535Q | |
| CrossMark / Creativity | |
| Dell XPS 15 9520 RTX 3050 Ti | |
| Average Intel Core i7-12700H, NVIDIA GeForce RTX 3050 Ti Laptop GPU (1699 - 1993, n=5) | |
| Asus Zenbook Pro 15 OLED UM535Q | |
| CrossMark / Responsiveness | |
| Dell XPS 15 9520 RTX 3050 Ti | |
| Average Intel Core i7-12700H, NVIDIA GeForce RTX 3050 Ti Laptop GPU (1383 - 1768, n=5) | |
| Asus Zenbook Pro 15 OLED UM535Q | |
| PCMark 10 Score | 7075 points | |
Help | ||
| AIDA64 / Memory Copy | |
| Dell XPS 15 9520 RTX 3050 Ti | |
| Average Intel Core i7-12700H (25615 - 80511, n=64) | |
| Asus Zenbook Pro 15 OLED UM535Q | |
| Dell XPS 15 9500 Core i7 4K UHD | |
| AIDA64 / Memory Read | |
| Dell XPS 15 9520 RTX 3050 Ti | |
| Average Intel Core i7-12700H (25586 - 79442, n=64) | |
| Asus Zenbook Pro 15 OLED UM535Q | |
| Dell XPS 15 9500 Core i7 4K UHD | |
| AIDA64 / Memory Write | |
| Dell XPS 15 9520 RTX 3050 Ti | |
| Average Intel Core i7-12700H (23679 - 88660, n=64) | |
| Asus Zenbook Pro 15 OLED UM535Q | |
| Dell XPS 15 9500 Core i7 4K UHD | |
| AIDA64 / Memory Latency | |
| Dell XPS 15 9520 RTX 3050 Ti | |
| Asus Zenbook Pro 15 OLED UM535Q | |
| Average Intel Core i7-12700H (76.2 - 133.9, n=62) | |
| Dell XPS 15 9500 Core i7 4K UHD | |
| Dell XPS 15 9510 11800H RTX 3050 Ti OLED | |
* ... smaller is better
DPC Latency
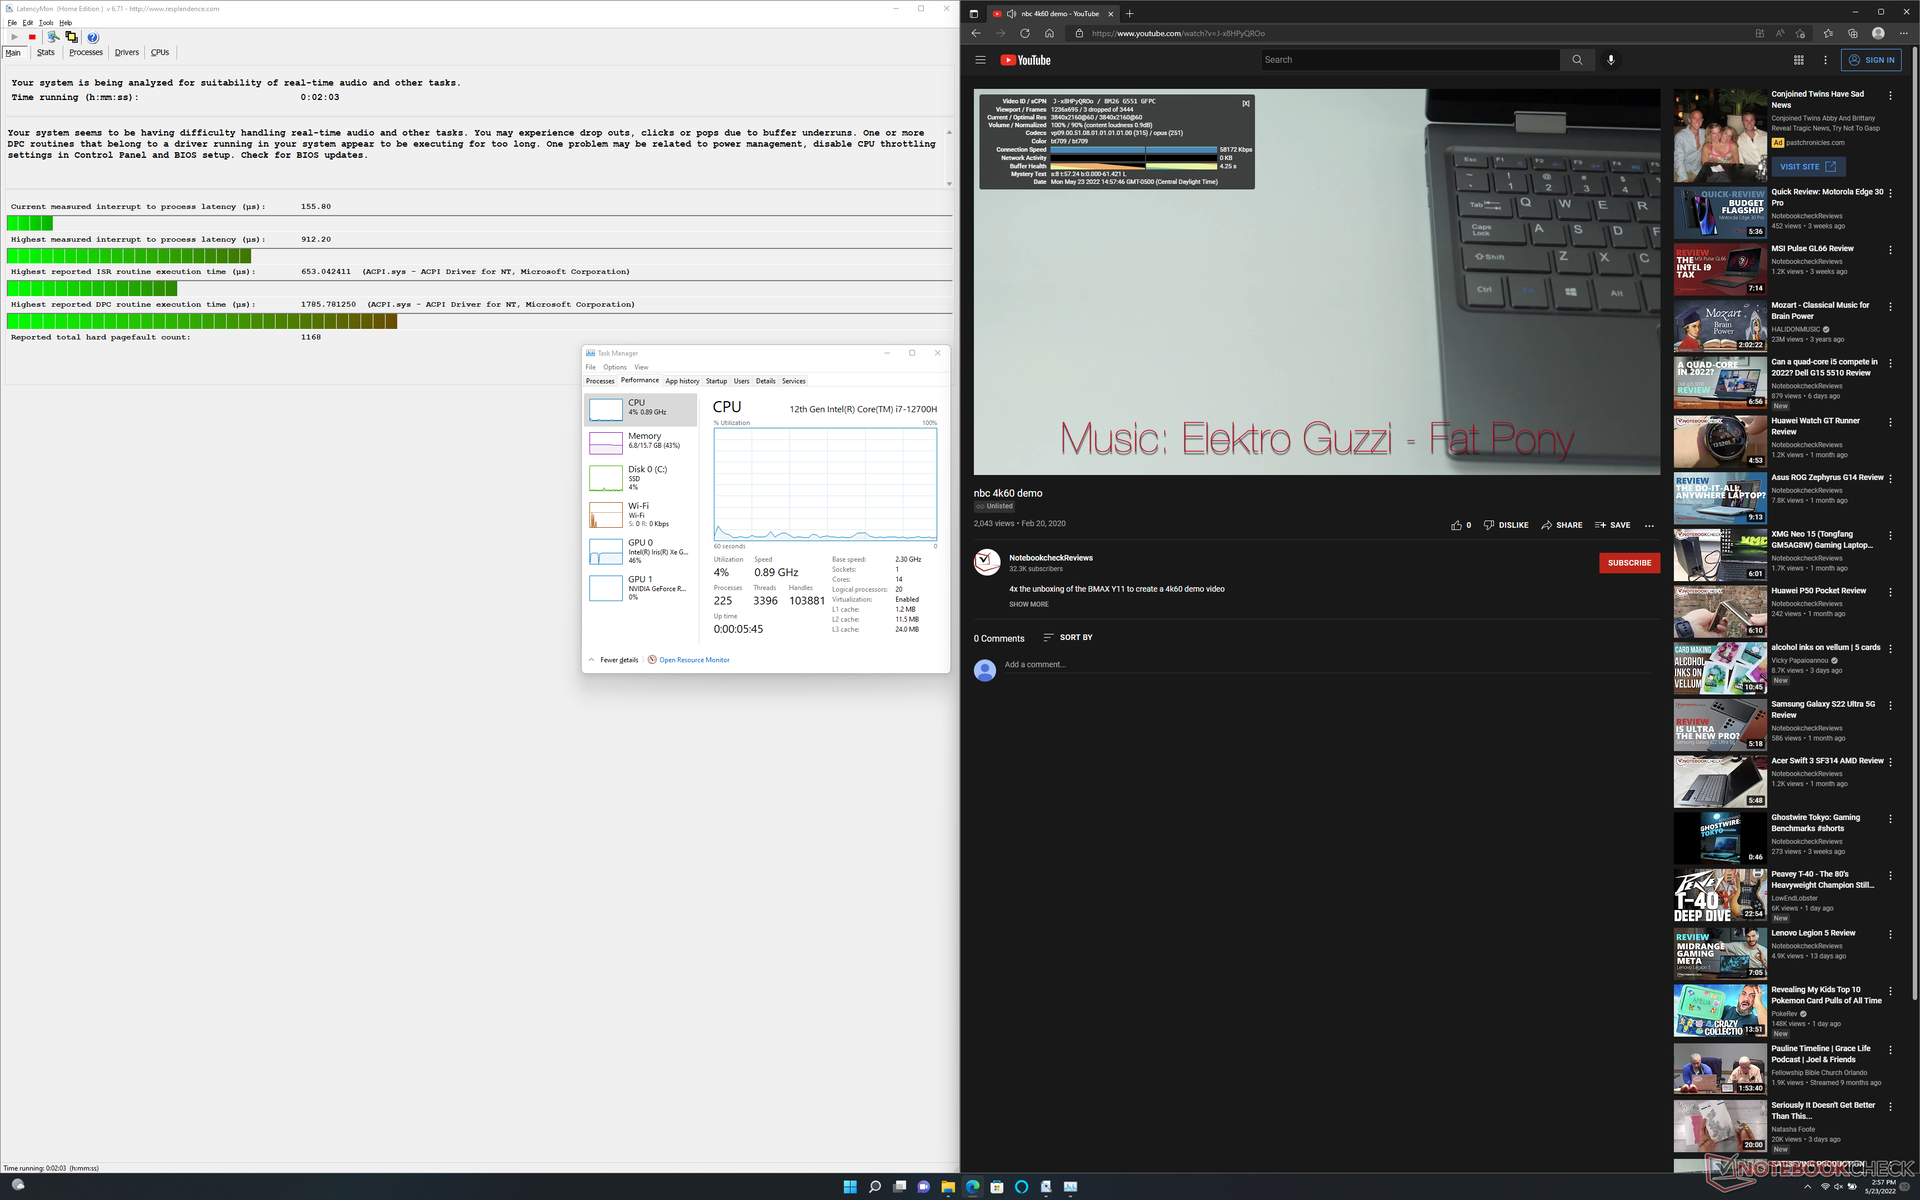
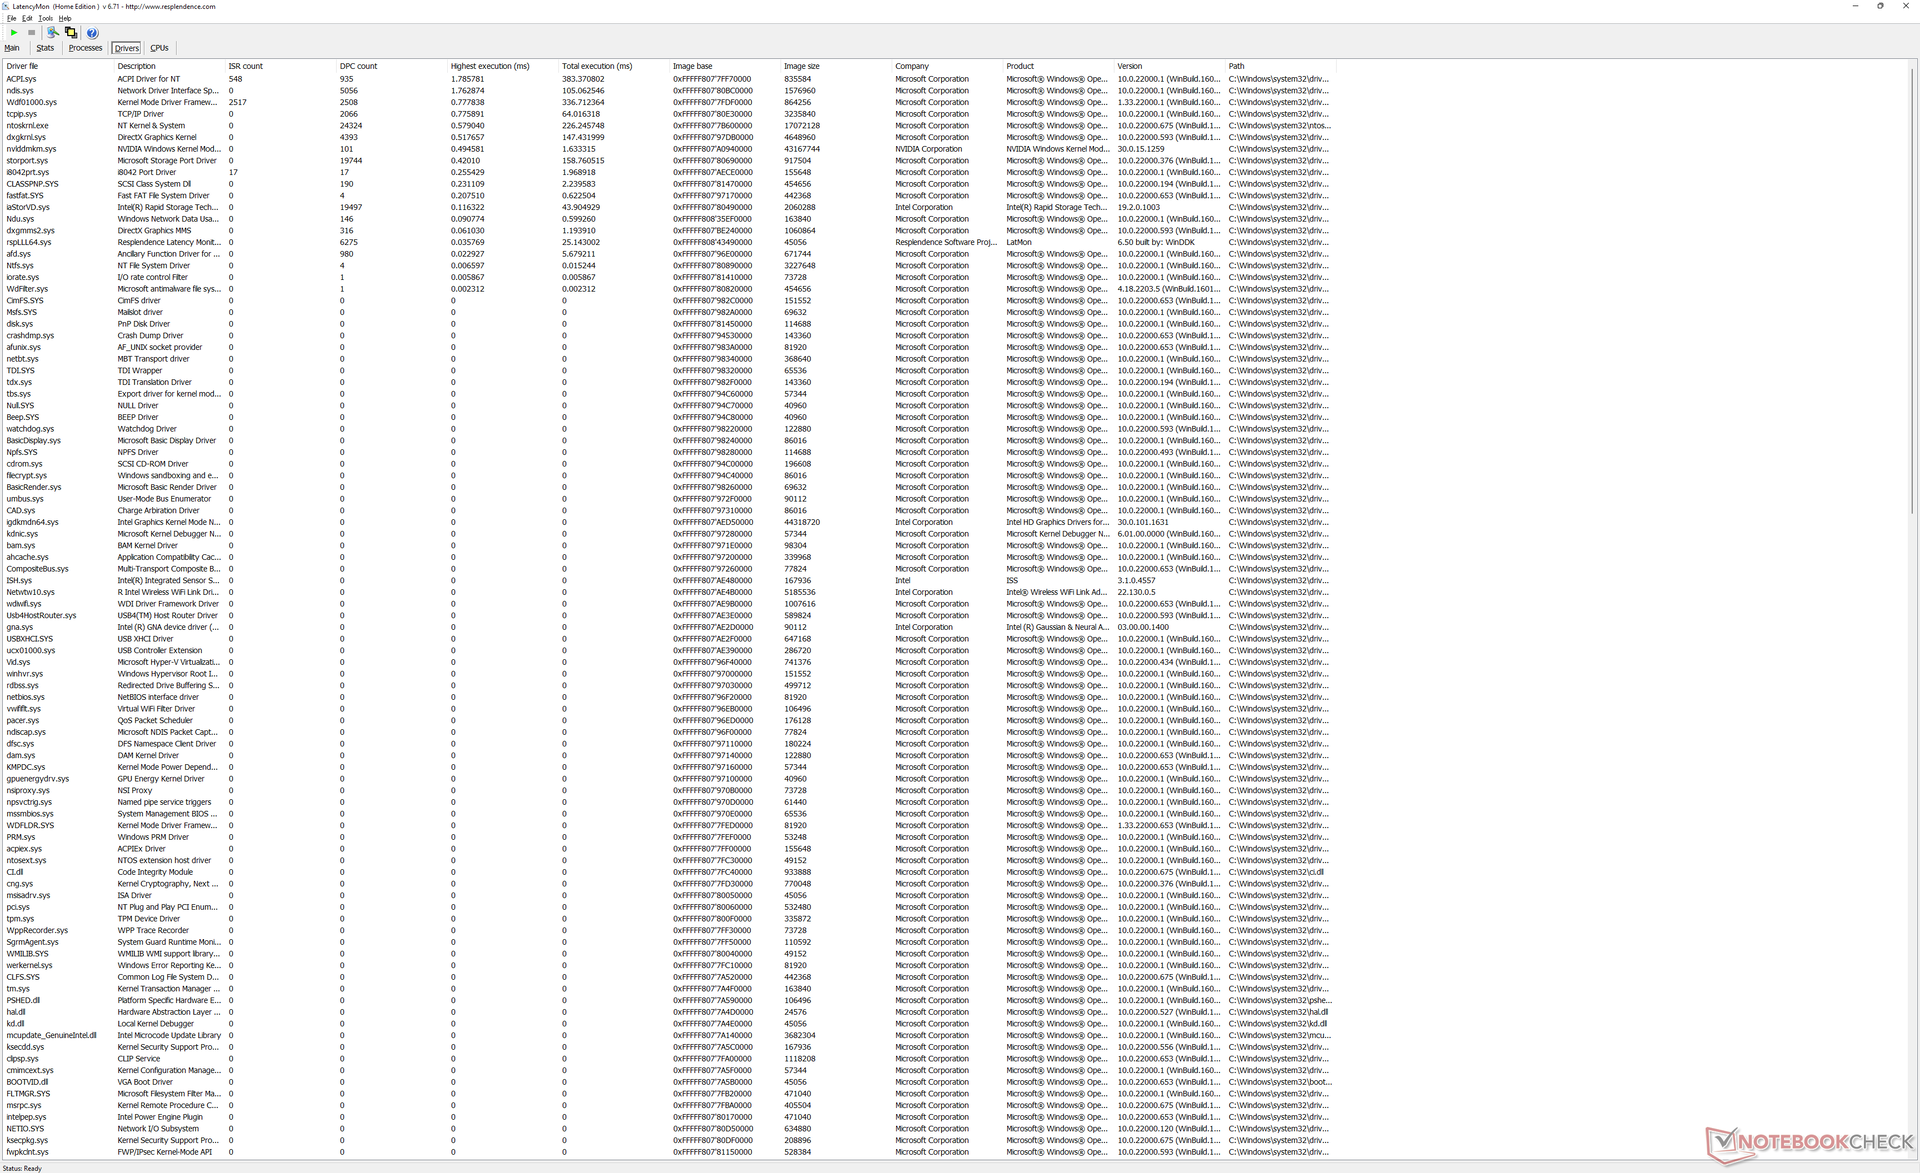
LatencyMon reveals minor DPC issues when opening multiple browser tabs on our homepage. 4K video playback at 60 FPS is otherwise smooth and with just 3 dropped frames during our minute-long video test.
| DPC Latencies / LatencyMon - interrupt to process latency (max), Web, Youtube, Prime95 | |
| Dell XPS 15 9500 Core i7 4K UHD | |
| Dell XPS 15 9510 11800H RTX 3050 Ti OLED | |
| Dell XPS 15 9520 RTX 3050 Ti | |
| MSI Stealth 15M A11SEK | |
| Asus Zenbook Pro 15 OLED UM535Q | |
* ... smaller is better
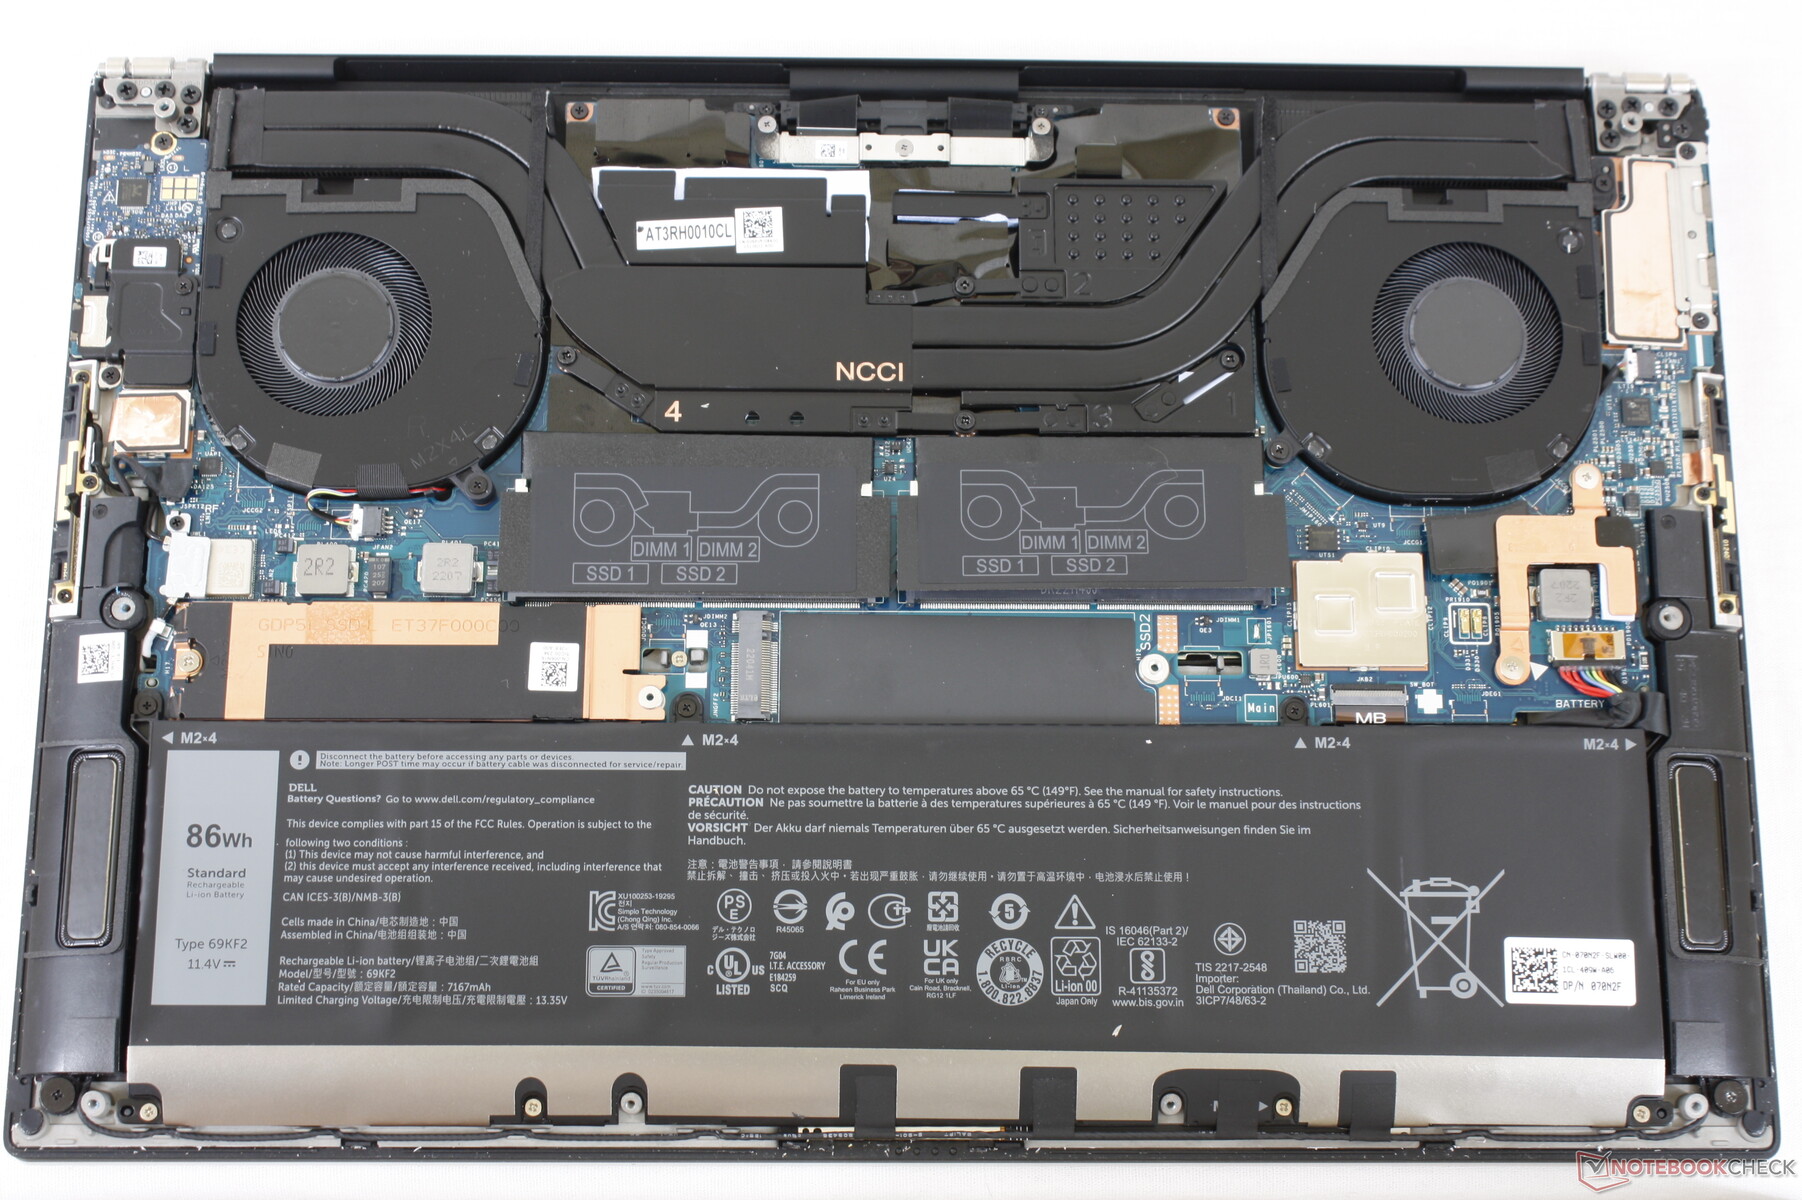
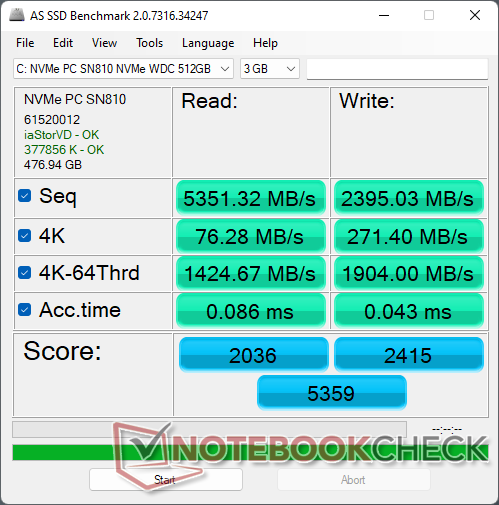
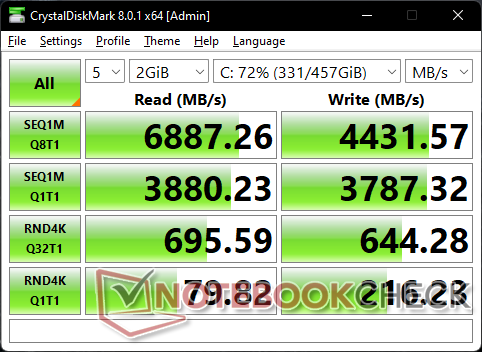
Storage Devices — Supports Up To Two PCIe4 NVMe SSDs
Our test unit ships with a PCIe4 x4 Western Digital SN810 NVMe SSD as opposed to the PCIe3 x4 solutions on older models. Transfer rates are significantly faster as a result at up to ~6700 MB/s or over twice that of most PCIe3 drives. The SN810 in our unit would have no issues maintaining its maximum transfer rate for extended periods when stressed under DiskSpd to suggest excellent heat dissipation.

* ... smaller is better
Disk Throttling: DiskSpd Read Loop, Queue Depth 8
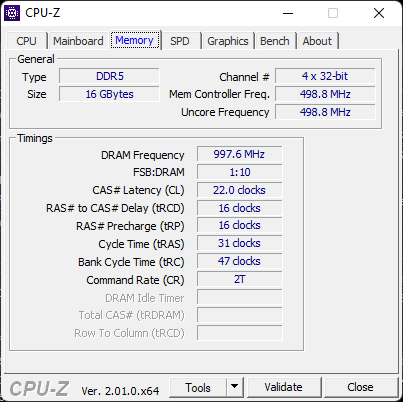
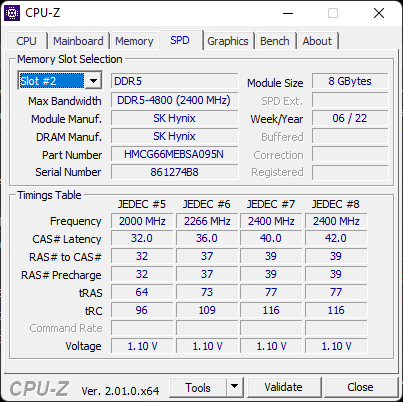
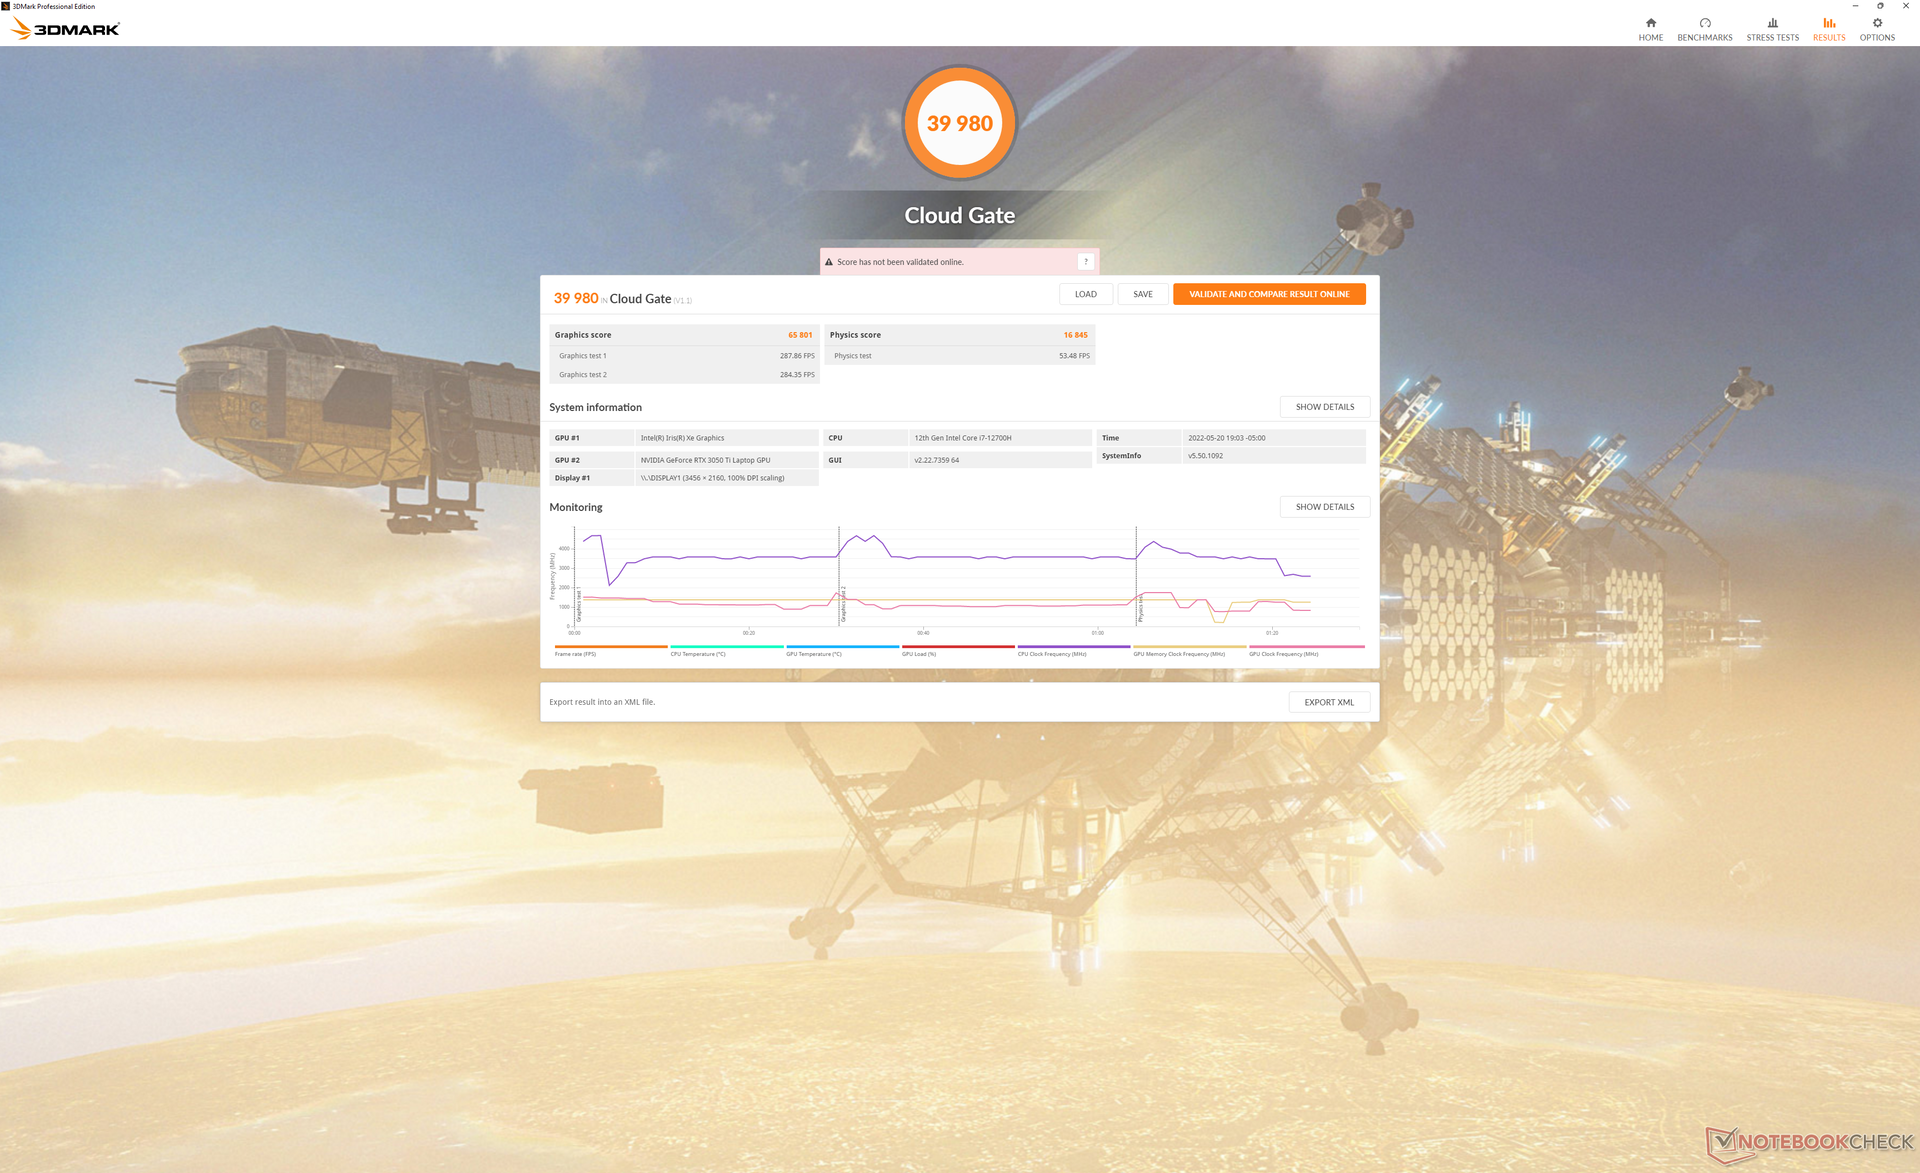
GPU Performance — GeForce RTX 3050 Ti For A Second Year In A Row
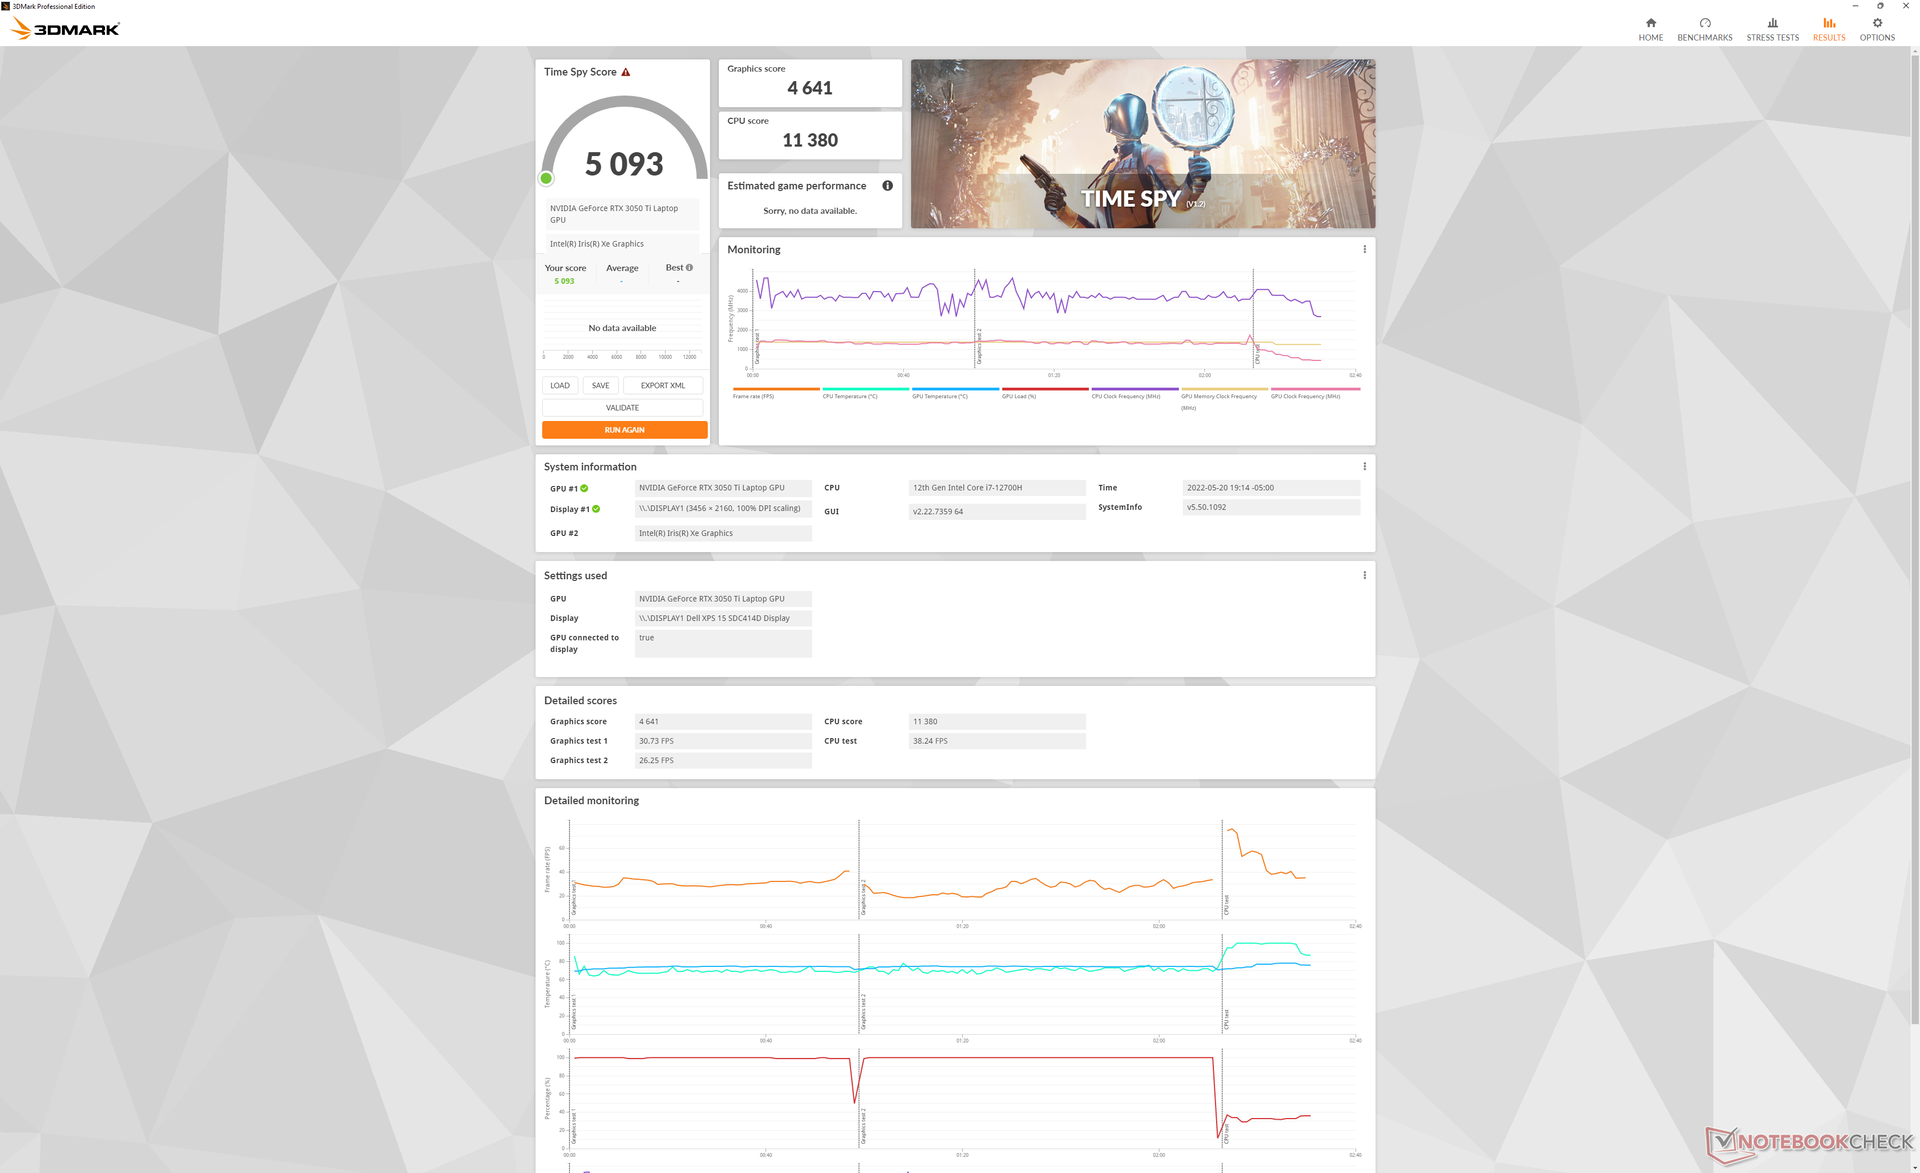
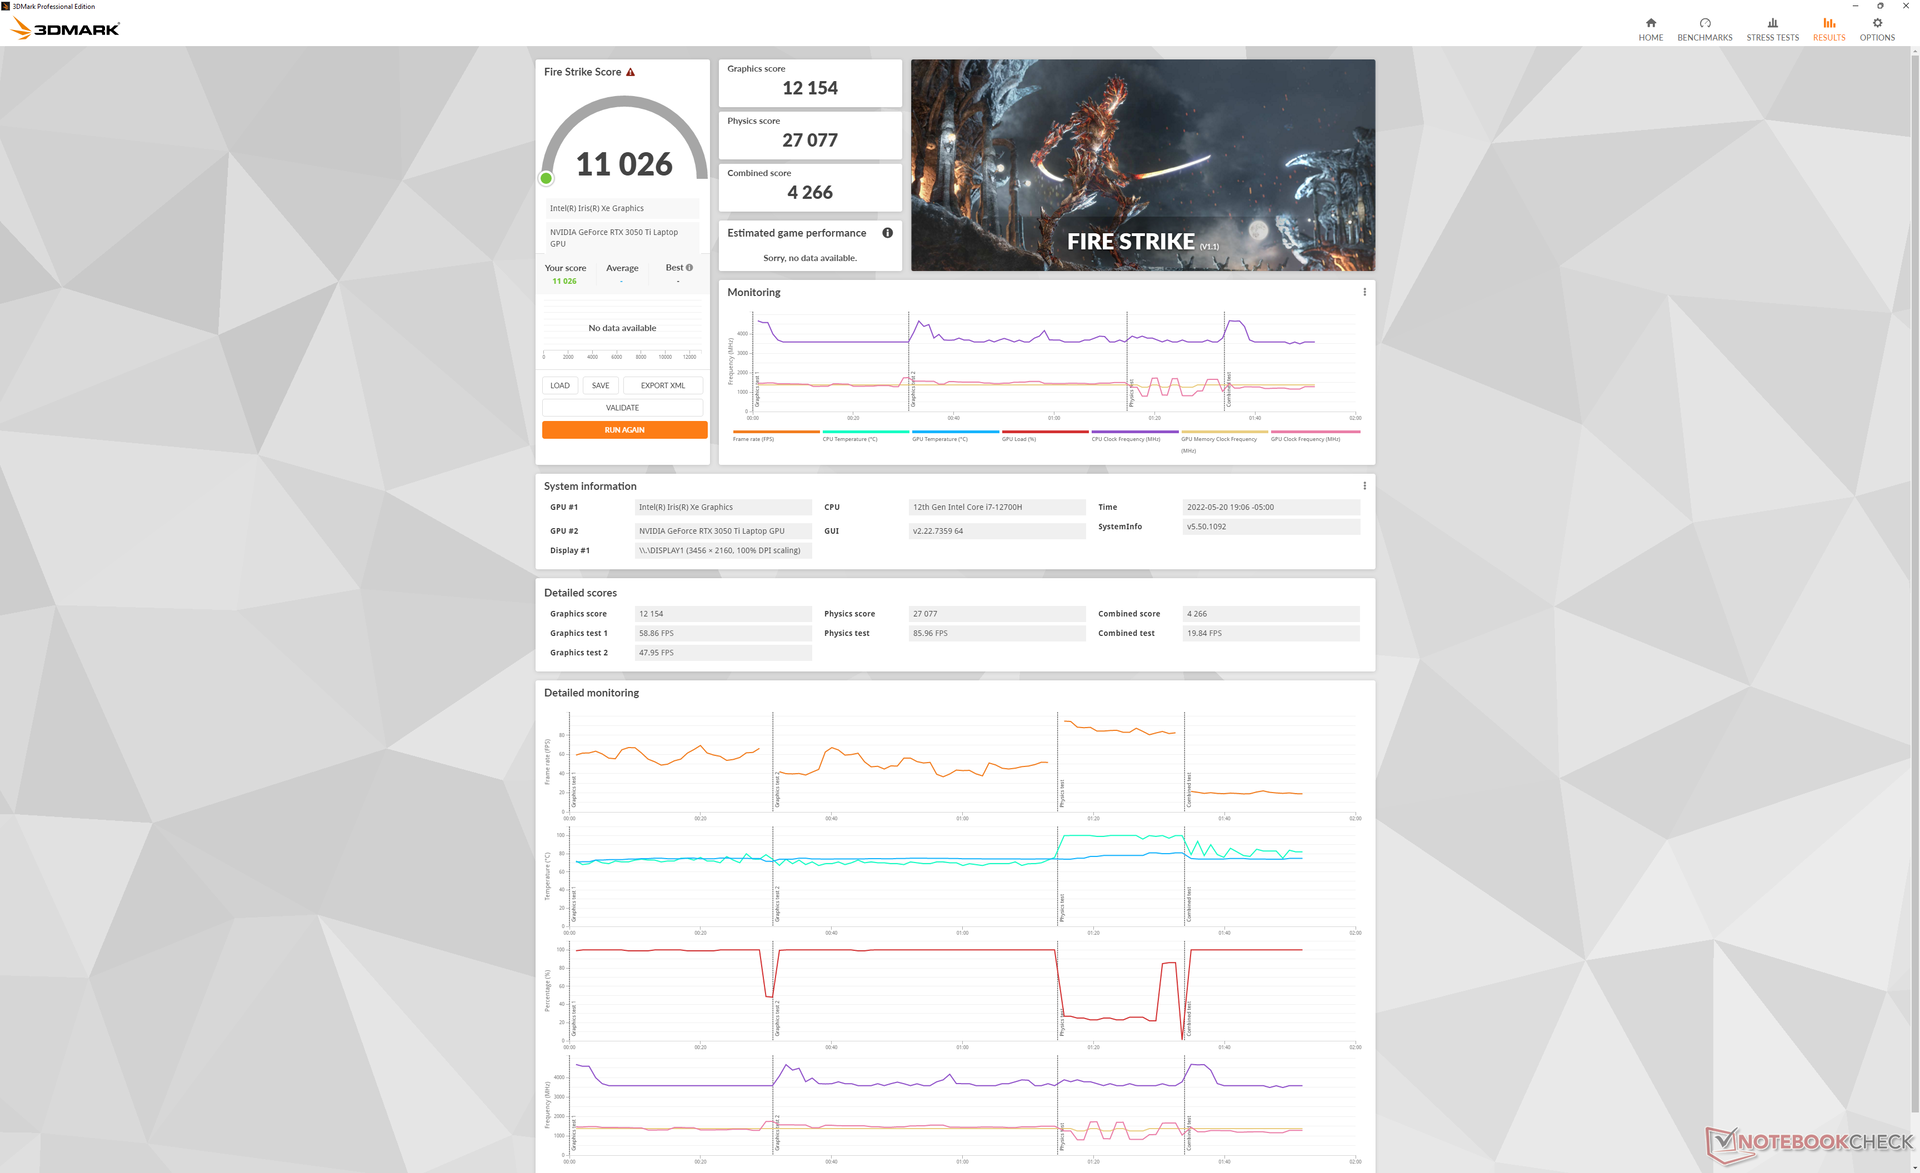
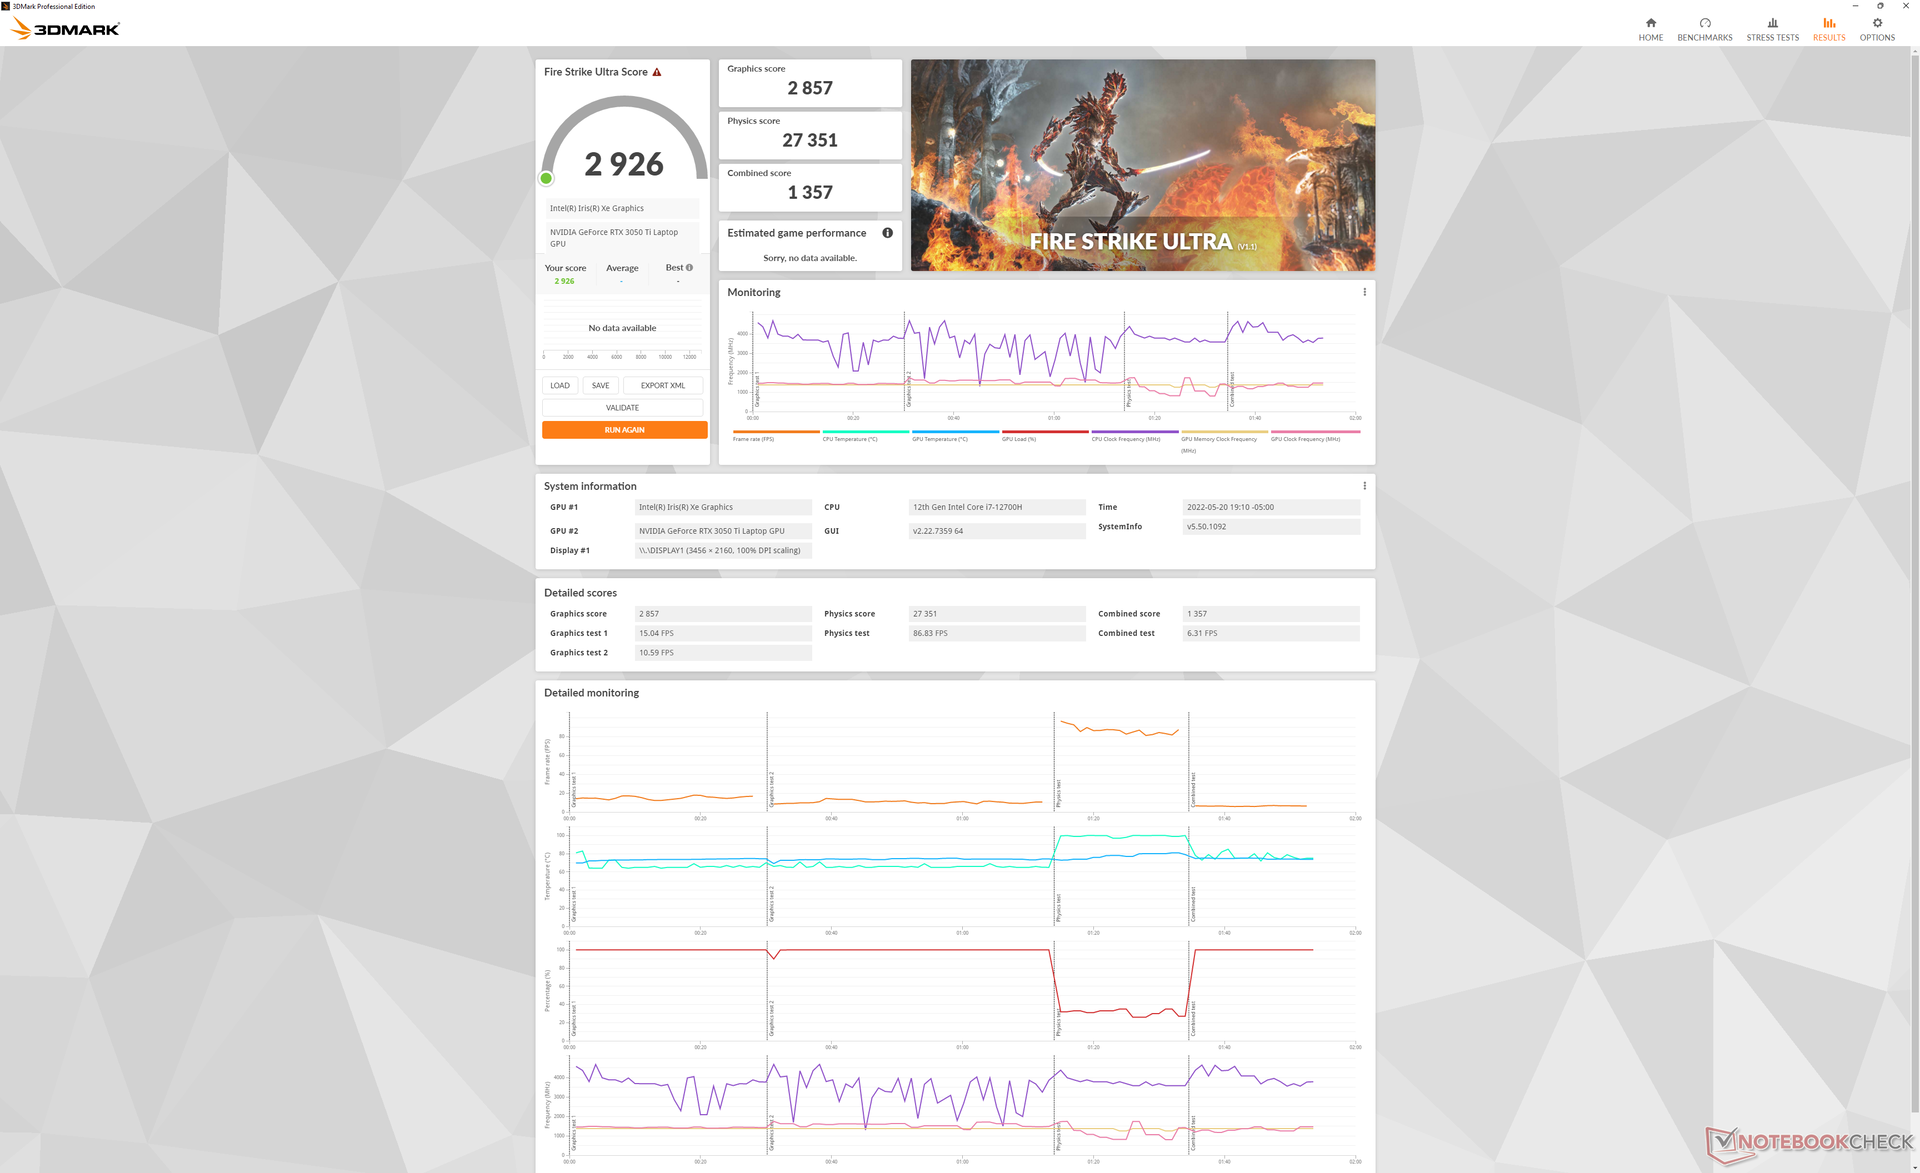
The XPS 15 9520 comes with faster RAM than on the XPS 15 9510 (DDR5-4800 vs. DDR4-3200) which should lead to slightly faster graphics performance. Unfortunately, Dell has downclocked the GPU clock rate from 1530 MHz on the XPS 15 9510 to 1035 MHz on the 9520 and so any potential performance gains from the faster RAM have been cancelled out. GeForce RTX 3050 Ti 3DMark results between the XPS 15 9510 and 9520 are nearly identical as a result.
Graphics performance remains around 20 to 30 percent faster than the GTX 1650 Ti on the older XPS 15 9500.
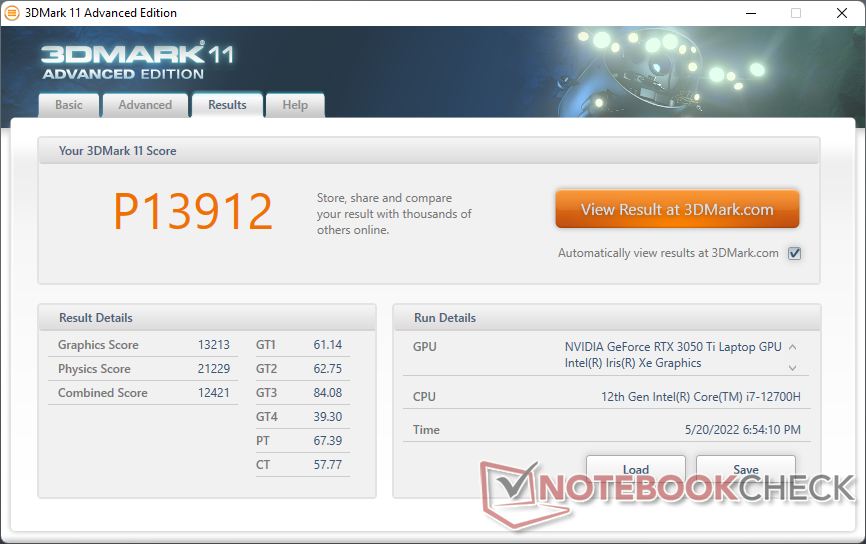
| 3DMark 11 Performance | 13912 points | |
| 3DMark Cloud Gate Standard Score | 39980 points | |
| 3DMark Fire Strike Score | 11026 points | |
| 3DMark Time Spy Score | 5093 points | |
Help | ||
Witcher 3 FPS Chart
| low | med. | high | ultra | QHD | 4K | |
|---|---|---|---|---|---|---|
| GTA V (2015) | 185 | 181.3 | 90.3 | 49.9 | 37.4 | |
| The Witcher 3 (2015) | 226.5 | 127.1 | 62.4 | 34.2 | ||
| Dota 2 Reborn (2015) | 180.3 | 166.1 | 116.1 | 104.5 | 47.1 | |
| Final Fantasy XV Benchmark (2018) | 106.6 | 62.9 | 45.7 | 34.1 | ||
| X-Plane 11.11 (2018) | 137.6 | 117 | 100.6 | 73.7 | ||
| Strange Brigade (2018) | 206 | 109.6 | 91.1 | 79.4 | 60.4 | |
| Cyberpunk 2077 1.6 (2022) | 59.4 | 47.4 | 39.3 | 39.5 | 20.2 |
Emissions
System Noise
Fan noise appears to be quieter than on the older XPS models when subjected to similar loads. Or, at the very least, it takes a bit longer for the fans in the 9520 to ramp up in RPMs when demanding loads are introduced. By the end of the first 3DMark 06 benchmark scene, for example, fan noise would be just 31 dB(A) compared to 36 dB(A) anf 46 dB(A) on the XPS 15 9510 and 9500, respectively. The system is still quieter than expected under most conditions even when set to Ultra Performance mode.
Noise level
| Idle |
| 22.9 / 22.9 / 22.9 dB(A) |
| Load |
| 30.9 / 44.7 dB(A) |
 | ||
30 dB silent 40 dB(A) audible 50 dB(A) loud |
||
min: | ||
| Dell XPS 15 9520 RTX 3050 Ti GeForce RTX 3050 Ti Laptop GPU, i7-12700H, WDC PC SN810 512GB | Dell XPS 15 9510 11800H RTX 3050 Ti OLED GeForce RTX 3050 Ti Laptop GPU, i7-11800H, Micron 2300 512GB MTFDHBA512TDV | Dell XPS 15 9500 Core i7 4K UHD GeForce GTX 1650 Ti Mobile, i7-10875H, SK Hynix PC611 512GB | HP Spectre X360 15-5ZV31AV GeForce MX250, i7-10510U, Intel SSD 660p 2TB SSDPEKNW020T8 | Asus Zenbook Pro 15 OLED UM535Q GeForce RTX 3050 Ti Laptop GPU, R9 5900HX, WDC PC SN730 SDBPNTY-1T00 | MSI Stealth 15M A11SEK GeForce RTX 2060 Max-Q, i7-1185G7, WDC PC SN530 SDBPNPZ-1T00 | |
|---|---|---|---|---|---|---|
| Noise | -2% | -23% | -17% | -7% | -34% | |
| off / environment * (dB) | 22.8 | 23.8 -4% | 28.4 -25% | 30.1 -32% | 22.8 -0% | 27.5 -21% |
| Idle Minimum * (dB) | 22.9 | 23.8 -4% | 28.4 -24% | 30.1 -31% | 22.9 -0% | 32.3 -41% |
| Idle Average * (dB) | 22.9 | 23.8 -4% | 28.4 -24% | 30.1 -31% | 22.9 -0% | 32.3 -41% |
| Idle Maximum * (dB) | 22.9 | 23.8 -4% | 28.4 -24% | 30.1 -31% | 22.9 -0% | 33.7 -47% |
| Load Average * (dB) | 30.9 | 36 -17% | 46 -49% | 30.1 3% | 33.2 -7% | 46.3 -50% |
| Witcher 3 ultra * (dB) | 37.8 | 36 5% | 42 -11% | 39.7 -5% | 47.3 -25% | 41.3 -9% |
| Load Maximum * (dB) | 44.7 | 38.2 15% | 47.1 -5% | 42 6% | 52.8 -18% | 56.2 -26% |
* ... smaller is better
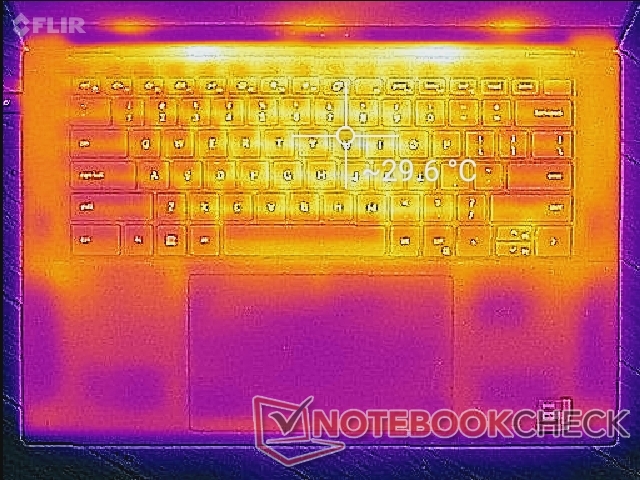
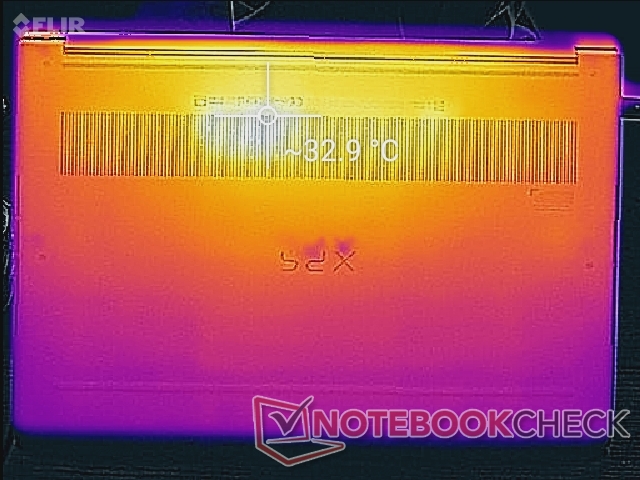
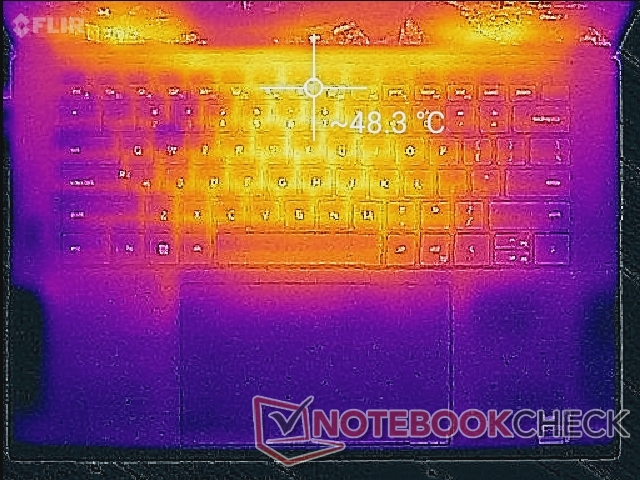
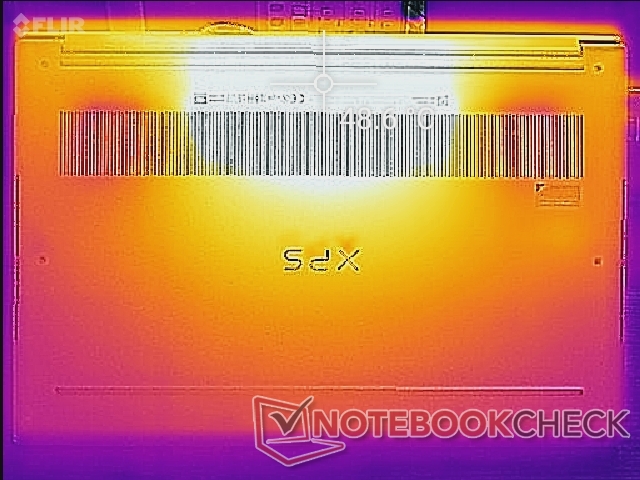
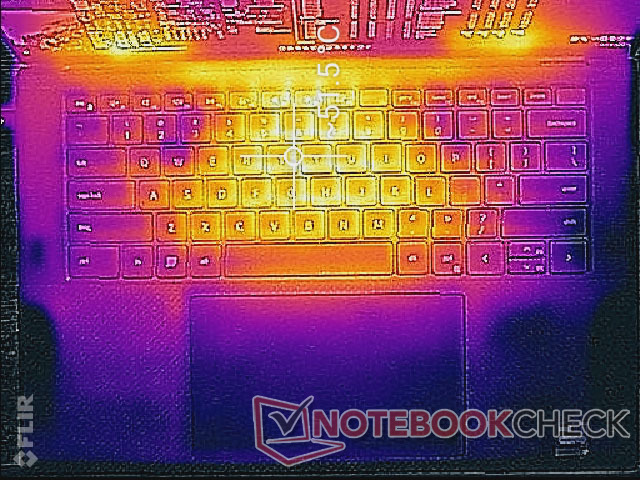
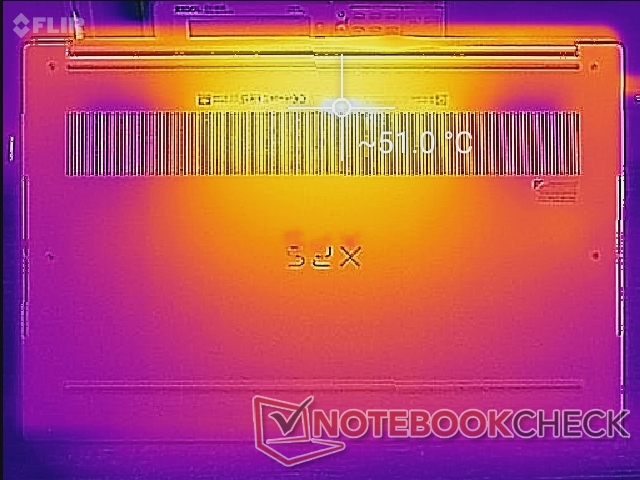
Temperature — Slightly Warmer Overall
Surface temperatures when under load are warmer than what we recorded on the older XPS 15 9510 and 9500 models. Hot spots can reach 51 C to 52 C on the top and bottom, respectively, compared to 44 C to 47 C on each of the previous versions. Hot spots on competitors like the Zenbook Pro 15 OLED are cooler by a few degrees C when under similar conditions. The XPS 9520 is one of the smallest Core H-powered 15.6-inch laptops in the market, after all.
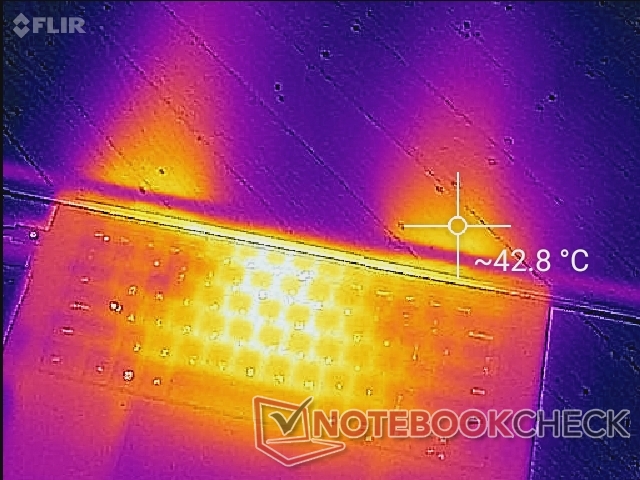
(-) The maximum temperature on the upper side is 51.4 °C / 125 F, compared to the average of 36.8 °C / 98 F, ranging from 21 to 71 °C for the class Multimedia.
(-) The bottom heats up to a maximum of 51 °C / 124 F, compared to the average of 39.1 °C / 102 F
(+) In idle usage, the average temperature for the upper side is 27.8 °C / 82 F, compared to the device average of 31.3 °C / 88 F.
(±) Playing The Witcher 3, the average temperature for the upper side is 35.2 °C / 95 F, compared to the device average of 31.3 °C / 88 F.
(+) The palmrests and touchpad are cooler than skin temperature with a maximum of 31.6 °C / 88.9 F and are therefore cool to the touch.
(-) The average temperature of the palmrest area of similar devices was 28.7 °C / 83.7 F (-2.9 °C / -5.2 F).
| Dell XPS 15 9520 RTX 3050 Ti Intel Core i7-12700H, NVIDIA GeForce RTX 3050 Ti Laptop GPU | Dell XPS 15 9510 11800H RTX 3050 Ti OLED Intel Core i7-11800H, NVIDIA GeForce RTX 3050 Ti Laptop GPU | Dell XPS 15 9500 Core i7 4K UHD Intel Core i7-10875H, NVIDIA GeForce GTX 1650 Ti Mobile | HP Spectre X360 15-5ZV31AV Intel Core i7-10510U, NVIDIA GeForce MX250 | Asus Zenbook Pro 15 OLED UM535Q AMD Ryzen 9 5900HX, NVIDIA GeForce RTX 3050 Ti Laptop GPU | MSI Stealth 15M A11SEK Intel Core i7-1185G7, NVIDIA GeForce RTX 2060 Max-Q | |
|---|---|---|---|---|---|---|
| Heat | 13% | 3% | 17% | -1% | 10% | |
| Maximum Upper Side * (°C) | 51.4 | 45.5 11% | 44 14% | 47 9% | 36 30% | 47.2 8% |
| Maximum Bottom * (°C) | 51 | 44.2 13% | 48.8 4% | 47.4 7% | 47.2 7% | 47.4 7% |
| Idle Upper Side * (°C) | 30 | 27 10% | 33 -10% | 22.8 24% | 37 -23% | 27.2 9% |
| Idle Bottom * (°C) | 33 | 26.7 19% | 32.4 2% | 23.6 28% | 39.2 -19% | 28.2 15% |
* ... smaller is better
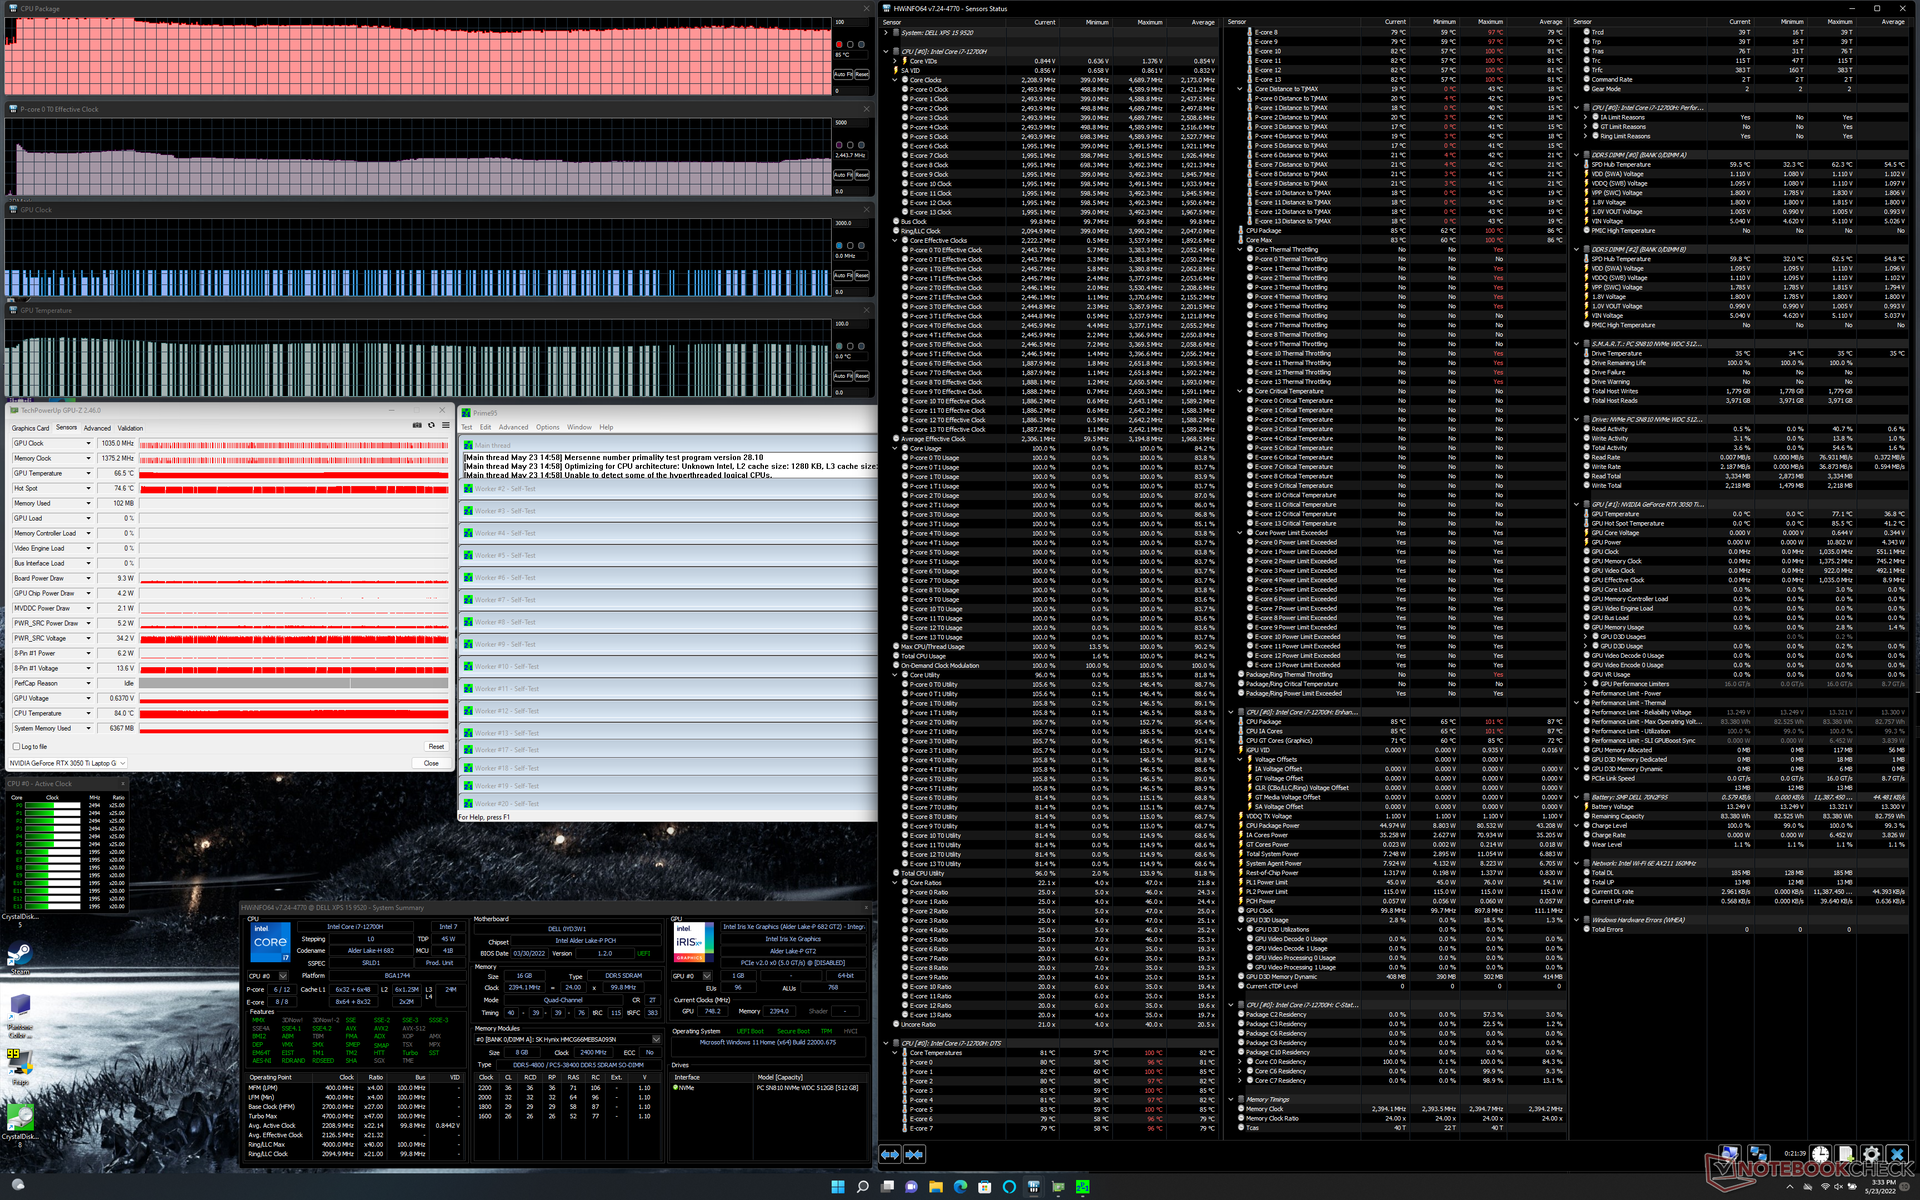
Stress Test
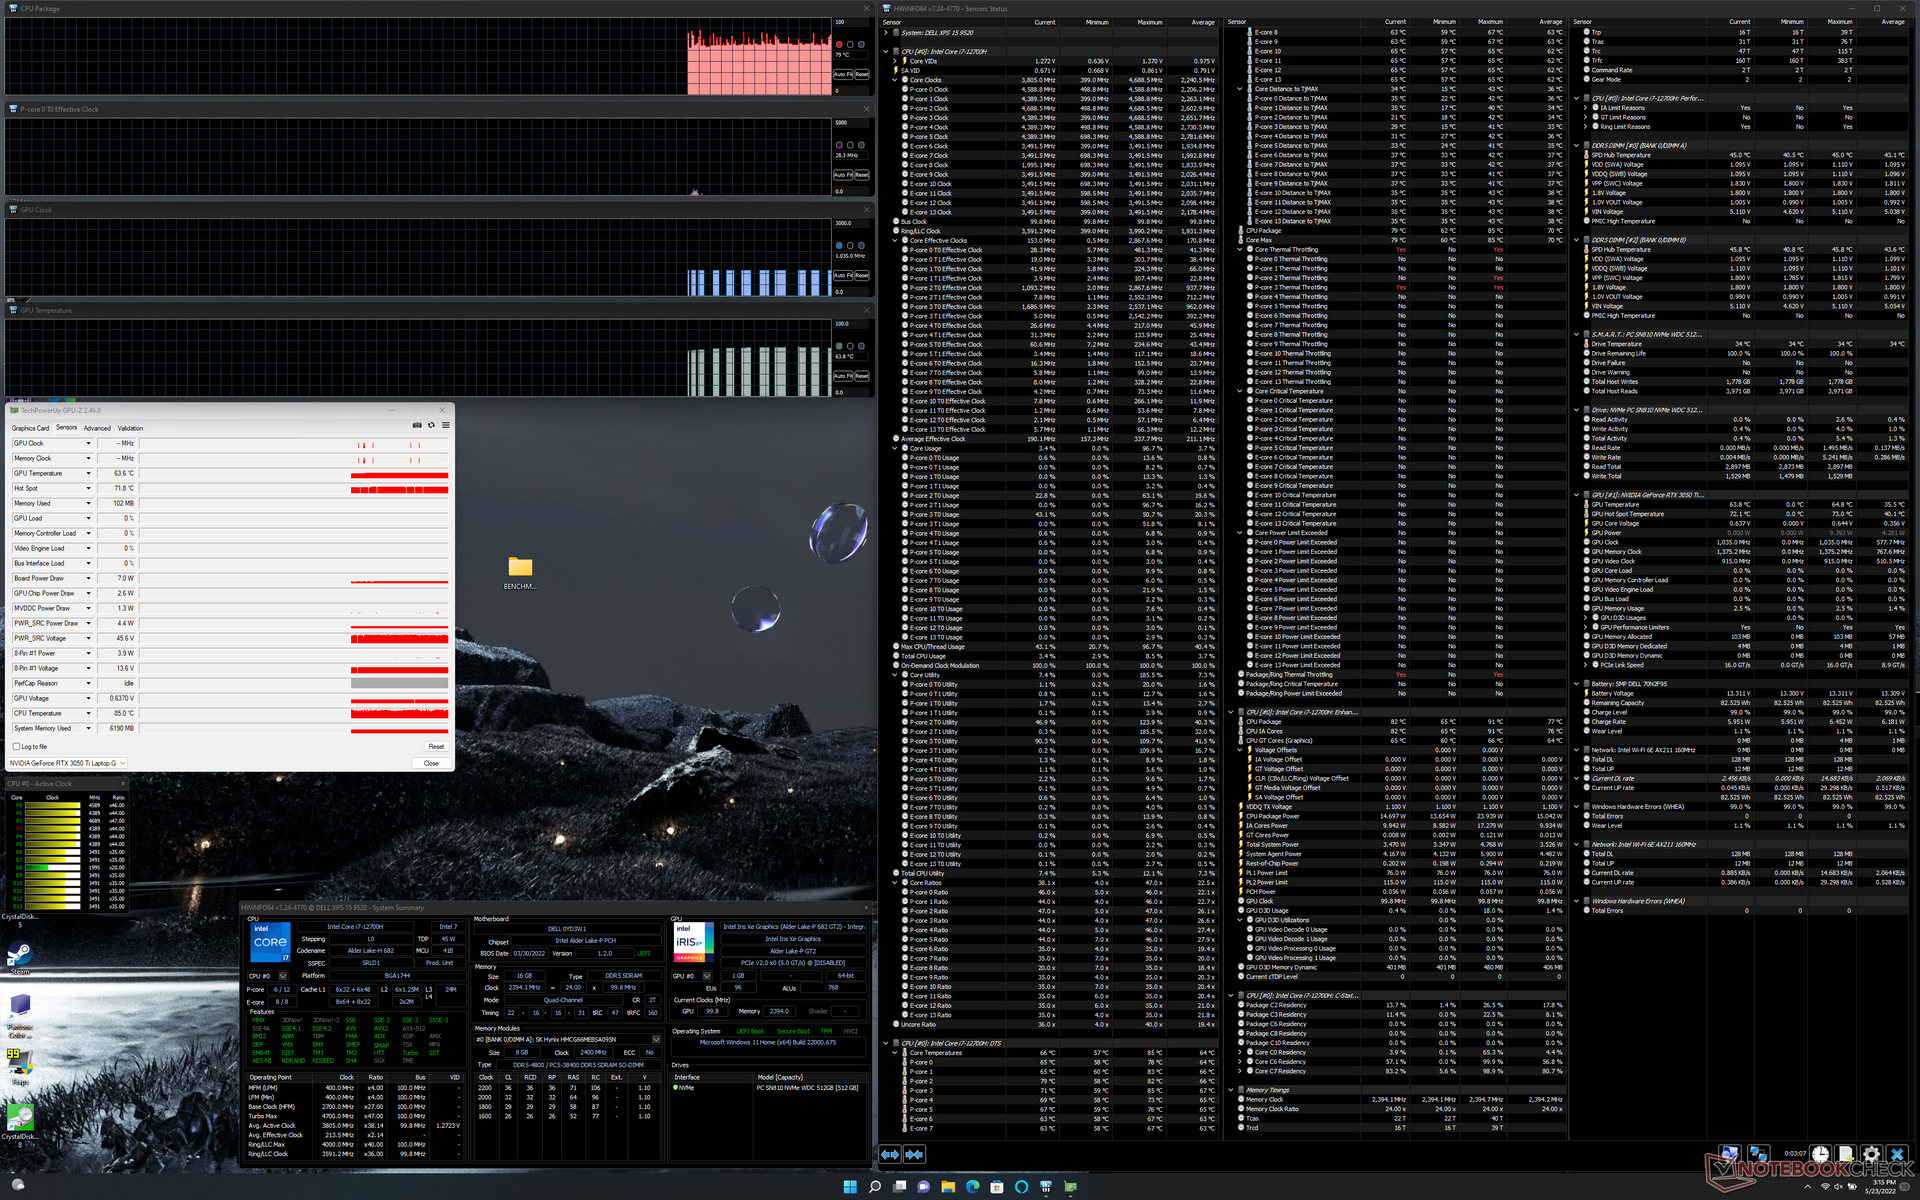
When stressed under Prime95, the CPU would boost to 81 W, 100 C, and 3.3 GHz for the first 10 seconds or so before quickly falling and stabilizing at 45 W, 85 C, and 2.5 GHz in order to keep temperatures in check. Running this same test on the XPS 15 9500 would result in a stable CPU temperature of 73 C in comparison. Thus, it appears that the XPS 15 9520 is running warmer than its predecessors in order to extract more processor performance from the same overall chassis design.
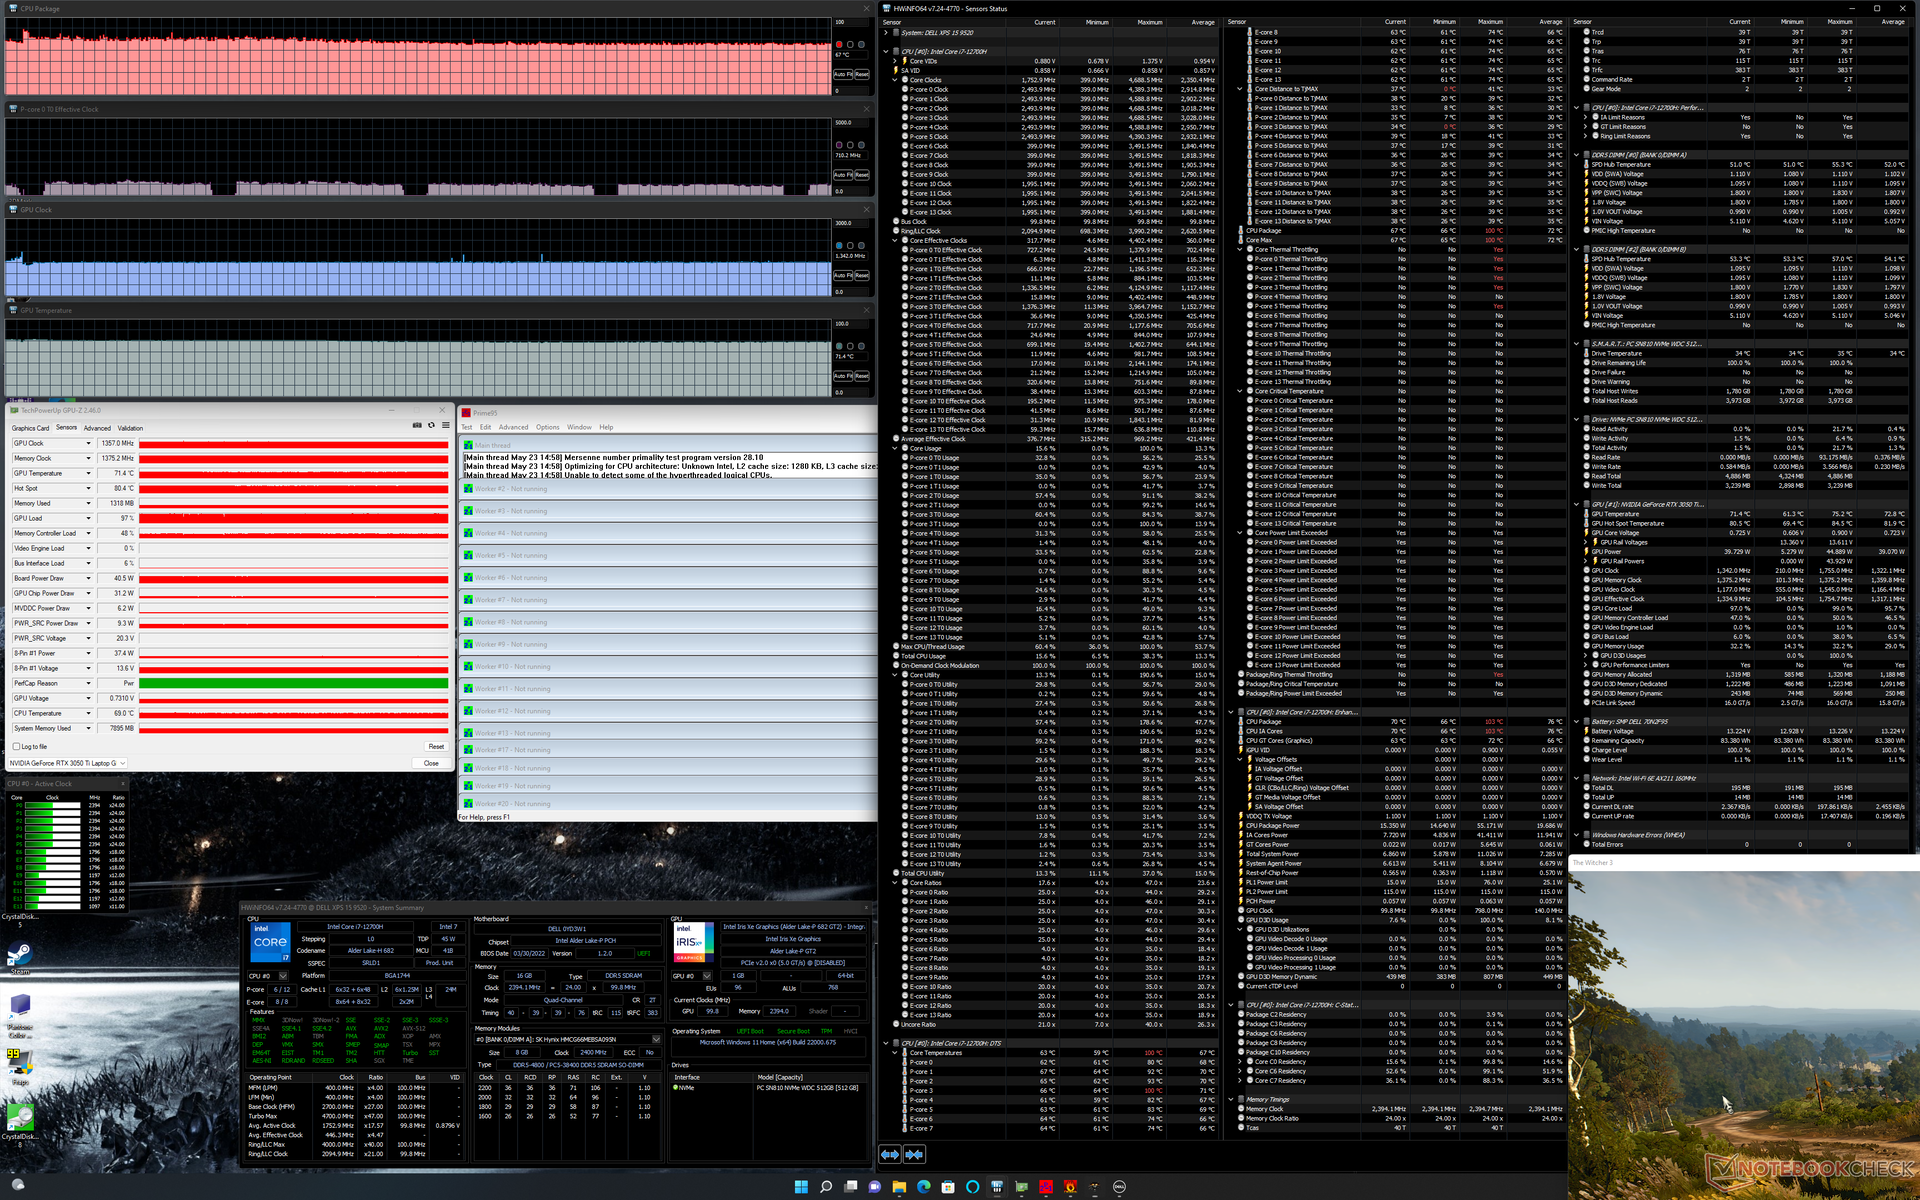
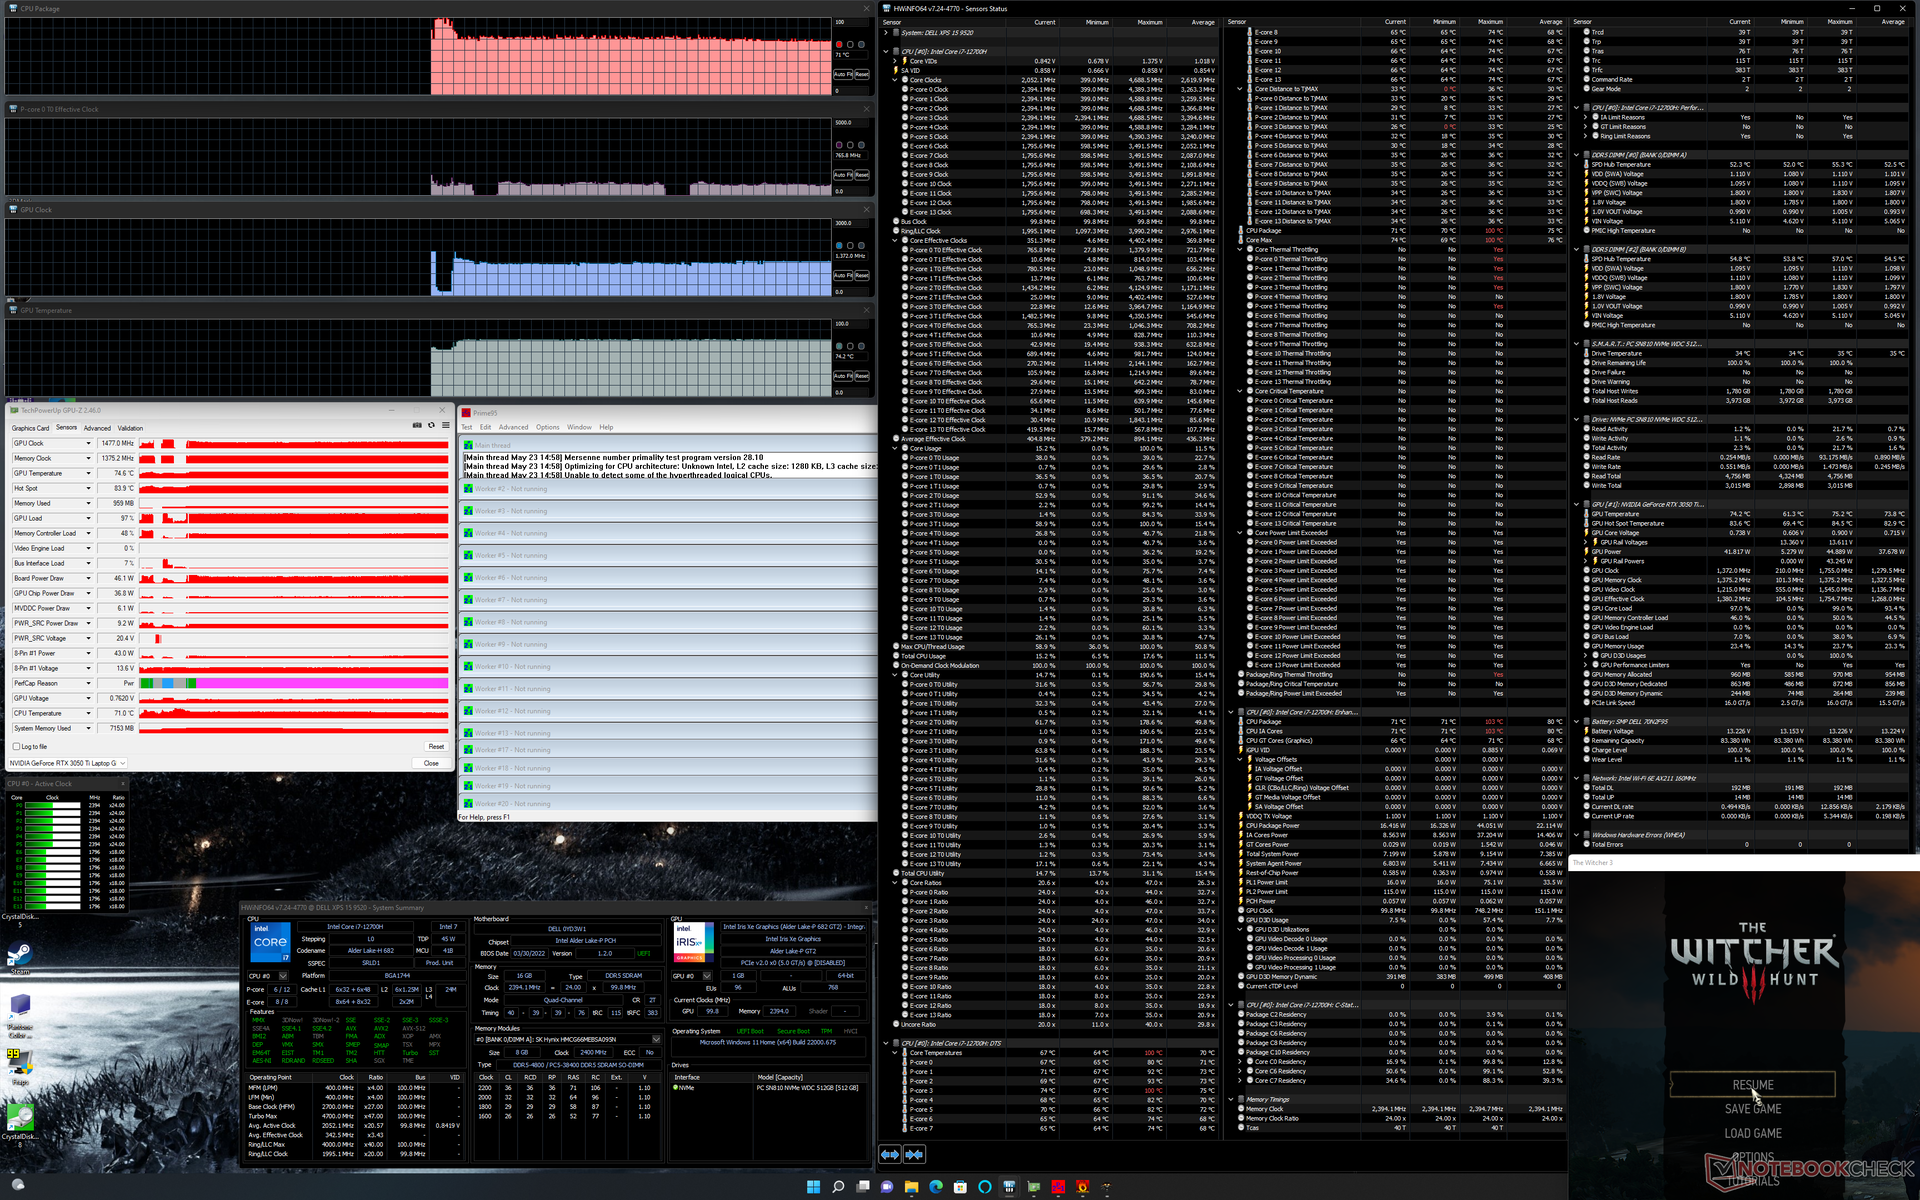
GPU clock rates, power draw, and temperature would stabilize at 1477 MHz, 46 W, and 74 C, respectively, when running Witcher 3 on Ultra Performance mode. Running on Optimized mode would result in slightly lower clock rates and temperatures as shown by the table below as well as a lower power draw of 41 W. Users must run the system on Ultra Performance mode if they want to extract as much performance as possible from the GPU. Running this same test on the XPS 15 9500 with the slower GeForce GTX 1650 Ti would result in similar CPU and GPU temperatures.
Running on battery power limits performance. A Fire Strike test on batteries would return Physics and Graphics scores of 9450 and 8332 points, respectively, compared to 27077 and 12154 points when on mains.

| CPU Clock (GHz) | GPU Clock (MHz) | Average CPU Temperature (°C) | Average GPU Temperature (°C) | |
| System Idle | -- | -- | 79 | 64 |
| Prime95 Stress | 2.4 | 85 | -- | 67 |
| Prime95 + FurMark Stress | 0.8 - 2.3 | 700 - 1100 | 79 - 86 | 62 - 75 |
| Witcher 3 Stress (Balanced mode) | 0.7 | 1357 | 67 | 71 |
| Witcher 3 Stress (Performance mode) | 0.8 | 1477 | 71 | 74 |
Speakers
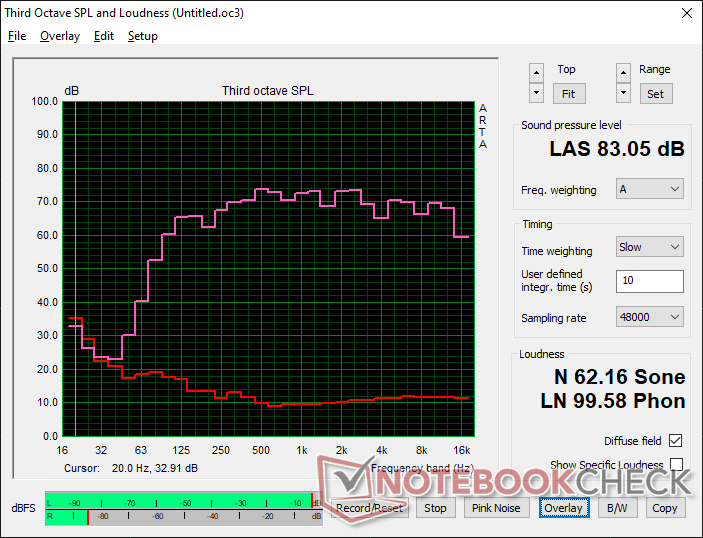
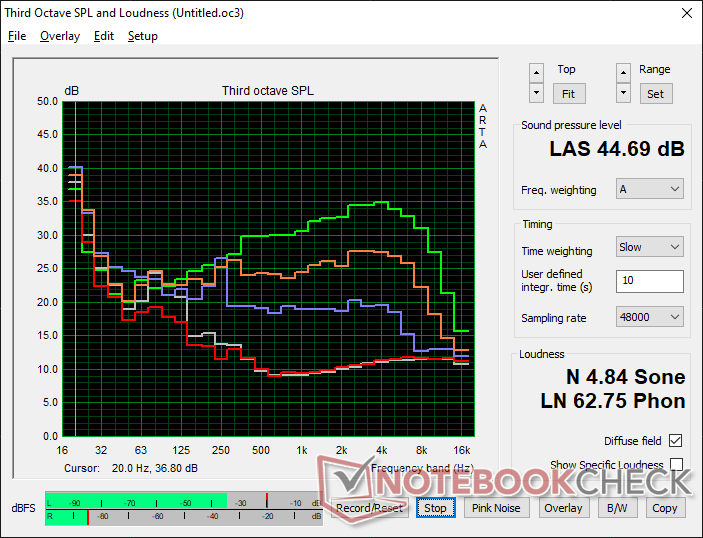
Dell XPS 15 9520 RTX 3050 Ti audio analysis
(+) | speakers can play relatively loud (83.1 dB)
Bass 100 - 315 Hz
(+) | good bass - only 4.4% away from median
(+) | bass is linear (6.8% delta to prev. frequency)
Mids 400 - 2000 Hz
(+) | balanced mids - only 2.6% away from median
(+) | mids are linear (4.1% delta to prev. frequency)
Highs 2 - 16 kHz
(+) | balanced highs - only 1.9% away from median
(+) | highs are linear (5.4% delta to prev. frequency)
Overall 100 - 16.000 Hz
(+) | overall sound is linear (6.4% difference to median)
Compared to same class
» 4% of all tested devices in this class were better, 1% similar, 95% worse
» The best had a delta of 5%, average was 17%, worst was 45%
Compared to all devices tested
» 1% of all tested devices were better, 0% similar, 99% worse
» The best had a delta of 4%, average was 24%, worst was 134%
Apple MacBook Pro 16 2021 M1 Pro audio analysis
(+) | speakers can play relatively loud (84.7 dB)
Bass 100 - 315 Hz
(+) | good bass - only 3.8% away from median
(+) | bass is linear (5.2% delta to prev. frequency)
Mids 400 - 2000 Hz
(+) | balanced mids - only 1.3% away from median
(+) | mids are linear (2.1% delta to prev. frequency)
Highs 2 - 16 kHz
(+) | balanced highs - only 1.9% away from median
(+) | highs are linear (2.7% delta to prev. frequency)
Overall 100 - 16.000 Hz
(+) | overall sound is linear (4.6% difference to median)
Compared to same class
» 0% of all tested devices in this class were better, 0% similar, 100% worse
» The best had a delta of 5%, average was 17%, worst was 45%
Compared to all devices tested
» 0% of all tested devices were better, 0% similar, 100% worse
» The best had a delta of 4%, average was 24%, worst was 134%
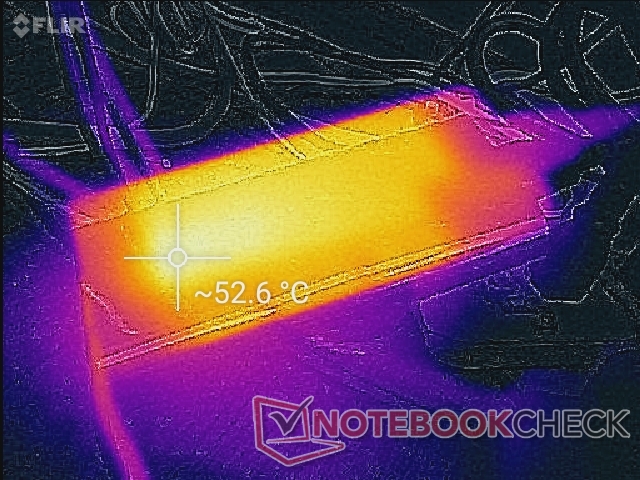
Energy Management — More Power
Power Consumption
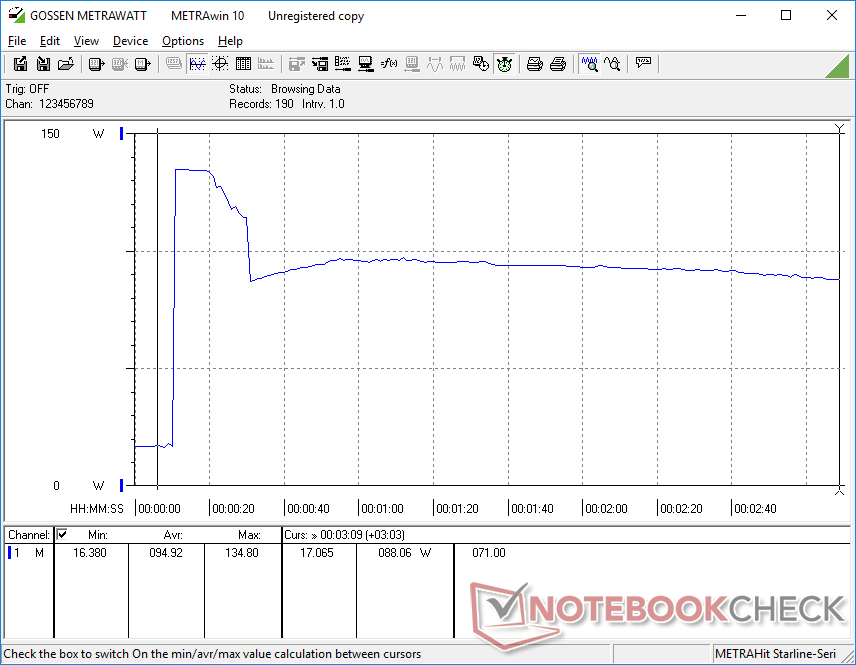
The XPS 15 9500, 9510, and 9520 are the only major laptops in the market at the moment with 130 W USB-C adapters to surpass the 100 W USB-C Power Delivery limit set by the USB-IF. The higher overhead allows the battery to continue charging at a decent rate even when running demanding loads like games. It's also worth noting that out test unit would not exhibit any charging issues that we experienced on the XPS 17 9700.
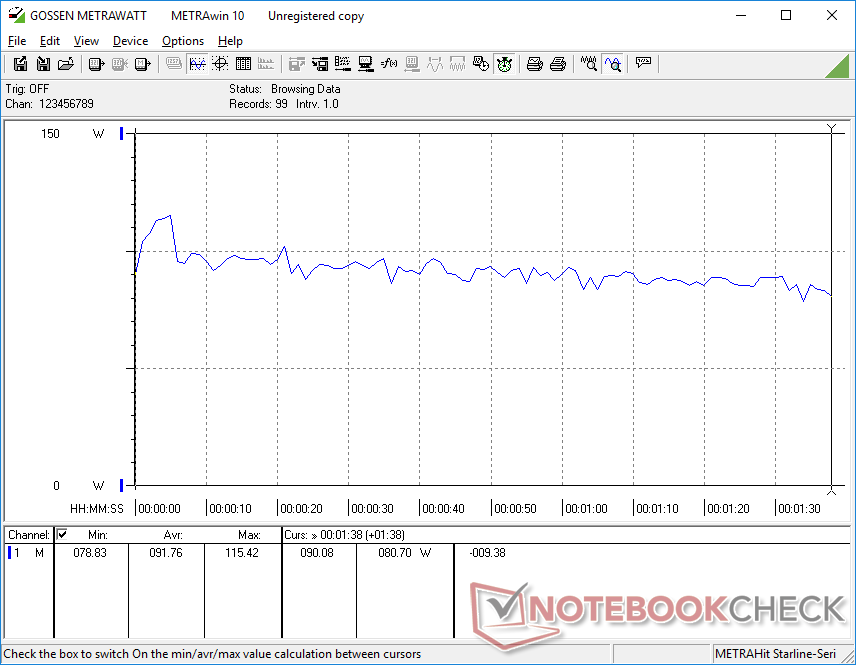
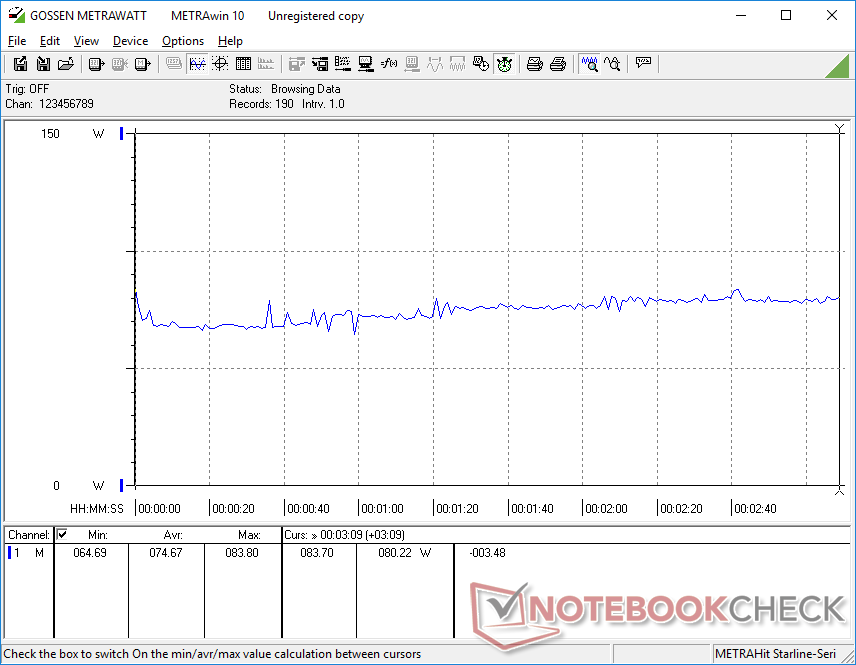
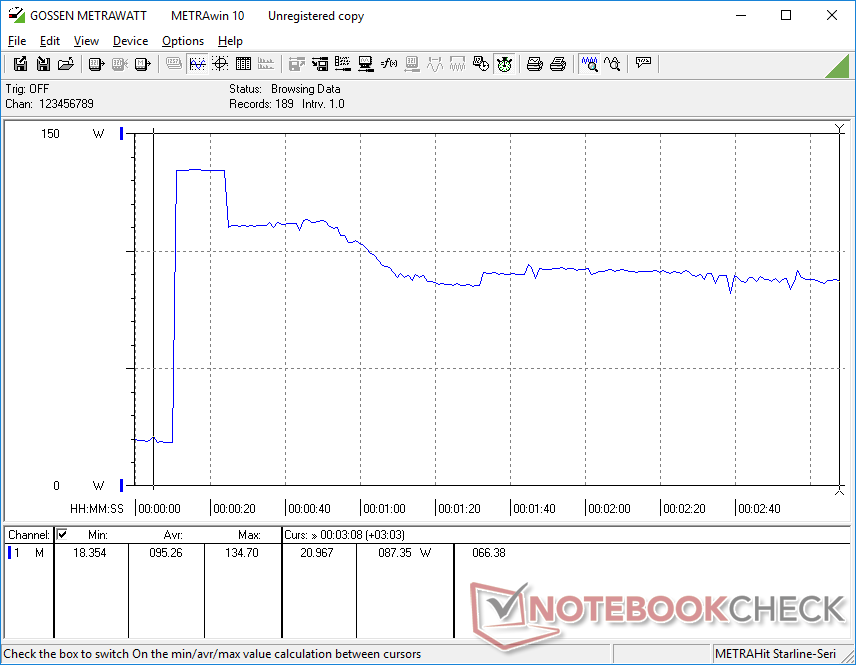
Running Witcher 3 consumes 75 W to be close to what we recorded on the XPS 15 9510 or competing AMD-powered Zenbook Pro 15 OLED. Perhaps more interestingly, running Prime95 would consume a steady 88 W compared to 65 W on the Core 7-11800H-powered XPS 15 9510. Thus, power consumption has increased by approximately 35 percent for the 35 to 42 percent year-over-year gain in multi-thread performance we recorded above. The generally higher power consumption aligns with what we are observing on the Alder Lake platform as a whole.
The small-medium (~14.3 x 6.6 x 2.3 cm) 130 W USB-C AC adapter that ships with the XPS 15 9520 is identical to the ones that shipped with the XPS 9500 and 9510.
| Off / Standby | |
| Idle | |
| Load |
|
Key:
min: | |
| Dell XPS 15 9520 RTX 3050 Ti i7-12700H, GeForce RTX 3050 Ti Laptop GPU, WDC PC SN810 512GB, OLED, 3456x2160, 15.6" | Dell XPS 15 9510 11800H RTX 3050 Ti OLED i7-11800H, GeForce RTX 3050 Ti Laptop GPU, Micron 2300 512GB MTFDHBA512TDV, OLED, 3456x2160, 15.6" | Dell XPS 15 9500 Core i7 4K UHD i7-10875H, GeForce GTX 1650 Ti Mobile, SK Hynix PC611 512GB, IPS, 3840x2400, 15.6" | HP Spectre X360 15-5ZV31AV i7-10510U, GeForce MX250, Intel SSD 660p 2TB SSDPEKNW020T8, IPS, 3840x2160, 15.6" | Asus Zenbook Pro 15 OLED UM535Q R9 5900HX, GeForce RTX 3050 Ti Laptop GPU, WDC PC SN730 SDBPNTY-1T00, OLED, 1920x1080, 15.6" | MSI Stealth 15M A11SEK i7-1185G7, GeForce RTX 2060 Max-Q, WDC PC SN530 SDBPNPZ-1T00, IPS, 1920x1080, 15.6" | |
|---|---|---|---|---|---|---|
| Power Consumption | -5% | -27% | 20% | 5% | -25% | |
| Idle Minimum * (Watt) | 5.5 | 7.6 -38% | 5.7 -4% | 5.2 5% | 5.5 -0% | 7.3 -33% |
| Idle Average * (Watt) | 7.2 | 9.9 -38% | 13.5 -88% | 8.5 -18% | 7.4 -3% | 10.1 -40% |
| Idle Maximum * (Watt) | 16 | 10.8 32% | 19.6 -23% | 8.7 46% | 14.9 7% | 17.6 -10% |
| Load Average * (Watt) | 91.8 | 81 12% | 114.1 -24% | 65.6 29% | 78.2 15% | 106.6 -16% |
| Witcher 3 ultra * (Watt) | 74.6 | 76.2 -2% | 93 -25% | 56.5 24% | 80.1 -7% | 105.4 -41% |
| Load Maximum * (Watt) | 134.7 | 131 3% | 135.2 -0% | 92.4 31% | 110.9 18% | 151.2 -12% |
* ... smaller is better
Power Consumption Witcher 3 / Stresstest
Power Consumption external Monitor
Battery Life
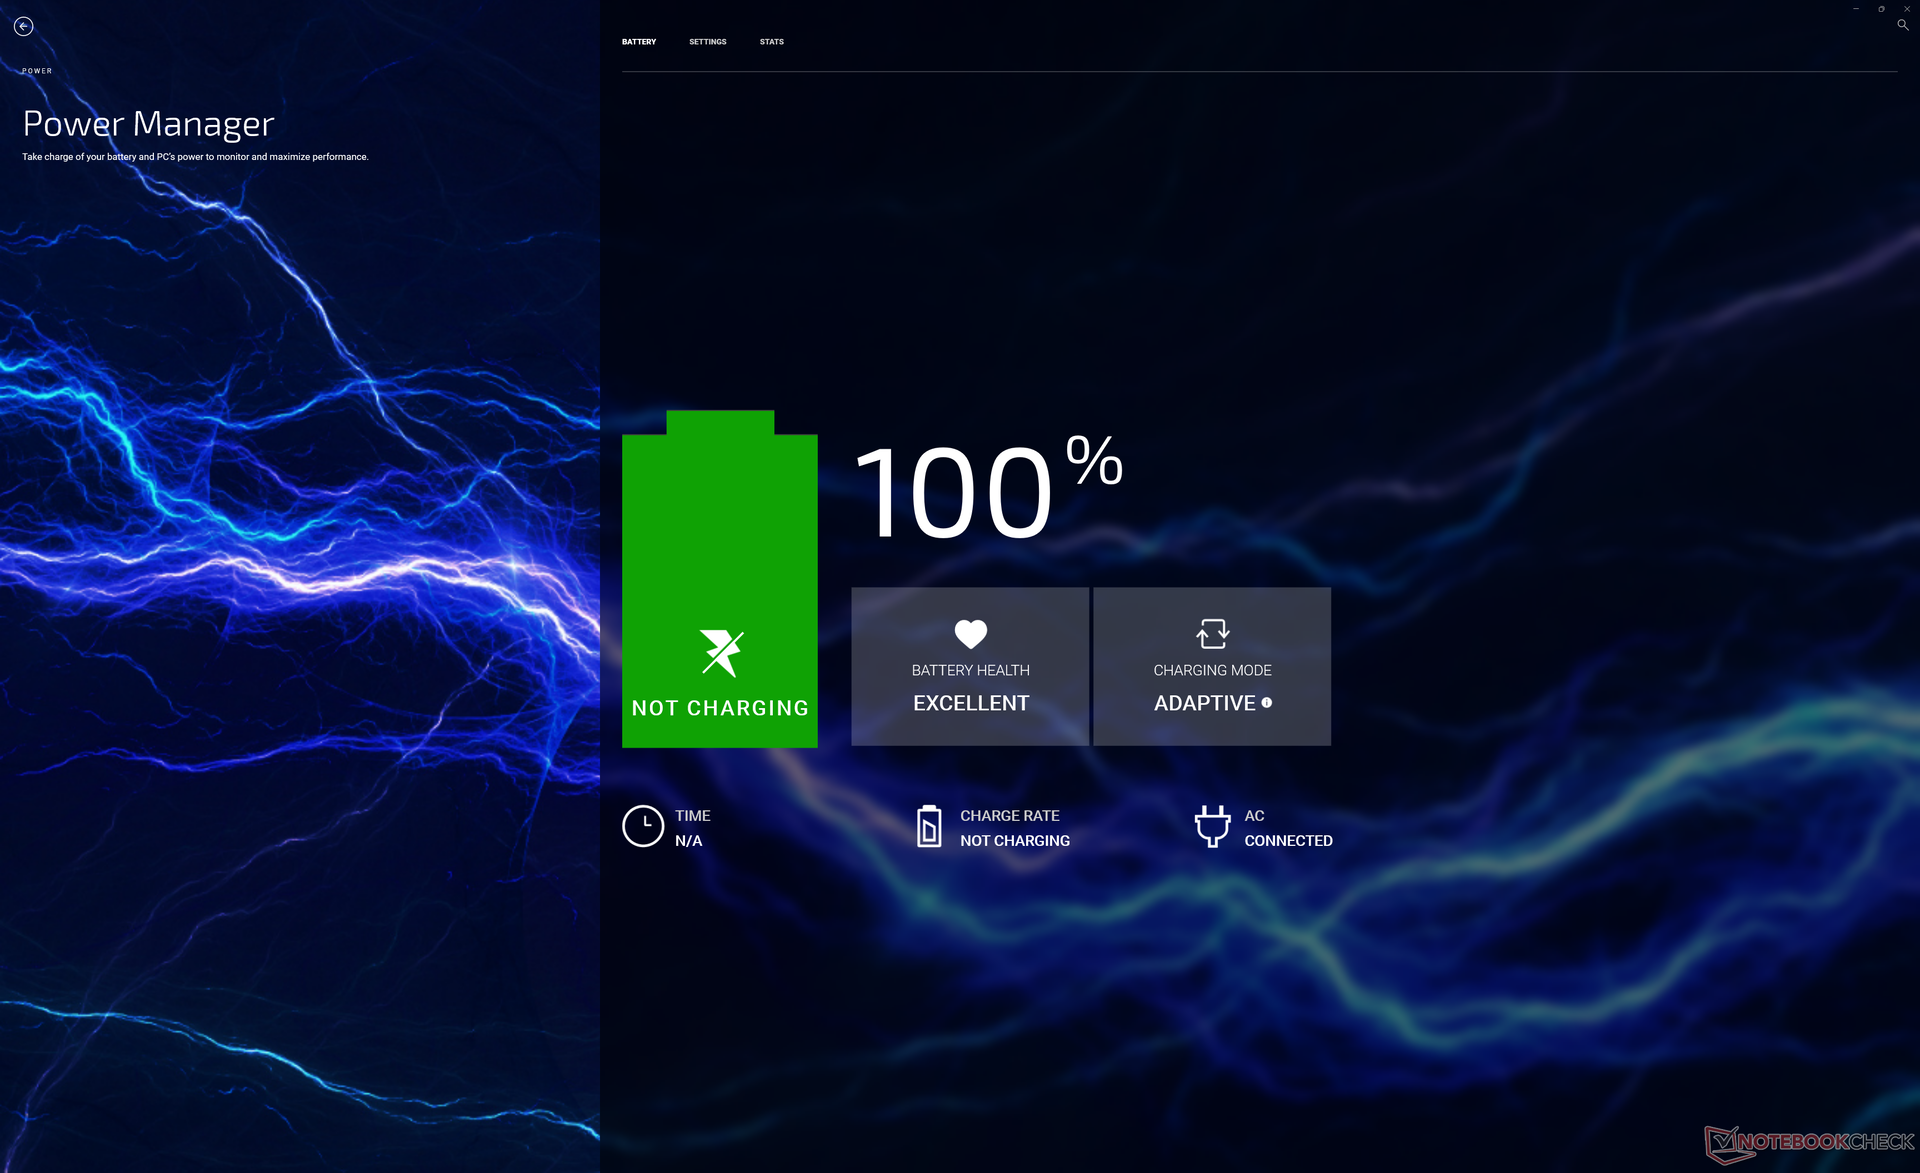
At almost 9 hours of constant real-world WLAN use, runtimes are overall similar to what we recorded on the XPS 9500 and almost 2 hours longer than on the XPS 9510. However, keep in mind that white colors will demand a few watts more than darker colors when at the same brightness setting since our configuration uses an OLED panel.
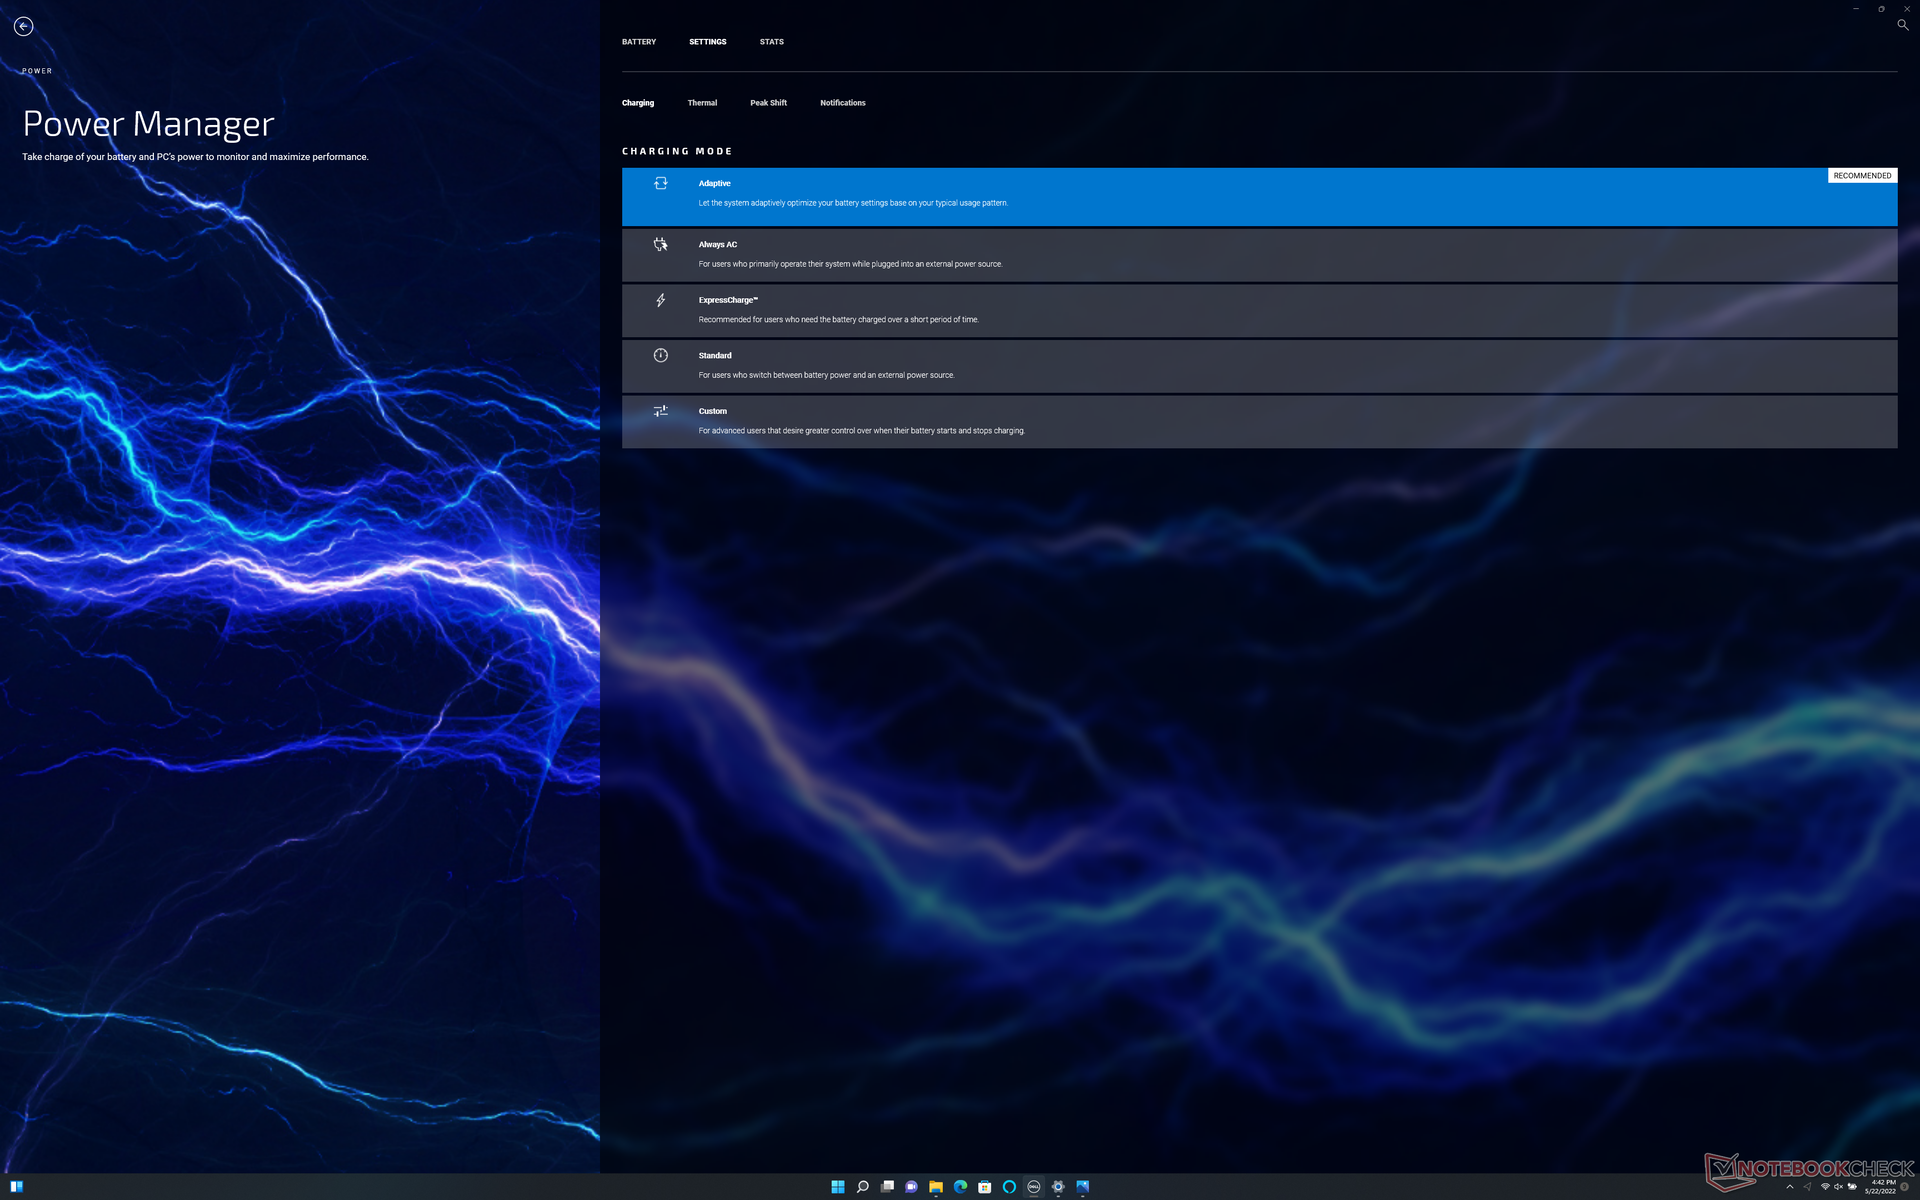
Charging from empty to full capacity with the included AC adapter. takes about 2 to 2.5 hours when idling or running low loads.
| Dell XPS 15 9520 RTX 3050 Ti i7-12700H, GeForce RTX 3050 Ti Laptop GPU, 86 Wh | Dell XPS 15 9510 11800H RTX 3050 Ti OLED i7-11800H, GeForce RTX 3050 Ti Laptop GPU, 86 Wh | Dell XPS 15 9500 Core i7 4K UHD i7-10875H, GeForce GTX 1650 Ti Mobile, 86 Wh | HP Spectre X360 15-5ZV31AV i7-10510U, GeForce MX250, 84 Wh | Asus Zenbook Pro 15 OLED UM535Q R9 5900HX, GeForce RTX 3050 Ti Laptop GPU, 96 Wh | MSI Stealth 15M A11SEK i7-1185G7, GeForce RTX 2060 Max-Q, 52 Wh | |
|---|---|---|---|---|---|---|
| Battery runtime | -32% | 7% | 22% | 45% | -42% | |
| Reader / Idle (h) | 14.8 | 23 55% | 22.6 53% | 26.2 77% | 10.5 -29% | |
| WiFi v1.3 (h) | 8.8 | 7 -20% | 9.1 3% | 10.8 23% | 12.8 45% | 6.3 -28% |
| Load (h) | 3.2 | 1.8 -44% | 2 -37% | 2.9 -9% | 3.6 13% | 1 -69% |
| H.264 (h) | 10.4 |
Pros
Cons
Verdict — The Alder Lake Difference
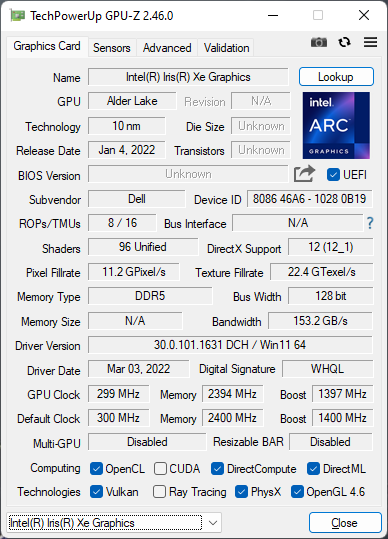
If the CPUs in the XPS 15 9500 or 9510 were too slow for your specific applications, then the 9520 would be worth considering. Its 12th gen Core i7-12700H can offer 70 percent and 40 percent faster multi-thread performance than the 10th gen Core i7-10875H and 11th gen Core i7-11800H, respectively, without significantly impacting battery life. The inherent boost to integrated graphics performance can also be enough to satisfy most office users without needing to upgrade to any pricey discrete Nvidia options.
Power users will appreciate the significant gains in processor performance over Intel 11th gen or 10th gen options. For more basic or moderate office tasks, however, the extra horsepower of the 12th gen series may not be worth the price uptick.
Outside of CPU performance, however, the experience remains the same as on the XPS 9510 or even 9500. The Nvidia GPU has been downclocked from the 9510 and so the benefits of faster DDR5 RAM has been minimized. Certain changes that we would have loved to see like higher refresh displays, a higher resolution webcam, proper Wi-Fi 6E support, or a privacy shutter continue to be absent. If the faster 12th gen CPU is not appealing, then you can instead purchase the XPS 15 9510 which has the exact same display and GPU options as our 9520 but at lower prices.
Price and Availability
Dell is currently shipping its XPS 15 9520 series starting at $1500 USD for the base model up to $3500 USD if configured with everything to maximum.
Dell XPS 15 9520 RTX 3050 Ti
- 08/30/2022 v7 (old)
Allen Ngo
Price comparison
