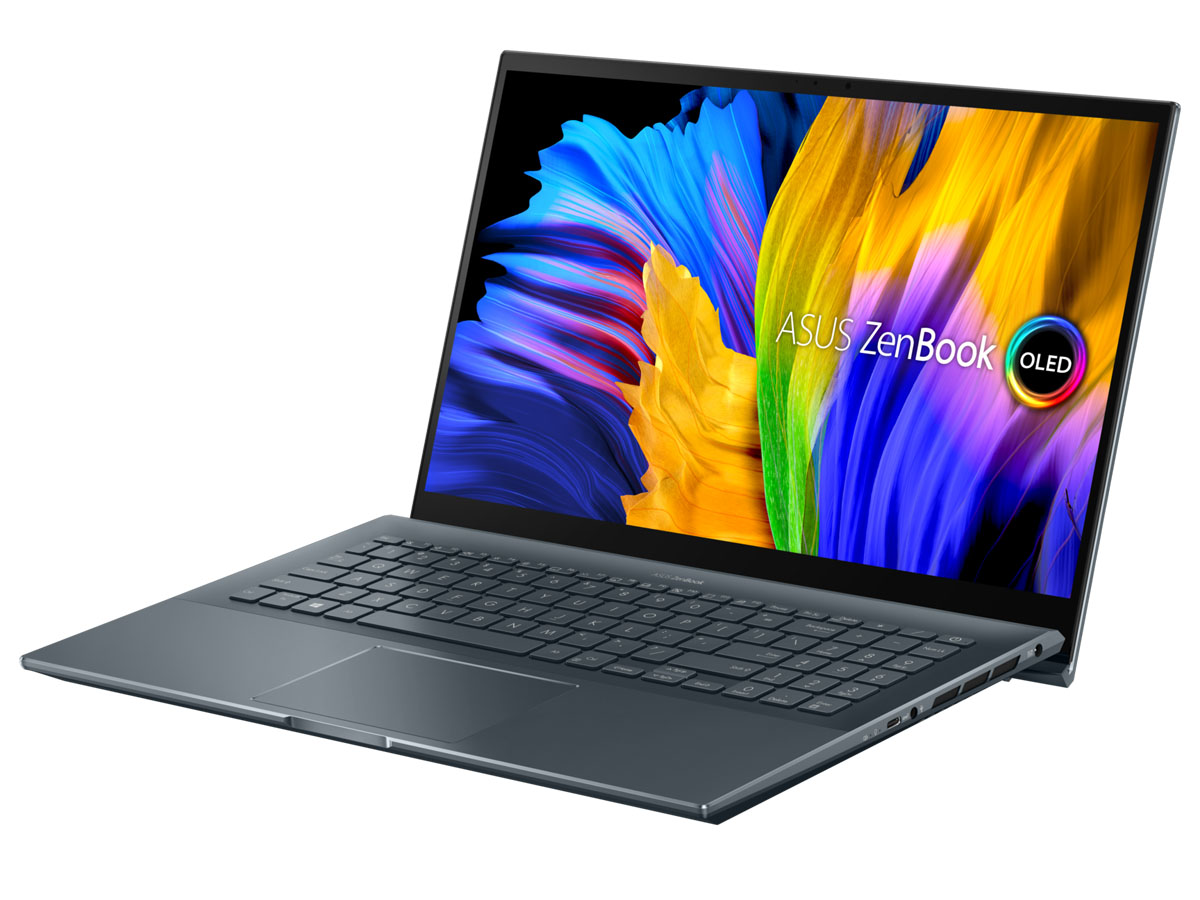
Asus Zenbook Pro 15 OLED UM535Q laptop review: Like an AMD-powered XPS 15
It's been two years since we last checked out the Zenbook 535 series. Our last model, the 2020 UX535 with 10th gen Intel Coffee Lake-H and GeForce GTX 1650 Max-Q graphics, came equipped with a ScreenPad for additional screen real estate. This particular 2022 version in review comes with a newer AMD Zen 3 5900HX CPU and GeForce RTX 3050 Ti GPU albeit without the ScreenPad on the 2020 model. Our top-end FHD OLED configuration as reviewed can be found online for about $1500 USD retail, but SKUs with the Ryzen 5 5600H CPU or 4K UHD OLED display are also available.
Alternatives to the Asus Zenbook UM535 include other 15.6-inch multimedia or prosumer laptops like the MSI Prestige 15, Dell XPS 15, HP Spectre x360 15, or the Microsoft Surface Laptop 15.
More Asus reviews:
Potential Competitors in Comparison
Rating | Date | Model | Weight | Height | Size | Resolution | Price |
|---|---|---|---|---|---|---|---|
| 87.7 % v7 (old) | 05 / 2022 | Asus Zenbook Pro 15 OLED UM535Q R9 5900HX, GeForce RTX 3050 Ti Laptop GPU | 1.9 kg | 18 mm | 15.60" | 1920x1080 | |
| 87 % v7 (old) | 12 / 2020 | Asus ZenBook UX535-M01440 i7-10750H, GeForce GTX 1650 Ti Max-Q | 2 kg | 20 mm | 15.60" | 3840x2160 | |
| 85.2 % v7 (old) | 03 / 2020 | Asus ZenBook 15 UX534FTC-A8190T i7-10510U, GeForce GTX 1650 Max-Q | 1.6 kg | 18.9 mm | 15.60" | 1920x1080 | |
| 87.1 % v7 (old) | 04 / 2021 | Lenovo Yoga Creator 7 15IMH05 82DS000VGE i7-10750H, GeForce GTX 1650 Mobile | 1.8 kg | 17.5 mm | 15.60" | 1920x1080 | |
| 83 % v7 (old) | 08 / 2020 | HP Envy 15-ep0098nr i7-10750H, GeForce RTX 2060 Max-Q | 2 kg | 19 mm | 15.60" | 3840x2160 | |
| 88.4 % v7 (old) | 08 / 2021 | Dell XPS 15 9510 11800H RTX 3050 Ti OLED i7-11800H, GeForce RTX 3050 Ti Laptop GPU | 1.9 kg | 18 mm | 15.60" | 3456x2160 |
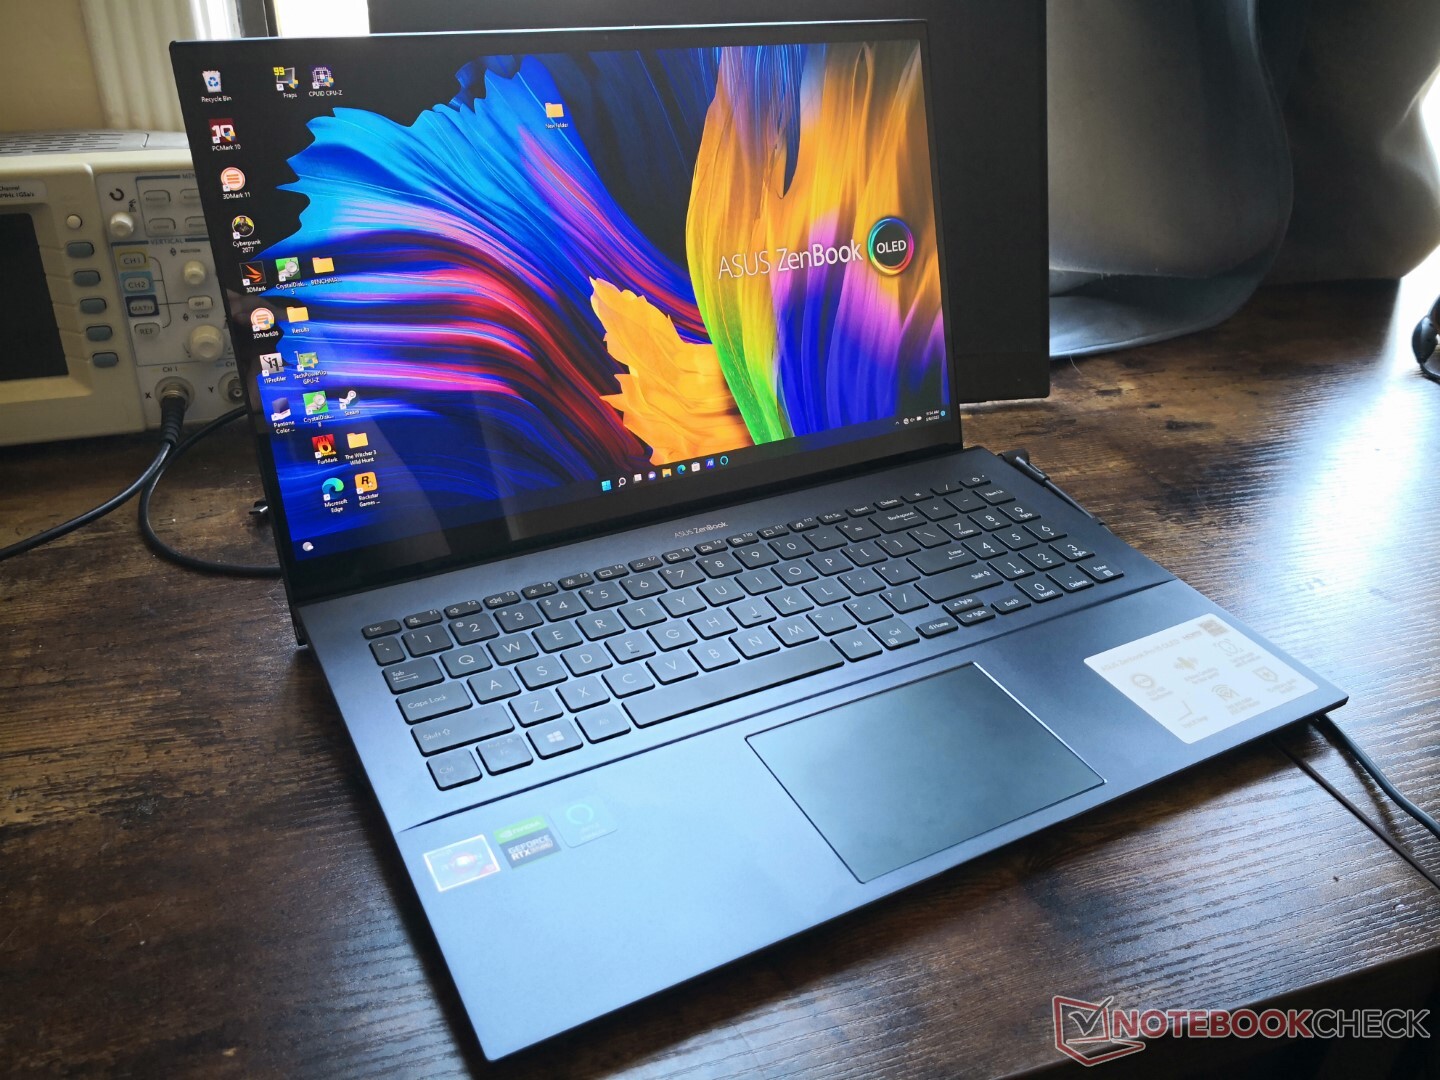
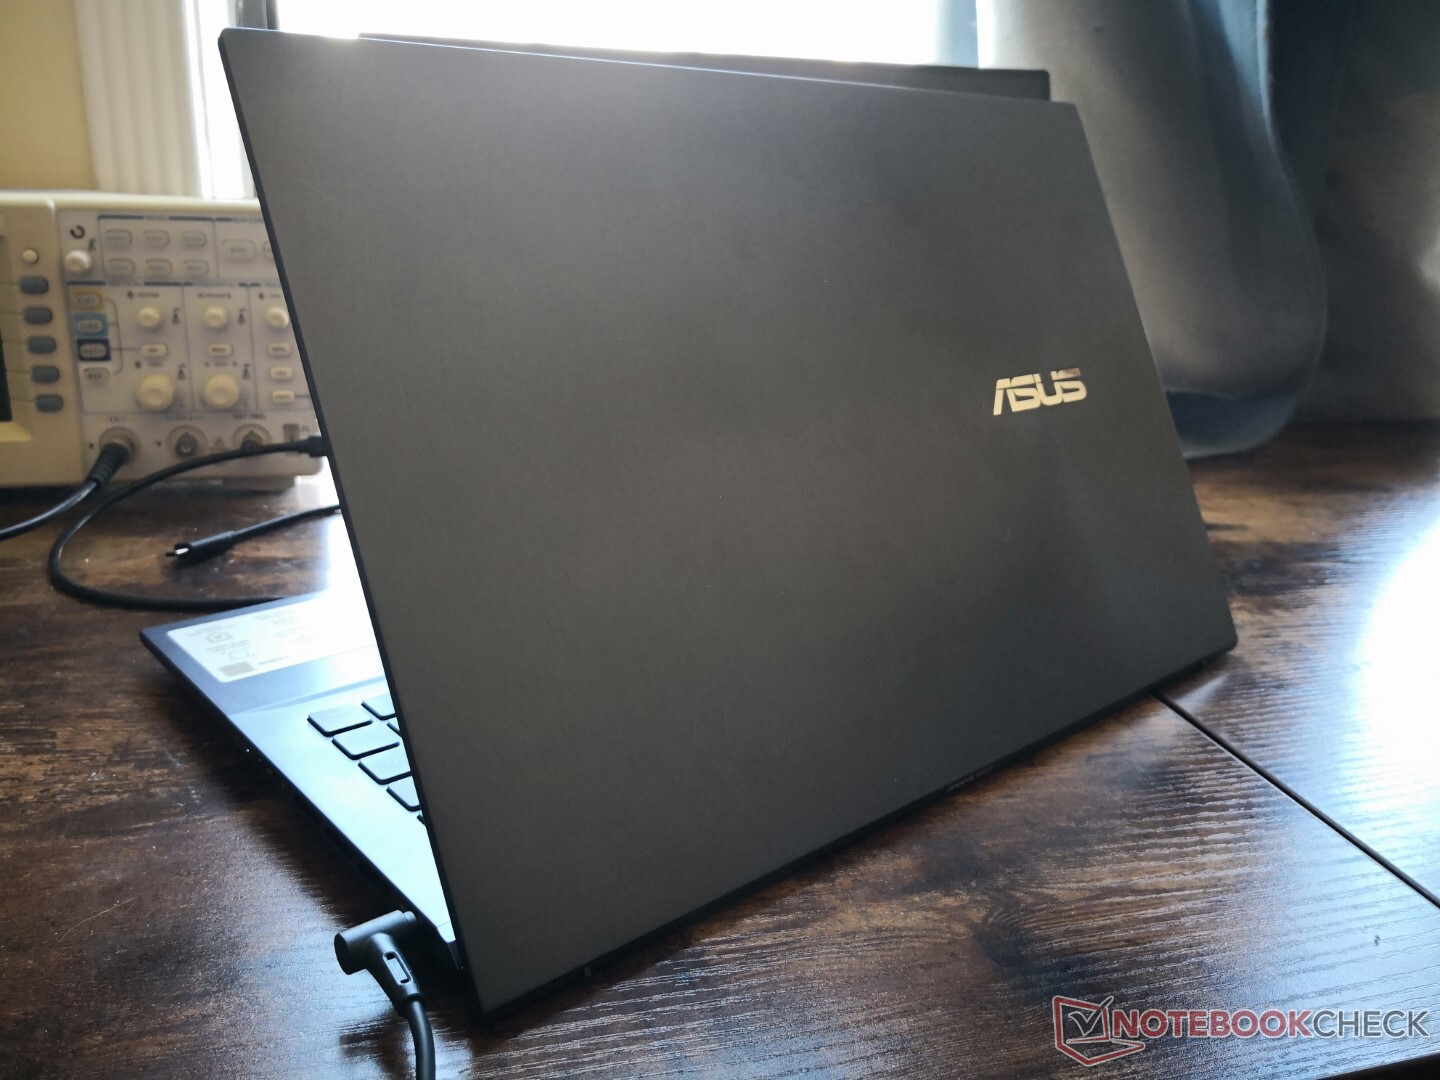
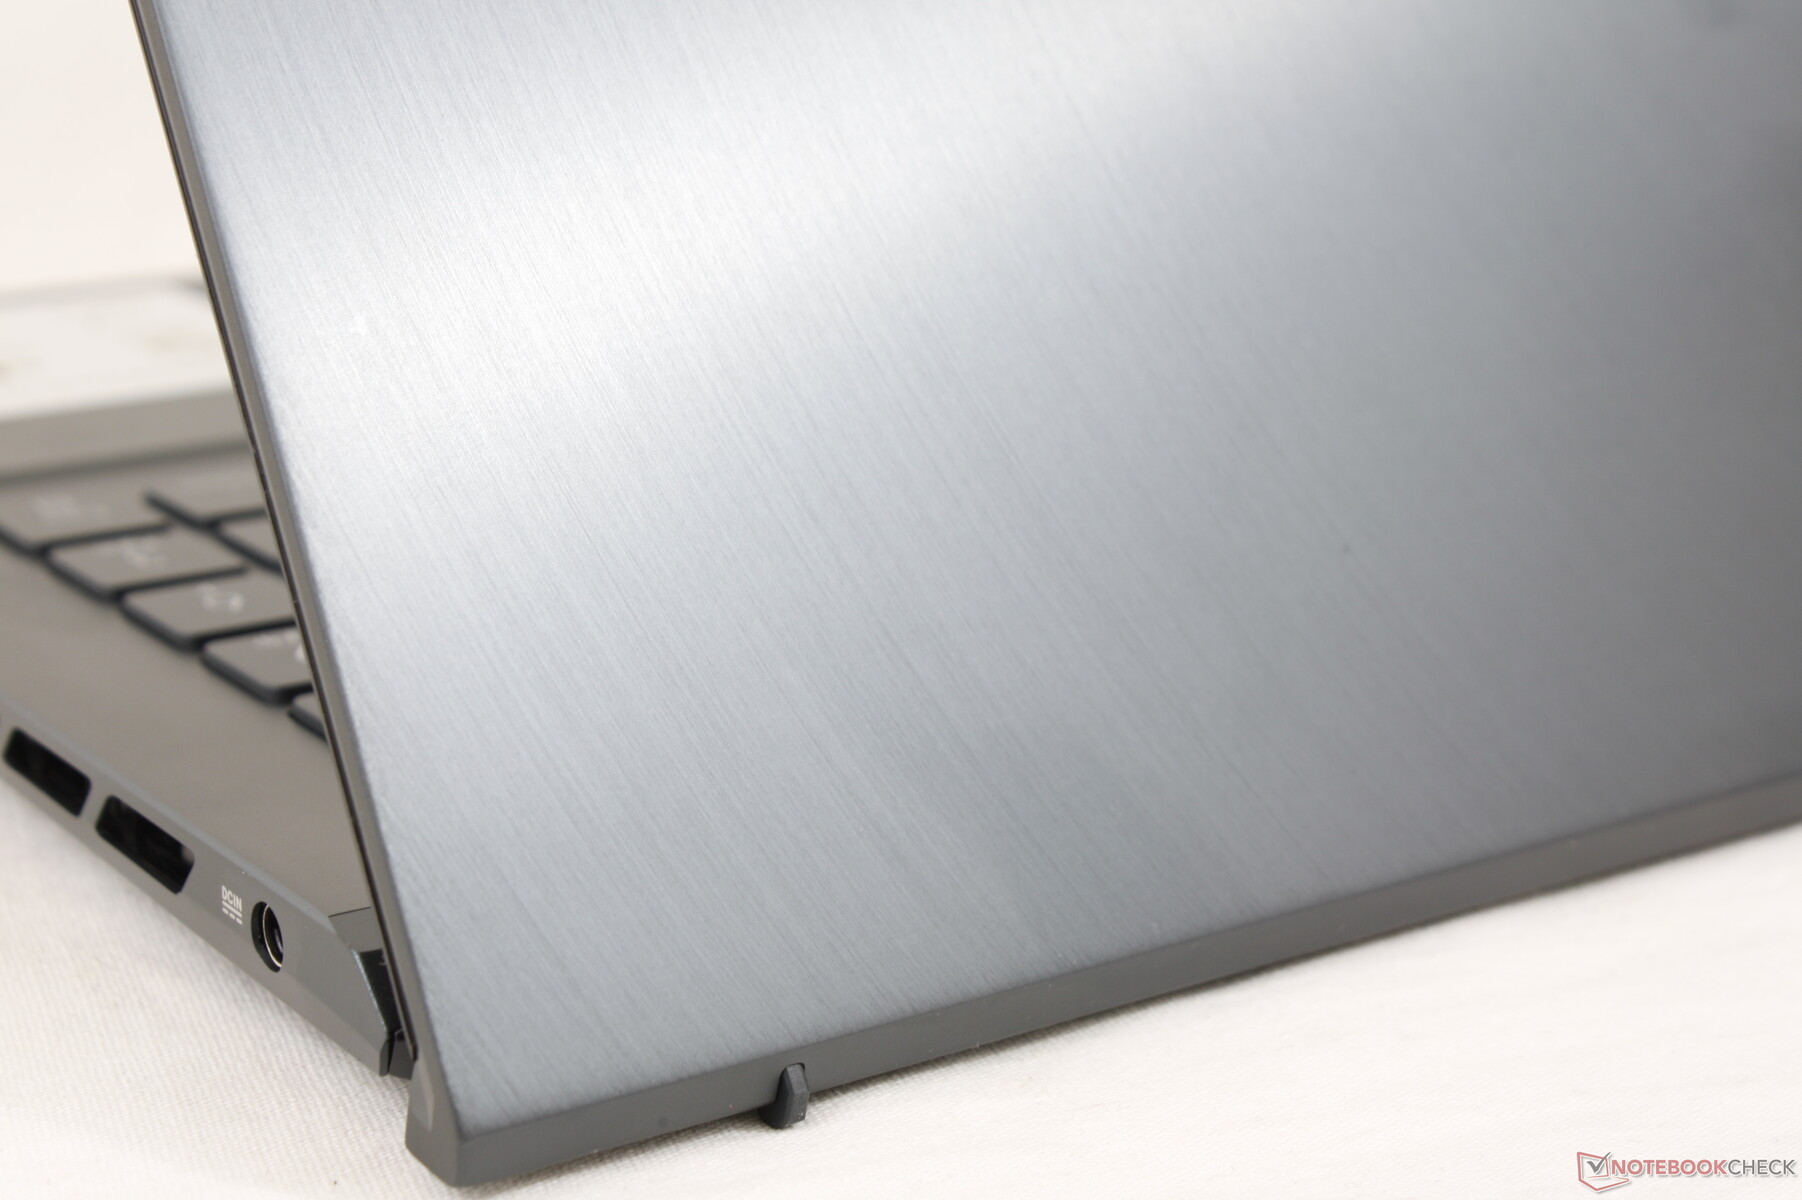
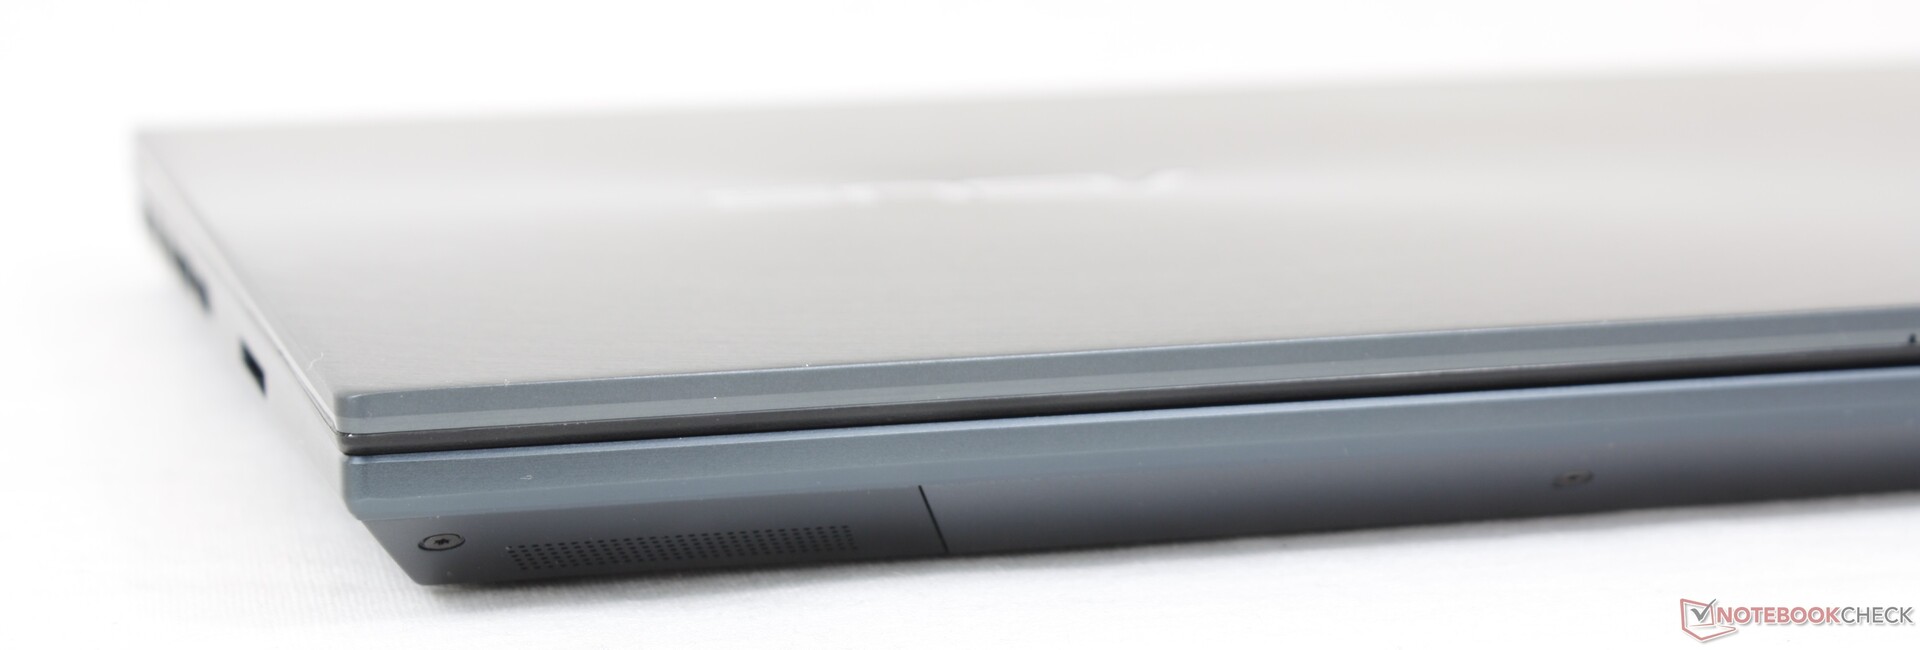
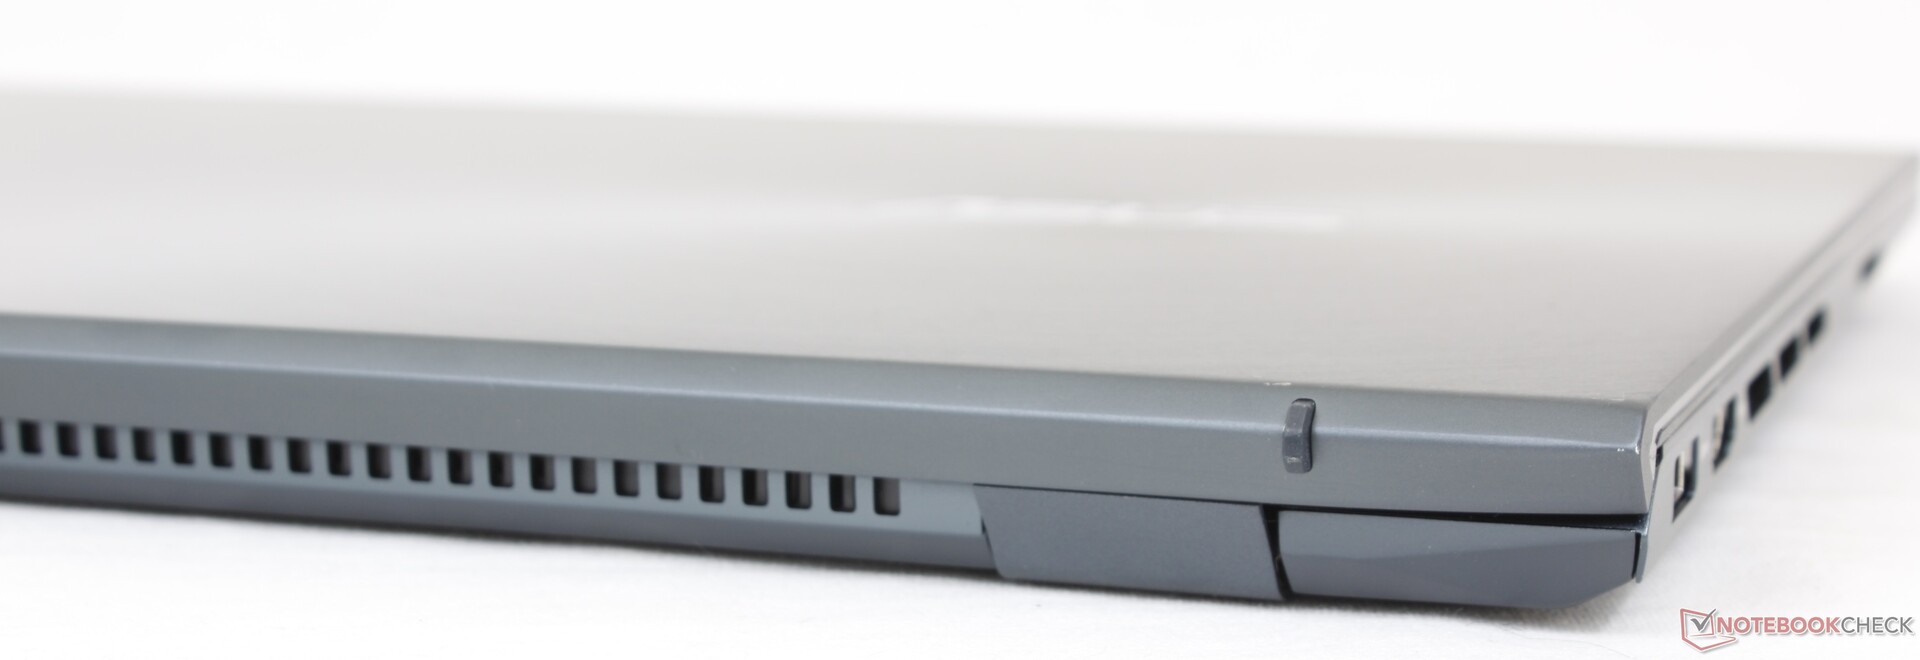
Case — Strong Base and Lid
The UM535 is the AMD version of the existing UX535. It's still a sleek chassis design despite being over two years old, but it's starting to show its age a bit with its large footprint and 16:9 form factor. Chassis rigidity remains strong with only minimal twisting and creaking even on the lid since all SKUs have glass reinforcement for the display.
In terms of size and weight, the UX535 is larger and slightly heavier than the Dell XPS 15 or Lenovo Yoga Creator 7 15 both of which offer similar H-series CPUs and GeForce GPUs.
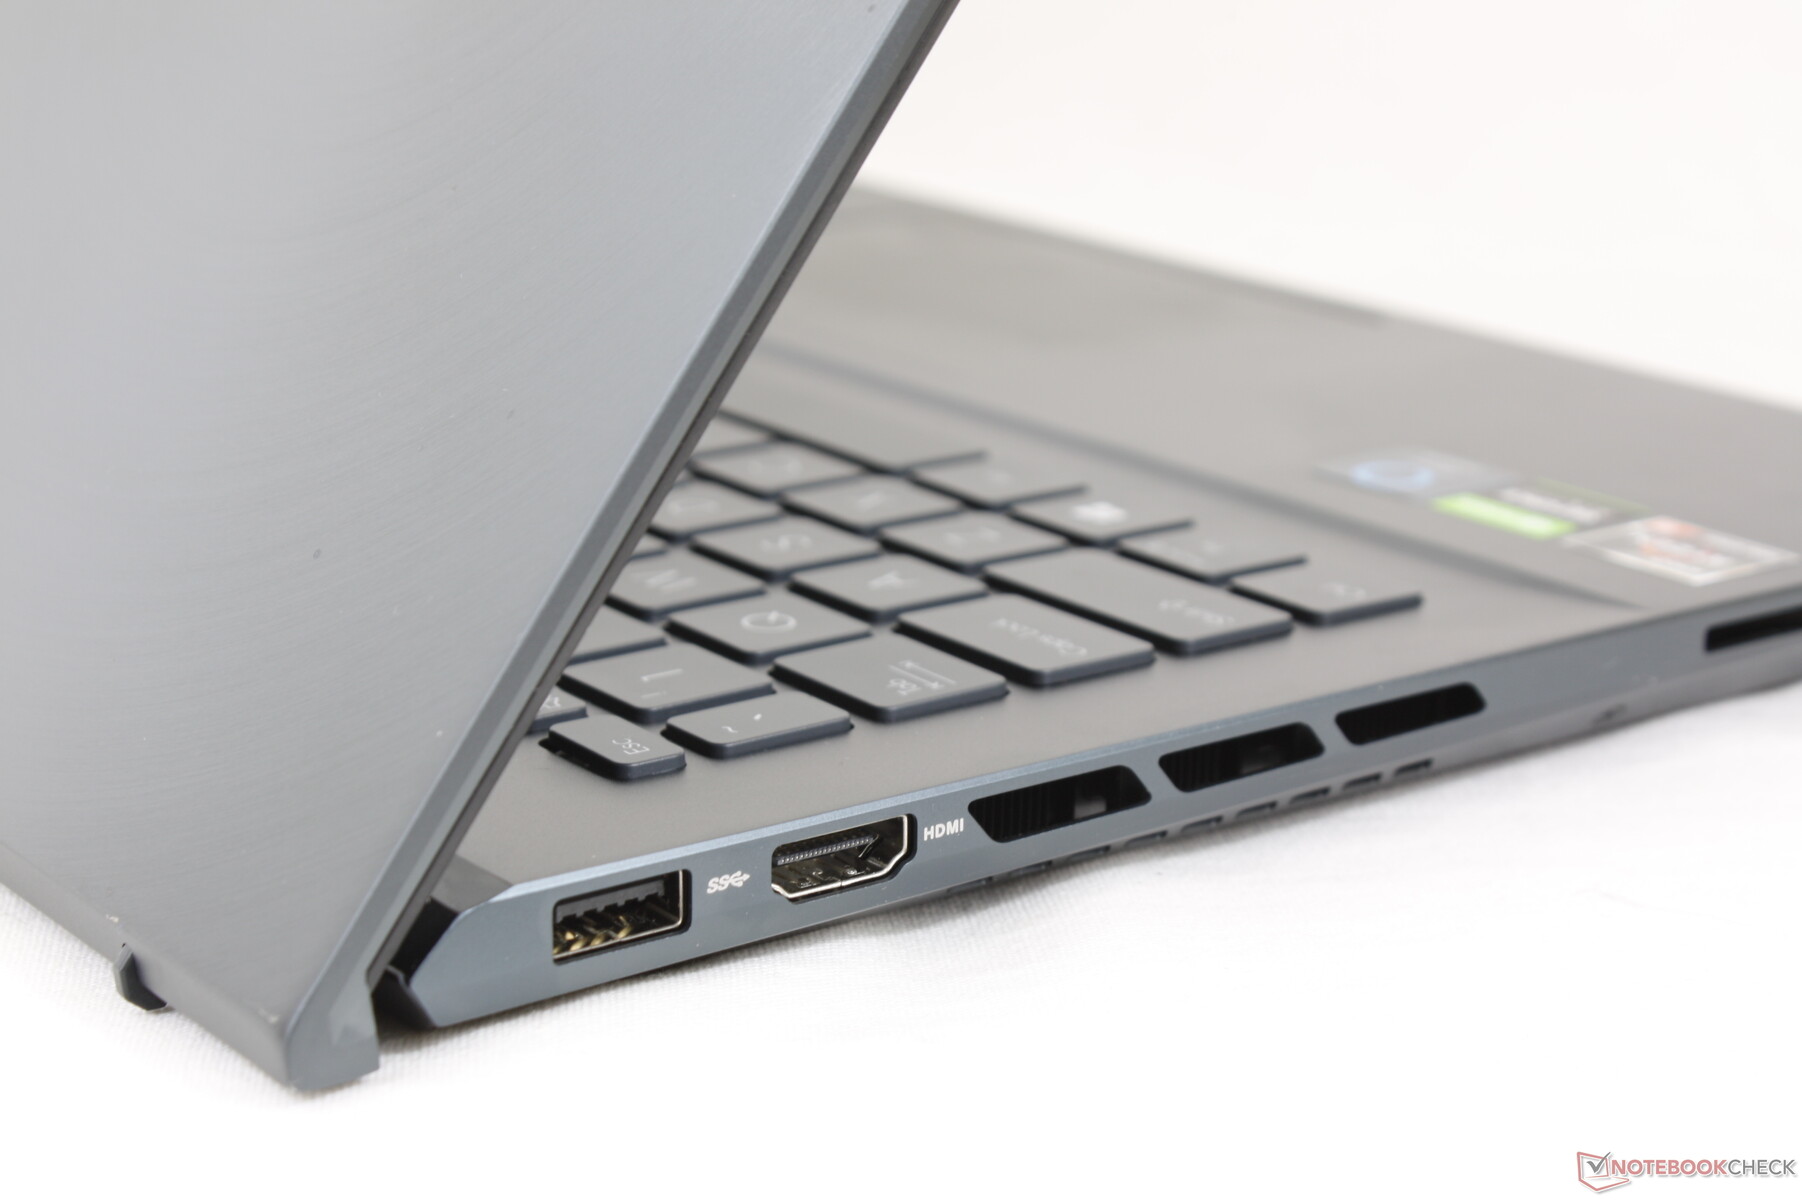
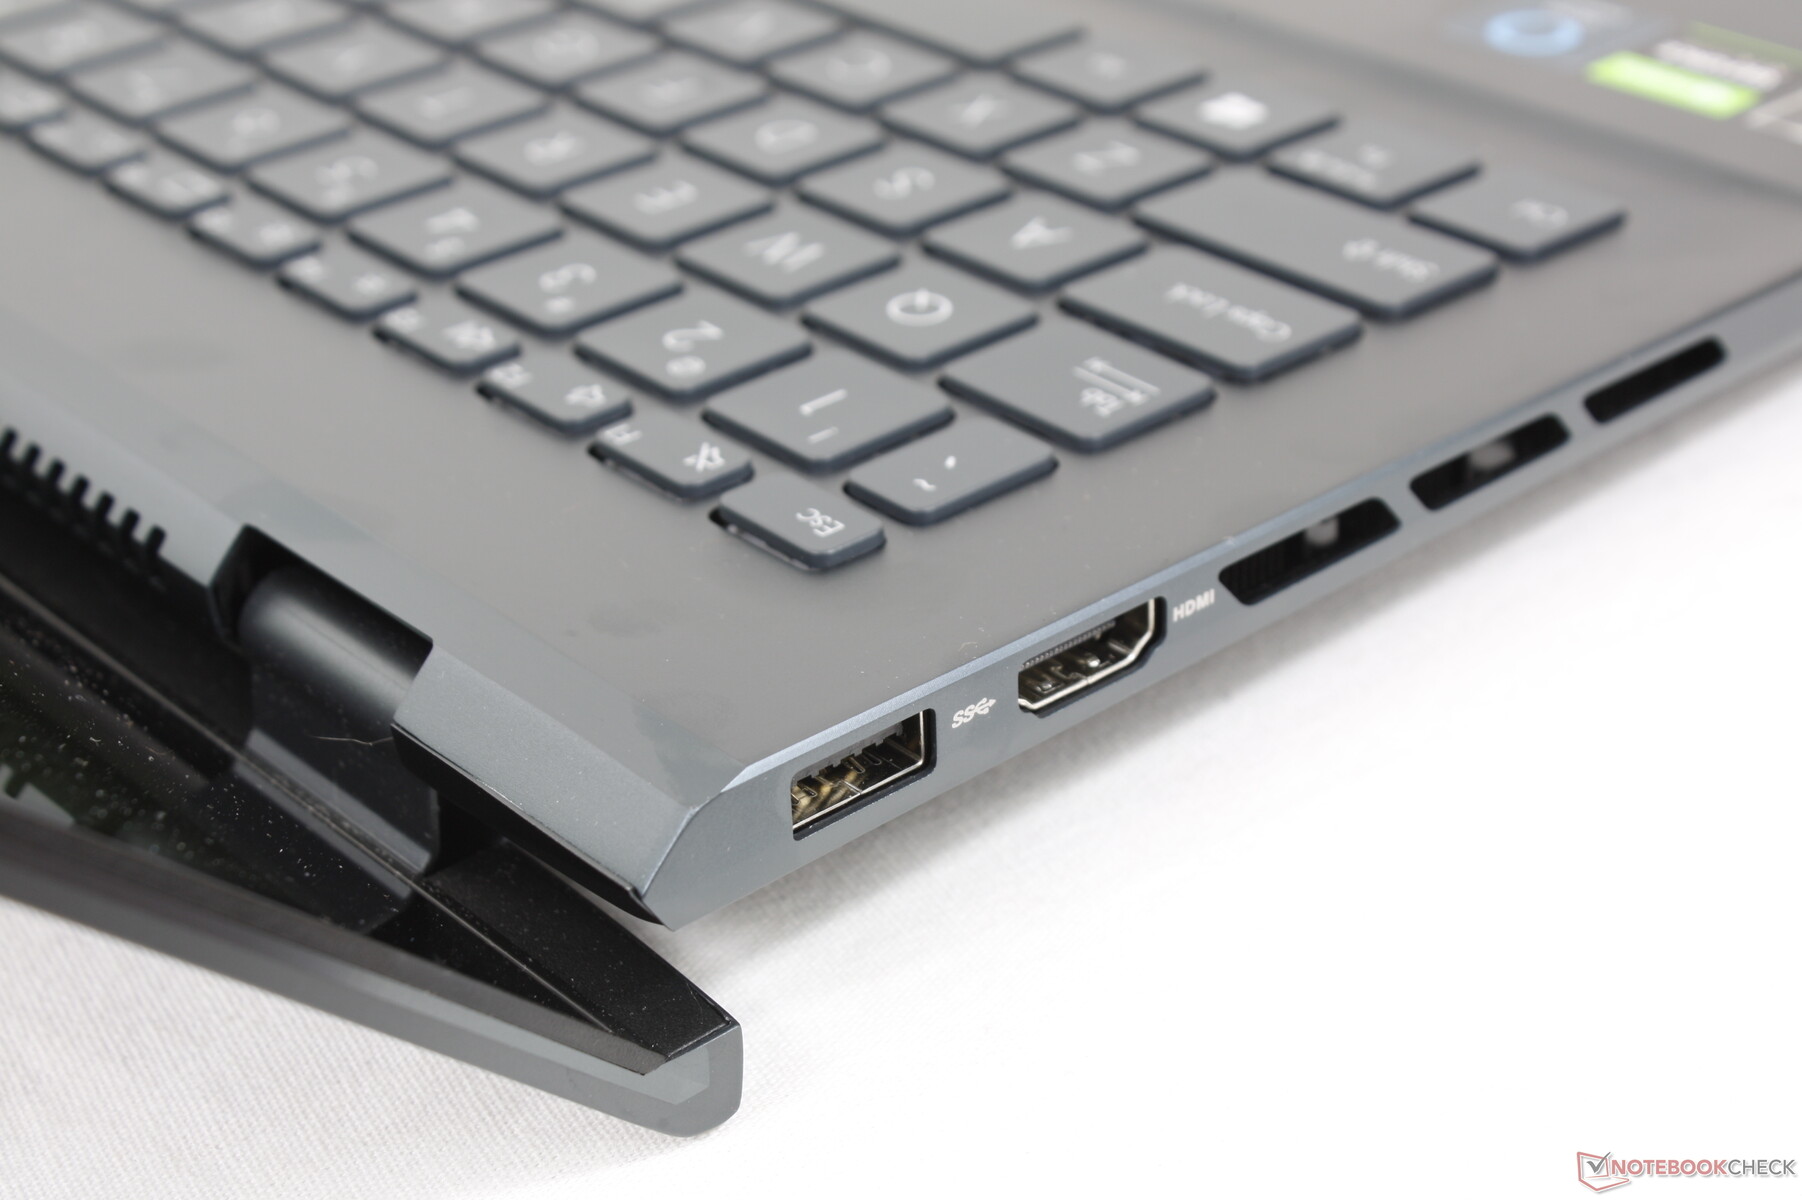
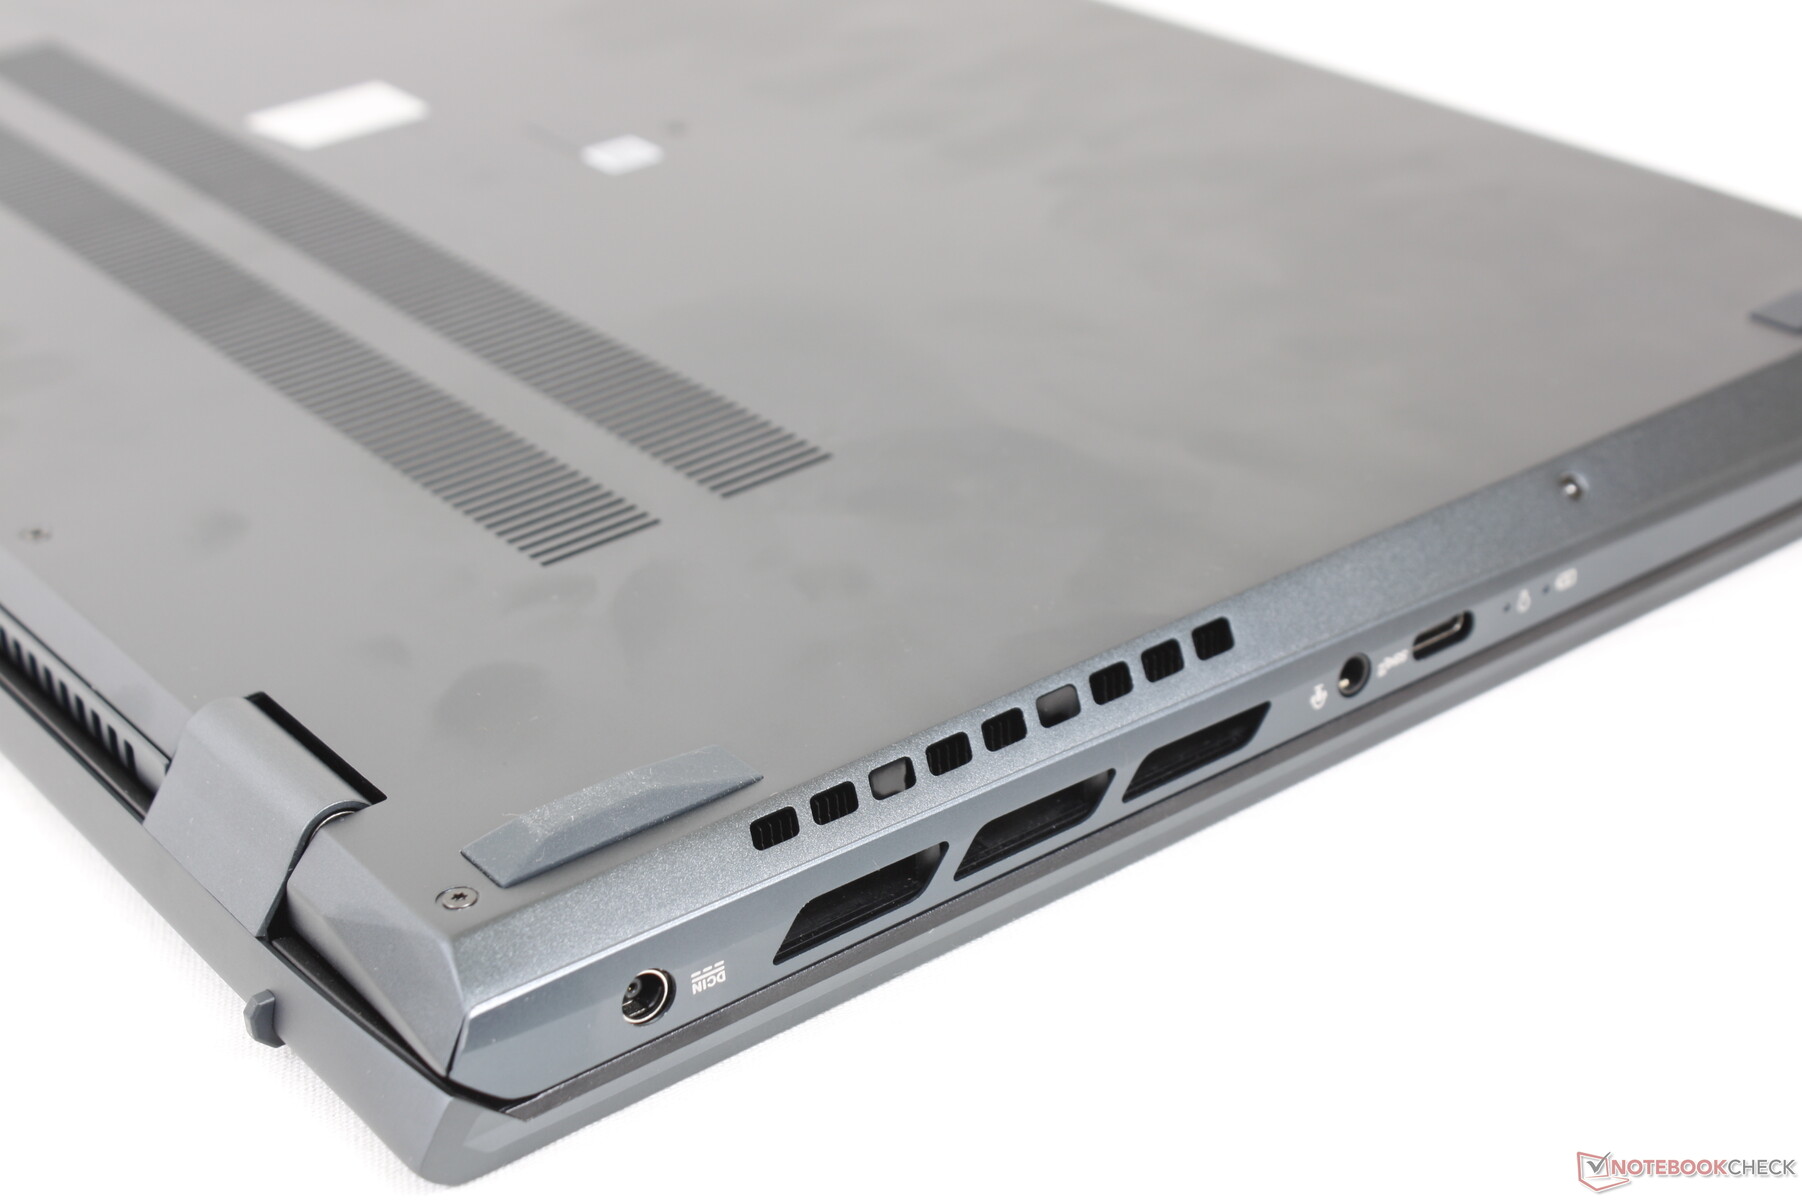
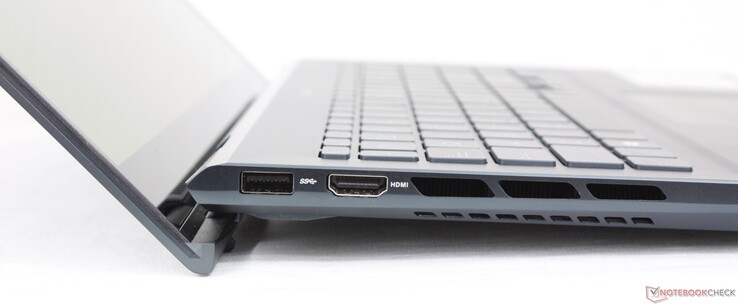
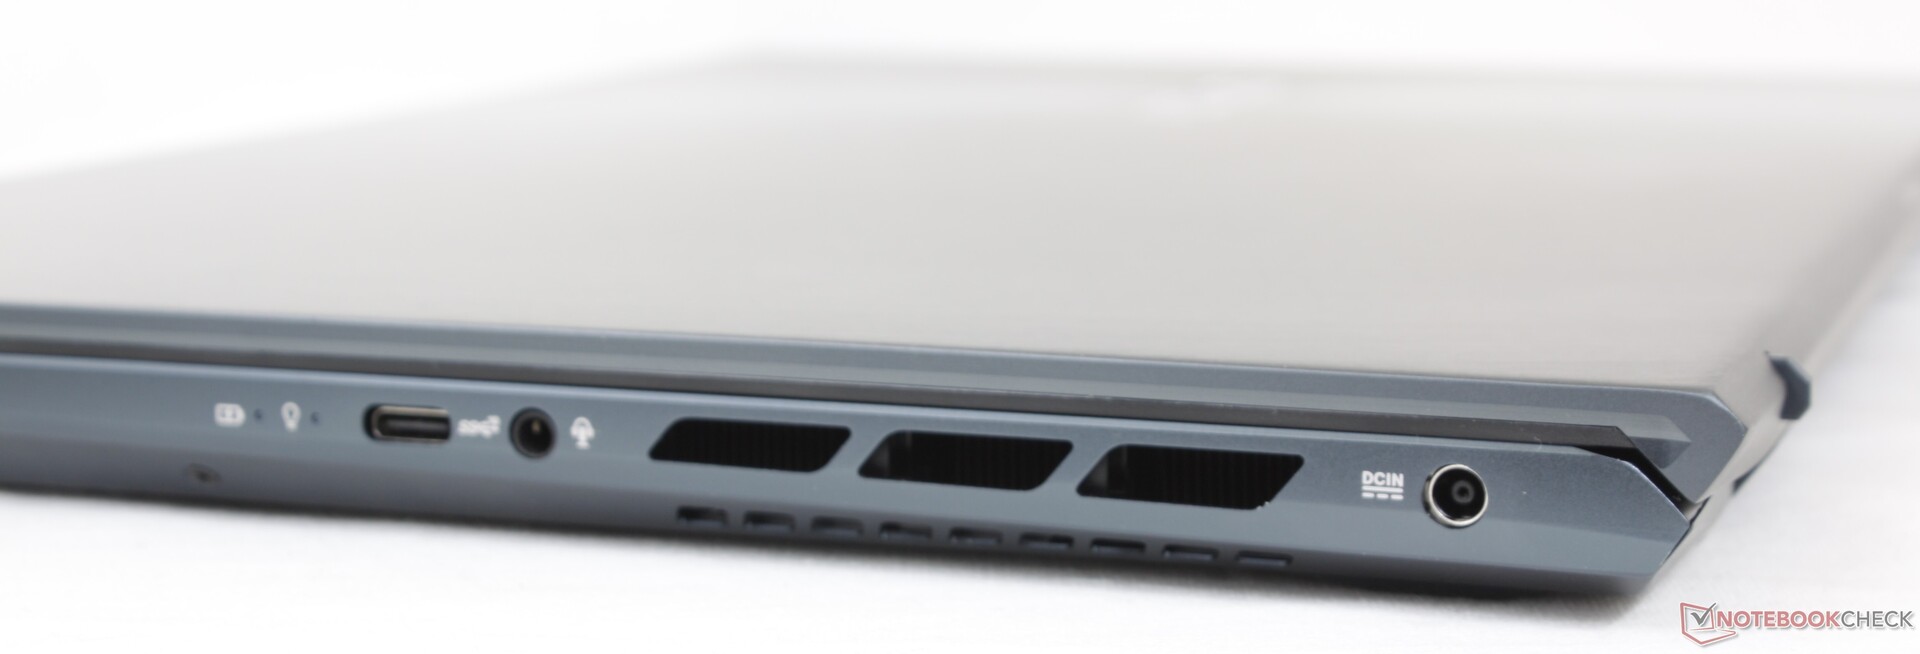
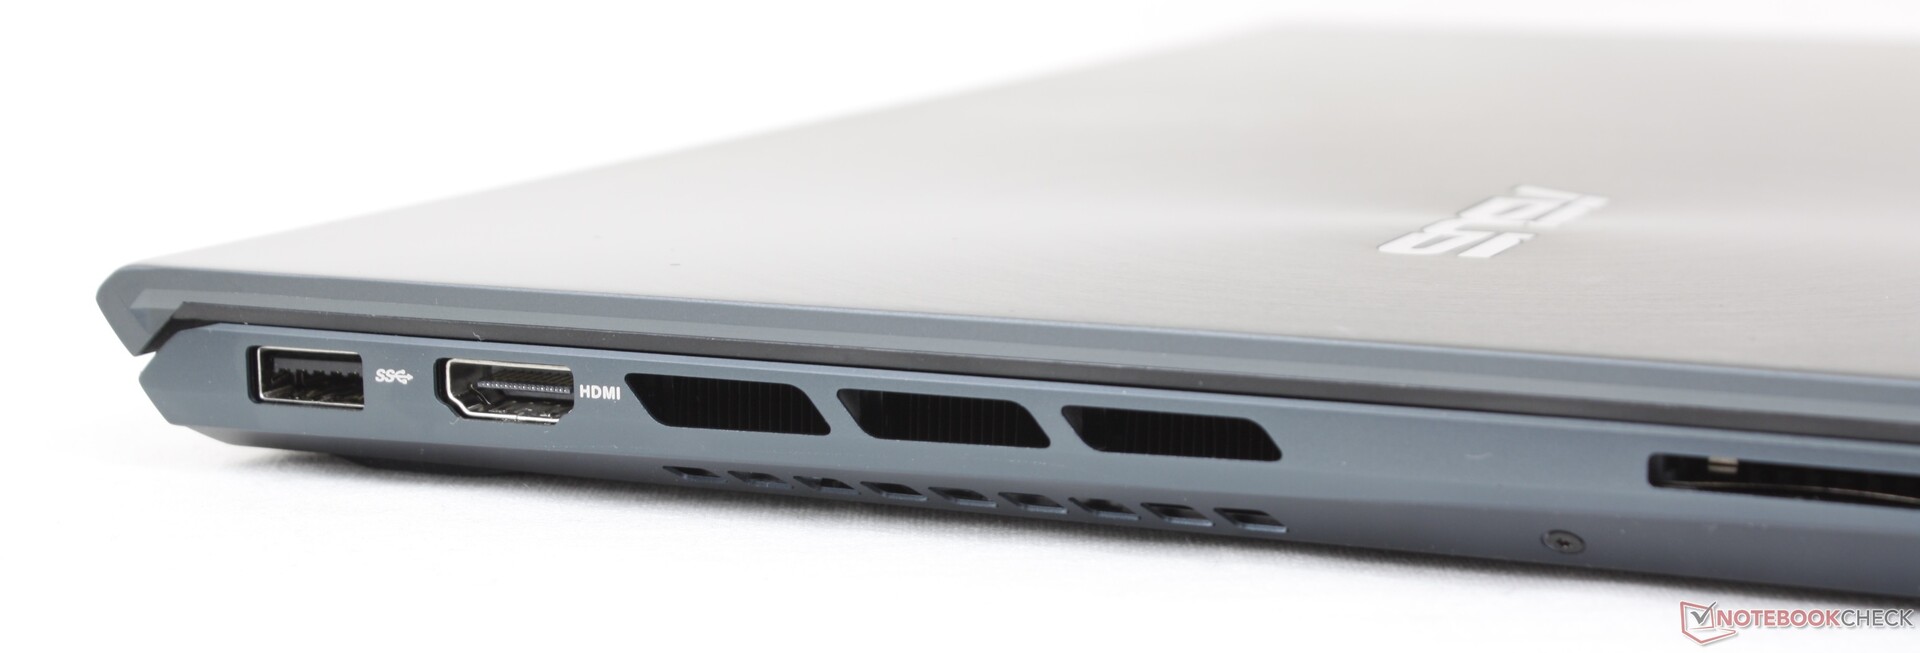
Connectivity — No Thunderbolt Support
Port options are identical to the UX535 but with one key difference: the USB-C port is not Thunderbolt compatible nor does it support Power Delivery or DisplayPort. The system offers very few USB ports considering its 15.6-inch form factor.
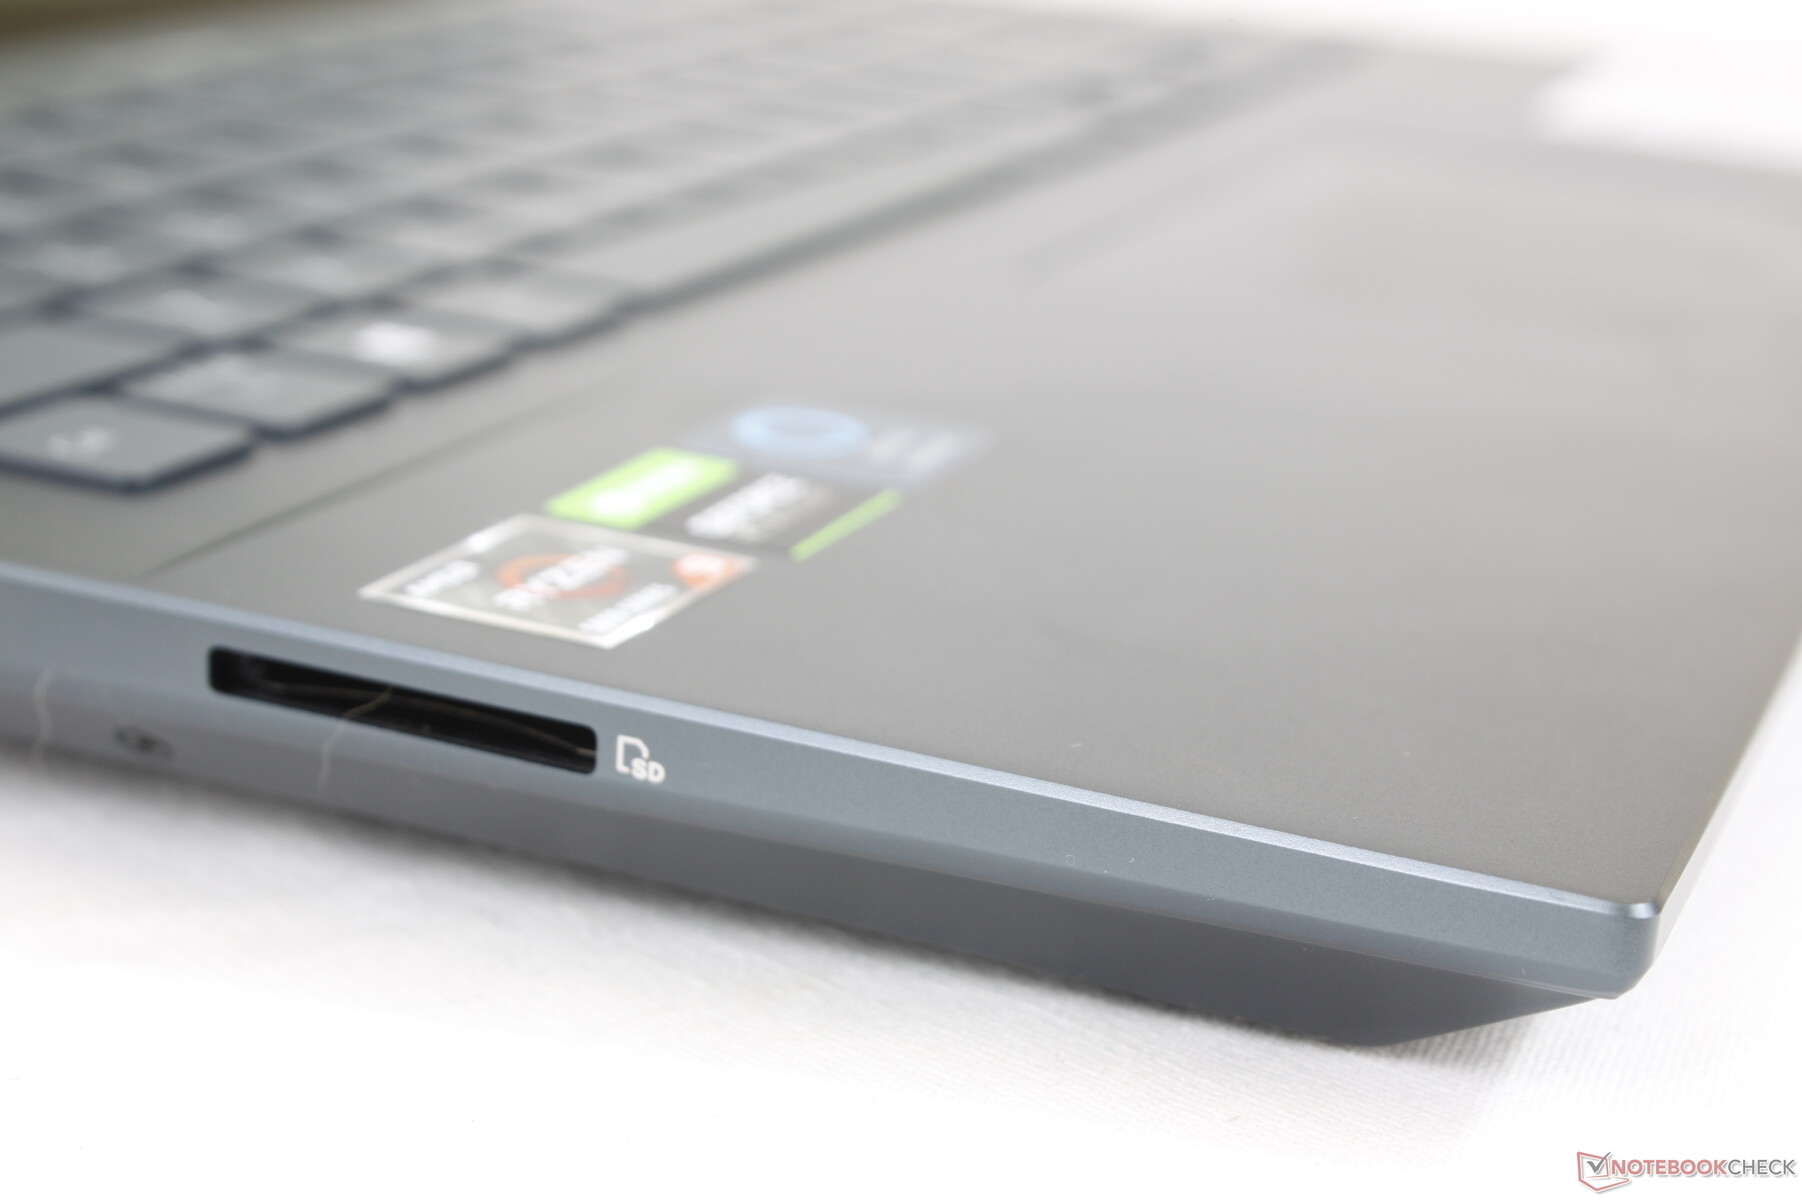
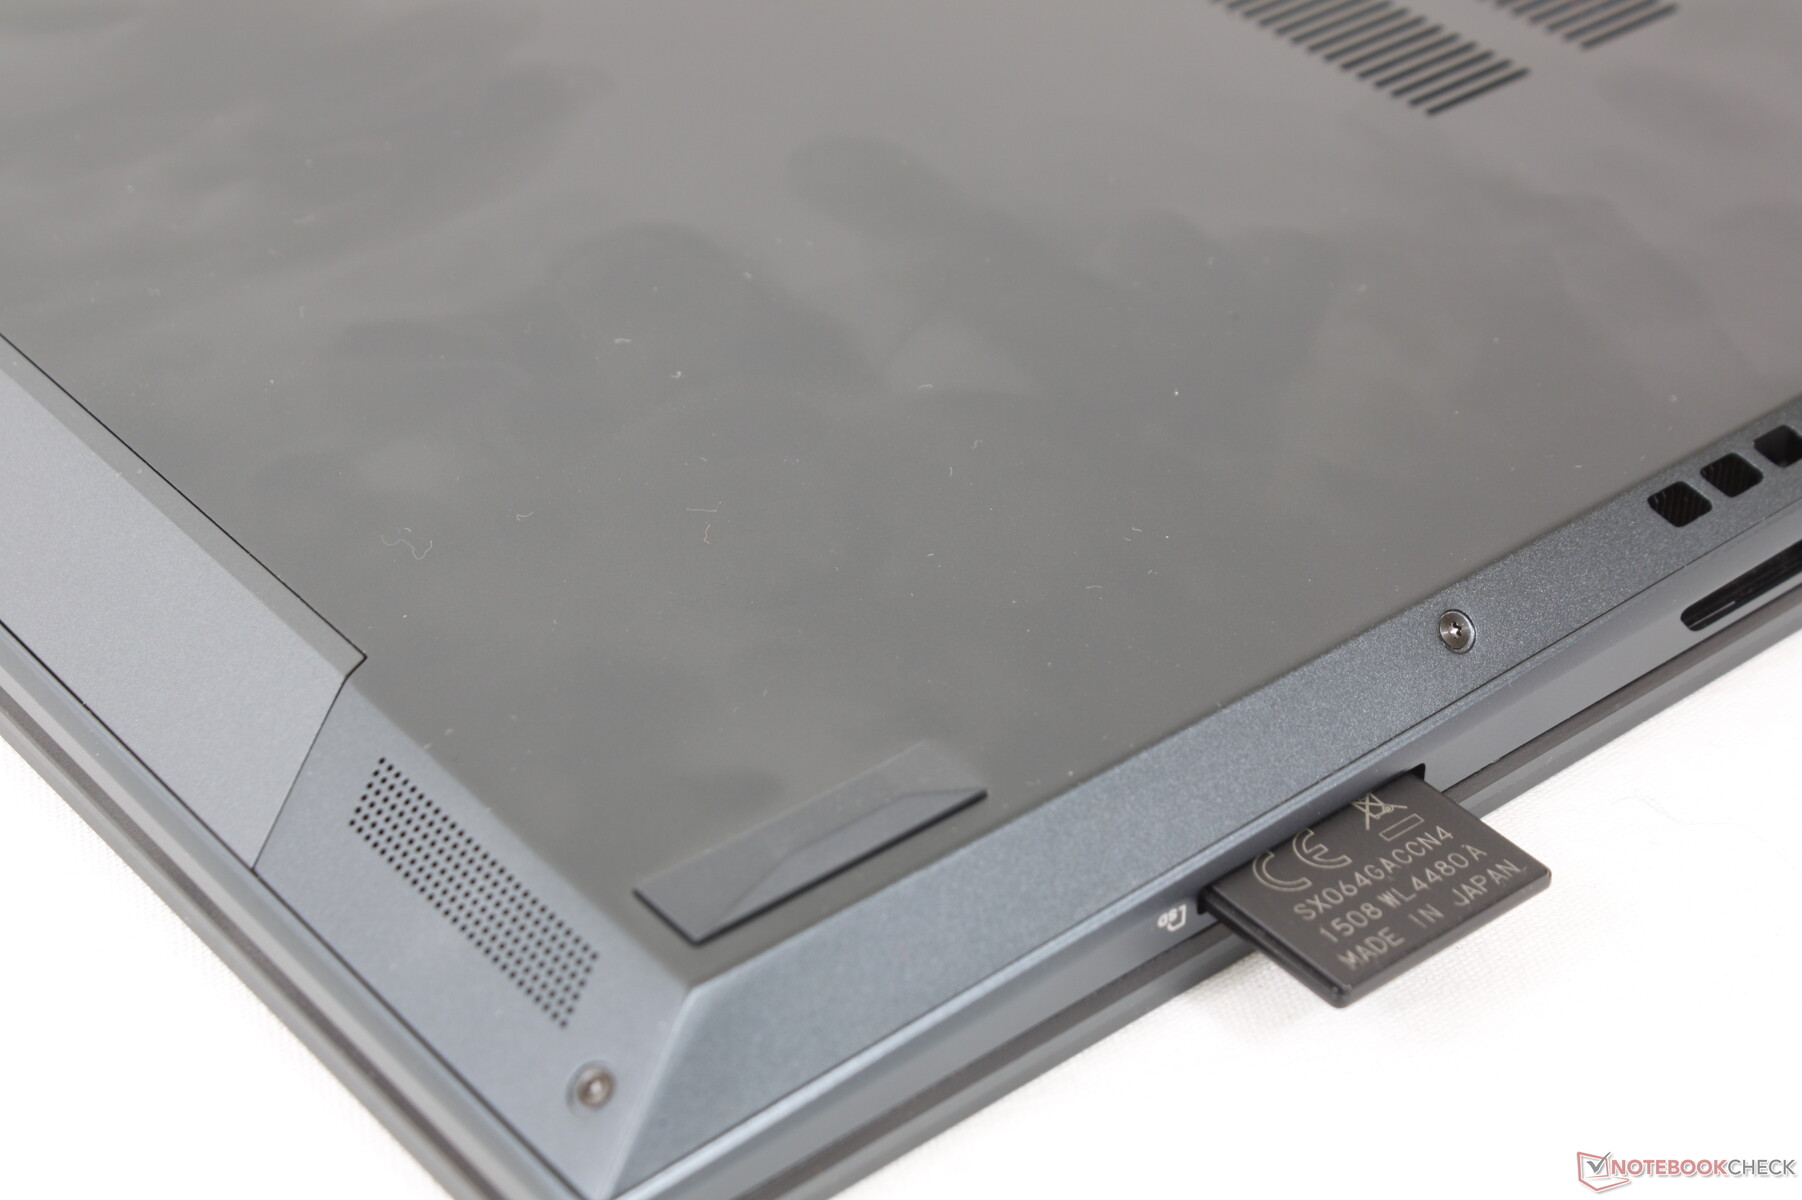
SD Card Reader
Like all other Zenbooks, transfer rates are relatively slow with the integrated SD reader. Moving 1 GB of images from our UHS-II test card to desktop takes about 13 seconds compared to half that on the XPS 15.
| SD Card Reader | |
| average JPG Copy Test (av. of 3 runs) | |
| Dell XPS 15 9510 11800H RTX 3050 Ti OLED (AV Pro V60) | |
| Asus Zenbook Pro 15 OLED UM535Q (Toshiba Exceria Pro SDXC 64 GB UHS-II) | |
| Asus ZenBook 15 UX534FTC-A8190T (Toshiba Exceria Pro SDXC 64 GB UHS-II) | |
| Asus ZenBook UX535-M01440 (Toshiba Exceria Pro M501 microSDXC 64GB) | |
| HP Envy 15-ep0098nr (Toshiba Exceria Pro M501 UHS-II) | |
| Lenovo Yoga Creator 7 15IMH05 82DS000VGE (Toshiba Exceria Pro SDXC 64 GB UHS-II) | |
| maximum AS SSD Seq Read Test (1GB) | |
| Dell XPS 15 9510 11800H RTX 3050 Ti OLED (AV Pro V60) | |
| HP Envy 15-ep0098nr (Toshiba Exceria Pro M501 UHS-II) | |
| Asus Zenbook Pro 15 OLED UM535Q (Toshiba Exceria Pro SDXC 64 GB UHS-II) | |
| Asus ZenBook UX535-M01440 (Toshiba Exceria Pro M501 microSDXC 64GB) | |
| Lenovo Yoga Creator 7 15IMH05 82DS000VGE (Toshiba Exceria Pro SDXC 64 GB UHS-II) | |
Communication
An Intel 9260 comes standard for Wi-Fi 6 connectivity whereas many other high-end multimedia laptops are beginning to ship with Wi-Fi 6E support. We experienced slower-than-usual transmit rates on our machine even after several retests. It's recommended to check wireless connectivity and stability after purchasing to identify for any potential issues.
Webcam
The webcam is limited to 720p compared to 1080p on the Razer Blade 15. Both a camera kill switch and IR sensor are present for Windows Hello support.


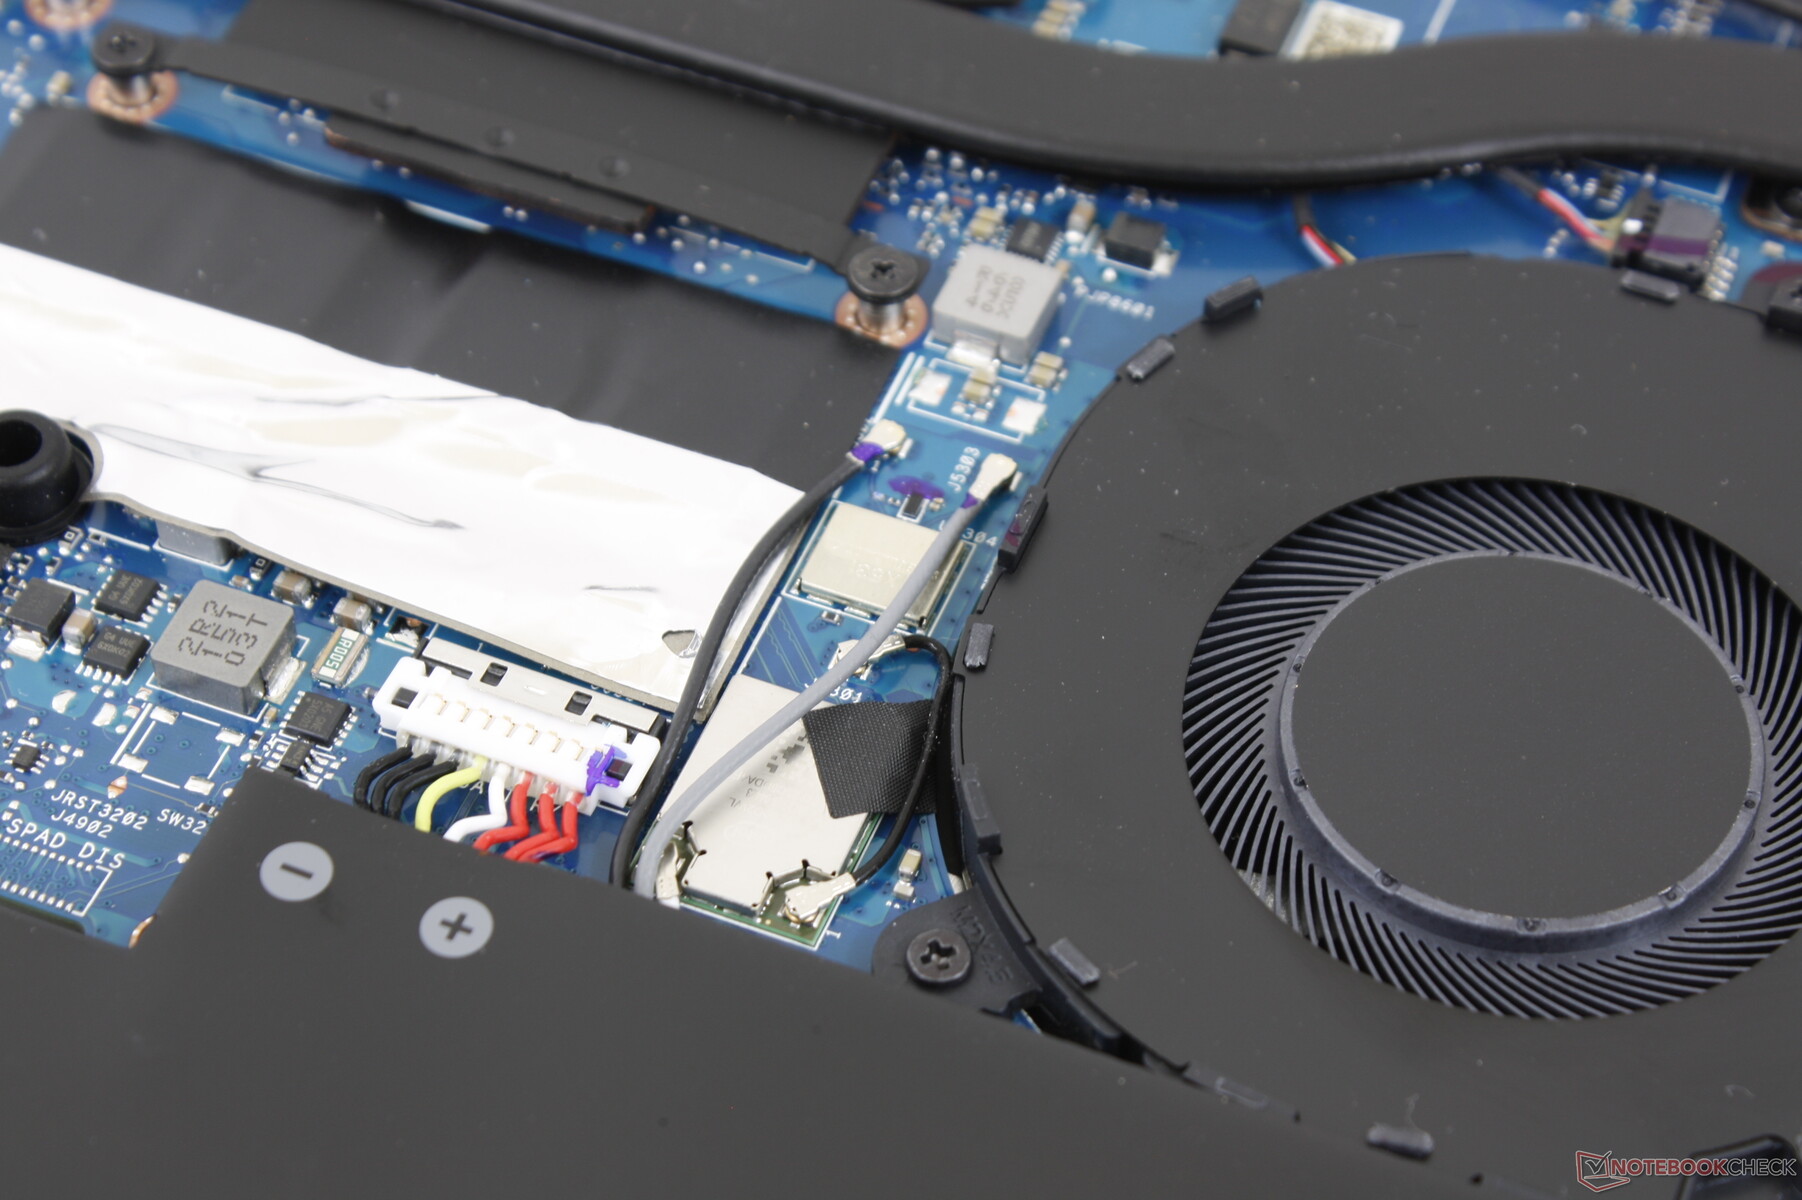
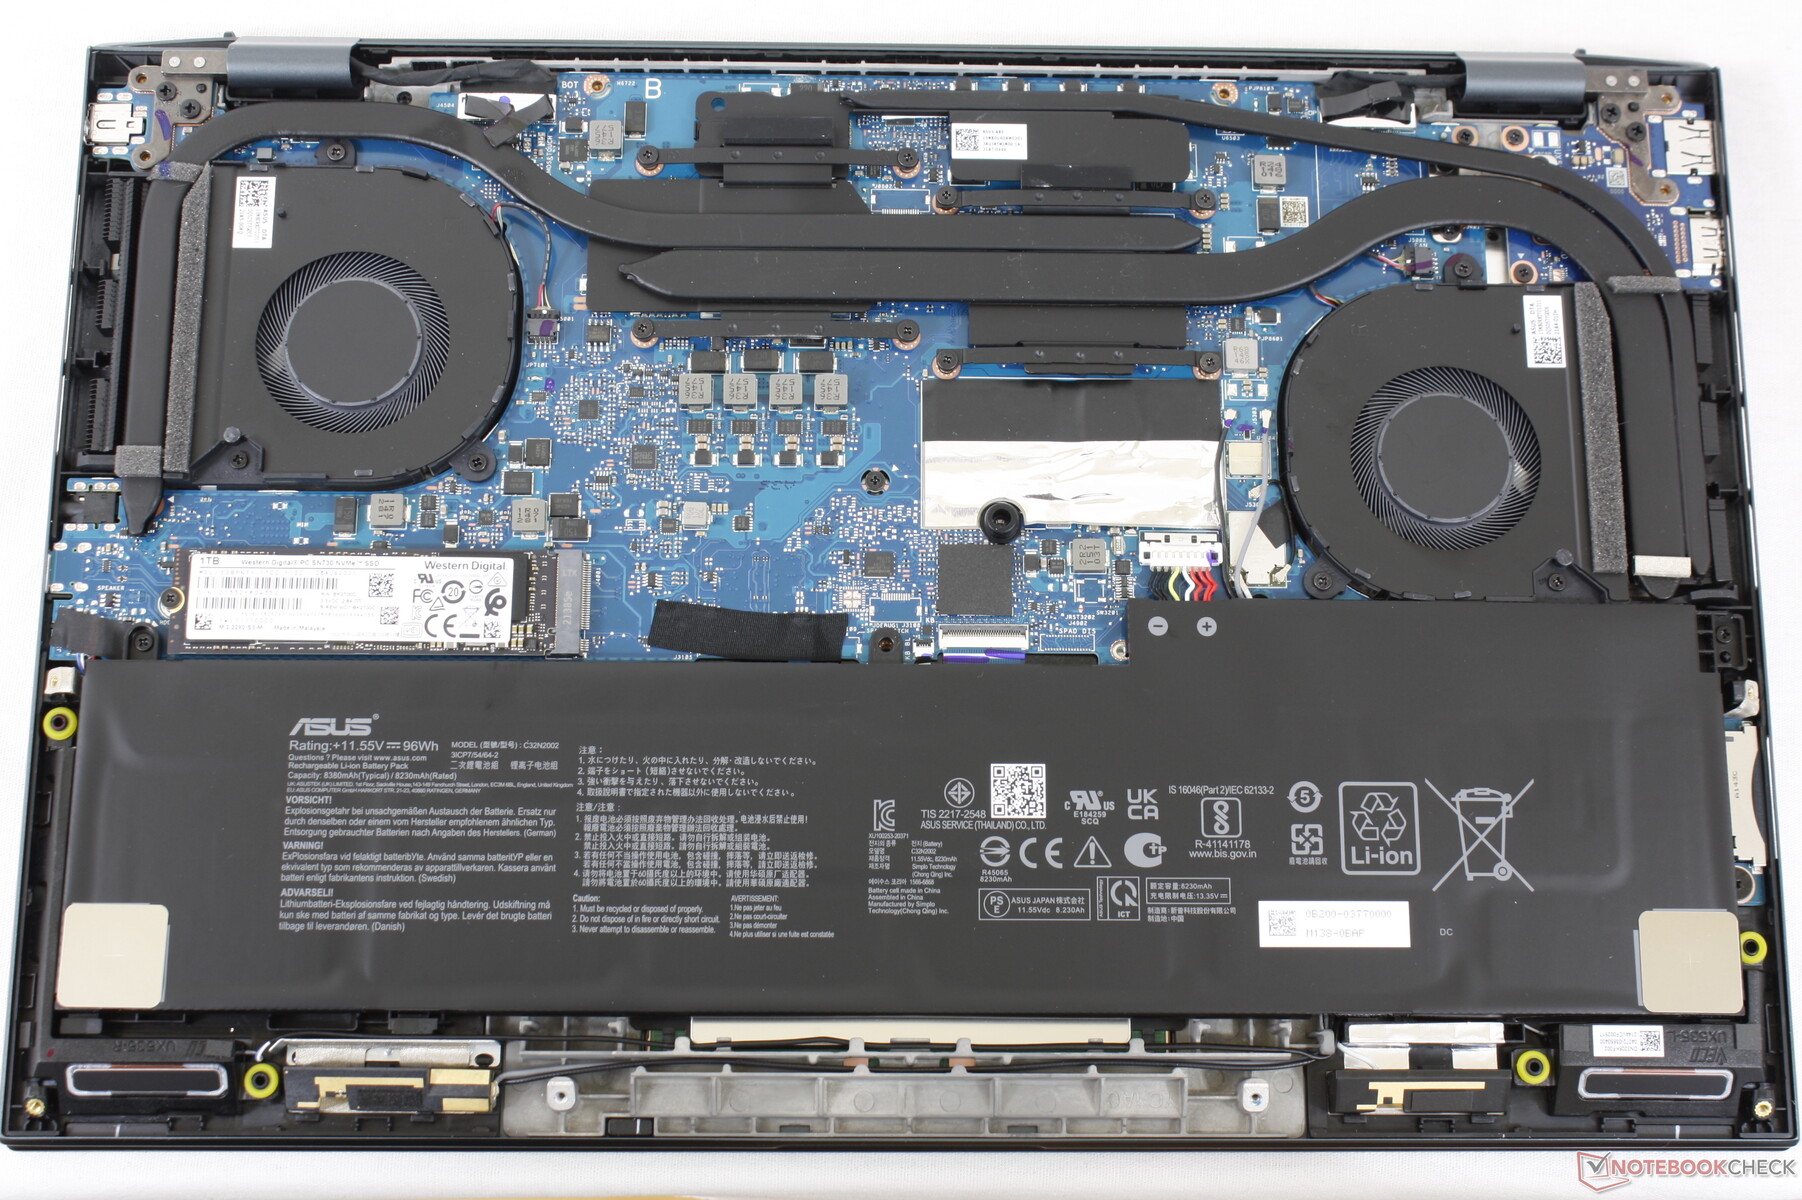
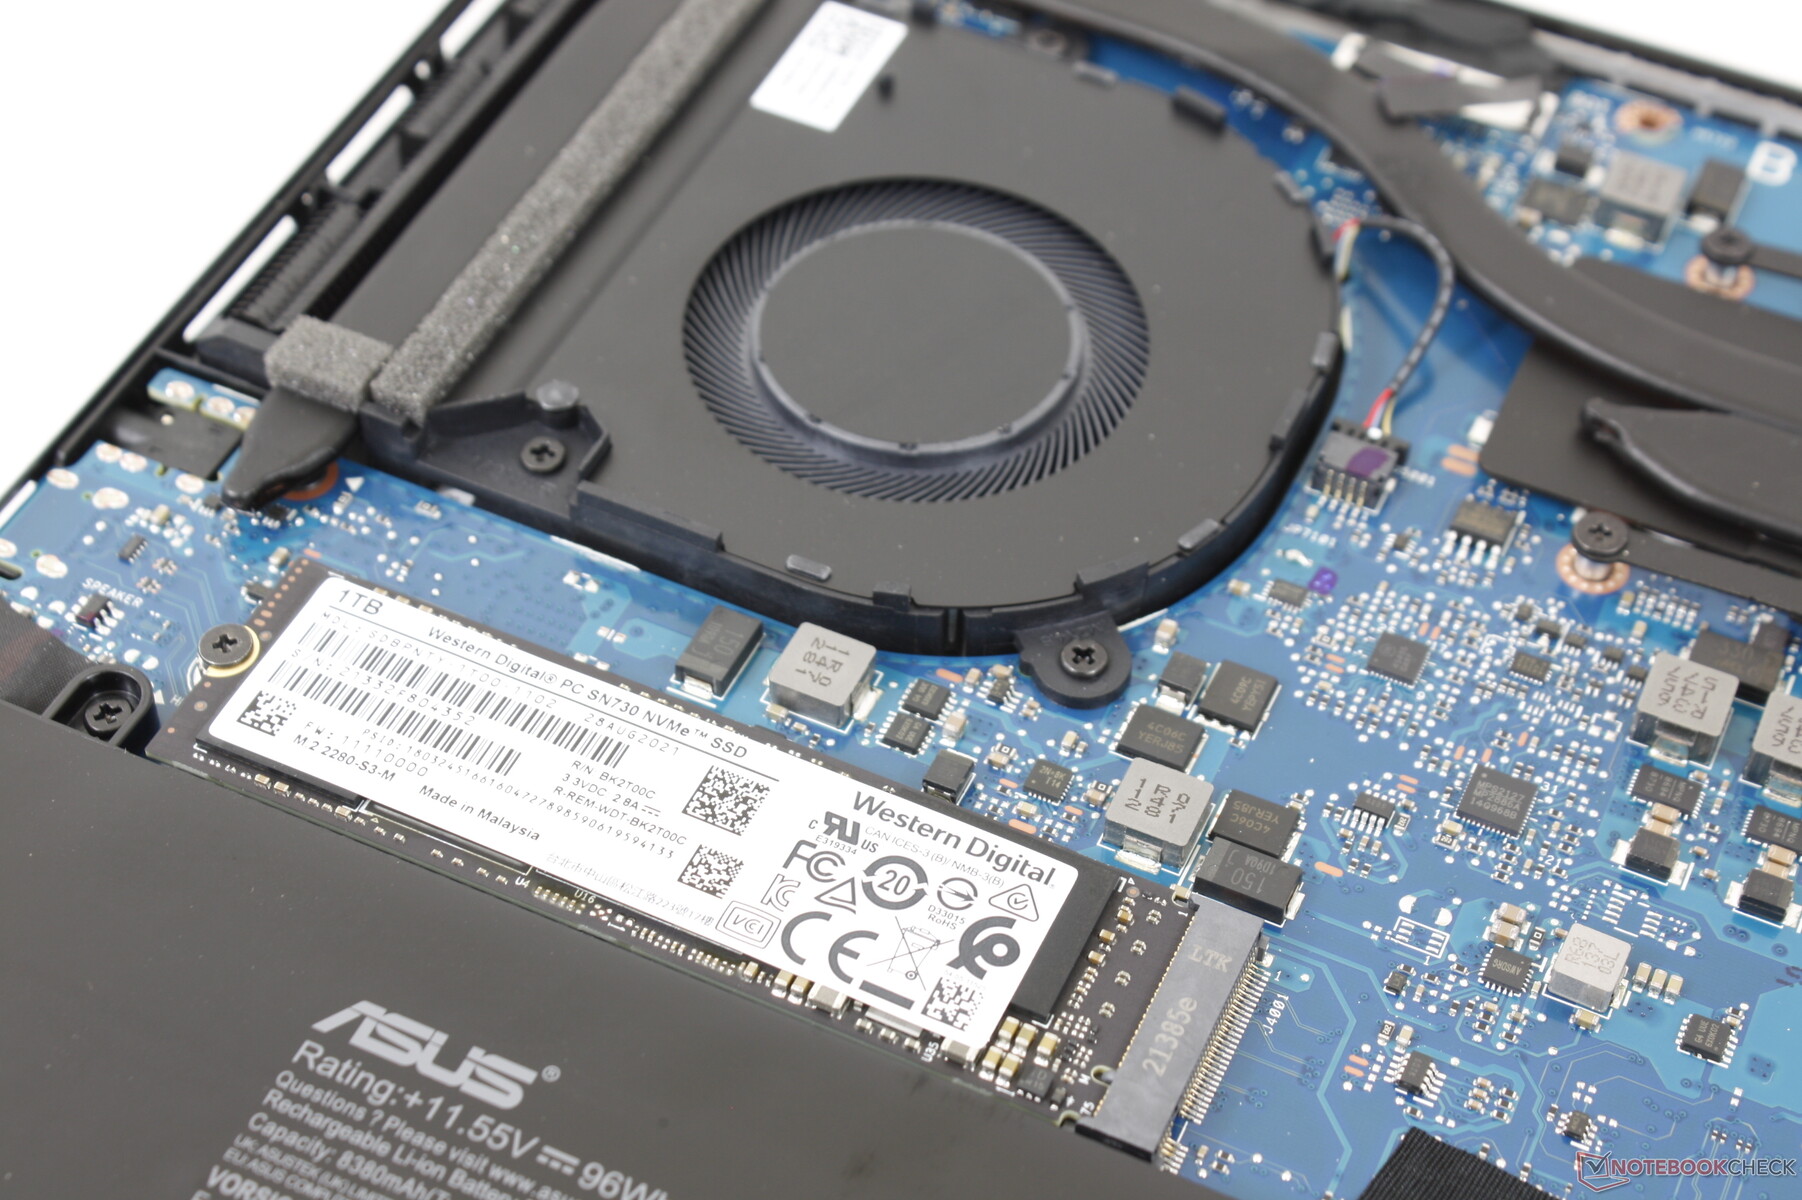
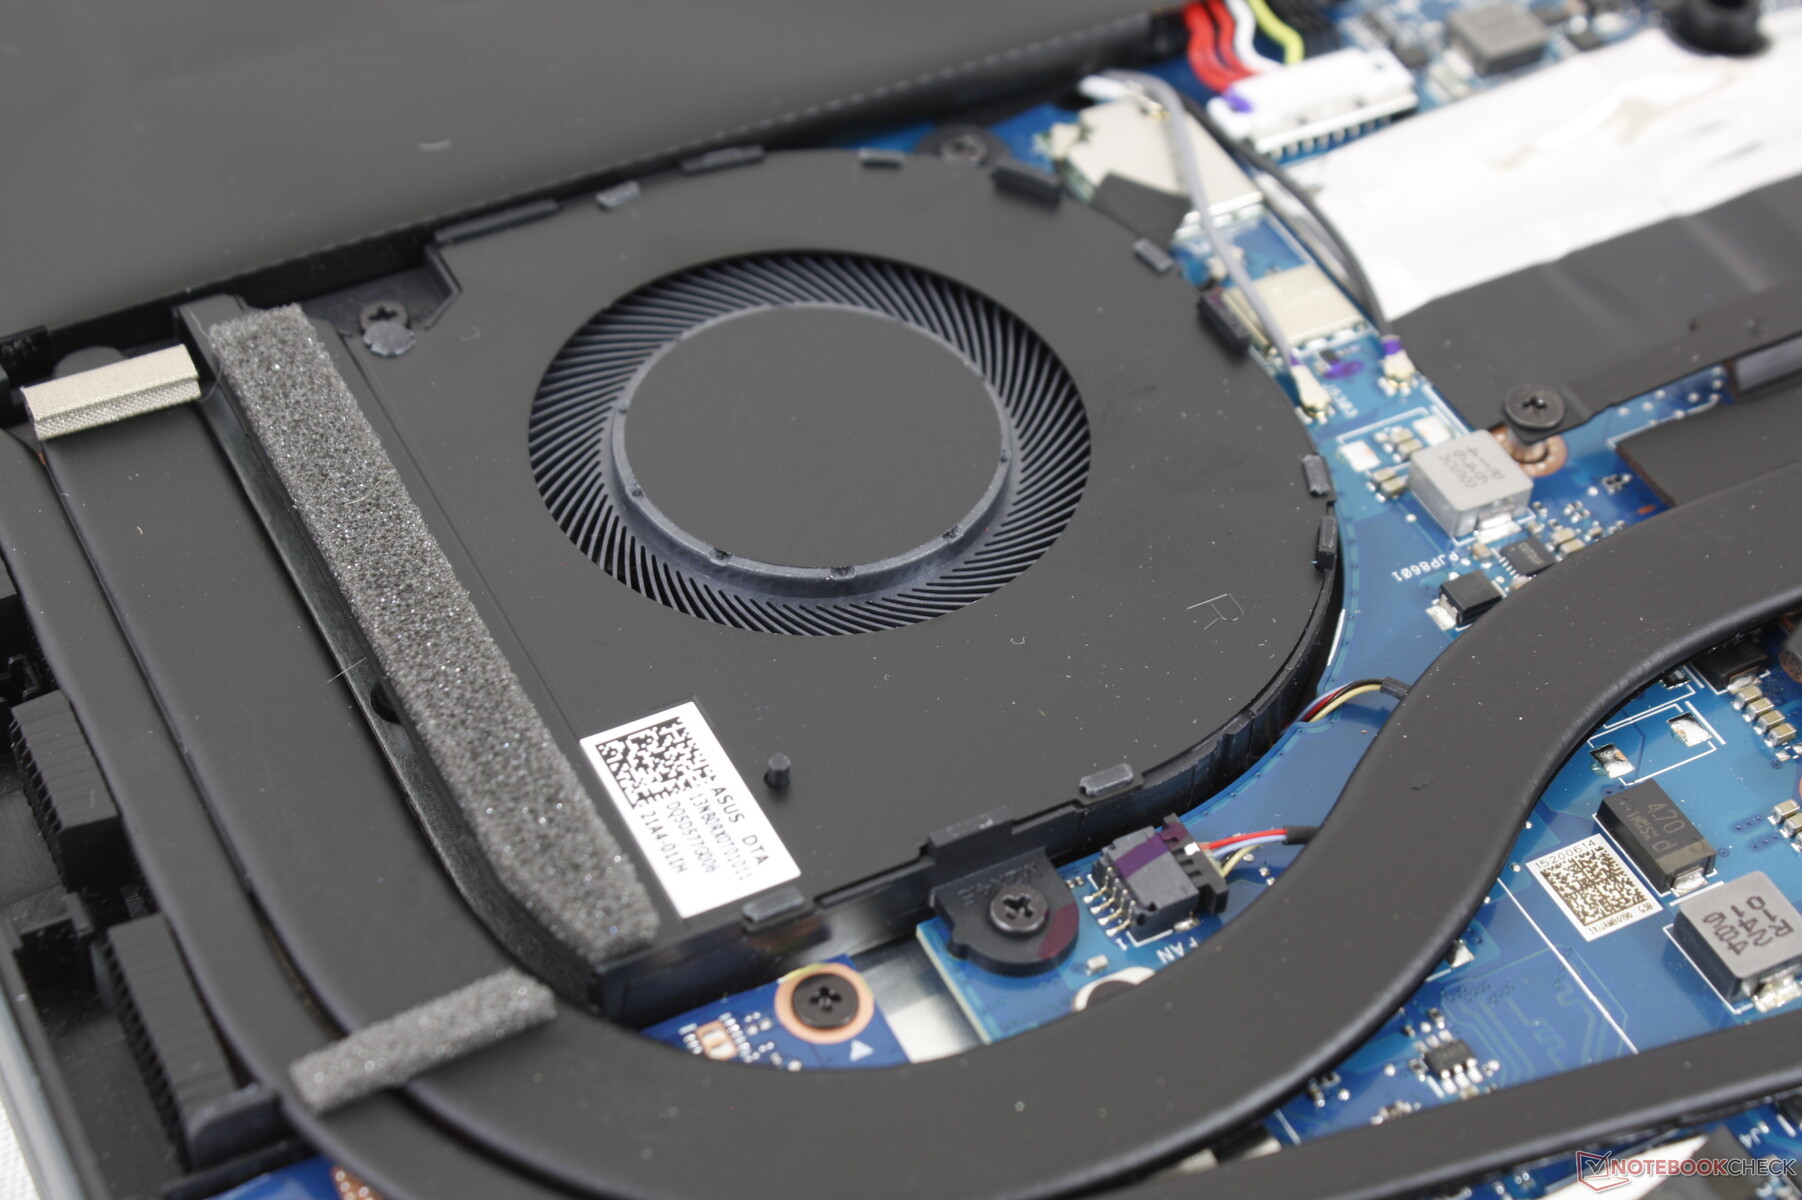
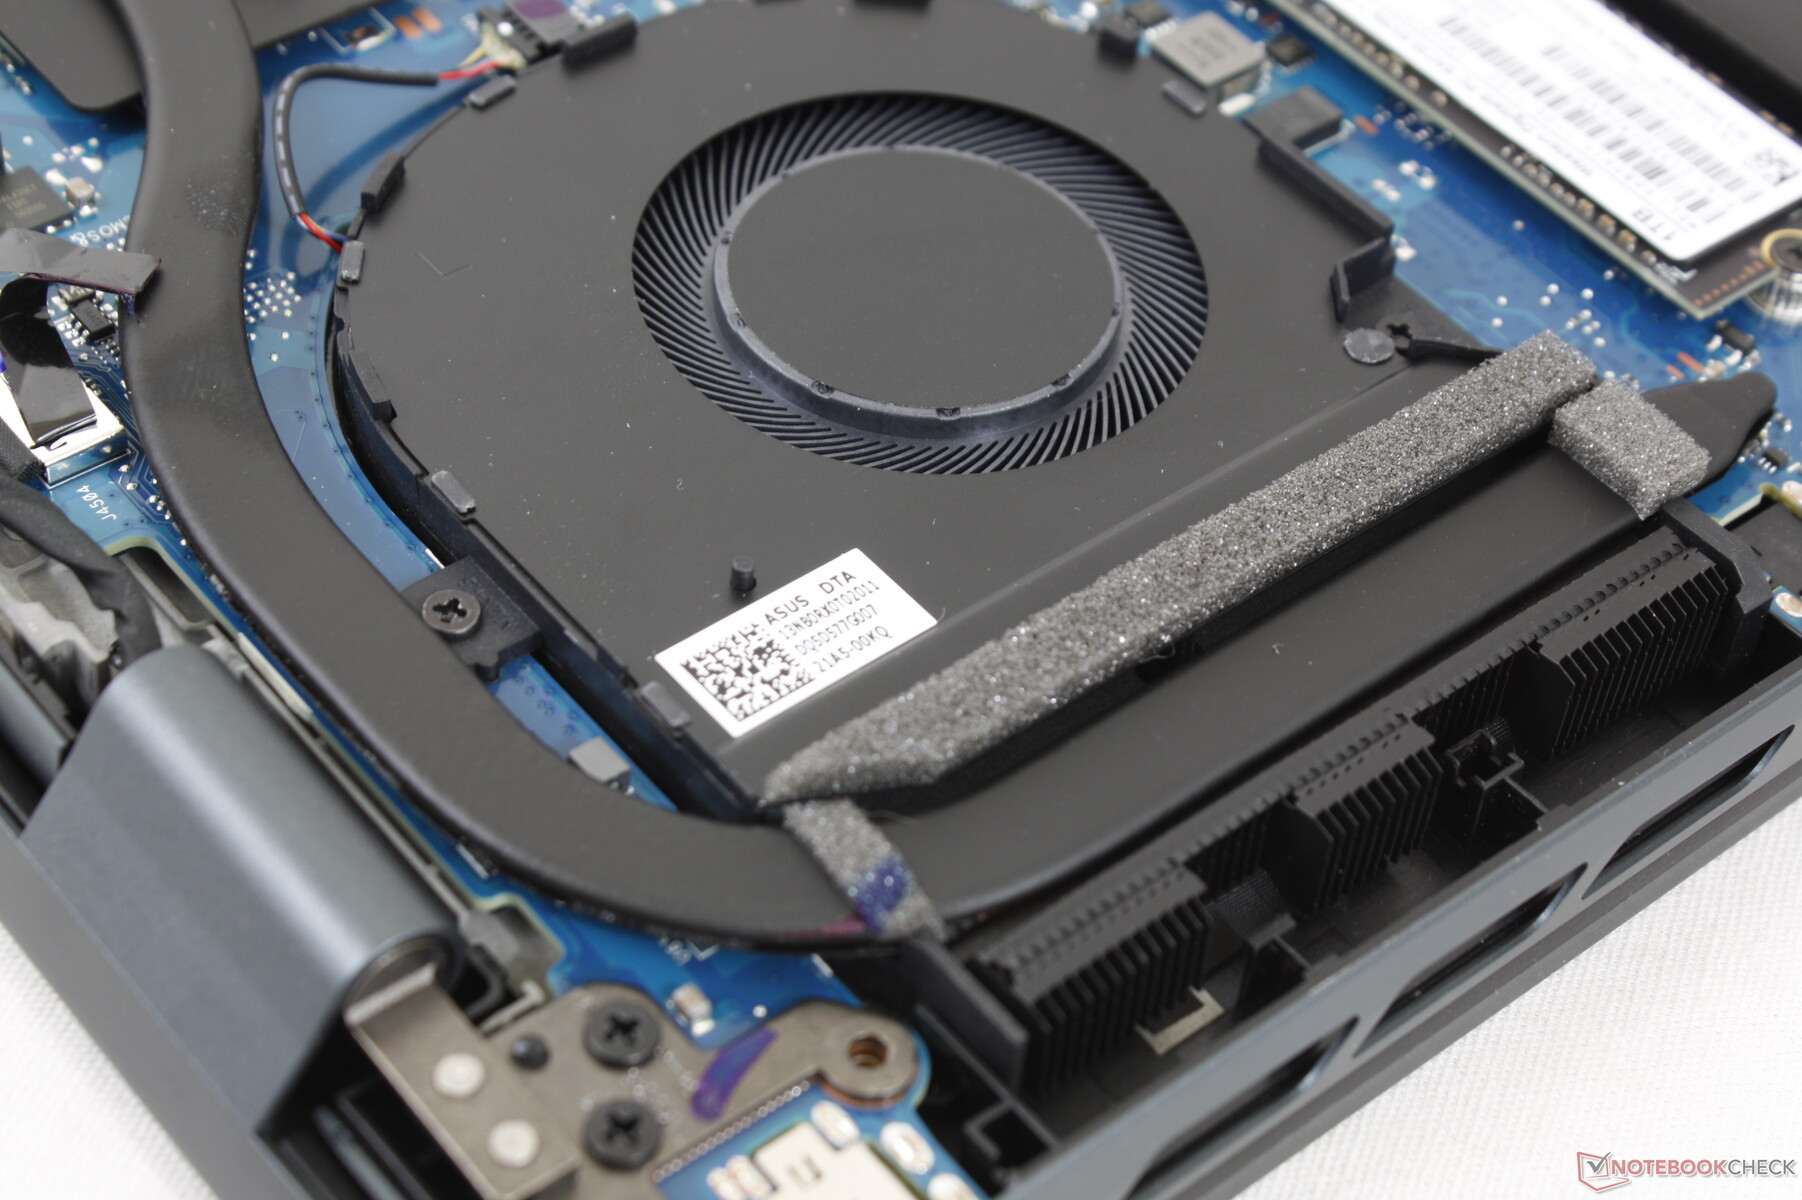
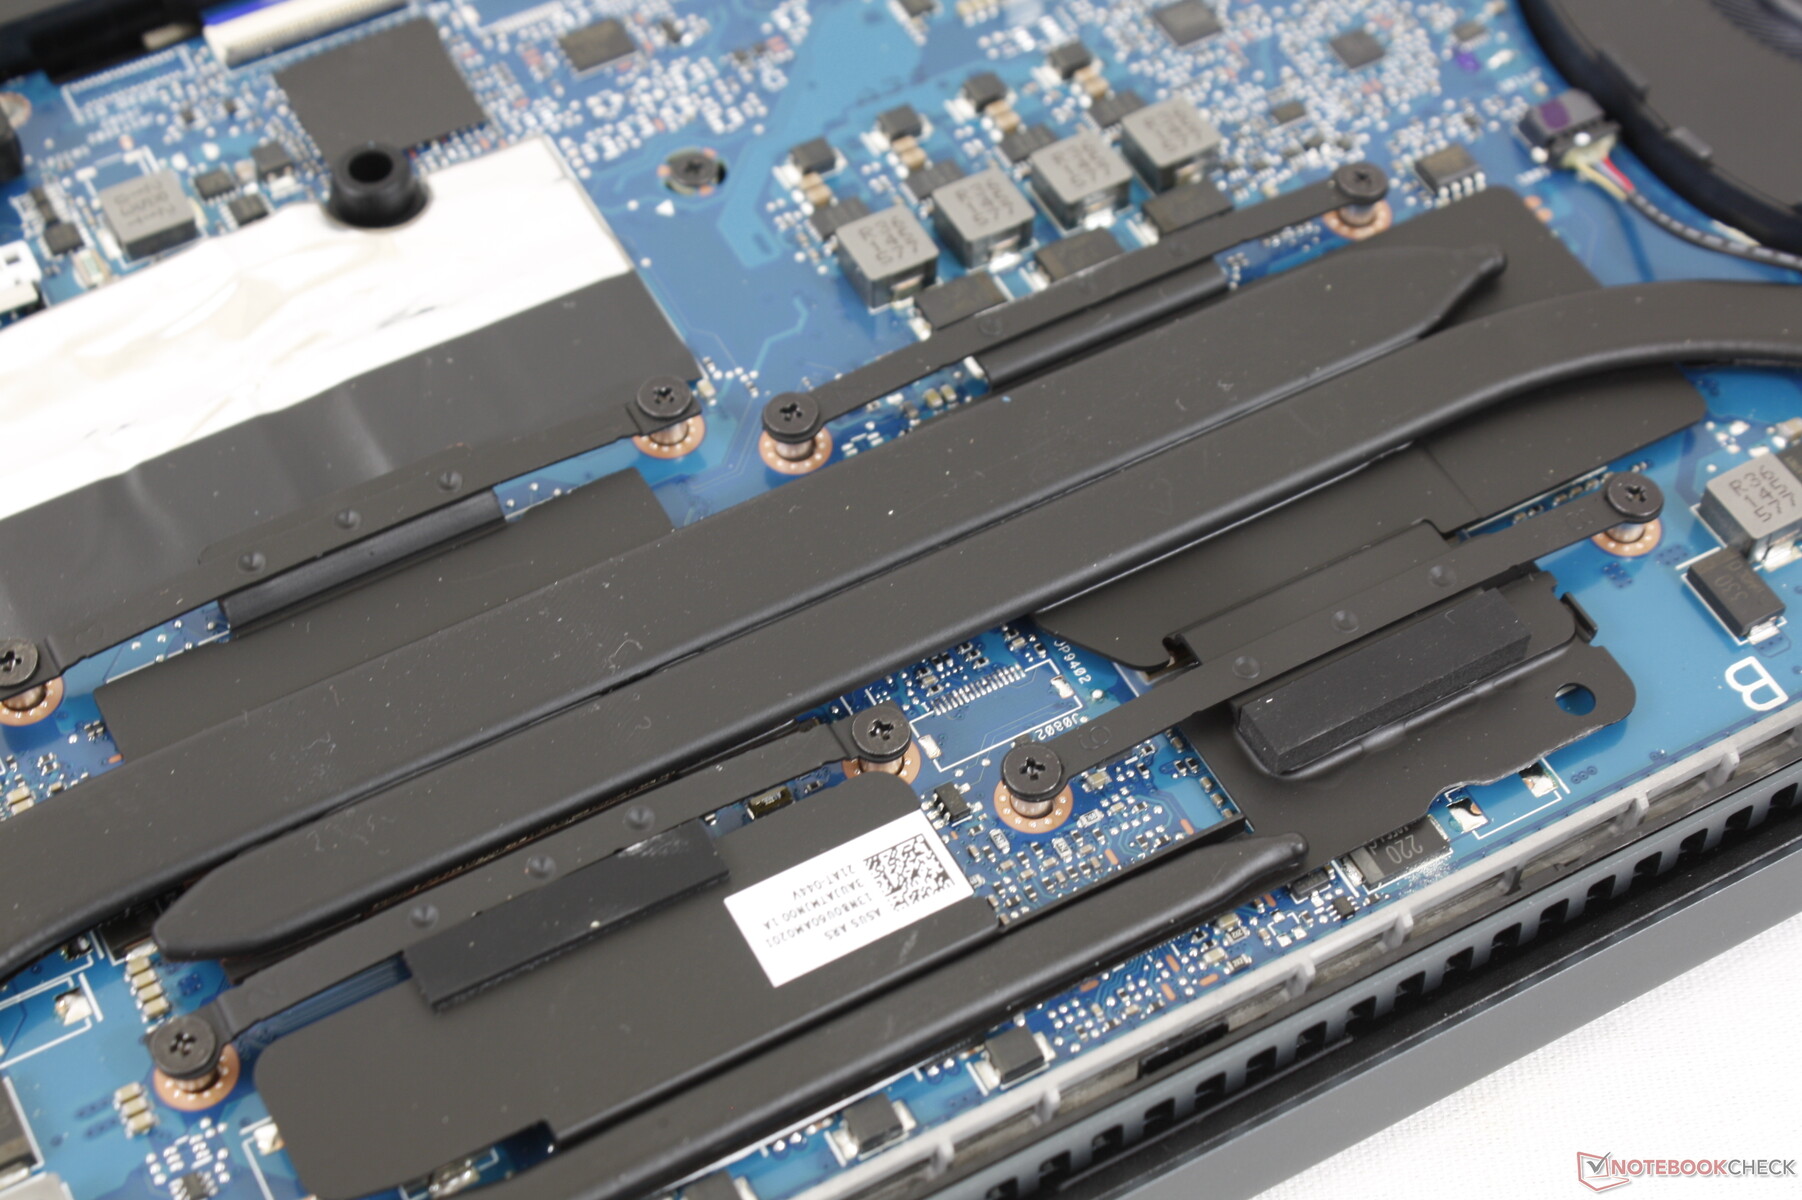
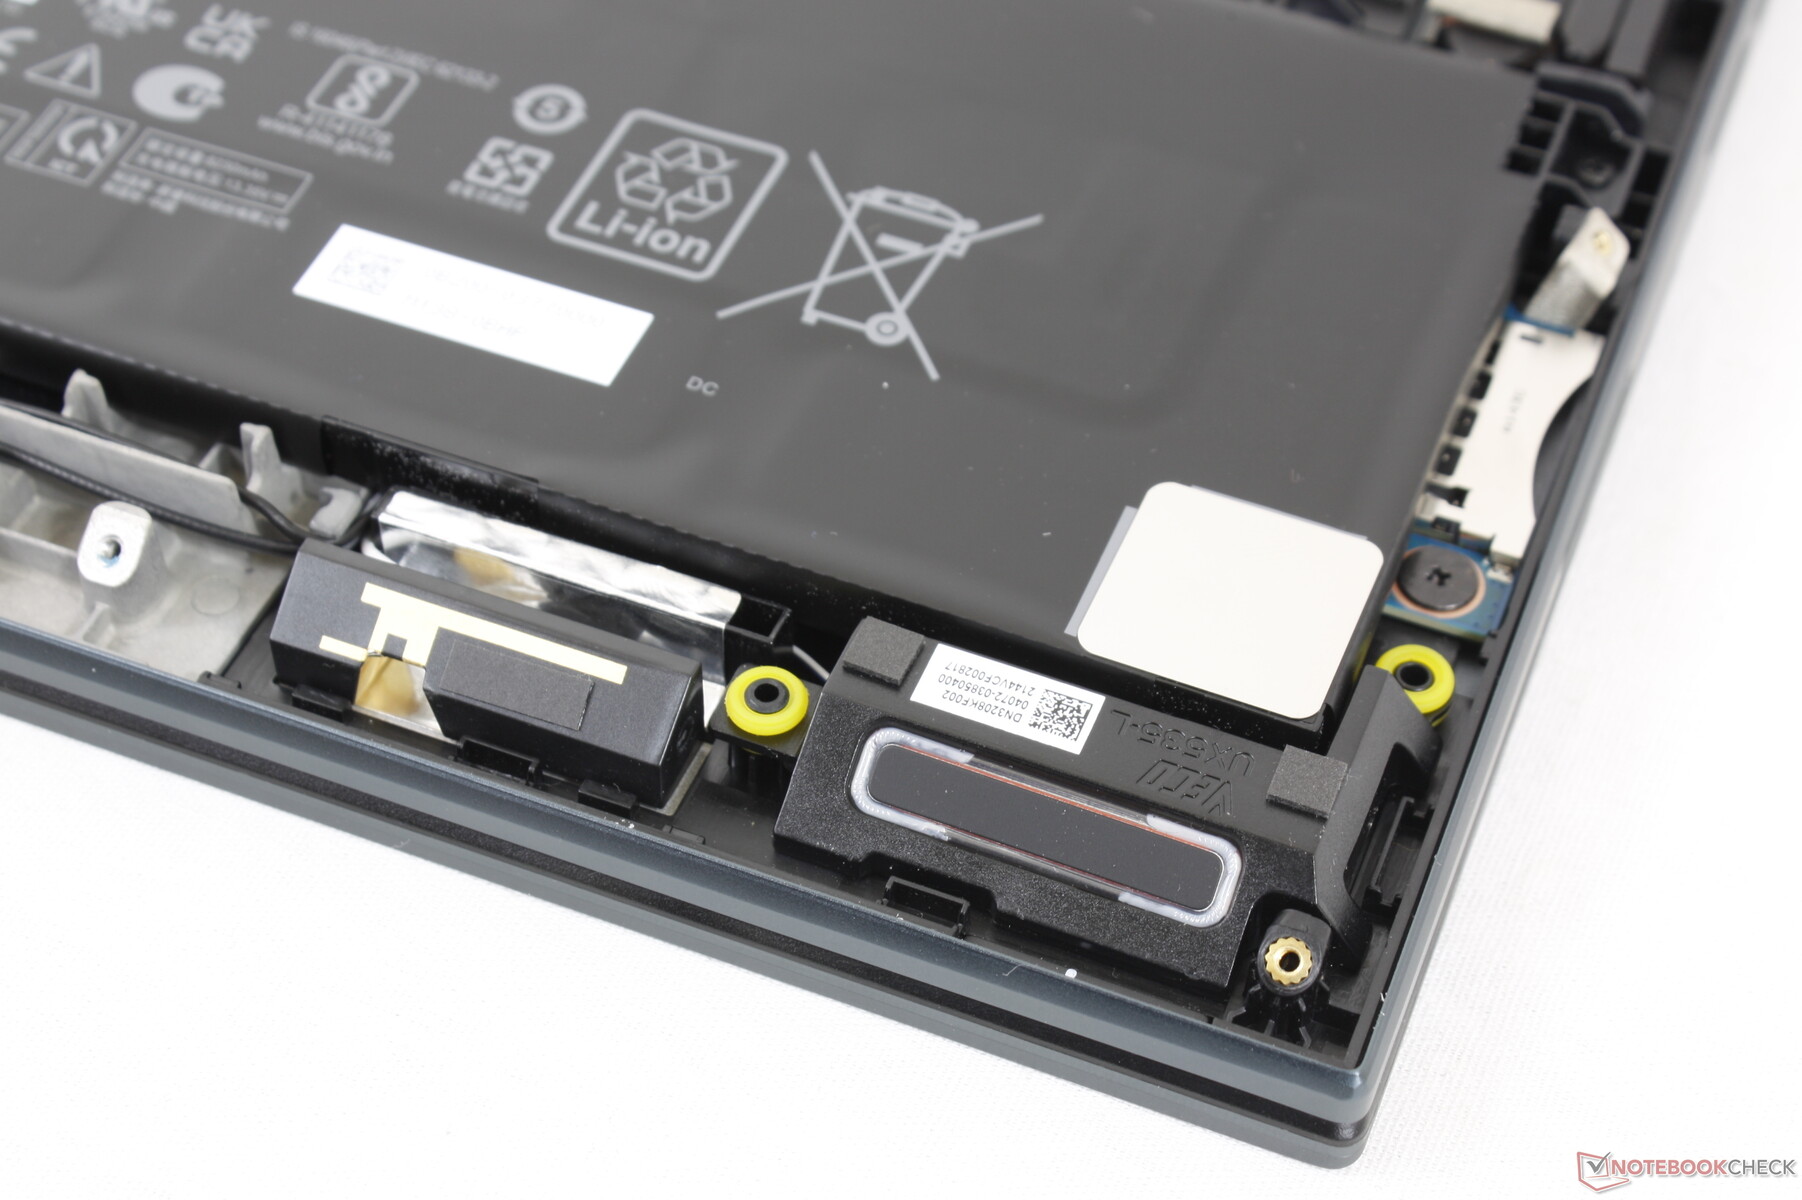
Maintenance
The bottom panel requires a T5 Torx wrench, Philips screwdriver, and a sharp edge to remove. Annoyingly, additional screws are hidden underneath the rear rubber feet. Both RAM and WLAN are soldered and therefore not upgradeable.
Accessories and Warranty
There are no extras in the box other than the AC adapter and paperwork. The standard one-year limited warranty applies.
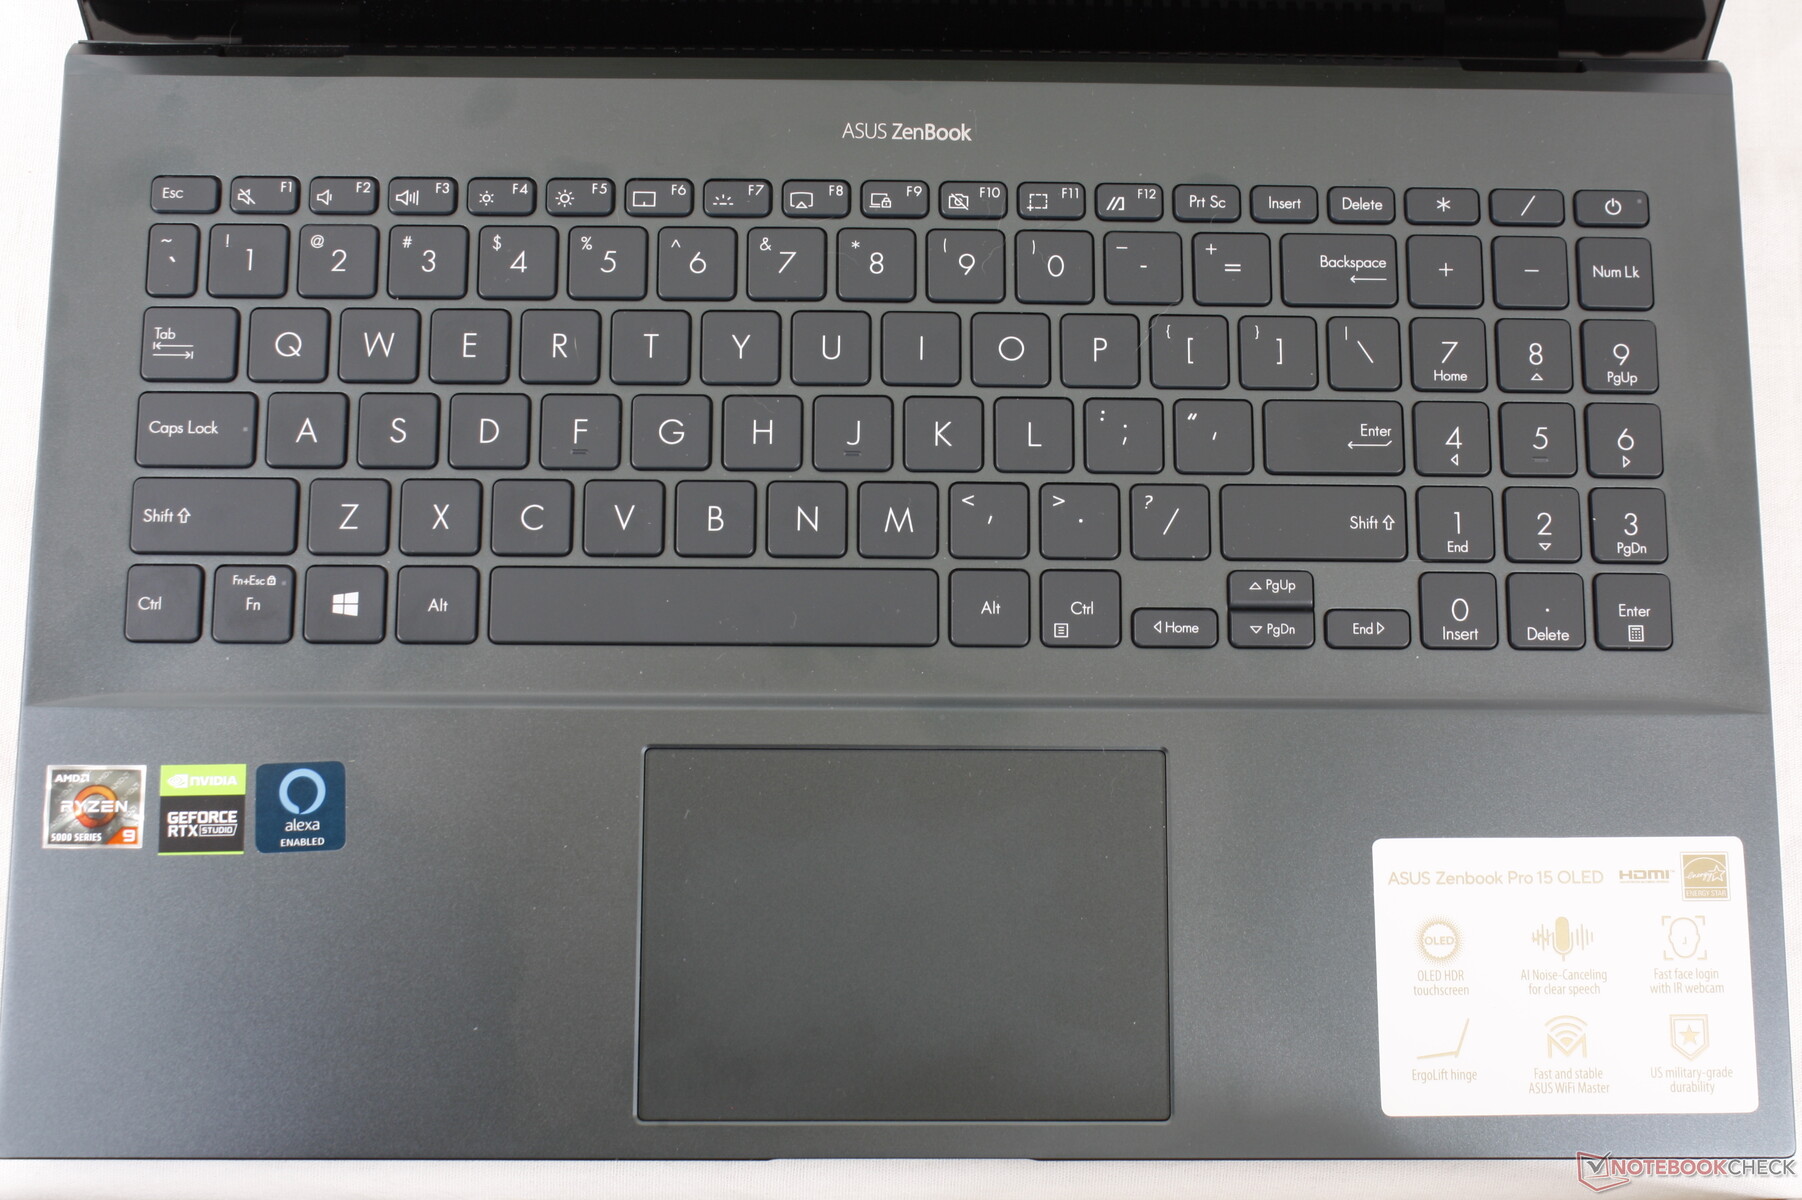
Input Devices — Feels Like a Vivobook
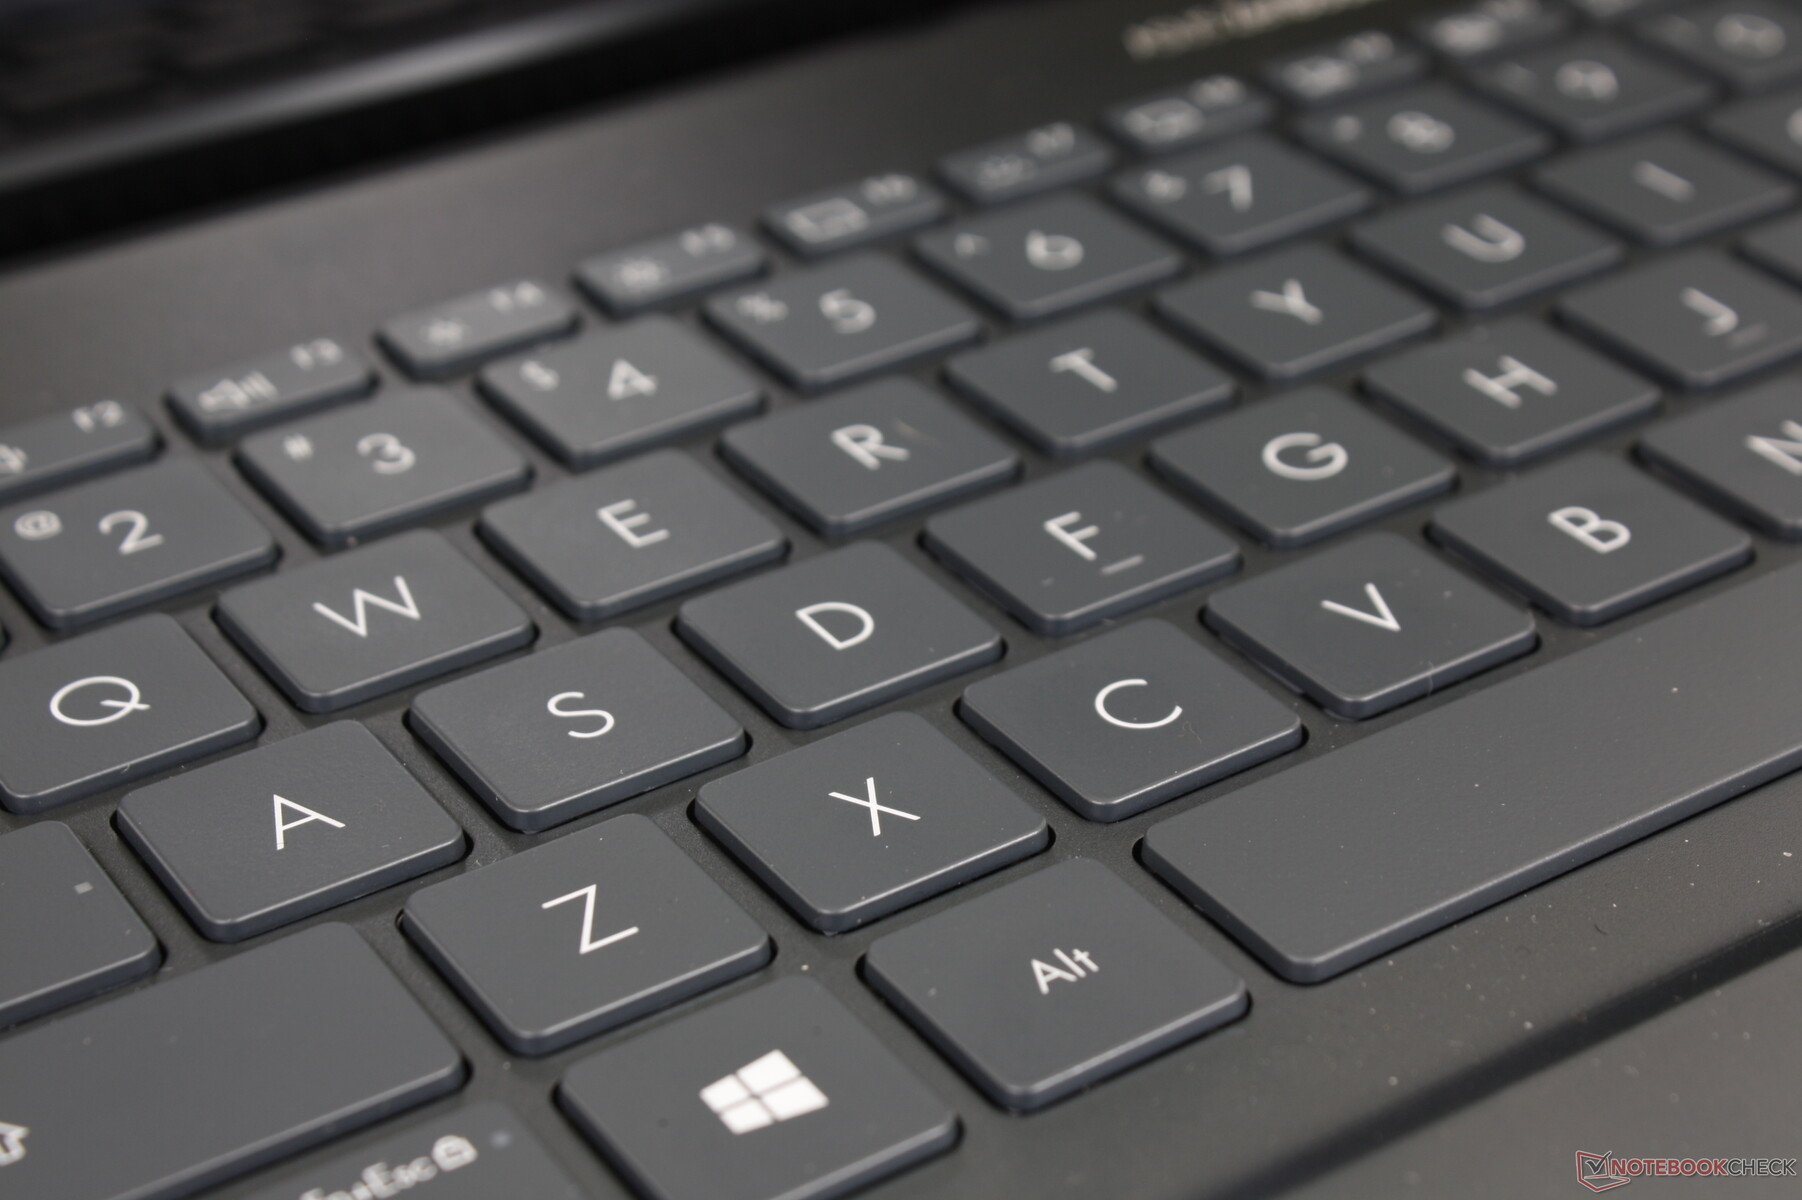
Keyboard
Overall key feedback feels similar to the Razer Blade 15 and most Vivobook models. Both travel and feedback are adequate if not slightly on the shallower and softer side, respectively. The keys on an HP Envy 15 or Lenovo ThinkPad X series are noticeably firmer and deeper for more satisfying feedback. It's a shame that there isn't a noticeable upgrade in terms of the keyboard when jumping from a cheaper Vivobook to the more expensive Zenbook.
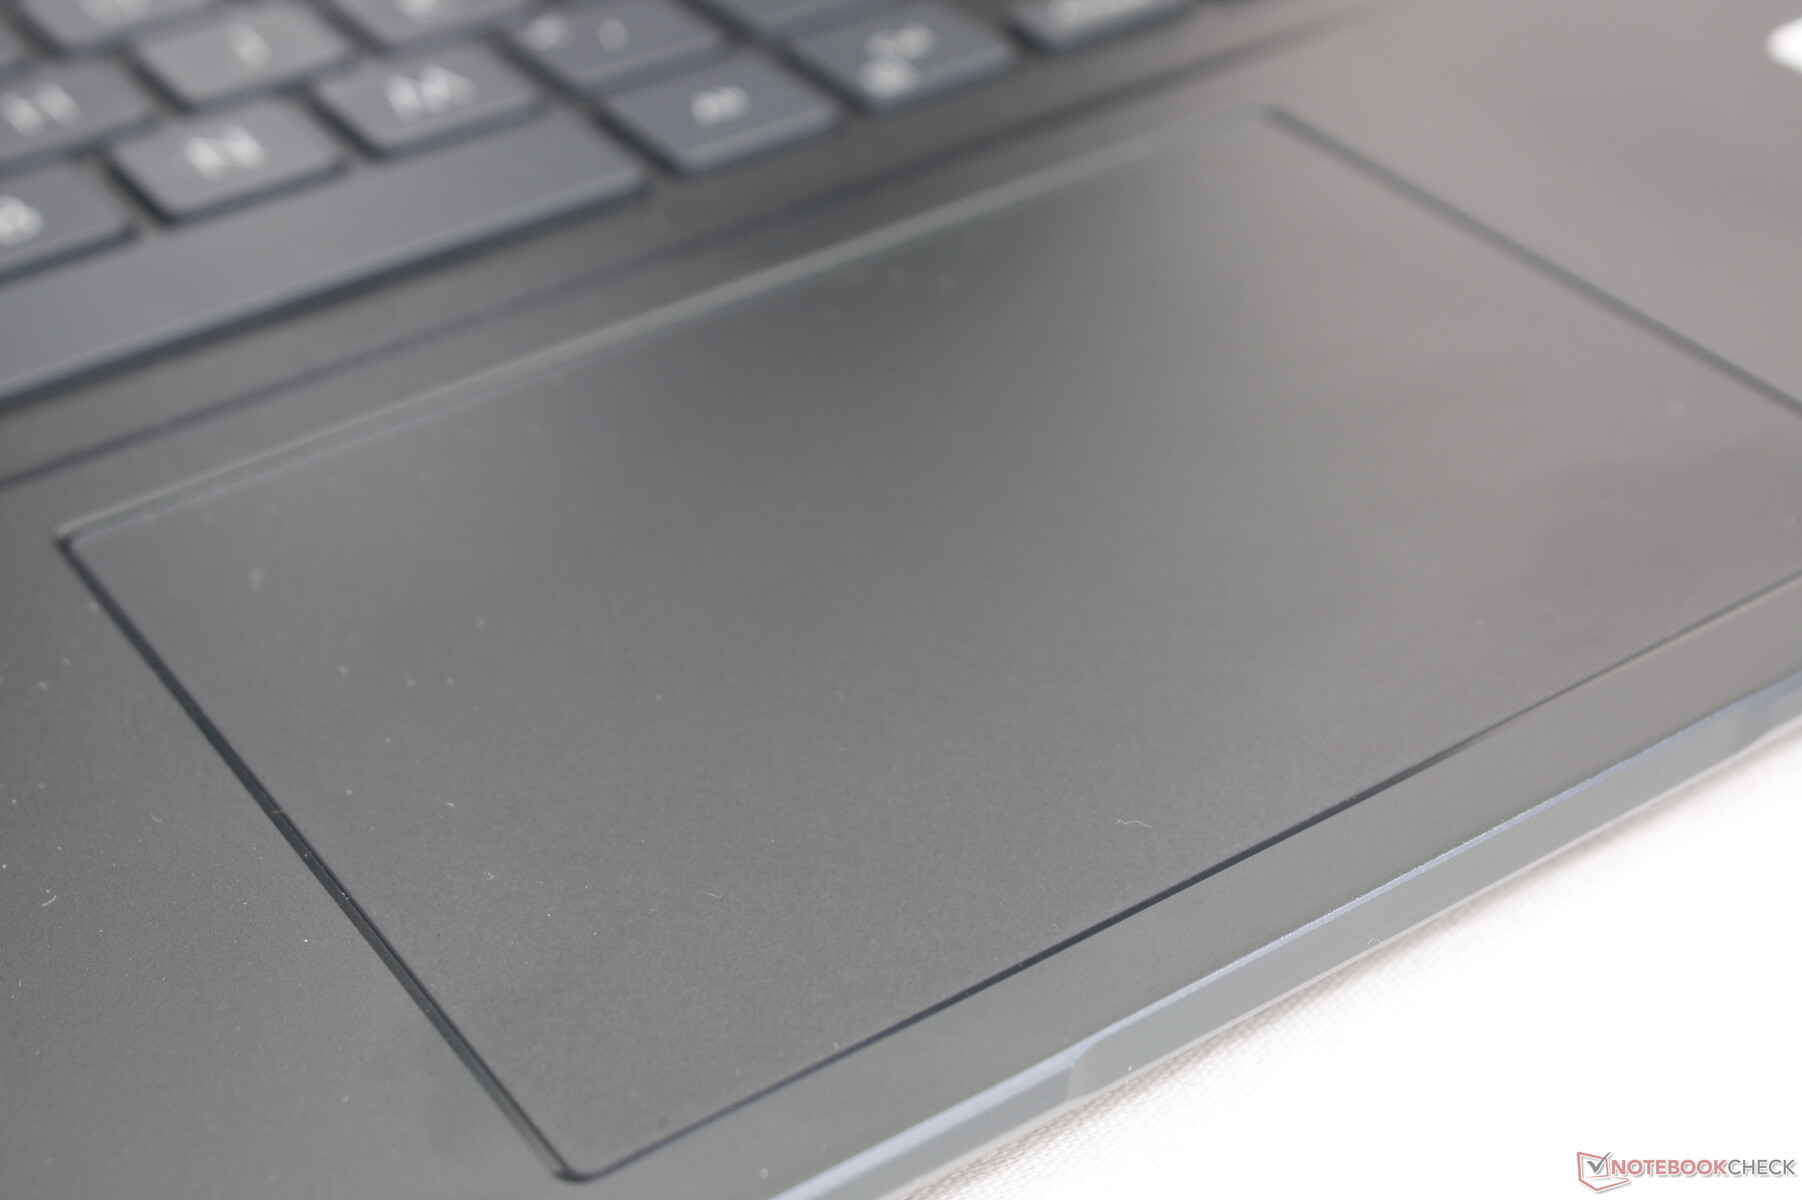
Touchpad
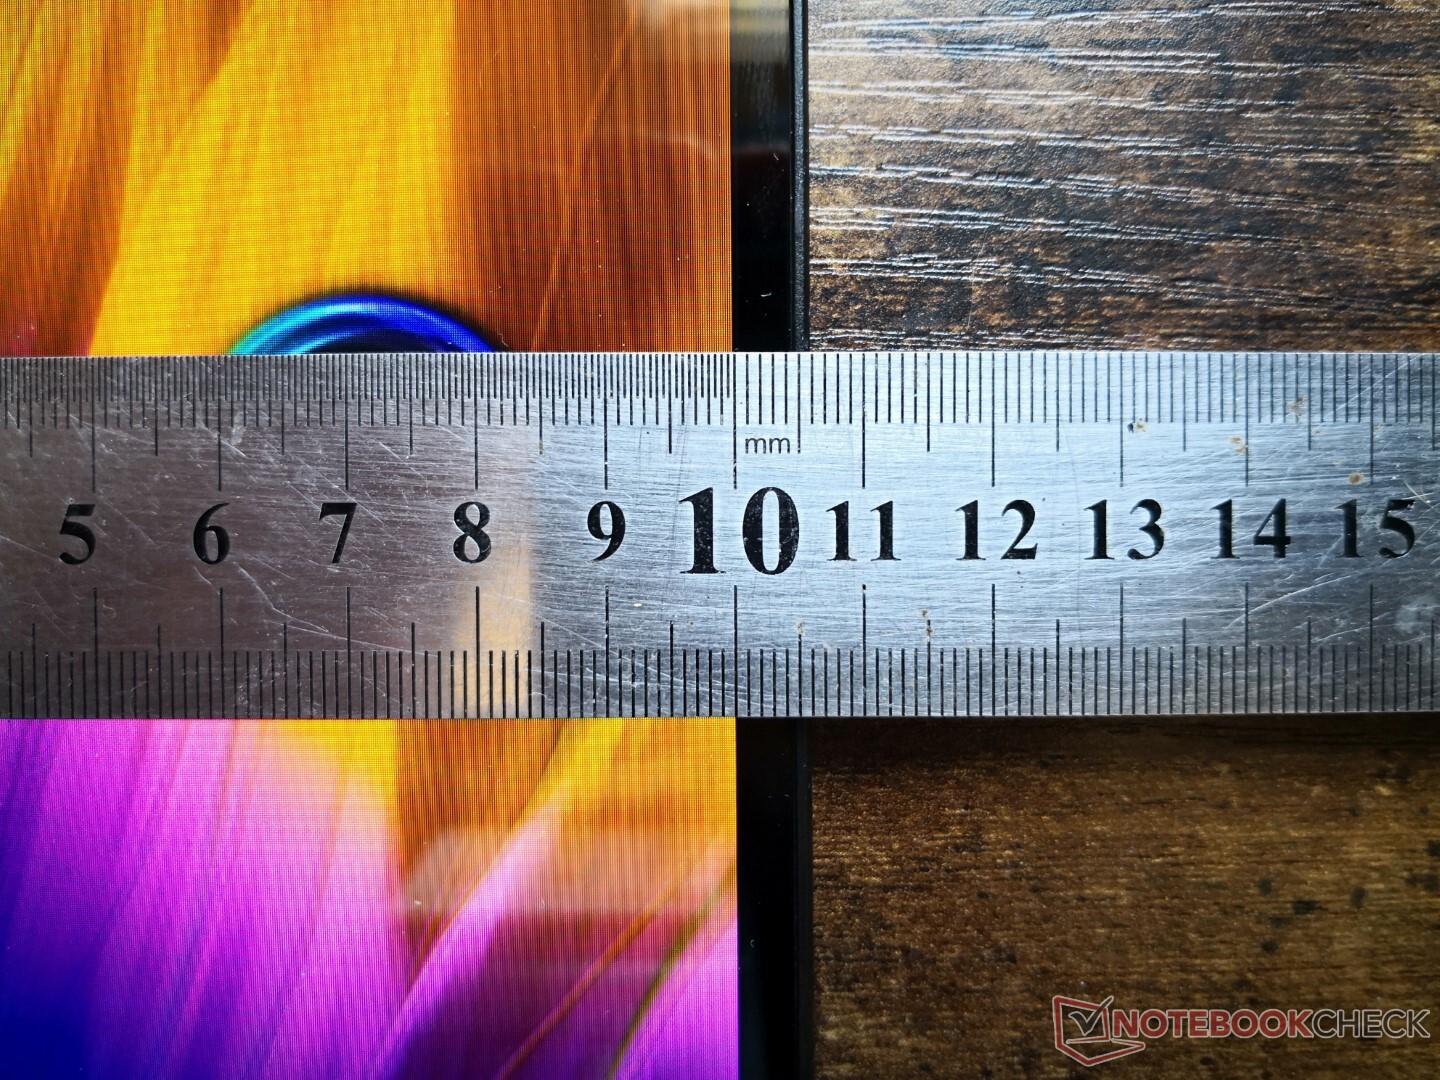
The clickpad is much smaller than the one on the XPS 15 (10.5 x 7.3 cm vs. 15.1 x 9 cm) despite the larger footprint of the Zenbook Pro 15. Nonetheless, feedback is firmer and more satisfying when pressed when compared to the softer and quieter clickpad of the Dell. Traction is smooth with just a bit of sticking when gliding at slow speeds.
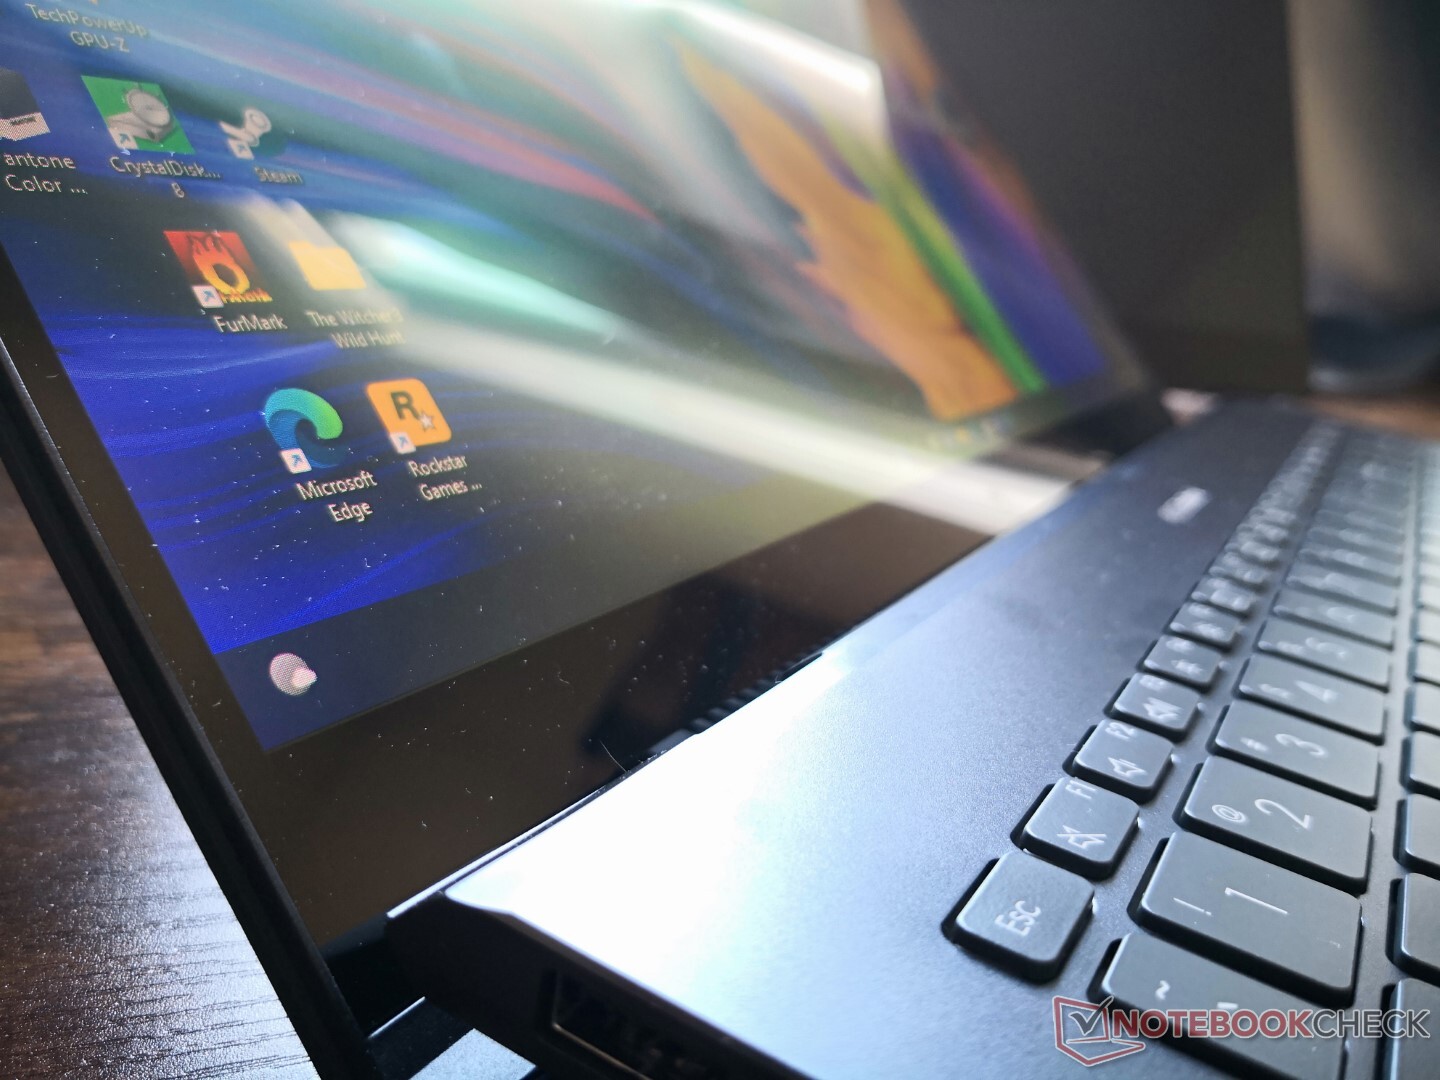
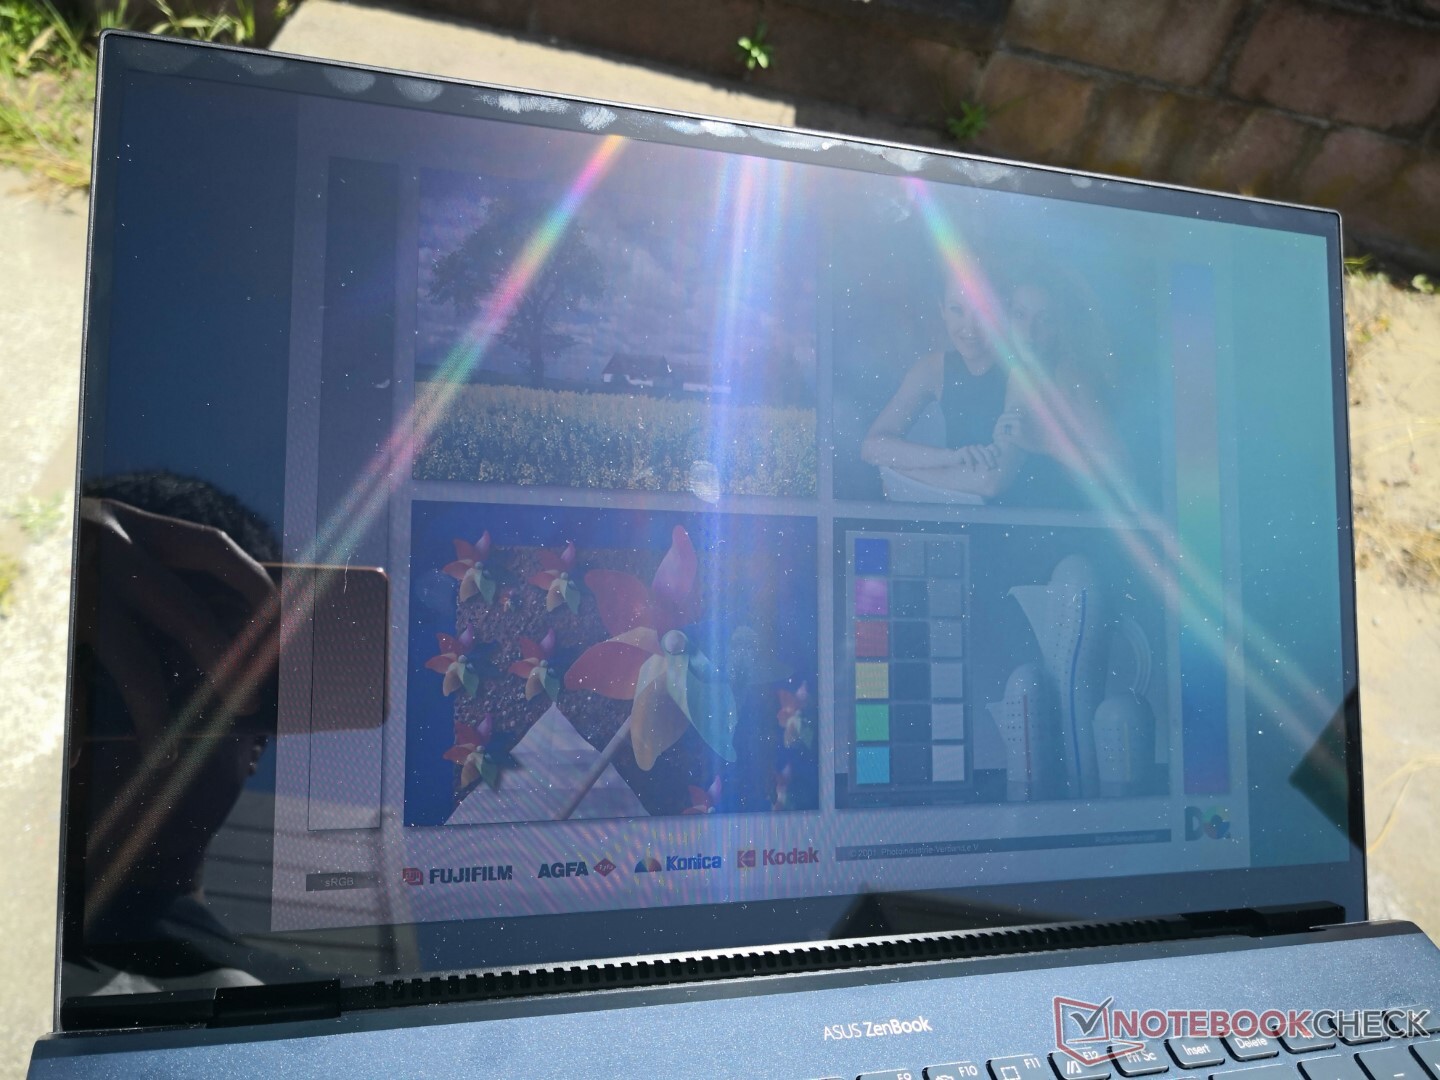
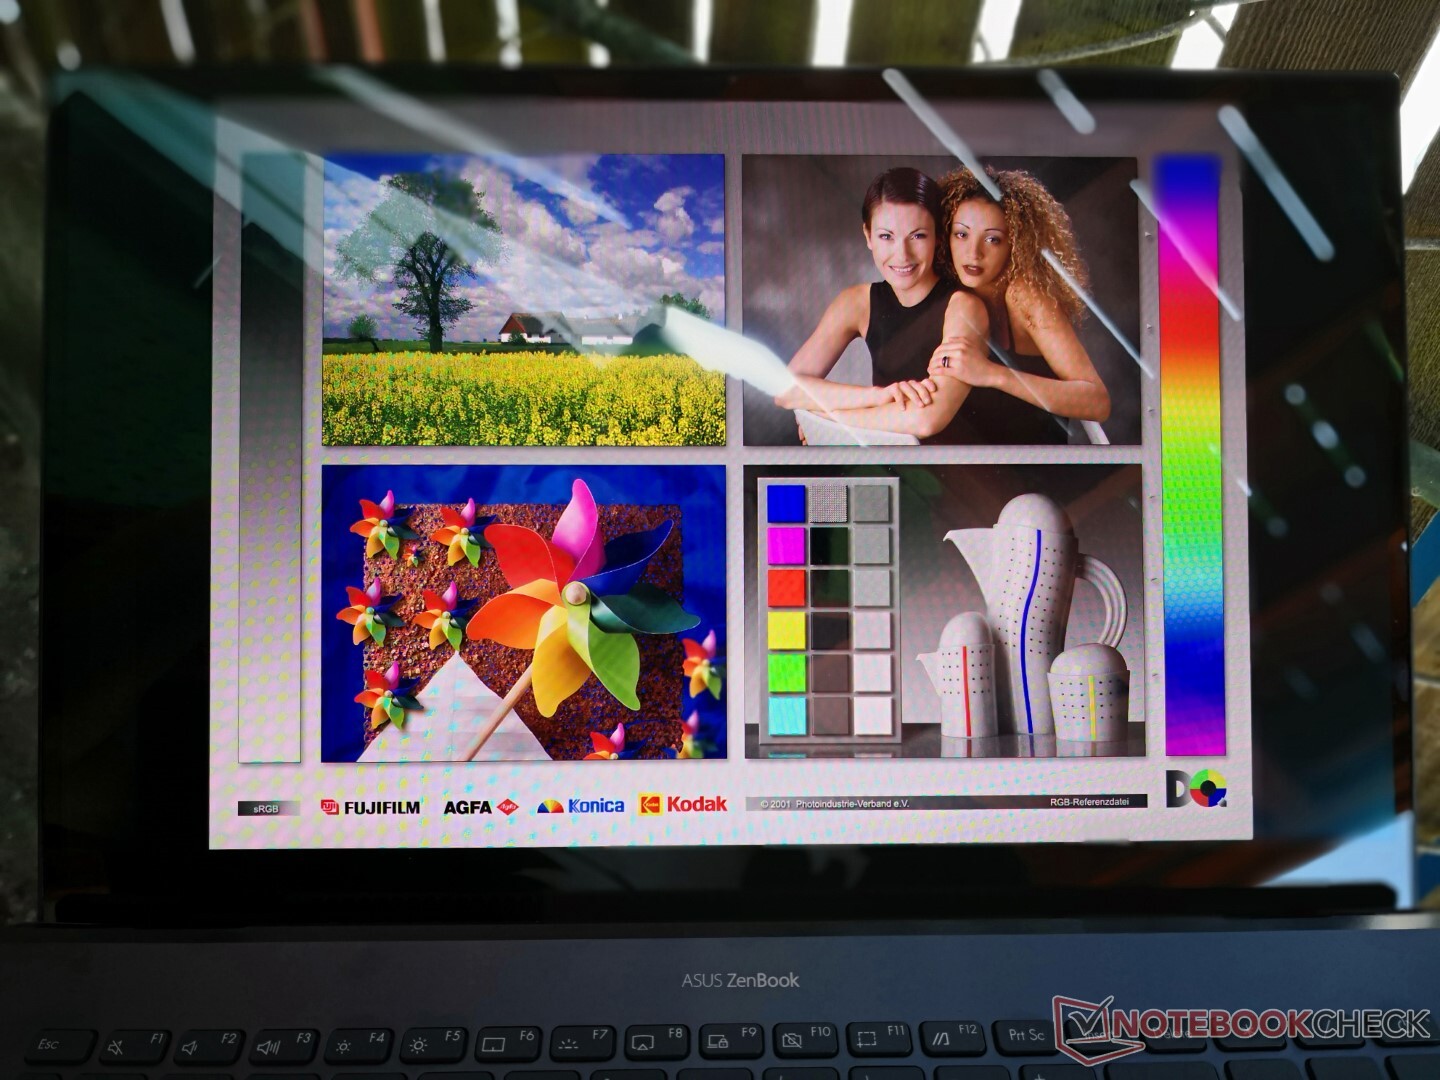
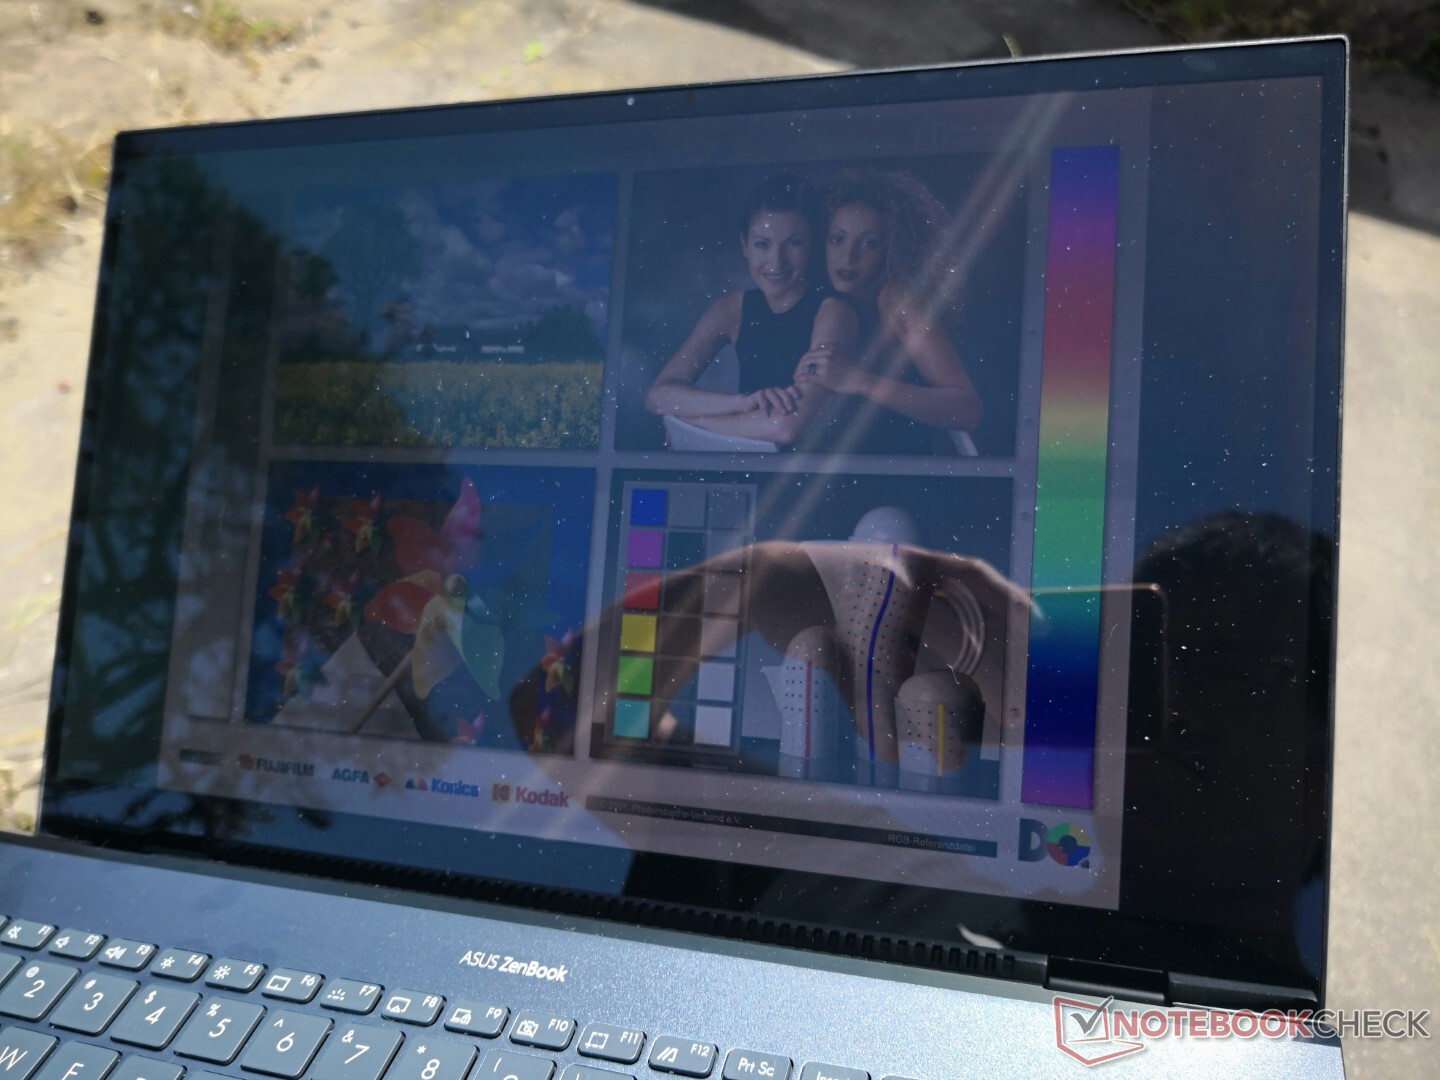
Display — Pushing OLED Mainstream
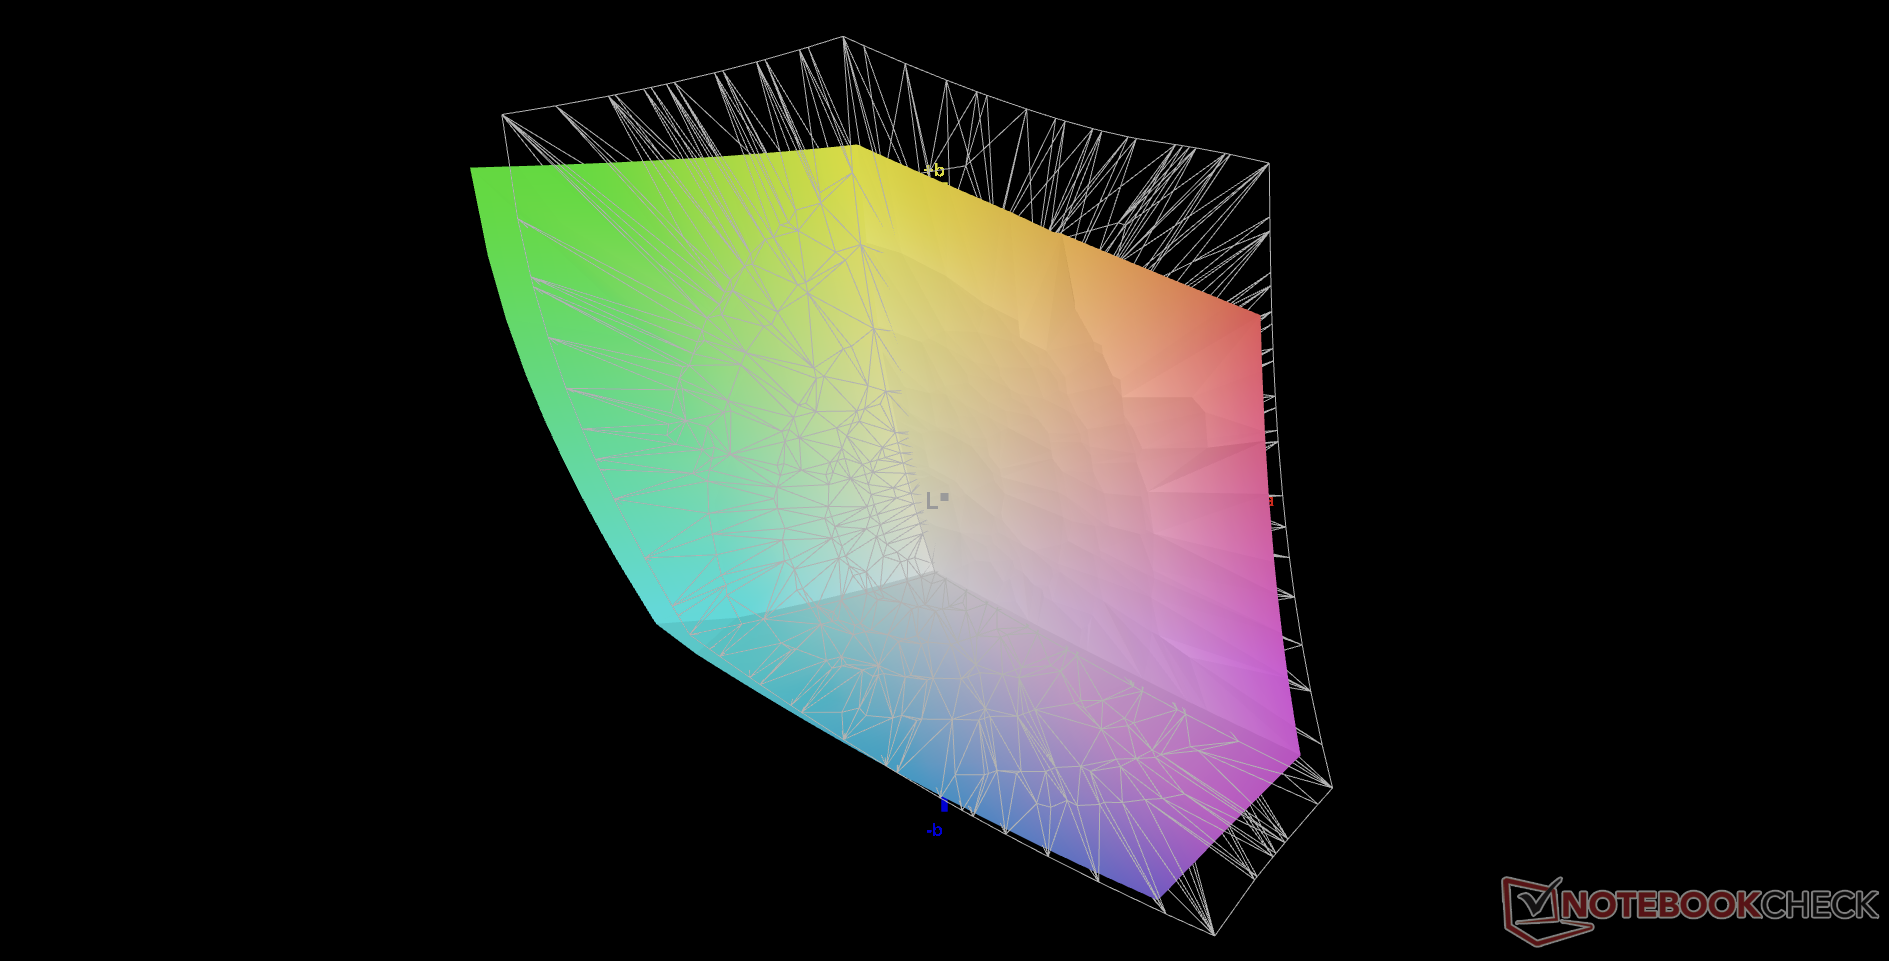
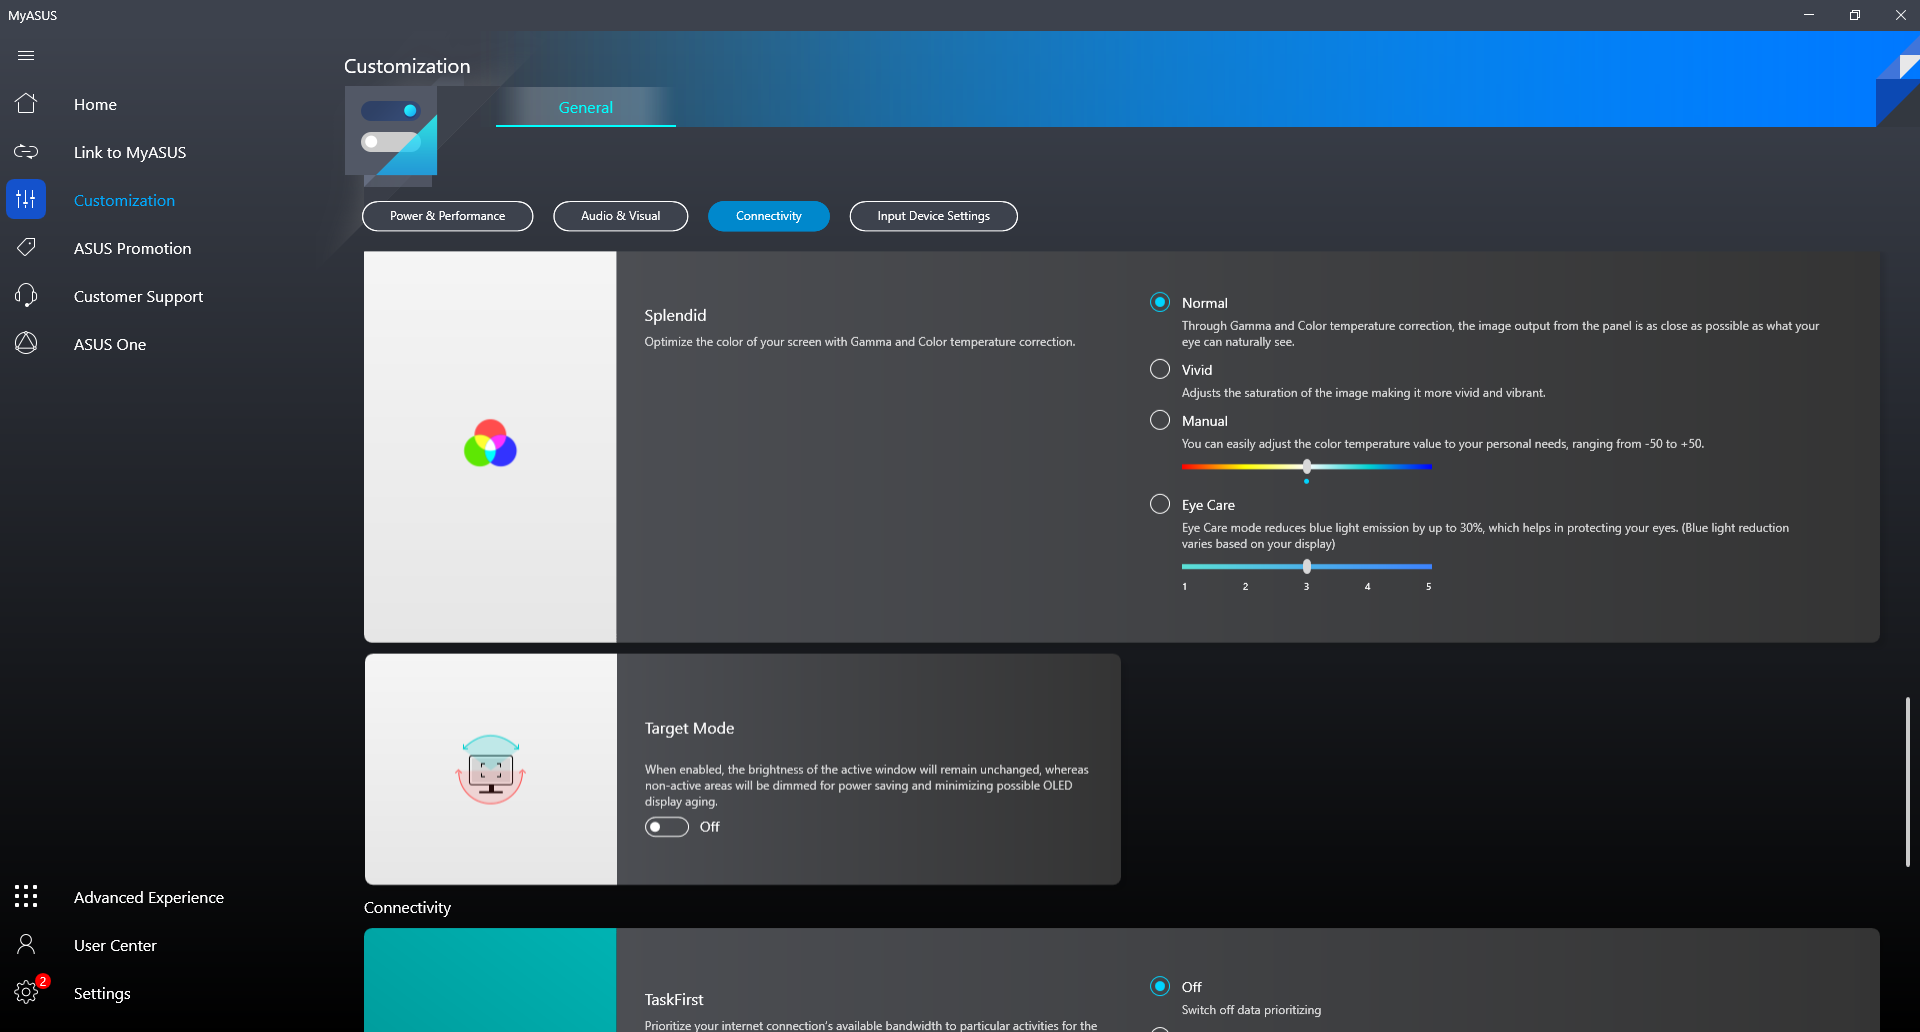
Asus uses the same 1080p 60 Hz Samsung ATNA56YX03 OLED panel across many of its 15.6-inch laptops including the VivoBook 15 KM513, VivoBook 15 Pro M3500QC, VivoBook 15 M513UA, and Vivobook 15 K513EQ. Thus, all of these laptops share very similar visual characteristics like the extremely fast response times and even brightness distribution, deep black levels, and good maximum brightness levels. These attributes allow content on an OLED panel to pop much more vividly than on a typical IPS panel. Strangely, however, we're only able to record a DCI-P3 coverage of just 79 percent even after attempting to adjust the default colors through the MyAsus software. The manufacturer advertises full DCI-P3 coverage and we've confirmed as much on all the aforementioned VivoBook laptops which may suggest that there could be a bug here in how the color profiles work between the Asus settings and Windows settings.
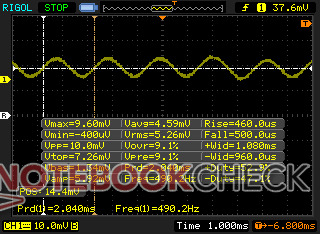
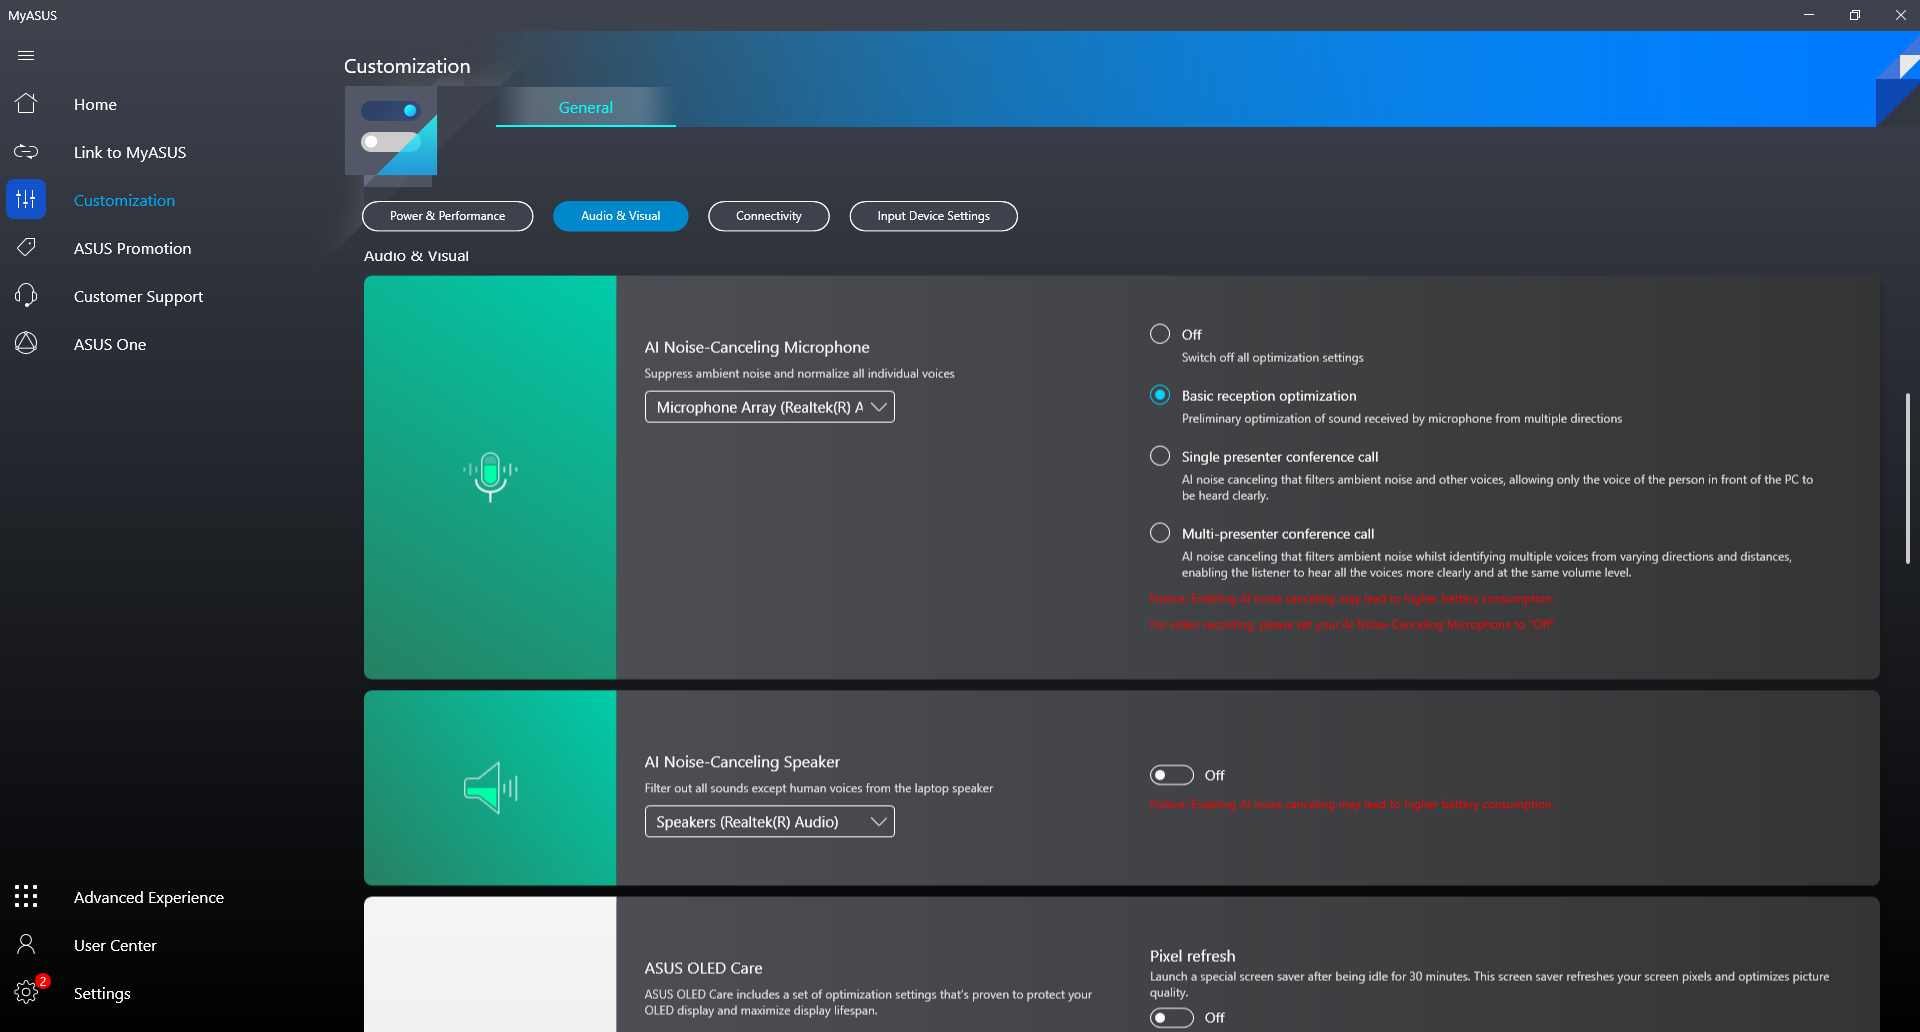
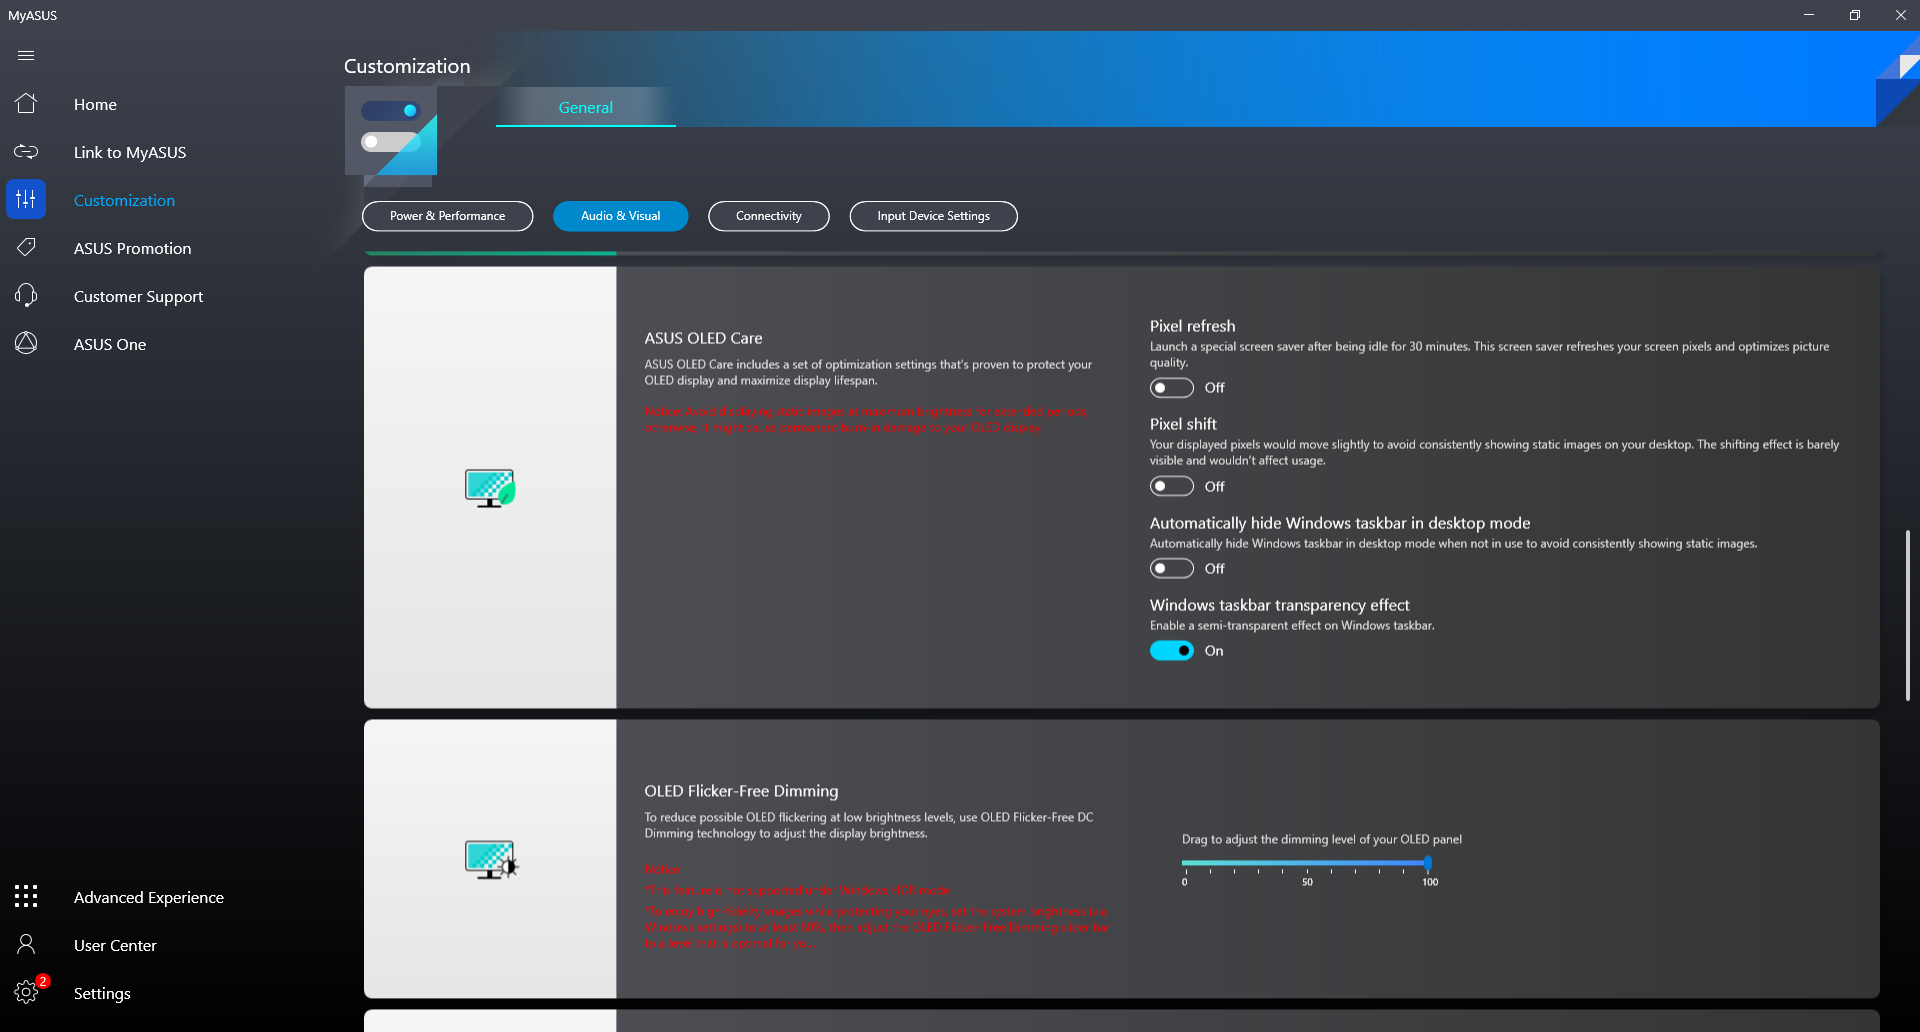
Keep in mind that pulse-width modulation is present on all brightness levels at 490 Hz from 0 to 49 percent brightness and 60 Hz from 50 percent brightness and up. The MyAsus software offers a slider tool to limit the maximum brightness of the display on top of the regular brightness slider via Windows Settings in an attempt to minimize the intensity of the flickering.

| |||||||||||||||||||||||||
Brightness Distribution: 98 %
Center on Battery: 342.9 cd/m²
Contrast: ∞:1 (Black: 0 cd/m²)
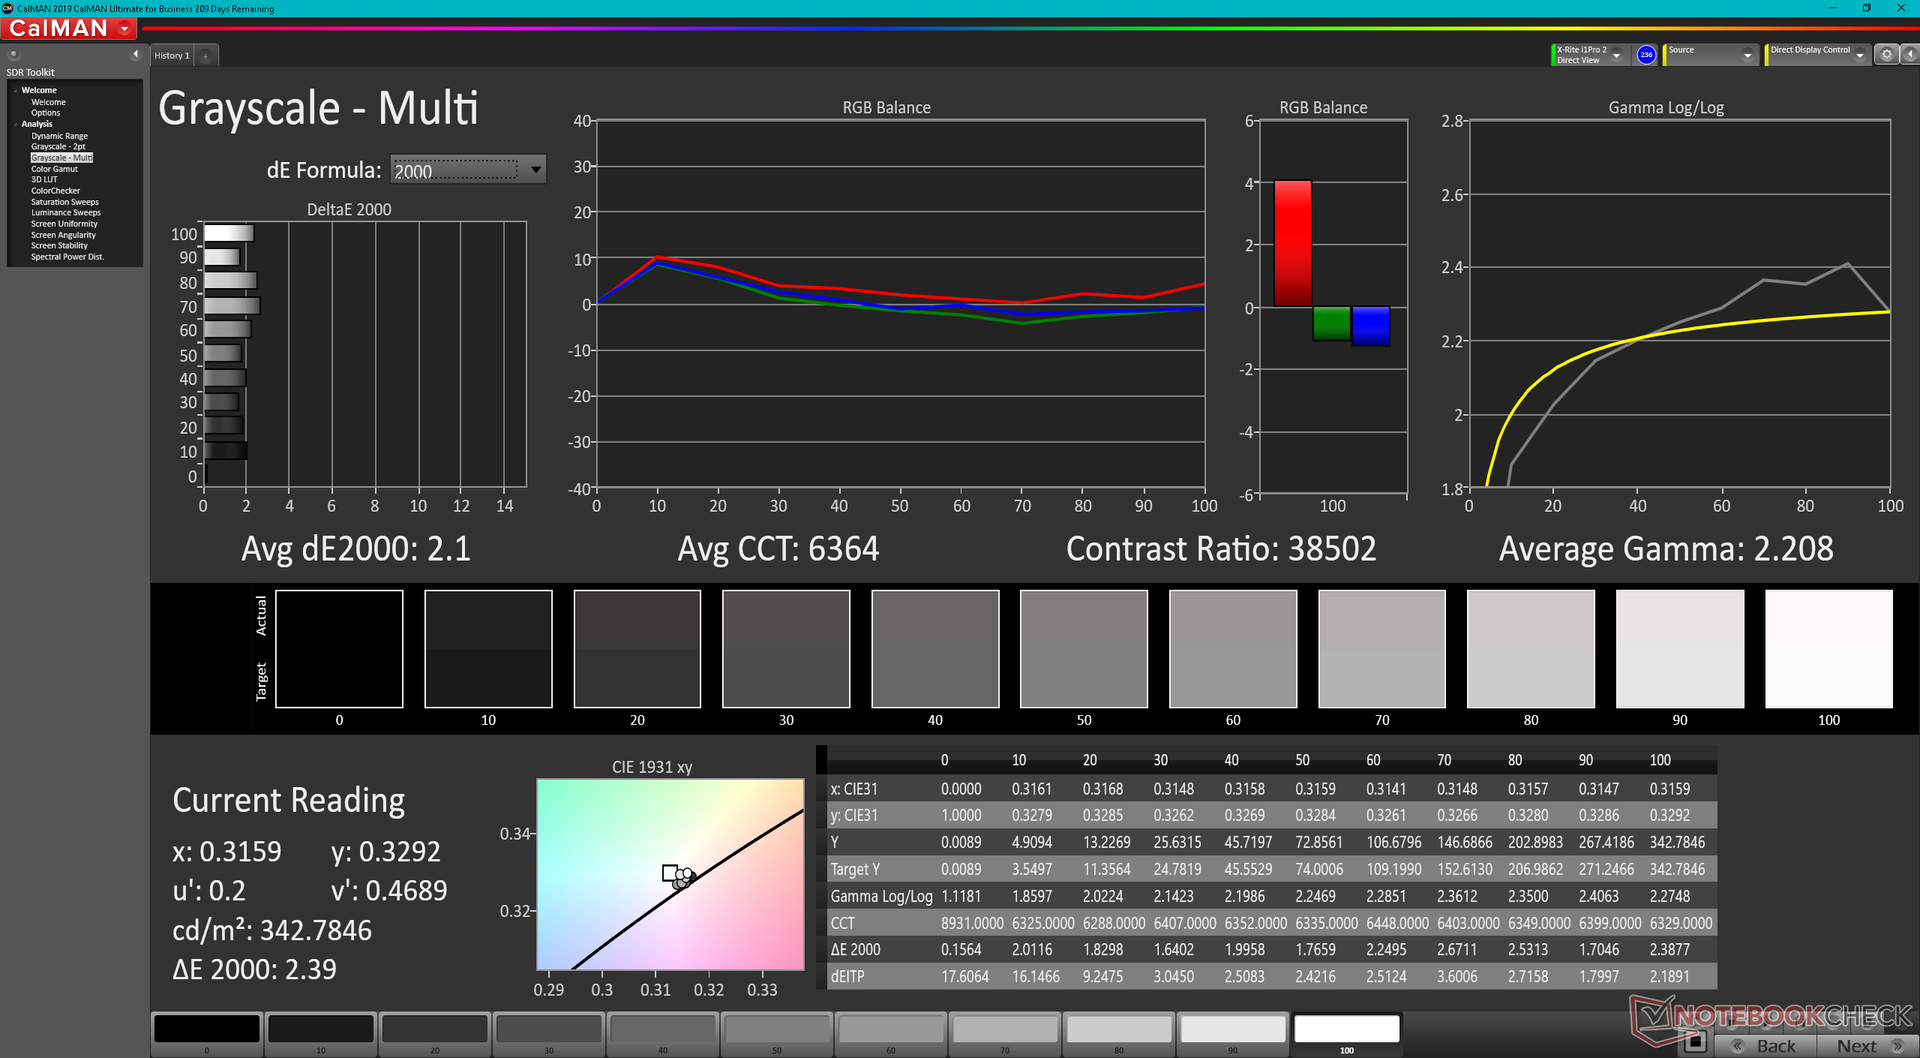
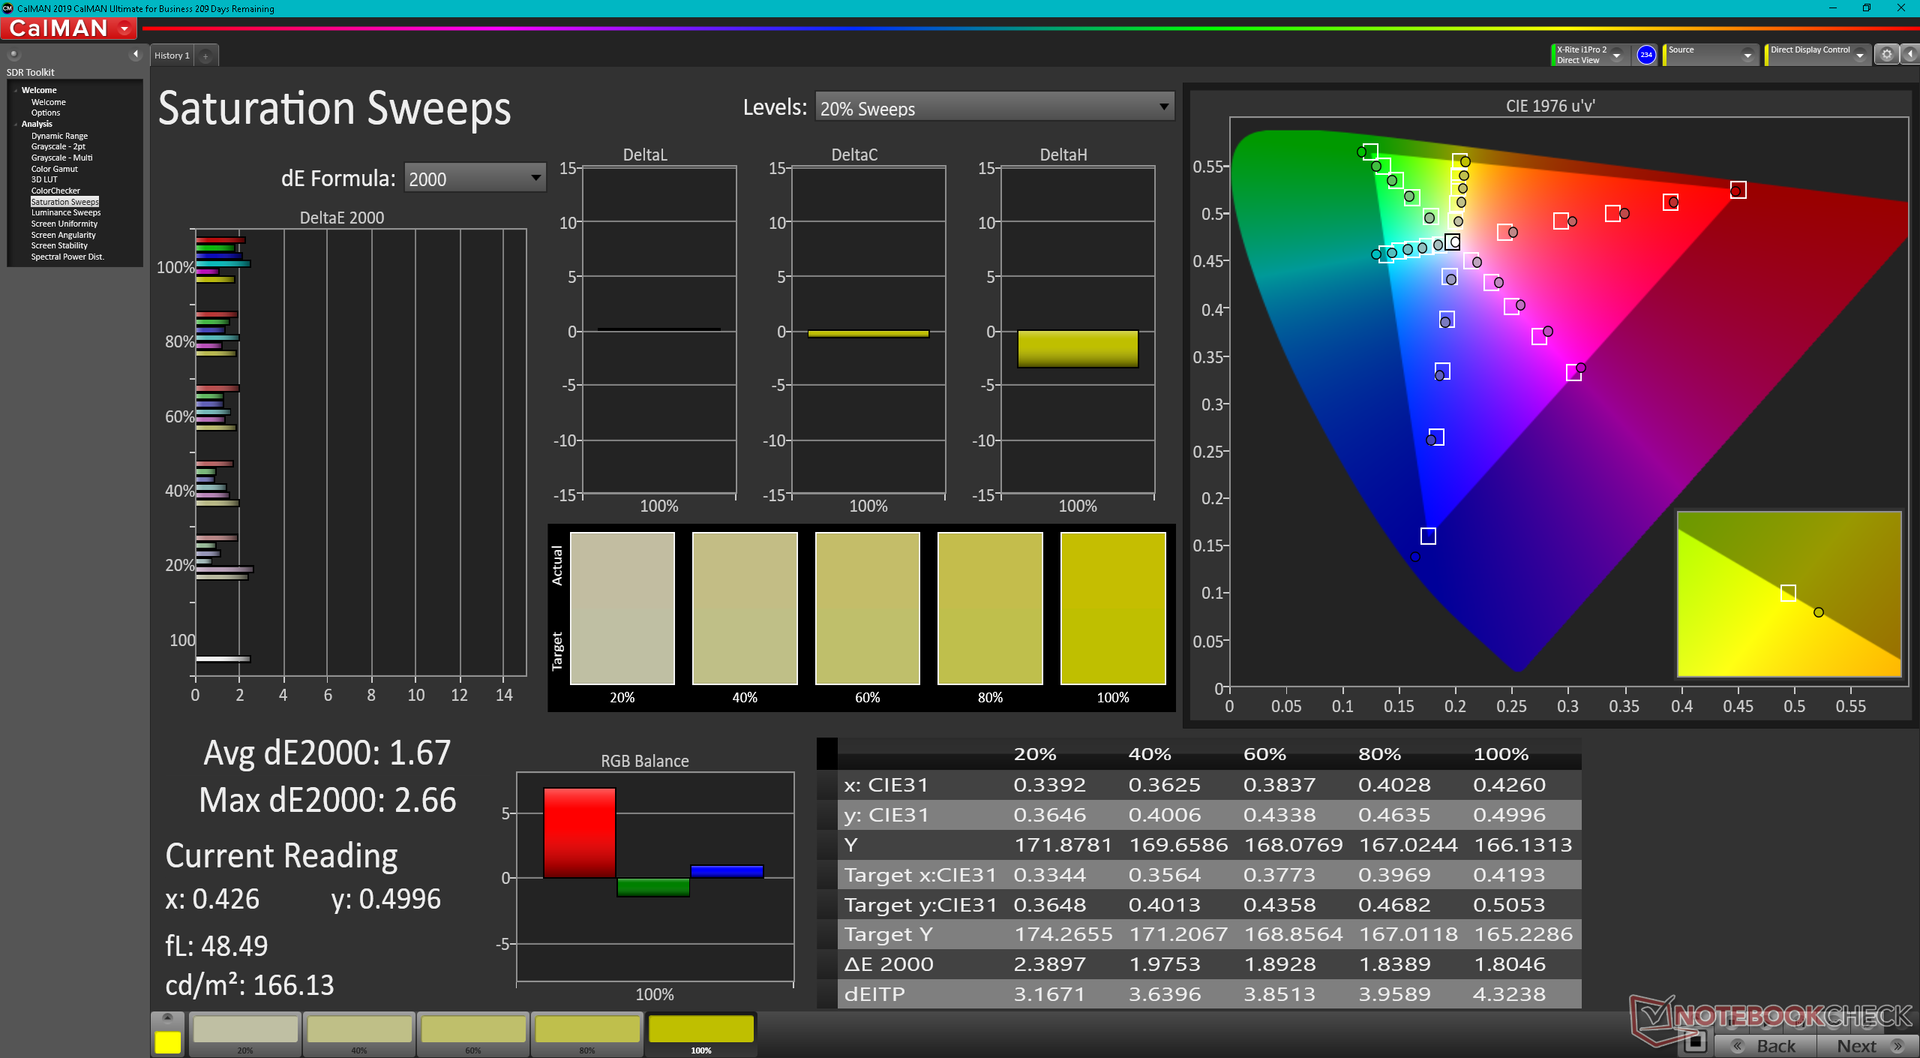
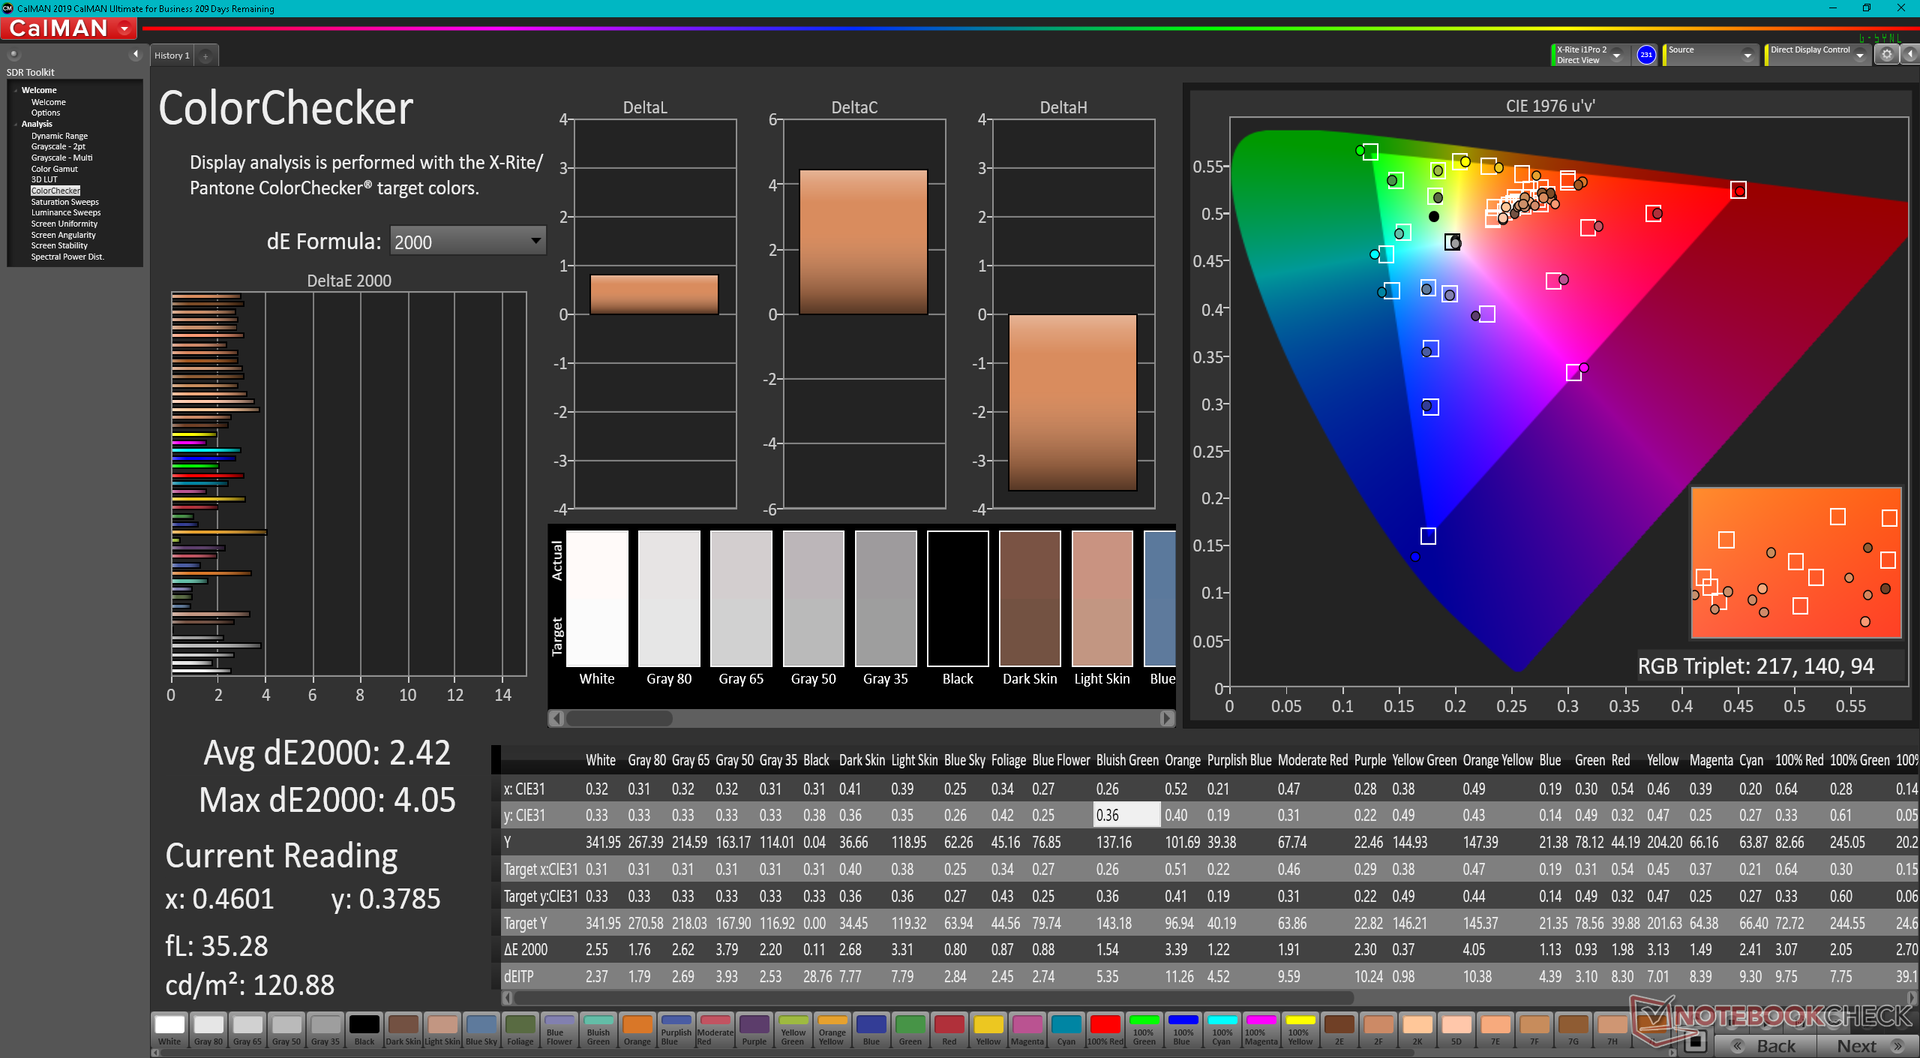
ΔE ColorChecker Calman: 2.42 | ∀{0.5-29.43 Ø4.72}
ΔE Greyscale Calman: 2.1 | ∀{0.09-98 Ø4.97}
87.3% AdobeRGB 1998 (Argyll 3D)
95.6% sRGB (Argyll 3D)
79.3% Display P3 (Argyll 3D)
Gamma: 2.21
CCT: 6364 K
| Asus Zenbook Pro 15 OLED UM535Q Samsung ATNA56YX03-0, OLED, 1920x1080, 15.6" | Asus ZenBook UX535-M01440 BOE0866, IPS, 3840x2160, 15.6" | Asus ZenBook 15 UX534FTC-A8190T BOE CQ NV156FHM-N63, IPS, 1920x1080, 15.6" | Lenovo Yoga Creator 7 15IMH05 82DS000VGE BOE CQ NV156FHM-N69, IPS, 1920x1080, 15.6" | HP Envy 15-ep0098nr Samsung SDC4145, AMOLED, 3840x2160, 15.6" | Dell XPS 15 9510 11800H RTX 3050 Ti OLED SDC414D, OLED, 3456x2160, 15.6" | |
|---|---|---|---|---|---|---|
| Display | -10% | -19% | -10% | 10% | 14% | |
| Display P3 Coverage (%) | 79.3 | 68.8 -13% | 65 -18% | 68.7 -13% | 88.5 12% | 99.9 26% |
| sRGB Coverage (%) | 95.6 | 99.5 4% | 86.2 -10% | 97.1 2% | 100 5% | 100 5% |
| AdobeRGB 1998 Coverage (%) | 87.3 | 70.1 -20% | 62.9 -28% | 70.3 -19% | 99.9 14% | 98.1 12% |
| Response Times | -1231% | -1667% | -150% | 23% | -47% | |
| Response Time Grey 50% / Grey 80% * (ms) | 2.1 ? | 34 ? -1519% | 45 ? -2043% | 5 ? -138% | 0.8 ? 62% | 3.6 ? -71% |
| Response Time Black / White * (ms) | 2.3 ? | 24 ? -943% | 32 ? -1291% | 6 ? -161% | 2.7 ? -17% | 2.8 ? -22% |
| PWM Frequency (Hz) | 60.2 | 242.7 ? | 59.5 ? | |||
| Screen | -1% | -55% | -155% | -38% | 9% | |
| Brightness middle (cd/m²) | 342.9 | 402 17% | 299 -13% | 360 5% | 374.3 9% | 362 6% |
| Brightness (cd/m²) | 346 | 375 8% | 280 -19% | 320 -8% | 379 10% | 367 6% |
| Brightness Distribution (%) | 98 | 84 -14% | 89 -9% | 81 -17% | 91 -7% | 97 -1% |
| Black Level * (cd/m²) | 0.35 | 0.21 | 0.18 | 0.06 | ||
| Colorchecker dE 2000 * | 2.42 | 2.47 -2% | 4.76 -97% | 6.84 -183% | 5.47 -126% | 2.1 13% |
| Colorchecker dE 2000 max. * | 4.05 | 4.32 -7% | 9 -122% | 12.52 -209% | 8.22 -103% | 4.1 -1% |
| Greyscale dE 2000 * | 2.1 | 2.26 -8% | 3.53 -68% | 12.94 -516% | 2.3 -10% | 1.4 33% |
| Gamma | 2.21 100% | 2.49 88% | 2.3 96% | 2.55 86% | 2.09 105% | 2.18 101% |
| CCT | 6364 102% | 6285 103% | 7228 90% | 6973 93% | 6340 103% | 6608 98% |
| Contrast (:1) | 1149 | 1424 | 2000 | 6033 | ||
| Colorchecker dE 2000 calibrated * | 2.36 | 2.54 | 4.61 | 2.5 | ||
| Color Space (Percent of AdobeRGB 1998) (%) | 99 | 56 | 63 | 87.8 | ||
| Color Space (Percent of sRGB) (%) | 86 | 97 | 100 | |||
| Total Average (Program / Settings) | -414% /
-227% | -580% /
-338% | -105% /
-114% | -2% /
-14% | -8% /
1% |
* ... smaller is better
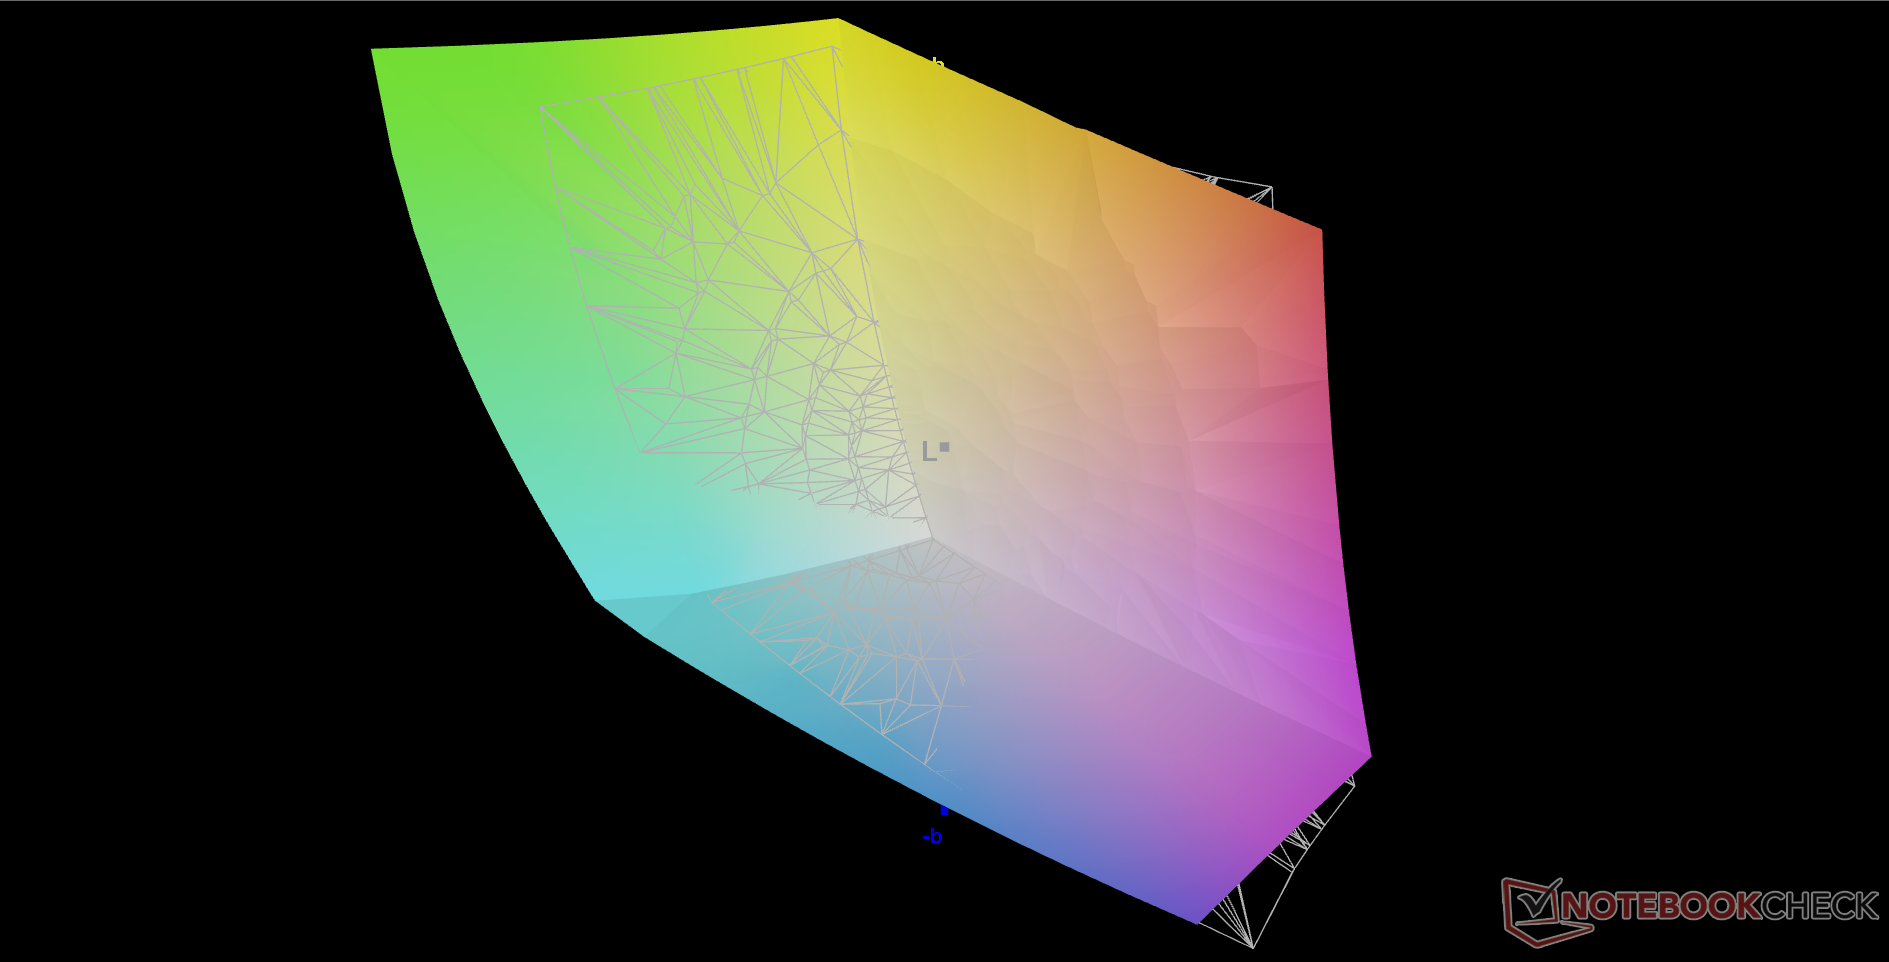
The display is set to sRGB by default out of the box even though the panel is capable of reproducing DCI-P3. Attempting to correct this via MyAsus or Windows does not appear to have an effect on the color profile.
Display Response Times
| ↔ Response Time Black to White | ||
|---|---|---|
| 2.3 ms ... rise ↗ and fall ↘ combined | ↗ 1.1 ms rise | 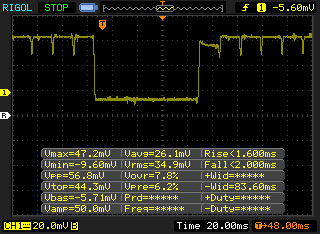 |
| ↘ 1.2 ms fall | ||
| The screen shows very fast response rates in our tests and should be very well suited for fast-paced gaming. In comparison, all tested devices range from 0.1 (minimum) to 240 (maximum) ms. » 12 % of all devices are better. This means that the measured response time is better than the average of all tested devices (19.8 ms). | ||
| ↔ Response Time 50% Grey to 80% Grey | ||
| 2.1 ms ... rise ↗ and fall ↘ combined | ↗ 1 ms rise | 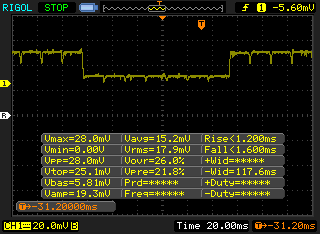 |
| ↘ 1.1 ms fall | ||
| The screen shows very fast response rates in our tests and should be very well suited for fast-paced gaming. In comparison, all tested devices range from 0.165 (minimum) to 636 (maximum) ms. » 11 % of all devices are better. This means that the measured response time is better than the average of all tested devices (31 ms). | ||
Screen Flickering / PWM (Pulse-Width Modulation)
| Screen flickering / PWM detected | 60.2 Hz | 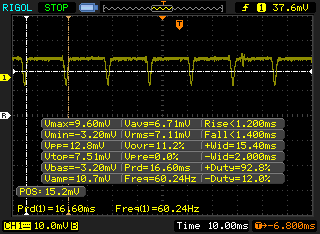 | |
The display backlight flickers at 60.2 Hz (worst case, e.g., utilizing PWM) . The frequency of 60.2 Hz is very low, so the flickering may cause eyestrain and headaches after extended use. In comparison: 52 % of all tested devices do not use PWM to dim the display. If PWM was detected, an average of 7747 (minimum: 5 - maximum: 343500) Hz was measured. | |||

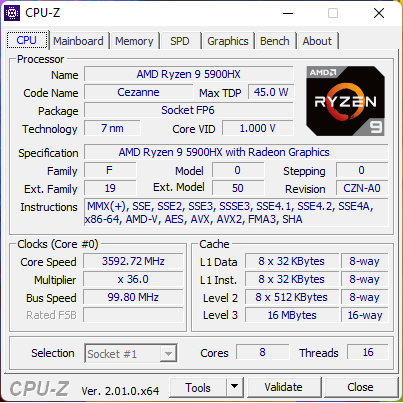
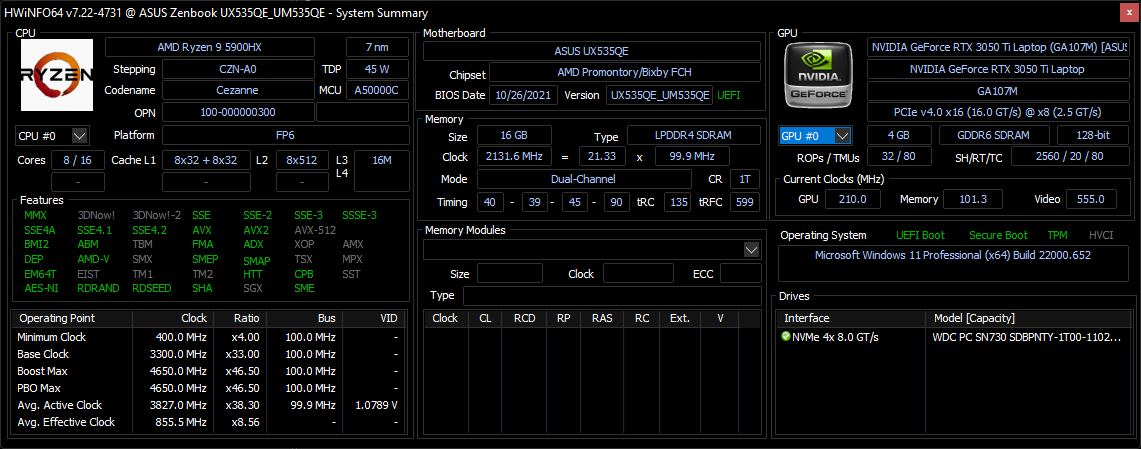
Performance — Zen 3 Ryzen 9 Is Still Top Tier
Testing Conditions
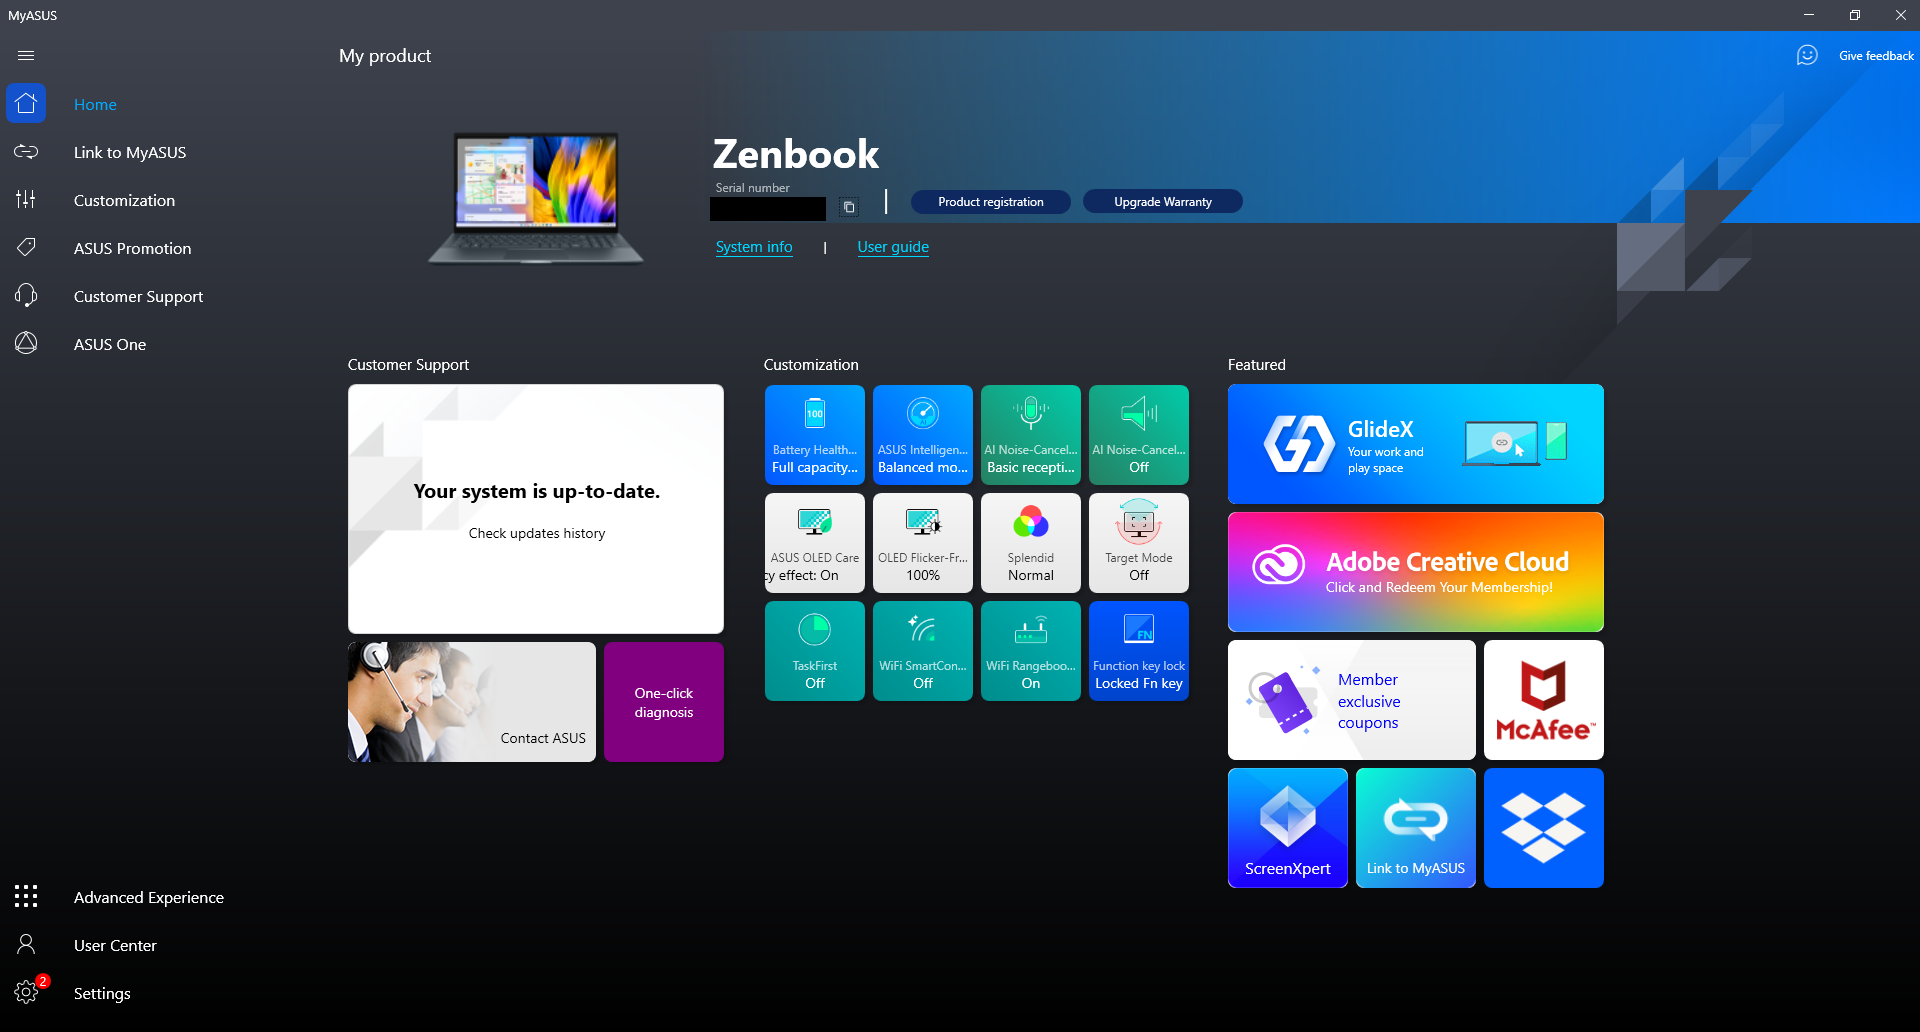
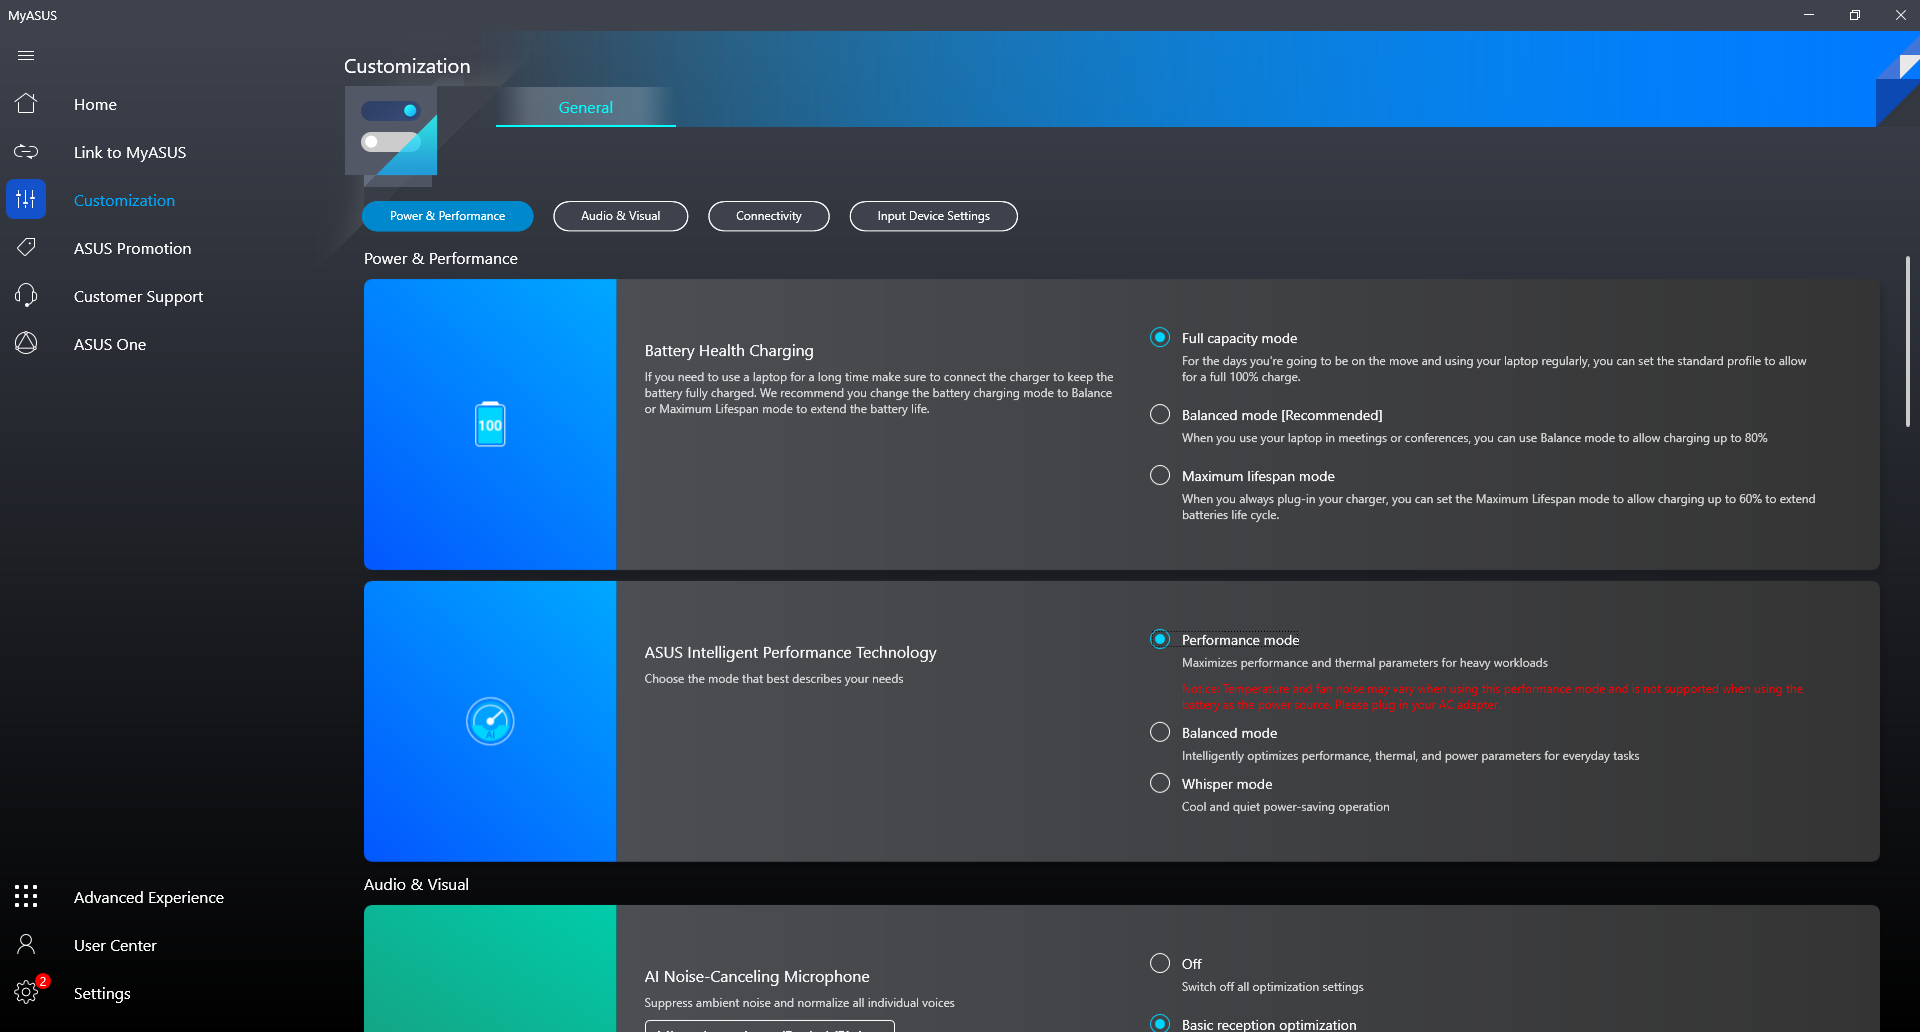
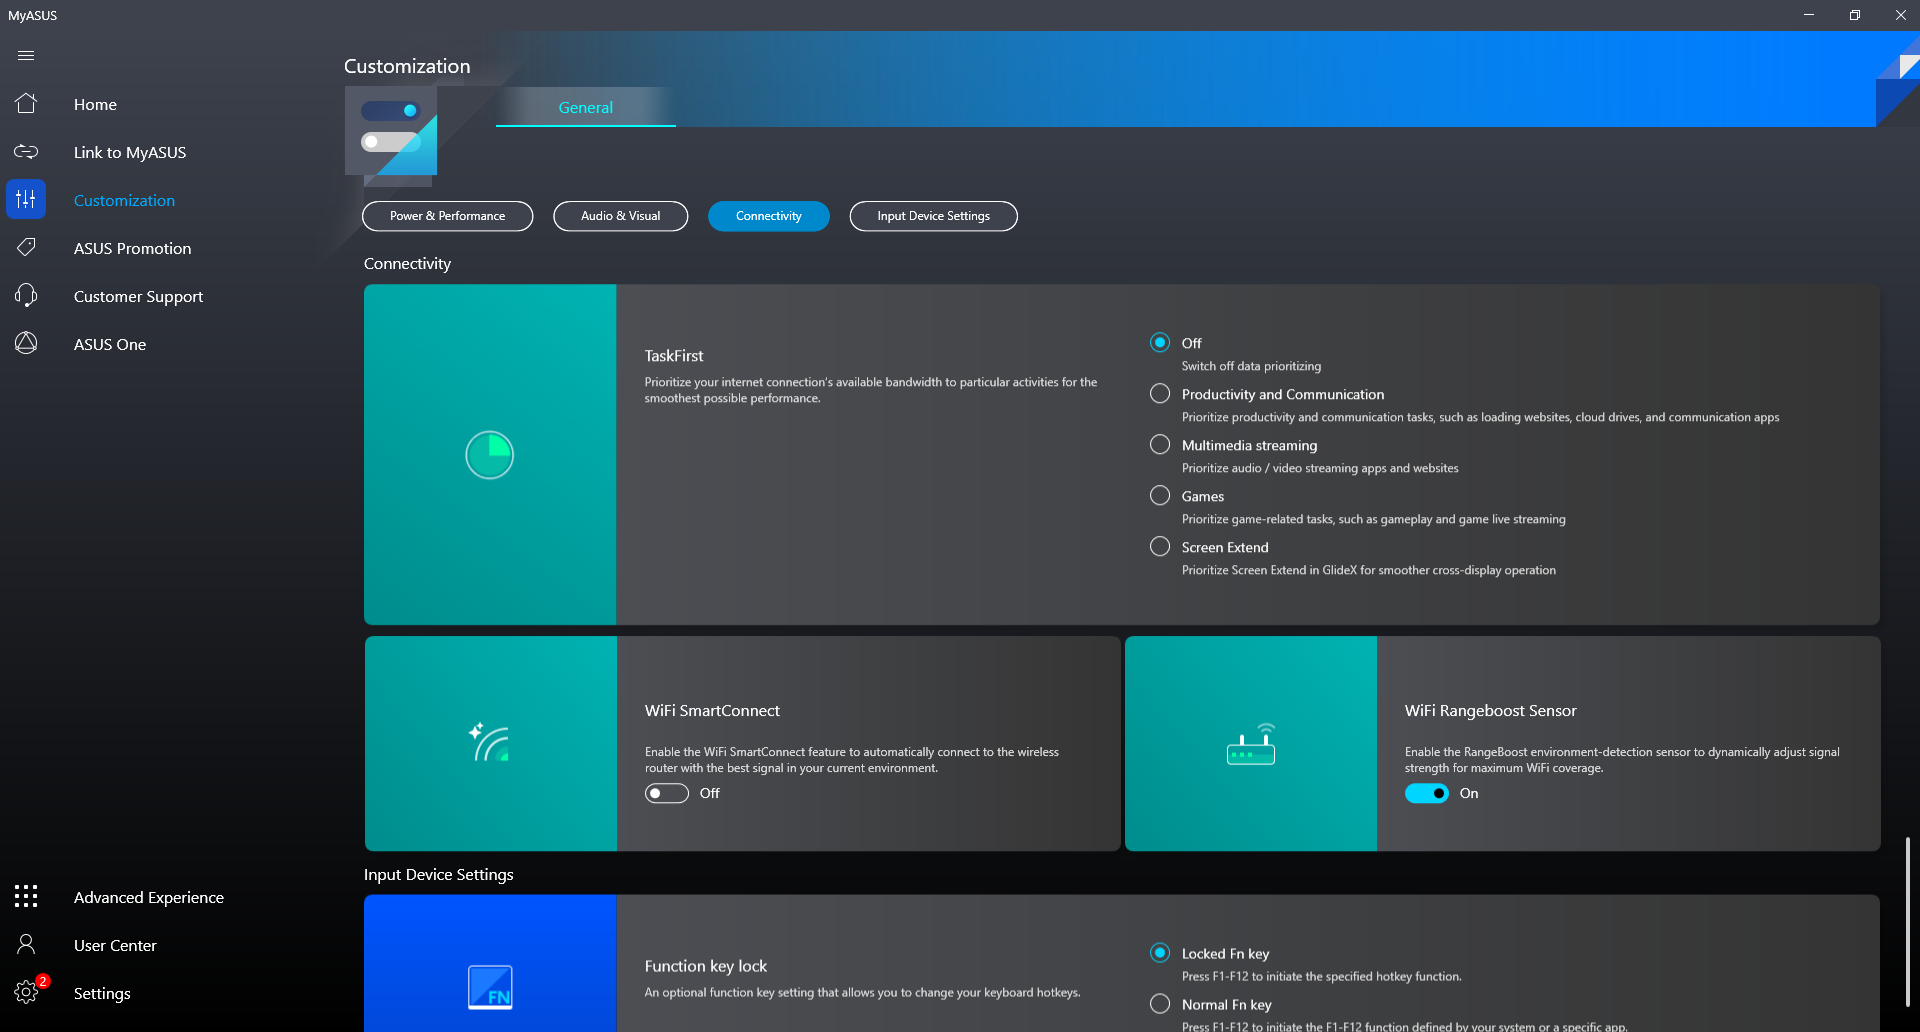
Our unit was set to Performance mode via both Windows and the MyAsus software prior to running any tests below for the highest possible scores. It's highly recommended that users become familiar with the MyAsus software as key features related to battery, performance, colors, and WiFi are all toggled here.
Optimus 1.0 comes standard for automatic switching between the CPU and Nvidia GPU. As expected, there is no MUX switch or internal G-Sync support since the Zenbook Pro 15 is not a gaming machine.
Processor
CPU performance and sustainability are both excellent and where we expect them to be relative to other laptops equipped with the same Ryzen 9 5900HX. Overall performance is only about 5 to 15 percent slower than the newest Zen 3+ Ryzen 9 6900HX and so users won't be missing very much by opting for the older 5900HX. The competing Core i7-12800H is about 25 percent slower in terms of raw multi-thread performance.
Cinebench R15 Multi Loop
Cinebench R23: Multi Core | Single Core
Cinebench R15: CPU Multi 64Bit | CPU Single 64Bit
Blender: v2.79 BMW27 CPU
7-Zip 18.03: 7z b 4 | 7z b 4 -mmt1
Geekbench 5.5: Multi-Core | Single-Core
HWBOT x265 Benchmark v2.2: 4k Preset
LibreOffice : 20 Documents To PDF
R Benchmark 2.5: Overall mean
* ... smaller is better
AIDA64: FP32 Ray-Trace | FPU Julia | CPU SHA3 | CPU Queen | FPU SinJulia | FPU Mandel | CPU AES | CPU ZLib | FP64 Ray-Trace | CPU PhotoWorxx
| Performance rating | |
| Asus Zenbook Pro 15 OLED UM535Q | |
| Average AMD Ryzen 9 5900HX | |
| Lenovo Yoga Creator 7 15IMH05 82DS000VGE | |
| Dell XPS 15 9510 11800H RTX 3050 Ti OLED -9! | |
| AIDA64 / FP32 Ray-Trace | |
| Asus Zenbook Pro 15 OLED UM535Q | |
| Average AMD Ryzen 9 5900HX (12470 - 16014, n=26) | |
| Lenovo Yoga Creator 7 15IMH05 82DS000VGE | |
| AIDA64 / FPU Julia | |
| Asus Zenbook Pro 15 OLED UM535Q | |
| Average AMD Ryzen 9 5900HX (79554 - 101008, n=26) | |
| Lenovo Yoga Creator 7 15IMH05 82DS000VGE | |
| AIDA64 / CPU SHA3 | |
| Asus Zenbook Pro 15 OLED UM535Q | |
| Average AMD Ryzen 9 5900HX (2754 - 3444, n=26) | |
| Lenovo Yoga Creator 7 15IMH05 82DS000VGE | |
| AIDA64 / CPU Queen | |
| Asus Zenbook Pro 15 OLED UM535Q | |
| Average AMD Ryzen 9 5900HX (87865 - 105123, n=26) | |
| Lenovo Yoga Creator 7 15IMH05 82DS000VGE | |
| AIDA64 / FPU SinJulia | |
| Asus Zenbook Pro 15 OLED UM535Q | |
| Average AMD Ryzen 9 5900HX (10899 - 12806, n=26) | |
| Lenovo Yoga Creator 7 15IMH05 82DS000VGE | |
| AIDA64 / FPU Mandel | |
| Asus Zenbook Pro 15 OLED UM535Q | |
| Average AMD Ryzen 9 5900HX (43685 - 55702, n=26) | |
| Lenovo Yoga Creator 7 15IMH05 82DS000VGE | |
| AIDA64 / CPU AES | |
| Asus Zenbook Pro 15 OLED UM535Q | |
| Average AMD Ryzen 9 5900HX (109927 - 137901, n=26) | |
| Lenovo Yoga Creator 7 15IMH05 82DS000VGE | |
| AIDA64 / CPU ZLib | |
| Asus Zenbook Pro 15 OLED UM535Q | |
| Average AMD Ryzen 9 5900HX (706 - 878, n=26) | |
| Lenovo Yoga Creator 7 15IMH05 82DS000VGE | |
| Dell XPS 15 9510 11800H RTX 3050 Ti OLED | |
| AIDA64 / FP64 Ray-Trace | |
| Asus Zenbook Pro 15 OLED UM535Q | |
| Average AMD Ryzen 9 5900HX (6664 - 8644, n=26) | |
| Lenovo Yoga Creator 7 15IMH05 82DS000VGE | |
| AIDA64 / CPU PhotoWorxx | |
| Lenovo Yoga Creator 7 15IMH05 82DS000VGE | |
| Asus Zenbook Pro 15 OLED UM535Q | |
| Average AMD Ryzen 9 5900HX (14344 - 25533, n=26) | |
System Performance
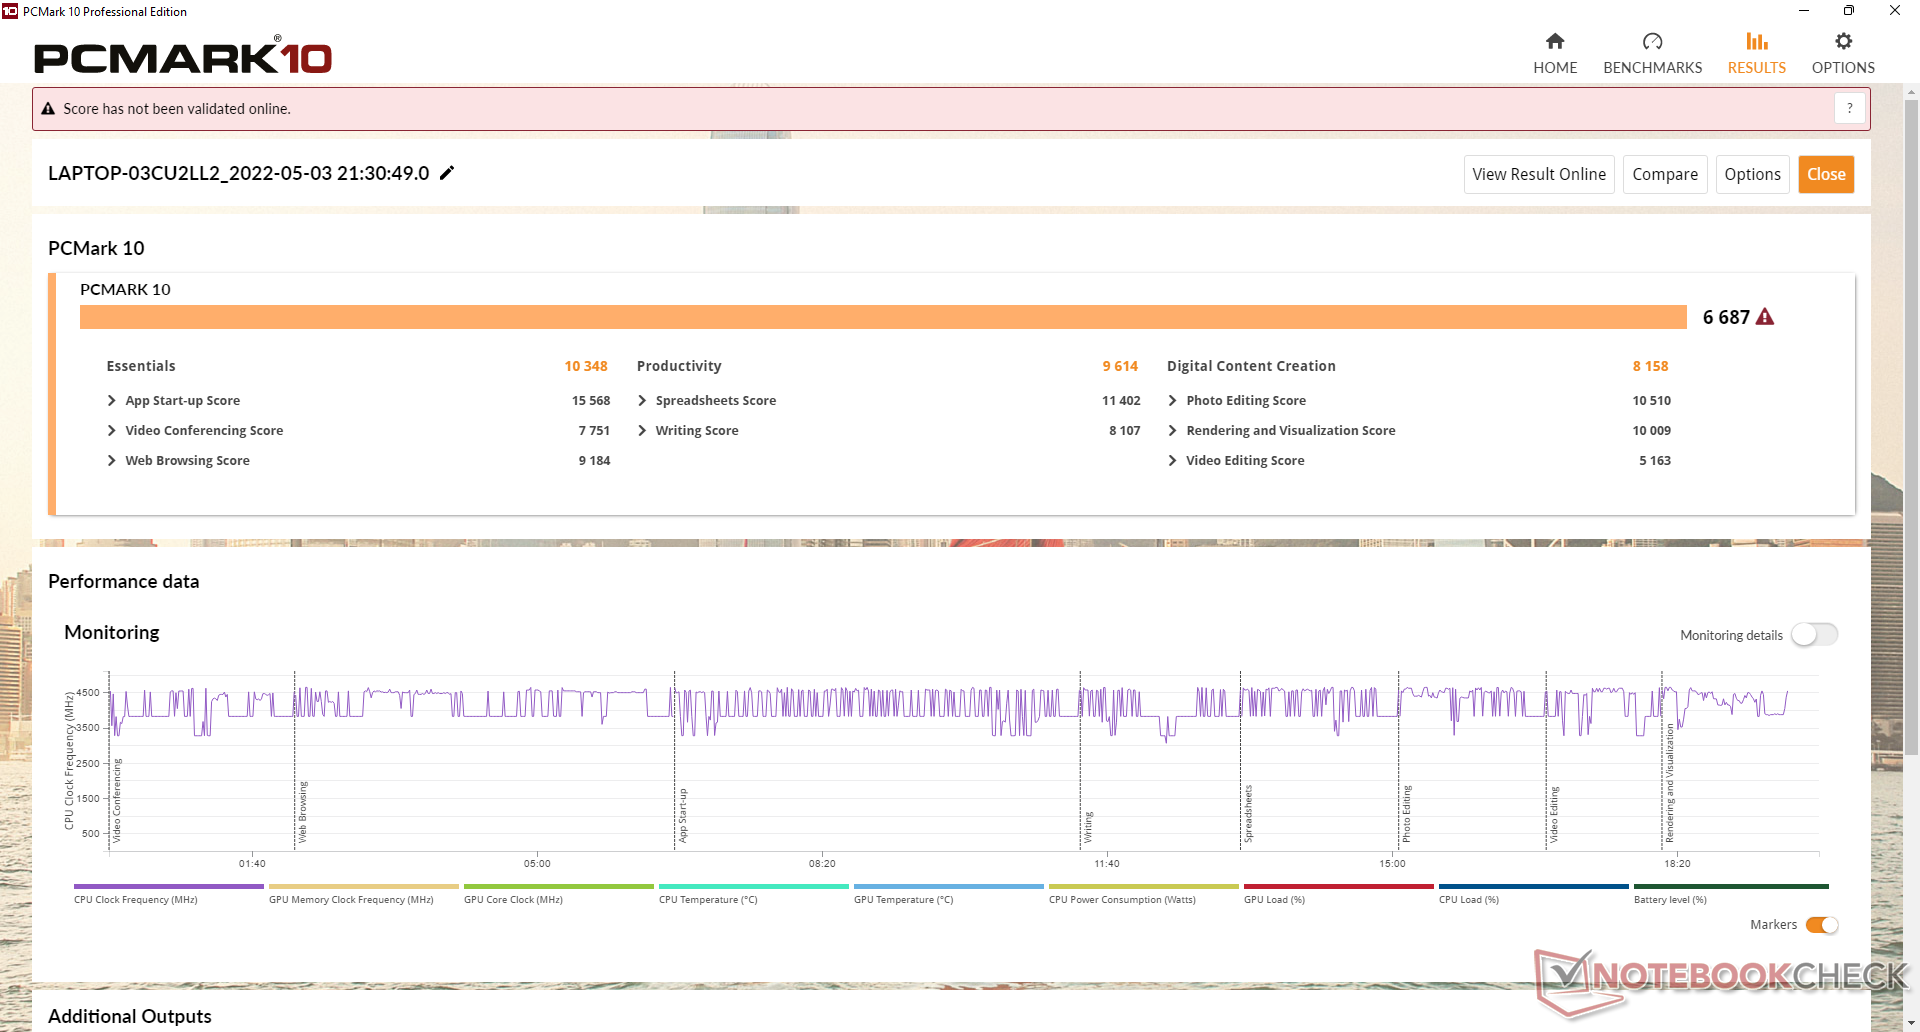
PCMark 10 scores are consistently higher than on the older 2020 UX535 due to the significant increase in both CPU and GPU performance. We experienced no software issues during our time with the test unit save for the narrower-than-expected default color space.
CrossMark: Overall | Productivity | Creativity | Responsiveness
| PCMark 10 / Score | |
| Asus Zenbook Pro 15 OLED UM535Q | |
| Average AMD Ryzen 9 5900HX, NVIDIA GeForce RTX 3050 Ti Laptop GPU (6592 - 6687, n=2) | |
| Dell XPS 15 9510 11800H RTX 3050 Ti OLED | |
| HP Envy 15-ep0098nr | |
| Lenovo Yoga Creator 7 15IMH05 82DS000VGE | |
| Asus ZenBook UX535-M01440 | |
| Asus ZenBook 15 UX534FTC-A8190T | |
| PCMark 10 / Essentials | |
| Average AMD Ryzen 9 5900HX, NVIDIA GeForce RTX 3050 Ti Laptop GPU (10348 - 10491, n=2) | |
| Asus Zenbook Pro 15 OLED UM535Q | |
| Dell XPS 15 9510 11800H RTX 3050 Ti OLED | |
| HP Envy 15-ep0098nr | |
| Lenovo Yoga Creator 7 15IMH05 82DS000VGE | |
| Asus ZenBook UX535-M01440 | |
| Asus ZenBook 15 UX534FTC-A8190T | |
| PCMark 10 / Productivity | |
| Average AMD Ryzen 9 5900HX, NVIDIA GeForce RTX 3050 Ti Laptop GPU (9614 - 9665, n=2) | |
| Asus Zenbook Pro 15 OLED UM535Q | |
| Dell XPS 15 9510 11800H RTX 3050 Ti OLED | |
| HP Envy 15-ep0098nr | |
| Lenovo Yoga Creator 7 15IMH05 82DS000VGE | |
| Asus ZenBook 15 UX534FTC-A8190T | |
| Asus ZenBook UX535-M01440 | |
| PCMark 10 / Digital Content Creation | |
| Asus Zenbook Pro 15 OLED UM535Q | |
| Average AMD Ryzen 9 5900HX, NVIDIA GeForce RTX 3050 Ti Laptop GPU (7667 - 8158, n=2) | |
| Dell XPS 15 9510 11800H RTX 3050 Ti OLED | |
| HP Envy 15-ep0098nr | |
| Lenovo Yoga Creator 7 15IMH05 82DS000VGE | |
| Asus ZenBook UX535-M01440 | |
| Asus ZenBook 15 UX534FTC-A8190T | |
| CrossMark / Overall | |
| Asus Zenbook Pro 15 OLED UM535Q | |
| Average AMD Ryzen 9 5900HX, NVIDIA GeForce RTX 3050 Ti Laptop GPU (n=1) | |
| CrossMark / Productivity | |
| Asus Zenbook Pro 15 OLED UM535Q | |
| Average AMD Ryzen 9 5900HX, NVIDIA GeForce RTX 3050 Ti Laptop GPU (n=1) | |
| CrossMark / Creativity | |
| Asus Zenbook Pro 15 OLED UM535Q | |
| Average AMD Ryzen 9 5900HX, NVIDIA GeForce RTX 3050 Ti Laptop GPU (n=1) | |
| CrossMark / Responsiveness | |
| Asus Zenbook Pro 15 OLED UM535Q | |
| Average AMD Ryzen 9 5900HX, NVIDIA GeForce RTX 3050 Ti Laptop GPU (n=1) | |
| PCMark 10 Score | 6687 points | |
Help | ||
| AIDA64 / Memory Copy | |
| Asus Zenbook Pro 15 OLED UM535Q | |
| Average AMD Ryzen 9 5900HX (36725 - 43318, n=26) | |
| Lenovo Yoga Creator 7 15IMH05 82DS000VGE | |
| AIDA64 / Memory Read | |
| Average AMD Ryzen 9 5900HX (41378 - 47593, n=26) | |
| Asus Zenbook Pro 15 OLED UM535Q | |
| Lenovo Yoga Creator 7 15IMH05 82DS000VGE | |
| AIDA64 / Memory Write | |
| Asus Zenbook Pro 15 OLED UM535Q | |
| Average AMD Ryzen 9 5900HX (32536 - 46718, n=26) | |
| Lenovo Yoga Creator 7 15IMH05 82DS000VGE | |
| AIDA64 / Memory Latency | |
| Asus Zenbook Pro 15 OLED UM535Q | |
| Average AMD Ryzen 9 5900HX (73.5 - 97.1, n=26) | |
| Lenovo Yoga Creator 7 15IMH05 82DS000VGE | |
| Dell XPS 15 9510 11800H RTX 3050 Ti OLED | |
* ... smaller is better
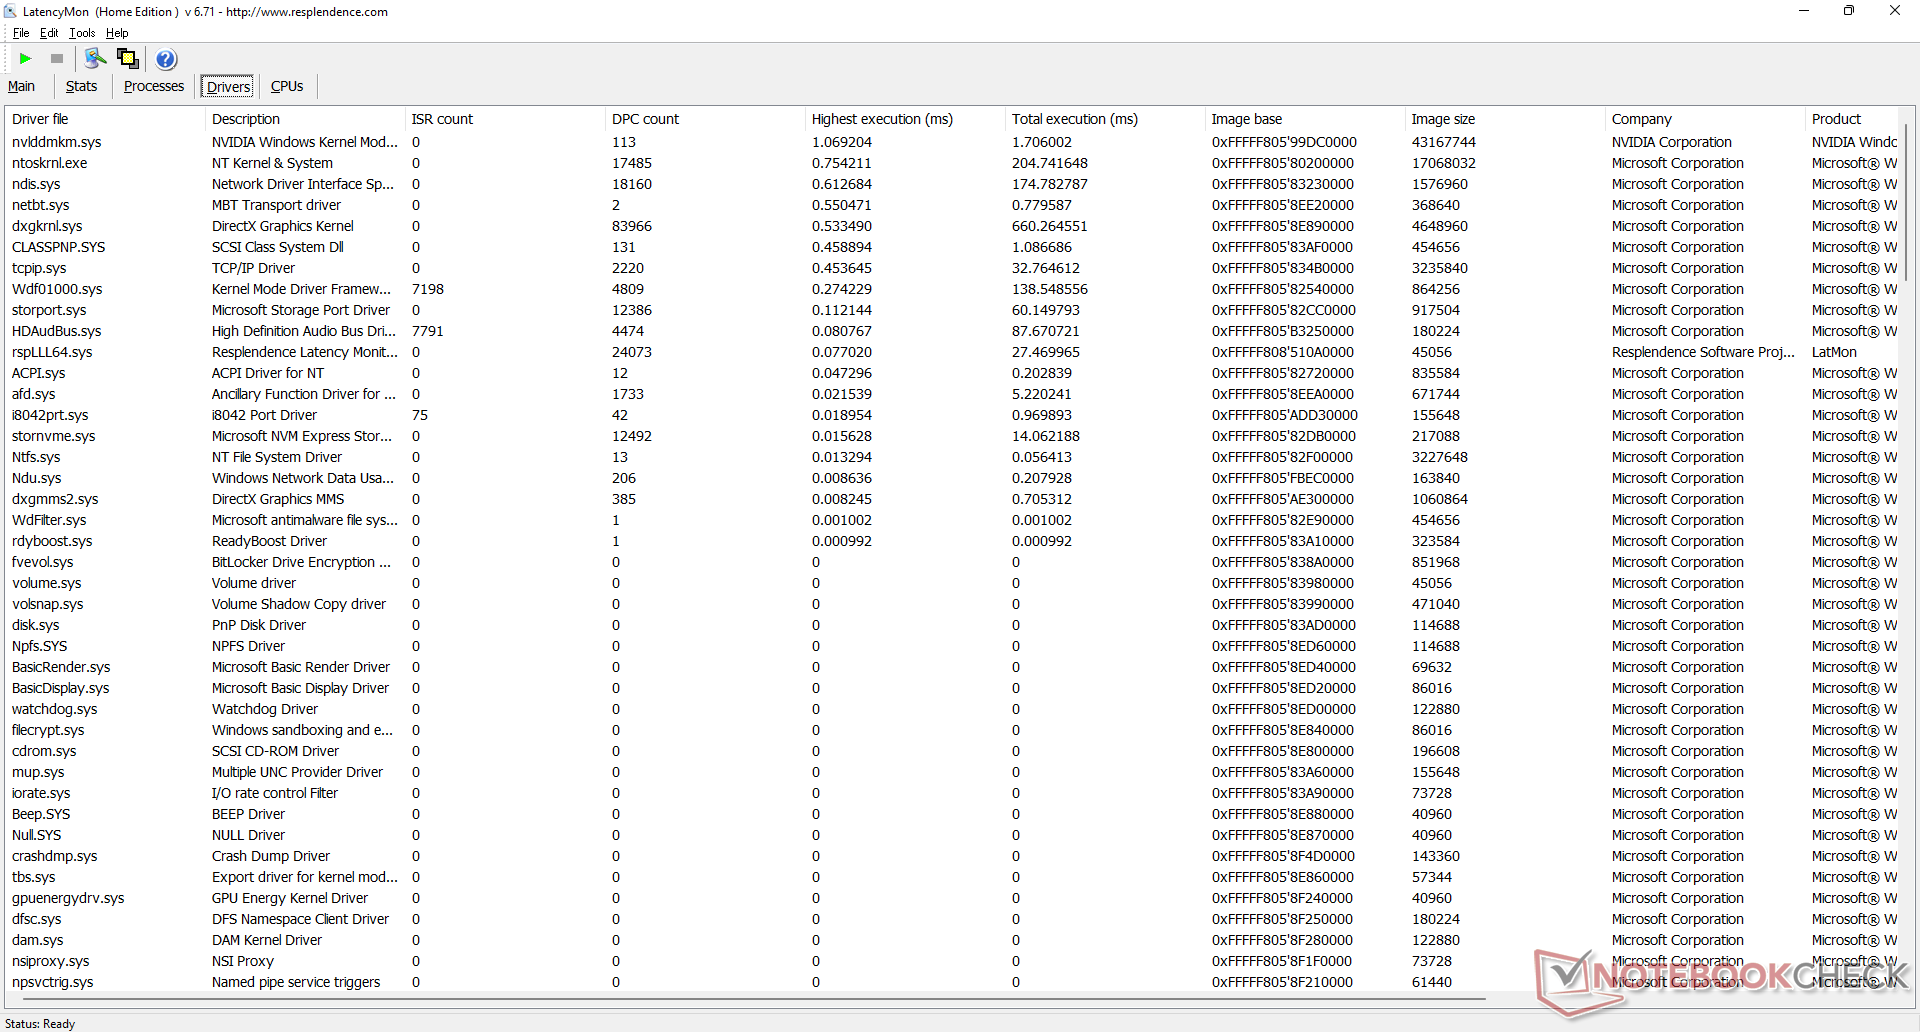
DPC Latency
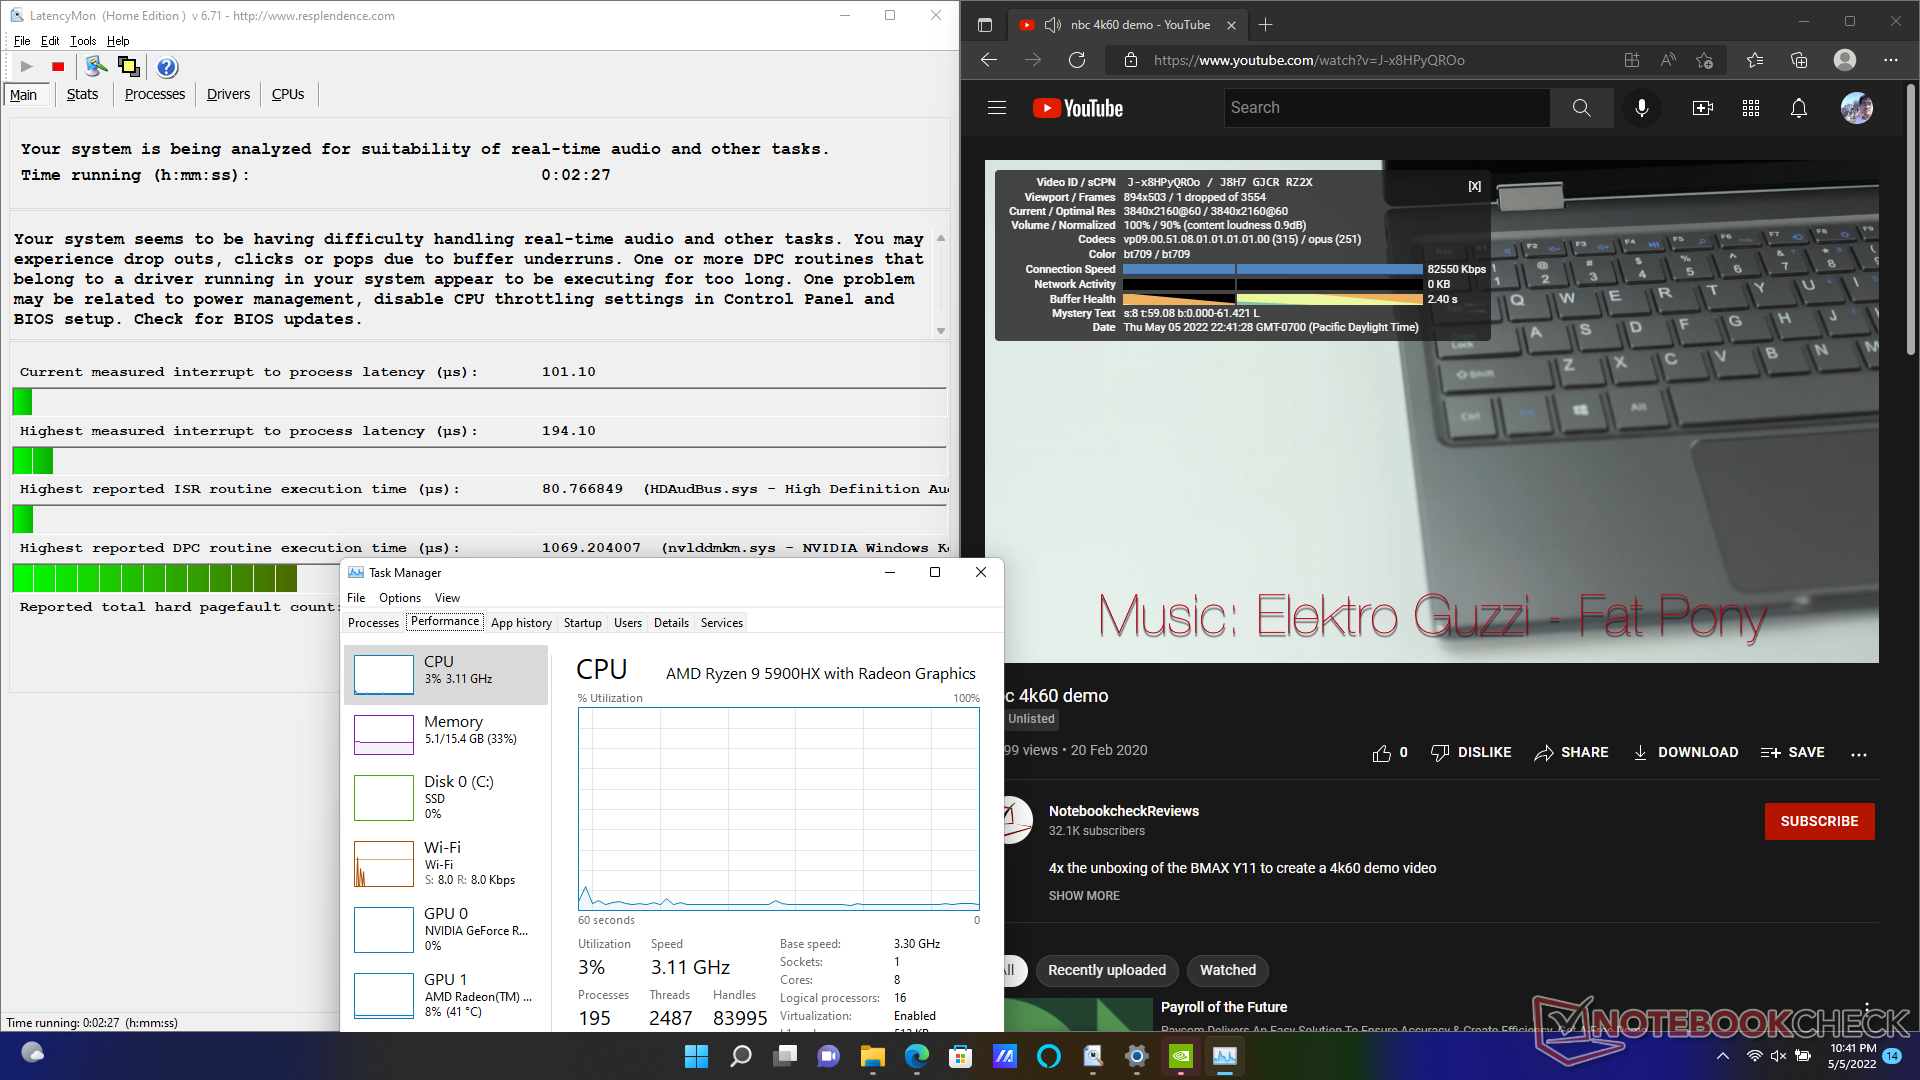
LatencyMon reveals minor DPC issues when opening multiple browser tabs of our homepage. 4K video playback at 60 FPS is otherwise perfect with just a single dropped frame during our minute-long test video.
| DPC Latencies / LatencyMon - interrupt to process latency (max), Web, Youtube, Prime95 | |
| HP Envy 15-ep0098nr | |
| Dell XPS 15 9510 11800H RTX 3050 Ti OLED | |
| Asus ZenBook UX535-M01440 | |
| Lenovo Yoga Creator 7 15IMH05 82DS000VGE | |
| Asus Zenbook Pro 15 OLED UM535Q | |
* ... smaller is better
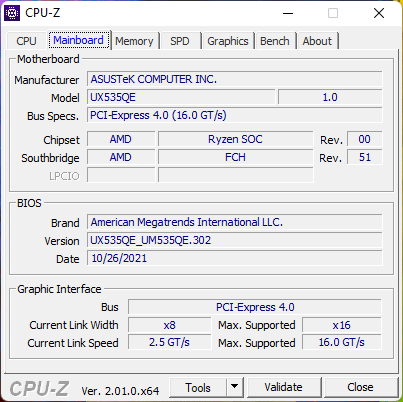
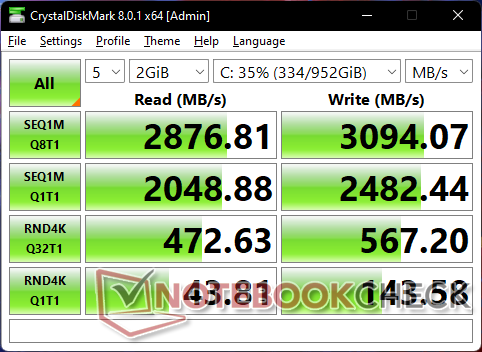
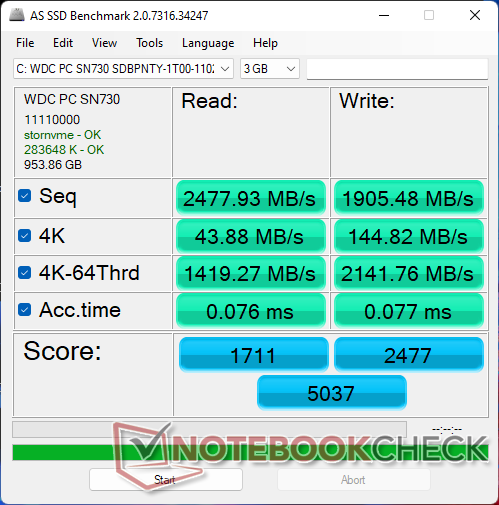
Storage Devices — Up To PCIe3 x4 Only
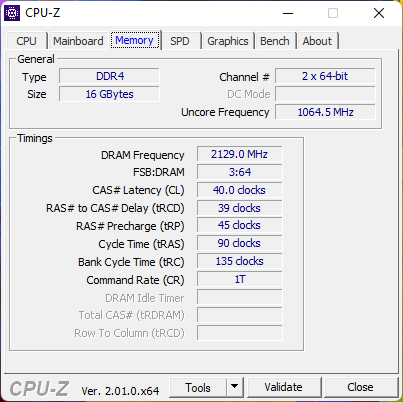
Our test unit ships with a midrange 1 TB WDC PC SN730 NVMe SSD offering sequential read and write rates of about 2900 MB/s and 3000 MB/s, respectively. The drive has no issues sustaining its maximum transfer rates for extended periods when running DiskSpd in a loop. PCIe4 speeds are not supported due to the Zen 3 chipset.

* ... smaller is better
Disk Throttling: DiskSpd Read Loop, Queue Depth 8
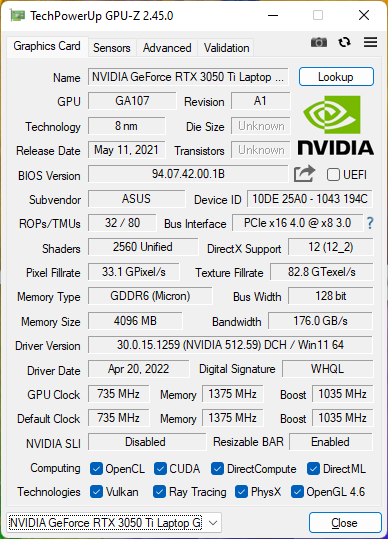
GPU Performance — The GTX 1660 Ti Would Have Been Better
The GeForce RTX 3050 Ti is a disappointing GPU. Though it's significantly faster than the entry-level GTX 1650, it falls short of the less expensive GTX 1660 Ti by roughly 20 percent. Its ray-tracing performance is significantly slower than the already slow mobile RTX 2060 as well.
Running on Balanced mode instead of Performance mode impacts GPU performance while CPU performance remains about the same. A Fire Strike test on Balanced mode would return a 9 percent smaller Graphics score.
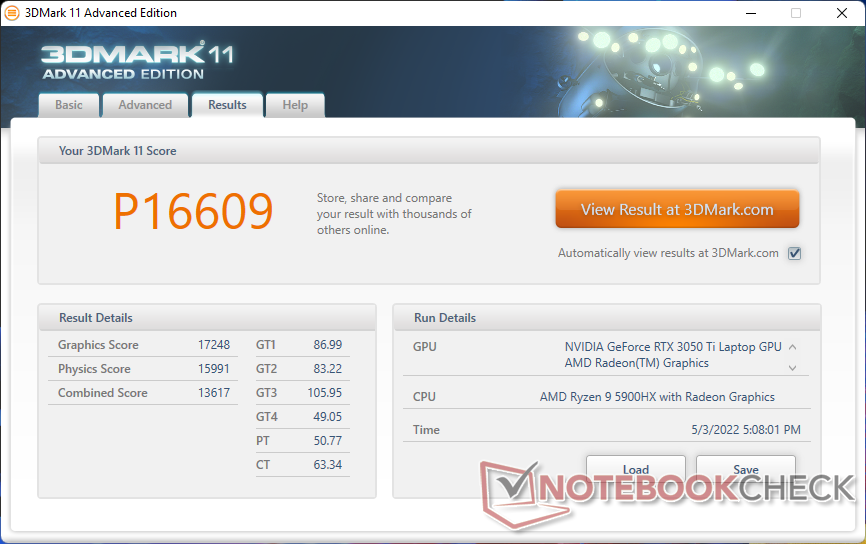
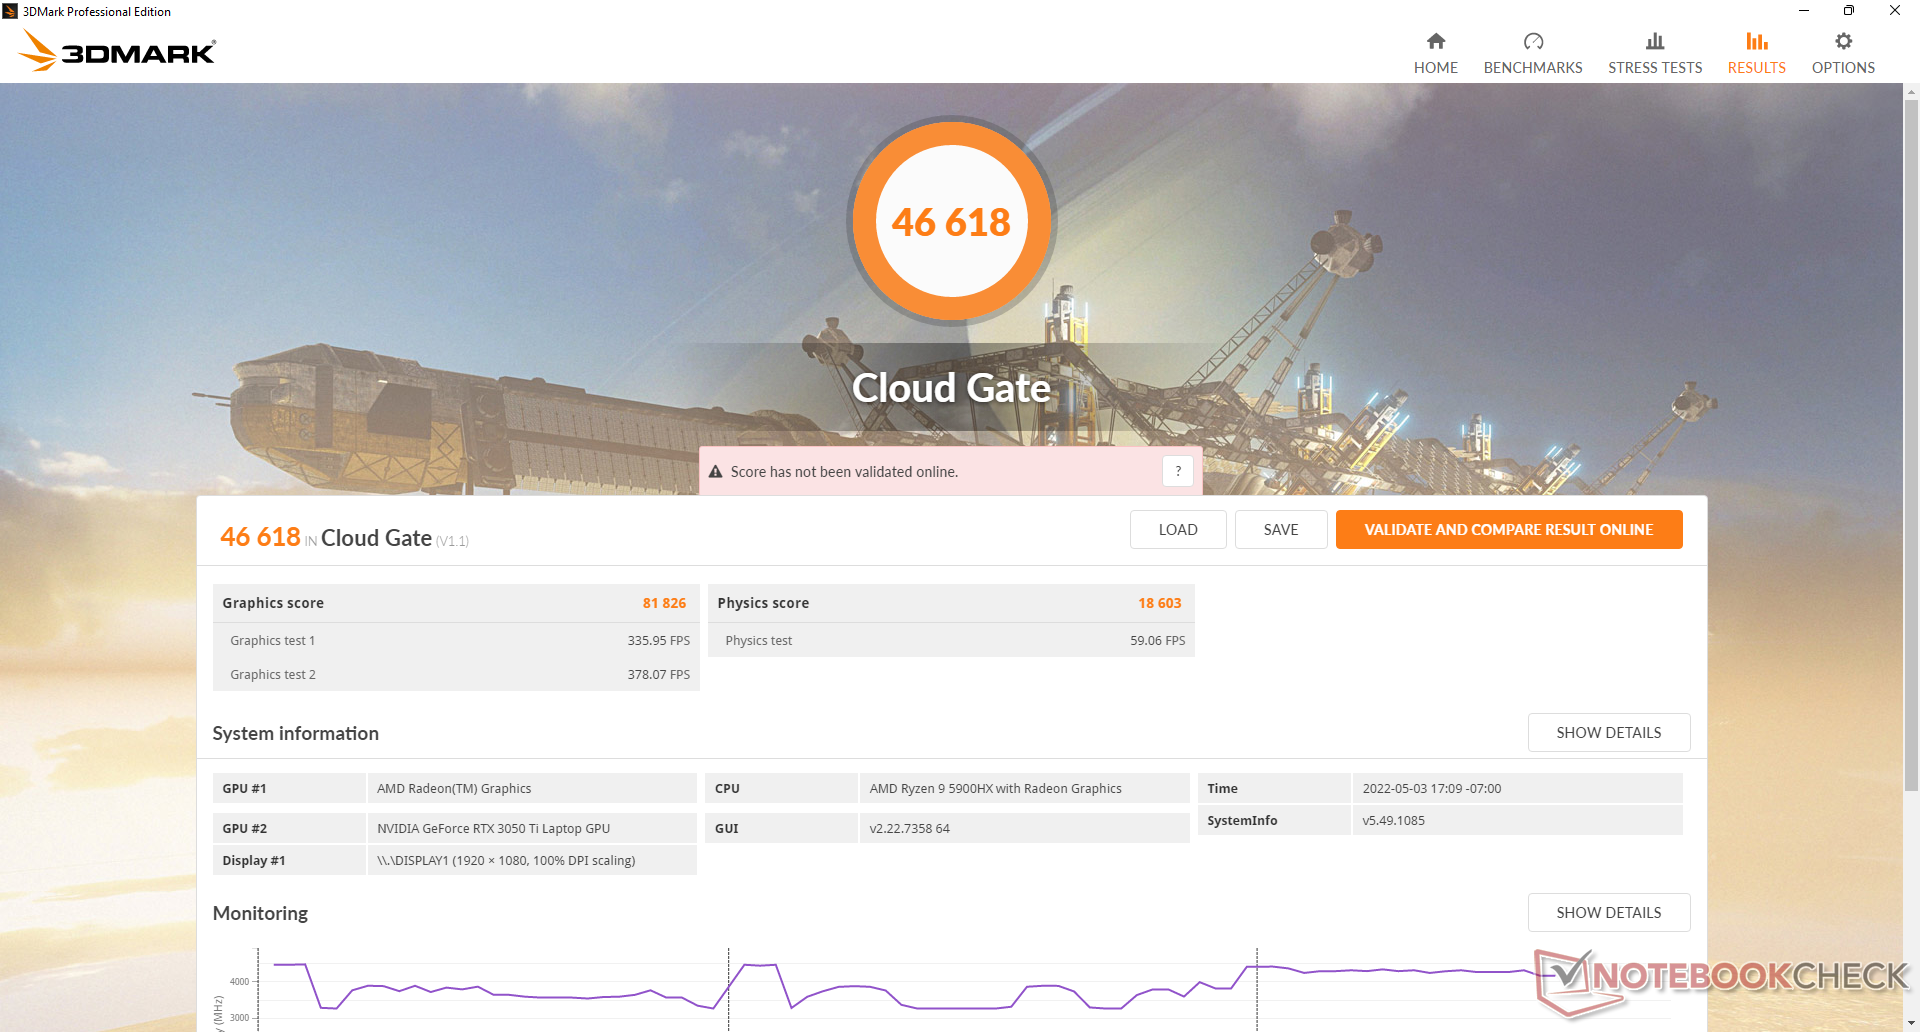
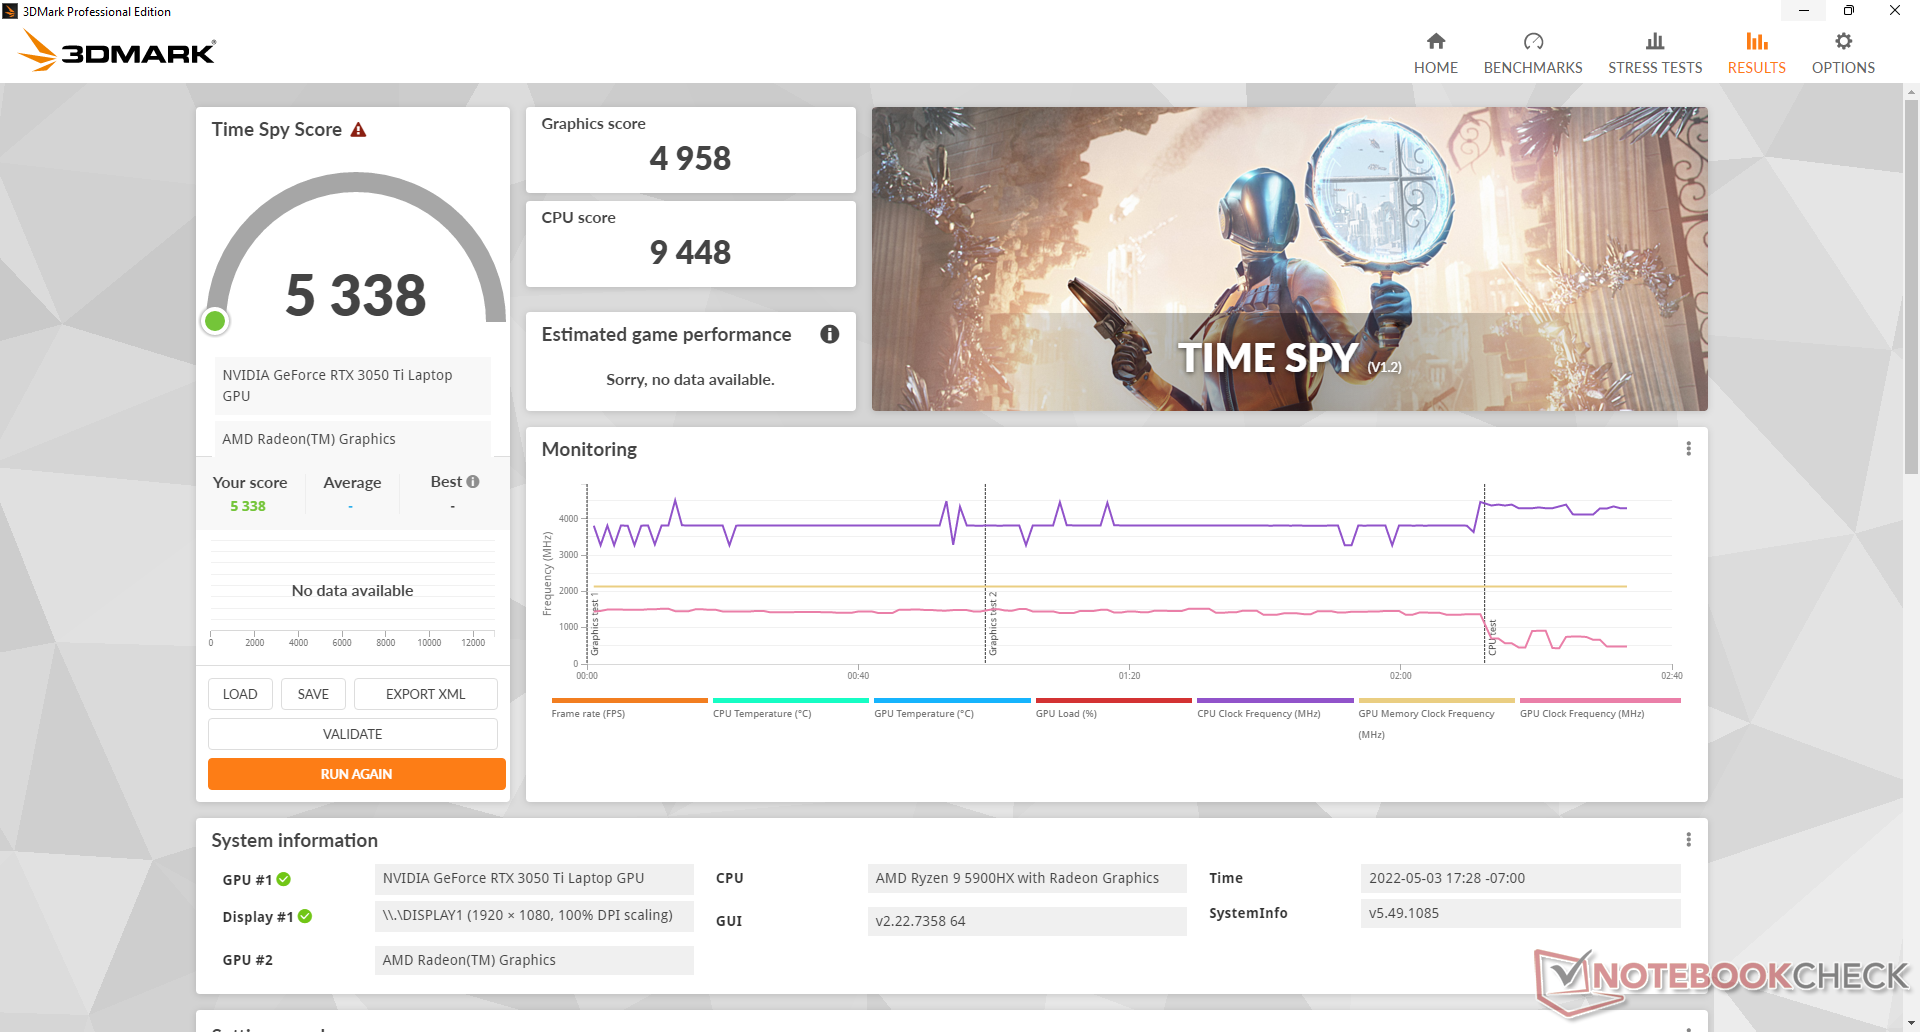
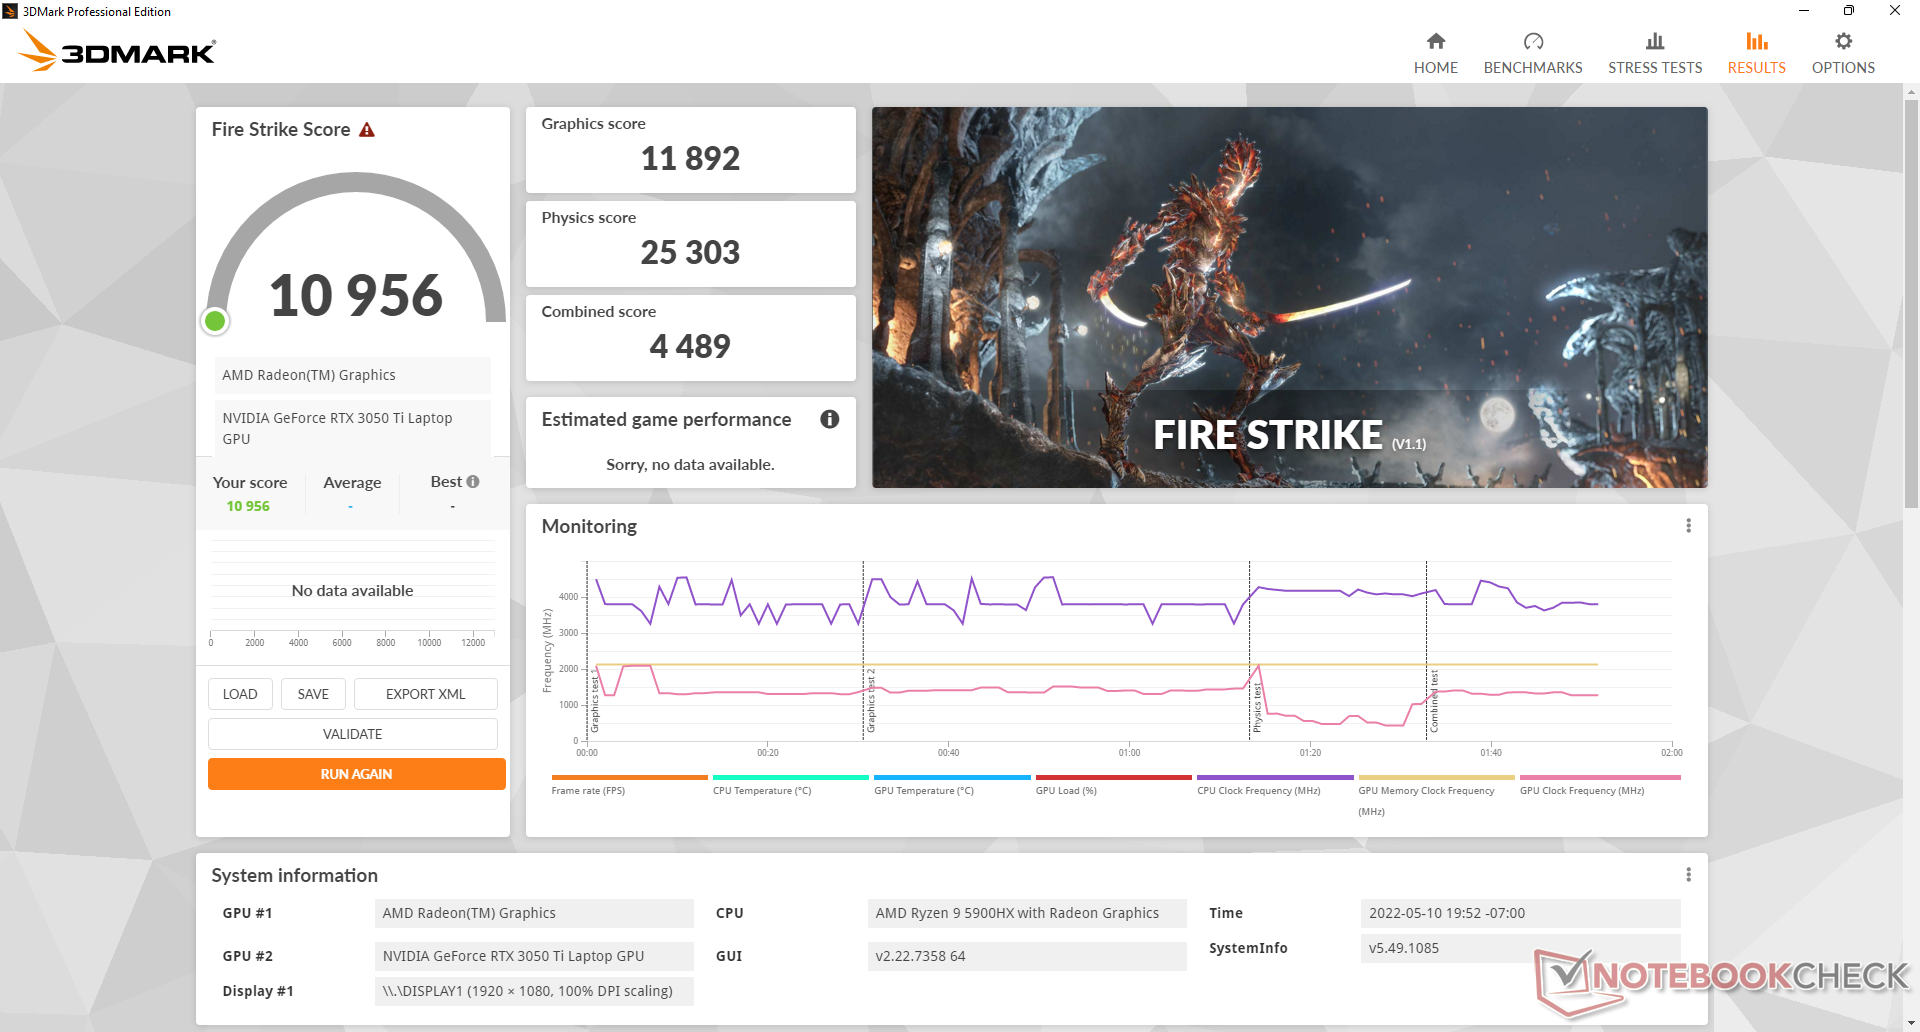

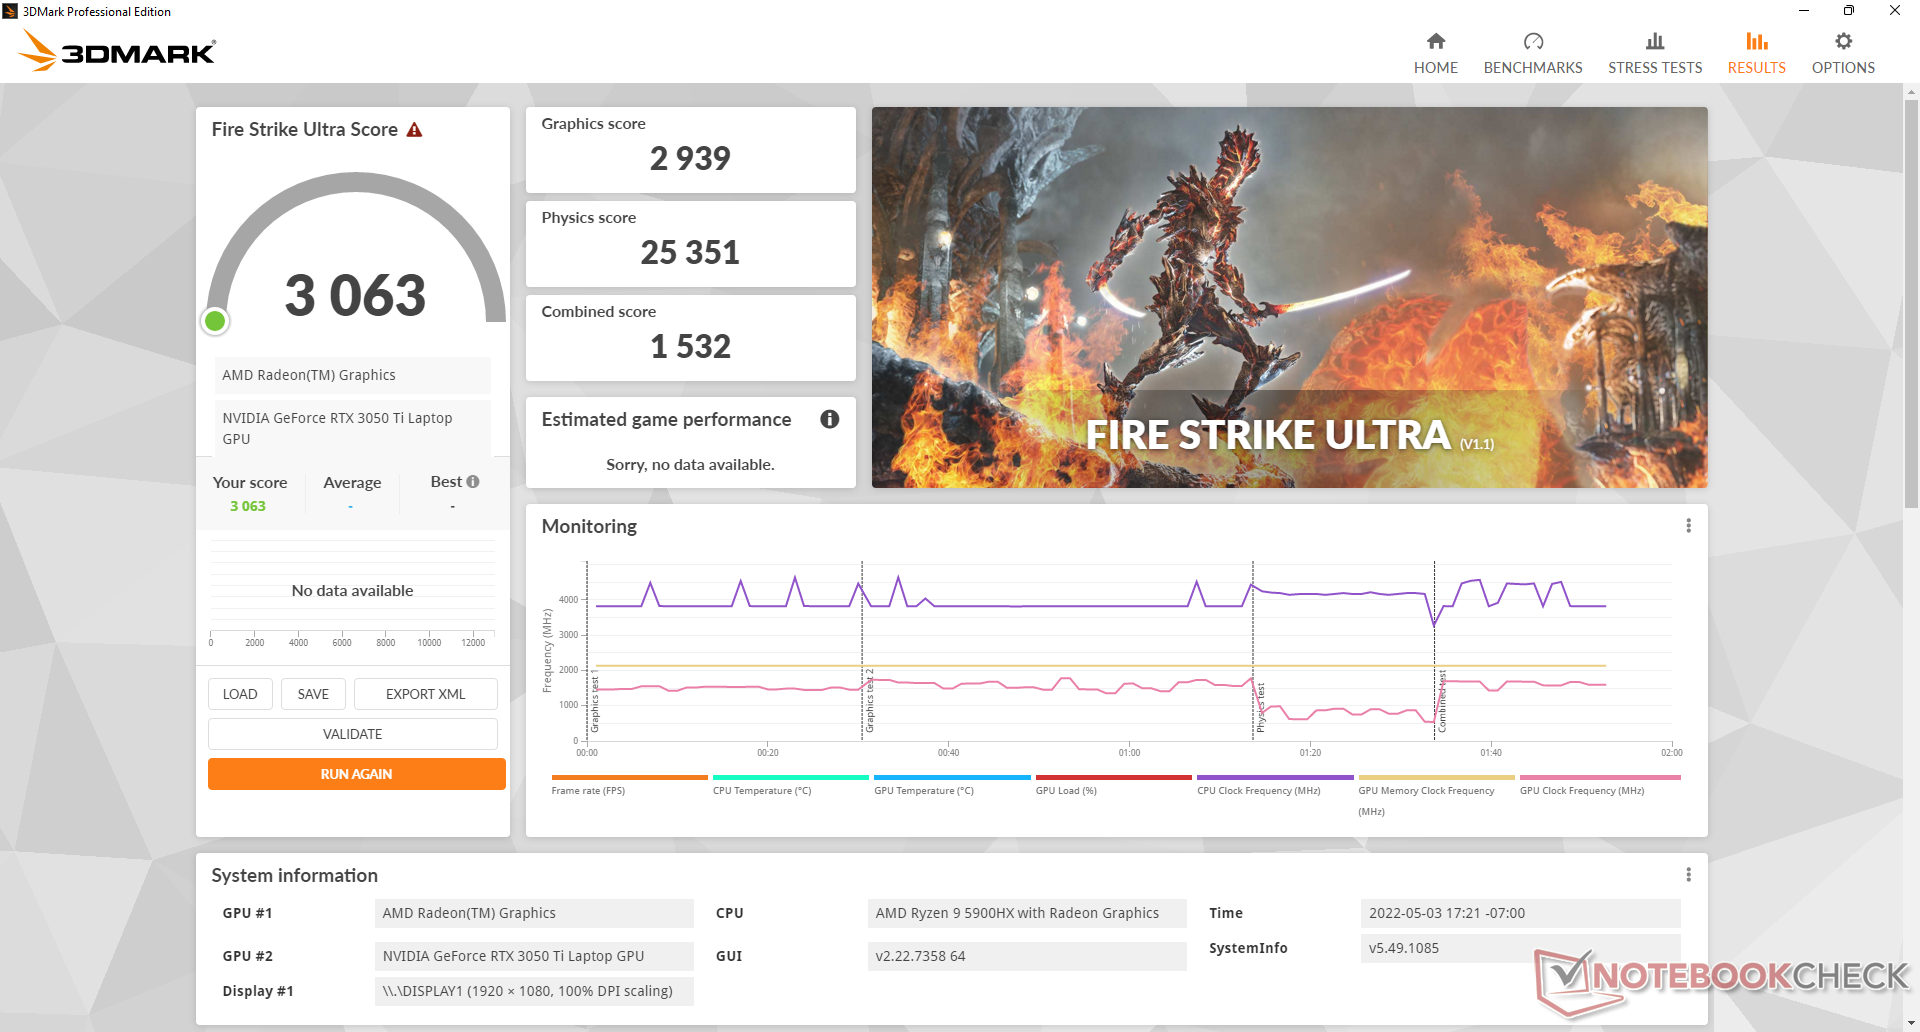
| 3DMark 11 Performance | 16609 points | |
| 3DMark Cloud Gate Standard Score | 46618 points | |
| 3DMark Fire Strike Score | 11932 points | |
| 3DMark Time Spy Score | 5338 points | |
Help | ||
Witcher 3 FPS Chart
| low | med. | high | ultra | |
|---|---|---|---|---|
| GTA V (2015) | 172.8 | 167.2 | 123.7 | 66.7 |
| The Witcher 3 (2015) | 220 | 161.6 | 92.1 | 49.9 |
| Dota 2 Reborn (2015) | 133.6 | 123.7 | 116.9 | 112.1 |
| Final Fantasy XV Benchmark (2018) | 115.9 | 71 | 50.2 | |
| X-Plane 11.11 (2018) | 96.6 | 84 | 68.5 | |
| Strange Brigade (2018) | 259 | 126.9 | 102.1 | 87.5 |
| Cyberpunk 2077 1.6 (2022) | 70.6 | 59 | 44.5 | 44 |
Emissions
System Noise — Quiet When Browsing, Loud When Gaming
Fan noise is dependent on the three MyAsus power profile settings: Performance, Balanced, and Whisper. Even when on Performance, however, the fans are barely noticeable when browsing or streaming. They tend to hover around 26 to 28 dB(A) when under such loads against a silent background of 22.8 dB(A).
Running Witcher 3 on Balanced and Performance mode would result in a steady fan noise of 34.7 dB(A) and 47.3 dB(A), respectively. Users may want to consider gaming in Balanced mode for the much quieter fan noise despite the slight performance deficit mentioned above. Fan noise when running high loads is louder than on the Dell XPS 15 9510 but quieter than on the more powerful HP Envy 15.
Fan noise can reach 53 dB(A) when both the CPU and GPU are at maximum utilization to be louder than most other 15.6-inch multimedia laptops.

Noise level
| Idle |
| 22.9 / 22.9 / 22.9 dB(A) |
| Load |
| 33.2 / 52.8 dB(A) |
 | ||
30 dB silent 40 dB(A) audible 50 dB(A) loud |
||
min: | ||
| Asus Zenbook Pro 15 OLED UM535Q GeForce RTX 3050 Ti Laptop GPU, R9 5900HX, WDC PC SN730 SDBPNTY-1T00 | Asus ZenBook UX535-M01440 GeForce GTX 1650 Ti Max-Q, i7-10750H, WDC PC SN730 SDBPNTY-1T00 | Asus ZenBook 15 UX534FTC-A8190T GeForce GTX 1650 Max-Q, i7-10510U, Samsung SSD PM981 MZVLB1T0HALR | Lenovo Yoga Creator 7 15IMH05 82DS000VGE GeForce GTX 1650 Mobile, i7-10750H, Samsung PM981a MZVLB1T0HBLR | HP Envy 15-ep0098nr GeForce RTX 2060 Max-Q, i7-10750H, Intel Optane Memory H10 with Solid State Storage 32GB + 512GB HBRPEKNX0202A(L/H) | Dell XPS 15 9510 11800H RTX 3050 Ti OLED GeForce RTX 3050 Ti Laptop GPU, i7-11800H, Micron 2300 512GB MTFDHBA512TDV | |
|---|---|---|---|---|---|---|
| Noise | -3% | -11% | -8% | -30% | 4% | |
| off / environment * (dB) | 22.8 | 24.6 -8% | 30.3 -33% | 24.9 -9% | 26.4 -16% | 23.8 -4% |
| Idle Minimum * (dB) | 22.9 | 24.6 -7% | 30.3 -32% | 24.9 -9% | 32.2 -41% | 23.8 -4% |
| Idle Average * (dB) | 22.9 | 24.6 -7% | 30.3 -32% | 24.9 -9% | 32.2 -41% | 23.8 -4% |
| Idle Maximum * (dB) | 22.9 | 24.6 -7% | 30.9 -35% | 30.8 -34% | 32.2 -41% | 23.8 -4% |
| Load Average * (dB) | 33.2 | 41.3 -24% | 31.3 6% | 41.9 -26% | 48.3 -45% | 36 -8% |
| Witcher 3 ultra * (dB) | 47.3 | 42 11% | 38.1 19% | 41.9 11% | 53.7 -14% | 36 24% |
| Load Maximum * (dB) | 52.8 | 41.4 22% | 38.2 28% | 41.7 21% | 58.8 -11% | 38.2 28% |
* ... smaller is better
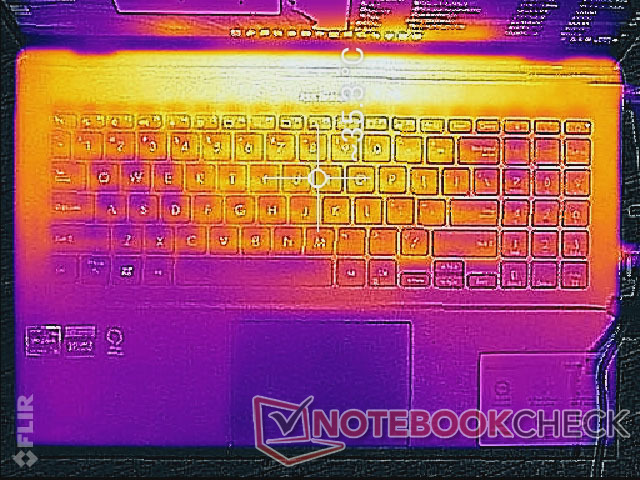
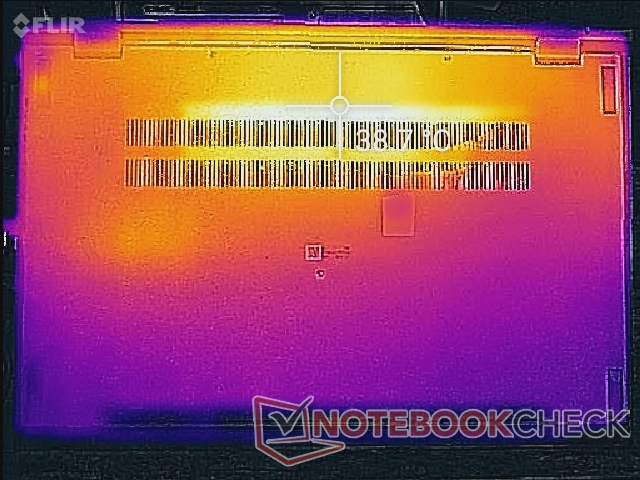
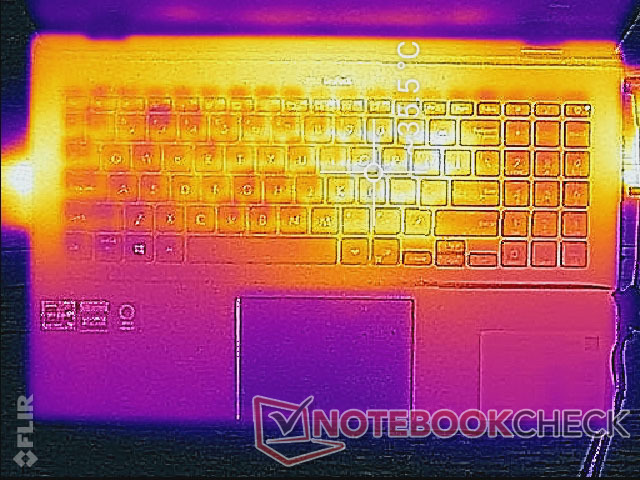
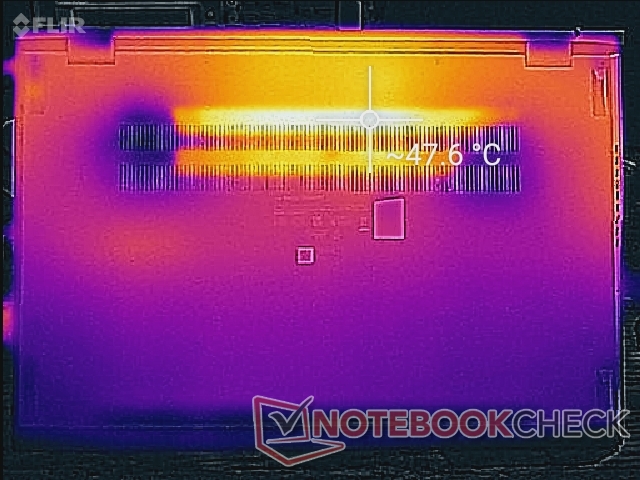
Temperature
Surface temperatures are somewhat warm even when not running any demanding activities. Hot spots when idling on desktop can be as warm as 35 C to 39 C on the top and bottom, respectively, compared to 33 C on the Dell XPS 15 9500.
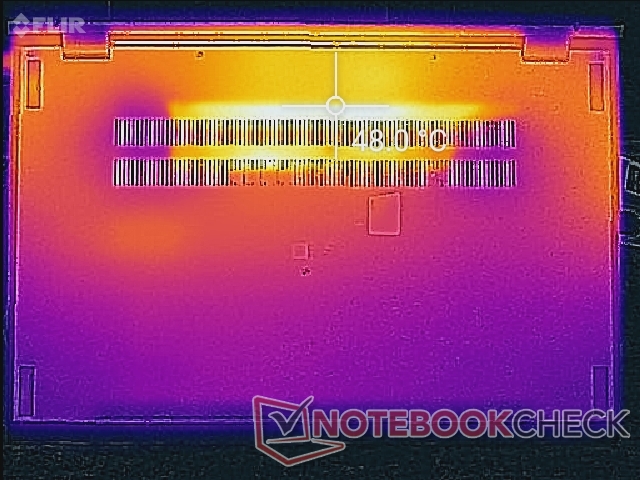
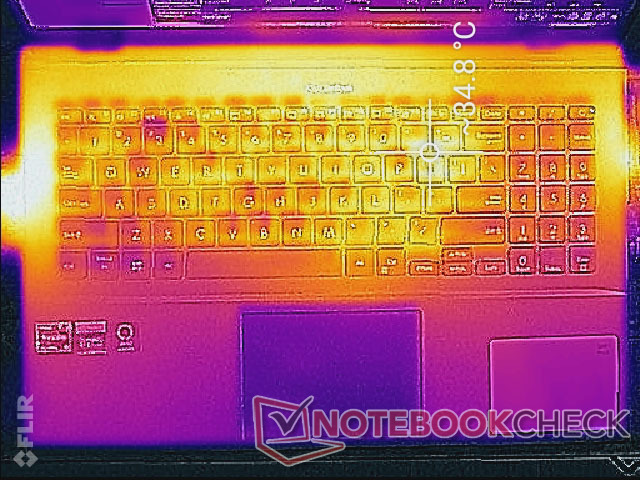
When gaming or running higher loads, hot spots on the top and bottom can reach 35 C and 48 C, respectively, compared to 44 C and 49 C on the aforementioned Dell. The Asus design does a good job at keeping the top surface much cooler than the bottom surface for more comfortable palms and fingers.
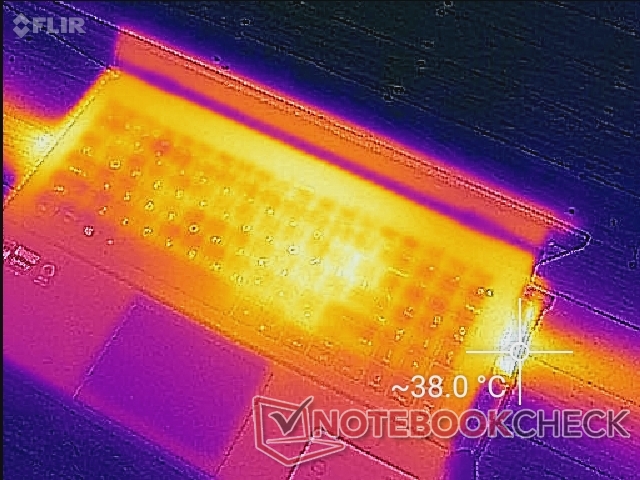
(+) The maximum temperature on the upper side is 36 °C / 97 F, compared to the average of 36.8 °C / 98 F, ranging from 21 to 71 °C for the class Multimedia.
(-) The bottom heats up to a maximum of 47.2 °C / 117 F, compared to the average of 39.1 °C / 102 F
(±) In idle usage, the average temperature for the upper side is 34.2 °C / 94 F, compared to the device average of 31.3 °C / 88 F.
(±) Playing The Witcher 3, the average temperature for the upper side is 32.3 °C / 90 F, compared to the device average of 31.3 °C / 88 F.
(+) The palmrests and touchpad are reaching skin temperature as a maximum (32.4 °C / 90.3 F) and are therefore not hot.
(-) The average temperature of the palmrest area of similar devices was 28.7 °C / 83.7 F (-3.7 °C / -6.6 F).
| Asus Zenbook Pro 15 OLED UM535Q AMD Ryzen 9 5900HX, NVIDIA GeForce RTX 3050 Ti Laptop GPU | Asus ZenBook UX535-M01440 Intel Core i7-10750H, NVIDIA GeForce GTX 1650 Ti Max-Q | Asus ZenBook 15 UX534FTC-A8190T Intel Core i7-10510U, NVIDIA GeForce GTX 1650 Max-Q | Lenovo Yoga Creator 7 15IMH05 82DS000VGE Intel Core i7-10750H, NVIDIA GeForce GTX 1650 Mobile | HP Envy 15-ep0098nr Intel Core i7-10750H, NVIDIA GeForce RTX 2060 Max-Q | Dell XPS 15 9510 11800H RTX 3050 Ti OLED Intel Core i7-11800H, NVIDIA GeForce RTX 3050 Ti Laptop GPU | |
|---|---|---|---|---|---|---|
| Heat | 14% | 16% | 23% | 1% | 10% | |
| Maximum Upper Side * (°C) | 36 | 37.8 -5% | 41.4 -15% | 39.8 -11% | 47.6 -32% | 45.5 -26% |
| Maximum Bottom * (°C) | 47.2 | 44.2 6% | 40.3 15% | 36.5 23% | 52 -10% | 44.2 6% |
| Idle Upper Side * (°C) | 37 | 28.1 24% | 25.7 31% | 22.9 38% | 28.6 23% | 27 27% |
| Idle Bottom * (°C) | 39.2 | 27.7 29% | 25.8 34% | 23 41% | 31 21% | 26.7 32% |
* ... smaller is better
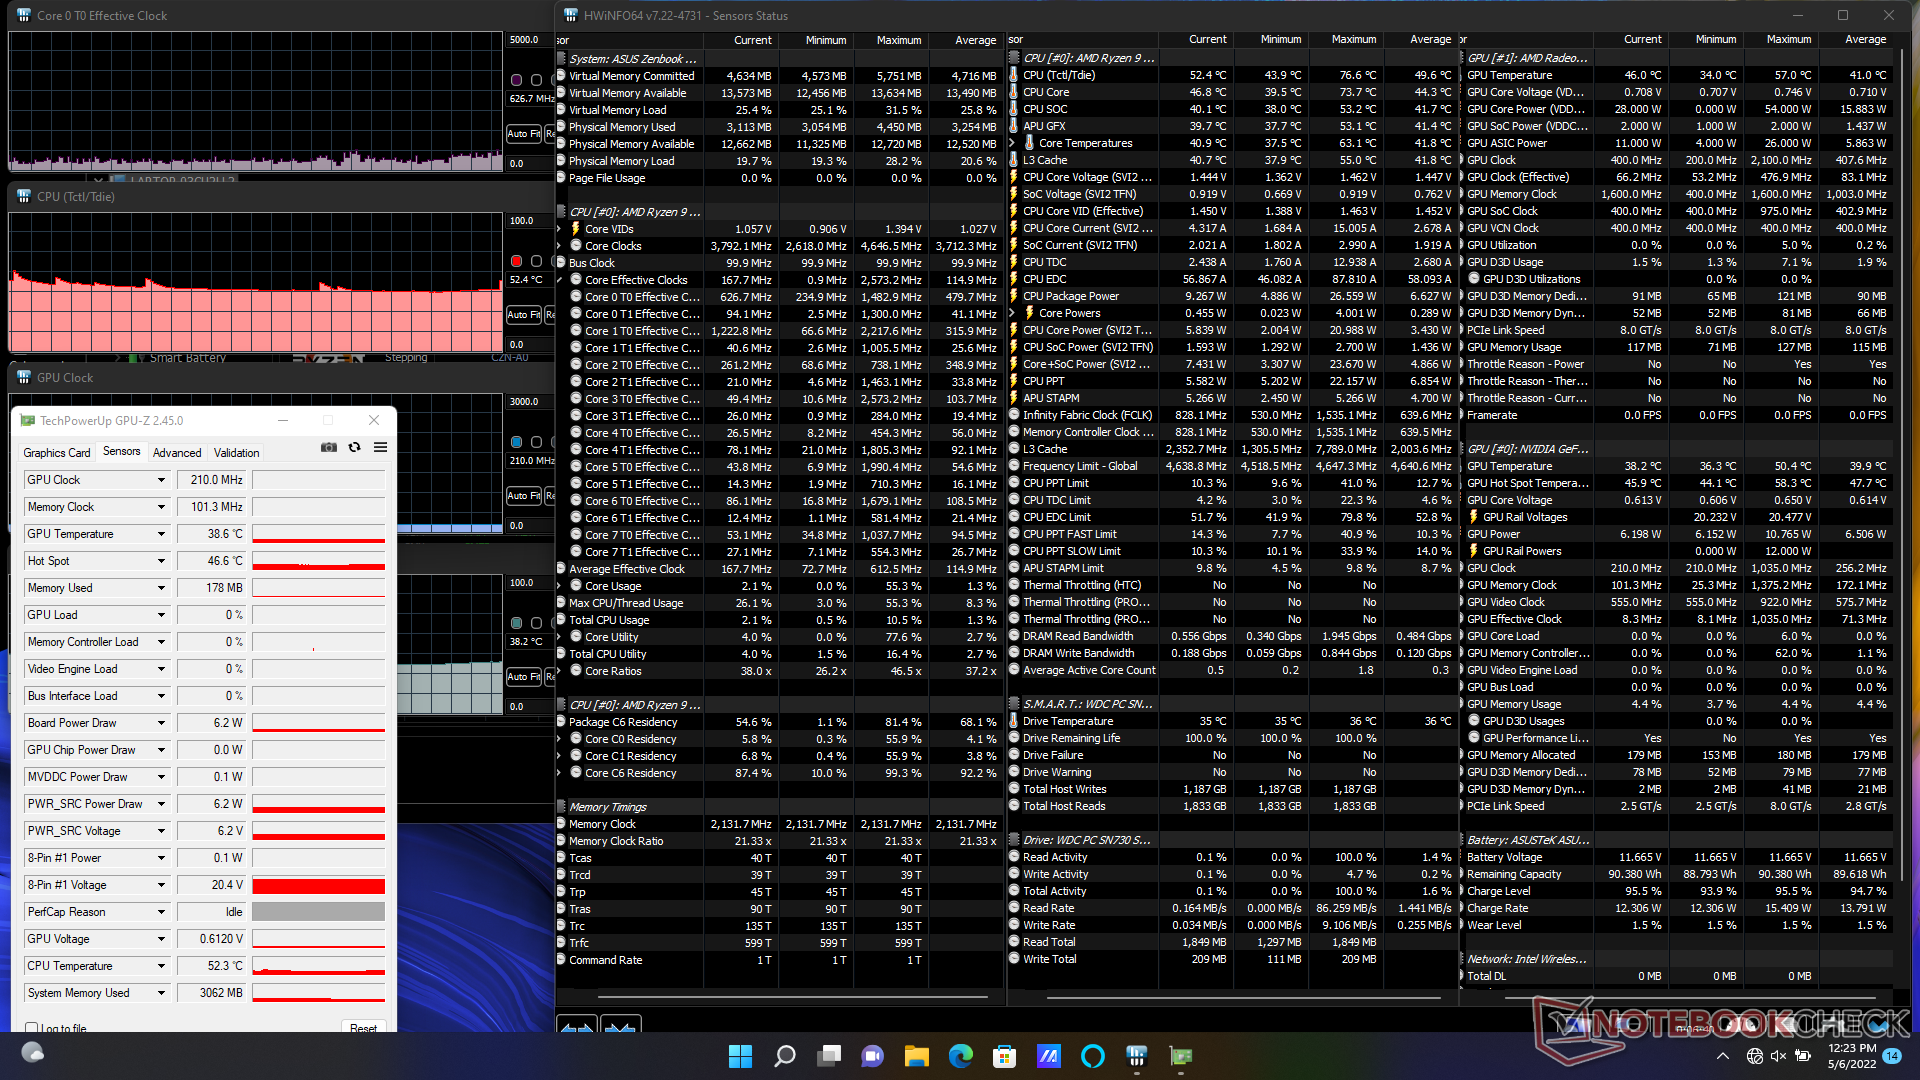
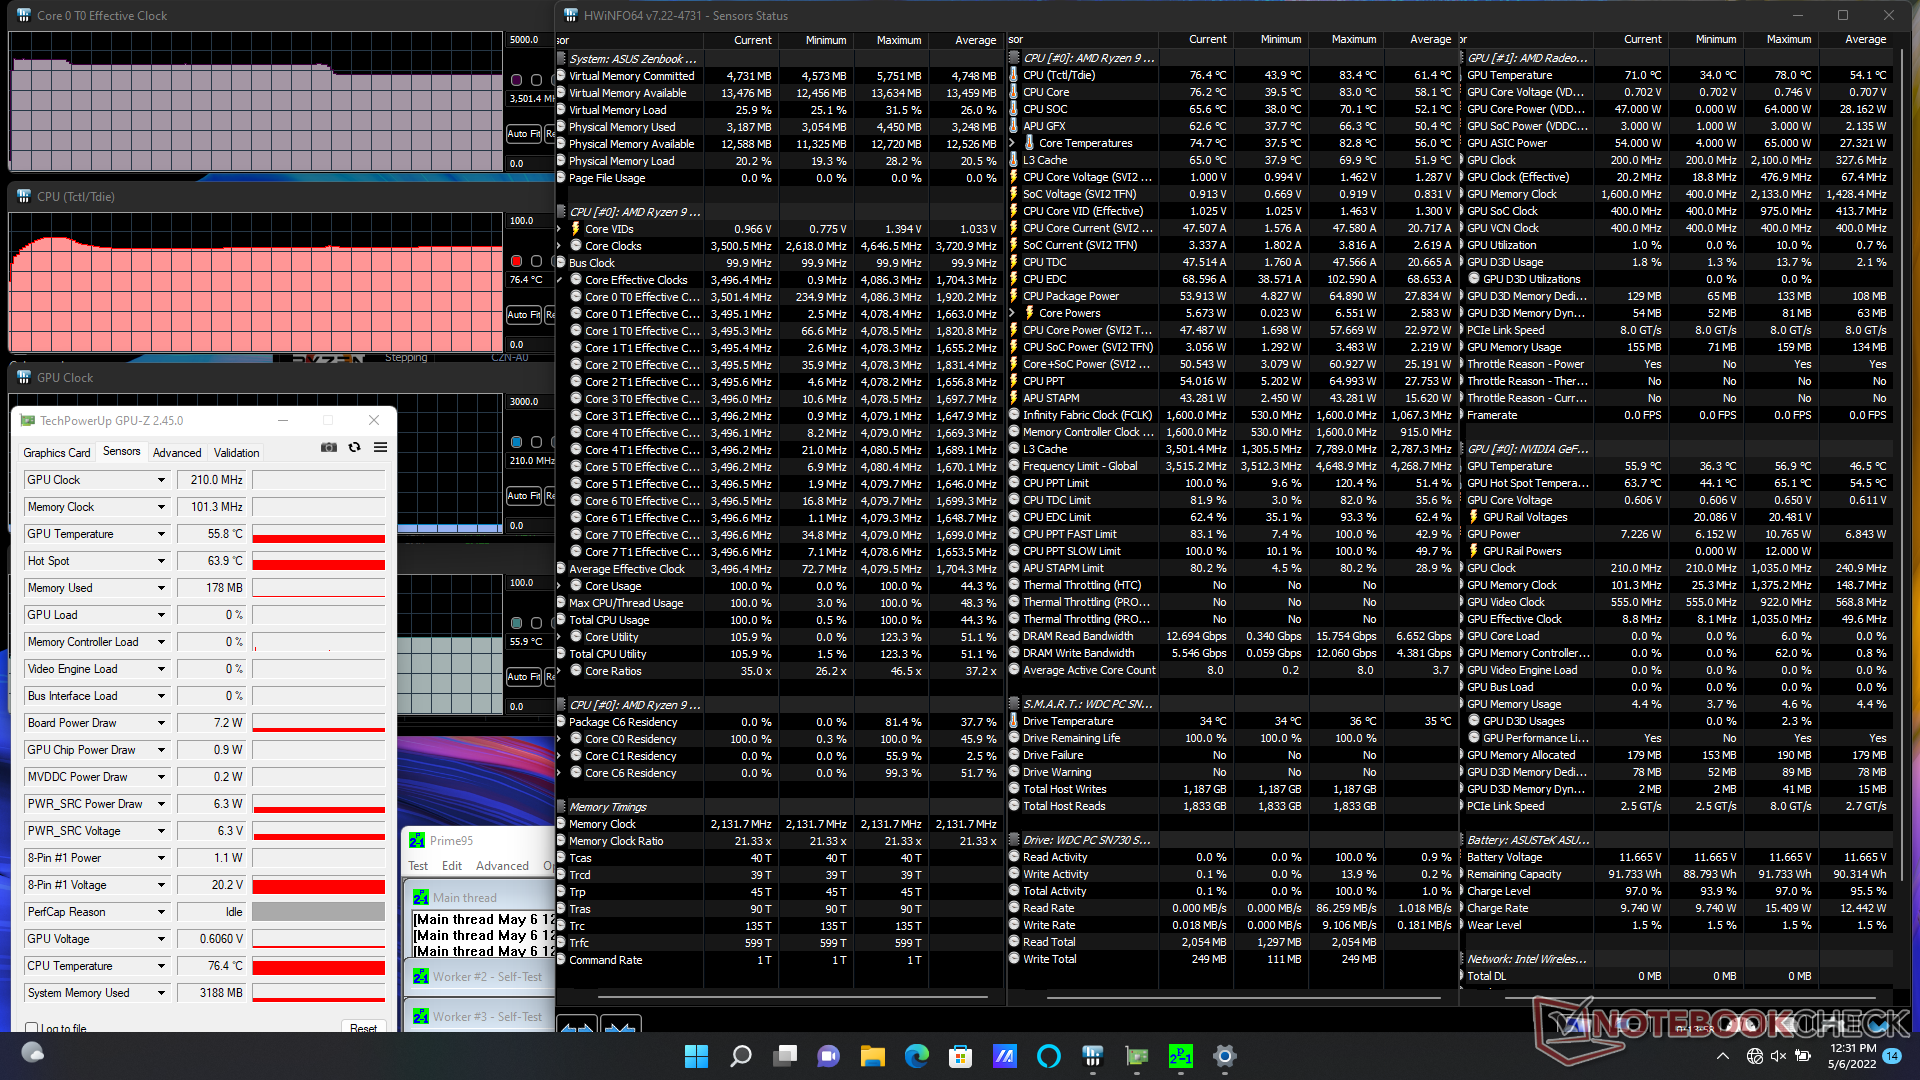
Stress Test
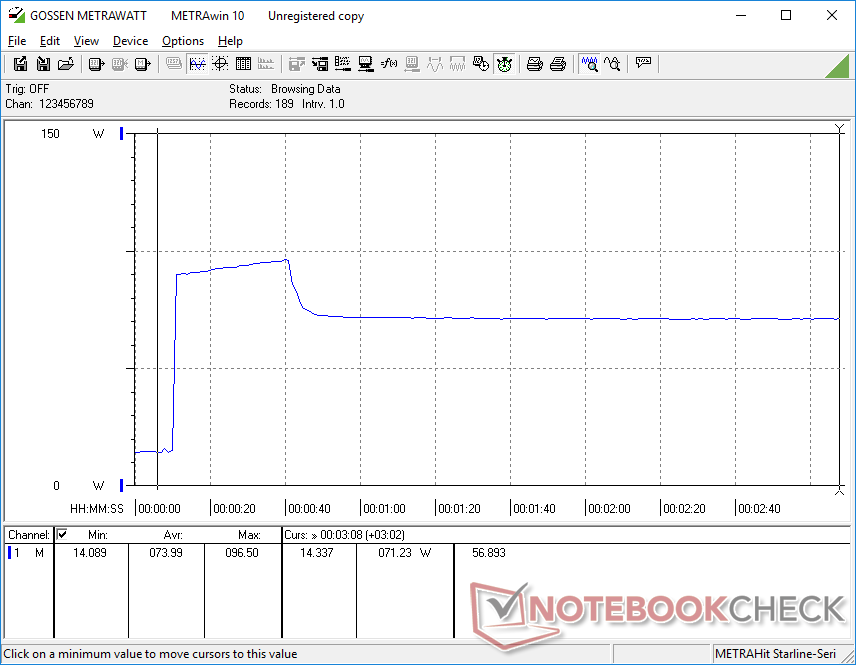
Running Prime95 to stress the CPU causes clock rates and temperature to spike to 4.1 GHz and 81 C, respectively, for about 30 seconds. The CPU would then drop to 3.9 GHz for the next few minutes before finally stabilizing at 3.5 GHz and 76 C. CPU package power would be as high as 65 W during the start of the test before stabilizing at 54 W.
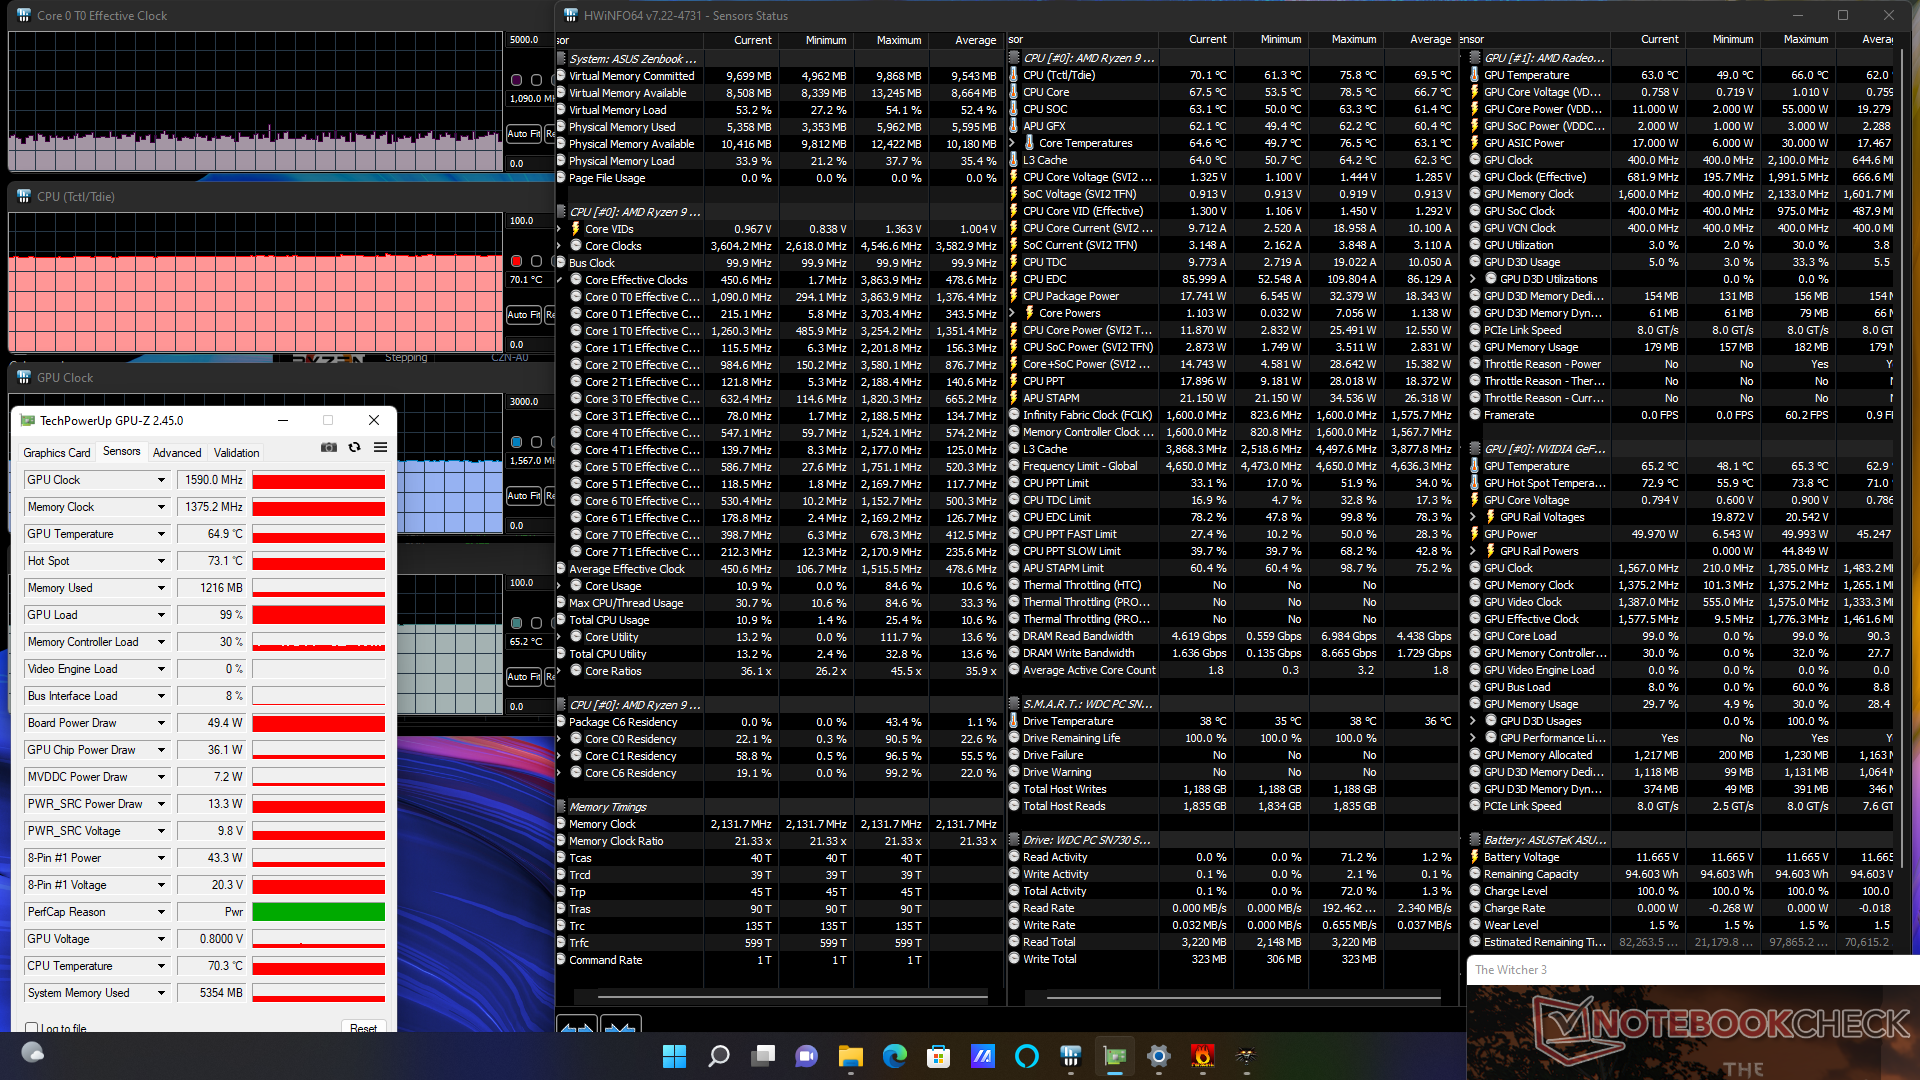
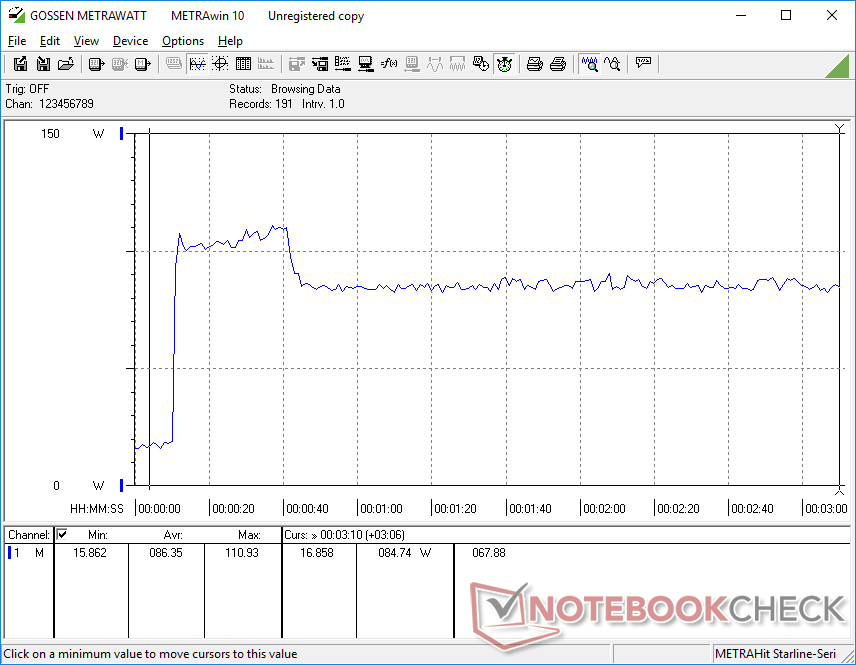
Running Witcher 3 would cause CPU and GPU temperatures to stabilize at 70 C and 65 C, respectively, compared to 71 C and 73 C on the Vivobook 15 K513EQ. GPU board power draw would be stable at 49 W or just below the 50 W target.
Performance is limited if on battery power. A Fire Strike test on batteries would return Physics and Graphics scores of 21320 and 9084 points, respectively, compared to 25284 and 13002 points when on mains.
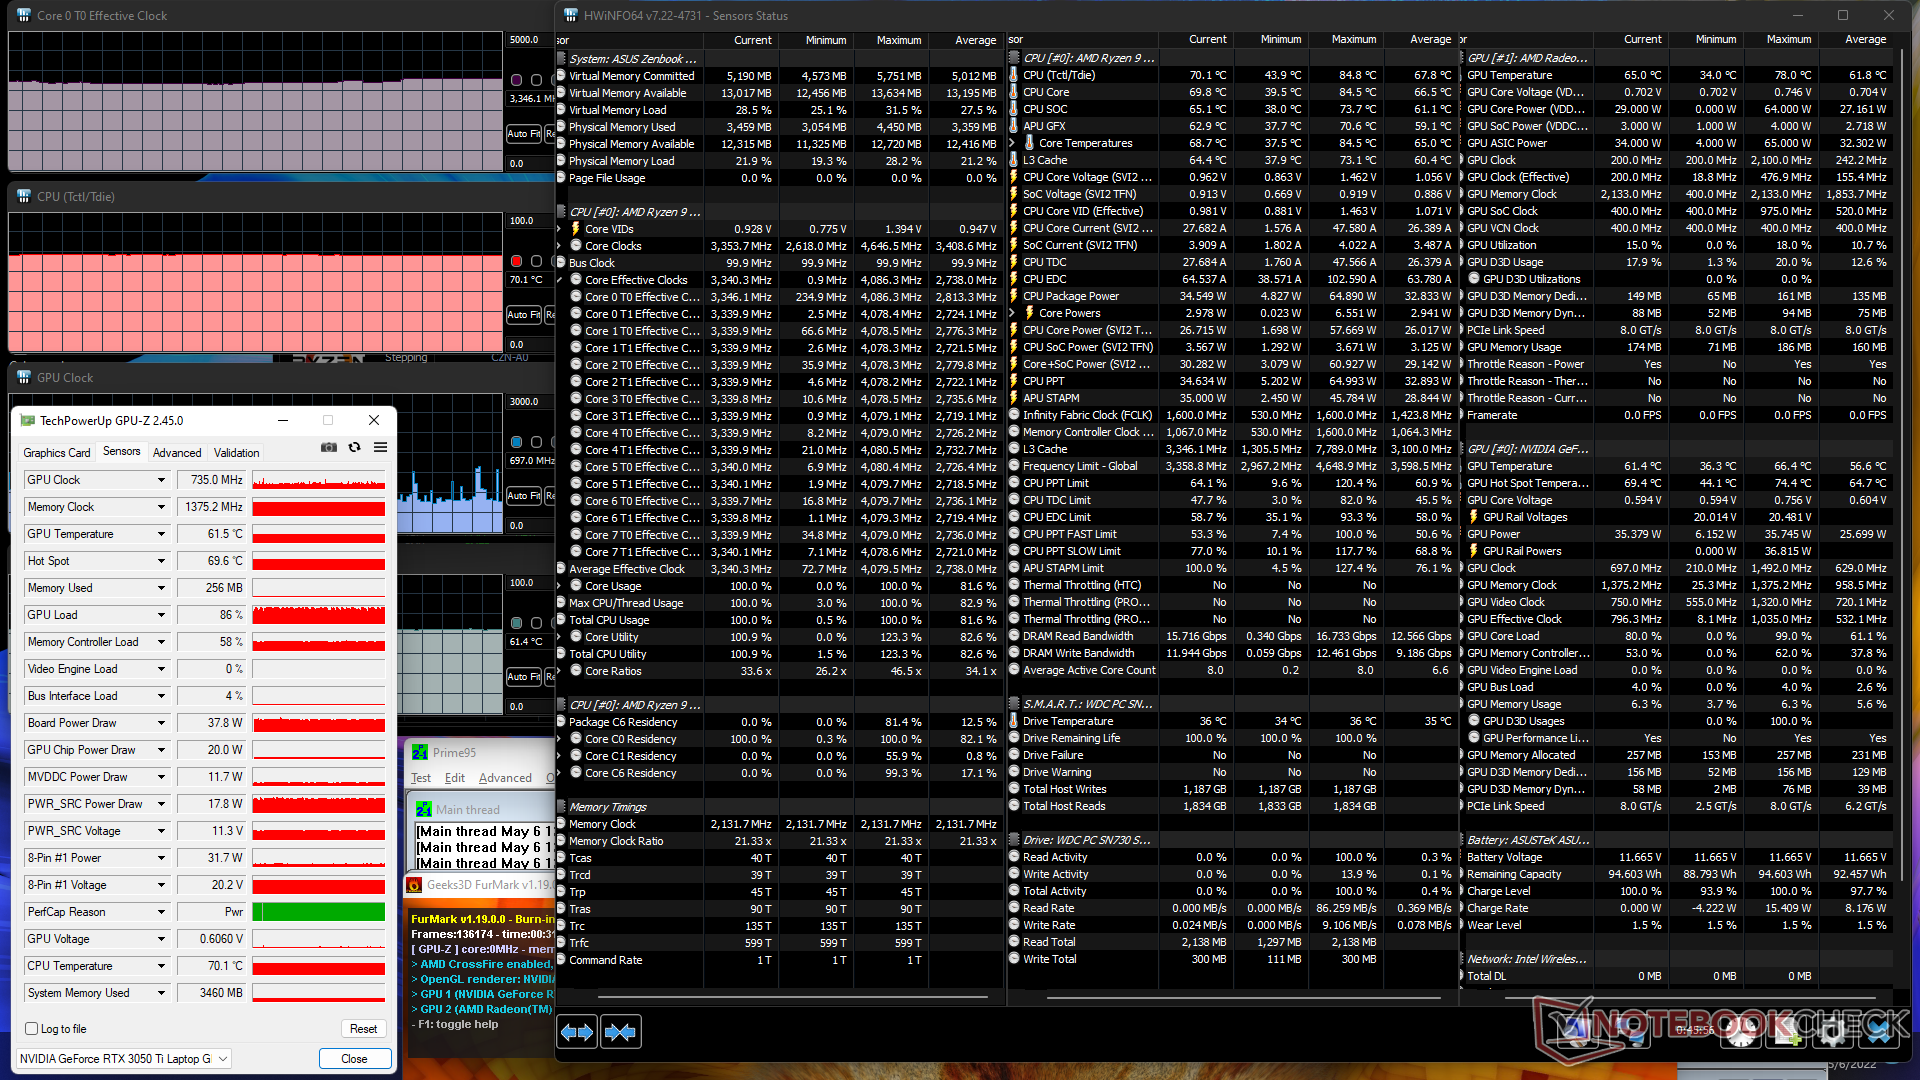
| CPU Clock (GHz) | GPU Clock (MHz) | Average CPU Temperature Tctl/Tdie (°C) | Average GPU Temperature (°C) | |
| System Idle | -- | -- | 52 | 39 |
| Prime95 Stress | 3.5 | -- | 76 | 56 |
| Prime95 + FurMark Stress | 3.3 | 735 | 70 | 62 |
| Witcher 3 Stress | ~1.0 | 1590 | 70 | 65 |
Speakers
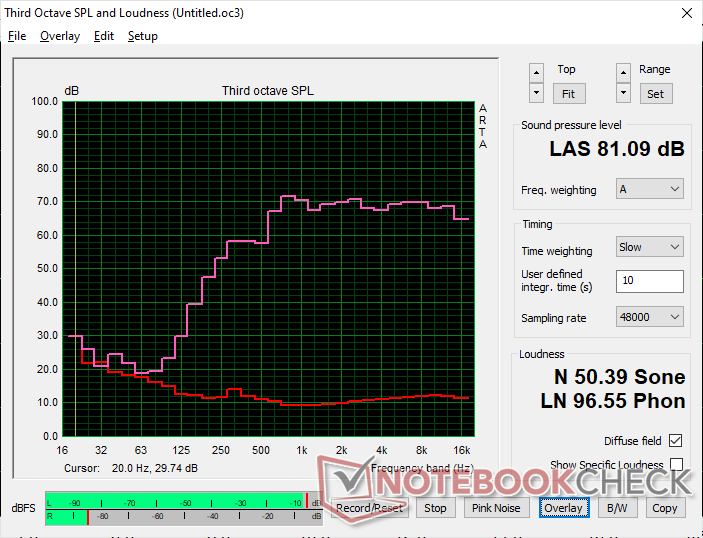
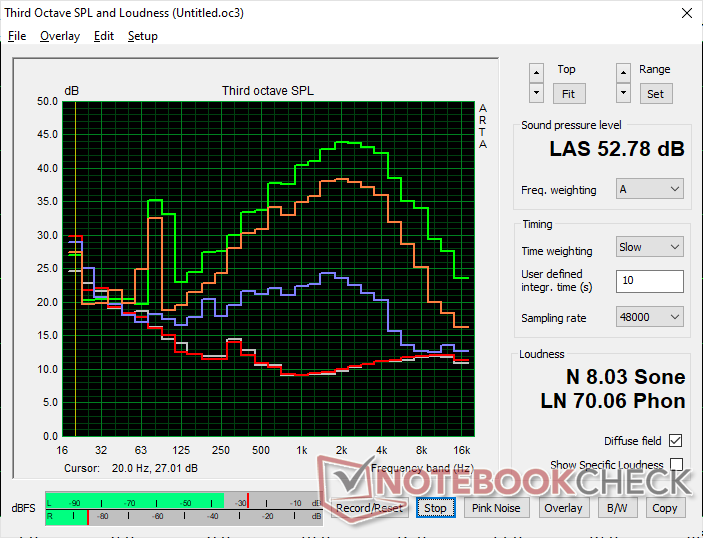
Asus Zenbook Pro 15 OLED UM535Q audio analysis
(±) | speaker loudness is average but good (81.1 dB)
Bass 100 - 315 Hz
(-) | nearly no bass - on average 25.6% lower than median
(±) | linearity of bass is average (11.5% delta to prev. frequency)
Mids 400 - 2000 Hz
(+) | balanced mids - only 3.8% away from median
(+) | mids are linear (4.8% delta to prev. frequency)
Highs 2 - 16 kHz
(+) | balanced highs - only 1.6% away from median
(+) | highs are linear (2.3% delta to prev. frequency)
Overall 100 - 16.000 Hz
(±) | linearity of overall sound is average (16.4% difference to median)
Compared to same class
» 42% of all tested devices in this class were better, 7% similar, 51% worse
» The best had a delta of 5%, average was 17%, worst was 45%
Compared to all devices tested
» 27% of all tested devices were better, 6% similar, 67% worse
» The best had a delta of 4%, average was 23%, worst was 134%
Apple MacBook Pro 16 2021 M1 Pro audio analysis
(+) | speakers can play relatively loud (84.7 dB)
Bass 100 - 315 Hz
(+) | good bass - only 3.8% away from median
(+) | bass is linear (5.2% delta to prev. frequency)
Mids 400 - 2000 Hz
(+) | balanced mids - only 1.3% away from median
(+) | mids are linear (2.1% delta to prev. frequency)
Highs 2 - 16 kHz
(+) | balanced highs - only 1.9% away from median
(+) | highs are linear (2.7% delta to prev. frequency)
Overall 100 - 16.000 Hz
(+) | overall sound is linear (4.6% difference to median)
Compared to same class
» 0% of all tested devices in this class were better, 0% similar, 100% worse
» The best had a delta of 5%, average was 17%, worst was 45%
Compared to all devices tested
» 0% of all tested devices were better, 0% similar, 100% worse
» The best had a delta of 4%, average was 23%, worst was 134%
Energy Management
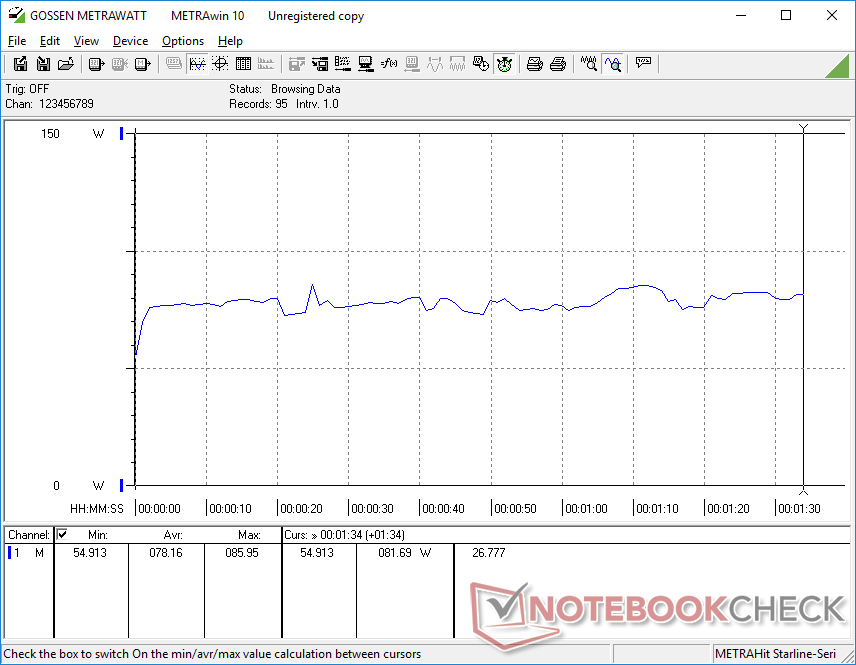
Power Consumption — Large 96 Wh Battery
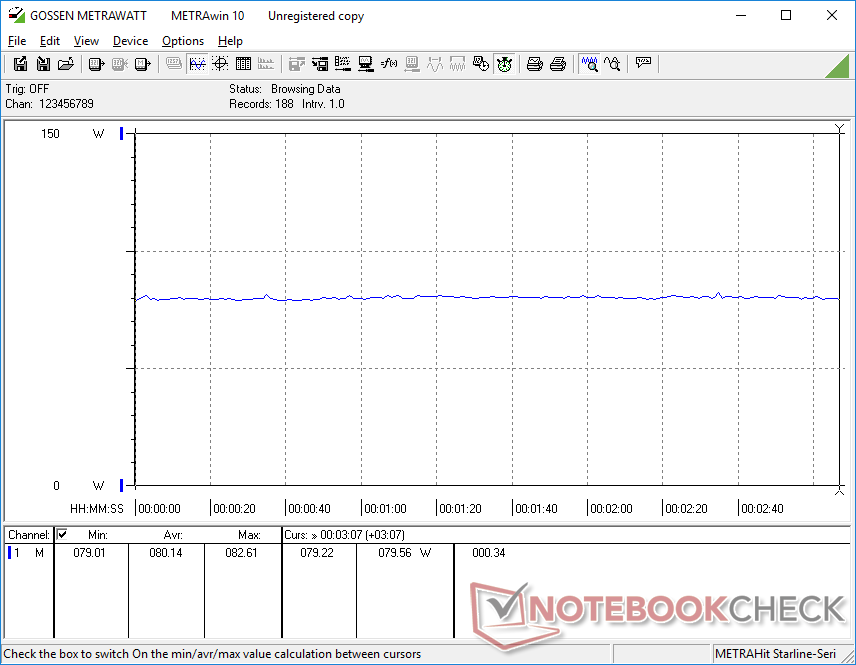
Idling on desktop can range between 5 W and 15 W depending on the brightness level and power profile. Since this is an OLED panel, displaying bright white colors will demand much more power than other colors as exemplified on other laptops with OLED panels.
Running Witcher 3 consumes about 20 percent more power than on the Zenbook UM535. However, our UM535Q is able to offer 70 percent and 60 percent faster multi-thread CPU performance and GPU performance, respectively, over the UM535. The increase in power consumption is small relative to the larger increase in overall performance.
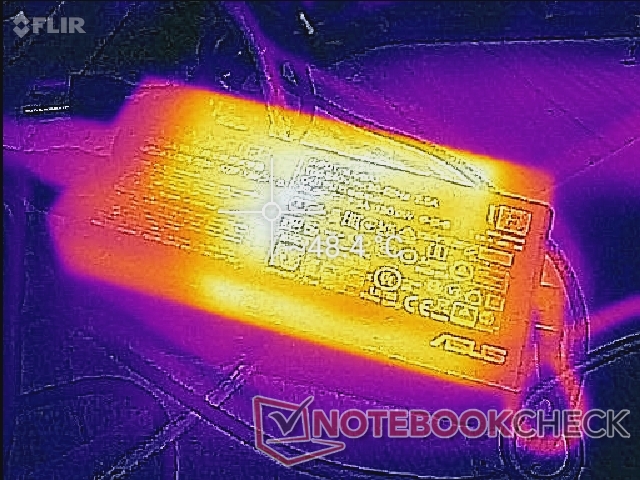
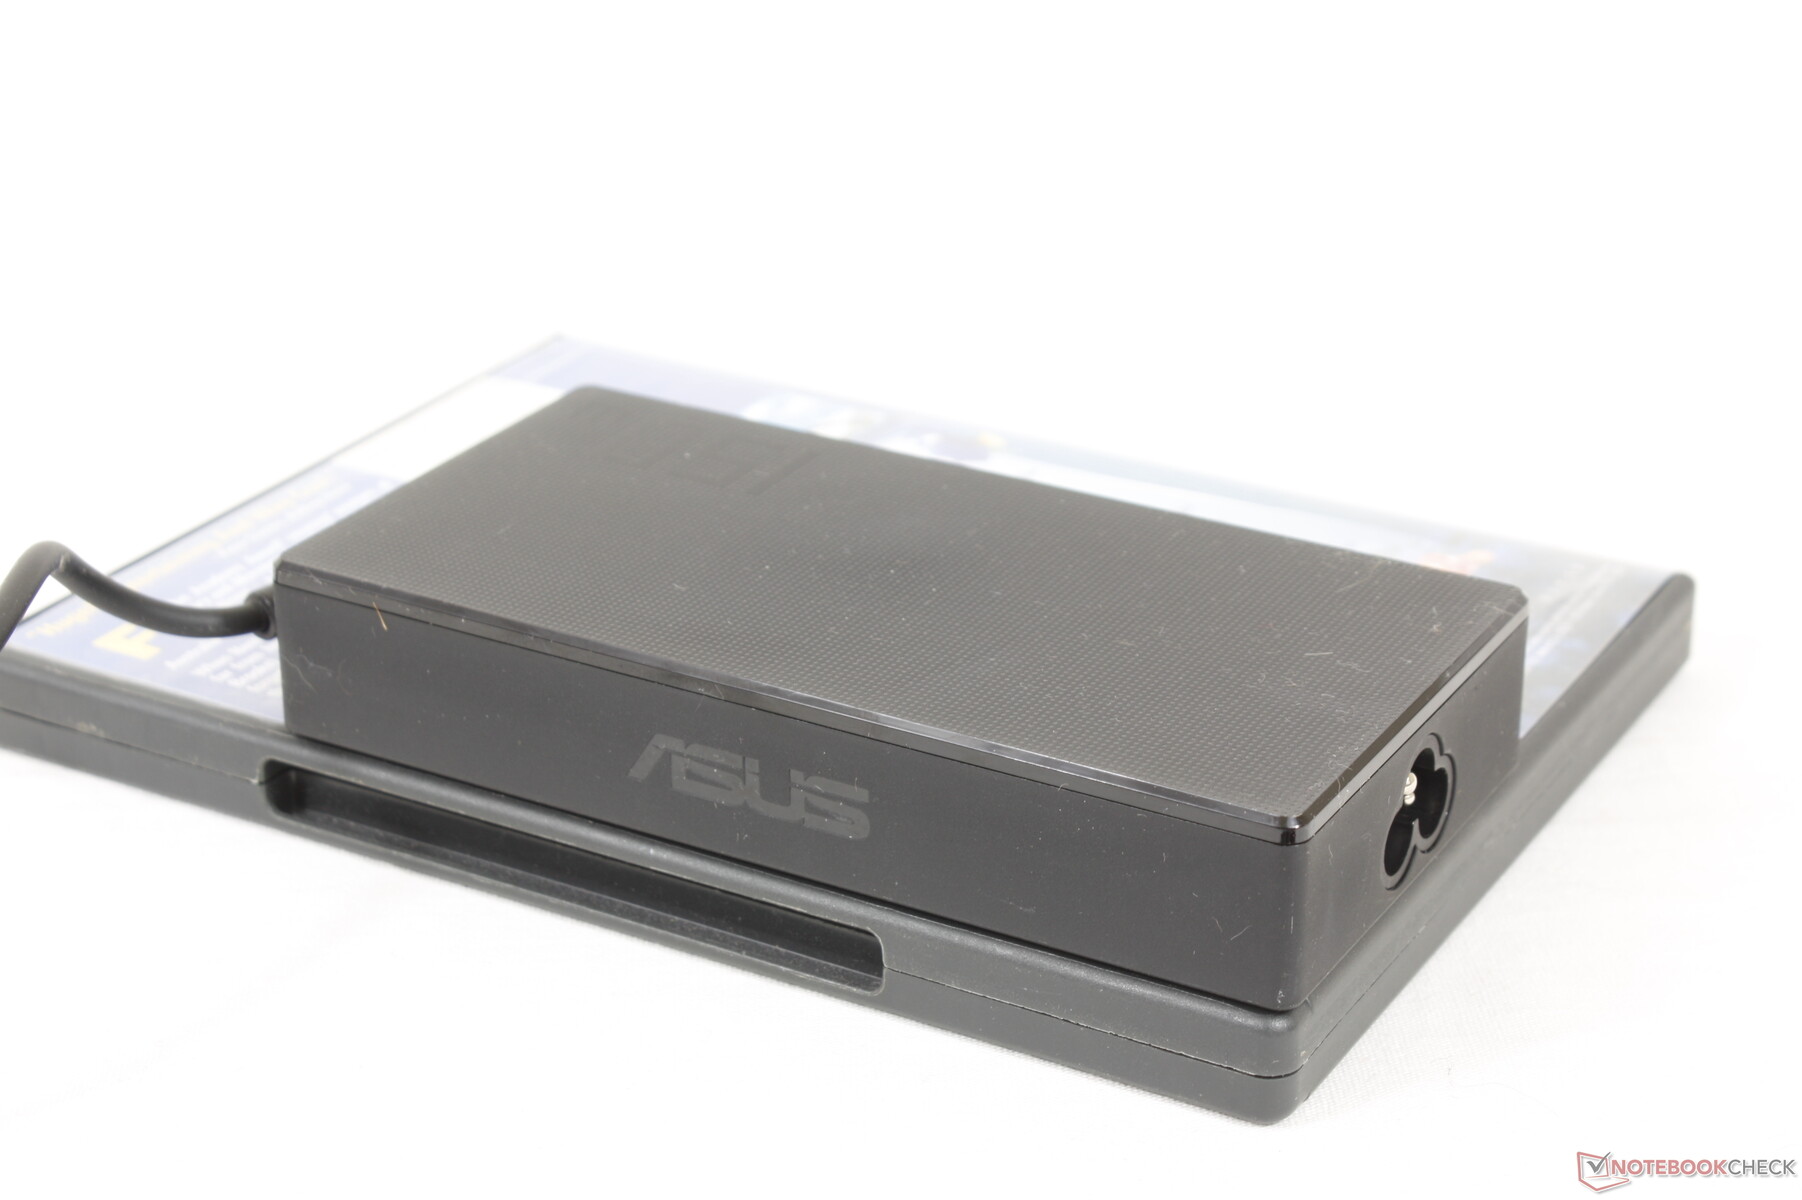
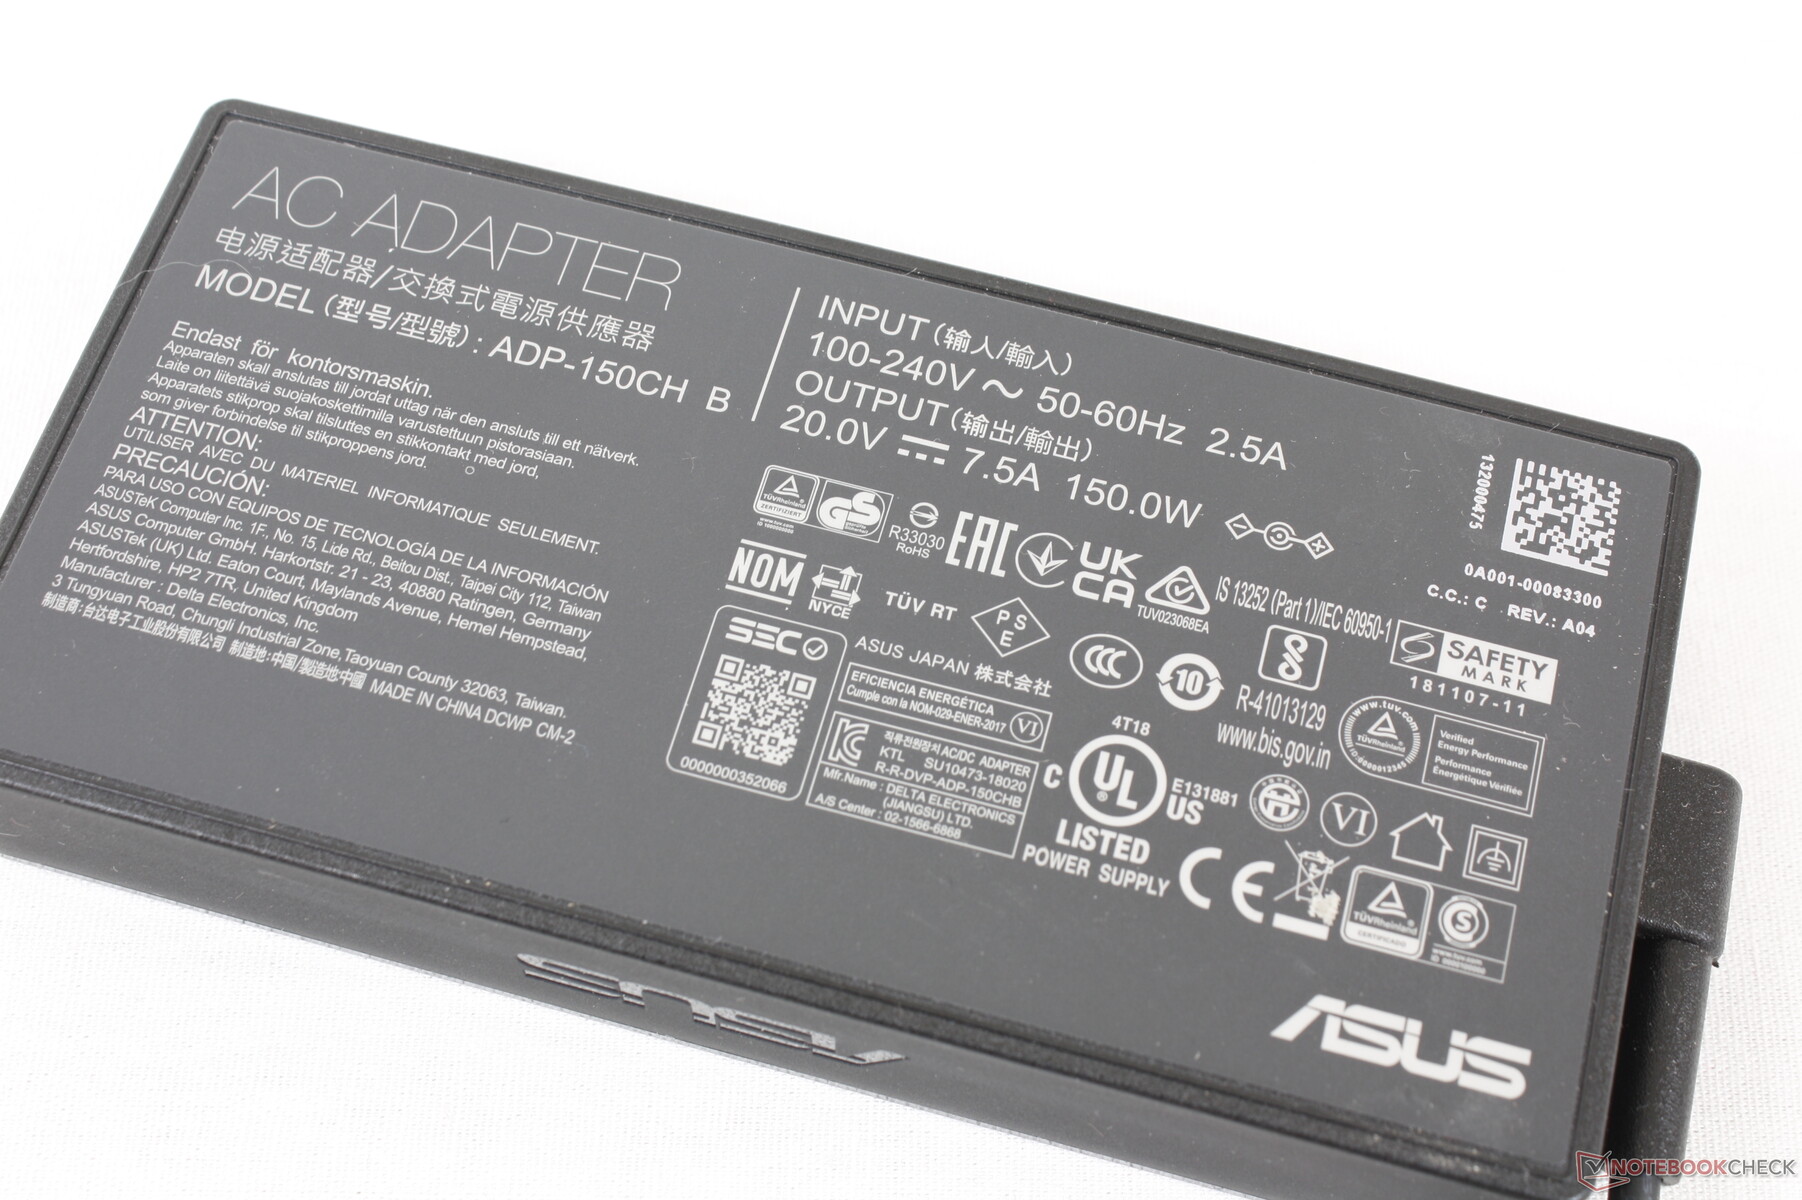
We're able to measure a temporary maximum draw of 111 W from the small-medium (~13.8 x 6.8 x 2.4 cm) 150 W AC adapter when running Prime95 and FurMark simultaneously.
| Off / Standby | |
| Idle | |
| Load |
|
Key:
min: | |
| Asus Zenbook Pro 15 OLED UM535Q R9 5900HX, GeForce RTX 3050 Ti Laptop GPU, WDC PC SN730 SDBPNTY-1T00, OLED, 1920x1080, 15.6" | Asus ZenBook UX535-M01440 i7-10750H, GeForce GTX 1650 Ti Max-Q, WDC PC SN730 SDBPNTY-1T00, IPS, 3840x2160, 15.6" | Asus ZenBook 15 UX534FTC-A8190T i7-10510U, GeForce GTX 1650 Max-Q, Samsung SSD PM981 MZVLB1T0HALR, IPS, 1920x1080, 15.6" | Lenovo Yoga Creator 7 15IMH05 82DS000VGE i7-10750H, GeForce GTX 1650 Mobile, Samsung PM981a MZVLB1T0HBLR, IPS, 1920x1080, 15.6" | HP Envy 15-ep0098nr i7-10750H, GeForce RTX 2060 Max-Q, Intel Optane Memory H10 with Solid State Storage 32GB + 512GB HBRPEKNX0202A(L/H), AMOLED, 3840x2160, 15.6" | Dell XPS 15 9510 11800H RTX 3050 Ti OLED i7-11800H, GeForce RTX 3050 Ti Laptop GPU, Micron 2300 512GB MTFDHBA512TDV, OLED, 3456x2160, 15.6" | |
|---|---|---|---|---|---|---|
| Power Consumption | -2% | 21% | -14% | -60% | -10% | |
| Idle Minimum * (Watt) | 5.5 | 4.4 20% | 2.8 49% | 6.9 -25% | 9.2 -67% | 7.6 -38% |
| Idle Average * (Watt) | 7.4 | 9.8 -32% | 7.7 -4% | 10 -35% | 14.5 -96% | 9.9 -34% |
| Idle Maximum * (Watt) | 14.9 | 14.5 3% | 9.4 37% | 12.6 15% | 18 -21% | 10.8 28% |
| Load Average * (Watt) | 78.2 | 83 -6% | 57 27% | 96 -23% | 110.9 -42% | 81 -4% |
| Witcher 3 ultra * (Watt) | 80.1 | 67 16% | 62 23% | 75 6% | 125.5 -57% | 76.2 5% |
| Load Maximum * (Watt) | 110.9 | 123 -11% | 116 -5% | 134 -21% | 194.6 -75% | 131 -18% |
* ... smaller is better
Power Consumption Witcher 3 / Stresstest
Power Consumption external Monitor
Battery Life — Good For The Whole Day
Runtimes are longer than what we recorded on the UX535 by a couple of hours. Expect almost 13 hours of real-world WLAN usage when on the Balanced power profile.
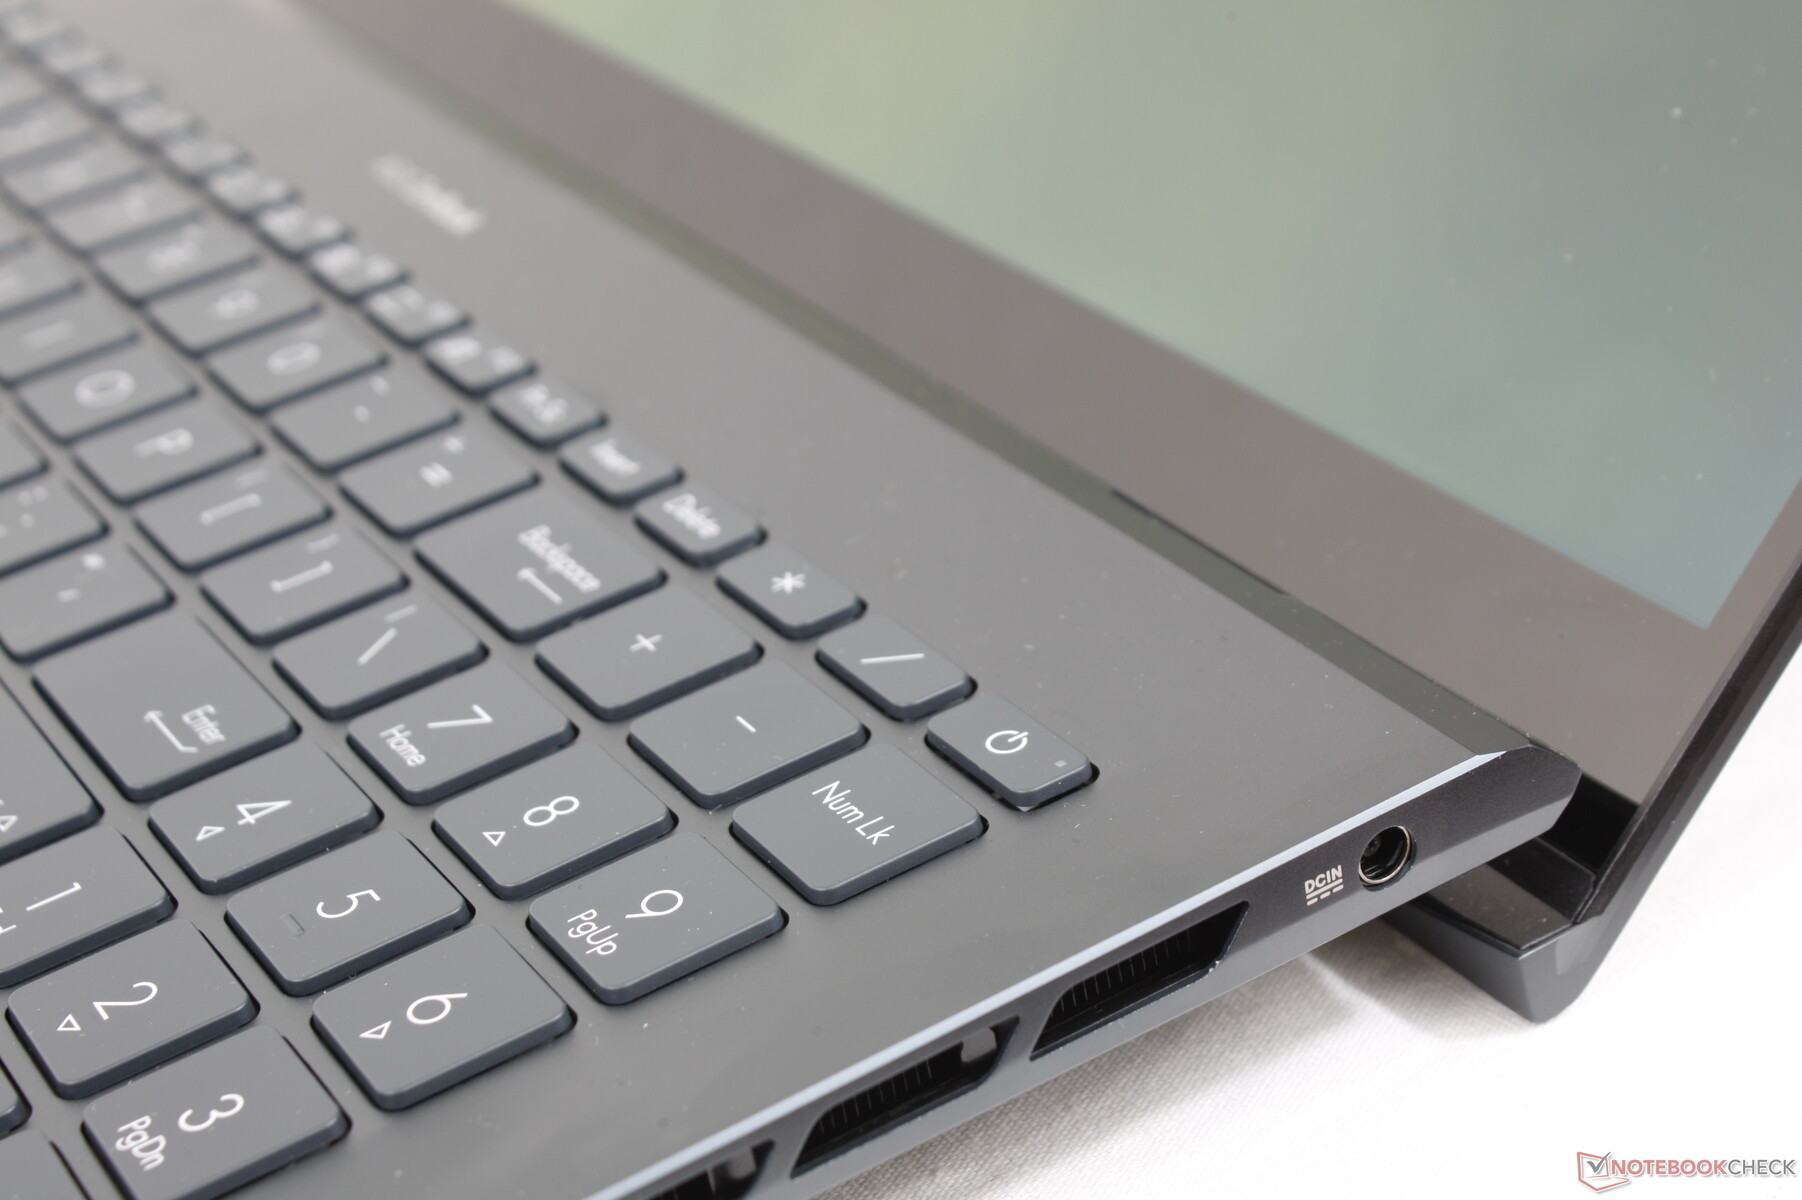
Charging from empty to full capacity takes about 1.5 hours. Unfortunately, the system cannot be recharged via USB-C unlike on most other Ultrabooks these days.
| Asus Zenbook Pro 15 OLED UM535Q R9 5900HX, GeForce RTX 3050 Ti Laptop GPU, 96 Wh | Asus ZenBook UX535-M01440 i7-10750H, GeForce GTX 1650 Ti Max-Q, 96 Wh | Asus ZenBook 15 UX534FTC-A8190T i7-10510U, GeForce GTX 1650 Max-Q, 71 Wh | Lenovo Yoga Creator 7 15IMH05 82DS000VGE i7-10750H, GeForce GTX 1650 Mobile, 70 Wh | HP Envy 15-ep0098nr i7-10750H, GeForce RTX 2060 Max-Q, 83 Wh | Dell XPS 15 9510 11800H RTX 3050 Ti OLED i7-11800H, GeForce RTX 3050 Ti Laptop GPU, 86 Wh | |
|---|---|---|---|---|---|---|
| Battery runtime | -32% | -11% | -35% | -51% | -48% | |
| Reader / Idle (h) | 26.2 | 18.3 -30% | 27.2 4% | 25.7 -2% | 15 -43% | |
| WiFi v1.3 (h) | 12.8 | 10.1 -21% | 12.4 -3% | 9 -30% | 6 -53% | 7 -45% |
| Load (h) | 3.6 | 2 -44% | 2.4 -33% | 1 -72% | 1.6 -56% | 1.8 -50% |
| H.264 (h) | 11.9 | 11.9 | 13.9 | 10.4 |
Pros
Cons
Verdict — Strong CPU, Chassis, and Display

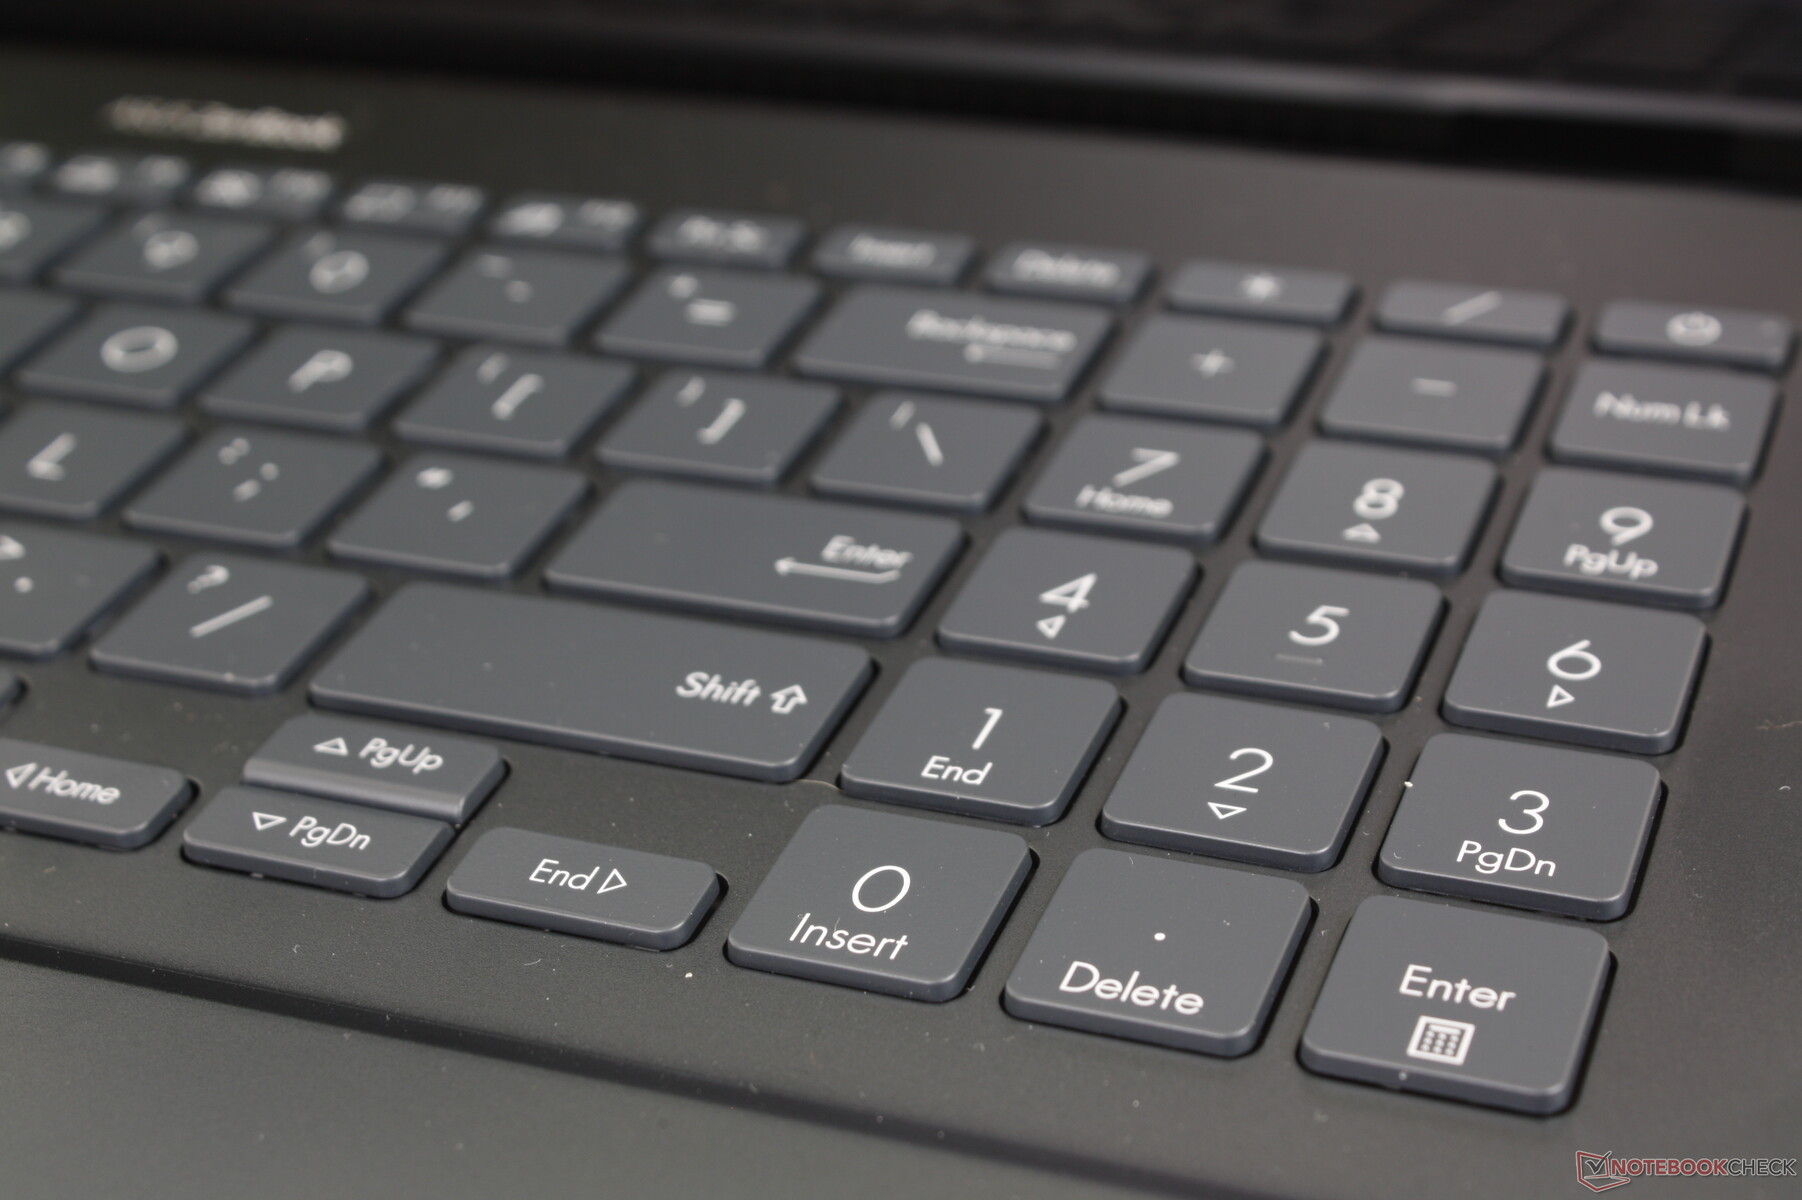
One of the most popular 15.6-inch prosumer or multimedia laptops out there is the Dell XPS 15. Thus, comparisons between it and the Asus Zenbook Pro 15 are inevitable. Asus has a couple of tricks up its sleeve that XPS users are still missing out on including 1080p OLED and an AMD Ryzen CPU which help separate the Zenbook Pro 15 from the XPS 15. It also integrates a numpad and a few more port options albeit at the cost of a larger chassis size. If these differentiating factors are important for your daily workloads, then the Zenbook Pro 15 would serve as a better alternative to the competing Dell machine without needing to sacrifice battery life or graphics performance along the way.
The AMD Ryzen 9 CPU and 1080p OLED touchscreen are the stars of the show on this well-rounded Asus Zenbook. Its USB-C docking capabilities are lacking, however.
Perhaps the most notable omission on the Asus is its lack of support for Thunderbolt, DisplayPort-over-USB-C, and Power Delivery. Docking capabilities are therefore more limited on the Asus when compared to most other multimedia laptops. If such USB-C features are important, then you may want to look elsewhere in Asus' portfolio.
Price and Availability
Xotic PC is now shipping the ZenBook Pro 15 UM535QE as configured in our review for $1500 USD. Alternatively, users can purchase from a different SKU from Amazon with half the storage space for $1380 USD.
Asus Zenbook Pro 15 OLED UM535Q
- 08/30/2022 v7 (old)
Allen Ngo
Price comparison
