MSI Bravo 15 B5DD laptop review: Terrible Radeon RX 5500M performance-per-dollar
The MSI Bravo 15 B5DD is an update to the 2020 Bravo 15 A4DCR. Though their names may be quite similar, the newer model carries a redesigned chassis with newer AMD processors while maintaining an attractive low price of $700 to $900 USD.
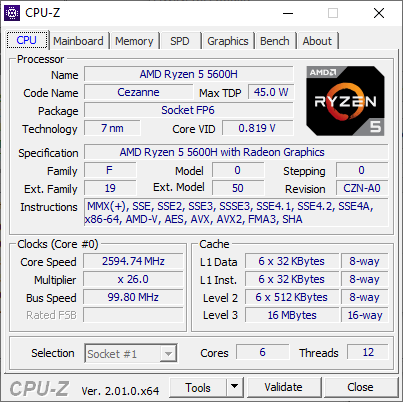
Current SKUs come equipped with the Ryzen 5 5600H or Ryzen 7 5800H CPU with various levels of storage or RAM. All configurations otherwise carry the same 144 Hz FHD panel and Radeon RX 5500M GPU with no other options.
Competitors in this space include other entry-level 15.6-inch gaming laptops like the Asus TUF Gaming F15, Lenovo Legion 5 15, Dell G15 series, or the HP Pavilion Gaming 15.
More MSI reviews:
Potential Competitors in Comparison
Rating | Date | Model | Weight | Height | Size | Resolution | Price |
|---|---|---|---|---|---|---|---|
| 78.2 % v7 (old) | 04 / 2022 | MSI Bravo 15 B5DD-010US R5 5600H, Radeon RX 5500M | 2.3 kg | 24.95 mm | 15.60" | 1920x1080 | |
| 79.5 % v7 (old) | 07 / 2020 | MSI Bravo 15 A4DCR R7 4800H, Radeon RX 5300M | 2 kg | 22 mm | 15.60" | 1920x1080 | |
| 87.2 % v7 (old) | 03 / 2022 | Asus TUF Gaming F15 FX507ZM i7-12700H, GeForce RTX 3060 Laptop GPU | 2.1 kg | 24.95 mm | 15.60" | 1920x1080 | |
| 82.7 % v7 (old) | 10 / 2021 | Dell G15 5515 R7 5800H, GeForce RTX 3050 Ti Laptop GPU | 2.4 kg | 24.9 mm | 15.60" | 1920x1080 | |
| 79.7 % v7 (old) | 03 / 2022 | Lenovo Ideapad Gaming 3 15IHU-82K1002RGE i5-11300H, GeForce RTX 3050 Ti Laptop GPU | 2 kg | 24.2 mm | 15.60" | 1920x1080 | |
| 82.2 % v7 (old) | 08 / 2021 | Acer Nitro 5 AN515-45-R1JH R7 5800H, GeForce RTX 3070 Laptop GPU | 2.3 kg | 23.9 mm | 15.60" | 2560x1440 |
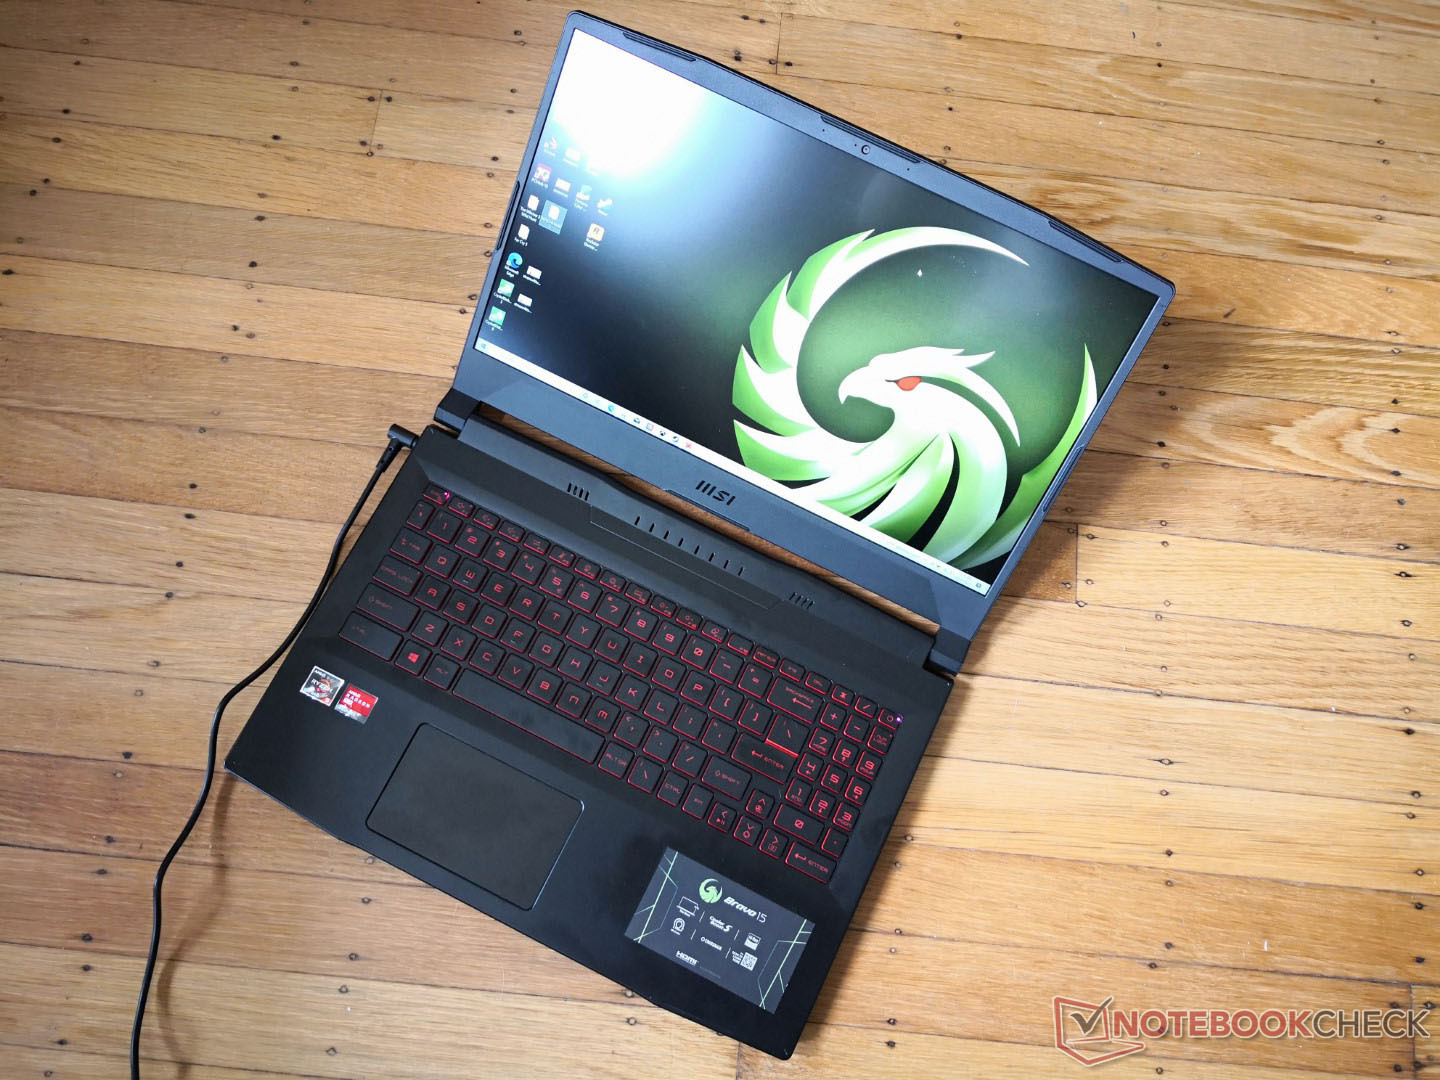
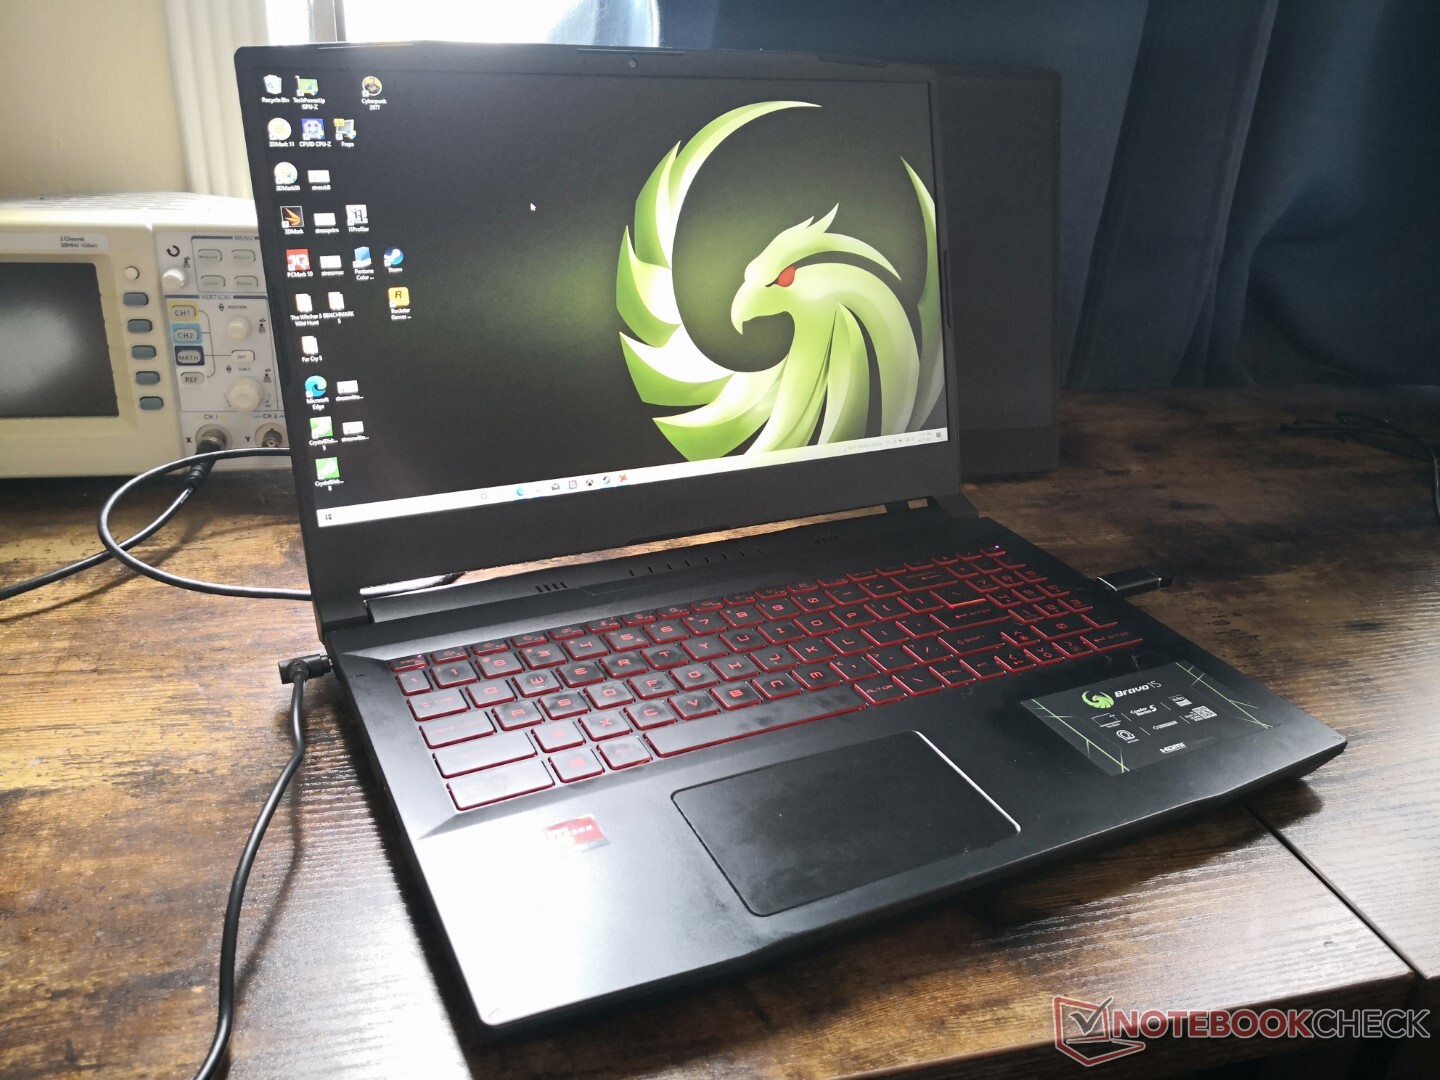
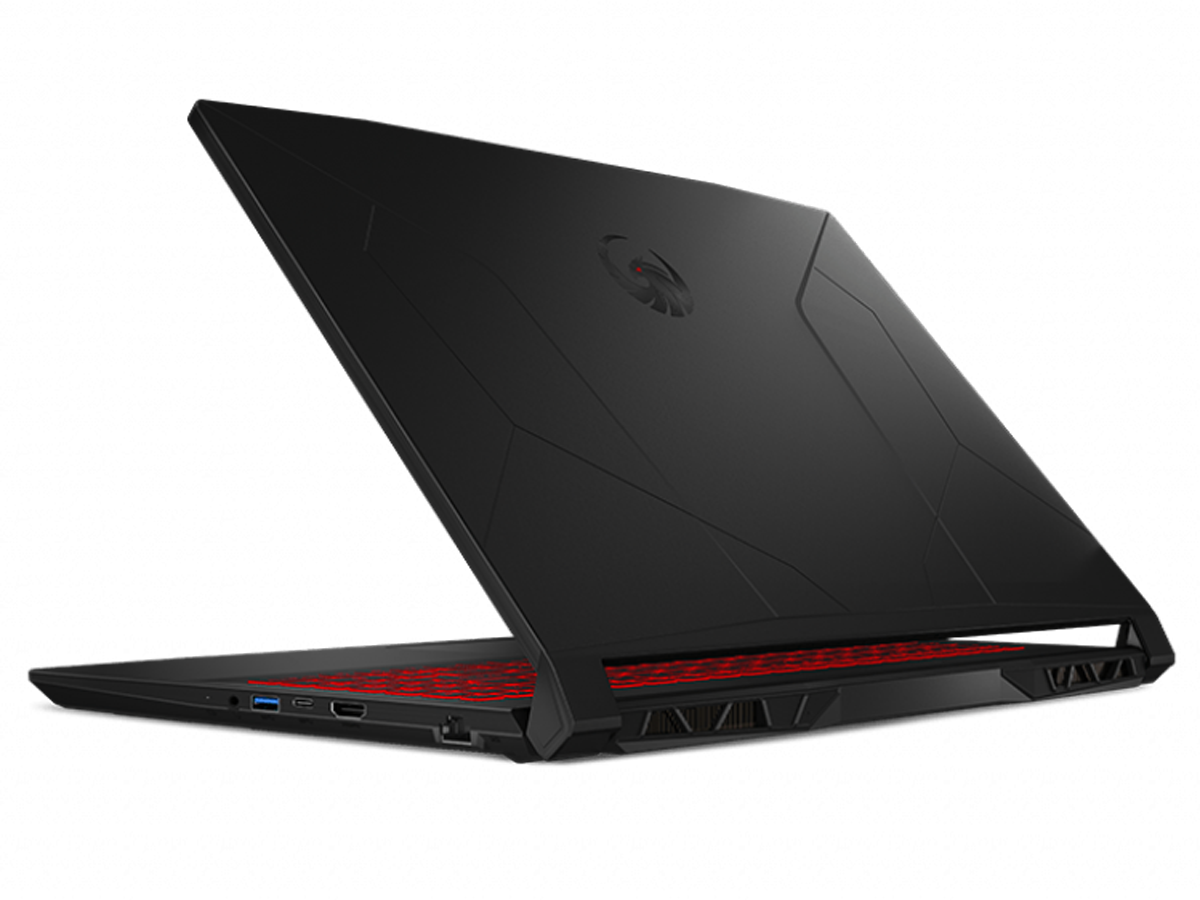
Case — Plastic Everywhere
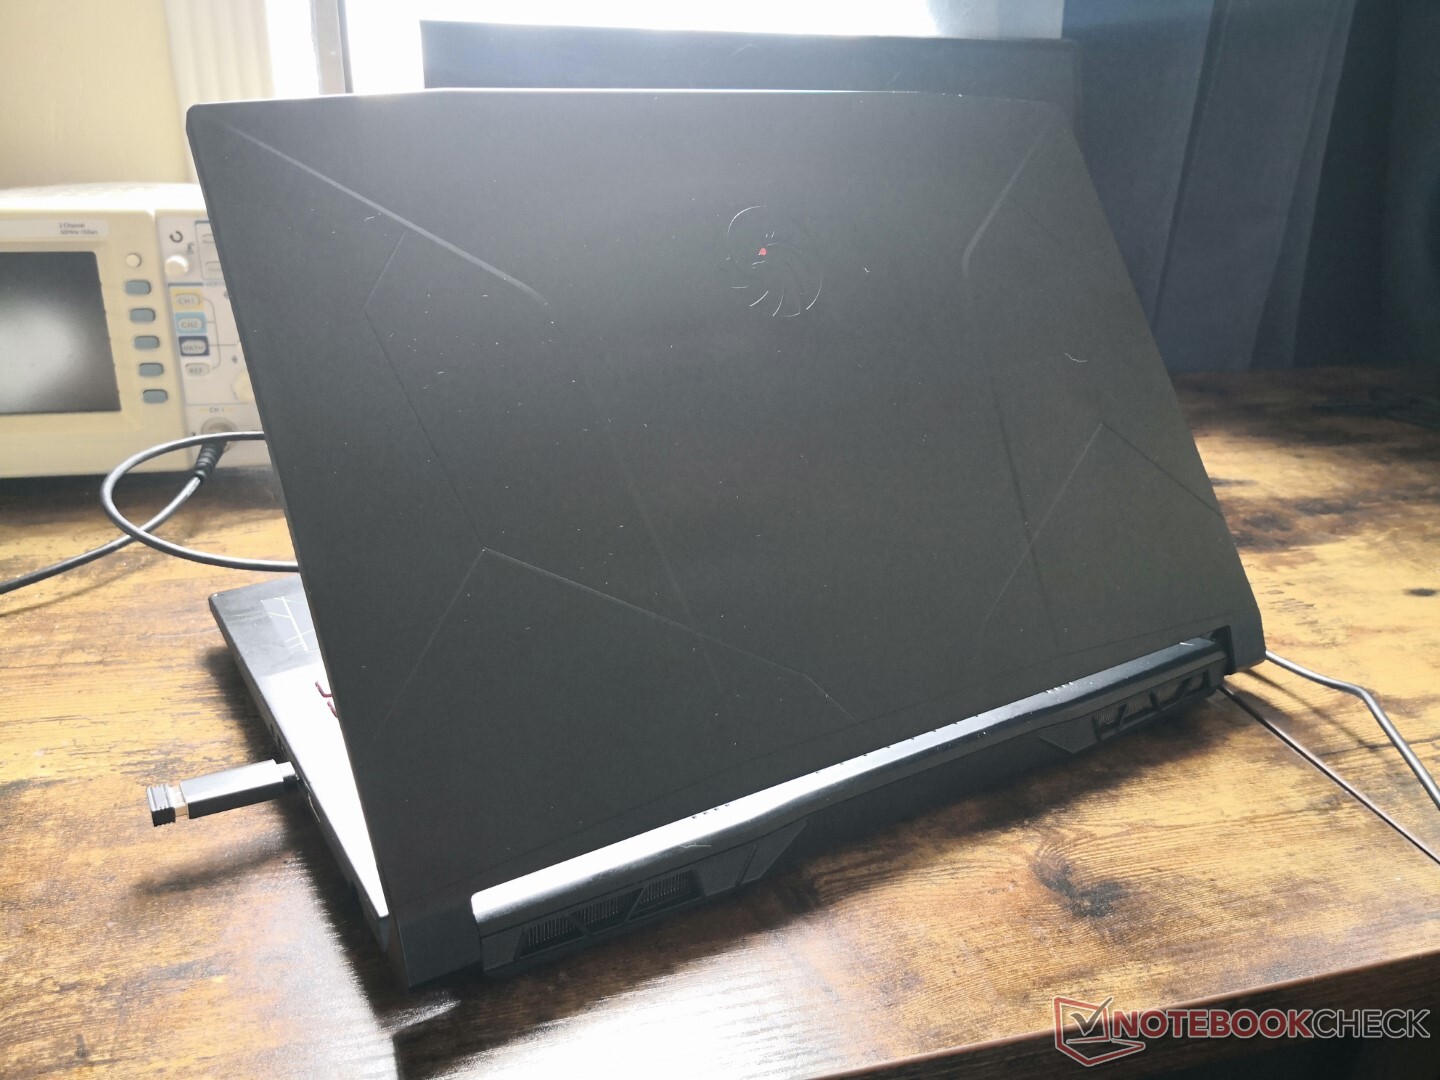
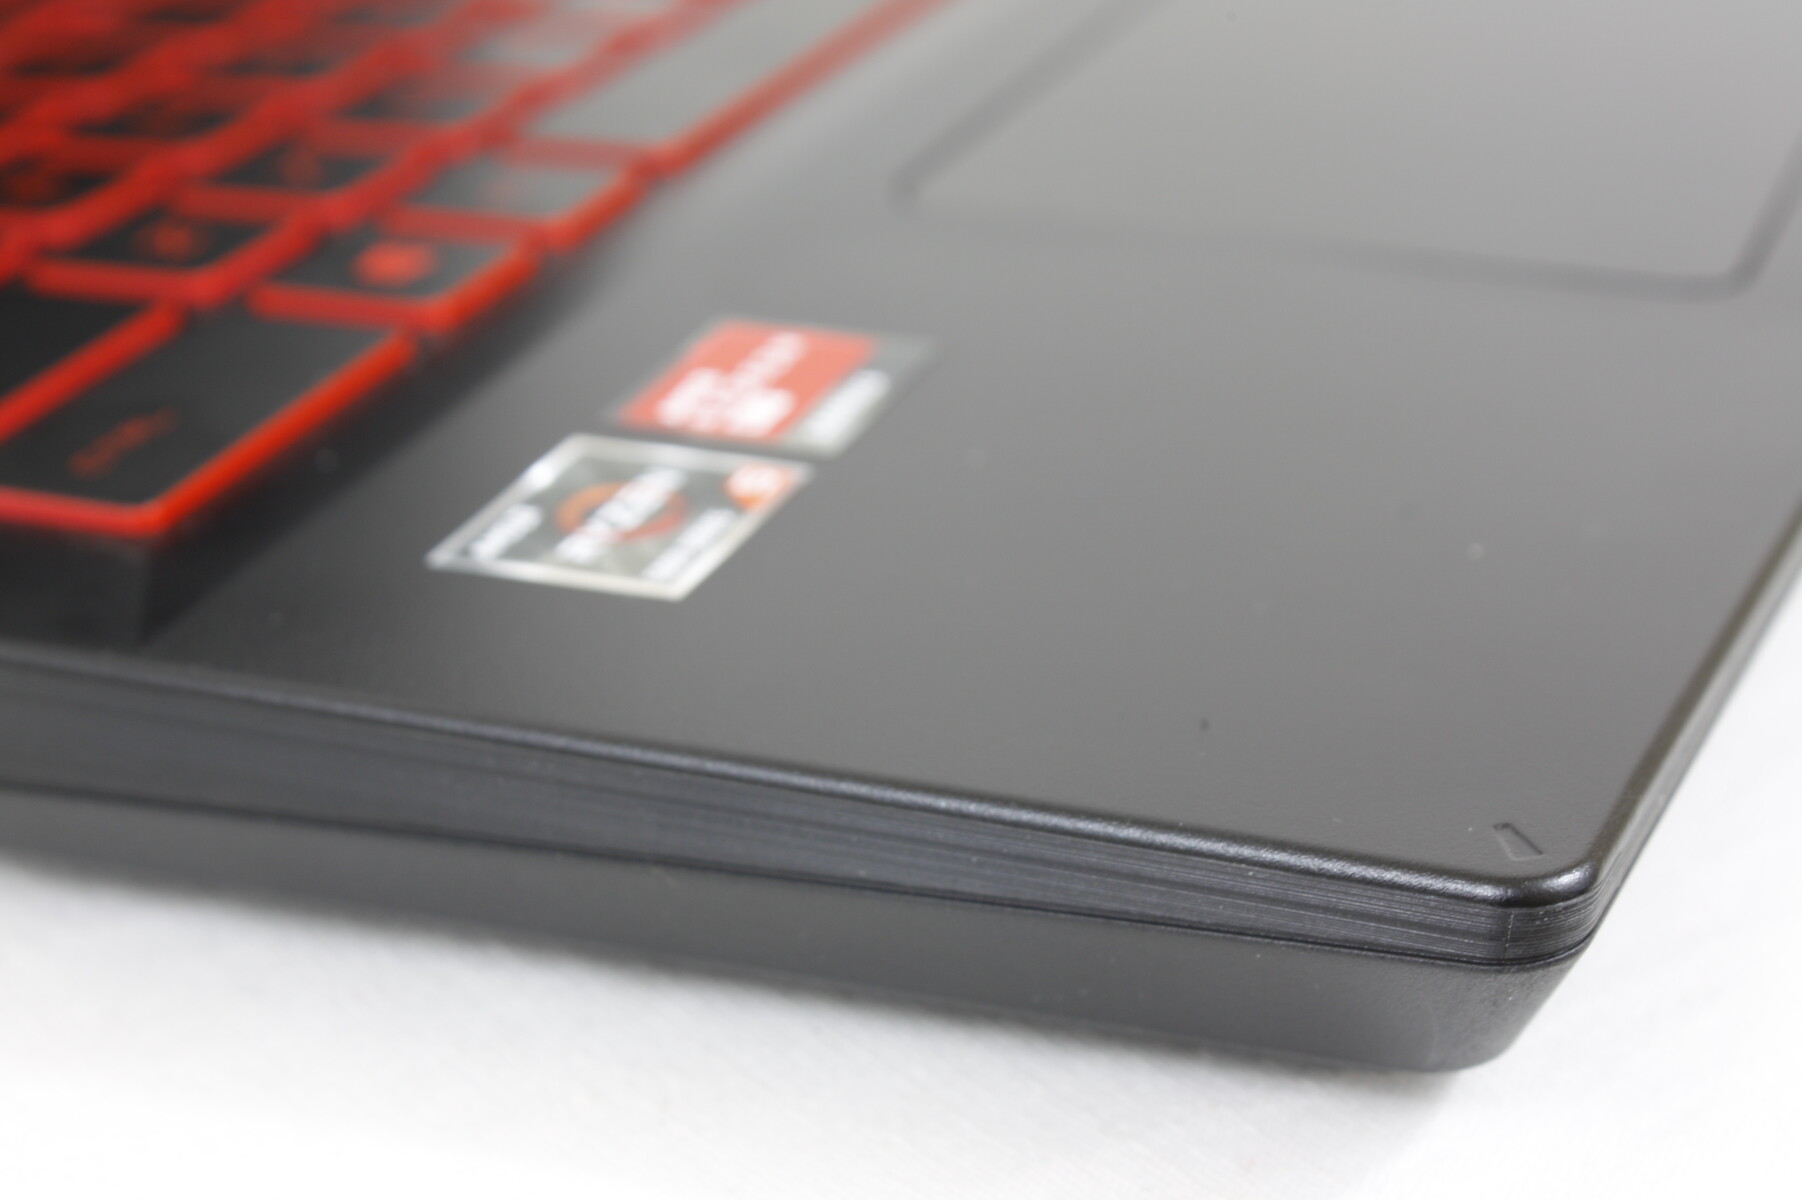
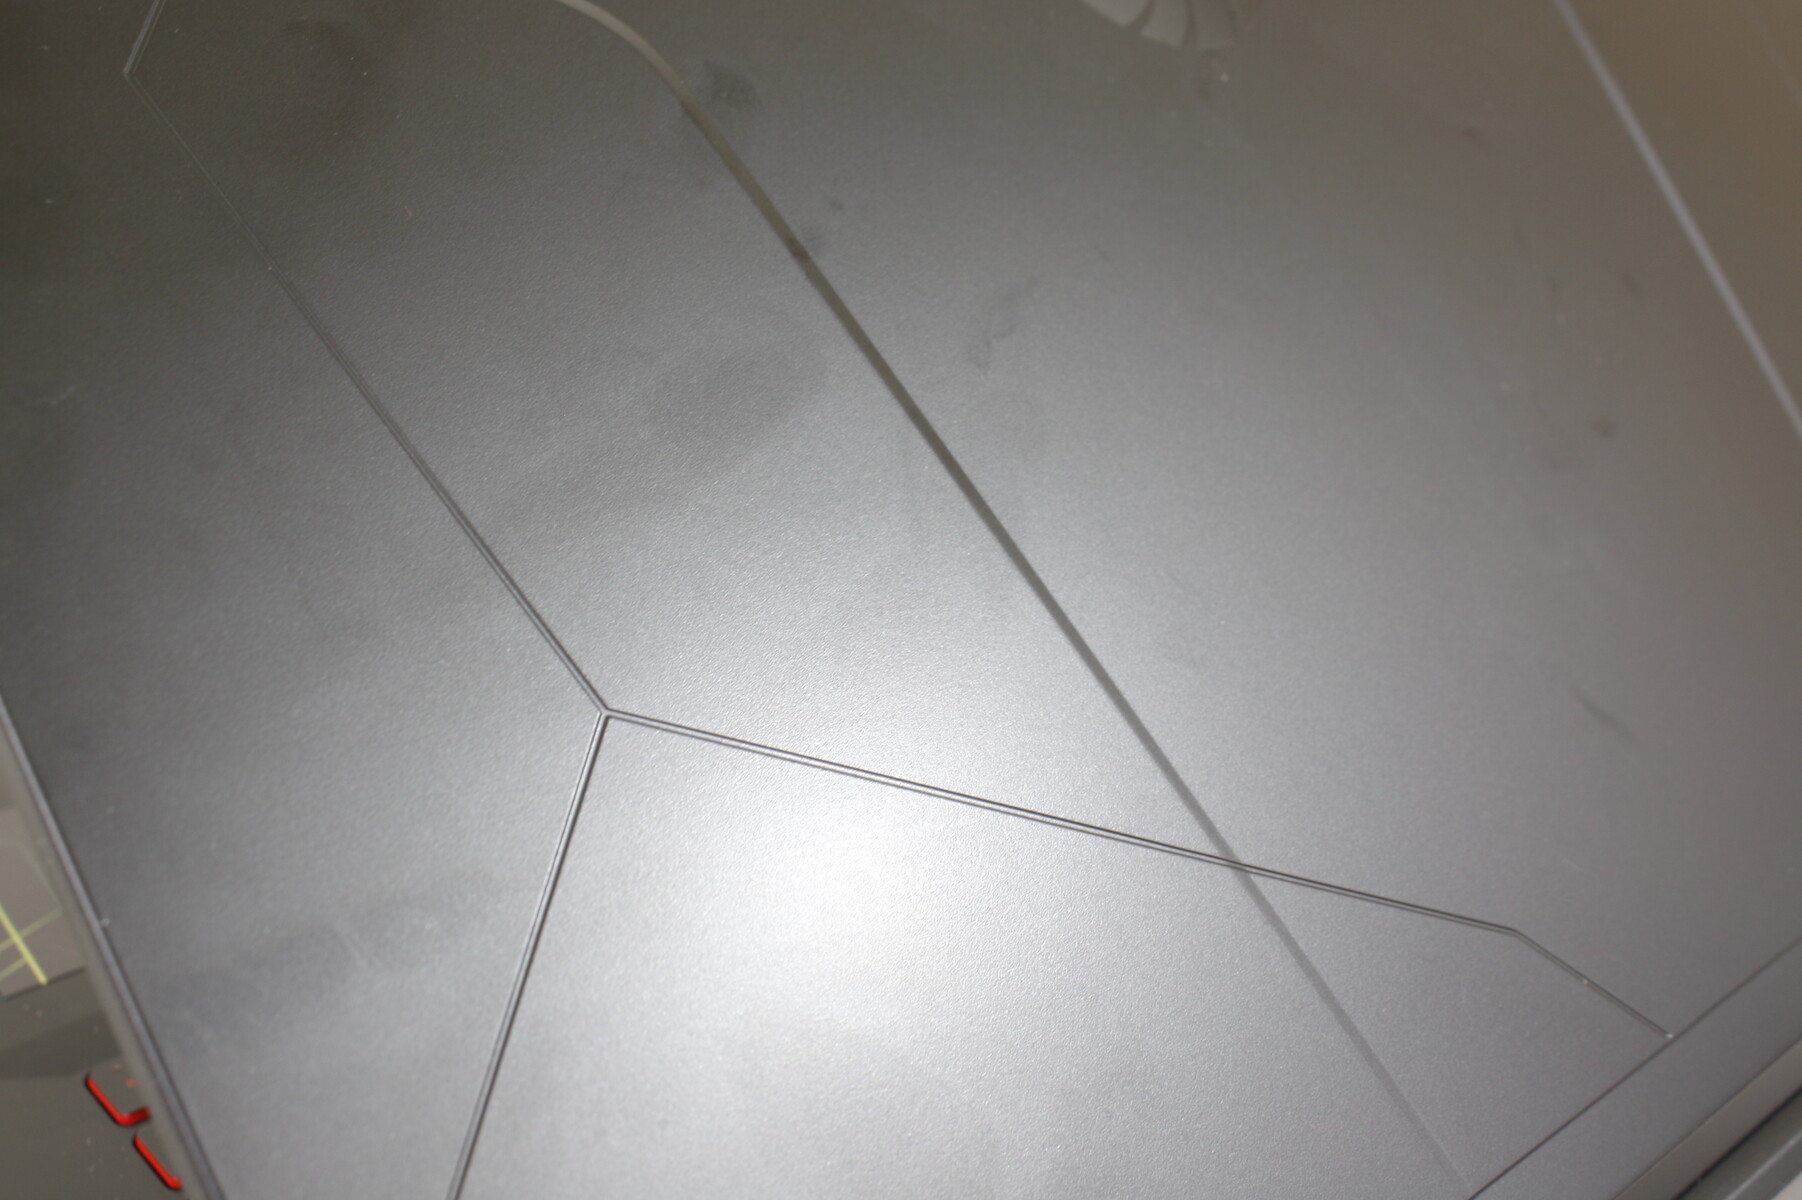
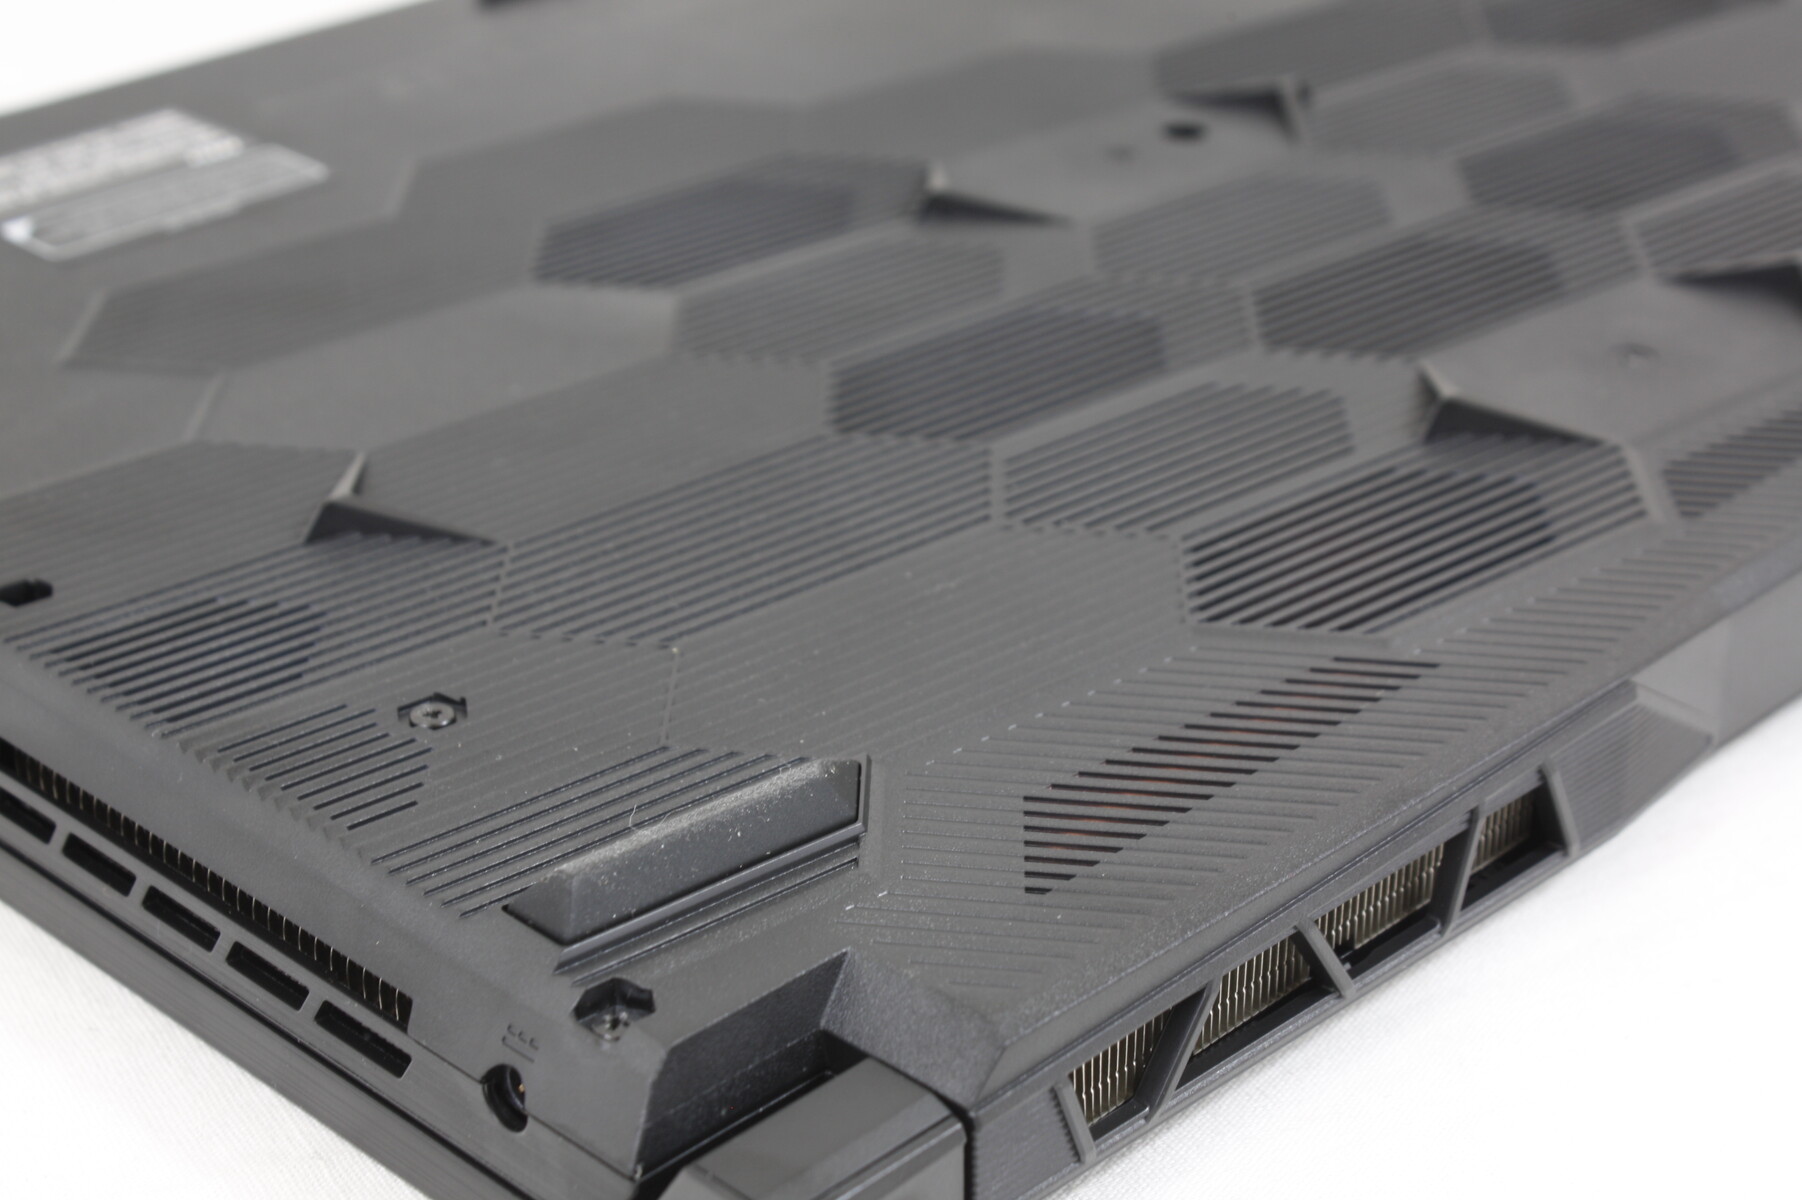
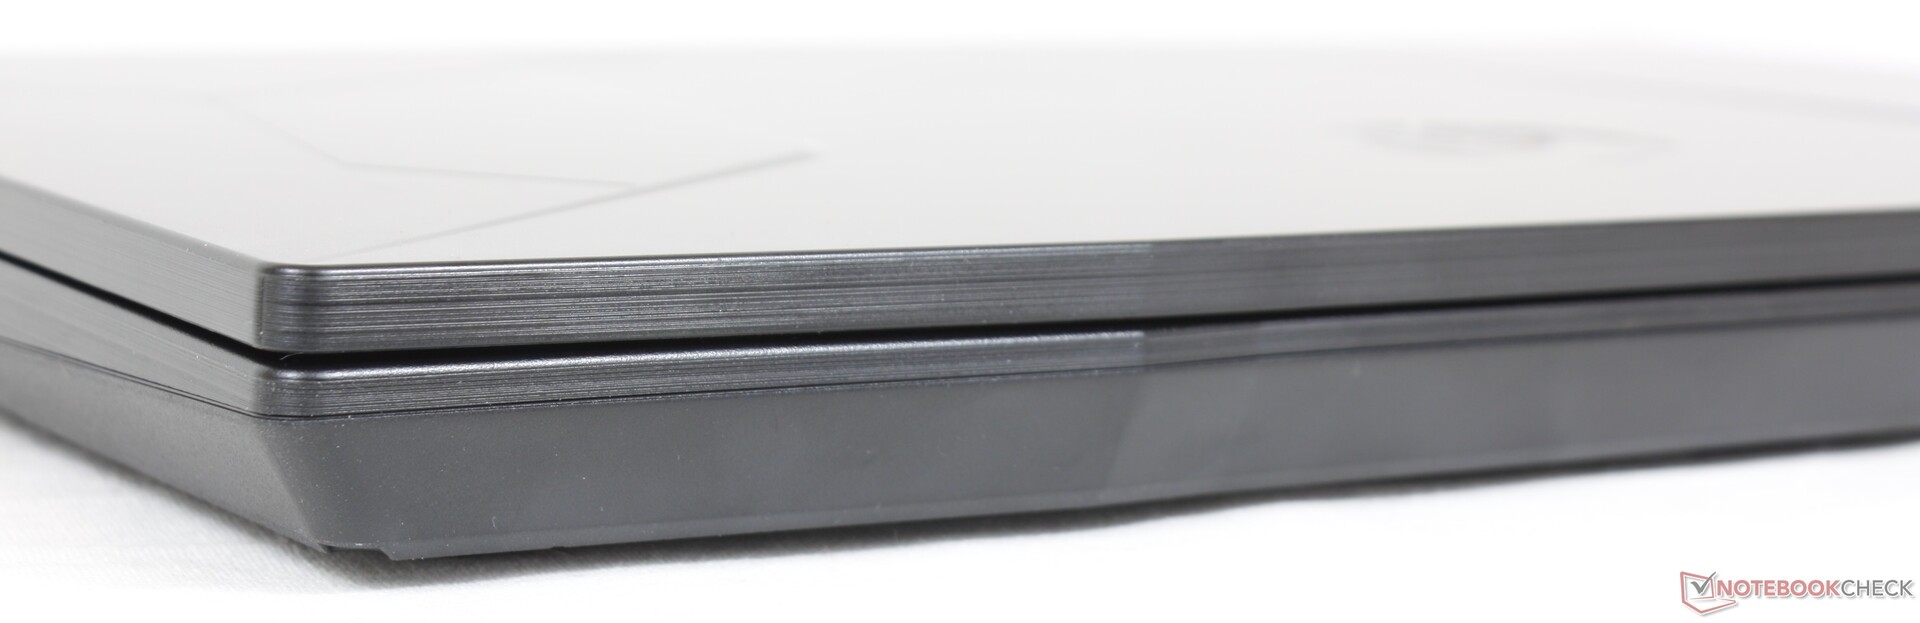
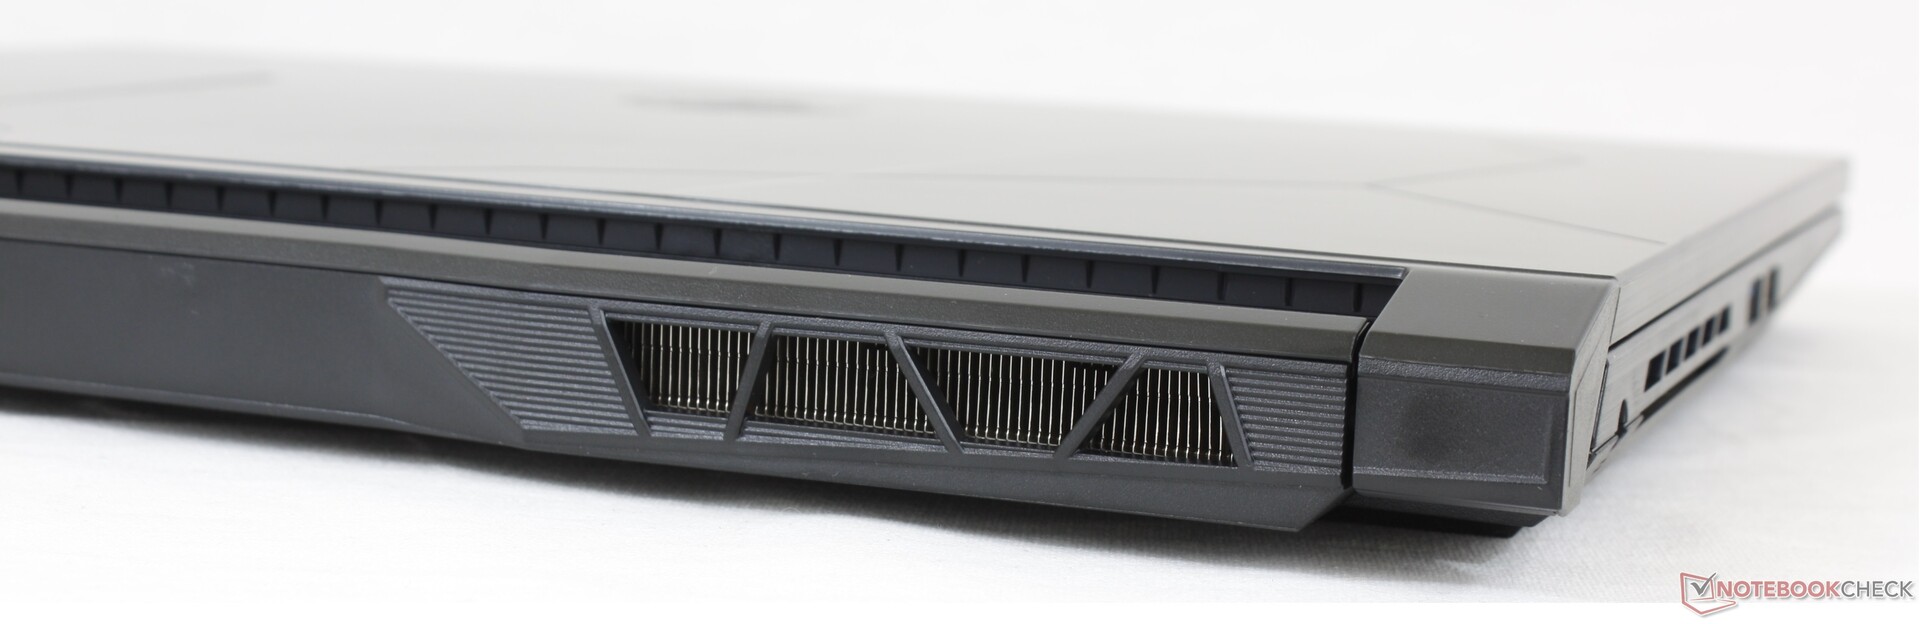
Whereas the 2020 Bravo 15 had a brushed aluminum outer lid and base, the latest Bravo 15 design is conversely mostly matte plastic. It's a duller look as a result akin to the other budget gaming laptops like the Acer Nitro 5 or Gigabyte G5. MSI reserves its sleeker and more luxurious designs for higher-end models from the pricier GE, GT, or GS families.
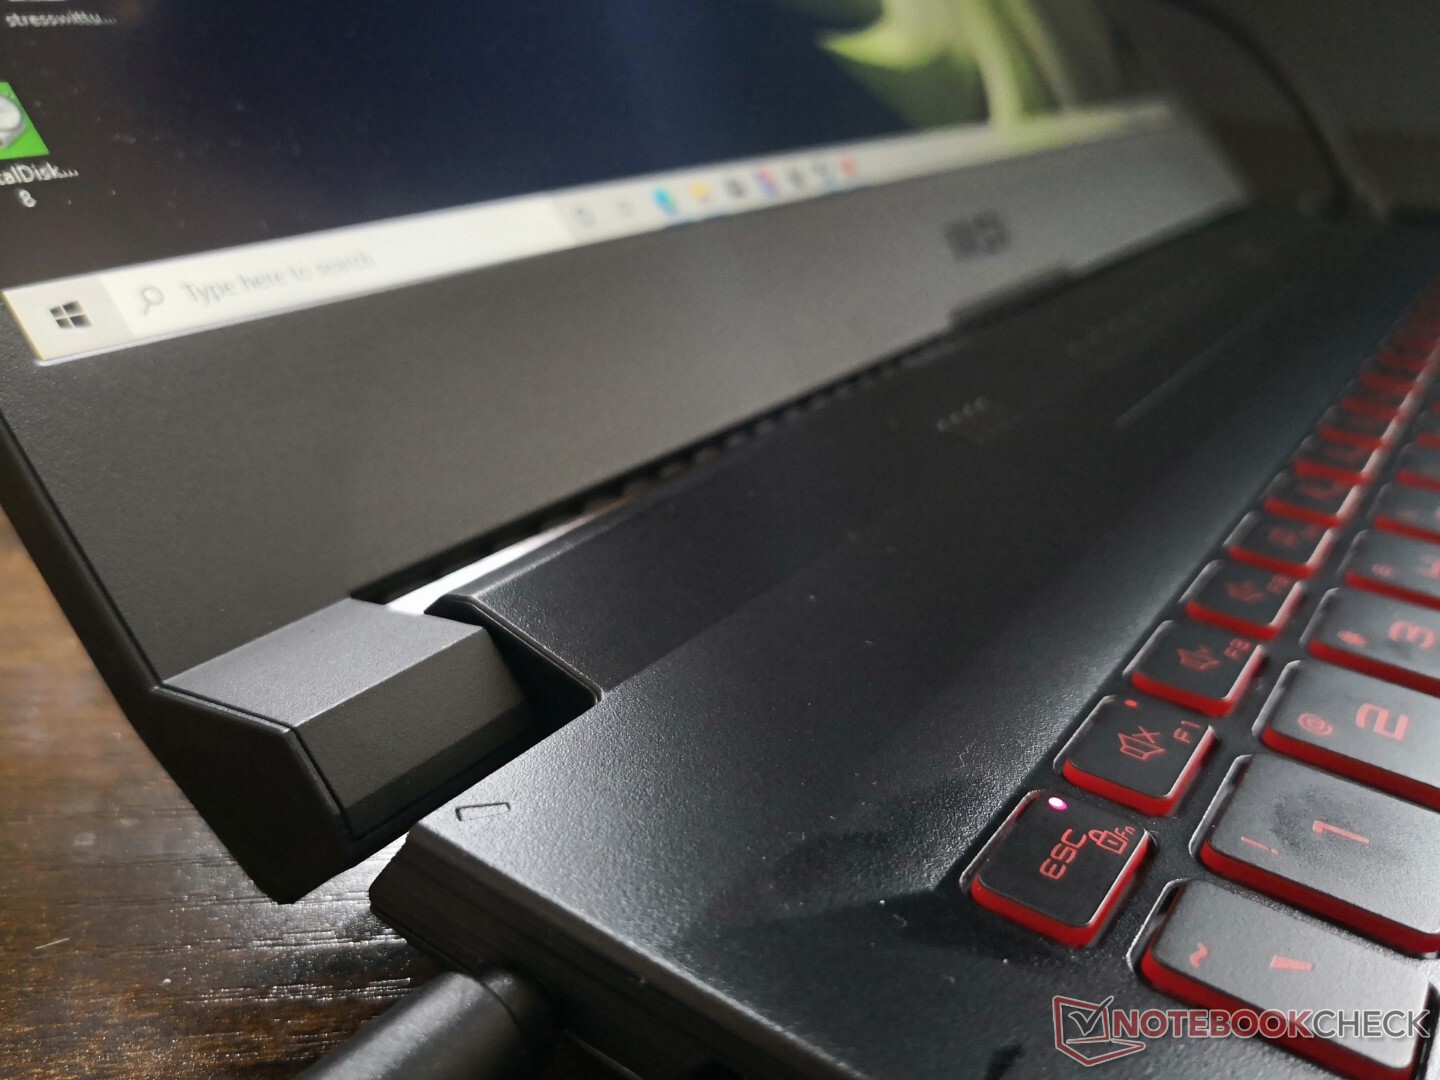
Chassis rigidity is strong for an inexpensive gaming laptop. Applying pressure on the keyboard center or outer lid will warp their respective surfaces slightly but not by a worrying degree. Attempting to twist the system would not result in any creaking, either. The hinges teeter too much for our liking when adjusting angles, however, which makes the system feel cheap.
In terms of size and weight, the newer Bravo 15 model is larger and heavier (2.3 kg vs. 2.0 kg) than its immediate predecessor as shown by our size comparison below. Competing models like the Lenovo Ideapad Gaming 3 15 or Asus TUF Gaming F15 FX507ZM are lighter and smaller overall.
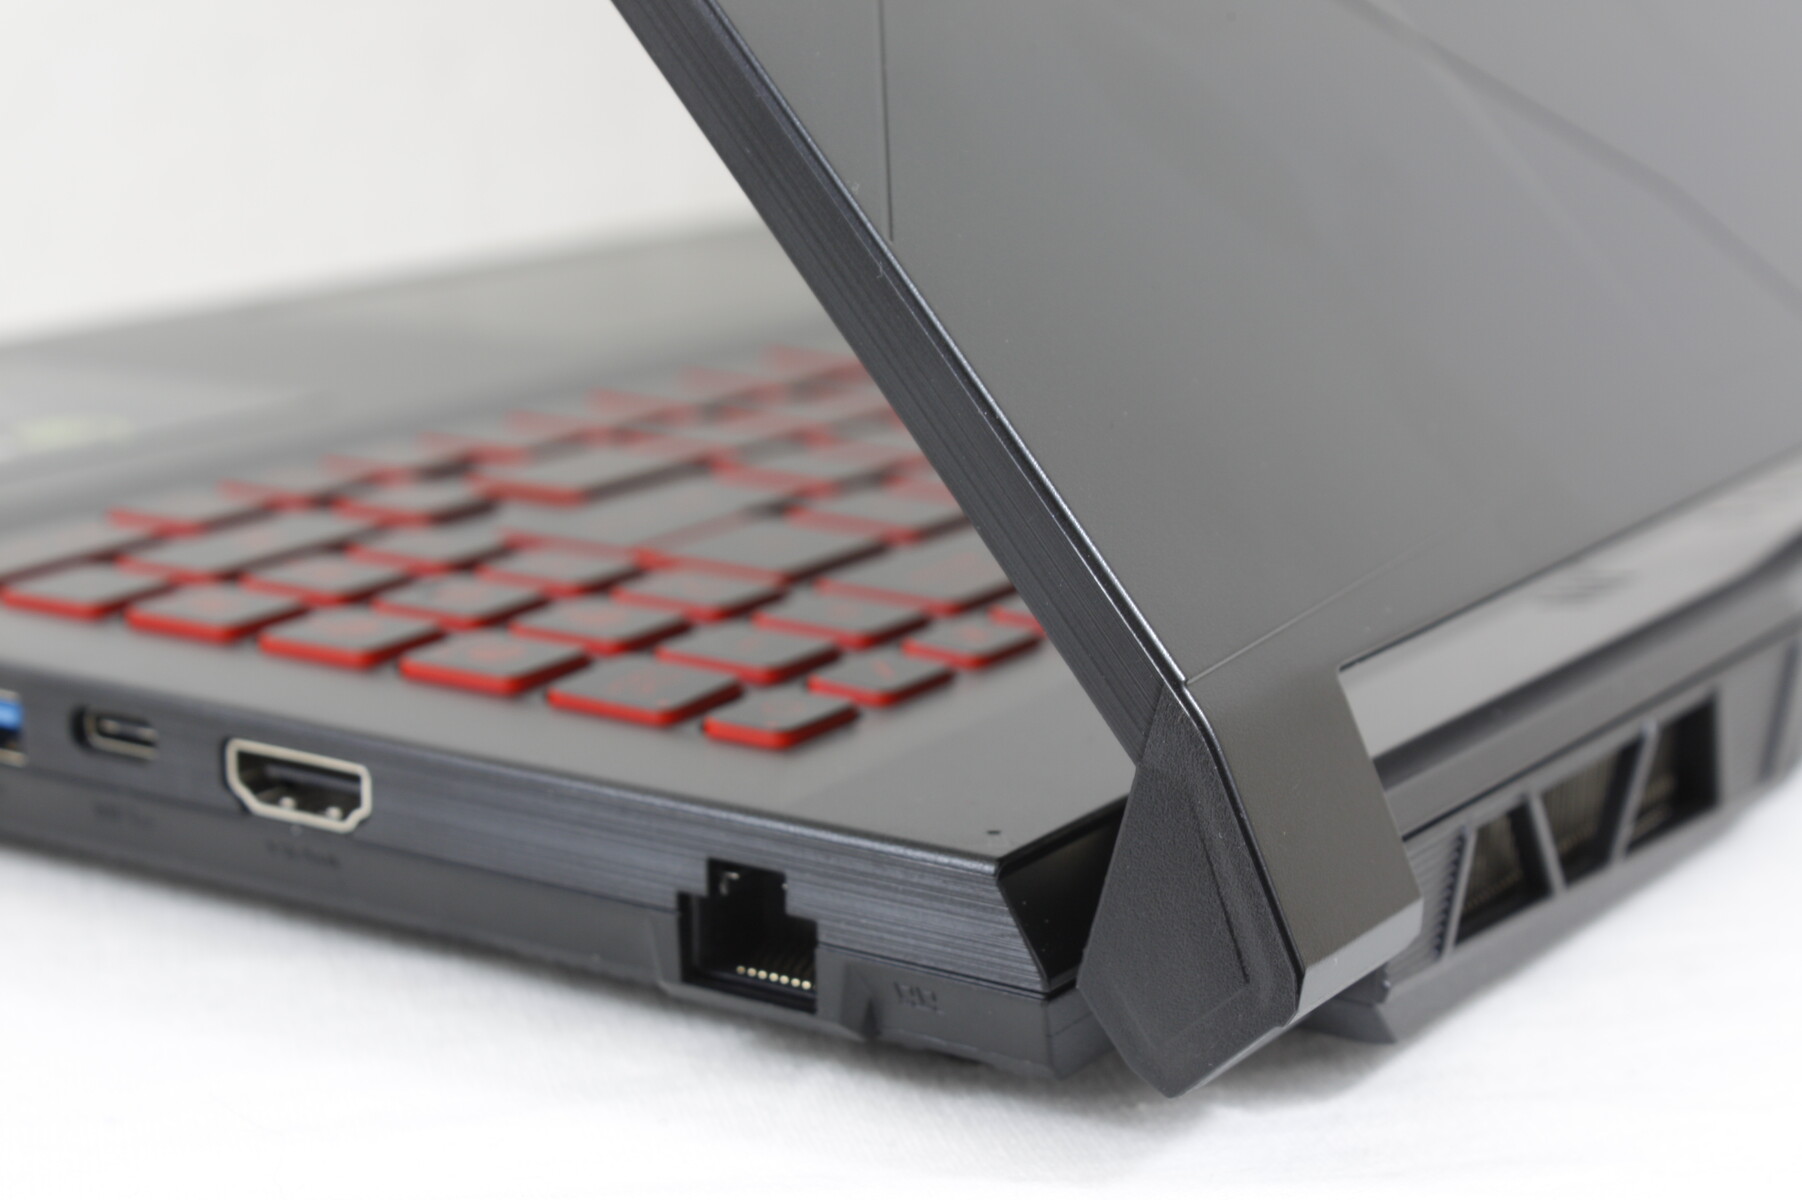
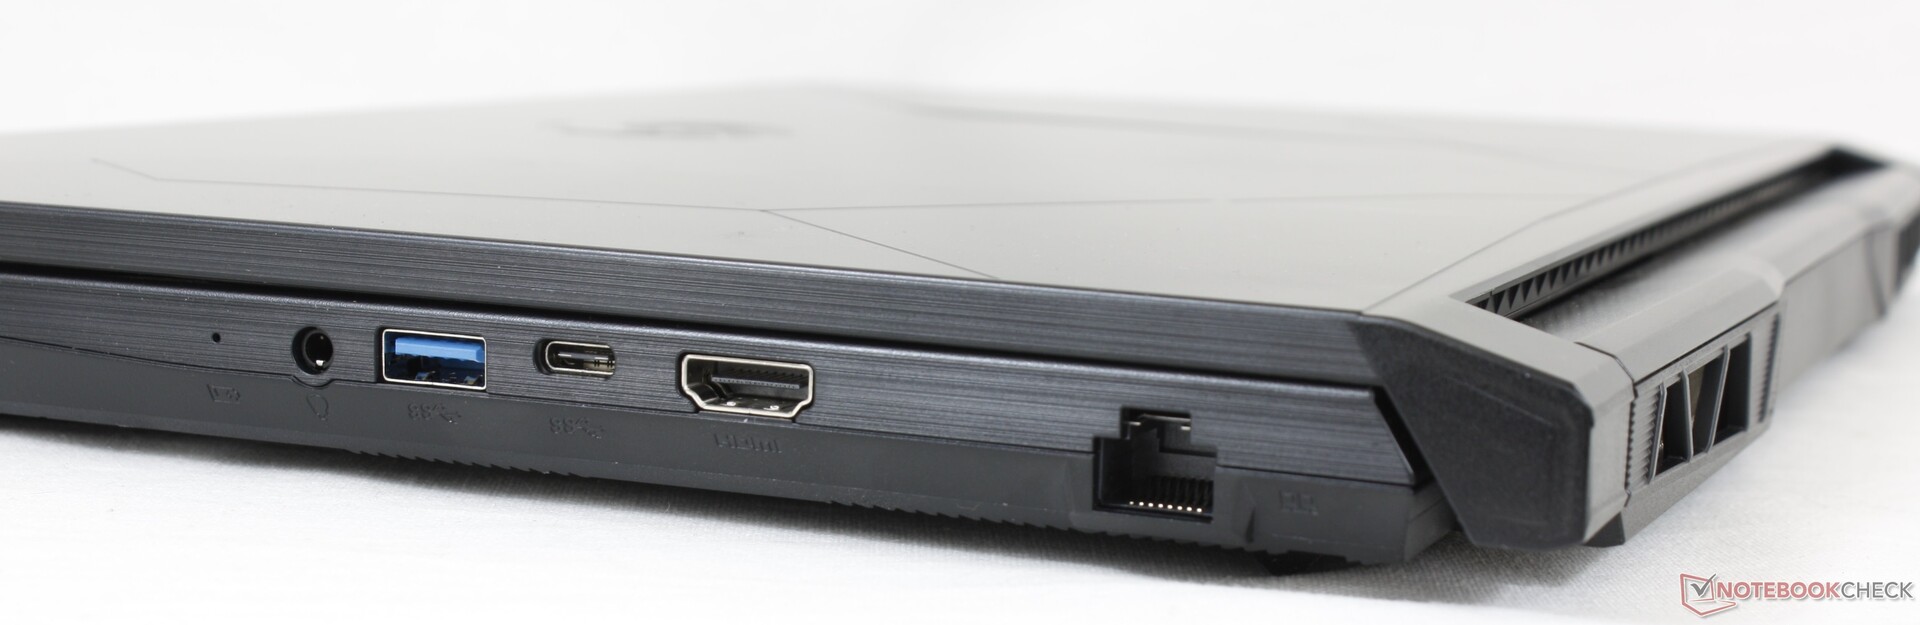
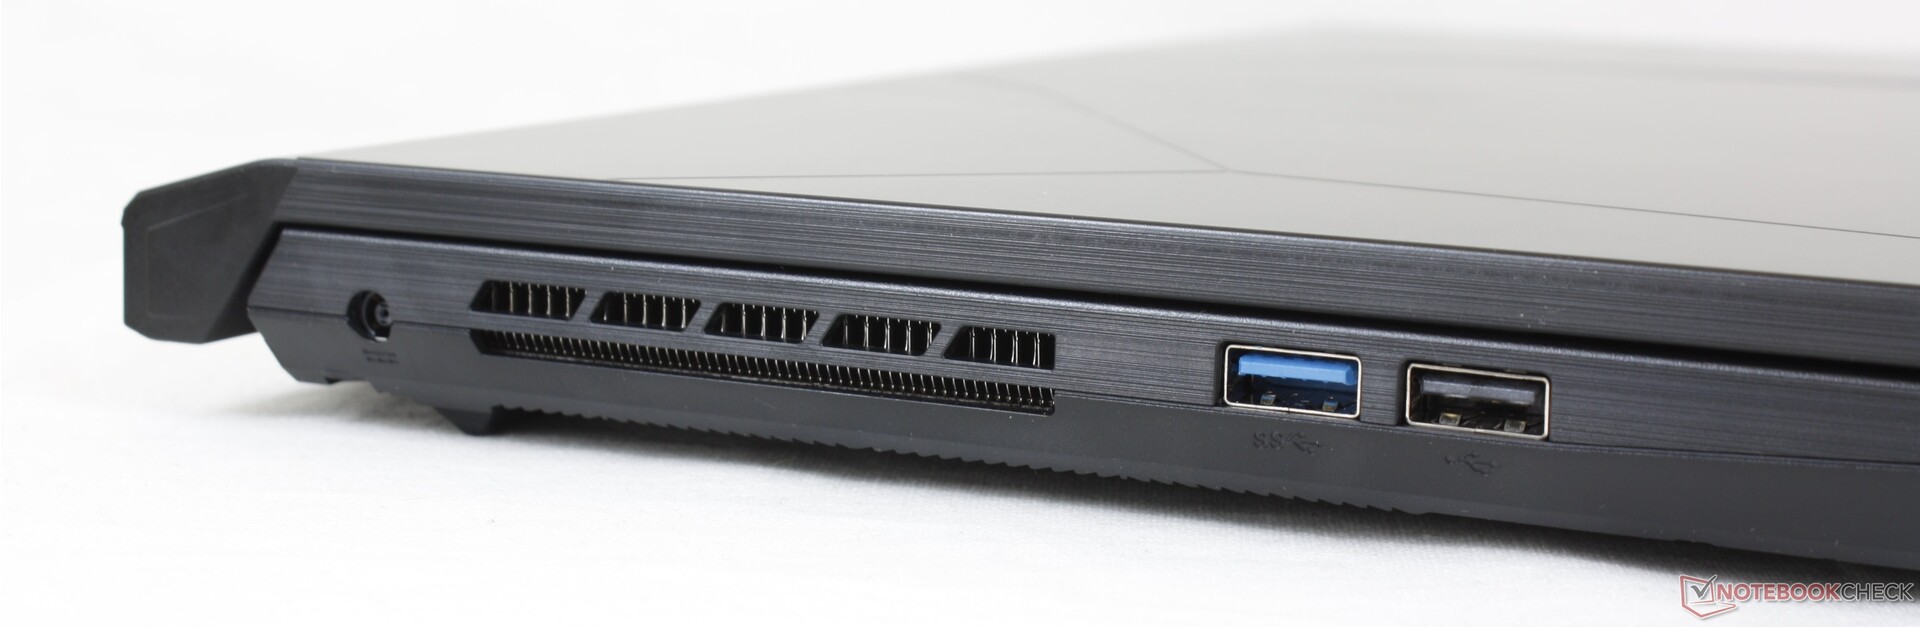
Connectivity — Just The Basics
Port options and positioning have changed significantly from the 2020 Bravo 15. The Kensington lock, for example, is now gone while one of the USB-C ports has been swapped for a third USB-A port. Most other gaming laptops tend to have multiple USB-C ports instead of just one including on the competing Asus TUF FX507 series.
Keep in mind that the USB-C port on this model does not support DisplayPort-out, Power Delivery, or Thunderbolt.
Communication
Webcam
The integrated webcam is the standard 720p with no support for Windows Hello. Users can disable the camera electronically via the F6 key.


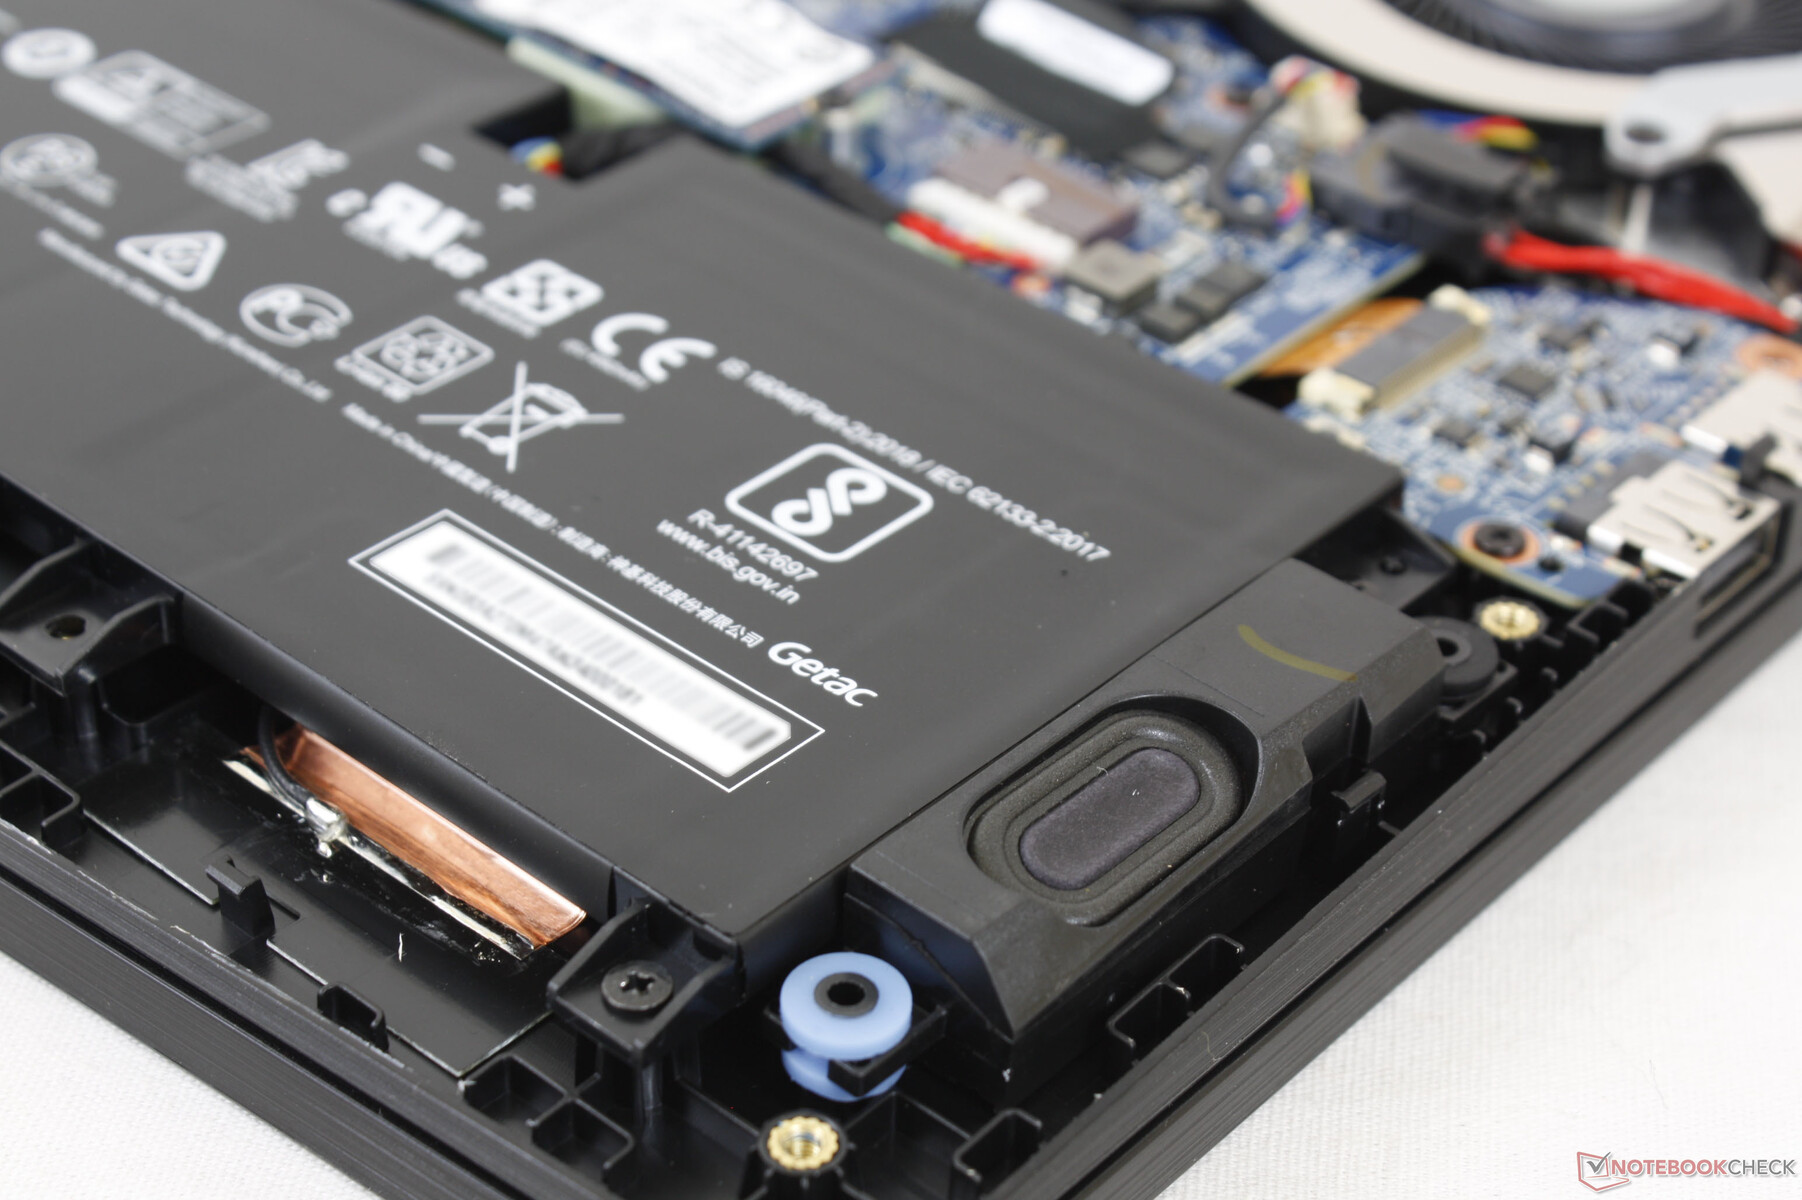
Maintenance
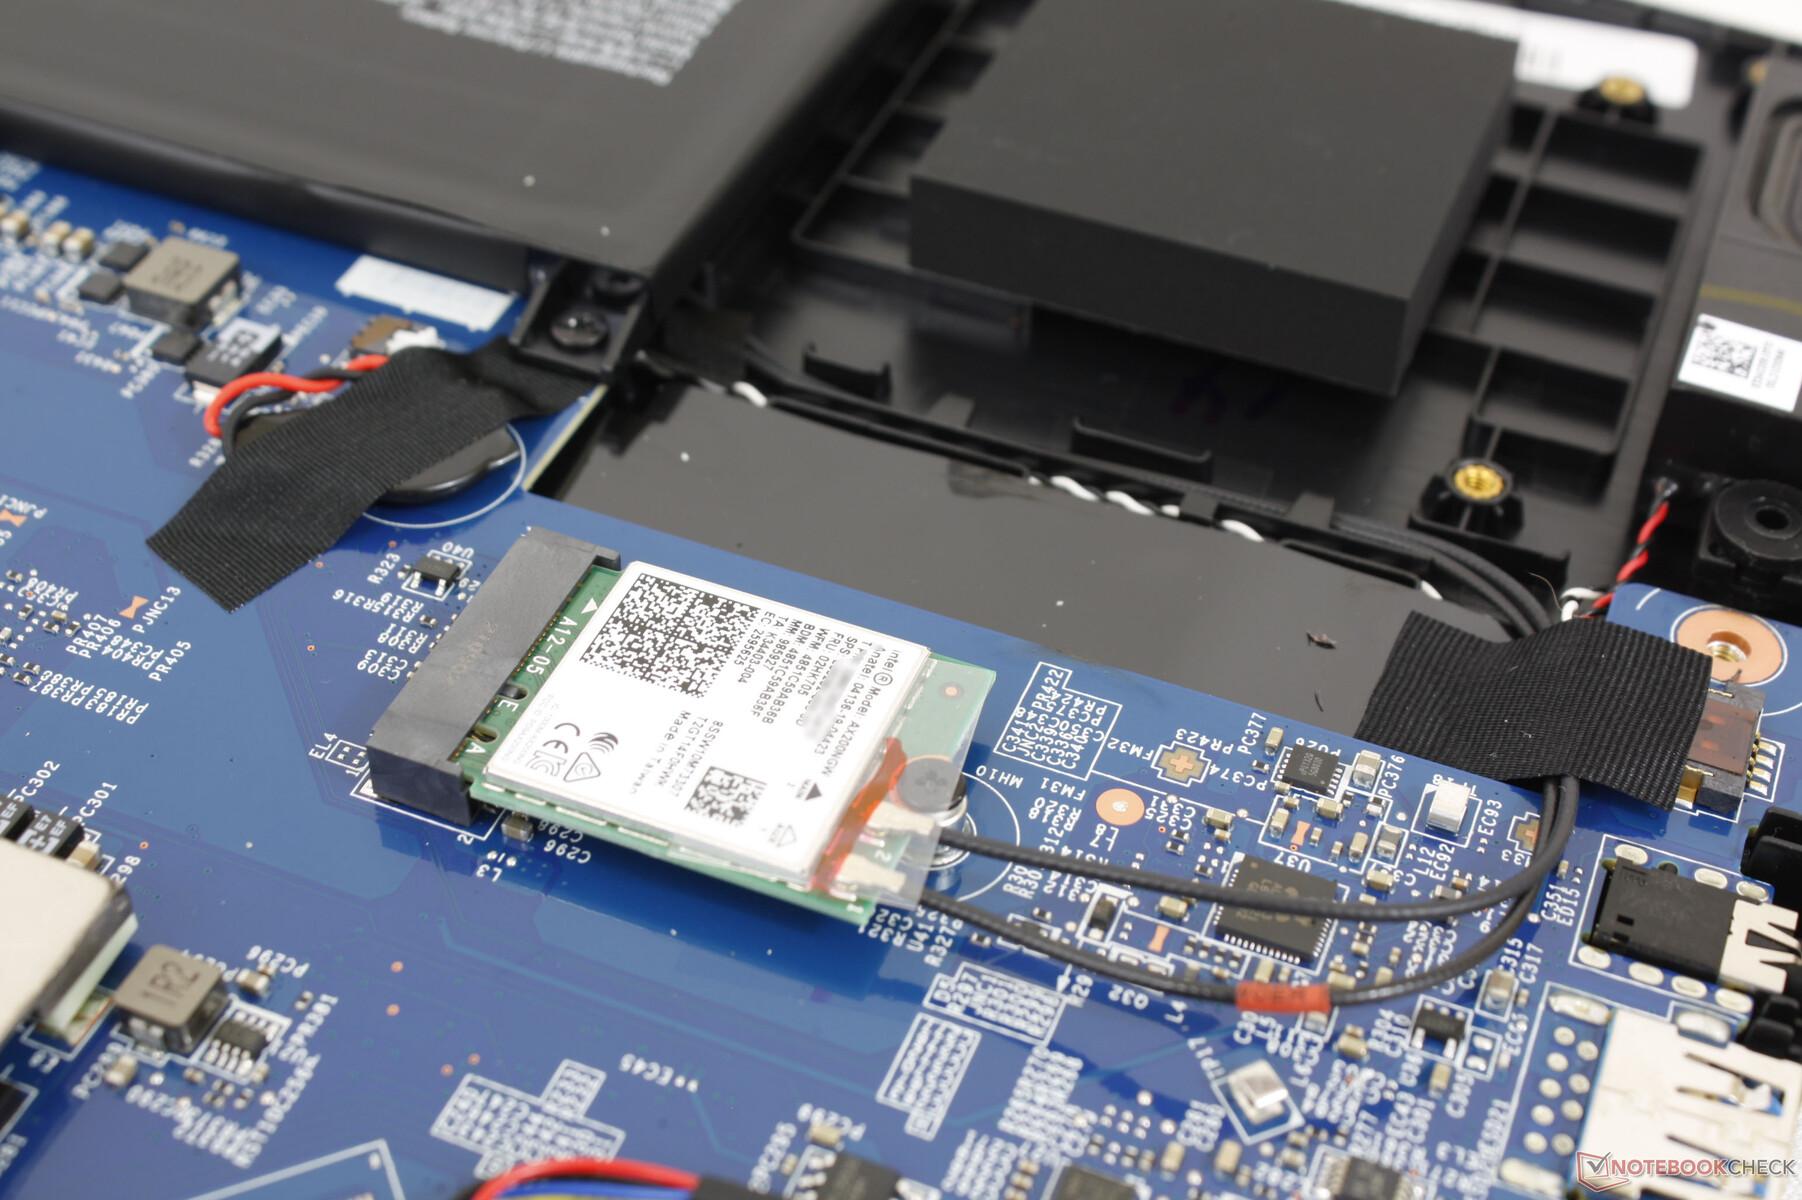
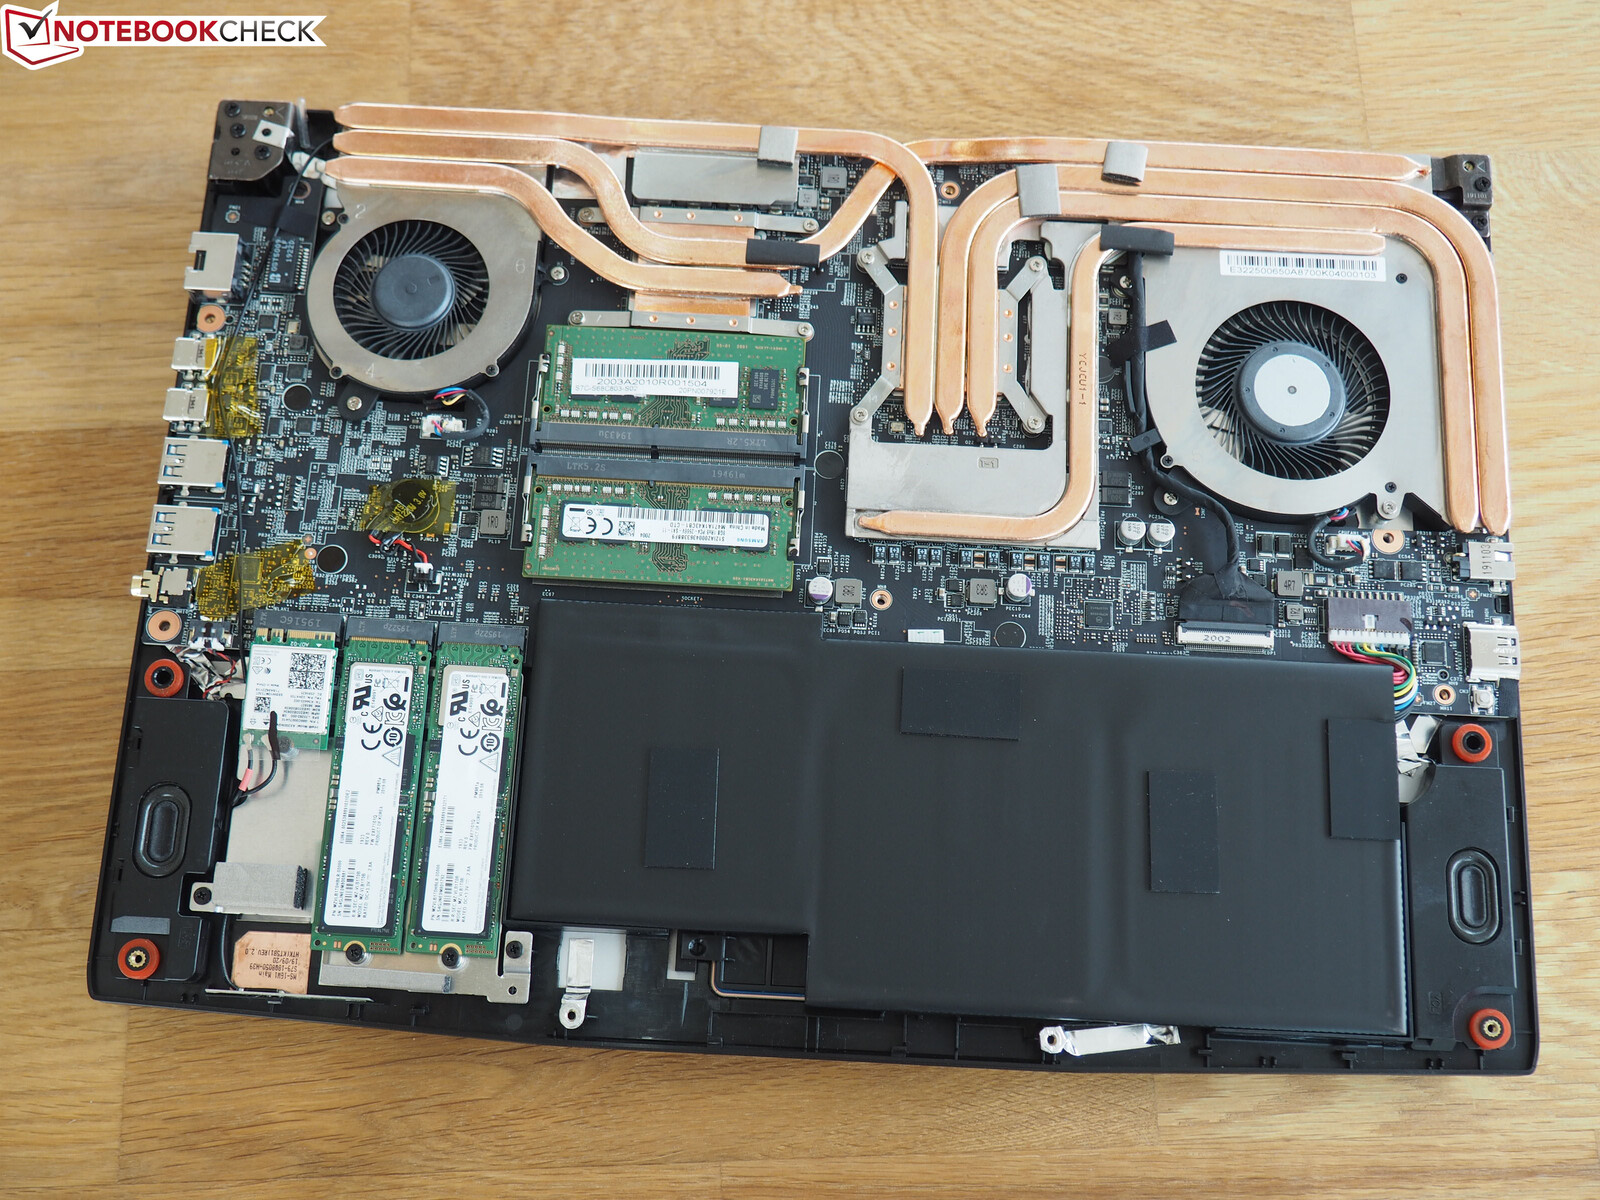
The bottom panel is relatively easy to remove with a Philips screwdriver and sharp edge. Note that a 'factory seal' sticker must be broken if you want access to the internals.
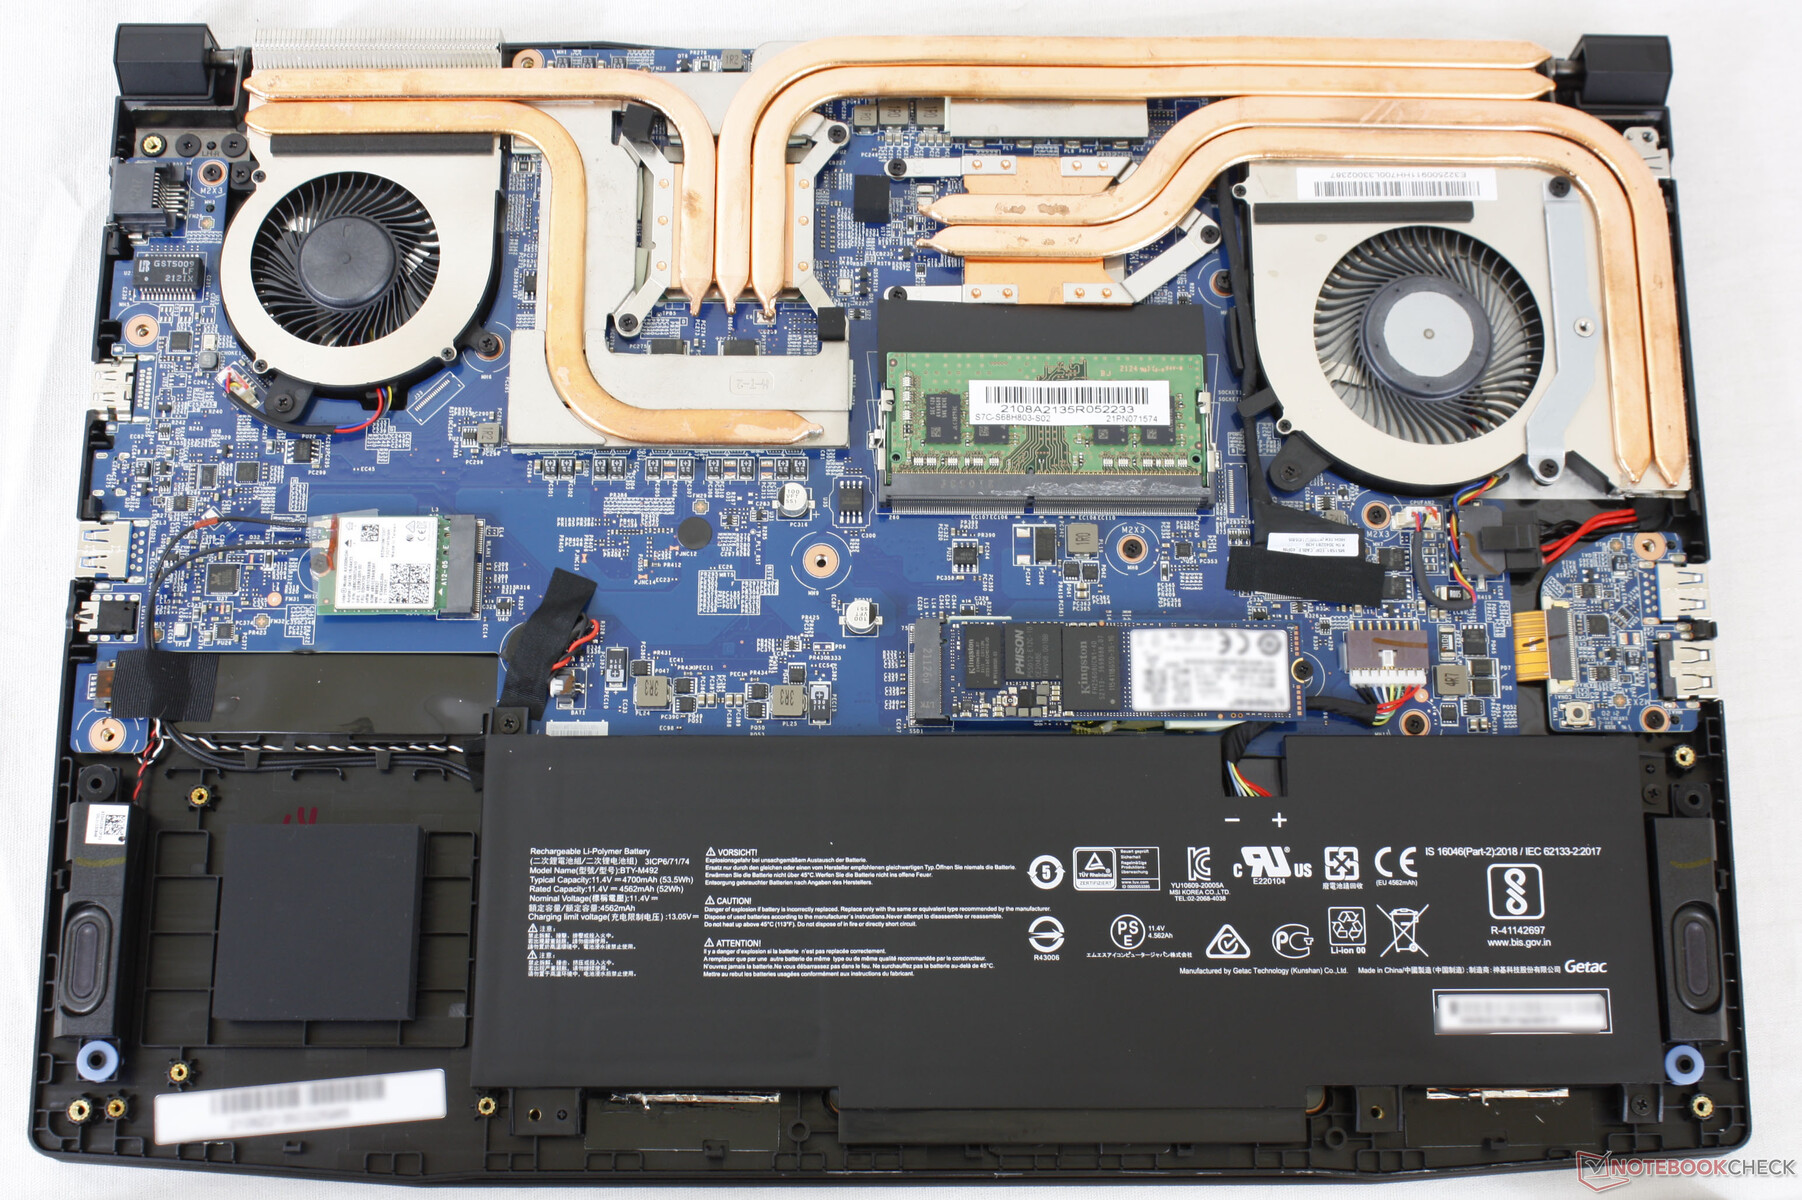
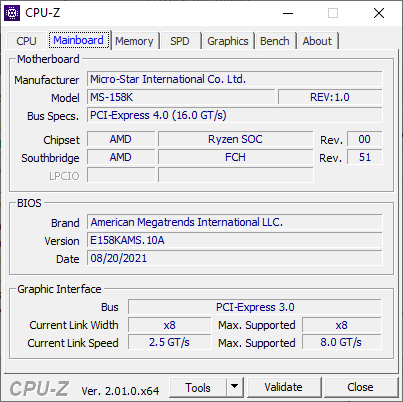
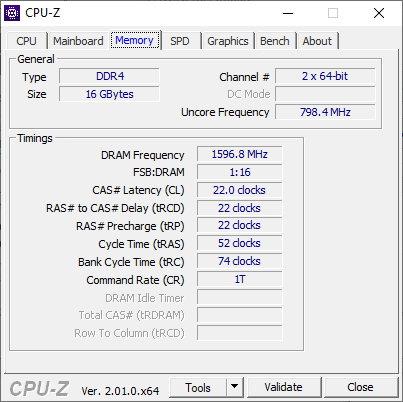
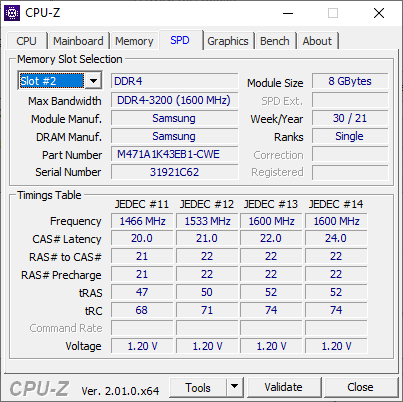
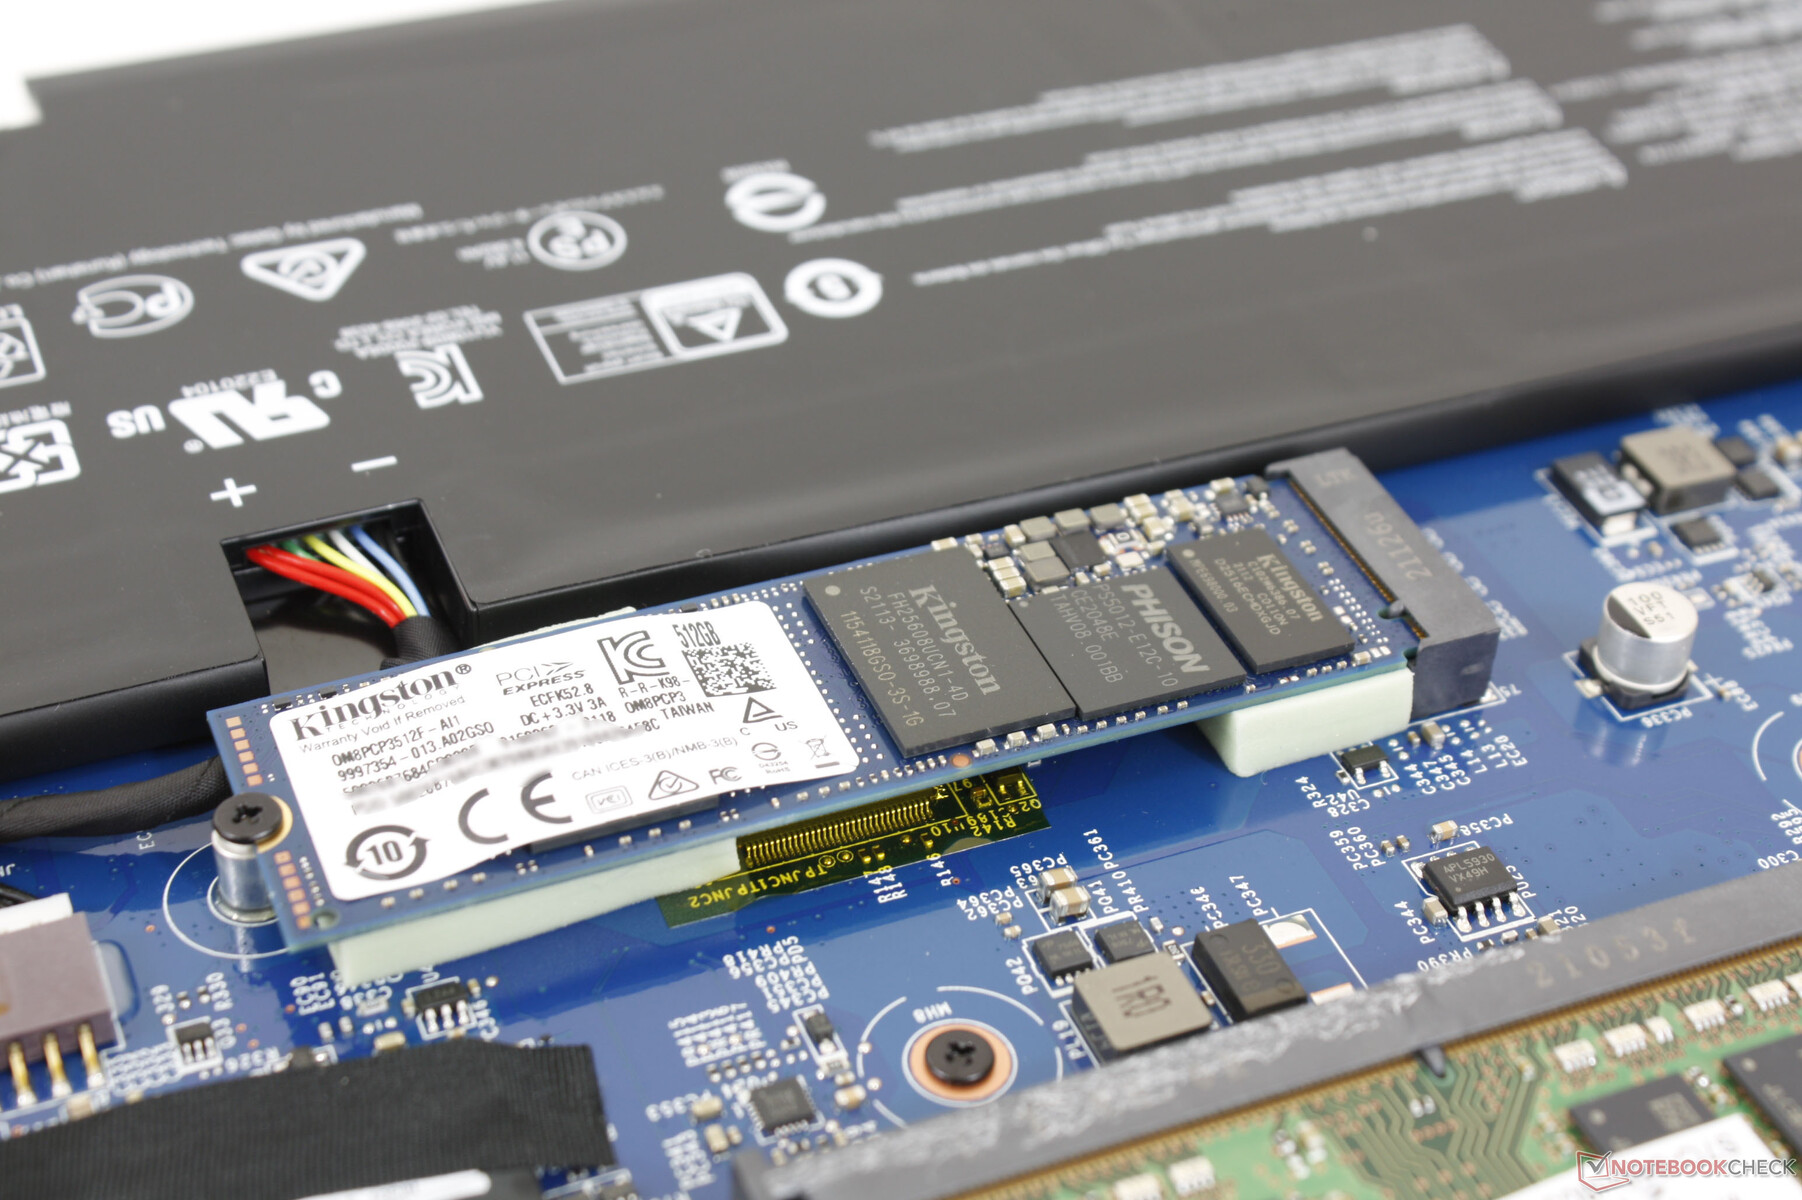
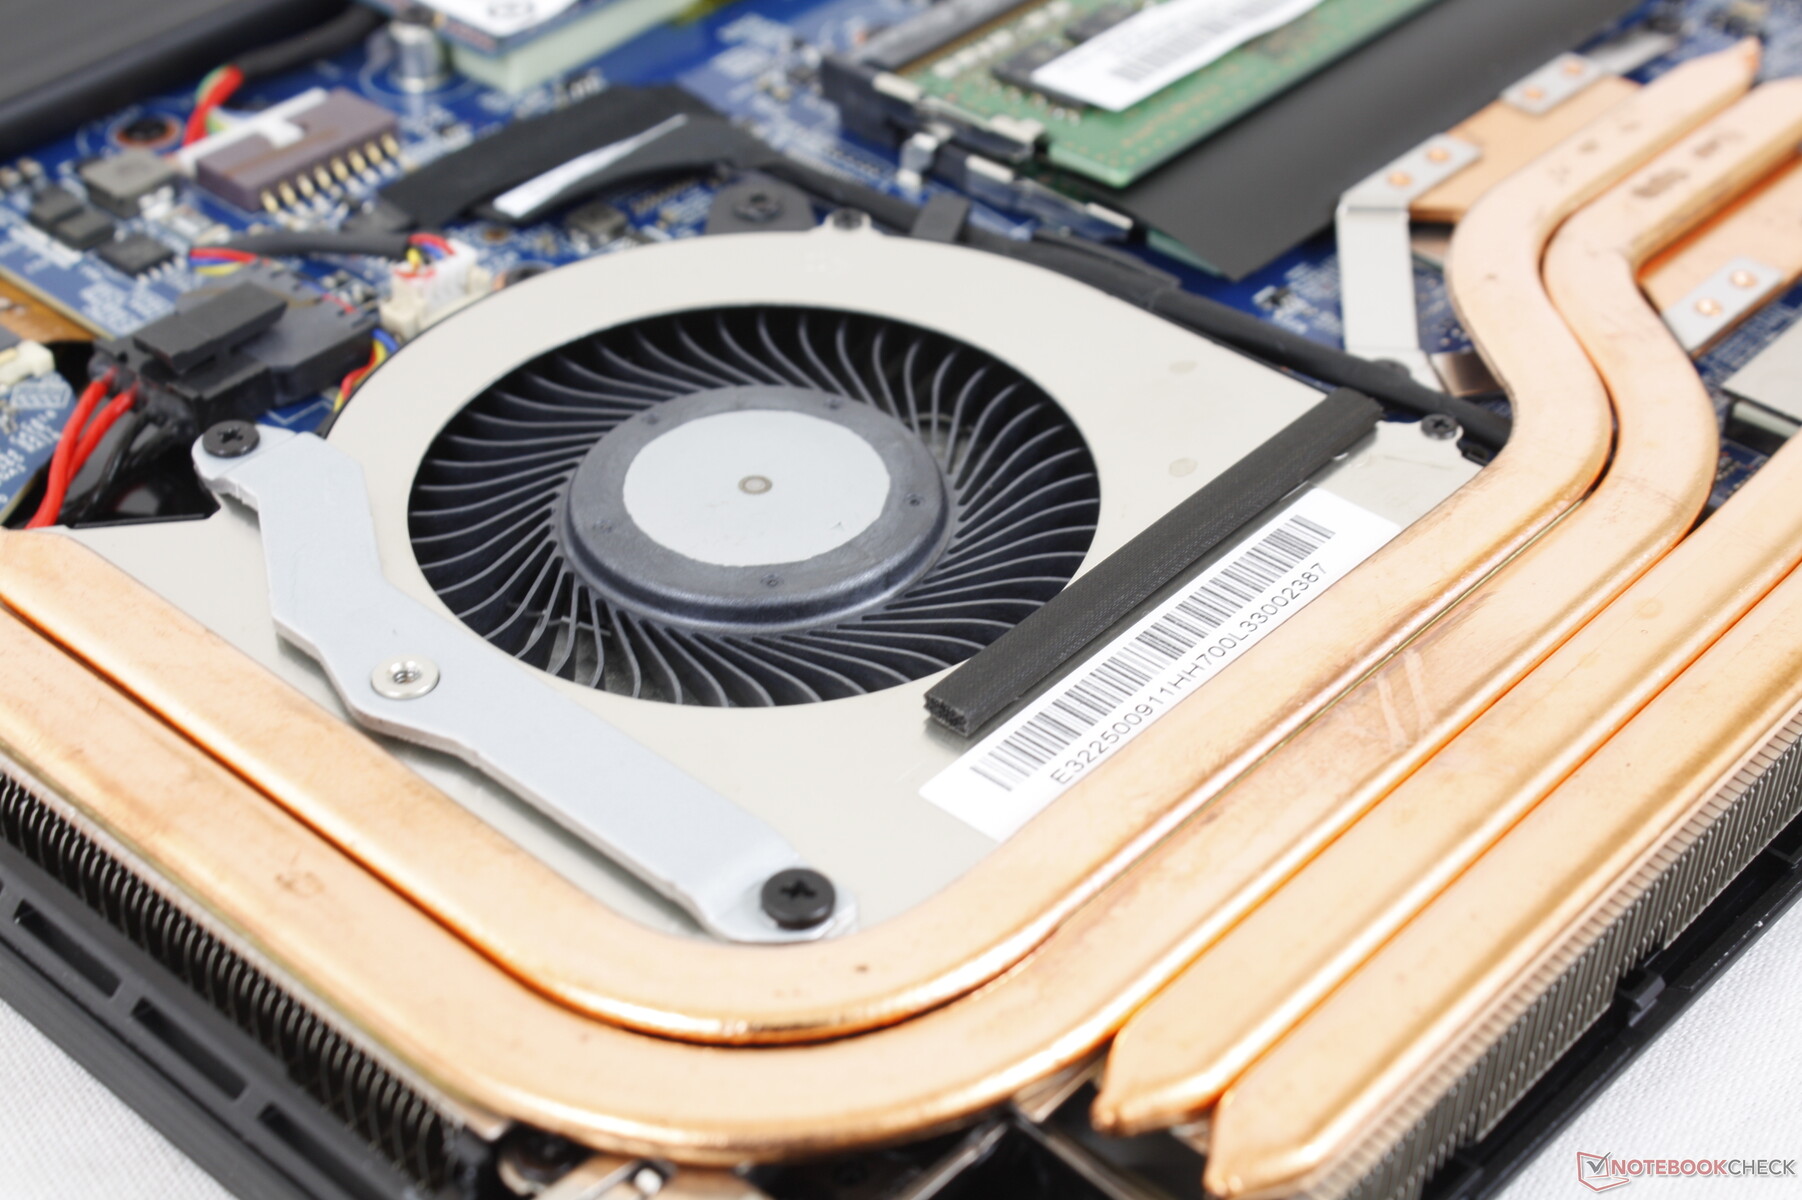
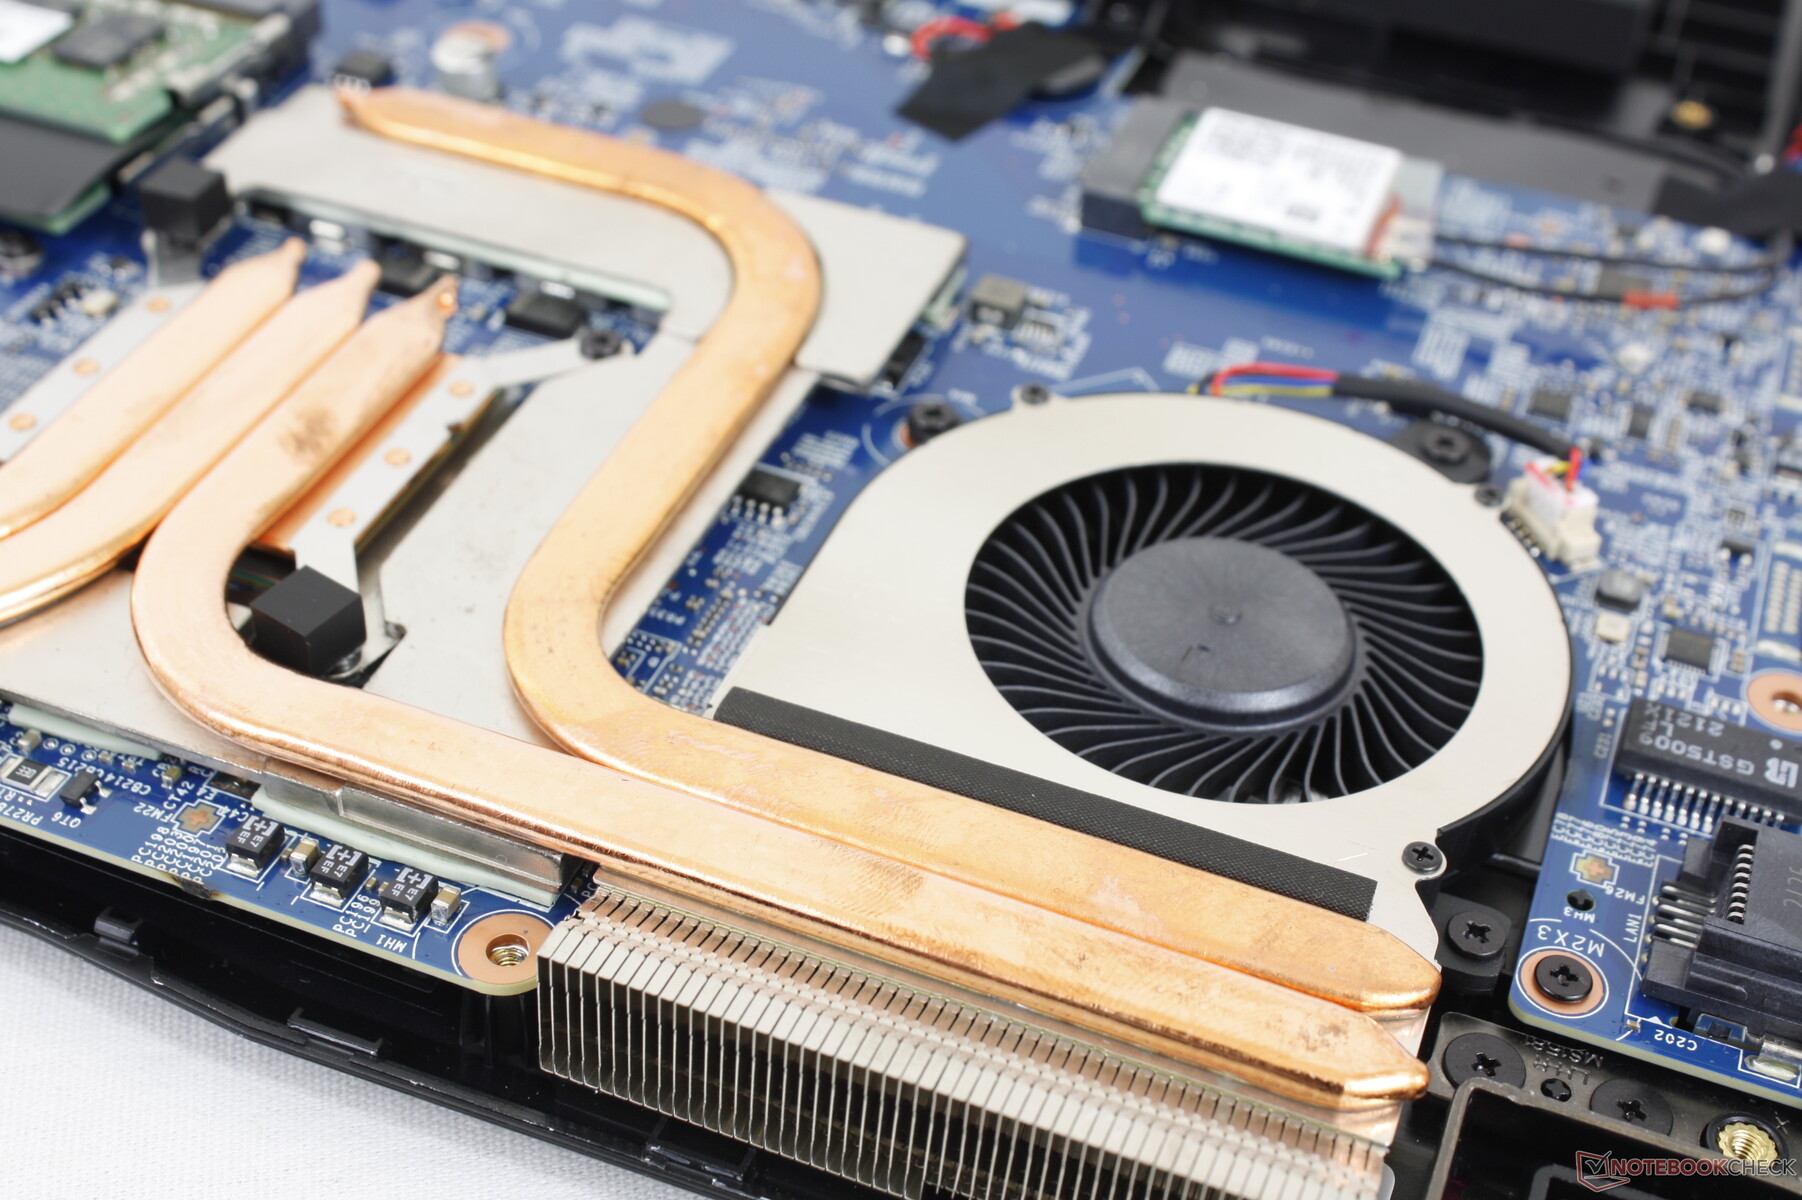
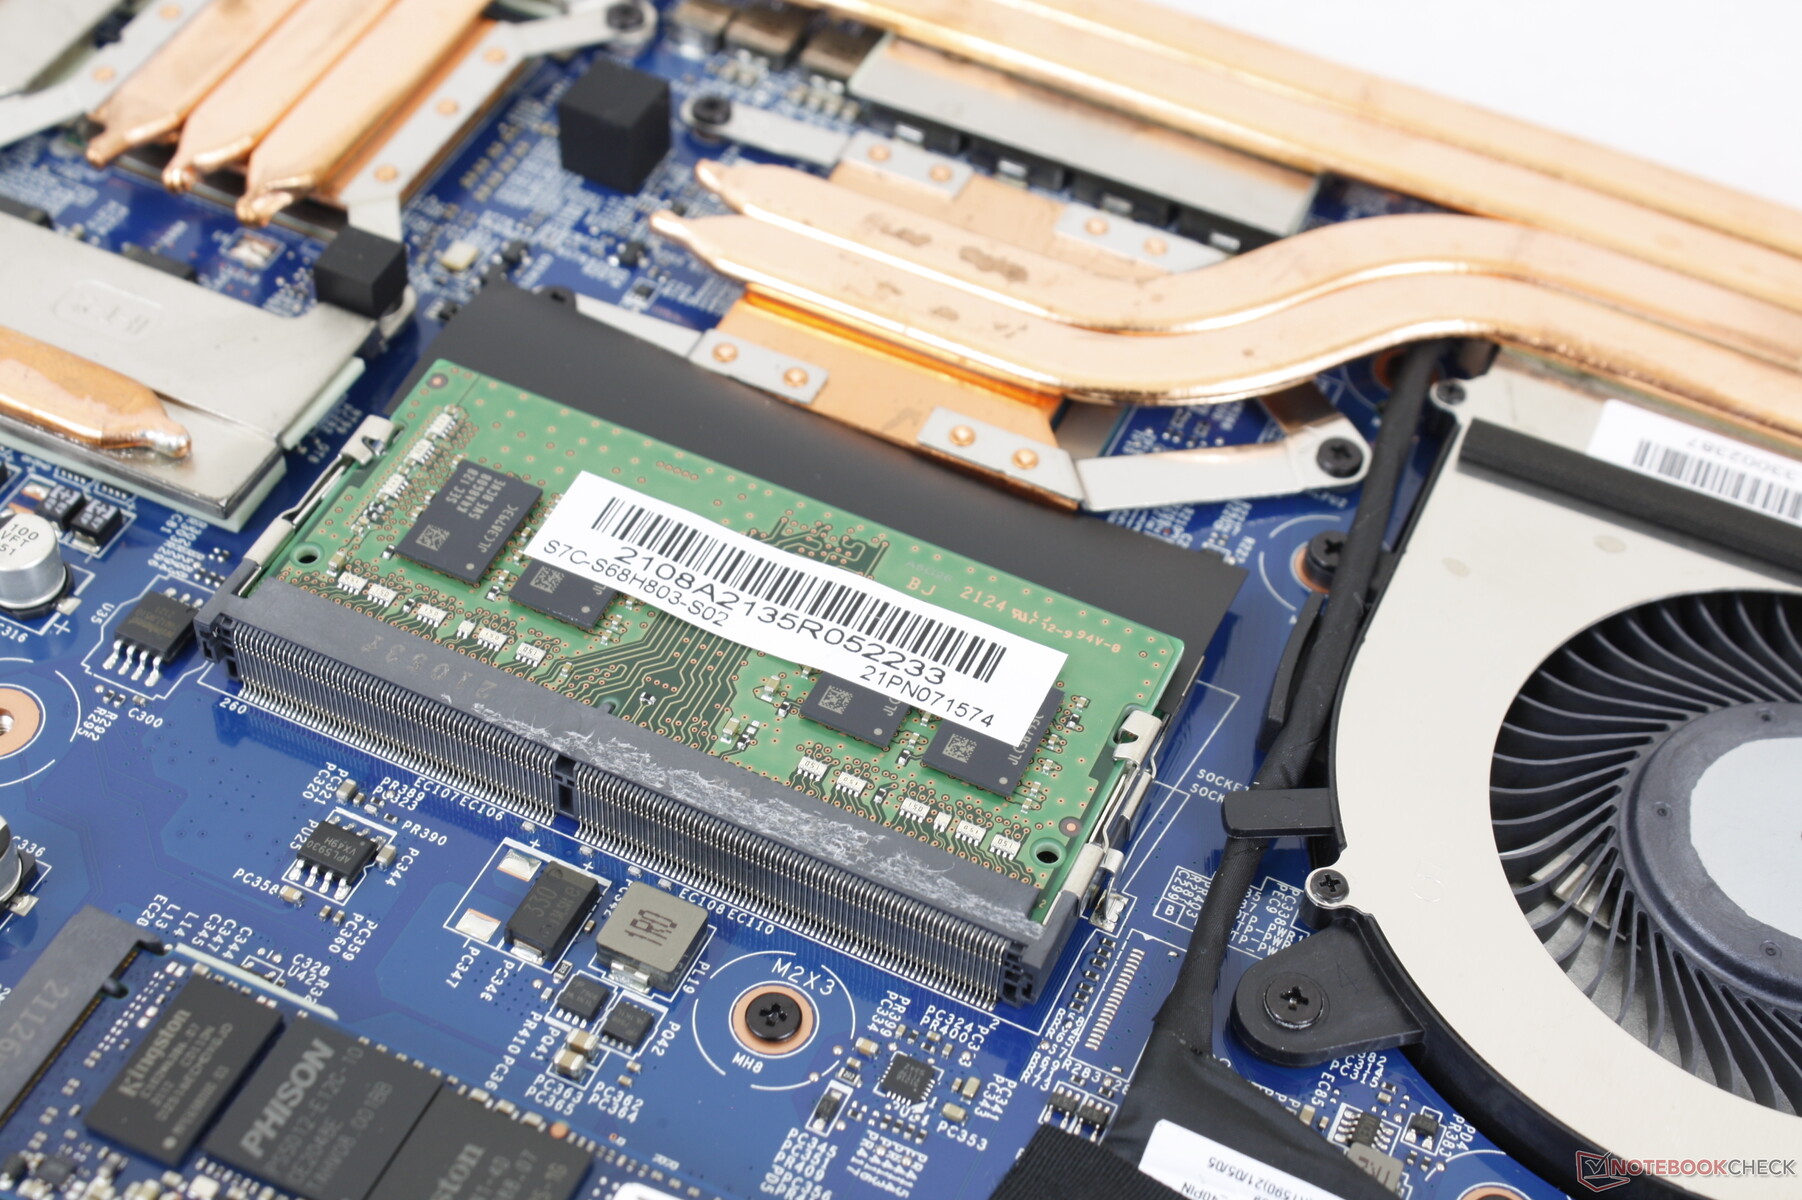
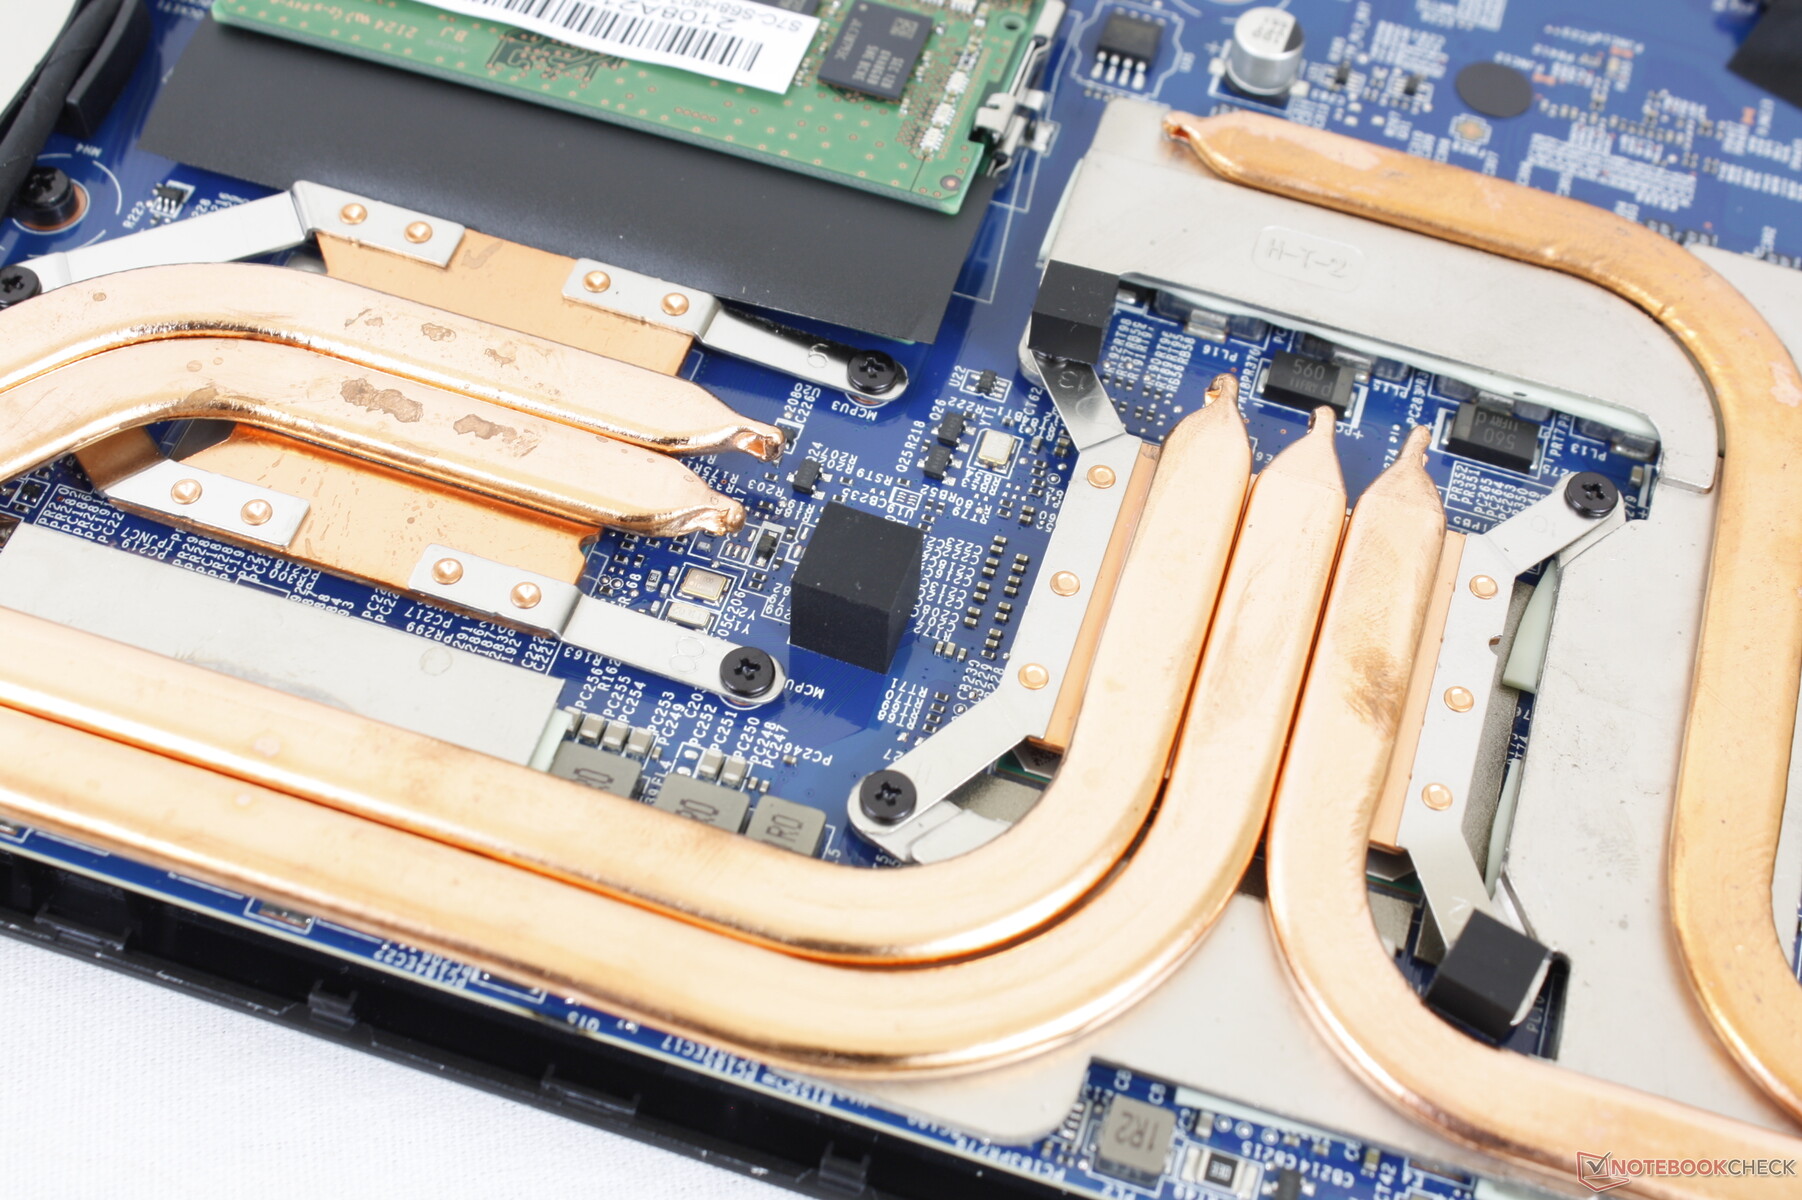
Once inside, users will have direct access to 2x SODIMM slots, removable WLAN module, and one M.2 2280 PCIe3 slot which is a downgrade from the two M.2 2280 slots on the 2020 Bravo model. MSI has made several motherboard changes this year as shown by our comparison images below.
Accessories and Warranty
There are no extras in the box other than the AC adapter and paperwork. The usual one-year limited warranty applies.
Input Devices — New Keyboard, Old Clickpad
Keyboard
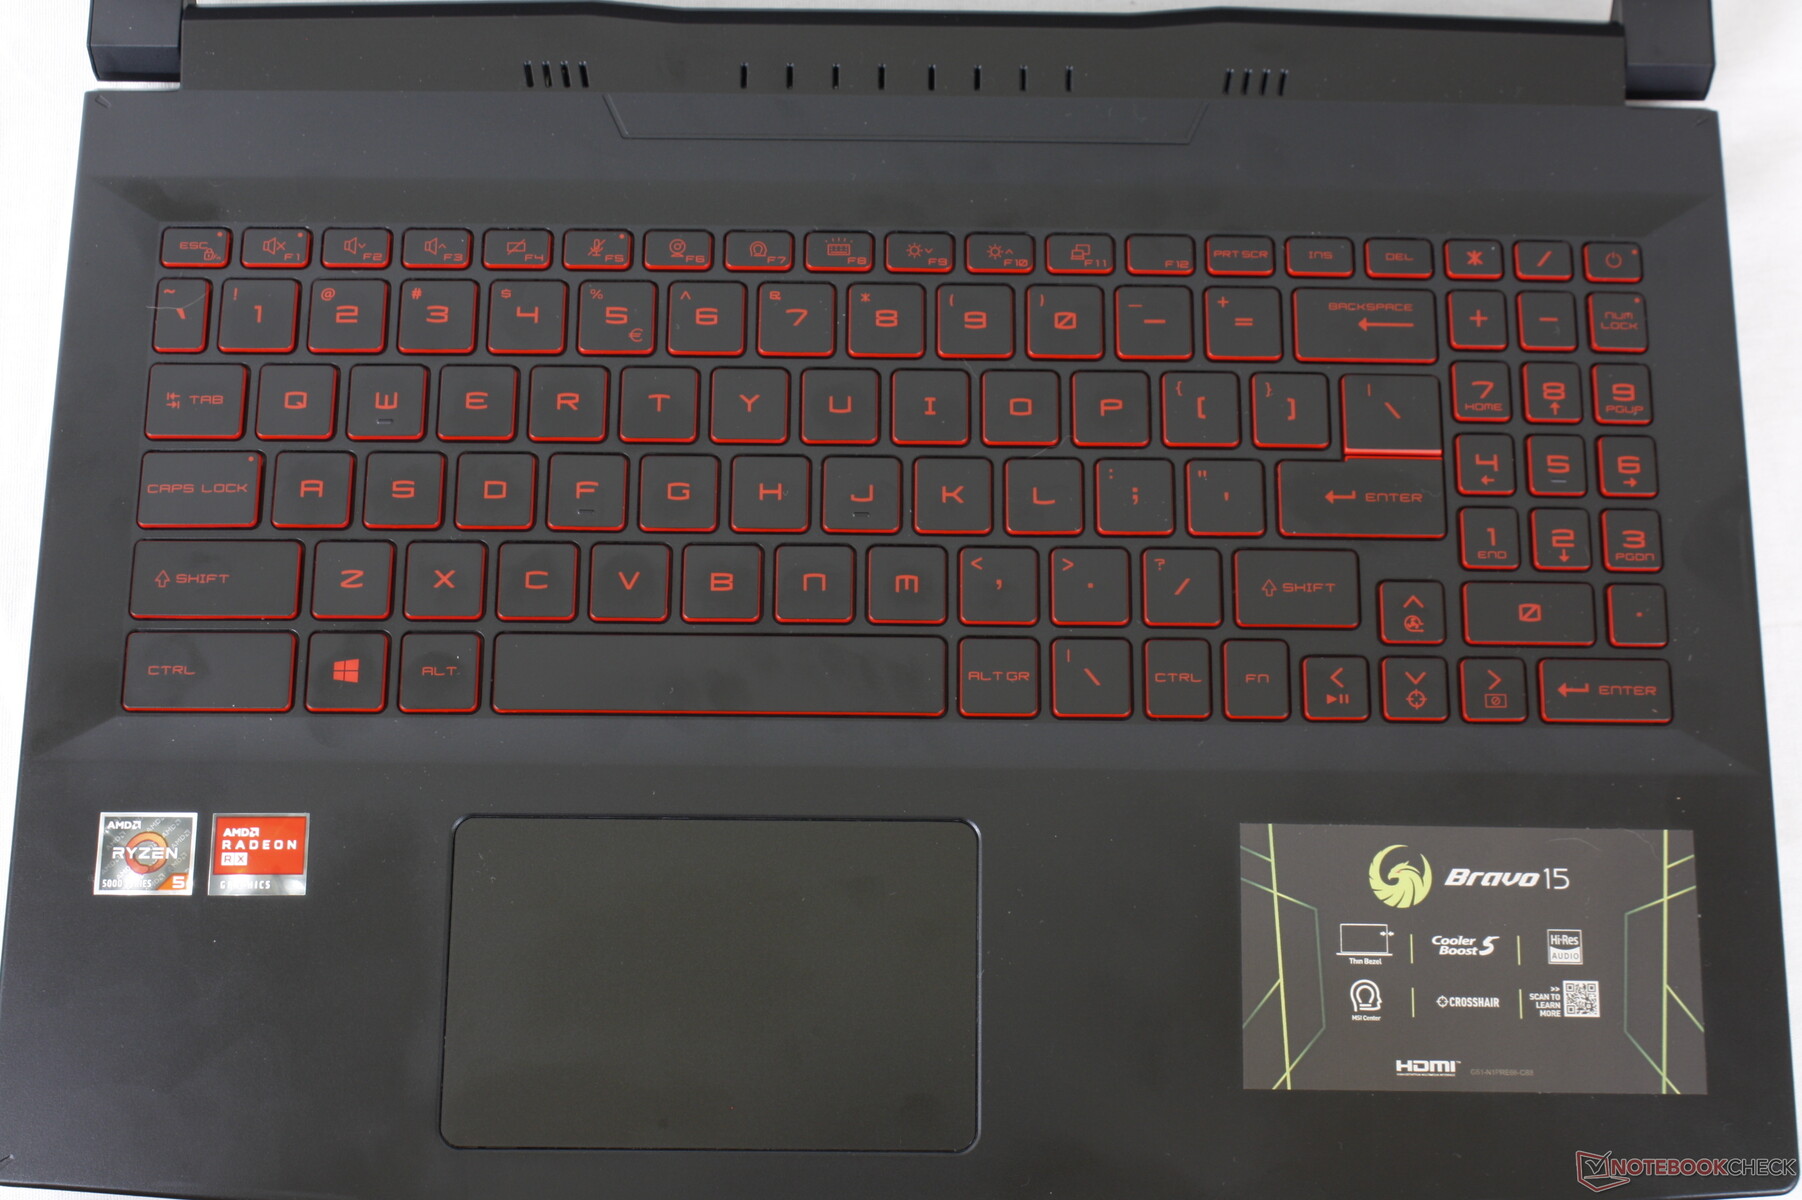
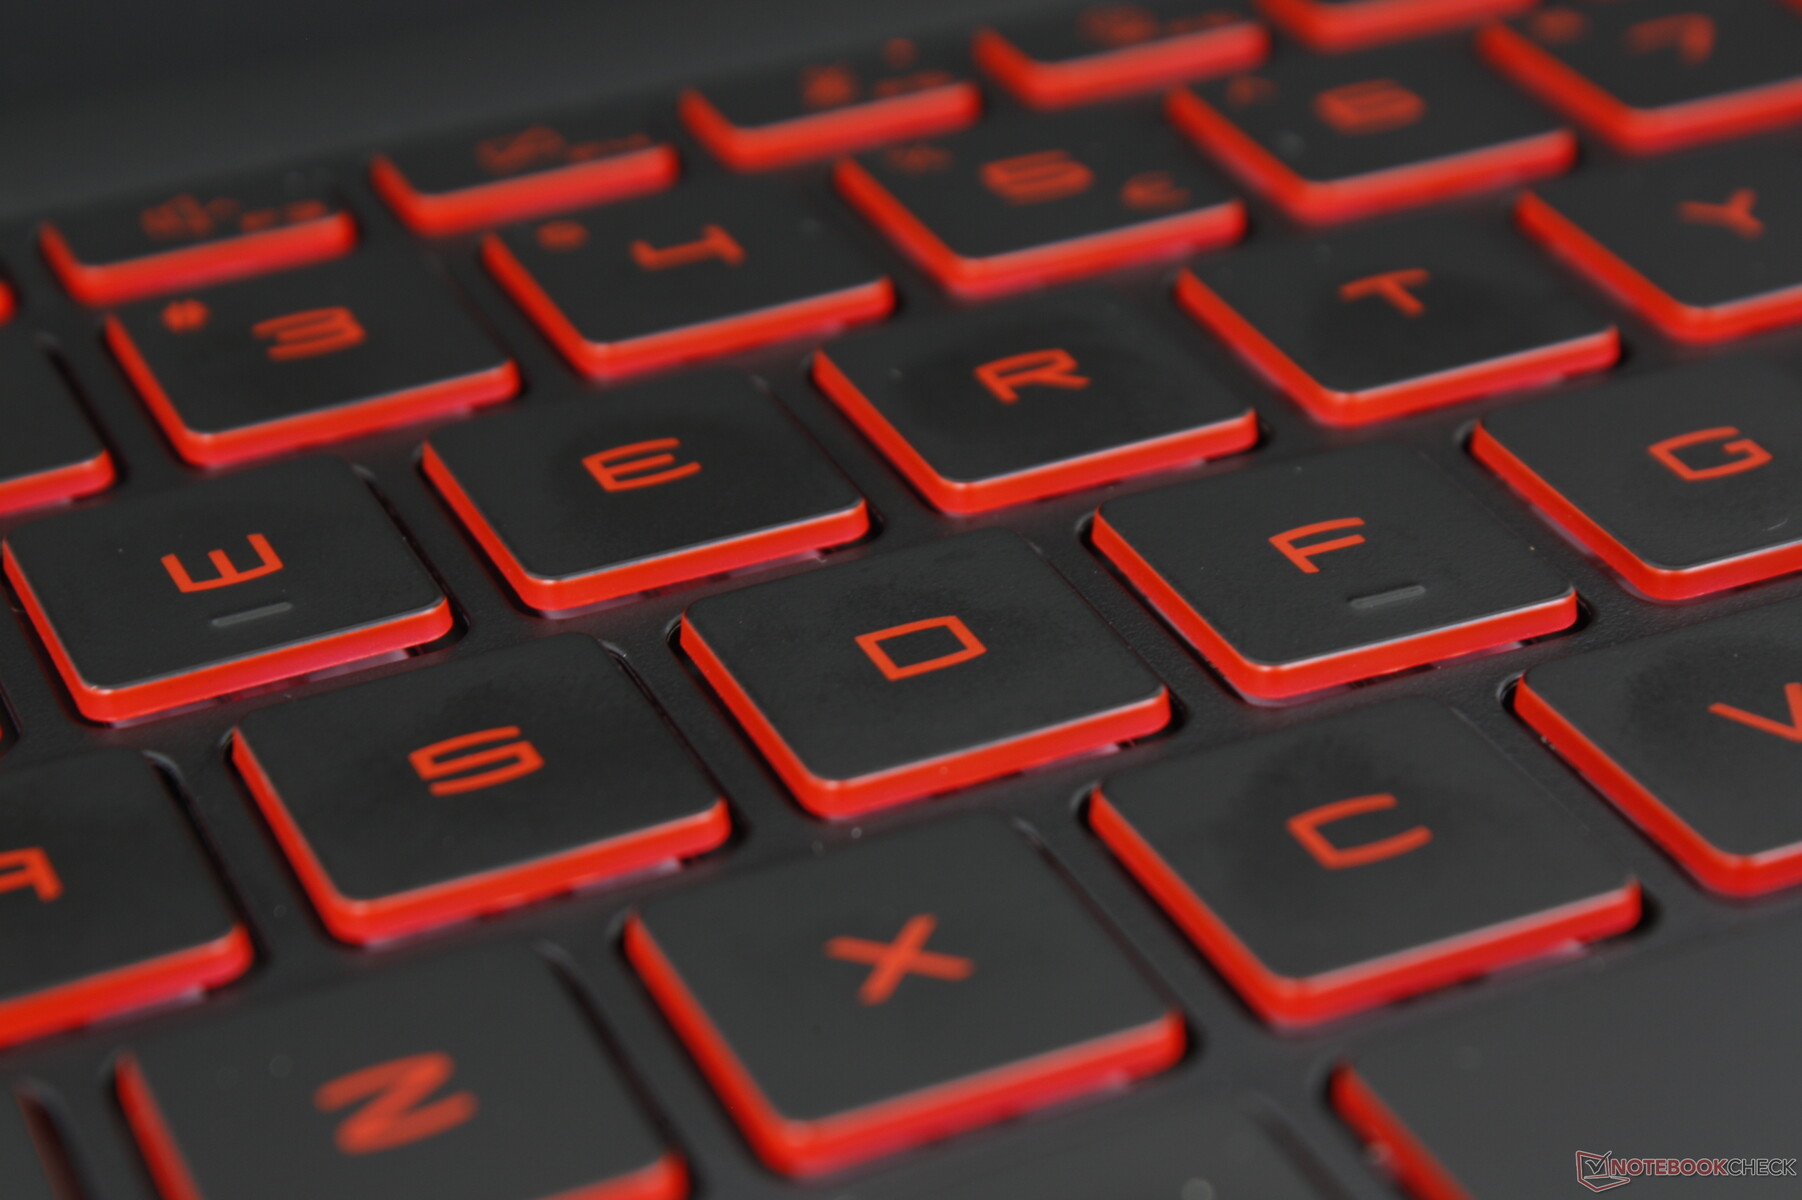
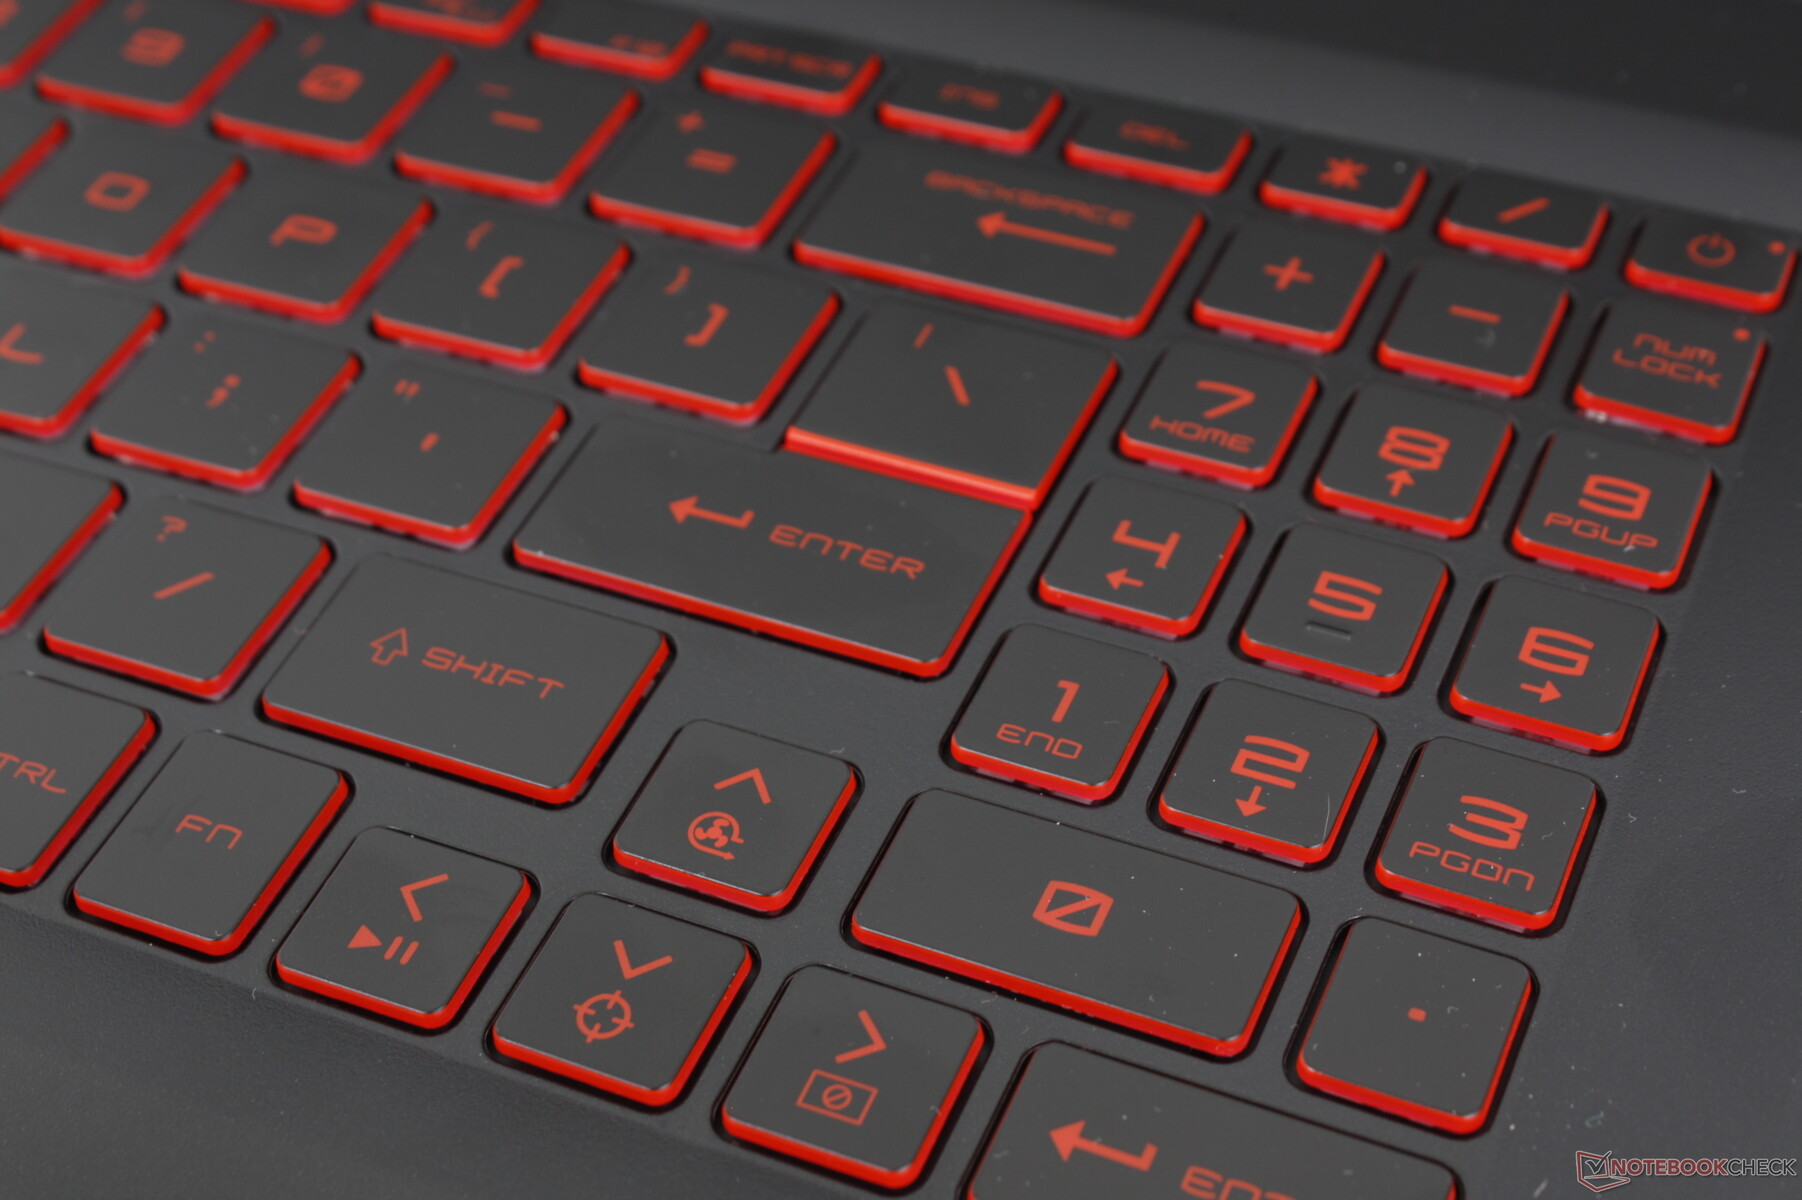
The new red-domed keys are very light in feedback with only shallow-to-moderate travel. Despite the overall thicker chassis year-over-year and the potential for a better keyboard, typing on the Bravo 15 still feels like a typical Ultrabook. The keyboards on an HP Spectre or MSI GT series are deeper and with stronger feedback in comparison.
Touchpad
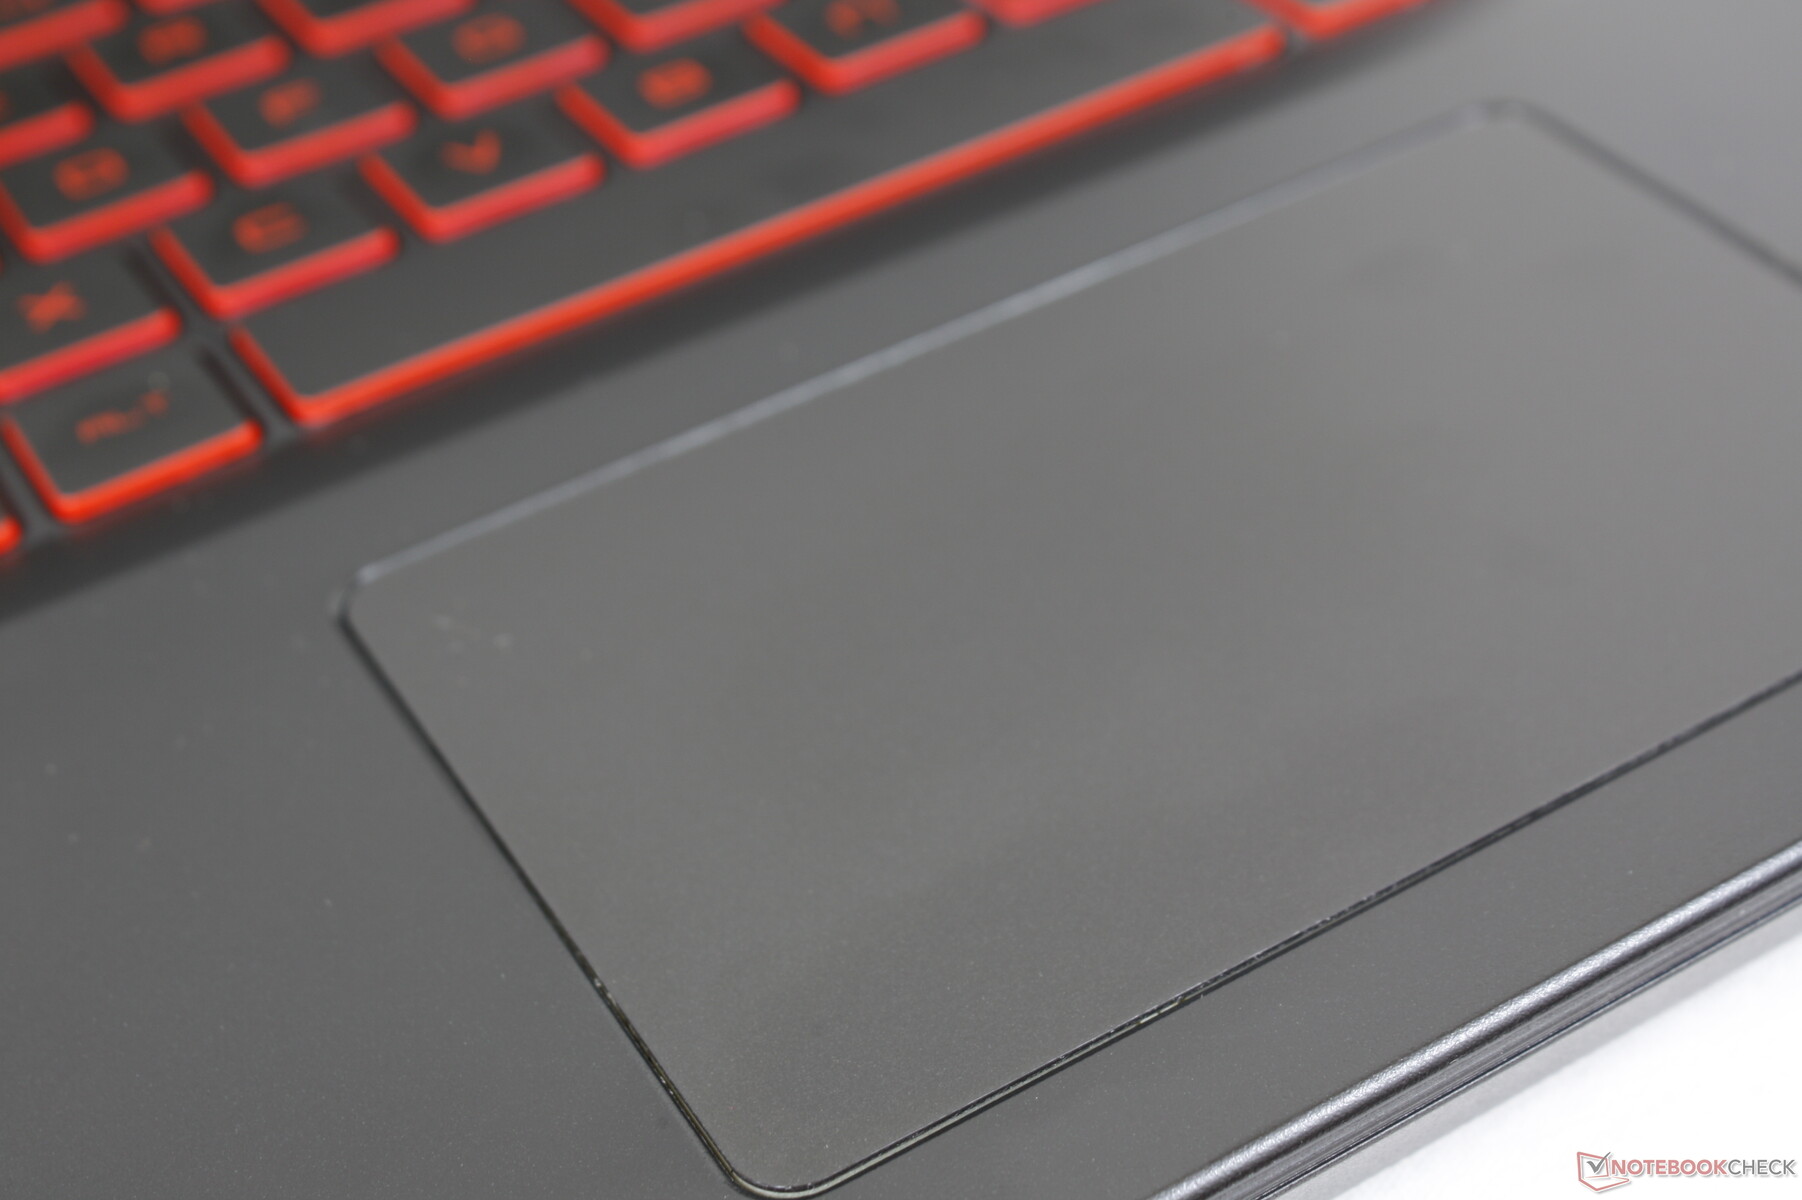
The clickpad (10.5 x 6.5 cm) is the same size as the one on the 2020 Bravo 15. It has unfortunately not improved in terms of traction or feedback which we found to also be poor on the older design. Gliding isn't very smooth as the finger sticks too easily while feedback is on the spongy side when pressed. If MSI insists on not increasing the size of the clickpad, then we would like to see dedicated mouse buttons to make clicking and drag-and-drop actions much easier.
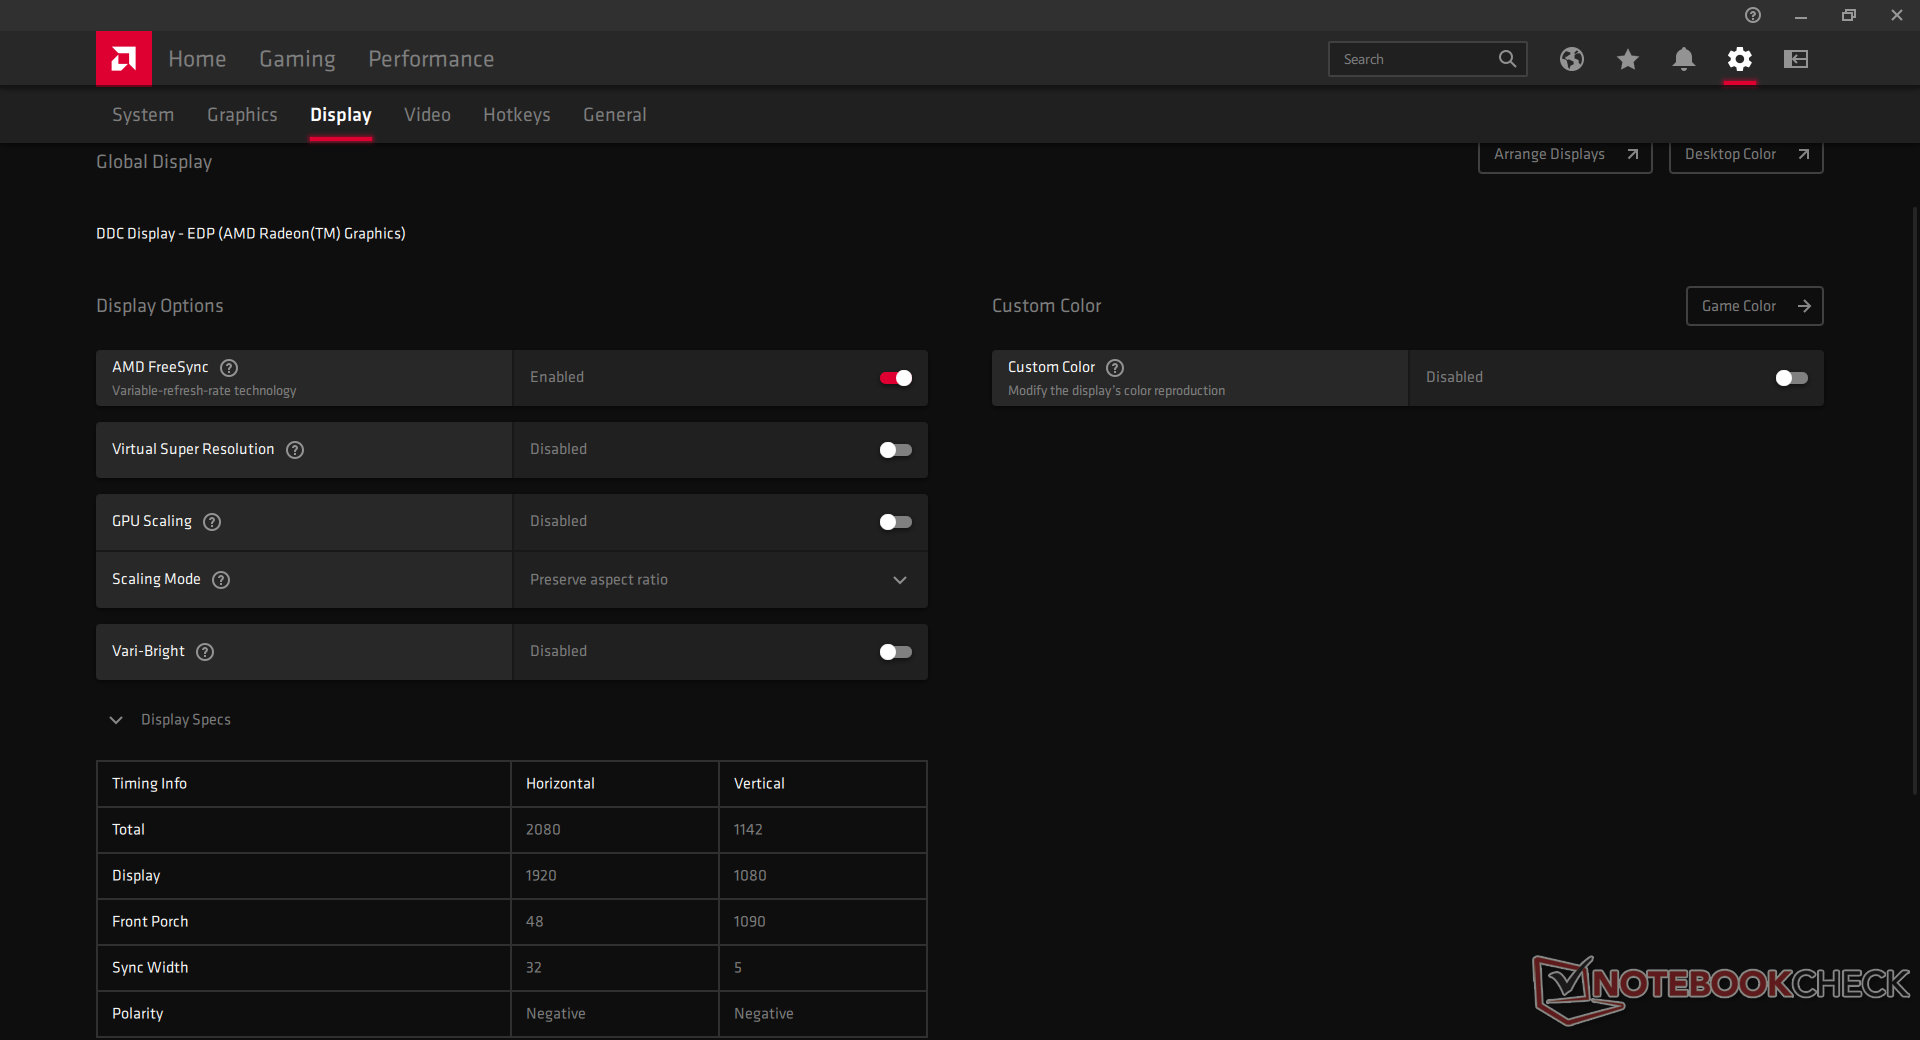
Display — FreeSync with 144 Hz Refresh Rate
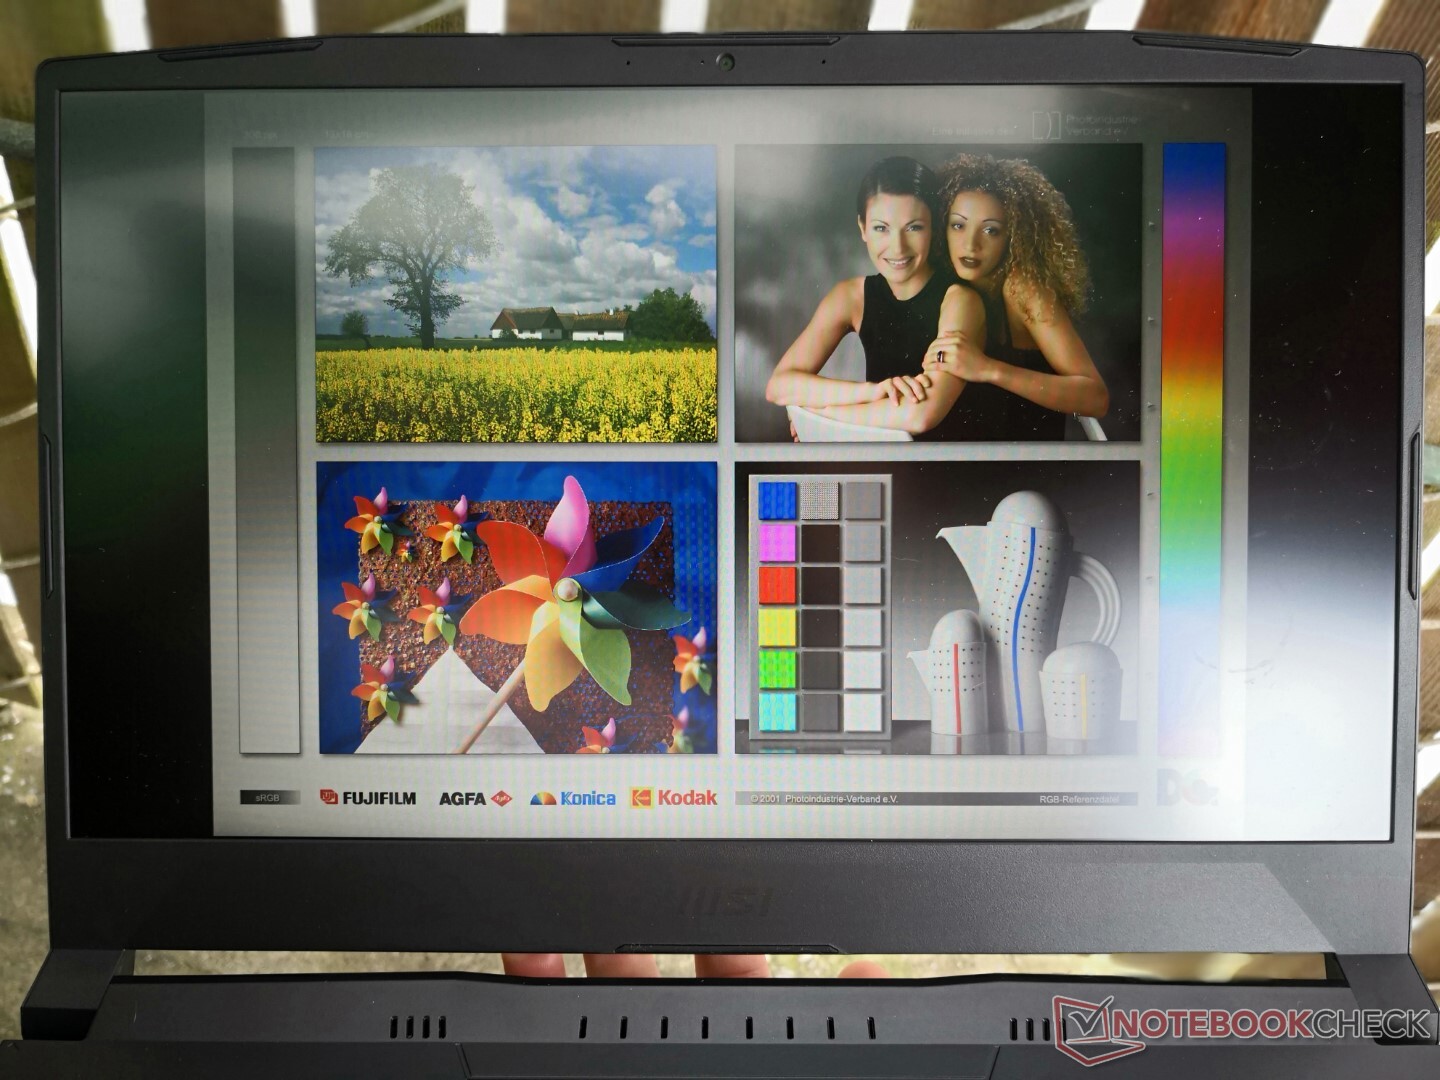
Our Bravo 15 test unit comes with the same Chi Mei N156HRA-EA1 IPS panel as found on the Acer Nitro 5 AN515 or Asus TUF Gaming F15 FX506HM. This panel is notable for its native 144 Hz refresh rate and decent black-white and gray-gray response times, but the limited gamut makes it unsuitable for most graphics editing work. Results are a downgrade from the 2020 Bravo 15 which had a higher quality AU Optronics panel with faster response times, better colors, and a brighter backlight.


| |||||||||||||||||||||||||
Brightness Distribution: 87 %
Center on Battery: 265.1 cd/m²
Contrast: 757:1 (Black: 0.35 cd/m²)
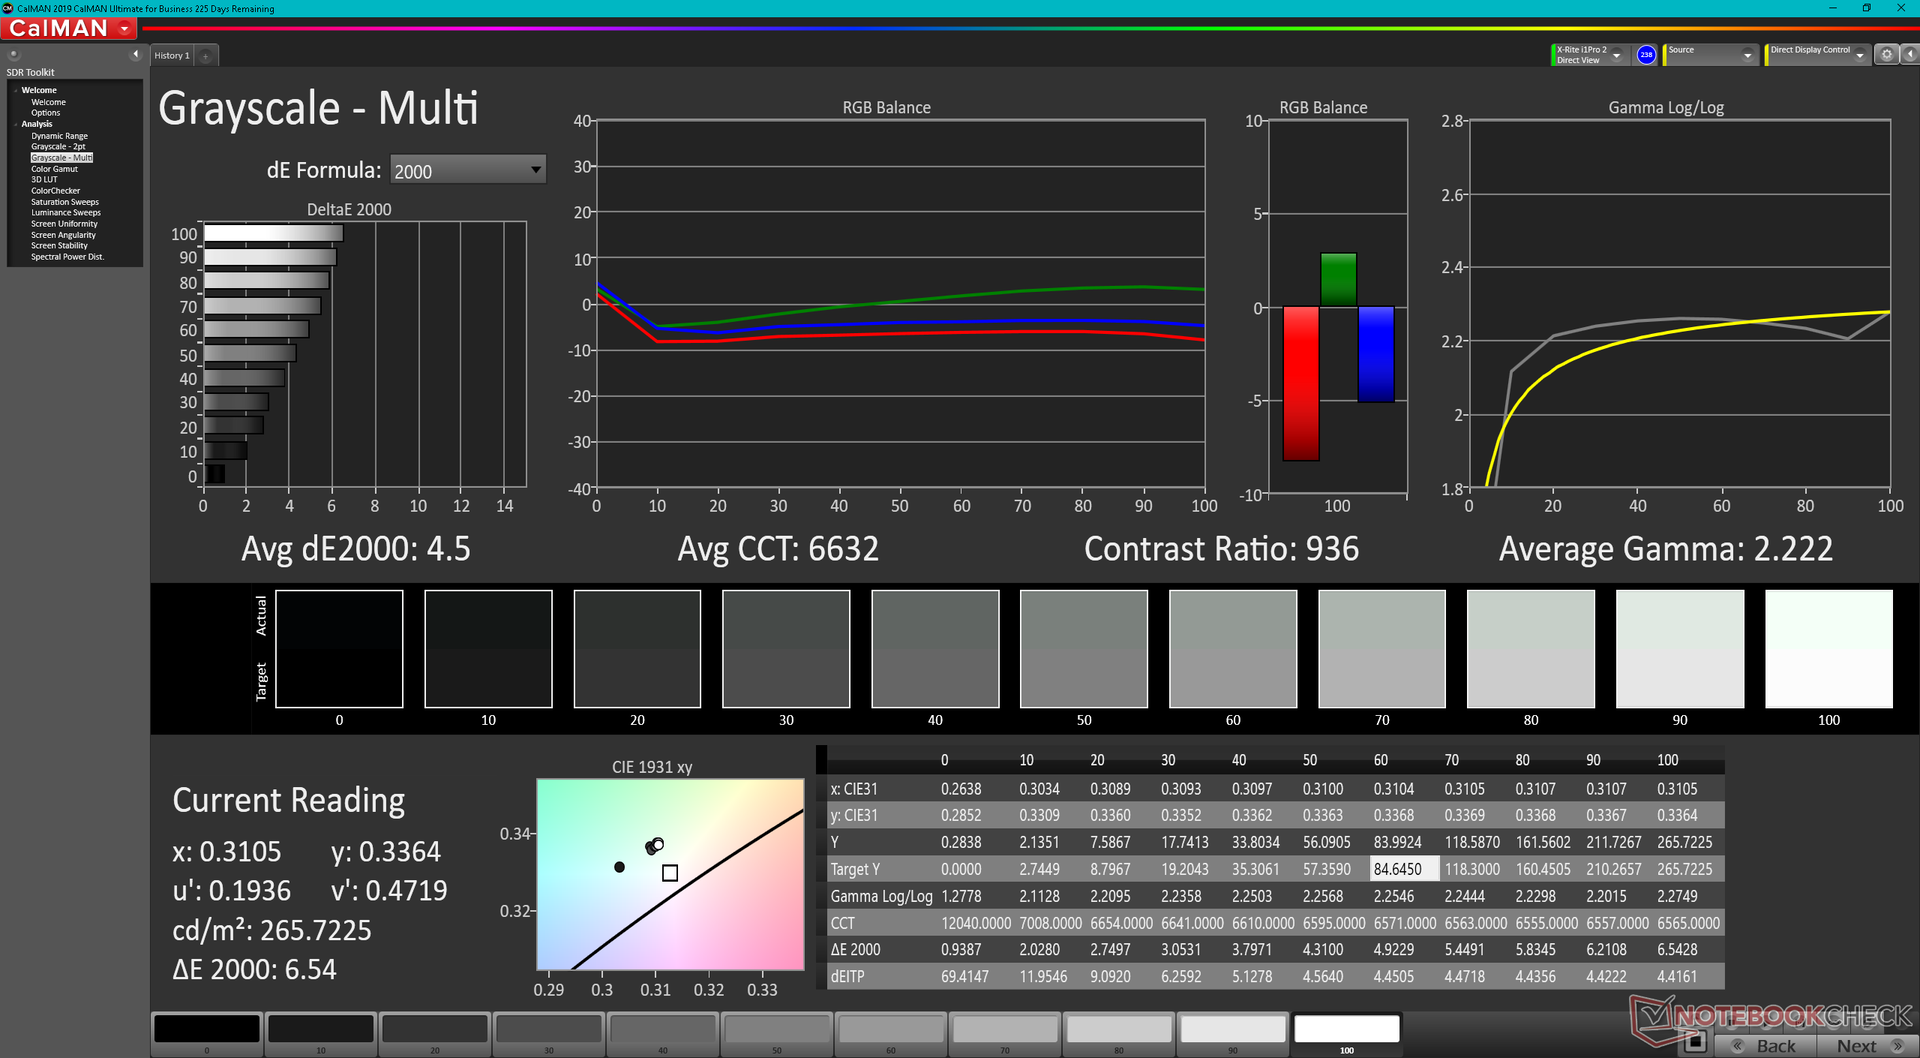
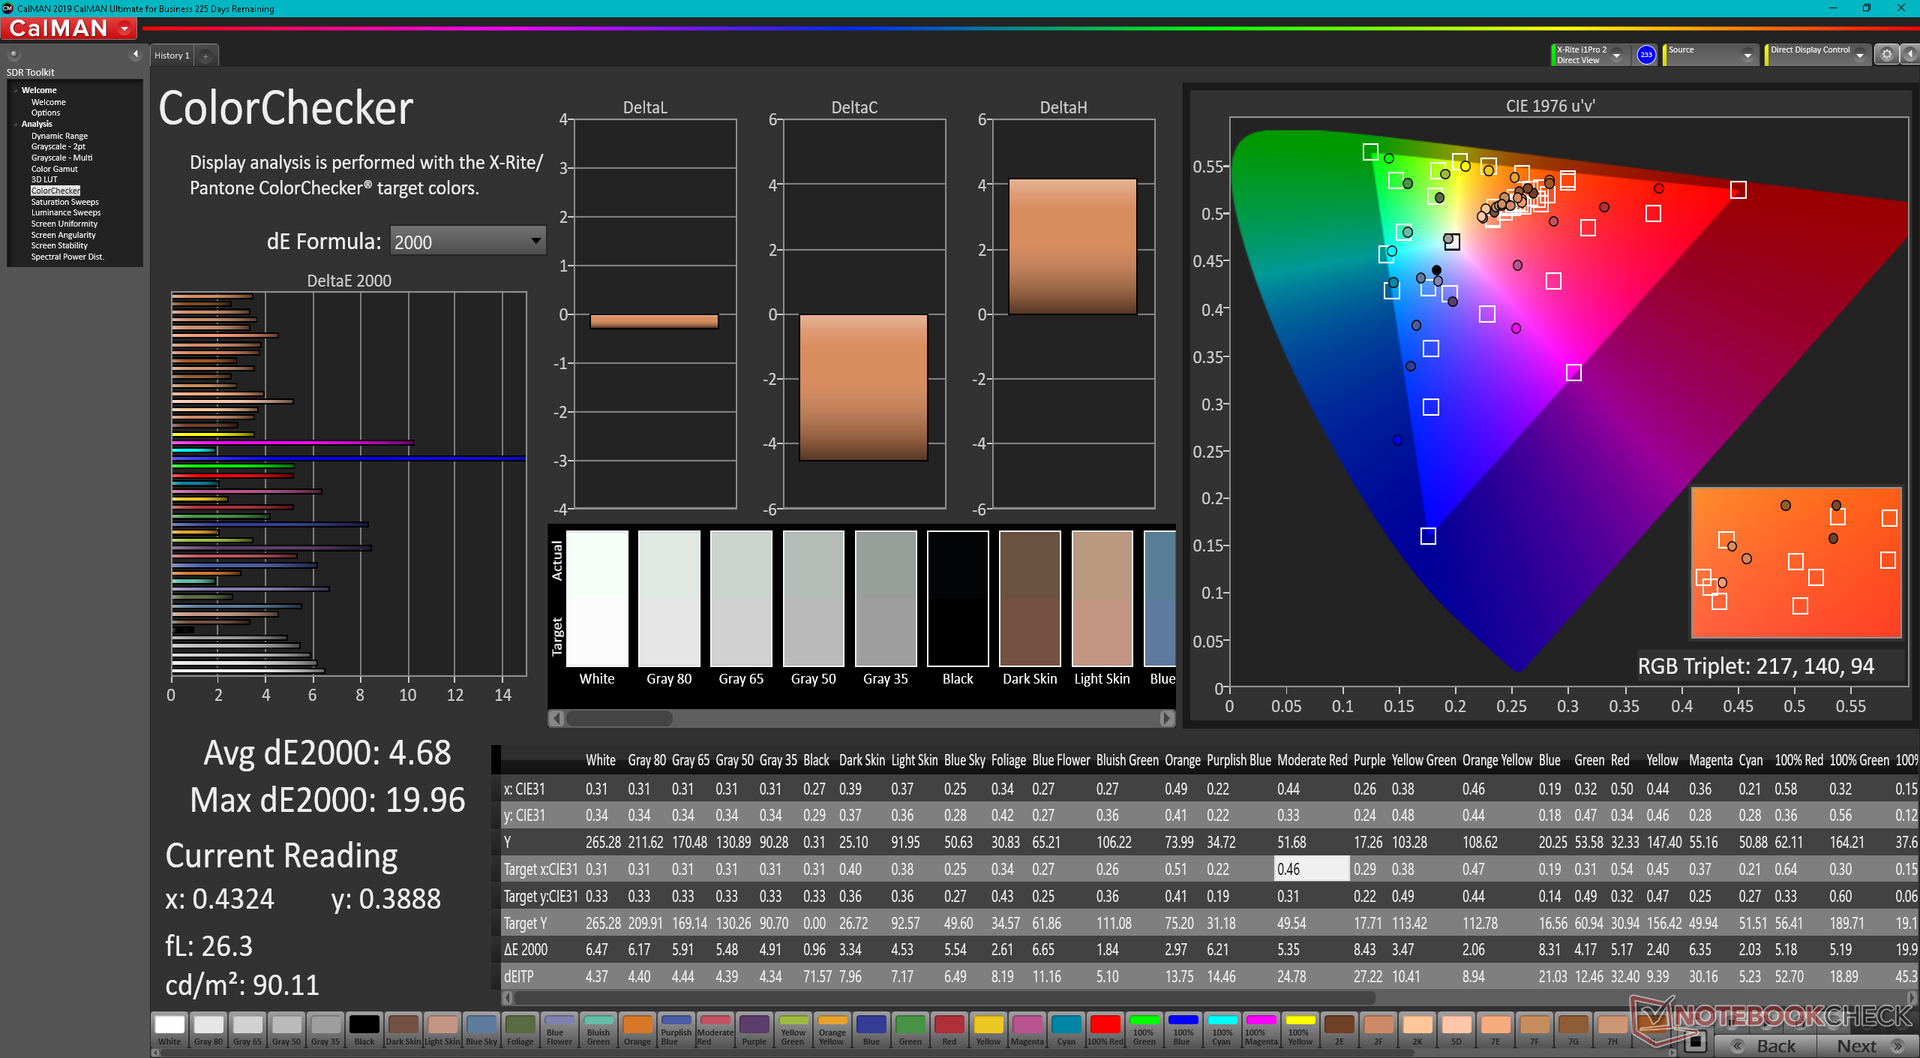
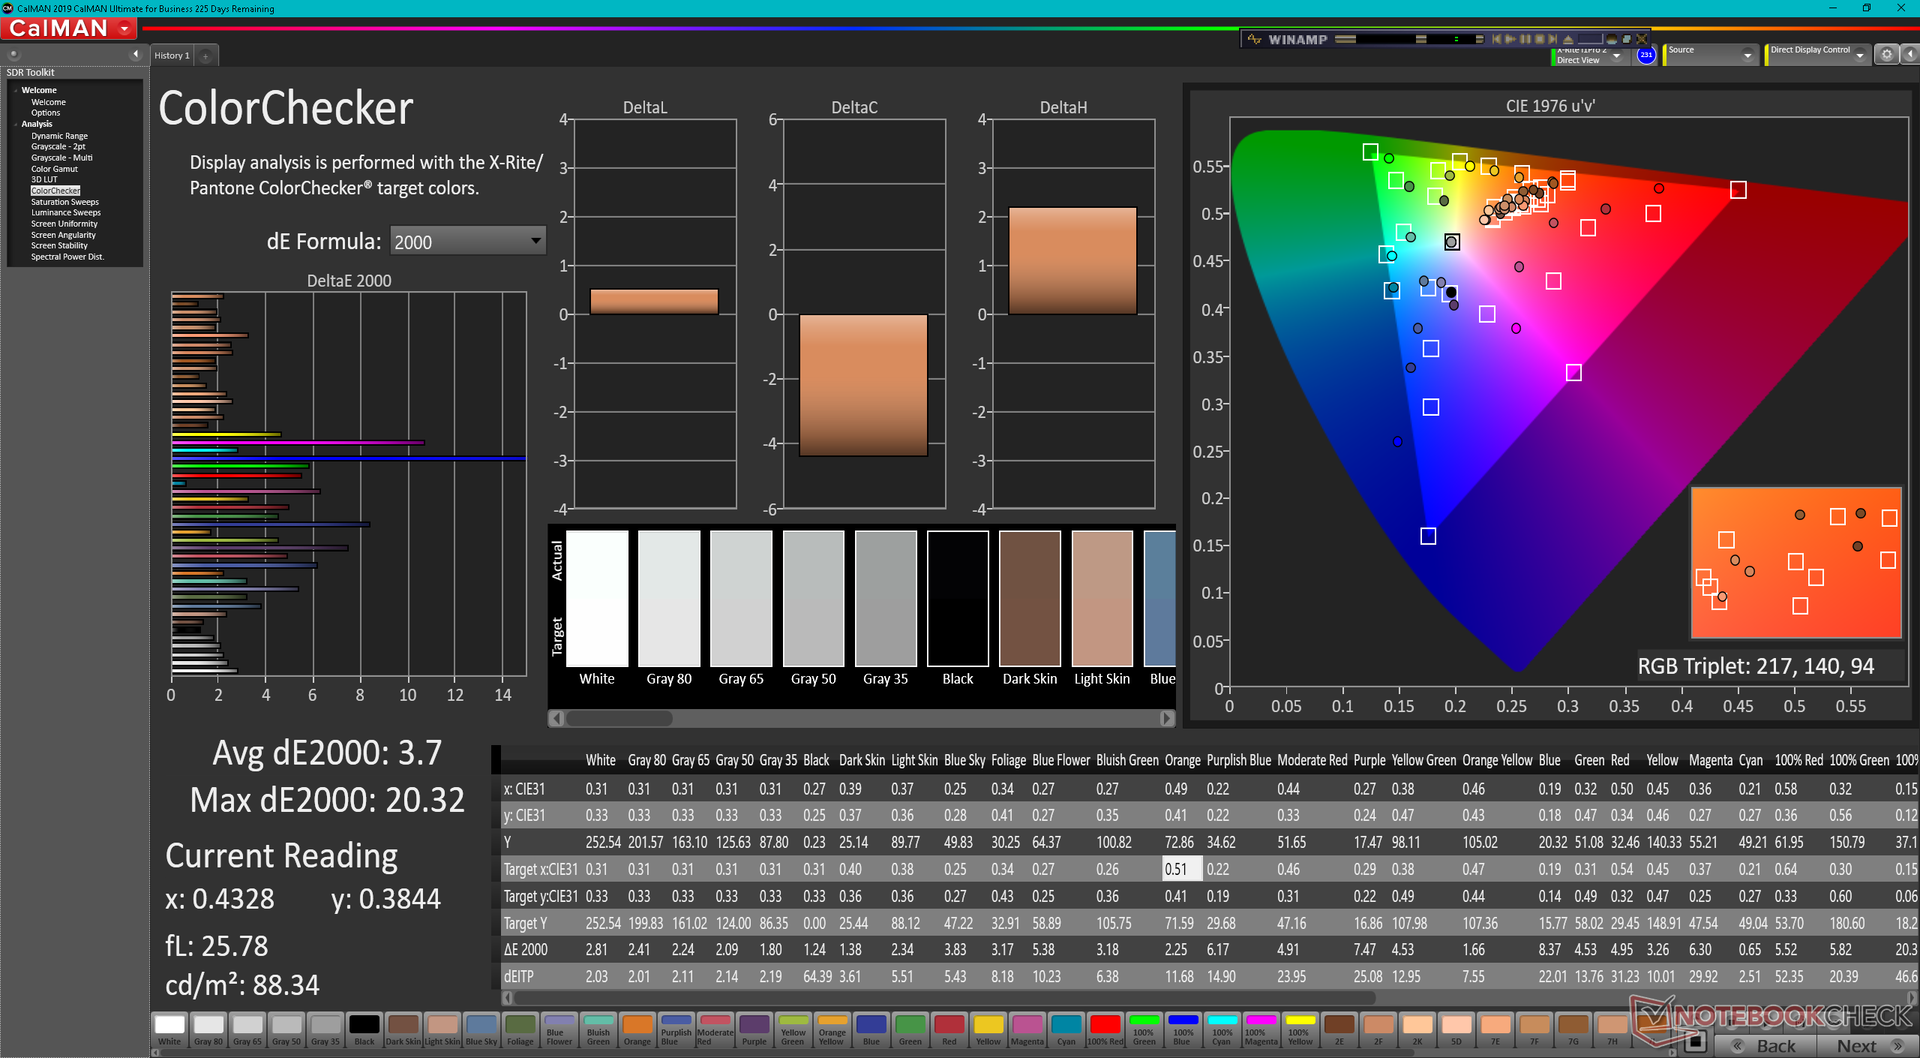
ΔE ColorChecker Calman: 4.68 | ∀{0.5-29.43 Ø4.71}
calibrated: 3.7
ΔE Greyscale Calman: 4.5 | ∀{0.09-98 Ø4.96}
43.6% AdobeRGB 1998 (Argyll 3D)
62.8% sRGB (Argyll 3D)
42.1% Display P3 (Argyll 3D)
Gamma: 2.22
CCT: 6632 K
| MSI Bravo 15 B5DD-010US Chi Mei N156HRA-EA1, IPS, 1920x1080, 15.6" | MSI Bravo 15 A4DCR AU Optronics B156HAN08.0 (AUO80ED), IPS-Level, 1920x1080, 15.6" | Asus TUF Gaming F15 FX507ZM TL156VDXP0101, IPS, 1920x1080, 15.6" | Dell G15 5515 BOE092A, IPS, 1920x1080, 15.6" | Lenovo Ideapad Gaming 3 15IHU-82K1002RGE LEN156FHD, IPS, 1920x1080, 15.6" | Acer Nitro 5 AN515-45-R1JH BOE BOE09B8, IPS, 2560x1440, 15.6" | |
|---|---|---|---|---|---|---|
| Display | 43% | 56% | -8% | -6% | 55% | |
| Display P3 Coverage (%) | 42.1 | 62 47% | 66.4 58% | 39.1 -7% | 39.7 -6% | 66.2 57% |
| sRGB Coverage (%) | 62.8 | 86.8 38% | 97 54% | 56.9 -9% | 59.6 -5% | 96.3 53% |
| AdobeRGB 1998 Coverage (%) | 43.6 | 62.7 44% | 68.5 57% | 40.4 -7% | 41.1 -6% | 67.1 54% |
| Response Times | 46% | 61% | 14% | -68% | 55% | |
| Response Time Grey 50% / Grey 80% * (ms) | 25.6 ? | 16 ? 37% | 5.6 ? 78% | 25.2 ? 2% | 46.4 ? -81% | 14 ? 45% |
| Response Time Black / White * (ms) | 22.8 ? | 10.4 ? 54% | 12.8 ? 44% | 16.8 ? 26% | 35.2 ? -54% | 8 ? 65% |
| PWM Frequency (Hz) | 200 ? | |||||
| Screen | 15% | 44% | -1% | 11% | 7% | |
| Brightness middle (cd/m²) | 265.1 | 311 17% | 353.7 33% | 278 5% | 307 16% | 349 32% |
| Brightness (cd/m²) | 245 | 313 28% | 340 39% | 262 7% | 292 19% | 304 24% |
| Brightness Distribution (%) | 87 | 88 1% | 89 2% | 83 -5% | 88 1% | 79 -9% |
| Black Level * (cd/m²) | 0.35 | 0.43 -23% | 0.34 3% | 0.36 -3% | 0.21 40% | 0.535 -53% |
| Contrast (:1) | 757 | 723 -4% | 1040 37% | 772 2% | 1462 93% | 652 -14% |
| Colorchecker dE 2000 * | 4.68 | 4.5 4% | 1.74 63% | 5.74 -23% | 5.9 -26% | 3.11 34% |
| Colorchecker dE 2000 max. * | 19.96 | 7.97 60% | 3.63 82% | 19.63 2% | 21.6 -8% | 9.57 52% |
| Colorchecker dE 2000 calibrated * | 3.7 | 2.65 28% | 0.5 86% | 4.7 -27% | 4.8 -30% | |
| Greyscale dE 2000 * | 4.5 | 3.3 27% | 2.1 53% | 3.1 31% | 4.9 -9% | 5 -11% |
| Gamma | 2.22 99% | 2.129 103% | 2.3 96% | 2.011 109% | 2.26 97% | 2.36 93% |
| CCT | 6632 98% | 7227 90% | 6257 104% | 6207 105% | 6504 100% | 6976 93% |
| Color Space (Percent of AdobeRGB 1998) (%) | 63 | |||||
| Color Space (Percent of sRGB) (%) | 86 | |||||
| Total Average (Program / Settings) | 35% /
26% | 54% /
49% | 2% /
-0% | -21% /
-4% | 39% /
25% |
* ... smaller is better
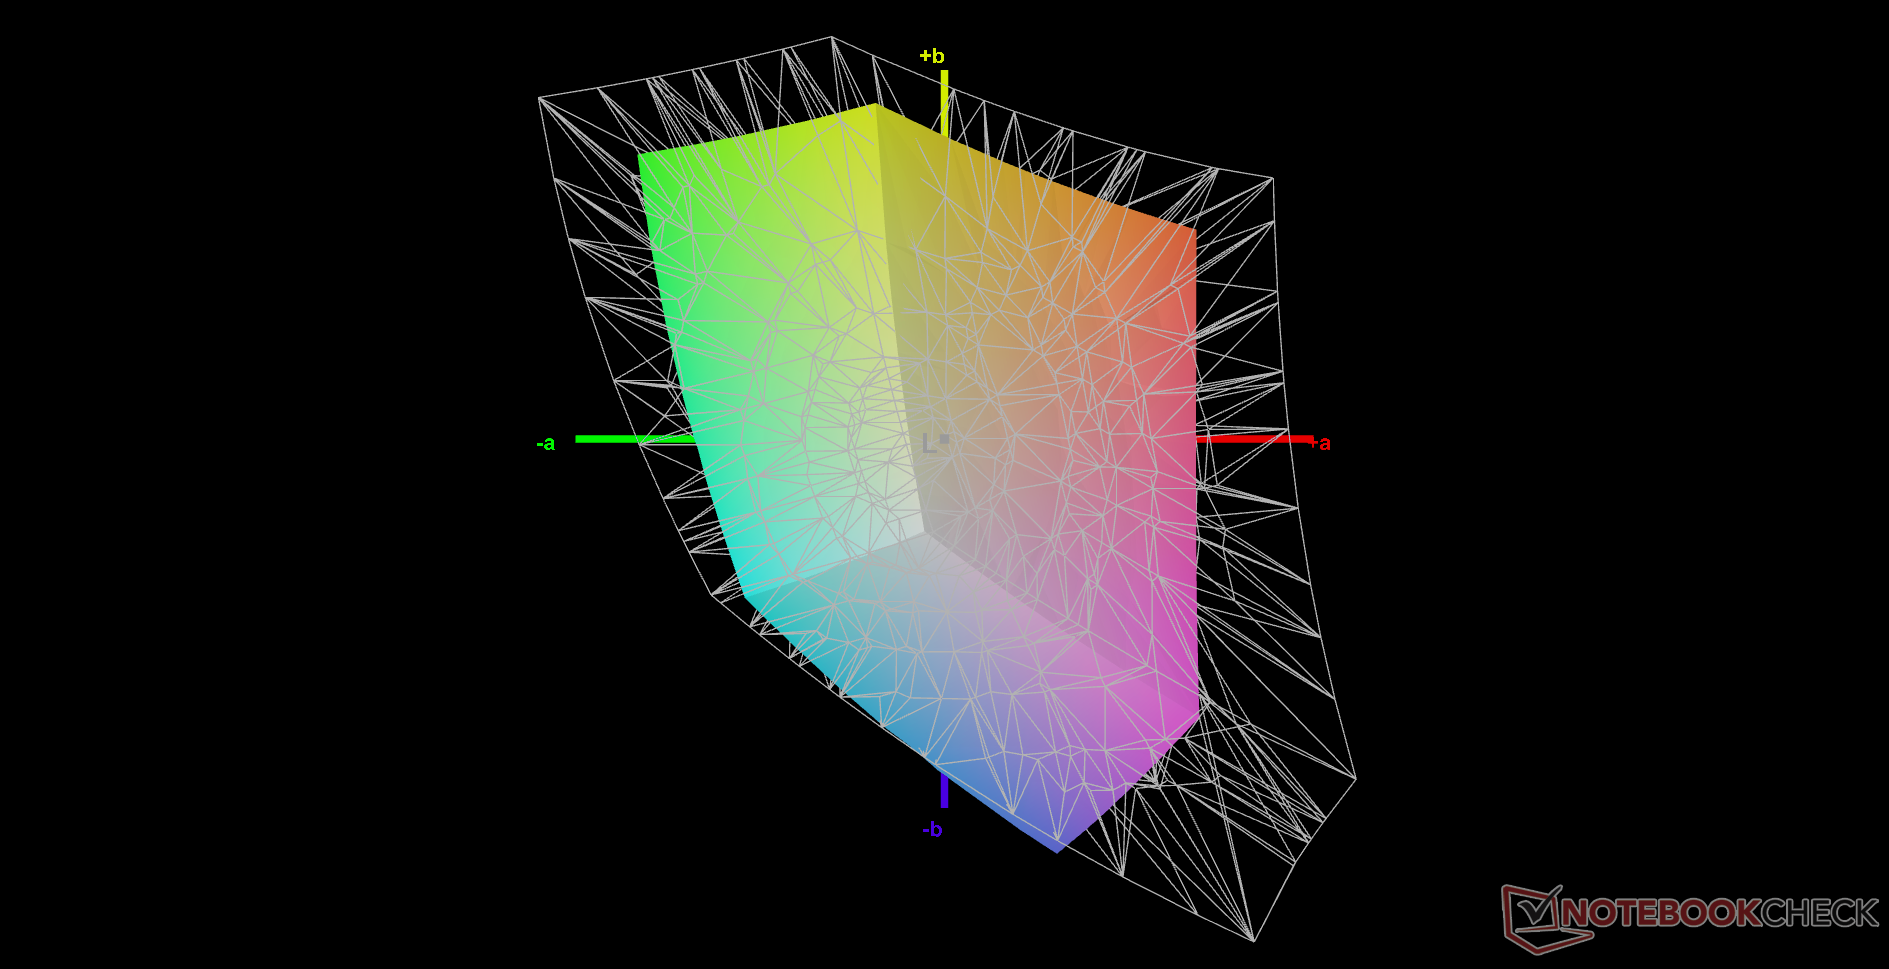
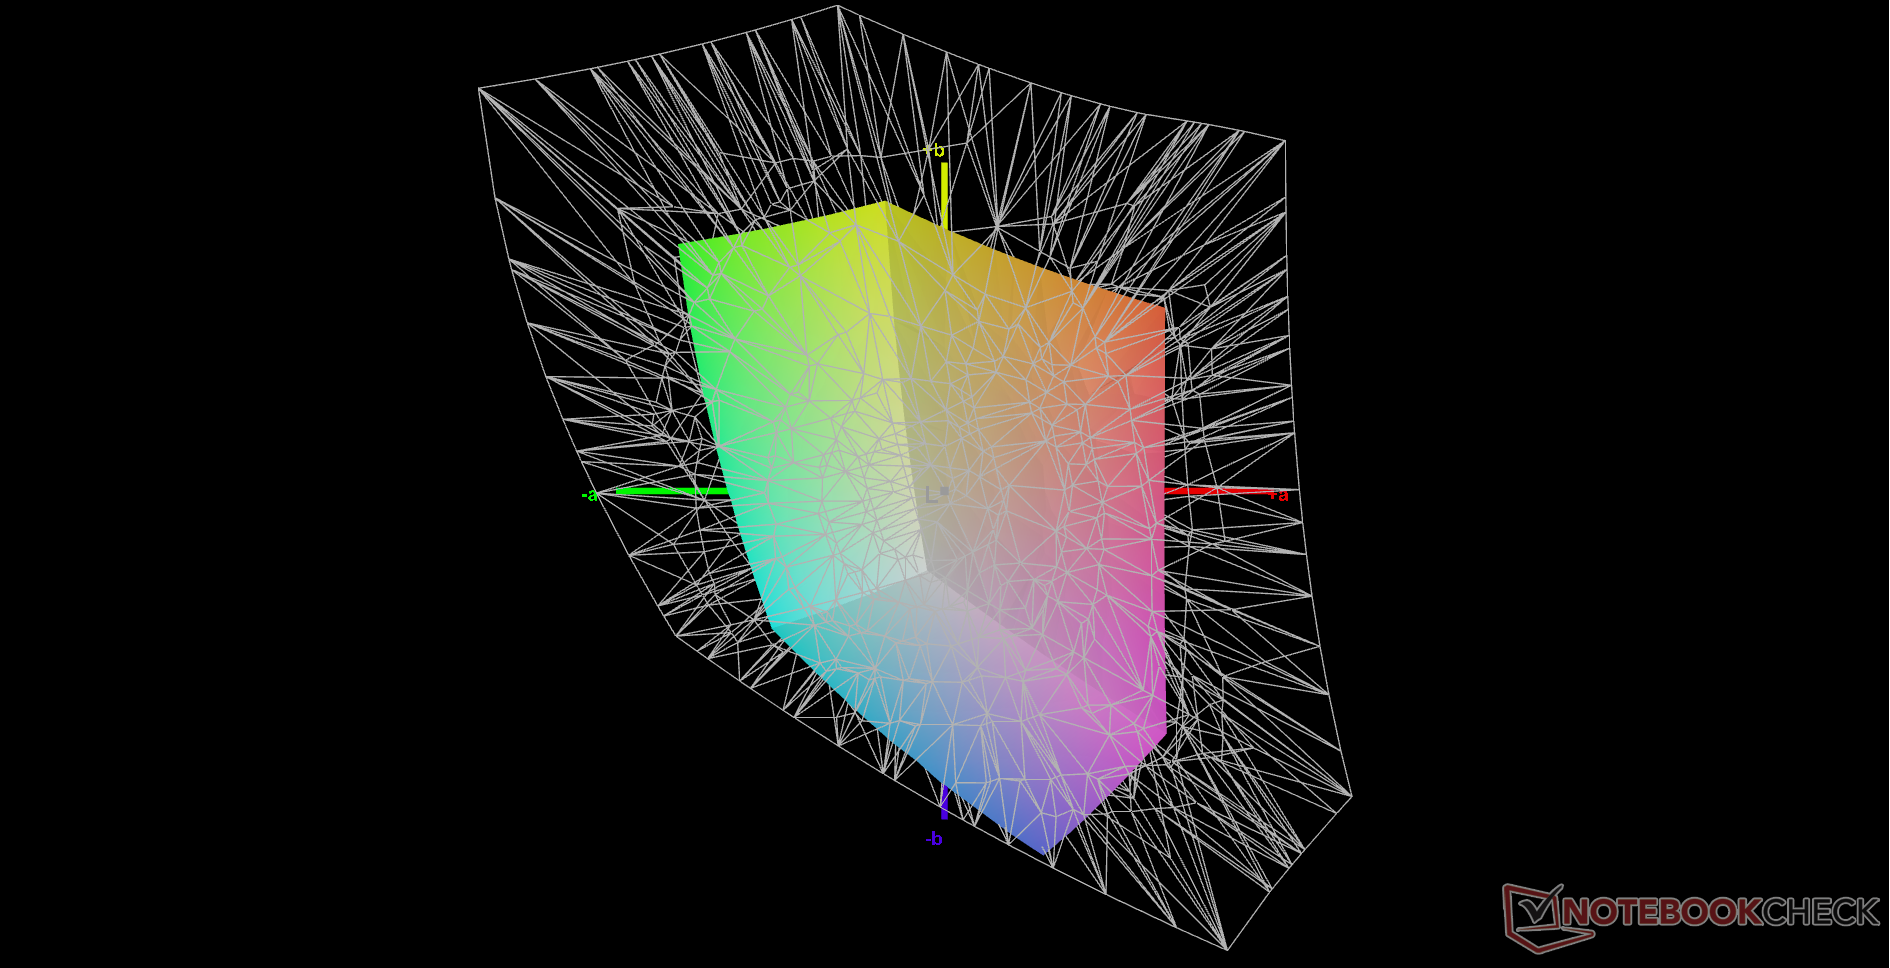
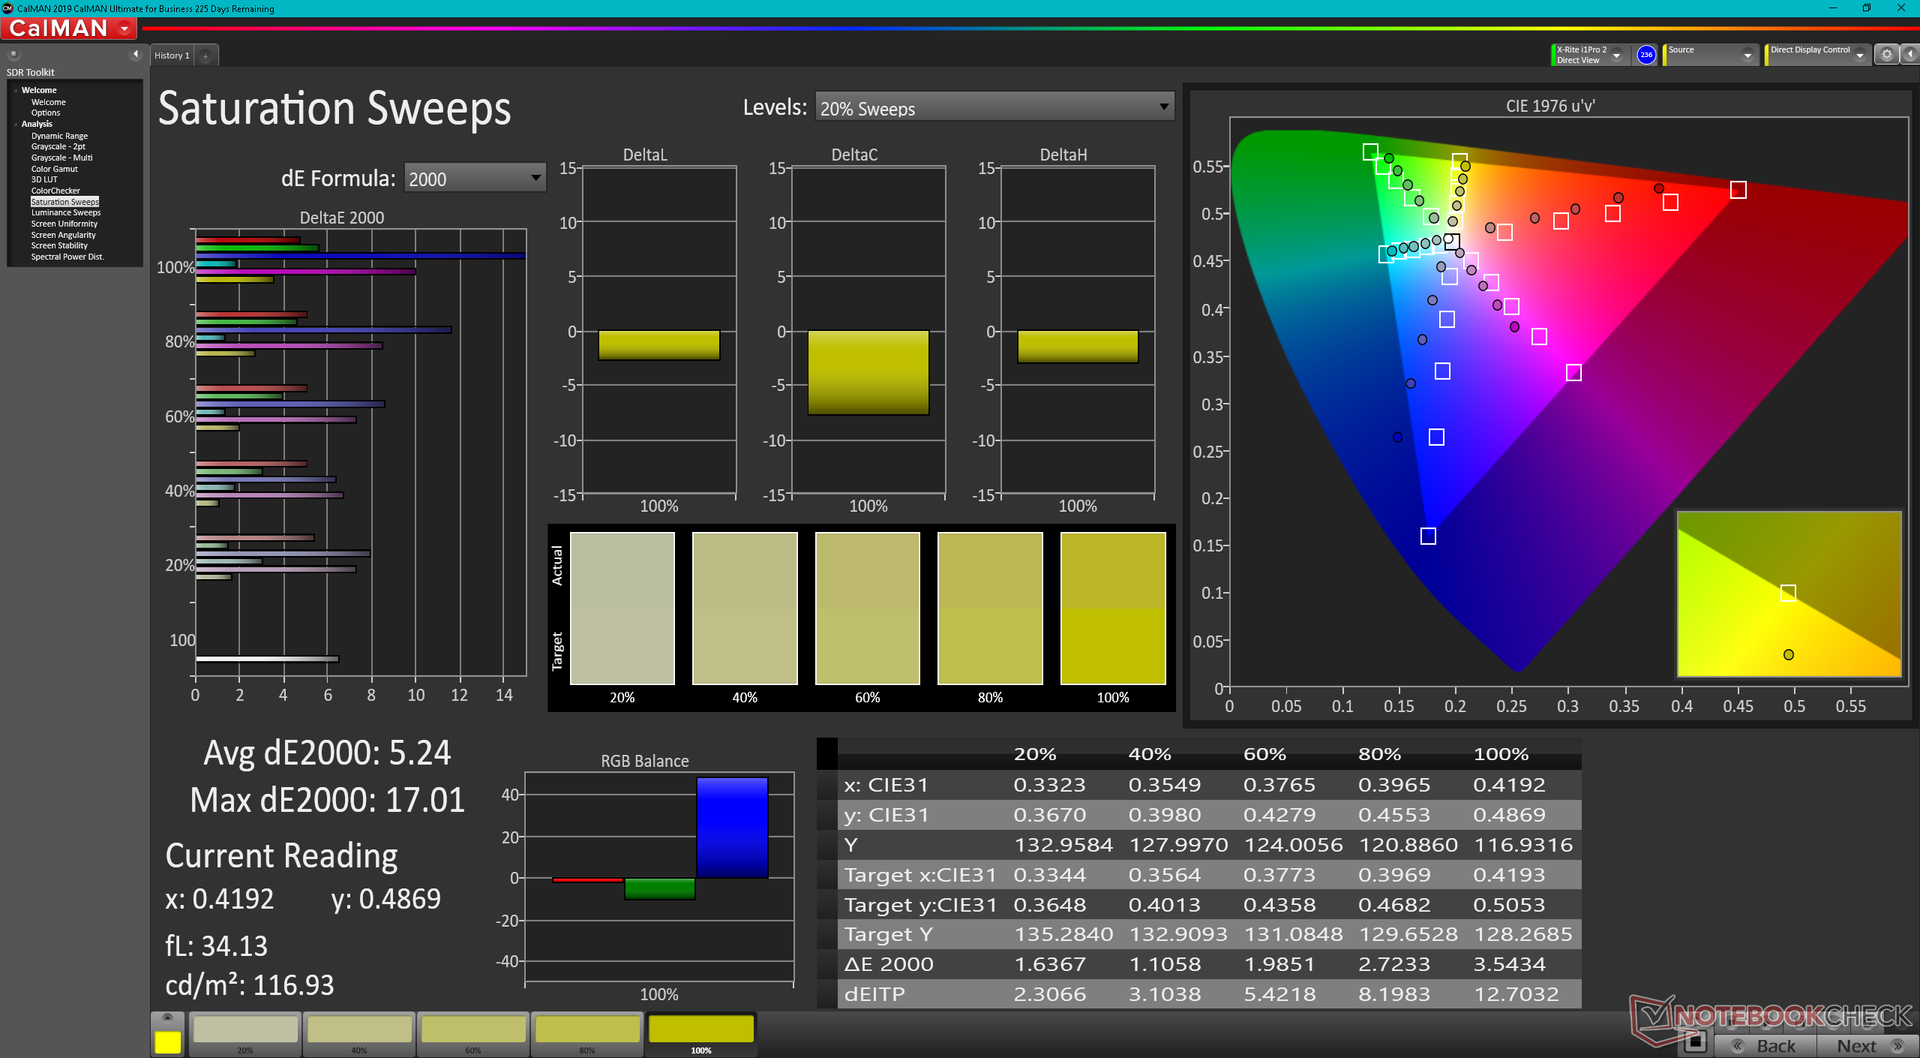
Color space is narrow at just 63 percent of sRGB which is a common attribute of budget-oriented panels. Most midrange gaming laptops have options for full sRGB coverage whereas the new Bravo 15 has none. It appears that MSI has removed some higher-end display options this time around.
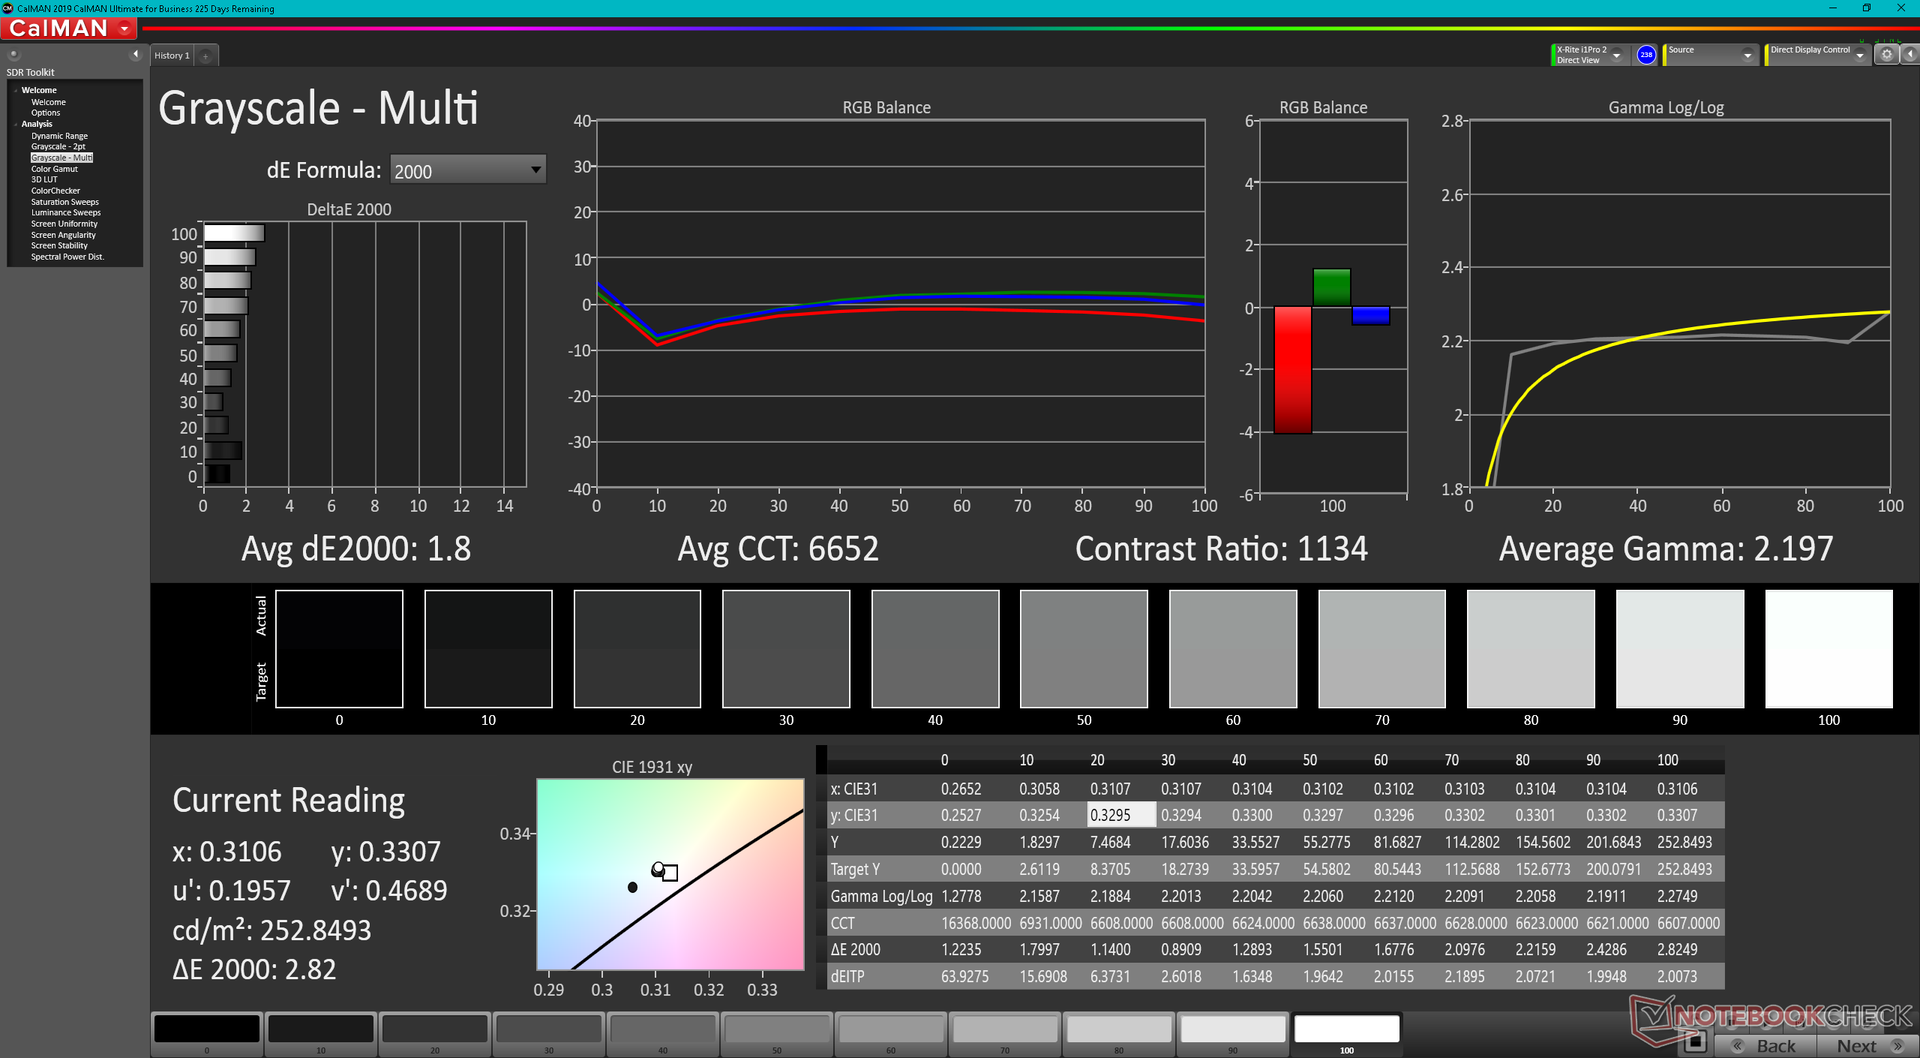
Average grayscale and color DeltaE values actually aren't bad for a budget gaming laptop as cheap panels tend to be overly cool by default. We're able to improve accuracy even further with our X-Rite colorimeter (Grayscale DeltaE 4.5 -> 1.8, ColorChecker DeltaE 4.68 -> 3.7), but users shouldn't expect anything significant due to the limited gamut mentioned above.

Display Response Times
| ↔ Response Time Black to White | ||
|---|---|---|
| 22.8 ms ... rise ↗ and fall ↘ combined | ↗ 13.2 ms rise | 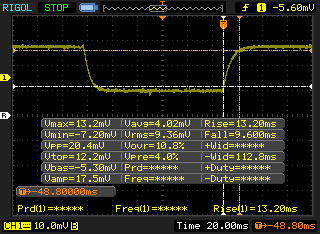 |
| ↘ 9.6 ms fall | ||
| The screen shows good response rates in our tests, but may be too slow for competitive gamers. In comparison, all tested devices range from 0.1 (minimum) to 240 (maximum) ms. » 51 % of all devices are better. This means that the measured response time is worse than the average of all tested devices (19.8 ms). | ||
| ↔ Response Time 50% Grey to 80% Grey | ||
| 25.6 ms ... rise ↗ and fall ↘ combined | ↗ 14 ms rise | 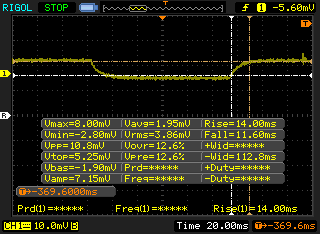 |
| ↘ 11.6 ms fall | ||
| The screen shows relatively slow response rates in our tests and may be too slow for gamers. In comparison, all tested devices range from 0.165 (minimum) to 636 (maximum) ms. » 36 % of all devices are better. This means that the measured response time is better than the average of all tested devices (31 ms). | ||
Screen Flickering / PWM (Pulse-Width Modulation)
| Screen flickering / PWM not detected | 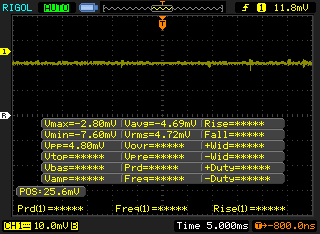 | ||
In comparison: 52 % of all tested devices do not use PWM to dim the display. If PWM was detected, an average of 7757 (minimum: 5 - maximum: 343500) Hz was measured. | |||
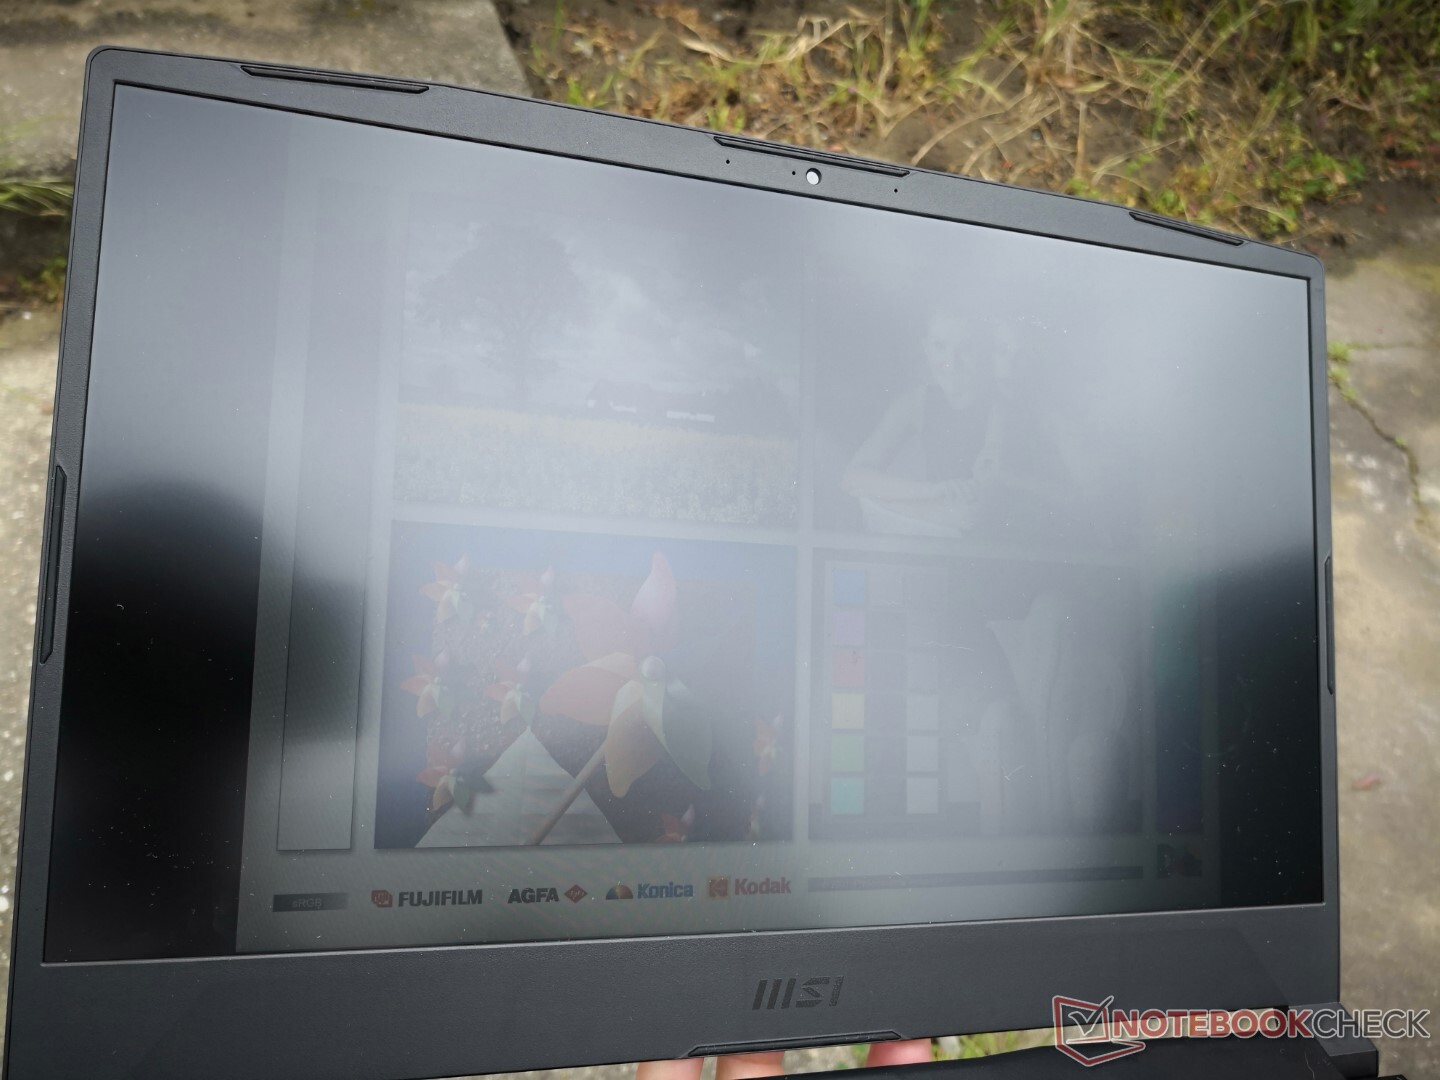
Outdoor visibility is below average as most other gaming laptop displays are around 300 nits whereas the display on our Bravo 15 test unit maxes out at around 250 nits on average across nine quadrants. Users may want to disable AMD Vari-Bright which is enabled by default or else the maximum brightness will dip even further when running on battery power.


Performance
Testing Conditions
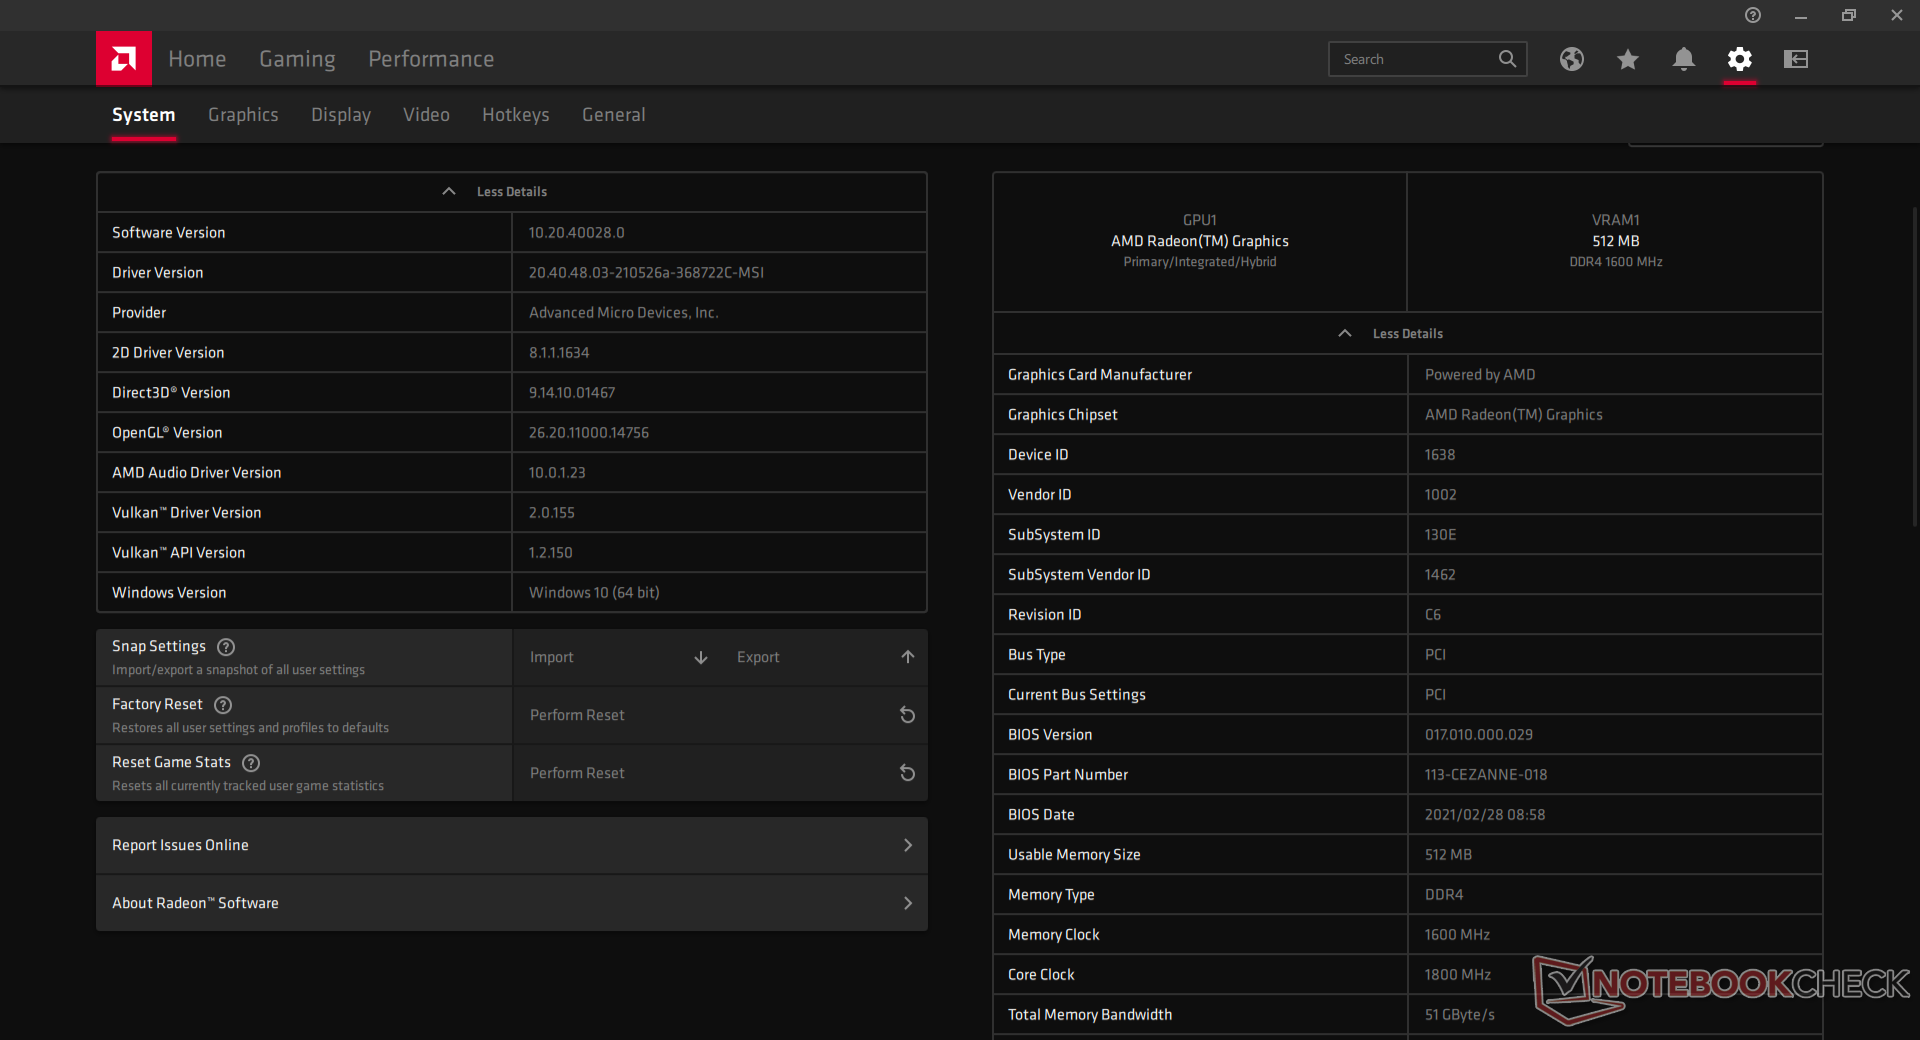
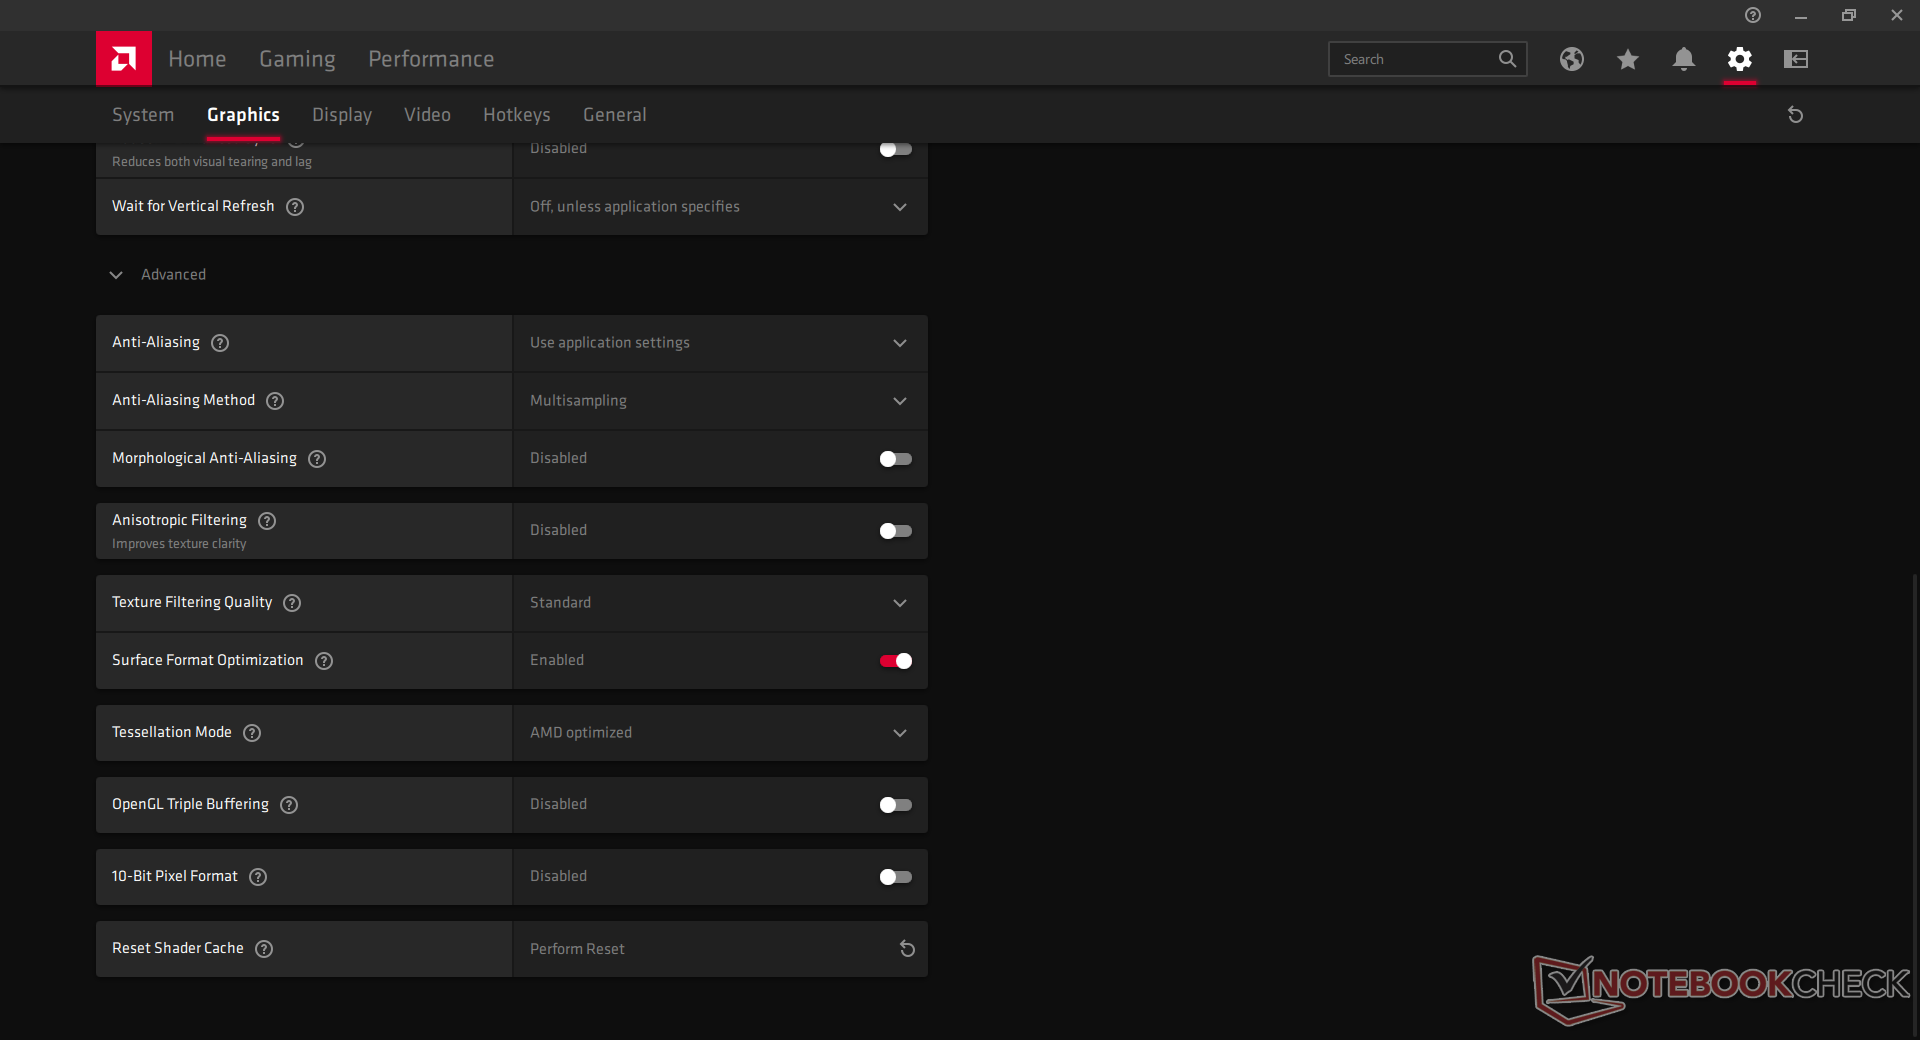
Our unit was set to Extreme Performance mode via the pre-installed MSI Center software prior to running any benchmarks below. It's highly recommended that users become familiar with MSI Center, the AMD Radeon software, and the Nahimic Companion software as key system features are toggled through these specific applications.
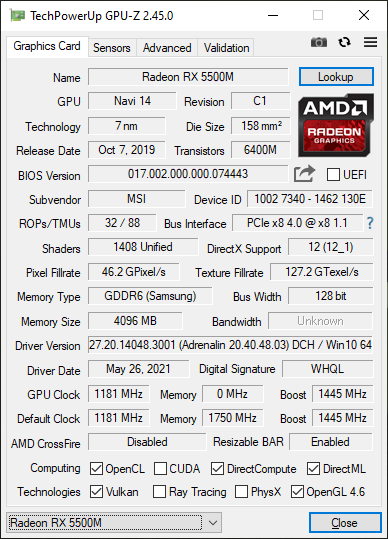
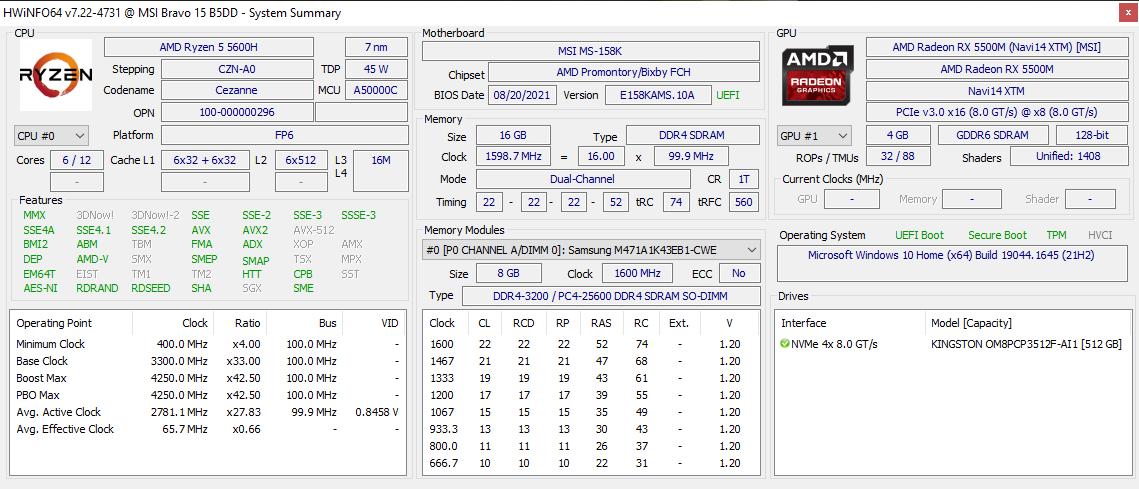
The default CPU PL states are set to 45 W according to the Renoir Mobile Tuning tool while the Radeon RX 5500M PPT is set to 65 W according to HWiNFO. The TGP here is in line with the mobile GeForce GTX 1060 that was common on many gaming laptops from 2016.
Processor — Ryzen CPU Is The Highlight
The jump from the Ryzen 5 3550H to the Ryzen 5 4600H was already significant for AMD. Thus, the jump from the Ryzen 5 4600H to the Ryzen 5 5600H as found on our MSI is comparatively minor. The CPU is only about 10 percent and 25 percent faster than its immediate predecessor in single- and multi-threaded loads, respectively, which is still decent nonetheless for a budget-oriented H-series CPU. Raw multi-thread performance is consistently faster than any 10th gen or 11th gen Intel Core i5 series CPU which the Ryzen 5 5600H directly competes with.
Performance sustainability is excellent with no fluctuating clock rates or dips over time when running CineBench R15 xT in a loop.
Cinebench R15 Multi Loop
Cinebench R23: Multi Core | Single Core
Cinebench R15: CPU Multi 64Bit | CPU Single 64Bit
Blender: v2.79 BMW27 CPU
7-Zip 18.03: 7z b 4 | 7z b 4 -mmt1
Geekbench 5.5: Multi-Core | Single-Core
HWBOT x265 Benchmark v2.2: 4k Preset
LibreOffice : 20 Documents To PDF
R Benchmark 2.5: Overall mean
Cinebench R23: Multi Core | Single Core
Cinebench R15: CPU Multi 64Bit | CPU Single 64Bit
Blender: v2.79 BMW27 CPU
7-Zip 18.03: 7z b 4 | 7z b 4 -mmt1
Geekbench 5.5: Multi-Core | Single-Core
HWBOT x265 Benchmark v2.2: 4k Preset
LibreOffice : 20 Documents To PDF
R Benchmark 2.5: Overall mean
* ... smaller is better
AIDA64: FP32 Ray-Trace | FPU Julia | CPU SHA3 | CPU Queen | FPU SinJulia | FPU Mandel | CPU AES | CPU ZLib | FP64 Ray-Trace | CPU PhotoWorxx
| Performance rating | |
| Acer Nitro 5 AN515-45-R1JH | |
| Dell G15 5515 | |
| MSI Bravo 15 A4DCR | |
| Asus TUF Gaming F15 FX507ZM | |
| MSI Bravo 15 B5DD-010US | |
| Average AMD Ryzen 5 5600H | |
| Lenovo Ideapad Gaming 3 15IHU-82K1002RGE | |
| AIDA64 / FP32 Ray-Trace | |
| Dell G15 5515 | |
| Acer Nitro 5 AN515-45-R1JH | |
| MSI Bravo 15 A4DCR | |
| Average AMD Ryzen 5 5600H (9181 - 12636, n=14) | |
| MSI Bravo 15 B5DD-010US | |
| Asus TUF Gaming F15 FX507ZM | |
| Lenovo Ideapad Gaming 3 15IHU-82K1002RGE | |
| AIDA64 / FPU Julia | |
| Acer Nitro 5 AN515-45-R1JH | |
| Dell G15 5515 | |
| Average AMD Ryzen 5 5600H (51994 - 78250, n=14) | |
| MSI Bravo 15 B5DD-010US | |
| MSI Bravo 15 A4DCR | |
| Asus TUF Gaming F15 FX507ZM | |
| Lenovo Ideapad Gaming 3 15IHU-82K1002RGE | |
| AIDA64 / CPU SHA3 | |
| Asus TUF Gaming F15 FX507ZM | |
| Acer Nitro 5 AN515-45-R1JH | |
| Dell G15 5515 | |
| Average AMD Ryzen 5 5600H (1587 - 2675, n=14) | |
| MSI Bravo 15 B5DD-010US | |
| Lenovo Ideapad Gaming 3 15IHU-82K1002RGE | |
| MSI Bravo 15 A4DCR | |
| AIDA64 / CPU Queen | |
| Asus TUF Gaming F15 FX507ZM | |
| Acer Nitro 5 AN515-45-R1JH | |
| MSI Bravo 15 A4DCR | |
| Dell G15 5515 | |
| MSI Bravo 15 B5DD-010US | |
| Average AMD Ryzen 5 5600H (66699 - 77213, n=14) | |
| Lenovo Ideapad Gaming 3 15IHU-82K1002RGE | |
| AIDA64 / FPU SinJulia | |
| MSI Bravo 15 A4DCR | |
| Dell G15 5515 | |
| Acer Nitro 5 AN515-45-R1JH | |
| Asus TUF Gaming F15 FX507ZM | |
| MSI Bravo 15 B5DD-010US | |
| Average AMD Ryzen 5 5600H (8340 - 9159, n=14) | |
| Lenovo Ideapad Gaming 3 15IHU-82K1002RGE | |
| AIDA64 / FPU Mandel | |
| Acer Nitro 5 AN515-45-R1JH | |
| Dell G15 5515 | |
| Average AMD Ryzen 5 5600H (28268 - 43274, n=14) | |
| MSI Bravo 15 B5DD-010US | |
| MSI Bravo 15 A4DCR | |
| Asus TUF Gaming F15 FX507ZM | |
| Lenovo Ideapad Gaming 3 15IHU-82K1002RGE | |
| AIDA64 / CPU AES | |
| Acer Nitro 5 AN515-45-R1JH | |
| Dell G15 5515 | |
| MSI Bravo 15 B5DD-010US | |
| Average AMD Ryzen 5 5600H (39852 - 98939, n=14) | |
| Lenovo Ideapad Gaming 3 15IHU-82K1002RGE | |
| Asus TUF Gaming F15 FX507ZM | |
| MSI Bravo 15 A4DCR | |
| AIDA64 / CPU ZLib | |
| Asus TUF Gaming F15 FX507ZM | |
| Acer Nitro 5 AN515-45-R1JH | |
| Dell G15 5515 | |
| MSI Bravo 15 A4DCR | |
| Average AMD Ryzen 5 5600H (507 - 649, n=14) | |
| MSI Bravo 15 B5DD-010US | |
| Lenovo Ideapad Gaming 3 15IHU-82K1002RGE | |
| AIDA64 / FP64 Ray-Trace | |
| Acer Nitro 5 AN515-45-R1JH | |
| Dell G15 5515 | |
| MSI Bravo 15 A4DCR | |
| Average AMD Ryzen 5 5600H (4811 - 6652, n=14) | |
| MSI Bravo 15 B5DD-010US | |
| Asus TUF Gaming F15 FX507ZM | |
| Lenovo Ideapad Gaming 3 15IHU-82K1002RGE | |
| AIDA64 / CPU PhotoWorxx | |
| Asus TUF Gaming F15 FX507ZM | |
| MSI Bravo 15 A4DCR | |
| MSI Bravo 15 B5DD-010US | |
| Average AMD Ryzen 5 5600H (7419 - 24746, n=14) | |
| Dell G15 5515 | |
| Acer Nitro 5 AN515-45-R1JH | |
| Lenovo Ideapad Gaming 3 15IHU-82K1002RGE | |
System Performance
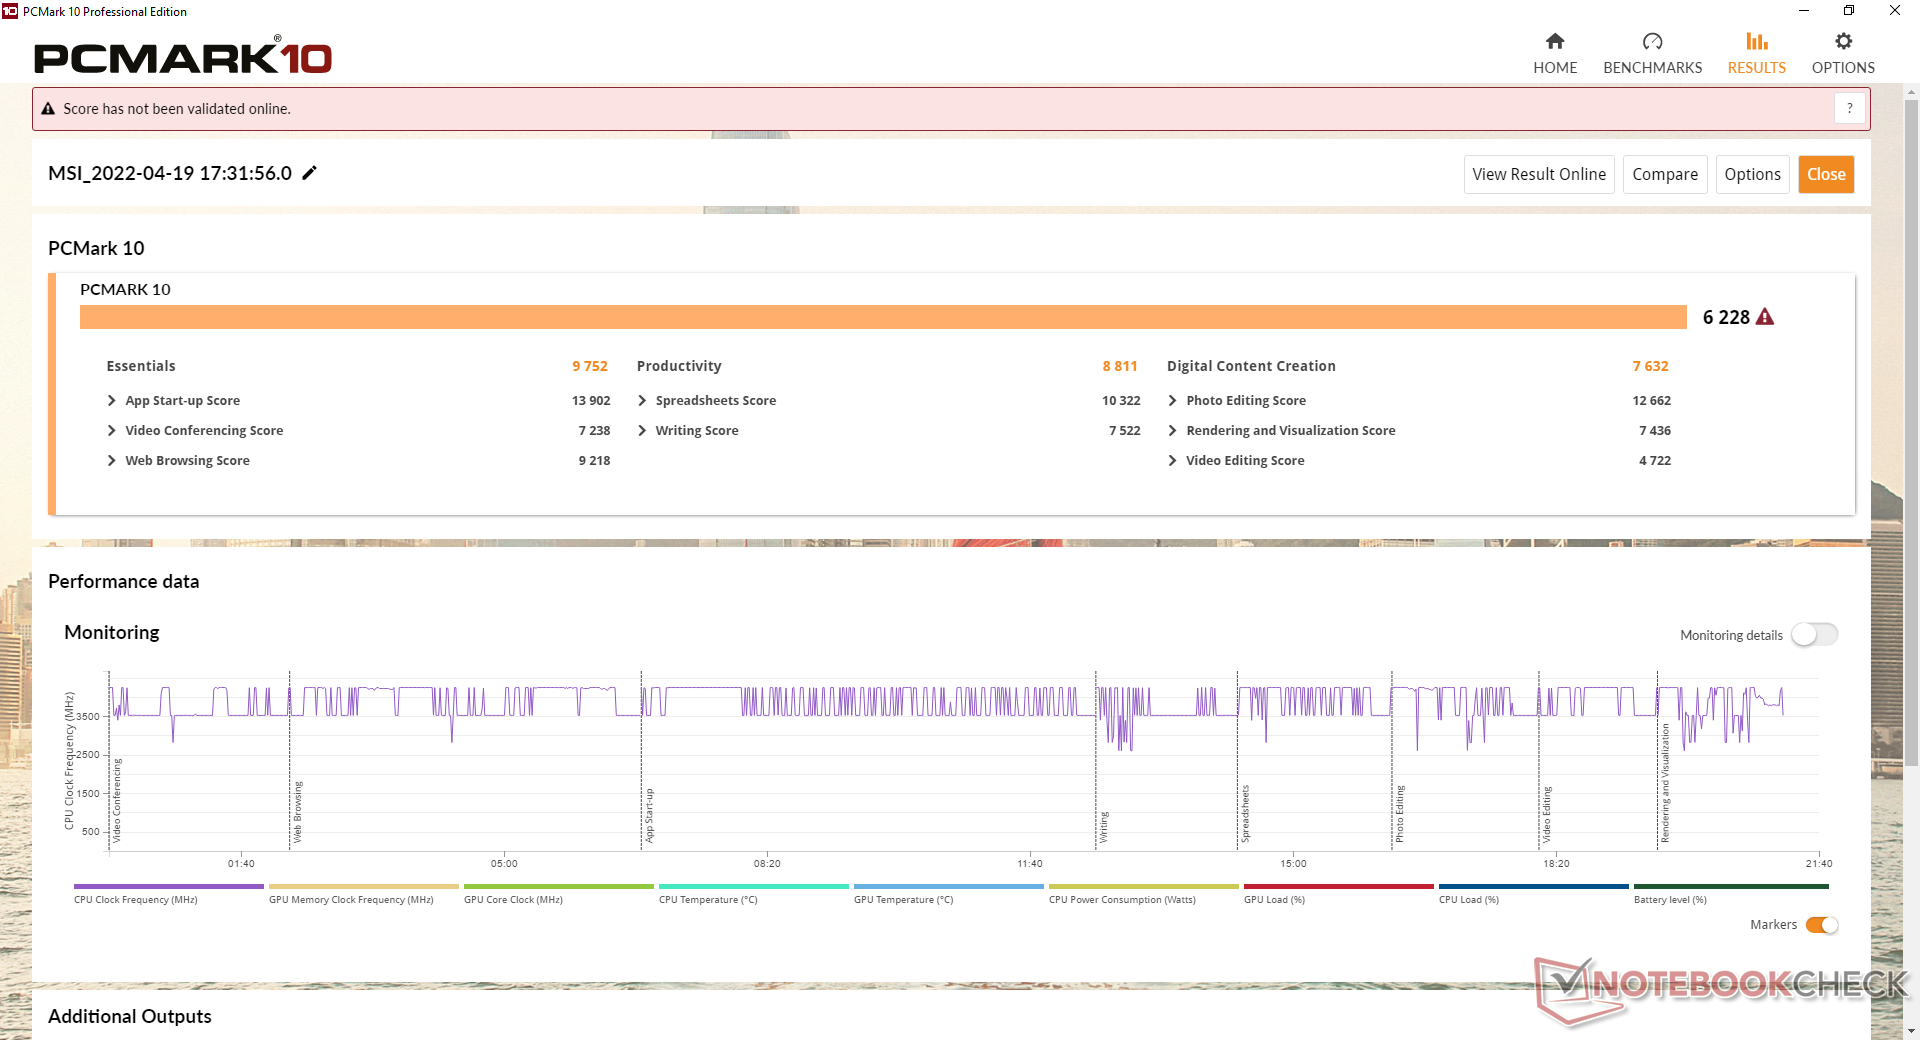
PCMark 10 scores are comparable to other gaming laptops with entry-level GPUs like the Dell G15 5515. Results are an improvement over the 2020 MSI Bravo 15 particularly in the Productivity sub-test.
CrossMark: Overall | Productivity | Creativity | Responsiveness
| PCMark 10 / Score | |
| Asus TUF Gaming F15 FX507ZM | |
| Acer Nitro 5 AN515-45-R1JH | |
| MSI Bravo 15 B5DD-010US | |
| Average AMD Ryzen 5 5600H, AMD Radeon RX 5500M (n=1) | |
| Dell G15 5515 | |
| Lenovo Ideapad Gaming 3 15IHU-82K1002RGE | |
| MSI Bravo 15 A4DCR | |
| PCMark 10 / Essentials | |
| Asus TUF Gaming F15 FX507ZM | |
| Acer Nitro 5 AN515-45-R1JH | |
| MSI Bravo 15 A4DCR | |
| MSI Bravo 15 B5DD-010US | |
| Average AMD Ryzen 5 5600H, AMD Radeon RX 5500M (n=1) | |
| Dell G15 5515 | |
| Lenovo Ideapad Gaming 3 15IHU-82K1002RGE | |
| PCMark 10 / Productivity | |
| Acer Nitro 5 AN515-45-R1JH | |
| Lenovo Ideapad Gaming 3 15IHU-82K1002RGE | |
| Asus TUF Gaming F15 FX507ZM | |
| MSI Bravo 15 B5DD-010US | |
| Average AMD Ryzen 5 5600H, AMD Radeon RX 5500M (n=1) | |
| Dell G15 5515 | |
| MSI Bravo 15 A4DCR | |
| PCMark 10 / Digital Content Creation | |
| Asus TUF Gaming F15 FX507ZM | |
| Acer Nitro 5 AN515-45-R1JH | |
| MSI Bravo 15 B5DD-010US | |
| Average AMD Ryzen 5 5600H, AMD Radeon RX 5500M (n=1) | |
| Dell G15 5515 | |
| MSI Bravo 15 A4DCR | |
| Lenovo Ideapad Gaming 3 15IHU-82K1002RGE | |
| CrossMark / Overall | |
| Lenovo Ideapad Gaming 3 15IHU-82K1002RGE | |
| CrossMark / Productivity | |
| Lenovo Ideapad Gaming 3 15IHU-82K1002RGE | |
| CrossMark / Creativity | |
| Lenovo Ideapad Gaming 3 15IHU-82K1002RGE | |
| CrossMark / Responsiveness | |
| Lenovo Ideapad Gaming 3 15IHU-82K1002RGE | |
| PCMark 10 Score | 6228 points | |
Help | ||
| AIDA64 / Memory Copy | |
| Asus TUF Gaming F15 FX507ZM | |
| MSI Bravo 15 B5DD-010US | |
| Dell G15 5515 | |
| Acer Nitro 5 AN515-45-R1JH | |
| Average AMD Ryzen 5 5600H (20549 - 42141, n=14) | |
| MSI Bravo 15 A4DCR | |
| Lenovo Ideapad Gaming 3 15IHU-82K1002RGE | |
| AIDA64 / Memory Read | |
| Asus TUF Gaming F15 FX507ZM | |
| MSI Bravo 15 B5DD-010US | |
| Dell G15 5515 | |
| Acer Nitro 5 AN515-45-R1JH | |
| Average AMD Ryzen 5 5600H (22917 - 47595, n=14) | |
| MSI Bravo 15 A4DCR | |
| Lenovo Ideapad Gaming 3 15IHU-82K1002RGE | |
| AIDA64 / Memory Write | |
| Asus TUF Gaming F15 FX507ZM | |
| MSI Bravo 15 A4DCR | |
| MSI Bravo 15 B5DD-010US | |
| Average AMD Ryzen 5 5600H (20226 - 44872, n=14) | |
| Dell G15 5515 | |
| Acer Nitro 5 AN515-45-R1JH | |
| Lenovo Ideapad Gaming 3 15IHU-82K1002RGE | |
| AIDA64 / Memory Latency | |
| MSI Bravo 15 A4DCR | |
| Lenovo Ideapad Gaming 3 15IHU-82K1002RGE | |
| Average AMD Ryzen 5 5600H (75 - 89.1, n=14) | |
| Dell G15 5515 | |
| MSI Bravo 15 B5DD-010US | |
| Acer Nitro 5 AN515-45-R1JH | |
| Asus TUF Gaming F15 FX507ZM | |
* ... smaller is better
DPC Latency
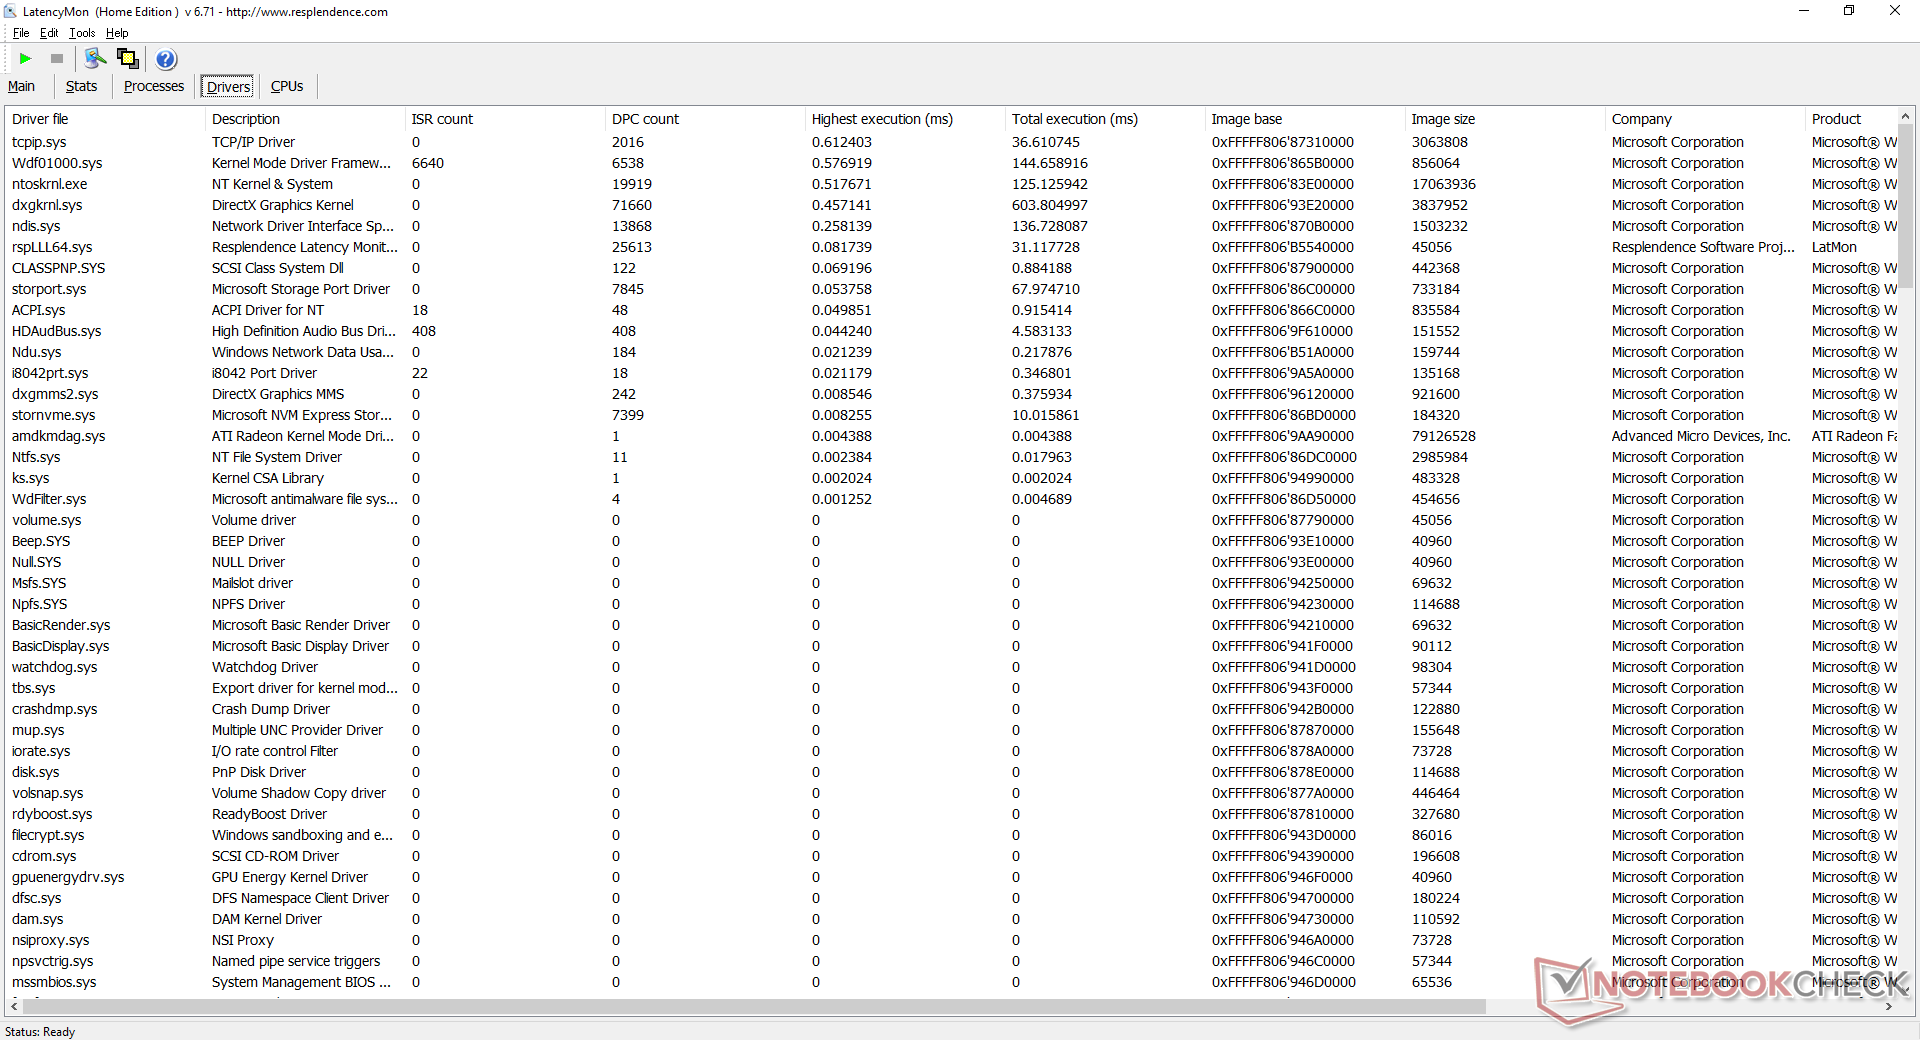
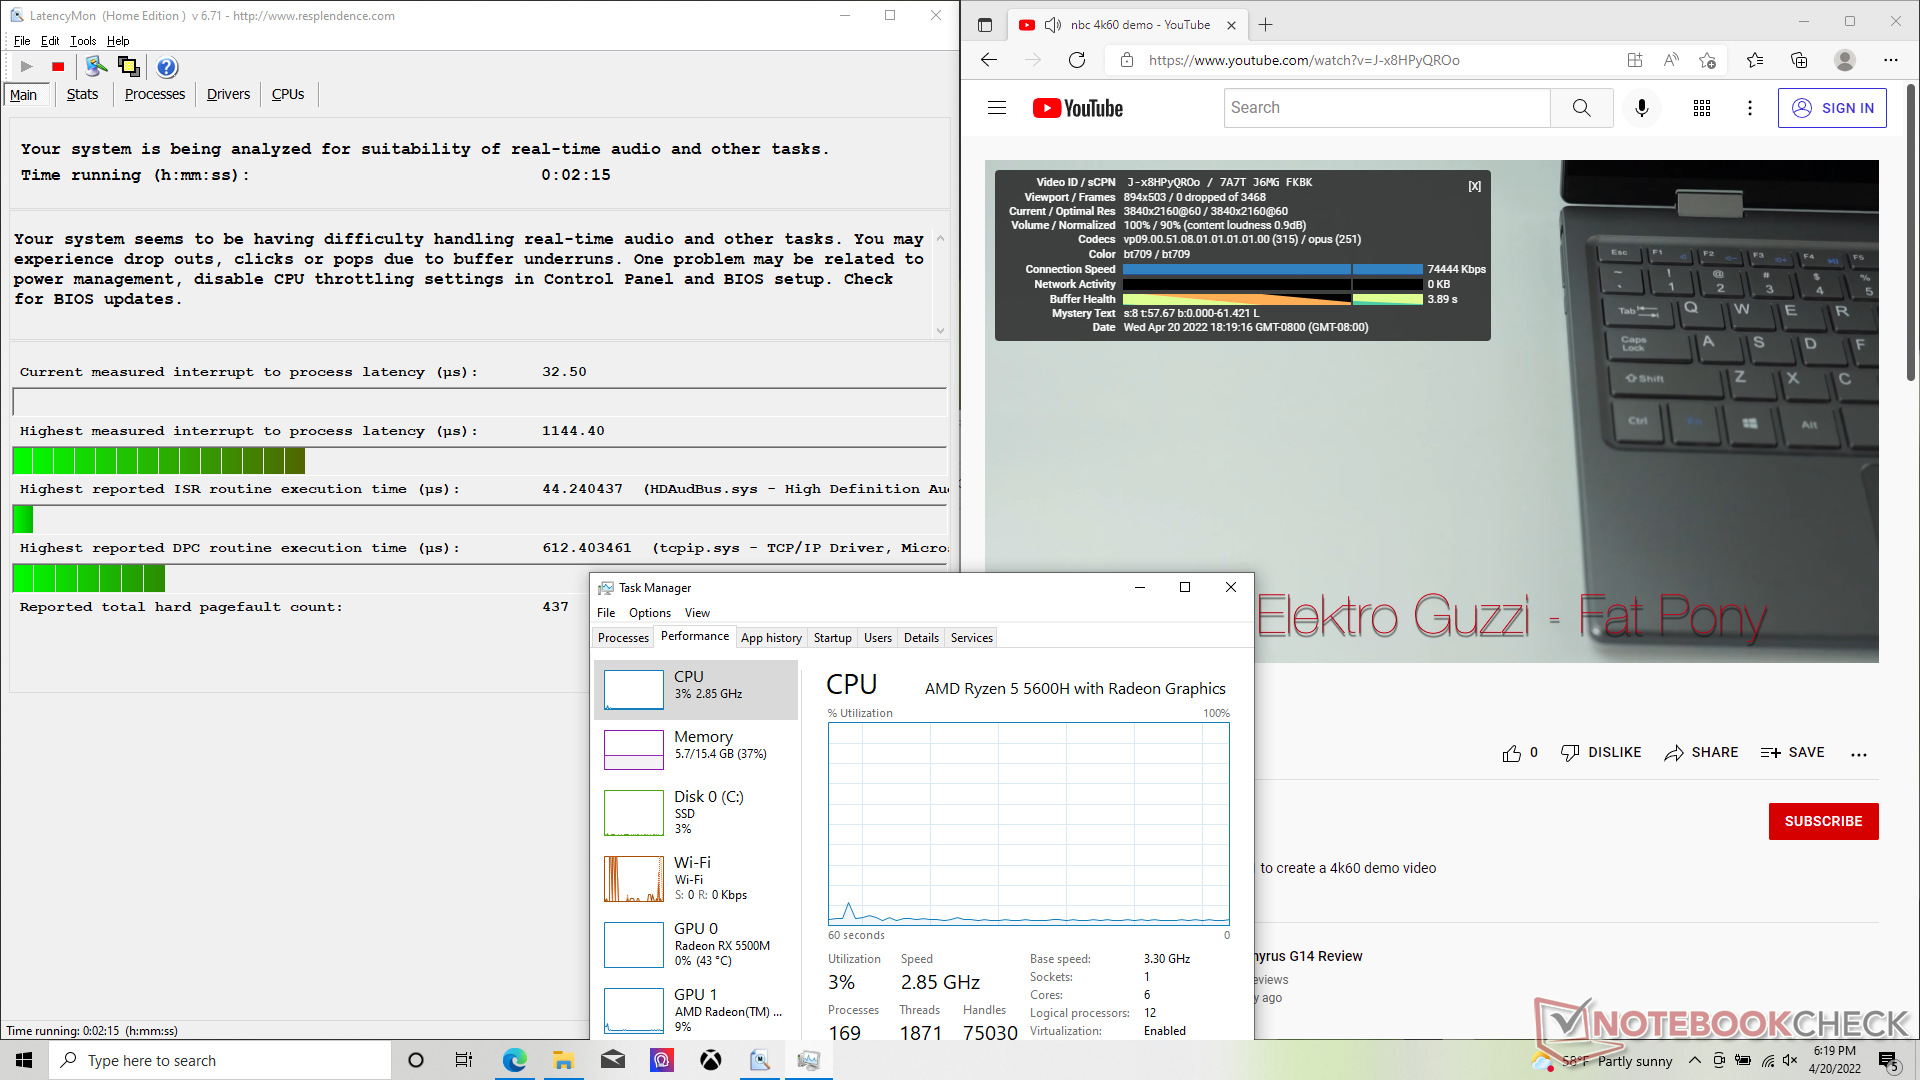
LatencyMon reveals only minor latency issues and no dropped frames during our 4K video playback test at 60 FPS.
| DPC Latencies / LatencyMon - interrupt to process latency (max), Web, Youtube, Prime95 | |
| MSI Bravo 15 A4DCR | |
| MSI Bravo 15 B5DD-010US | |
| Lenovo Ideapad Gaming 3 15IHU-82K1002RGE | |
| Asus TUF Gaming F15 FX507ZM | |
| Dell G15 5515 | |
| Acer Nitro 5 AN515-45-R1JH | |
* ... smaller is better
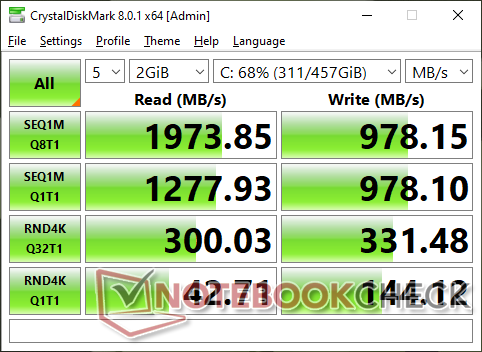
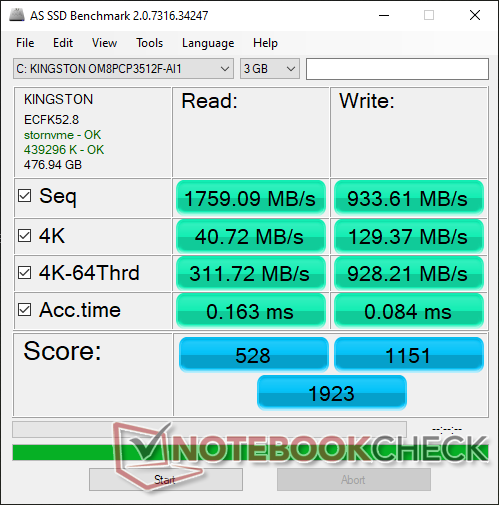
Storage Devices — Up To One Drive Only
Our unit comes configured with the budget 512 GB Kingston OM8PCP3512F PCIe3 NVMe SSD offering transfer rates of up 2000 MB/s. Though write rates are only about half as fast, they are nonetheless reflective of the budget price point.

| Drive Performance rating - Percent | |
| Asus TUF Gaming F15 FX507ZM | |
| MSI Bravo 15 A4DCR | |
| Dell G15 5515 | |
| Lenovo Ideapad Gaming 3 15IHU-82K1002RGE | |
| Acer Nitro 5 AN515-45-R1JH -1! | |
| MSI Bravo 15 B5DD-010US | |
* ... smaller is better
Disk Throttling: DiskSpd Read Loop, Queue Depth 8
GPU Performance — Old Generation Radeon
Graphics performance is within a few percentage points of the older mobile GeForce GTX 1060. Upgrading to an entry-level Nvidia alternative like the mobile GTX 1660 Ti or mobile RTX 3050 Ti can boost frame rates by as much as 40 to 60 percent. Thankfully, the internal display supports FreeSync which helps immensely for lower-performance GPUs such as our Radeon RX 5500M.
MSI does not offer a Radeon RX 5600M option as of this writing which would have boosted graphics performance by about 40 percent over our RX 5500M.
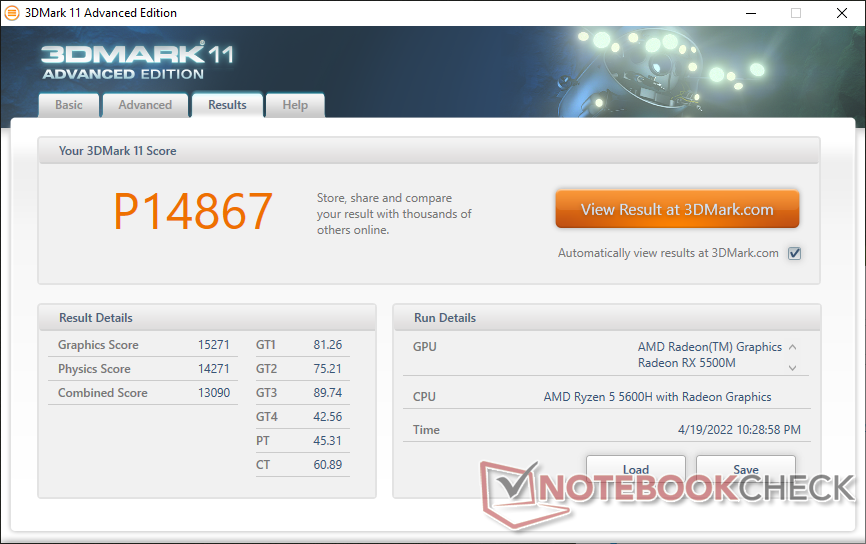
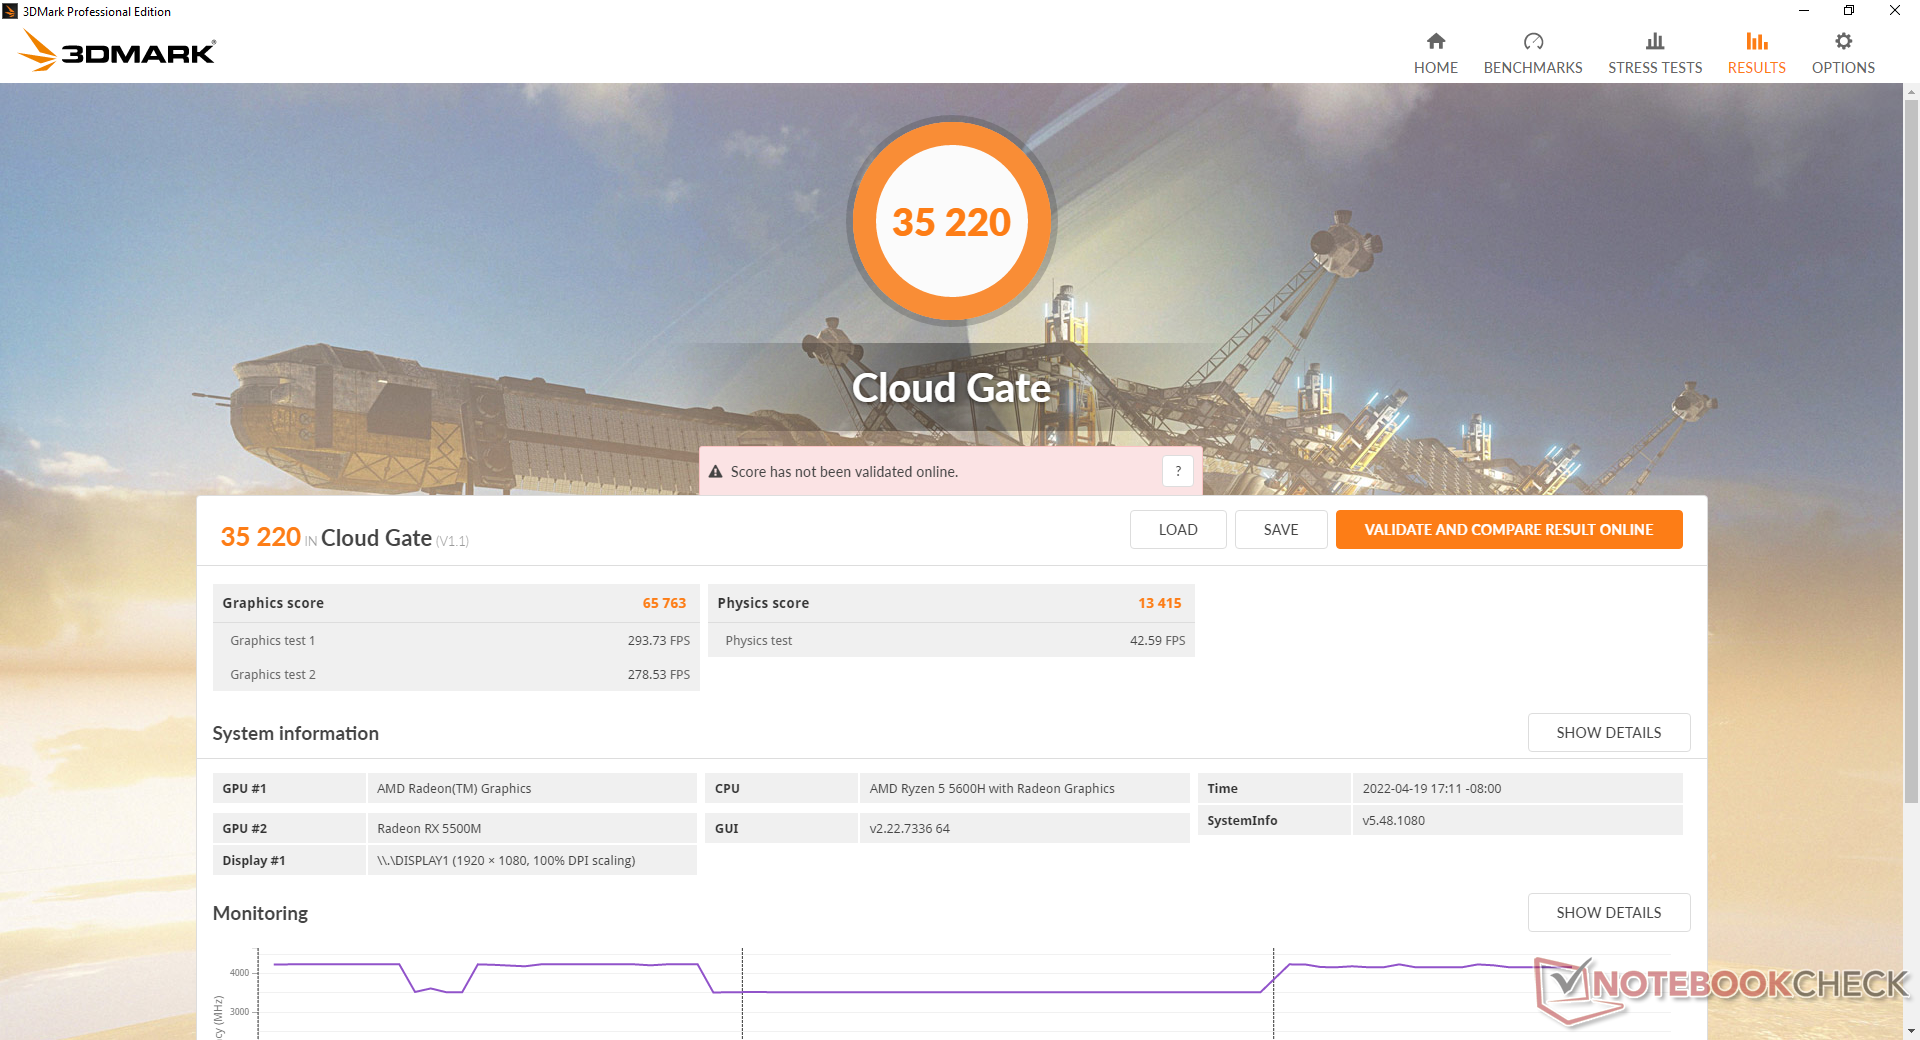
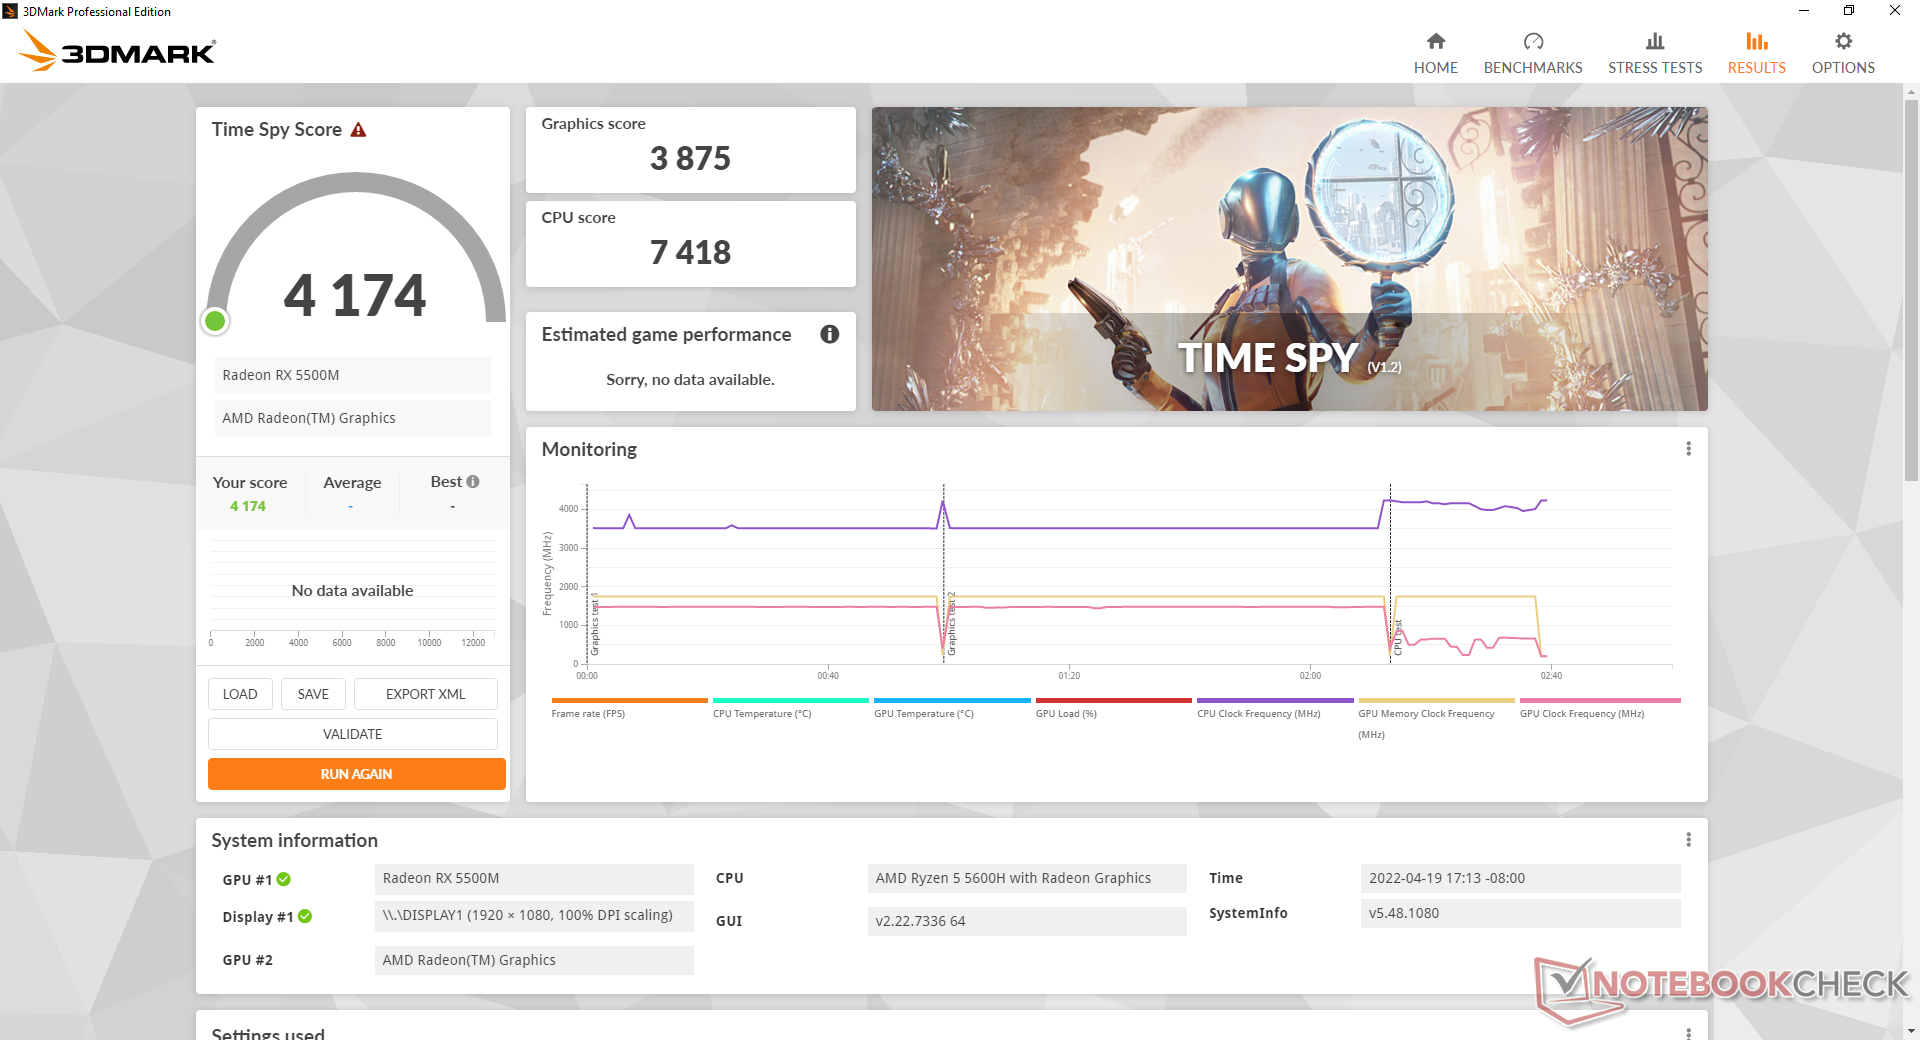
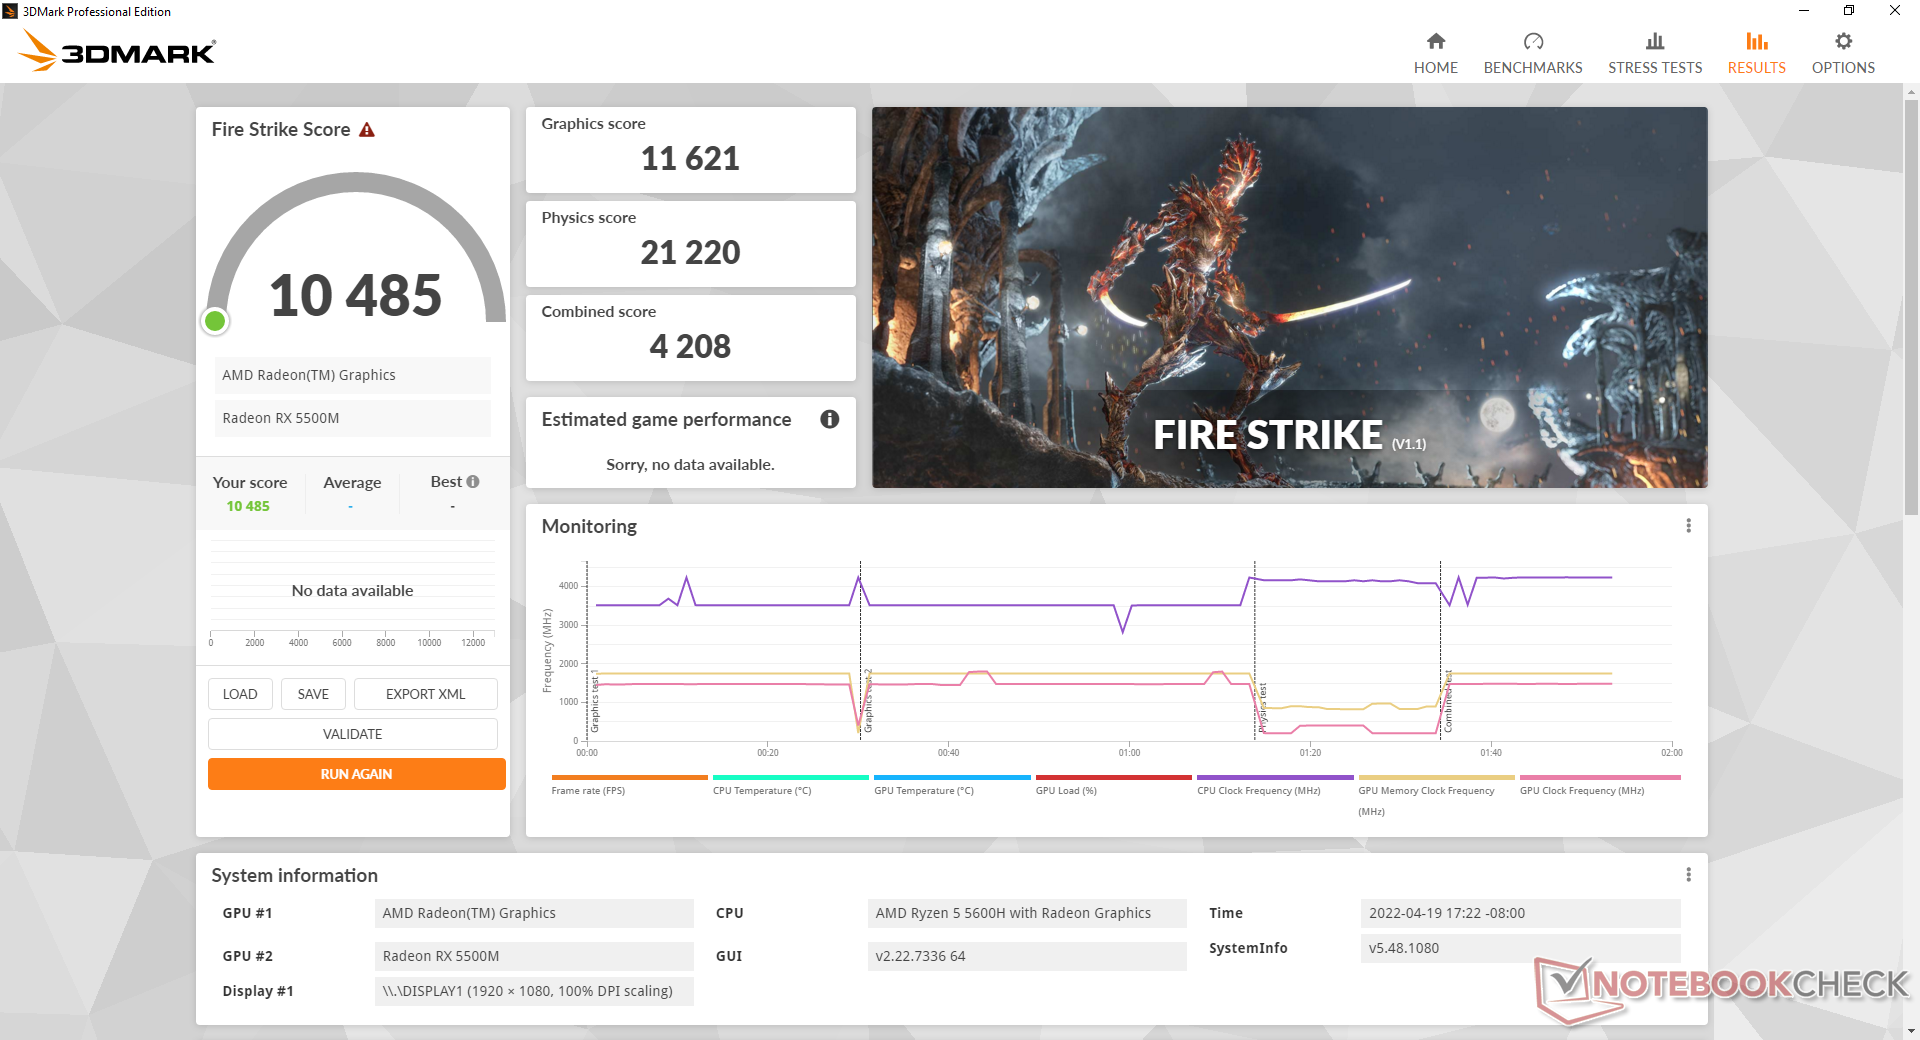
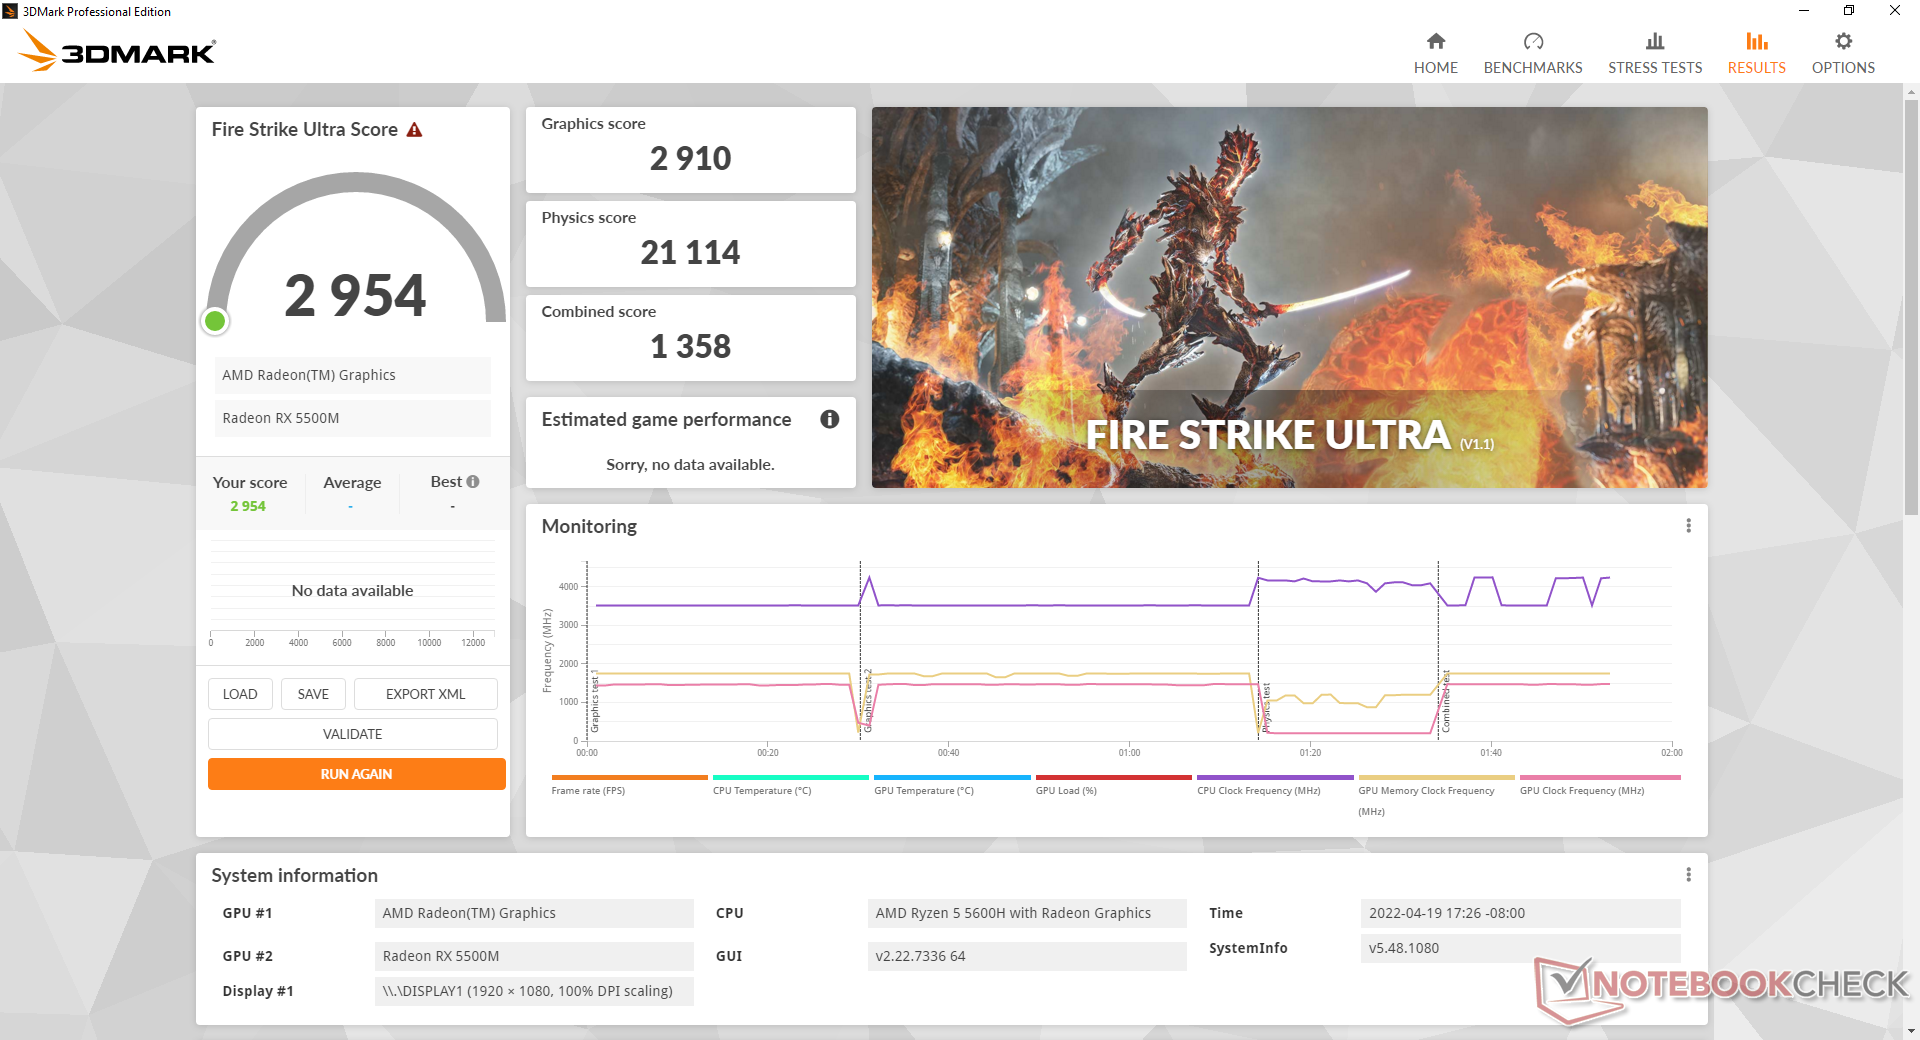
| 3DMark 11 Performance | 14867 points | |
| 3DMark Cloud Gate Standard Score | 35220 points | |
| 3DMark Fire Strike Score | 10485 points | |
| 3DMark Time Spy Score | 4174 points | |
Help | ||
| Cyberpunk 2077 1.6 | |
| 1920x1080 Low Preset | |
| Lenovo Ideapad Gaming 3 15IHU-82K1002RGE | |
| Average AMD Radeon RX 5500M (53.2 - 55.9, n=2) | |
| MSI Bravo 15 B5DD-010US | |
| 1920x1080 Medium Preset | |
| Lenovo Ideapad Gaming 3 15IHU-82K1002RGE | |
| Average AMD Radeon RX 5500M (41.5 - 44.9, n=2) | |
| MSI Bravo 15 B5DD-010US | |
| 1920x1080 High Preset | |
| Lenovo Ideapad Gaming 3 15IHU-82K1002RGE | |
| Average AMD Radeon RX 5500M (31.2 - 34.4, n=2) | |
| MSI Bravo 15 B5DD-010US | |
| 1920x1080 Ultra Preset | |
| Lenovo Ideapad Gaming 3 15IHU-82K1002RGE | |
| MSI Bravo 15 B5DD-010US | |
| Average AMD Radeon RX 5500M (27.7 - 31.3, n=2) | |
Witcher 3 FPS Chart
| low | med. | high | ultra | |
|---|---|---|---|---|
| GTA V (2015) | 173.8 | 106.6 | 54.1 | |
| The Witcher 3 (2015) | 221.1 | 72.5 | 45.5 | |
| Dota 2 Reborn (2015) | 156.4 | 141.7 | 128.4 | 119.8 |
| Final Fantasy XV Benchmark (2018) | 113.2 | 58.6 | 39.2 | |
| X-Plane 11.11 (2018) | 55.4 | 41.9 | 36.5 | |
| Strange Brigade (2018) | 237 | 100.9 | 81.5 | 71.8 |
| Cyberpunk 2077 1.6 (2022) | 53.2 | 41.5 | 31.2 | 31.3 |
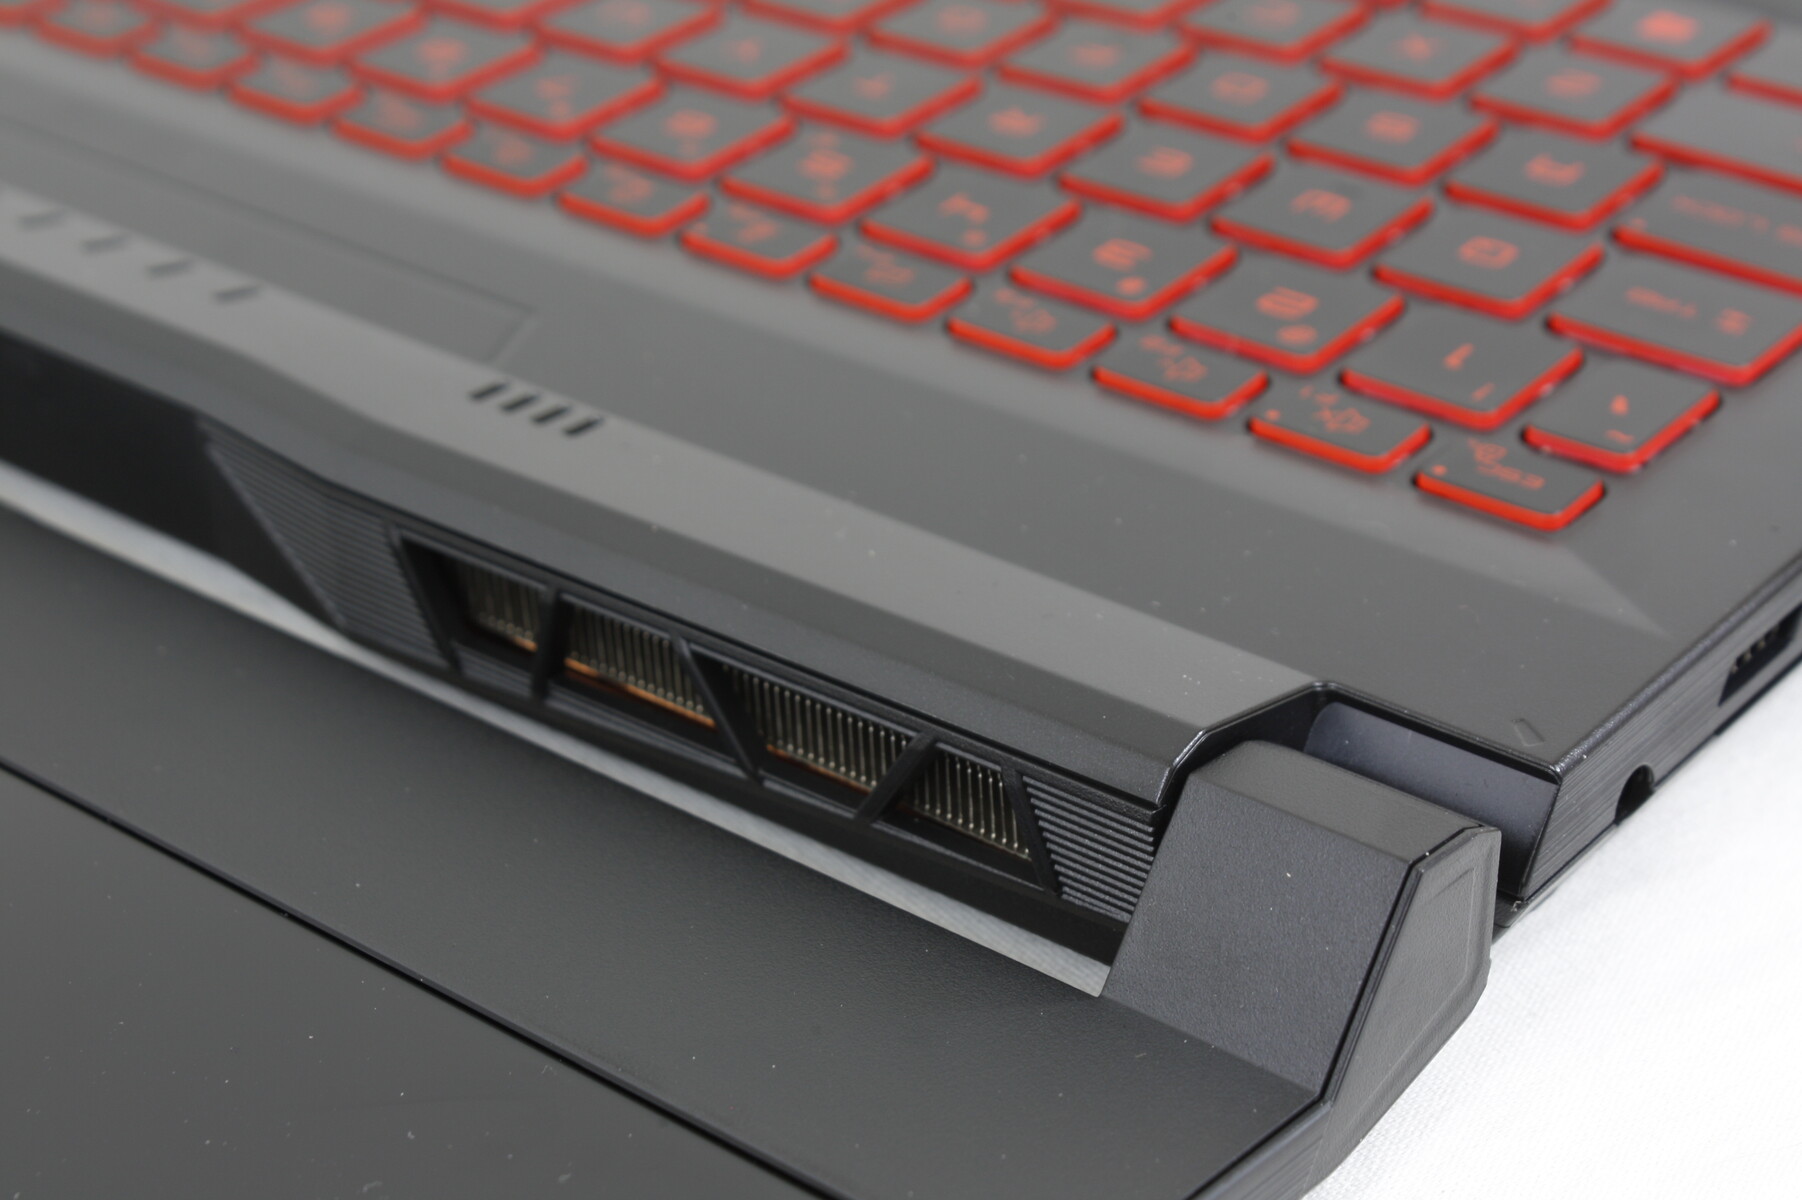
Emissions — Quiet Under The Correct Settings
System Noise
The cooling solution consists of two asymmetric fans and six copper heat pipes that arranged differently than on the older 2020 Bravo 15. Fan noise is highly dependent on the MSI Center power profiles: Super Battery, Silent, Balanced, Extreme Performance, and Cooler Boost. If set to Silent or lower, the fans remain very quiet to be almost inaudible in a typical office setting. If set to Balanced or Extreme Performance, however, the fans tend to hover around 32.8 dB(A) against a silent background of 24.5 dB(A) even during low loads like browsing or video streaming. Silent mode is thus worth considering for noise-sensitive environments.
When gaming on Extreme Performance mode, the fans tend to stabilize at 42.5 dB(A) with infrequent pulses up to 49.4 dB(A). The low 40 dB(A) range is nonetheless quieter than many faster gaming laptops like the Asus TUF Gaming F15 FX507 or Acer Nitro 5 AN515. Enabling Cooler Boost mode will bump fan noise to a flat 58.5 dB(A) regardless of the activity.
Noise level
| Idle |
| 24.5 / 32.8 / 32.8 dB(A) |
| Load |
| 34.5 / 58.5 dB(A) |
 | ||
30 dB silent 40 dB(A) audible 50 dB(A) loud |
||
min: | ||
| MSI Bravo 15 B5DD-010US Radeon RX 5500M, R5 5600H, Kingston OM8PCP3512F-AB | MSI Bravo 15 A4DCR Radeon RX 5300M, R7 4800H, Samsung PM981a MZVLB1T0HBLR | Asus TUF Gaming F15 FX507ZM GeForce RTX 3060 Laptop GPU, i7-12700H, SK Hynix HFM001TD3JX013N | Dell G15 5515 GeForce RTX 3050 Ti Laptop GPU, R7 5800H, Samsung PM991a MZ9LQ512HBLU-00BD1 | Lenovo Ideapad Gaming 3 15IHU-82K1002RGE GeForce RTX 3050 Ti Laptop GPU, i5-11300H, Micron 2210 MTFDHBA512QFD | Acer Nitro 5 AN515-45-R1JH GeForce RTX 3070 Laptop GPU, R7 5800H, WDC PC SN530 SDBPNPZ-1T00 | |
|---|---|---|---|---|---|---|
| Noise | -16% | 4% | 2% | 3% | 1% | |
| off / environment * (dB) | 24.5 | 30 -22% | 23.2 5% | 24 2% | 23.9 2% | 25 -2% |
| Idle Minimum * (dB) | 24.5 | 31 -27% | 23.6 4% | 25 -2% | 23.9 2% | 25 -2% |
| Idle Average * (dB) | 32.8 | 32 2% | 23.6 28% | 26 21% | 26.8 18% | 25 24% |
| Idle Maximum * (dB) | 32.8 | 40 -22% | 25.4 23% | 30 9% | 26.8 18% | 32.2 2% |
| Load Average * (dB) | 34.5 | 48 -39% | 38 -10% | 44 -28% | 43.5 -26% | 45.8 -33% |
| Witcher 3 ultra * (dB) | 42.5 | 48 -13% | 54.1 -27% | 44 -4% | 43.5 -2% | |
| Load Maximum * (dB) | 58.5 | 54 8% | 57.2 2% | 48 18% | 53.1 9% | 49.1 16% |
* ... smaller is better
Temperature
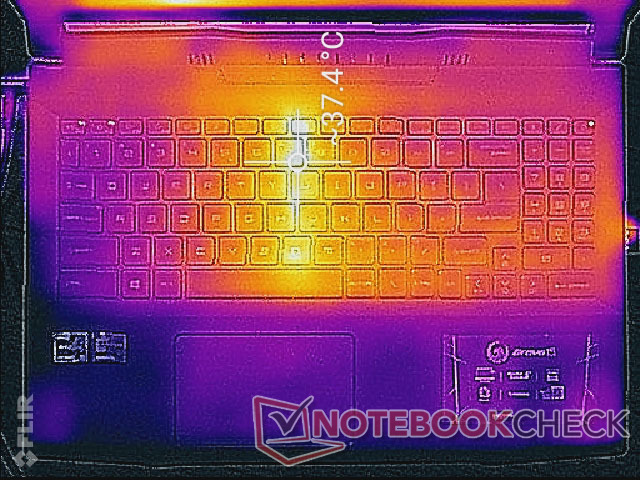
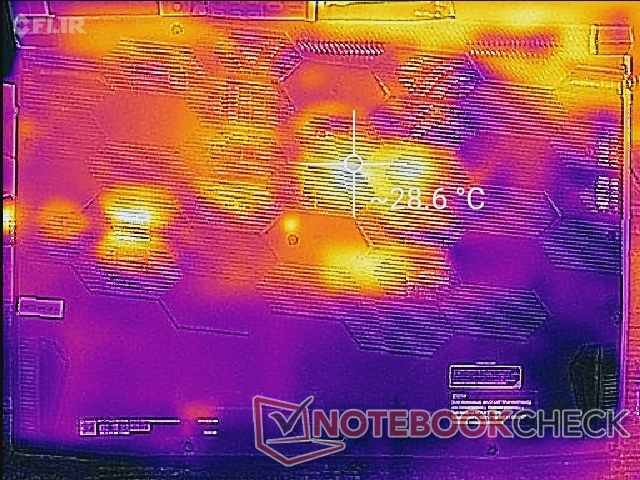
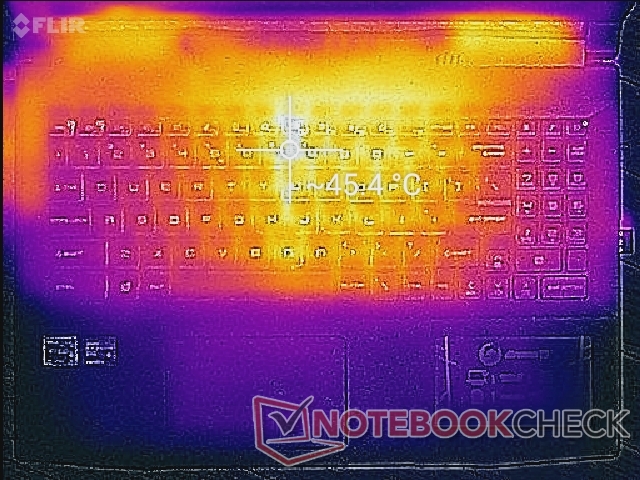
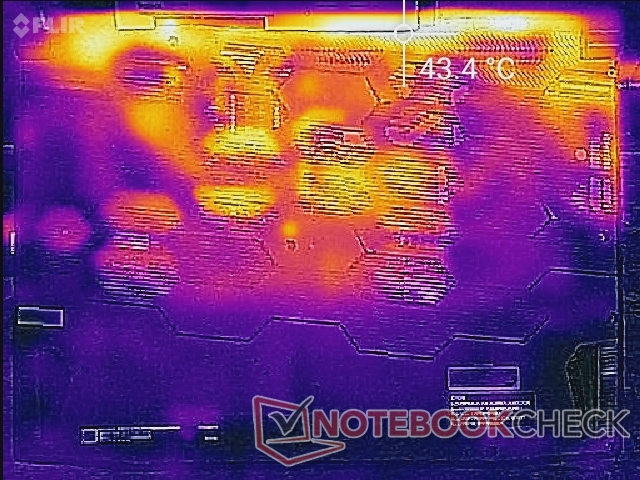
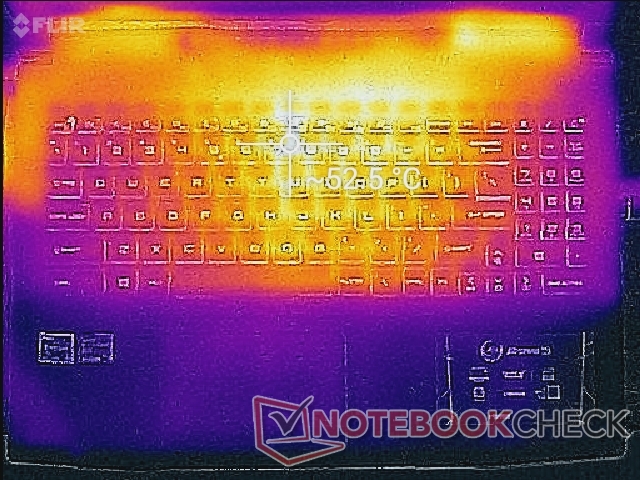
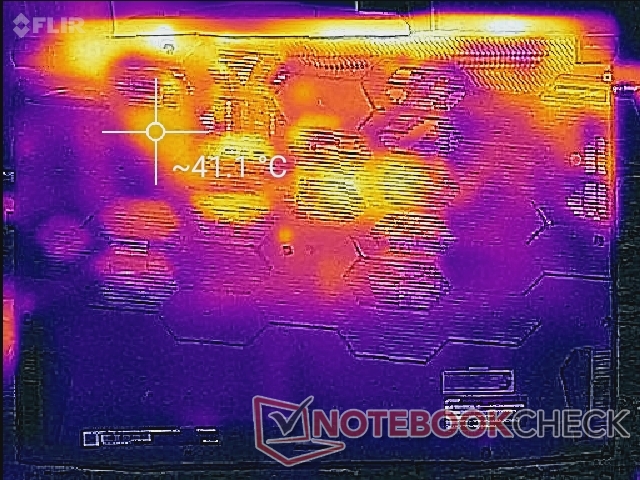
Most of the plastic chassis remains relatively cool to the touch even when under heavy loads as this is not an ultrathin metal design. The palm rests, WASD keys, and numpad area, for example, are only around 30 C when gaming. Hot spots are nearest the keyboard center and rear edge where skin is unlikely to touch for long periods during use. Average temperatures are lower than what we observed on the 2020 Bravo 15 especially around the WASD keys.
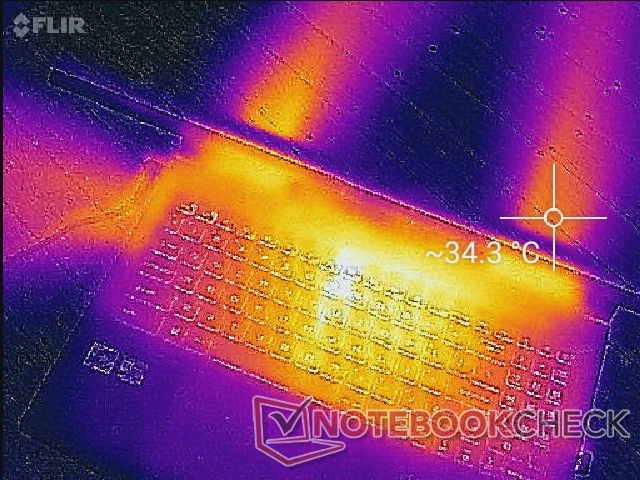
(-) The maximum temperature on the upper side is 52.2 °C / 126 F, compared to the average of 40.4 °C / 105 F, ranging from 21.2 to 68.8 °C for the class Gaming.
(-) The bottom heats up to a maximum of 48.6 °C / 119 F, compared to the average of 43.2 °C / 110 F
(+) In idle usage, the average temperature for the upper side is 30 °C / 86 F, compared to the device average of 33.9 °C / 93 F.
(+) Playing The Witcher 3, the average temperature for the upper side is 31.9 °C / 89 F, compared to the device average of 33.9 °C / 93 F.
(+) The palmrests and touchpad are cooler than skin temperature with a maximum of 27.6 °C / 81.7 F and are therefore cool to the touch.
(±) The average temperature of the palmrest area of similar devices was 28.8 °C / 83.8 F (+1.2 °C / 2.1 F).
| MSI Bravo 15 B5DD-010US AMD Ryzen 5 5600H, AMD Radeon RX 5500M | MSI Bravo 15 A4DCR AMD Ryzen 7 4800H, AMD Radeon RX 5300M | Asus TUF Gaming F15 FX507ZM Intel Core i7-12700H, NVIDIA GeForce RTX 3060 Laptop GPU | Dell G15 5515 AMD Ryzen 7 5800H, NVIDIA GeForce RTX 3050 Ti Laptop GPU | Lenovo Ideapad Gaming 3 15IHU-82K1002RGE Intel Core i5-11300H, NVIDIA GeForce RTX 3050 Ti Laptop GPU | Acer Nitro 5 AN515-45-R1JH AMD Ryzen 7 5800H, NVIDIA GeForce RTX 3070 Laptop GPU | |
|---|---|---|---|---|---|---|
| Heat | 3% | -6% | 11% | 14% | -3% | |
| Maximum Upper Side * (°C) | 52.2 | 51 2% | 44.4 15% | 50 4% | 43.2 17% | 53.2 -2% |
| Maximum Bottom * (°C) | 48.6 | 50 -3% | 48.8 -0% | 49 -1% | 47.9 1% | 58.2 -20% |
| Idle Upper Side * (°C) | 38 | 30 21% | 37.8 1% | 26 32% | 24.9 34% | 29.5 22% |
| Idle Bottom * (°C) | 28.4 | 31 -9% | 39.6 -39% | 26 8% | 27 5% | 31.2 -10% |
* ... smaller is better
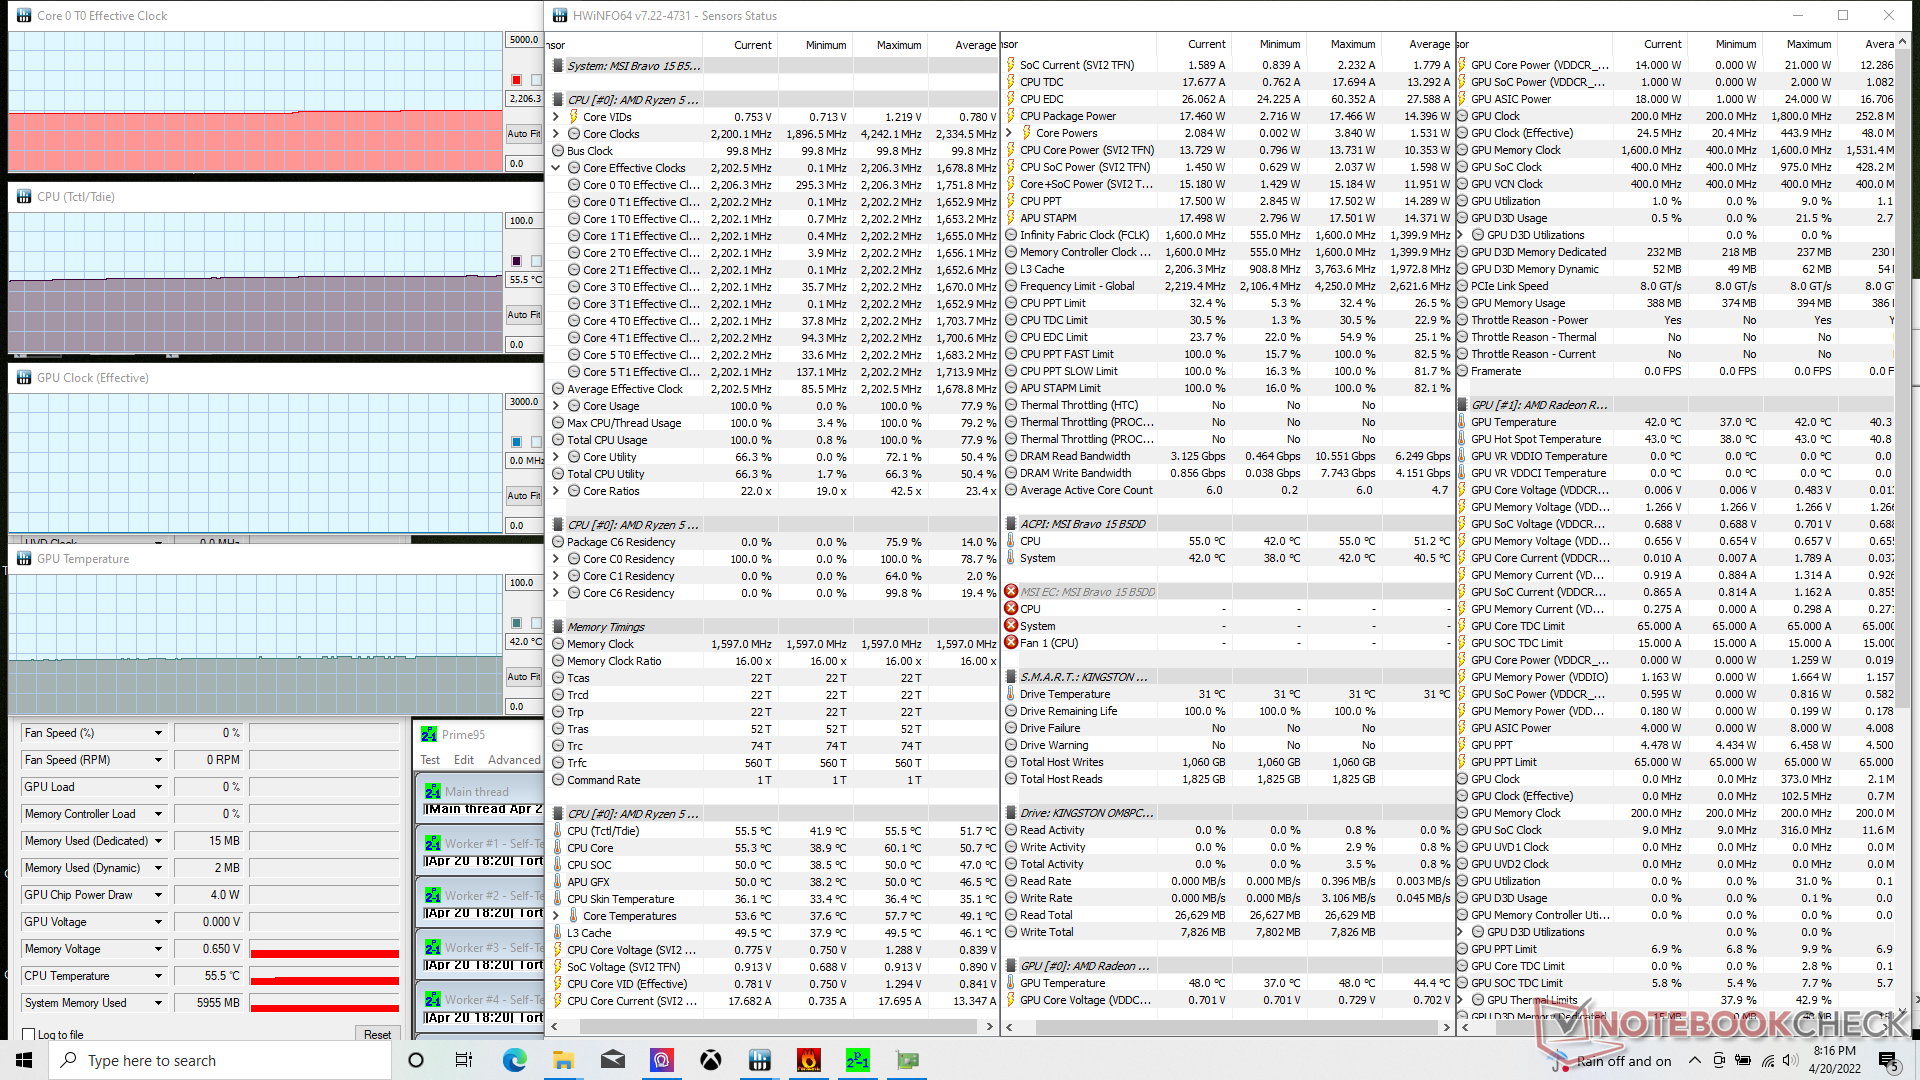
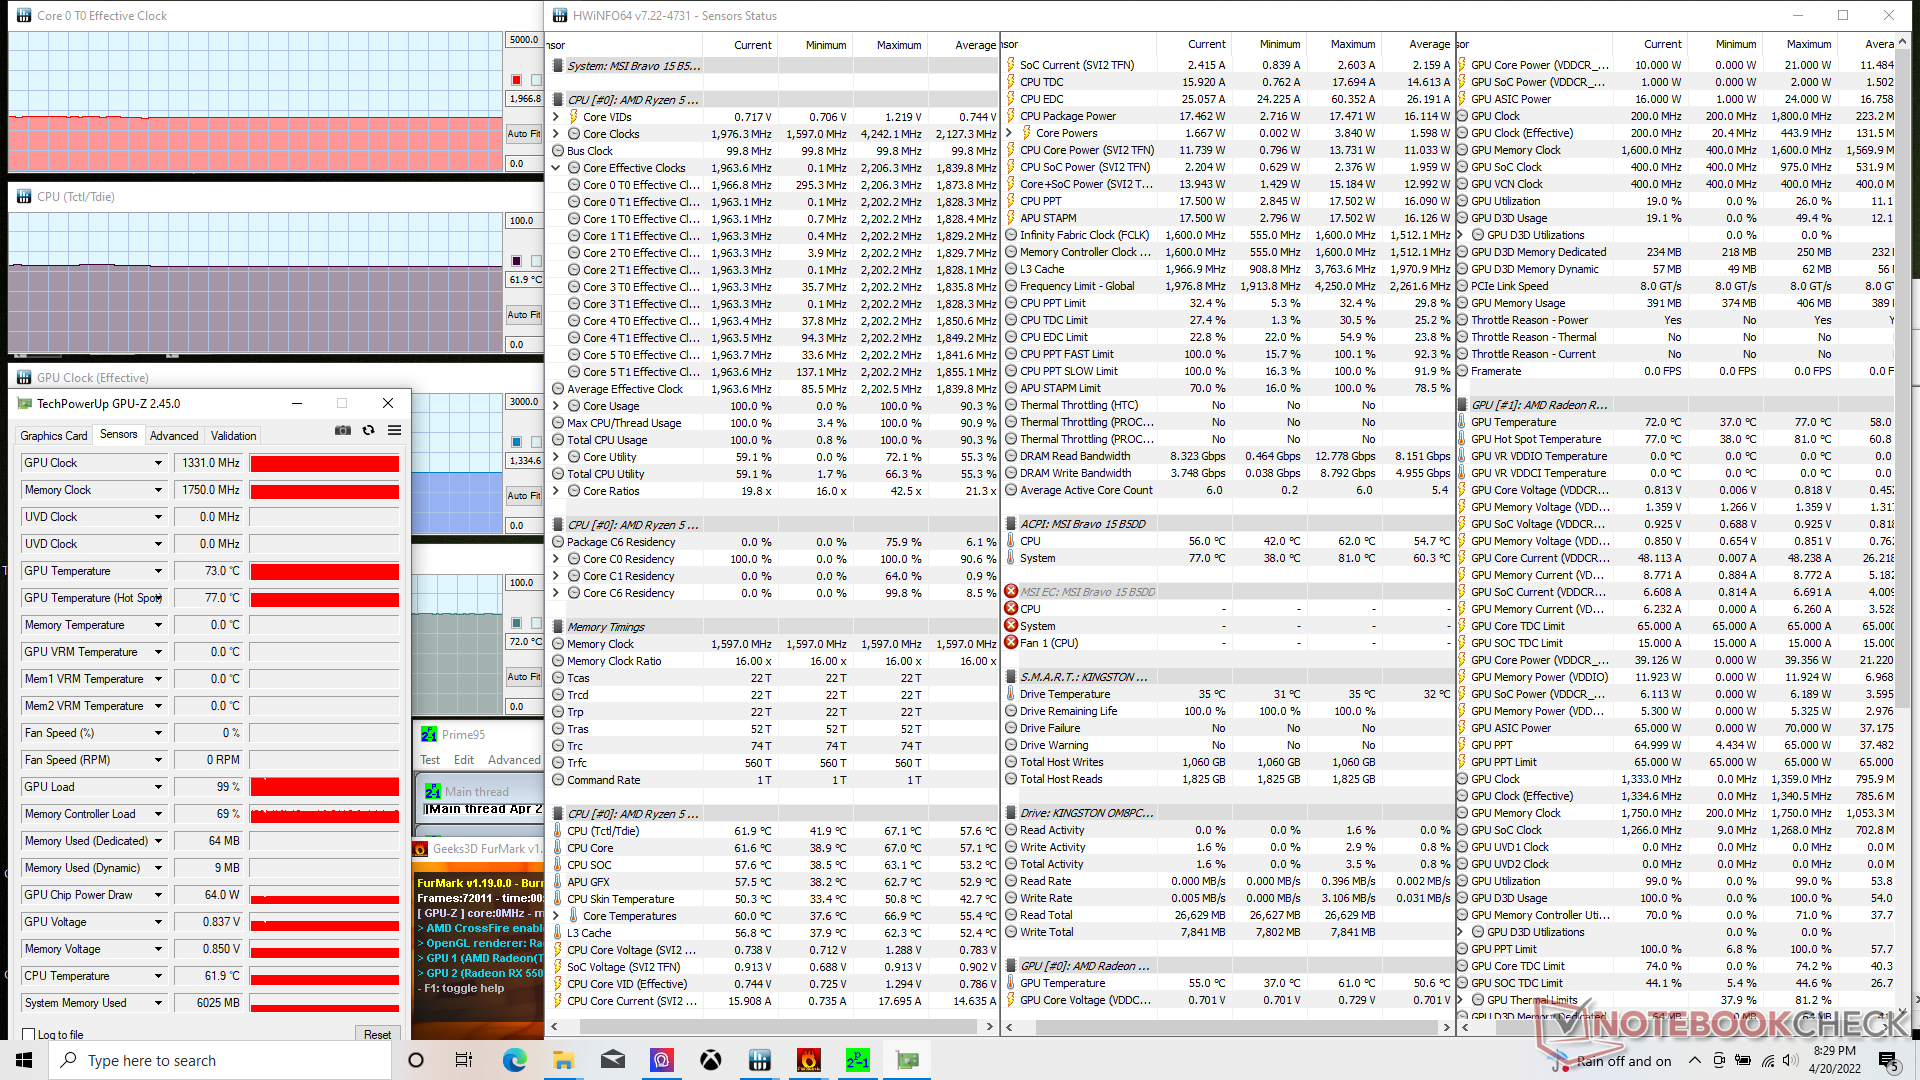
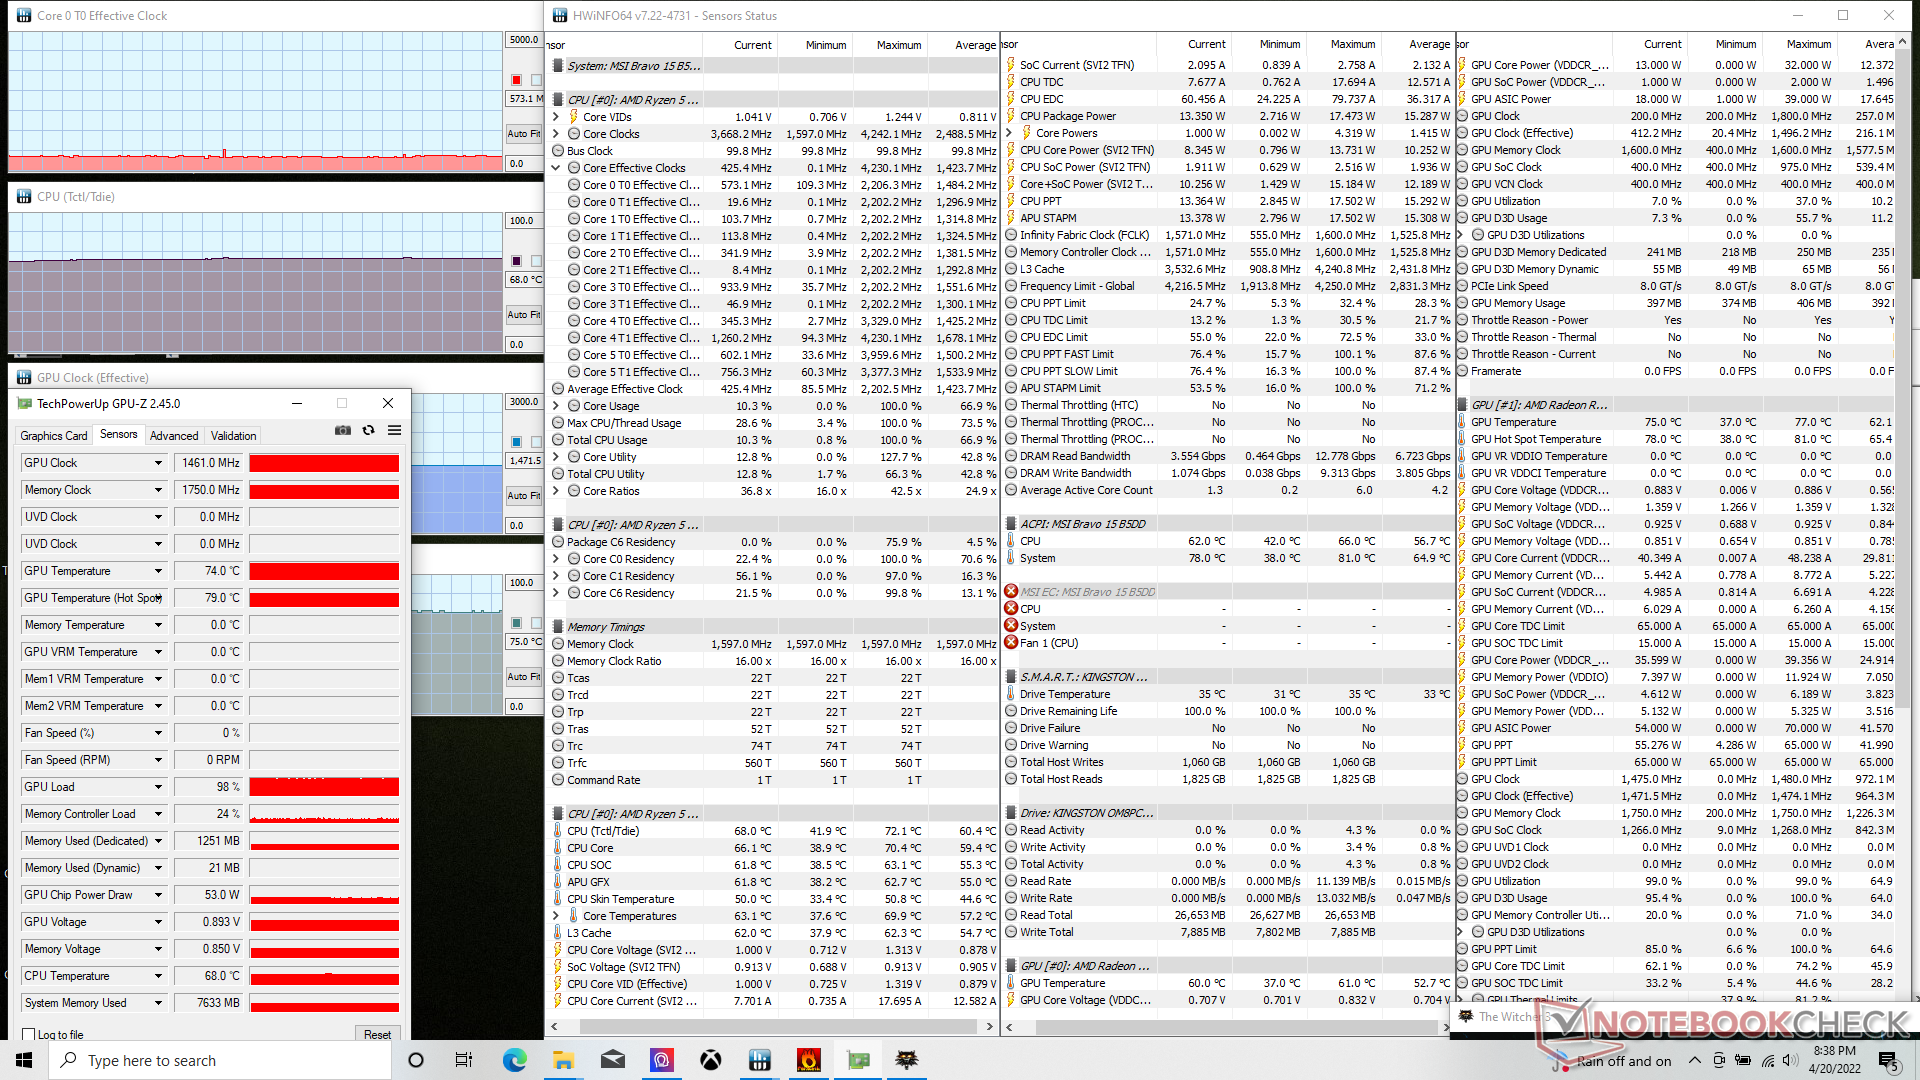
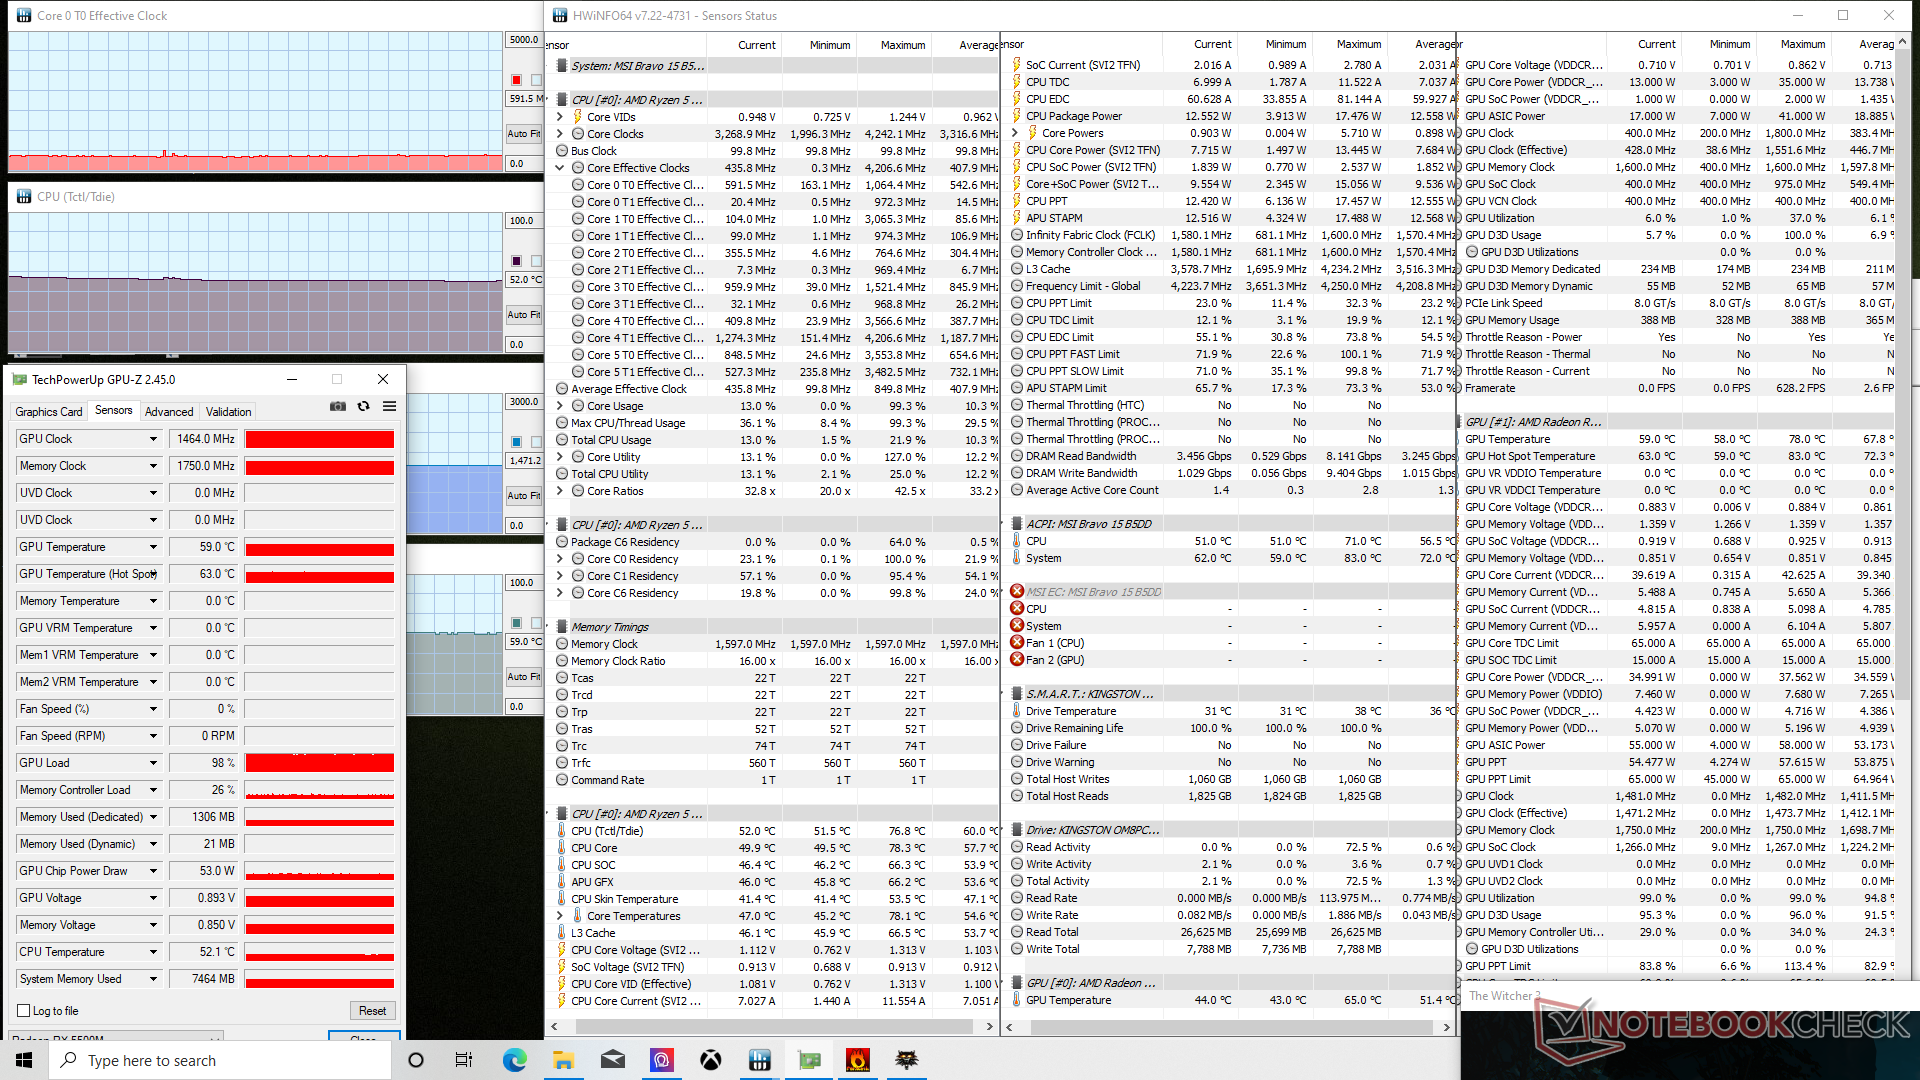
Stress Test
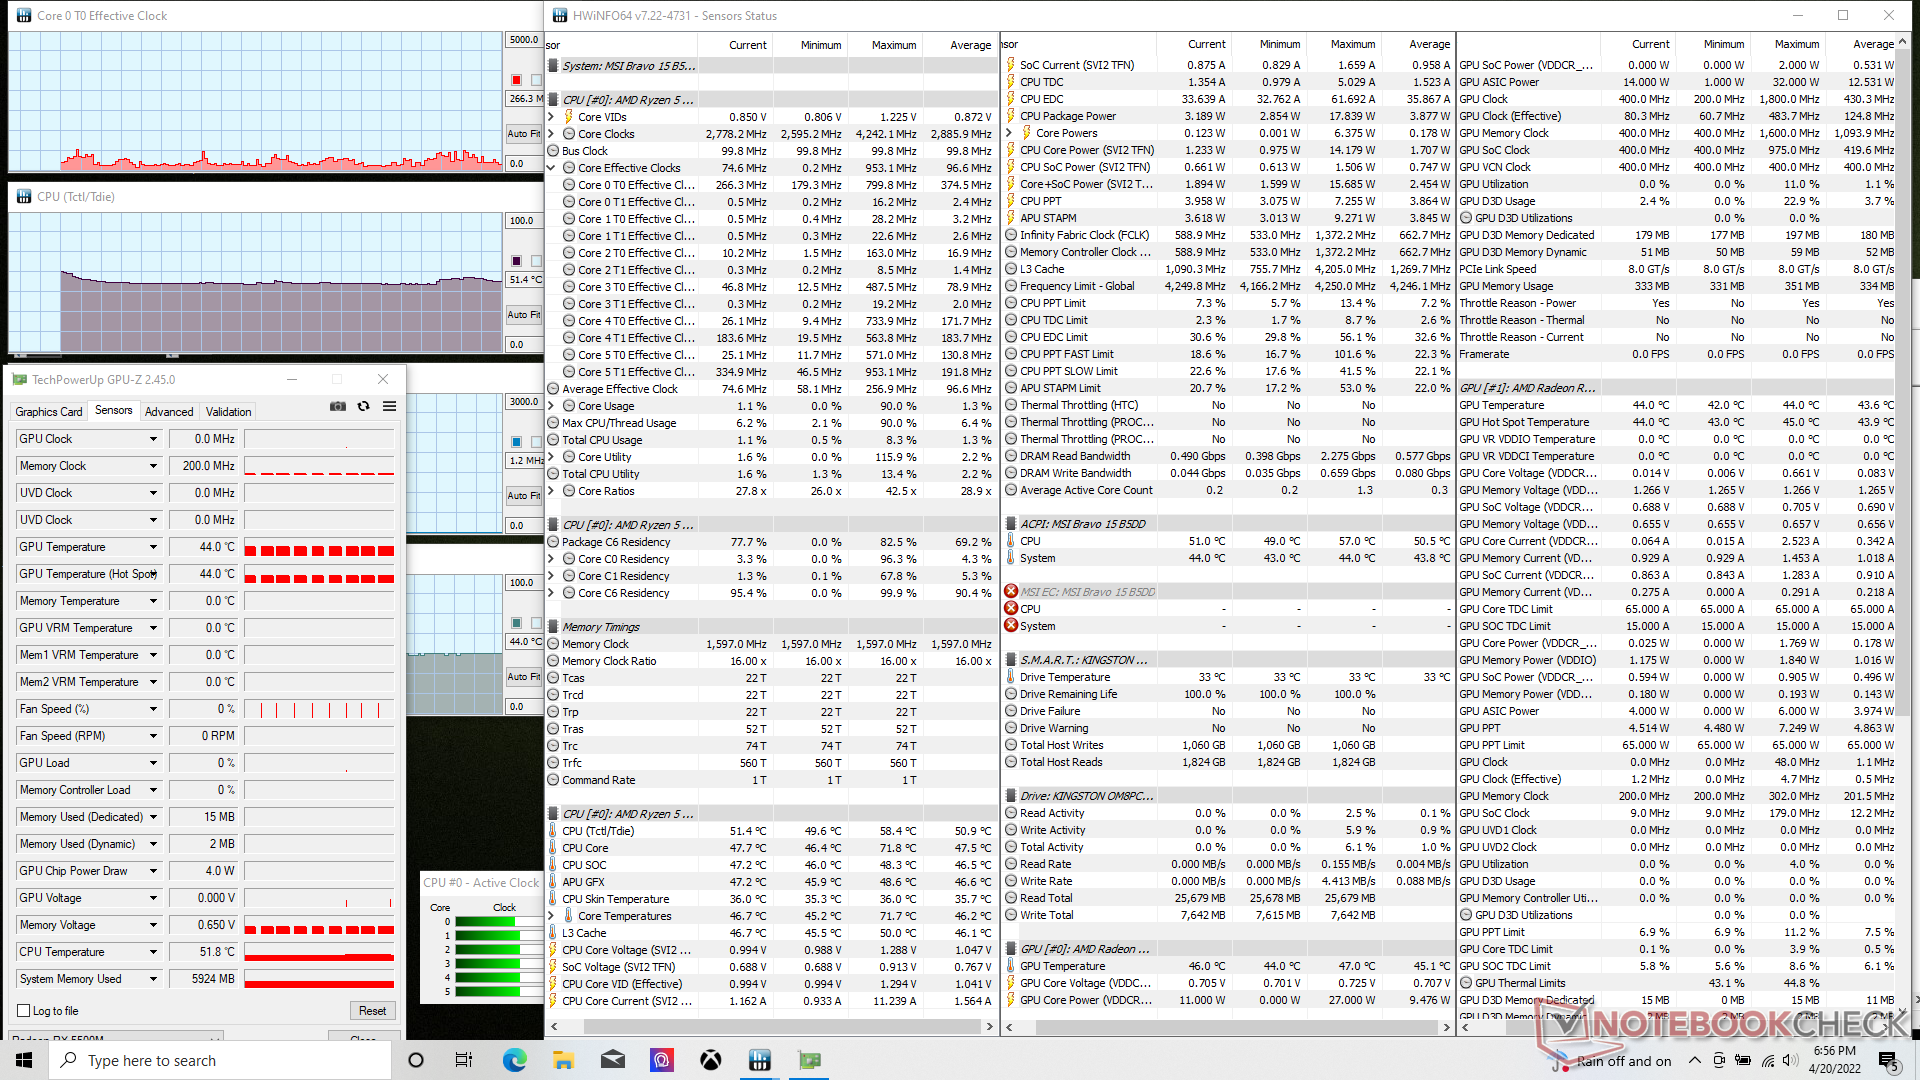
CPU clock rates would stabilize at 2.2 GHz and 56 C when running Prime95 on Extreme Performance mode compared to 3.8 GHz and 95 C on the Ryzen 9-powered Asus ROG Strix Scar 15 G533QS. CPU and GPU temperatures would stabilize at just 68 C and 75 C, respectively, when running Witcher 3. In comparison, the CPU core and GPU in the 2020 Bravo 15 would stabilize at 77 C and 71 C, respectively. The relatively low temperatures even when under heavy loads are common amongst entry-level gaming laptops such as our Bravo 15 series.
Enabling Cooler Boost (or maximum fan mode) would reduce core temperatures without necessarily increasing CPU or GPU performance as shown by our table below which is consistent with what we've observed on other MSI gaming laptops with the same Cooler Boost feature. Since temperatures are already quite low in the first place, the feature can be disabled in most scenarios.
Running on battery power will limit performance. A Fire Strike run on batteries would return Physics and Graphics scores 16804 and 4552 points, respectively, compared to 21220 and 11621 points when on mains.
| CPU Clock (GHz) | GPU Clock (MHz) | Average CPU Temperature Tctl/Tdie (°C) | Average GPU Temperature (°C) | |
| System Idle | -- | -- | 51 | 44 |
| Prime95 Stress | 2.2 | -- | 56 | 42 |
| Prime95 + FurMark Stress | 2.0 | 1331 | 62 | 72 |
| Witcher 3 Stress (Cooler Boost off) | 0.6 | 1461 | 68 | 75 |
| Witcher 3 Stress (Cooler Boost on) | 0.6 | 1464 | 52 | 59 |
Speakers
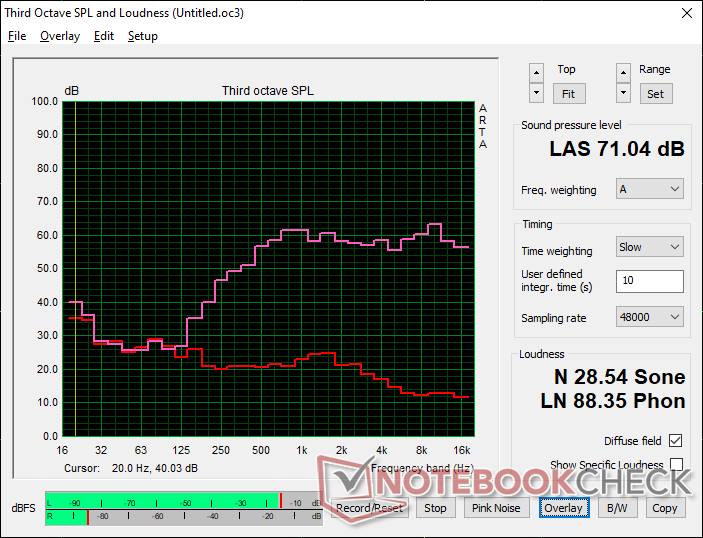
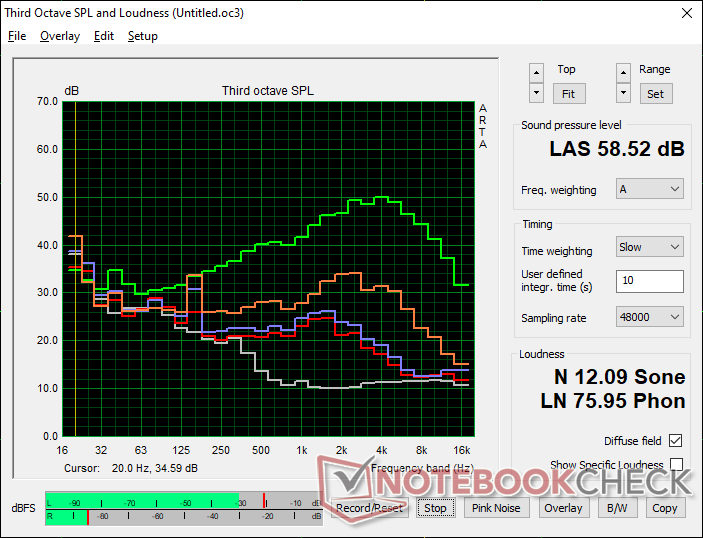
MSI Bravo 15 B5DD-010US audio analysis
(-) | not very loud speakers (71 dB)
Bass 100 - 315 Hz
(-) | nearly no bass - on average 20.2% lower than median
(±) | linearity of bass is average (11.7% delta to prev. frequency)
Mids 400 - 2000 Hz
(+) | balanced mids - only 2.6% away from median
(+) | mids are linear (6.8% delta to prev. frequency)
Highs 2 - 16 kHz
(+) | balanced highs - only 1.9% away from median
(+) | highs are linear (5.1% delta to prev. frequency)
Overall 100 - 16.000 Hz
(±) | linearity of overall sound is average (21.7% difference to median)
Compared to same class
» 78% of all tested devices in this class were better, 5% similar, 17% worse
» The best had a delta of 6%, average was 18%, worst was 132%
Compared to all devices tested
» 62% of all tested devices were better, 7% similar, 31% worse
» The best had a delta of 4%, average was 23%, worst was 134%
Apple MacBook Pro 16 2021 M1 Pro audio analysis
(+) | speakers can play relatively loud (84.7 dB)
Bass 100 - 315 Hz
(+) | good bass - only 3.8% away from median
(+) | bass is linear (5.2% delta to prev. frequency)
Mids 400 - 2000 Hz
(+) | balanced mids - only 1.3% away from median
(+) | mids are linear (2.1% delta to prev. frequency)
Highs 2 - 16 kHz
(+) | balanced highs - only 1.9% away from median
(+) | highs are linear (2.7% delta to prev. frequency)
Overall 100 - 16.000 Hz
(+) | overall sound is linear (4.6% difference to median)
Compared to same class
» 0% of all tested devices in this class were better, 0% similar, 100% worse
» The best had a delta of 5%, average was 17%, worst was 45%
Compared to all devices tested
» 0% of all tested devices were better, 0% similar, 100% worse
» The best had a delta of 4%, average was 23%, worst was 134%
Energy Management
Power Consumption — Good CPU, Bad GPU
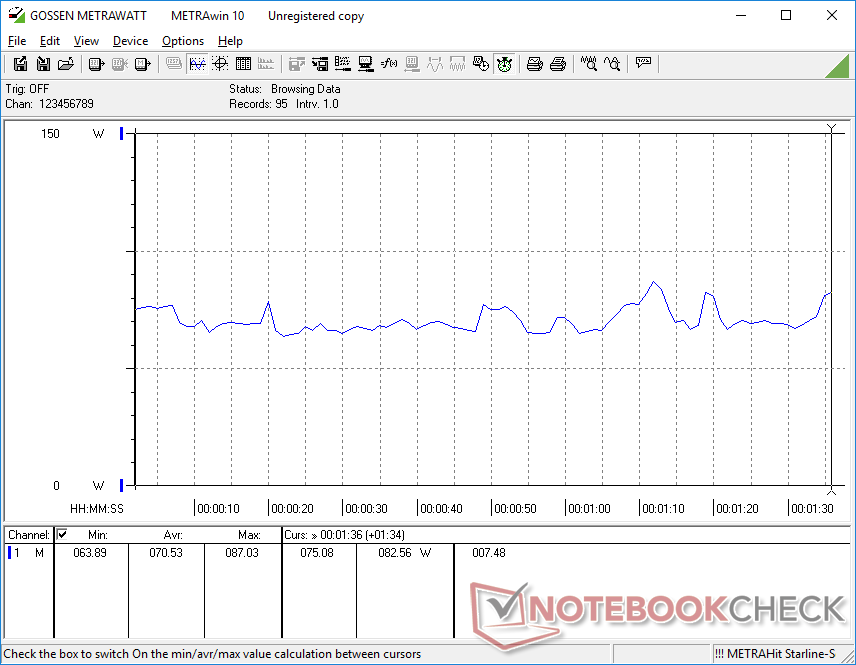
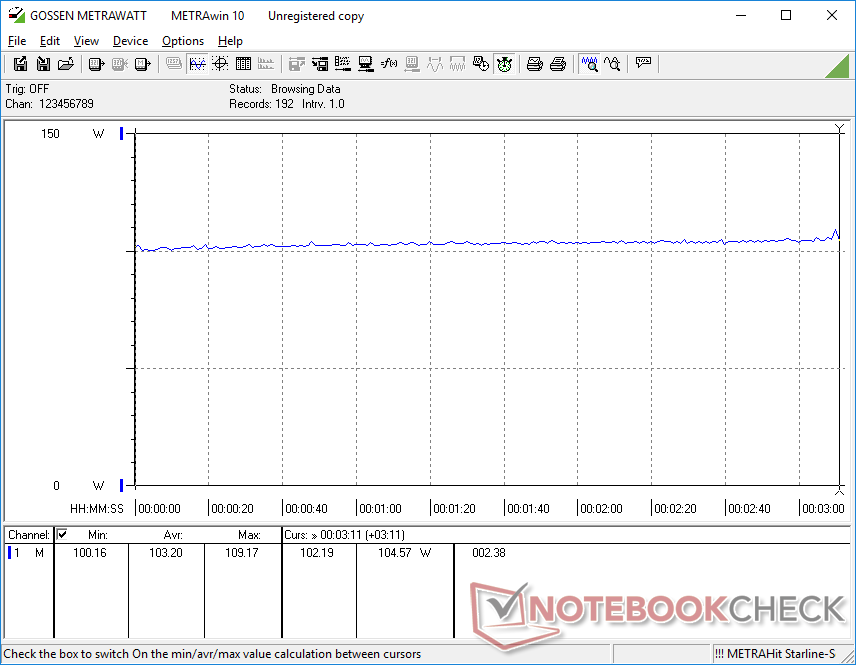
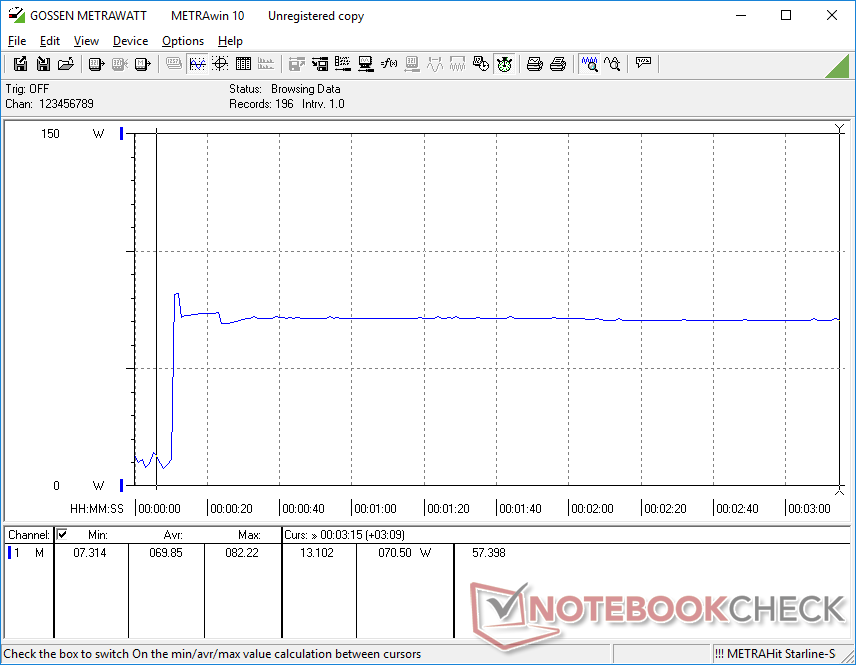
Power consumption when running games or other higher loads is nearly identical to what we recorded on the 2020 Bravo 15 which uses an older generation Ryzen 7 4800H and slower Radeon RX 5300M. Performance-per-watt, however, is a mixed bag. Though our Ryzen 5 5600H CPU can offer 60 percent faster multi-thread performance over the competing Core i5-11300H at a 12 percent lower power draw, our Radeon RX5500M is around 15 to 30 percent slower than the competing GeForce RTX 3050 Ti while consuming 13 percent less power. In short, the AMD CPU has a clear performance-per-watt advantage over Intel while the AMD GPU has a clear disadvantage when compared to the latest GPUs from Nvidia.
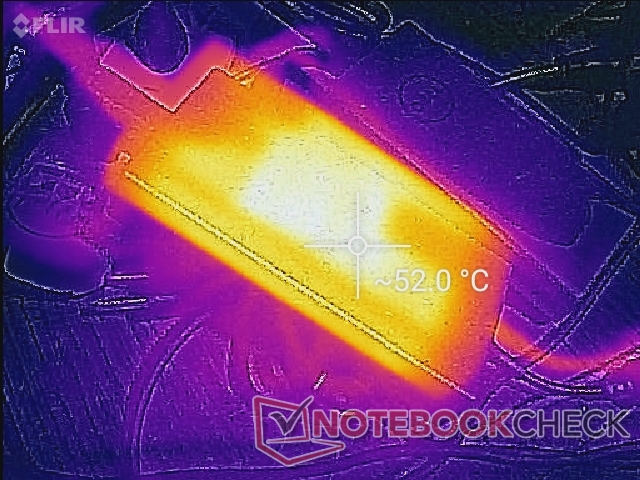
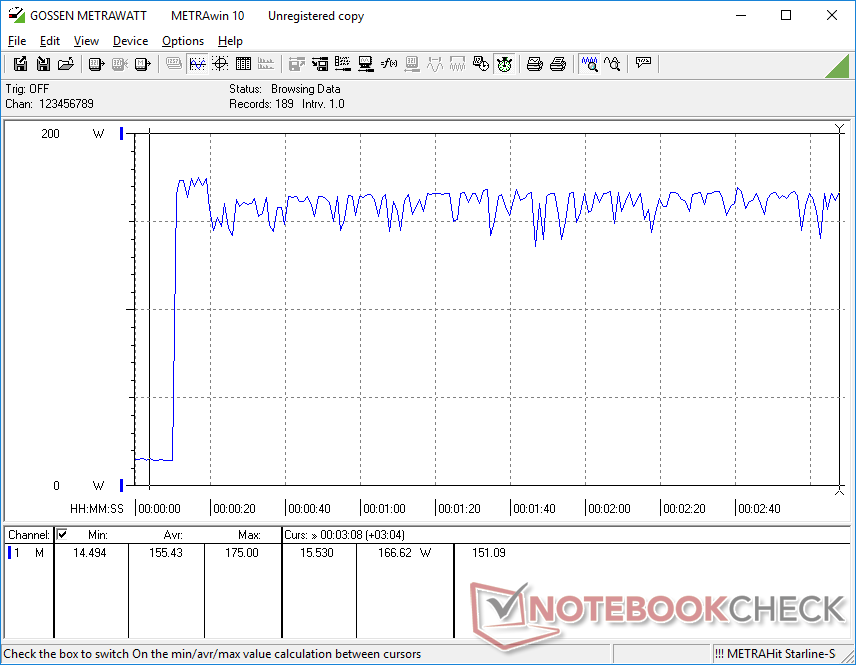
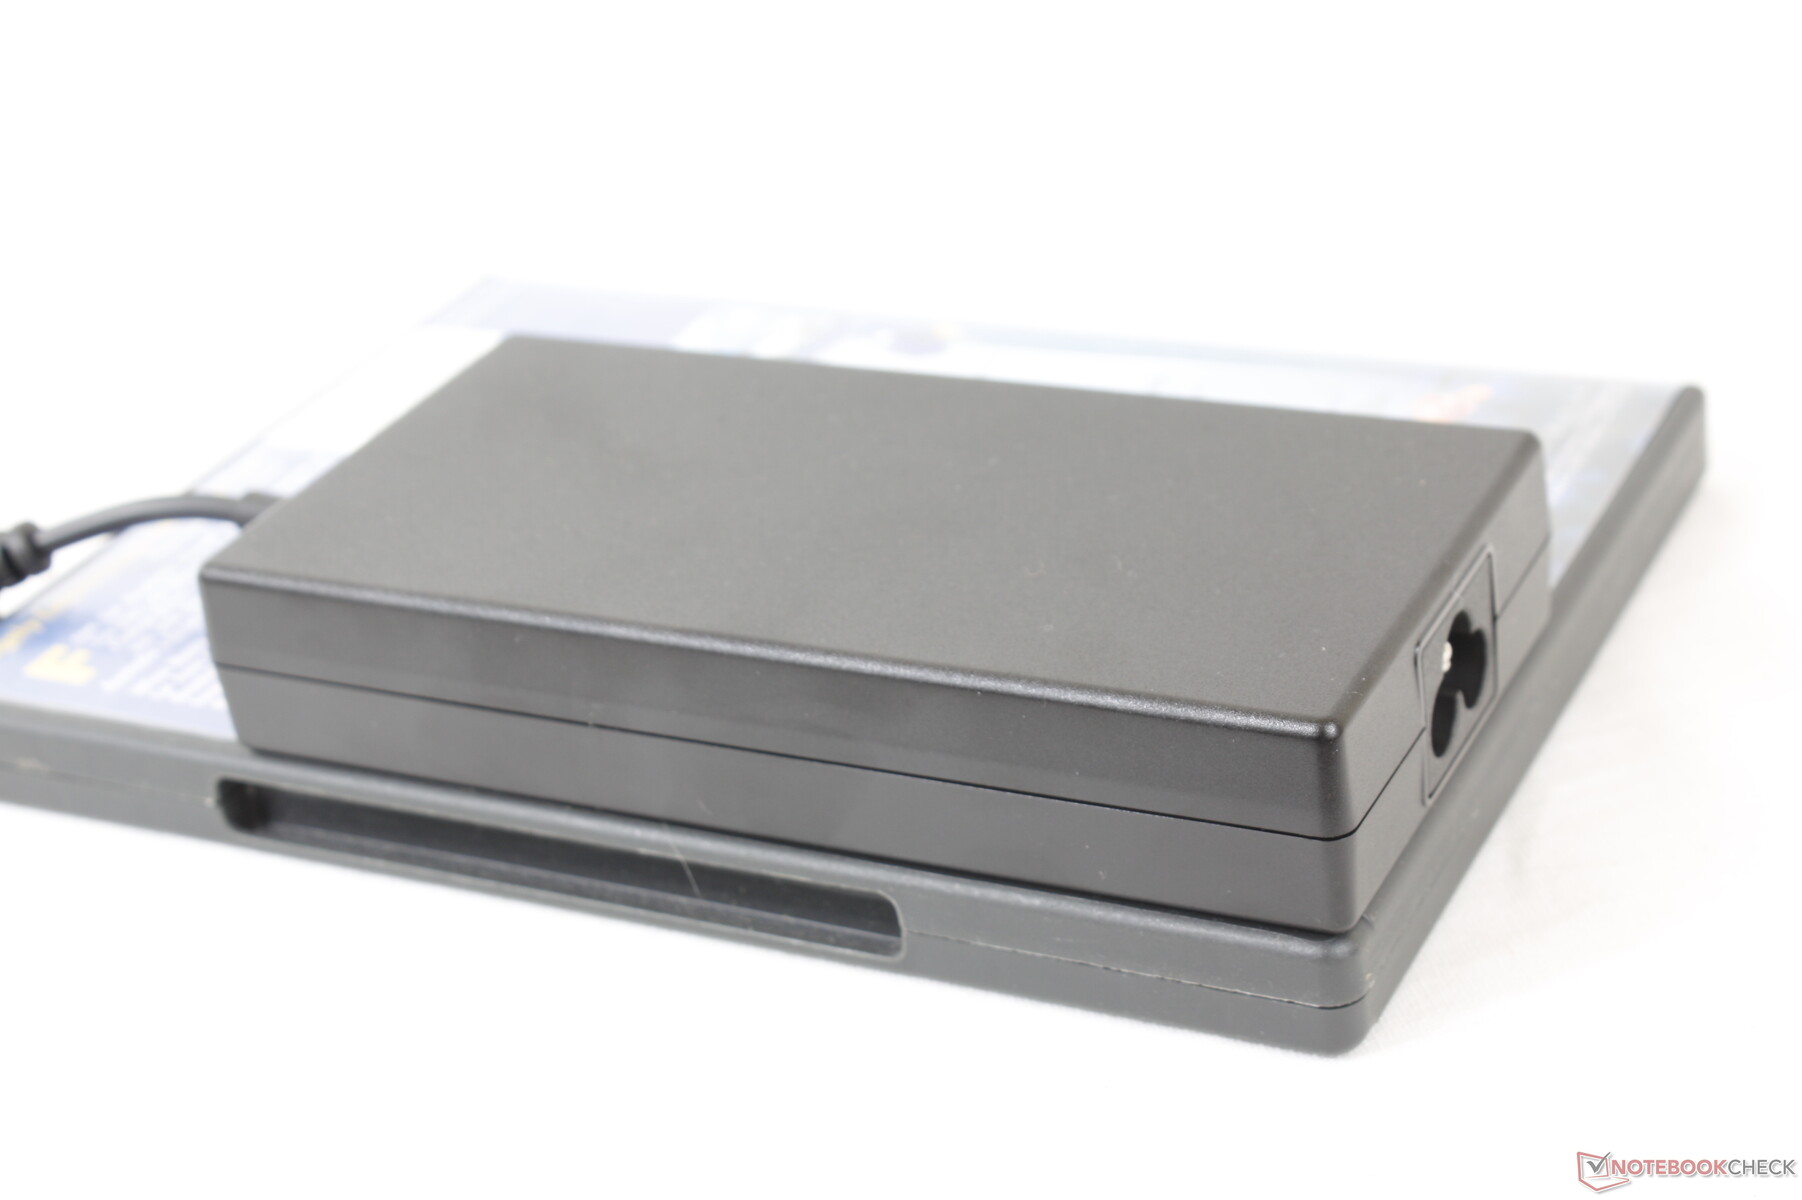
We're able to record a maximum consumption of 175 W from the small-medium (~13.6 x 6.6 x 2.9 cm) 150 W AC adapter when both the CPU and GPU are at 100 percent utilization. Since the system can demand more power than what the AC adapter is rated for, it's possible that the model could have benefited from a higher capacity adapter. Expect the charge rate to slow considerably when running such extreme loads. Thankfully, typical gaming loads will consume around 100 W to be well within the rated output range of the AC adapter.
| Off / Standby | |
| Idle | |
| Load |
|
Key:
min: | |
| MSI Bravo 15 B5DD-010US R5 5600H, Radeon RX 5500M, Kingston OM8PCP3512F-AB, IPS, 1920x1080, 15.6" | MSI Bravo 15 A4DCR R7 4800H, Radeon RX 5300M, Samsung PM981a MZVLB1T0HBLR, IPS-Level, 1920x1080, 15.6" | Asus TUF Gaming F15 FX507ZM i7-12700H, GeForce RTX 3060 Laptop GPU, SK Hynix HFM001TD3JX013N, IPS, 1920x1080, 15.6" | Dell G15 5515 R7 5800H, GeForce RTX 3050 Ti Laptop GPU, Samsung PM991a MZ9LQ512HBLU-00BD1, IPS, 1920x1080, 15.6" | Lenovo Ideapad Gaming 3 15IHU-82K1002RGE i5-11300H, GeForce RTX 3050 Ti Laptop GPU, Micron 2210 MTFDHBA512QFD, IPS, 1920x1080, 15.6" | Asus ROG Zephyrus M15 GU502LU-BI7N4 i7-10750H, GeForce GTX 1660 Ti Mobile, Intel SSD 660p SSDPEKNW512G8, IPS, 1920x1080, 15.6" | |
|---|---|---|---|---|---|---|
| Power Consumption | -39% | -51% | -17% | 5% | -71% | |
| Idle Minimum * (Watt) | 6.6 | 11 -67% | 6.3 5% | 5 24% | 4.9 26% | 10 -52% |
| Idle Average * (Watt) | 9.8 | 14 -43% | 9.8 -0% | 9 8% | 8.3 15% | 16.9 -72% |
| Idle Maximum * (Watt) | 10.8 | 25 -131% | 26.5 -145% | 20 -85% | 8.9 18% | 28.3 -162% |
| Load Average * (Watt) | 70.5 | 72 -2% | 103.8 -47% | 94 -33% | 81 -15% | 122.7 -74% |
| Witcher 3 ultra * (Watt) | 103.2 | 100 3% | 189 -83% | 123 -19% | 119 -15% | 143.2 -39% |
| Load Maximum * (Watt) | 175 | 163 7% | 241.9 -38% | 172 2% | 172 2% | 224.1 -28% |
* ... smaller is better
Power Consumption Witcher 3 / Stresstest
Power Consumption external Monitor
Battery Life — Decent For A Gaming Laptop
Runtimes are up even though battery capacity hasn't changed significantly from last year's Bravo model. We're able to record just over 6 hours of real-world WLAN usage or about 2 hours longer than on the preceding model.
Charging from empty to full capacity is on the slow side at almost 2.5 hours whereas most other laptops take only 1.5 to 2 hours. The model cannot be recharged via USB-C unlike on the costlier MSI GS or GT series.
| MSI Bravo 15 B5DD-010US R5 5600H, Radeon RX 5500M, 53 Wh | MSI Bravo 15 A4DCR R7 4800H, Radeon RX 5300M, 51 Wh | Asus TUF Gaming F15 FX507ZM i7-12700H, GeForce RTX 3060 Laptop GPU, 90 Wh | Dell G15 5515 R7 5800H, GeForce RTX 3050 Ti Laptop GPU, 56 Wh | Lenovo Ideapad Gaming 3 15IHU-82K1002RGE i5-11300H, GeForce RTX 3050 Ti Laptop GPU, 45 Wh | Acer Nitro 5 AN515-45-R1JH R7 5800H, GeForce RTX 3070 Laptop GPU, 57.5 Wh | |
|---|---|---|---|---|---|---|
| Battery runtime | -21% | 19% | 41% | 8% | -3% | |
| Reader / Idle (h) | 9.2 | 7 -24% | 15.8 72% | 13.5 47% | 9.2 0% | |
| WiFi v1.3 (h) | 6.3 | 4.5 -29% | 4.8 -24% | 8 27% | 6.6 5% | 5.7 -10% |
| Load (h) | 1 | 0.9 -10% | 1.1 10% | 1.5 50% | 1.1 10% | 1 0% |
| H.264 (h) | 8.8 | 7.7 | 6.9 |
Pros
Cons
Verdict — The One To Avoid
Paying around $800 USD in 2022 for a gaming laptop that's slower than a GeForce GTX 1060 from 2016 just doesn't sit right. The Zen 3 CPU options may be excellent, but they are paired with such an old Radeon RX 5500M GPU that the system will begin to struggle with newer games sooner than we would like.
The Bravo 15 B5DD is a 2022 gaming laptop with a mid-range GPU from 2016. The fast AMD Ryzen CPU is bottlenecked by the aging Radeon RX 5500M.
As for the rest of the laptop, the manufacturer has actually made some notable downgrades from the 2020 Bravo 15. The newer model now only supports one M.2 SSD instead of two, for example, alongside fewer USB-C ports and no other display options to choose from. The fact that the newer design is heavier and larger than the older one doesn't help, either.
We can at least appreciate the relatively cool running temperatures and good processor performance for the price. For a better gaming experience, however, you're going to get much more bang for the buck from other budget gaming laptops sporting the GeForce RTX 3050 or even GeForce GTX 1660 Ti instead.
Price and Availability
MSI Bravo 15 B5DD-010US
- 04/23/2022 v7 (old)
Allen Ngo
Price comparison
