The Intel Core i7-12800HX is insane: MSI Raider GE67 HX 12UGS laptop review
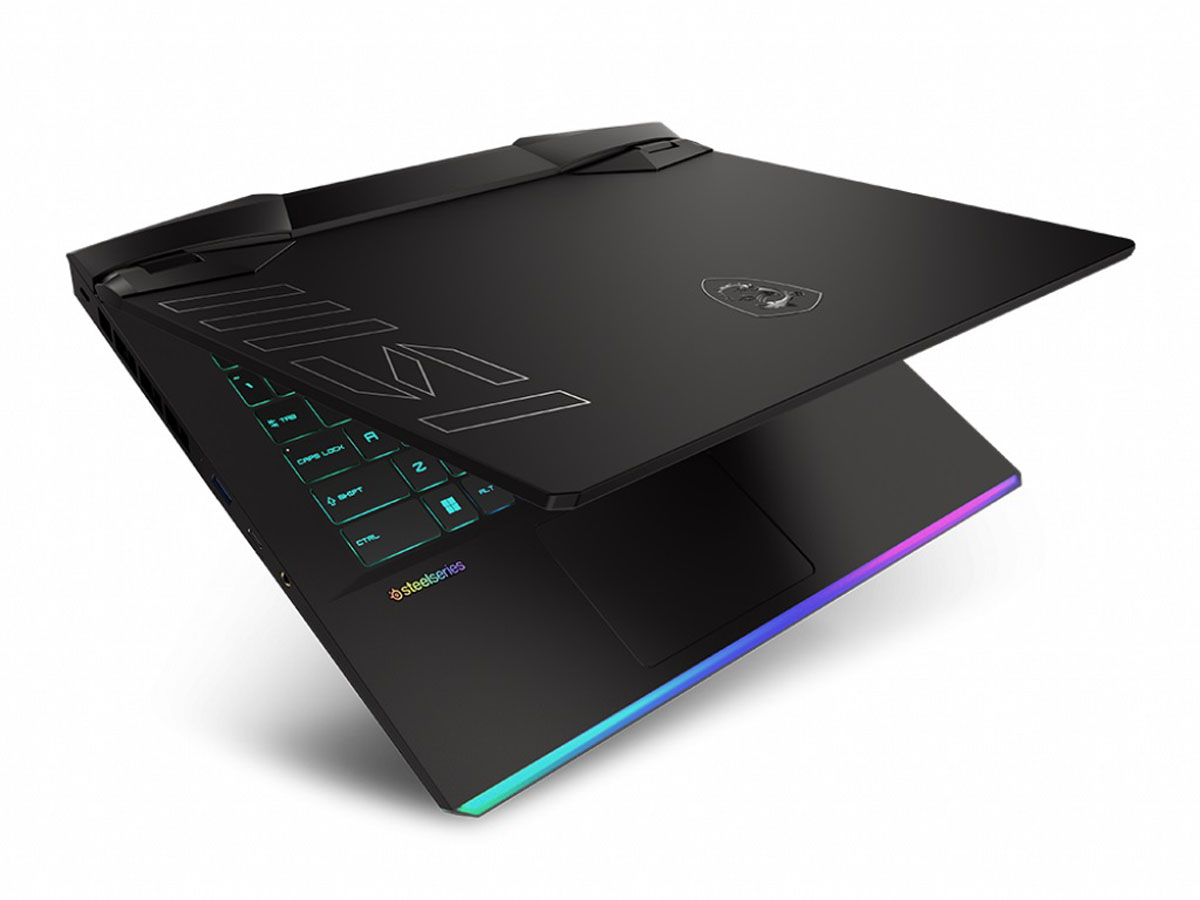
The MSI GE67 is a high-end gaming series that sits above the less expensive Katana GF or Vector GP series but below the enthusiast Titan GT series. Our GE67 test unit is a direct successor to the 2020 GE66. Instead of shipping with Intel 10th gen Comet Lake-H CPUs and Nvidia GeForce Super GPUs, the GE67 comes with 12th gen Alder Lake-H CPUs and mobile GeForce Ti GPUs.
We recommend checking out our existing two reviews on the GE66 as the GE67 utilizes mostly the same chassis design and features. There are nonetheless some relatively minor visual differences that we will detail in our review below.
Our test unit comes equipped with the 16-core Core i7-12800HX CPU, GeForce RTX 3070 Ti GPU, and 240 Hz QHD OLED panel promising full DCI-P3 coverage for approximately $2500 USD retail. Direct competitors in this space include other high-end 15.6-inch gaming laptops like the Asus ROG Strix Scar 15, Razer Blade 15, or Alienware m15 R6.
More MSI reviews:
Potential Competitors in Comparison
Rating | Date | Model | Weight | Height | Size | Resolution | Price |
|---|---|---|---|---|---|---|---|
| 87.7 % v7 (old) | 07 / 2022 | MSI GE67 HX 12UGS i7-12800HX, GeForce RTX 3070 Ti Laptop GPU | 2.5 kg | 23.4 mm | 15.60" | 1920x1080 | |
| 87.4 % v7 (old) | 06 / 2022 | MSI Raider GE66 12UHS i9-12900HK, GeForce RTX 3080 Ti Laptop GPU | 2.4 kg | 23.4 mm | 15.60" | 3840x2160 | |
| 86.9 % v7 (old) | 03 / 2022 | MSI Vector GP66 12UGS i9-12900H, GeForce RTX 3070 Ti Laptop GPU | 2.3 kg | 23.4 mm | 15.60" | 1920x1080 | |
| 86.3 % v7 (old) | 05 / 2022 | Asus ROG Strix Scar 15 G533ZW-LN106WS i9-12900H, GeForce RTX 3070 Ti Laptop GPU | 2.3 kg | 27.2 mm | 15.60" | 2560x1440 | |
| 86.1 % v7 (old) | 11 / 2021 | Alienware m15 R6, i7-11800H RTX 3080 i7-11800H, GeForce RTX 3080 Laptop GPU | 2.5 kg | 22.85 mm | 15.60" | 1920x1080 | |
| 89.1 % v7 (old) | 03 / 2022 | Razer Blade 15 2022 i7-12800H, GeForce RTX 3080 Ti Laptop GPU | 2.1 kg | 16.99 mm | 15.60" | 2560x1440 |
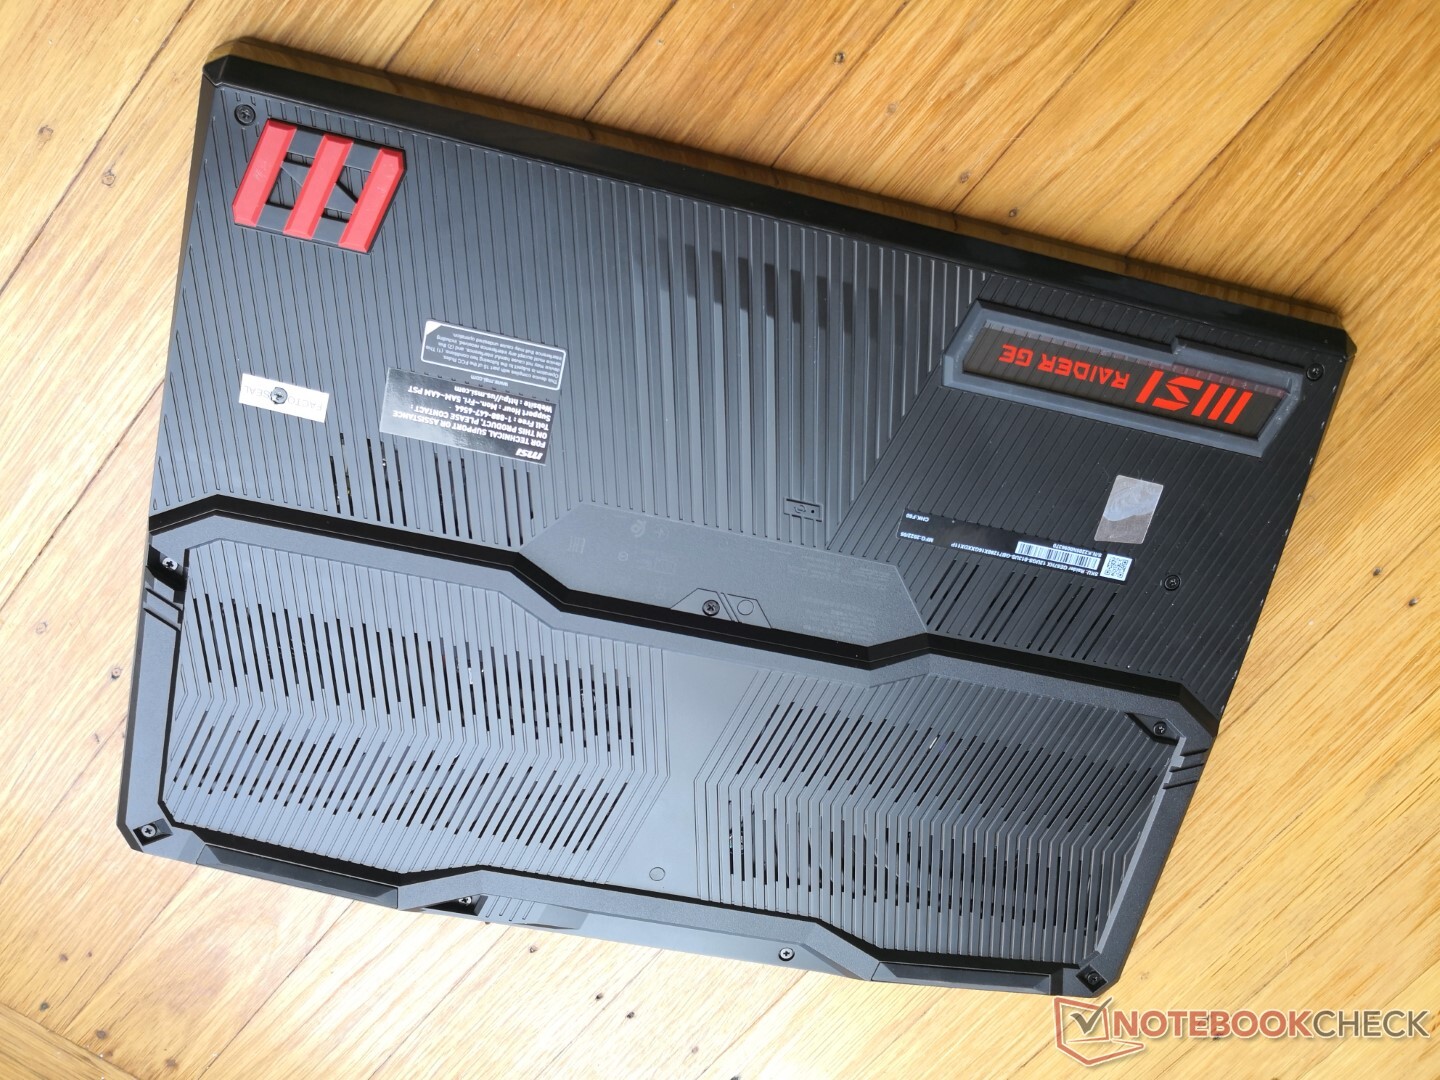
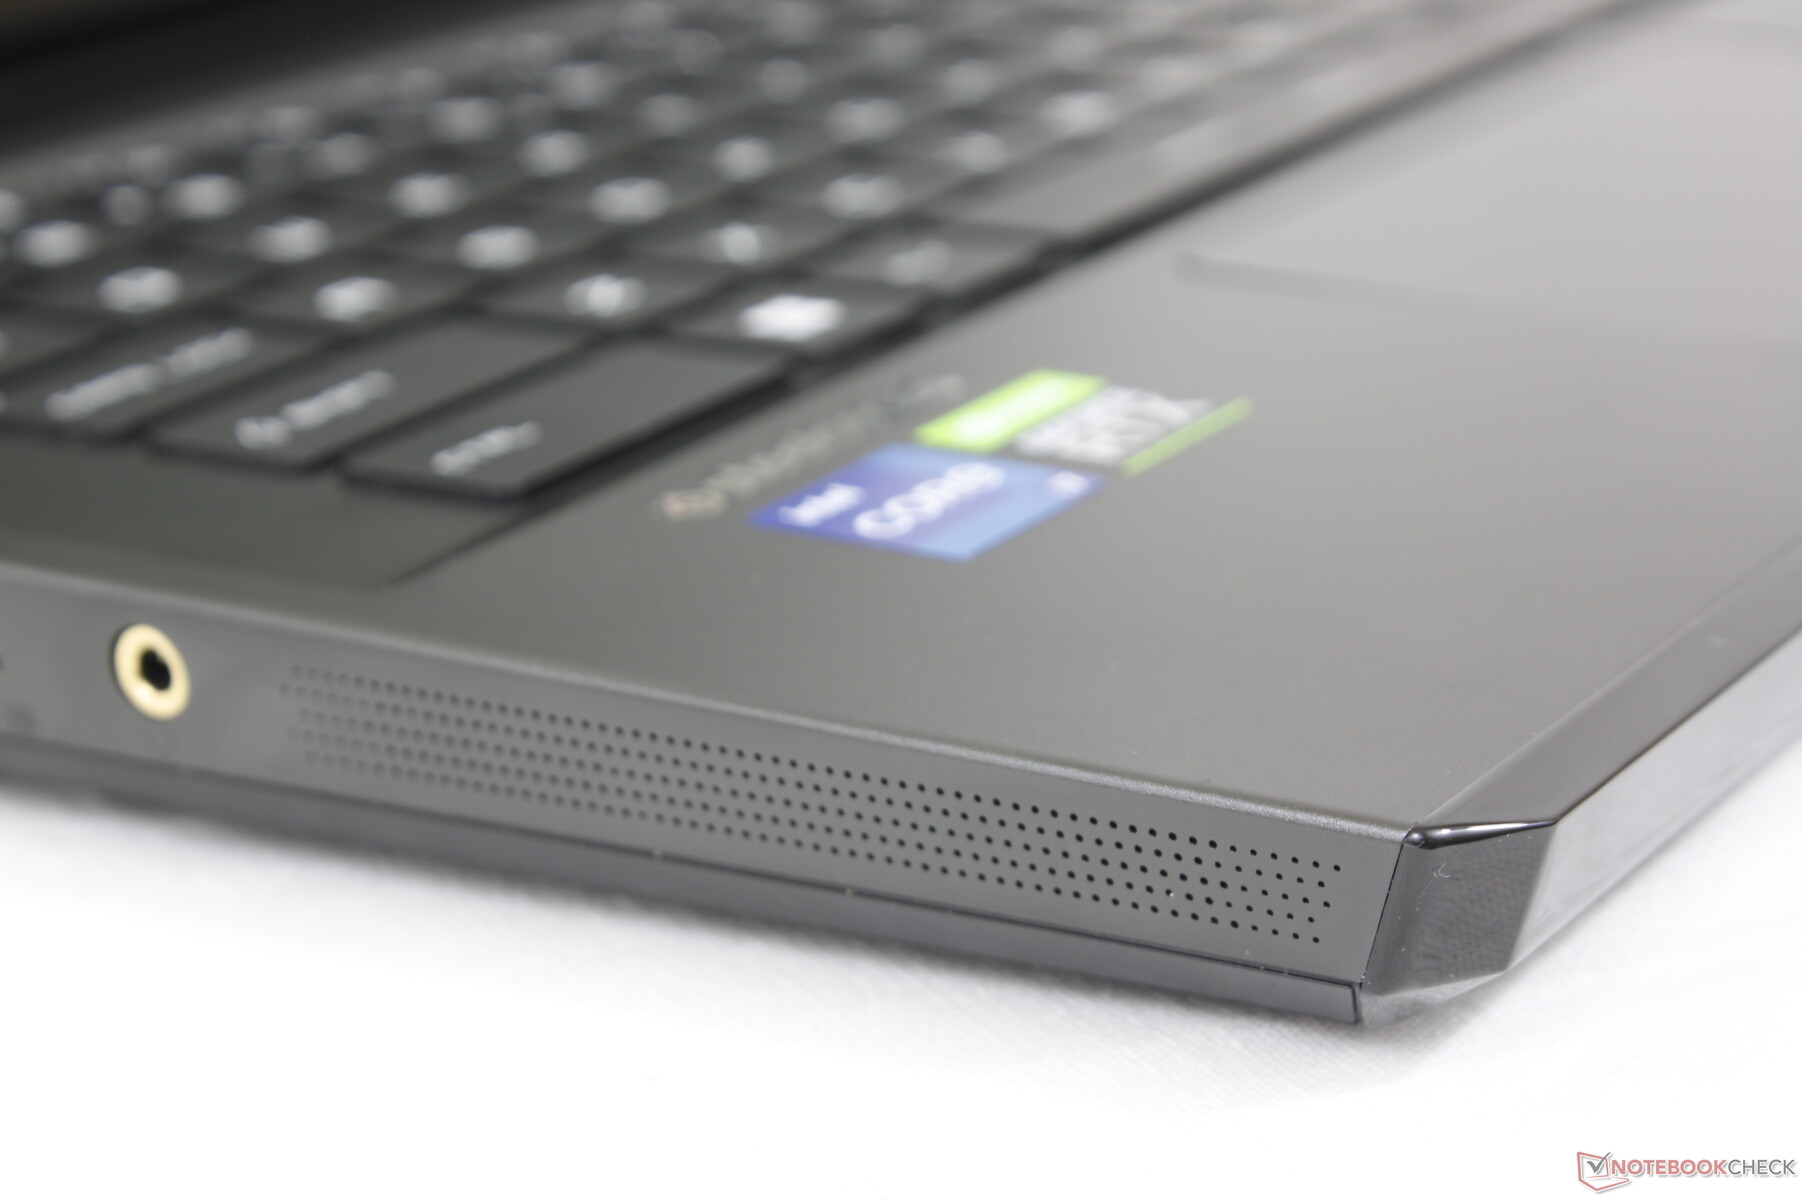
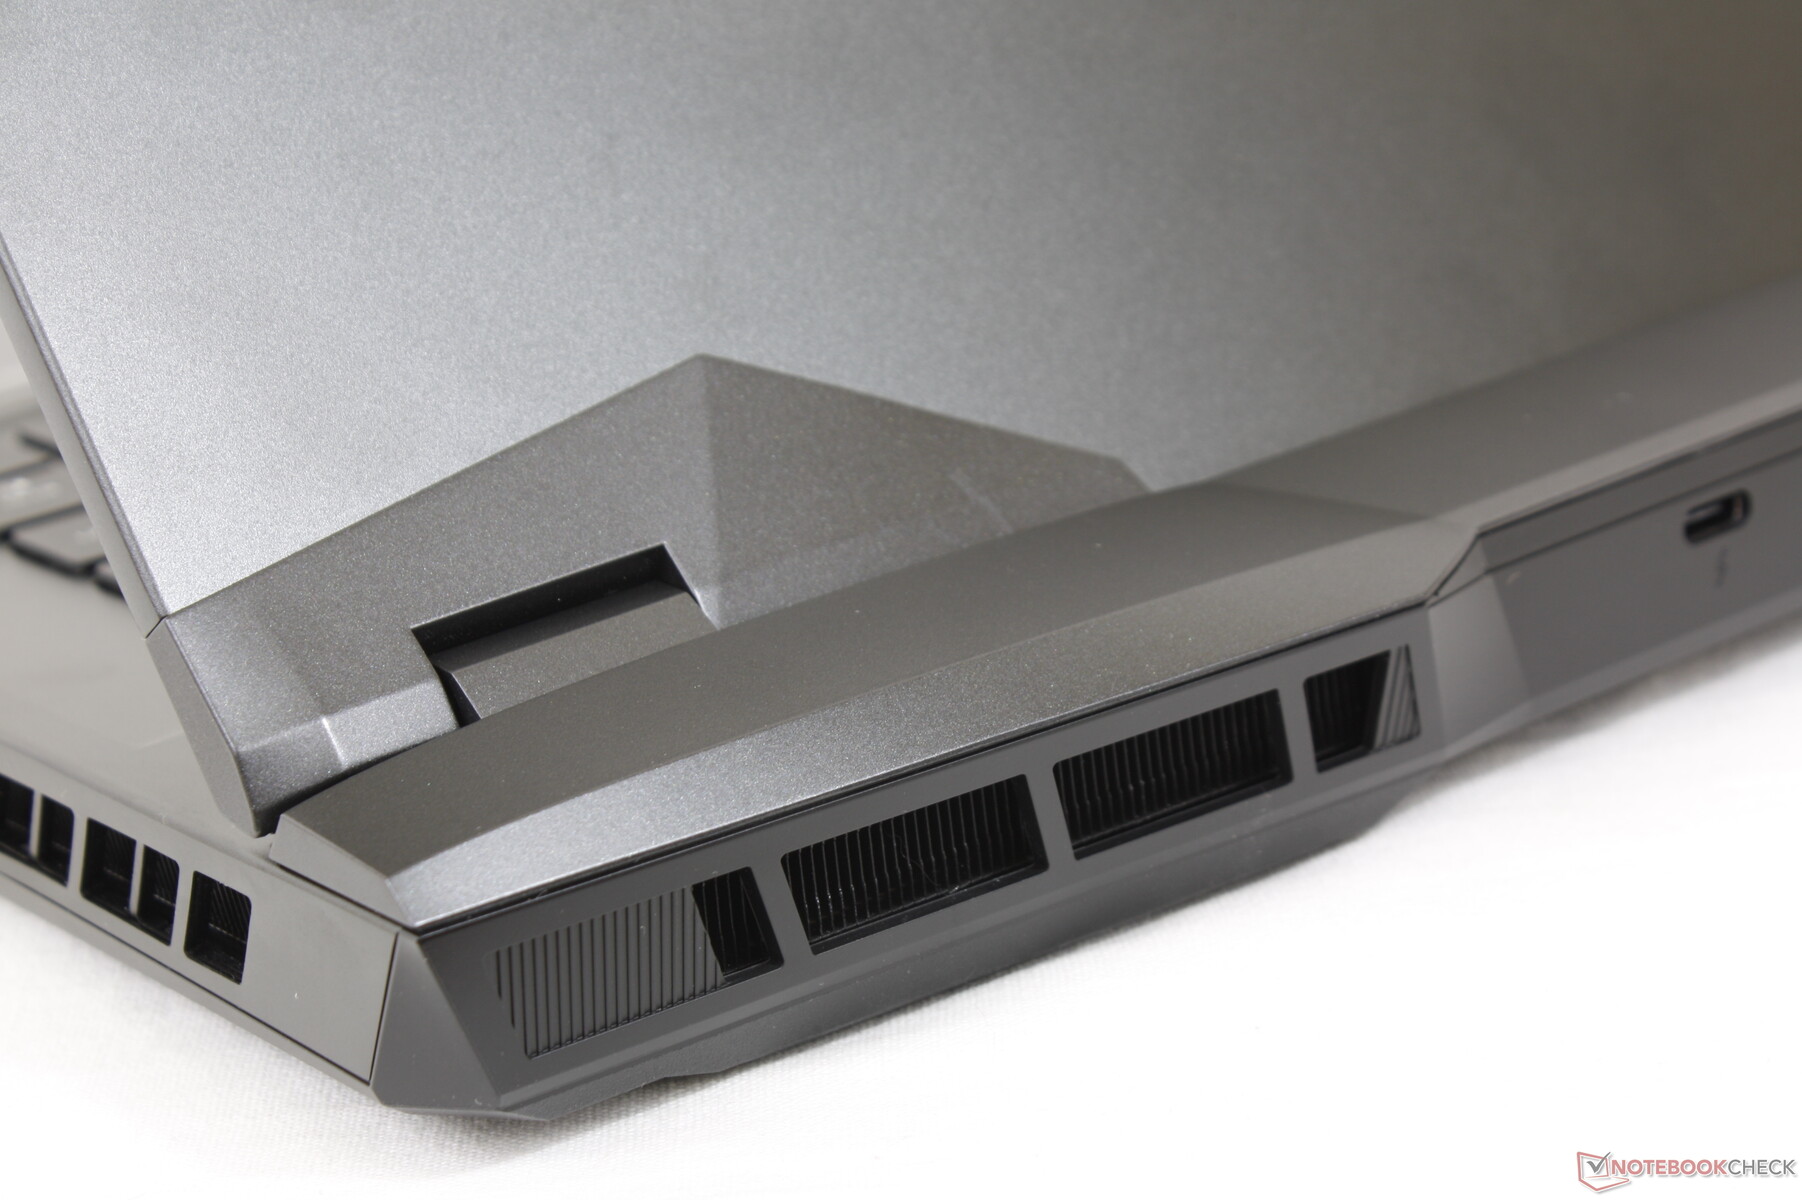
Case — Same On Top, Different On Bottom
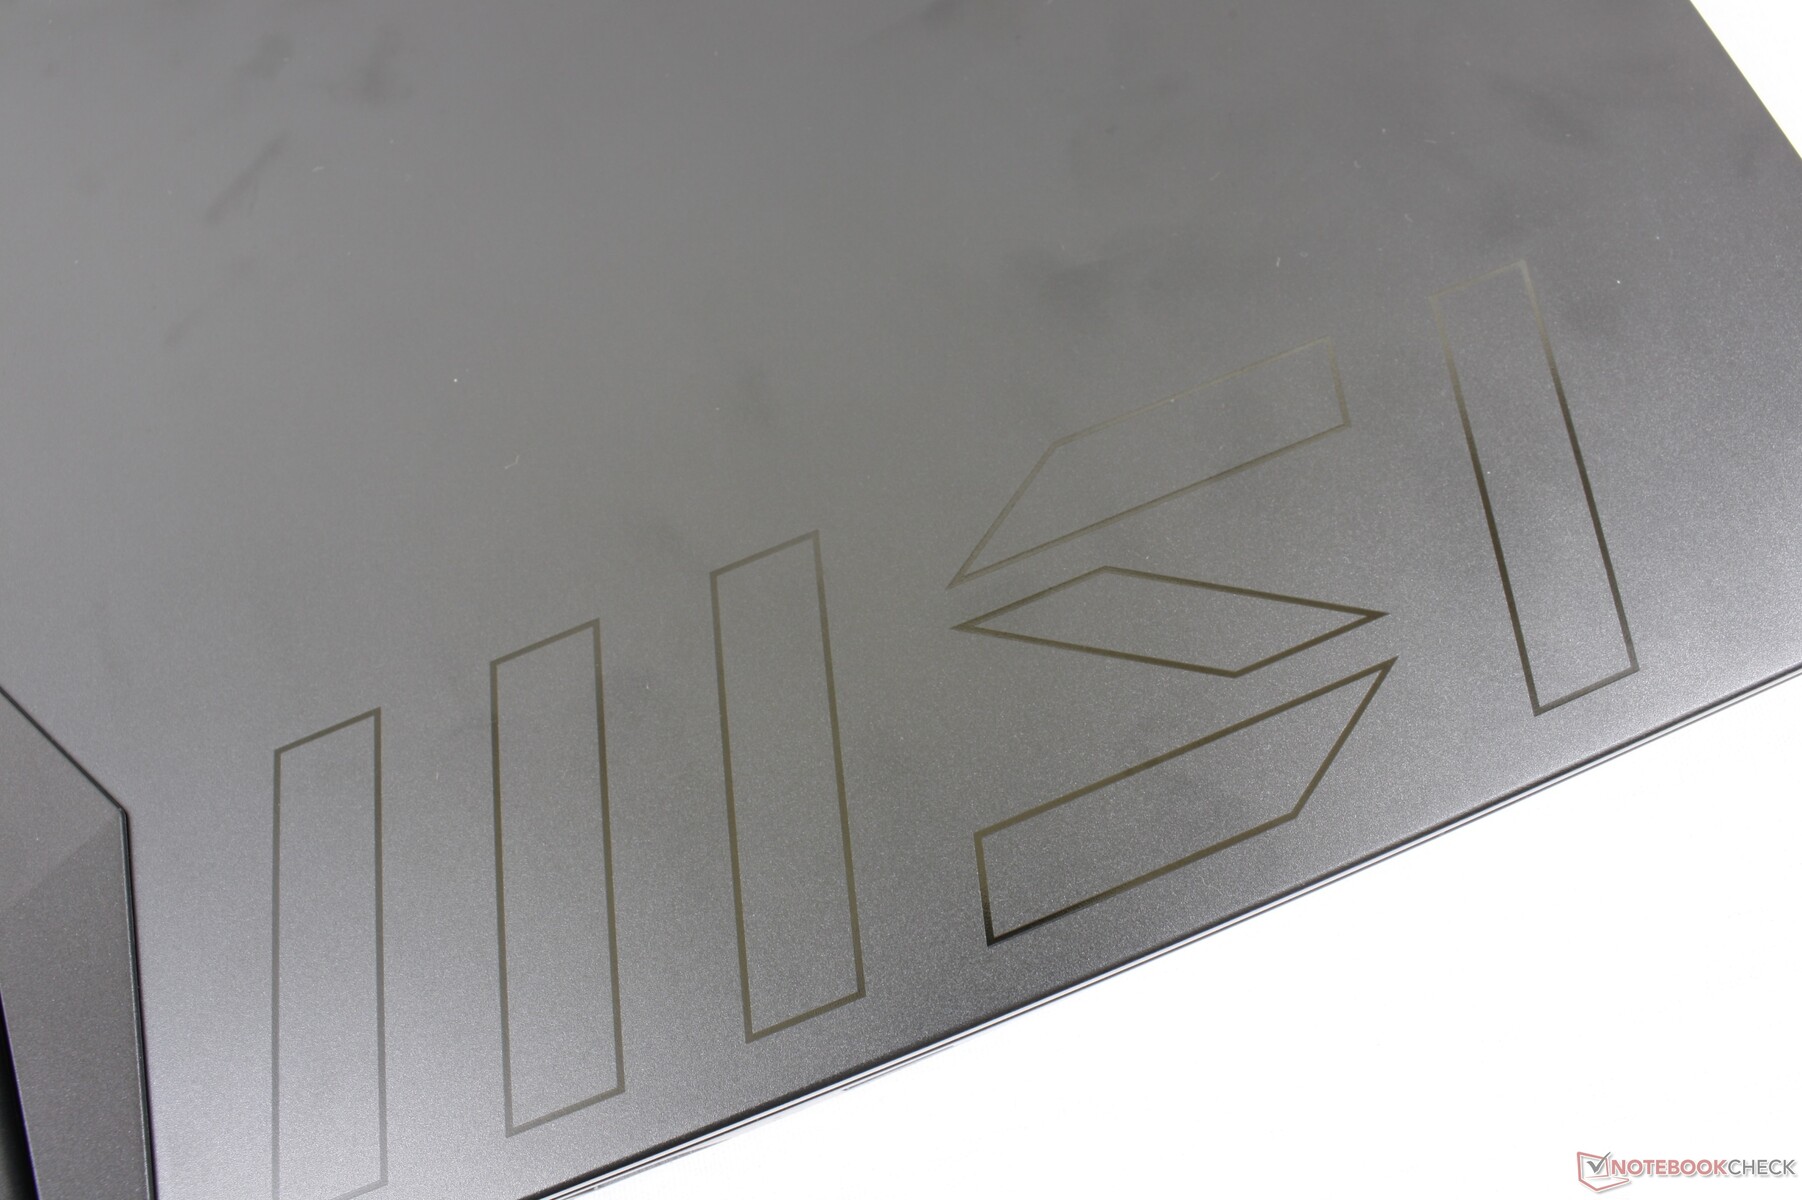
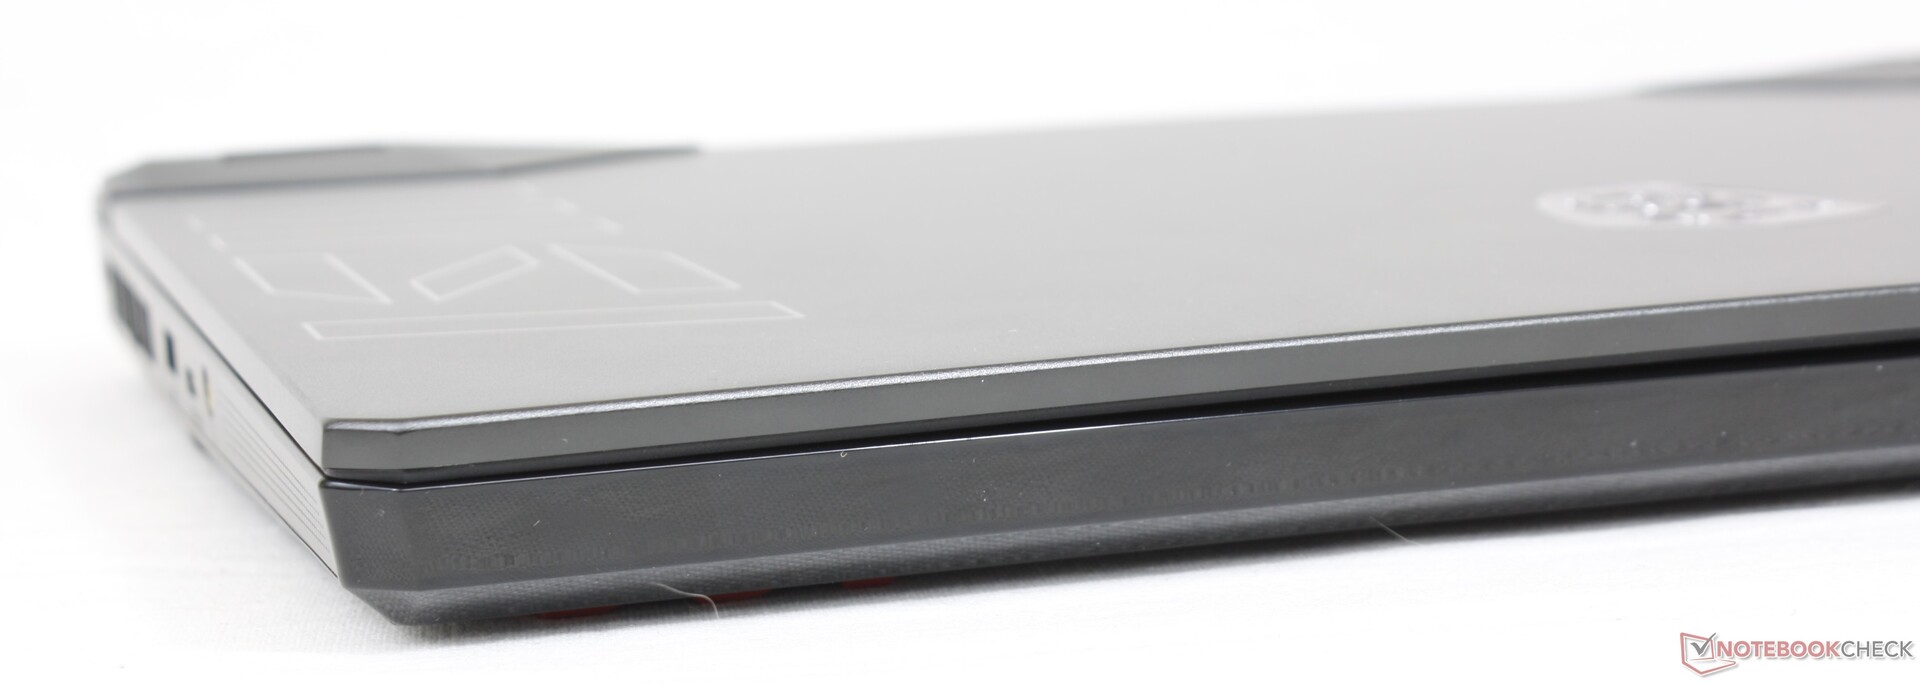
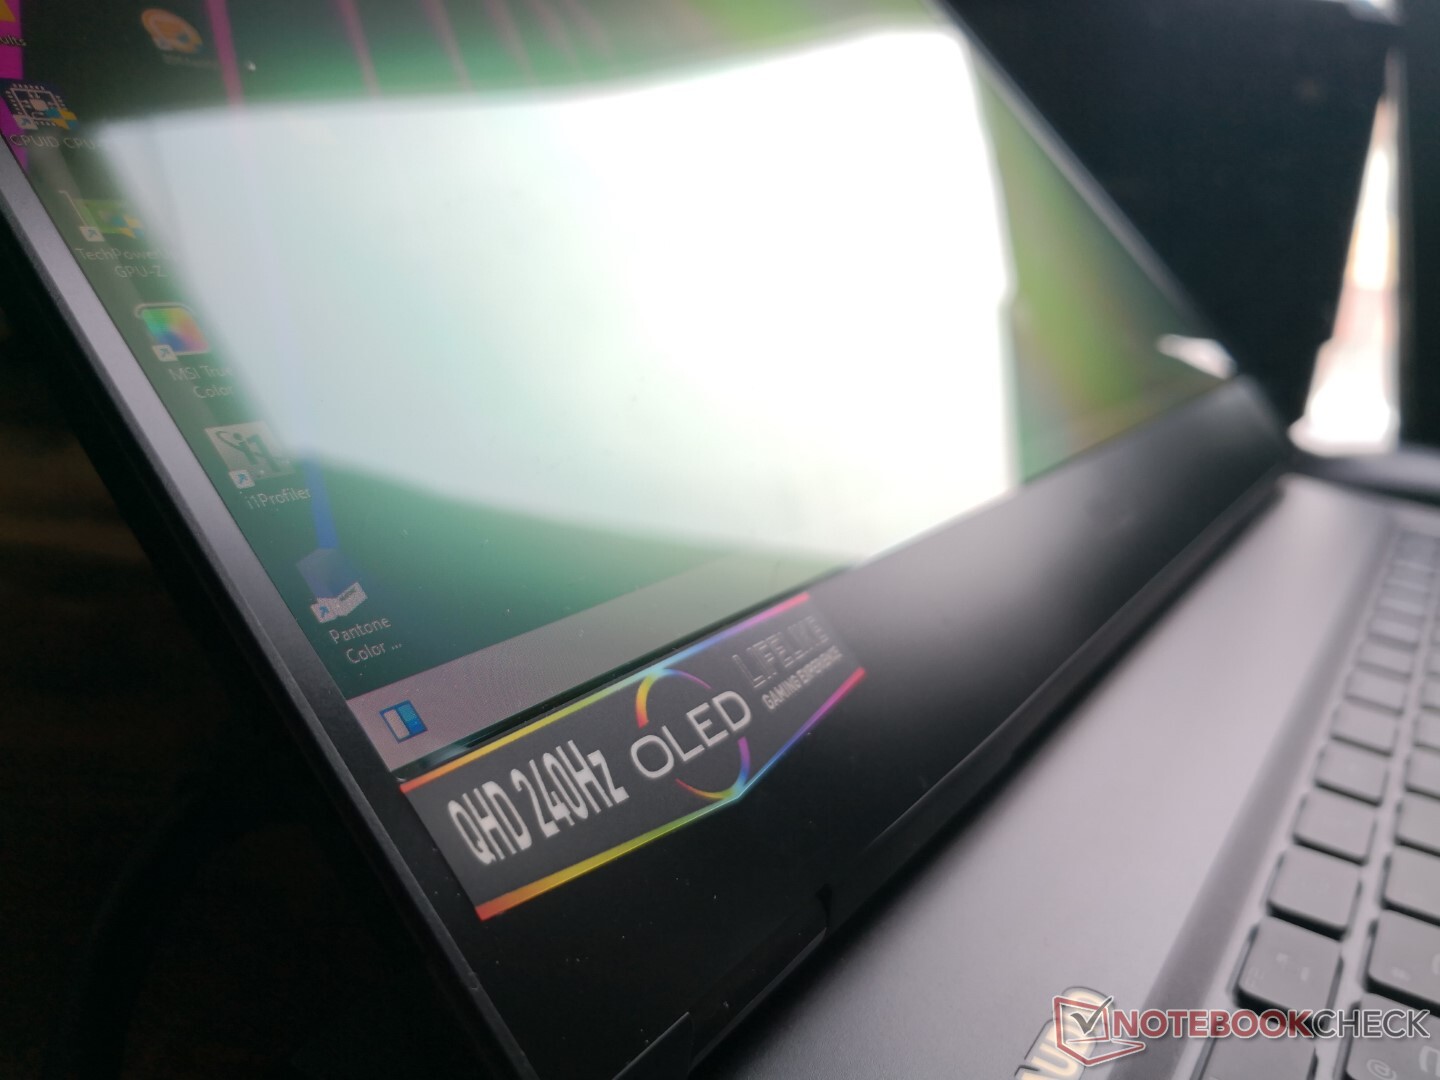
While chassis dimensions are exactly the same as they were on the GE66, there are a number of visual differences. Firstly, the GE67 includes a large MSI logo along the left edge of the outer lid which helps to more easily distinguish between the GE66 and GE67. Secondly, MSI has completely redesigned the bottom side of the GE67 likely to improve upon the overall cooling potential of the model. Otherwise, both the GE66 and GE67 utilize similar metal materials for the lid and keyboard deck and plastic for the bottom plate. The signature LED bar along the front edge remains unscathed.
The new model is slightly heavier than its predecessor by about 100 g likely because of the minor changes.
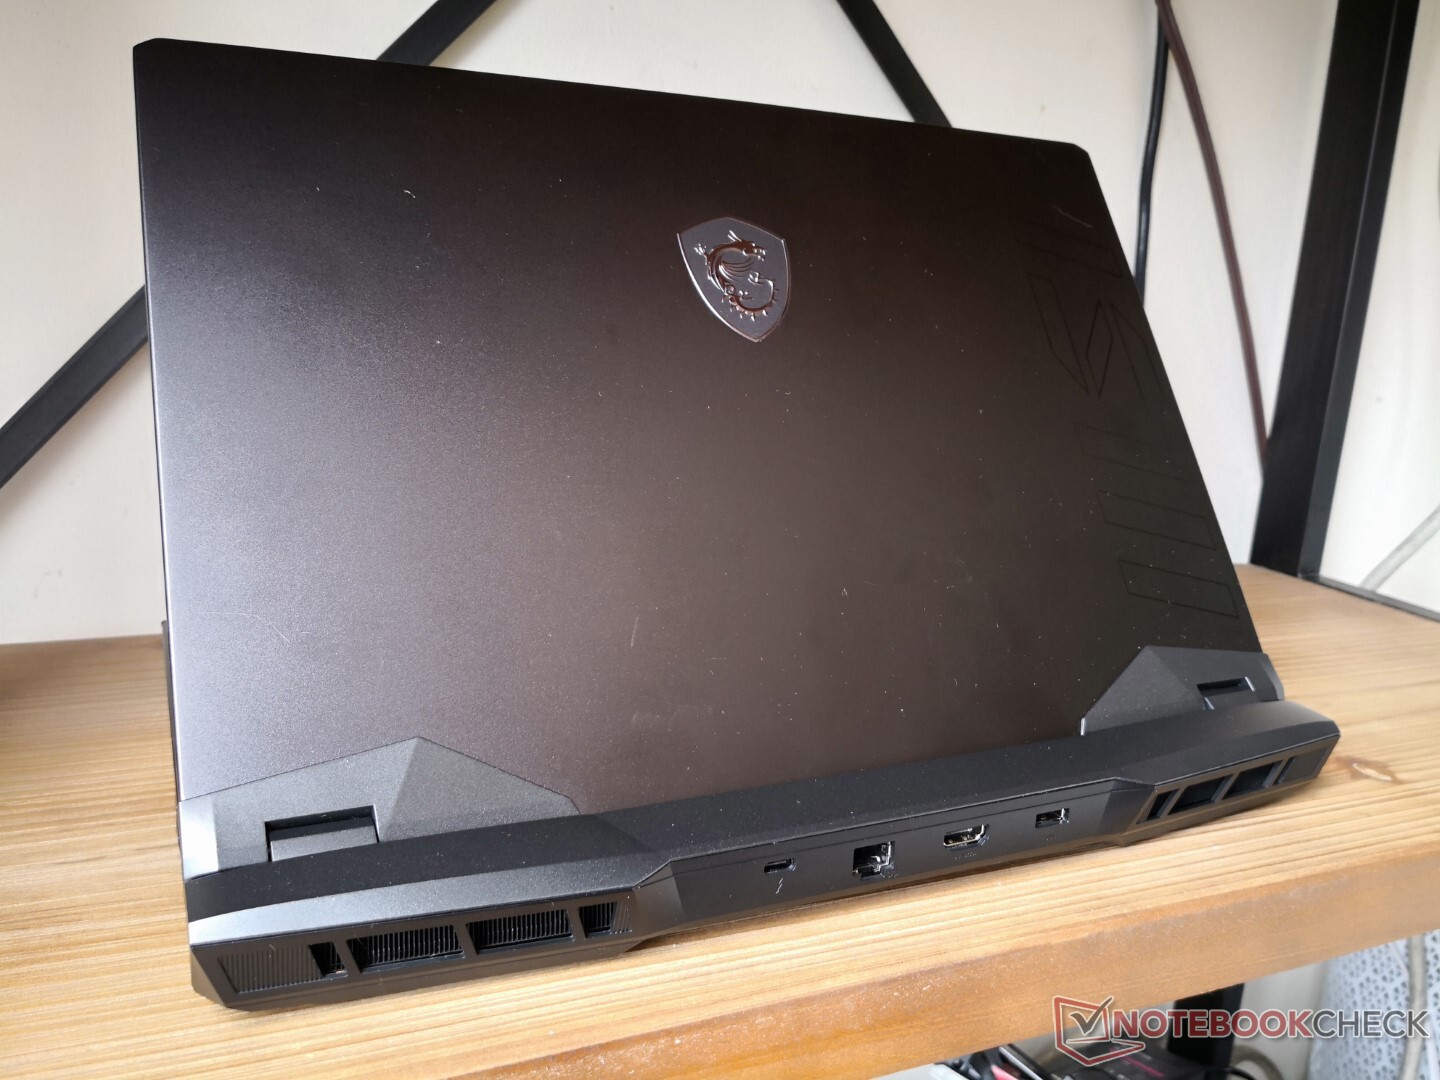
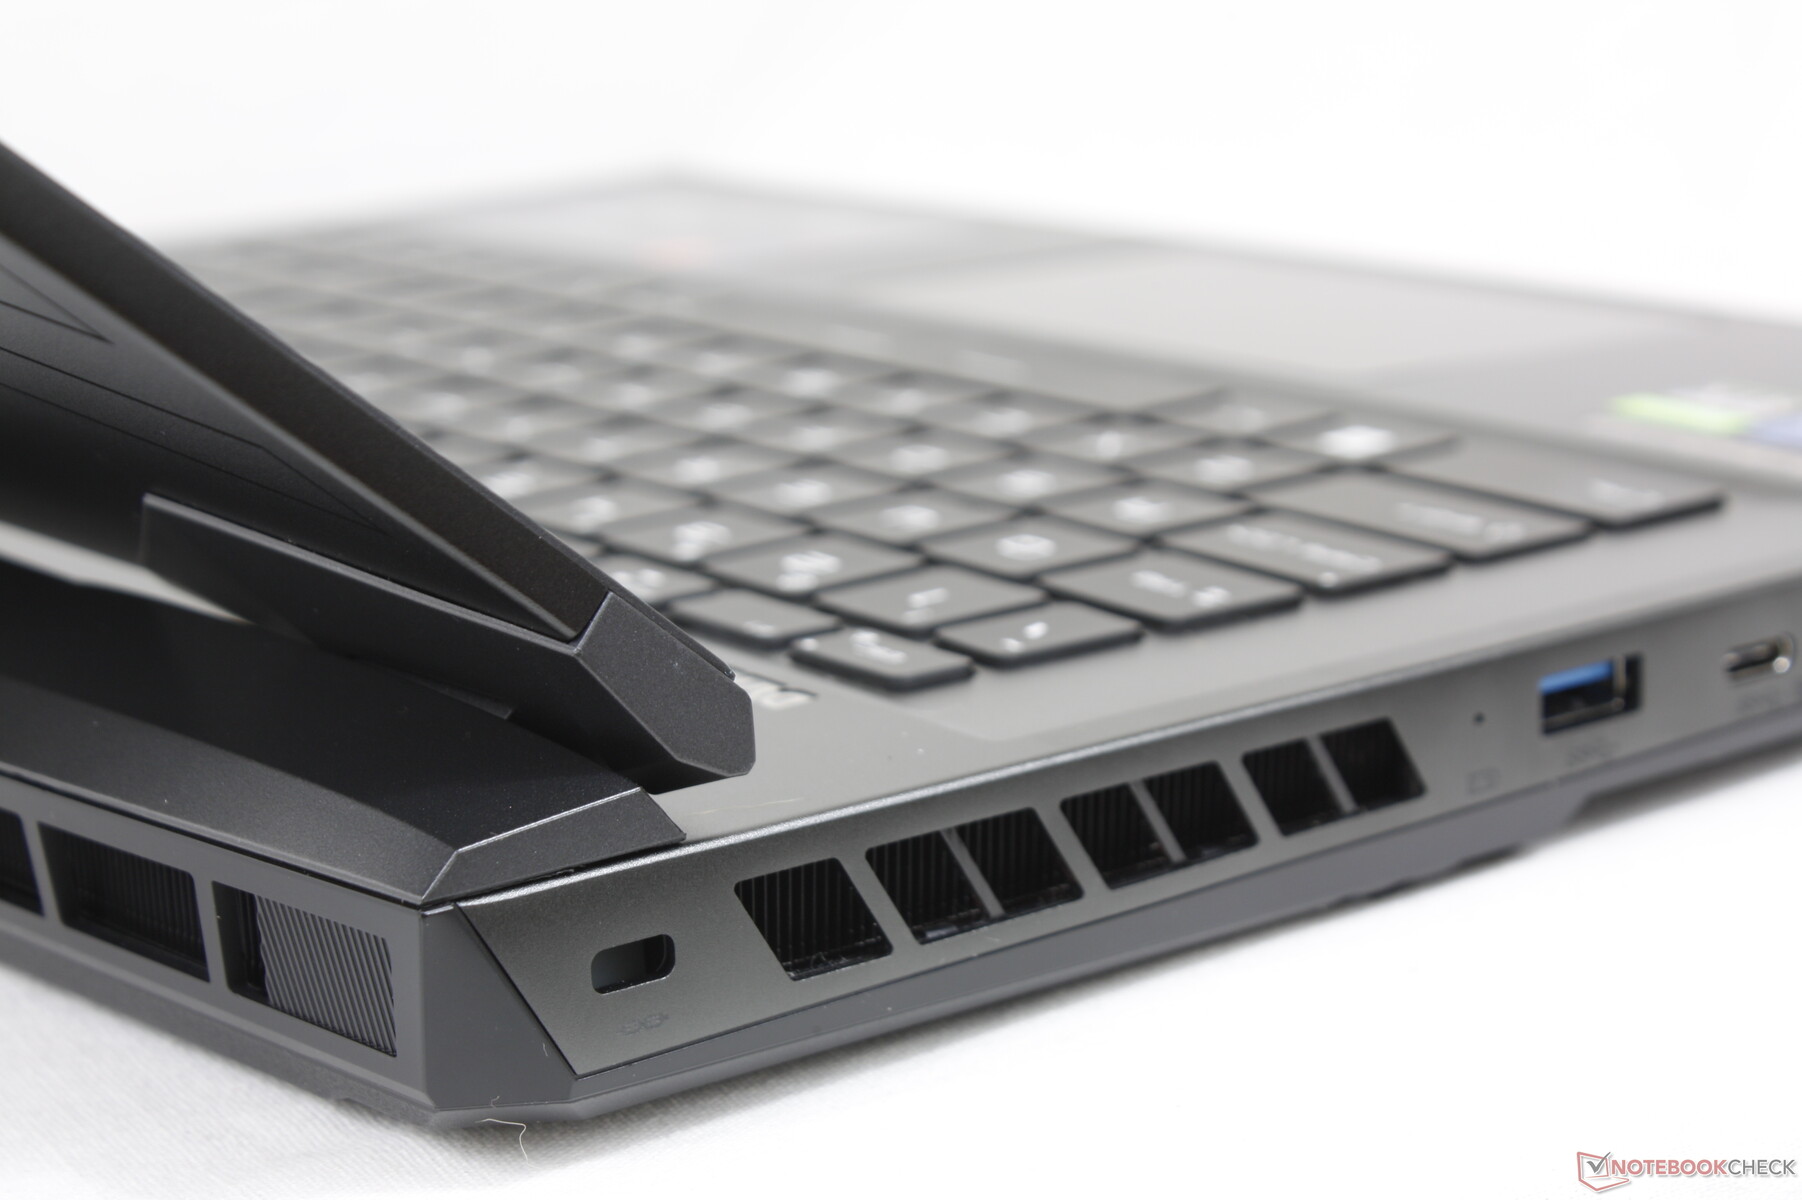
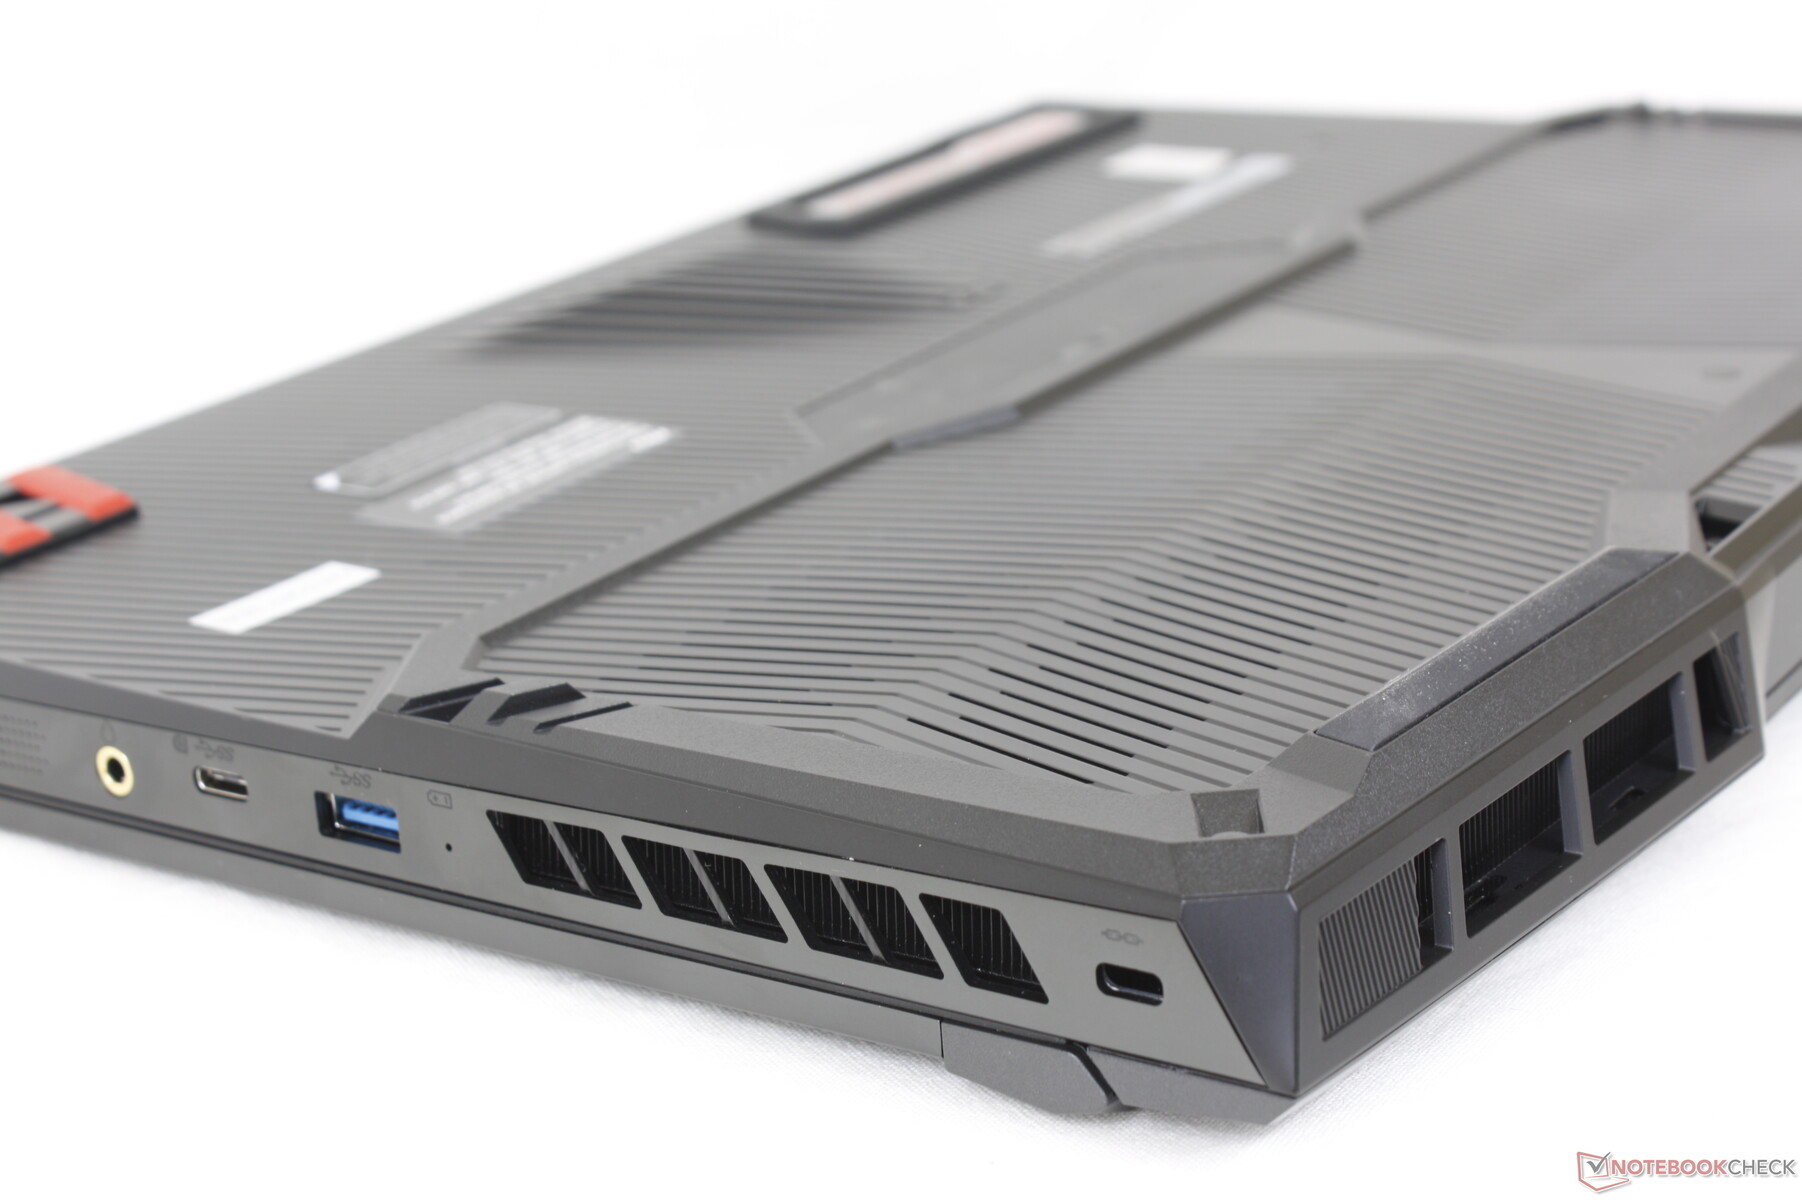
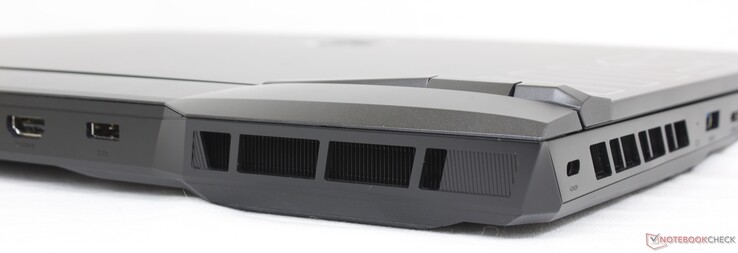
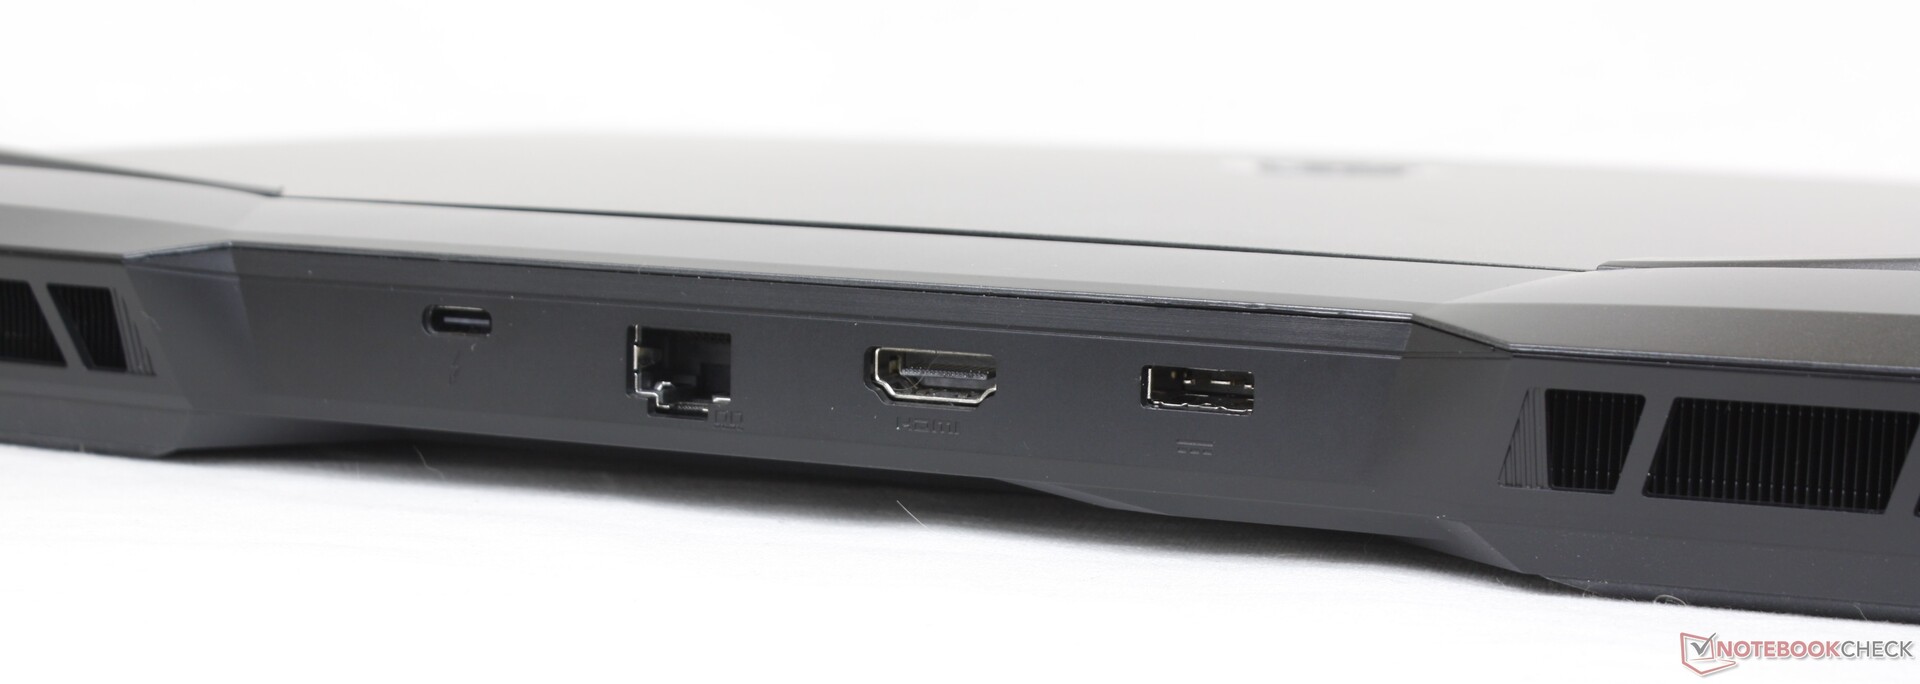
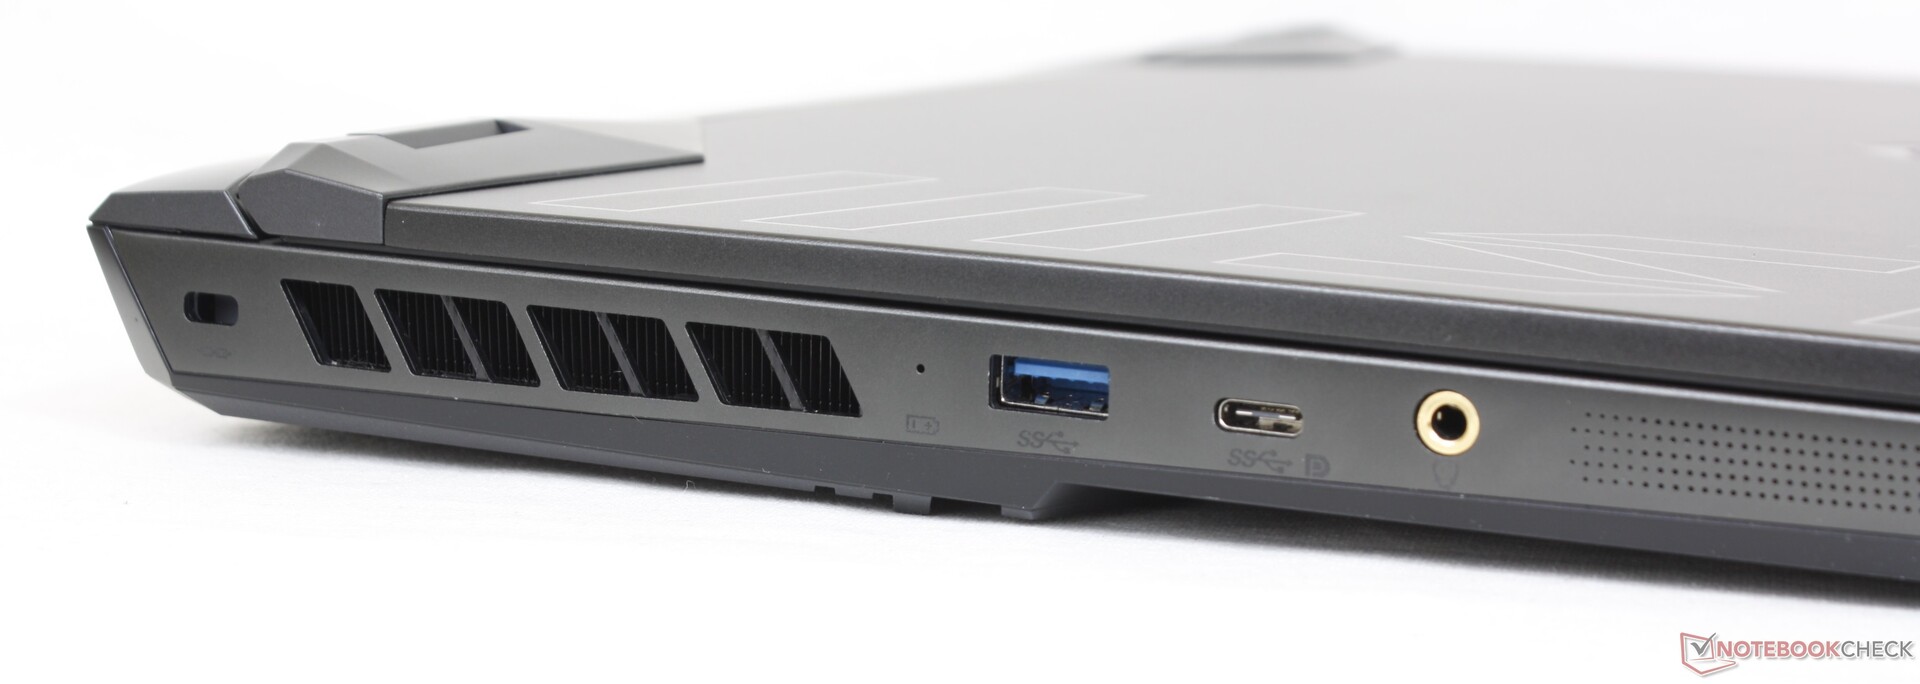
Connectivity — No More Mini-DisplayPort
The GE67 has dropped the dedicated mini-DisplayPort that was present on the GE66. DisplayPort is still supported via the two USB-C ports.
As with other gaming laptops based on the Alder-Lake-H platform like the Asus TUF Gaming F15 FX507ZM, Thunderbolt 4 connectivity will be disabled if running on discrete graphics mode.
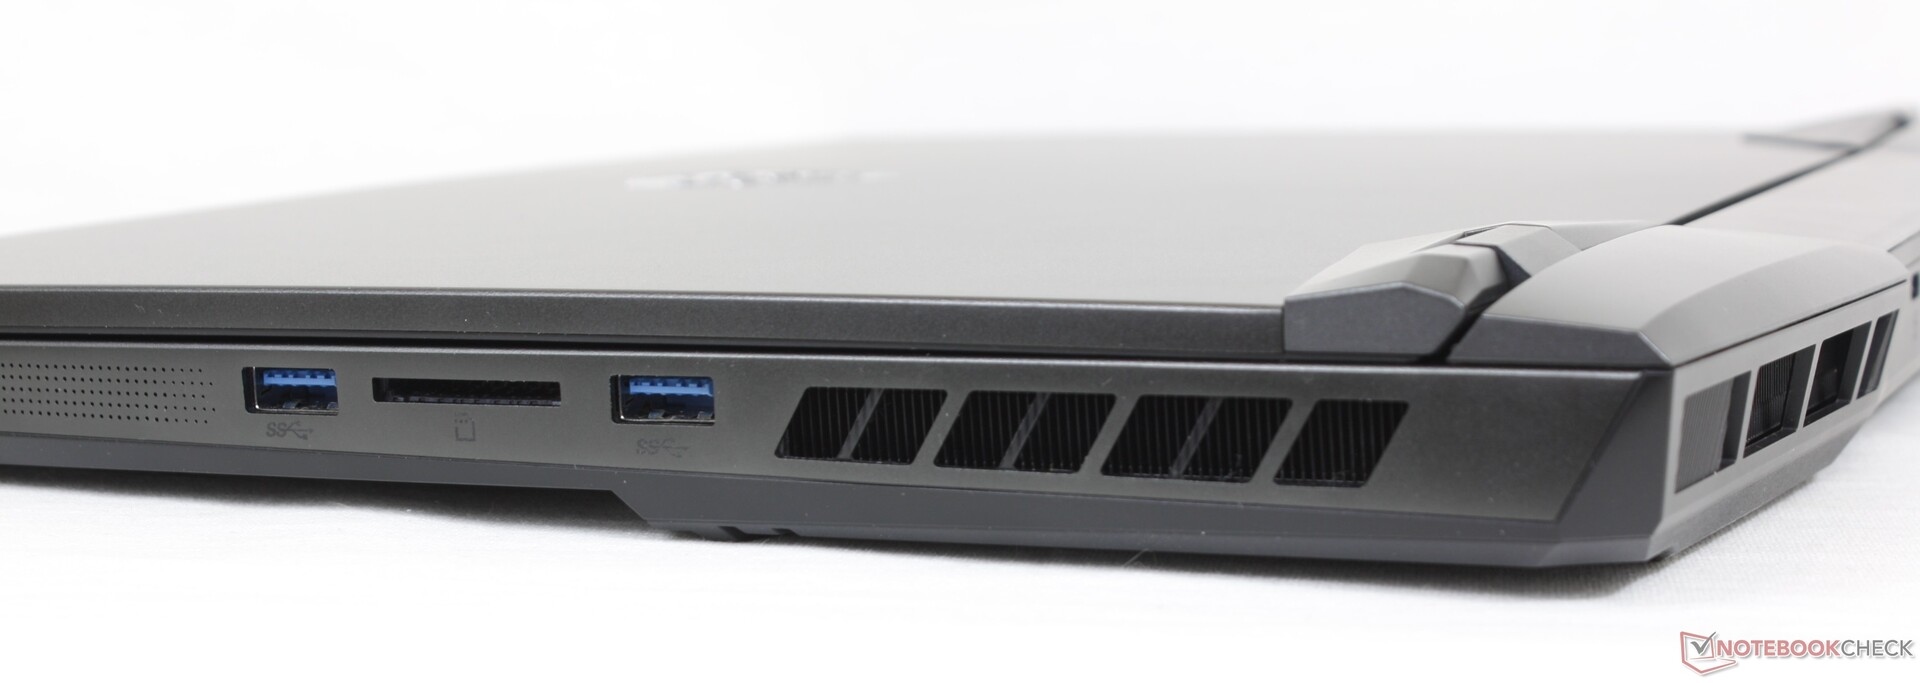
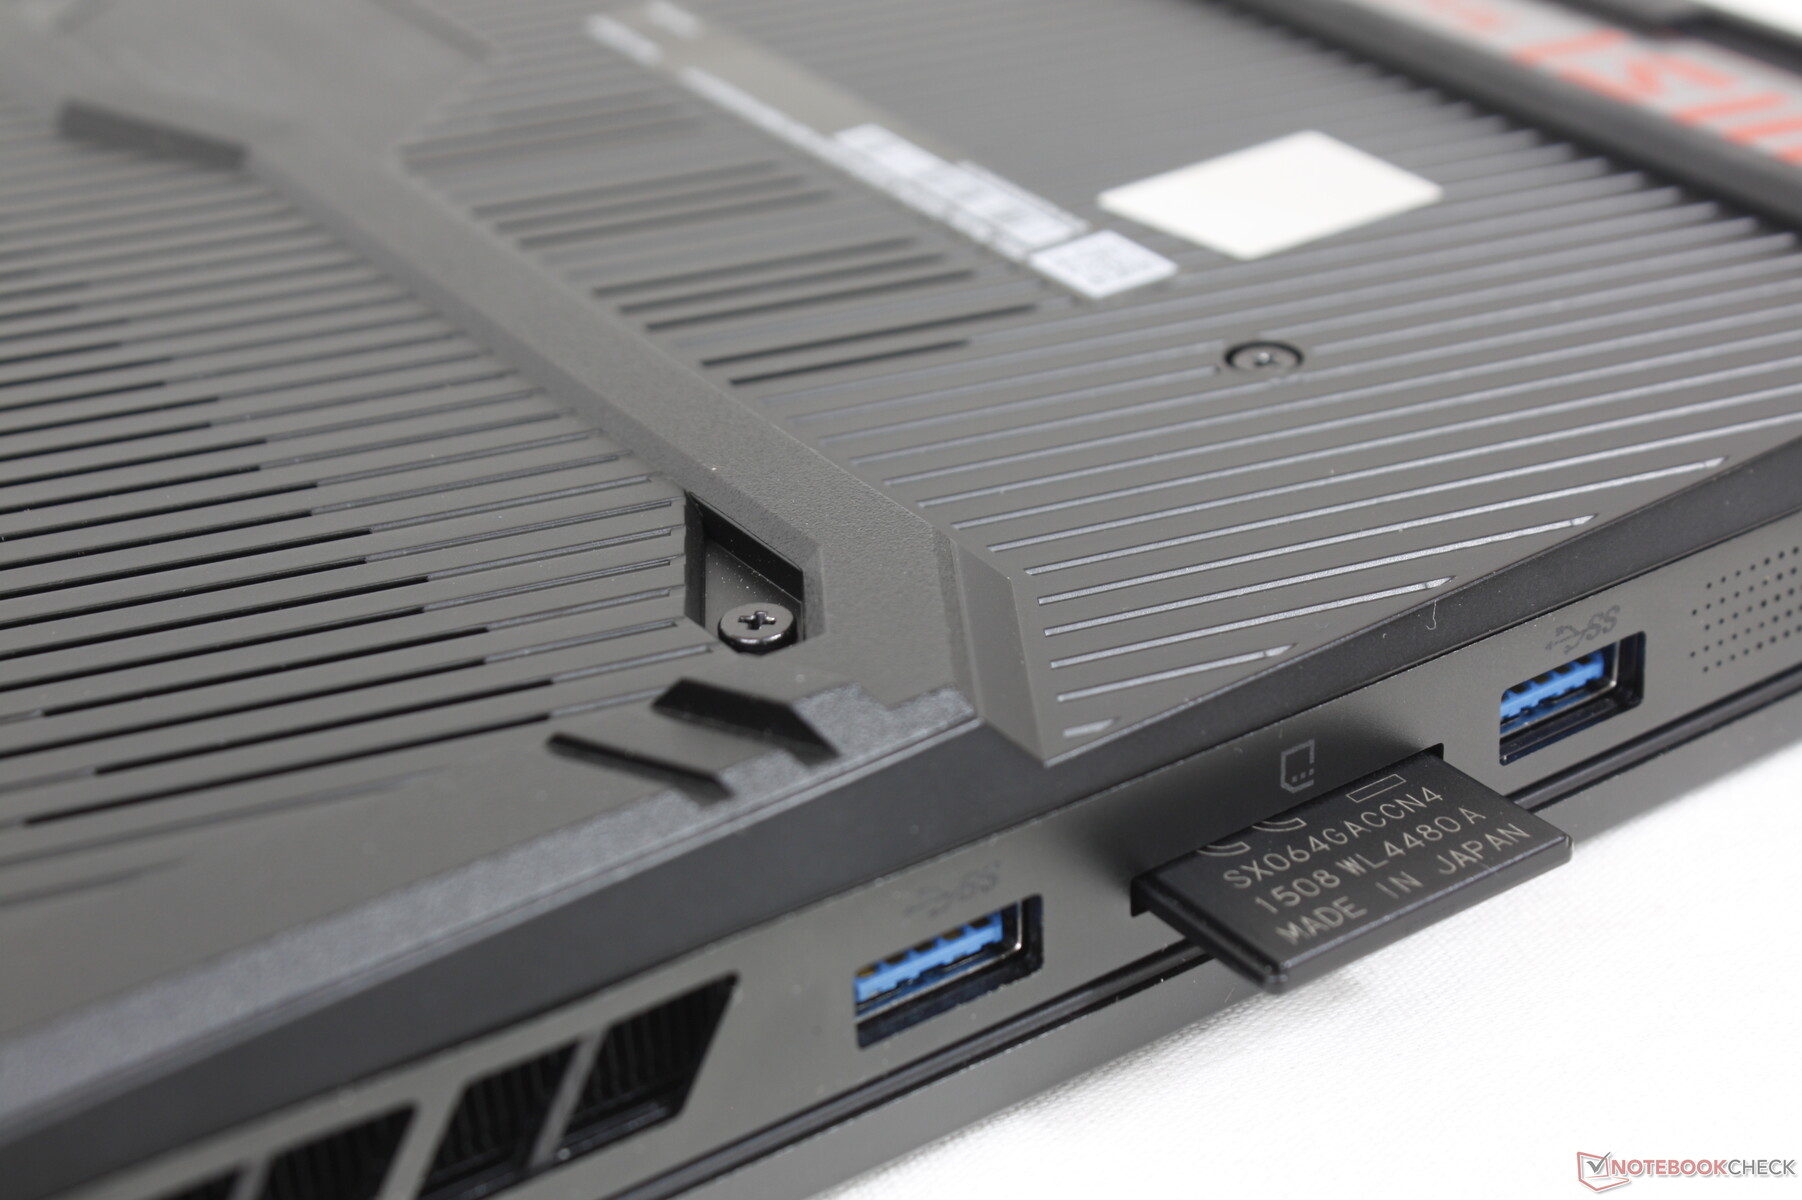
SD Card Reader
Transfer rates from the integrated SD card reader is slow relative to the asking price of the configuration. Users will see 2x faster SD reader performance from competing models like the Razer Blade 15 or Asus ROG Zephyrus Duo 16.
| SD Card Reader | |
| average JPG Copy Test (av. of 3 runs) | |
| Razer Blade 15 2022 (Toshiba Exceria Pro SDXC 64 GB UHS-II) | |
| MSI GE67 HX 12UGS (Toshiba Exceria Pro SDXC 64 GB UHS-II) | |
| MSI Raider GE66 12UHS (AV PRO microSD 128 GB V60) | |
| maximum AS SSD Seq Read Test (1GB) | |
| Razer Blade 15 2022 (Toshiba Exceria Pro SDXC 64 GB UHS-II) | |
| MSI GE67 HX 12UGS (Toshiba Exceria Pro SDXC 64 GB UHS-II) | |
Communication
| Networking | |
| iperf3 transmit AX12 | |
| Razer Blade 15 2022 | |
| MSI Vector GP66 12UGS | |
| Alienware m15 R6, i7-11800H RTX 3080 | |
| iperf3 receive AX12 | |
| Razer Blade 15 2022 | |
| MSI Vector GP66 12UGS | |
| Alienware m15 R6, i7-11800H RTX 3080 | |
| iperf3 receive AXE11000 6GHz | |
| Asus ROG Strix Scar 15 G533ZW-LN106WS | |
| MSI GE67 HX 12UGS | |
| iperf3 transmit AXE11000 6GHz | |
| Asus ROG Strix Scar 15 G533ZW-LN106WS | |
| MSI GE67 HX 12UGS | |
Webcam
There are no changes to the 2 MP webcam which also means that there is still no physical privacy shutter or even Windows Hello support. Users can instead disable the webcam electronically via the F4 key.
Note that the webcam activity light is always flashing when the webcam is active. This is particularly annoying during video calls and we can find no option to switch off the flashing light.


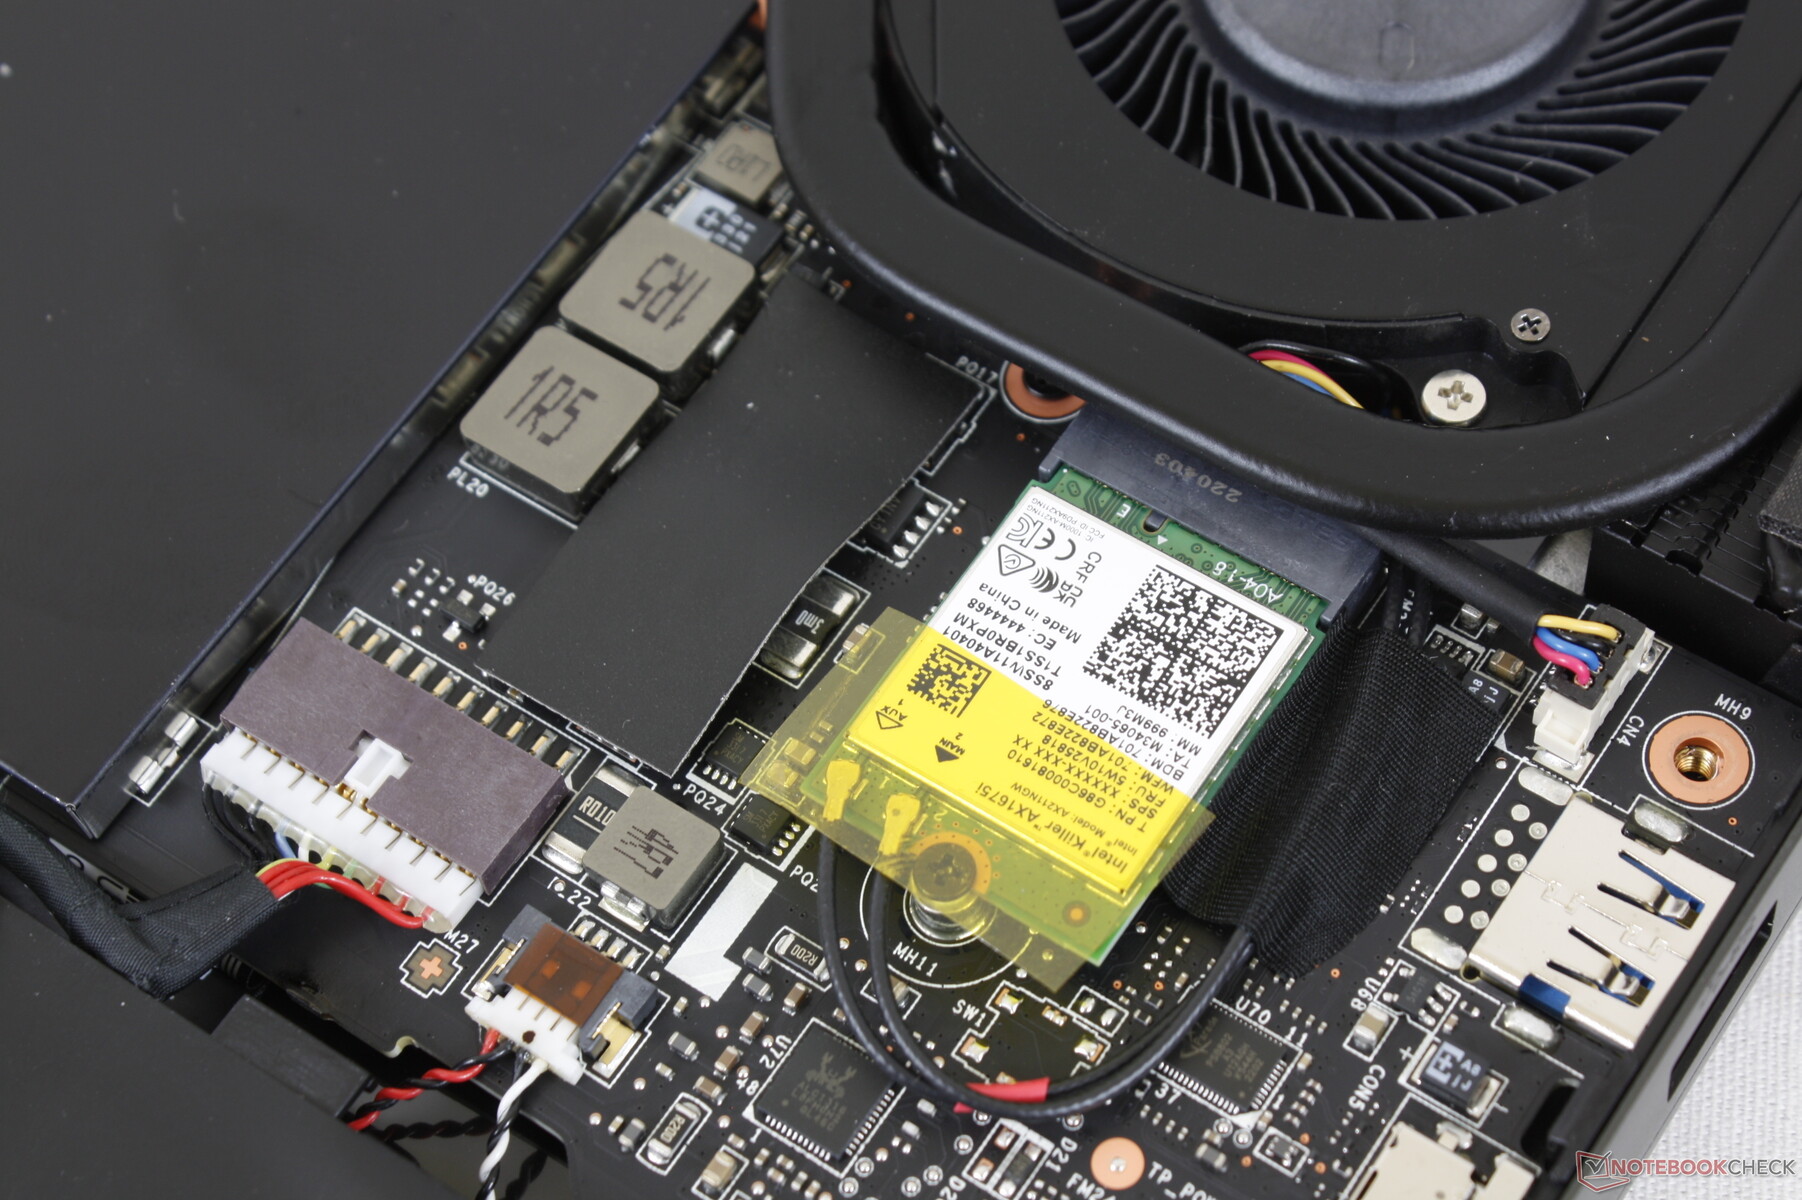
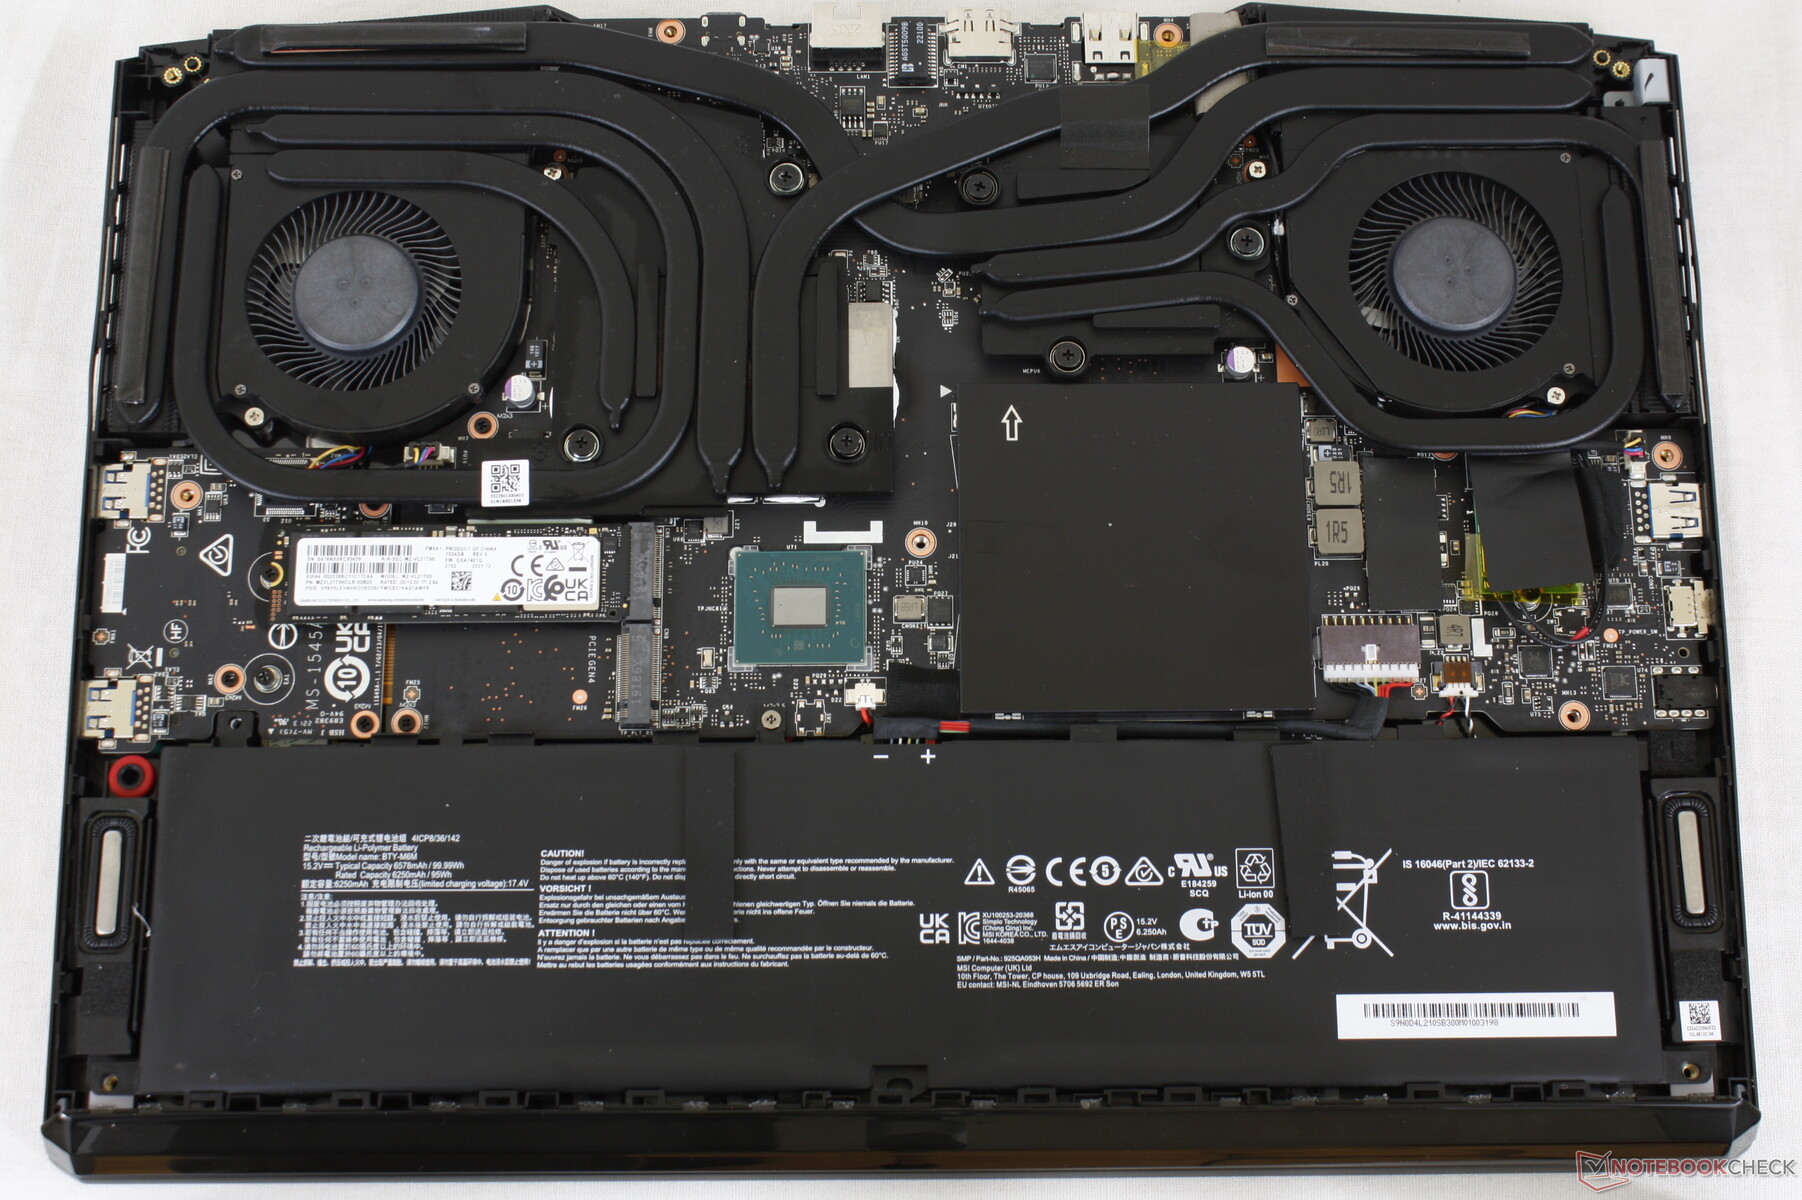
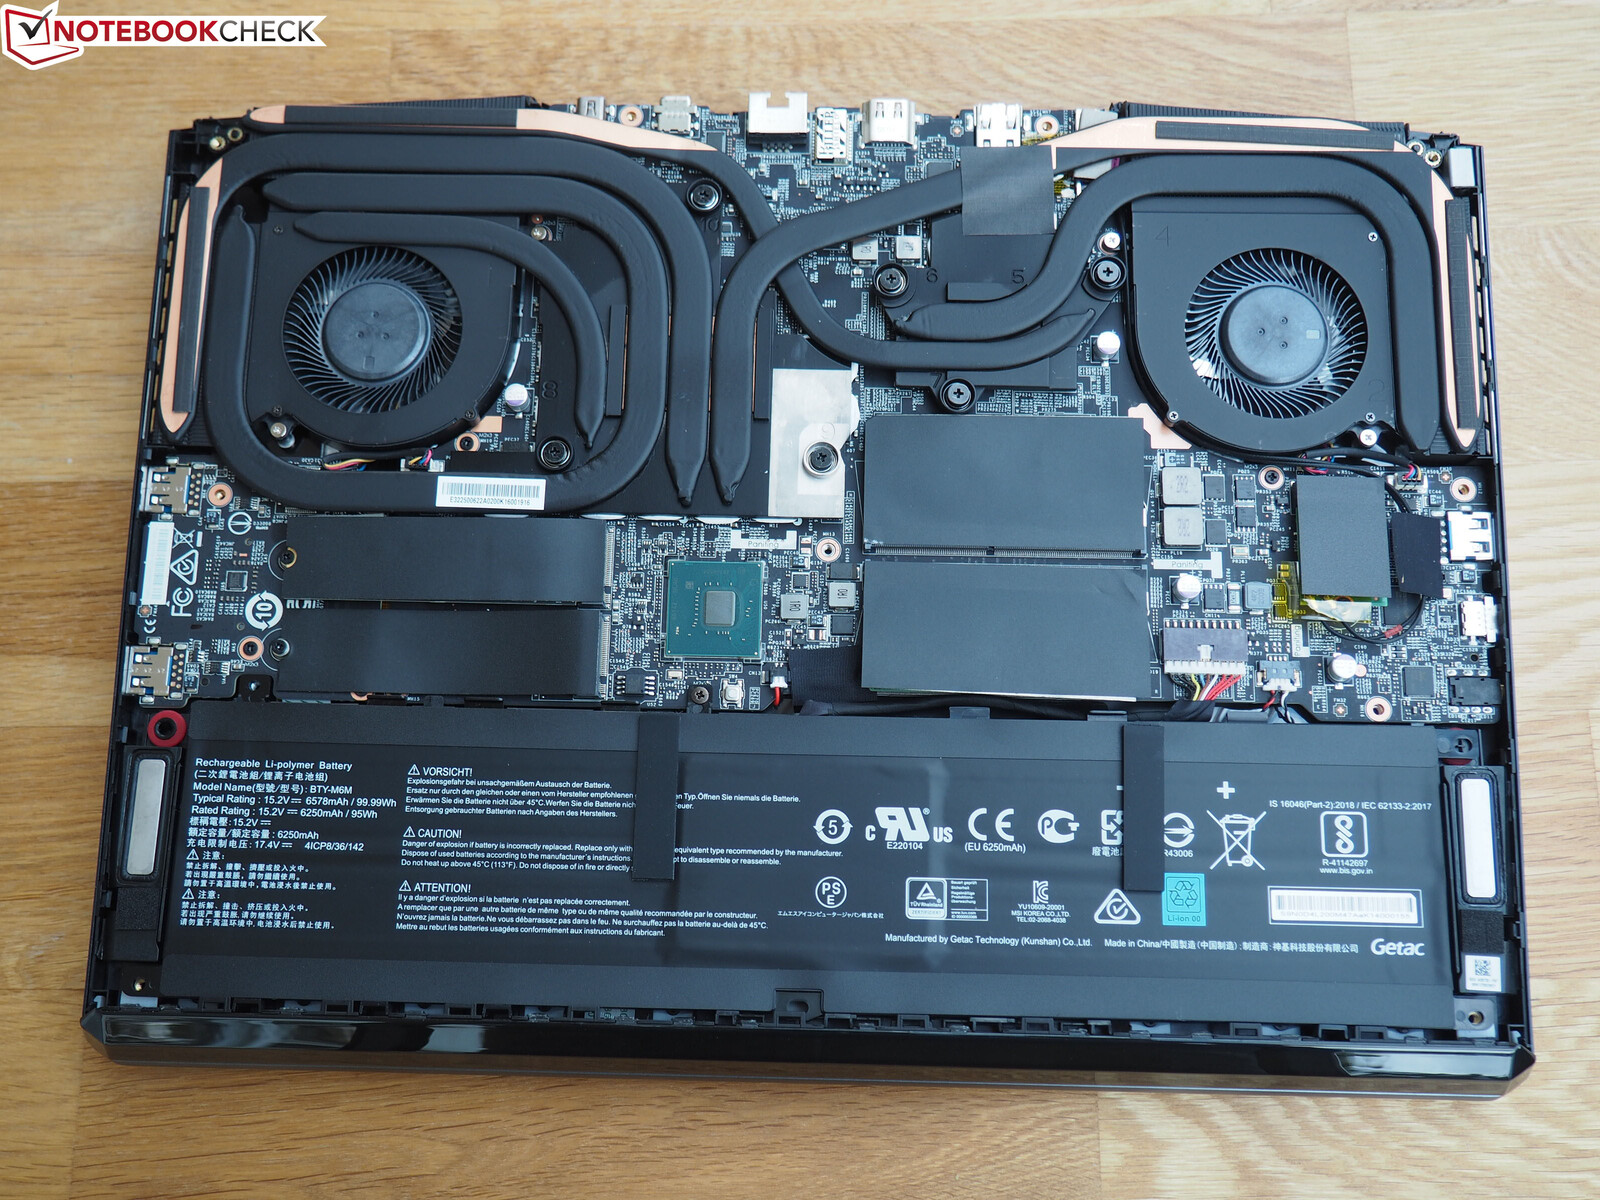
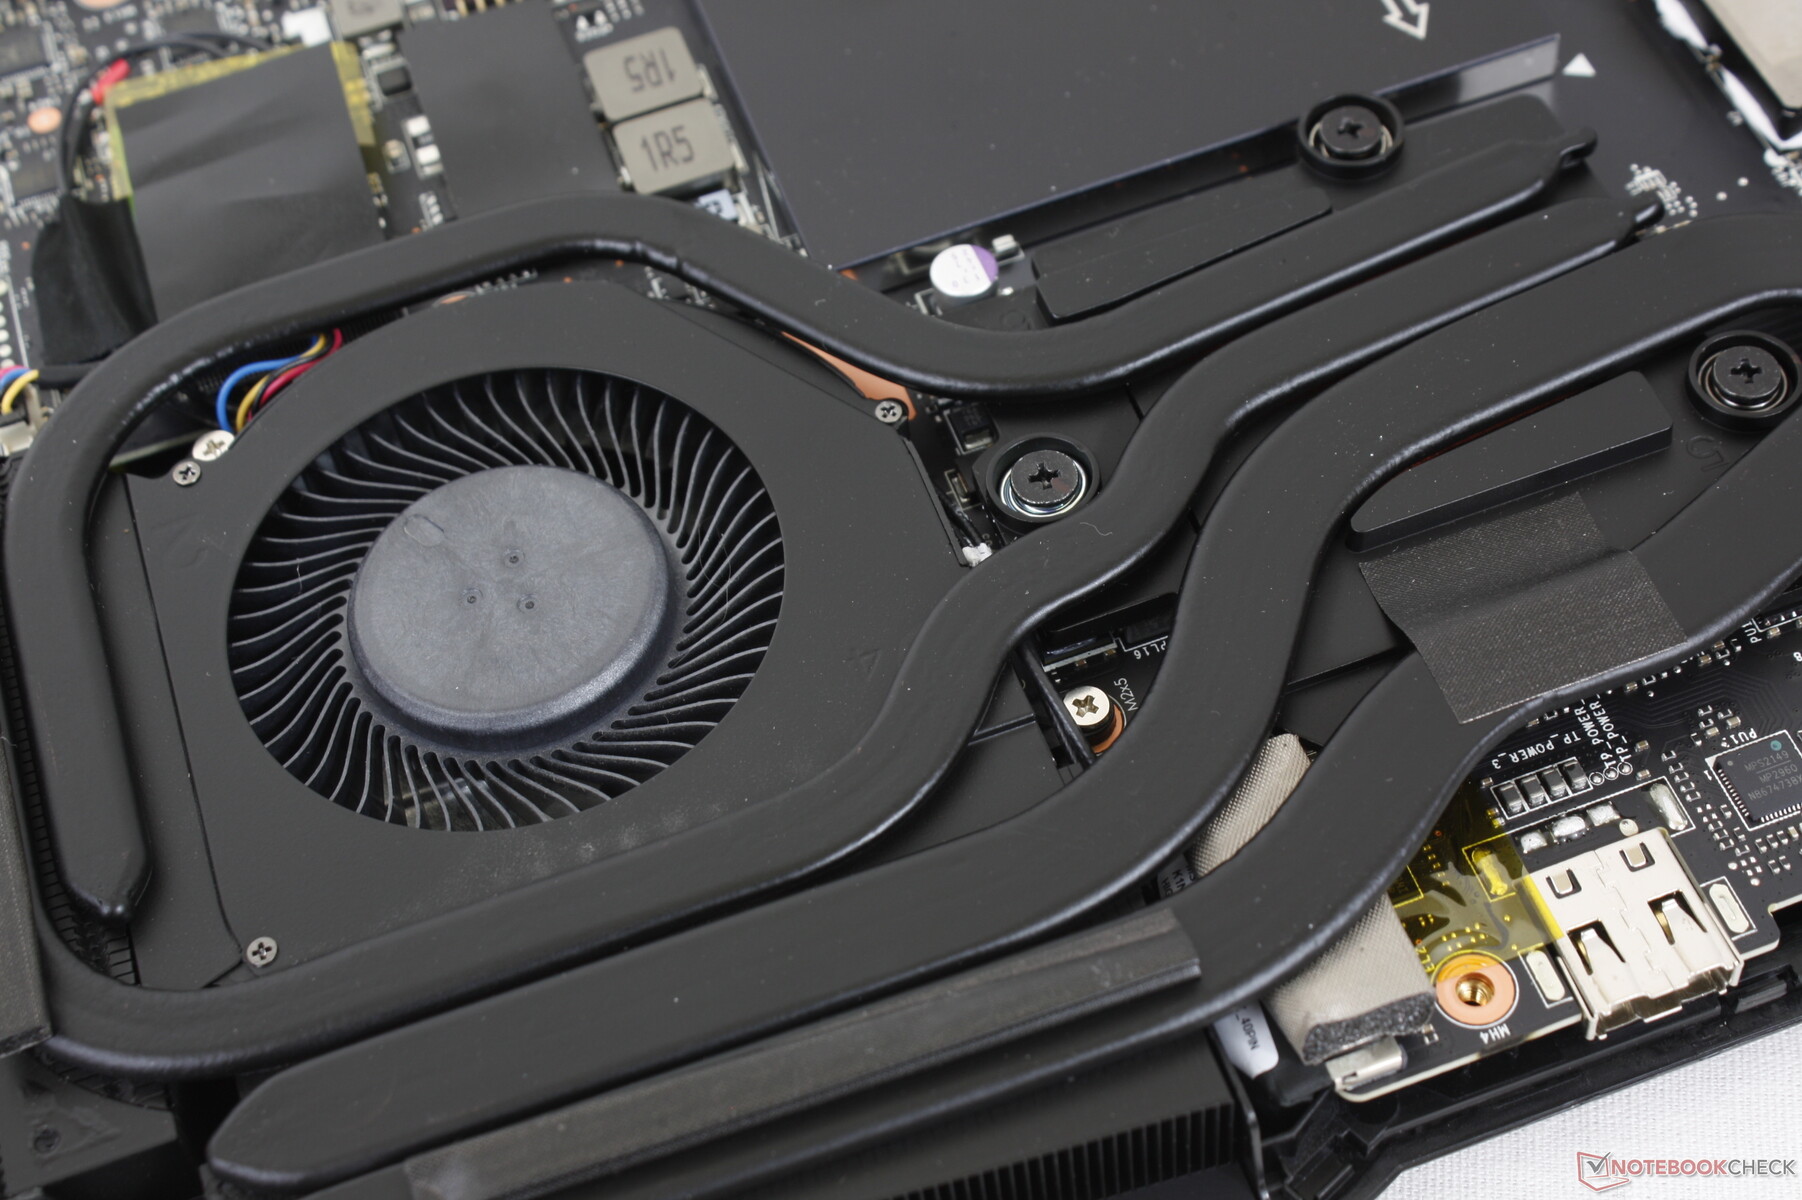
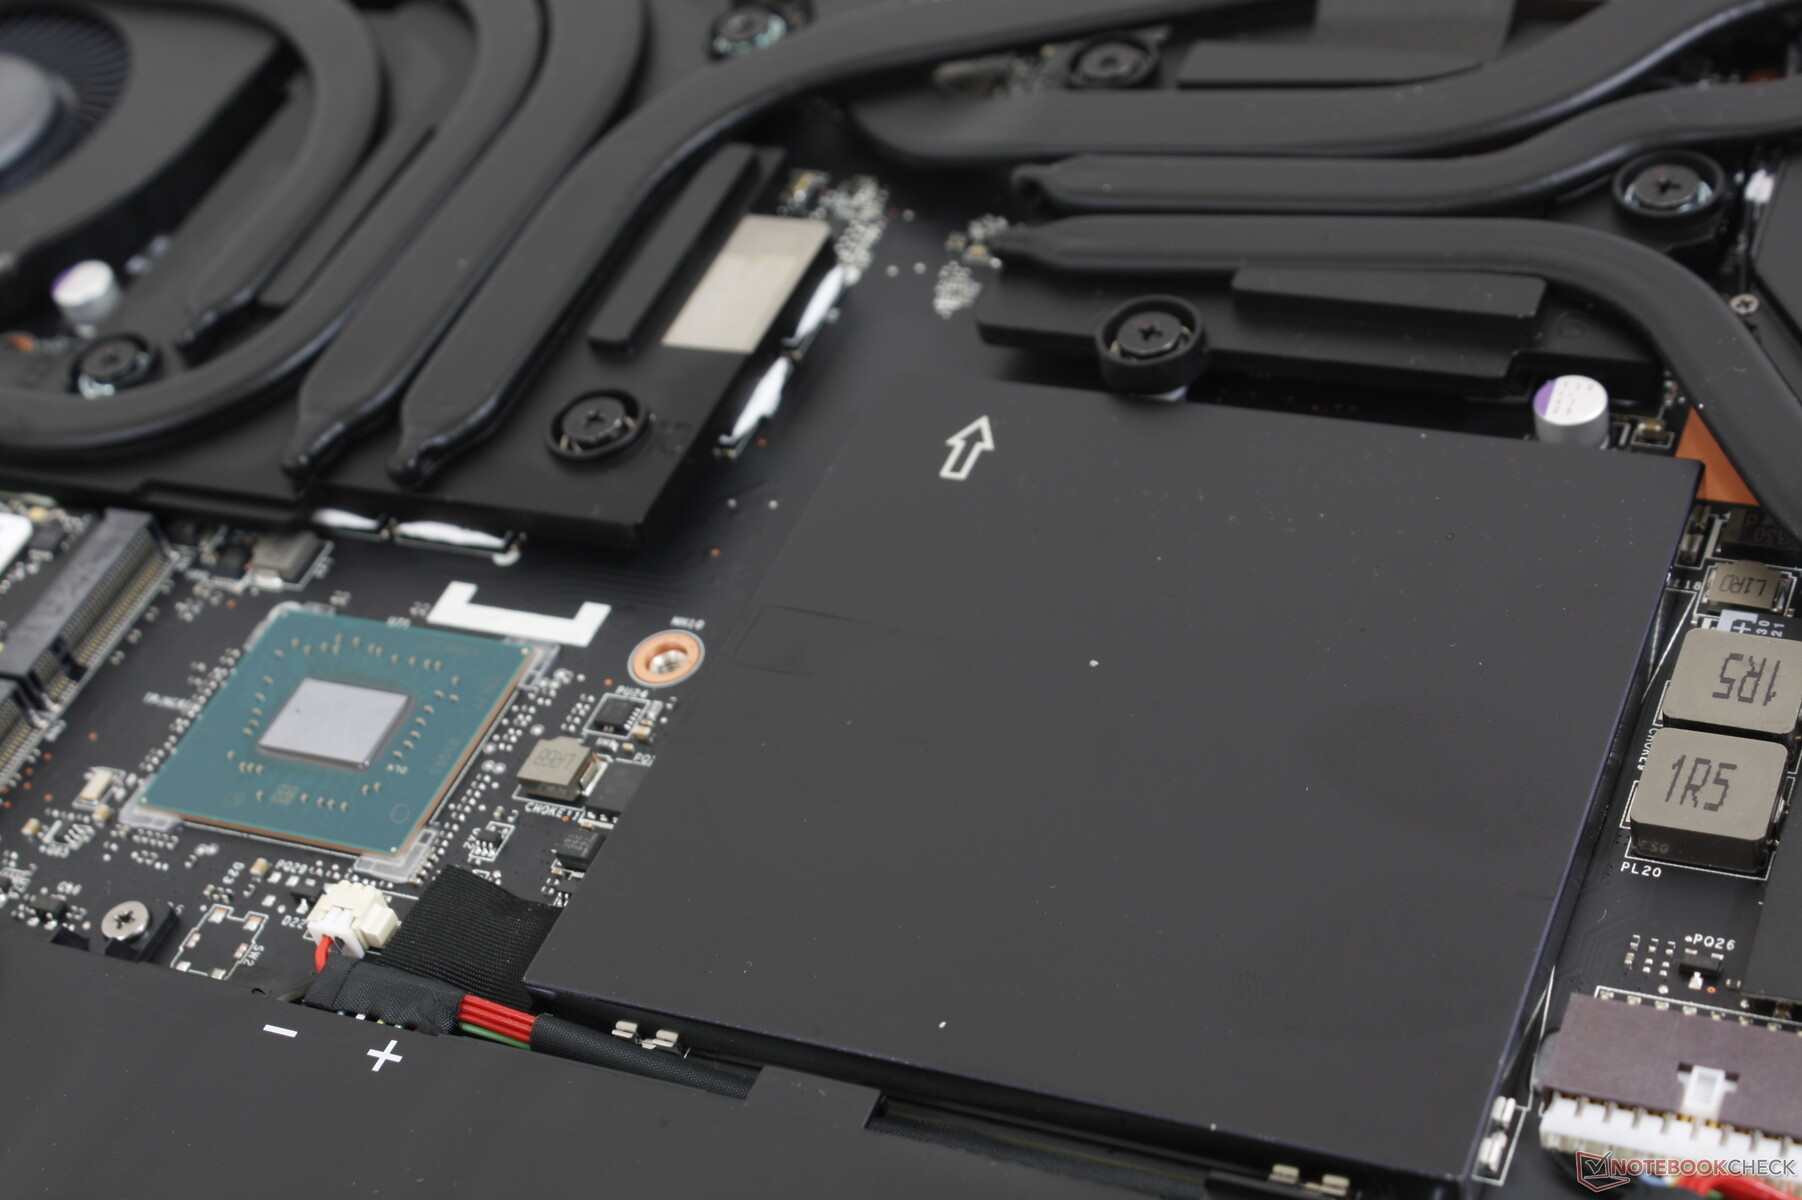
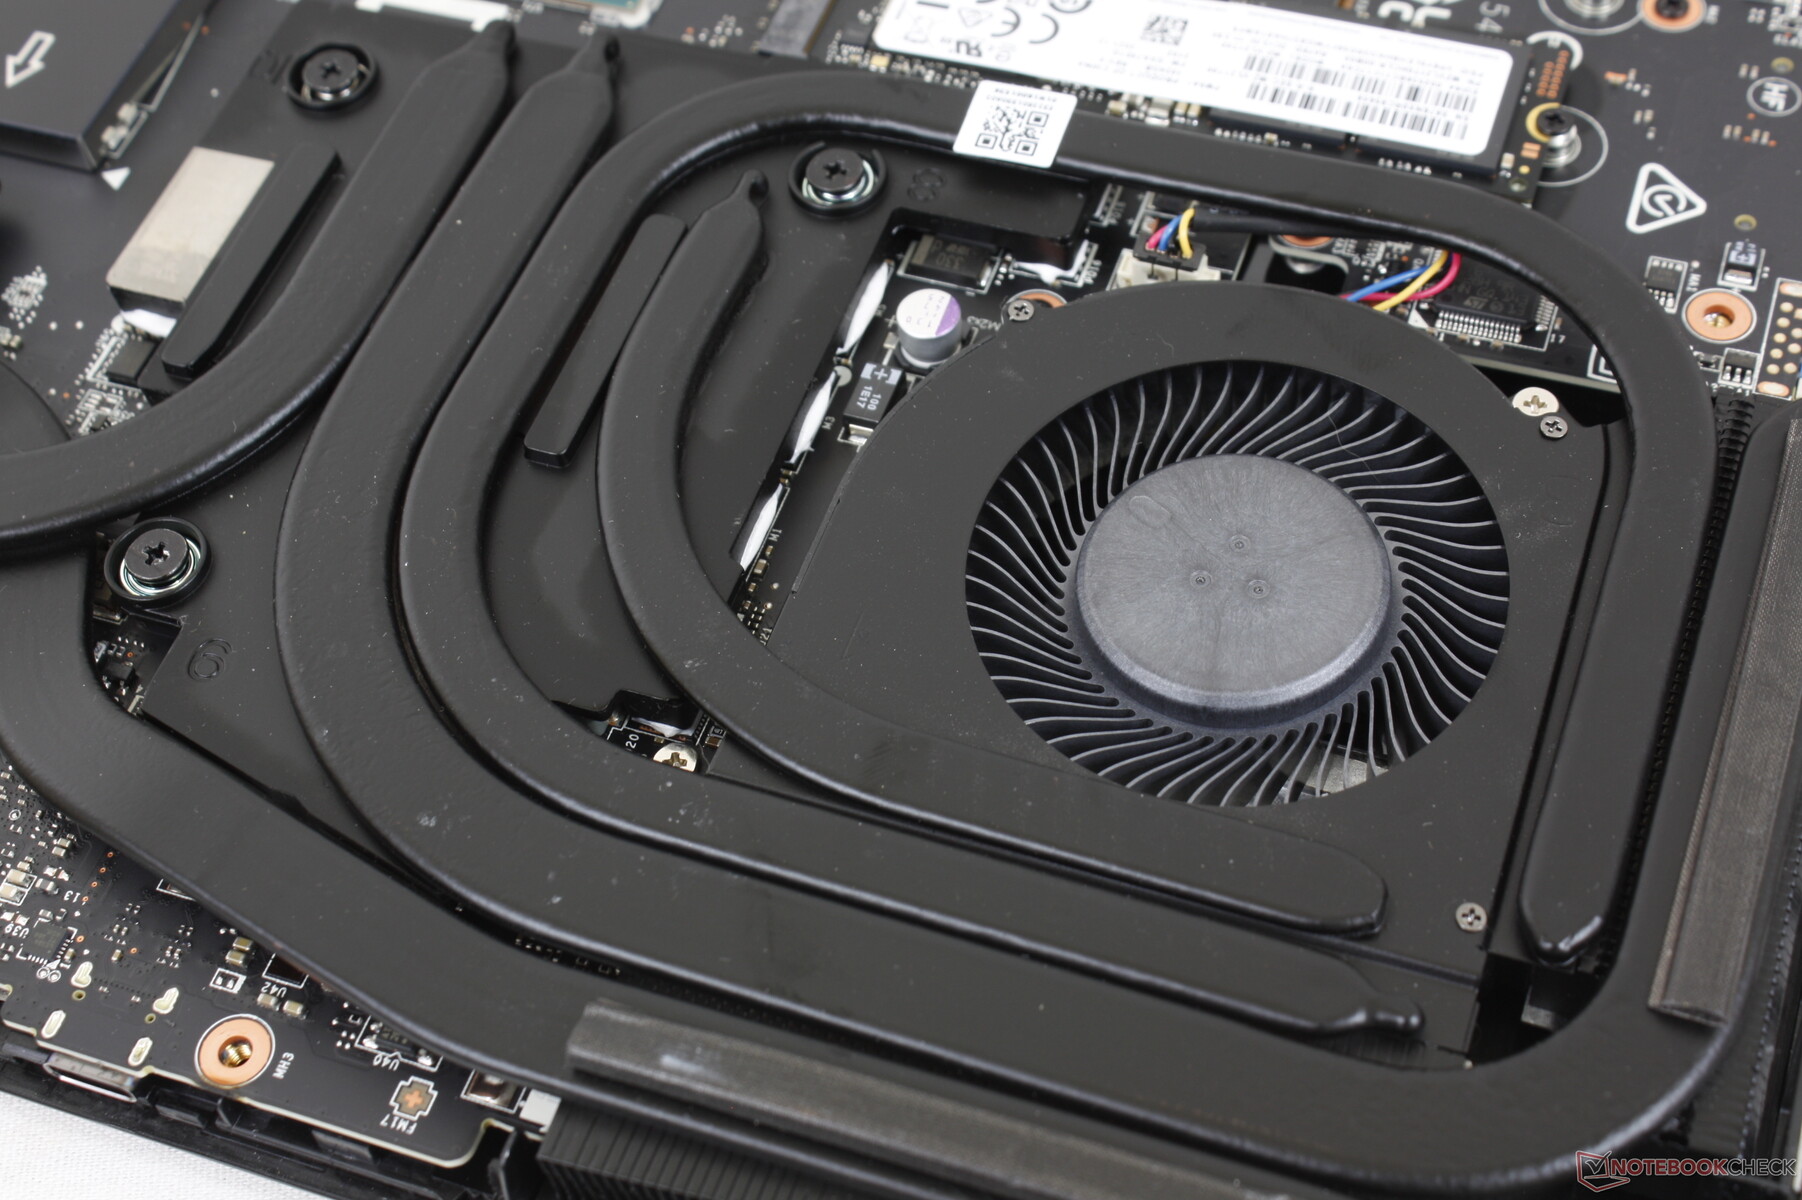
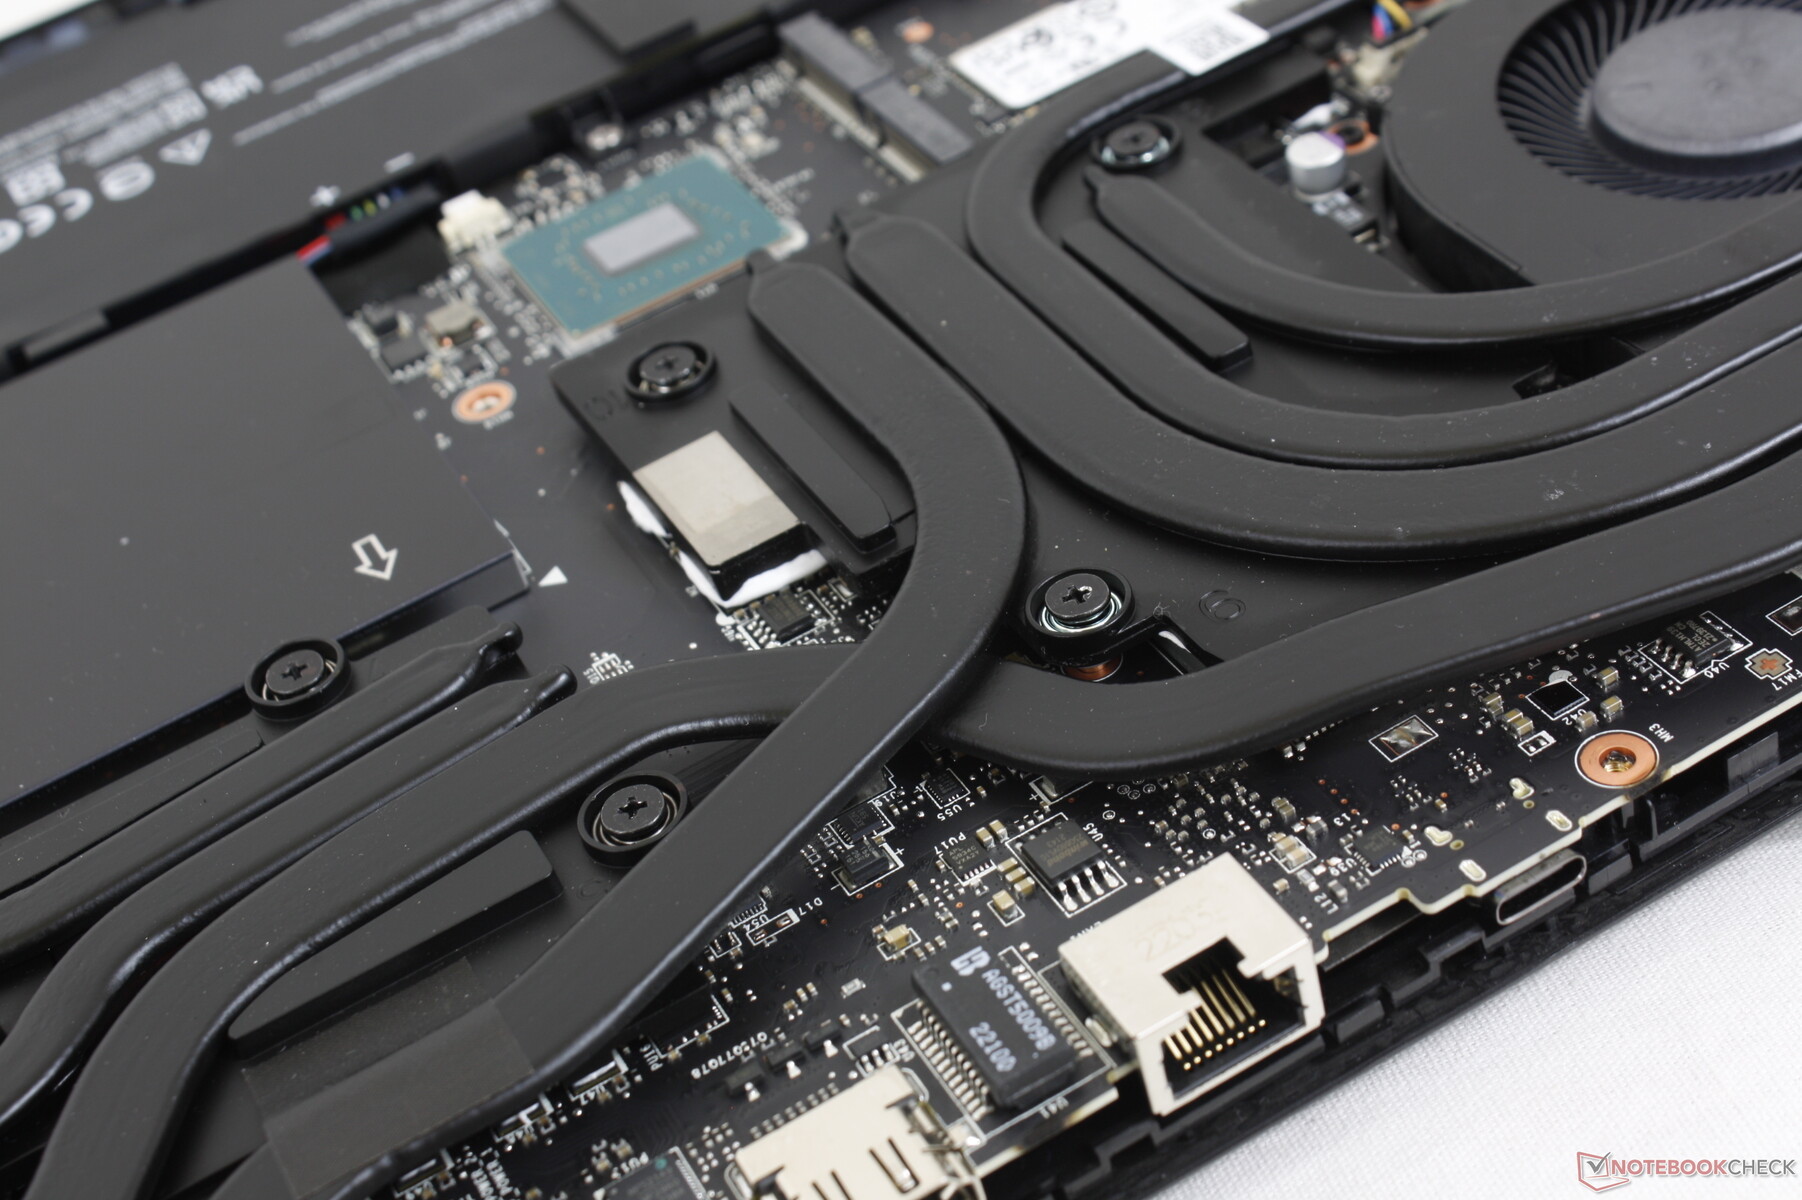
Maintenance
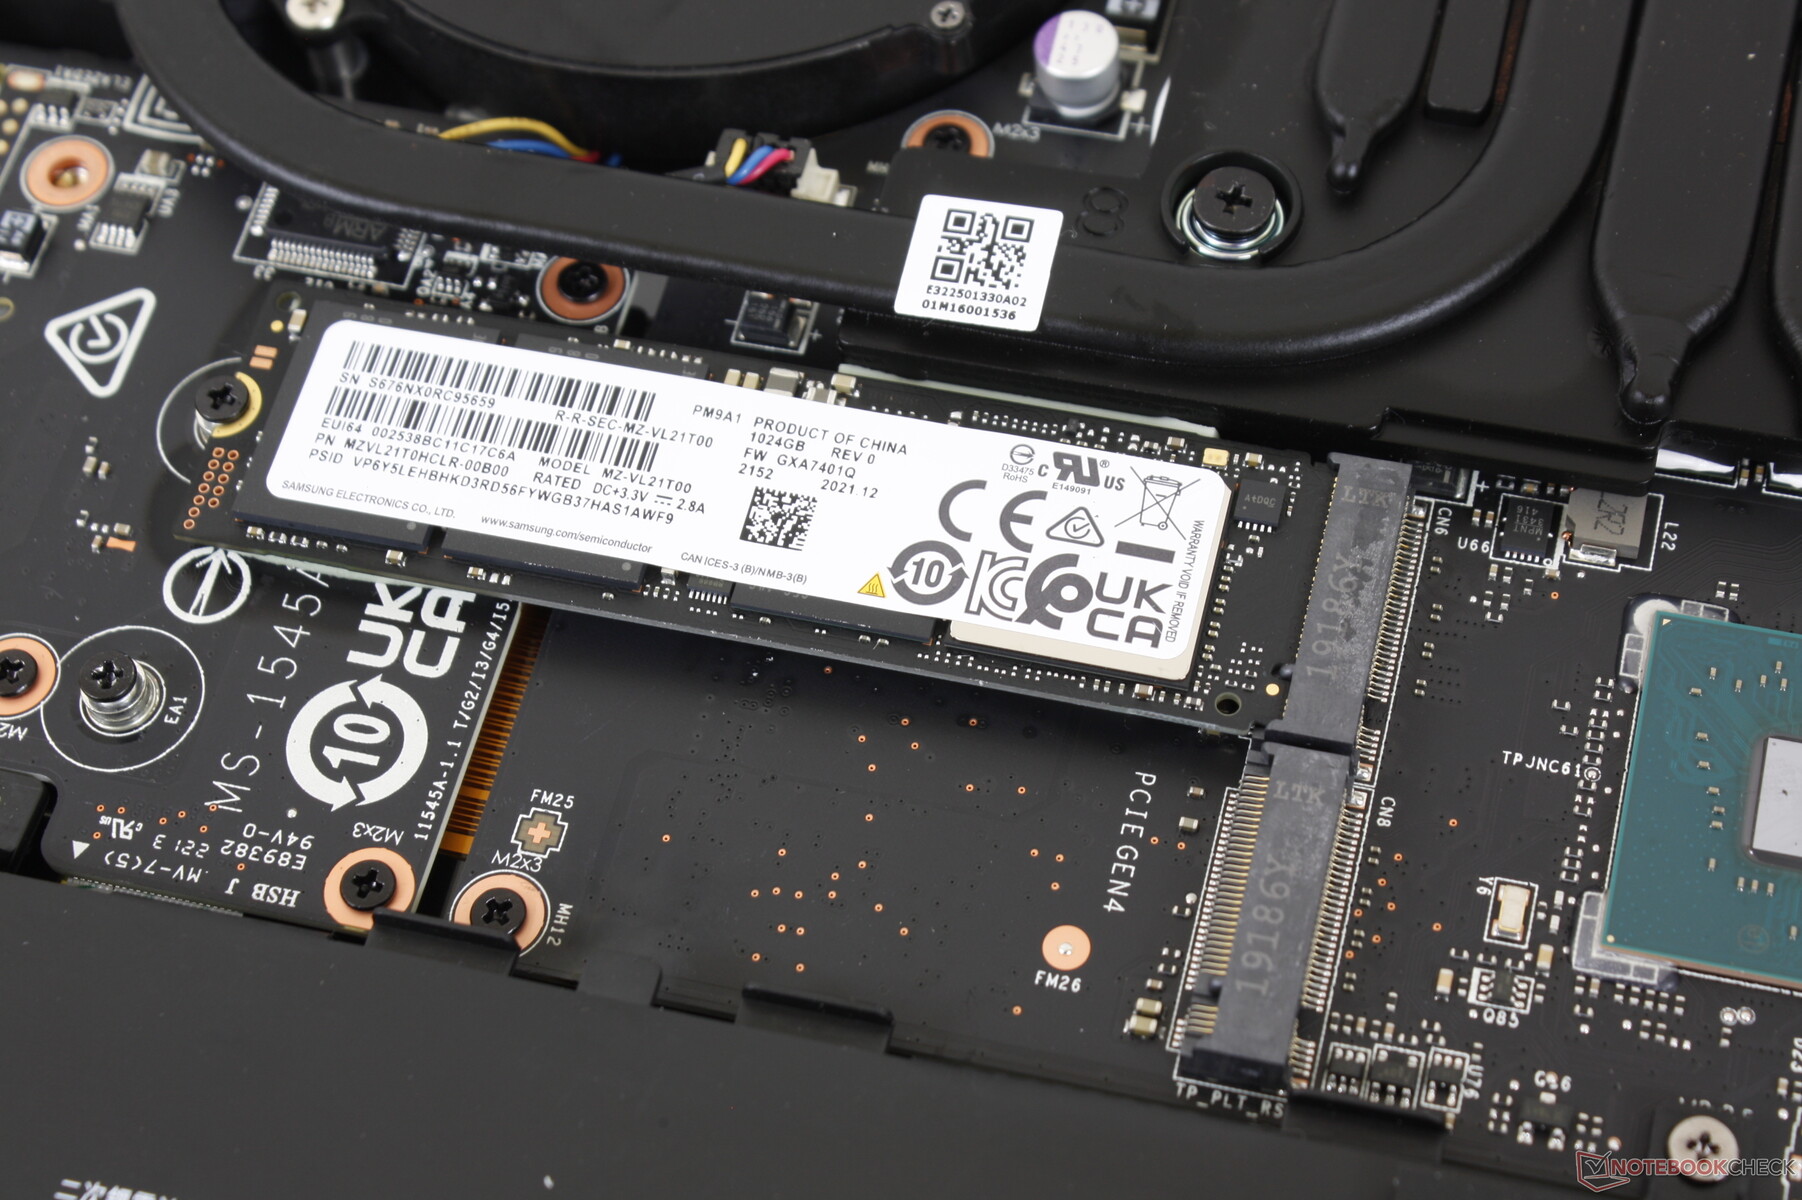
The bottom panel requires a Philips screwdriver and a flat edge to remove. When compared to the GE66, the GE67 has an additional heat pipe over the CPU as shown below to improve cooling.
Accessories and Warranty
The retail box includes a large velvet wipe in addition to the AC adapter and paperwork. The standard one-year manufacturer warranty applies if purchased in the US.
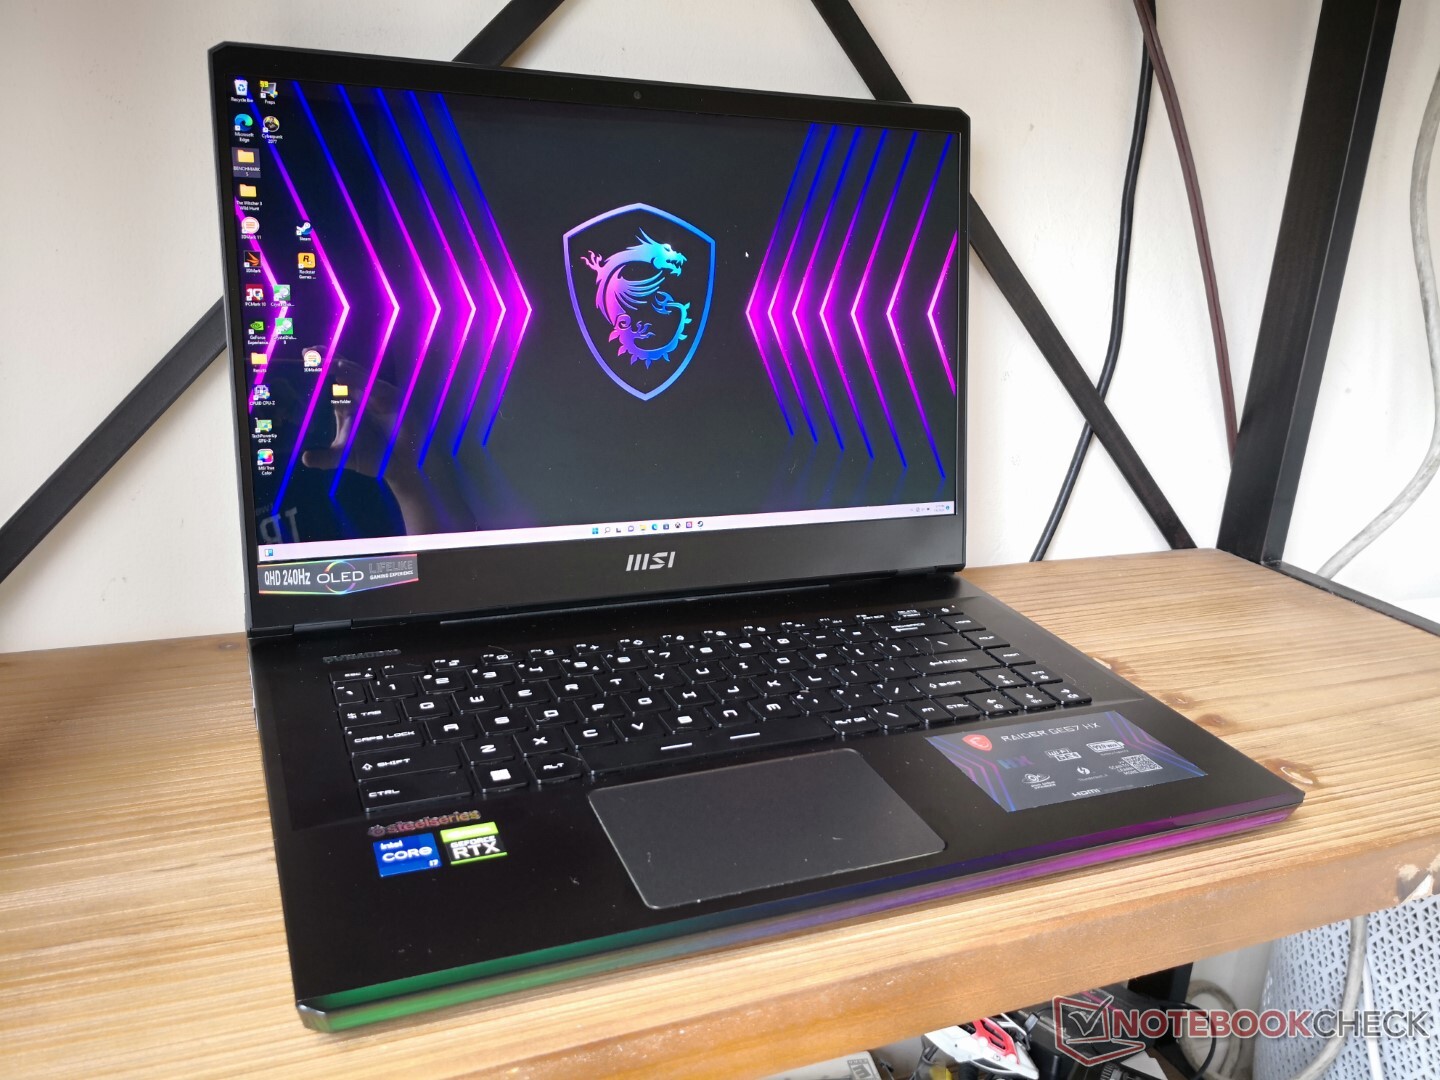
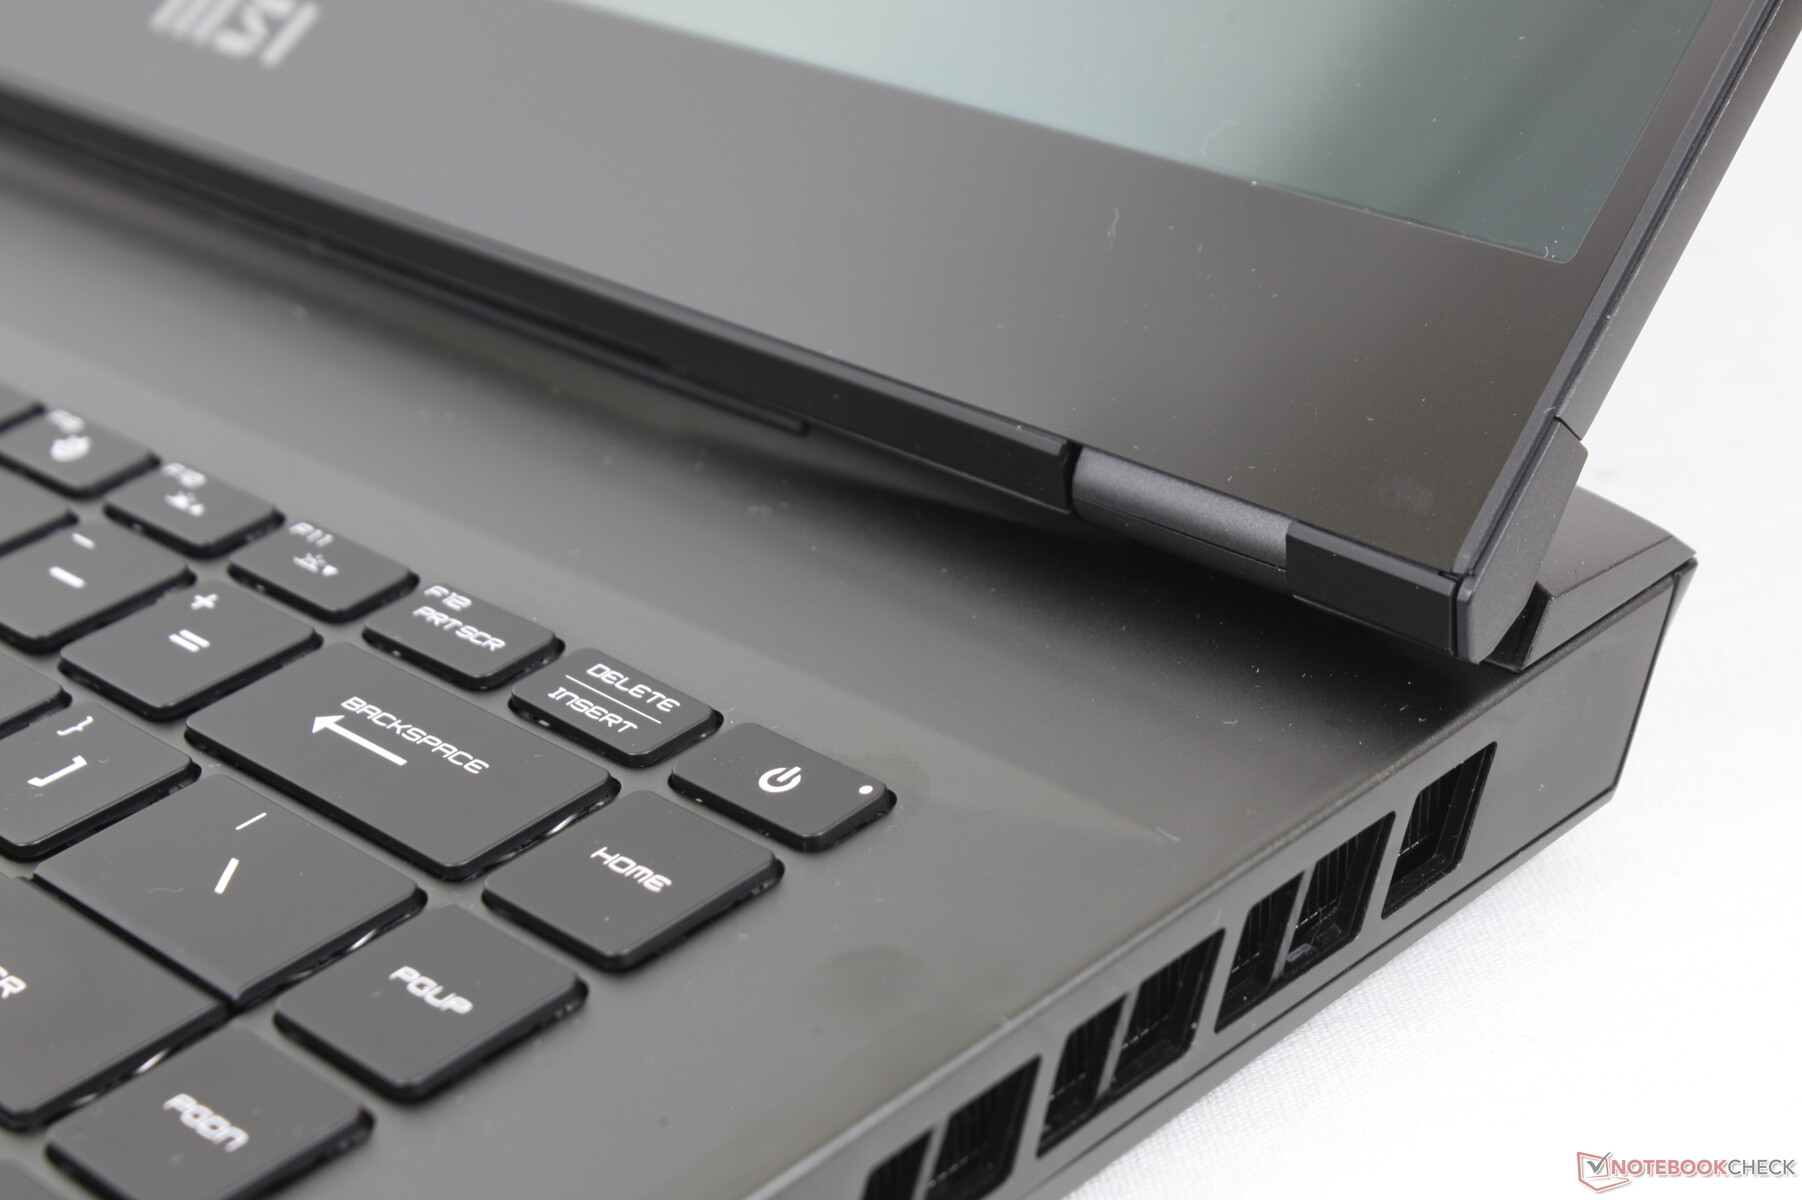
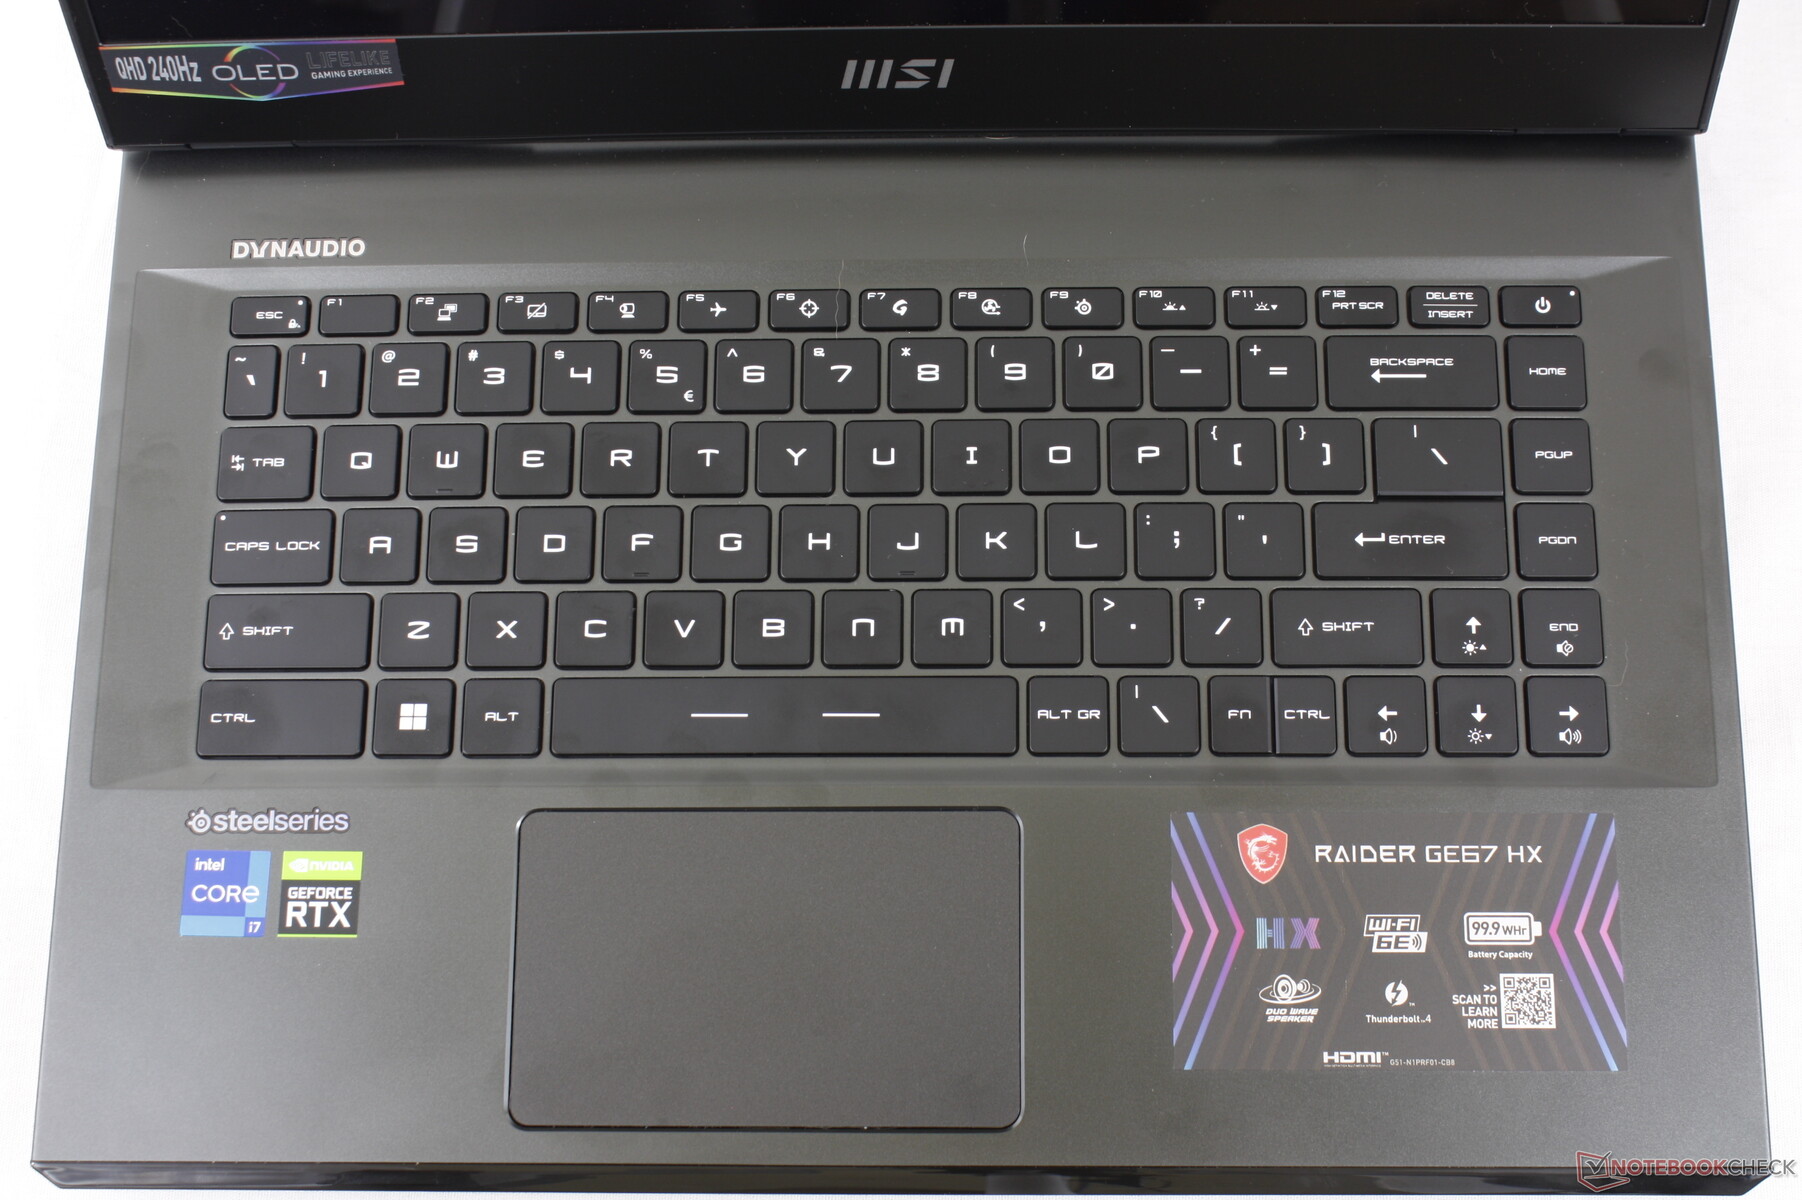
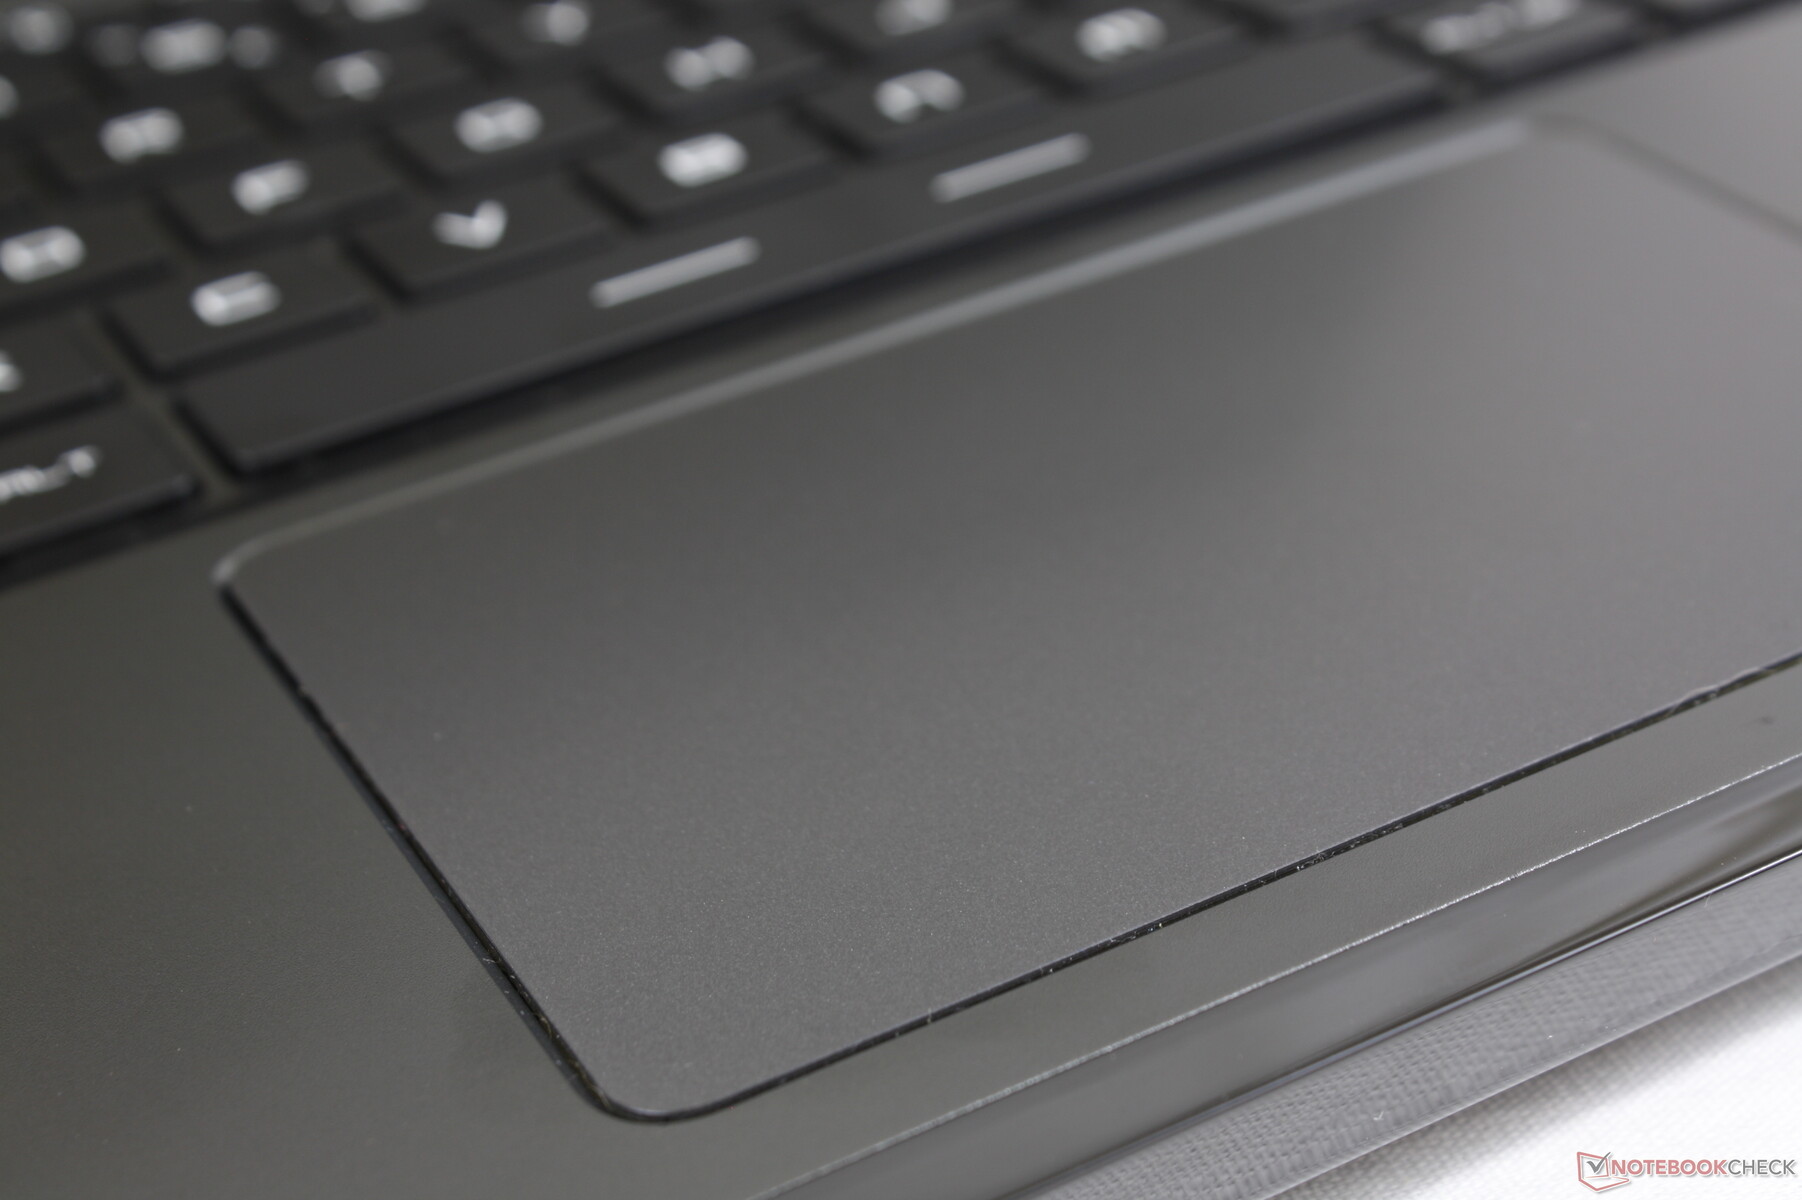
Input Devices — No Major Changes From GE66
Keyboard and Touchpad


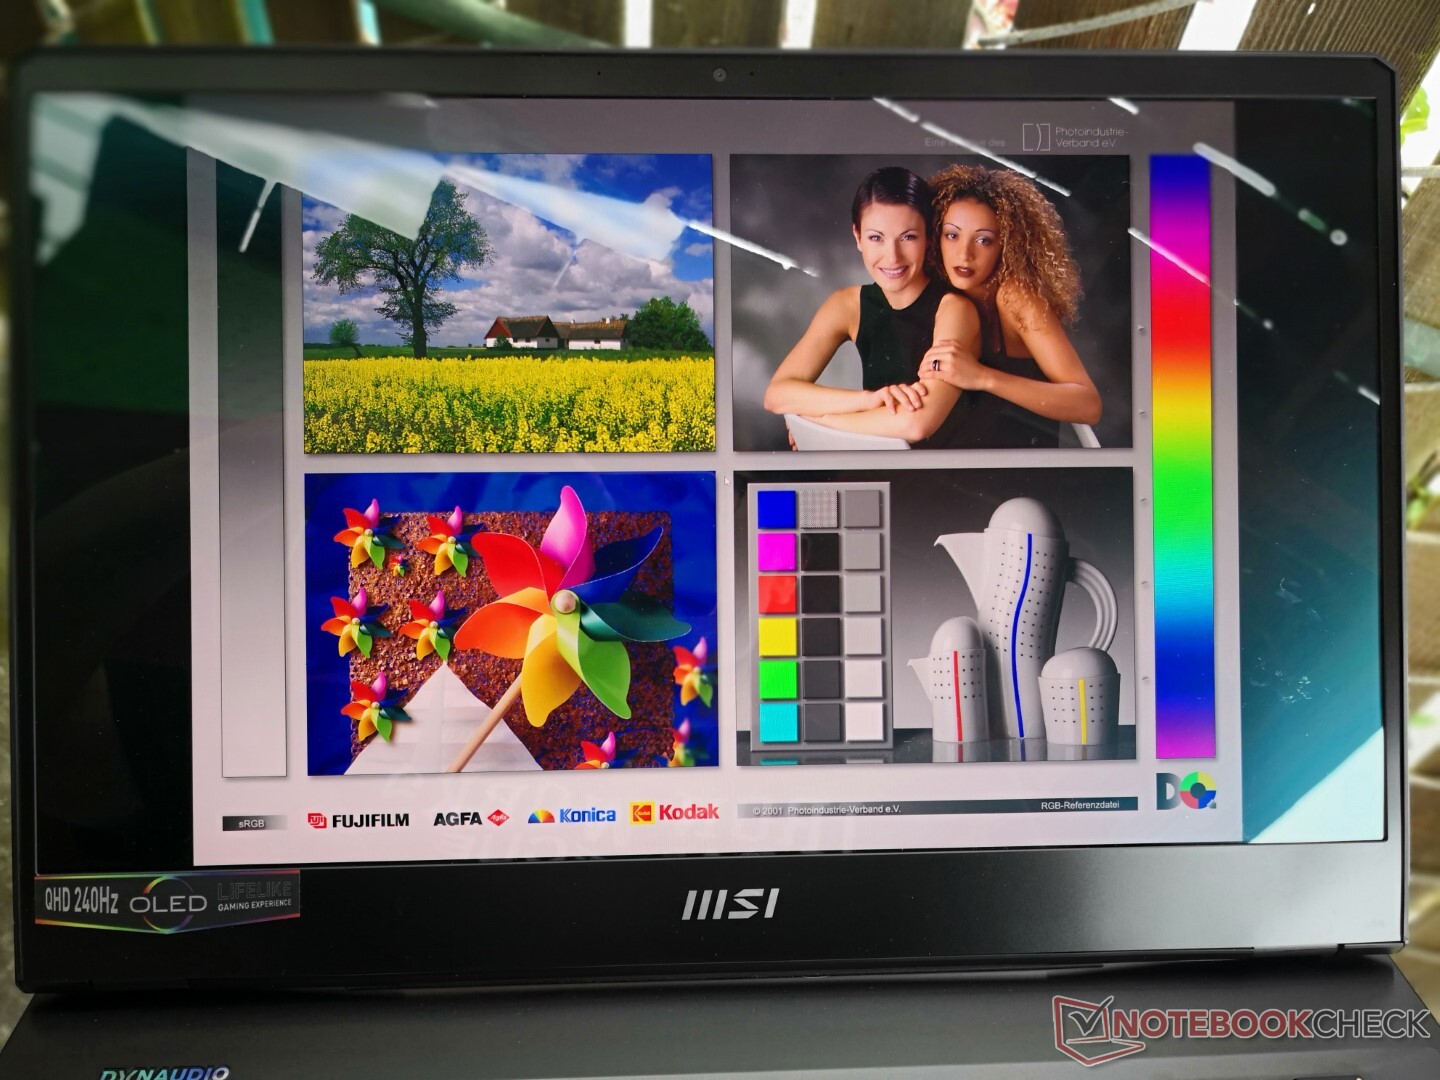
Display — Almost Ideal For Gaming
(July 16, 2022 update: MSI says AdobeRGB and Display P3 color options should be available via the True Color software after reinstalling the software and the Intel VGA drivers. The two color options were missing on our version of True Color installed even after updating to the latest version.)
The MSI GE67 and Razer Blade 15 are two of the first laptops to offer QHD OLED 240 Hz display options. Though this may sound excellent on paper, there are some asterisks to keep in mind.
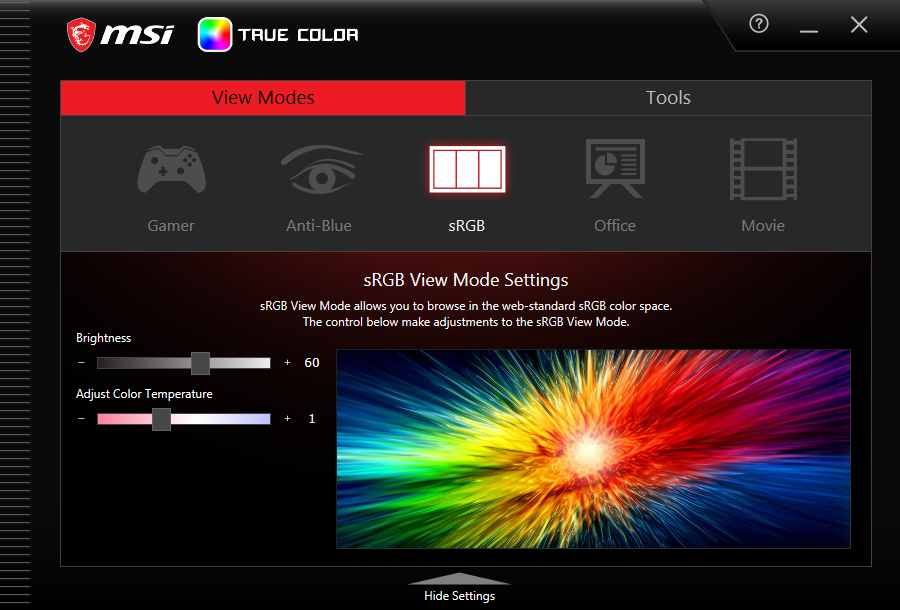
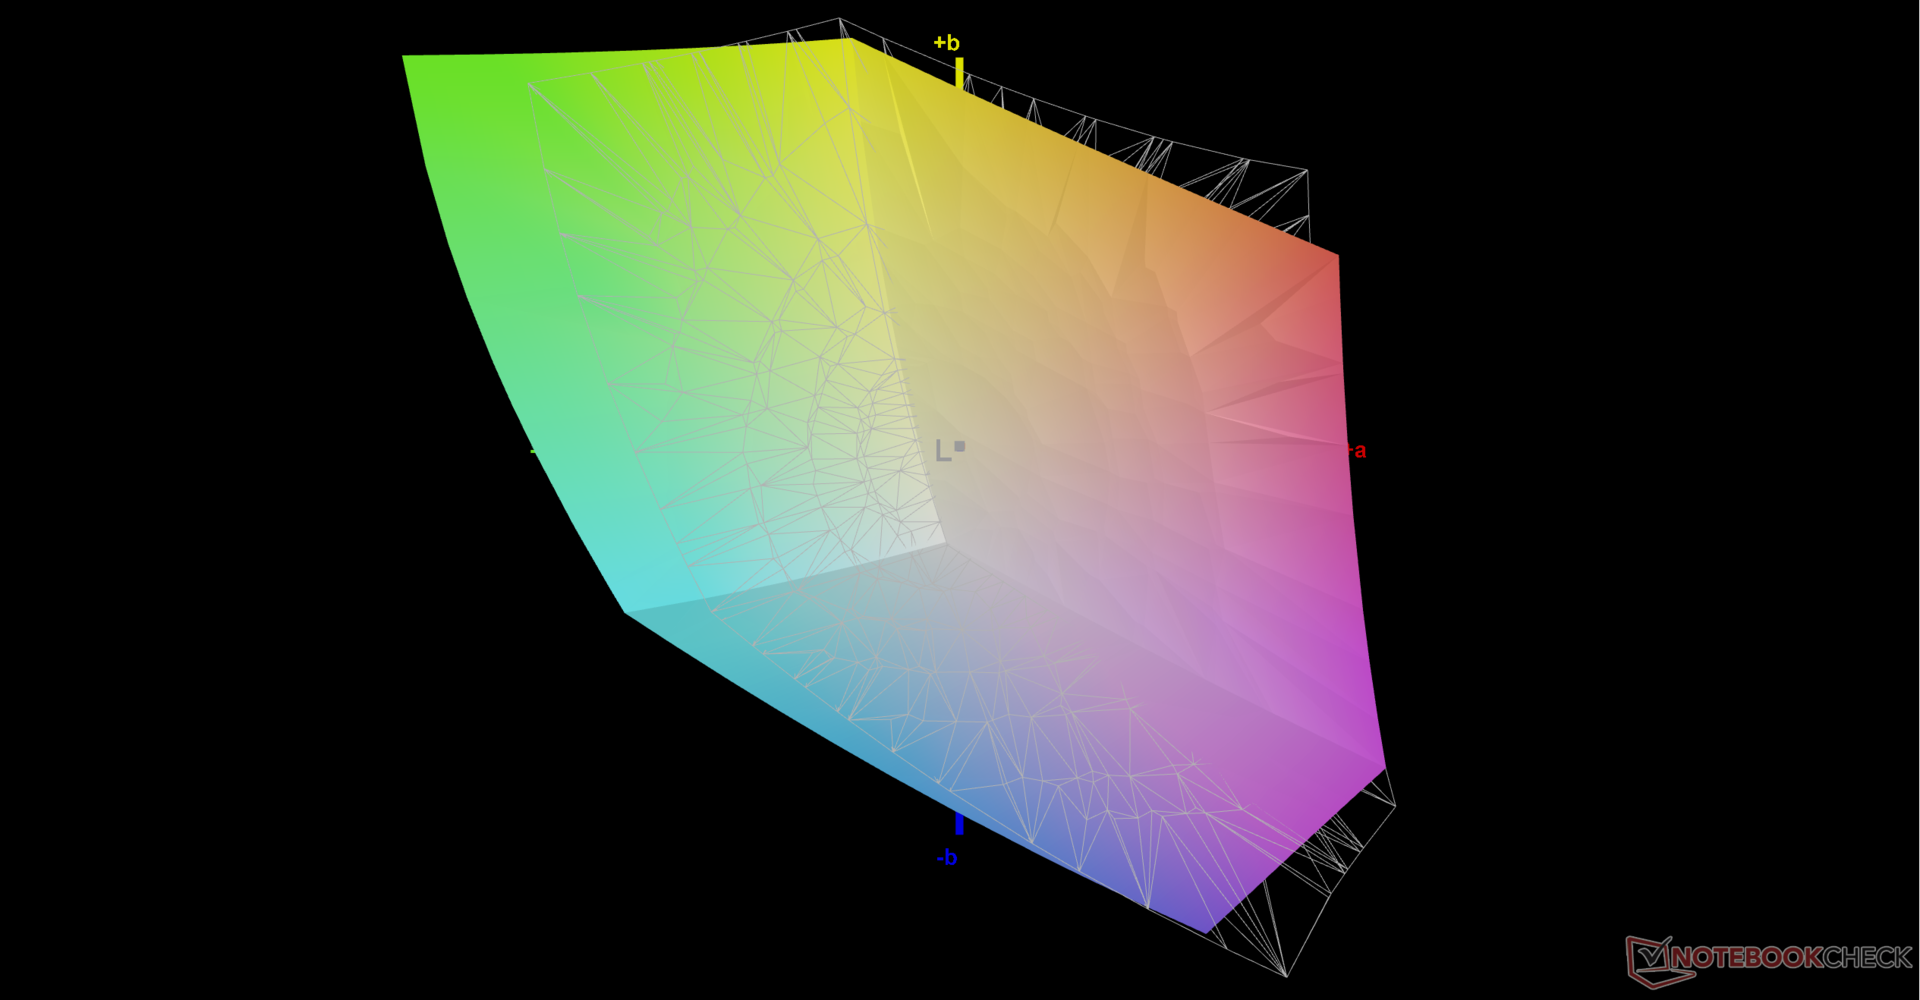
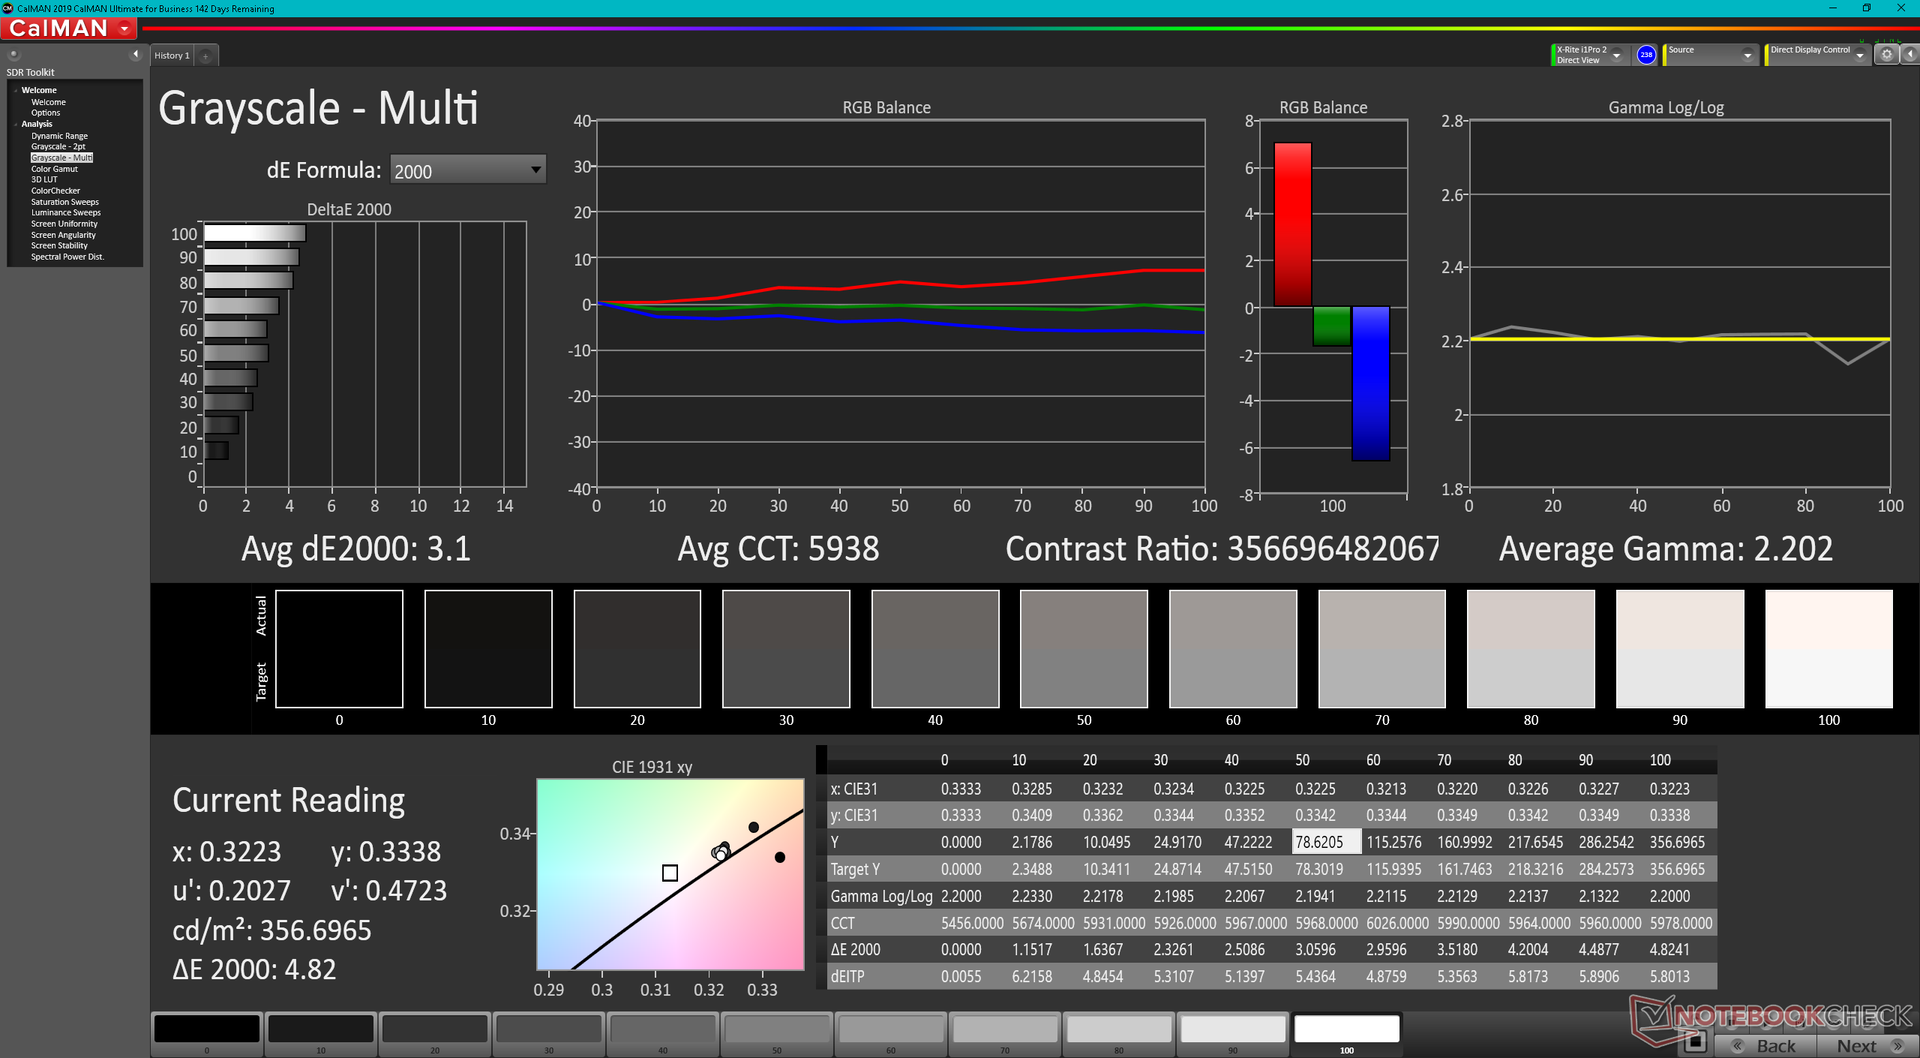
Firstly, the GE67 display is not calibrated at factory even though the OLED panel advertises full DCI-P3 coverage. In fact, we're only able to record a coverage of just 72 percent and the MSI True Color software itself has no DCI-P3 option to choose from. When pressed for comment, MSI responded that DCI-P3 mode is "more for video editors and on our Creator laptop series" and that the GE67 implements Display P3 mode instead.
Secondly, the panel exhibits flickering at 480 Hz on all brightness levels including the 100 percent setting. We've record similar results on many recent Asus Vivobook and Zenbook OLED laptops as well. If your eyes are sensitive to onscreen flicker, then it may be best to lower the brightness or avoid using the GE67 for long periods.
And lastly, the internal display does not support G-Sync or adaptive sync.
Other than the above drawbacks, the QHD OLED 240 Hz panel definitely offers one of the smoothest OLED experiences we've seen when gaming. Older OLED panels were limited to 60 Hz which, while perfectly fine for editing purposes, would be unappealing to enthusiast gamers. MSI has molded the display for gaming purposes and less so for editing or professionals here.

| |||||||||||||||||||||||||
Brightness Distribution: 99 %
Center on Battery: 356.1 cd/m²
Contrast: ∞:1 (Black: 0 cd/m²)
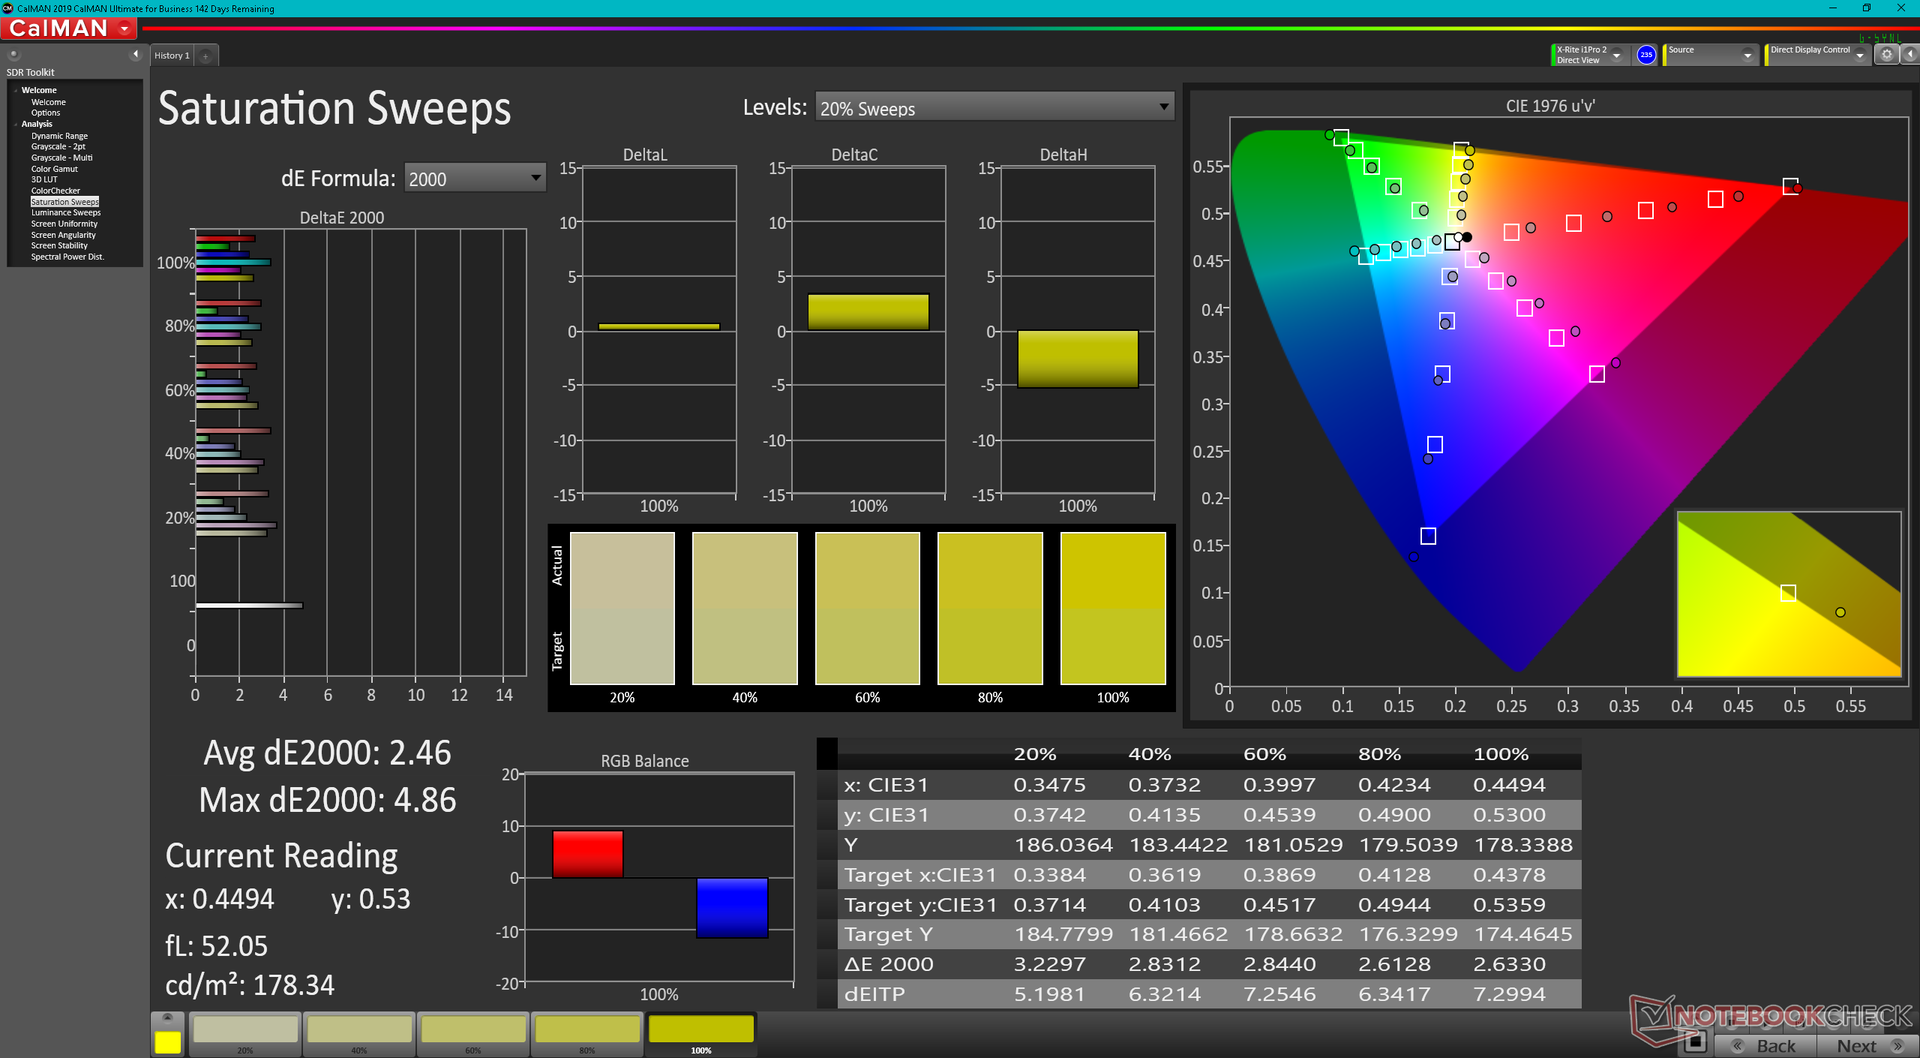
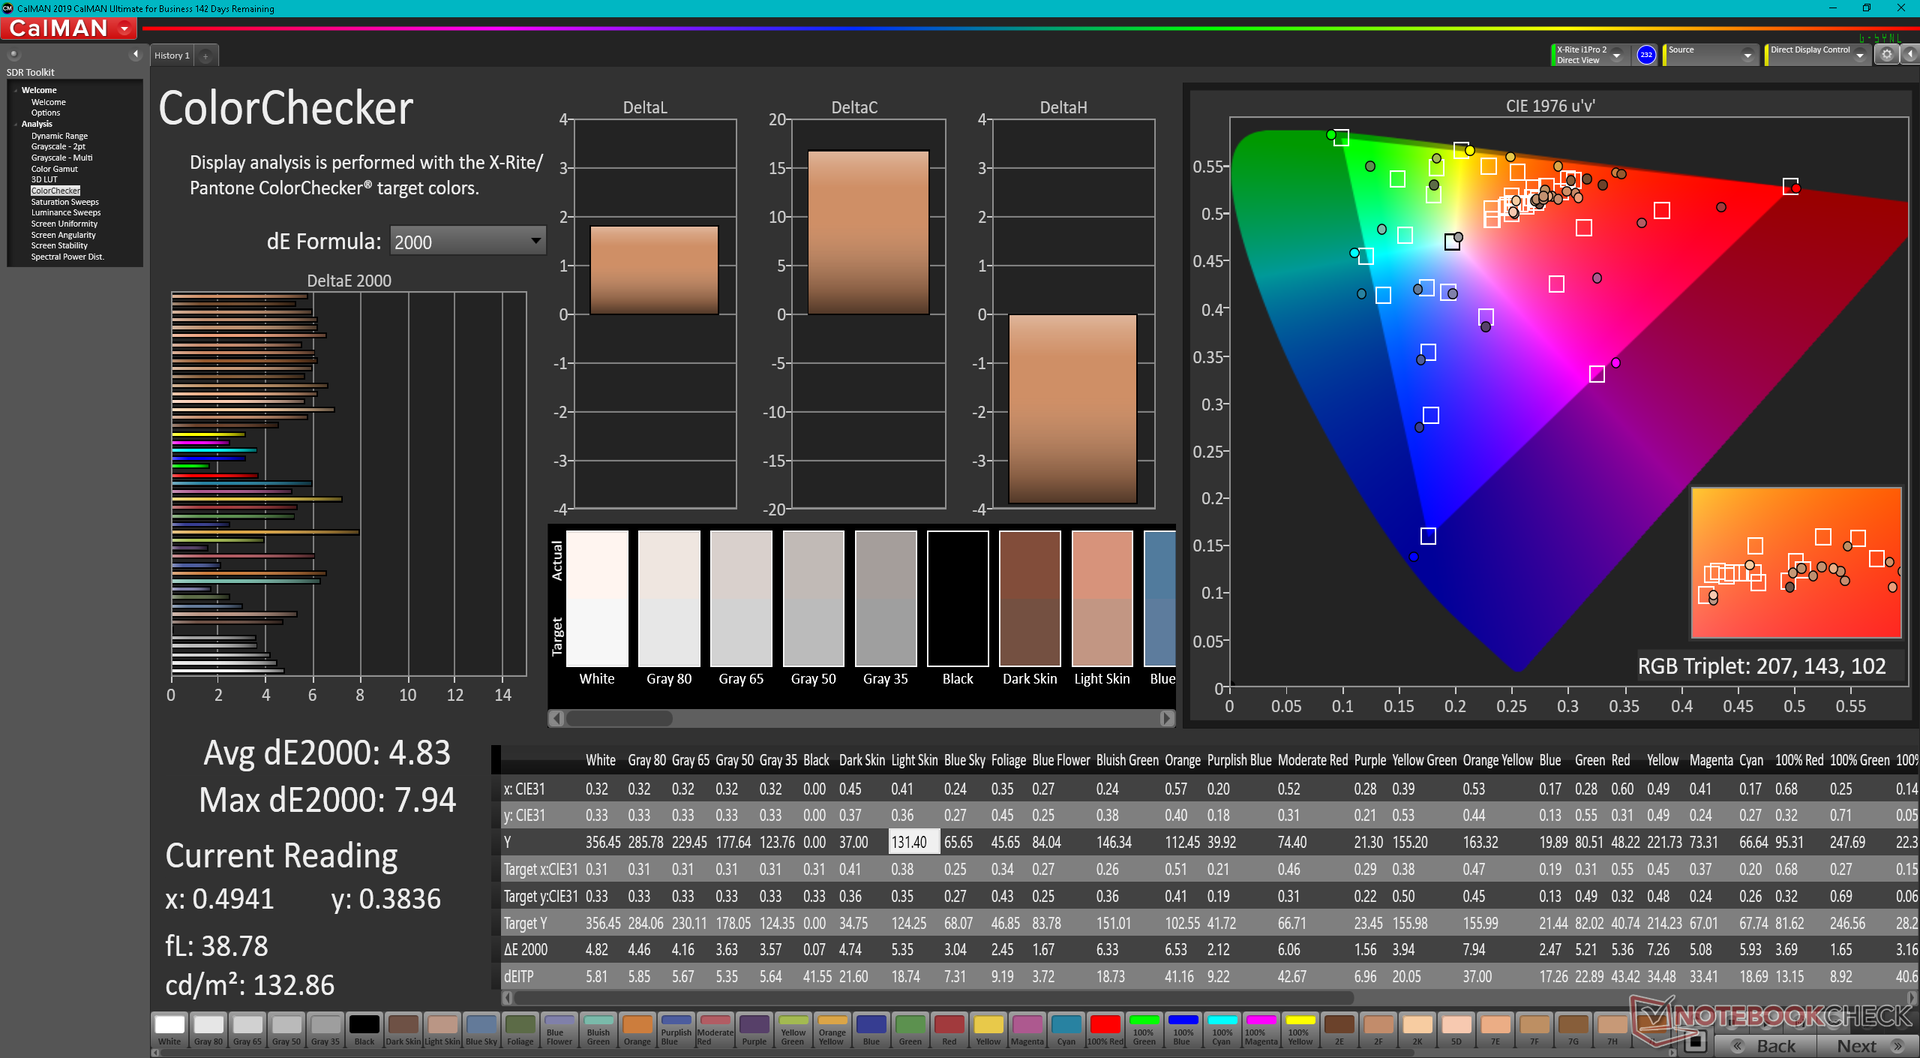
ΔE ColorChecker Calman: 4.83 | ∀{0.5-29.43 Ø4.72}
ΔE Greyscale Calman: 3.1 | ∀{0.09-98 Ø4.97}
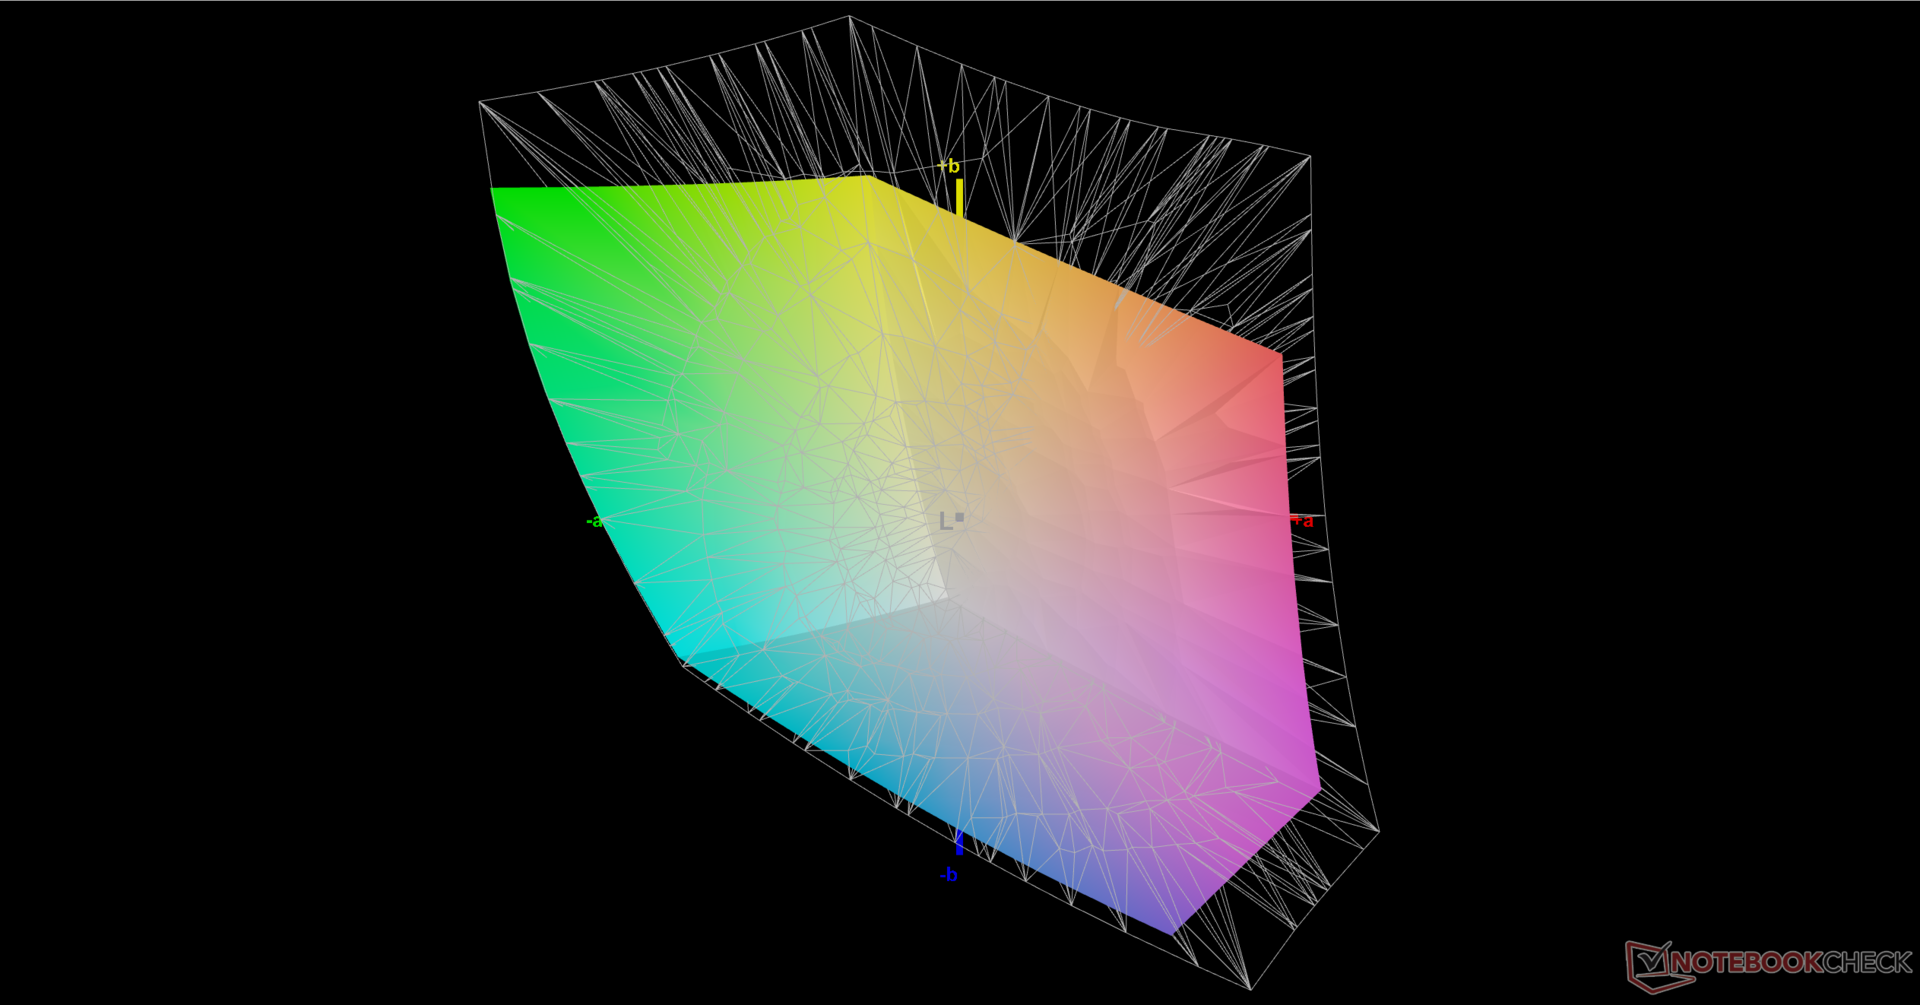
75.2% AdobeRGB 1998 (Argyll 3D)
89.7% sRGB (Argyll 3D)
71.7% Display P3 (Argyll 3D)
Gamma: 2.2
CCT: 5938 K
| MSI GE67 HX 12UGS Samsung ATNA562P02-0, OLED, 1920x1080, 15.6" | MSI Raider GE66 12UHS AUO51EB, IPS, 3840x2160, 15.6" | MSI Vector GP66 12UGS BOE NE156FHM-NZ3, IPS, 1920x1080, 15.6" | Asus ROG Strix Scar 15 G533ZW-LN106WS BOE CQ NE156QHM-NZ2, IPS-level, 2560x1440, 15.6" | Alienware m15 R6, i7-11800H RTX 3080 AU Optronics AUO9092 (B156HAN), IPS, 1920x1080, 15.6" | Razer Blade 15 2022 Sharp LQ156T1JW03, IPS, 2560x1440, 15.6" | |
|---|---|---|---|---|---|---|
| Display | 16% | 2% | 19% | 5% | 21% | |
| Display P3 Coverage (%) | 71.7 | 80.4 12% | 70.1 -2% | 96.2 34% | 74.1 3% | 99.1 38% |
| sRGB Coverage (%) | 89.7 | 98.4 10% | 99.5 11% | 99.9 11% | 99.5 11% | 99.9 11% |
| AdobeRGB 1998 Coverage (%) | 75.2 | 94.7 26% | 72.1 -4% | 84.5 12% | 75.7 1% | 86.8 15% |
| Response Times | -5260% | -2260% | -2134% | -1160% | -4230% | |
| Response Time Grey 50% / Grey 80% * (ms) | 0.25 ? | 18.8 ? -7420% | 5.8 ? -2220% | 7.86 ? -3044% 4.21 ? -1584% | 2.8 -1020% | 14.4 ? -5660% |
| Response Time Black / White * (ms) | 0.4 ? | 12.8 ? -3100% | 9.6 ? -2300% | 7.5 ? -1775% | 5.6 -1300% | 11.6 ? -2800% |
| PWM Frequency (Hz) | 480.4 ? | |||||
| Screen | -1% | 6% | 9% | 6% | 15% | |
| Brightness middle (cd/m²) | 356.1 | 351 -1% | 353.1 -1% | 346 -3% | 359 1% | 286 -20% |
| Brightness (cd/m²) | 358 | 347 -3% | 325 -9% | 329 -8% | 344 -4% | 271 -24% |
| Brightness Distribution (%) | 99 | 90 -9% | 85 -14% | 91 -8% | 85 -14% | 89 -10% |
| Black Level * (cd/m²) | 0.35 | 0.38 | 0.59 | 0.35 | 0.25 | |
| Colorchecker dE 2000 * | 4.83 | 2.54 47% | 2.24 54% | 3.06 37% | 3.3 32% | 2.74 43% |
| Colorchecker dE 2000 max. * | 7.94 | 8.36 -5% | 5 37% | 5.81 27% | 4.84 39% | 5.21 34% |
| Greyscale dE 2000 * | 3.1 | 4.1 -32% | 4 -29% | 3.66 -18% | 1.1 65% | |
| Gamma | 2.2 100% | 2.089 105% | 2.24 98% | 2.12 104% | 2.43 91% | 2.2 100% |
| CCT | 5938 109% | 7036 92% | 6864 95% | 7021 93% | 5896 110% | 6408 101% |
| Contrast (:1) | 1003 | 929 | 586 | 1026 | 1144 | |
| Colorchecker dE 2000 calibrated * | 0.67 | 1.02 | 2.57 | 3.28 | 2.52 | |
| Total Average (Program / Settings) | -1748% /
-952% | -751% /
-407% | -702% /
-573% | -383% /
-206% | -1398% /
-755% |
* ... smaller is better
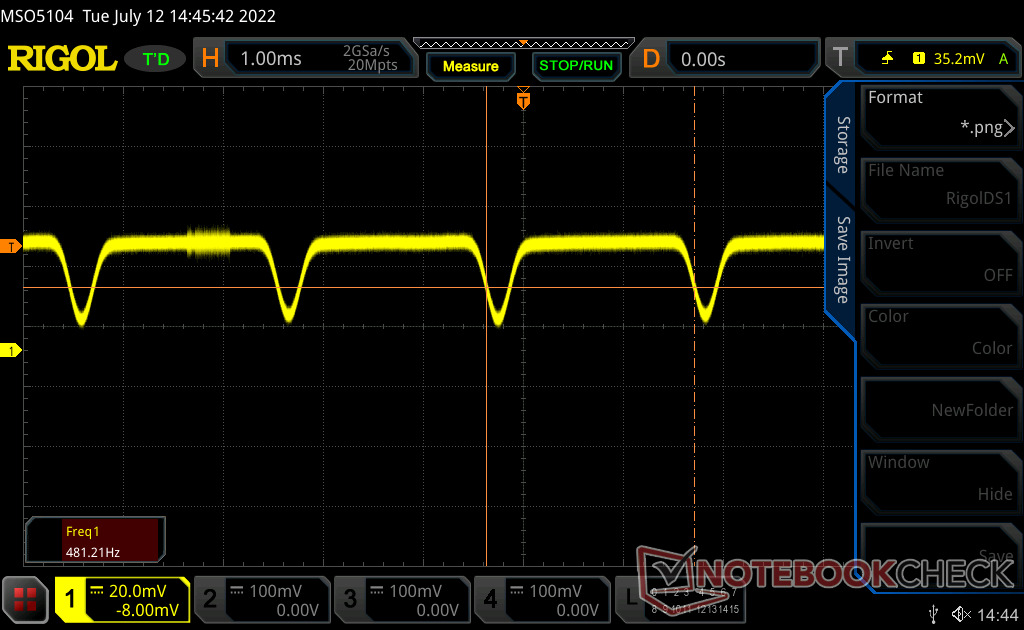
Display Response Times
| ↔ Response Time Black to White | ||
|---|---|---|
| 0.4 ms ... rise ↗ and fall ↘ combined | ↗ 0.2 ms rise | 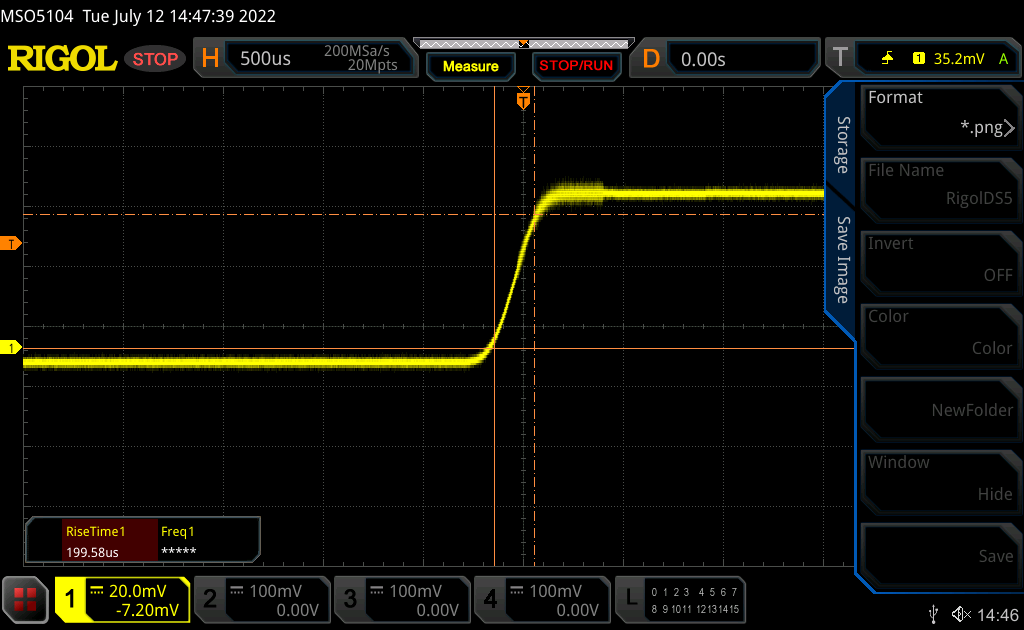 |
| ↘ 0.2 ms fall | ||
| The screen shows very fast response rates in our tests and should be very well suited for fast-paced gaming. In comparison, all tested devices range from 0.1 (minimum) to 240 (maximum) ms. » 0 % of all devices are better. This means that the measured response time is better than the average of all tested devices (19.8 ms). | ||
| ↔ Response Time 50% Grey to 80% Grey | ||
| 0.25 ms ... rise ↗ and fall ↘ combined | ↗ 0.13 ms rise | 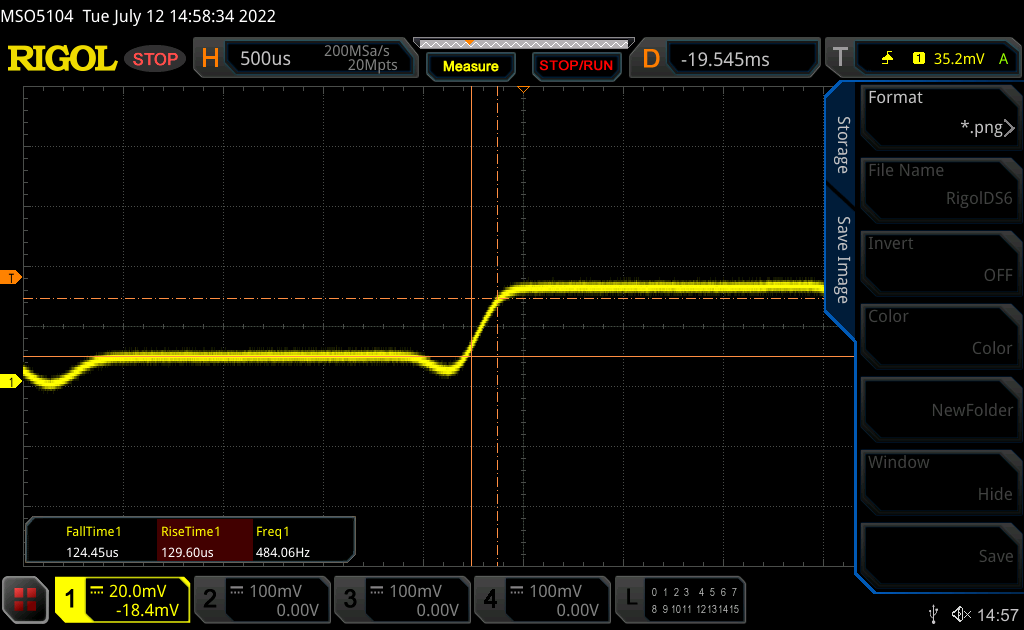 |
| ↘ 0.12 ms fall | ||
| The screen shows very fast response rates in our tests and should be very well suited for fast-paced gaming. In comparison, all tested devices range from 0.165 (minimum) to 636 (maximum) ms. » 0 % of all devices are better. This means that the measured response time is better than the average of all tested devices (31 ms). | ||
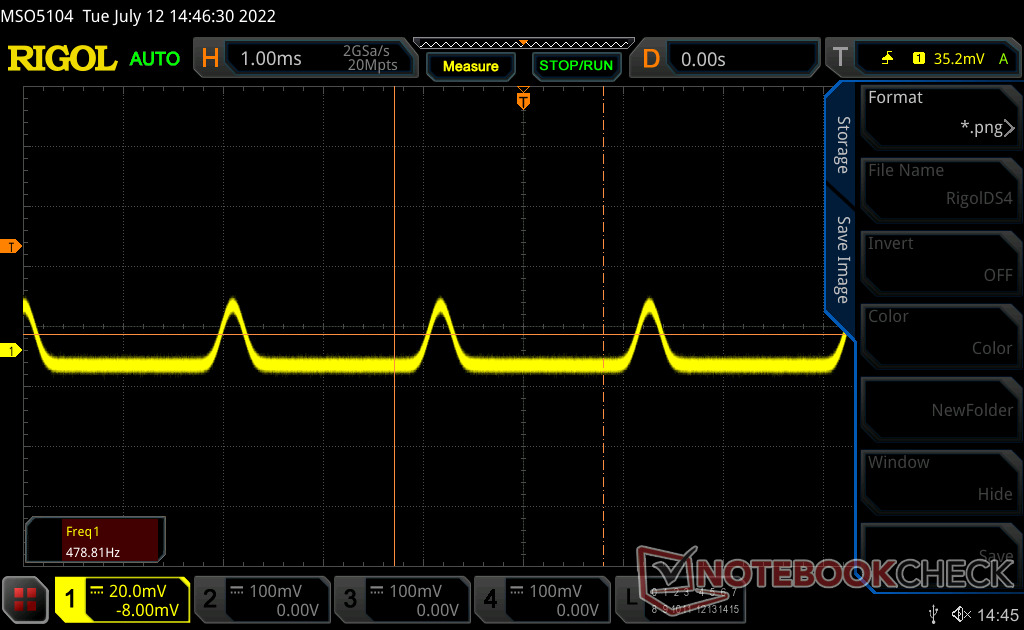
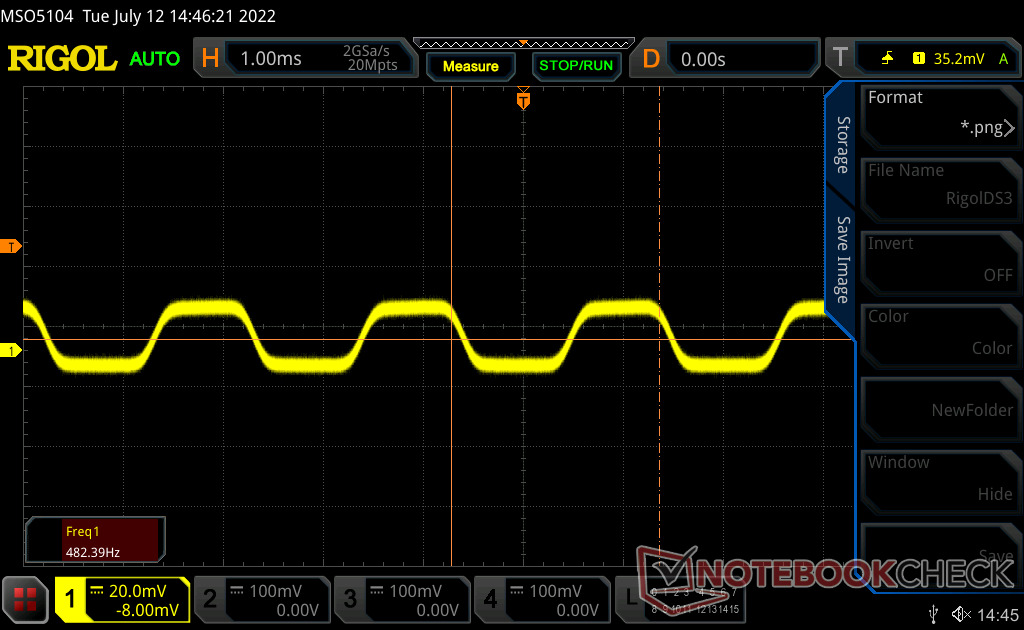
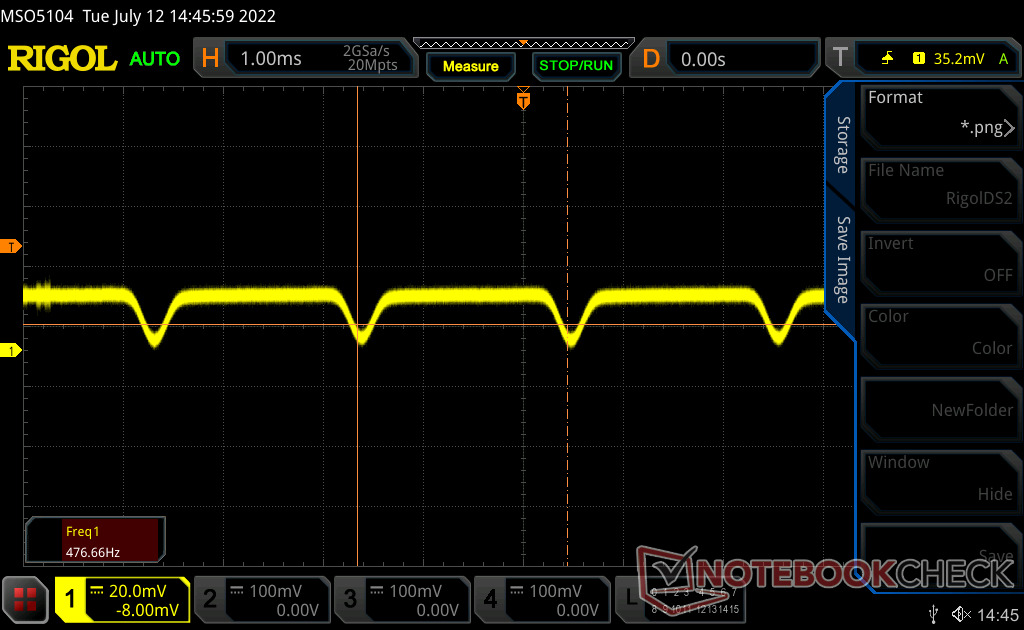
Screen Flickering / PWM (Pulse-Width Modulation)
| Screen flickering / PWM detected | 480.4 Hz | ≤ 100 % brightness setting | 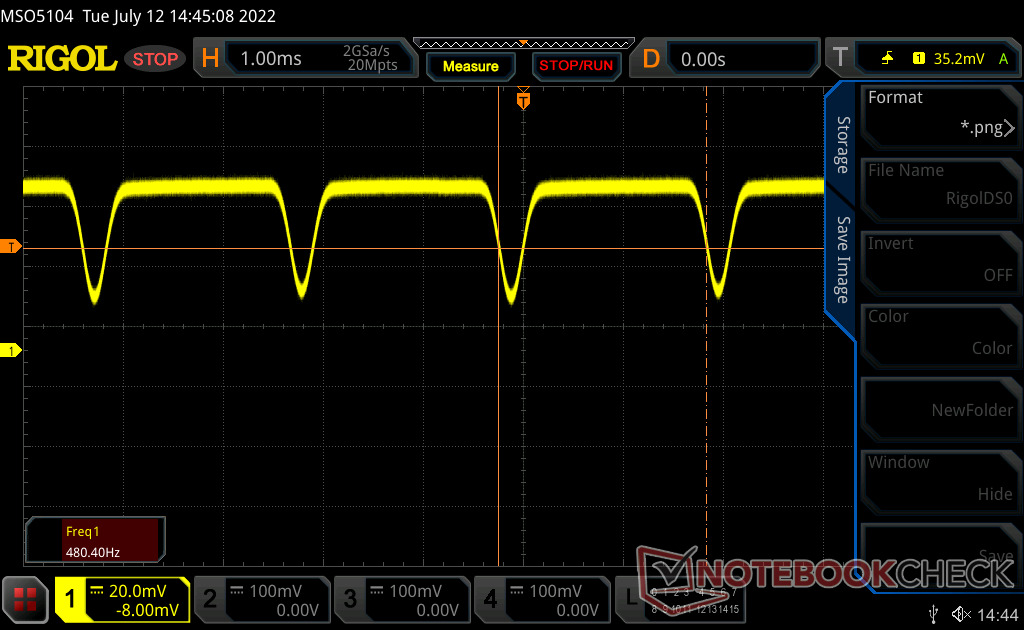 |
The display backlight flickers at 480.4 Hz (worst case, e.g., utilizing PWM) Flickering detected at a brightness setting of 100 % and below. There should be no flickering or PWM above this brightness setting. The frequency of 480.4 Hz is relatively high, so most users sensitive to PWM should not notice any flickering. However, there are reports that some users are still sensitive to PWM at 500 Hz and above, so be aware. In comparison: 52 % of all tested devices do not use PWM to dim the display. If PWM was detected, an average of 7775 (minimum: 5 - maximum: 343500) Hz was measured. | |||


Performance — 16 Cores And 24 Threads
Testing Conditions
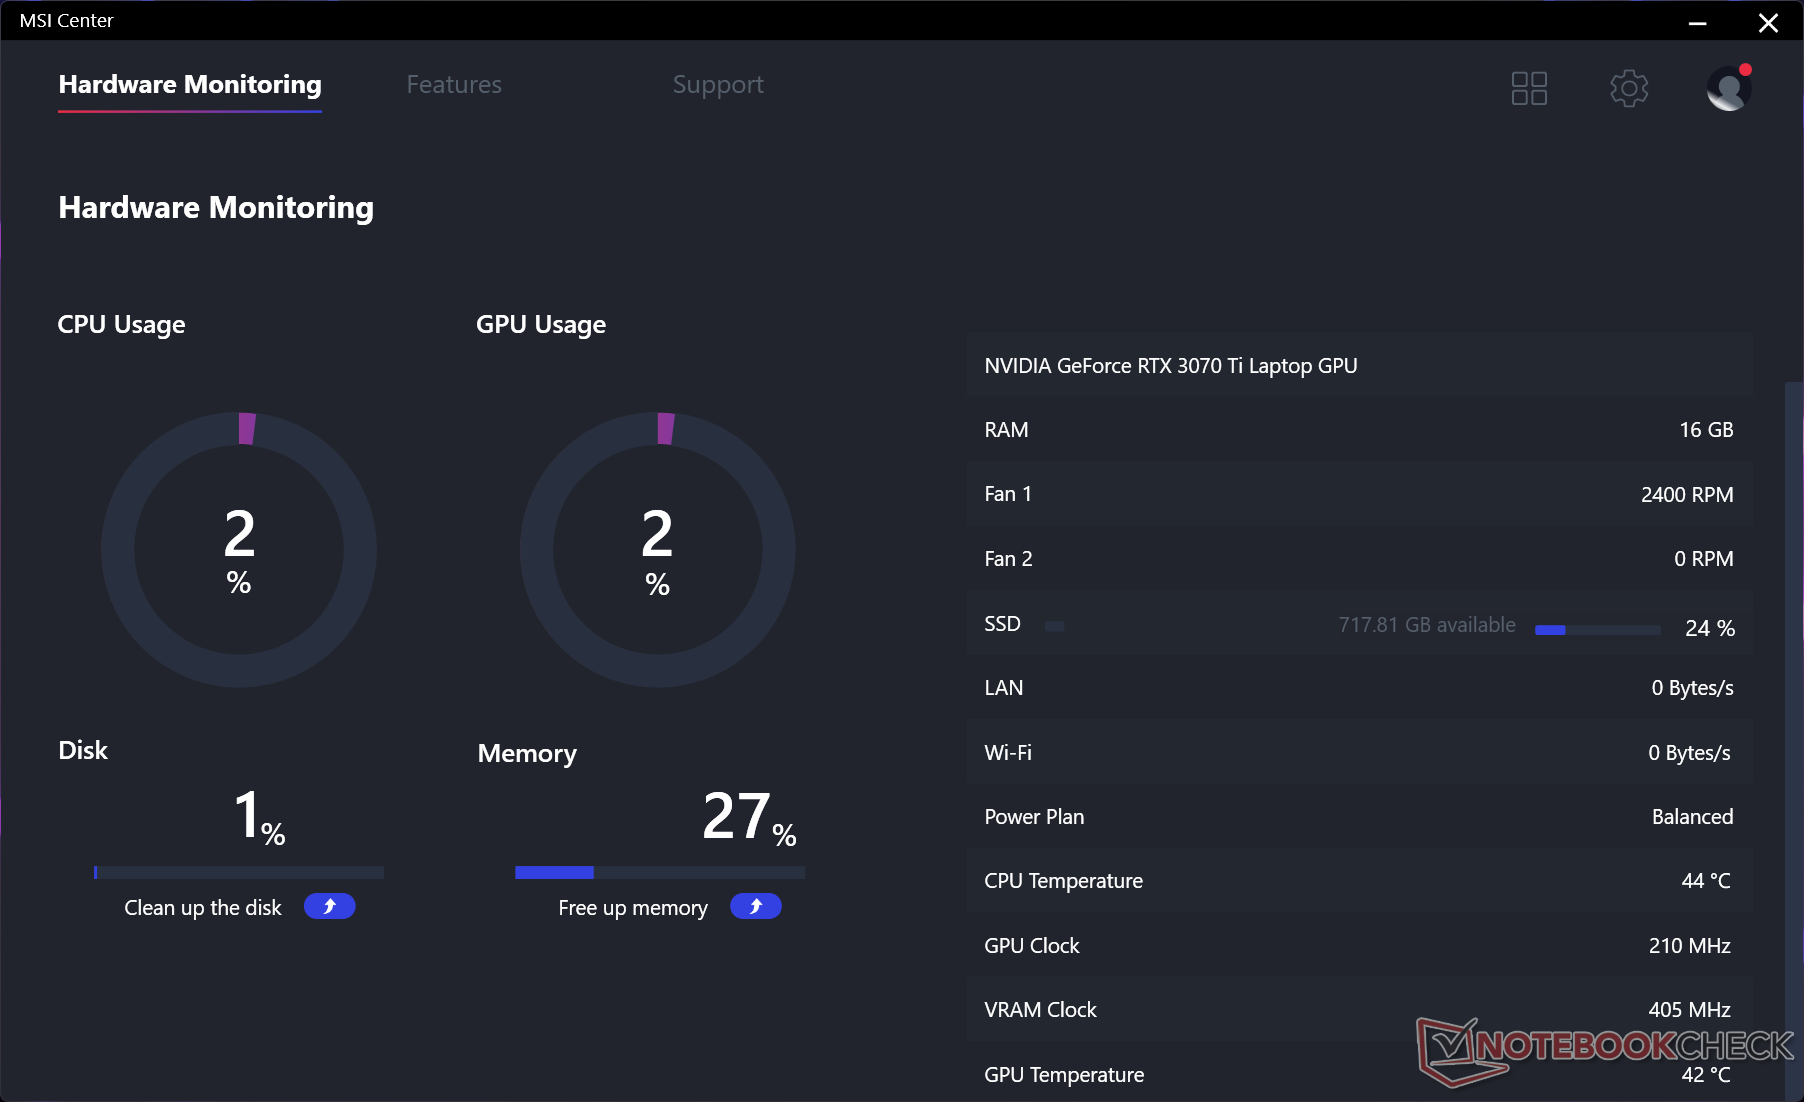
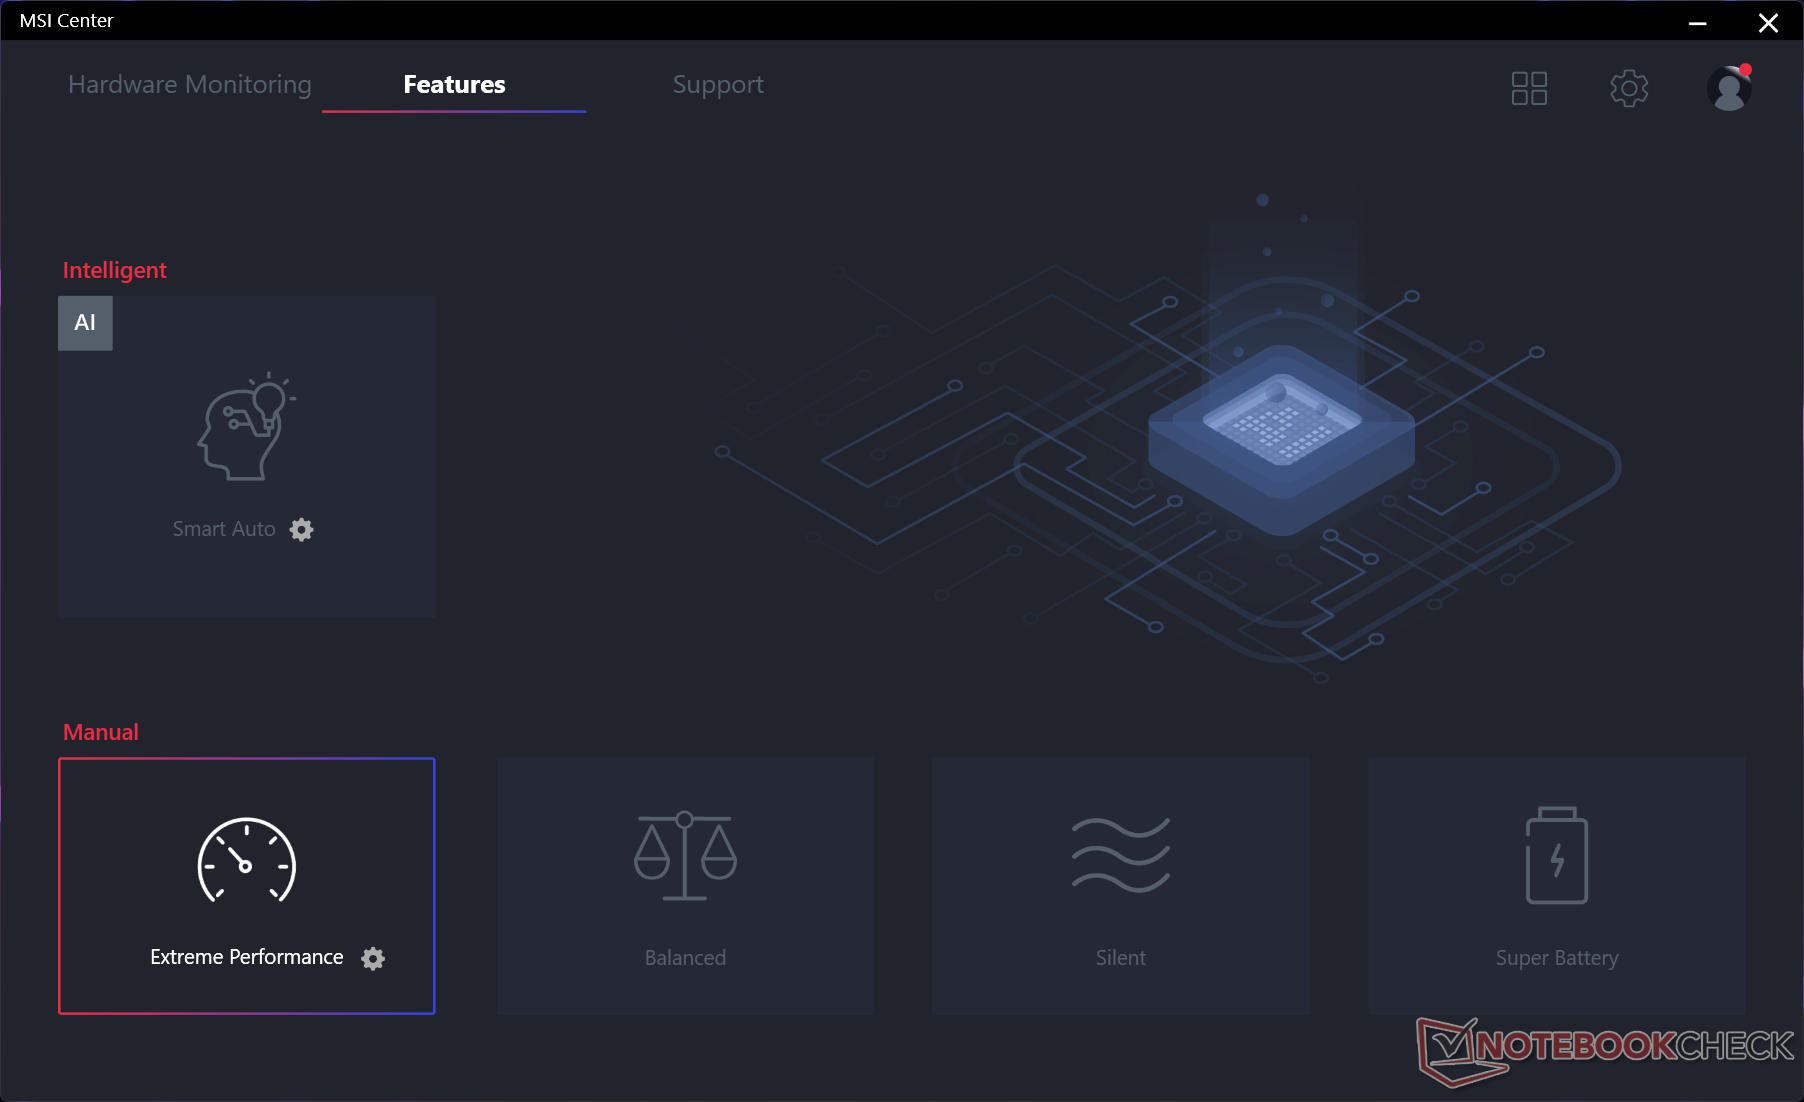
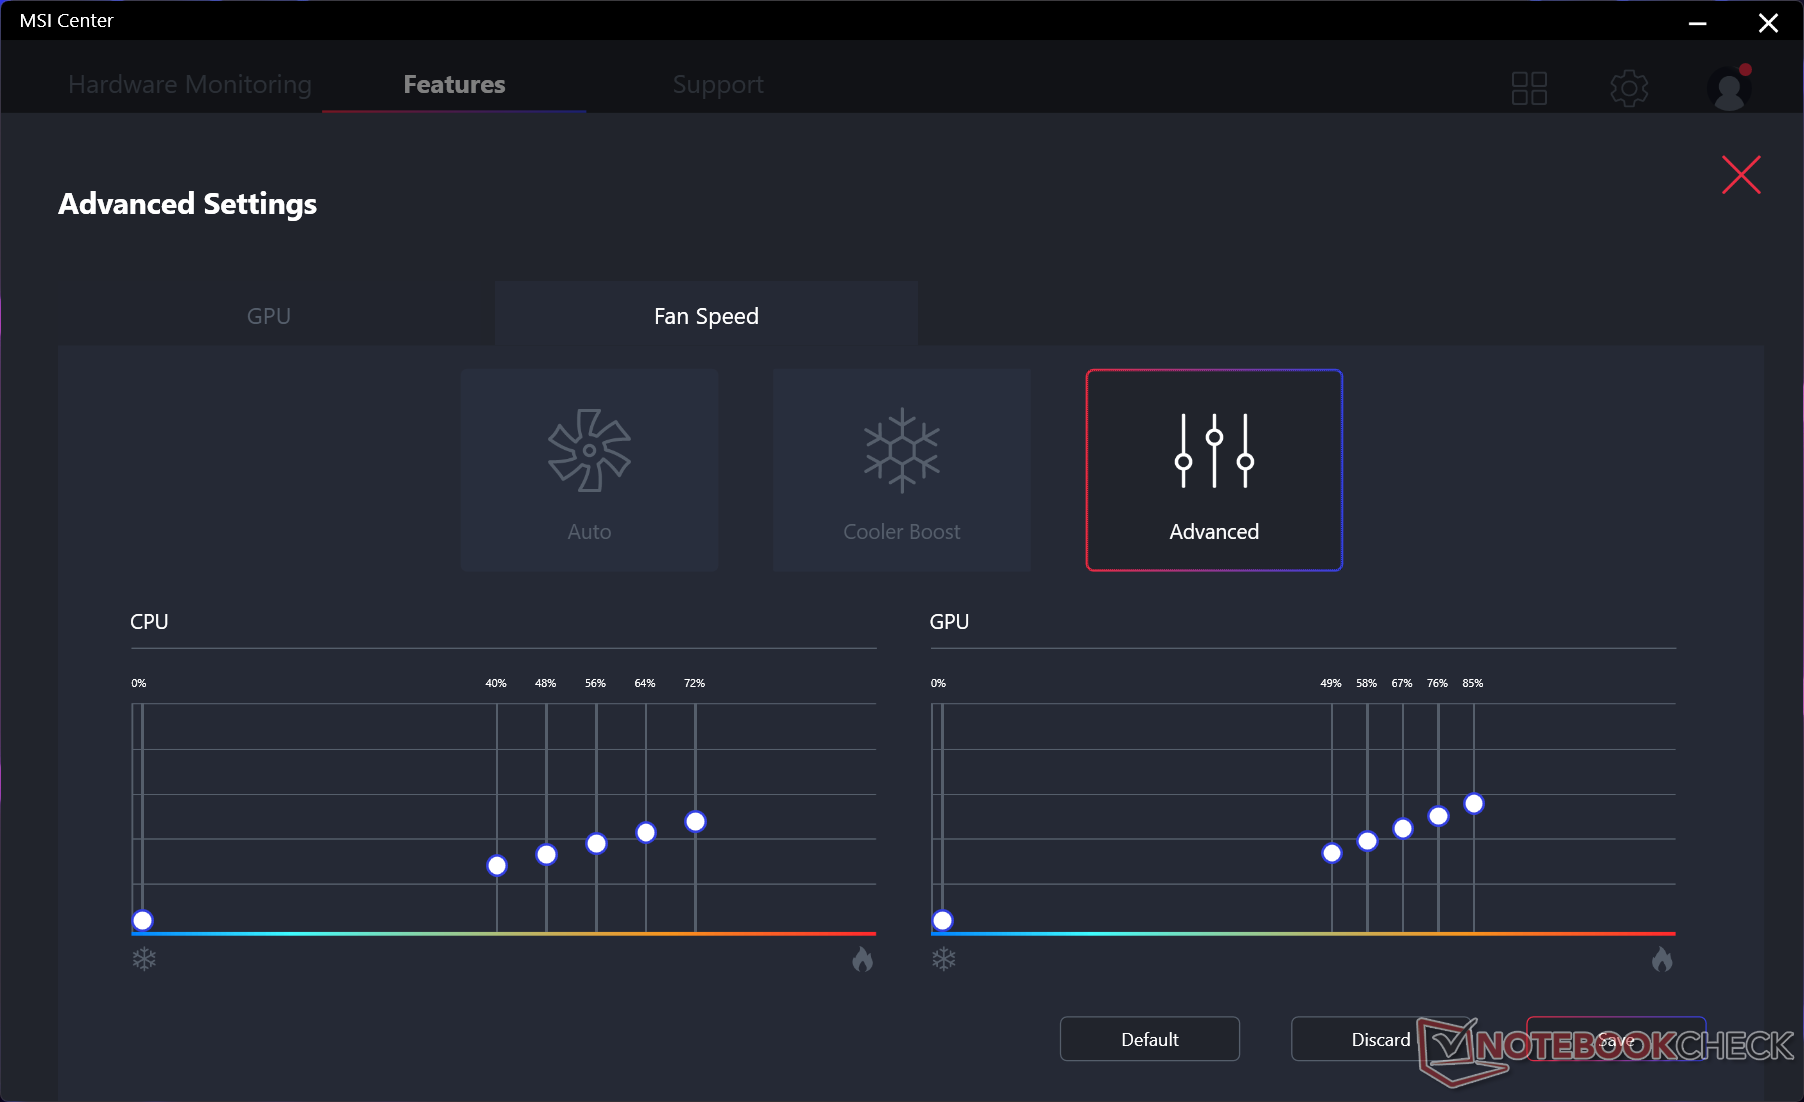
We set our unit to Performance mode via Windows, Extreme Performance mode vis MSI Center, and the discrete GPU active instead of MSHybrid mode prior to running any benchmarks below. We recommend that users become familiar with the pre-installed MSI Center software as key performance and auxiliary features are toggled here.
Processor
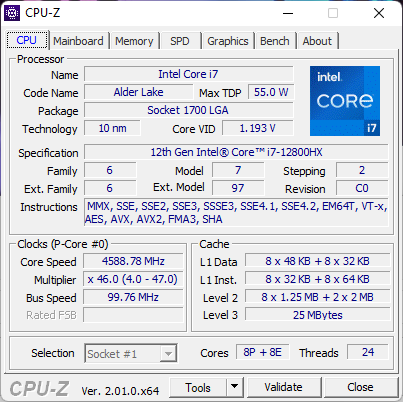
The Core i7-12800HX is easily a highlight of the GE67 HX. Raw multi-thread performance is approximately 25 percent faster than the Core i9-12900HK in the Q1 2022 GE66 and this delta is even greater when compared to the 10th gen Core i9-10980HK in the original 2020 GE66. It easily outperforms any mobile processor in AMD's Zen 3 lineup. The Ryzen 9 5900HX, for example, is slower by 40 to 45 percent in multi-threaded loads.
Performance sustainability is also very good with no major dips in clock rates over time even when stressed for long periods.
Single-thread performance remains similar to the Core i9-12900HK despite their differences in core count (16 vs. 14) and thread count (24 vs. 20).
Cinebench R15 Multi Loop
Cinebench R23: Multi Core | Single Core
Cinebench R15: CPU Multi 64Bit | CPU Single 64Bit
Blender: v2.79 BMW27 CPU
7-Zip 18.03: 7z b 4 | 7z b 4 -mmt1
Geekbench 5.5: Multi-Core | Single-Core
HWBOT x265 Benchmark v2.2: 4k Preset
LibreOffice : 20 Documents To PDF
R Benchmark 2.5: Overall mean
| Cinebench R23 / Multi Core | |
| Intel Core i9-12900K | |
| MSI GE67 HX 12UGS | |
| Average Intel Core i7-12800HX (n=1) | |
| MSI GE76 Raider | |
| Schenker XMG Neo 15 (i7-12700H, RTX 3080 Ti) | |
| Eurocom Raptor X15 | |
| Asus ROG Strix Scar 15 G533zm | |
| MSI Raider GE66 12UHS | |
| Schenker XMG Apex 15 NH57E PS | |
| MSI Delta 15 A5EFK | |
| Cinebench R23 / Single Core | |
| Intel Core i9-12900K | |
| MSI GE76 Raider | |
| MSI Raider GE66 12UHS | |
| MSI GE67 HX 12UGS | |
| Average Intel Core i7-12800HX (n=1) | |
| Schenker XMG Neo 15 (i7-12700H, RTX 3080 Ti) | |
| Eurocom Raptor X15 | |
| Asus ROG Strix Scar 15 G533zm | |
| MSI Delta 15 A5EFK | |
| Schenker XMG Apex 15 NH57E PS | |
Cinebench R23: Multi Core | Single Core
Cinebench R15: CPU Multi 64Bit | CPU Single 64Bit
Blender: v2.79 BMW27 CPU
7-Zip 18.03: 7z b 4 | 7z b 4 -mmt1
Geekbench 5.5: Multi-Core | Single-Core
HWBOT x265 Benchmark v2.2: 4k Preset
LibreOffice : 20 Documents To PDF
R Benchmark 2.5: Overall mean
* ... smaller is better
AIDA64: FP32 Ray-Trace | FPU Julia | CPU SHA3 | CPU Queen | FPU SinJulia | FPU Mandel | CPU AES | CPU ZLib | FP64 Ray-Trace | CPU PhotoWorxx
| Performance rating | |
| Alienware m15 R6, i7-11800H RTX 3080 | |
| MSI GE67 HX 12UGS | |
| Average Intel Core i7-12800HX | |
| Asus ROG Strix Scar 15 G533ZW-LN106WS | |
| MSI Raider GE66 12UHS | |
| MSI Vector GP66 12UGS | |
| Razer Blade 15 2022 | |
| AIDA64 / FP32 Ray-Trace | |
| Alienware m15 R6, i7-11800H RTX 3080 | |
| MSI GE67 HX 12UGS | |
| Average Intel Core i7-12800HX (n=1) | |
| Asus ROG Strix Scar 15 G533ZW-LN106WS | |
| MSI Raider GE66 12UHS | |
| MSI Vector GP66 12UGS | |
| Razer Blade 15 2022 | |
| AIDA64 / FPU Julia | |
| Alienware m15 R6, i7-11800H RTX 3080 | |
| MSI GE67 HX 12UGS | |
| Average Intel Core i7-12800HX (n=1) | |
| Asus ROG Strix Scar 15 G533ZW-LN106WS | |
| MSI Raider GE66 12UHS | |
| MSI Vector GP66 12UGS | |
| Razer Blade 15 2022 | |
| AIDA64 / CPU SHA3 | |
| Alienware m15 R6, i7-11800H RTX 3080 | |
| MSI GE67 HX 12UGS | |
| Average Intel Core i7-12800HX (n=1) | |
| Asus ROG Strix Scar 15 G533ZW-LN106WS | |
| MSI Vector GP66 12UGS | |
| MSI Raider GE66 12UHS | |
| Razer Blade 15 2022 | |
| AIDA64 / CPU Queen | |
| MSI Vector GP66 12UGS | |
| MSI Raider GE66 12UHS | |
| Asus ROG Strix Scar 15 G533ZW-LN106WS | |
| Razer Blade 15 2022 | |
| Alienware m15 R6, i7-11800H RTX 3080 | |
| MSI GE67 HX 12UGS | |
| Average Intel Core i7-12800HX (n=1) | |
| AIDA64 / FPU SinJulia | |
| MSI GE67 HX 12UGS | |
| Average Intel Core i7-12800HX (n=1) | |
| Asus ROG Strix Scar 15 G533ZW-LN106WS | |
| Alienware m15 R6, i7-11800H RTX 3080 | |
| MSI Vector GP66 12UGS | |
| MSI Raider GE66 12UHS | |
| Razer Blade 15 2022 | |
| AIDA64 / FPU Mandel | |
| Alienware m15 R6, i7-11800H RTX 3080 | |
| MSI GE67 HX 12UGS | |
| Average Intel Core i7-12800HX (n=1) | |
| Asus ROG Strix Scar 15 G533ZW-LN106WS | |
| MSI Raider GE66 12UHS | |
| MSI Vector GP66 12UGS | |
| Razer Blade 15 2022 | |
| AIDA64 / CPU AES | |
| Alienware m15 R6, i7-11800H RTX 3080 | |
| MSI GE67 HX 12UGS | |
| Average Intel Core i7-12800HX (n=1) | |
| Asus ROG Strix Scar 15 G533ZW-LN106WS | |
| MSI Vector GP66 12UGS | |
| MSI Raider GE66 12UHS | |
| Razer Blade 15 2022 | |
| AIDA64 / CPU ZLib | |
| MSI GE67 HX 12UGS | |
| Average Intel Core i7-12800HX (n=1) | |
| Asus ROG Strix Scar 15 G533ZW-LN106WS | |
| MSI Vector GP66 12UGS | |
| MSI Raider GE66 12UHS | |
| Razer Blade 15 2022 | |
| Alienware m15 R6, i7-11800H RTX 3080 | |
| AIDA64 / FP64 Ray-Trace | |
| Alienware m15 R6, i7-11800H RTX 3080 | |
| MSI GE67 HX 12UGS | |
| Average Intel Core i7-12800HX (n=1) | |
| Asus ROG Strix Scar 15 G533ZW-LN106WS | |
| MSI Raider GE66 12UHS | |
| MSI Vector GP66 12UGS | |
| Razer Blade 15 2022 | |
| AIDA64 / CPU PhotoWorxx | |
| Razer Blade 15 2022 | |
| MSI Raider GE66 12UHS | |
| Asus ROG Strix Scar 15 G533ZW-LN106WS | |
| MSI GE67 HX 12UGS | |
| Average Intel Core i7-12800HX (n=1) | |
| MSI Vector GP66 12UGS | |
| Alienware m15 R6, i7-11800H RTX 3080 | |
System Performance
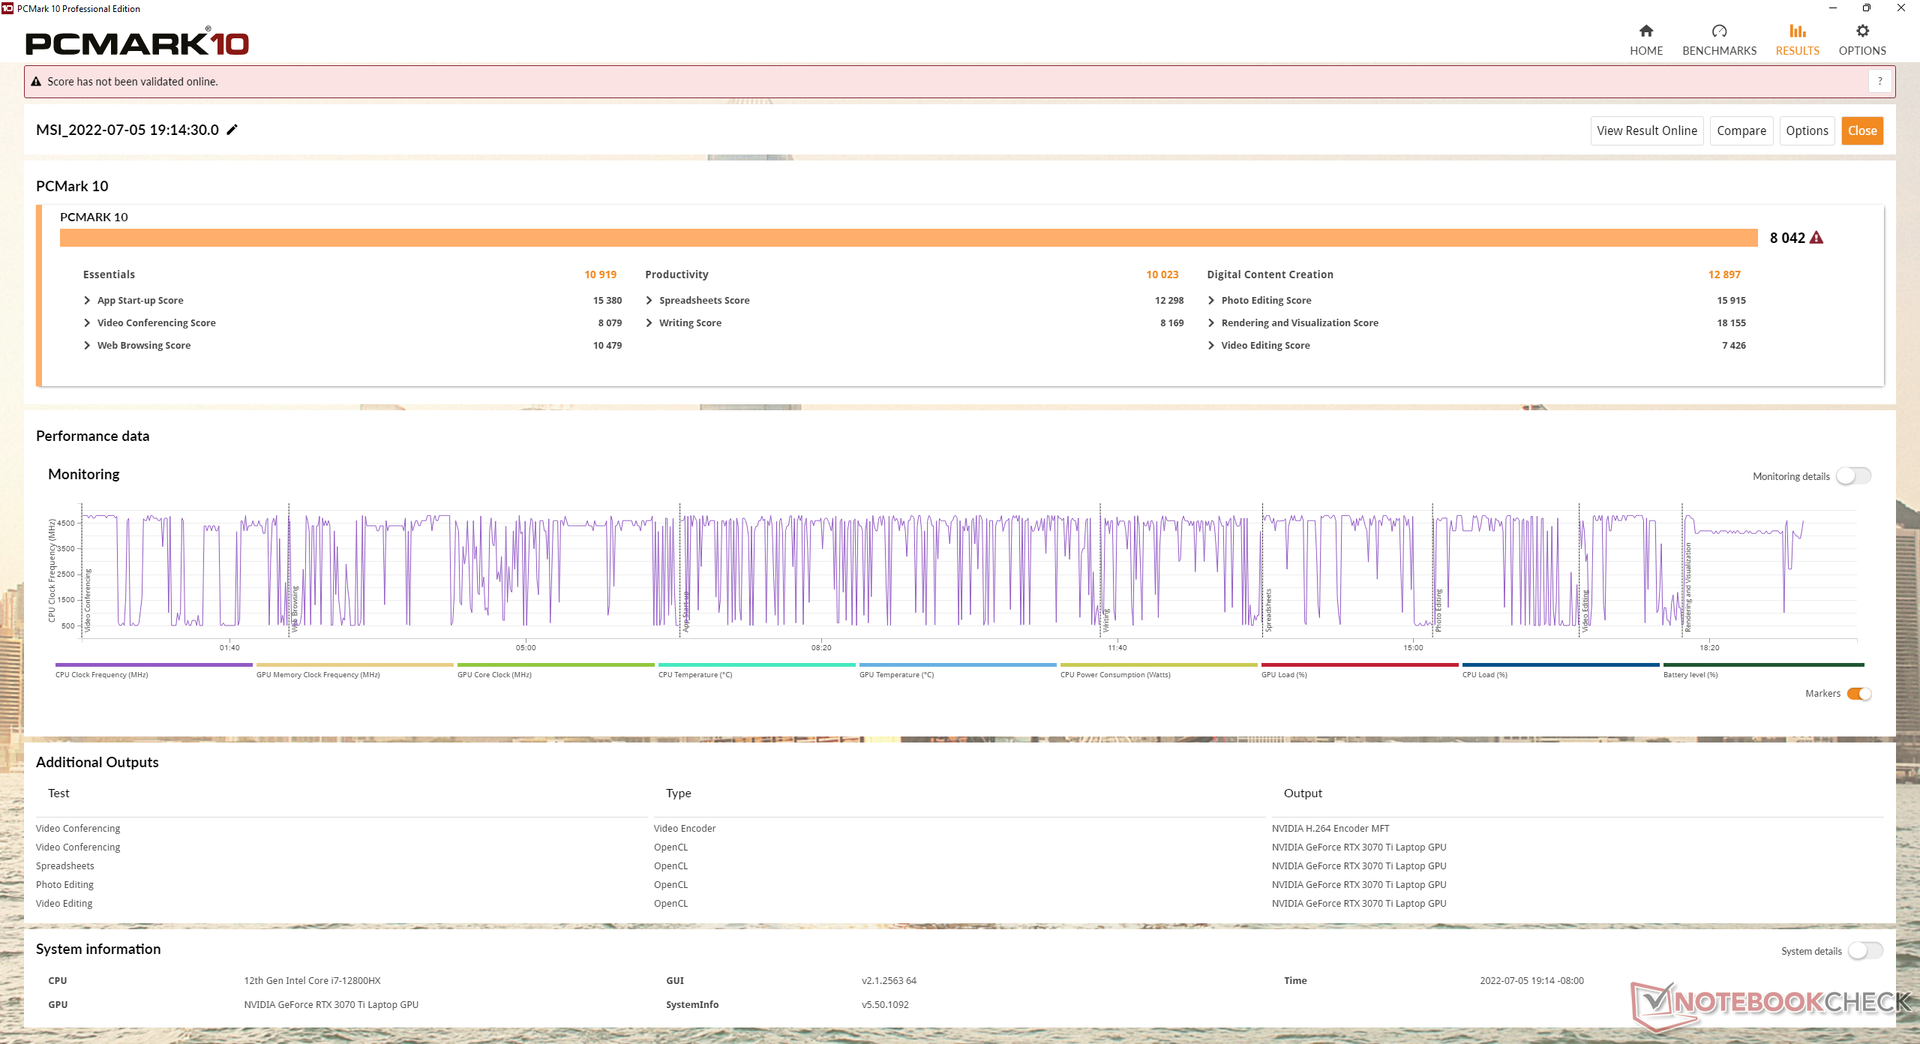
PCMark 10 results are some of the highest in our database with scores that are similar to what we observed on the older GE66 running on the slower Core i9-12900HK but faster GeForce RTX 3080 Ti.
Interestingly, the Digital Content Creation subscore would drop from 12897 points to just 9568 points when on MSHybrid mode.
CrossMark: Overall | Productivity | Creativity | Responsiveness
| PCMark 10 / Score | |
| MSI Raider GE66 12UHS | |
| MSI GE67 HX 12UGS | |
| Average Intel Core i7-12800HX, NVIDIA GeForce RTX 3070 Ti Laptop GPU (n=1) | |
| MSI Vector GP66 12UGS | |
| Asus ROG Strix Scar 15 G533ZW-LN106WS | |
| Razer Blade 15 2022 | |
| Alienware m15 R6, i7-11800H RTX 3080 | |
| PCMark 10 / Essentials | |
| MSI Raider GE66 12UHS | |
| MSI Vector GP66 12UGS | |
| MSI GE67 HX 12UGS | |
| Average Intel Core i7-12800HX, NVIDIA GeForce RTX 3070 Ti Laptop GPU (n=1) | |
| Razer Blade 15 2022 | |
| Asus ROG Strix Scar 15 G533ZW-LN106WS | |
| Alienware m15 R6, i7-11800H RTX 3080 | |
| PCMark 10 / Productivity | |
| Asus ROG Strix Scar 15 G533ZW-LN106WS | |
| MSI Raider GE66 12UHS | |
| MSI Vector GP66 12UGS | |
| MSI GE67 HX 12UGS | |
| Average Intel Core i7-12800HX, NVIDIA GeForce RTX 3070 Ti Laptop GPU (n=1) | |
| Razer Blade 15 2022 | |
| Alienware m15 R6, i7-11800H RTX 3080 | |
| PCMark 10 / Digital Content Creation | |
| MSI GE67 HX 12UGS | |
| Average Intel Core i7-12800HX, NVIDIA GeForce RTX 3070 Ti Laptop GPU (n=1) | |
| MSI Raider GE66 12UHS | |
| MSI Vector GP66 12UGS | |
| Razer Blade 15 2022 | |
| Asus ROG Strix Scar 15 G533ZW-LN106WS | |
| Alienware m15 R6, i7-11800H RTX 3080 | |
| CrossMark / Overall | |
| Asus ROG Strix Scar 15 G533ZW-LN106WS | |
| MSI GE67 HX 12UGS | |
| Average Intel Core i7-12800HX, NVIDIA GeForce RTX 3070 Ti Laptop GPU (n=1) | |
| CrossMark / Productivity | |
| Asus ROG Strix Scar 15 G533ZW-LN106WS | |
| MSI GE67 HX 12UGS | |
| Average Intel Core i7-12800HX, NVIDIA GeForce RTX 3070 Ti Laptop GPU (n=1) | |
| CrossMark / Creativity | |
| Asus ROG Strix Scar 15 G533ZW-LN106WS | |
| MSI GE67 HX 12UGS | |
| Average Intel Core i7-12800HX, NVIDIA GeForce RTX 3070 Ti Laptop GPU (n=1) | |
| CrossMark / Responsiveness | |
| Asus ROG Strix Scar 15 G533ZW-LN106WS | |
| MSI GE67 HX 12UGS | |
| Average Intel Core i7-12800HX, NVIDIA GeForce RTX 3070 Ti Laptop GPU (n=1) | |
| PCMark 10 Score | 8042 points | |
Help | ||
| AIDA64 / Memory Copy | |
| MSI Raider GE66 12UHS | |
| Razer Blade 15 2022 | |
| Asus ROG Strix Scar 15 G533ZW-LN106WS | |
| MSI GE67 HX 12UGS | |
| Average Intel Core i7-12800HX (n=1) | |
| MSI Vector GP66 12UGS | |
| Alienware m15 R6, i7-11800H RTX 3080 | |
| AIDA64 / Memory Read | |
| MSI Raider GE66 12UHS | |
| Razer Blade 15 2022 | |
| Asus ROG Strix Scar 15 G533ZW-LN106WS | |
| MSI GE67 HX 12UGS | |
| Average Intel Core i7-12800HX (n=1) | |
| Alienware m15 R6, i7-11800H RTX 3080 | |
| MSI Vector GP66 12UGS | |
| AIDA64 / Memory Write | |
| Razer Blade 15 2022 | |
| MSI Raider GE66 12UHS | |
| Asus ROG Strix Scar 15 G533ZW-LN106WS | |
| MSI GE67 HX 12UGS | |
| Average Intel Core i7-12800HX (n=1) | |
| MSI Vector GP66 12UGS | |
| Alienware m15 R6, i7-11800H RTX 3080 | |
| AIDA64 / Memory Latency | |
| Asus ROG Strix Scar 15 G533ZW-LN106WS | |
| Alienware m15 R6, i7-11800H RTX 3080 | |
| MSI GE67 HX 12UGS | |
| Average Intel Core i7-12800HX (n=1) | |
| MSI Raider GE66 12UHS | |
| MSI Vector GP66 12UGS | |
| Razer Blade 15 2022 | |
* ... smaller is better
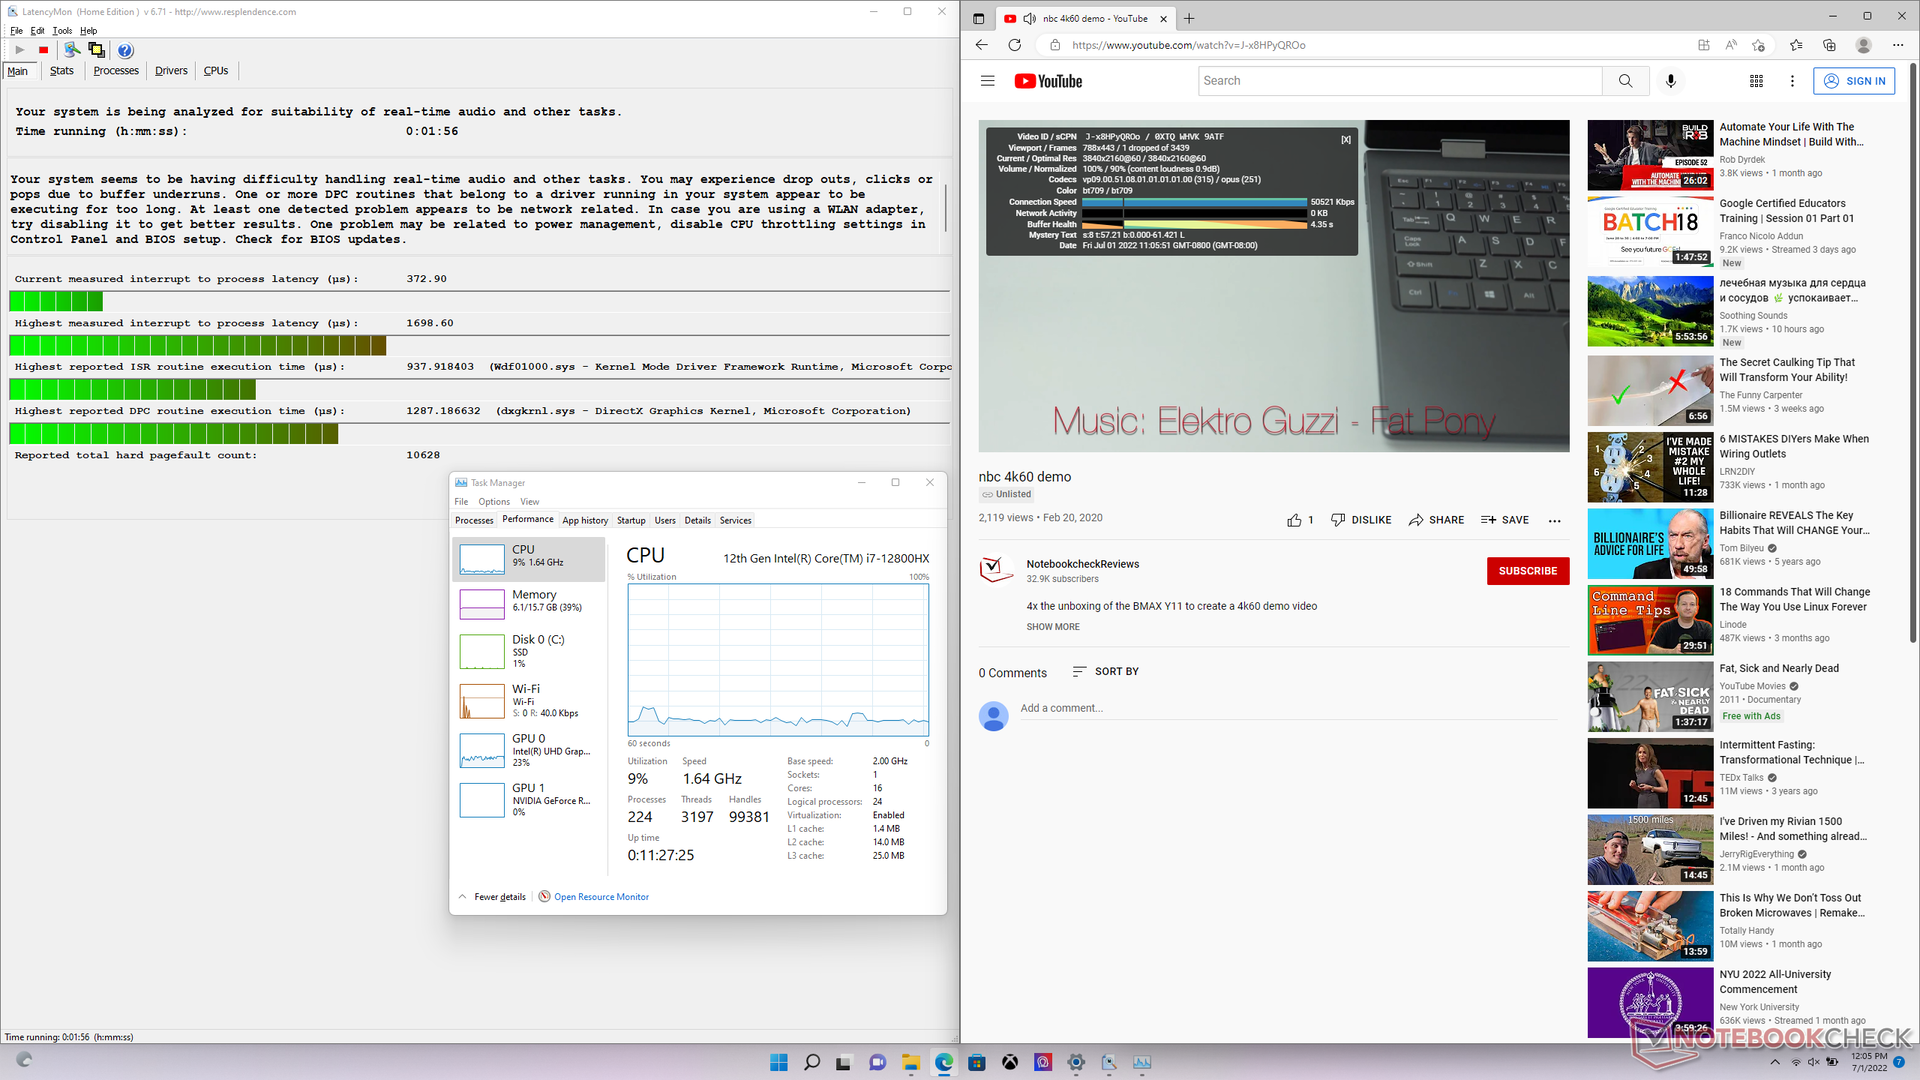
DPC Latency
LatencyMon reveals minor DPC issues when opening multiple browser tabs on our homepage. 4K video playback at 60 FPS is otherwise smooth with just one dropped frame during our 60-second video test.
| DPC Latencies / LatencyMon - interrupt to process latency (max), Web, Youtube, Prime95 | |
| MSI Raider GE66 12UHS | |
| MSI Vector GP66 12UGS | |
| MSI GE67 HX 12UGS | |
| Razer Blade 15 2022 | |
| Alienware m15 R6, i7-11800H RTX 3080 | |
| Asus ROG Strix Scar 15 G533ZW-LN106WS | |
* ... smaller is better
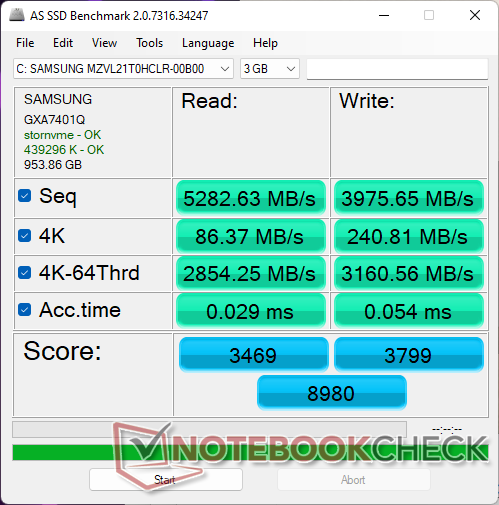
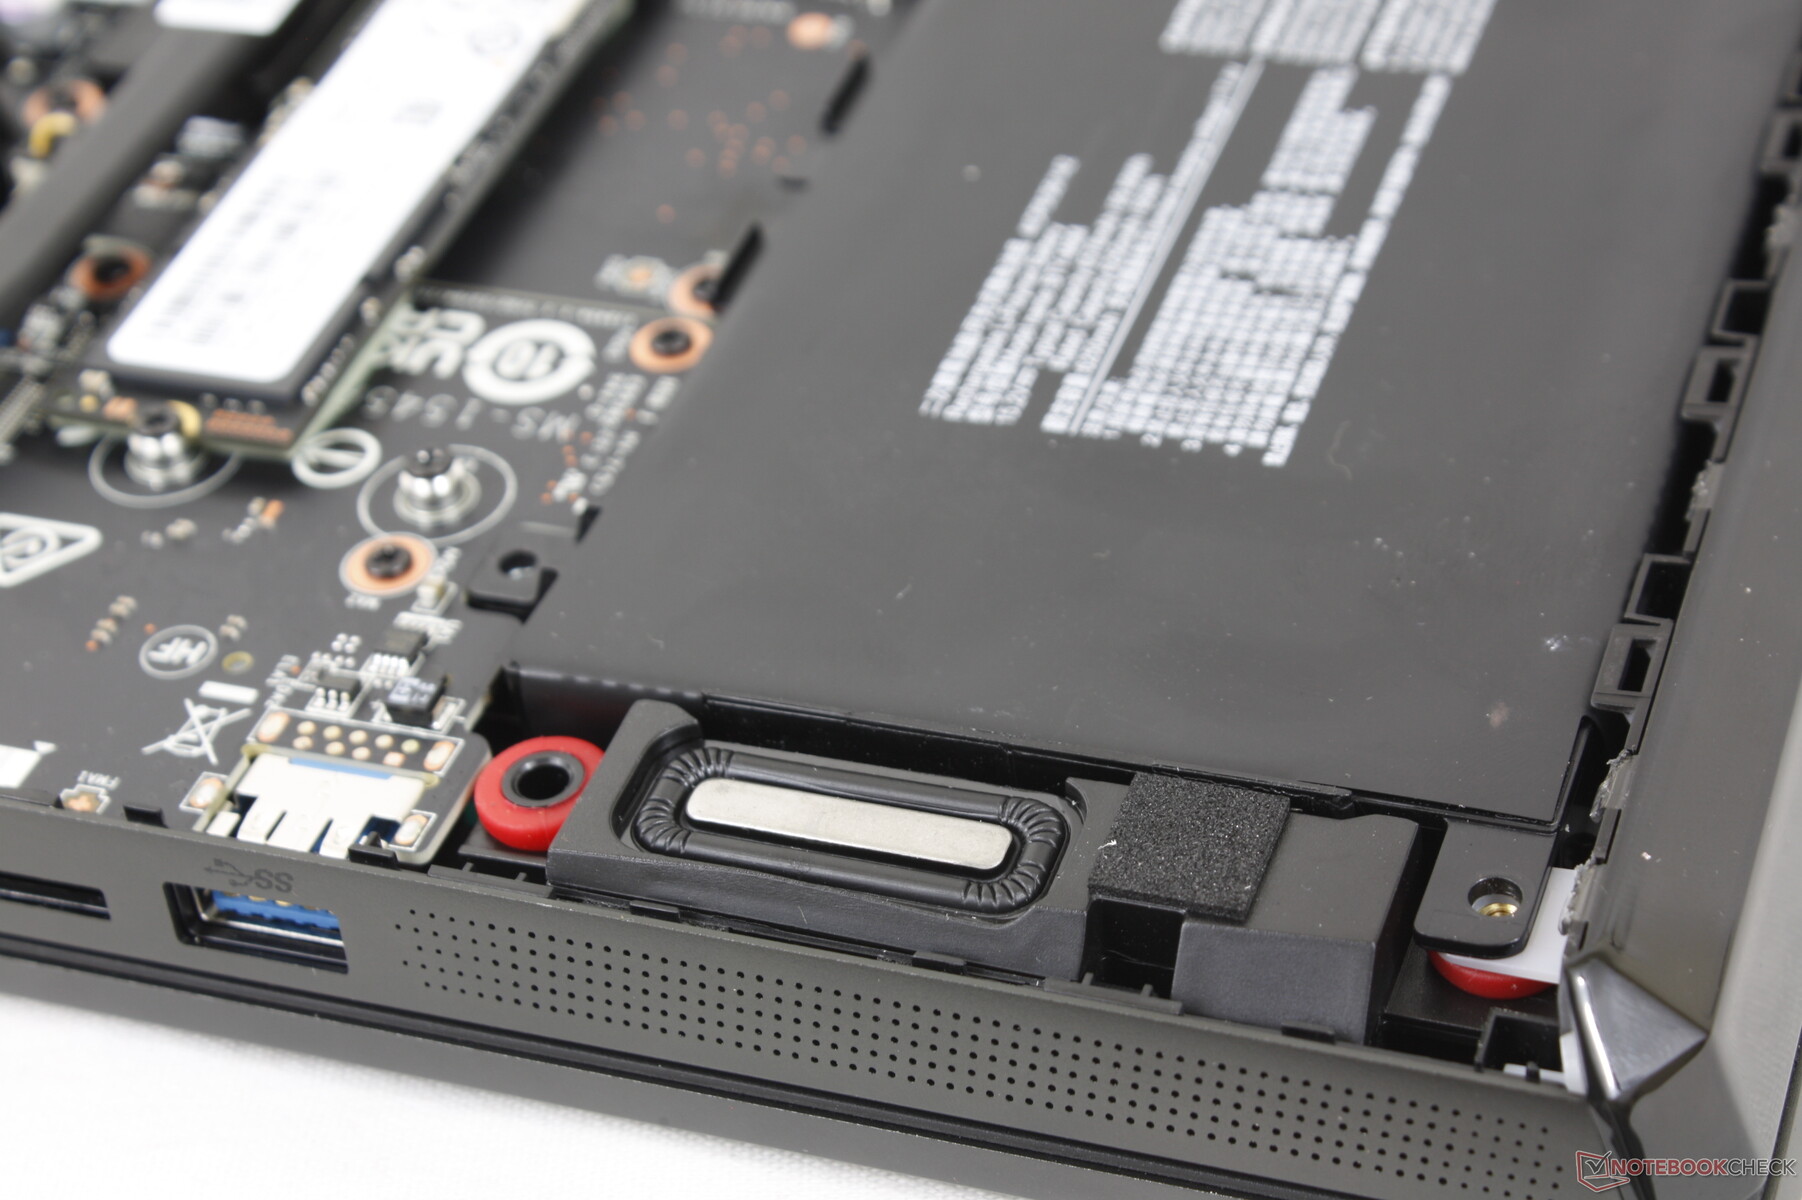
Storage Devices — PCIe4 x4 Standard
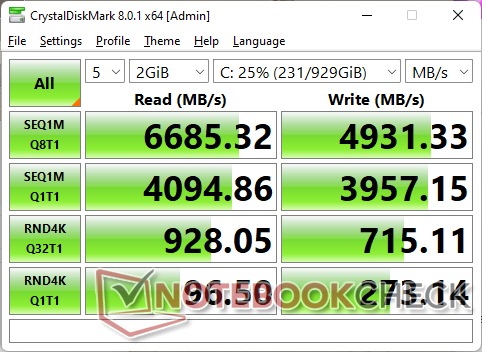
Our unit comes with a 1 TB Samsung PM9A1 PCIe4 x4 NVMe SSD for sequential read and write rates of up to 7000 MB/s and 5100 MB/s, respectively. Unfortunately, our drive would have issues maintaining its maximum read rate for extended periods as shown by our DiskSpd loop test below. Read rates would eventually fall to as low as 1500 MB/s likely due to temperature limits and the lack of a proper heat spreader over the SSD.

* ... smaller is better
Disk Throttling: DiskSpd Read Loop, Queue Depth 8
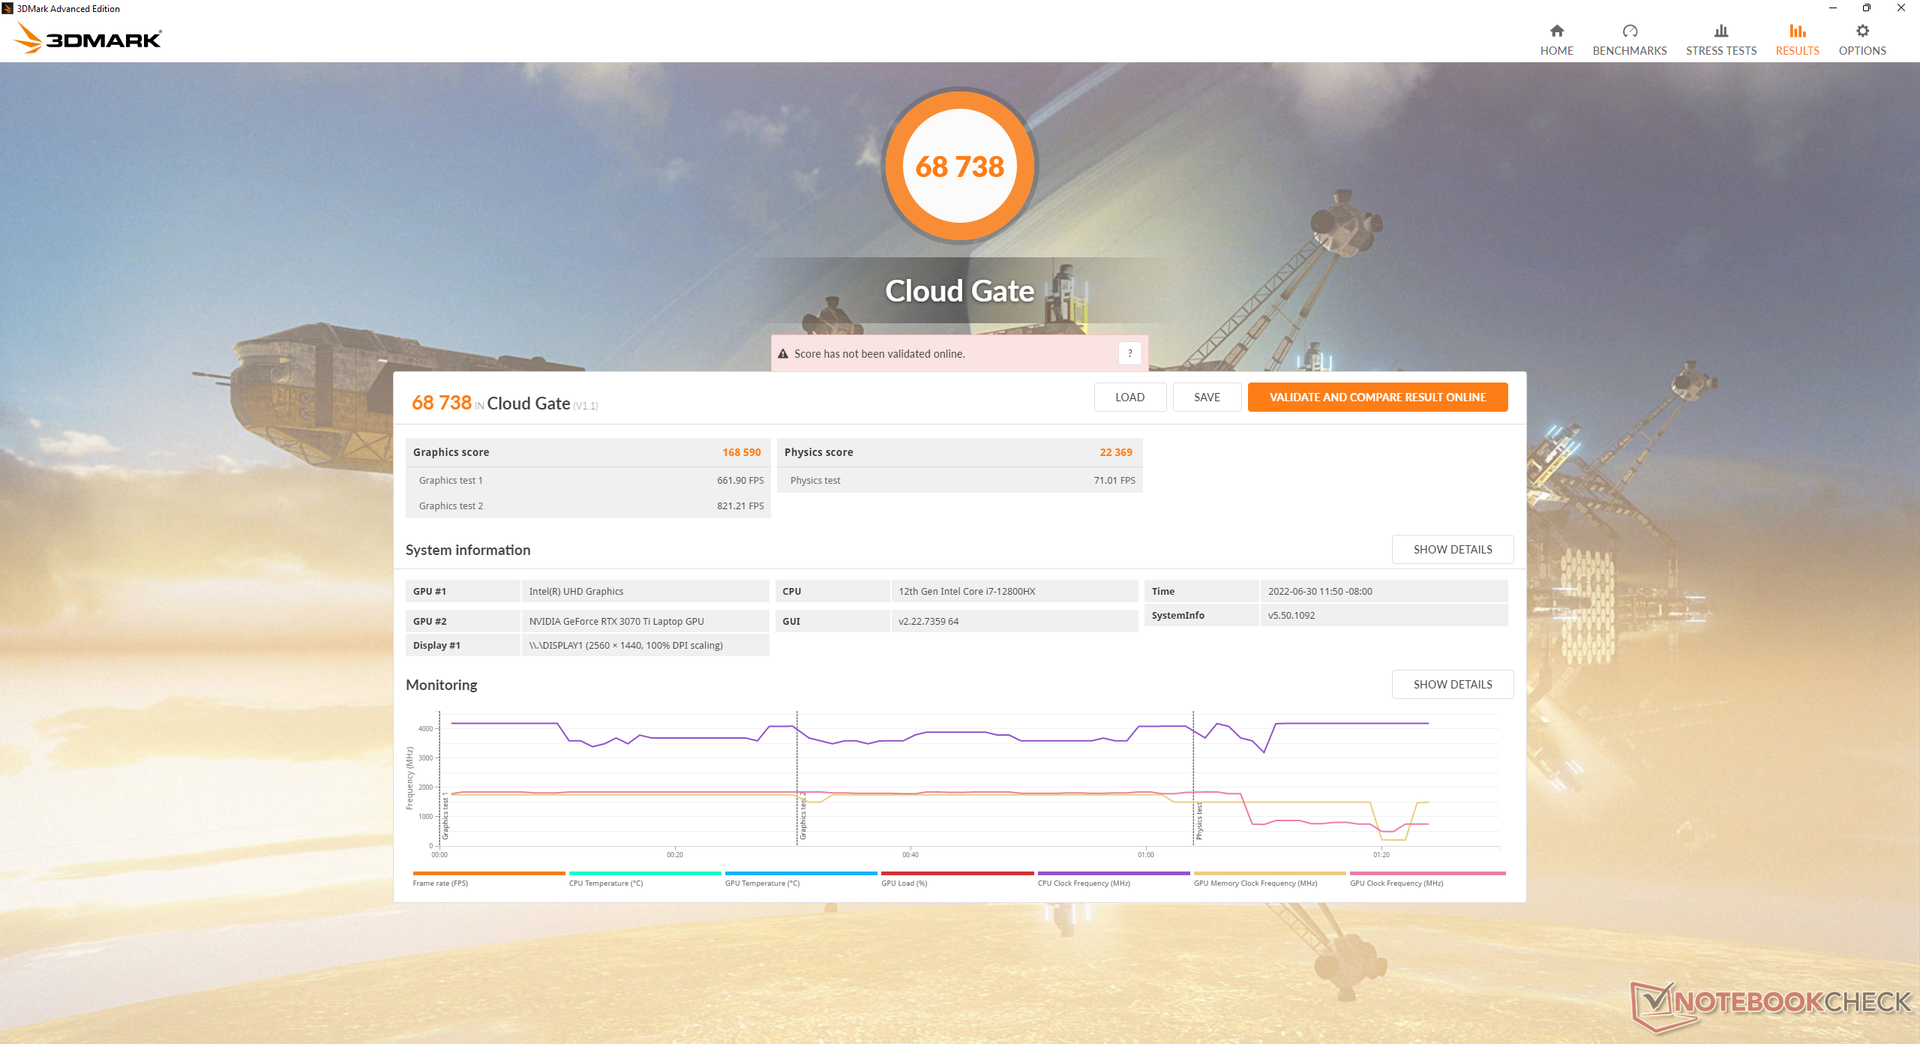
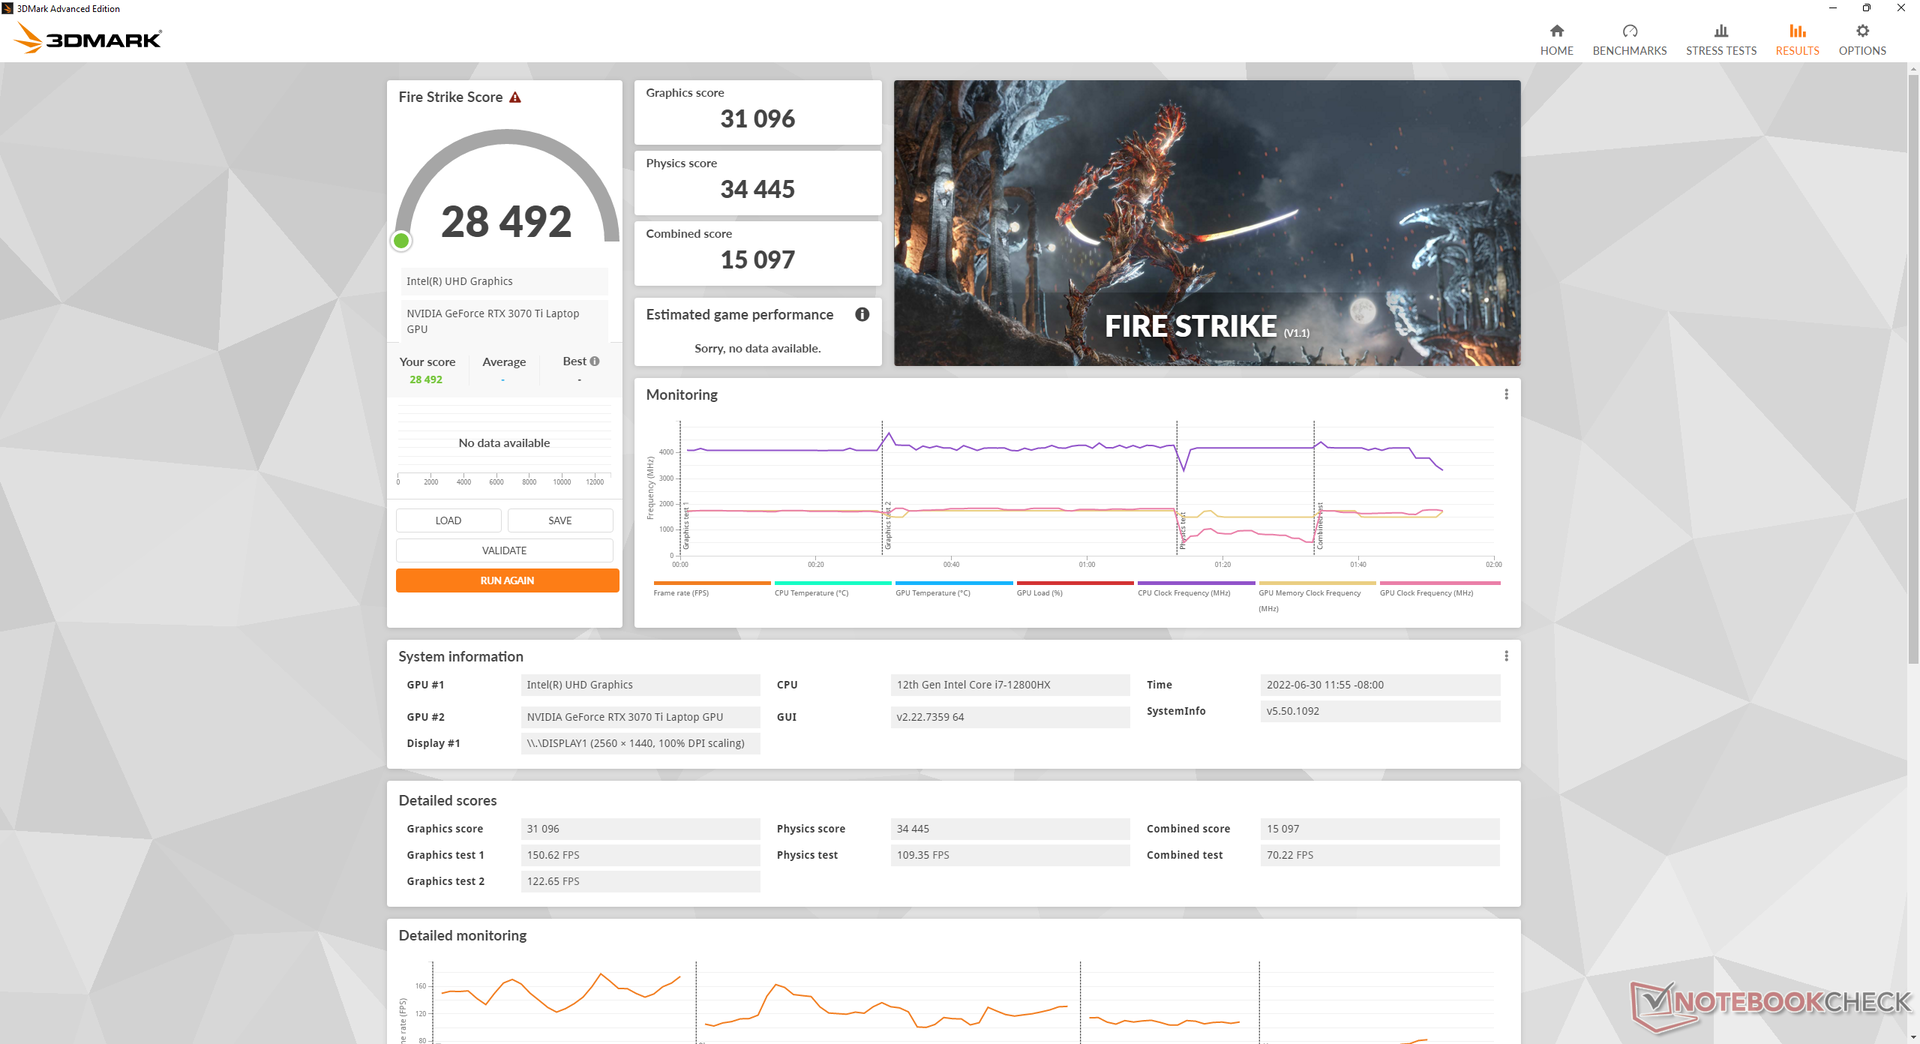
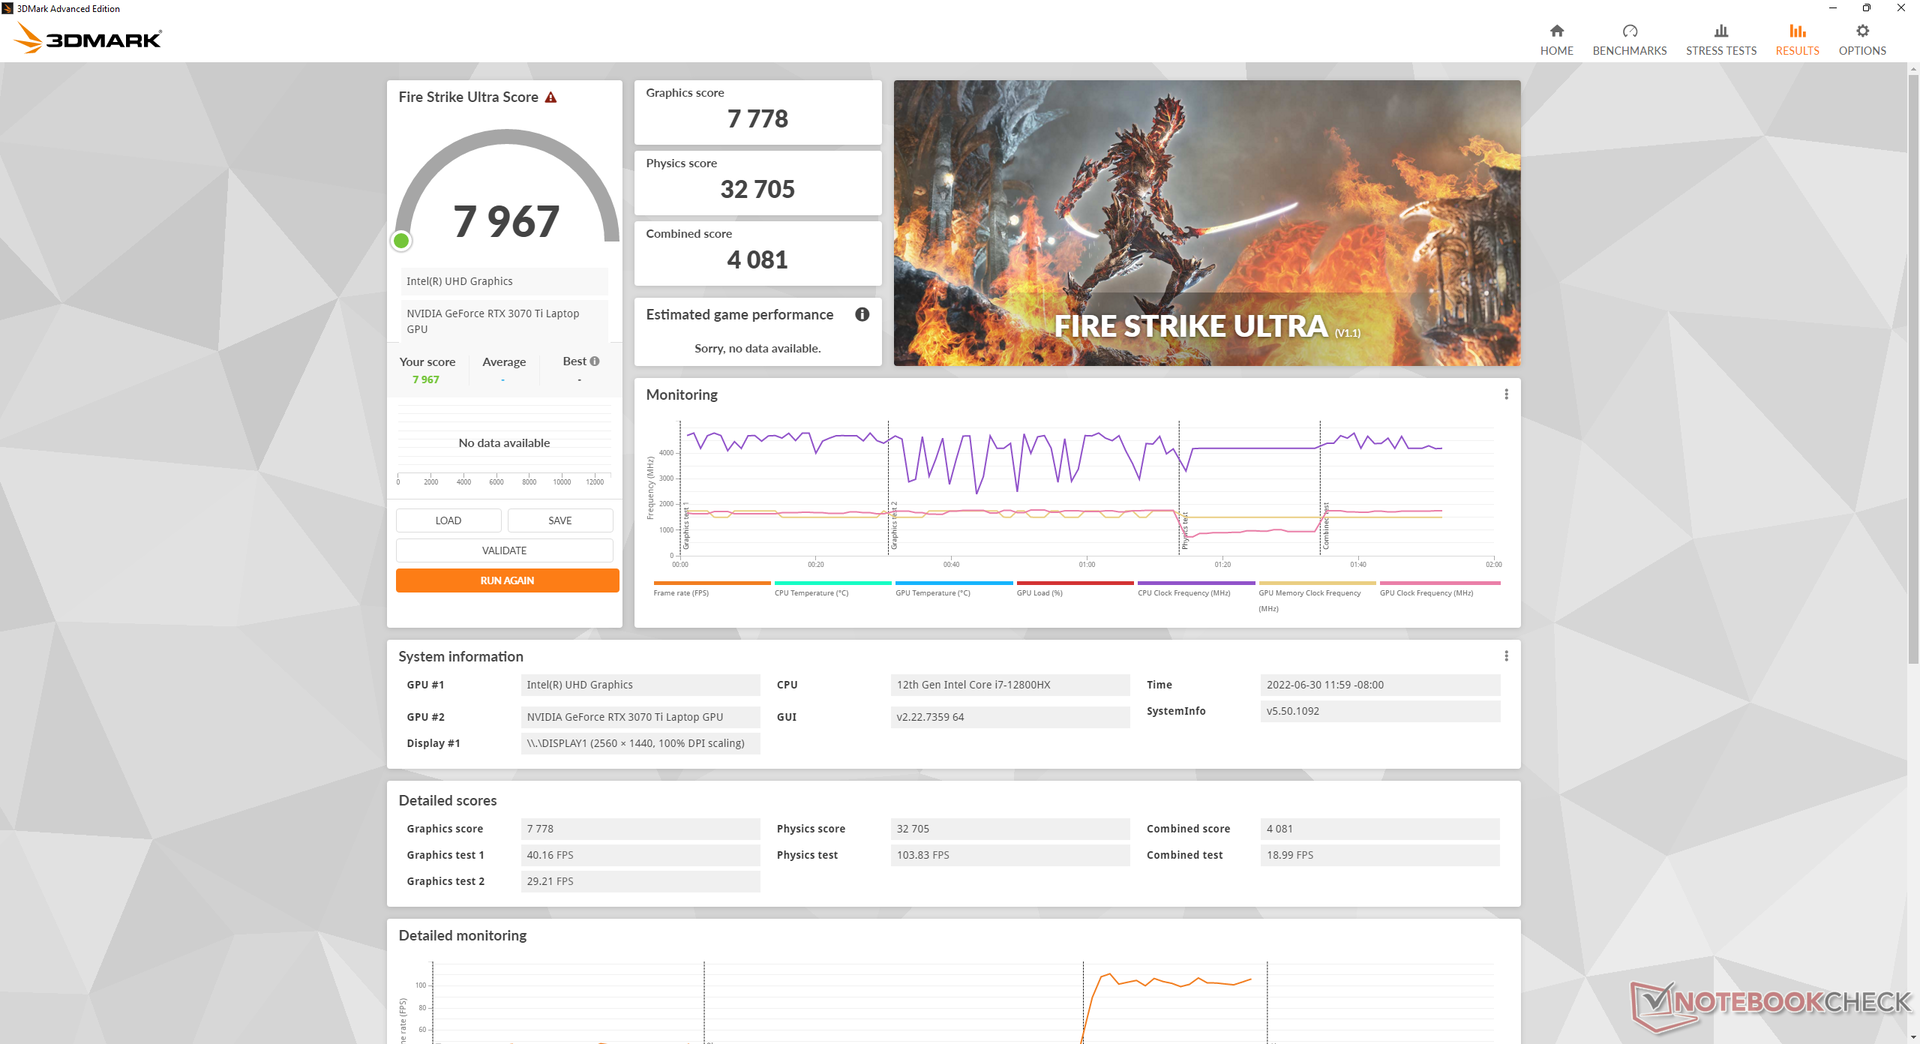
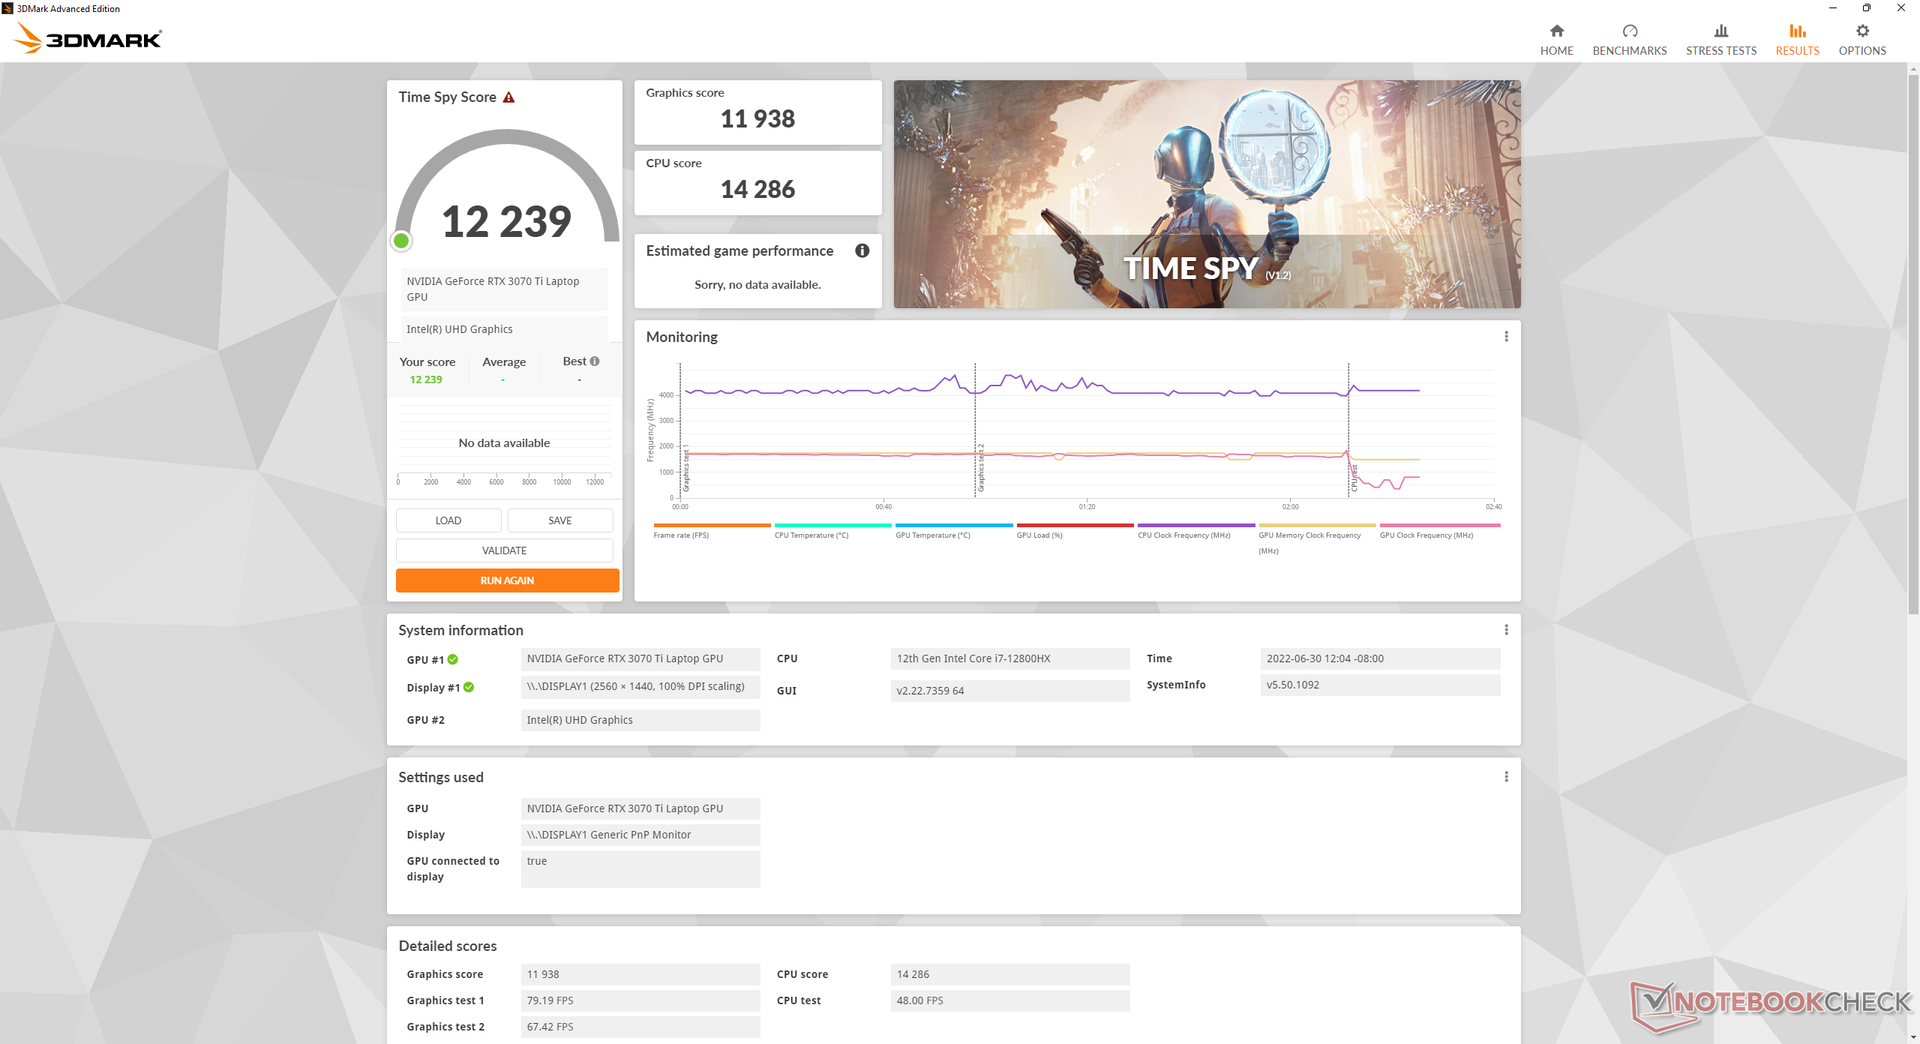
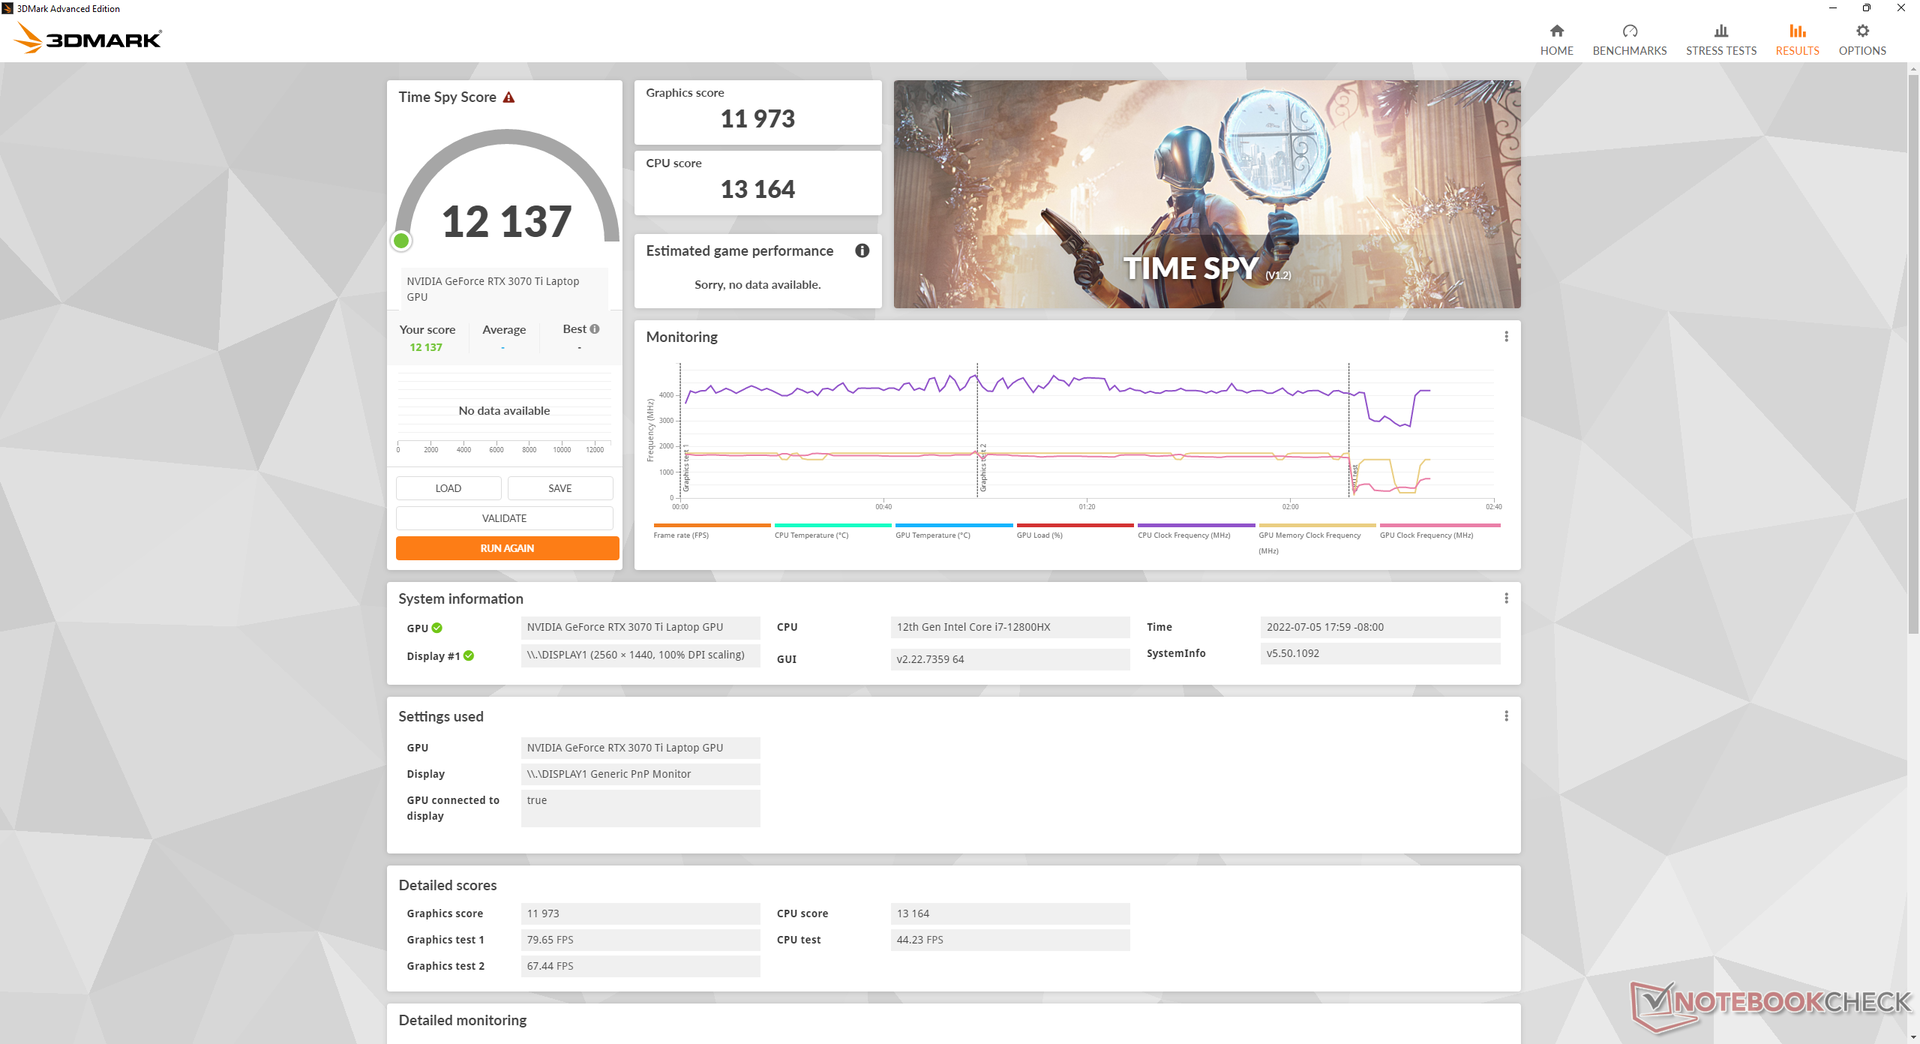
GPU Performance — 150 W with 25 W Dynamic Boost
3DMark results are approximately 12 percent higher than the average laptop in our database equipped with the same mobile GeForce RTX 3070 Ti GPU. The higher-than-expected numbers can be attributed to the high 150 W TGP target and fast DDR5 RAM whereas the majority of gaming laptops are still running on 130 W or lower GPUs and/or slower DDR4 RAM. The differences are enough to propel our mobile GTX 3070 Ti to perform similarly to the mobile RTX 3080 Ti running on the older Q1 2022 GE66.
For gaming purposes, the Nvidia GPU would perform almost identically between MSHybrid and discrete modes.
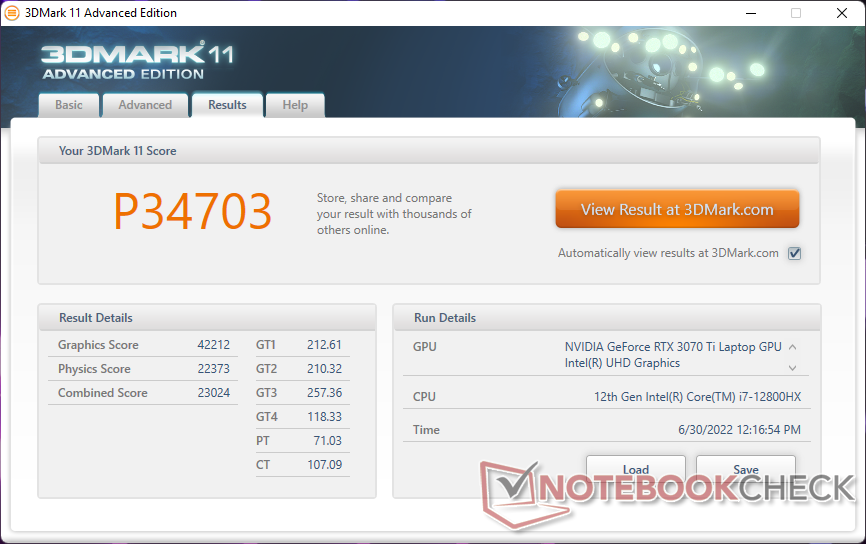
| 3DMark 11 Performance | 34703 points | |
| 3DMark Cloud Gate Standard Score | 68738 points | |
| 3DMark Fire Strike Score | 28492 points | |
| 3DMark Time Spy Score | 12239 points | |
Help | ||
Witcher 3 FPS Chart
| low | med. | high | ultra | QHD | 4K | |
|---|---|---|---|---|---|---|
| GTA V (2015) | 186.8 | 184.7 | 178.1 | 122 | 108.7 | |
| The Witcher 3 (2015) | 426.4 | 329 | 223.3 | 112.7 | ||
| Dota 2 Reborn (2015) | 181.2 | 165.6 | 155.3 | 147.7 | 148.9 | |
| Final Fantasy XV Benchmark (2018) | 201 | 162.6 | 122.4 | 93 | ||
| X-Plane 11.11 (2018) | 145.5 | 133.4 | 105.9 | |||
| Strange Brigade (2018) | 453 | 288 | 235 | 207 | 154.1 | |
| Cyberpunk 2077 1.6 (2022) | 141.2 | 133.2 | 106 | 88.1 | 56.4 |
Emissions
System Noise
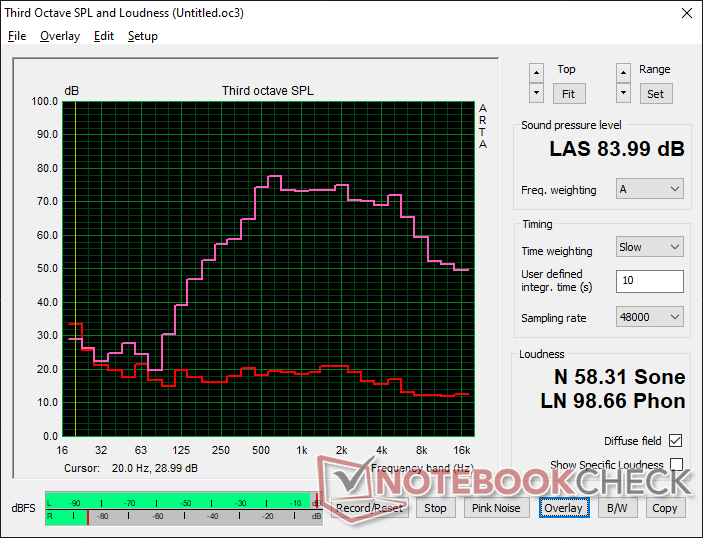
Fan noise is dependent on the five preset power profiles as mentioned in the Testing Conditions above. When idling on desktop with no running applications, our unit is able to remain silent at 22.9 dB(A) even when set to the Extreme Performance profile. However, small demands like web browsing or video streaming will induce a fan noise in the audible 30 to 34 dB(A) range no matter the profile setting. Running the first benchmark scene of 3DMark 06 on Balanced mode would induce a fan noise of 44 dB(A) to be similar to what we recorded on the GE66 or Razer Blade 15.
Running Witcher 3 on Balanced mode and Extreme Performance mode would result in a fan noise of 49.8 dB(A) and 55.7 dB(A), respectively. We consider anything in the 50 dB(A) range to be very loud to the point where headphones are recommended when gaming. Nonetheless, this range is unfortunately common on many enthusiast gaming laptops including the Vector GP66, Asus ROG Strix Scar 15, or Alienware m15 R6. If Cooler Boost (i.e. maximum fan noise mode) is active, fan noise will be even higher at 57.4 dB(A). Users will have to game on Extreme Performance mode on the GE67 to maximize TGP as our Stress Test section below will show. The GE66 was not as loud when under similar conditions.
Noise level
| Idle |
| 22.9 / 22.9 / 22.9 dB(A) |
| Load |
| 44.4 / 57.4 dB(A) |
 | ||
30 dB silent 40 dB(A) audible 50 dB(A) loud |
||
min: | ||
| MSI GE67 HX 12UGS GeForce RTX 3070 Ti Laptop GPU, i7-12800HX, Samsung PM9A1 MZVL21T0HCLR | MSI Raider GE66 12UHS GeForce RTX 3080 Ti Laptop GPU, i9-12900HK, Samsung PM9A1 MZVL22T0HBLB | MSI Vector GP66 12UGS GeForce RTX 3070 Ti Laptop GPU, i9-12900H | Asus ROG Strix Scar 15 G533ZW-LN106WS GeForce RTX 3070 Ti Laptop GPU, i9-12900H, Samsung PM9A1 MZVL22T0HBLB | Alienware m15 R6, i7-11800H RTX 3080 GeForce RTX 3080 Laptop GPU, i7-11800H, Samsung PM9A1 MZVL21T0HCLR | Razer Blade 15 2022 GeForce RTX 3080 Ti Laptop GPU, i7-12800H, SSSTC CA6-8D1024 | |
|---|---|---|---|---|---|---|
| Noise | -14% | -2% | -36% | -2% | -5% | |
| off / environment * (dB) | 22.7 | 26 -15% | 22.9 -1% | 26.86 -18% | 23 -1% | 25.4 -12% |
| Idle Minimum * (dB) | 22.9 | 27 -18% | 23.4 -2% | 39.07 -71% | 23 -0% | 26.2 -14% |
| Idle Average * (dB) | 22.9 | 30 -31% | 23.4 -2% | 39.07 -71% | 23 -0% | 26.2 -14% |
| Idle Maximum * (dB) | 22.9 | 39 -70% | 27.4 -20% | 39.07 -71% | 30 -31% | 28.4 -24% |
| Load Average * (dB) | 44.4 | 45 -1% | 36 19% | 53.34 -20% | 41.26 7% | 44.7 -1% |
| Witcher 3 ultra * (dB) | 55.7 | 45 19% | 58.2 -4% | 56.6 -2% | 53.4 4% | 44.7 20% |
| Load Maximum * (dB) | 57.4 | 47 18% | 58 -1% | 56.6 1% | 53.37 7% | 51.9 10% |
* ... smaller is better
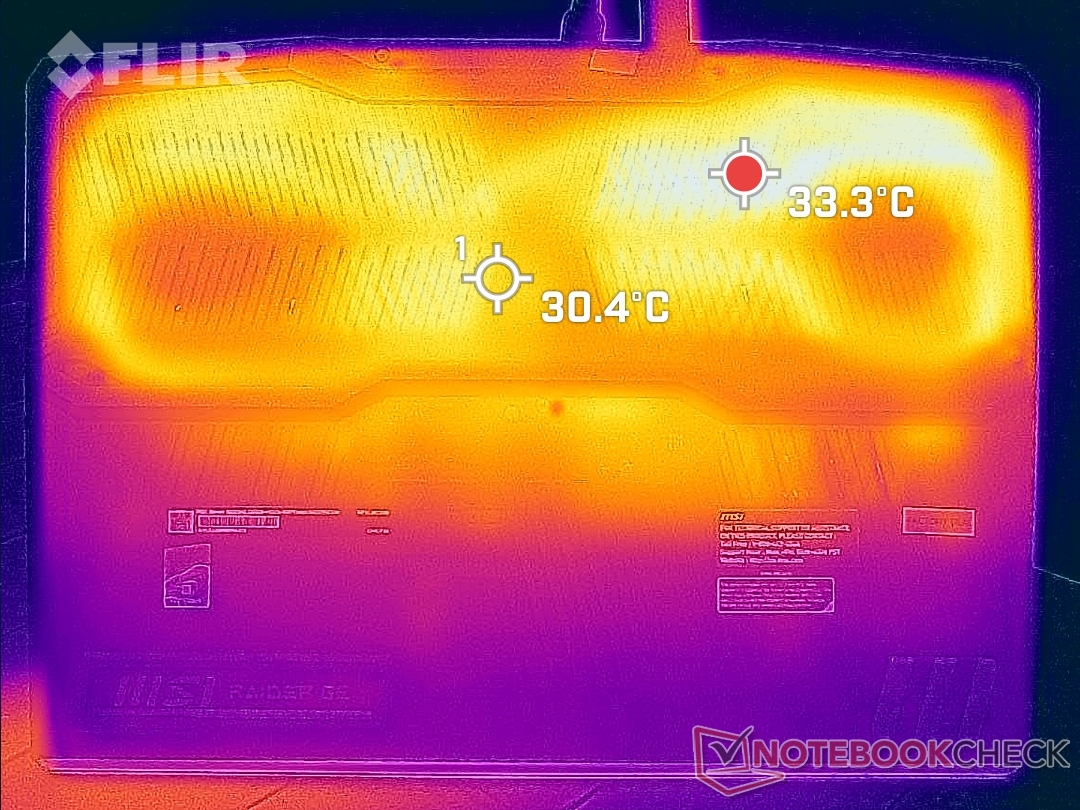
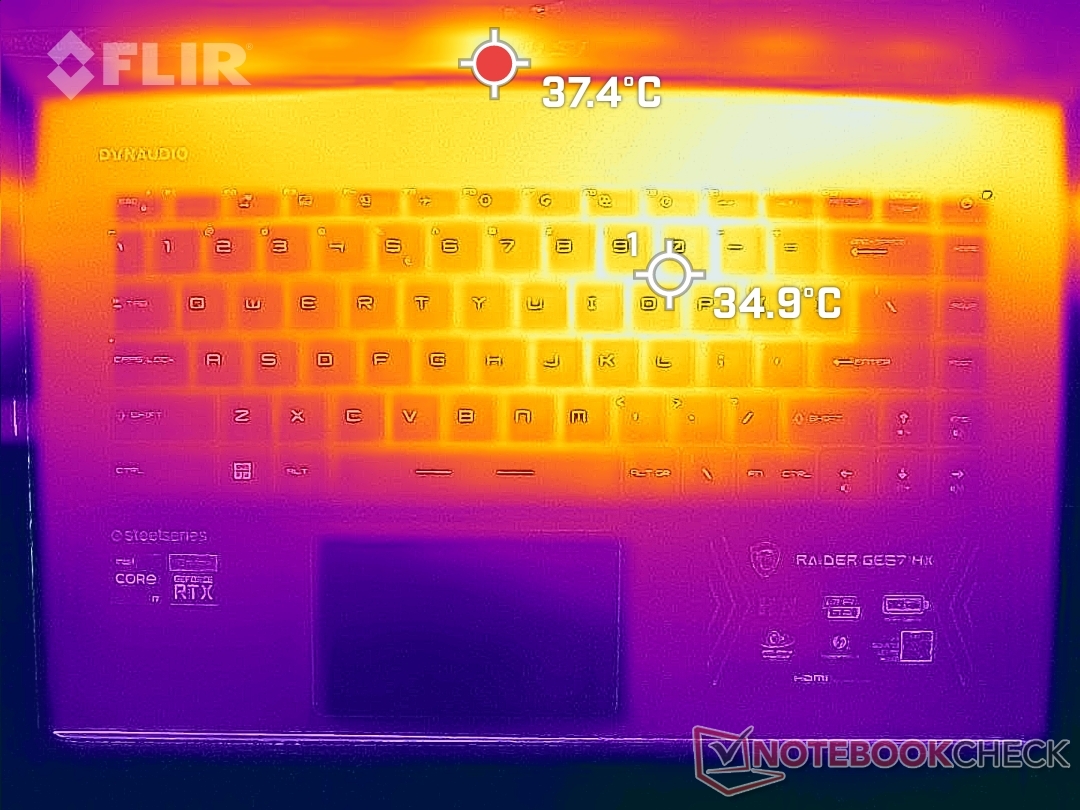
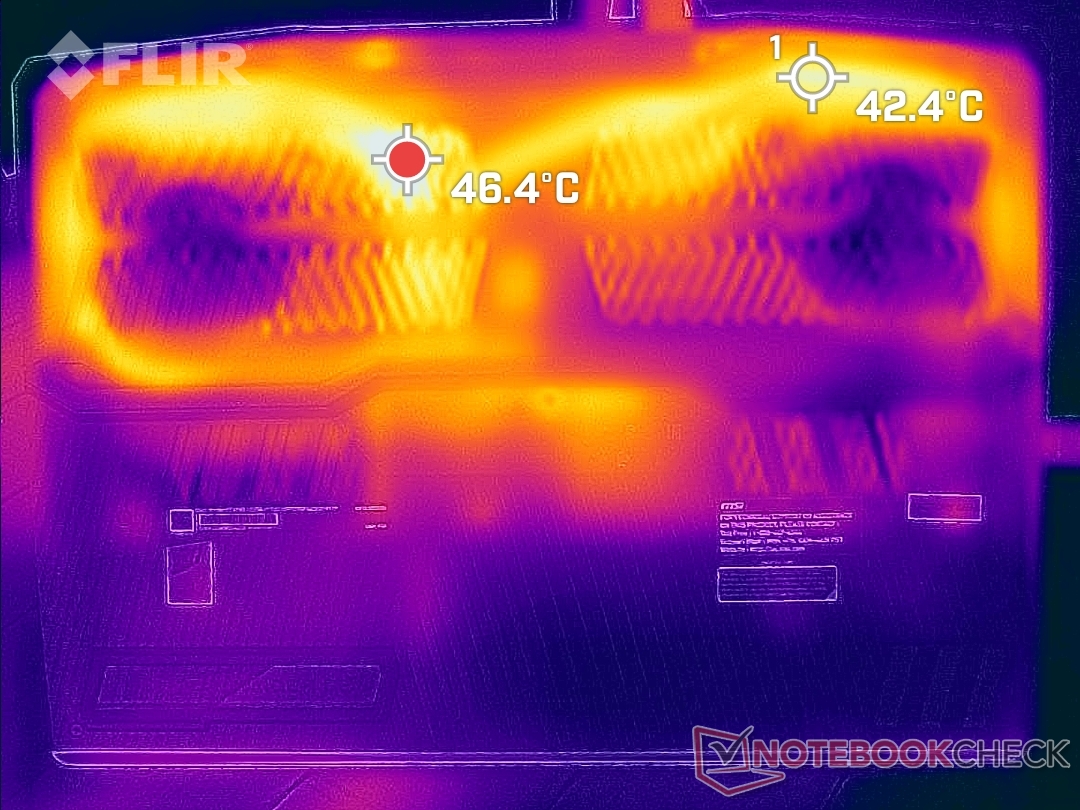
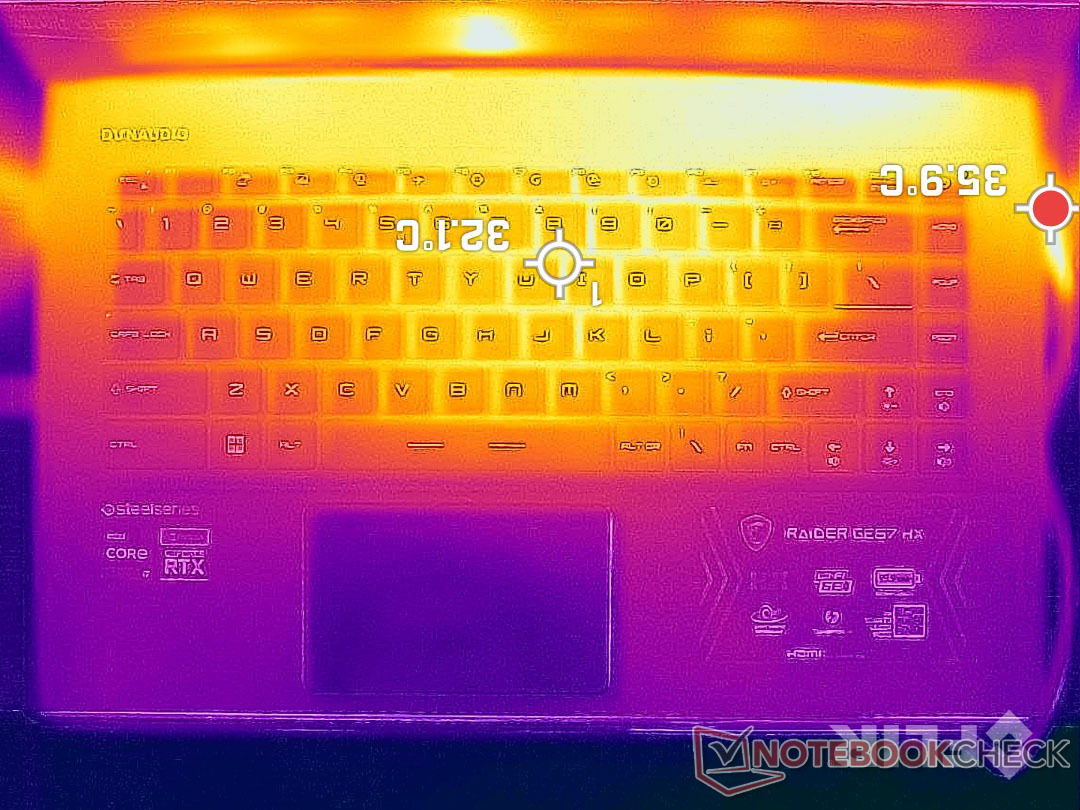
Temperature
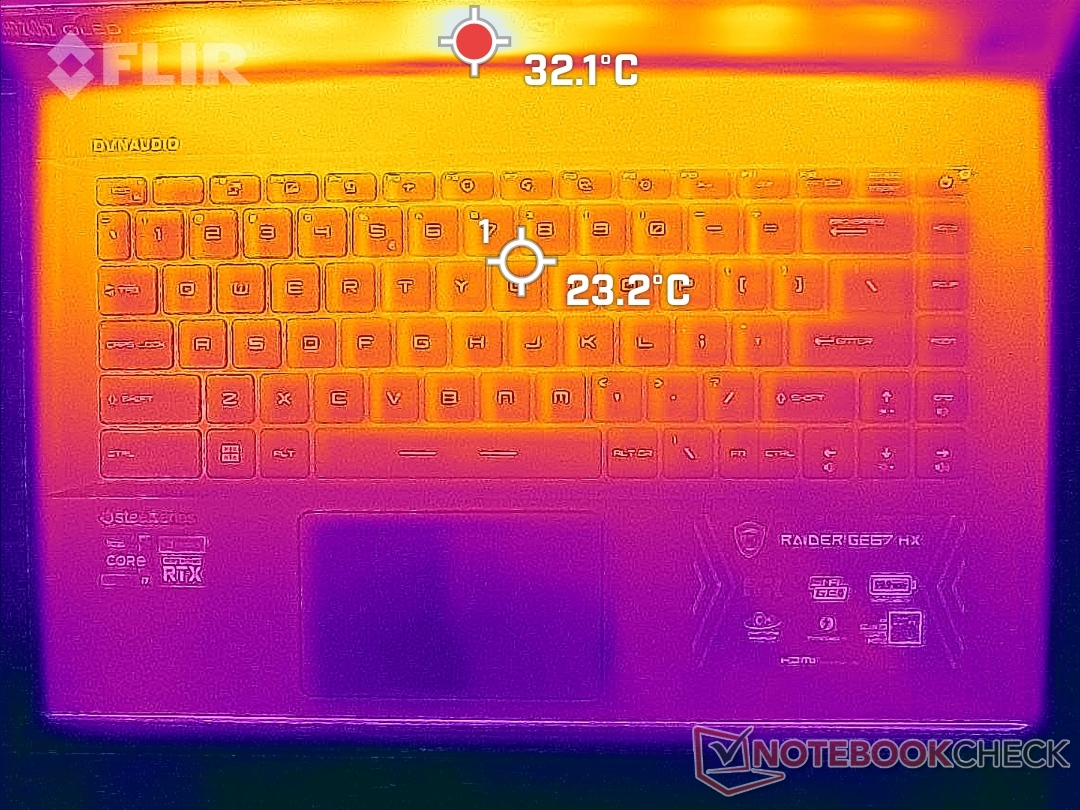
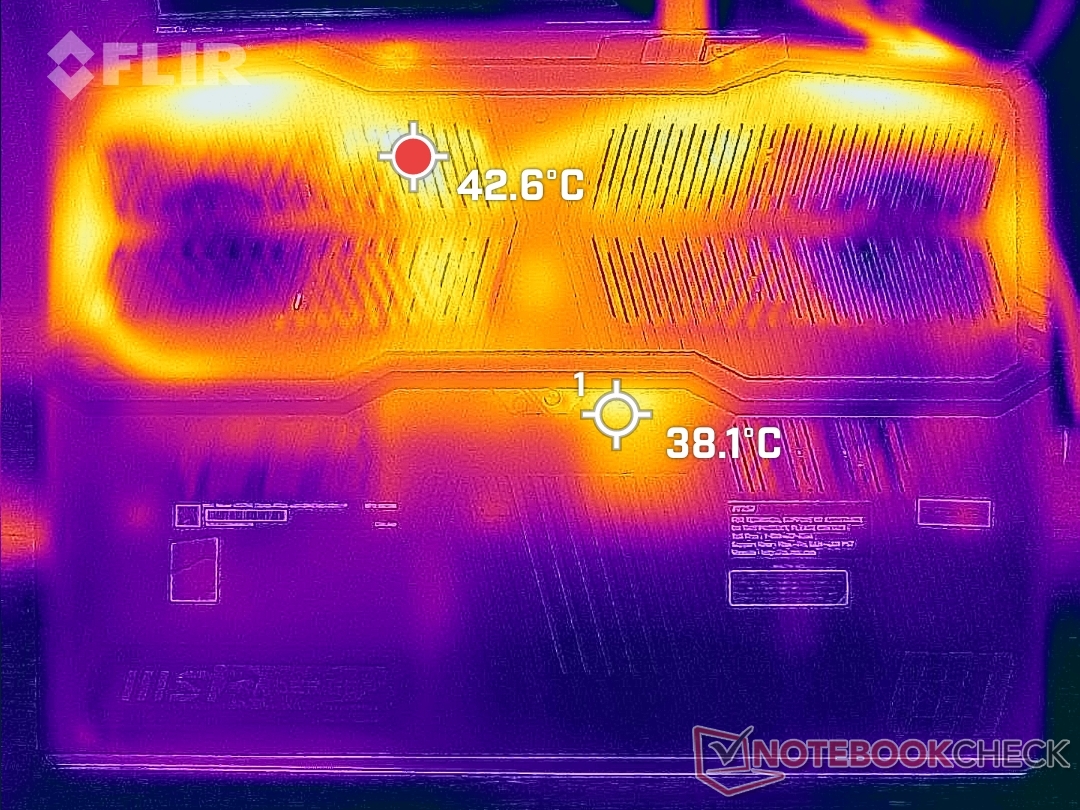
Surface temperatures are cooler than what we observed on the older GE66. When gaming, hot spots on the keyboard deck and bottom panel can reach 35 C and 46 C, respectively. These zones are toward the rear of the chassis as shown by the temperature maps below.
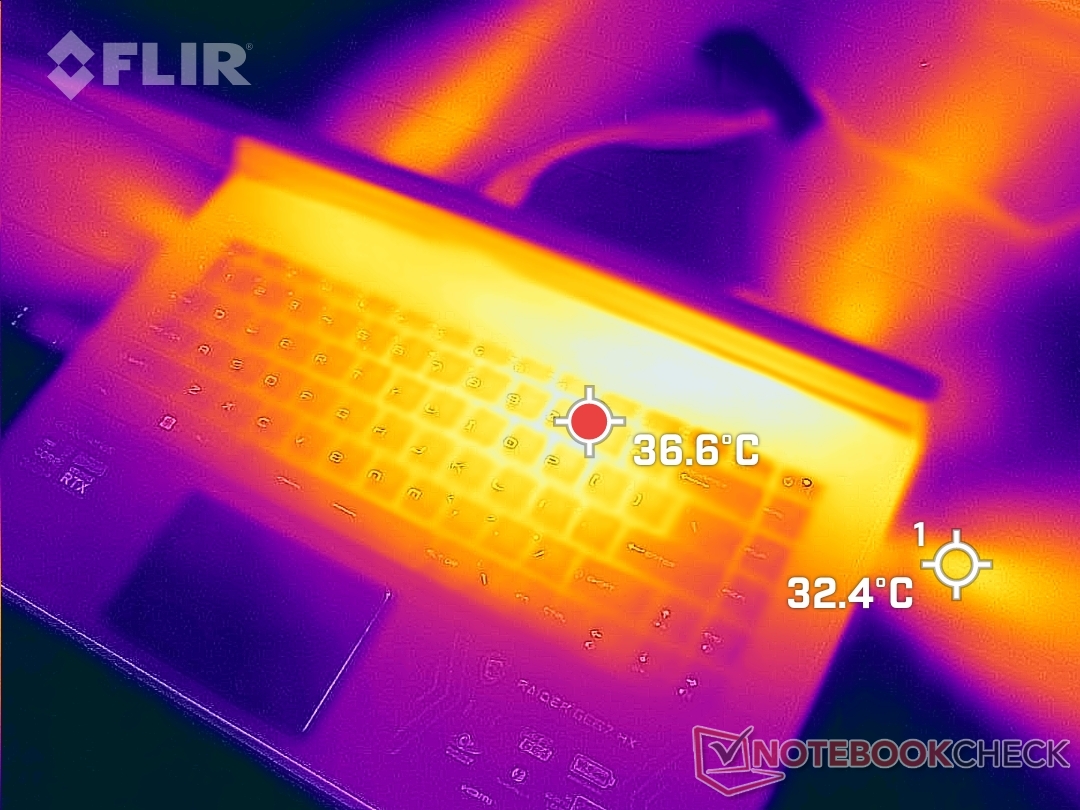
(+) The maximum temperature on the upper side is 34.4 °C / 94 F, compared to the average of 40.4 °C / 105 F, ranging from 21.2 to 68.8 °C for the class Gaming.
(±) The bottom heats up to a maximum of 42 °C / 108 F, compared to the average of 43.2 °C / 110 F
(+) In idle usage, the average temperature for the upper side is 21.4 °C / 71 F, compared to the device average of 33.9 °C / 93 F.
(+) Playing The Witcher 3, the average temperature for the upper side is 27.9 °C / 82 F, compared to the device average of 33.9 °C / 93 F.
(+) The palmrests and touchpad are cooler than skin temperature with a maximum of 20.4 °C / 68.7 F and are therefore cool to the touch.
(+) The average temperature of the palmrest area of similar devices was 28.8 °C / 83.8 F (+8.4 °C / 15.1 F).
| MSI GE67 HX 12UGS Intel Core i7-12800HX, NVIDIA GeForce RTX 3070 Ti Laptop GPU | MSI Raider GE66 12UHS Intel Core i9-12900HK, NVIDIA GeForce RTX 3080 Ti Laptop GPU | MSI Vector GP66 12UGS Intel Core i9-12900H, NVIDIA GeForce RTX 3070 Ti Laptop GPU | Asus ROG Strix Scar 15 G533ZW-LN106WS Intel Core i9-12900H, NVIDIA GeForce RTX 3070 Ti Laptop GPU | Alienware m15 R6, i7-11800H RTX 3080 Intel Core i7-11800H, NVIDIA GeForce RTX 3080 Laptop GPU | Razer Blade 15 2022 Intel Core i7-12800H, NVIDIA GeForce RTX 3080 Ti Laptop GPU | |
|---|---|---|---|---|---|---|
| Heat | -36% | -19% | -29% | -45% | -32% | |
| Maximum Upper Side * (°C) | 34.4 | 54 -57% | 40.2 -17% | 42.6 -24% | 61 -77% | 50 -45% |
| Maximum Bottom * (°C) | 42 | 65 -55% | 43.8 -4% | 50.2 -20% | 58 -38% | 47 -12% |
| Idle Upper Side * (°C) | 24 | 30 -25% | 34.8 -45% | 36.2 -51% | 38 -58% | 37.4 -56% |
| Idle Bottom * (°C) | 33.2 | 35 -5% | 37 -11% | 40.2 -21% | 36 -8% | 38.4 -16% |
* ... smaller is better
Stress Test
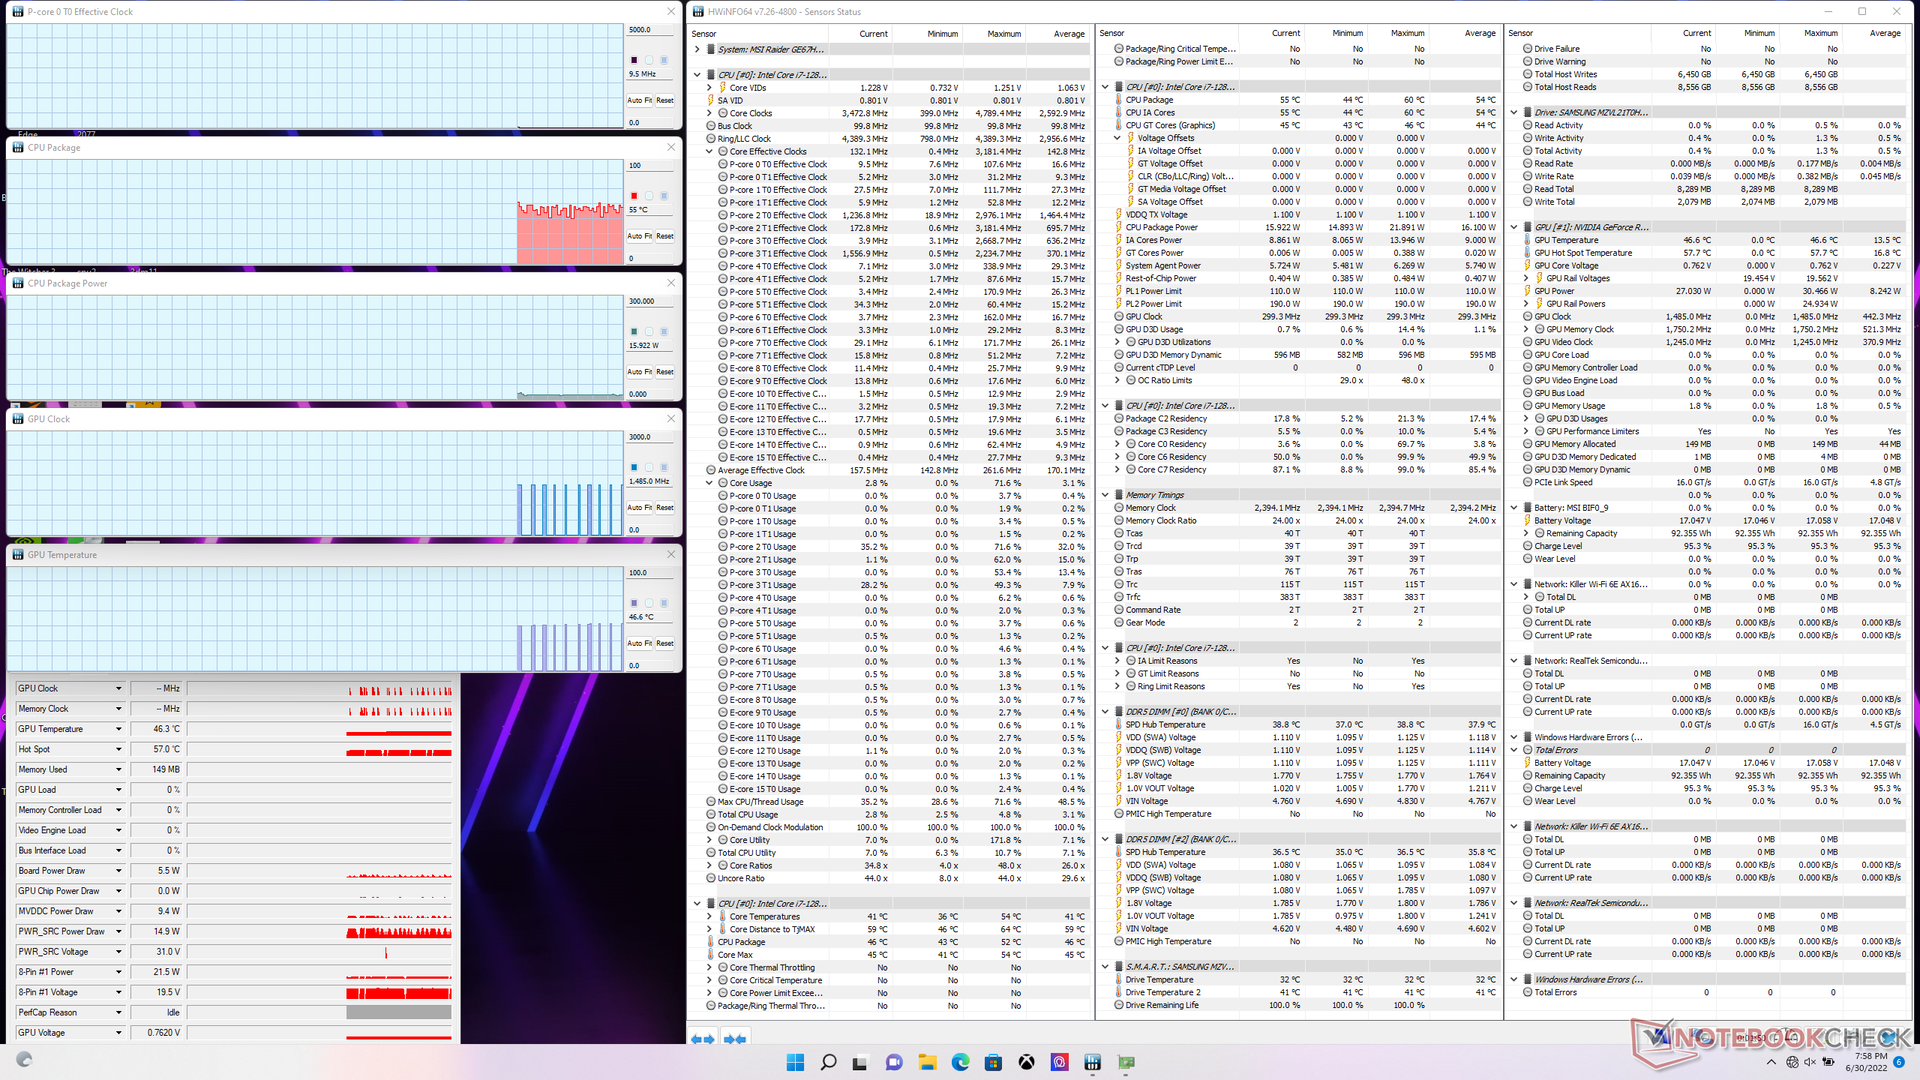
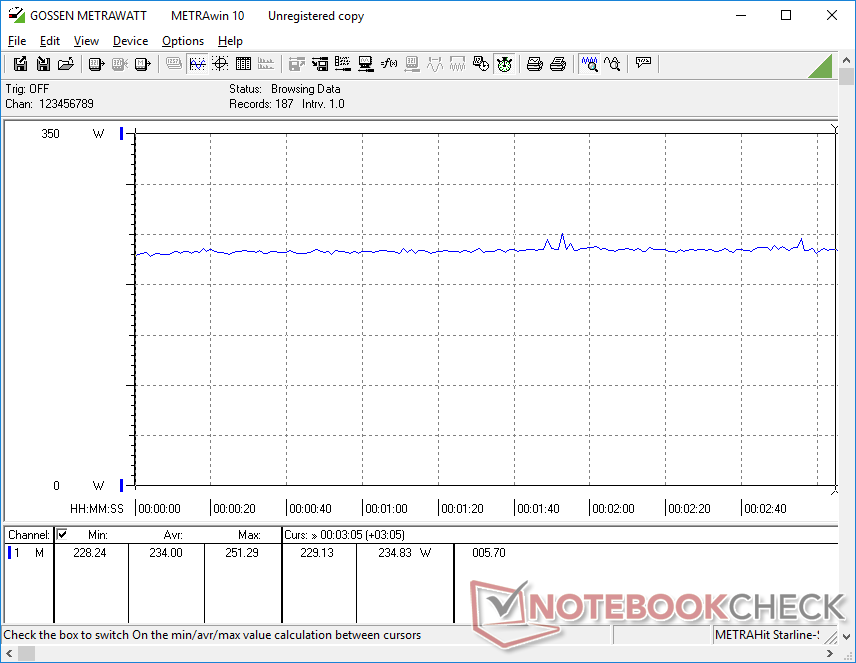
When stressed under Prime95, the CPU would boost to 4.2 GHz until about 90 seconds later when the core temperature would hit 96 C. Thereafter, clock rates would fall in the 3.4 to 3.7 GHz range in order to maintain a cooler core temperature of around 87 C. CPU package power draw would be as high as 140 W during the first 90 seconds of the test before stabilizing at 110 W. In comparison, the Core i7-12900HK in the older GE66 would stabilize at just 45 W when under similar conditions.
GPU board power draw would top out at 148 W when on Extreme Performance mode compared to ~135 W when on the Balanced power profile. You're going to want to enable Extreme Performance mode to maximize GPU potential as a result. Average CPU and GPU temperatures are reasonable at 69 C and 77 C, respectively, compared to 71 C and 70 C on the Vector GP66 which comes with the same GeForce RTX 3070 Ti GPU but a slower 11th gen CPU.
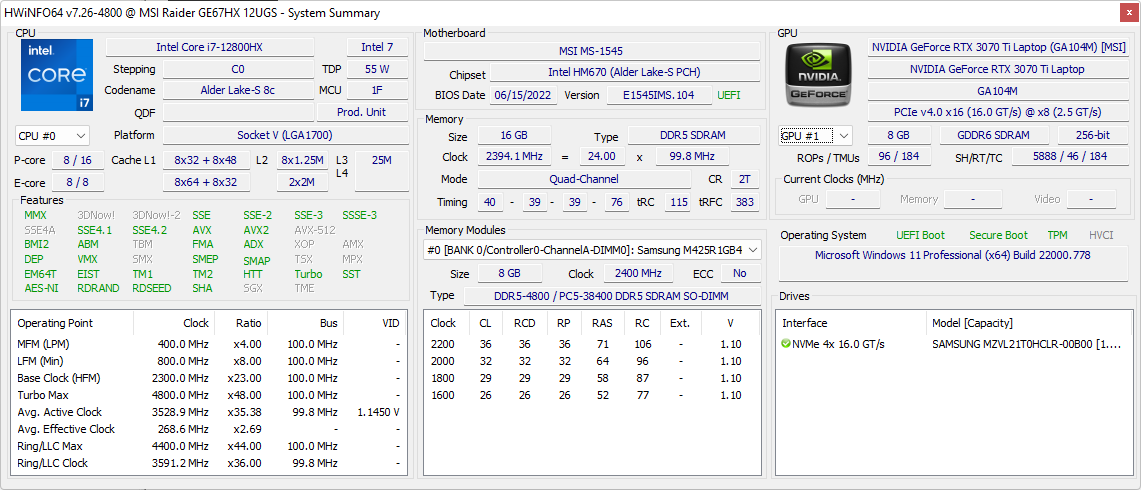
It's worth noting that we were only able to reach a GPU board power draw of only 148 W despite the MSI advertisement of 150 W + 25 W Dynamic Boost even when running on Extreme Performance mode at least according to GPU-Z.
Running on batteries impacts performance. A Fire Strike test on battery power would return Physics and Graphics scores of 22492 and 11614 points, respectively, compared to 34445 and 31096 points when on mains.
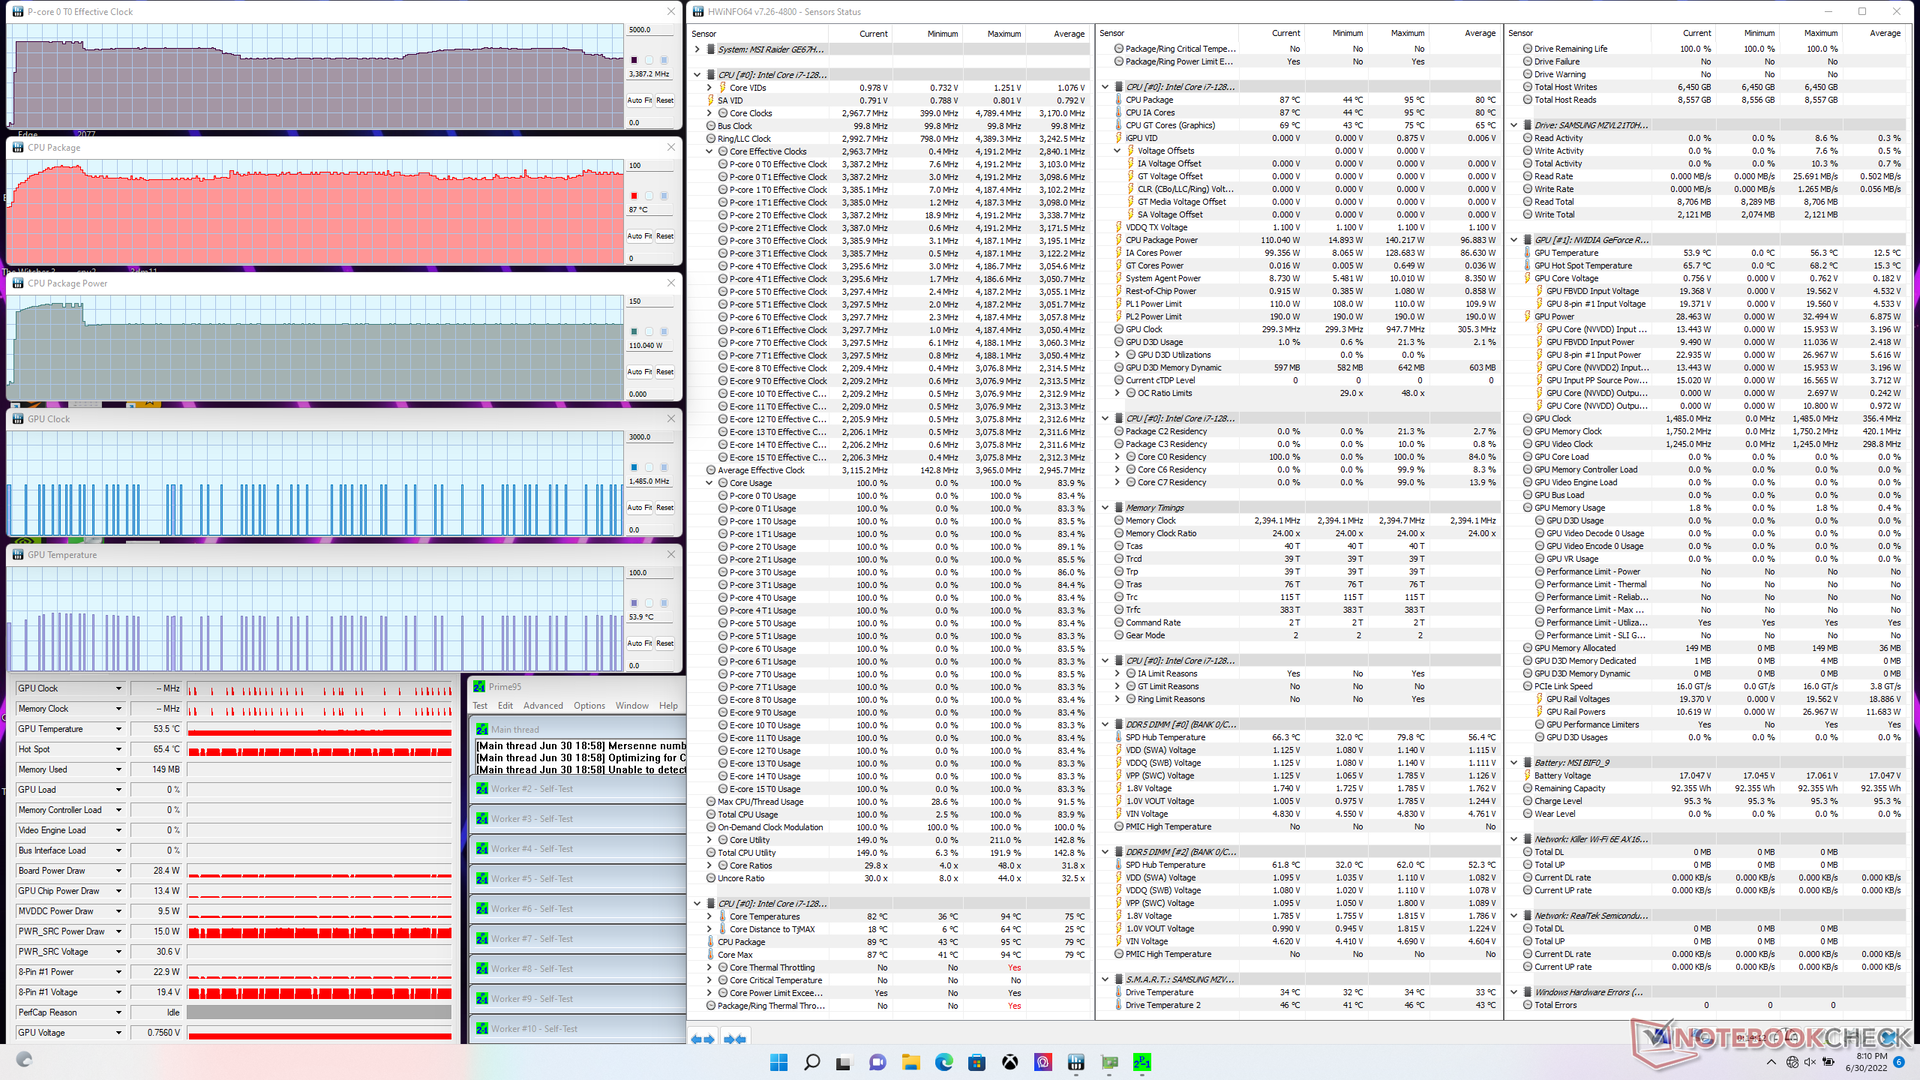
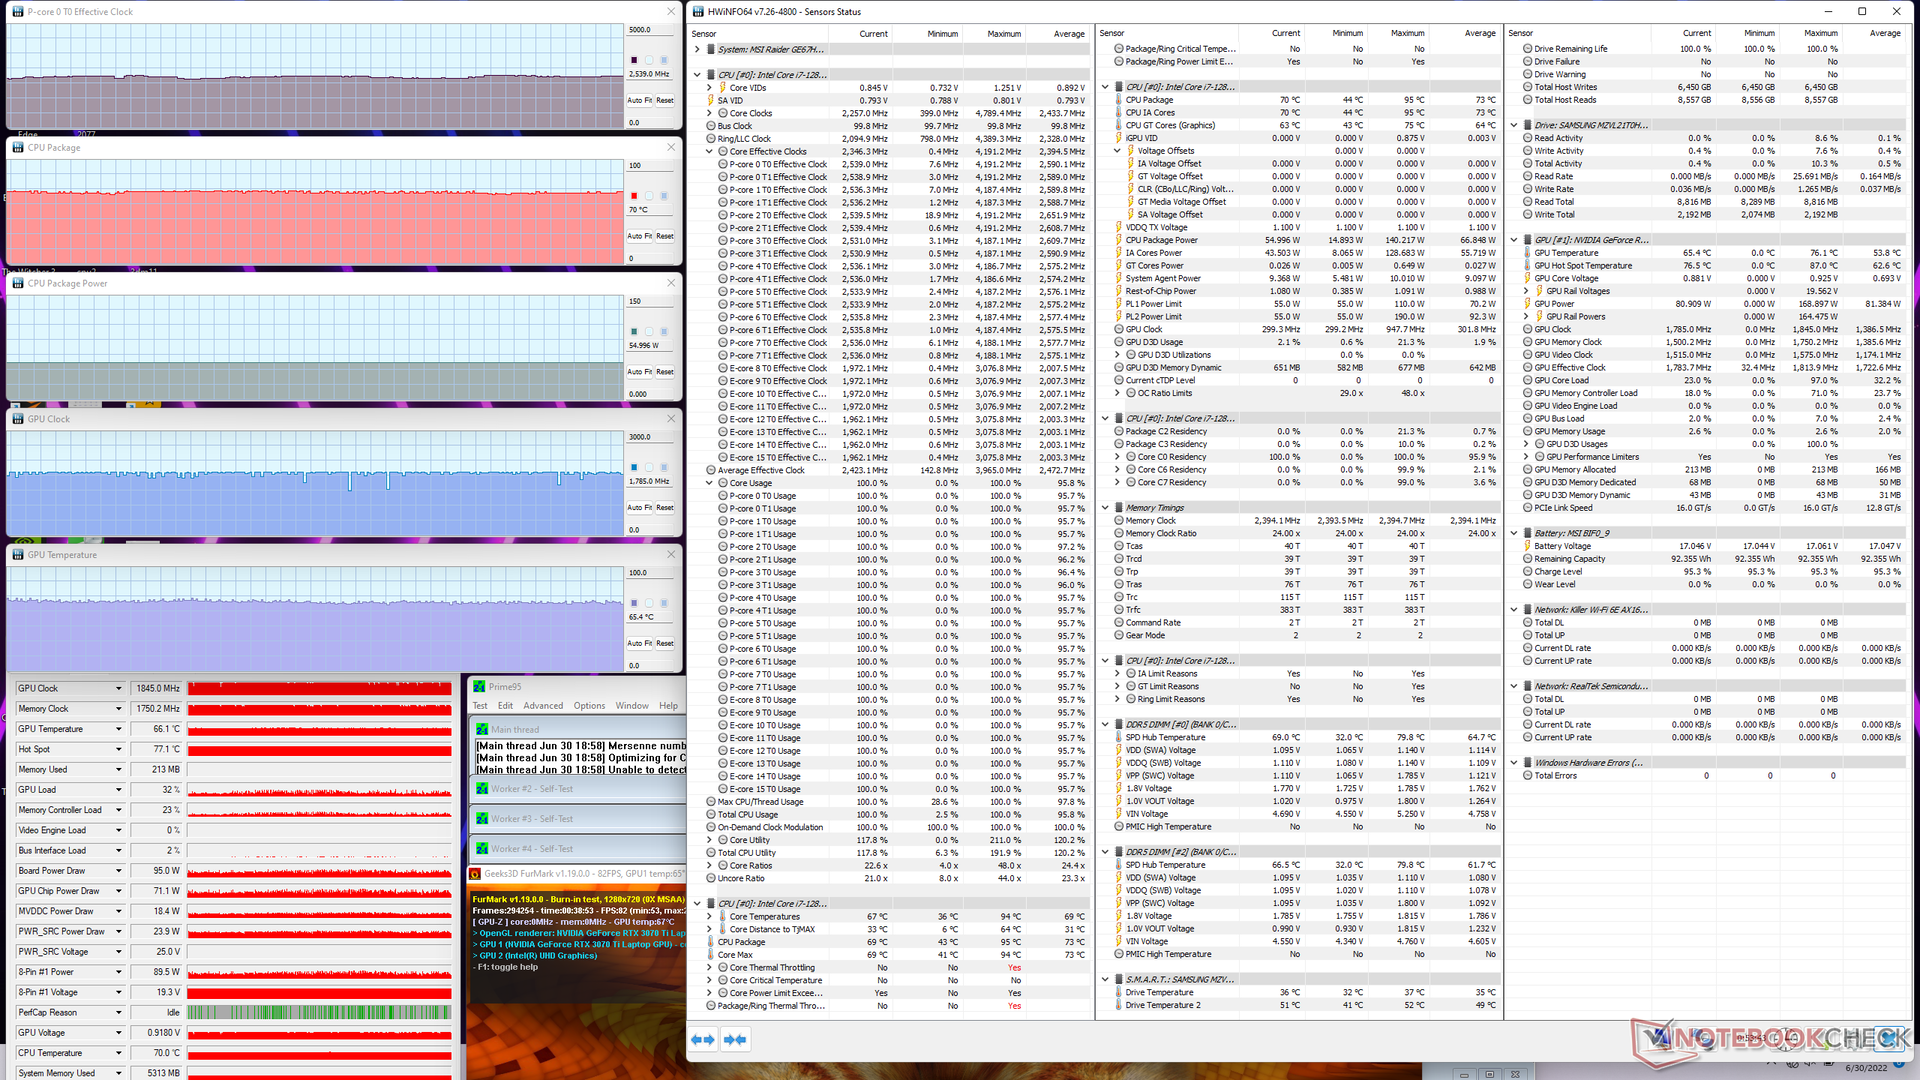
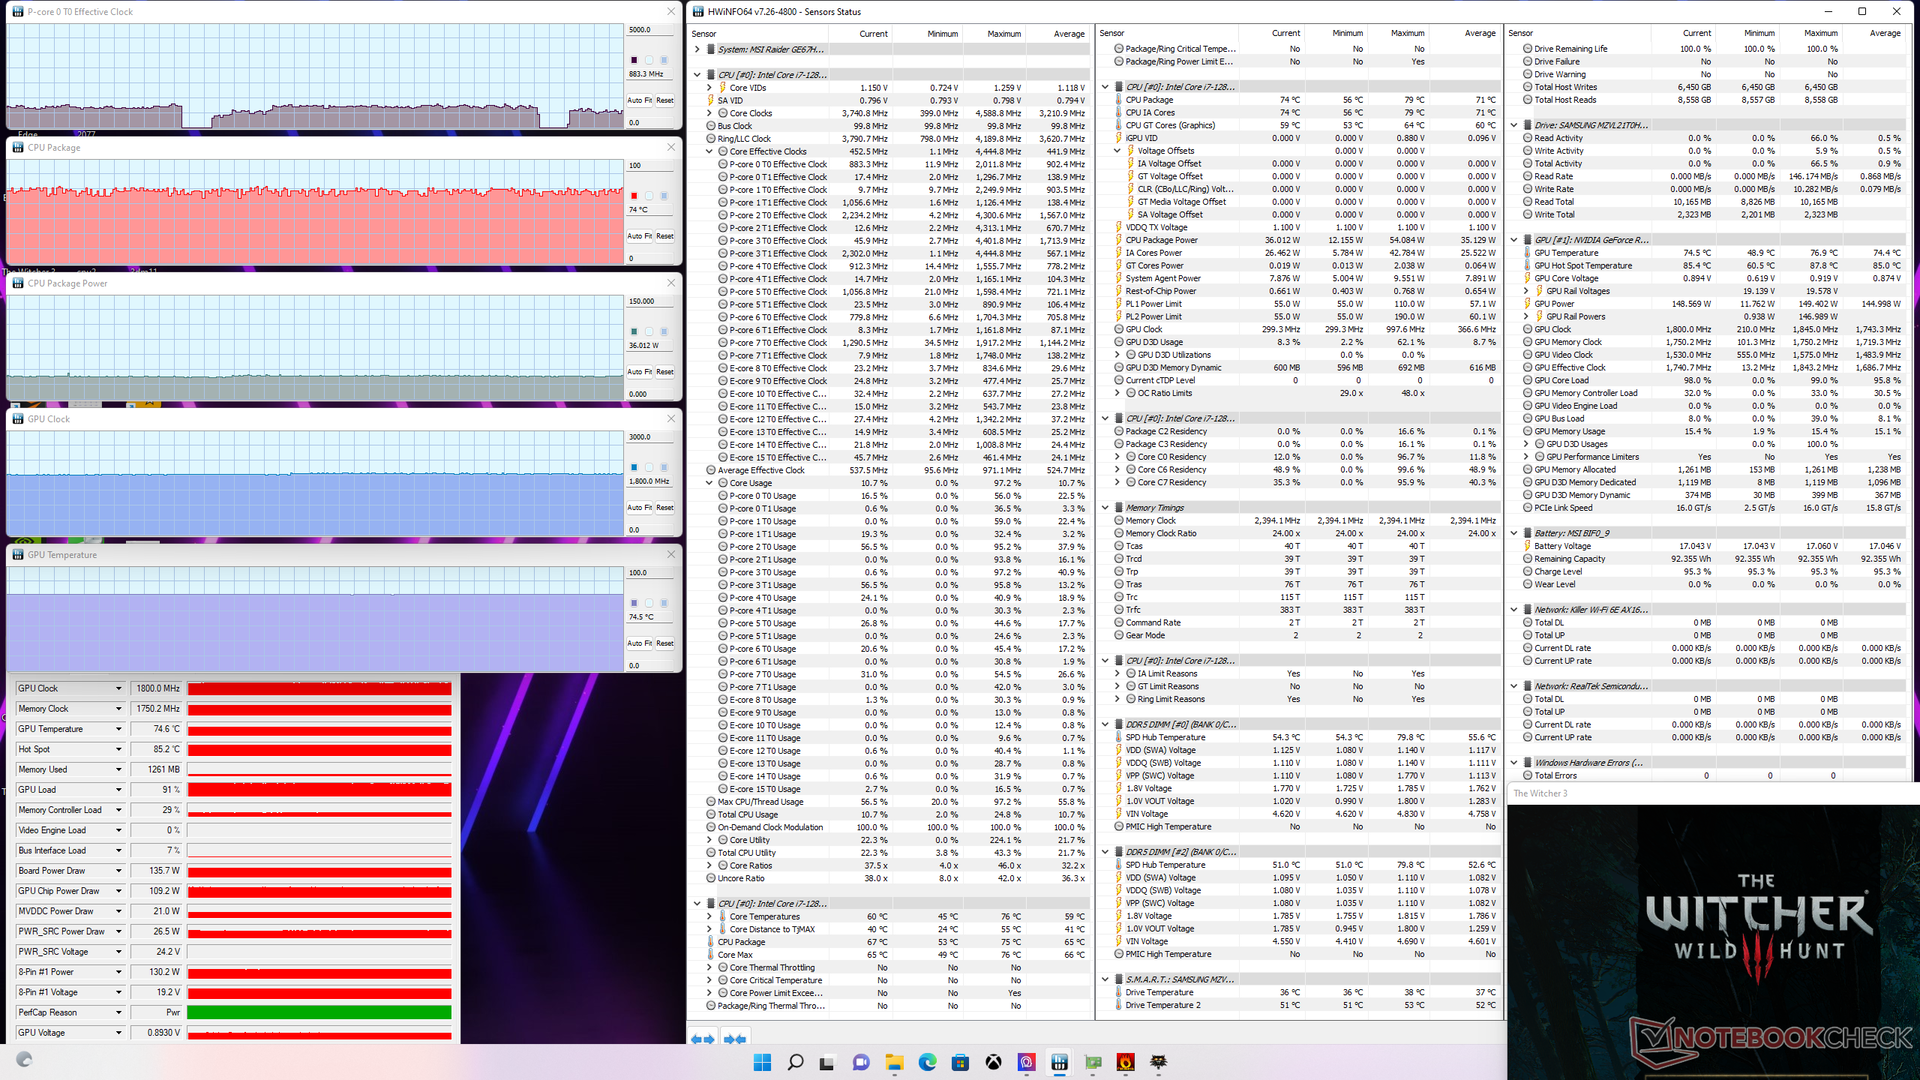
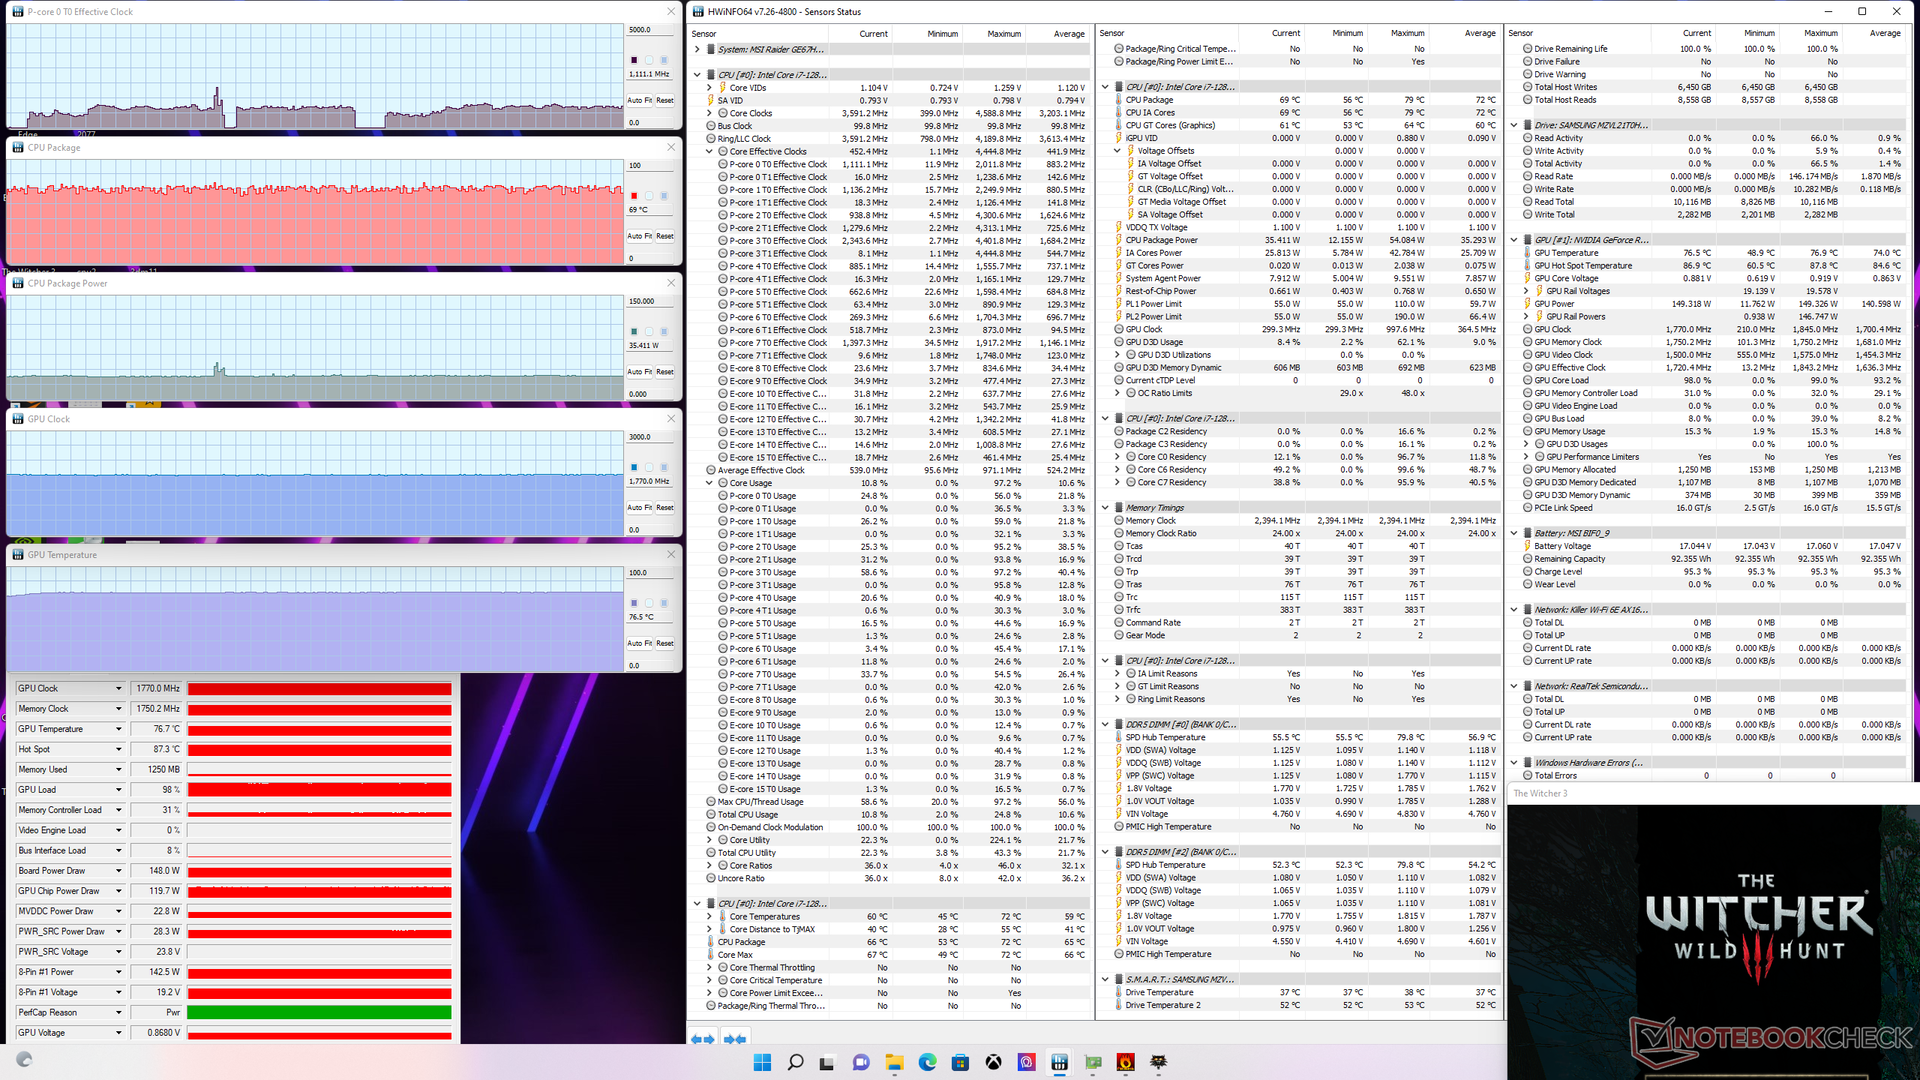
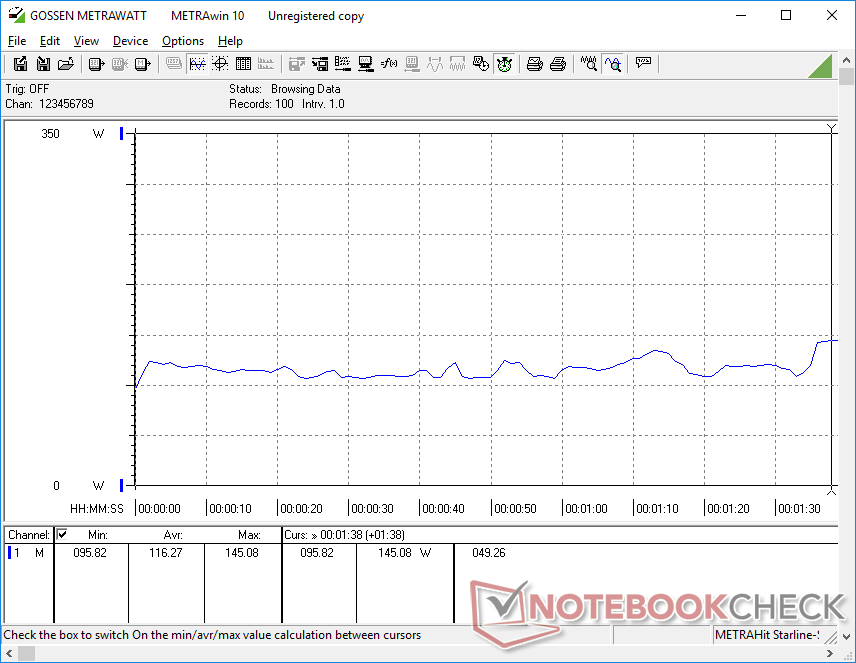
| CPU Clock (GHz) | GPU Clock (MHz) | Average CPU Temperature (°C) | Average GPU Temperature (°C) | |
| System Idle | -- | -- | 55 | 47 |
| Prime95 Stress | 3.4 - 3.7 | -- | 87 | 54 |
| Prime95 + FurMark Stress | 2.6 | 1845 | 70 | 65 |
| Witcher 3 Stress (Balanced mode) | 0.9 | 1800 | 74 | 75 |
| Witcher 3 Stress (Extreme Performance mode) | 1.1 | 1770 | 69 | 77 |
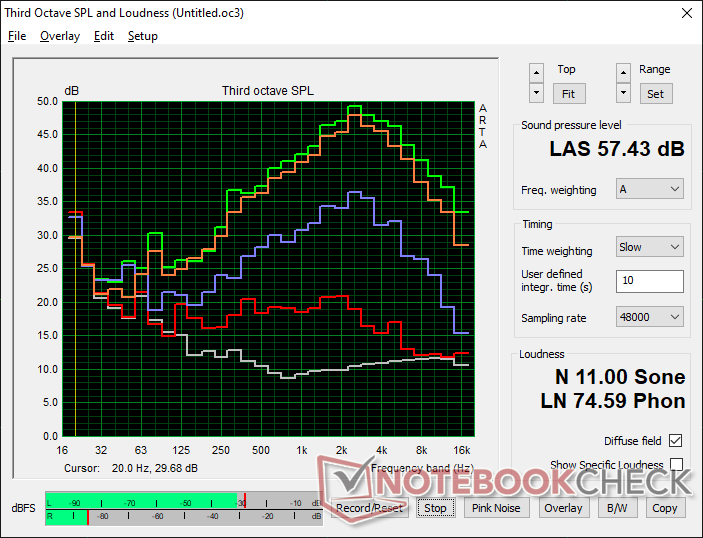
Speakers
MSI GE67 HX 12UGS audio analysis
(+) | speakers can play relatively loud (84 dB)
Bass 100 - 315 Hz
(-) | nearly no bass - on average 17.9% lower than median
(±) | linearity of bass is average (13.7% delta to prev. frequency)
Mids 400 - 2000 Hz
(±) | higher mids - on average 7.9% higher than median
(+) | mids are linear (6.6% delta to prev. frequency)
Highs 2 - 16 kHz
(±) | higher highs - on average 5.5% higher than median
(±) | linearity of highs is average (8.6% delta to prev. frequency)
Overall 100 - 16.000 Hz
(±) | linearity of overall sound is average (22.1% difference to median)
Compared to same class
» 79% of all tested devices in this class were better, 6% similar, 15% worse
» The best had a delta of 6%, average was 18%, worst was 132%
Compared to all devices tested
» 64% of all tested devices were better, 6% similar, 30% worse
» The best had a delta of 4%, average was 24%, worst was 134%
Apple MacBook Pro 16 2021 M1 Pro audio analysis
(+) | speakers can play relatively loud (84.7 dB)
Bass 100 - 315 Hz
(+) | good bass - only 3.8% away from median
(+) | bass is linear (5.2% delta to prev. frequency)
Mids 400 - 2000 Hz
(+) | balanced mids - only 1.3% away from median
(+) | mids are linear (2.1% delta to prev. frequency)
Highs 2 - 16 kHz
(+) | balanced highs - only 1.9% away from median
(+) | highs are linear (2.7% delta to prev. frequency)
Overall 100 - 16.000 Hz
(+) | overall sound is linear (4.6% difference to median)
Compared to same class
» 0% of all tested devices in this class were better, 0% similar, 100% worse
» The best had a delta of 5%, average was 17%, worst was 45%
Compared to all devices tested
» 0% of all tested devices were better, 0% similar, 100% worse
» The best had a delta of 4%, average was 24%, worst was 134%
Energy Management — High Consumption And Heavy Power Brick
Power Consumption
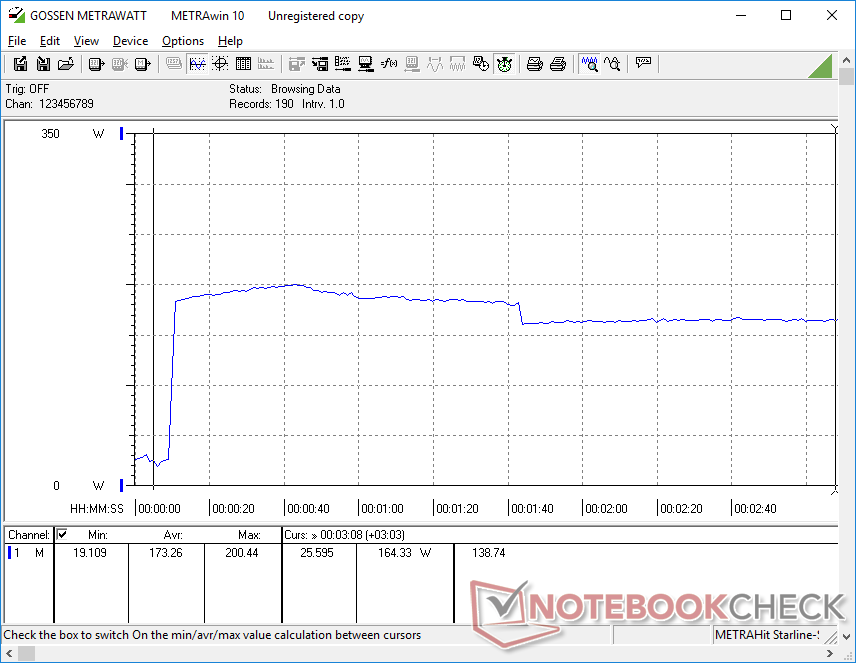
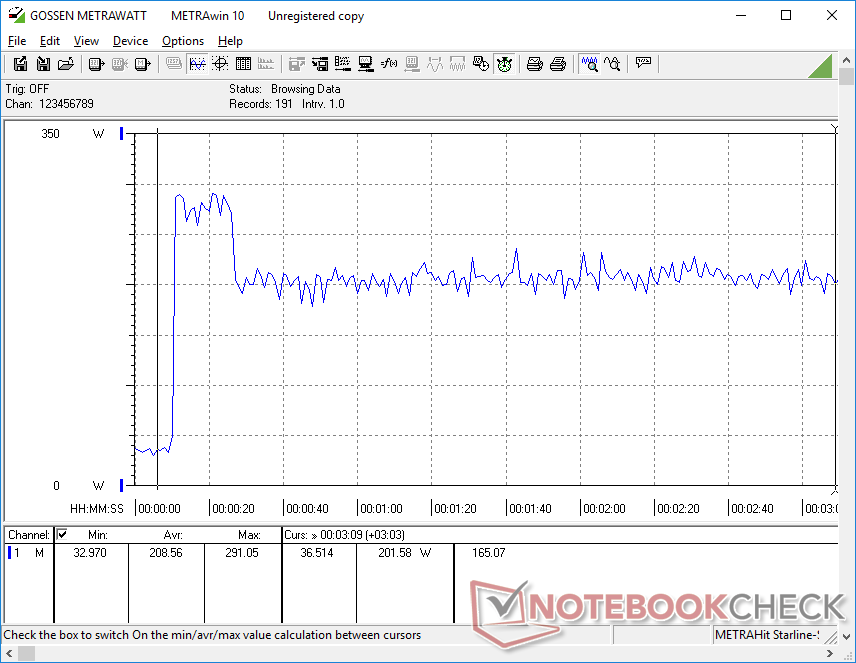
Consumption is noticeably higher than what we recorded on the older Core i9-12900HK GE66 especially when running CPU-heavy applications. Prime95, for example, would consume about 165 W on our GE67 compared to only 90 W on the GE66 to represent an 83 percent increase. It's a high price to pay for the 35 to 40 percent increase in raw multi-thread performance between the Core i9-12900HK and Core i7-12800HX.
Running Witcher 3 would consume about 237 W which is again higher than the 202 W that we recorded on the GE66. Even when compared to other high-performance gaming laptops like the Asus ROG Strix Scar 15 or Alienware m15 R6, our GE67 would be more power-hungry in both occasions.
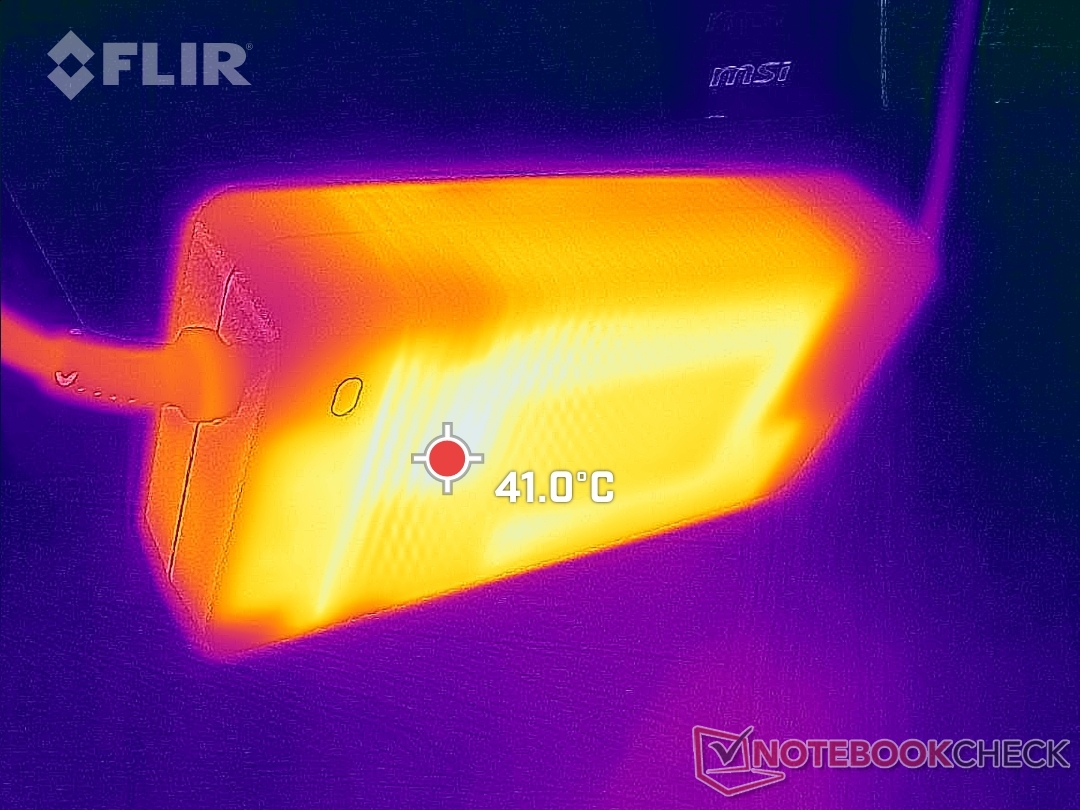
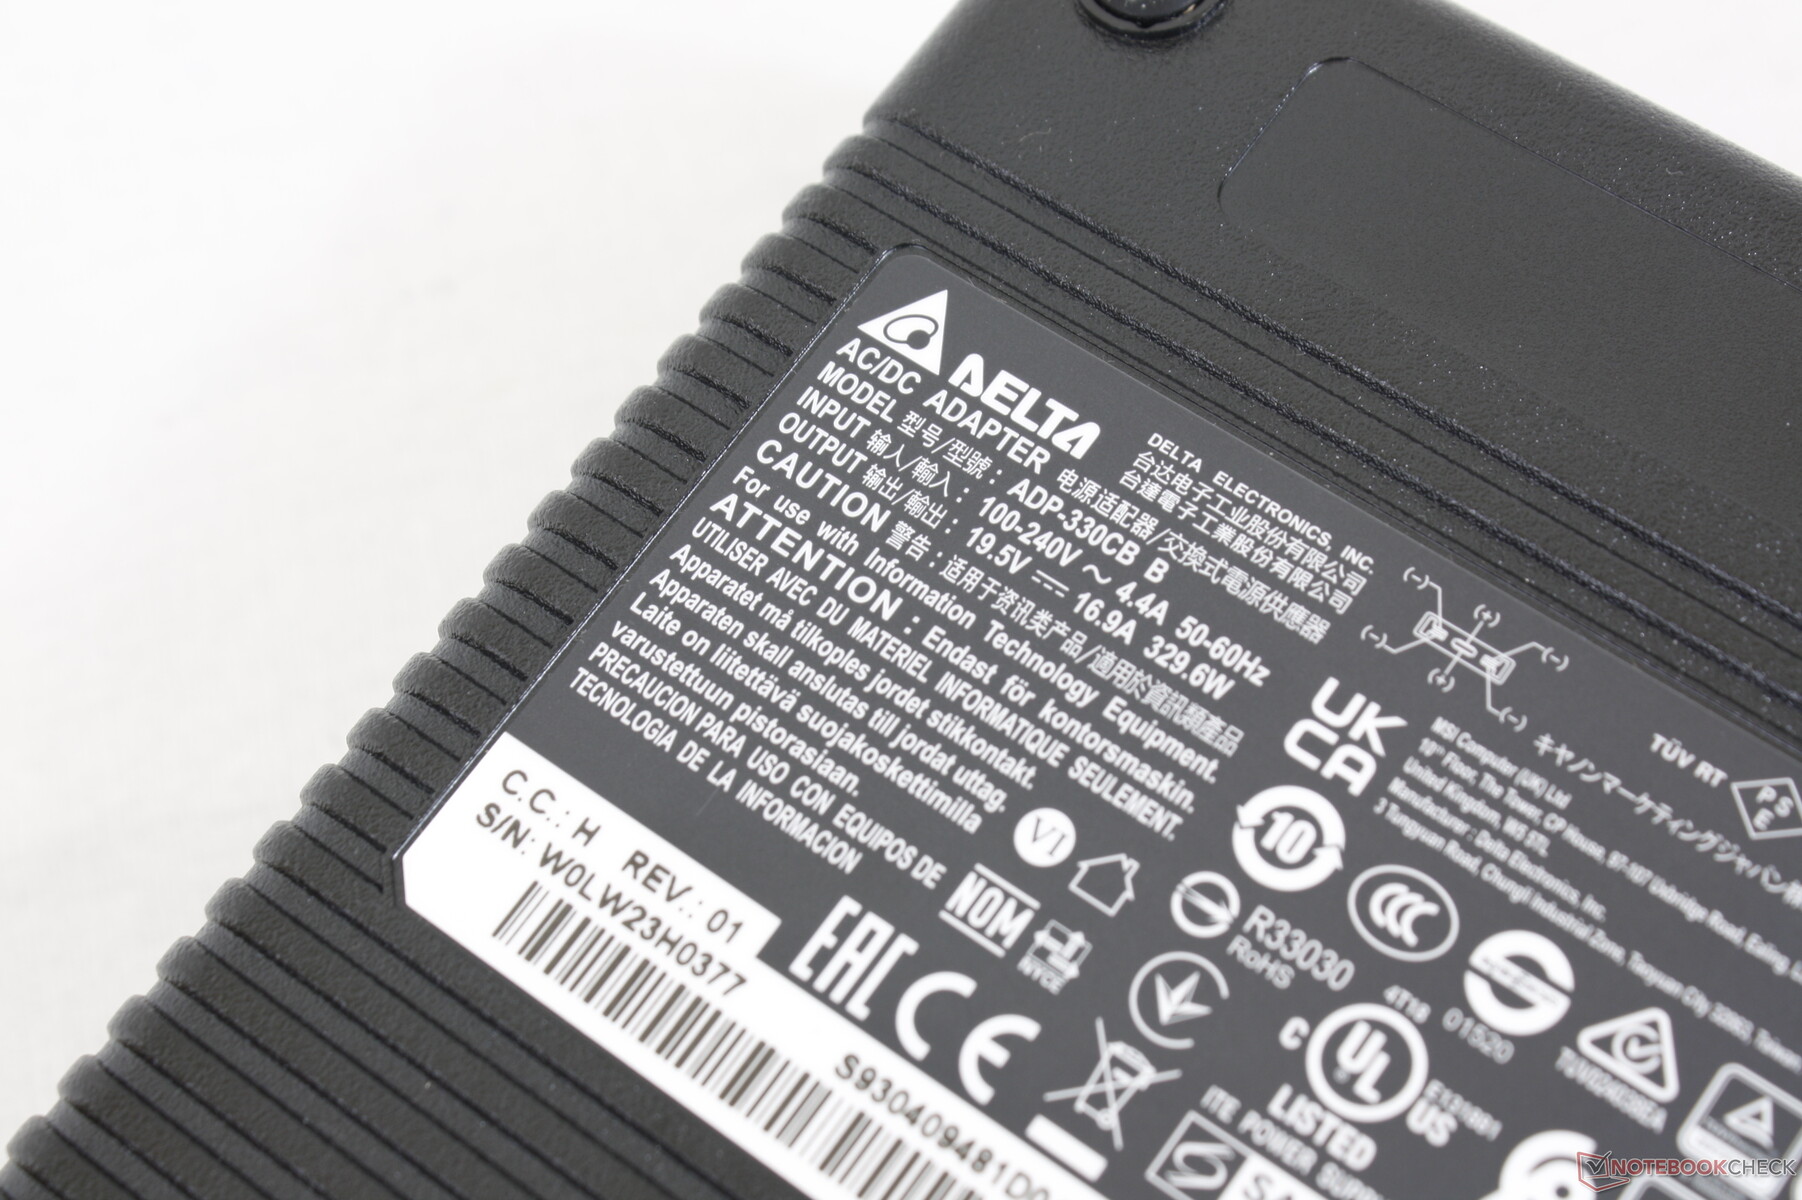
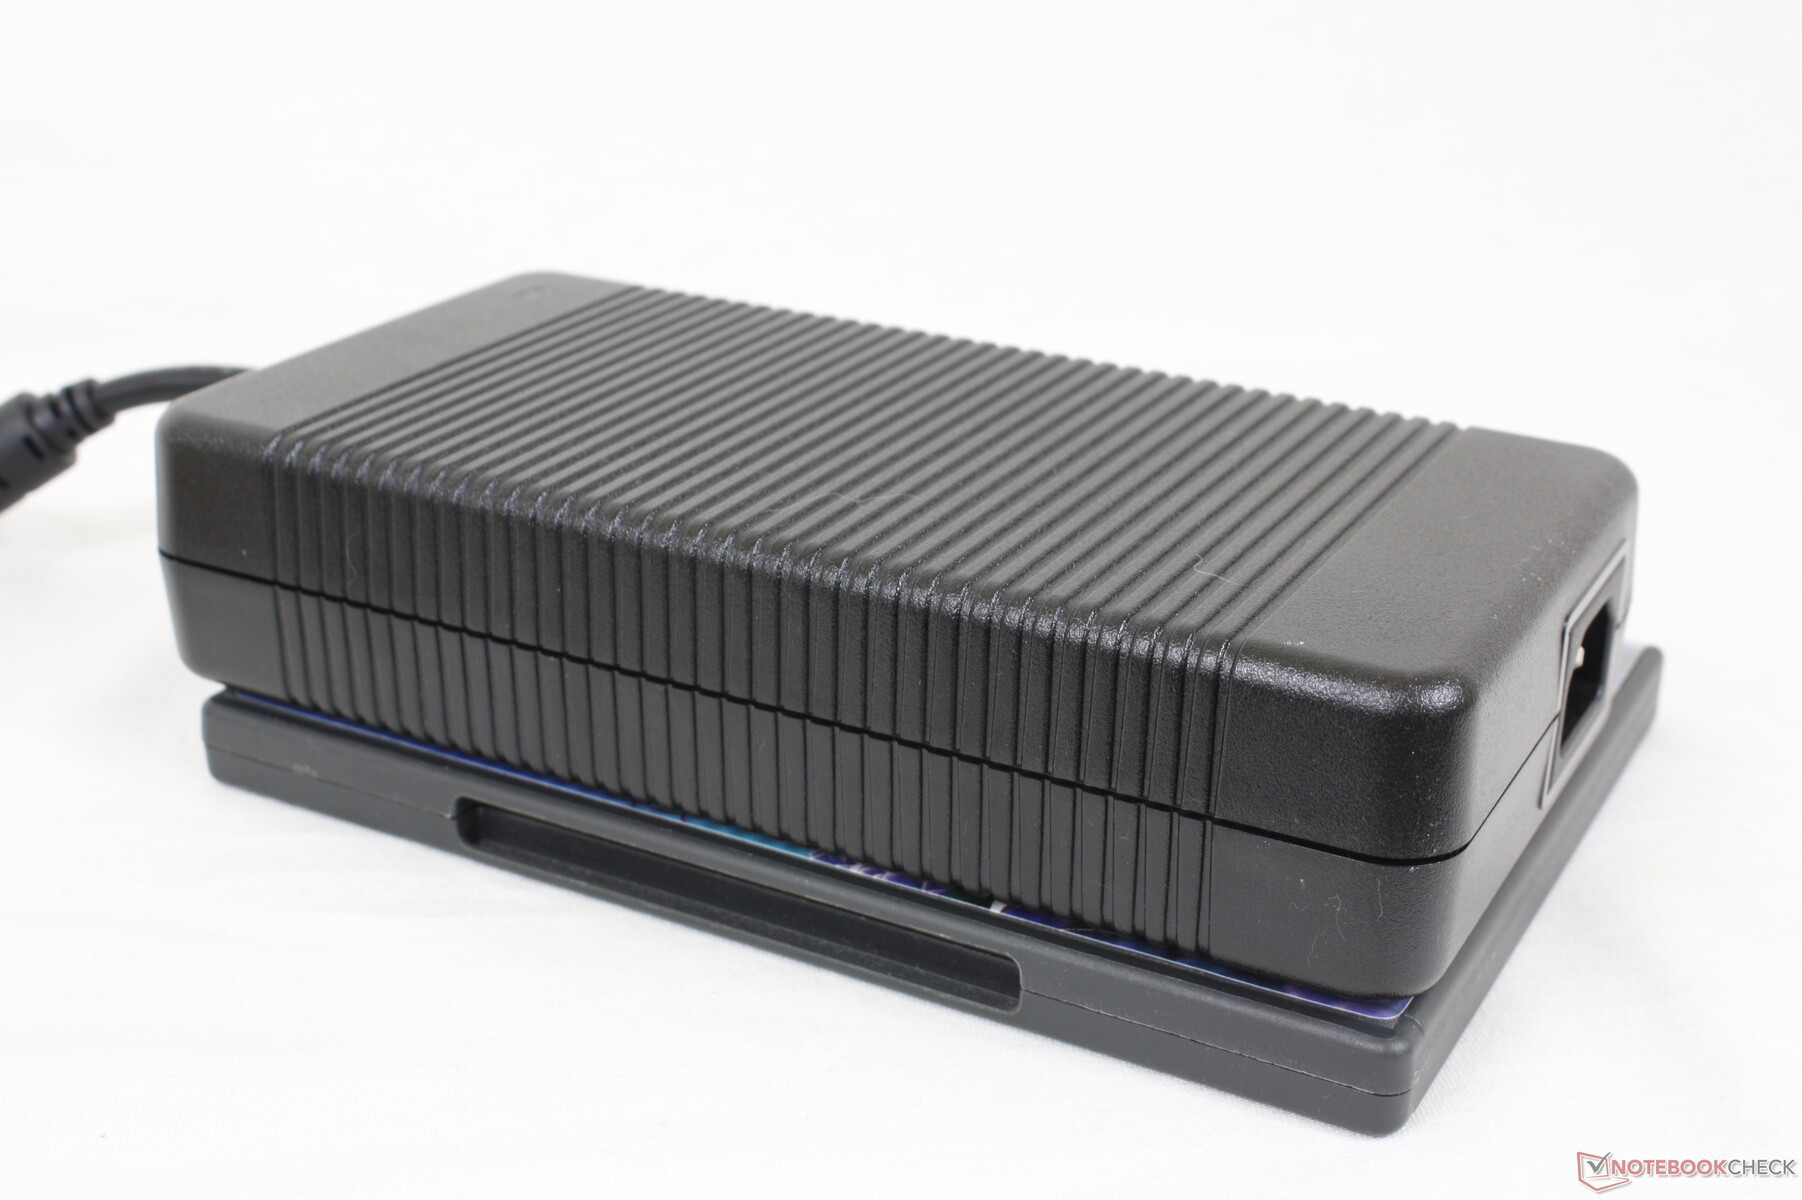
We're able to record a maximum draw of 291 W from the massive (~20 x 9.8 x 4.3 cm) and heavy (1.3 kg) 330 W power brick when running both Prime95 and FurMark simultaneously. Note that most other gaming laptops ship with 280 W or smaller AC adapters.
| Off / Standby | |
| Idle | |
| Load |
|
Key:
min: | |
| MSI GE67 HX 12UGS i7-12800HX, GeForce RTX 3070 Ti Laptop GPU, Samsung PM9A1 MZVL21T0HCLR, OLED, 1920x1080, 15.6" | MSI Raider GE66 12UHS i9-12900HK, GeForce RTX 3080 Ti Laptop GPU, Samsung PM9A1 MZVL22T0HBLB, IPS, 3840x2160, 15.6" | MSI Vector GP66 12UGS i9-12900H, GeForce RTX 3070 Ti Laptop GPU, , IPS, 1920x1080, 15.6" | Asus ROG Strix Scar 15 G533ZW-LN106WS i9-12900H, GeForce RTX 3070 Ti Laptop GPU, Samsung PM9A1 MZVL22T0HBLB, IPS-level, 2560x1440, 15.6" | Alienware m15 R6, i7-11800H RTX 3080 i7-11800H, GeForce RTX 3080 Laptop GPU, Samsung PM9A1 MZVL21T0HCLR, IPS, 1920x1080, 15.6" | Razer Blade 15 2022 i7-12800H, GeForce RTX 3080 Ti Laptop GPU, SSSTC CA6-8D1024, IPS, 2560x1440, 15.6" | |
|---|---|---|---|---|---|---|
| Power Consumption | 5% | -15% | 21% | 12% | -35% | |
| Idle Minimum * (Watt) | 16.1 | 16 1% | 17.5 -9% | 7.56 53% | 14 13% | 33.2 -106% |
| Idle Average * (Watt) | 17.1 | 19 -11% | 20.1 -18% | 13.5 21% | 18 -5% | 36.4 -113% |
| Idle Maximum * (Watt) | 26.6 | 26 2% | 47.3 -78% | 16.87 37% | 29 -9% | 37.6 -41% |
| Load Average * (Watt) | 116.3 | 110 5% | 107.3 8% | 128.9 -11% | 93 20% | 116.7 -0% |
| Witcher 3 ultra * (Watt) | 237 | 202 15% | 225 5% | 196.2 17% | 190 20% | 172 27% |
| Load Maximum * (Watt) | 291.1 | 242 17% | 277.7 5% | 274.86 6% | 203 30% | 228.6 21% |
* ... smaller is better
Power Consumption Witcher 3 / Stresstest
Power Consumption external Monitor
Battery Life — Actually Not Bad
Battery capacity is the largest allowable at 99.9 Wh as any higher would violate FAA lithium battery safety regulations. Users can expect WLAN runtimes of about 5.5 hours when set to the Balanced power profile which is similar to what we recorded on the GE66 despite their performance differences.
Charging from empty to full is slow at 2 to 2.5 hours. The system cannot be charged via USB-C unlike on the Razer Blade series or most Asus ROG models.
| MSI GE67 HX 12UGS i7-12800HX, GeForce RTX 3070 Ti Laptop GPU, 99.9 Wh | MSI Raider GE66 12UHS i9-12900HK, GeForce RTX 3080 Ti Laptop GPU, 99 Wh | MSI Vector GP66 12UGS i9-12900H, GeForce RTX 3070 Ti Laptop GPU, 65 Wh | Asus ROG Strix Scar 15 G533ZW-LN106WS i9-12900H, GeForce RTX 3070 Ti Laptop GPU, 90 Wh | Alienware m15 R6, i7-11800H RTX 3080 i7-11800H, GeForce RTX 3080 Laptop GPU, 84 Wh | Razer Blade 15 2022 i7-12800H, GeForce RTX 3080 Ti Laptop GPU, 80 Wh | |
|---|---|---|---|---|---|---|
| Battery runtime | -9% | -19% | -4% | -18% | -12% | |
| Reader / Idle (h) | 8.4 | 7.9 -6% | ||||
| WiFi v1.3 (h) | 5.6 | 5.7 2% | 5.7 2% | 8.4 50% | 5 -11% | 4.9 -12% |
| Load (h) | 2.1 | 1.7 -19% | 1 -52% | 0.9 -57% | 1.6 -24% | |
| H.264 (h) | 7.1 | 8.5 | 5.6 | |||
| Witcher 3 ultra (h) | 1.2 |
Pros
Cons
Verdict — Higher Performance, Higher Power Bills
The performance advantages of the Core i7-12800HX are undeniable. When compared to the Ryzen 7 5800H or even the Core i9-12900H, the Intel HX CPU can offer up to 80 percent faster multi-thread performance than the former and 30 to 60 percent faster performance than the latter. The gains are significant enough to pull ahead of the desktop-class Core i7-12700K in many cases. Enthusiasts and gamers who know they can take advantage of the processor, such as for higher frame rates when gaming, will find a lot to like about what the GE67 can offer.
All that extra performance doesn't come free. While the GE66 would ship with a slimmer 280 W AC adapter, the GE67 ships with a bulkier 330 W AC adapter just to accommodate the power-hungry Intel 12th gen HX CPU. Power consumption is unquestionably higher as a result. Some users may find these disadvantages worthwhile when considering the immense CPU gains, but it is still something to keep in mind if from a performance-per-watt perspective.
The GE67 is one of the fastest 15.6-inch gaming laptops thanks to the Core i7-12800HX CPU and 150 W GeForce RTX GPU. It's also one of the most power-hungry as it requires a large 330 W power brick to run.
As for the QHD OLED 240 Hz display, it is easily the best OLED panel currently available for gaming purposes and it pairs very well with the HX CPU and 150 W GeForce RTX 3070 Ti GPU. Its implementation on the GE67 is not for professional editing purposes, however, and the flickering may impact a minority of users.
Price and Availability
The MSI GE67 is not yet widely available on Amazon or Best Buy as of this writing. However, outlets like XoticPC and EXcaliberPC have SKUs in stock starting at $2500 USD.
MSI GE67 HX 12UGS
- 08/30/2022 v7 (old)
Allen Ngo
Price comparison
