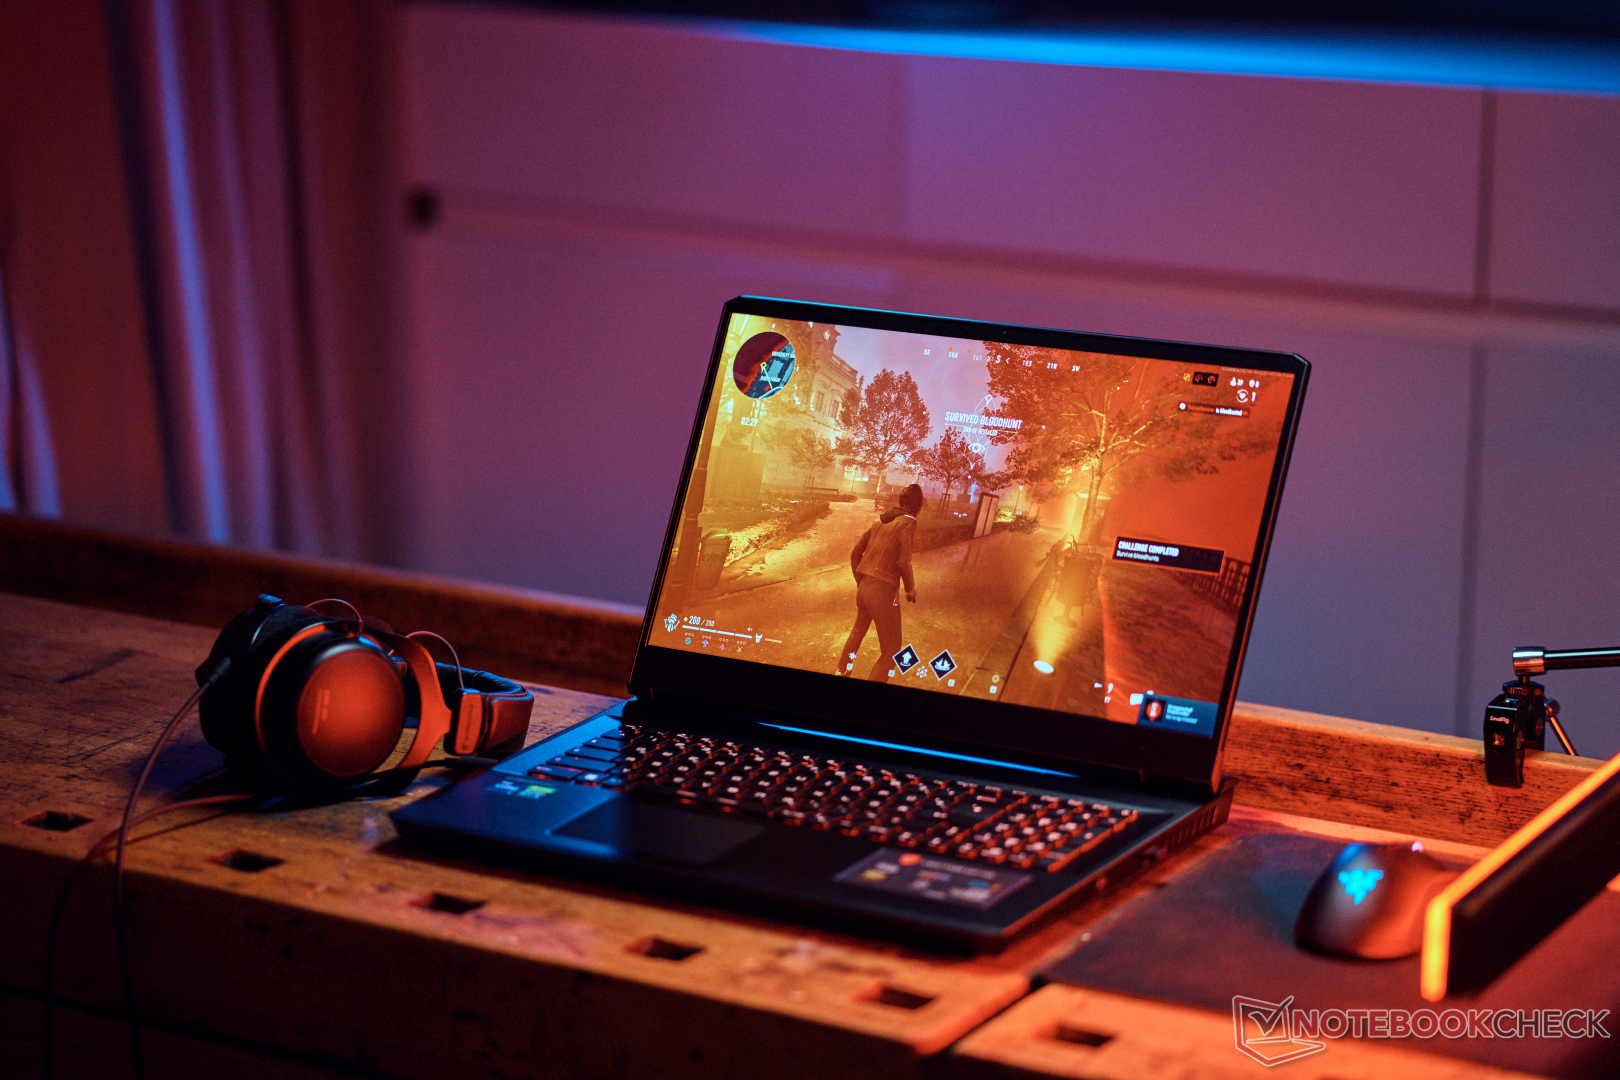
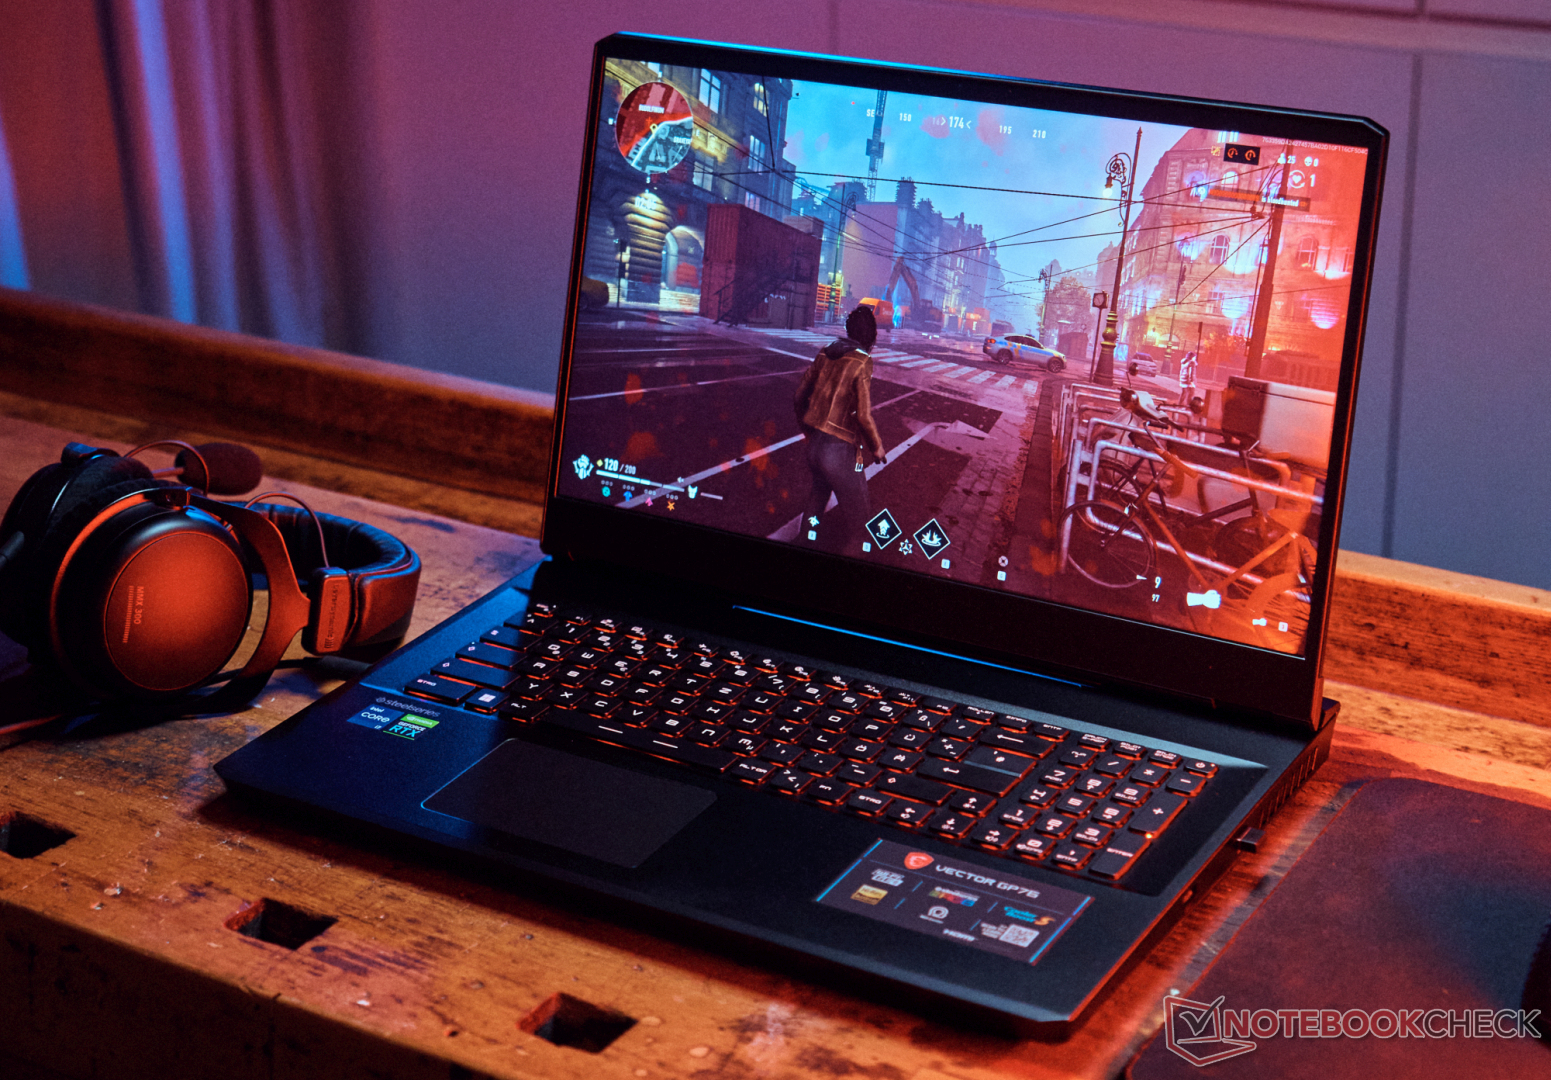
MSI Vector GP76 12UGS review: Gaming laptop on speed

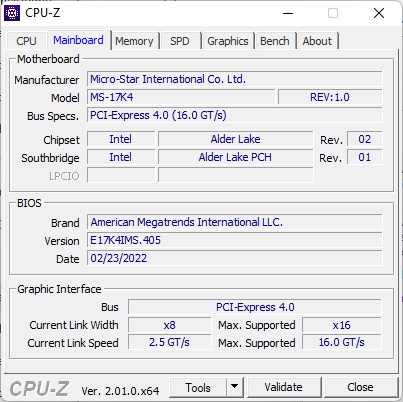
With its new Vector series, MSI is introducing two new notebooks to the gaming battlefields this year. The smaller 15-incher already delivers outstanding performance, but what upgrades does the Vector GP76 offer as a direct successor to the GP76 Leopard? Unlike the MSI Alpha, Katana or Pulse, the Vector range is not designed for entry-level or mid-range users, but offers high-end gaming machines with mid-range elements, which is also reflected in the price of around US$ 2,600.
However, a few features are missing compared to the GE series for enthusiasts and the compact GS series. For example, Thunderbolt 4, a card reader and USB-C charging are omitted, alongside a lack of options for QHD or UHD displays, or a Nvidia GeForce RTX 3080 Ti. Furthermore, it comes with somewhat slower DDR4 RAM and a smaller battery. Nevertheless, there are many strong features and upgrades that we highlight in this report, such as the 360 Hz fast panel with 4ms response time.
Competirors include the Asus ROG Strix G17, the Gigabyte Aorus 17, Schenker's XMG Neo 17 and Lenovo's Legion 5 Pro. Also of interest is the comparison to the similarly priced Asus ROG Zephyrus M16.
Possible Competitors in Comparison
Rating | Date | Model | Weight | Height | Size | Resolution | Price |
|---|---|---|---|---|---|---|---|
| 86.7 % v7 (old) | 05 / 2022 | MSI Vector GP76 12UGS-434 i7-12700H, GeForce RTX 3070 Ti Laptop GPU | 2.9 kg | 25.9 mm | 17.30" | 1920x1080 | |
| 85.1 % v7 (old) | 03 / 2021 | MSI GP76 Leopard 10UG i7-10750H, GeForce RTX 3070 Laptop GPU | 2.9 kg | 26 mm | 17.30" | 1920x1080 | |
| 83.4 % v7 (old) | 08 / 2021 | Asus ROG Strix G17 G713QE-RB74 R7 5800H, GeForce RTX 3050 Ti Laptop GPU | 2.5 kg | 24.6 mm | 17.30" | 1920x1080 | |
| 85.2 % v7 (old) | 04 / 2022 | Aorus 17 XE4 i7-12700H, GeForce RTX 3070 Ti Laptop GPU | 2.6 kg | 27 mm | 17.30" | 1920x1080 | |
| 87.4 % v7 (old) | 09 / 2021 | Schenker XMG NEO 17 GM7TG8S i7-11800H, GeForce RTX 3080 Laptop GPU | 2.6 kg | 27.45 mm | 17.30" | 2560x1440 | |
| 88 % v7 (old) | 03 / 2022 | Lenovo Legion 5 Pro 16 G7 i7 RTX 3070Ti i7-12700H, GeForce RTX 3070 Ti Laptop GPU | 2.6 kg | 26.6 mm | 16.00" | 2560x1600 | |
| 85.6 % v7 (old) | 07 / 2021 | Asus ROG Zephyrus M16 GU603H i9-11900H, GeForce RTX 3070 Laptop GPU | 2 kg | 20 mm | 16.00" | 2560x1600 | |
| 86.9 % v7 (old) | 03 / 2022 | MSI Vector GP66 12UGS i9-12900H, GeForce RTX 3070 Ti Laptop GPU | 2.3 kg | 23.4 mm | 15.60" | 1920x1080 |
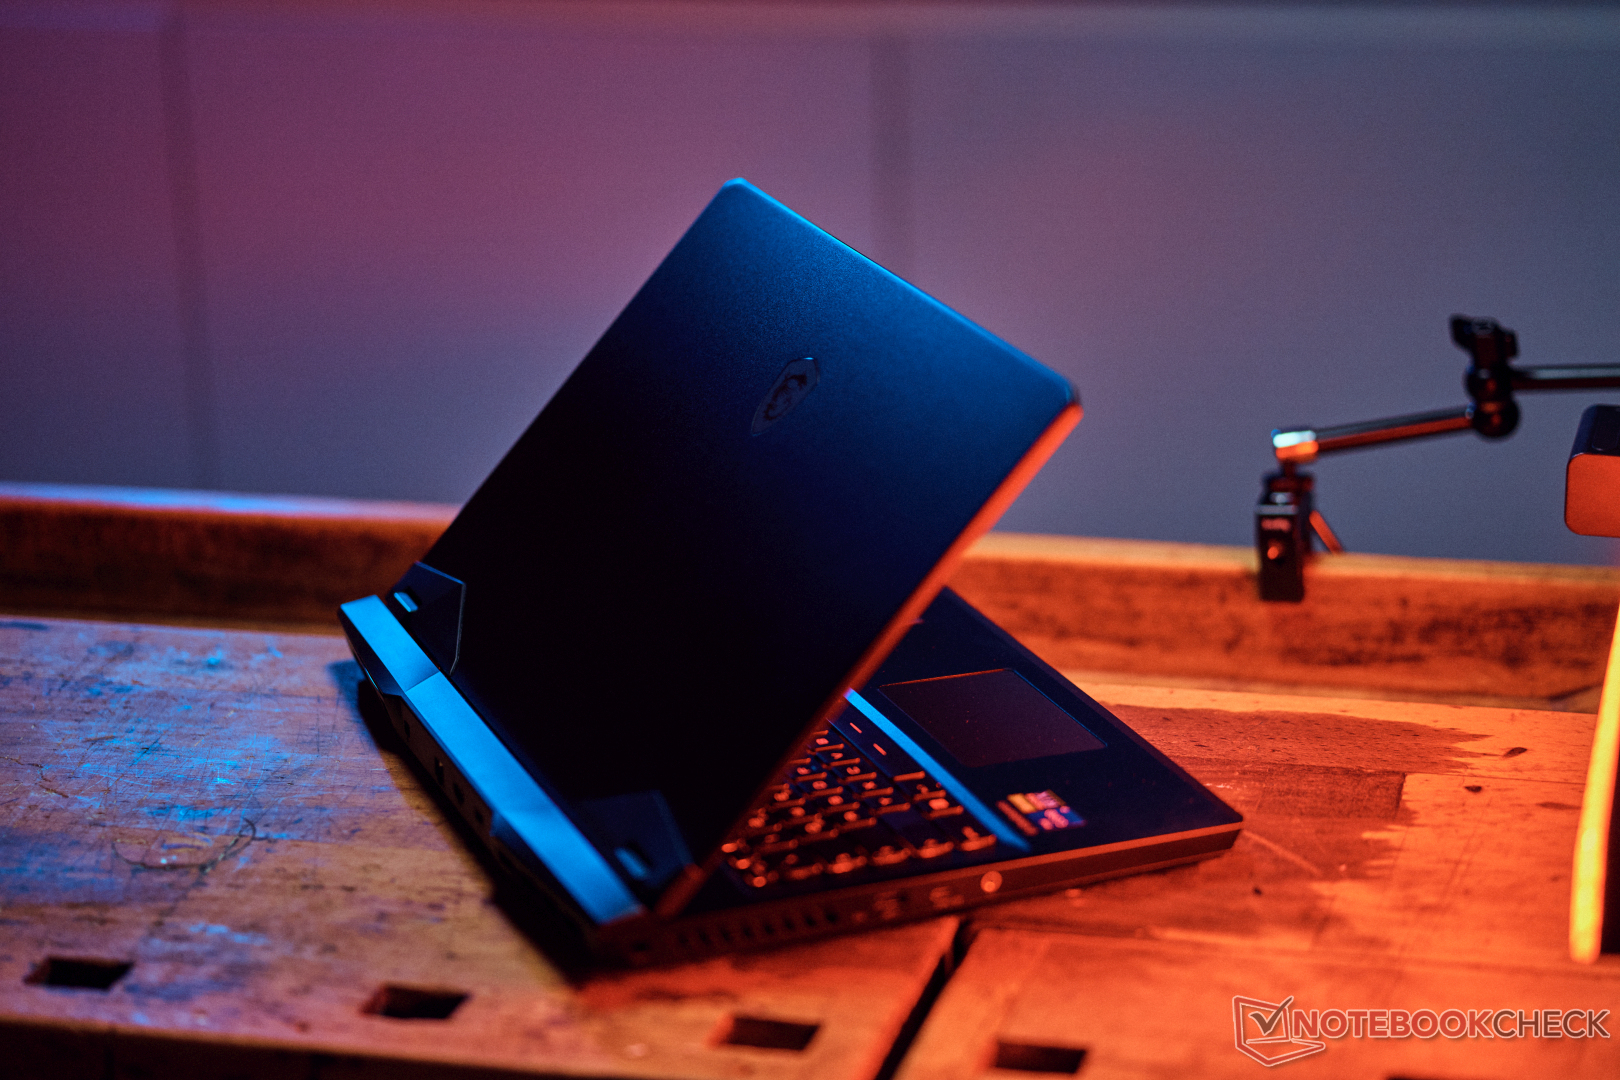
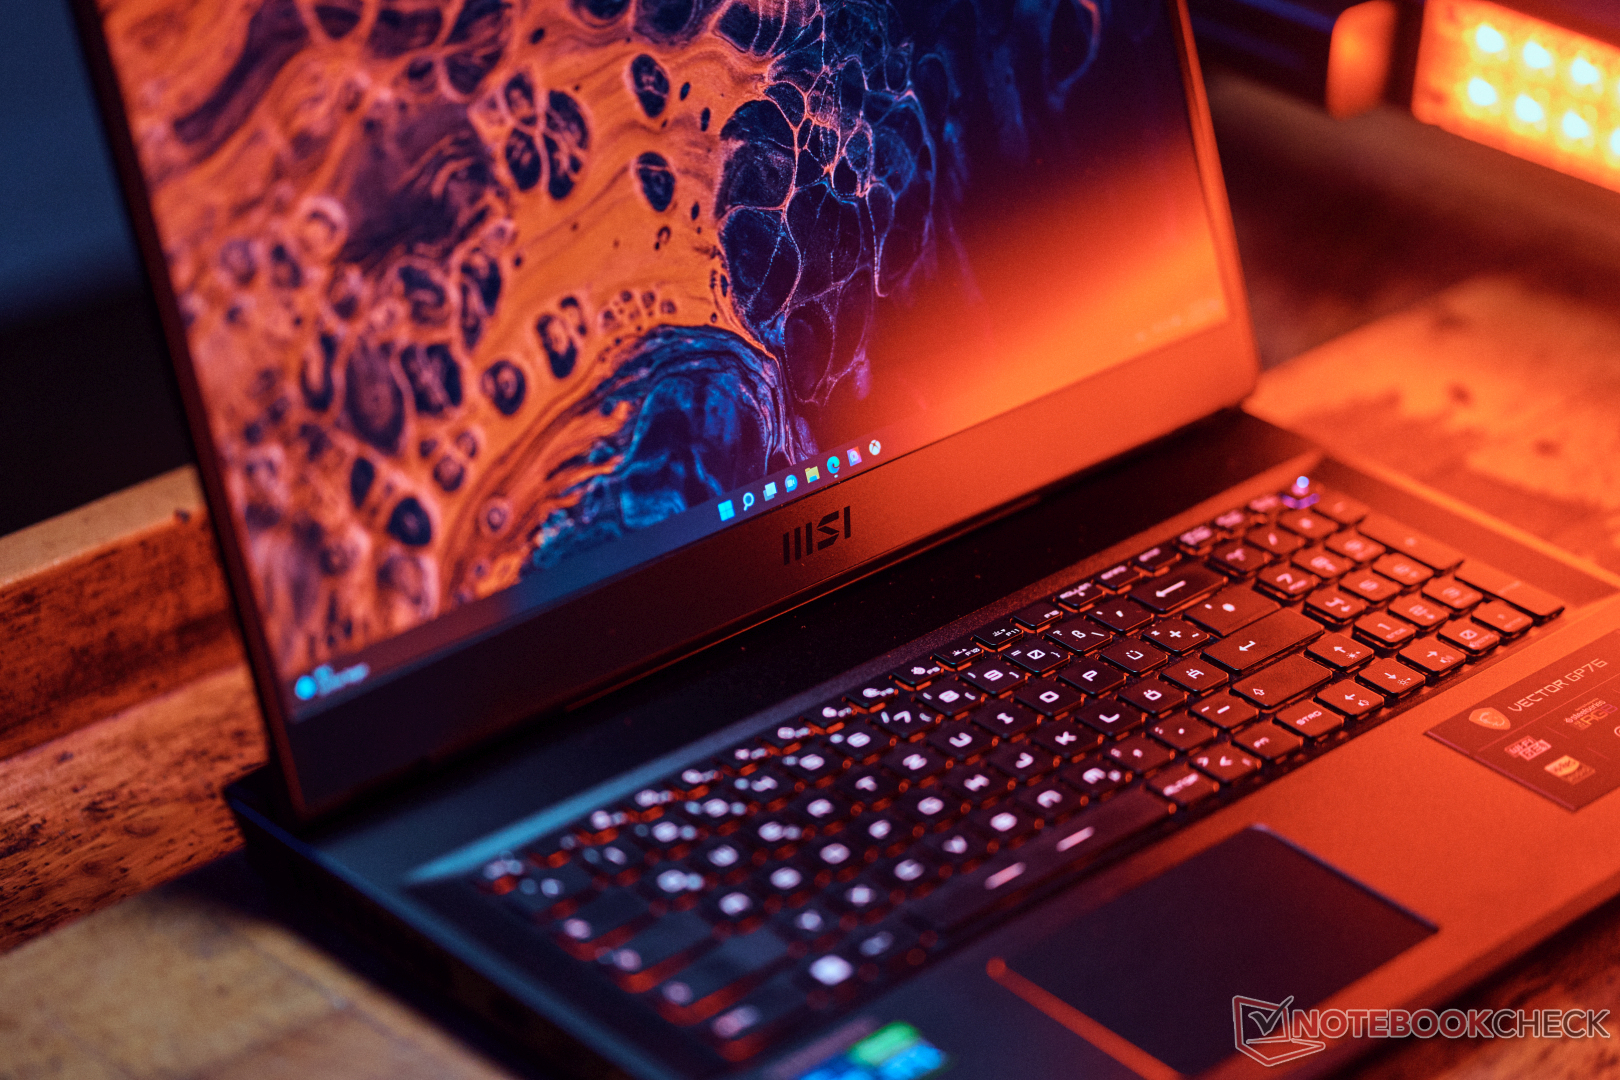
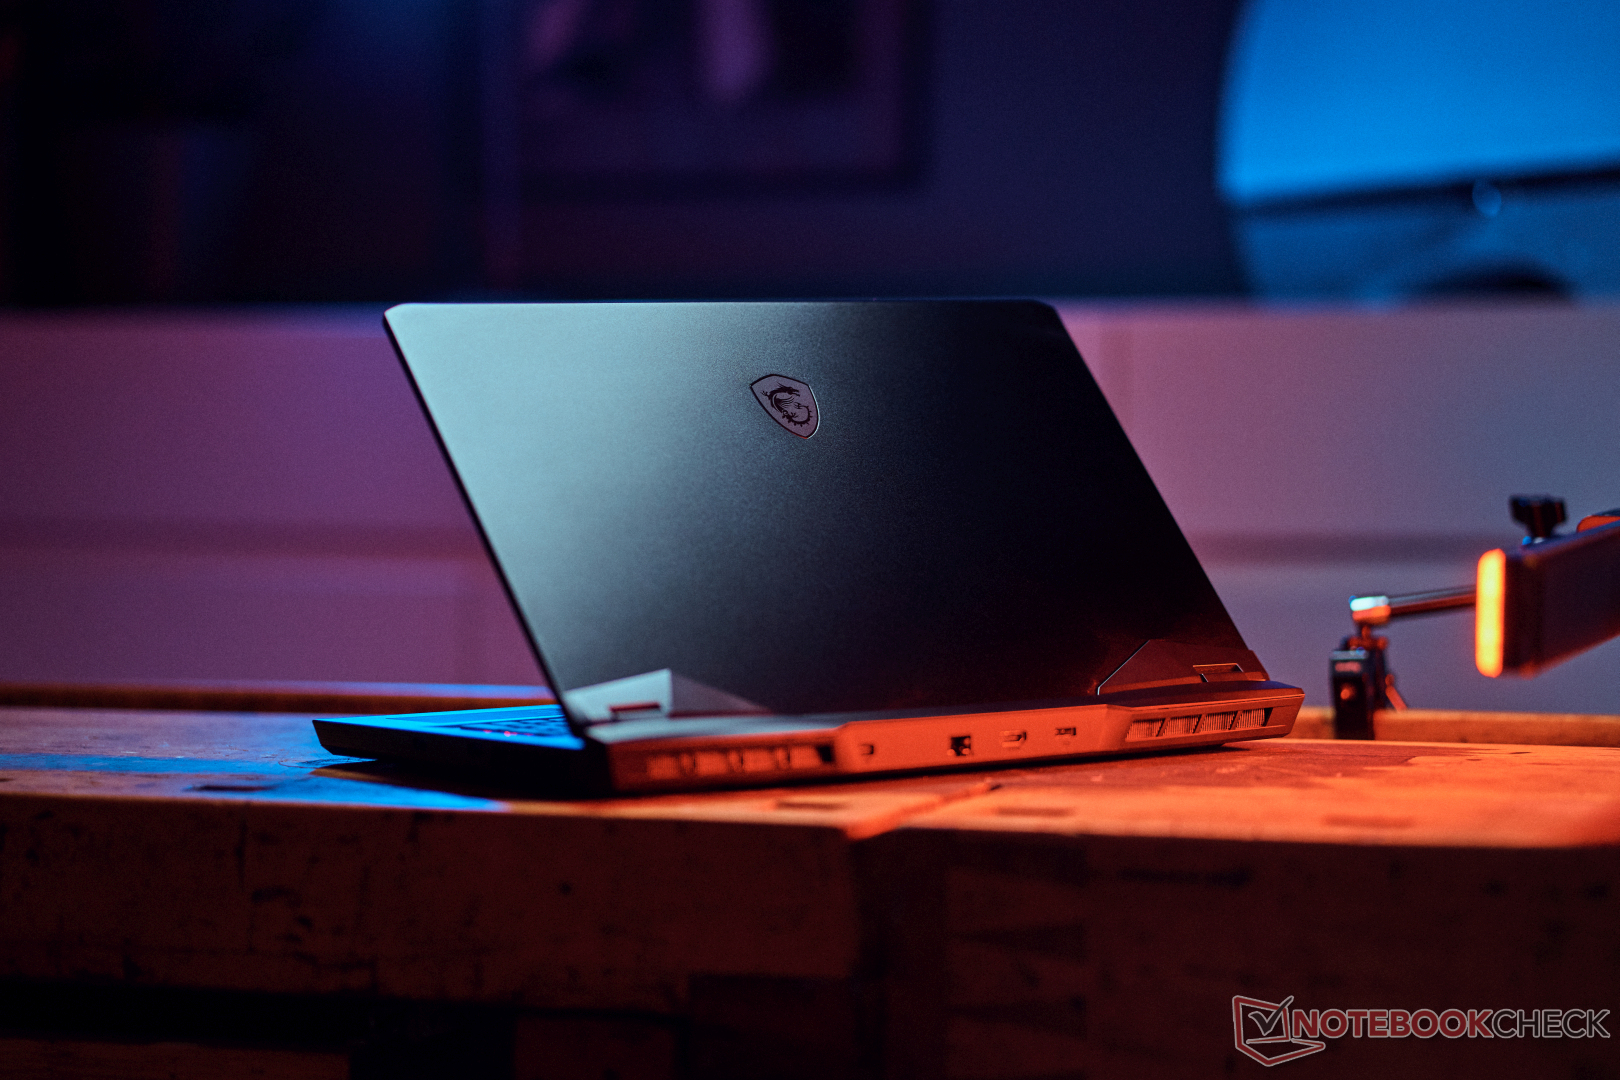
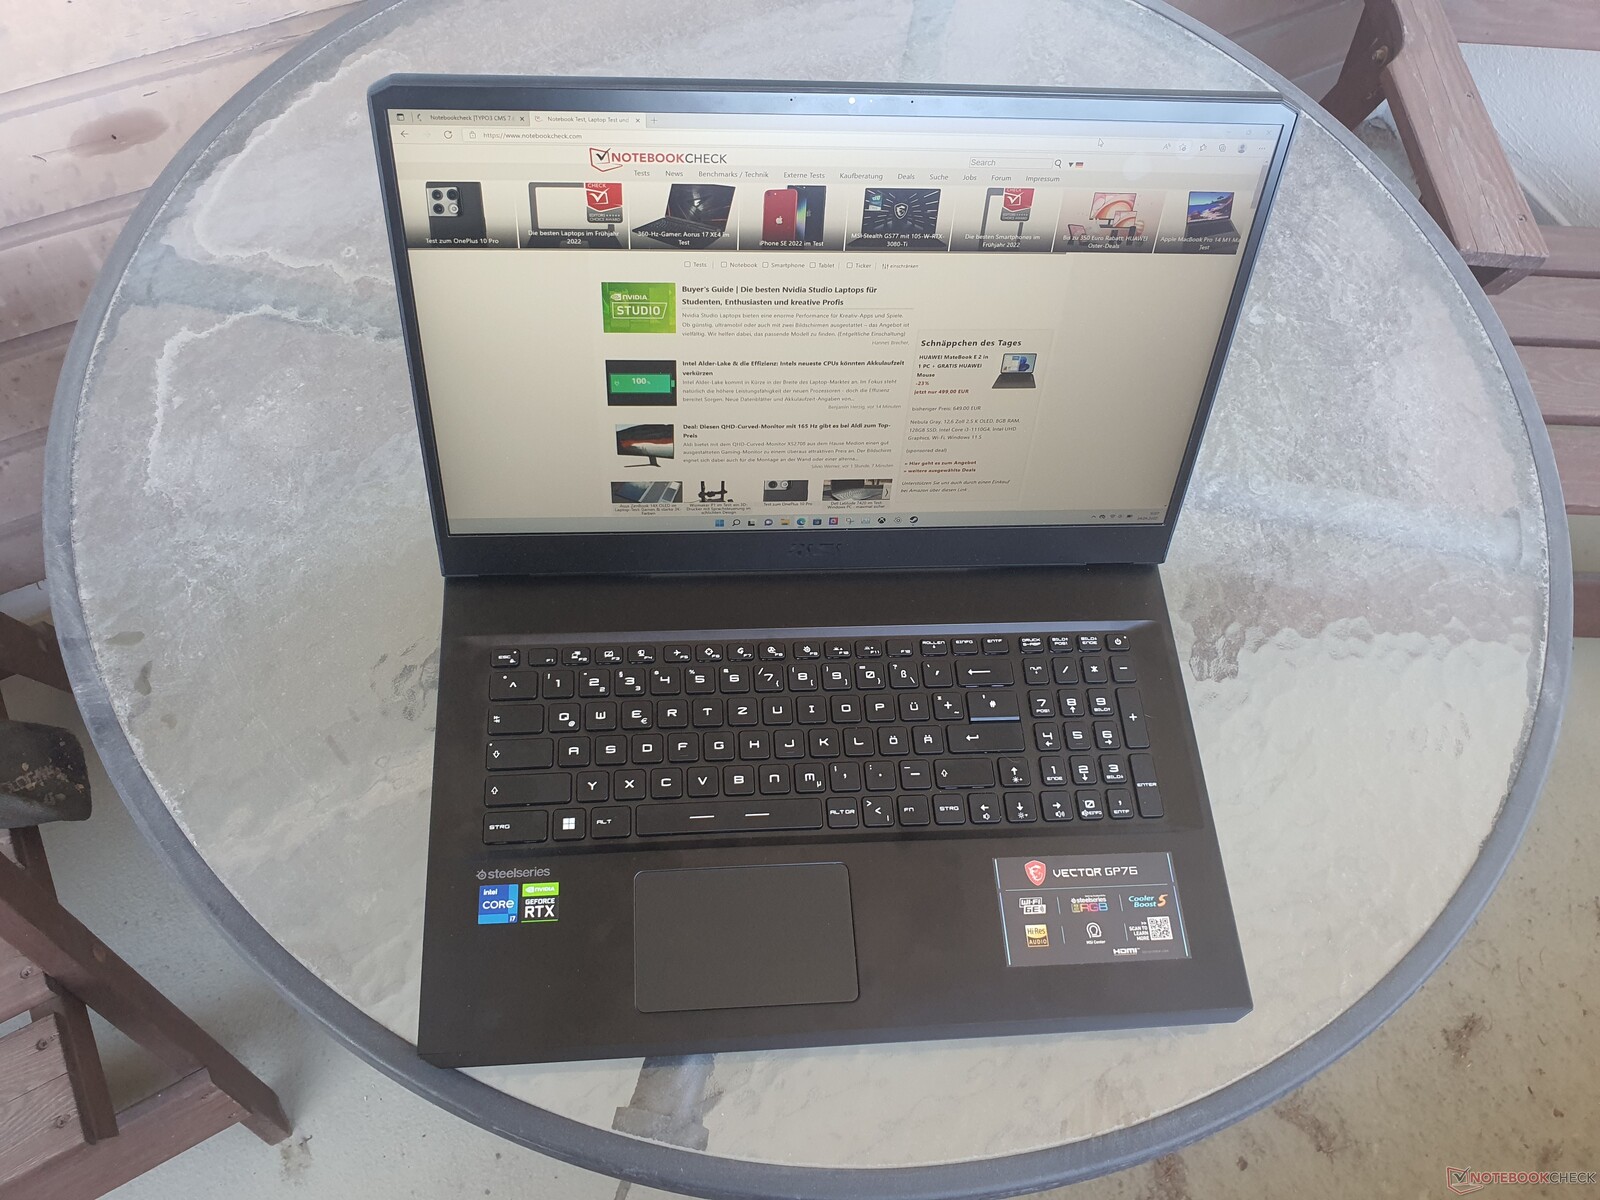
Case: MSI with stable Vector and lots of metal
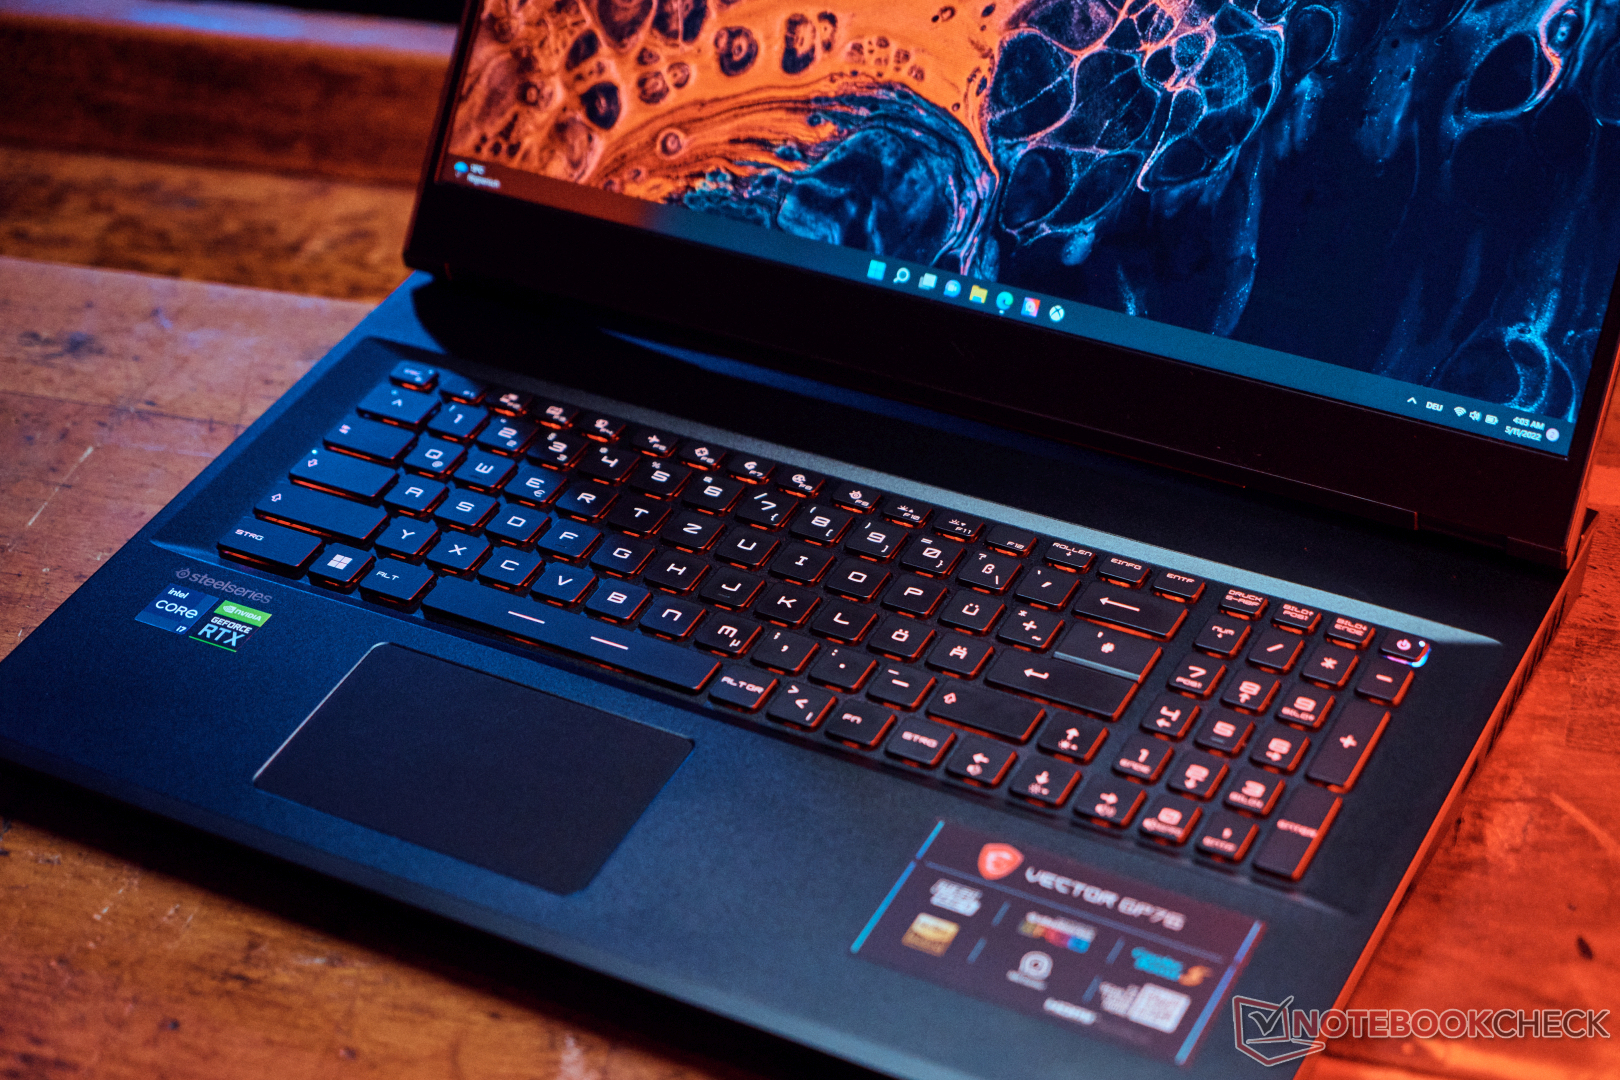
The MSI Vector GP76, which is only available in "Coral Black", has an extremely sturdy case with a display lid and keyboard area made out of aluminium. Compared to the predecessor model, the case has largely remained the same and has a plastic underside. The Vector is resistant to torsion, including the display, and targeted pressure on the back of the display does not cause any image distortions. Only the bottom of the display frame yields a little to pressure, but this is not a major issue. The screen teeters only slightly.
The lid can be opened with one hand, while the maximum opening angle of 140 degrees is a little small. The keyboard is well buil into the case and does not bend at all. The surfaces are slightly rough and have a high-quality feel. Some edges are a little sharp due to the gaming design, but are still acceptable. However, since the front edge of the case is connected to the bottom panel, this can loosen or detach a little over time, which spoils the overall impression of quality.

The weight of 2.85kg is acceptable in view of the fact that this is a 17-inch gaming machine with powerful components. The competition offers imperceptibly lighter devices, whereby the 16-inch class, such as the Asus ROG Zephyrus M16, is significantly lighter with a weight of only 2kg and is also the most compact device by far in the comparison field. The difference here is quite significant and definitely worth taking into consideration for mobile gaming. The thickness of 26mm is not bad. Overall, the GP76 is slightly thicker than other comparable 17-inch devices.
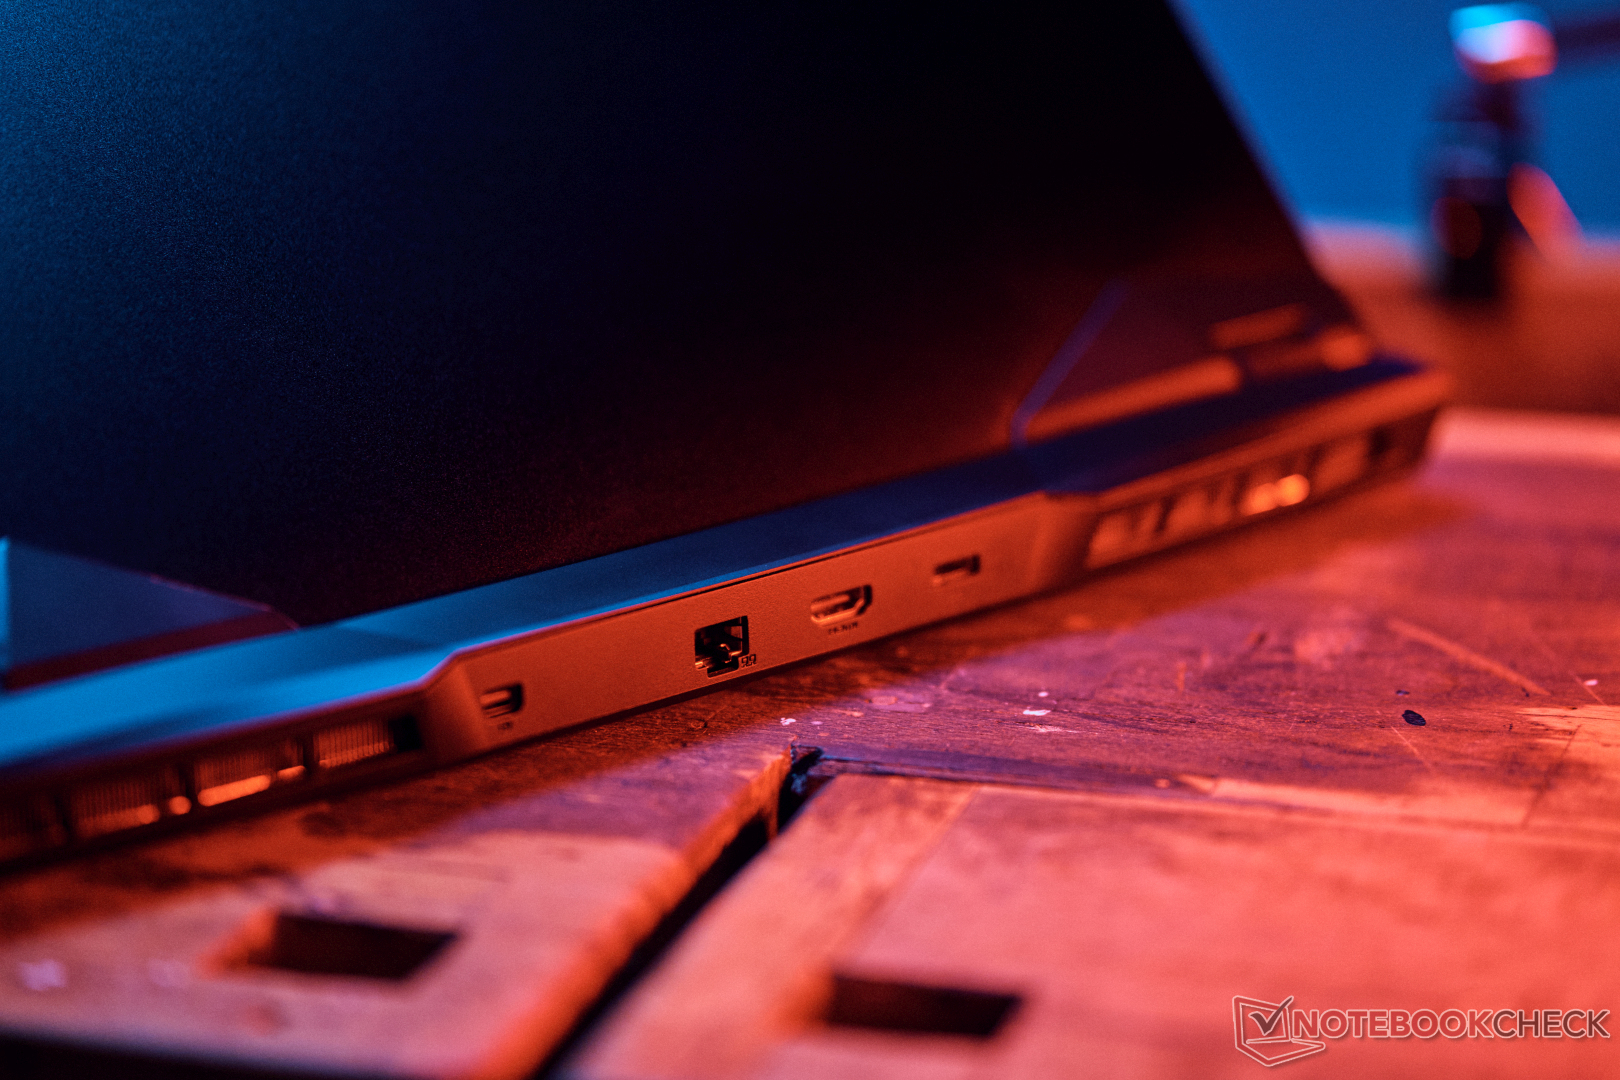
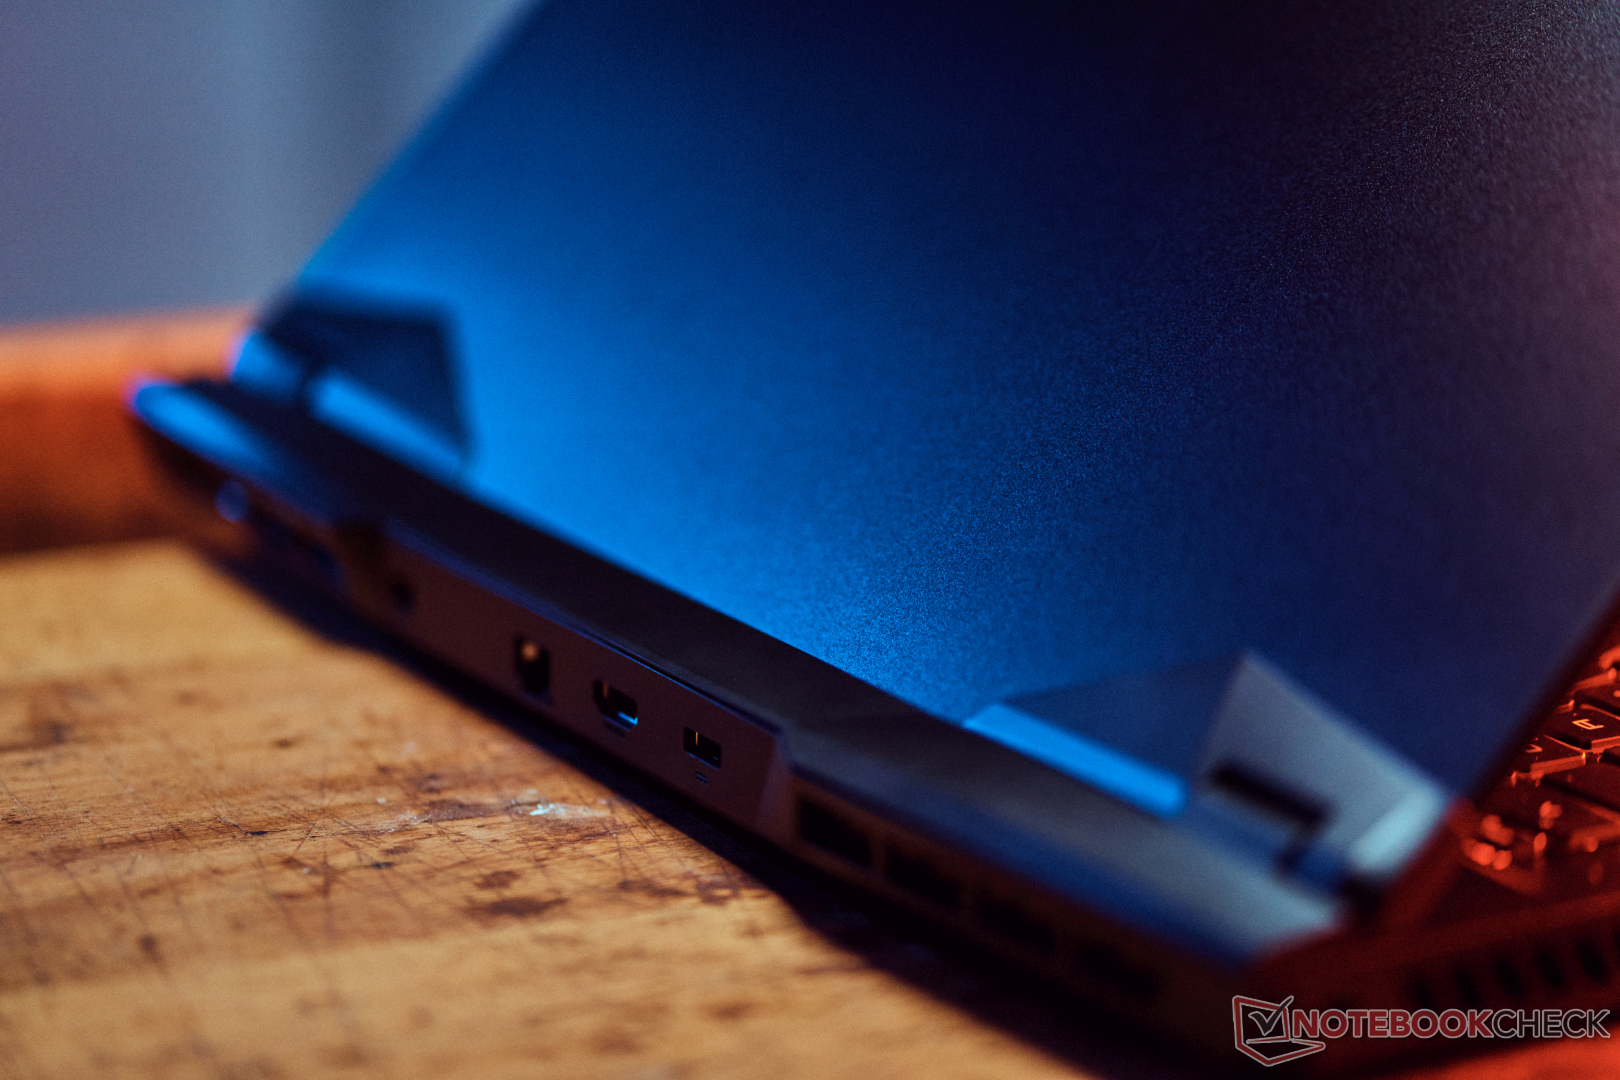
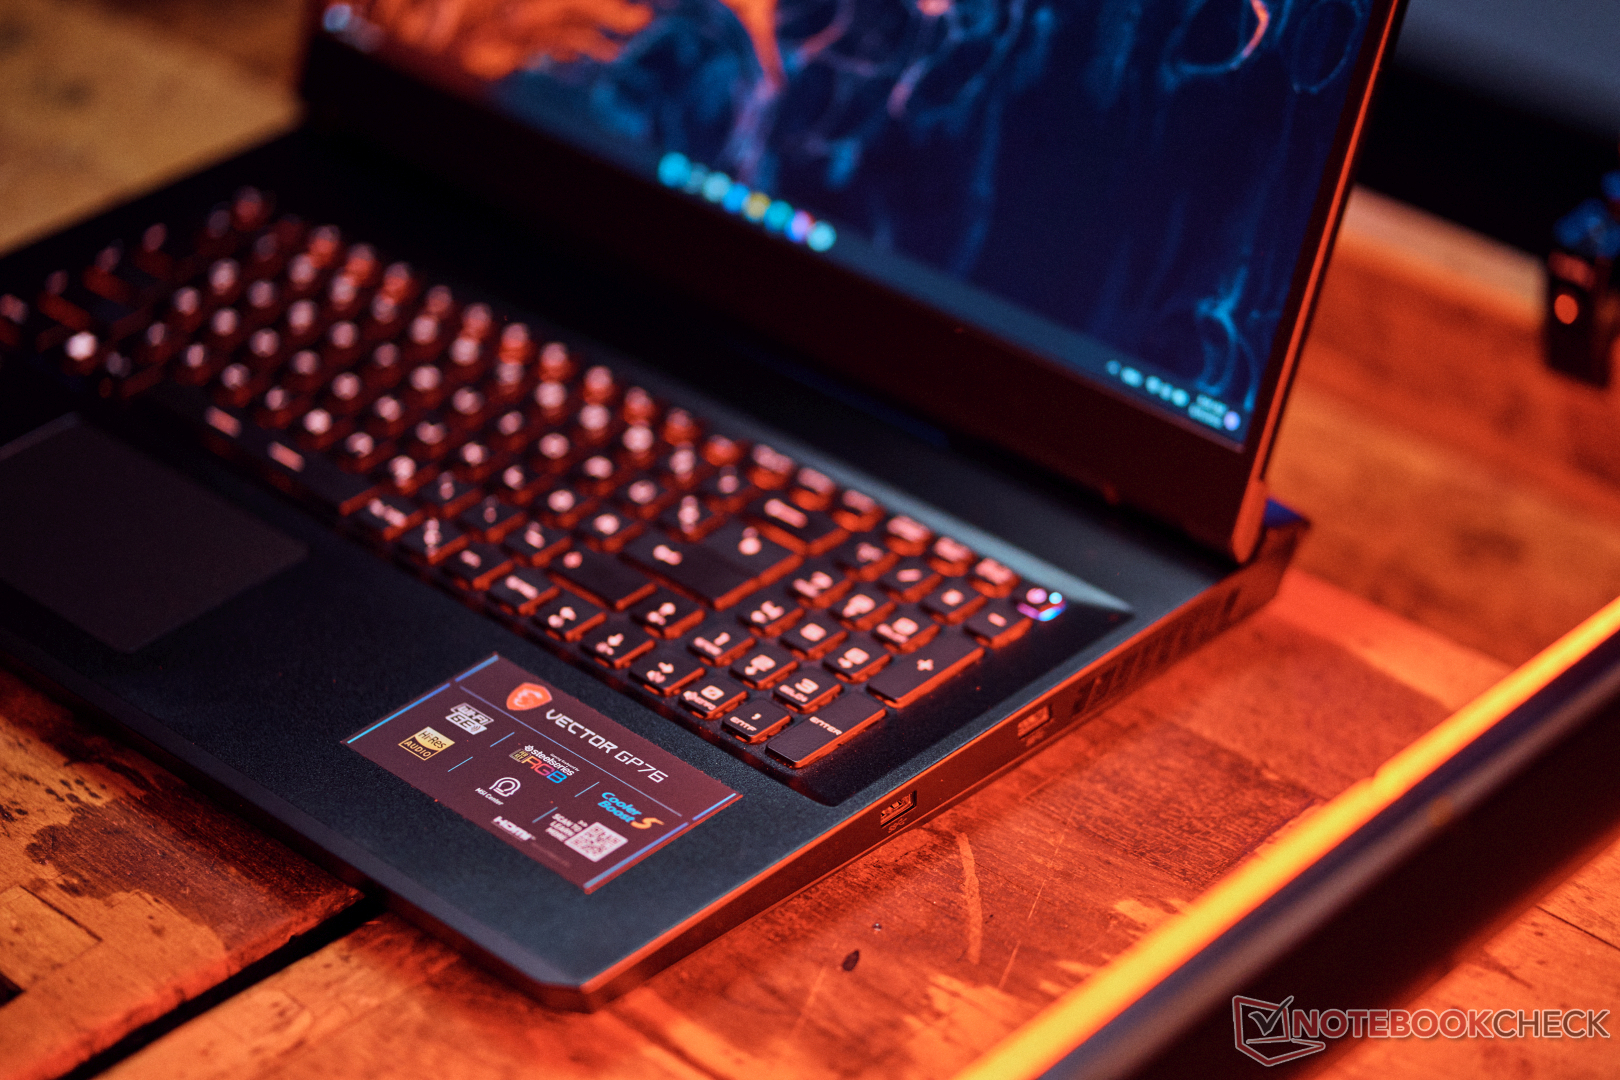
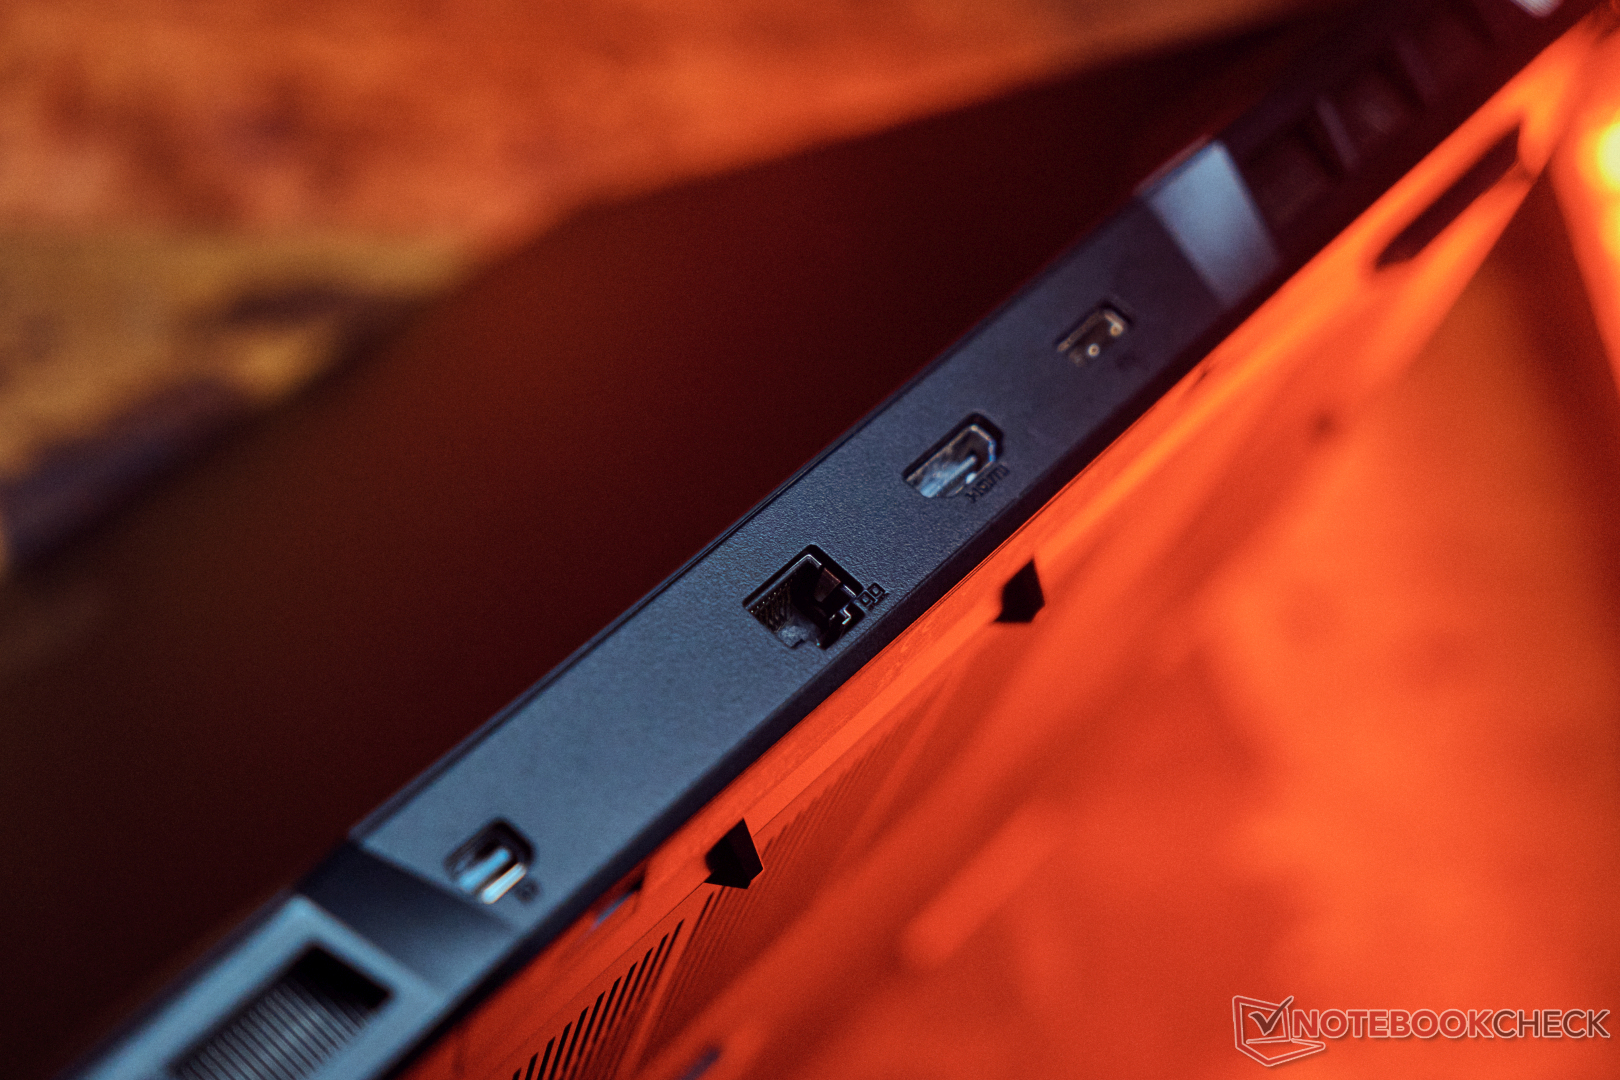
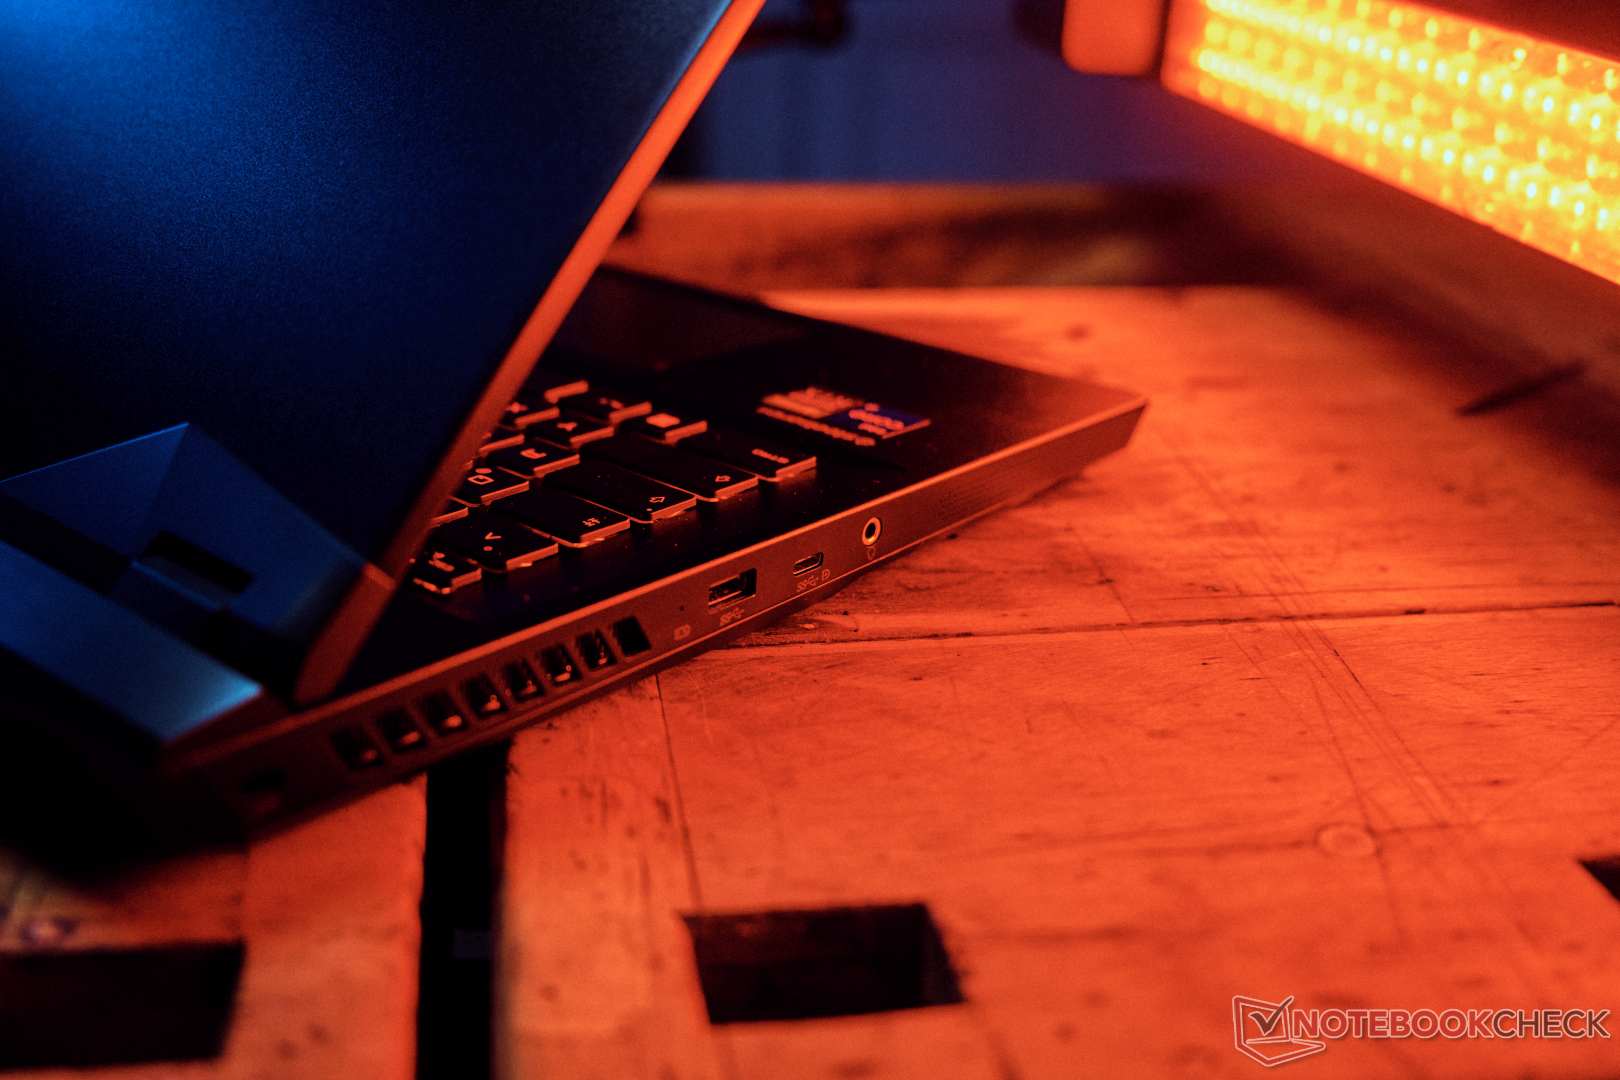
Hardware: No charging via USB-C
Fortunately, some of the ports are located at the back of the device so that the corresponding cables are not visible. A mini DisplayPort with Adaptive Sync is present, along with an HDMI output (4K @120Hz), 2.5-GBit LAN and the proprietary power connector.
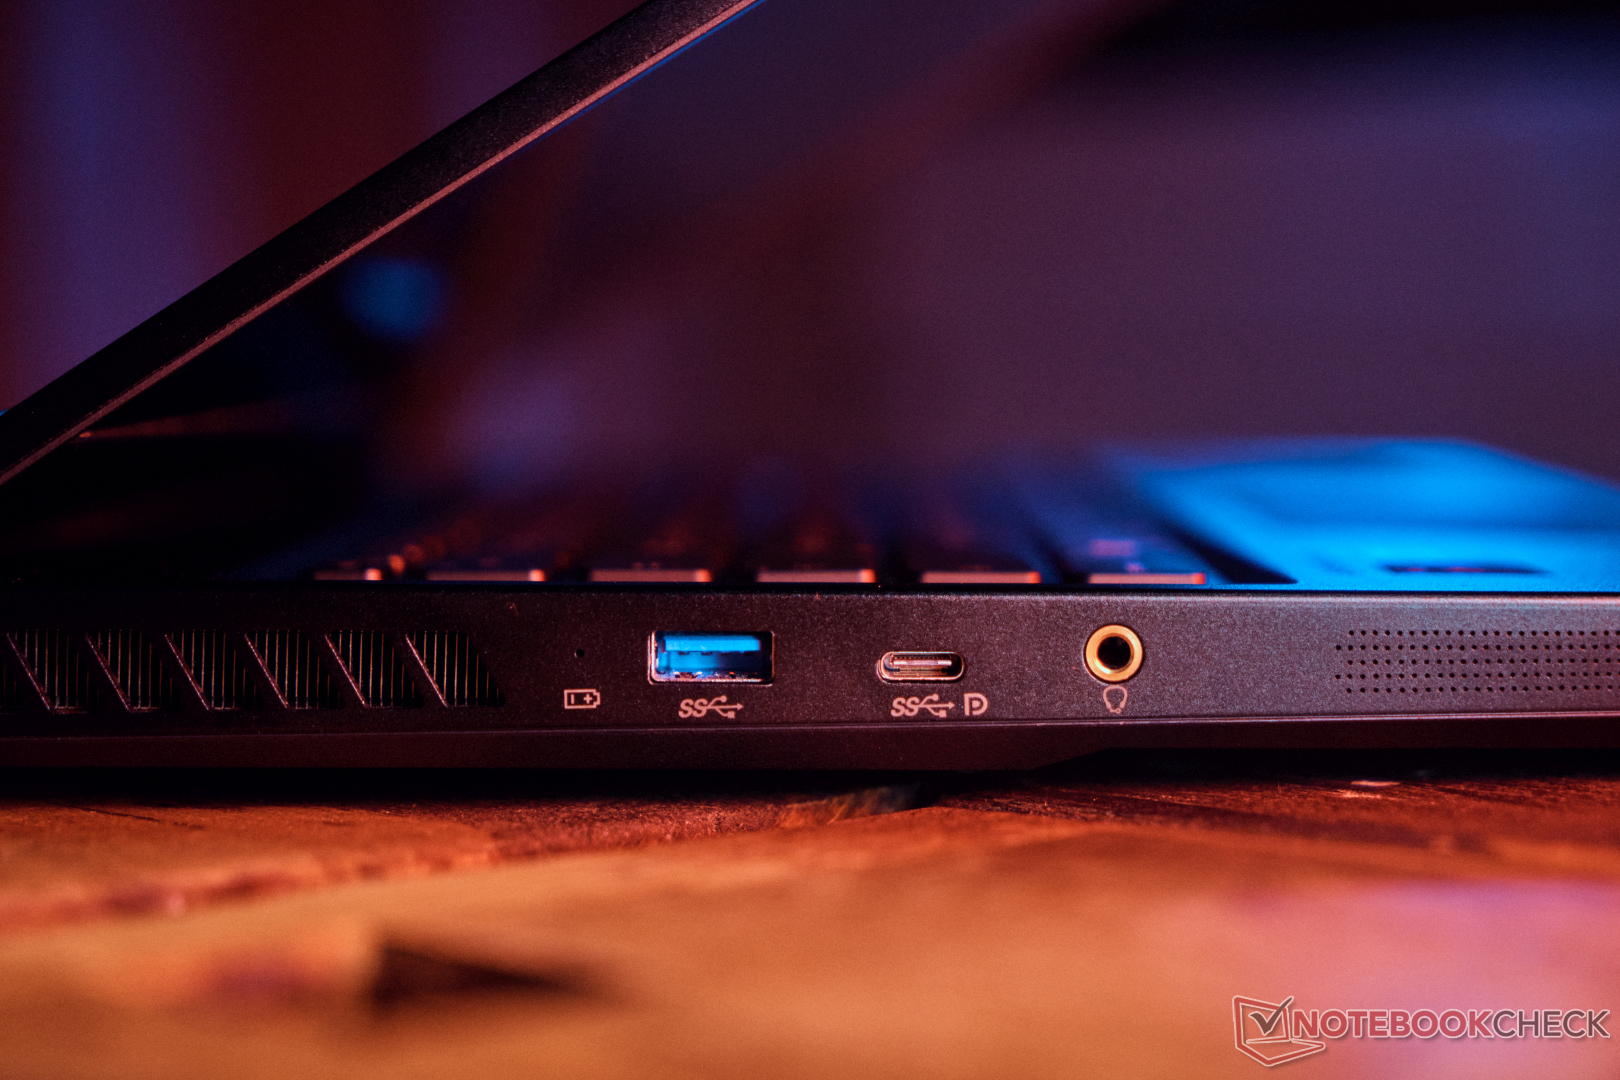
On the left side is a Kensington lock, 1x USB-A 3.2 Gen1 (5 GBit/s), 1x USB-C 3.2 Gen2 (10 GBit/s) with DisplayPort functionality. However, Power Delivery and Thunderbolt are lacking. Mobile gaming in the absence of an 800-gram power supply therefore cannot be guranteed. A stronger, external graphics card cannot be used either.
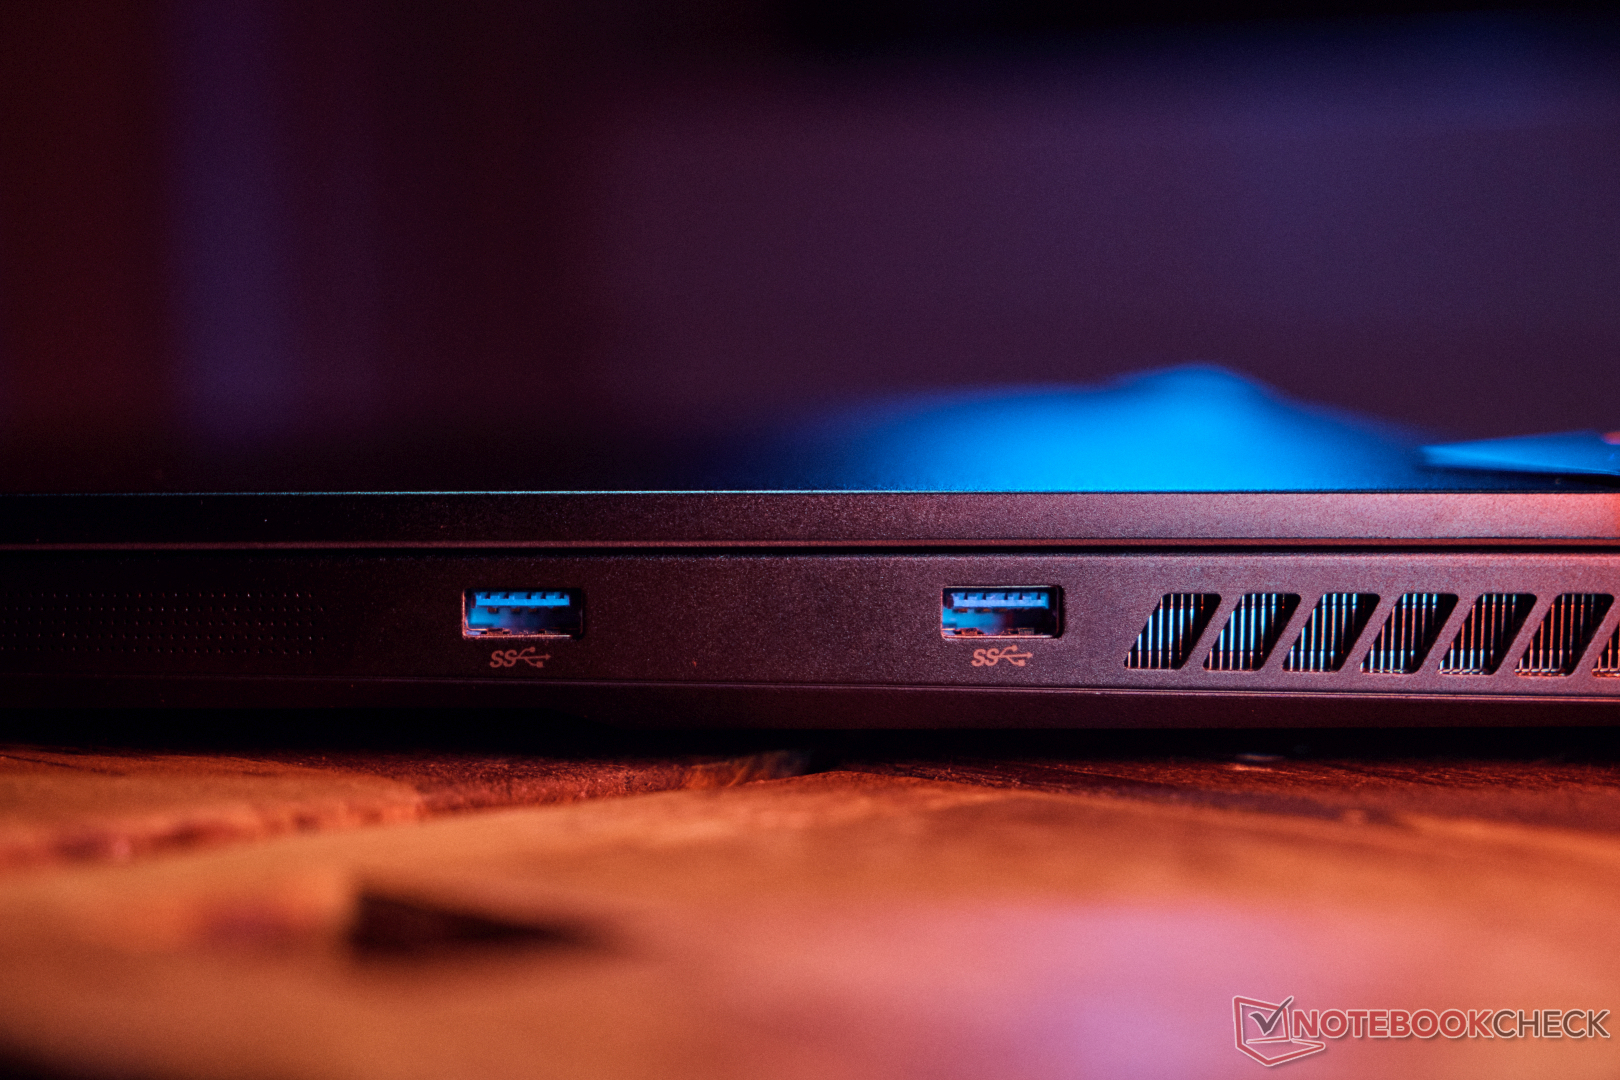
Otherwise, there is a jack connection and two more USB A 3.2 Gen1 ports on the right side of the notebook. There is no SD card reader or fingerprint reader. With an external hard drive, we achieved transfer rates of around 1 GB/s on the fastest port (USB-C at 10GBIt/s), which roughly maxes out the port. The external SSD (USB 3.2 Gen 2x2) achieves twice the transfer rate on a Thunderbolt port.
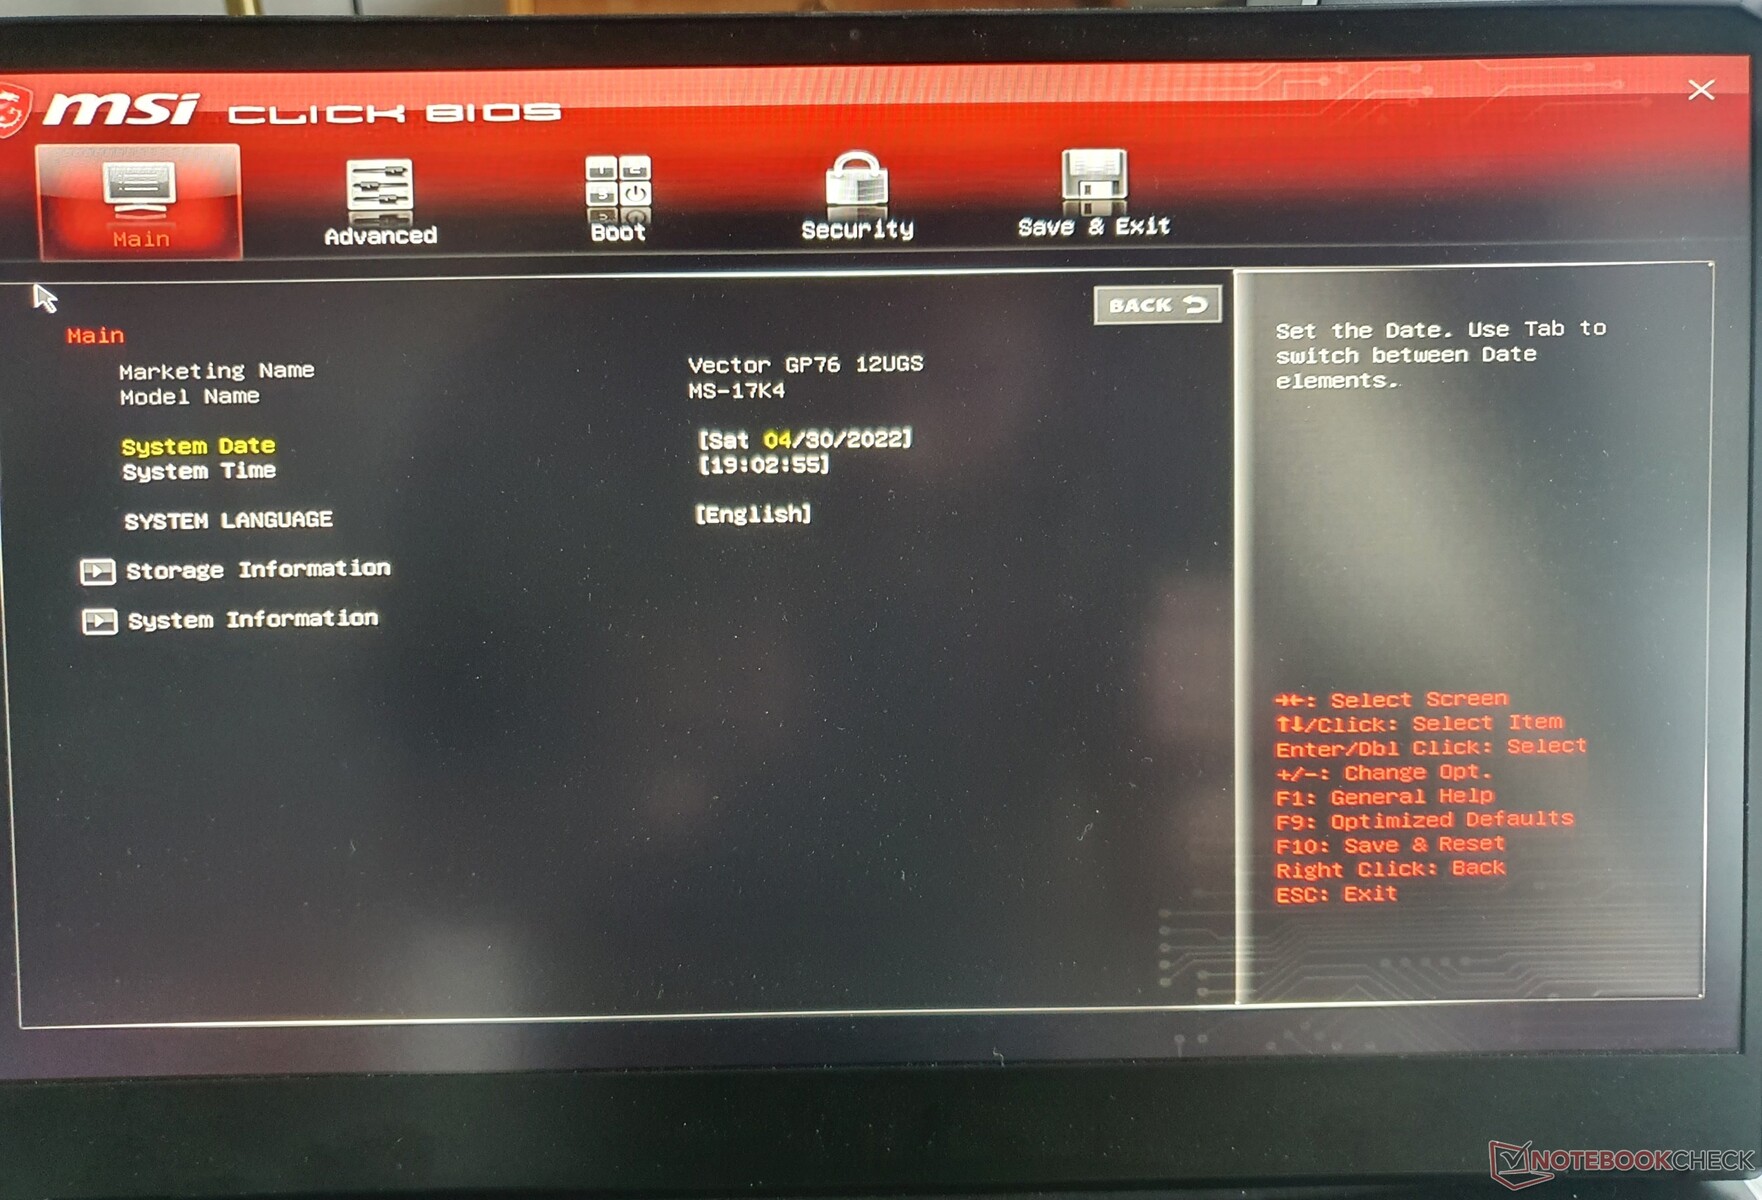
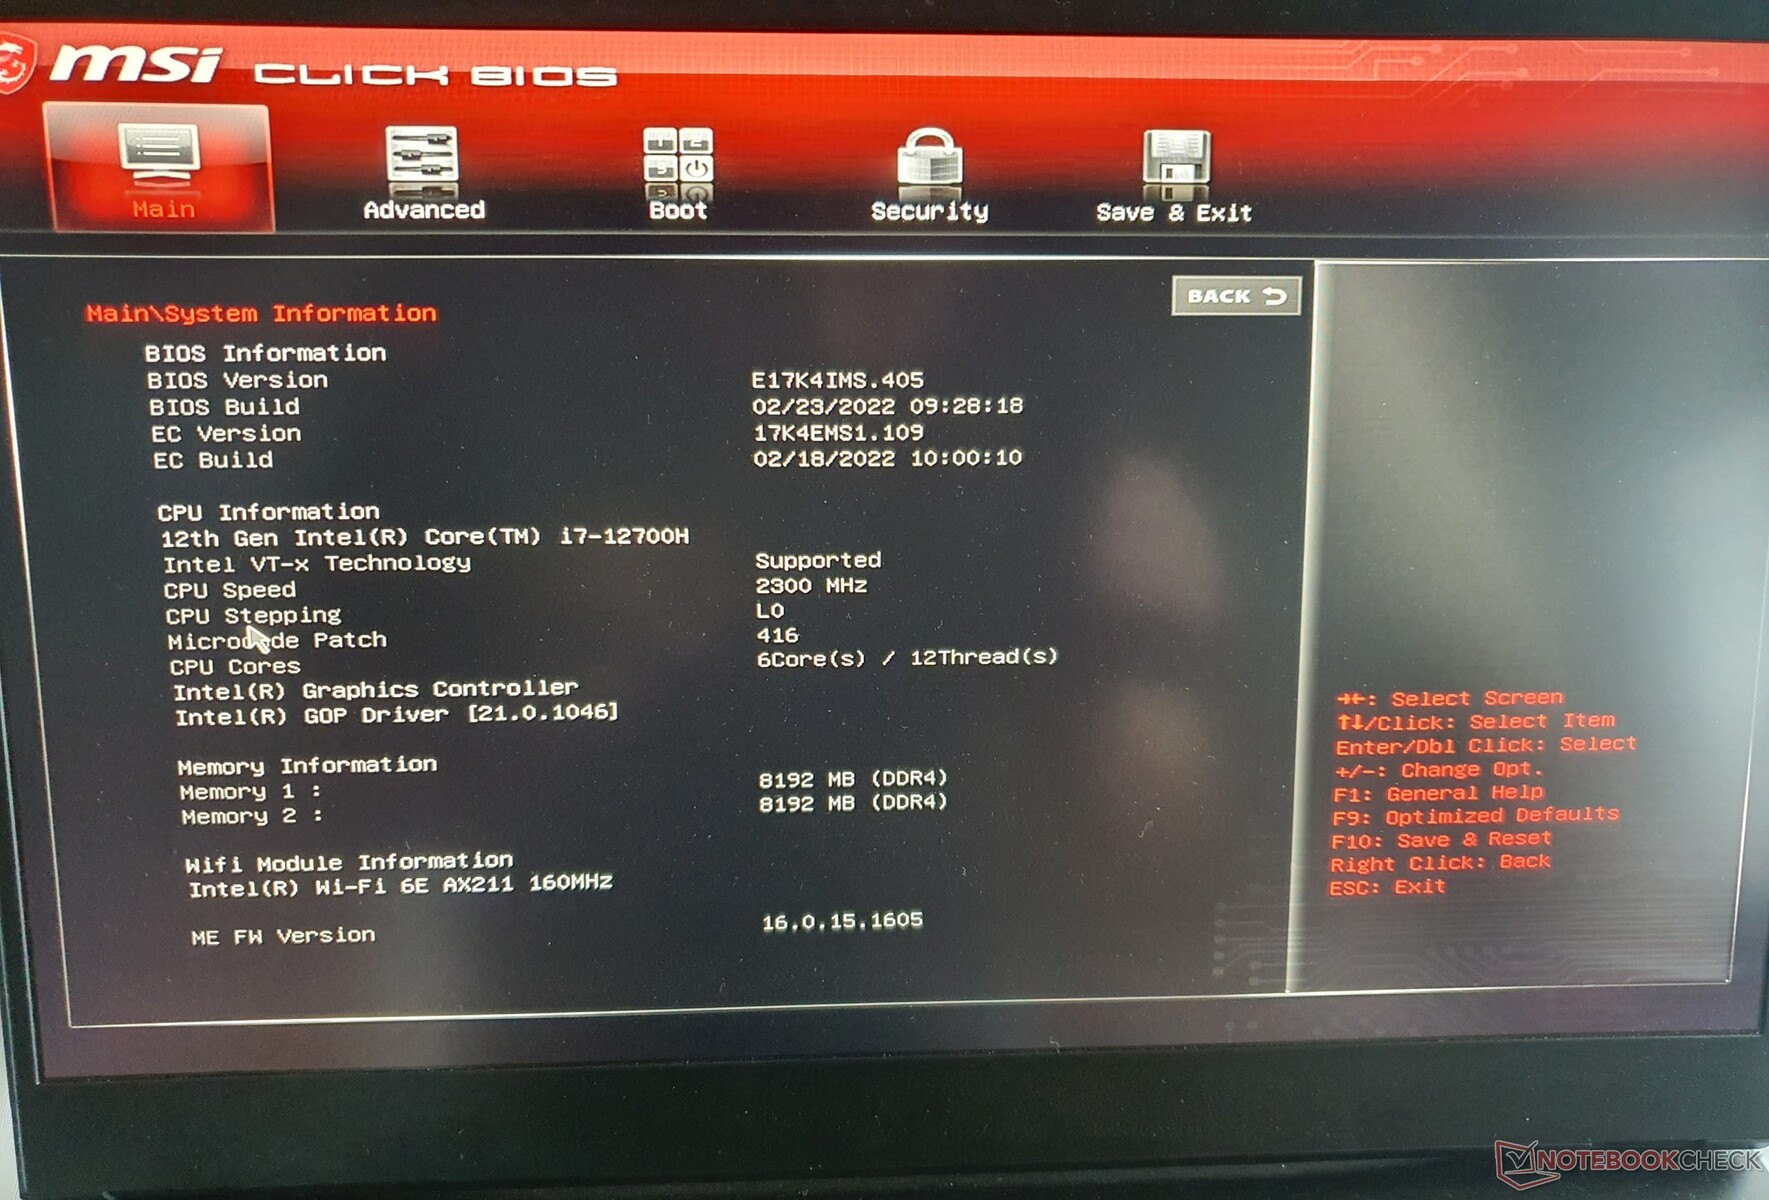
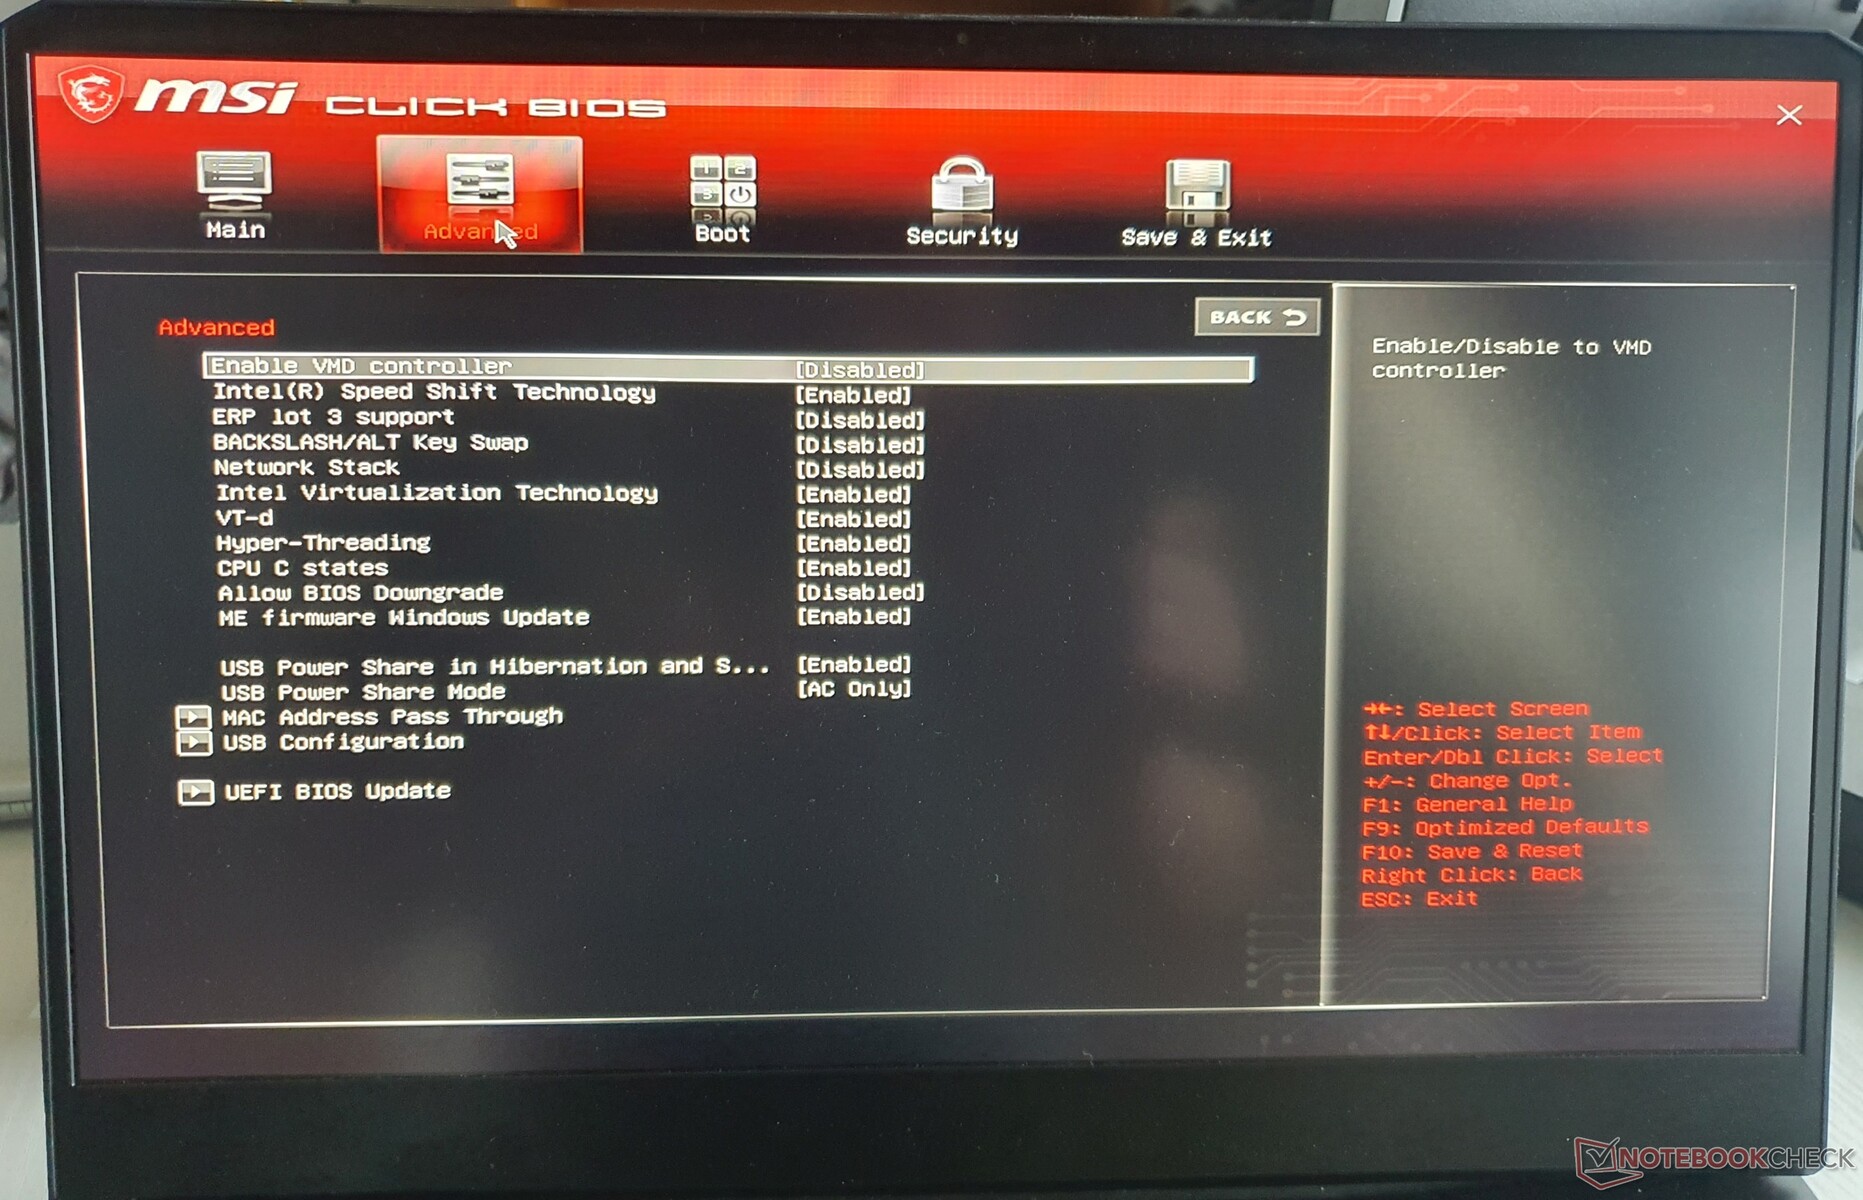
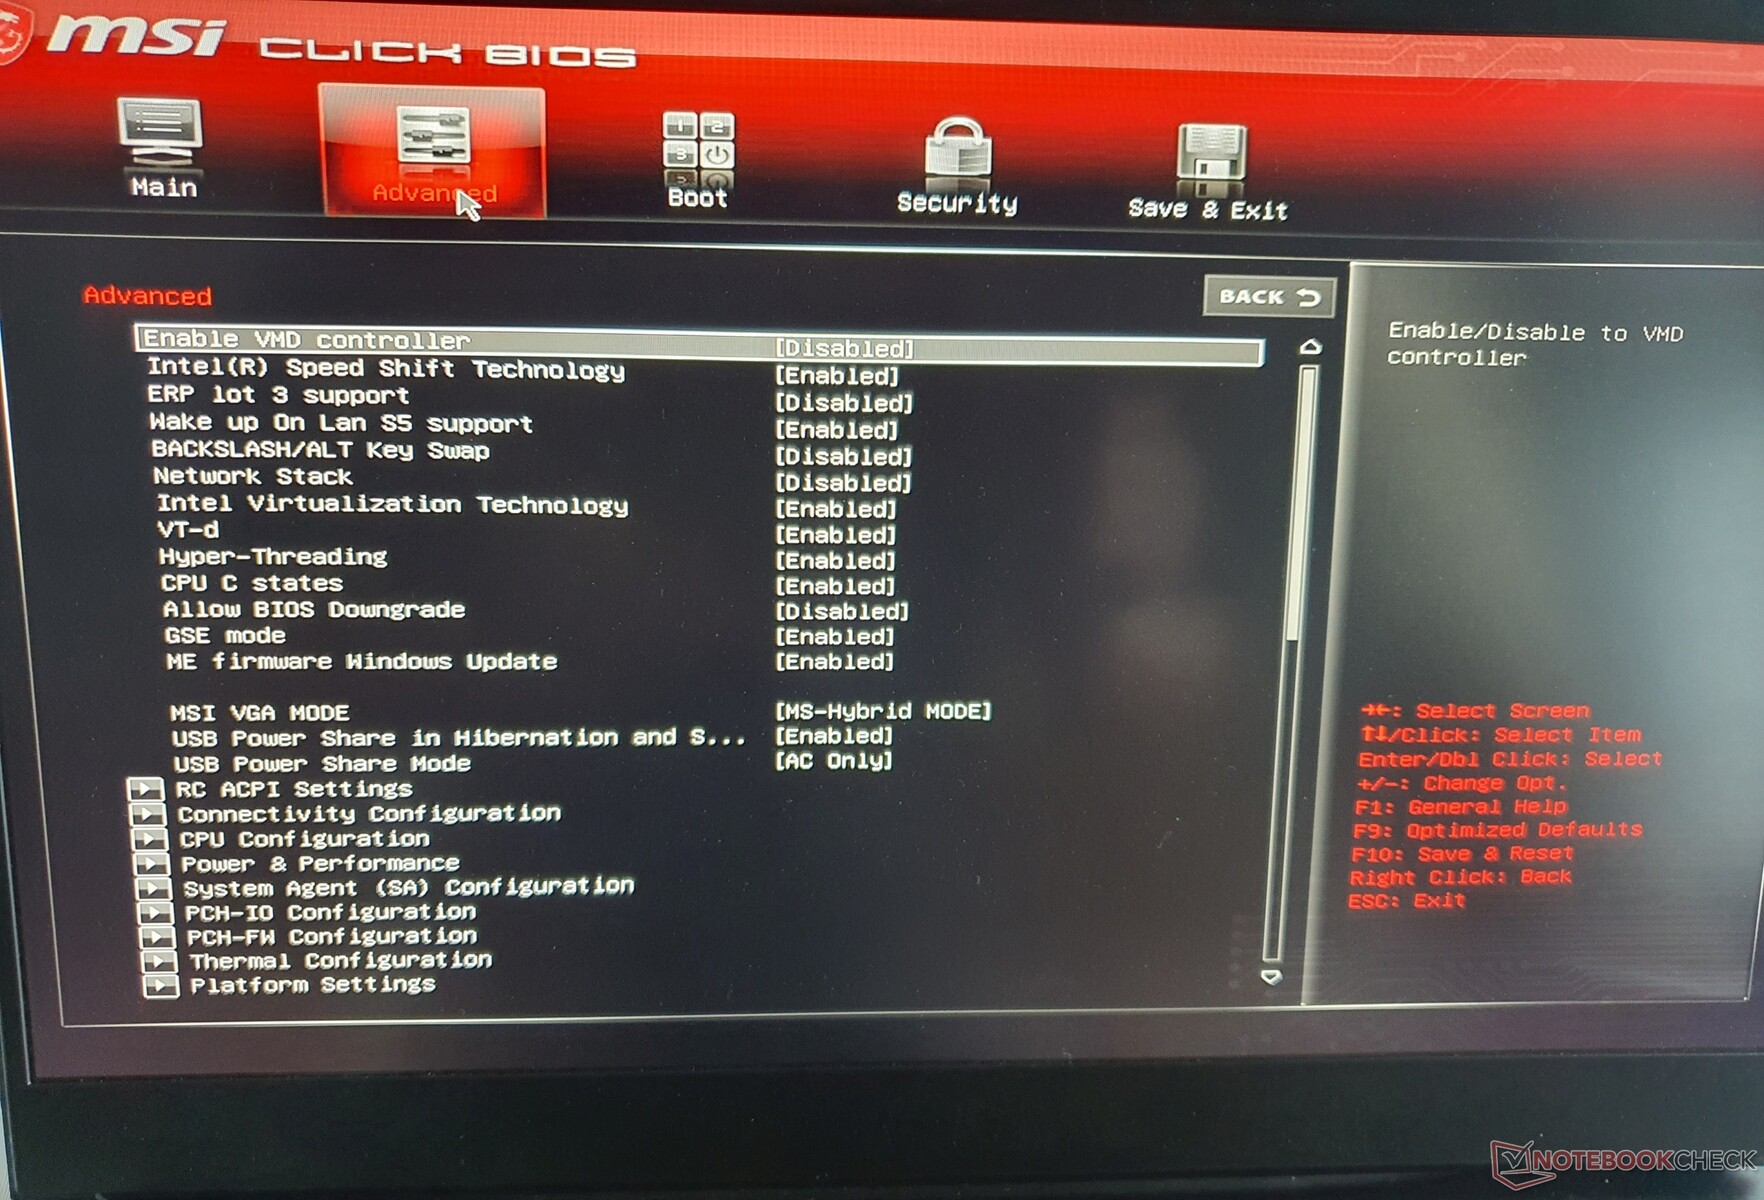
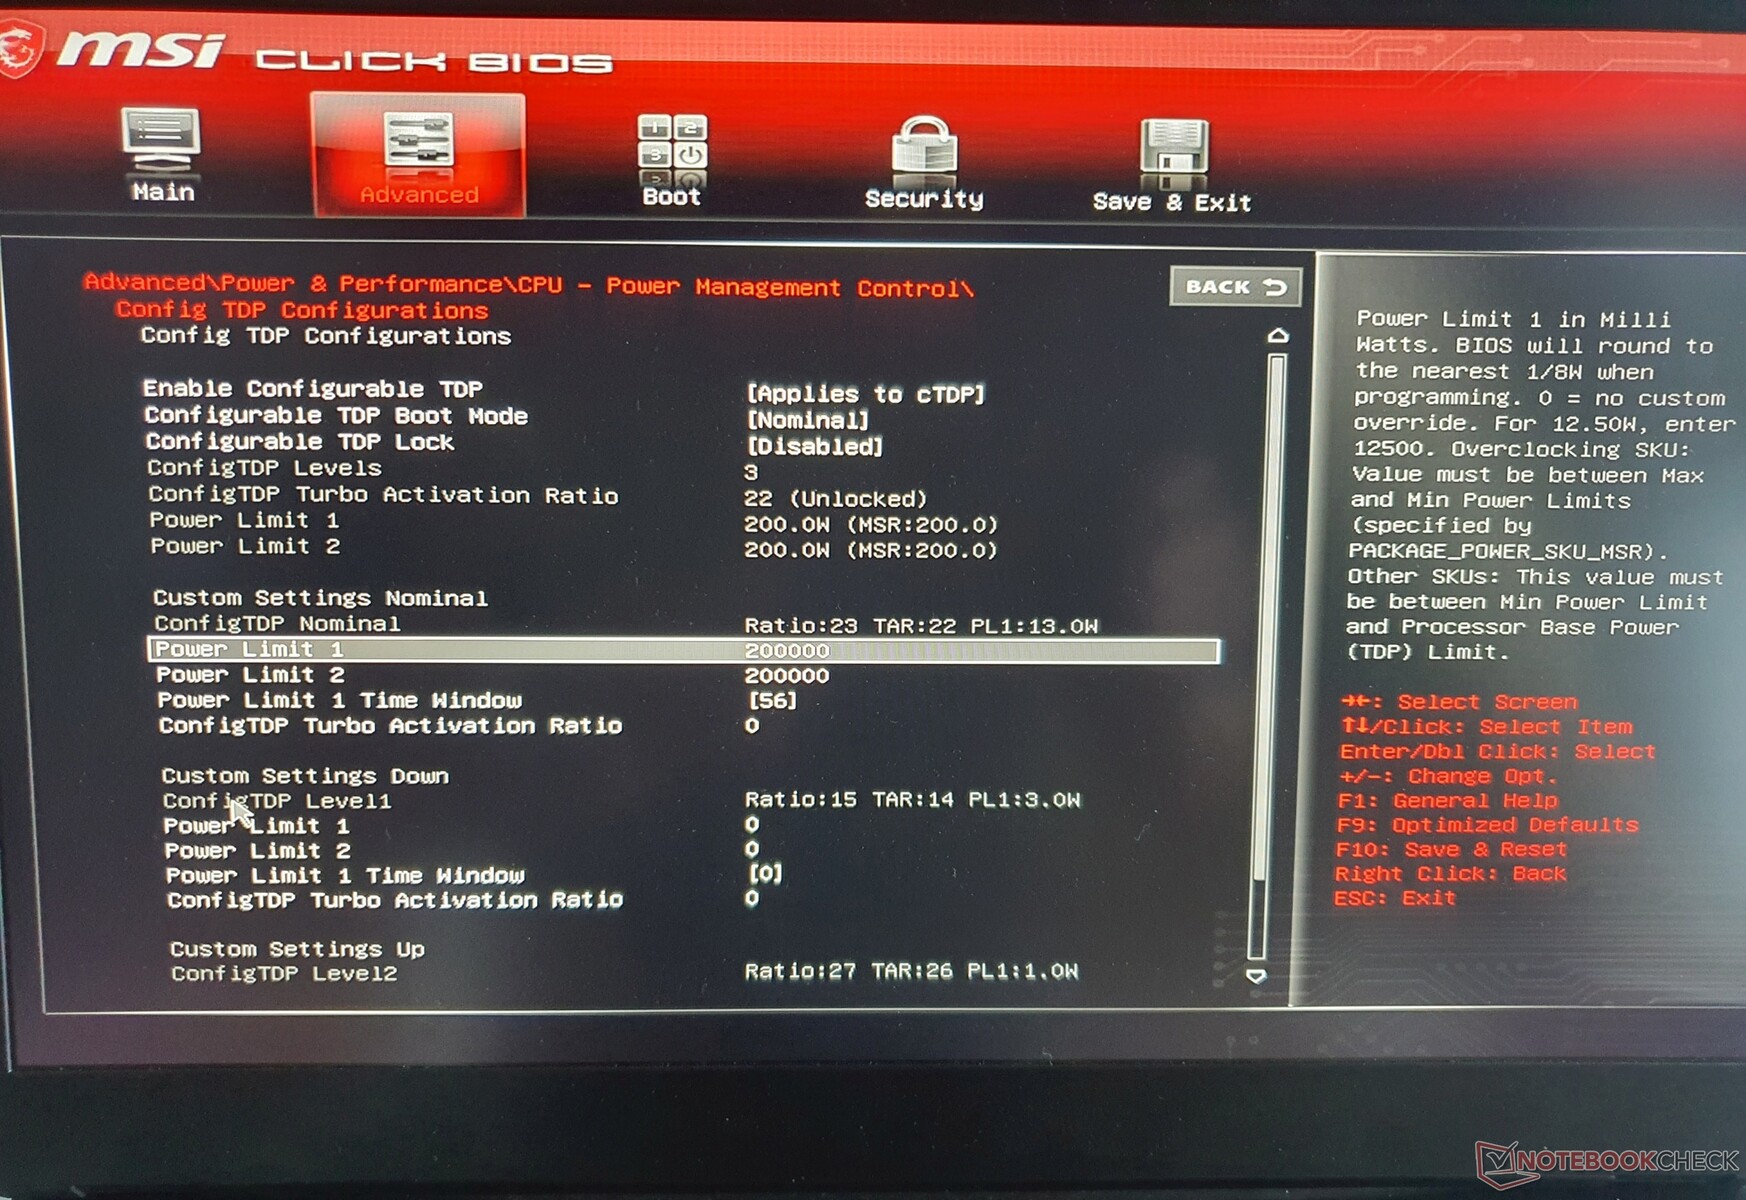
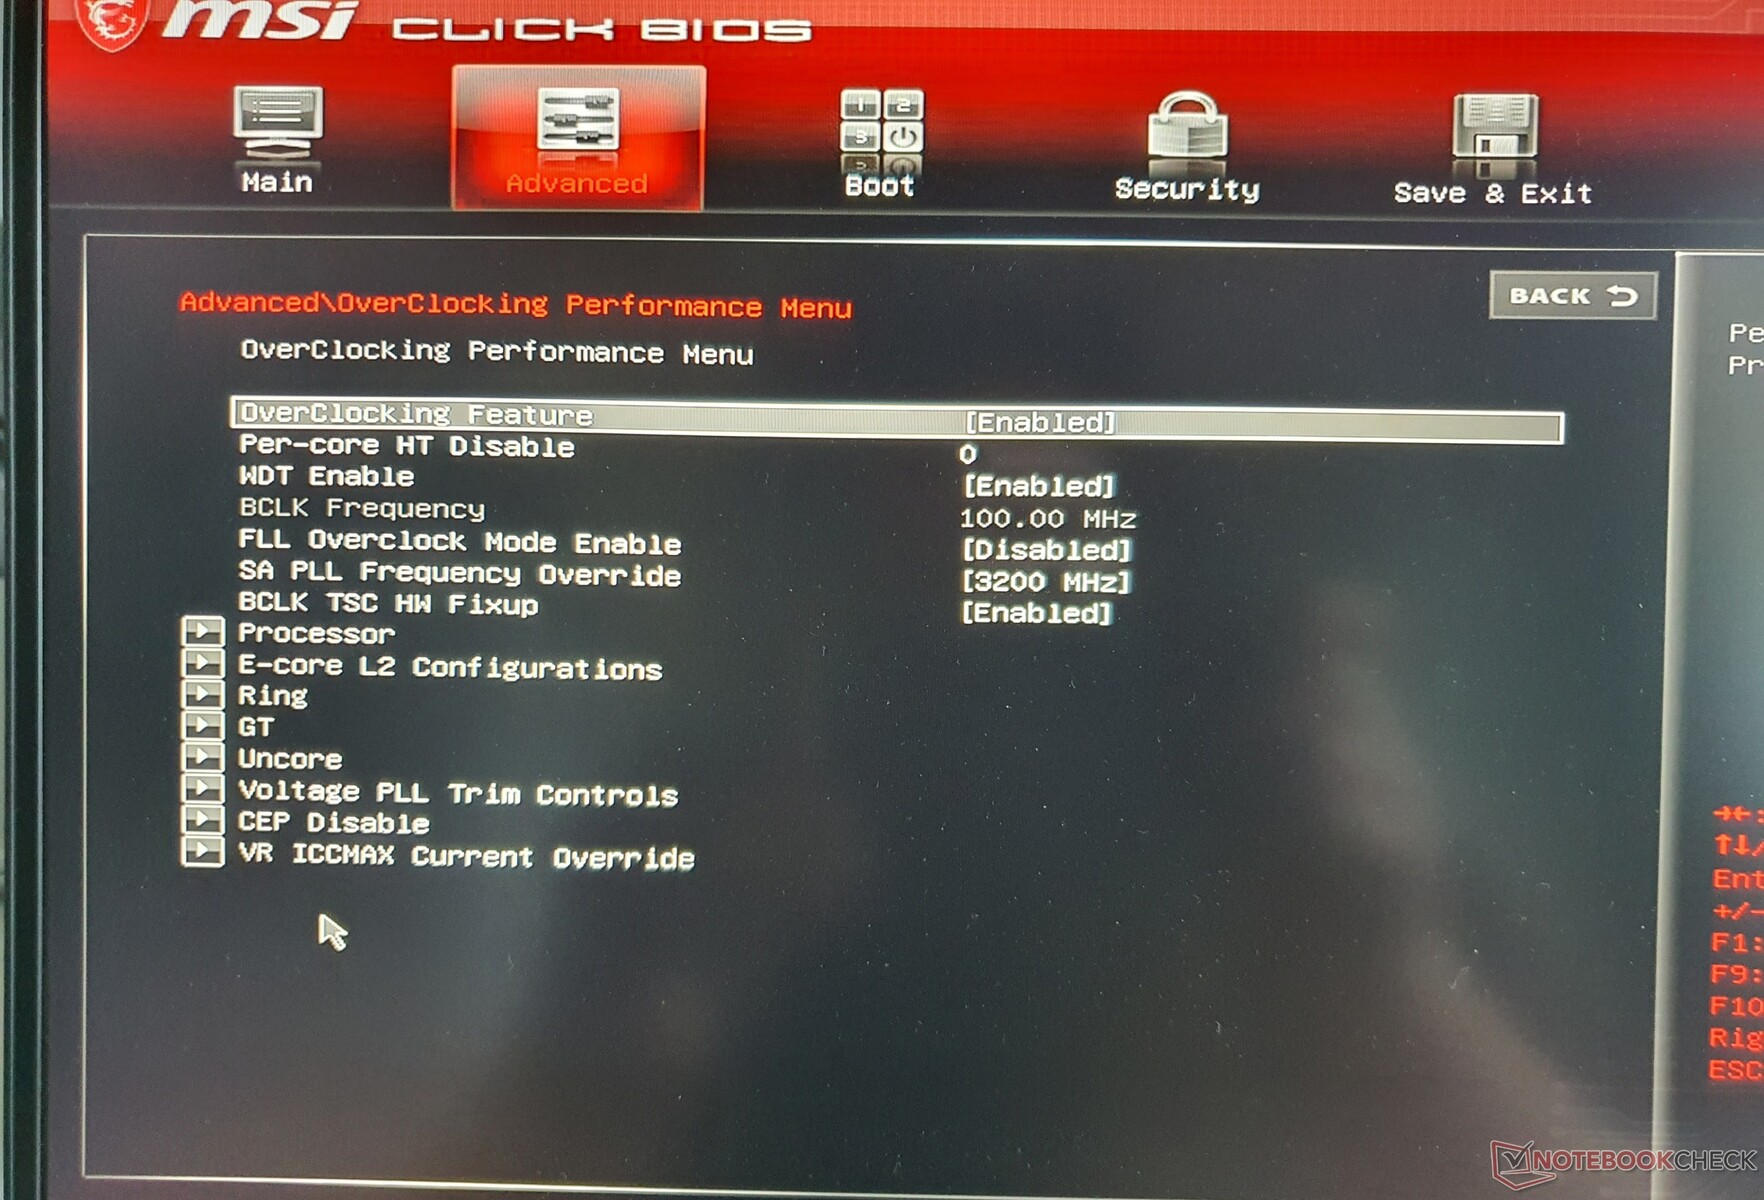
BIOS
The BIOS can typically be accessed on MSI gaming laptops via the "F1 + DEL" combination. At first sight, there is not much to see, but the key combination of "Shift (right) + CTRL (right) + ALT + F2" unlocks all possible BIOS functions ranging from performance limits, thermal settings to overclock possibilities (at your own risk, of course).
Communication
The screwed Wi-Fi 6-capable module from Intel (AX211) unleashes its full potential with a signal power of around 1.6 GBit/s. Competing laptops with the same or similar WLAN card have similar levels on average. The two Asus laptops are far behind in the comparison field.
In addition, the Vector GP76 has Bluetooth 5.2, but not WWAN, which cannot be retrofitted either.
Webcam

The webcam, which has a resolution of 1280x720, offers substandard quality. 1080p is to yet reach the Vector series, even in 2022. IR, Windows Hello and a mechanical shutter are also missing.


Accessories
Included in delivery is a 280-watt power supply unit, which delivers 50 more watts than its predecessor. There are no other accessories and recycled materials are not (yet) used in the packaging.
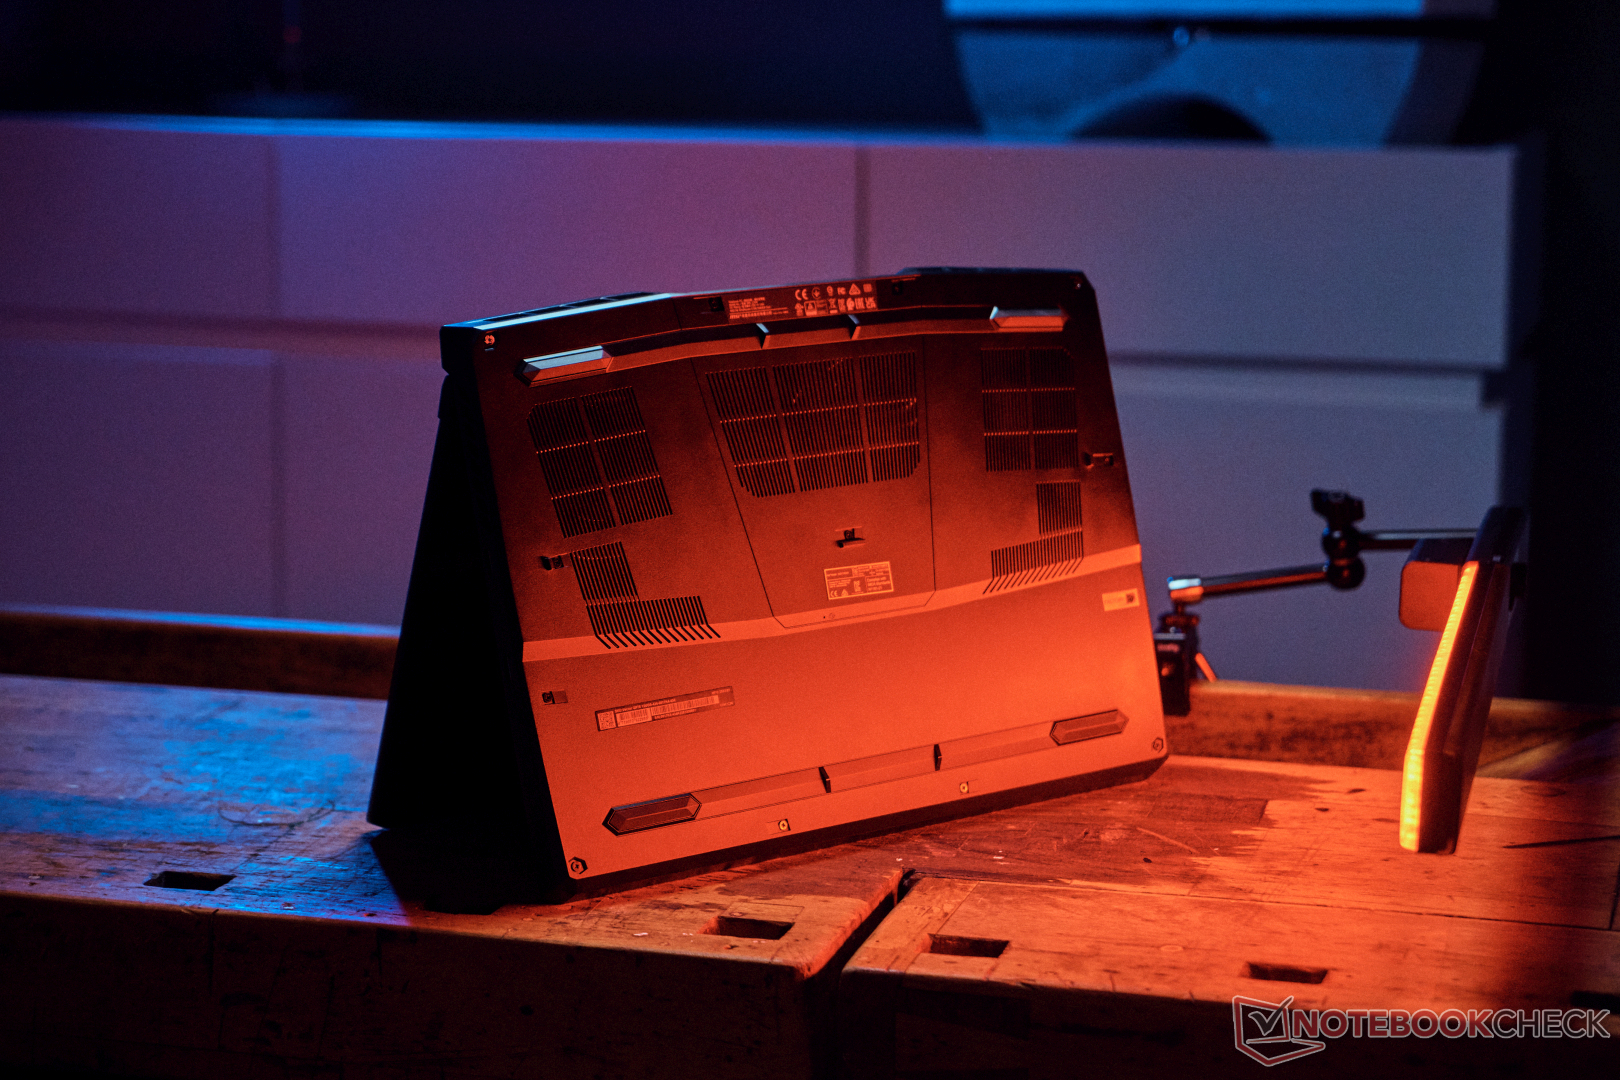
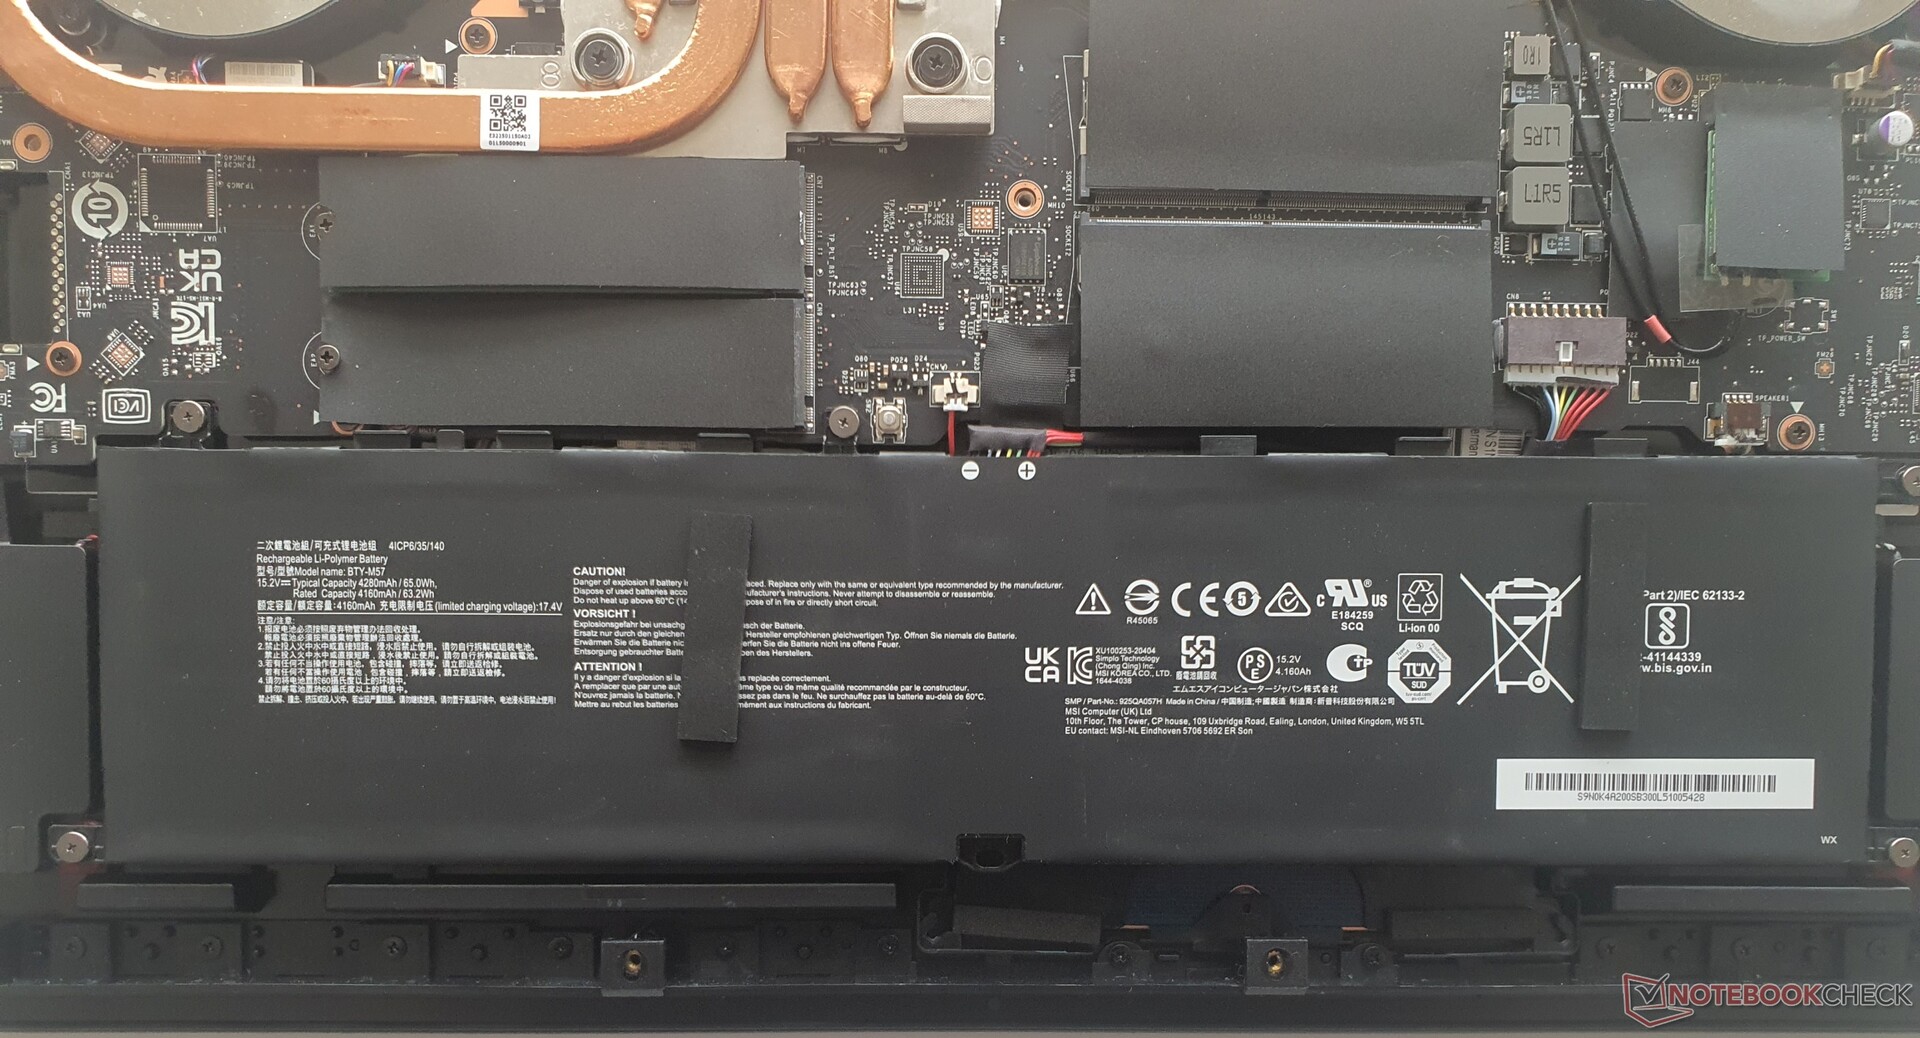
Maintenance
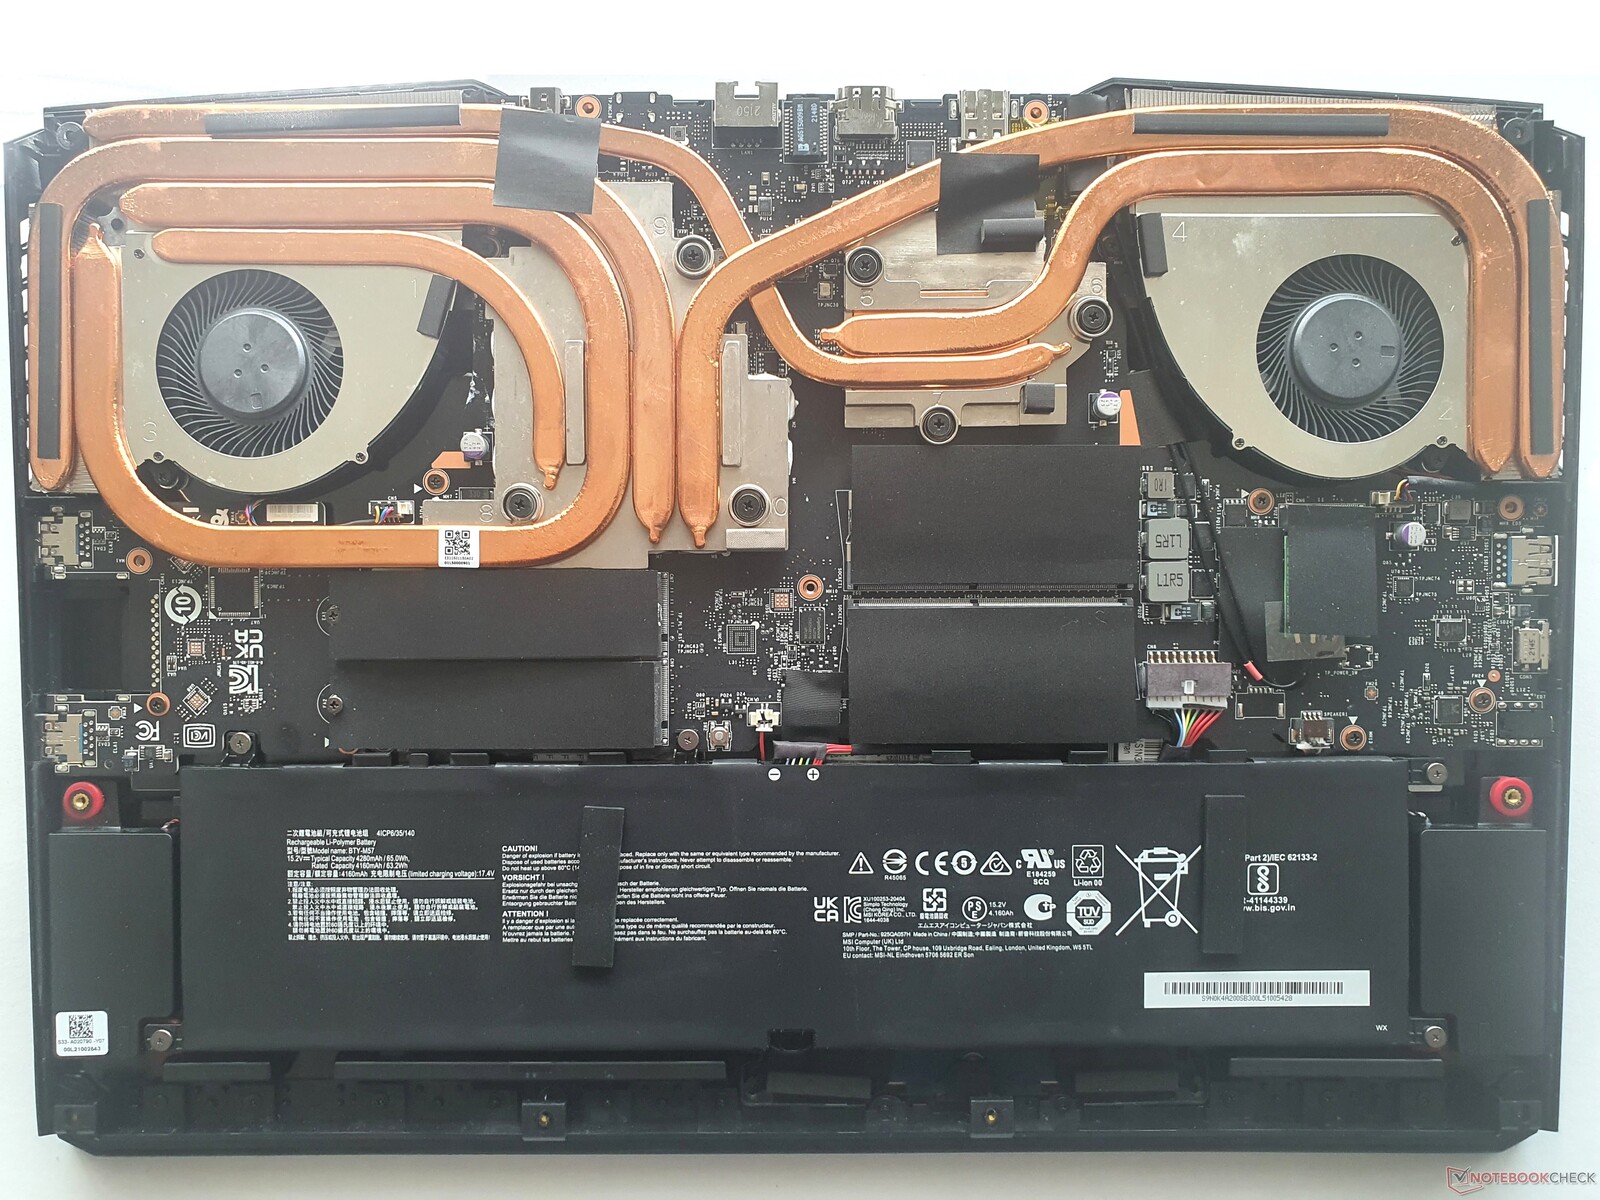
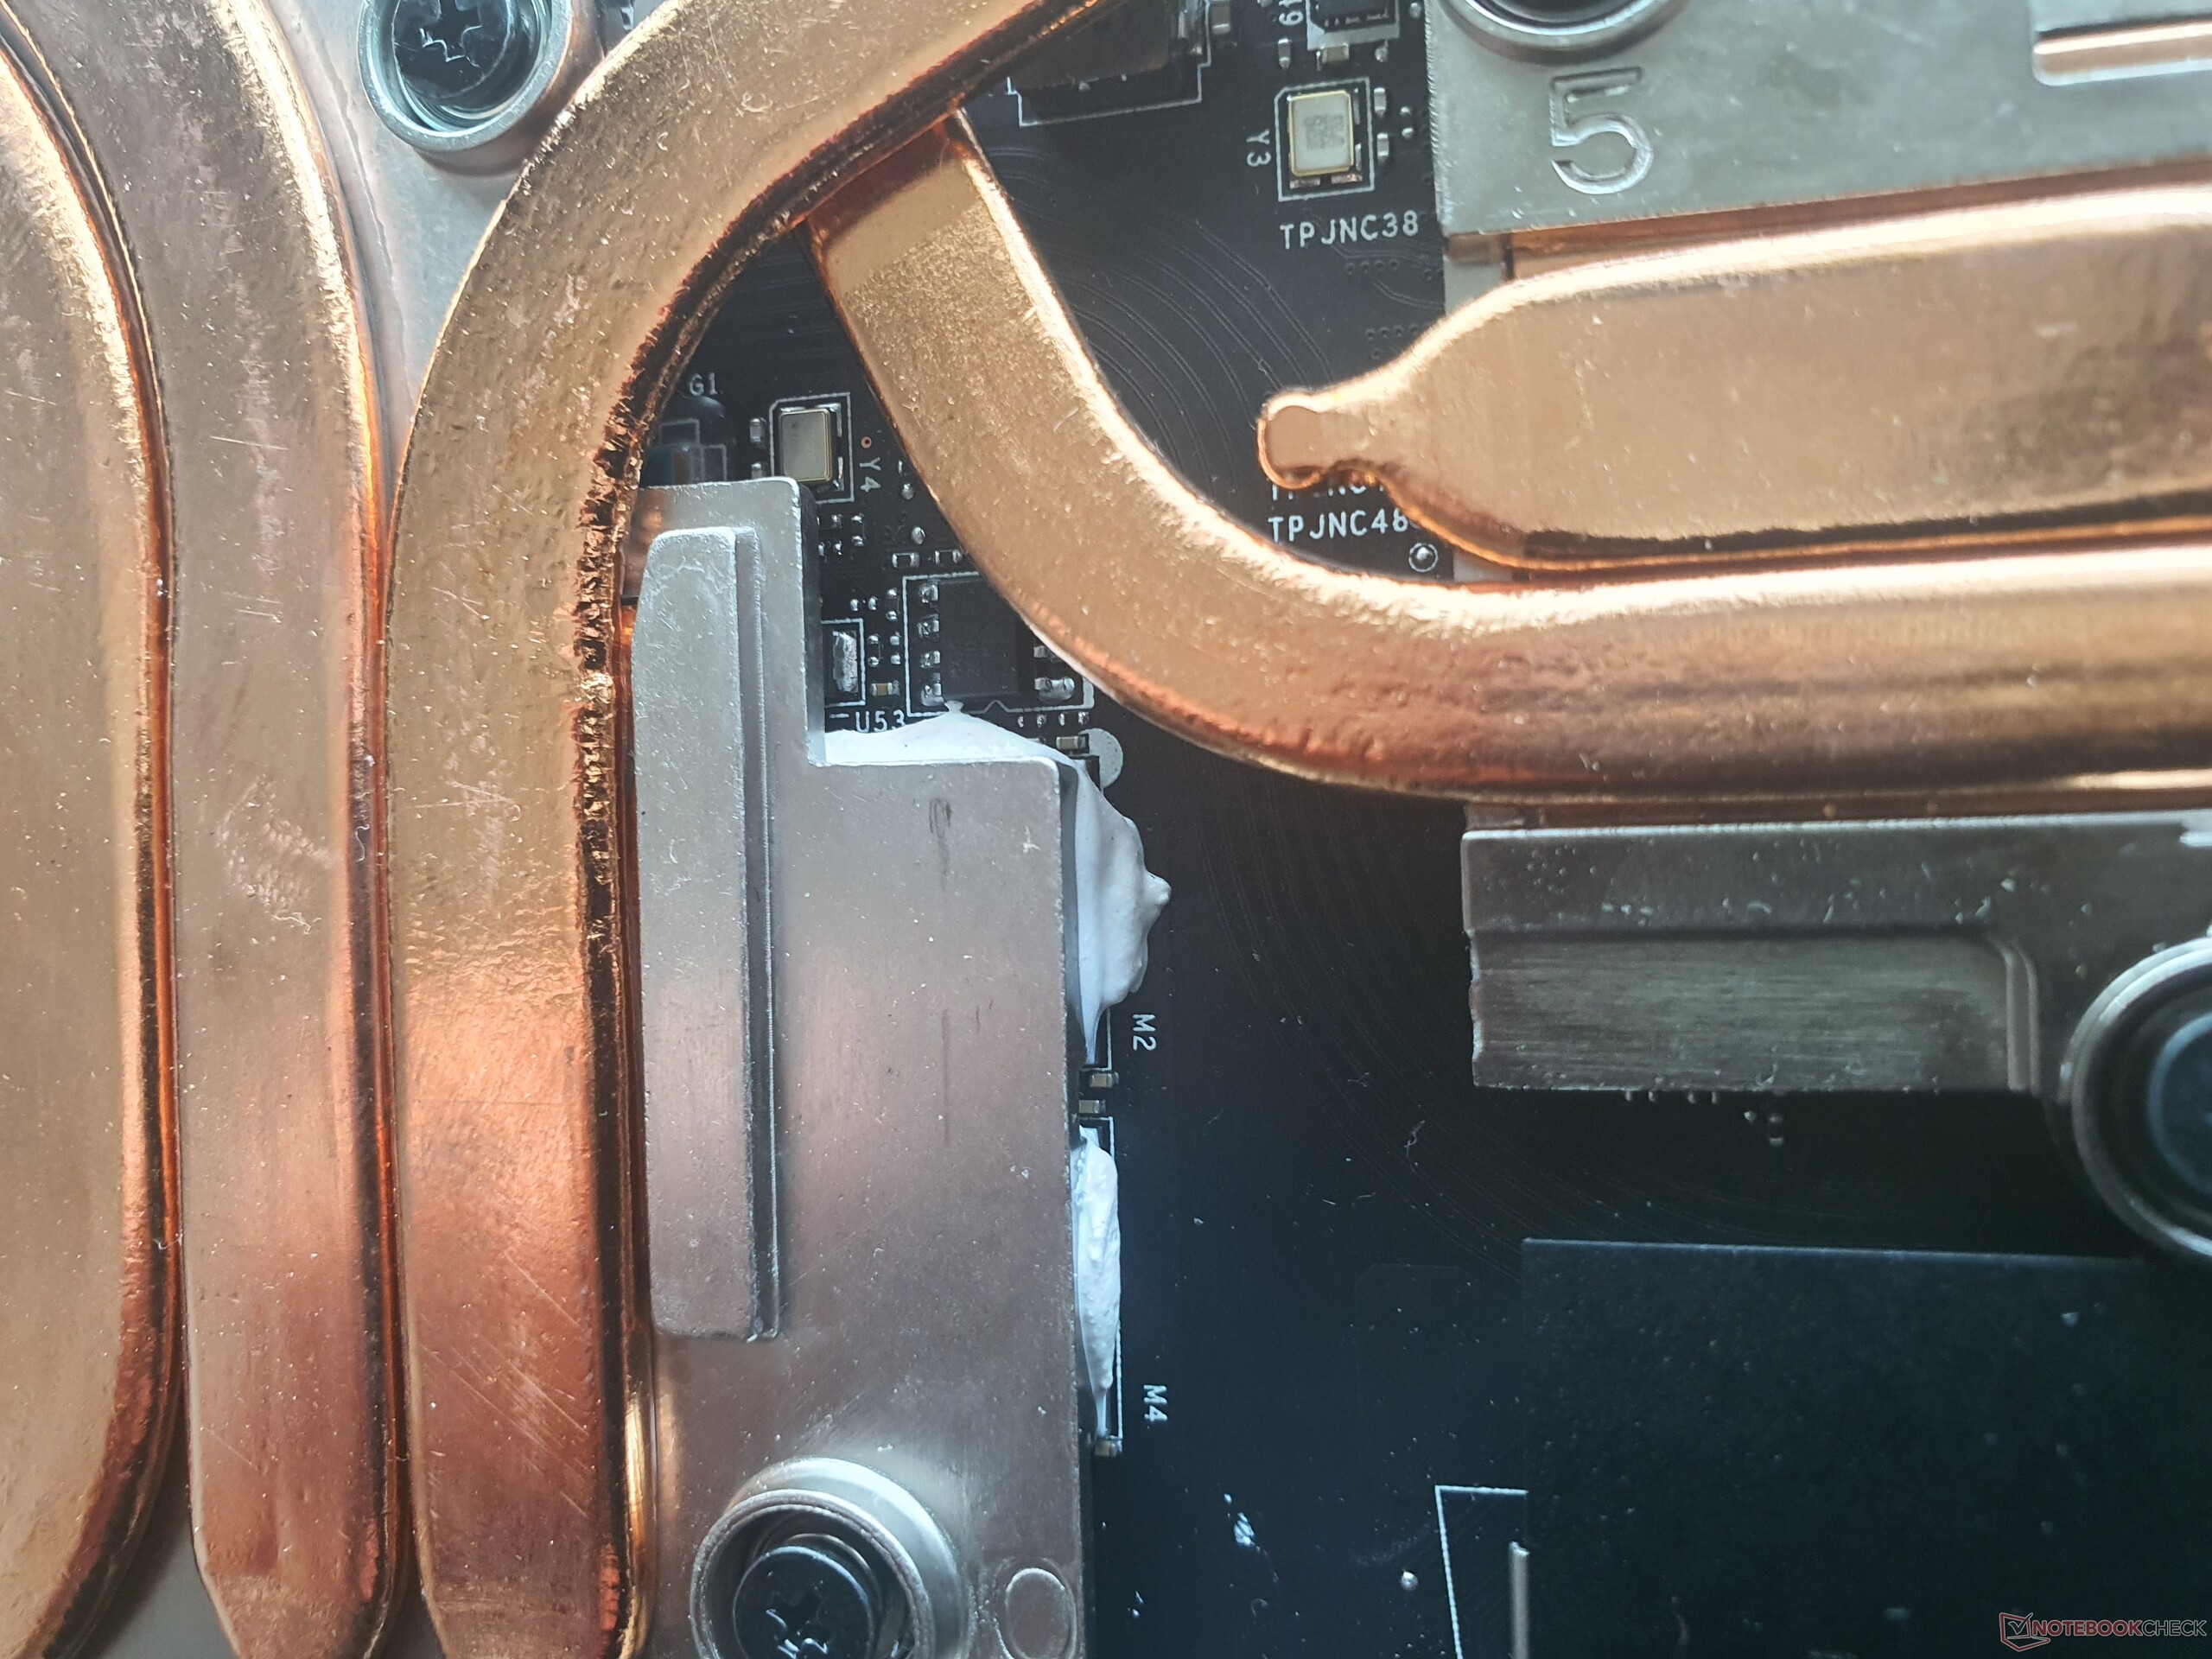
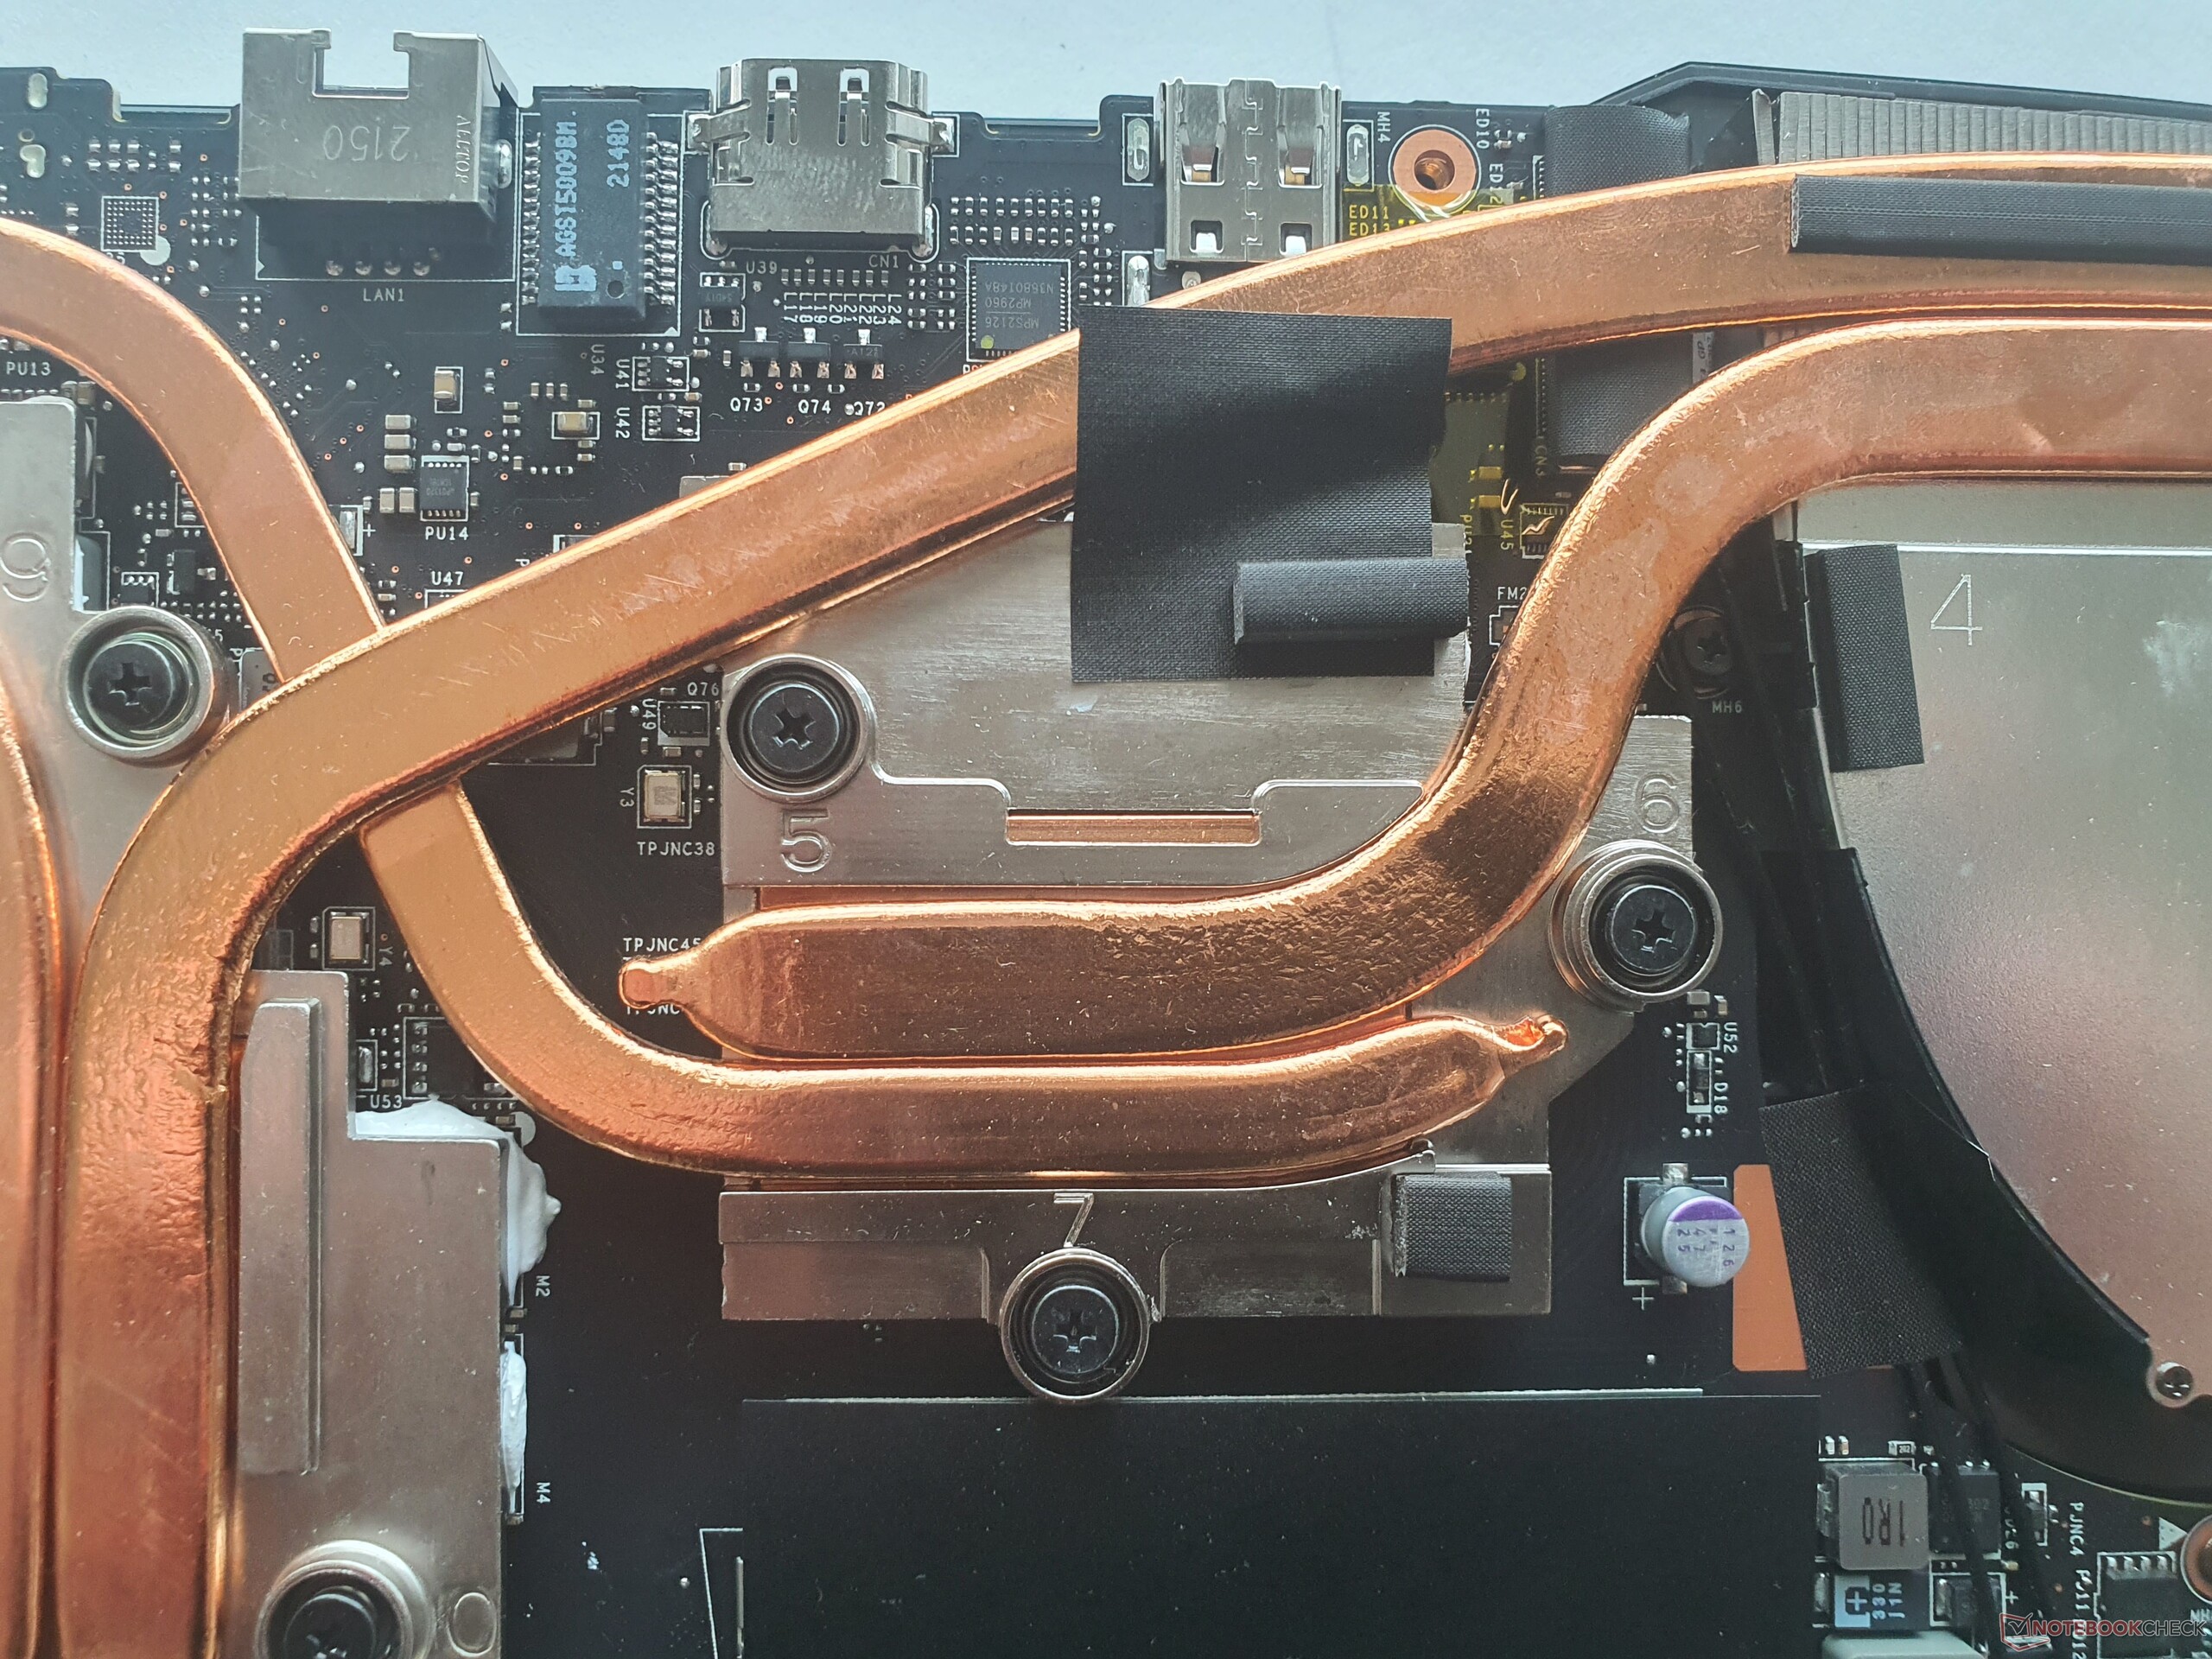
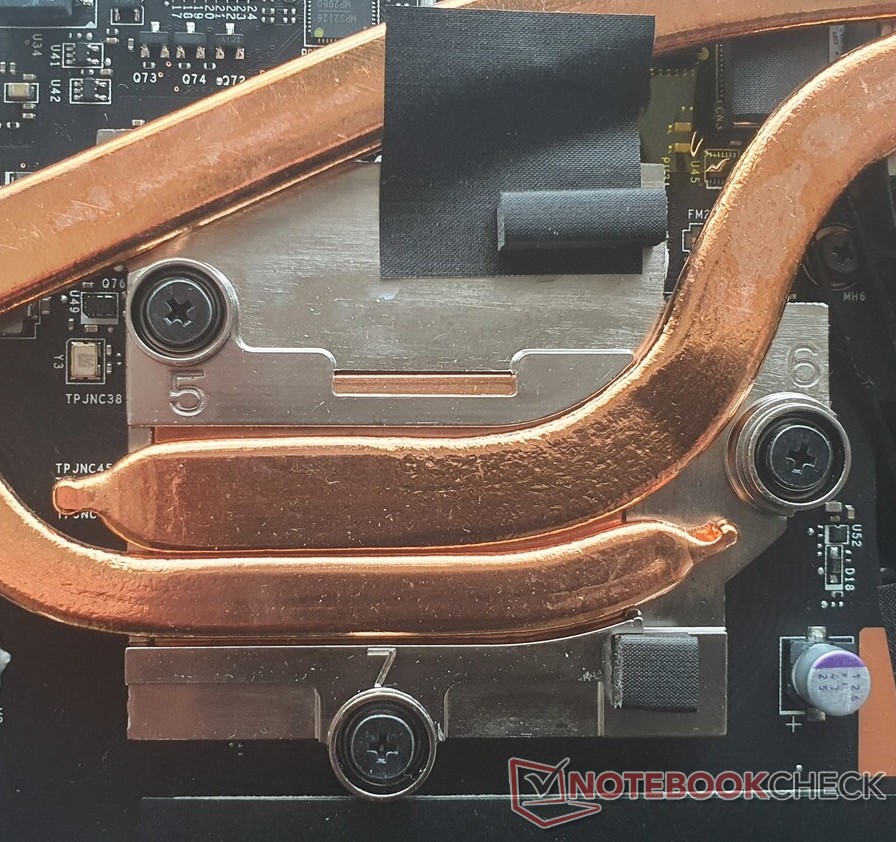
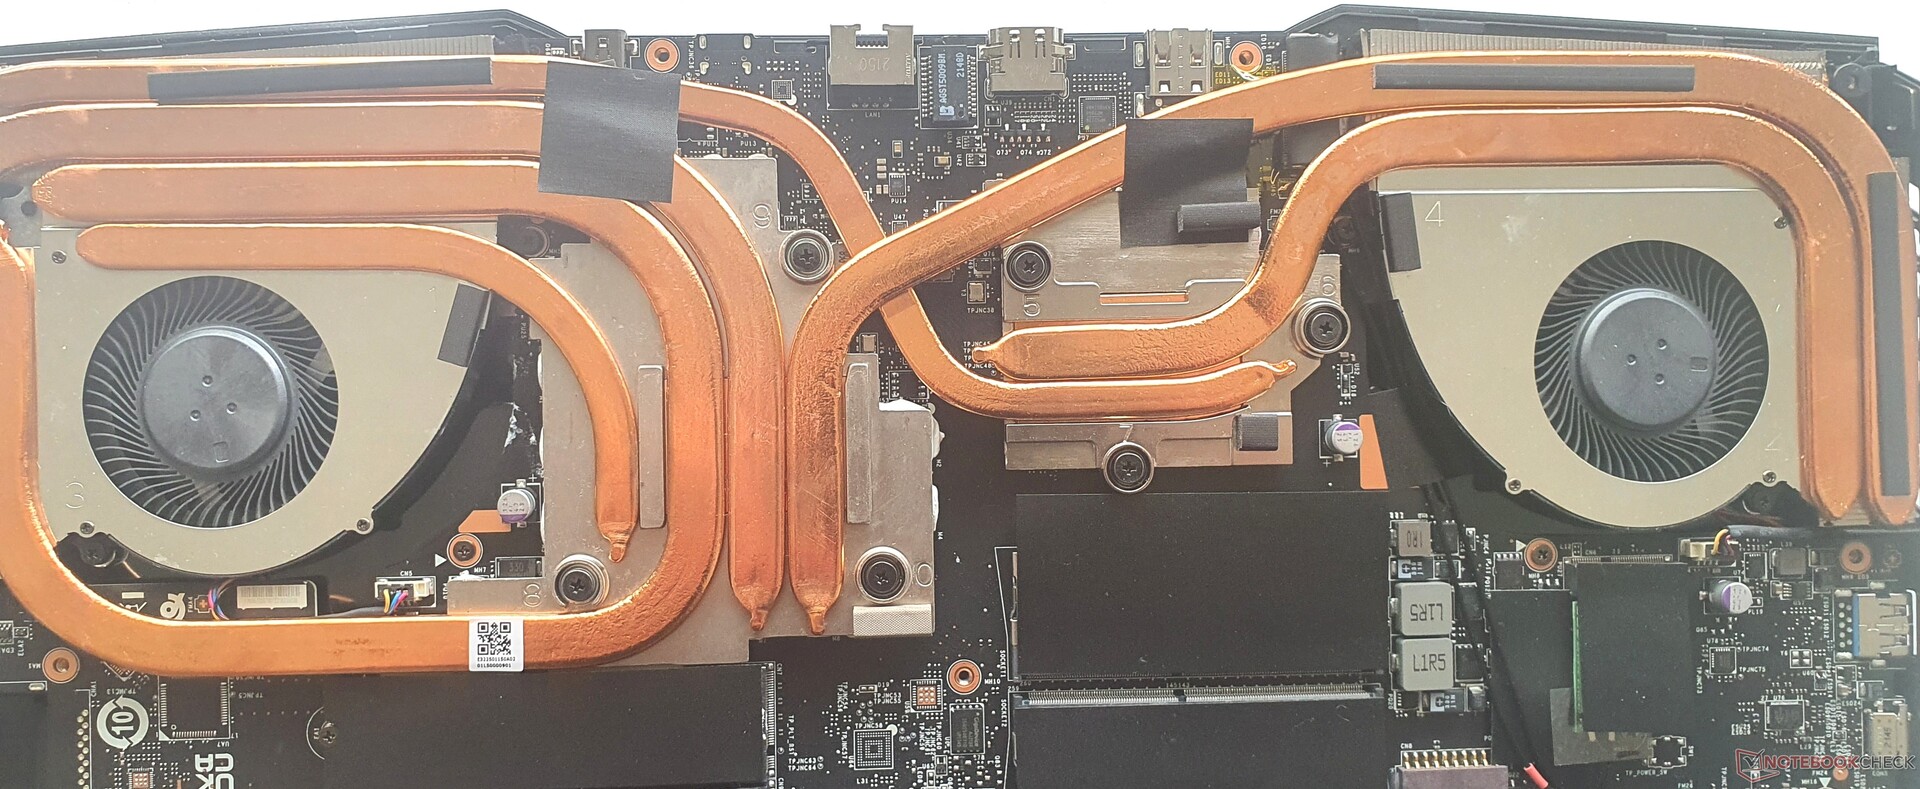
The back of the case can be detached after removing 13 Phillips screws and using a spudger tool. The front edge, which reaches up to the top of the laptop and has lots of hooks, requires some doses of well-applied strength and skill.
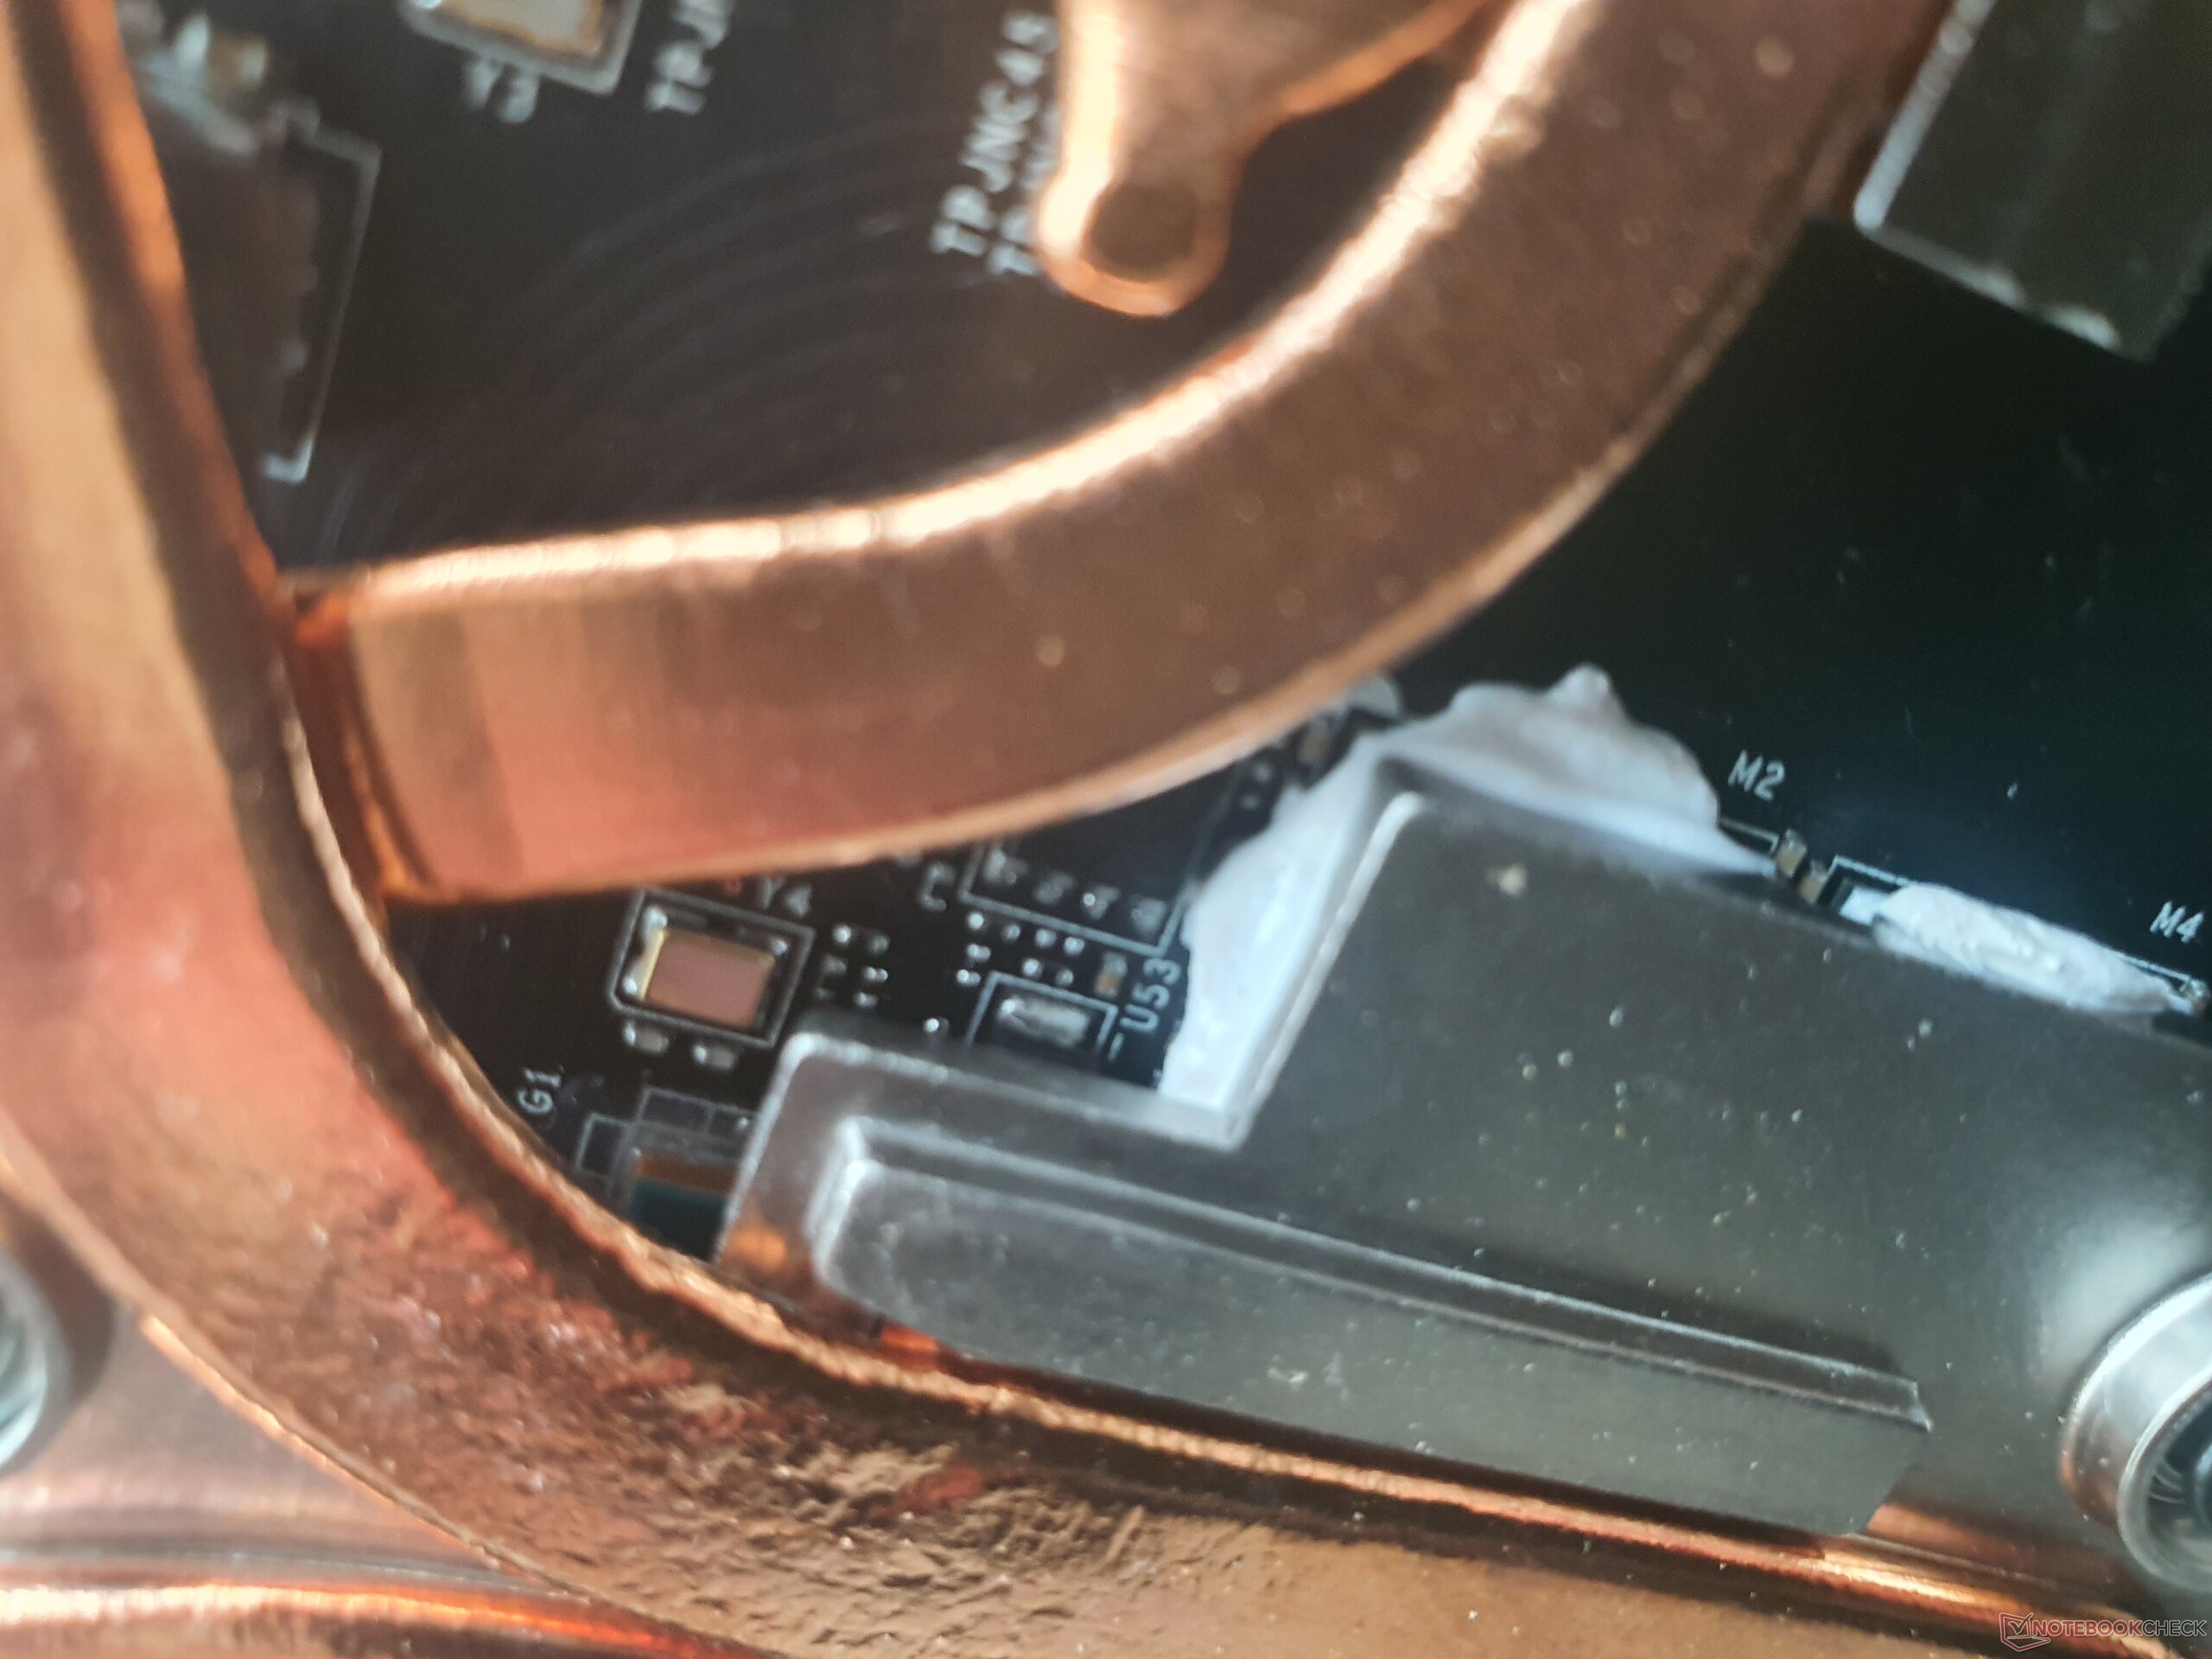
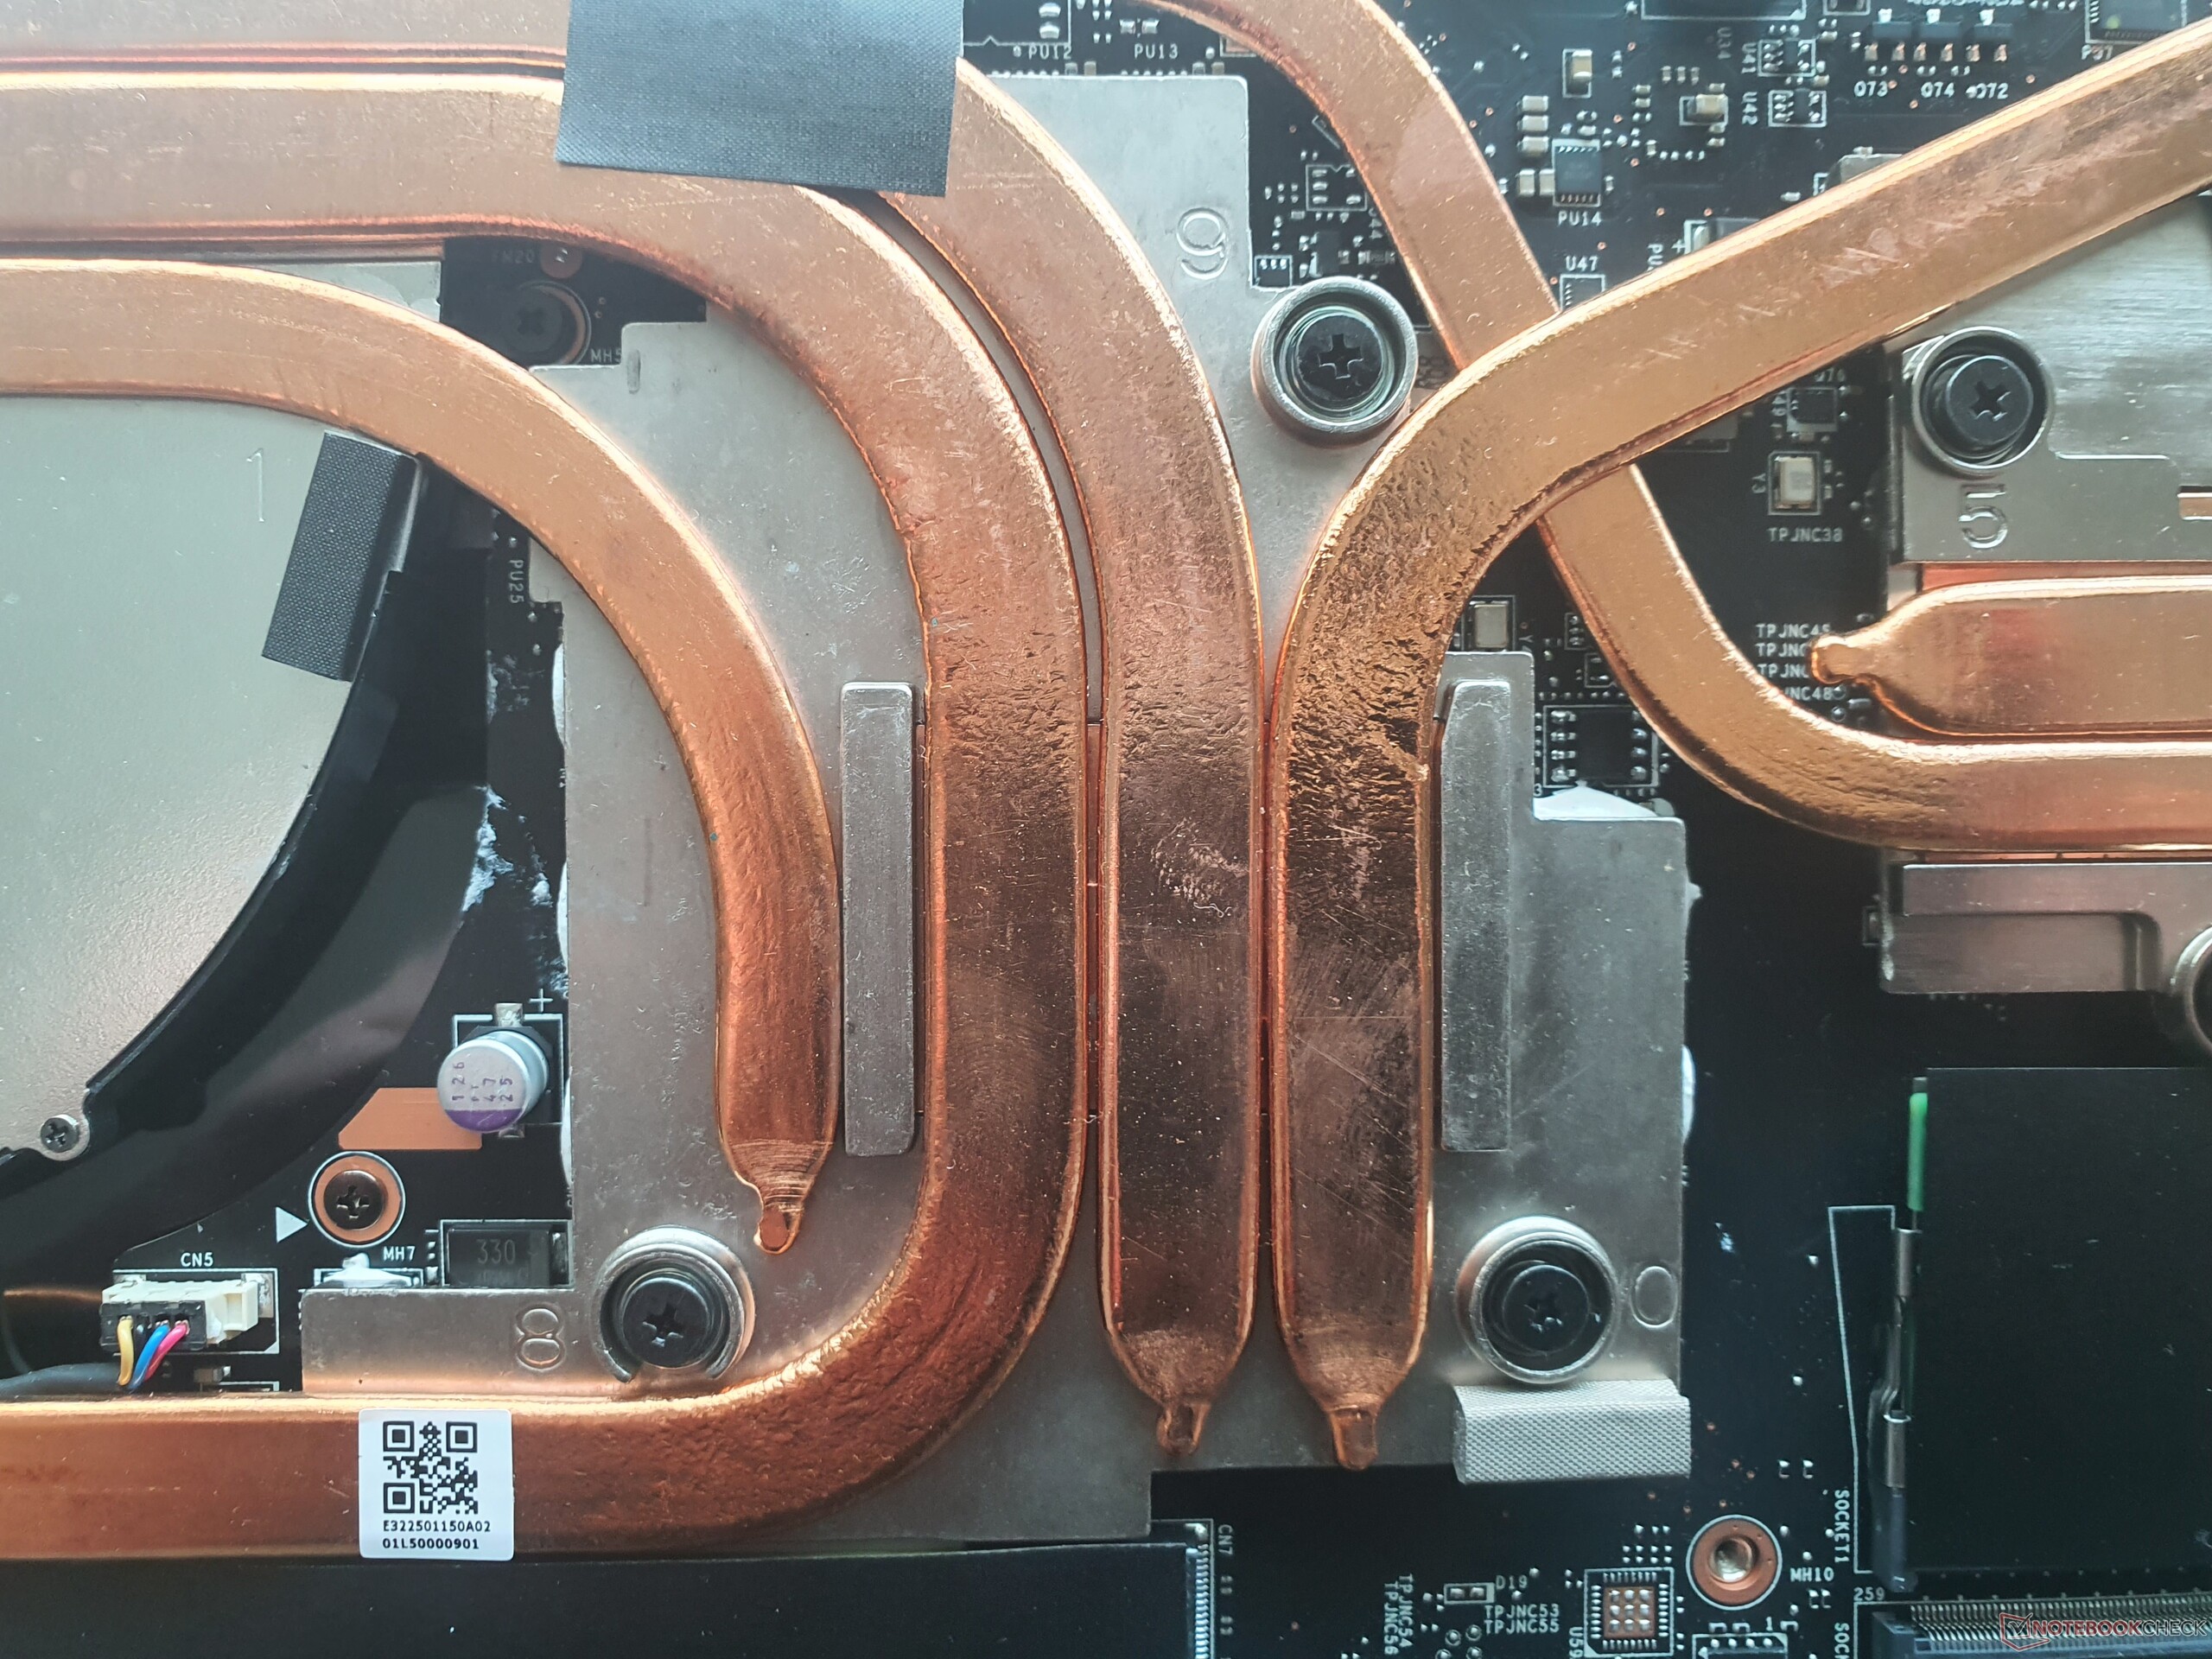
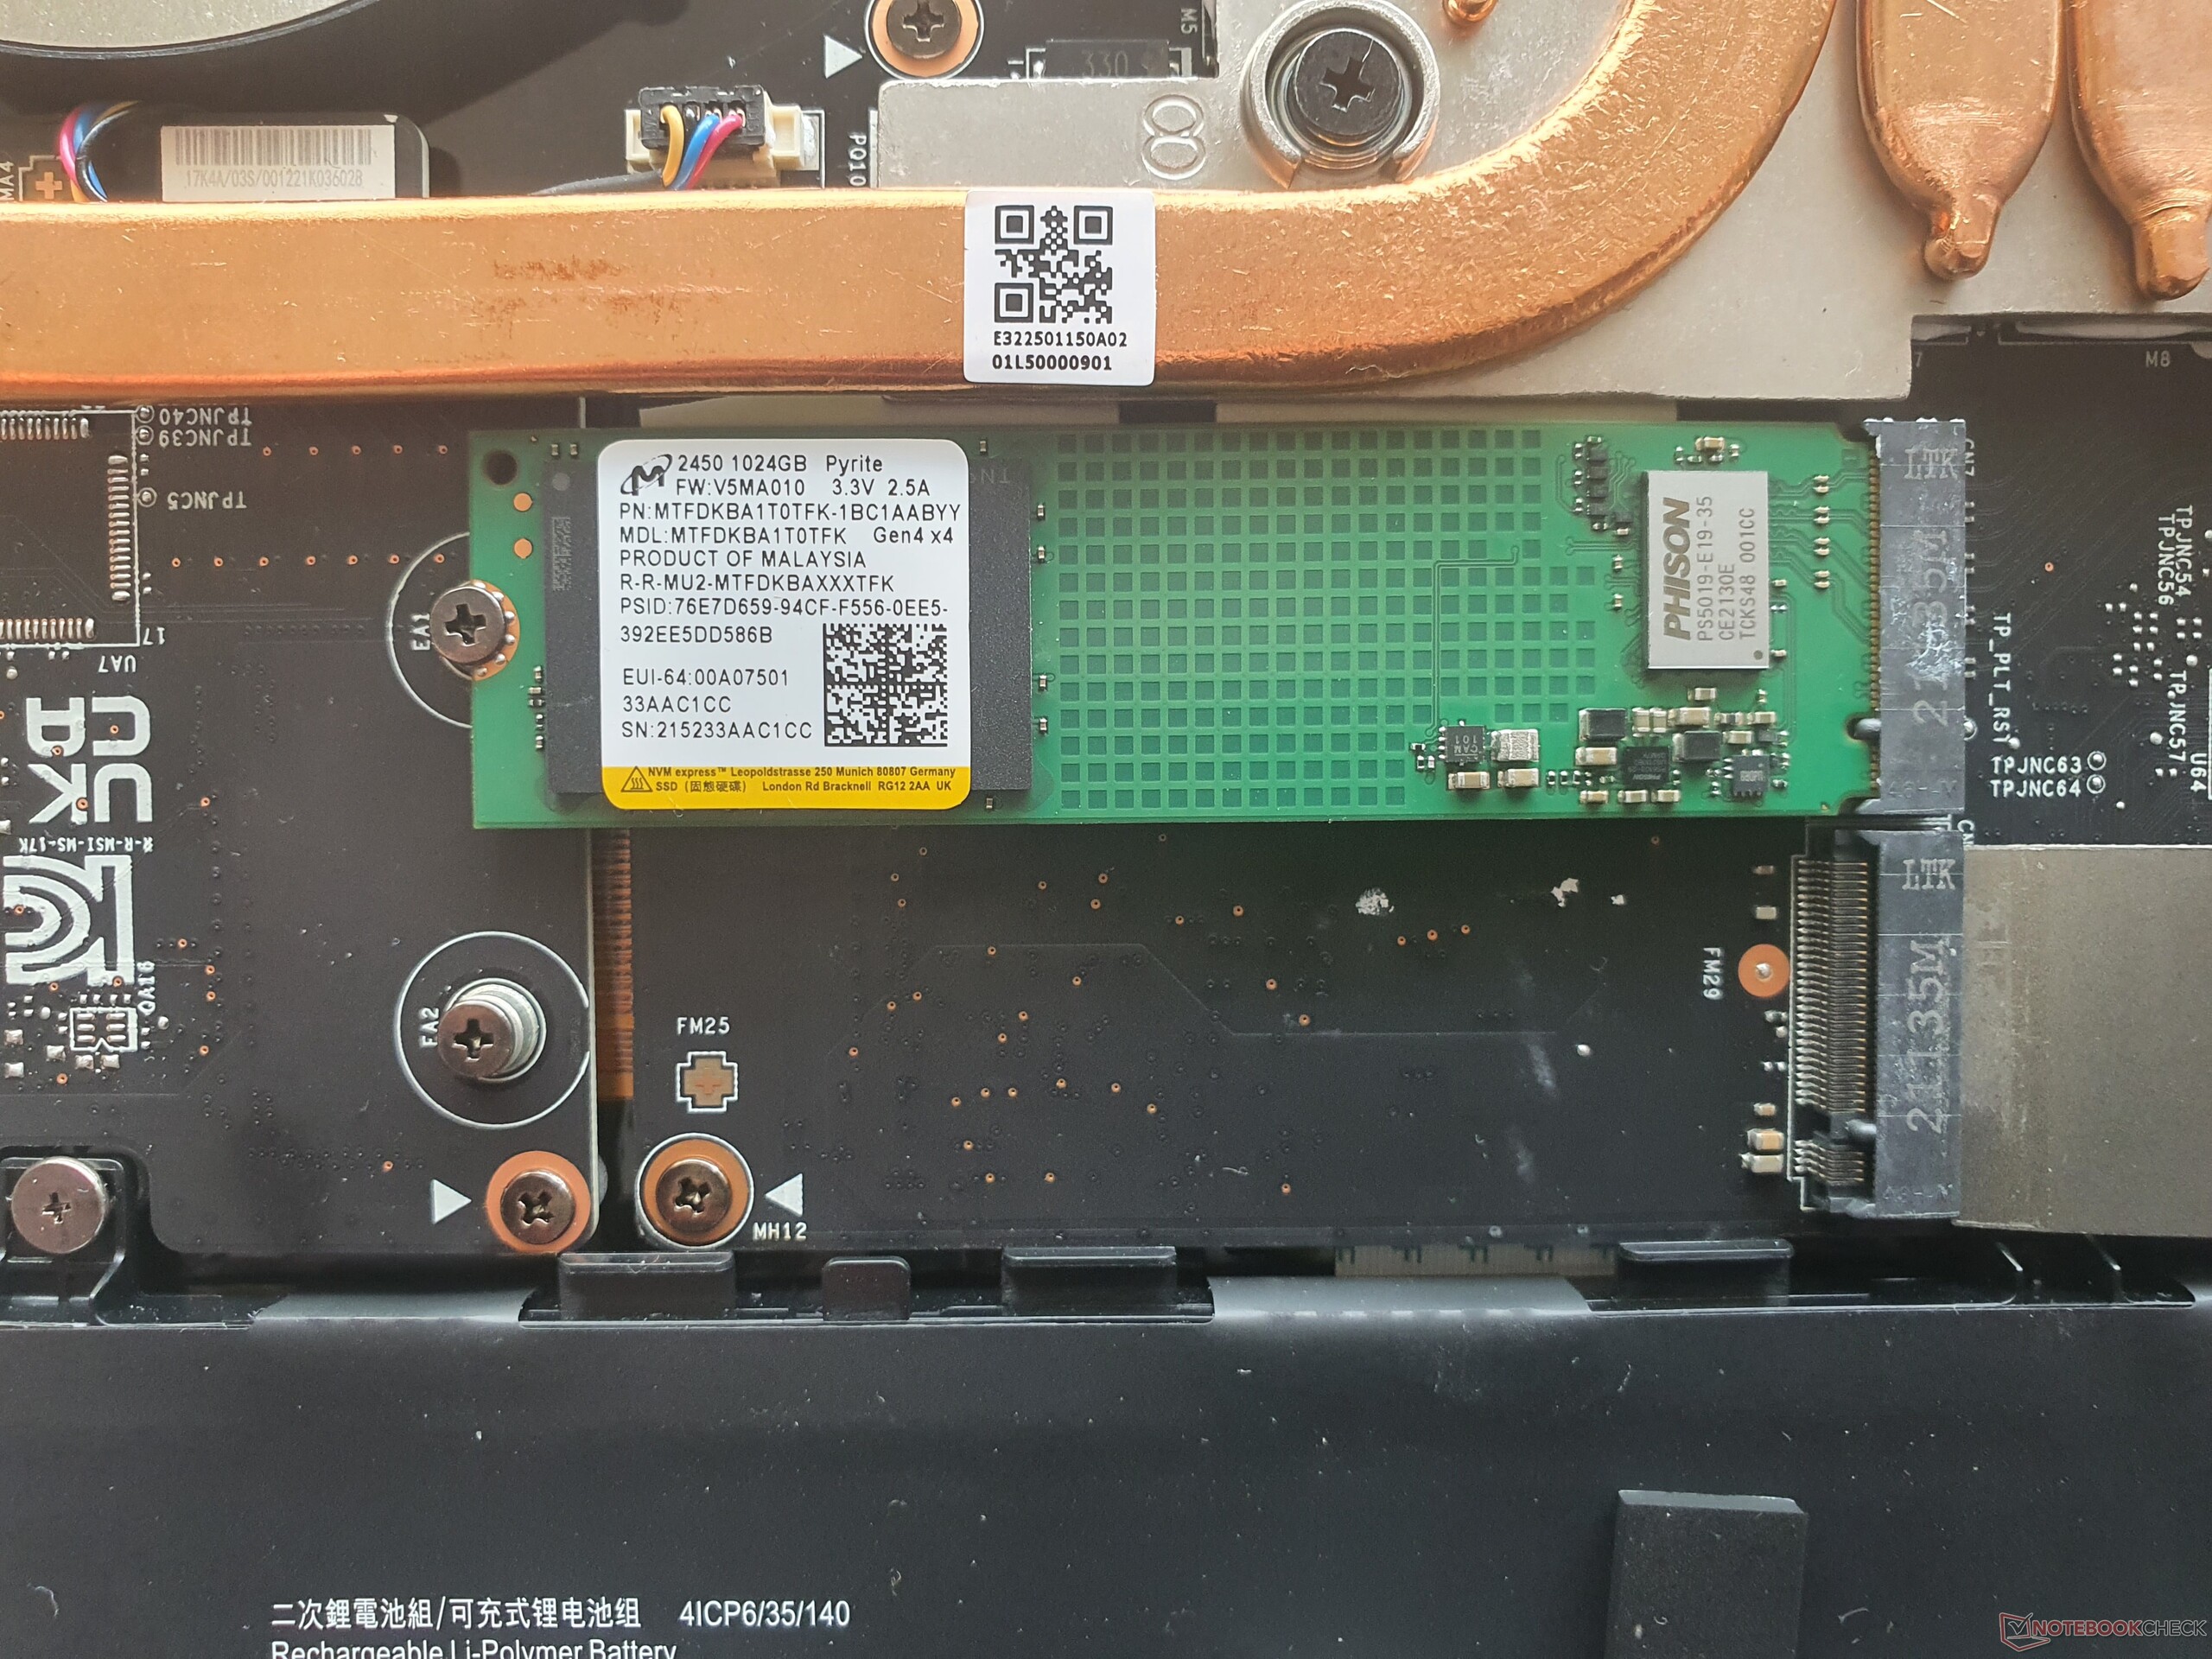
Afterwards, one encounters a great deal of copper in the form of 6 heat pipes, including two large fans that can be cleaned. The elements that can be cooled, such as the CPU and GPU, are covered with heat-conducting paste which "overflows" and partly spills onto the circuit board.
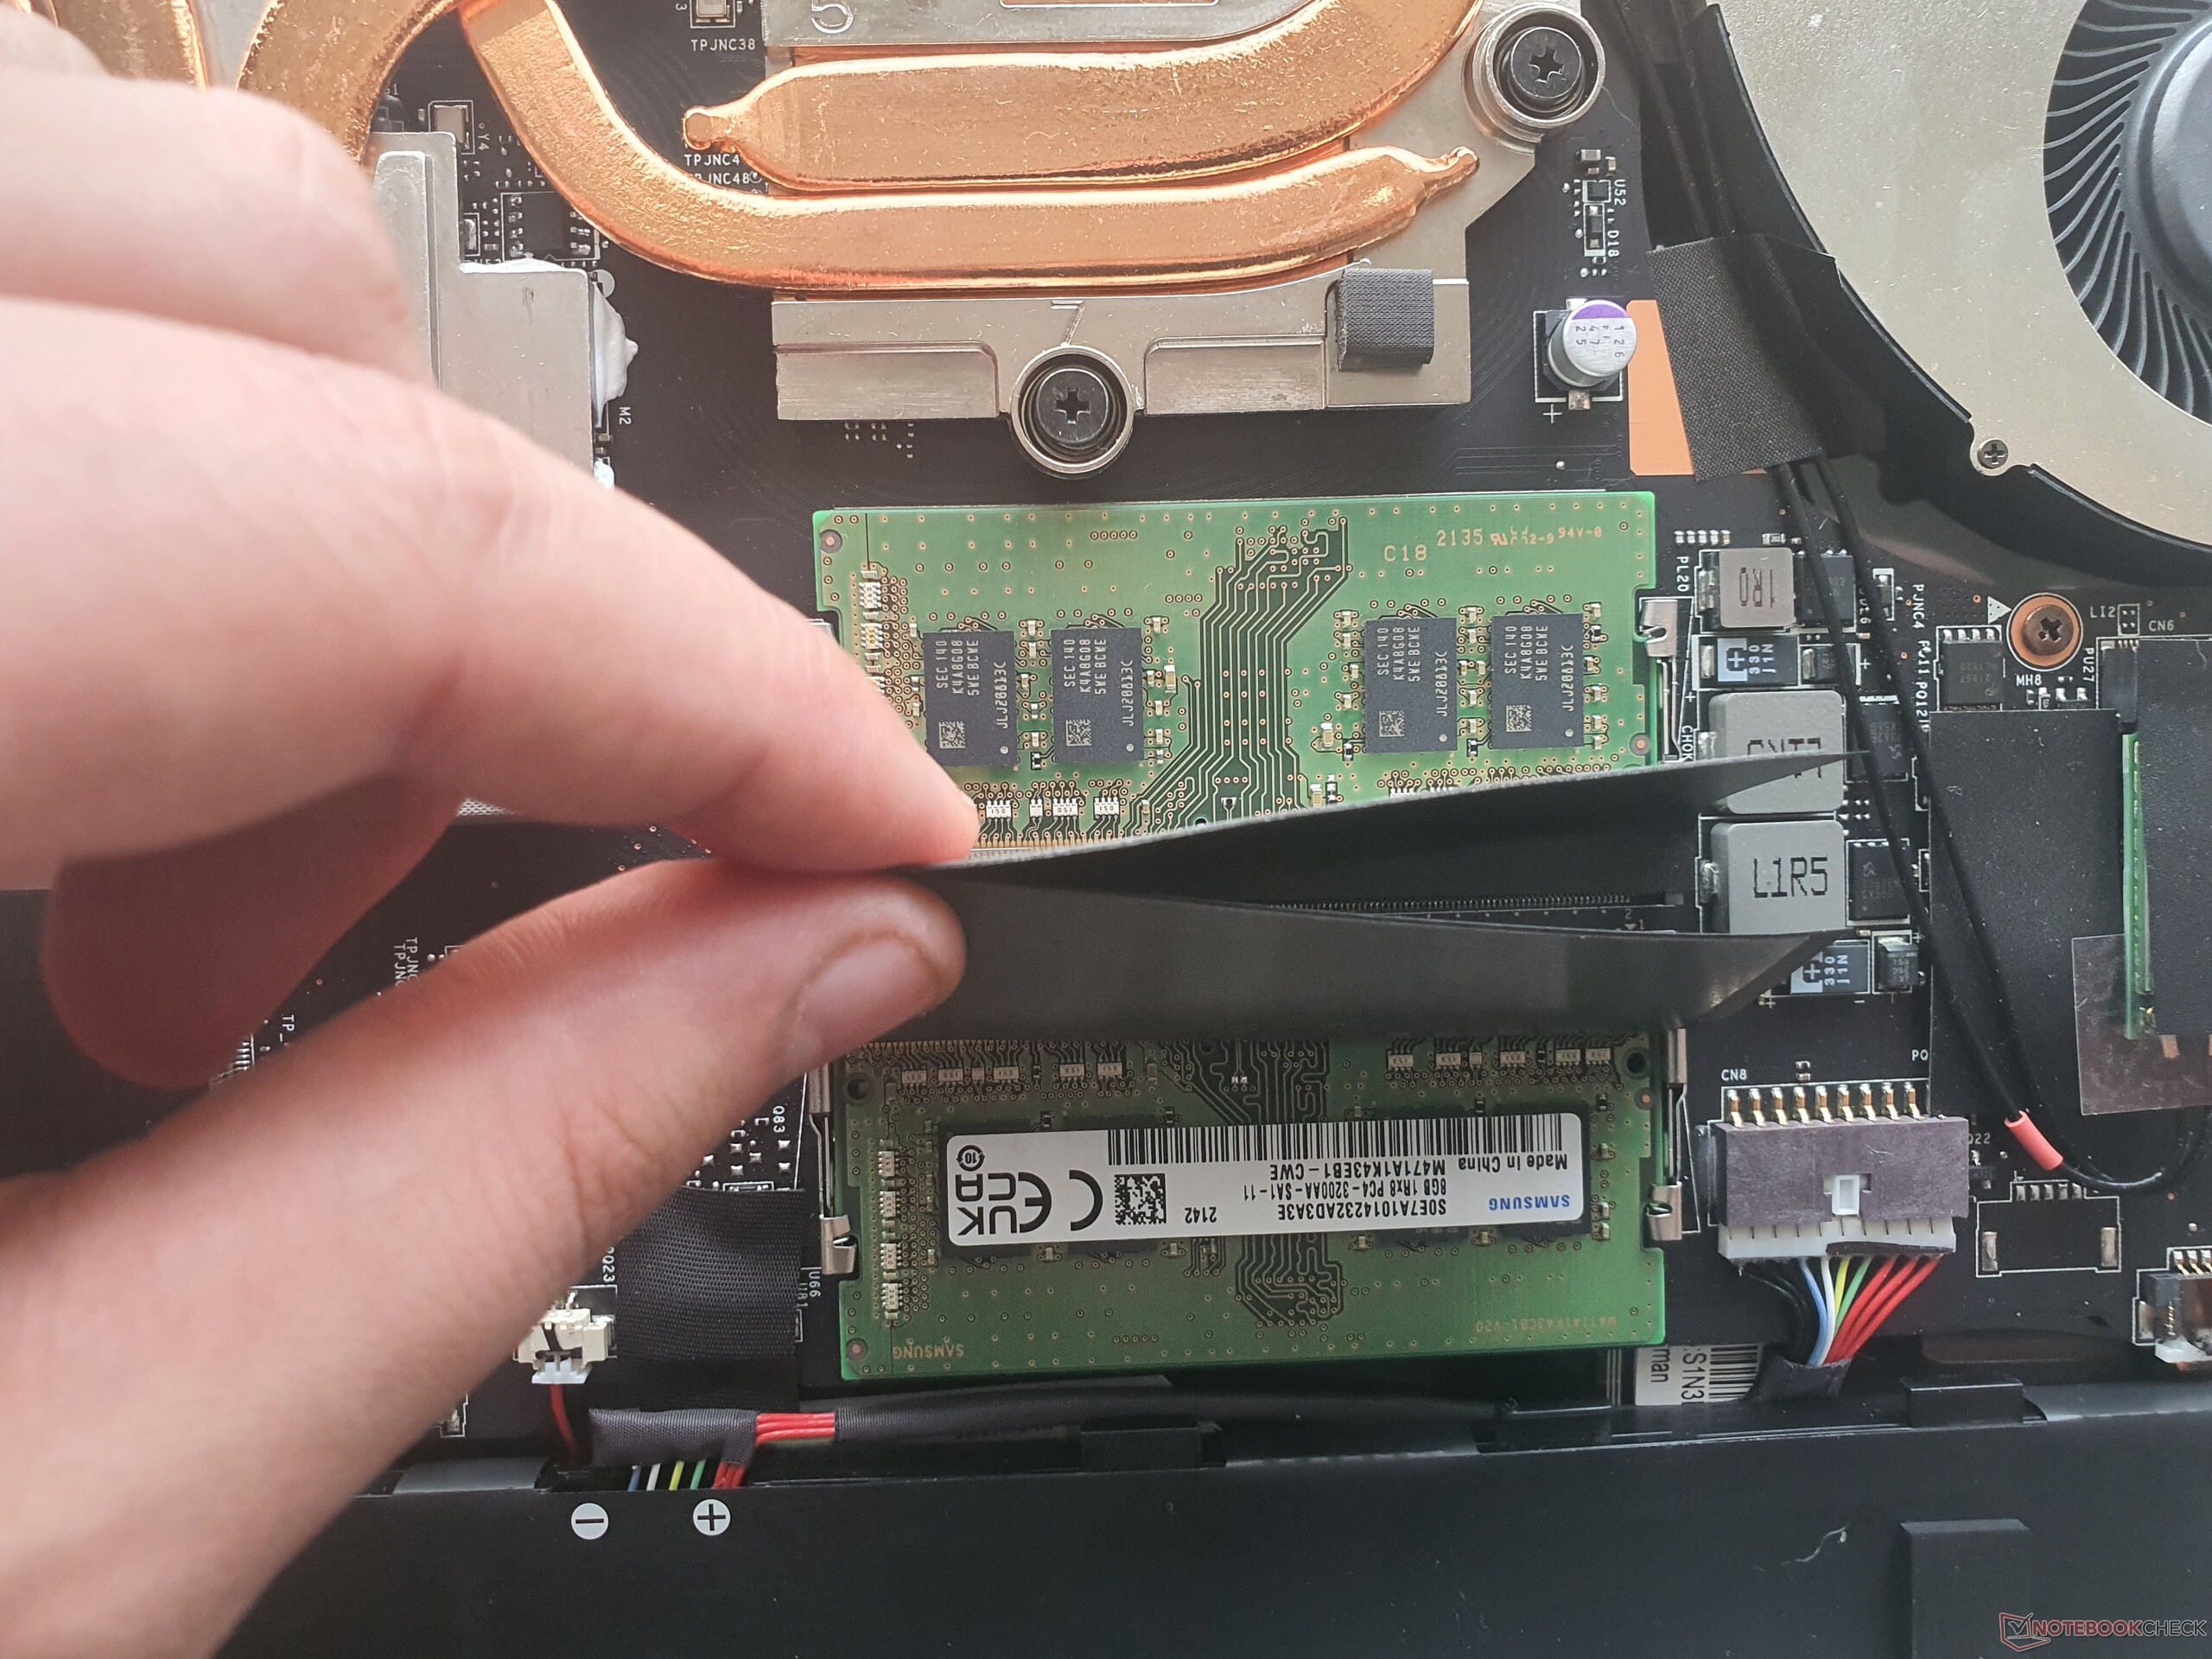
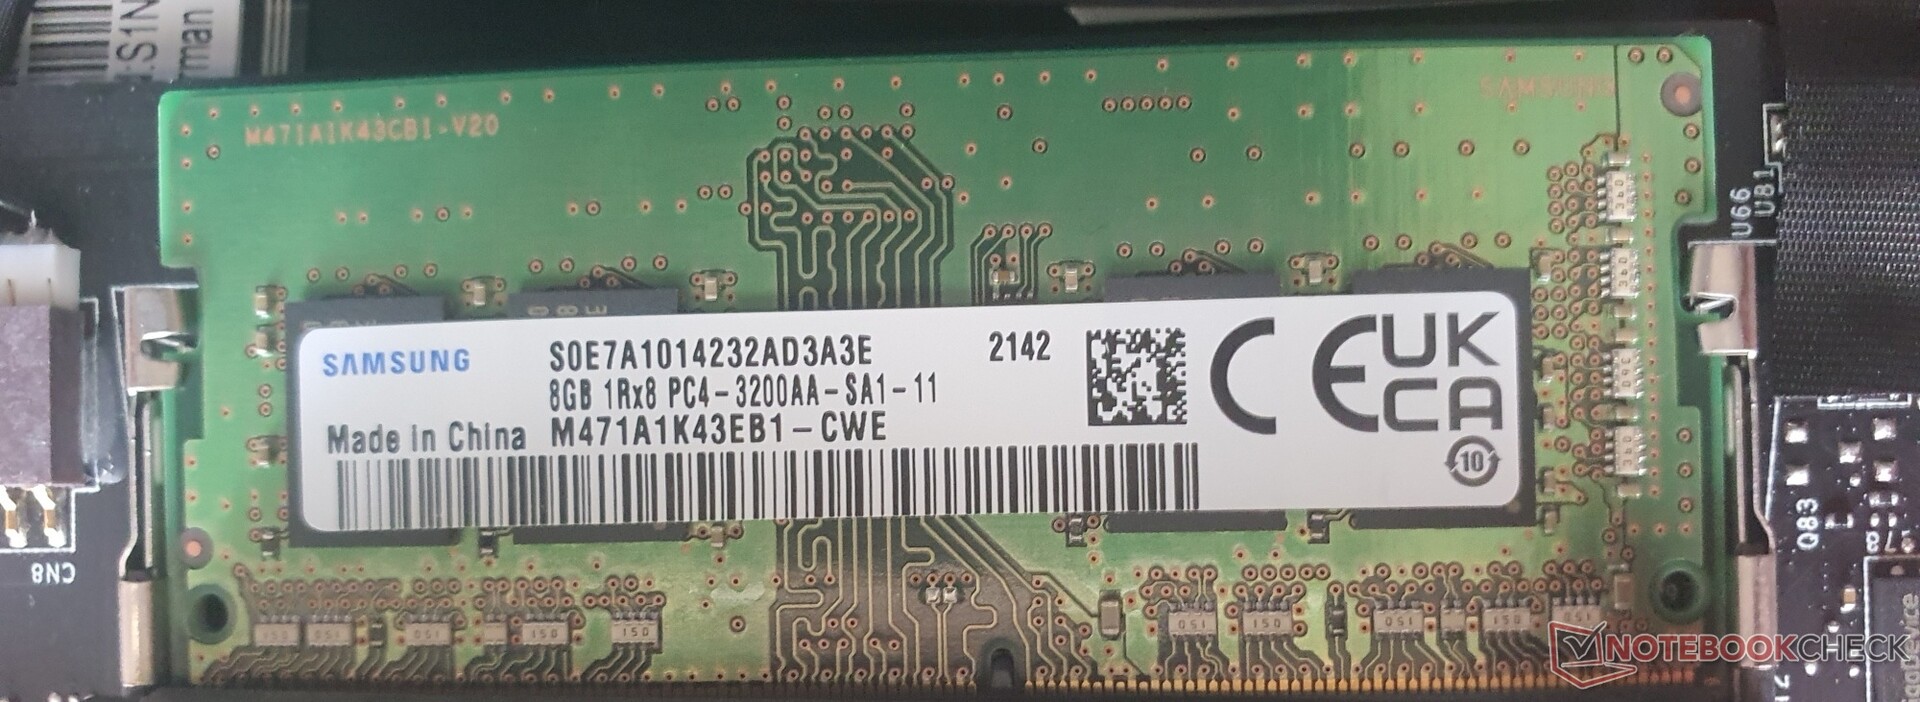
The next largest, maintainable component is the 65 Wh battery (screwed). In addition, two M.2 slots with PCIe4x4 specification (RAID 0.1 capable) are provided, which are rounded off by two SODIMMs for up to 64GB of DDR4-3200 RAM. As already mentioned, the Wi-Fi module is also replaceable. So overall, the Vector GP76 is maintenance-friendly.
Warranty
The warranty within the EU is 24 months with pick-up service. In most other regions this is 12 months. An extension is also possible for a surcharge.
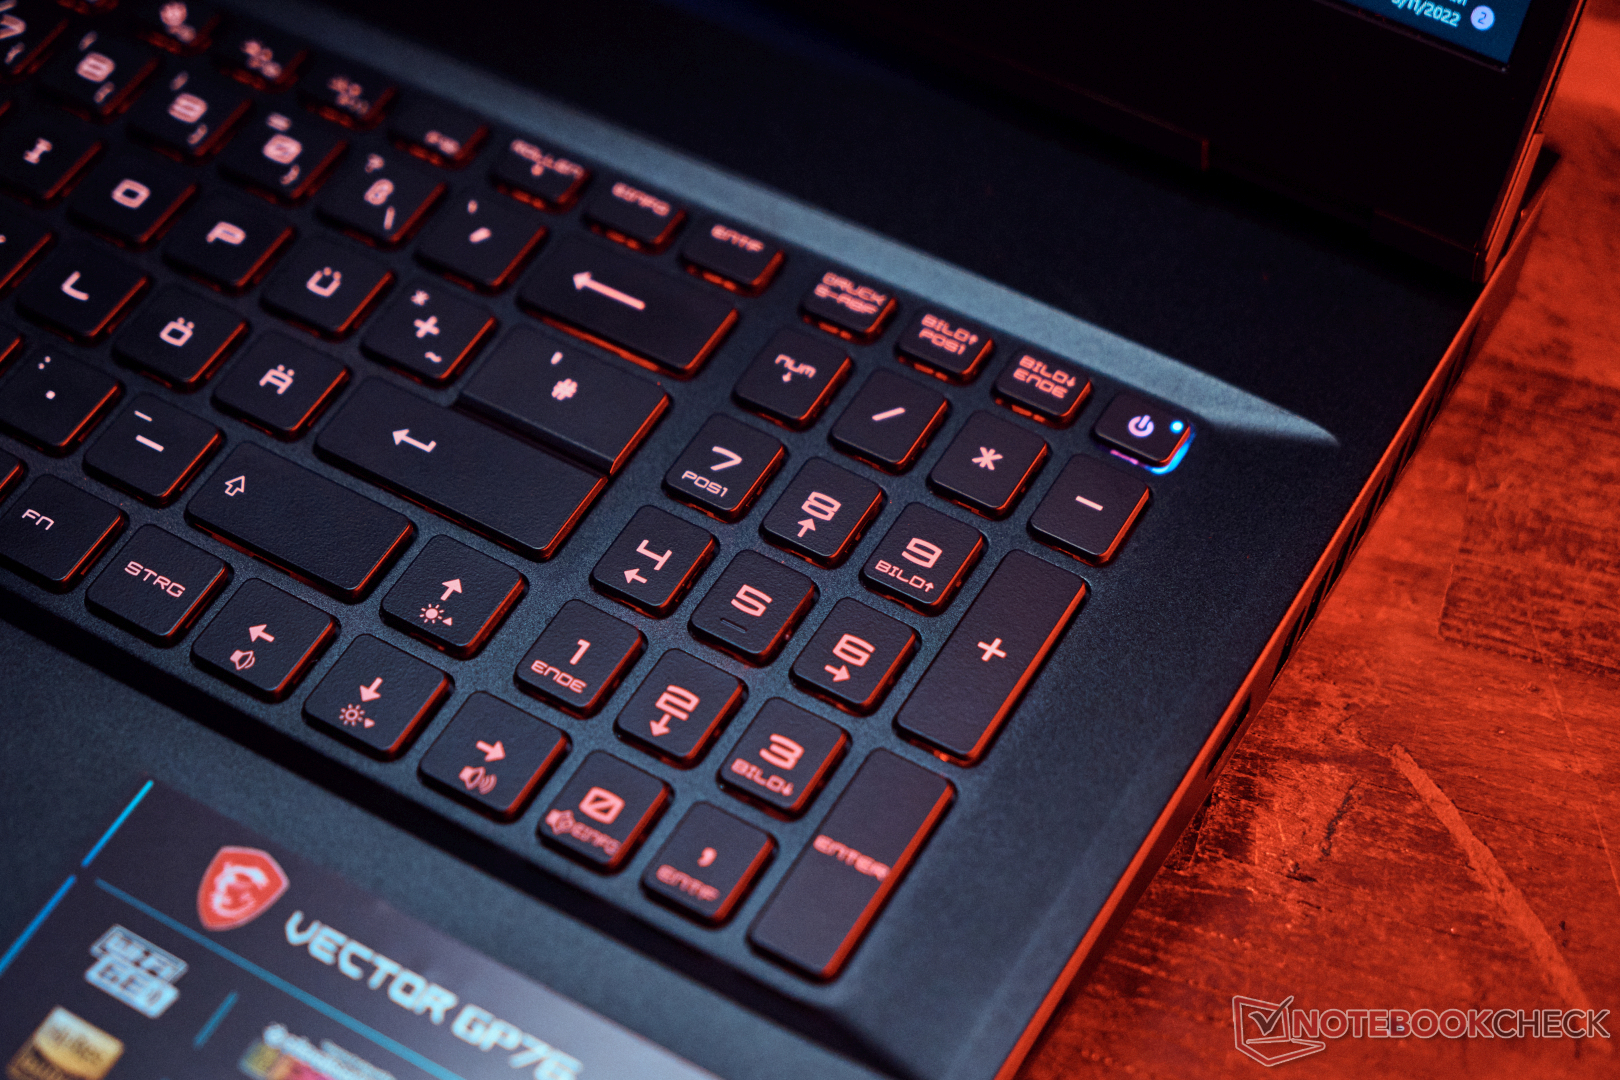
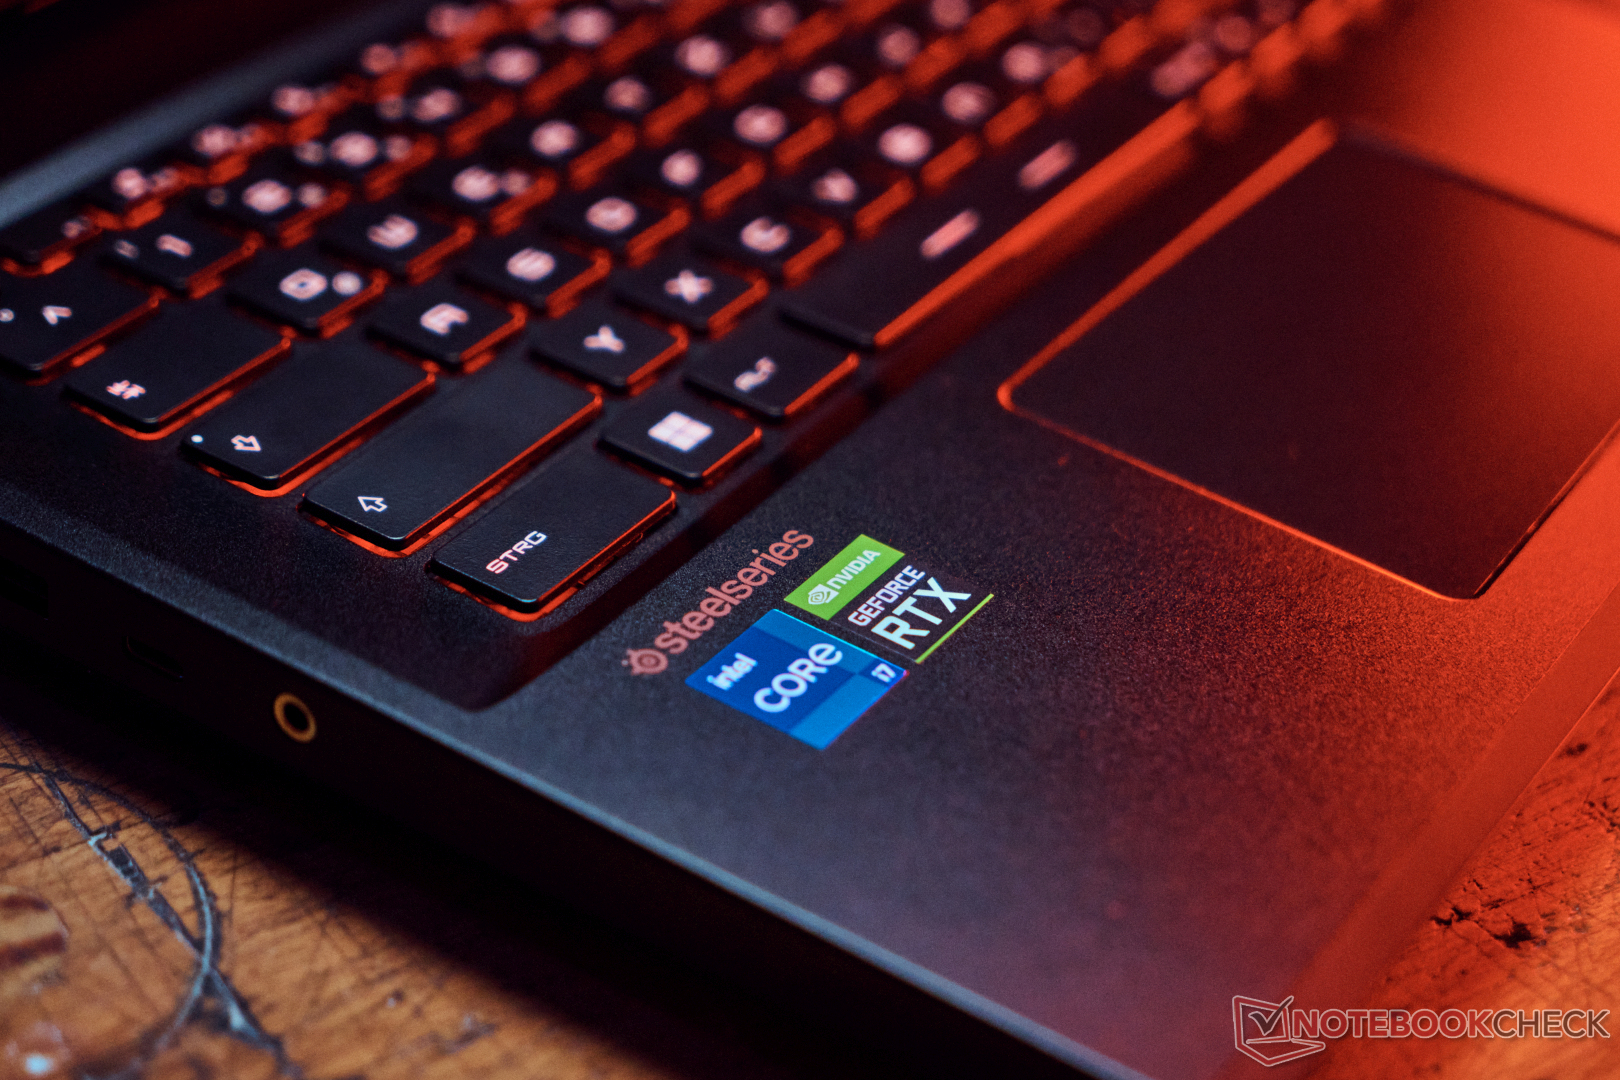
Input devices: MSI with per-key RGB for a splash of color
Keyboard
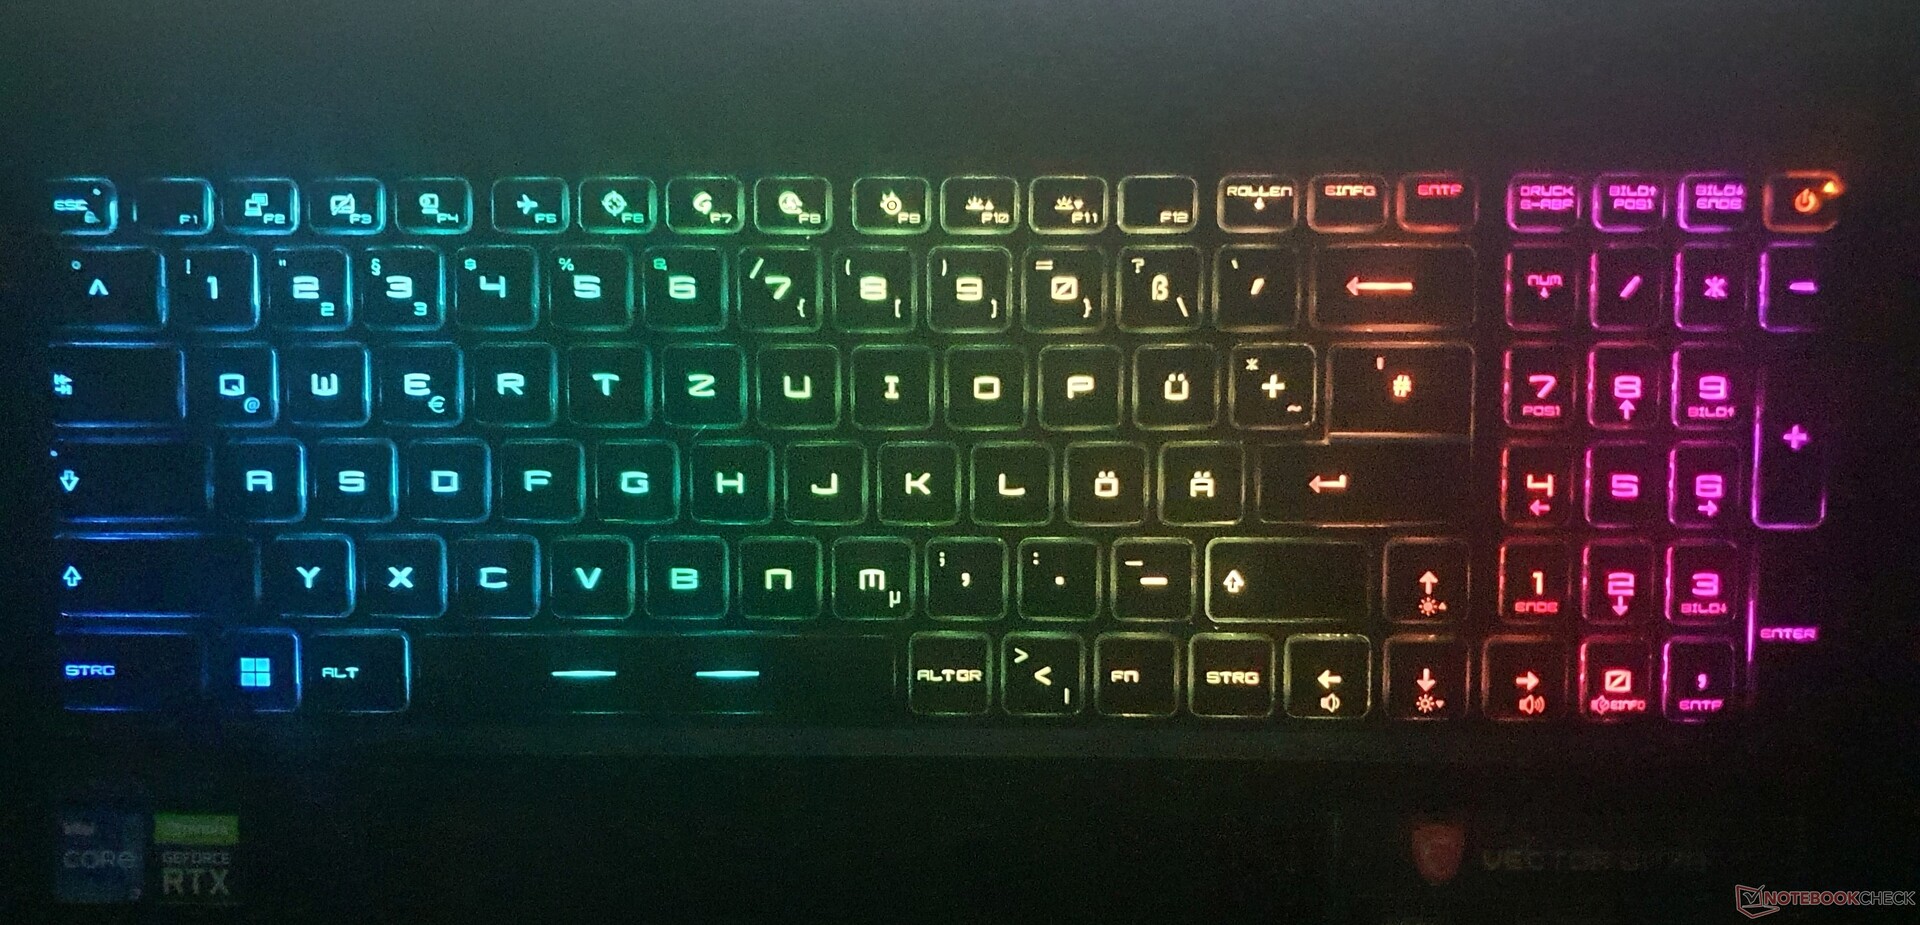
The SteelSeries keyboard, which hasn't changed for generations, offers somewhat smaller but grippy keys with a moderate pressure point and medium travel.
Longer texts can be written without any problems, even if the stroke is a little soft. There are a few things to note about the layout: Like most other keys, the arrow keys are 15x15mm in size, but the Enter key is divided and the right Shift, number block and F keys are smaller. The keyboard thus corresponds to that of the US market with adapted DE labelling. Some function keys also have dual functions.
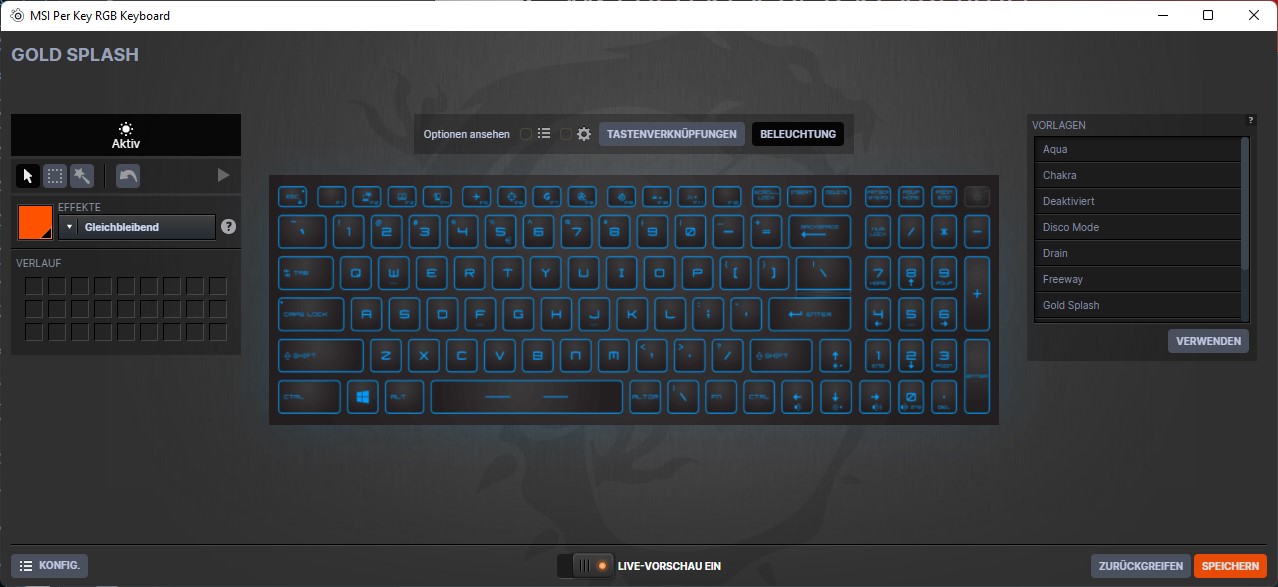
One advantage is the low noise level. Thanks to anti-ghosting, up to 10 keystrokes are possible at the same time and individual key backlighting can be configured using the "SteelSeries Engine 3" software.
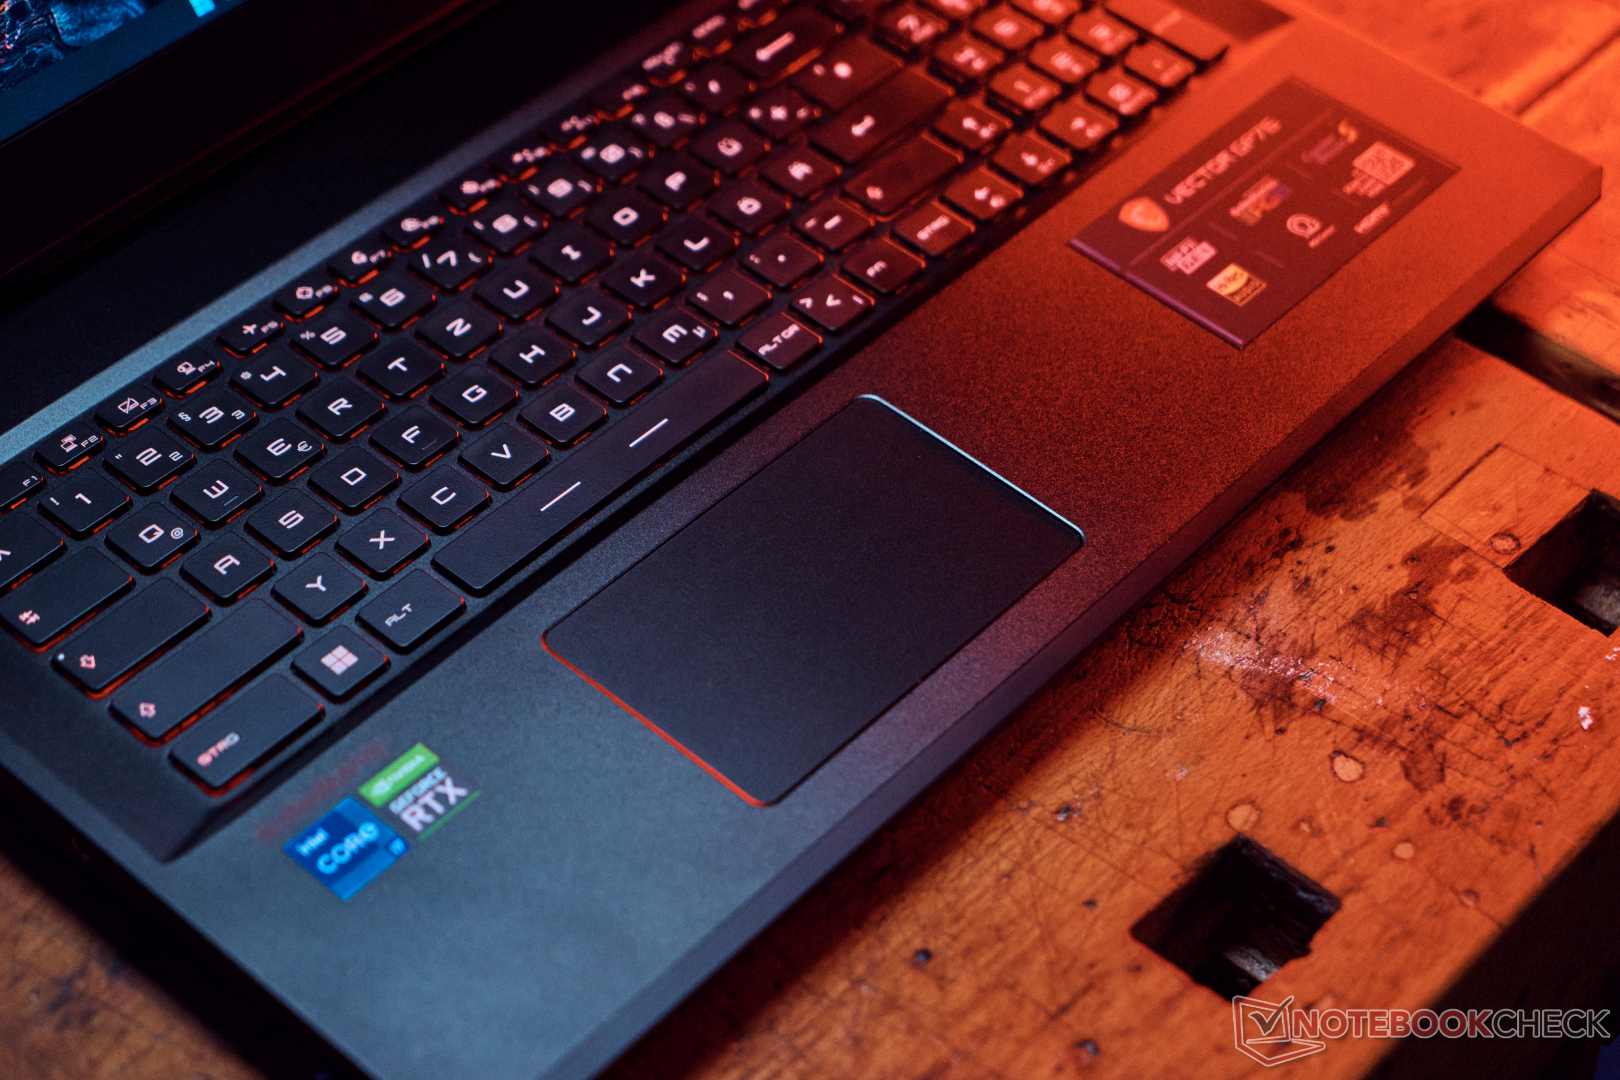
Touchpad

The touchpad measures 10.5 x 6.5cm and is thus not the largest, but the gliding quality is very good and works very accurately. However, the integrated click buttons only function with a lot of pressure and do not offer optimal feedback. That said, there are much worse clickpads on the market.
Display: Rapid 360 Hz and 4ms gray-to-gray on the Vector GP76

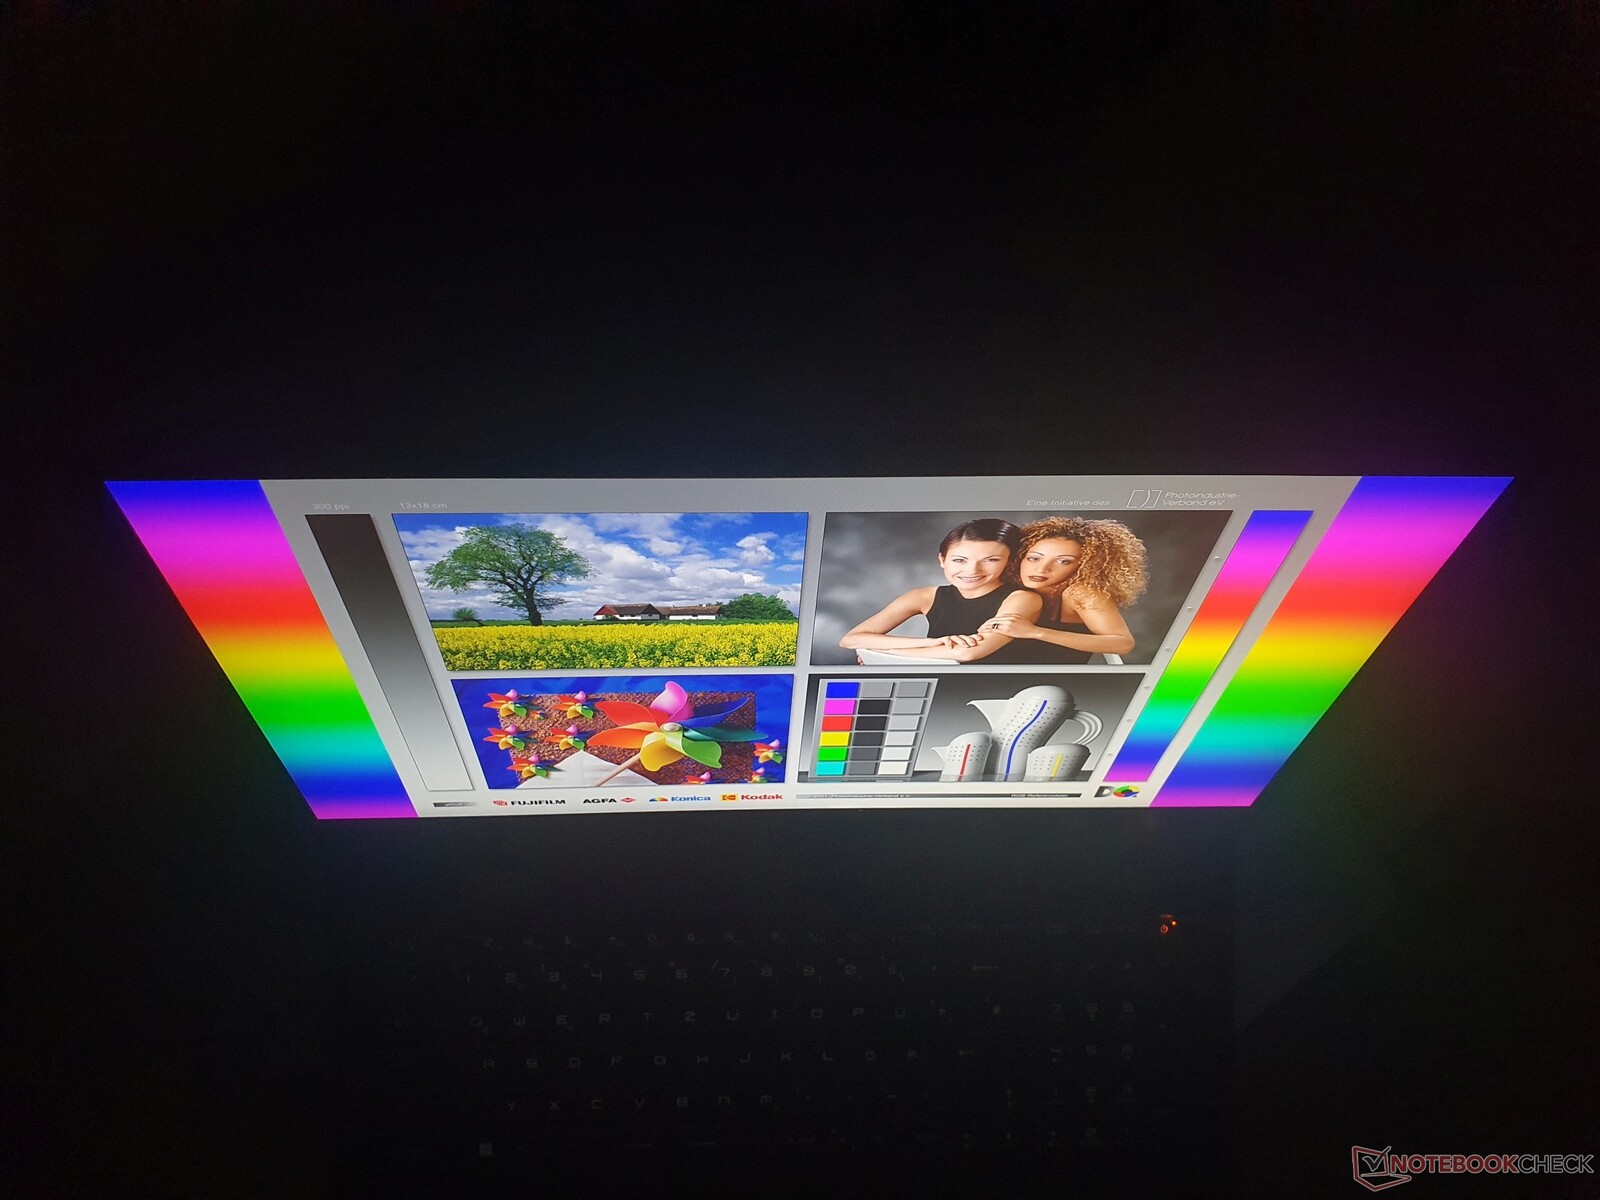
The matte, 17.3-inch IPS display in 16:9 format offers a mediocre brightness of 264 cd/m², which proves to be sufficient for indoor use. The 1920x1080 (Full HD) resolution is the only one MSI offers in the Vector series and is sufficiently sharp as long as you don't stick your nose to the display. Images are also very sharp and clear, reinforced by good subpixel quality.
The contrast of 1,096:1 is acceptable, and the good black value of 0.25 results in a rich black. While the comparison field is generally on a similar level, the smaller Vector GP66 (together with its own predecessor) is even brighter at 324 cd/m². However, the Legion 5 Pro and Zephyrus M16 outshine the competition at just under 500 cd/m² and are thus also suitable for outdoor use.
In terms of response times, nothing can compete with the GP76: In addition to the super-fast refresh rate of 360 Hz, a gray to gray signal takes only 4ms and black to white is still a very good 8ms. The competition lies between 15 and 27 ms for gray to gray. Overall, the panel corresponds to the high-end specifications appropriate for gaming. The predecessor uses a 144 Hz panel.
However, there is no internal G-Sync. Adaptive Sync is supported on an external monitor via DisplayPort. PWM flickering was not detected.
| |||||||||||||||||||||||||
Brightness Distribution: 87 %
Center on Battery: 270 cd/m²
Contrast: 1096:1 (Black: 0.25 cd/m²)
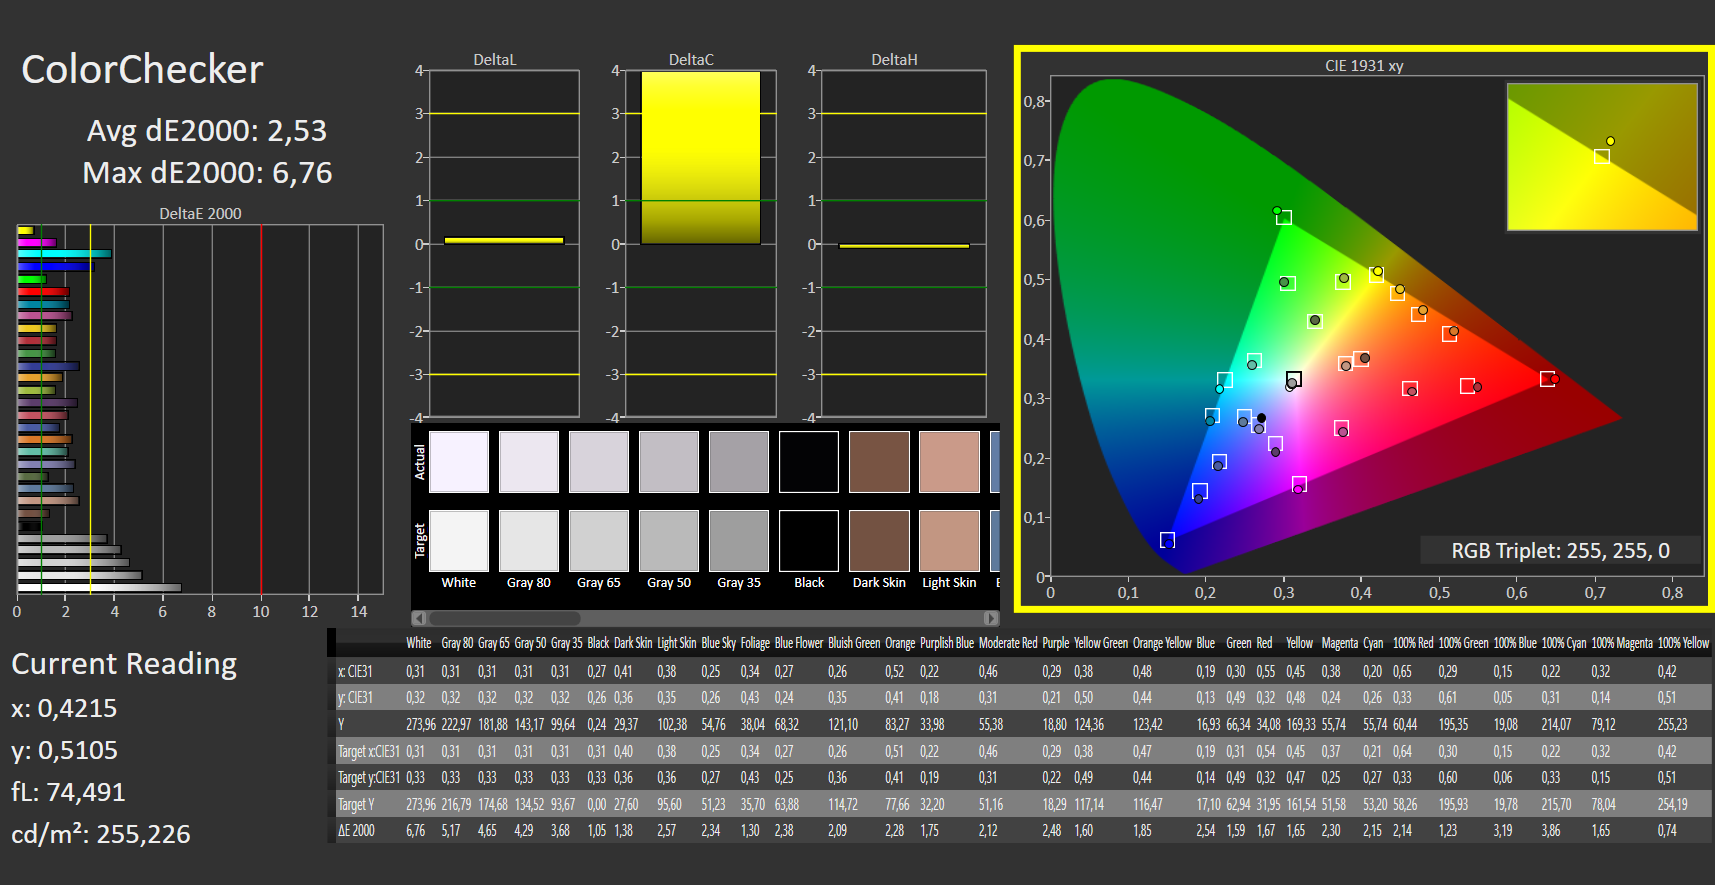
ΔE ColorChecker Calman: 2.53 | ∀{0.5-29.43 Ø4.73}
calibrated: 0.98
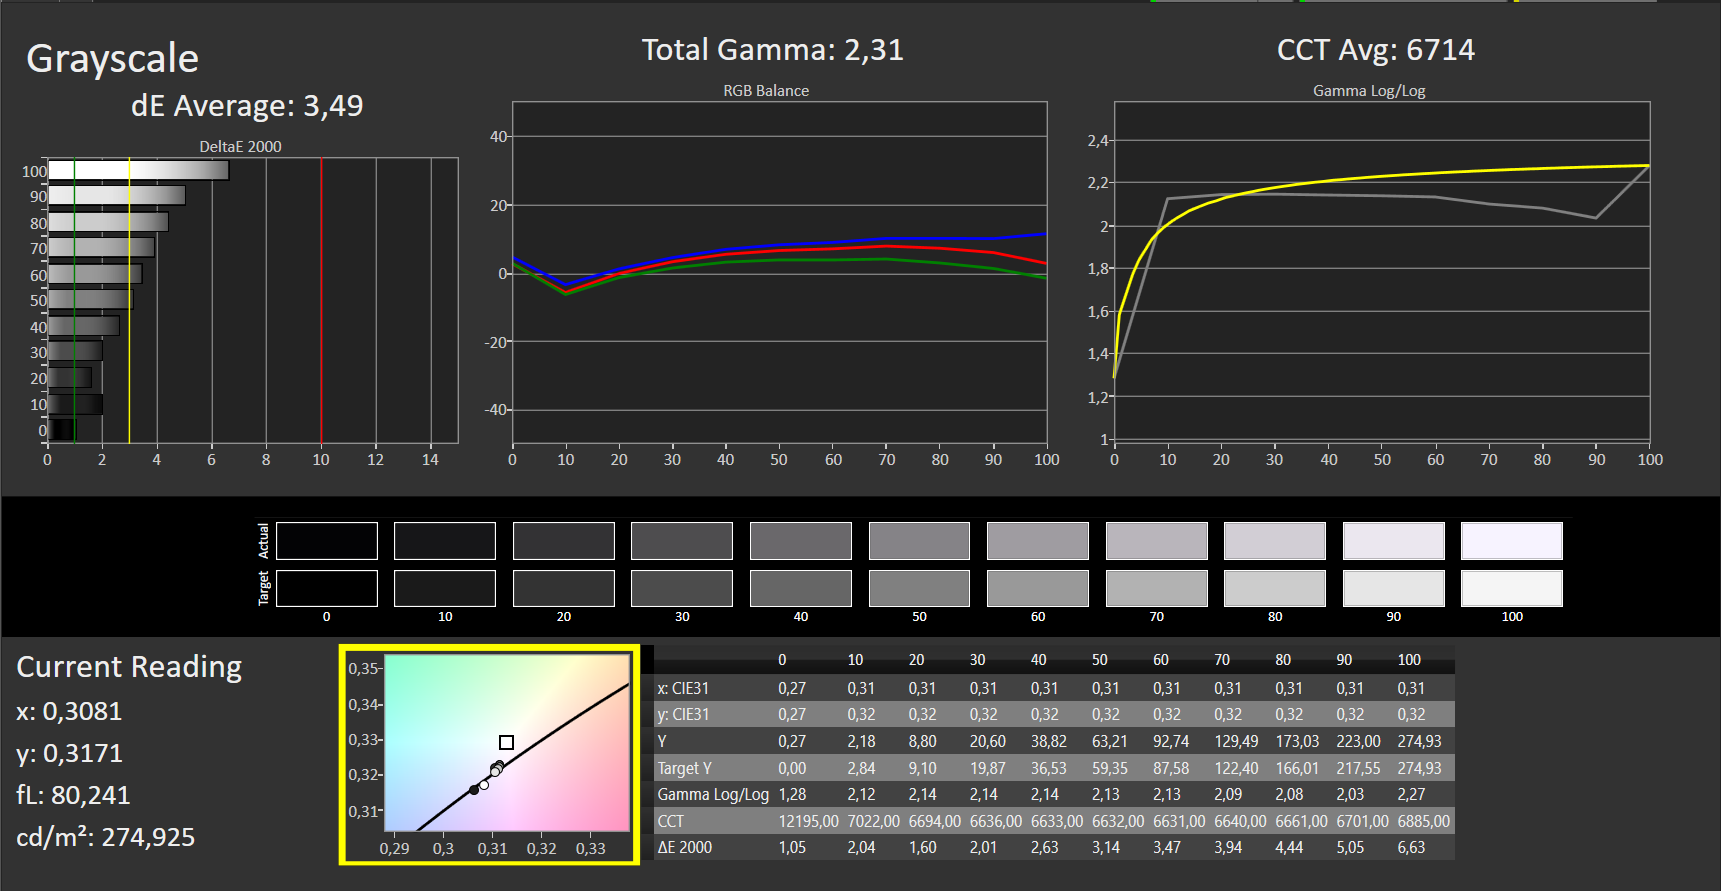
ΔE Greyscale Calman: 3.49 | ∀{0.09-98 Ø4.97}
70.91% AdobeRGB 1998 (Argyll 3D)
98.98% sRGB (Argyll 3D)
70.09% Display P3 (Argyll 3D)
Gamma: 2.31
CCT: 6714 K
| MSI Vector GP76 12UGS-434 AUO B173HAN05.4, IPS, 1920x1080, 17.3" | MSI GP76 Leopard 10UG Chi Mei CMN176E, IPS, 1920x1080, 17.3" | Asus ROG Strix G17 G713QE-RB74 AU Optronics B173HAN04.9, IPS, 1920x1080, 17.3" | Aorus 17 XE4 Sharp LQ173M1JW12, IPS, 1920x1080, 17.3" | Schenker XMG NEO 17 GM7TG8S BOE0977 (NE173QHM-NY2), IPS, 2560x1440, 17.3" | Lenovo Legion 5 Pro 16 G7 i7 RTX 3070Ti NE160QDM-NY1, IPS, 2560x1600, 16" | Asus ROG Zephyrus M16 GU603H AU Optronics AUOC199, IPS, 2560x1600, 16" | MSI Vector GP66 12UGS BOE NE156FHM-NZ3, IPS, 1920x1080, 15.6" | |
|---|---|---|---|---|---|---|---|---|
| Display | -6% | -41% | -1% | -3% | -1% | 1% | ||
| Display P3 Coverage (%) | 70.09 | 64.7 -8% | 40.2 -43% | 69 -2% | 67.1 -4% | 68.7 -2% | 70.1 0% | |
| sRGB Coverage (%) | 98.98 | 96.4 -3% | 60.3 -39% | 99.4 0% | 96.3 -3% | 97.6 -1% | 99.5 1% | |
| AdobeRGB 1998 Coverage (%) | 70.91 | 66.9 -6% | 41.6 -41% | 71.2 0% | 68.6 -3% | 70.9 0% | 72.1 2% | |
| Response Times | -60% | -355% | -160% | -145% | -168% | 3% | -33% | |
| Response Time Grey 50% / Grey 80% * (ms) | 4 ? | 7.4 ? -85% | 26.8 ? -570% | 15.2 ? -280% | 15.2 -280% | 17.6 ? -340% | 4.8 ? -20% | 5.8 ? -45% |
| Response Time Black / White * (ms) | 8 ? | 10.8 ? -35% | 19.2 ? -140% | 11.2 ? -40% | 8.8 -10% | 7.6 ? 5% | 6 ? 25% | 9.6 ? -20% |
| PWM Frequency (Hz) | 24510 ? | |||||||
| Screen | 14% | -30% | 8% | 11% | 17% | -19% | 0% | |
| Brightness middle (cd/m²) | 274 | 328 20% | 270.5 -1% | 274 0% | 396 45% | 502 83% | 448 64% | 353.1 29% |
| Brightness (cd/m²) | 264 | 314 19% | 269 2% | 267 1% | 366 39% | 491 86% | 446 69% | 325 23% |
| Brightness Distribution (%) | 87 | 87 0% | 92 6% | 82 -6% | 82 -6% | 91 5% | 86 -1% | 85 -2% |
| Black Level * (cd/m²) | 0.25 | 0.29 -16% | 0.19 24% | 0.25 -0% | 0.45 -80% | 0.37 -48% | 0.48 -92% | 0.38 -52% |
| Contrast (:1) | 1096 | 1131 3% | 1424 30% | 1096 0% | 880 -20% | 1357 24% | 933 -15% | 929 -15% |
| Colorchecker dE 2000 * | 2.53 | 1.93 24% | 4.39 -74% | 2.07 18% | 1.43 43% | 2.7 -7% | 2.76 -9% | 2.24 11% |
| Colorchecker dE 2000 max. * | 6.76 | 4.94 27% | 20.8 -208% | 4.89 28% | 2.2 67% | 4.5 33% | 7.09 -5% | 5 26% |
| Colorchecker dE 2000 calibrated * | 0.98 | 0.68 31% | 1.56 -59% | 0.83 15% | 1.34 -37% | 1.4 -43% | 2.86 -192% | 1.02 -4% |
| Greyscale dE 2000 * | 3.49 | 2.8 20% | 3.1 11% | 3 14% | 1.8 48% | 2.7 23% | 3.1 11% | 4 -15% |
| Gamma | 2.31 95% | 2.18 101% | 2.14 103% | 2.207 100% | 2.4 92% | 2.44 90% | 2.153 102% | 2.24 98% |
| CCT | 6714 97% | 7023 93% | 6927 94% | 6999 93% | 6489 100% | 6326 103% | 6826 95% | 6864 95% |
| Color Space (Percent of AdobeRGB 1998) (%) | 67 | 87 | ||||||
| Color Space (Percent of sRGB) (%) | 89 | 100 | ||||||
| Total Average (Program / Settings) | -17% /
-1% | -142% /
-79% | -51% /
-18% | -46% /
-14% | -51% /
-13% | -8% /
-15% | -11% /
-4% |
* ... smaller is better
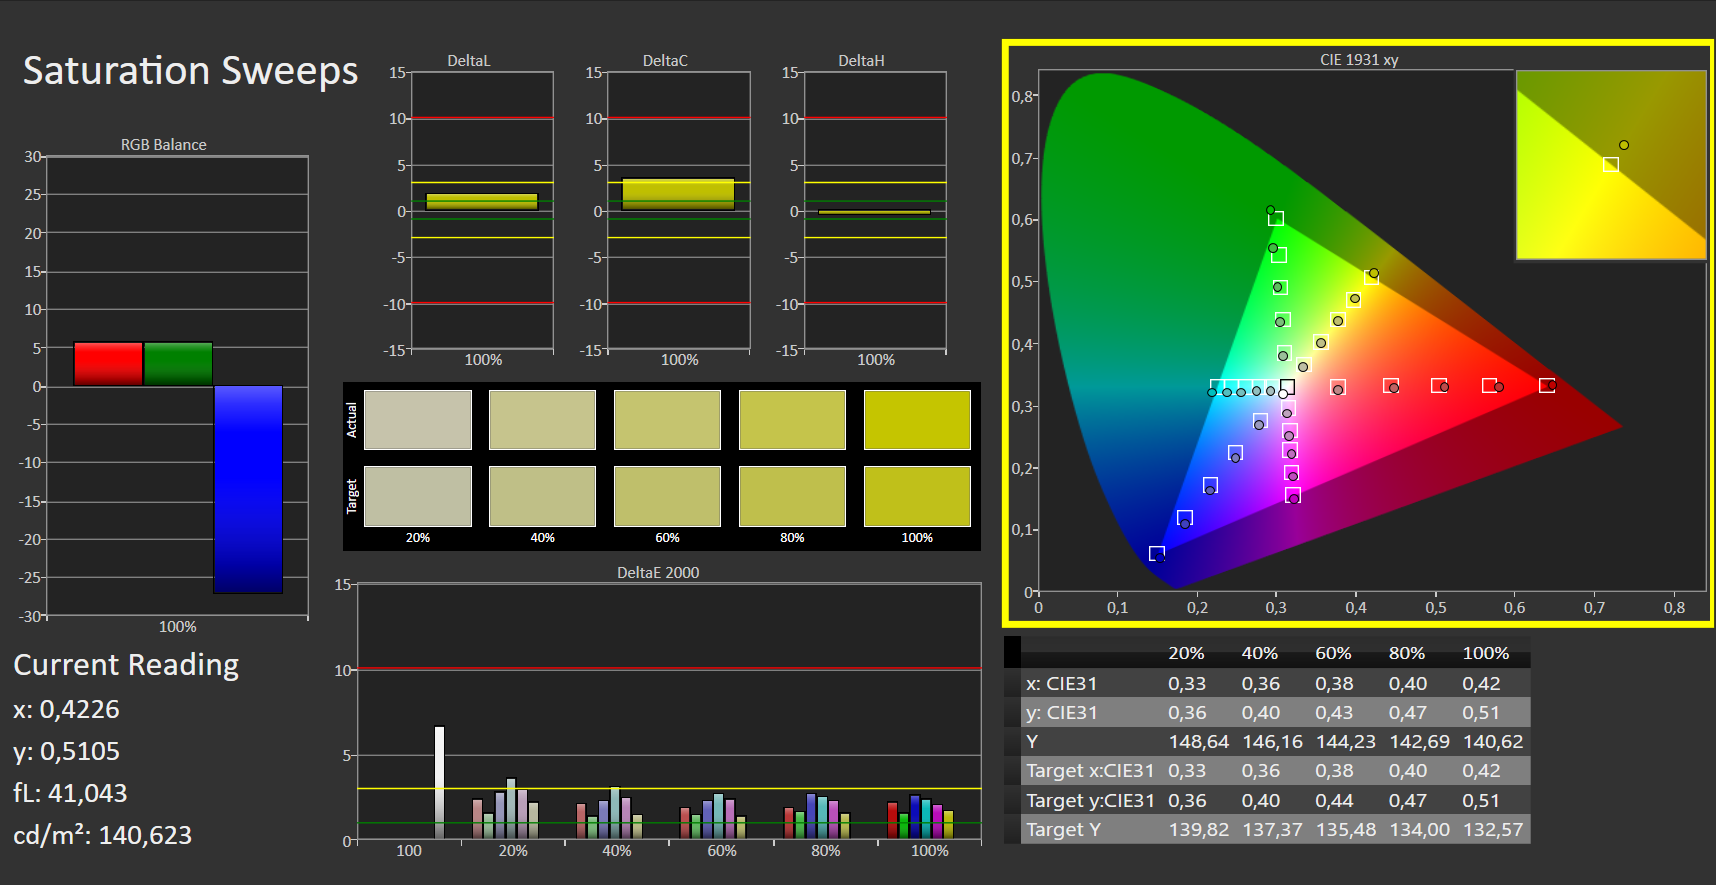
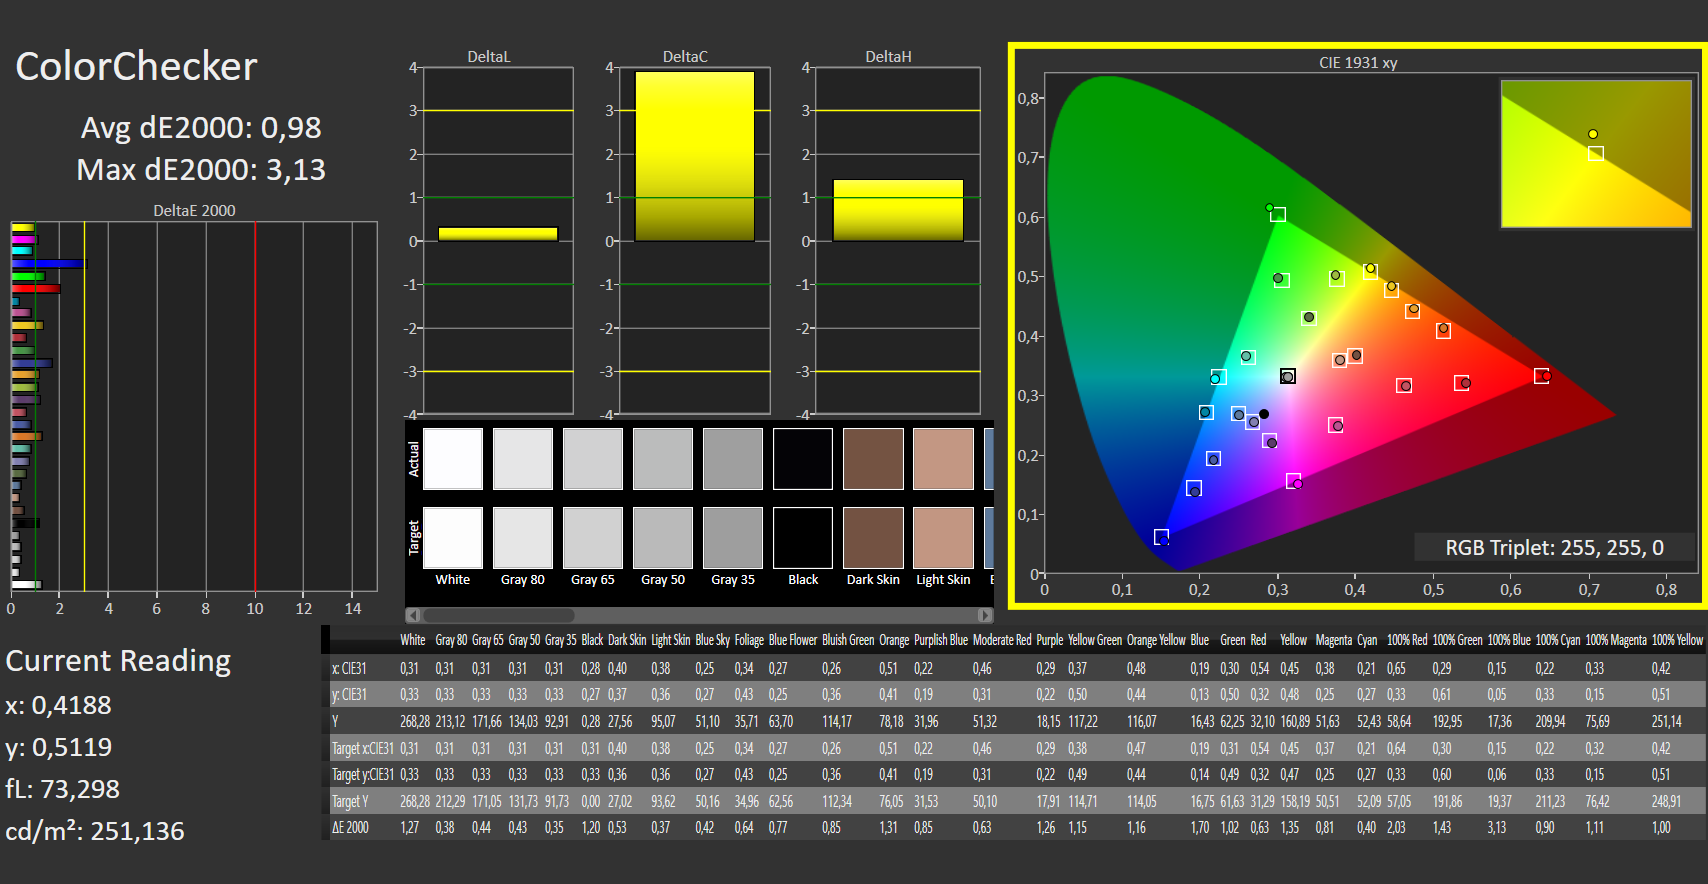
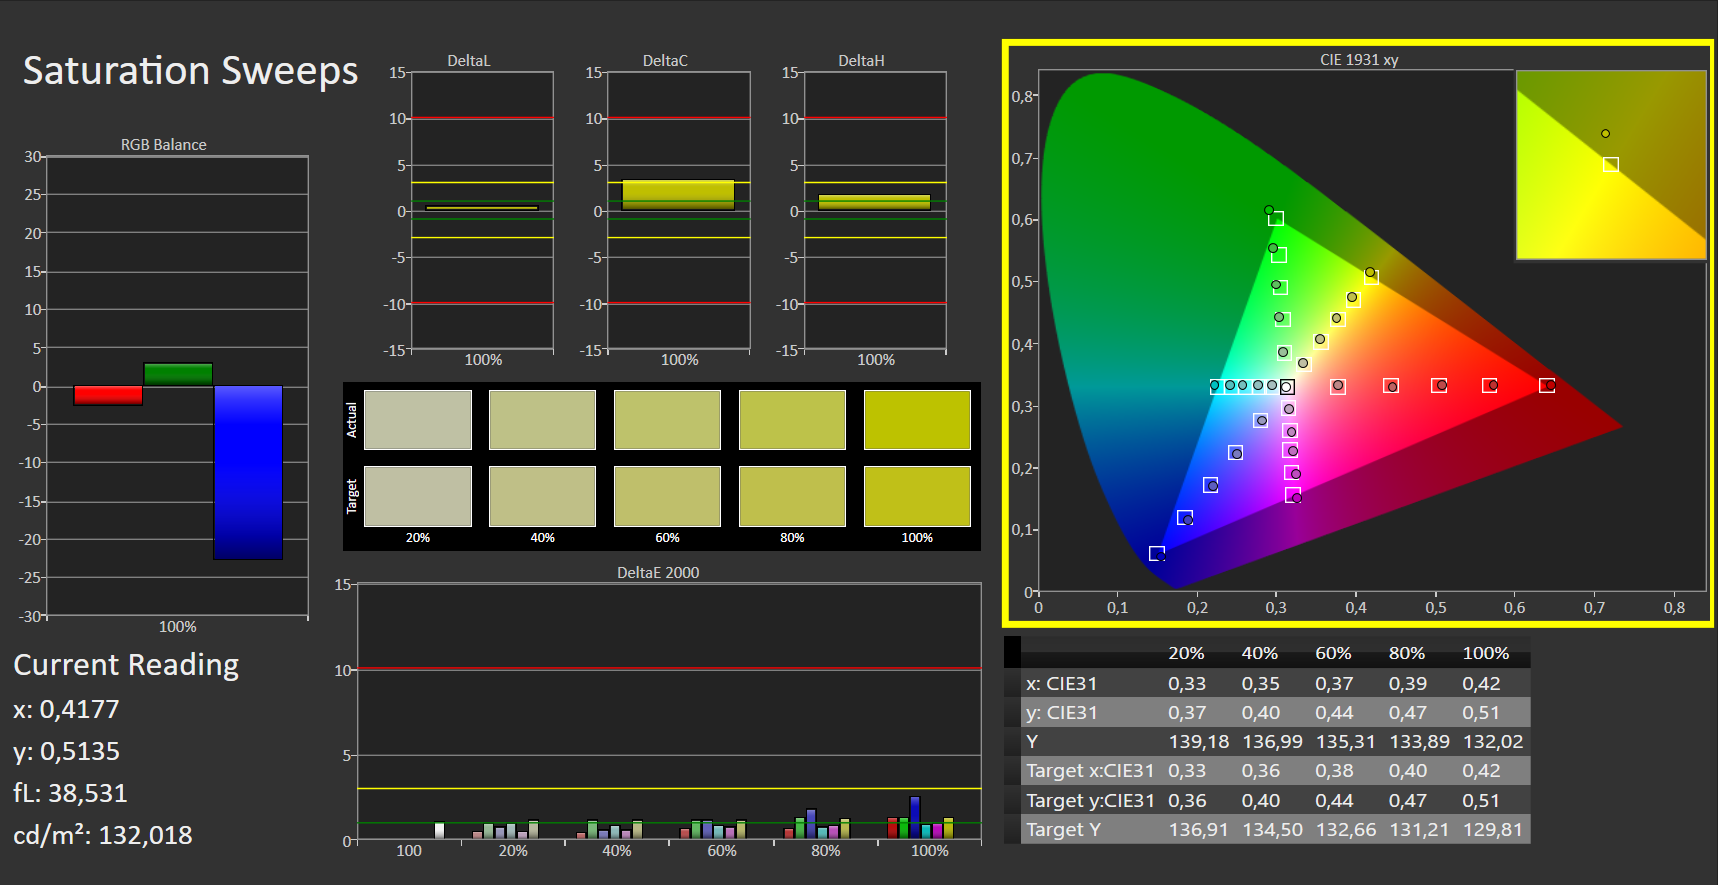
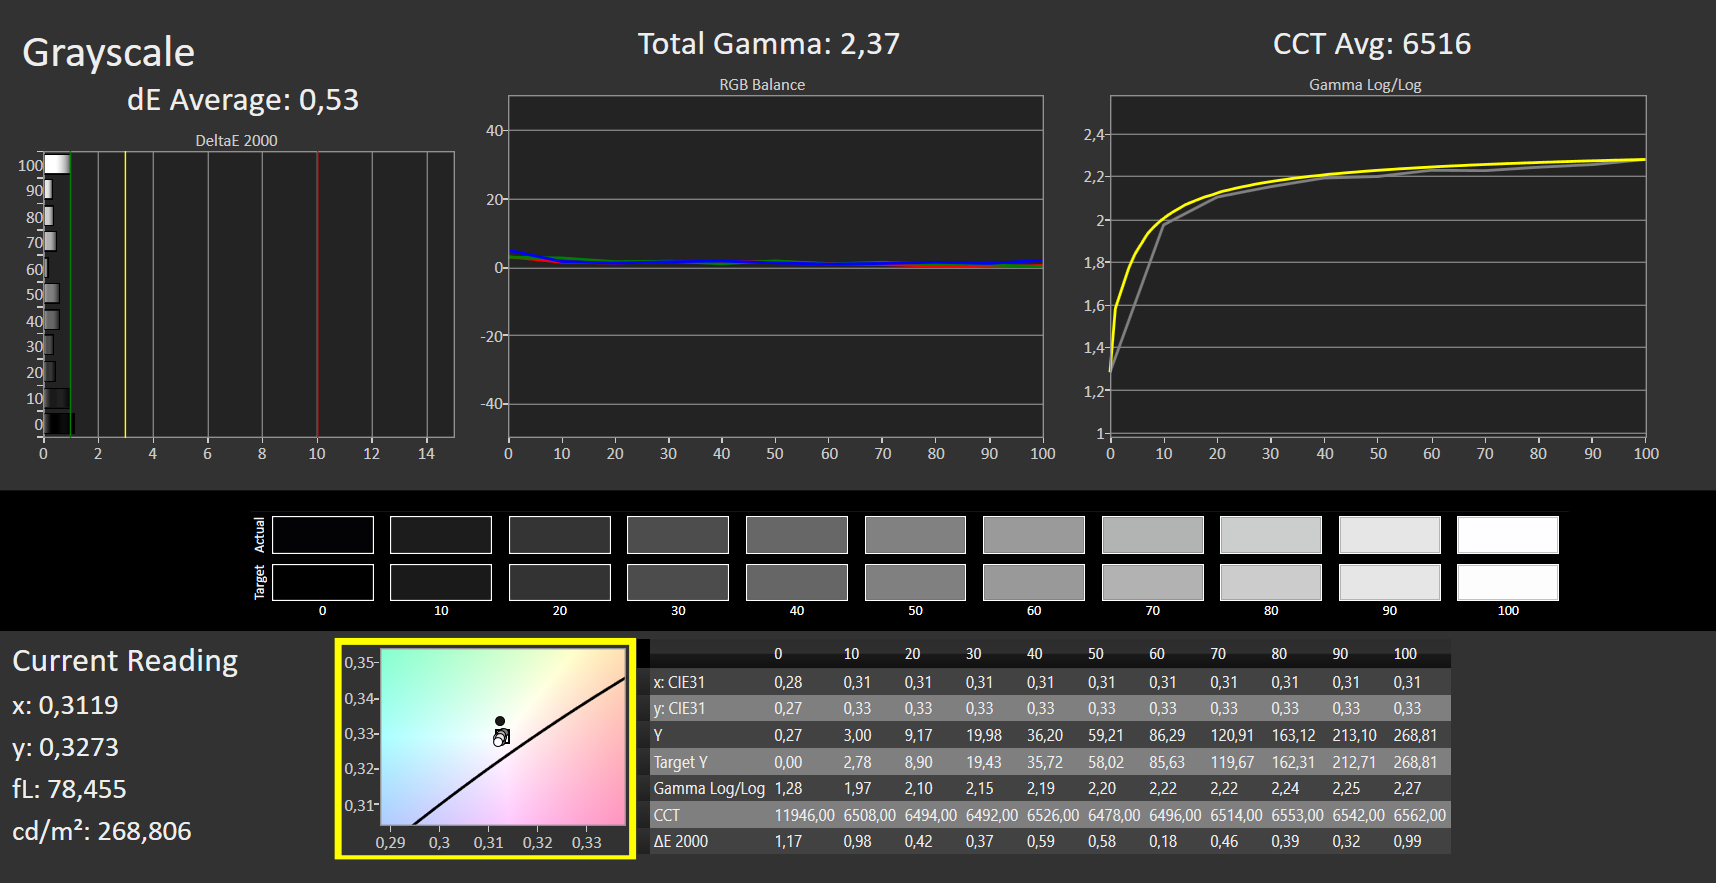
The sRGB colour range is covered very well at just under 99%. For DCI-P3 and AdobeRGB, this is 70 to 71%, which is sufficient for this laptop class. The DeltaE value of 2.54 is slightly above the threshold of 2 and therefore roughly in line with the competition.
Calibration improves the values, but the slightly underrepresented blue can only be slightly optimized. The subjective colour perception also tesifies to relatively unadulterated color tones, which appear very rich, but not particularly oversaturated. The ICC file of the calibration is available for download in the window next to the coverage graph.
Display Response Times
| ↔ Response Time Black to White | ||
|---|---|---|
| 8 ms ... rise ↗ and fall ↘ combined | ↗ 4 ms rise |  |
| ↘ 4 ms fall | ||
| The screen shows fast response rates in our tests and should be suited for gaming. In comparison, all tested devices range from 0.1 (minimum) to 240 (maximum) ms. » 22 % of all devices are better. This means that the measured response time is better than the average of all tested devices (19.9 ms). | ||
| ↔ Response Time 50% Grey to 80% Grey | ||
| 4 ms ... rise ↗ and fall ↘ combined | ↗ 1 ms rise |  |
| ↘ 3 ms fall | ||
| The screen shows very fast response rates in our tests and should be very well suited for fast-paced gaming. In comparison, all tested devices range from 0.165 (minimum) to 636 (maximum) ms. » 15 % of all devices are better. This means that the measured response time is better than the average of all tested devices (31.1 ms). | ||
Screen Flickering / PWM (Pulse-Width Modulation)
| Screen flickering / PWM not detected |  | ||
In comparison: 52 % of all tested devices do not use PWM to dim the display. If PWM was detected, an average of 7798 (minimum: 5 - maximum: 343500) Hz was measured. | |||
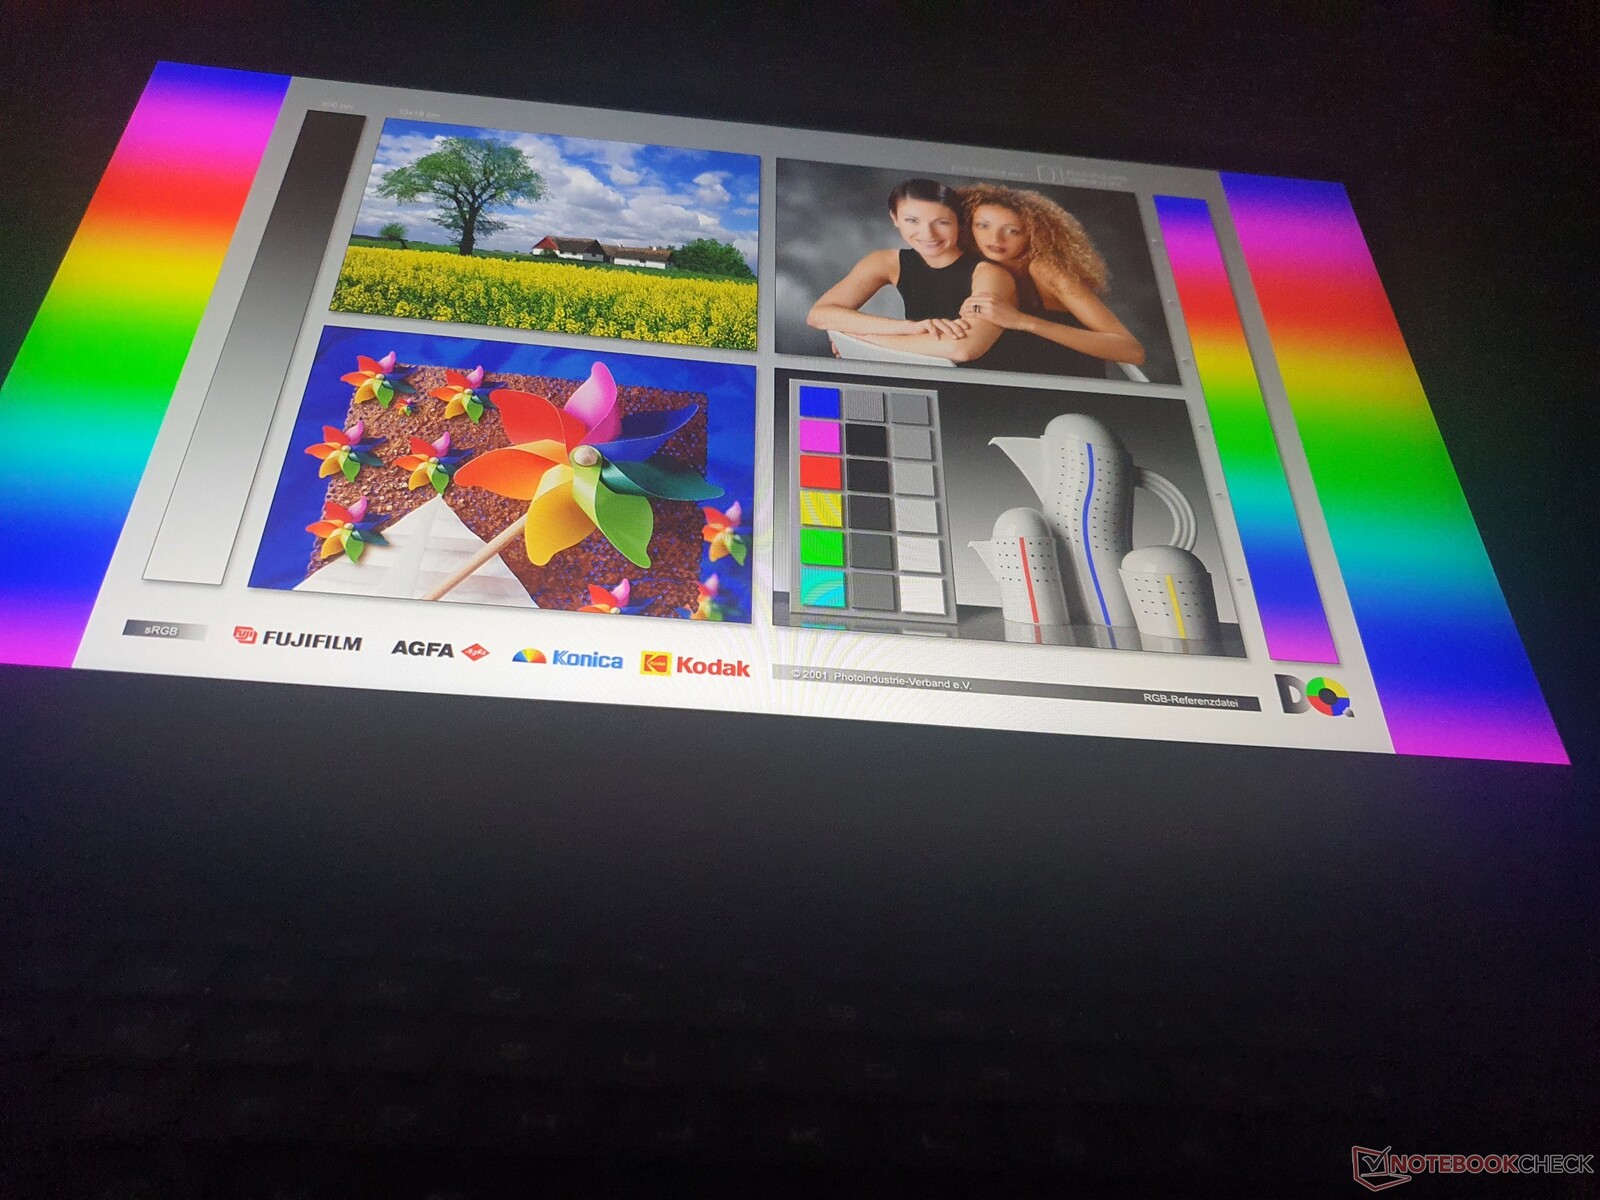
If you want to enjoy gaming in the fresh air, you have to do it in the shade. More than a LAN party under the pavilion is not possible at a brightness of 264 cd/m², even with a matte screen.
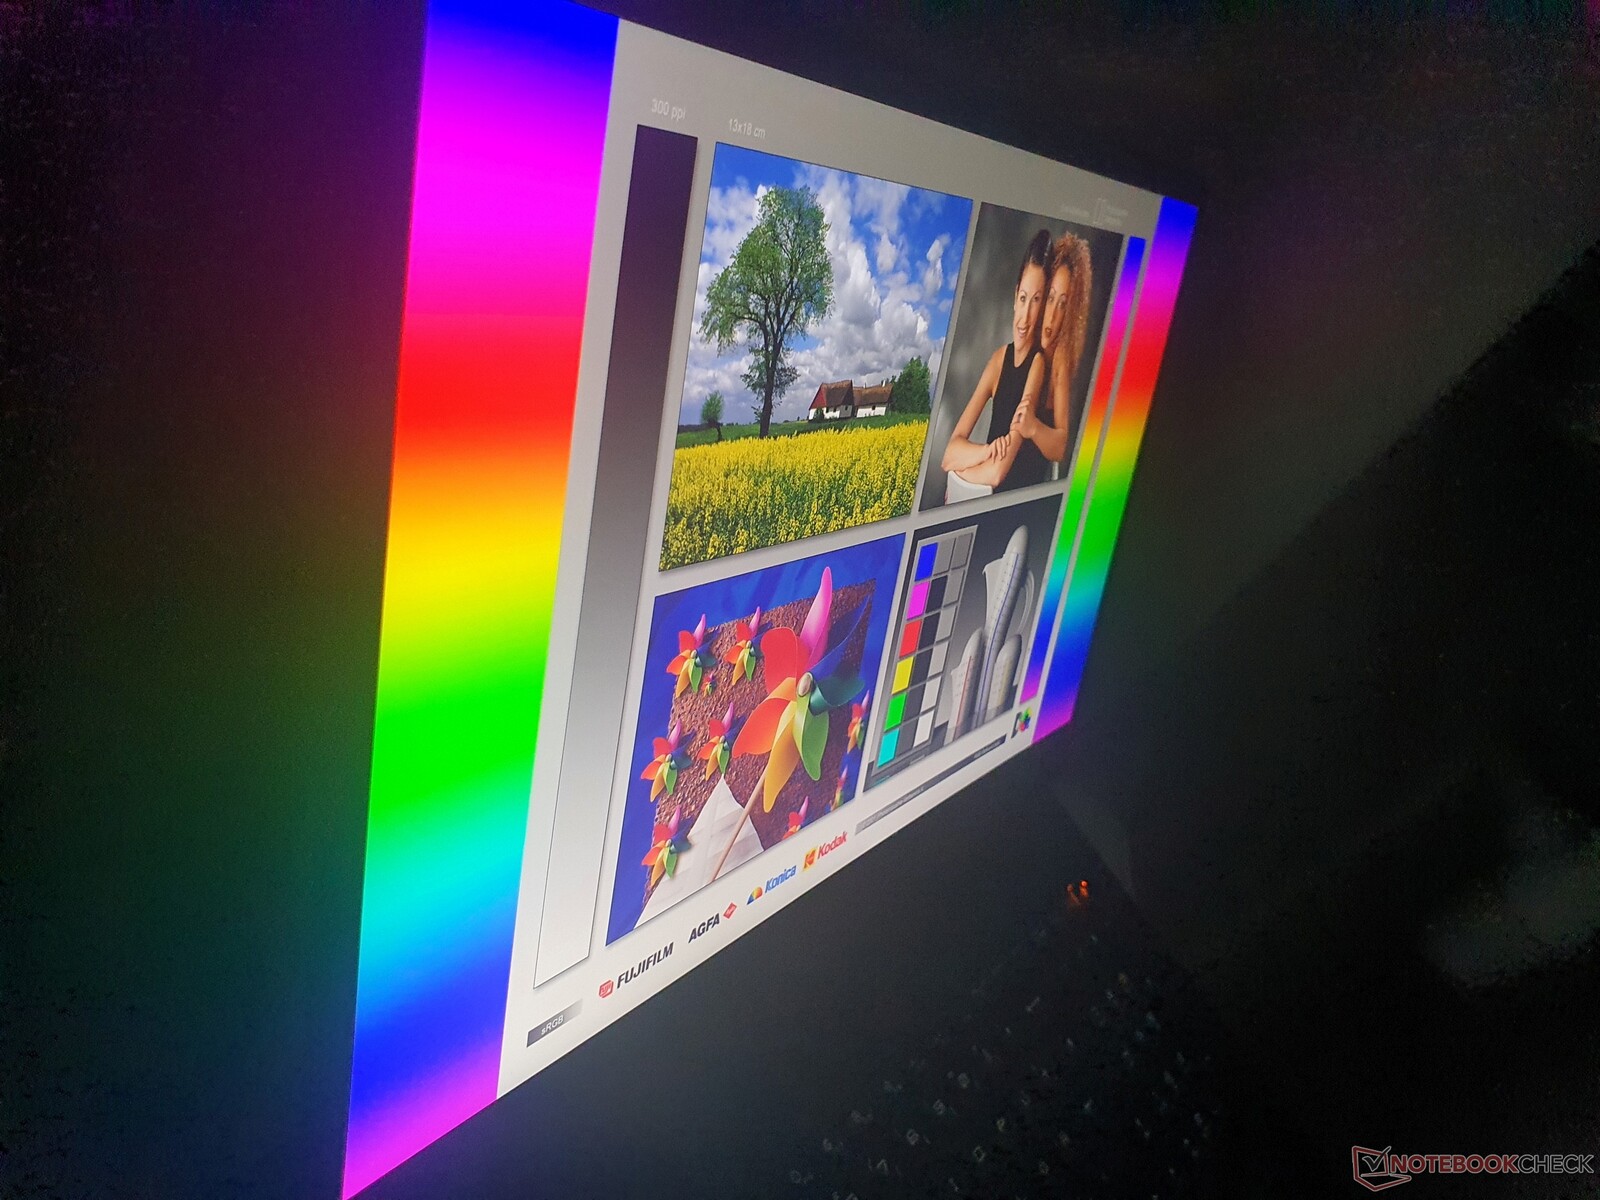
The viewing angles are good on every IPS display, including our test model. No wishes remain unfulfilled here. OLED, for example, offers even better viewing angle stability.
Performance: MSI cranks the GeForce RTX 3070 Ti to the max
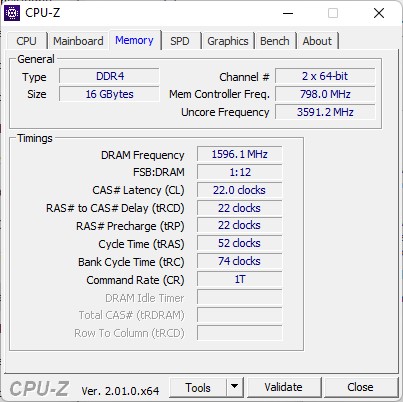
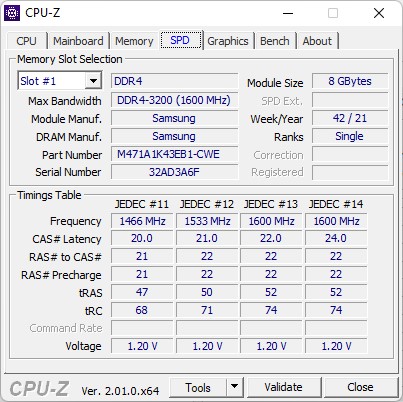
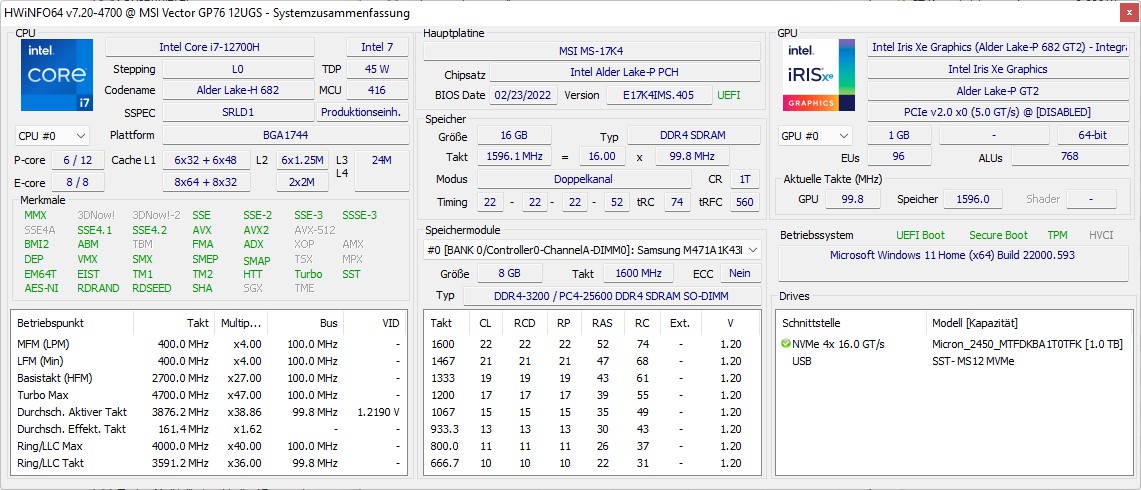
In terms of the CPU, interested buyers can decide between the Core i7-12700H or the Intel i9-12900HK. For graphics, there is only the Nvidia RTX 3070 Ti (150 W) and the RTX 3080 (non-Ti, 165 W). The RAM always comes as 2x 8GB DDR4-3200 ex factory (2x 16 GB in other regions of the world).
The approximately 25% faster DDR5 RAM (see below: AIDA comparison table) is reserved for MSI's high-end classes. However, this has no negative impact on gaming and professional graphics applications, for which the Vector GP76 is intended. Also standard is a 1 TB PCIe4x4 SSD, whose performance is tested below.
Test Conditions
We first tested the MSI Vector GP76 in Auto mode. Of course, we also tested the performance in Extreme Performance mode, but in the middle of it we encountered the following problem with the fan control:
The fans only functioned at a very low speed even under full load, which led to overheating of the system with subsequent severe throttling and even to the point that the system was unusable. We are already familiar with this error from MSI gaming laptops, which was previously resolved through BIOS and EC updates.
Since we were already using the latest BIOS at this point, we were able to temporarily fix the problem by pressing the "Turbo Fan" button twice, but it occurred again a little later, so we were unable to complete the tests in Extreme Performance mode.
However, the mode has no influence on pure CPU performance, while about 7% more performance is possible in gaming. The Witcher 3 and PCMark 10 still managed to run under Extreme Performance mode. You can also take a look at the MSI Vector GP66 that we recently reviewed, which was tested fully in Extreme Performance mode and generated very similar values. The GPU benchmarks were also performed in discrete GPU mode.
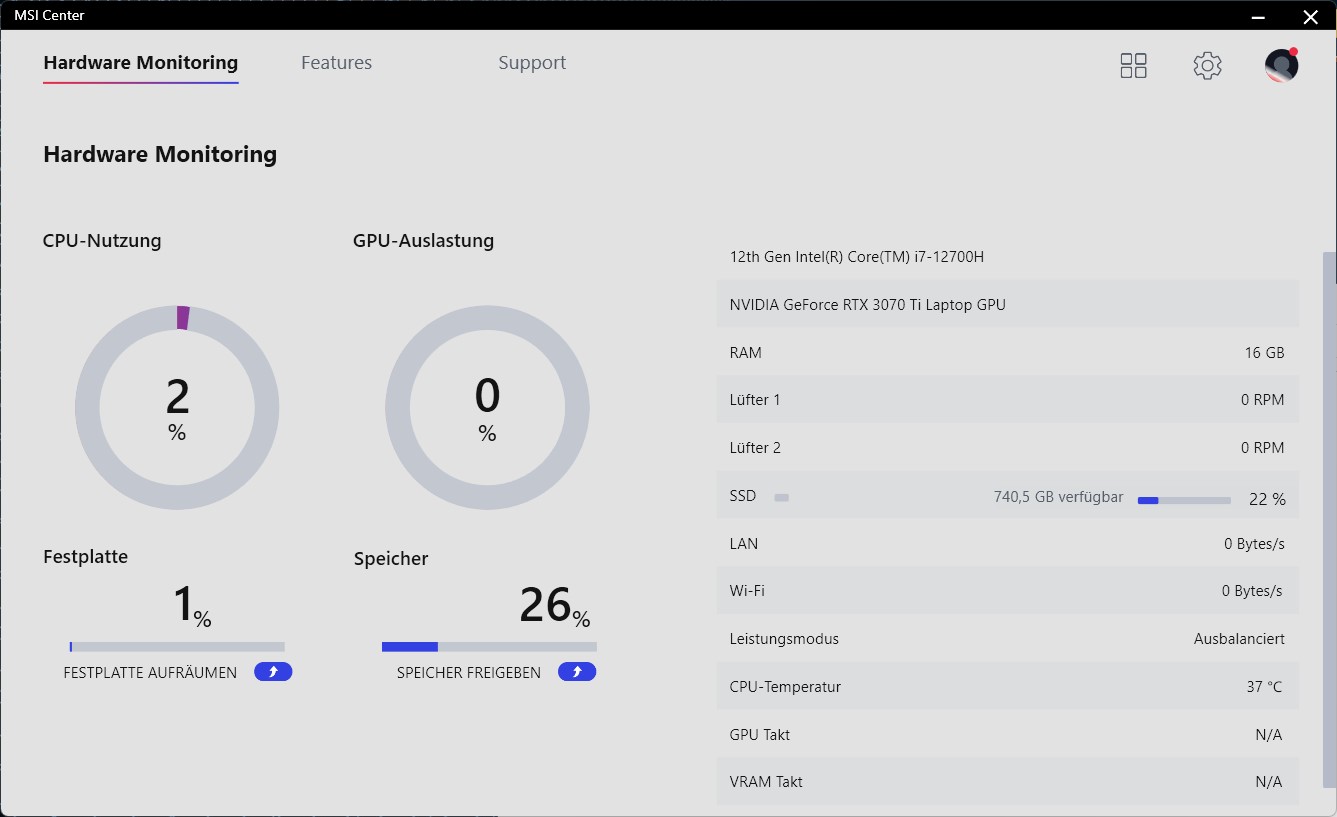
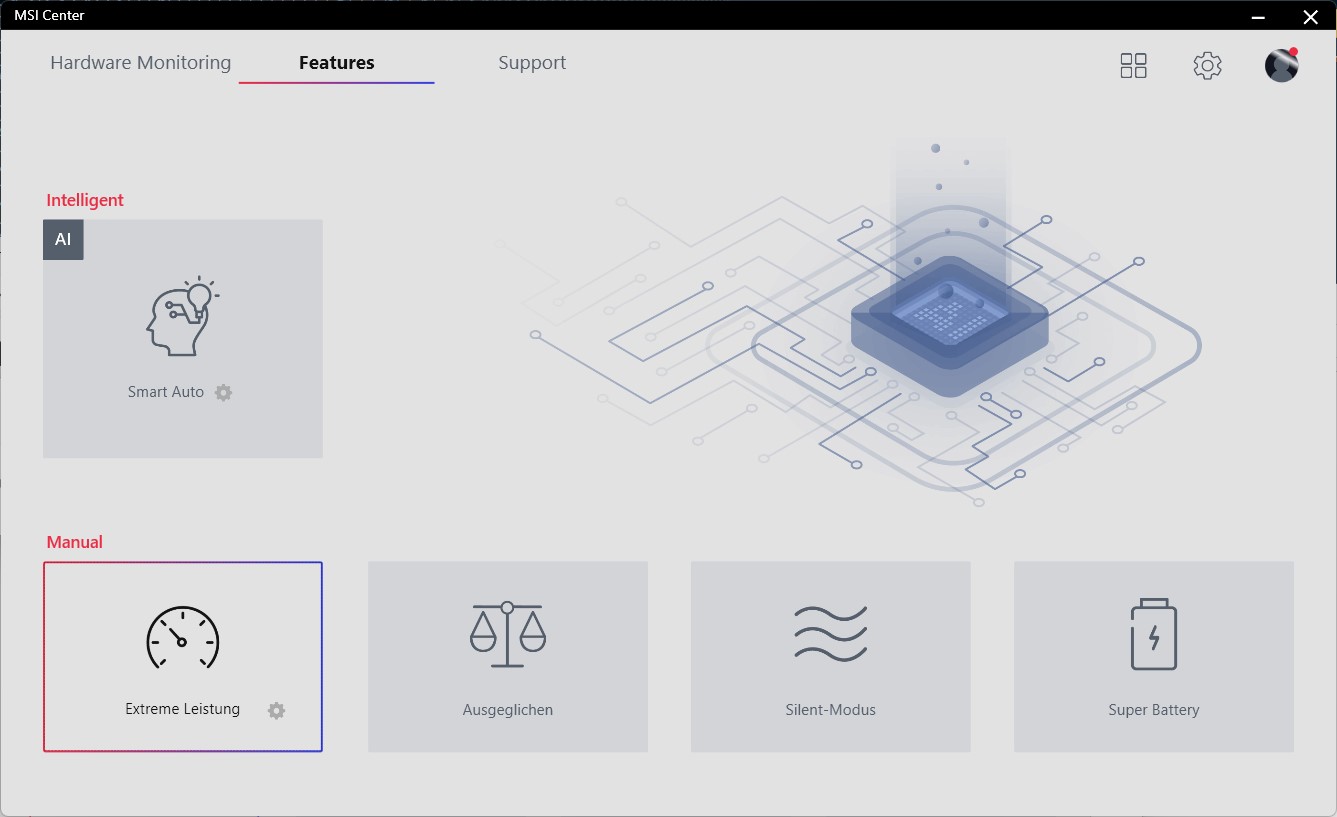
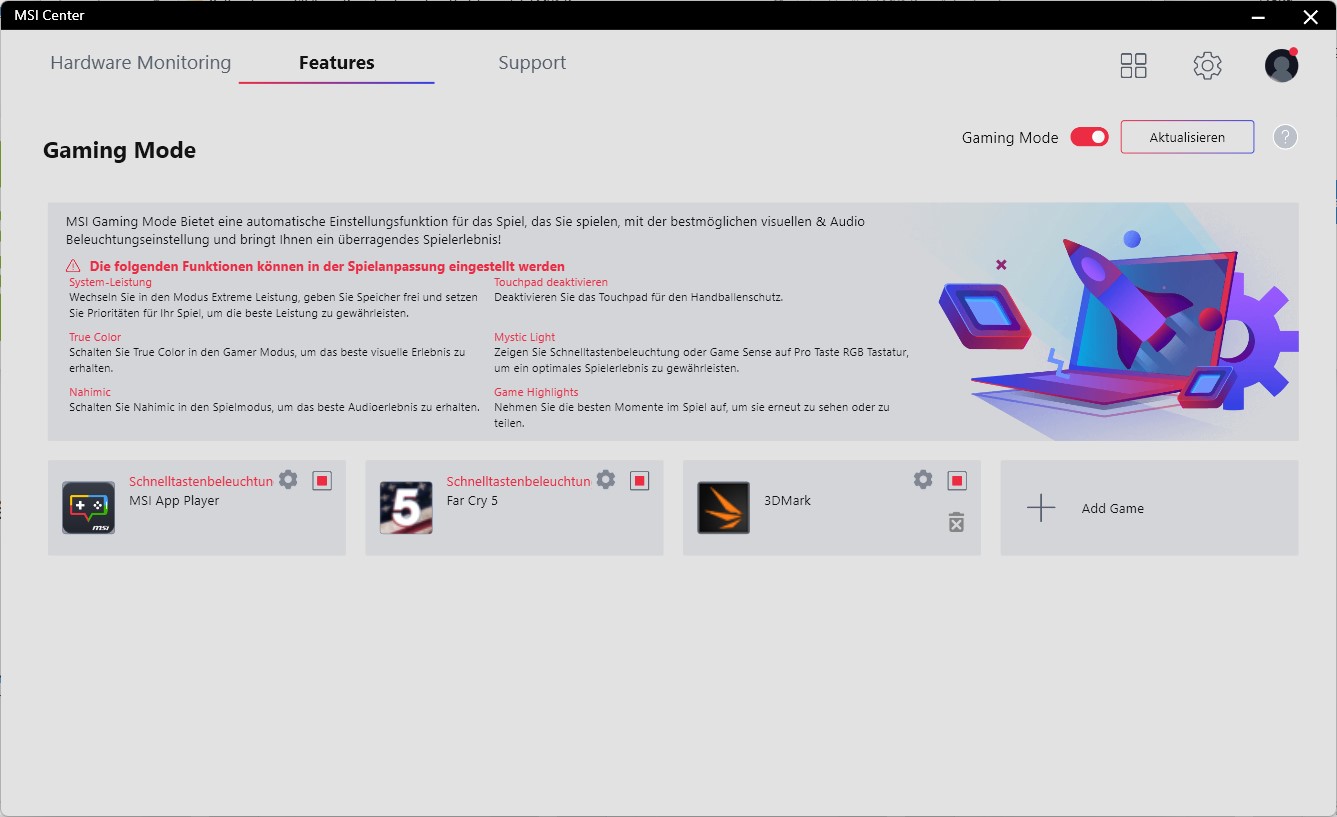
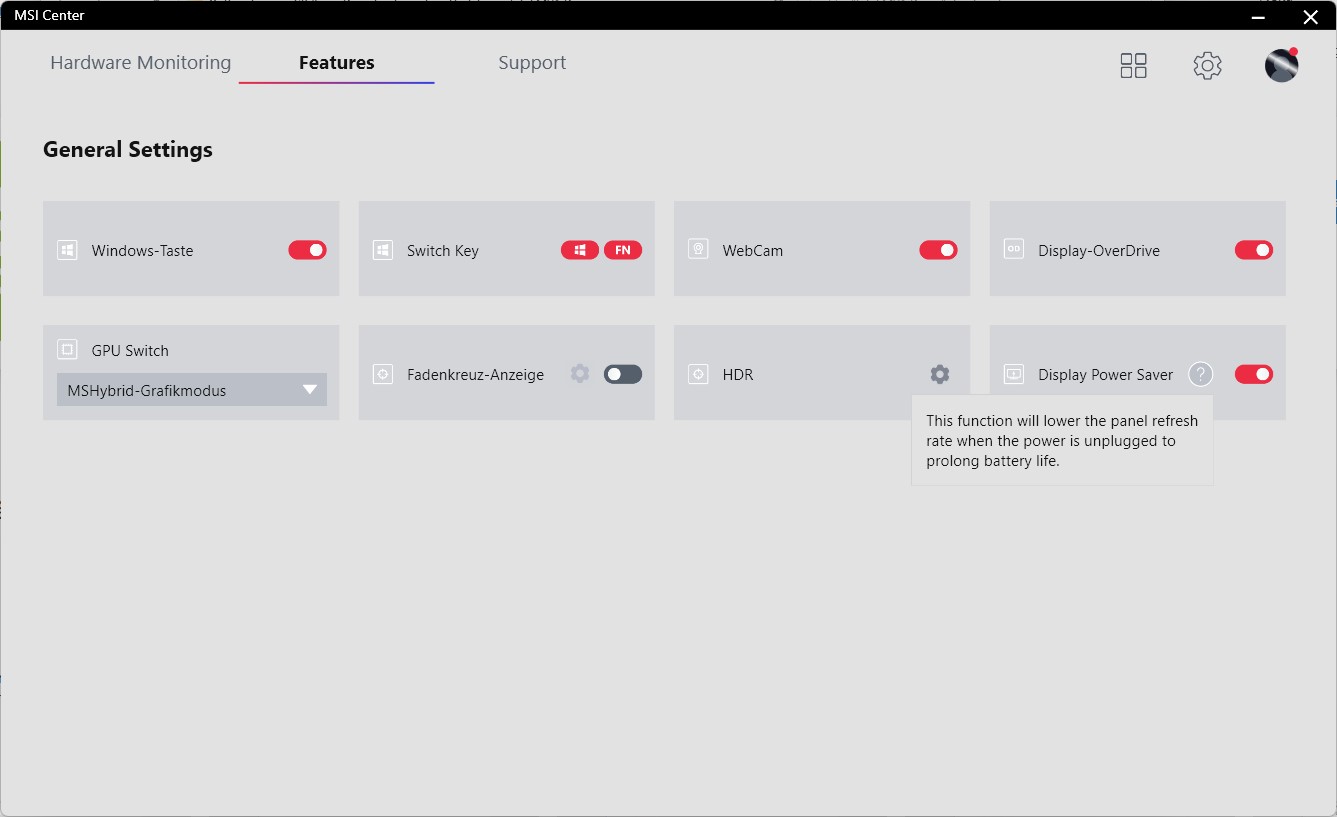
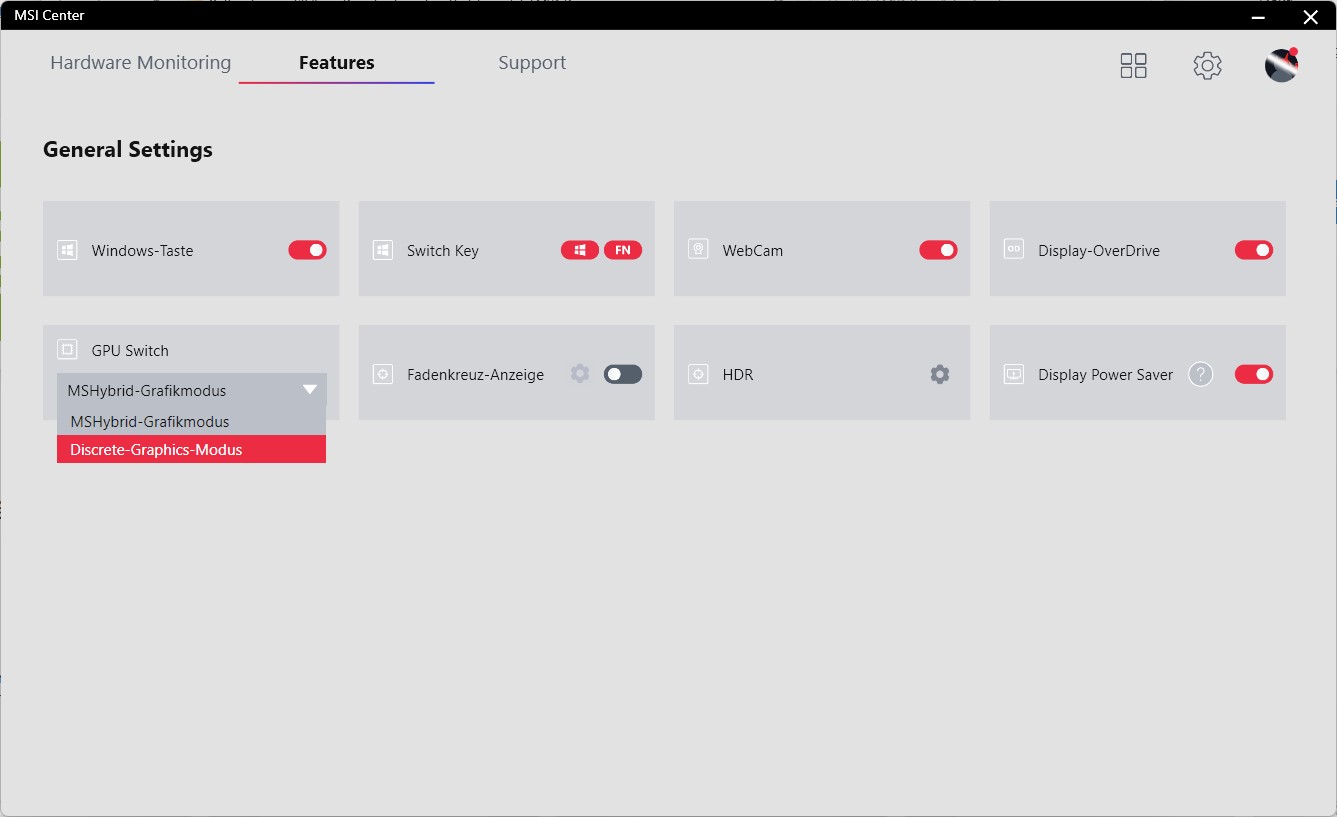
MSI Center:
The MSI Center offers a number of settings in addition to the four "Extreme Performance", "Balanced", "Silent" and "Super Battery" modes, such as the MUX switch and a function that allows for switching to a 60 Hz refresh rate in battery mode to save energy.
| Szenario | Silent Mode | Auto Mode | Extreme-Perf. | Battery |
|---|---|---|---|---|
| CPU-Last | 30 Watt | 45 Watt | 70 Watt | 15 Watt |
| GPU-Last | 125 Watt | 125 Watt | 150 Watt | 35 Watt |
| Stresstest | CPU: 30 Watt | CPU: 50 Watt | CPU: 70 Watt | |
| GPU: 35 Watt | GPU: 120 Watt | GPU: 150 Watt |
Processor
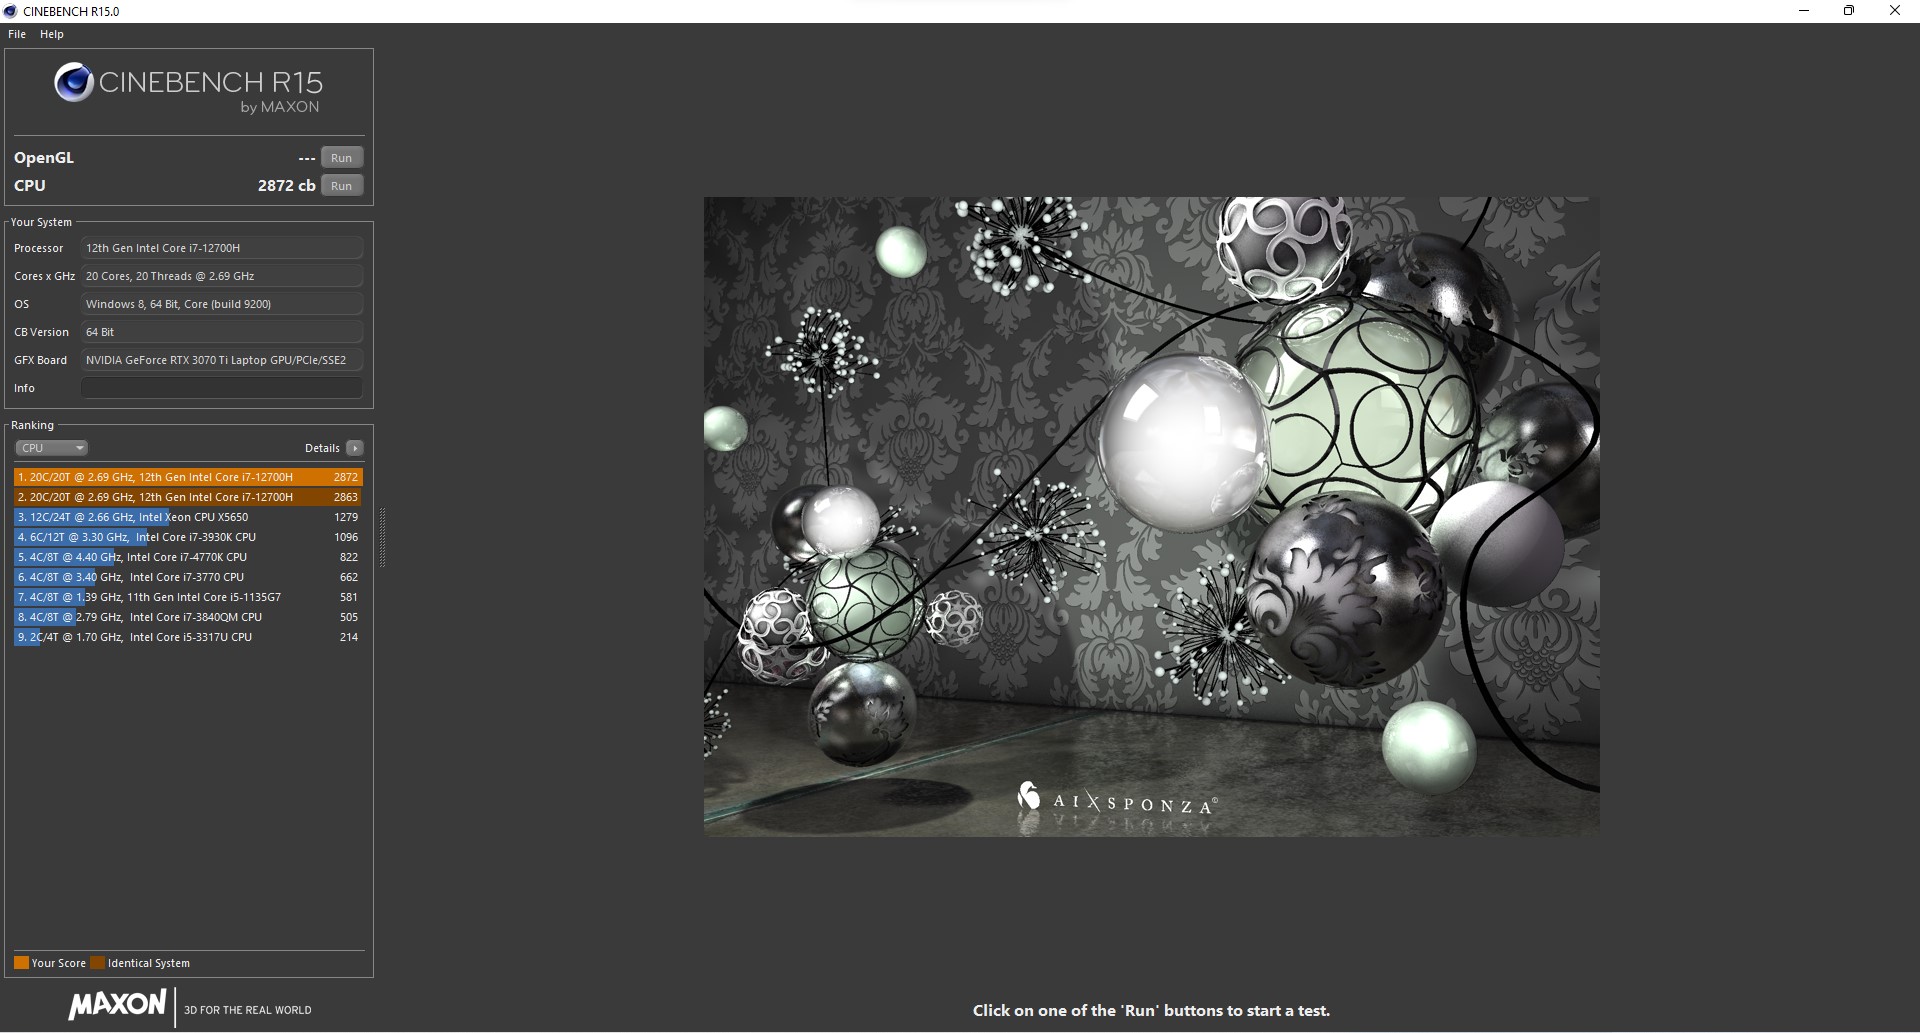
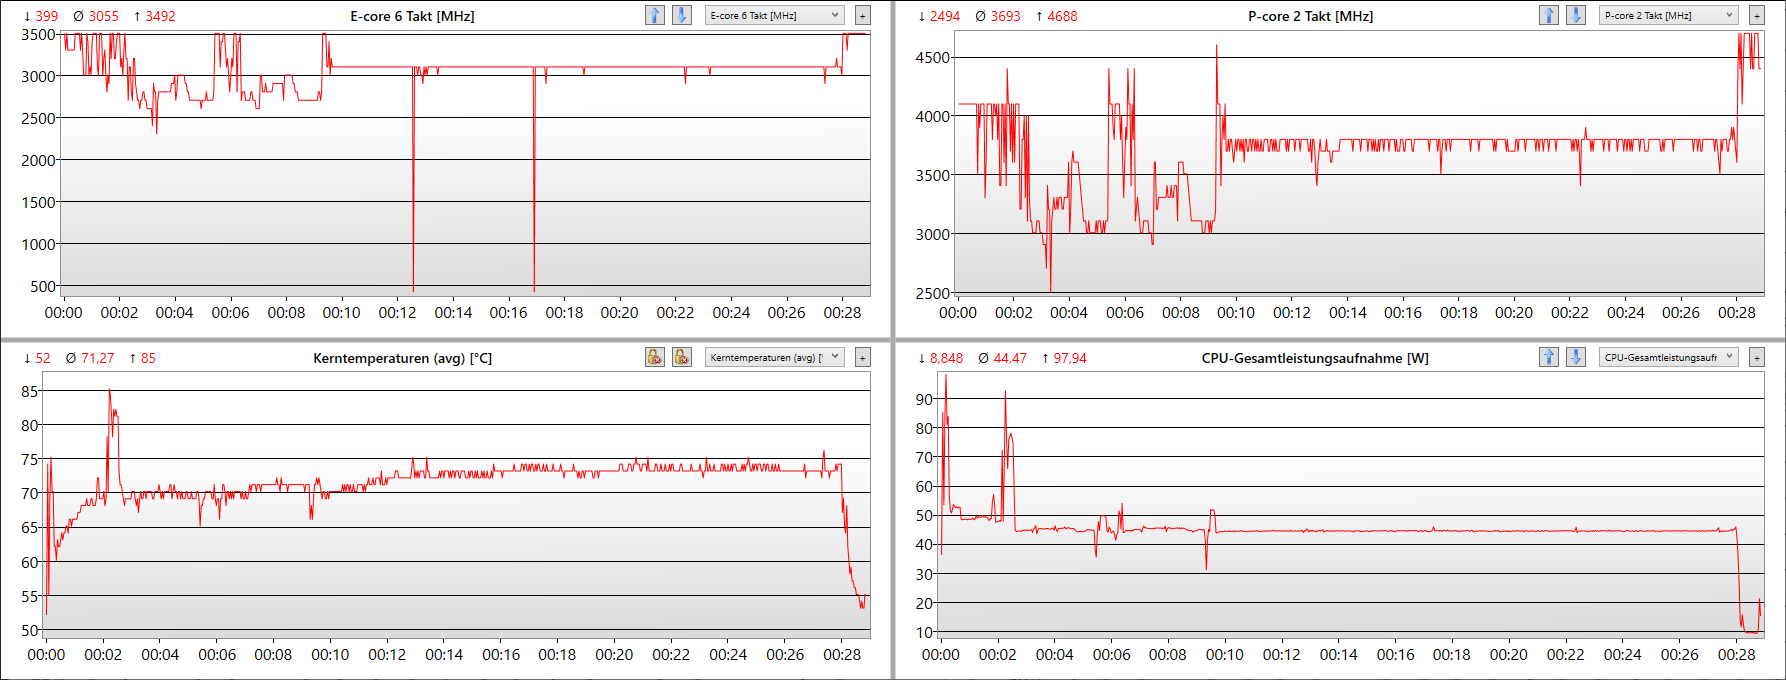
The Core i7-12700H is about twice as fast as its predecessor under sustained load and is not inferior to the Core i9-12900H. Only Lenovo's Legion 5 Pro is faster, since it does not have a TDP lock and can consume 127 watts continuously. The Core i7 in the Vector GP76, on the other hand, is downregulated from 100 watts to 45 watts after a short time, which the Cinebench R15 loop shows. Performance is thus reduced by 20%.
The clock frequency of the performance cores is a stable 3.7 GHz and temperatures are in cooler territory at around 74°C. In terms of pure processor load, the cooling system has plenty of room for improvement. In Extreme Performance mode, the CPU treats itself to 70 watts, which does not really improve results, at least not in Cinebench R15.
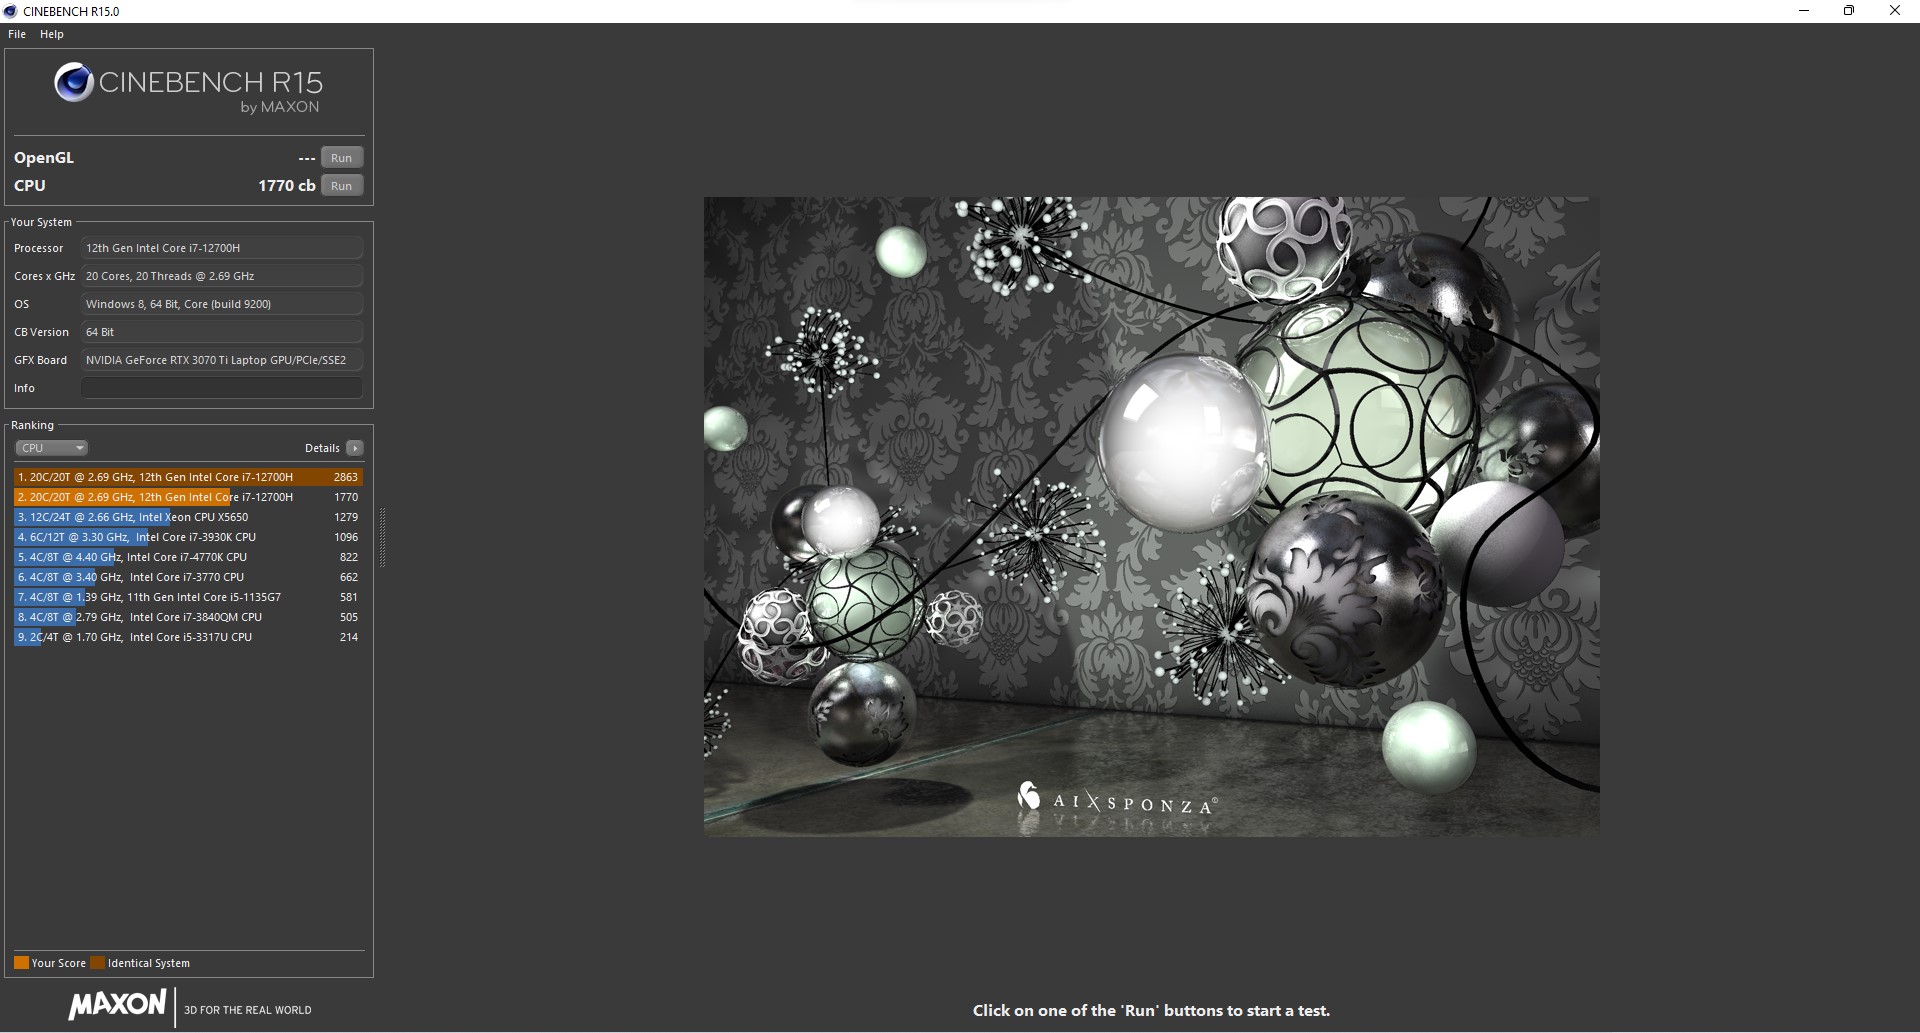
In battery mode, the CPU TDP, typical for laptops with a high combined TDP, is severely limited at 15 watts. Accordingly, the Intel processor's performance drops by a whopping 40% (See CB15 screenshots). However, this is still 45% faster than the full performance of the predecessor, and if you look at the value under sustained load, the loss is only around 25%.
AMD's 45-watt CPUs, such as the Ryzen 7 5800H in the Asus ROG Strix G17, are generally somewhat slower, but they hardly display any performance loss when running on battery power.
Cinebench R15 Multi Sustained Load
Cinebench R23: Multi Core | Single Core
Cinebench R20: CPU (Multi Core) | CPU (Single Core)
Cinebench R15: CPU Multi 64Bit | CPU Single 64Bit
Blender: v2.79 BMW27 CPU
7-Zip 18.03: 7z b 4 | 7z b 4 -mmt1
Geekbench 5.5: Multi-Core | Single-Core
HWBOT x265 Benchmark v2.2: 4k Preset
LibreOffice : 20 Documents To PDF
R Benchmark 2.5: Overall mean
Geekbench 5.5: OpenCL Score
| CPU Performance rating | |
| Average of class Gaming | |
| Lenovo Legion 5 Pro 16 G7 i7 RTX 3070Ti | |
| MSI Vector GP66 12UGS | |
| MSI Vector GP76 12UGS-434 | |
| Aorus 17 XE4 | |
| Average Intel Core i7-12700H | |
| Asus ROG Zephyrus M16 GU603H -2! | |
| Schenker XMG NEO 17 GM7TG8S | |
| Asus ROG Strix G17 G713QE-RB74 -3! | |
| MSI GP76 Leopard 10UG -2! | |
| Cinebench R23 / Multi Core | |
| Average of class Gaming (10488 - 40970, n=112, last 2 years) | |
| Lenovo Legion 5 Pro 16 G7 i7 RTX 3070Ti | |
| MSI Vector GP76 12UGS-434 | |
| MSI Vector GP66 12UGS | |
| Aorus 17 XE4 | |
| Average Intel Core i7-12700H (4032 - 19330, n=64) | |
| Asus ROG Strix G17 G713QE-RB74 | |
| Schenker XMG NEO 17 GM7TG8S | |
| Cinebench R23 / Single Core | |
| Average of class Gaming (1166 - 2356, n=112, last 2 years) | |
| MSI Vector GP66 12UGS | |
| Lenovo Legion 5 Pro 16 G7 i7 RTX 3070Ti | |
| Aorus 17 XE4 | |
| MSI Vector GP76 12UGS-434 | |
| Average Intel Core i7-12700H (778 - 1826, n=63) | |
| Schenker XMG NEO 17 GM7TG8S | |
| Asus ROG Strix G17 G713QE-RB74 | |
| Cinebench R20 / CPU (Multi Core) | |
| Average of class Gaming (4029 - 16108, n=111, last 2 years) | |
| Lenovo Legion 5 Pro 16 G7 i7 RTX 3070Ti | |
| MSI Vector GP76 12UGS-434 | |
| MSI Vector GP66 12UGS | |
| Aorus 17 XE4 | |
| Average Intel Core i7-12700H (1576 - 7407, n=64) | |
| Asus ROG Zephyrus M16 GU603H | |
| Asus ROG Strix G17 G713QE-RB74 | |
| Schenker XMG NEO 17 GM7TG8S | |
| MSI GP76 Leopard 10UG | |
| Cinebench R20 / CPU (Single Core) | |
| Average of class Gaming (442 - 895, n=111, last 2 years) | |
| MSI Vector GP66 12UGS | |
| Lenovo Legion 5 Pro 16 G7 i7 RTX 3070Ti | |
| Aorus 17 XE4 | |
| MSI Vector GP76 12UGS-434 | |
| Average Intel Core i7-12700H (300 - 704, n=64) | |
| Asus ROG Zephyrus M16 GU603H | |
| Schenker XMG NEO 17 GM7TG8S | |
| Asus ROG Strix G17 G713QE-RB74 | |
| MSI GP76 Leopard 10UG | |
| Cinebench R15 / CPU Multi 64Bit | |
| Average of class Gaming (1578 - 6271, n=111, last 2 years) | |
| Lenovo Legion 5 Pro 16 G7 i7 RTX 3070Ti | |
| MSI Vector GP76 12UGS-434 | |
| Aorus 17 XE4 | |
| Average Intel Core i7-12700H (1379 - 2916, n=70) | |
| MSI Vector GP66 12UGS | |
| Asus ROG Zephyrus M16 GU603H | |
| Asus ROG Strix G17 G713QE-RB74 | |
| Schenker XMG NEO 17 GM7TG8S | |
| MSI GP76 Leopard 10UG | |
| Cinebench R15 / CPU Single 64Bit | |
| Average of class Gaming (188.8 - 343, n=111, last 2 years) | |
| MSI Vector GP66 12UGS | |
| Lenovo Legion 5 Pro 16 G7 i7 RTX 3070Ti | |
| Aorus 17 XE4 | |
| MSI Vector GP76 12UGS-434 | |
| Average Intel Core i7-12700H (113 - 263, n=65) | |
| Asus ROG Zephyrus M16 GU603H | |
| Asus ROG Strix G17 G713QE-RB74 | |
| Schenker XMG NEO 17 GM7TG8S | |
| MSI GP76 Leopard 10UG | |
| Blender / v2.79 BMW27 CPU | |
| MSI GP76 Leopard 10UG | |
| Schenker XMG NEO 17 GM7TG8S | |
| Asus ROG Zephyrus M16 GU603H | |
| Asus ROG Strix G17 G713QE-RB74 | |
| Aorus 17 XE4 | |
| Average Intel Core i7-12700H (168 - 732, n=63) | |
| MSI Vector GP76 12UGS-434 | |
| MSI Vector GP66 12UGS | |
| Lenovo Legion 5 Pro 16 G7 i7 RTX 3070Ti | |
| Average of class Gaming (80 - 330, n=109, last 2 years) | |
| 7-Zip 18.03 / 7z b 4 | |
| Average of class Gaming (33491 - 148086, n=110, last 2 years) | |
| Lenovo Legion 5 Pro 16 G7 i7 RTX 3070Ti | |
| MSI Vector GP66 12UGS | |
| MSI Vector GP76 12UGS-434 | |
| Average Intel Core i7-12700H (22844 - 73067, n=63) | |
| Aorus 17 XE4 | |
| Asus ROG Strix G17 G713QE-RB74 | |
| Asus ROG Zephyrus M16 GU603H | |
| Schenker XMG NEO 17 GM7TG8S | |
| MSI GP76 Leopard 10UG | |
| 7-Zip 18.03 / 7z b 4 -mmt1 | |
| Average of class Gaming (4199 - 7436, n=110, last 2 years) | |
| MSI Vector GP66 12UGS | |
| Aorus 17 XE4 | |
| Lenovo Legion 5 Pro 16 G7 i7 RTX 3070Ti | |
| Average Intel Core i7-12700H (2743 - 5972, n=63) | |
| Asus ROG Zephyrus M16 GU603H | |
| Asus ROG Strix G17 G713QE-RB74 | |
| Schenker XMG NEO 17 GM7TG8S | |
| MSI Vector GP76 12UGS-434 | |
| MSI GP76 Leopard 10UG | |
| Geekbench 5.5 / Multi-Core | |
| Average of class Gaming (6460 - 27010, n=110, last 2 years) | |
| Lenovo Legion 5 Pro 16 G7 i7 RTX 3070Ti | |
| MSI Vector GP66 12UGS | |
| Aorus 17 XE4 | |
| MSI Vector GP76 12UGS-434 | |
| Average Intel Core i7-12700H (5144 - 13745, n=64) | |
| Asus ROG Zephyrus M16 GU603H | |
| Schenker XMG NEO 17 GM7TG8S | |
| MSI GP76 Leopard 10UG | |
| Geekbench 5.5 / Single-Core | |
| Average of class Gaming (986 - 2474, n=110, last 2 years) | |
| MSI Vector GP66 12UGS | |
| Aorus 17 XE4 | |
| MSI Vector GP76 12UGS-434 | |
| Lenovo Legion 5 Pro 16 G7 i7 RTX 3070Ti | |
| Average Intel Core i7-12700H (803 - 1851, n=64) | |
| Asus ROG Zephyrus M16 GU603H | |
| Schenker XMG NEO 17 GM7TG8S | |
| MSI GP76 Leopard 10UG | |
| HWBOT x265 Benchmark v2.2 / 4k Preset | |
| Average of class Gaming (11.5 - 44.3, n=110, last 2 years) | |
| Lenovo Legion 5 Pro 16 G7 i7 RTX 3070Ti | |
| MSI Vector GP66 12UGS | |
| MSI Vector GP76 12UGS-434 | |
| Average Intel Core i7-12700H (4.67 - 21.8, n=64) | |
| Aorus 17 XE4 | |
| Asus ROG Zephyrus M16 GU603H | |
| Asus ROG Strix G17 G713QE-RB74 | |
| Schenker XMG NEO 17 GM7TG8S | |
| MSI GP76 Leopard 10UG | |
| LibreOffice / 20 Documents To PDF | |
| Asus ROG Strix G17 G713QE-RB74 | |
| MSI GP76 Leopard 10UG | |
| Average of class Gaming (19 - 88.8, n=110, last 2 years) | |
| Average Intel Core i7-12700H (34.2 - 95.3, n=63) | |
| MSI Vector GP76 12UGS-434 | |
| Lenovo Legion 5 Pro 16 G7 i7 RTX 3070Ti | |
| Asus ROG Zephyrus M16 GU603H | |
| MSI Vector GP66 12UGS | |
| Schenker XMG NEO 17 GM7TG8S | |
| Aorus 17 XE4 | |
| R Benchmark 2.5 / Overall mean | |
| MSI GP76 Leopard 10UG | |
| Schenker XMG NEO 17 GM7TG8S | |
| Asus ROG Zephyrus M16 GU603H | |
| Asus ROG Strix G17 G713QE-RB74 | |
| Average Intel Core i7-12700H (0.4441 - 1.052, n=63) | |
| MSI Vector GP76 12UGS-434 | |
| Aorus 17 XE4 | |
| Lenovo Legion 5 Pro 16 G7 i7 RTX 3070Ti | |
| Average of class Gaming (0.3439 - 0.759, n=111, last 2 years) | |
| MSI Vector GP66 12UGS | |
| Geekbench 5.5 / OpenCL Score | |
| Average of class Gaming (80702 - 277970, n=107, last 2 years) | |
| Aorus 17 XE4 | |
| Schenker XMG NEO 17 GM7TG8S | |
| Lenovo Legion 5 Pro 16 G7 i7 RTX 3070Ti | |
| MSI Vector GP76 12UGS-434 | |
| MSI Vector GP66 12UGS | |
| Asus ROG Zephyrus M16 GU603H | |
| MSI GP76 Leopard 10UG | |
| Average Intel Core i7-12700H (13944 - 148757, n=62) | |
* ... smaller is better
AIDA64: FP32 Ray-Trace | FPU Julia | CPU SHA3 | CPU Queen | FPU SinJulia | FPU Mandel | CPU AES | CPU ZLib | FP64 Ray-Trace | CPU PhotoWorxx
| Performance rating | |
| Average of class Gaming | |
| Asus ROG Strix G17 G713QE-RB74 | |
| Lenovo Legion 5 Pro 16 G7 i7 RTX 3070Ti | |
| Average Intel Core i7-12700H | |
| MSI Vector GP76 12UGS-434 | |
| MSI Vector GP66 12UGS | |
| Aorus 17 XE4 | |
| MSI GP76 Leopard 10UG | |
| AIDA64 / FP32 Ray-Trace | |
| Average of class Gaming (10227 - 85542, n=109, last 2 years) | |
| Asus ROG Strix G17 G713QE-RB74 | |
| Average Intel Core i7-12700H (2585 - 17957, n=64) | |
| Lenovo Legion 5 Pro 16 G7 i7 RTX 3070Ti | |
| MSI GP76 Leopard 10UG | |
| MSI Vector GP66 12UGS | |
| MSI Vector GP76 12UGS-434 | |
| Aorus 17 XE4 | |
| AIDA64 / FPU Julia | |
| Average of class Gaming (51376 - 238426, n=109, last 2 years) | |
| Asus ROG Strix G17 G713QE-RB74 | |
| Average Intel Core i7-12700H (12439 - 90760, n=64) | |
| MSI GP76 Leopard 10UG | |
| Lenovo Legion 5 Pro 16 G7 i7 RTX 3070Ti | |
| MSI Vector GP76 12UGS-434 | |
| MSI Vector GP66 12UGS | |
| Aorus 17 XE4 | |
| AIDA64 / CPU SHA3 | |
| Average of class Gaming (2180 - 9817, n=109, last 2 years) | |
| Lenovo Legion 5 Pro 16 G7 i7 RTX 3070Ti | |
| MSI Vector GP76 12UGS-434 | |
| Asus ROG Strix G17 G713QE-RB74 | |
| Average Intel Core i7-12700H (833 - 4242, n=64) | |
| MSI Vector GP66 12UGS | |
| Aorus 17 XE4 | |
| MSI GP76 Leopard 10UG | |
| AIDA64 / CPU Queen | |
| Average of class Gaming (49785 - 173351, n=100, last 2 years) | |
| MSI Vector GP66 12UGS | |
| Aorus 17 XE4 | |
| Lenovo Legion 5 Pro 16 G7 i7 RTX 3070Ti | |
| Average Intel Core i7-12700H (57923 - 103202, n=63) | |
| MSI Vector GP76 12UGS-434 | |
| Asus ROG Strix G17 G713QE-RB74 | |
| MSI GP76 Leopard 10UG | |
| AIDA64 / FPU SinJulia | |
| Average of class Gaming (4424 - 33636, n=109, last 2 years) | |
| Asus ROG Strix G17 G713QE-RB74 | |
| Lenovo Legion 5 Pro 16 G7 i7 RTX 3070Ti | |
| MSI Vector GP76 12UGS-434 | |
| MSI Vector GP66 12UGS | |
| Average Intel Core i7-12700H (3249 - 9939, n=64) | |
| Aorus 17 XE4 | |
| MSI GP76 Leopard 10UG | |
| AIDA64 / FPU Mandel | |
| Average of class Gaming (25115 - 128721, n=109, last 2 years) | |
| Asus ROG Strix G17 G713QE-RB74 | |
| Average Intel Core i7-12700H (7135 - 44760, n=64) | |
| Lenovo Legion 5 Pro 16 G7 i7 RTX 3070Ti | |
| MSI Vector GP66 12UGS | |
| MSI GP76 Leopard 10UG | |
| MSI Vector GP76 12UGS-434 | |
| Aorus 17 XE4 | |
| AIDA64 / CPU AES | |
| Asus ROG Strix G17 G713QE-RB74 | |
| Average of class Gaming (39258 - 247074, n=109, last 2 years) | |
| Lenovo Legion 5 Pro 16 G7 i7 RTX 3070Ti | |
| MSI Vector GP76 12UGS-434 | |
| MSI Vector GP66 12UGS | |
| Average Intel Core i7-12700H (31839 - 144360, n=64) | |
| Aorus 17 XE4 | |
| MSI GP76 Leopard 10UG | |
| AIDA64 / CPU ZLib | |
| Average of class Gaming (574 - 2531, n=109, last 2 years) | |
| Lenovo Legion 5 Pro 16 G7 i7 RTX 3070Ti | |
| MSI Vector GP76 12UGS-434 | |
| MSI Vector GP66 12UGS | |
| Average Intel Core i7-12700H (305 - 1171, n=64) | |
| Aorus 17 XE4 | |
| Asus ROG Strix G17 G713QE-RB74 | |
| MSI GP76 Leopard 10UG | |
| AIDA64 / FP64 Ray-Trace | |
| Average of class Gaming (5509 - 45446, n=109, last 2 years) | |
| Asus ROG Strix G17 G713QE-RB74 | |
| Average Intel Core i7-12700H (1437 - 9692, n=64) | |
| Lenovo Legion 5 Pro 16 G7 i7 RTX 3070Ti | |
| MSI GP76 Leopard 10UG | |
| MSI Vector GP66 12UGS | |
| MSI Vector GP76 12UGS-434 | |
| Aorus 17 XE4 | |
| AIDA64 / CPU PhotoWorxx | |
| Average of class Gaming (12271 - 89891, n=109, last 2 years) | |
| Lenovo Legion 5 Pro 16 G7 i7 RTX 3070Ti | |
| Average Intel Core i7-12700H (12863 - 52207, n=64) | |
| MSI Vector GP66 12UGS | |
| MSI Vector GP76 12UGS-434 | |
| Aorus 17 XE4 | |
| MSI GP76 Leopard 10UG | |
| Asus ROG Strix G17 G713QE-RB74 | |
System Performance
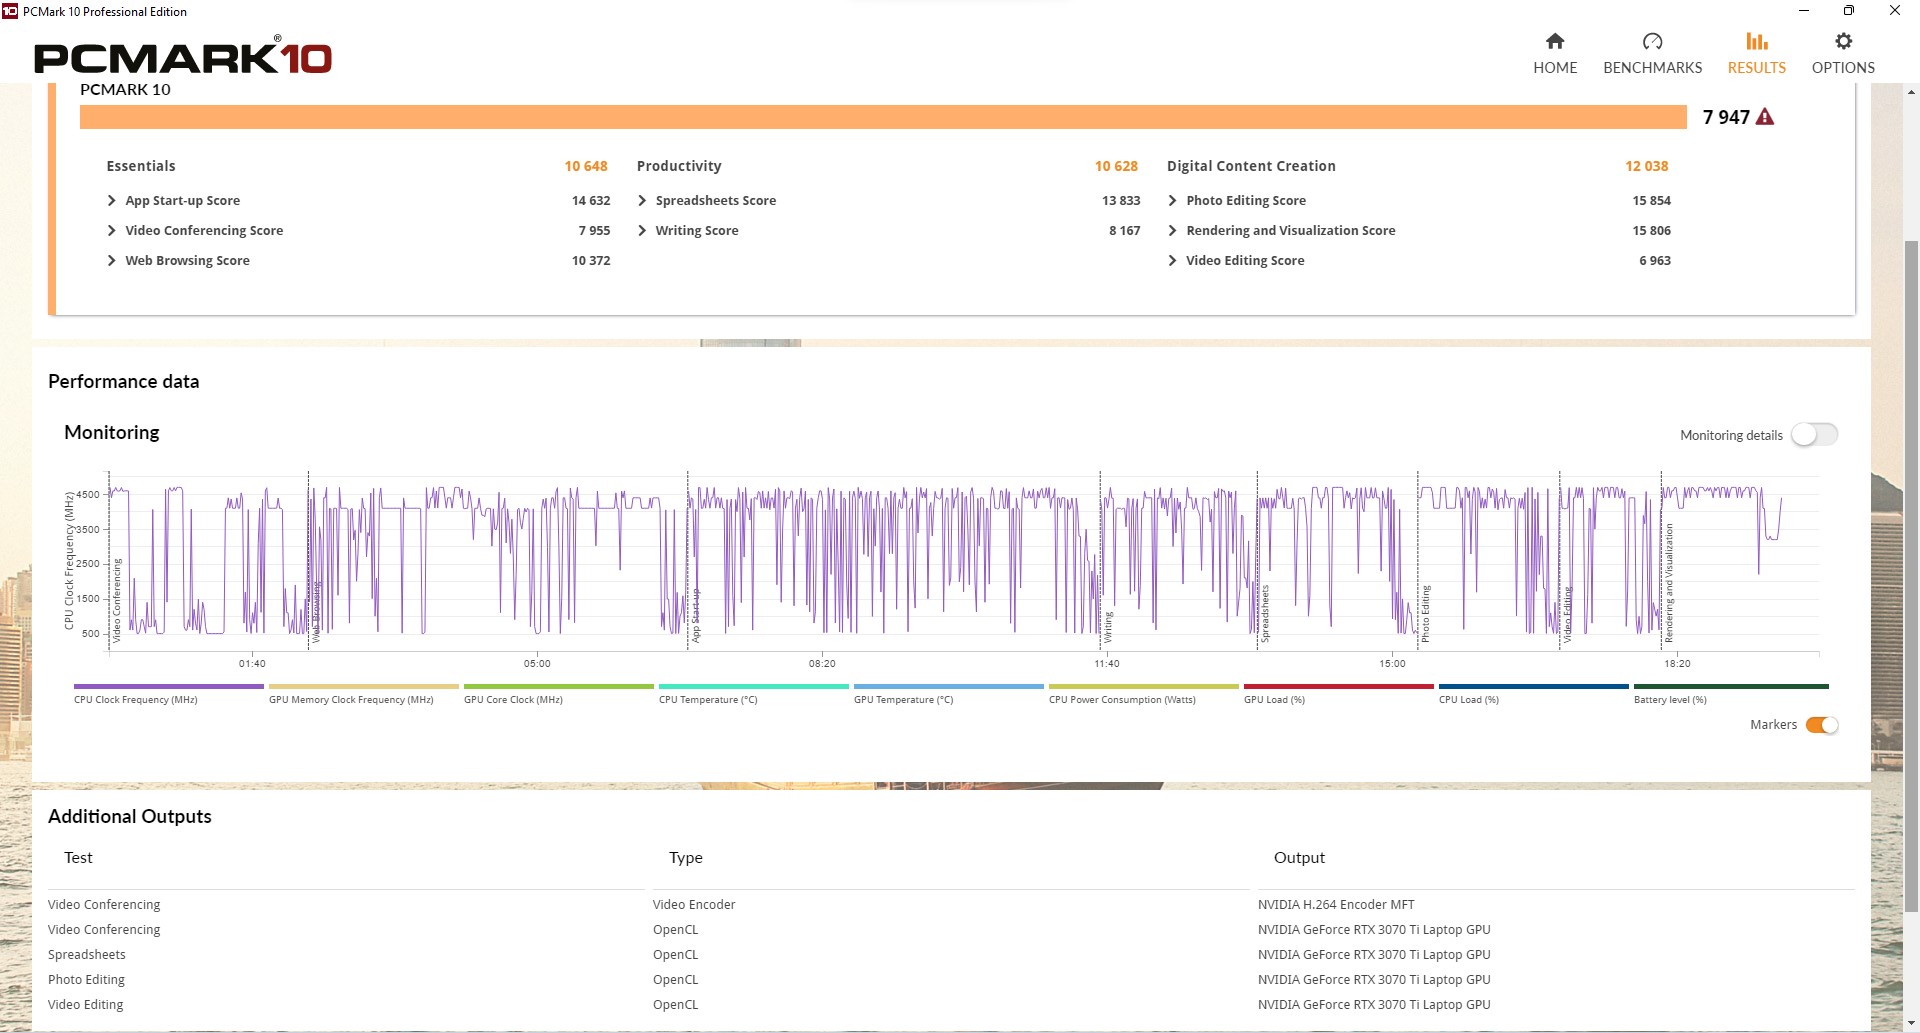
Here, our review device is right at the top; in fact, there is almost no better result in our entire database. The predecessor is outperformed by 33%. Programs open immediately, as do multiple browser tabs.
The 360 Hz panel definitely contributes to a high responsive system. 4K YouTube playback also requires very little CPU resources.
CrossMark: Overall | Productivity | Creativity | Responsiveness
| PCMark 10 / Score | |
| Average of class Gaming (5828 - 11574, n=95, last 2 years) | |
| MSI Vector GP66 12UGS | |
| MSI Vector GP76 12UGS-434 | |
| Aorus 17 XE4 | |
| Lenovo Legion 5 Pro 16 G7 i7 RTX 3070Ti | |
| Average Intel Core i7-12700H, NVIDIA GeForce RTX 3070 Ti Laptop GPU (6941 - 7947, n=11) | |
| Schenker XMG NEO 17 GM7TG8S | |
| Asus ROG Zephyrus M16 GU603H | |
| Asus ROG Strix G17 G713QE-RB74 | |
| MSI GP76 Leopard 10UG | |
| PCMark 10 / Essentials | |
| MSI Vector GP66 12UGS | |
| Aorus 17 XE4 | |
| Average of class Gaming (8810 - 12600, n=99, last 2 years) | |
| MSI Vector GP76 12UGS-434 | |
| Asus ROG Zephyrus M16 GU603H | |
| Average Intel Core i7-12700H, NVIDIA GeForce RTX 3070 Ti Laptop GPU (9892 - 10935, n=11) | |
| Schenker XMG NEO 17 GM7TG8S | |
| Asus ROG Strix G17 G713QE-RB74 | |
| Lenovo Legion 5 Pro 16 G7 i7 RTX 3070Ti | |
| MSI GP76 Leopard 10UG | |
| PCMark 10 / Productivity | |
| Average of class Gaming (6845 - 18766, n=97, last 2 years) | |
| MSI Vector GP76 12UGS-434 | |
| MSI Vector GP66 12UGS | |
| Lenovo Legion 5 Pro 16 G7 i7 RTX 3070Ti | |
| Aorus 17 XE4 | |
| Average Intel Core i7-12700H, NVIDIA GeForce RTX 3070 Ti Laptop GPU (9024 - 10638, n=11) | |
| Schenker XMG NEO 17 GM7TG8S | |
| Asus ROG Strix G17 G713QE-RB74 | |
| Asus ROG Zephyrus M16 GU603H | |
| MSI GP76 Leopard 10UG | |
| PCMark 10 / Digital Content Creation | |
| Average of class Gaming (7602 - 19657, n=97, last 2 years) | |
| MSI Vector GP66 12UGS | |
| MSI Vector GP76 12UGS-434 | |
| Lenovo Legion 5 Pro 16 G7 i7 RTX 3070Ti | |
| Aorus 17 XE4 | |
| Average Intel Core i7-12700H, NVIDIA GeForce RTX 3070 Ti Laptop GPU (10165 - 12546, n=11) | |
| Schenker XMG NEO 17 GM7TG8S | |
| Asus ROG Zephyrus M16 GU603H | |
| Asus ROG Strix G17 G713QE-RB74 | |
| MSI GP76 Leopard 10UG | |
| CrossMark / Overall | |
| Aorus 17 XE4 | |
| Average of class Gaming (1366 - 2409, n=97, last 2 years) | |
| MSI Vector GP76 12UGS-434 | |
| Lenovo Legion 5 Pro 16 G7 i7 RTX 3070Ti | |
| Average Intel Core i7-12700H, NVIDIA GeForce RTX 3070 Ti Laptop GPU (974 - 2000, n=12) | |
| CrossMark / Productivity | |
| Aorus 17 XE4 | |
| MSI Vector GP76 12UGS-434 | |
| Lenovo Legion 5 Pro 16 G7 i7 RTX 3070Ti | |
| Average of class Gaming (1386 - 2254, n=97, last 2 years) | |
| Average Intel Core i7-12700H, NVIDIA GeForce RTX 3070 Ti Laptop GPU (907 - 1962, n=12) | |
| CrossMark / Creativity | |
| Average of class Gaming (1343 - 2729, n=97, last 2 years) | |
| Lenovo Legion 5 Pro 16 G7 i7 RTX 3070Ti | |
| Aorus 17 XE4 | |
| MSI Vector GP76 12UGS-434 | |
| Average Intel Core i7-12700H, NVIDIA GeForce RTX 3070 Ti Laptop GPU (1027 - 2057, n=12) | |
| CrossMark / Responsiveness | |
| Aorus 17 XE4 | |
| MSI Vector GP76 12UGS-434 | |
| Lenovo Legion 5 Pro 16 G7 i7 RTX 3070Ti | |
| Average Intel Core i7-12700H, NVIDIA GeForce RTX 3070 Ti Laptop GPU (1029 - 2142, n=12) | |
| Average of class Gaming (1226 - 2334, n=97, last 2 years) | |
| PCMark 10 Score | 7947 points | |
Help | ||
| AIDA64 / Memory Copy | |
| Average of class Gaming (21750 - 129946, n=109, last 2 years) | |
| Average Intel Core i7-12700H (25615 - 80511, n=64) | |
| Lenovo Legion 5 Pro 16 G7 i7 RTX 3070Ti | |
| MSI Vector GP66 12UGS | |
| Aorus 17 XE4 | |
| MSI Vector GP76 12UGS-434 | |
| Asus ROG Strix G17 G713QE-RB74 | |
| MSI GP76 Leopard 10UG | |
| AIDA64 / Memory Read | |
| Average of class Gaming (22956 - 118858, n=109, last 2 years) | |
| Lenovo Legion 5 Pro 16 G7 i7 RTX 3070Ti | |
| Average Intel Core i7-12700H (25586 - 79442, n=64) | |
| MSI Vector GP66 12UGS | |
| Aorus 17 XE4 | |
| MSI Vector GP76 12UGS-434 | |
| Asus ROG Strix G17 G713QE-RB74 | |
| MSI GP76 Leopard 10UG | |
| AIDA64 / Memory Write | |
| Average of class Gaming (22297 - 135096, n=109, last 2 years) | |
| Lenovo Legion 5 Pro 16 G7 i7 RTX 3070Ti | |
| Average Intel Core i7-12700H (23679 - 88660, n=64) | |
| MSI Vector GP76 12UGS-434 | |
| MSI Vector GP66 12UGS | |
| Aorus 17 XE4 | |
| MSI GP76 Leopard 10UG | |
| Asus ROG Strix G17 G713QE-RB74 | |
| AIDA64 / Memory Latency | |
| Average of class Gaming (75.3 - 259, n=109, last 2 years) | |
| Lenovo Legion 5 Pro 16 G7 i7 RTX 3070Ti | |
| MSI Vector GP76 12UGS-434 | |
| Aorus 17 XE4 | |
| MSI Vector GP66 12UGS | |
| Asus ROG Strix G17 G713QE-RB74 | |
| Average Intel Core i7-12700H (76.2 - 133.9, n=62) | |
| MSI GP76 Leopard 10UG | |
| Asus ROG Zephyrus M16 GU603H | |
| Schenker XMG NEO 17 GM7TG8S | |
* ... smaller is better
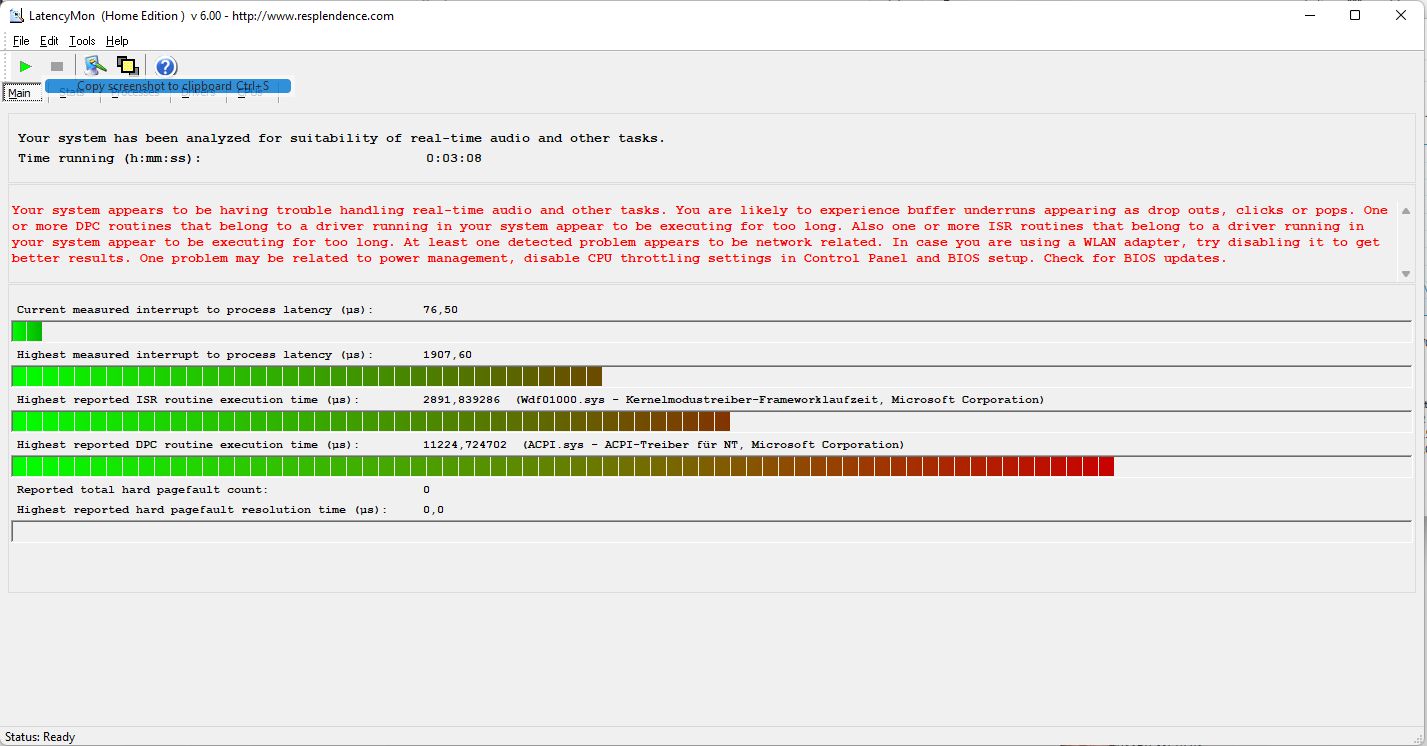
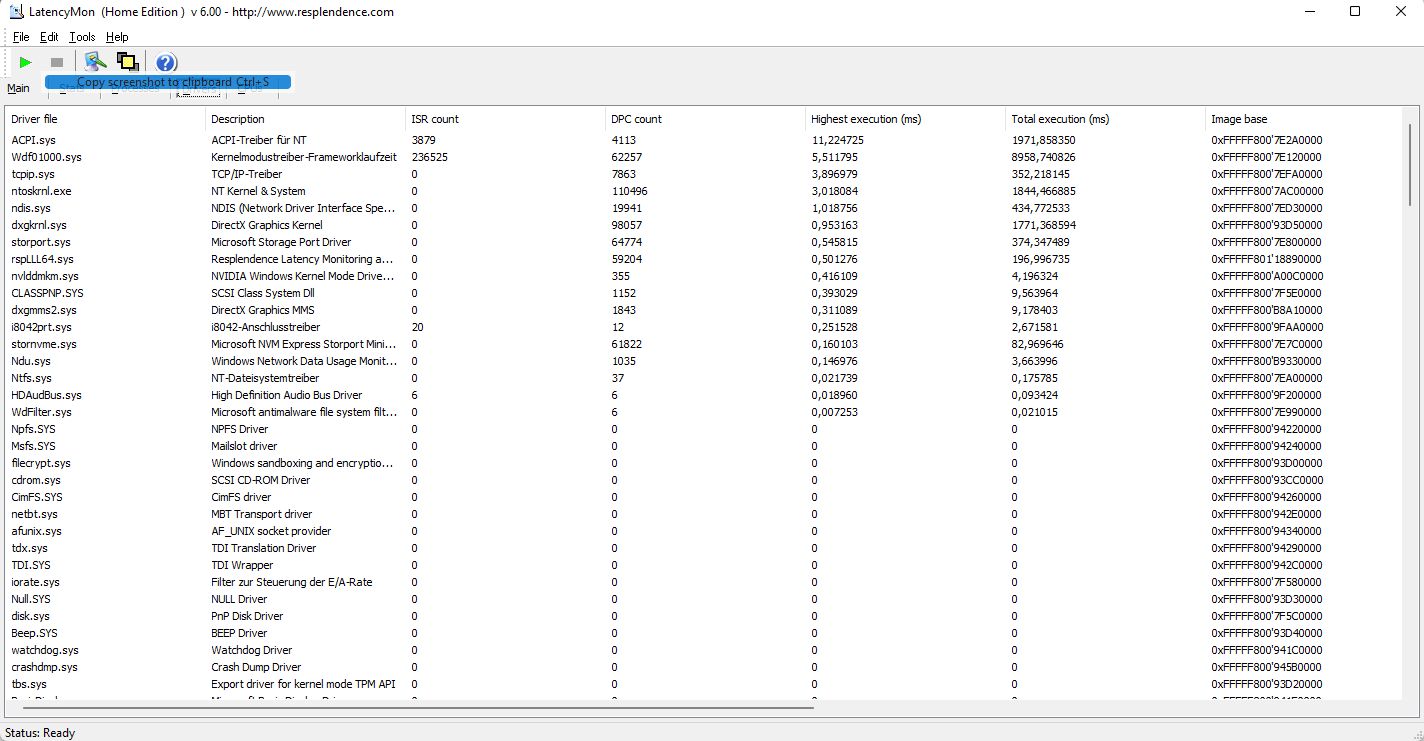
DPC Latencies
The DPC latencies show the delay from input to display: the system here proves unsuitable for real-time video and audio editing because the latencies are very high with a delay of 1,907ms. The ACPI driver is the culprit here. However, this can be improved after a BIOS update.
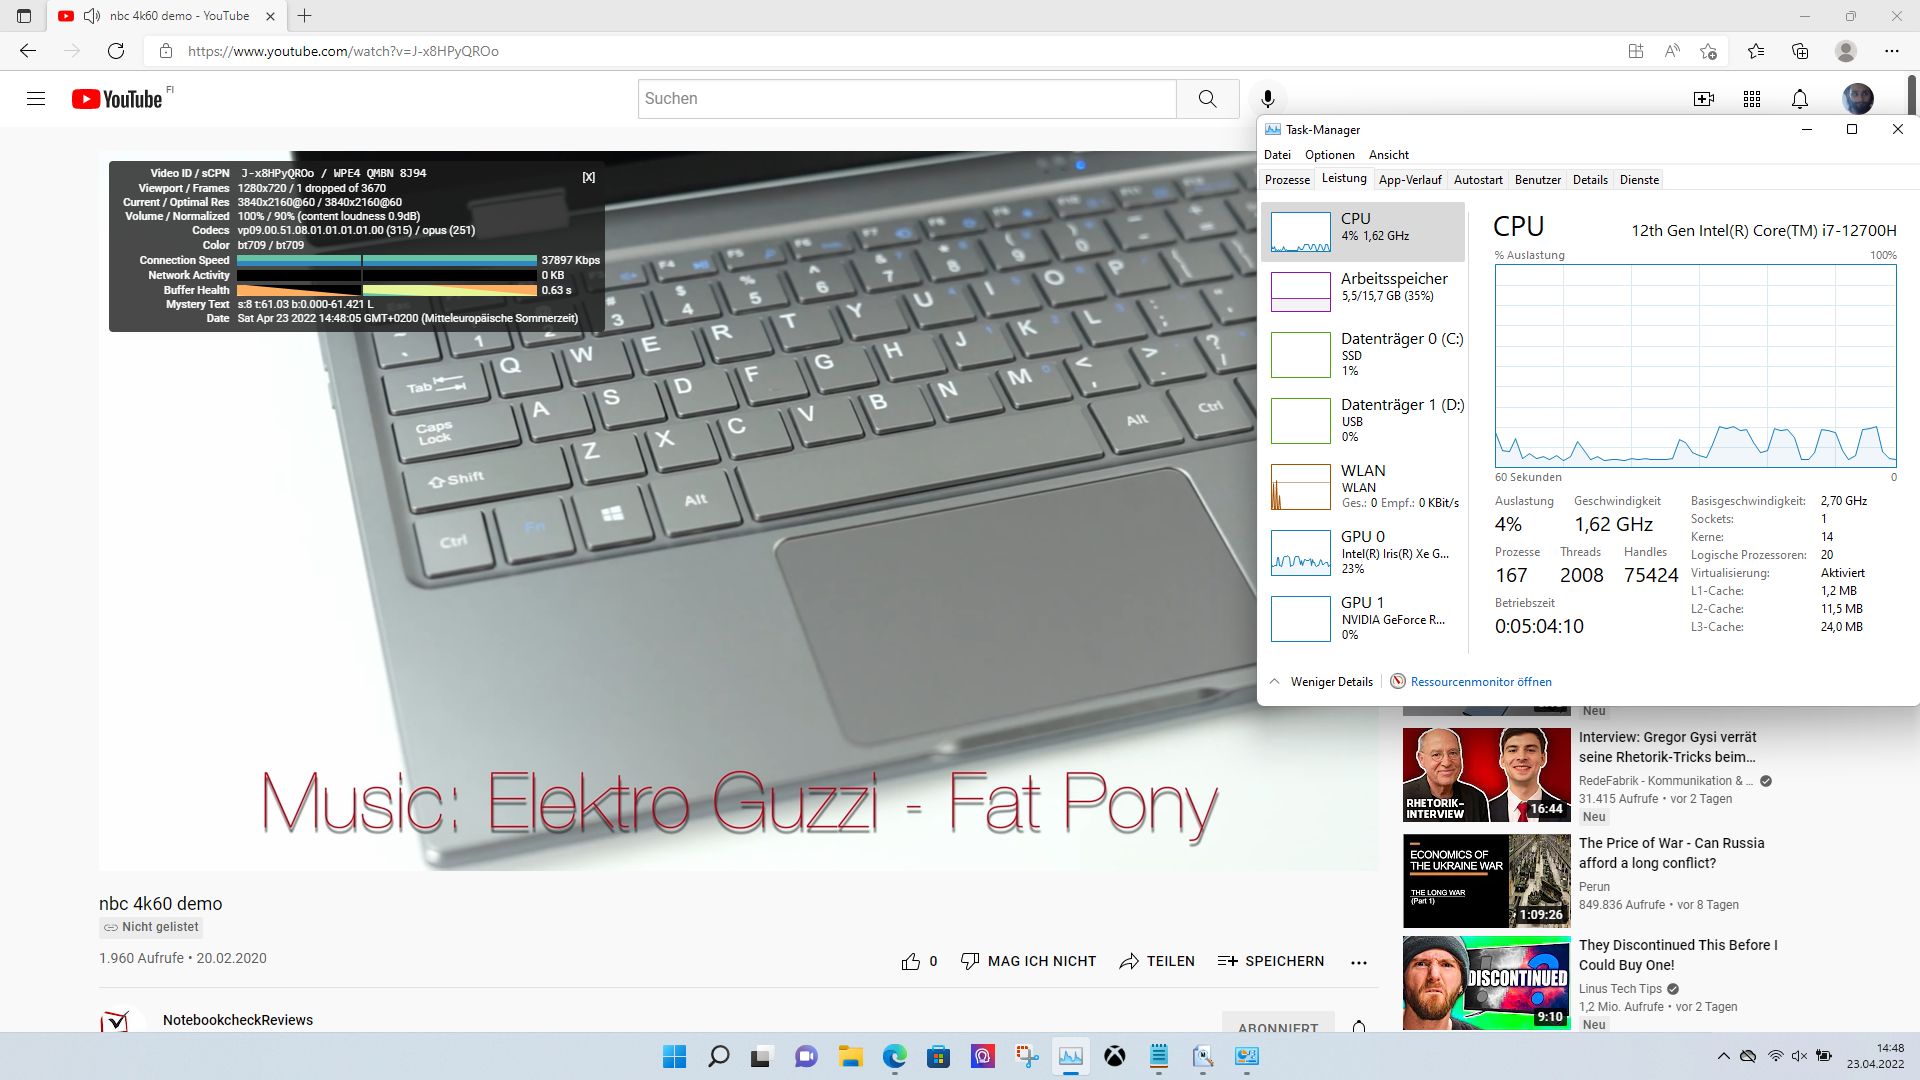
Fortunately, there were no dropped frames during YouTube 4K playback and CPU load remained low. However, the integrated Intel GPU remains a little occupied with a load of 23%.
| DPC Latencies / LatencyMon - interrupt to process latency (max), Web, Youtube, Prime95 | |
| Schenker XMG NEO 17 GM7TG8S | |
| MSI Vector GP66 12UGS | |
| MSI Vector GP76 12UGS-434 | |
| Aorus 17 XE4 | |
| MSI GP76 Leopard 10UG | |
| Asus ROG Strix G17 G713QE-RB74 | |
| Asus ROG Zephyrus M16 GU603H | |
| Lenovo Legion 5 Pro 16 G7 i7 RTX 3070Ti | |
* ... smaller is better
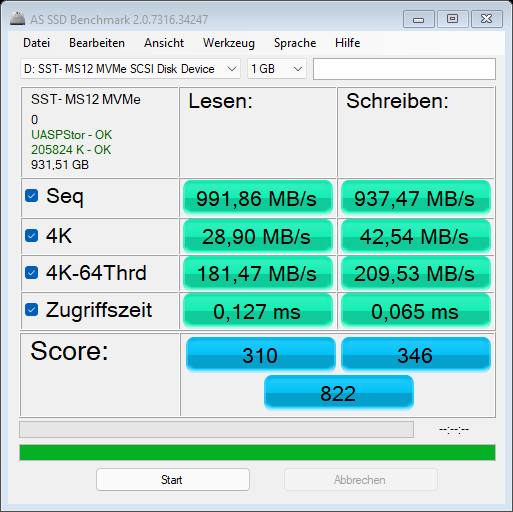
Storage Devices
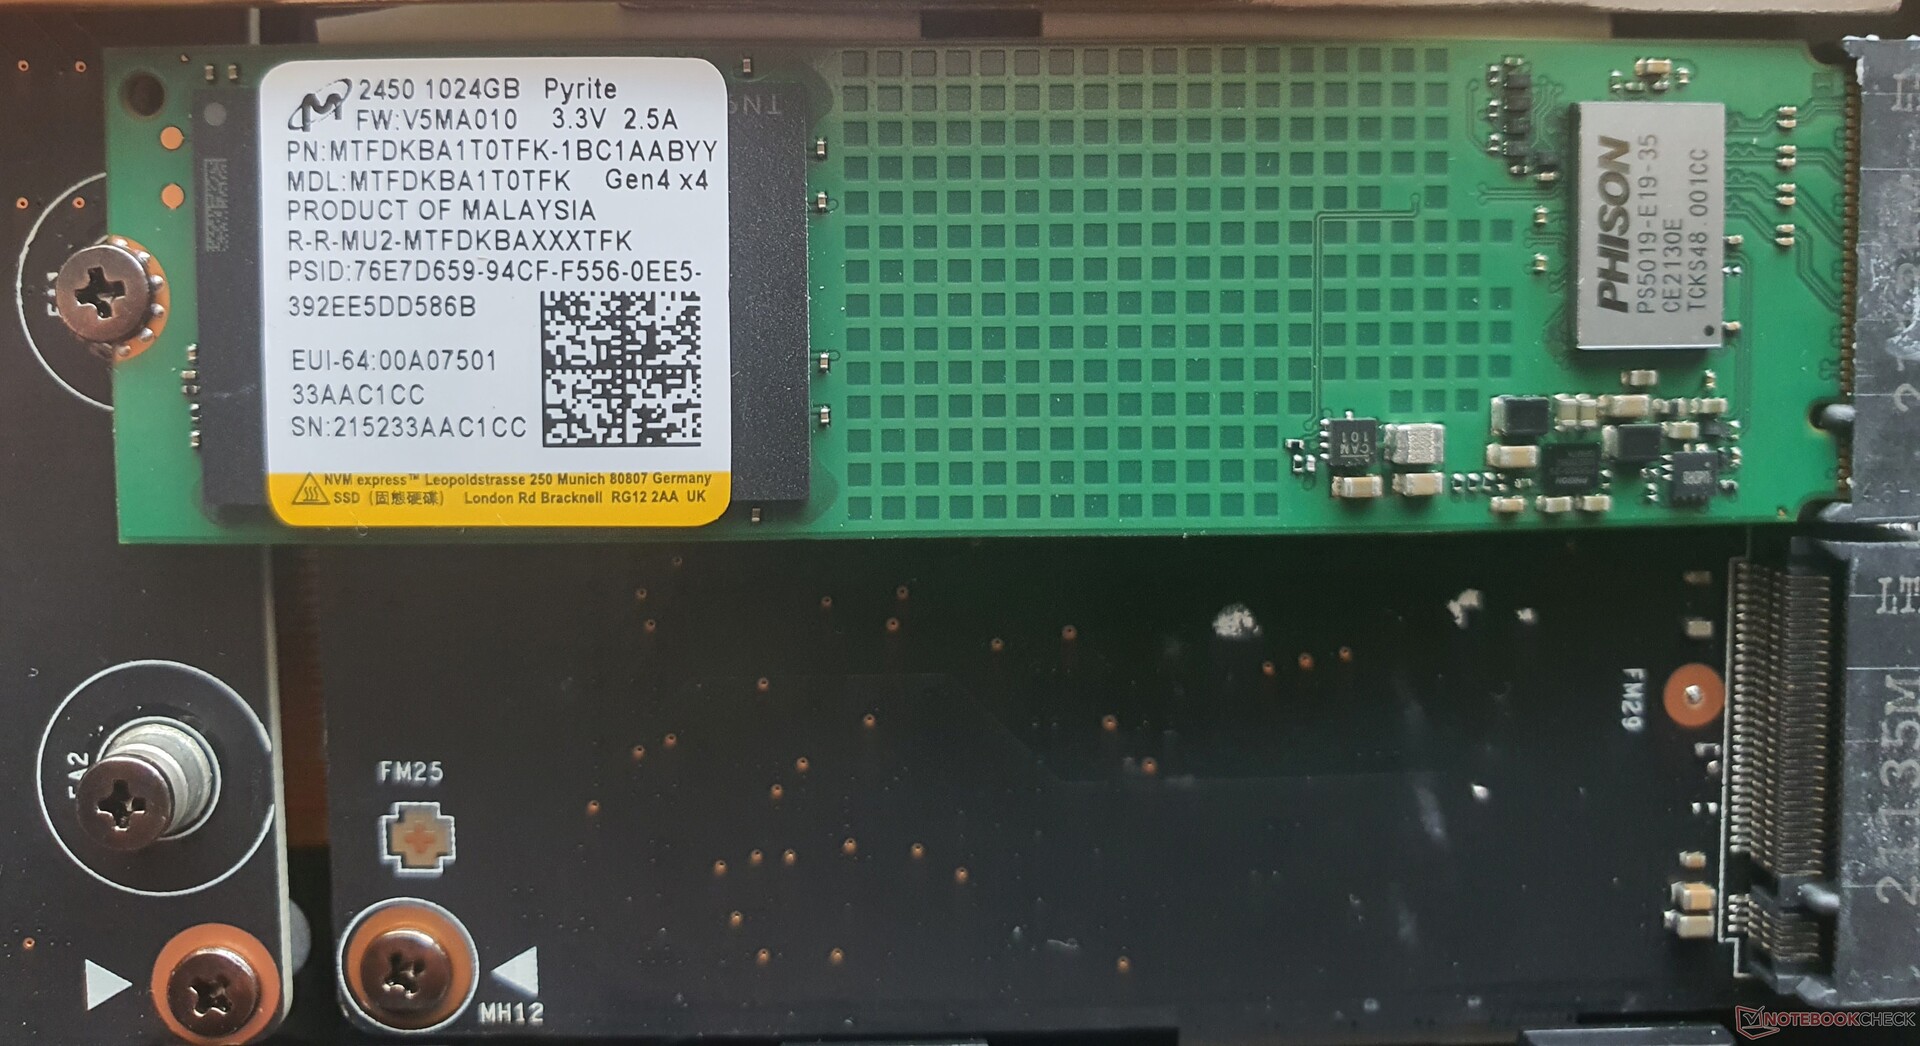
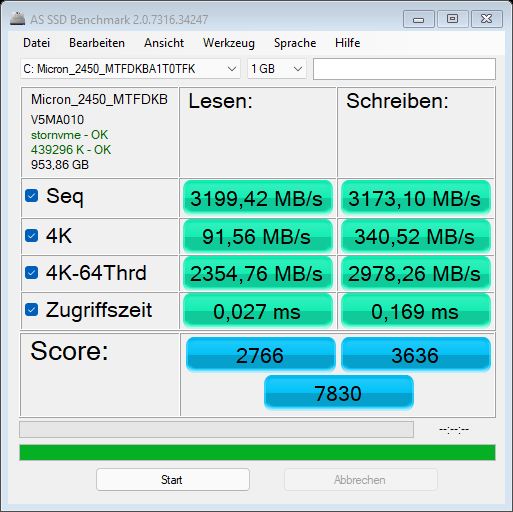
The 1 TB M.2 2280 NVMe SSD from Micron uses the latest PCIe4x4 standard, but this should been seen as a budget SSD that only achieves PCIe 3.0 speeds.
Nevertheless, two faster hard drives can be retrofitted and also in RAID (0,1) configuration. The comparison field offers faster SSDs but at least the predecessor is clearly surpassed.
| MSI Vector GP76 12UGS-434 GeForce RTX 3070 Ti Laptop GPU, i7-12700H, Micron 2450 1TB MTFDKBA1T0TFK | MSI GP76 Leopard 10UG GeForce RTX 3070 Laptop GPU, i7-10750H, Kingston OM8PCP3512F-AB | Asus ROG Strix G17 G713QE-RB74 GeForce RTX 3050 Ti Laptop GPU, R7 5800H, Samsung PM991 MZVLQ512HBLU | Aorus 17 XE4 GeForce RTX 3070 Ti Laptop GPU, i7-12700H, Gigabyte AG470S1TB-SI B10 | Schenker XMG NEO 17 GM7TG8S GeForce RTX 3080 Laptop GPU, i7-11800H, Samsung SSD 980 Pro 1TB MZ-V8P1T0BW | Lenovo Legion 5 Pro 16 G7 i7 RTX 3070Ti GeForce RTX 3070 Ti Laptop GPU, i7-12700H, Samsung PM9A1 MZVL21T0HCLR | Asus ROG Zephyrus M16 GU603H GeForce RTX 3070 Laptop GPU, i9-11900H, Samsung PM9A1 MZVL22T0HBLB | MSI Vector GP66 12UGS GeForce RTX 3070 Ti Laptop GPU, i9-12900H | |
|---|---|---|---|---|---|---|---|---|
| AS SSD | -98% | -45% | 13% | 27% | 36% | 9% | -5% | |
| Seq Read (MB/s) | 3199 | 1659 -48% | 2602 -19% | 5031 57% | 5223 63% | 5036 57% | 5615 76% | 3080 -4% |
| Seq Write (MB/s) | 3173 | 921 -71% | 1218 -62% | 3162 0% | 3922 24% | 3784 19% | 4297 35% | 2997 -6% |
| 4K Read (MB/s) | 91.56 | 51 -44% | 42.31 -54% | 108 18% | 82.2 -10% | 88.1 -4% | 55.3 -40% | 70 -24% |
| 4K Write (MB/s) | 340.52 | 120.1 -65% | 122 -64% | 308.6 -9% | 207.6 -39% | 240.4 -29% | 170.5 -50% | 352 3% |
| 4K-64 Read (MB/s) | 2355 | 463.5 -80% | 1182 -50% | 2938 25% | 2439 4% | 2788 18% | 2591 10% | 1630 -31% |
| 4K-64 Write (MB/s) | 2978 | 909 -69% | 972 -67% | 3371 13% | 2652 -11% | 3424 15% | 3190 7% | 2435 -18% |
| Access Time Read * (ms) | 0.027 | 0.179 -563% | 0.101 -274% | 0.048 -78% | 0.022 19% | 0.02 26% | 0.04 -48% | 0.033 -22% |
| Access Time Write * (ms) | 0.169 | 0.032 81% | 0.096 43% | 0.013 92% | 0.021 88% | 0.018 89% | 0.025 85% | 0.425 -151% |
| Score Read (Points) | 2766 | 680 -75% | 1484 -46% | 3549 28% | 3044 10% | 3380 22% | 3208 16% | 2008 -27% |
| Score Write (Points) | 3636 | 1121 -69% | 1216 -67% | 3996 10% | 3252 -11% | 4043 11% | 3790 4% | 3087 -15% |
| Score Total (Points) | 7830 | 2130 -73% | 3394 -57% | 9279 19% | 7794 0% | 9094 16% | 8563 9% | 6130 -22% |
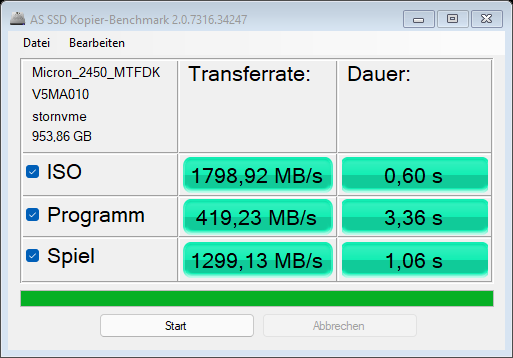
| Copy ISO MB/s (MB/s) | 1799 | 1538 -15% | 1967 9% | 3221 79% | 3221 79% | 3576 99% | ||
| Copy Program MB/s (MB/s) | 419 | 805 92% | 458.2 9% | 1151 175% | 939 124% | 791 89% | ||
| Copy Game MB/s (MB/s) | 1299 | 1418 9% | 1194 -8% | 1194 -8% | 1995 54% | 2134 64% |
* ... smaller is better

* ... smaller is better
Sustained Read Performance: DiskSpd Read Loop, Queue Depth 8
GPU
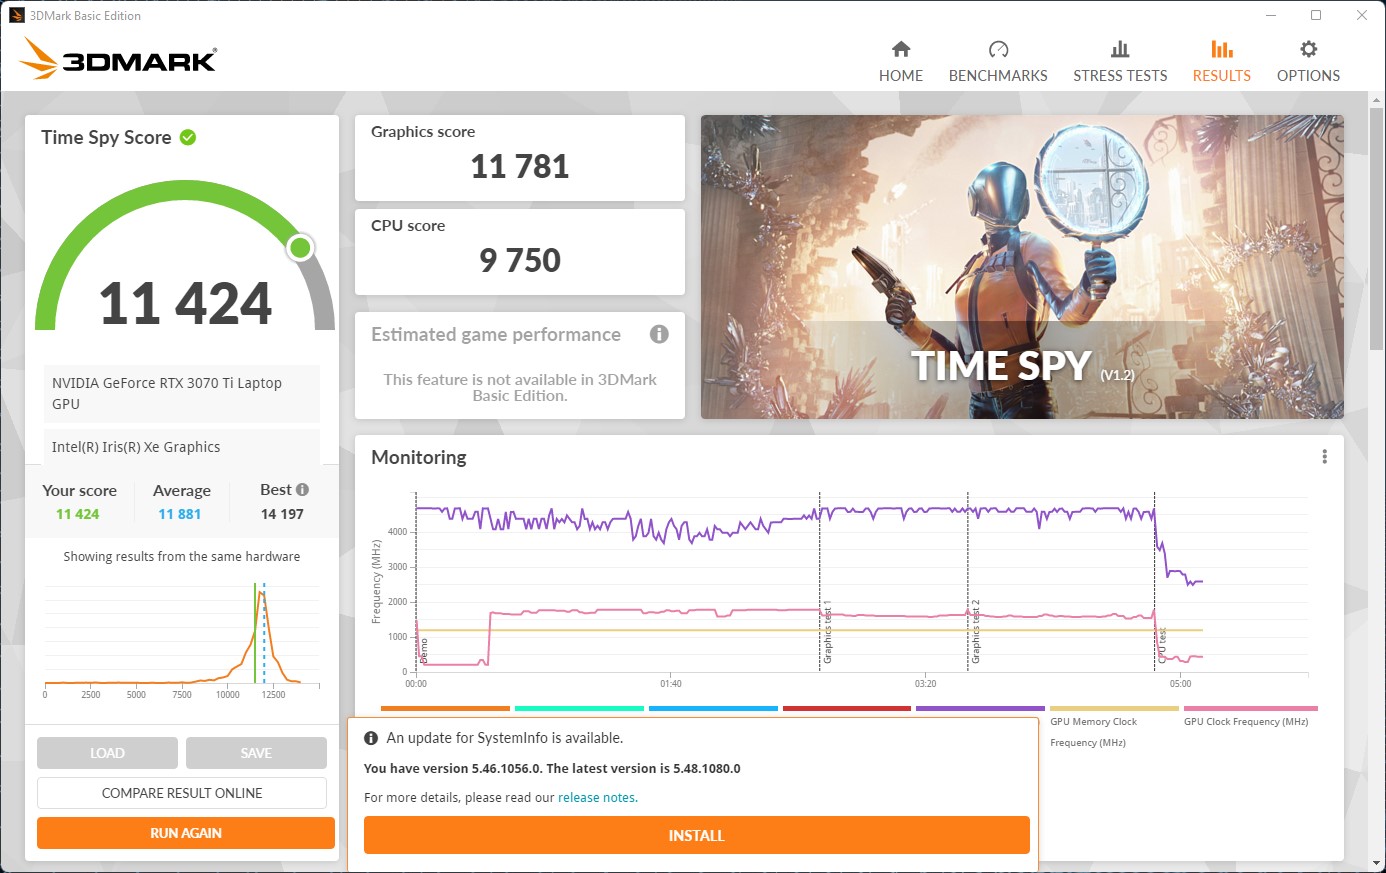
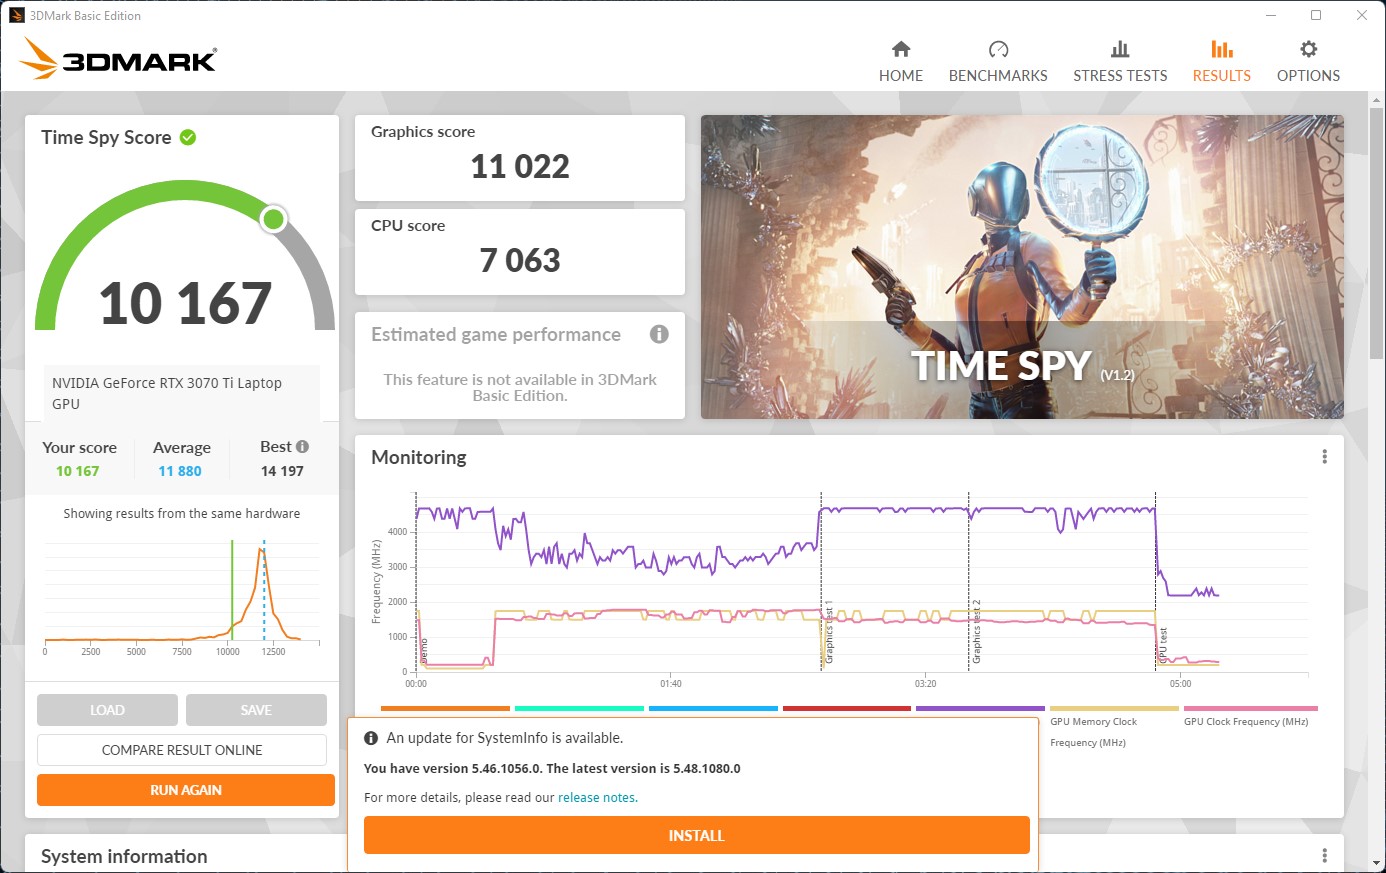
MSI promises a 100 MHz higher boost clock of 1,585 MHz for the RTX 3070 Ti (8 GB VRAM). Overall, the GPU performs only around 5% slower than a mobile RTX 3080 and about 10% below a desktop RTX-3070. The thin Asus ROG Zephyrus M16 is even beaten by 80%.
In the mobile sector, there are practically no GPUs that are any more powerful. It should be noted that the results in Extreme mode are about 7% higher. Silent mode reduces the results by only 10%, while the fans are much quieter and you can even use the internal speakers when gaming. However, this increases surface temperatures.
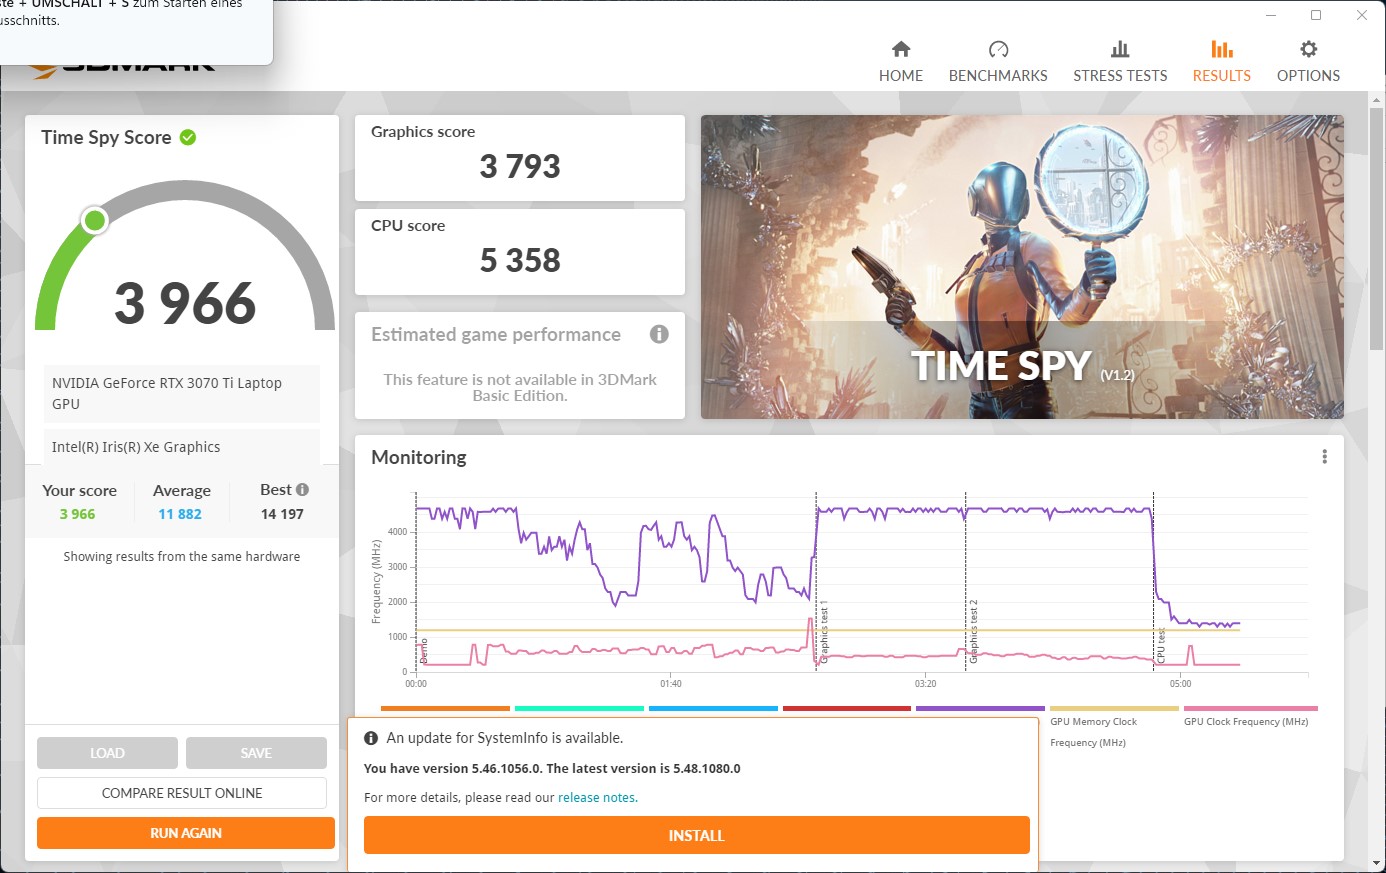
In Battery mode, the TGP and thus the performance is greatly reduced: With a total allowed consumption of 50 watts (CPU: 15 W + GPU: 35 W), the result of 3DMark Time Spy is almost tripled and is therefore roughly on the level of a GTX 1650 Ti.
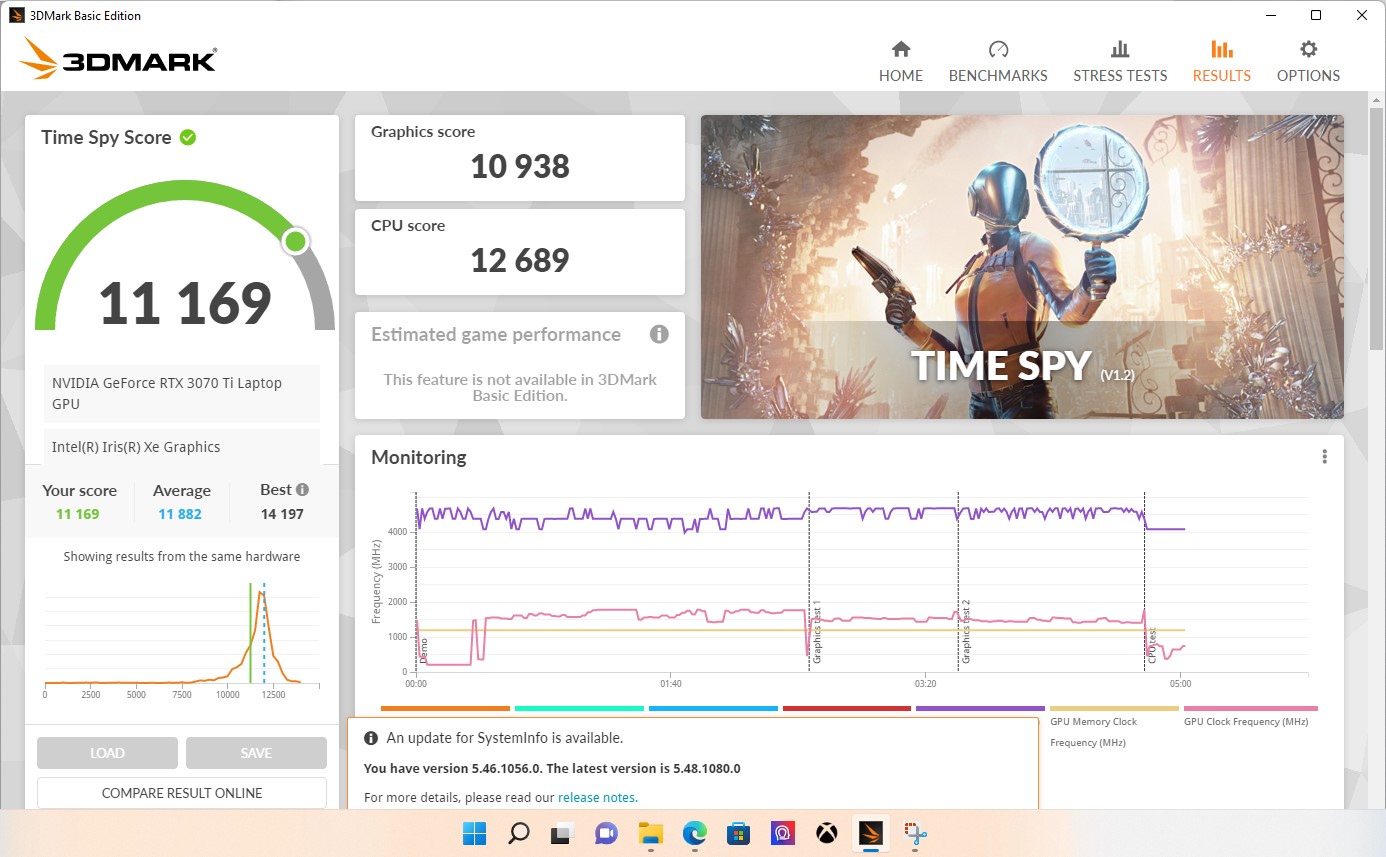
| 3DMark 11 Performance | 32326 points | |
| 3DMark Fire Strike Score | 25633 points | |
| 3DMark Time Spy Score | 11169 points | |
Help | ||
Gaming Performance
The solid performance of the RTX 3070 Ti with its 150 watt TGP is also reflected in gaming. All games run at high FPS. Even at maximum settings and with a corresponding external monitor, 4K resolutions are flawless.
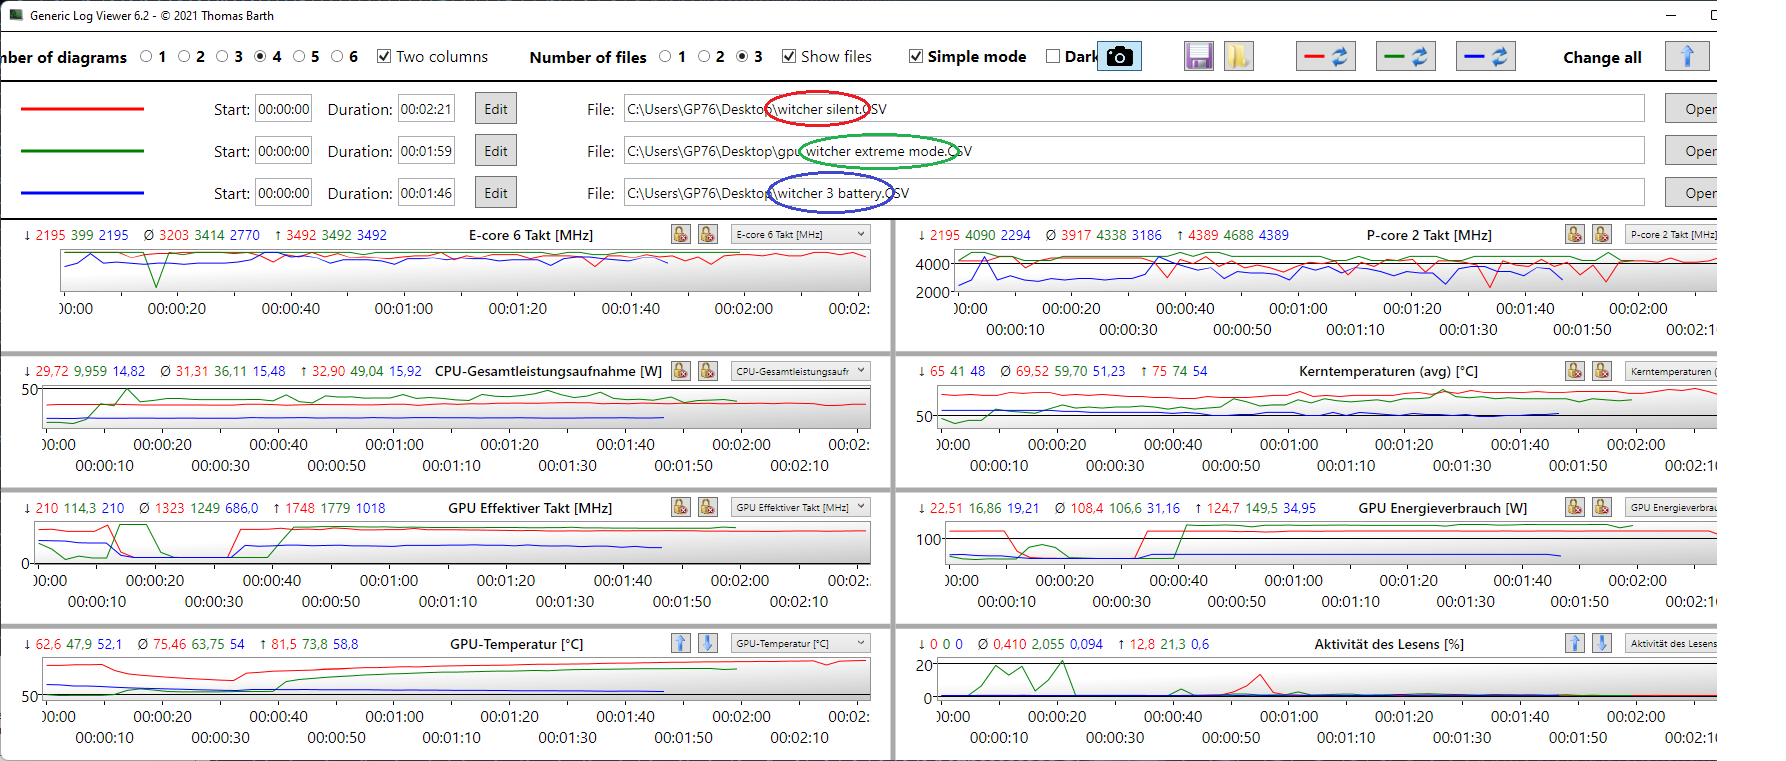
While The Witcher 3 reaches 113 FPS at maximum settings @FHD, this drops slightly to 105 FPS in Silent mode and to just under 24 FPS in Battery mode, so you have to reduce the details significantly without an external power supply.
The chart below shows the "Extreme", "Silent" and "Battery" modes. The TGP drops to about 125 watts in Silent mode. The GPU clock is almost fully utilized in Extreme mode at 1,780 MHz.
| Elden Ring | |
| 1920x1080 High Preset | |
| MSI Vector GP76 12UGS-434 | |
| Average NVIDIA GeForce RTX 3070 Ti Laptop GPU (59.8 - 59.9, n=2) | |
| 1920x1080 Maximum Preset | |
| Average NVIDIA GeForce RTX 3070 Ti Laptop GPU (46.3 - 59.7, n=2) | |
| MSI Vector GP76 12UGS-434 | |
| Elex 2 | |
| 1920x1080 High / On AA:FX AF:16x | |
| MSI Vector GP76 12UGS-434 | |
| Average NVIDIA GeForce RTX 3070 Ti Laptop GPU (83 - 99.4, n=3) | |
| Aorus 17 XE4 | |
| 1920x1080 Ultra / On AA:SM AF:16x | |
| MSI Vector GP76 12UGS-434 | |
| Average NVIDIA GeForce RTX 3070 Ti Laptop GPU (75 - 89, n=3) | |
| Aorus 17 XE4 | |
The Witcher 3 graph does not reveal frame drops and stutters in the tested modes.
Witcher 3 FPS Chart
| low | med. | high | ultra | |
|---|---|---|---|---|
| GTA V (2015) | 179.1 | 167.9 | 109.7 | |
| The Witcher 3 (2015) | 219 | 112.8 | ||
| Dota 2 Reborn (2015) | 164.8 | 150.7 | 140.9 | 134.5 |
| Final Fantasy XV Benchmark (2018) | 107.7 | |||
| X-Plane 11.11 (2018) | 139.1 | 114.7 | 91.1 | |
| Far Cry 5 (2018) | 147 | 138 | ||
| Strange Brigade (2018) | 263 | 222 | 195.1 | |
| Shadow of the Tomb Raider (2018) | 131 | 129 | ||
| Elden Ring (2022) | 59.9 | 46.3 | ||
| Elex 2 (2022) | 99.4 | 89 |
Emissions of the Vector GP76: Silent mode for the win
Noise
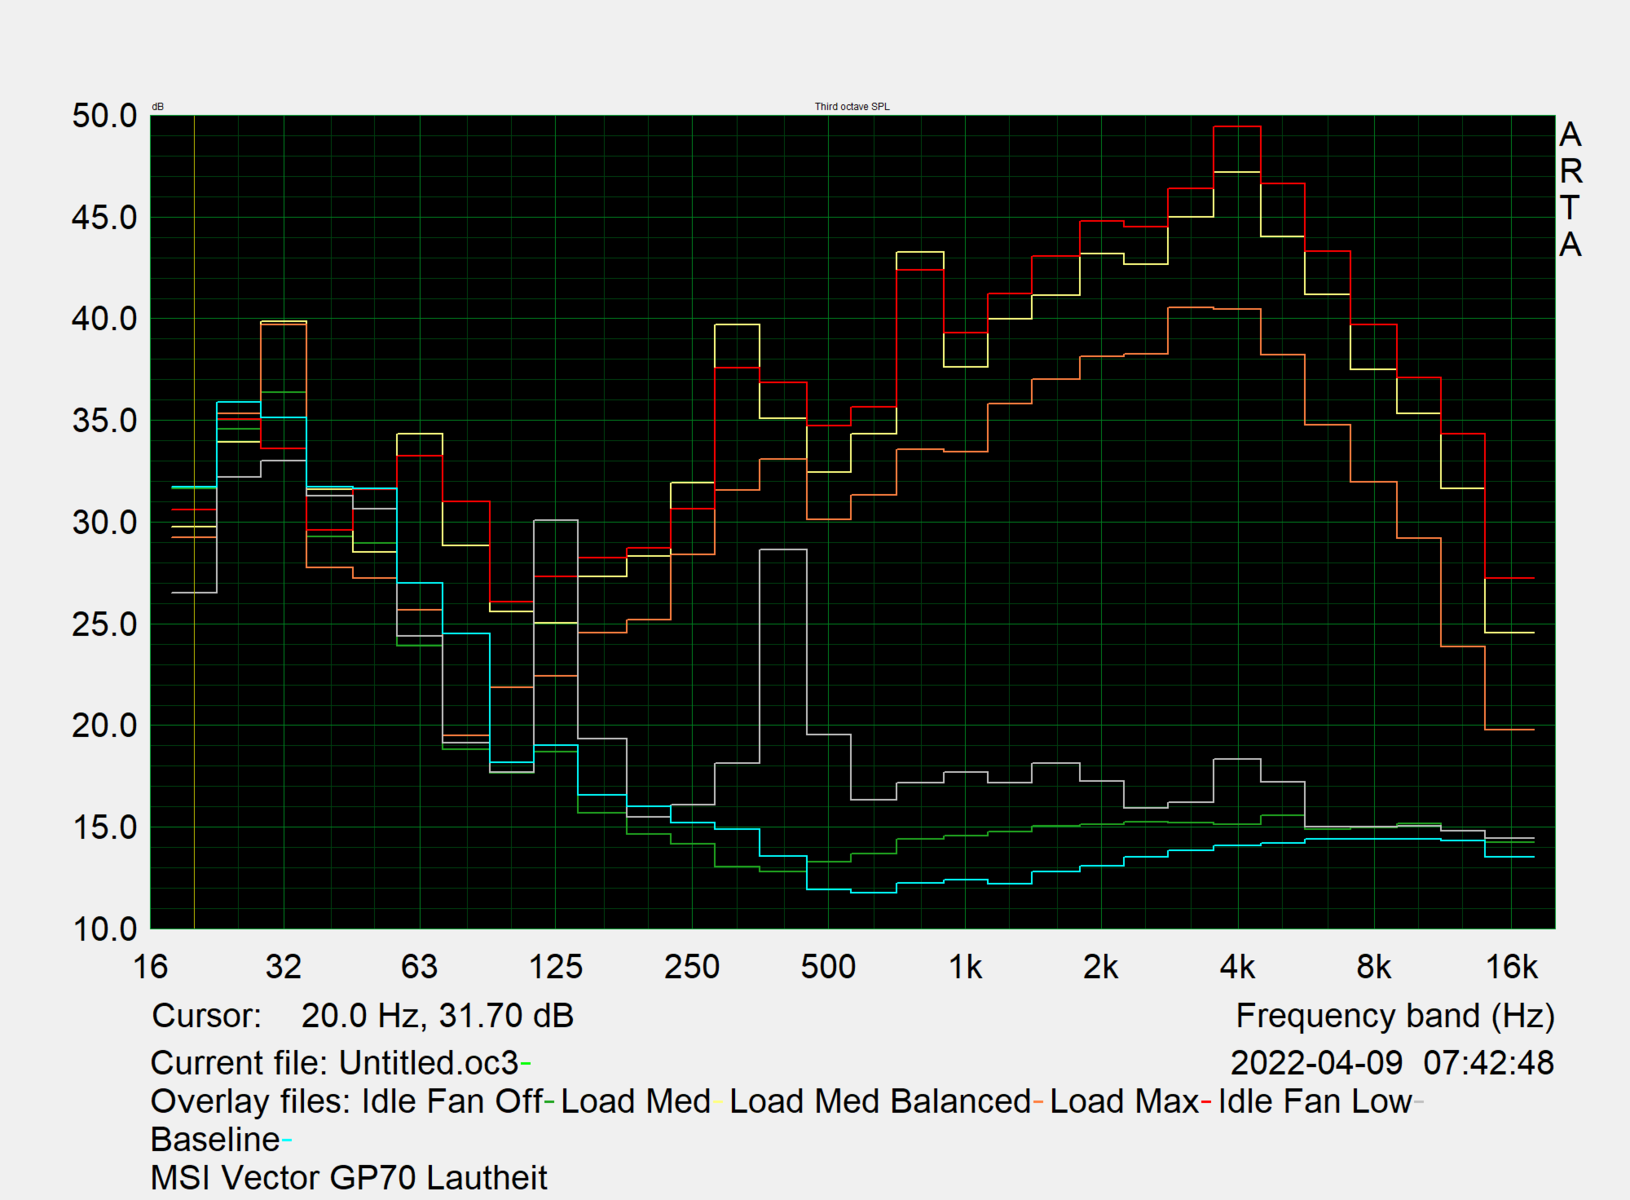
When idling, the MSI Vector GP76 is almost silent and since Silent mode does not restrict CPU performance, there is no overly annoying fan noise under appropriate load and no high-pitch frequencies can be heard.
When gaming in Extreme mode, however, it becomes quite loud to the point that it can be annoying. An external sound system or headphones would be appropriate here, or you can use Silent mode. But even in Balanced mode, the noise is much better with only very slight losses in performance.
Noise level
| Idle |
| 27 / 27 / 30.1 dB(A) |
| Load |
| 54.4 / 56.2 dB(A) |
 | ||
30 dB silent 40 dB(A) audible 50 dB(A) loud |
||
min: | ||
| MSI Vector GP76 12UGS-434 GeForce RTX 3070 Ti Laptop GPU, i7-12700H, Micron 2450 1TB MTFDKBA1T0TFK | MSI GP76 Leopard 10UG GeForce RTX 3070 Laptop GPU, i7-10750H, Kingston OM8PCP3512F-AB | Asus ROG Strix G17 G713QE-RB74 GeForce RTX 3050 Ti Laptop GPU, R7 5800H, Samsung PM991 MZVLQ512HBLU | Aorus 17 XE4 GeForce RTX 3070 Ti Laptop GPU, i7-12700H, Gigabyte AG470S1TB-SI B10 | Schenker XMG NEO 17 GM7TG8S GeForce RTX 3080 Laptop GPU, i7-11800H, Samsung SSD 980 Pro 1TB MZ-V8P1T0BW | Lenovo Legion 5 Pro 16 G7 i7 RTX 3070Ti GeForce RTX 3070 Ti Laptop GPU, i7-12700H, Samsung PM9A1 MZVL21T0HCLR | Asus ROG Zephyrus M16 GU603H GeForce RTX 3070 Laptop GPU, i9-11900H, Samsung PM9A1 MZVL22T0HBLB | MSI Vector GP66 12UGS GeForce RTX 3070 Ti Laptop GPU, i9-12900H | |
|---|---|---|---|---|---|---|---|---|
| Noise | -2% | 13% | -0% | 16% | 2% | -6% | 13% | |
| off / environment * (dB) | 25.6 | 24 6% | 24.9 3% | 24 6% | 23 10% | 24.6 4% | 25 2% | 22.9 11% |
| Idle Minimum * (dB) | 27 | 25 7% | 25.1 7% | 30 -11% | 23 15% | 28.4 -5% | 25 7% | 23.4 13% |
| Idle Average * (dB) | 27 | 32 -19% | 25.1 7% | 31 -15% | 23 15% | 28.4 -5% | 31 -15% | 23.4 13% |
| Idle Maximum * (dB) | 30.1 | 34 -13% | 25.1 17% | 34 -13% | 23 24% | 28.4 6% | 42 -40% | 27.4 9% |
| Load Average * (dB) | 54.4 | 54 1% | 36.3 33% | 44 19% | 39.5 27% | 49.4 9% | 48 12% | 36 34% |
| Load Maximum * (dB) | 56.2 | 54 4% | 49.9 11% | 49 13% | 55.09 2% | 54.7 3% | 56 -0% | 58 -3% |
| Witcher 3 ultra * (dB) | 51 | 49.9 | 51 | 54.5 | 49.4 | 52 | 58.2 |
* ... smaller is better
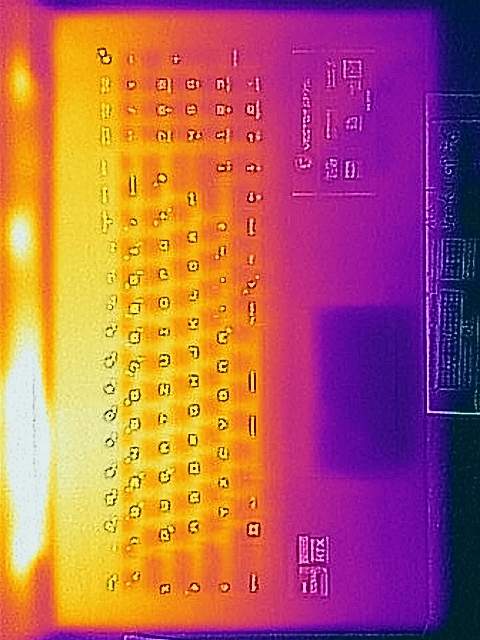
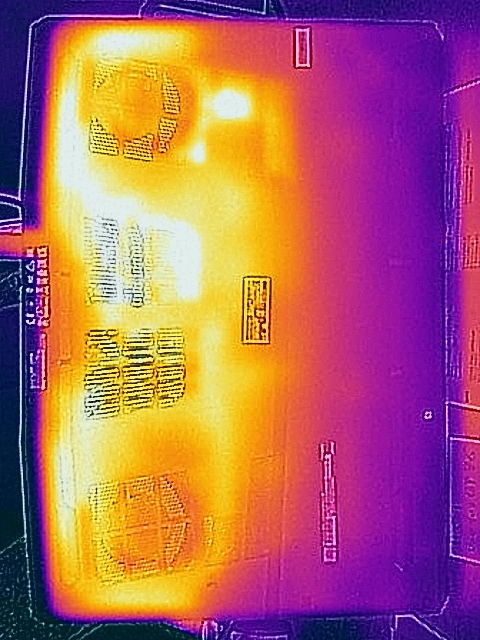
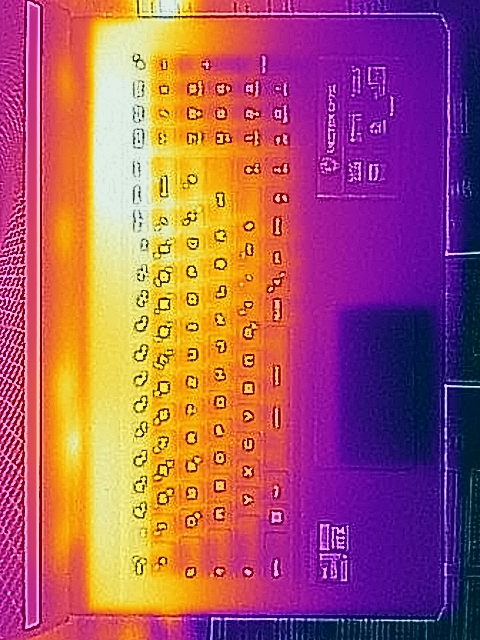
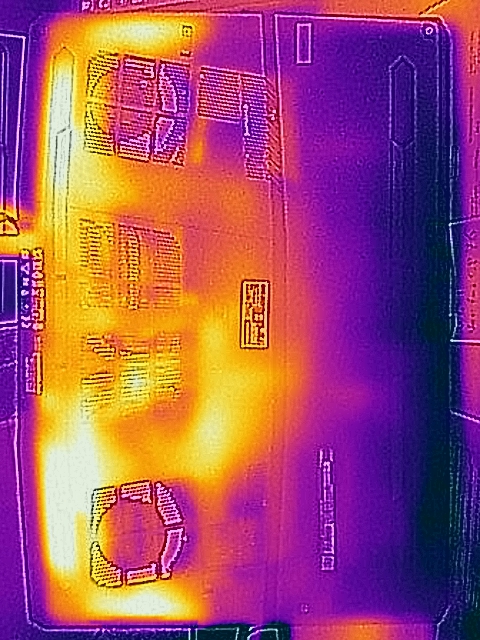
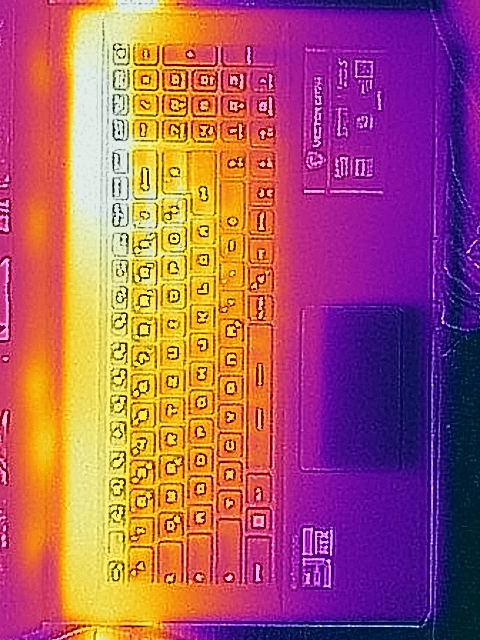
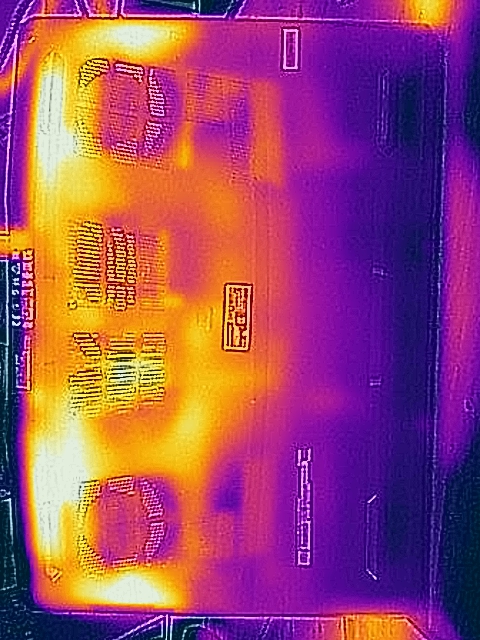
Temperature
MSI's gaming laptop is quite cool in every scenario except in Silent mode during gaming, when the fans spin much more slowly. However, surfaces never become too warm. Thinner devices like the MSI Stealth GS66 or the Razer Blade 15 struggle with significantly higher temperatures.
(-) The maximum temperature on the upper side is 46.3 °C / 115 F, compared to the average of 40.4 °C / 105 F, ranging from 21.2 to 68.8 °C for the class Gaming.
(±) The bottom heats up to a maximum of 45 °C / 113 F, compared to the average of 43.2 °C / 110 F
(+) In idle usage, the average temperature for the upper side is 30.8 °C / 87 F, compared to the device average of 33.9 °C / 93 F.
(±) Playing The Witcher 3, the average temperature for the upper side is 34.8 °C / 95 F, compared to the device average of 33.9 °C / 93 F.
(+) The palmrests and touchpad are cooler than skin temperature with a maximum of 27.4 °C / 81.3 F and are therefore cool to the touch.
(±) The average temperature of the palmrest area of similar devices was 28.8 °C / 83.8 F (+1.4 °C / 2.5 F).
| MSI Vector GP76 12UGS-434 Intel Core i7-12700H, NVIDIA GeForce RTX 3070 Ti Laptop GPU | MSI GP76 Leopard 10UG Intel Core i7-10750H, NVIDIA GeForce RTX 3070 Laptop GPU | Asus ROG Strix G17 G713QE-RB74 AMD Ryzen 7 5800H, NVIDIA GeForce RTX 3050 Ti Laptop GPU | Aorus 17 XE4 Intel Core i7-12700H, NVIDIA GeForce RTX 3070 Ti Laptop GPU | Schenker XMG NEO 17 GM7TG8S Intel Core i7-11800H, NVIDIA GeForce RTX 3080 Laptop GPU | Lenovo Legion 5 Pro 16 G7 i7 RTX 3070Ti Intel Core i7-12700H, NVIDIA GeForce RTX 3070 Ti Laptop GPU | Asus ROG Zephyrus M16 GU603H Intel Core i9-11900H, NVIDIA GeForce RTX 3070 Laptop GPU | MSI Vector GP66 12UGS Intel Core i9-12900H, NVIDIA GeForce RTX 3070 Ti Laptop GPU | |
|---|---|---|---|---|---|---|---|---|
| Heat | 7% | -0% | -2% | -12% | 0% | -12% | 4% | |
| Maximum Upper Side * (°C) | 46.3 | 43 7% | 43.8 5% | 50 -8% | 51 -10% | 45.3 2% | 52 -12% | 40.2 13% |
| Maximum Bottom * (°C) | 45 | 47 -4% | 47.2 -5% | 58 -29% | 62 -38% | 61.2 -36% | 53 -18% | 43.8 3% |
| Idle Upper Side * (°C) | 34.2 | 30 12% | 33.4 2% | 30 12% | 35 -2% | 28.6 16% | 38 -11% | 34.8 -2% |
| Idle Bottom * (°C) | 38.3 | 33 14% | 39.4 -3% | 32 16% | 38 1% | 31.4 18% | 41 -7% | 37 3% |
* ... smaller is better
Stress Test
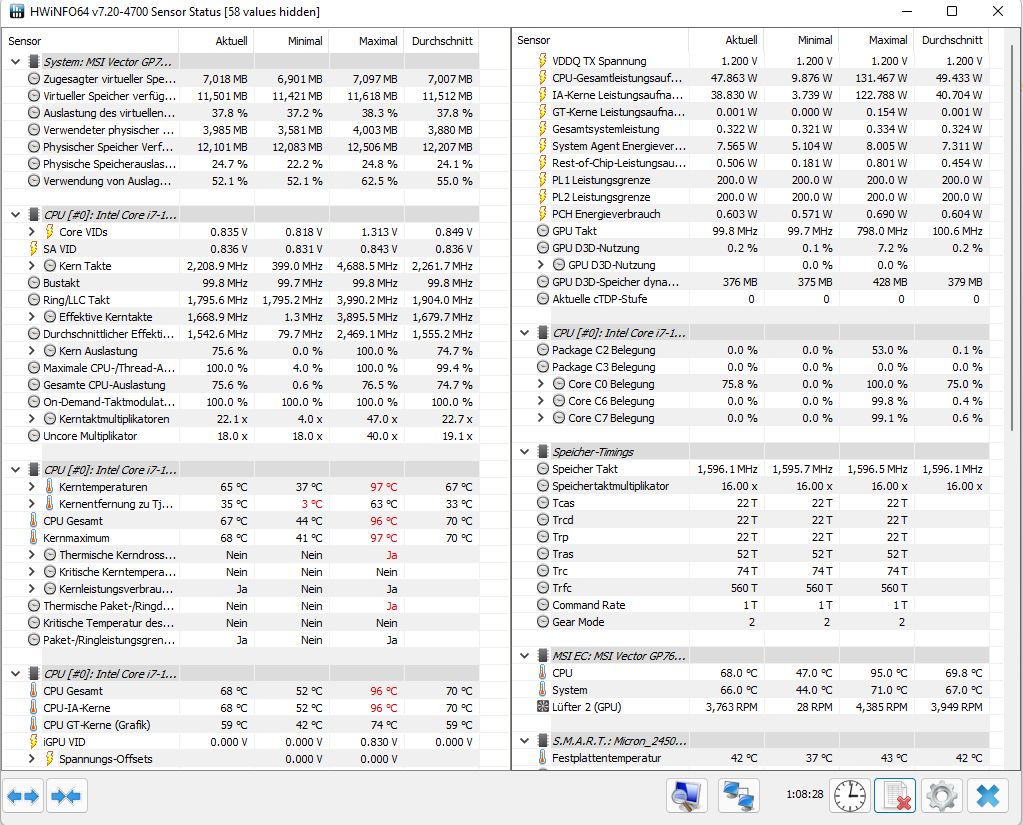
At 2.3 GHz, the CPU only works 100 MHz below the base clock speed in the combined stress test (Prime95 + FurMark), while the smaller Vector GP66 only manages 1 GHz. The GPU can also perform at full clock speed in this extreme scenario. So throttling does not come into play, and no performance reduction can be seen in the 3D benchmark directly after the stress test.
The processor initially began at 131 watts, but this was quickly throttled down to 50 watts, which kept core temperatures very low. The temperatures of the Nvidia GPU can also be described as very inconspicuous, although it still consumes over 140 watts. Under pure CPU stress, it allows itself a constant 70 watts (extreme mode) and remains quite cool at 76°C.
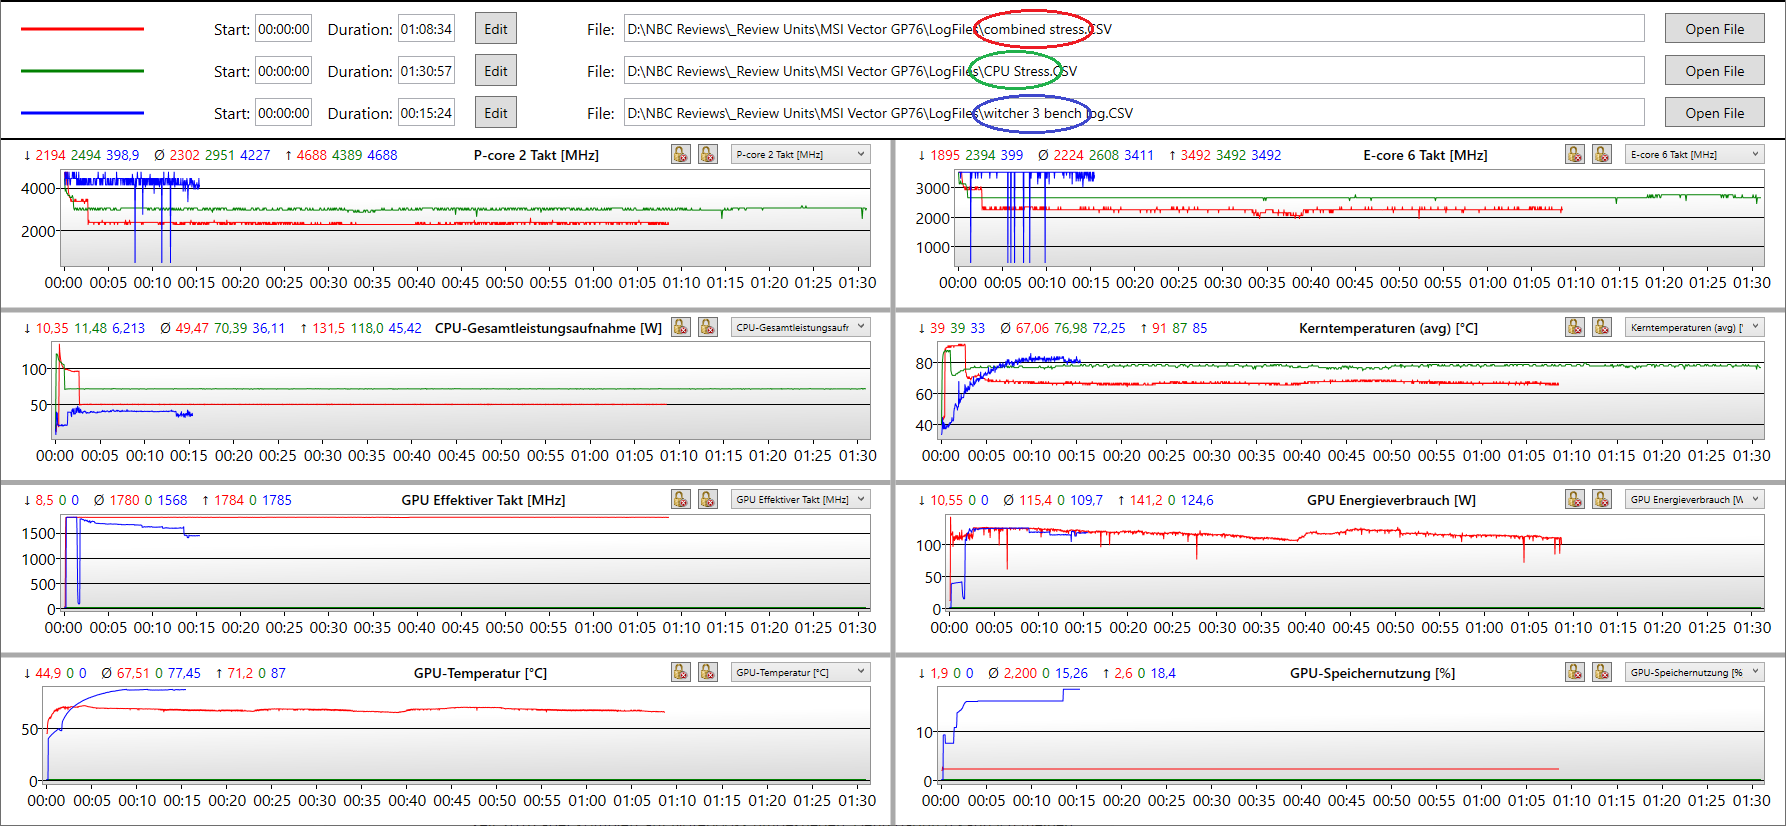
| CPU Clock (GHz) | GPU Clock (MHz) | Average CPU Temperature (°C) | Average GPU Temperature (°C) | |
| System Idle | -- | 200 | 36 | 40 |
| Prime95 Stress | 2.6 | 200 | 77 | -- |
| Prime95 + FurMark Stress | 2.2 | 1.780 | 67 | 68 |
| Witcher 3 Stress | 3.4 | 1.780 | 82 | 78 |
| Witcher 3 @Battery | 3.2 | 1.000 | 51 | 59 |
Speakers
The speakers are decent, even if Asus goes one better with its SCAR series. But they are certainly better than Gigabyte's Aorus series.
Trebles and mids are reproduced very well, while bass is rudimentary. The maximum volume is good. You can't get much more out of a stereo speaker system with 2x 2.5 watts.
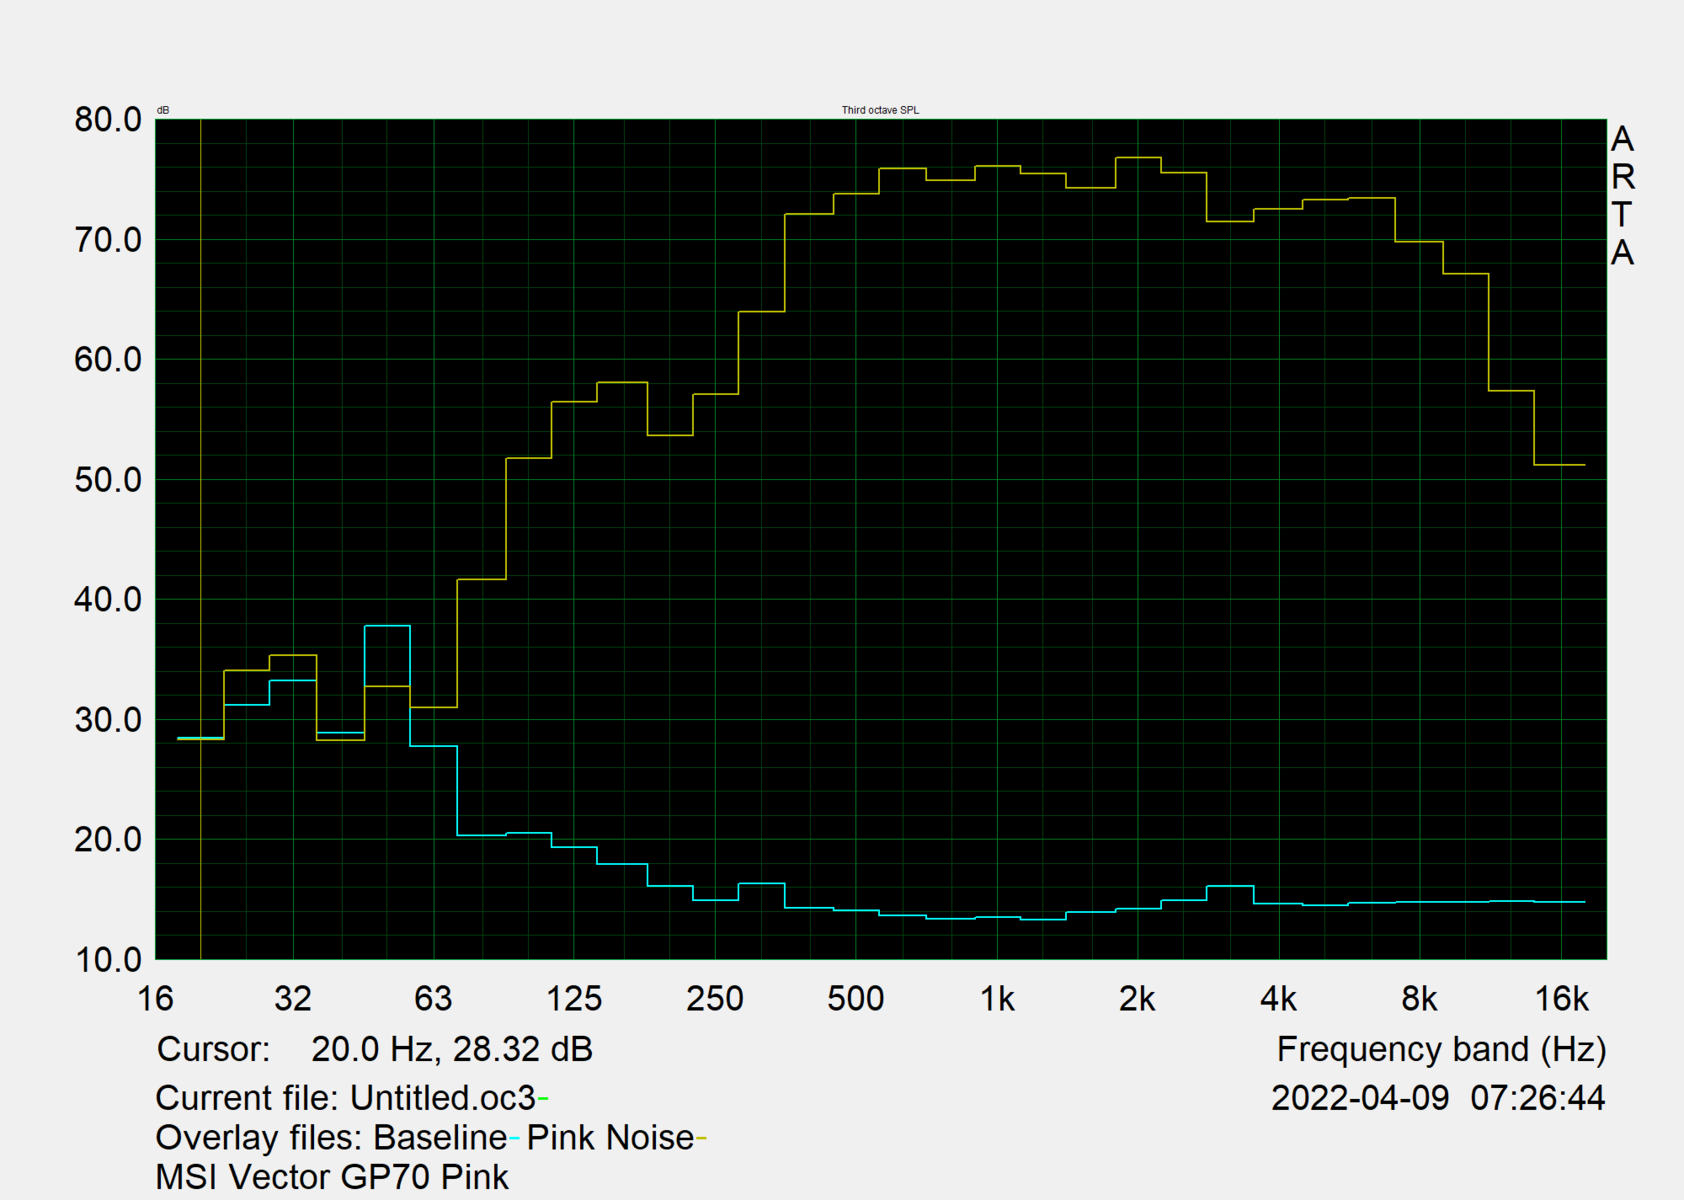
MSI Vector GP76 12UGS-434 audio analysis
(±) | speaker loudness is average but good (76.7 dB)
Bass 100 - 315 Hz
(-) | nearly no bass - on average 15.3% lower than median
(±) | linearity of bass is average (9% delta to prev. frequency)
Mids 400 - 2000 Hz
(+) | balanced mids - only 2.8% away from median
(+) | mids are linear (4% delta to prev. frequency)
Highs 2 - 16 kHz
(+) | balanced highs - only 2% away from median
(+) | highs are linear (3.4% delta to prev. frequency)
Overall 100 - 16.000 Hz
(+) | overall sound is linear (12.6% difference to median)
Compared to same class
» 16% of all tested devices in this class were better, 3% similar, 81% worse
» The best had a delta of 6%, average was 18%, worst was 132%
Compared to all devices tested
» 11% of all tested devices were better, 2% similar, 86% worse
» The best had a delta of 4%, average was 24%, worst was 134%
Asus ROG Strix G17 G713QE-RB74 audio analysis
(±) | speaker loudness is average but good (73.5 dB)
Bass 100 - 315 Hz
(±) | reduced bass - on average 13% lower than median
(±) | linearity of bass is average (9.8% delta to prev. frequency)
Mids 400 - 2000 Hz
(±) | higher mids - on average 5.6% higher than median
(+) | mids are linear (6.5% delta to prev. frequency)
Highs 2 - 16 kHz
(+) | balanced highs - only 3.4% away from median
(±) | linearity of highs is average (12% delta to prev. frequency)
Overall 100 - 16.000 Hz
(±) | linearity of overall sound is average (16.9% difference to median)
Compared to same class
» 44% of all tested devices in this class were better, 11% similar, 45% worse
» The best had a delta of 6%, average was 18%, worst was 132%
Compared to all devices tested
» 30% of all tested devices were better, 8% similar, 62% worse
» The best had a delta of 4%, average was 24%, worst was 134%
Power Management: MSI improves battery life on the Vector GP76
Power Consumption

For a gaming machine, the idle consumption of 15.6 watts is average to good, while the standby consumption of 0.5 watts is pleasing and promises a standby time of more than 5 days (usually much longer in practice).
Permanent maximum consumption under combined load and gaming lies just under 200 watts. In principle, a high value is good here, meaning that the GPU can consume a lot of power and thus work faster. Under pure CPU load, the value (according to HWInfo) should be between 50 and 80 watts, depending on the mode.
In Balanced and Silent mode, the consumption values are lower according to the table above ("Test Conditions"). A peak load of just under 320 watts only occurs very briefly at the beginning of the combined stress test and does not occur in everyday use. Overall, the 280 watt power supply unit is sufficiently sized.
| Off / Standby | |
| Idle | |
| Load |
|
Key:
min: | |
| MSI Vector GP76 12UGS-434 i7-12700H, GeForce RTX 3070 Ti Laptop GPU, Micron 2450 1TB MTFDKBA1T0TFK, IPS, 1920x1080, 17.3" | MSI GP76 Leopard 10UG i7-10750H, GeForce RTX 3070 Laptop GPU, Kingston OM8PCP3512F-AB, IPS, 1920x1080, 17.3" | Asus ROG Strix G17 G713QE-RB74 R7 5800H, GeForce RTX 3050 Ti Laptop GPU, Samsung PM991 MZVLQ512HBLU, IPS, 1920x1080, 17.3" | Aorus 17 XE4 i7-12700H, GeForce RTX 3070 Ti Laptop GPU, Gigabyte AG470S1TB-SI B10, IPS, 1920x1080, 17.3" | Schenker XMG NEO 17 GM7TG8S i7-11800H, GeForce RTX 3080 Laptop GPU, Samsung SSD 980 Pro 1TB MZ-V8P1T0BW, IPS, 2560x1440, 17.3" | Lenovo Legion 5 Pro 16 G7 i7 RTX 3070Ti i7-12700H, GeForce RTX 3070 Ti Laptop GPU, Samsung PM9A1 MZVL21T0HCLR, IPS, 2560x1600, 16" | Asus ROG Zephyrus M16 GU603H i9-11900H, GeForce RTX 3070 Laptop GPU, Samsung PM9A1 MZVL22T0HBLB, IPS, 2560x1600, 16" | MSI Vector GP66 12UGS i9-12900H, GeForce RTX 3070 Ti Laptop GPU, , IPS, 1920x1080, 15.6" | Average NVIDIA GeForce RTX 3070 Ti Laptop GPU | Average of class Gaming | |
|---|---|---|---|---|---|---|---|---|---|---|
| Power Consumption | 10% | 29% | -12% | -12% | 12% | 8% | -24% | -0% | 6% | |
| Idle Minimum * (Watt) | 13.5 | 12 11% | 9.2 32% | 20 -48% | 19 -41% | 8.6 36% | 11 19% | 17.5 -30% | 14.2 ? -5% | 13.2 ? 2% |
| Idle Average * (Watt) | 15.6 | 16 -3% | 12.6 19% | 23 -47% | 25 -60% | 17.6 -13% | 20 -28% | 20.1 -29% | 19.9 ? -28% | 18.9 ? -21% |
| Idle Maximum * (Watt) | 20.6 | 28 -36% | 23.3 -13% | 28 -36% | 28 -36% | 18.5 10% | 30 -46% | 47.3 -130% | 26.2 ? -27% | 24.3 ? -18% |
| Load Average * (Watt) | 198 | 92 54% | 89.3 55% | 120 39% | 105 47% | 110 44% | 111 44% | 107.3 46% | 125.8 ? 36% | 108 ? 45% |
| Witcher 3 ultra * (Watt) | 199 | 198 1% | 136 32% | 196 2% | 223 -12% | 227 -14% | 156 22% | 225 -13% | ||
| Load Maximum * (Watt) | 319 | 210 34% | 162.7 49% | 257 19% | 226 29% | 294.6 8% | 197 38% | 277.7 13% | 248 ? 22% | 254 ? 20% |
* ... smaller is better
Power Consumption Witcher 3 / Stress test
Power Consumption with external monitor
Battery Life
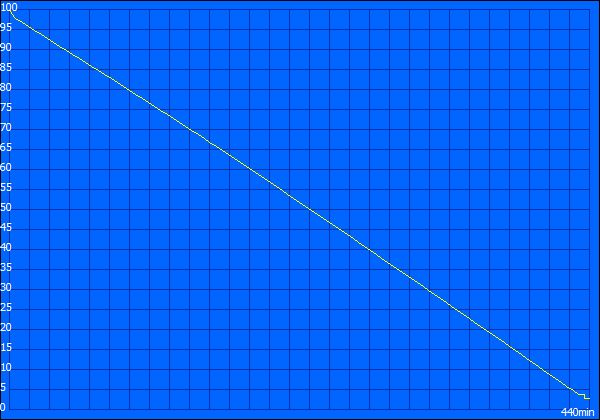
The battery life has improved by 20% on average compared to the predecessor. The rest of the test field does not offer much more even with stronger batteries, apart from the slim Zephyrus M16.
Just over 5 hours were possible in our WLAN test at 150 cd/m² brightness in balanced Windows performance mode. The 65 Wh battery took almost 2.5 hours to be fully recharged. This is significantly longer than many other notebooks of any class.
| MSI Vector GP76 12UGS-434 i7-12700H, GeForce RTX 3070 Ti Laptop GPU, 65 Wh | MSI GP76 Leopard 10UG i7-10750H, GeForce RTX 3070 Laptop GPU, 65 Wh | Asus ROG Strix G17 G713QE-RB74 R7 5800H, GeForce RTX 3050 Ti Laptop GPU, 56 Wh | Aorus 17 XE4 i7-12700H, GeForce RTX 3070 Ti Laptop GPU, 99 Wh | Schenker XMG NEO 17 GM7TG8S i7-11800H, GeForce RTX 3080 Laptop GPU, 62 Wh | Lenovo Legion 5 Pro 16 G7 i7 RTX 3070Ti i7-12700H, GeForce RTX 3070 Ti Laptop GPU, 80 Wh | Asus ROG Zephyrus M16 GU603H i9-11900H, GeForce RTX 3070 Laptop GPU, 90 Wh | MSI Vector GP66 12UGS i9-12900H, GeForce RTX 3070 Ti Laptop GPU, 65 Wh | Average of class Gaming | |
|---|---|---|---|---|---|---|---|---|---|
| Battery runtime | -31% | 12% | 4% | -17% | -30% | 42% | -7% | 14% | |
| Reader / Idle (h) | 7.3 | 5.6 -23% | 11.1 52% | 8.6 18% | 13.3 82% | 7.9 8% | 8.71 ? 19% | ||
| WiFi v1.3 (h) | 5.1 | 4.2 -18% | 6 18% | 5.1 0% | 3.7 -27% | 5.4 6% | 7.7 51% | 5.7 12% | 7.02 ? 38% |
| Load (h) | 1.7 | 0.8 -53% | 1.1 -35% | 1.6 -6% | 1.6 -6% | 0.6 -65% | 1.6 -6% | 1 -41% | 1.47 ? -14% |
| H.264 (h) | 6.1 | 3.7 | 6.3 | 8.26 ? |
Pros
Cons
Verdict: Top performance on all levels thanks to MSI Vector graphics

The advantages are clear: The Vector GP76 is a real gamer with its 360 Hz display and super-fast response times. In addition, the Core i7-12700H has double the power of the CPU in its predecessor and another highlight is the Nvidia RTX 3070 Ti with a real power consumption of 150 watts. This places the device in the top range of our database.
The Vector can also operate rather quietly, offers a full sound range, improved battery runtimes, a key-configurable RGB keyboard, a very stable chassis and good upgrade options. Moreover, the display produces a nice, rich and clear picture, but could shine a little more brightly and offer higher resolutions as options.
The MSI Vector GP76 operates with speed on all levels: Display, CPU and a GPU with 150-watt TGP. Criticism only applies to minor areas such as the somewhat dark screen.
Furthermore, there is no Thunderbolt and no Power Delivery via USB-C. The power supply is heavy and bulky, and there is no SD card reader. The SSD is not the fastest on the market and performance is significantly reduced in battery mode. In addition, the price of currently US$ 2,649 is a little steep.
If you can live with these limitations, you get a very solid gaming machine. Alternatively, you can go for the Zephyrus M16 if compactness is more important to you than full performance, or the Legion 5 Pro for better value, a brighter screen, a better keyboard and the unleashed Core i9. The Asus ROG Strix G17 is also a good choice with the right configuration (QHD display + RTX 3070) because not only is it affordable and extremely robust, it is very quiet and cool thanks to AMD. It also has the best keyboard in its class.
Price and Availability
Our review model (12UGS-434) does not appear to be available outside Germany at the time of publishing. Instead, Amazon US offers two variations in the form of the 12UGS-298 and the 12UGS-61. The former comes with an Intel i7-12700H and the latter an Intel i9-12900HK. Prices begin at US$ 2,449.00 and US$ 2,649.00, respectively, and are subject to change depending on the chosen SSD configuration.
MSI Vector GP76 12UGS-434
- 05/06/2022 v7 (old)
Marvin Gollor
Price comparison

