MSI Stealth GS66 12UGS gaming laptop review: Powerful enough for QHD

Three models of the latest GS66 generation are currently listed on MSI's German website. While the GS66 12UGS in review and the GS66 12UH are equipped with a Core i7-12700H, 32 GB of DDR5 RAM, and a QHD panel, the GS66 12UHS can be configured with a Core i9-12900H, 64 GB of RAM, and a UHD display. Depending on the version, a GeForce RTX 3070 Ti, GeForce RTX 3080, or GeForce RTX 3080 Ti is used as the graphics card. Common to all models is Windows 11 Pro as the operating system. The price of the new GS66 starts at 3,149 Euros (~$3,580) - a considerable amount. The top model will even set you back 4,899 Euros (~$5,569).
The competitors of the GS66 12UGS include 15-inch laptops with the "classic" RTX 3070 and comparable TGPs, such as the Asus TUF A15 FA506QR, the Gigabyte Aero 15 OLED XD, the Alienware x15 P111F, and the Eurocom Nightsky ARX15. These laptops appear in the tables as comparison devices.
Possible contenders in comparison
Rating | Date | Model | Weight | Height | Size | Resolution | Price |
|---|---|---|---|---|---|---|---|
| 84.5 % v7 (old) | 02 / 2022 | MSI Stealth GS66 12UGS i7-12700H, GeForce RTX 3070 Ti Laptop GPU | 2.2 kg | 19.8 mm | 15.60" | 2560x1440 | |
| 85 % v7 (old) | 07 / 2021 | Asus TUF Gaming A15 FA506QR-AZ061T R7 5800H, GeForce RTX 3070 Laptop GPU | 2.3 kg | 24 mm | 15.60" | 1920x1080 | |
| 85.6 % v7 (old) | 08 / 2021 | Gigabyte Aero 15 OLED XD i7-11800H, GeForce RTX 3070 Laptop GPU | 2.2 kg | 20 mm | 15.60" | 3840x2160 | |
| 87.2 % v7 (old) | 09 / 2021 | Alienware x15 RTX 3070 P111F i7-11800H, GeForce RTX 3070 Laptop GPU | 2.4 kg | 15.9 mm | 15.60" | 2560x1440 | |
| 83 % v7 (old) | 01 / 2022 | Eurocom Nightsky ARX315 R9 5900X, GeForce RTX 3070 Laptop GPU | 2.6 kg | 32.5 mm | 15.60" | 1920x1080 |
Case
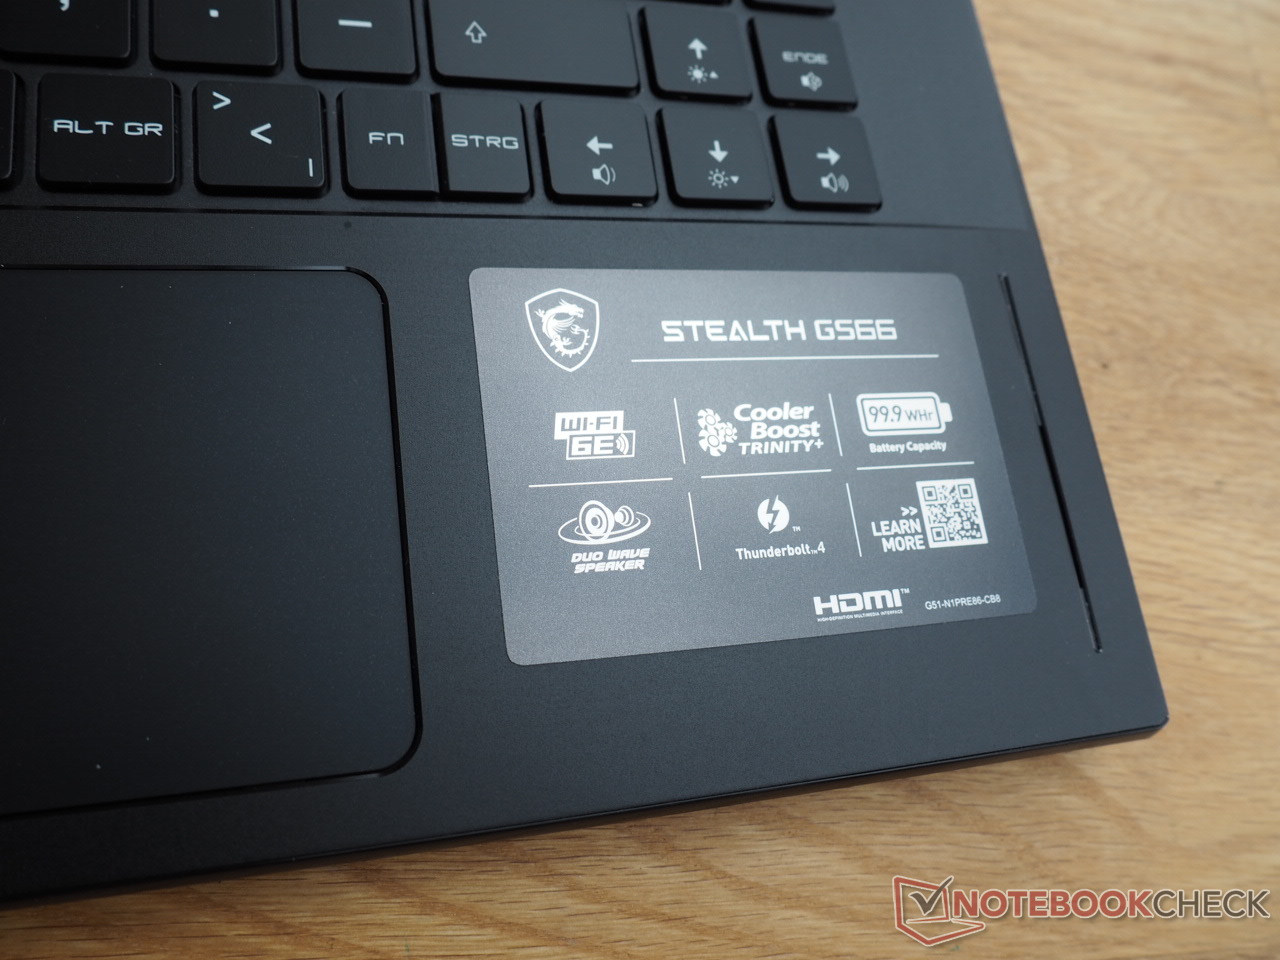
At first glance, the case closely resembles that of the GS66 10UG reviewed in 2021. However, some changes have been made by MSI when it comes to the details. For example, one of the USB-A ports has been replaced by a Type-C counterpart. Furthermore, there's now a fingerprint sensor in the upper left corner of the touchpad.
The general build of the case along with its advantages and disadvantages has remained unchanged. One of the GS66's biggest strengths is its compact design. With a width of 35.8 cm and a depth of 24.8 cm, the 15-incher takes up the smallest footprint among the test field. The Stealth is only beaten by the Alienware x15 in terms of height (19.8 mm). Things look similarly good regarding the weight. 2.2 kg, which is the same as the Gigabyte Aero 15, is pleasantly light by gaming standards as well as easy to transport.
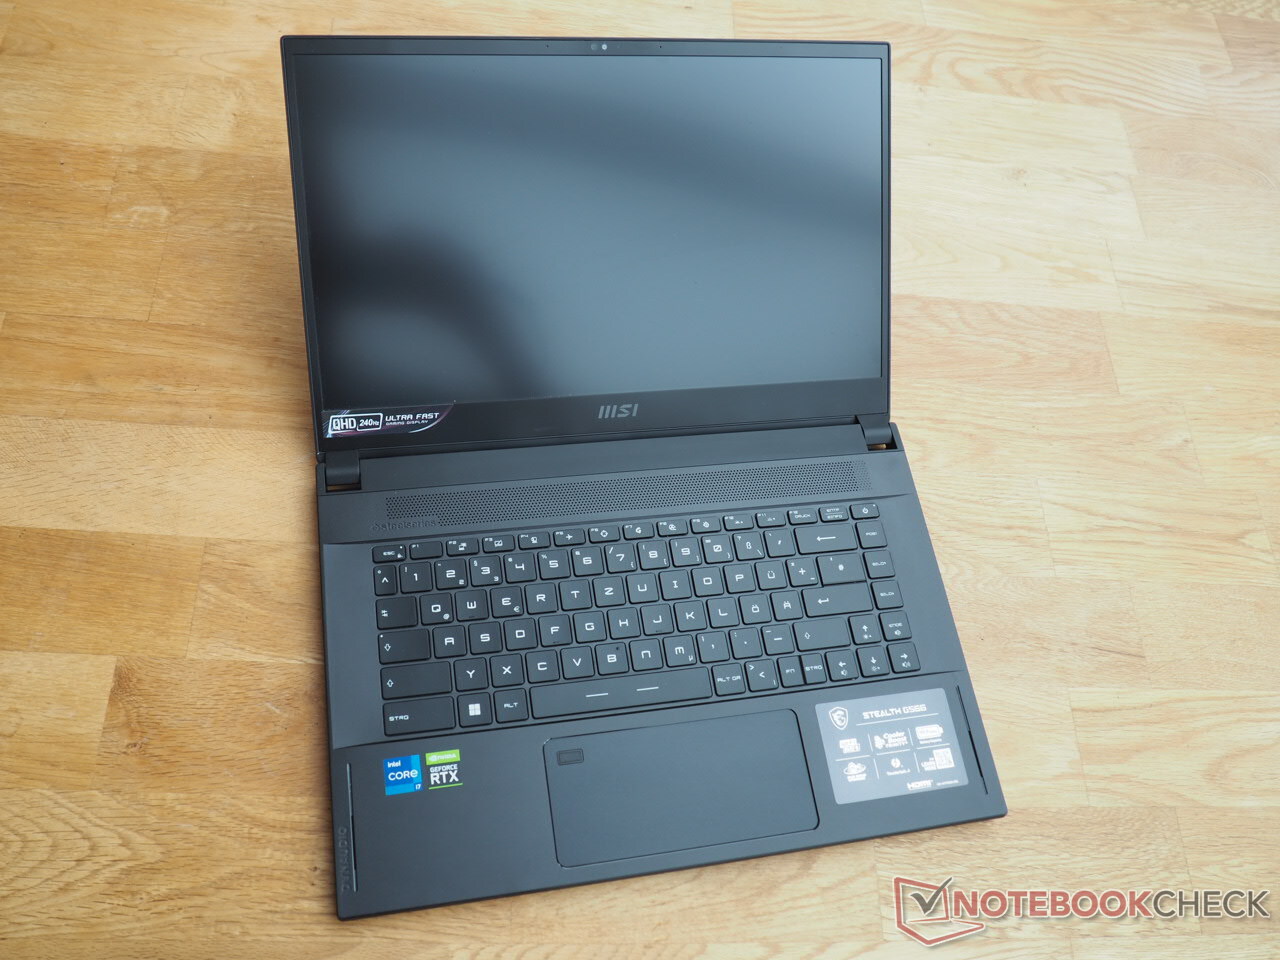
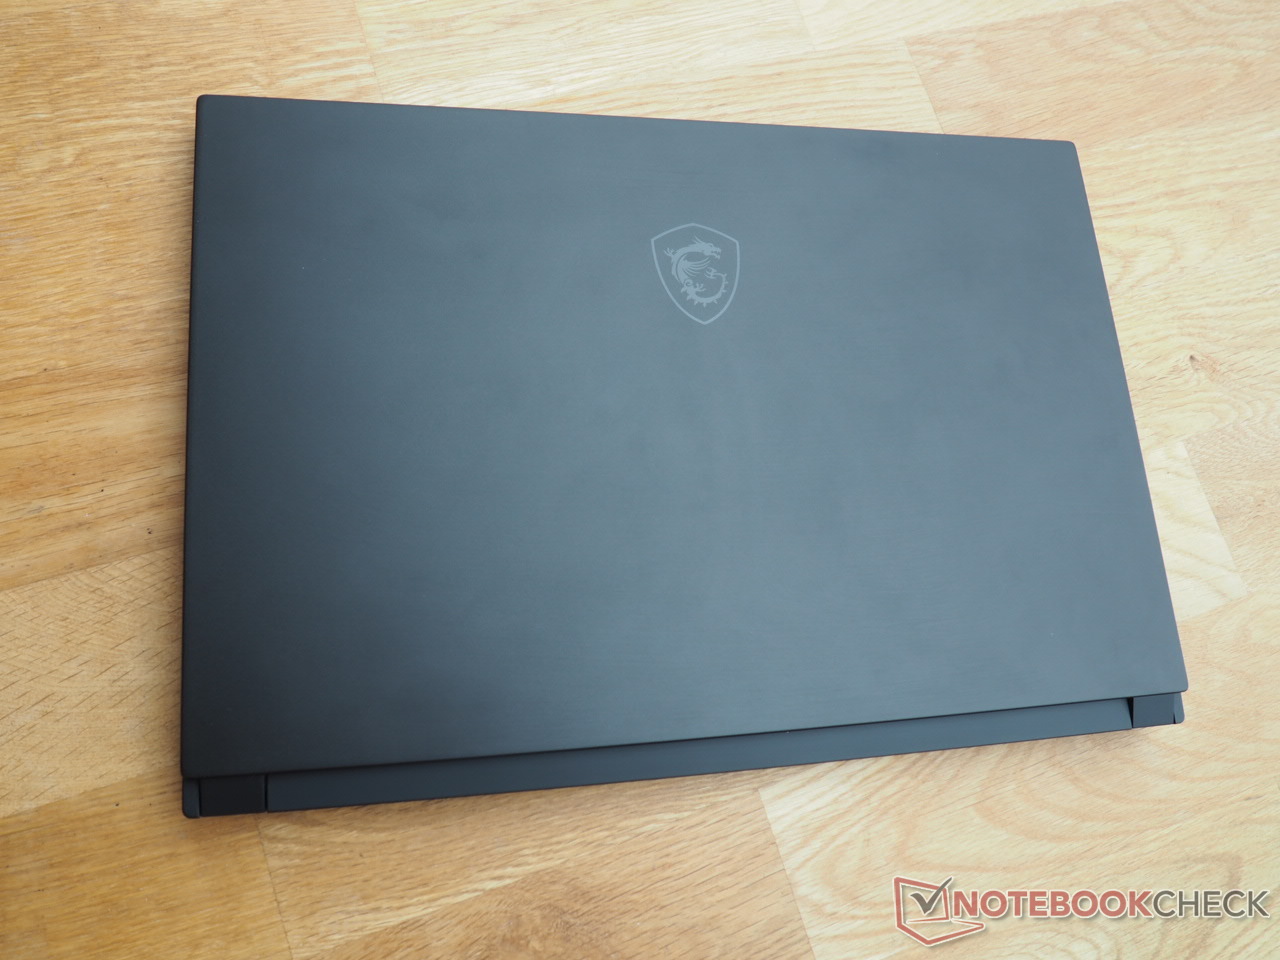
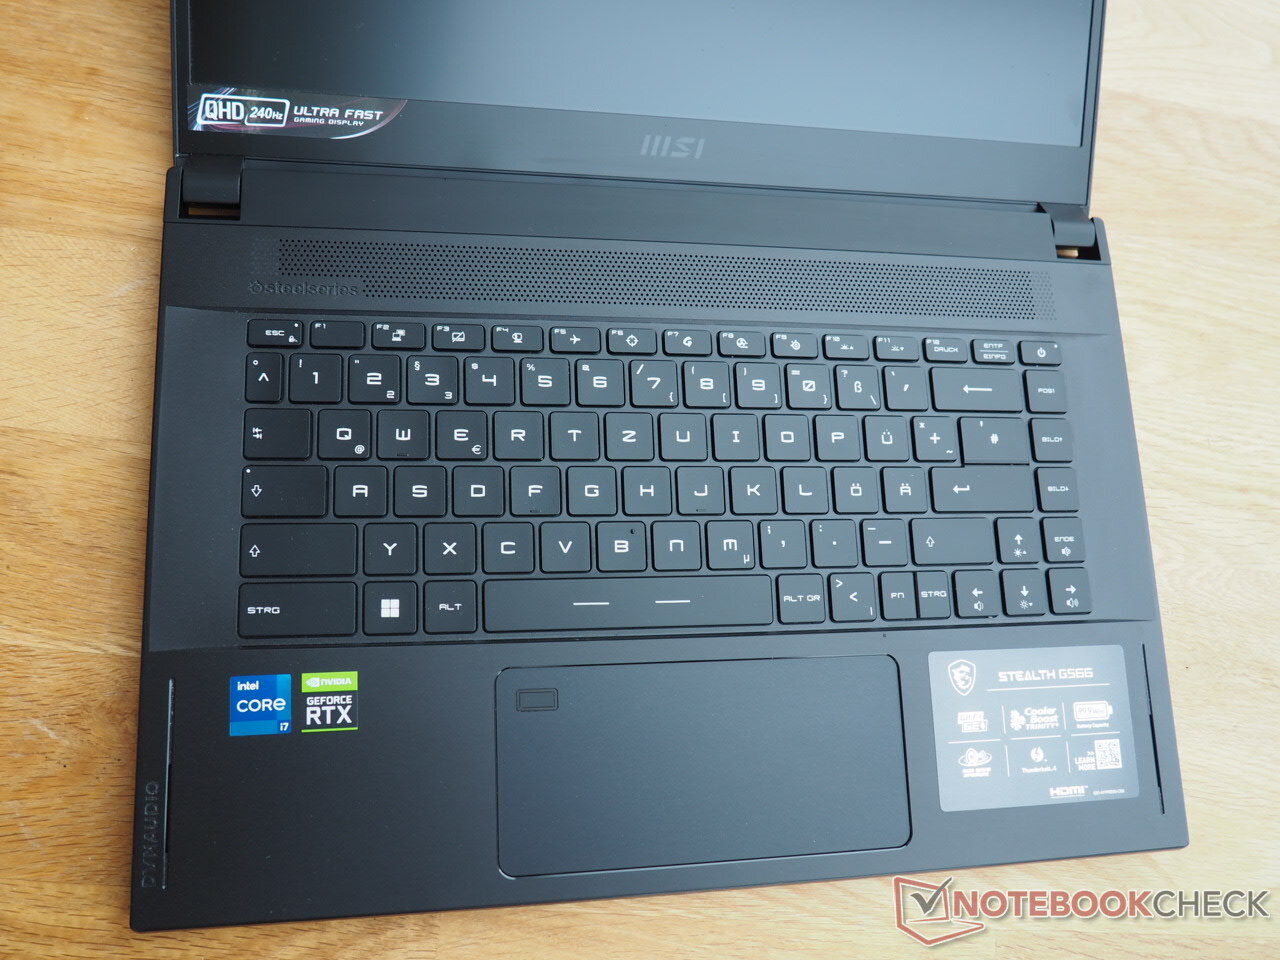
In terms of looks, besides the colorful keyboard illumination, the chassis is rather unimpressive, which might be appreciated by some buyers. Thanks to the use of metal, the matte black surfaces look very high quality. Workmanship is also good, although the transition between the base unit and bottom cover could be a bit more refined.
Stability is okay for such a low-profile case. The keyboard and touchpad flex a bit, and the lid could have used more resistance to torsion. The hinges do a passable job. The wide opening angle of 180° is especially praiseworthy.
Connectivity
Ports
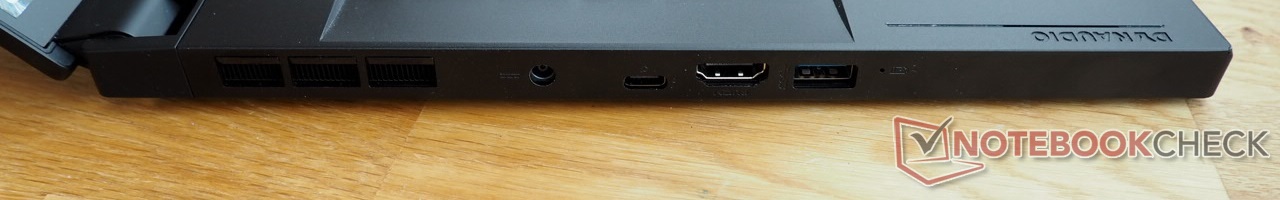
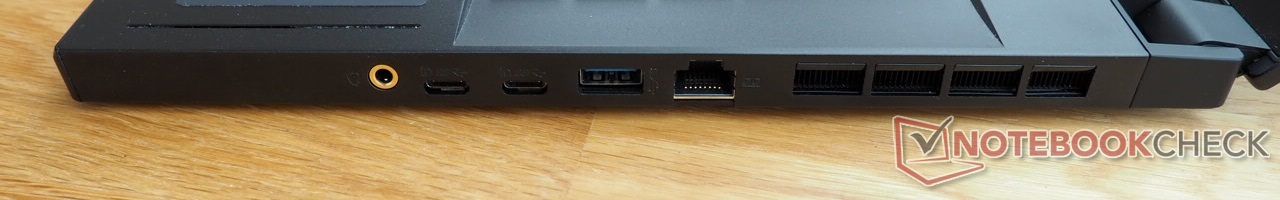
If you ignore the absence of a card reader, connectivity cuts a very fine figure. Despite the low build height, a full-fledged RJ45 port is on board. In addition, there's an audio jack, a modern HDMI 2.1 port (4K @120Hz), and a total of five USB ports, three of which are in the Type-C format and support the DisplayPort function. MSI even uses Thunderbolt 4 for one of the Type-C ports.
The distribution of the interfaces is a bit disappointing. Since the rear areas of the sides are taken up by fan outlets, the ports are located quite far in front, which can lead to collisions and space restrictions when using an external mouse, depending on the amount of cables involved.
Communication
After we recently updated our router setup (an Asus ROG Rapture GT-AXE11000 is used now), the results obtained aren't comparable 1:1 with older tests, which is why the values of the competition are missing. The Killer 6E AX1675i chip built into the GS66 delivers a very good performance all the same. Wired network connectivity supports up to 2.5 Gigabit (Killer E3100G).
| Networking - iperf3 receive AXE11000 | |
| MSI Stealth GS66 12UGS | |
| Average of class Gaming (680 - 1745, n=88, last 2 years) | |
Webcam
As with almost any gaming laptop, the webcam's quality is very low. In addition to color accuracy, image sharpness is also lacking - which can be seen in our photos.


Accessories
The box includes a 240-watt power adapter weighing just under 600 g, and a few information booklets.
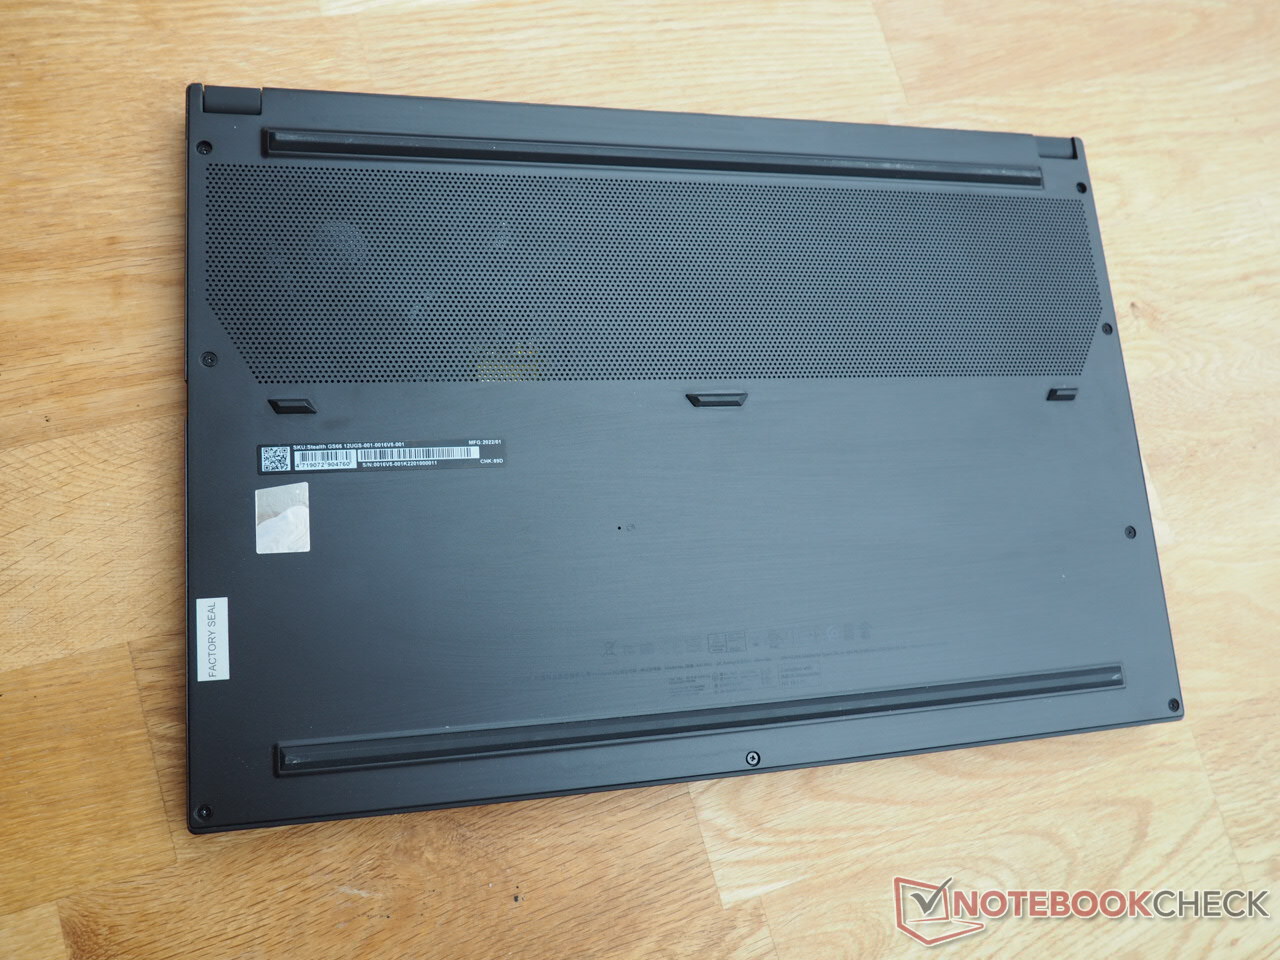
Maintenance
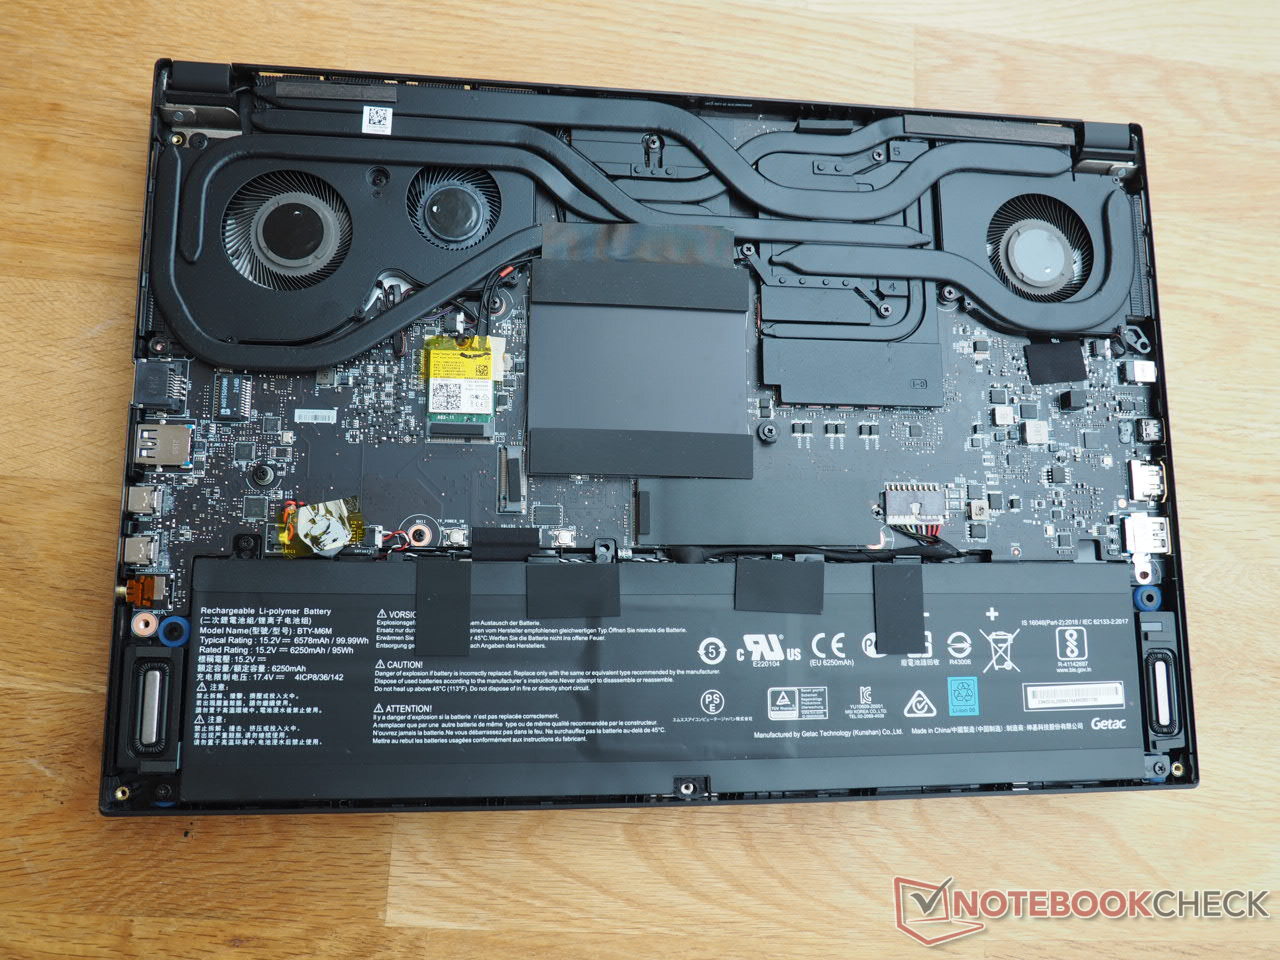
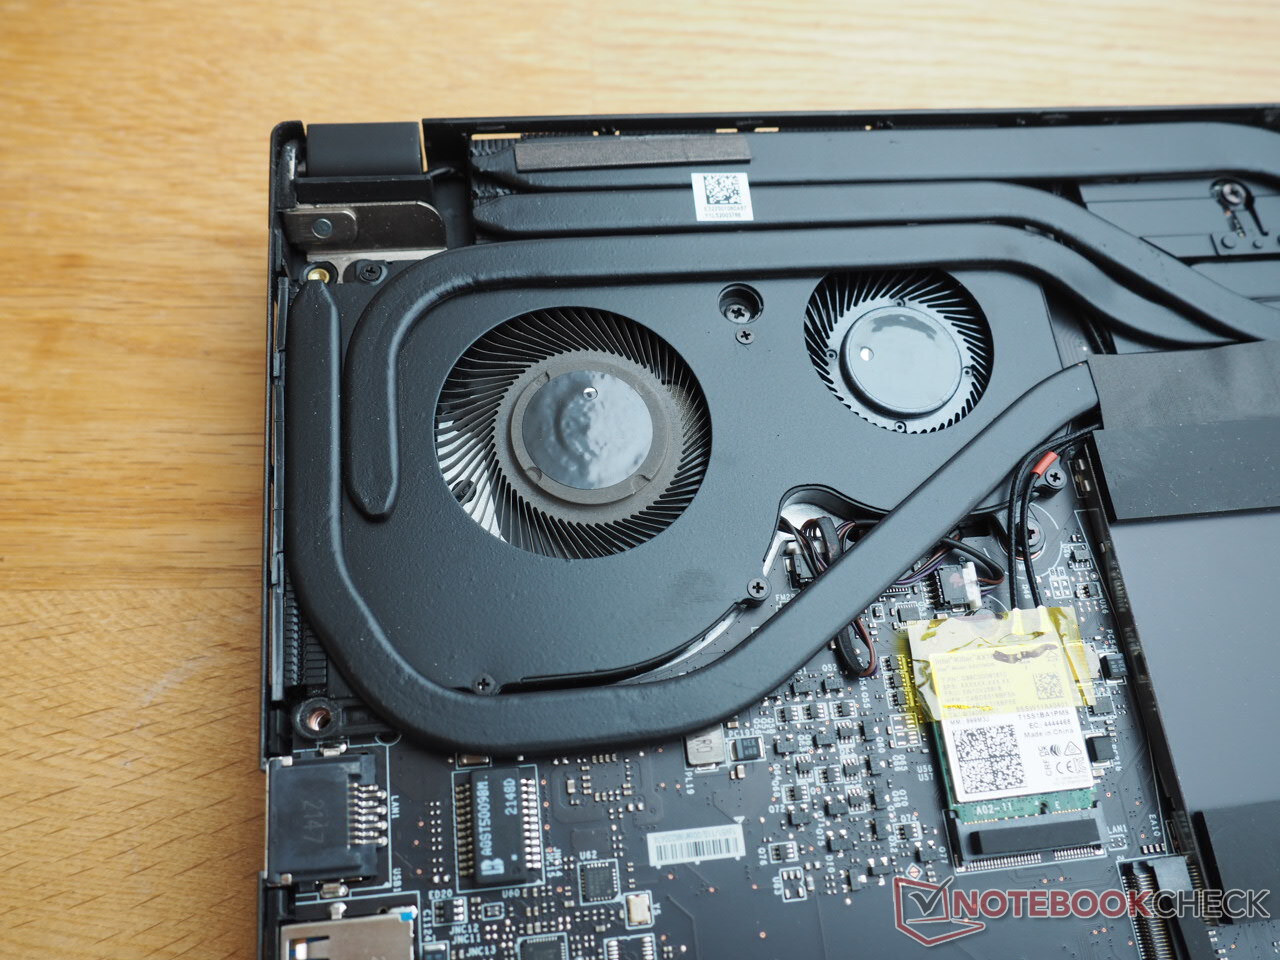
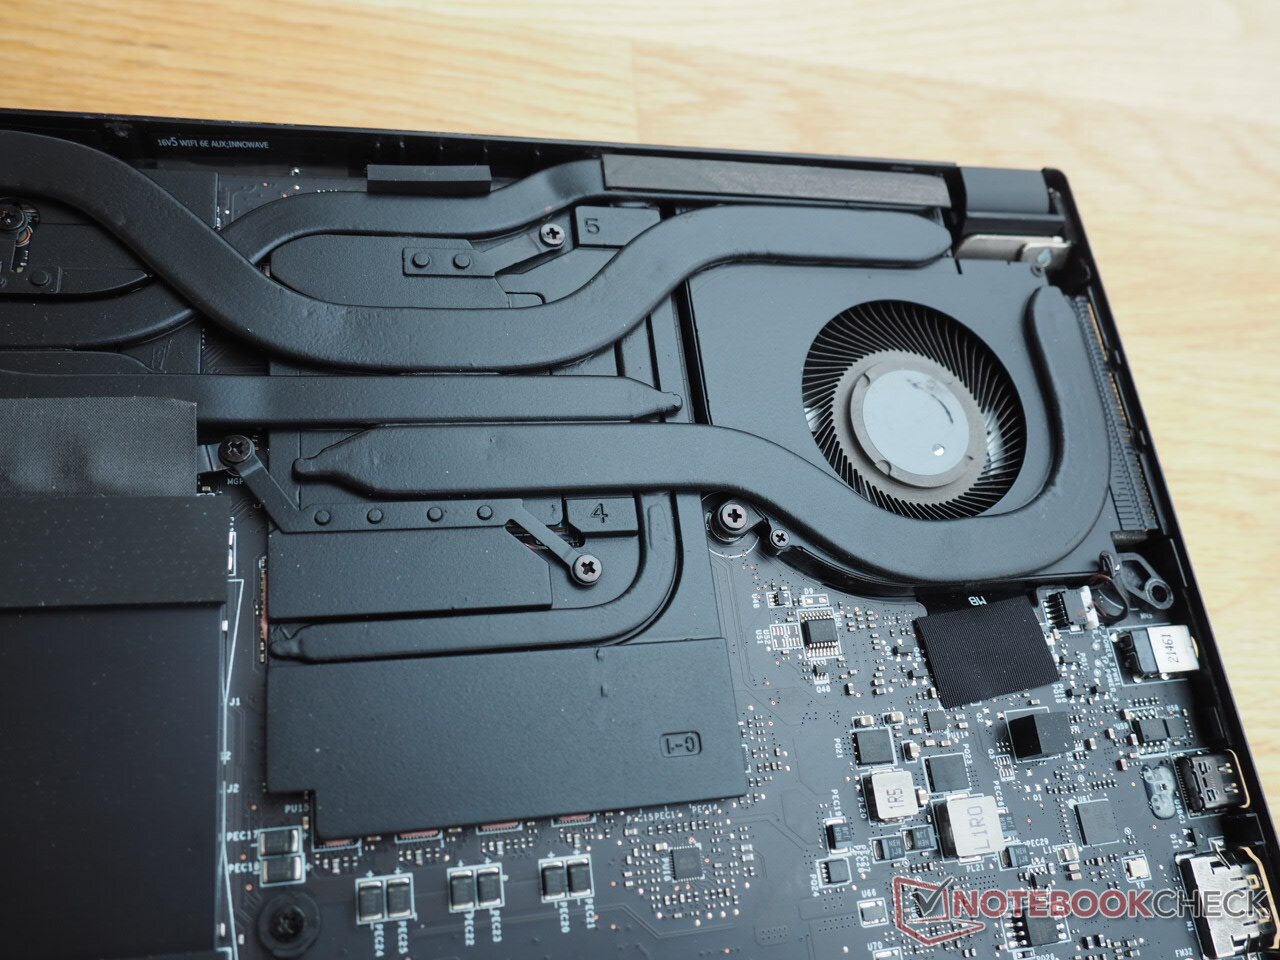
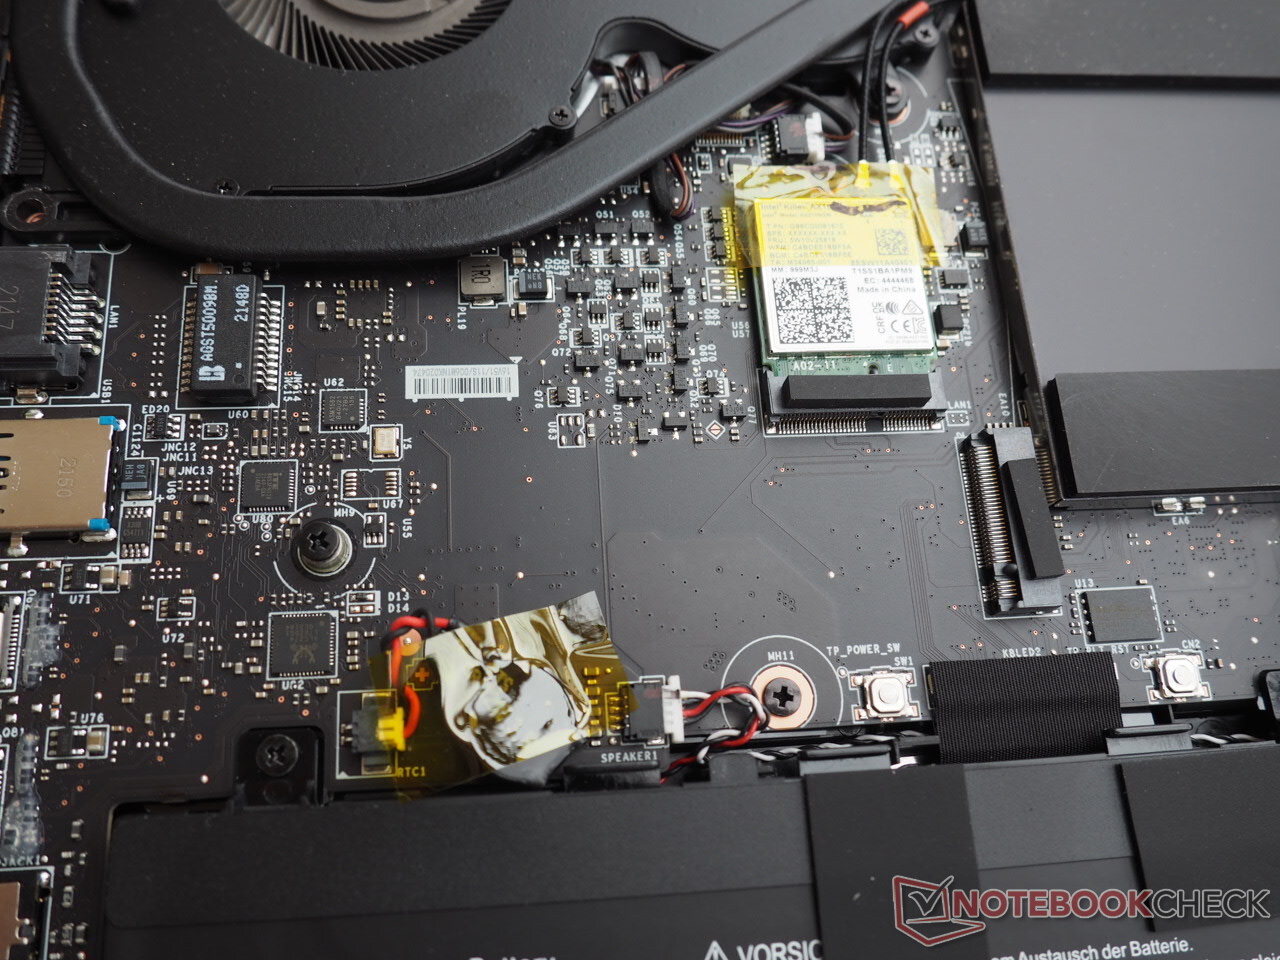
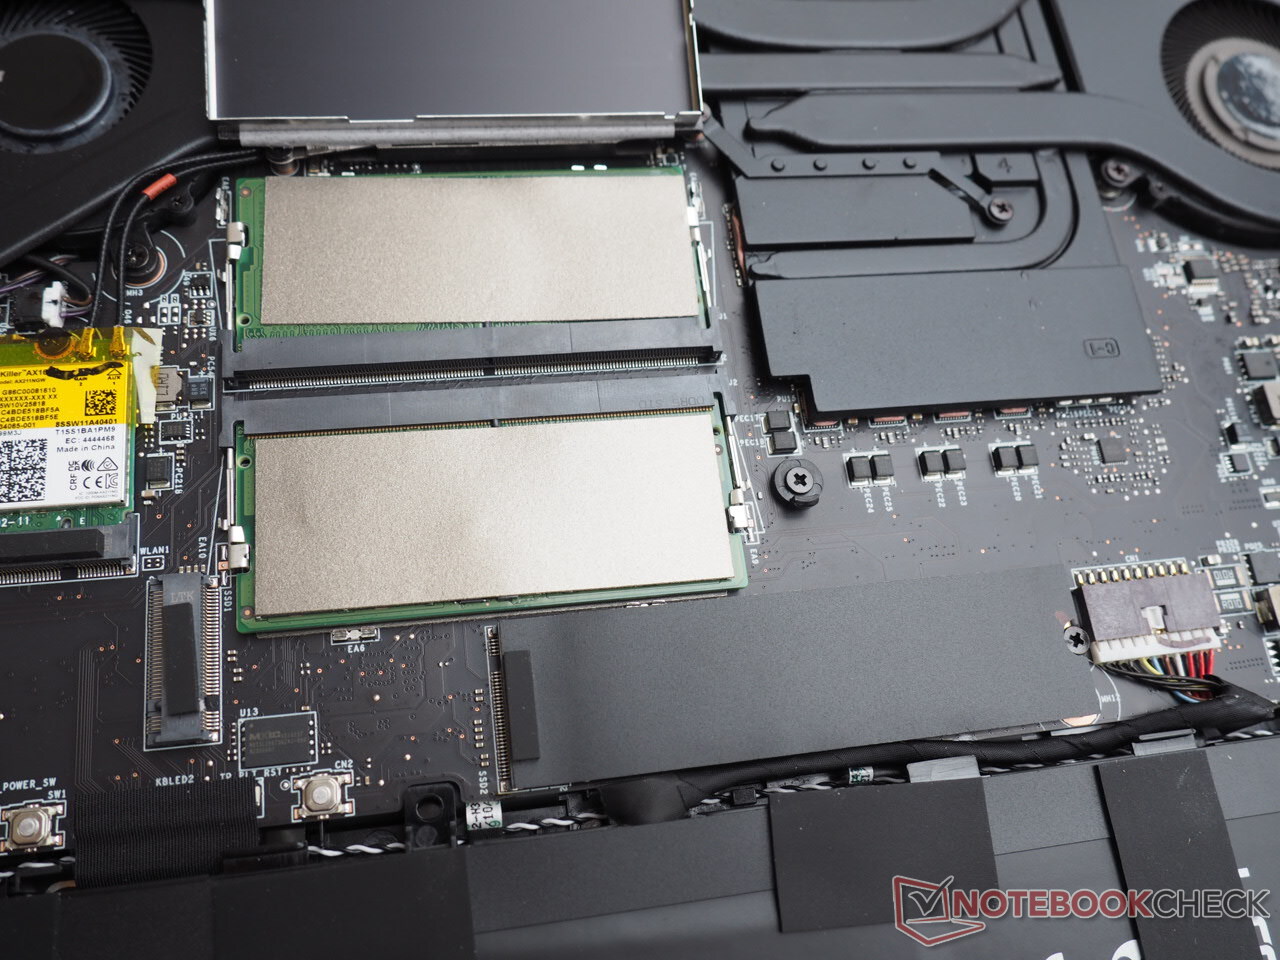
In order to access the interior, a total of nine cross-head screws have to be removed from the bottom of the case (one is located underneath the factory seal). After this, the bottom cover can be pried out of its anchoring with a flat tool, which requires both strength and dexterity. The enormous battery, two M.2 slots, and two RAM slots protected by a cover can be found under the hood. The cooling system consists of three fans and several heat pipes.

Warranty
MSI provides a two-year warranty (Pick-up and Return Service) for the product.
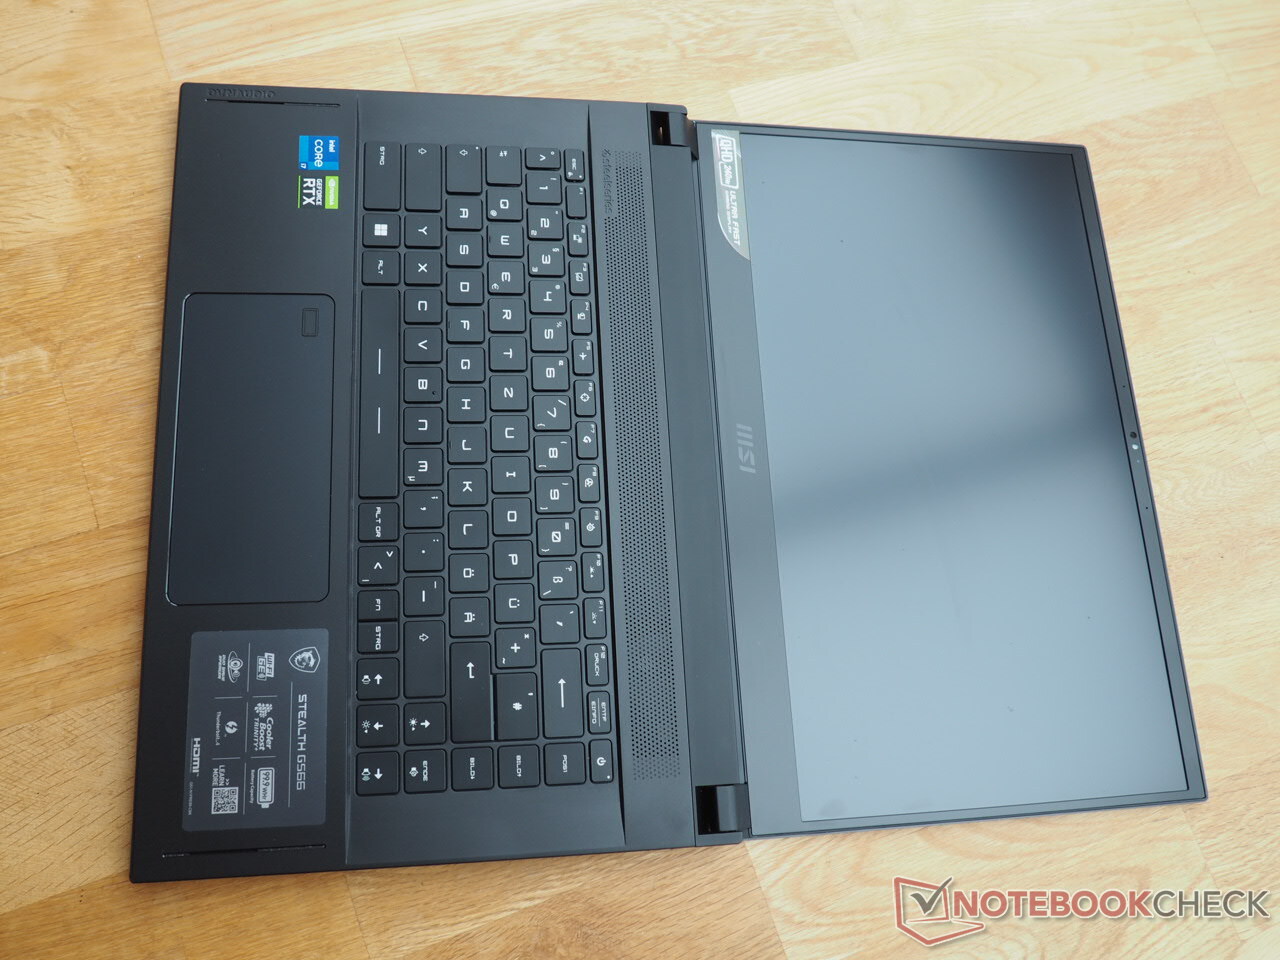
Input devices
Keyboard
The keyboard has been primarily tailored to the needs of gamers. The extensive and customizable RGB lighting, which can turn the GS66 into a disco in extreme cases (see photo), should be particularly mentioned as a positive feature.
The layout didn't fare as well in the test. Starting with the single-line Enter key, which is rather unusual for German keyboards. The position of the ><| key and the '# key also deviates from the standard. This is accompanied by some awkward combinations (F12/Print Screen, Delete/Insert) and a few other questionable design choices. For example, the Fn and right Ctrl keys are severely squeezed together. At least the arrow keys are pleasantly large. We would describe the typing experience as acceptable. It's not particularly crisp, but it rather tends towards feeling mushy (keyword: travel).

Touchpad
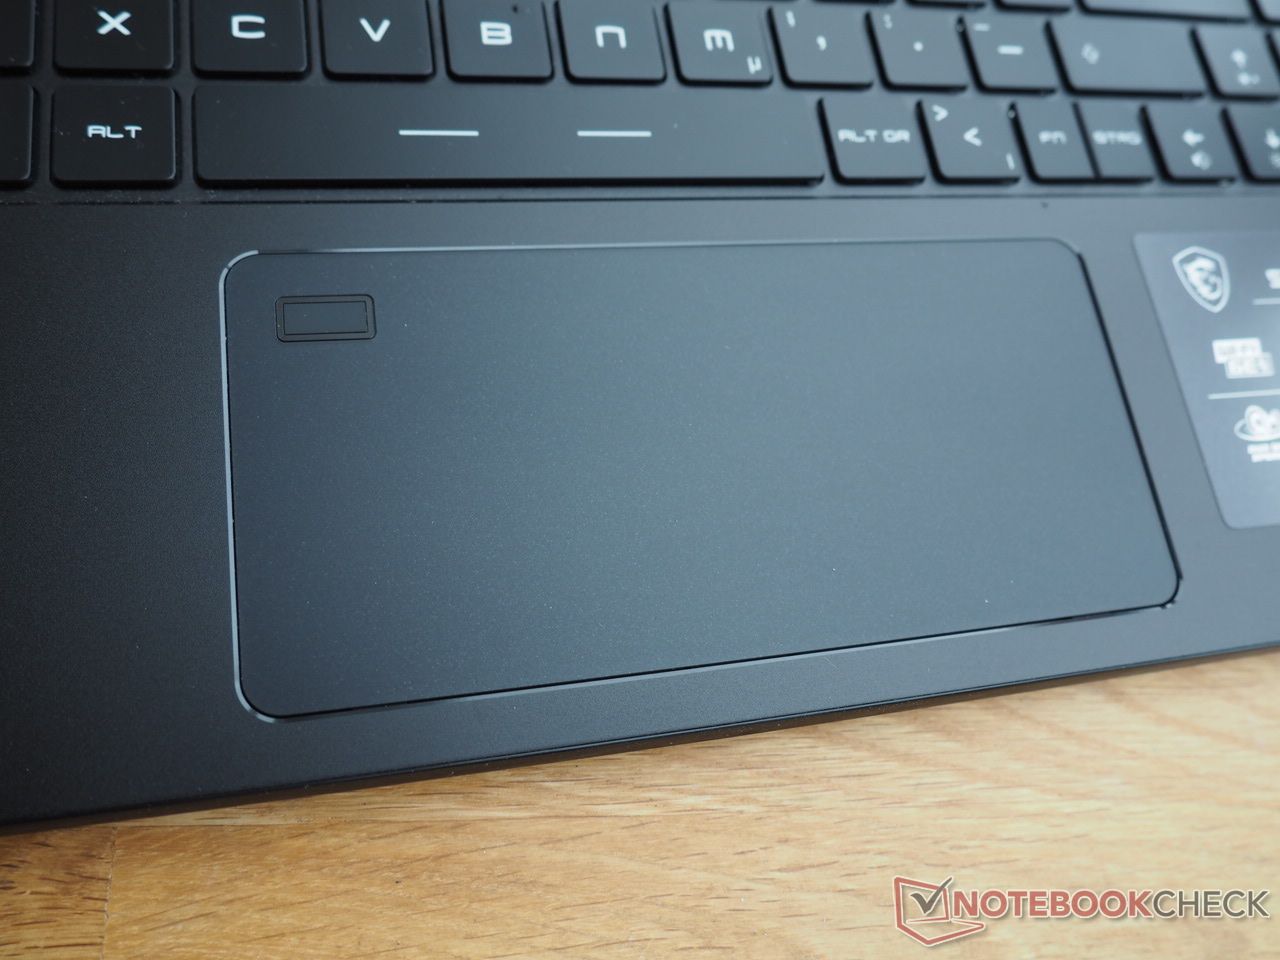
While the touchpad's height of 6.5 cm is no cause for enthusiasm, its width of 14 cm is more than impressive. The smooth surface provides good gliding properties. There's hardly anything to complain about in terms of precision and gesture support, either. However, MSI still needs to work on its stability. Especially at the left and right edges, the touchpad can be pressed quite significantly into the case, resulting in a lower perceived quality.
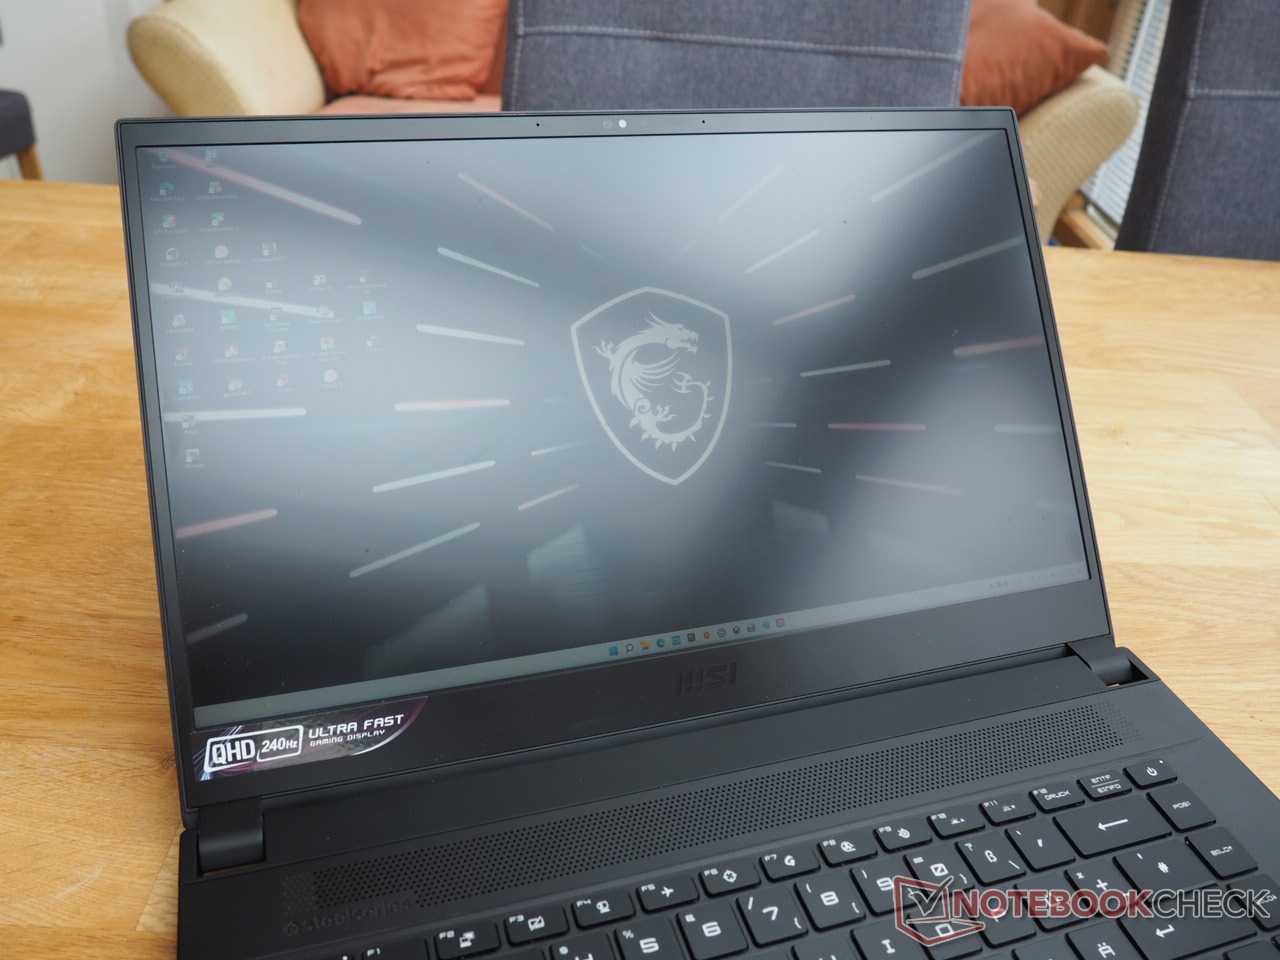
Display
As mentioned at the beginning, the manufacturer uses a fast 240 Hz panel for the display, which also does its refresh rate justice. The response times measured in our test were under 10 ms each, something that deserves respect in the laptop sector.
| |||||||||||||||||||||||||
Brightness Distribution: 87 %
Center on Battery: 272 cd/m²
Contrast: 1088:1 (Black: 0.25 cd/m²)
ΔE ColorChecker Calman: 3.73 | ∀{0.5-29.43 Ø4.71}
calibrated: 0.98
ΔE Greyscale Calman: 6.5 | ∀{0.09-98 Ø4.96}
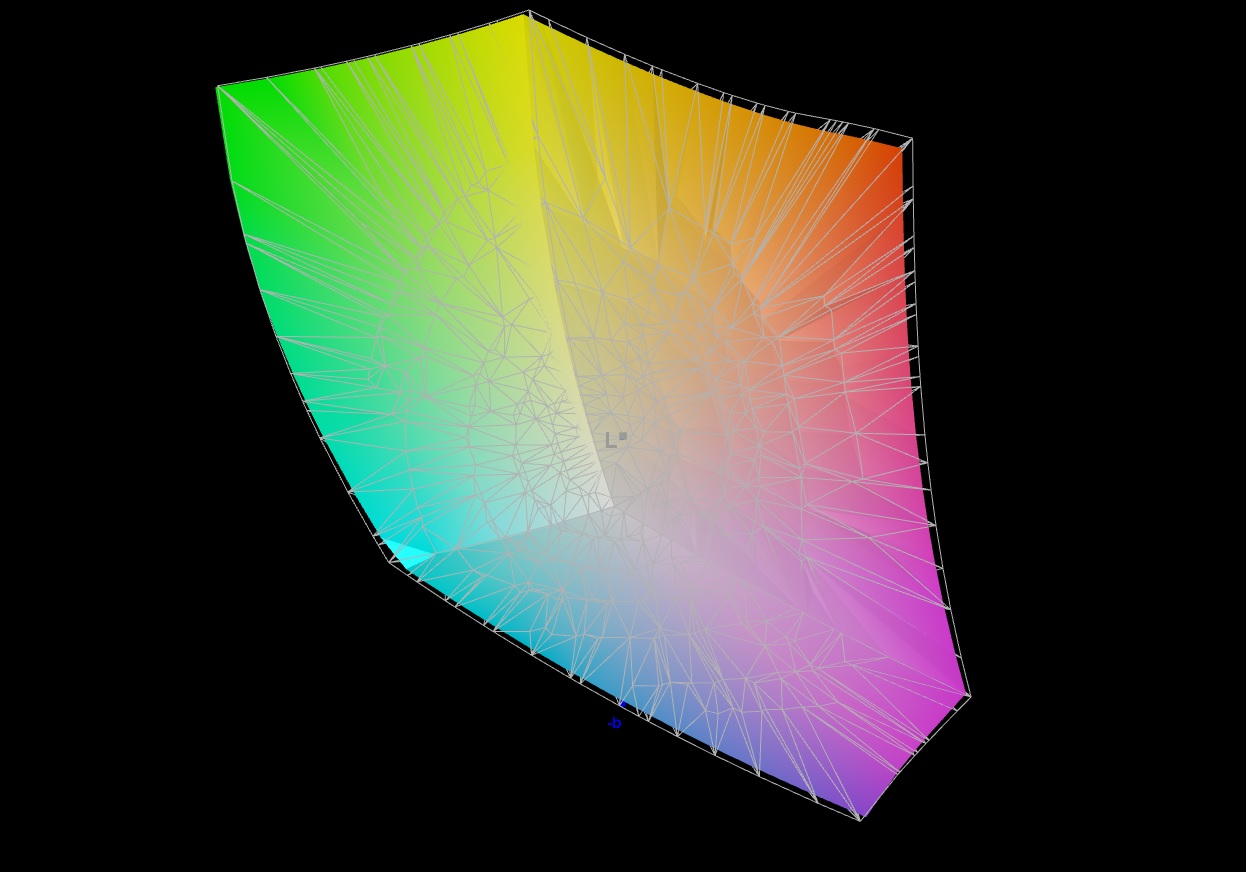
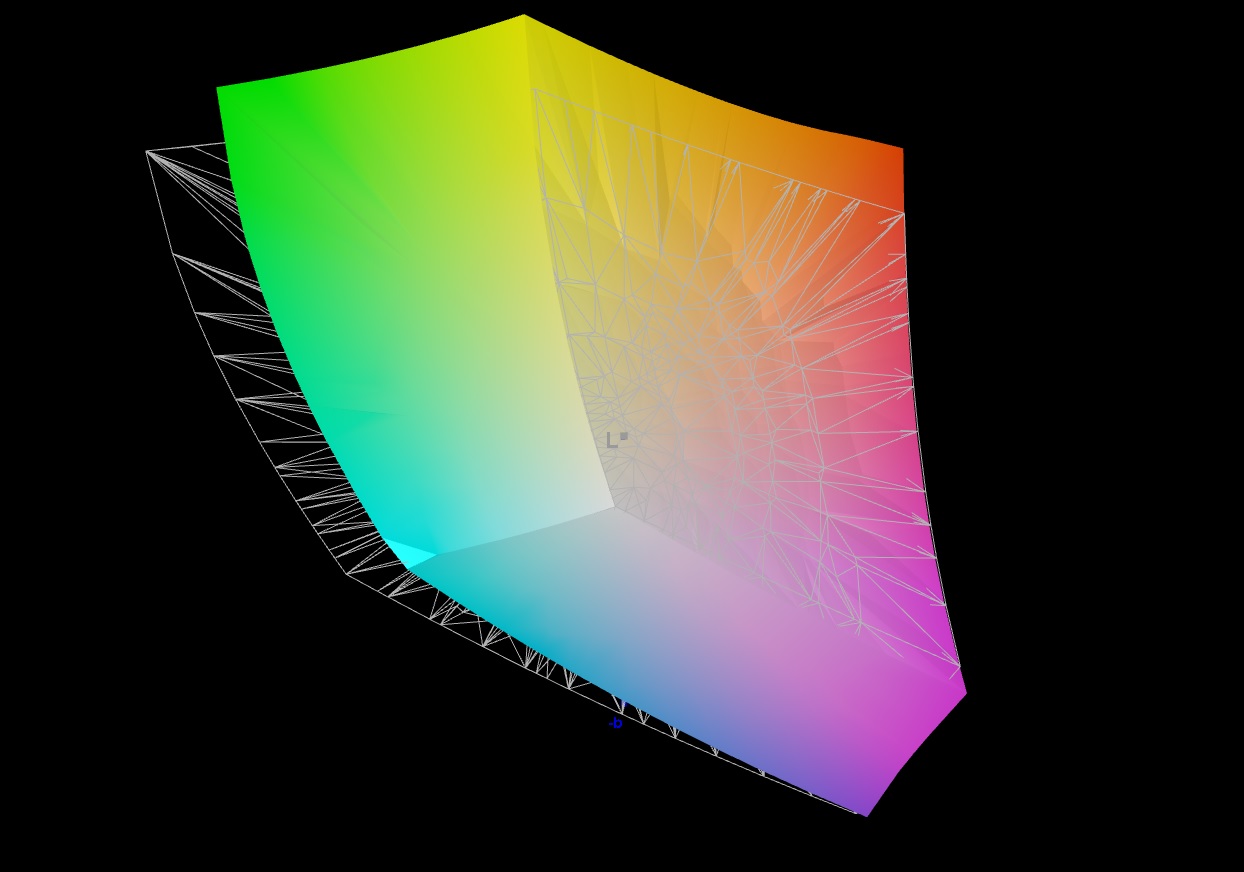
85.6% AdobeRGB 1998 (Argyll 3D)
99.7% sRGB (Argyll 3D)
96.4% Display P3 (Argyll 3D)
Gamma: 2.172
CCT: 6485 K
| MSI Stealth GS66 12UGS Sharp LQ156T1JW04 (SHP153C), IPS-Level, 2560x1440, 15.6" | Asus TUF Gaming A15 FA506QR-AZ061T Sharp SHP1532, IPS, 1920x1080, 15.6" | Gigabyte Aero 15 OLED XD Samsung SDC4143, OLED, 3840x2160, 15.6" | Alienware x15 RTX 3070 P111F LG Philips 156QHG, IPS, 2560x1440, 15.6" | Eurocom Nightsky ARX315 Sharp LQ156M1JW03, IPS, 1920x1080, 15.6" | |
|---|---|---|---|---|---|
| Display | 7% | 1% | -15% | ||
| Display P3 Coverage (%) | 96.4 | 99.9 4% | 97.8 1% | 67.9 -30% | |
| sRGB Coverage (%) | 99.7 | 100 0% | 99.9 0% | 99.7 0% | |
| AdobeRGB 1998 Coverage (%) | 85.6 | 99.5 16% | 73.7 -14% | ||
| Response Times | -48% | 65% | -62% | -93% | |
| Response Time Grey 50% / Grey 80% * (ms) | 6 ? | 12 ? -100% | 2.8 ? 53% | 12 ? -100% | 15.2 ? -153% |
| Response Time Black / White * (ms) | 8.4 ? | 8 ? 5% | 2 ? 76% | 10.4 ? -24% | 11.2 ? -33% |
| PWM Frequency (Hz) | 1250 ? | 240 ? | 23150 ? | ||
| Screen | 30% | 123% | 8% | 14% | |
| Brightness middle (cd/m²) | 272 | 297 9% | 440 62% | 409.5 51% | 312.8 15% |
| Brightness (cd/m²) | 253 | 268 6% | 446 76% | 390 54% | 294 16% |
| Brightness Distribution (%) | 87 | 84 -3% | 92 6% | 88 1% | 90 3% |
| Black Level * (cd/m²) | 0.25 | 0.22 12% | 0.04 84% | 0.47 -88% | 0.28 -12% |
| Contrast (:1) | 1088 | 1350 24% | 11000 911% | 871 -20% | 1117 3% |
| Colorchecker dE 2000 * | 3.73 | 1.36 64% | 2.53 32% | 3.48 7% | 2.96 21% |
| Colorchecker dE 2000 max. * | 9.43 | 3.82 59% | 7.82 17% | 6.31 33% | 6.23 34% |
| Colorchecker dE 2000 calibrated * | 0.98 | 2.57 -162% | 0.89 9% | ||
| Greyscale dE 2000 * | 6.5 | 1.88 71% | 1.2 82% | 5 23% | 4.2 35% |
| Gamma | 2.172 101% | 2.48 89% | 2.206 100% | 2.16 102% | 2.32 95% |
| CCT | 6485 100% | 6768 96% | 6371 102% | 6591 99% | 7145 91% |
| Color Space (Percent of AdobeRGB 1998) (%) | 63 | ||||
| Color Space (Percent of sRGB) (%) | 99 | ||||
| Total Average (Program / Settings) | -9% /
15% | 65% /
90% | -18% /
-4% | -31% /
-9% |
* ... smaller is better
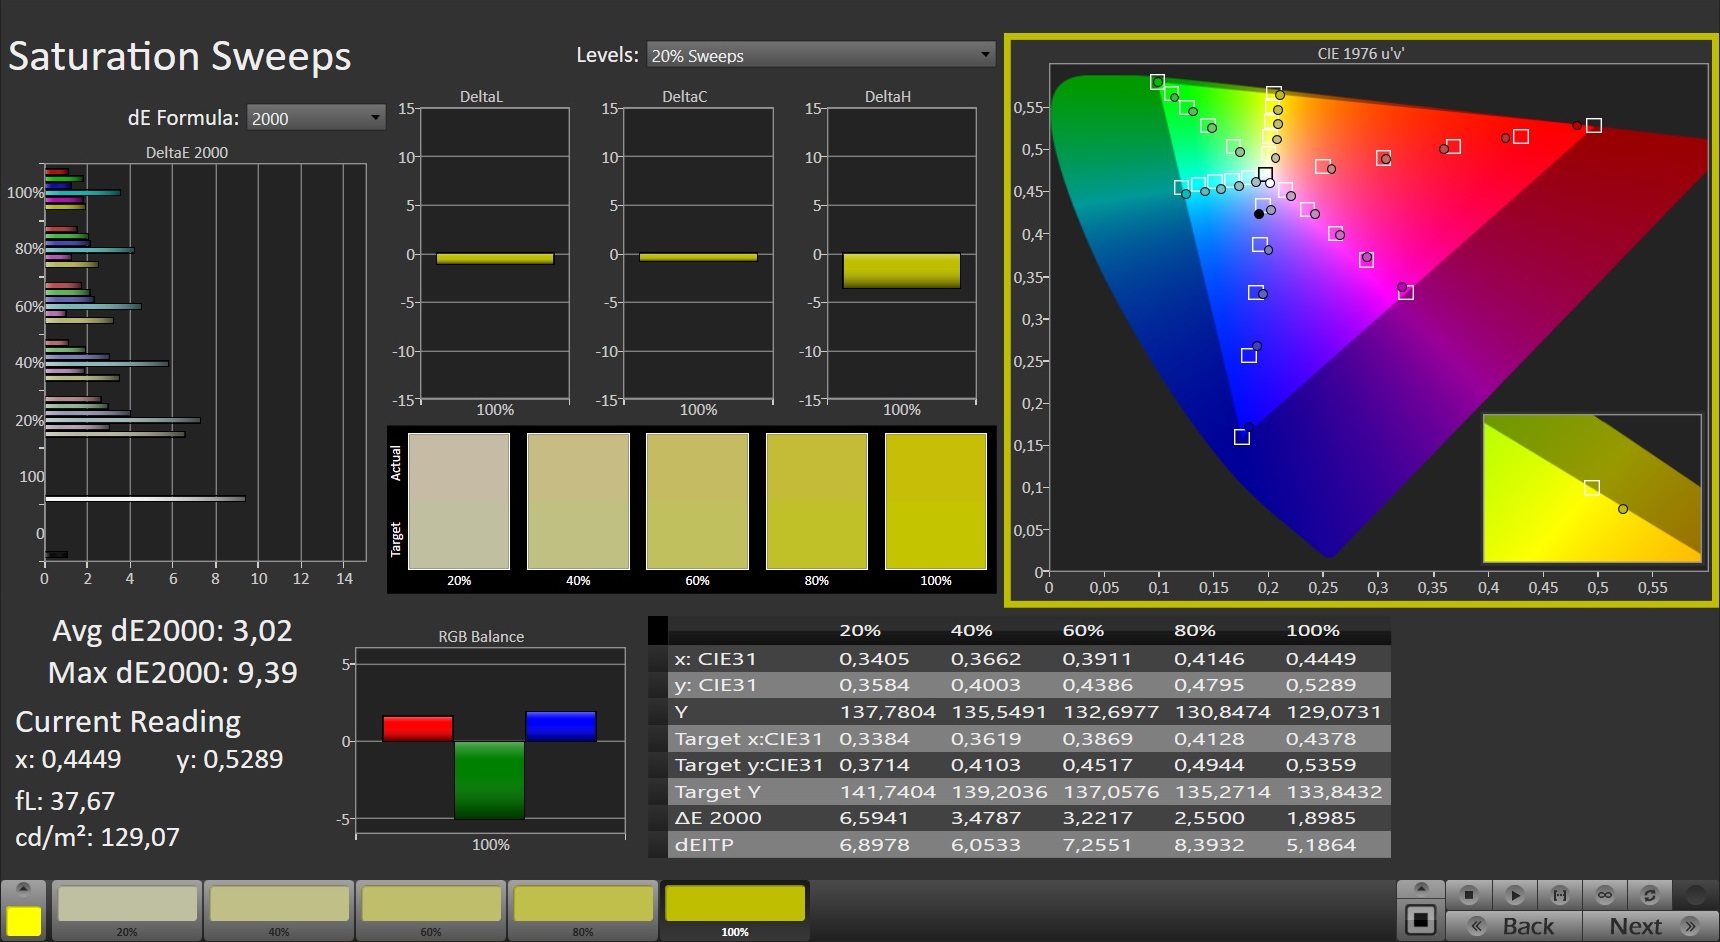
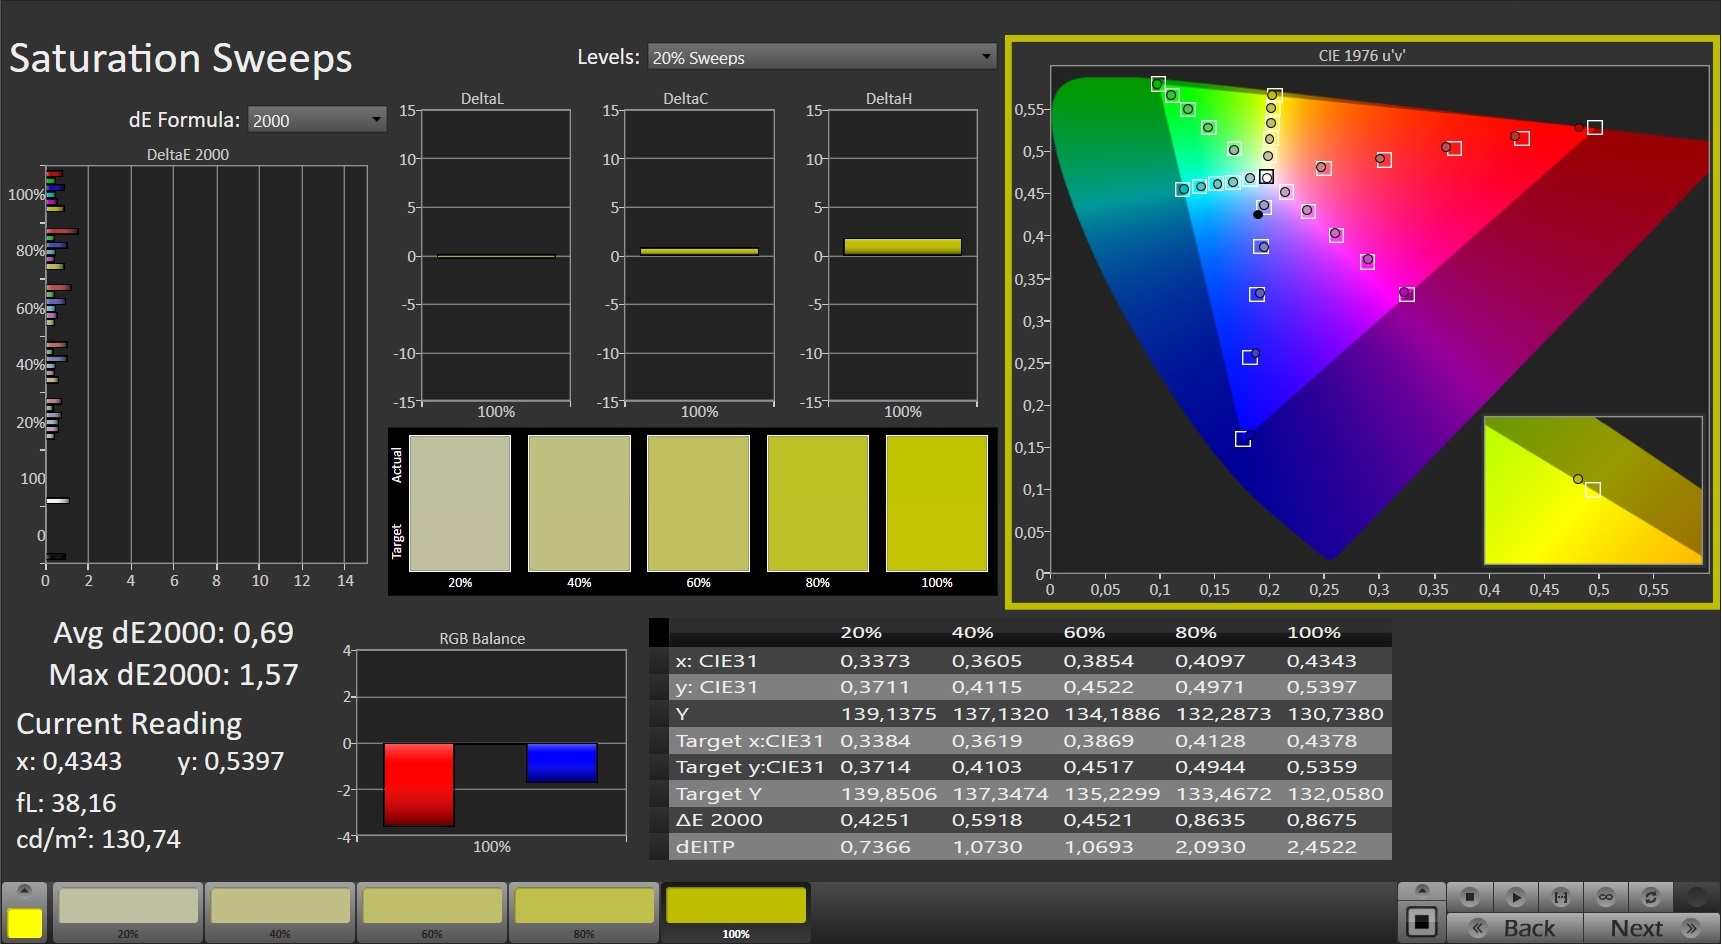
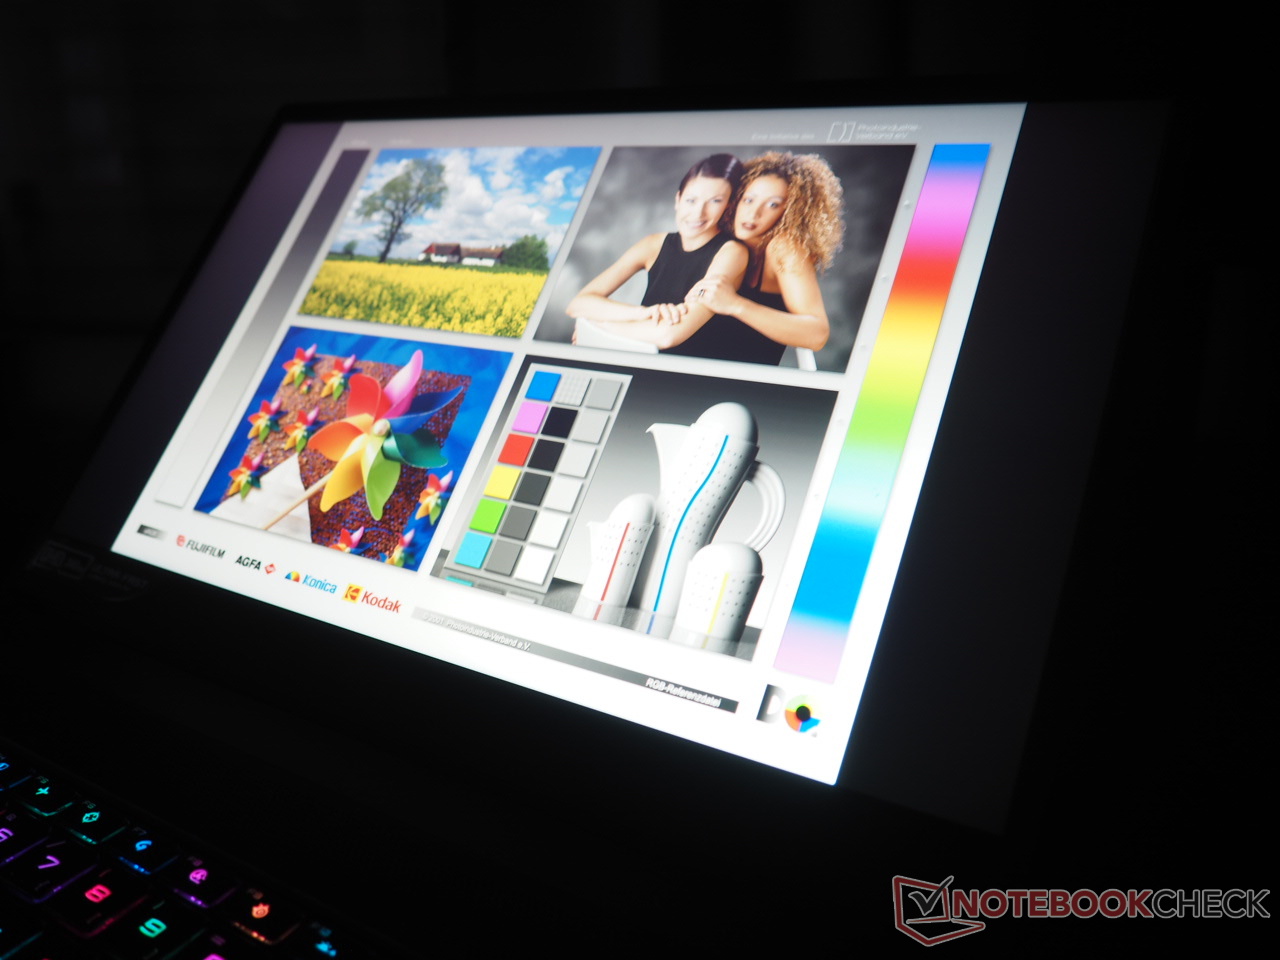
Another highlight is the rich color space. Although we weren't quite able to measure the 100% DCI-P3 coverage specified by MSI (despite selecting the corresponding profile in the True Color software), a P3 coverage of 96% is still excellent and leaves most gaming laptops in the dust. Looking at the comparison field, only the panels of the Gigabyte Aero 15 and Alienware x15 can keep up.
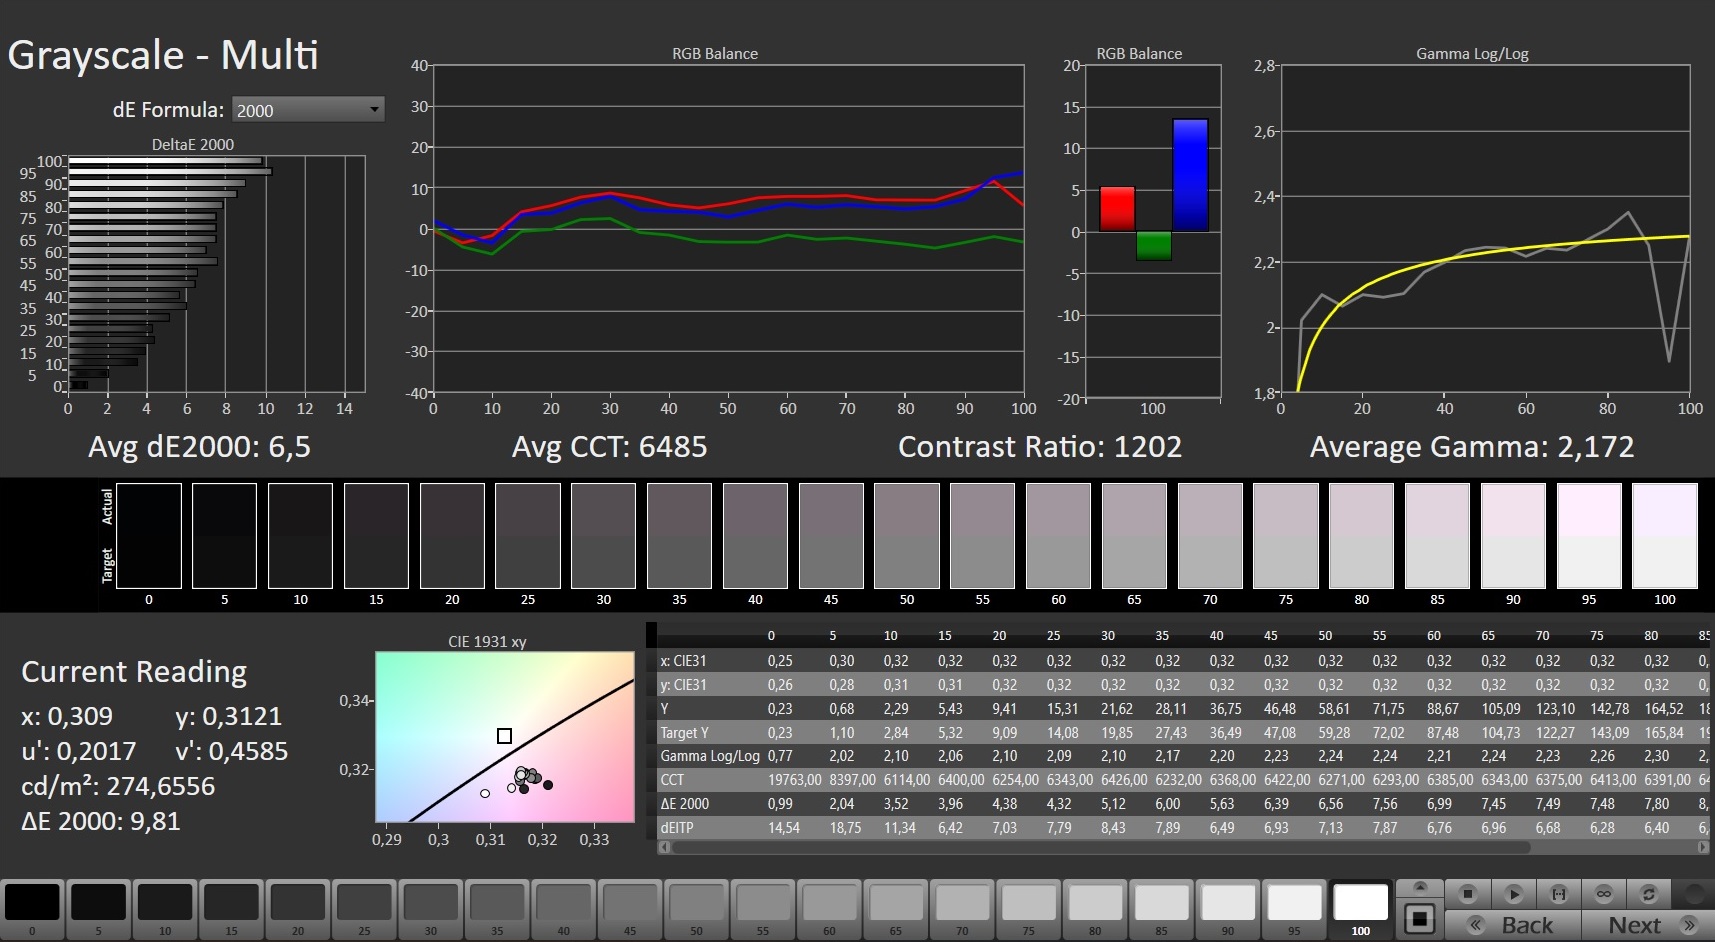
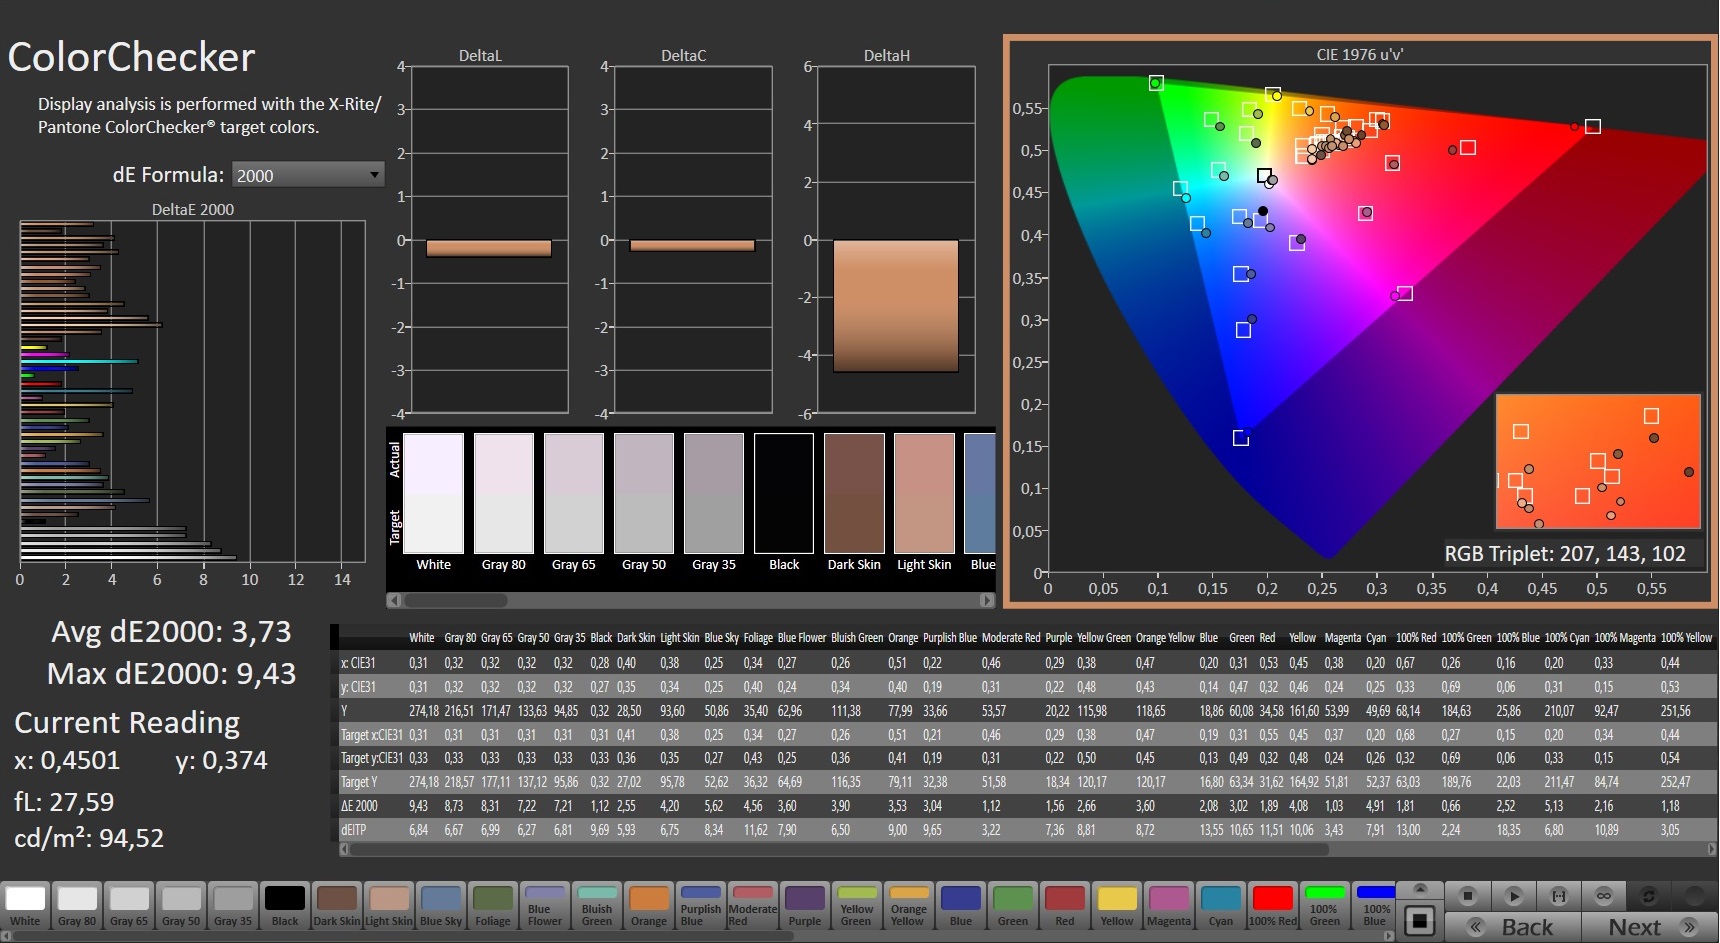
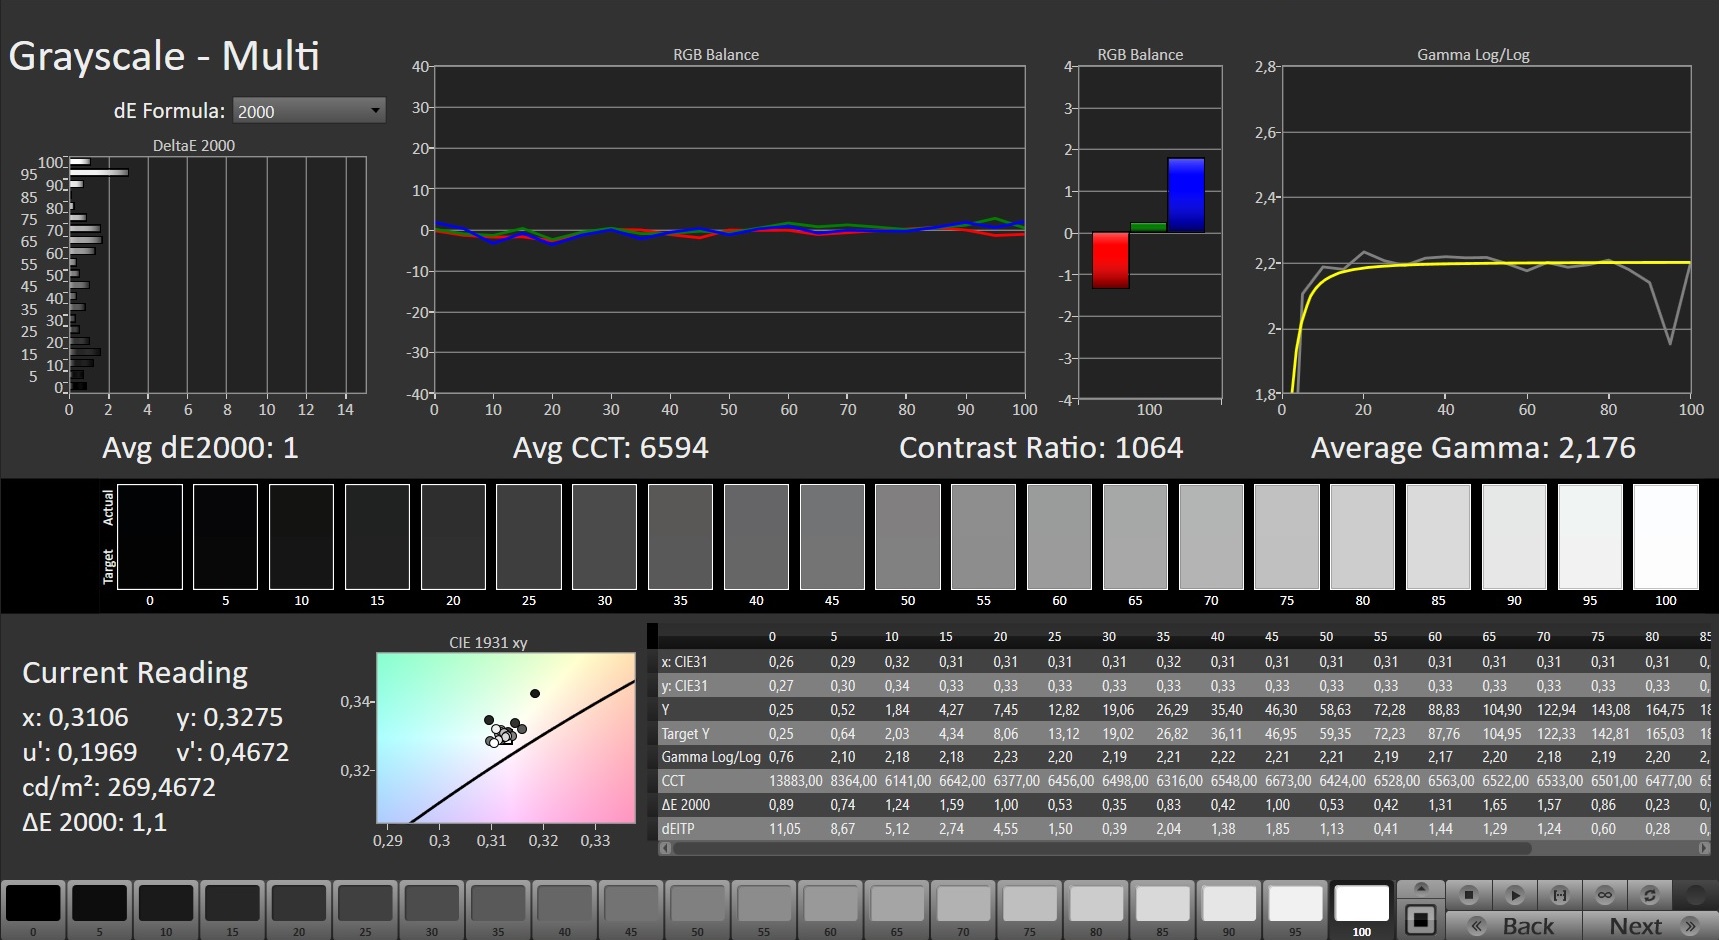
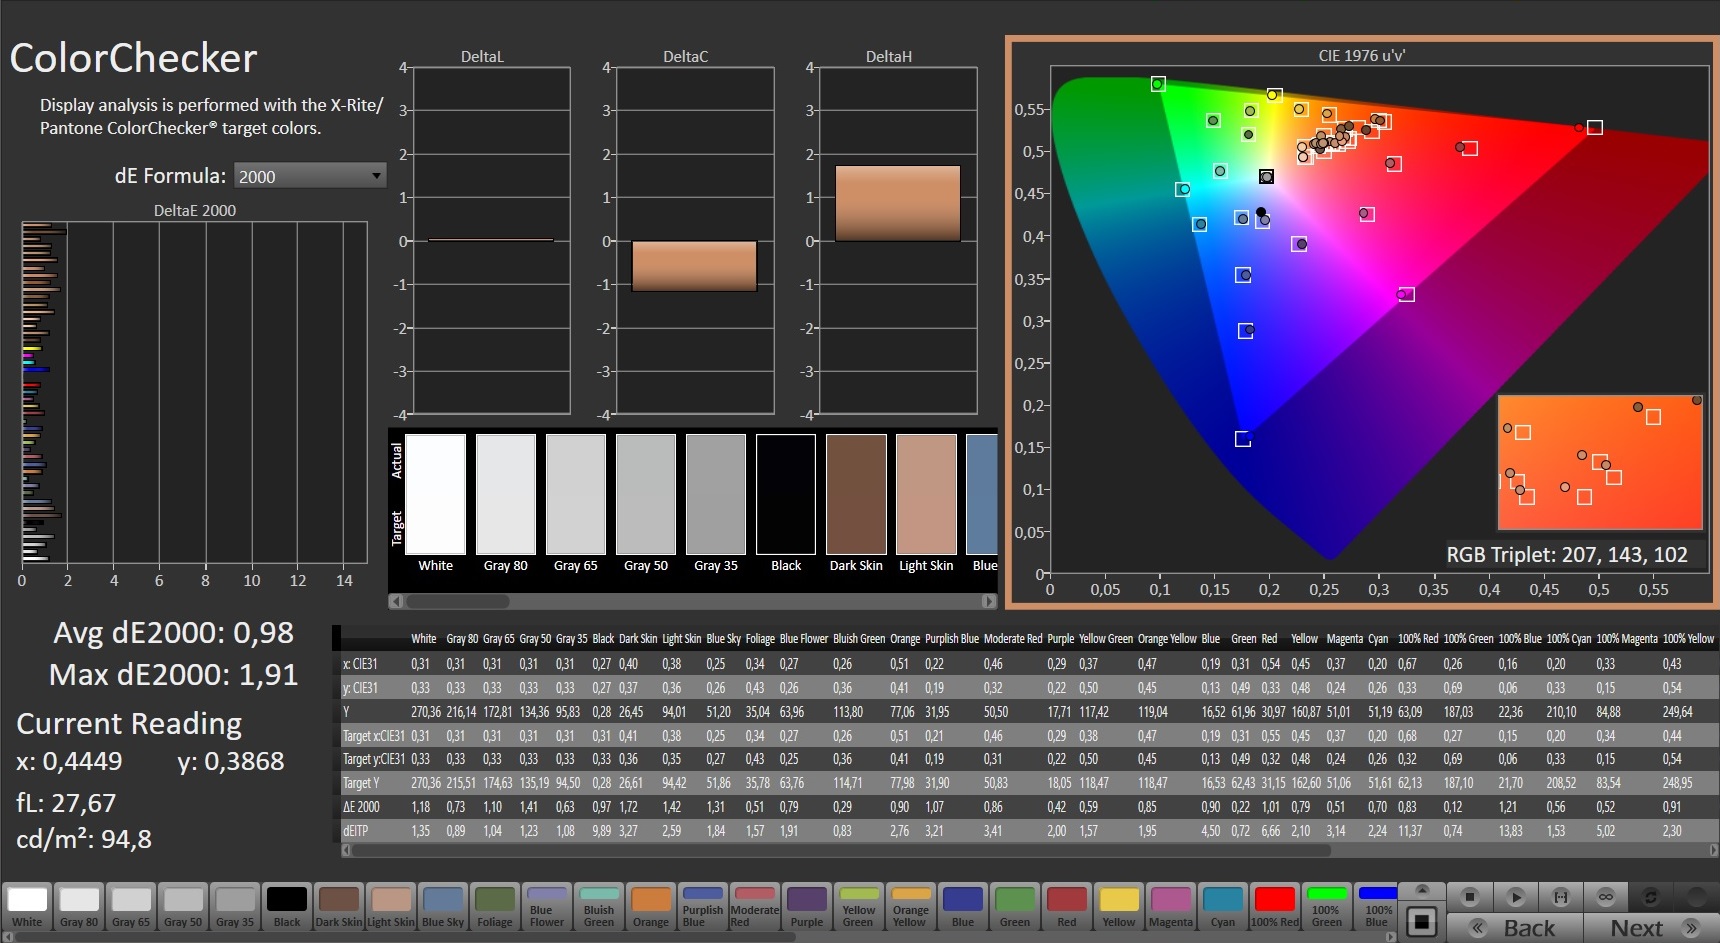
The rest of the measurement results of the GS66 12UGS left us with mixed feelings. While the contrast (over 1,000:1) and black level (0.25 cd/m²) are compelling, the color accuracy and brightness fall a bit short of what is expected or feasible.

An average brightness of 253 cd/m² pretty much makes the Stealth unsuitable for outdoor use. For this, a minimum of 300, or better yet, 350 cd/m² would be required.
Display Response Times
| ↔ Response Time Black to White | ||
|---|---|---|
| 8.4 ms ... rise ↗ and fall ↘ combined | ↗ 4.4 ms rise | 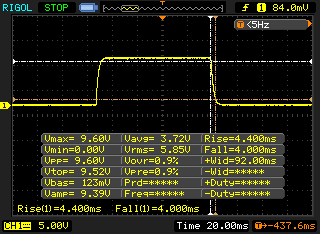 |
| ↘ 4 ms fall | ||
| The screen shows fast response rates in our tests and should be suited for gaming. In comparison, all tested devices range from 0.1 (minimum) to 240 (maximum) ms. » 24 % of all devices are better. This means that the measured response time is better than the average of all tested devices (19.8 ms). | ||
| ↔ Response Time 50% Grey to 80% Grey | ||
| 6 ms ... rise ↗ and fall ↘ combined | ↗ 3.2 ms rise | 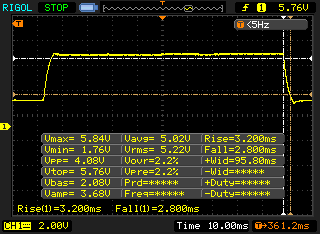 |
| ↘ 2.8 ms fall | ||
| The screen shows very fast response rates in our tests and should be very well suited for fast-paced gaming. In comparison, all tested devices range from 0.165 (minimum) to 636 (maximum) ms. » 19 % of all devices are better. This means that the measured response time is better than the average of all tested devices (31 ms). | ||
Screen Flickering / PWM (Pulse-Width Modulation)
| Screen flickering / PWM not detected |  | ||
In comparison: 52 % of all tested devices do not use PWM to dim the display. If PWM was detected, an average of 7754 (minimum: 5 - maximum: 343500) Hz was measured. | |||
Performance
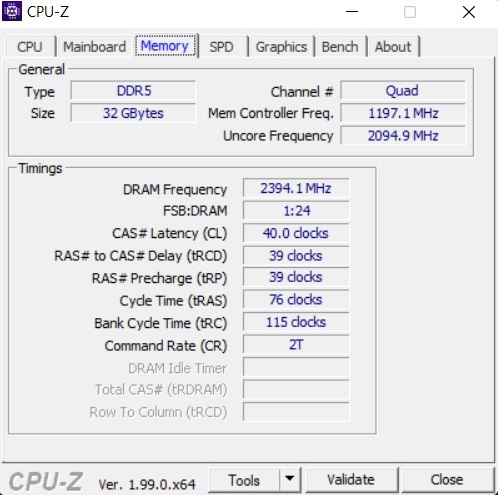
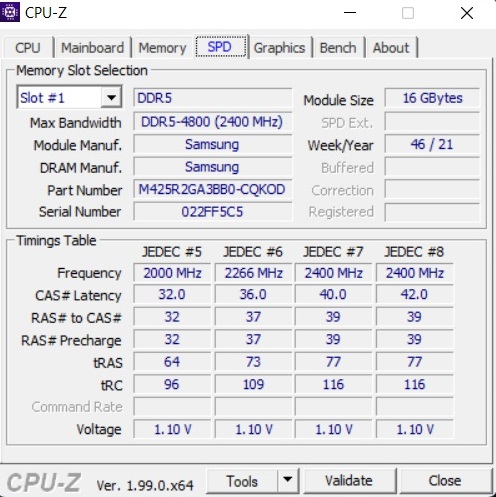
Even the entry-level variant of the GS66 ranks in the high-end range. 32 GB of RAM should be sufficient for the coming years as well as a CPU with 14 cores. A 1,000 GB SSD capacity isn't bad either, especially since you can expand the storage space with a second M.2 drive if needed. The VRAM is the only area that might become limited in the near future as we'll explain in a moment.
Test conditions
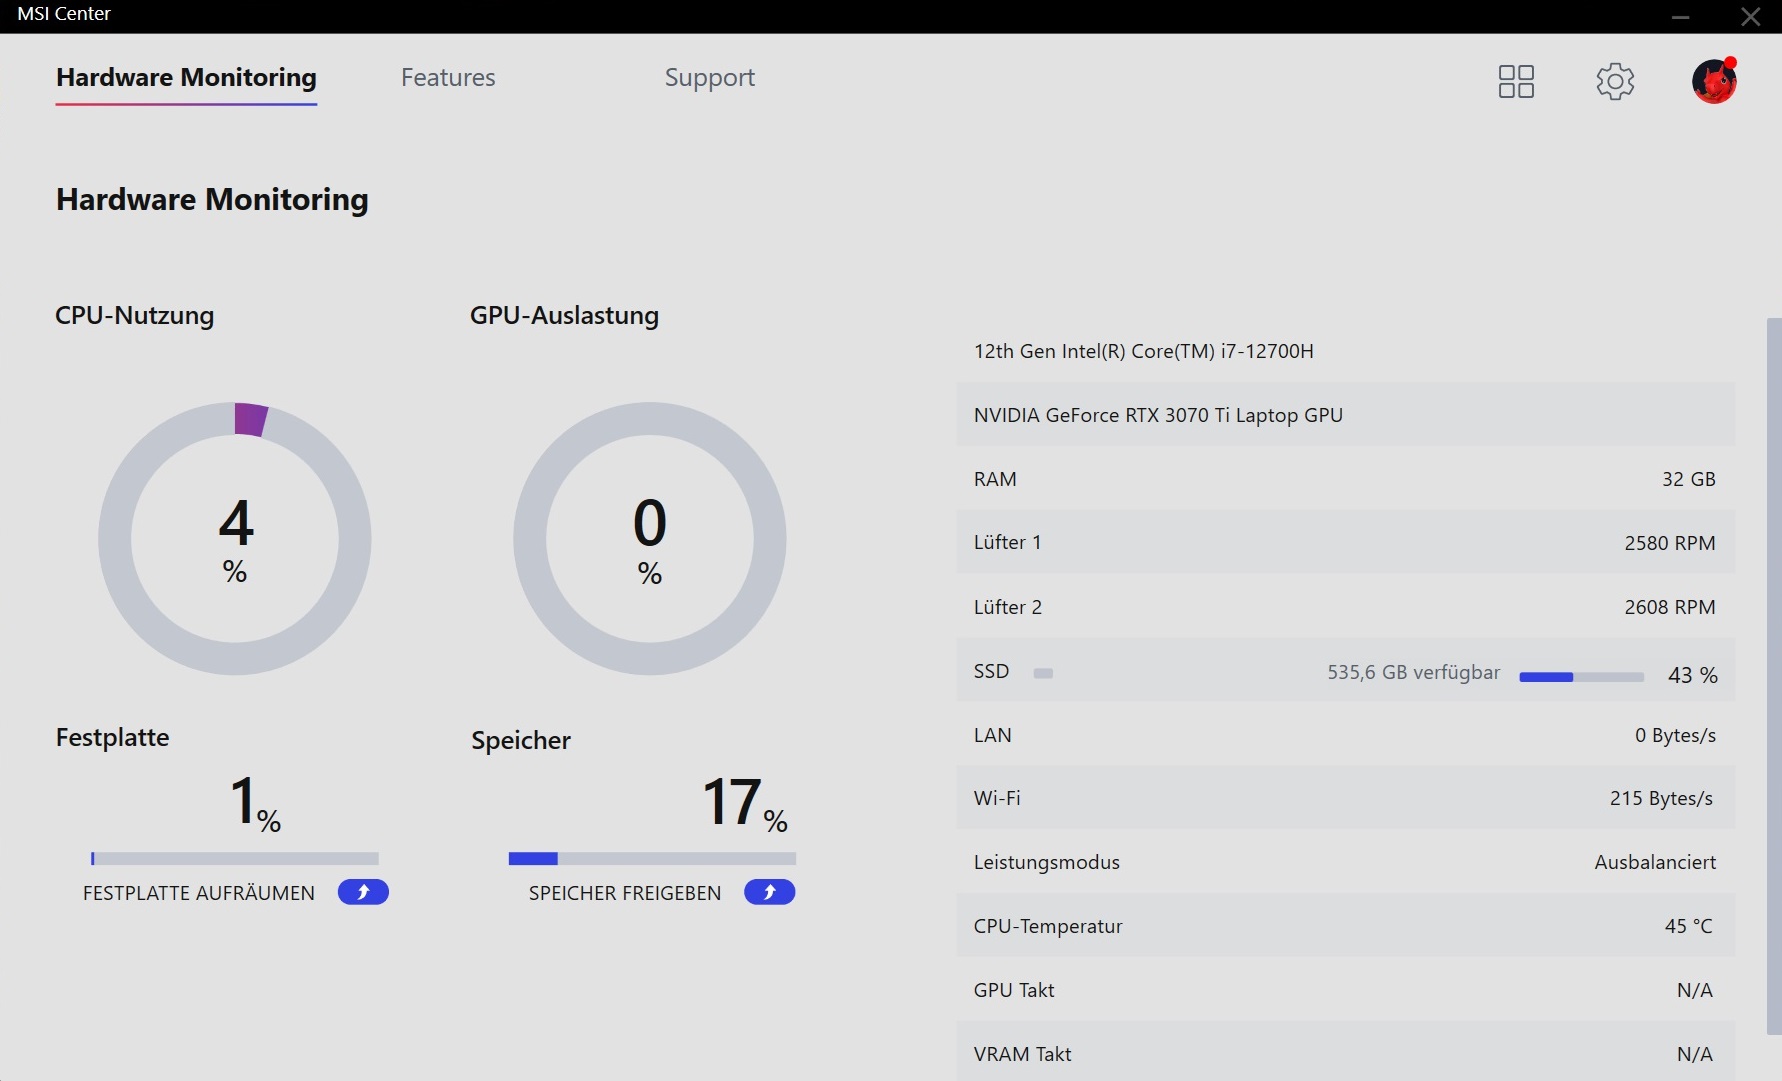
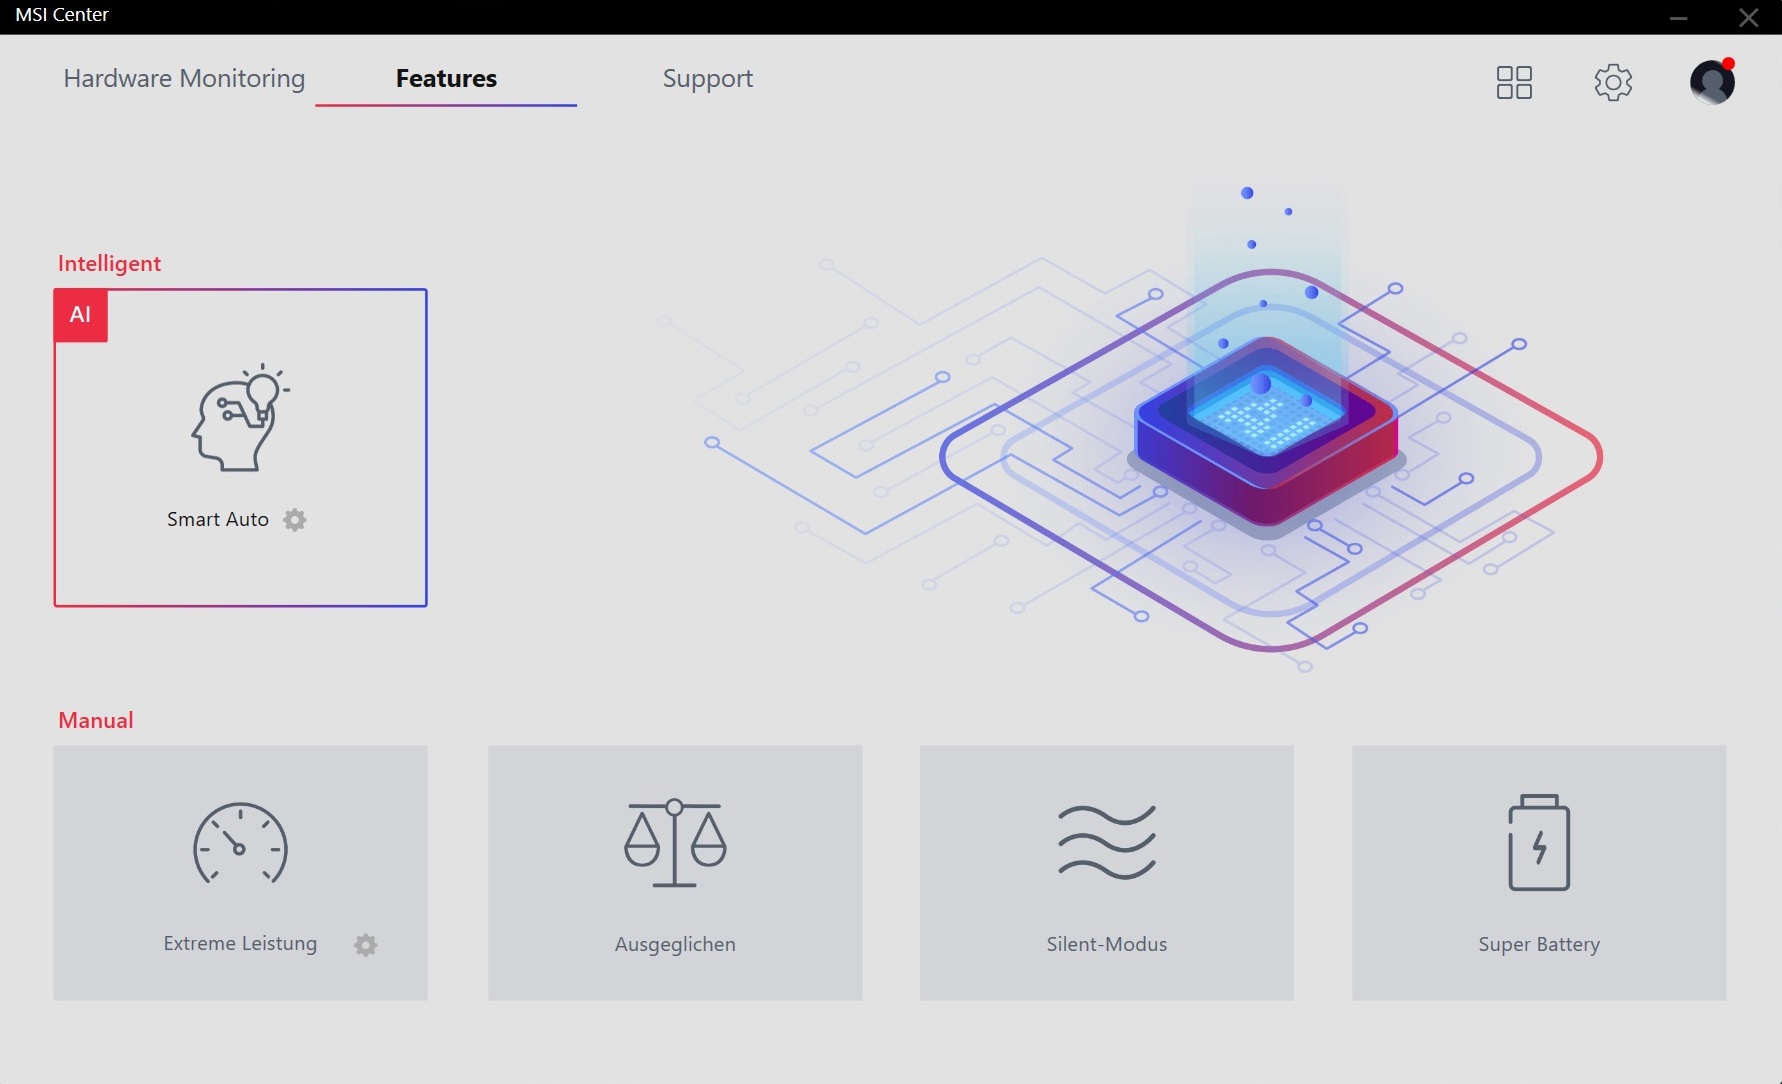
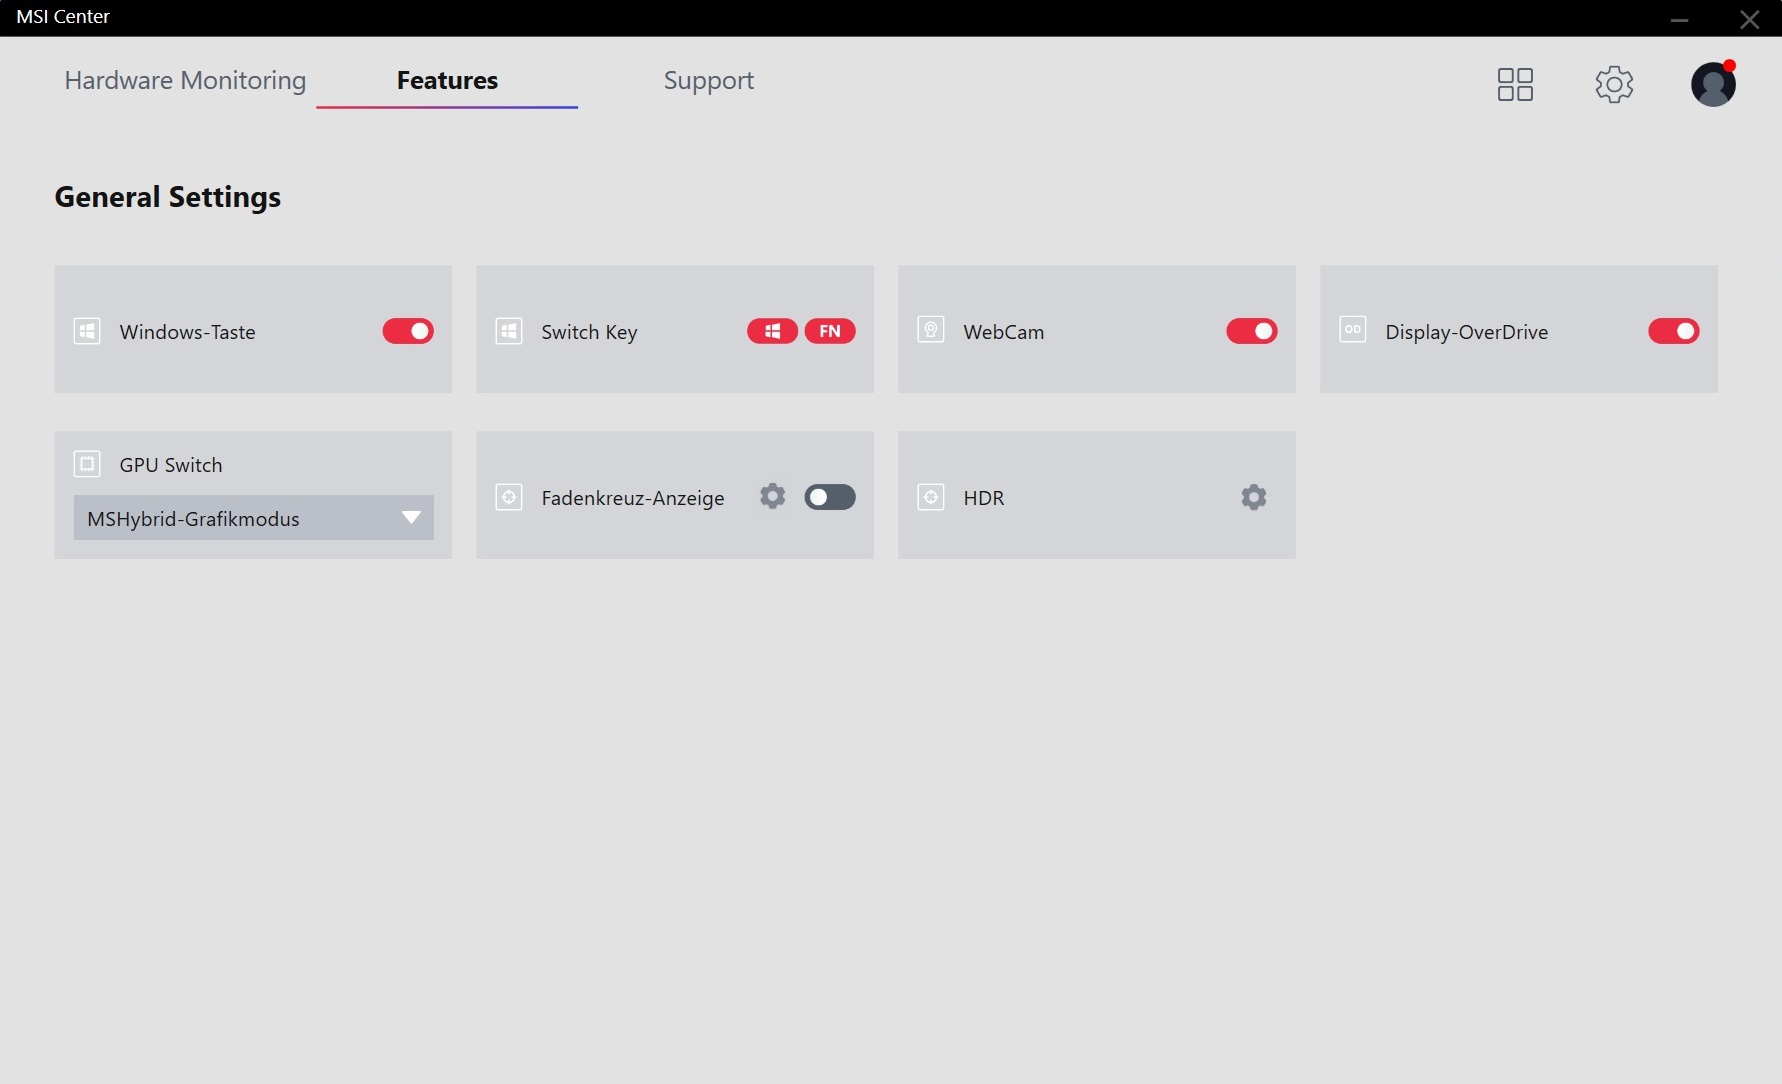
Users can adjust various system settings in the preinstalled MSI Center. With the exception of the 3D and gaming tests, which were carried out with graphics switching disabled and in the Extreme Performance mode, all measurements were done using the Smart Auto Mode (User Scenario menu) with the Optimus technology enabled (General Settings menu).
Processor
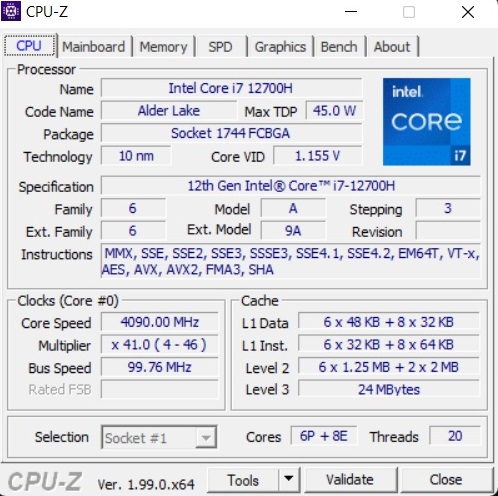
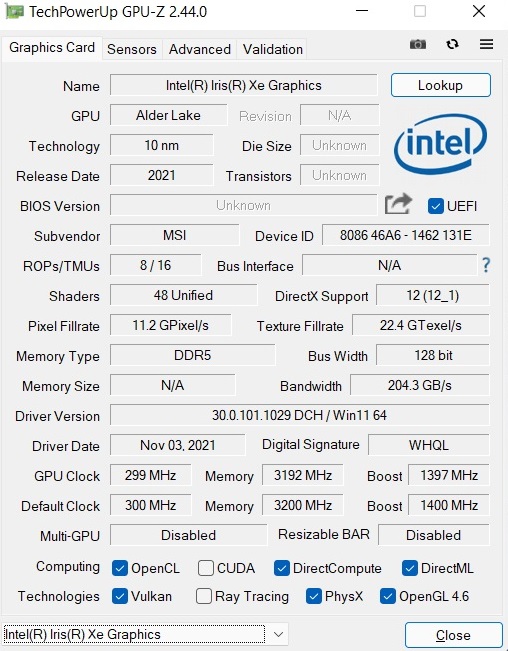
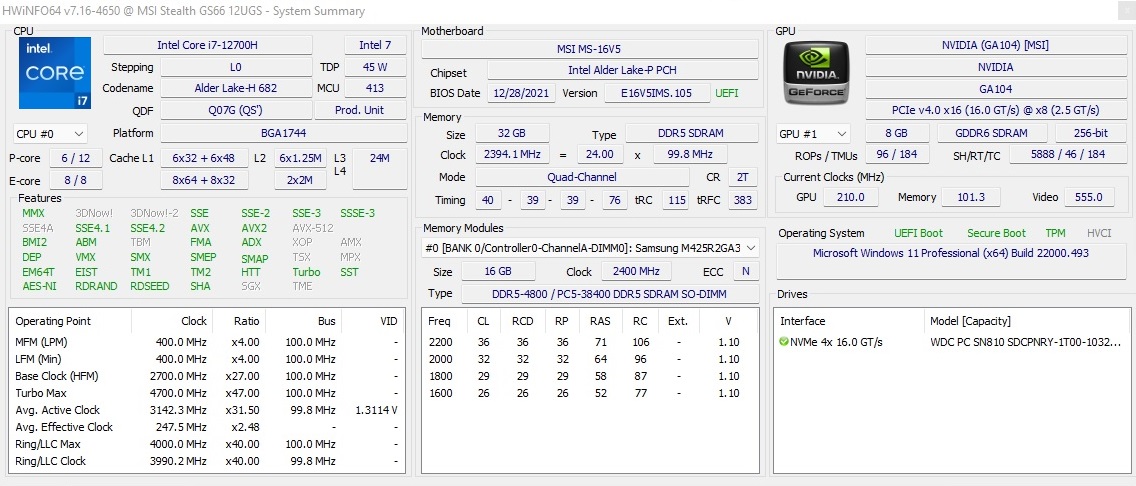
The Core i7-12700H is a brand new model based on Intel's Alder Lake architecture with clock rates of 1.7 to 4.7 GHz. The 10 nm chip houses six performance cores that support Hyper-Threading, as well as eight efficiency cores without HT. This allows the 45-watt CPU to process up to 20 threads in parallel.
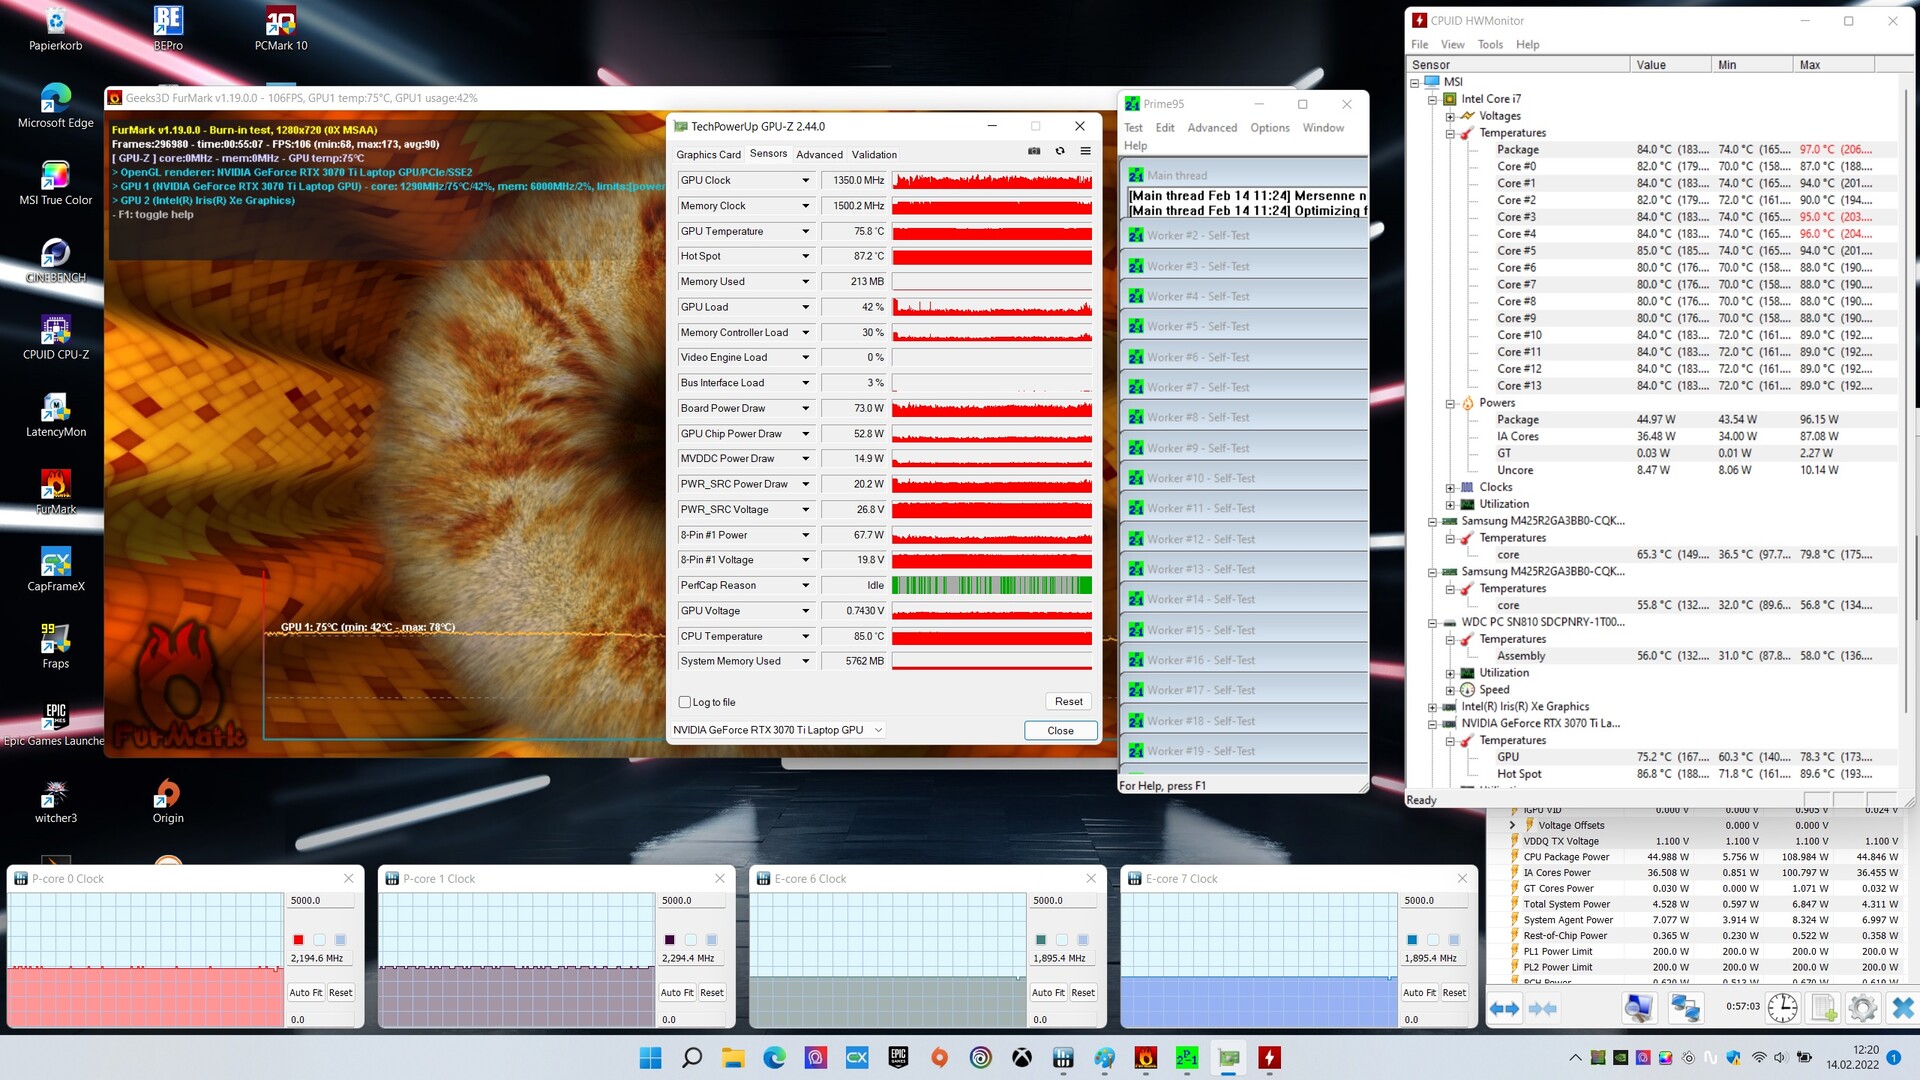
To get the most out of the processor, MSI is using very high TDP settings. According to the HWiNFO tool, we're looking at 200 watts for both PL1 and PL2. Although the values are lower in practice, the i7-12700H easily surpasses its old Tiger Lake siblings. In the Cinebench R15 multithread test, for example, this means an increase of 30% to 50% compared to the Core i7-11800H contenders. The AMD competition in the form of the Ryzen 7 5800H or the Ryzen 9 5900HX must also admit defeat, although the performance-per-watt ratio is more in favor of AMD as previous tests have shown.
Cinebench R15 multi endurance test
| CPU Performance rating - Percent | |
| Average of class Gaming | |
| MSI Stealth GS66 12UGS | |
| Eurocom Nightsky ARX315 | |
| Alienware x15 RTX 3070 P111F -2! | |
| Asus TUF Gaming A15 FA506QR-AZ061T -2! | |
| Gigabyte Aero 15 OLED XD | |
* ... smaller is better
AIDA64: FP32 Ray-Trace | FPU Julia | CPU SHA3 | CPU Queen | FPU SinJulia | FPU Mandel | CPU AES | CPU ZLib | FP64 Ray-Trace | CPU PhotoWorxx
| Performance rating | |
| Average of class Gaming | |
| Eurocom Nightsky ARX315 | |
| MSI Stealth GS66 12UGS | |
| Asus TUF Gaming A15 FA506QR-AZ061T | |
| Gigabyte Aero 15 OLED XD -9! | |
| Alienware x15 RTX 3070 P111F -9! | |
| AIDA64 / FP32 Ray-Trace | |
| Average of class Gaming (10227 - 85542, n=105, last 2 years) | |
| Asus TUF Gaming A15 FA506QR-AZ061T | |
| Eurocom Nightsky ARX315 | |
| MSI Stealth GS66 12UGS | |
| AIDA64 / FPU Julia | |
| Average of class Gaming (51376 - 238426, n=105, last 2 years) | |
| Eurocom Nightsky ARX315 | |
| Asus TUF Gaming A15 FA506QR-AZ061T | |
| MSI Stealth GS66 12UGS | |
| AIDA64 / CPU SHA3 | |
| Average of class Gaming (2180 - 10115, n=105, last 2 years) | |
| MSI Stealth GS66 12UGS | |
| Eurocom Nightsky ARX315 | |
| Asus TUF Gaming A15 FA506QR-AZ061T | |
| AIDA64 / CPU Queen | |
| Average of class Gaming (49785 - 173351, n=90, last 2 years) | |
| Eurocom Nightsky ARX315 | |
| MSI Stealth GS66 12UGS | |
| Asus TUF Gaming A15 FA506QR-AZ061T | |
| AIDA64 / FPU SinJulia | |
| Eurocom Nightsky ARX315 | |
| Average of class Gaming (4424 - 33636, n=105, last 2 years) | |
| Asus TUF Gaming A15 FA506QR-AZ061T | |
| MSI Stealth GS66 12UGS | |
| AIDA64 / FPU Mandel | |
| Average of class Gaming (25115 - 128721, n=105, last 2 years) | |
| Eurocom Nightsky ARX315 | |
| Asus TUF Gaming A15 FA506QR-AZ061T | |
| MSI Stealth GS66 12UGS | |
| AIDA64 / CPU AES | |
| Eurocom Nightsky ARX315 | |
| Average of class Gaming (39258 - 247074, n=105, last 2 years) | |
| MSI Stealth GS66 12UGS | |
| Asus TUF Gaming A15 FA506QR-AZ061T | |
| AIDA64 / CPU ZLib | |
| Average of class Gaming (574 - 2531, n=105, last 2 years) | |
| MSI Stealth GS66 12UGS | |
| Eurocom Nightsky ARX315 | |
| Asus TUF Gaming A15 FA506QR-AZ061T | |
| Gigabyte Aero 15 OLED XD | |
| Alienware x15 RTX 3070 P111F | |
| AIDA64 / FP64 Ray-Trace | |
| Average of class Gaming (5509 - 45446, n=105, last 2 years) | |
| Asus TUF Gaming A15 FA506QR-AZ061T | |
| Eurocom Nightsky ARX315 | |
| MSI Stealth GS66 12UGS | |
| AIDA64 / CPU PhotoWorxx | |
| Average of class Gaming (12271 - 89891, n=105, last 2 years) | |
| MSI Stealth GS66 12UGS | |
| Eurocom Nightsky ARX315 | |
| Asus TUF Gaming A15 FA506QR-AZ061T | |
System performance
The MSI GS66 also snatches first place when it comes to system performance, although the differences are much smaller here. Subjectively, the operating system responds as smoothly and quickly as you would expect from a modern gaming laptop.
| PCMark 10 / Score | |
| Average of class Gaming (5828 - 12414, n=93, last 2 years) | |
| MSI Stealth GS66 12UGS | |
| Eurocom Nightsky ARX315 | |
| Alienware x15 RTX 3070 P111F | |
| Gigabyte Aero 15 OLED XD | |
| Asus TUF Gaming A15 FA506QR-AZ061T | |
| PCMark 10 / Essentials | |
| MSI Stealth GS66 12UGS | |
| Average of class Gaming (8810 - 11935, n=97, last 2 years) | |
| Eurocom Nightsky ARX315 | |
| Alienware x15 RTX 3070 P111F | |
| Asus TUF Gaming A15 FA506QR-AZ061T | |
| Gigabyte Aero 15 OLED XD | |
| PCMark 10 / Productivity | |
| Average of class Gaming (6845 - 25323, n=95, last 2 years) | |
| Gigabyte Aero 15 OLED XD | |
| Asus TUF Gaming A15 FA506QR-AZ061T | |
| MSI Stealth GS66 12UGS | |
| Eurocom Nightsky ARX315 | |
| Alienware x15 RTX 3070 P111F | |
| PCMark 10 / Digital Content Creation | |
| Average of class Gaming (7602 - 19954, n=95, last 2 years) | |
| MSI Stealth GS66 12UGS | |
| Alienware x15 RTX 3070 P111F | |
| Eurocom Nightsky ARX315 | |
| Gigabyte Aero 15 OLED XD | |
| Asus TUF Gaming A15 FA506QR-AZ061T | |
| PCMark 10 Score | 7582 points | |
Help | ||
| AIDA64 / Memory Copy | |
| Average of class Gaming (21750 - 129946, n=105, last 2 years) | |
| MSI Stealth GS66 12UGS | |
| Eurocom Nightsky ARX315 | |
| Asus TUF Gaming A15 FA506QR-AZ061T | |
| AIDA64 / Memory Read | |
| Average of class Gaming (22956 - 118858, n=105, last 2 years) | |
| MSI Stealth GS66 12UGS | |
| Eurocom Nightsky ARX315 | |
| Asus TUF Gaming A15 FA506QR-AZ061T | |
| AIDA64 / Memory Write | |
| Average of class Gaming (22297 - 135096, n=105, last 2 years) | |
| MSI Stealth GS66 12UGS | |
| Eurocom Nightsky ARX315 | |
| Asus TUF Gaming A15 FA506QR-AZ061T | |
| AIDA64 / Memory Latency | |
| Average of class Gaming (75.3 - 259, n=105, last 2 years) | |
| MSI Stealth GS66 12UGS | |
| Asus TUF Gaming A15 FA506QR-AZ061T | |
| Eurocom Nightsky ARX315 | |
| Gigabyte Aero 15 OLED XD | |
| Alienware x15 RTX 3070 P111F | |
* ... smaller is better
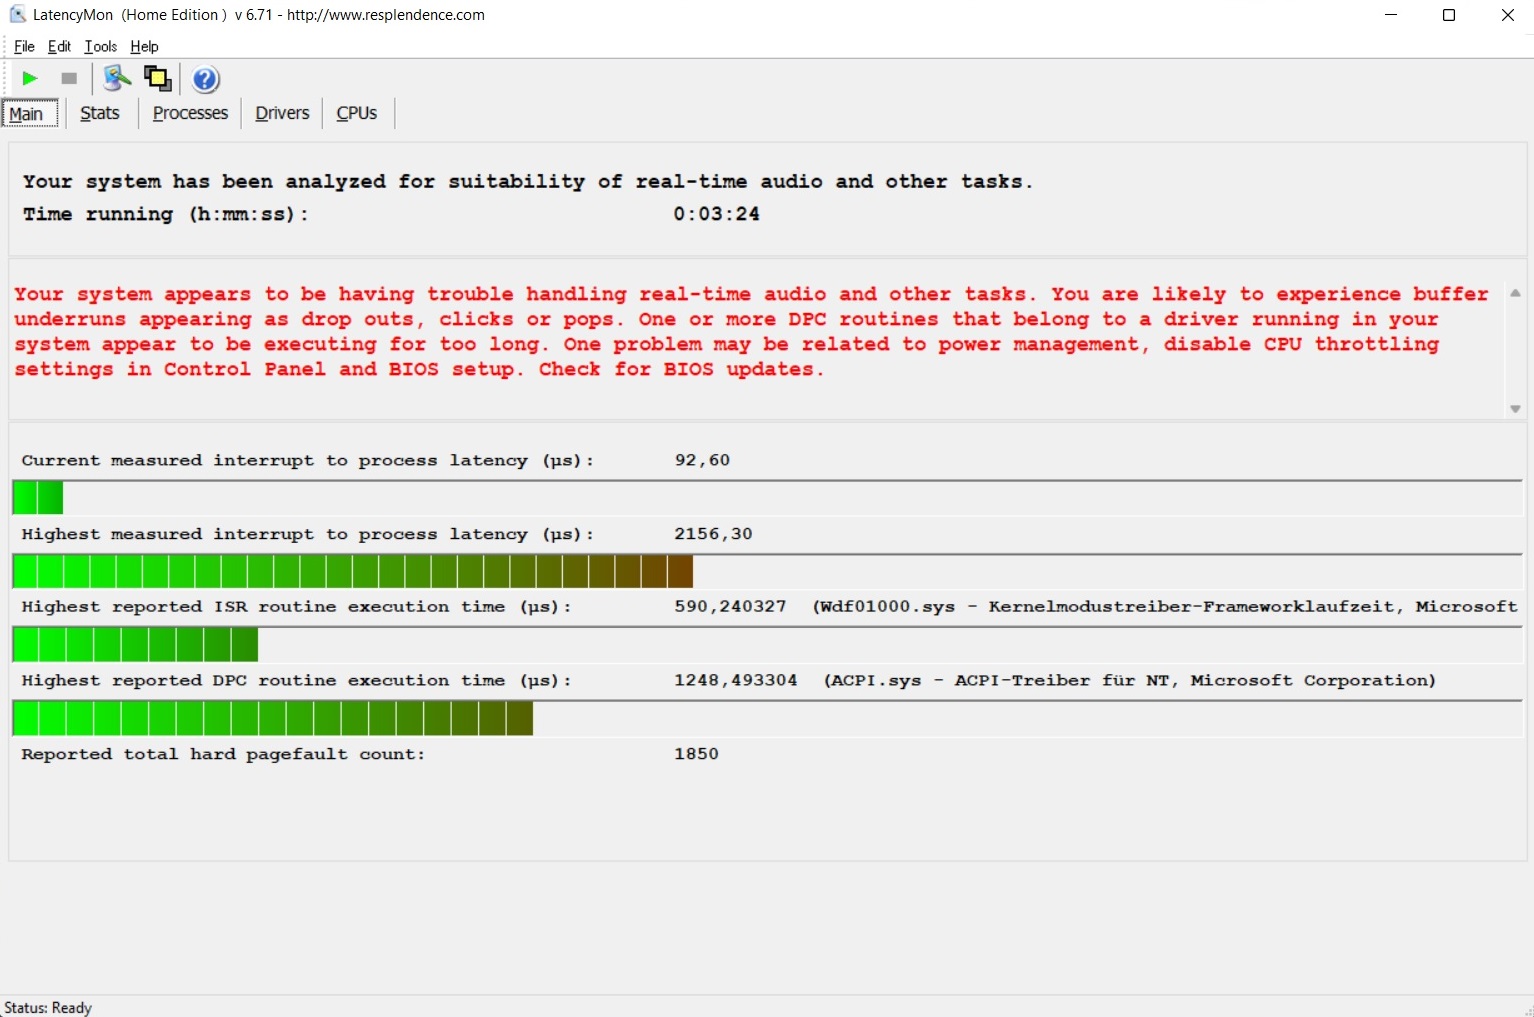
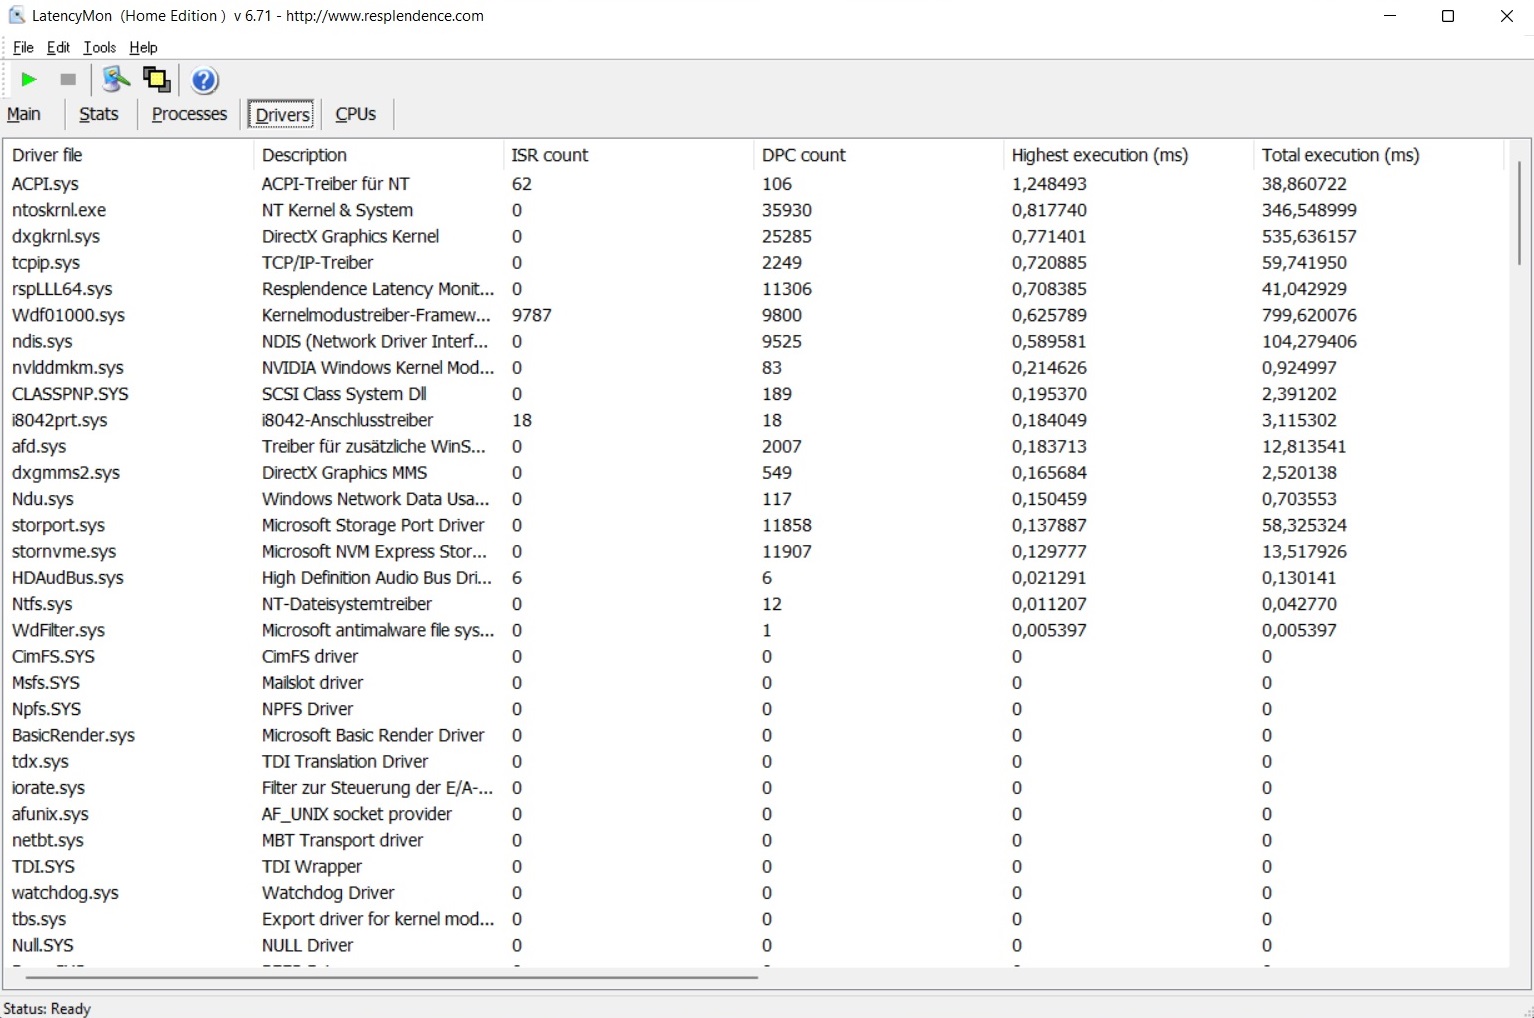
DPC latencies
The GS66 doesn't fare as well in terms of latencies. According to the LatencyMon tool, the MSI laptop is for once at the bottom of the list. You will have to make some adjustments for certain application scenarios.
| DPC Latencies / LatencyMon - interrupt to process latency (max), Web, Youtube, Prime95 | |
| Average of class Gaming (410 - 11799, n=93, last 2 years) | |
| MSI Stealth GS66 12UGS | |
| Alienware x15 RTX 3070 P111F | |
| Asus TUF Gaming A15 FA506QR-AZ061T | |
| Gigabyte Aero 15 OLED XD | |
| Eurocom Nightsky ARX315 | |
* ... smaller is better
Storage
We have nothing to criticize about the storage device. Thanks to PCIe 4.0, the 1 TB SSD from WDC (PC SN810) built into our test device excels with an outstanding performance that can only be rivaled by the Samsung drive in the Gigabyte Aero 15. In the AS SSD benchmark, sequential rates of around 5,000 MB/s are achieved - an excellent result.

| Drive Performance rating - Percent | |
| MSI Stealth GS66 12UGS -8! | |
| Gigabyte Aero 15 OLED XD | |
| Average of class Gaming | |
| Eurocom Nightsky ARX315 | |
| Asus TUF Gaming A15 FA506QR-AZ061T | |
| Alienware x15 RTX 3070 P111F | |
* ... smaller is better
Continuous load read: DiskSpd Read Loop, Queue Depth 8
Graphics card
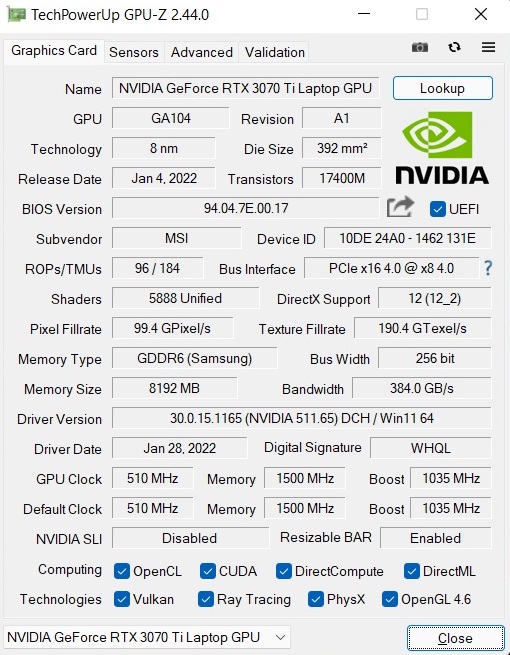
With the GeForce RTX 3070 Ti, Nvidia has launched a somewhat more powerful version of the RTX 3070. Instead of 5,120 shader units, the GPU now offers 5,888 shaders, which corresponds to an increase of 15%. Furthermore, the amount of tensor cores (184 vs. 160) and ray tracing cores (46 vs 40) has also been increased. However, the performance of Nvidia's current Ampere generation not only depends on the base specifications, but also heavily on the cooling system and the predefined TGP. Similar to the RTX 3070, the TGP of the RTX 3070 Ti ranges from 80 to 125 watts (without Dynamic Boost). MSI opted for a pretty low value with the GS66: Including Dynamic Boost, it's "only" 105 watts. Therefore, the RTX 3070 Ti's potential is not taken full advantage of.
This is also visible in the benchmark course. In spite of its better configuration in terms of shaders and the like, the GS66's performance rating is roughly on par with the Eurocom Nightsky ARX15 and the Alienware x15, both of which have RTX 3070s with a TGP of 115 and 110 watts, respectively. Only in the Port Royal ray tracing test does the GS66 come close to the top spot. It's very annoying that Nvidia didn't increase the video memory when refreshing the GPU. Even today, 8 GB of GDDR6 VRAM reaches its limits at higher resolutions and detail levels from time to time. Considering the price and the high-end requirements, at least 10 GB of VRAM would be necessary in 2022 (more like 12 GB). After all, the RTX 3080 Ti offers 16 GB of GDDR6 memory straight out of the box - the VRAM configuration is adequate here.
| 3DMark Performance rating - Percent | |
| Average of class Gaming | |
| Eurocom Nightsky ARX315 | |
| Alienware x15 RTX 3070 P111F | |
| MSI Stealth GS66 12UGS | |
| Gigabyte Aero 15 OLED XD -1! | |
| Asus TUF Gaming A15 FA506QR-AZ061T -1! | |
| 3DMark 06 Standard Score | 54178 points | |
| 3DMark Vantage P Result | 81895 points | |
| 3DMark 11 Performance | 29249 points | |
| 3DMark Cloud Gate Standard Score | 58095 points | |
| 3DMark Fire Strike Score | 22334 points | |
| 3DMark Time Spy Score | 10079 points | |
Help | ||
Gaming performance
The "Ti" identifier doesn't quite live up to its name when gaming, either. If you put all the 40 tested games together, the GS66's RTX 3070 Ti can hardly differentiate itself from other RTX 3070 laptop GPUs due to its meager TGP. The somewhat faster Eurocom Nightsky ARX15 demonstrates very clearly that higher TGPs compensate for lower shader numbers.
In general, the GeForce RTX 3070 Ti is fast enough to run demanding games in the native resolution of 2560x1440 smoothly and in high to maximum details. Apart from Cyberpunk 2077, a combination of Ultra presets and QHD always resulted in a minimum of 40 FPS - most of the time even over 60 FPS. Only at 4K does the RTX 3070 Ti reach its limit more frequently.
| Performance rating - Percent | |
| Average of class Gaming -176! | |
| MSI Stealth GS66 12UGS -34! | |
| Eurocom Nightsky ARX315 -193! | |
| Gigabyte Aero 15 OLED XD -160! | |
| Alienware x15 RTX 3070 P111F -189! | |
| Asus TUF Gaming A15 FA506QR-AZ061T -194! | |
| Dying Light 2 | |
| 1920x1080 High Quality Raytracing | |
| MSI Stealth GS66 12UGS | |
| 3840x2160 High Quality | |
| MSI Stealth GS66 12UGS | |
| 2560x1440 High Quality | |
| MSI Stealth GS66 12UGS | |
| 1920x1080 High Quality | |
| MSI Stealth GS66 12UGS | |
| 1920x1080 Medium Quality | |
| MSI Stealth GS66 12UGS | |
| Rainbow Six Extraction | |
| 3840x2160 Ultra Preset (with Fixed Resolution Quality) | |
| MSI Stealth GS66 12UGS | |
| 2560x1440 Ultra Preset (with Fixed Resolution Quality) | |
| MSI Stealth GS66 12UGS | |
| 1920x1080 Ultra Preset (with Fixed Resolution Quality) | |
| MSI Stealth GS66 12UGS | |
| 1920x1080 High Preset (with Fixed Resolution Quality) | |
| MSI Stealth GS66 12UGS | |
| 1920x1080 Medium Preset (with Fixed Resolution Quality) | |
| MSI Stealth GS66 12UGS | |
| God of War | |
| 3840x2160 Ultra Preset | |
| MSI Stealth GS66 12UGS | |
| 2560x1440 Ultra Preset | |
| MSI Stealth GS66 12UGS | |
| 1920x1080 Ultra Preset | |
| MSI Stealth GS66 12UGS | |
| 1920x1080 High Preset | |
| MSI Stealth GS66 12UGS | |
| 1920x1080 Original Preset | |
| MSI Stealth GS66 12UGS | |
| Halo Infinite | |
| 3840x2160 Ultra Preset | |
| MSI Stealth GS66 12UGS | |
| 2560x1440 Ultra Preset | |
| MSI Stealth GS66 12UGS | |
| 1920x1080 Ultra Preset | |
| MSI Stealth GS66 12UGS | |
| 1920x1080 High Preset | |
| MSI Stealth GS66 12UGS | |
| 1920x1080 Medium Preset | |
| MSI Stealth GS66 12UGS | |
| Farming Simulator 22 | |
| 3840x2160 Very High Preset | |
| MSI Stealth GS66 12UGS | |
| 2560x1440 Very High Preset | |
| MSI Stealth GS66 12UGS | |
| 1920x1080 Very High Preset | |
| MSI Stealth GS66 12UGS | |
| 1920x1080 High Preset | |
| MSI Stealth GS66 12UGS | |
| 1920x1080 Medium Preset | |
| MSI Stealth GS66 12UGS | |
| Battlefield 2042 | |
| 1920x1080 Ultra Preset + Ray Tracing | |
| MSI Stealth GS66 12UGS | |
| 3840x2160 Ultra Preset | |
| MSI Stealth GS66 12UGS | |
| 2560x1440 Ultra Preset | |
| MSI Stealth GS66 12UGS | |
| 1920x1080 Ultra Preset | |
| MSI Stealth GS66 12UGS | |
| 1920x1080 High Preset | |
| MSI Stealth GS66 12UGS | |
| 1920x1080 Medium Preset | |
| MSI Stealth GS66 12UGS | |
| Forza Horizon 5 | |
| 3840x2160 Extreme Preset | |
| MSI Stealth GS66 12UGS | |
| 2560x1440 Extreme Preset | |
| MSI Stealth GS66 12UGS | |
| 1920x1080 Extreme Preset | |
| MSI Stealth GS66 12UGS | |
| 1920x1080 High Preset | |
| MSI Stealth GS66 12UGS | |
| 1920x1080 Medium Preset | |
| MSI Stealth GS66 12UGS | |
| Riders Republic | |
| 3840x2160 Ultra Preset | |
| MSI Stealth GS66 12UGS | |
| 2560x1440 Ultra Preset | |
| MSI Stealth GS66 12UGS | |
| 1920x1080 Ultra Preset | |
| MSI Stealth GS66 12UGS | |
| 1920x1080 High Preset | |
| MSI Stealth GS66 12UGS | |
| 1920x1080 Medium Preset | |
| MSI Stealth GS66 12UGS | |
| Guardians of the Galaxy | |
| 1920x1080 Ultra Preset + Ultra Ray-Tracing | |
| MSI Stealth GS66 12UGS | |
| 3840x2160 Ultra Preset | |
| MSI Stealth GS66 12UGS | |
| 2560x1440 Ultra Preset | |
| MSI Stealth GS66 12UGS | |
| 1920x1080 Ultra Preset | |
| MSI Stealth GS66 12UGS | |
| 1920x1080 High Preset | |
| MSI Stealth GS66 12UGS | |
| 1920x1080 Medium Preset | |
| MSI Stealth GS66 12UGS | |
| Alan Wake Remastered | |
| 3840x2160 High Preset | |
| MSI Stealth GS66 12UGS | |
| 2560x1440 High Preset | |
| MSI Stealth GS66 12UGS | |
| 1920x1080 High Preset | |
| MSI Stealth GS66 12UGS | |
| 1920x1080 Medium Preset | |
| MSI Stealth GS66 12UGS | |
| Back 4 Blood | |
| 3840x2160 Epic Preset (DX12) AA:T | |
| MSI Stealth GS66 12UGS | |
| 2560x1440 Epic Preset (DX12) AA:T | |
| MSI Stealth GS66 12UGS | |
| 1920x1080 Epic Preset (DX12) AA:T | |
| MSI Stealth GS66 12UGS | |
| 1920x1080 High Preset (DX12) AA:T | |
| MSI Stealth GS66 12UGS | |
| 1920x1080 Medium Preset (DX12) AA:FX | |
| MSI Stealth GS66 12UGS | |
| Far Cry 6 | |
| 1920x1080 Ultra Graphics Quality + HD Textures + DXR AA:T | |
| Average of class Gaming (n=1last 2 years) | |
| MSI Stealth GS66 12UGS | |
| 3840x2160 Ultra Graphics Quality + HD Textures AA:T | |
| MSI Stealth GS66 12UGS | |
| 2560x1440 Ultra Graphics Quality + HD Textures AA:T | |
| Average of class Gaming (n=1last 2 years) | |
| MSI Stealth GS66 12UGS | |
| 1920x1080 Ultra Graphics Quality + HD Textures AA:T | |
| Average of class Gaming (n=1last 2 years) | |
| MSI Stealth GS66 12UGS | |
| 1920x1080 High Graphics Quality AA:T | |
| Average of class Gaming (n=1last 2 years) | |
| MSI Stealth GS66 12UGS | |
| 1920x1080 Medium Graphics Quality AA:SM | |
| Average of class Gaming (n=1last 2 years) | |
| MSI Stealth GS66 12UGS | |
| New World | |
| 3840x2160 Very High Video Quality | |
| MSI Stealth GS66 12UGS | |
| 2560x1440 Very High Video Quality | |
| MSI Stealth GS66 12UGS | |
| 1920x1080 Very High Video Quality | |
| MSI Stealth GS66 12UGS | |
| 1920x1080 High Video Quality | |
| MSI Stealth GS66 12UGS | |
| 1920x1080 Medium Video Quality | |
| MSI Stealth GS66 12UGS | |
| Deathloop | |
| 3840x2160 Ultra Preset | |
| MSI Stealth GS66 12UGS | |
| 2560x1440 Ultra Preset | |
| MSI Stealth GS66 12UGS | |
| 1920x1080 Ultra Preset | |
| MSI Stealth GS66 12UGS | |
| 1920x1080 High Preset | |
| MSI Stealth GS66 12UGS | |
| 1920x1080 Medium Preset | |
| MSI Stealth GS66 12UGS | |
| F1 2021 | |
| 3840x2160 Ultra High Preset + Raytracing AA:T AF:16x | |
| MSI Stealth GS66 12UGS | |
| 2560x1440 Ultra High Preset + Raytracing AA:T AF:16x | |
| MSI Stealth GS66 12UGS | |
| 1920x1080 Ultra High Preset + Raytracing AA:T AF:16x | |
| MSI Stealth GS66 12UGS | |
| 1920x1080 High Preset AA:T AF:16x | |
| MSI Stealth GS66 12UGS | |
| 1920x1080 Medium Preset AA:T AF:16x | |
| MSI Stealth GS66 12UGS | |
| Days Gone | |
| 3840x2160 Very High Preset | |
| MSI Stealth GS66 12UGS | |
| 2560x1440 Very High Preset | |
| MSI Stealth GS66 12UGS | |
| 1920x1080 Very High Preset | |
| MSI Stealth GS66 12UGS | |
| 1920x1080 High Preset | |
| MSI Stealth GS66 12UGS | |
| 1920x1080 Medium Preset | |
| MSI Stealth GS66 12UGS | |
| Mass Effect Legendary Edition | |
| 3840x2160 On | |
| MSI Stealth GS66 12UGS | |
| 2560x1440 On | |
| MSI Stealth GS66 12UGS | |
| 1920x1080 On | |
| MSI Stealth GS66 12UGS | |
| Resident Evil Village | |
| 1920x1080 Ray Tracing Preset | |
| MSI Stealth GS66 12UGS | |
| 3840x2160 Max Preset | |
| MSI Stealth GS66 12UGS | |
| 2560x1440 Max Preset | |
| MSI Stealth GS66 12UGS | |
| 1920x1080 Max Preset | |
| MSI Stealth GS66 12UGS | |
| 1920x1080 Prioritize Graphics Preset | |
| MSI Stealth GS66 12UGS | |
| 1920x1080 Balanced Preset | |
| MSI Stealth GS66 12UGS | |
| Outriders | |
| 3840x2160 Ultra Preset | |
| MSI Stealth GS66 12UGS | |
| 2560x1440 Ultra Preset | |
| MSI Stealth GS66 12UGS | |
| 1920x1080 Ultra Preset | |
| MSI Stealth GS66 12UGS | |
| 1920x1080 High Preset | |
| MSI Stealth GS66 12UGS | |
| 1920x1080 Medium Preset | |
| MSI Stealth GS66 12UGS | |
| Hitman 3 | |
| 3840x2160 Maximum Settings AF:16x | |
| MSI Stealth GS66 12UGS | |
| 2560x1440 Maximum Settings AF:16x | |
| MSI Stealth GS66 12UGS | |
| 1920x1080 Maximum Settings AF:16x | |
| MSI Stealth GS66 12UGS | |
| 1920x1080 High Settings AF:16x | |
| MSI Stealth GS66 12UGS | |
| 1920x1080 Medium Settings AF:16x | |
| MSI Stealth GS66 12UGS | |
| Cyberpunk 2077 1.0 | |
| 3840x2160 Ray Tracing Ultra Preset (DLSS off) | |
| Gigabyte Aero 15 OLED XD | |
| 1920x1080 Ray Tracing Ultra Preset (DLSS off) | |
| MSI Stealth GS66 12UGS | |
| Gigabyte Aero 15 OLED XD | |
| 3840x2160 Ultra Preset | |
| MSI Stealth GS66 12UGS | |
| Gigabyte Aero 15 OLED XD | |
| 2560x1440 Ultra Preset | |
| Gigabyte Aero 15 OLED XD | |
| MSI Stealth GS66 12UGS | |
| 1920x1080 Ultra Preset | |
| Gigabyte Aero 15 OLED XD | |
| Asus TUF Gaming A15 FA506QR-AZ061T | |
| MSI Stealth GS66 12UGS | |
| 1920x1080 High Preset | |
| Gigabyte Aero 15 OLED XD | |
| MSI Stealth GS66 12UGS | |
| Asus TUF Gaming A15 FA506QR-AZ061T | |
| 1920x1080 Medium Preset | |
| MSI Stealth GS66 12UGS | |
| Gigabyte Aero 15 OLED XD | |
| Asus TUF Gaming A15 FA506QR-AZ061T | |
| 1920x1080 Low Preset | |
| Gigabyte Aero 15 OLED XD | |
| 1280x720 Low Preset | |
| Gigabyte Aero 15 OLED XD | |
| Asus TUF Gaming A15 FA506QR-AZ061T | |
| Immortals Fenyx Rising | |
| 3840x2160 Very High Preset | |
| Gigabyte Aero 15 OLED XD | |
| 2560x1440 Very High Preset | |
| Gigabyte Aero 15 OLED XD | |
| 1920x1080 Very High Preset | |
| Gigabyte Aero 15 OLED XD | |
| 1920x1080 High Preset | |
| Gigabyte Aero 15 OLED XD | |
| 1920x1080 Medium Preset | |
| Gigabyte Aero 15 OLED XD | |
| 1280x720 Very Low Preset | |
| Gigabyte Aero 15 OLED XD | |
| Crysis Remastered | |
| 3840x2160 Very High Preset AA:SM | |
| MSI Stealth GS66 12UGS | |
| 2560x1440 Very High Preset AA:SM | |
| MSI Stealth GS66 12UGS | |
| 1920x1080 Very High Preset AA:SM | |
| MSI Stealth GS66 12UGS | |
| 1920x1080 High Preset AA:SM | |
| MSI Stealth GS66 12UGS | |
| 1920x1080 Medium Preset | |
| MSI Stealth GS66 12UGS | |
| Yakuza Like a Dragon | |
| 3840x2160 Ultra Preset | |
| MSI Stealth GS66 12UGS | |
| 2560x1440 Ultra Preset | |
| MSI Stealth GS66 12UGS | |
| 1920x1080 Ultra Preset | |
| MSI Stealth GS66 12UGS | |
| 1920x1080 High Preset | |
| MSI Stealth GS66 12UGS | |
| 1920x1080 Medium Preset | |
| MSI Stealth GS66 12UGS | |
| Assassin´s Creed Valhalla | |
| 3840x2160 Ultra High Preset | |
| MSI Stealth GS66 12UGS | |
| 2560x1440 Ultra High Preset | |
| MSI Stealth GS66 12UGS | |
| 1920x1080 Ultra High Preset | |
| MSI Stealth GS66 12UGS | |
| 1920x1080 High Preset | |
| MSI Stealth GS66 12UGS | |
| 1920x1080 Medium Preset | |
| MSI Stealth GS66 12UGS | |
| Dirt 5 | |
| 3840x2160 Ultra High Preset | |
| MSI Stealth GS66 12UGS | |
| 2560x1440 Ultra High Preset | |
| MSI Stealth GS66 12UGS | |
| 1920x1080 Ultra High Preset | |
| MSI Stealth GS66 12UGS | |
| 1920x1080 High Preset | |
| MSI Stealth GS66 12UGS | |
| 1920x1080 Medium Preset | |
| MSI Stealth GS66 12UGS | |
| Watch Dogs Legion | |
| 1920x1080 Ultra Preset + Ultra Ray Tracing (DX12) | |
| MSI Stealth GS66 12UGS | |
| 3840x2160 Ultra Preset (DX12) | |
| MSI Stealth GS66 12UGS | |
| 2560x1440 Ultra Preset (DX12) | |
| MSI Stealth GS66 12UGS | |
| 1920x1080 Ultra Preset (DX12) | |
| MSI Stealth GS66 12UGS | |
| 1920x1080 High Preset (DX12) | |
| MSI Stealth GS66 12UGS | |
| 1920x1080 Medium Preset (DX12) | |
| MSI Stealth GS66 12UGS | |
| Star Wars Squadrons | |
| 3840x2160 Ultra Preset | |
| MSI Stealth GS66 12UGS | |
| 2560x1440 Ultra Preset | |
| MSI Stealth GS66 12UGS | |
| 1920x1080 Ultra Preset | |
| MSI Stealth GS66 12UGS | |
| 1920x1080 High Preset | |
| MSI Stealth GS66 12UGS | |
| 1920x1080 Medium Preset | |
| MSI Stealth GS66 12UGS | |
| Mafia Definitive Edition | |
| 3840x2160 High Preset | |
| MSI Stealth GS66 12UGS | |
| 2560x1440 High Preset | |
| MSI Stealth GS66 12UGS | |
| 1920x1080 High Preset | |
| MSI Stealth GS66 12UGS | |
| 1920x1080 Medium Preset | |
| MSI Stealth GS66 12UGS | |
| Serious Sam 4 | |
| 3840x2160 Ultra (DX12) AA:2xMS | |
| MSI Stealth GS66 12UGS | |
| 2560x1440 Ultra (DX12) AA:2xMS | |
| MSI Stealth GS66 12UGS | |
| 1920x1080 Ultra (DX12) AA:2xMS | |
| MSI Stealth GS66 12UGS | |
| 1920x1080 High (DX12) | |
| MSI Stealth GS66 12UGS | |
| 1920x1080 Medium (DX12) | |
| MSI Stealth GS66 12UGS | |
| Death Stranding | |
| 3840x2160 Very High Preset | |
| MSI Stealth GS66 12UGS | |
| 2560x1440 Very High Preset | |
| MSI Stealth GS66 12UGS | |
| 1920x1080 Very High Preset | |
| MSI Stealth GS66 12UGS | |
| 1920x1080 Default Preset | |
| MSI Stealth GS66 12UGS | |
| 1920x1080 Medium Preset | |
| MSI Stealth GS66 12UGS | |
| F1 2020 | |
| 3840x2160 Ultra High Preset AA:T AF:16x | |
| Gigabyte Aero 15 OLED XD | |
| 2560x1440 Ultra High Preset AA:T AF:16x | |
| Gigabyte Aero 15 OLED XD | |
| 1920x1080 Ultra High Preset AA:T AF:16x | |
| Gigabyte Aero 15 OLED XD | |
| 1920x1080 High Preset AA:T AF:16x | |
| Gigabyte Aero 15 OLED XD | |
| 1920x1080 Medium Preset AF:16x | |
| Gigabyte Aero 15 OLED XD | |
| 1280x720 Ultra Low Preset | |
| Gigabyte Aero 15 OLED XD | |
| Gears Tactics | |
| 3840x2160 Ultra Preset | |
| MSI Stealth GS66 12UGS | |
| 2560x1440 Ultra Preset | |
| MSI Stealth GS66 12UGS | |
| 1920x1080 Ultra Preset | |
| MSI Stealth GS66 12UGS | |
| 1920x1080 High Preset | |
| MSI Stealth GS66 12UGS | |
| 1920x1080 Medium Preset | |
| MSI Stealth GS66 12UGS | |
| Doom Eternal | |
| 3840x2160 Ultra Preset | |
| MSI Stealth GS66 12UGS | |
| 2560x1440 Ultra Preset | |
| MSI Stealth GS66 12UGS | |
| 1920x1080 Ultra Preset | |
| MSI Stealth GS66 12UGS | |
| 1920x1080 High Preset | |
| MSI Stealth GS66 12UGS | |
| 1920x1080 Medium Preset | |
| MSI Stealth GS66 12UGS | |
| Hunt Showdown | |
| 3840x2160 High Preset | |
| MSI Stealth GS66 12UGS | |
| 2560x1440 High Preset | |
| MSI Stealth GS66 12UGS | |
| 1920x1080 High Preset | |
| MSI Stealth GS66 12UGS | |
| 1920x1080 Medium Preset | |
| MSI Stealth GS66 12UGS | |
| The Witcher 3 | |
| 3840x2160 High Graphics & Postprocessing (Nvidia HairWorks Off) | |
| Average of class Gaming (114 - 170.9, n=4, last 2 years) | |
| Gigabyte Aero 15 OLED XD | |
| 1920x1080 Ultra Graphics & Postprocessing (HBAO+) | |
| Average of class Gaming (104.7 - 240, n=7, last 2 years) | |
| Alienware x15 RTX 3070 P111F | |
| Eurocom Nightsky ARX315 | |
| Gigabyte Aero 15 OLED XD | |
| MSI Stealth GS66 12UGS | |
| Asus TUF Gaming A15 FA506QR-AZ061T | |
| 1920x1080 High Graphics & Postprocessing (Nvidia HairWorks Off) | |
| Average of class Gaming (341 - 404, n=2, last 2 years) | |
| Eurocom Nightsky ARX315 | |
| Alienware x15 RTX 3070 P111F | |
| Gigabyte Aero 15 OLED XD | |
| MSI Stealth GS66 12UGS | |
| 1366x768 Medium Graphics & Postprocessing | |
| Average of class Gaming (428 - 517, n=2, last 2 years) | |
| Eurocom Nightsky ARX315 | |
| Alienware x15 RTX 3070 P111F | |
| MSI Stealth GS66 12UGS | |
| Gigabyte Aero 15 OLED XD | |
| 1024x768 Low Graphics & Postprocessing | |
| Average of class Gaming (447 - 686, n=2, last 2 years) | |
| Eurocom Nightsky ARX315 | |
| Alienware x15 RTX 3070 P111F | |
| Gigabyte Aero 15 OLED XD | |
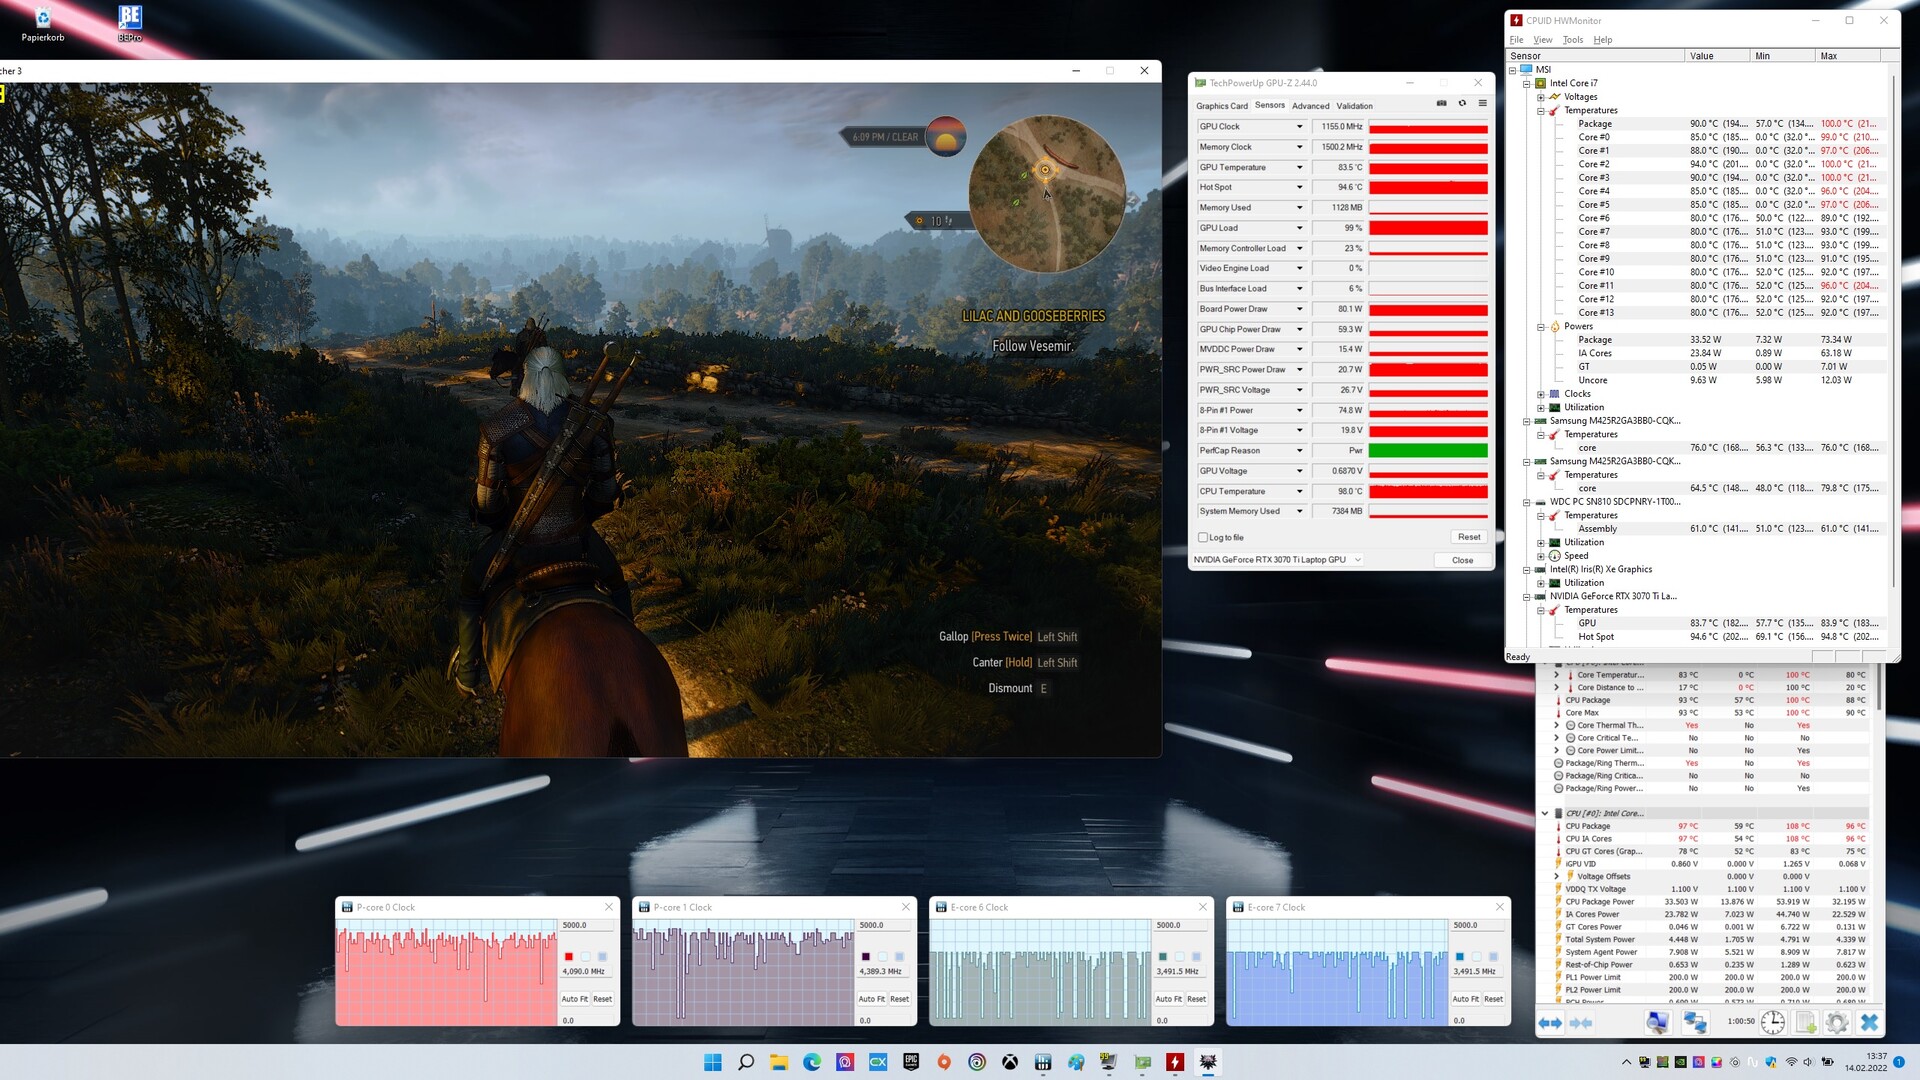
We tested how the graphics performance behaves over a prolonged period of time with The Witcher 3 for about 60 minutes. Although there were no severe FPS drops, the base performance and clock rates decrease to a certain extent after a while, just like in the Cinebench loop.
The Witcher 3 FPS diagram
| low | med. | high | ultra | QHD | 4K | |
|---|---|---|---|---|---|---|
| GTA V (2015) | 181 | 170 | 105 | |||
| The Witcher 3 (2015) | 271 | 166 | 90.4 | |||
| Dota 2 Reborn (2015) | 181 | 166 | 158 | 151 | ||
| Final Fantasy XV Benchmark (2018) | 117 | 87 | ||||
| X-Plane 11.11 (2018) | 128 | 117 | 91.6 | |||
| Far Cry 5 (2018) | 139 | 131 | 118 | |||
| Strange Brigade (2018) | 216 | 175 | 153 | |||
| Hunt Showdown (2020) | 139 | 116 | 75.1 | 36.5 | ||
| Doom Eternal (2020) | 222 | 196 | 188 | 145 | 78.2 | |
| Gears Tactics (2020) | 204 | 135 | 102 | 75.2 | 40.1 | |
| Death Stranding (2020) | 139 | 132 | 129 | 94.4 | 55.2 | |
| Crysis Remastered (2020) | 178 | 71.8 | 64.3 | 48.5 | 27.6 | |
| Serious Sam 4 (2020) | 110 | 99.2 | 82.4 | 64.2 | 40.5 | |
| Mafia Definitive Edition (2020) | 103 | 95.1 | 66.1 | 35.7 | ||
| Star Wars Squadrons (2020) | 292 | 269 | 237 | 167 | 92.9 | |
| Watch Dogs Legion (2020) | 107 | 97 | 65 | 50 | 29 | |
| Dirt 5 (2020) | 124 | 98.4 | 78.5 | 64 | 41.6 | |
| Assassin´s Creed Valhalla (2020) | 102 | 85 | 73 | 56 | 35 | |
| Yakuza Like a Dragon (2020) | 117 | 113 | 100 | 68.5 | 37 | |
| Cyberpunk 2077 1.0 (2020) | 82.1 | 66.9 | 56.1 | 35.9 | 17.5 | |
| Hitman 3 (2021) | 169 | 146 | 138 | 95.8 | 54.3 | |
| Outriders (2021) | 143 | 124 | 104 | 70 | 37.4 | |
| Resident Evil Village (2021) | 176 | 160 | 141 | 98.1 | 52.9 | |
| Mass Effect Legendary Edition (2021) | 147 | 128 | 80.5 | |||
| Days Gone (2021) | 130 | 115 | 86.3 | 64.1 | 36.9 | |
| F1 2021 (2021) | 268 | 201 | 108 | 80 | 47 | |
| Deathloop (2021) | 117 | 98.1 | 80.2 | 56.1 | 30.8 | |
| New World (2021) | 107 | 94.3 | 83.3 | 58.3 | 32.2 | |
| Alan Wake Remastered (2021) | 154 | 146 | 104 | 56.7 | ||
| Far Cry 6 (2021) | 125 | 108 | 95 | 70 | 38 | |
| Back 4 Blood (2021) | 221 | 189 | 176 | 120 | 63.9 | |
| Guardians of the Galaxy (2021) | 126 | 125 | 120 | 87 | 49 | |
| Riders Republic (2021) | 127 | 104 | 96 | 70 | 39 | |
| Forza Horizon 5 (2021) | 136 | 122 | 76 | 65 | 47 | |
| Battlefield 2042 (2021) | 115 | 96.7 | 85.6 | 63.2 | 39.5 | |
| Farming Simulator 22 (2021) | 196 | 170 | 144 | 112 | 69.7 | |
| Halo Infinite (2021) | 120 | 101 | 95.5 | 65.5 | 34.6 | |
| God of War (2022) | 91.3 | 76.6 | 55.1 | 45.2 | 31.5 | |
| Rainbow Six Extraction (2022) | 181 | 176 | 138 | 91 | 46 | |
| Dying Light 2 (2022) | 78.4 | 69.6 | 51.3 | 28.3 |
Emissions
Noise emissions
The GS66 12UGS is neither quiet nor particularly loud when using the automatic AI profile. In idle usage, the fans are always active and rotate at a moderate 31 to 32 dB(A) (up to 35 dB occasionally). Under load, the noise level increases significantly to between 43 and 48 dB(A), although in contrast to many competitors, the 50 dB(A) mark is never exceeded. Nevertheless, users who are sensitive to noise will have to use a headset when gaming.
Noise level
| Idle |
| 31 / 32 / 35 dB(A) |
| Load |
| 48 / 48 dB(A) |
 | ||
30 dB silent 40 dB(A) audible 50 dB(A) loud |
||
min: | ||
| MSI Stealth GS66 12UGS i7-12700H, GeForce RTX 3070 Ti Laptop GPU | Asus TUF Gaming A15 FA506QR-AZ061T R7 5800H, GeForce RTX 3070 Laptop GPU | Gigabyte Aero 15 OLED XD i7-11800H, GeForce RTX 3070 Laptop GPU | Alienware x15 RTX 3070 P111F i7-11800H, GeForce RTX 3070 Laptop GPU | Eurocom Nightsky ARX315 R9 5900X, GeForce RTX 3070 Laptop GPU | Average of class Gaming | |
|---|---|---|---|---|---|---|
| Noise | 8% | -5% | 9% | -8% | 7% | |
| off / environment * (dB) | 24 | 26 -8% | 25 -4% | 24.1 -0% | 25.3 -5% | 24.1 ? -0% |
| Idle Minimum * (dB) | 31 | 26 16% | 30 3% | 26.6 14% | 25.9 16% | 26 ? 16% |
| Idle Average * (dB) | 32 | 26 19% | 32 -0% | 26.6 17% | 27.9 13% | 27.4 ? 14% |
| Idle Maximum * (dB) | 35 | 27.4 22% | 35 -0% | 26.6 24% | 40.8 -17% | 30.1 ? 14% |
| Load Average * (dB) | 48 | 46.6 3% | 44 8% | 30.9 36% | 55.2 -15% | 43.6 ? 9% |
| Witcher 3 ultra * (dB) | 43 | 51 -19% | 49.9 -16% | 52.4 -22% | ||
| Load Maximum * (dB) | 48 | 49.3 -3% | 60 -25% | 53.5 -11% | 60.3 -26% | 54.2 ? -13% |
* ... smaller is better
Temperature
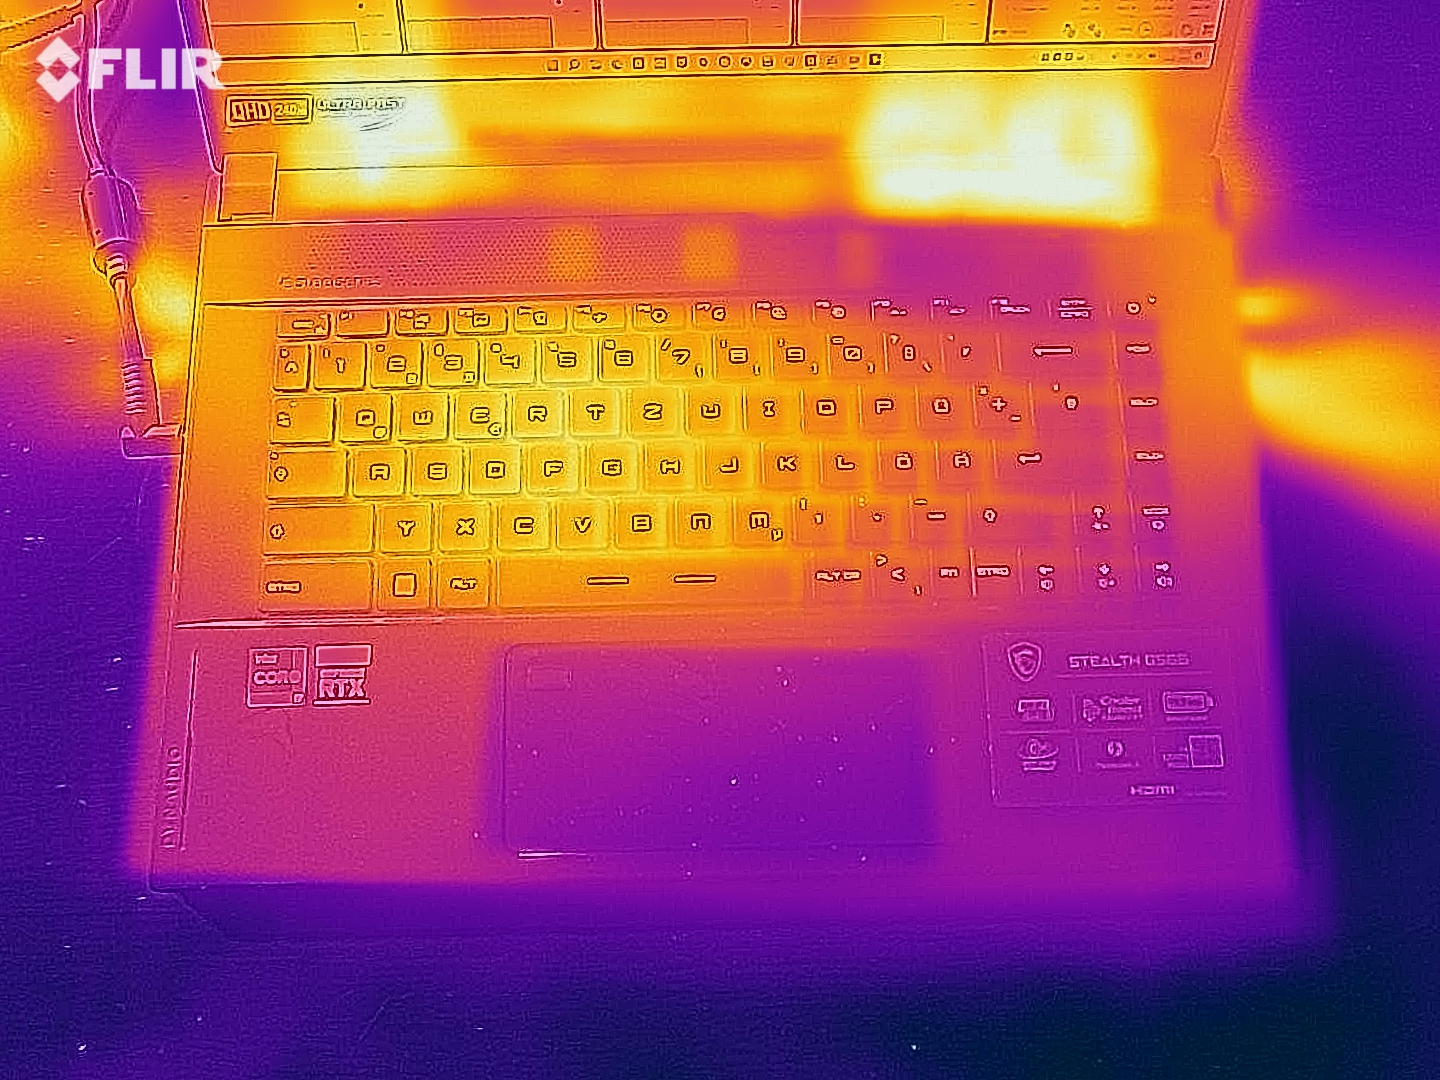
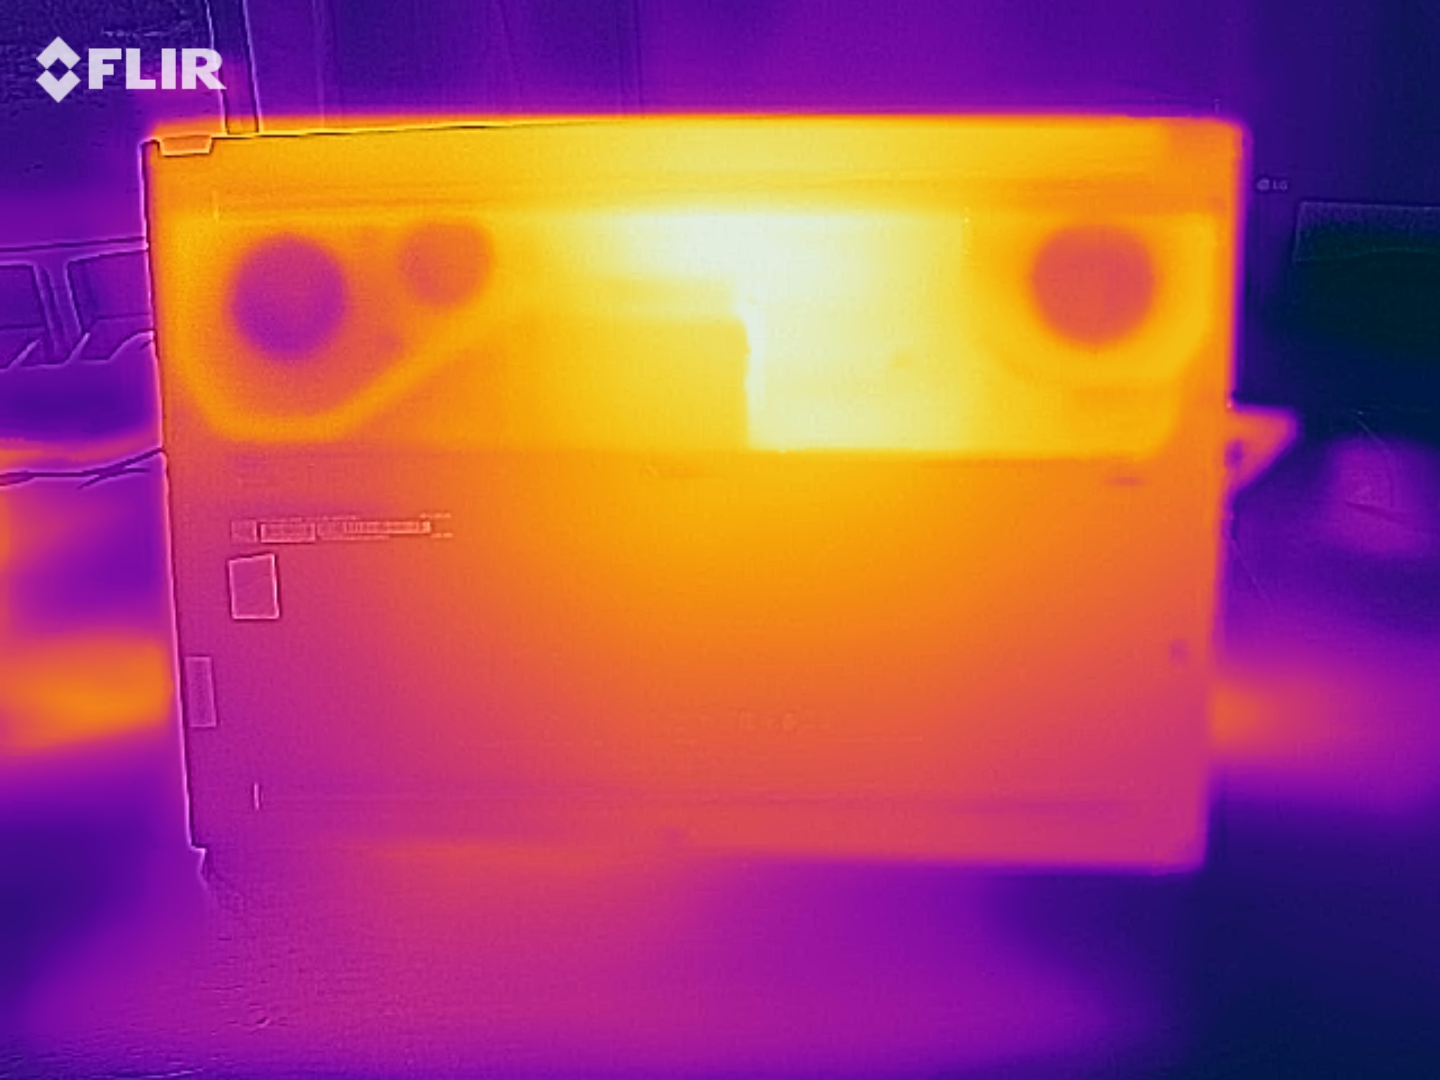
The GS66 has to accept some criticism for its heat development. In the stress test with the FurMark and Prime95 tools, the chassis heated up to 54 °C (~129 °F) (top) and 59 °C (~138 °F) (bottom), respectively, in the rear area. Consequently, gaming sessions with the device on the lap are not a good idea. When the laptop is idle, the situation is much more relaxed: The surfaces stay below the 30 °C mark (~86 °F). The fact that the cooling system is rather limited in capacity becomes clear when looking at the components. In our The Witcher 3 test, the GPU and CPU reached temperatures of over 80 °C (~176 °F) and 90 °C (~194 °F), respectively.
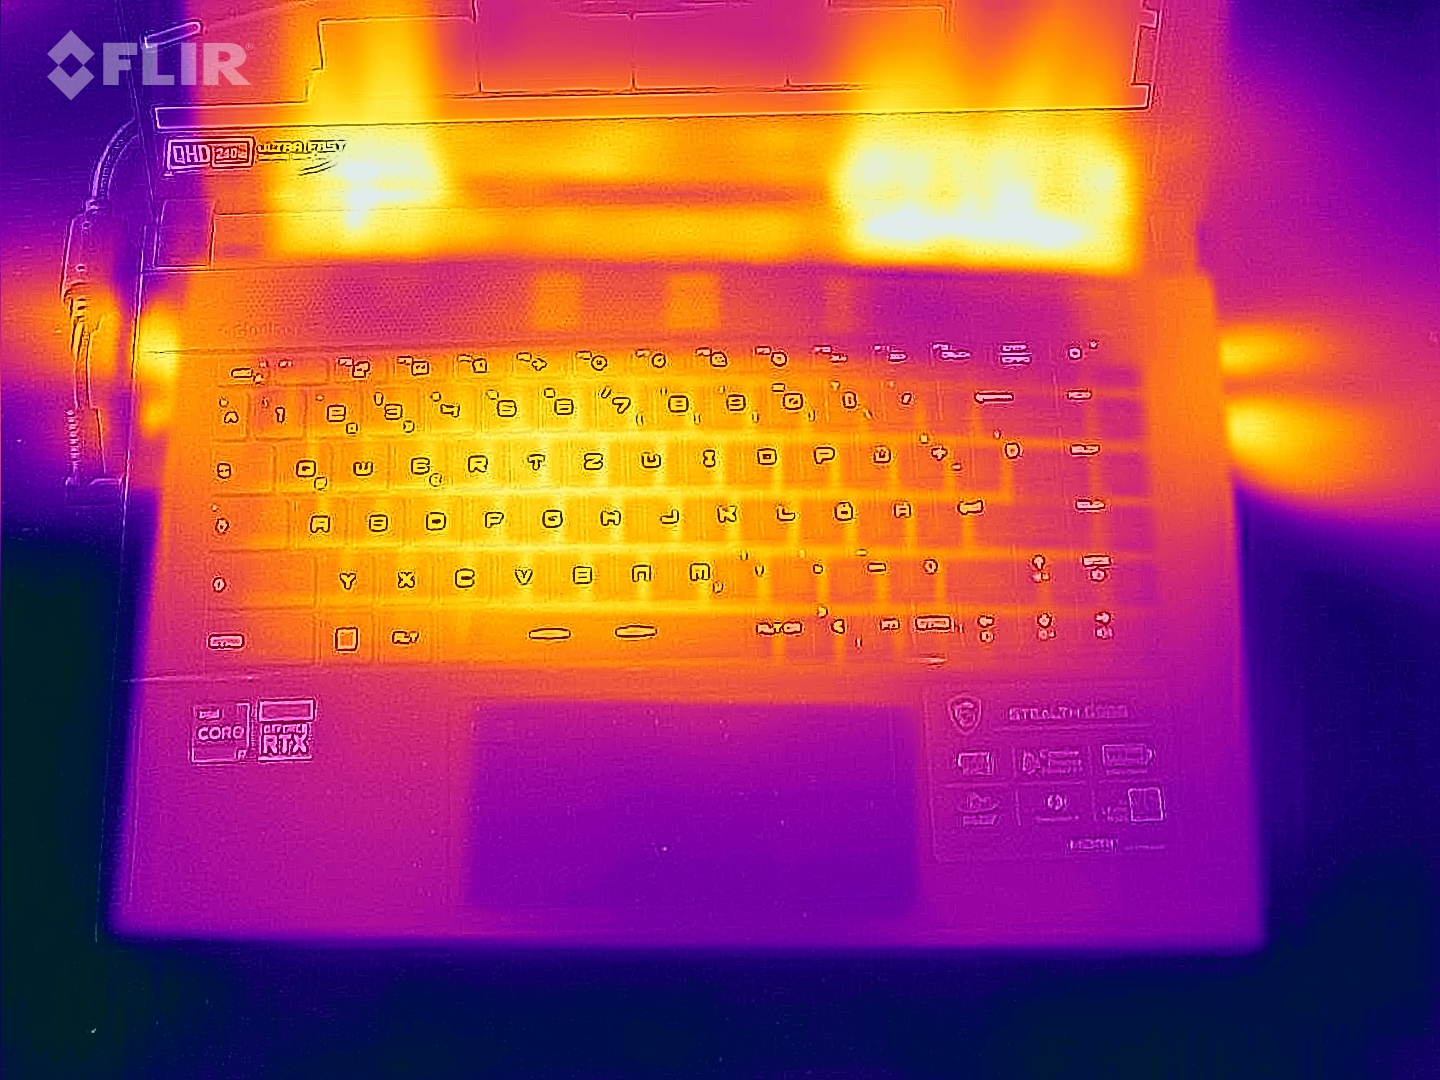
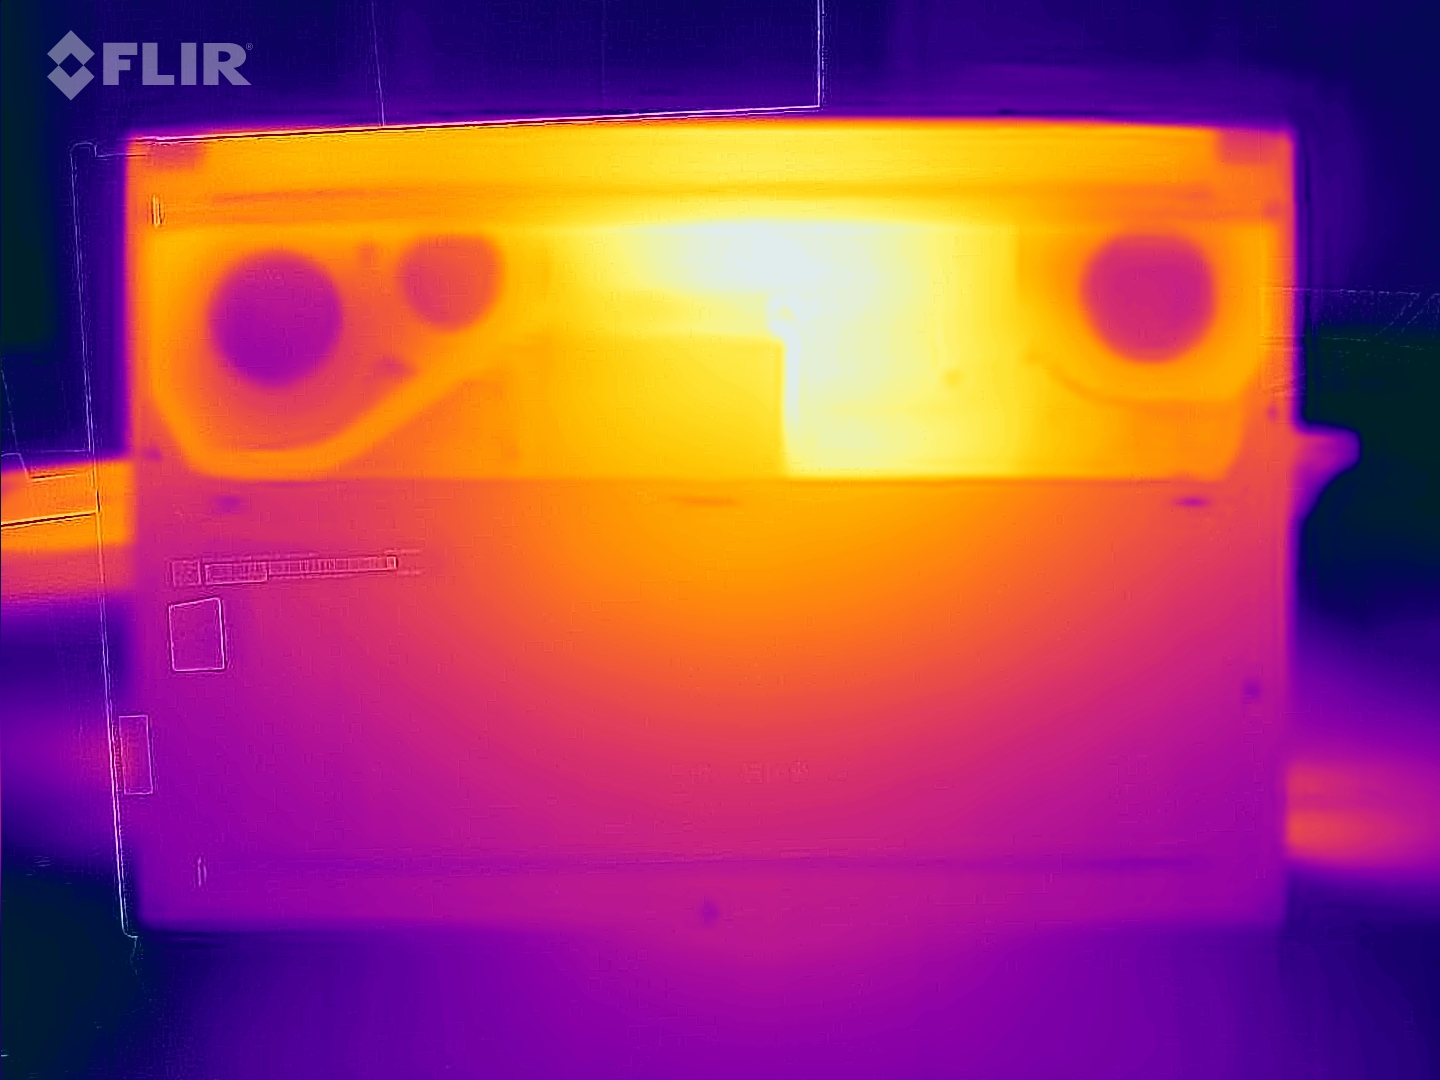
(-) The maximum temperature on the upper side is 54 °C / 129 F, compared to the average of 40.4 °C / 105 F, ranging from 21.2 to 68.8 °C for the class Gaming.
(-) The bottom heats up to a maximum of 59 °C / 138 F, compared to the average of 43.2 °C / 110 F
(+) In idle usage, the average temperature for the upper side is 25.1 °C / 77 F, compared to the device average of 33.9 °C / 93 F.
(-) Playing The Witcher 3, the average temperature for the upper side is 45.1 °C / 113 F, compared to the device average of 33.9 °C / 93 F.
(±) The palmrests and touchpad can get very hot to the touch with a maximum of 38 °C / 100.4 F.
(-) The average temperature of the palmrest area of similar devices was 28.8 °C / 83.8 F (-9.2 °C / -16.6 F).
| MSI Stealth GS66 12UGS i7-12700H, GeForce RTX 3070 Ti Laptop GPU | Asus TUF Gaming A15 FA506QR-AZ061T R7 5800H, GeForce RTX 3070 Laptop GPU | Gigabyte Aero 15 OLED XD i7-11800H, GeForce RTX 3070 Laptop GPU | Alienware x15 RTX 3070 P111F i7-11800H, GeForce RTX 3070 Laptop GPU | Eurocom Nightsky ARX315 R9 5900X, GeForce RTX 3070 Laptop GPU | Average of class Gaming | |
|---|---|---|---|---|---|---|
| Heat | -16% | -10% | -6% | -9% | -3% | |
| Maximum Upper Side * (°C) | 54 | 46.7 14% | 45 17% | 59.2 -10% | 36.2 33% | 45.2 ? 16% |
| Maximum Bottom * (°C) | 59 | 55.9 5% | 54 8% | 58 2% | 49.6 16% | 48.1 ? 18% |
| Idle Upper Side * (°C) | 26 | 37.1 -43% | 34 -31% | 28.4 -9% | 32.6 -25% | 31 ? -19% |
| Idle Bottom * (°C) | 27 | 38.1 -41% | 36 -33% | 29 -7% | 43.2 -60% | 34.2 ? -27% |
* ... smaller is better
Speakers
The new Stealth GS66's sound quality is average. As is typical for laptops, bass is particularly lacking. Mids and highs are played reasonably clear according to our audio analysis. The biggest plus point is the ample maximum volume of 86 dB(A). For comparison: The Gigabyte Aero 15 only manages up to 75 dB(A).
MSI Stealth GS66 12UGS audio analysis
(+) | speakers can play relatively loud (86 dB)
Bass 100 - 315 Hz
(-) | nearly no bass - on average 18.8% lower than median
(±) | linearity of bass is average (10.8% delta to prev. frequency)
Mids 400 - 2000 Hz
(±) | higher mids - on average 6.3% higher than median
(+) | mids are linear (4.8% delta to prev. frequency)
Highs 2 - 16 kHz
(+) | balanced highs - only 3.5% away from median
(+) | highs are linear (5.3% delta to prev. frequency)
Overall 100 - 16.000 Hz
(±) | linearity of overall sound is average (16.5% difference to median)
Compared to same class
» 42% of all tested devices in this class were better, 7% similar, 51% worse
» The best had a delta of 6%, average was 18%, worst was 132%
Compared to all devices tested
» 28% of all tested devices were better, 6% similar, 66% worse
» The best had a delta of 4%, average was 23%, worst was 134%
Gigabyte Aero 15 OLED XD audio analysis
(±) | speaker loudness is average but good (75 dB)
Bass 100 - 315 Hz
(-) | nearly no bass - on average 21.1% lower than median
(±) | linearity of bass is average (12.7% delta to prev. frequency)
Mids 400 - 2000 Hz
(+) | balanced mids - only 4.8% away from median
(±) | linearity of mids is average (7.7% delta to prev. frequency)
Highs 2 - 16 kHz
(+) | balanced highs - only 3.5% away from median
(±) | linearity of highs is average (8.1% delta to prev. frequency)
Overall 100 - 16.000 Hz
(±) | linearity of overall sound is average (19.8% difference to median)
Compared to same class
» 70% of all tested devices in this class were better, 6% similar, 24% worse
» The best had a delta of 6%, average was 18%, worst was 132%
Compared to all devices tested
» 51% of all tested devices were better, 7% similar, 42% worse
» The best had a delta of 4%, average was 23%, worst was 134%
Energy management
When graphics switching is active (GPU switch: MSHybrid @MSI Center), the GS66 is quite frugal in idle mode. 11 to 23 watts provide solid battery runtimes. Under load, energy consumption climbs to between 110 and 230 watts - acceptable in view of the performance you get.
Energy consumption
| Off / Standby | |
| Idle | |
| Load |
|
Key:
min: | |
| MSI Stealth GS66 12UGS i7-12700H, GeForce RTX 3070 Ti Laptop GPU | Asus TUF Gaming A15 FA506QR-AZ061T R7 5800H, GeForce RTX 3070 Laptop GPU | Gigabyte Aero 15 OLED XD i7-11800H, GeForce RTX 3070 Laptop GPU | Alienware x15 RTX 3070 P111F i7-11800H, GeForce RTX 3070 Laptop GPU | Eurocom Nightsky ARX315 R9 5900X, GeForce RTX 3070 Laptop GPU | Average of class Gaming | |
|---|---|---|---|---|---|---|
| Power Consumption | 12% | -34% | -22% | -174% | -12% | |
| Idle Minimum * (Watt) | 11 | 10.2 7% | 23 -109% | 15.7 -43% | 55 -400% | 13 ? -18% |
| Idle Average * (Watt) | 16 | 12.8 20% | 26 -63% | 20.3 -27% | 68.2 -326% | 19 ? -19% |
| Idle Maximum * (Watt) | 23 | 15 35% | 34 -48% | 43 -87% | 72.5 -215% | 24.6 ? -7% |
| Load Average * (Watt) | 110 | 130 -18% | 99 10% | 94.4 14% | 149.2 -36% | 110.7 ? -1% |
| Witcher 3 ultra * (Watt) | 151 | 137 9% | 163 -8% | 167 -11% | 233 -54% | |
| Load Maximum * (Watt) | 230 | 184 20% | 190 17% | 183.4 20% | 255.8 -11% | 259 ? -13% |
* ... smaller is better
Energy consumption during The Witcher 3 / stress test
Energy consumption with an external monitor
Battery life
MSI has equipped the GS66 with a massive 99 Wh battery, which doesn't really come into its own despite its ample capacity. Even under perfect conditions (minimum brightness, maximum power saving, no load), the 15-incher can't even reach 8 hours. The Alienware x15 achieves over 9 hours with a lower battery capacity, and the Asus TUF A15 even over 17 hours. We were able to get around 5:30 hours out of the MSI laptop in our real-world Wi-Fi test at medium brightness - a viable result.
| MSI Stealth GS66 12UGS i7-12700H, GeForce RTX 3070 Ti Laptop GPU, 99.9 Wh | Asus TUF Gaming A15 FA506QR-AZ061T R7 5800H, GeForce RTX 3070 Laptop GPU, 90 Wh | Gigabyte Aero 15 OLED XD i7-11800H, GeForce RTX 3070 Laptop GPU, 99 Wh | Alienware x15 RTX 3070 P111F i7-11800H, GeForce RTX 3070 Laptop GPU, 87 Wh | Eurocom Nightsky ARX315 R9 5900X, GeForce RTX 3070 Laptop GPU, 62 Wh | Average of class Gaming | |
|---|---|---|---|---|---|---|
| Battery runtime | 95% | 57% | -2% | -81% | 11% | |
| Reader / Idle (h) | 7.8 | 17.4 123% | 9.7 24% | 8.27 ? 6% | ||
| WiFi v1.3 (h) | 5.4 | 11.4 111% | 8.5 57% | 6.1 13% | 1 -81% | 7.11 ? 32% |
| Load (h) | 1.6 | 2.4 50% | 0.9 -44% | 1.502 ? -6% | ||
| Witcher 3 ultra (h) | 2.2 |
Pros
Cons
Verdict
With the new GS66 generation, MSI not only updates the processor, but also the graphics card.
The Core i7-12700H and the GeForce RTX 3070 Ti found in the 12UGS model that we tested run all modern games smoothly in the native QHD resolution (2560x1440 pixels).
The 15-inch display is very fast with its 240 Hz refresh rate, and it also offers a great color space (almost 100% DCI-P3) on top of that, which should please gamers as well as content creators, although we would have still wished for a higher brightness.
Case, input devices, and connectivity (Thunderbolt 4) are at a good level. However, among other things, the GS66 loses points due to the high temperature development in 3D mode and its poor webcam - as is the case with most laptops.
Overall, the Stealth GS66 12UGS achieves a score of 85%, which puts it on par with the Asus TUF A15 FA506QR. The other RTX 3070 competitors are either slightly behind (Eurocom Nightsky ARX15) or marginally ahead (Gigabyte Aero 15 OLED XD and Alienware x15 P111F).
Price and availability
MSI Stealth GS66 12UGS
- 02/16/2022 v7 (old)
Florian Glaser
Price comparison

