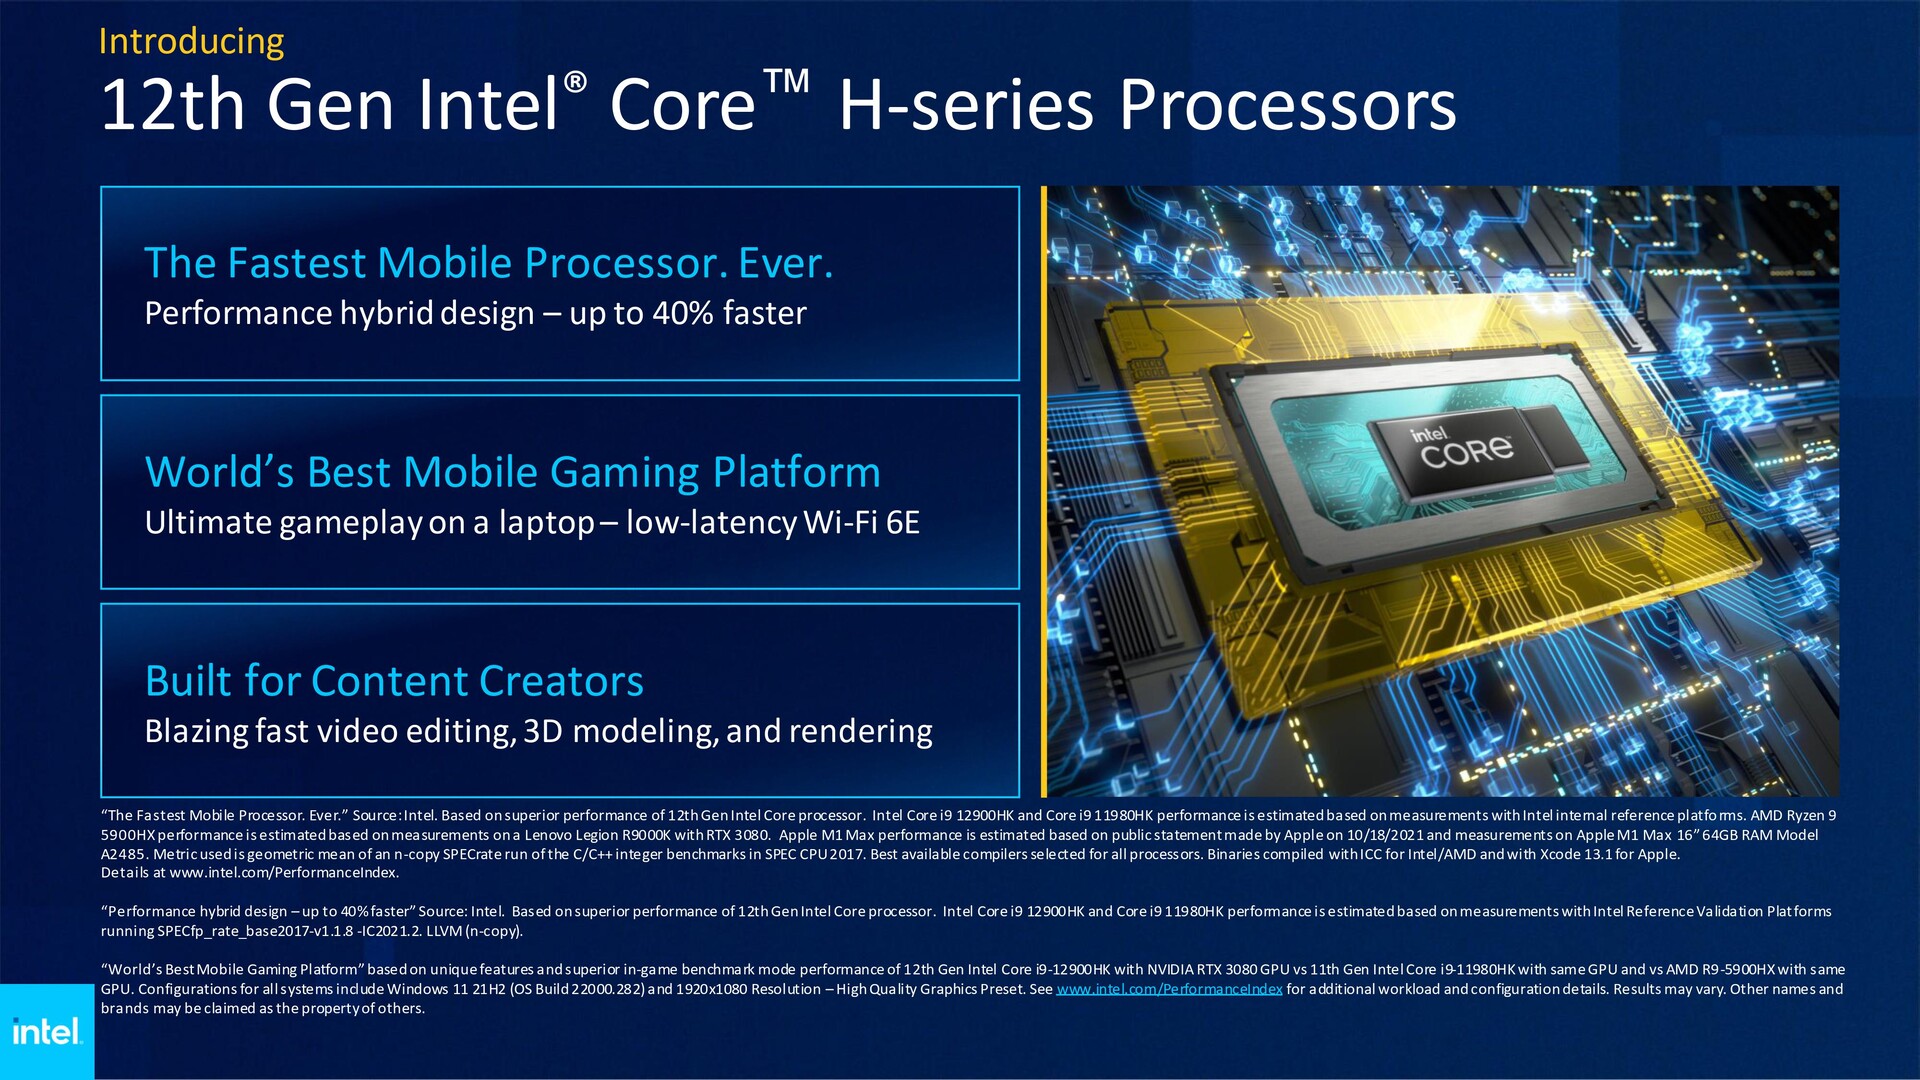
Intel Core i9-12900HK performance and power efficiency comparison: Significant gains with potential to put even upcoming AMD offerings at a disadvantage
Intel launched the 12th gen Alder Lake-H processors at CES 2022 with the promise of significant upticks in gaming and productivity performance. With Alder Lake-H, Intel is bringing its hybrid core architecture to the mobile space in a more mainstream manner after experimenting with Lakefield.
The first laptops with Alder Lake-H CPUs will be available from today. A noteworthy contender among those is the brand new MSI GE76 Raider powered by the Intel Core i9-12900HK and Nvidia GeForce RTX 3080 Ti Laptop GPU along with 32 GB of DDR5-4800 memory., which we had a chance to review.
In this article, we take a look at the Core i9-12900HK's performance from the GE76 Raider and see how much of Intel's claims during its keynote presentation have come true.
About the Intel Core i9-12900HK
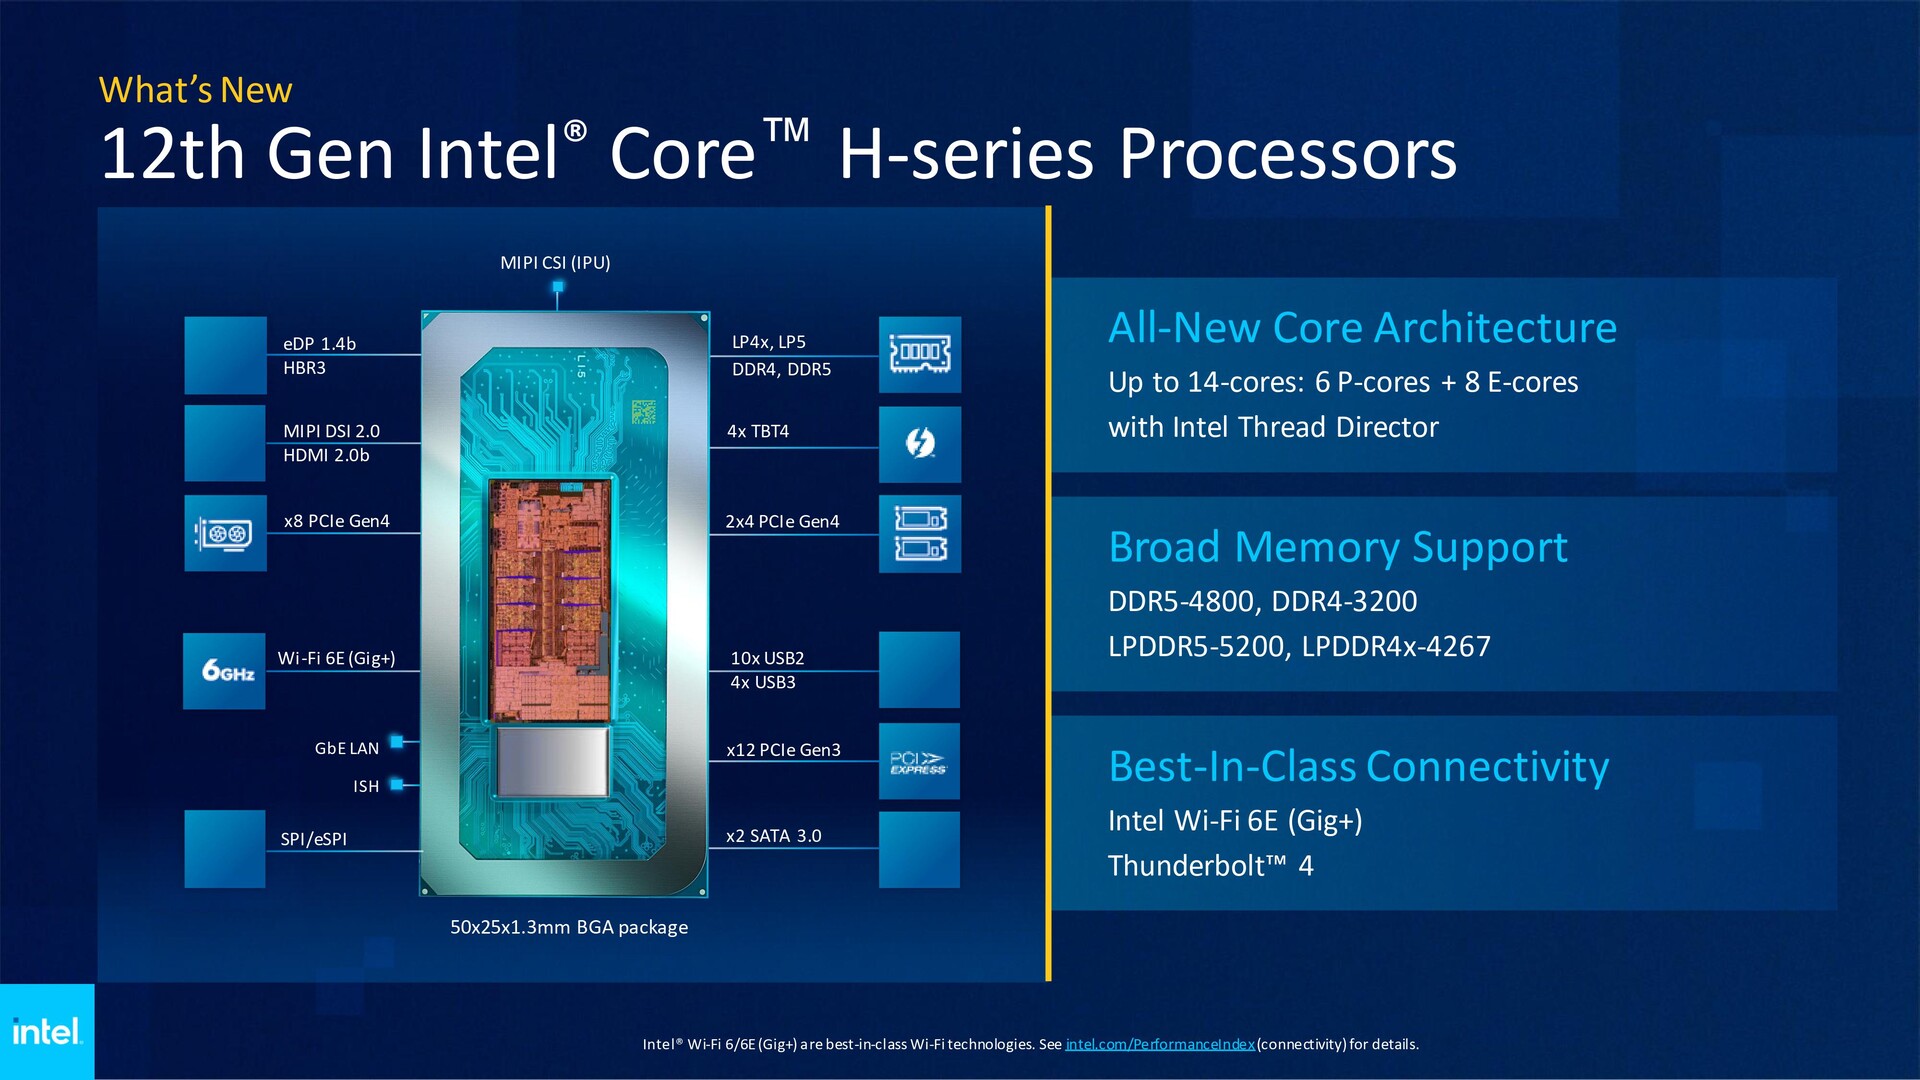
The Core i9-12900HK is based on the new Intel 7 process, which is essentially the 10 nm Enhanced SuperFin architecture. The Core i9-12900HK offers a combination of performance (P) Golden Cove cores and efficient (E) Gracemont cores. Unlike the P-cores, the E-cores do not support hyperthreading. Therefore, we get a total of 14 cores (6P+8E) and 20 threads. Given this unique hybrid core architecture, Windows 11 incorporates improvements to thread scheduling to appropriately designate tasks for each core type in combination with Intel Thread Director.
The Core i9-12900HK offers 24 MB L3 cache and is rated at a 45 W base TDP. Our MSI GE76 Raider test sample enables a sustained PL1 of 110 W and a burst PL2 of 135 W. MSI's use of new cooling solutions such as the phase-change liquid metal pad also plays its part in enabling longer sustained performance. Consequently, the scores below were taken in the Extreme Performance mode offered by the MSI Center app to allow the Core i9-12900HK flex its muscles fully.
Single-core performance: Core i9-12900HK convincingly beats the desktop Core i9-11900K and M1 Max
Intel is no strange to single-core chart leads, and Alder Lake-H has further upped the ante. Right off the bat, the Core i9-12900HK is tangibly faster than even the desktop Core i9-11900K by about 7% in Cinebench R15 and trails the new Core i9-12900K by only 4%.
A similar trend can be seen with Cinebench R20 as well wherein the Core i9-12900HK leads the Tiger Lake mainstream desktop flagship by 15% while being well-within striking distance of the Core i9-12900K. A 24% performance boost can be observed in comparison with the Core i9-11980HK in this test.
Perhaps, the biggest gains in single-core can be seen in comparison with AMD Cezanne Zen 3 APUs. While AMD did a commendable job in shattering conventional wisdom and almost matching Tiger Lake-H's single-core prowess, Intel has just extended the finish line a bit longer with Alder Lake-H. The Core i9-12900HK turns out to be 28% faster than the Ryzen 9 5900HX in Cinebench R20 single.
While AMD's upcoming Rembrandt APUs such as the Ryzen 9 6900HX can be expected to perform better than Cezanne, they may not be able to fully match up to the Core i9-12900HK in single-core performance, at least if early leaked benchmark scores are anything to go by.
Even in M1-native benchmarks such as Cinebench R23 and Geekbench, the Core i9-12900HK holds its turf with 25% and 8% leads, respectively against the Apple M1 Max.
Multi-core performance: Alder Lake-H trounces Cezanne Zen 3
Alder Lake's hybrid core approach is paying dividends in multi-core performance, which has traditionally been an AMD bastion for far too long. We see substantial leads in all multi-core benchmarks with the Core i9-12900HK. In Cinebench R15, the Core i9-12900HK leads the Ryzen 9 5900HX and the Core i9-11980HK by a comfortable 42%. This delta with Zen 3 is more or less consistent across all kinds of Cinebench runs. Cinebench R23 multi shows a very good 48% performance gain over the Apple M1 Max.
The performance gap between the Core i9-12900HK and the Ryzen 9 5900HX widens to a massive 68% in Geekbench multi-core. Interestingly, the M1 Max is now just 7% behind the Core i9-12900HK.
Sustained performance in longer loads such as Blender BMW CPU is very good as well with the Core i9-12900HK finishing just ahead of the M1 Max while being nearly 30% quicker than the Ryzen 9 5900HX and the Core i9-11980HK.
These multi-core gains can probably be attributed to the increased parallelism facilitated by the lower-clocked E-cores, though not all workloads may show similar benefits.
* ... smaller is better
Power efficiency: Intel still has work to do
We had recently published power efficiency charts comparing Intel Tiger Lake and AMD Cezanne Zen 3. It was evident that AMD clearly had the edge when it came to power efficiency. We speculated that Alder Lake can potentially help improve things for Intel. While that is true in a way, AMD continues to be more efficient offering as seen in the chart below.
The Core i9-12900K shows a marked 29% improvement in power efficiency over the Core i7-11800H and a similar gain over the Core i9-11980HK. While this is a great statistic in itself, AMD's Cezanne Zen 3 still has the upper hand when it comes to overall power efficiency. The Ryzen 9 5900HS leads the Core i9-12900HK by 24% in this regard. And with tangible architectural improvements coming to Rembrandt, we can expect AMD to further sustain these power efficiency leads.
The Apple M1 Pro SoC, however, is a whopping 61% more efficient chip than the Core i9-12900HK. Of course, an unlocked 45 W chip will never be as efficient as a 30 W one, but it is interesting to see that the Ryzen 9 5900HS is able to reduce this delta by half in comparison.
Intel takes the performance crown this gen, at least for now
Intel seems to have gotten a lot of things right with Alder Lake-H. While single-core performance boosts are on expected lines, the hybrid core approach really helps with multi-core scores. With the Core i9-12900HK, Intel now has six additional cores and four additional threads compared to the Ryzen 9 5900HX and the numbers are there for all to see.
Despite the performance improvements, the Core i9-12900HK seems to lag behind AMD Cezanne Zen 3 when it comes to power efficiency. The Ryzen 9 5900HX is also an unlocked processor, but it is still comparatively more power efficient than the Alder Lake-H flagship.
Apple's M1 SoCs also have to be factored-in here. The M1 Max's single-core performance is in the same ballpark as that of the Core i9-12900HK while the M1 Pro leads the efficiency charts. Also, Apple SoCs have the advantage of a tightly knit ecosystem in their favor, which does lend an advantage in macOS-exclusive applications.
Overall, Intel has set the bar high for this year's high-performance productivity and gaming laptops. We are yet to get numbers from the AMD camp, which should make the comparison all the more interesting. While we do expect tangible improvements from Rembrandt, the real meat lies with Phoenix-H and Raphael-H that are slated to debut later this year.
We will be reviewing even more Alder Lake-H designs in the coming days and weeks, which will give us a much better idea of where each CPU stands. We will also be revisiting our power efficiency article to include Alder Lake's numbers, so stay tuned for that.
Till then, let's savor the fact that a mobile processor has convincingly beaten last generation's flagship desktop CPU while nearly blurring the lines with this year's top desktop offering.
Buy the Asus ROG Strix G15 with Ryzen 9 5900HX and RTX 3060 on Amazon
Price comparison
