Notebook reviews with NVIDIA GeForce RTX 3080 Ti Laptop GPU graphics card
Aorus 15 YE5 review: The high-end gaming laptop for money savers
Aorus has made use of a last-gen CPU and GPU in order to market the ex-flagship RTX 3080 Ti for a price of only US$1,500. In turn, the laptop's case and connectivity are actually quite modern. Will you have to make any further compromises for the price, or is the Aorus YE5 a real high-end hidden gem for money savers?
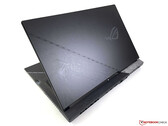
Intel Core i5-12500H, NVIDIA GeForce RTX 3080 Ti Laptop GPU, 15.6", 2.3 kgAsus ROG Strix Scar 17 SE review - Fully equipped gaming laptop with RTX 3080 Ti
With the new ROG Strix Scar 17 SE from 2022, Asus offers a high-end gaming laptop with the best hardware currently available on the market. In addition to the GeForce RTX 3080 Ti, this also includes the Core i9-12950HX and a fast 240-Hz display.
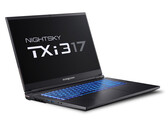
Intel Core i9-12950HX, NVIDIA GeForce RTX 3080 Ti Laptop GPU, 17.3", 2.9 kgEurocom Nightsky TXi317 laptop review: 125 W GeForce RTX 3080 Ti speedster
The Nightsky TXi317 incorporates some of the fastest CPU and GPU options currently available on any laptop, but they're wrapped in an aging chassis design that's missing some features common on other flagship gaming laptops.
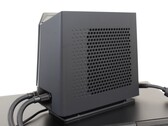
Intel Core i7-12700H, NVIDIA GeForce RTX 3080 Ti Laptop GPU, 17.3", 2.9 kgLiquid cooling box runs quieter than expected: Uniwell Technology GM7AG8N laptop review
The external water cooler is able to do most of the heavy lifting even when set to its quietest level. It's clunkier for sure, but it's not necessarily any more cumbersome than an external GPU docking station.
Intel Core i9-12900H, NVIDIA GeForce RTX 3080 Ti Laptop GPU, 17", 2.7 kgAlienware x15 R2 Laptop Review: Ultrabook-like UFO soars with Core i9-12900H and 140 W RTX 3080 Ti
Dell has refreshed the Alienware x15 lineup with the new x15 R2. This year's x15 R2 offers internal upgrades to Intel Alder Lake-H and Nvidia RTX 30 Series Ti GPUs while retaining much of the design as the previous generation. The Alienware x15 R2 finds enough room to flex its muscles despite the thin chassis and will definitely appeal to the enthusiast gamer, but there are a few areas of concern to be aware of.
Intel Core i9-12900H, NVIDIA GeForce RTX 3080 Ti Laptop GPU, 15.6", 2.4 kgLenovo Legion 7 16IAX7-82TD004SGE: Intel Core i9-12900HX, 16.00", 2.6 kg
Review » Lenovo Legion 7 16IAX7 laptop review: Fast 16-inch gamer with 165 Hz display
MSI Titan GT77 12UHS: Intel Core i9-12900HX, 17.30", 3.4 kg
Review » MSI Titan GT77 12UHS 4K review: Elite amongst UHD DTR laptops
Schenker XMG Neo 17 M22: AMD Ryzen 9 6900HX, 17.00", 2.8 kg
Review » Schenker XMG Neo 17 M22 in review: High performance gaming laptop with mechanical Cherry MX keys
MSI Titan GT77 12UHS: Intel Core i9-12900HX, 17.30", 3.3 kg
Review » MSI Titan GT77 12UHS Laptop Review: Alder Lake-HX poster child with unhindered desktop-class performance
Schenker XMG Pro 15 (i7-12700H, RTX 3080 Ti): Intel Core i7-12700H, 15.60", 2.4 kg
Review » Schenker XMG Pro 15 (RTX 3080 Ti) laptop review: The Mike Tyson of all-round laptops
Schenker XMG Pro 17 E22: Intel Core i9-12900H, 17.30", 2.8 kg
Review » Schenker XMG Pro 17 E22 review: Gaming laptop with RTX 3080 Ti delivers the goods
MSI Raider GE77 HX 12UHS: Intel Core i9-12900HX, 17.30", 3.1 kg
Review » MSI Raider GE77 HX 12UHS in review: 4K gaming notebook with top performance
Schenker XMG Neo 15 (i7-12700H, RTX 3080 Ti): Intel Core i7-12700H, 15.60", 2.3 kg
Review » Schenker XMG Neo 15 with XMG Oasis in review: RTX 3080 Ti without thermal limits
Razer Blade 17 Early 2022: Intel Core i9-12900H, 17.30", 2.8 kg
Review » Razer Blade 17 (Early 2022) review: Elegant 4k gaming laptop with a bright screen
MSI Creator Z16P B12UHST: Intel Core i9-12900H, 16.00", 2.4 kg
Review » MSI Creator Z16P laptop in review: Creative work with an i9 and the RTX 3080 Ti
Acer Predator Triton 500 SE PT516-52s-70KX: Intel Core i7-12700H, 16.00", 2.3 kg
Review » Acer Predator Triton 500 SE review: Slim gaming laptop with RTX 3080 Ti and Alder Lake
MSI Raider GE66 12UHS: Intel Core i9-12900HK, 15.60", 2.4 kg
Review » MSI Raider GE66 12UHS notebook review: Passes with flying colors
Asus ROG Zephyrus Duo 16 GX650RX: AMD Ryzen 9 6900HX, 16.00", 2.6 kg
Review » Asus ROG Zephyrus Duo 16 review: An unusual gaming laptop with a good battery life
Alienware x17 R2 P48E: Intel Core i9-12900HK, 17.30", 3.1 kg
Review » Alienware x17 R2 laptop review: Peak 175 W GeForce RTX 3080 Ti performance
Medion Erazer Beast X30: Intel Core i9-12900HK, 17.30", 2.2 kg
Review » Medion Erazer Beast X30 review: Slim, powerful QHD gaming notebook
Razer Blade 15 Advanced Model Early 2022: Intel Core i7-12800H, 15.60", 2.1 kg
Review » Razer Blade 15 Advanced Model Early 2022 review - Compact gaming laptop with fast display
MSI Stealth GS77 12UHS-083US: Intel Core i7-12700H, 17.30", 2.9 kg
Review » MSI Stealth GS77 laptop review: A good Razer Blade 17 alternative?
Razer Blade 17 RTX 3080 Ti: Intel Core i7-12800H, 17.30", 2.7 kg
Review » Razer Blade 17 2022 Core i7 RTX 3080 Ti laptop review: Supercharged performance
Gigabyte Aero 16 YE5: Intel Core i9-12900HK, 16.00", 2.3 kg
Review » Gigabyte Aero 16 YE5 Review: Compact 4K Multimedia Notebook
Razer Blade 15 2022: Intel Core i7-12800H, 15.60", 2.1 kg
Review » Intel Core i7-12800H debut: Razer Blade 15 laptop review
Schenker XMG Neo 15 E22 (Early 2022, RTX 3080 Ti): Intel Core i7-12700H, 15.60", 2.2 kg
Review » Preliminary XMG Neo 15 E22 with RTX 3080 Ti (Tongfang GM5AG8W) Review: Is water cooling an interim but viable solution for gaming laptops?
Schenker Uniwill Technology GM7AG8P: Intel Core i9-12900H, 17.30", 2.3 kg
Review » Intel Core i9-12900H debut: Uniwill Technology GM7AG8P laptop review
MSI GE76 Raider: Intel Core i9-12900HK, 17.30", 3 kg
Review » MSI GE76 Raider Laptop Review: With Alder Lake and RTX 3080 Ti to gaming heaven
MSI Raider GE66 12UHS: Intel Core i9-12900HK, 15.60", 2.4 kg
External Review » MSI Raider GE66 12UHS
Alienware x15 R2 P111F: Intel Core i9-12900H, 15.60", 2.4 kg
External Review » Alienware x15 R2 P111F
HP ZBook Studio 16 G9, i9-12900H RTX 3080 Ti: Intel Core i9-12900H, 16.00", 1.7 kg
External Review » HP ZBook Studio 16 G9, i9-12900H RTX 3080 Ti
Razer Blade 15 2022: Intel Core i7-12800H, 15.60", 2.1 kg
External Review » Razer Blade 15 2022
MSI Titan GT77 12UHS-066RU: Intel Core i9-12900HX, 17.30", 3.4 kg
External Review » MSI Titan GT77 12UHS-066RU
Asus ROG Strix SCAR 15 G533ZX-LN060W: Intel Core i9-12900H, 15.60", 2.4 kg
External Review » Asus ROG Strix SCAR 15 G533ZX-LN060W
HP Omen 17-ck1098ng: Intel Core i9-12900HX, 17.30", 2.8 kg
External Review » HP Omen 17-ck1098ng
Asus ROG Strix Scar 17 SE G733CX-LL014W: Intel Core i9-12950HX, 17.30", 2.9 kg
External Review » Asus ROG Strix Scar 17 SE G733CX-LL014W
MSI Raider GE67 HX 12UHS-026: Intel Core i9-12900HX, 15.60", 2.4 kg
External Review » MSI Raider GE67 HX 12UHS-026
MSI Raider GE67 HX 12UHS-039AU: Intel Core i7-12800HX, 15.60", 2.4 kg
External Review » MSI Raider GE67 HX 12UHS-039AU
MSI Raider GE77 HX 12UHS: Intel Core i9-12900HX, 17.30", 3.1 kg
External Review » MSI Raider GE77 HX 12UHS
Hyperbook SL705, i7-12700H RTX 3080 Ti: Intel Core i7-12700H, 17.30", 2.8 kg
External Review » Hyperbook SL705, i7-12700H RTX 3080 Ti
Schenker XMG Neo 17 M22: AMD Ryzen 9 6900HX, 17.00", 2.8 kg
External Review » Schenker XMG Neo 17 M22
Razer Blade 14 Ryzen 9 RTX 3080 Ti: AMD Ryzen 9 6900HX, 14.00", 1.8 kg
External Review » Razer Blade 14 Ryzen 9 RTX 3080 Ti
MSI Titan GT77 12UHS: Intel Core i9-12900HX, 17.30", 3.3 kg
External Review » MSI Titan GT77 12UHS
Alienware x15 R2-8PYH6: Intel Core i7-12700H, 15.60", 2.5 kg
External Review » Alienware x15 R2-8PYH6
Hyperbook SL505, i7-12700H RTX 3080 Ti: Intel Core i7-12700H, 15.60", 2.4 kg
External Review » Hyperbook SL505, i7-12700H RTX 3080 Ti
Origin PC EVO17-S 2022, i9 3080 Ti: Intel Core i9-12900H, 17.30", 2.7 kg
External Review » Origin PC EVO17-S 2022, i9 3080 Ti
MSI Creator Z17 A12UHST-052: Intel Core i9-12900H, 17.30", 2.5 kg
External Review » MSI Creator Z17 A12UHST-052
Asus ROG Strix Scar 17 SE G733CX-LL016W: Intel Core i9-12950HX, 17.30", 3.1 kg
External Review » Asus ROG Strix Scar 17 SE G733CX-LL016W
Alienware m15 R7-VPV1K: Intel Core i7-12700H, 15.60", 2.7 kg
External Review » Alienware m15 R7-VPV1K
Lenovo Legion 7 16IAX7-82TD004SGE: Intel Core i9-12900HX, 16.00", 2.6 kg
External Review » Lenovo Legion 7 16IAX7-82TD004SGE
MSI Titan GT77 12UHS-010: Intel Core i9-12900HX, 17.30", 3.3 kg
External Review » MSI Titan GT77 12UHS-010
Asus ROG Zephyrus Duo 16 GX650RX: AMD Ryzen 9 6900HX, 16.00", 2.6 kg
External Review » Asus ROG Zephyrus Duo 16 GX650RX
Medion Erazer Beast X30: Intel Core i9-12900HK, 17.30", 2.2 kg
External Review » Medion Erazer Beast X30
Razer Blade 15 Advanced Model Early 2022: Intel Core i7-12800H, 15.60", 2.1 kg
External Review » Razer Blade 15 Advanced Model Early 2022
Alienware x17 R2-KTJKT: Intel Core i7-12700H, 17.30", 3.1 kg
External Review » Alienware x17 R2-KTJKT
Acer Predator Triton 500SE PT516-52s-98LC: Intel Core i9-12900H, 16.00", 2.4 kg
External Review » Acer Predator Triton 500SE PT516-52s-98LC
Razer Blade 17 Early 2022: Intel Core i9-12900H, 17.30", 2.8 kg
External Review » Razer Blade 17 Early 2022
Asus ROG Zephyrus M16 GU603ZX-K8001W: Intel Core i9-12900H, 16.00", 1.9 kg
External Review » Asus ROG Zephyrus M16 GU603ZX-K8001W
MSI Stealth GS66 12UHS-091: Intel Core i9-12900H, 15.60", 2.1 kg
External Review » MSI Stealth GS66 12UHS-091
MSI Creator Z16P B12UHST-046: Intel Core i9-12900H, 16.00", 2.3 kg
External Review » MSI Creator Z16P B12UHST-046
Asus ROG Strix G17 G733ZX-LL009W: Intel Core i9-12900H, 17.30", 2.9 kg
External Review » Asus ROG Strix G17 G733ZX-LL009W
Razer Blade 17 RTX 3080 Ti: Intel Core i7-12800H, 17.30", 2.7 kg
External Review » Razer Blade 17 RTX 3080 Ti
Alienware x17 R2 P48E: Intel Core i9-12900HK, 17.30", 3.1 kg
External Review » Alienware x17 R2 P48E
Asus ROG Strix Scar 15 G533ZX-XS96: Intel Core i9-12900H, 15.60", 2.4 kg
External Review » Asus ROG Strix Scar 15 G533ZX-XS96
Razer Blade 17 RZ09-0423PGD3-R3G1: Intel Core i7-12800H, 17.30", 2.8 kg
External Review » Razer Blade 17 RZ09-0423PGD3-R3G1
Razer Blade 15 Advanced RZ09-0421PGF3-R3G1: Intel Core i9-12900HK, 15.60", 2 kg
External Review » Razer Blade 15 Advanced RZ09-0421PGF3-R3G1
Gigabyte Aero 16 YE5: Intel Core i9-12900HK, 16.00", 2.3 kg
External Review » Gigabyte Aero 16 YE5
MSI Raider GE76 12UHS-293: Intel Core i7-12700H, 17.30", 2.9 kg
External Review » MSI Raider GE76 12UHS-293
MSI Raider GE76 12UHS-214: Intel Core i9-12900HK, 17.30", 2.9 kg
External Review » MSI Raider GE76 12UHS-214
MSI Stealth GS77 12UHS-063: Intel Core i9-12900H, 17.30", 2.8 kg
External Review » MSI Stealth GS77 12UHS-063
Razer Blade 17 RZ09-0423PGD3: Intel Core i7-12800H, 17.30", 2.8 kg
External Review » Razer Blade 17 RZ09-0423PGD3
MSI GE76 Raider: Intel Core i9-12900HK, 17.30", 3 kg
Article » Intel Core i9-12900HK performance and power efficiency comparison: Significant gains with potential to put even upcoming AMD offerings at a disadvantage
MSI Titan GT77 12UHS: Intel Core i9-12900HX, 17.30", 3.4 kg
» MSI Titan GT77 with 64GB RAM, 4K display, Core i9 and RTX 3080 Ti becomes a refurbished gaming laptop steal
» MSI Titan GT77 with 64GB RAM, 4K display, Core i9 and RTX 3080 Ti becomes a refurbished gaming laptop steal
» MSI Titan GT77 with 64GB RAM, 4K display, Core i9 and RTX 3080 Ti becomes a refurbished gaming laptop steal
» MSI Titan GT77 with 64GB RAM, 4K display, Core i9 and RTX 3080 Ti becomes a refurbished gaming laptop steal
Aorus 15 YE5-54DEB34SH: Intel Core i5-12500H, 15.60", 2.3 kg
» Aorus 15 review: More powerful than most laptops with an RTX 4070 and it only costs US$1,500
Alienware x17 R2 P48E: Intel Core i9-12900HK, 17.30", 3.1 kg
» Alienware x17 R2 gaming laptop with RTX 3080 Ti, Core i9-12900H and 480Hz display gets hefty discount thanks to stackable coupon codes
Alienware m15 R7-VPV1K: Intel Core i7-12700H, 15.60", 2.7 kg
» Alienware m15 R7 gaming laptop with RTX 3080 Ti, 240Hz QHD display and 32GB RAM now 47% off
MSI Titan GT77 12UHS: Intel Core i9-12900HX, 17.30", 3.4 kg
» MSI Titan GT77 12UHS 4K: Hot rod with RTX 3080 Ti delivers top performance
Schenker XMG Pro 17 E22: Intel Core i9-12900H, 17.30", 2.8 kg
» Schenker XMG Pro 17 E22: Graphics performance above all
Schenker XMG Pro 15 (i7-12700H, RTX 3080 Ti): Intel Core i7-12700H, 15.60", 2.4 kg
» Our review of the Schenker XMG Pro 15: The RTX 3080 Ti gamer has a lot of good features
MSI Raider GE77 HX 12UHS: Intel Core i9-12900HX, 17.30", 3.1 kg
» MSI Raider GE77 HX 12UHS: GeForce RTX 3080 Ti tops the charts
Schenker XMG Neo 15 (i7-12700H, RTX 3080 Ti): Intel Core i7-12700H, 15.60", 2.3 kg
» Schenker XMG Neo 15 with Oasis liquid cooling put to the test: Cool and quiet high-performance gaming at last?
Razer Blade 17 Early 2022: Intel Core i9-12900H, 17.30", 2.8 kg
» Razer Blade 17 (Early 2022): High priced and power hungry
MSI Creator Z16P B12UHST: Intel Core i9-12900H, 16.00", 2.4 kg
» Creator flagship for high performance: MSI Creator Z16P
Acer Predator Triton 500 SE PT516-52s-70KX: Intel Core i7-12700H, 16.00", 2.3 kg
» Acer Predator Triton 500 SE: Without the ability to upgrade it, a gaming laptop is only half as good
Asus ROG Zephyrus Duo 16 GX650RX: AMD Ryzen 9 6900HX, 16.00", 2.6 kg
» Asus ROG Zephyrus Duo 16 GX650RX: Gaming racer with two displays
Alienware x17 R2 P48E: Intel Core i9-12900HK, 17.30", 3.1 kg
» The Alienware x17 R2 is an absolute power-hungry monster and we wouldn't have it any other way
Medion Erazer Beast X30: Intel Core i9-12900HK, 17.30", 2.2 kg
» Medion Erazer Beast X30: Lots of gaming power at a high price
MSI Stealth GS77 12UHS-083US: Intel Core i7-12700H, 17.30", 2.9 kg
» 165 W vs. 105 W GeForce RTX 3080 Ti: It matters most at higher resolutions
Razer Blade 17 RTX 3080 Ti: Intel Core i7-12800H, 17.30", 2.7 kg
» The Razer Blade 17 suddenly has a bigger battery this year. What's the secret?
Gigabyte Aero 16 YE5: Intel Core i9-12900HK, 16.00", 2.3 kg
» Gigabyte Aero 16: 4K OLED and Thunderbolt 4 for Gamers and Creators
Razer Blade 15 2022: Intel Core i7-12800H, 15.60", 2.1 kg
» Razer Blade 15 2022 vs. Blade 15 2018: Four years of accumulating improvements
Schenker Uniwill Technology GM7AG8P: Intel Core i9-12900H, 17.30", 2.3 kg
» 27 AMD Ryzen 9 5900HX PCs vs. the Core i9-12900H: Intel comes out on top, but there's a catch