MSI Creator Z16P laptop in review: Creative work with an i9 and the RTX 3080 Ti

Expectations should be set correspondingly high for a device that costs just under 4,500 Euros (~$4,737). As such, the list of components reads like a collection of the best hardware currently available for laptops. With the Intel i9-12900H and the Nvidia GeForce 3080 Ti, the 16-incher even competes with powerful gaming laptops.
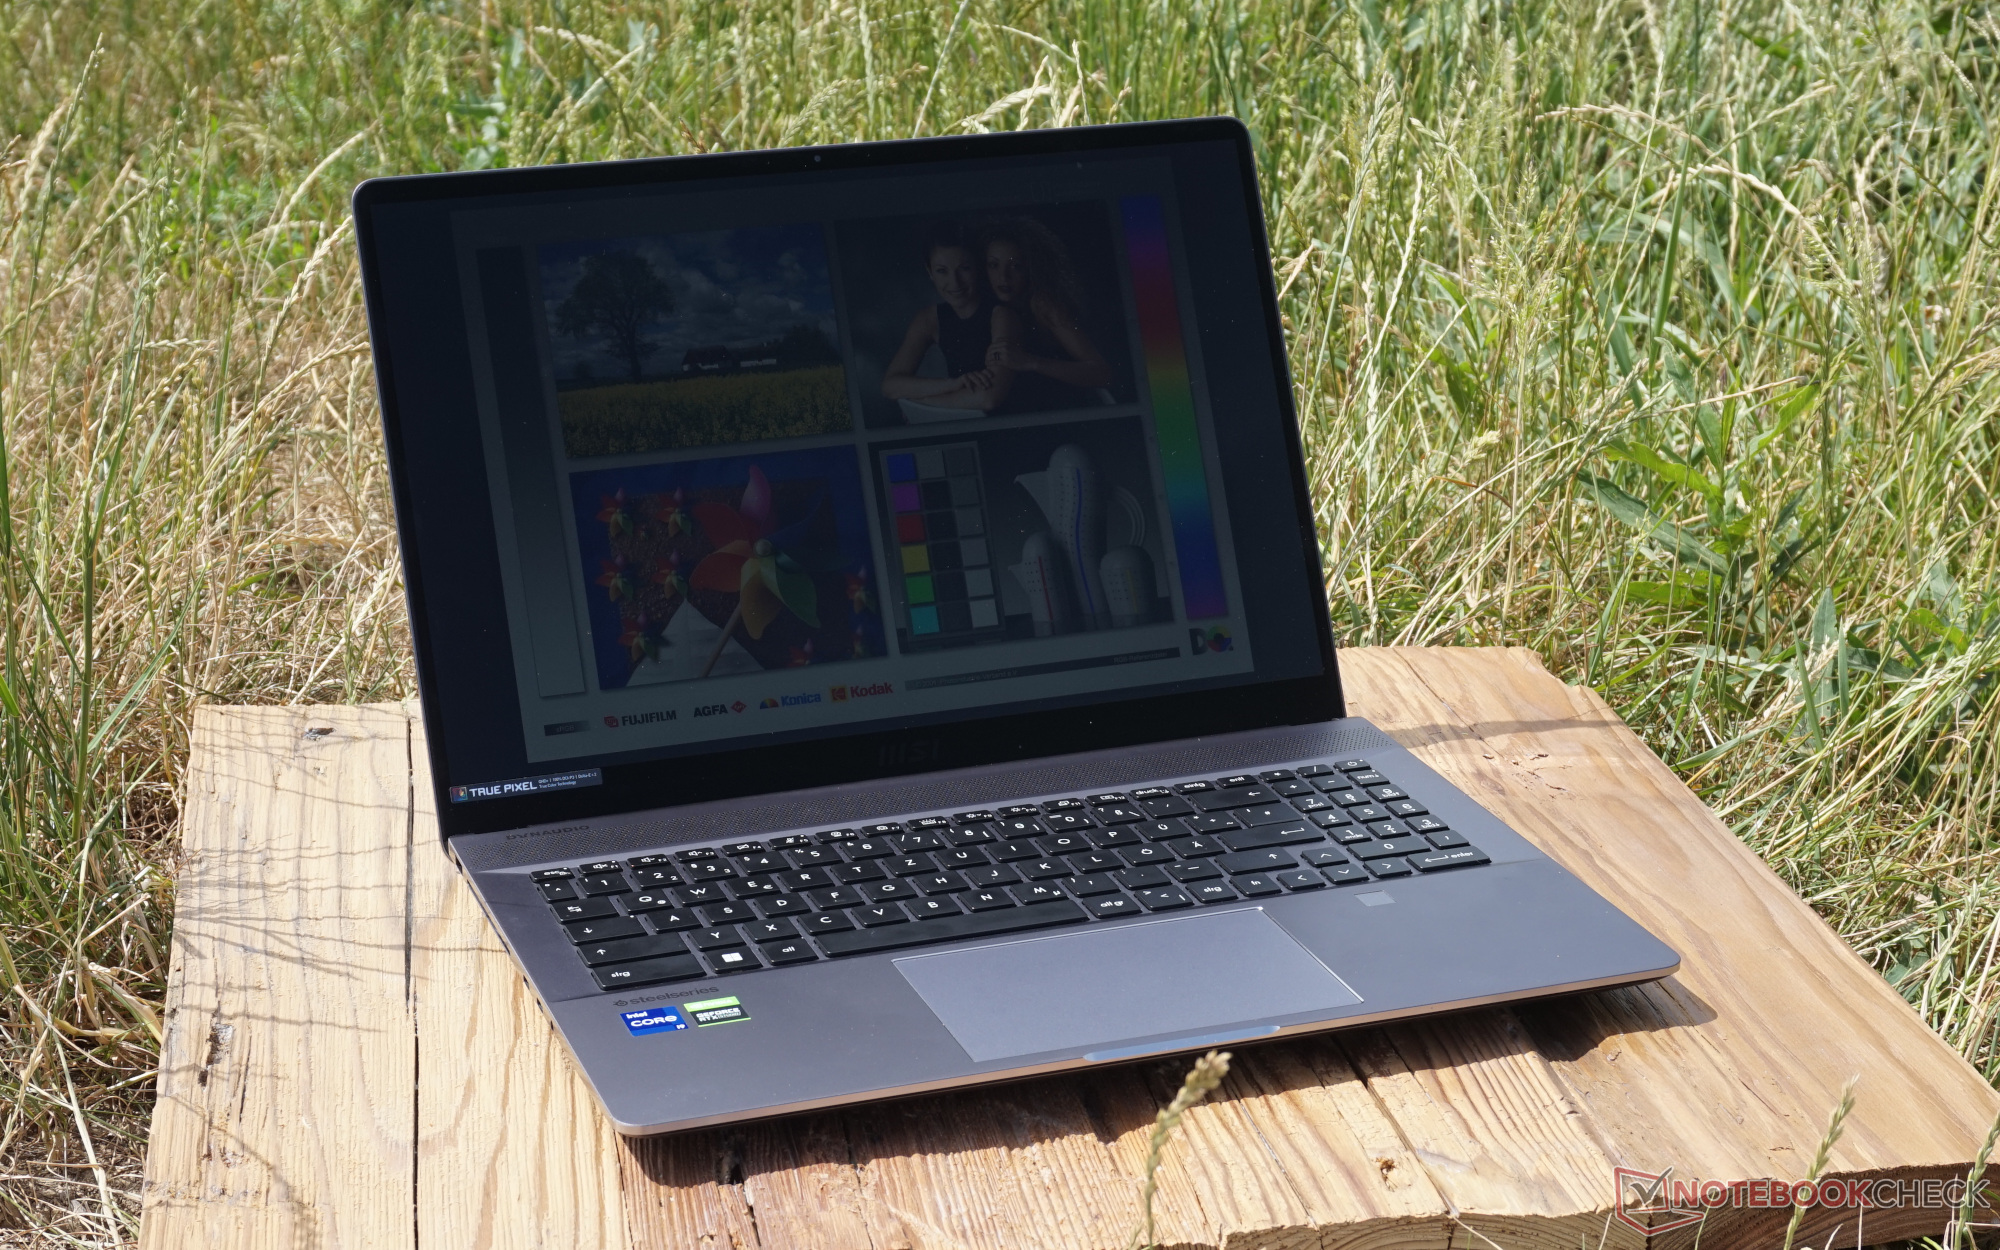
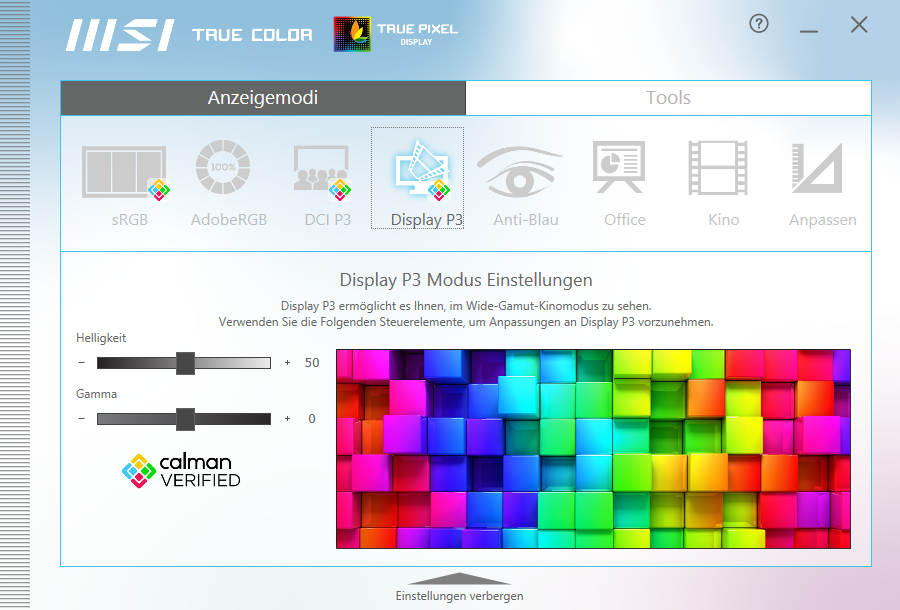
The difference, however, becomes clear even before you turn it on. The slim and elegant case can still be stored reasonably well in a bag or backpack in this format. This doesn't look like a gaming machine, but rather like a work device. This is, of course, matched by the display, which is precalibrated to almost completely cover the DCI-P3 color space and is ideally suited for video editing.
On the other hand, 4K or OLED have been left out, but this shouldn't result in any restrictions for creative work. It remains to be seen how well the fans can cope with the overwhelming energy consumption of an almost unrestrained Intel Alder Lake processor in such a small space.
While we reviewed the MSI Creator Z16 predecessor with a smaller graphics chip and "only" an i7, we now have the maxed-out version that requires twice as much power at its peak. There are also two less powerful versions. The MSI Creator Z16P with the i7-12700H and the Nvidia GeForce RTX 3070 Ti is available for 1,000 Euros (~$1,053) less, depending on the rest of the configuration, but it still offers an identical display. An intermediate solution is to save on the graphics card by choosing the Nvidia GeForce RTX 3080.
The Apple MacBook Pro 16 2021 M1 Max immediately presents itself as a logical comparison device. The Gigabyte Aero 16 YE5 is also a direct competitor. It's also worth taking a look at the Alienware x17 R2, which has similar components, but has been designed with a considerably greater focus on continuous load.
Possible contenders in comparison
Rating | Date | Model | Weight | Height | Size | Resolution | Price |
|---|---|---|---|---|---|---|---|
| 83.7 % v7 (old) | 06 / 2022 | MSI Creator Z16P B12UHST i9-12900H, GeForce RTX 3080 Ti Laptop GPU | 2.4 kg | 20.4 mm | 16.00" | 2560x1600 | |
| 86.7 % v7 (old) | 11 / 2021 | MSI Creator Z16 A11UET-209 i7-11800H, GeForce RTX 3060 Laptop GPU | 2.2 kg | 15.9 mm | 16.00" | 2560x1600 | |
| 92.5 % v7 (old) | 11 / 2021 | Apple MacBook Pro 16 2021 M1 Max M1 Max, M1 Max 32-Core GPU | 2.2 kg | 16.8 mm | 16.20" | 3456x2234 | |
| 89.2 % v7 (old) | 05 / 2022 | Alienware x17 R2 P48E i9-12900HK, GeForce RTX 3080 Ti Laptop GPU | 3.1 kg | 20.9 mm | 17.30" | 1920x1080 | |
| 84.7 % v7 (old) | 03 / 2022 | Gigabyte Aero 16 YE5 i9-12900HK, GeForce RTX 3080 Ti Laptop GPU | 2.3 kg | 22.4 mm | 16.00" | 3840x2400 | |
| 87.2 % v7 (old) | 06 / 2022 | Acer Predator Triton 500 SE PT516-52s-70KX i7-12700H, GeForce RTX 3080 Ti Laptop GPU | 2.3 kg | 19.9 mm | 16.00" | 2560x1600 |
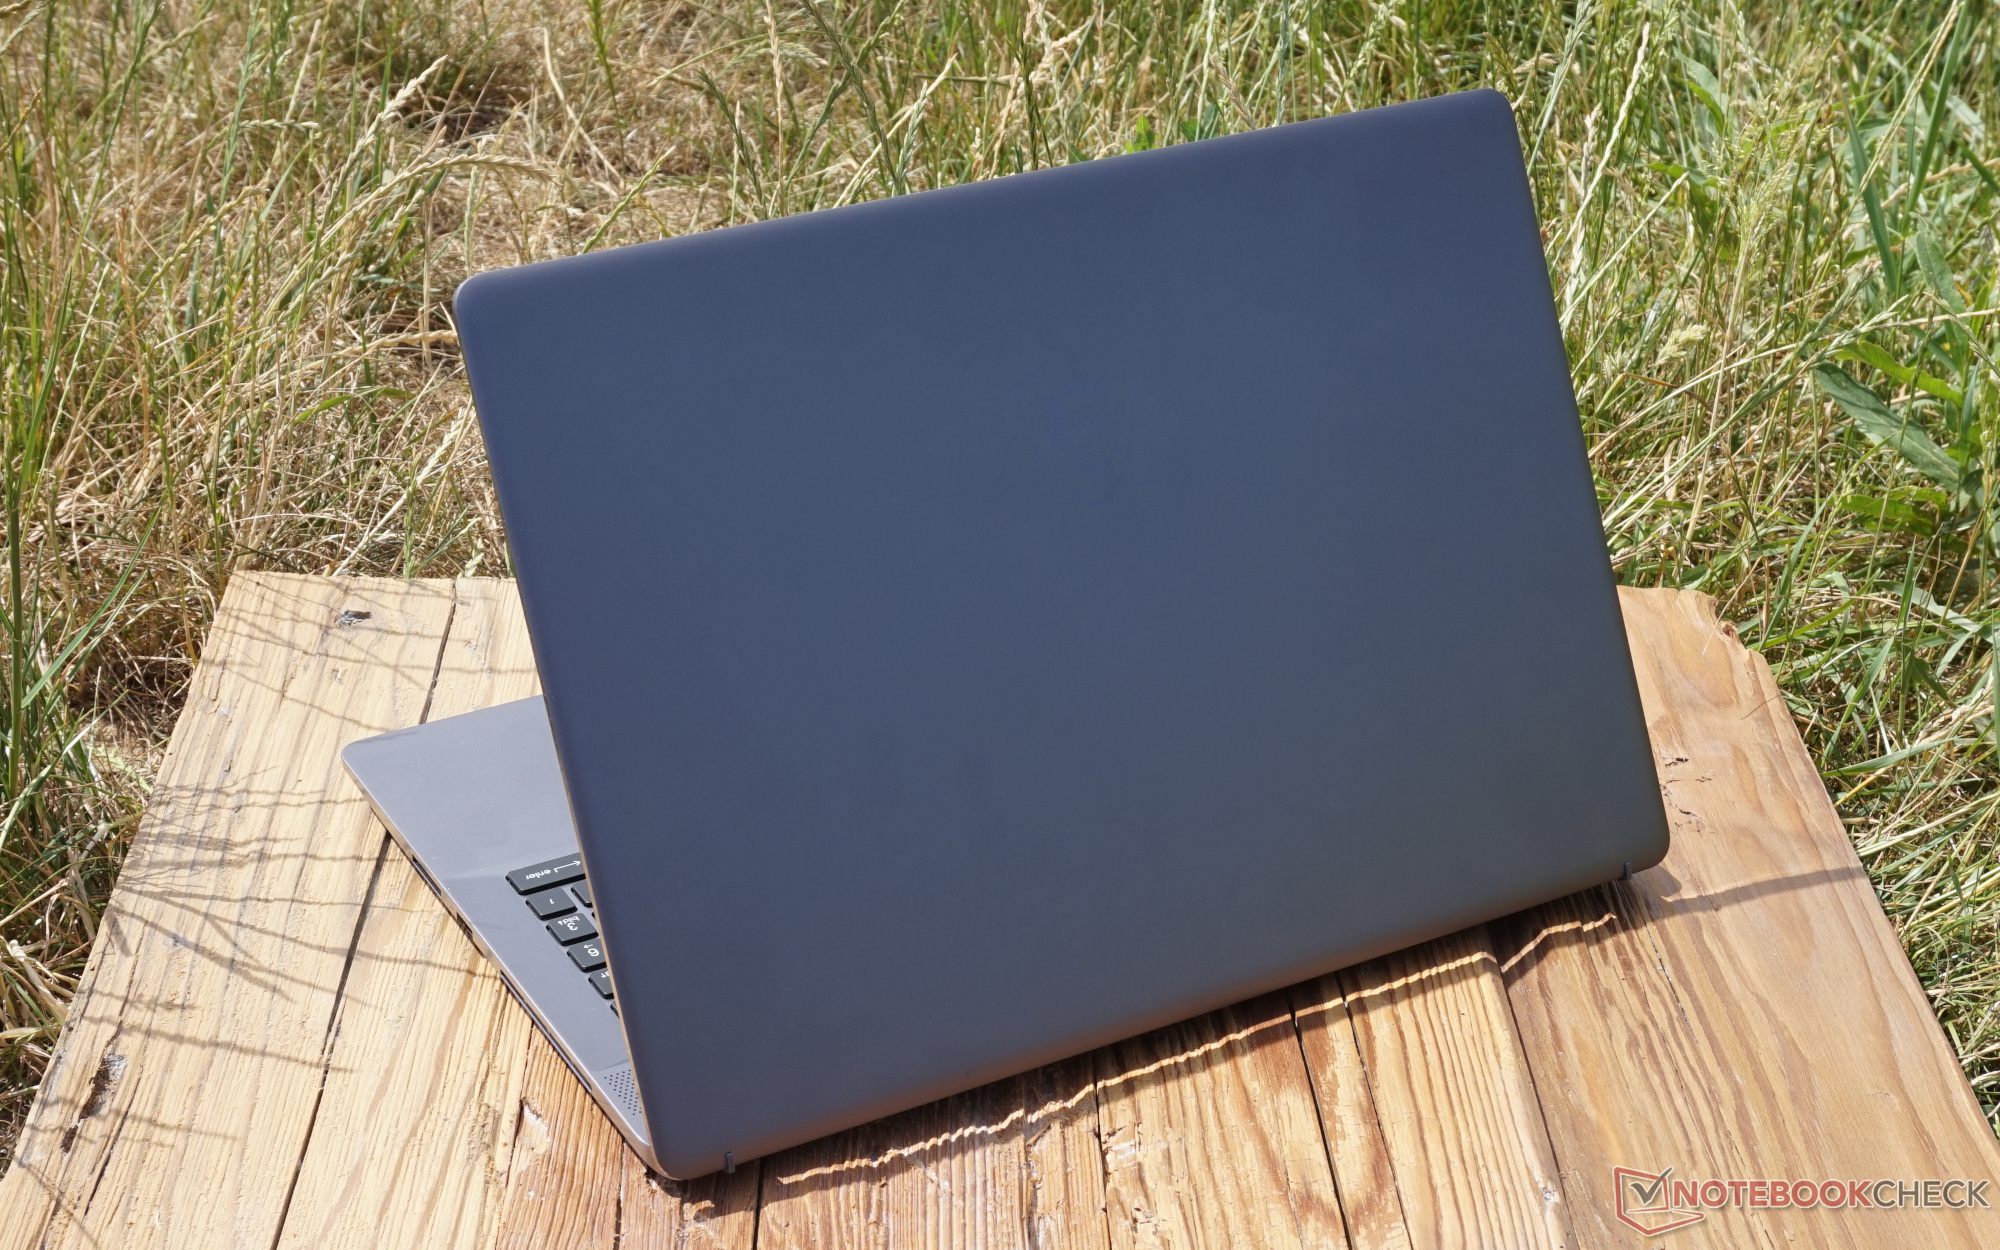
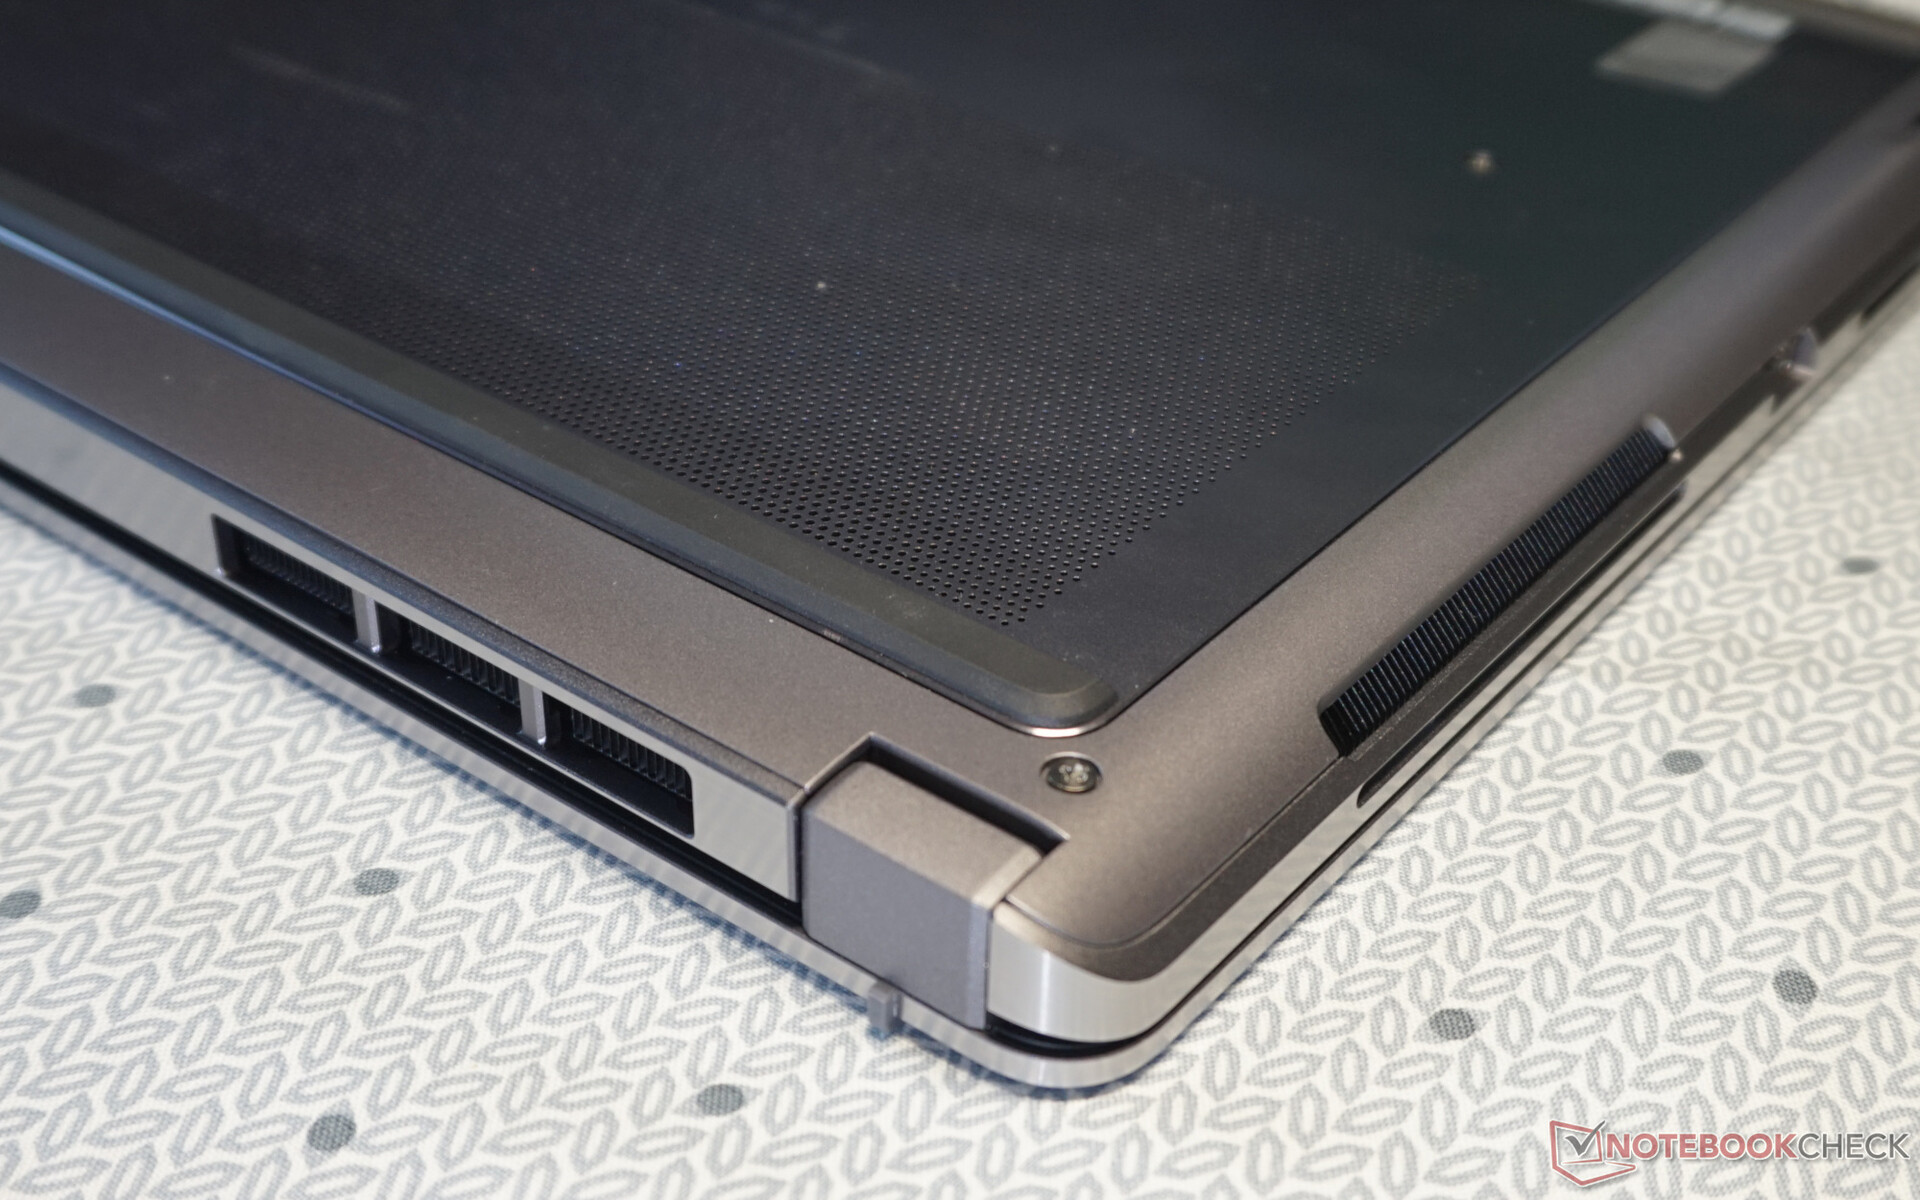
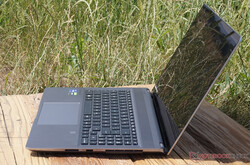
Case - Creator laptop housed in a solid chassis
Not only does the case look sober, but also quite premium. The aluminum display lid and keyboard frame provide the MSI Creator with a high degree of stability. In addition, the surface has been treated in such a way that it's almost impossible to get fingerprints on it. The bottom cover's plastic is by no means visible; you can only feel it.
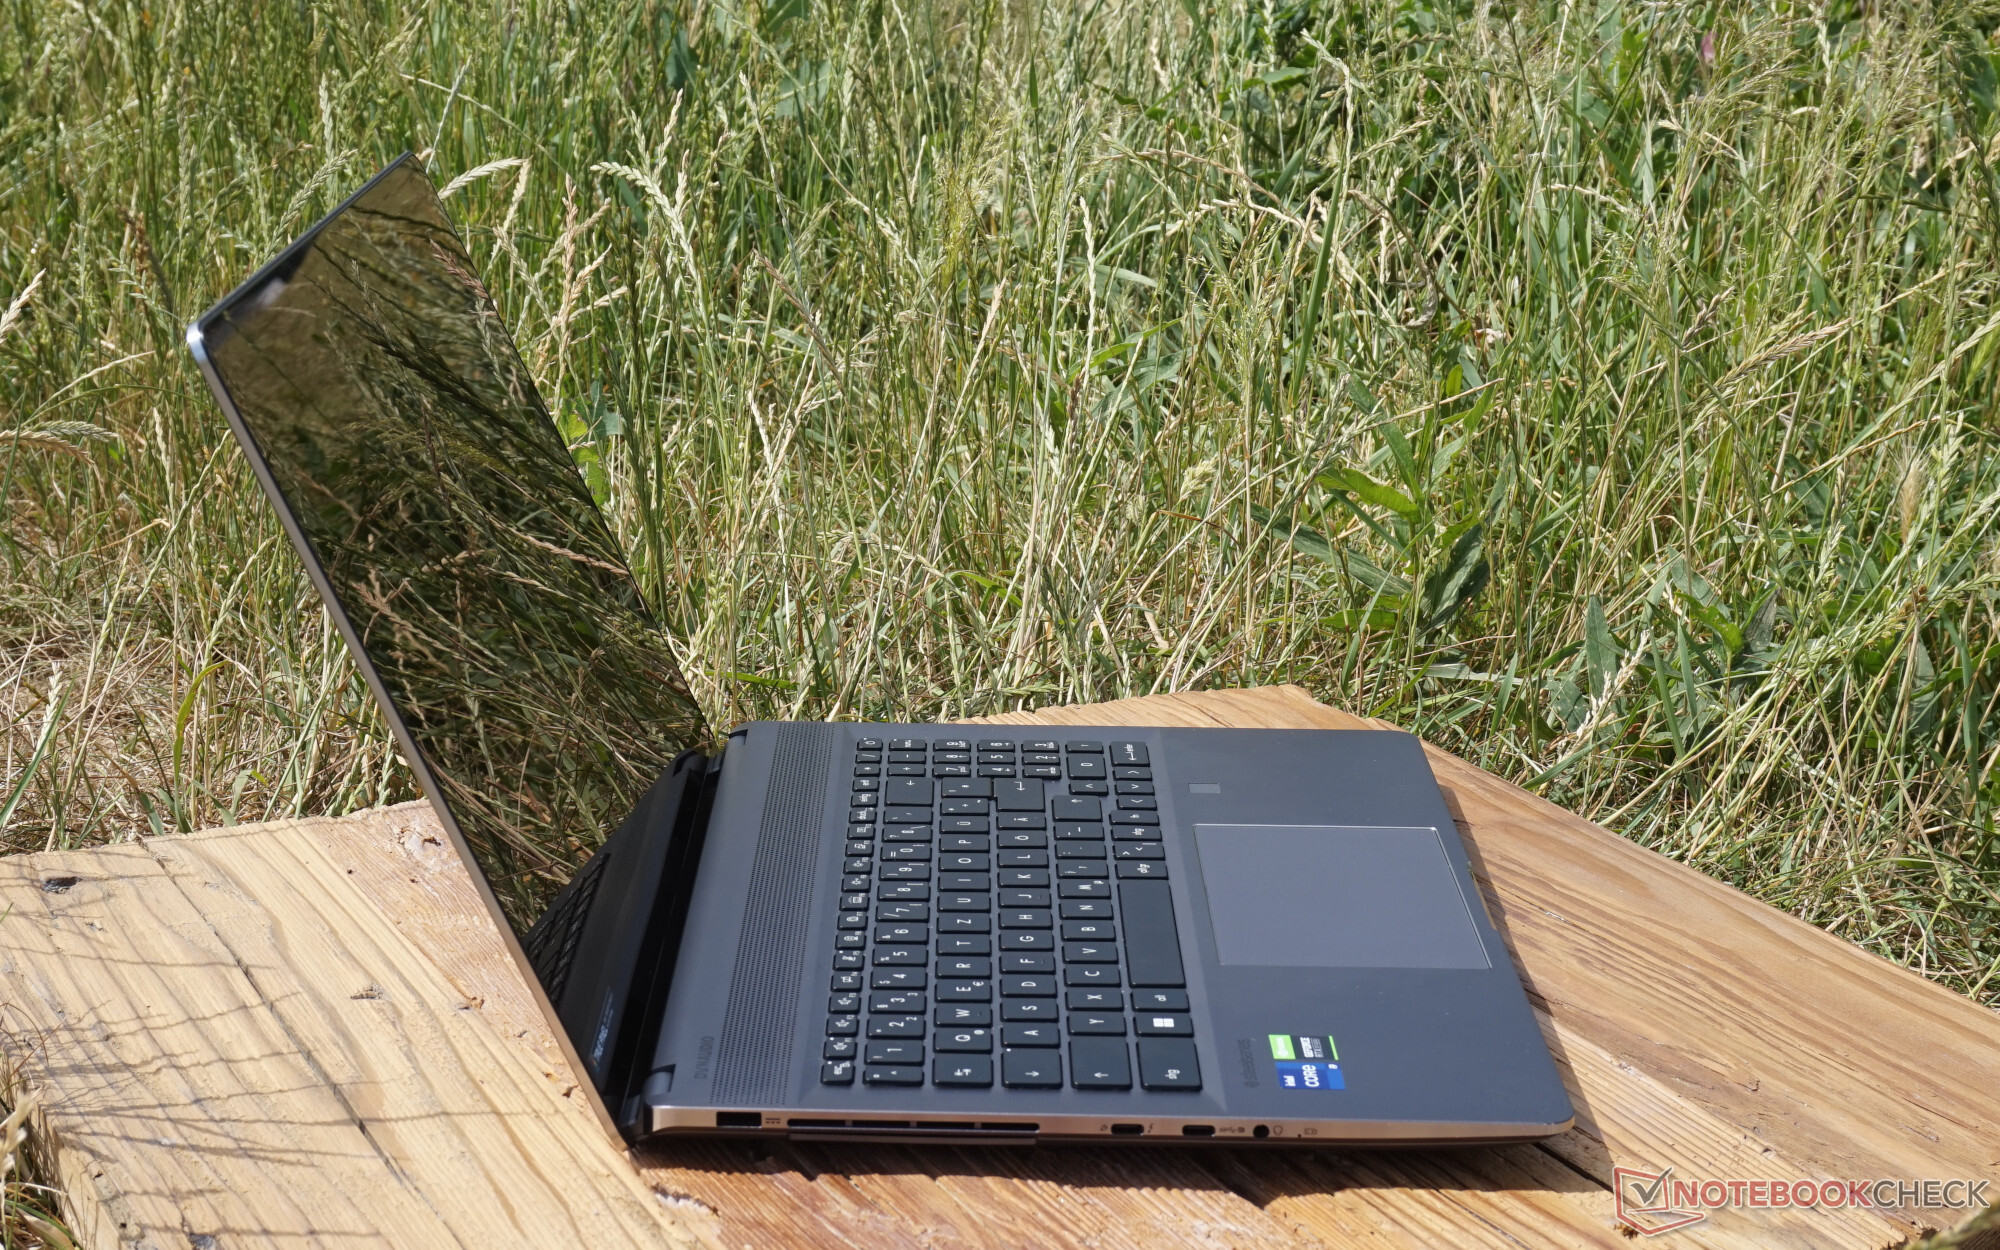
What's remarkable, on the other hand, is the sturdiness of the construction. Nothing bends, gives way, or vibrates at any point. Even when it's open and you hold it from one corner, you can only sense a deformation at most, which is definitely something that has to be achieved with a weight of 2.4 kg. We didn't hear any noises either. This rigidity has a positive effect when using the laptop. The touchscreen hardly wobbles, which is due to the fact that it touches the surface with its own small rubber feet. Even during vigorous typing, the keyboard frame remains unaffected.
The size is quite average in comparison. Other 16-inch devices for media editing are similarly wide, deep, and thick. The display bezel is appropriately slim at just under 6 mm on the sides and 10 mm on the top. The MSI Creator Z16P only surpasses the competition in terms of weight. However, this isn't a surprise in view of the rich configuration.
On the other hand, a gaming laptop with comparable components, such as the Alienware x17 R2, is much heavier and bulkier. More space is needed for the cooling here, after all.
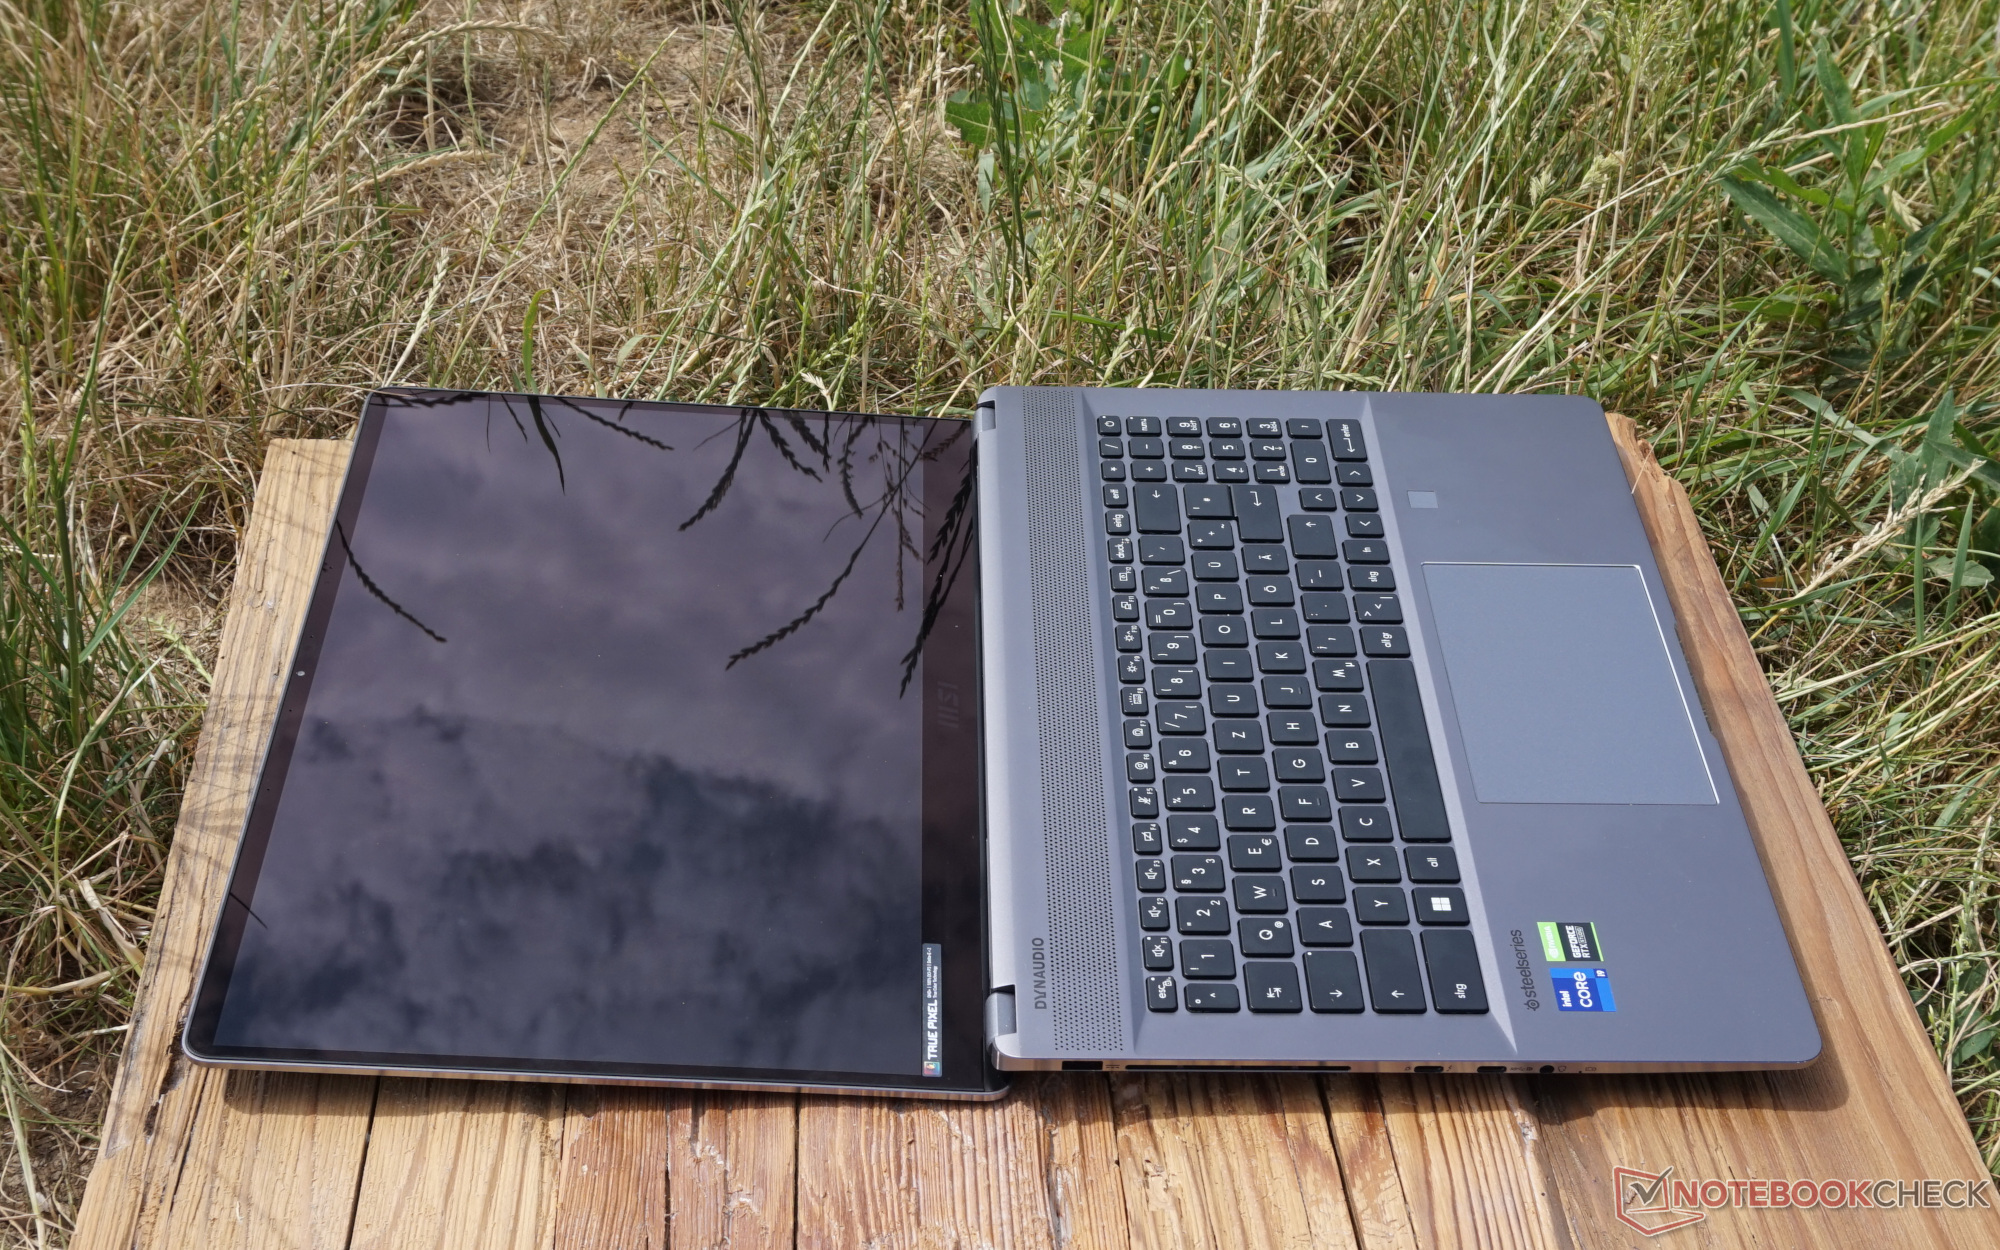
Connectivity - Only TB4 really does the MSI Creator justice
Connectivity seems rather poor. The single Thunderbolt 4 port is particularly striking, which just about does justice to the MSI Z16P's premium segment. The second USB-C port only manages 10 Gb/s, i.e. one fourth. At least a monitor can be connected here as well. However, there's no additional HDMI output, which would be handy on the road from time to time.
Overall, some things have been changed compared to the predecessor, but not exactly for the better. The second Thunderbolt 4 port was removed. There's also only one USB-A port. In addition, the USB-A port is now on the right, and both USB-C ports are on the left. If a full-size card slot hadn't finally been included instead of a microSD one, we could've called this a total step backwards.


SD card reader
The rather modest situation in terms of ports carries over to the card slot. With our AV Pro microSD 128 GB V60 reference card, not even the average value of all multimedia laptops could be achieved. Once again, the MSI Creator Z16 demonstrates how to do a better job.
Admittedly: Even large video files are copied in a short time. However, instead of 1 to 2 minutes, the MSI Creator Z16P now needs 5 minutes to read 25 GB, for example.
| SD Card Reader - average JPG Copy Test (av. of 3 runs) | |
| MSI Creator Z16 A11UET-209 (AV Pro SD microSD 128 GB V60) | |
| Average of class Multimedia (23 - 531, n=43, last 2 years) | |
| MSI Creator Z16P B12UHST (AV PRO microSD 128 GB V60) | |
| Acer Predator Triton 500 SE PT516-52s-70KX (AV PRO microSD 128 GB V60) | |
Communication
The Killer Wi-Fi 6E AX1675i almost inevitably puts the creative laptop at the top of the ranking. Although a correspondingly capable router is still necessary for these transfer rates, a modern Fritzbox is already sufficient for this.
Consequently, the fast wireless communication compensates a bit for the limited selection of ports or the lack of a LAN port.
Webcam
The 2 MP resolution ensures relatively detailed images, and it offers a sensible middle ground between high quality and low data volume, especially for video calls.
The four-way microphone also contributes to a pleasant video conferencing experience. Voices are picked up clearly from different directions and distances, even when speaking in the opposite direction. In addition, there are two software solutions to further boost the voice in the speakers and over the microphone in relation to ambient noise. This works quite well with street noise, for example.


Security
The high-priced laptop has two solid security features in the form of an IR sensor and a fingerprint scanner. They work reliably, but they don't do much more.
Maintenance
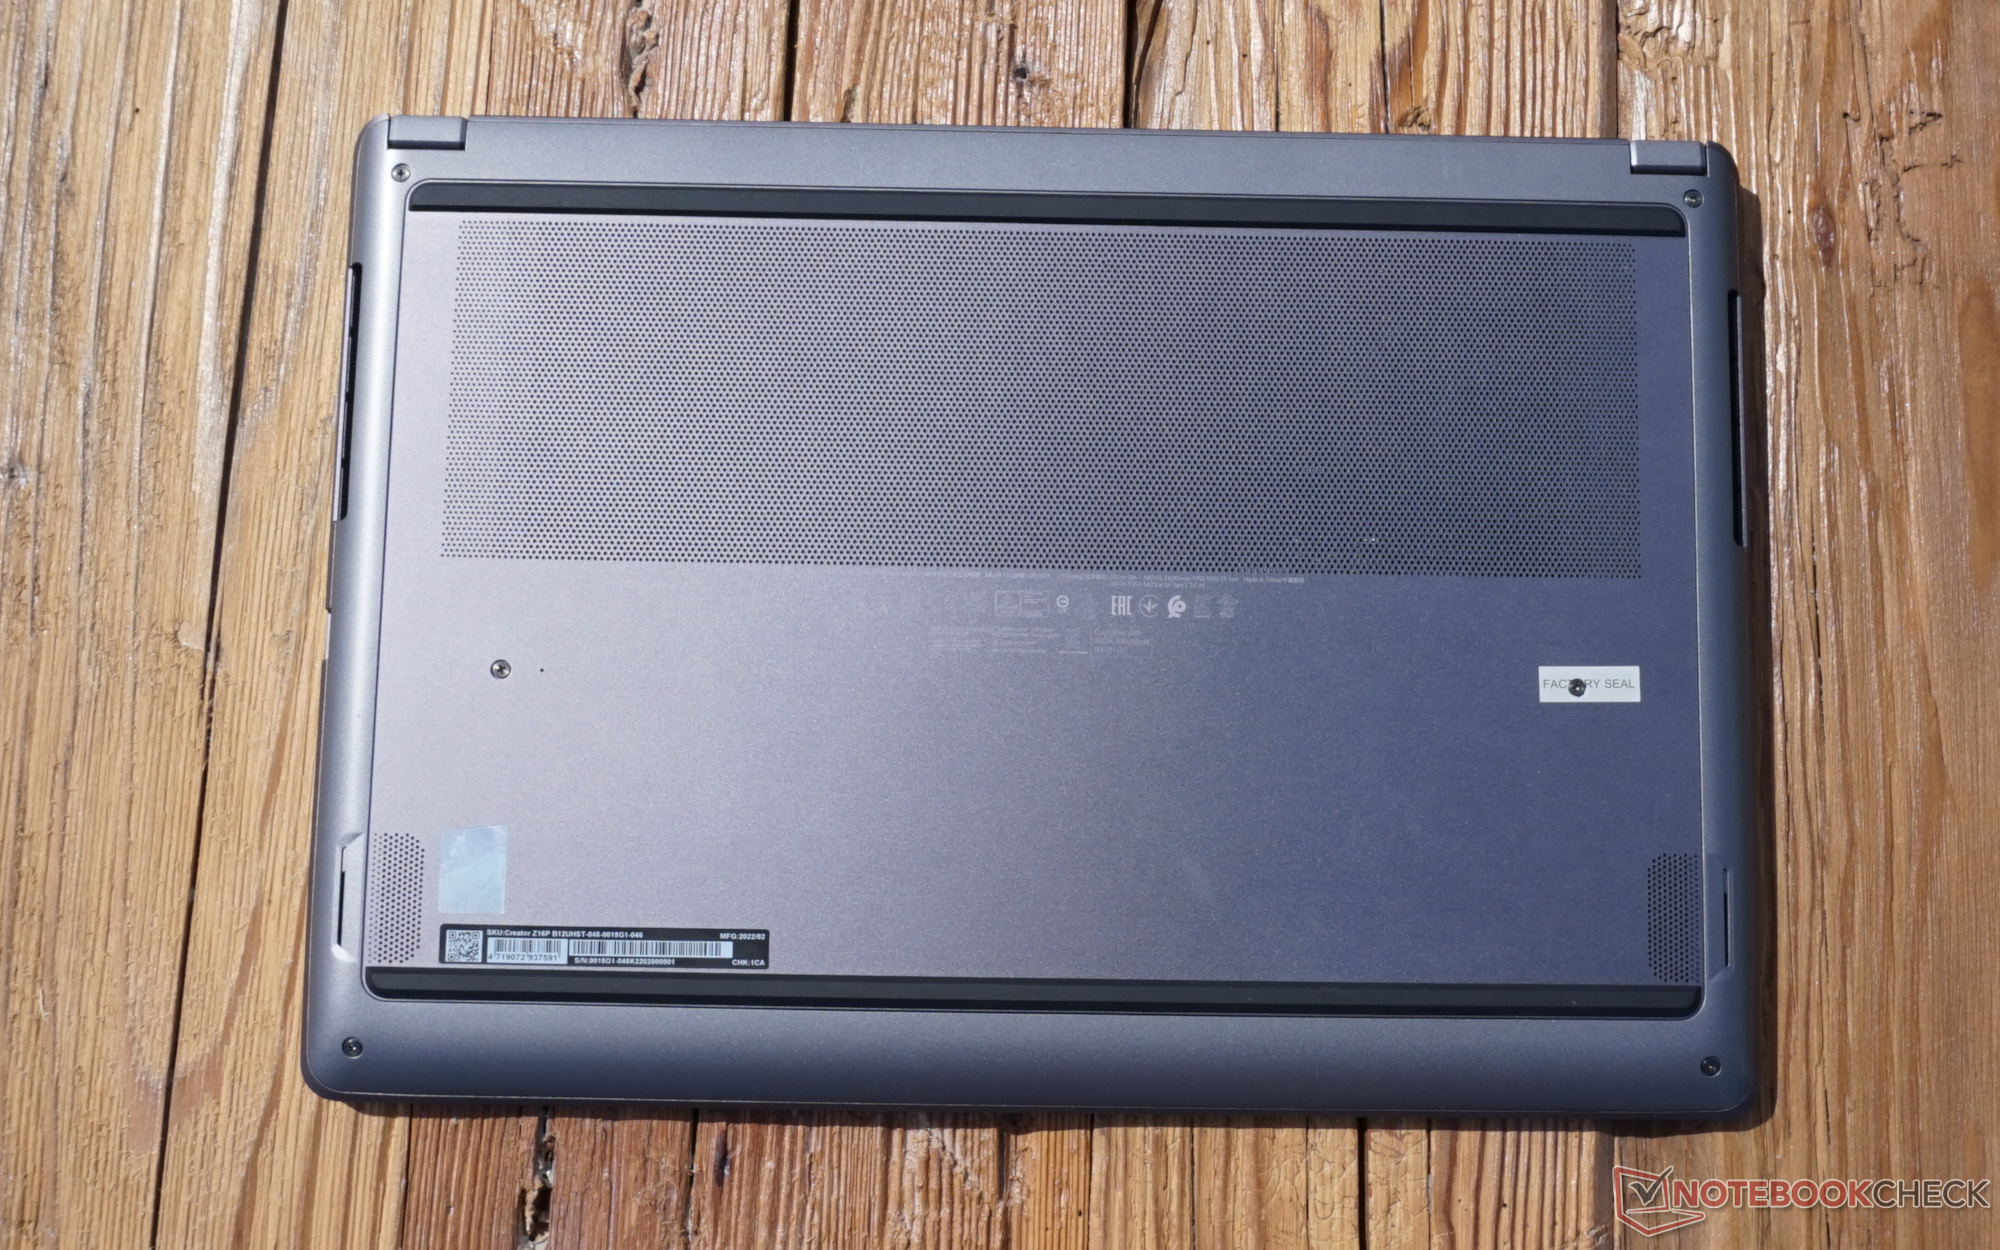
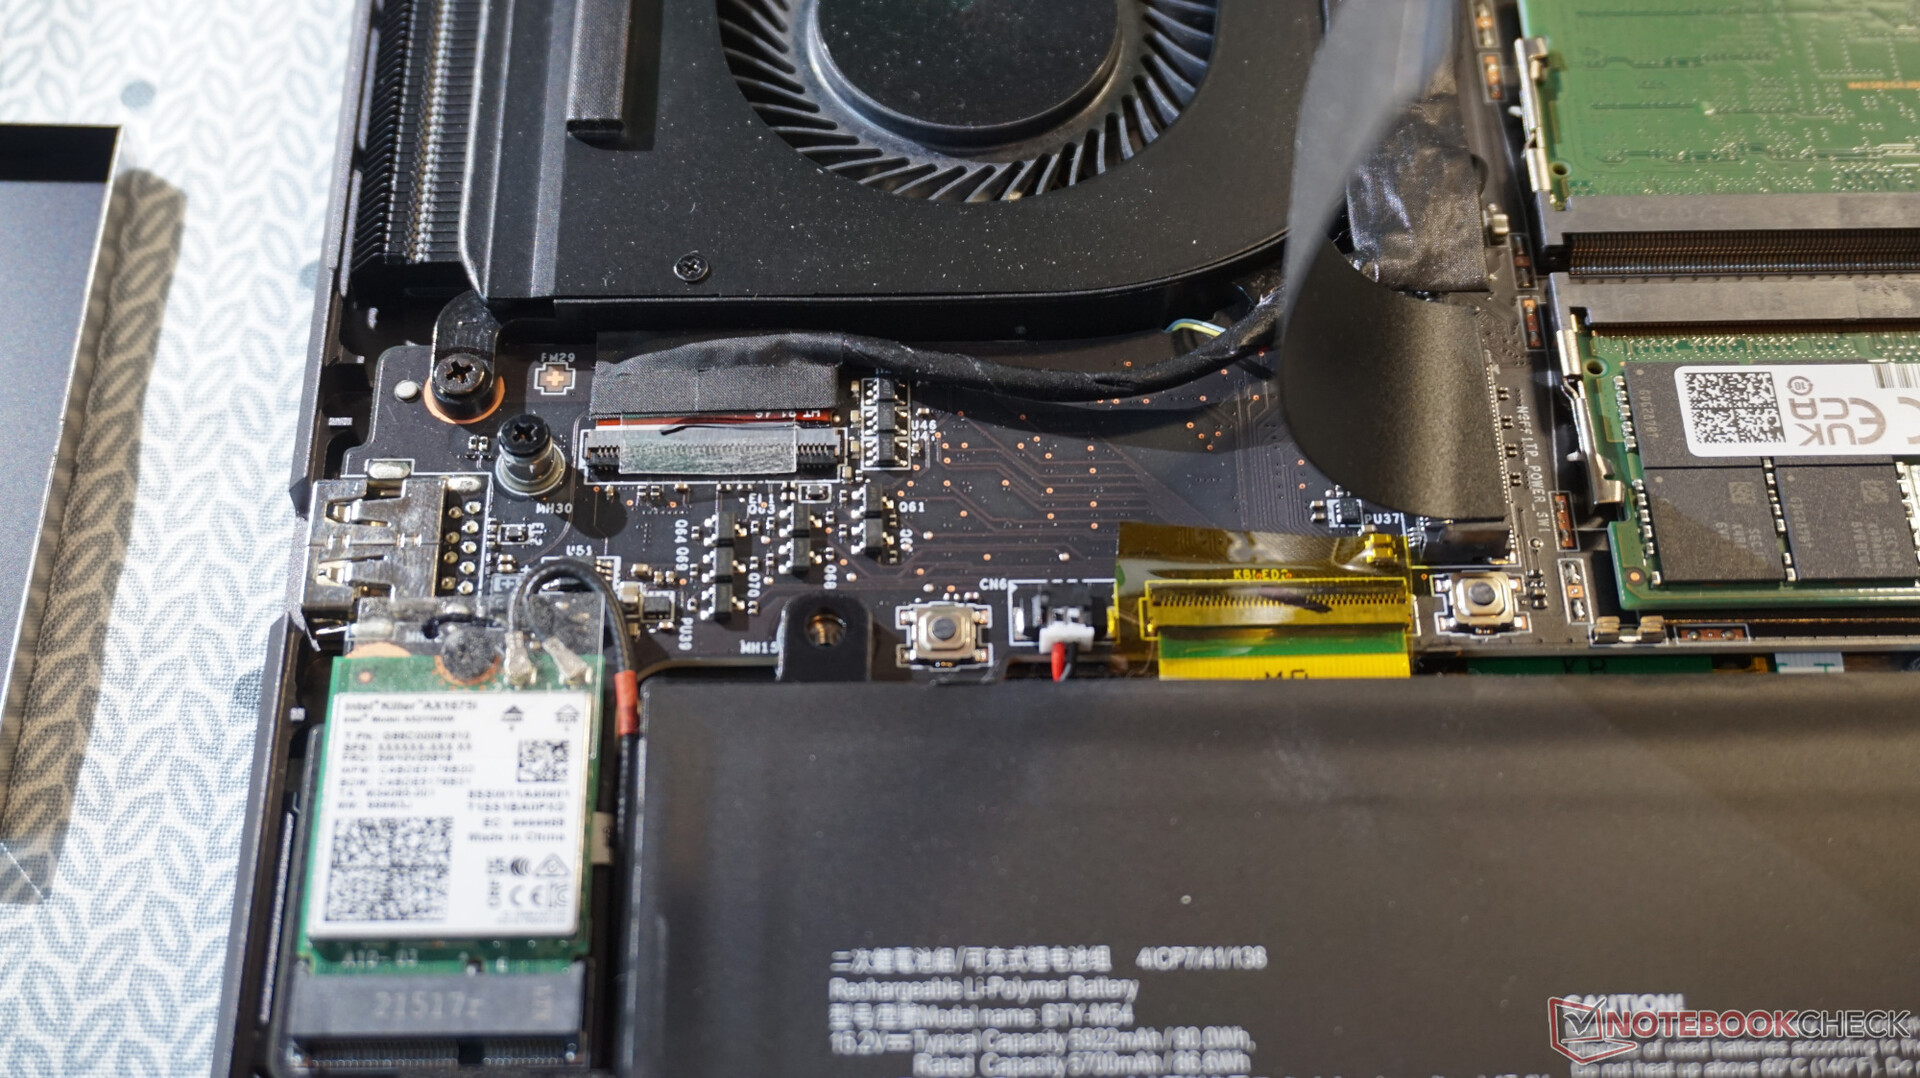
The MSI Creator Z16P is an impressive demonstration of how a laptop should be opened. Admittedly, one of the screws is under a seal. However, this is immediately recognizable as such. You have to loosen six identical cross-head screws, and afterwards, finger strength is enough (a pry tool is advisable, though) to pull off the entire bottom cover without damaging it.
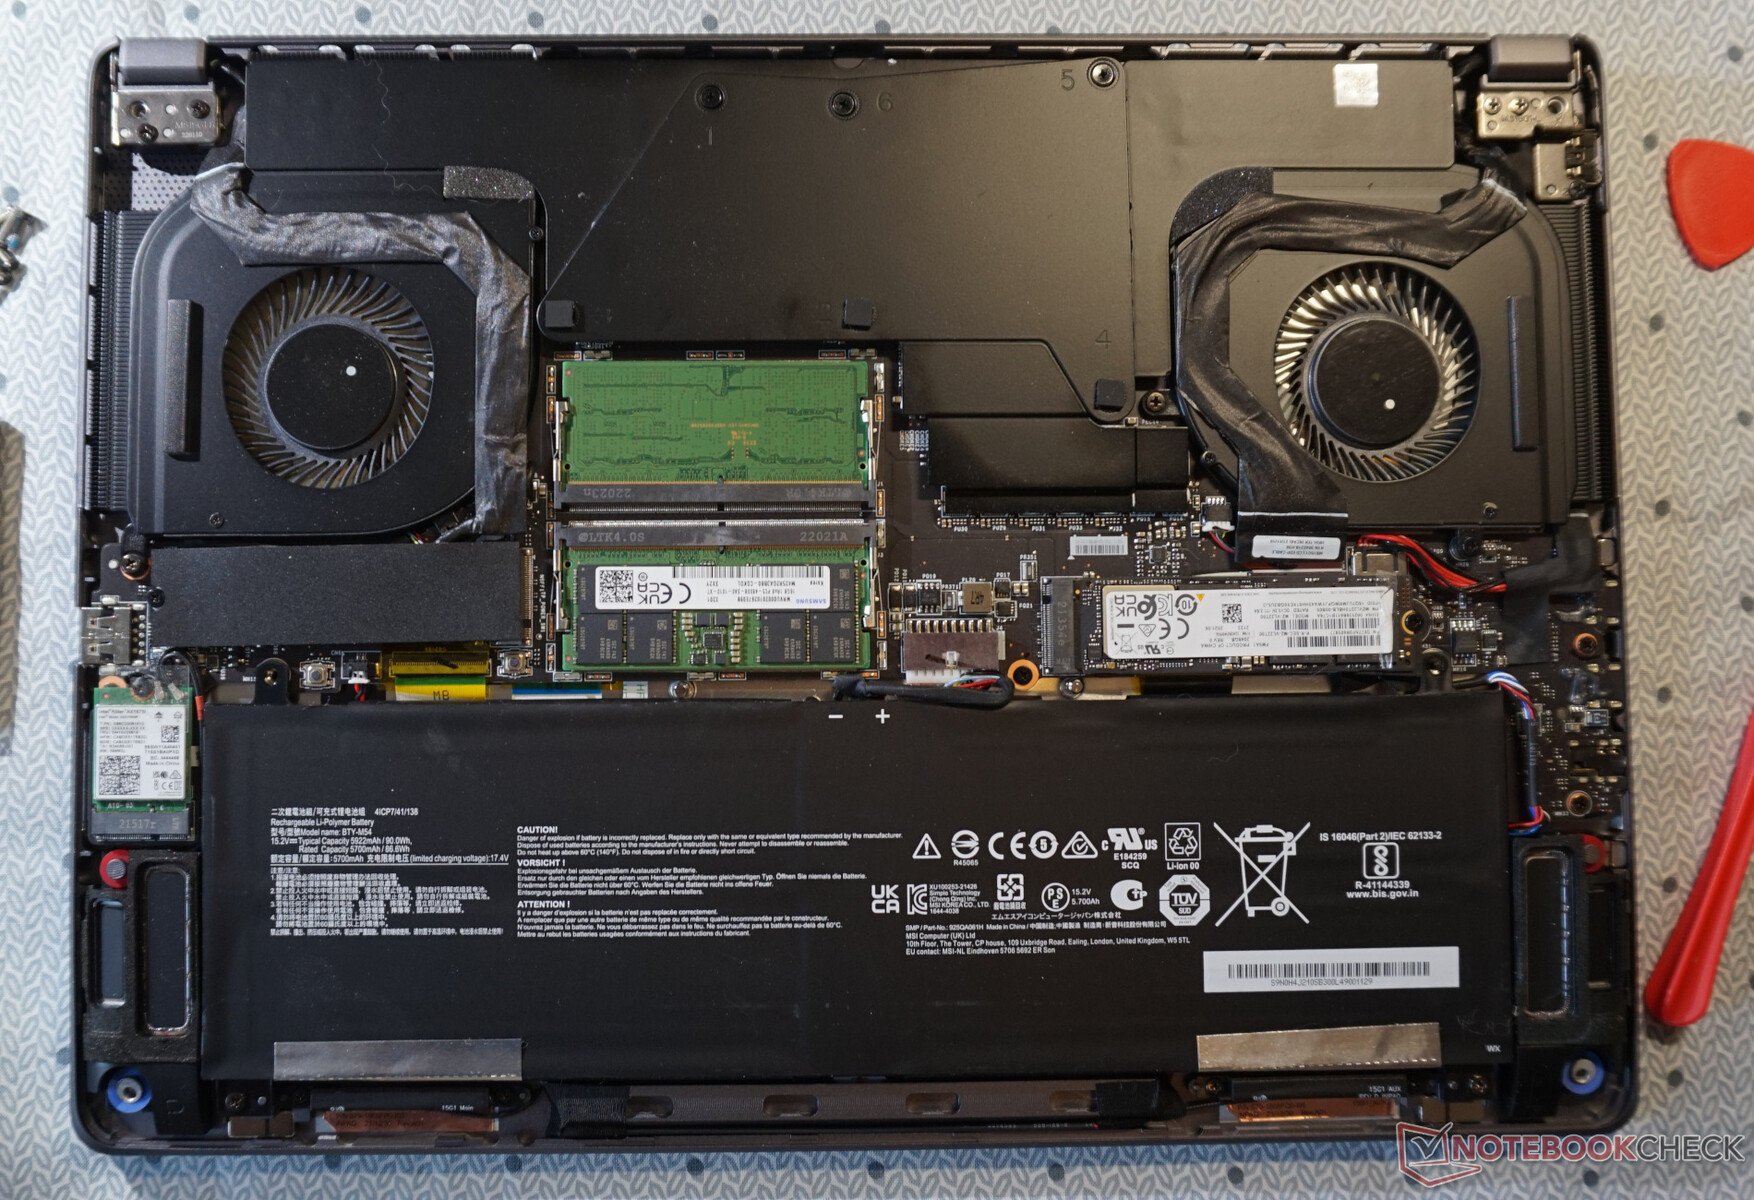
A second M.2 slot for storage expansion is available and already equipped with a heat dissipating cover. The battery and RAM components can also be replaced without any hassle. Cleaning the fans is just as easy.
Input devices - Colorful illumination, limited precision
Keyboard
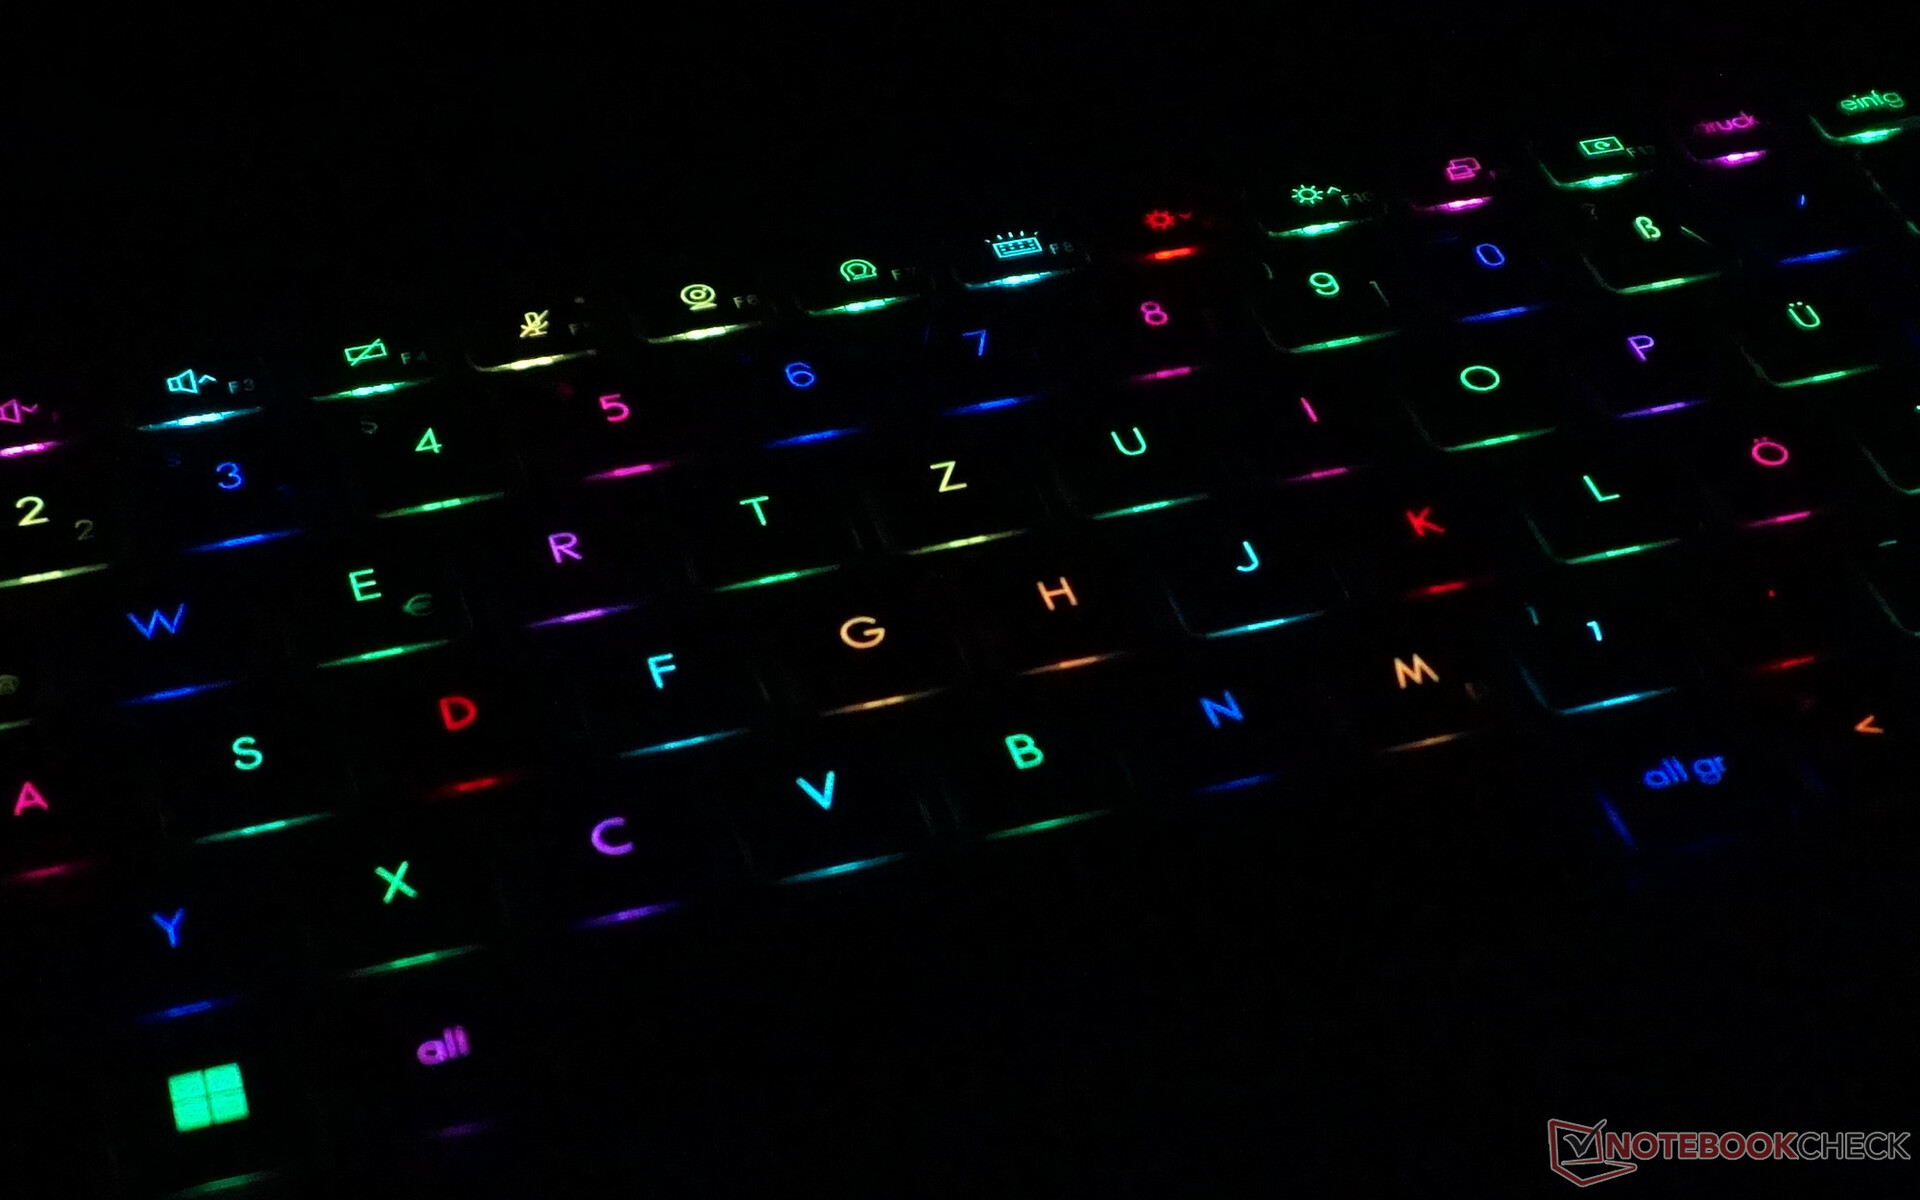
As soon as you start using the MSI Creator Z16P, the colorful keyboard illumination stands out. In addition to the preset effects, you can also select your own assignments, even separately for each individual key. Only the link to certain sensor values or the CPU load, for example, didn't work for us.
The keyboard itself has the usual standard size, so it's also suitable for users who are typing in a hurry. However, the limited feedback caused by the short travel could become a bit bothersome in the long run. This is perfectly acceptable for a laptop, especially since the counterpressure is very pleasant.
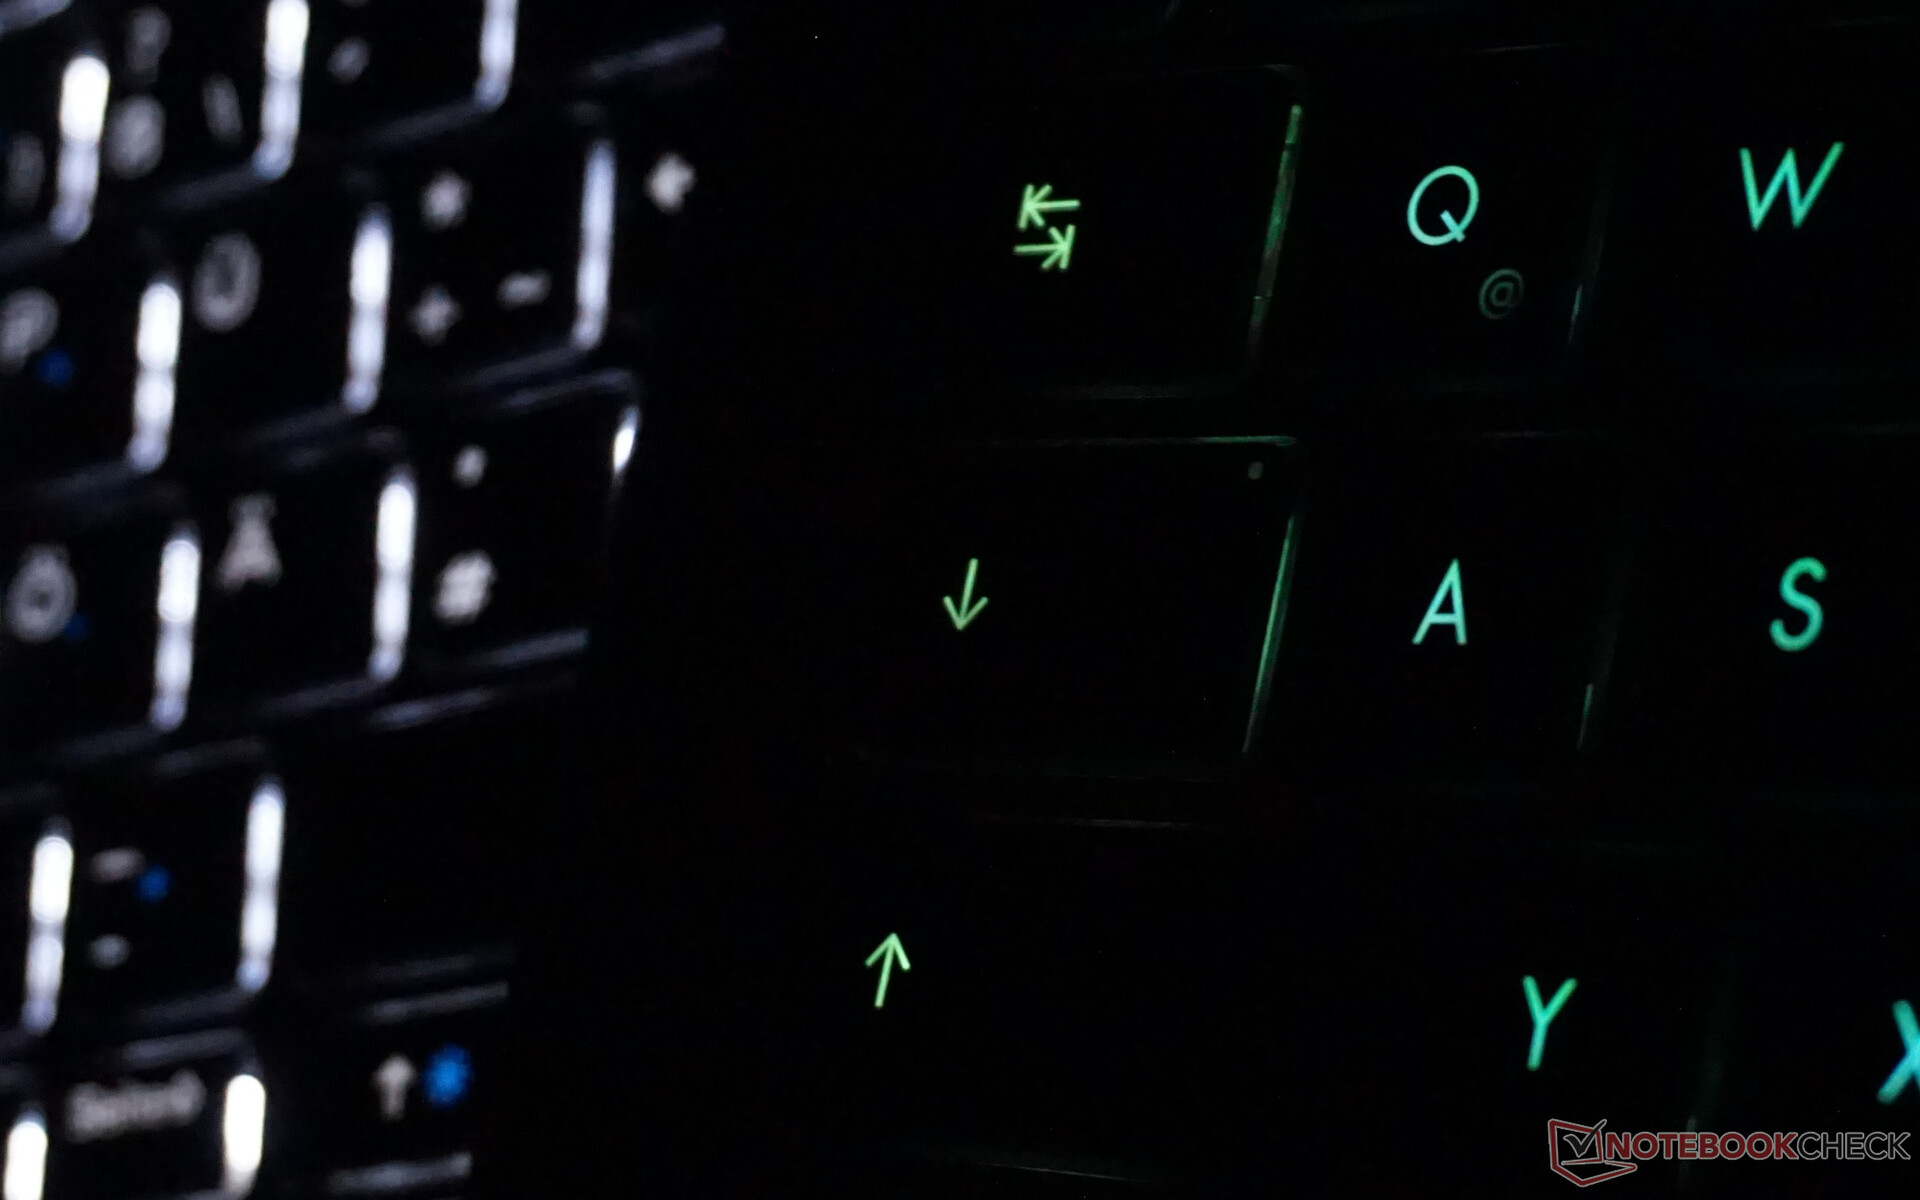
The model that we reviewed showed a green tint both when selecting a completely white color setting and a yellow color setting. MSI sent us the following statement in response: Because the white illumination is made up of the three basic colors of the RGB illumination, individual differences in the reproduction of the individual colors of the keyboard illumination are possible depending on the ambient light, and personal perception, all within the technical tolerances. The SteelSeries Engine 3 can be used to optimize the appearance according to one's own preferences and to find the most suitable color tone.
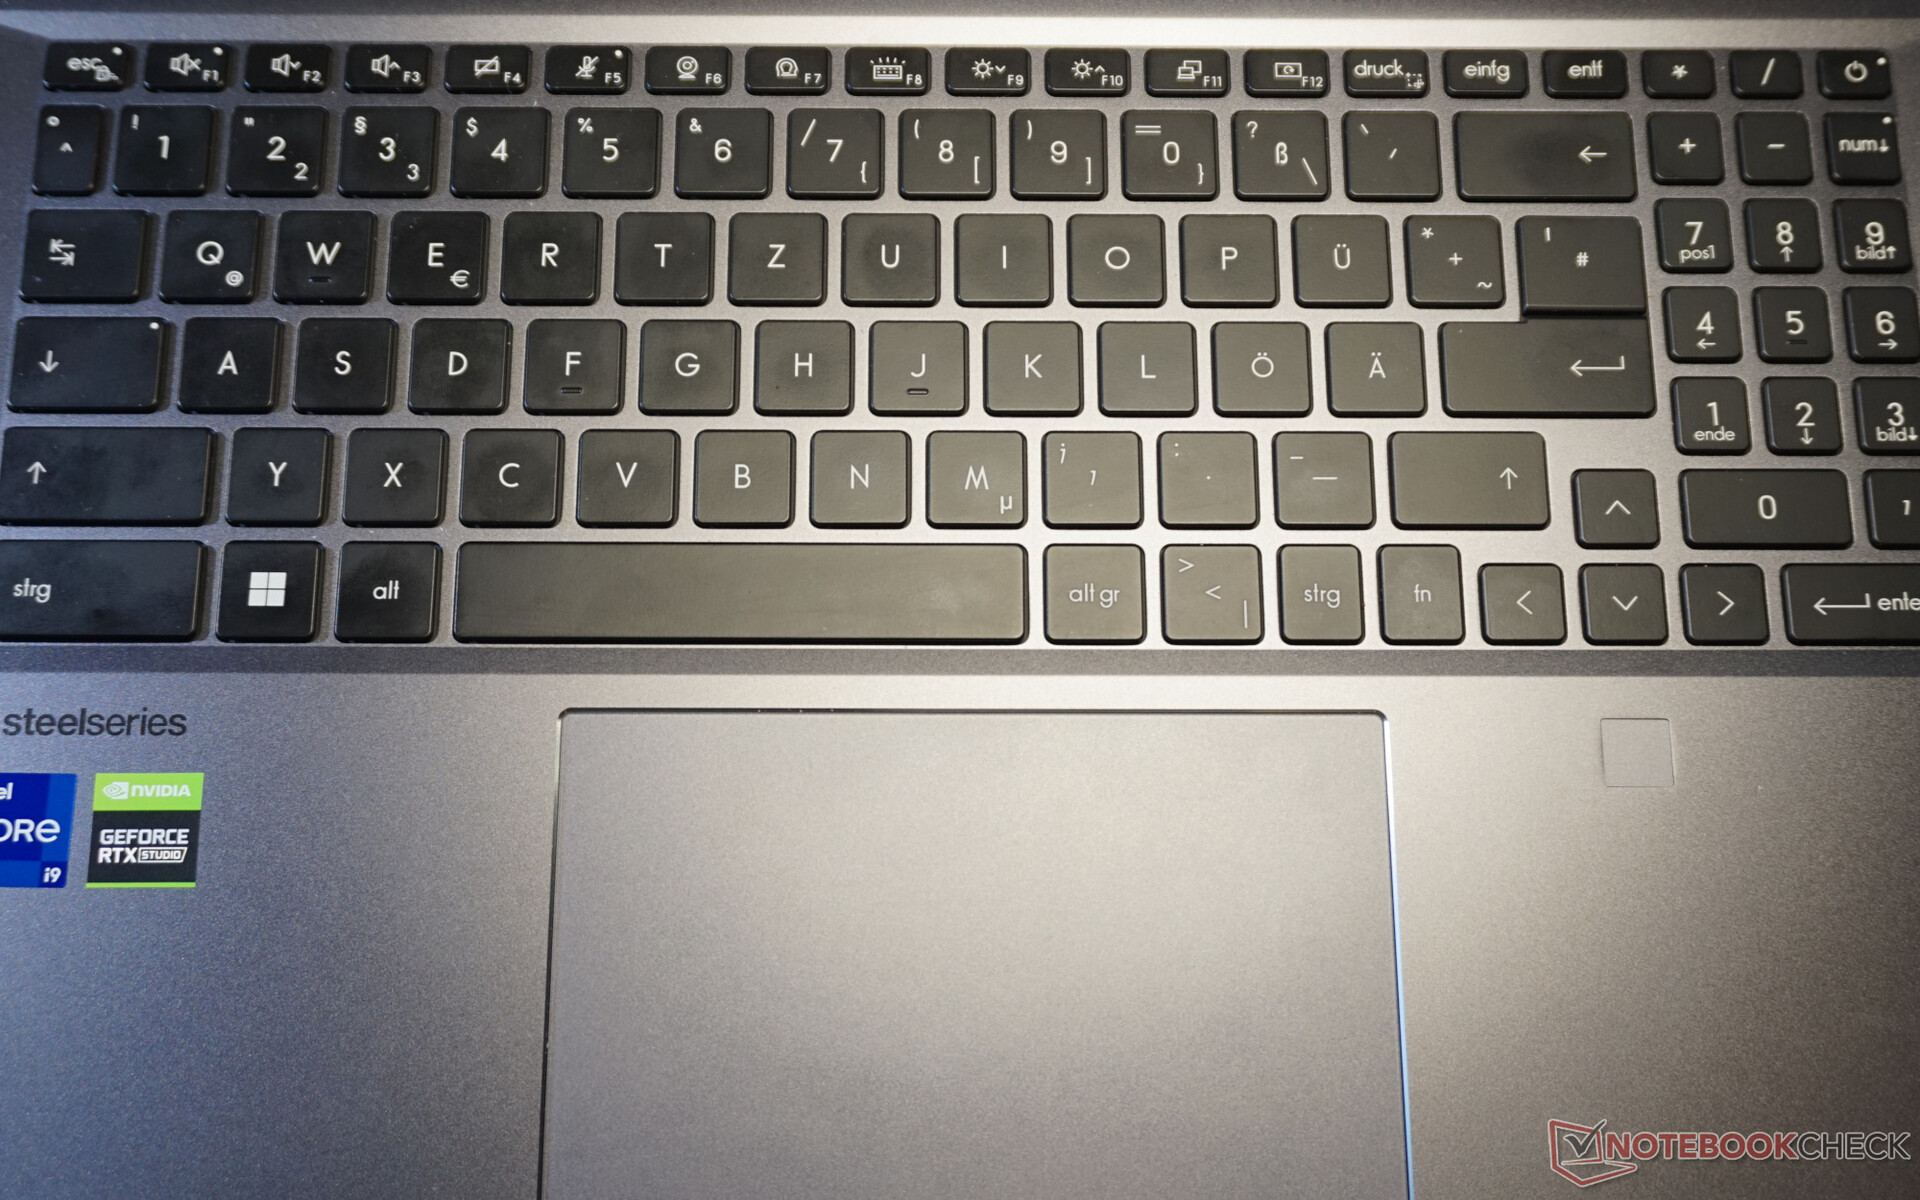
Touchpad
The comfortable size of the 8 by 13 cm touchpad in particular facilitates swift and versatile operation. The slightly roughened surface allows precise inputs with one to four fingers.
The lack of physical keys is less optimal. At the very least, the pressure point and necessary strength feel odd.
Touchscreen
Firm hinges and the two small rubber feet provide sufficient stability when using the touchscreen. It can be used precisely and without problems. However, using the fingers inevitably leaves marks that interfere with the display's high-quality reproduction.
The MSI Pen, which is therefore highly recommended, isn't included despite the significant price. There's no slot for the pen in the case, either, which could have certainly been found.
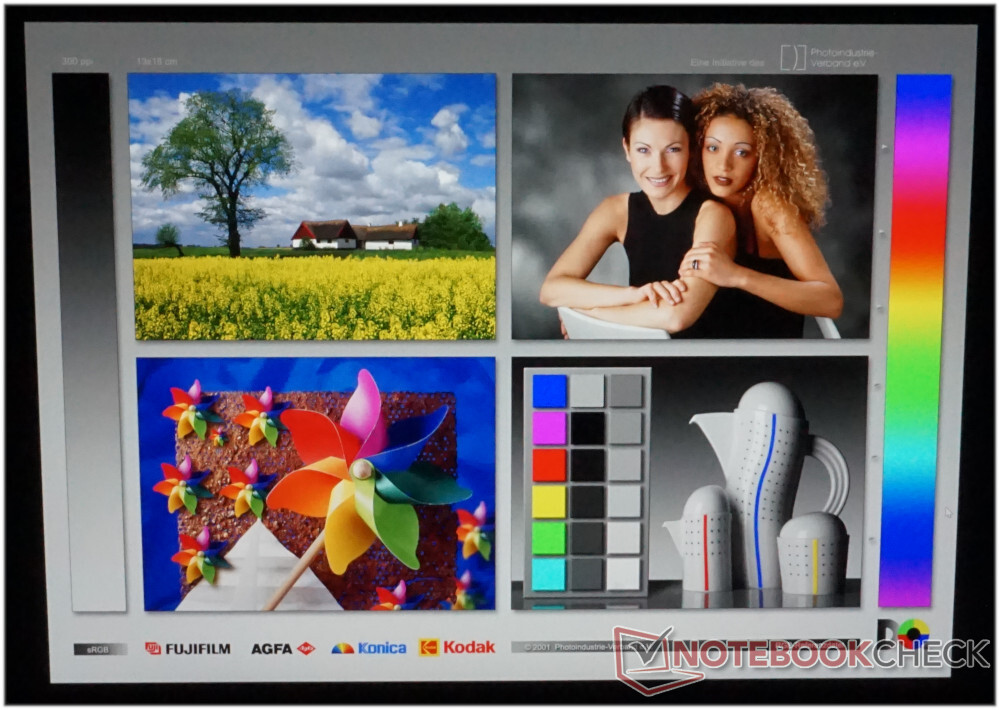
Display - Creator laptop with an almost perfect color accuracy
Even without OLED technology and a 4K resolution, the display rates can be described as excellent. The attempt to work with a 16-inch diagonal size without the recommended magnification of 150% shows that the 4 MP of the QHD+ resolution (2,560x1,600 pixels) is entirely sufficient. In addition, there's a maximum refresh rate of 165 hz.
The other image rates match the strong overall impression. The response time of 13 ms (gray-to-gray), the good contrast values, and the average brightness of just under 400 cd/m² essentially leave nothing to be desired.
It also makes sense that MSI did without an OLED display here. On the contrary, the IPS panel used here doesn't exhibit any PWM flickering. With an OLED panel, on the other hand, a trained eye would notice a smooth progression of black bars, especially at lower brightness levels. Therefore, users who want and need to look at fast video sequences to assess their quality will make the right choice here.
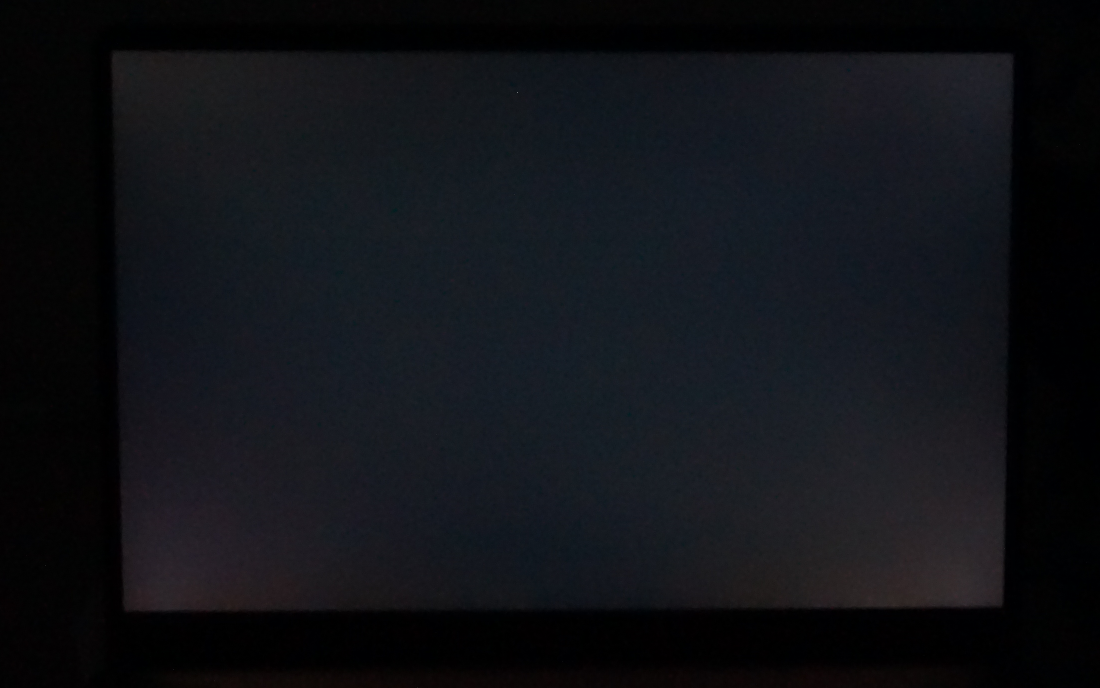
The drawback of the technology is screen bleeding. In combination with the slightly above-average brightness, slight halos can be seen at the bottom left and right when using a black background.
| |||||||||||||||||||||||||
Brightness Distribution: 86 %
Center on Battery: 428 cd/m²
Contrast: 1019:1 (Black: 0.42 cd/m²)
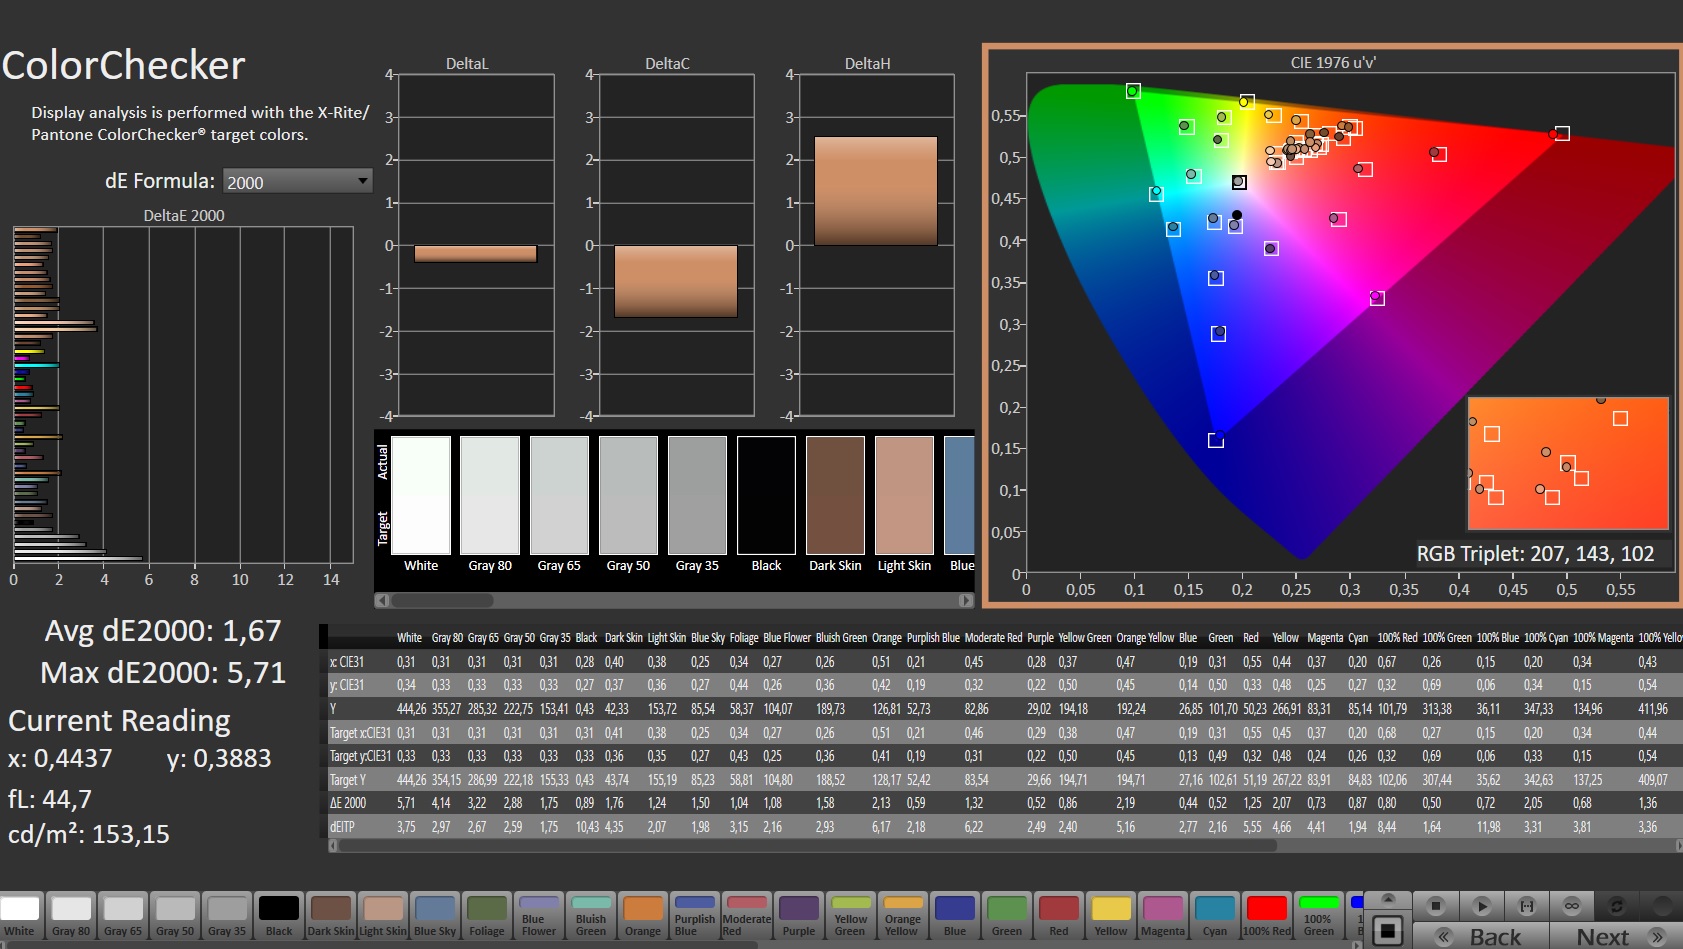
ΔE ColorChecker Calman: 1.67 | ∀{0.5-29.43 Ø4.73}
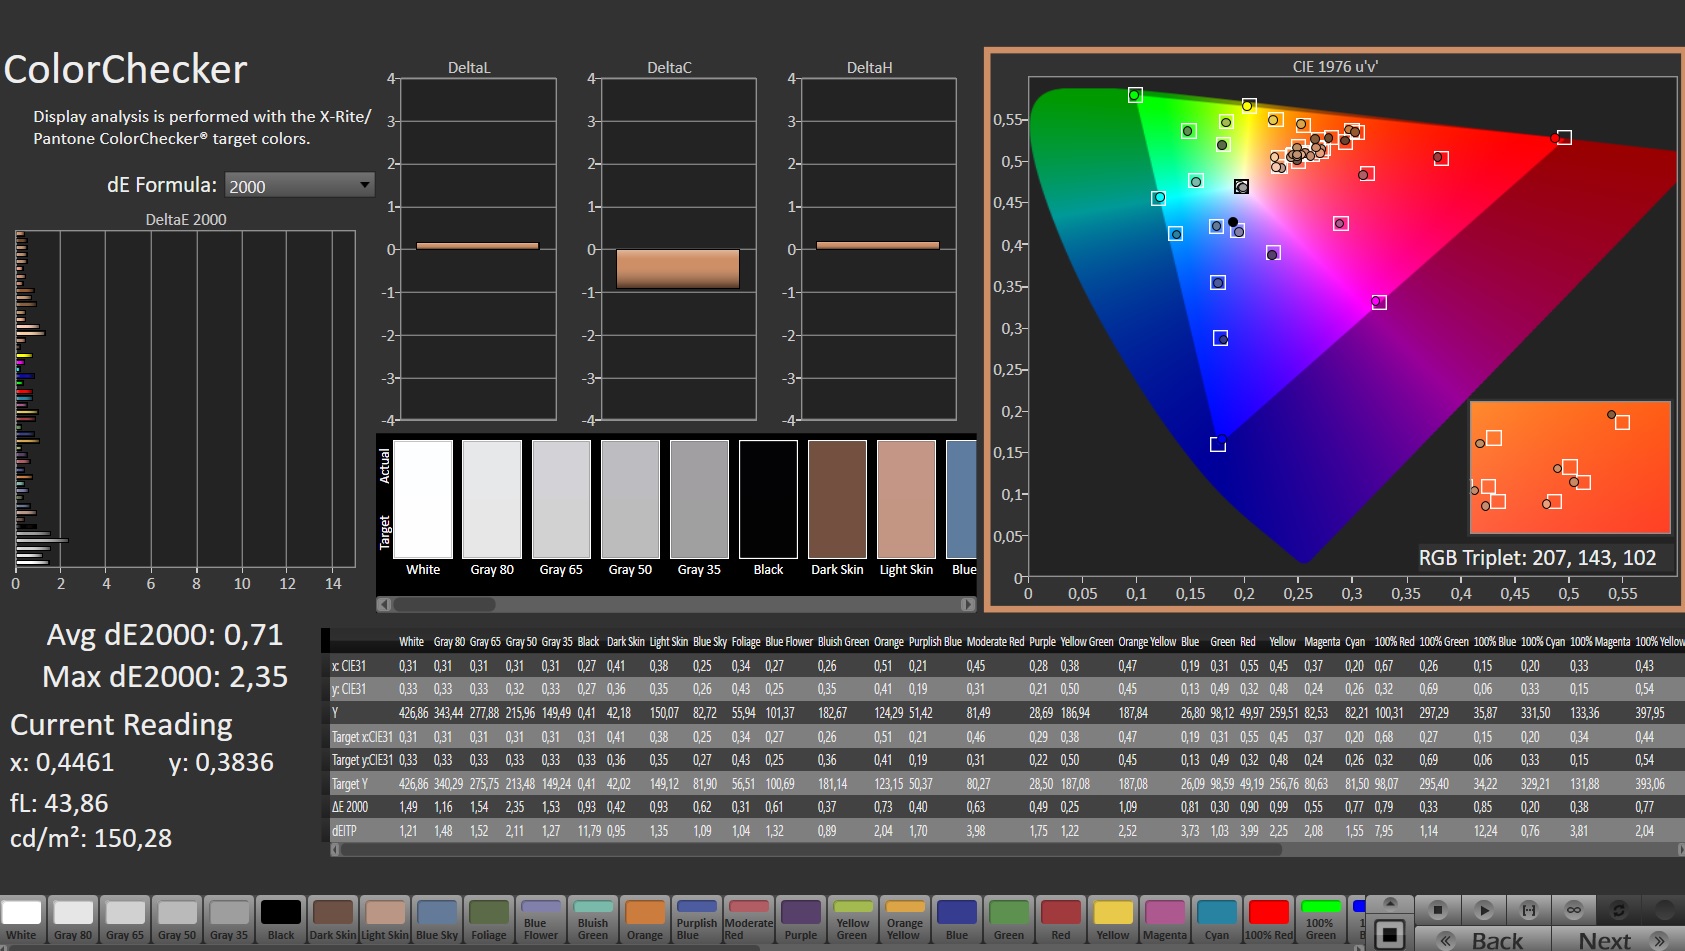
calibrated: 0.71
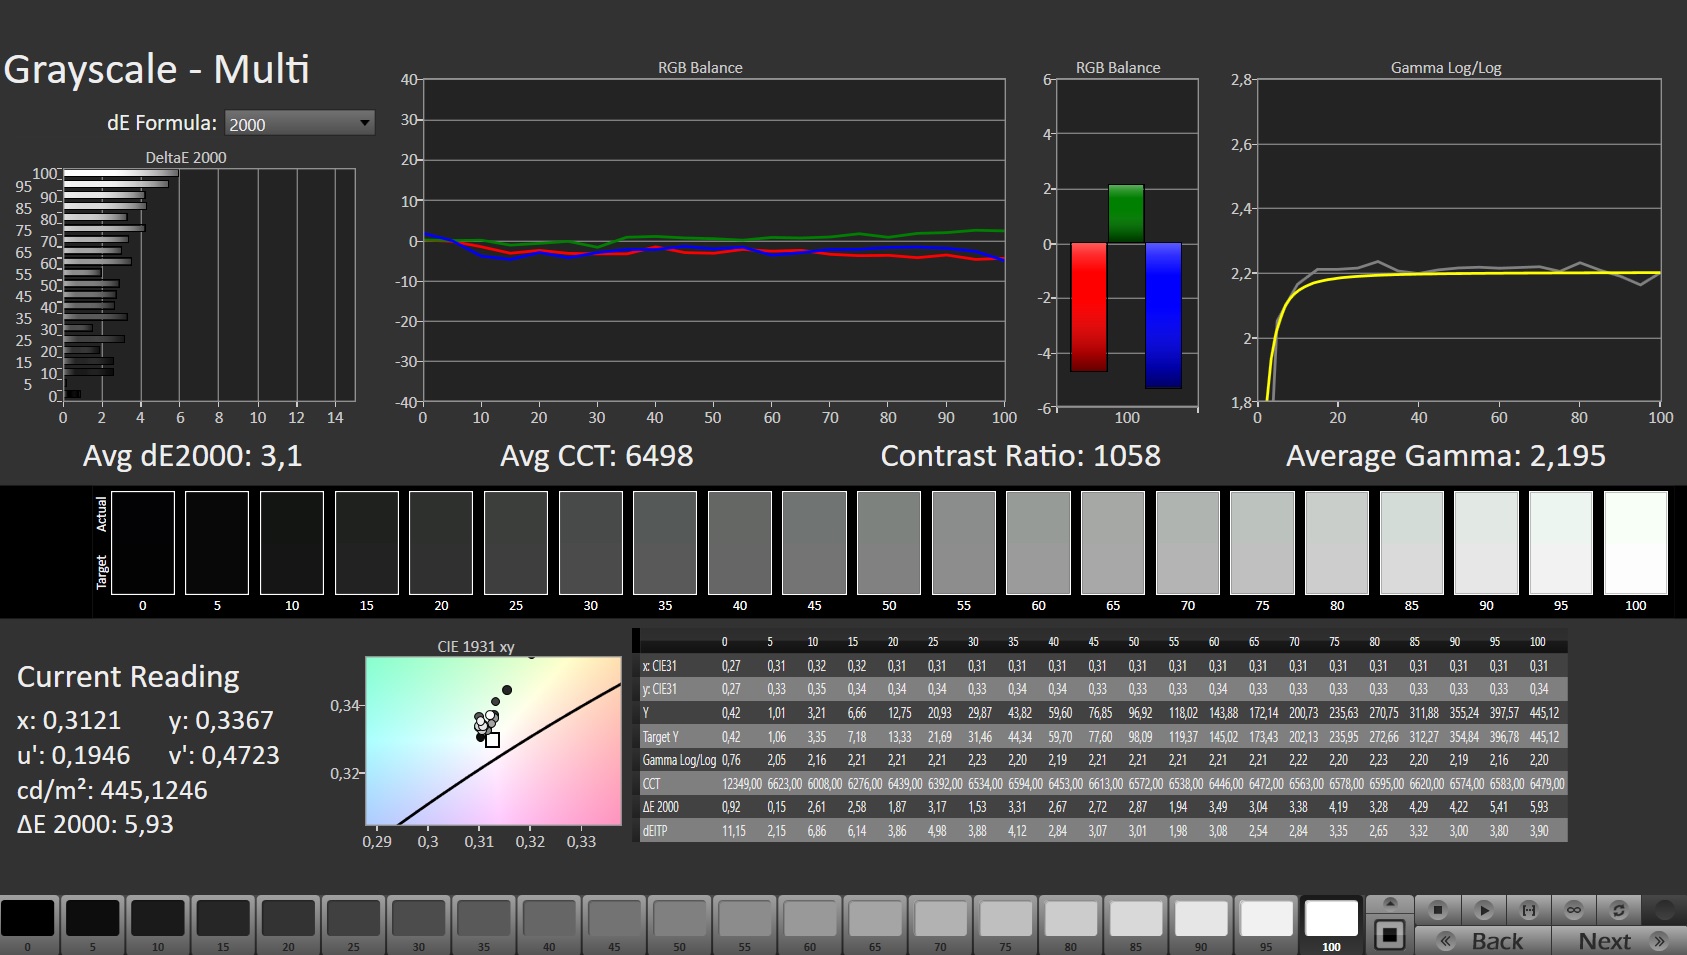
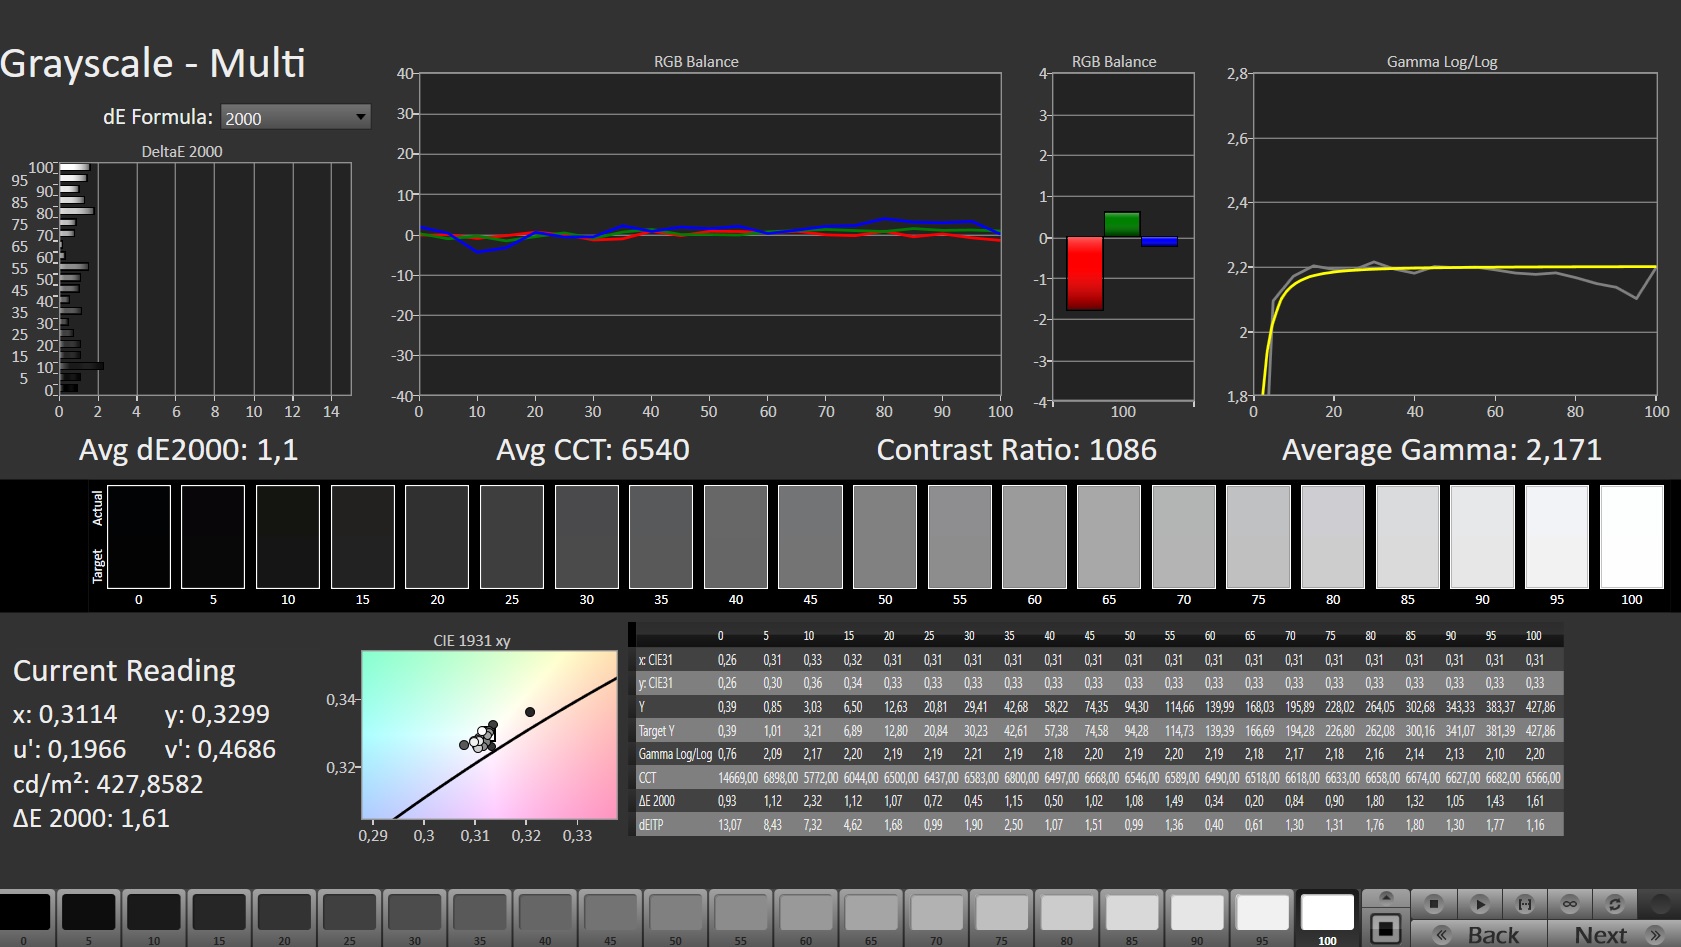
ΔE Greyscale Calman: 3.1 | ∀{0.09-98 Ø4.97}
86.8% AdobeRGB 1998 (Argyll 3D)
99.9% sRGB (Argyll 3D)
97.6% Display P3 (Argyll 3D)
Gamma: 2.195
CCT: 6498 K
| MSI Creator Z16P B12UHST AUOD298, IPS True Pixel (~100% DCI-P3), 2560x1600, 16" | MSI Creator Z16 A11UET-209 AUO B160QAN02.P, IPS True Pixel, 2560x1600, 16" | Apple MacBook Pro 16 2021 M1 Max Mini-LED, 3456x2234, 16.2" | Gigabyte Aero 16 YE5 Samsung SDC416B, AMOLED, 3840x2400, 16" | Acer Predator Triton 500 SE PT516-52s-70KX NE160QDM-NZ2, IPS LED, 2560x1600, 16" | |
|---|---|---|---|---|---|
| Display | 4% | -1% | |||
| Display P3 Coverage (%) | 97.6 | 100 2% | 97.3 0% | ||
| sRGB Coverage (%) | 99.9 | 100 0% | 100 0% | ||
| AdobeRGB 1998 Coverage (%) | 86.8 | 96 11% | 84.9 -2% | ||
| Response Times | -9% | 75% | -4% | ||
| Response Time Grey 50% / Grey 80% * (ms) | 12.9 ? | 14 ? -9% | 2.4 ? 81% | 13.8 ? -7% | |
| Response Time Black / White * (ms) | 6.4 ? | 7 ? -9% | 2 ? 69% | 6.4 ? -0% | |
| PWM Frequency (Hz) | 60 ? | ||||
| Screen | -31% | 329% | 457% | 13% | |
| Brightness middle (cd/m²) | 428 | 375 -12% | 507 18% | 368 -14% | 498 16% |
| Brightness (cd/m²) | 394 | 348 -12% | 494 25% | 368 -7% | 468 19% |
| Brightness Distribution (%) | 86 | 89 3% | 96 12% | 93 8% | 80 -7% |
| Black Level * (cd/m²) | 0.42 | 0.41 2% | 0.02 95% | 0.01 98% | 0.36 14% |
| Contrast (:1) | 1019 | 915 -10% | 25350 2388% | 36800 3511% | 1383 36% |
| Colorchecker dE 2000 * | 1.67 | 2.59 -55% | 1.4 16% | 2.33 -40% | 1.77 -6% |
| Colorchecker dE 2000 max. * | 5.71 | 7.08 -24% | 2.8 51% | 4.34 24% | 5.24 8% |
| Colorchecker dE 2000 calibrated * | 0.71 | 2.18 -207% | 0.63 11% | ||
| Greyscale dE 2000 * | 3.1 | 1.88 39% | 2.3 26% | 0.8 74% | 2.4 23% |
| Gamma | 2.195 100% | 2.37 93% | 2.27 97% | 2.119 104% | 2.14 103% |
| CCT | 6498 100% | 6470 100% | 6792 96% | 6569 99% | 7046 92% |
| Total Average (Program / Settings) | -12% /
-20% | 329% /
329% | 266% /
380% | 3% /
8% |
* ... smaller is better
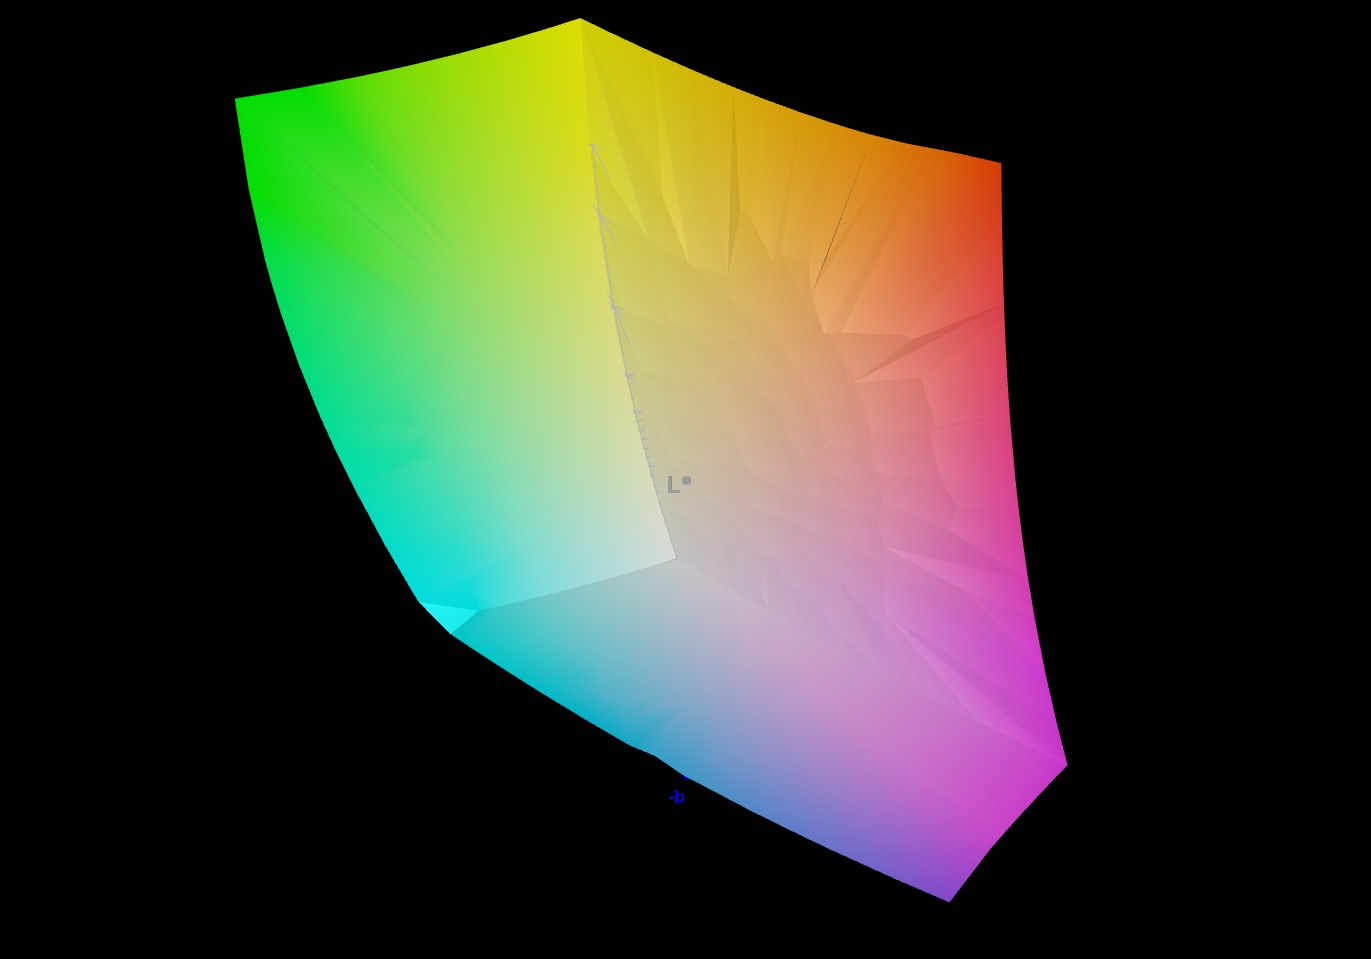
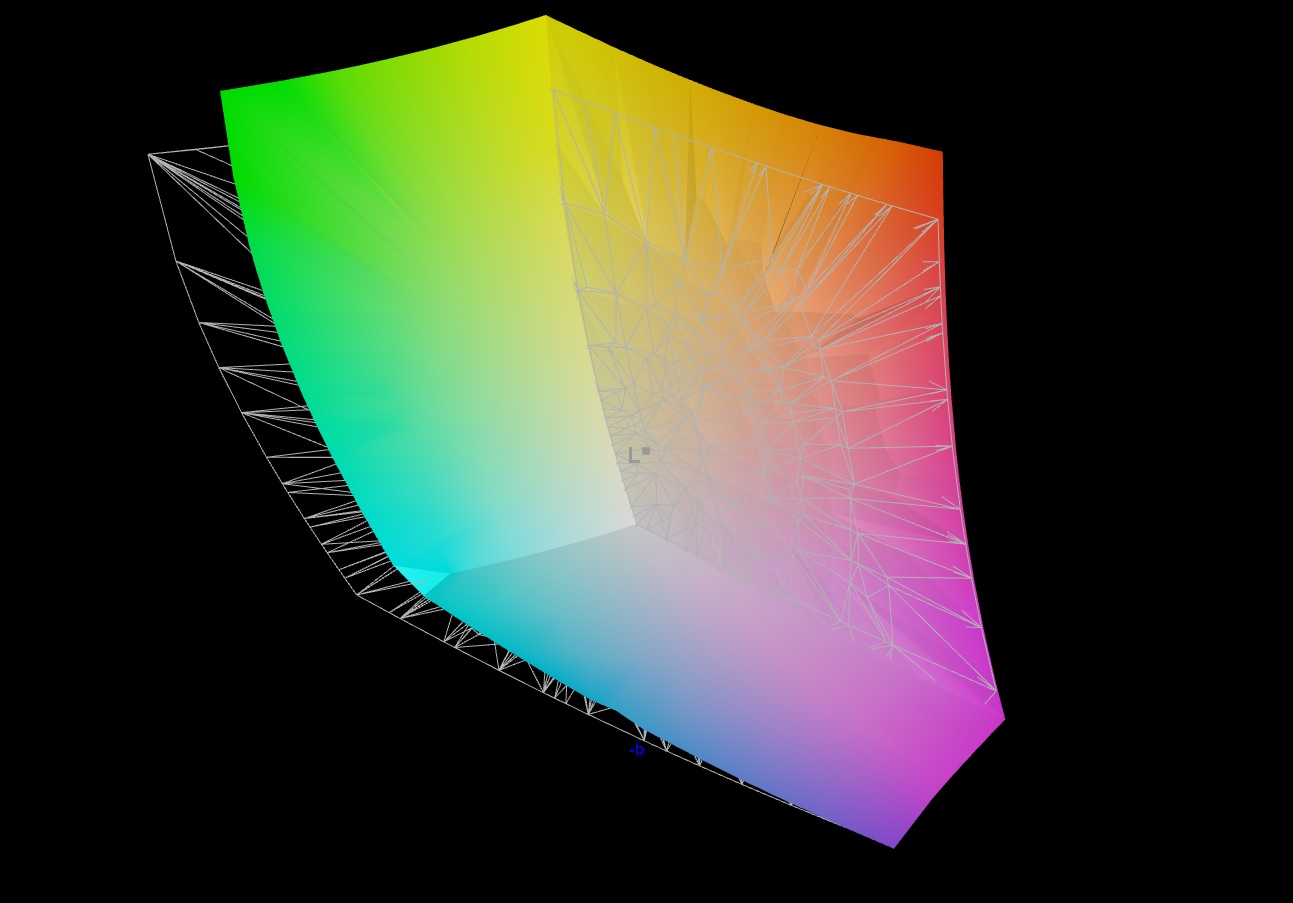
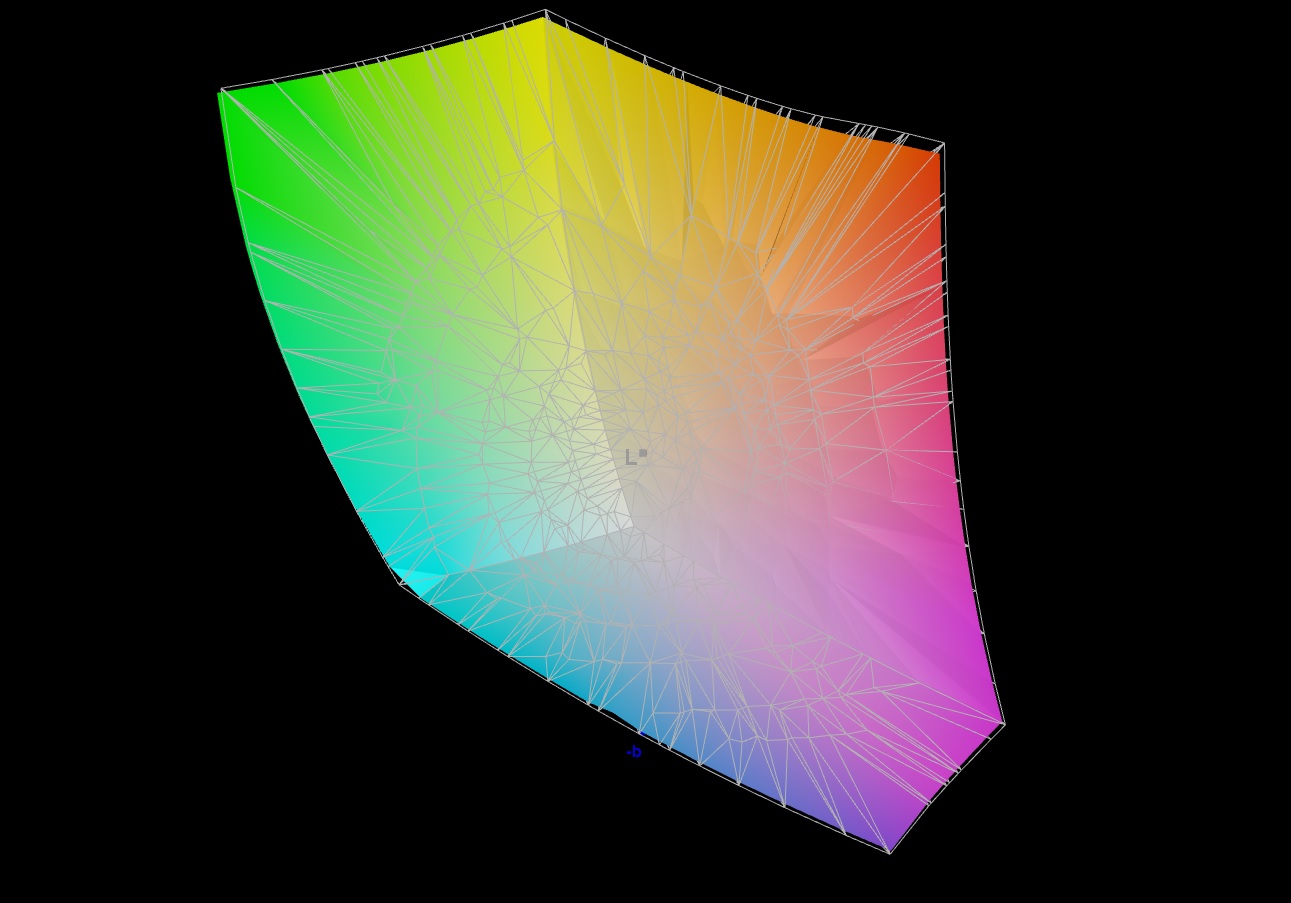
The display, which is exactly the same in all the variants of the multimedia laptop, is supposed to be precalibrated and offer nearly complete coverage of the DCI-P3 color space. This is exactly what our measurements confirm. The Delta E is 1.67. This means that no color deviations can be detected with the naked eye. After another calibration, the value even drops to 0.71. The respective file with the color profile is available for download in the field next to the display values.
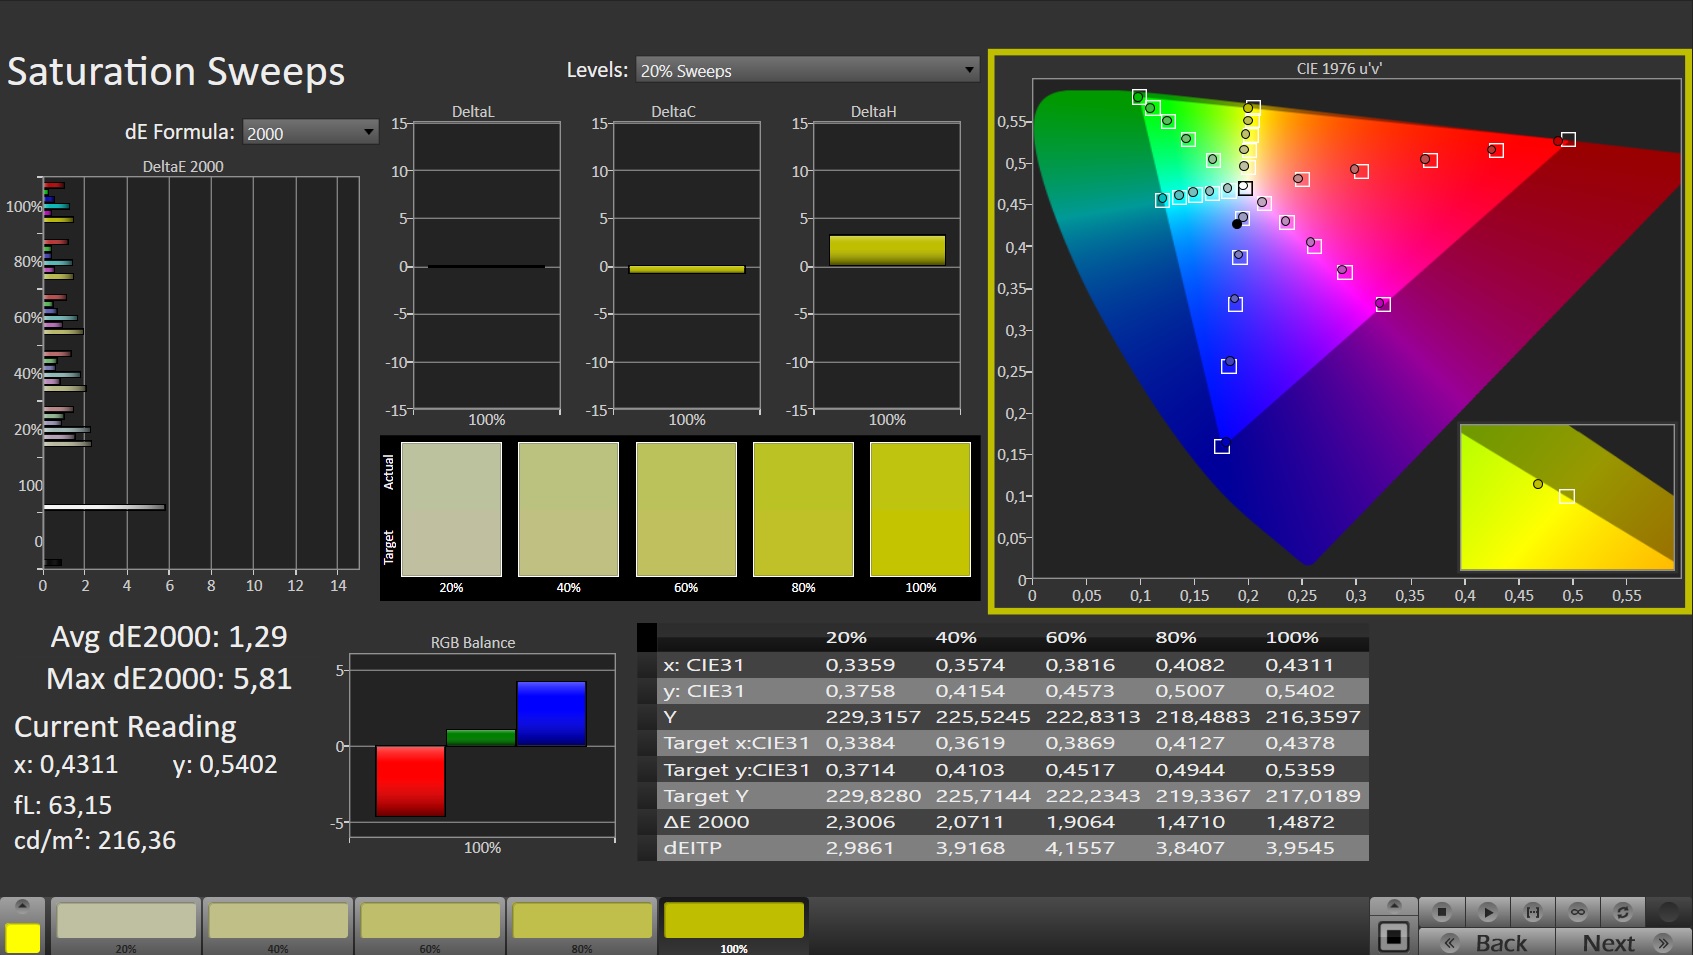
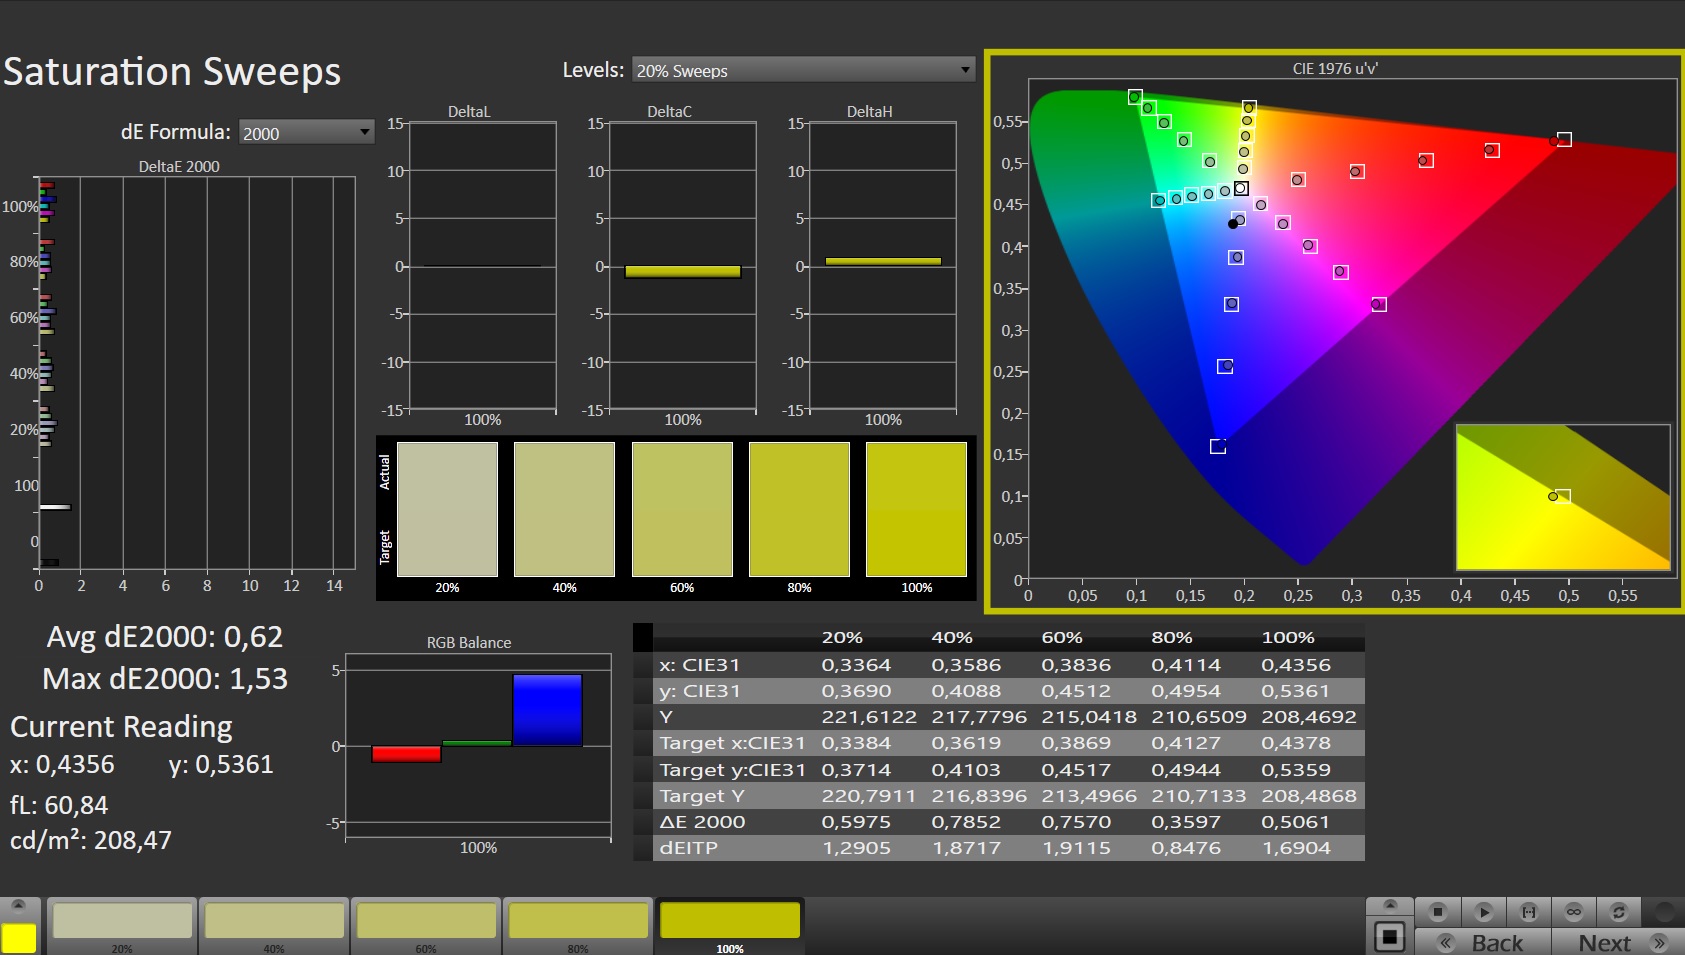
The reproducible color space of 97.6% of DCI-P3 should also satisfy professional requirements, especially in terms of video editing. In contrast to the predecessor, the display is unable to fully handle the AdobeRGB color space, which extends much further into green.
Display Response Times
| ↔ Response Time Black to White | ||
|---|---|---|
| 6.4 ms ... rise ↗ and fall ↘ combined | ↗ 2.6 ms rise | 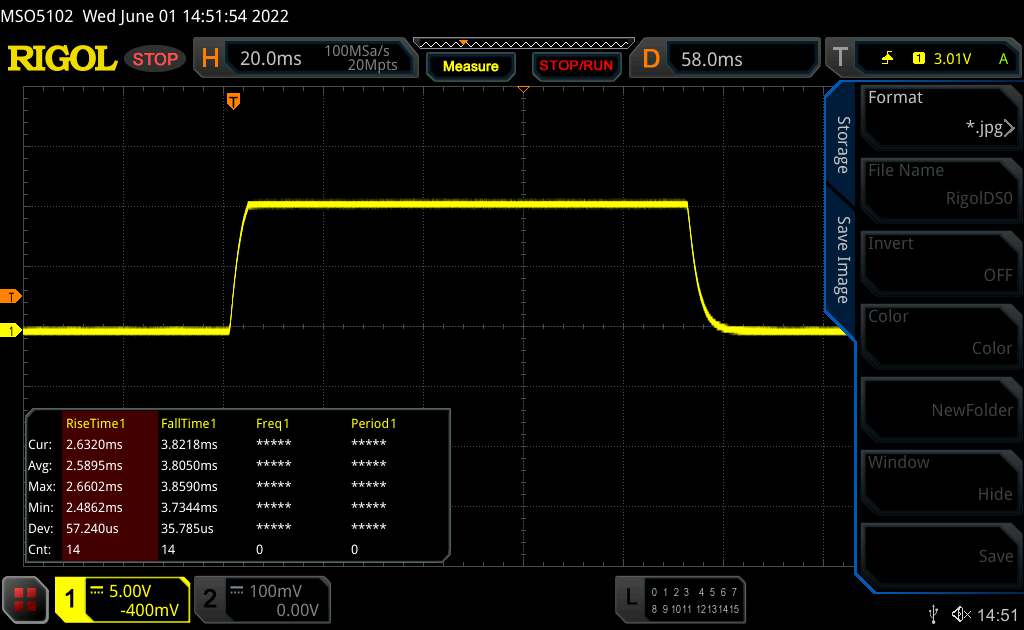 |
| ↘ 3.8 ms fall | ||
| The screen shows very fast response rates in our tests and should be very well suited for fast-paced gaming. In comparison, all tested devices range from 0.1 (minimum) to 240 (maximum) ms. » 20 % of all devices are better. This means that the measured response time is better than the average of all tested devices (19.9 ms). | ||
| ↔ Response Time 50% Grey to 80% Grey | ||
| 12.9 ms ... rise ↗ and fall ↘ combined | ↗ 6.4 ms rise | 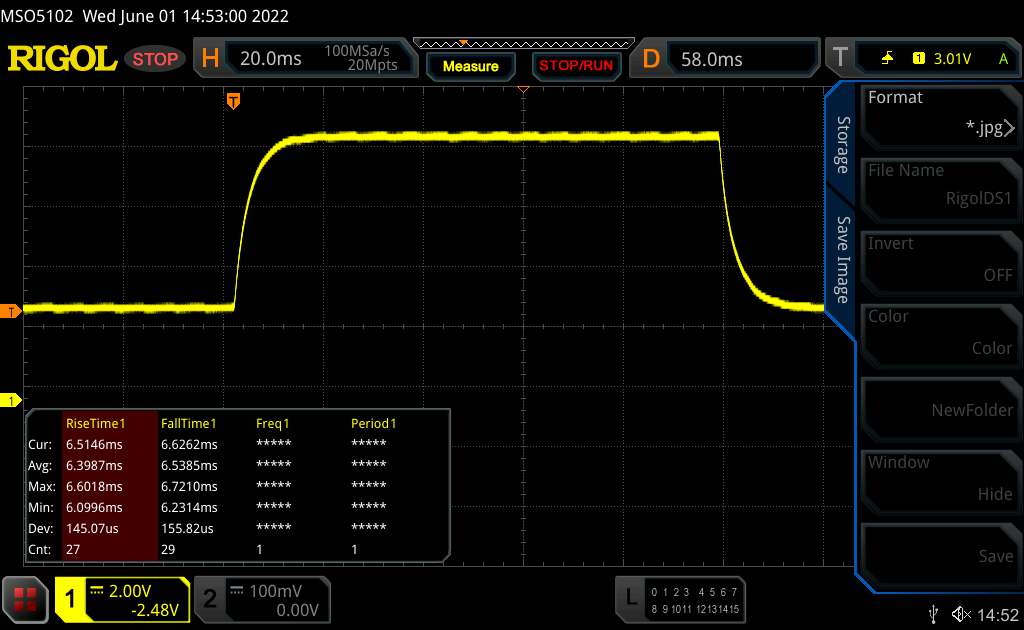 |
| ↘ 6.5 ms fall | ||
| The screen shows good response rates in our tests, but may be too slow for competitive gamers. In comparison, all tested devices range from 0.165 (minimum) to 636 (maximum) ms. » 26 % of all devices are better. This means that the measured response time is better than the average of all tested devices (31.1 ms). | ||
Screen Flickering / PWM (Pulse-Width Modulation)
| Screen flickering / PWM not detected | 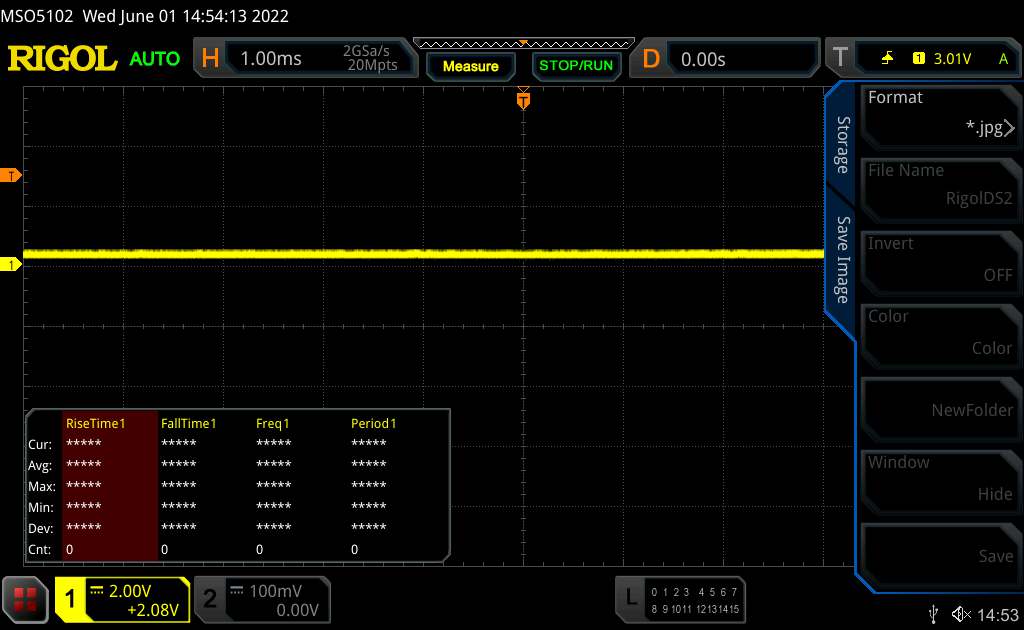 | ||
In comparison: 52 % of all tested devices do not use PWM to dim the display. If PWM was detected, an average of 7794 (minimum: 5 - maximum: 343500) Hz was measured. | |||
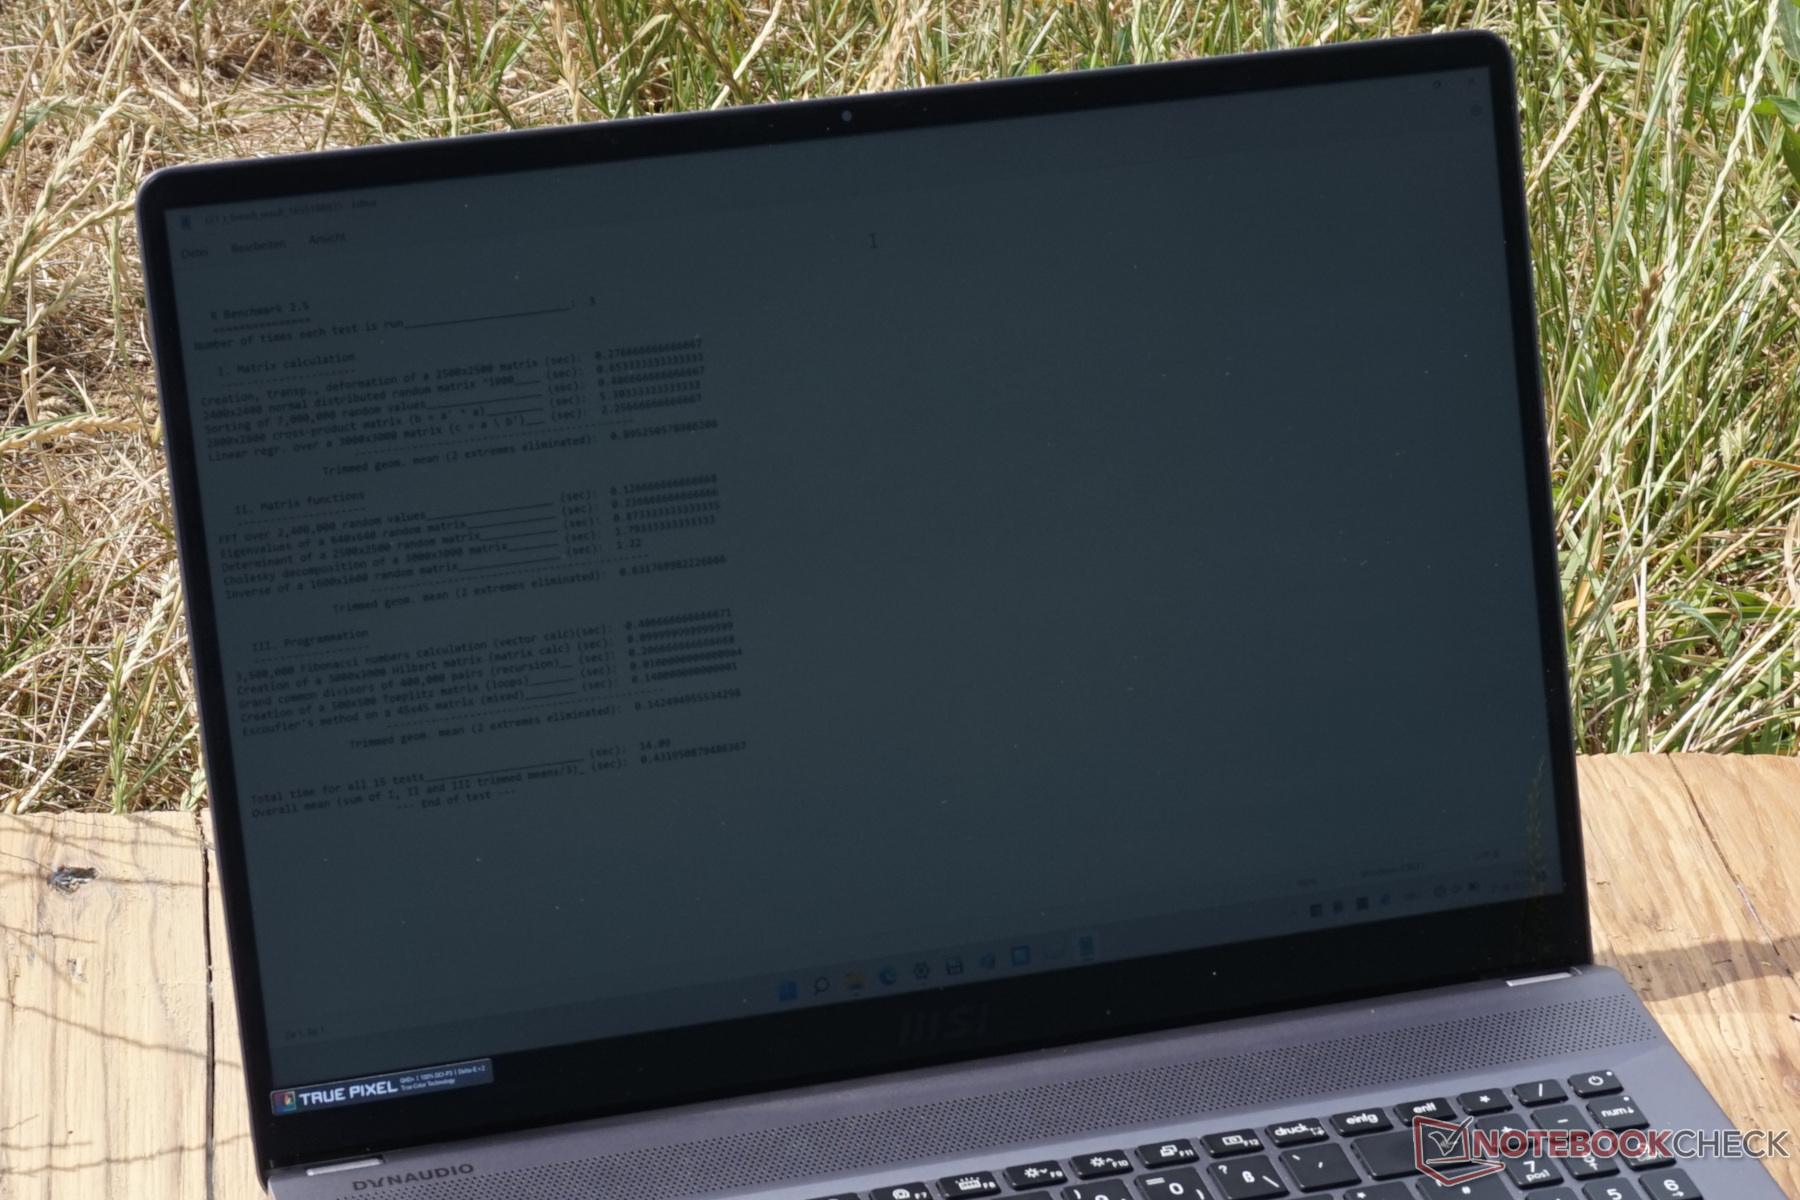
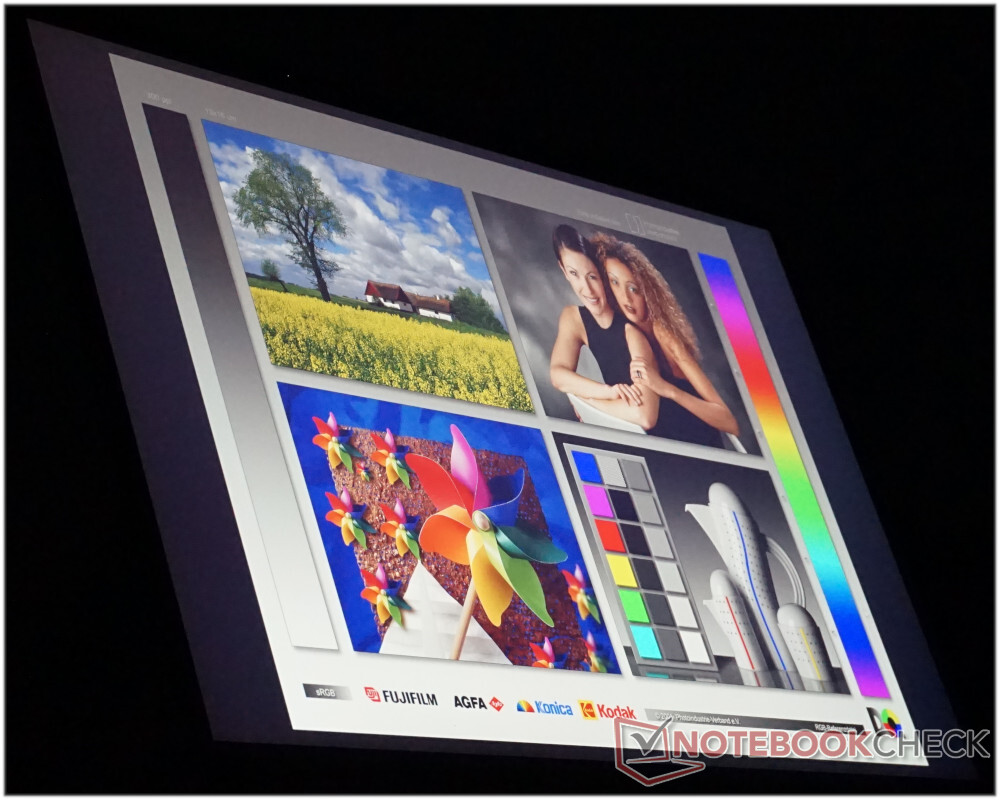
Thanks to the rather high brightness, text remains legible even outdoors in sunlight. Only the colors look a bit paler. The reflective surface is hardly noticeable, at least not in direct sunlight. However, having background light from the sky is, as expected, very detrimental.
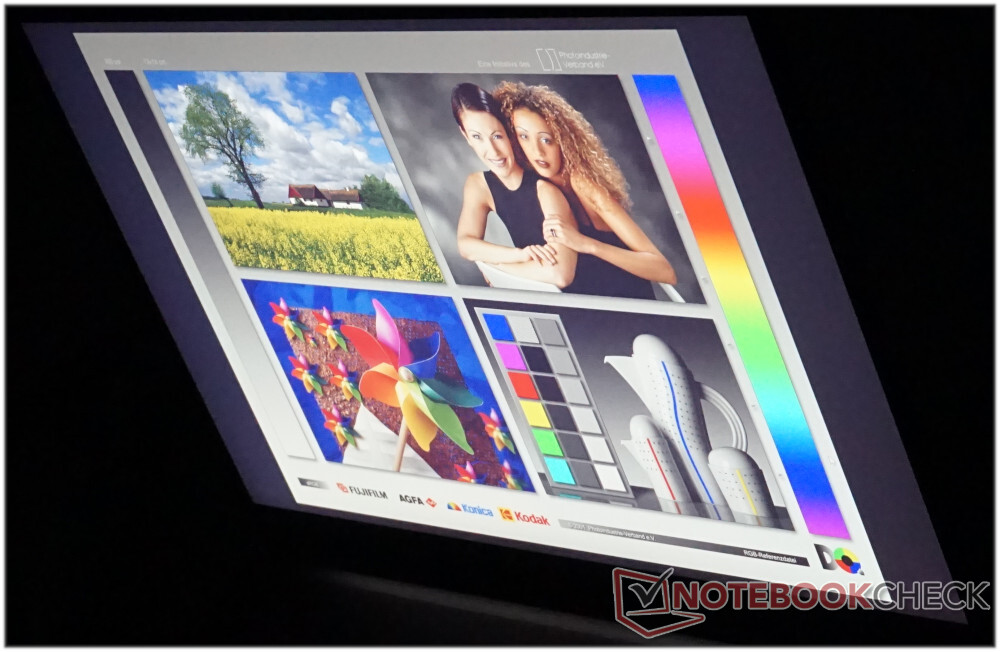
The IPS panel doesn't show any weaknesses in terms of viewing-angle stability. Even from an angle of almost 90 degrees, color distortions aren't perceptible.
Performance - Faster than the MSI Z16P? Tough!
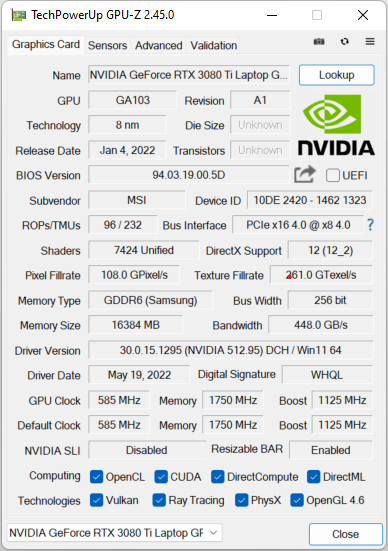
With the Intel i9-12900H, the Nvidia GeForce RTX 3080 Ti, 32 GB of RAM, and a PCIe 4.0 SSD, there's basically no angle to improve the hardware even further.
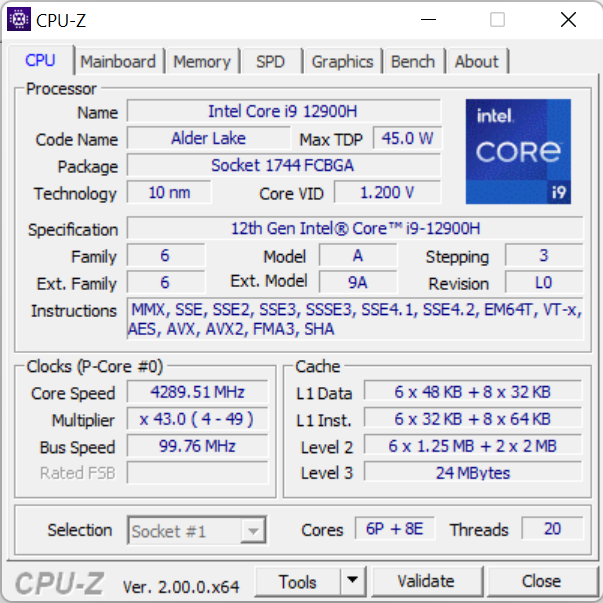
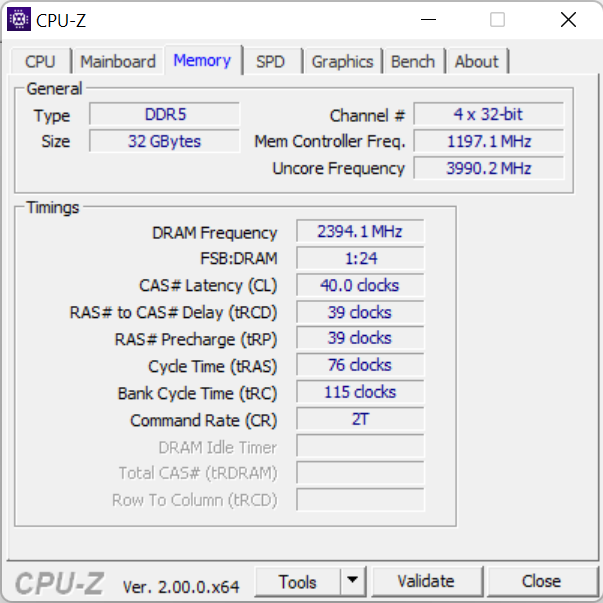
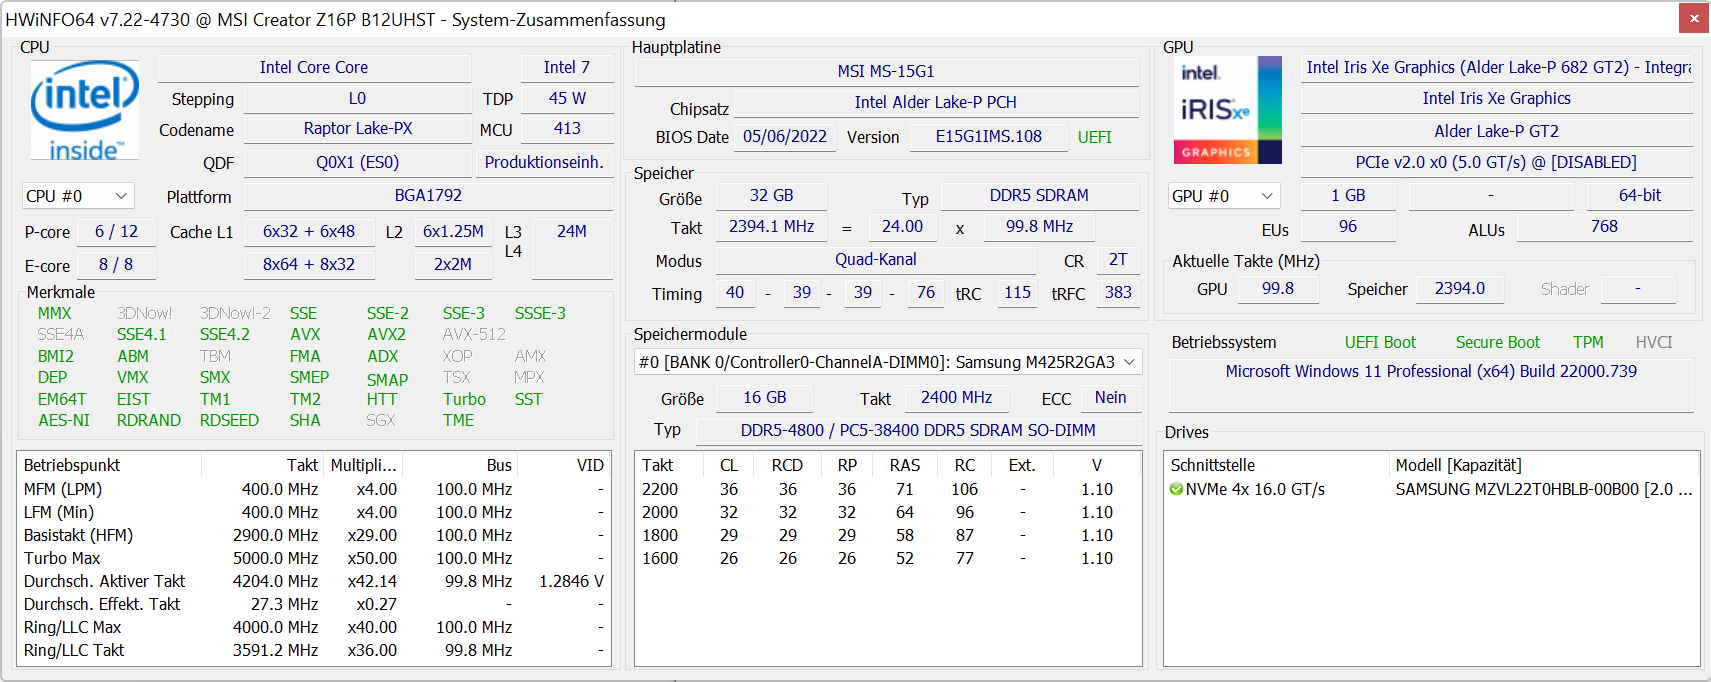
The Intel Alder Lake i9-12900H processor with its six performance cores and eight efficiency cores reaches a peak of 5.0 GHz. A total of 20 threads result here. The L3 cache is also very generous at 24 MB.
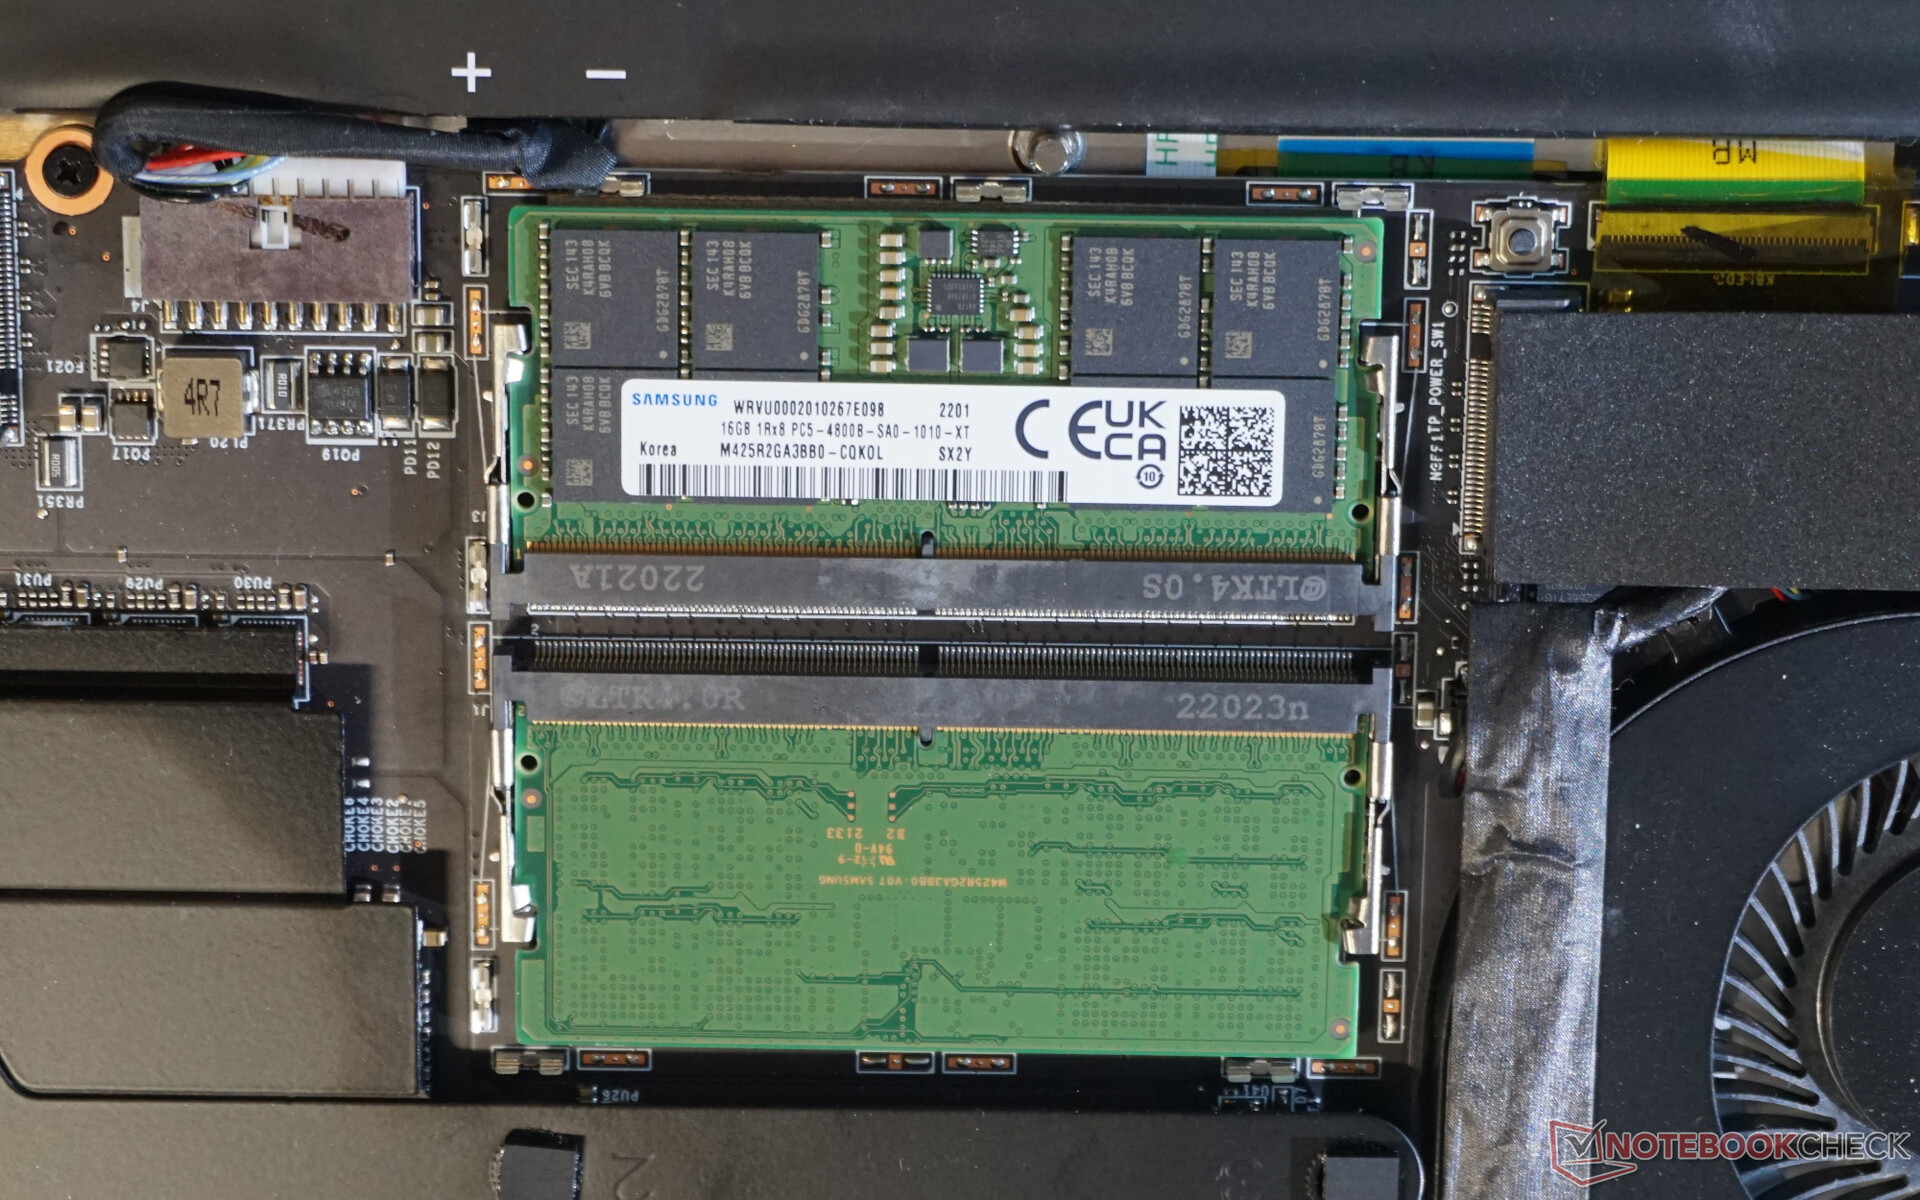
The CPU's maximum supported memory of DDR5-4800 is installed. The two 16 GB modules can be replaced by two 32 GB modules to reach a total of 64 GB.
Apart from the version with the Nvidia GeForce RTX 3080 Ti that we're reviewing, the Z16P is also sold with an RTX 3080 and an RTX 3070 Ti.
One thing that the components have in common is their high power consumption. Admittedly, this is limited to 90 watts for the GPU, which is much lower than on a gaming laptop. On the other hand, the processor is assigned 160 watts for a short time, and 110 watts for up to one minute. Our performance tests need to show the extent to which the slim case's cooling is able to dissipate the enormous amount of heat.
Test conditions
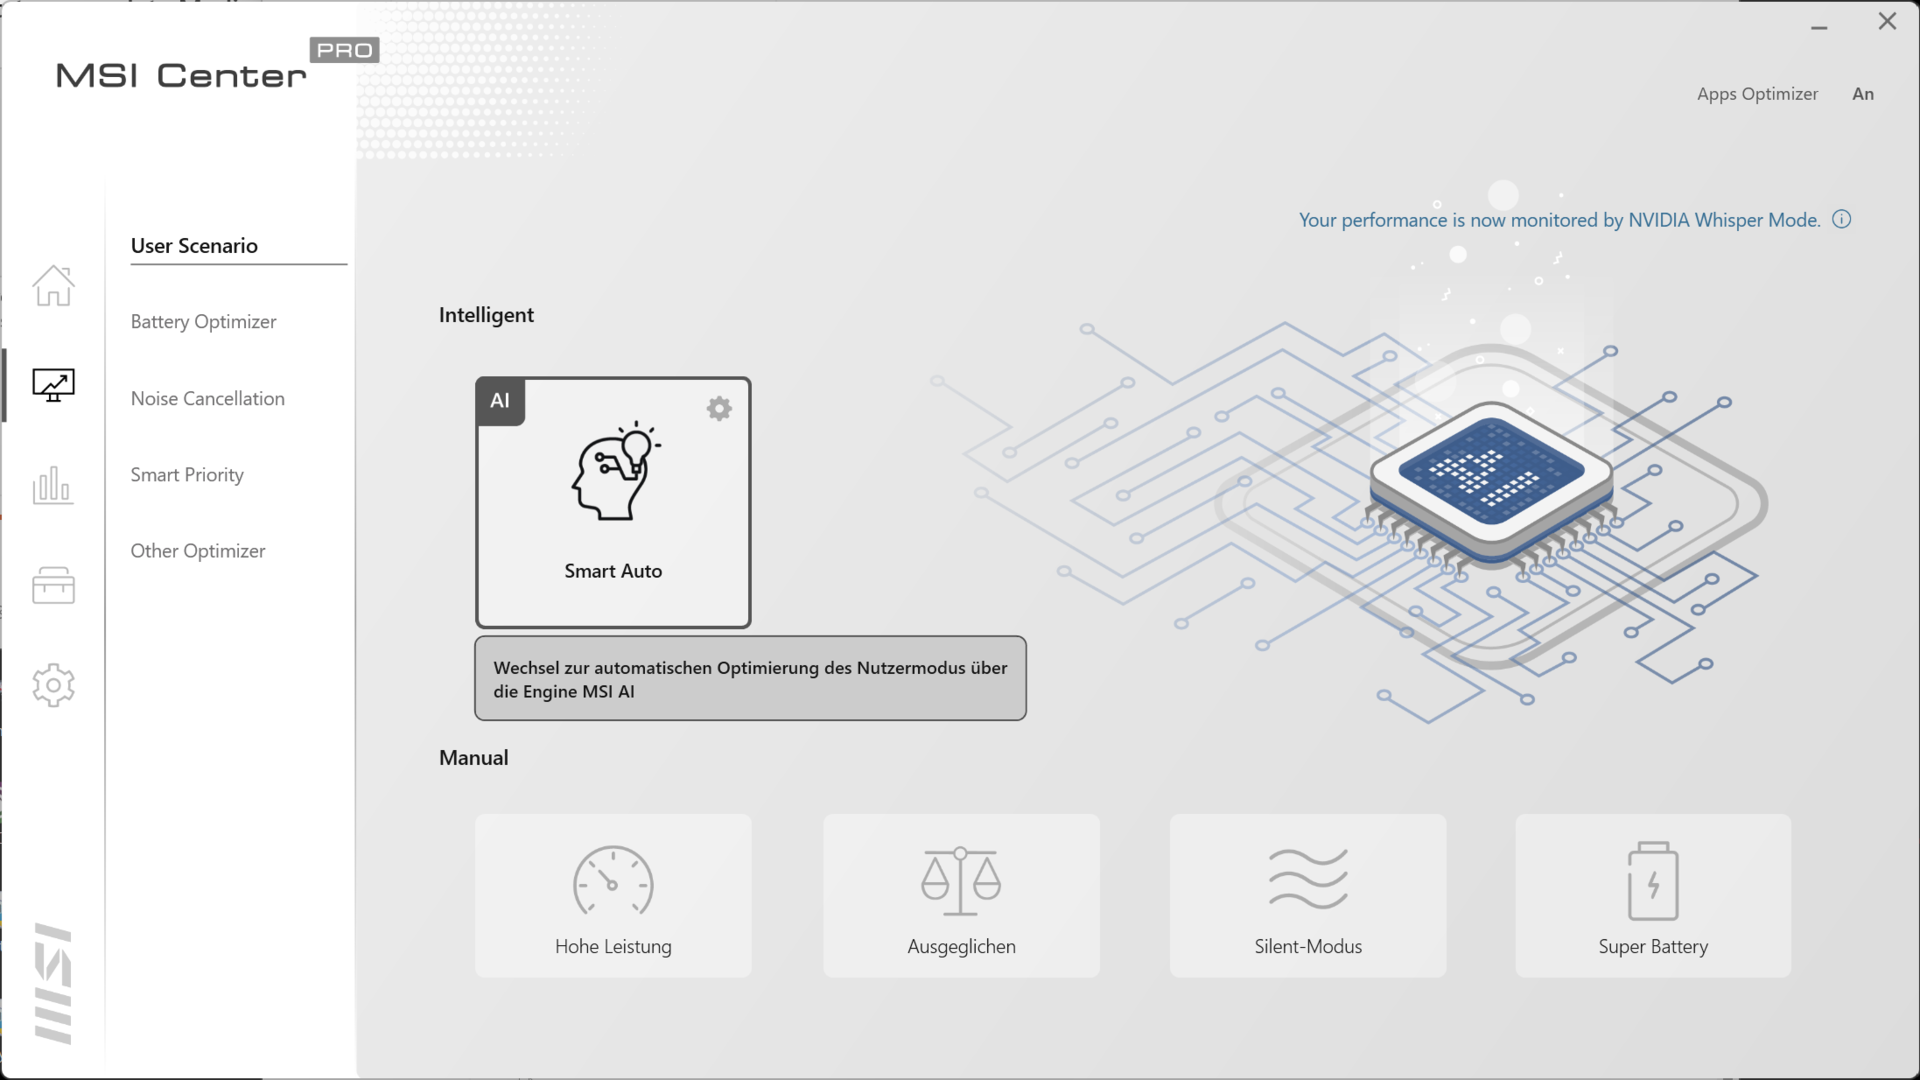
With Center Pro, MSI offers a software solution that can easily adjust the creator laptop's performance to the current needs. In principle, we tried to run all tests in "Smart Auto" mode. In this case, the system informs the user via short messages when it changes its performance mode on its own.
Only in the gaming benchmarks was this not very reliable, since the laptop isn't designed for gaming, but for creative work. The "High Performance" mode provides help here. Furthermore, the effects of "Super Battery" shouldn't be underestimated. This can extend battery life by almost 30%.
Processor
It's not surprising that the i9-12900H finishes at the very top of the Cinebench endurance test, in view of its 14 cores, 20 threads, and 5.0 GHz speed at its peak. Above all, the gap to the predecessor with the i7-11800H is impressive.
Furthermore, it's visible that the Creator Z16P only needs minimal cooling phases in order to be able to access almost its full performance. Although the Alienware x17 R2 gaming laptop demonstrates how to do a better job of cooling, the drop of almost 6% in the endurance test is more than acceptable.
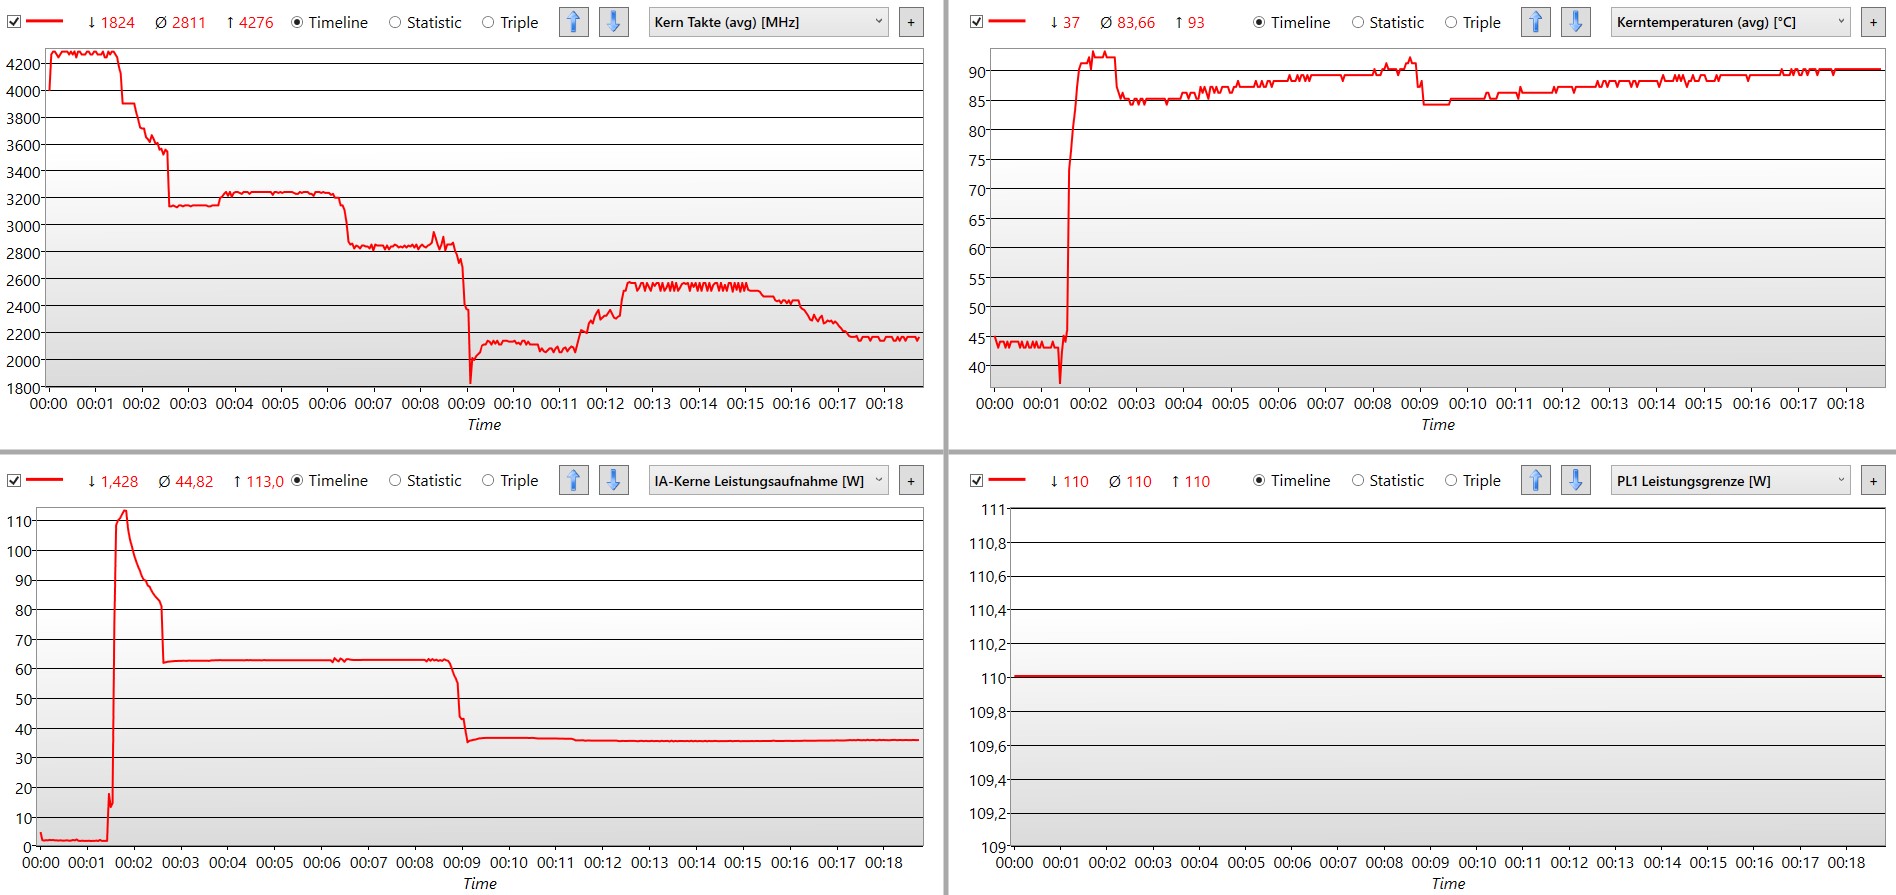
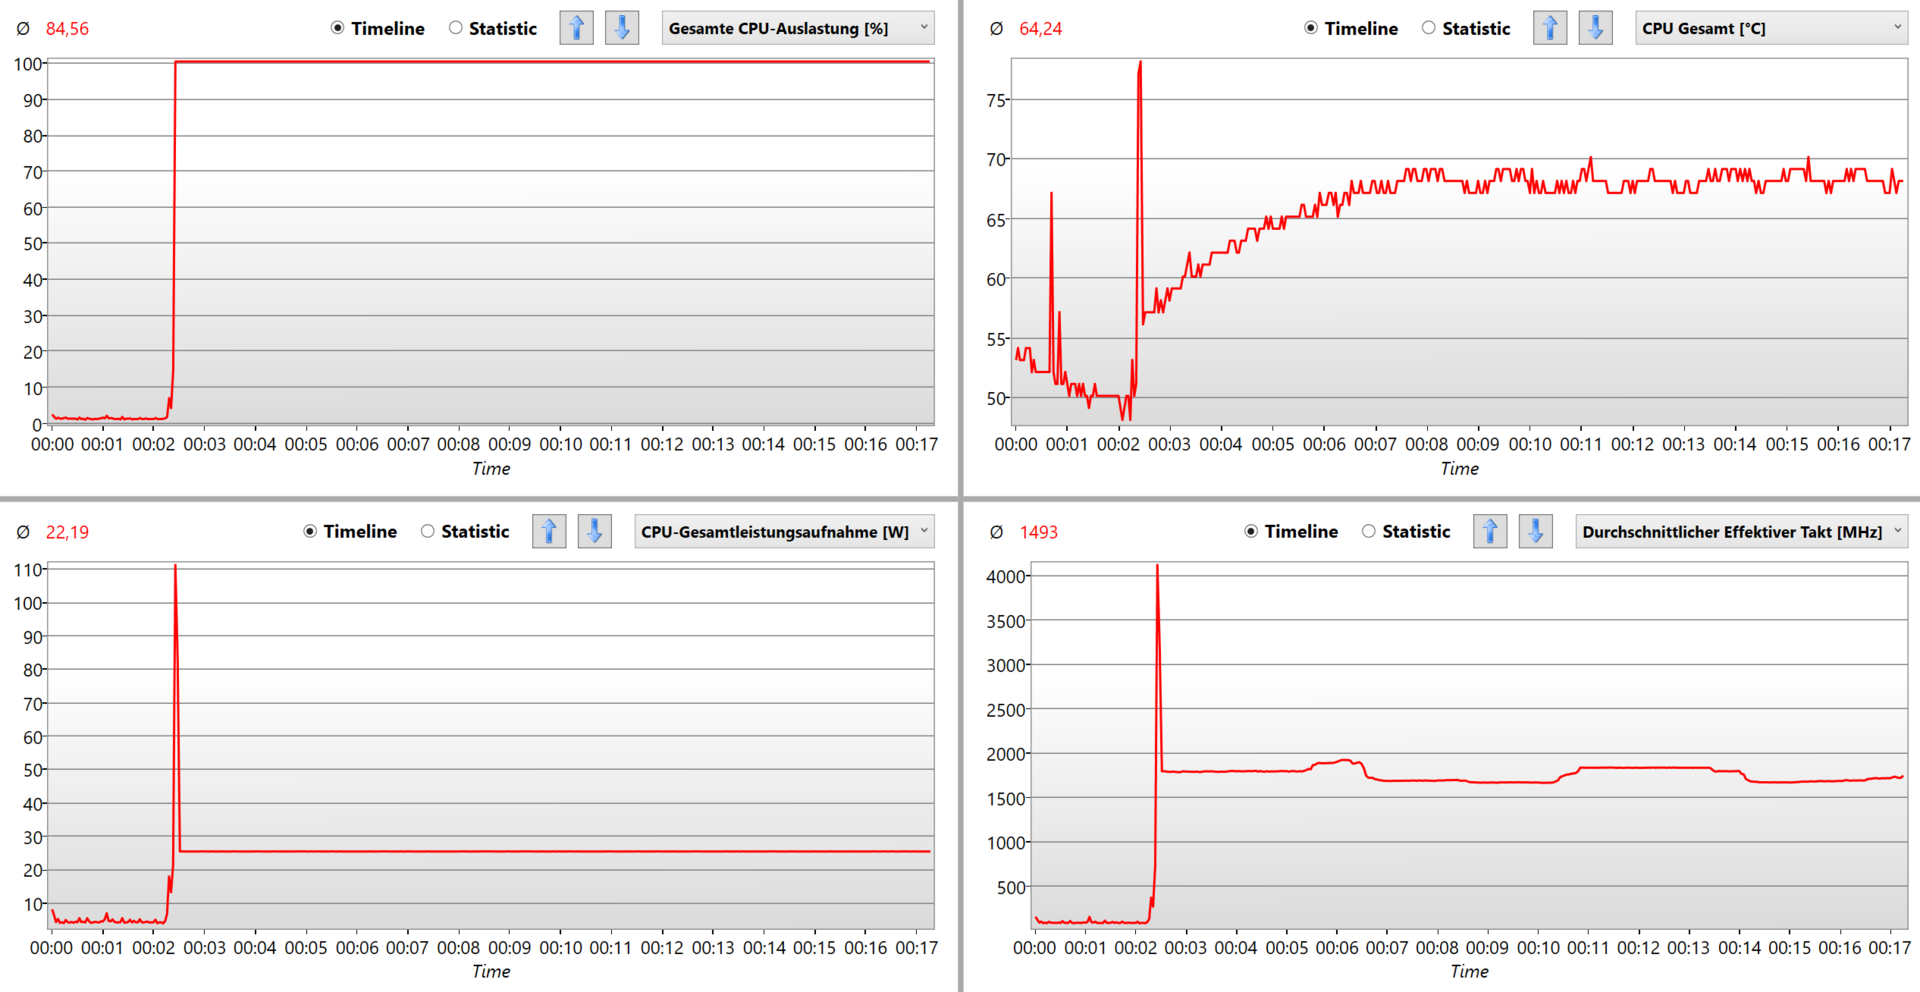
The situation is a bit different in the stress test: Without any breathers, the power consumption and clock rate need to be reduced significantly. In this particular case, the power supply drops from 110 to only 25 watts. However, this scenario isn't really realistic for a creator laptop.
Performance is essentially reduced instantaneously on battery power.
Cinebench R15 Multi endurance test
* ... smaller is better
AIDA64: FP32 Ray-Trace | FPU Julia | CPU SHA3 | CPU Queen | FPU SinJulia | FPU Mandel | CPU AES | CPU ZLib | FP64 Ray-Trace | CPU PhotoWorxx
| Performance rating | |
| Average of class Multimedia | |
| Lenovo ThinkPad X1 Extreme G4-20Y5CTO1WW (3050 Ti) | |
| Alienware x17 R2 P48E | |
| Acer Predator Triton 500 SE PT516-52s-70KX | |
| Average Intel Core i9-12900H | |
| MSI Creator Z16P B12UHST | |
| Gigabyte Aero 16 YE5 | |
| MSI Creator Z16 A11UET-209 -7! | |
| AIDA64 / FP32 Ray-Trace | |
| Average of class Multimedia (2214 - 50388, n=60, last 2 years) | |
| Lenovo ThinkPad X1 Extreme G4-20Y5CTO1WW (3050 Ti) | |
| Average Intel Core i9-12900H (4074 - 18289, n=29) | |
| Alienware x17 R2 P48E | |
| Acer Predator Triton 500 SE PT516-52s-70KX | |
| MSI Creator Z16P B12UHST | |
| Gigabyte Aero 16 YE5 | |
| AIDA64 / FPU Julia | |
| Average of class Multimedia (12867 - 201874, n=61, last 2 years) | |
| Lenovo ThinkPad X1 Extreme G4-20Y5CTO1WW (3050 Ti) | |
| Average Intel Core i9-12900H (22307 - 93236, n=29) | |
| Alienware x17 R2 P48E | |
| Acer Predator Triton 500 SE PT516-52s-70KX | |
| MSI Creator Z16P B12UHST | |
| Gigabyte Aero 16 YE5 | |
| AIDA64 / CPU SHA3 | |
| Lenovo ThinkPad X1 Extreme G4-20Y5CTO1WW (3050 Ti) | |
| Average of class Multimedia (653 - 8623, n=61, last 2 years) | |
| Alienware x17 R2 P48E | |
| Acer Predator Triton 500 SE PT516-52s-70KX | |
| Average Intel Core i9-12900H (1378 - 4215, n=29) | |
| MSI Creator Z16P B12UHST | |
| Gigabyte Aero 16 YE5 | |
| AIDA64 / CPU Queen | |
| Alienware x17 R2 P48E | |
| Gigabyte Aero 16 YE5 | |
| MSI Creator Z16P B12UHST | |
| Average Intel Core i9-12900H (78172 - 111241, n=28) | |
| Acer Predator Triton 500 SE PT516-52s-70KX | |
| Lenovo ThinkPad X1 Extreme G4-20Y5CTO1WW (3050 Ti) | |
| Average of class Multimedia (13483 - 181505, n=49, last 2 years) | |
| AIDA64 / FPU SinJulia | |
| Alienware x17 R2 P48E | |
| MSI Creator Z16P B12UHST | |
| Acer Predator Triton 500 SE PT516-52s-70KX | |
| Lenovo ThinkPad X1 Extreme G4-20Y5CTO1WW (3050 Ti) | |
| Gigabyte Aero 16 YE5 | |
| Average of class Multimedia (1240 - 28794, n=61, last 2 years) | |
| Average Intel Core i9-12900H (5709 - 10410, n=29) | |
| AIDA64 / FPU Mandel | |
| Average of class Multimedia (6395 - 105740, n=60, last 2 years) | |
| Lenovo ThinkPad X1 Extreme G4-20Y5CTO1WW (3050 Ti) | |
| Average Intel Core i9-12900H (11257 - 45581, n=29) | |
| Alienware x17 R2 P48E | |
| Acer Predator Triton 500 SE PT516-52s-70KX | |
| MSI Creator Z16P B12UHST | |
| Gigabyte Aero 16 YE5 | |
| AIDA64 / CPU AES | |
| Lenovo ThinkPad X1 Extreme G4-20Y5CTO1WW (3050 Ti) | |
| Alienware x17 R2 P48E | |
| MSI Creator Z16P B12UHST | |
| Acer Predator Triton 500 SE PT516-52s-70KX | |
| Gigabyte Aero 16 YE5 | |
| Average Intel Core i9-12900H (31935 - 151546, n=29) | |
| Average of class Multimedia (13243 - 126790, n=61, last 2 years) | |
| AIDA64 / CPU ZLib | |
| Alienware x17 R2 P48E | |
| MSI Creator Z16P B12UHST | |
| Acer Predator Triton 500 SE PT516-52s-70KX | |
| Average of class Multimedia (167.2 - 2022, n=61, last 2 years) | |
| Gigabyte Aero 16 YE5 | |
| Average Intel Core i9-12900H (449 - 1193, n=29) | |
| MSI Creator Z16 A11UET-209 | |
| Lenovo ThinkPad X1 Extreme G4-20Y5CTO1WW (3050 Ti) | |
| AIDA64 / FP64 Ray-Trace | |
| Average of class Multimedia (1014 - 26875, n=61, last 2 years) | |
| MSI Creator Z16 A11UET-209 | |
| Lenovo ThinkPad X1 Extreme G4-20Y5CTO1WW (3050 Ti) | |
| Average Intel Core i9-12900H (2235 - 10511, n=29) | |
| Alienware x17 R2 P48E | |
| Acer Predator Triton 500 SE PT516-52s-70KX | |
| MSI Creator Z16P B12UHST | |
| Gigabyte Aero 16 YE5 | |
| AIDA64 / CPU PhotoWorxx | |
| Average of class Multimedia (12860 - 88154, n=61, last 2 years) | |
| MSI Creator Z16P B12UHST | |
| Gigabyte Aero 16 YE5 | |
| Average Intel Core i9-12900H (20960 - 48269, n=30) | |
| Acer Predator Triton 500 SE PT516-52s-70KX | |
| Alienware x17 R2 P48E | |
| MSI Creator Z16 A11UET-209 | |
| Lenovo ThinkPad X1 Extreme G4-20Y5CTO1WW (3050 Ti) | |
System performance
As expected, the MSI Creator Z16P scores excellently in terms of system performance. Traditional tasks like browsing in countless tabs, a bit of image editing in between, or a video call, as well as general multitasking don't cause the laptop any trouble at all.
Consequently, our PCMark 10 test also shows consistently excellent rates, which are only surpassed by the Alienware x17 R2. On the other hand, our review unit manages to secure a top spot among multimedia laptops and is on par with the Gigabyte Aero 16 YE5.
| PCMark 10 / Score | |
| Alienware x17 R2 P48E | |
| MSI Creator Z16P B12UHST | |
| Gigabyte Aero 16 YE5 | |
| Average Intel Core i9-12900H, NVIDIA GeForce RTX 3080 Ti Laptop GPU (7139 - 8083, n=6) | |
| Average of class Multimedia (4325 - 10386, n=58, last 2 years) | |
| Acer Predator Triton 500 SE PT516-52s-70KX | |
| MSI Creator Z16 A11UET-209 | |
| PCMark 10 / Essentials | |
| Alienware x17 R2 P48E | |
| MSI Creator Z16P B12UHST | |
| Gigabyte Aero 16 YE5 | |
| Average Intel Core i9-12900H, NVIDIA GeForce RTX 3080 Ti Laptop GPU (10254 - 11178, n=6) | |
| Acer Predator Triton 500 SE PT516-52s-70KX | |
| Average of class Multimedia (8025 - 11664, n=57, last 2 years) | |
| MSI Creator Z16 A11UET-209 | |
| PCMark 10 / Productivity | |
| Average of class Multimedia (7323 - 18233, n=57, last 2 years) | |
| MSI Creator Z16P B12UHST | |
| Alienware x17 R2 P48E | |
| Gigabyte Aero 16 YE5 | |
| Average Intel Core i9-12900H, NVIDIA GeForce RTX 3080 Ti Laptop GPU (9102 - 11186, n=6) | |
| Acer Predator Triton 500 SE PT516-52s-70KX | |
| MSI Creator Z16 A11UET-209 | |
| PCMark 10 / Digital Content Creation | |
| Alienware x17 R2 P48E | |
| Gigabyte Aero 16 YE5 | |
| MSI Creator Z16P B12UHST | |
| Average Intel Core i9-12900H, NVIDIA GeForce RTX 3080 Ti Laptop GPU (9847 - 12627, n=6) | |
| Acer Predator Triton 500 SE PT516-52s-70KX | |
| Average of class Multimedia (3651 - 16240, n=57, last 2 years) | |
| MSI Creator Z16 A11UET-209 | |
| PCMark 10 Score | 8083 points | |
Help | ||
| AIDA64 / Memory Copy | |
| Average of class Multimedia (21158 - 132135, n=61, last 2 years) | |
| MSI Creator Z16P B12UHST | |
| Gigabyte Aero 16 YE5 | |
| Acer Predator Triton 500 SE PT516-52s-70KX | |
| Average Intel Core i9-12900H (34438 - 74264, n=29) | |
| Alienware x17 R2 P48E | |
| MSI Creator Z16 A11UET-209 | |
| Lenovo ThinkPad X1 Extreme G4-20Y5CTO1WW (3050 Ti) | |
| AIDA64 / Memory Read | |
| Average of class Multimedia (19699 - 174586, n=61, last 2 years) | |
| Acer Predator Triton 500 SE PT516-52s-70KX | |
| MSI Creator Z16P B12UHST | |
| Gigabyte Aero 16 YE5 | |
| Average Intel Core i9-12900H (36365 - 74642, n=29) | |
| Alienware x17 R2 P48E | |
| Lenovo ThinkPad X1 Extreme G4-20Y5CTO1WW (3050 Ti) | |
| AIDA64 / Memory Write | |
| Average of class Multimedia (17733 - 134998, n=61, last 2 years) | |
| MSI Creator Z16P B12UHST | |
| Gigabyte Aero 16 YE5 | |
| Average Intel Core i9-12900H (32276 - 67858, n=29) | |
| Alienware x17 R2 P48E | |
| Acer Predator Triton 500 SE PT516-52s-70KX | |
| Lenovo ThinkPad X1 Extreme G4-20Y5CTO1WW (3050 Ti) | |
| AIDA64 / Memory Latency | |
| Acer Predator Triton 500 SE PT516-52s-70KX | |
| Average of class Multimedia (7 - 535, n=60, last 2 years) | |
| Alienware x17 R2 P48E | |
| MSI Creator Z16 A11UET-209 | |
| MSI Creator Z16P B12UHST | |
| Gigabyte Aero 16 YE5 | |
| Average Intel Core i9-12900H (74.7 - 118.1, n=28) | |
| Lenovo ThinkPad X1 Extreme G4-20Y5CTO1WW (3050 Ti) | |
* ... smaller is better
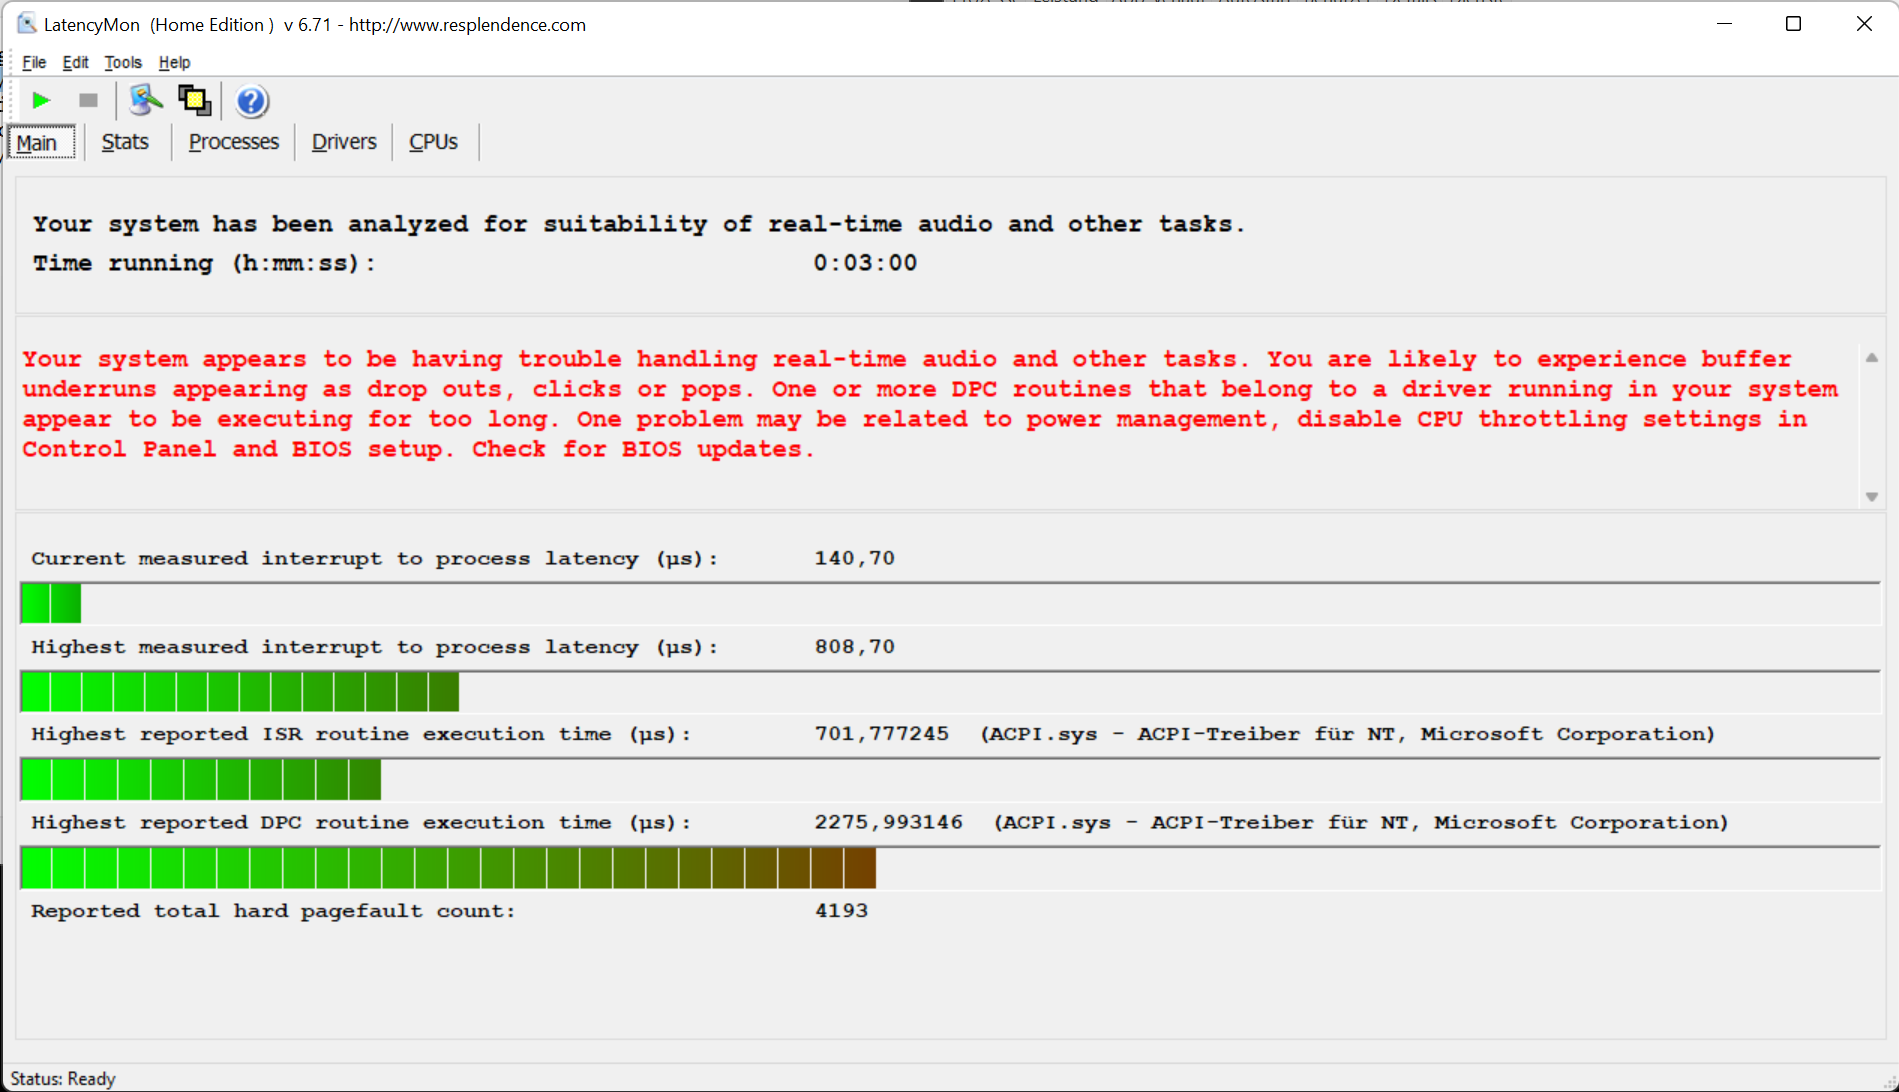
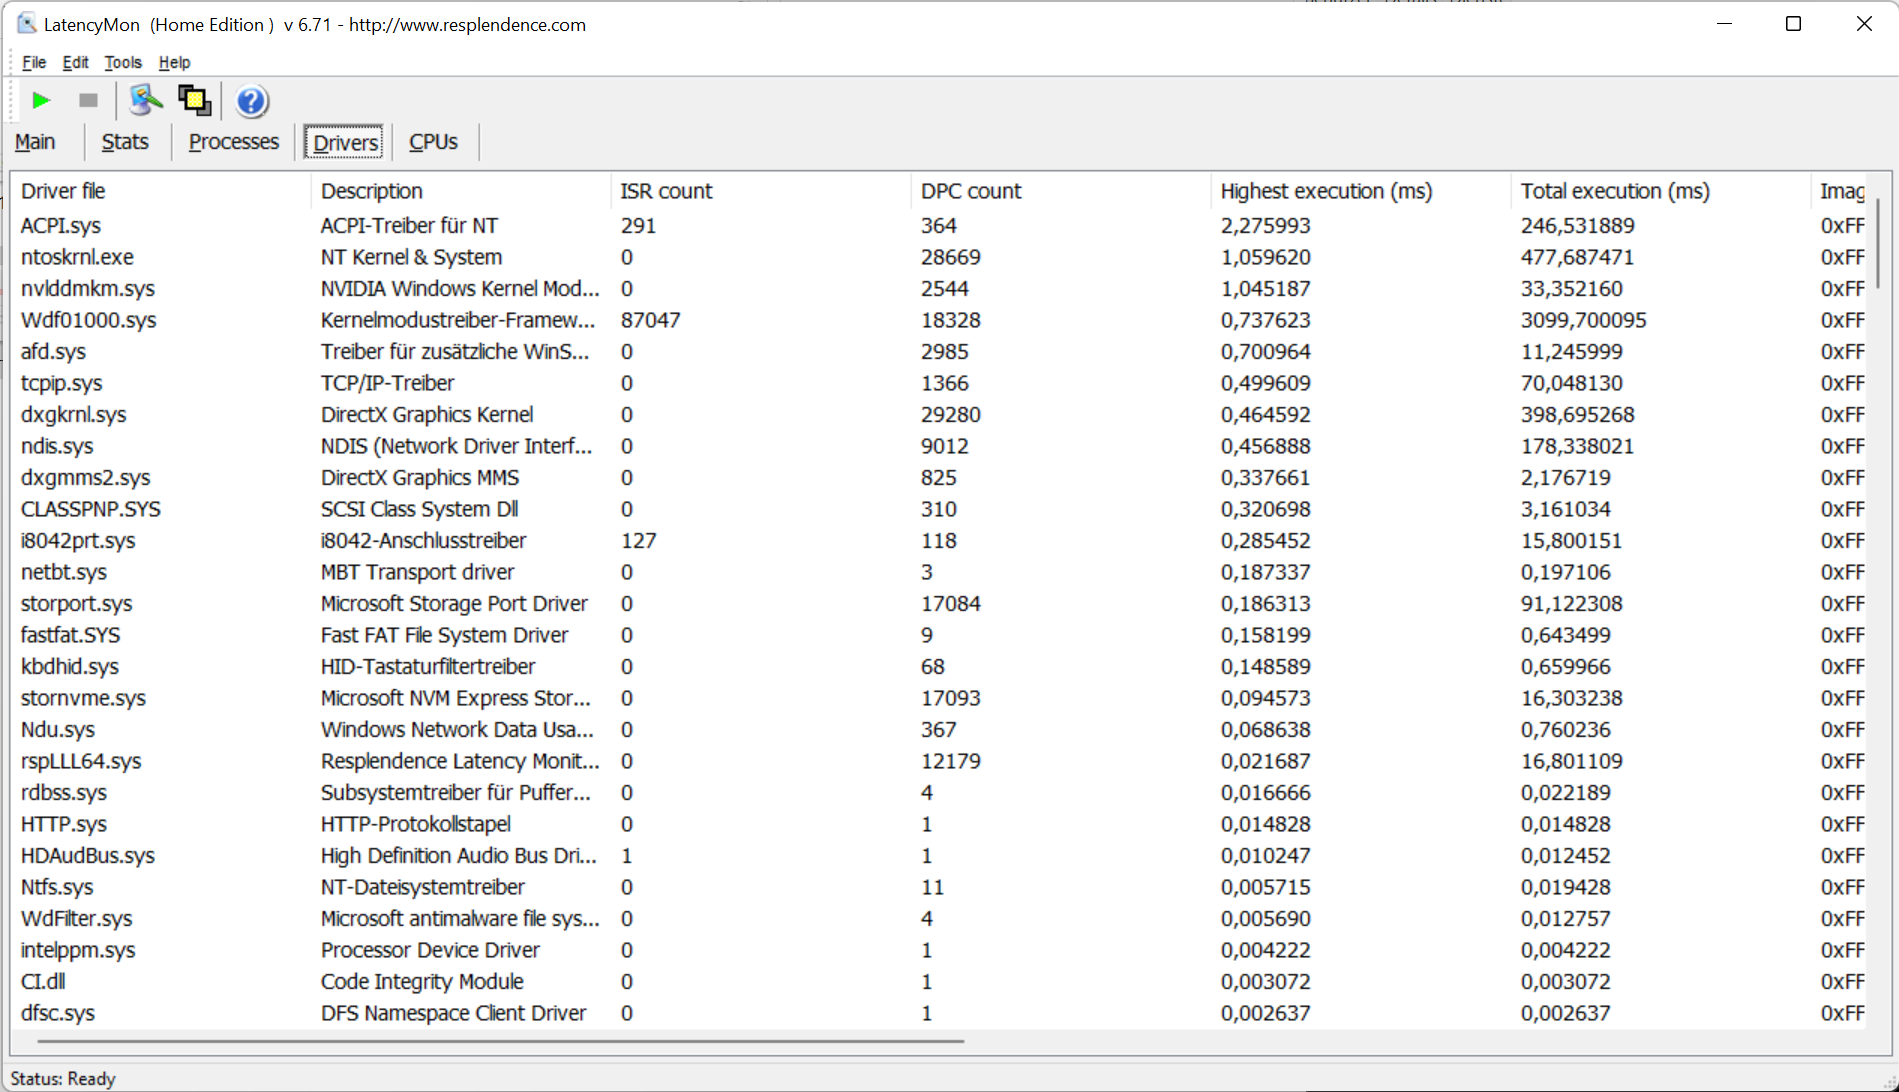
DPC latencies
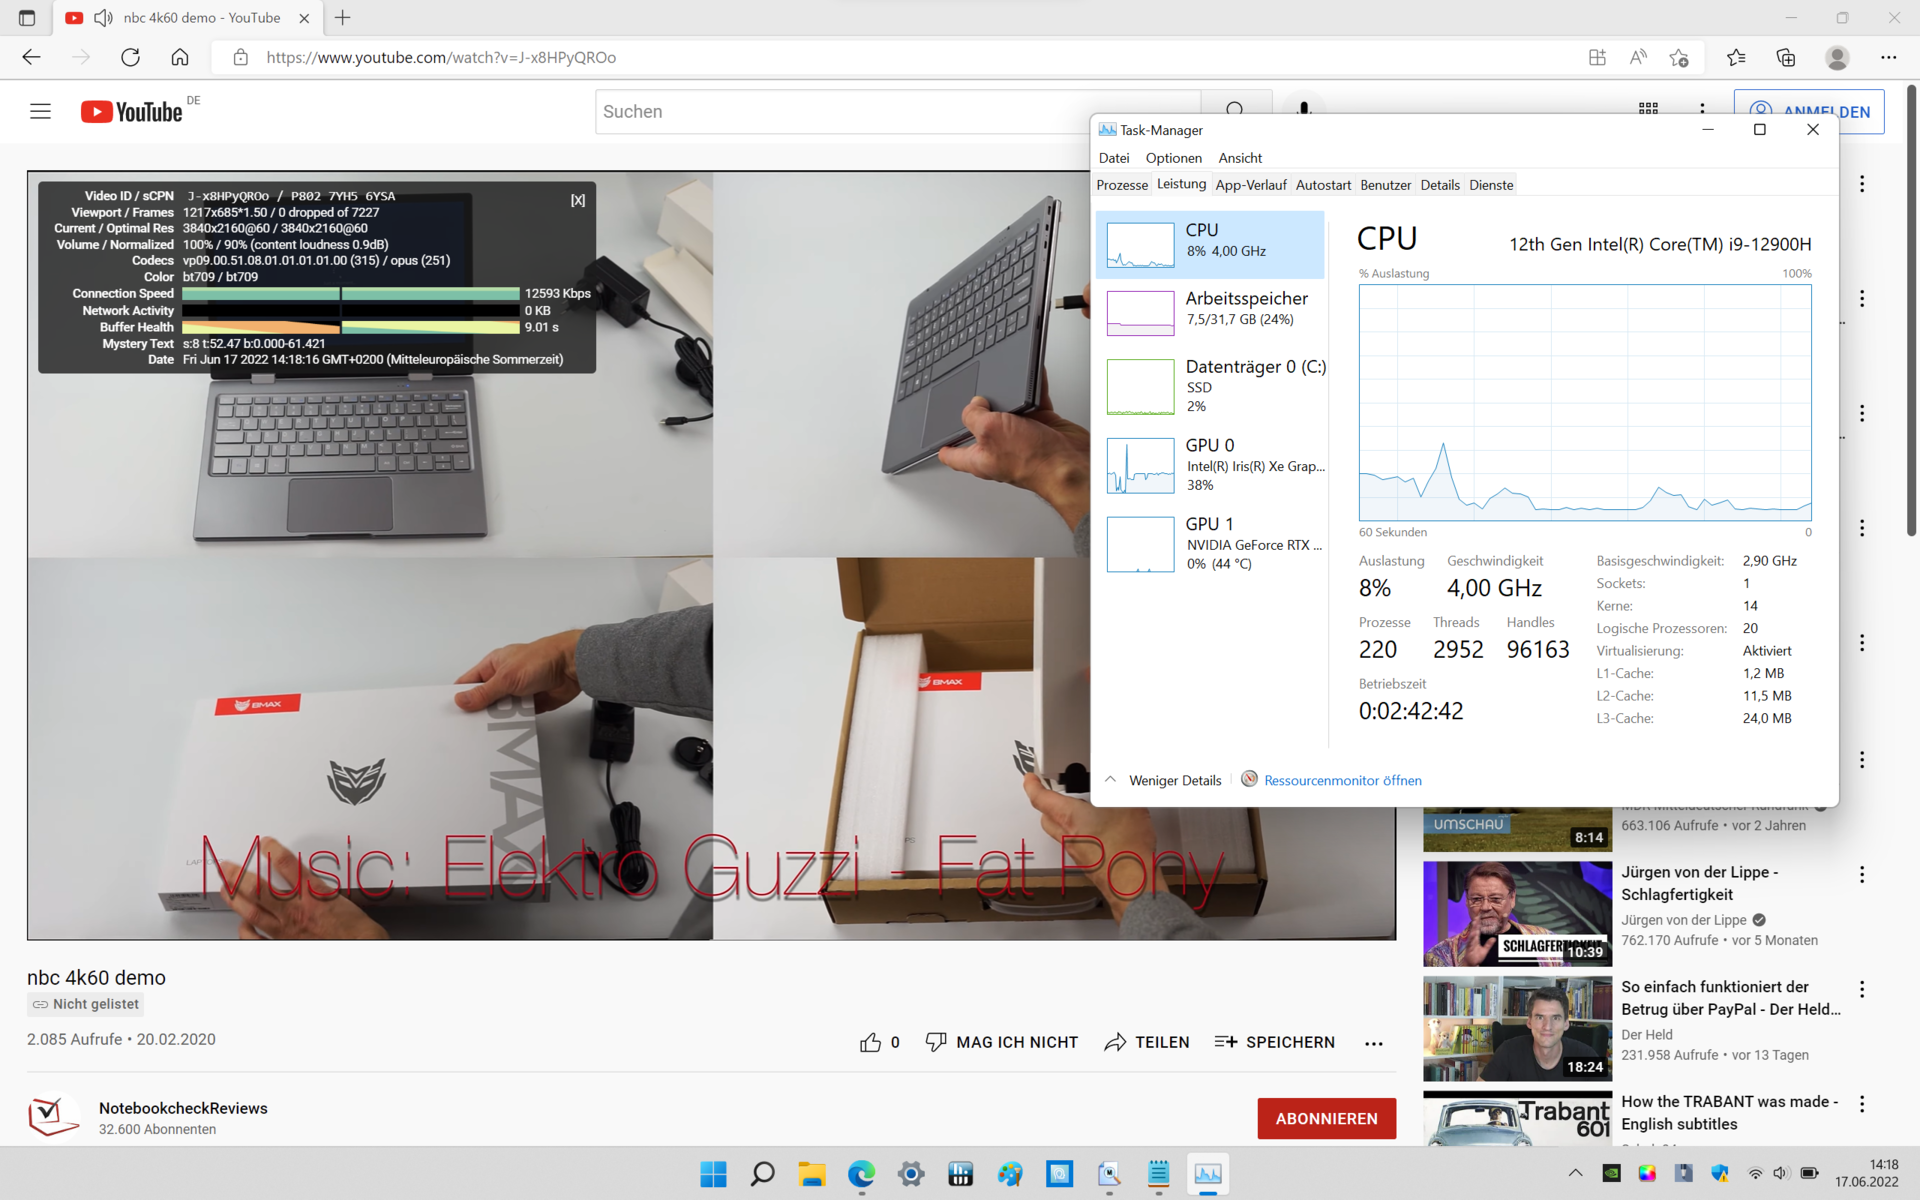
Only the Gigabyte Aero 16 YE5 is able to deliver a better rate in terms of DPC latencies. With just under 800 µs, the MSI Creator isn't suited for real-time audio editing. 4K video playback was mastered brilliantly, though. The system load stays in a very low range, and intermediate frames weren't dropped.
| DPC Latencies / LatencyMon - interrupt to process latency (max), Web, Youtube, Prime95 | |
| MSI Creator Z16 A11UET-209 | |
| Acer Predator Triton 500 SE PT516-52s-70KX | |
| Alienware x17 R2 P48E | |
| MSI Creator Z16P B12UHST | |
| Gigabyte Aero 16 YE5 | |
* ... smaller is better
Storage
The SSD can tap its full potential. Thanks to the PCIe 4.0 interface, it achieves almost 7,000 MB/s, and even the AS SSD copy benchmark results in almost 3,000 MB/s. The fact that a drop can be observed in the endurance test is due to the high internal temperature. The critical rate of 90 °C (~194 °F) is reached here, and the SSD throttles its speed.
The built-in 2 TB model provides just under 1,800 GB of free space. You can easily expand the storage capacity via the free M.2 slot, which is also equipped with PCIe 4.0.

| MSI Creator Z16P B12UHST Samsung PM9A1 MZVL22T0HBLB | MSI Creator Z16 A11UET-209 Phison 1TB SM2801T24GKBB4S-E162 | Alienware x17 R2 P48E 2x Samsung PM9A1 1TB (RAID 0) | Gigabyte Aero 16 YE5 Phison ESR01TBMFCT | Acer Predator Triton 500 SE PT516-52s-70KX Micron 3400 1TB MTFDKBA1T0TFH | Average of class Multimedia | |
|---|---|---|---|---|---|---|
| Drive Performance rating | ||||||
| Percent (pt) | 82.9 | 54.5 -34% | 63 -24% | 86.8 5% | 71.5 -14% | 49.8 -40% |
| DiskSpd | -37% | -3% | 4% | -13% | -37% | |
| seq read (MB/s) | 4409 | 2561 -42% 2503 -43% | 4931 12% | 3819 -13% | 3595 -18% | 2914 ? -34% |
| seq write (MB/s) | 4357 | 2432 -44% 2421 -44% | 4819 11% | 4457 2% | 4599 6% | 3089 ? -29% |
| seq q8 t1 read (MB/s) | 6693 | 4999 -25% 4977 -26% | 13195 97% | 7028 5% | 6499 -3% | 5634 ? -16% |
| seq q8 t1 write (MB/s) | 4935 | 2425 -51% 2422 -51% | 8227 67% | 5004 1% | 4765 -3% | 4523 ? -8% |
| 4k q1 t1 read (MB/s) | 90.1 | 59.5 -34% 59 -35% | 79.3 -12% | 88.7 -2% | 70.3 -22% | 62.1 ? -31% |
| 4k q1 t1 write (MB/s) | 254 | 226 -11% 226 -11% | 170.2 -33% | 373 47% | 222 -13% | 157.9 ? -38% |
| 4k q32 t16 read (MB/s) | 4071 | 1649 -59% 1648 -60% | 874 -79% | 3555 -13% | 2750 -32% | 1401 ? -66% |
| 4k q32 t16 write (MB/s) | 3453 | 2426 -30% 2426 -30% | 461 -87% | 3612 5% | 2786 -19% | 994 ? -71% |
| AS SSD | -31% | -42% | 9% | -16% | -56% | |
| Score Total (Points) | 8935 | 6101 -32% | 4941 -45% | 9380 5% | 7009 -22% | 5052 ? -43% |
| Score Read (Points) | 3363 | 2347 -30% | 1948 -42% | 3634 8% | 2709 -19% | 1590 ? -53% |
| Score Write (Points) | 3919 | 2650 -32% | 2137 -45% | 3991 2% | 2930 -25% | 2705 ? -31% |
| Seq Read (MB/s) | 5367 | 3641 -32% | 6561.69 22% | 5588 4% | 4531.51 -16% | 4442 ? -17% |
| Seq Write (MB/s) | 3994 | 1557 -61% | 3480.87 -13% | 3267 -18% | 4186.78 5% | 3060 ? -23% |
| 4K Read (MB/s) | 80.4 | 69.3 -14% | 69.21 -14% | 109.4 36% | 64.38 -20% | 61.2 ? -24% |
| 4K Write (MB/s) | 225.3 | 226 0% | 184.49 -18% | 321.6 43% | 212.27 -6% | 185.6 ? -18% |
| 4K-64 Read (MB/s) | 2746 | 1913 -30% | 1223.07 -55% | 2966 8% | 2191.95 -20% | 1085 ? -60% |
| 4K-64 Write (MB/s) | 3294 | 2268 -31% | 1604.89 -51% | 3342 1% | 2298.82 -30% | 2213 ? -33% |
| Access Time Read * (ms) | 0.042 | 0.082 -95% | 0.03 29% | 0.056 -33% | 0.05759 ? -37% | |
| Access Time Write * (ms) | 0.02 | 0.017 15% | 0.066 -230% | 0.012 40% | 0.022 -10% | 0.07513 ? -276% |
| Total Average (Program / Settings) | -34% /
-35% | -23% /
-26% | 6% /
7% | -14% /
-15% | -44% /
-47% |
* ... smaller is better
Continuous load read: DiskSpd Read Loop, Queue Depth 8
Graphics card
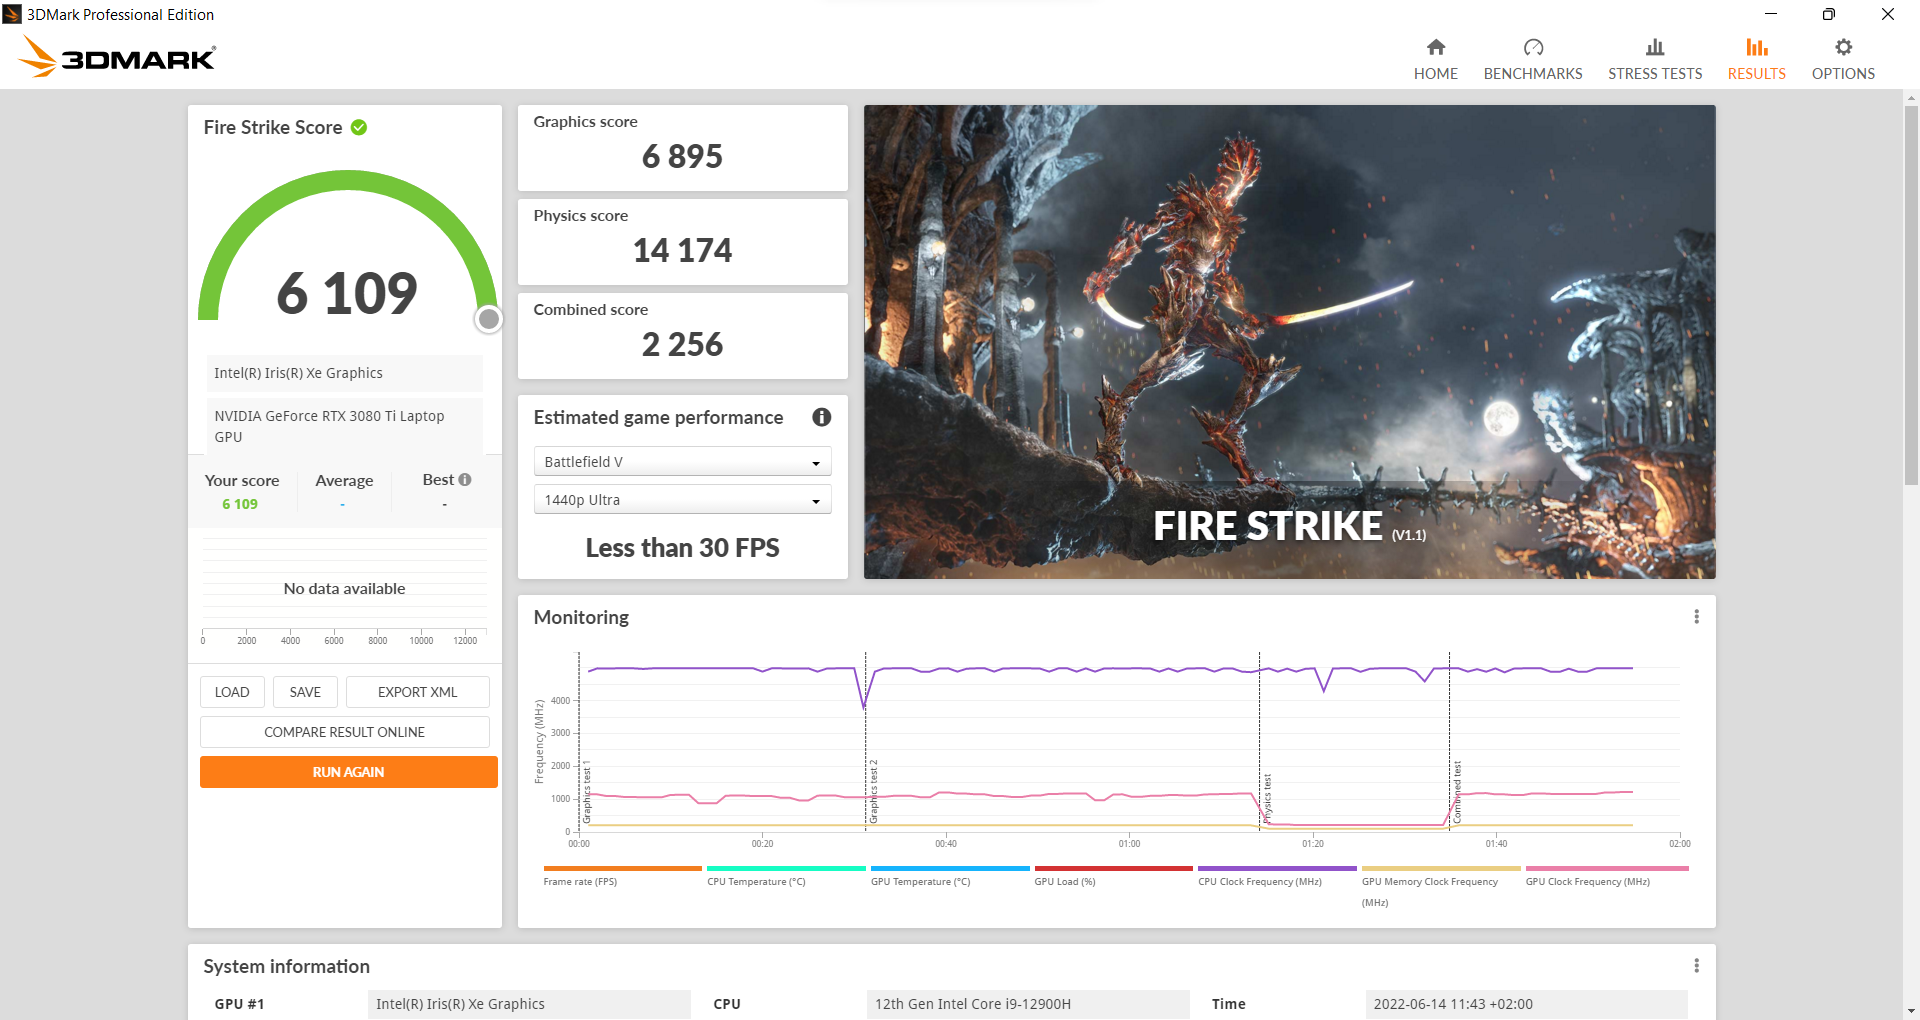
The Nvidia GeForce RTX 3080 Ti is popular among high-end gaming laptops. Even as a mobile alternative, it provides an enormous amount of graphical processing power. This is the reason for the MSI Creator Z16P's big lead over the average value for multimedia laptops. In addition, there's 16 GB of VRAM for rendering tasks at high resolutions.
| 3DMark 11 Performance | 14367 points | |
| 3DMark Cloud Gate Standard Score | 60157 points | |
| 3DMark Fire Strike Score | 24189 points | |
| 3DMark Time Spy Score | 10497 points | |
Help | ||
Gaming performance

Certainly, gaming performance isn't the main focus of a creator laptop. Nevertheless, the gap to gaming laptops isn't that big, which is due to the aforementioned high-performance RTX 3080 Ti.
Obviously, this isn't enough for one of the top rankings. The cooling performance is way too low for that. Furthermore, power supply is limited because there would be an even higher temperature increase inside the laptop otherwise. Instead of the typical 115 to 135 watts, MSI only grants its creator laptop a maximum of 90 watts. In our stress test with The Witcher 3, this rate is available for a short time before throttling kicks in.
Nevertheless, the results are decent. Users looking for distraction after some exhausting video editing can at least play recent titles at Full HD resolution and high details. For this, however, a power outlet needs to be available at all times. The integrated GPU is generally used on battery power, which leads to considerable performance losses.
| The Witcher 3 | |
| 1920x1080 High Graphics & Postprocessing (Nvidia HairWorks Off) | |
| Alienware x17 R2 P48E | |
| Average NVIDIA GeForce RTX 3080 Ti Laptop GPU (144 - 268, n=28) | |
| Acer Predator Triton 500 SE PT516-52s-70KX | |
| MSI Creator Z16P B12UHST | |
| Gigabyte Aero 16 YE5 | |
| Average of class Multimedia (22 - 224, n=13, last 2 years) | |
| MSI Creator Z16 A11UET-209 | |
| 1920x1080 Ultra Graphics & Postprocessing (HBAO+) | |
| Alienware x17 R2 P48E | |
| Average NVIDIA GeForce RTX 3080 Ti Laptop GPU (30 - 130.6, n=43) | |
| Acer Predator Triton 500 SE PT516-52s-70KX | |
| Gigabyte Aero 16 YE5 | |
| MSI Creator Z16P B12UHST | |
| MSI Creator Z16 A11UET-209 | |
| Average of class Multimedia (11 - 121, n=13, last 2 years) | |
| Elex 2 | |
| 1920x1080 High / On AA:FX AF:16x | |
| Gigabyte Aero 16 YE5 | |
| Average NVIDIA GeForce RTX 3080 Ti Laptop GPU (43 - 96, n=3) | |
| MSI Creator Z16P B12UHST | |
| 1920x1080 Ultra / On AA:SM AF:16x | |
| Gigabyte Aero 16 YE5 | |
| Average NVIDIA GeForce RTX 3080 Ti Laptop GPU (31 - 91, n=3) | |
| MSI Creator Z16P B12UHST | |
| 2560x1440 Ultra / On AA:SM AF:16x | |
| Average NVIDIA GeForce RTX 3080 Ti Laptop GPU (31 - 93, n=3) | |
| Gigabyte Aero 16 YE5 | |
| MSI Creator Z16P B12UHST | |
| Forza Horizon 5 | |
| 1920x1080 High Preset | |
| Average NVIDIA GeForce RTX 3080 Ti Laptop GPU (66 - 144, n=5) | |
| Gigabyte Aero 16 YE5 | |
| MSI Creator Z16P B12UHST | |
| 1920x1080 Extreme Preset | |
| Average NVIDIA GeForce RTX 3080 Ti Laptop GPU (48 - 95, n=5) | |
| Gigabyte Aero 16 YE5 | |
| MSI Creator Z16P B12UHST | |
| 2560x1440 Extreme Preset | |
| Average NVIDIA GeForce RTX 3080 Ti Laptop GPU (40 - 82, n=5) | |
| Gigabyte Aero 16 YE5 | |
| MSI Creator Z16P B12UHST | |
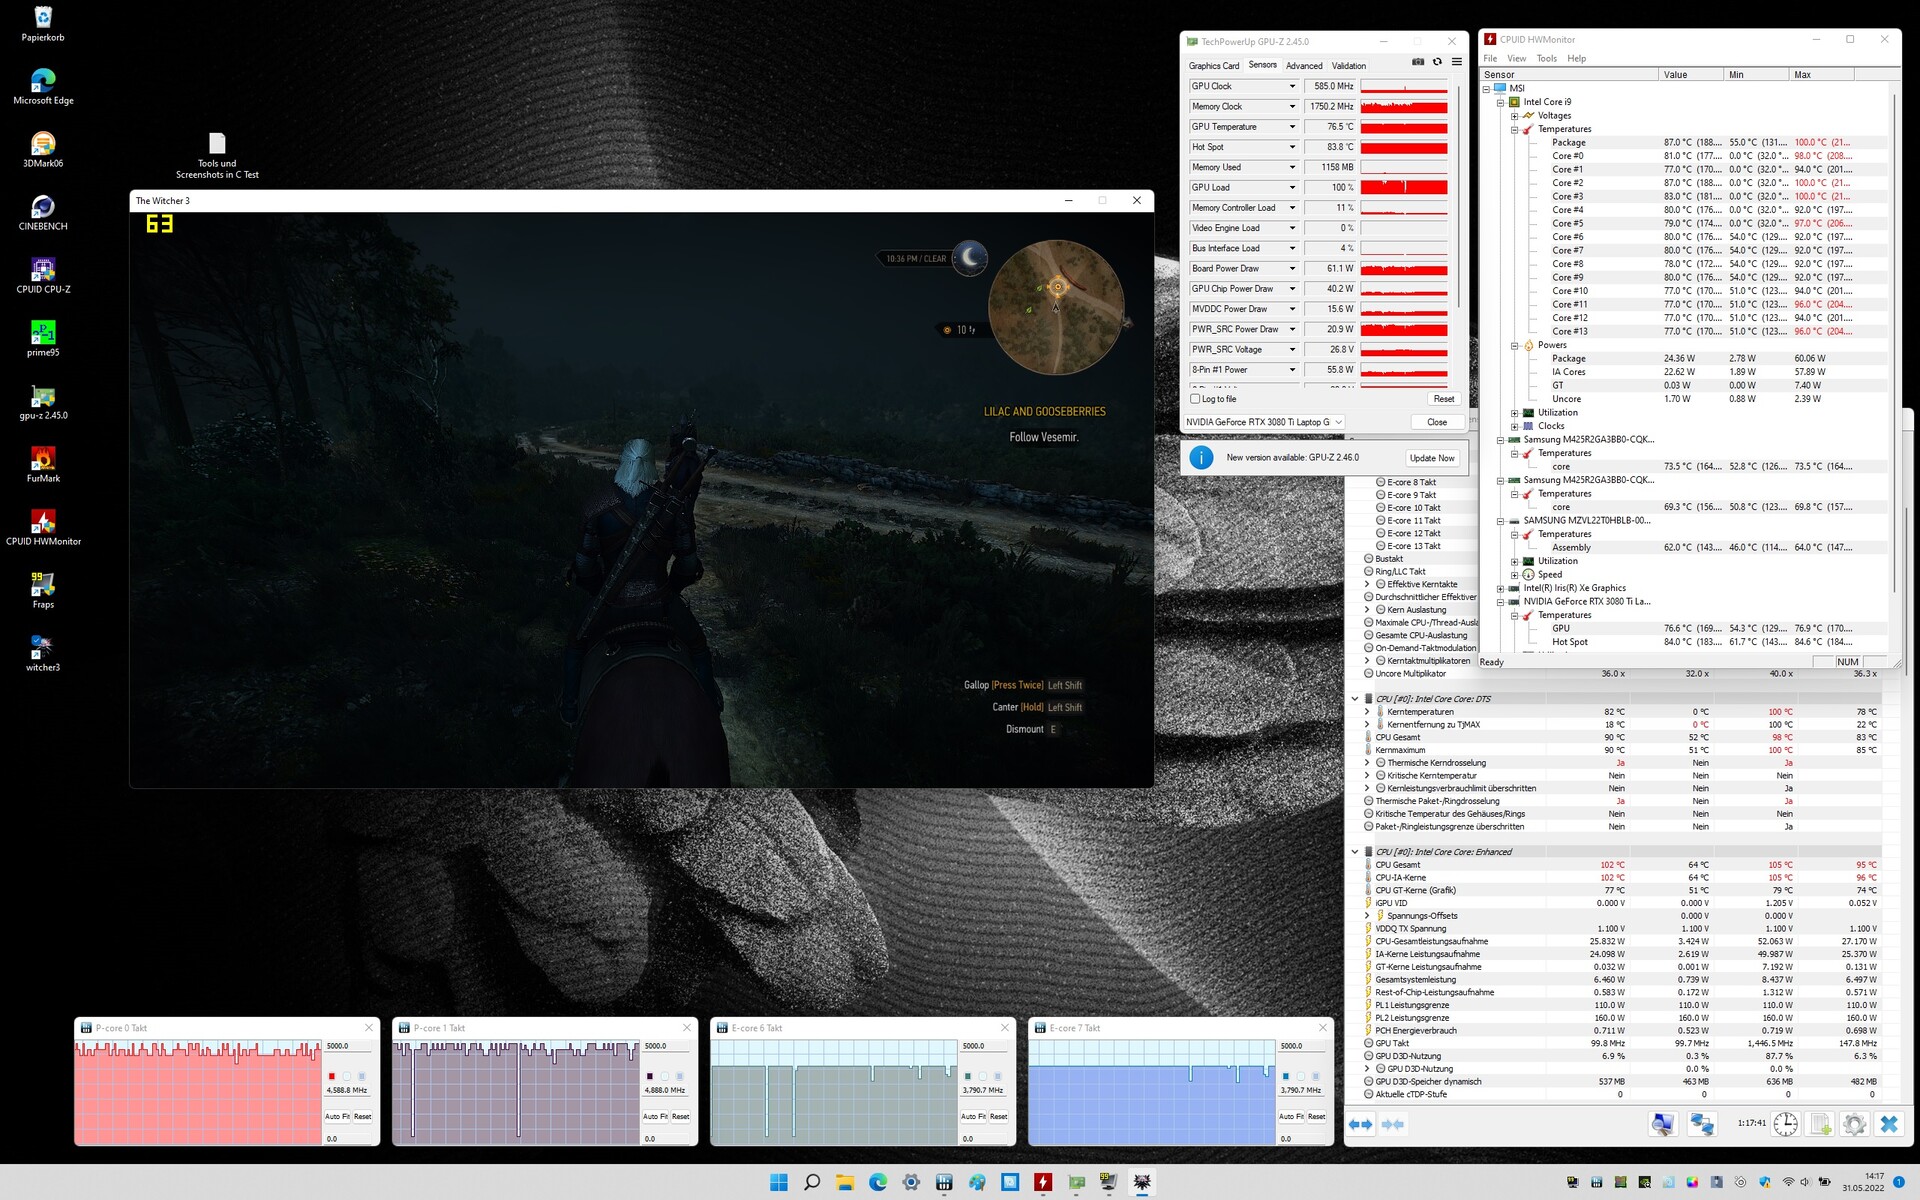
The FPS chart for The Witcher 3 shows the typical trend for a powerful and at the same time particularly slim creator laptop. Starting at an excellent 90 frames per second, the system has to cool down quickly because temperatures of up to 100 °C (~212 °F) are reached. For this purpose, the CPU and GPU's power supply is limited considerably. Instead of 90 watts, the graphics card ultimately only receives 35 watts. The laptop remains hot, but it can eventually maintain its temperature at 55 - 60 fps.
For the sake of comparison, you can see an Nvidia GeForce RTX 3070, which is actually much weaker. In the Gigabyte A5 X1, it gets a considerable 140 watts and is cooled accordingly in a fairly large case. This results in identical rates at the start, which the mid-range laptop can also maintain solidly.
The Witcher 3 FPS chart
| low | med. | high | ultra | QHD | |
|---|---|---|---|---|---|
| GTA V (2015) | 176.5 | 91.1 | 74.9 | ||
| The Witcher 3 (2015) | 145 | 68 | |||
| Dota 2 Reborn (2015) | 163.9 | 157.2 | |||
| Final Fantasy XV Benchmark (2018) | 93.7 | 69.6 | |||
| X-Plane 11.11 (2018) | 102 | ||||
| Far Cry 5 (2018) | 134 | 123 | 98 | ||
| Strange Brigade (2018) | 159 | 156.7 | 96.5 | ||
| Forza Horizon 5 (2021) | 66 | 48 | 40 | ||
| Elex 2 (2022) | 43 | 31 | 31 |
Emissions - The MSI Z16P is usually hot and rarely loud
Noise emissions
We liked how the fans are tuned. Although they're audible even during normal tasks, they're never invasive. A continuous, clearly perceptible noise is produced under load.
Looking at the competition, the maximum noise level of 46 dB is only undercut by the Apple MacBook Pro 16, which consumes much less power, though. Considering the powerful components, the cooling is remarkably quiet.
Noise level
| Idle |
| 27 / 29 / 31 dB(A) |
| Load |
| 43 / 46 dB(A) |
 | ||
30 dB silent 40 dB(A) audible 50 dB(A) loud |
||
min: | ||
| MSI Creator Z16P B12UHST i9-12900H, GeForce RTX 3080 Ti Laptop GPU | MSI Creator Z16 A11UET-209 i7-11800H, GeForce RTX 3060 Laptop GPU | Apple MacBook Pro 16 2021 M1 Max M1 Max, M1 Max 32-Core GPU | Alienware x17 R2 P48E i9-12900HK, GeForce RTX 3080 Ti Laptop GPU | Gigabyte Aero 16 YE5 i9-12900HK, GeForce RTX 3080 Ti Laptop GPU | Acer Predator Triton 500 SE PT516-52s-70KX i7-12700H, GeForce RTX 3080 Ti Laptop GPU | |
|---|---|---|---|---|---|---|
| Noise | -6% | 10% | 9% | -8% | -10% | |
| off / environment * (dB) | 26 | 26.3 -1% | 24.2 7% | 22.7 13% | 25 4% | 26 -0% |
| Idle Minimum * (dB) | 27 | 26.3 3% | 24.2 10% | 23.1 14% | 30 -11% | 26 4% |
| Idle Average * (dB) | 29 | 26.3 9% | 24.2 17% | 23.1 20% | 32 -10% | 29 -0% |
| Idle Maximum * (dB) | 31 | 26.3 15% | 24.2 22% | 23.1 25% | 33 -6% | 34 -10% |
| Load Average * (dB) | 43 | 53.9 -25% | 42.9 -0% | 31.9 26% | 45 -5% | 50 -16% |
| Witcher 3 ultra * (dB) | 43 | 53.9 -25% | 39.5 8% | 52.5 -22% | 50 -16% | 53 -23% |
| Load Maximum * (dB) | 46 | 54.8 -19% | 42.9 7% | 52.5 -14% | 52 -13% | 56 -22% |
* ... smaller is better
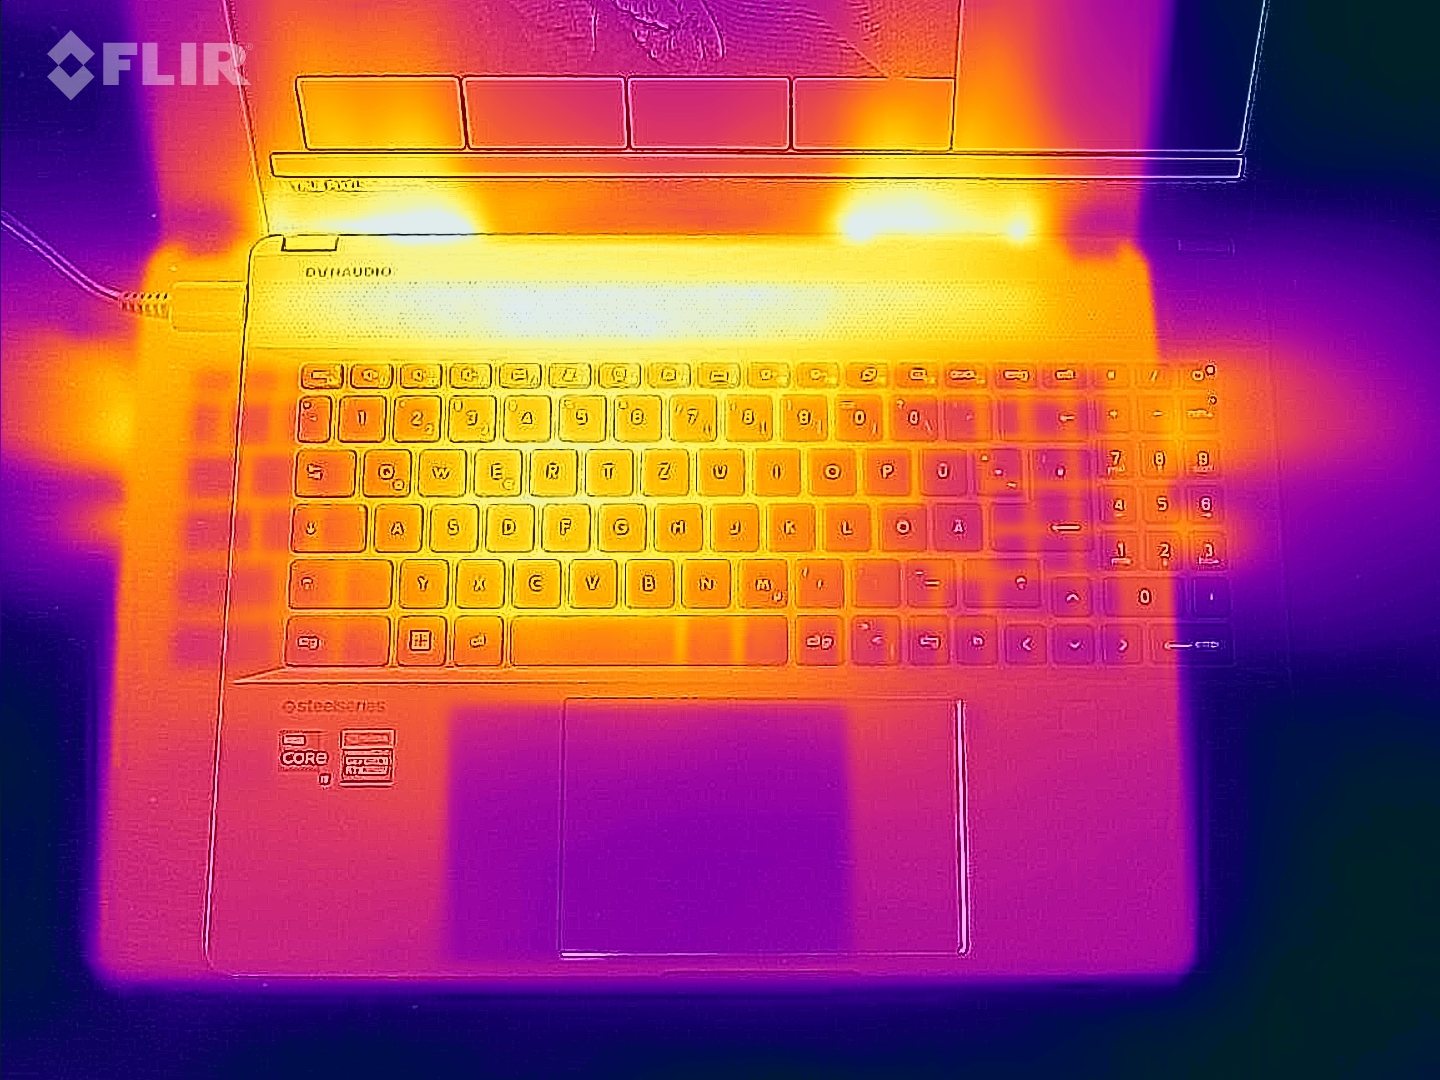
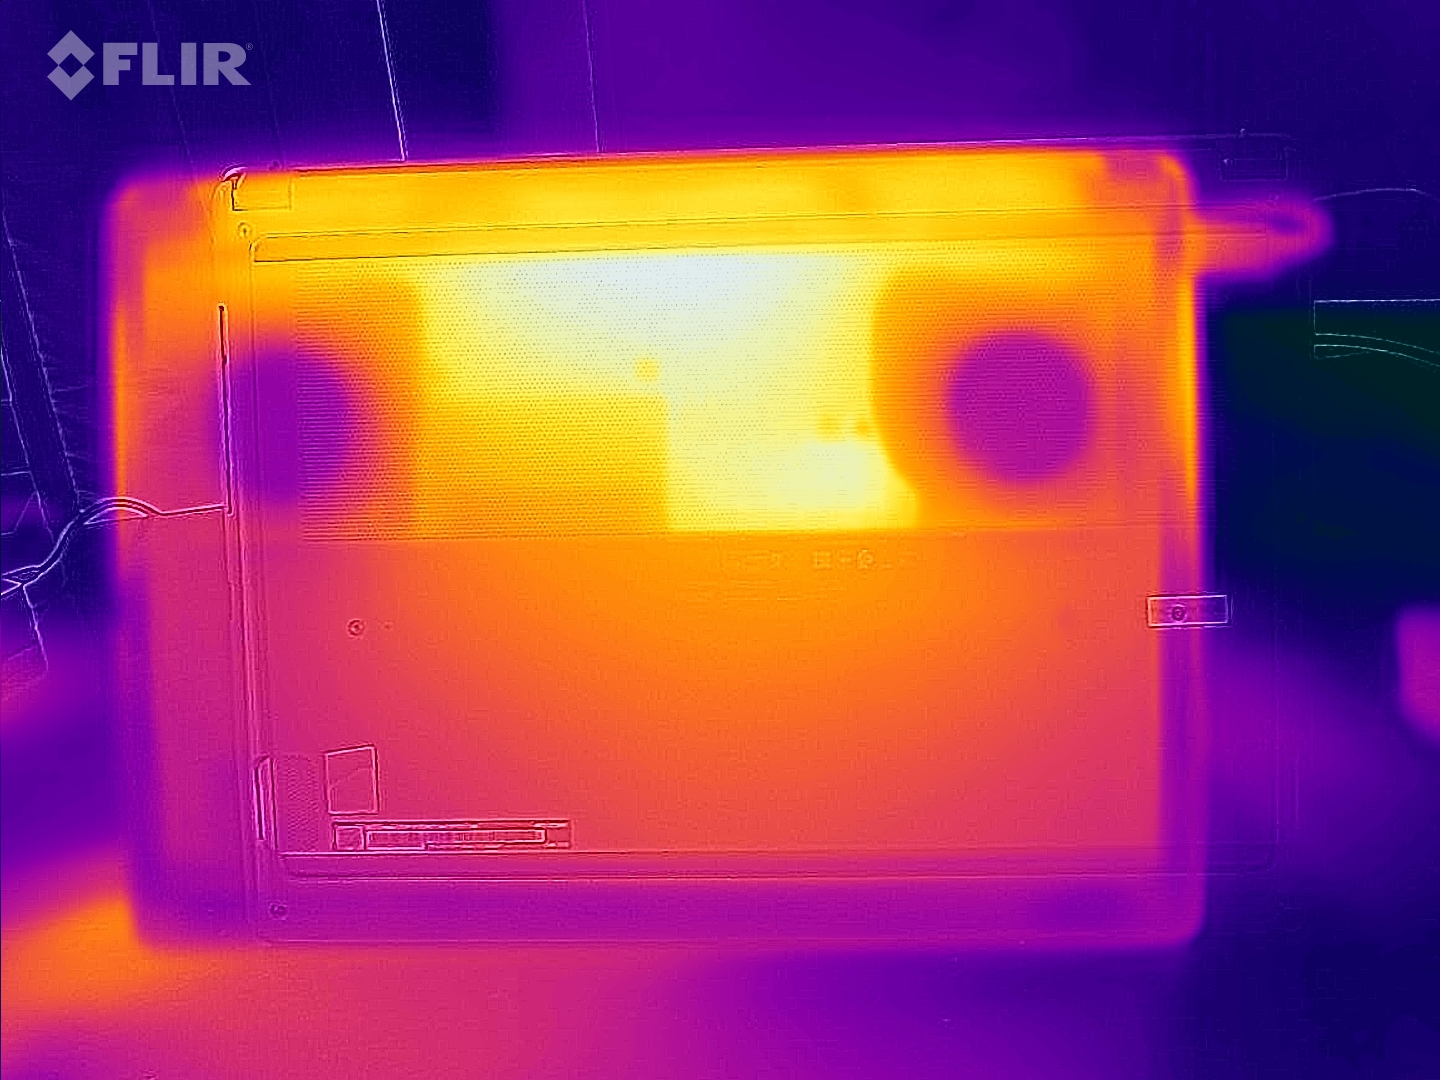
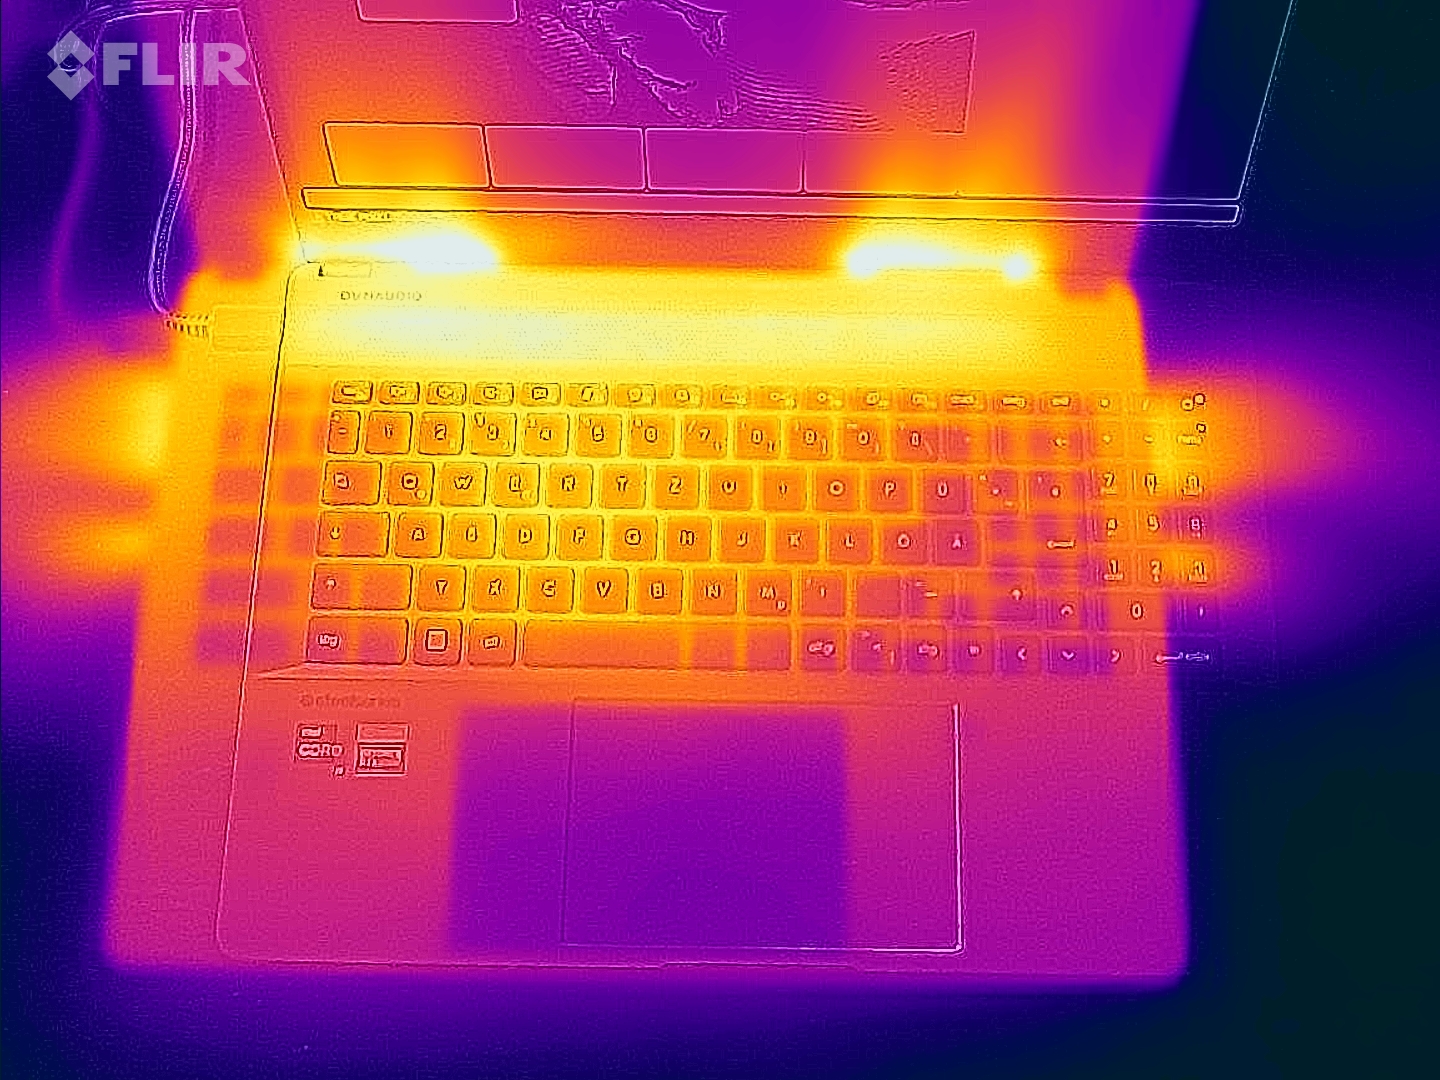
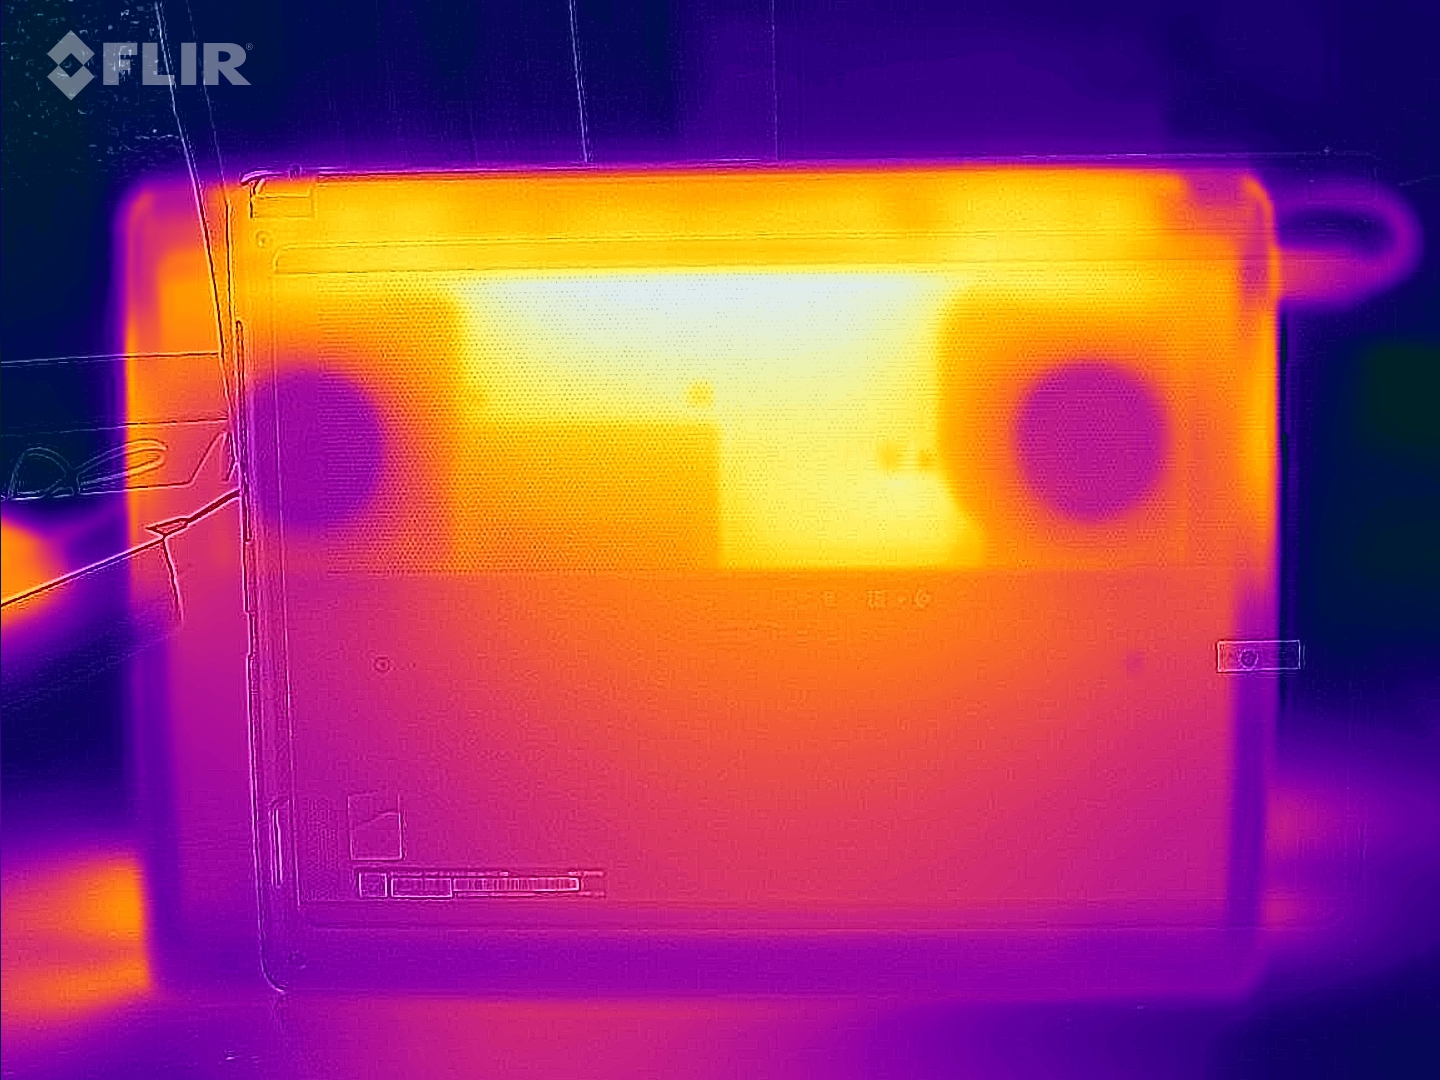
Temperature
The quieter the fans in the MSI Creator Z16P rotate, the higher the temperature in the case. 60 °C (~140 °F) is even surpassed in the keyboard area when the maximum performance is required for a prolonged period of time - such as in our performance tests.
Unfortunately, the situation isn't particularly different during normal use. Rendering a Full HD video also takes its time. After that, you won't want to start typing on the keyboard right away, and proper cooling is only offered by Silent mode afterwards.
Furthermore, the creator laptop is basically always warm. All it takes is a bit of web browsing and the case temperature exceeds 35 °C (~95 °F). This doesn't make working impossible, but it isn't pleasant at all.
(-) The maximum temperature on the upper side is 67 °C / 153 F, compared to the average of 36.8 °C / 98 F, ranging from 21 to 71 °C for the class Multimedia.
(-) The bottom heats up to a maximum of 69 °C / 156 F, compared to the average of 39.1 °C / 102 F
(+) In idle usage, the average temperature for the upper side is 26.2 °C / 79 F, compared to the device average of 31.3 °C / 88 F.
(-) Playing The Witcher 3, the average temperature for the upper side is 49 °C / 120 F, compared to the device average of 31.3 °C / 88 F.
(-) The palmrests and touchpad can get very hot to the touch with a maximum of 44 °C / 111.2 F.
(-) The average temperature of the palmrest area of similar devices was 28.7 °C / 83.7 F (-15.3 °C / -27.5 F).
| MSI Creator Z16P B12UHST i9-12900H, GeForce RTX 3080 Ti Laptop GPU | MSI Creator Z16 A11UET-209 i7-11800H, GeForce RTX 3060 Laptop GPU | Apple MacBook Pro 16 2021 M1 Max M1 Max, M1 Max 32-Core GPU | Alienware x17 R2 P48E i9-12900HK, GeForce RTX 3080 Ti Laptop GPU | Gigabyte Aero 16 YE5 i9-12900HK, GeForce RTX 3080 Ti Laptop GPU | Acer Predator Triton 500 SE PT516-52s-70KX i7-12700H, GeForce RTX 3080 Ti Laptop GPU | |
|---|---|---|---|---|---|---|
| Heat | 3% | 28% | 14% | 5% | 11% | |
| Maximum Upper Side * (°C) | 67 | 52.5 22% | 42.3 37% | 49.6 26% | 49 27% | 47 30% |
| Maximum Bottom * (°C) | 69 | 56.7 18% | 41.7 40% | 42.4 39% | 55 20% | 49 29% |
| Idle Upper Side * (°C) | 29 | 33.9 -17% | 23.9 18% | 29.2 -1% | 33 -14% | 31 -7% |
| Idle Bottom * (°C) | 29 | 32.7 -13% | 23.9 18% | 32 -10% | 33 -14% | 32 -10% |
* ... smaller is better
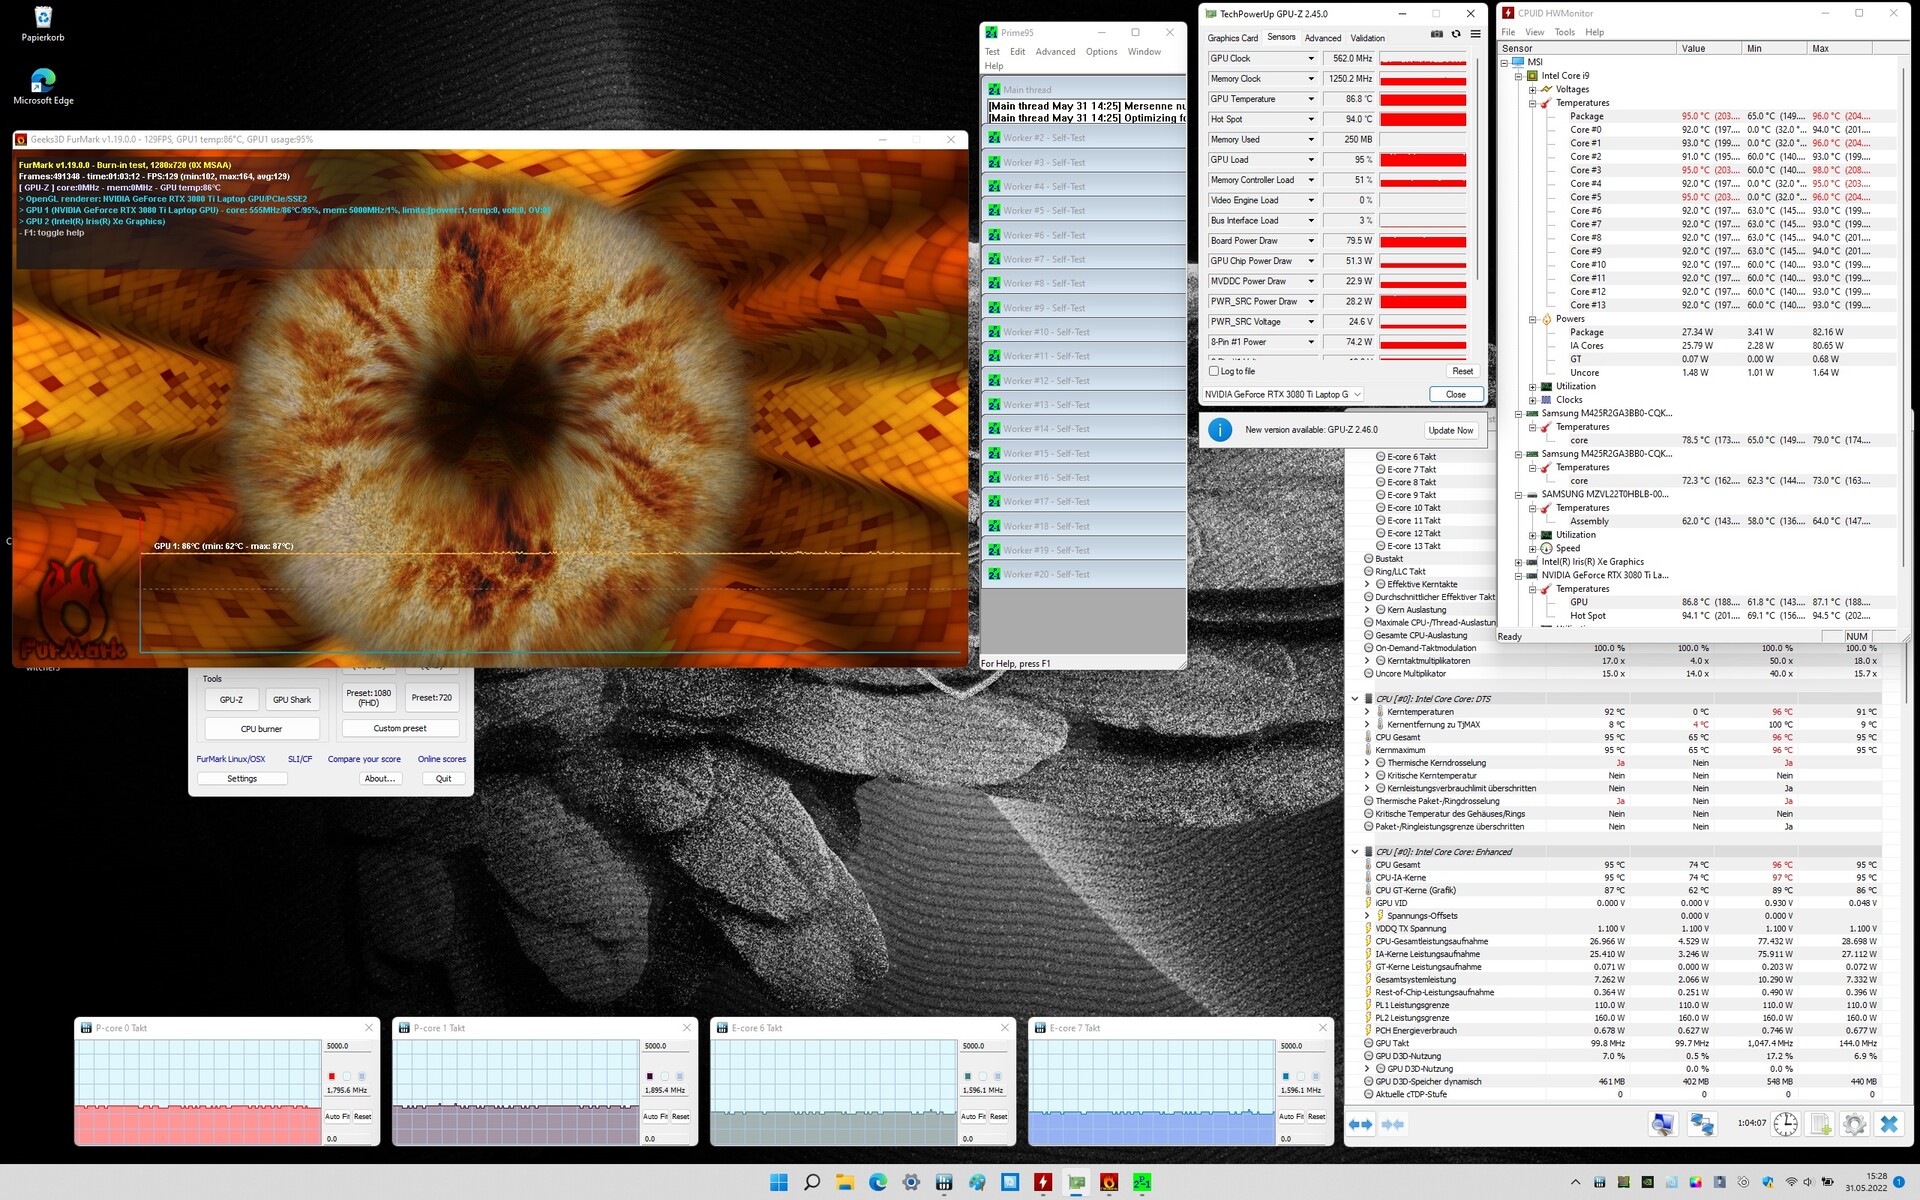
Stress test
In contrast to gaming laptops, the Z16P creator is unlikely to be forced to work at peak performance for a prolonged period of time. There should be at least a short breather after 5-10 minutes of computations at the latest, which isn't really the case when spending a long time in complex gaming worlds.
The stress test results are correspondingly poor, as the device wasn't designed for this. The case heats up considerably, while triple-digit temperatures are measured in the interior. Moreover, the system reduces the clock rate as well as the power consumption of the CPU and GPU considerably shortly after the start. Needless to say, this is also due to the slim case and the low level of ventilation, both of which are by no means designed for this.
Speakers
The volume of the Dynaudio two-way speakers is immediately impressive. In a larger room or with easily audible ambient noise, the content on the MSI laptop remains very audible.
Basses aren't necessarily the Z16P's strength. Mids and highs can convince to some extent, though.
Generally, the sound quality is decent. Unfortunately, the ranges of guitars and the like aren't emphasized enough when it comes to music. Vocals sound a bit overamplified.
MSI Creator Z16P B12UHST audio analysis
(+) | speakers can play relatively loud (91 dB)
Bass 100 - 315 Hz
(-) | nearly no bass - on average 17.9% lower than median
(±) | linearity of bass is average (11% delta to prev. frequency)
Mids 400 - 2000 Hz
(±) | higher mids - on average 5.8% higher than median
(+) | mids are linear (6.4% delta to prev. frequency)
Highs 2 - 16 kHz
(±) | higher highs - on average 7.2% higher than median
(+) | highs are linear (6.6% delta to prev. frequency)
Overall 100 - 16.000 Hz
(±) | linearity of overall sound is average (17% difference to median)
Compared to same class
» 47% of all tested devices in this class were better, 7% similar, 46% worse
» The best had a delta of 5%, average was 17%, worst was 45%
Compared to all devices tested
» 30% of all tested devices were better, 8% similar, 62% worse
» The best had a delta of 4%, average was 24%, worst was 134%
Apple MacBook Pro 16 2021 M1 Pro audio analysis
(+) | speakers can play relatively loud (84.7 dB)
Bass 100 - 315 Hz
(+) | good bass - only 3.8% away from median
(+) | bass is linear (5.2% delta to prev. frequency)
Mids 400 - 2000 Hz
(+) | balanced mids - only 1.3% away from median
(+) | mids are linear (2.1% delta to prev. frequency)
Highs 2 - 16 kHz
(+) | balanced highs - only 1.9% away from median
(+) | highs are linear (2.7% delta to prev. frequency)
Overall 100 - 16.000 Hz
(+) | overall sound is linear (4.6% difference to median)
Compared to same class
» 0% of all tested devices in this class were better, 0% similar, 100% worse
» The best had a delta of 5%, average was 17%, worst was 45%
Compared to all devices tested
» 0% of all tested devices were better, 0% similar, 100% worse
» The best had a delta of 4%, average was 24%, worst was 134%
Energy management - Creator laptop with typical consumption
Energy consumption
With an average of 17 watts under no extra load, the MSI Creator Z16P is unnecessarily power-hungry when it's not performing any tasks yet. However, this is also true for the competition, since it has a comparable configuration. The bright and large display requires a lot of power, and even the lightest requests to the CPU generate considerable power consumption.
The peak power consumption is 212 watts. Therefore, the 240-watt power adapter is a very good fit, and it can still charge the battery even under maximum load. At the same time, it can be observed that the maximum power consumption of the CPU with its PL1 of 110 watts and the GPU with 90 watts is actually even reached in combination.
The typical power consumption under load of 124 watts is in the range of other multimedia laptops. Even the Apple MacBook Pro 16 2021 M1 Max can't really set itself apart despite its actually much more frugal components, but it still only consumes three quarters of what the Z16P does.
| Off / Standby | |
| Idle | |
| Load |
|
Key:
min: | |
| MSI Creator Z16P B12UHST i9-12900H, GeForce RTX 3080 Ti Laptop GPU | MSI Creator Z16 A11UET-209 i7-11800H, GeForce RTX 3060 Laptop GPU | Apple MacBook Pro 16 2021 M1 Max M1 Max, M1 Max 32-Core GPU | Gigabyte Aero 16 YE5 i9-12900HK, GeForce RTX 3080 Ti Laptop GPU | Acer Predator Triton 500 SE PT516-52s-70KX i7-12700H, GeForce RTX 3080 Ti Laptop GPU | Average of class Multimedia | |
|---|---|---|---|---|---|---|
| Power Consumption | 11% | 29% | -50% | -0% | 47% | |
| Idle Minimum * (Watt) | 11 | 9 18% | 5.4 51% | 26 -136% | 7 36% | 5.71 ? 48% |
| Idle Average * (Watt) | 17 | 14 18% | 16.4 4% | 30 -76% | 19 -12% | 10.1 ? 41% |
| Idle Maximum * (Watt) | 26 | 26.7 -3% | 16.7 36% | 37 -42% | 28 -8% | 12.4 ? 52% |
| Load Average * (Watt) | 124 | 119 4% | 94 24% | 127 -2% | 114 8% | 65 ? 48% |
| Witcher 3 ultra * (Watt) | 133.5 | 125 6% | 104 22% | 176 -32% | 159 -19% | |
| Load Maximum * (Watt) | 212 | 160 25% | 135 36% | 236 -11% | 227 -7% | 112.2 ? 47% |
* ... smaller is better
Energy consumption during our The Witcher 3 test / stress test
Energy consumption with an external monitor
Battery life
As expected, not even the 90 Wh battery and the intelligent optimization for long battery life (Super Battery mode in the MSI Center) can do much. Although the RTX 3080 Ti remains disabled on battery power, the bright display and a total of 14 processor cores still take their toll.
The battery was drained after less than 6 hours even when watching Full HD videos in Airplane mode. The creator laptop shuts down even half an hour earlier after our Wi-Fi test. When performance is required, only one hour is realistic.
Once again, the Apple MacBook Pro 16 demonstrates how to do a better job here. The very frugal processor (as long as it's not pushed too hard) is clearly in the lead with pretty much exactly 14 hours of video playback. But the Z16P is distant even from the average rates of the multimedia class, which is once again due to the powerful internals.
| MSI Creator Z16P B12UHST i9-12900H, GeForce RTX 3080 Ti Laptop GPU, 90 Wh | MSI Creator Z16 A11UET-209 i7-11800H, GeForce RTX 3060 Laptop GPU, 90 Wh | Apple MacBook Pro 16 2021 M1 Max M1 Max, M1 Max 32-Core GPU, 99.6 Wh | Gigabyte Aero 16 YE5 i9-12900HK, GeForce RTX 3080 Ti Laptop GPU, 99 Wh | Acer Predator Triton 500 SE PT516-52s-70KX i7-12700H, GeForce RTX 3080 Ti Laptop GPU, 99.98 Wh | Average of class Multimedia | |
|---|---|---|---|---|---|---|
| Battery runtime | 67% | 130% | 37% | 57% | 127% | |
| H.264 (h) | 5.8 | 17 193% | 7.5 29% | 8.2 41% | 16.4 ? 183% | |
| WiFi v1.3 (h) | 5.2 | 9.5 83% | 14.9 187% | 6.4 23% | 5.7 10% | 12 ? 131% |
| Load (h) | 1 | 1.5 50% | 1.1 10% | 1.6 60% | 2.2 120% | 1.675 ? 68% |
Pros
Cons
Verdict - High-end laptop with several pros and cons

There's almost nothing left to be desired with the MSI Z16P. The creator laptop offers enormous performance resources for image editing, video editing, rendering, and more. All this is presented on a precalibrated, adequately sized, and high-resolution display. Its color space, refresh rate, and panel technology are also perfectly suited for a device that specializes in video reproduction and editing.
There's nothing to complain about in terms of looks, either. The slim laptop in elegant gray and with plenty of aluminum looks high-quality in terms of workmanship while remaining discreet. However, when the RGB keyboard lights up after opening the lid, it quickly becomes clear that what's on the table is no business laptop. Furthermore, other details like an above-average webcam, very fast Wi-Fi, and two-way speakers can set the laptop apart from the competition.
At a high price, the Z16P creator aims for a top position among multimedia laptops. It doesn't entirely accomplish this, as its slim case equipped with powerful components, and its cooling system get somewhat in the way.
Its connectivity isn't very compelling. Especially the loss of one Thunderbolt 4 and one USB-A compared to the MSI Creator Z16 is confusing. The card slot has also lost a lot of speed. The keyboard and touchpad could have a better build quality as well. And it would be nice to have an integrated stylus the next time around.
On the other hand, the high heat development, and the moderate battery life are due to the creative laptop's design. Unfortunately, placing such powerful components in such a small space leads to a case that ranges from warm to hot. And the fact that even a large battery can't sustain the processing power for very long isn't surprising, either.
The competition isn't too far away, even though the Z16P consistently dominates when it comes to system performance in particular. The Gigabyte Aero 16 YE5, for example, is on par, and it seems better suited for continuous load due to its slightly better cooling. Naturally, the Apple MacBook Pro 16 M1 Max shouldn't be left out. It has the short end of the stick when it comes to raw computing power, but it's ahead in terms of battery life, cooling, and usually its software configuration as well.
However, other laptops are meant for gaming. With a larger case and more comprehensive cooling, models like the Alienware x17 R2 can also deliver maximum performance over longer periods of time.
In the end, the MSI Creator Z16P offers exactly what's required. So much performance and the right display are combined in a portable device to tackle even complex and elaborate video projects almost everywhere, so also at trade shows, for example. However, it's also worth taking a look at the two smaller variants, since the restrictions due to overheating aren't quite as pronounced here. And neither of them are slow at all.
Price and availability
At the time of writing, you can find the MSI Creator Z16P in almost our same exact configuration on Amazon for around $4,350 (Core i9-12900H, 64 GB of RAM, 2 TB NVMe SSD, RTX 3080 Ti, QHD+ 165 Hz touchscreen, Windows 11 Pro).
MSI Creator Z16P B12UHST
- 06/23/2022 v7 (old)
Mario Petzold
Price comparison

