Gigabyte Aero 16 YE5 Review: Compact 4K Multimedia Notebook

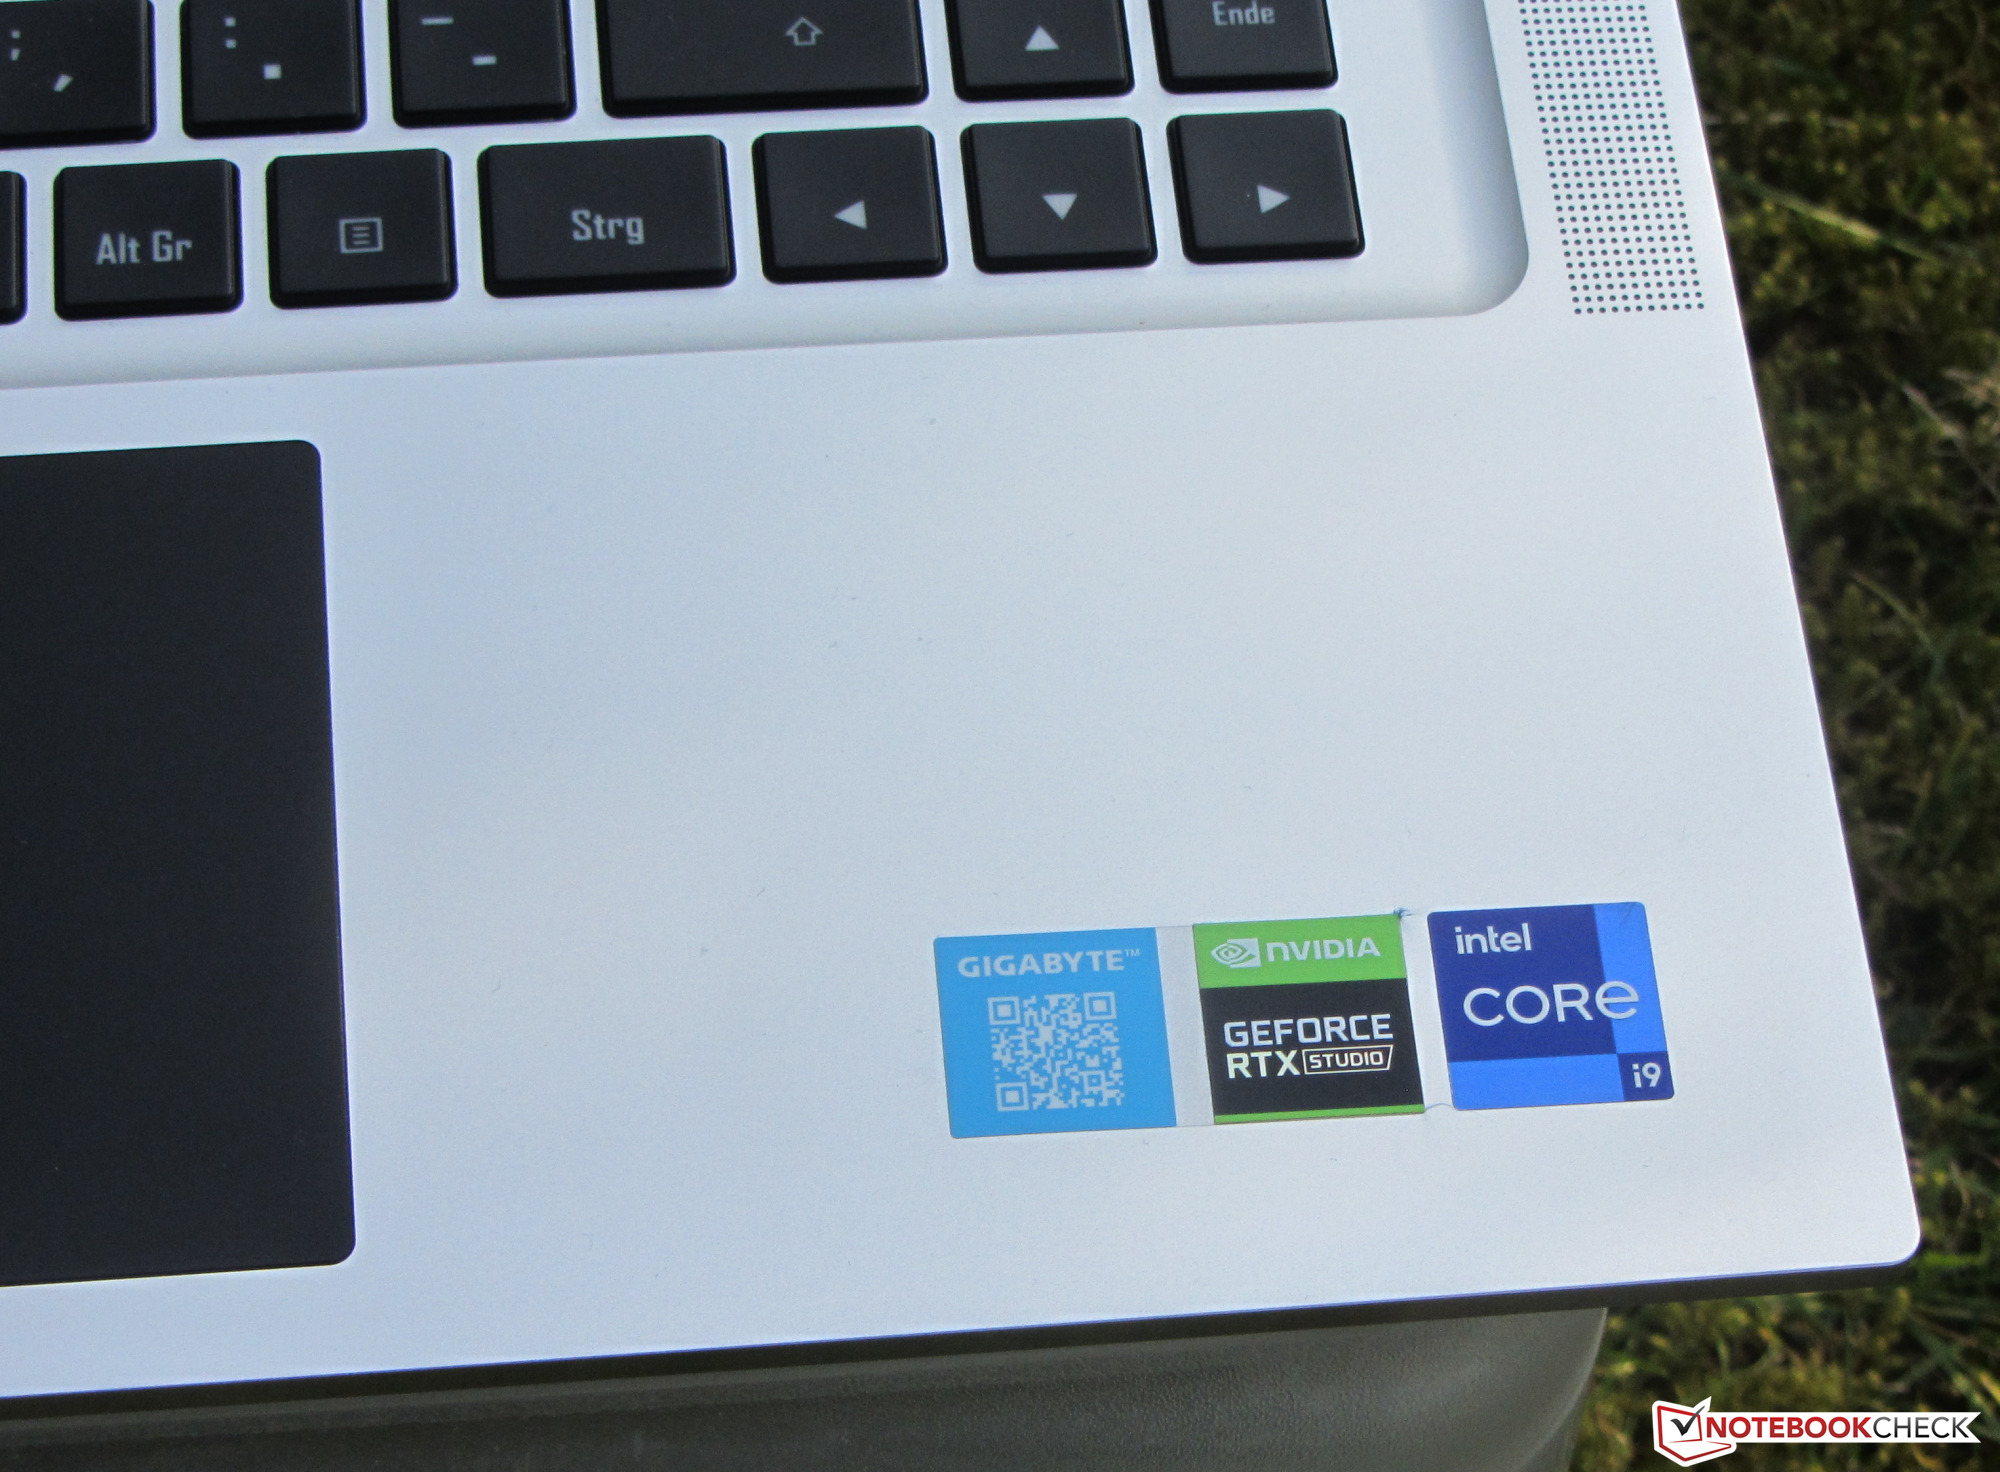
Gigabyte’s Aero 16 is a blend between a compact gaming notebook, a portable workstation, and a laptop for creatives. It is powered by a Core i9-12900HK (Alder Lake) and a GeForce RTX 3080 Ti. Its main competitors are devices such as the Lenovo ThinkPad X1 Extreme G4, the Schenker XMG Pro 15 (Late 2021), the HP ZBook Studio 15 G8, the Apple MacBook Pro 16 2021 M1 Max, and the Razer Blade 15 2022.
Potential Competitors in Comparison
Rating | Date | Model | Weight | Height | Size | Resolution | Price |
|---|---|---|---|---|---|---|---|
| 84.7 % v7 (old) | 03 / 2022 | Gigabyte Aero 16 YE5 i9-12900HK, GeForce RTX 3080 Ti Laptop GPU | 2.3 kg | 22.4 mm | 16.00" | 3840x2400 | |
| 88.3 % v7 (old) | 12 / 2021 | Lenovo ThinkPad X1 Extreme G4-20Y50040GE i9-11950H, GeForce RTX 3080 Laptop GPU | 1.9 kg | 18.2 mm | 16.00" | 3840x2400 | |
| 92.5 % v7 (old) | 11 / 2021 | Apple MacBook Pro 16 2021 M1 Max M1 Max, M1 Max 32-Core GPU | 2.2 kg | 16.8 mm | 16.20" | 3456x2234 | |
| 87.8 % v7 (old) | 08 / 2021 | HP ZBook Studio 15 G8 i9-11950H, GeForce RTX 3070 Laptop GPU | 1.9 kg | 18 mm | 15.60" | 3840x2160 | |
| 84.6 % v7 (old) | 01 / 2022 | Schenker XMG Pro 15 (Late 2021) i7-11800H, GeForce RTX 3080 Laptop GPU | 2 kg | 19.8 mm | 15.60" | 3840x2160 | |
| 89.1 % v7 (old) | 03 / 2022 | Razer Blade 15 2022 i7-12800H, GeForce RTX 3080 Ti Laptop GPU | 2.1 kg | 16.99 mm | 15.60" | 2560x1440 |
Case – Aero with Robust Metal Case
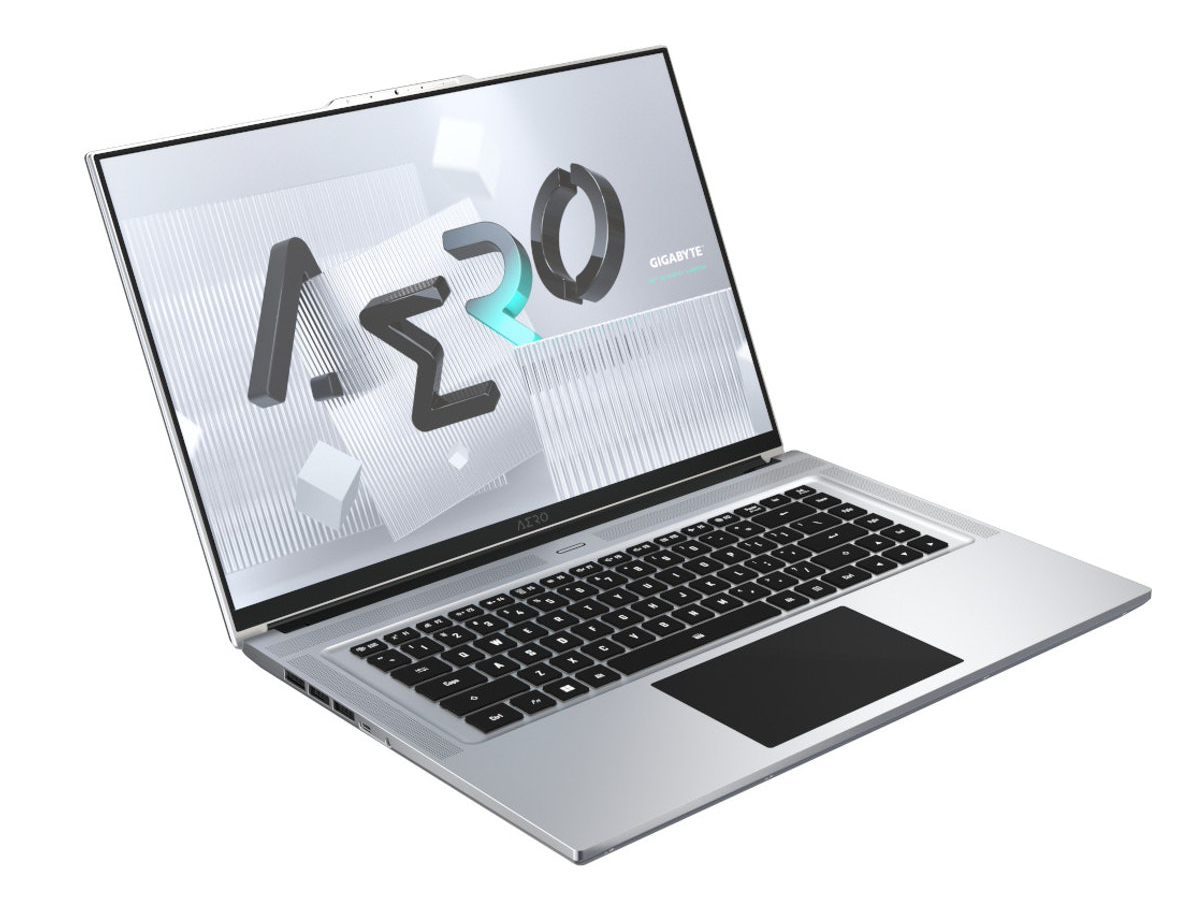
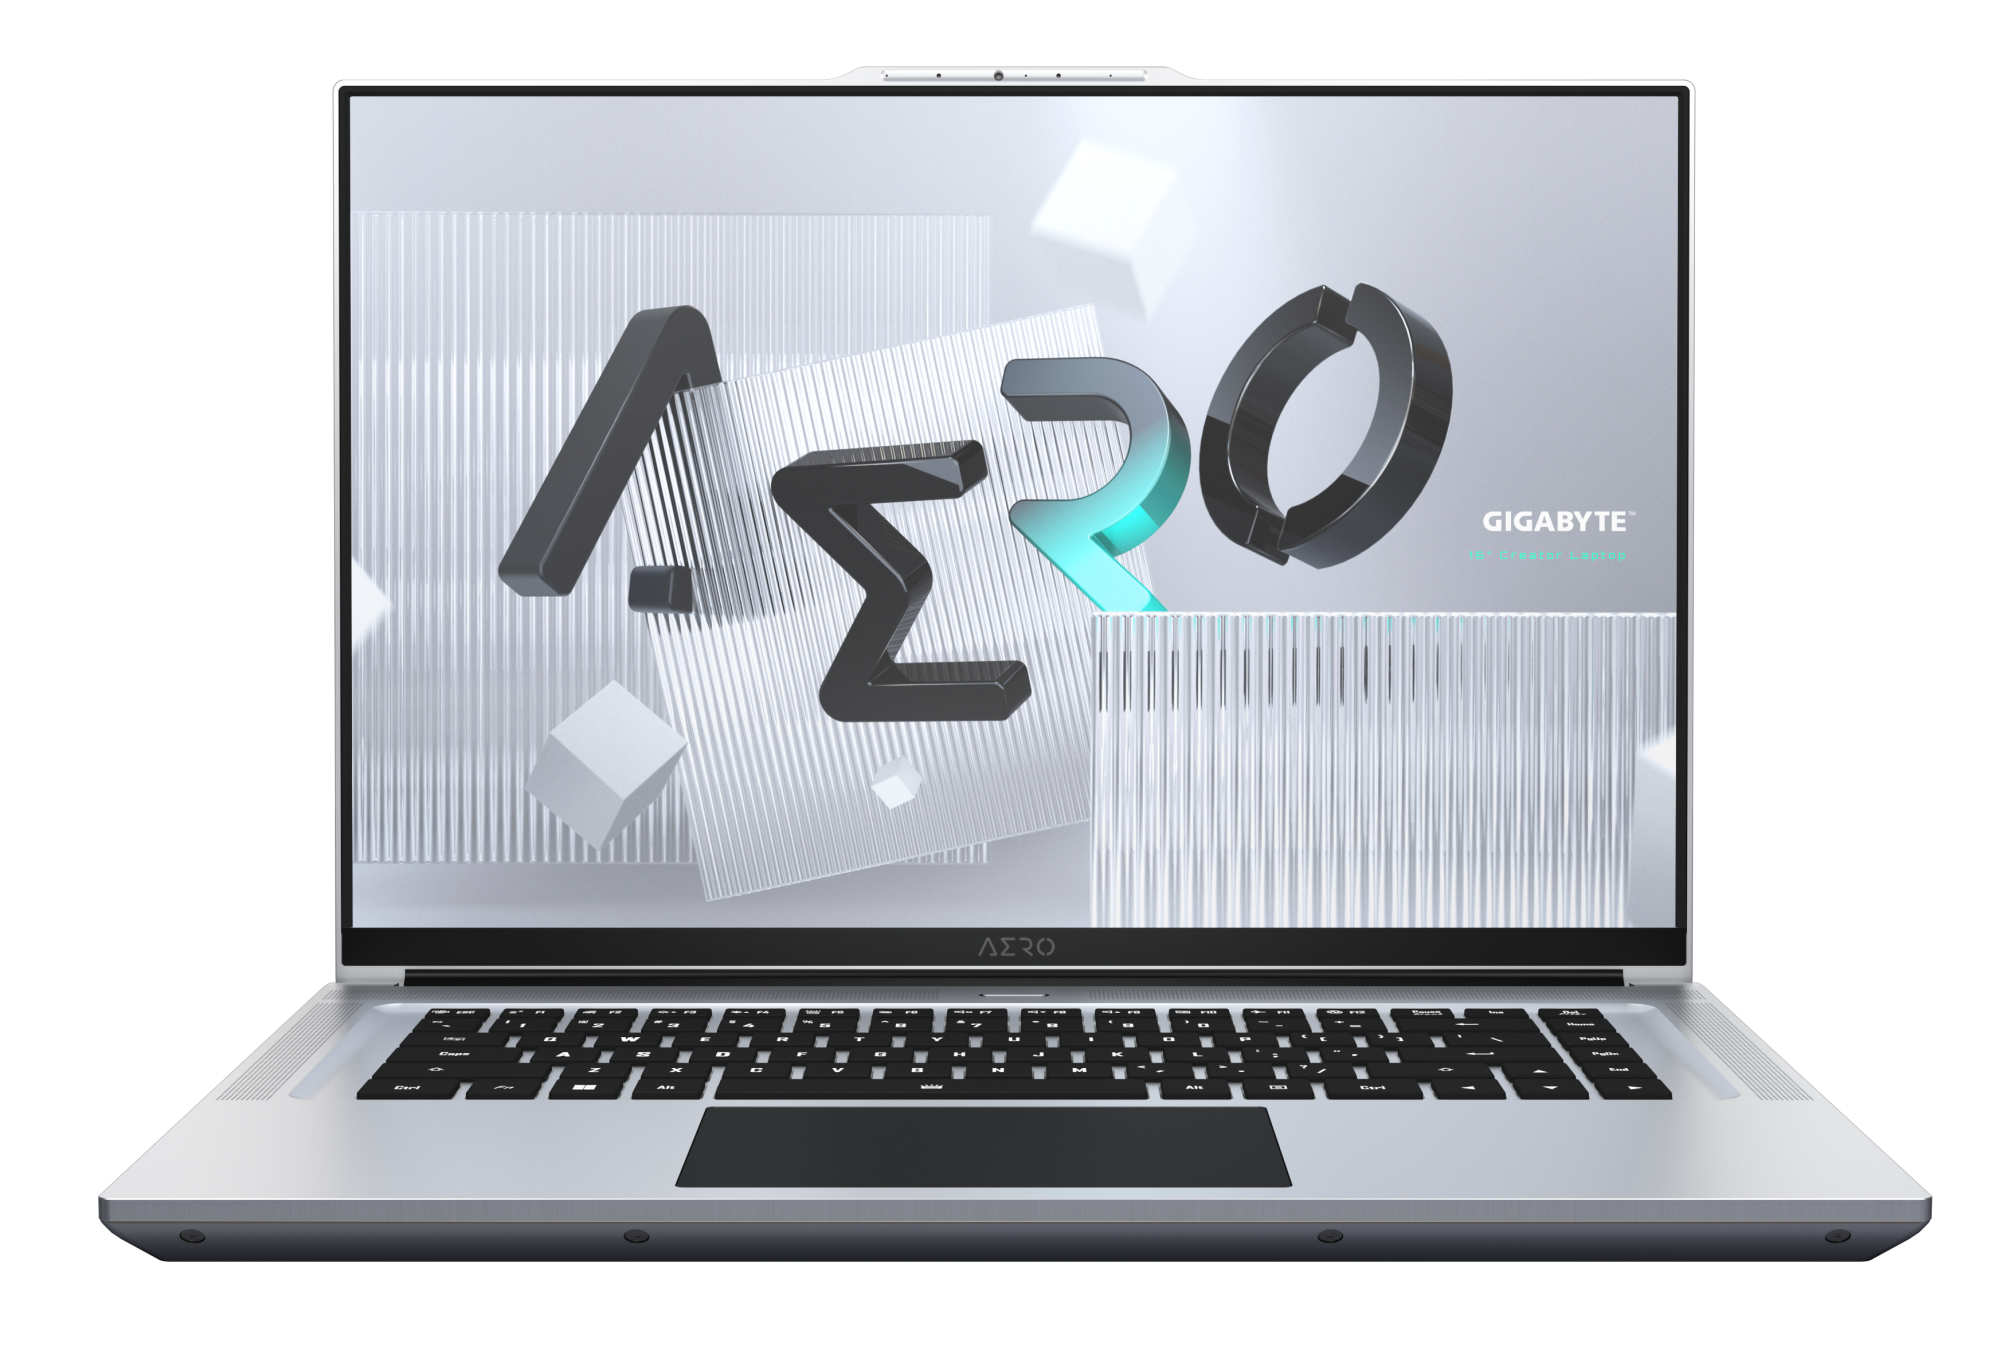
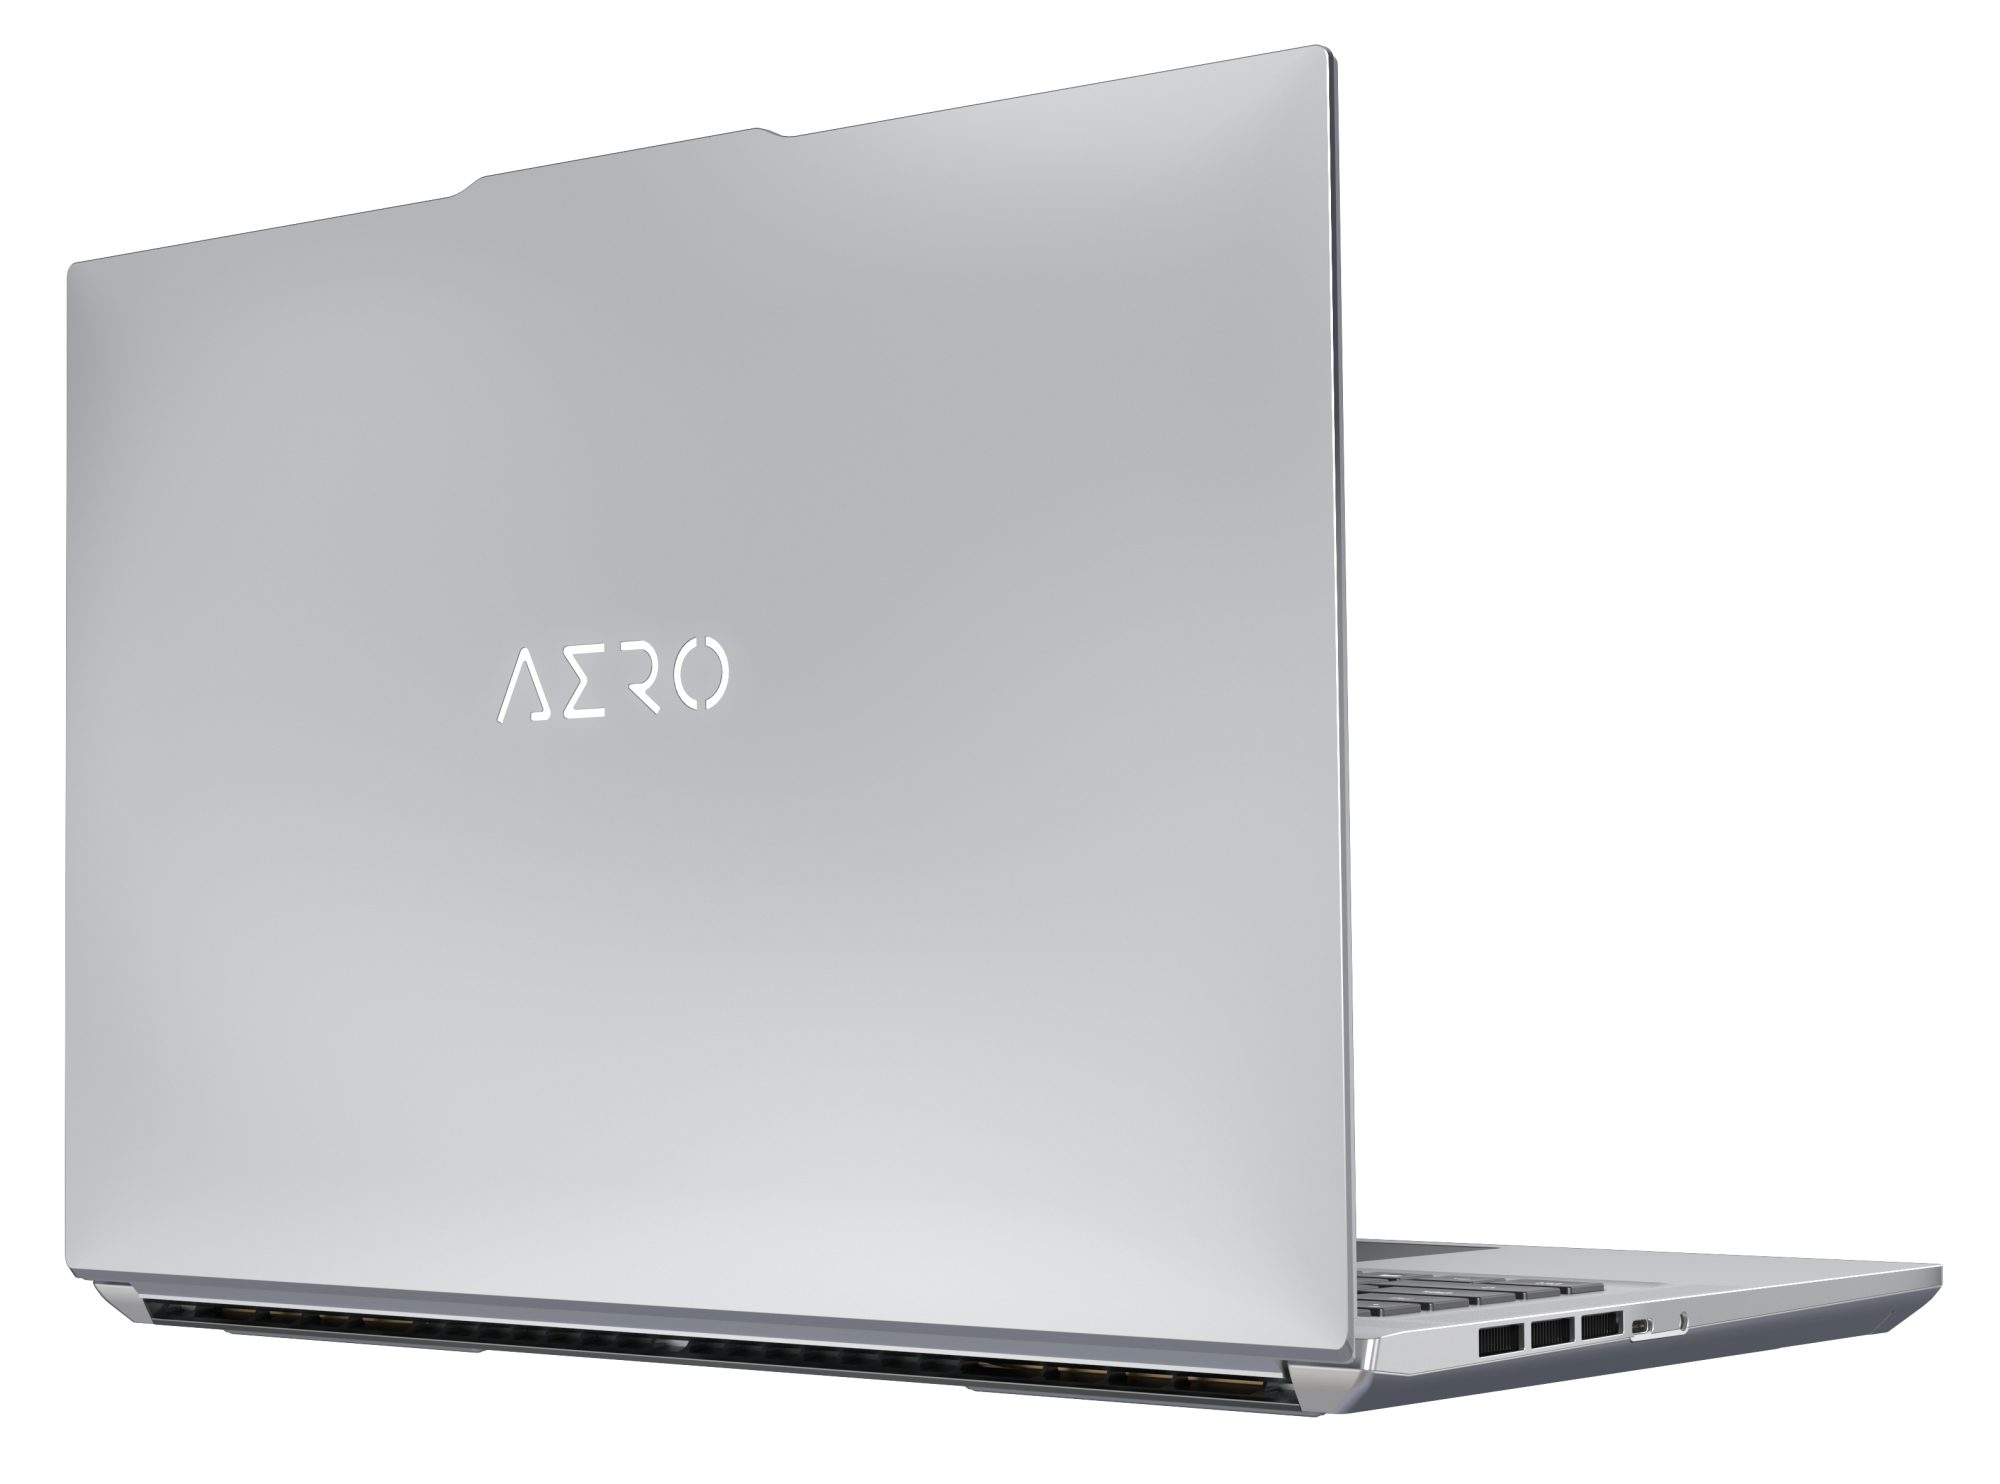
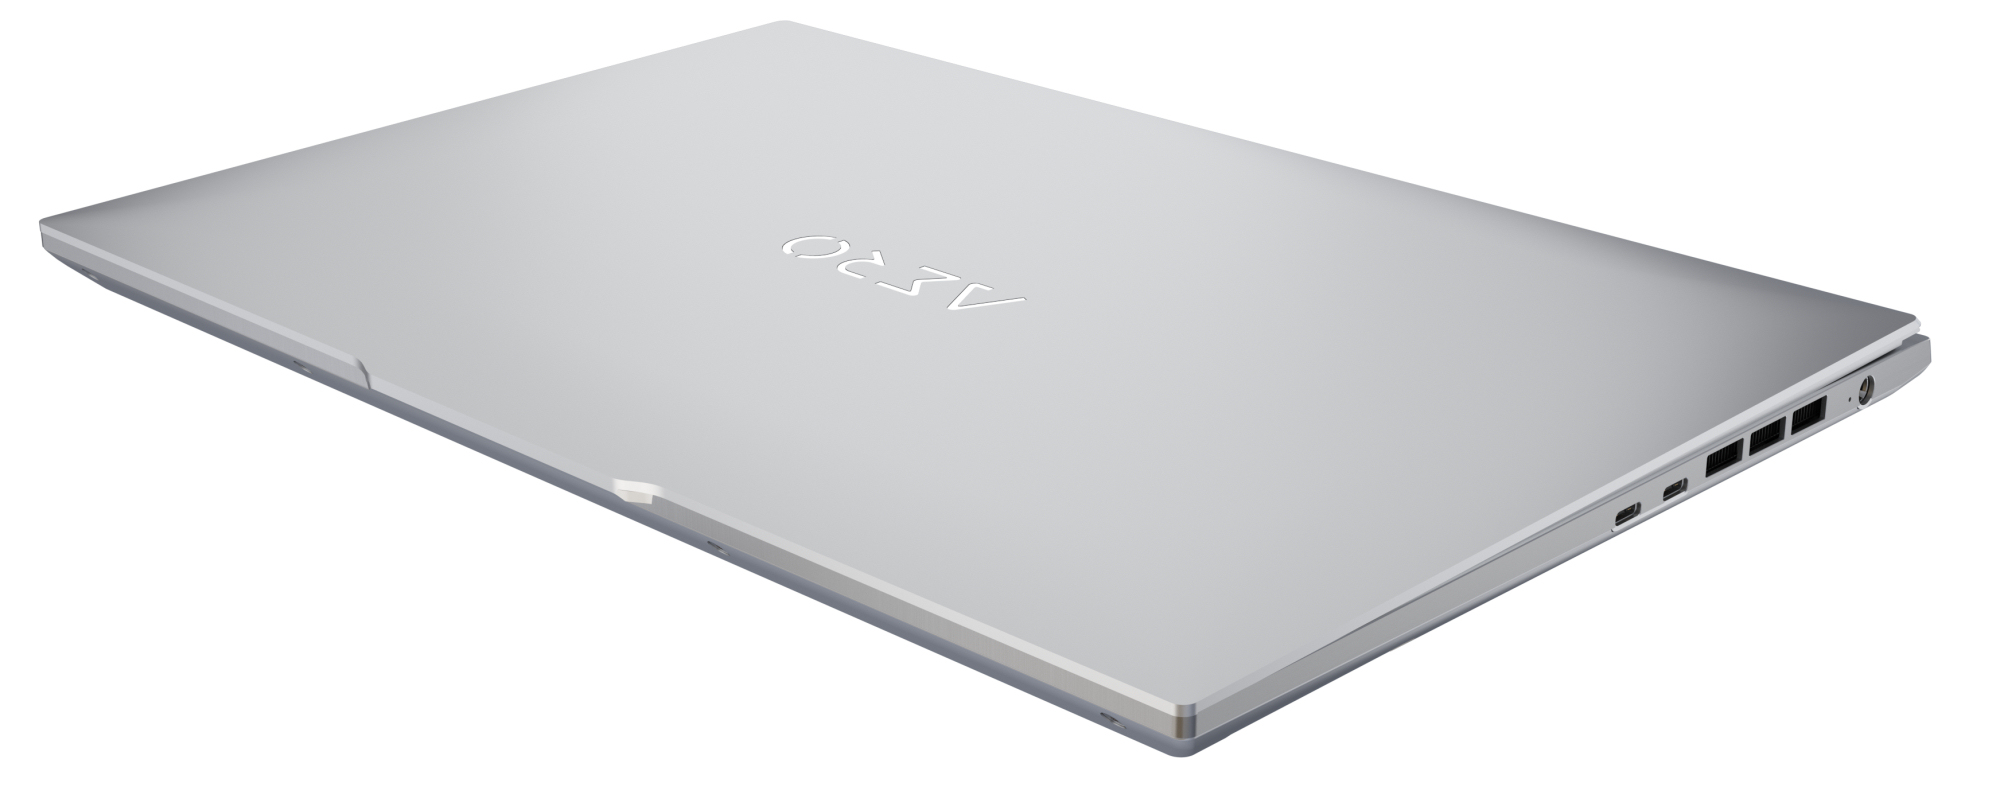
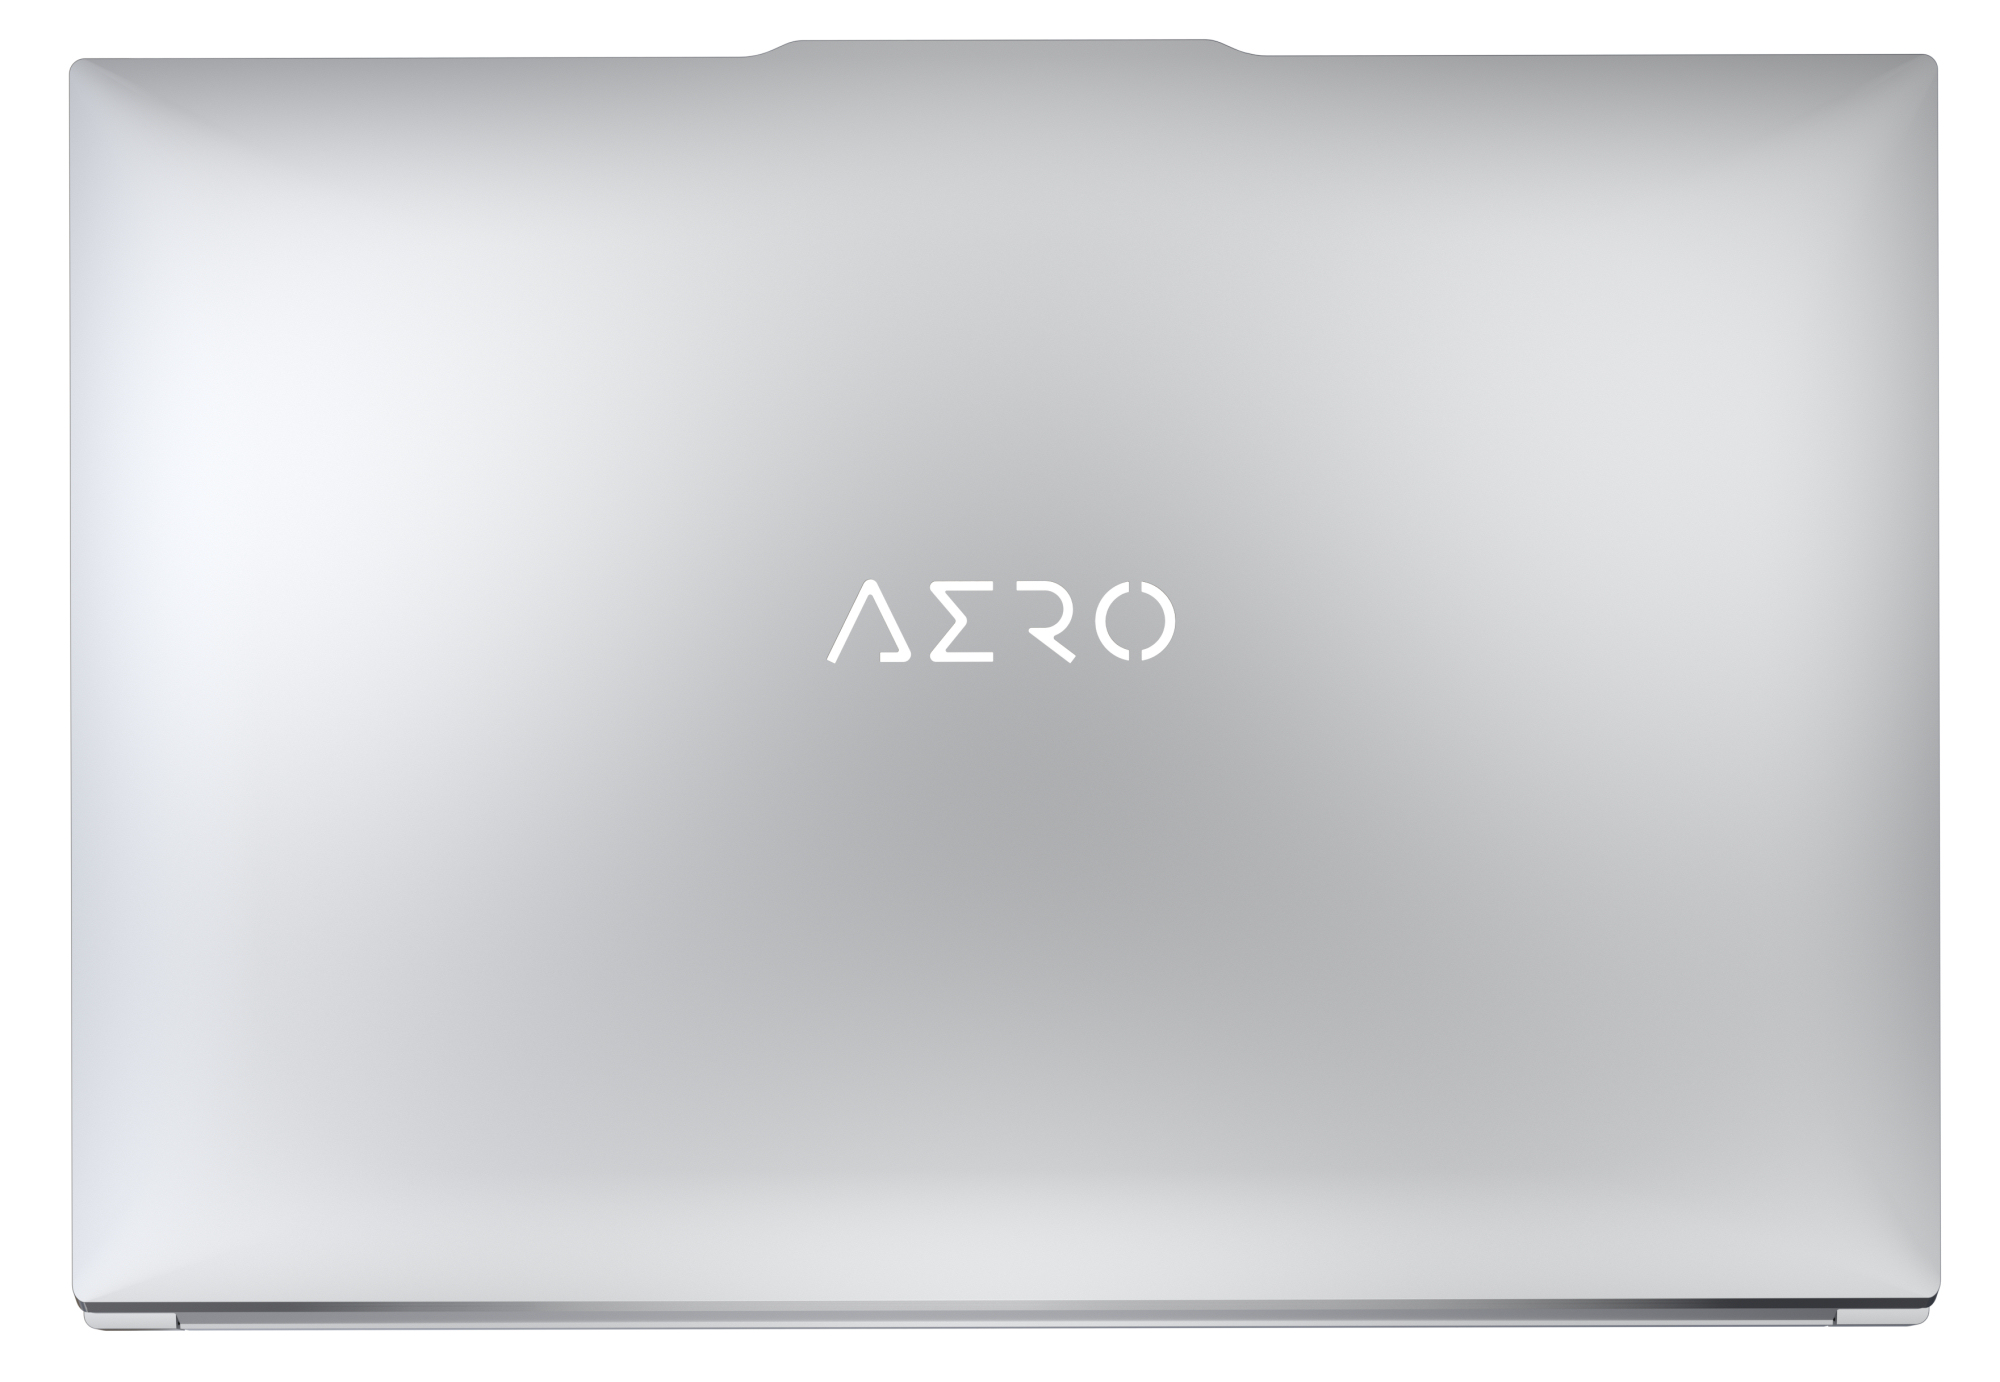
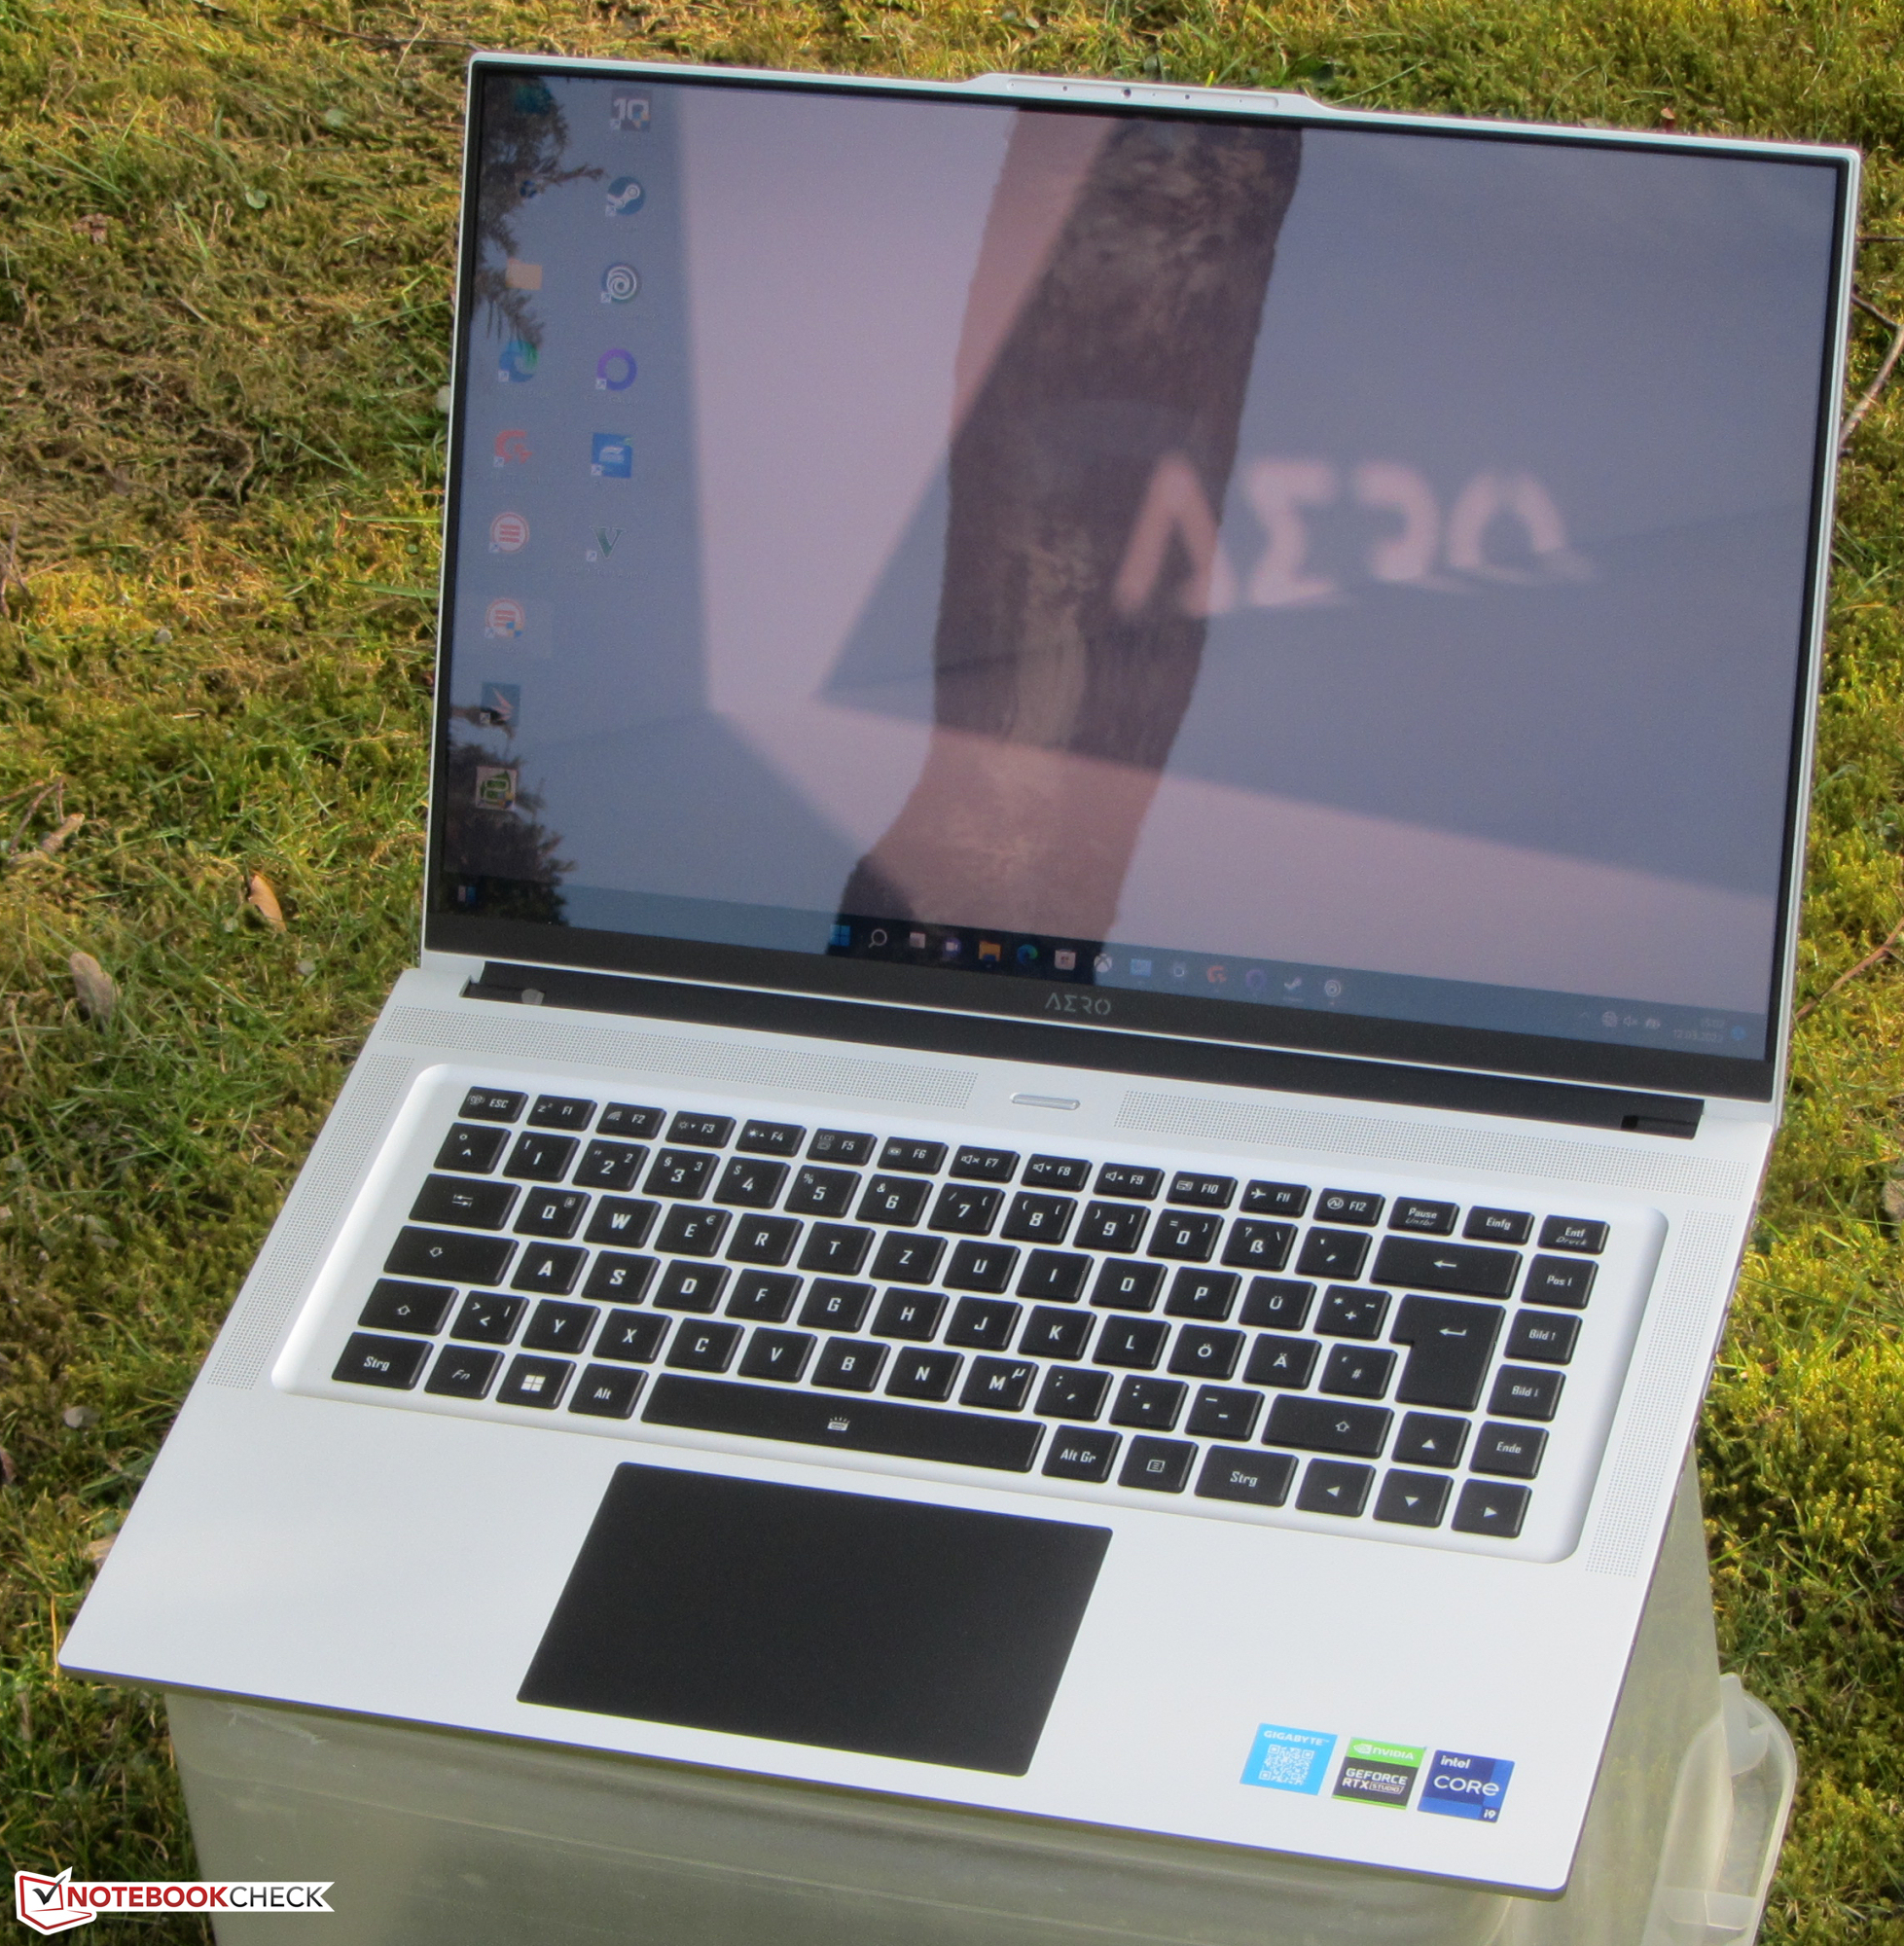
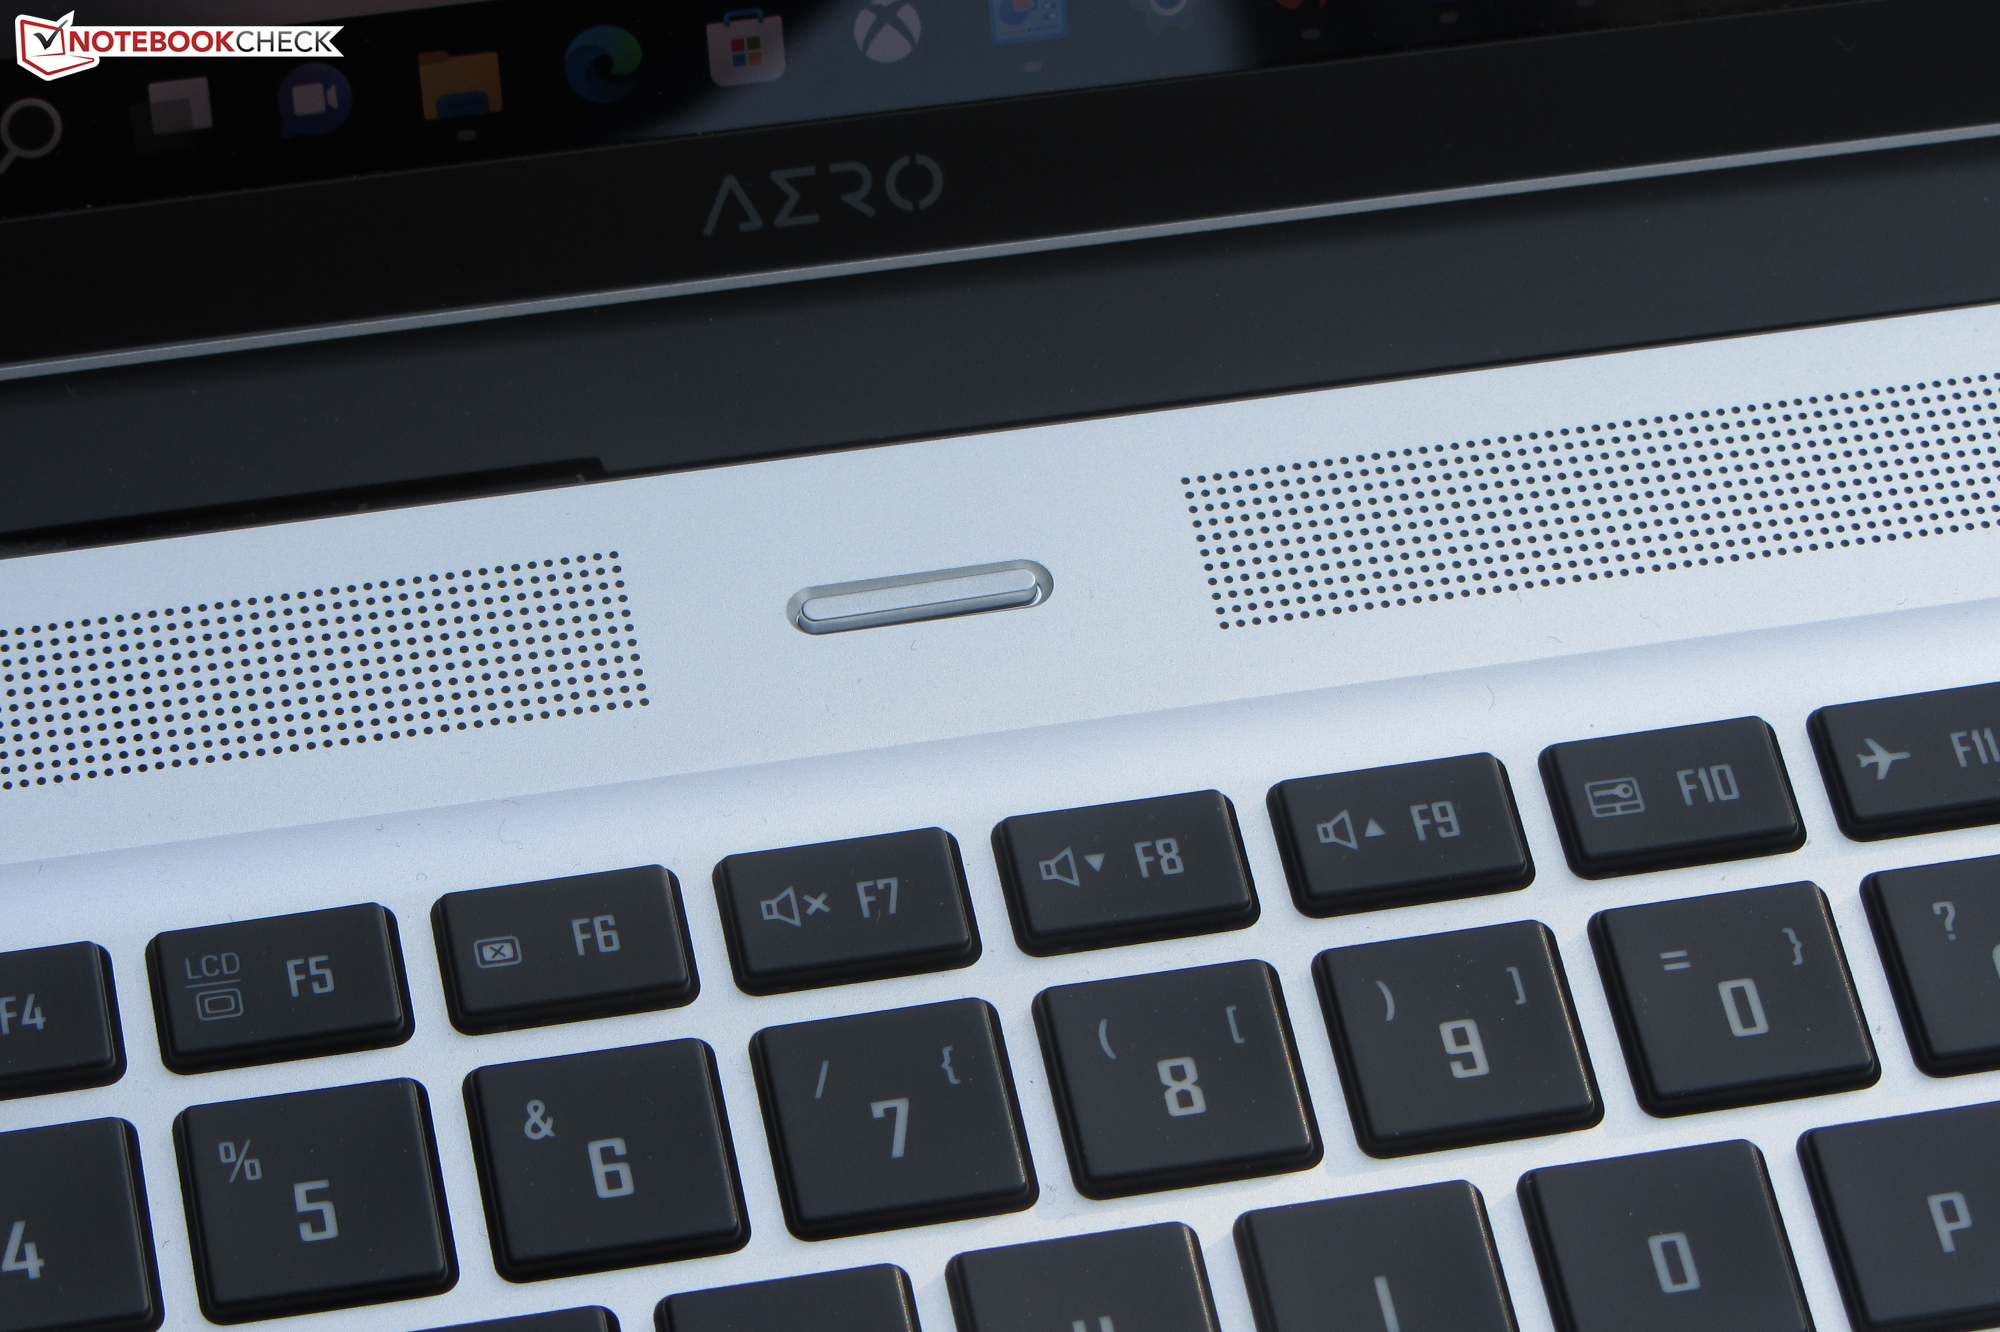
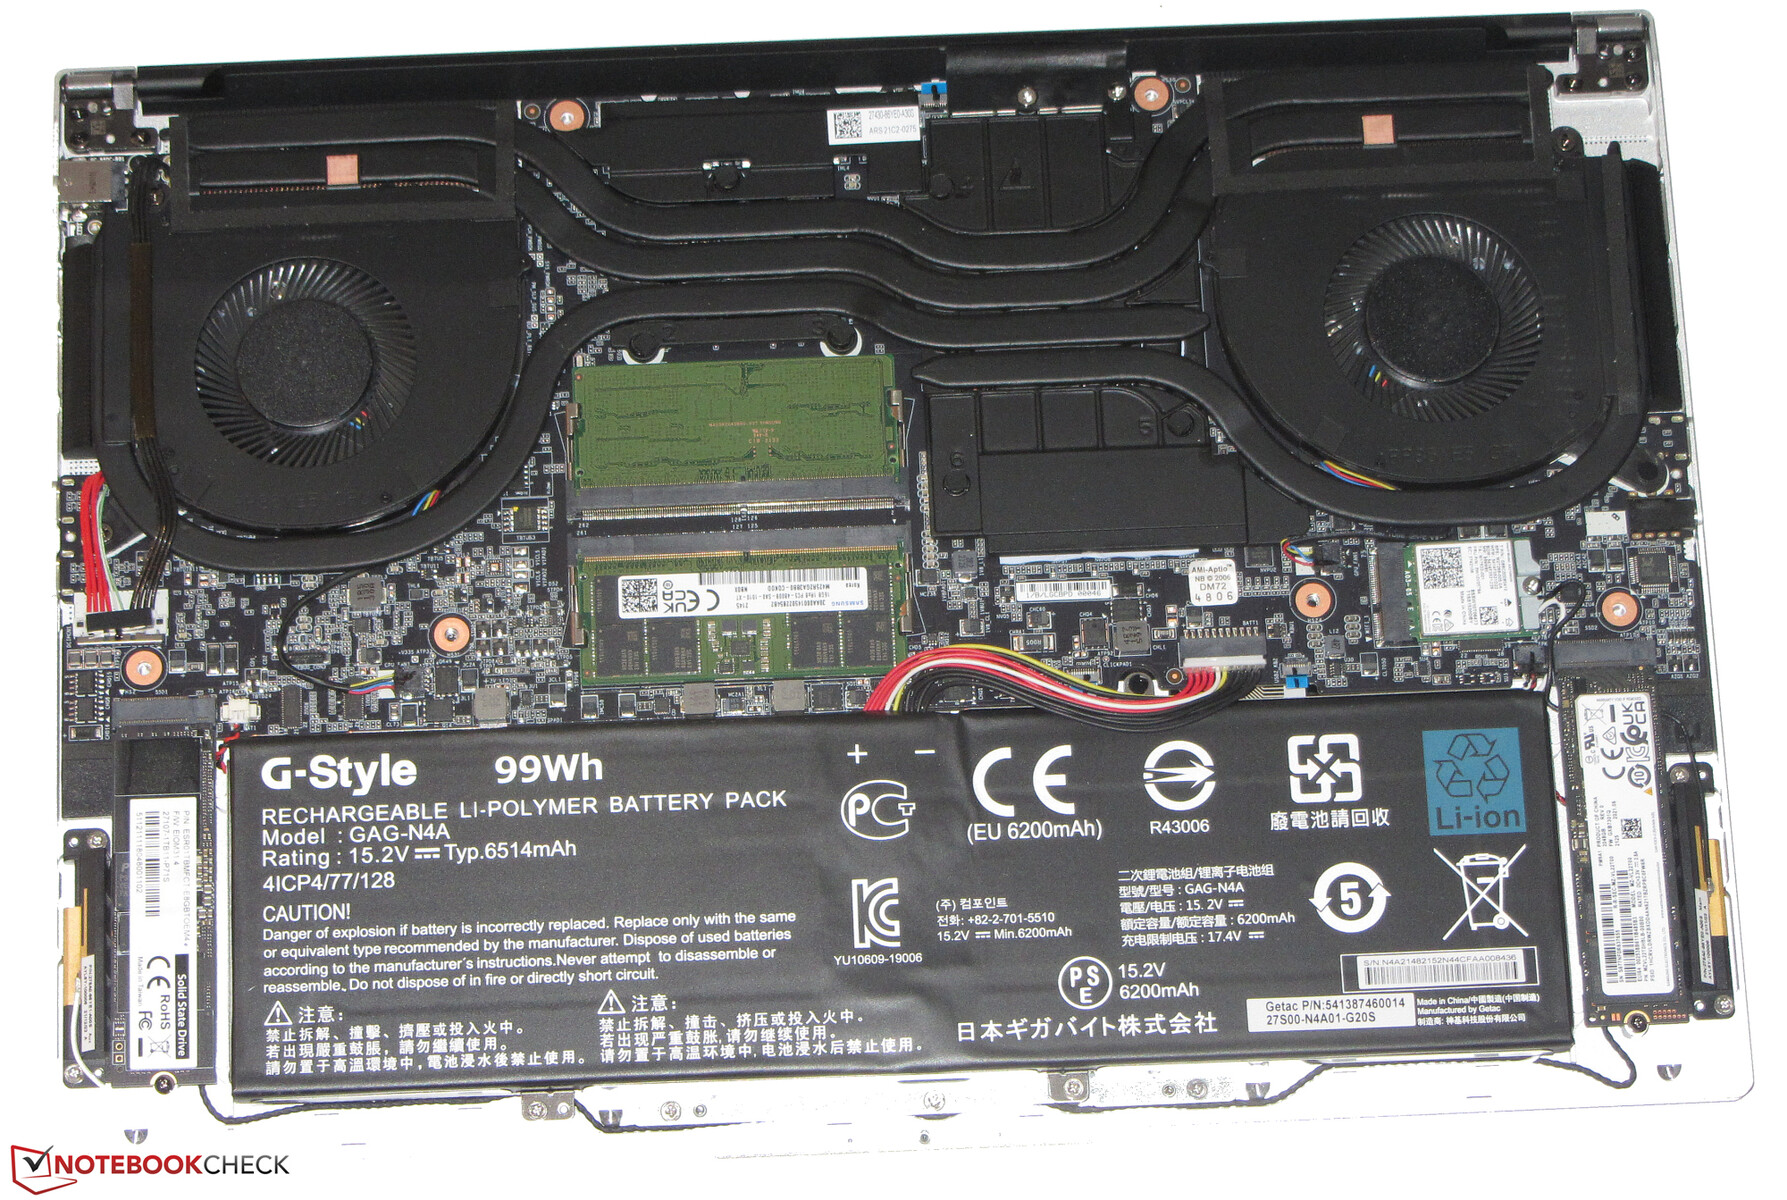
The Aero 16 features a good-looking compact silver metal case with a matte and smooth surface. Various black elements, such as the keyboard, the trackpad, the display bezels, and the hinge cover, serve as design embellishments, as does the backlit Aero logo on the back of the display lid. The inside is easily accessible through removal of the bottom cover. The battery is not replaceable.
Overall build quality is good. Panel gaps are consistent, and we found no gap protrusions either. Rigidity is decent with a base that barely warps and a lid that warps and bends only slightly. The hinge is firm and manages to keep the display firmly in place without too much teetering. Its maximum opening angle is around 125-130° and it can be opened and adjusted one-handed.

Among our test group the Aero is one of the larger devices, and the heaviest by a small margin. With its 2.3 kg (5.07 lbs) it is a good 400 g (0.88 lbs) heavier than the Lenovo ThinkPad X1 Extreme G4.
Connectivity – Gigabyte Notebook with USB-C
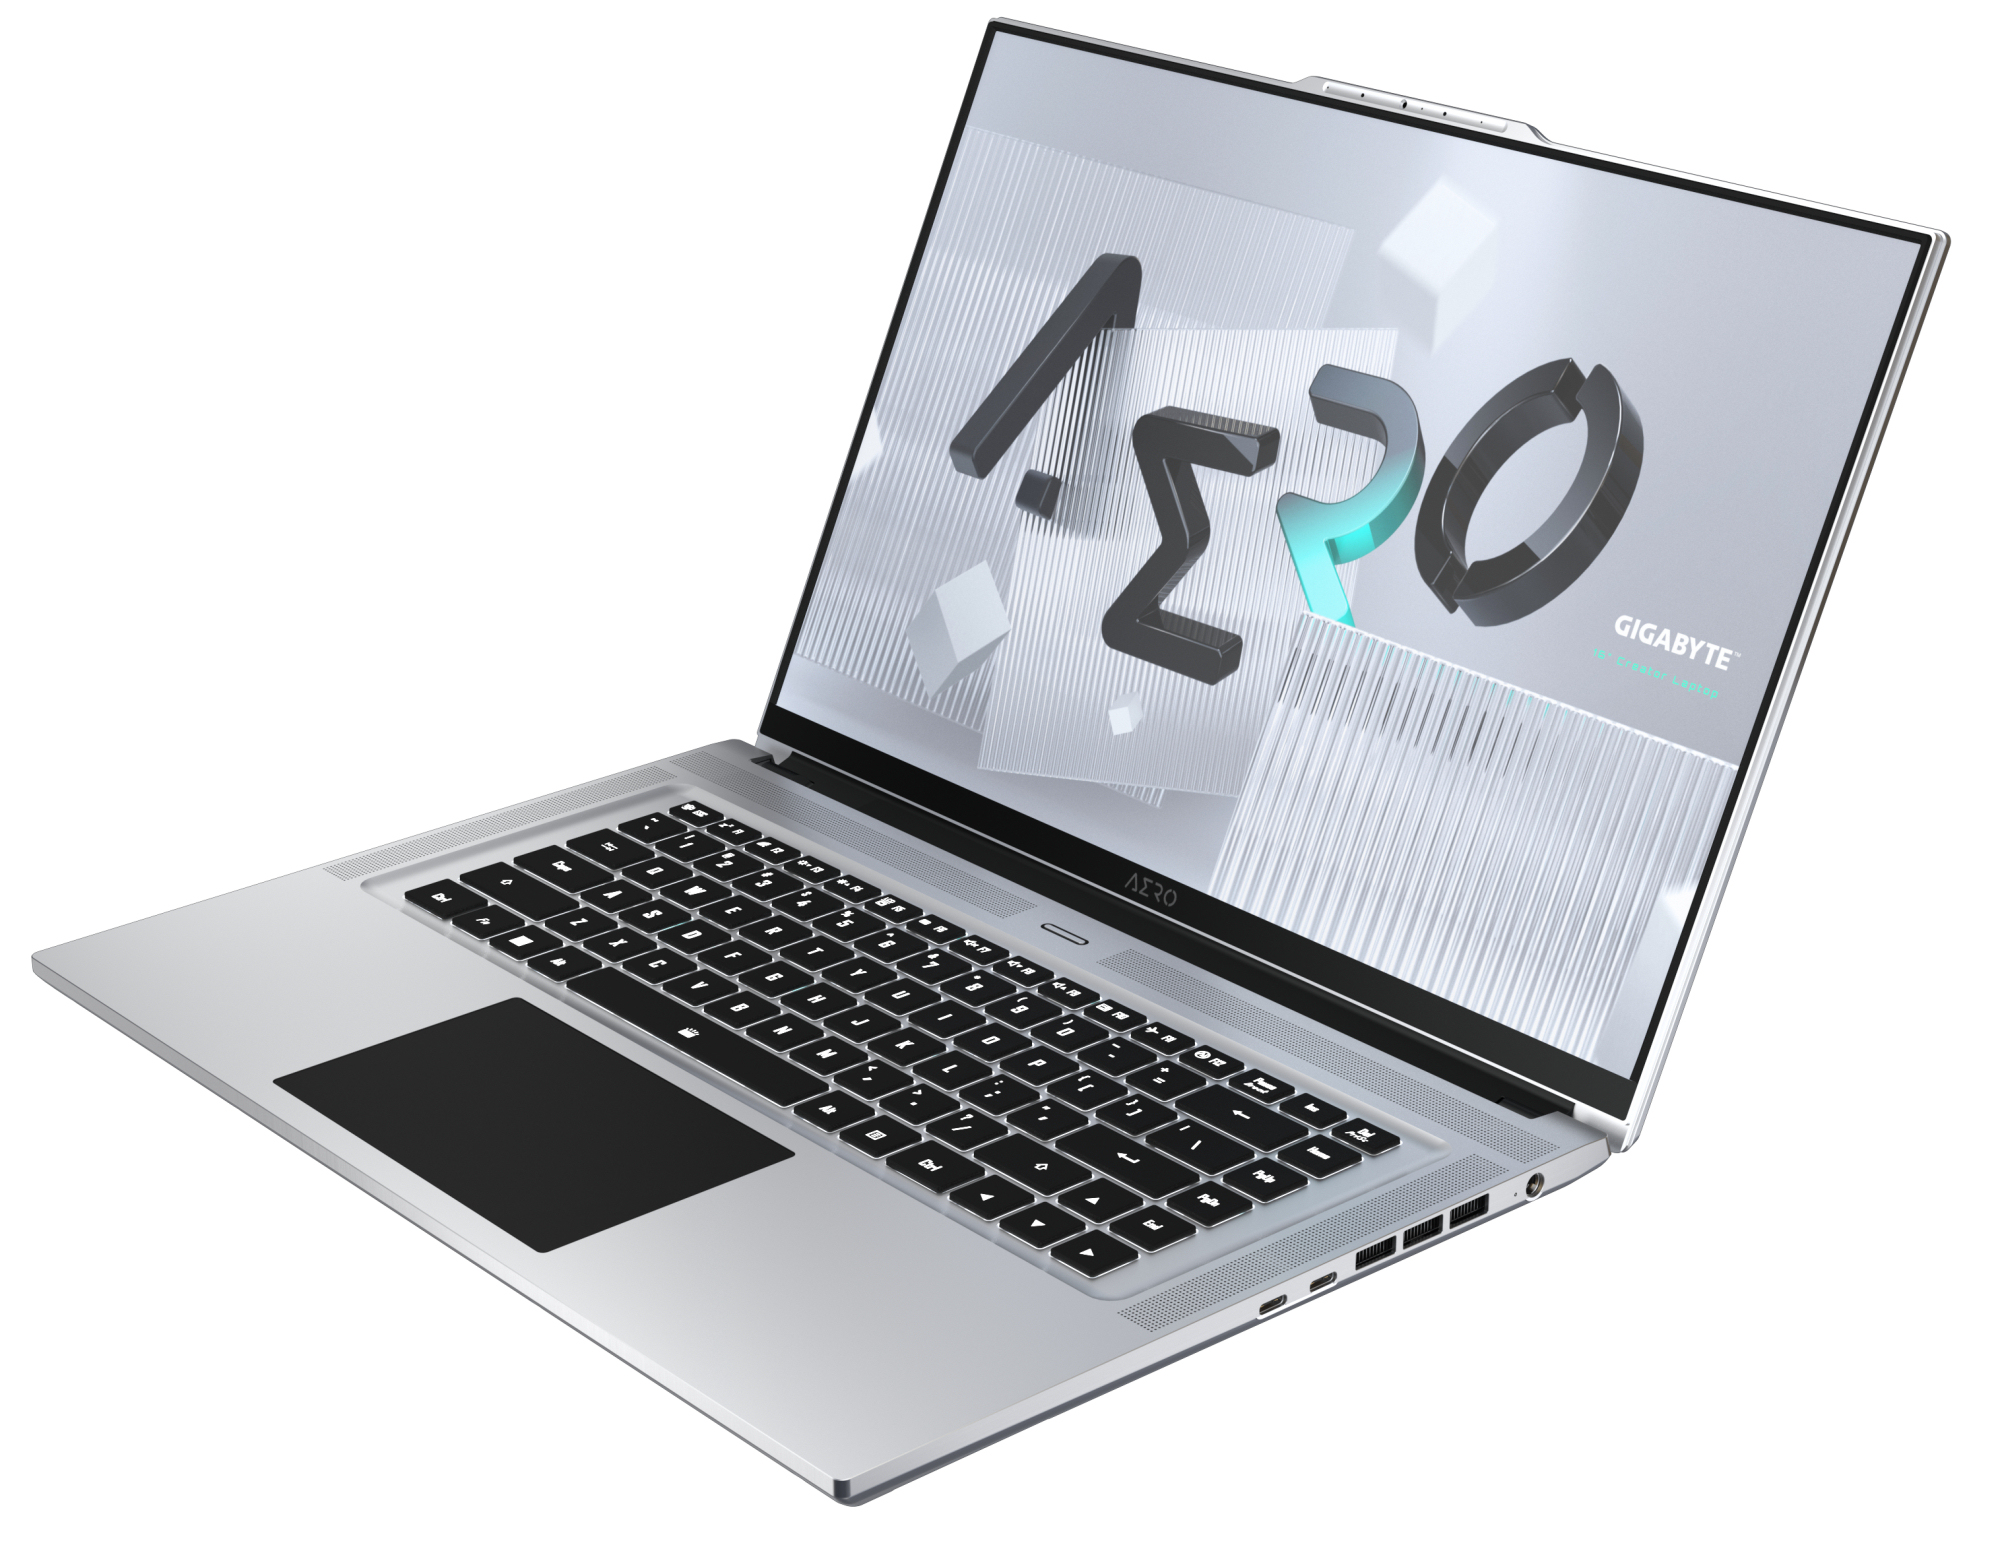
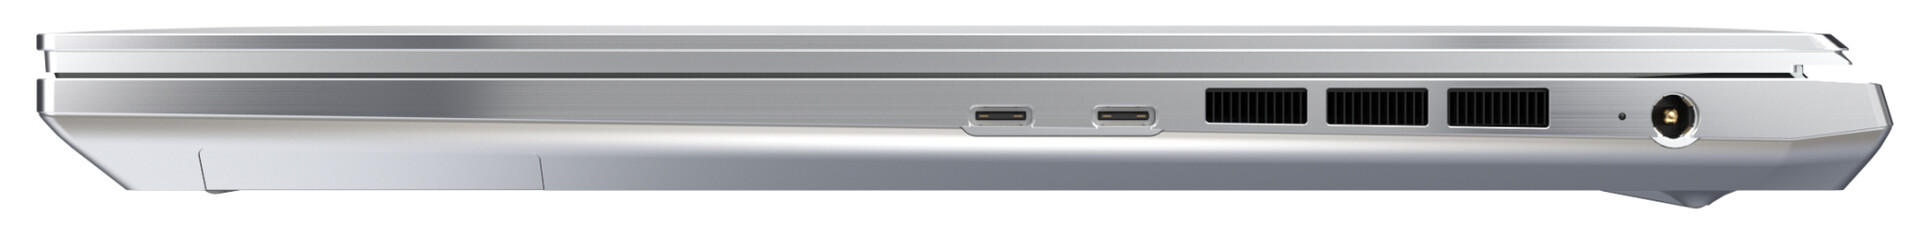
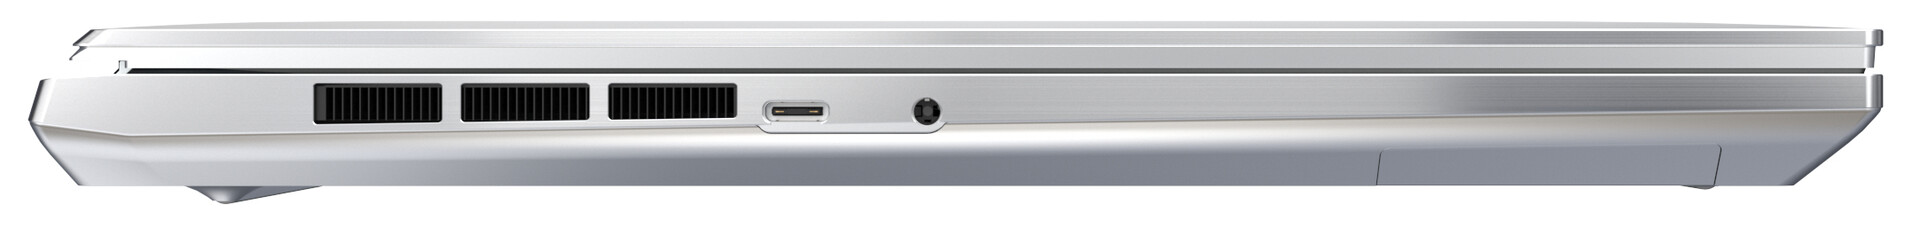
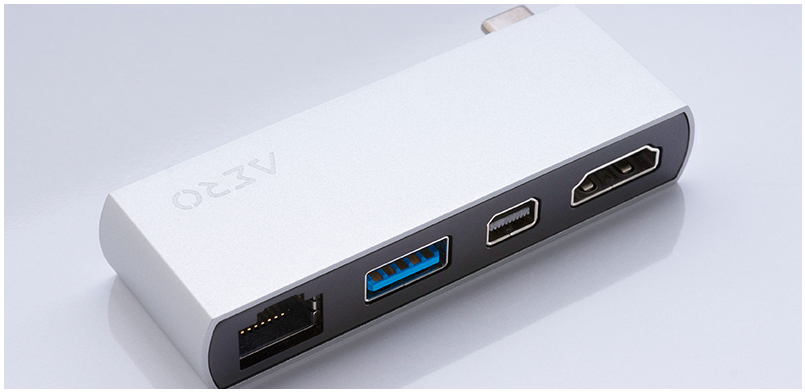
In addition to a charging port and a headphone jack we find a total of three USB-C ports on the device, two of which support Thunderbolt 4 and one that is limited to just USB 3.2 Gen 2. All ports carry a DisplayPort signal, and the rear Thunderbolt 4 port also supports Power Delivery for charging the battery with a USB-C power supply, which has to be rated at 45 W or more. The included Aero hub adds additional more common ports, such as HDMI, Mini DisplayPort, USB-A, and Ethernet.
Communication
The built-in AX210 Wi-Fi modem is made by Intel and supports 802.11a/b/g/n/ac/ax. Its data transfer rates were very good overall under ideal conditions (no other Wi-Fi devices nearby, close distance between notebook and server).
| Networking | |
| iperf3 receive AXE11000 | |
| Average of class Multimedia (682 - 1818, n=61, last 2 years) | |
| Gigabyte Aero 16 YE5 | |
| iperf3 transmit AXE11000 | |
| Average of class Multimedia (606 - 1978, n=61, last 2 years) | |
| Gigabyte Aero 16 YE5 | |
Webcam
The 0.9 MP webcam runs at a resolution of 1280 x 720 and is not particularly color accurate with a DeltaE deviation of 9. Ideally, we would want to see less than 3.


Accessories
In addition to the usual paperwork (quick start guide, warranty information booklet) the device also comes with a USB-C hub.
Maintenance
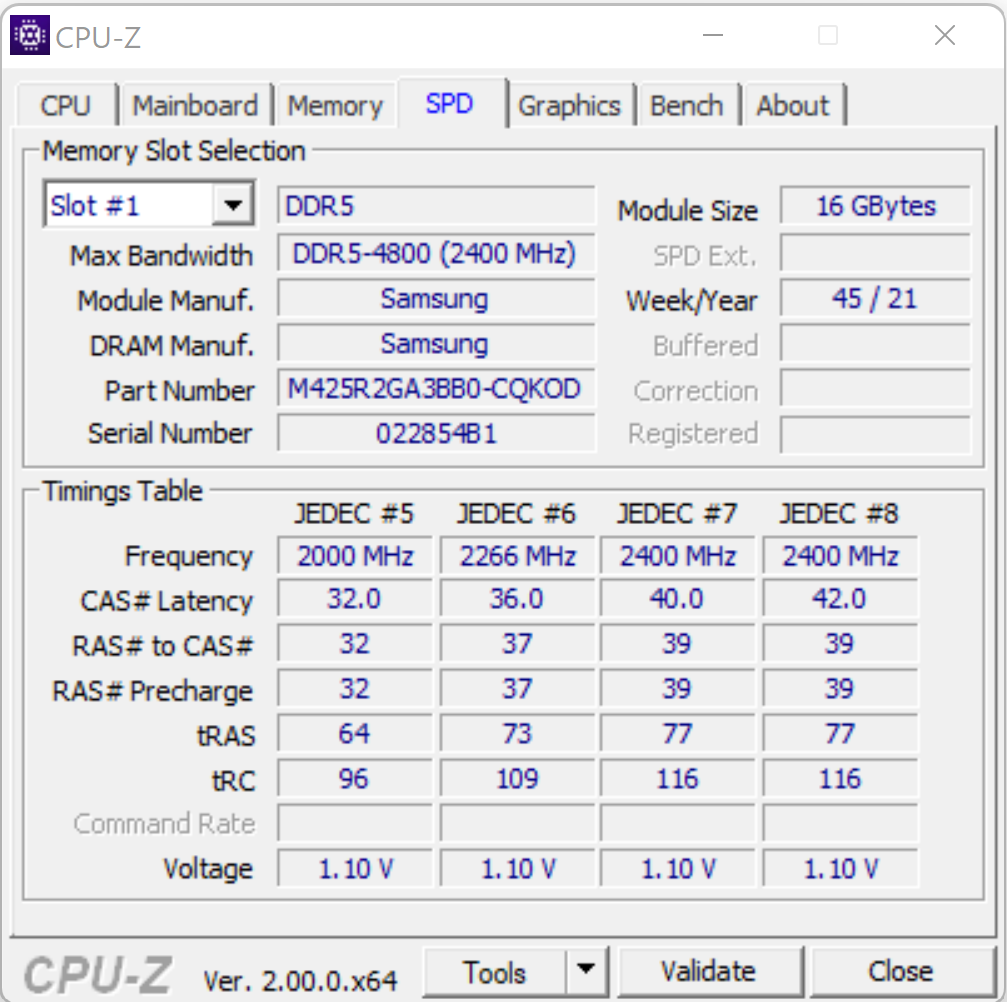
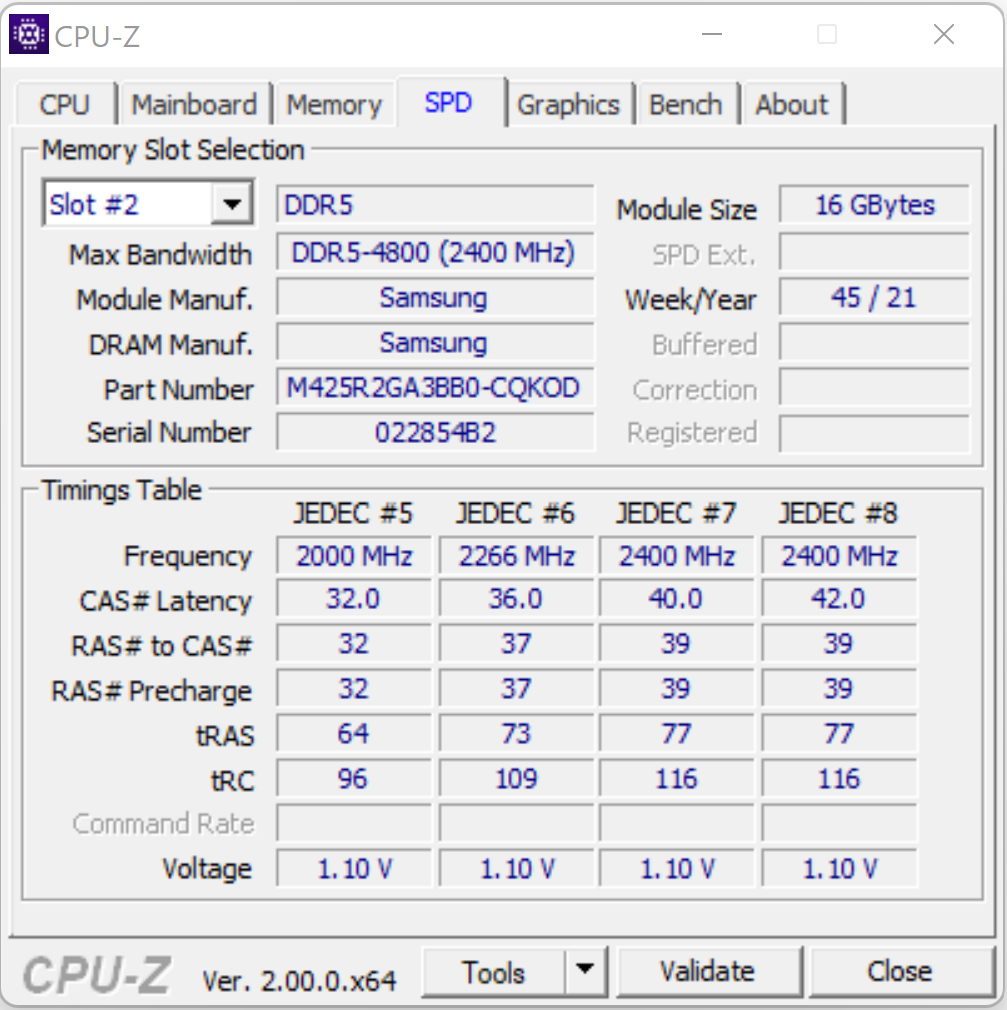
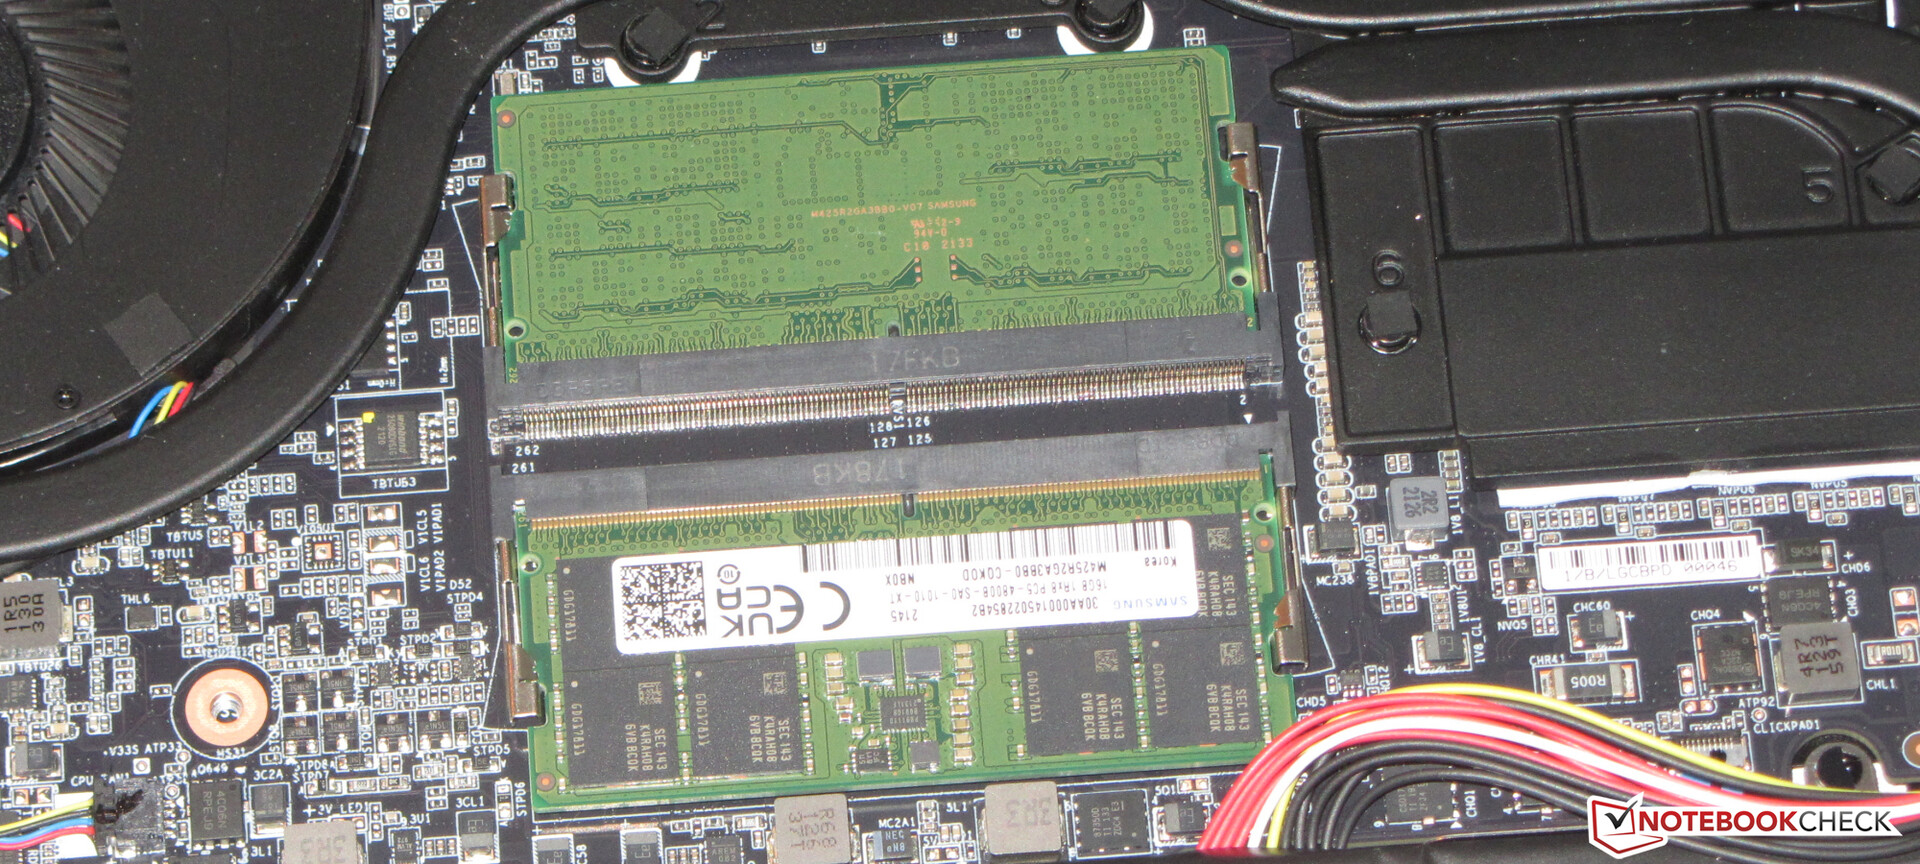
Maintenance and upgrades are comparatively easy to perform. After undoing every screw at the bottom the cover can be easily removed with a small spudger. Once removed you have access to both SSDs, the Wi-Fi modem, the RAM, and the fans.
Warranty
As usual European customers get two years of limited warranty while US customers are once again limited to just 12 months. Gigabyte does not offer any warranty extensions.
Input Devices – Gigabyte Laptop with Backlit Keyboard
Keyboard
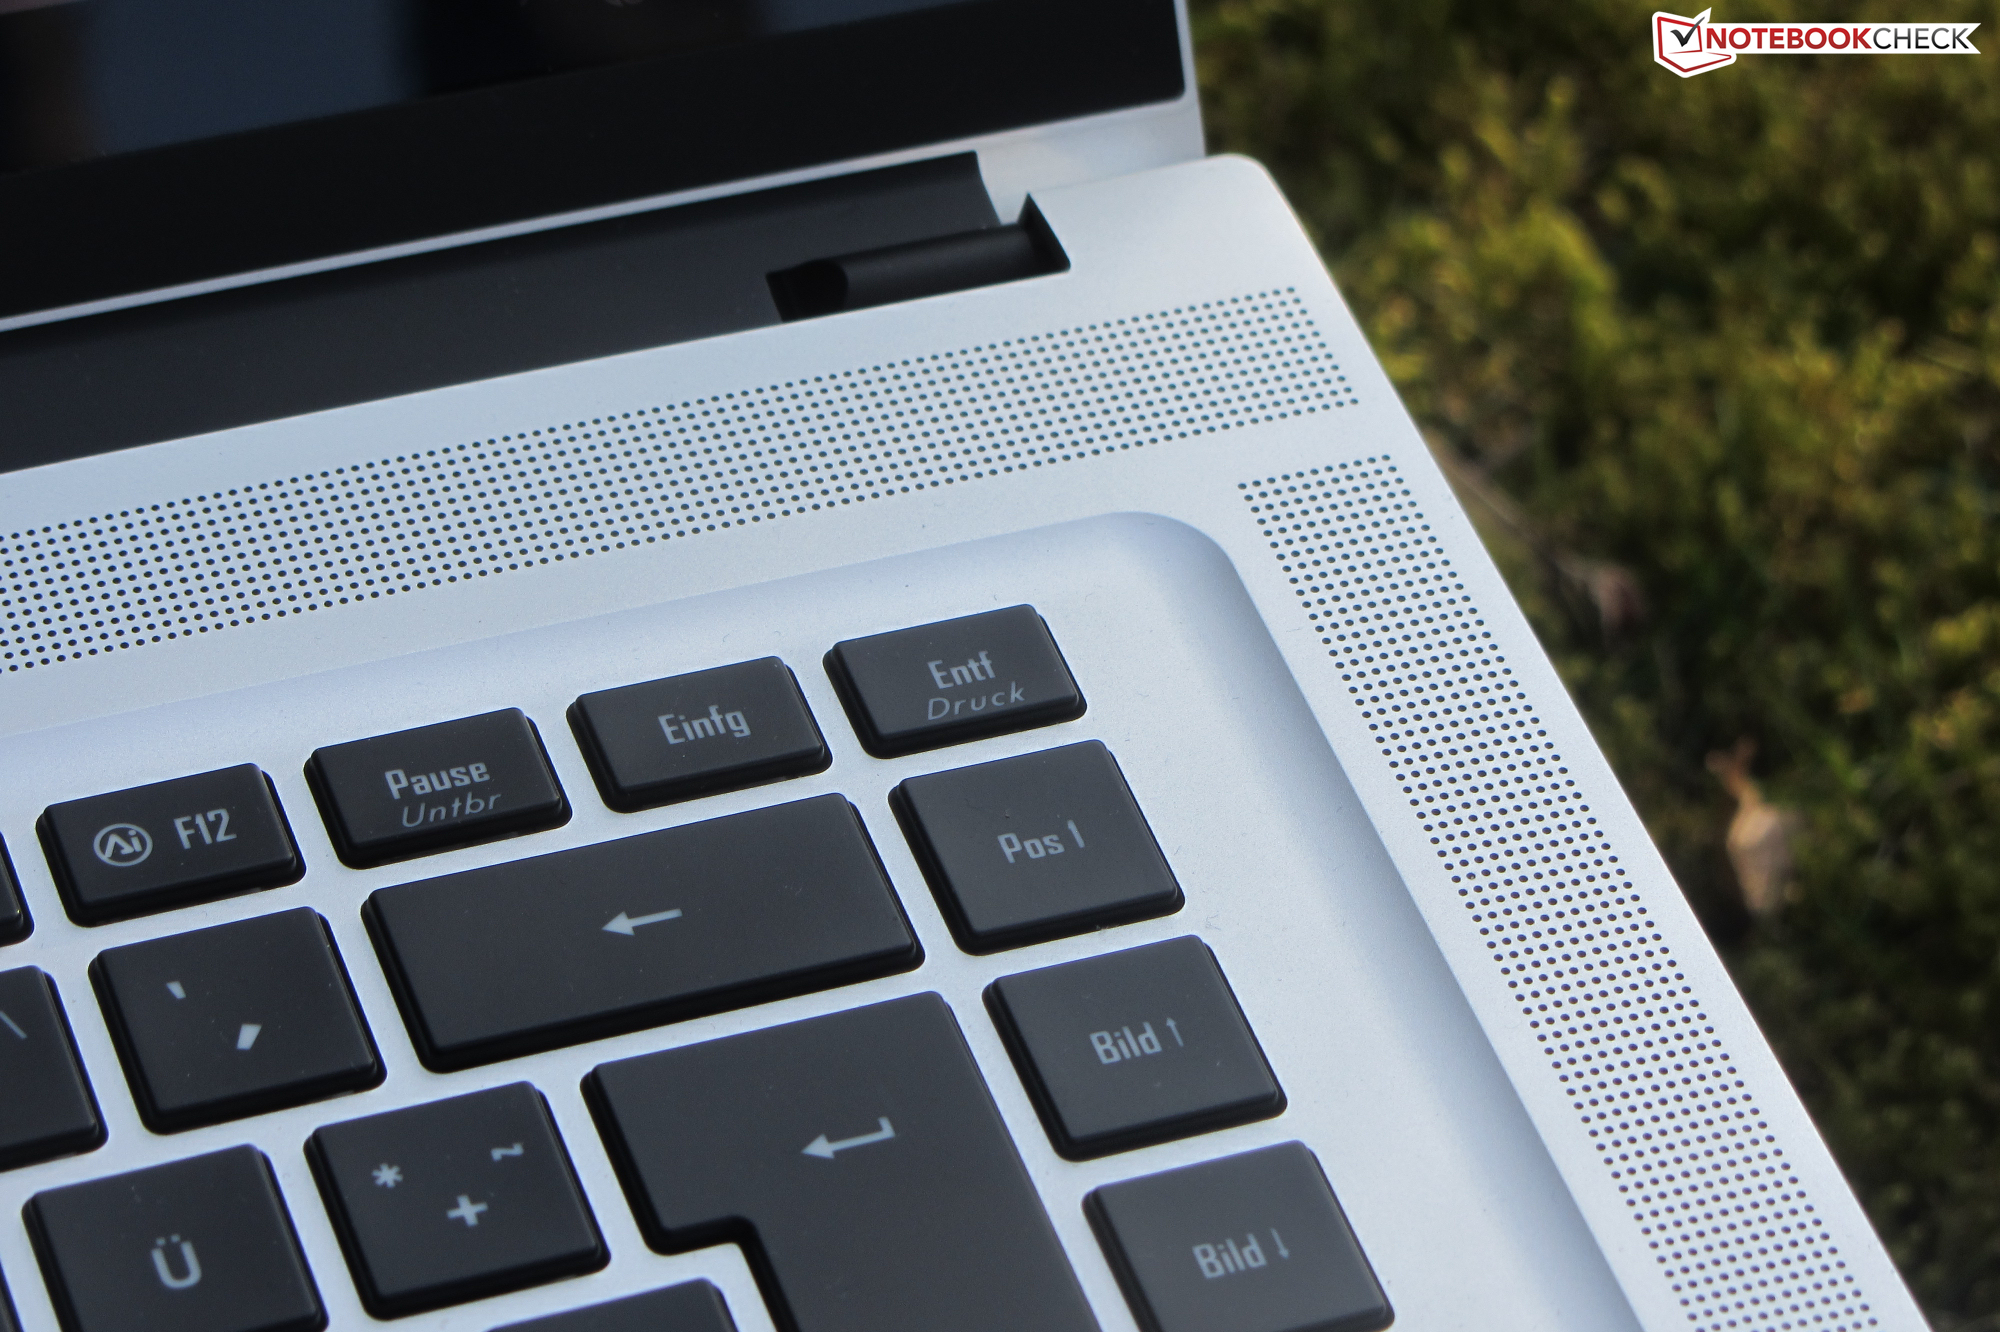
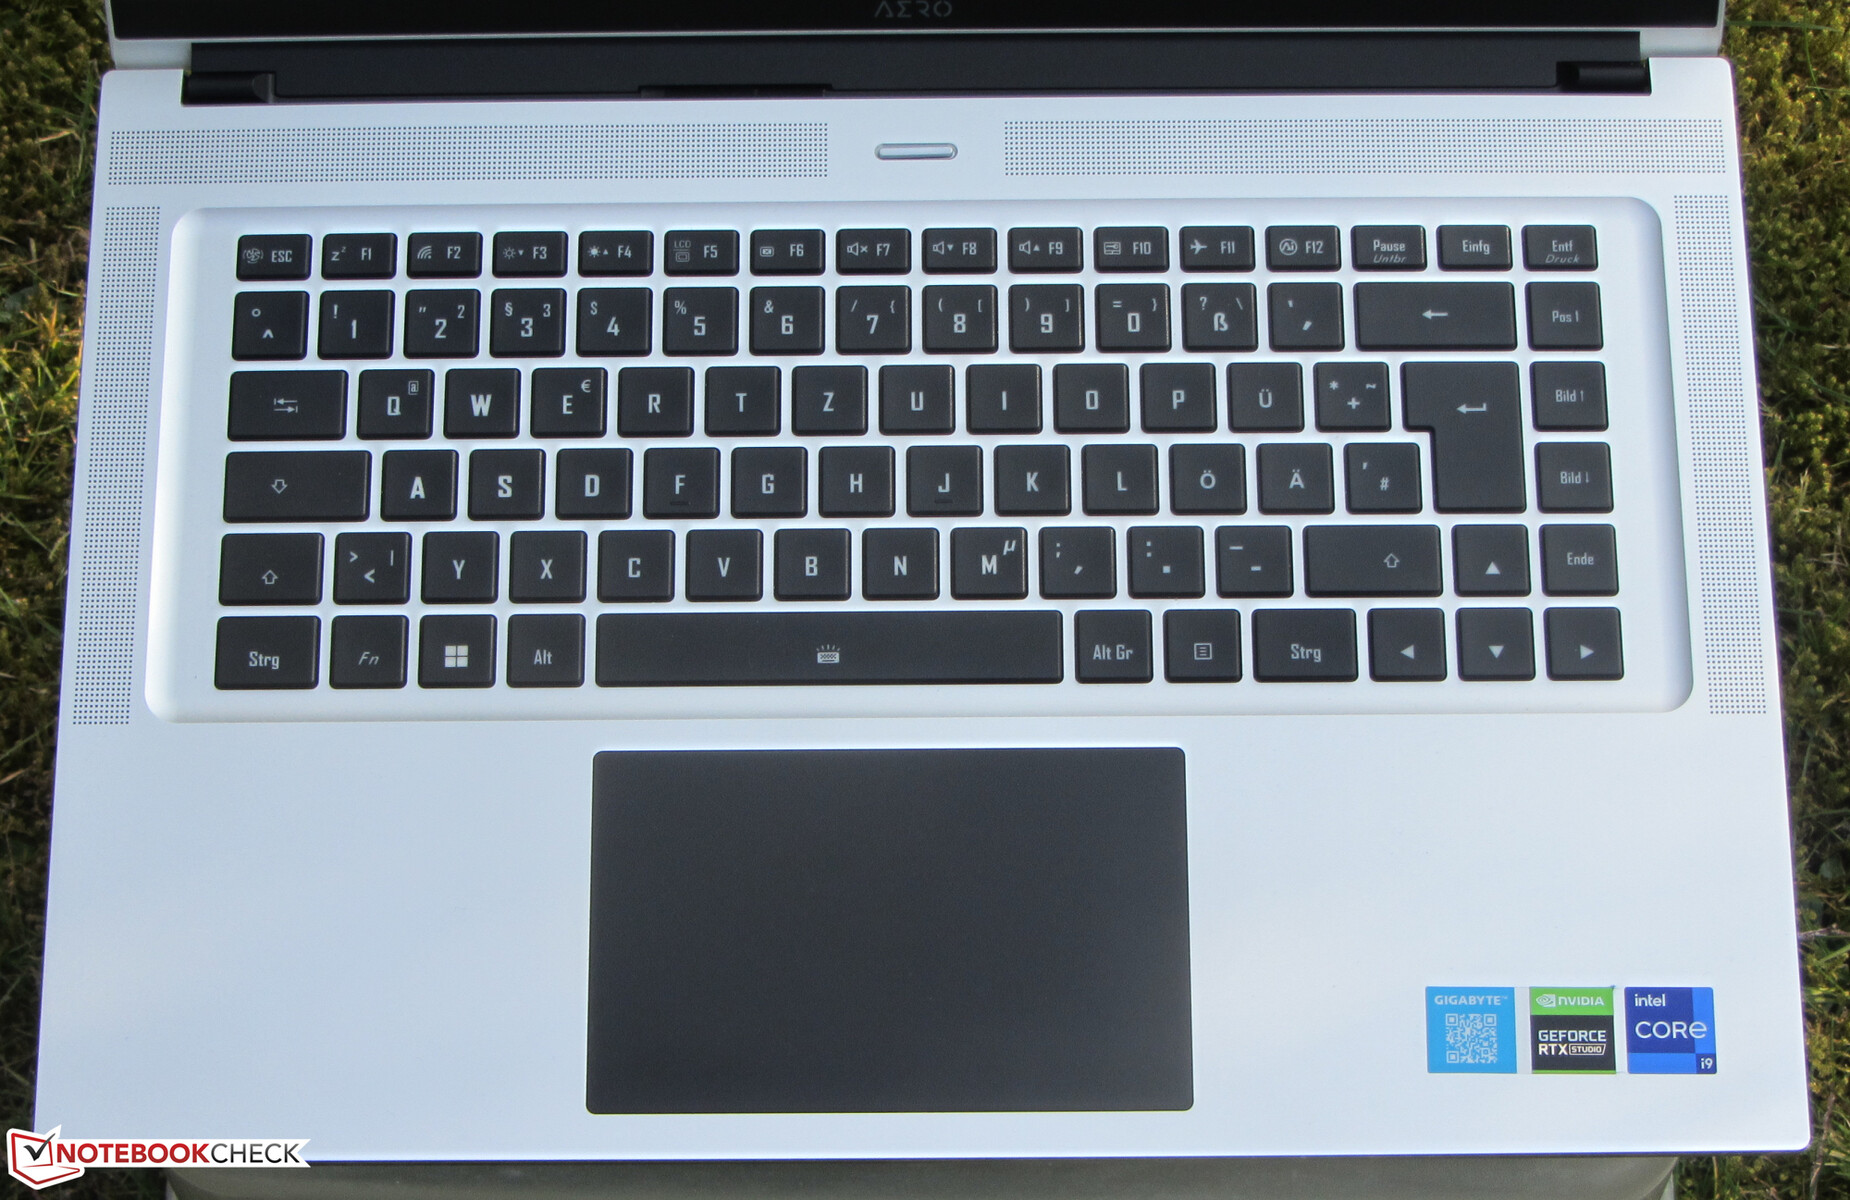
The backlit chiclet keyboard is fairly smooth with moderate key travel and clear accentuation points with decent feedback and resistance. The keyboard does not flex while typing. The two-stage backlight is controlled by a function key. All things considered this Gigabyte keyboard is decent for everyday use.
Touchpad
The multi-touch touchpad (12.1 x 7.6 cm/4.8 x 3 inches) is very smooth for great usability. It detects user input up to its very edges, and its integrated buttons feature a rather shallow travel with a clear accentuation point.
Display – Deep Blacks Thanks to OLED
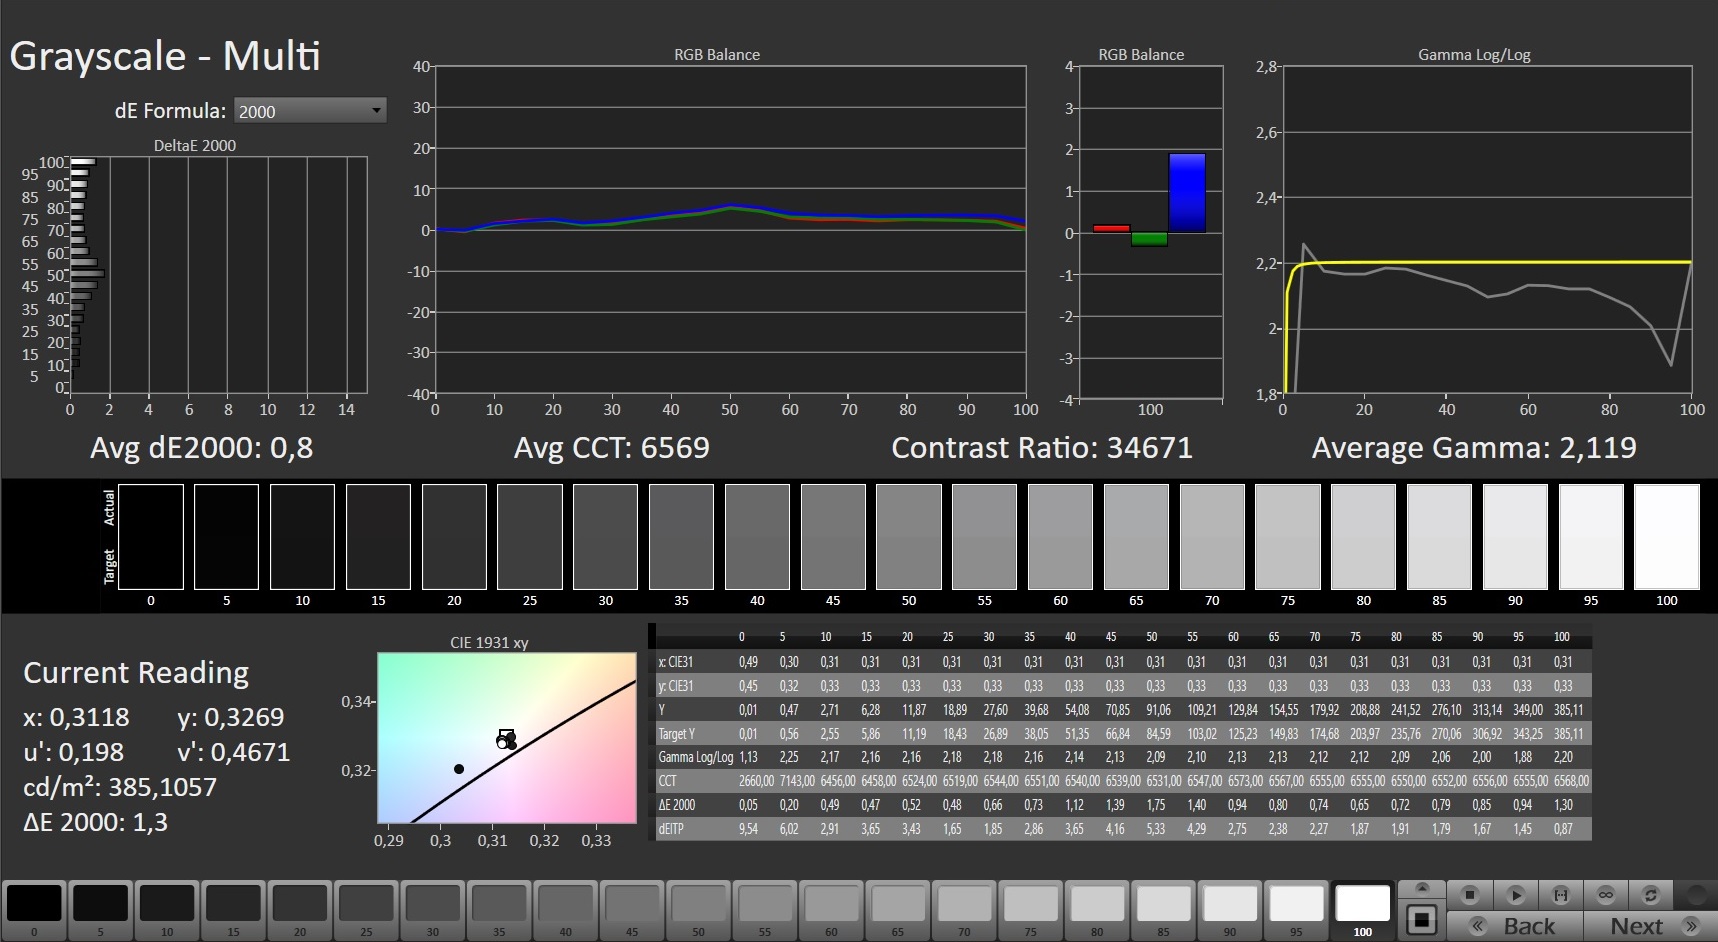
The Aero 16 comes with a reflective 16:10 16-inch 4K OLED display (3840 x 2400) with an excellent contrast ratio of 36,000:1, a black level of 0.01, and short response times. Its peak brightness of 367.6 nits is okay but nowhere near some of its competitors, such as the Macbook Pro 16.
At brightness levels of 58 % and below we found PWM flickering at 60 Hz, which increased to 240 Hz at brightness levels of less than 26 %. Sensitive users might suffer from headaches and eyestrain due to this low frequency.
| |||||||||||||||||||||||||
Brightness Distribution: 93 %
Center on Battery: 368 cd/m²
Contrast: 36800:1 (Black: 0.01 cd/m²)
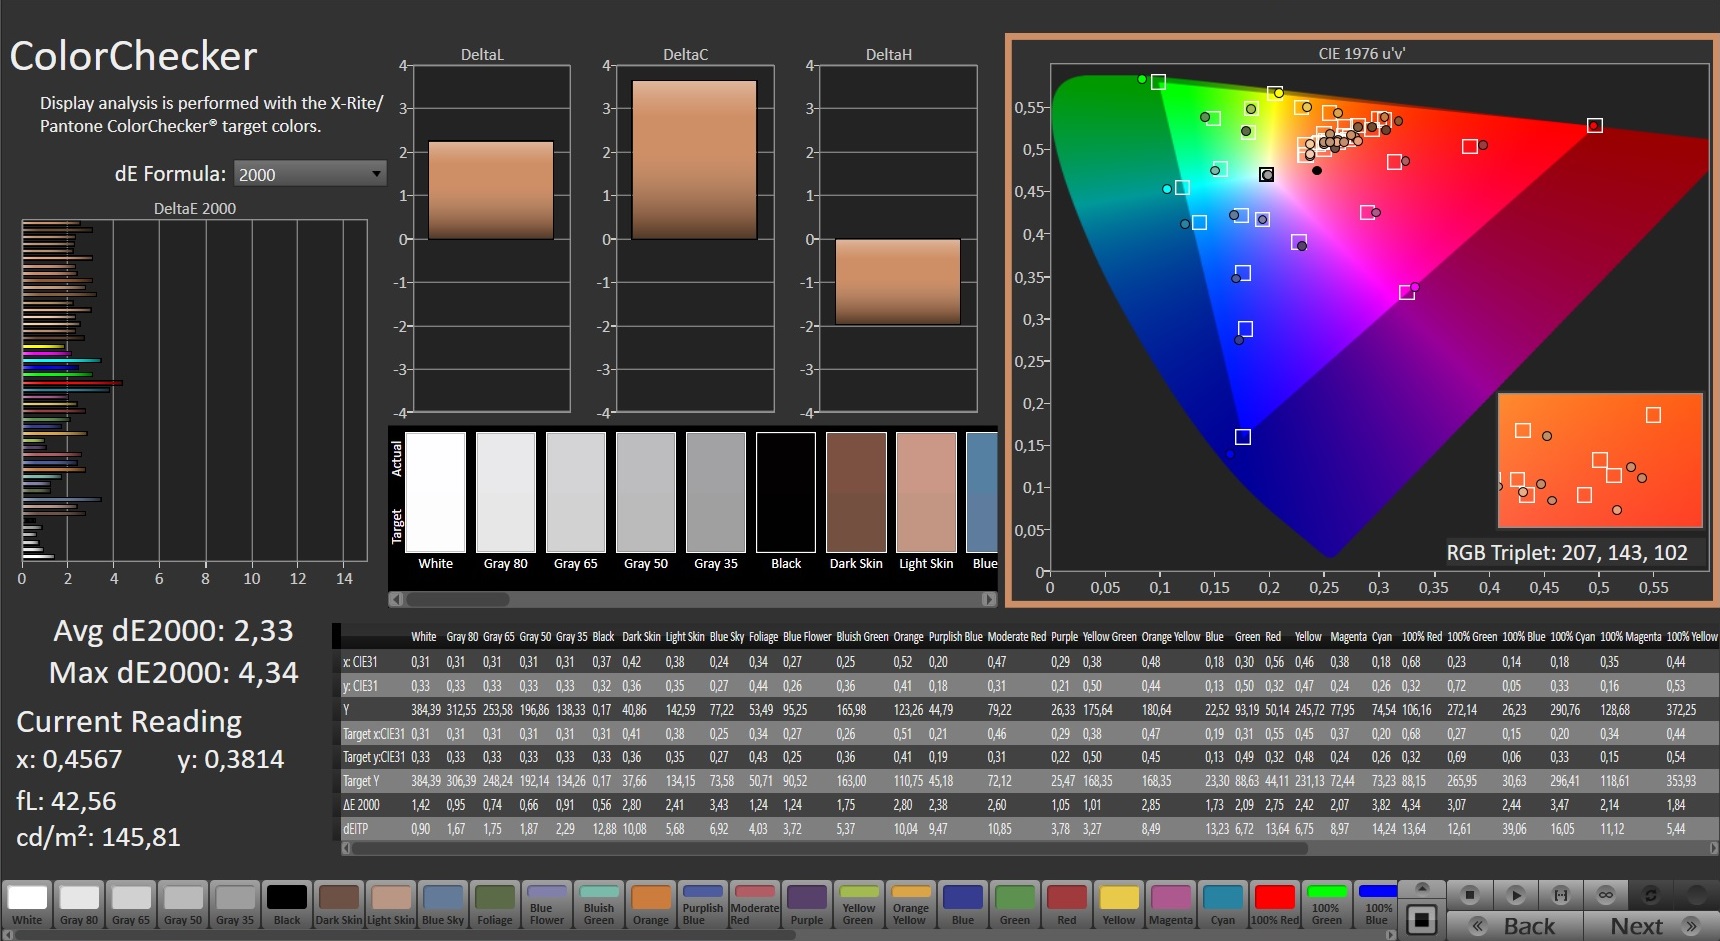
ΔE ColorChecker Calman: 2.33 | ∀{0.5-29.43 Ø4.73}
ΔE Greyscale Calman: 0.8 | ∀{0.09-98 Ø4.97}
Gamma: 2.119
CCT: 6569 K
| Gigabyte Aero 16 YE5 Samsung SDC416B, AMOLED, 3840x2400, 16" | Apple MacBook Pro 16 2021 M1 Max Mini-LED, 3456x2234, 16.2" | HP ZBook Studio 15 G8 SDC4145, OLED, 3840x2160, 15.6" | Schenker XMG Pro 15 (Late 2021) Samsung ATNA56WR14-0, OLED, 3840x2160, 15.6" | Razer Blade 15 2022 Sharp LQ156T1JW03, IPS, 2560x1440, 15.6" | Lenovo ThinkPad X1 Extreme G4-20Y5CTO1WW (3050 Ti) LP160UQ1-SPB1, IPS LED, 3840x2400, 16" | |
|---|---|---|---|---|---|---|
| Display | ||||||
| Display P3 Coverage (%) | 99.9 | 81.2 | 99.1 | 84.3 | ||
| sRGB Coverage (%) | 100 | 97.7 | 99.9 | 98.3 | ||
| AdobeRGB 1998 Coverage (%) | 95.3 | 89.1 | 86.8 | 97.8 | ||
| Response Times | -10% | -7% | -490% | -2200% | ||
| Response Time Grey 50% / Grey 80% * (ms) | 2.4 ? | 2.4 ? -0% | 3.2 ? -33% | 14.4 ? -500% | 60 ? -2400% | |
| Response Time Black / White * (ms) | 2 ? | 2.4 ? -20% | 1.6 ? 20% | 11.6 ? -480% | 42 ? -2000% | |
| PWM Frequency (Hz) | 60 ? | 240.4 ? | 60 ? | |||
| Screen | -21% | -70% | -58% | -328% | -587% | |
| Brightness middle (cd/m²) | 368 | 507 38% | 379.6 3% | 443 20% | 286 -22% | 639 74% |
| Brightness (cd/m²) | 368 | 494 34% | 380 3% | 434 18% | 271 -26% | 612 66% |
| Brightness Distribution (%) | 93 | 96 3% | 95 2% | 94 1% | 89 -4% | 84 -10% |
| Black Level * (cd/m²) | 0.01 | 0.02 -100% | 0.02 -100% | 0.25 -2400% | 0.47 -4600% | |
| Contrast (:1) | 36800 | 25350 -31% | 22150 -40% | 1144 -97% | 1360 -96% | |
| Colorchecker dE 2000 * | 2.33 | 1.4 40% | 5.15 -121% | 3.73 -60% | 2.74 -18% | 2.2 6% |
| Colorchecker dE 2000 max. * | 4.34 | 2.8 35% | 7.79 -79% | 8.12 -87% | 5.21 -20% | 5.3 -22% |
| Greyscale dE 2000 * | 0.8 | 2.3 -187% | 2.6 -225% | 2.5 -213% | 1.1 -38% | 1.7 -113% |
| Gamma | 2.119 104% | 2.27 97% | 1.99 111% | 2.001 110% | 2.2 100% | 2.31 95% |
| CCT | 6569 99% | 6792 96% | 6166 105% | 6522 100% | 6408 101% | 6390 102% |
| Colorchecker dE 2000 calibrated * | 3.1 | 2.52 | 1.4 | |||
| Total Average (Program / Settings) | -21% /
-21% | -40% /
-55% | -33% /
-47% | -409% /
-361% | -1394% /
-910% |
* ... smaller is better
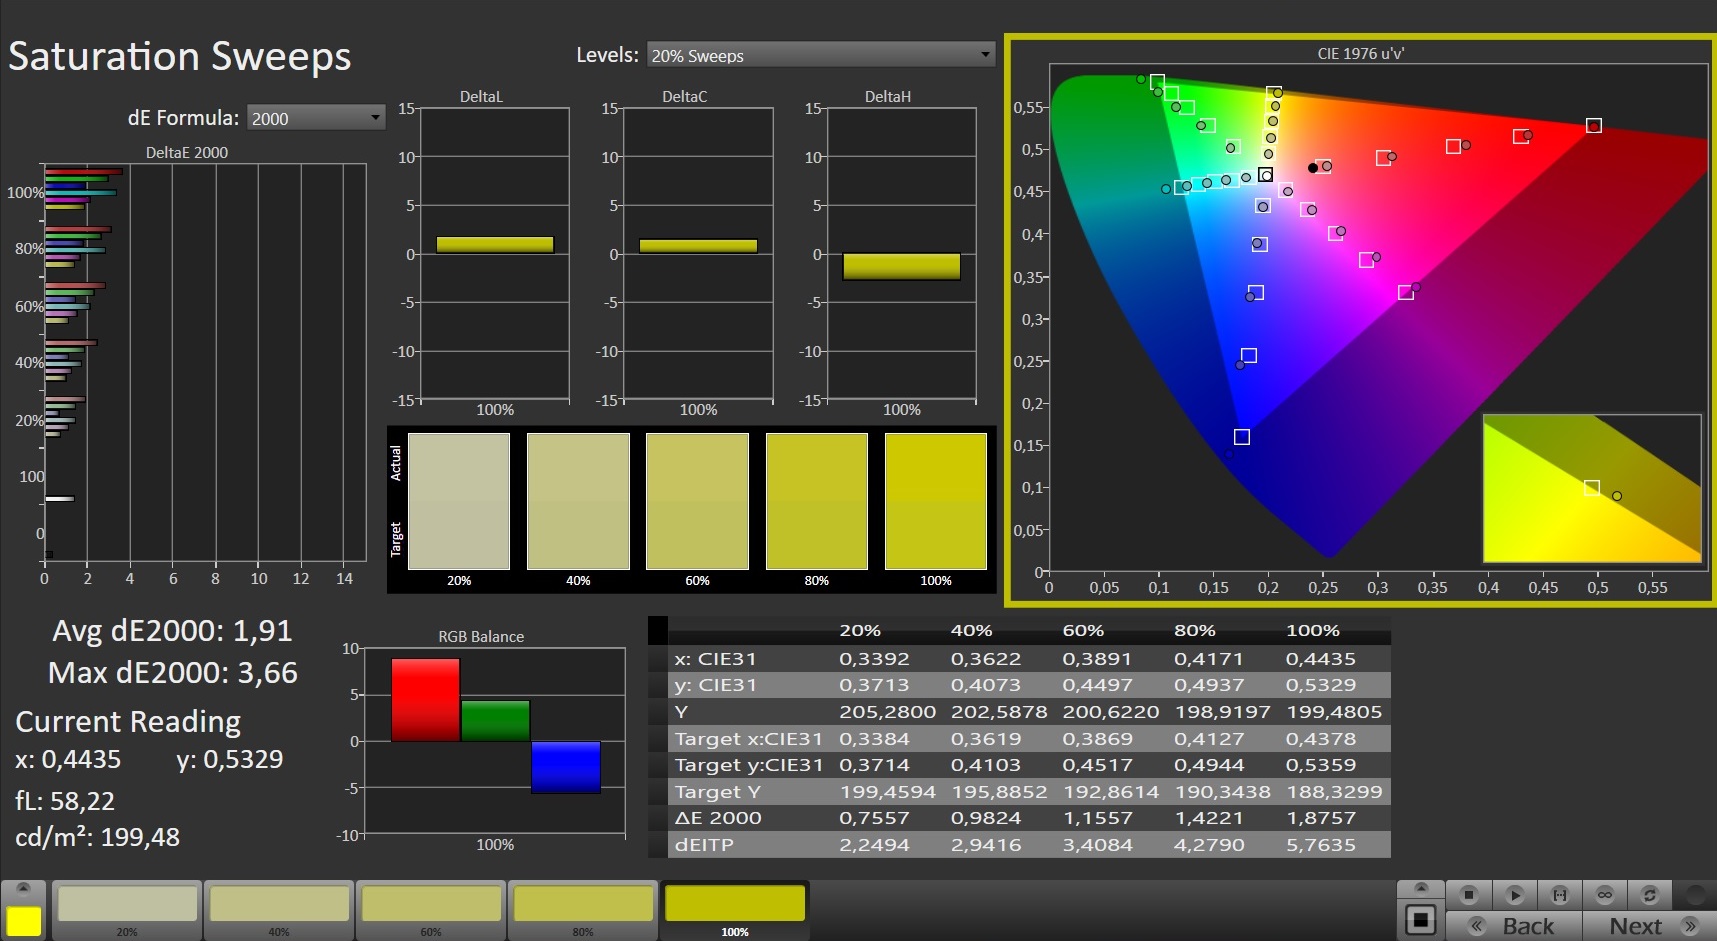
The display is X-Rite Pantone-certified to ensure natural color representation, and as expected color deviations were very minor and imperceptible out of the box. We also found no evidence of a blue tint. At this point during the review we would usually present you with and comment on our color space coverage readings. However, we have decided to hold these back for the time being as they differed immensely from Gigabyte’s official specs and we cannot rule out issues with our test equipment at this time.
Display Response Times
| ↔ Response Time Black to White | ||
|---|---|---|
| 2 ms ... rise ↗ and fall ↘ combined | ↗ 1 ms rise | 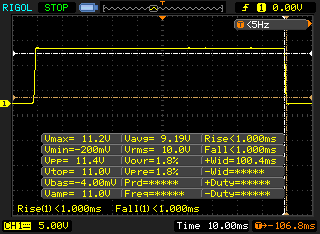 |
| ↘ 1 ms fall | ||
| The screen shows very fast response rates in our tests and should be very well suited for fast-paced gaming. In comparison, all tested devices range from 0.1 (minimum) to 240 (maximum) ms. » 11 % of all devices are better. This means that the measured response time is better than the average of all tested devices (19.9 ms). | ||
| ↔ Response Time 50% Grey to 80% Grey | ||
| 2.4 ms ... rise ↗ and fall ↘ combined | ↗ 1.2 ms rise | 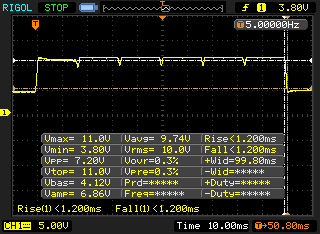 |
| ↘ 1.2 ms fall | ||
| The screen shows very fast response rates in our tests and should be very well suited for fast-paced gaming. In comparison, all tested devices range from 0.165 (minimum) to 636 (maximum) ms. » 11 % of all devices are better. This means that the measured response time is better than the average of all tested devices (31.1 ms). | ||
Screen Flickering / PWM (Pulse-Width Modulation)
| Screen flickering / PWM detected | 60 Hz | ≤ 58 % brightness setting | 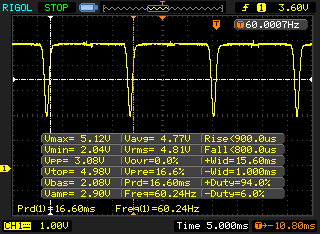 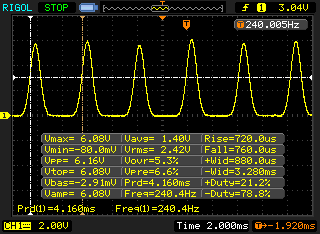 |
The display backlight flickers at 60 Hz (worst case, e.g., utilizing PWM) Flickering detected at a brightness setting of 58 % and below. There should be no flickering or PWM above this brightness setting. The frequency of 60 Hz is very low, so the flickering may cause eyestrain and headaches after extended use. In comparison: 52 % of all tested devices do not use PWM to dim the display. If PWM was detected, an average of 7801 (minimum: 5 - maximum: 343500) Hz was measured. | |||
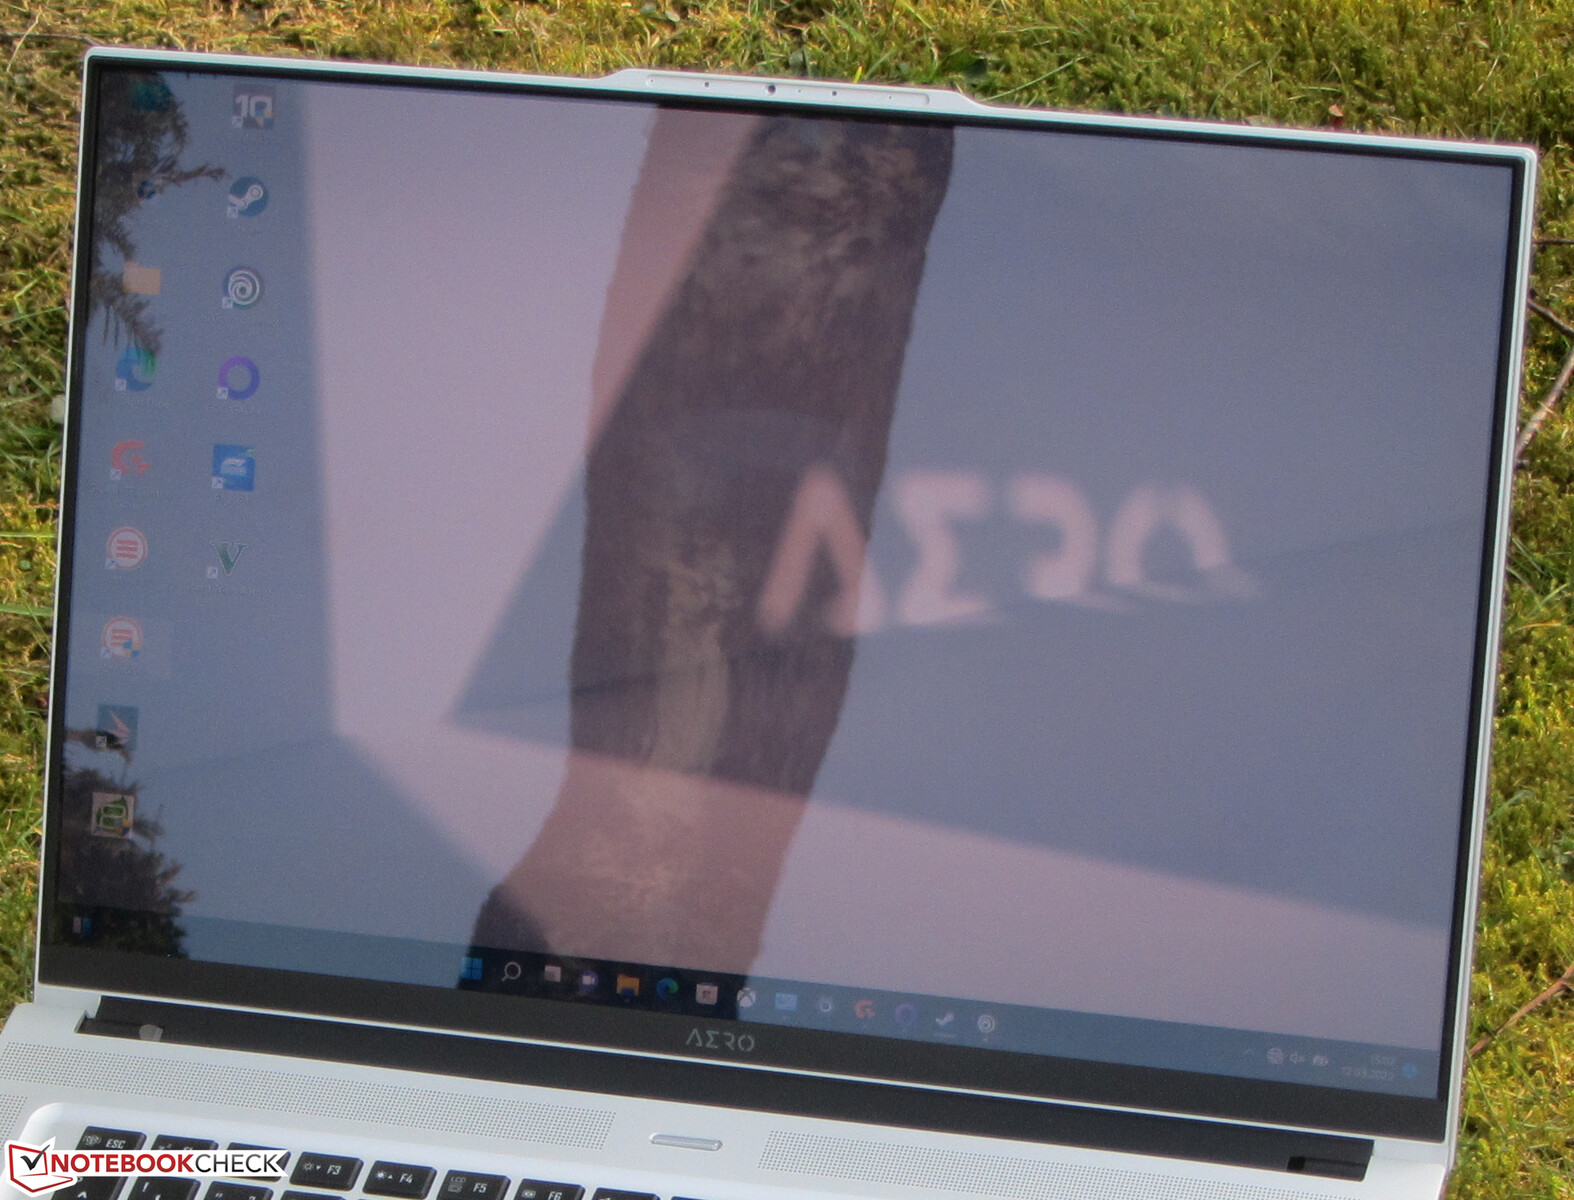
The panel offers very wide viewing angles and is easily readable from every position. Outdoors, we found the reflective coating to impede usability drastically.

Performance – A Gigabyte Laptop with Cutting Edge Performance
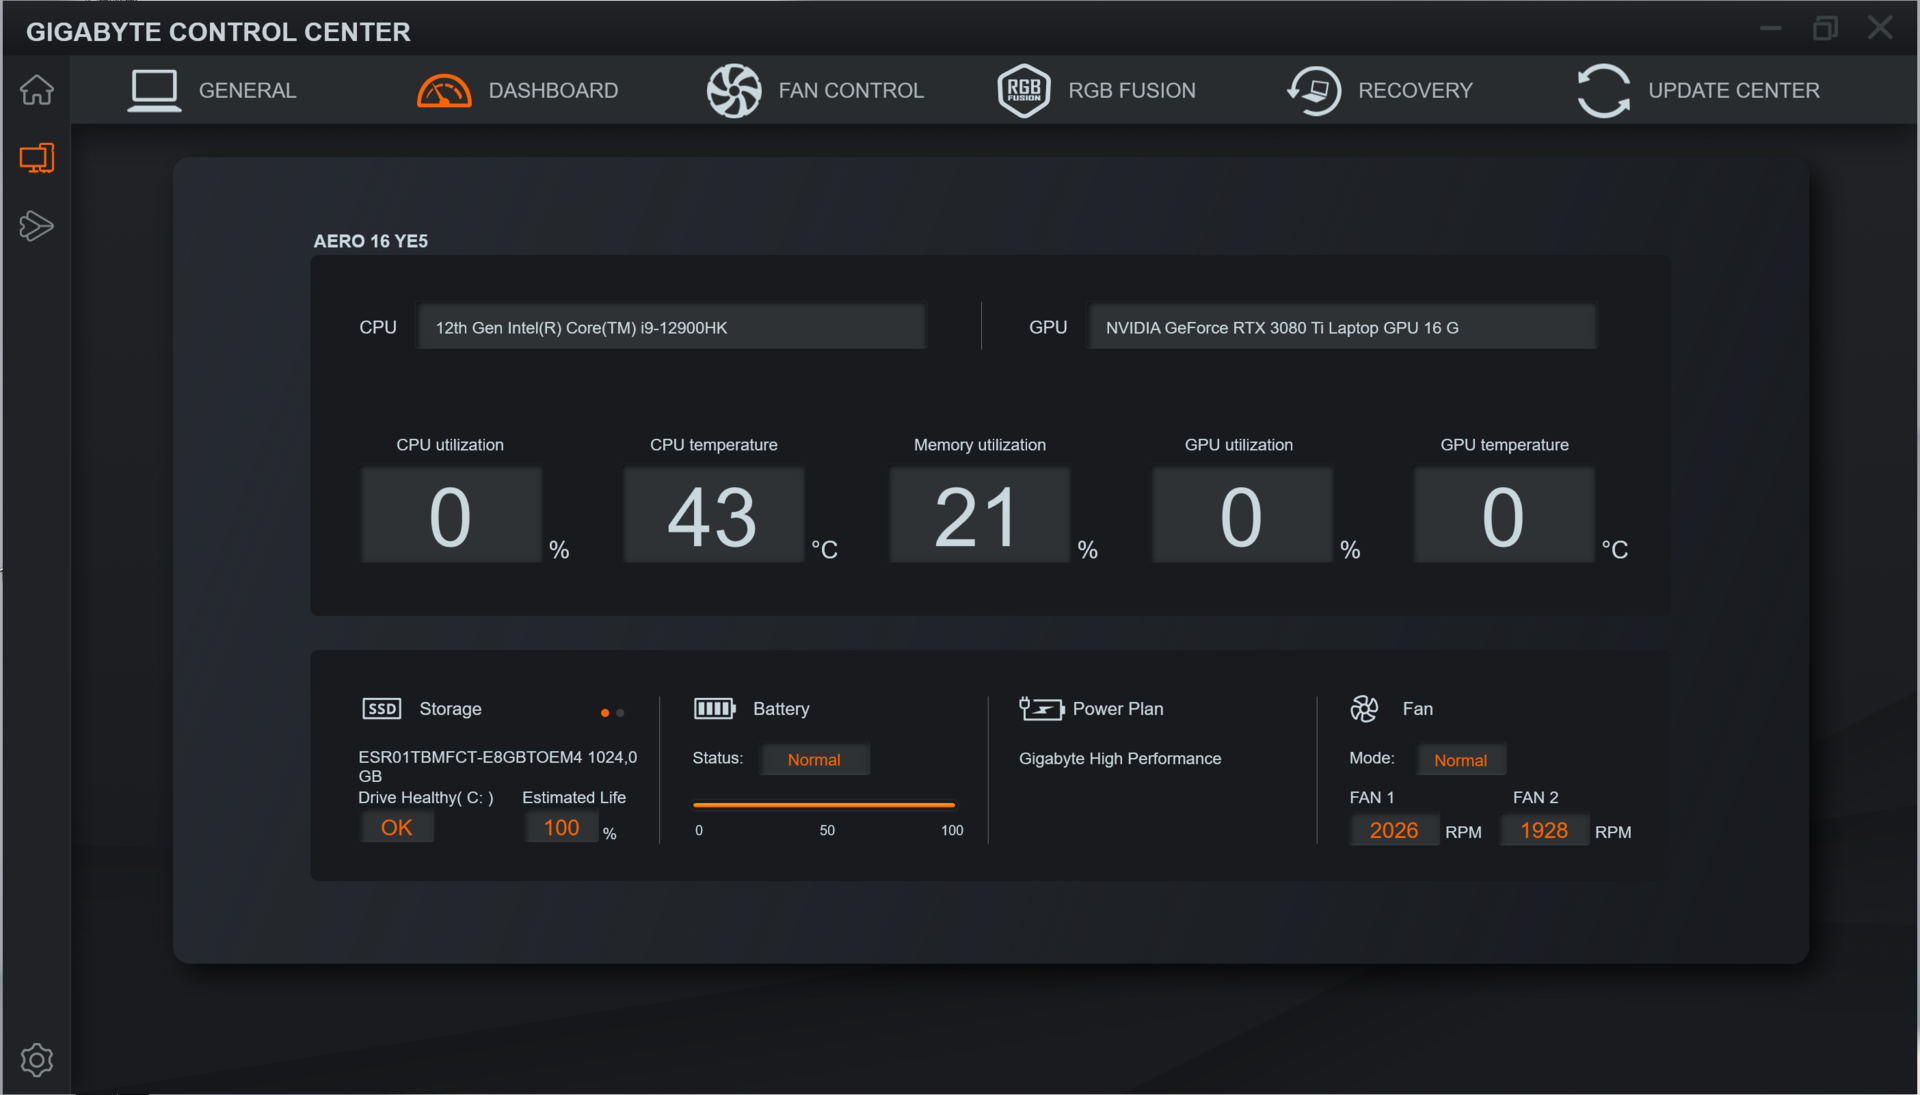
The Gigabyte Aero 16 is a powerful compact 16-inch notebook with highly versatile usability in all areas. Its GeForce RTX Studio certification ensures high performance, optimized drivers, good software compatibility, and a high color space coverage.
Test Conditions
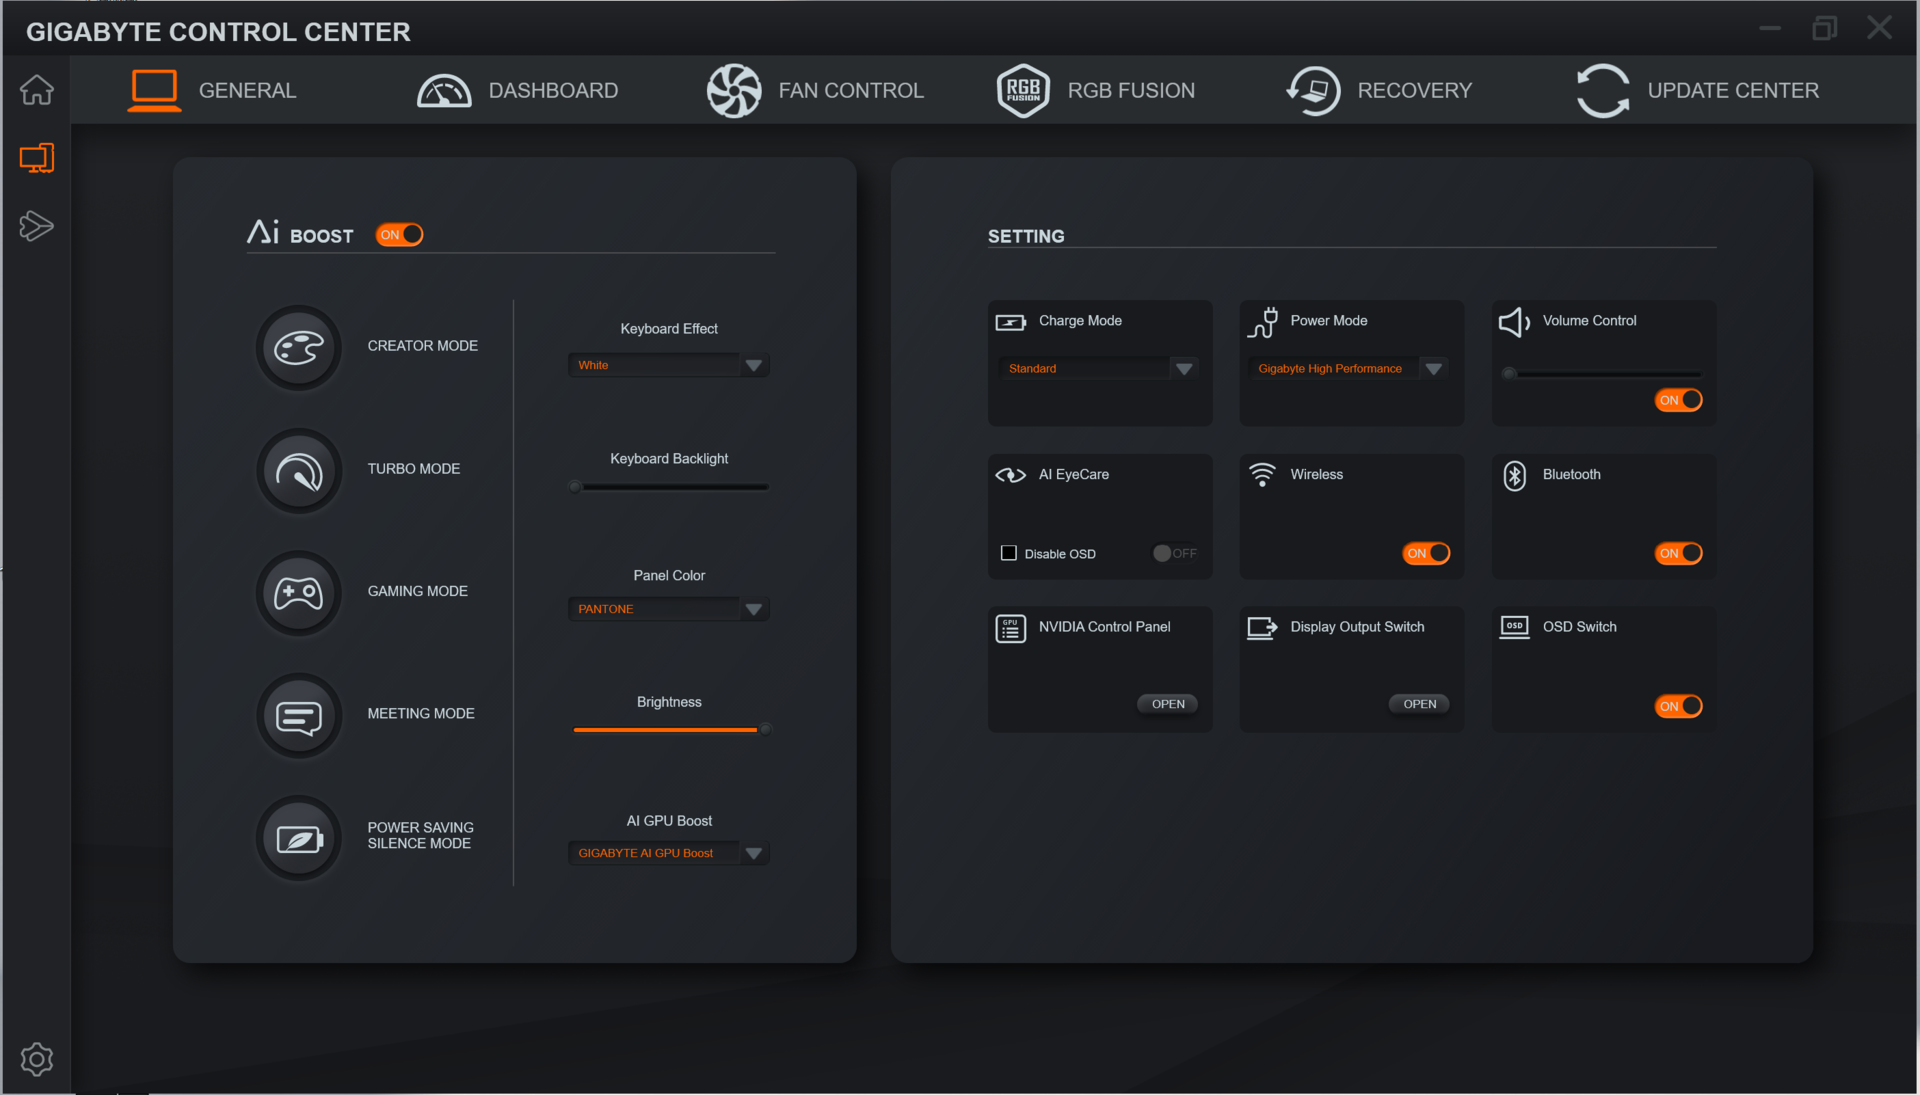
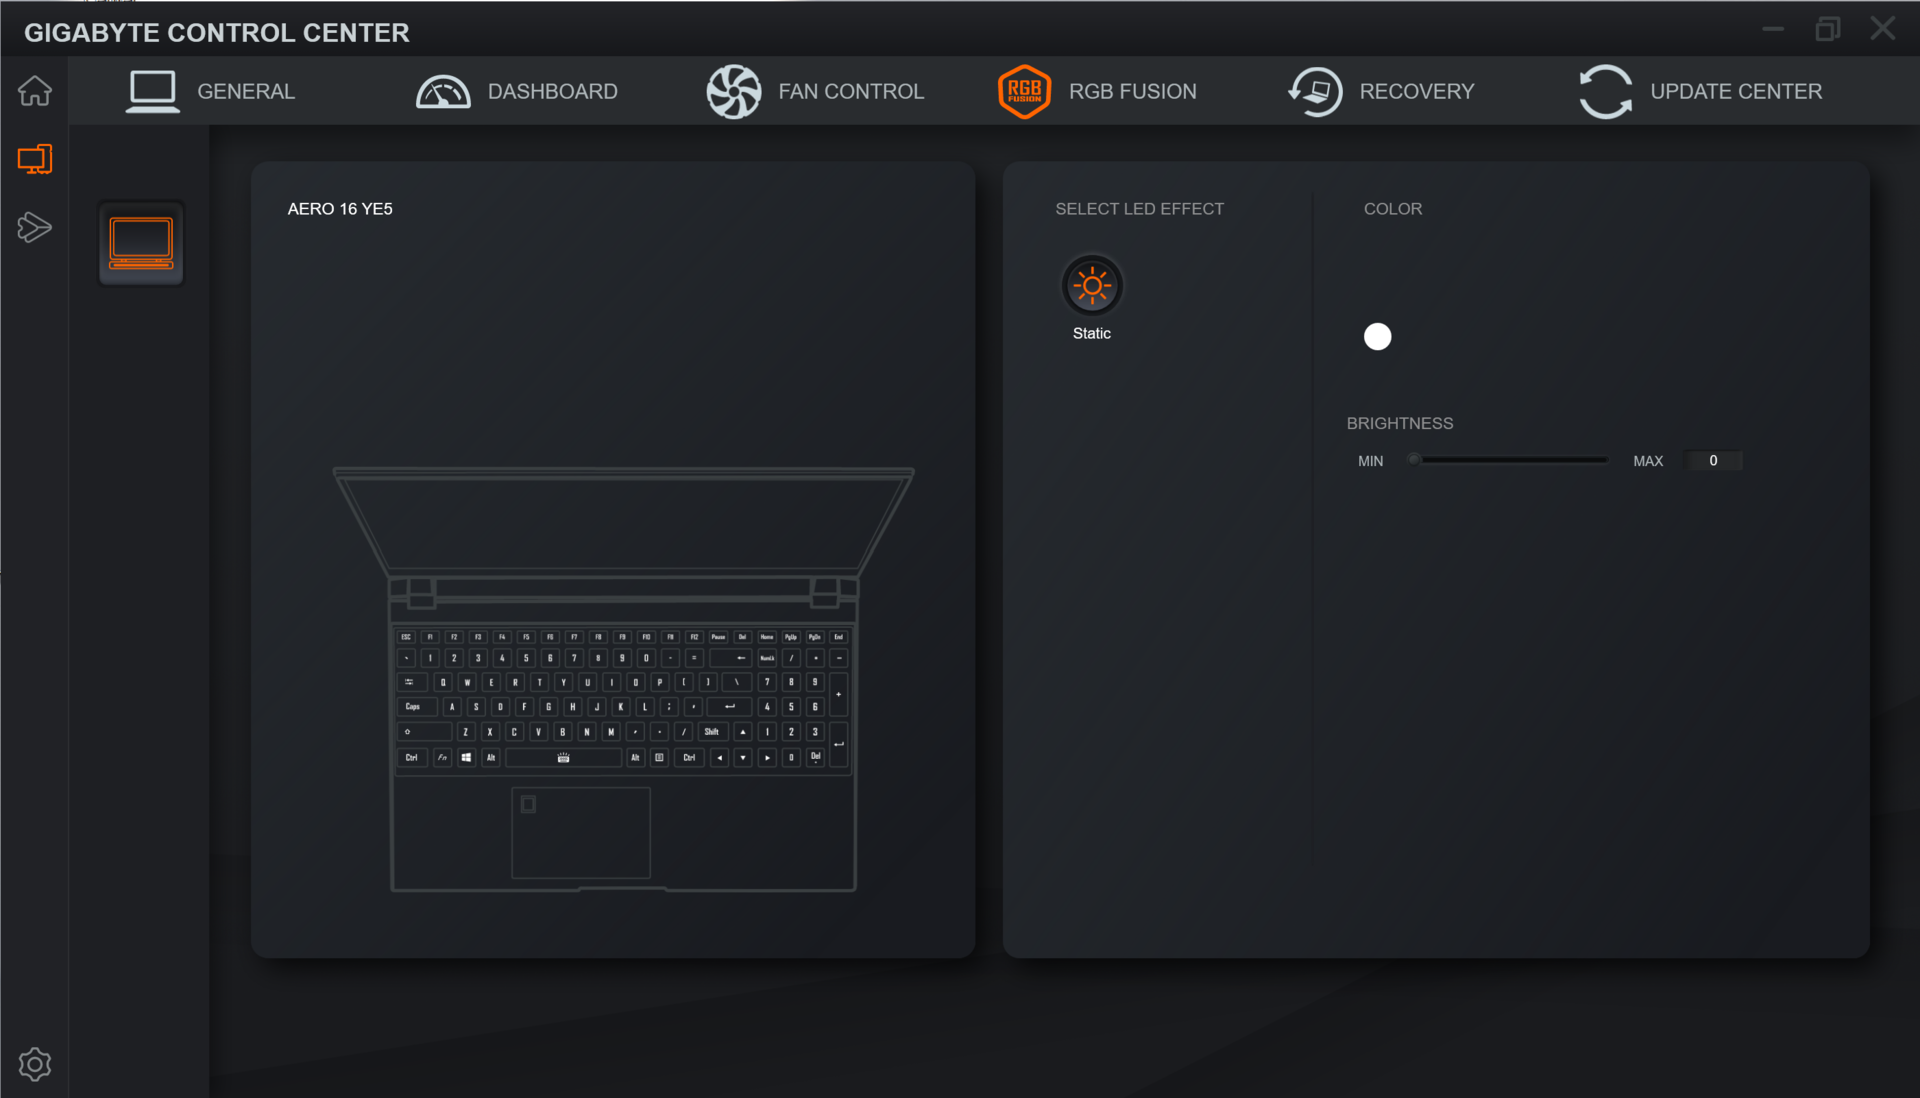
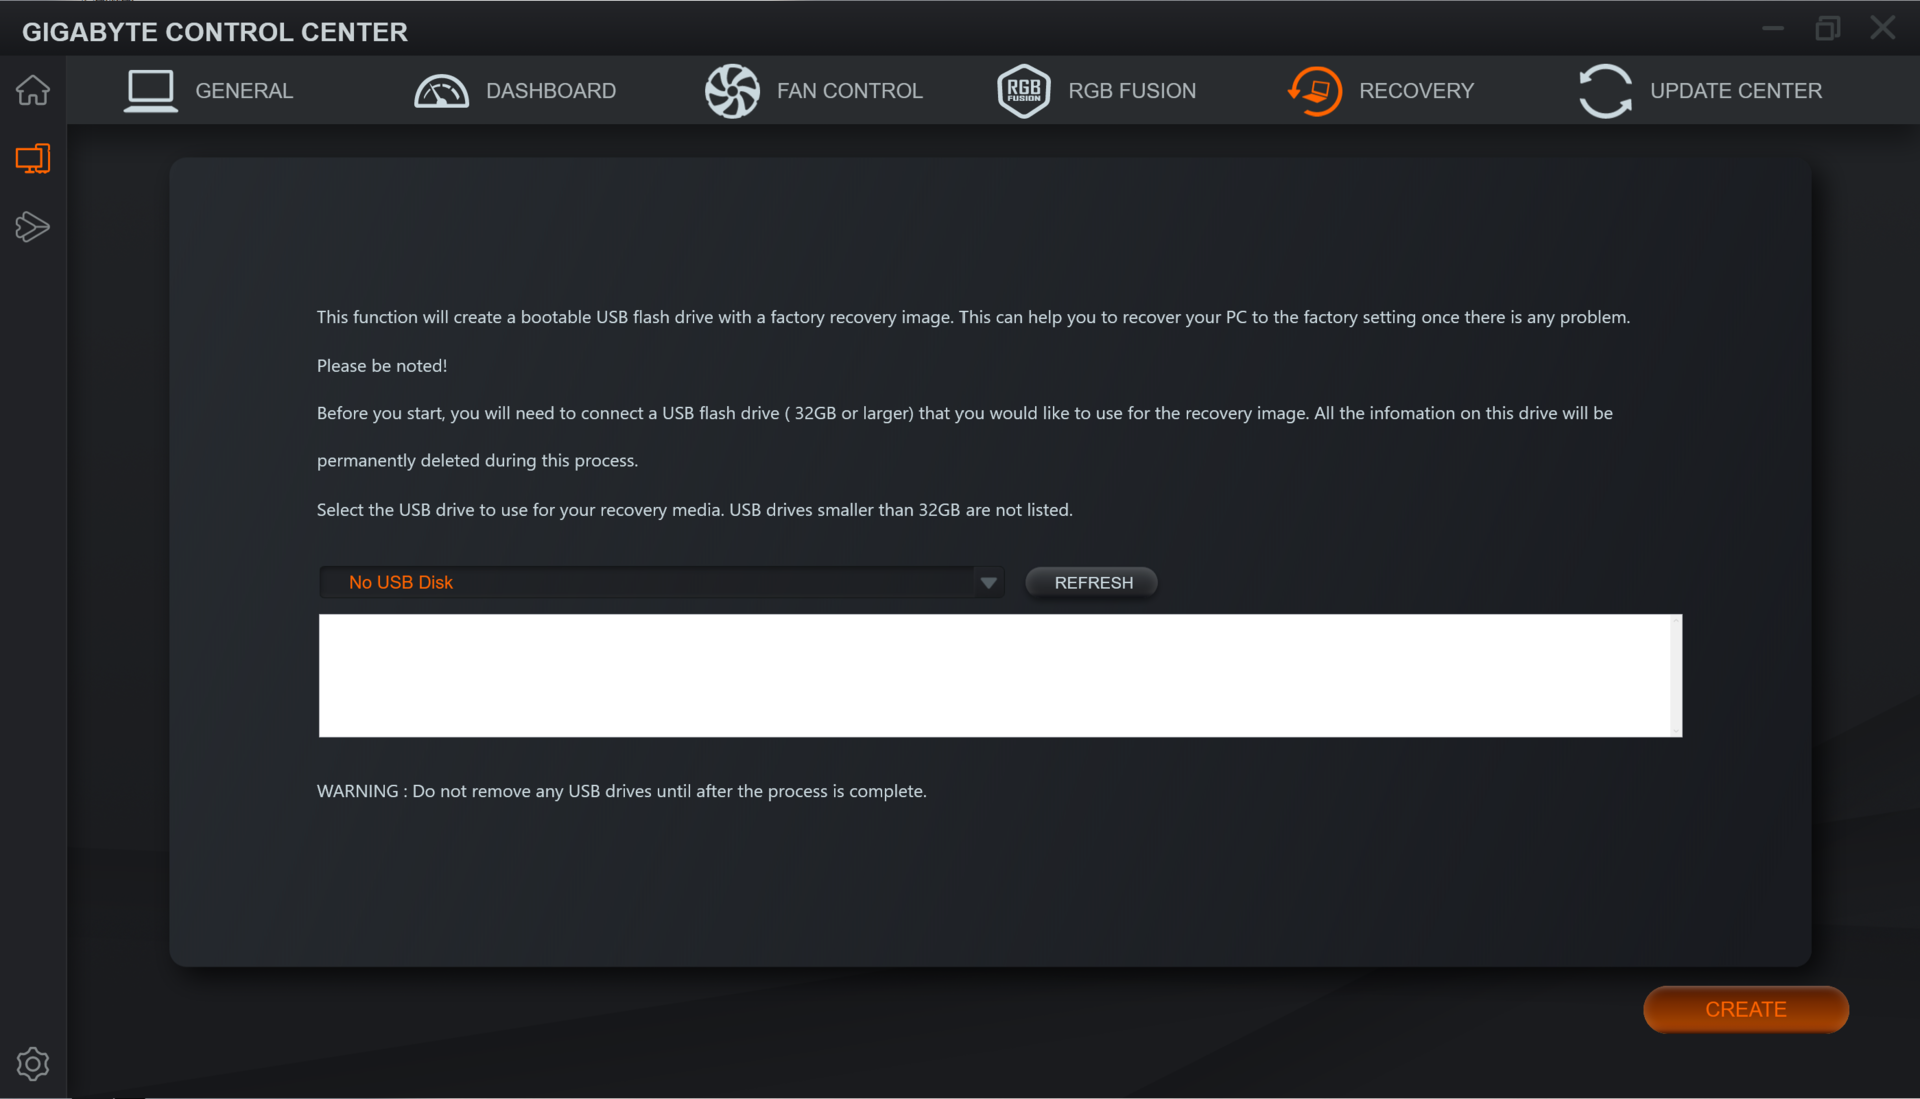
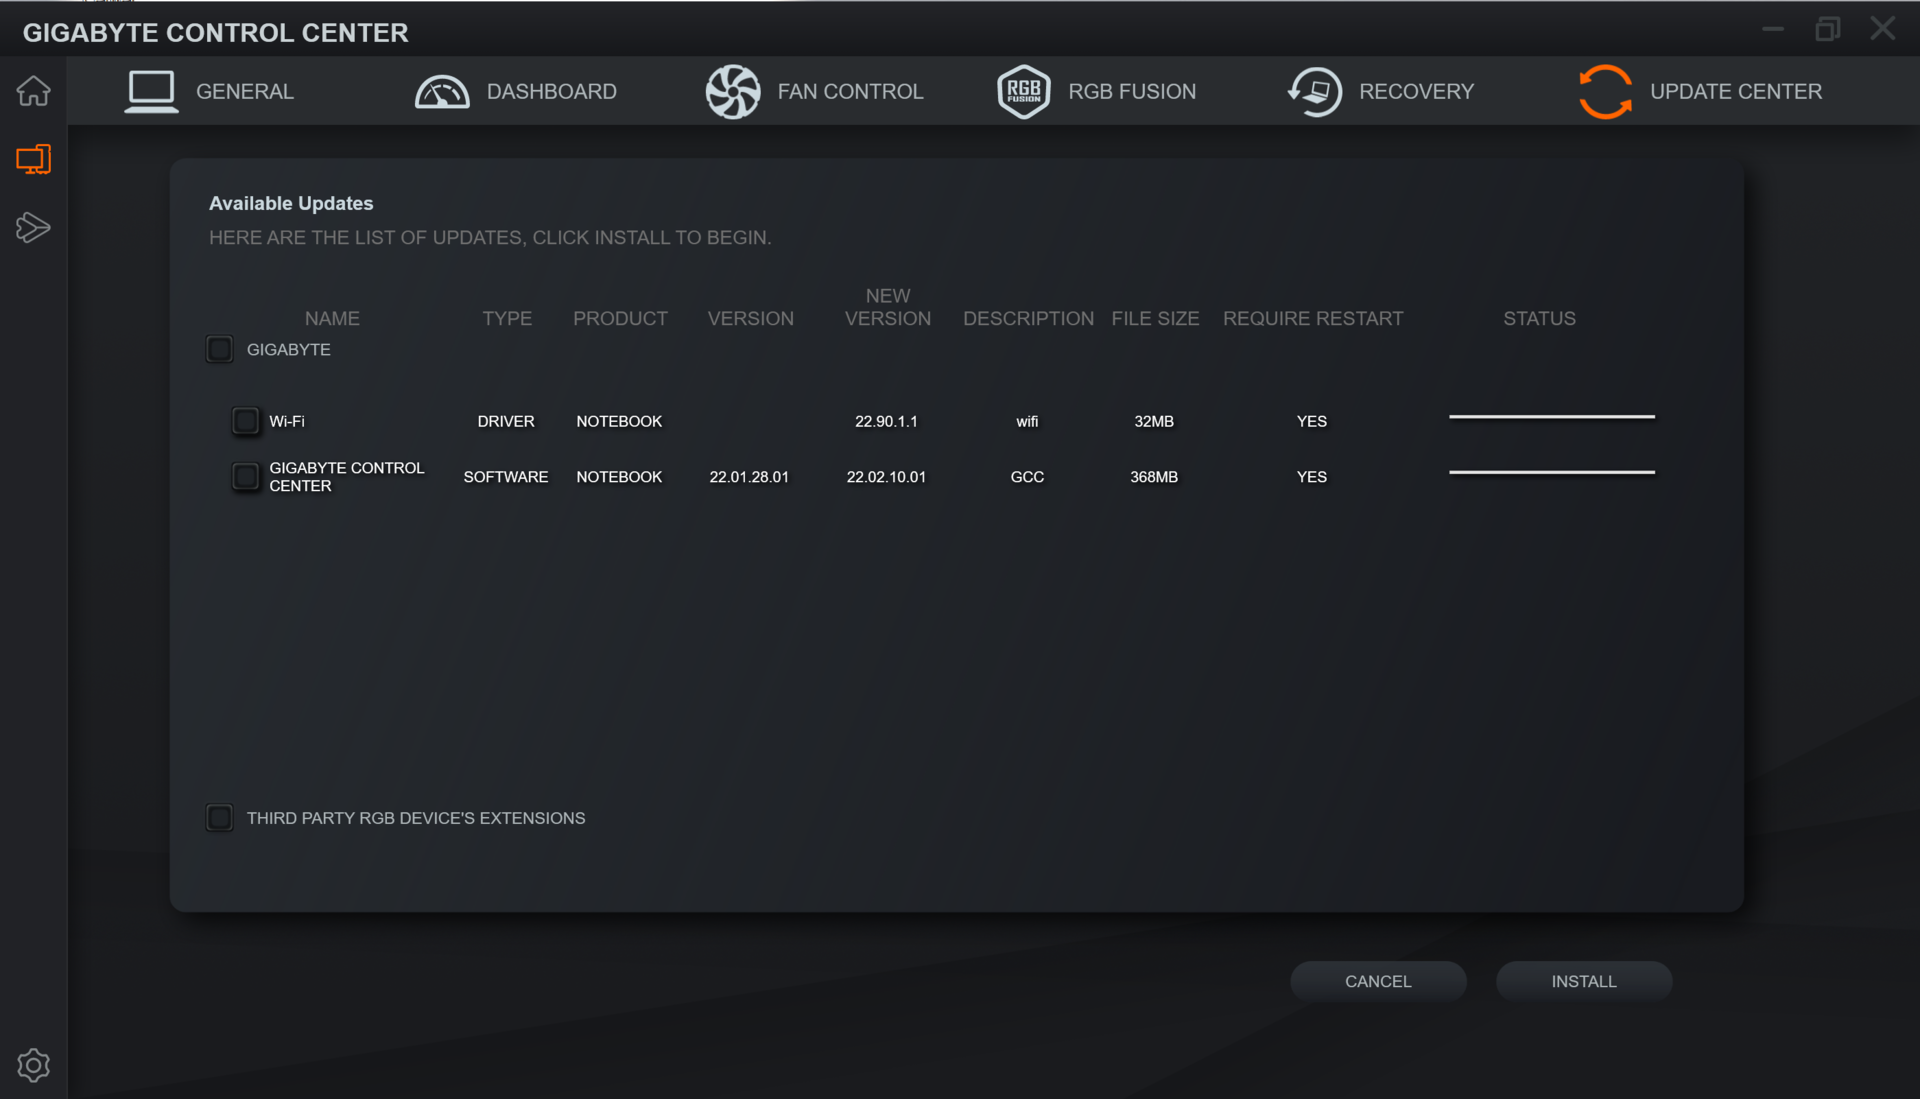
The device comes with the Gigabyte Control Center preloaded, which offers various performance profiles. These not only affect CPU and GPU performance but also brightness and the display’s color temperature. We decided to entrust our fate to the included AI mode allowing Control Center to make that decision and choose the best profile for us.
In addition, we ran some benchmarks with “Power Saving Silence Mode” and “Turbo Mode” enabled manually. The latter is not particularly well suited for long periods of time as it ramps up the fans to their maximum speed instantaneously and permanently.
| Creator Mode | Turbo Mode | Gaming Mode | Meeting Mode | Power Saving Silence Mode | |
|---|---|---|---|---|---|
| Power Limit 1 | 86 Watt | 86 Watt | 62 Watt | 15 Watt | 15 Watt |
| Power Limit 2 | 115 Watt | 115 Watt | 115 Watt | 30 Watt | 30 Watt |
Processor
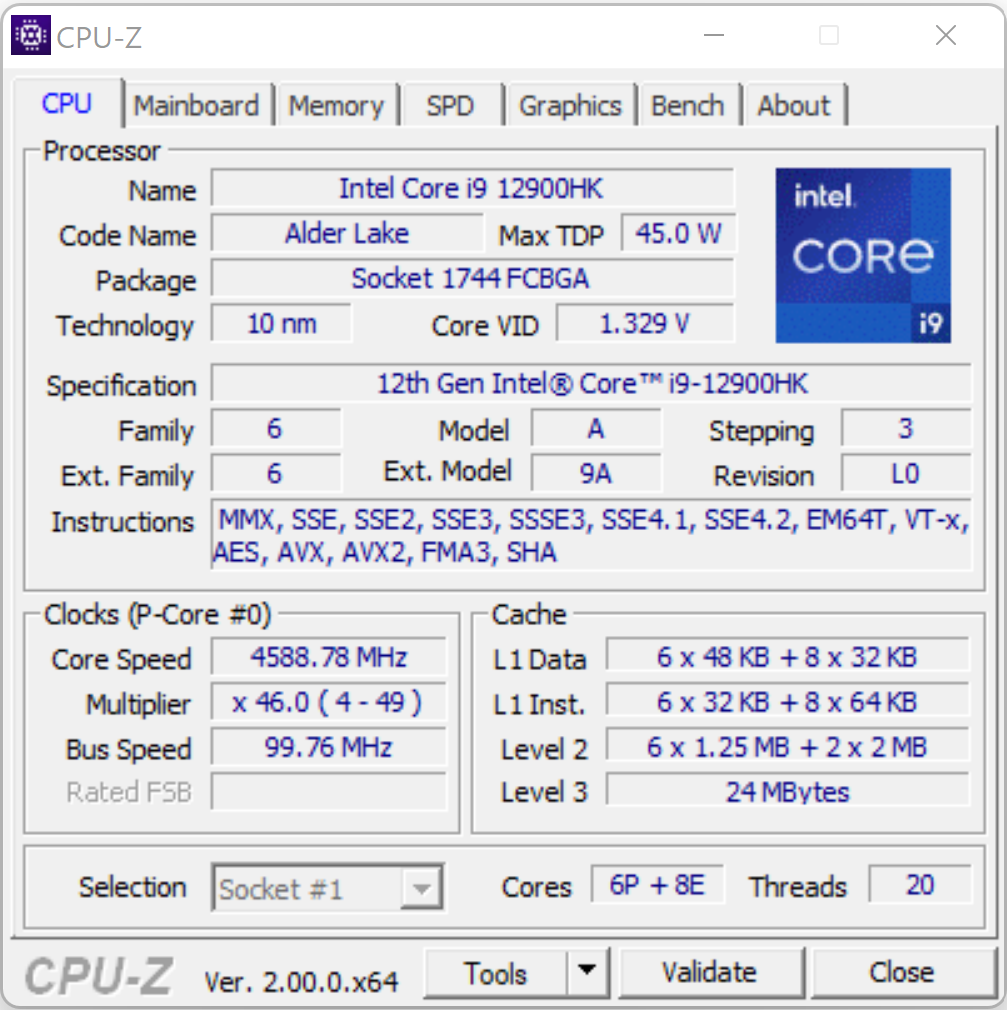
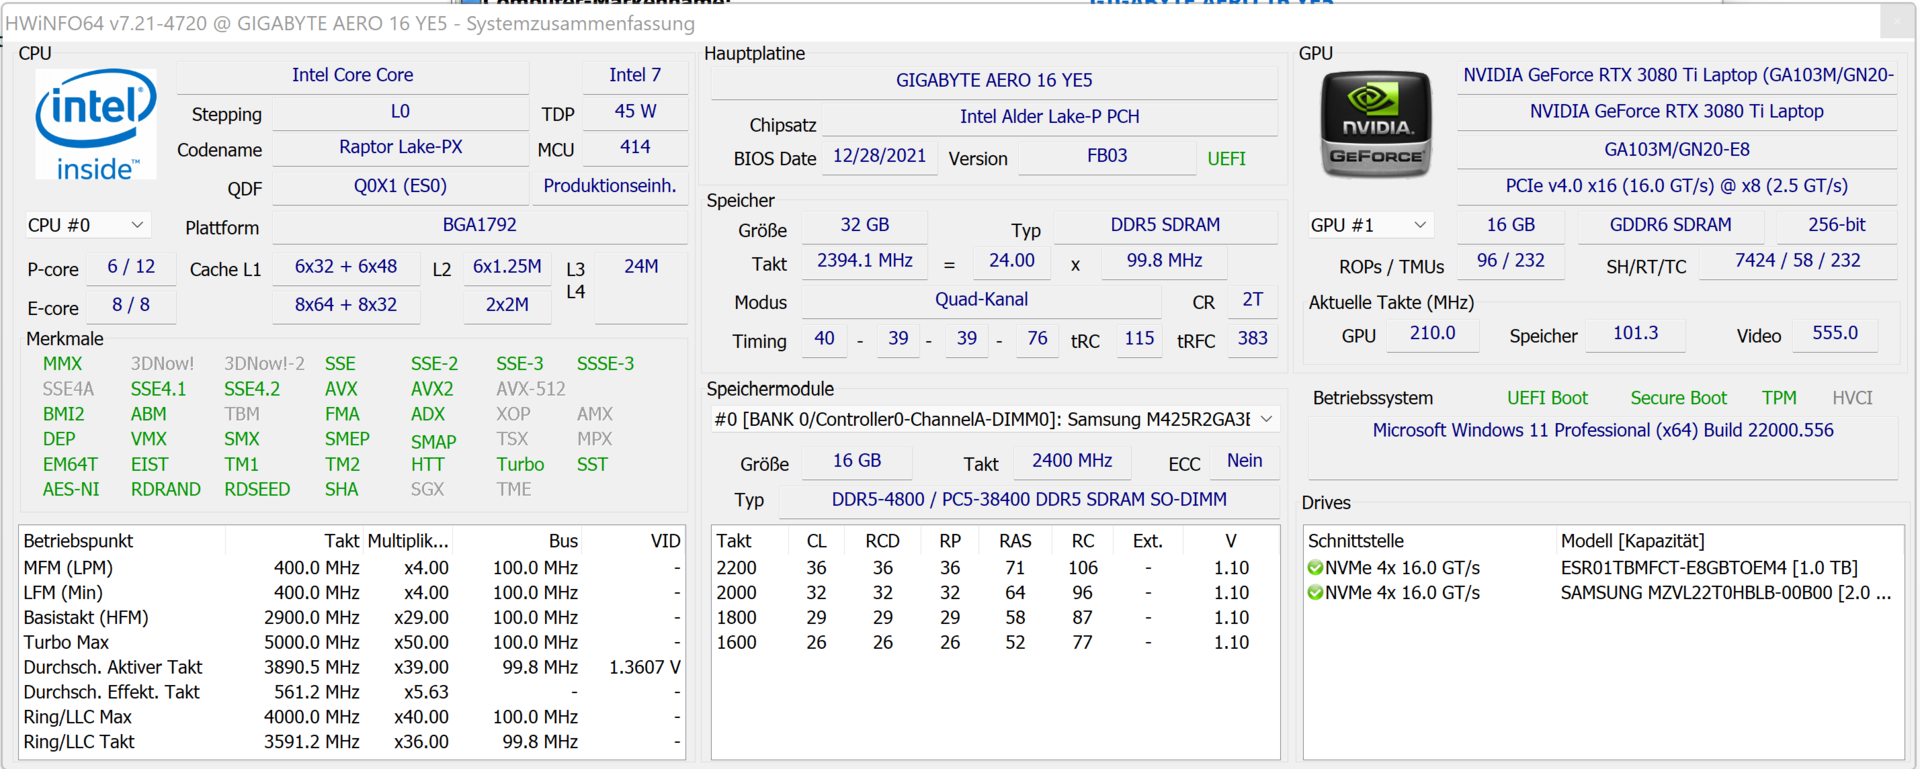
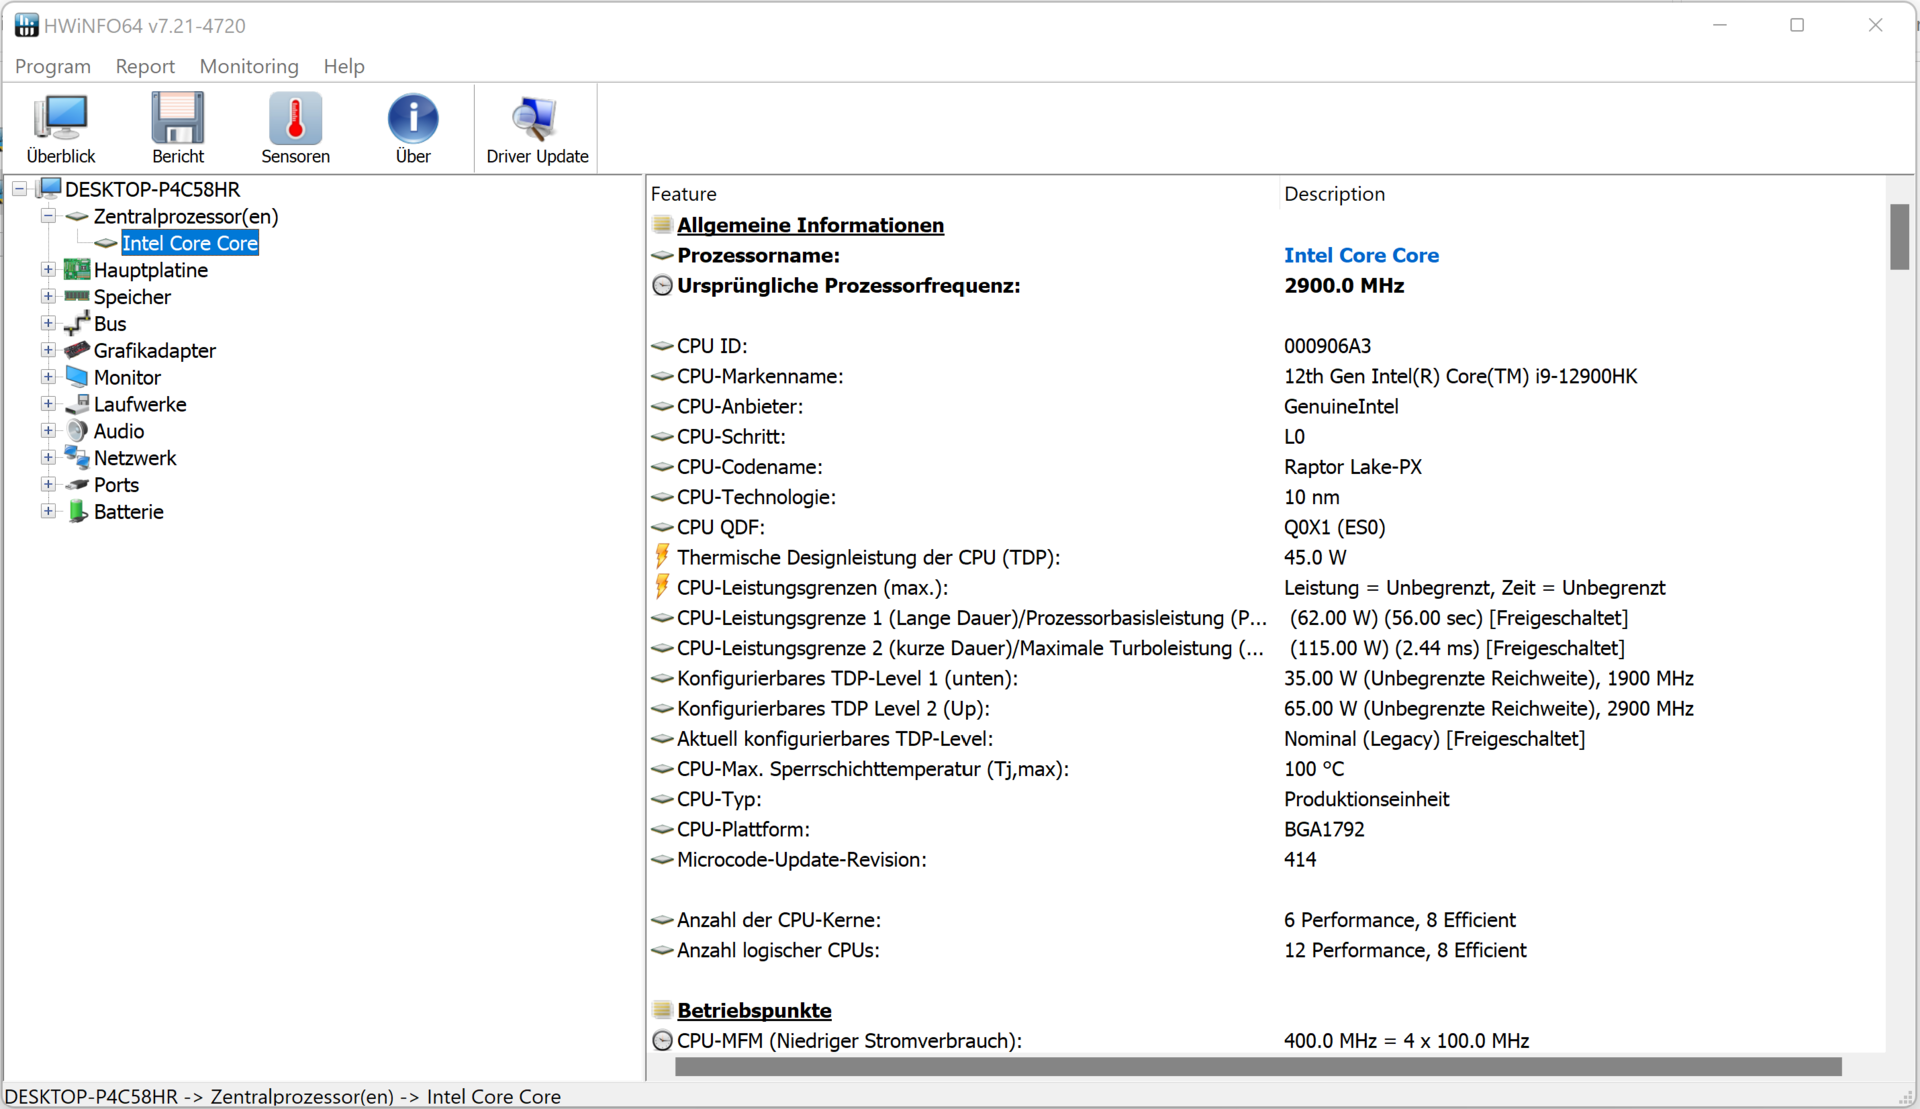
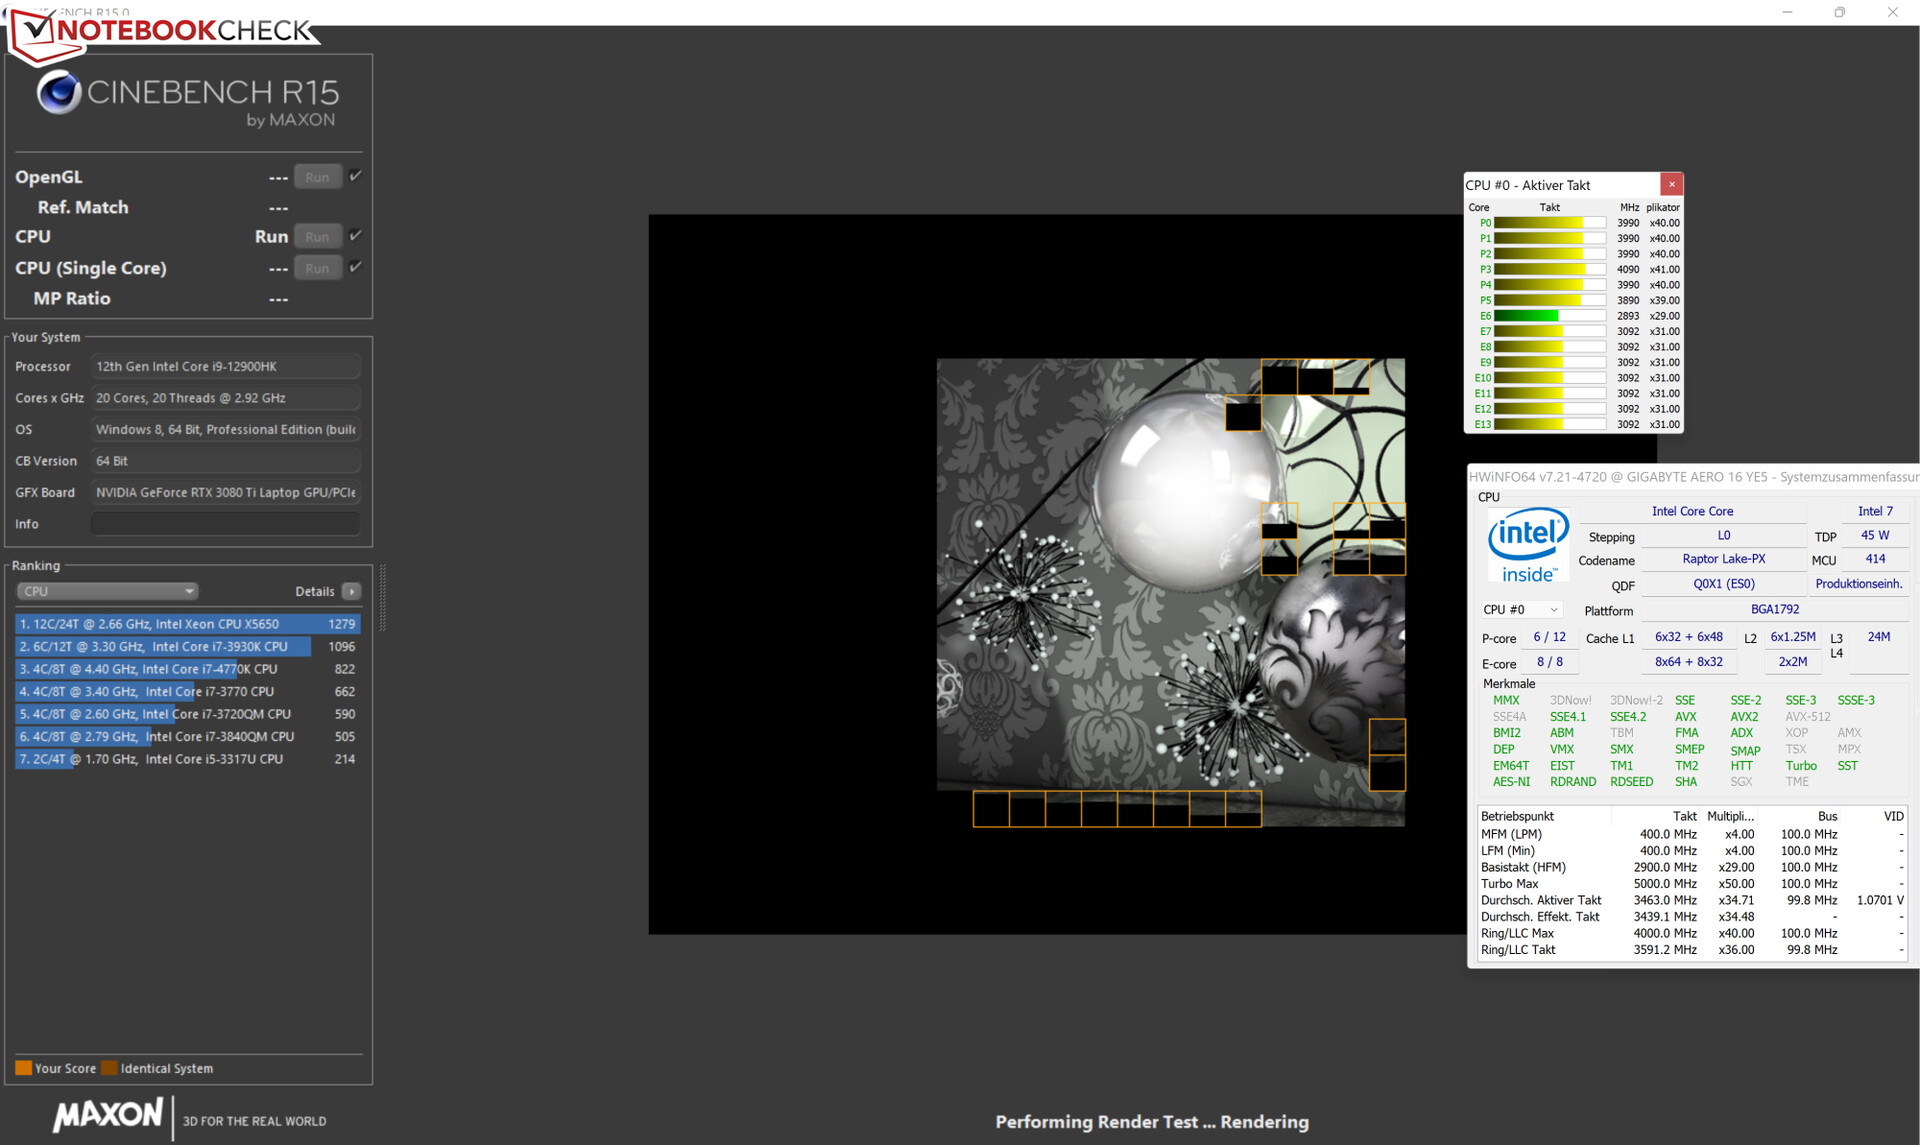
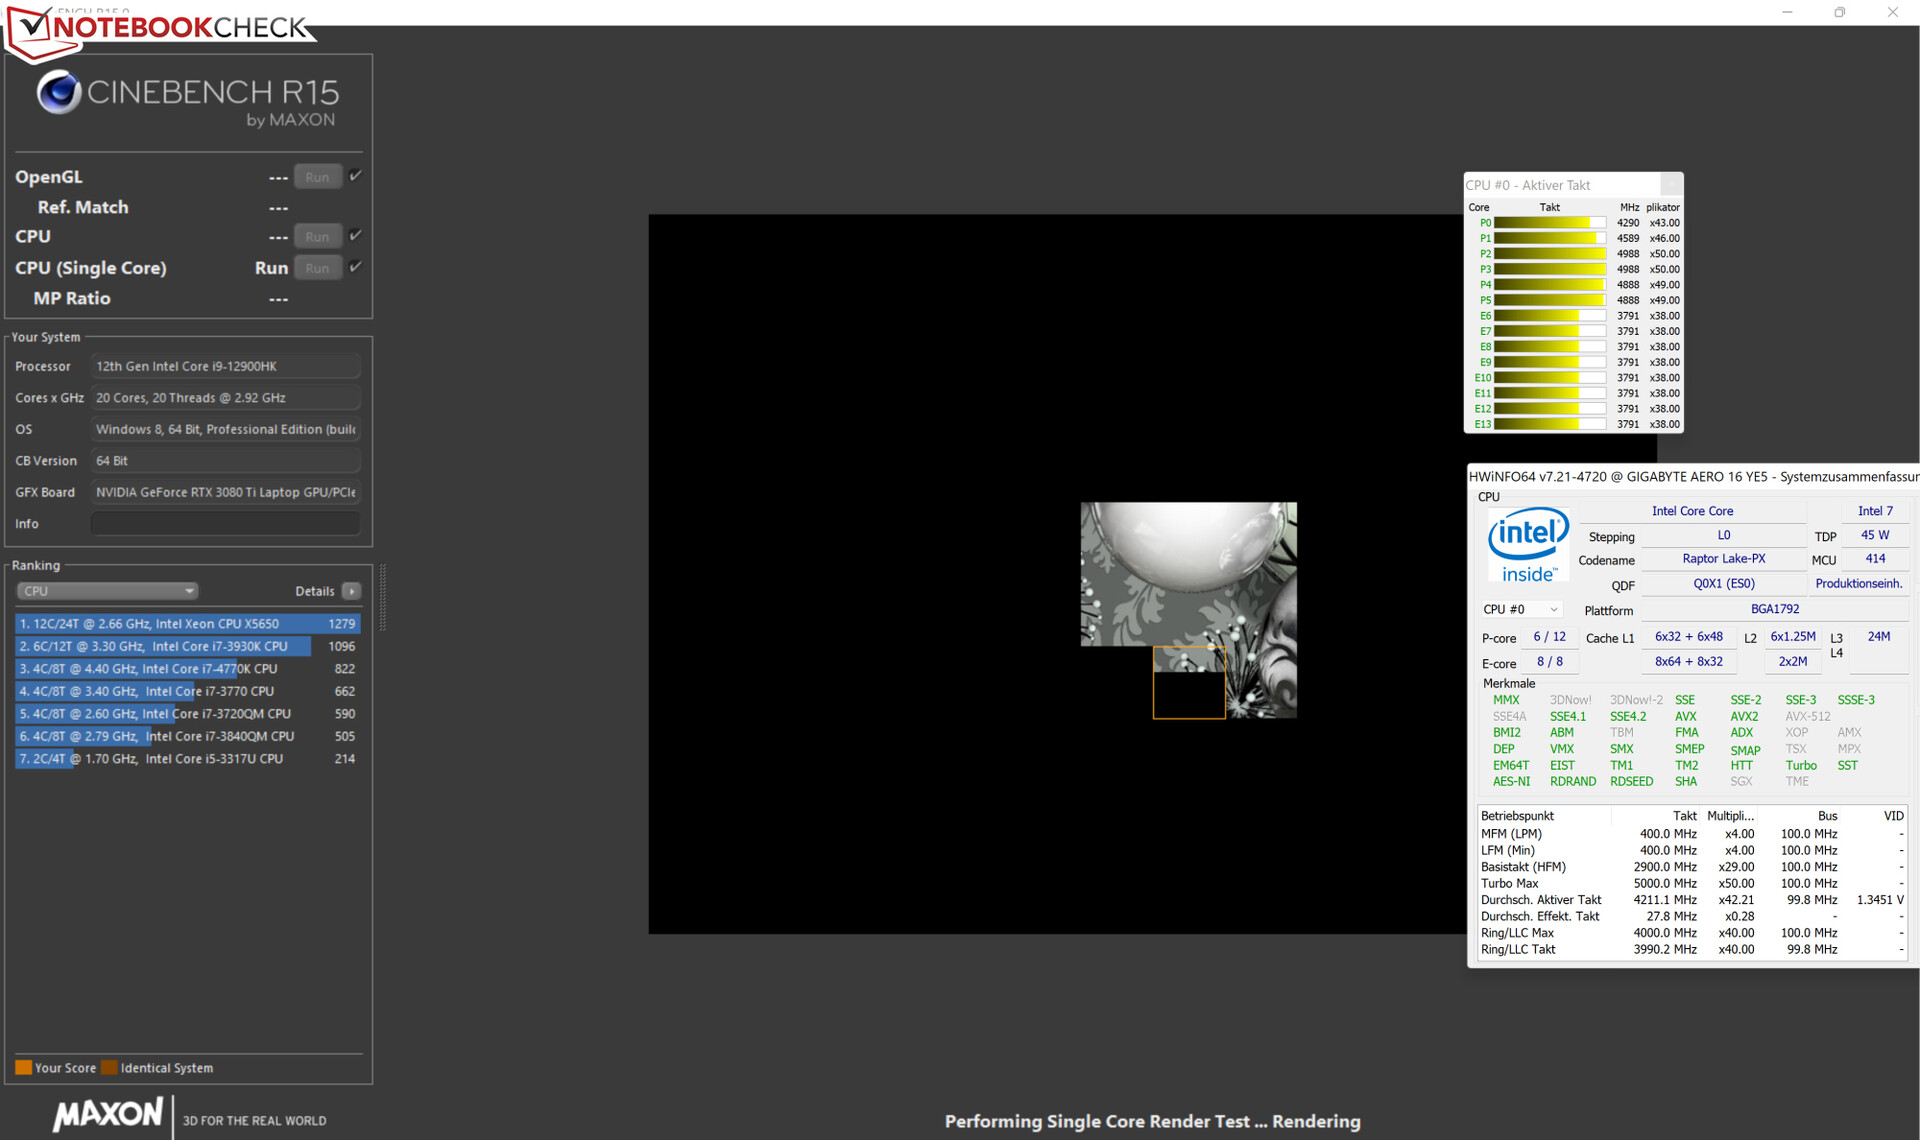
Intel’s Alder Lake Core i9-12900HK features six performance cores with Hyperthreading running at between 2.5 and 5 GHz as well as eight efficiency cores without Hyperthreading running at 1.8 to 3.8 GHz. Combined, this makes for a total of 20 available CPU cores. Thanks to an unlocked multiplier, the CPU can also be overclocked quite easily.
When running our CineBench R15 benchmark the CPU ran at very high (multi-thread: P-cores 4-4.1 GHz, E-cores: 3-3,1 GHz) or even maximum (single-thread: P-cores 4.3-5 GHz, E-cores: 3.8 GHz) clock speeds. On battery, those were reduced significantly.
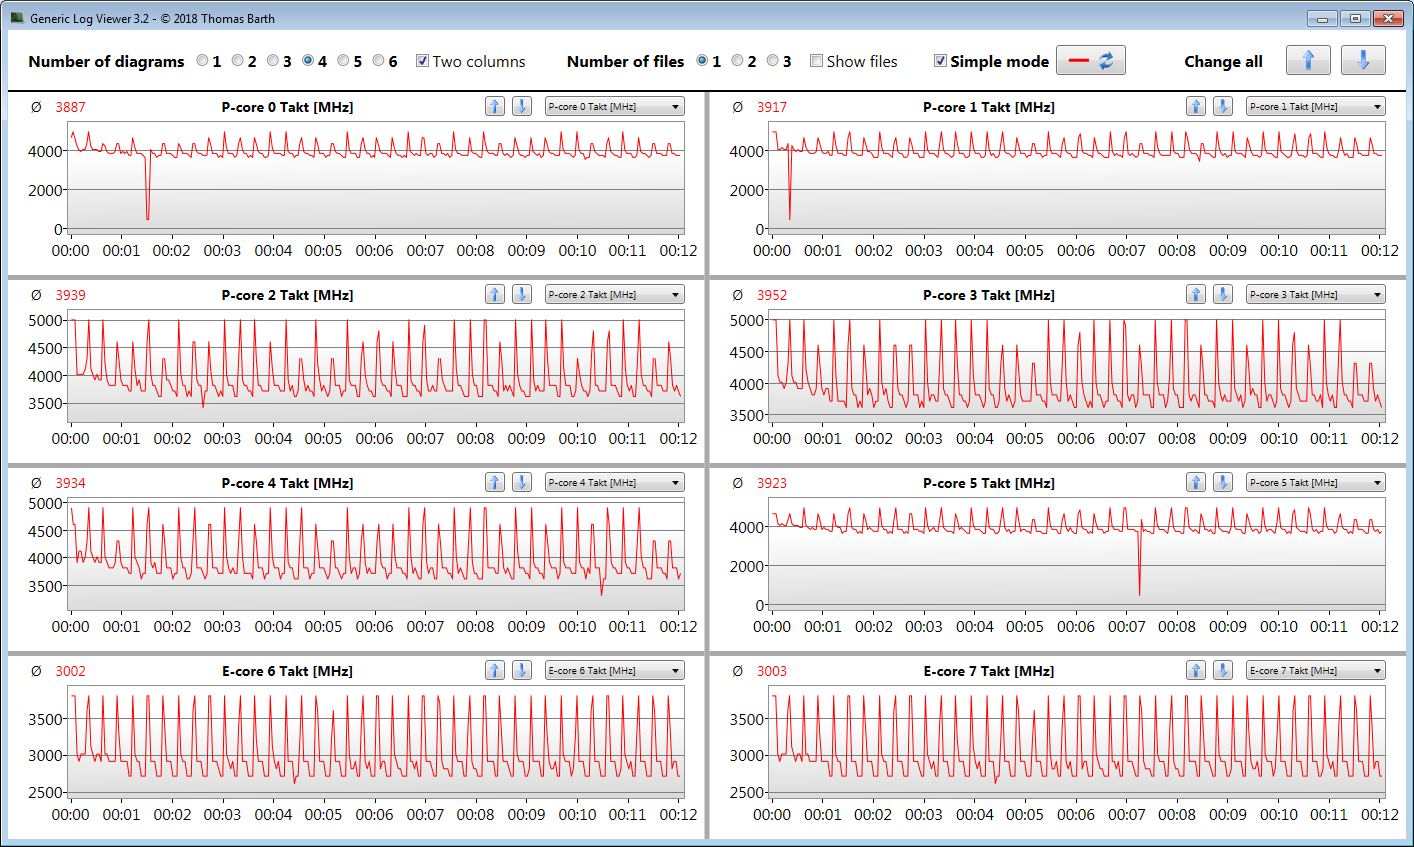
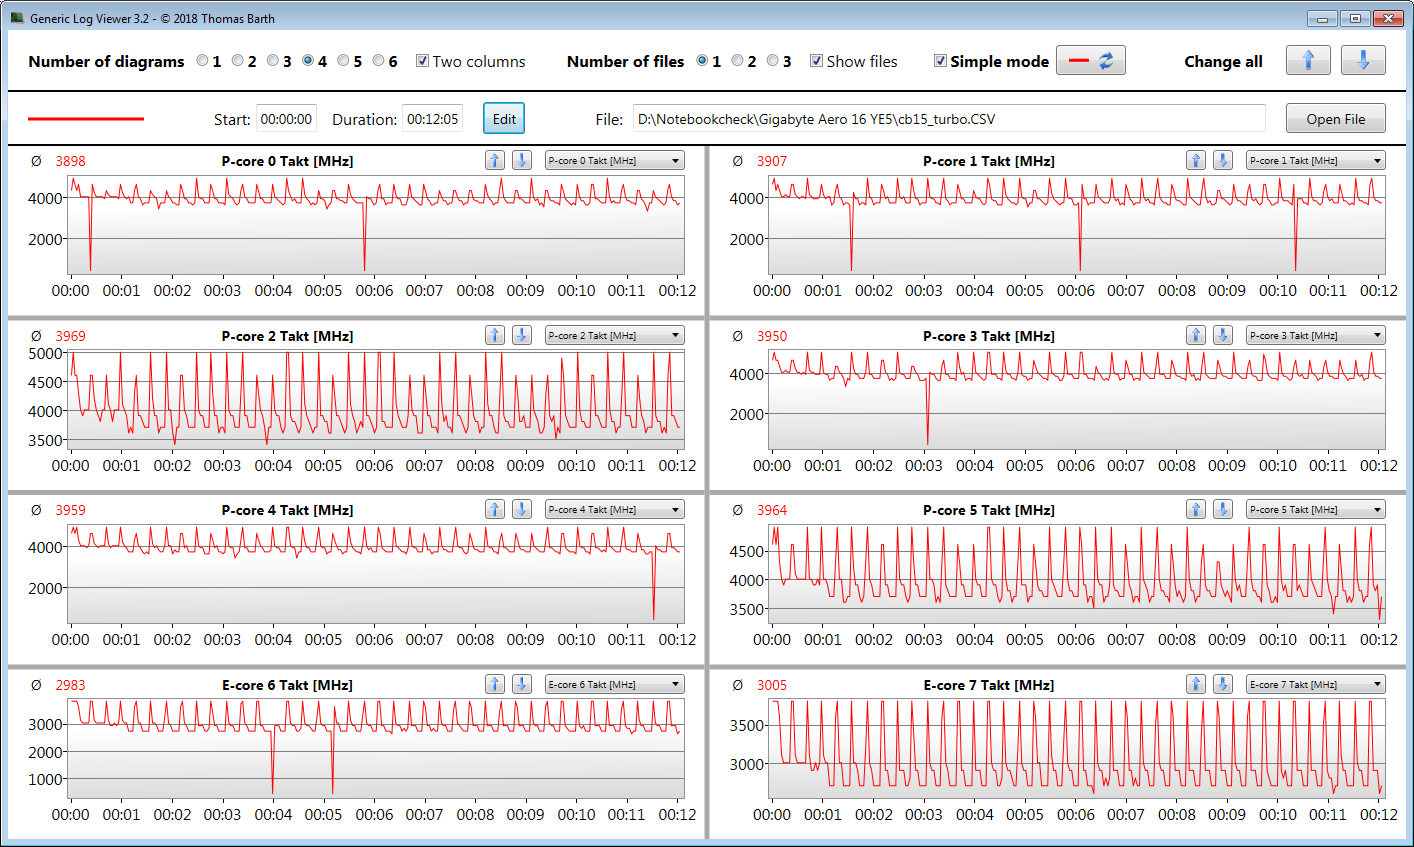
We run the CineBench R15 multi-thread test for at least 30 minutes in a loop in order to determine whether or not a processor is capable of utilizing high turbo-boost clock speeds under sustained load. The Aero 16 managed to maintain its high initial level of performance on both performance and efficiency cores. Enabling the “Turbo Mode” manually had no positive effect whatsoever.
Cinebench R15 Multi Loop
| Cinebench R23 | |
| Multi Core | |
| Gigabyte Aero 16 YE5 (Turbo Mode) | |
| Gigabyte Aero 16 YE5 | |
| Average of class Multimedia (4861 - 33362, n=81, last 2 years) | |
| Average Intel Core i9-12900HK (4796 - 19282, n=14) | |
| Razer Blade 15 2022 | |
| Schenker XMG Pro 15 (Late 2021) | |
| Apple MacBook Pro 16 2021 M1 Max | |
| HP ZBook Studio 15 G8 | |
| Lenovo ThinkPad X1 Extreme G4-20Y50040GE | |
| Gigabyte Aero 16 YE5 (Silence Mode) | |
| Single Core | |
| Gigabyte Aero 16 YE5 | |
| Gigabyte Aero 16 YE5 (Turbo Mode) | |
| Average of class Multimedia (1128 - 2459, n=73, last 2 years) | |
| Razer Blade 15 2022 | |
| Average Intel Core i9-12900HK (819 - 1940, n=15) | |
| Lenovo ThinkPad X1 Extreme G4-20Y50040GE | |
| HP ZBook Studio 15 G8 | |
| Apple MacBook Pro 16 2021 M1 Max | |
| Schenker XMG Pro 15 (Late 2021) | |
| Gigabyte Aero 16 YE5 (Silence Mode) | |
| Cinebench R20 | |
| CPU (Multi Core) | |
| Gigabyte Aero 16 YE5 (Turbo Mode) | |
| Gigabyte Aero 16 YE5 | |
| Average of class Multimedia (1887 - 12912, n=64, last 2 years) | |
| Average Intel Core i9-12900HK (1828 - 7366, n=14) | |
| Razer Blade 15 2022 | |
| Schenker XMG Pro 15 (Late 2021) | |
| HP ZBook Studio 15 G8 | |
| Lenovo ThinkPad X1 Extreme G4-20Y50040GE | |
| Apple MacBook Pro 16 2021 M1 Max | |
| Gigabyte Aero 16 YE5 (Silence Mode) | |
| CPU (Single Core) | |
| Gigabyte Aero 16 YE5 (Turbo Mode) | |
| Average of class Multimedia (425 - 853, n=64, last 2 years) | |
| Razer Blade 15 2022 | |
| Gigabyte Aero 16 YE5 | |
| Average Intel Core i9-12900HK (316 - 739, n=14) | |
| Lenovo ThinkPad X1 Extreme G4-20Y50040GE | |
| HP ZBook Studio 15 G8 | |
| Schenker XMG Pro 15 (Late 2021) | |
| Apple MacBook Pro 16 2021 M1 Max | |
| Gigabyte Aero 16 YE5 (Silence Mode) | |
| Cinebench R15 | |
| CPU Multi 64Bit | |
| Gigabyte Aero 16 YE5 (Turbo Mode) | |
| Gigabyte Aero 16 YE5 | |
| Average of class Multimedia (856 - 5224, n=68, last 2 years) | |
| Average Intel Core i9-12900HK (965 - 2944, n=14) | |
| Razer Blade 15 2022 | |
| Lenovo ThinkPad X1 Extreme G4-20Y50040GE (BIOS 1.13) | |
| Lenovo ThinkPad X1 Extreme G4-20Y50040GE (BIOS 1.10) | |
| Schenker XMG Pro 15 (Late 2021) | |
| HP ZBook Studio 15 G8 | |
| Apple MacBook Pro 16 2021 M1 Max (Rosetta 2) | |
| Gigabyte Aero 16 YE5 (Silence Mode) | |
| CPU Single 64Bit | |
| Gigabyte Aero 16 YE5 | |
| Average of class Multimedia (184.8 - 326, n=66, last 2 years) | |
| Gigabyte Aero 16 YE5 (Turbo Mode) | |
| Razer Blade 15 2022 | |
| Lenovo ThinkPad X1 Extreme G4-20Y50040GE | |
| Average Intel Core i9-12900HK (119 - 279, n=14) | |
| HP ZBook Studio 15 G8 | |
| Schenker XMG Pro 15 (Late 2021) | |
| Apple MacBook Pro 16 2021 M1 Max (Rosetta 2) | |
| Gigabyte Aero 16 YE5 (Silence Mode) | |
| Blender - v2.79 BMW27 CPU | |
| HP ZBook Studio 15 G8 | |
| Average of class Multimedia (100 - 557, n=65, last 2 years) | |
| Schenker XMG Pro 15 (Late 2021) | |
| Razer Blade 15 2022 | |
| Average Intel Core i9-12900HK (172.5 - 483, n=13) | |
| Gigabyte Aero 16 YE5 | |
| Apple MacBook Pro 16 2021 M1 Max (Blender 3.0 beta for mac) | |
| Gigabyte Aero 16 YE5 (Turbo Mode) | |
| 7-Zip 18.03 | |
| 7z b 4 | |
| Gigabyte Aero 16 YE5 (Turbo Mode) | |
| Gigabyte Aero 16 YE5 | |
| Average Intel Core i9-12900HK (25736 - 75564, n=14) | |
| Razer Blade 15 2022 | |
| Average of class Multimedia (29095 - 130368, n=62, last 2 years) | |
| Schenker XMG Pro 15 (Late 2021) | |
| HP ZBook Studio 15 G8 | |
| Gigabyte Aero 16 YE5 (Silence Mode) | |
| 7z b 4 -mmt1 | |
| Gigabyte Aero 16 YE5 | |
| Gigabyte Aero 16 YE5 (Turbo Mode) | |
| Average of class Multimedia (3666 - 7545, n=63, last 2 years) | |
| HP ZBook Studio 15 G8 | |
| Razer Blade 15 2022 | |
| Schenker XMG Pro 15 (Late 2021) | |
| Average Intel Core i9-12900HK (2898 - 6186, n=14) | |
| Gigabyte Aero 16 YE5 (Silence Mode) | |
| Geekbench 5.5 | |
| Multi-Core | |
| Gigabyte Aero 16 YE5 (Turbo Mode) | |
| Gigabyte Aero 16 YE5 | |
| Average of class Multimedia (4652 - 20422, n=62, last 2 years) | |
| Apple MacBook Pro 16 2021 M1 Max | |
| Razer Blade 15 2022 | |
| Average Intel Core i9-12900HK (5869 - 14294, n=13) | |
| Schenker XMG Pro 15 (Late 2021) | |
| Lenovo ThinkPad X1 Extreme G4-20Y50040GE | |
| HP ZBook Studio 15 G8 | |
| Gigabyte Aero 16 YE5 (Silence Mode) | |
| Single-Core | |
| Average of class Multimedia (805 - 2974, n=62, last 2 years) | |
| Gigabyte Aero 16 YE5 (Turbo Mode) | |
| Gigabyte Aero 16 YE5 | |
| Apple MacBook Pro 16 2021 M1 Max | |
| Razer Blade 15 2022 | |
| HP ZBook Studio 15 G8 | |
| Average Intel Core i9-12900HK (843 - 1918, n=13) | |
| Lenovo ThinkPad X1 Extreme G4-20Y50040GE | |
| Schenker XMG Pro 15 (Late 2021) | |
| Gigabyte Aero 16 YE5 (Silence Mode) | |
| HWBOT x265 Benchmark v2.2 - 4k Preset | |
| Gigabyte Aero 16 YE5 (Turbo Mode) | |
| Average of class Multimedia (5.26 - 36.1, n=63, last 2 years) | |
| Gigabyte Aero 16 YE5 | |
| Razer Blade 15 2022 | |
| Average Intel Core i9-12900HK (5.33 - 21.6, n=14) | |
| Schenker XMG Pro 15 (Late 2021) | |
| HP ZBook Studio 15 G8 | |
| Lenovo ThinkPad X1 Extreme G4-20Y50040GE | |
| Gigabyte Aero 16 YE5 (Silence Mode) | |
| LibreOffice - 20 Documents To PDF | |
| Gigabyte Aero 16 YE5 (Silence Mode) | |
| Razer Blade 15 2022 | |
| Average of class Multimedia (23.9 - 146.7, n=64, last 2 years) | |
| Schenker XMG Pro 15 (Late 2021) | |
| HP ZBook Studio 15 G8 | |
| Average Intel Core i9-12900HK (34.8 - 89.1, n=14) | |
| Gigabyte Aero 16 YE5 | |
| Lenovo ThinkPad X1 Extreme G4-20Y50040GE | |
| Gigabyte Aero 16 YE5 (Turbo Mode) | |
| R Benchmark 2.5 - Overall mean | |
| Gigabyte Aero 16 YE5 (Silence Mode) | |
| HP ZBook Studio 15 G8 | |
| Schenker XMG Pro 15 (Late 2021) | |
| Lenovo ThinkPad X1 Extreme G4-20Y50040GE | |
| Average Intel Core i9-12900HK (0.4155 - 0.994, n=14) | |
| Razer Blade 15 2022 | |
| Average of class Multimedia (0.3604 - 0.947, n=63, last 2 years) | |
| Gigabyte Aero 16 YE5 (Turbo Mode) | |
| Gigabyte Aero 16 YE5 | |
* ... smaller is better
AIDA64: FP32 Ray-Trace | FPU Julia | CPU SHA3 | CPU Queen | FPU SinJulia | FPU Mandel | CPU AES | CPU ZLib | FP64 Ray-Trace | CPU PhotoWorxx
| Performance rating | |
| Average of class Multimedia | |
| Schenker XMG Pro 15 (Late 2021) | |
| Lenovo ThinkPad X1 Extreme G4-20Y50040GE | |
| HP ZBook Studio 15 G8 | |
| Gigabyte Aero 16 YE5 | |
| Gigabyte Aero 16 YE5 | |
| Average Intel Core i9-12900HK | |
| Razer Blade 15 2022 | |
| Gigabyte Aero 16 YE5 | |
| AIDA64 / FP32 Ray-Trace | |
| Average of class Multimedia (2214 - 50388, n=60, last 2 years) | |
| Schenker XMG Pro 15 (Late 2021) (v6.50.5800) | |
| Lenovo ThinkPad X1 Extreme G4-20Y50040GE (v6.50.5800) | |
| HP ZBook Studio 15 G8 (v6.33.5700) | |
| Average Intel Core i9-12900HK (2677 - 13948, n=15) | |
| Gigabyte Aero 16 YE5 (v6.50.5800, Turbo Mode) | |
| Gigabyte Aero 16 YE5 (v6.50.5800) | |
| Razer Blade 15 2022 (v6.50.5800) | |
| Gigabyte Aero 16 YE5 (v6.50.5800, Silence Mode) | |
| AIDA64 / FPU Julia | |
| Average of class Multimedia (12867 - 201874, n=61, last 2 years) | |
| Schenker XMG Pro 15 (Late 2021) (v6.50.5800) | |
| Lenovo ThinkPad X1 Extreme G4-20Y50040GE (v6.50.5800) | |
| HP ZBook Studio 15 G8 (v6.33.5700) | |
| Average Intel Core i9-12900HK (12762 - 70764, n=15) | |
| Gigabyte Aero 16 YE5 (v6.50.5800, Turbo Mode) | |
| Gigabyte Aero 16 YE5 (v6.50.5800) | |
| Razer Blade 15 2022 (v6.50.5800) | |
| Gigabyte Aero 16 YE5 (v6.50.5800, Silence Mode) | |
| AIDA64 / CPU SHA3 | |
| Schenker XMG Pro 15 (Late 2021) (v6.50.5800) | |
| Lenovo ThinkPad X1 Extreme G4-20Y50040GE (v6.50.5800) | |
| HP ZBook Studio 15 G8 (v6.33.5700) | |
| Average of class Multimedia (653 - 8623, n=61, last 2 years) | |
| Gigabyte Aero 16 YE5 (v6.50.5800, Turbo Mode) | |
| Gigabyte Aero 16 YE5 (v6.50.5800) | |
| Average Intel Core i9-12900HK (841 - 3504, n=15) | |
| Razer Blade 15 2022 (v6.50.5800) | |
| Gigabyte Aero 16 YE5 (v6.50.5800, Silence Mode) | |
| AIDA64 / CPU Queen | |
| Gigabyte Aero 16 YE5 (v6.50.5800, Turbo Mode) | |
| Gigabyte Aero 16 YE5 (v6.50.5800) | |
| HP ZBook Studio 15 G8 (v6.33.5700) | |
| Lenovo ThinkPad X1 Extreme G4-20Y50040GE (v6.50.5800) | |
| Average Intel Core i9-12900HK (60202 - 107161, n=15) | |
| Razer Blade 15 2022 (v6.50.5800) | |
| Schenker XMG Pro 15 (Late 2021) (v6.50.5800) | |
| Average of class Multimedia (13483 - 181505, n=49, last 2 years) | |
| Gigabyte Aero 16 YE5 (v6.50.5800, Silence Mode) | |
| AIDA64 / FPU SinJulia | |
| Lenovo ThinkPad X1 Extreme G4-20Y50040GE (v6.50.5800) | |
| Gigabyte Aero 16 YE5 (v6.50.5800, Turbo Mode) | |
| HP ZBook Studio 15 G8 (v6.33.5700) | |
| Schenker XMG Pro 15 (Late 2021) (v6.50.5800) | |
| Gigabyte Aero 16 YE5 (v6.50.5800) | |
| Razer Blade 15 2022 (v6.50.5800) | |
| Average of class Multimedia (1240 - 28794, n=61, last 2 years) | |
| Average Intel Core i9-12900HK (3225 - 10402, n=15) | |
| Gigabyte Aero 16 YE5 (v6.50.5800, Silence Mode) | |
| AIDA64 / FPU Mandel | |
| Average of class Multimedia (6395 - 105740, n=60, last 2 years) | |
| Schenker XMG Pro 15 (Late 2021) (v6.50.5800) | |
| Lenovo ThinkPad X1 Extreme G4-20Y50040GE (v6.50.5800) | |
| HP ZBook Studio 15 G8 (v6.33.5700) | |
| Average Intel Core i9-12900HK (7417 - 34233, n=15) | |
| Gigabyte Aero 16 YE5 (v6.50.5800, Turbo Mode) | |
| Gigabyte Aero 16 YE5 (v6.50.5800) | |
| Razer Blade 15 2022 (v6.50.5800) | |
| Gigabyte Aero 16 YE5 (v6.50.5800, Silence Mode) | |
| AIDA64 / CPU AES | |
| Lenovo ThinkPad X1 Extreme G4-20Y50040GE (v6.50.5800) | |
| Schenker XMG Pro 15 (Late 2021) (v6.50.5800) | |
| Gigabyte Aero 16 YE5 (v6.50.5800, Turbo Mode) | |
| Gigabyte Aero 16 YE5 (v6.50.5800) | |
| HP ZBook Studio 15 G8 (v6.33.5700) | |
| Average Intel Core i9-12900HK (32382 - 112498, n=15) | |
| Average of class Multimedia (13243 - 126790, n=61, last 2 years) | |
| Razer Blade 15 2022 (v6.50.5800) | |
| Gigabyte Aero 16 YE5 (v6.50.5800, Silence Mode) | |
| AIDA64 / CPU ZLib | |
| Gigabyte Aero 16 YE5 (v6.50.5800, Turbo Mode) | |
| Average of class Multimedia (167.2 - 2022, n=61, last 2 years) | |
| Gigabyte Aero 16 YE5 (v6.50.5800) | |
| Average Intel Core i9-12900HK (314 - 1209, n=15) | |
| Razer Blade 15 2022 (v6.50.5800) | |
| Lenovo ThinkPad X1 Extreme G4-20Y50040GE (v6.50.5800) | |
| Schenker XMG Pro 15 (Late 2021) (v6.50.5800) | |
| HP ZBook Studio 15 G8 (v6.33.5700) | |
| Gigabyte Aero 16 YE5 (v6.50.5800, Silence Mode) | |
| AIDA64 / FP64 Ray-Trace | |
| Average of class Multimedia (1014 - 26875, n=61, last 2 years) | |
| Schenker XMG Pro 15 (Late 2021) (v6.50.5800) | |
| Lenovo ThinkPad X1 Extreme G4-20Y50040GE (v6.50.5800) | |
| HP ZBook Studio 15 G8 (v6.33.5700) | |
| Average Intel Core i9-12900HK (1501 - 7616, n=15) | |
| Gigabyte Aero 16 YE5 (v6.50.5800, Turbo Mode) | |
| Gigabyte Aero 16 YE5 (v6.50.5800) | |
| Razer Blade 15 2022 (v6.50.5800) | |
| Gigabyte Aero 16 YE5 (v6.50.5800, Silence Mode) | |
| AIDA64 / CPU PhotoWorxx | |
| Average of class Multimedia (12860 - 88154, n=61, last 2 years) | |
| Razer Blade 15 2022 (v6.50.5800) | |
| Gigabyte Aero 16 YE5 (v6.50.5800) | |
| Gigabyte Aero 16 YE5 (v6.50.5800, Turbo Mode) | |
| Average Intel Core i9-12900HK (24446 - 42462, n=15) | |
| Schenker XMG Pro 15 (Late 2021) (v6.50.5800) | |
| Gigabyte Aero 16 YE5 (v6.50.5800, Silence Mode) | |
| HP ZBook Studio 15 G8 (v6.33.5700) | |
| Lenovo ThinkPad X1 Extreme G4-20Y50040GE (v6.50.5800) | |
System Performance
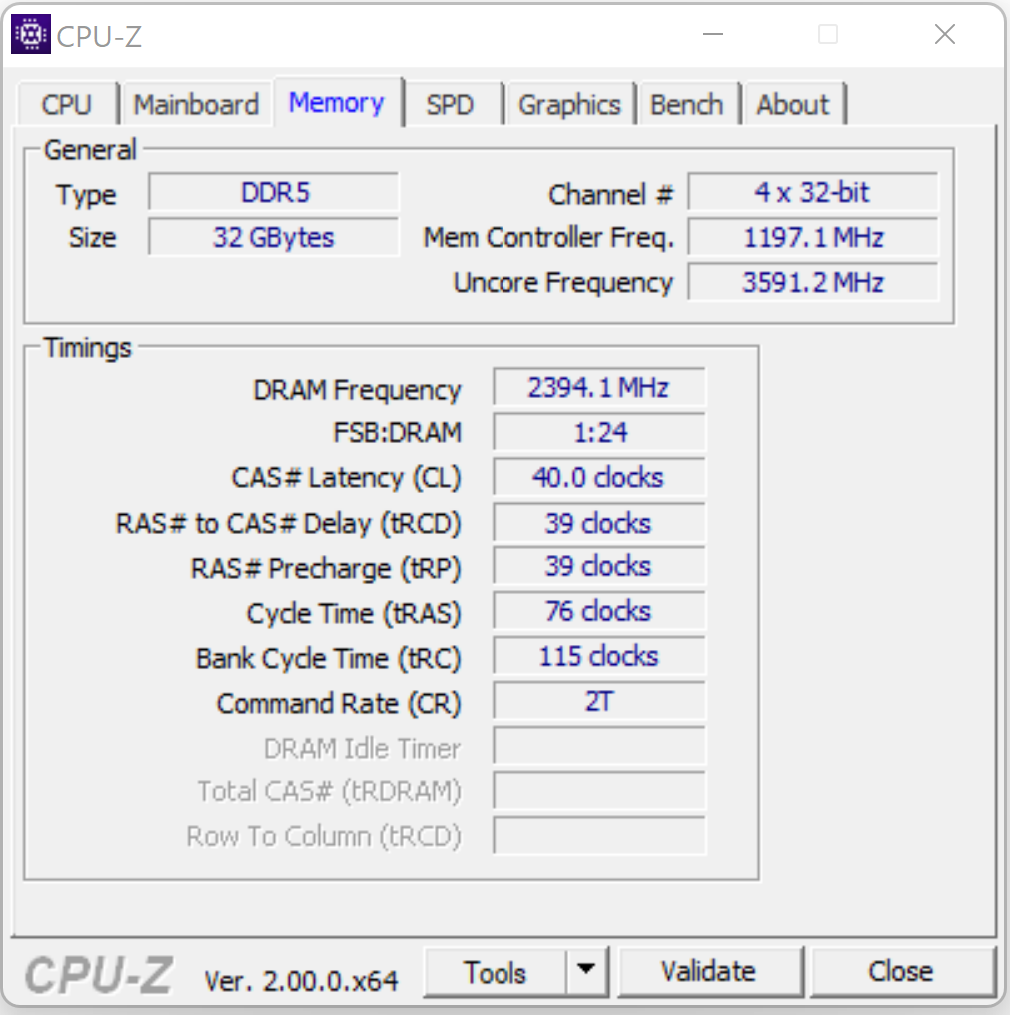
Unsurprisingly, overall system performance was very fast and smooth thanks to its powerful internal hardware. The computer did a fantastic job in all application tests. Overall performance is further increased by the dual-channel DDR5 memory interface, as the excellent PCMark benchmark results bear witness to.
| PCMark 8 Home Score Accelerated v2 | 4775 points | |
| PCMark 8 Creative Score Accelerated v2 | 6920 points | |
| PCMark 8 Work Score Accelerated v2 | 5343 points | |
| PCMark 10 Score | 7816 points | |
Help | ||
CrossMark: Overall | Productivity | Creativity | Responsiveness
| PCMark 10 / Score | |
| Average Intel Core i9-12900HK, NVIDIA GeForce RTX 3080 Ti Laptop GPU (7149 - 8186, n=5) | |
| Gigabyte Aero 16 YE5 | |
| Razer Blade 15 2022 | |
| Average of class Multimedia (4325 - 10386, n=58, last 2 years) | |
| Lenovo ThinkPad X1 Extreme G4-20Y50040GE | |
| PCMark 10 / Essentials | |
| Gigabyte Aero 16 YE5 | |
| Average Intel Core i9-12900HK, NVIDIA GeForce RTX 3080 Ti Laptop GPU (9870 - 11205, n=5) | |
| Razer Blade 15 2022 | |
| Lenovo ThinkPad X1 Extreme G4-20Y50040GE | |
| Average of class Multimedia (8025 - 11664, n=57, last 2 years) | |
| PCMark 10 / Productivity | |
| Average of class Multimedia (7323 - 18233, n=57, last 2 years) | |
| Gigabyte Aero 16 YE5 | |
| Average Intel Core i9-12900HK, NVIDIA GeForce RTX 3080 Ti Laptop GPU (9173 - 10422, n=5) | |
| Razer Blade 15 2022 | |
| Lenovo ThinkPad X1 Extreme G4-20Y50040GE | |
| PCMark 10 / Digital Content Creation | |
| Average Intel Core i9-12900HK, NVIDIA GeForce RTX 3080 Ti Laptop GPU (10951 - 13098, n=5) | |
| Razer Blade 15 2022 | |
| Gigabyte Aero 16 YE5 | |
| Average of class Multimedia (3651 - 16240, n=57, last 2 years) | |
| Lenovo ThinkPad X1 Extreme G4-20Y50040GE | |
| CrossMark / Overall | |
| Gigabyte Aero 16 YE5 | |
| Average of class Multimedia (866 - 2728, n=67, last 2 years) | |
| Average Intel Core i9-12900HK, NVIDIA GeForce RTX 3080 Ti Laptop GPU (970 - 2138, n=5) | |
| Lenovo ThinkPad X1 Extreme G4-20Y50040GE | |
| Apple MacBook Pro 16 2021 M1 Max | |
| CrossMark / Productivity | |
| Gigabyte Aero 16 YE5 | |
| Average of class Multimedia (931 - 2489, n=67, last 2 years) | |
| Average Intel Core i9-12900HK, NVIDIA GeForce RTX 3080 Ti Laptop GPU (921 - 2038, n=5) | |
| Lenovo ThinkPad X1 Extreme G4-20Y50040GE | |
| Apple MacBook Pro 16 2021 M1 Max | |
| CrossMark / Creativity | |
| Gigabyte Aero 16 YE5 | |
| Average of class Multimedia (907 - 3465, n=67, last 2 years) | |
| Apple MacBook Pro 16 2021 M1 Max | |
| Average Intel Core i9-12900HK, NVIDIA GeForce RTX 3080 Ti Laptop GPU (1007 - 2210, n=5) | |
| Lenovo ThinkPad X1 Extreme G4-20Y50040GE | |
| CrossMark / Responsiveness | |
| Gigabyte Aero 16 YE5 | |
| Average Intel Core i9-12900HK, NVIDIA GeForce RTX 3080 Ti Laptop GPU (1012 - 2234, n=5) | |
| Lenovo ThinkPad X1 Extreme G4-20Y50040GE | |
| Average of class Multimedia (605 - 2024, n=67, last 2 years) | |
| Apple MacBook Pro 16 2021 M1 Max | |
| AIDA64 / Memory Copy | |
| Average of class Multimedia (21158 - 132135, n=61, last 2 years) | |
| Razer Blade 15 2022 | |
| Gigabyte Aero 16 YE5 | |
| Average Intel Core i9-12900HK (42967 - 62959, n=15) | |
| Lenovo ThinkPad X1 Extreme G4-20Y50040GE | |
| AIDA64 / Memory Read | |
| Average of class Multimedia (19699 - 174586, n=61, last 2 years) | |
| Razer Blade 15 2022 | |
| Gigabyte Aero 16 YE5 | |
| Average Intel Core i9-12900HK (44419 - 66989, n=15) | |
| Lenovo ThinkPad X1 Extreme G4-20Y50040GE | |
| AIDA64 / Memory Write | |
| Average of class Multimedia (17733 - 134998, n=61, last 2 years) | |
| Razer Blade 15 2022 | |
| Gigabyte Aero 16 YE5 | |
| Average Intel Core i9-12900HK (42144 - 65268, n=15) | |
| Lenovo ThinkPad X1 Extreme G4-20Y50040GE | |
| AIDA64 / Memory Latency | |
| Average of class Multimedia (7 - 535, n=60, last 2 years) | |
| Gigabyte Aero 16 YE5 | |
| Lenovo ThinkPad X1 Extreme G4-20Y50040GE | |
| Average Intel Core i9-12900HK (79.9 - 109, n=15) | |
| Razer Blade 15 2022 | |
* ... smaller is better
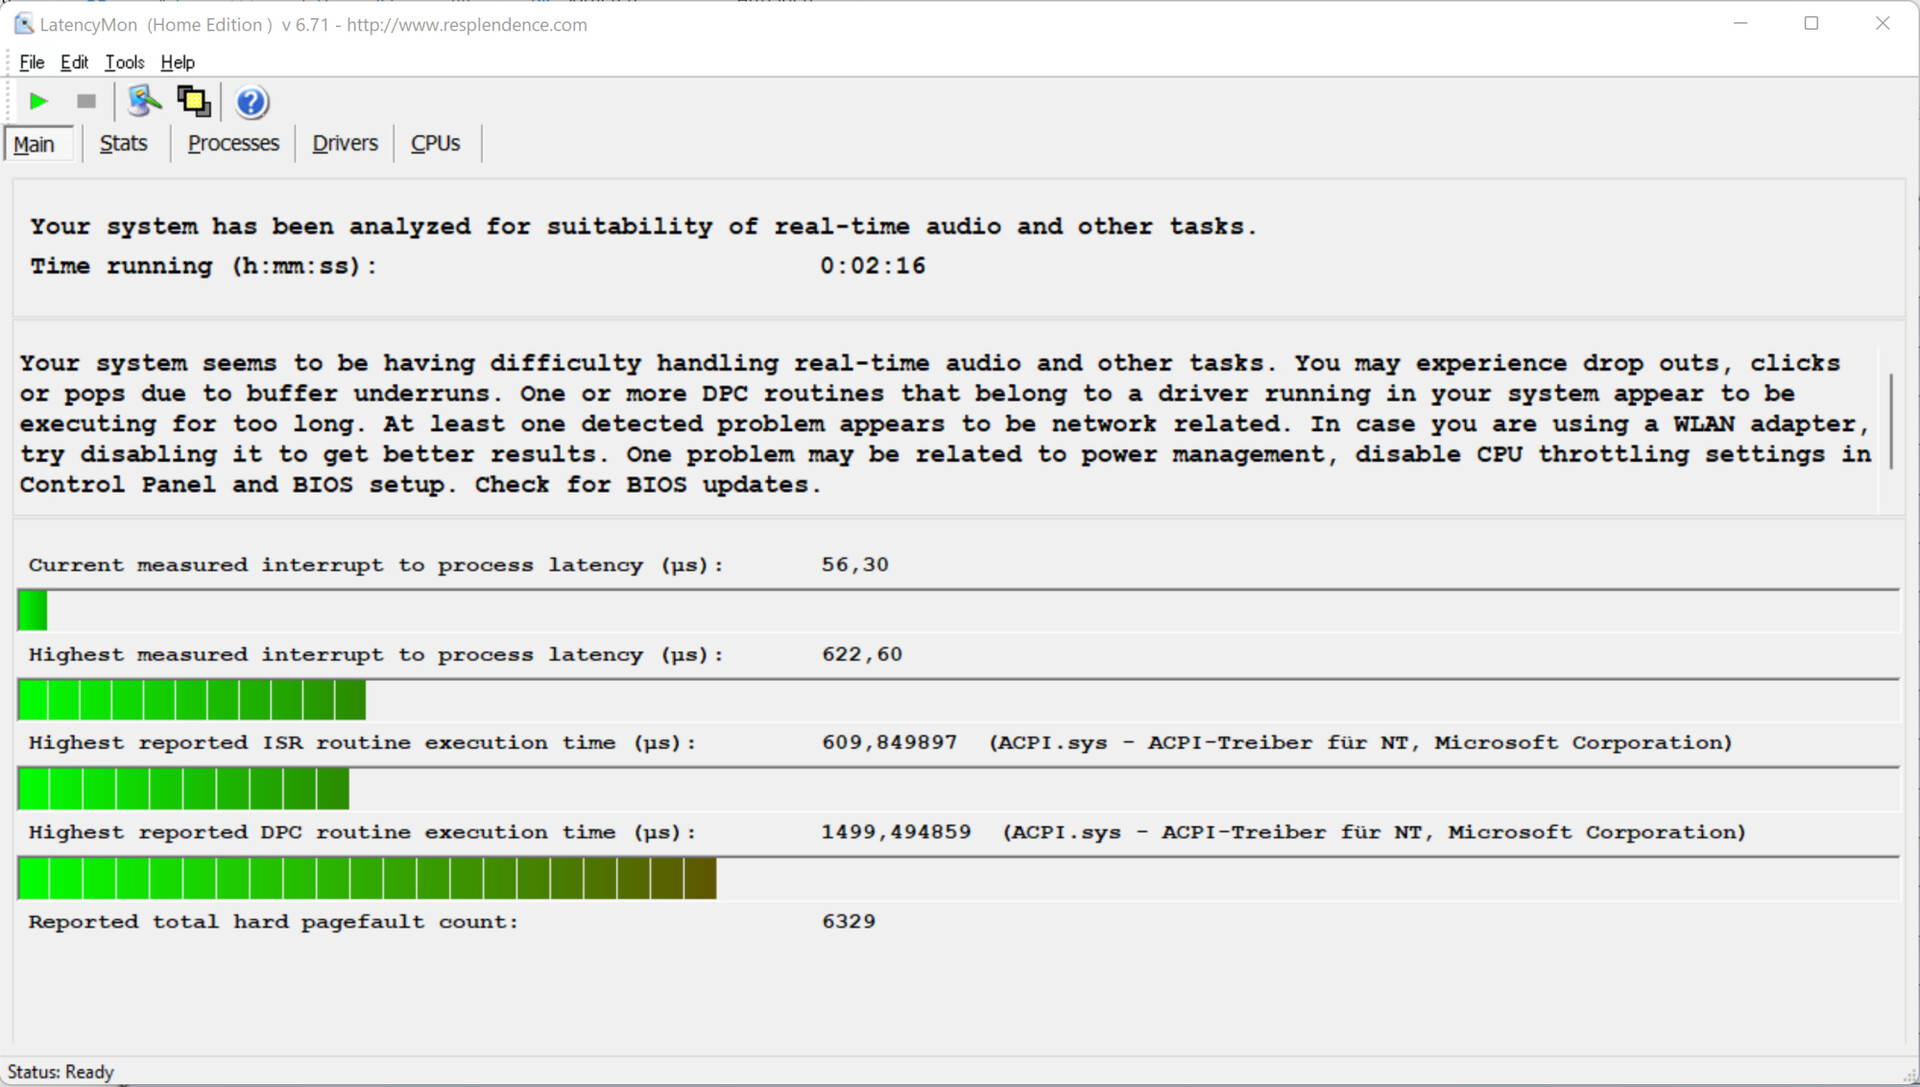
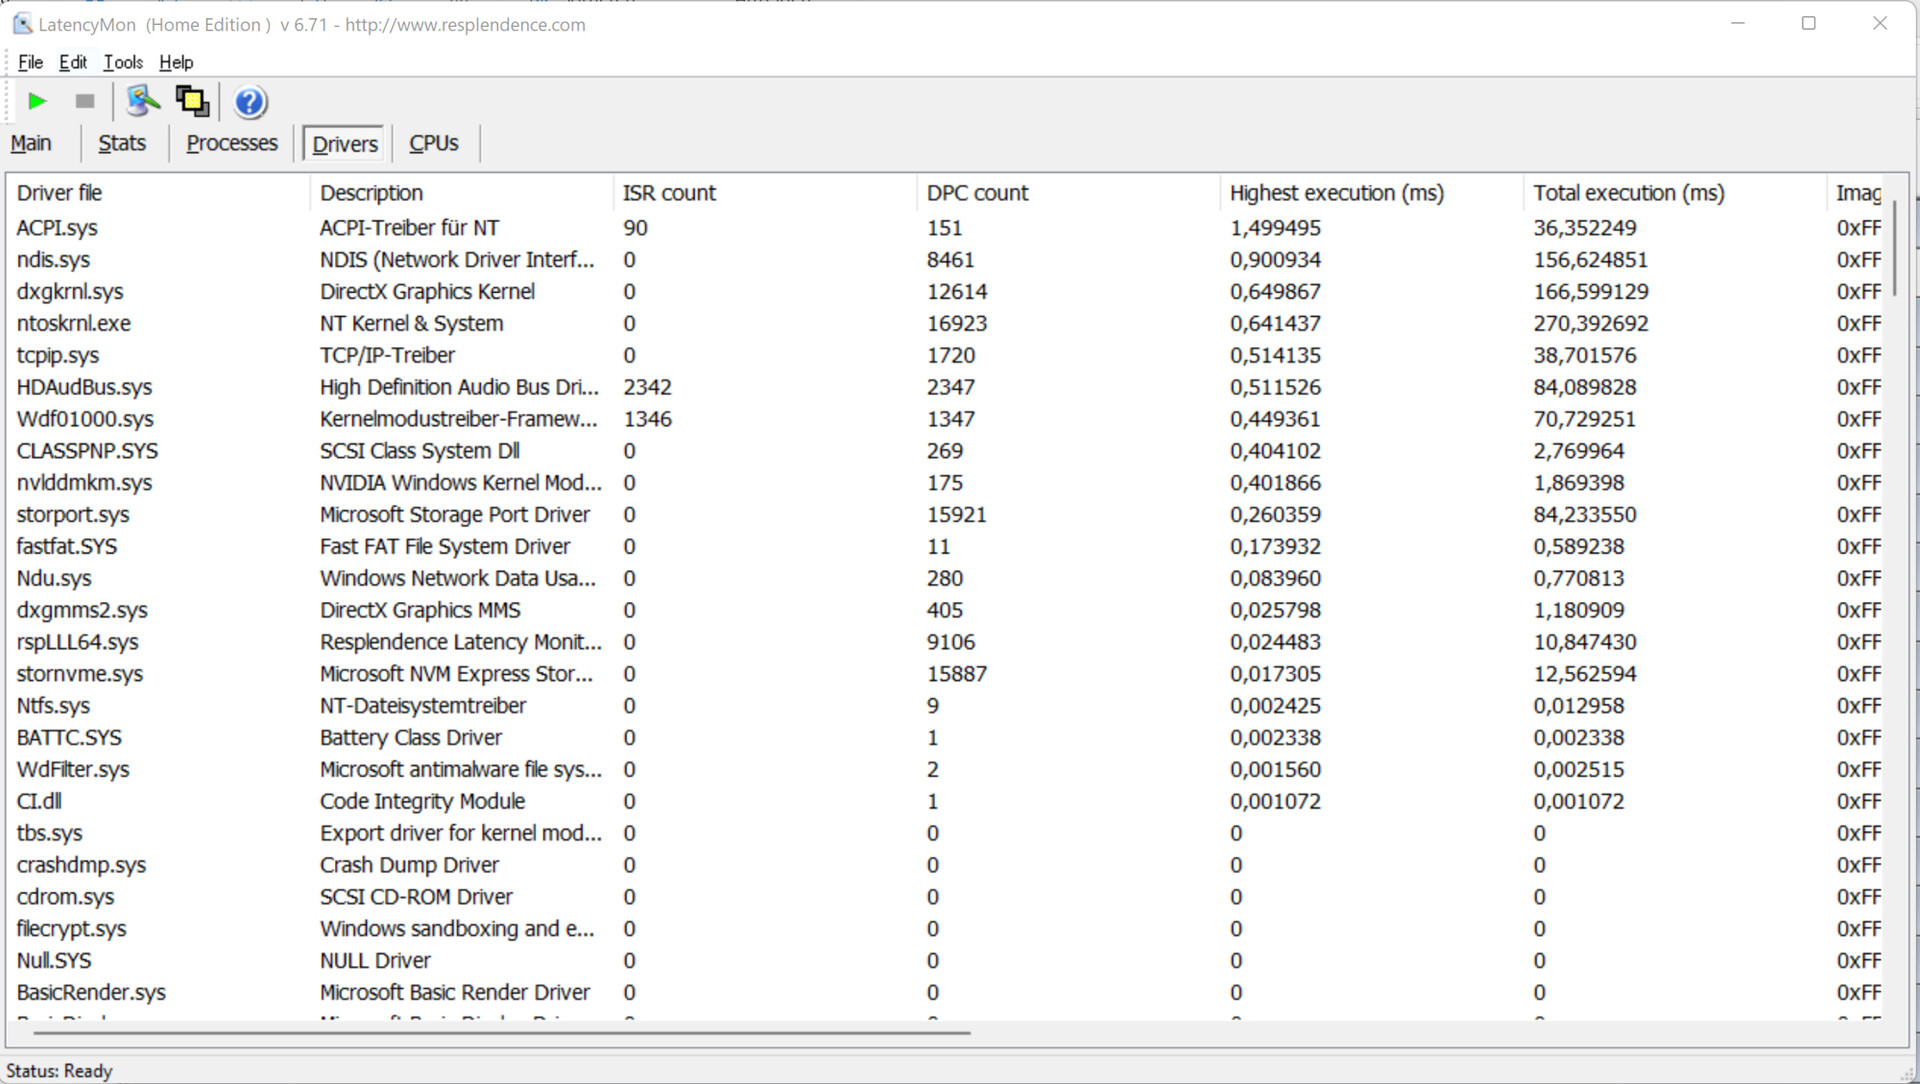
DPC Latencies
In our standardized latency monitor test (browsing the web, 4K video playback, Prime95 high load) we were able to detect a few DPC latencies inconsistencies. The Aero 16 does not seem to be suited particularly well for video and audio editing. Having said that some of its competitors suffer from even higher DPC latencies. In the past, we found that DPC latencies can be improved by software updates over time. Unfortunately, the opposite is also possible.
| DPC Latencies / LatencyMon - interrupt to process latency (max), Web, Youtube, Prime95 | |
| Lenovo ThinkPad X1 Extreme G4-20Y50040GE | |
| HP ZBook Studio 15 G8 | |
| Razer Blade 15 2022 | |
| Schenker XMG Pro 15 (Late 2021) | |
| Gigabyte Aero 16 YE5 | |
* ... smaller is better
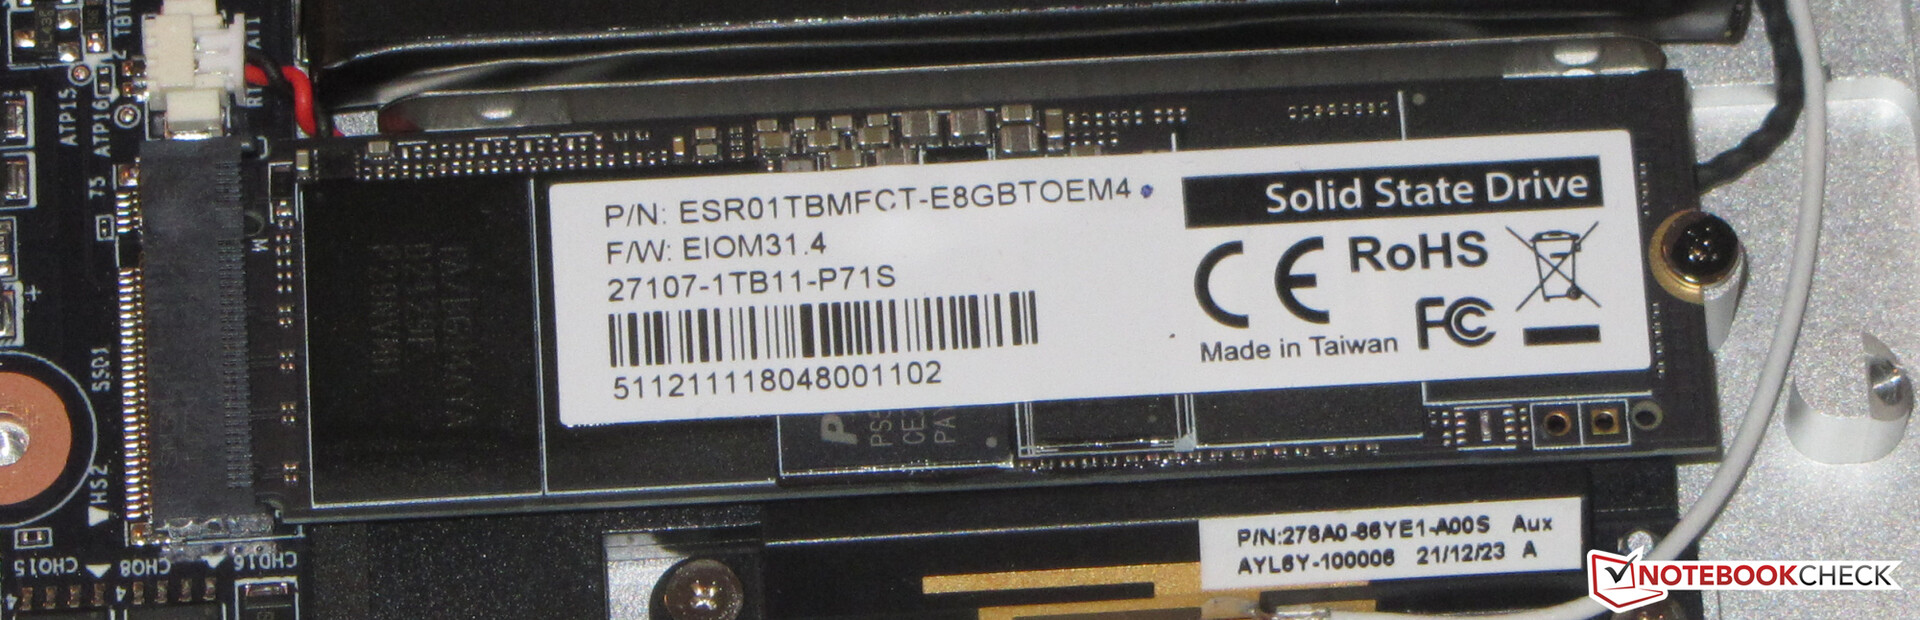
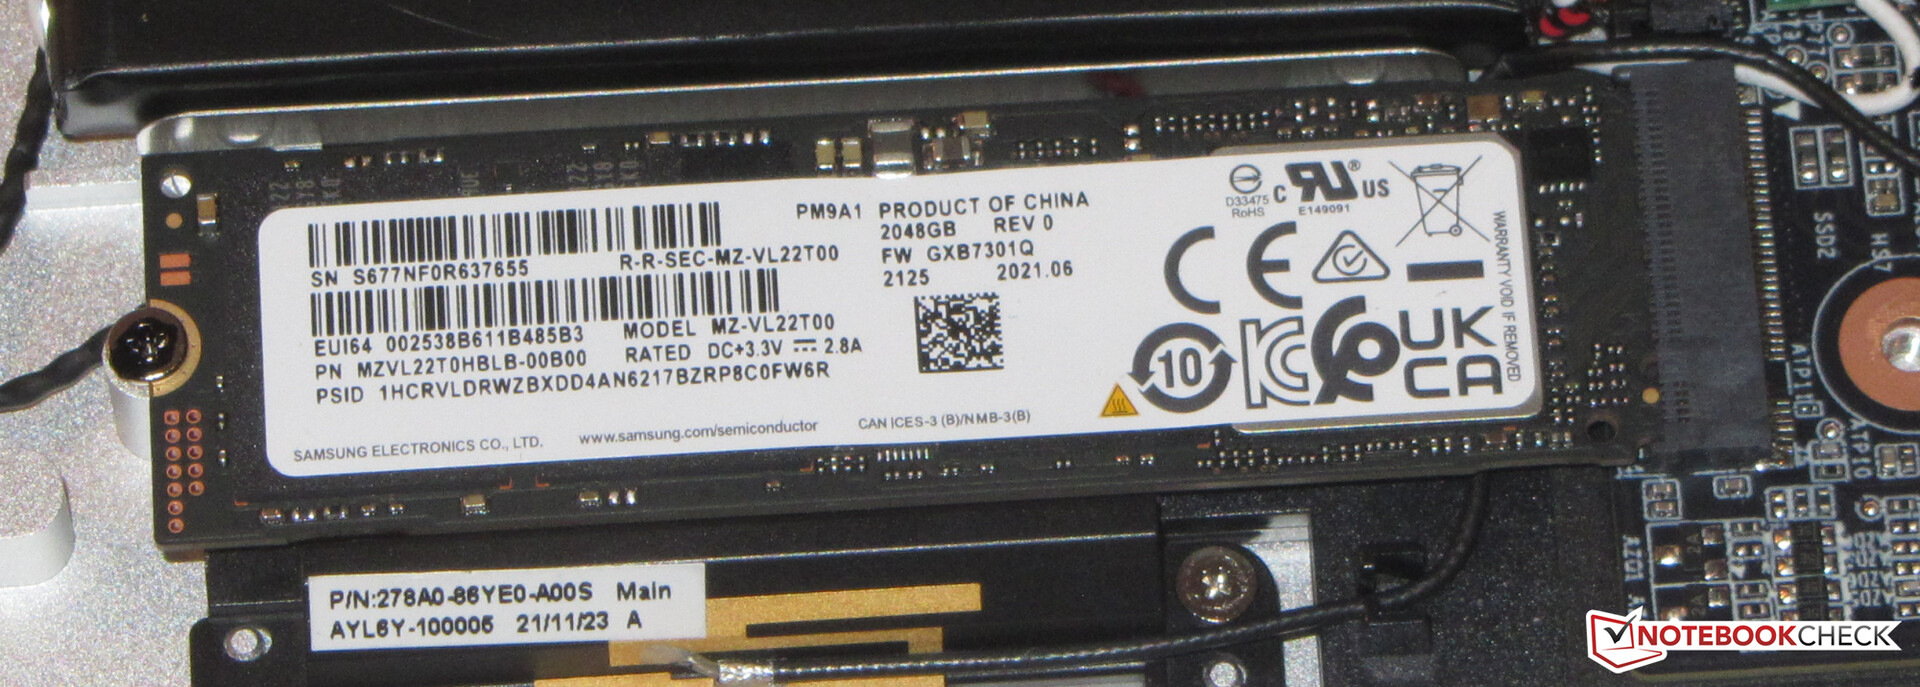
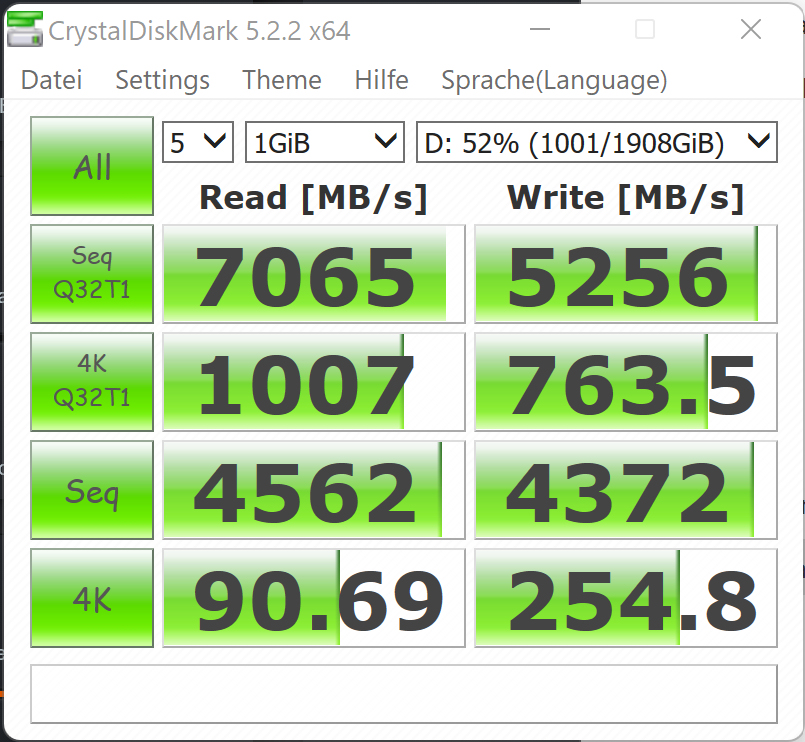
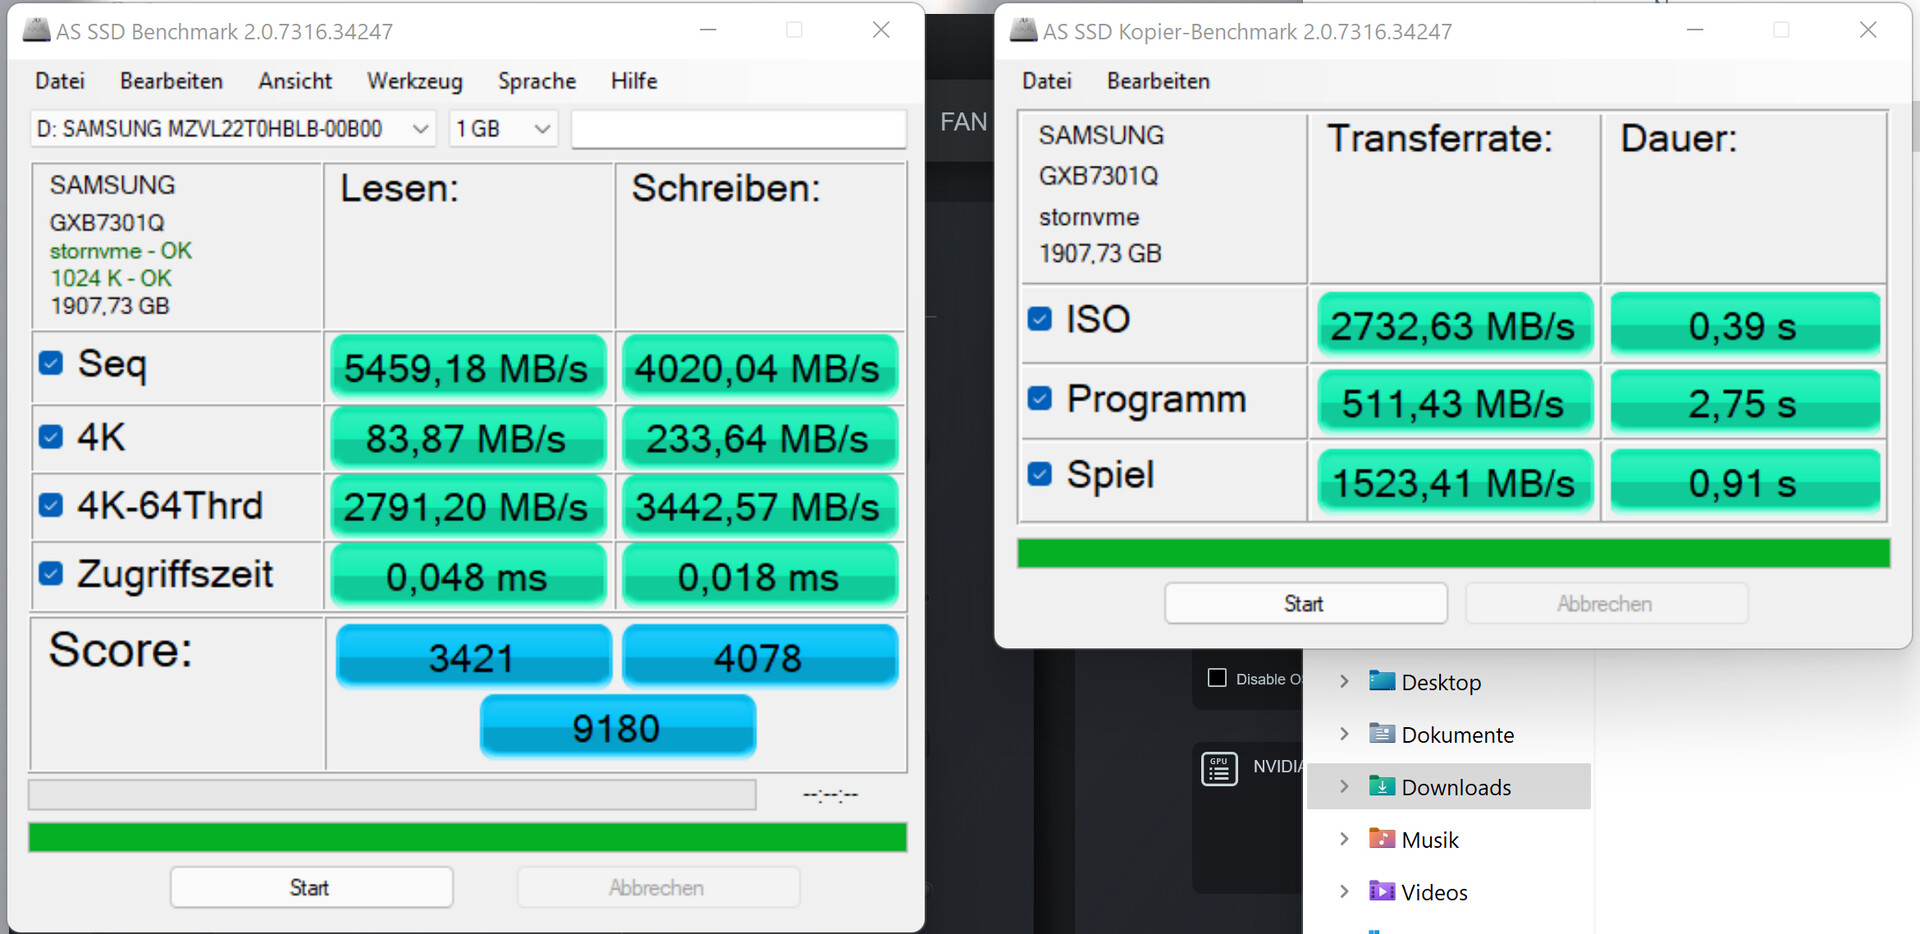
Storage Devices
Our review unit came with two SSDs installed, a 2 TB Samsung M.2-2280 and a 1 TB Phison M.2-2280, the latter of which was used for the operating system. Thanks to their PCIe 4.0 interface both SSDs performed admirably and very fast.

* ... smaller is better
Sustained Read: DiskSpd Read Loop, Queue Depth 8
Graphics Performance
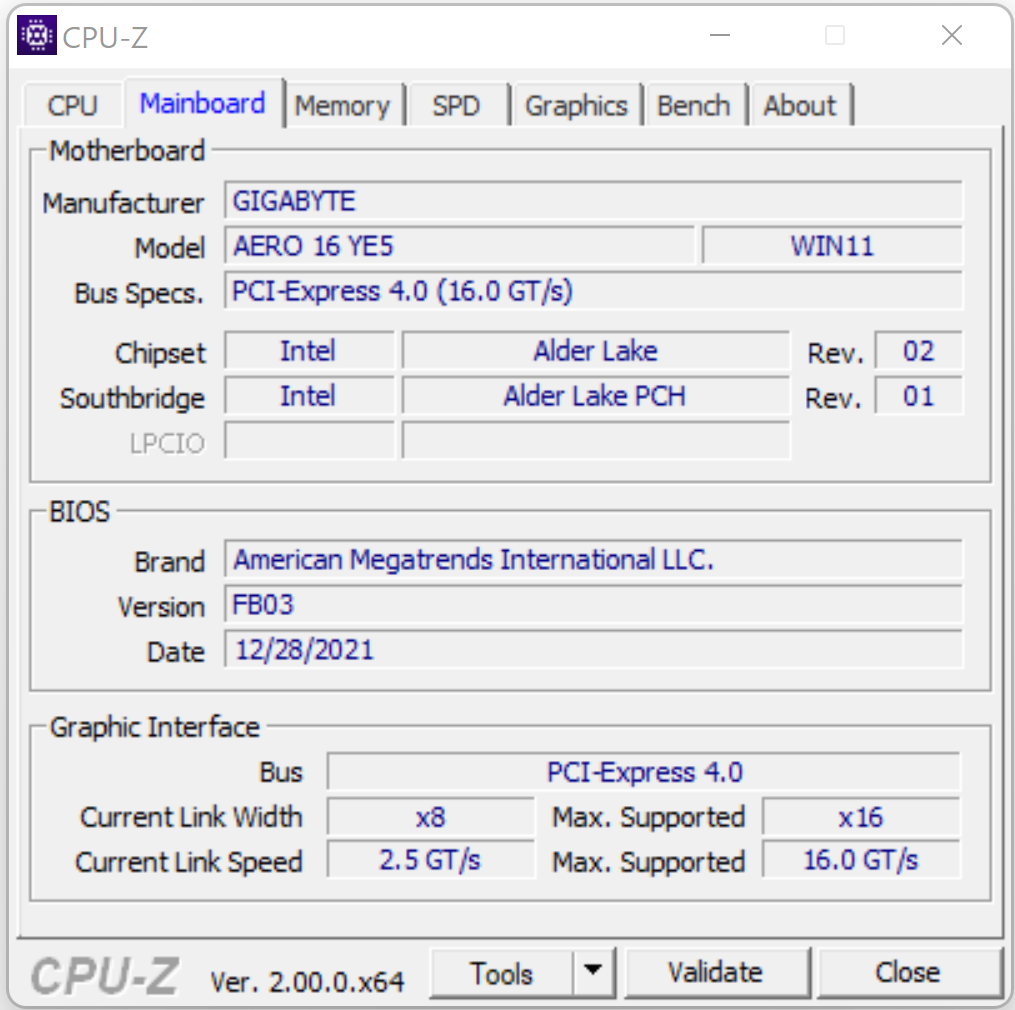
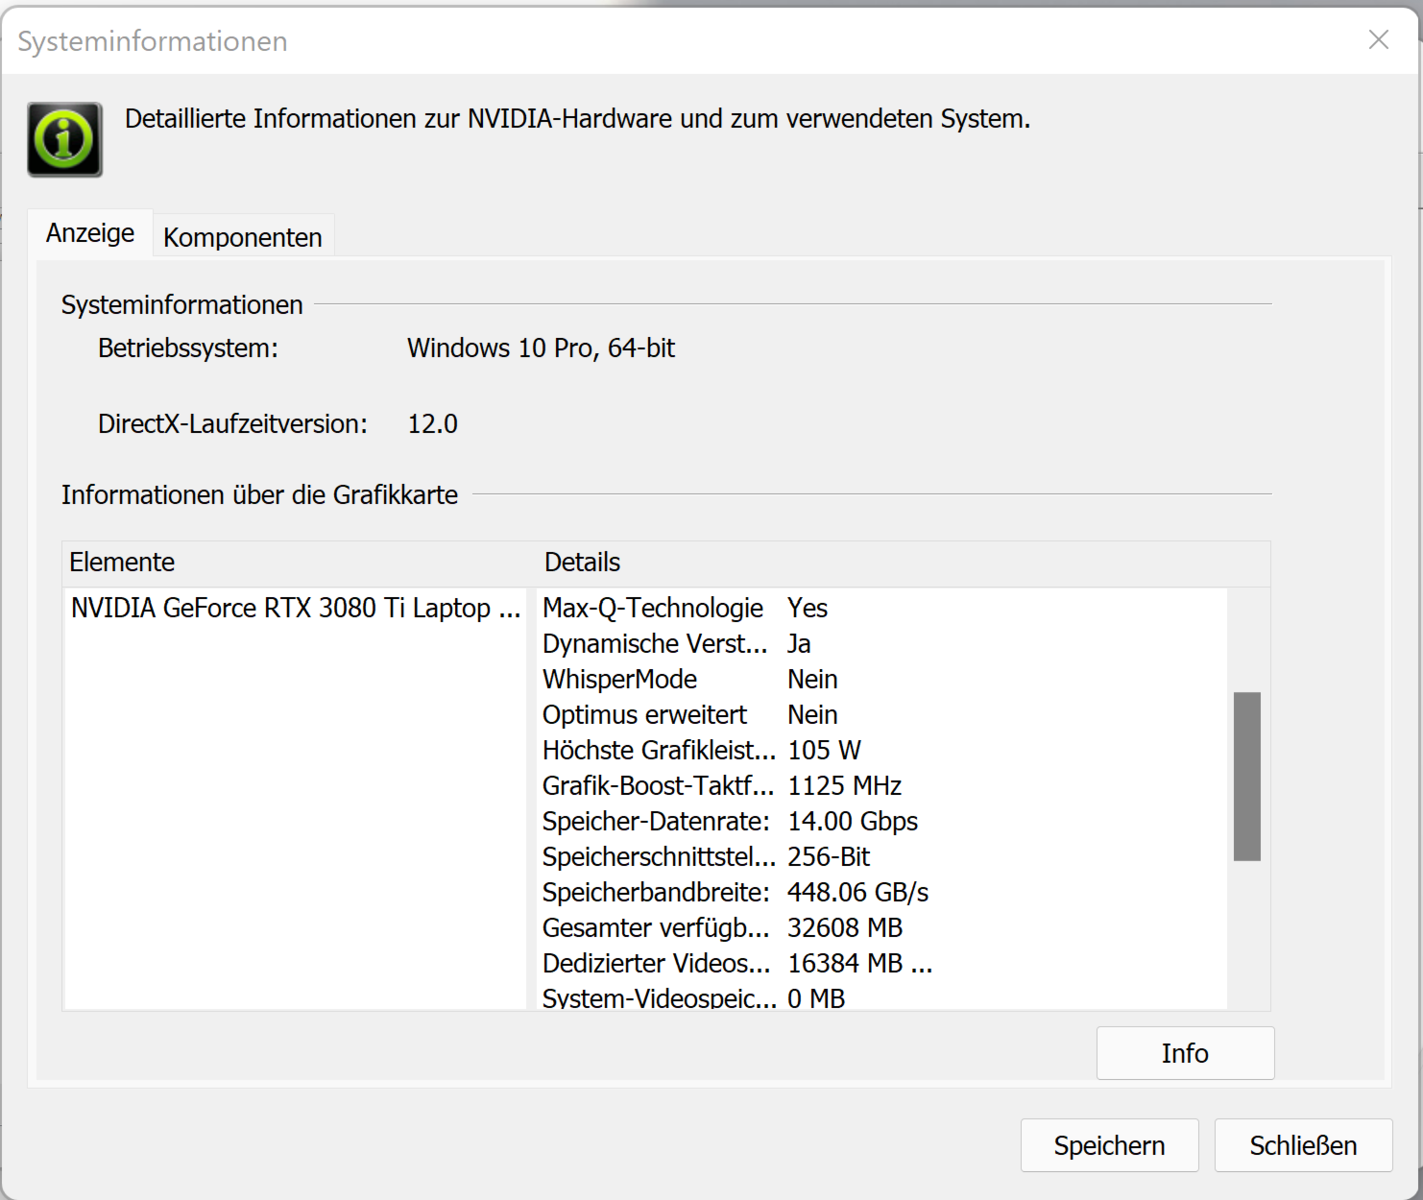
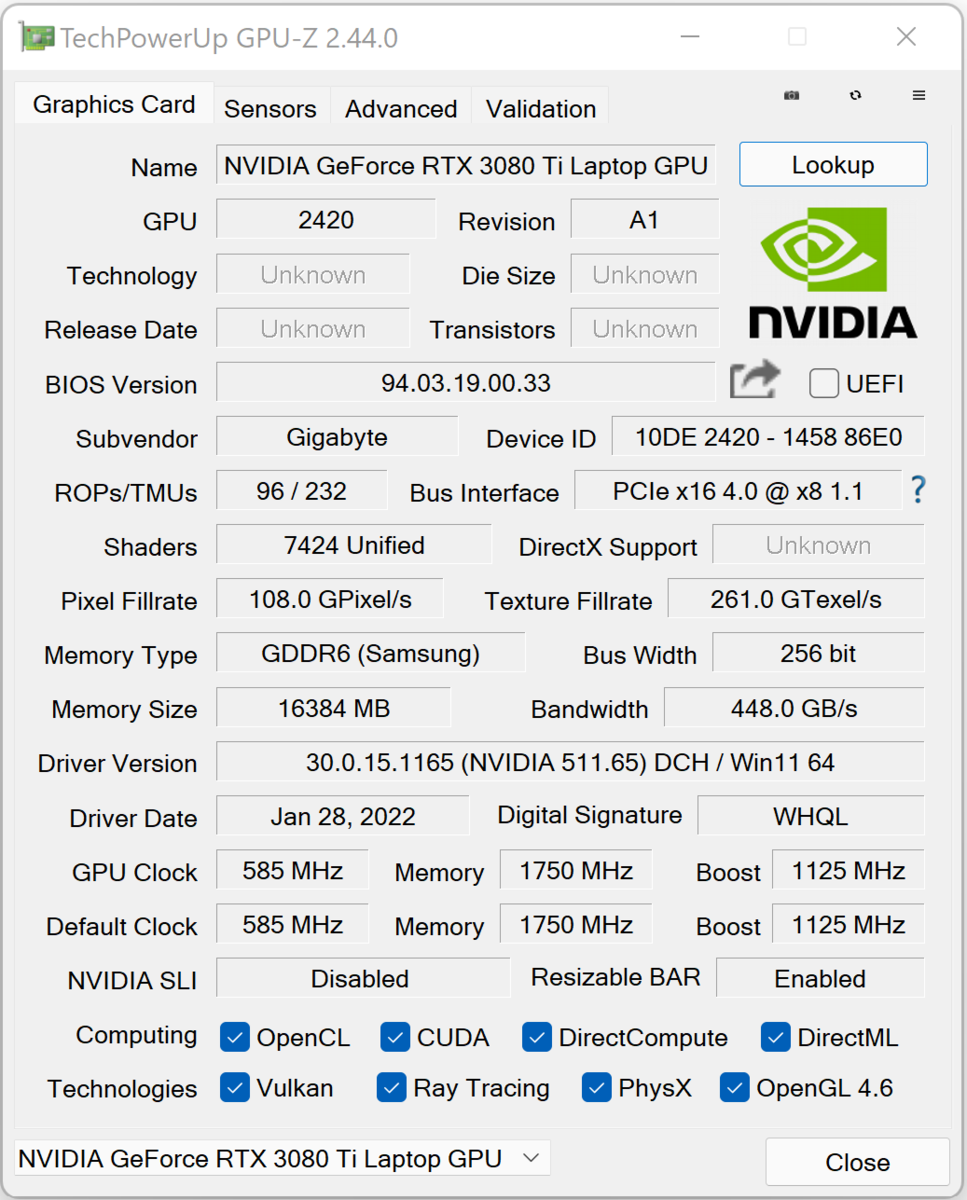
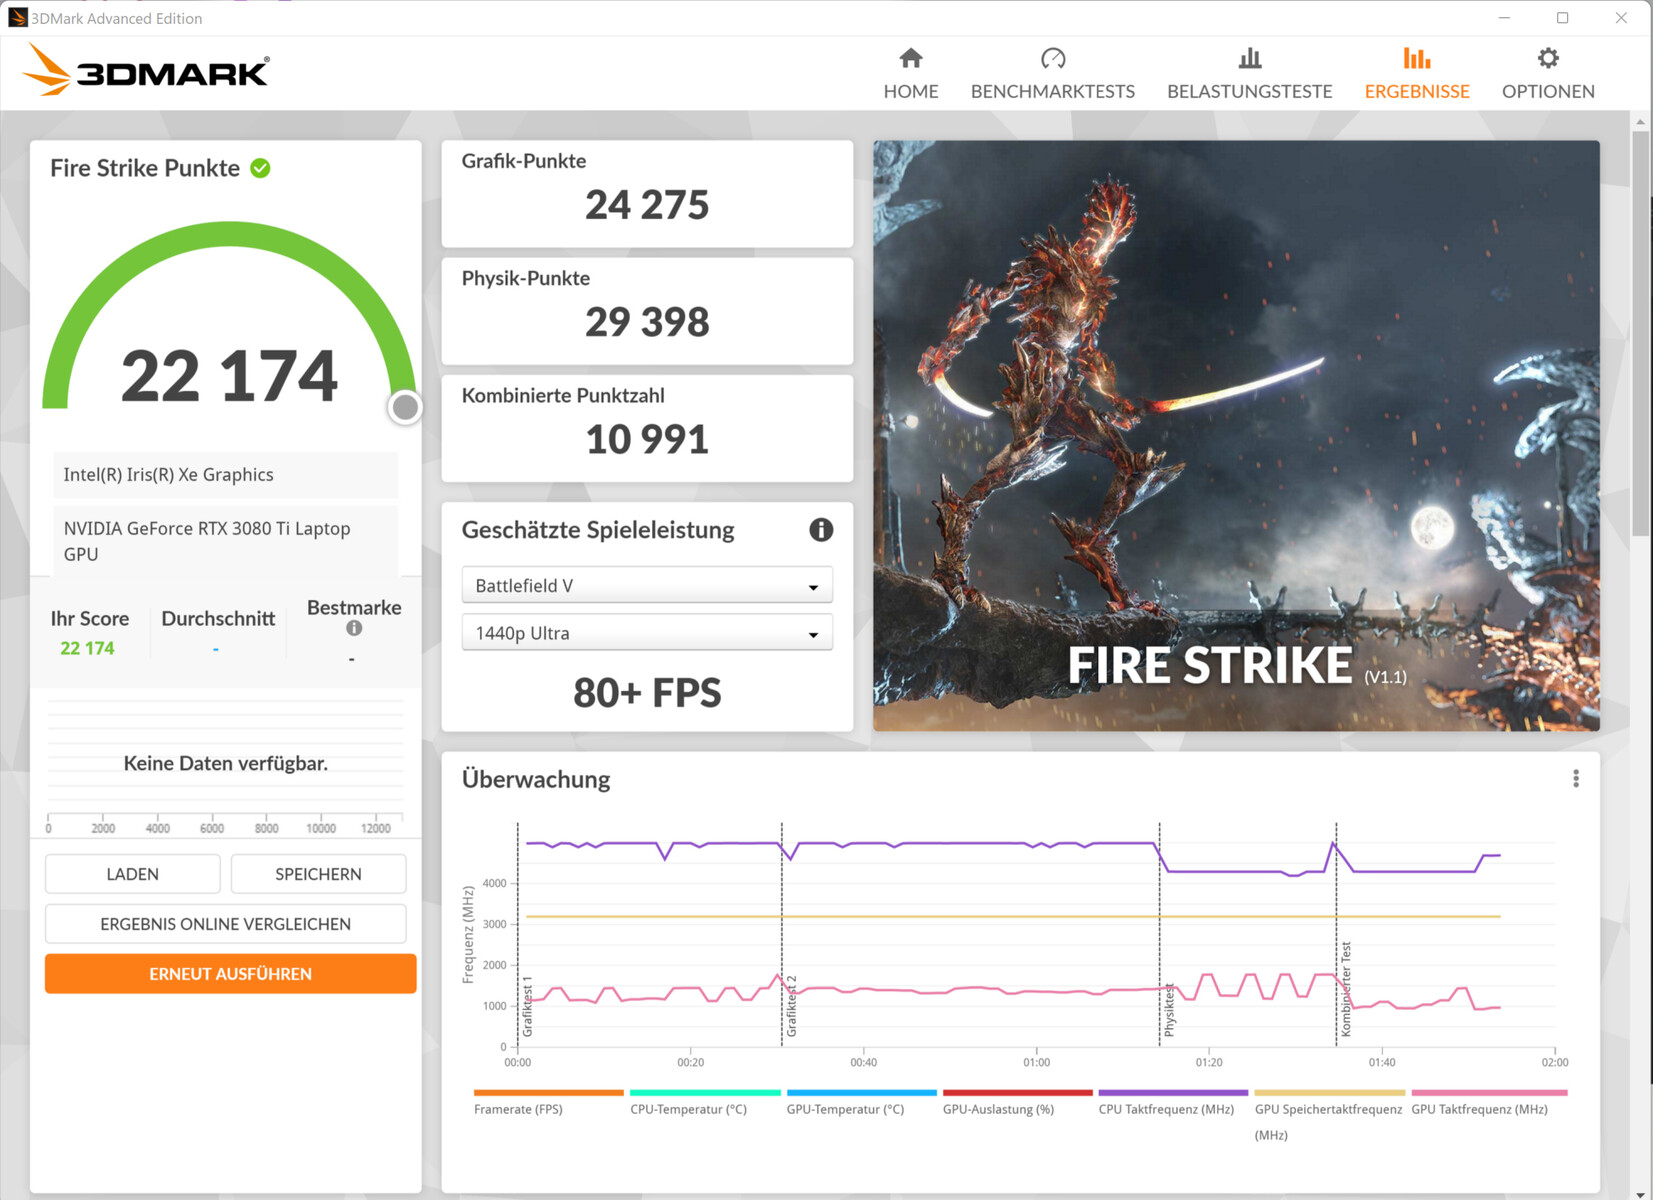
As we know, an RTX 3000’s true performance depends on a number of factors, such as cooling, memory configuration, and maximum TGP as set by the OEM within Nvidia’s predefined limits. In the Aero 16, Gigabyte opted for an GeForce RTX 3080 Ti Laptop GPU with maximum TGP of 105 W (90 W + 15 W Dynamic Boost).
In our benchmarks, the unit performed slower than the average of all previously tested RTX 3080 Ti-equipped devices, courtesy of its comparatively low TGP. In addition, our Witcher 3 test revealed that this maximum TGP cannot be maintained over long periods of time. The Razer Blade 15, which is equipped with the exact same GPU, performed noticeably better, among others thanks to its additional 5 W of TGP headroom.
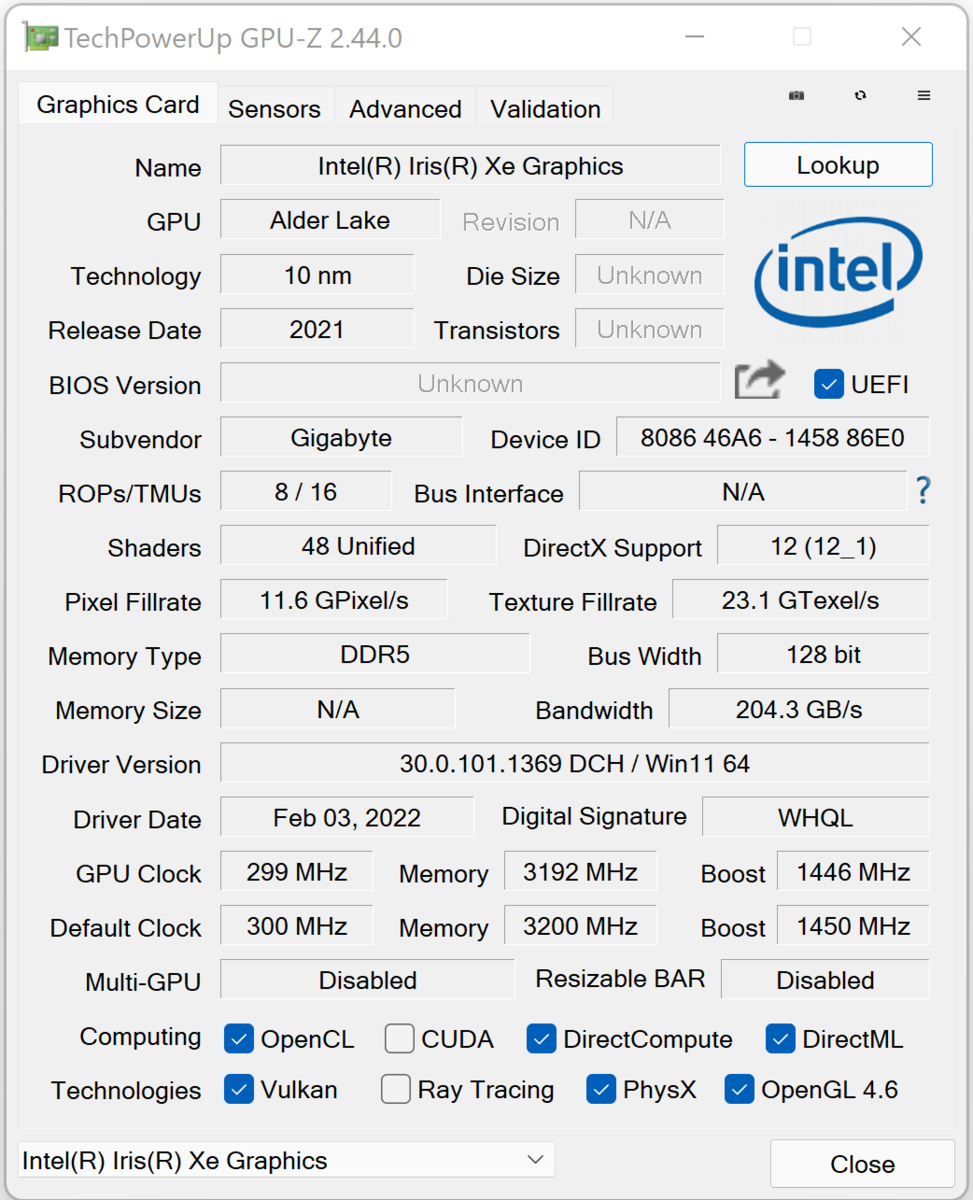
The GPU has access to a total of 16 GB of GDDR6 VRAM, and the notebook supports dynamic on-demand GPU switching between the dedicated GPU and the integrated Iris Xe Graphics G7 (Nvidia Optimus).


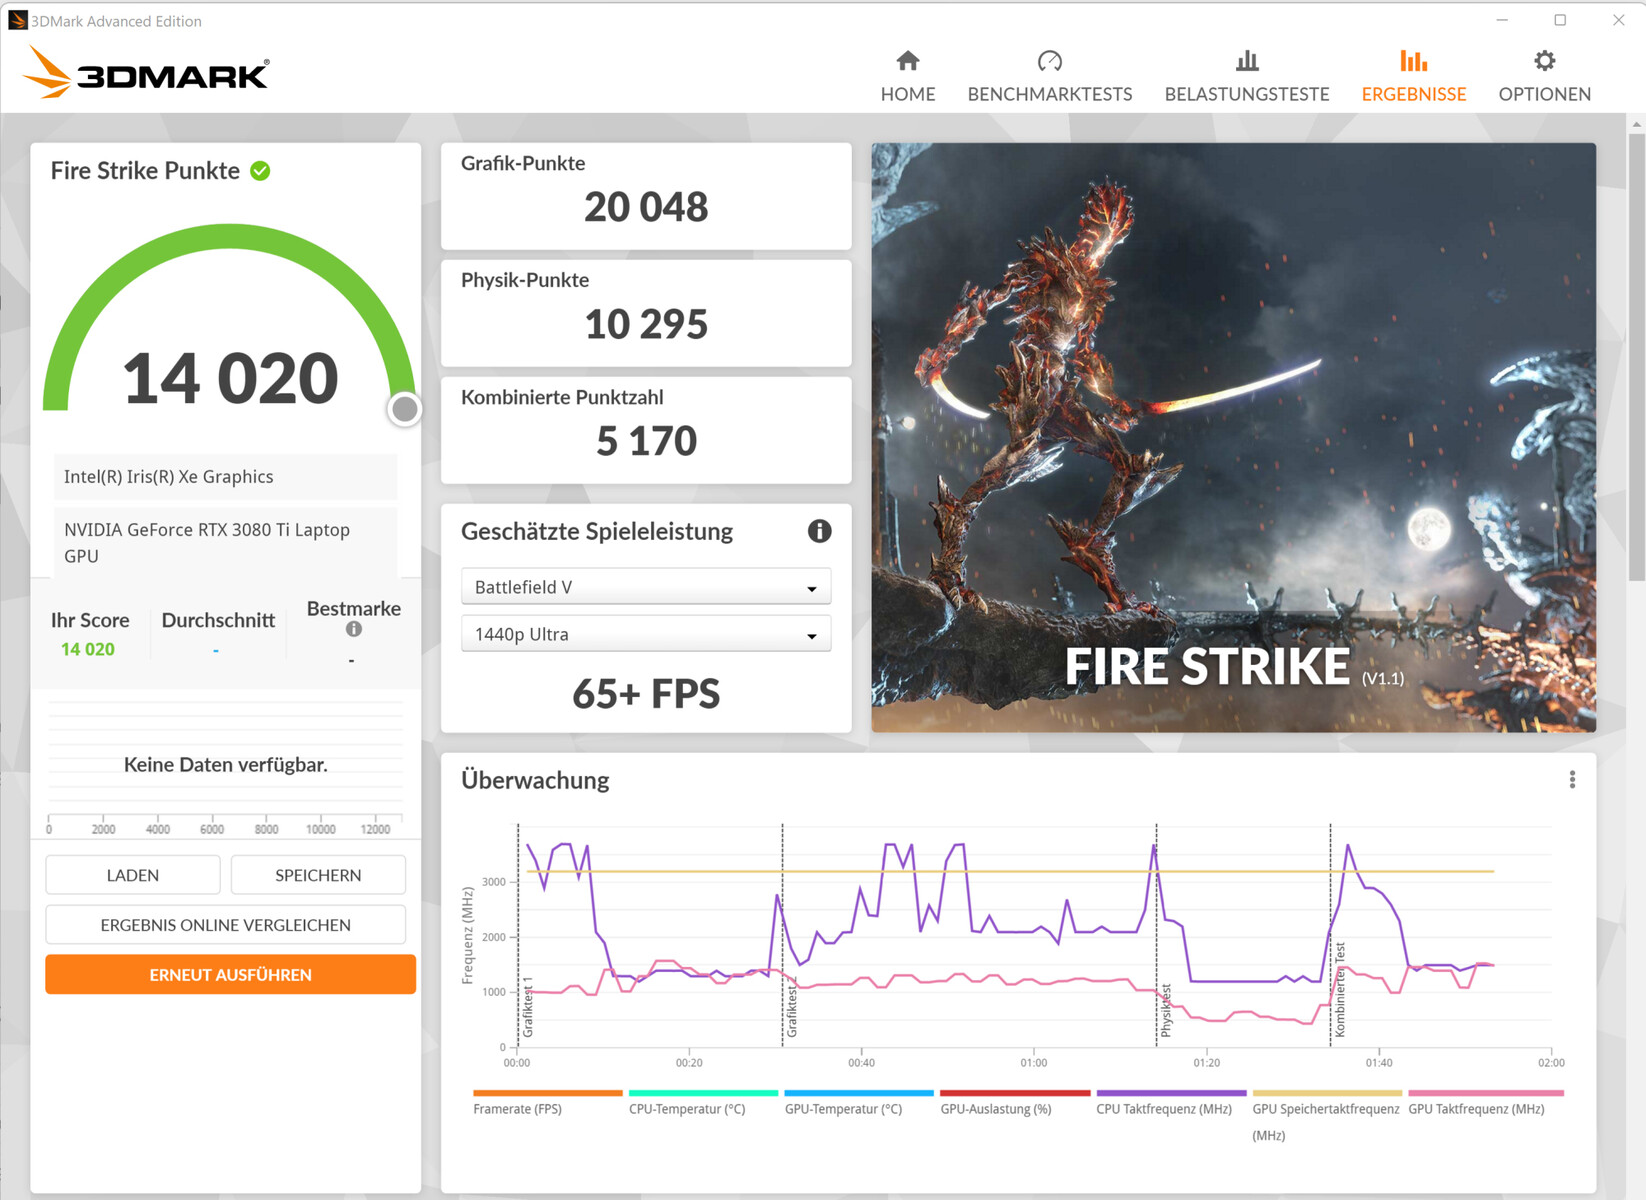
| 3DMark 06 Standard Score | 55891 points | |
| 3DMark 11 Performance | 30249 points | |
| 3DMark Cloud Gate Standard Score | 45491 points | |
| 3DMark Fire Strike Score | 22132 points | |
| 3DMark Time Spy Score | 9875 points | |
Help | ||
| 3DMark 11 - 1280x720 Performance GPU | |
| Average NVIDIA GeForce RTX 3080 Ti Laptop GPU (13920 - 45841, n=45) | |
| Razer Blade 15 2022 | |
| Schenker XMG Pro 15 (Late 2021) | |
| Gigabyte Aero 16 YE5 (Turbo Mode) | |
| Lenovo ThinkPad X1 Extreme G4-20Y50040GE | |
| Gigabyte Aero 16 YE5 | |
| Gigabyte Aero 16 YE5 (Silence Mode) | |
| HP ZBook Studio 15 G8 | |
| Average of class Multimedia (3765 - 60002, n=62, last 2 years) | |
| SPECviewperf 2020 | |
| 3840x2160 3ds Max (3dsmax-07) | |
| Average NVIDIA GeForce RTX 3080 Ti Laptop GPU (69.5 - 144, n=7) | |
| Gigabyte Aero 16 YE5 | |
| Gigabyte Aero 16 YE5 (Turbo Mode) | |
| Gigabyte Aero 16 YE5 (Silence Mode) | |
| 3840x2160 CATIA (catia-06) | |
| Average NVIDIA GeForce RTX 3080 Ti Laptop GPU (30.3 - 69.6, n=7) | |
| Gigabyte Aero 16 YE5 | |
| Gigabyte Aero 16 YE5 (Turbo Mode) | |
| Gigabyte Aero 16 YE5 (Silence Mode) | |
| 3840x2160 Creo (creo-03) | |
| Gigabyte Aero 16 YE5 (Turbo Mode) | |
| Average NVIDIA GeForce RTX 3080 Ti Laptop GPU (49 - 93.3, n=7) | |
| Gigabyte Aero 16 YE5 | |
| Gigabyte Aero 16 YE5 (Silence Mode) | |
| 3840x2160 Energy (energy-03) | |
| Average NVIDIA GeForce RTX 3080 Ti Laptop GPU (27.7 - 118.7, n=7) | |
| Gigabyte Aero 16 YE5 | |
| Gigabyte Aero 16 YE5 (Turbo Mode) | |
| Gigabyte Aero 16 YE5 (Silence Mode) | |
| 3840x2160 Maya (maya-06) | |
| Average NVIDIA GeForce RTX 3080 Ti Laptop GPU (137.4 - 345, n=7) | |
| Gigabyte Aero 16 YE5 (Turbo Mode) | |
| Gigabyte Aero 16 YE5 | |
| Gigabyte Aero 16 YE5 (Silence Mode) | |
| 3840x2160 Medical (medical-03) | |
| Average NVIDIA GeForce RTX 3080 Ti Laptop GPU (13.2 - 34.3, n=7) | |
| Gigabyte Aero 16 YE5 | |
| Gigabyte Aero 16 YE5 (Turbo Mode) | |
| Gigabyte Aero 16 YE5 (Silence Mode) | |
| 3840x2160 Siemens NX (snx-04) | |
| Average NVIDIA GeForce RTX 3080 Ti Laptop GPU (15.5 - 21.1, n=7) | |
| Gigabyte Aero 16 YE5 (Turbo Mode) | |
| Gigabyte Aero 16 YE5 | |
| Gigabyte Aero 16 YE5 (Silence Mode) | |
| 3840x2160 Solidworks (solidworks-05) | |
| Average NVIDIA GeForce RTX 3080 Ti Laptop GPU (87.9 - 255, n=4) | |
| Gigabyte Aero 16 YE5 | |
| Gigabyte Aero 16 YE5 (Turbo Mode) | |
| Gigabyte Aero 16 YE5 (Silence Mode) | |
| 1920x1080 3ds Max (3dsmax-07) | |
| Average NVIDIA GeForce RTX 3080 Ti Laptop GPU (99.2 - 153, n=6) | |
| Gigabyte Aero 16 YE5 | |
| Gigabyte Aero 16 YE5 (Turbo Mode) | |
| Average of class Multimedia (n=1last 2 years) | |
| Gigabyte Aero 16 YE5 (Silence Mode) | |
| 1920x1080 CATIA (catia-06) | |
| Average NVIDIA GeForce RTX 3080 Ti Laptop GPU (51.8 - 78.7, n=6) | |
| Average of class Multimedia (n=1last 2 years) | |
| Gigabyte Aero 16 YE5 (Turbo Mode) | |
| Gigabyte Aero 16 YE5 | |
| Gigabyte Aero 16 YE5 (Silence Mode) | |
| 1920x1080 Creo (creo-03) | |
| Gigabyte Aero 16 YE5 (Turbo Mode) | |
| Average of class Multimedia (n=1last 2 years) | |
| Average NVIDIA GeForce RTX 3080 Ti Laptop GPU (55.3 - 114.7, n=6) | |
| Gigabyte Aero 16 YE5 | |
| Gigabyte Aero 16 YE5 (Silence Mode) | |
| 1920x1080 Energy (energy-03) | |
| Average of class Multimedia (n=1last 2 years) | |
| Average NVIDIA GeForce RTX 3080 Ti Laptop GPU (19.6 - 27, n=6) | |
| Gigabyte Aero 16 YE5 | |
| Gigabyte Aero 16 YE5 (Turbo Mode) | |
| Gigabyte Aero 16 YE5 (Silence Mode) | |
| 1920x1080 Maya (maya-06) | |
| Average NVIDIA GeForce RTX 3080 Ti Laptop GPU (248 - 456, n=6) | |
| Gigabyte Aero 16 YE5 (Turbo Mode) | |
| Gigabyte Aero 16 YE5 | |
| Gigabyte Aero 16 YE5 (Silence Mode) | |
| 1920x1080 Medical (medical-03) | |
| Average NVIDIA GeForce RTX 3080 Ti Laptop GPU (33 - 40.2, n=6) | |
| Gigabyte Aero 16 YE5 | |
| Gigabyte Aero 16 YE5 (Turbo Mode) | |
| Average of class Multimedia (n=1last 2 years) | |
| Gigabyte Aero 16 YE5 (Silence Mode) | |
| 1920x1080 Siemens NX (snx-04) | |
| Average of class Multimedia (n=1last 2 years) | |
| Gigabyte Aero 16 YE5 (Turbo Mode) | |
| Average NVIDIA GeForce RTX 3080 Ti Laptop GPU (18.1 - 25, n=6) | |
| Gigabyte Aero 16 YE5 | |
| Gigabyte Aero 16 YE5 (Silence Mode) | |
| 1920x1080 Solidworks (solidworks-05) | |
| Average of class Multimedia (n=1last 2 years) | |
| Gigabyte Aero 16 YE5 | |
| Gigabyte Aero 16 YE5 (Turbo Mode) | |
| Average NVIDIA GeForce RTX 3080 Ti Laptop GPU (174.7 - 211, n=3) | |
| Gigabyte Aero 16 YE5 (Silence Mode) | |
| Geekbench 5.5 - OpenCL Score | |
| Average NVIDIA GeForce RTX 3080 Ti Laptop GPU (88580 - 151633, n=41) | |
| Gigabyte Aero 16 YE5 (Turbo Mode) | |
| Gigabyte Aero 16 YE5 | |
| Razer Blade 15 2022 | |
| Lenovo ThinkPad X1 Extreme G4-20Y50040GE | |
| Gigabyte Aero 16 YE5 (Silence Mode) | |
| Schenker XMG Pro 15 (Late 2021) | |
| Average of class Multimedia (11562 - 217159, n=62, last 2 years) | |
| Apple MacBook Pro 16 2021 M1 Max | |
| GFXBench | |
| on screen Aztec Ruins High Tier Onscreen | |
| Apple MacBook Pro 16 2021 M1 Max | |
| Gigabyte Aero 16 YE5 (DX11) | |
| Average NVIDIA GeForce RTX 3080 Ti Laptop GPU (n=1) | |
| Average of class Multimedia (36.8 - 133.5, n=10, last 2 years) | |
| 2560x1440 Aztec Ruins High Tier Offscreen | |
| Apple MacBook Pro 16 2021 M1 Max | |
| Average NVIDIA GeForce RTX 3080 Ti Laptop GPU (262 - 328, n=2) | |
| Gigabyte Aero 16 YE5 (DX11) | |
| Average of class Multimedia (73.3 - 516, n=11, last 2 years) | |
| on screen Aztec Ruins Normal Tier Onscreen | |
| Gigabyte Aero 16 YE5 (DX11) | |
| Average NVIDIA GeForce RTX 3080 Ti Laptop GPU (n=1) | |
| Apple MacBook Pro 16 2021 M1 Max | |
| Average of class Multimedia (52 - 177.1, n=9, last 2 years) | |
| 1920x1080 Aztec Ruins Normal Tier Offscreen | |
| Apple MacBook Pro 16 2021 M1 Max | |
| Gigabyte Aero 16 YE5 (DX11) | |
| Average NVIDIA GeForce RTX 3080 Ti Laptop GPU (n=1) | |
| Average of class Multimedia (178.3 - 1302, n=11, last 2 years) | |
| V-Ray 5 Benchmark | |
| GPU RTX | |
| Average NVIDIA GeForce RTX 3080 Ti Laptop GPU (1225 - 1915, n=19) | |
| Lenovo ThinkPad X1 Extreme G4-20Y50040GE (5.0.1) | |
| Gigabyte Aero 16 YE5 (5.0.1) | |
| Schenker XMG Pro 15 (Late 2021) (5.0.1) | |
| Average of class Multimedia (370 - 1956, n=6, last 2 years) | |
| Gigabyte Aero 16 YE5 (5.0.1, Silence Mode) | |
| GPU CUDA | |
| Average NVIDIA GeForce RTX 3080 Ti Laptop GPU (846 - 1384, n=20) | |
| Gigabyte Aero 16 YE5 (5.0.1, Turbo Mode) | |
| Gigabyte Aero 16 YE5 (5.0.1) | |
| Schenker XMG Pro 15 (Late 2021) (5.0.1) | |
| Lenovo ThinkPad X1 Extreme G4-20Y50040GE (5.0.1) | |
| Average of class Multimedia (277 - 1482, n=7, last 2 years) | |
| Gigabyte Aero 16 YE5 (5.0.1, Silence Mode) | |
| CPU | |
| Gigabyte Aero 16 YE5 (5.0.1, Turbo Mode) | |
| Average NVIDIA GeForce RTX 3080 Ti Laptop GPU (3692 - 15811, n=25) | |
| Gigabyte Aero 16 YE5 (5.0.1) | |
| Razer Blade 15 2022 (5.0.1) | |
| Average of class Multimedia (3126 - 16017, n=30, last 2 years) | |
| Schenker XMG Pro 15 (Late 2021) | |
| Lenovo ThinkPad X1 Extreme G4-20Y50040GE (5.0.1) | |
| Gigabyte Aero 16 YE5 (5.0.1, Silence Mode) | |
| V-Ray Benchmark Next 4.10 | |
| GPU | |
| Average NVIDIA GeForce RTX 3080 Ti Laptop GPU (311 - 552, n=35) | |
| Gigabyte Aero 16 YE5 (v4.10.07 ) | |
| Gigabyte Aero 16 YE5 (v4.10.07, Turbo Mode) | |
| Schenker XMG Pro 15 (Late 2021) (v4.10.07 ) | |
| Gigabyte Aero 16 YE5 (v4.10.07, Silence Mode) | |
| Average of class Multimedia (32 - 1191, n=60, last 2 years) | |
| CPU | |
| Gigabyte Aero 16 YE5 (v4.10.07, Turbo Mode) | |
| Average NVIDIA GeForce RTX 3080 Ti Laptop GPU (5564 - 23947, n=35) | |
| Average of class Multimedia (4772 - 35165, n=60, last 2 years) | |
| Gigabyte Aero 16 YE5 (v4.10.07 ) | |
| Schenker XMG Pro 15 (Late 2021) (v4.10.07 ) | |
| Gigabyte Aero 16 YE5 (v4.10.07, Silence Mode) | |
Gaming Performance
Thanks to its powerful hardware, the Aero 16 runs all current games smoothly in FHD resolution and maximum details. This is also true for higher resolutions albeit sometimes with reduced details. By and large, the notebook performed slightly slower than the average RTX 3080 Ti-equipped device.
| The Witcher 3 | |
| 1920x1080 Ultra Graphics & Postprocessing (HBAO+) | |
| Average NVIDIA GeForce RTX 3080 Ti Laptop GPU (30 - 130.6, n=43) | |
| Razer Blade 15 2022 | |
| Schenker XMG Pro 15 (Late 2021) | |
| Gigabyte Aero 16 YE5 (Turbo Mode) | |
| Gigabyte Aero 16 YE5 | |
| Lenovo ThinkPad X1 Extreme G4-20Y50040GE | |
| HP ZBook Studio 15 G8 | |
| Gigabyte Aero 16 YE5 (SIlence Mode) | |
| Average of class Multimedia (11 - 121, n=13, last 2 years) | |
| 3840x2160 High Graphics & Postprocessing (Nvidia HairWorks Off) | |
| Average NVIDIA GeForce RTX 3080 Ti Laptop GPU (62.1 - 94.3, n=8) | |
| Schenker XMG Pro 15 (Late 2021) | |
| Average of class Multimedia (61 - 71, n=2, last 2 years) | |
| Gigabyte Aero 16 YE5 | |
| HP ZBook Studio 15 G8 | |
| Dota 2 Reborn | |
| 1920x1080 ultra (3/3) best looking | |
| Gigabyte Aero 16 YE5 | |
| Gigabyte Aero 16 YE5 (Turbo Mode) | |
| Razer Blade 15 2022 | |
| Average NVIDIA GeForce RTX 3080 Ti Laptop GPU (29.9 - 170.5, n=45) | |
| Schenker XMG Pro 15 (Late 2021) | |
| HP ZBook Studio 15 G8 | |
| Lenovo ThinkPad X1 Extreme G4-20Y50040GE | |
| Average of class Multimedia (29 - 179.9, n=68, last 2 years) | |
| Gigabyte Aero 16 YE5 (Silence Mode) | |
| 3840x2160 ultra (3/3) best looking | |
| Average NVIDIA GeForce RTX 3080 Ti Laptop GPU (70.8 - 155.6, n=19) | |
| Gigabyte Aero 16 YE5 (Turbo Mode) | |
| Schenker XMG Pro 15 (Late 2021) | |
| Gigabyte Aero 16 YE5 | |
| Average of class Multimedia (31.8 - 139.3, n=5, last 2 years) | |
| HP ZBook Studio 15 G8 | |
| Gigabyte Aero 16 YE5 (Silence Mode) | |
| Lenovo ThinkPad X1 Extreme G4-20Y50040GE | |
| X-Plane 11.11 | |
| 1920x1080 high (fps_test=3) | |
| Razer Blade 15 2022 | |
| Gigabyte Aero 16 YE5 | |
| Gigabyte Aero 16 YE5 (Turbo Mode) | |
| Average NVIDIA GeForce RTX 3080 Ti Laptop GPU (32.6 - 127, n=45) | |
| Schenker XMG Pro 15 (Late 2021) | |
| HP ZBook Studio 15 G8 | |
| Lenovo ThinkPad X1 Extreme G4-20Y50040GE | |
| Gigabyte Aero 16 YE5 (Silence Mode) | |
| Average of class Multimedia (16.9 - 141.1, n=62, last 2 years) | |
| 3840x2160 high (fps_test=3) | |
| Average NVIDIA GeForce RTX 3080 Ti Laptop GPU (32.9 - 109.5, n=20) | |
| Gigabyte Aero 16 YE5 (Turbo Mode) | |
| Gigabyte Aero 16 YE5 | |
| Schenker XMG Pro 15 (Late 2021) | |
| Average of class Multimedia (19.3 - 114.7, n=5, last 2 years) | |
| HP ZBook Studio 15 G8 | |
| Gigabyte Aero 16 YE5 (Silence Mode) | |
| Lenovo ThinkPad X1 Extreme G4-20Y50040GE | |
| Final Fantasy XV Benchmark | |
| 1920x1080 High Quality | |
| Average NVIDIA GeForce RTX 3080 Ti Laptop GPU (30.7 - 140.6, n=42) | |
| Razer Blade 15 2022 (1.3) | |
| Schenker XMG Pro 15 (Late 2021) (1.3) | |
| Gigabyte Aero 16 YE5 (1.3, Turbo Mode) | |
| Gigabyte Aero 16 YE5 (1.3) | |
| HP ZBook Studio 15 G8 (1.3) | |
| Lenovo ThinkPad X1 Extreme G4-20Y50040GE (1.3) | |
| Average of class Multimedia (7.61 - 144.4, n=66, last 2 years) | |
| 3840x2160 High Quality | |
| Average NVIDIA GeForce RTX 3080 Ti Laptop GPU (35.1 - 61.2, n=18) | |
| Average of class Multimedia (8.98 - 83.4, n=5, last 2 years) | |
| Schenker XMG Pro 15 (Late 2021) (1.3) | |
| Gigabyte Aero 16 YE5 (1.3, Turbo Mode) | |
| Gigabyte Aero 16 YE5 (1.3) | |
| Lenovo ThinkPad X1 Extreme G4-20Y50040GE (1.3) | |
| HP ZBook Studio 15 G8 (1.3) | |
| Gigabyte Aero 16 YE5 (1.3, Silence Mode) | |
| GTA V | |
| 1920x1080 Highest AA:4xMSAA + FX AF:16x | |
| Razer Blade 15 2022 | |
| Gigabyte Aero 16 YE5 (Turbo Mode) | |
| Gigabyte Aero 16 YE5 | |
| Average NVIDIA GeForce RTX 3080 Ti Laptop GPU (30 - 139.2, n=42) | |
| Schenker XMG Pro 15 (Late 2021) | |
| Average of class Multimedia (7.92 - 141.6, n=63, last 2 years) | |
| Gigabyte Aero 16 YE5 (Silence Mode) | |
| 3840x2160 Highest AA:4xMSAA + FX AF:16x | |
| Average NVIDIA GeForce RTX 3080 Ti Laptop GPU (37.7 - 67.2, n=14) | |
| Schenker XMG Pro 15 (Late 2021) | |
| Average of class Multimedia (5.03 - 90.1, n=3, last 2 years) | |
| Gigabyte Aero 16 YE5 (Turbo Mode) | |
| Gigabyte Aero 16 YE5 | |
| Gigabyte Aero 16 YE5 (Silence Mode) | |
| Strange Brigade | |
| 1920x1080 ultra AA:ultra AF:16 | |
| Average NVIDIA GeForce RTX 3080 Ti Laptop GPU (42.3 - 224, n=41) | |
| Razer Blade 15 2022 (1.47.22.14 D3D12) | |
| Schenker XMG Pro 15 (Late 2021) (1.47.22.14 D3D12) | |
| Gigabyte Aero 16 YE5 (1.47.22.14 D3D12, Turbo Mode) | |
| Gigabyte Aero 16 YE5 (1.47.22.14 D3D12) | |
| Gigabyte Aero 16 YE5 (1.47.22.14 D3D12, Silence Mode) | |
| Average of class Multimedia (13.3 - 303, n=66, last 2 years) | |
| 3840x2160 ultra AA:ultra AF:16 | |
| Average NVIDIA GeForce RTX 3080 Ti Laptop GPU (61.7 - 100.7, n=15) | |
| Average of class Multimedia (14.2 - 151.4, n=3, last 2 years) | |
| Schenker XMG Pro 15 (Late 2021) (1.47.22.14 D3D12) | |
| Gigabyte Aero 16 YE5 (1.47.22.14 D3D12, Turbo Mode) | |
| Gigabyte Aero 16 YE5 (1.47.22.14 D3D12) | |
| Gigabyte Aero 16 YE5 (1.47.22.14 D3D12, Silence Mode) | |
| F1 2021 | |
| 1920x1080 Ultra High Preset + Raytracing AA:T AF:16x | |
| Average NVIDIA GeForce RTX 3080 Ti Laptop GPU (30.2 - 160.6, n=30) | |
| Schenker XMG Pro 15 (Late 2021) (831795) | |
| Gigabyte Aero 16 YE5 (852849, Turbo Mode) | |
| Gigabyte Aero 16 YE5 (852849) | |
| Gigabyte Aero 16 YE5 (852849, Silence Mode) | |
| 3840x2160 Ultra High Preset + Raytracing AA:T AF:16x | |
| Average NVIDIA GeForce RTX 3080 Ti Laptop GPU (41.1 - 70.2, n=18) | |
| Gigabyte Aero 16 YE5 (852849, Turbo Mode) | |
| Schenker XMG Pro 15 (Late 2021) (831795) | |
| Gigabyte Aero 16 YE5 (852849) | |
| Gigabyte Aero 16 YE5 (852849, Silence Mode) | |
| Riders Republic | |
| 1920x1080 Ultra Preset | |
| Average NVIDIA GeForce RTX 3080 Ti Laptop GPU (92 - 129, n=3) | |
| Schenker XMG Pro 15 (Late 2021) | |
| Gigabyte Aero 16 YE5 | |
| 3840x2160 Ultra Preset | |
| Average NVIDIA GeForce RTX 3080 Ti Laptop GPU (39 - 56, n=2) | |
| Schenker XMG Pro 15 (Late 2021) | |
| Gigabyte Aero 16 YE5 | |
| Forza Horizon 5 | |
| 1920x1080 Extreme Preset | |
| Schenker XMG Pro 15 (Late 2021) | |
| Average NVIDIA GeForce RTX 3080 Ti Laptop GPU (48 - 95, n=5) | |
| Gigabyte Aero 16 YE5 | |
| 3840x2160 Extreme Preset | |
| Average NVIDIA GeForce RTX 3080 Ti Laptop GPU (38 - 61, n=2) | |
| Schenker XMG Pro 15 (Late 2021) | |
| Gigabyte Aero 16 YE5 | |
| Rainbow Six Extraction | |
| 1920x1080 Ultra Preset (with Fixed Resolution Quality) | |
| Average NVIDIA GeForce RTX 3080 Ti Laptop GPU (128 - 169, n=3) | |
| Gigabyte Aero 16 YE5 | |
| 3840x2160 Ultra Preset (with Fixed Resolution Quality) | |
| Average NVIDIA GeForce RTX 3080 Ti Laptop GPU (44 - 57, n=2) | |
| Gigabyte Aero 16 YE5 | |
| GRID Legends | |
| 1920x1080 Ultra Preset | |
| Average NVIDIA GeForce RTX 3080 Ti Laptop GPU (100.4 - 102.6, n=2) | |
| Gigabyte Aero 16 YE5 | |
| 3840x2160 Ultra Preset | |
| Gigabyte Aero 16 YE5 | |
| Average NVIDIA GeForce RTX 3080 Ti Laptop GPU (n=1) | |
| Cyberpunk 2077 1.6 | |
| 1920x1080 Ultra Preset | |
| Average NVIDIA GeForce RTX 3080 Ti Laptop GPU (54 - 144.1, n=16) | |
| Gigabyte Aero 16 YE5 | |
| 3840x2160 Ultra Preset | |
| Average NVIDIA GeForce RTX 3080 Ti Laptop GPU (19.6 - 32.4, n=6) | |
| Gigabyte Aero 16 YE5 | |
| 1920x1080 Ray Tracing Ultra Preset (DLSS off) | |
| Gigabyte Aero 16 YE5 | |
| Average NVIDIA GeForce RTX 3080 Ti Laptop GPU (39.2 - 49.9, n=7) | |
| 3840x2160 Ray Tracing Ultra Preset (DLSS off) | |
| Average NVIDIA GeForce RTX 3080 Ti Laptop GPU (9.22 - 12.3, n=3) | |
| Gigabyte Aero 16 YE5 | |
| Elex 2 | |
| 1920x1080 Ultra / On AA:SM AF:16x | |
| Gigabyte Aero 16 YE5 | |
| Average NVIDIA GeForce RTX 3080 Ti Laptop GPU (31 - 91, n=3) | |
| 3840x2160 Ultra / On AA:SM AF:16x | |
| Gigabyte Aero 16 YE5 | |
| Average NVIDIA GeForce RTX 3080 Ti Laptop GPU (n=1) | |
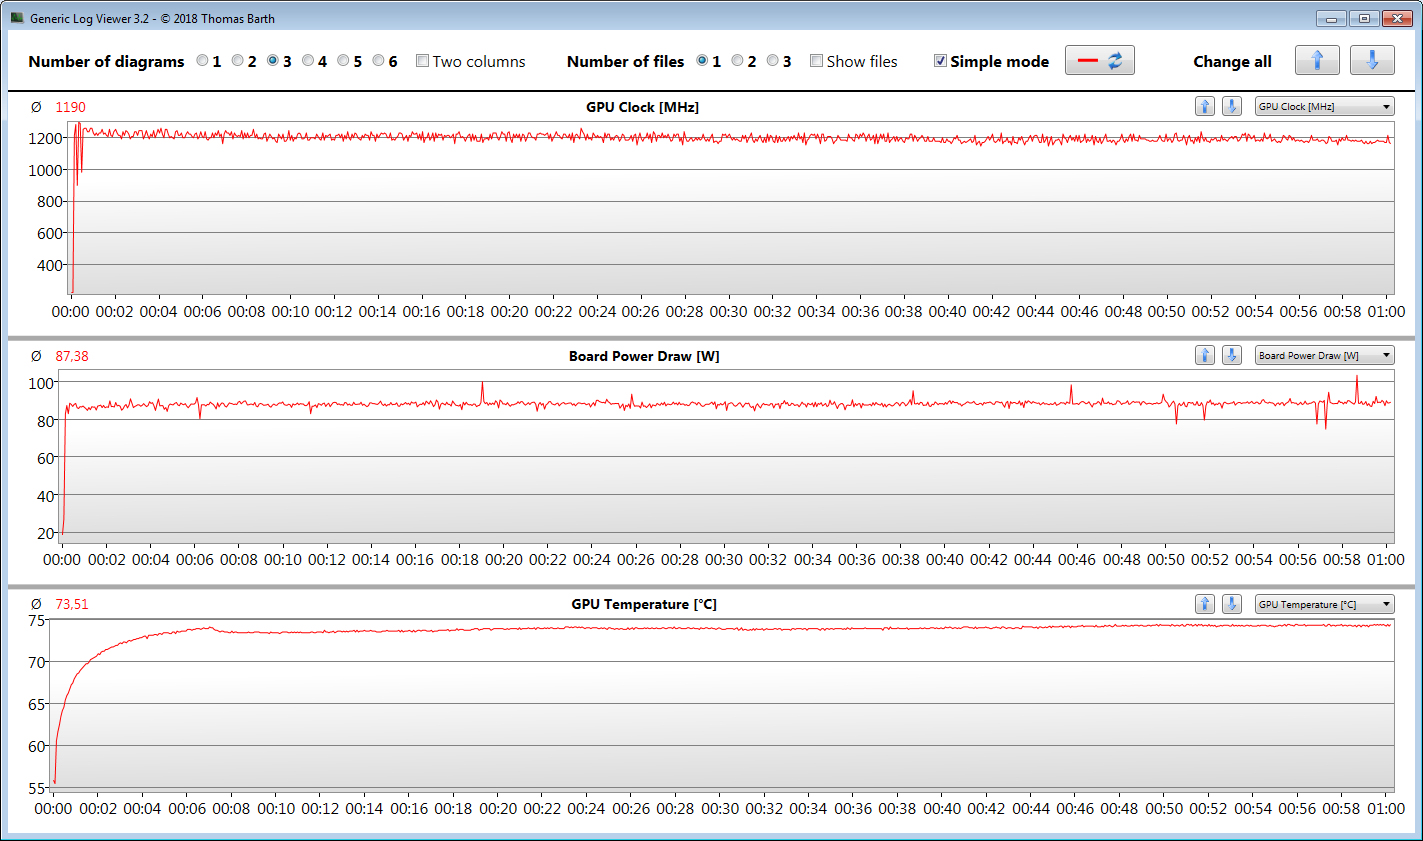
We run Witcher 3 for 60 minutes in FHD and maximum details to determine whether or not a device is capable of maintaining consistent high levels of performance over long periods of times. The avatar is stationary throughout the entire test to ensure comparability. In this case, we found no evidence of decreased frame rates throughout the test.
Witcher 3 FPS Graph


| low | med. | high | ultra | QHD | 4K | |
|---|---|---|---|---|---|---|
| GTA V (2015) | 187 | 185 | 179 | 113 | 82.7 | 78.2 |
| The Witcher 3 (2015) | 408 | 278 | 144 | 92.2 | 64 | |
| Dota 2 Reborn (2015) | 191 | 176 | 168 | 160 | 112 | |
| Final Fantasy XV Benchmark (2018) | 195 | 110 | 85.8 | 64.8 | 40.1 | |
| X-Plane 11.11 (2018) | 154 | 134 | 108 | 78.6 | ||
| Far Cry 5 (2018) | 189 | 141 | 130 | 122 | 86 | 45 |
| Strange Brigade (2018) | 424 | 200 | 168 | 151 | 113 | 68.4 |
| F1 2021 (2021) | 383 | 236 | 196 | 103 | 84 | 47.3 |
| Riders Republic (2021) | 202 | 126 | 101 | 92 | 65 | 39 |
| Forza Horizon 5 (2021) | 221 | 131 | 116 | 72 | 61 | 38 |
| Rainbow Six Extraction (2022) | 185 | 160 | 157 | 128 | 87 | 44 |
| Dying Light 2 (2022) | 97.1 | 79 | 69.2 | 49.6 | 27.3 | |
| GRID Legends (2022) | 206.6 | 159.5 | 139.2 | 100.4 | 81 | 54.4 |
| Cyberpunk 2077 1.6 (2022) | 121.7 | 96.4 | 72.4 | 73.2 | 39.7 | 19.6 |
| Elex 2 (2022) | 93.5 | 89.5 | 76.5 | 70.3 | 48.1 | 28.2 |
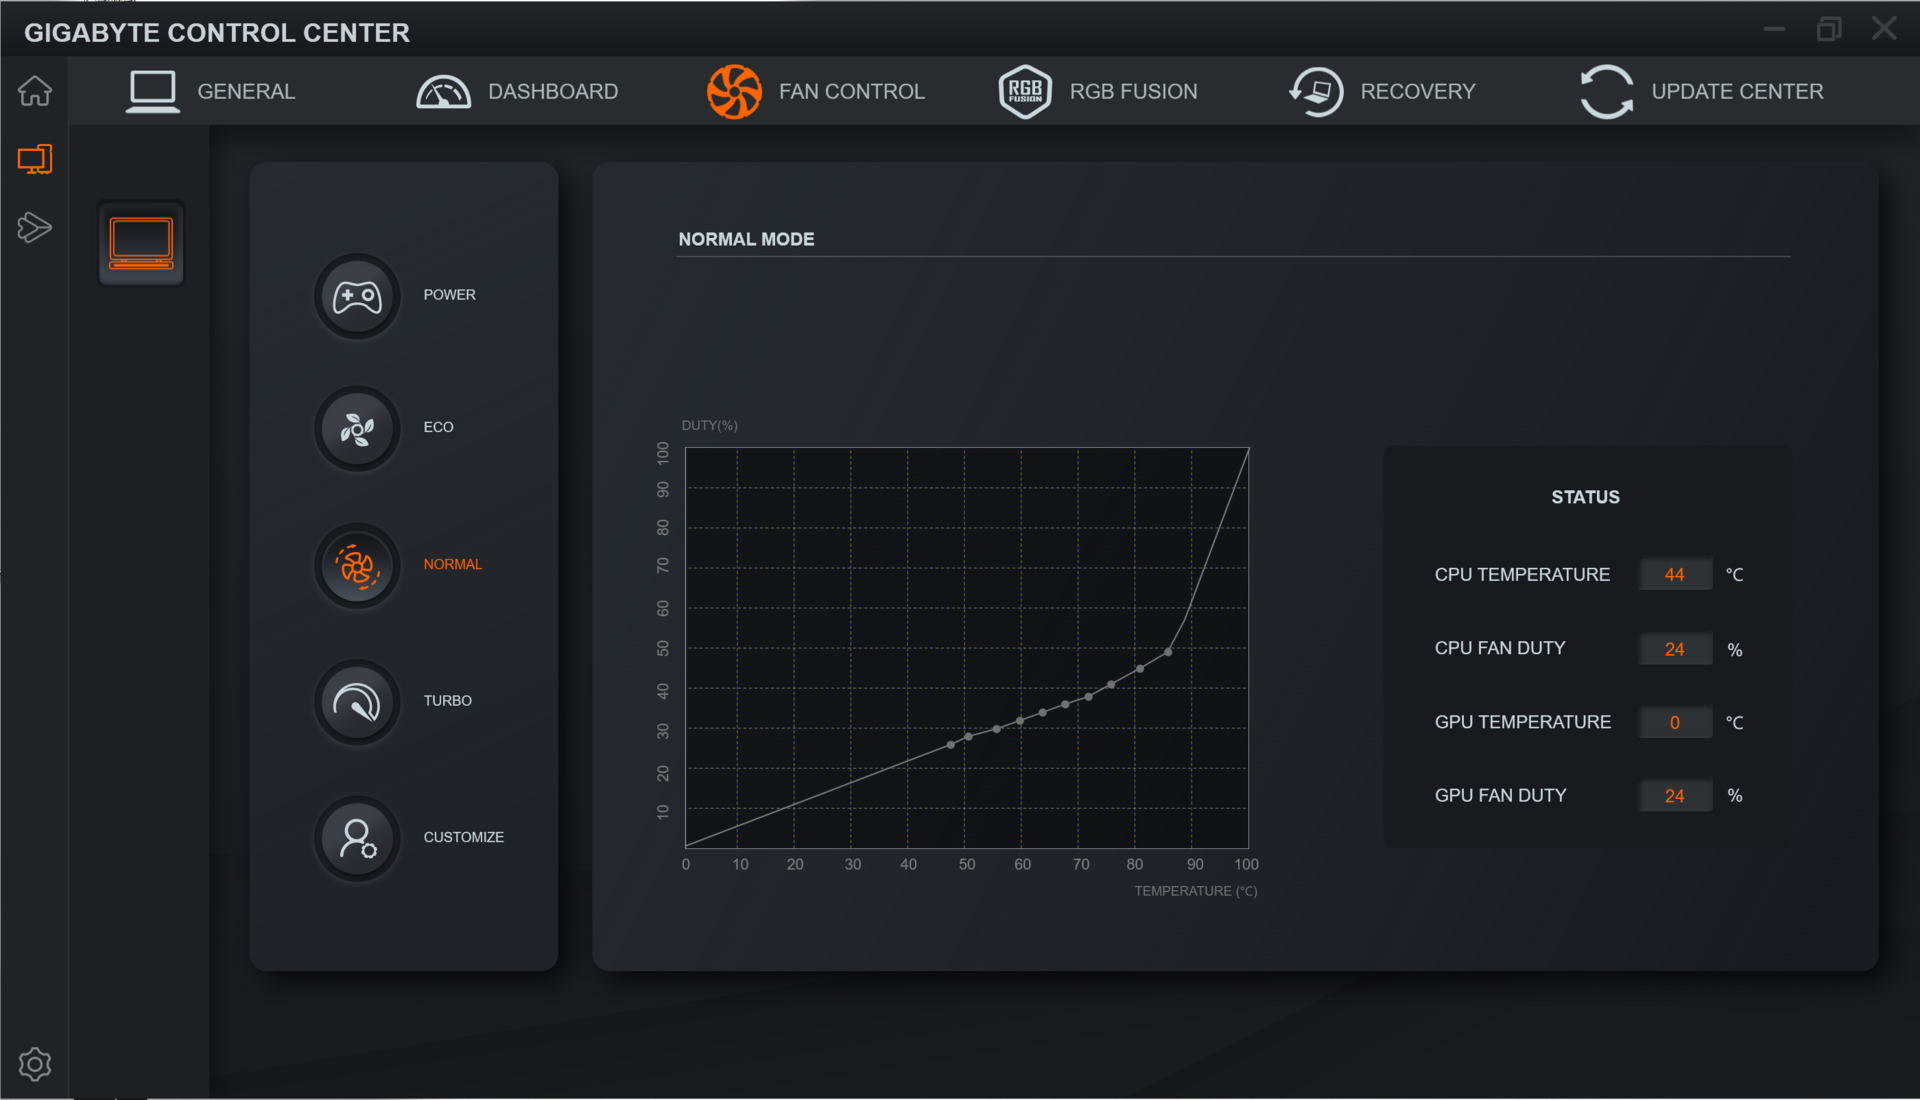
Emissions – Aero Makes a Lot of Noise
Noise Emissions
In everyday use (office, internet) both fans remain inconspicuous and comparatively quiet overall. Under load, however, they ramp up and become very audible very quickly. Unfortunately, they also produce a noticeable whine in high revs. Noise emissions can be lowered significantly by selecting the “Power Saving Silence Mode” profile albeit at the expense of performance.
Noise level
| Idle |
| 30 / 32 / 33 dB(A) |
| Load |
| 45 / 52 dB(A) |
 | ||
30 dB silent 40 dB(A) audible 50 dB(A) loud |
||
min: | ||
| Gigabyte Aero 16 YE5 GeForce RTX 3080 Ti Laptop GPU, i9-12900HK | Lenovo ThinkPad X1 Extreme G4-20Y50040GE GeForce RTX 3080 Laptop GPU, i9-11950H | Apple MacBook Pro 16 2021 M1 Max M1 Max 32-Core GPU, M1 Max | HP ZBook Studio 15 G8 GeForce RTX 3070 Laptop GPU, i9-11950H | Schenker XMG Pro 15 (Late 2021) GeForce RTX 3080 Laptop GPU, i7-11800H | Razer Blade 15 2022 GeForce RTX 3080 Ti Laptop GPU, i7-12800H | |
|---|---|---|---|---|---|---|
| Noise | 10% | 17% | 11% | -12% | 8% | |
| off / environment * (dB) | 25 | 24.7 1% | 24.2 3% | 23.5 6% | 24 4% | 25.4 -2% |
| Idle Minimum * (dB) | 30 | 24.7 18% | 24.2 19% | 25.3 16% | 31 -3% | 26.2 13% |
| Idle Average * (dB) | 32 | 24.7 23% | 24.2 24% | 25.3 21% | 37 -16% | 26.2 18% |
| Idle Maximum * (dB) | 33 | 28.1 15% | 24.2 27% | 25.3 23% | 41 -24% | 28.4 14% |
| Load Average * (dB) | 45 | 42.5 6% | 42.9 5% | 41.2 8% | 56 -24% | 44.7 1% |
| Witcher 3 ultra * (dB) | 50 | 46.4 7% | 39.5 21% | 49.4 1% | 53 -6% | 44.7 11% |
| Load Maximum * (dB) | 52 | 52.1 -0% | 42.9 17% | 49.4 5% | 58 -12% | 51.9 -0% |
* ... smaller is better
Temperature
In everyday use (office, internet) case temperatures remain fairly low. Under load (stress test, Witcher 3) it warms up dramatically with hot spots of up to 60 °C.


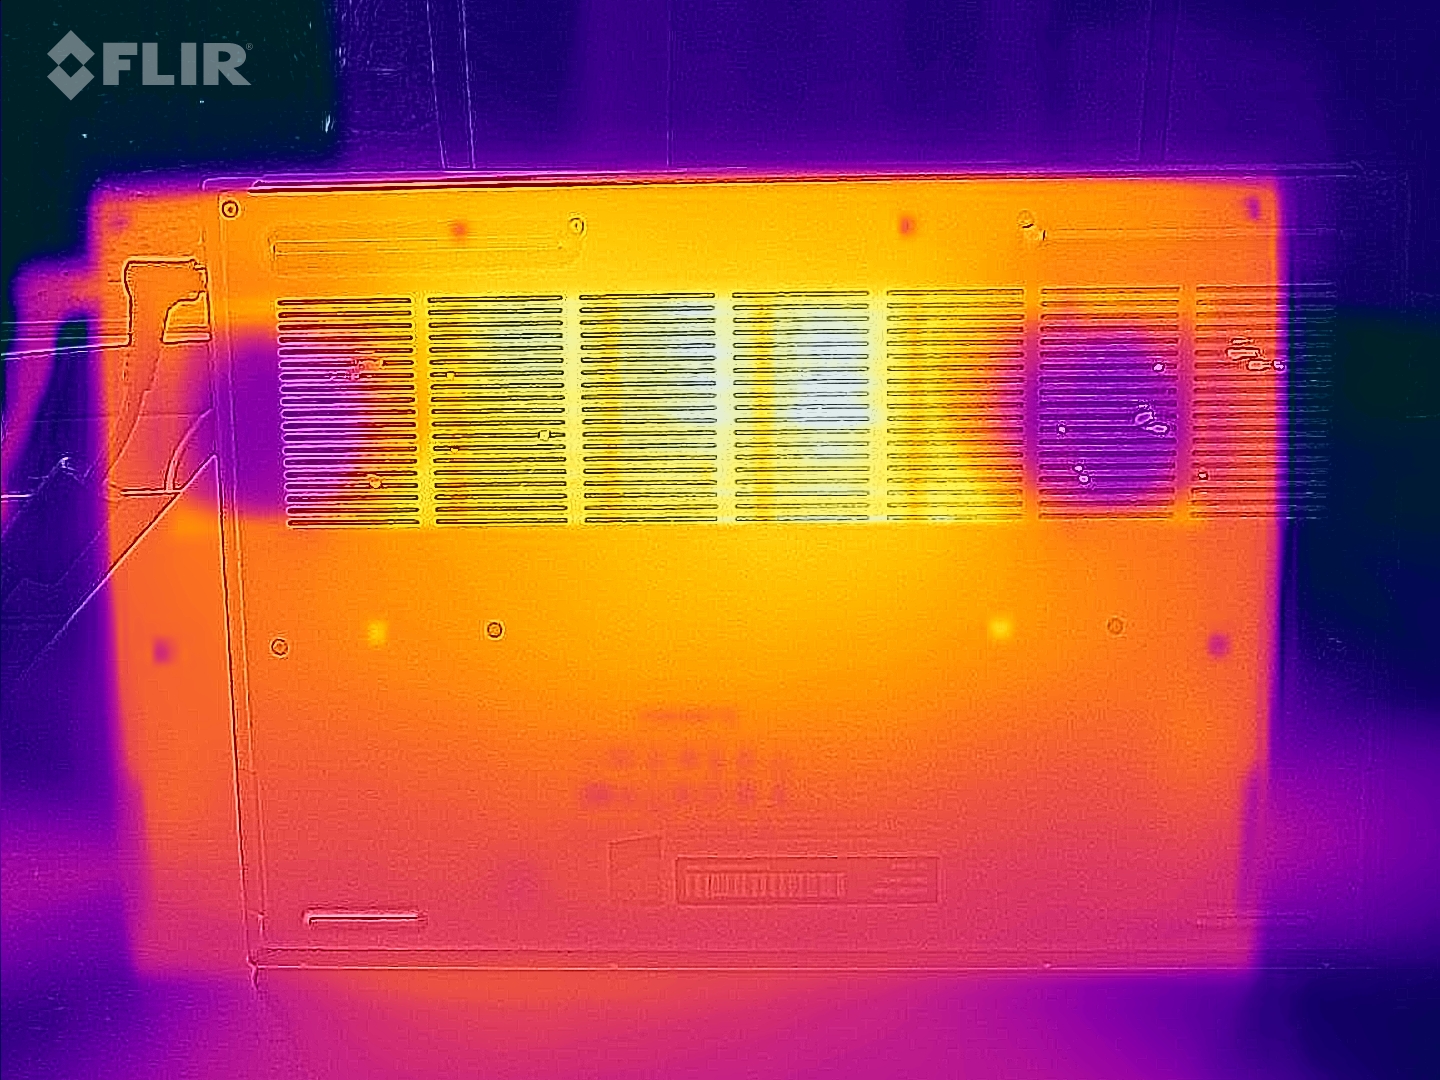


(-) The maximum temperature on the upper side is 49 °C / 120 F, compared to the average of 36.8 °C / 98 F, ranging from 21 to 71 °C for the class Multimedia.
(-) The bottom heats up to a maximum of 55 °C / 131 F, compared to the average of 39.1 °C / 102 F
(+) In idle usage, the average temperature for the upper side is 31.1 °C / 88 F, compared to the device average of 31.3 °C / 88 F.
(-) Playing The Witcher 3, the average temperature for the upper side is 48.3 °C / 119 F, compared to the device average of 31.3 °C / 88 F.
(-) The palmrests and touchpad can get very hot to the touch with a maximum of 45 °C / 113 F.
(-) The average temperature of the palmrest area of similar devices was 28.7 °C / 83.7 F (-16.3 °C / -29.3 F).
| Gigabyte Aero 16 YE5 Intel Core i9-12900HK, NVIDIA GeForce RTX 3080 Ti Laptop GPU | Lenovo ThinkPad X1 Extreme G4-20Y50040GE Intel Core i9-11950H, NVIDIA GeForce RTX 3080 Laptop GPU | Apple MacBook Pro 16 2021 M1 Max Apple M1 Max, Apple M1 Max 32-Core GPU | HP ZBook Studio 15 G8 Intel Core i9-11950H, NVIDIA GeForce RTX 3070 Laptop GPU | Schenker XMG Pro 15 (Late 2021) Intel Core i7-11800H, NVIDIA GeForce RTX 3080 Laptop GPU | Razer Blade 15 2022 Intel Core i7-12800H, NVIDIA GeForce RTX 3080 Ti Laptop GPU | |
|---|---|---|---|---|---|---|
| Heat | 6% | 24% | 8% | 2% | -4% | |
| Maximum Upper Side * (°C) | 49 | 51.4 -5% | 42.3 14% | 49 -0% | 44 10% | 50 -2% |
| Maximum Bottom * (°C) | 55 | 55.9 -2% | 41.7 24% | 54.2 1% | 60 -9% | 47 15% |
| Idle Upper Side * (°C) | 33 | 27.2 18% | 23.9 28% | 26.2 21% | 30 9% | 37.4 -13% |
| Idle Bottom * (°C) | 33 | 28.8 13% | 23.9 28% | 30.2 8% | 34 -3% | 38.4 -16% |
* ... smaller is better
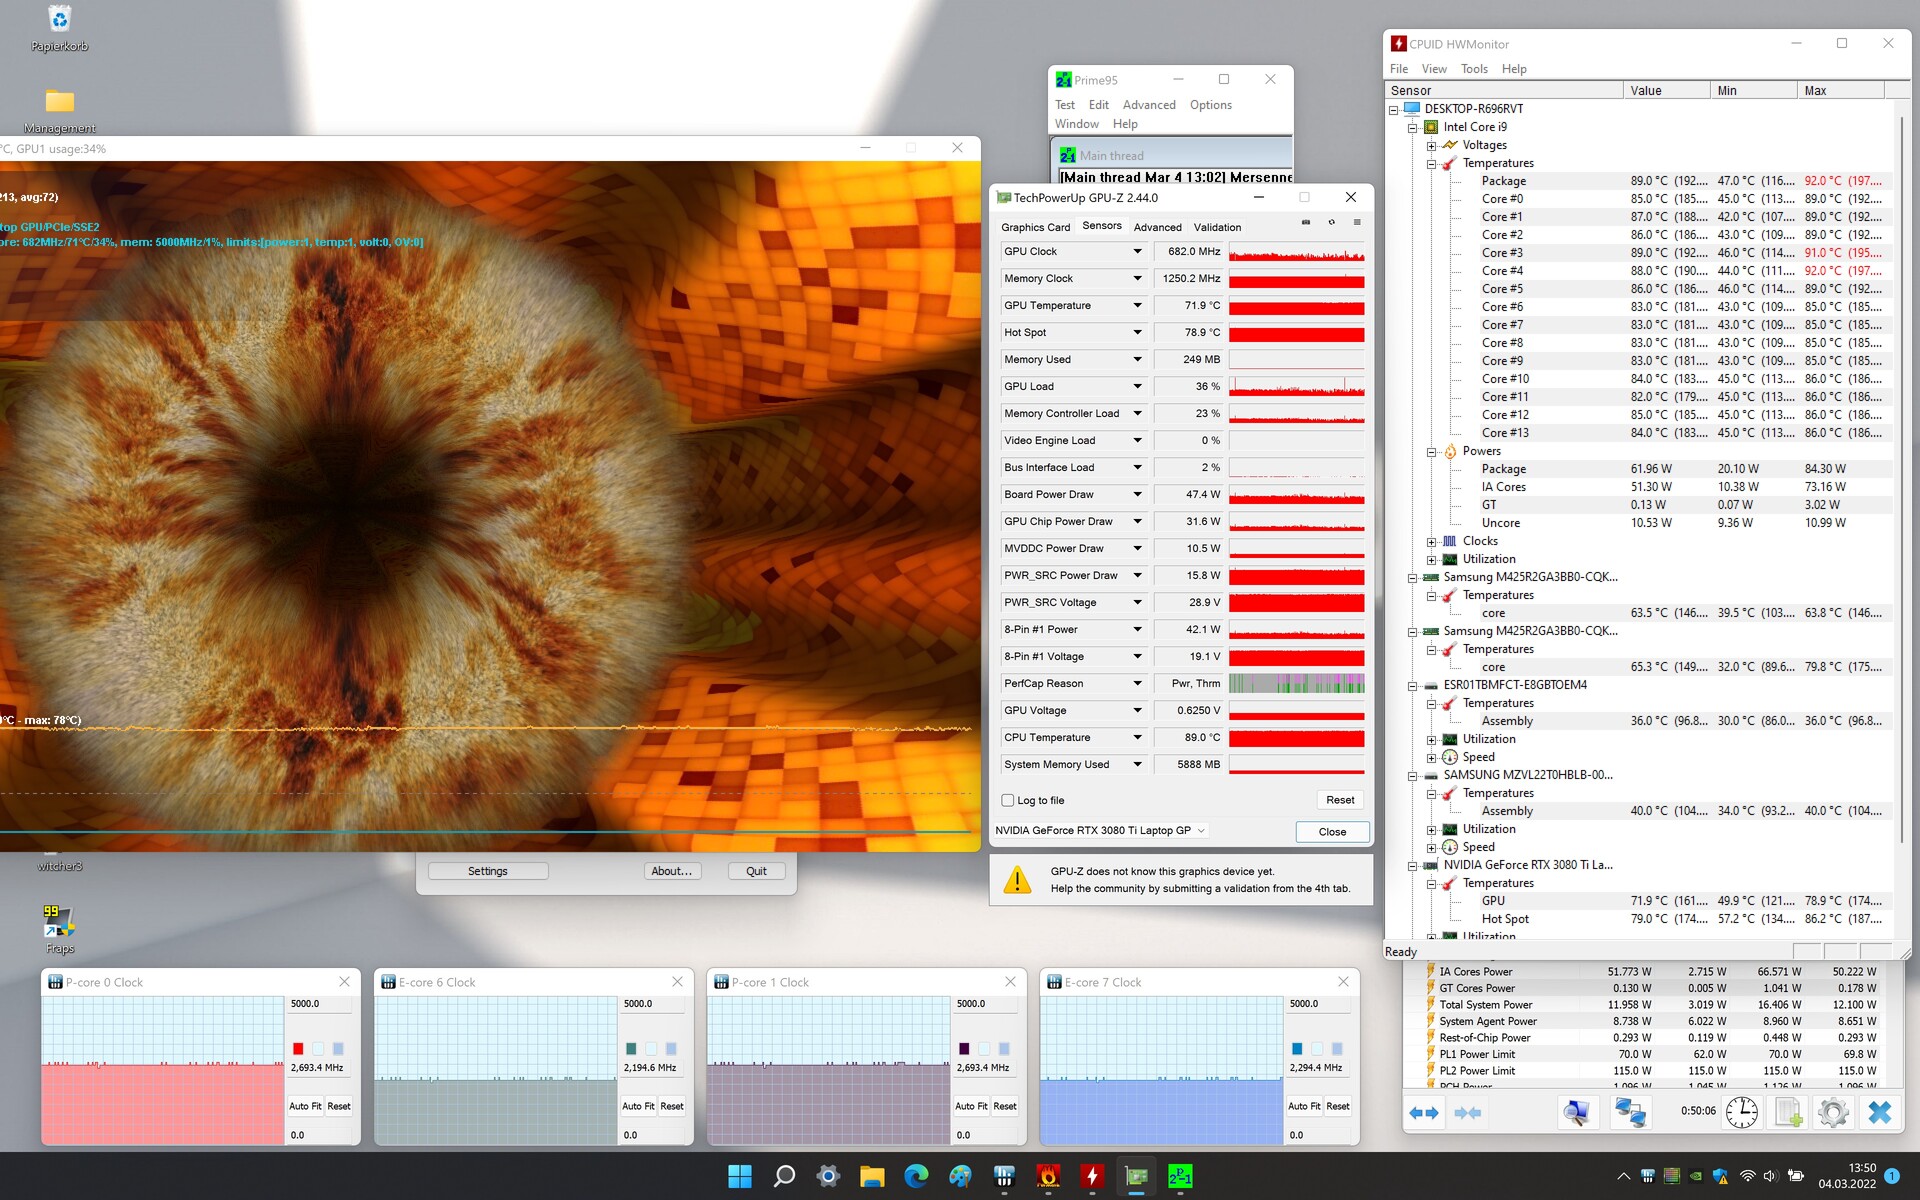
Stress Test
Our stress test is completed with the CPU running at 2.7 GHz (P-cores) and 2.2-2.3 GHz (E-cores) and the GPU running at between 600 and 700 MHz. Keep in mind that our stress test is an extreme load scenario that does not occur during everyday use. We use this test to determine potential throttling and stability issues.
Speakers
The unit’s stereo speakers produce a decent sound with lack of bass and a comparatively high maximum volume. We suggest using headphones or external speakers for a much improved audio experience.
Gigabyte Aero 16 YE5 audio analysis
(+) | speakers can play relatively loud (85 dB)
Bass 100 - 315 Hz
(-) | nearly no bass - on average 25.6% lower than median
(-) | bass is not linear (15.5% delta to prev. frequency)
Mids 400 - 2000 Hz
(+) | balanced mids - only 4.8% away from median
(+) | mids are linear (5.8% delta to prev. frequency)
Highs 2 - 16 kHz
(+) | balanced highs - only 2% away from median
(+) | highs are linear (3.1% delta to prev. frequency)
Overall 100 - 16.000 Hz
(±) | linearity of overall sound is average (16.6% difference to median)
Compared to same class
» 44% of all tested devices in this class were better, 7% similar, 49% worse
» The best had a delta of 5%, average was 17%, worst was 45%
Compared to all devices tested
» 29% of all tested devices were better, 6% similar, 66% worse
» The best had a delta of 4%, average was 24%, worst was 134%
Razer Blade 15 2022 audio analysis
(+) | speakers can play relatively loud (90.9 dB)
Bass 100 - 315 Hz
(-) | nearly no bass - on average 21% lower than median
(±) | linearity of bass is average (9.7% delta to prev. frequency)
Mids 400 - 2000 Hz
(+) | balanced mids - only 3.9% away from median
(+) | mids are linear (3.9% delta to prev. frequency)
Highs 2 - 16 kHz
(+) | balanced highs - only 4.2% away from median
(±) | linearity of highs is average (7.8% delta to prev. frequency)
Overall 100 - 16.000 Hz
(±) | linearity of overall sound is average (15.7% difference to median)
Compared to same class
» 36% of all tested devices in this class were better, 7% similar, 57% worse
» The best had a delta of 6%, average was 18%, worst was 132%
Compared to all devices tested
» 24% of all tested devices were better, 5% similar, 71% worse
» The best had a delta of 4%, average was 24%, worst was 134%
Energy Management – Decent Overall Battery Life
Power Consumption
We found no inconsistencies with the Aero 16’s power consumption, which was determined to be at a level expected of this particular hardware. Early into our stress test we detected a short peak of up 236 W, which quickly decreased to a more reasonable 180 W. Our Witcher 3 test is completed with an average power consumption of 184 W. Accordingly, the included 230 W power supply is more than adequately dimensioned.
| Off / Standby | |
| Idle | |
| Load |
|
Key:
min: | |
| Gigabyte Aero 16 YE5 i9-12900HK, GeForce RTX 3080 Ti Laptop GPU | Lenovo ThinkPad X1 Extreme G4-20Y50040GE i9-11950H, GeForce RTX 3080 Laptop GPU | Apple MacBook Pro 16 2021 M1 Max M1 Max, M1 Max 32-Core GPU | HP ZBook Studio 15 G8 i9-11950H, GeForce RTX 3070 Laptop GPU | Schenker XMG Pro 15 (Late 2021) i7-11800H, GeForce RTX 3080 Laptop GPU | Razer Blade 15 2022 i7-12800H, GeForce RTX 3080 Ti Laptop GPU | Average of class Multimedia | |
|---|---|---|---|---|---|---|---|
| Power Consumption | 34% | 48% | 28% | 17% | -6% | 62% | |
| Idle Minimum * (Watt) | 26 | 12.3 53% | 5.4 79% | 11 58% | 20 23% | 33.2 -28% | 5.71 ? 78% |
| Idle Average * (Watt) | 30 | 22.8 24% | 16.4 45% | 18.8 37% | 22 27% | 36.4 -21% | 10.1 ? 66% |
| Idle Maximum * (Watt) | 37 | 13.9 62% | 16.7 55% | 31.7 14% | 26 30% | 37.6 -2% | 12.4 ? 66% |
| Load Average * (Watt) | 127 | 95.4 25% | 94 26% | 105.2 17% | 103 19% | 116.7 8% | 65 ? 49% |
| Witcher 3 ultra * (Watt) | 176 | 154 12% | 104 41% | 148 16% | 186 -6% | 172 2% | |
| Load Maximum * (Watt) | 236 | 170.7 28% | 135 43% | 171.8 27% | 218 8% | 228.6 3% | 112.2 ? 52% |
* ... smaller is better
Power Consumption Witcher 3 / stress test
Power Consumption with External Monitor
Battery Life
In our Wi-Fi (loading websites via script) and our video playback test (playing the H.264-encoded Big Buck Bunny short film in FHD in a loop), the Aero 16 managed a battery life of 6:21 and 7:32 hours, respectively. All power saving features are disabled during both tests, and display brightness is normalized at 150 nits. In addition, we also disable all communication modules during the video playback test.

| Gigabyte Aero 16 YE5 i9-12900HK, GeForce RTX 3080 Ti Laptop GPU, 99 Wh | Lenovo ThinkPad X1 Extreme G4-20Y50040GE i9-11950H, GeForce RTX 3080 Laptop GPU, 90 Wh | Apple MacBook Pro 16 2021 M1 Max M1 Max, M1 Max 32-Core GPU, 99.6 Wh | HP ZBook Studio 15 G8 i9-11950H, GeForce RTX 3070 Laptop GPU, 83 Wh | Schenker XMG Pro 15 (Late 2021) i7-11800H, GeForce RTX 3080 Laptop GPU, 73 Wh | Razer Blade 15 2022 i7-12800H, GeForce RTX 3080 Ti Laptop GPU, 80 Wh | Average of class Multimedia | |
|---|---|---|---|---|---|---|---|
| Battery runtime | -11% | 76% | 18% | -8% | -23% | 99% | |
| Reader / Idle (h) | 8.9 | 12.9 45% | 10.6 19% | 25.2 ? 183% | |||
| H.264 (h) | 7.5 | 6.9 -8% | 17 127% | 6.5 -13% | 16.4 ? 119% | ||
| WiFi v1.3 (h) | 6.4 | 6.8 6% | 14.9 133% | 6.2 -3% | 5.2 -19% | 4.9 -23% | 12 ? 88% |
| Load (h) | 1.6 | 1.1 -31% | 1.1 -31% | 1.8 13% | 1.3 -19% | 1.675 ? 5% |
Pros
Cons
Verdict Aero 16: A Portable Laptop for Gamers and Creatives
Video and photo editing, rendering, and gaming are chief among the Aero 16’s intended use cases. It allows for FHD gaming in maximum details and gaming in higher resolutions with reduced details. Its Core i9-12900HK CPU and GeForce RTX 3080 Ti GPU with a TGP of 105 W ensure high levels of performance.
The device heats up quite significantly under load, and it makes a lot of noise which unfortunately includes a noticeable fan whine. Noise emissions can be lowered significantly by selecting the “Power Saving Silence Mode” profile albeit at the expense of performance.
Gigabyte’s Aero 16 YE5 is a well-made notebook for gamers and creatives. It is, however, not entirely free of shortcomings.
Battery life is decent for a laptop as powerful as this with a 4K display. The battery can be charged with either the included power supply or a universal USB-C charger, as long as it is rated for at least 45 W of power deilivery. The rear of the two Thunderbolt 4 ports supports Power Delivery. In addition, its two Thunderbolt 4 ports allow for extensive external peripherals connectivity, such as for example docks or even external GPUs.
The built-in 16:10 OLED display running at a high resolution of 3840 x 2400 is without any doubt the Aero 16’s pièce de resistance. It offers good brightness, an excellent contrast ratio, wide viewing angles, short response times, and great color space coverage. On the flip side it is glossy and suffers from PWM flickering below a certain brightness threshold.
A good alternative to the Aero 16 is the Razer Blade 15 with more GPU performance and no need to carry around a hub or additional dongles. In return, its battery life is shorter. If you are looking for a good mix between high performance and excellent battery life the Apple MacBook Pro 16 2021 M1 Max might be the best choice. With that said you also need to keep in mind that the Apple laptop’s biggest flaws are the inability to upgrade both SSD and RAM.
Price and Availability
At the time of writing the Gigabyte Aero 16 was already listed on Gigabyte’s homepage but not yet available for purchase anywhere.
Gigabyte Aero 16 YE5
- 03/28/2022 v7 (old)
Sascha Mölck
Price comparison

