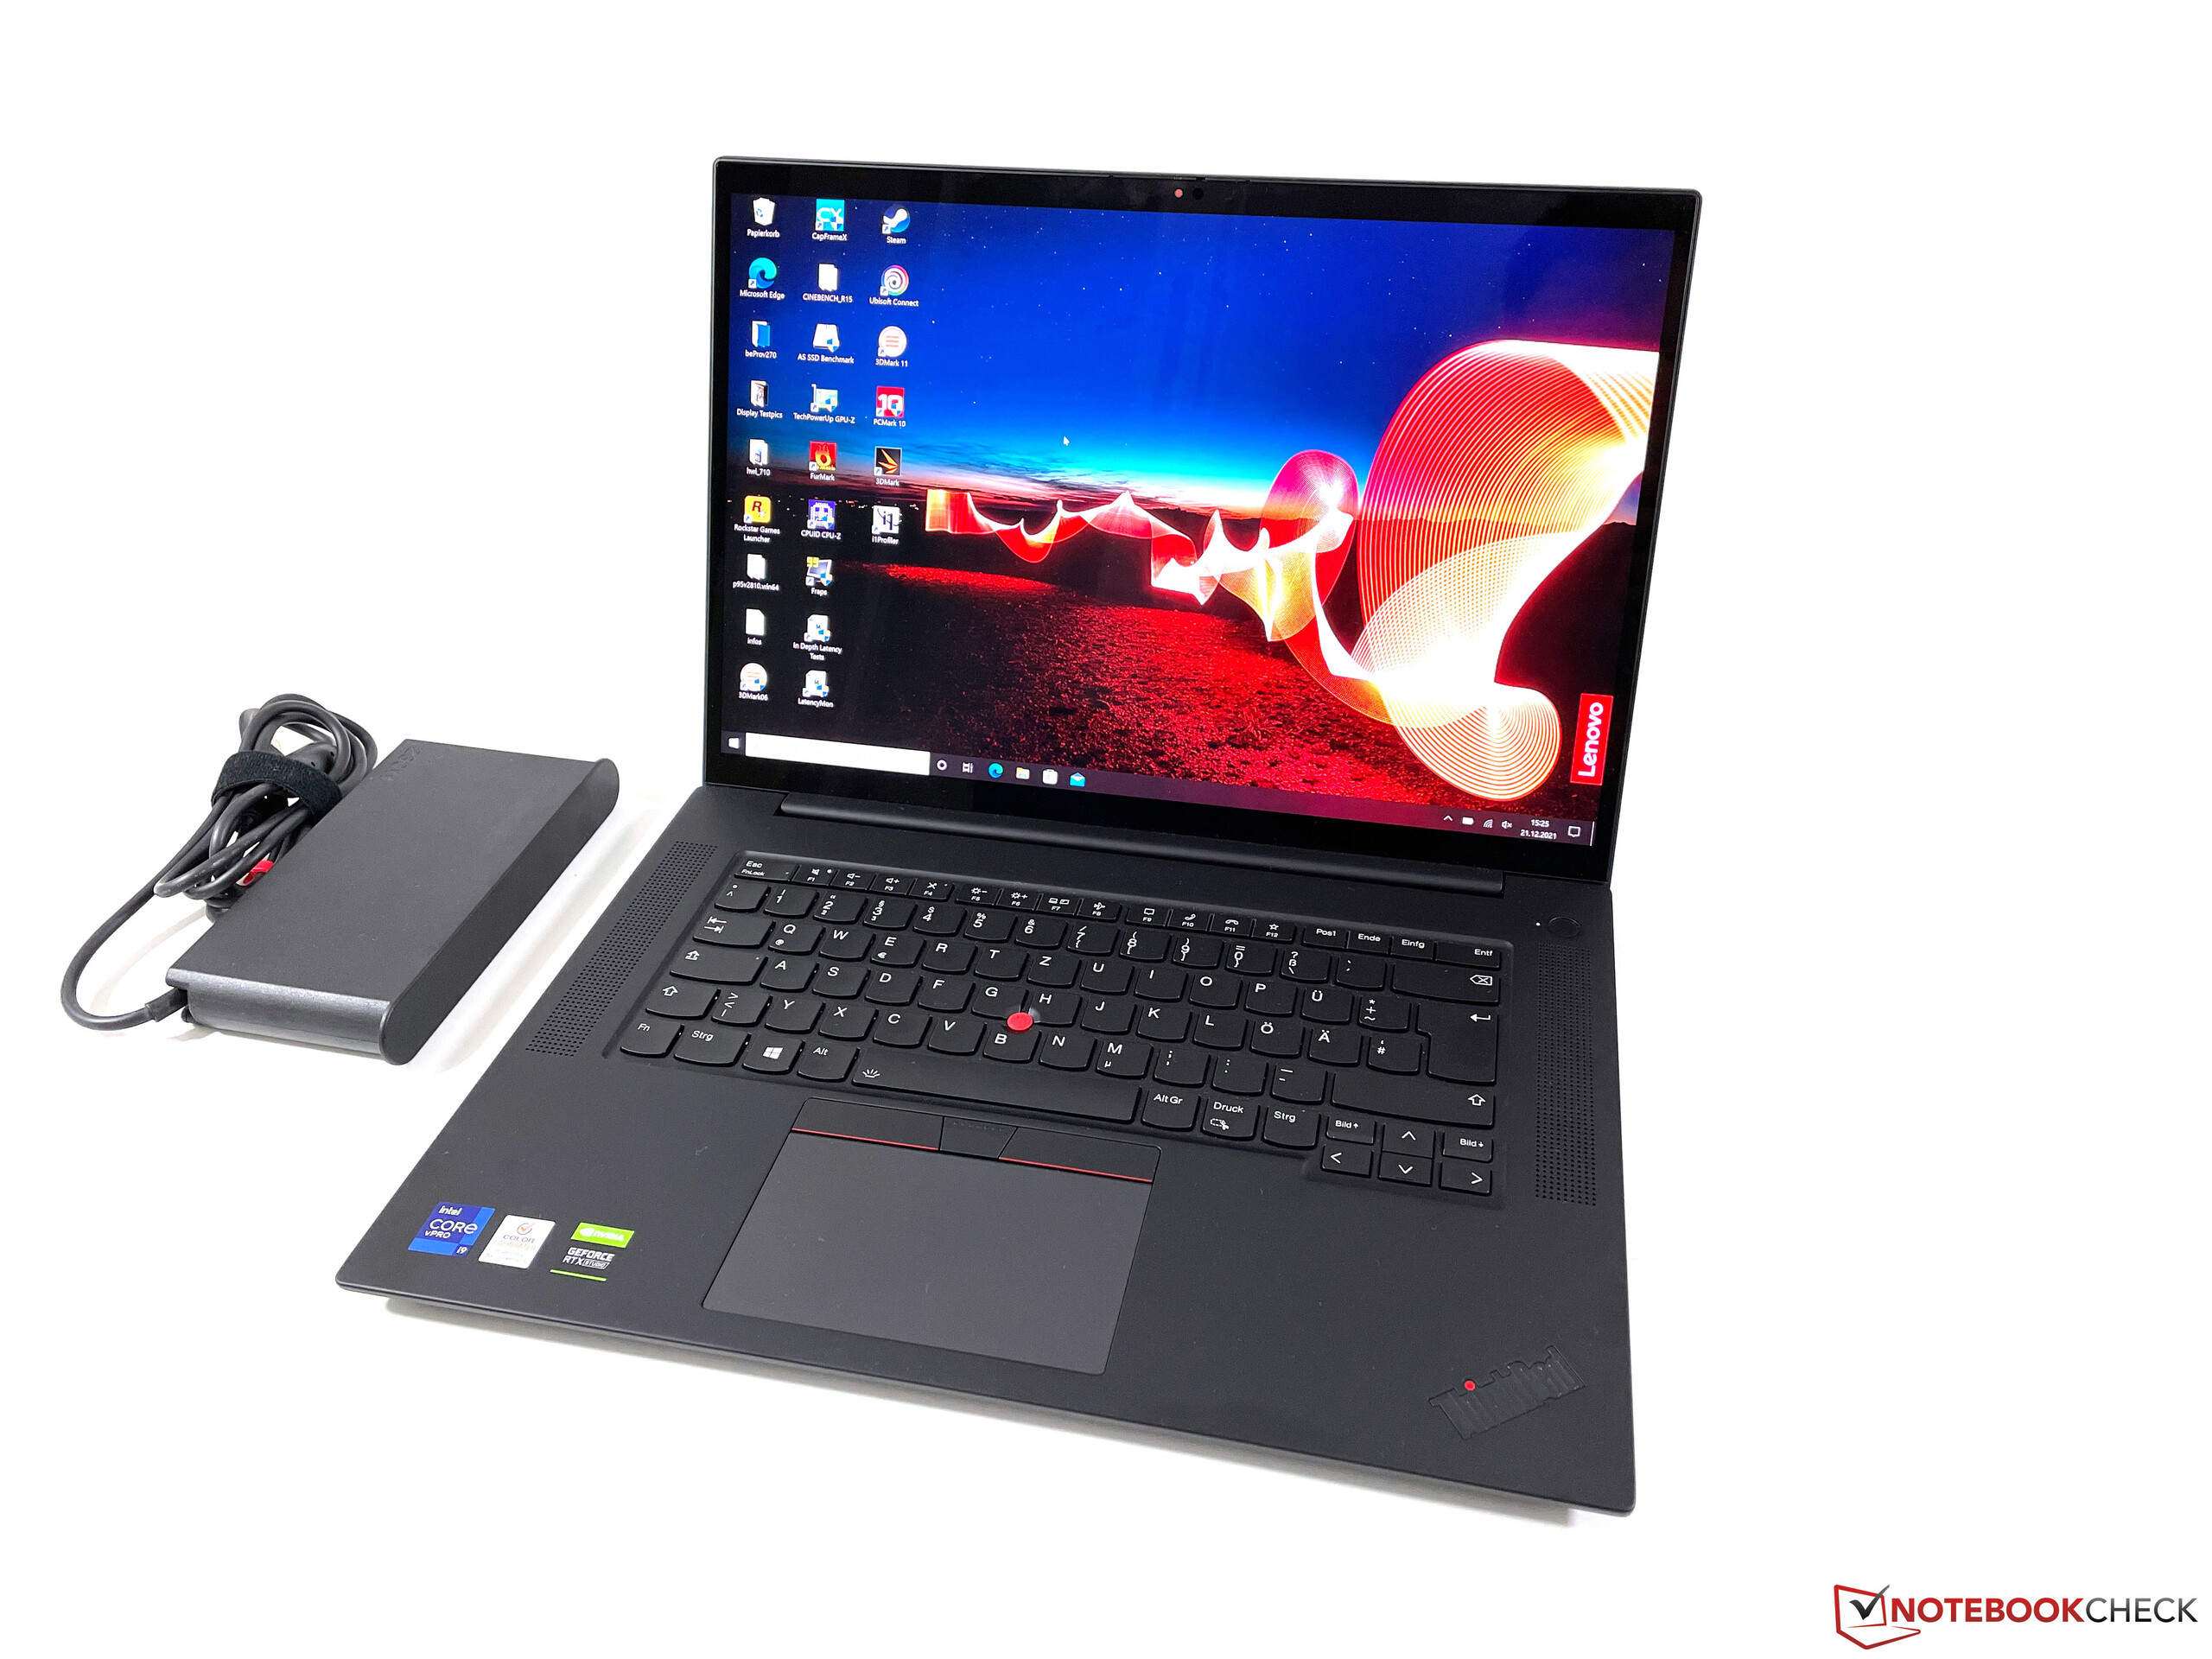
Lenovo ThinkPad X1 Extreme G4 Review: The best Multimedia Laptop thanks to Core i9 and RTX 3080?

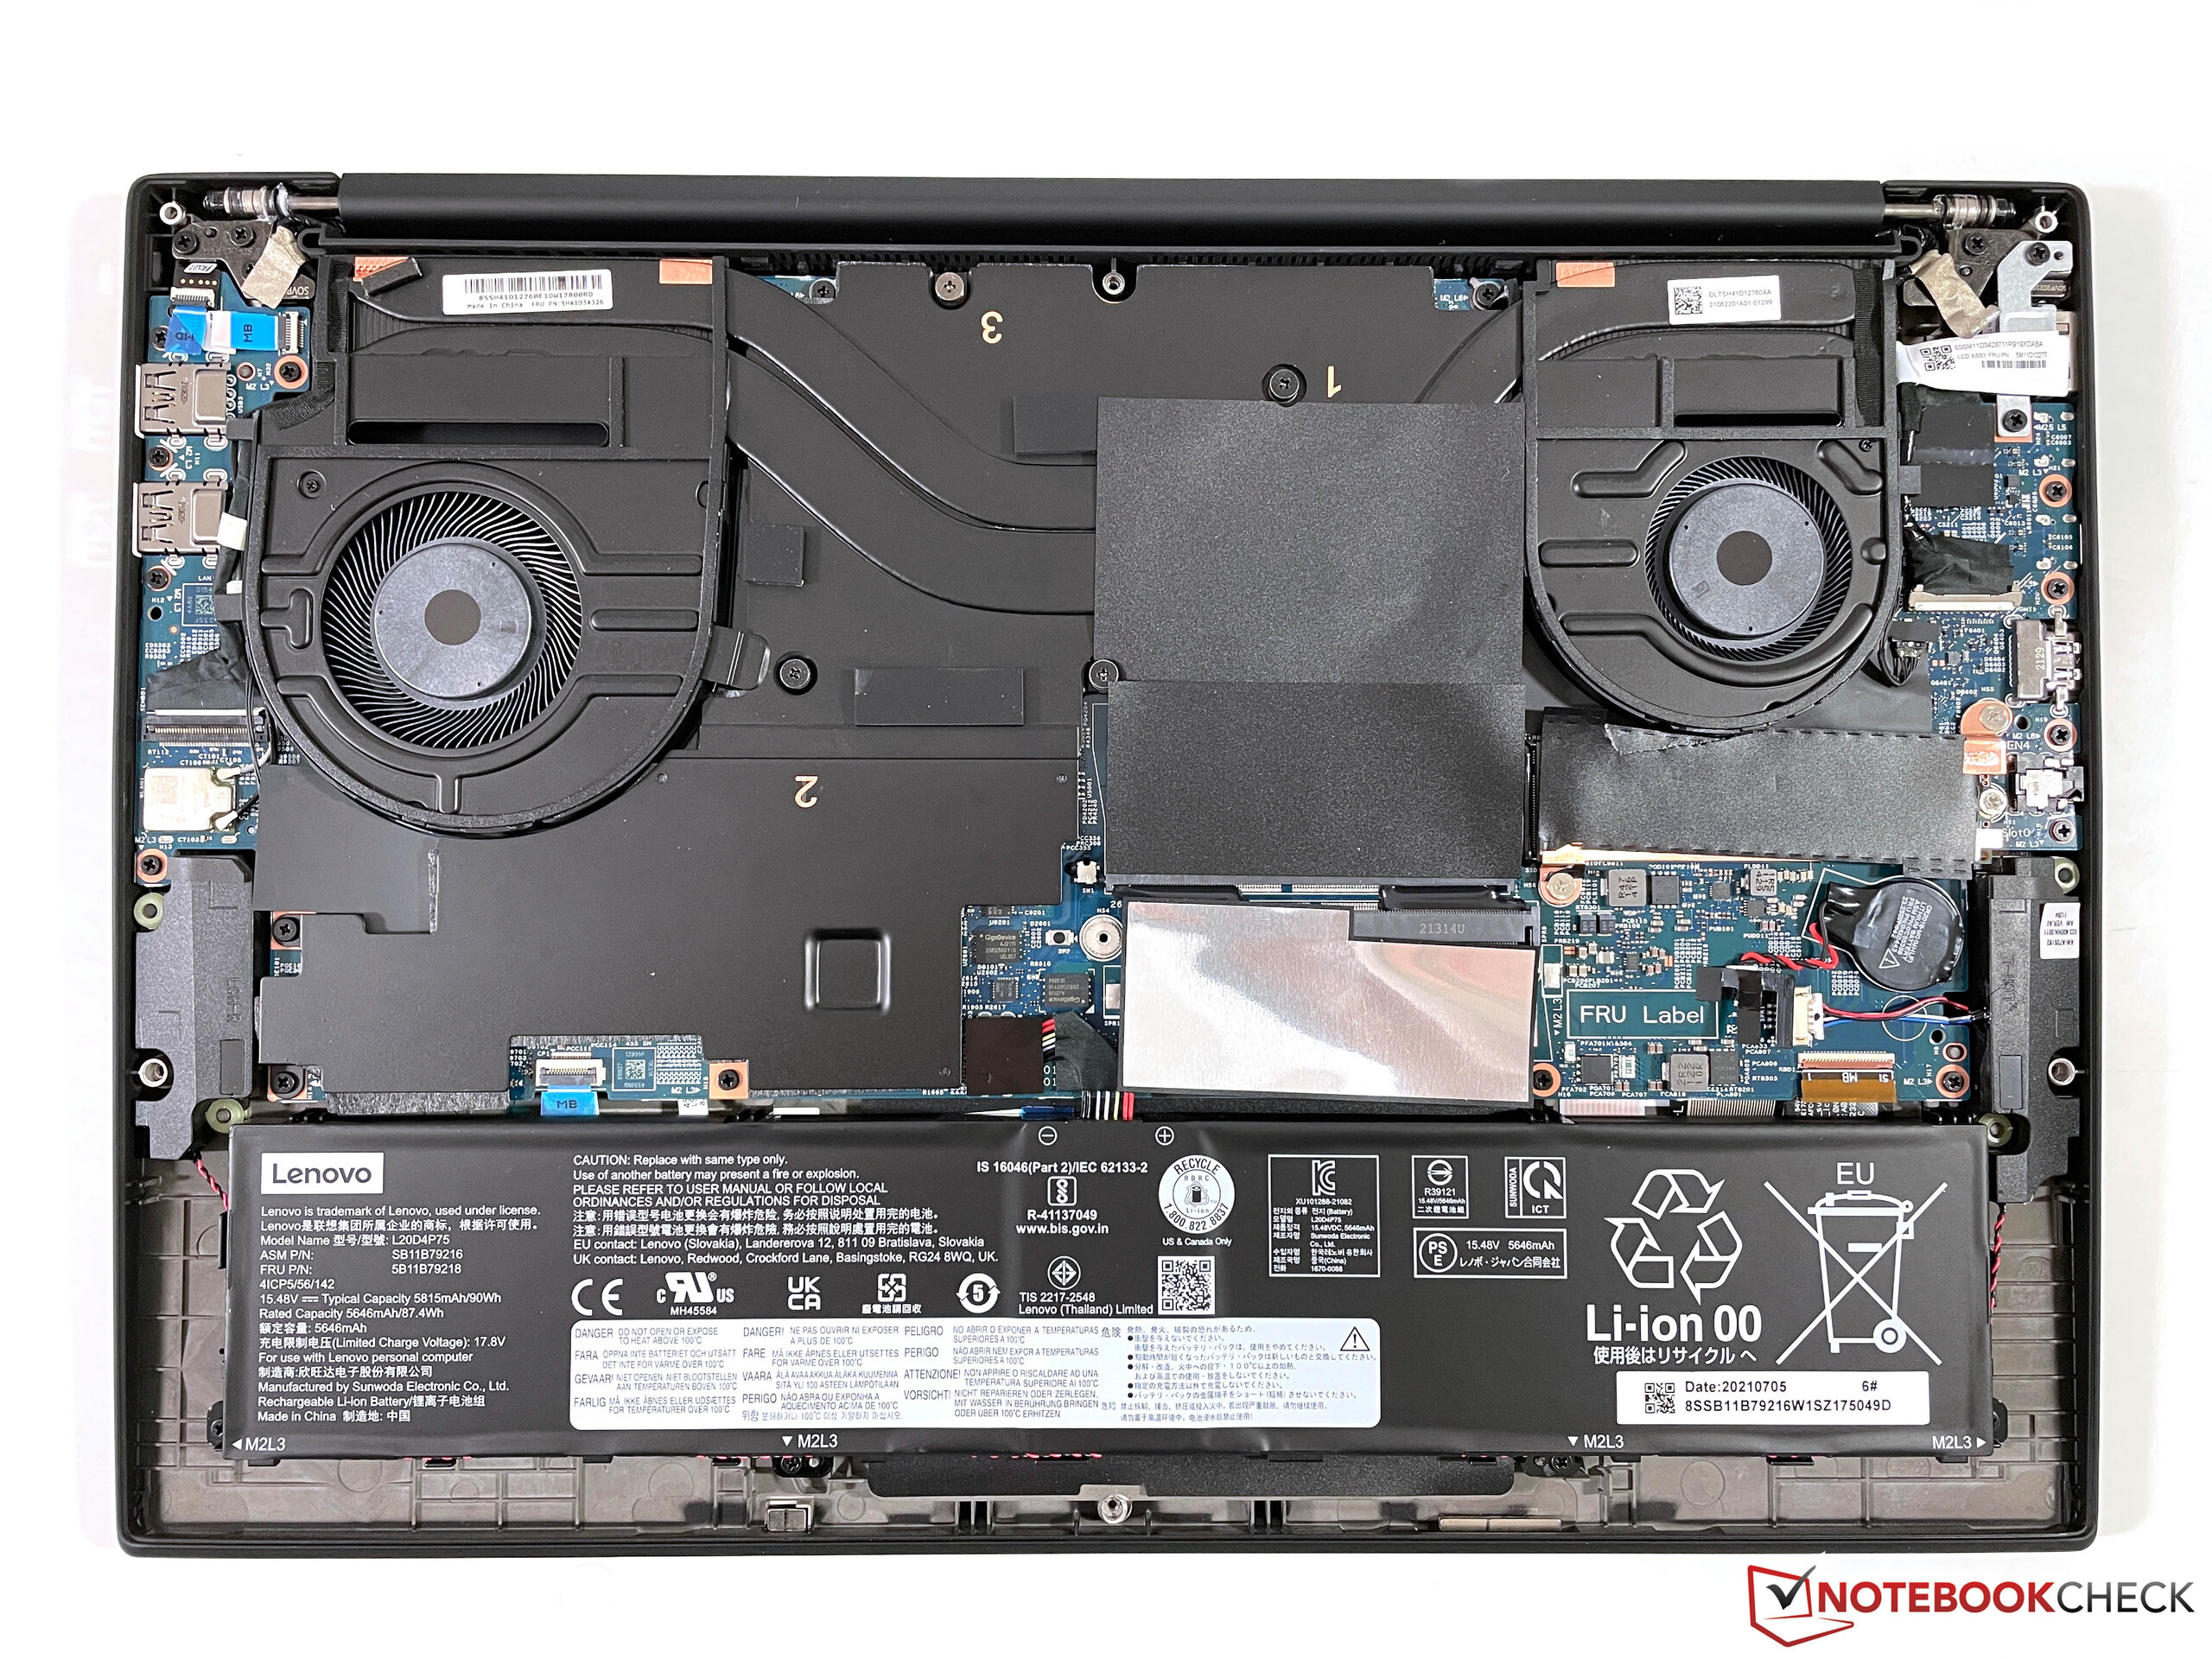
The fourth generation of Lenovo’s high-end multimedia laptop is also available with a more powerful vapor chamber cooling solution, which allows the implementation of much more powerful graphics cards. Due to the increases size of the cooling, however, these models lack the secondary M.2-SSD slot as well as the optional WWAN module; they are only available on models with regular cooling and the GeForce RTX 3050 Ti.
We have already reviewed the similarly constructed workstation counterpart ThinkPad P1 G4 with the Core i7 processor and Nvidia’s GeForce RTX 3070, and now we have a look at the high-end spec of the new X1 Extreme G4 with an Intel Core i9 and the GeForce RTX 3080. Like the RTX 3070, this is the 90W version of the RTX 3080, so it is one of the slowest models on the market. We want to find our if the upgrades to the Core i9 and the RTX 3080 make sense or not.
Our test unit is equipped with the high-resolution 4K touchscreen, which we have already tested in the slower model of the X1 Extreme G4, so we will focus on the performance as well as the emissions in this review. Please see our comprehensive reviews of the current X1 Extreme as well as ThinkPad P1 models for more information on the chassis, connectivity and the input devices:
- Review Lenovo ThinkPad X1 Extreme G4 (i7, RTX 3050 Ti, 4K Touch glossy)
- Review Lenovo ThinkPad P1 G4 (i7, RTX 3070, 4K matt)
- Review Lenovo ThinkPad P1 G4 (i7, T1200, WQHD matt)
Update December 24th: We found a solution for the graphics issues. It is related to a setting in Intel's Drivers Control Panel (Automatic Display Refresh). Please scroll down to the System Performance section for all details.
Possible Competitors
Rating | Date | Model | Weight | Height | Size | Resolution | Price |
|---|---|---|---|---|---|---|---|
| 88.3 % v7 (old) | 12 / 2021 | Lenovo ThinkPad X1 Extreme G4-20Y50040GE i9-11950H, GeForce RTX 3080 Laptop GPU | 1.9 kg | 18.2 mm | 16.00" | 3840x2400 | |
| 89.8 % v7 (old) | 11 / 2021 | Lenovo ThinkPad P1 G4-20Y4S0KS00 i7-11850H, GeForce RTX 3070 Laptop GPU | 2 kg | 17.7 mm | 16.00" | 3840x2400 | |
| 92.5 % v7 (old) | 11 / 2021 | Apple MacBook Pro 16 2021 M1 Max M1 Max, M1 Max 32-Core GPU | 2.2 kg | 16.8 mm | 16.20" | 3456x2234 | |
| 87.8 % v7 (old) | 08 / 2021 | HP ZBook Studio 15 G8 i9-11950H, GeForce RTX 3070 Laptop GPU | 1.9 kg | 18 mm | 15.60" | 3840x2160 | |
| 88.9 % v7 (old) | 07 / 2021 | Razer Blade 15 Advanced (Mid 2021) i7-11800H, GeForce RTX 3080 Laptop GPU | 2 kg | 16.99 mm | 15.60" | 1920x1080 | |
| 86.6 % v7 (old) | 02 / 2021 | Asus ROG Zephyrus Duo 15 SE GX551QS R9 5900HX, GeForce RTX 3080 Laptop GPU | 2.5 kg | 20.9 mm | 15.60" | 3840x2160 |
Display - 4K Touchscreen with HDR
We already tested all three available screens for the new ThinkPad X1 Extreme G4 or ThinkPad P1 G4, respectively. Our test unit is equipped with the glossy 4K touchscreen (identical panel ID) and we have analyzed it in our review of the slower X1 Extreme G4 configuration.
| Lenovo ThinkPad X1 Extreme G4-20Y50040GE LP160UQ1-SPB1, IPS, 3840x2400, 16" | Lenovo ThinkPad X1 Extreme G4-20Y5CTO1WW (3050 Ti) LP160UQ1-SPB1, IPS LED, 3840x2400, 16" | Lenovo ThinkPad P1 G4-20Y4S0KS00 LP160UQ1-SPB1, IPS LED, 3840x2400, 16" | Lenovo ThinkPad P1 G4-20Y30017GE B160QAN02.M, IPS, 2560x1600, 16" | |
|---|---|---|---|---|
| Display | ||||
| Display P3 Coverage (%) | 84.3 | 85.7 | 77.3 | |
| sRGB Coverage (%) | 98.3 | 99.4 | 99.9 | |
| AdobeRGB 1998 Coverage (%) | 97.8 | 98.9 | 78.1 | |
| Response Times | ||||
| Response Time Grey 50% / Grey 80% * (ms) | 60 ? | 55.2 ? | 40.8 ? | |
| Response Time Black / White * (ms) | 42 ? | 31.2 ? | 26.4 ? | |
| PWM Frequency (Hz) | ||||
| Screen | ||||
| Brightness middle (cd/m²) | 639 | 630 | 420 | |
| Black Level * (cd/m²) | 0.47 | 0.41 | 0.3 | |
| Brightness (cd/m²) | 612 | 622 | 401 | |
| Brightness Distribution (%) | 84 | 90 | 90 | |
| Contrast (:1) | 1360 | 1537 | 1400 | |
| Colorchecker dE 2000 * | 2.2 | 2.2 | 2.5 | |
| Colorchecker dE 2000 max. * | 5.3 | 5 | 4.9 | |
| Colorchecker dE 2000 calibrated * | 1.4 | 1 | 1.6 | |
| Greyscale dE 2000 * | 1.7 | 2.7 | 3.4 | |
| Gamma | 2.31 95% | 2.26 97% | 2.24 98% | |
| CCT | 6390 102% | 6886 94% | 6479 100% | |
| Total Average (Program / Settings) |
* ... smaller is better
Performance - X1 Extreme with Core i9 and RTX 3080
Review Settings
Lenovo used to offer additional performance settings, which were available via Vantage app. For a while now, however, they are implemented into the regular Windows power settings, which is very comfortable. Shortly before the release of this review, Lenovo offered a new BIOS version (1.13) with updated thermal settings. We noticed small performance gains in some tests, so we decided to repeat all the tests and measurements with the new BIOS version.
Processor
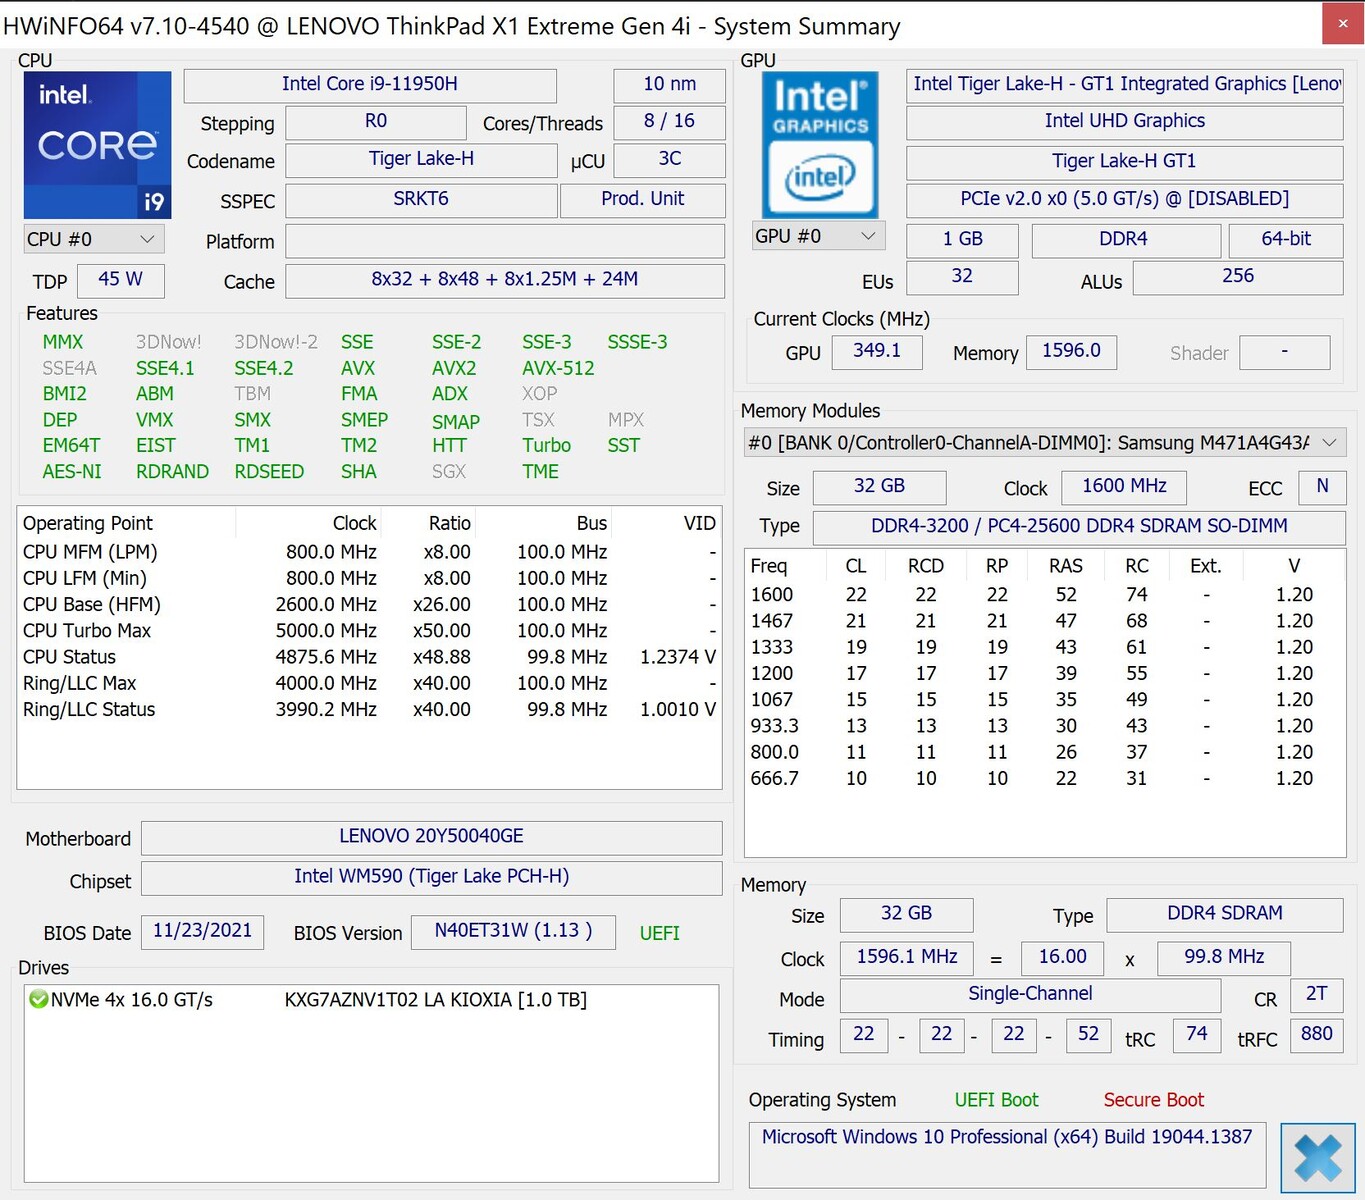
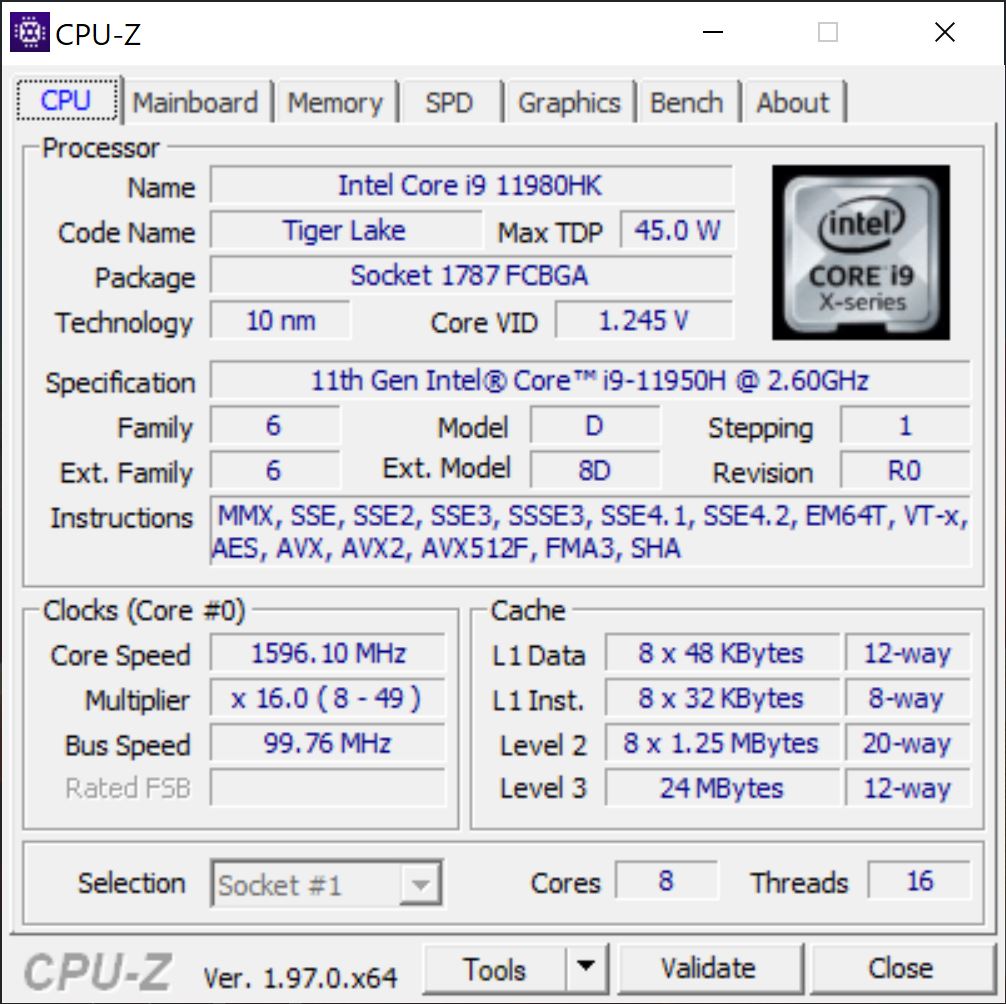
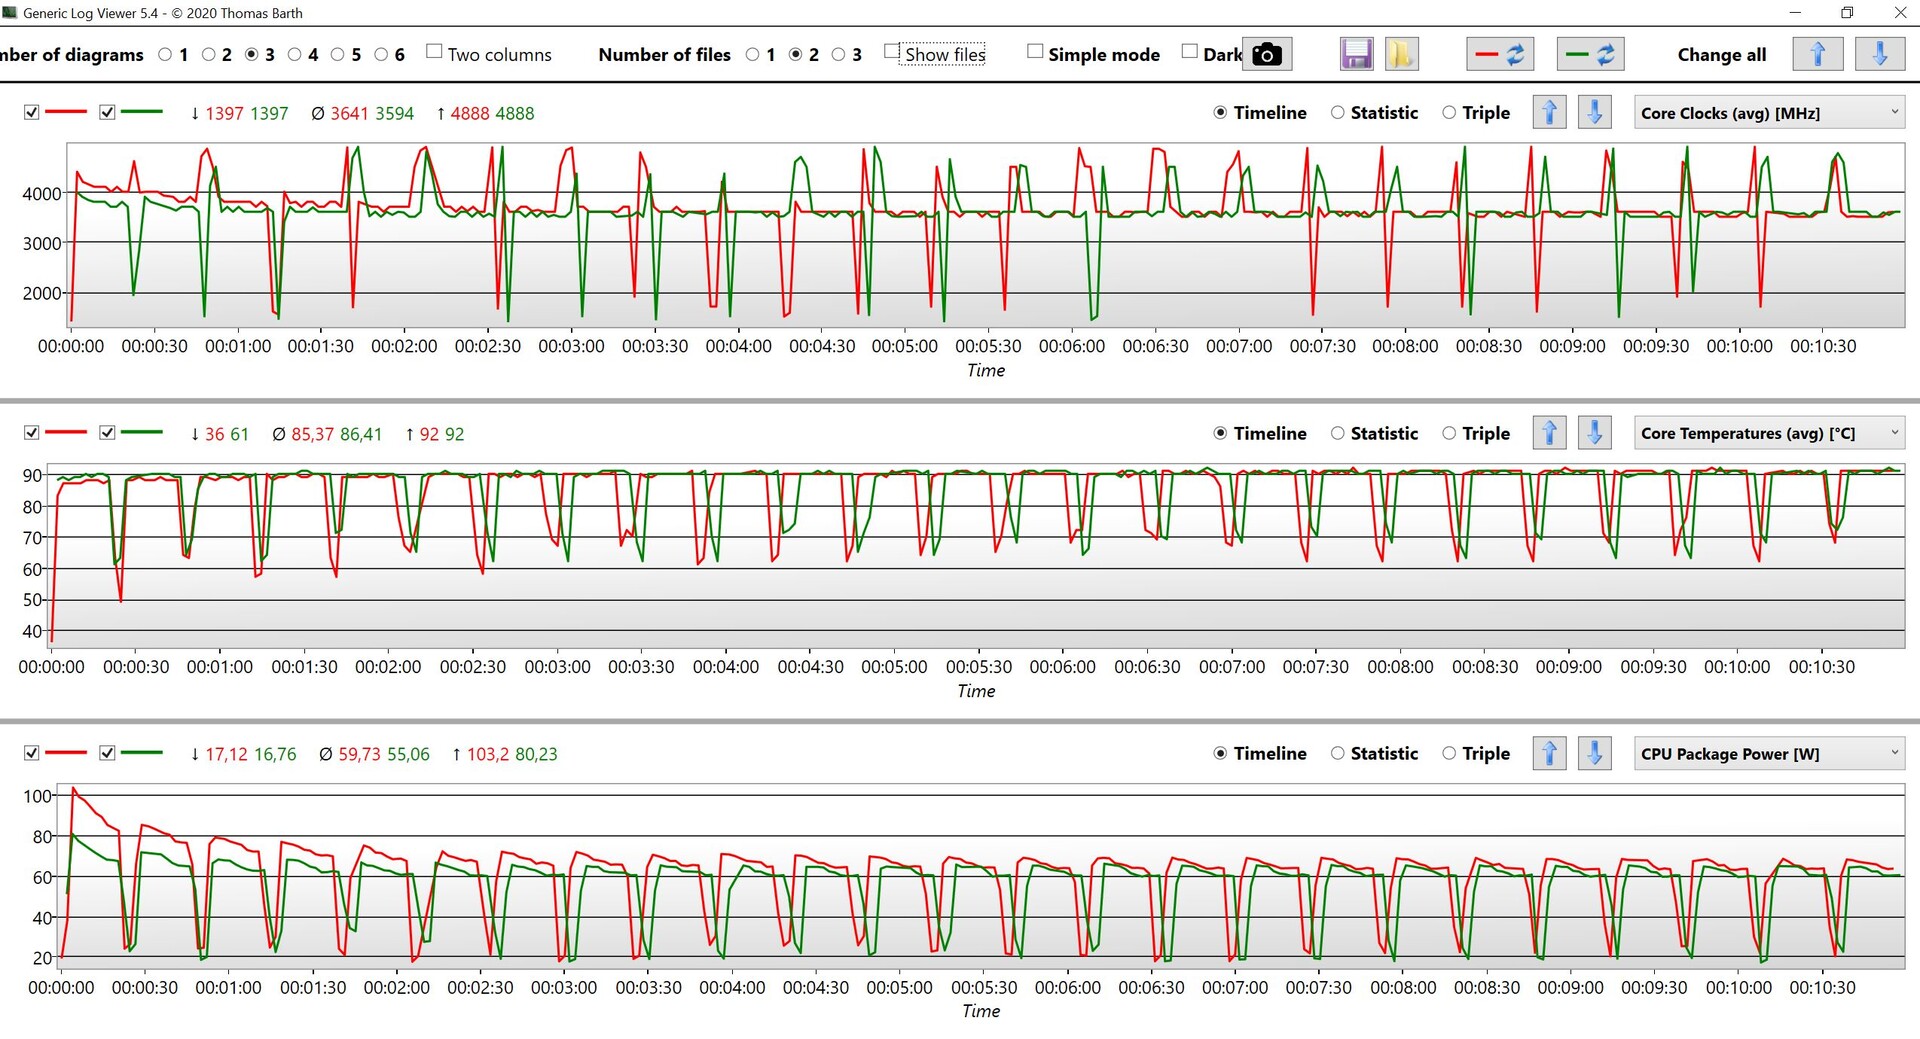
Our test unit is equipped with the Core i9-11950H, which supports Intel’s vPro technology. The processor can reach a maximum clock of 5.0 GHz on one core and up to 4.5 GHz when you stress all cores, respectively. We saw a maximum clock of 4.9 GHz during the benchmarks for one core and 4.4 GHz for all 8 cores, which results in a power consumption of 100 Watts. This value can only be maintained for a brief period and the device has to be “cold”, otherwise the maximum TDP is limited to 80W. Both values quickly drop under sustained workloads and the processor will level off at little more than 60W. The BIOS update to version 1.13 improved the situation a bit and the performance was lower before. All in all decent results, but this means the Core i9 only has an advantage in very short peak-load scenarios or when you stress one core, but it is not much faster than the supposedly slower Core i7 chips in sustained workloads.
The AMD counterpart AMD Ryzen 9 5900HX in the Asus Zephyrus Duo 15 is noticeably faster in multi-core tests and there is no performance drop (TDP @ 70W). Apple’s M1 Pro or M1 Max CPU is also slightly faster in native apps like Cinebench R23, but is just miles ahead in terms of efficiency with a power consumption of just ~30W.
All in all, the optional Core i9-11950H does nor make much sense in the ThinkPad X1 Extreme G4. The TDP fluctuates quite a lot between 35W and 70W on battery power, so the benchmark results vary as well (between 1500-1670 points @CBR15 Multi), so you will have to expect a performance deficit between 20-30 percent if you are not running on mains. More CPU benchmarks are available in our tech section.
Cinebench R15 Multi Loop
Cinebench R23: Multi Core | Single Core
Cinebench R20: CPU (Multi Core) | CPU (Single Core)
Cinebench R15: CPU Multi 64Bit | CPU Single 64Bit
Blender: v2.79 BMW27 CPU
7-Zip 18.03: 7z b 4 | 7z b 4 -mmt1
Geekbench 5.5: Multi-Core | Single-Core
HWBOT x265 Benchmark v2.2: 4k Preset
LibreOffice : 20 Documents To PDF
R Benchmark 2.5: Overall mean
| CPU Performance rating | |
| Average of class Multimedia | |
| Asus ROG Zephyrus Duo 15 SE GX551QS | |
| Apple MacBook Pro 16 2021 M1 Max -5! | |
| Lenovo ThinkPad X1 Extreme G4-20Y50040GE -3! | |
| Lenovo ThinkPad P1 G4-20Y4S0KS00 | |
| Average Intel Core i9-11950H | |
| HP ZBook Studio 15 G8 | |
| Razer Blade 15 Advanced (Mid 2021) -2! | |
| Cinebench R23 / Multi Core | |
| Average of class Multimedia (4861 - 33362, n=81, last 2 years) | |
| Asus ROG Zephyrus Duo 15 SE GX551QS | |
| Average Intel Core i9-11950H (12048 - 13113, n=4) | |
| Apple MacBook Pro 16 2021 M1 Max | |
| Razer Blade 15 Advanced (Mid 2021) | |
| HP ZBook Studio 15 G8 | |
| Lenovo ThinkPad X1 Extreme G4-20Y50040GE | |
| Lenovo ThinkPad P1 G4-20Y4S0KS00 | |
| Cinebench R23 / Single Core | |
| Average of class Multimedia (1128 - 2459, n=73, last 2 years) | |
| Average Intel Core i9-11950H (1569 - 1633, n=4) | |
| Lenovo ThinkPad X1 Extreme G4-20Y50040GE | |
| HP ZBook Studio 15 G8 | |
| Lenovo ThinkPad P1 G4-20Y4S0KS00 | |
| Apple MacBook Pro 16 2021 M1 Max | |
| Razer Blade 15 Advanced (Mid 2021) | |
| Asus ROG Zephyrus Duo 15 SE GX551QS | |
| Cinebench R20 / CPU (Multi Core) | |
| Average of class Multimedia (1887 - 12912, n=64, last 2 years) | |
| Asus ROG Zephyrus Duo 15 SE GX551QS | |
| Razer Blade 15 Advanced (Mid 2021) | |
| Average Intel Core i9-11950H (4471 - 5000, n=4) | |
| Lenovo ThinkPad P1 G4-20Y4S0KS00 | |
| HP ZBook Studio 15 G8 | |
| Lenovo ThinkPad X1 Extreme G4-20Y50040GE | |
| Apple MacBook Pro 16 2021 M1 Max | |
| Cinebench R20 / CPU (Single Core) | |
| Average of class Multimedia (425 - 853, n=64, last 2 years) | |
| Lenovo ThinkPad X1 Extreme G4-20Y50040GE | |
| Average Intel Core i9-11950H (610 - 632, n=4) | |
| HP ZBook Studio 15 G8 | |
| Lenovo ThinkPad P1 G4-20Y4S0KS00 | |
| Razer Blade 15 Advanced (Mid 2021) | |
| Asus ROG Zephyrus Duo 15 SE GX551QS | |
| Apple MacBook Pro 16 2021 M1 Max | |
| Cinebench R15 / CPU Multi 64Bit | |
| Average of class Multimedia (856 - 5224, n=68, last 2 years) | |
| Asus ROG Zephyrus Duo 15 SE GX551QS | |
| Lenovo ThinkPad X1 Extreme G4-20Y50040GE | |
| Lenovo ThinkPad X1 Extreme G4-20Y50040GE | |
| Lenovo ThinkPad P1 G4-20Y4S0KS00 | |
| Average Intel Core i9-11950H (1827 - 2130, n=5) | |
| Razer Blade 15 Advanced (Mid 2021) | |
| HP ZBook Studio 15 G8 | |
| Apple MacBook Pro 16 2021 M1 Max | |
| Cinebench R15 / CPU Single 64Bit | |
| Average of class Multimedia (184.8 - 326, n=66, last 2 years) | |
| Lenovo ThinkPad X1 Extreme G4-20Y50040GE | |
| Average Intel Core i9-11950H (236 - 249, n=4) | |
| HP ZBook Studio 15 G8 | |
| Asus ROG Zephyrus Duo 15 SE GX551QS | |
| Lenovo ThinkPad P1 G4-20Y4S0KS00 | |
| Razer Blade 15 Advanced (Mid 2021) | |
| Apple MacBook Pro 16 2021 M1 Max | |
| Blender / v2.79 BMW27 CPU | |
| Razer Blade 15 Advanced (Mid 2021) | |
| Lenovo ThinkPad P1 G4-20Y4S0KS00 | |
| HP ZBook Studio 15 G8 | |
| Average Intel Core i9-11950H (244 - 261, n=3) | |
| Average of class Multimedia (100 - 557, n=65, last 2 years) | |
| Asus ROG Zephyrus Duo 15 SE GX551QS | |
| Apple MacBook Pro 16 2021 M1 Max | |
| 7-Zip 18.03 / 7z b 4 | |
| Asus ROG Zephyrus Duo 15 SE GX551QS | |
| Average of class Multimedia (29095 - 130368, n=62, last 2 years) | |
| Razer Blade 15 Advanced (Mid 2021) | |
| Lenovo ThinkPad P1 G4-20Y4S0KS00 | |
| Average Intel Core i9-11950H (50050 - 51402, n=3) | |
| HP ZBook Studio 15 G8 | |
| 7-Zip 18.03 / 7z b 4 -mmt1 | |
| Average of class Multimedia (3666 - 7545, n=63, last 2 years) | |
| Average Intel Core i9-11950H (5755 - 5919, n=3) | |
| HP ZBook Studio 15 G8 | |
| Lenovo ThinkPad P1 G4-20Y4S0KS00 | |
| Asus ROG Zephyrus Duo 15 SE GX551QS | |
| Razer Blade 15 Advanced (Mid 2021) | |
| Geekbench 5.5 / Multi-Core | |
| Average of class Multimedia (4652 - 20422, n=62, last 2 years) | |
| Apple MacBook Pro 16 2021 M1 Max | |
| Lenovo ThinkPad P1 G4-20Y4S0KS00 | |
| Asus ROG Zephyrus Duo 15 SE GX551QS | |
| Lenovo ThinkPad X1 Extreme G4-20Y50040GE | |
| Average Intel Core i9-11950H (7286 - 8152, n=3) | |
| HP ZBook Studio 15 G8 | |
| Geekbench 5.5 / Single-Core | |
| Average of class Multimedia (805 - 2974, n=62, last 2 years) | |
| Apple MacBook Pro 16 2021 M1 Max | |
| HP ZBook Studio 15 G8 | |
| Lenovo ThinkPad P1 G4-20Y4S0KS00 | |
| Average Intel Core i9-11950H (1623 - 1702, n=3) | |
| Lenovo ThinkPad X1 Extreme G4-20Y50040GE | |
| Asus ROG Zephyrus Duo 15 SE GX551QS | |
| HWBOT x265 Benchmark v2.2 / 4k Preset | |
| Average of class Multimedia (5.26 - 36.1, n=63, last 2 years) | |
| Asus ROG Zephyrus Duo 15 SE GX551QS | |
| Razer Blade 15 Advanced (Mid 2021) | |
| HP ZBook Studio 15 G8 | |
| Lenovo ThinkPad P1 G4-20Y4S0KS00 | |
| Average Intel Core i9-11950H (13.8 - 14.5, n=4) | |
| Lenovo ThinkPad X1 Extreme G4-20Y50040GE | |
| LibreOffice / 20 Documents To PDF | |
| Average of class Multimedia (23.9 - 146.7, n=64, last 2 years) | |
| HP ZBook Studio 15 G8 | |
| Average Intel Core i9-11950H (38.6 - 53.2, n=4) | |
| Razer Blade 15 Advanced (Mid 2021) | |
| Lenovo ThinkPad P1 G4-20Y4S0KS00 | |
| Asus ROG Zephyrus Duo 15 SE GX551QS | |
| Lenovo ThinkPad X1 Extreme G4-20Y50040GE | |
| R Benchmark 2.5 / Overall mean | |
| HP ZBook Studio 15 G8 | |
| Razer Blade 15 Advanced (Mid 2021) | |
| Lenovo ThinkPad X1 Extreme G4-20Y50040GE | |
| Lenovo ThinkPad P1 G4-20Y4S0KS00 | |
| Average Intel Core i9-11950H (0.521 - 0.551, n=4) | |
| Asus ROG Zephyrus Duo 15 SE GX551QS | |
| Average of class Multimedia (0.3604 - 0.947, n=63, last 2 years) | |
* ... smaller is better
AIDA64: FP32 Ray-Trace | FPU Julia | CPU SHA3 | CPU Queen | FPU SinJulia | FPU Mandel | CPU AES | CPU ZLib | FP64 Ray-Trace | CPU PhotoWorxx
| Performance rating | |
| Average of class Multimedia | |
| Lenovo ThinkPad X1 Extreme G4-20Y50040GE | |
| Average Intel Core i9-11950H | |
| HP ZBook Studio 15 G8 | |
| Lenovo ThinkPad P1 G4-20Y4S0KS00 -9! | |
| Razer Blade 15 Advanced (Mid 2021) -9! | |
| AIDA64 / FP32 Ray-Trace | |
| Average of class Multimedia (2214 - 50388, n=60, last 2 years) | |
| Lenovo ThinkPad X1 Extreme G4-20Y50040GE | |
| Average Intel Core i9-11950H (14407 - 15655, n=4) | |
| HP ZBook Studio 15 G8 | |
| AIDA64 / FPU Julia | |
| Average of class Multimedia (12867 - 201874, n=61, last 2 years) | |
| Lenovo ThinkPad X1 Extreme G4-20Y50040GE | |
| Average Intel Core i9-11950H (60286 - 63537, n=4) | |
| HP ZBook Studio 15 G8 | |
| AIDA64 / CPU SHA3 | |
| Lenovo ThinkPad X1 Extreme G4-20Y50040GE | |
| Average Intel Core i9-11950H (4003 - 4254, n=4) | |
| HP ZBook Studio 15 G8 | |
| Average of class Multimedia (653 - 8623, n=61, last 2 years) | |
| AIDA64 / CPU Queen | |
| HP ZBook Studio 15 G8 | |
| Average Intel Core i9-11950H (97840 - 98772, n=4) | |
| Lenovo ThinkPad X1 Extreme G4-20Y50040GE | |
| Average of class Multimedia (13483 - 181505, n=49, last 2 years) | |
| AIDA64 / FPU SinJulia | |
| Lenovo ThinkPad X1 Extreme G4-20Y50040GE | |
| Average Intel Core i9-11950H (9828 - 10462, n=4) | |
| HP ZBook Studio 15 G8 | |
| Average of class Multimedia (1240 - 28794, n=61, last 2 years) | |
| AIDA64 / FPU Mandel | |
| Average of class Multimedia (6395 - 105740, n=60, last 2 years) | |
| Lenovo ThinkPad X1 Extreme G4-20Y50040GE | |
| Average Intel Core i9-11950H (35735 - 38450, n=4) | |
| HP ZBook Studio 15 G8 | |
| AIDA64 / CPU AES | |
| Lenovo ThinkPad X1 Extreme G4-20Y50040GE | |
| Average Intel Core i9-11950H (83095 - 147249, n=4) | |
| HP ZBook Studio 15 G8 | |
| Average of class Multimedia (13243 - 126790, n=61, last 2 years) | |
| AIDA64 / CPU ZLib | |
| Average of class Multimedia (167.2 - 2022, n=61, last 2 years) | |
| Lenovo ThinkPad X1 Extreme G4-20Y50040GE | |
| Average Intel Core i9-11950H (756 - 820, n=4) | |
| HP ZBook Studio 15 G8 | |
| Razer Blade 15 Advanced (Mid 2021) | |
| Lenovo ThinkPad P1 G4-20Y4S0KS00 | |
| AIDA64 / FP64 Ray-Trace | |
| Average of class Multimedia (1014 - 26875, n=61, last 2 years) | |
| Lenovo ThinkPad X1 Extreme G4-20Y50040GE | |
| Average Intel Core i9-11950H (7871 - 8549, n=4) | |
| HP ZBook Studio 15 G8 | |
| AIDA64 / CPU PhotoWorxx | |
| Average of class Multimedia (12860 - 88154, n=61, last 2 years) | |
| HP ZBook Studio 15 G8 | |
| Average Intel Core i9-11950H (12933 - 26370, n=4) | |
| Lenovo ThinkPad X1 Extreme G4-20Y50040GE | |
System Performance
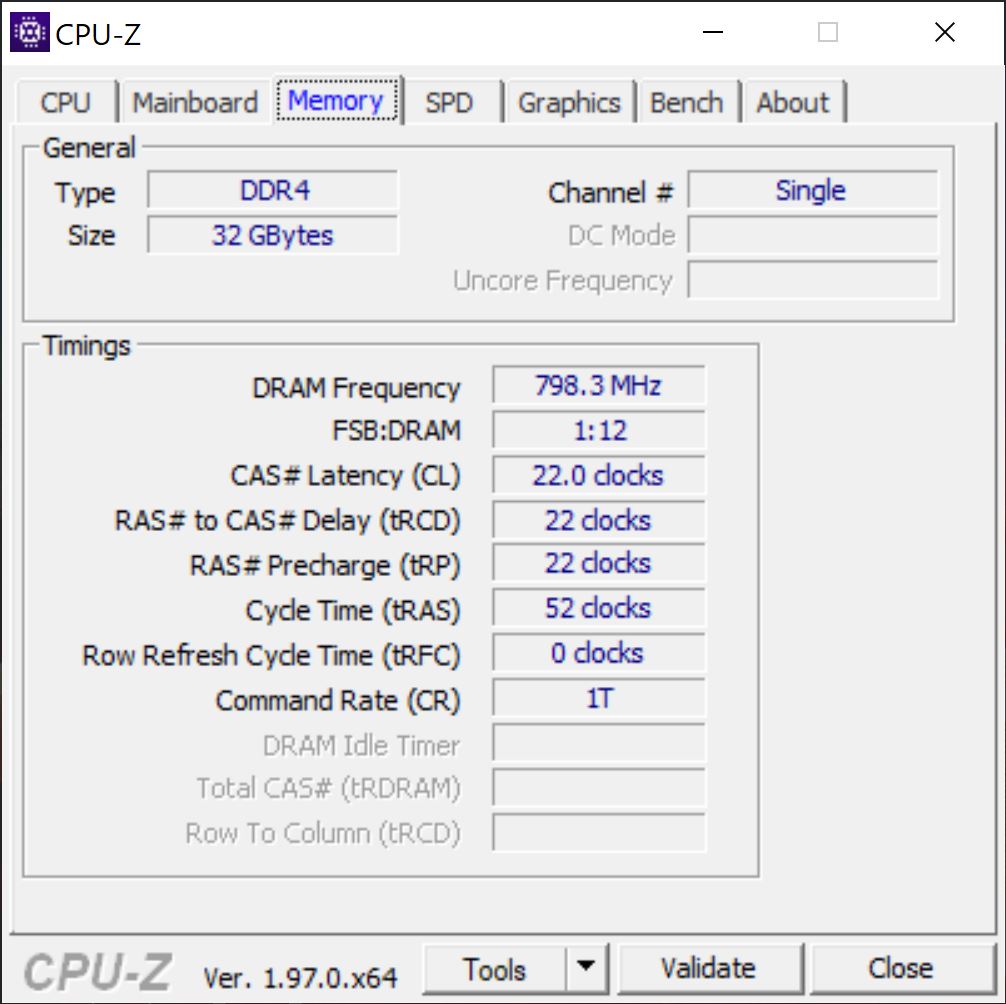
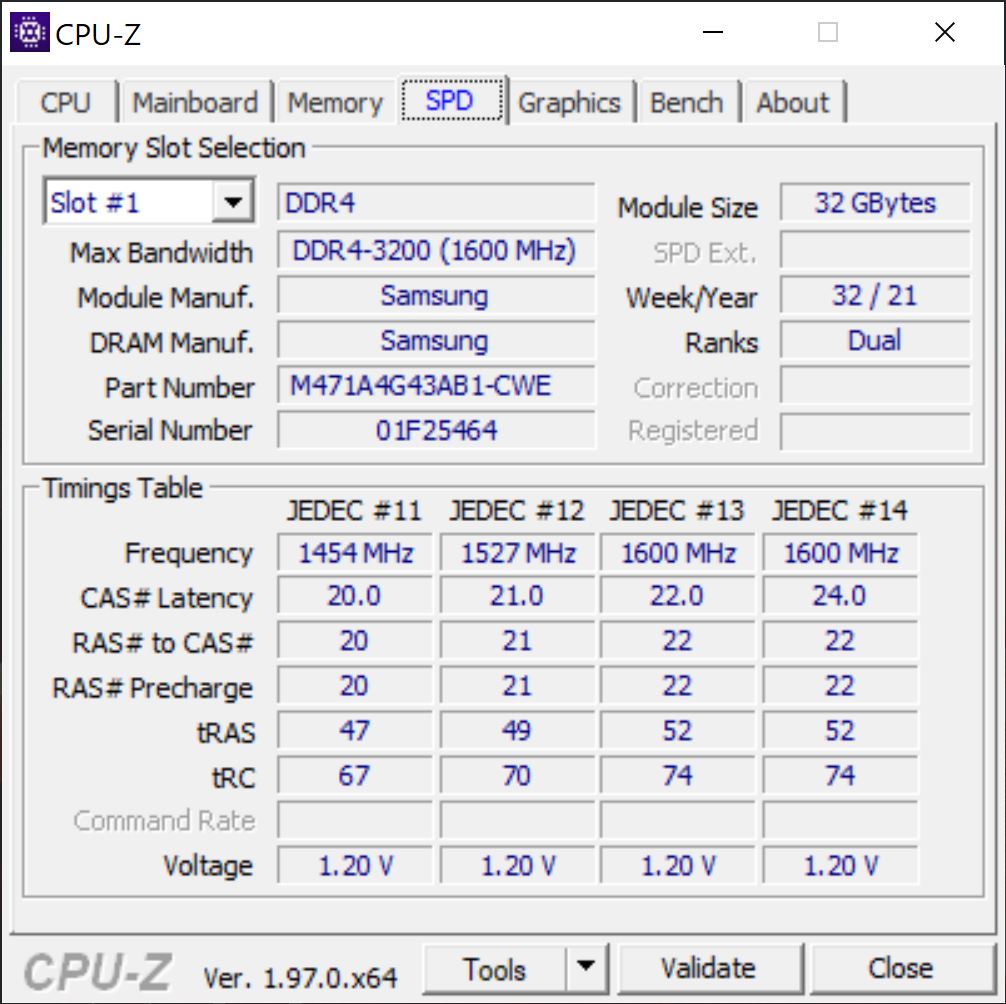
The system performance in general is very good; the system is subjectively very responsive and manages high benchmark scores. However, it is on par with the ThinkPad P1 G4 we tested with the regular Core i7 and the RTX 3070. The memory performance should have an effect as well, because you do get 32 GB, but only one module in a single-channel configuration. This also explains the comparatively low performance in AIDA’s memory benchmarks.
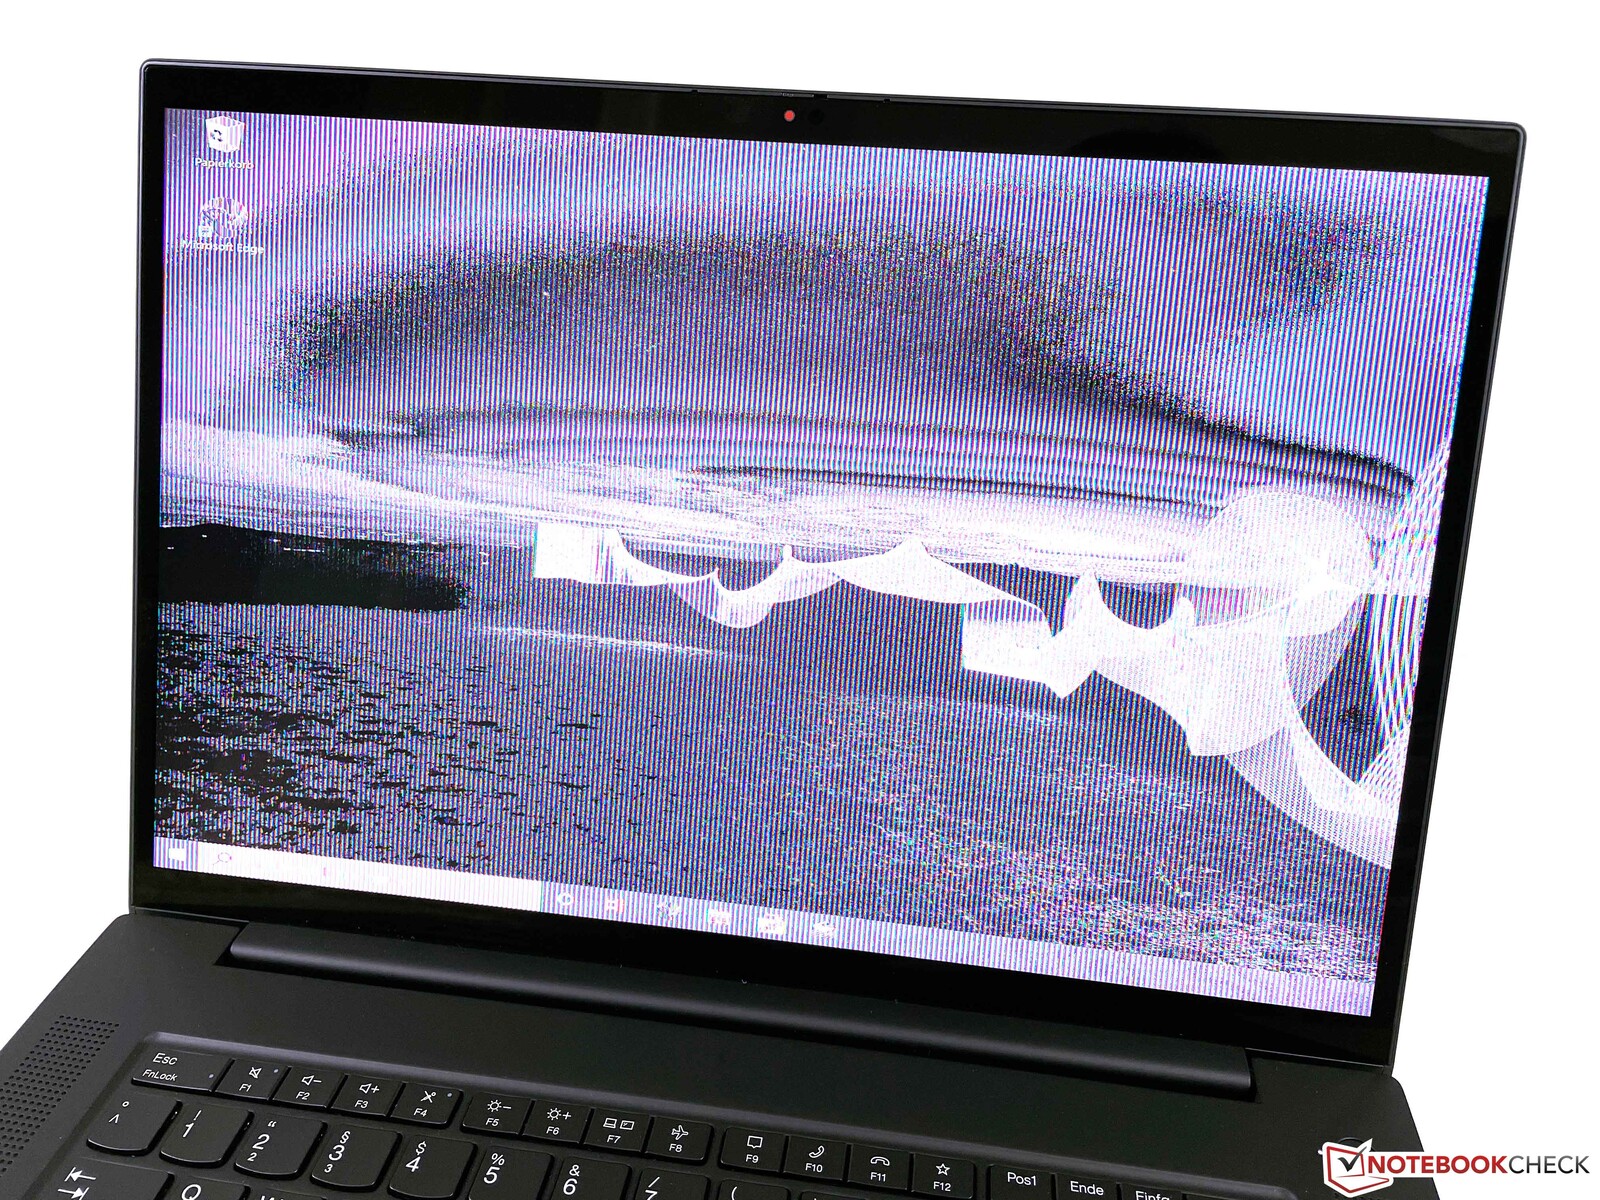
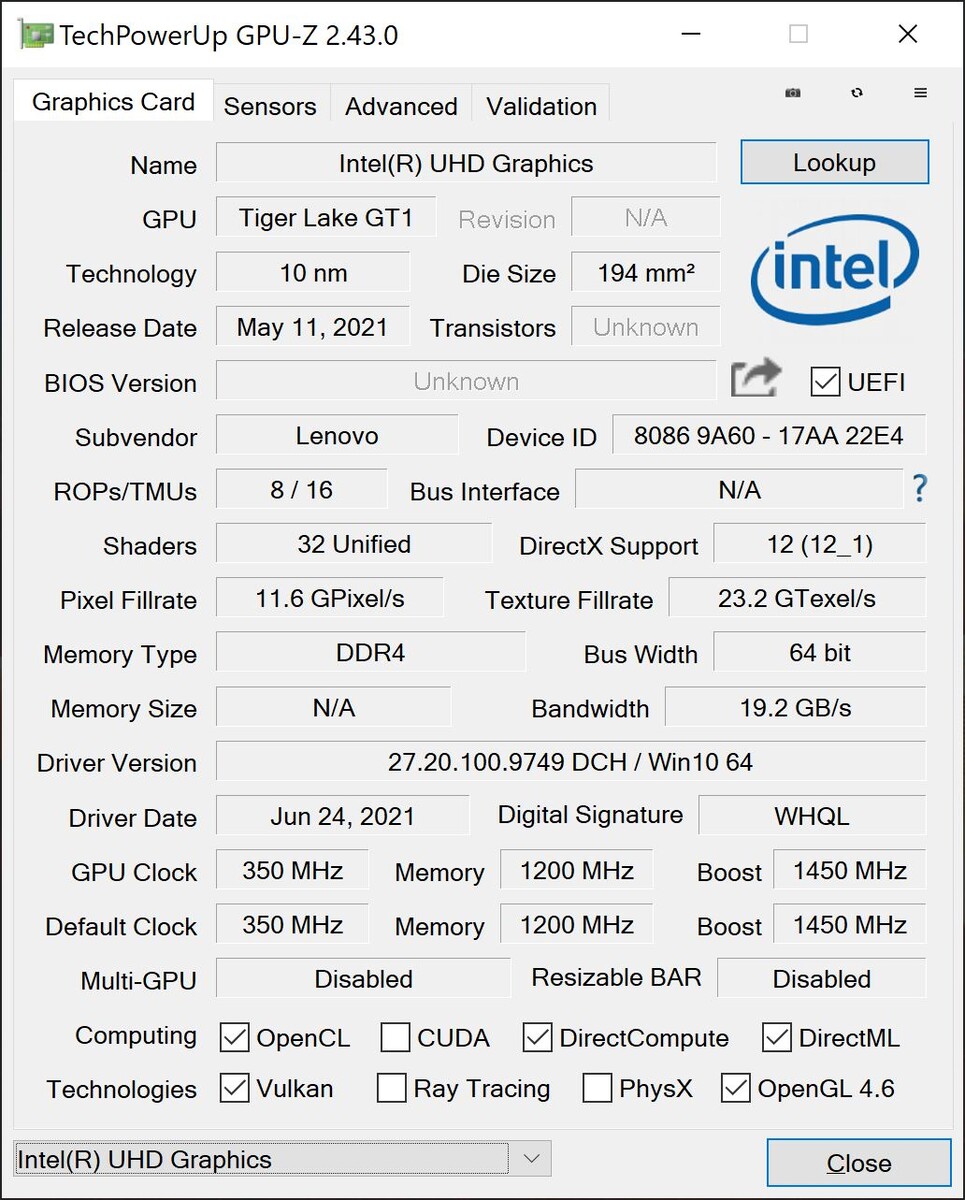
Similar to our previous test models of the X1 Extreme G4/P1 G4, there are severe graphics issues when the device wakes up from standby and sometimes even when you launch 3D applications or attach external monitors. This will require a restart of the device and it seems to be connected to the iGPU drivers. The only way to get rid of the issue right now is to deactivate Hybrid Graphics in the BIOS. Lenovo should offer a solution to this problem as soon as possible, because you cannot really use the laptop reliably with this problem.
Update December 24th: We found a solution for the GPU bug. You have to activate the option Automatic Display Refresh in Intel's Drivers Control Panel (System -> Energy).
CrossMark: Overall | Productivity | Creativity | Responsiveness
| PCMark 10 / Score | |
| Average of class Multimedia (4325 - 10386, n=58, last 2 years) | |
| Razer Blade 15 Advanced (Mid 2021) | |
| Lenovo ThinkPad P1 G4-20Y4S0KS00 | |
| Lenovo ThinkPad X1 Extreme G4-20Y50040GE | |
| Average Intel Core i9-11950H, NVIDIA GeForce RTX 3080 Laptop GPU (n=1) | |
| Asus ROG Zephyrus Duo 15 SE GX551QS | |
| HP ZBook Studio 15 G8 | |
| PCMark 10 / Essentials | |
| Razer Blade 15 Advanced (Mid 2021) | |
| Lenovo ThinkPad P1 G4-20Y4S0KS00 | |
| Lenovo ThinkPad X1 Extreme G4-20Y50040GE | |
| Average Intel Core i9-11950H, NVIDIA GeForce RTX 3080 Laptop GPU (n=1) | |
| Average of class Multimedia (8025 - 11664, n=57, last 2 years) | |
| Asus ROG Zephyrus Duo 15 SE GX551QS | |
| HP ZBook Studio 15 G8 | |
| PCMark 10 / Productivity | |
| Average of class Multimedia (7323 - 18233, n=57, last 2 years) | |
| Razer Blade 15 Advanced (Mid 2021) | |
| Lenovo ThinkPad P1 G4-20Y4S0KS00 | |
| Lenovo ThinkPad X1 Extreme G4-20Y50040GE | |
| Average Intel Core i9-11950H, NVIDIA GeForce RTX 3080 Laptop GPU (n=1) | |
| Asus ROG Zephyrus Duo 15 SE GX551QS | |
| HP ZBook Studio 15 G8 | |
| PCMark 10 / Digital Content Creation | |
| Razer Blade 15 Advanced (Mid 2021) | |
| Average of class Multimedia (3651 - 16240, n=57, last 2 years) | |
| Lenovo ThinkPad P1 G4-20Y4S0KS00 | |
| HP ZBook Studio 15 G8 | |
| Asus ROG Zephyrus Duo 15 SE GX551QS | |
| Lenovo ThinkPad X1 Extreme G4-20Y50040GE | |
| Average Intel Core i9-11950H, NVIDIA GeForce RTX 3080 Laptop GPU (n=1) | |
| CrossMark / Overall | |
| Average of class Multimedia (866 - 2728, n=67, last 2 years) | |
| Lenovo ThinkPad X1 Extreme G4-20Y50040GE | |
| Average Intel Core i9-11950H, NVIDIA GeForce RTX 3080 Laptop GPU (n=1) | |
| Lenovo ThinkPad P1 G4-20Y4S0KS00 | |
| Apple MacBook Pro 16 2021 M1 Max | |
| CrossMark / Productivity | |
| Average of class Multimedia (931 - 2489, n=67, last 2 years) | |
| Lenovo ThinkPad X1 Extreme G4-20Y50040GE | |
| Average Intel Core i9-11950H, NVIDIA GeForce RTX 3080 Laptop GPU (n=1) | |
| Lenovo ThinkPad P1 G4-20Y4S0KS00 | |
| Apple MacBook Pro 16 2021 M1 Max | |
| CrossMark / Creativity | |
| Average of class Multimedia (907 - 3465, n=67, last 2 years) | |
| Apple MacBook Pro 16 2021 M1 Max | |
| Lenovo ThinkPad P1 G4-20Y4S0KS00 | |
| Lenovo ThinkPad X1 Extreme G4-20Y50040GE | |
| Average Intel Core i9-11950H, NVIDIA GeForce RTX 3080 Laptop GPU (n=1) | |
| CrossMark / Responsiveness | |
| Lenovo ThinkPad X1 Extreme G4-20Y50040GE | |
| Average Intel Core i9-11950H, NVIDIA GeForce RTX 3080 Laptop GPU (n=1) | |
| Average of class Multimedia (605 - 2024, n=67, last 2 years) | |
| Lenovo ThinkPad P1 G4-20Y4S0KS00 | |
| Apple MacBook Pro 16 2021 M1 Max | |
| PCMark 10 Score | 6919 points | |
Help | ||
| AIDA64 / Memory Copy | |
| Average of class Multimedia (21158 - 132135, n=61, last 2 years) | |
| HP ZBook Studio 15 G8 | |
| Average Intel Core i9-11950H (25952 - 48565, n=4) | |
| Lenovo ThinkPad X1 Extreme G4-20Y50040GE | |
| AIDA64 / Memory Read | |
| Average of class Multimedia (19699 - 174586, n=61, last 2 years) | |
| HP ZBook Studio 15 G8 | |
| Average Intel Core i9-11950H (26064 - 47921, n=4) | |
| Lenovo ThinkPad X1 Extreme G4-20Y50040GE | |
| AIDA64 / Memory Write | |
| Average of class Multimedia (17733 - 134998, n=61, last 2 years) | |
| HP ZBook Studio 15 G8 | |
| Average Intel Core i9-11950H (22302 - 46818, n=4) | |
| Lenovo ThinkPad X1 Extreme G4-20Y50040GE | |
| AIDA64 / Memory Latency | |
| Average of class Multimedia (7 - 535, n=60, last 2 years) | |
| Lenovo ThinkPad X1 Extreme G4-20Y50040GE | |
| Average Intel Core i9-11950H (82.6 - 88.6, n=4) | |
| HP ZBook Studio 15 G8 | |
| Razer Blade 15 Advanced (Mid 2021) | |
| Lenovo ThinkPad P1 G4-20Y4S0KS00 | |
* ... smaller is better
DPC Latency
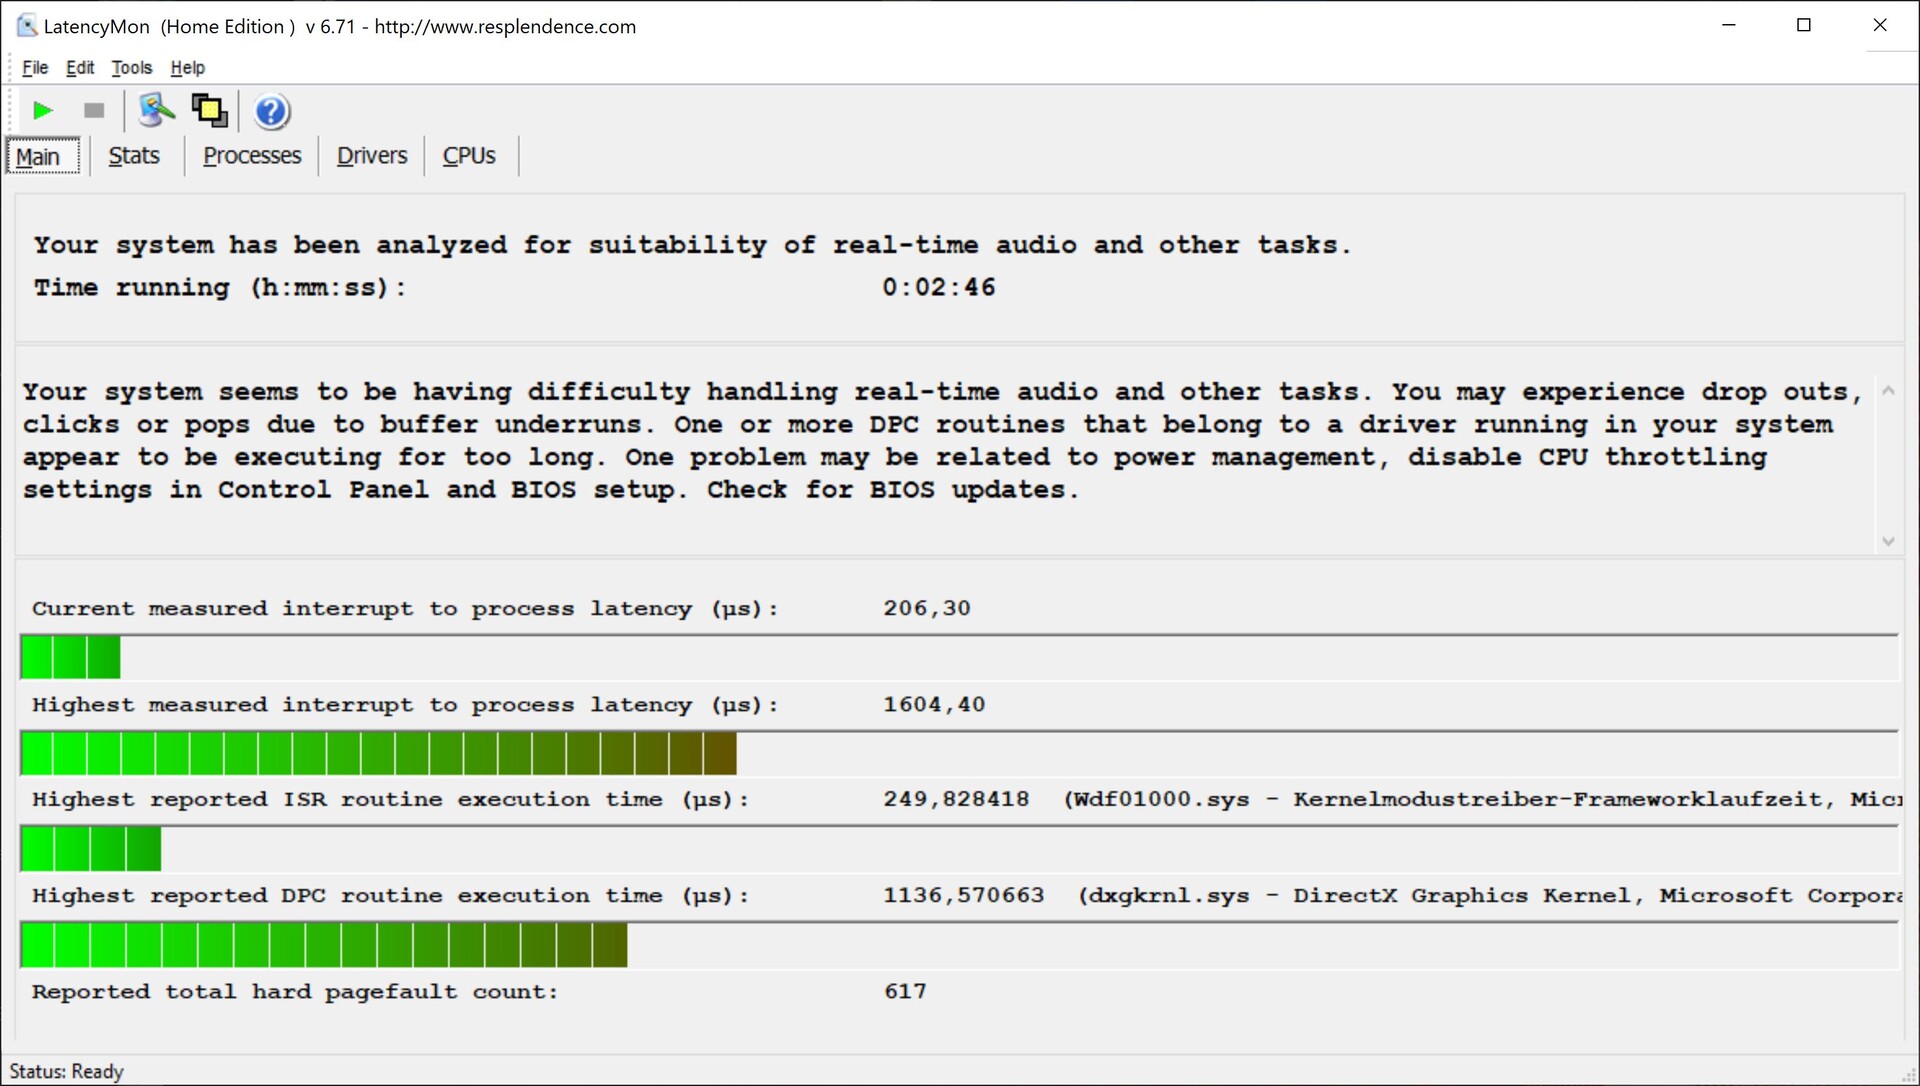
Our test unit with the BIOS version 1.13 has problems with increased latencies in our standardized test, which means it is not suited for real-time audio applications.
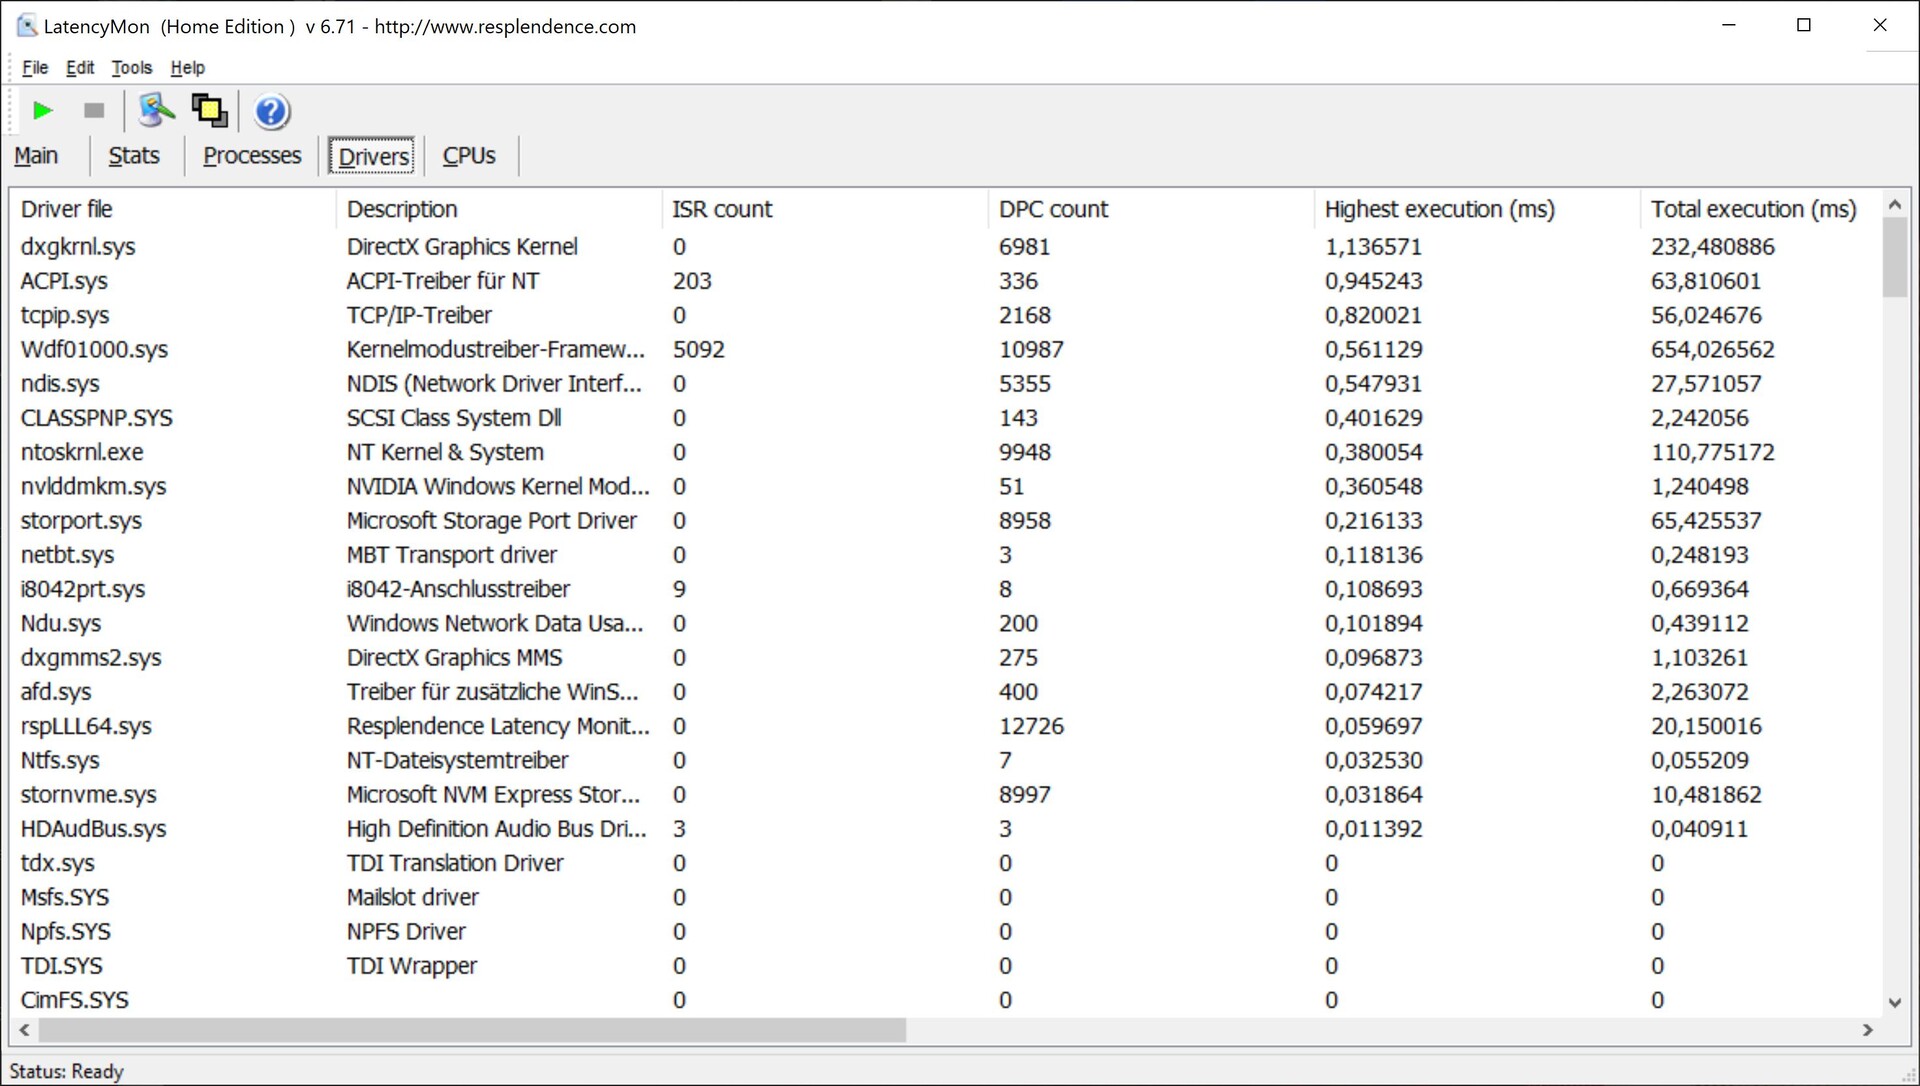
| DPC Latencies / LatencyMon - interrupt to process latency (max), Web, Youtube, Prime95 | |
| Razer Blade 15 Advanced (Mid 2021) | |
| Lenovo ThinkPad X1 Extreme G4-20Y50040GE | |
| HP ZBook Studio 15 G8 | |
| Asus ROG Zephyrus Duo 15 SE GX551QS | |
| Lenovo ThinkPad P1 G4-20Y4S0KS00 | |
* ... smaller is better
Storage Devices
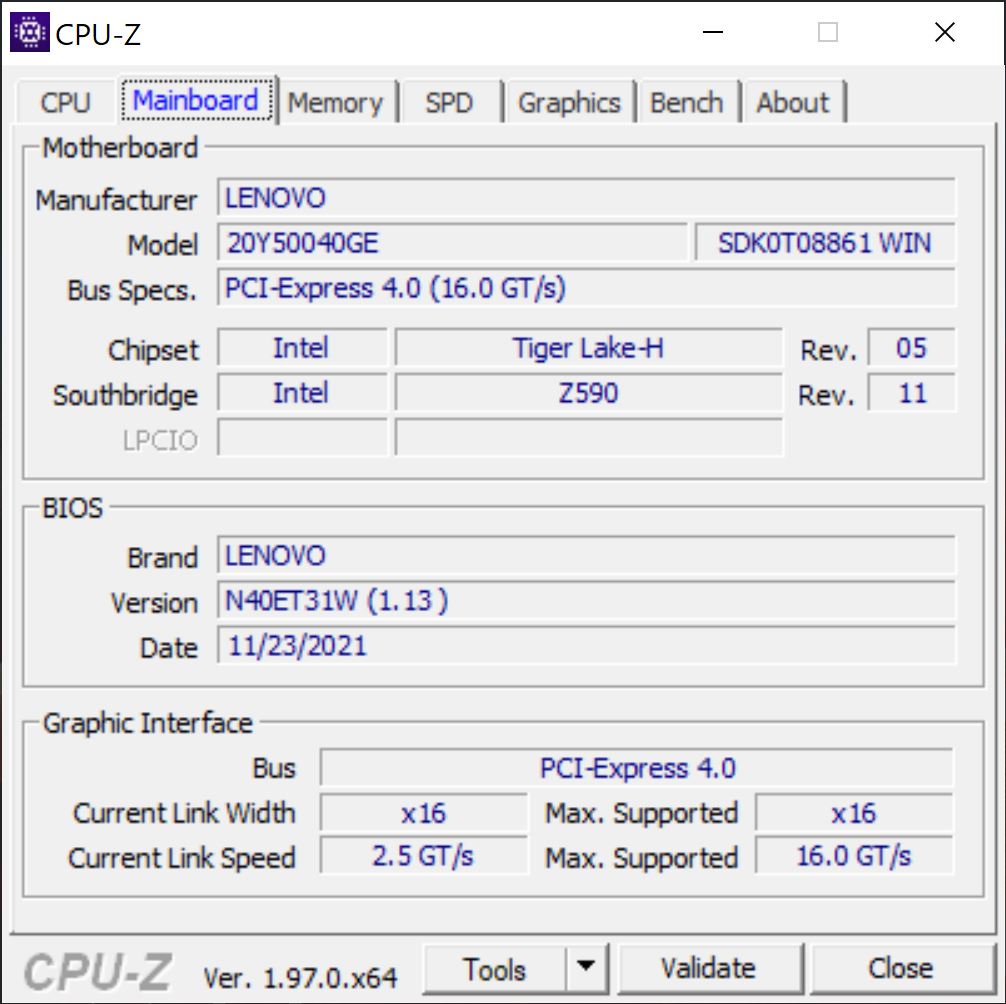
Models with the more powerful vapor chamber cooling solution only have one M.2-2280 slot for SSDs, but it does at least support the fast PCIe 4.0 interface and the Kioxia XG7 in our unit can utilize the new standard. It offers a storage capacity of 1 TB (895 GB are available after the initial setup) and manages very high transfer rates of more than 6 GB/s. More SSD benchmarks are available here.

* ... smaller is better
Disk Throttling: DiskSpd Read Loop, Queue Depth 8
GPU Performance
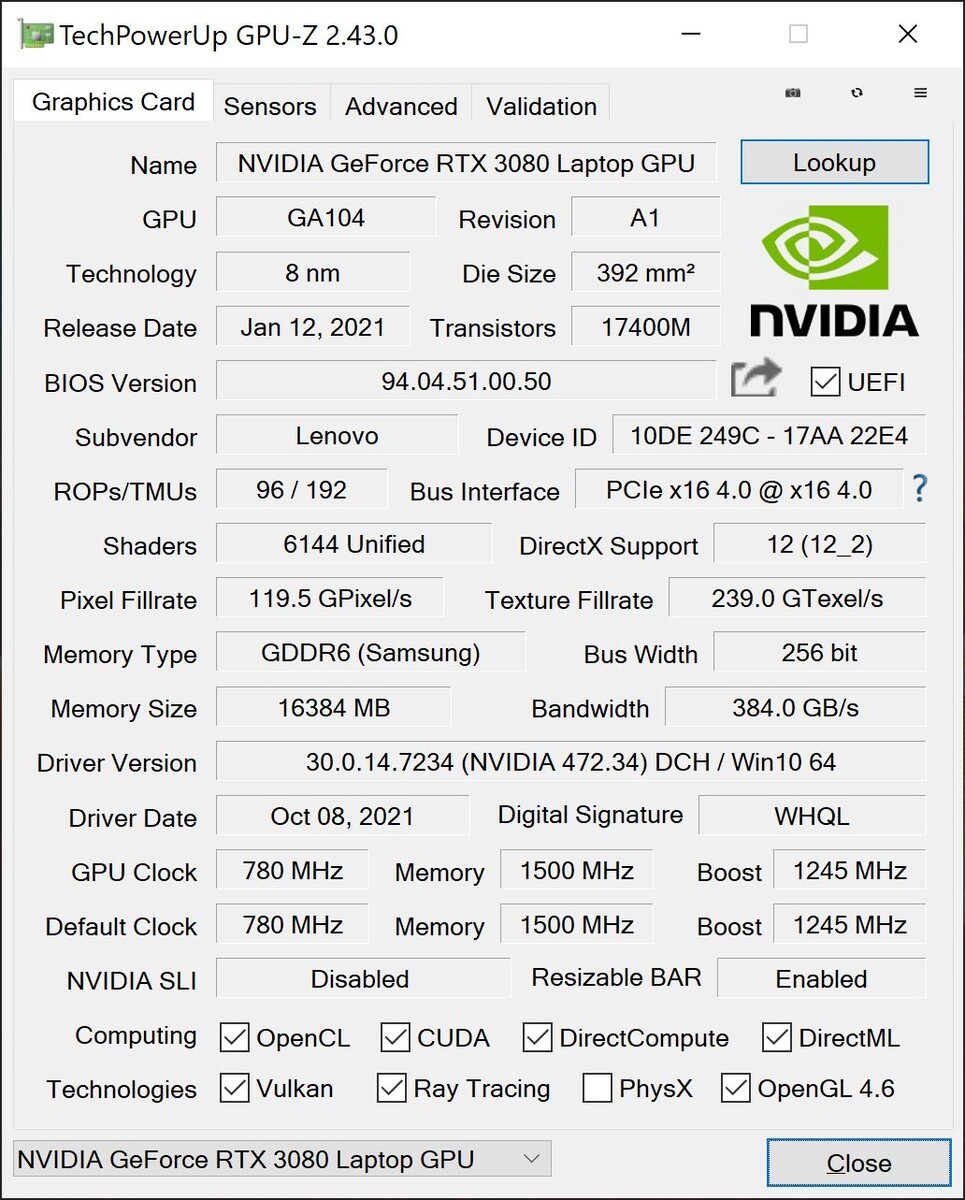
While the third generation of the ThinkPad X1 Extreme was only available with midrange GPUs, Lenovo is now able to implement more powerful Nvidia RTX GPUs thanks to the vapor chamber cooling. The fastest option is the RTX 3080, which is also inside our review unit. However, it is the 90W model and therefore one of the slowest RTX 3080 versions. We see a maximum core clock of 1425 MHz in the benchmarks. This is not much faster than the RTX 3070 we tested in the workstation counterpart ThinkPad P1 G4, but the RTX 3080 has the advantage of 16 GB VRAM.
The benchmarks show that the RTX 3080 in the X1 Extreme is about 15-20 percent slower than the average results for this GPU and it is actually just slightly faster than the RTX 3070 in the ThinkPad P1 G4. This means the RTX 3080 only makes sense when you can utilize the larger VRAM.
The GPU performance is stable under sustained workloads and the device easily passes the Time Spy stress test. The GPU is limited to 55W on battery power, which results in a performance deficit of ~45 percent. More benchmarks with the RTX 3080 are listed in our tech section.
| 3DMark 11 Performance | 24326 points | |
| 3DMark Fire Strike Score | 15666 points | |
| 3DMark Time Spy Score | 8195 points | |
Help | ||
Gaming Performance
Gaming is obviously possible on the X1 Extreme G4, but the performance once again does not really meet the expectations for the RTX 3080 and the overall performance is very similar to the RTX 3070 in the ThinkPad P1 G4. The performance is still easily sufficient for maximum settings in most games. Despite the 4K screen, we often could not select the 4K resolution (16:9) in many titles, so these results are missing. The gaming performance is stable during longer sessions, but drops by ~40 percent (50 vs. 85 fps @Witcher 3 Ultra) on battery power. You can find more gaming benchmarks here.
| Cyberpunk 2077 1.0 - 1920x1080 Ultra Preset | |
| Average NVIDIA GeForce RTX 3080 Laptop GPU (52.9 - 84.3, n=9) | |
| Lenovo ThinkPad X1 Extreme G4-20Y50040GE | |
| Lenovo ThinkPad P1 G4-20Y30017GE | |
Witcher 3 FPS Diagram
| low | med. | high | ultra | QHD | 4K | |
|---|---|---|---|---|---|---|
| The Witcher 3 (2015) | 371 | 261 | 177 | 85.1 | ||
| Dota 2 Reborn (2015) | 133.5 | 111 | 108.1 | 98 | 55.2 | |
| Final Fantasy XV Benchmark (2018) | 123 | 97 | 78.2 | 61.6 | 37.5 | |
| X-Plane 11.11 (2018) | 112 | 90.8 | 74 | 39.9 | ||
| Far Cry 5 (2018) | 129 | 108 | 104 | 93 | 86 | |
| Cyberpunk 2077 1.0 (2020) | 105 | 86 | 72 | 61 | 40 | |
| Far Cry 6 (2021) | 101 | 73 | 65 | 55 |
Emissions - The cooling of the ThinkPad is at its limits
System Noise
Subjectively, the fans of the X1 Extreme G4 will kick in sooner a after the BIOS update and you can almost always hear a quiet murmur while idling, at least when you use the Best Performance setting of Windows. We recommend you shift the performance slider one setting to the left (Better Performance) for everyday tasks, where the device is noticeable quieter. The fans are very loud while gaming and under load at 47 and 52 dB(A), respectively, but the fan noise is not high-pitched. The x1 Extreme G4 is therefore one of the loudest devices in our comparison group and similar to the Razer Blade 15 as well as the Asus Zephyrus Duo 15, even though they are equipped with faster versions of the RTX 3080.
We noticed occasional coil whine from the RTX 3080, which was not the case when the iGPU was active.
Noise level
| Idle |
| 24.7 / 24.7 / 28.1 dB(A) |
| Load |
| 42.5 / 52.1 dB(A) |
 | ||
30 dB silent 40 dB(A) audible 50 dB(A) loud |
||
min: | ||
| Lenovo ThinkPad X1 Extreme G4-20Y50040GE GeForce RTX 3080 Laptop GPU, i9-11950H, Kioxia XG7 KXG7AZNV1T02 | Lenovo ThinkPad P1 G4-20Y4S0KS00 GeForce RTX 3070 Laptop GPU, i7-11850H, Samsung PM9A1 MZVL21T0HCLR | Apple MacBook Pro 16 2021 M1 Max M1 Max 32-Core GPU, M1 Max, Apple SSD AP2048R | HP ZBook Studio 15 G8 GeForce RTX 3070 Laptop GPU, i9-11950H, Samsung PM981a MZVLB2T0HALB | Razer Blade 15 Advanced (Mid 2021) GeForce RTX 3080 Laptop GPU, i7-11800H, SSSTC CA6-8D1024 | Asus ROG Zephyrus Duo 15 SE GX551QS GeForce RTX 3080 Laptop GPU, R9 5900HX, 2x Samsung PM981a MZVLB1T0HBLR (RAID 0) | |
|---|---|---|---|---|---|---|
| Noise | 4% | 7% | 2% | 1% | 1% | |
| off / environment * (dB) | 24.7 | 23.8 4% | 24.2 2% | 23.5 5% | 25.1 -2% | 27 -9% |
| Idle Minimum * (dB) | 24.7 | 23.8 4% | 24.2 2% | 25.3 -2% | 25.3 -2% | 27 -9% |
| Idle Average * (dB) | 24.7 | 23.8 4% | 24.2 2% | 25.3 -2% | 25.3 -2% | 27 -9% |
| Idle Maximum * (dB) | 28.1 | 28.3 -1% | 24.2 14% | 25.3 10% | 25.3 10% | 27 4% |
| Load Average * (dB) | 42.5 | 38.6 9% | 42.9 -1% | 41.2 3% | 42 1% | 31.2 27% |
| Witcher 3 ultra * (dB) | 46.4 | 47.4 -2% | 39.5 15% | 49.4 -6% | 45.6 2% | 44.5 4% |
| Load Maximum * (dB) | 52.1 | 47.4 9% | 42.9 18% | 49.4 5% | 51.6 1% | 53.5 -3% |
* ... smaller is better
Temperature
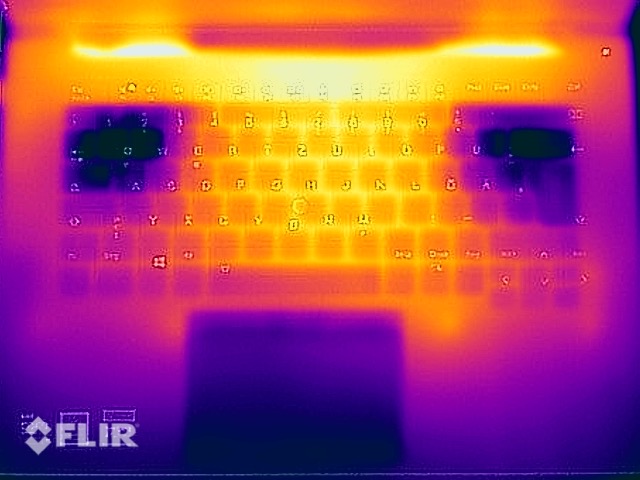
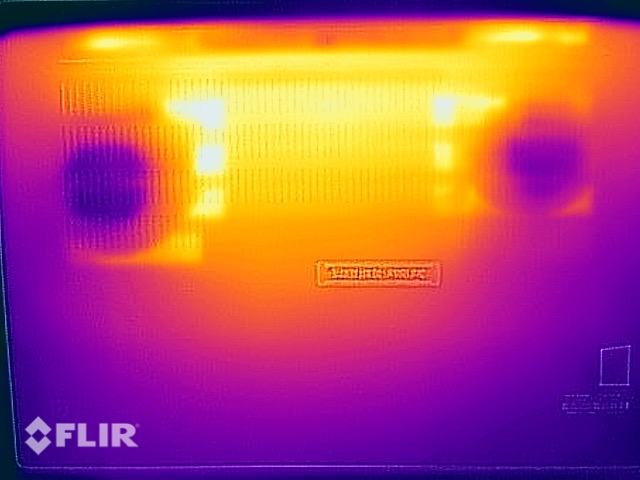
The X1 Extreme G4 does not have any temperature problems during everyday tasks and light workloads, but you should not put it on your lap while gaming or when you really stress the machine. We can measure more than 50 °C at hotspots on the bottom and the temperatures are even a bit higher during gaming, where the fan speed is a bit lower.
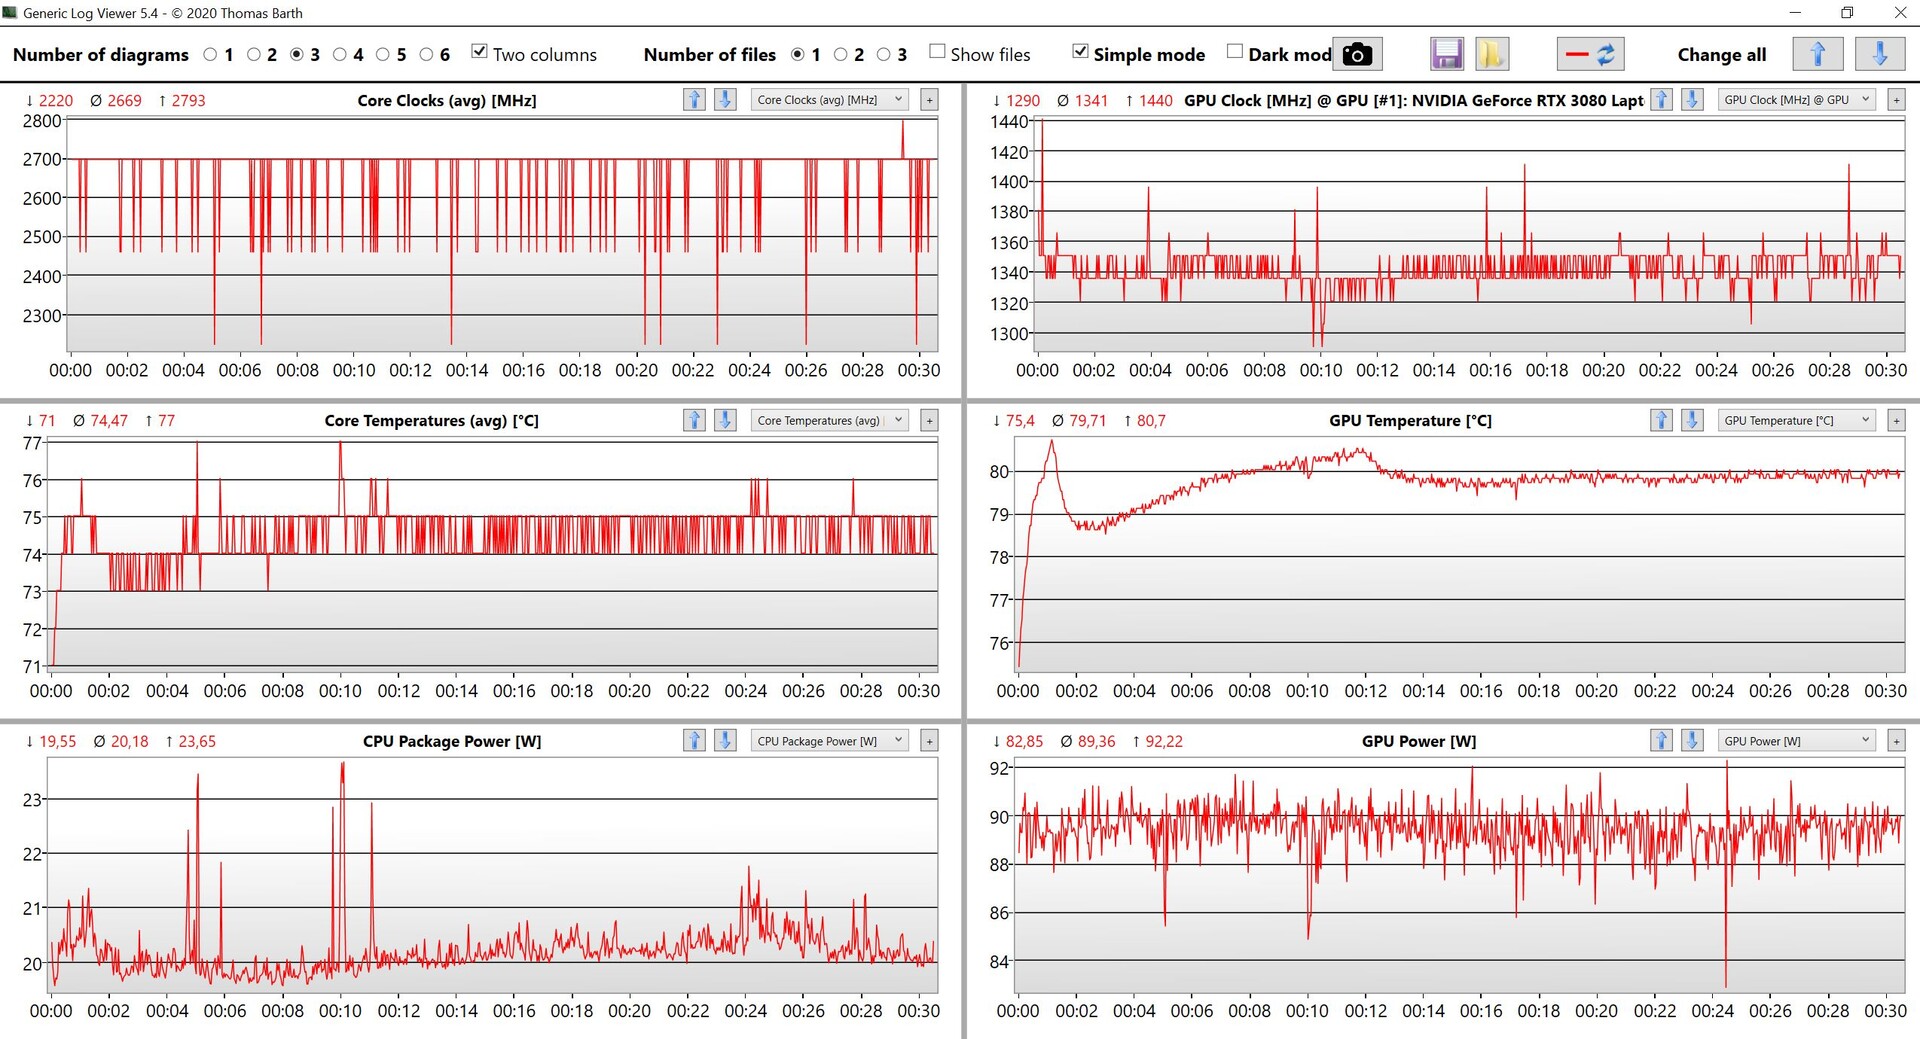
The system favors the dedicated graphics card during the stress test. It operates at 80W while the processor almost immediately drops to just 30W and stays on this level.
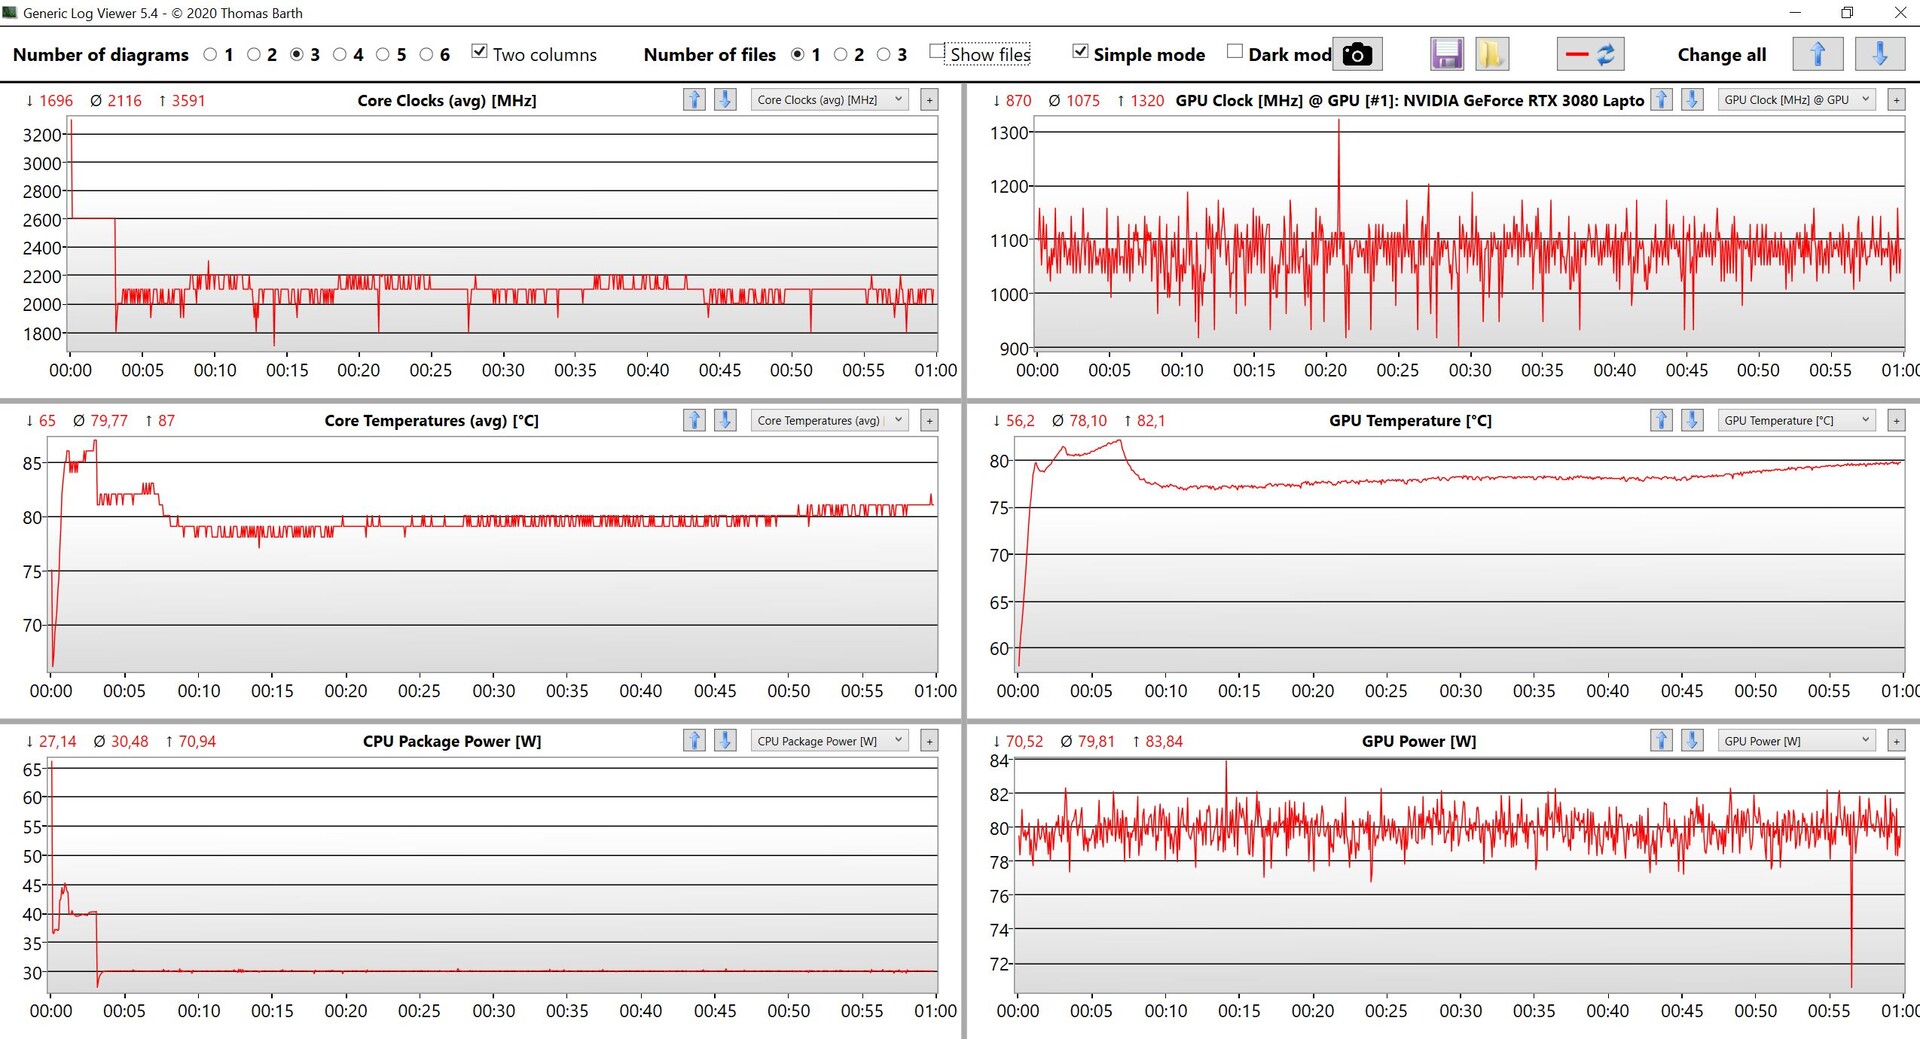
(-) The maximum temperature on the upper side is 51.4 °C / 125 F, compared to the average of 36.8 °C / 98 F, ranging from 21 to 71 °C for the class Multimedia.
(-) The bottom heats up to a maximum of 55.9 °C / 133 F, compared to the average of 39.1 °C / 102 F
(+) In idle usage, the average temperature for the upper side is 26.4 °C / 80 F, compared to the device average of 31.3 °C / 88 F.
(-) Playing The Witcher 3, the average temperature for the upper side is 43.6 °C / 110 F, compared to the device average of 31.3 °C / 88 F.
(-) The palmrests and touchpad can get very hot to the touch with a maximum of 41.3 °C / 106.3 F.
(-) The average temperature of the palmrest area of similar devices was 28.7 °C / 83.7 F (-12.6 °C / -22.6 F).
| Lenovo ThinkPad X1 Extreme G4-20Y50040GE Intel Core i9-11950H, NVIDIA GeForce RTX 3080 Laptop GPU | Lenovo ThinkPad P1 G4-20Y4S0KS00 Intel Core i7-11850H, NVIDIA GeForce RTX 3070 Laptop GPU | Apple MacBook Pro 16 2021 M1 Max Apple M1 Max, Apple M1 Max 32-Core GPU | HP ZBook Studio 15 G8 Intel Core i9-11950H, NVIDIA GeForce RTX 3070 Laptop GPU | Razer Blade 15 Advanced (Mid 2021) Intel Core i7-11800H, NVIDIA GeForce RTX 3080 Laptop GPU | Asus ROG Zephyrus Duo 15 SE GX551QS AMD Ryzen 9 5900HX, NVIDIA GeForce RTX 3080 Laptop GPU | |
|---|---|---|---|---|---|---|
| Heat | -1% | 18% | 2% | -13% | 5% | |
| Maximum Upper Side * (°C) | 51.4 | 51 1% | 42.3 18% | 49 5% | 51 1% | 33.4 35% |
| Maximum Bottom * (°C) | 55.9 | 53.5 4% | 41.7 25% | 54.2 3% | 52 7% | 45 19% |
| Idle Upper Side * (°C) | 27.2 | 28.8 -6% | 23.9 12% | 26.2 4% | 35.2 -29% | 30.8 -13% |
| Idle Bottom * (°C) | 28.8 | 29.3 -2% | 23.9 17% | 30.2 -5% | 37.8 -31% | 35.4 -23% |
* ... smaller is better
Energy Management - 4K panel costs battery runtime
Power Consumption
Our consumption measurements are slightly higher compared to the review unit of the ThinkPad P1 G4, but overall, basically on the same level, which once again shows the same power limits for the components. The maximum consumption is 170 Watts and levels off at ~155 Watts during the stress test, so the included 230W power adapter is completely sufficient and even has plenty of headroom to charge the battery. However, it is also quite a brick at almost 900 grams. We noticed that the standby consumption is more than 3 Watts, which is way too much and you should probably turn the laptop off overnight.
| Off / Standby | |
| Idle | |
| Load |
|
Key:
min: | |
| Lenovo ThinkPad X1 Extreme G4-20Y50040GE i9-11950H, GeForce RTX 3080 Laptop GPU, Kioxia XG7 KXG7AZNV1T02, IPS, 3840x2400, 16" | Lenovo ThinkPad P1 G4-20Y4S0KS00 i7-11850H, GeForce RTX 3070 Laptop GPU, Samsung PM9A1 MZVL21T0HCLR, IPS LED, 3840x2400, 16" | Apple MacBook Pro 16 2021 M1 Max M1 Max, M1 Max 32-Core GPU, Apple SSD AP2048R, Mini-LED, 3456x2234, 16.2" | HP ZBook Studio 15 G8 i9-11950H, GeForce RTX 3070 Laptop GPU, Samsung PM981a MZVLB2T0HALB, OLED, 3840x2160, 15.6" | Razer Blade 15 Advanced (Mid 2021) i7-11800H, GeForce RTX 3080 Laptop GPU, SSSTC CA6-8D1024, IPS, 1920x1080, 15.6" | Asus ROG Zephyrus Duo 15 SE GX551QS R9 5900HX, GeForce RTX 3080 Laptop GPU, 2x Samsung PM981a MZVLB1T0HBLR (RAID 0), IPS, 3840x2160, 15.6" | Average NVIDIA GeForce RTX 3080 Laptop GPU | Average of class Multimedia | |
|---|---|---|---|---|---|---|---|---|
| Power Consumption | -0% | 20% | -18% | -49% | -46% | -51% | 37% | |
| Idle Minimum * (Watt) | 12.3 | 8.1 34% | 5.4 56% | 11 11% | 19.5 -59% | 16.3 -33% | 19.8 ? -61% | 5.71 ? 54% |
| Idle Average * (Watt) | 22.8 | 20.2 11% | 16.4 28% | 18.8 18% | 23.3 -2% | 22.5 1% | 24.3 ? -7% | 10.1 ? 56% |
| Idle Maximum * (Watt) | 13.9 | 21.9 -58% | 16.7 -20% | 31.7 -128% | 40.1 -188% | 39.9 -187% | 33.3 ? -140% | 12.4 ? 11% |
| Load Average * (Watt) | 95.4 | 88.2 8% | 94 1% | 105.2 -10% | 98.9 -4% | 116.1 -22% | 108.1 ? -13% | 65 ? 32% |
| Witcher 3 ultra * (Watt) | 154 | 149 3% | 104 32% | 148 4% | 174 -13% | 181.2 -18% | ||
| Load Maximum * (Watt) | 170.7 | 170.6 -0% | 135 21% | 171.8 -1% | 214 -25% | 196.7 -15% | 230 ? -35% | 112.2 ? 34% |
* ... smaller is better
Energieaufnahme Witcher 3 / Stresstest
Power Consumption external monitor
Battery Runtime
The battery runtime clearly suffers from the high power consumption of the 4K panel and the results are once again comparable to the ThinkPad P1 G4. You will have a hard time to get more than 7 hours even when the brightness is adjusted to 150 nits. The Wi-Fi runtime with the maximum panel brightness even drops to just four hours. However, the rivals are not much better, only the Apple MacBook Pro 16 last noticeably longer on battery.
If you deactivate hybrid graphics due to the previously mentioned problems and only use the Nvidia GPU instead, you will get even shorter battery runtimes. The Wi-Fi test at 150 nits only runs for 2.5 hours with the dGPU.
| Lenovo ThinkPad X1 Extreme G4-20Y50040GE i9-11950H, GeForce RTX 3080 Laptop GPU, 90 Wh | Lenovo ThinkPad P1 G4-20Y4S0KS00 i7-11850H, GeForce RTX 3070 Laptop GPU, 90 Wh | Apple MacBook Pro 16 2021 M1 Max M1 Max, M1 Max 32-Core GPU, 99.6 Wh | HP ZBook Studio 15 G8 i9-11950H, GeForce RTX 3070 Laptop GPU, 83 Wh | Razer Blade 15 Advanced (Mid 2021) i7-11800H, GeForce RTX 3080 Laptop GPU, 80 Wh | Asus ROG Zephyrus Duo 15 SE GX551QS R9 5900HX, GeForce RTX 3080 Laptop GPU, 90 Wh | Lenovo ThinkPad P1 G4-20Y30017GE i7-11800H, T1200 Laptop GPU, 90 Wh | Average of class Multimedia | |
|---|---|---|---|---|---|---|---|---|
| Battery runtime | 5% | 88% | 28% | -13% | -7% | 33% | 89% | |
| H.264 (h) | 6.9 | 7.2 4% | 17 146% | 9 30% | 16.4 ? 138% | |||
| WiFi v1.3 (h) | 6.8 | 7 3% | 14.9 119% | 6.2 -9% | 5.9 -13% | 5.3 -22% | 9 32% | 12 ? 76% |
| Load (h) | 1.1 | 1.2 9% | 1.1 0% | 1.8 64% | 1.2 9% | 1.5 36% | 1.675 ? 52% | |
| Reader / Idle (h) | 12.9 | 6.8 | 25.2 ? |
Pros
Cons
Verdict - ThinkPad X1 Extreme G4 still has issues
We have to start our verdict with the fact that we are very surprised Lenovo did not yet fix the problem with the graphics bug almost two months after our review of the workstation counterpart ThinkPad P1 G4, which is just extremely annoying when you just want to use the laptop. You are forced to restart the device after it was in standby and there can be issues when you use 3D applications. The only solution right now is to deactivate the iGPU in the BIOS, but this obviously affects the power consumption and the battery runtime. Lenovo should quickly fix this issue.
Neither the Core i9-11950H, nor the GeForce RTX 3080 are really convincing in the case of the X1 Extreme G4. The performance is not bad, but the results are hardly better compared to the Core i7-11850H and the GeForce RTX 3070 (with the same power limits) in the ThinkPad P1 G4. The cooling solution is definitely the limiting factor here.
Neither the Core i9 CPU, nor the RTX 3080 GPU leave a good impression since the performance advantage over the Core i7 and the RTX 3070 is just marginal. The bigger issue, however, is the graphics problem, which has not been fixed by Lenovo even after two months.
The 4K touchscreen, which we have already reviewed in the less powerful configuration of the ThinkPad X1 Extreme G4, consumes a lot of power and affects the battery runtime. We did not manage more than 7 hours from the 90Wh battery, and even much less when you use the full panel brightness. If you need longer battery runtimes, you should select the default WQHD screen.
Thanks to the fast graphics cards, the current generation of the ThinkPad X1 Extreme G4 clearly elevates itself from the Dell XPS 15, which is only available with the GeForce RTX 3050 Ti (RTX 3060 on the larger XPS 17). Content creators should definitely have a look at the new Apple MacBook Pro 16, which has advantages over the X1 Extreme G4 in some areas. We will have a closer look at the differences of these two high-end multimedia laptops in a separate article. The Razer Blade 15 is also a good rival with a slightly faster RTX 3080 GPU, but it is definitely a bit more noticeable in a professional environment.
<strike>Because of the severe graphics issues, which often force users to restart the machine (which is annoying and costs time), we can currently no recommend the ThinkPad x1 Extreme G4 at this time. If you are interested in the device, you should wait until Lenovo offers a solution, otherwise you will not be happy with the device. This problem is not represented in the final rating.</strike>
Update December 24th: We found a solution for the GPU bug. You have to activate the option Automatic Display Refresh in Intel's Drivers Control Panel (System -> Energy).
Price and Availability
The availability of the new ThinkPad X1 Extreme G4 is still limited. You can build your own model in Lenovo's online store and our test unit retails for about $6100, but is currently available for ~$3500 with an automatic discount.
Lenovo ThinkPad X1 Extreme G4-20Y50040GE
- 12/22/2021 v7 (old)
Andreas Osthoff
Price comparison
