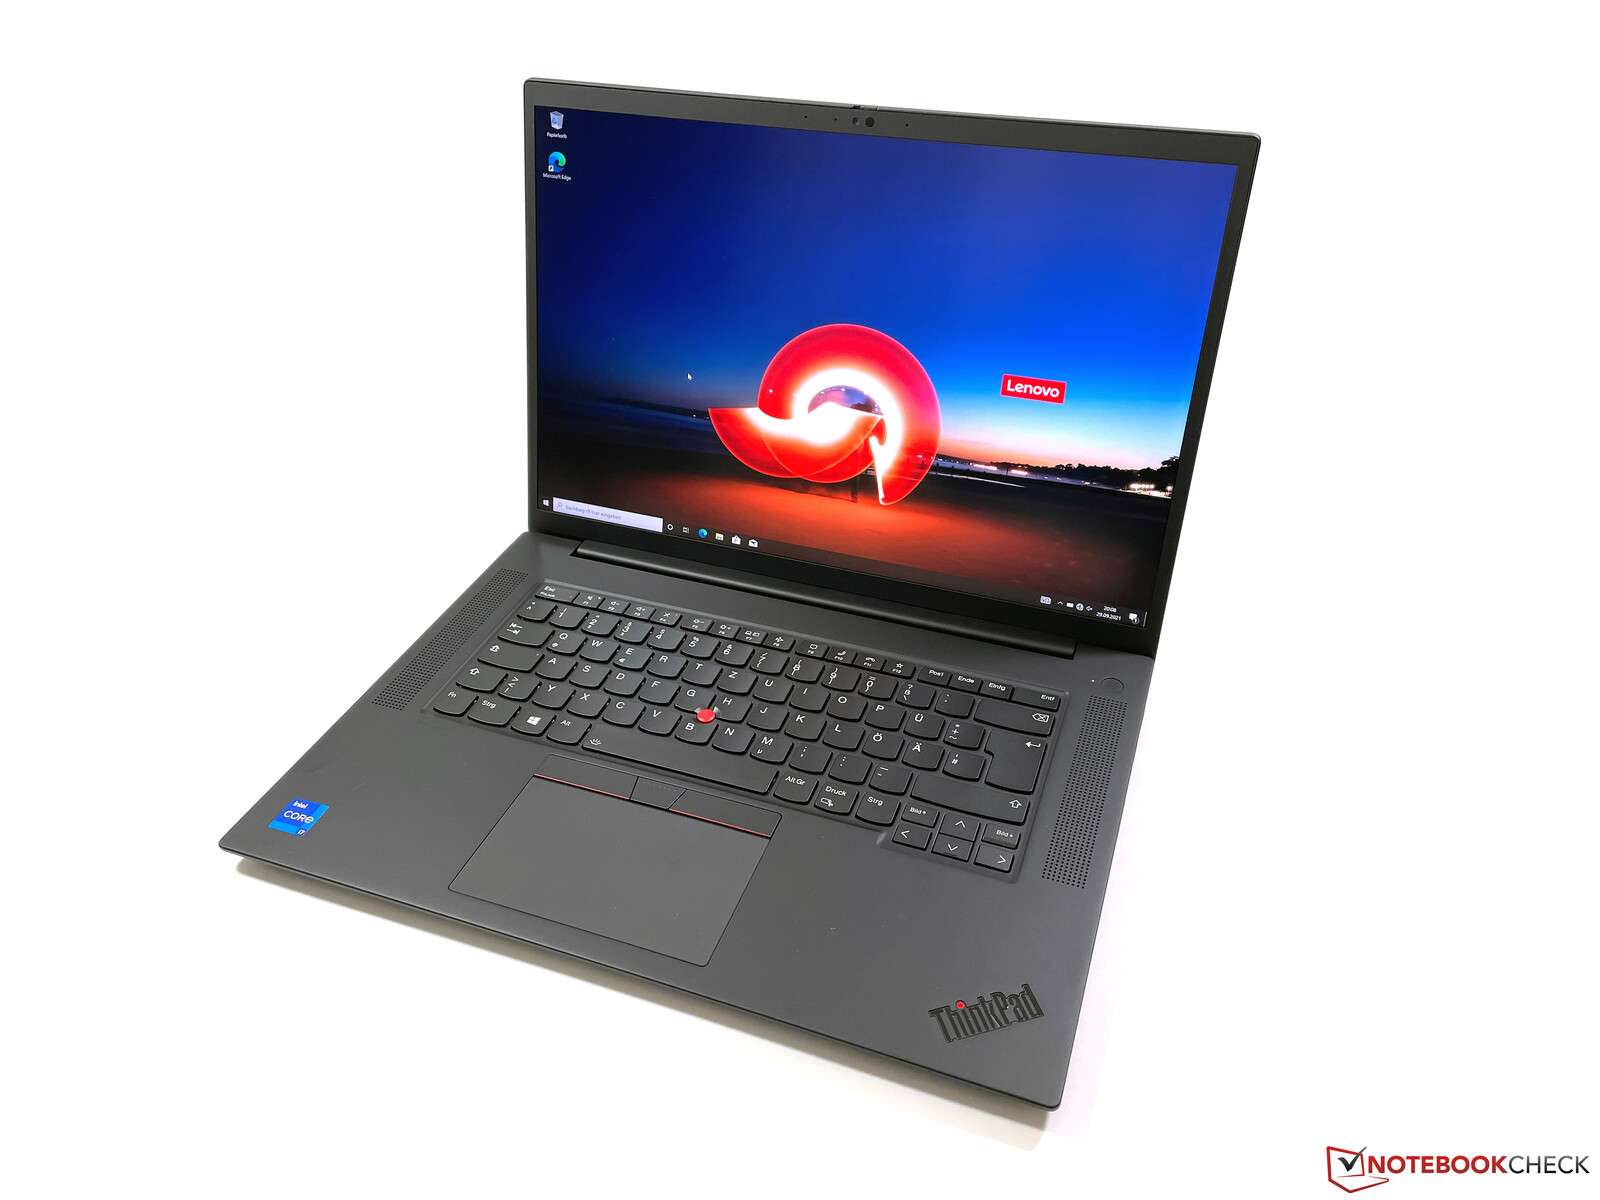
Lenovo ThinkPad P1 G4 Laptop - Workstation Version of the X1 Extreme G4 in Review
The ThinkPad X1 Extreme is Lenovo’s Multimedia flagship notebook for a couple of years now and is primarily competing with the Dell XPS 15. The ThinkPad P1 is the workstation counterpart and the fourth generation gets a major update, because Lenovo now uses 16-inch displays with the 16:10 aspect ratio. In addition to new Tiger Lake-H45 processors from Intel (including Xeon), you also get new professional GPUs from Nvidia.
Lenovo offers two basic models of the ThinkPad P1 G4 (also applies for the X1 Extreme G4), because depending on the graphics card, you either get a traditional cooling solution (with the Nvidia T1200 & RTX A2000 in the P1 G4 or RTX 3050 Ti in the X1 Extreme G4) or a vapor chamber cooling in combination with more powerful graphics cards. This cooling solution requires more space though, so there is only one M.2-2280 slot and you cannot equip them with a WWAN module.
Our test unit of the ThinkPad P1 G4 is an entry-level model with the designation 20Y30017GE for about 2400 Euros is equipped with the new 16-inch display and the WQHD resolution (2560 x 1600 pixels), the Core i7-11800H, the new Nvidia T1200 GPU), and a fast PCIe 4.0 SSD with a storage capacity of 512 GB. More ThinkPad reviews:
Update 10/12/2021: We retested some of the CPU benchmarks with an additional RAM module (16 GB DDR4-3200). As expected, the pure CPU performance did not improve since the cooling solution is the limiting factor. We did, however, notice an improvement in PCMark 10, but the advantage was very small (up to 5% depending on the sub-test) and therefore negligible.
Possible Competitors
Rating | Date | Model | Weight | Height | Size | Resolution | Price |
|---|---|---|---|---|---|---|---|
| 89.4 % v7 (old) | 10 / 2021 | Lenovo ThinkPad P1 G4-20Y30017GE i7-11800H, T1200 Laptop GPU | 1.8 kg | 17.7 mm | 16.00" | 2560x1600 | |
| 86.9 % v7 (old) | 11 / 2019 | Dell Precision 5540 i9-9980HK, Quadro T2000 Max-Q | 2 kg | 17 mm | 15.60" | 3840x2160 | |
| 89.7 % v7 (old) | 12 / 2019 | Apple MacBook Pro 16 2019 i9 5500M i9-9880H, Radeon Pro 5500M | 2 kg | 16.2 mm | 16.00" | 3072x1920 | |
| 87.8 % v7 (old) | 08 / 2021 | HP ZBook Studio 15 G8 i9-11950H, GeForce RTX 3070 Laptop GPU | 1.9 kg | 18 mm | 15.60" | 3840x2160 | |
| 87 % v7 (old) | 09 / 2021 | Lenovo ThinkBook 16p G2 ACH R9 5900HX, GeForce RTX 3060 Laptop GPU | 2 kg | 19.5 mm | 16.00" | 2560x1600 |
Case - Still a typical ThinkPad
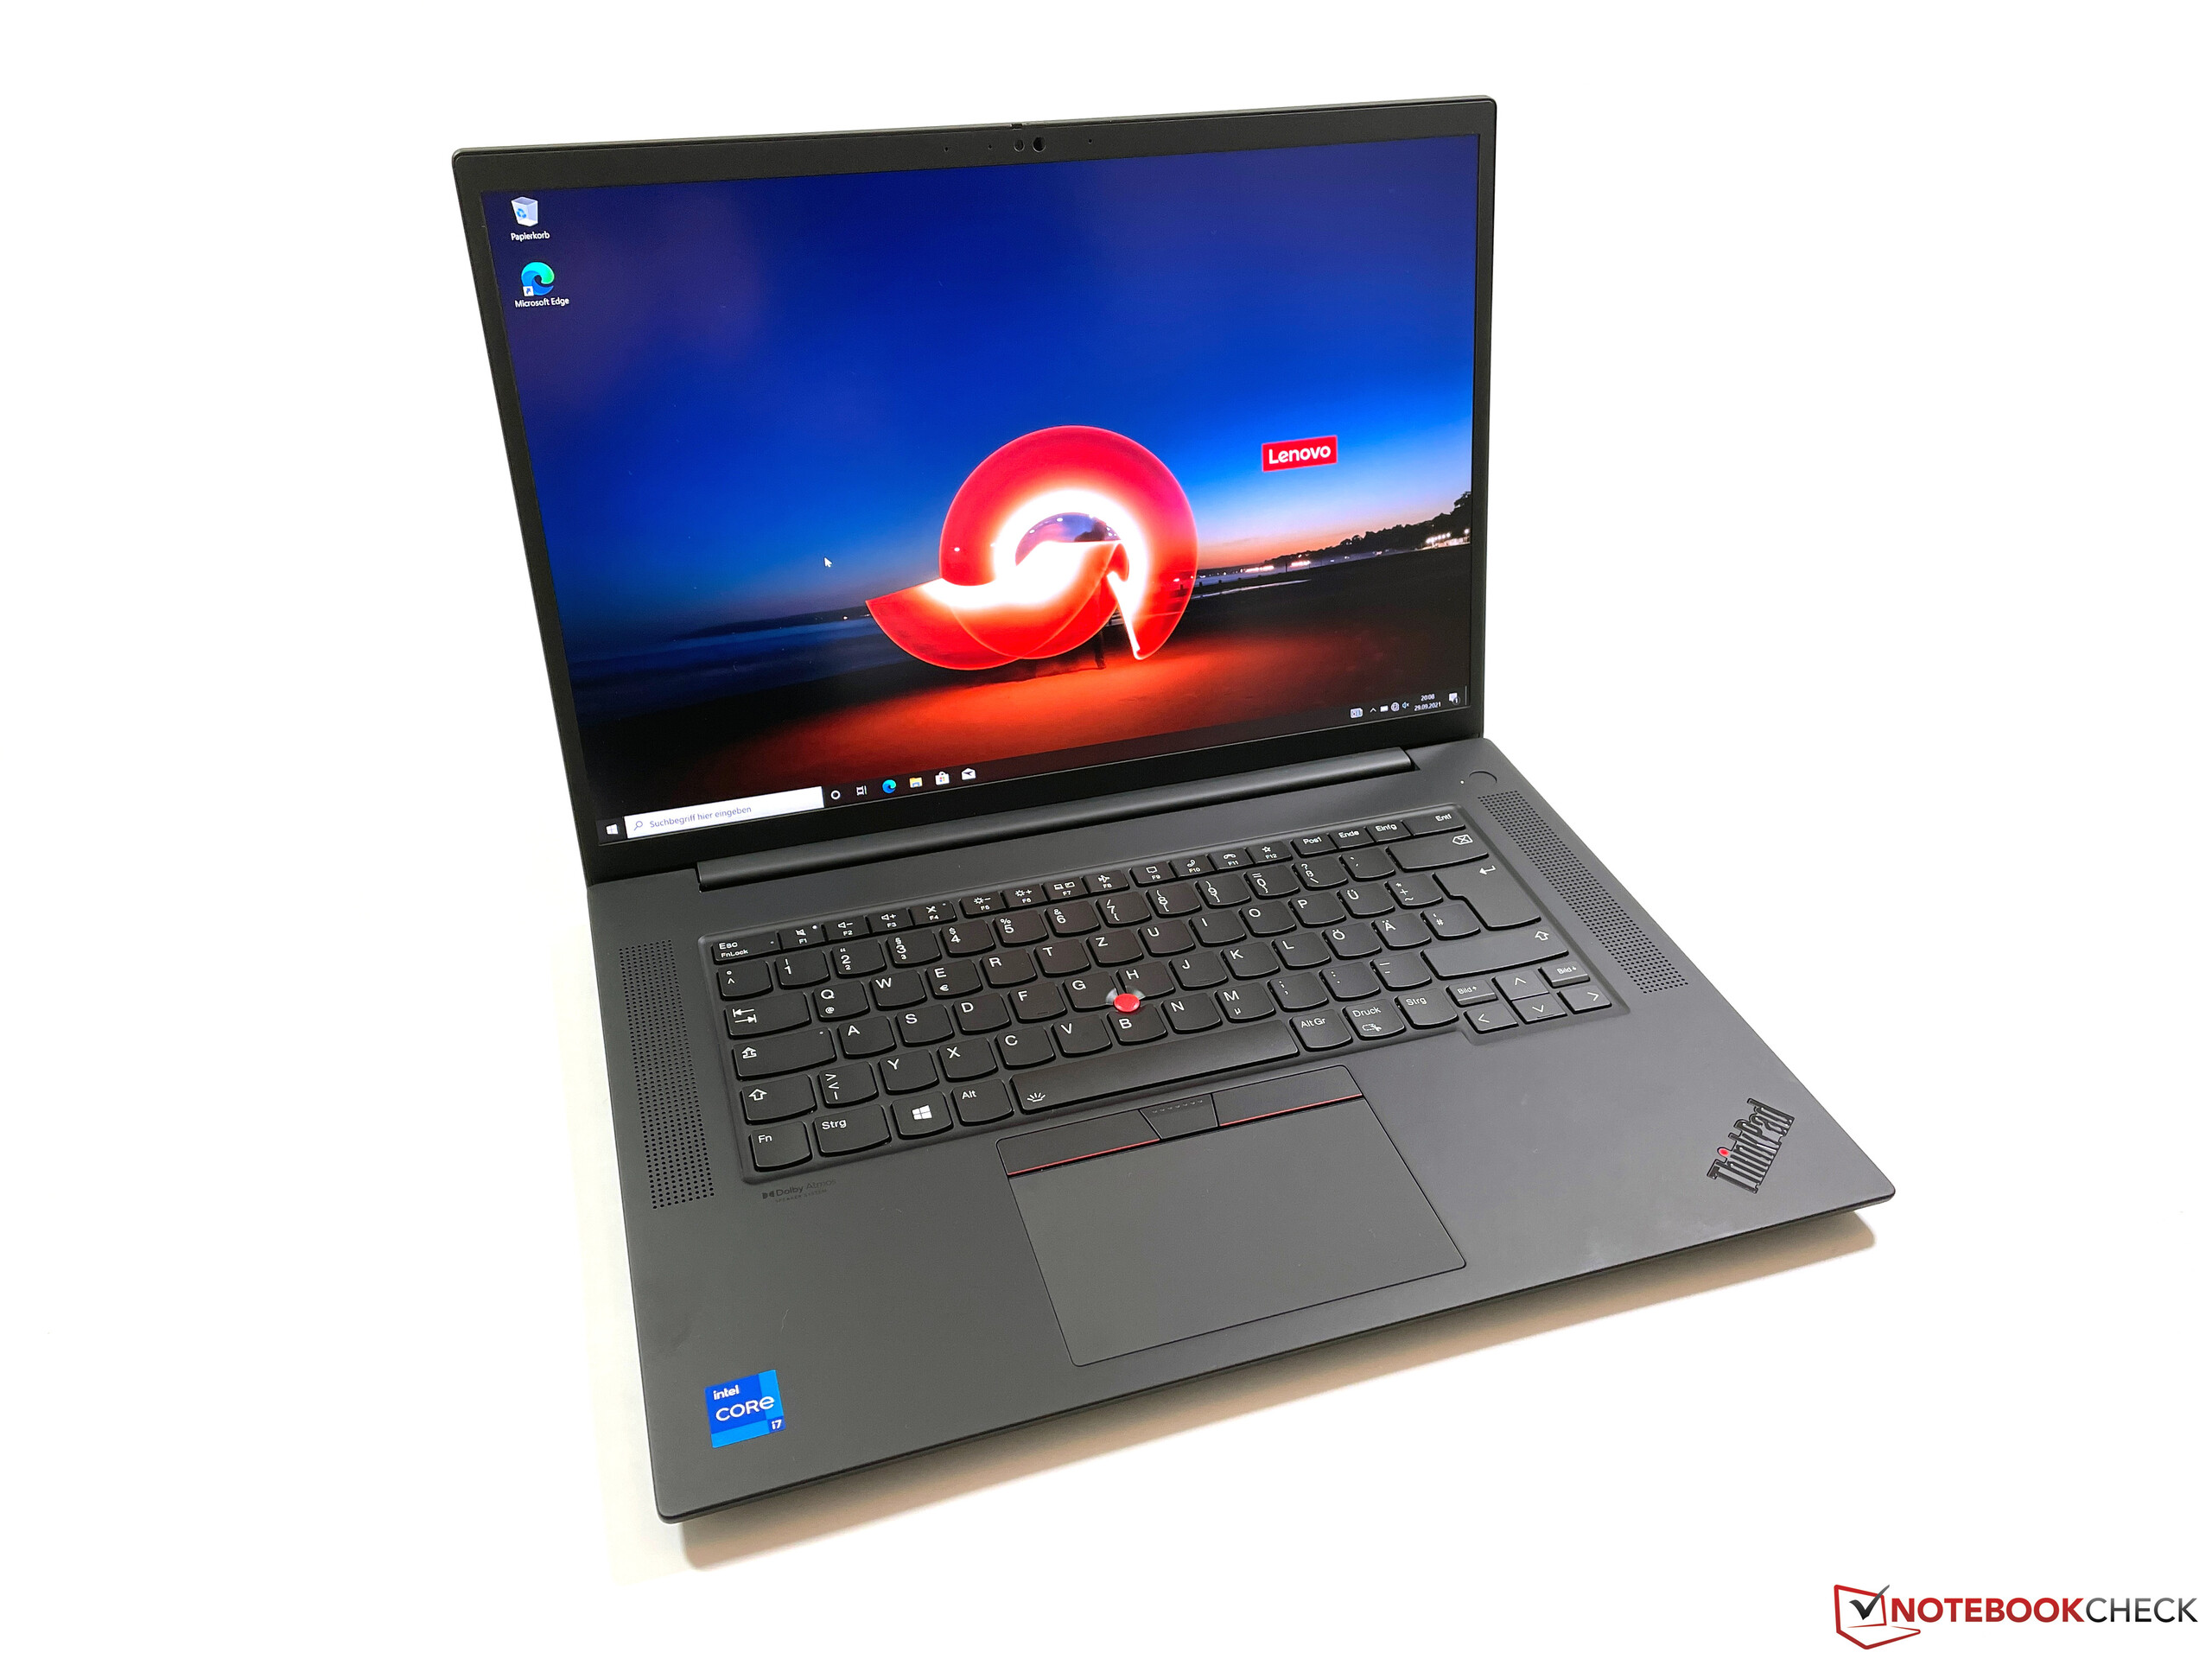
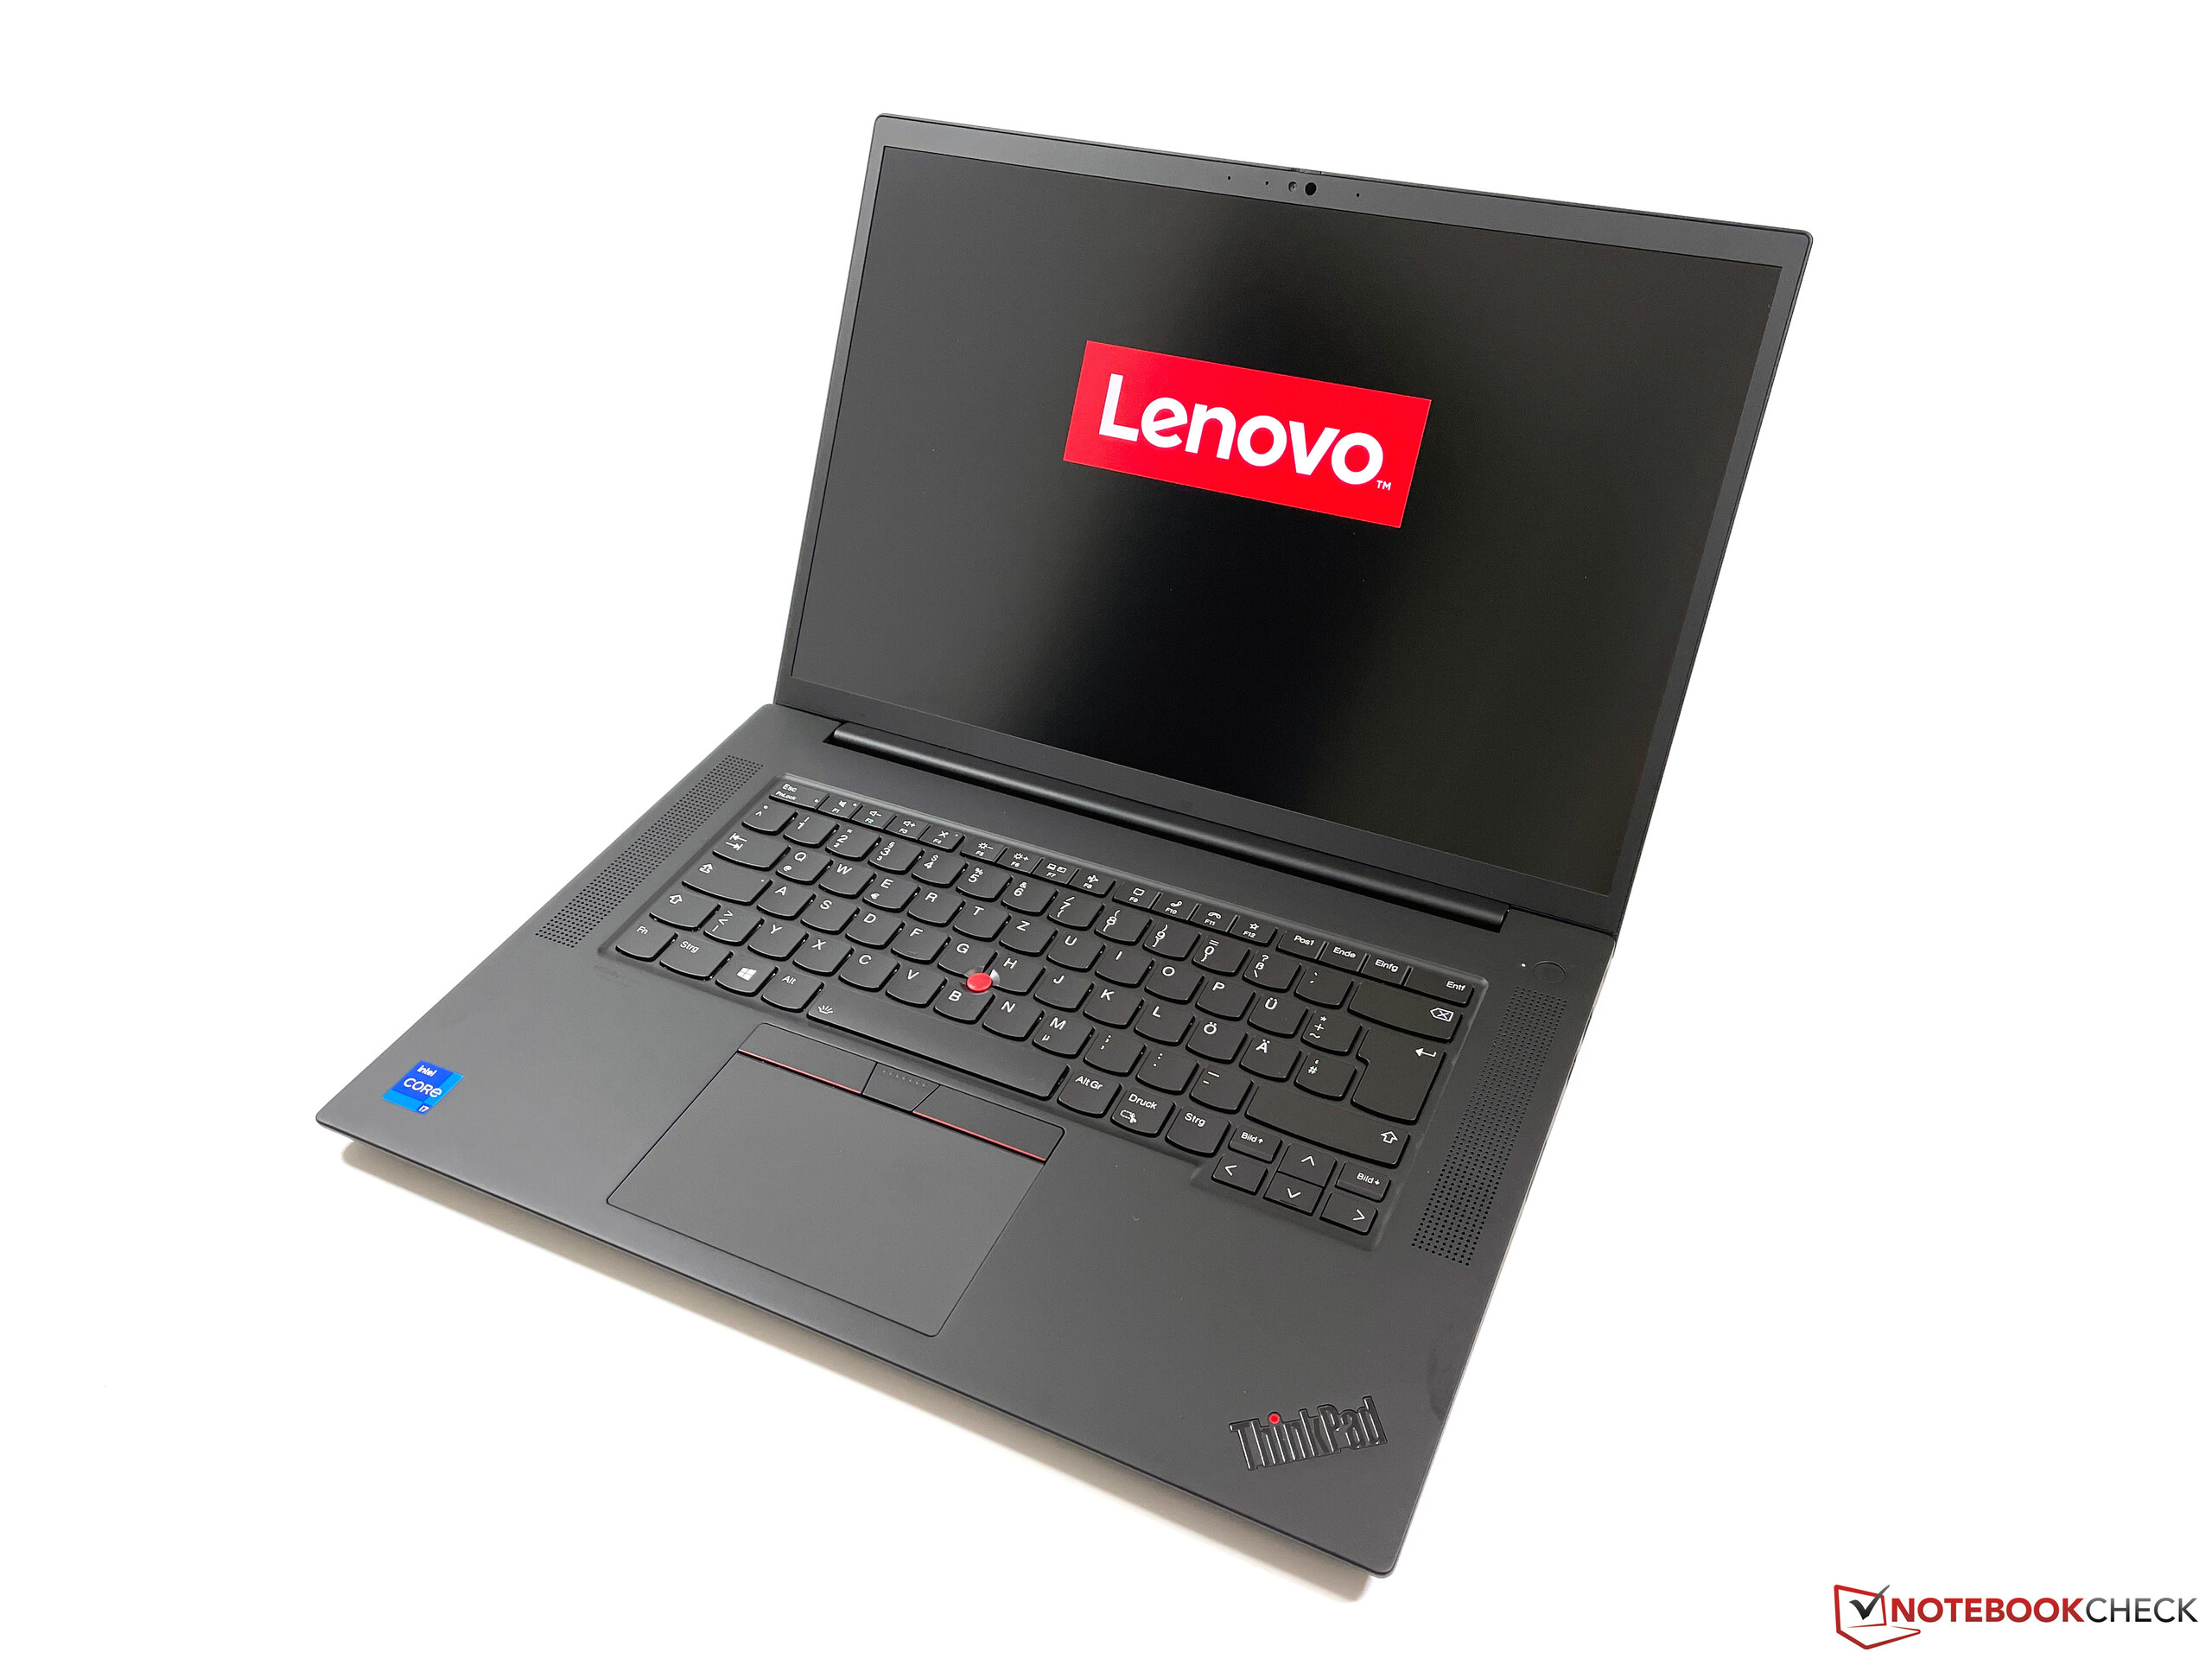
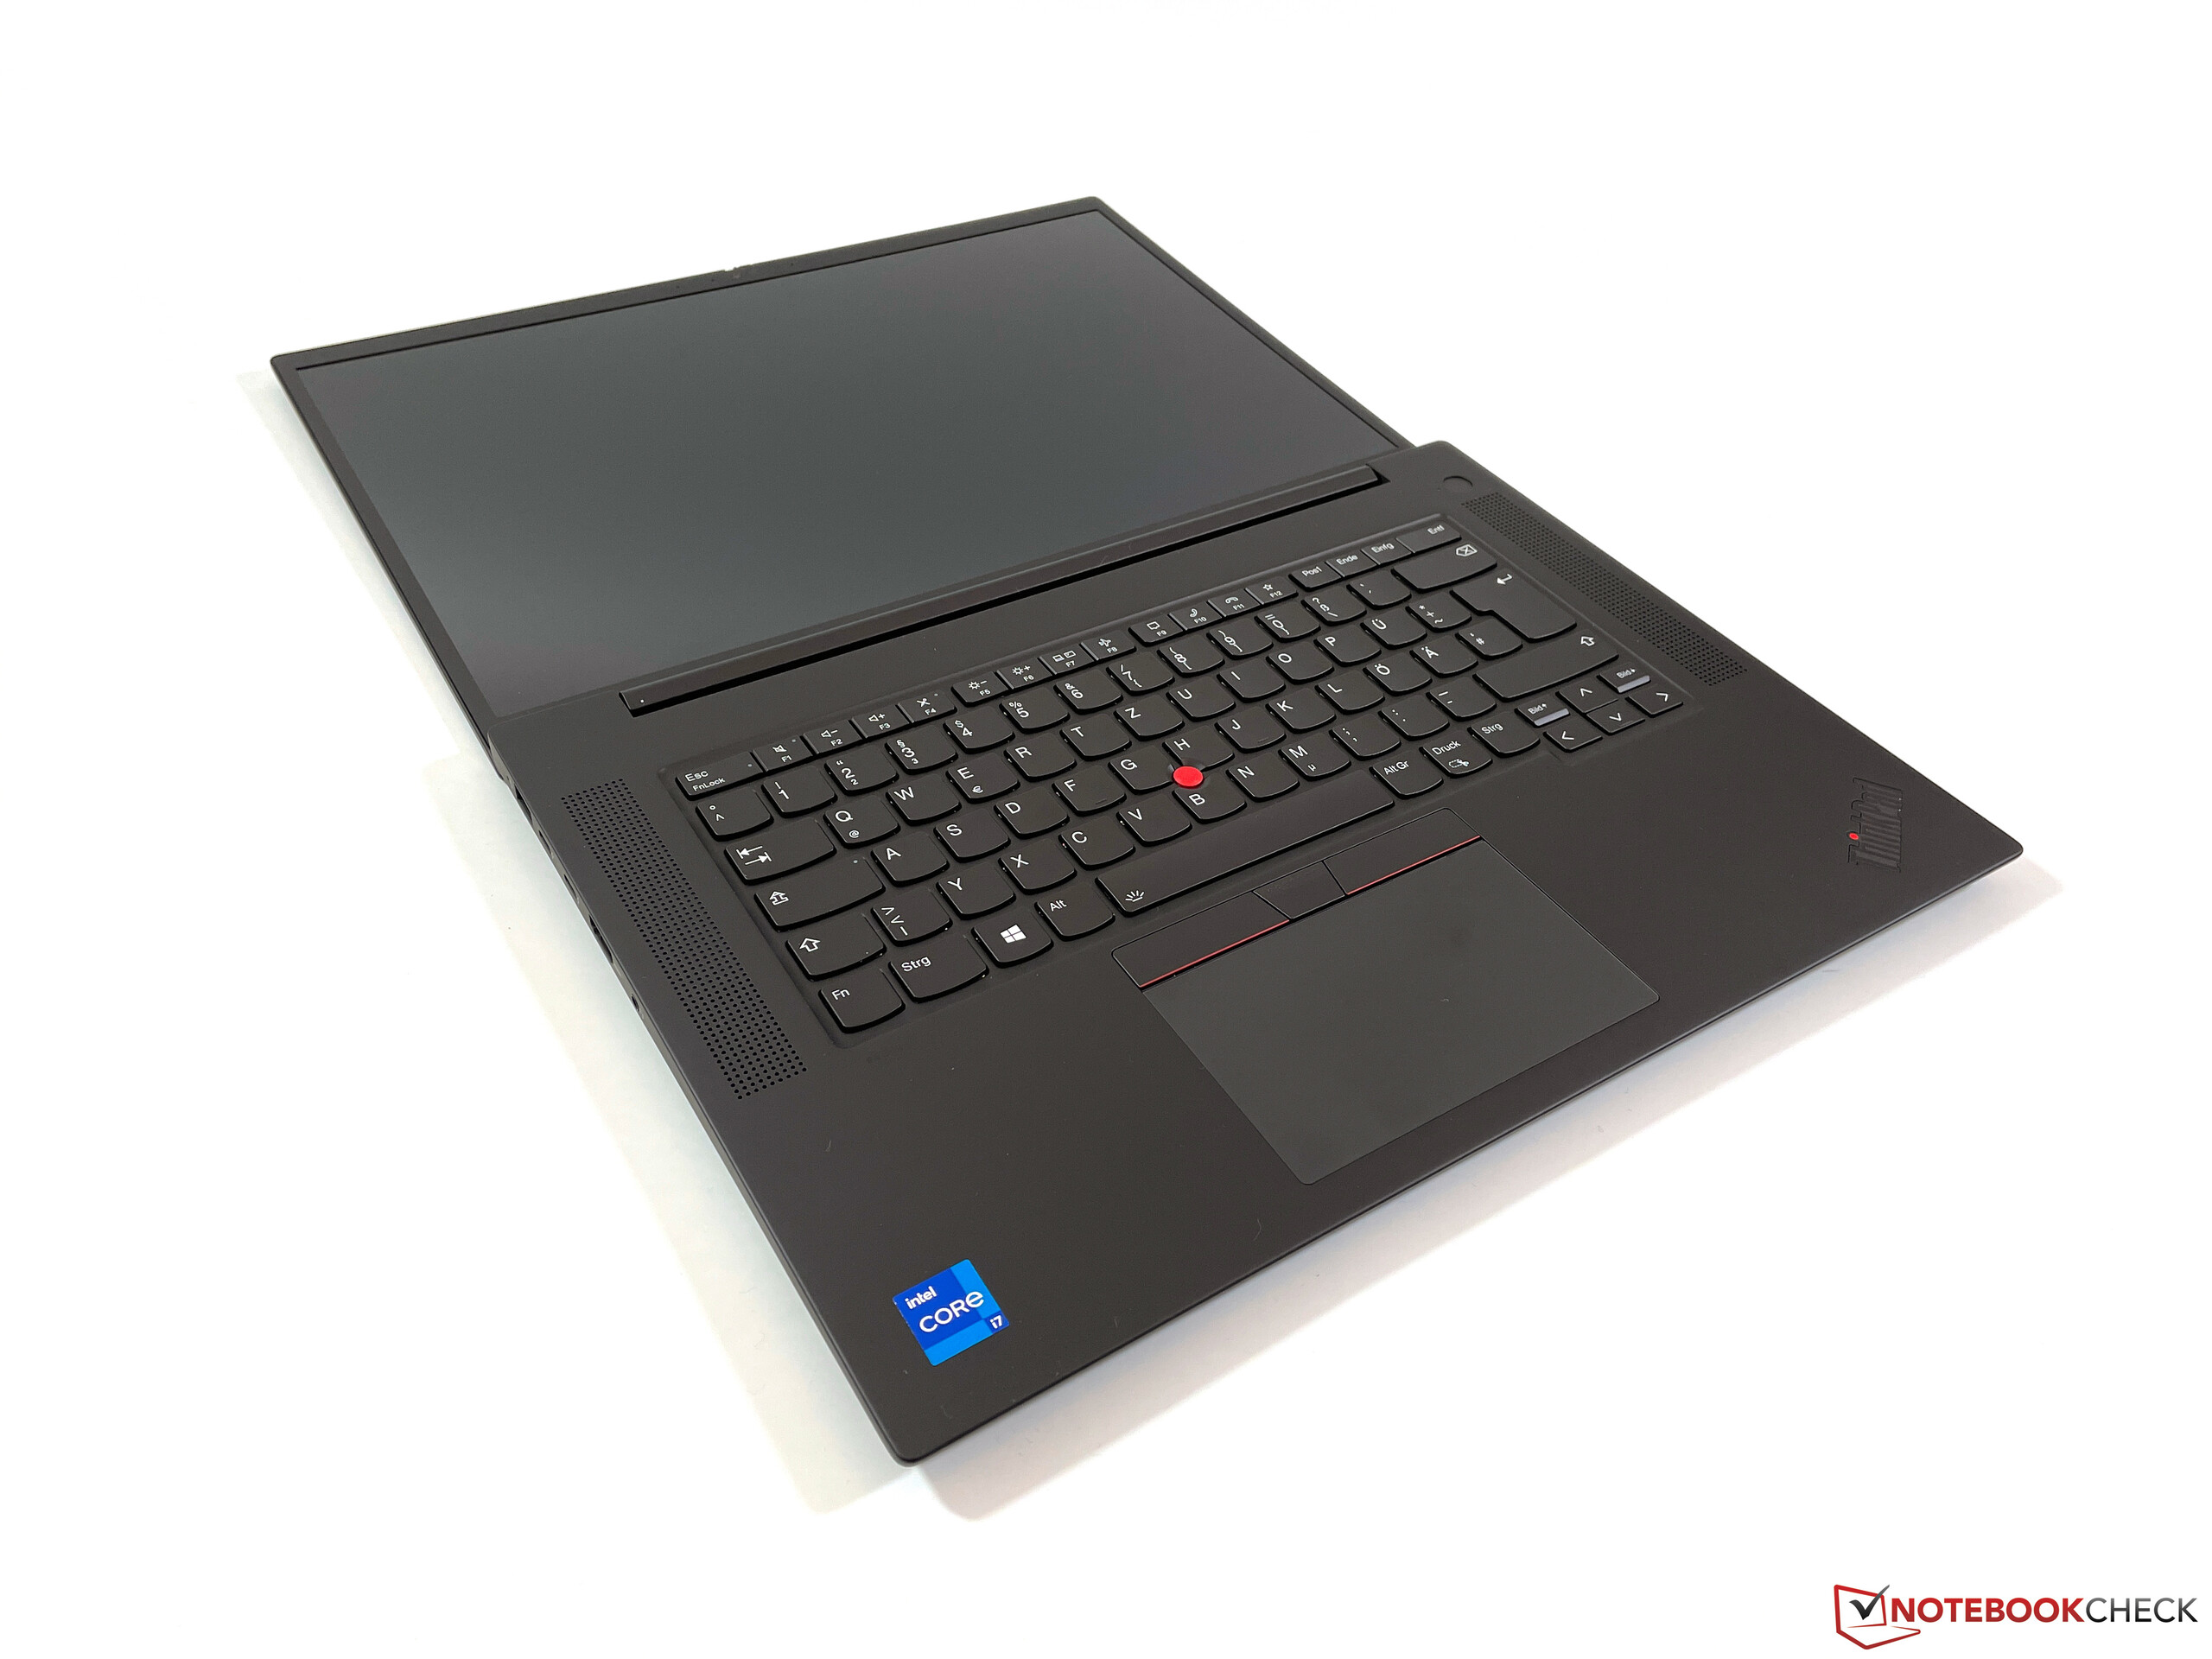
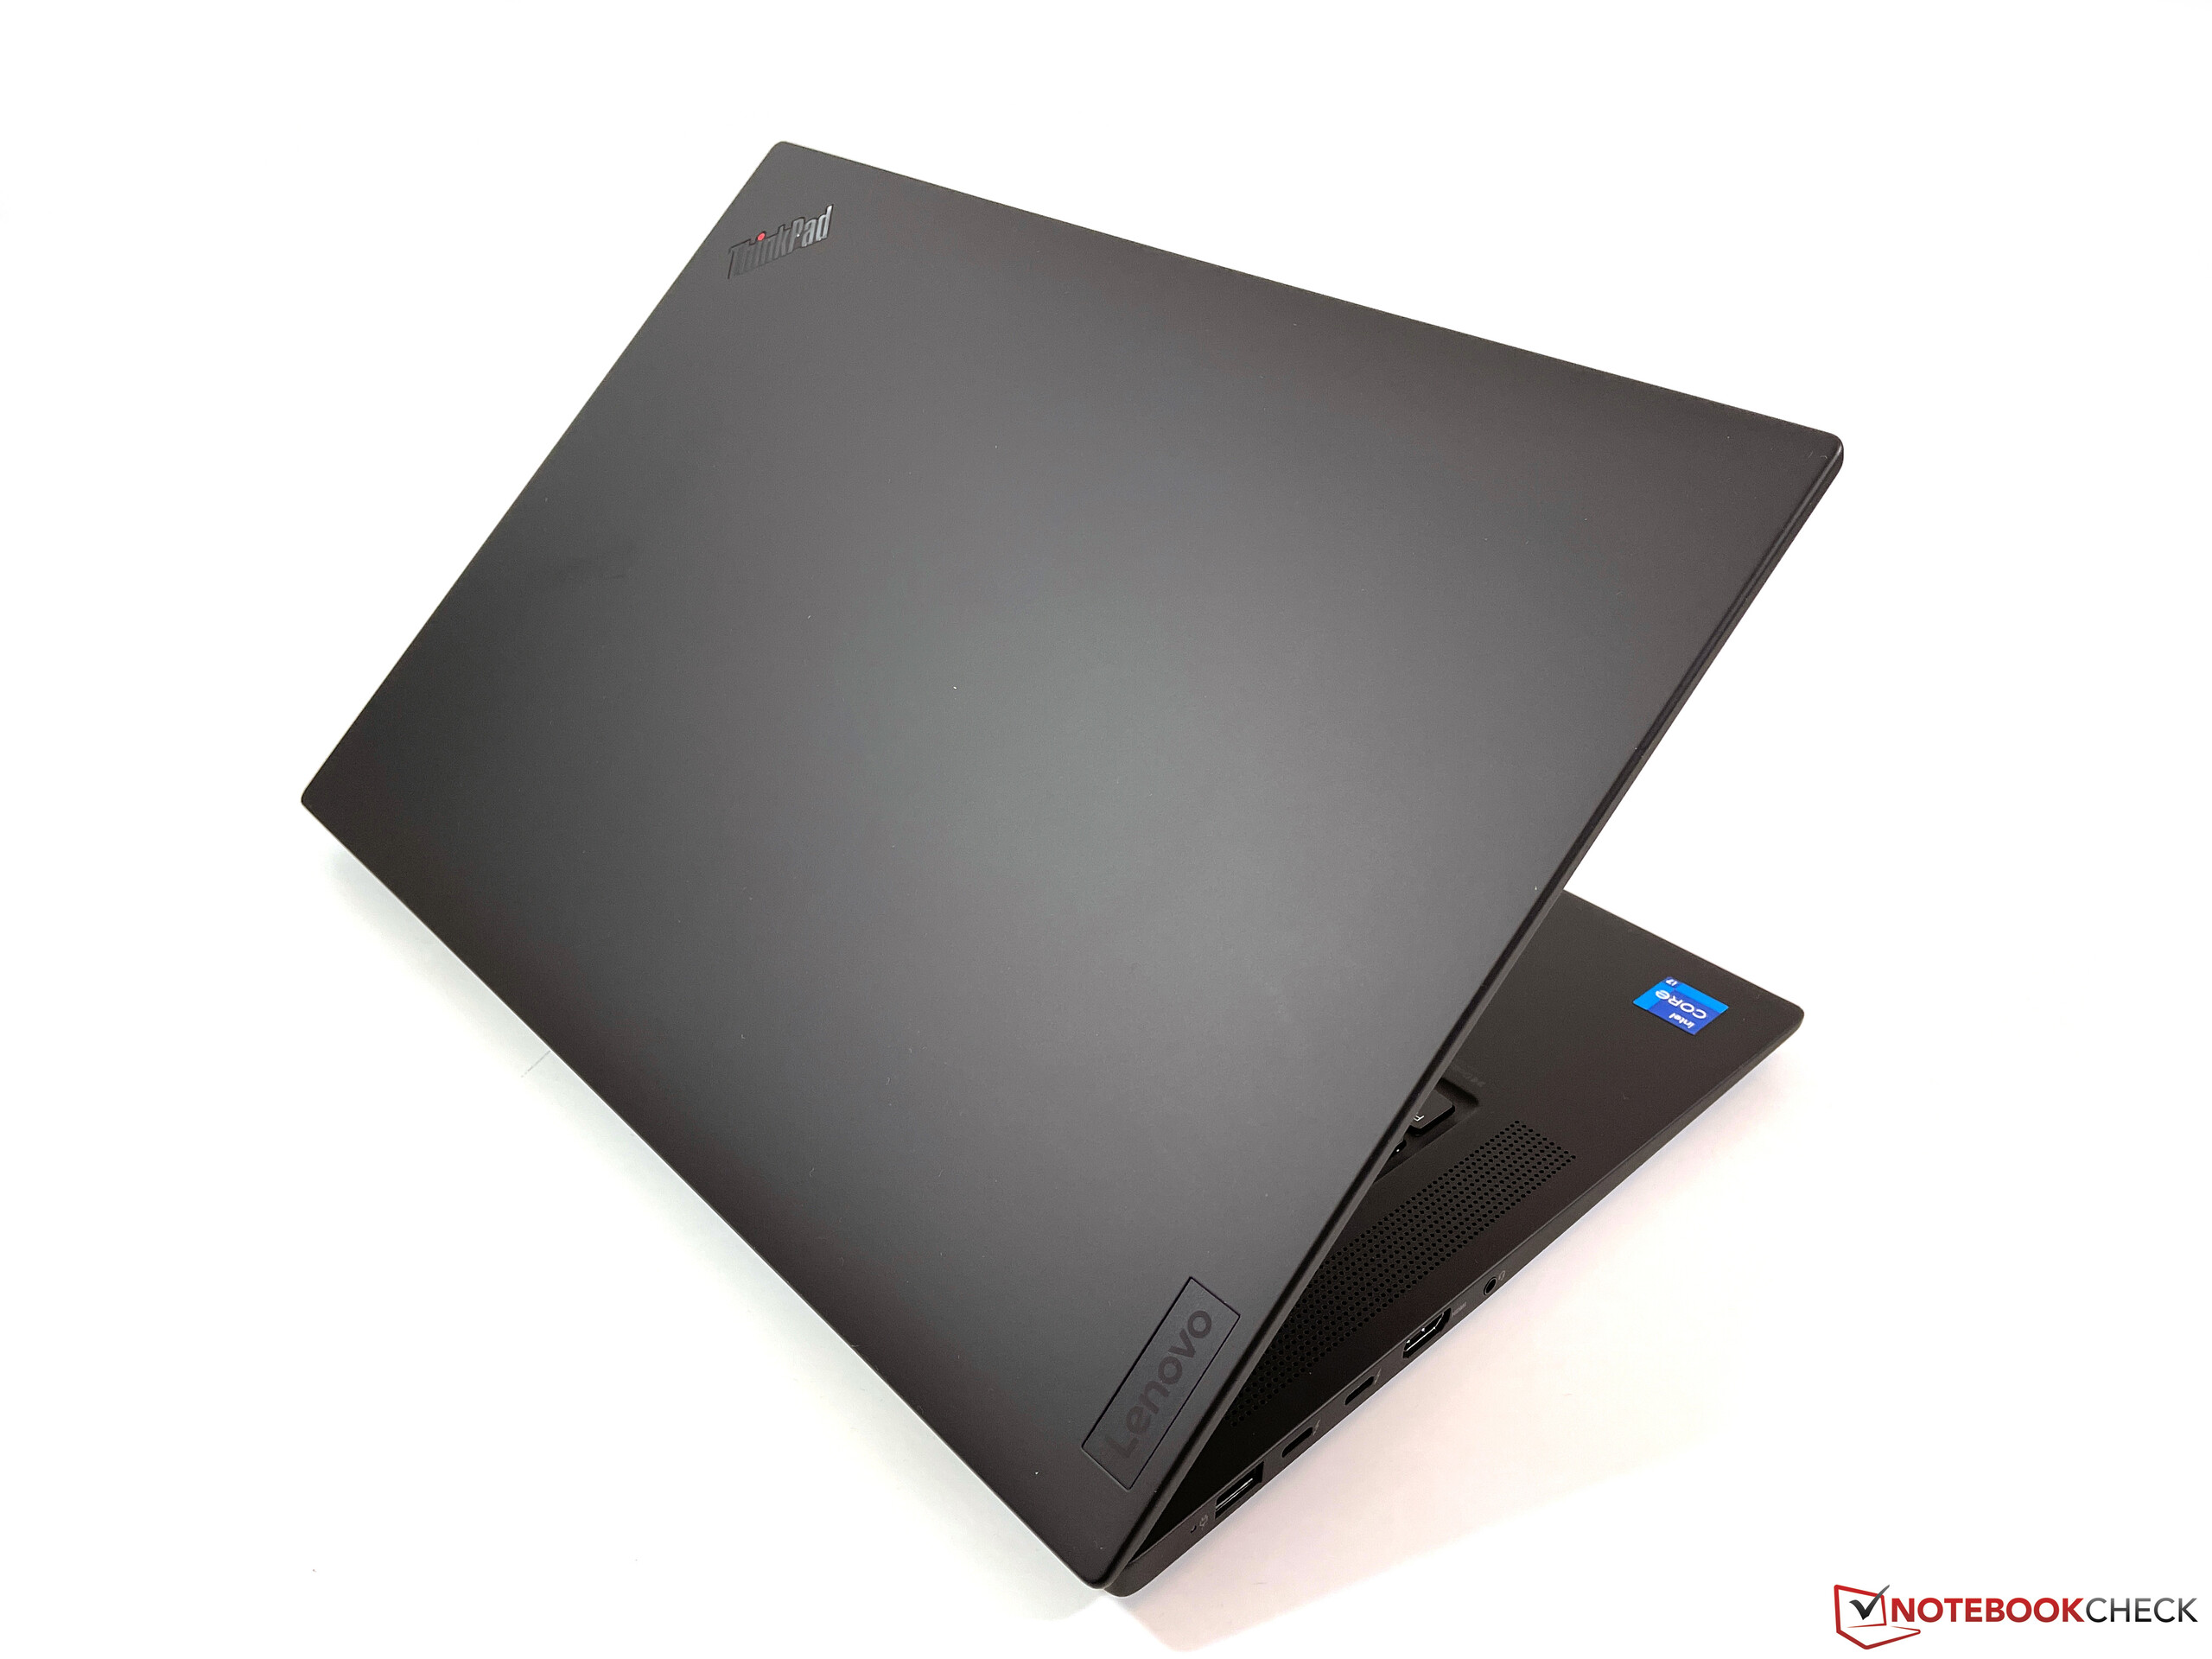
Looking at the chassis, you will have a hard time to distinguish the new ThinkPad P1 G4 from its predecessors. When you open the lid, however, you immediately notice the new 16:10 screen with narrower bezels and the new speaker grilles next to the keyboard. The new power button, which also includes the fingerprint scanner, is slightly shifted upwards.
The materials are pretty much the same and you still get smooth plastic surfaces with metallic or hybrid materials underneath. You can quickly see fingerprints and similar to other ThinkPads, we expect there will be greasy spots. The stability is still excellent and neither the base unit, nor the lid can be noticeable twisted or dented and there are no creaking sounds. Like previous ThinkPad models, the P1 G4 meets the MIL-STD-810H requirements, but Lenovo does not list the individual tests.
The two hinges allow a maximum opening angle of 180 degrees and are well adjusted, because there is hardly any bouncing. At an angle of 25 degrees or lower, however, the lid closes automatically. You will hardly use this screen position in practice, so this is not a deal-breaker. Models with the 4K touchscreen once again get a different lid design with carbon fiber pattern (printed).
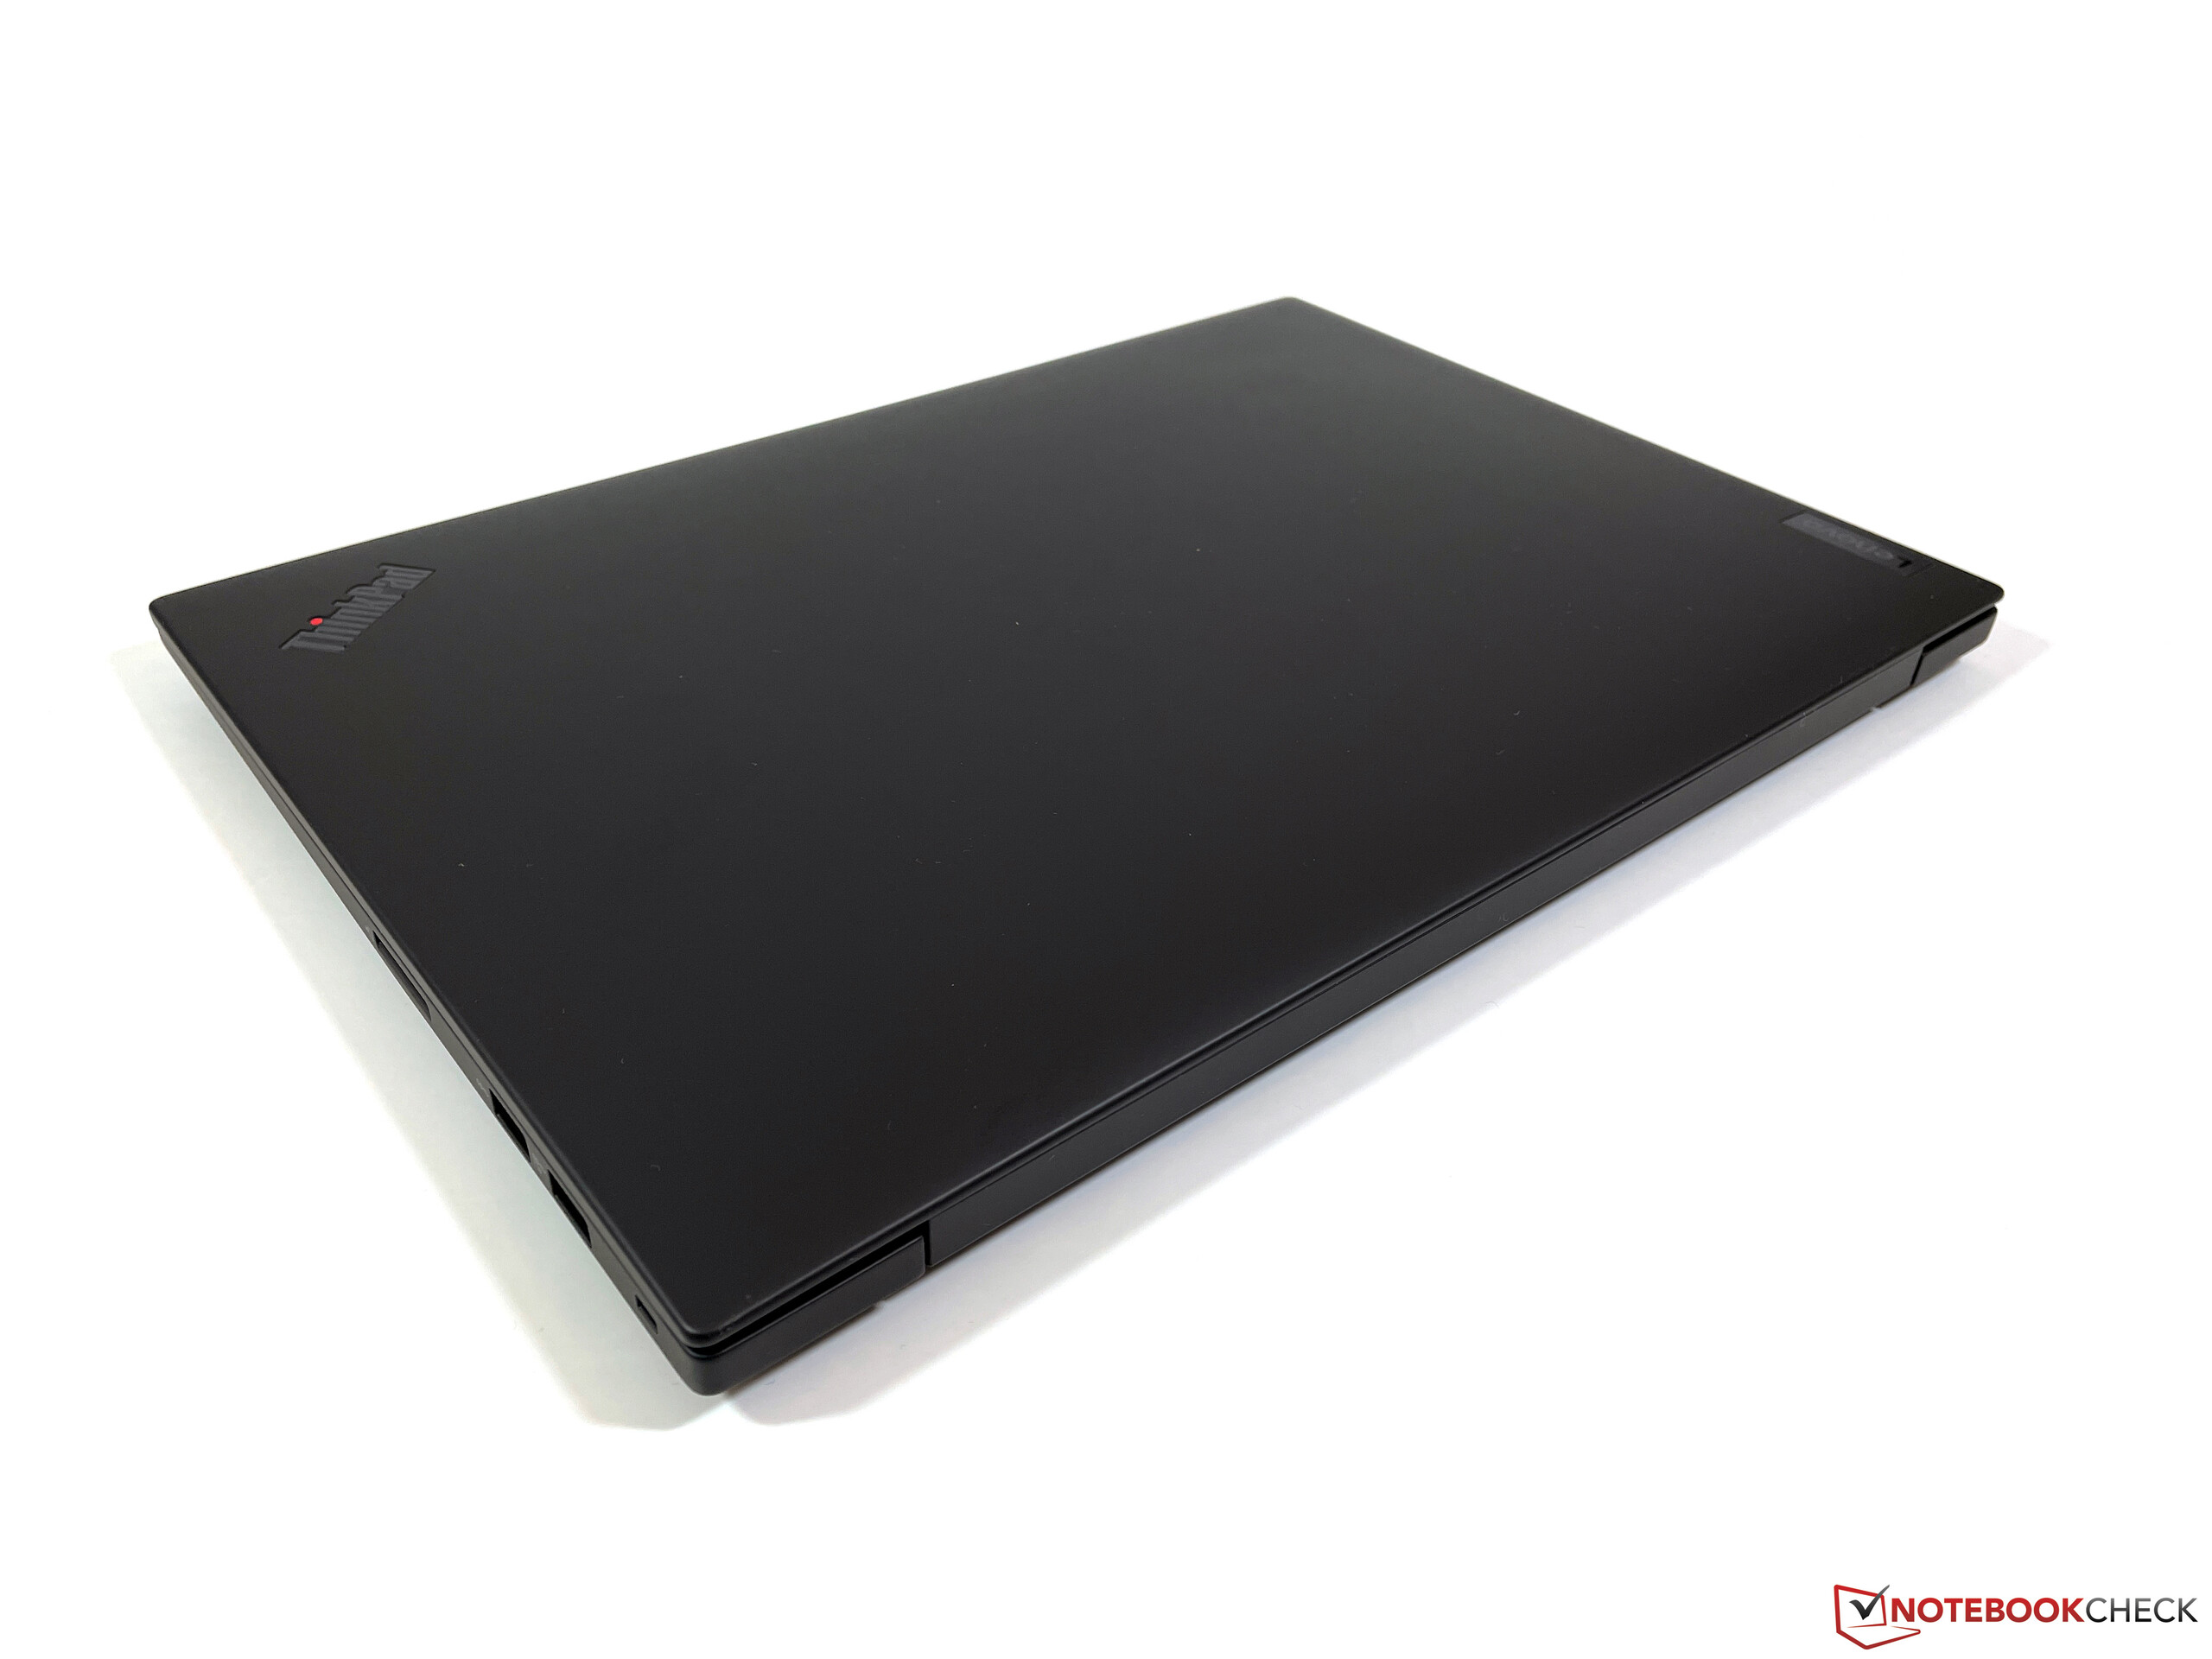
Compared to the previous ThinkPad P1, the fourth generation is slightly narrower and thinner, but also a bit deeper in return. The larger 16-inch screen therefore die not really impact the overall chassis size. Within the comparison group, the new P1 G4 is one of the largest, but at 1.8 kg also one of the lightest devices.
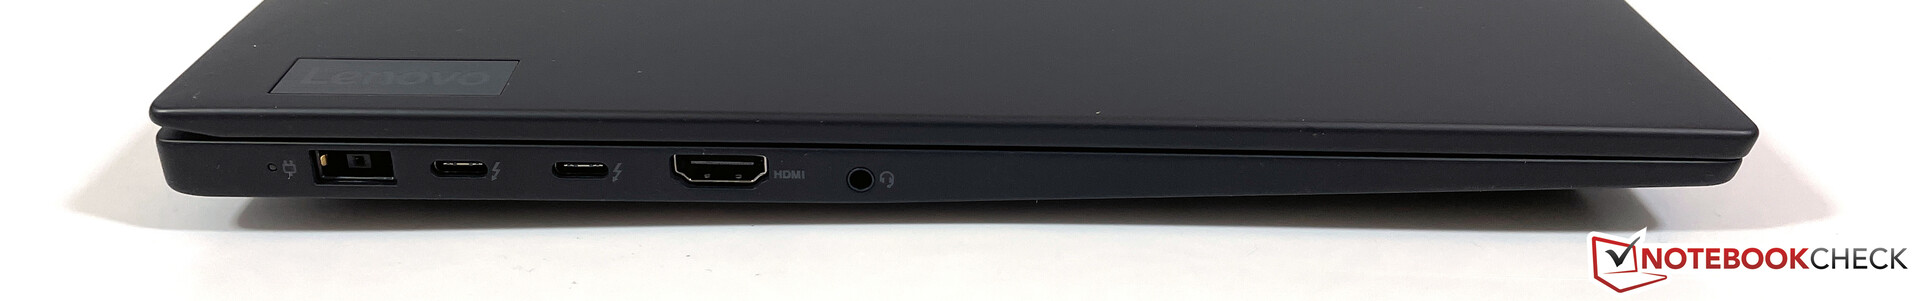
Connectivity - ThinkPad with Thunderbolt 4
The port situation of the ThinkPad P1 G4 is very good. In addition to two modern USB-C ports including Thunderbolt 4, you also get two regular USB-A ports and even a full-size SD-card reader. Power is supplied via familiar SlimTip connector, but you can also charge the battery via USB-C. However, a standard ThinkPad adapter with 65 Watts did not work, we had to use at least a 90W unit. Models with the T1200 GPU get an HDMI 2.0 output (4K @60 Hz), while more powerful RTX GPUs get HDMI 2.1 (max. 8k @60 Hz). Lenovo does not offer a SmartCard reader for the new P1 anymore.
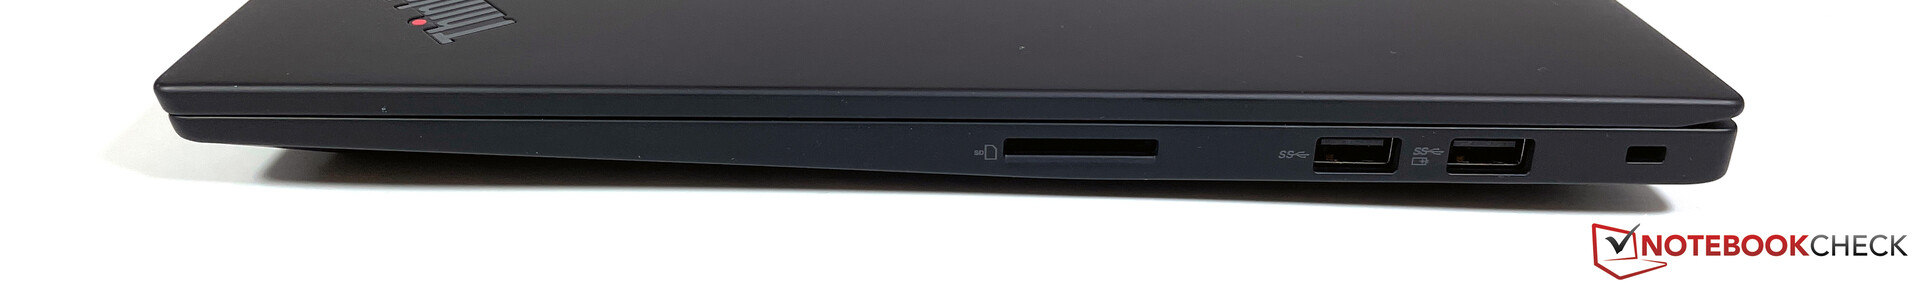
SDCardreader
The full-size SD-card reader is still included, and we determine very fast transfer rates of more than 200 MB/s in combination with our UHS-II reference card (AV Pro V60).
| SD Card Reader | |
| average JPG Copy Test (av. of 3 runs) | |
| Lenovo ThinkPad P1 G4-20Y30017GE (AV PRO V60) | |
| Lenovo ThinkPad P1 2019-20QT000RGE (Toshiba Exceria Pro SDXC 64 GB UHS-II) | |
| Dell Precision 5540 (Toshiba Exceria Pro SDXC 64 GB UHS-II) | |
| Average of class Workstation (49.6 - 681, n=13, last 2 years) | |
| Lenovo ThinkBook 16p G2 ACH | |
| HP ZBook Studio 15 G8 (AV Pro V60) | |
| maximum AS SSD Seq Read Test (1GB) | |
| Average of class Workstation (87.6 - 1455, n=13, last 2 years) | |
| Lenovo ThinkPad P1 2019-20QT000RGE (Toshiba Exceria Pro SDXC 64 GB UHS-II) | |
| Lenovo ThinkPad P1 G4-20Y30017GE (AV PRO V60) | |
| Dell Precision 5540 (Toshiba Exceria Pro SDXC 64 GB UHS-II) | |
| HP ZBook Studio 15 G8 (AV Pro V60) | |
| Lenovo ThinkBook 16p G2 ACH | |
Communication - Wi-Fi 6E and Bluetooth 5.2
The ThinkPad P1 G4 is equipped with the latest Wi-Fi module from Intel, the AX210. It supports the new Wi-Fi 6E standard as well as Bluetooth 5.2. Transfer rates in our standardized Wi-Fi test with the router Netgear Nighthawk RAX120 are around 1.4 Gbps and we did not notice any problems with the signal quality or range in our practical test, either. There is no Ethernet port, so you have to use a corresponding USB-C adapter if you want to use wired networks.
You can configure the ThinkPad P1 G4 with a 5G module from Qualcomm (Snapdragon X55), but it cannot be installed afterwards, because the necessary antennas are not included (not WWAN-ready).
Webcam - ThinkPad with 1080p sensor
The ThinkPad P1 G4 is one of the few modern ThinkPads with a 1080p webcam (incl. mechanical shutter). Both the resolution and the picture quality are slightly better compared to the usual 720p sensors, but we still recommend your smartphone for good pictures. There is also an additional IR camera for facial recognition via Windows Hello.


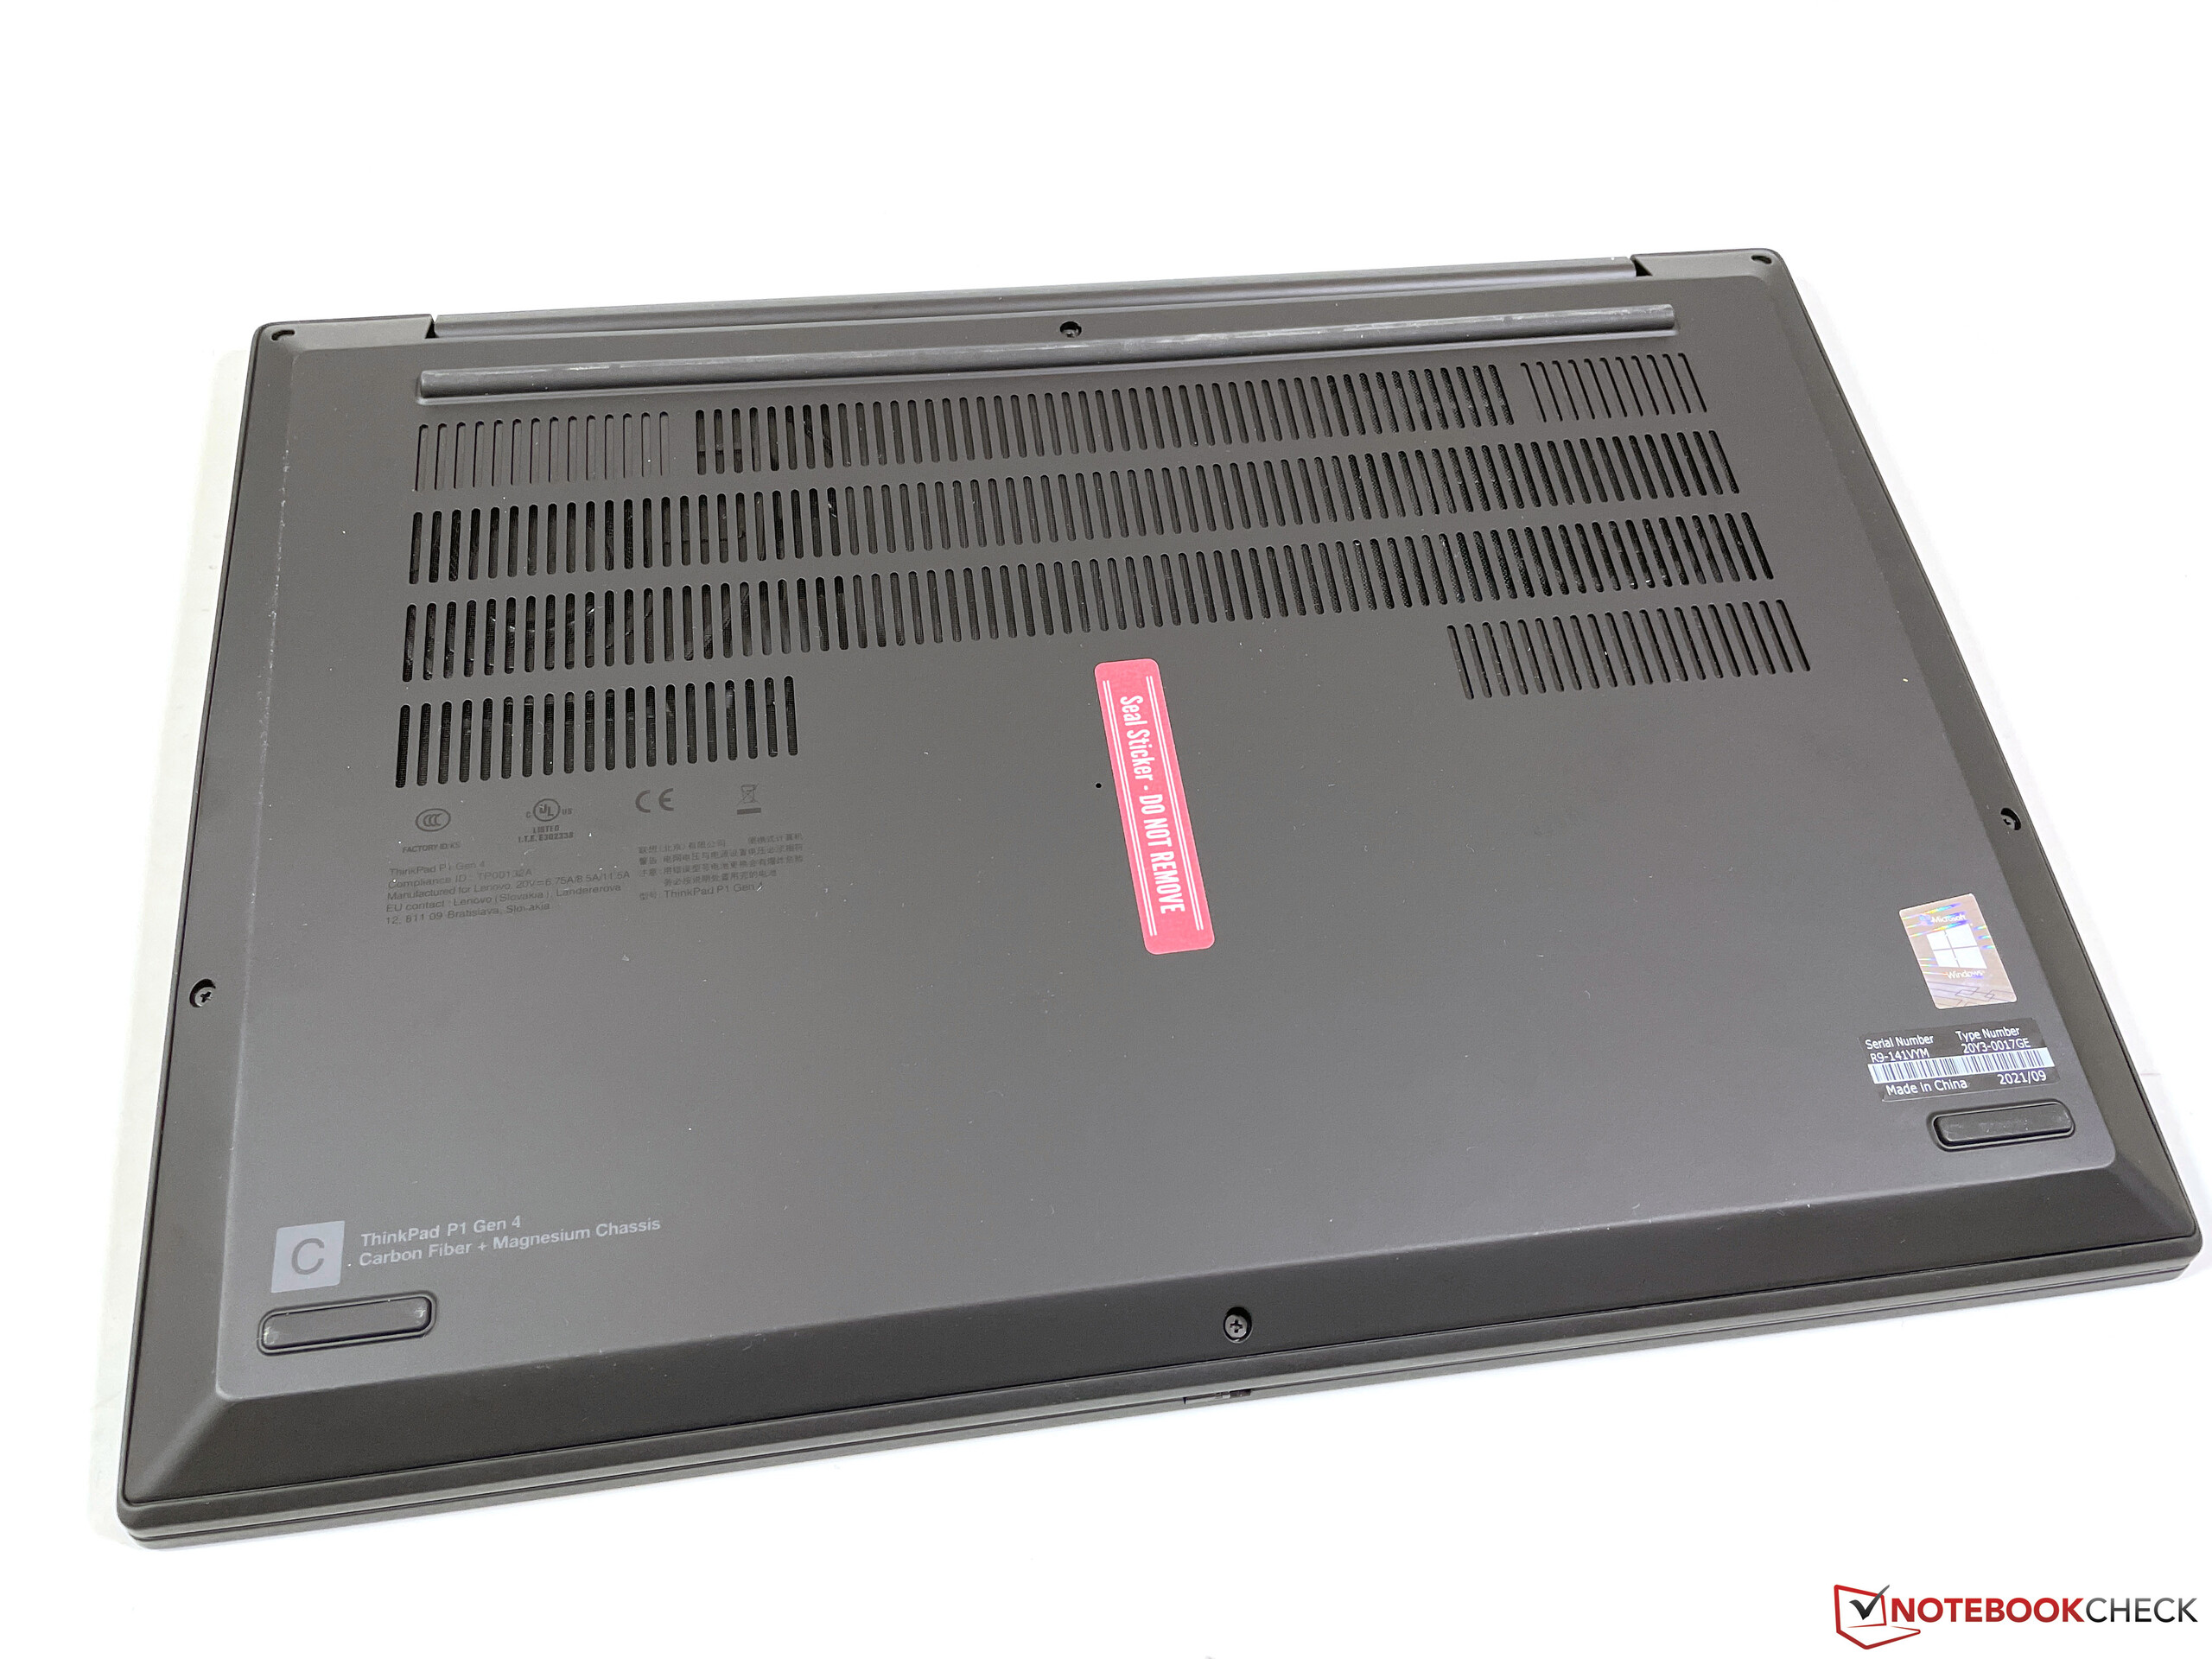
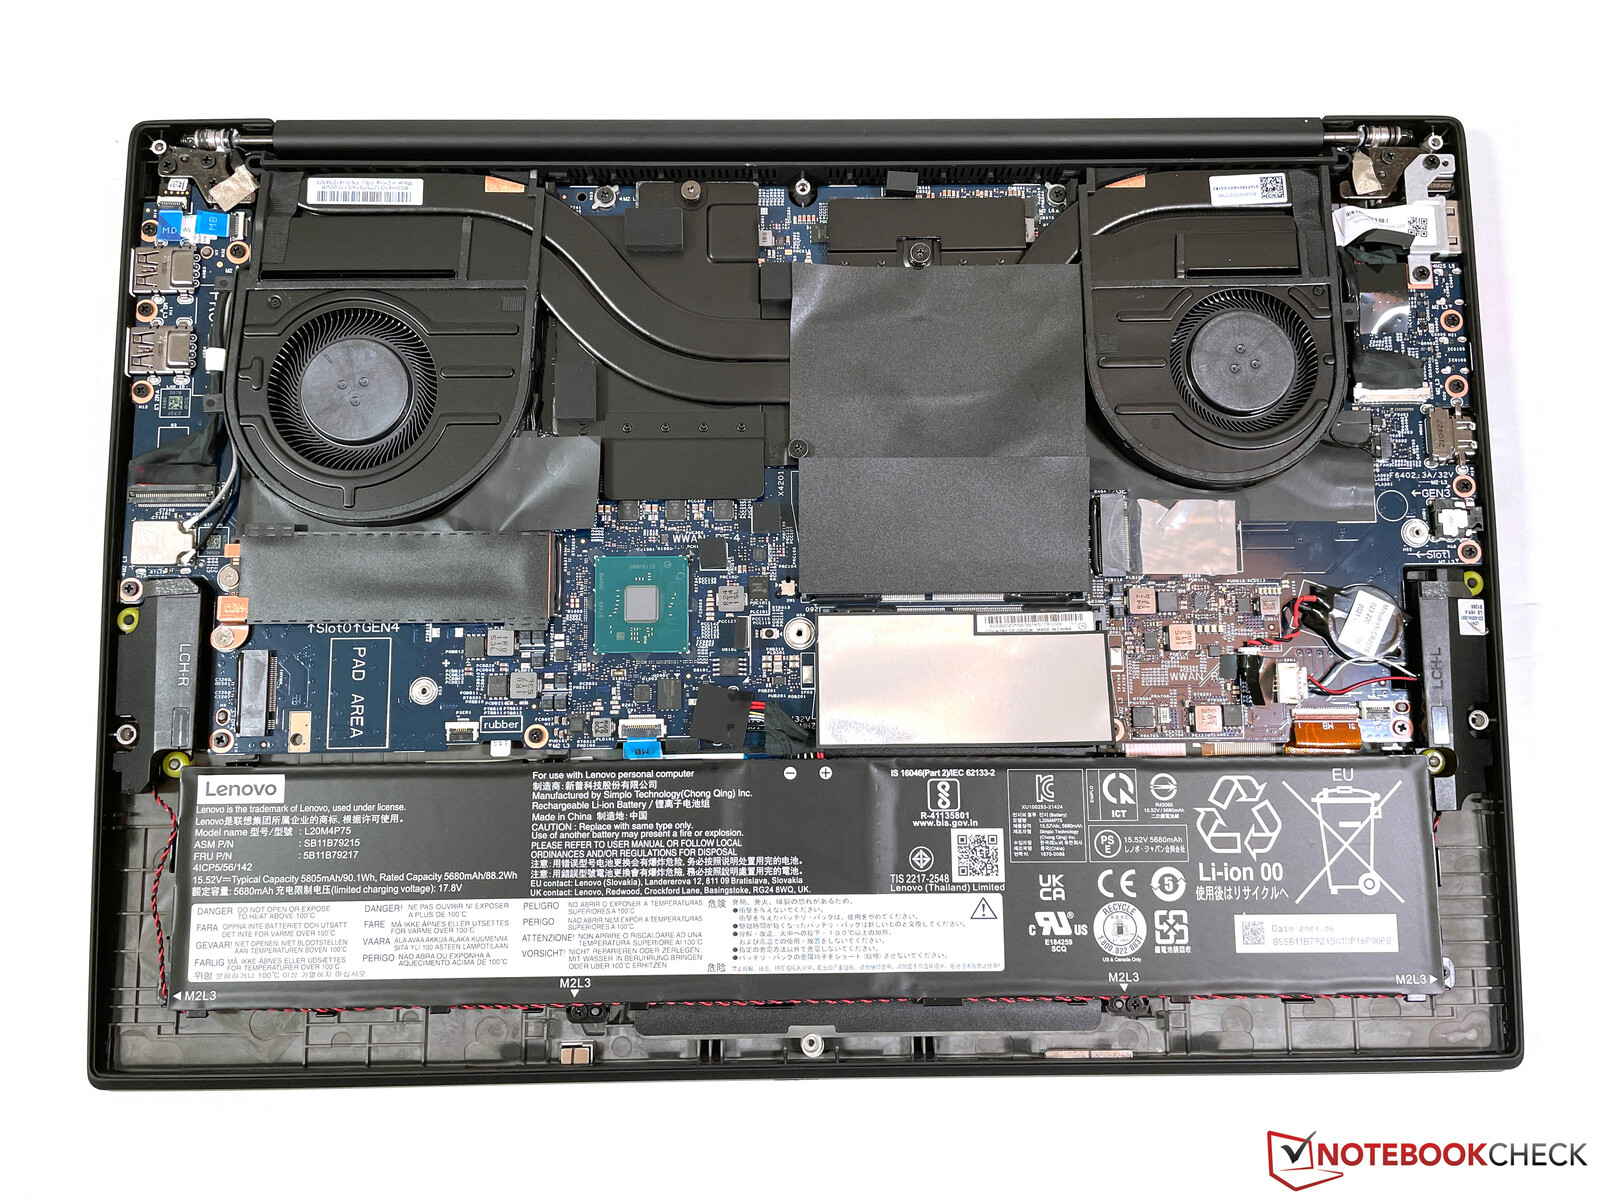
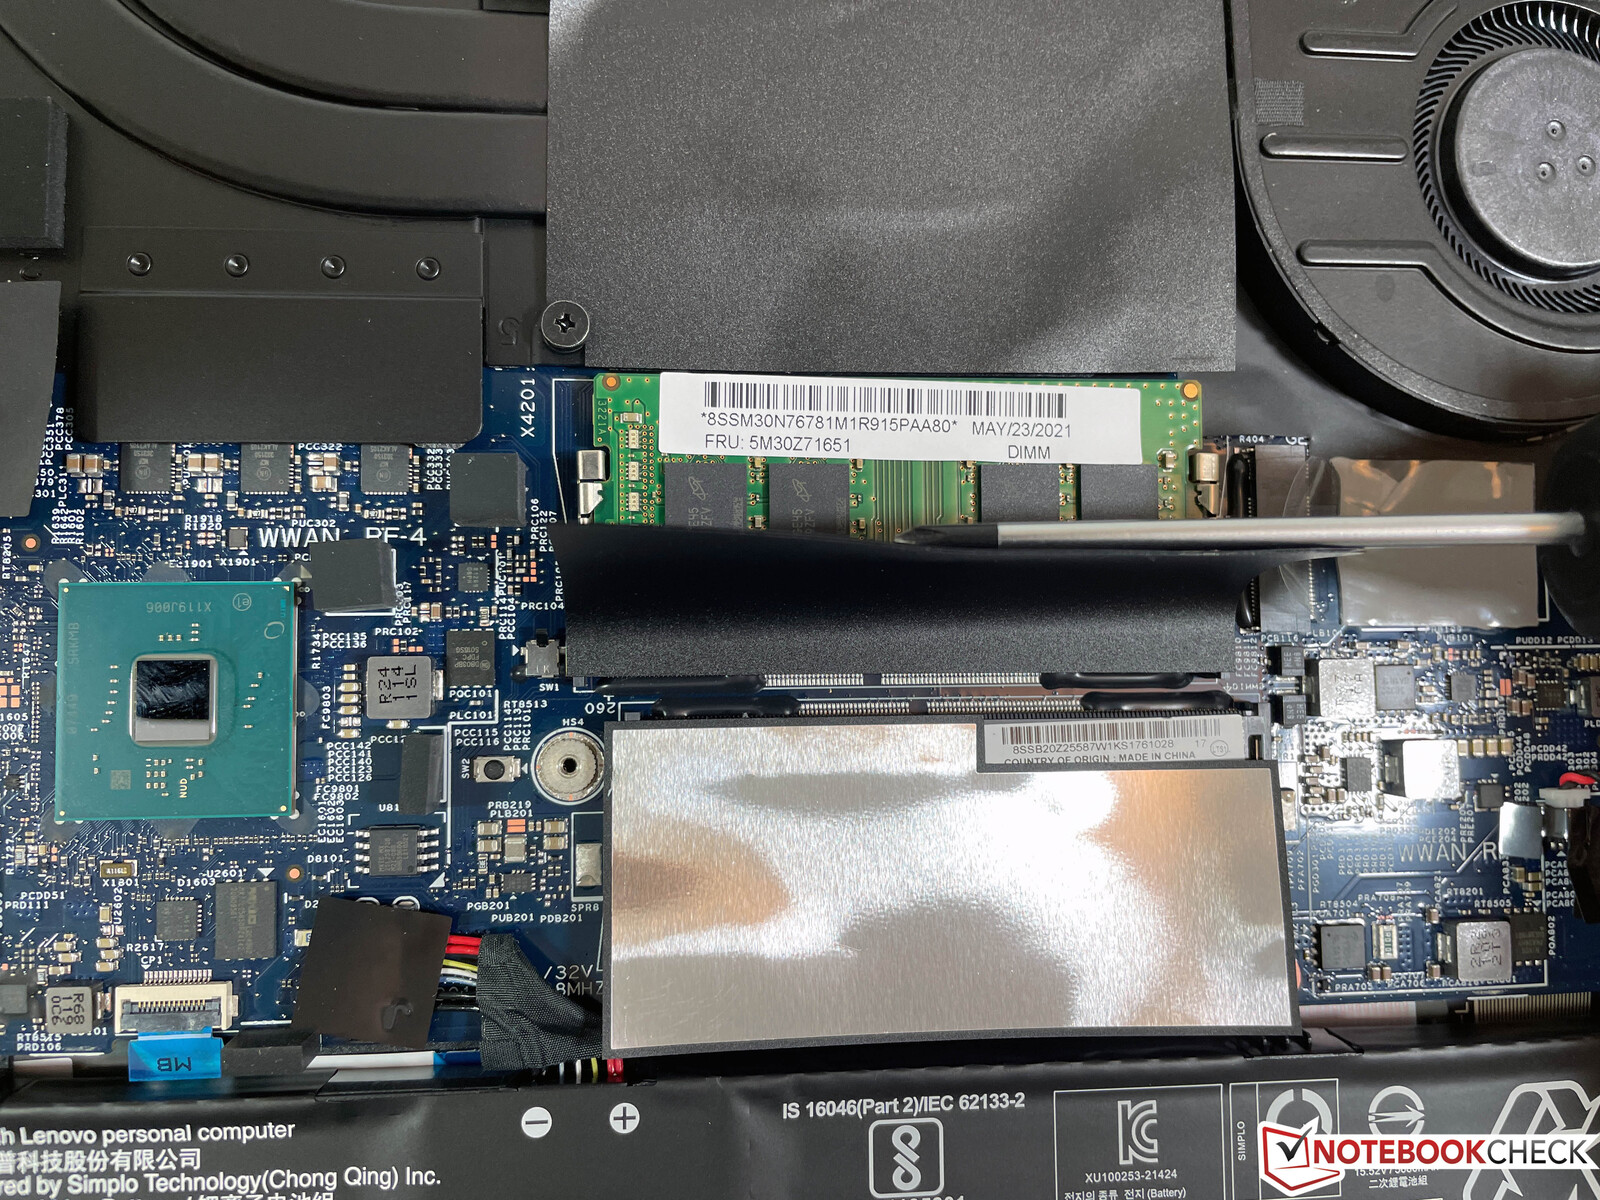
Maintenance
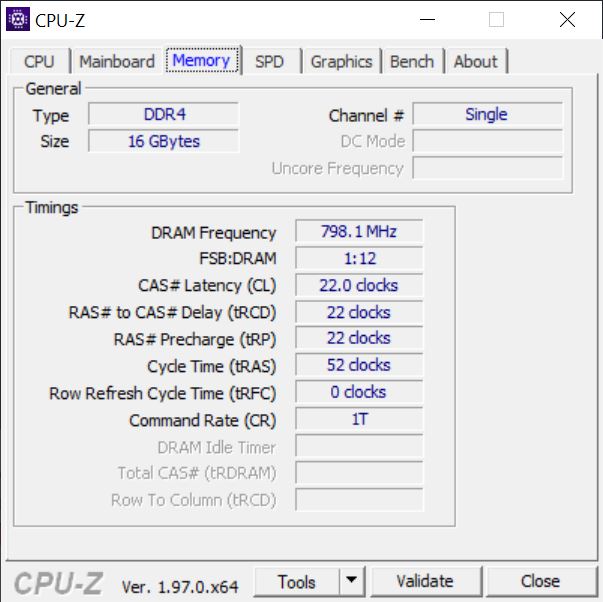
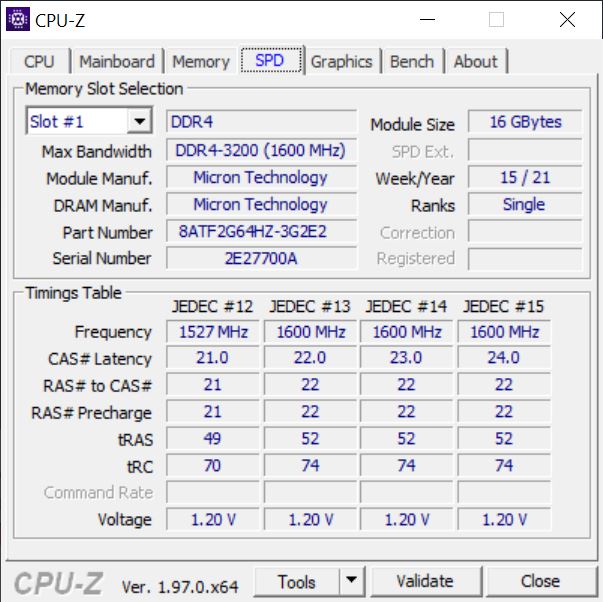
You only have to loosen eight standard Philips screws to remove the bottom cover and lift it up. Every version of the P1 G4 has two SODIMM slots (DDR4-3200, up to 64 GB) and one M.2-2280 slot for fast PCIe 4.0 SSDs. Our unit with the T1200 GPU (also applies for the RTX A2000 GPU) offers an additional M.2-2280 slot (PCIe 3.0 x4). You can clean the fans and replace the battery (screwed), but all the other components including the Wi-Fi module are soldered onto the mainboard.
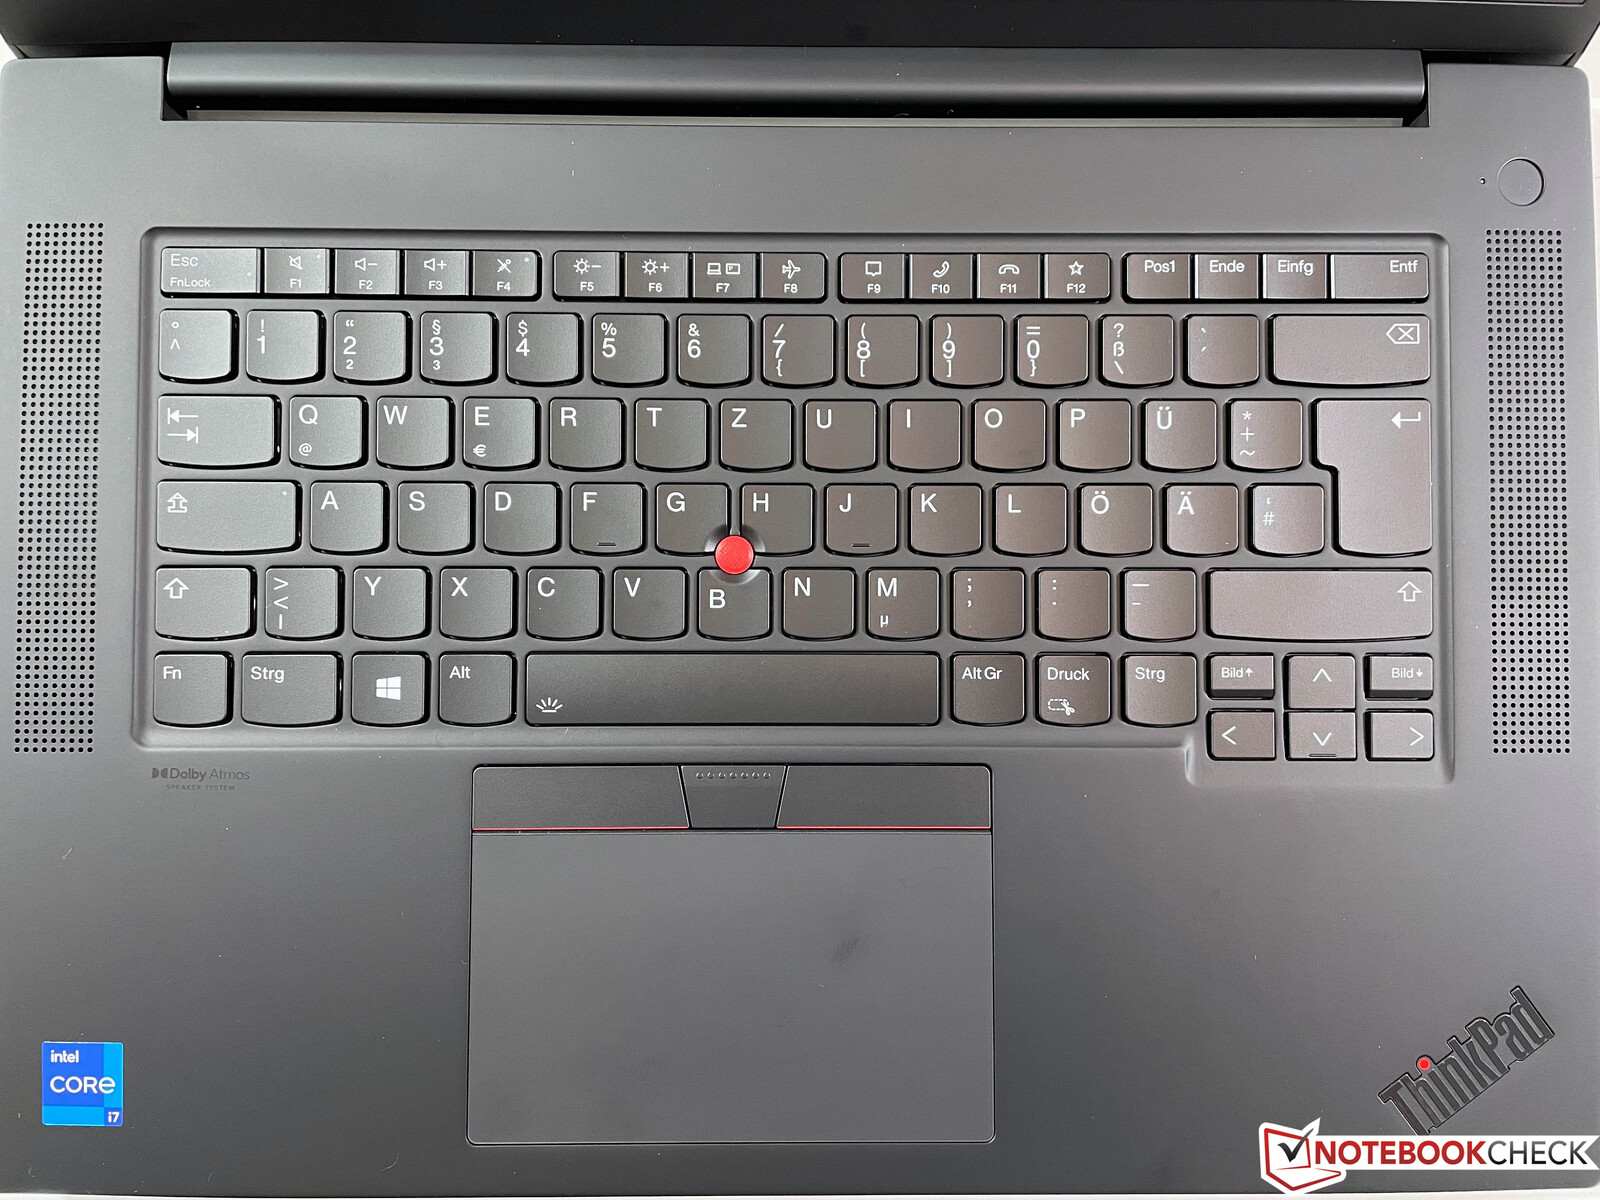
Input Devices - Reduced Key Travel like on the X1 Carbon G9
Keyboard
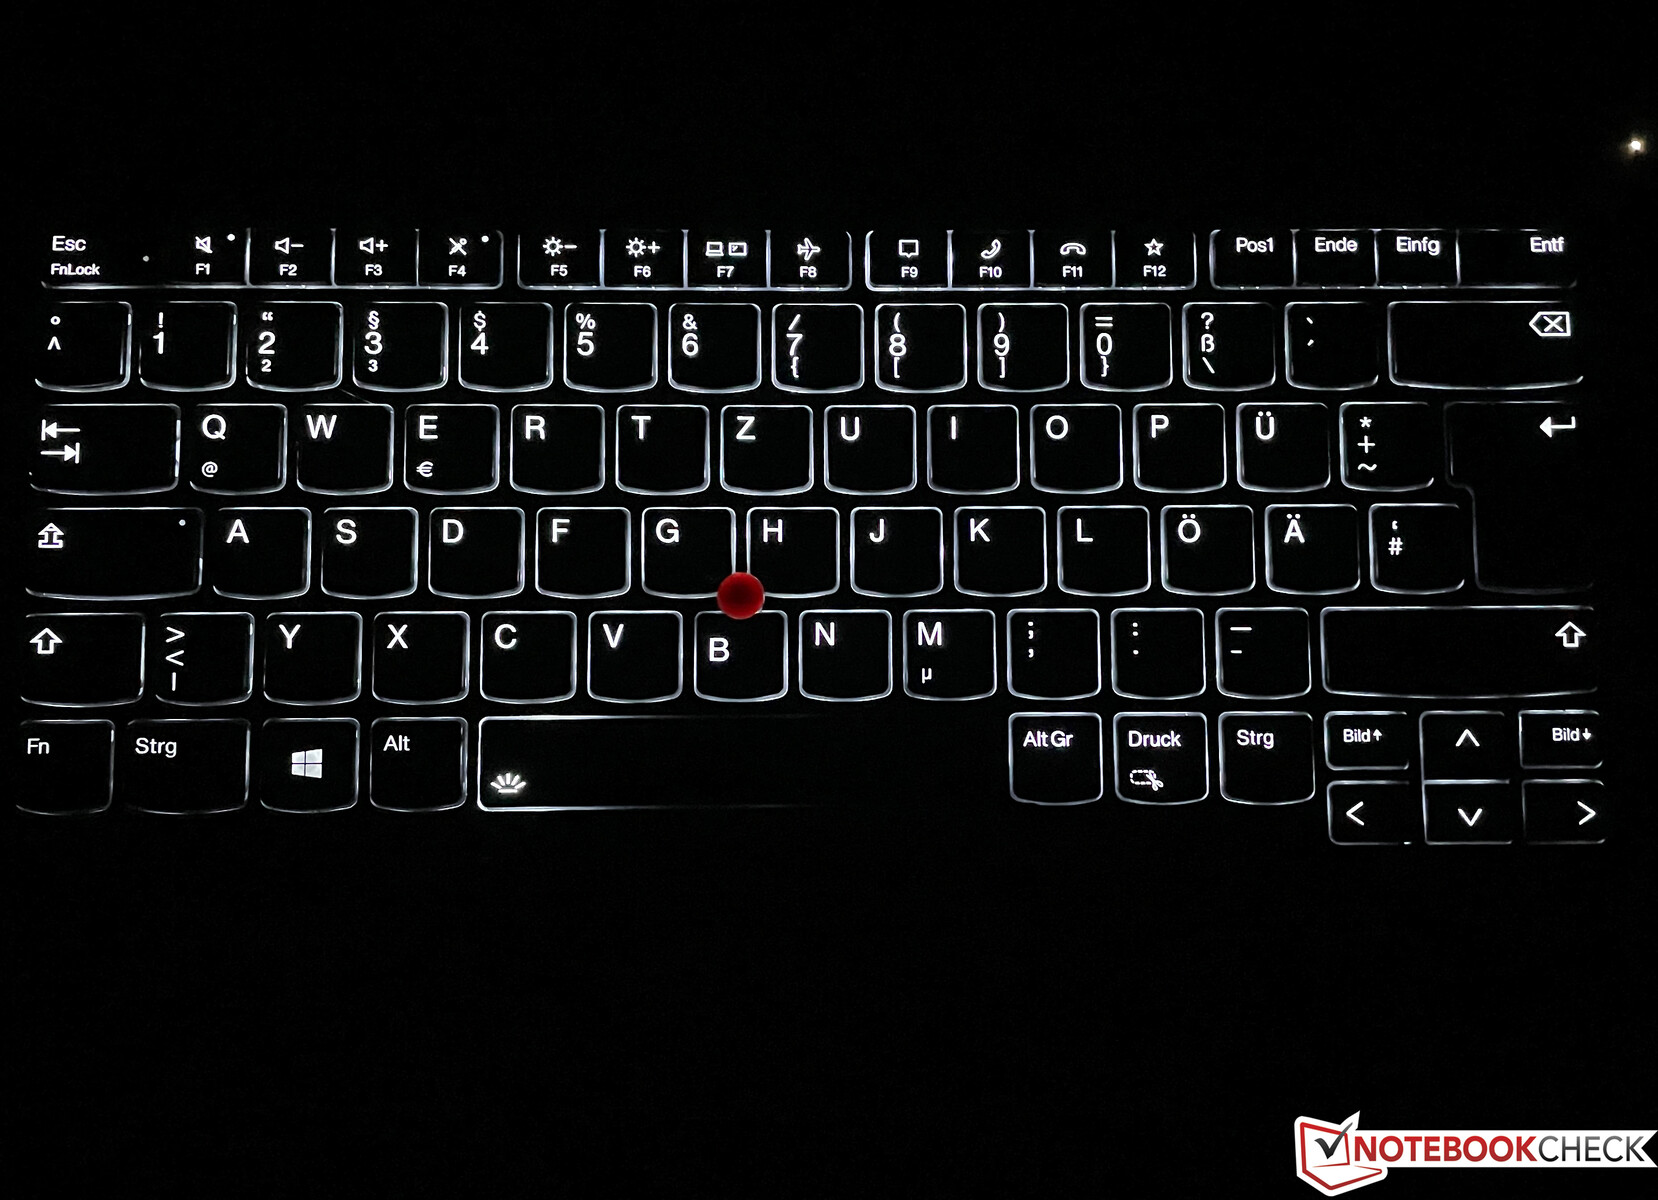
The next big change is the keyboard, because Lenovo basically uses the same unit we know from the X1 Carbon G9, but it is slightly wider because all the keys (also on the right side) have the same size. Lenovo reduces the key travel from 1.8 mm on the previous P1 G3/X1 Extreme G3 and also uses flatter keys. Compared to the old ThinkPad X1 Carbon G7/G8, which also used 1.5 mm key travel, this results in a slightly worse typing experience. Compared to the current X1 Carbon G9, the subjective experience is slightly better on the P1 G4 thanks to the firmer base unit. All in all, it is still a good keyboard, but worse compared to previous models and there is no advantage over rivals like Dell or HP anymore. There is a two-stage white illumination for darker environments.
Touchpad & TrackPoint
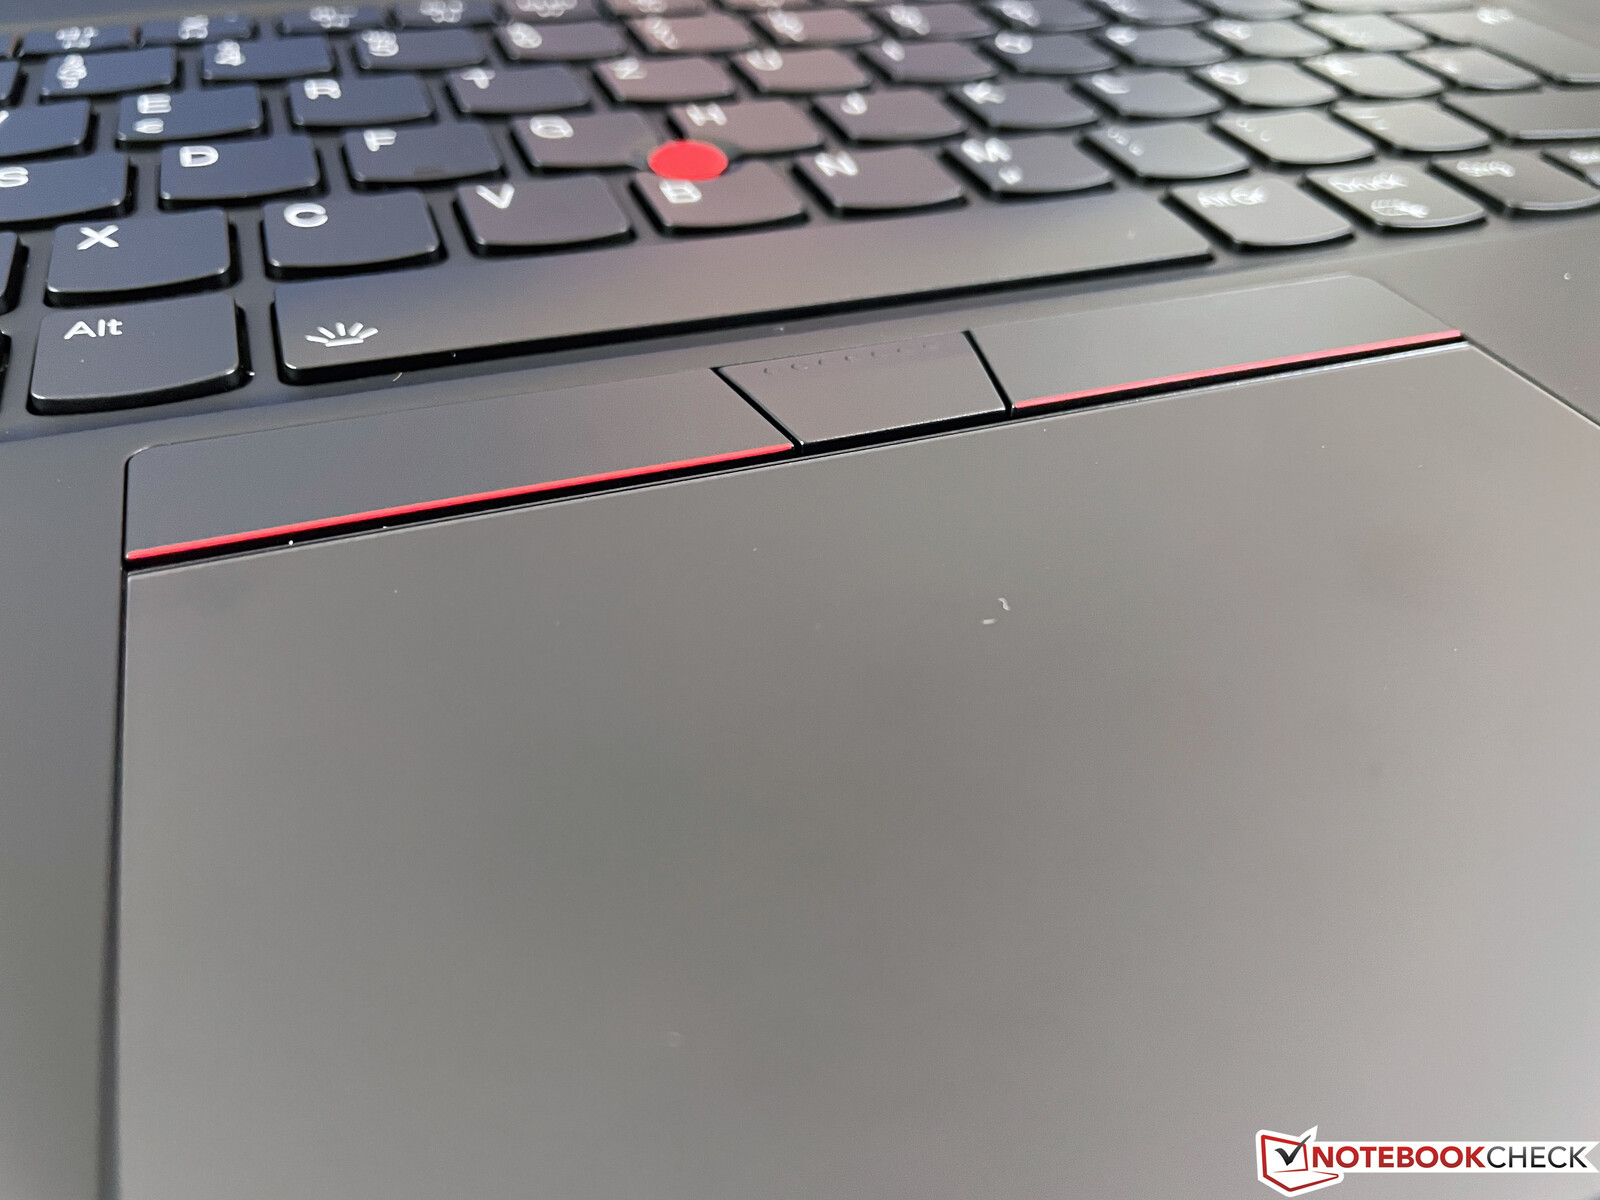
The ClickPad (11.5 x 6.9 cm) offers good gliding capabilities and supports Microsoft’s Precision standard, so the standard handling including gestures works well. The clicking mechanism also leaves a good and high-quality impression with a muffled click. Compared to the old ThinkPad P1, the TrackPoint keys are no similar to the X1 Carbon and they are completely flat. This also means the travel is reduced and the subjective impression is worse. The clicks are also pretty loud and clatter a bit. The TrackPoint itself works well and we did not experience any cursor drifting on you unit.
Display - WQHD with 16:10
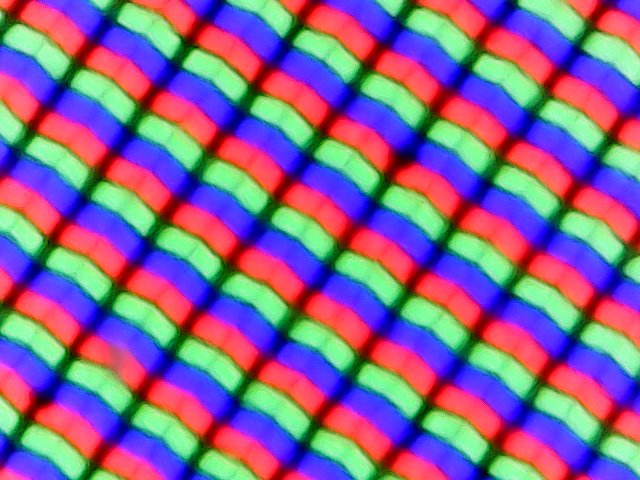
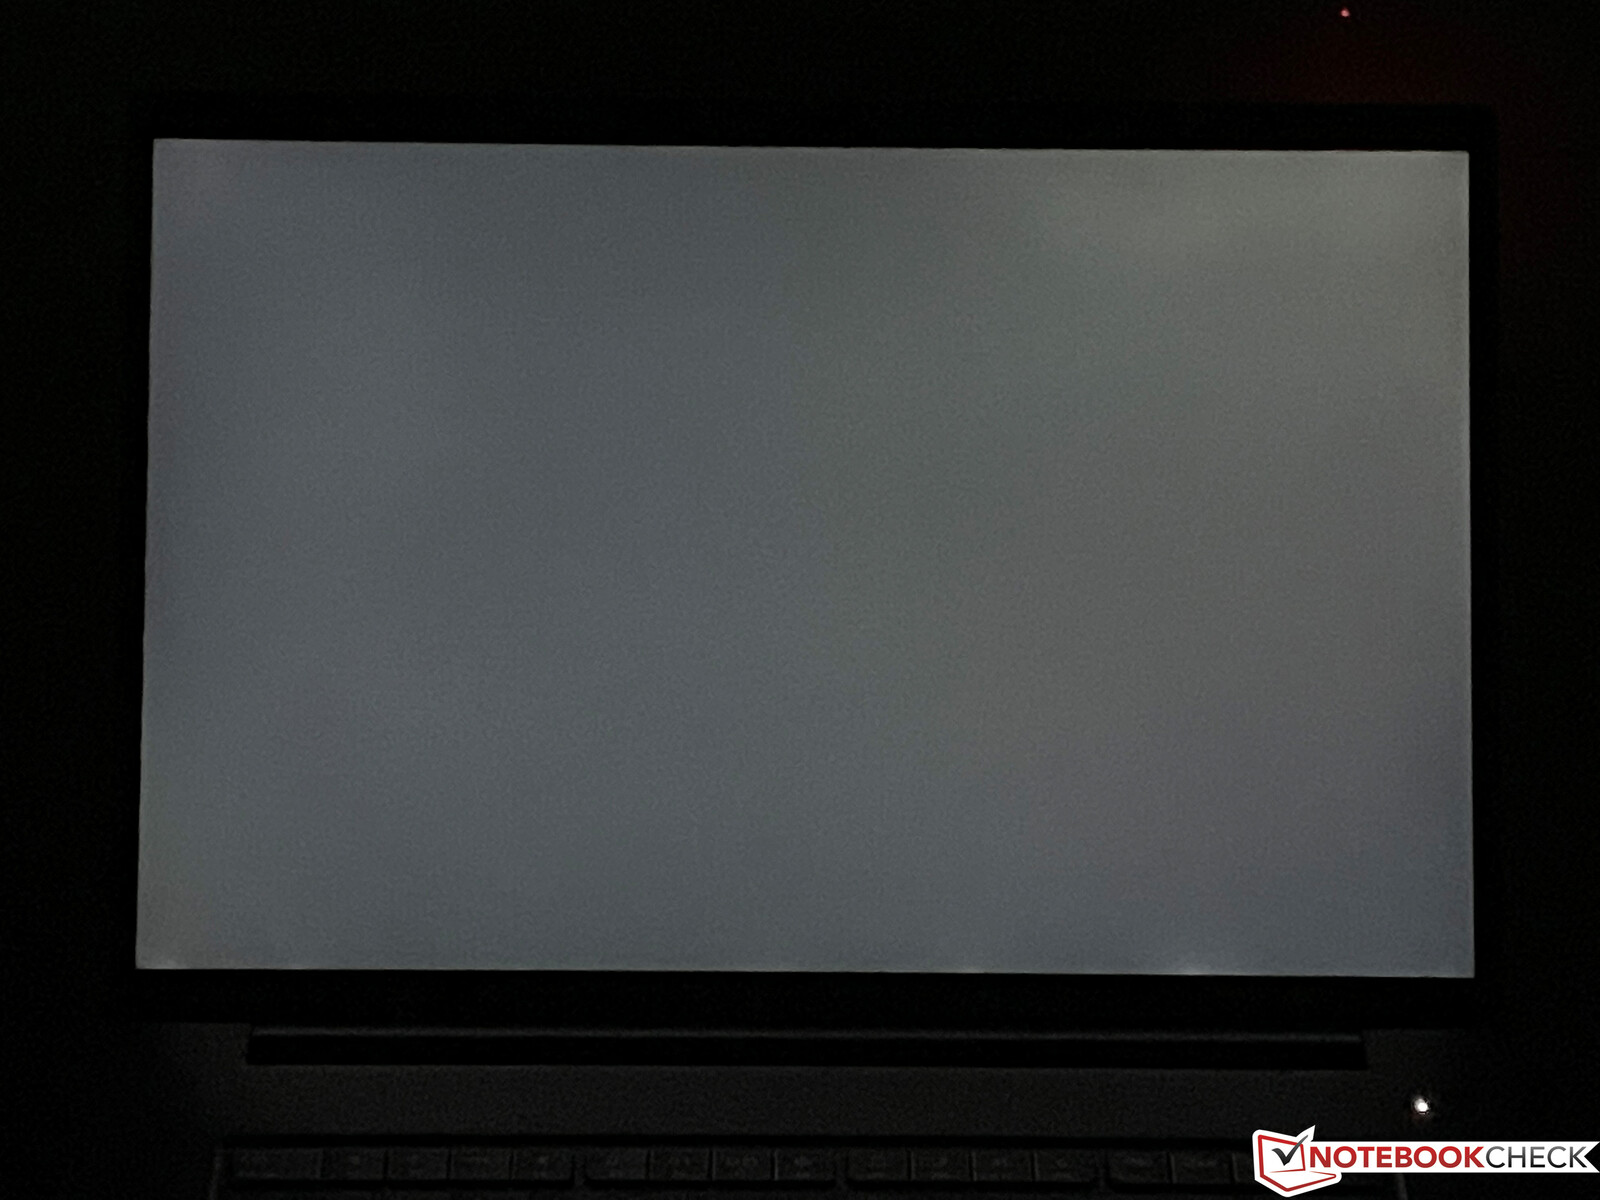
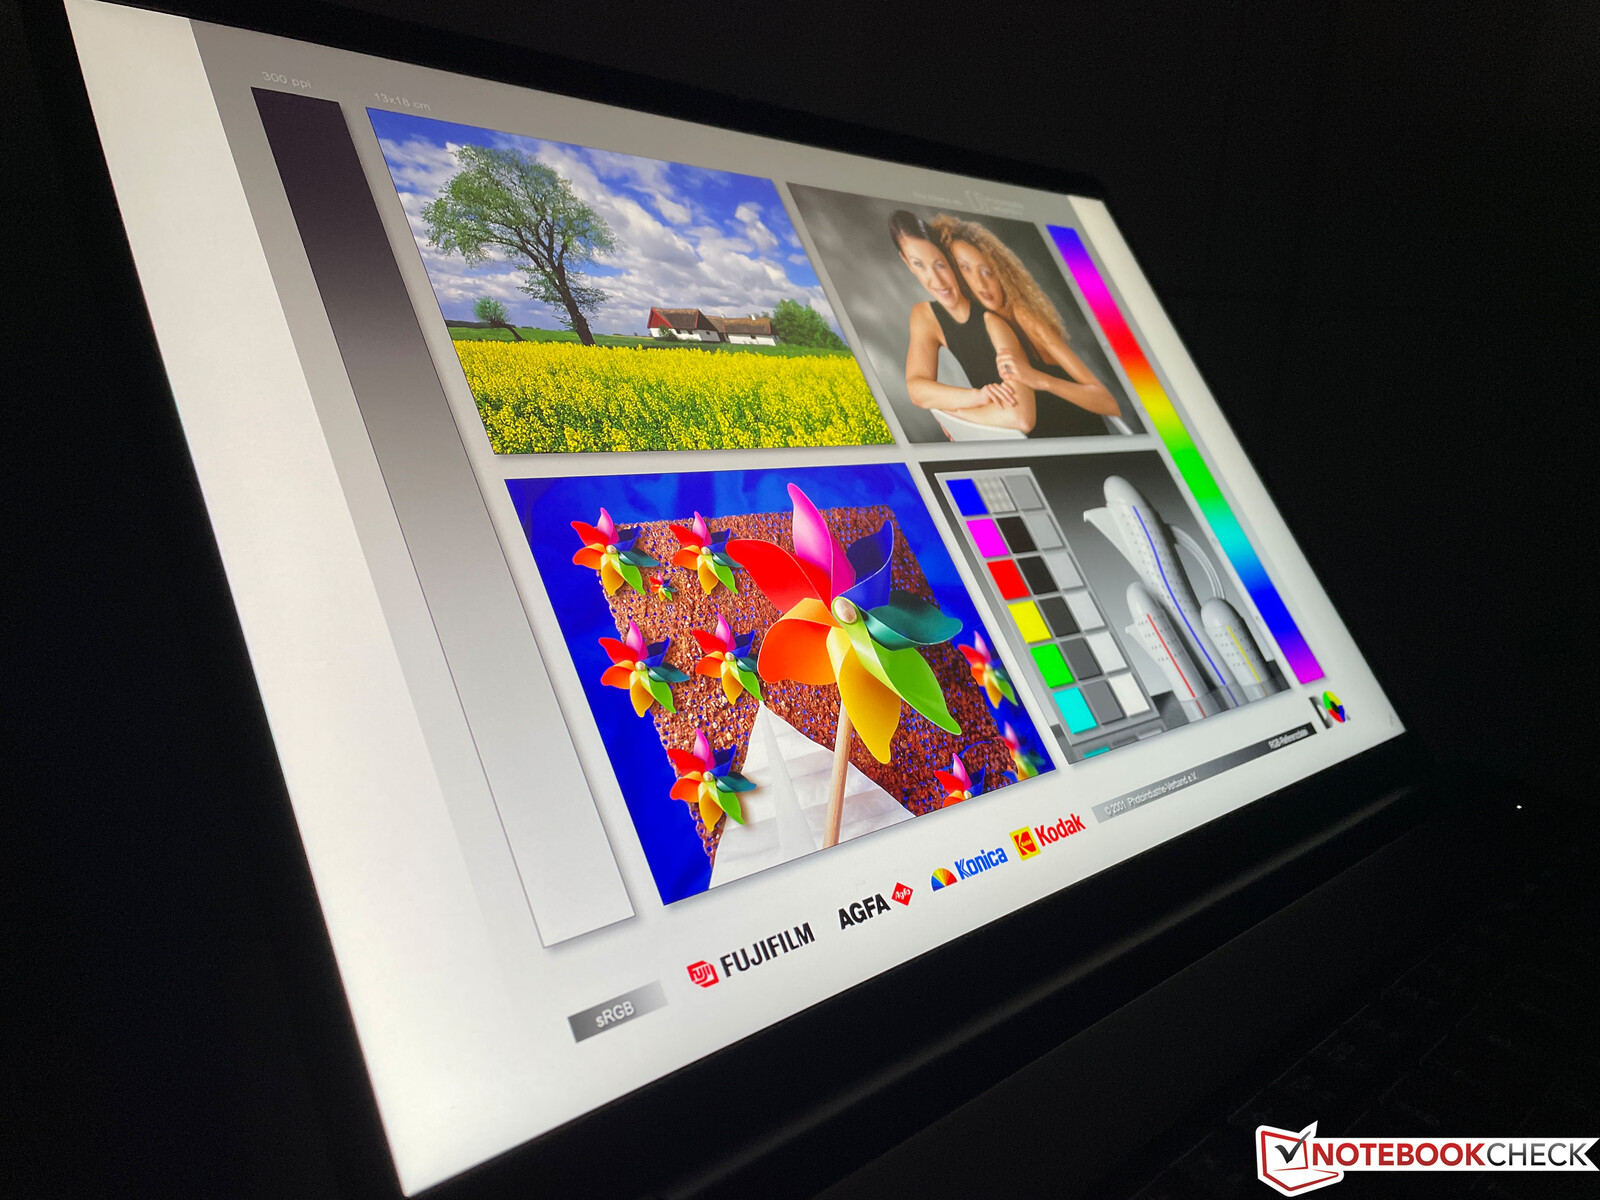
Lenovo equips the fourth generation of the ThinkPad P1 with IPS displays and 16:10 aspect ratio. The default screen is already a WQHD panel with a resolution of 2560 x 1600 pixels and there are two optional 4K screens (UHD+, HDR, one with touch). The standard display in our test unit offers good subjective picture quality, and bright surfaces do not appear grainy, despite the matte surface. Contents are crisp and the colors appear rich.
The manufacturer advertises a brightness of 400 nits and a contrast ratio of 1200:1, and the AU Optronics panel in the test unit is slightly better according to our measurements (X-Rite i1 Pro 2 & CalMAN). Lenovo also uses the same panel for its own ThinkBook 16p. We did not detect PWM flickering and the response times are also inconspicuous. You can notice some clouding in the upper right corner on a black background at the maximum brightness, but it is hardly noticeable during everyday tasks.
| |||||||||||||||||||||||||
Brightness Distribution: 90 %
Center on Battery: 418 cd/m²
Contrast: 1400:1 (Black: 0.3 cd/m²)
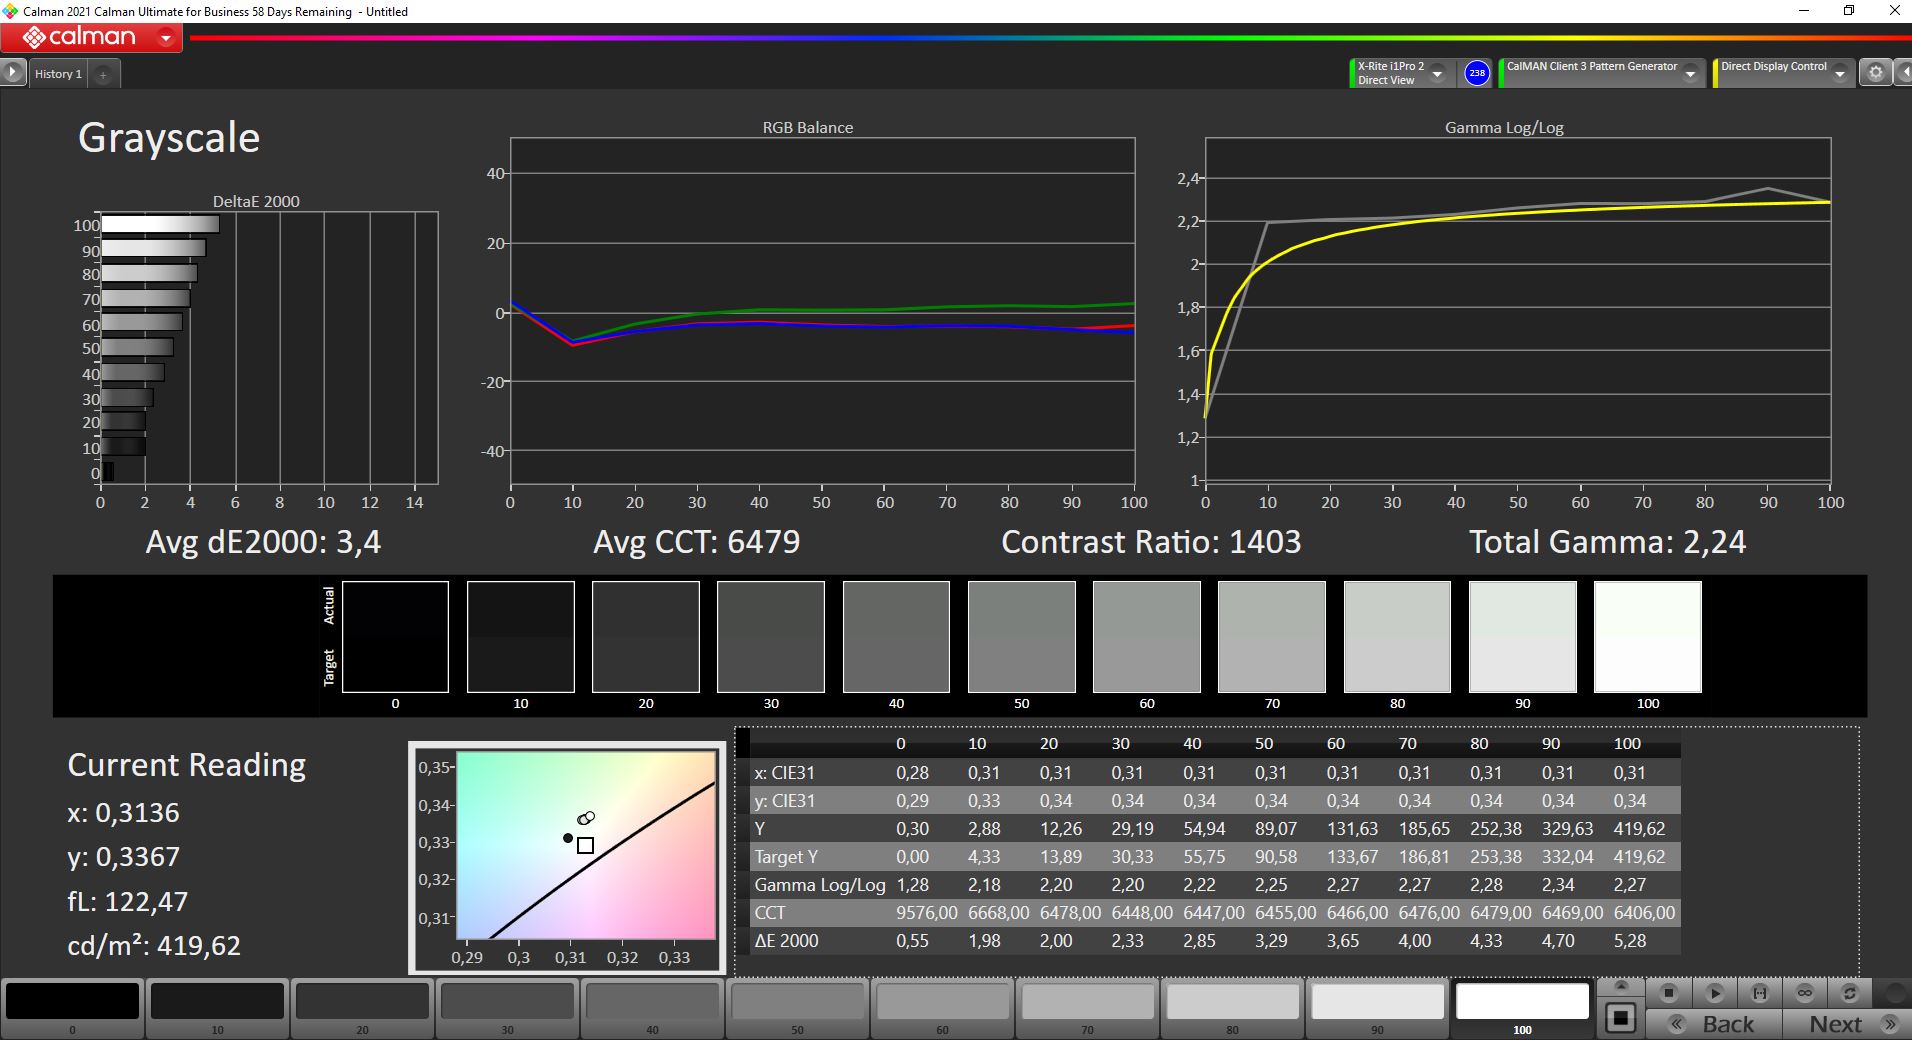
ΔE ColorChecker Calman: 2.5 | ∀{0.5-29.43 Ø4.75}
calibrated: 1.6
ΔE Greyscale Calman: 3.4 | ∀{0.09-98 Ø5}
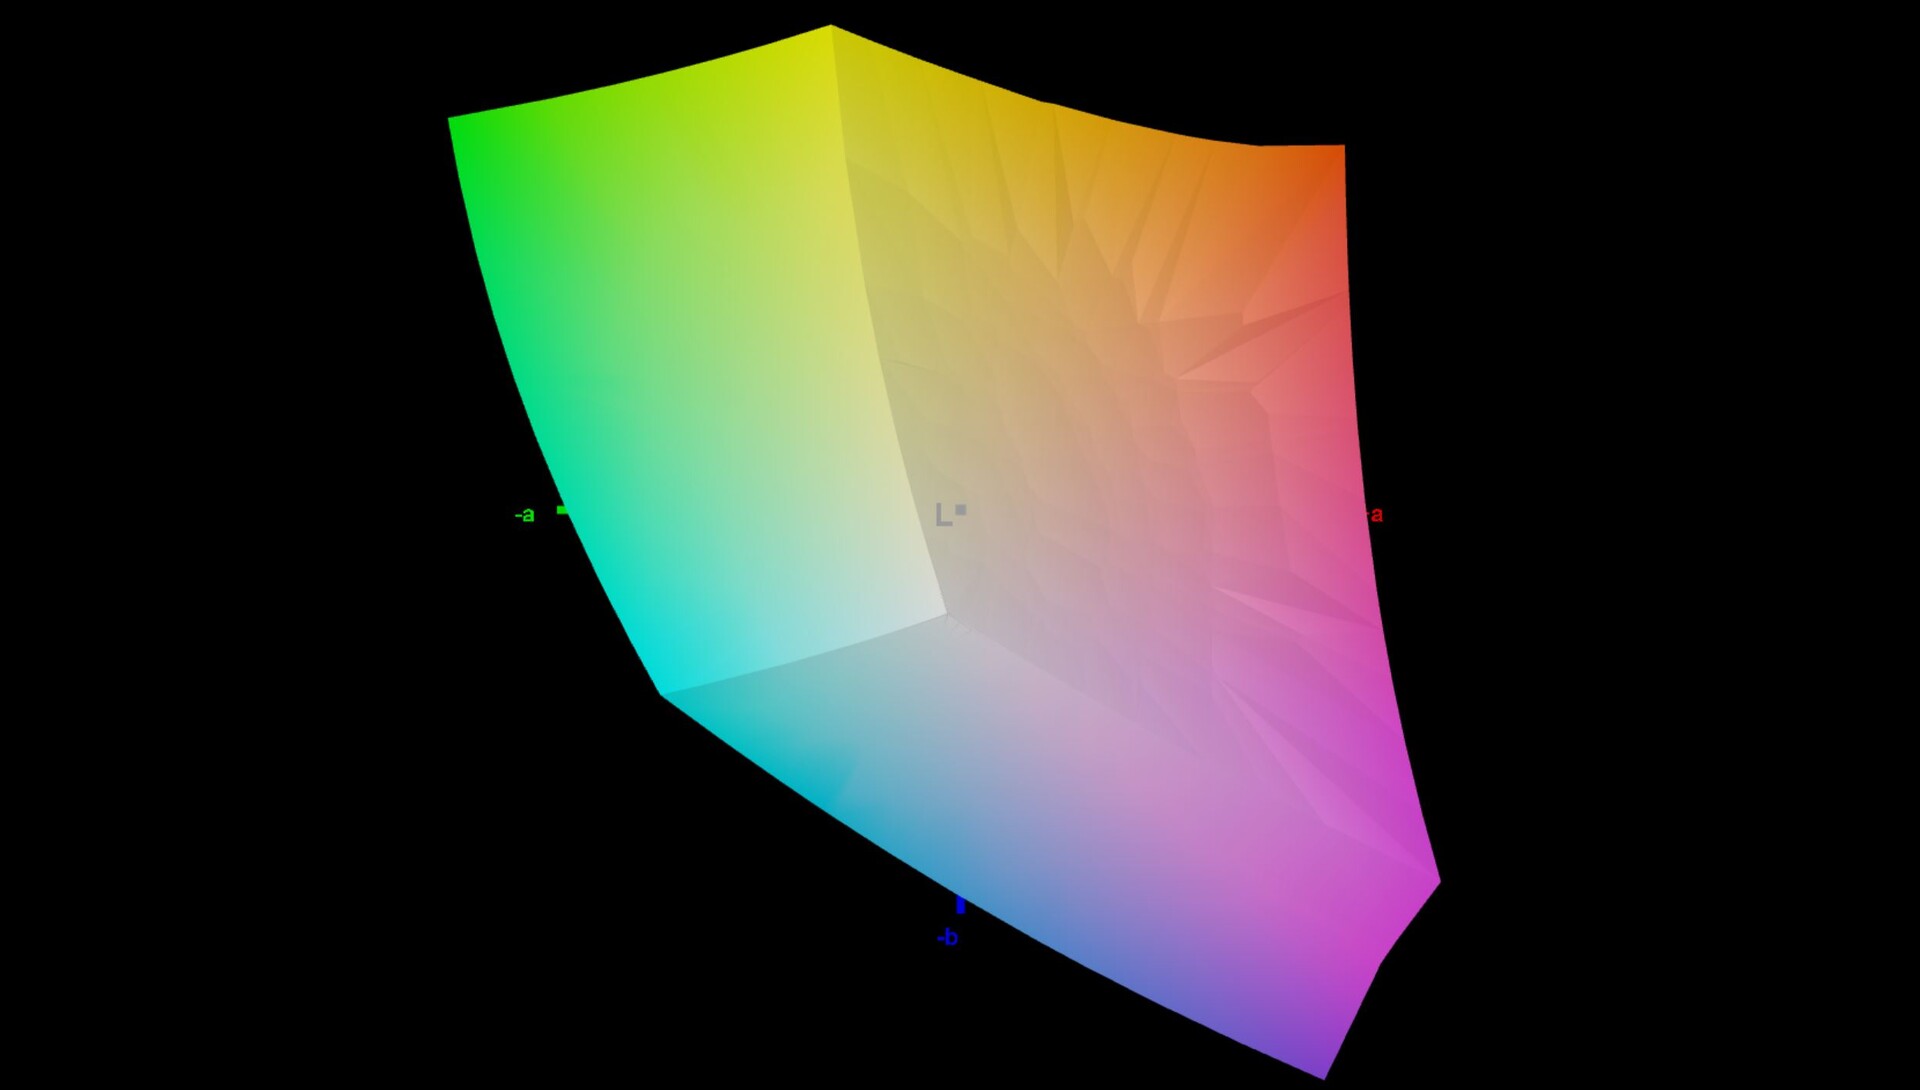
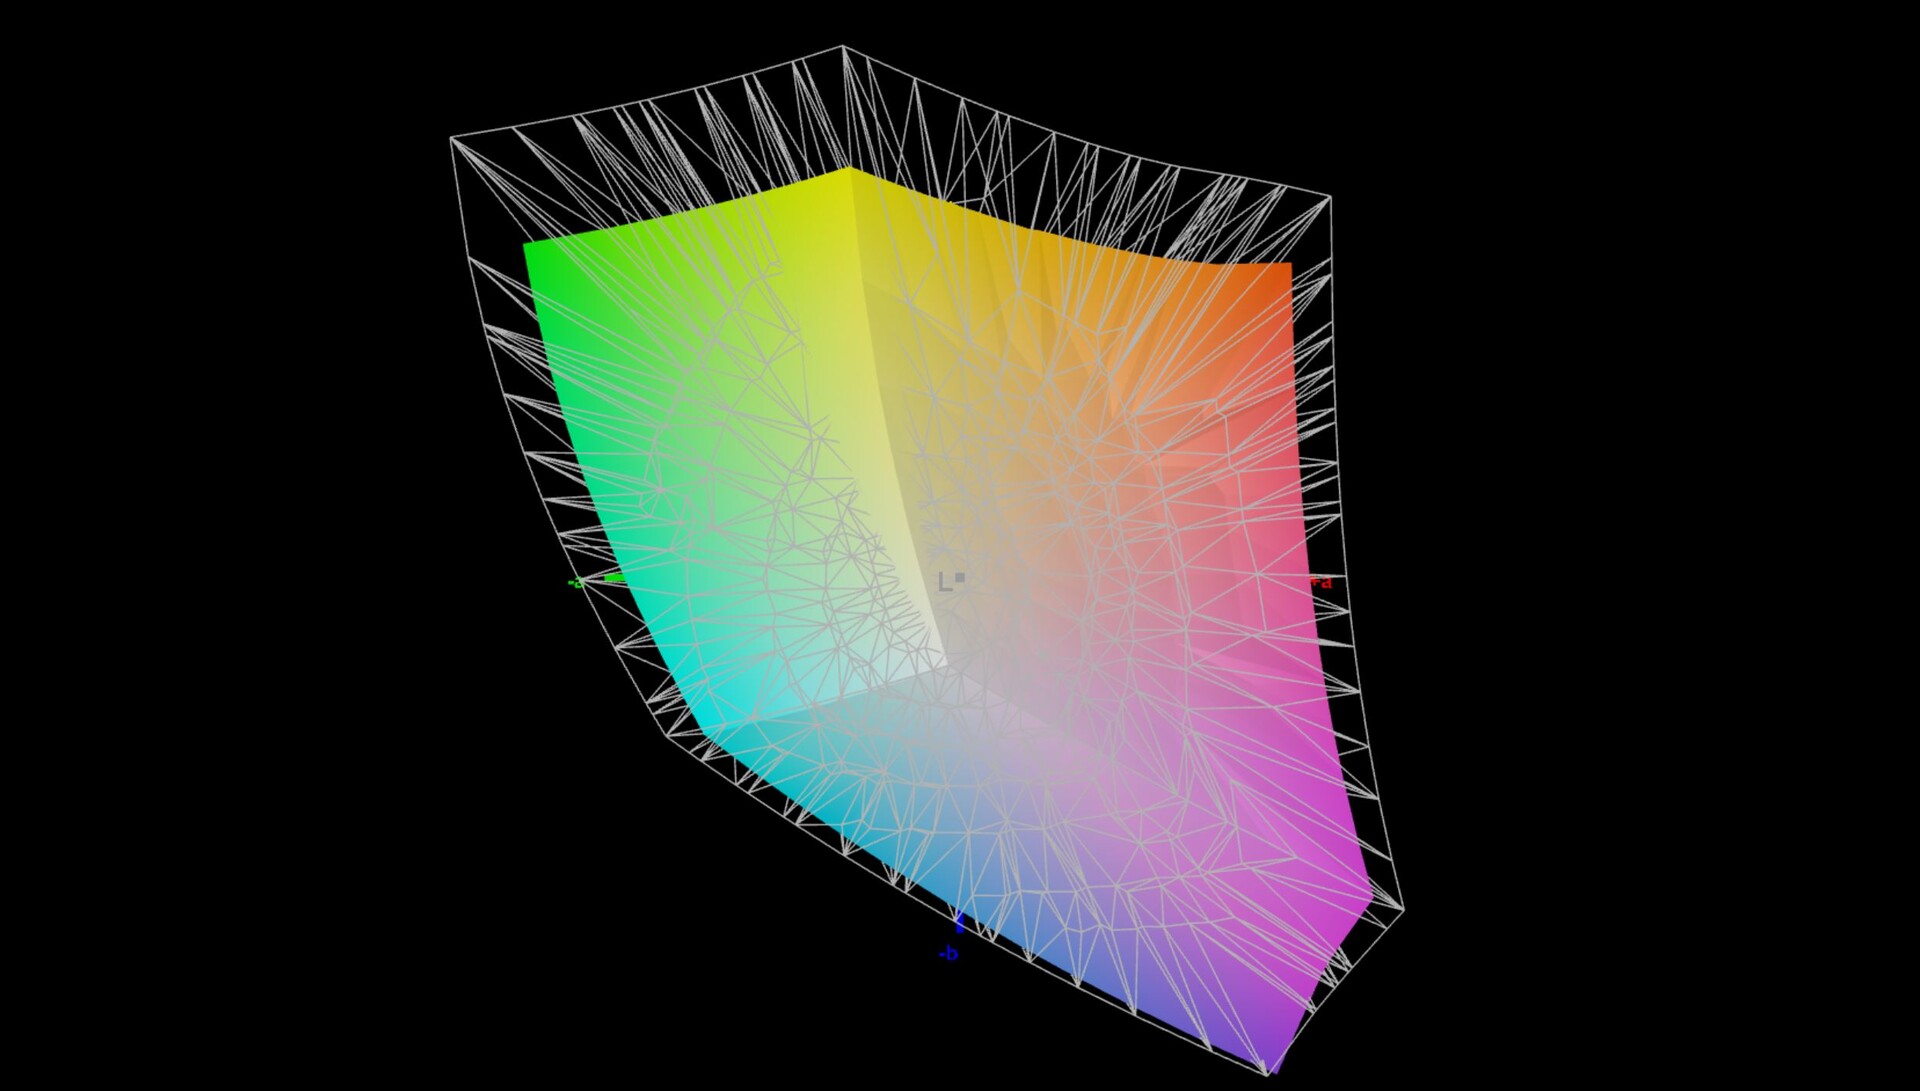
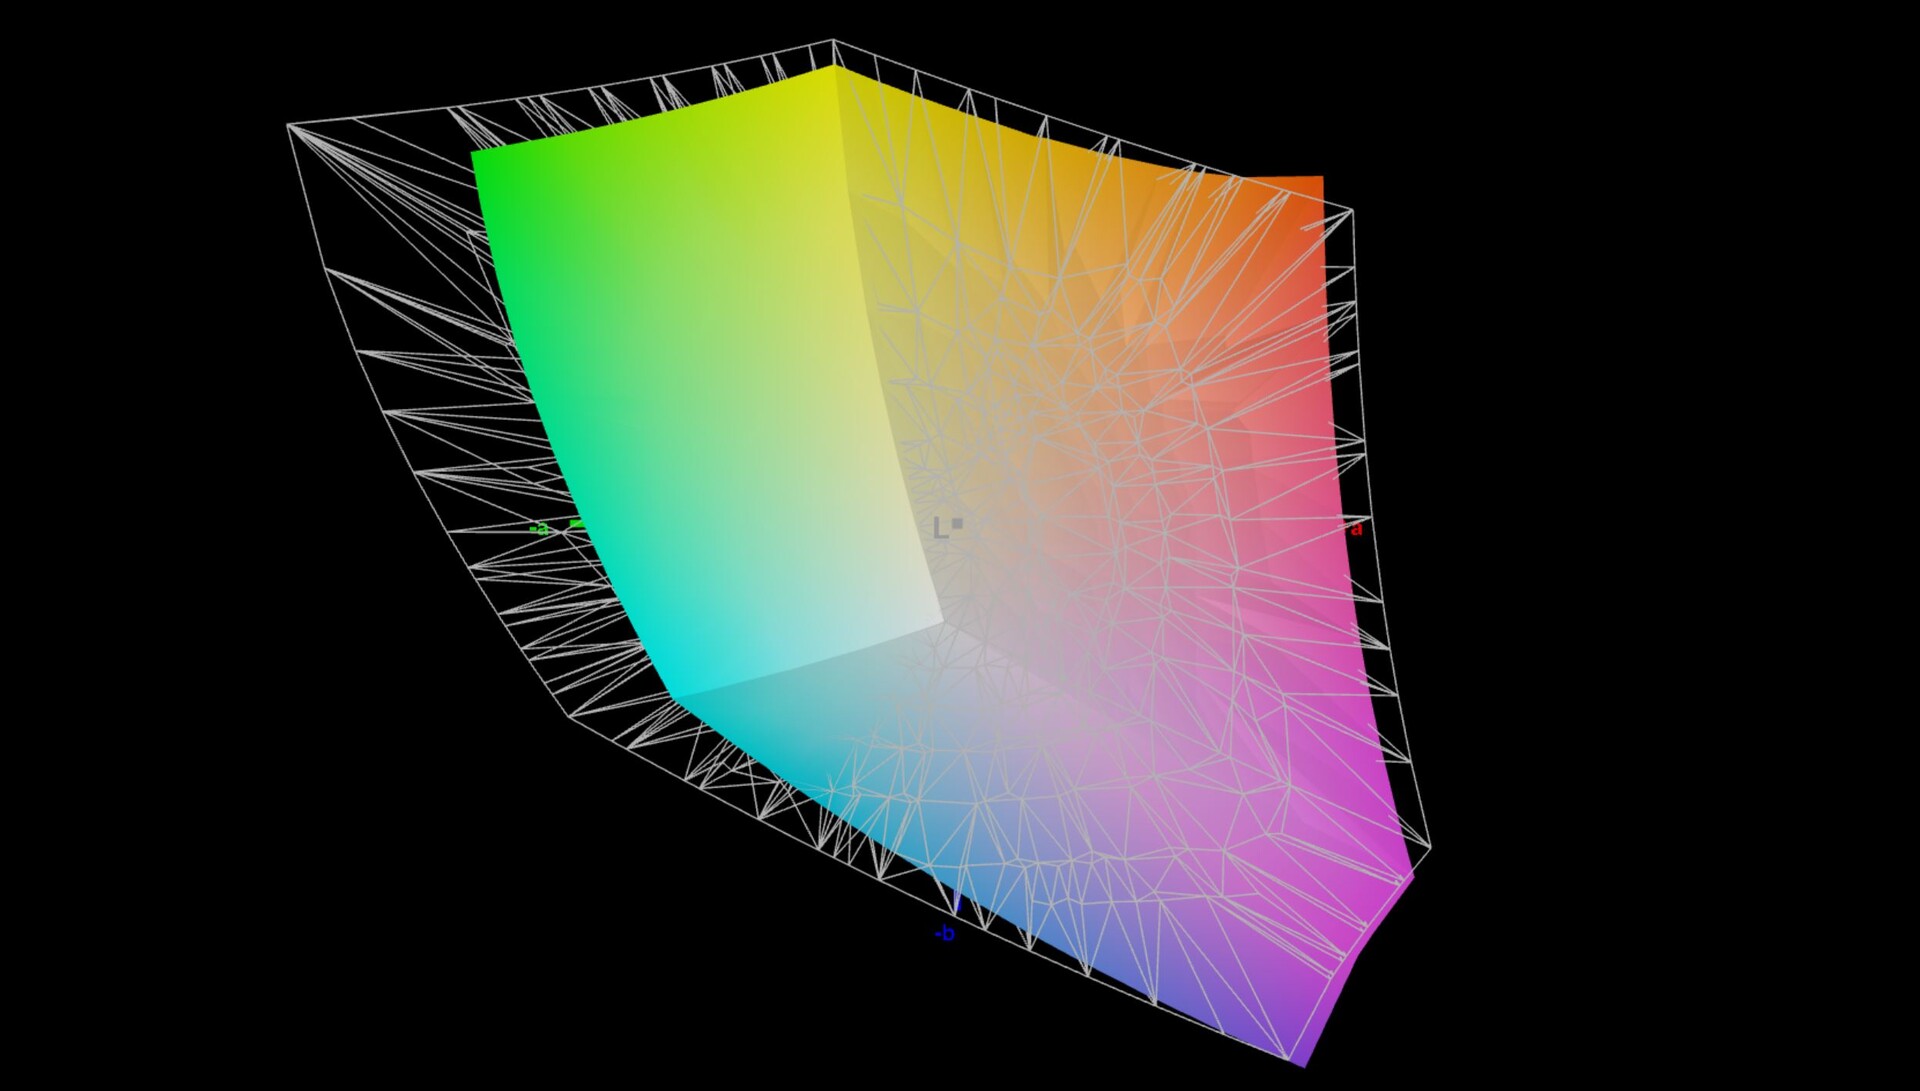
78.1% AdobeRGB 1998 (Argyll 3D)
99.9% sRGB (Argyll 3D)
77.3% Display P3 (Argyll 3D)
Gamma: 2.24
CCT: 6479 K
| Lenovo ThinkPad P1 G4-20Y30017GE B160QAN02.M, IPS, 2560x1600, 16" | Dell Precision 5540 SDCA029, OLED, 3840x2160, 15.6" | Apple MacBook Pro 16 2019 i9 5500M APPA044, IPS, 3072x1920, 16" | HP ZBook Studio 15 G8 SDC4145, OLED, 3840x2160, 15.6" | Lenovo ThinkBook 16p G2 ACH Lenovo LEN8A95 (AUO B160QAN02.M), IPS, 2560x1600, 16" | Lenovo ThinkPad P1 2019-20QT000RGE N156HCE-GN1, IPS LED, 1920x1080, 15.6" | |
|---|---|---|---|---|---|---|
| Display | 18% | 17% | -1% | -15% | ||
| Display P3 Coverage (%) | 77.3 | 99.9 29% | 99.9 29% | 76.4 -1% | 62.4 -19% | |
| sRGB Coverage (%) | 99.9 | 100 0% | 100 0% | 100 0% | 91.5 -8% | |
| AdobeRGB 1998 Coverage (%) | 78.1 | 97.3 25% | 95.3 22% | 77.4 -1% | 63.4 -19% | |
| Response Times | 91% | -30% | 93% | 25% | 32% | |
| Response Time Grey 50% / Grey 80% * (ms) | 40.8 ? | 2.8 ? 93% | 52.4 ? -28% | 2.4 ? 94% | 36 12% | 34.4 ? 16% |
| Response Time Black / White * (ms) | 26.4 ? | 3.2 ? 88% | 34.9 ? -32% | 2.4 ? 91% | 16.4 38% | 14 ? 47% |
| PWM Frequency (Hz) | 240.9 ? | 131700 | 240.4 ? | 26040 ? | ||
| Screen | -18% | 11% | -35% | 7% | -12% | |
| Brightness middle (cd/m²) | 420 | 427 2% | 519 24% | 379.6 -10% | 439 5% | 542 29% |
| Brightness (cd/m²) | 401 | 411 2% | 477 19% | 380 -5% | 397 -1% | 528 32% |
| Brightness Distribution (%) | 90 | 89 -1% | 86 -4% | 95 6% | 83 -8% | 84 -7% |
| Black Level * (cd/m²) | 0.3 | 0.39 -30% | 0.44 -47% | 0.41 -37% | ||
| Contrast (:1) | 1400 | 1331 -5% | 998 -29% | 1322 -6% | ||
| Colorchecker dE 2000 * | 2.5 | 3.2 -28% | 2.28 9% | 5.15 -106% | 1.68 33% | 3.5 -40% |
| Colorchecker dE 2000 max. * | 4.9 | 8.4 -71% | 6.54 -33% | 7.79 -59% | 2.36 52% | 7.8 -59% |
| Colorchecker dE 2000 calibrated * | 1.6 | 2.8 -75% | 0.86 46% | 3.1 -94% | 1.57 2% | 1.3 19% |
| Greyscale dE 2000 * | 3.4 | 1.8 47% | 0.9 74% | 2.6 24% | 1.64 52% | 4.8 -41% |
| Gamma | 2.24 98% | 2.15 102% | 2145 0% | 1.99 111% | 2.39 92% | 2.33 94% |
| CCT | 6479 100% | 6176 105% | 6572 99% | 6166 105% | 6616 98% | 7690 85% |
| Color Space (Percent of AdobeRGB 1998) (%) | 86.8 | 78 | 58.8 | |||
| Color Space (Percent of sRGB) (%) | 100 | 91.1 | ||||
| Total Average (Program / Settings) | 30% /
9% | -10% /
4% | 25% /
-1% | 10% /
8% | 2% /
-7% |
* ... smaller is better
The panel is already well calibrated out of the box and there is just a minor green hue in the grayscale, but it is hardly visible with the naked eye. The DeltaE-2000 deviations of the colors compared to the sRGB reference color space are also very small and most users will not need an additional calibration.

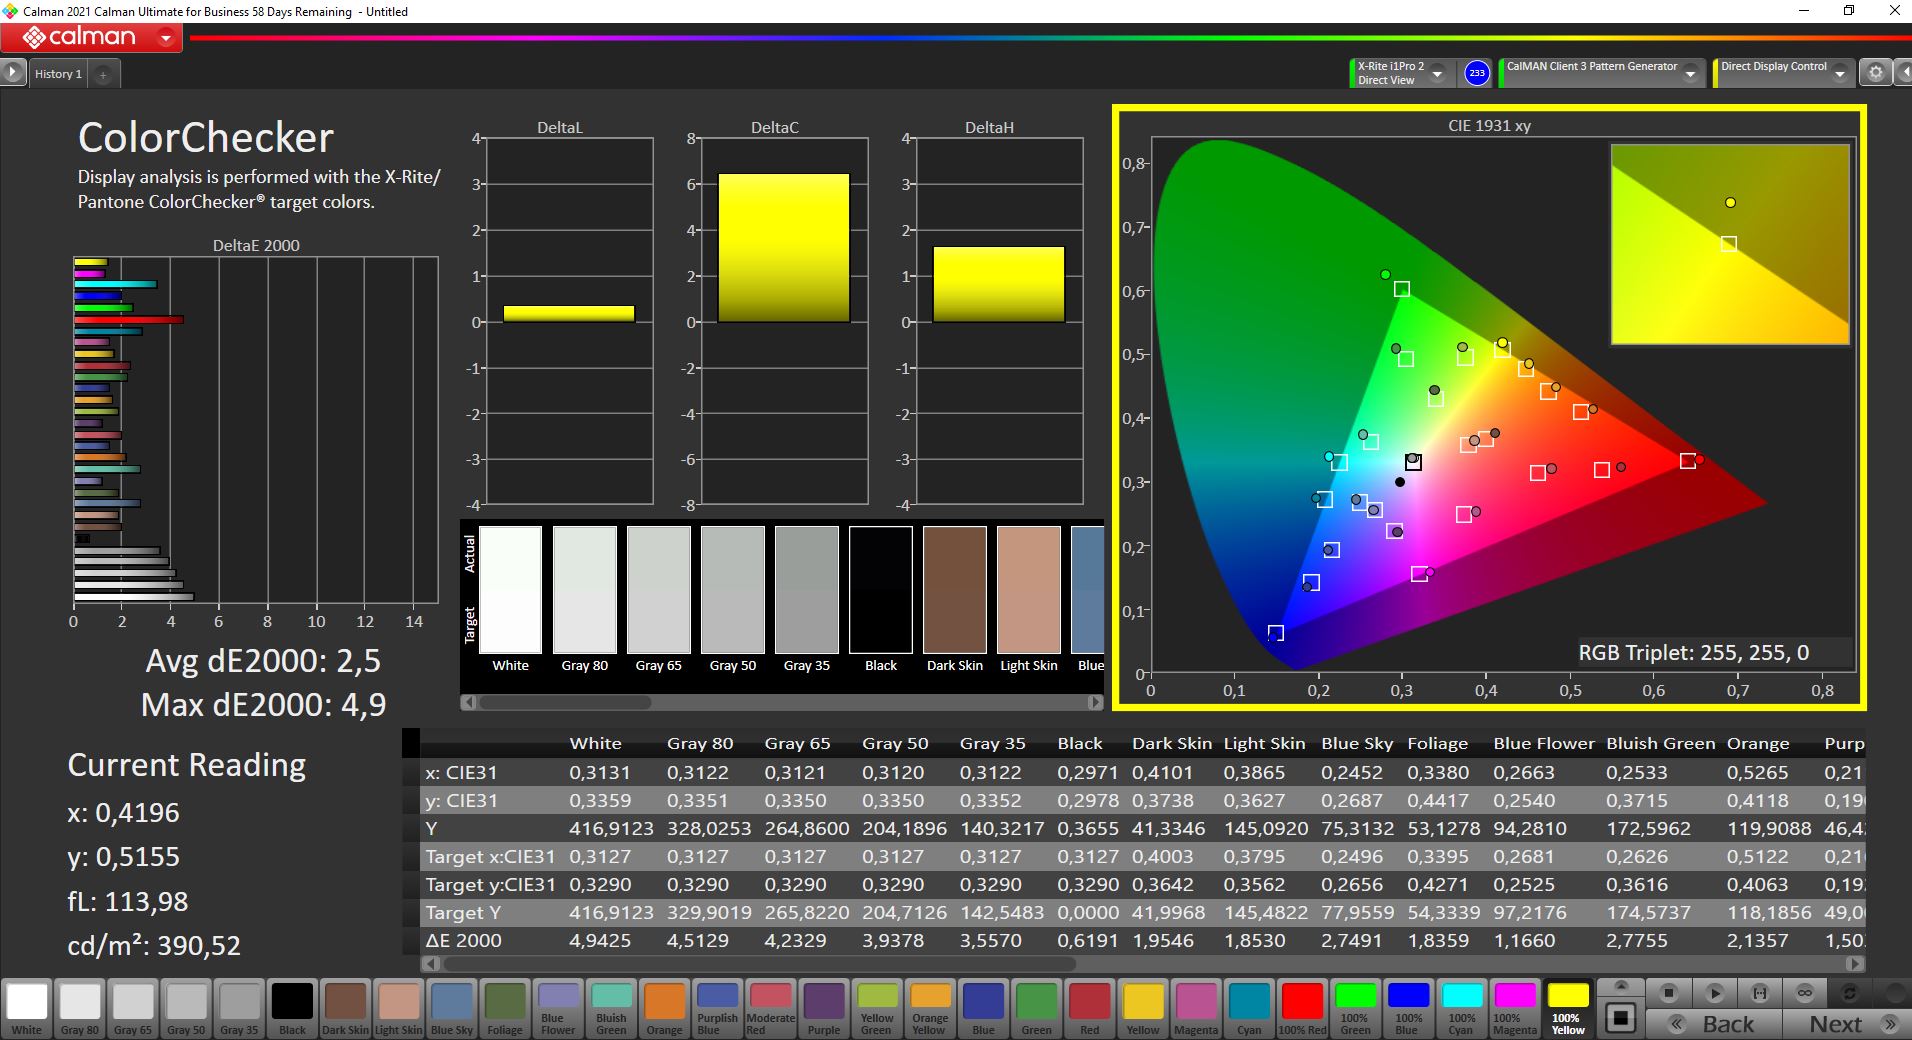
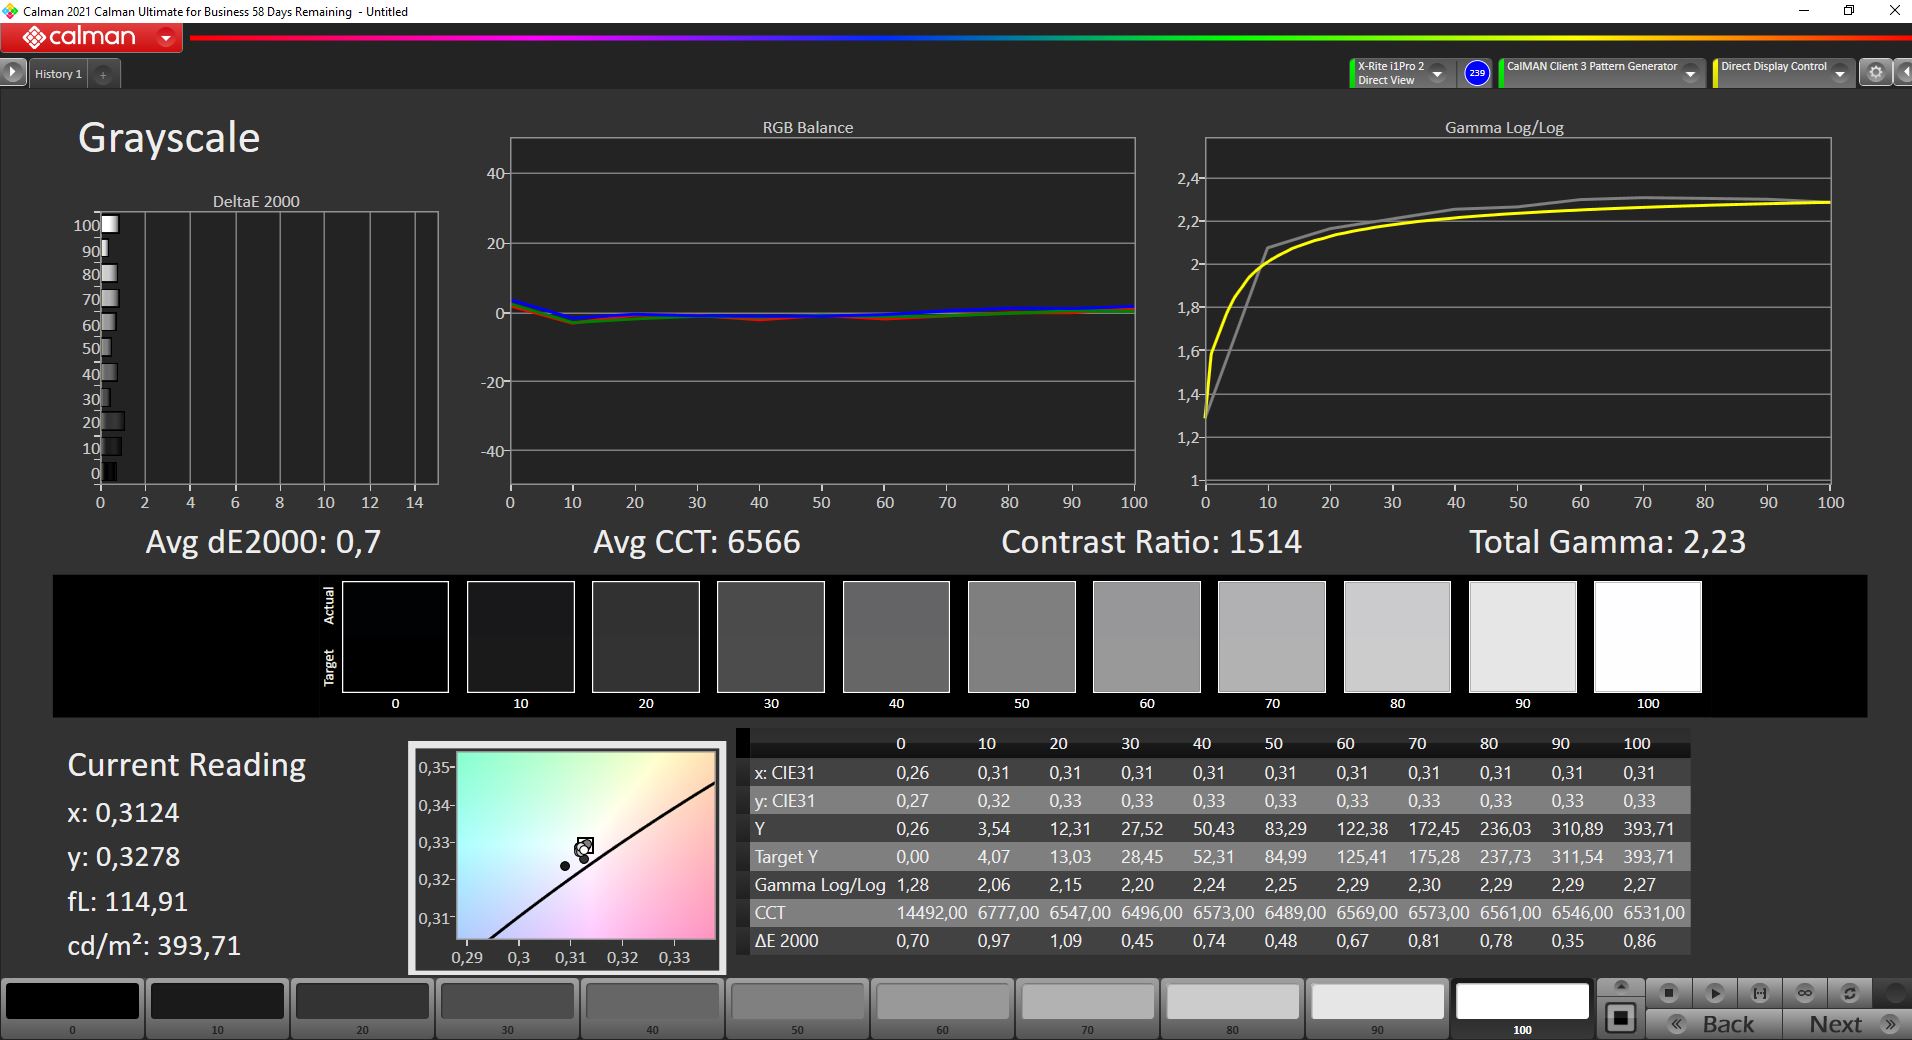
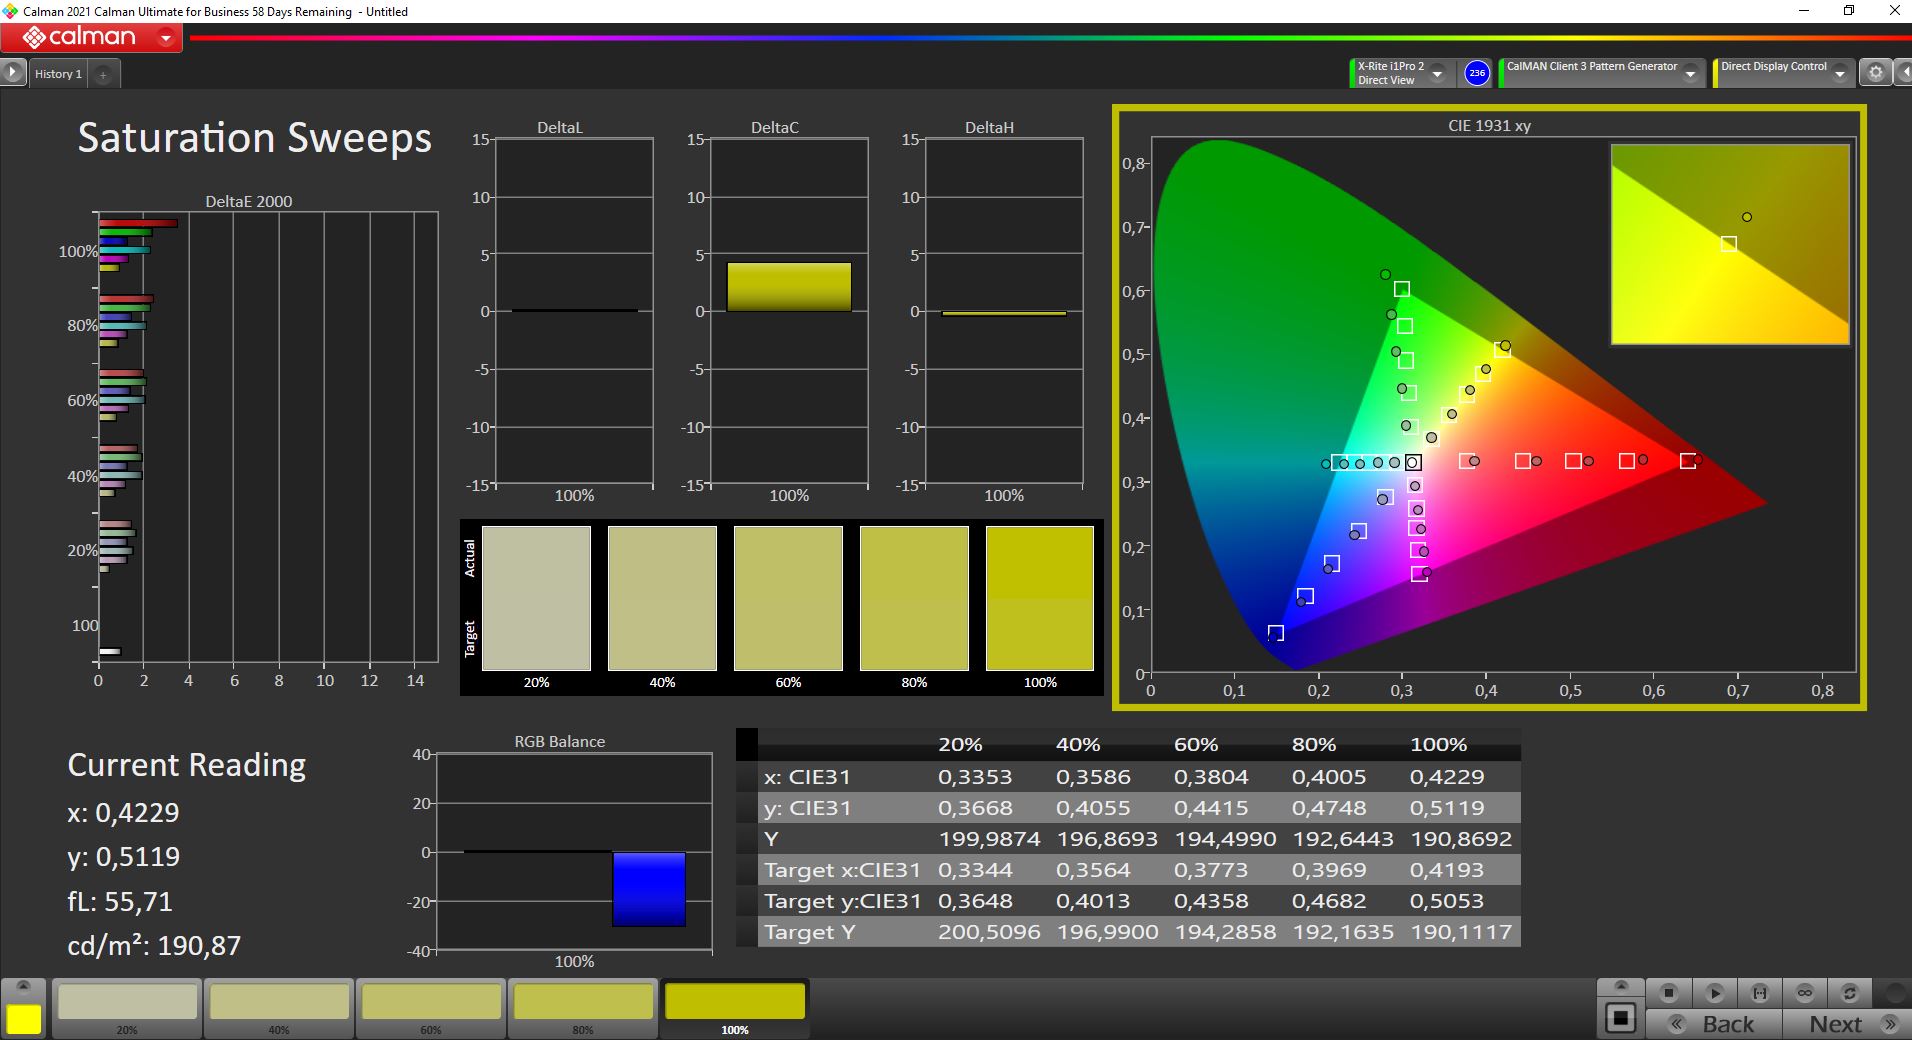
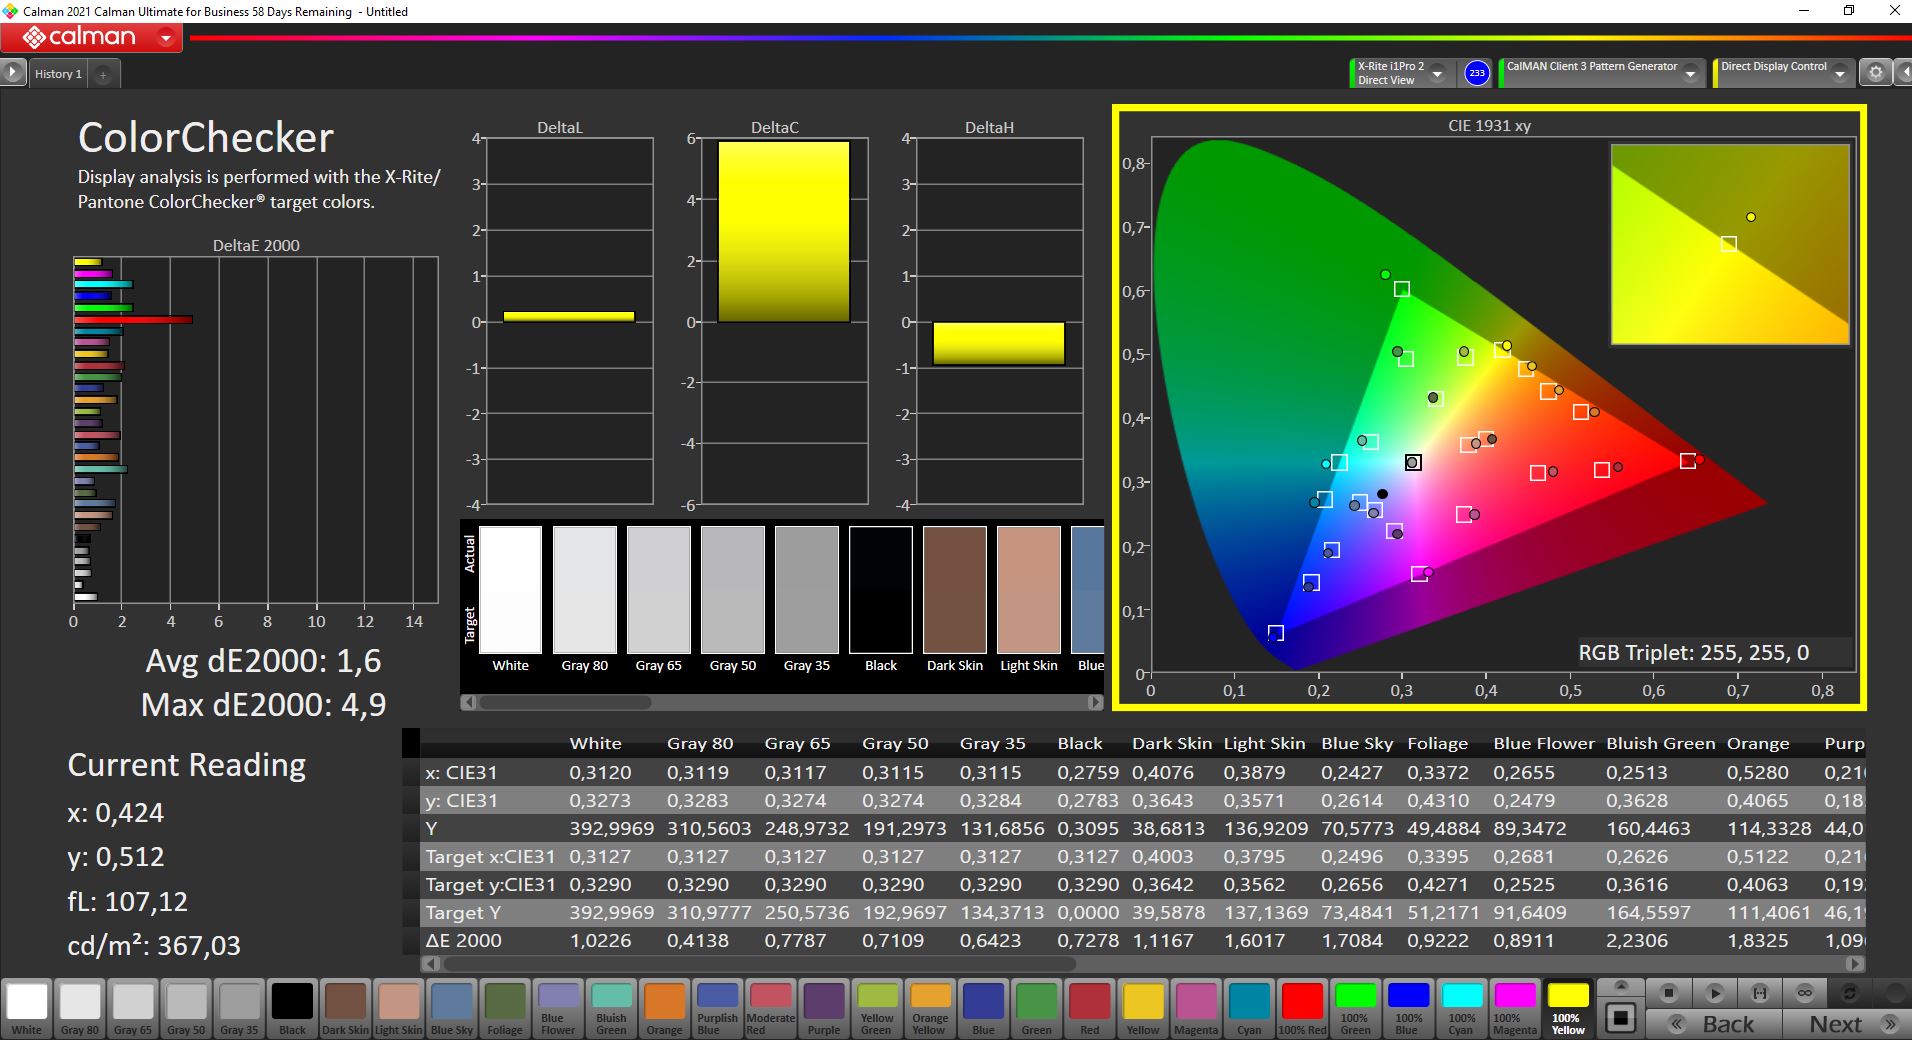
We managed to improve the picture quality slightly with our calibration (profile is available for free in the box above), but the maximum brightness drops by 30 nits. Only red surpasses the important mark of 3, but the display is still suited for picture/video editing thanks to the full sRGB gamut.
Display Response Times
| ↔ Response Time Black to White | ||
|---|---|---|
| 26.4 ms ... rise ↗ and fall ↘ combined | ↗ 14 ms rise | 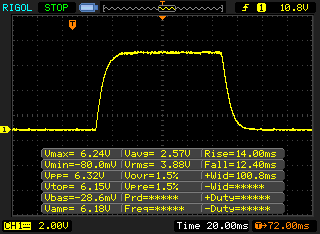 |
| ↘ 12.4 ms fall | ||
| The screen shows relatively slow response rates in our tests and may be too slow for gamers. In comparison, all tested devices range from 0.1 (minimum) to 240 (maximum) ms. » 65 % of all devices are better. This means that the measured response time is worse than the average of all tested devices (20 ms). | ||
| ↔ Response Time 50% Grey to 80% Grey | ||
| 40.8 ms ... rise ↗ and fall ↘ combined | ↗ 20.4 ms rise | 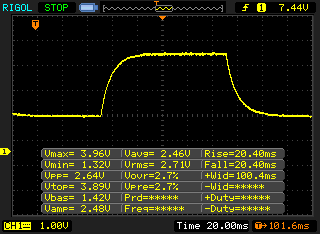 |
| ↘ 20.4 ms fall | ||
| The screen shows slow response rates in our tests and will be unsatisfactory for gamers. In comparison, all tested devices range from 0.165 (minimum) to 636 (maximum) ms. » 64 % of all devices are better. This means that the measured response time is worse than the average of all tested devices (31.4 ms). | ||
Screen Flickering / PWM (Pulse-Width Modulation)
| Screen flickering / PWM not detected | 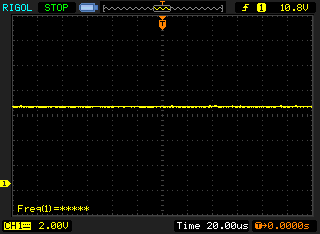 | ||
In comparison: 53 % of all tested devices do not use PWM to dim the display. If PWM was detected, an average of 7969 (minimum: 5 - maximum: 343500) Hz was measured. | |||
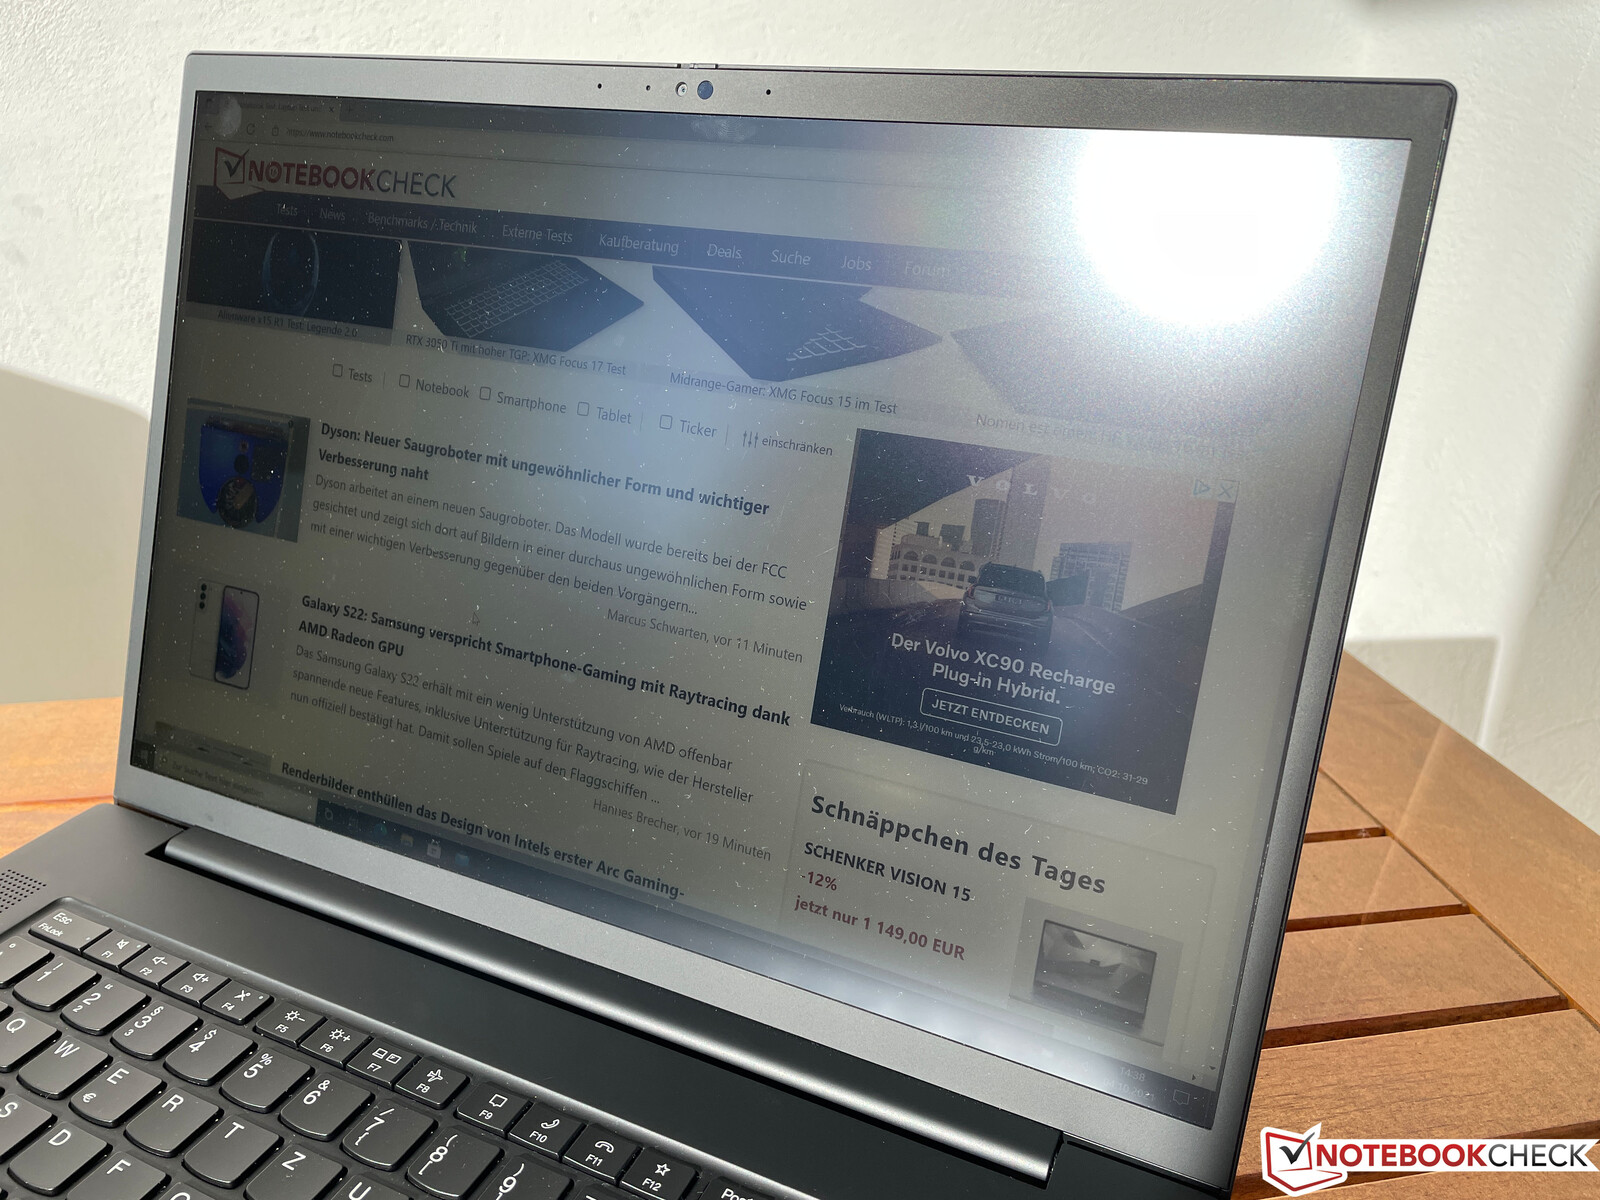
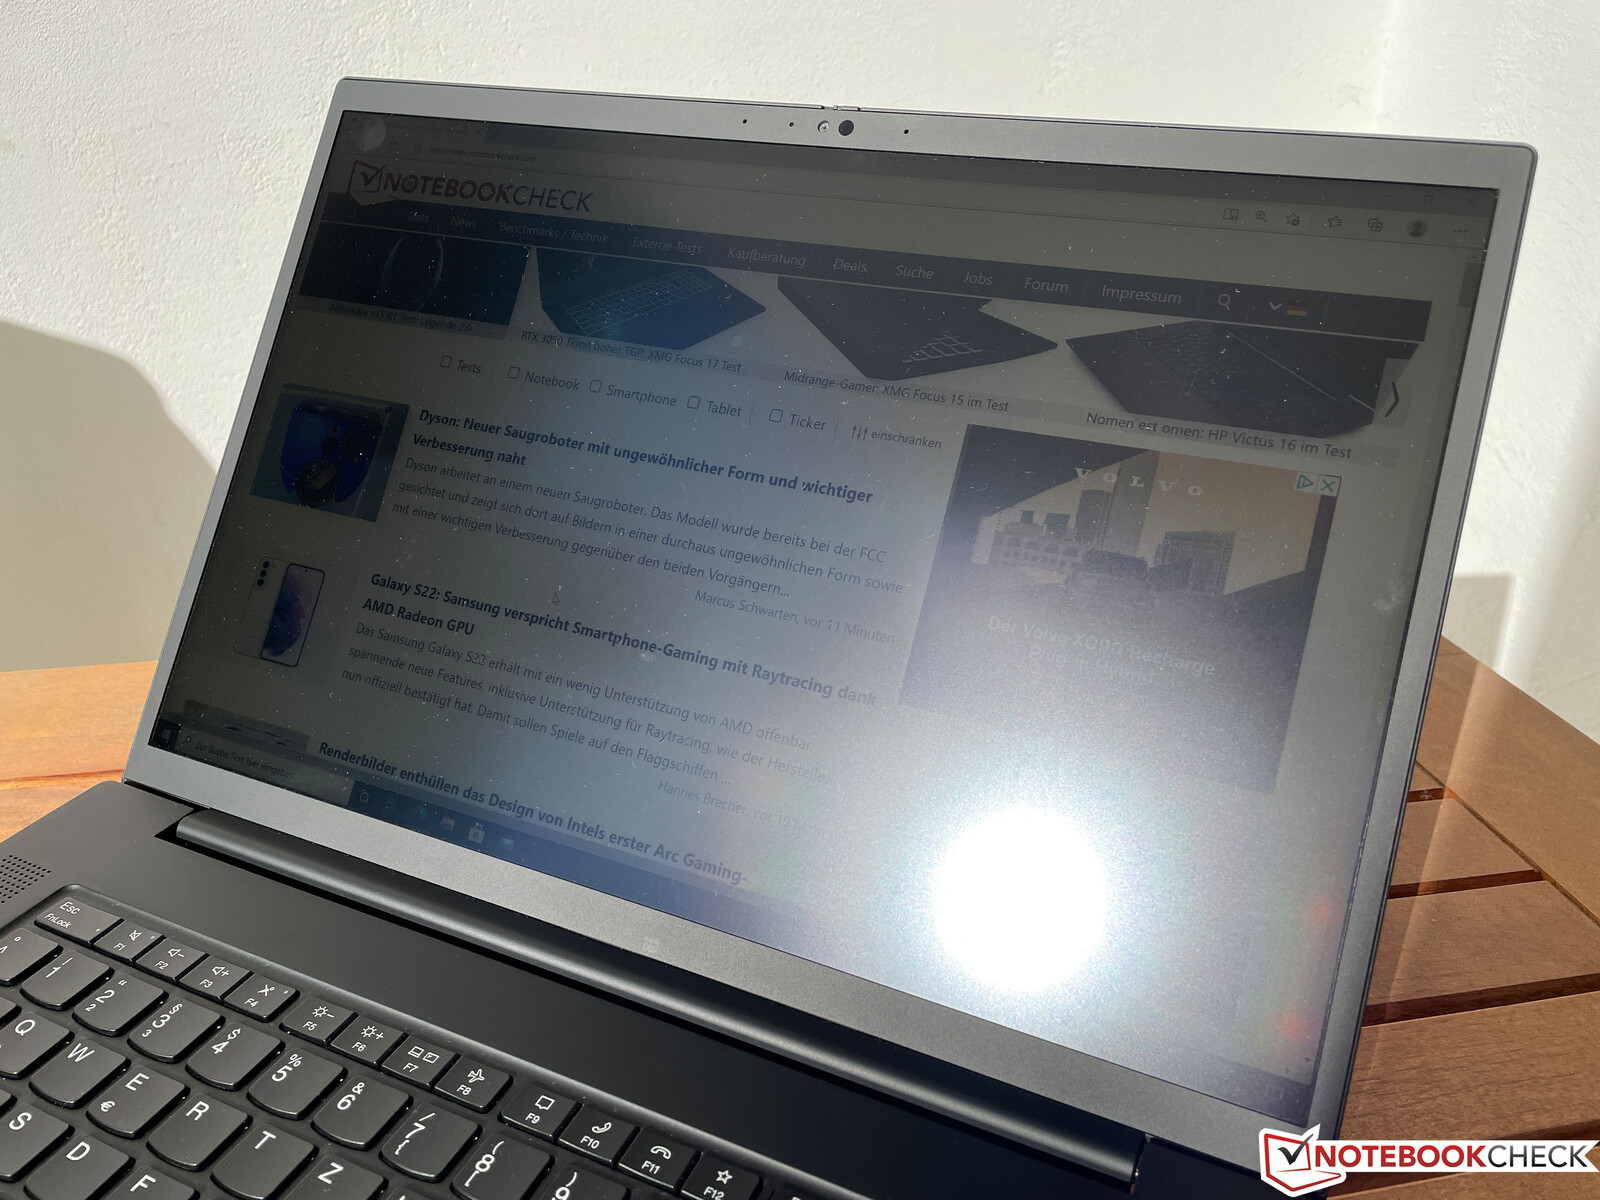
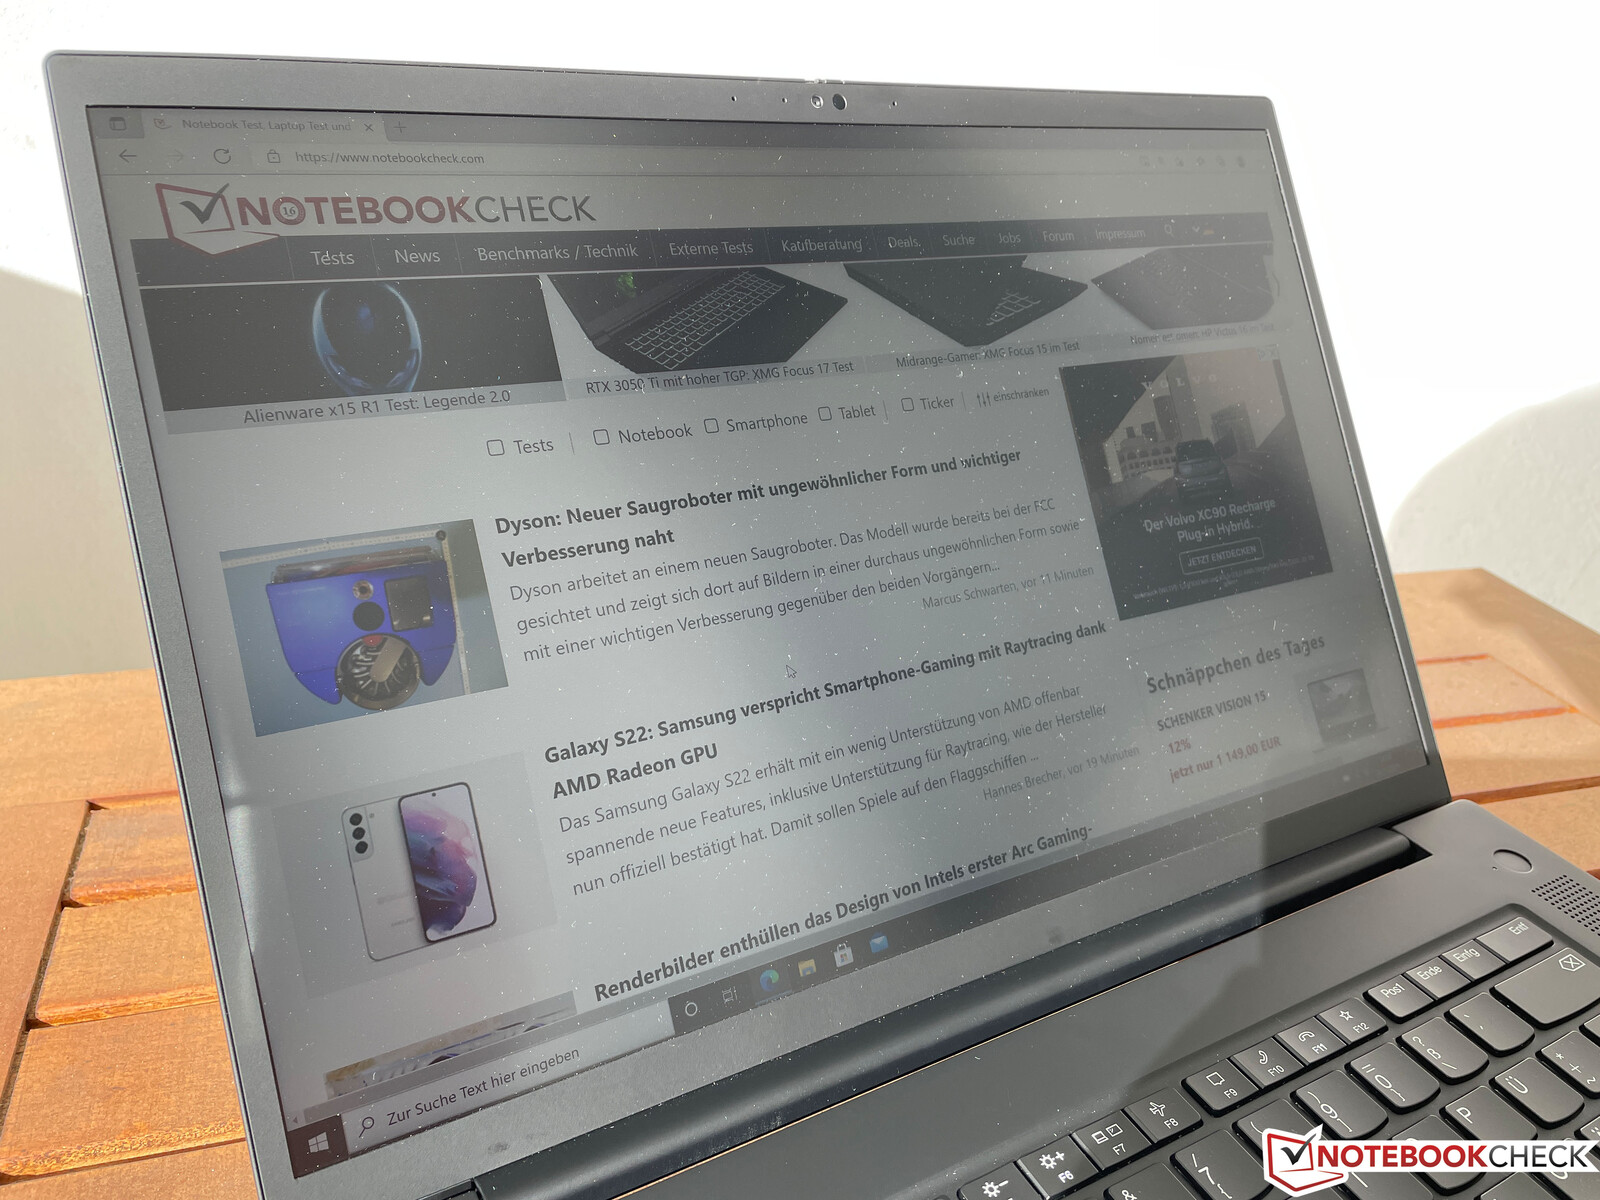
The 16-inch screen works well outdoors and you can still use it in bright environments. The viewing angle stability is also very good.
Performance - Tiger Lake-H45 and Nvidia T1200
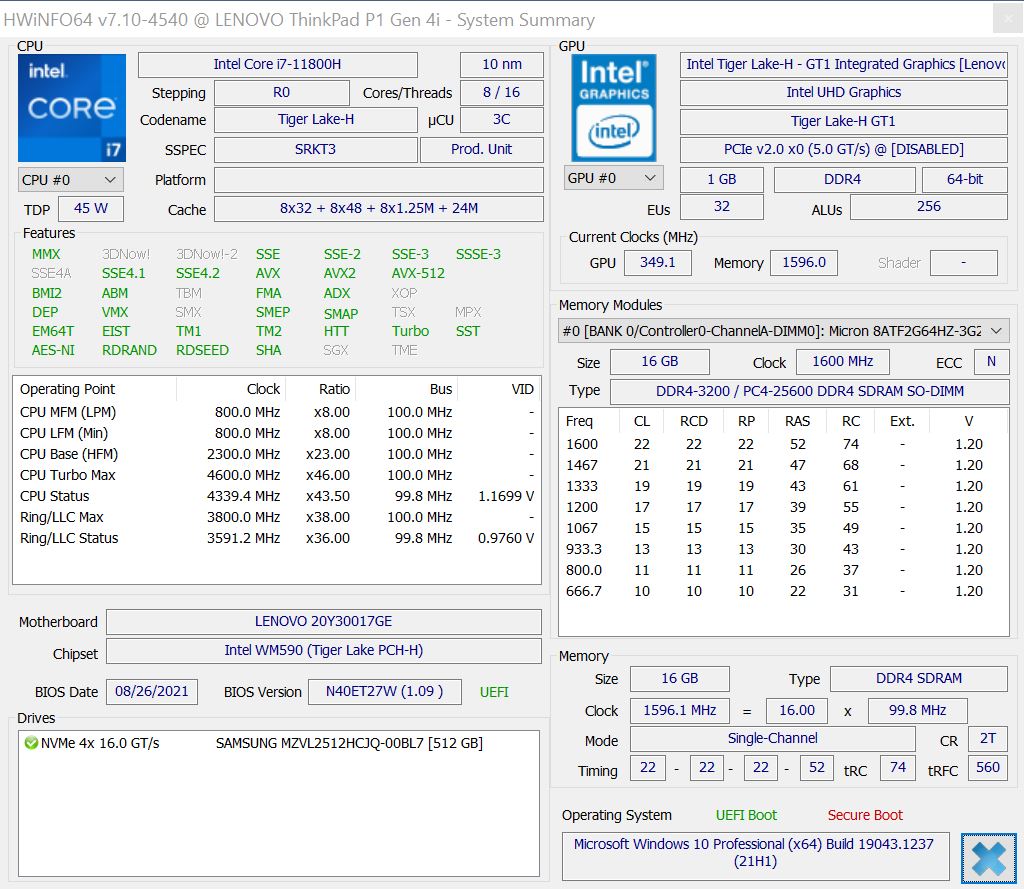
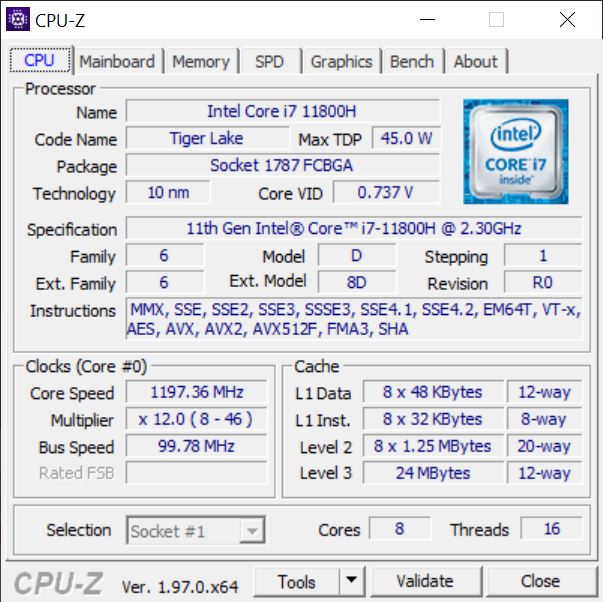
Processor - Core i7-11800H
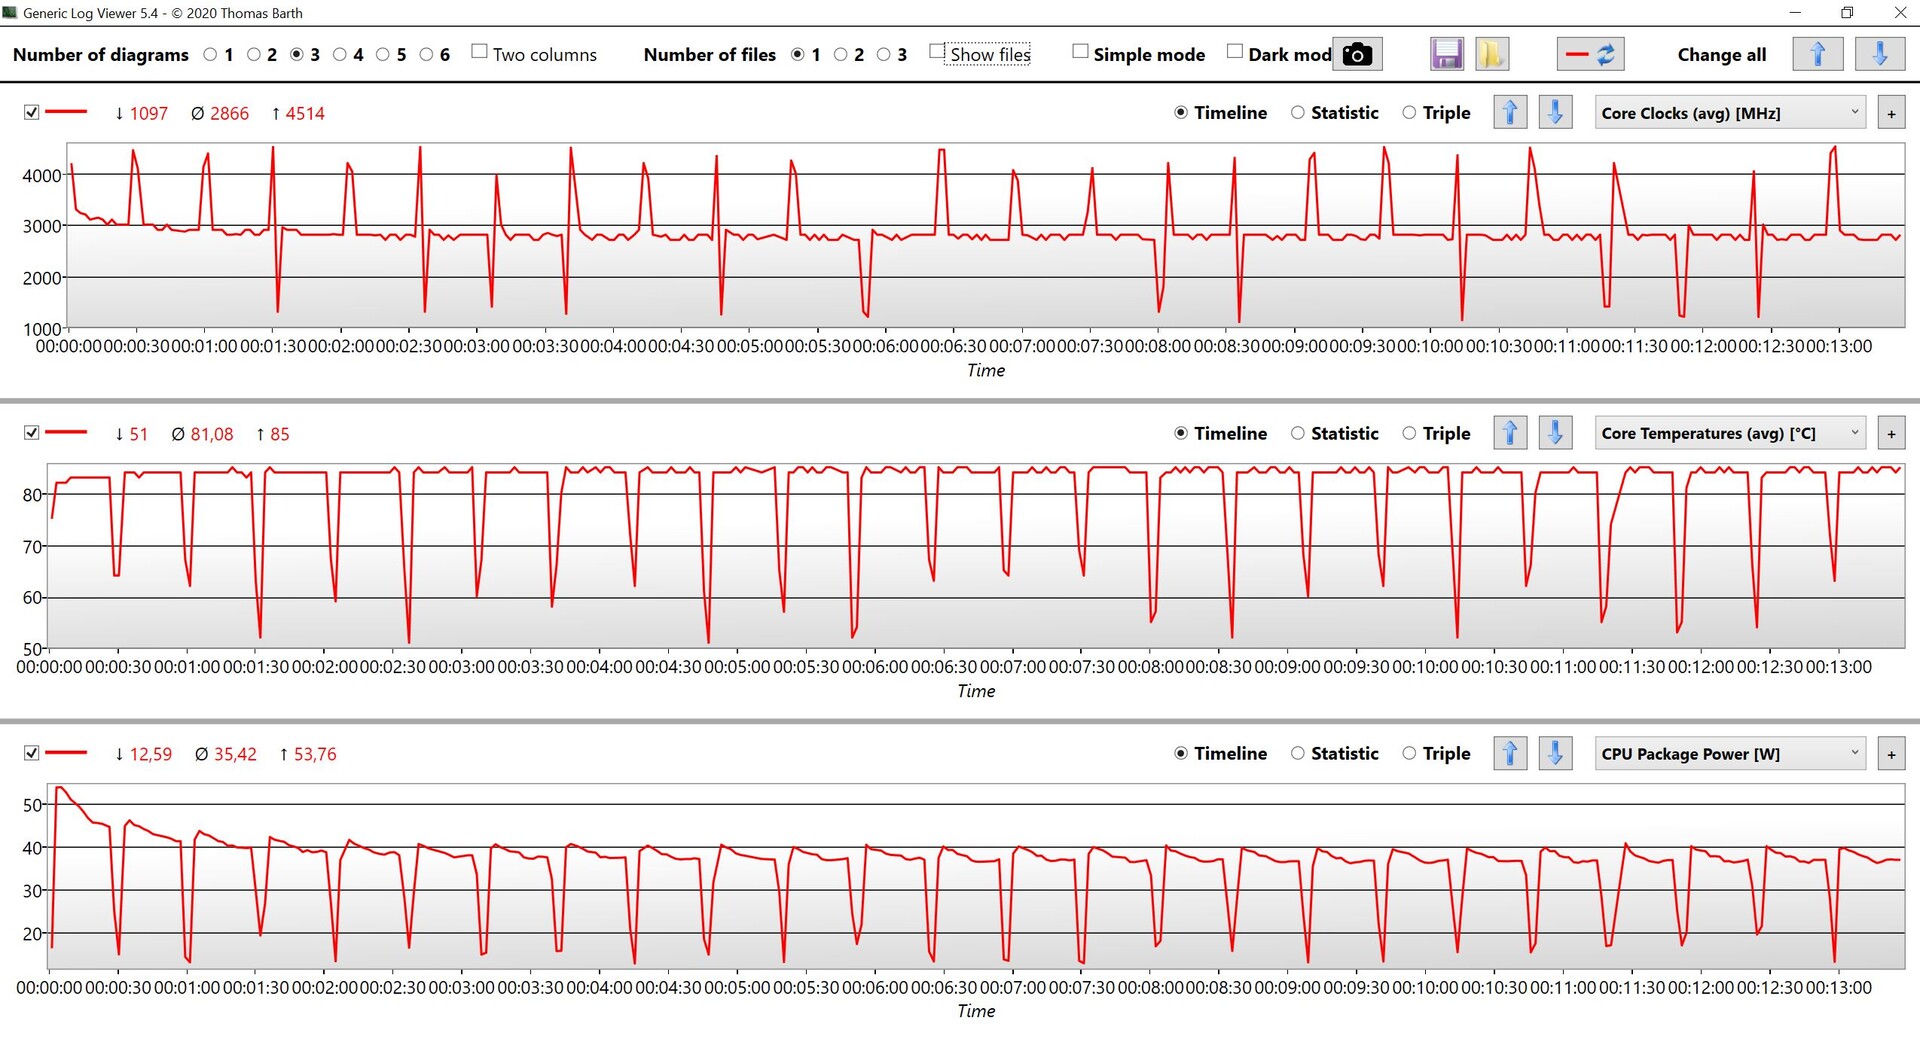
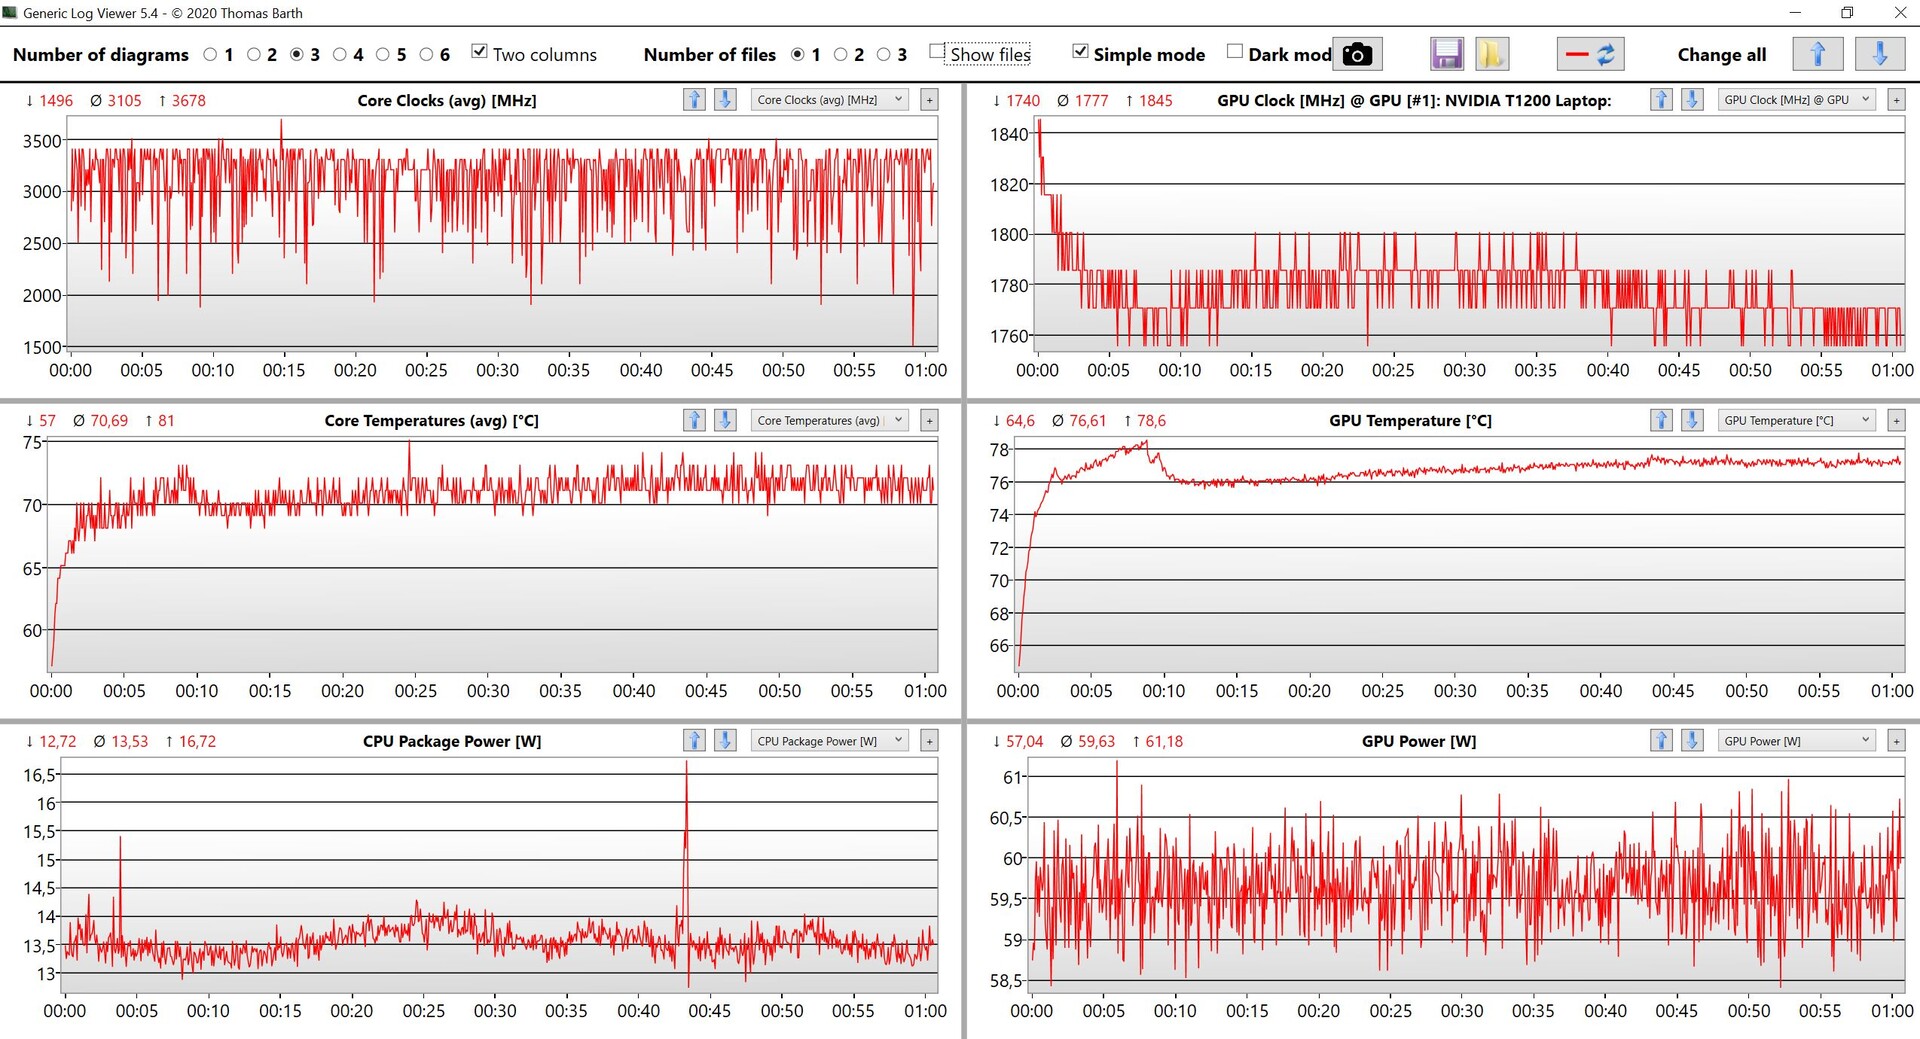
The Core i7-11800H from Intel is currently used in many notebooks. It has 8 cores (16 threads) and reaches a maximum clock of up to 4.6 GHz. Lenovo sets the TDP limits very generously to 109 Watts, but this value is purely theoretical. In practice, however, the processor even struggles to run at its nominal TDP of 45 Watts. A look at the data from our Cinebench loop below shows that the TDP is shortly above 50 Watts, but then quickly drops below 40 Watts.
This is a very poor result for an expensive workstation for pure CPU-load scenarios. The i7-11800H is also 20-30% slower compared to our average score for the i7-11800H in our database. All in all, the CPU performance is comparable to mobile workstations with 9th generation Intel CPUs (so more than two years old). That the i7-11800H can be much faster is shown by the slim gaming laptop Alienware x15, for example. AMD’s current mobile processors like the Ryzen 9 5900HX in the less expensive ThinkBook 16p offer much more performance. We are already eager to see how models with the vapor chamber cooling will perform.
The performance is at least steady on battery power. More processor benchmarks are available in our Tech section.
Cinebench R15 Multi Dauertest
Cinebench R20: CPU (Multi Core) | CPU (Single Core)
Cinebench R15: CPU Multi 64Bit | CPU Single 64Bit
Blender: v2.79 BMW27 CPU
7-Zip 18.03: 7z b 4 | 7z b 4 -mmt1
Geekbench 5.5: Multi-Core | Single-Core
HWBOT x265 Benchmark v2.2: 4k Preset
LibreOffice : 20 Documents To PDF
R Benchmark 2.5: Overall mean
| Cinebench R23 / Multi Core | |
| Average of class Workstation (14055 - 38520, n=28, last 2 years) | |
| Lenovo ThinkBook 16p G2 ACH | |
| HP ZBook Studio 15 G8 | |
| Average Intel Core i7-11800H (6508 - 14088, n=48) | |
| Lenovo ThinkPad P1 G4-20Y30017GE | |
| Apple MacBook Pro 16 2019 i9 5500M | |
| Apple MacBook Pro 16 2019 i9 5500M | |
| Cinebench R23 / Single Core | |
| Average of class Workstation (1712 - 2228, n=28, last 2 years) | |
| HP ZBook Studio 15 G8 | |
| Average Intel Core i7-11800H (1386 - 1522, n=45) | |
| Lenovo ThinkBook 16p G2 ACH | |
| Lenovo ThinkPad P1 G4-20Y30017GE | |
| Apple MacBook Pro 16 2019 i9 5500M | |
| Cinebench R20 / CPU (Multi Core) | |
| Average of class Workstation (5471 - 15043, n=28, last 2 years) | |
| Lenovo ThinkBook 16p G2 ACH | |
| HP ZBook Studio 15 G8 | |
| Average Intel Core i7-11800H (2498 - 5408, n=50) | |
| Lenovo ThinkPad P1 G4-20Y30017GE | |
| Apple MacBook Pro 16 2019 i9 5500M | |
| Apple MacBook Pro 16 2019 i9 5500M | |
| Lenovo ThinkPad P1 2019-20QT000RGE | |
| Cinebench R20 / CPU (Single Core) | |
| Average of class Workstation (671 - 857, n=28, last 2 years) | |
| HP ZBook Studio 15 G8 | |
| Lenovo ThinkBook 16p G2 ACH | |
| Average Intel Core i7-11800H (520 - 586, n=47) | |
| Lenovo ThinkPad P1 G4-20Y30017GE | |
| Apple MacBook Pro 16 2019 i9 5500M | |
| Apple MacBook Pro 16 2019 i9 5500M | |
| Lenovo ThinkPad P1 2019-20QT000RGE | |
| Cinebench R15 / CPU Multi 64Bit | |
| Average of class Workstation (2404 - 5810, n=28, last 2 years) | |
| Lenovo ThinkBook 16p G2 ACH | |
| Average Intel Core i7-11800H (1342 - 2173, n=50) | |
| HP ZBook Studio 15 G8 | |
| Lenovo ThinkPad P1 G4-20Y30017GE | |
| Apple MacBook Pro 16 2019 i9 5500M | |
| Apple MacBook Pro 16 2019 i9 5500M | |
| Dell Precision 5540 | |
| Lenovo ThinkPad P1 2019-20QT000RGE | |
| Cinebench R15 / CPU Single 64Bit | |
| Average of class Workstation (191.4 - 328, n=28, last 2 years) | |
| Lenovo ThinkBook 16p G2 ACH | |
| HP ZBook Studio 15 G8 | |
| Average Intel Core i7-11800H (201 - 231, n=46) | |
| Lenovo ThinkPad P1 G4-20Y30017GE | |
| Lenovo ThinkPad P1 2019-20QT000RGE | |
| Dell Precision 5540 | |
| Apple MacBook Pro 16 2019 i9 5500M | |
| Apple MacBook Pro 16 2019 i9 5500M | |
| Blender / v2.79 BMW27 CPU | |
| Lenovo ThinkPad P1 2019-20QT000RGE | |
| Dell Precision 5540 | |
| Apple MacBook Pro 16 2019 i9 5500M | |
| Lenovo ThinkPad P1 G4-20Y30017GE | |
| Average Intel Core i7-11800H (217 - 454, n=46) | |
| HP ZBook Studio 15 G8 | |
| Lenovo ThinkBook 16p G2 ACH | |
| Average of class Workstation (91 - 261, n=28, last 2 years) | |
| 7-Zip 18.03 / 7z b 4 | |
| Average of class Workstation (53407 - 116969, n=28, last 2 years) | |
| Lenovo ThinkBook 16p G2 ACH | |
| HP ZBook Studio 15 G8 | |
| Average Intel Core i7-11800H (33718 - 56758, n=46) | |
| Dell Precision 5540 | |
| Apple MacBook Pro 16 2019 i9 5500M | |
| Lenovo ThinkPad P1 G4-20Y30017GE | |
| Lenovo ThinkPad P1 2019-20QT000RGE | |
| 7-Zip 18.03 / 7z b 4 -mmt1 | |
| Average of class Workstation (4981 - 6960, n=28, last 2 years) | |
| Lenovo ThinkBook 16p G2 ACH | |
| HP ZBook Studio 15 G8 | |
| Lenovo ThinkPad P1 G4-20Y30017GE | |
| Average Intel Core i7-11800H (5138 - 5732, n=46) | |
| Dell Precision 5540 | |
| Lenovo ThinkPad P1 2019-20QT000RGE | |
| Apple MacBook Pro 16 2019 i9 5500M | |
| Geekbench 5.5 / Multi-Core | |
| Average of class Workstation (11542 - 25554, n=28, last 2 years) | |
| Lenovo ThinkBook 16p G2 ACH | |
| Average Intel Core i7-11800H (4655 - 9851, n=40) | |
| HP ZBook Studio 15 G8 | |
| Apple MacBook Pro 16 2019 i9 5500M | |
| Lenovo ThinkPad P1 G4-20Y30017GE | |
| Geekbench 5.5 / Single-Core | |
| Average of class Workstation (1759 - 2183, n=28, last 2 years) | |
| HP ZBook Studio 15 G8 | |
| Average Intel Core i7-11800H (1429 - 1625, n=40) | |
| Lenovo ThinkBook 16p G2 ACH | |
| Lenovo ThinkPad P1 G4-20Y30017GE | |
| Apple MacBook Pro 16 2019 i9 5500M | |
| HWBOT x265 Benchmark v2.2 / 4k Preset | |
| Average of class Workstation (14.4 - 40.5, n=28, last 2 years) | |
| Lenovo ThinkBook 16p G2 ACH | |
| HP ZBook Studio 15 G8 | |
| Average Intel Core i7-11800H (7.38 - 17.4, n=46) | |
| Dell Precision 5540 | |
| Lenovo ThinkPad P1 G4-20Y30017GE | |
| Apple MacBook Pro 16 2019 i9 5500M | |
| Lenovo ThinkPad P1 2019-20QT000RGE | |
| LibreOffice / 20 Documents To PDF | |
| Apple MacBook Pro 16 2019 i9 5500M | |
| Apple MacBook Pro 16 2019 i9 5500M | |
| Lenovo ThinkBook 16p G2 ACH | |
| Lenovo ThinkPad P1 G4-20Y30017GE | |
| HP ZBook Studio 15 G8 | |
| Average of class Workstation (37.1 - 74.7, n=28, last 2 years) | |
| Average Intel Core i7-11800H (38.6 - 59.9, n=45) | |
| R Benchmark 2.5 / Overall mean | |
| Apple MacBook Pro 16 2019 i9 5500M | |
| Apple MacBook Pro 16 2019 i9 5500M | |
| Lenovo ThinkPad P1 G4-20Y30017GE | |
| Average Intel Core i7-11800H (0.548 - 0.615, n=46) | |
| HP ZBook Studio 15 G8 | |
| Lenovo ThinkBook 16p G2 ACH | |
| Average of class Workstation (0.3825 - 0.603, n=28, last 2 years) | |
* ... smaller is better
System Performance
Subjectively, the new ThinkPad P1 G4 is a very responsive system, but this should not be surprising when you consider the components including the fast PCIe 4.0. The benchmark scores are average and do not indicate any limitations.
According to Lenovo, the ThinkPad P1 G4 is fully compatible with the new Windows 11, which will be available as a free upgrade.
| PCMark 10 / Score | |
| Average of class Workstation (6436 - 10409, n=23, last 2 years) | |
| HP ZBook Studio 15 G8 | |
| Lenovo ThinkBook 16p G2 ACH | |
| Average Intel Core i7-11800H, NVIDIA T1200 Laptop GPU (5889 - 6147, n=3) | |
| Lenovo ThinkPad P1 G4-20Y30017GE | |
| Apple MacBook Pro 16 2019 i9 5500M | |
| Dell Precision 5540 | |
| Lenovo ThinkPad P1 2019-20QT000RGE | |
| PCMark 10 / Essentials | |
| Average of class Workstation (9622 - 11157, n=23, last 2 years) | |
| Lenovo ThinkBook 16p G2 ACH | |
| HP ZBook Studio 15 G8 | |
| Average Intel Core i7-11800H, NVIDIA T1200 Laptop GPU (9776 - 9956, n=3) | |
| Lenovo ThinkPad P1 G4-20Y30017GE | |
| Dell Precision 5540 | |
| Lenovo ThinkPad P1 2019-20QT000RGE | |
| PCMark 10 / Productivity | |
| Average of class Workstation (8789 - 20616, n=23, last 2 years) | |
| Lenovo ThinkBook 16p G2 ACH | |
| HP ZBook Studio 15 G8 | |
| Lenovo ThinkPad P1 G4-20Y30017GE | |
| Average Intel Core i7-11800H, NVIDIA T1200 Laptop GPU (8276 - 8445, n=3) | |
| Lenovo ThinkPad P1 2019-20QT000RGE | |
| Dell Precision 5540 | |
| PCMark 10 / Digital Content Creation | |
| Average of class Workstation (7744 - 15631, n=23, last 2 years) | |
| HP ZBook Studio 15 G8 | |
| Lenovo ThinkBook 16p G2 ACH | |
| Average Intel Core i7-11800H, NVIDIA T1200 Laptop GPU (6851 - 7581, n=3) | |
| Lenovo ThinkPad P1 G4-20Y30017GE | |
| Dell Precision 5540 | |
| Lenovo ThinkPad P1 2019-20QT000RGE | |
| PCMark 10 Score | 5969 points | |
Help | ||
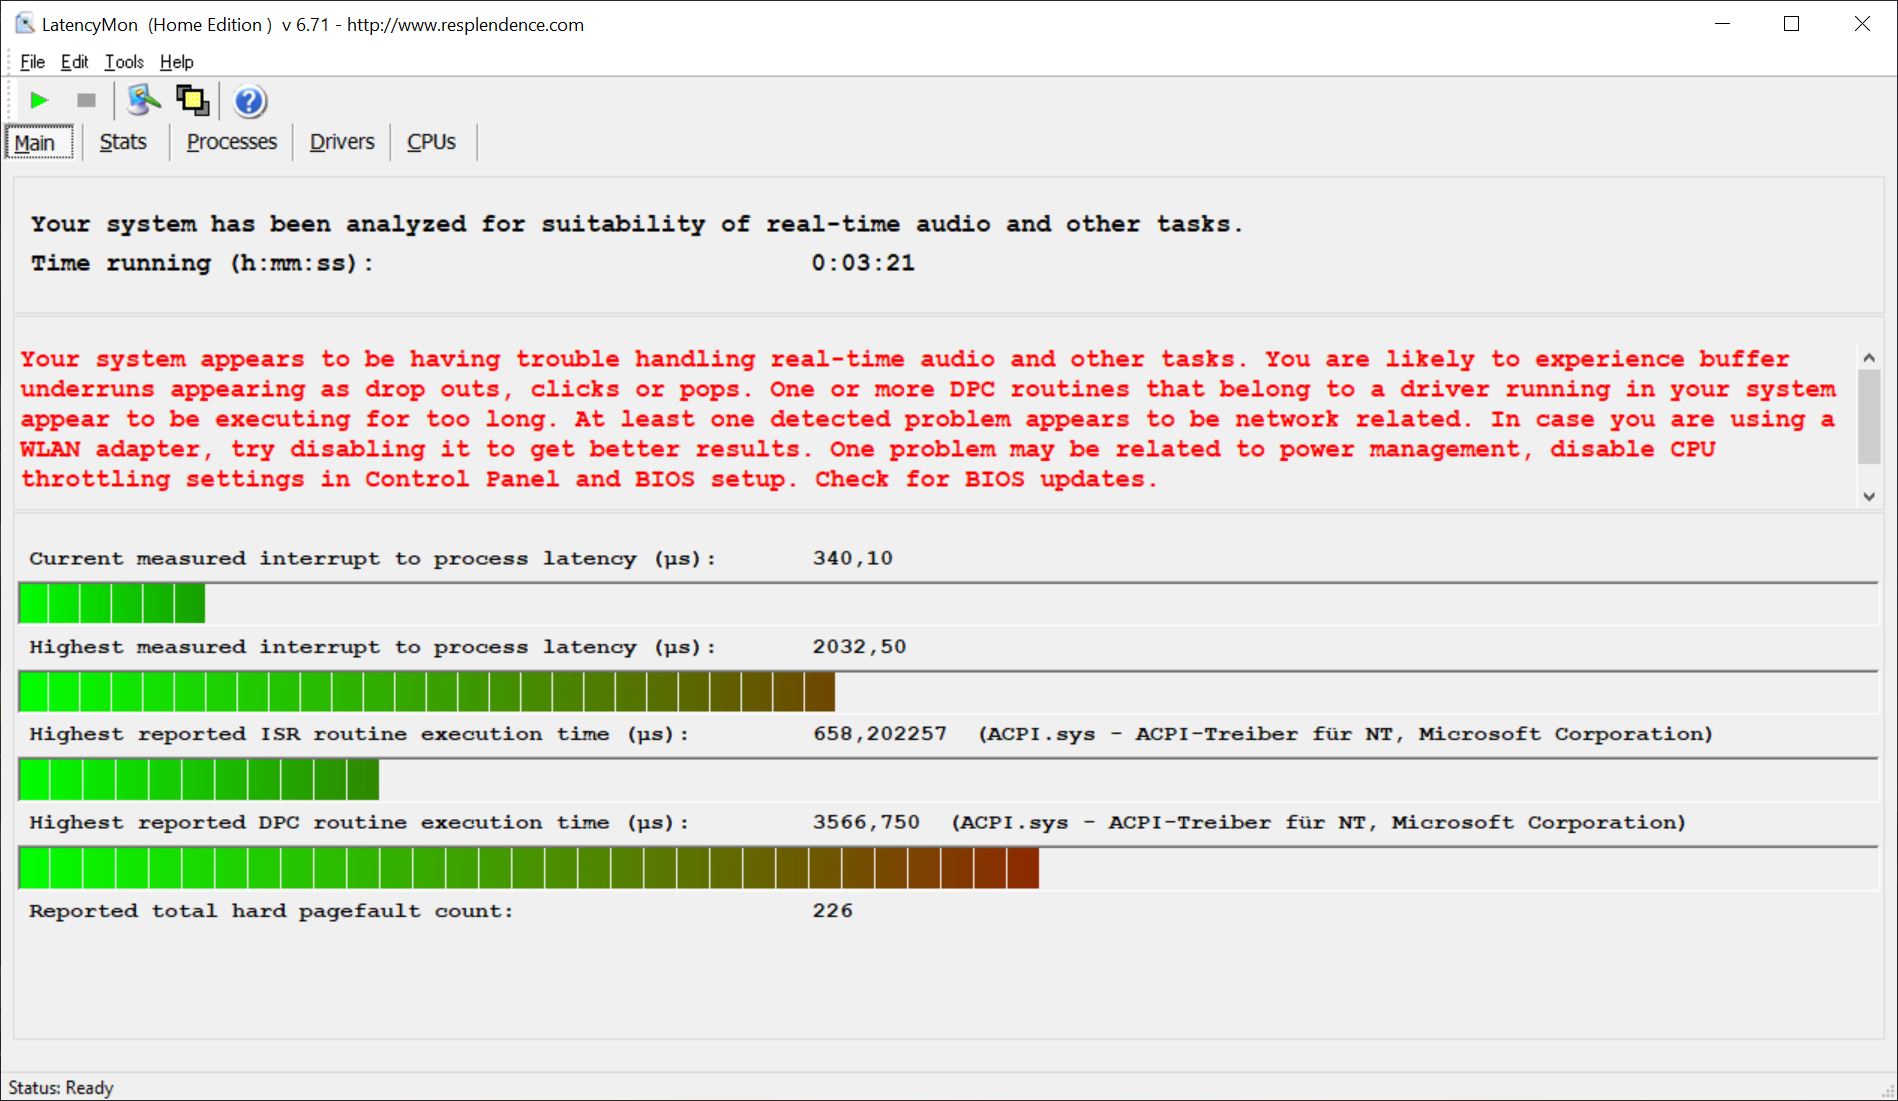
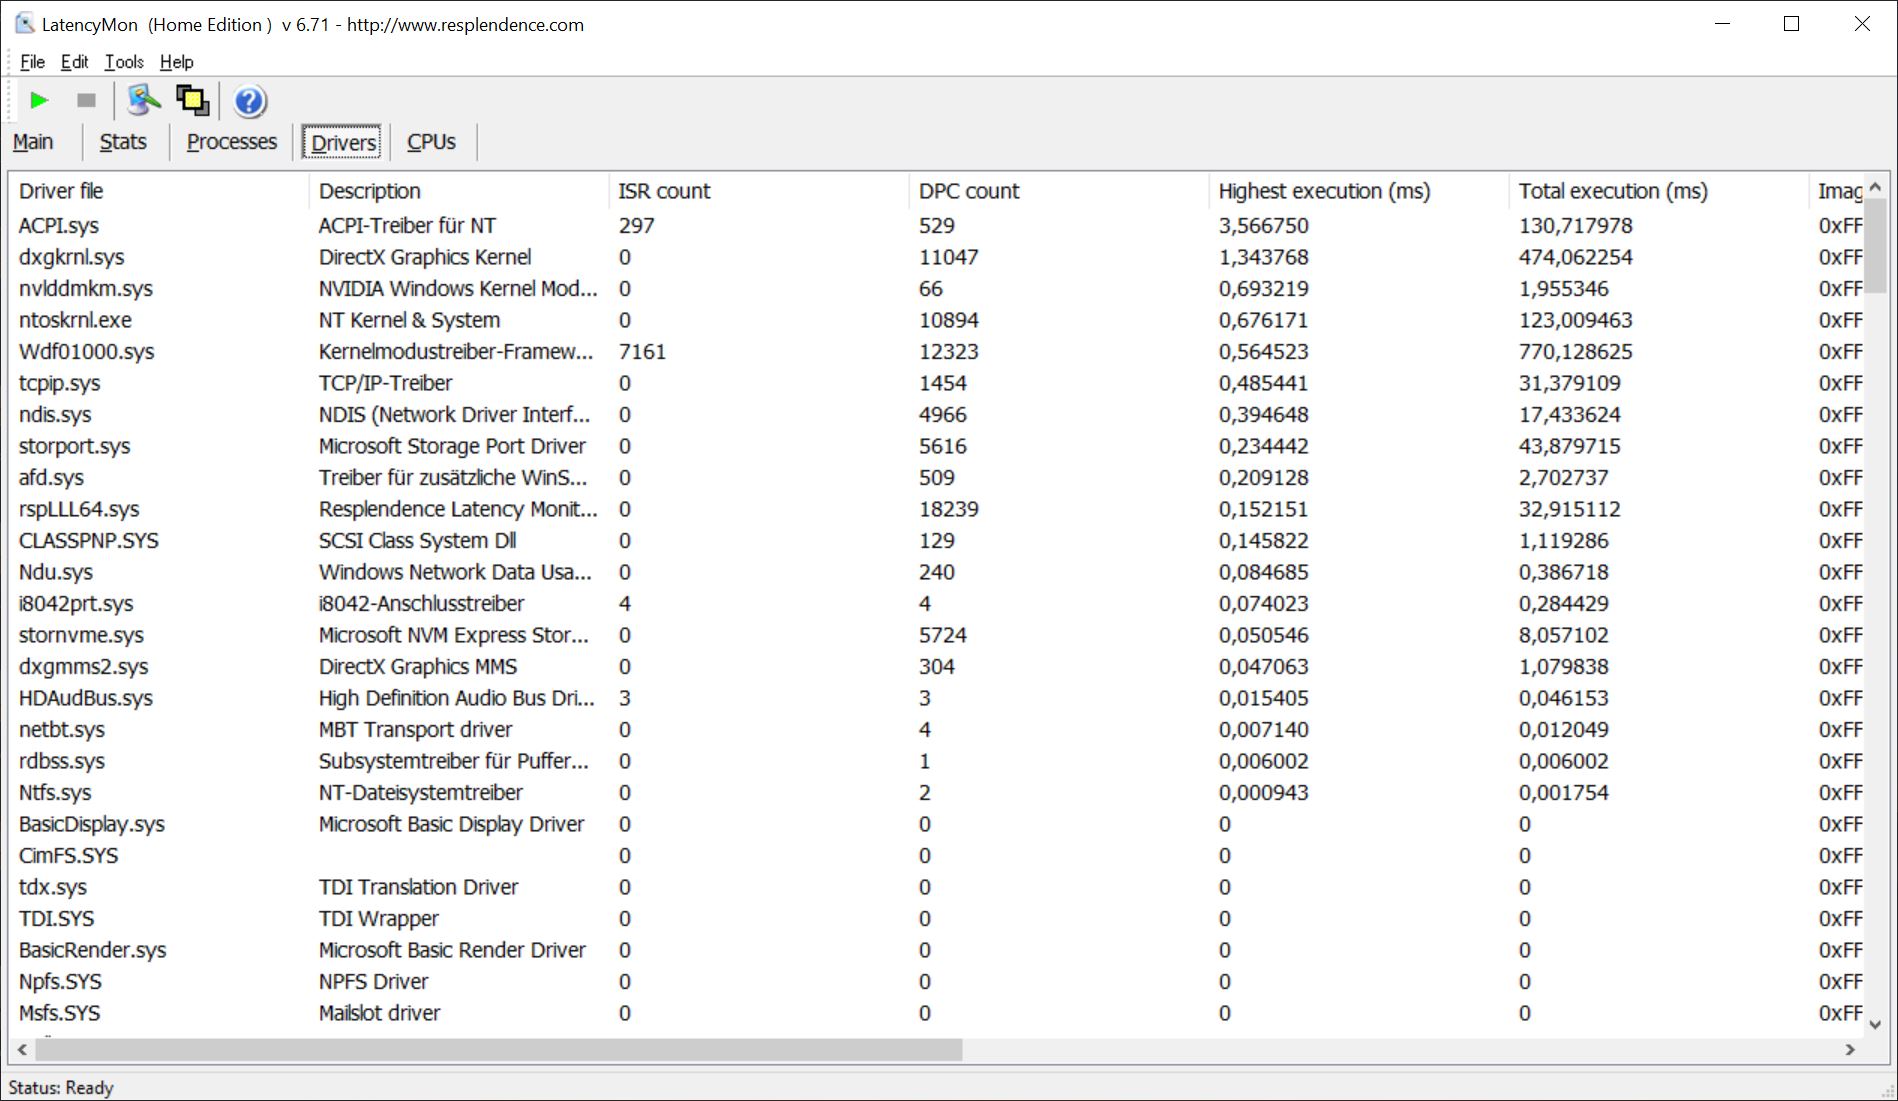
DPC-Latency
Our standardized latency test shows some problems and the P1 G4 is not suited for real-time audio applications. 4K video playback (YouTube) also resulted in some dropped frames. We hope Lenovo can fix these issues with an upcoming BIOS update.
| DPC Latencies / LatencyMon - interrupt to process latency (max), Web, Youtube, Prime95 | |
| Lenovo ThinkPad P1 G4-20Y30017GE | |
| HP ZBook Studio 15 G8 | |
| Lenovo ThinkBook 16p G2 ACH | |
* ... smaller is better
Storage Devices
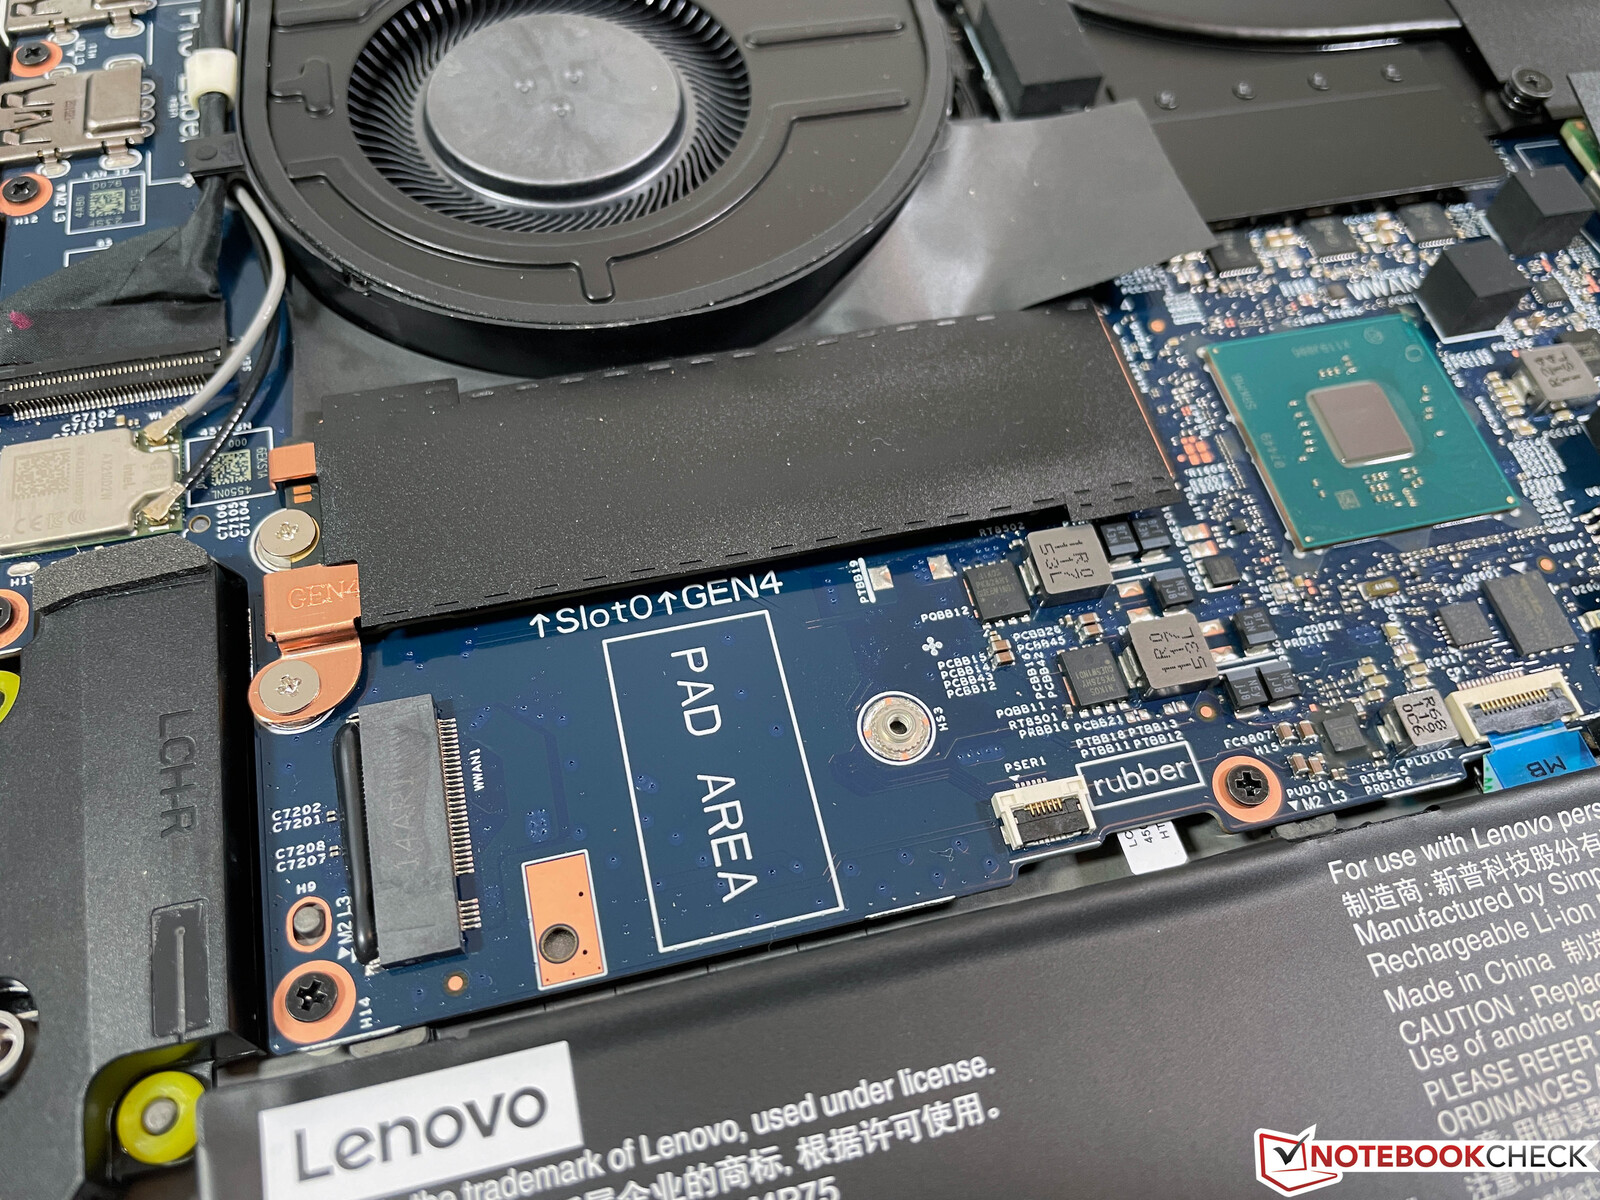
We have already mentioned that our test unit with the conventional cooling solution has two M.2-2280 slots (1x PCIe 4.0 x3, 1x PCIe 3.0 x4), while models with the vapor chamber cooling only have one slot (PCIe 4.0 x4).
Our test unit is equipped with the Samsung PM9A1 (OEM version of the 980 Pro) with a storage capacity of 512 GB (429 GB are free to use after the initial setup). The transfer rates are excellent at up to 6 GB/s. More SSD benchmarks are available in our Tech section.
| Lenovo ThinkPad P1 G4-20Y30017GE Samsung PM9A1 MZVL2512HCJQ | Dell Precision 5540 SK hynix PC400 512 GB | Apple MacBook Pro 16 2019 i9 5500M Apple SSD AP1024 7171 | HP ZBook Studio 15 G8 Samsung PM981a MZVLB2T0HALB | Lenovo ThinkBook 16p G2 ACH WDC PC SN730 SDBPNTY-1T00 | Lenovo ThinkPad P1 2019-20QT000RGE WDC PC SN720 SDAQNTW-512G | Average Samsung PM9A1 MZVL2512HCJQ | |
|---|---|---|---|---|---|---|---|
| CrystalDiskMark 5.2 / 6 | -54% | -50% | -42% | -35% | -39% | -20% | |
| Write 4K (MB/s) | 224.1 | 98 -56% | 55.5 -75% | 110.5 -51% | 158.1 -29% | 162.2 -28% | 179.1 ? -20% |
| Read 4K (MB/s) | 88.5 | 41.25 -53% | 16.21 -82% | 51.8 -41% | 49.09 -45% | 43.71 -51% | 75.6 ? -15% |
| Write Seq (MB/s) | 1295 | 1959 | 2071 | 2830 | 2441 | 3016 ? | |
| Read Seq (MB/s) | 1441 | 1763 | 2505 | 2531 | 1753 | 3350 ? | |
| Write 4K Q32T1 (MB/s) | 664 | 429.2 -35% | 398.5 -40% | 429.8 -35% | 453.4 -32% | 397.6 -40% | 459 ? -31% |
| Read 4K Q32T1 (MB/s) | 720 | 400.1 -44% | 648 -10% | 418.3 -42% | 573 -20% | 520 -28% | 554 ? -23% |
| Write Seq Q32T1 (MB/s) | 5089 | 1366 -73% | 2727 -46% | 3060 -40% | 3088 -39% | 2519 -51% | 4346 ? -15% |
| Read Seq Q32T1 (MB/s) | 6088 | 2201 -64% | 3242 -47% | 3539 -42% | 3394 -44% | 3448 -43% | 6346 ? 4% |
| Write 4K Q8T8 (MB/s) | 2021 | 1381 -32% | 1356 ? -33% | ||||
| Read 4K Q8T8 (MB/s) | 2328 | 1371 -41% | 1746 ? -25% | ||||
| AS SSD | -67% | -73% | -43% | -20% | -33% | -18% | |
| Seq Read (MB/s) | 5505 | 1743 -68% | 2531 -54% | 2953 -46% | 2986 -46% | 2980 -46% | 4656 ? -15% |
| Seq Write (MB/s) | 3908 | 930 -76% | 2289 -41% | 1691 -57% | 2426 -38% | 2094 -46% | 2742 ? -30% |
| 4K Read (MB/s) | 54.4 | 39.1 -28% | 15.85 -71% | 43.98 -19% | 45.93 -16% | 45.05 -17% | 67 ? 23% |
| 4K Write (MB/s) | 146.1 | 92.1 -37% | 39.88 -73% | 105.4 -28% | 152.3 4% | 155.4 6% | 173.8 ? 19% |
| 4K-64 Read (MB/s) | 2356 | 956 -59% | 1267 -46% | 1065 -55% | 1683 -29% | 1291 -45% | 1514 ? -36% |
| 4K-64 Write (MB/s) | 3300 | 863 -74% | 1749 -47% | 1957 -41% | 2010 -39% | 1506 -54% | 2355 ? -29% |
| Access Time Read * (ms) | 0.035 | 0.074 -111% | 0.122 -249% | 0.04 -14% | 0.045 -29% | 0.064 -83% | 0.04867 ? -39% |
| Access Time Write * (ms) | 0.029 | 0.053 -83% | 0.095 -228% | 0.105 -262% | 0.025 14% | 0.024 17% | 0.03605 ? -24% |
| Score Read (Points) | 2961 | 1170 -60% | 1536 -48% | 1404 -53% | 2028 -32% | 1634 -45% | 2047 ? -31% |
| Score Write (Points) | 3837 | 1048 -73% | 2018 -47% | 2232 -42% | 2405 -37% | 1871 -51% | 2778 ? -28% |
| Score Total (Points) | 8226 | 2781 -66% | 4317 -48% | 4297 -48% | 5441 -34% | 4300 -48% | 5812 ? -29% |
| Copy ISO MB/s (MB/s) | 2287 | 1995 -13% | 2474 8% | 2256 -1% | 2015 -12% | 2192 ? -4% | |
| Copy Program MB/s (MB/s) | 757 | 584 -23% | 1074 42% | 779 3% | 597 -21% | 629 ? -17% | |
| Copy Game MB/s (MB/s) | 1644 | 1135 -31% | 1929 17% | 1627 -1% | 1449 -12% | 1393 ? -15% | |
| Total Average (Program / Settings) | -61% /
-62% | -62% /
-66% | -43% /
-42% | -28% /
-25% | -36% /
-35% | -19% /
-19% |
* ... smaller is better

Disk Throttling: DiskSpd Read Loop, Queue Depth 8
GPU Performance - Nvidia T1200 with 60 Watt
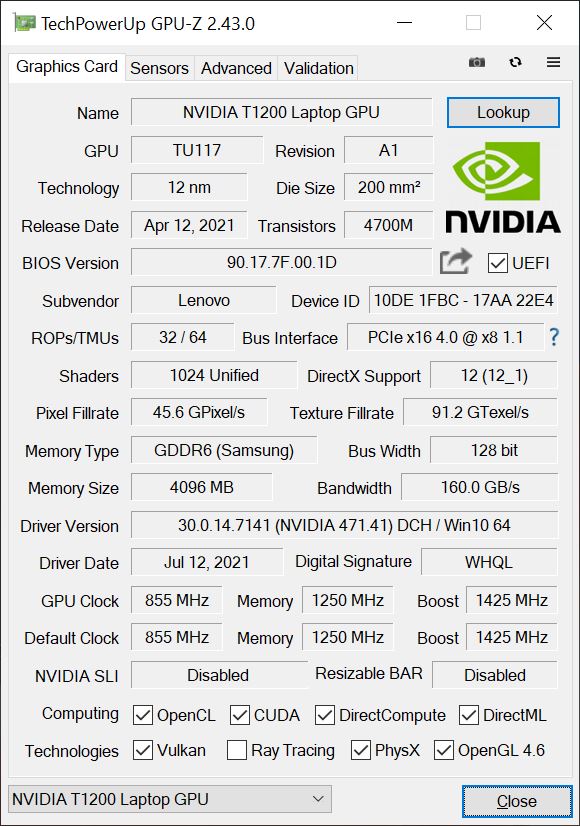
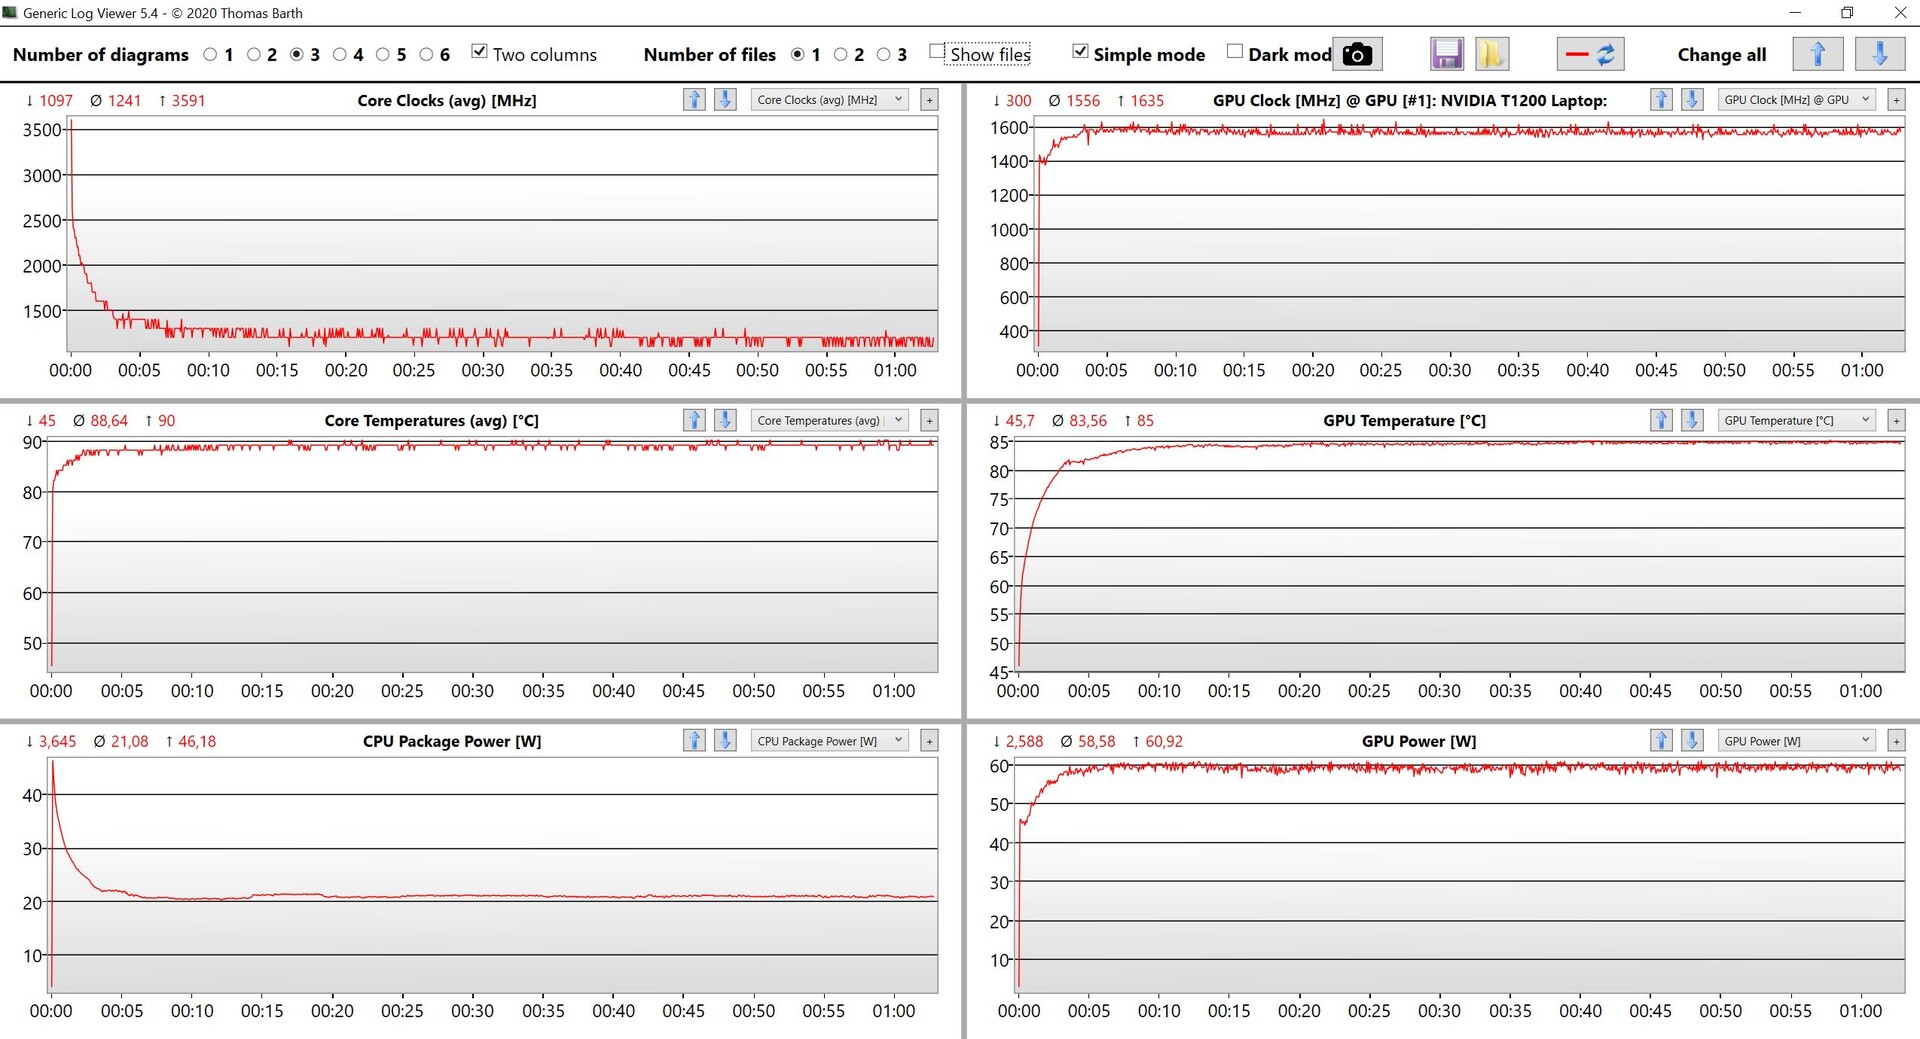
Nvidia’s new entry-level professional GPU is called T1200 (the Quadro designation is not used anymore) and does not support Raytracing compared to the more powerful RTX models. Lenovo lists the GPU as Max-Q model, but Max-Q is not used by Nvidia anymore. The GPU is based on the Turing TU117 chip, so it is comparable to the consumer version GeForce GTX 1650 Ti. It runs at 60 Watts in the P1 G4, which is an average value (35-95 Watts are possible according to Nvidia). Our benchmarks show a maximum core clock of 1840 MHz.
The pure performance is slightly better than the consumer GPU GeForce GTX 1650 Ti Max-Q in the old ThinkPad X1 Extreme G3 and also clearly ahead of the old Quadro T1000/T2000. The next professional GPU in line, the new RTX A2000, is noticeable faster. Our professional SPECviewperf tests show that the new T1200 and it is even pretty close to the RTX A2000 in some scenarios. All in all, a good performance of the new entry-level GPU from Nvidia.
The performance is also stable under sustained workloads and the device easily passes the demanding Time Spy stress test (98.2%). The TGP is reduced from 60 to 35 Watts on battery power, which results in a performance deficit of around 15% in the synthetic benchmarks. More GPU benchmarks are available here.
| 3DMark Vantage P Result | 44135 points | |
| 3DMark 11 Performance | 13779 points | |
| 3DMark Cloud Gate Standard Score | 27580 points | |
| 3DMark Fire Strike Score | 9255 points | |
| 3DMark Time Spy Score | 3891 points | |
Help | ||
Gaming Performance
It is no problem to play games with the professional drivers and we did not notice any issues during our gaming benchmarks. The native WQHD resolution is usually too demanding, but many titles runs smoothly at high settings in 1080p. Our Witcher 3 test also shows that the performance is stable in longer gaming sessions. More gaming benchmarks are listed here.
Witcher 3 FPS Chart
| low | med. | high | ultra | QHD | 4K | |
|---|---|---|---|---|---|---|
| GTA V (2015) | 166 | 152 | 94.9 | 52.3 | 37.4 | |
| The Witcher 3 (2015) | 195 | 127 | 72 | 38 | ||
| Dota 2 Reborn (2015) | 155 | 131 | 114 | 107 | 109 | |
| Final Fantasy XV Benchmark (2018) | 103 | 56.5 | 37 | 26 | ||
| X-Plane 11.11 (2018) | 105 | 85.3 | 66.8 | 52.4 | ||
| Far Cry 5 (2018) | 110 | 69 | 64 | 60 | 41 | |
| Strange Brigade (2018) | 218 | 94 | 77 | 67 | 47 | |
| Borderlands 3 (2019) | 99 | 62 | 43 | 33 | 23 | |
| Gears Tactics (2020) | 268 | 101 | 66 | 46 | 32 | |
| F1 2020 (2020) | 222 | 109 | 90 | 63 | 45 | |
| Death Stranding (2020) | 86 | 68 | 61 | 59 | 40 | |
| Horizon Zero Dawn (2020) | 88 | 60 | 50 | 43 | 32 | |
| Watch Dogs Legion (2020) | 66 | 54 | 47 | 19 | 12 | |
| Dirt 5 (2020) | 125 | 56 | 45 | 12 | ||
| Assassin´s Creed Valhalla (2020) | 77 | 47 | 28 | 21 | 18 | |
| Immortals Fenyx Rising (2020) | 84 | 55 | 44 | 40 | 26 | |
| Cyberpunk 2077 1.0 (2020) | 61 | 33 | 27 | 22 | 14 | |
| F1 2021 (2021) | 164 | 106 | 89.5 | 53.6 | 39 | |
| FIFA 22 (2021) | 175 | 121 | 119 | 111 | 76 | |
| Far Cry 6 (2021) | 86 | 58 | 54 | 47 | 26 |
Emissions - Entry-Level ThinkPad P1 with conventional cooling
System Noise
The two fans are very quiet while idling and when you perform everyday tasks, but they can start spinning occasionally when you use the high-performance mode. We recommend you use the balanced mode (left click on the battery symbol in the task bar) when you browse the web or watch videos, then you will usually enjoy a silent device. We did not notice any electronic sounds or coil whine, either.
More load (gaming, pure CPU/GPU load or combined load) quickly results in the maximum fan noise of almost 47 dB(A), which is clearly audible. The frequency of the fan murmur is not high-pitched or annoying though, but it will attract attention in quieter environments. We would also recommend headphones while gaming. We cannot say anything about the behavior of the vapor-chamber cooling yet.
Noise level
| Idle |
| 24.3 / 24.3 / 26.6 dB(A) |
| Load |
| 46.8 / 46.8 dB(A) |
 | ||
30 dB silent 40 dB(A) audible 50 dB(A) loud |
||
min: | ||
| Lenovo ThinkPad P1 G4-20Y30017GE T1200 Laptop GPU, i7-11800H, Samsung PM9A1 MZVL2512HCJQ | Dell Precision 5540 Quadro T2000 Max-Q, i9-9980HK, SK hynix PC400 512 GB | Apple MacBook Pro 16 2019 i9 5500M Radeon Pro 5500M, i9-9880H, Apple SSD AP1024 7171 | HP ZBook Studio 15 G8 GeForce RTX 3070 Laptop GPU, i9-11950H, Samsung PM981a MZVLB2T0HALB | Lenovo ThinkBook 16p G2 ACH GeForce RTX 3060 Laptop GPU, R9 5900HX, WDC PC SN730 SDBPNTY-1T00 | Lenovo ThinkPad P1 2019-20QT000RGE Quadro T1000 (Laptop), i7-9850H, WDC PC SN720 SDAQNTW-512G | |
|---|---|---|---|---|---|---|
| Noise | 2% | -10% | 0% | 7% | -3% | |
| off / environment * (dB) | 24.3 | 28.6 -18% | 29.8 -23% | 23.5 3% | 23 5% | 28.8 -19% |
| Idle Minimum * (dB) | 24.3 | 28.6 -18% | 29.9 -23% | 25.3 -4% | 23 5% | 28.8 -19% |
| Idle Average * (dB) | 24.3 | 28.6 -18% | 29.9 -23% | 25.3 -4% | 23 5% | 28.8 -19% |
| Idle Maximum * (dB) | 26.6 | 28.6 -8% | 29.9 -12% | 25.3 5% | 23 14% | 28.8 -8% |
| Load Average * (dB) | 46.8 | 33.3 29% | 43 8% | 41.2 12% | 35.66 24% | 36.1 23% |
| Witcher 3 ultra * (dB) | 46.8 | 34.7 26% | 45.4 3% | 49.4 -6% | 48.7 -4% | |
| Load Maximum * (dB) | 46.8 | 38 19% | 46.1 1% | 49.4 -6% | 48.13 -3% | 36.7 22% |
* ... smaller is better
Temperature
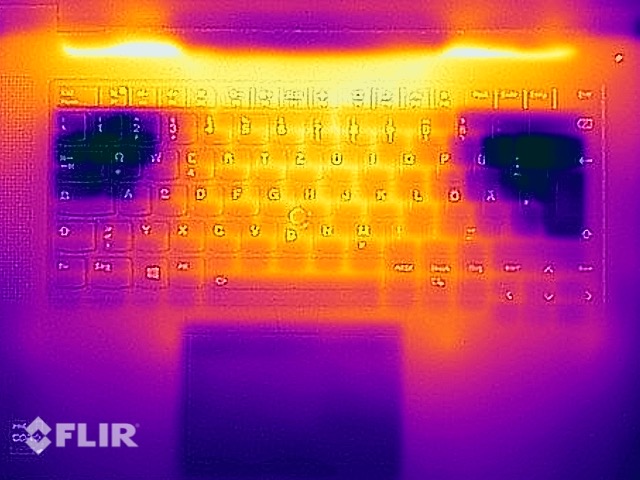
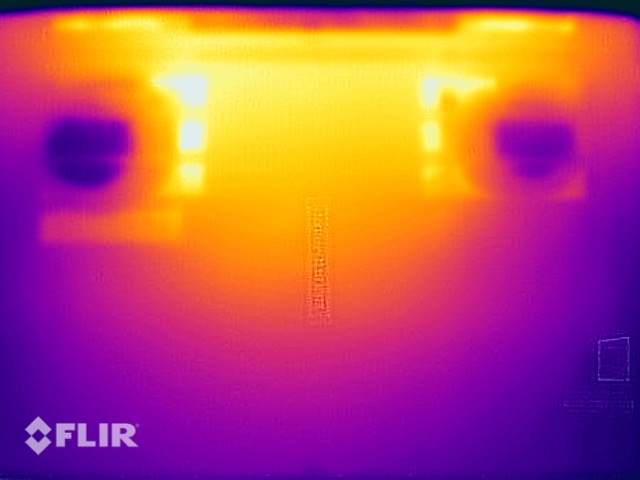
The ThinkPad P1 G4 does not have any temperature issues with common tasks, but there are some spots with more than 50 °C during gaming or when you really stress the notebook. You should not put the mobile workstation on your lap in these situations.
Looking at the data from the processor and the graphics card, we notice two things. The GPU is preferred by the system and can maintain its TGP of 60 Watts during the stress test, while the processor only gets 20 Watts. The cooling solutions does not seem to have a lot of headroom since the two fans are already spinning very quickly. The low CPU performance in the stress test is once again a bit disappointing for a mobile workstation, which should offer high and reliable performance figures.
Models with the RTX A2000 GPU, which use the same conventional cooling setup, will either suffer from higher surface temperatures, or the GPU will be limited at 60 Watts as well under combined workloads.
(-) The maximum temperature on the upper side is 50.6 °C / 123 F, compared to the average of 38.2 °C / 101 F, ranging from 22.2 to 69.8 °C for the class Workstation.
(-) The bottom heats up to a maximum of 53.6 °C / 128 F, compared to the average of 41.1 °C / 106 F
(+) In idle usage, the average temperature for the upper side is 24.3 °C / 76 F, compared to the device average of 32 °C / 90 F.
(-) Playing The Witcher 3, the average temperature for the upper side is 38.8 °C / 102 F, compared to the device average of 32 °C / 90 F.
(+) The palmrests and touchpad are reaching skin temperature as a maximum (35.5 °C / 95.9 F) and are therefore not hot.
(-) The average temperature of the palmrest area of similar devices was 27.8 °C / 82 F (-7.7 °C / -13.9 F).
Speakers
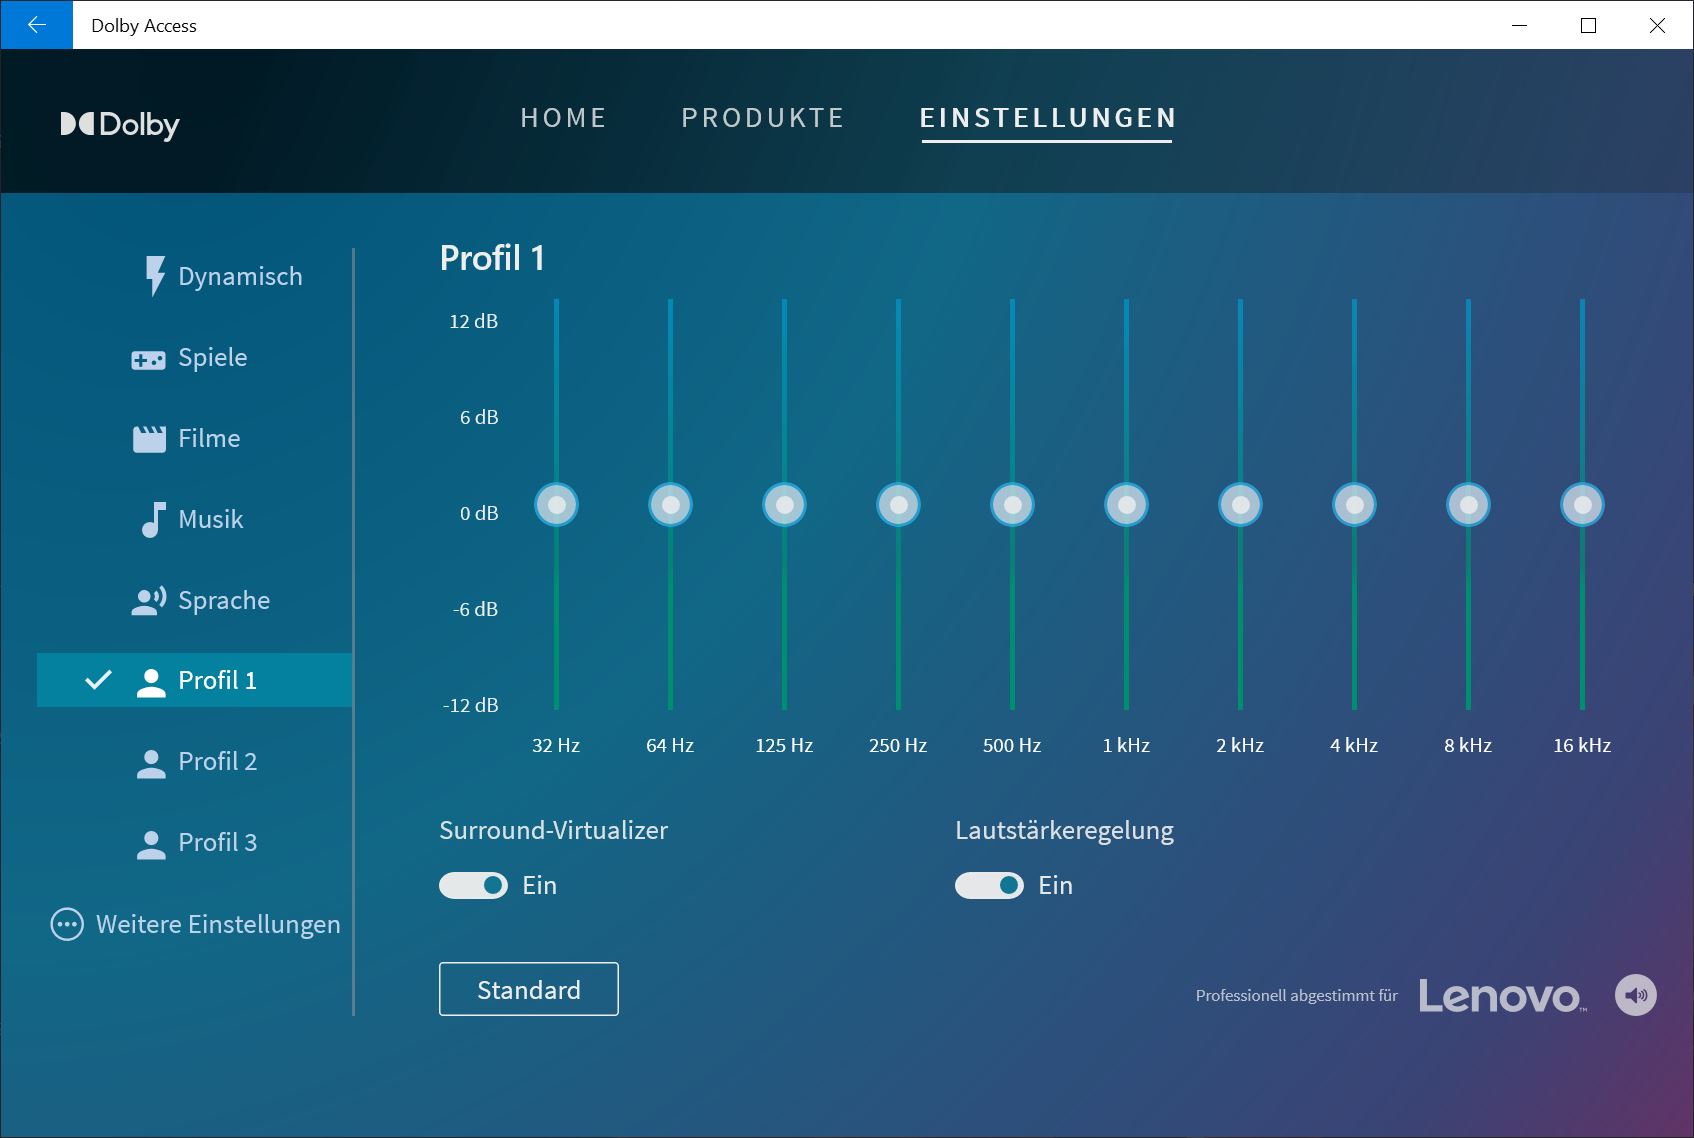
The two stereo speakers (2x 2 Watts) are located next to the keyboard and direct the sound towards the user. Lenovo installs the Dolby Access app, which offers different presets (including customizable ones). You should make sure the Dolby software is running, the modules will otherwise sound tinny and quiet. Once the software is running, you can enjoy a very good sound, which can easily keep up with other good multimedia laptops. We would only like to see a small dedicated subwoofer for a bit more punch.
Lenovo ThinkPad P1 G4-20Y30017GE audio analysis
(+) | speakers can play relatively loud (84.3 dB)
Bass 100 - 315 Hz
(±) | reduced bass - on average 12.2% lower than median
(±) | linearity of bass is average (9.8% delta to prev. frequency)
Mids 400 - 2000 Hz
(+) | balanced mids - only 3.4% away from median
(+) | mids are linear (3.4% delta to prev. frequency)
Highs 2 - 16 kHz
(+) | balanced highs - only 2.9% away from median
(+) | highs are linear (5% delta to prev. frequency)
Overall 100 - 16.000 Hz
(+) | overall sound is linear (11.8% difference to median)
Compared to same class
» 16% of all tested devices in this class were better, 3% similar, 81% worse
» The best had a delta of 7%, average was 17%, worst was 35%
Compared to all devices tested
» 8% of all tested devices were better, 2% similar, 89% worse
» The best had a delta of 4%, average was 24%, worst was 134%
Dell Precision 5540 audio analysis
(±) | speaker loudness is average but good (80.7 dB)
Bass 100 - 315 Hz
(-) | nearly no bass - on average 16.6% lower than median
(±) | linearity of bass is average (7.2% delta to prev. frequency)
Mids 400 - 2000 Hz
(+) | balanced mids - only 3.8% away from median
(+) | mids are linear (6.6% delta to prev. frequency)
Highs 2 - 16 kHz
(+) | balanced highs - only 3.3% away from median
(+) | highs are linear (6.6% delta to prev. frequency)
Overall 100 - 16.000 Hz
(±) | linearity of overall sound is average (16% difference to median)
Compared to same class
» 40% of all tested devices in this class were better, 9% similar, 51% worse
» The best had a delta of 7%, average was 17%, worst was 35%
Compared to all devices tested
» 25% of all tested devices were better, 5% similar, 70% worse
» The best had a delta of 4%, average was 24%, worst was 134%
Apple MacBook Pro 16 2019 i9 5500M audio analysis
(+) | speakers can play relatively loud (82.3 dB)
Bass 100 - 315 Hz
(+) | good bass - only 2.3% away from median
(+) | bass is linear (5% delta to prev. frequency)
Mids 400 - 2000 Hz
(+) | balanced mids - only 2.7% away from median
(+) | mids are linear (3.4% delta to prev. frequency)
Highs 2 - 16 kHz
(+) | balanced highs - only 2.1% away from median
(+) | highs are linear (2.6% delta to prev. frequency)
Overall 100 - 16.000 Hz
(+) | overall sound is linear (6.9% difference to median)
Compared to same class
» 5% of all tested devices in this class were better, 1% similar, 95% worse
» The best had a delta of 5%, average was 17%, worst was 45%
Compared to all devices tested
» 1% of all tested devices were better, 0% similar, 99% worse
» The best had a delta of 4%, average was 24%, worst was 134%
Energy Management
Power Consumption
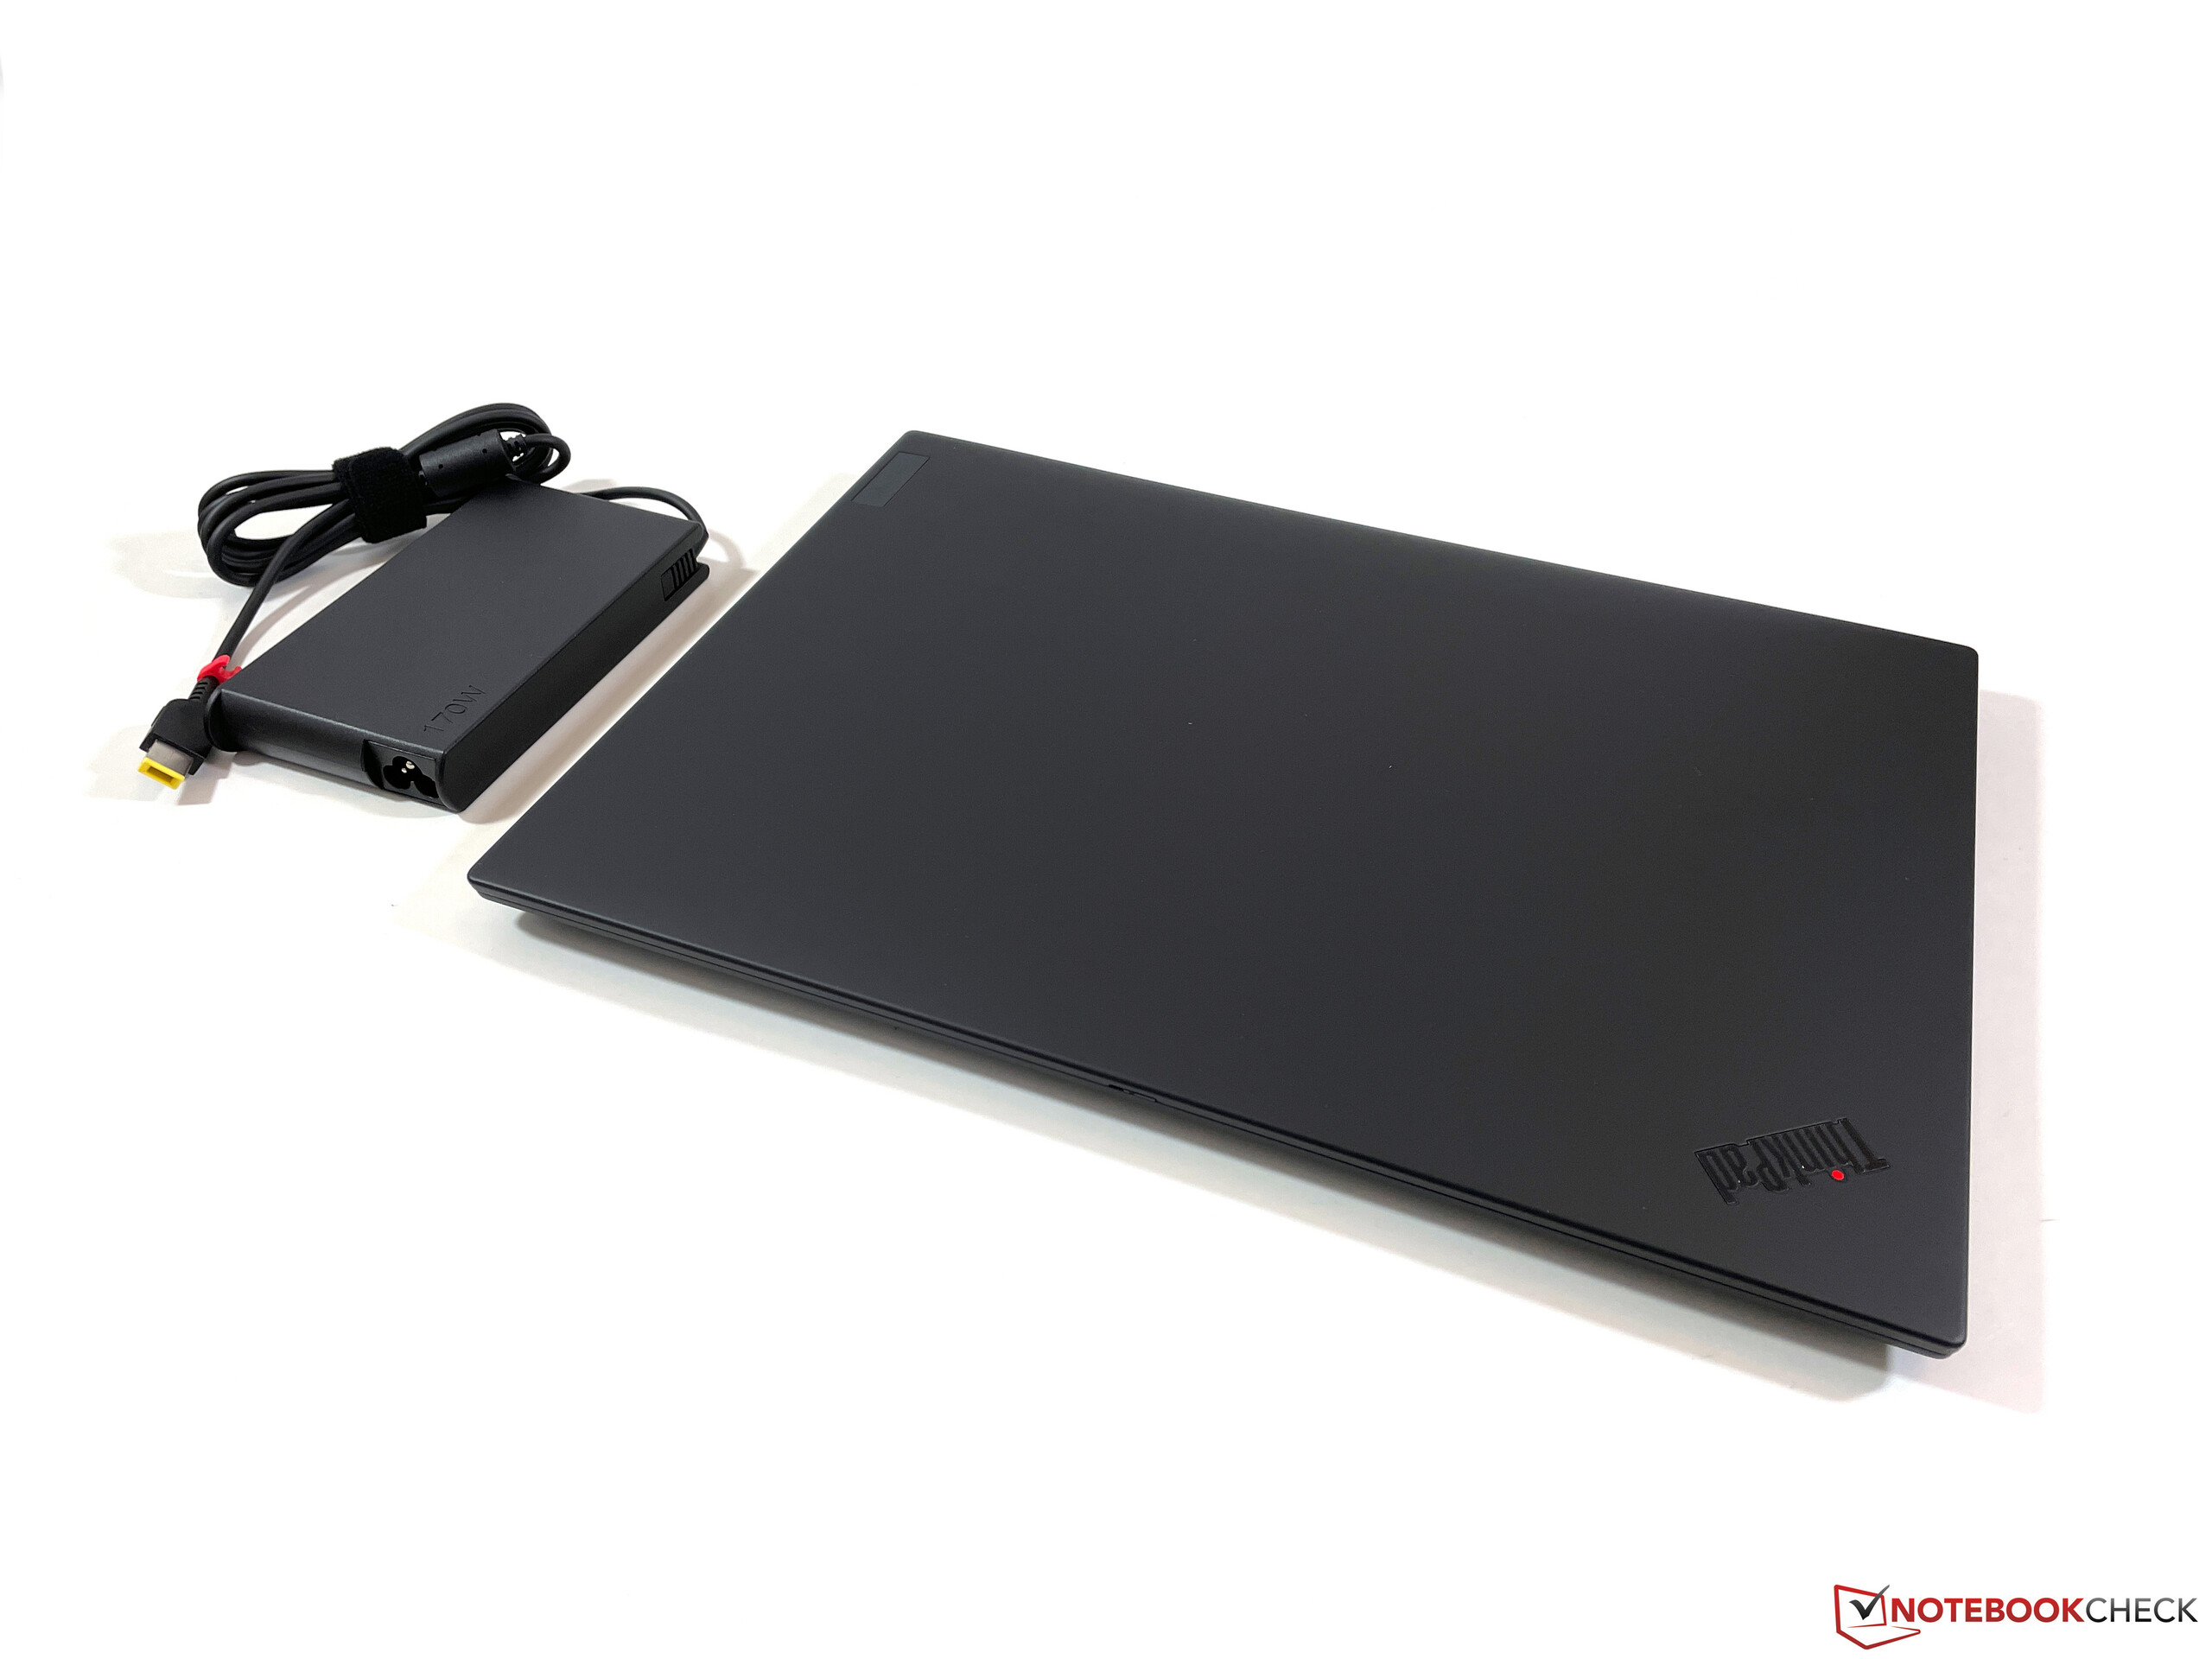
The ThinkPad P1 G4 is one of the most efficient devices in our comparison group while idling. All in all, the results are inconspicuous, and we can measure little more than 130 Watts during the stress test for a short period, but it will quickly level off at around 110 Watts. The included 170W power adapter is more than sufficient and still has headroom to charge the battery under load. Lenovo should, however, once again look at the standby consumption, which is too high at ~2 Watts.
| Off / Standby | |
| Idle | |
| Load |
|
Key:
min: | |
| Lenovo ThinkPad P1 G4-20Y30017GE i7-11800H, T1200 Laptop GPU, Samsung PM9A1 MZVL2512HCJQ, IPS, 2560x1600, 16" | Dell Precision 5540 i9-9980HK, Quadro T2000 Max-Q, SK hynix PC400 512 GB, OLED, 3840x2160, 15.6" | Apple MacBook Pro 16 2019 i9 5500M i9-9880H, Radeon Pro 5500M, Apple SSD AP1024 7171, IPS, 3072x1920, 16" | HP ZBook Studio 15 G8 i9-11950H, GeForce RTX 3070 Laptop GPU, Samsung PM981a MZVLB2T0HALB, OLED, 3840x2160, 15.6" | Lenovo ThinkBook 16p G2 ACH R9 5900HX, GeForce RTX 3060 Laptop GPU, WDC PC SN730 SDBPNTY-1T00, IPS, 2560x1600, 16" | Lenovo ThinkPad P1 2019-20QT000RGE i7-9850H, Quadro T1000 (Laptop), WDC PC SN720 SDAQNTW-512G, IPS LED, 1920x1080, 15.6" | Average NVIDIA T1200 Laptop GPU | Average of class Workstation | |
|---|---|---|---|---|---|---|---|---|
| Power Consumption | 1% | 6% | -58% | -29% | -34% | -0% | -20% | |
| Idle Minimum * (Watt) | 7.7 | 7.4 4% | 3.7 52% | 11 -43% | 13.2 -71% | 13.7 -78% | 7.85 ? -2% | 8.89 ? -15% |
| Idle Average * (Watt) | 11.8 | 12.1 -3% | 12.1 -3% | 18.8 -59% | 17 -44% | 17.5 -48% | 11.4 ? 3% | 13.5 ? -14% |
| Idle Maximum * (Watt) | 12.4 | 12.7 -2% | 17 -37% | 31.7 -156% | 18.6 -50% | 20.9 -69% | 12 ? 3% | 17.6 ? -42% |
| Load Average * (Watt) | 94.6 | 98 -4% | 91.5 3% | 105.2 -11% | 88.8 6% | 77.2 18% | 93.8 ? 1% | 93.9 ? 1% |
| Witcher 3 ultra * (Watt) | 99.6 | 89.9 10% | 103 -3% | 148 -49% | 123 -23% 123 -23% | |||
| Load Maximum * (Watt) | 134 | 135.1 -1% | 102.3 24% | 171.8 -28% | 132 1% | 123.7 8% | 143.7 ? -7% | 171.1 ? -28% |
* ... smaller is better
Power Consumption Witcher 3 / Stresstest
Battery Runtime
The 90 Wh battery enables practical runtimes of around 9 hours (Wi-Fi and video test at 150 nits), which is pretty much on par with the old ThinkPad P1. The Wi-Fi runtime drops to around 6.5 hours when you use the maximum brightness; the minimum runtime under load is ~90 minutes.
| Lenovo ThinkPad P1 G4-20Y30017GE i7-11800H, T1200 Laptop GPU, 90 Wh | Dell Precision 5540 i9-9980HK, Quadro T2000 Max-Q, 97 Wh | Apple MacBook Pro 16 2019 i9 5500M i9-9880H, Radeon Pro 5500M, 99.8 Wh | HP ZBook Studio 15 G8 i9-11950H, GeForce RTX 3070 Laptop GPU, 83 Wh | Lenovo ThinkBook 16p G2 ACH R9 5900HX, GeForce RTX 3060 Laptop GPU, 71 Wh | Lenovo ThinkPad P1 2019-20QT000RGE i7-9850H, Quadro T1000 (Laptop), 80 Wh | Average of class Workstation | |
|---|---|---|---|---|---|---|---|
| Battery runtime | 6% | 3% | -6% | 2% | -4% | -3% | |
| H.264 (h) | 9 | 10.6 18% | 9.7 8% | 7 -22% | 9.3 3% | 9.51 ? 6% | |
| WiFi v1.3 (h) | 9 | 7.7 -14% | 12 33% | 6.2 -31% | 8.5 -6% | 8.9 -1% | 8.55 ? -5% |
| Load (h) | 1.5 | 1.7 13% | 1 -33% | 1.8 20% | 2 33% | 1.3 -13% | 1.364 ? -9% |
| Reader / Idle (h) | 15 | 12.9 | 26.1 ? | ||||
| Witcher 3 ultra (h) | 0.9 |
Pros
Cons
Verdict - ThinkPad P1 G4 with mediocre CPU Performance
Lenovo uses the fourth generation of the ThinkPad P1 for a major update. The most noticeable changes are the new 16-inch display with the 16:10 aspect ratio, while the chassis size is pretty much unchanged. The new entry-level panel already offers the WQHD resolution and leaves a good impression during our measurements. The second noticeable change is the keyboard, which is now similar to the smaller sibling ThinkPad X1 Carbon G9. We are pretty critical about this development, because the input devices are definitely a decline from the previous models. Previous ThinkPads used to have excellent keyboards, but it seems this is a thing of the past. Sure, the new keyboard is not bad by any means, but there is no more advantage over rivals from Dell or HP.
The new Lenovo ThinkPad P1 G4 has some positive changes like the bigger 16-inch screen or the good speakers. The development of the input devices is a problem though. The keyboard is not bad, but previous models offered noticeably better input devices.
Considering the performance, our entry-level configuration leaves mixed impressions. The new Nvidia T1200 GPU performance well and offers stable performance under load, but the processor is more problematic. Lenovo uses a 45W CPU from Intel, but the P1 G4 struggles to maintain even this nominal TDP under pure CPU load and it quickly drops below the 40W mark. Combined workloads only result in 20W for the CPU, which is hardly a good result for an expensive mobile workstation.
All in all, the new ThinkPad P1 G4 is once again a very good mobile workstation, but there is a catch. The CPU performance, especially in combined workload scenarios, is pretty low. Nvidia’s T1200 GPU on the other hand performs well, especially in professional benchmarks.
The situation is even more complex considering there are two basic models of the ThinkPad P1 G4 (or the X1 Extreme G4, respectively). Models with the “smaller” GPUs uses a conventional cooling solution with heat pipes, which requires less space and gives room for a second M.2-2280 slot as well as an optional WWAN module (but the P1 G4 is not WWAN-ready). Models with more powerful GPUs (at least RTX A3000 or RTX 3060 for the X1 Extreme G4) get a new vapor-chamber cooling, but it requires more space and is probably a bit heavier as well.
We are currently reviewing Dell’s new Precision 5560 and we expect a much more powerful version of the ThinkPad P1 G4 with the GeForce RTX 3070 and the matte 4K display next week. We are already eager to find out how the new vapor chamber cooling performs.
Price ans Availability
Our review unit is listed on Lenovo.com for $2319 and other models are available as well.
Lenovo ThinkPad P1 G4-20Y30017GE
- 10/08/2021 v7 (old)
Andreas Osthoff
