Lenovo ThinkPad X1 Carbon G7 2020 Laptop Review: Same Look, New Processor
")
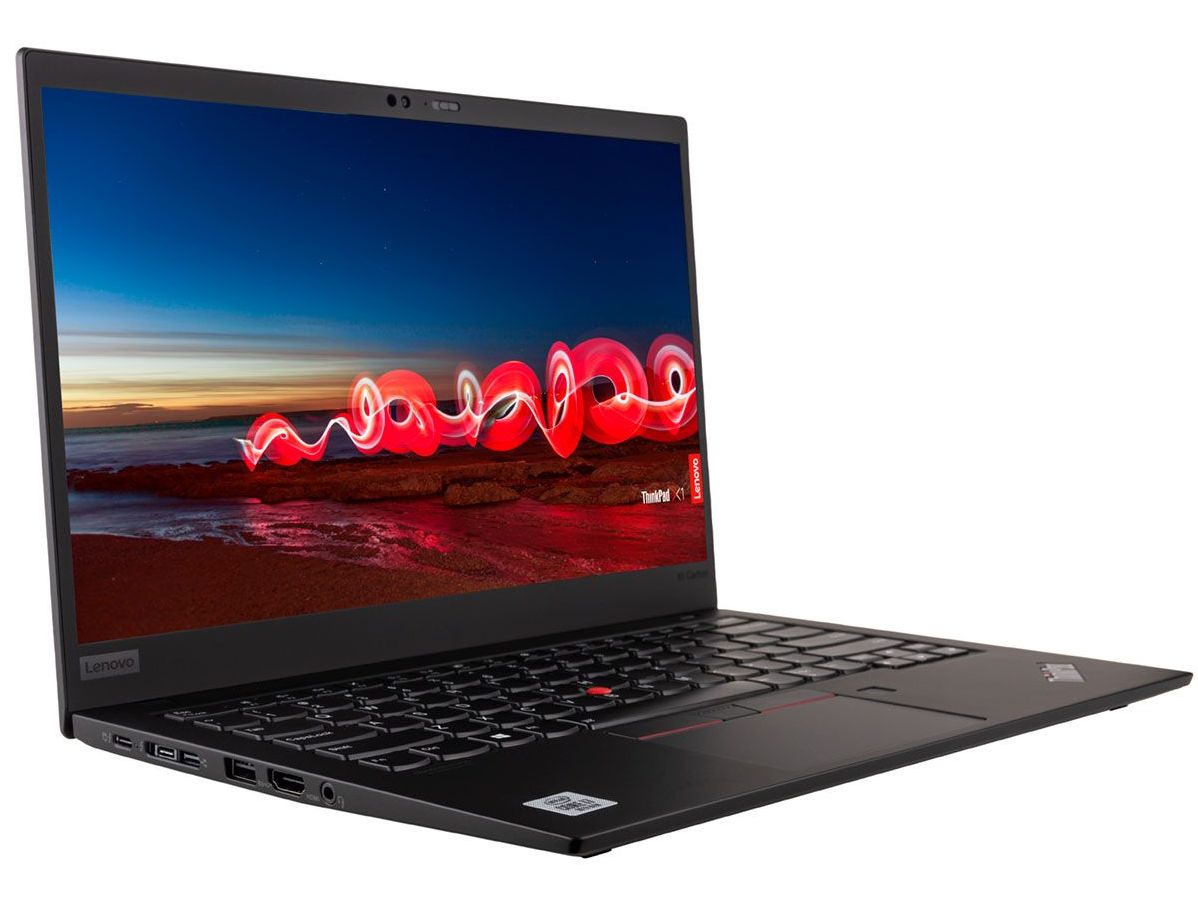
Now in its 7th generation, the Lenovo ThinkPad X1 Carbon series has been successful at attracting users who want a ThinkPad T series laptop without the girth, size, and weight normally associated with it. It's as close to a ThinkPad Ultrabook as you can get without sacrificing many of the features that have come to define a ThinkPad.
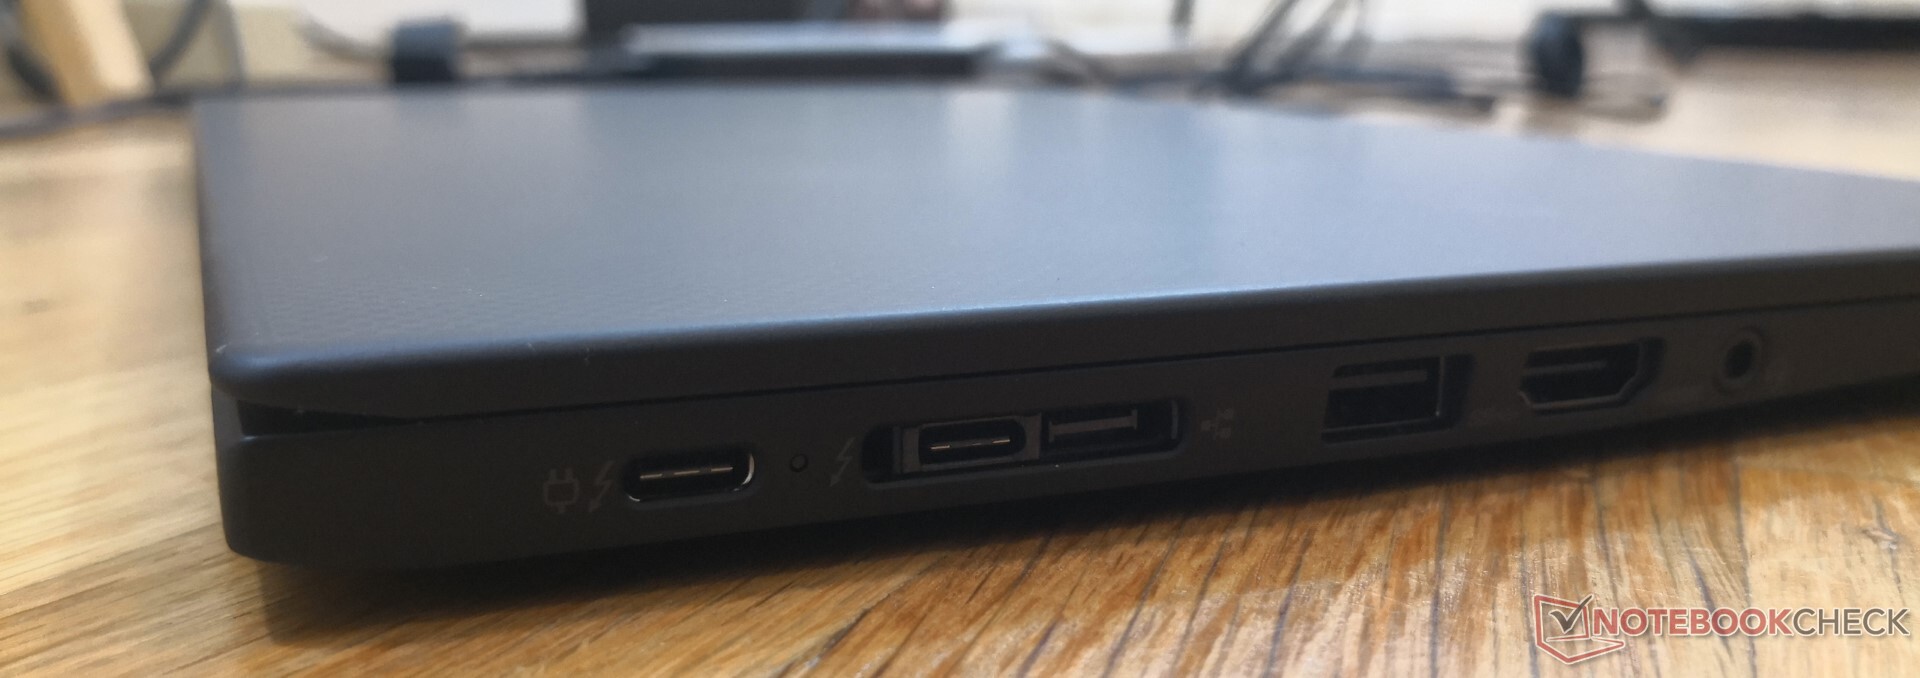
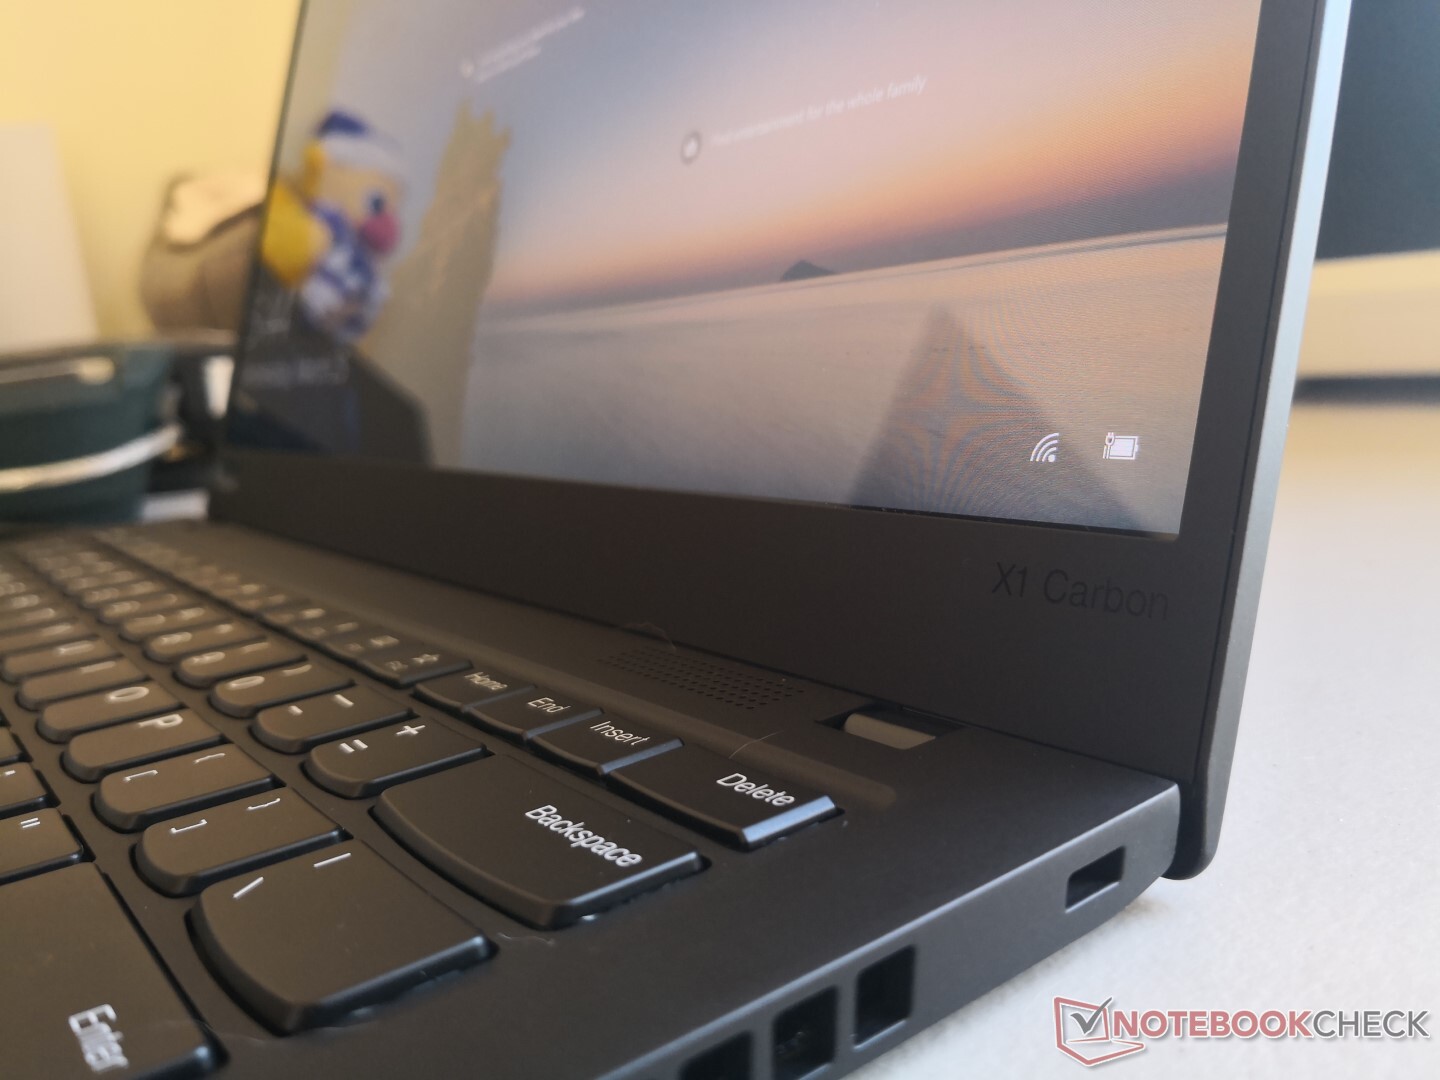
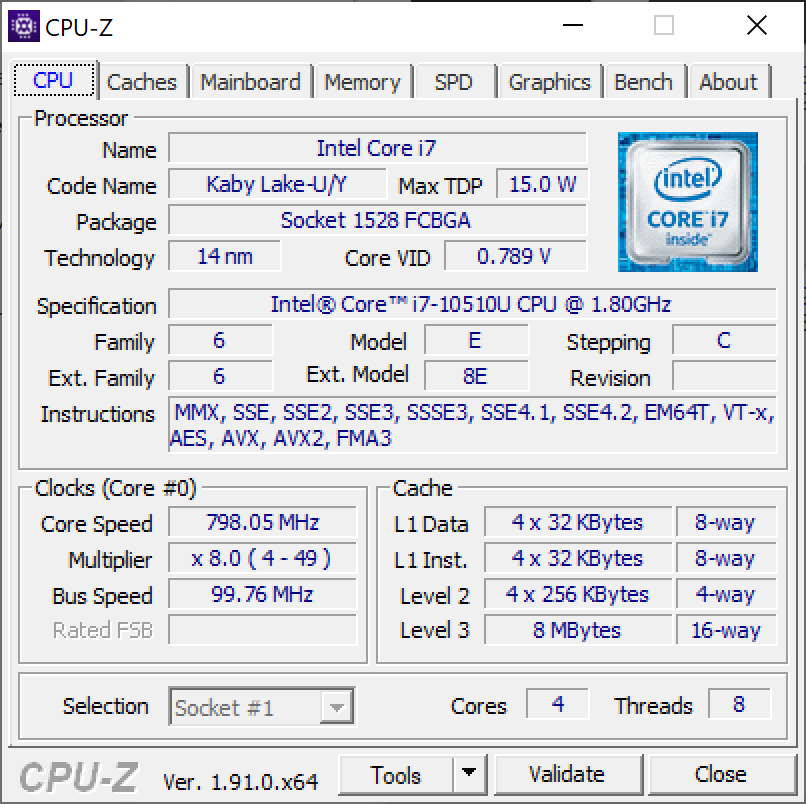
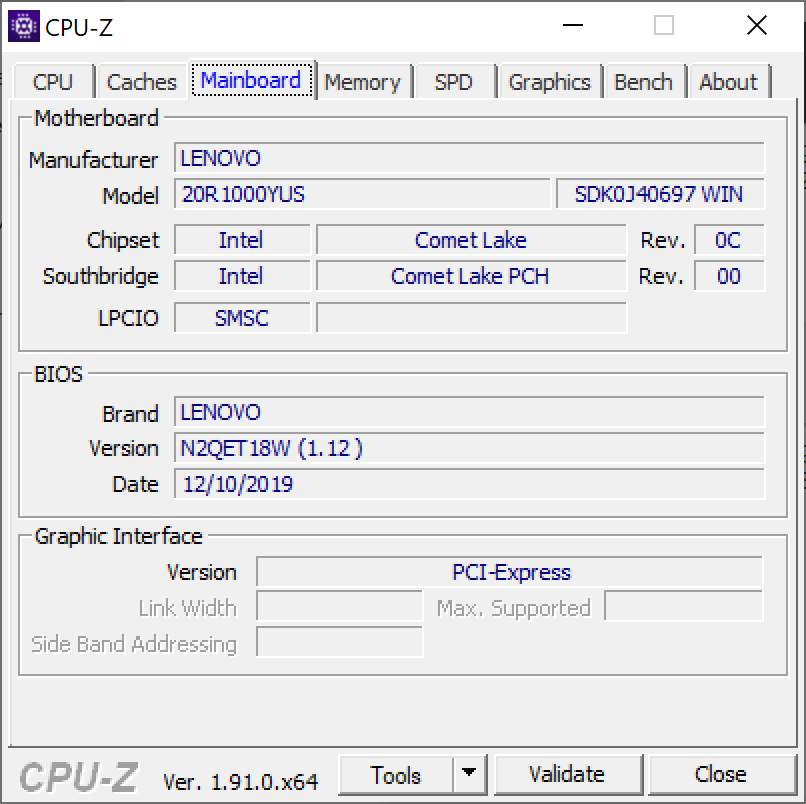
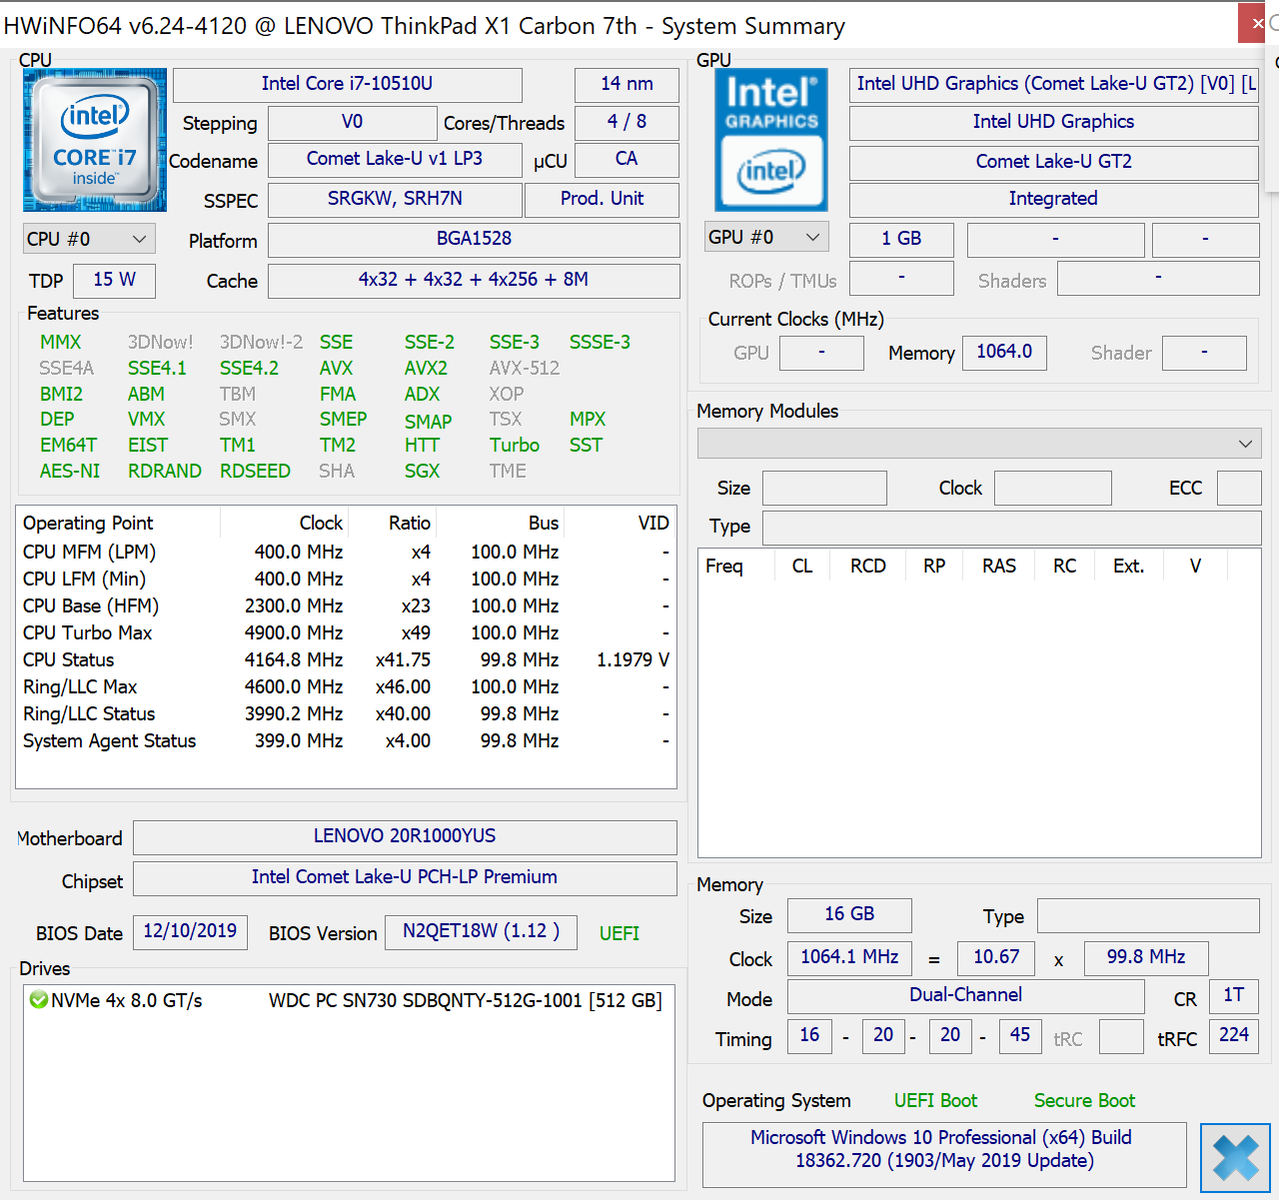
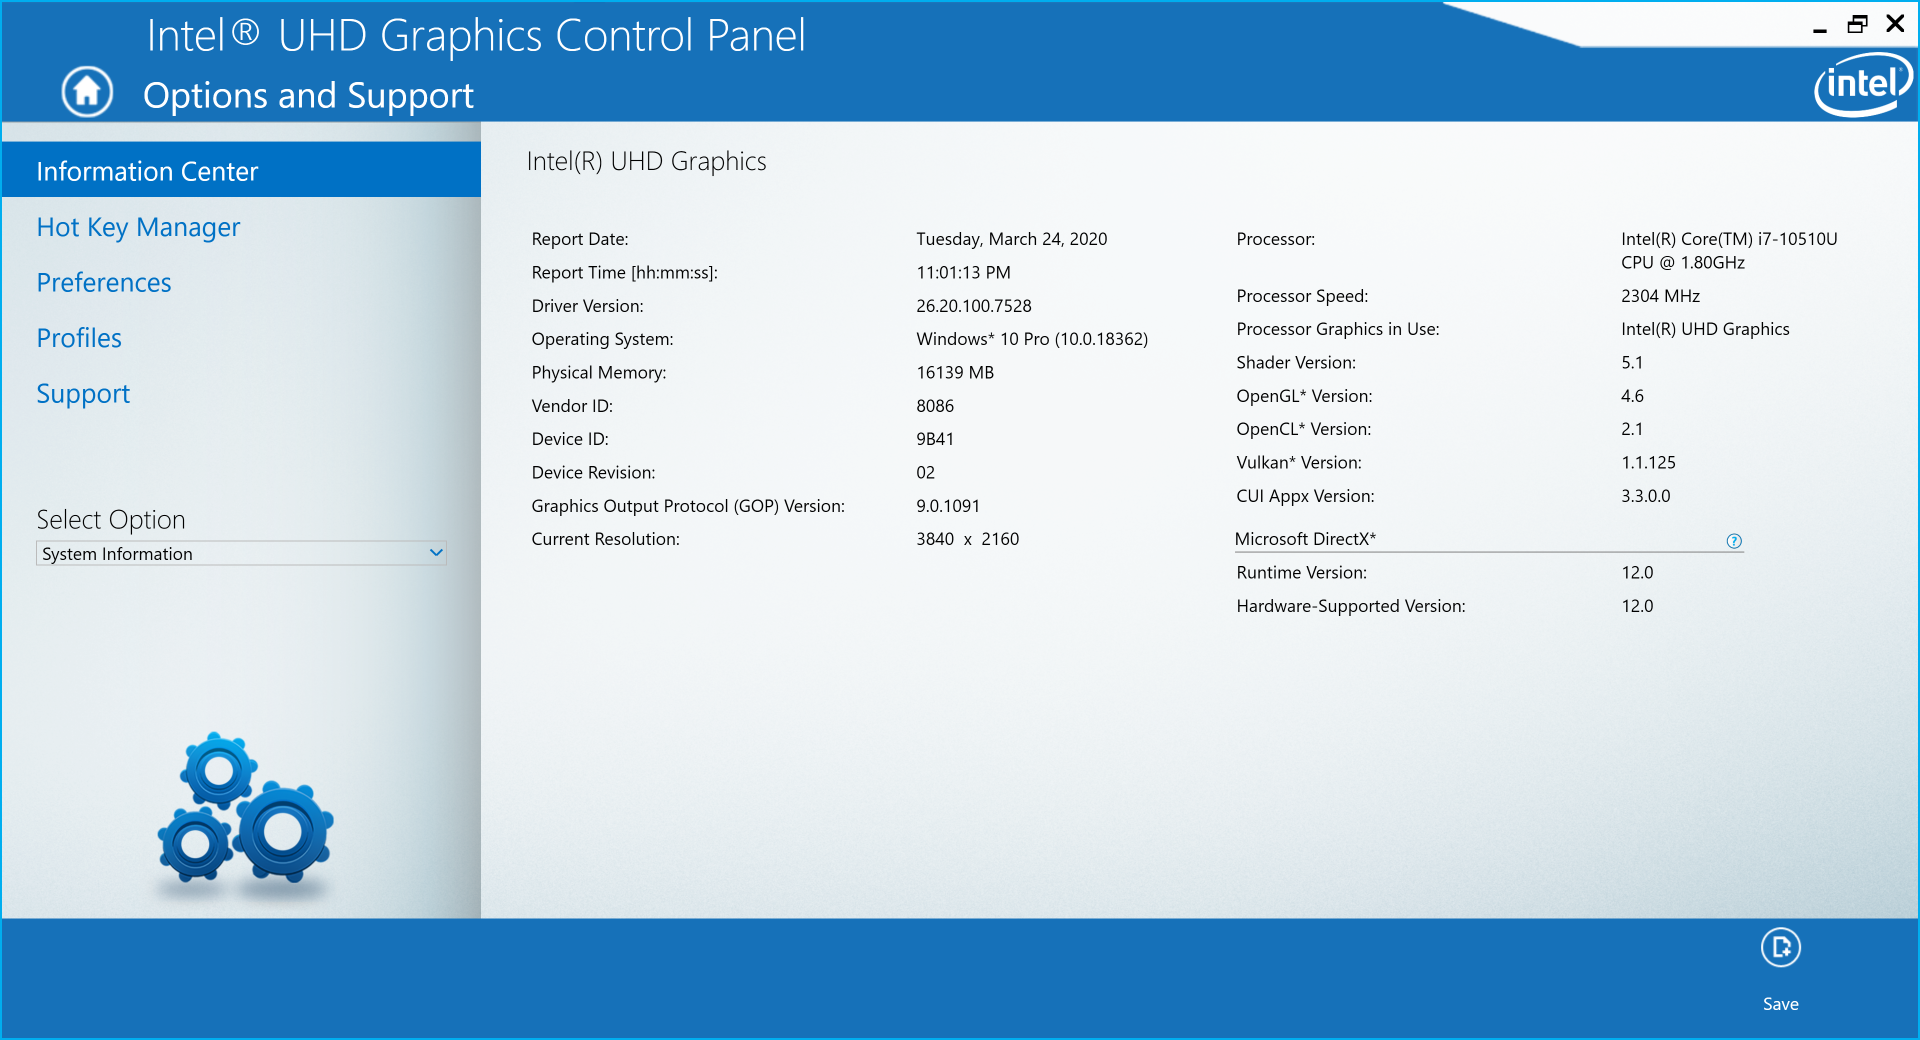
The unit we'll be looking at here comes equipped with the latest Intel Comet Lake-U Core i7-10510U CPU and a 4K UHD glossy display to replace last year's 2019 Whiskey Lake-U configurations. Its chassis is otherwise identical to the 2019 and 2018 models and so our comments on the ports, keyboard, speakers, and other physical features can be found on our existing reviews below.
Computer Upgrade King and Amazon have this exact SKU for $2300 USD. Direct competitors to the ThinkPad X1 Carbon include other thin-and-light business laptops like the HP EliteBook 1040 series, Dell Latitude 7000/9000 series, Microsoft Surface Laptop series, and the Toshiba Portege series.
More Lenovo ThinkPad reviews:
Rating | Date | Model | Weight | Height | Size | Resolution | Price |
|---|---|---|---|---|---|---|---|
| 88.5 % v7 (old) | 03 / 2020 | Lenovo ThinkPad X1 Carbon G7 20R1-000YUS i7-10510U, UHD Graphics 620 | 1.2 kg | 15.4 mm | 14.00" | 3840x2160 | |
| 89.6 % v7 (old) | 08 / 2019 | Lenovo ThinkPad X1 Yoga 2019-20QGS00A00 i7-8565U, UHD Graphics 620 | 1.3 kg | 15.5 mm | 14.00" | 1920x1080 | |
| 87.4 % v7 (old) | 05 / 2019 | Lenovo ThinkPad T490-20N3S02L00 i7-8565U, GeForce MX250 | 1.5 kg | 17.9 mm | 14.00" | 1920x1080 | |
| 90.1 % v7 (old) | 07 / 2019 | Lenovo ThinkPad X1 Carbon 2019-20QE000VGE i7-8665U, UHD Graphics 620 | 1.1 kg | 14.9 mm | 14.00" | 2560x1440 | |
| 83.9 % v7 (old) | 12 / 2019 | Microsoft Surface Laptop 3 15 i7-1065G7 i7-1065G7, Iris Plus Graphics G7 (Ice Lake 64 EU) | 1.5 kg | 14.7 mm | 15.00" | 2496x1664 |
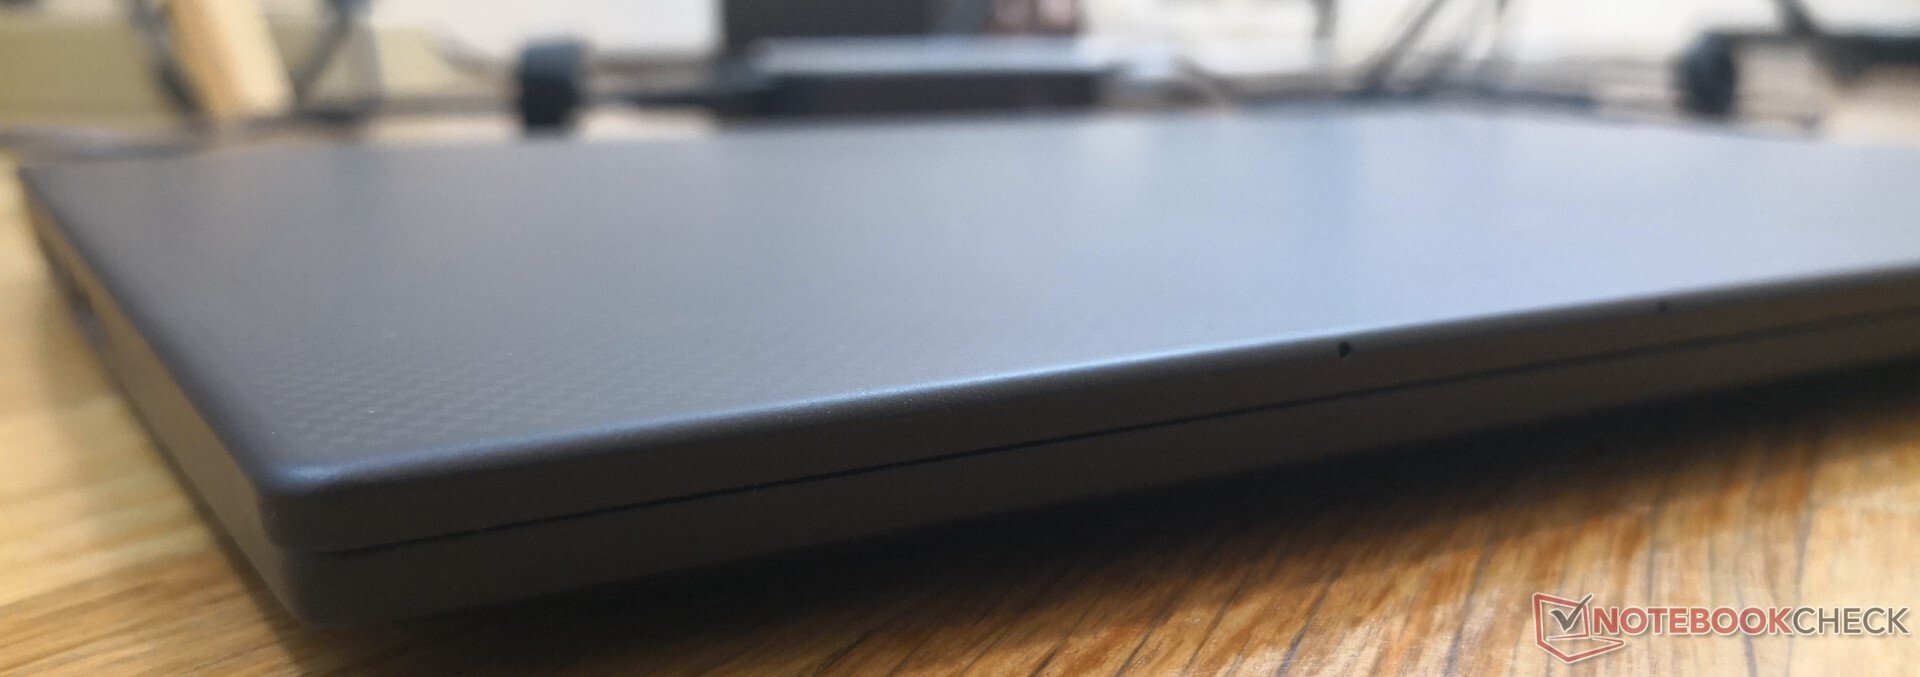
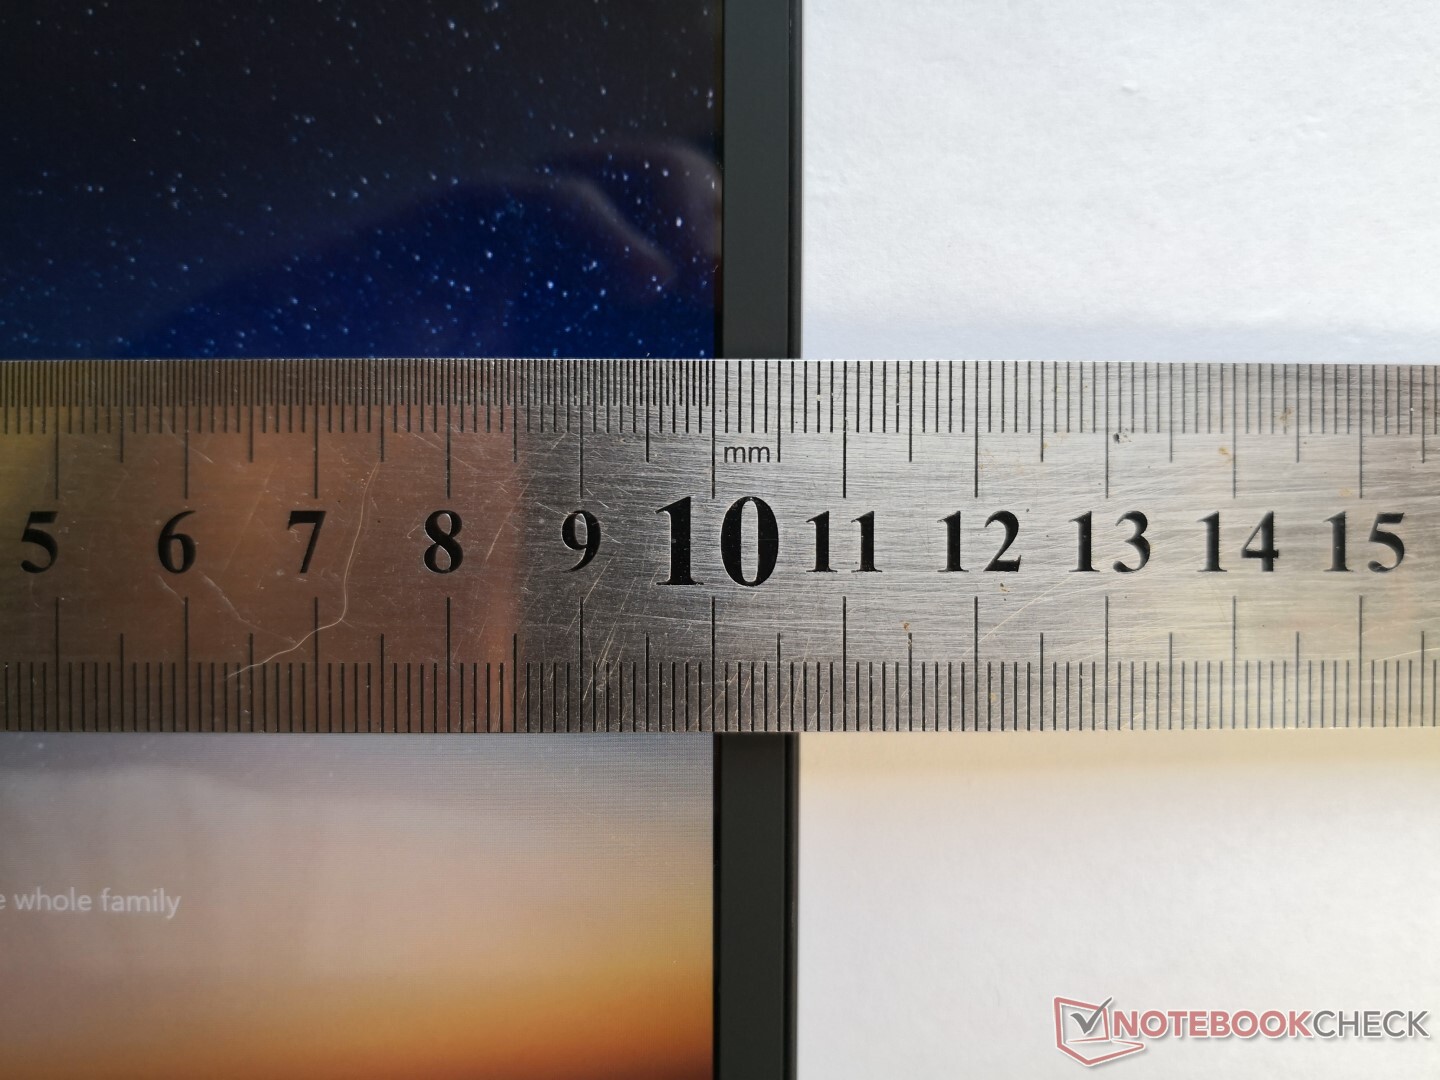
Case
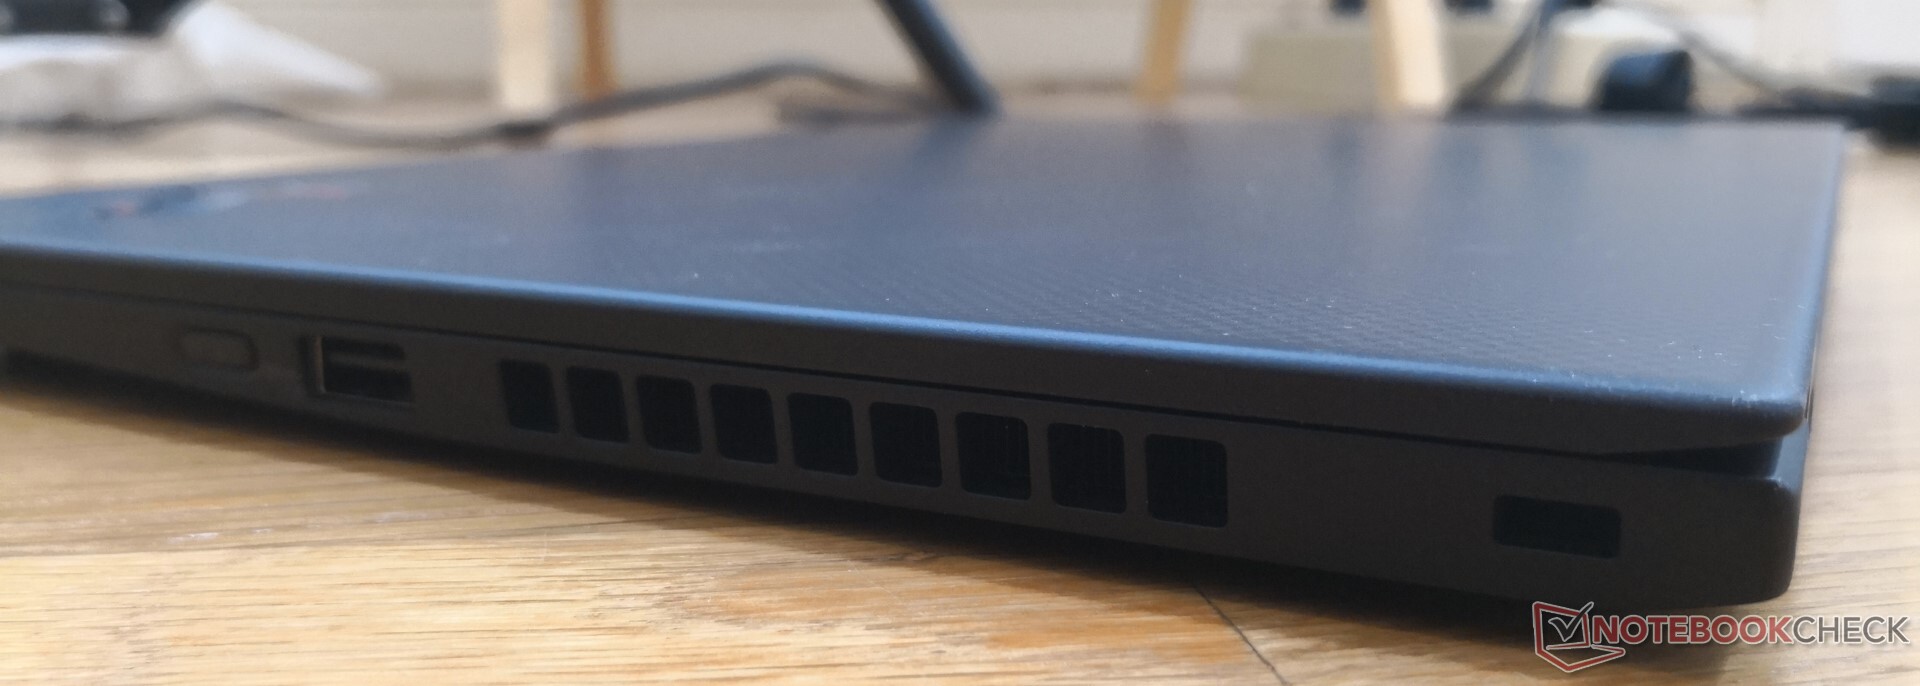
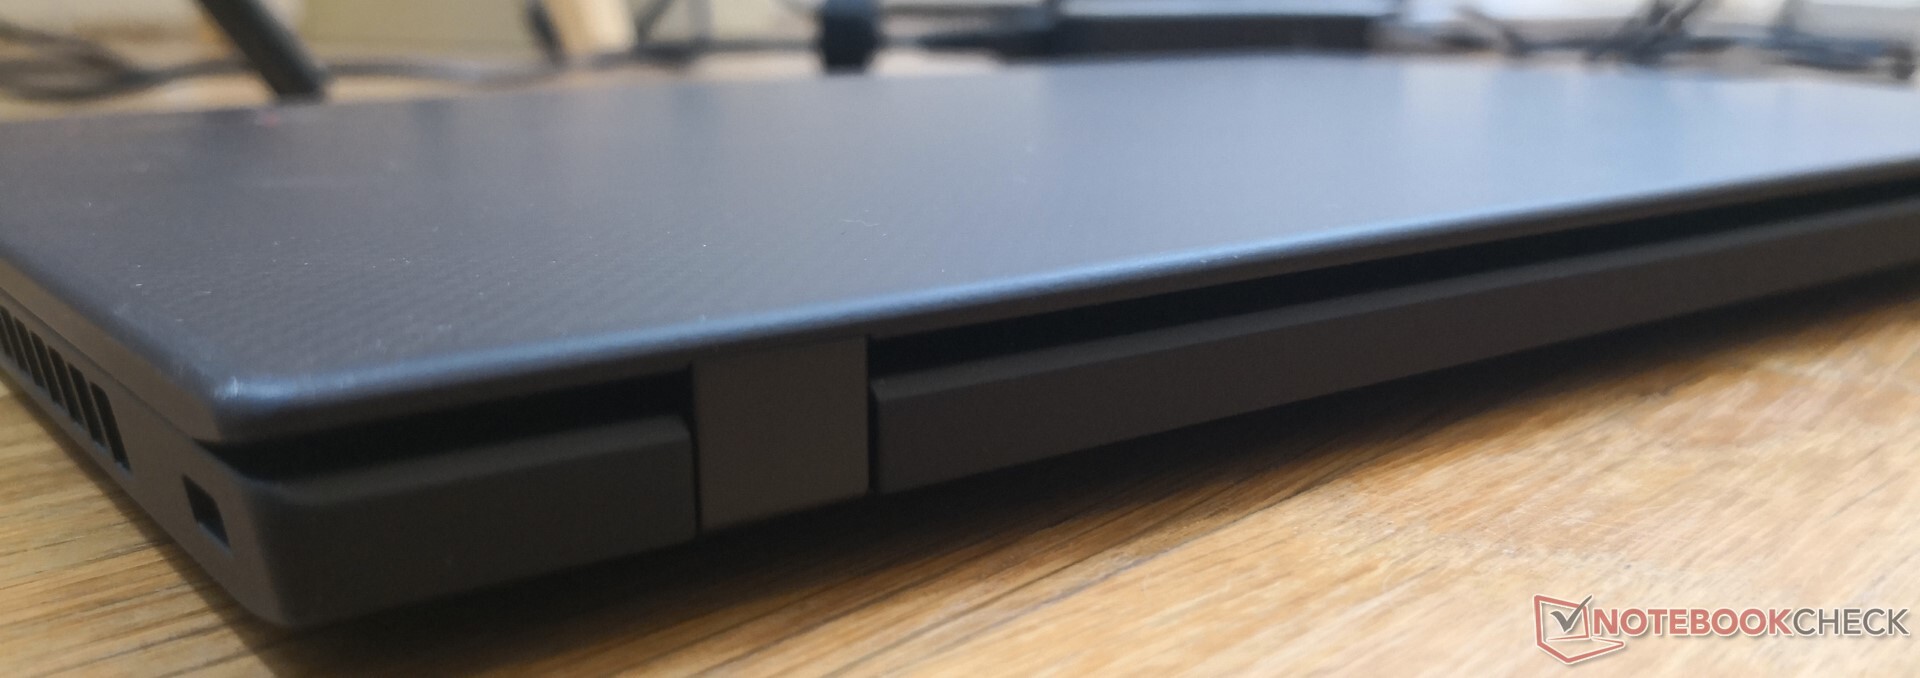
Connectivity
Communication
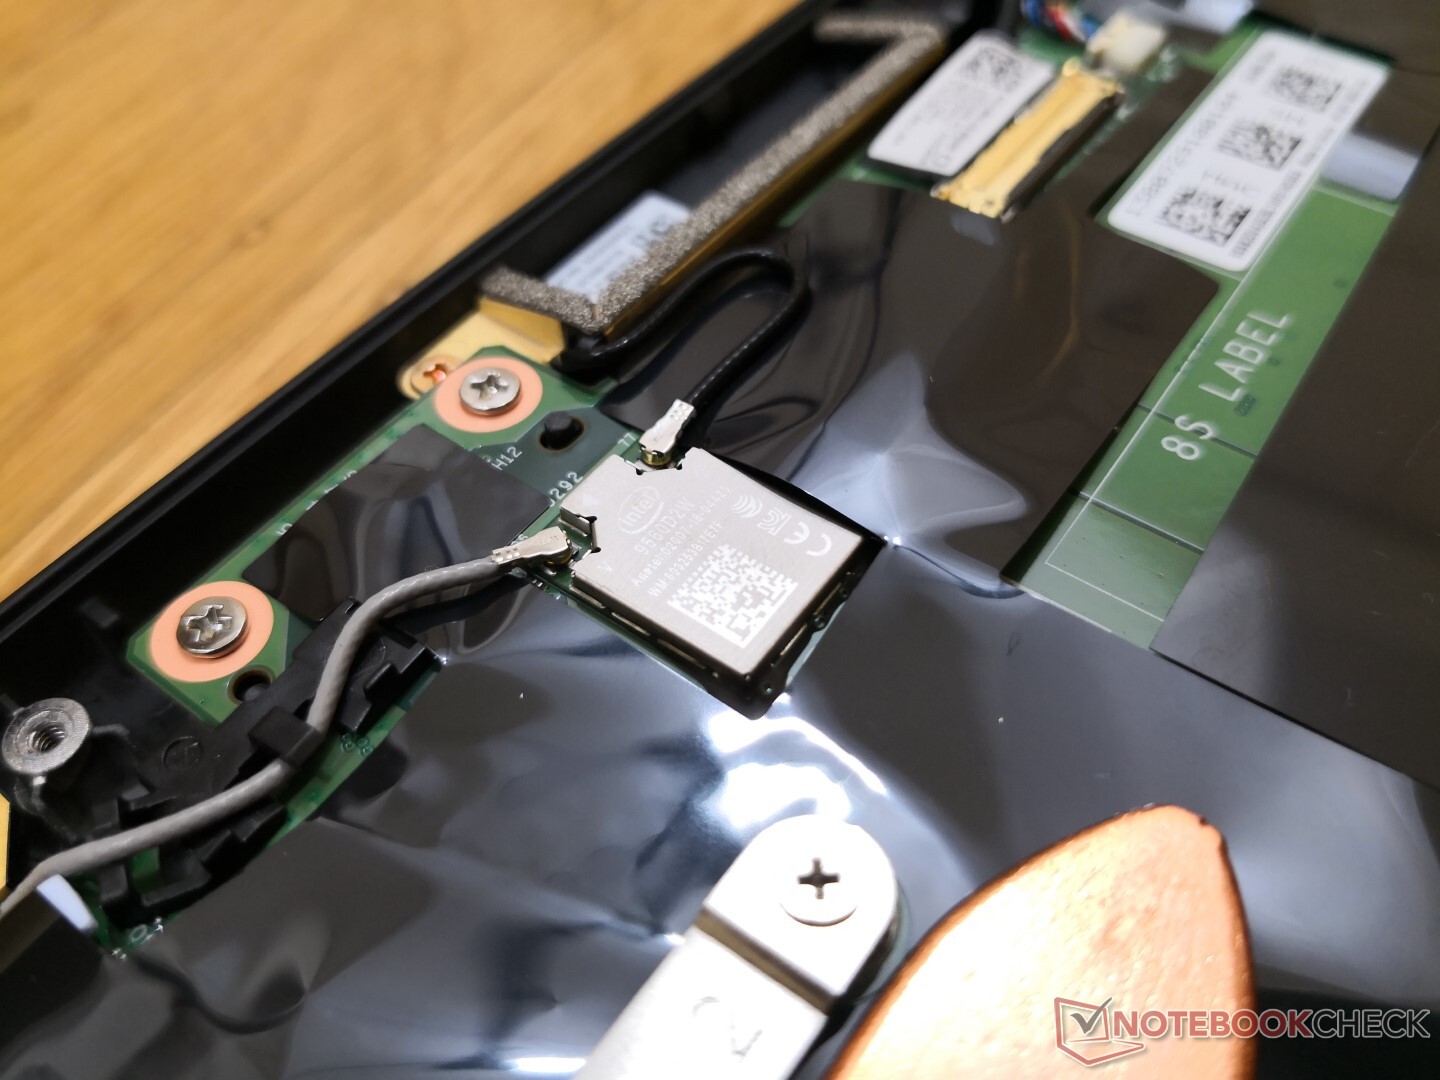
The Intel 9560 comes standard for 802.11ac or Wi-Fi 5 connectivity. Unfortunately, Lenovo offers no AX200/AX201 options for Wi-Fi 6 connectivity but at least users can configure with optional WWAN 4G LTE CAT9 or upgrade to the Intel 9560 vPro. We're able to record average transfer rates of 1100 to 1200 Mbps when standing a meter away from our Netgear RAX200 Wi-Fi 6-enabled router.
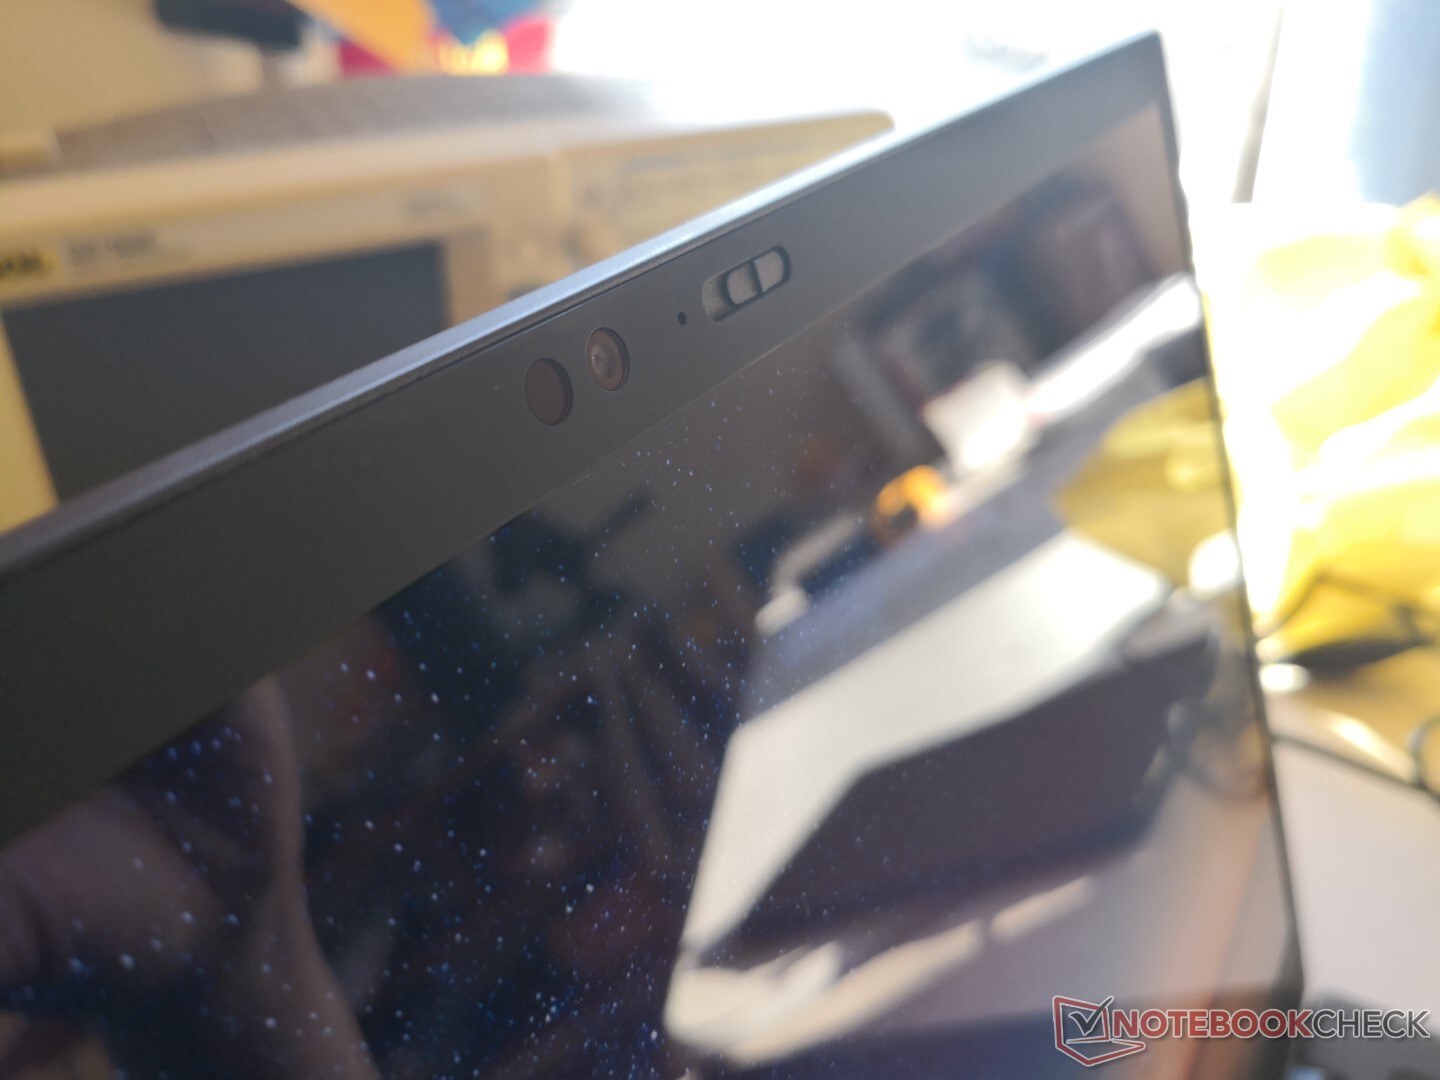
Webcam

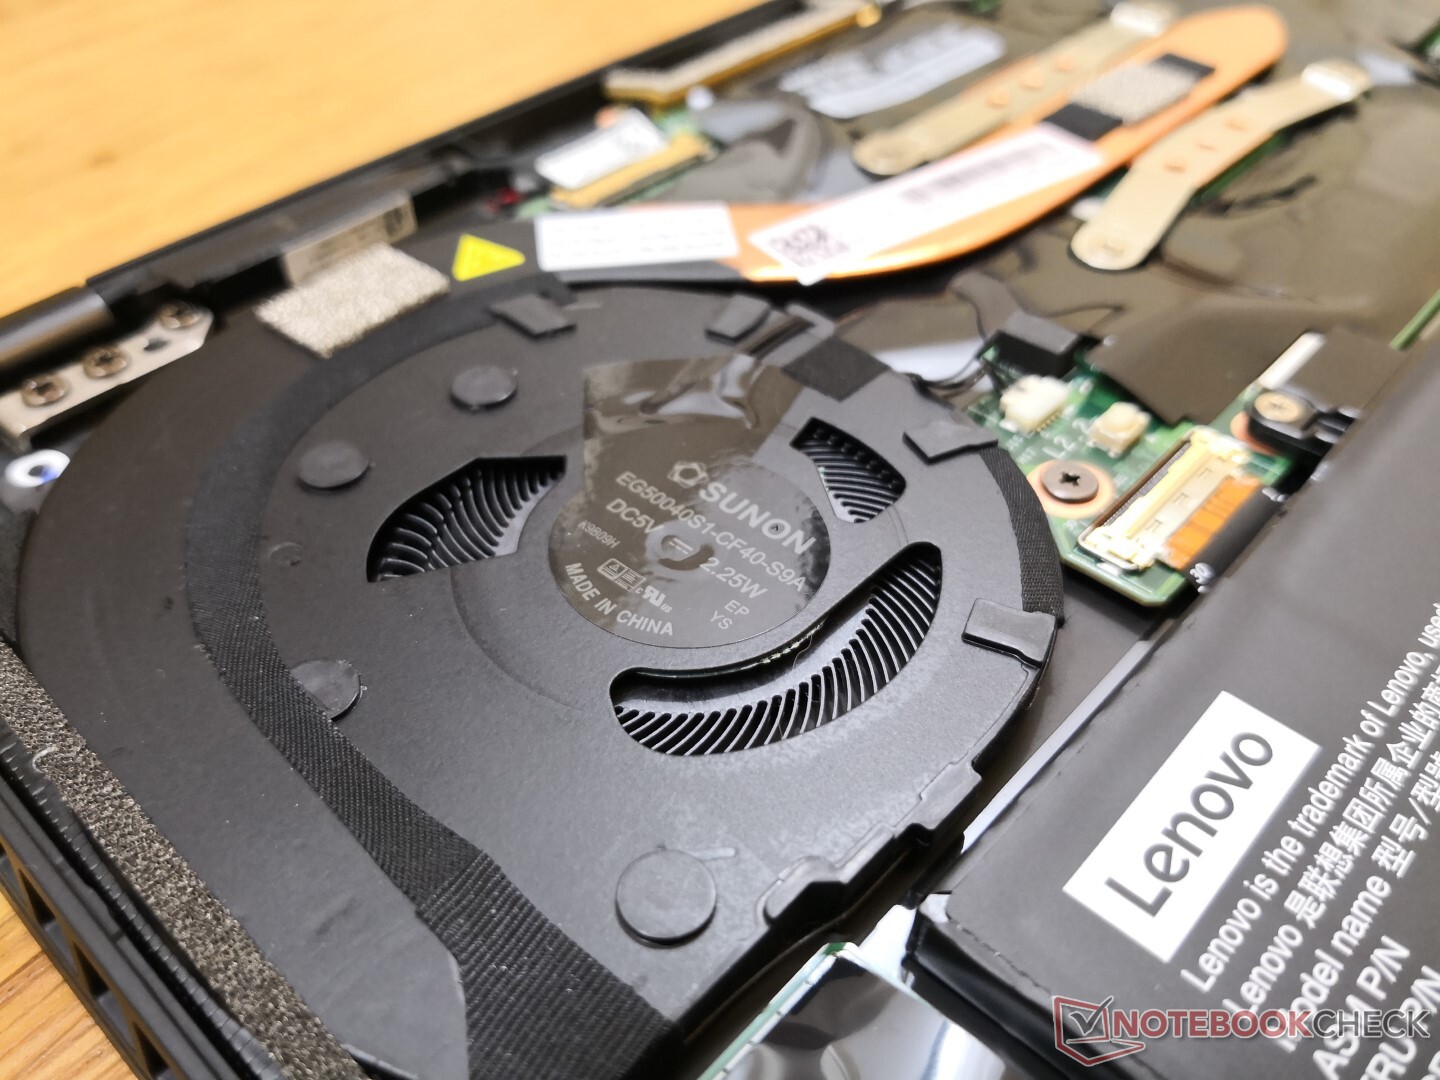
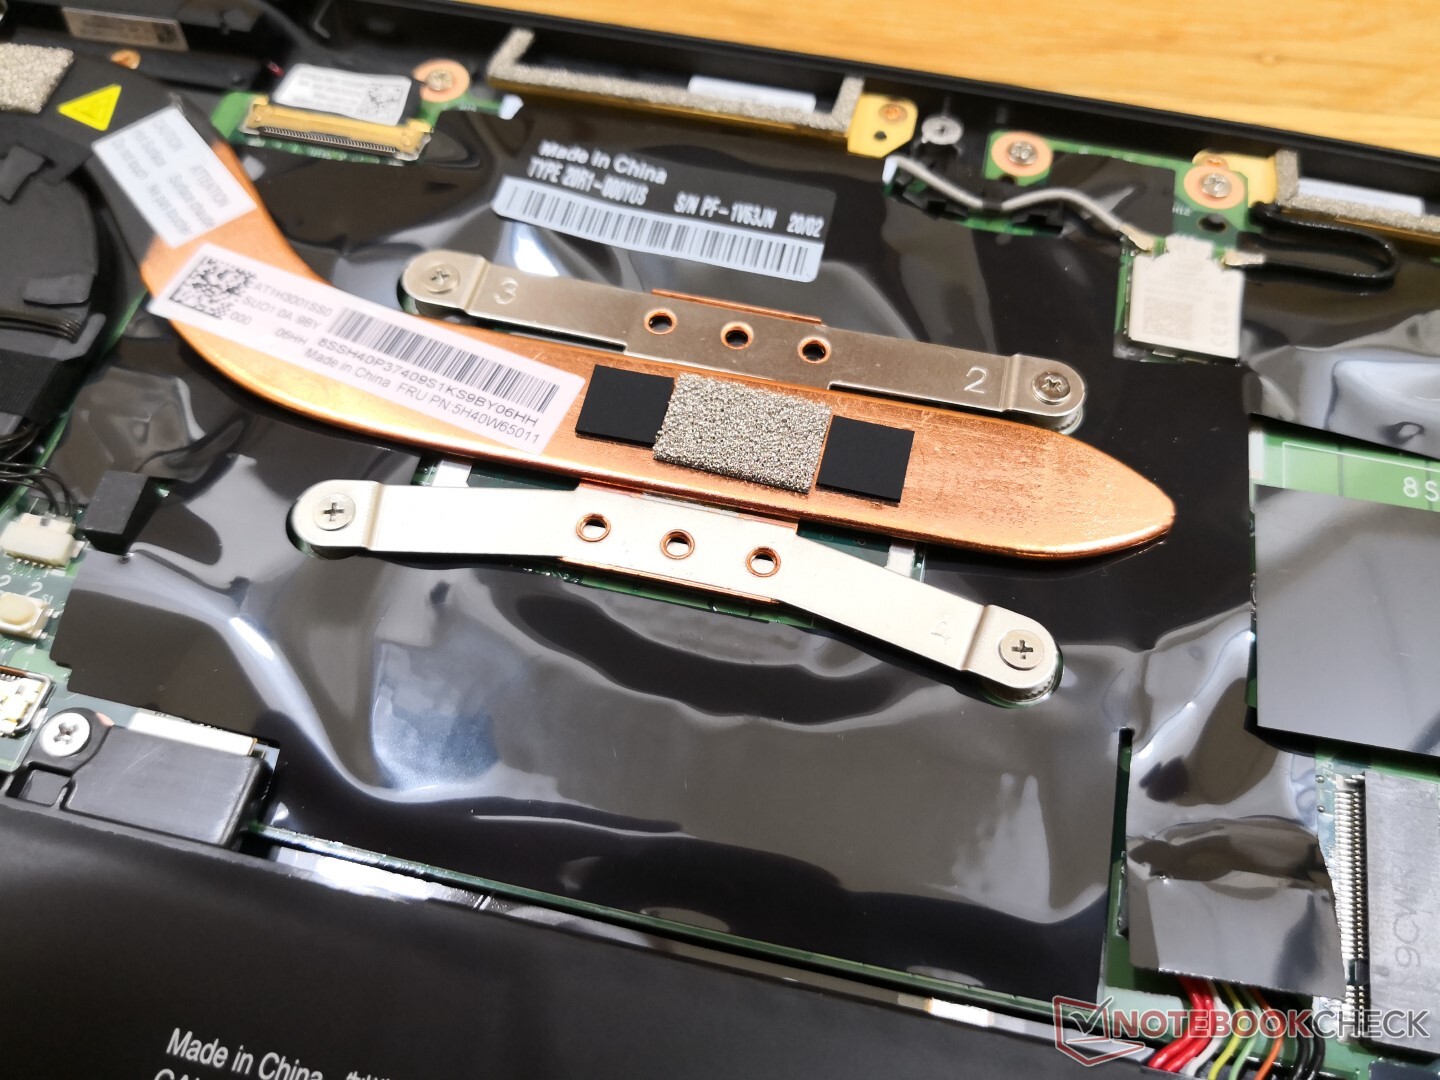
Maintenance
Display
This is the first ThinkPad X1 Carbon we've tested with a 4K UHD display as all previous units would have FHD or WQHD panels instead. Its exact BOE NV140QUM-N53 IPS panel can be found on no other laptop in our database, but the latest Yoga C940 uses a very similar BOE NV140QUM-N54.
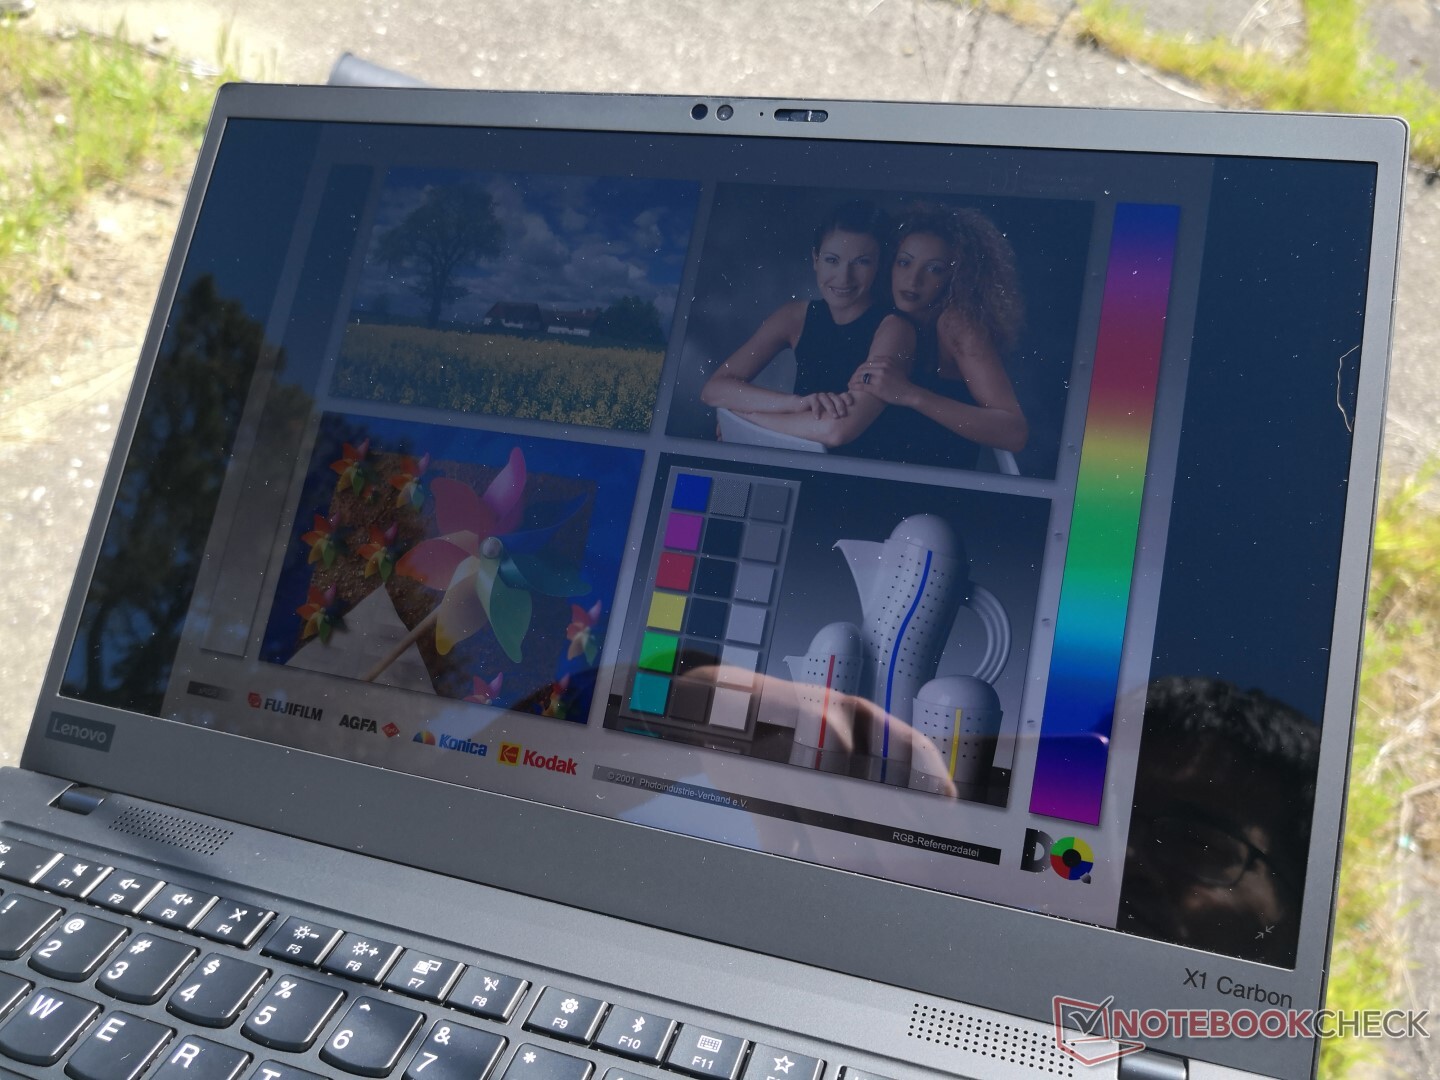
Visual quality is excellent as the glossy display is crisper and brighter and with a slightly wider color gamut than older models. It's biggest drawback is the slower response times for more noticeable ghosting, but this is a common trade off between FHD and 4K UHD displays. Unfortunately, pulse-width modulation is now present on all brightness levels except maximum which may impact users sensitive to onscreen flickering.


| |||||||||||||||||||||||||
Brightness Distribution: 90 %
Center on Battery: 532 cd/m²
Contrast: 1298:1 (Black: 0.41 cd/m²)
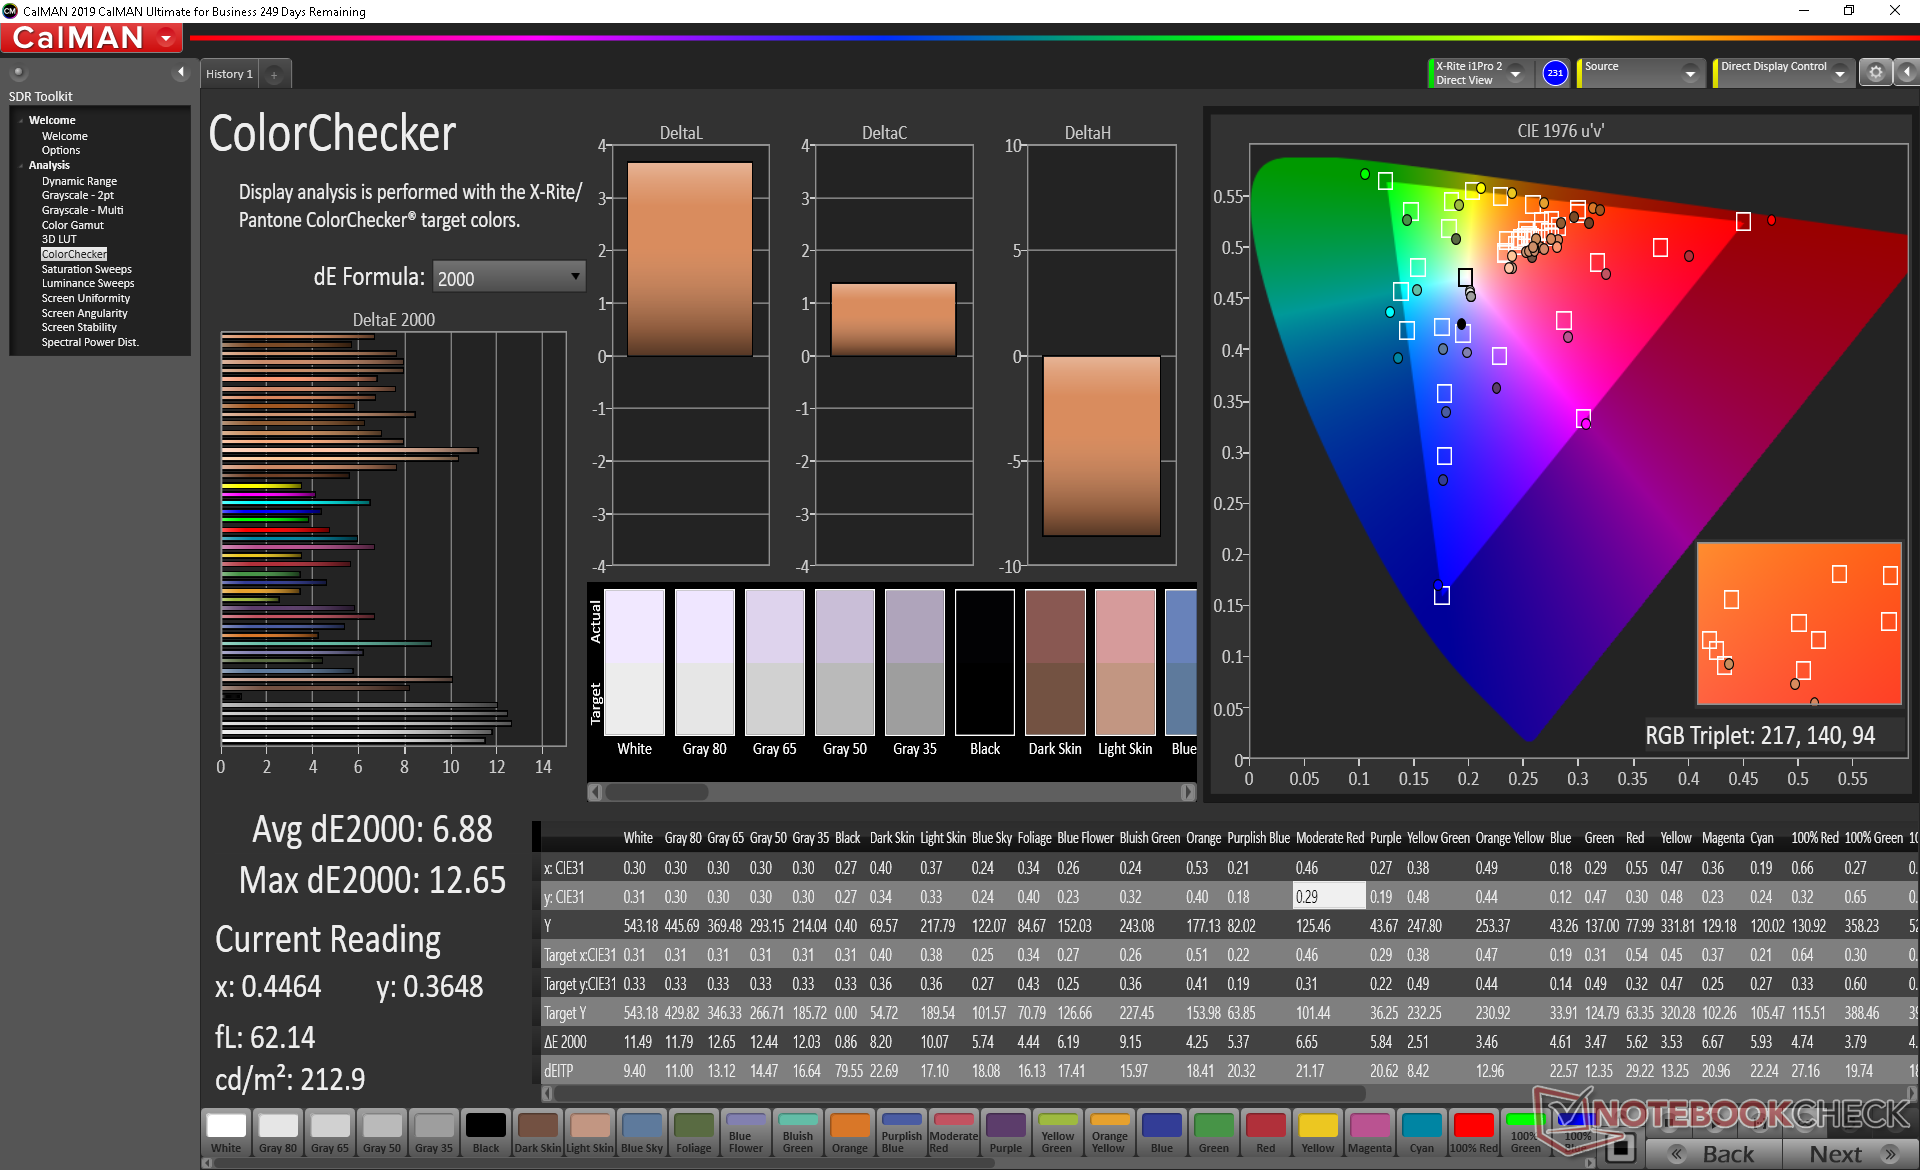
ΔE ColorChecker Calman: 6.88 | ∀{0.5-29.43 Ø4.72}
calibrated: 2.52
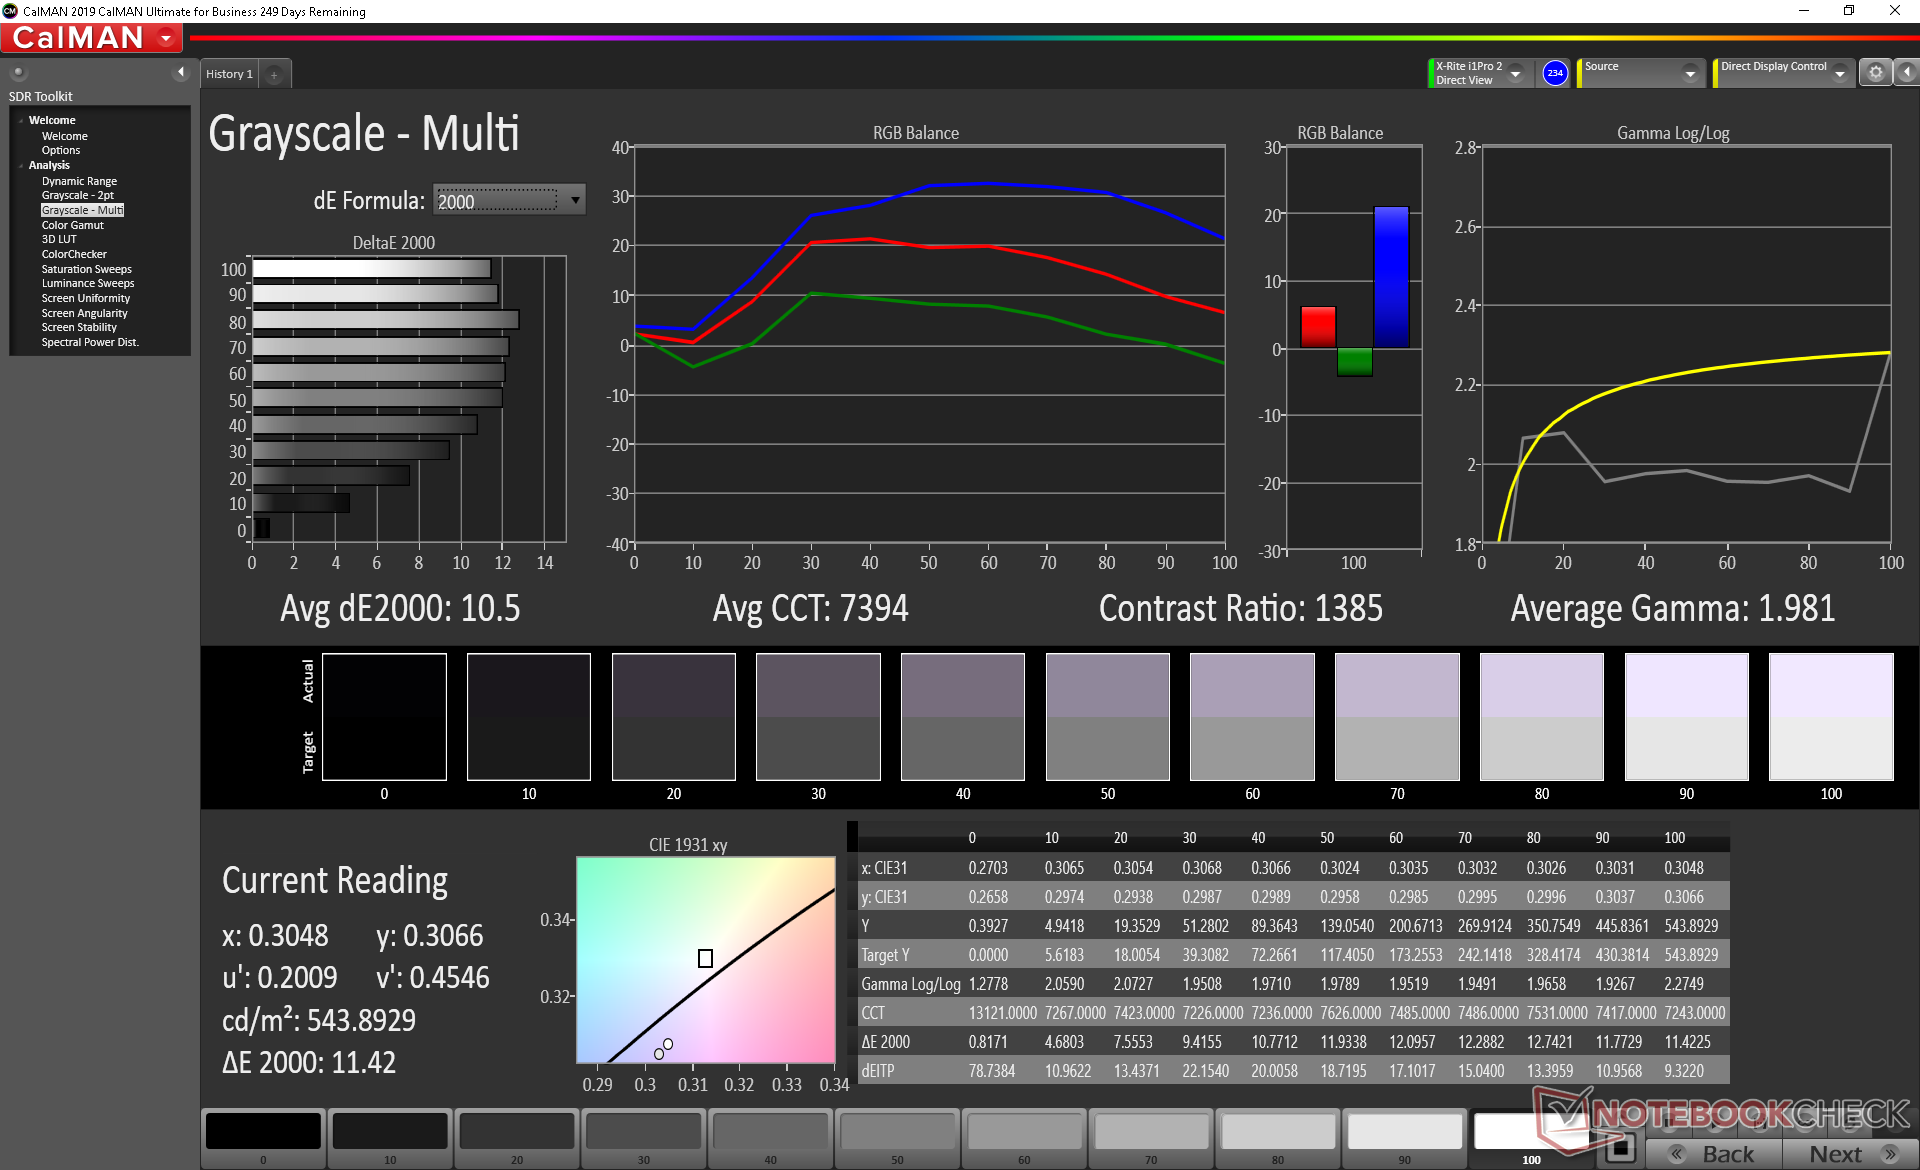
ΔE Greyscale Calman: 10.5 | ∀{0.09-98 Ø4.97}
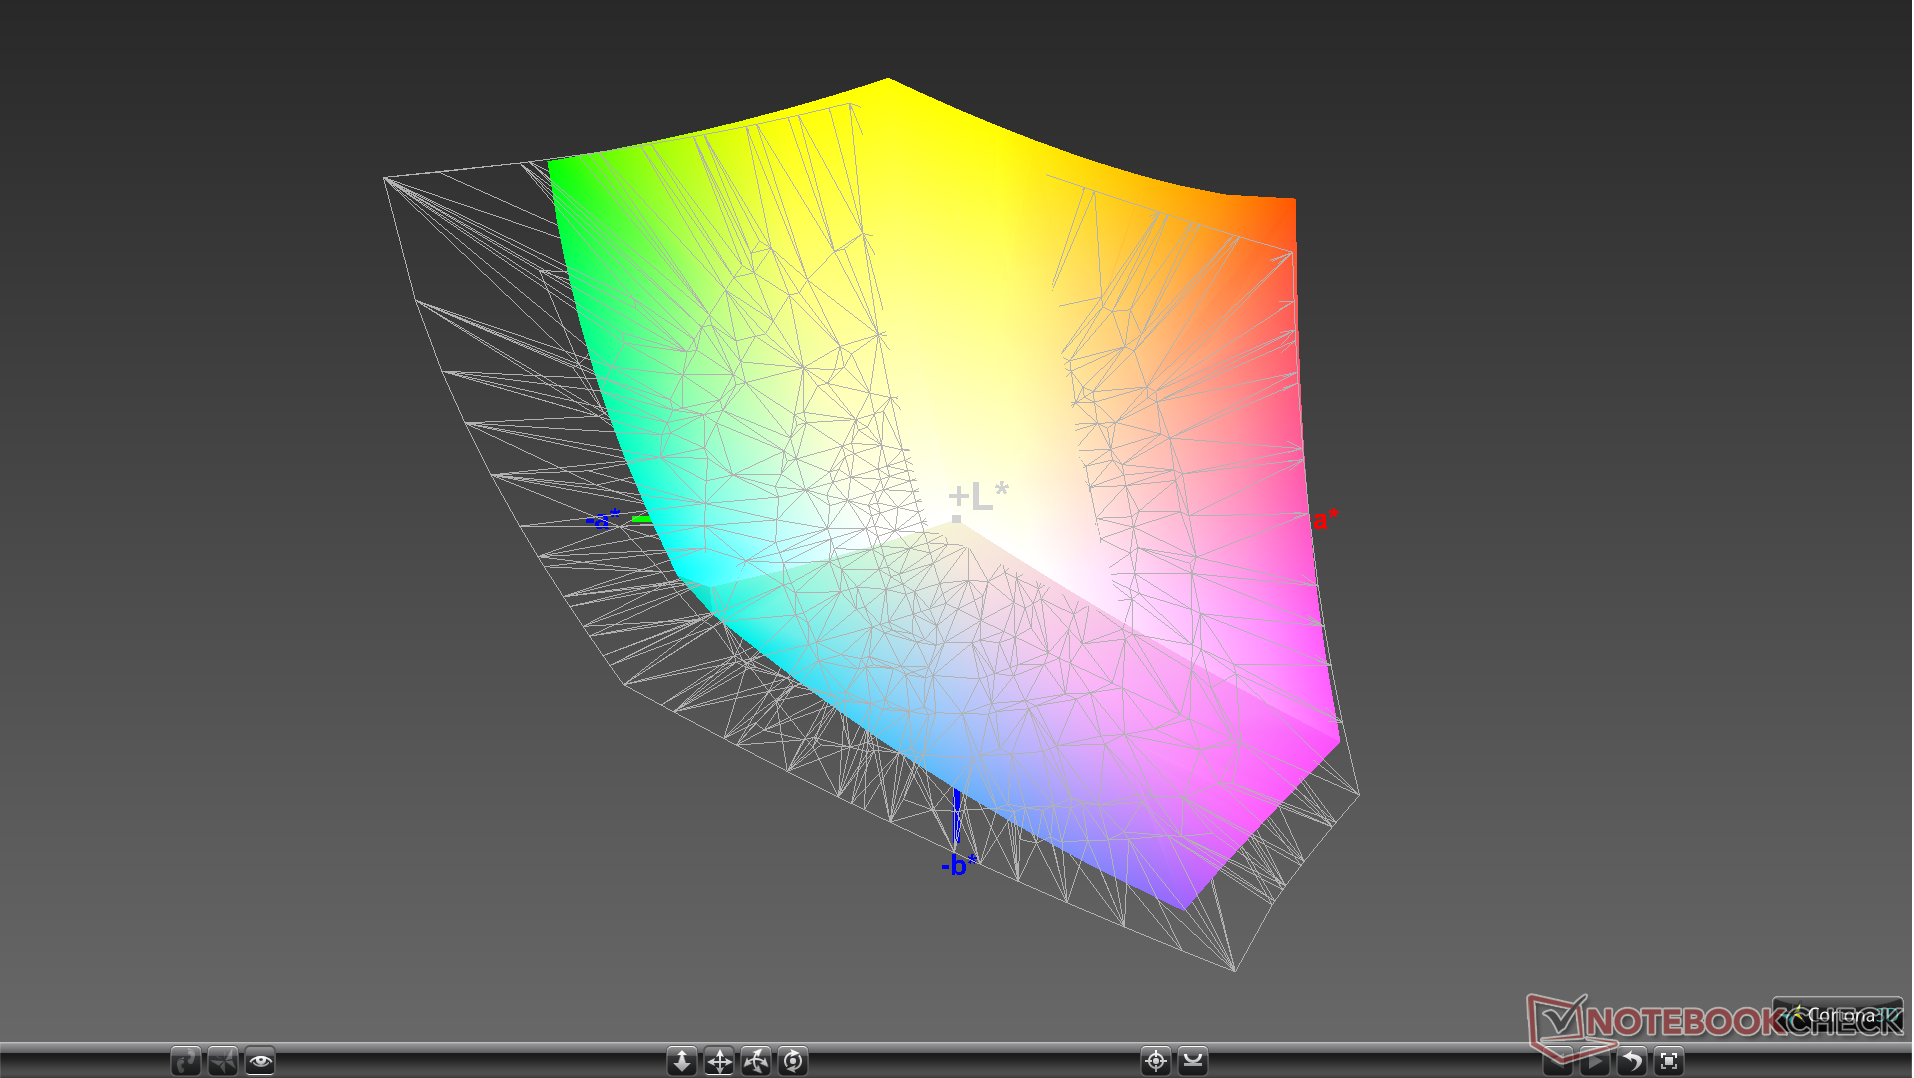
99.7% sRGB (Argyll 1.6.3 3D)
74.1% AdobeRGB 1998 (Argyll 1.6.3 3D)
83.1% AdobeRGB 1998 (Argyll 3D)
99.7% sRGB (Argyll 3D)
83% Display P3 (Argyll 3D)
Gamma: 1.98
CCT: 7394 K
| Lenovo ThinkPad X1 Carbon G7 20R1-000YUS BOE NV140QUM-N53, IPS, 14", 3840x2160 | Lenovo ThinkPad X1 Carbon 2019-20QD00M7GE N140HCR-GA2, IPS, 14", 1920x1080 | Lenovo ThinkPad X1 Carbon 2018-20KGS5DU00 LP140QH2-SPB1, IPS, 14", 2560x1440 | Lenovo ThinkPad X1 Carbon G6-20KG0025UK Lenovo LEN40A9 / AUO B140HAK02.3, IPS, 14", 1920x1080 | Lenovo ThinkPad X1 Carbon 2017-20HR0021GE B140HAN03_1, IPS, 14", 1920x1080 | Lenovo ThinkPad X1 Carbon Touch 20A7-002DGE LG Philips LP140GH1-SPA2, IPS-Panel, 14", 2560x1440 | |
|---|---|---|---|---|---|---|
| Display | -11% | -8% | -13% | -21% | -30% | |
| Display P3 Coverage (%) | 83 | 68.3 -18% | 72.7 -12% | 68.3 -18% | 61.6 -26% | 54.1 -35% |
| sRGB Coverage (%) | 99.7 | 98.6 -1% | 97.9 -2% | 94.9 -5% | 87.6 -12% | 77.5 -22% |
| AdobeRGB 1998 Coverage (%) | 83.1 | 70.3 -15% | 74.6 -10% | 69.3 -17% | 62.6 -25% | 55.2 -34% |
| Response Times | 17% | 21% | 21% | 4% | ||
| Response Time Grey 50% / Grey 80% * (ms) | 49.2 ? | 40.8 ? 17% | 38 ? 23% | 40 ? 19% | 48 ? 2% | |
| Response Time Black / White * (ms) | 32.2 ? | 27.2 ? 16% | 26 ? 19% | 25 ? 22% | 30.4 ? 6% | |
| PWM Frequency (Hz) | 201.6 ? | 25000 ? | ||||
| Screen | 20% | 1% | 19% | 11% | -11% | |
| Brightness middle (cd/m²) | 532 | 406 -24% | 316 -41% | 298 -44% | 278 -48% | 228 -57% |
| Brightness (cd/m²) | 513 | 372 -27% | 311 -39% | 287 -44% | 271 -47% | 226 -56% |
| Brightness Distribution (%) | 90 | 88 -2% | 84 -7% | 91 1% | 91 1% | 89 -1% |
| Black Level * (cd/m²) | 0.41 | 0.25 39% | 0.35 15% | 0.2 51% | 0.16 61% | 0.23 44% |
| Contrast (:1) | 1298 | 1624 25% | 903 -30% | 1490 15% | 1738 34% | 991 -24% |
| Colorchecker dE 2000 * | 6.88 | 2.9 58% | 4.5 35% | 2.19 68% | 4.5 35% | 6.29 9% |
| Colorchecker dE 2000 max. * | 12.65 | 6.1 52% | 10.3 19% | 4.39 65% | 8.4 34% | |
| Colorchecker dE 2000 calibrated * | 2.52 | 1.1 56% | 1.6 37% | 1.67 34% | ||
| Greyscale dE 2000 * | 10.5 | 4.4 58% | 7.7 27% | 1.97 81% | 3.2 70% | 7.79 26% |
| Gamma | 1.98 111% | 2.24 98% | 2.2 100% | 2.43 91% | 2.02 109% | 2.36 93% |
| CCT | 7394 88% | 5967 109% | 6639 98% | 6571 99% | 7042 92% | 5531 118% |
| Color Space (Percent of AdobeRGB 1998) (%) | 74.1 | 63.4 -14% | 68.6 -7% | 62 -16% | 57 -23% | 51.7 -30% |
| Color Space (Percent of sRGB) (%) | 99.7 | 98.6 -1% | 97.9 -2% | 95 -5% | 87.5 -12% | |
| Total Average (Program / Settings) | 9% /
14% | 5% /
2% | 9% /
13% | -2% /
3% | -21% /
-16% |
* ... smaller is better
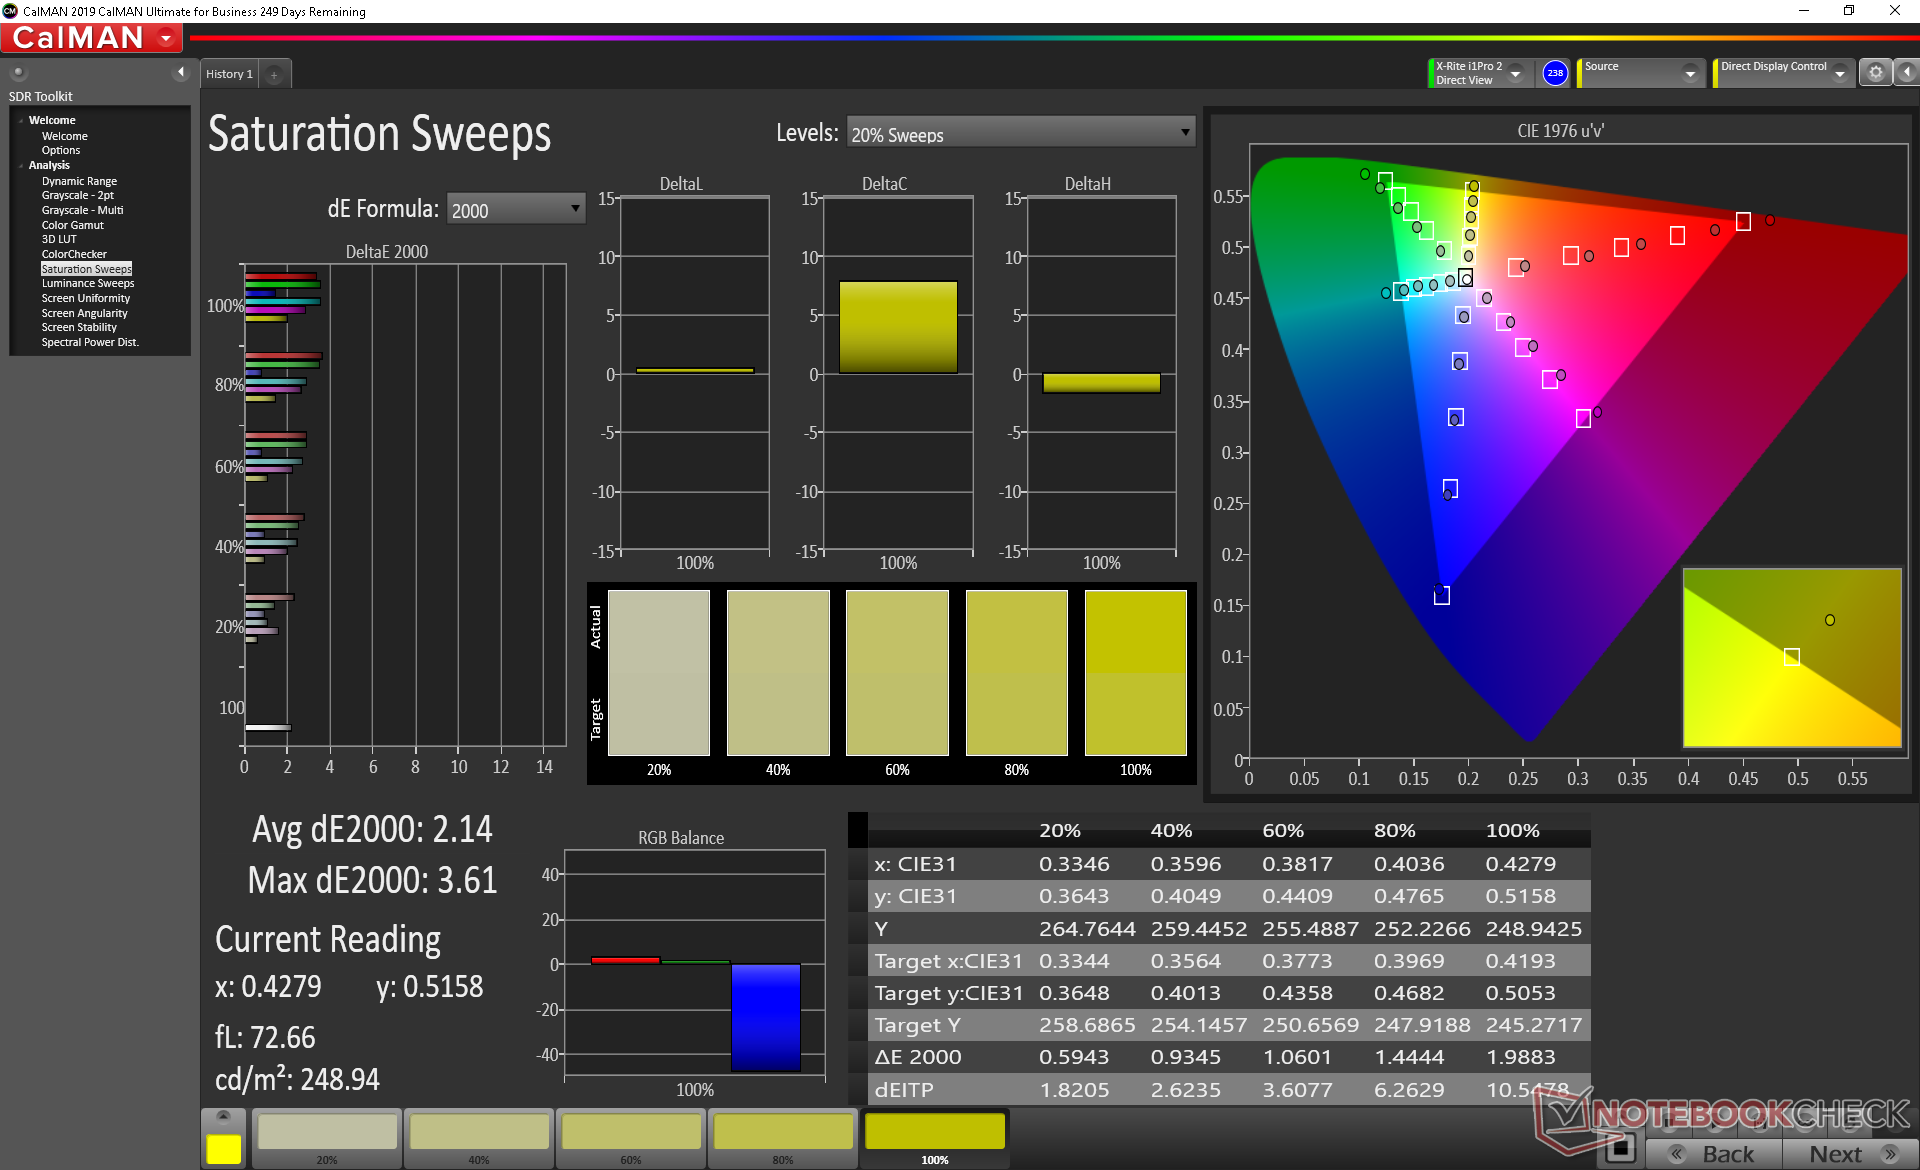
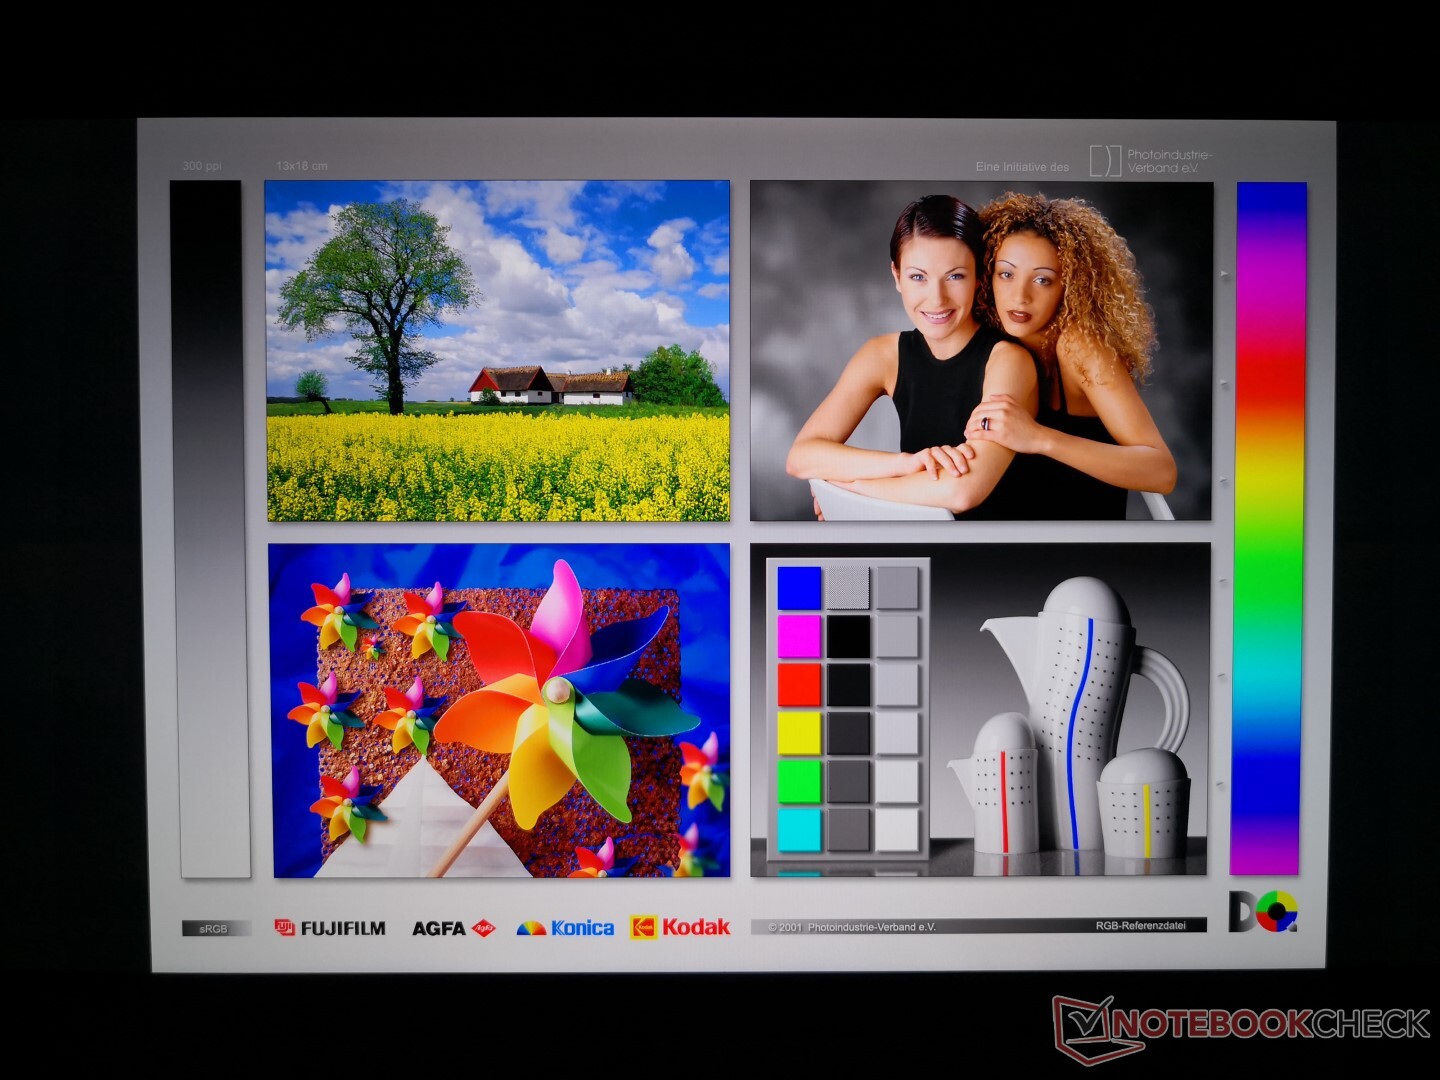
Color space covers all of sRGB and 74 percent of AdobeRGB to be slightly larger than on most other flagship subnotebooks. Larger 15.6-inch 4K UHD solutions like the XPS 15, Razer Blade 15, or ZenBook Pro series have even wider gamuts at 88 percent AdobeRGB or larger for potentially more accurate colors.
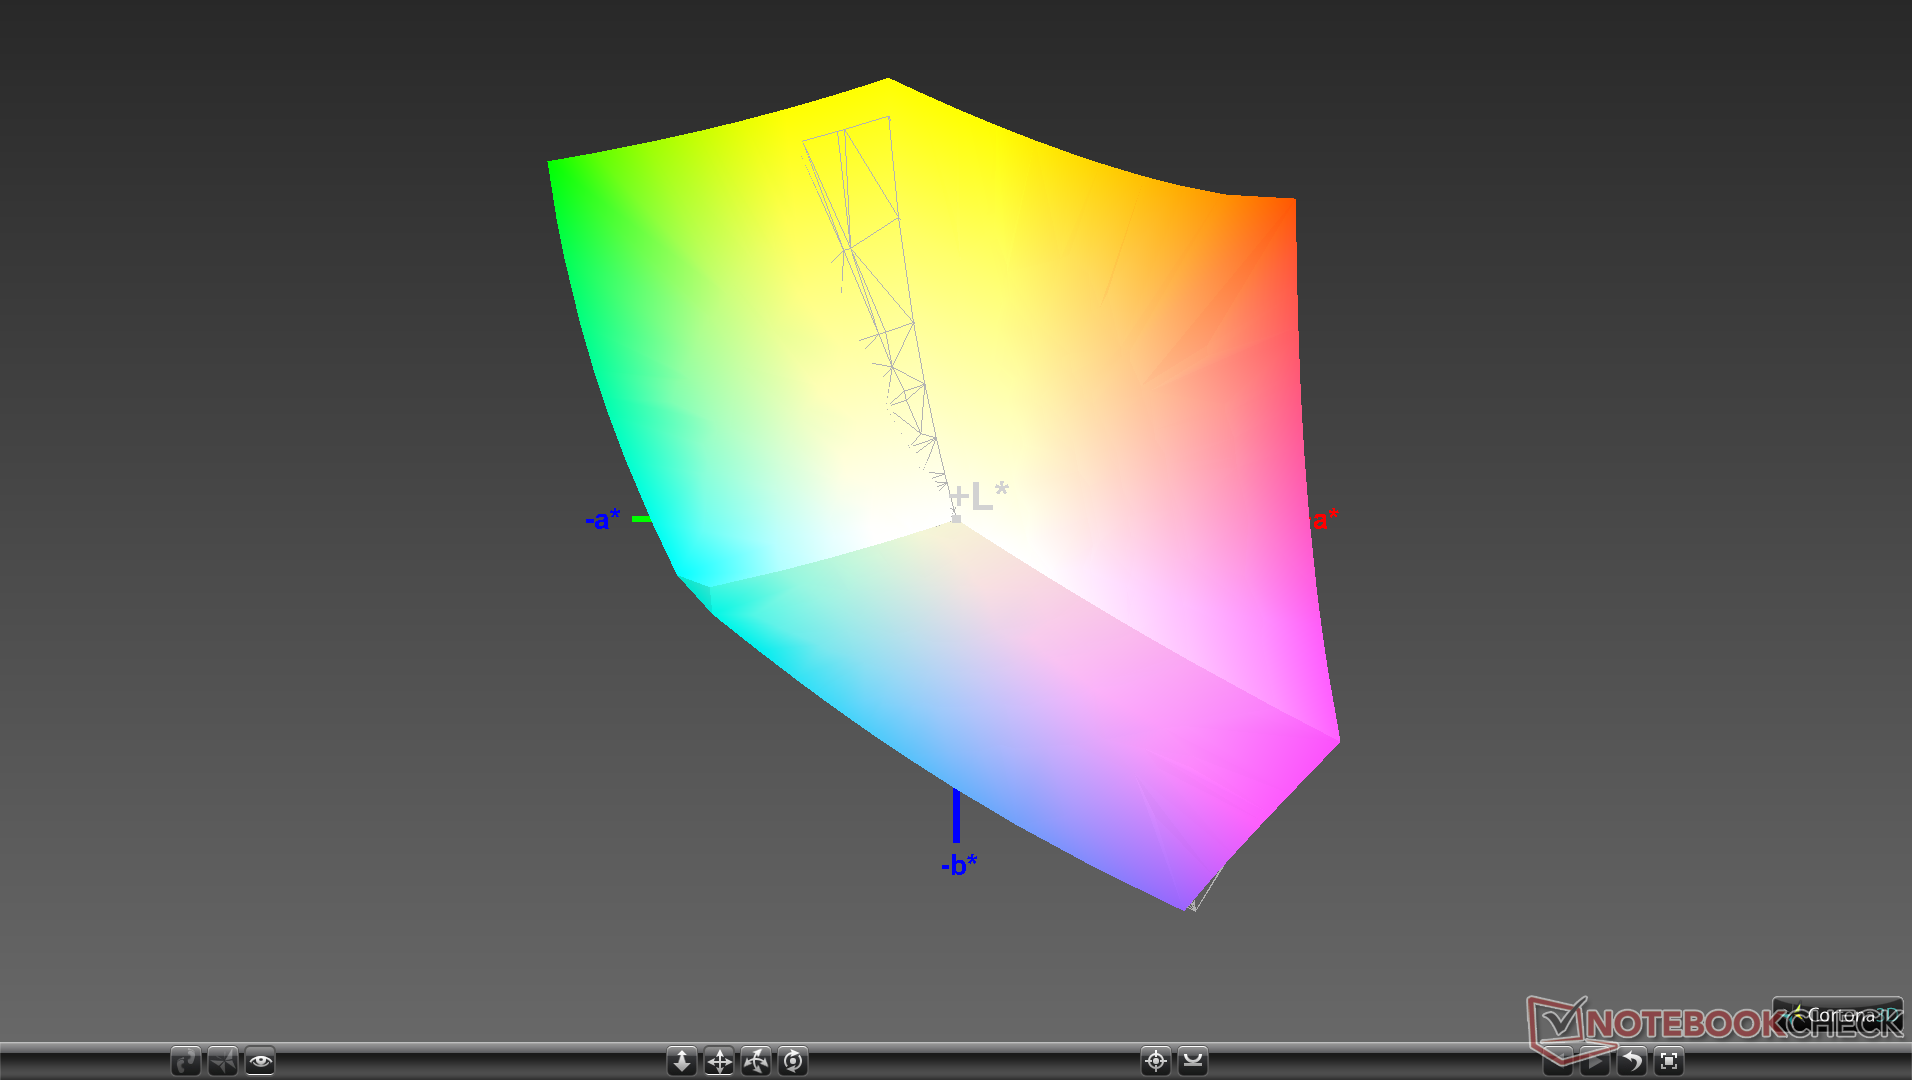
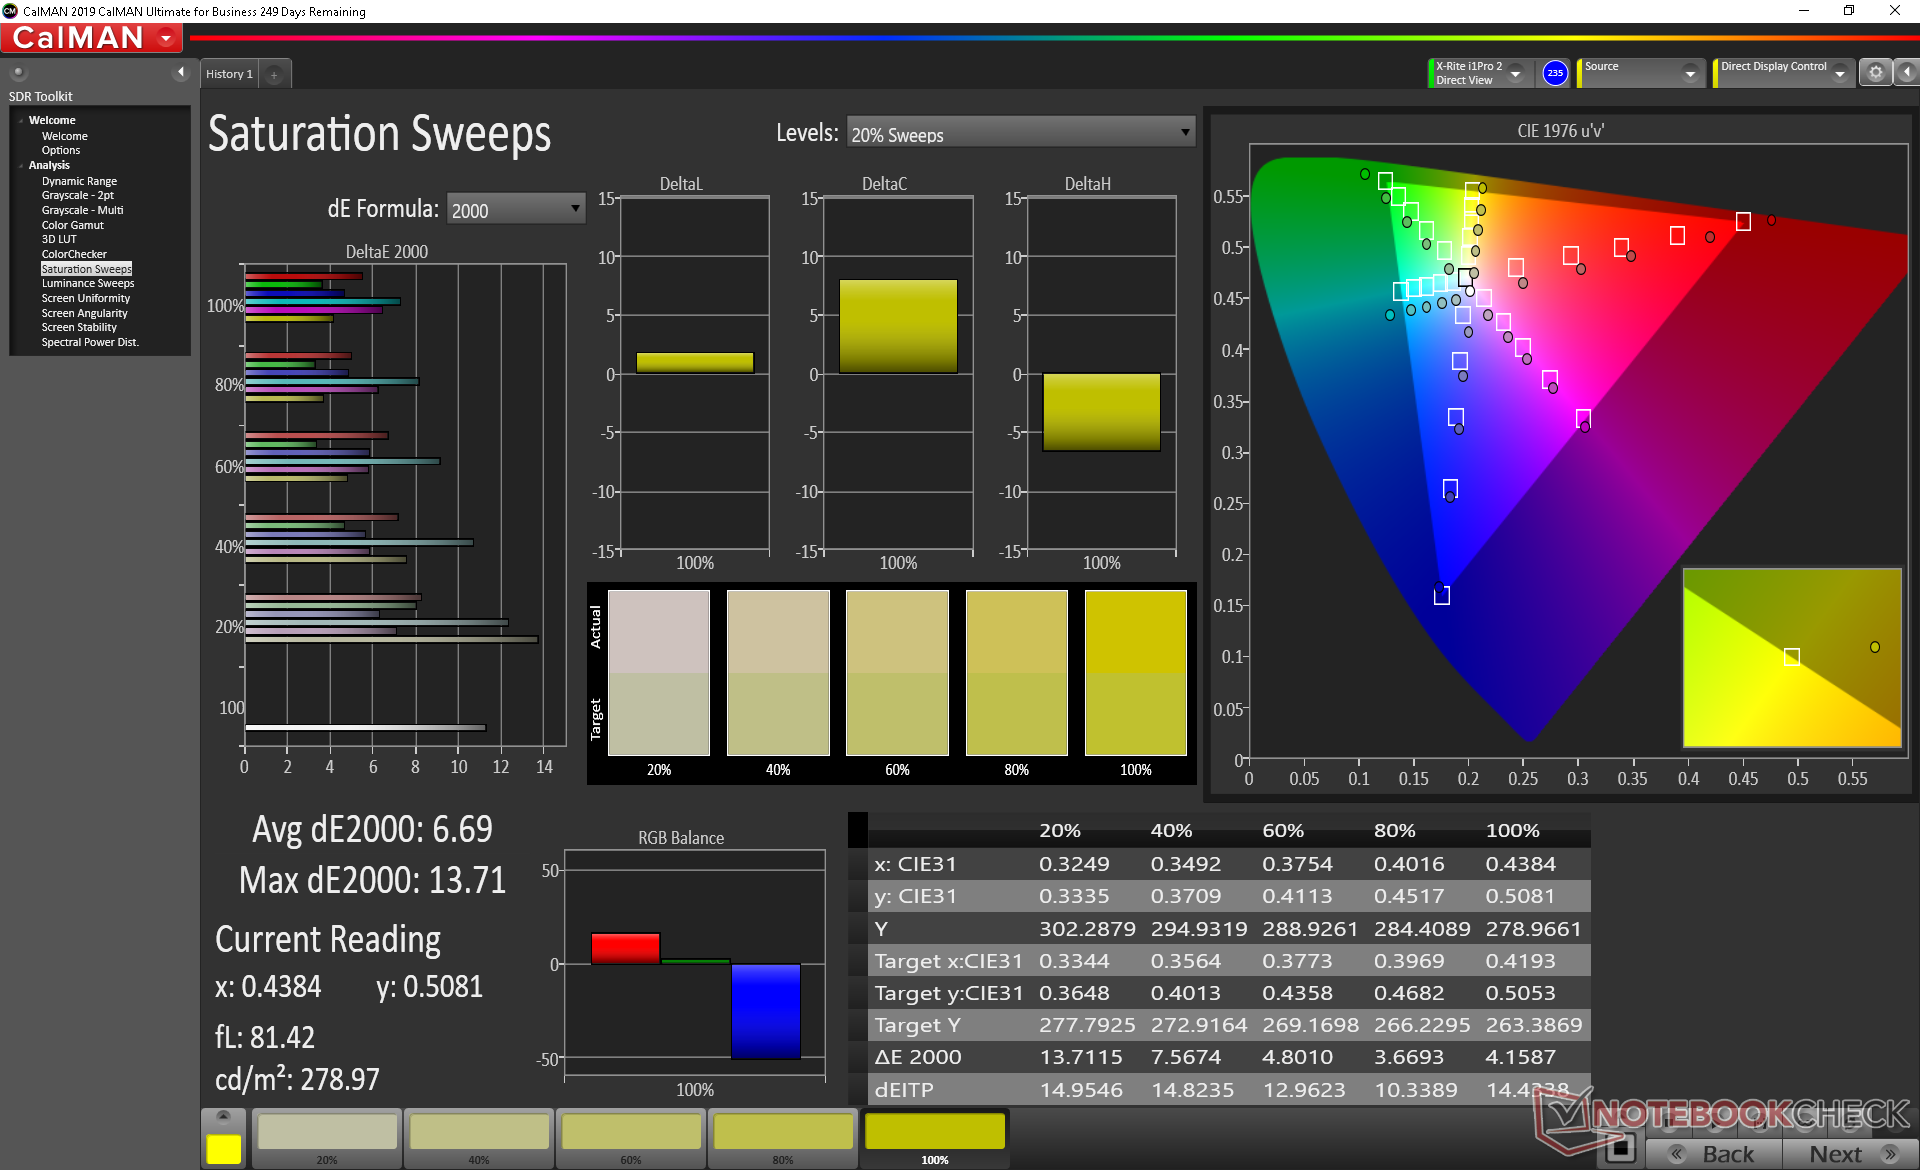
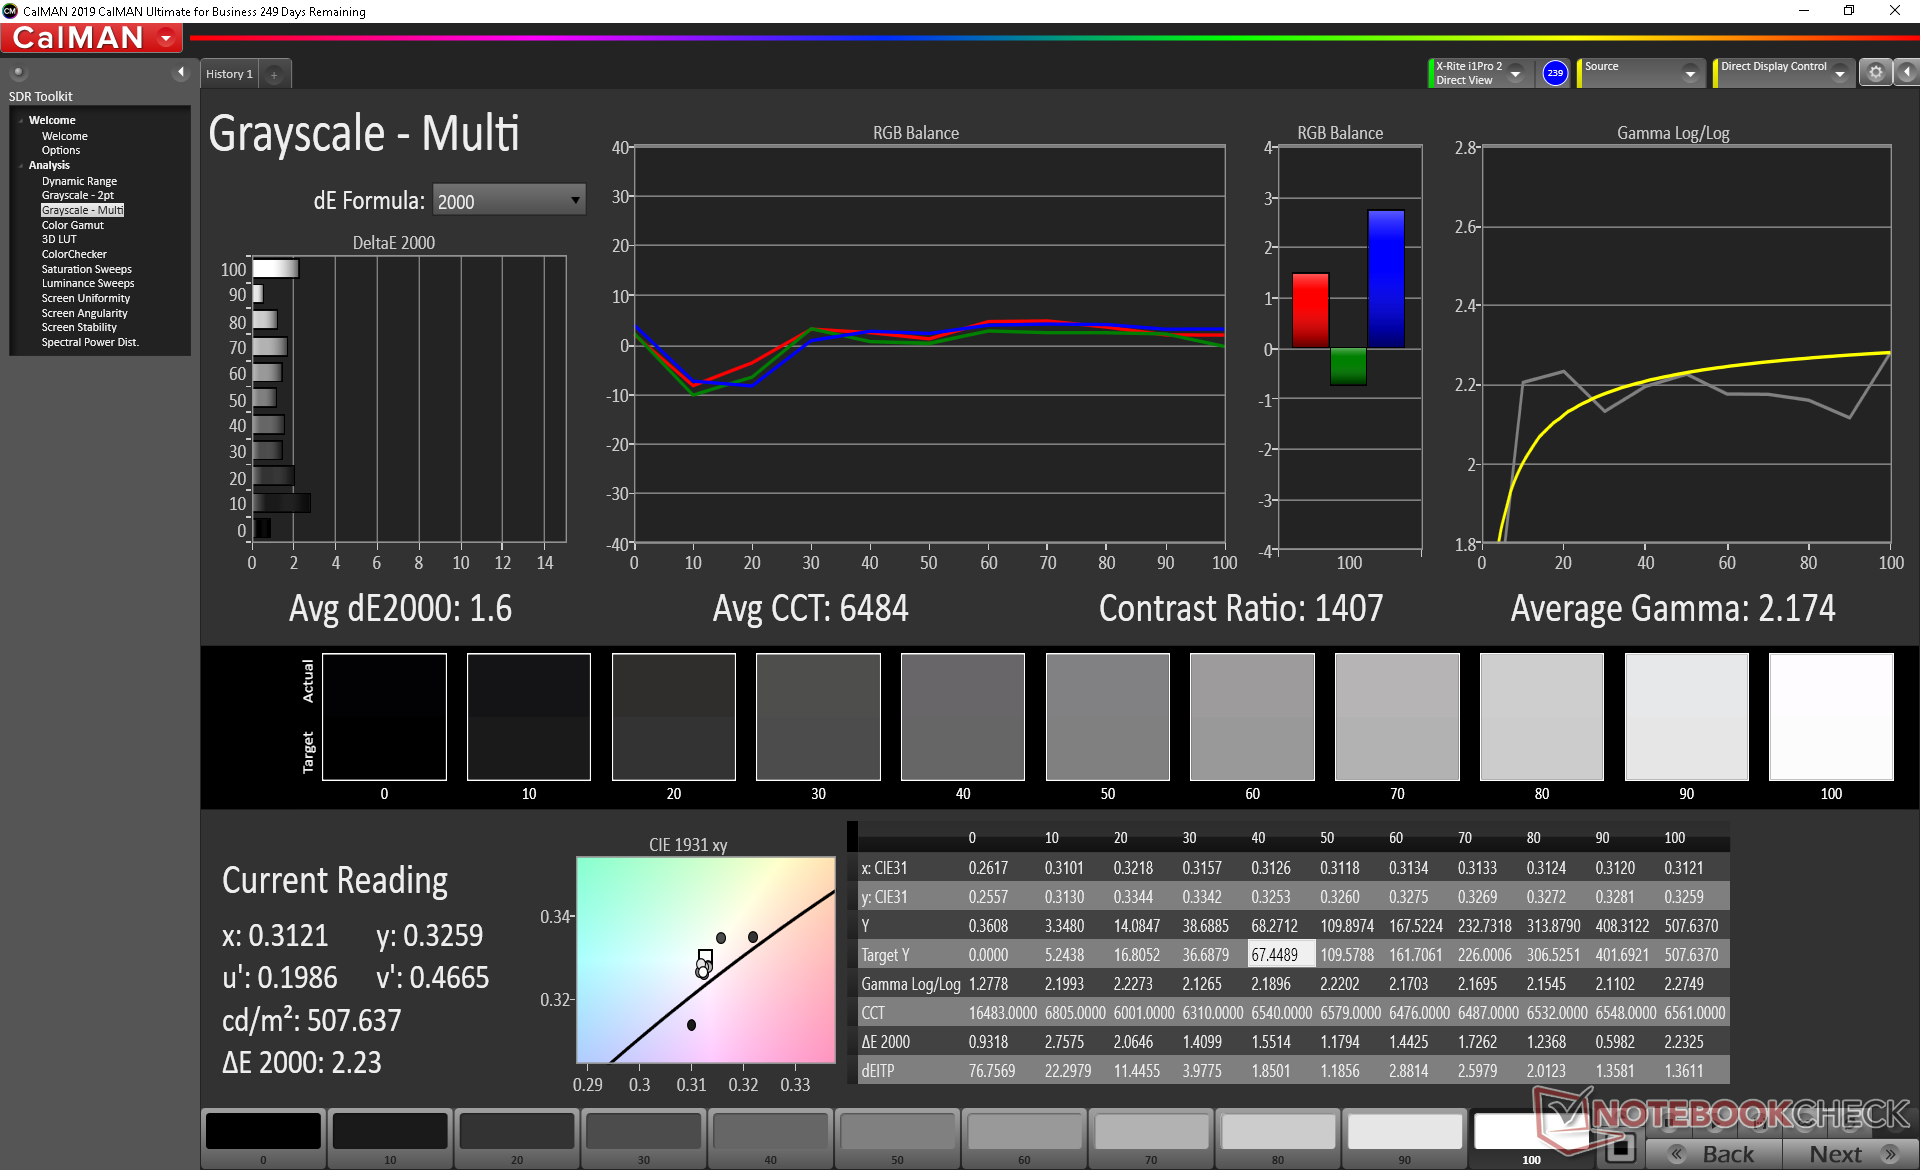
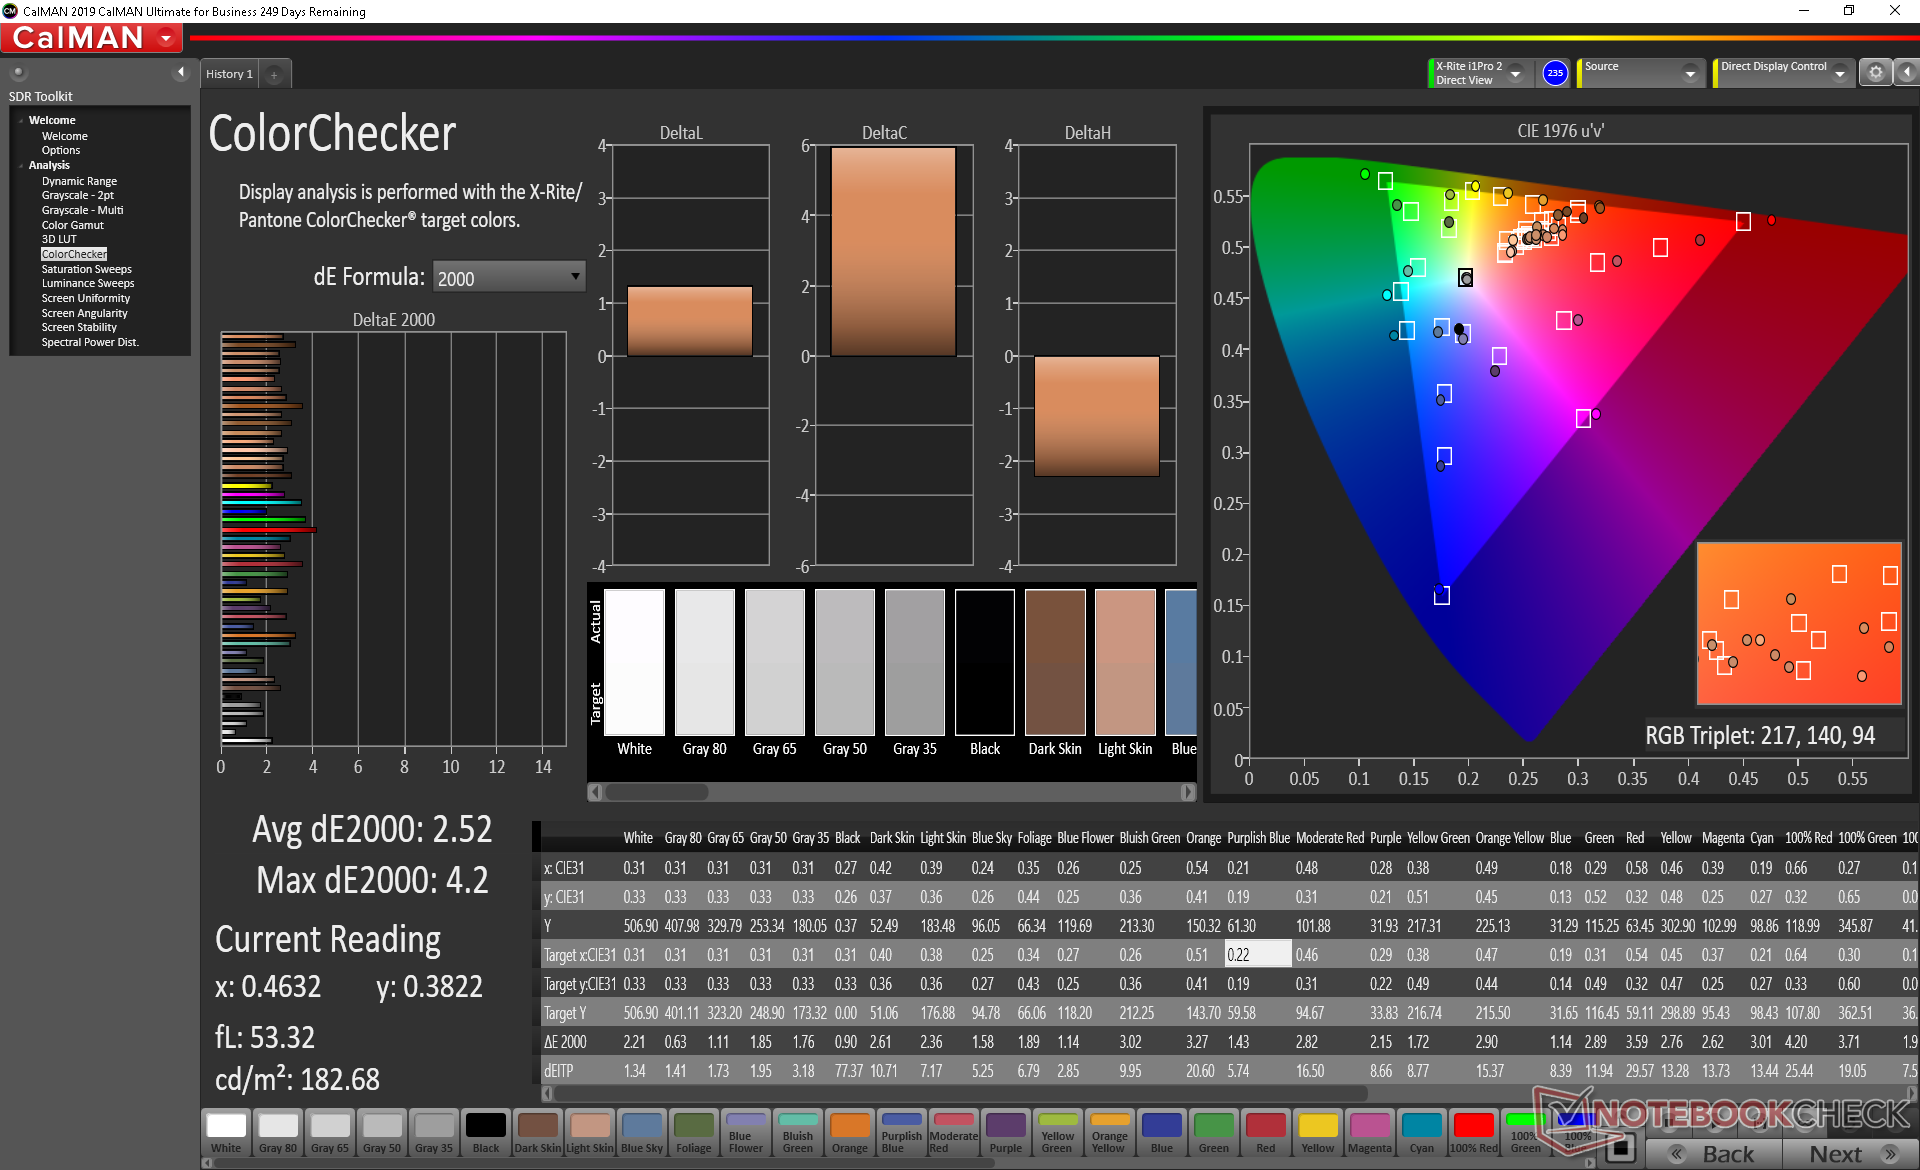
Further measurements with an X-Rite colorimeter reveal that the display could have been better calibrated out of the box. Color temperature, for example, is on the cool side and RGB balance is way off. Our calibration attempt improves colors and grayscale significantly by reducing the average DeltaE values to just 1 to 3. We recommend playing around with the Lenovo Display Optimizer software or applying our calibreated ICM profile above to get the most out of the display.
Display Response Times
| ↔ Response Time Black to White | ||
|---|---|---|
| 32.2 ms ... rise ↗ and fall ↘ combined | ↗ 19.2 ms rise | 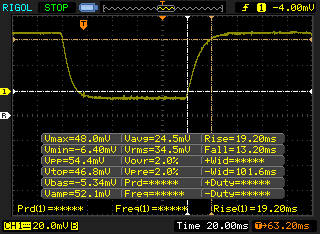 |
| ↘ 13.2 ms fall | ||
| The screen shows slow response rates in our tests and will be unsatisfactory for gamers. In comparison, all tested devices range from 0.1 (minimum) to 240 (maximum) ms. » 88 % of all devices are better. This means that the measured response time is worse than the average of all tested devices (19.8 ms). | ||
| ↔ Response Time 50% Grey to 80% Grey | ||
| 49.2 ms ... rise ↗ and fall ↘ combined | ↗ 22 ms rise | 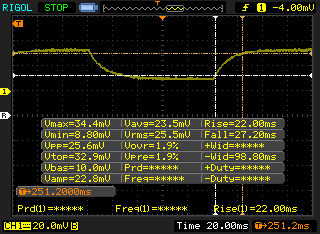 |
| ↘ 27.2 ms fall | ||
| The screen shows slow response rates in our tests and will be unsatisfactory for gamers. In comparison, all tested devices range from 0.165 (minimum) to 636 (maximum) ms. » 85 % of all devices are better. This means that the measured response time is worse than the average of all tested devices (31 ms). | ||
Screen Flickering / PWM (Pulse-Width Modulation)
| Screen flickering / PWM detected | 201.6 Hz | ≤ 99 % brightness setting | 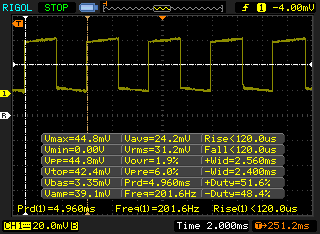 |
The display backlight flickers at 201.6 Hz (worst case, e.g., utilizing PWM) Flickering detected at a brightness setting of 99 % and below. There should be no flickering or PWM above this brightness setting. The frequency of 201.6 Hz is relatively low, so sensitive users will likely notice flickering and experience eyestrain at the stated brightness setting and below. In comparison: 52 % of all tested devices do not use PWM to dim the display. If PWM was detected, an average of 7753 (minimum: 5 - maximum: 343500) Hz was measured. | |||
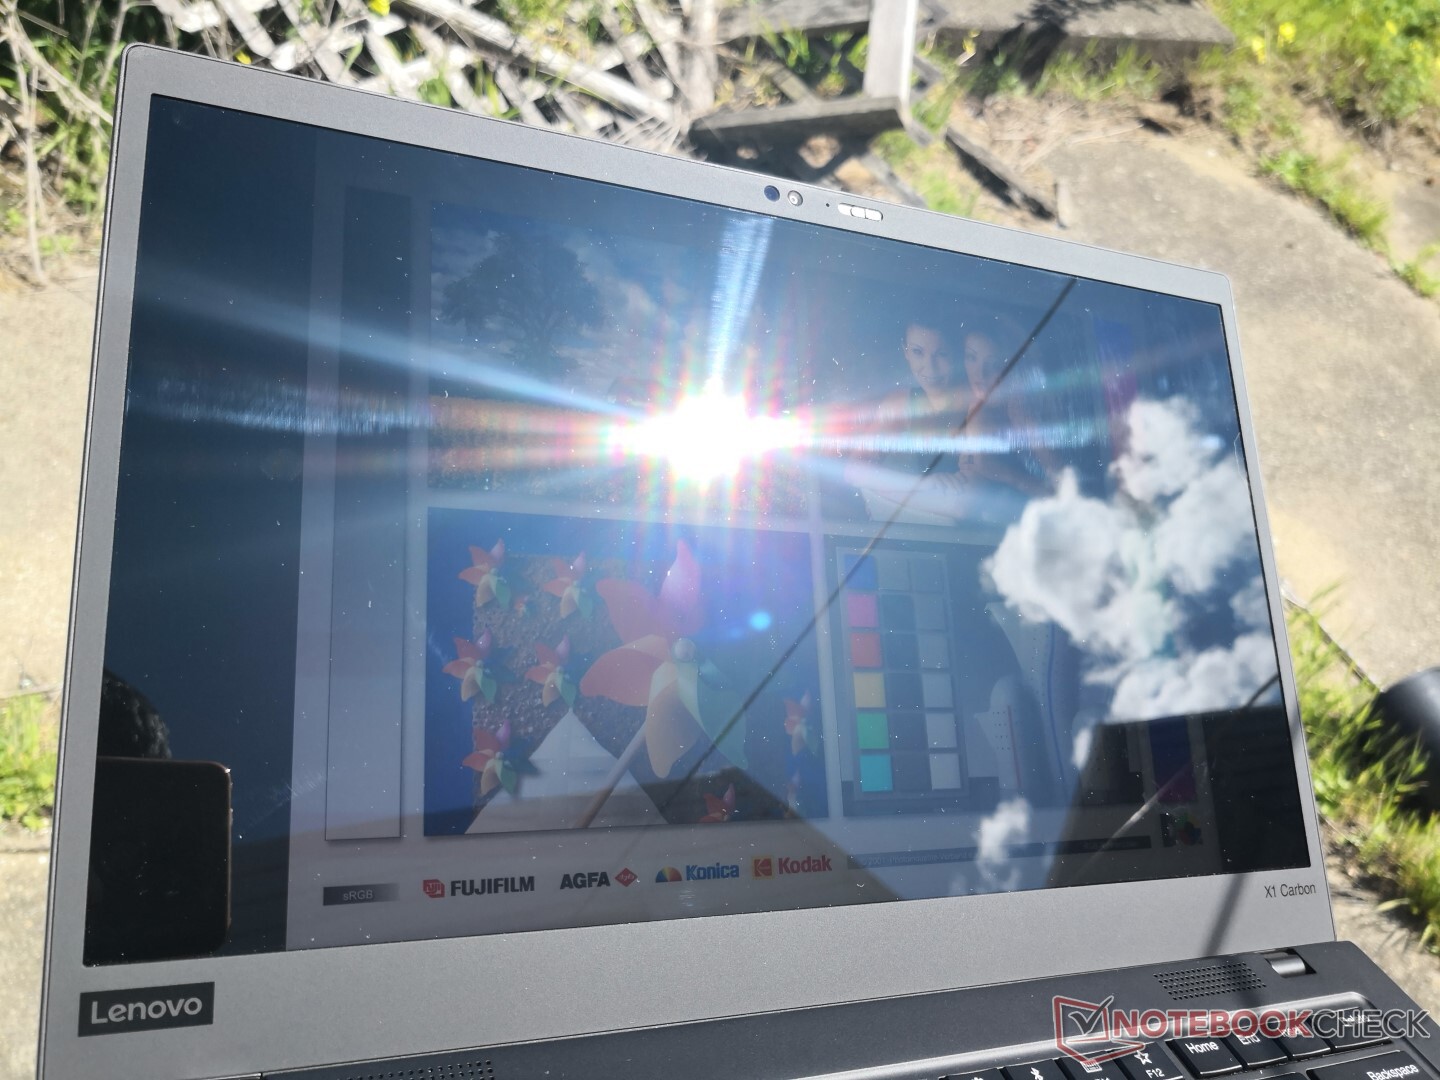
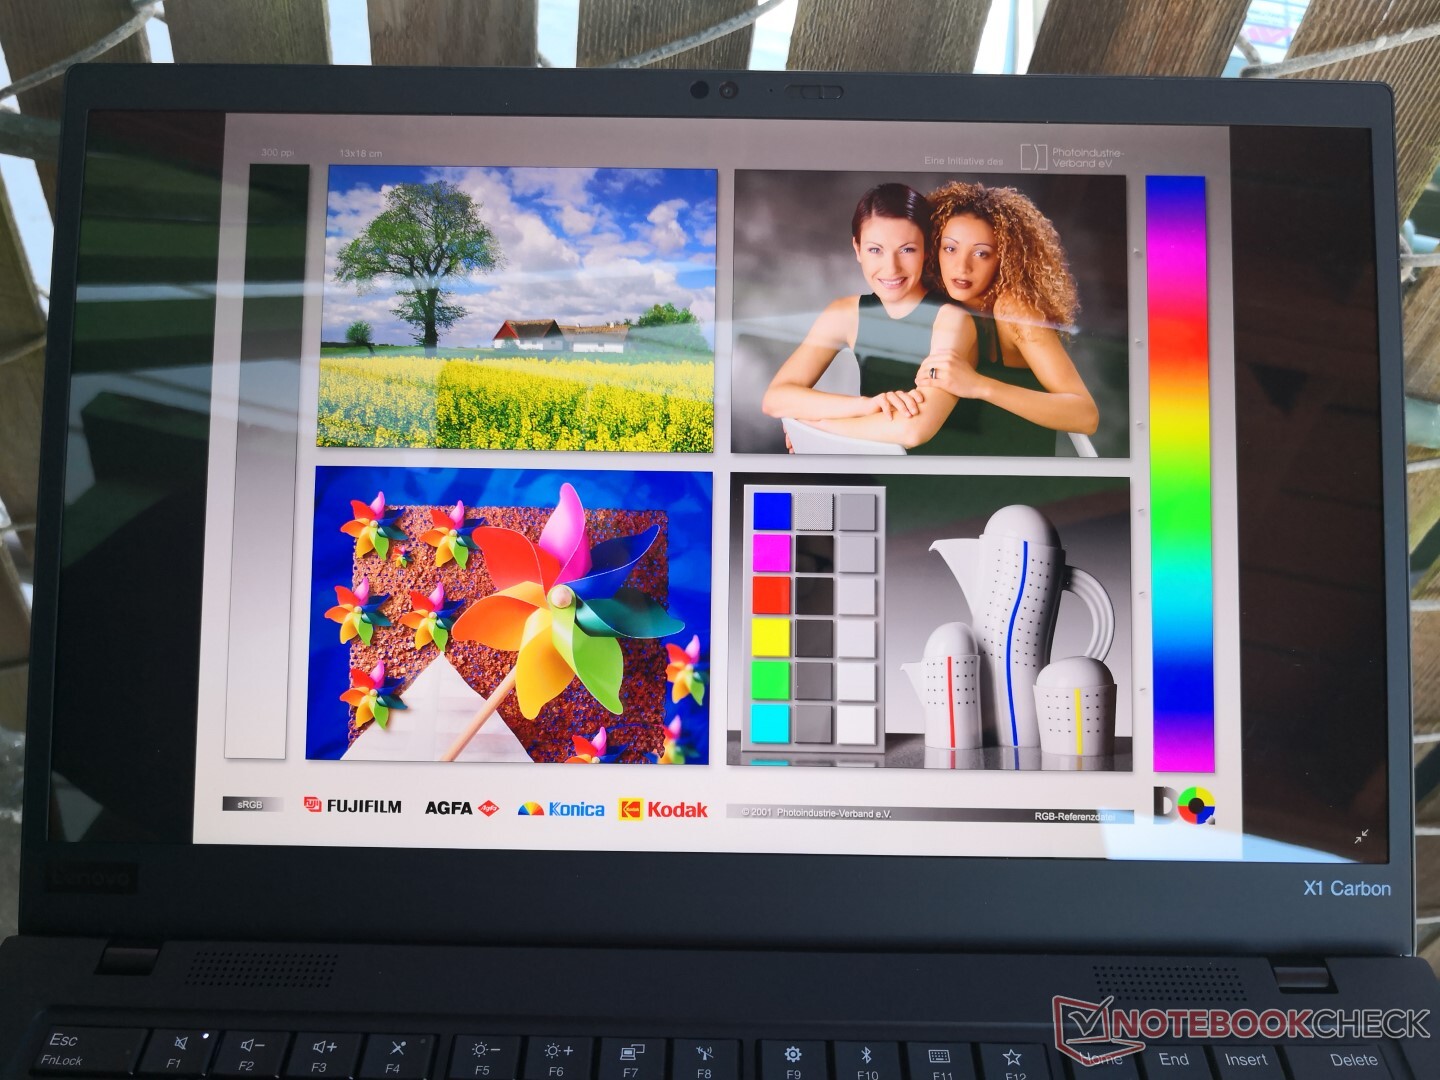
Glare is inevitable on the glossy display and the backlight is nowhere near bright enough for comfortable use when working under sunlight. Even so, outdoor visibility is still better than the 2018 or 2017 X1 Carbon models where the displays were much dimmer. The wide viewing angles and 180-degree hinges help to minimize glare somewhat.
Performance
Like most ThinkPad systems, Lenovo offers a wide range of CPU and display options from the 8th gen quad-core Core i5-8265U all the way up to the 10th gen hexa-core Core i7-10710U. There are no discrete GPUs or Iris Plus options, however, so heavy photo editors or light gamers need not apply. It would have been great to see some AMD Ryzen options since the RX Vega series is significantly faster than the UHD Graphics 620 without needing the break the 15 W to 25 W TDP.
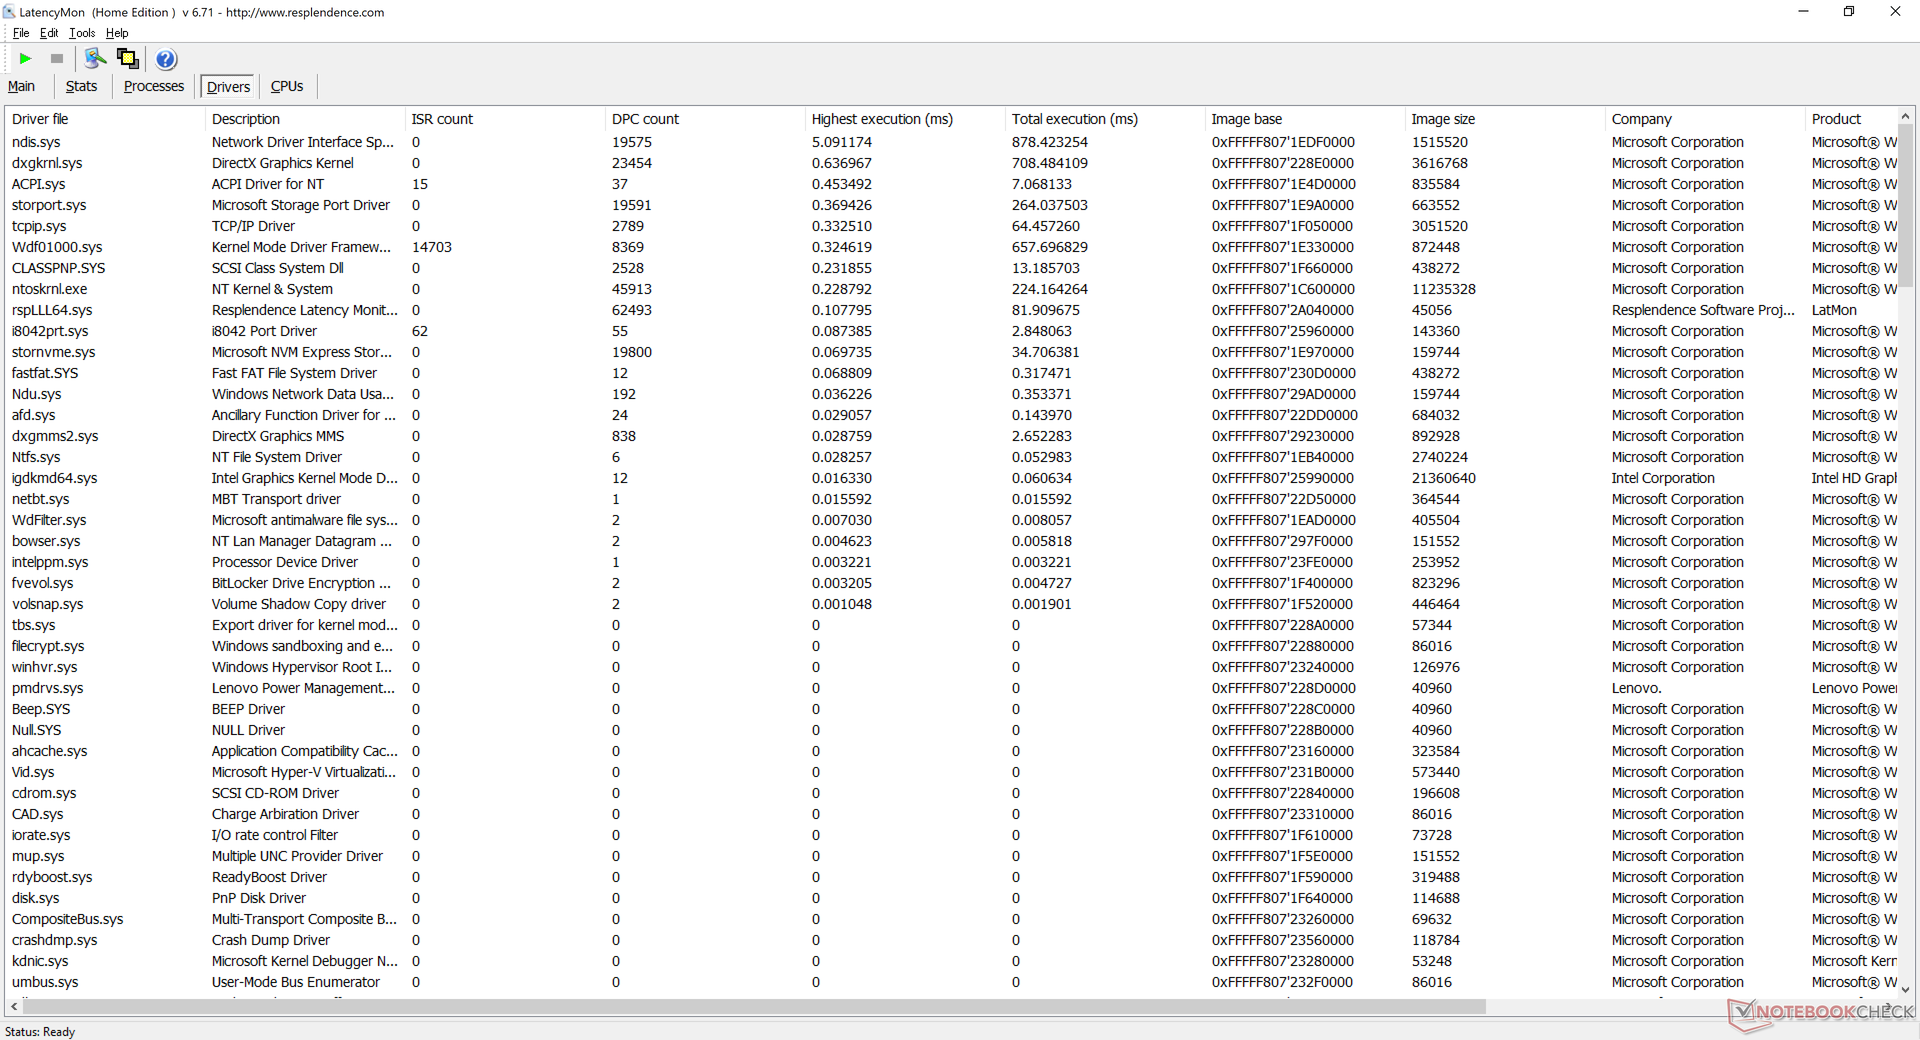
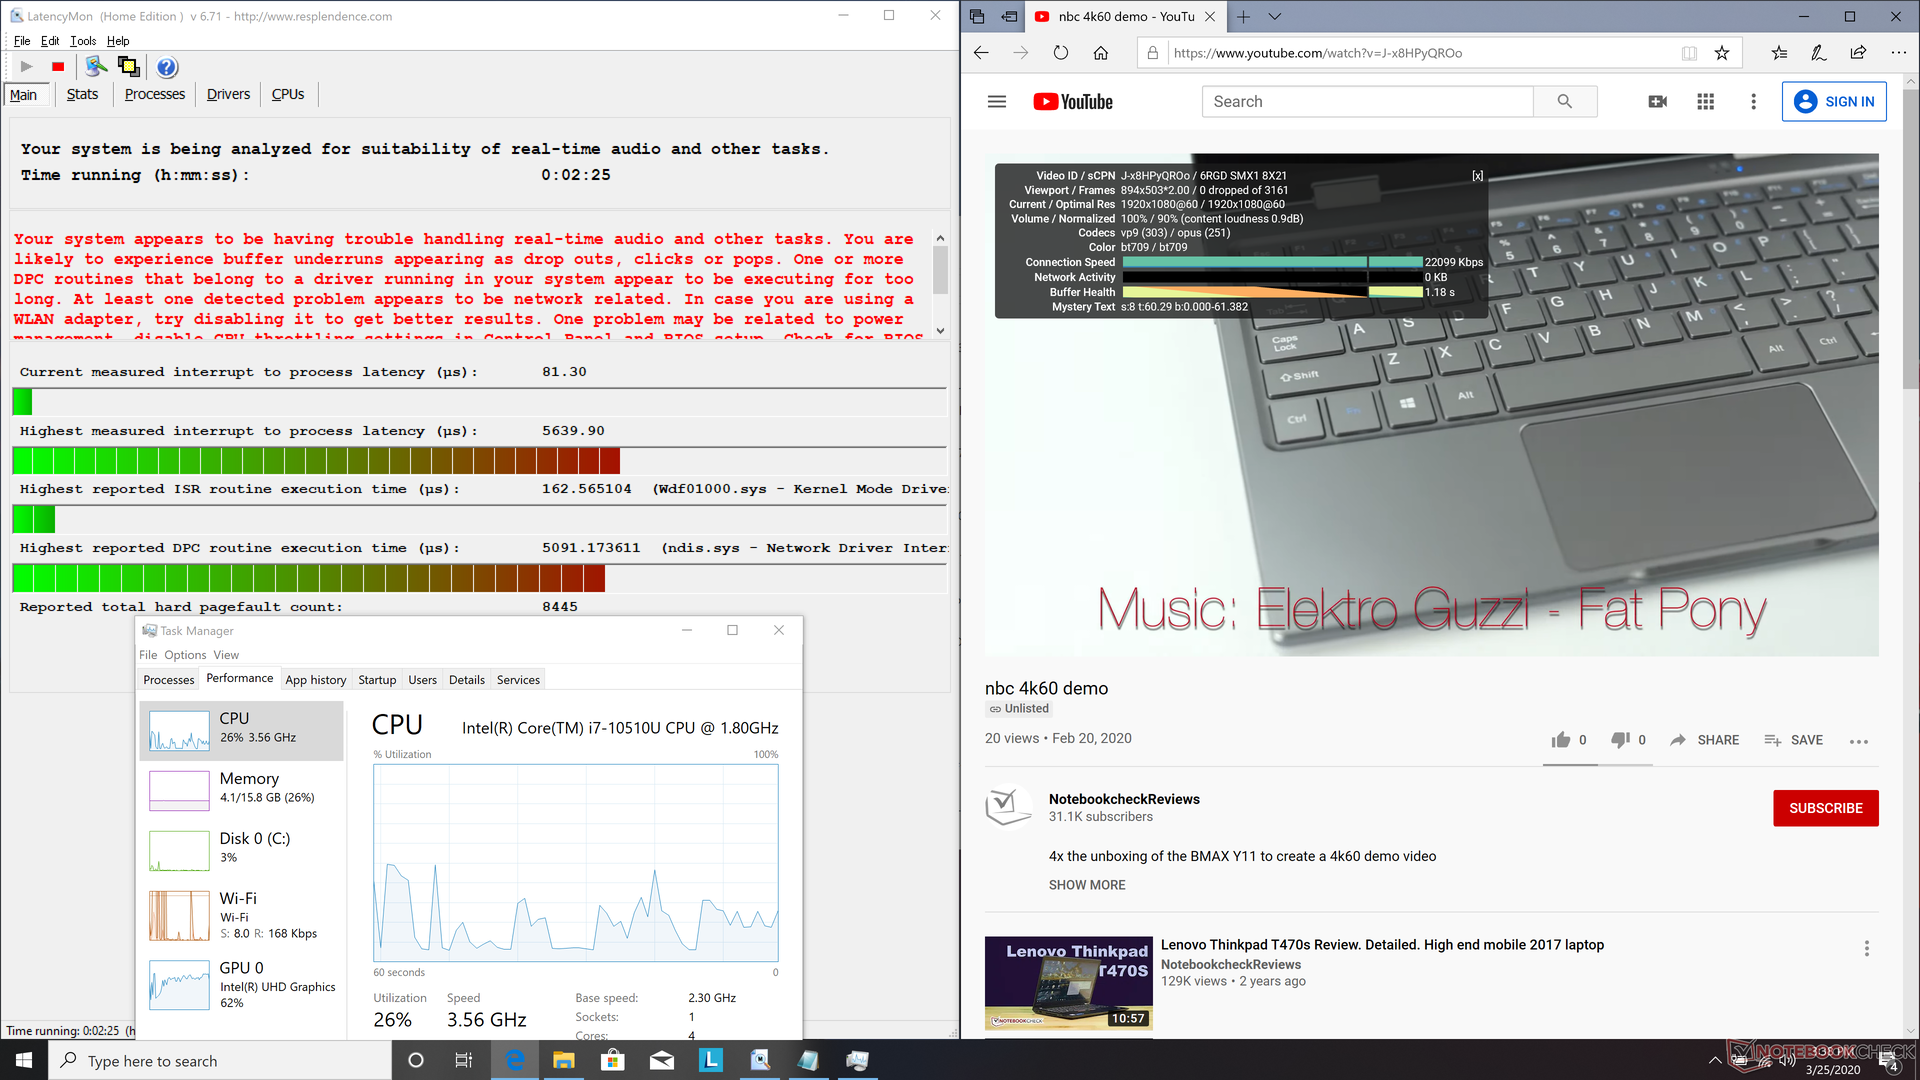
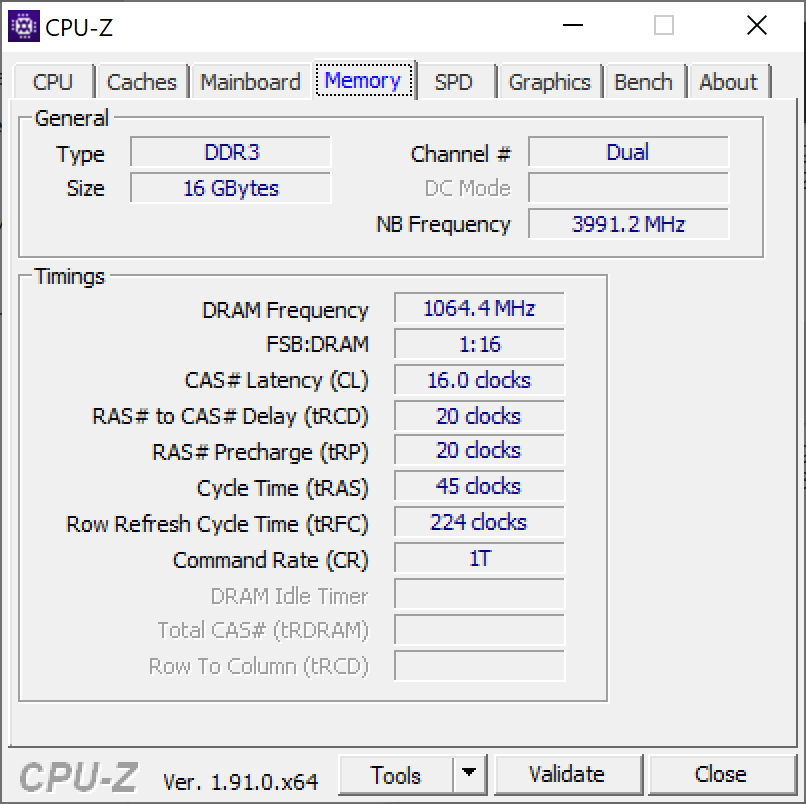
RAM is soldered up to 16 GB of LPDDR3-2133. The system exhibits DPC latency issues when web browsing, playing 4K YouTube videos, and running Prime95 in sequence.
Processor
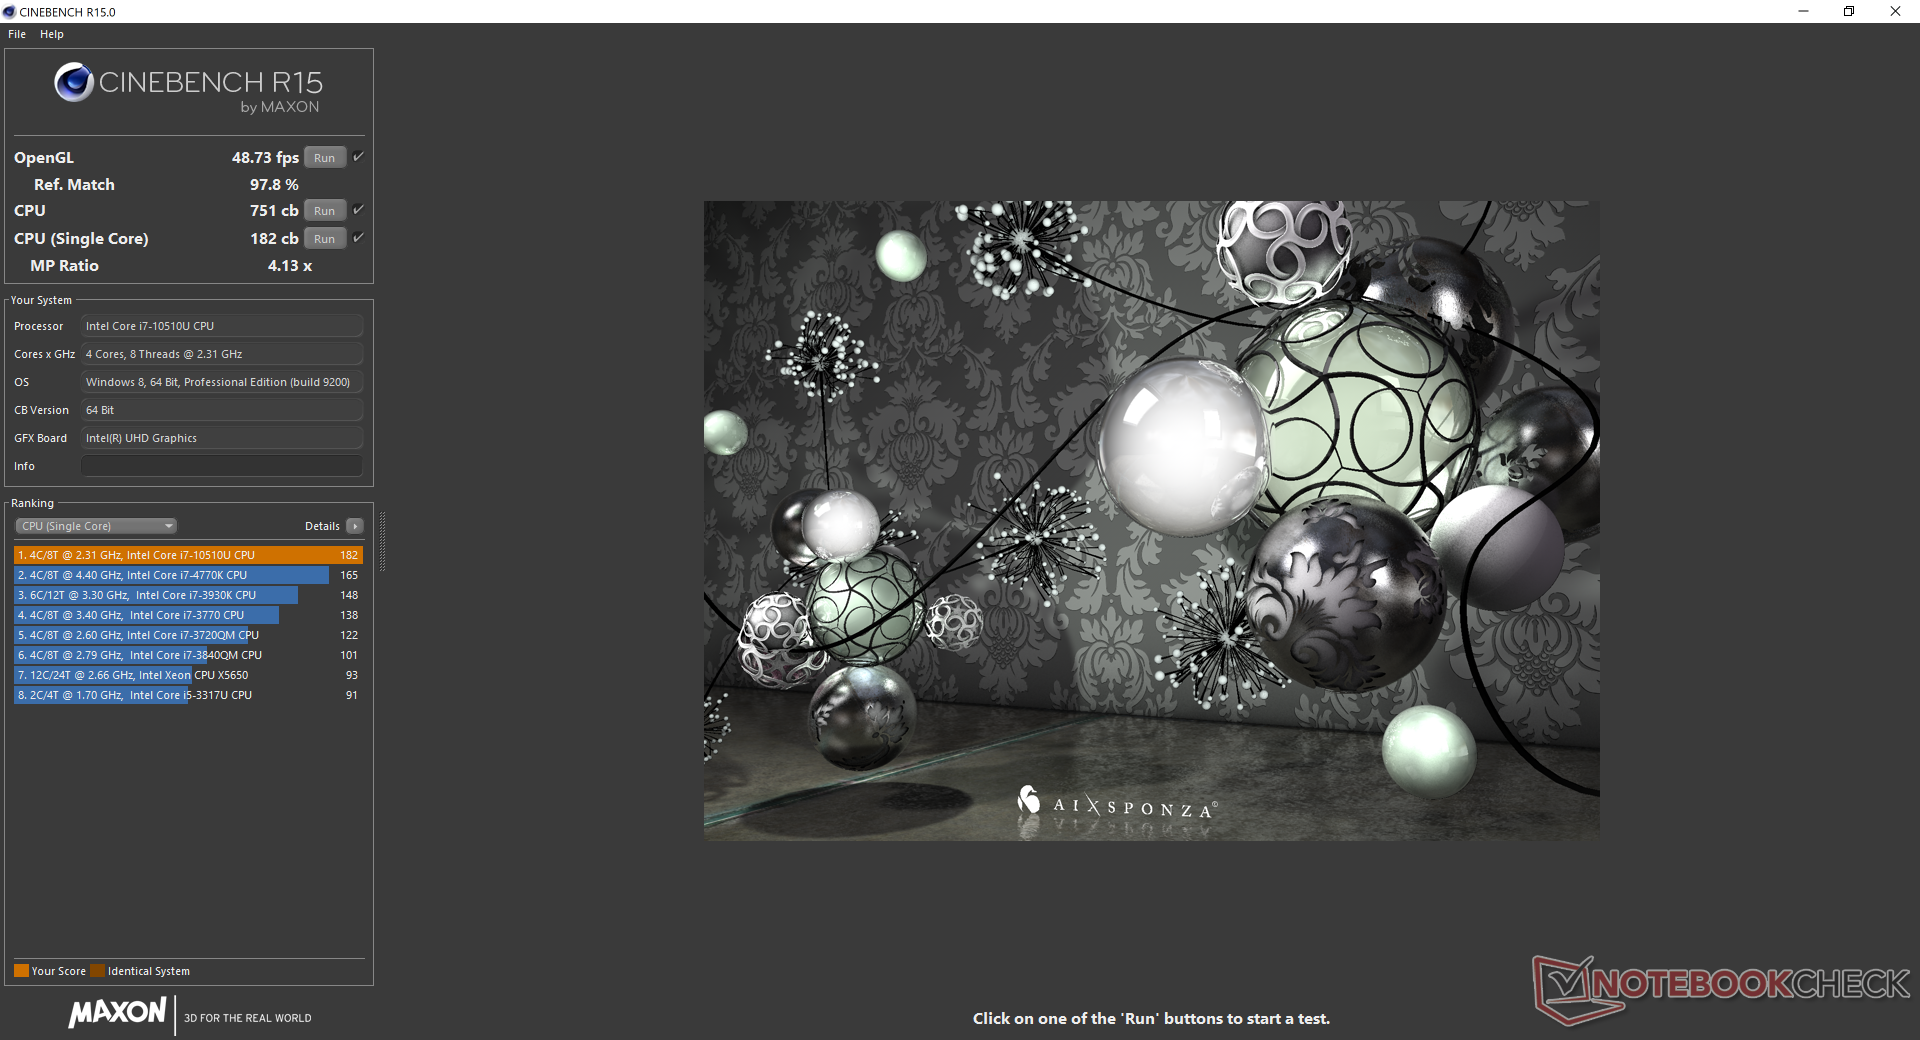
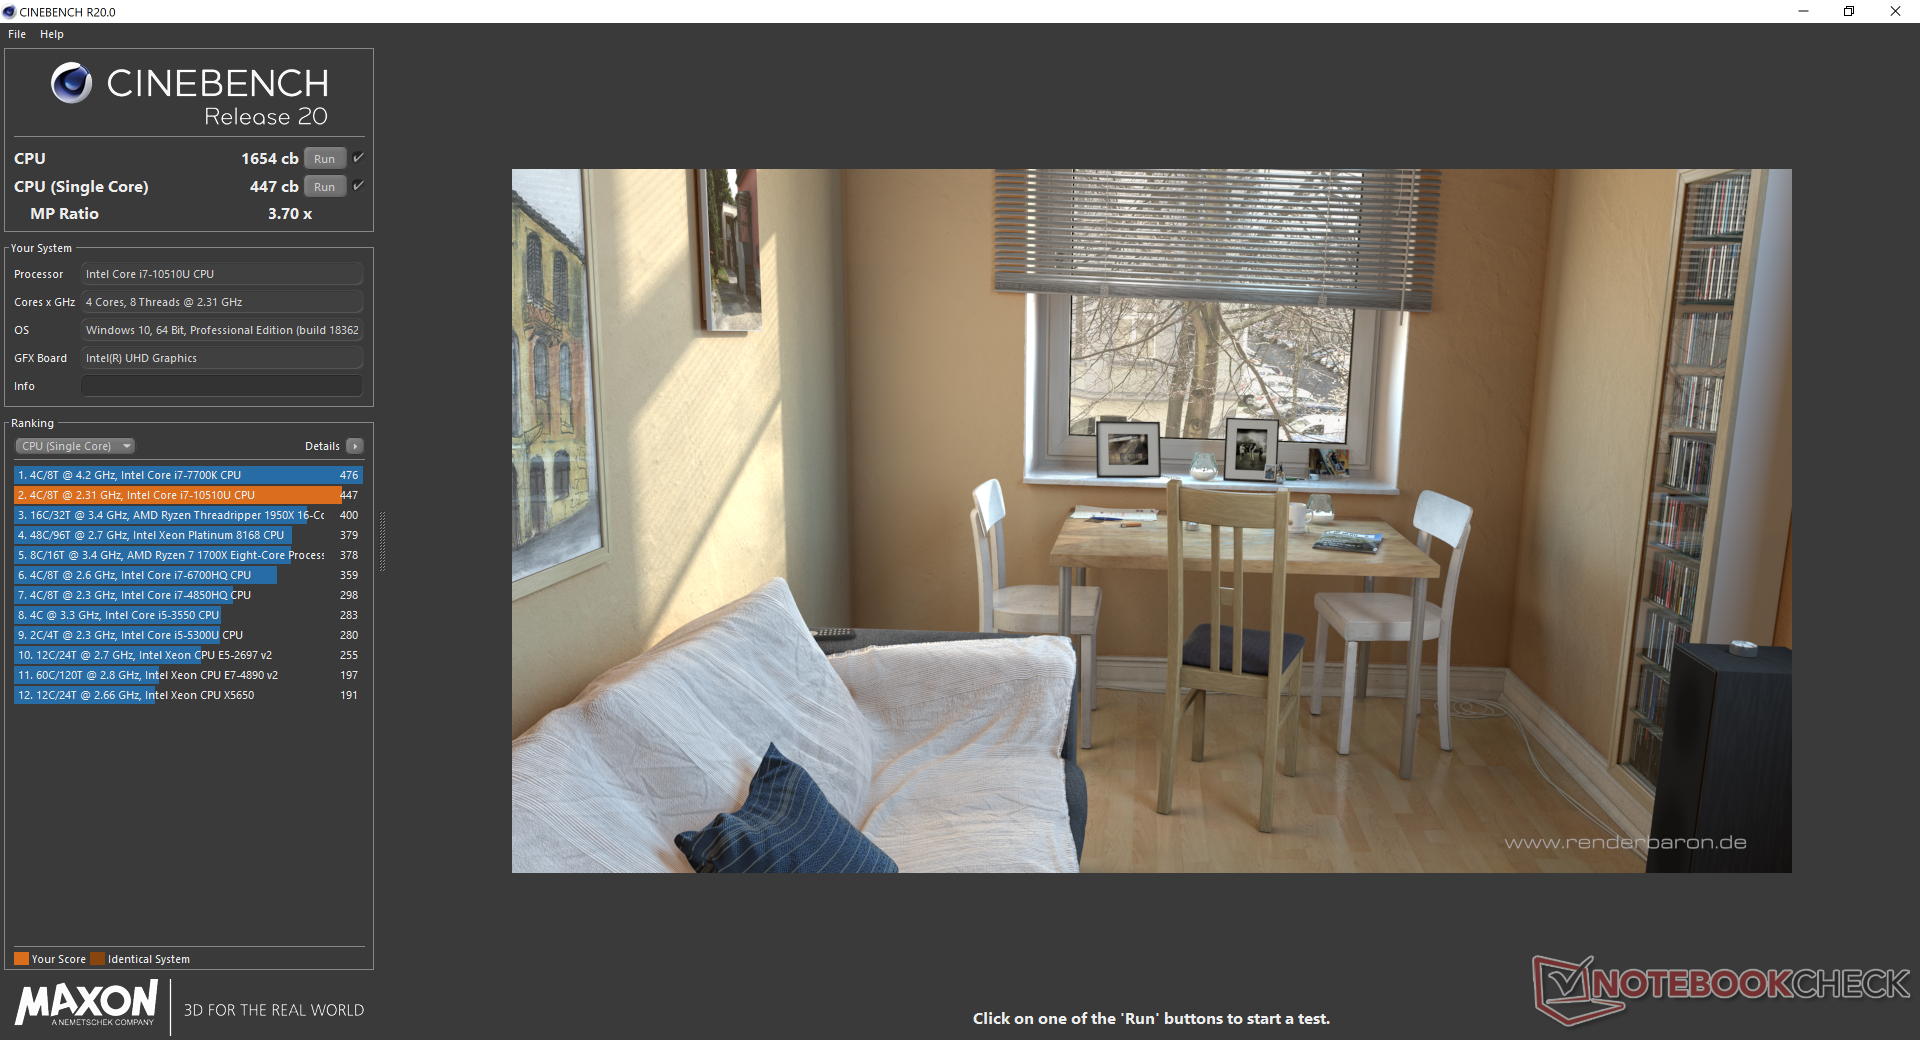
Much like what we discovered on last year's ThinkPad X1 Carbon and the ThinkPad T590 each with the Core i7-8565U, this newer Core i7-10510U SKU exhibits the same cycling clock rate behavior when subjected to long periods of processing stress as shown by our CineBench R15 Multi-Thread loop test below. CPU performance would start out strong before slowly declining into a steep variable pattern. Running CPU benchmarks just once or twice is therefore not an accurate representation of the performance of the ThinkPad X1 Carbon. Other laptops, like the Microsoft Surface Laptop 3 15, do not suffer from this issue and are able to maintain more consistent performance levels over time.
Opting for the pricier hexa-core Core i7-10710U SKU instead of the Core i5-10510U will improve CPU performance by 40 to 50 percent. However, we suspect that the Core i7 configuration will also suffer from the same cycling clock rates meaning that its advantages over our Core i5 SKU will likely diminish when running high loads for long periods.
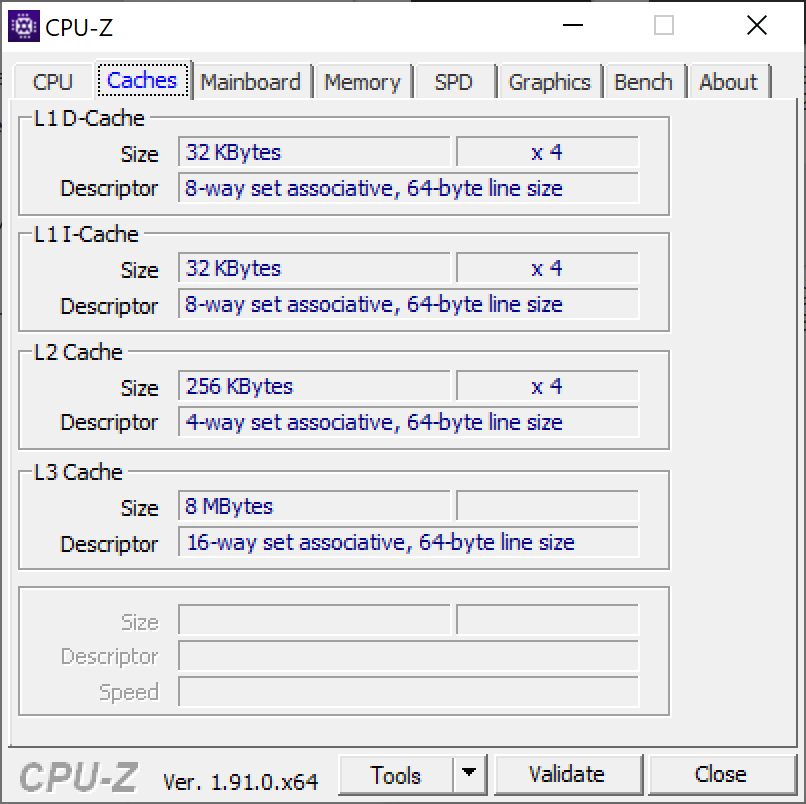
See our dedicated page on the Core i7-10510U for more technical information benchmark comparisons.
| Cinebench R11.5 | |
| CPU Single 64Bit | |
| Dell XPS 13 7390 Core i7-10710U | |
| Average Intel Core i7-10510U (n=1) | |
| Lenovo ThinkPad L13 Yoga 20R6S00800 | |
| CPU Multi 64Bit | |
| Dell XPS 13 7390 Core i7-10710U | |
| Average Intel Core i7-10510U (n=1) | |
| Lenovo ThinkPad L13 Yoga 20R6S00800 | |
| Cinebench R10 | |
| Rendering Multiple CPUs 32Bit | |
| Dell XPS 13 7390 Core i7-10710U | |
| Average Intel Core i7-10510U (6763 - 26265, n=3) | |
| Rendering Single 32Bit | |
| Dell XPS 13 7390 Core i7-10710U | |
| Average Intel Core i7-10510U (5740 - 7748, n=3) | |
| wPrime 2.10 - 1024m | |
| Dell XPS 13 7390 Core i7-10710U | |
* ... smaller is better
System Performance
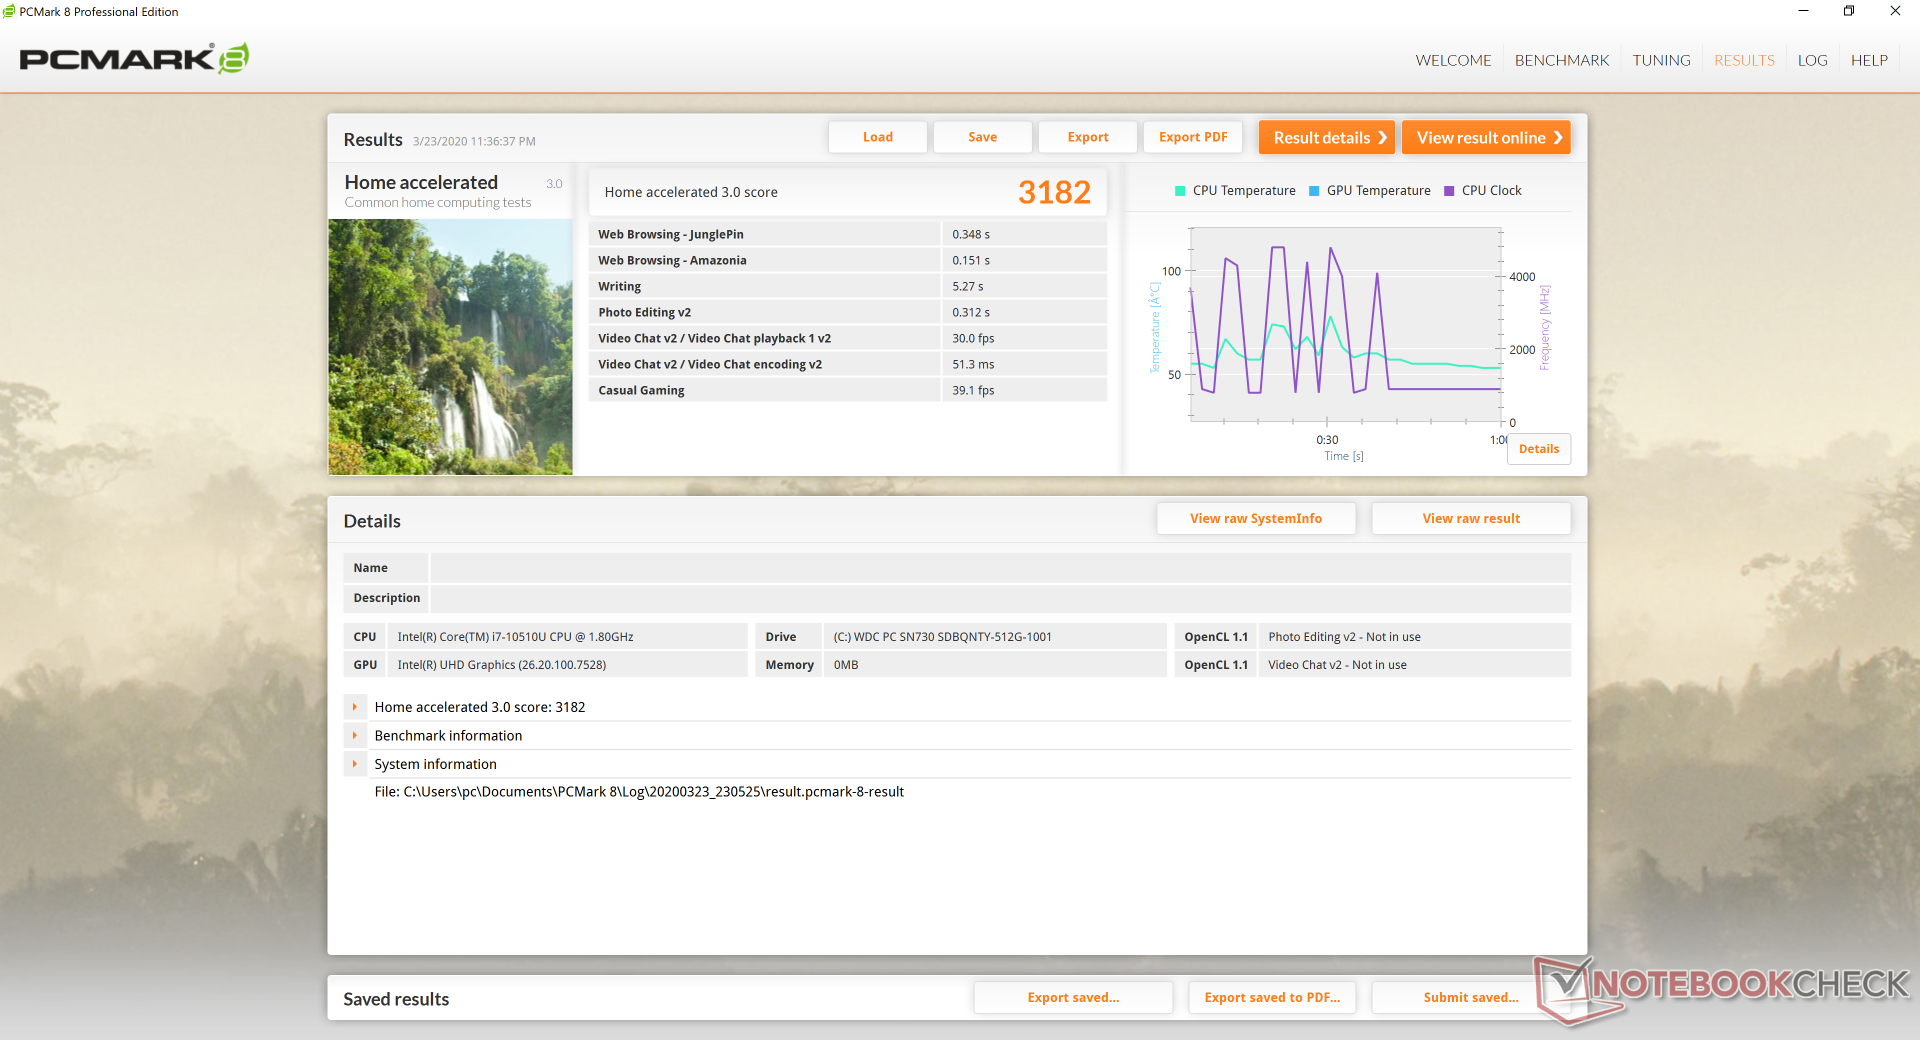
| PCMark 8 Home Score Accelerated v2 | 3182 points | |
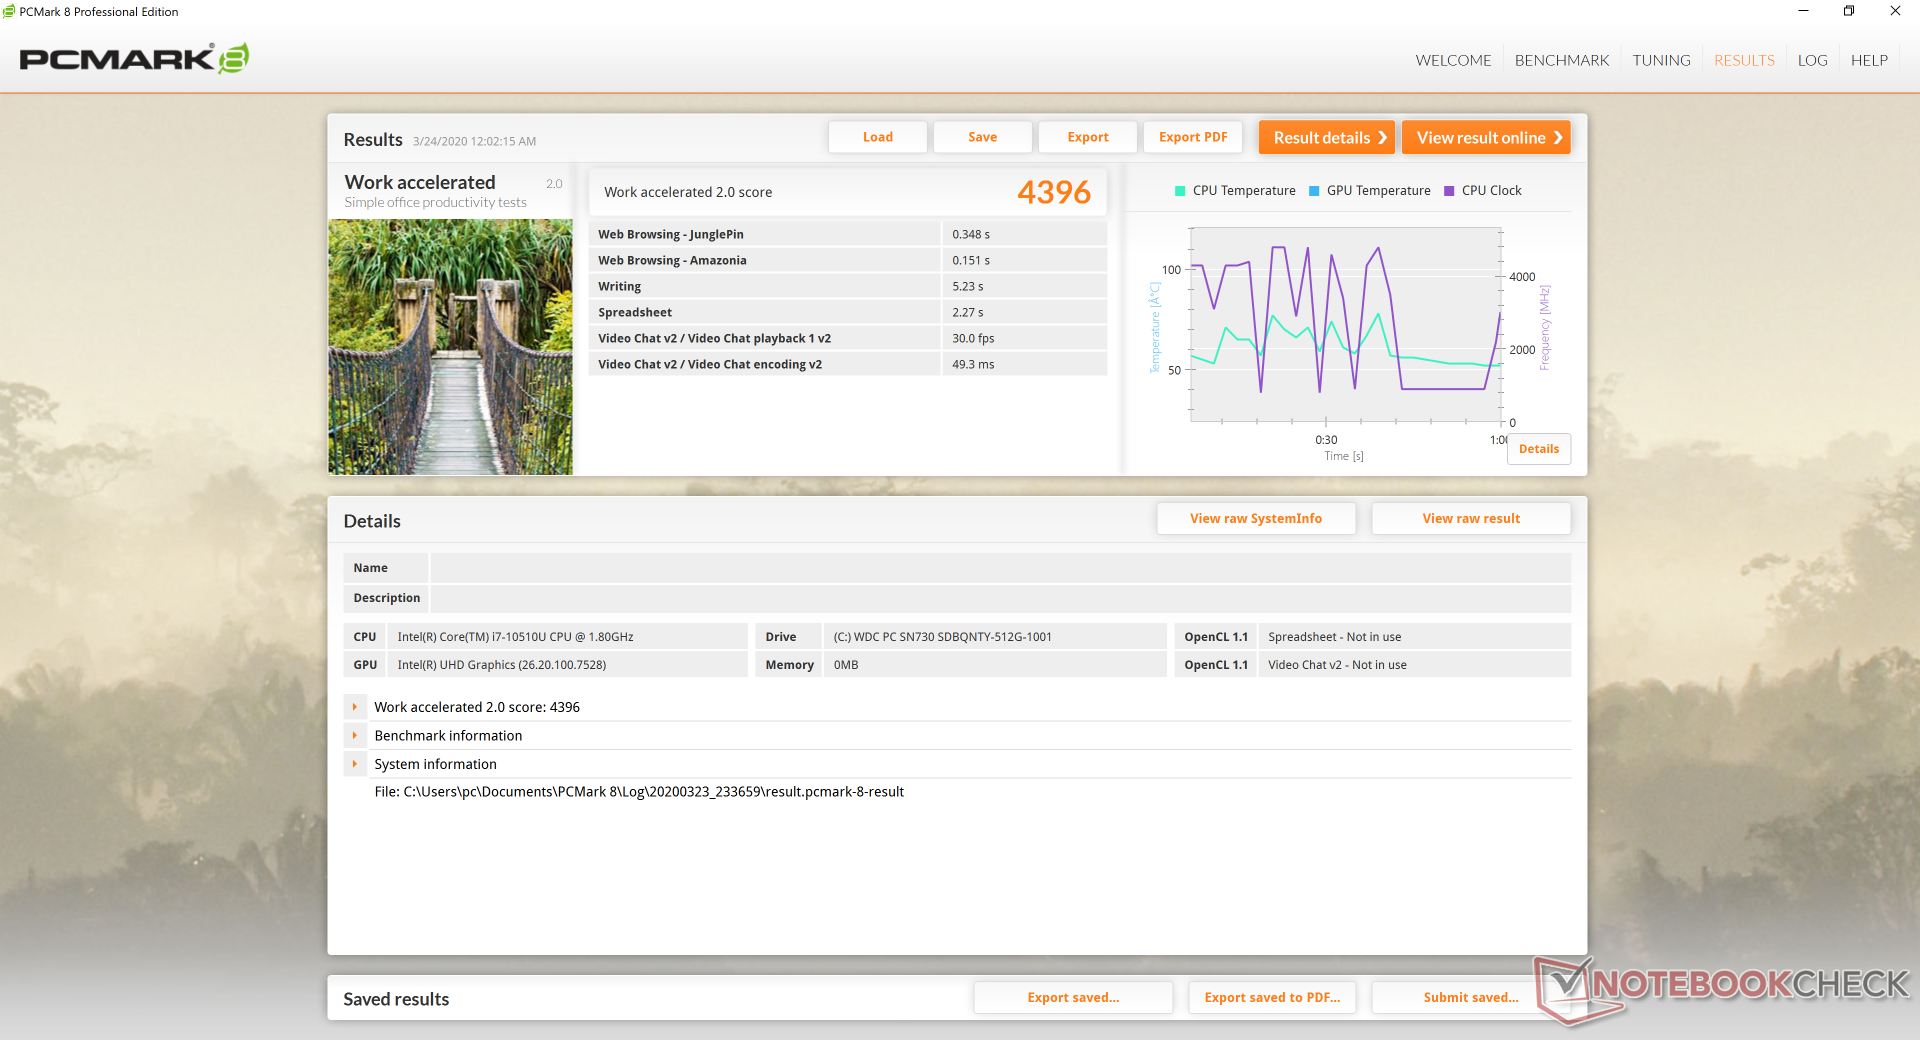
| PCMark 8 Work Score Accelerated v2 | 4396 points | |
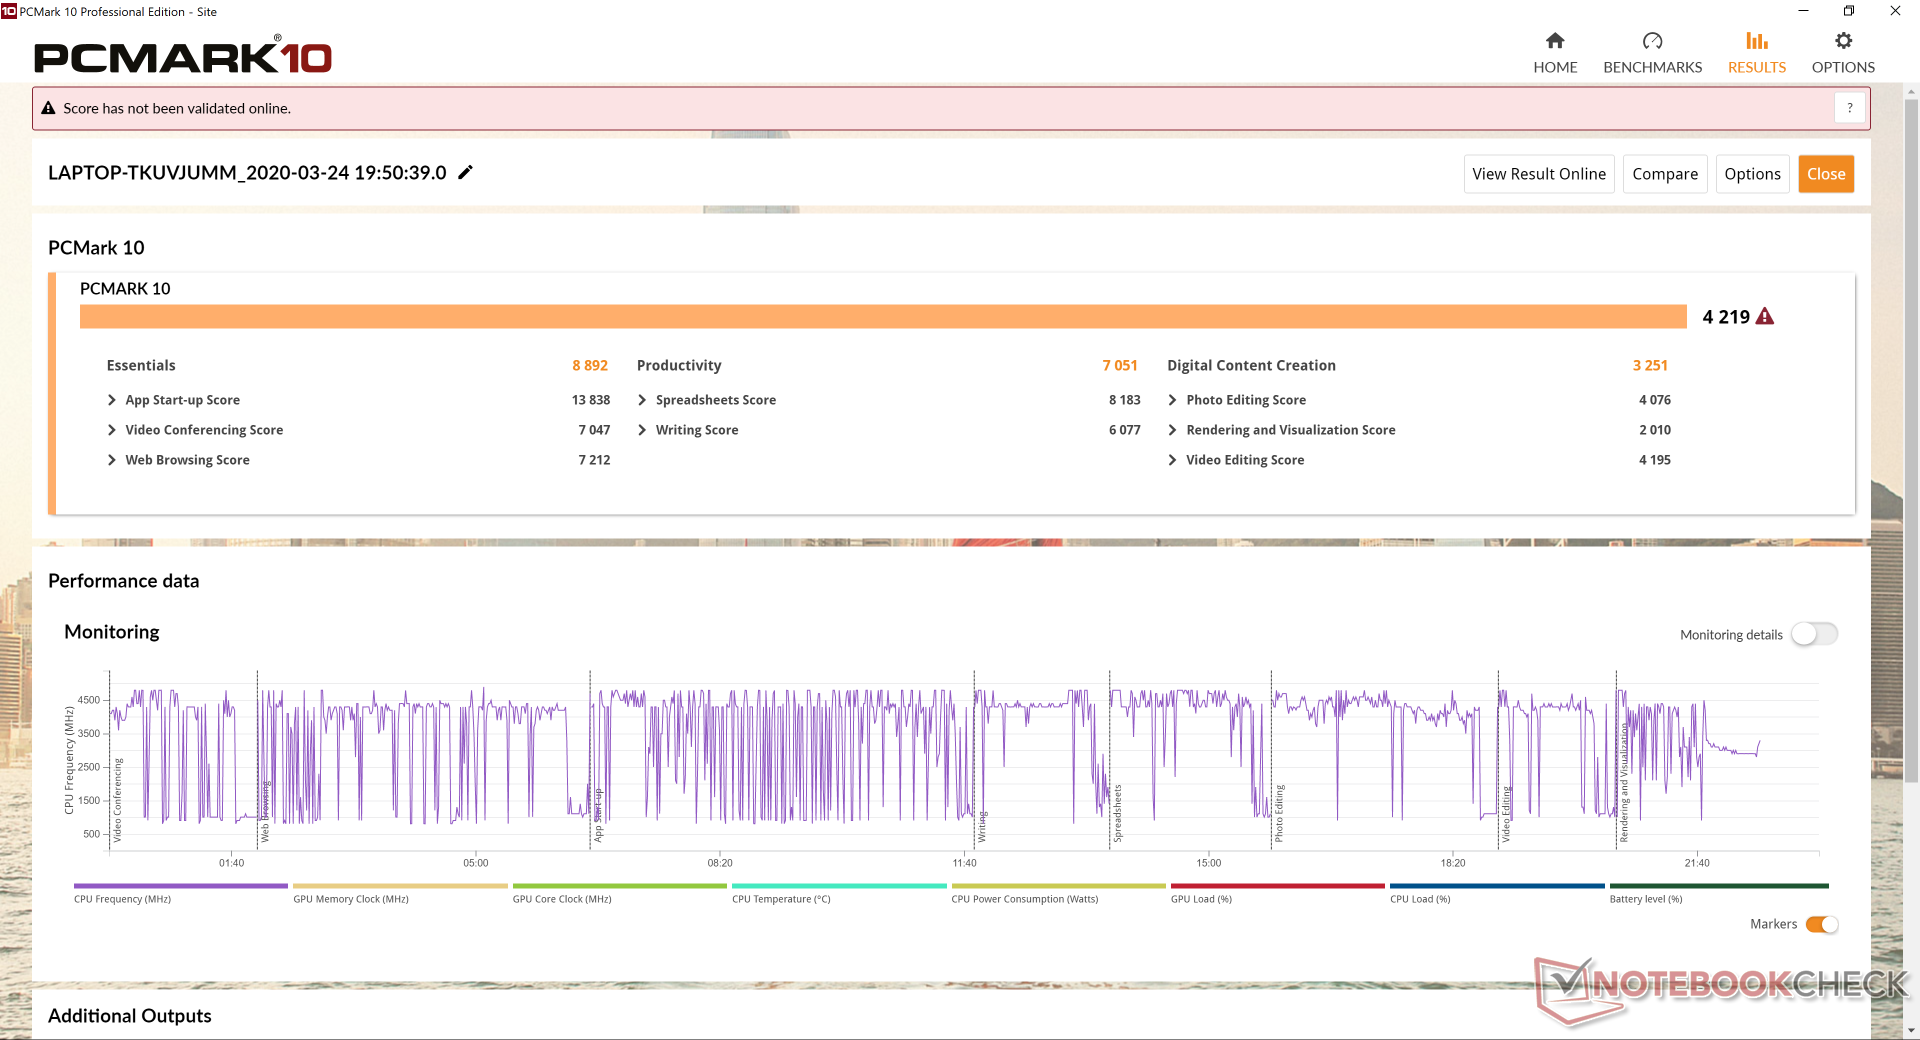
| PCMark 10 Score | 4219 points | |
Help | ||
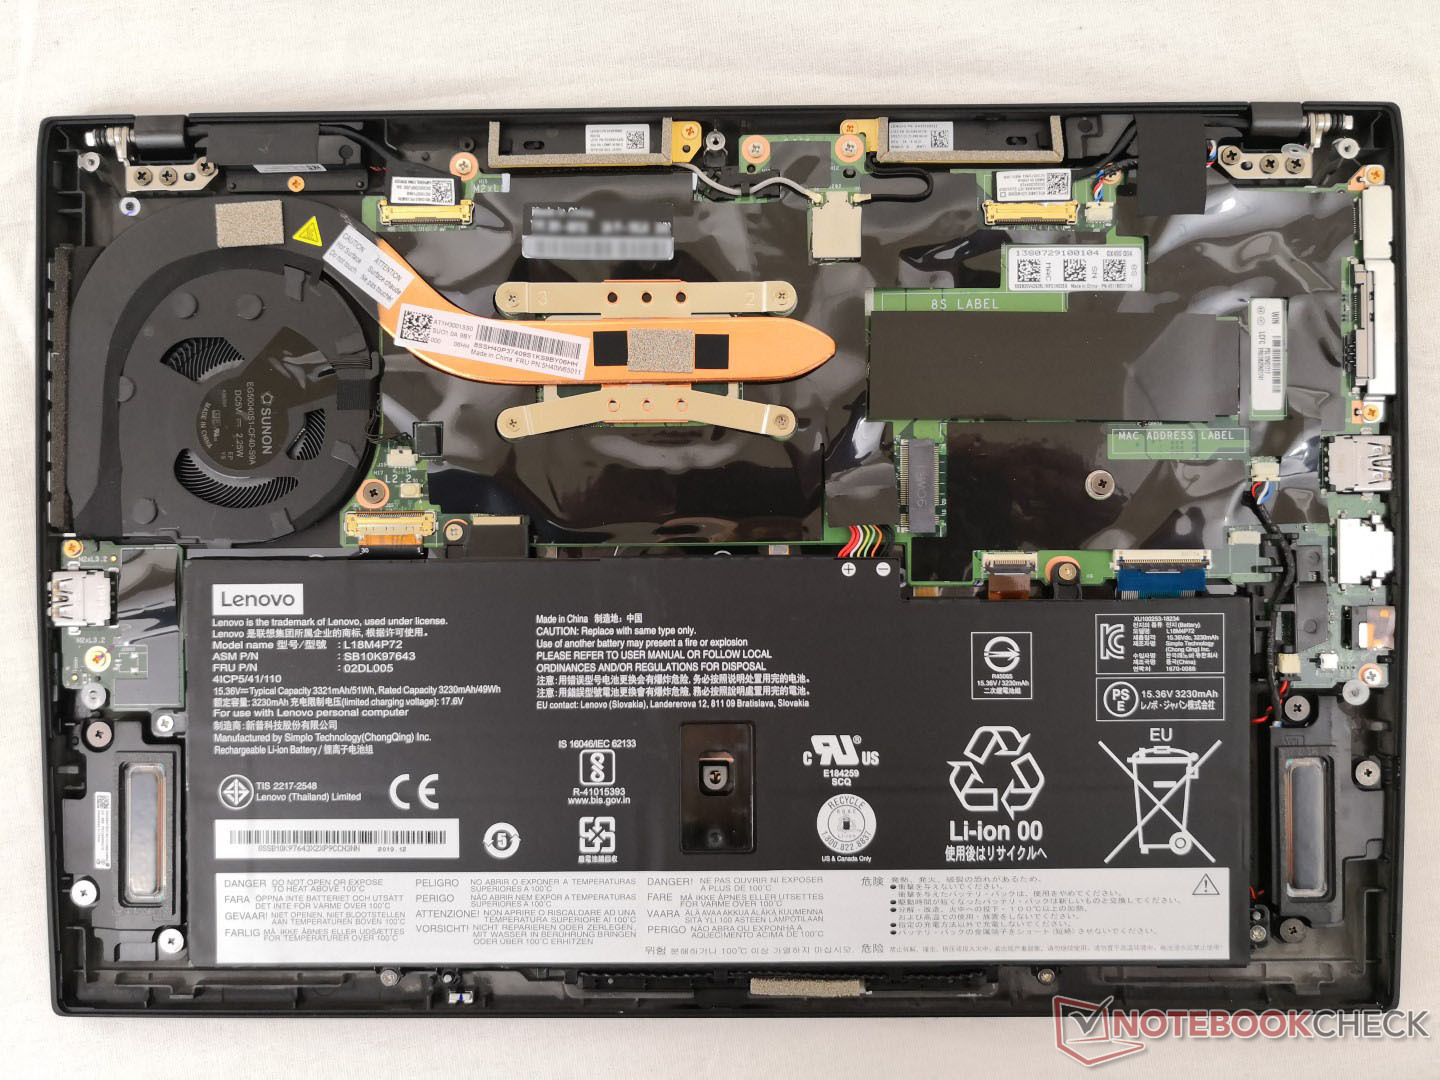
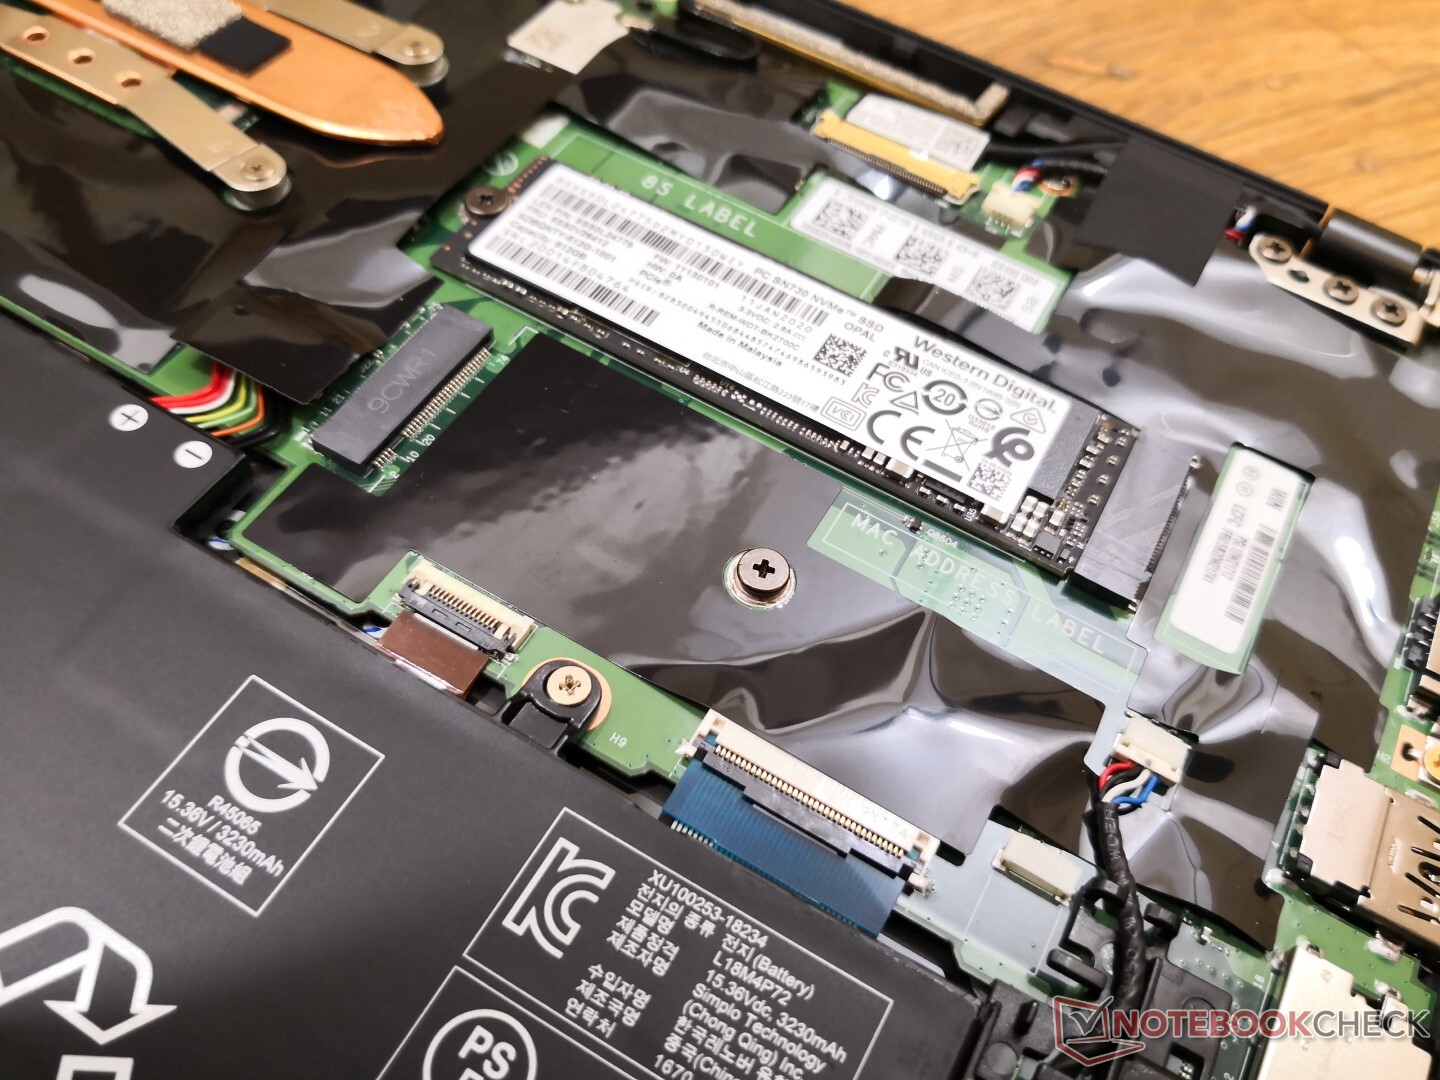
Storage Devices
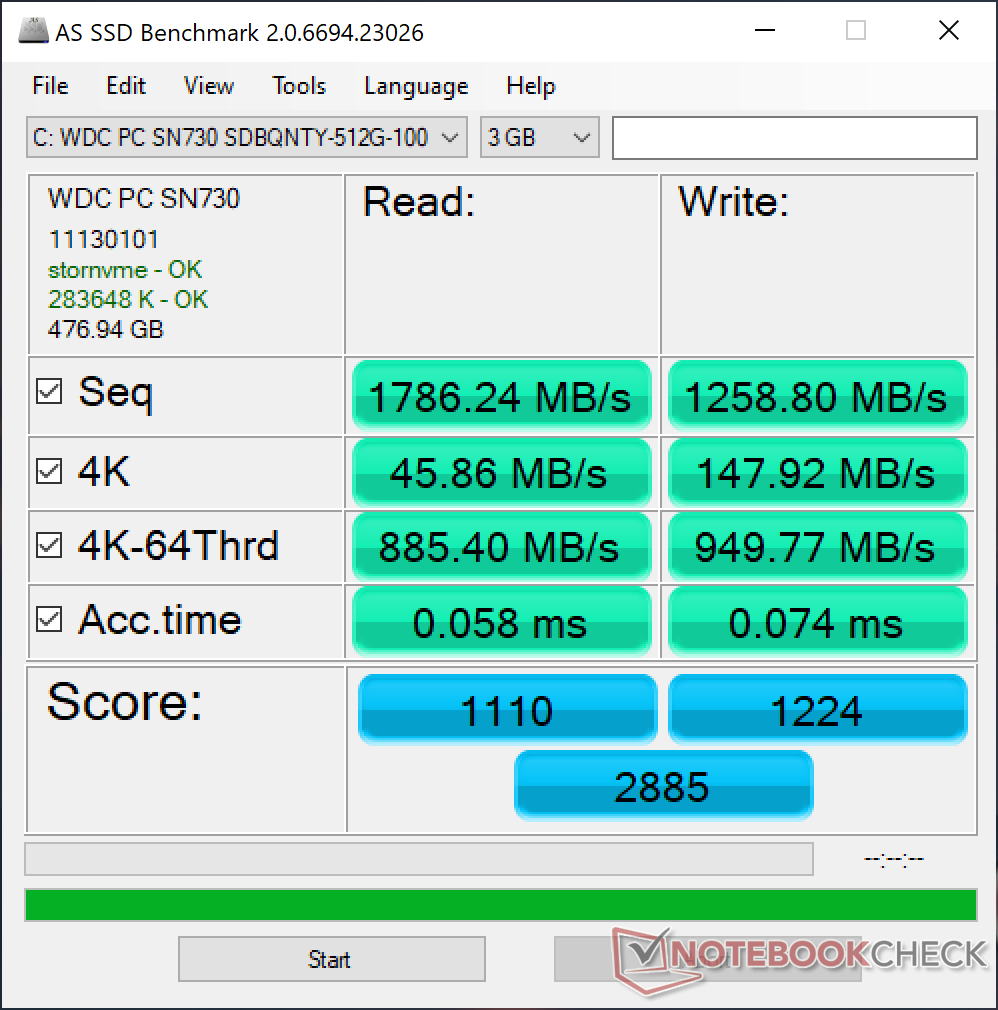
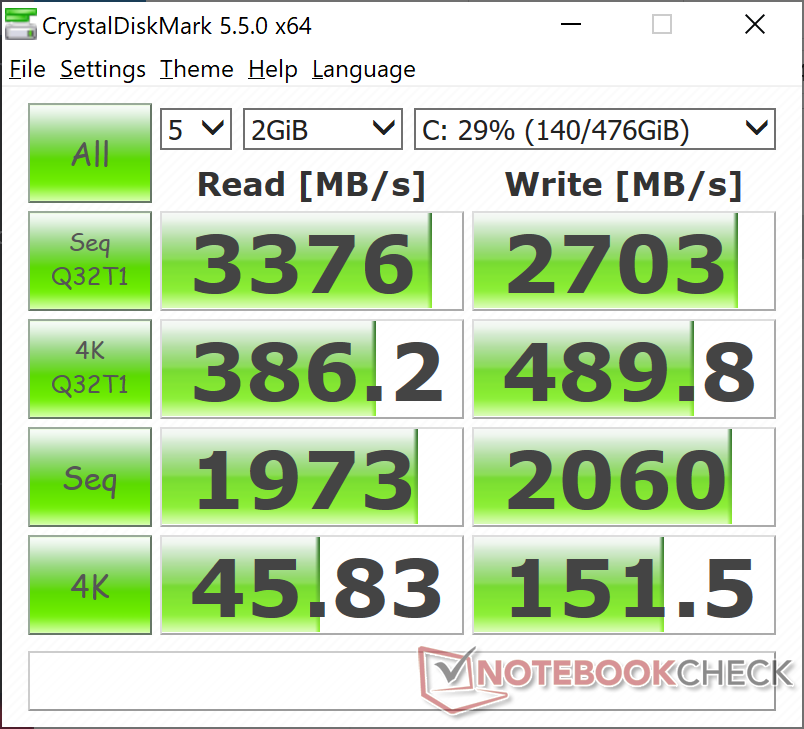
There is only room for one internal storage drive as the second smaller M.2 slot may be occupied by a WWAN module. Our 2020 test unit comes equipped with a 512 GB WDC PC SN730 NVMe SSD whereas our 2019 unit came with a 512 GB WDC PC SN720. Western Digital advertises maximum sequential read and write rates of 3400 MB/s and 2700 MB/s, respectively, which we are able to confirm when running the CrystalDiskMark 5 Q32T1 test. In practice, users won't notice the minor speed upgrades over the SN720 series.
See our table of HDDs and SSDs for more benchmark comparisons.
| Lenovo ThinkPad X1 Carbon G7 20R1-000YUS WDC PC SN730 SDBPNTY-512G | Lenovo ThinkPad X1 Carbon 2019-20QE000VGE WDC PC SN720 SDAQNTW-512G | Lenovo ThinkPad X1 Extreme 2019 20QV000WGE Samsung SSD PM981 MZVLB512HAJQ | Lenovo ThinkPad X1 Yoga 2019-20QGS00A00 WDC PC SN720 SDAPNTW-512G | Lenovo ThinkPad X1 Carbon 2018-20KGS5DU00 Samsung SSD PM981 MZVLB512HAJQ | |
|---|---|---|---|---|---|
| AS SSD | 40% | 47% | 31% | 3% | |
| Seq Read (MB/s) | 1786 | 2978 67% | 2352 32% | 2888 62% | 2399 34% |
| Seq Write (MB/s) | 1259 | 2287 82% | 2106 67% | 2381 89% | 1343 7% |
| 4K Read (MB/s) | 45.86 | 47.39 3% | 55 20% | 45.66 0% | 46.21 1% |
| 4K Write (MB/s) | 147.9 | 175.6 19% | 138.1 -7% | 162.4 10% | 109.4 -26% |
| 4K-64 Read (MB/s) | 885 | 1209 37% | 1265 43% | 1276 44% | 664 -25% |
| 4K-64 Write (MB/s) | 950 | 1148 21% | 1952 105% | 1432 51% | 1020 7% |
| Access Time Read * (ms) | 0.058 | 0.053 9% | 0.088 -52% | 0.056 3% | |
| Access Time Write * (ms) | 0.074 | 0.023 69% | 0.027 64% | 0.023 69% | 0.033 55% |
| Score Read (Points) | 1110 | 1554 40% | 1556 40% | 1610 45% | 950 -14% |
| Score Write (Points) | 1224 | 1553 27% | 2301 88% | 1832 50% | 1264 3% |
| Score Total (Points) | 2885 | 3874 34% | 4650 61% | 4245 47% | 2659 -8% |
| Copy ISO MB/s (MB/s) | 1384 | 1810 31% | |||
| Copy Program MB/s (MB/s) | 525 | 498.3 -5% | |||
| Copy Game MB/s (MB/s) | 1008 | 921 -9% | |||
| CrystalDiskMark 5.2 / 6 | 9% | 1% | 10% | -24% | |
| Write 4K (MB/s) | 151.5 | 196.9 30% | 148.1 -2% | 194.3 28% | 98.6 -35% |
| Read 4K (MB/s) | 45.83 | 51.3 12% | 47.31 3% | 51.2 12% | 39.75 -13% |
| Write Seq (MB/s) | 2060 | 1715 -17% | 1414 -31% | 1773 -14% | 1757 -15% |
| Read Seq (MB/s) | 1973 | 2464 25% | 1320 -33% | 2512 27% | 1169 -41% |
| Write 4K Q32T1 (MB/s) | 489.8 | 429.1 -12% | 493.6 1% | 431.7 -12% | 333.8 -32% |
| Read 4K Q32T1 (MB/s) | 386.2 | 542 40% | 594 54% | 539 40% | 268 -31% |
| Write Seq Q32T1 (MB/s) | 2703 | 2521 -7% | 2970 10% | 2538 -6% | 2069 -23% |
| Read Seq Q32T1 (MB/s) | 3376 | 3481 3% | 3472 3% | 3489 3% | 3426 1% |
| Write 4K Q8T8 (MB/s) | 867 | ||||
| Read 4K Q8T8 (MB/s) | 1315 | ||||
| Total Average (Program / Settings) | 25% /
26% | 24% /
28% | 21% /
23% | -11% /
-8% |
* ... smaller is better

GPU Performance
The Comet Lake-U family uses the same UHD Graphics 620 GPU as found on the much older Kaby Lake family. It's sufficient for 4K video streaming and monitor output, but the GPU has become outdated for any sort of gaming or editing by today's standards. For significantly faster graphics performance, consider laptops with Ice Lake CPUs or the AMD Ryzen series.
See our dedicated page on the UHD Graphics 620 for more benchmark comparisons.
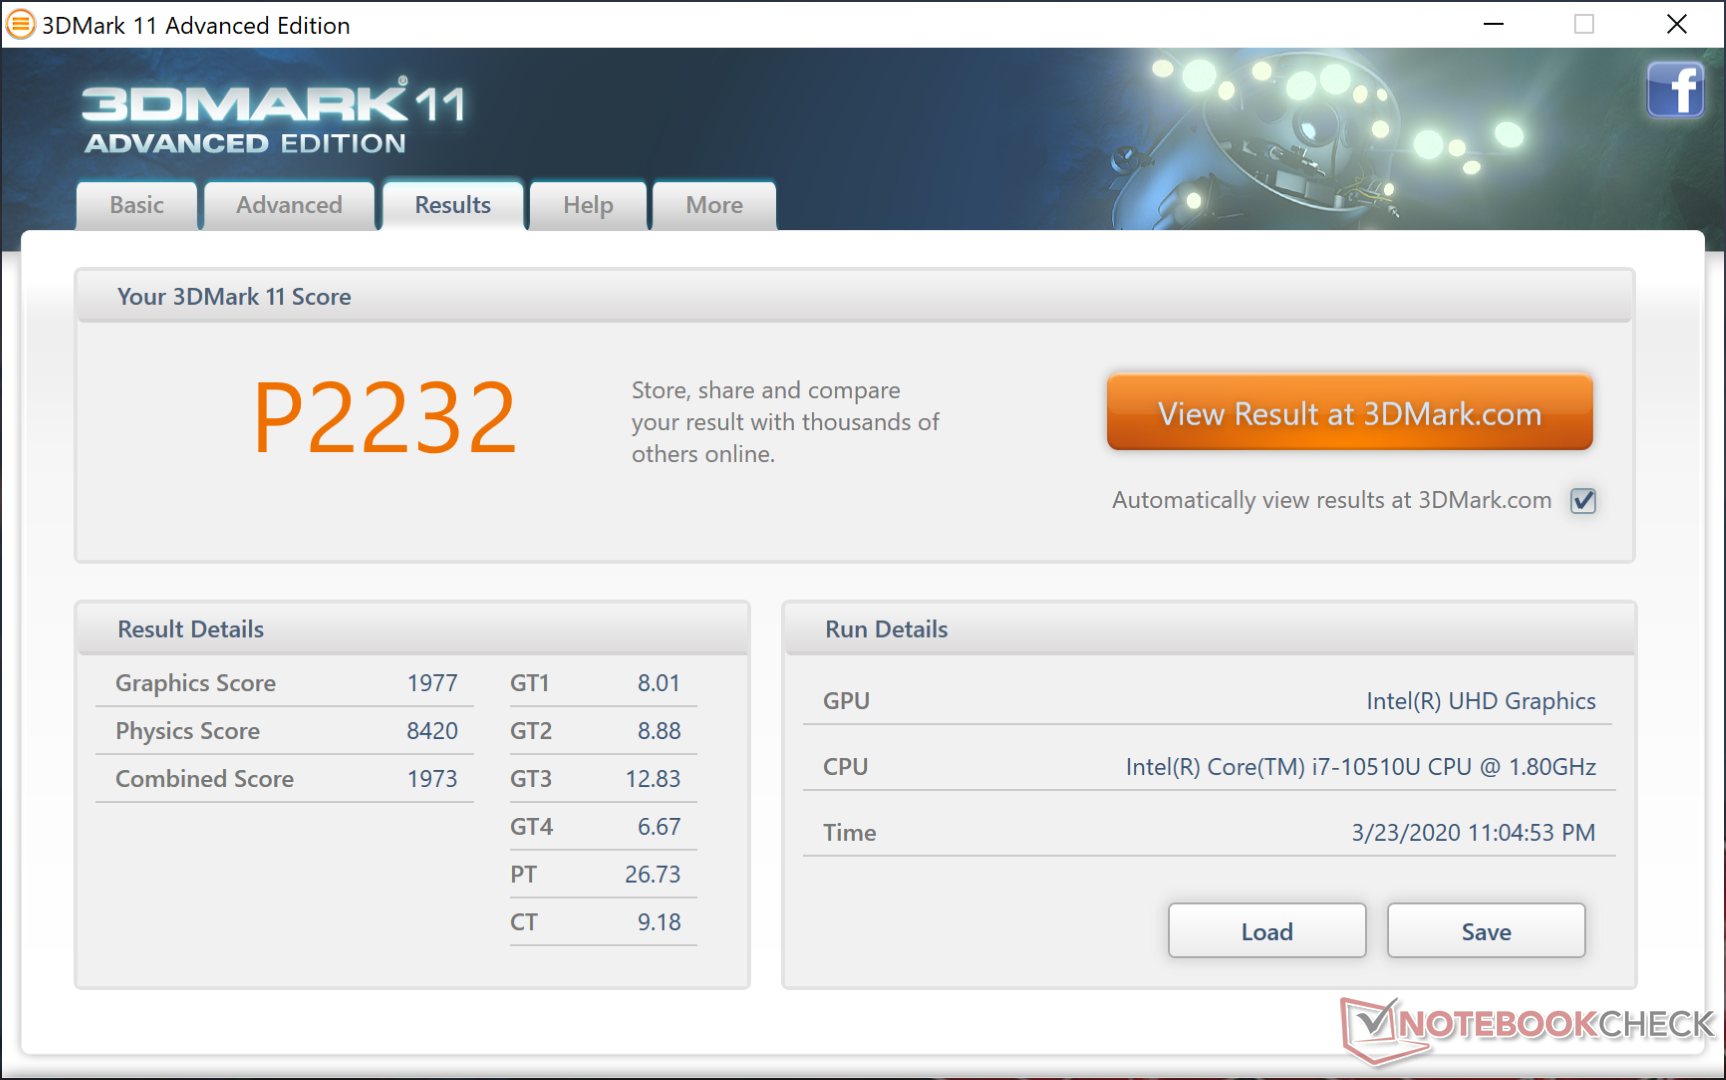
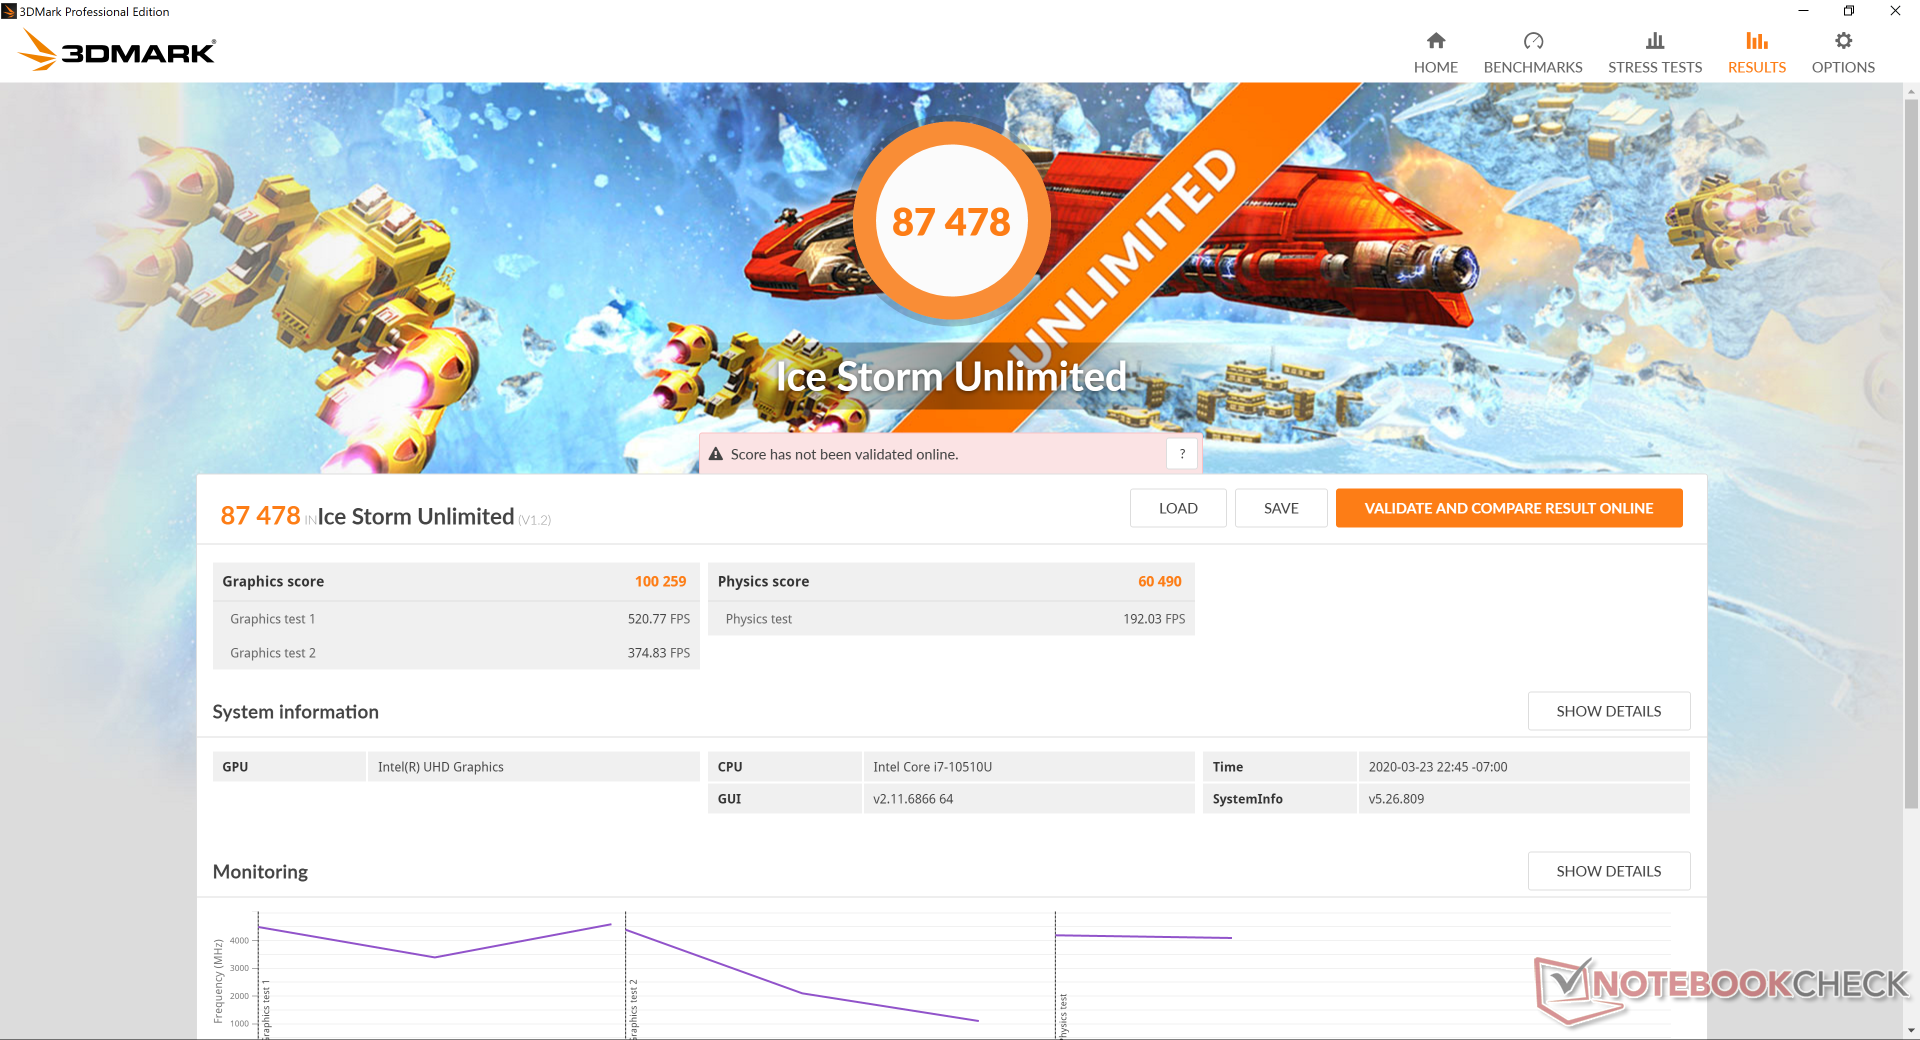
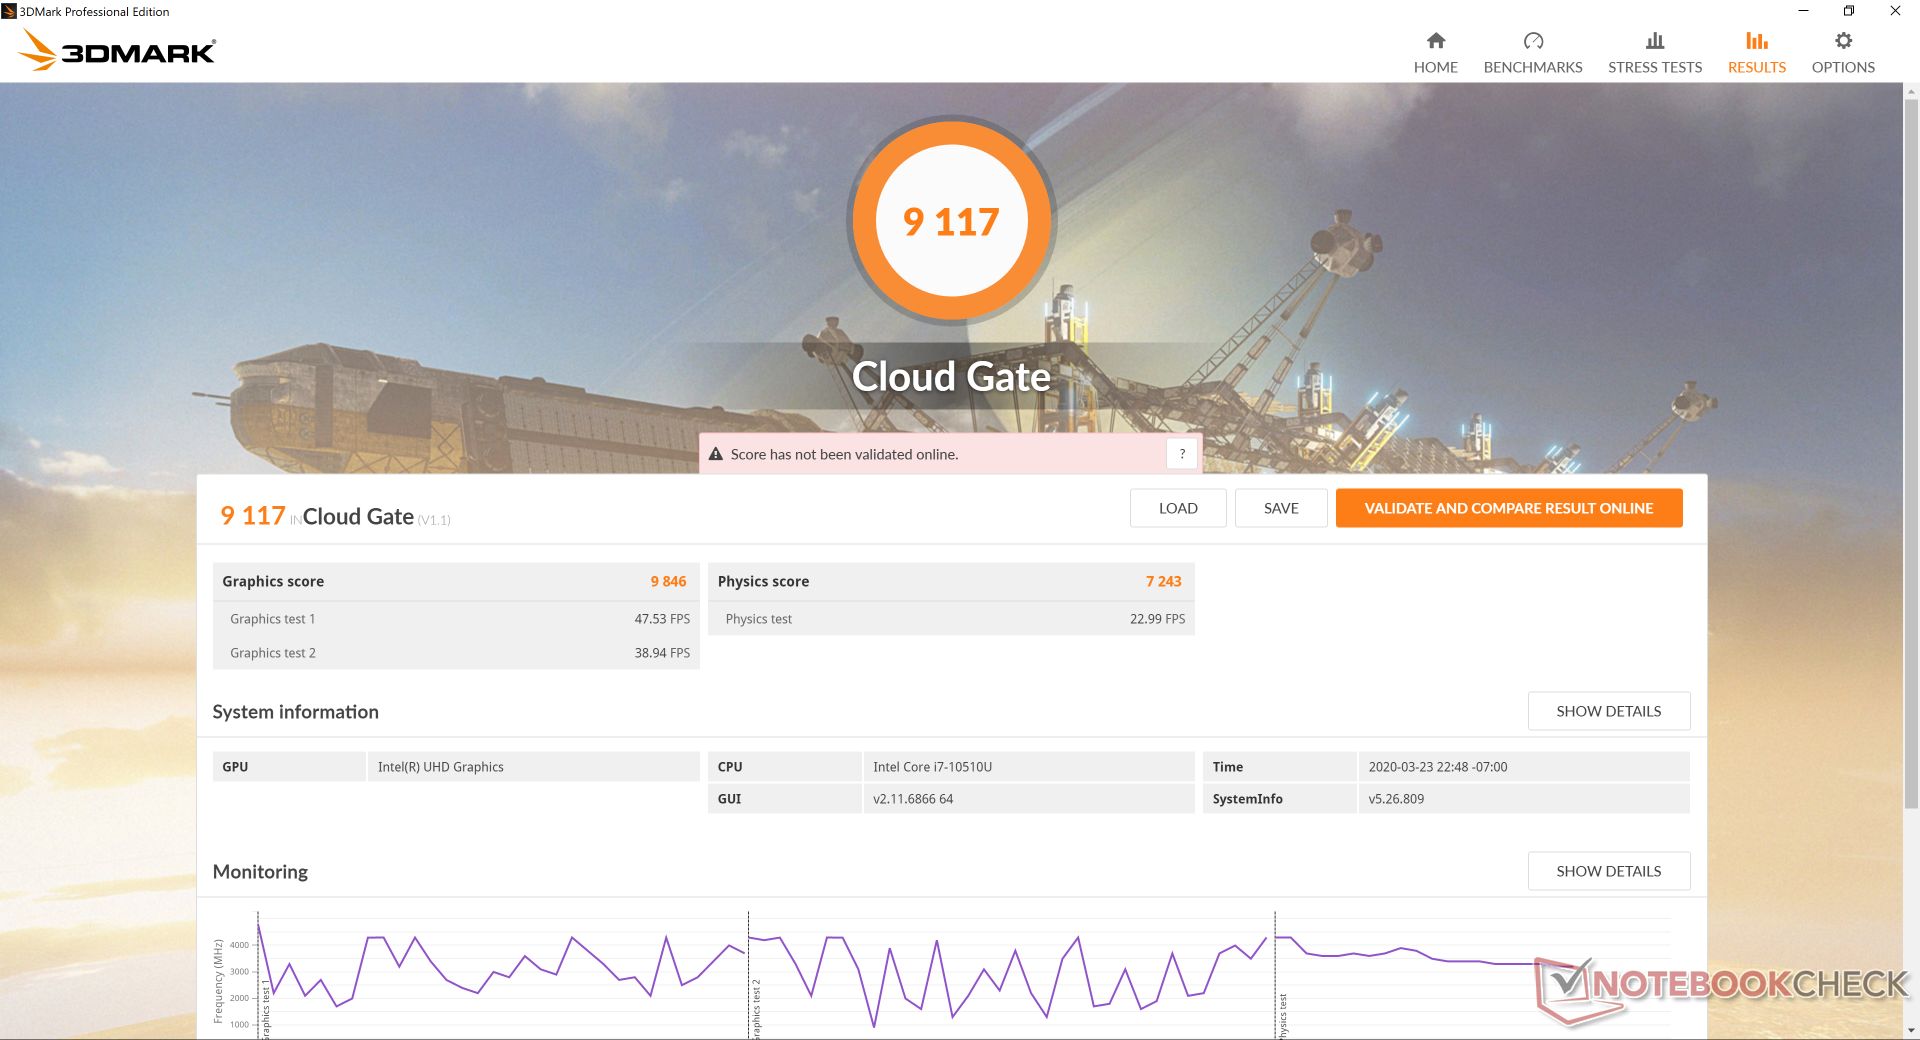
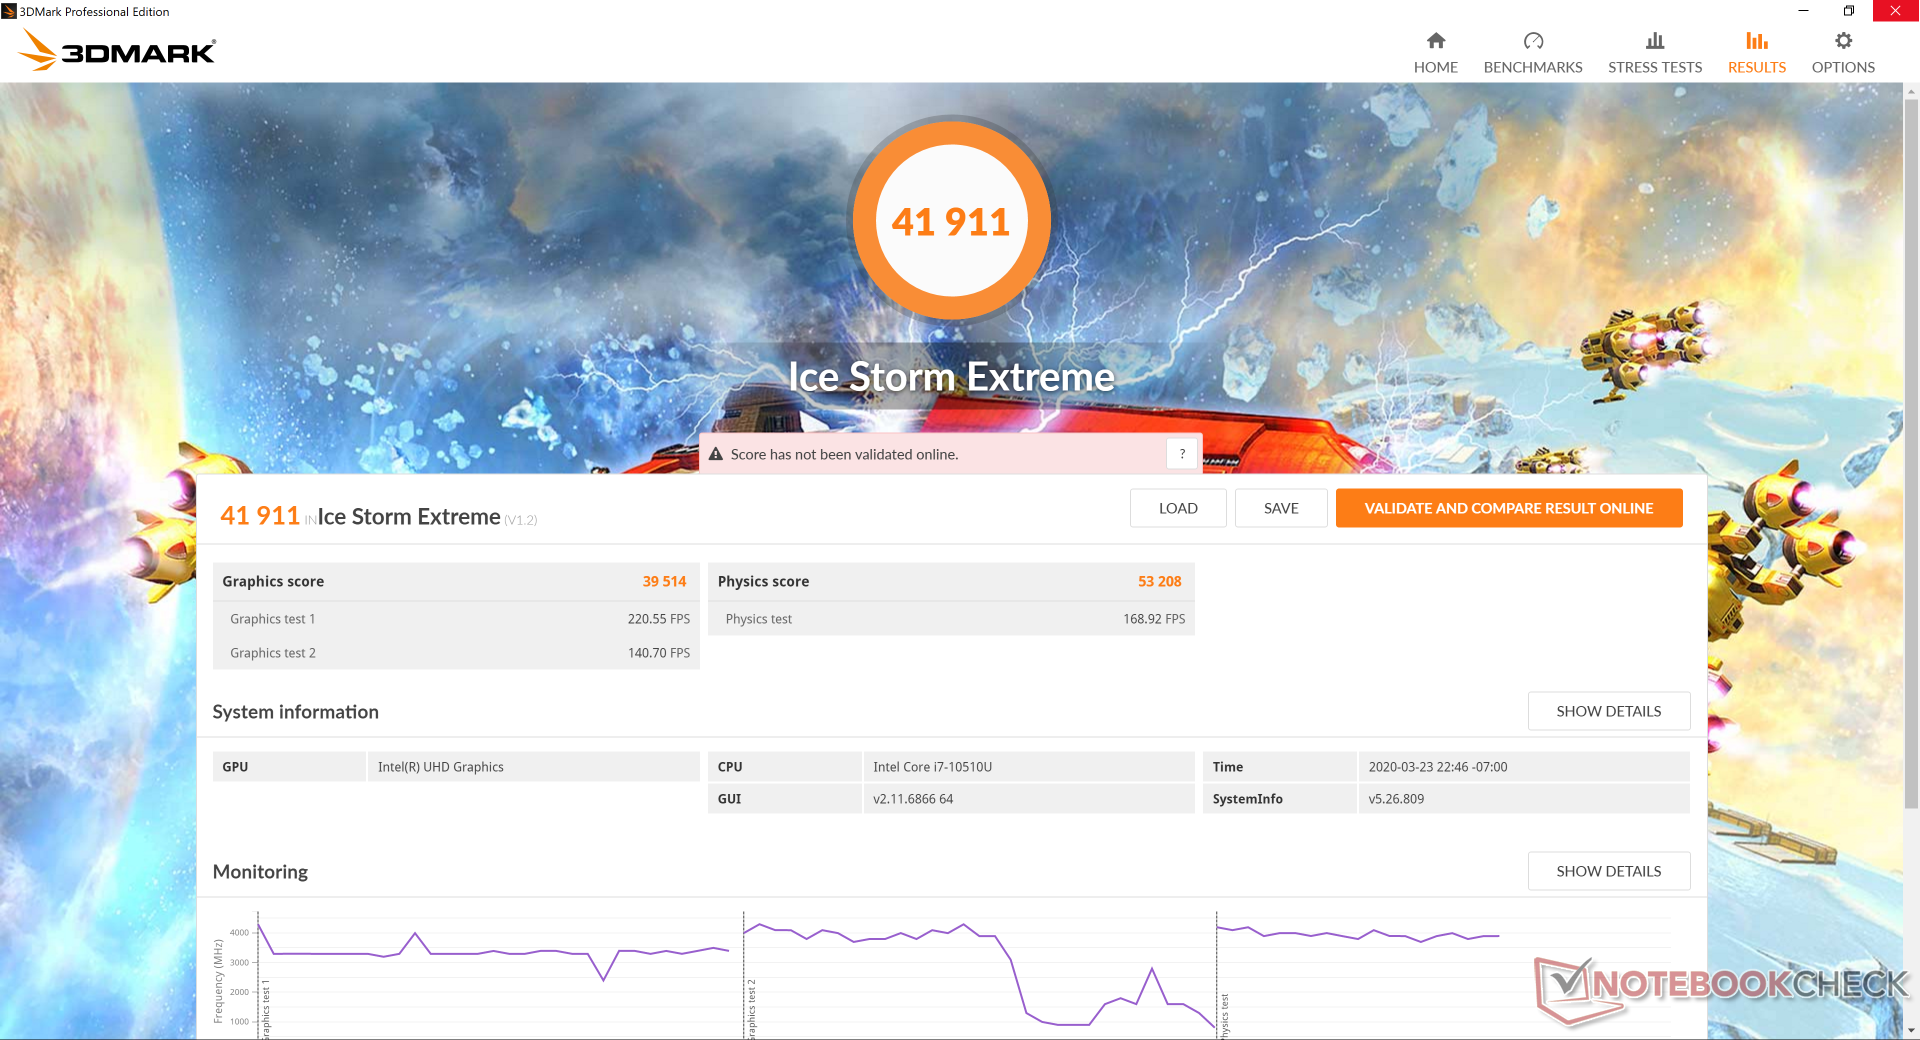
| 3DMark 11 Performance | 2232 points | |
| 3DMark Ice Storm Standard Score | 61083 points | |
| 3DMark Cloud Gate Standard Score | 9117 points | |
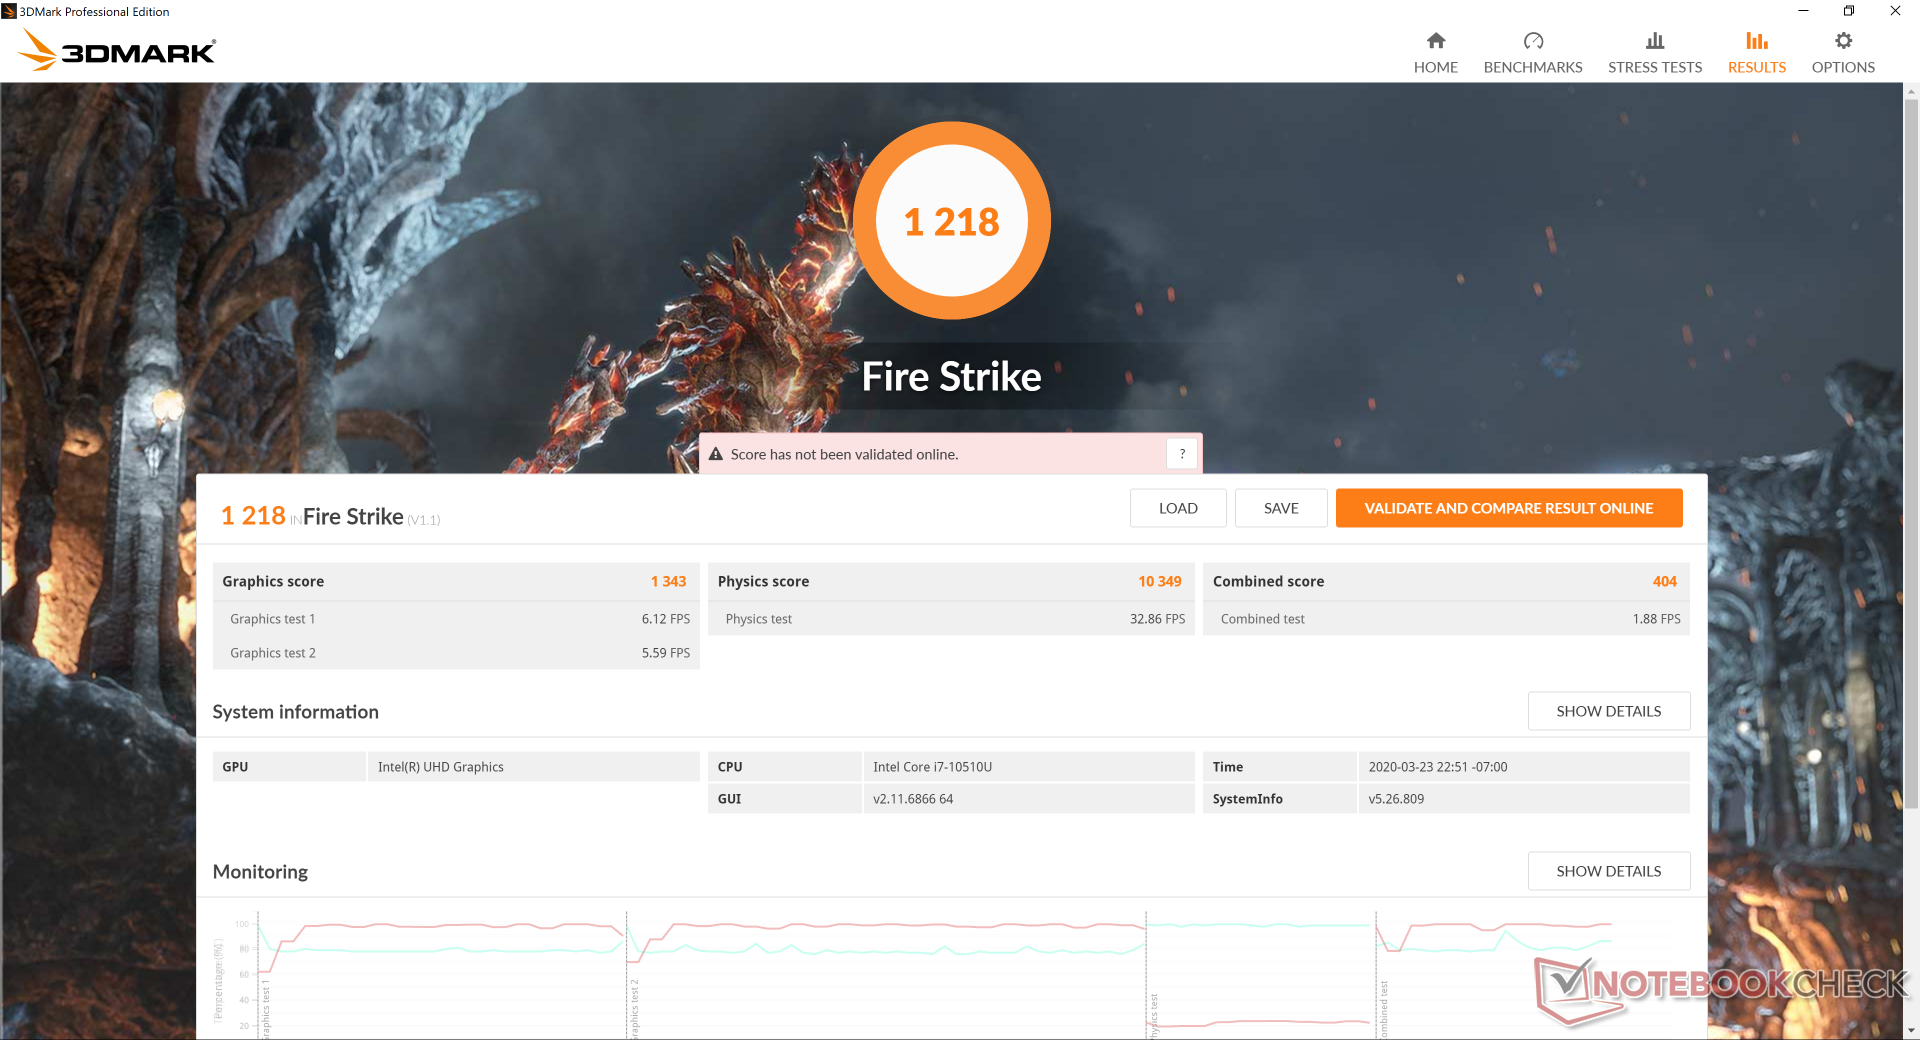
| 3DMark Fire Strike Score | 1218 points | |
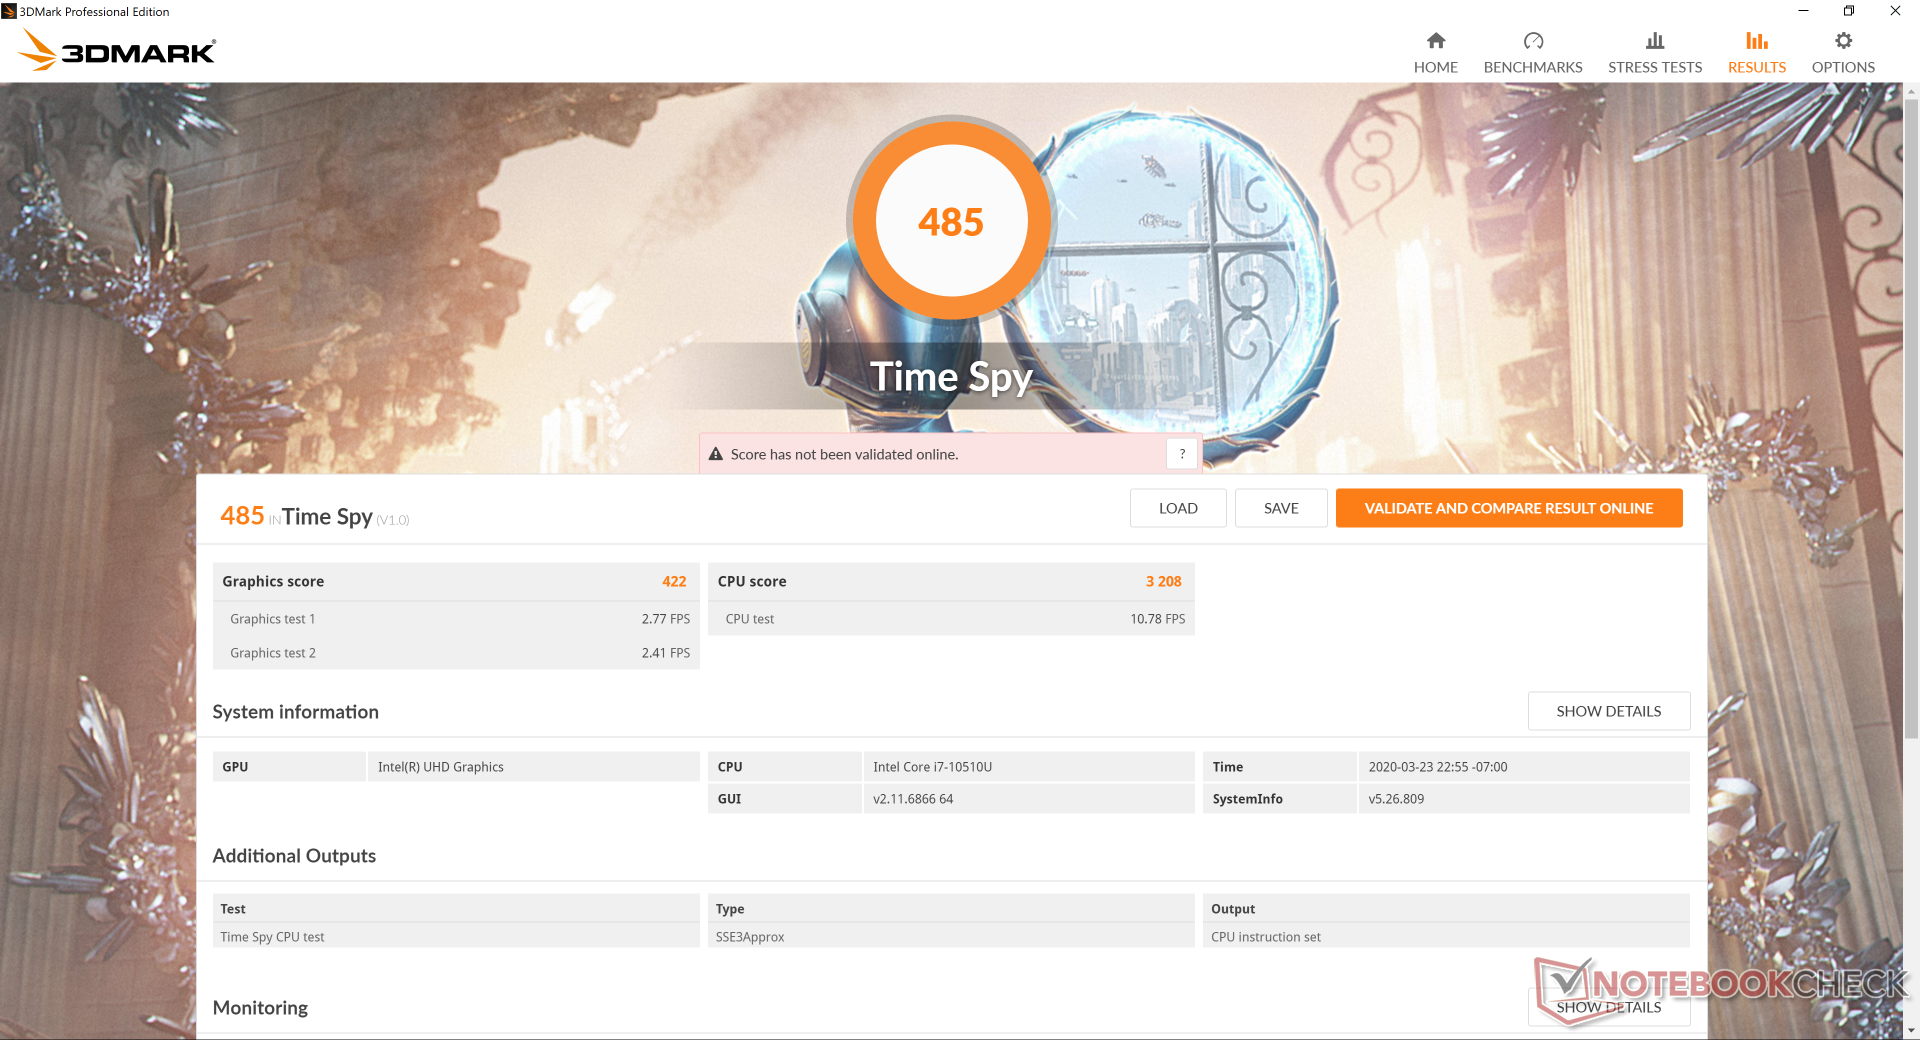
| 3DMark Time Spy Score | 485 points | |
Help | ||
| low | med. | high | ultra | |
|---|---|---|---|---|
| BioShock Infinite (2013) | 81.2 | 39.7 | 34.3 | 11 |
| The Witcher 3 (2015) | 20.7 | 11 | ||
| Rocket League (2017) | 44 | 27.7 | 20.6 | |
| Shadow of the Tomb Raider (2018) | 14 |
Emissions
System Noise
If the Windows Power slider is set to Balanced or Power Saver, then the system will be silent during low loads like browsing or word processing. If set to High Performance, the fan will automatically bump up to 29.4 dB(A) against a background of 28.2 dB(A) which is still barely audible. Running the first benchmark scene of 3DMark 06 results in a fan noise of 31.5 dB(A) to be quieter than many Ultrabooks.
Running Prime95 induces a fan noise of 38 dB(A) until it stabilizes at 41.2 dB(A) after a few minutes. Most users will not likely experience the fan at full speed during real-world scenarios since the CPU has to be pushed to 100 percent load for this to happen.
We can notice no electronic noise or coil whine from our test unit.
| Lenovo ThinkPad X1 Carbon G7 20R1-000YUS UHD Graphics 620, i7-10510U, WDC PC SN730 SDBPNTY-512G | Lenovo ThinkPad X1 Extreme 2019 20QV000WGE GeForce GTX 1650 Mobile, i7-9750H, Samsung SSD PM981 MZVLB512HAJQ | Lenovo ThinkPad X1 Yoga 2019-20QGS00A00 UHD Graphics 620, i7-8565U, WDC PC SN720 SDAPNTW-512G | Lenovo ThinkPad X1 Carbon 2017-20HR0021GE HD Graphics 620, i5-7200U, Toshiba THNSF5256GPUK | Lenovo ThinkPad X1 Carbon G6-20KG0025UK UHD Graphics 620, i5-8350U, Lenovo LENSE20256GMSP34MEAT2TA | Lenovo ThinkPad X1 Carbon Touch 20A7-002DGE HD Graphics 5000, 4550U, Samsung MZNTD512HAGL | |
|---|---|---|---|---|---|---|
| Noise | -1% | -0% | -4% | 0% | 2% | |
| off / environment * (dB) | 28.2 | 28.5 -1% | 29.3 -4% | 29.6 -5% | 30.25 -7% | |
| Idle Minimum * (dB) | 28.2 | 28.5 -1% | 29.3 -4% | 29.6 -5% | 30.25 -7% | 28.8 -2% |
| Idle Average * (dB) | 28.2 | 28.5 -1% | 29.3 -4% | 29.6 -5% | 30.25 -7% | 28.8 -2% |
| Idle Maximum * (dB) | 29.4 | 28.5 3% | 31.1 -6% | 32.2 -10% | 30.25 -3% | 28.8 2% |
| Load Average * (dB) | 31.5 | 36.3 -15% | 32.7 -4% | 34.2 -9% | 31.3 1% | 33.7 -7% |
| Load Maximum * (dB) | 41.2 | 36.3 12% | 32.7 21% | 36.1 12% | 31.3 24% | 34 17% |
| Witcher 3 ultra * (dB) | 36.3 |
* ... smaller is better
Noise level
| Idle |
| 28.2 / 28.2 / 29.4 dB(A) |
| Load |
| 31.5 / 41.2 dB(A) |
 | ||
30 dB silent 40 dB(A) audible 50 dB(A) loud |
||
min: | ||
Temperature
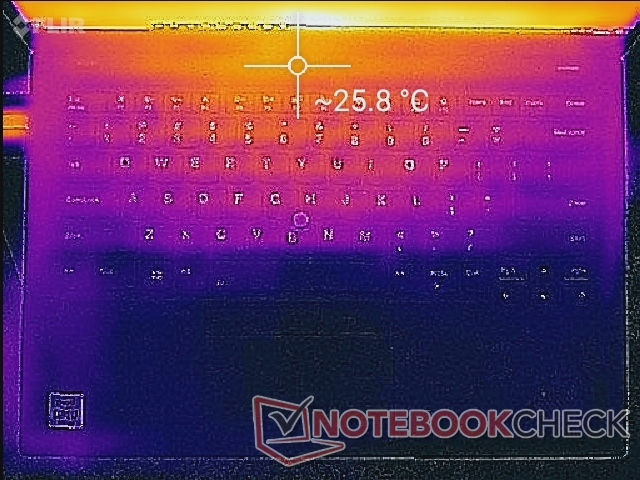
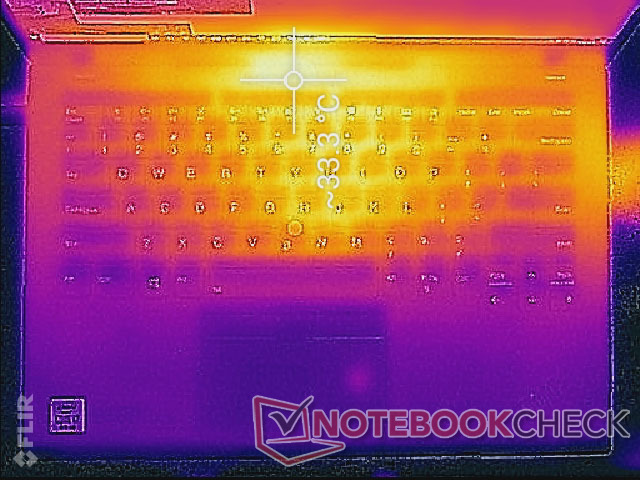
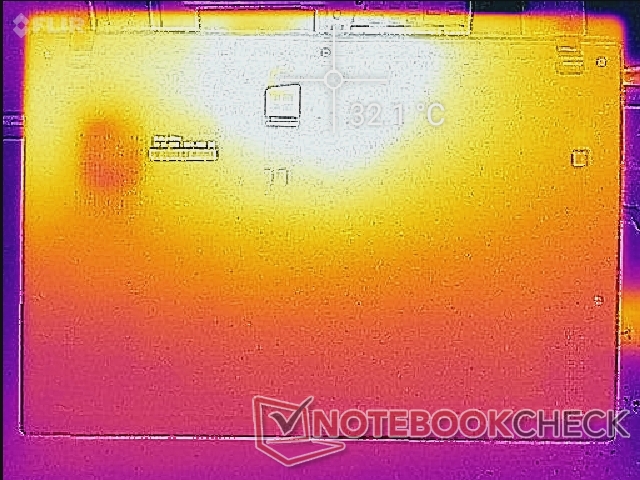
Surface temperatures are cooler than expected when running Prime95 and FurMark simultaneously. Hot spots, for example, come out to be only 32 C to 33 C compared to 46 C to 48 C on last year's ThinkPad X1 Carbon. The heavier CPU throttling when running the two benchmark programs simultaneously is the likely culprit as detailed in the next section below. Expect surface temperatures to be much higher and closer to the 2019 model if running only Prime95 or FurMark.
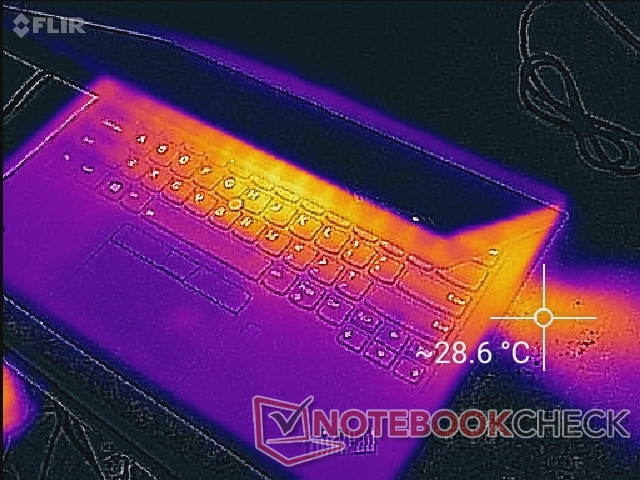
(+) The maximum temperature on the upper side is 33.6 °C / 92 F, compared to the average of 34.3 °C / 94 F, ranging from 21.2 to 62.5 °C for the class Office.
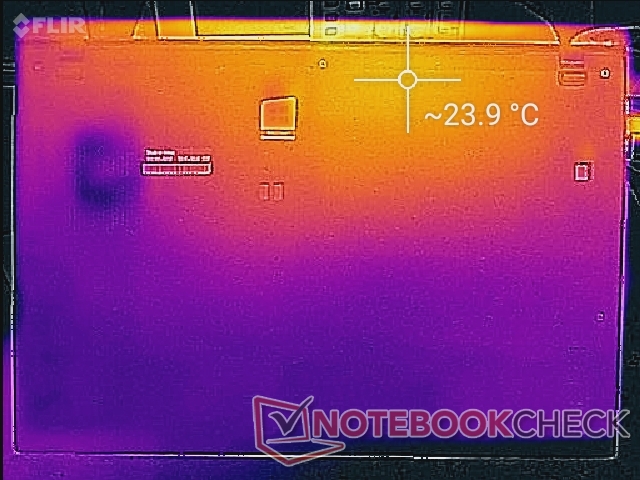
(+) The bottom heats up to a maximum of 32.2 °C / 90 F, compared to the average of 36.8 °C / 98 F
(+) In idle usage, the average temperature for the upper side is 22.6 °C / 73 F, compared to the device average of 29.5 °C / 85 F.
(+) The palmrests and touchpad are cooler than skin temperature with a maximum of 22.6 °C / 72.7 F and are therefore cool to the touch.
(+) The average temperature of the palmrest area of similar devices was 27.5 °C / 81.5 F (+4.9 °C / 8.8 F).
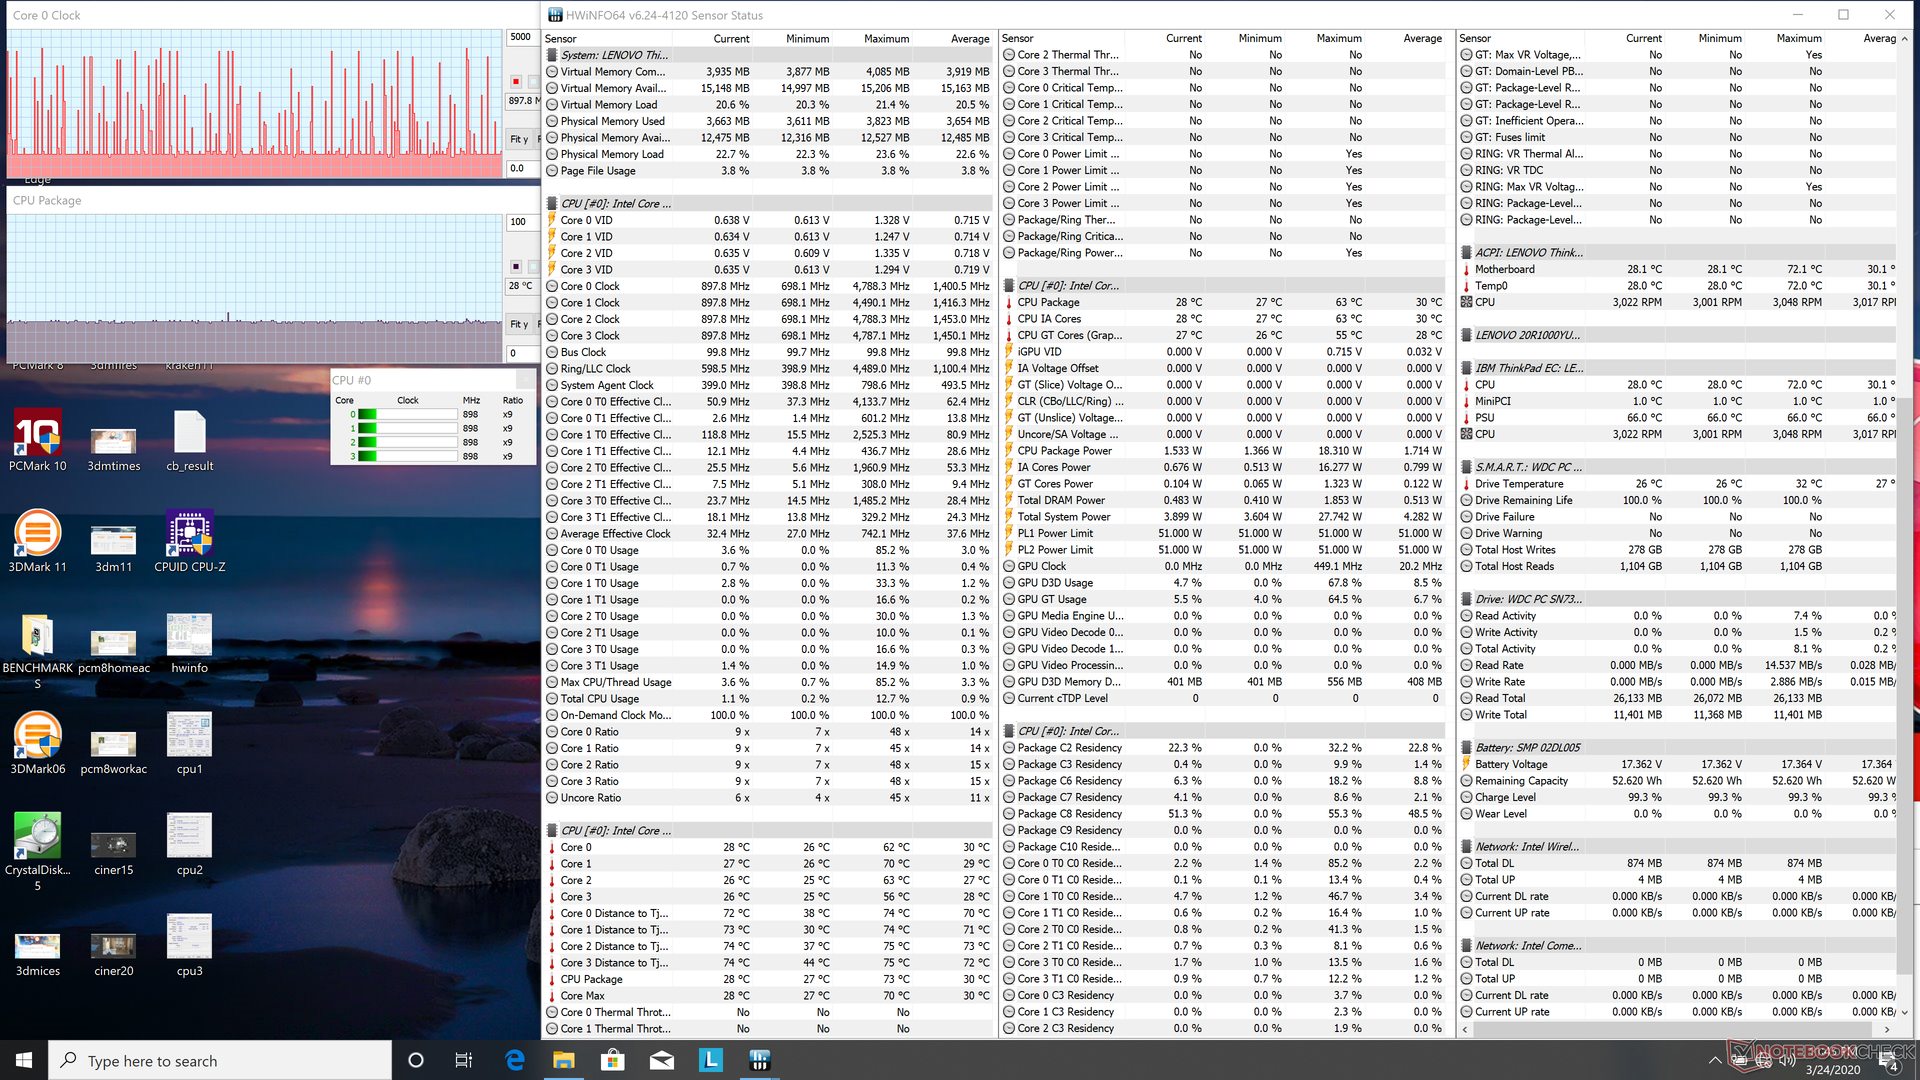
Stress Test
We stress the system with synthetic loads to identify for any potential throttling issues. When running Prime95, the CPU will boost to 4.1 GHz for just a few seconds before core temperature reaches 98 C. Thereafter, clock rates stabilize at 3.2 to 3.3 GHz at a temperature of 97 C for a few minutes. Clock rates and temperature would then eventually cycle between 2.0 to 3.2 GHz and 73 C to 97 C, respectively, to corroborate with our CineBench R15 loop observations from above.
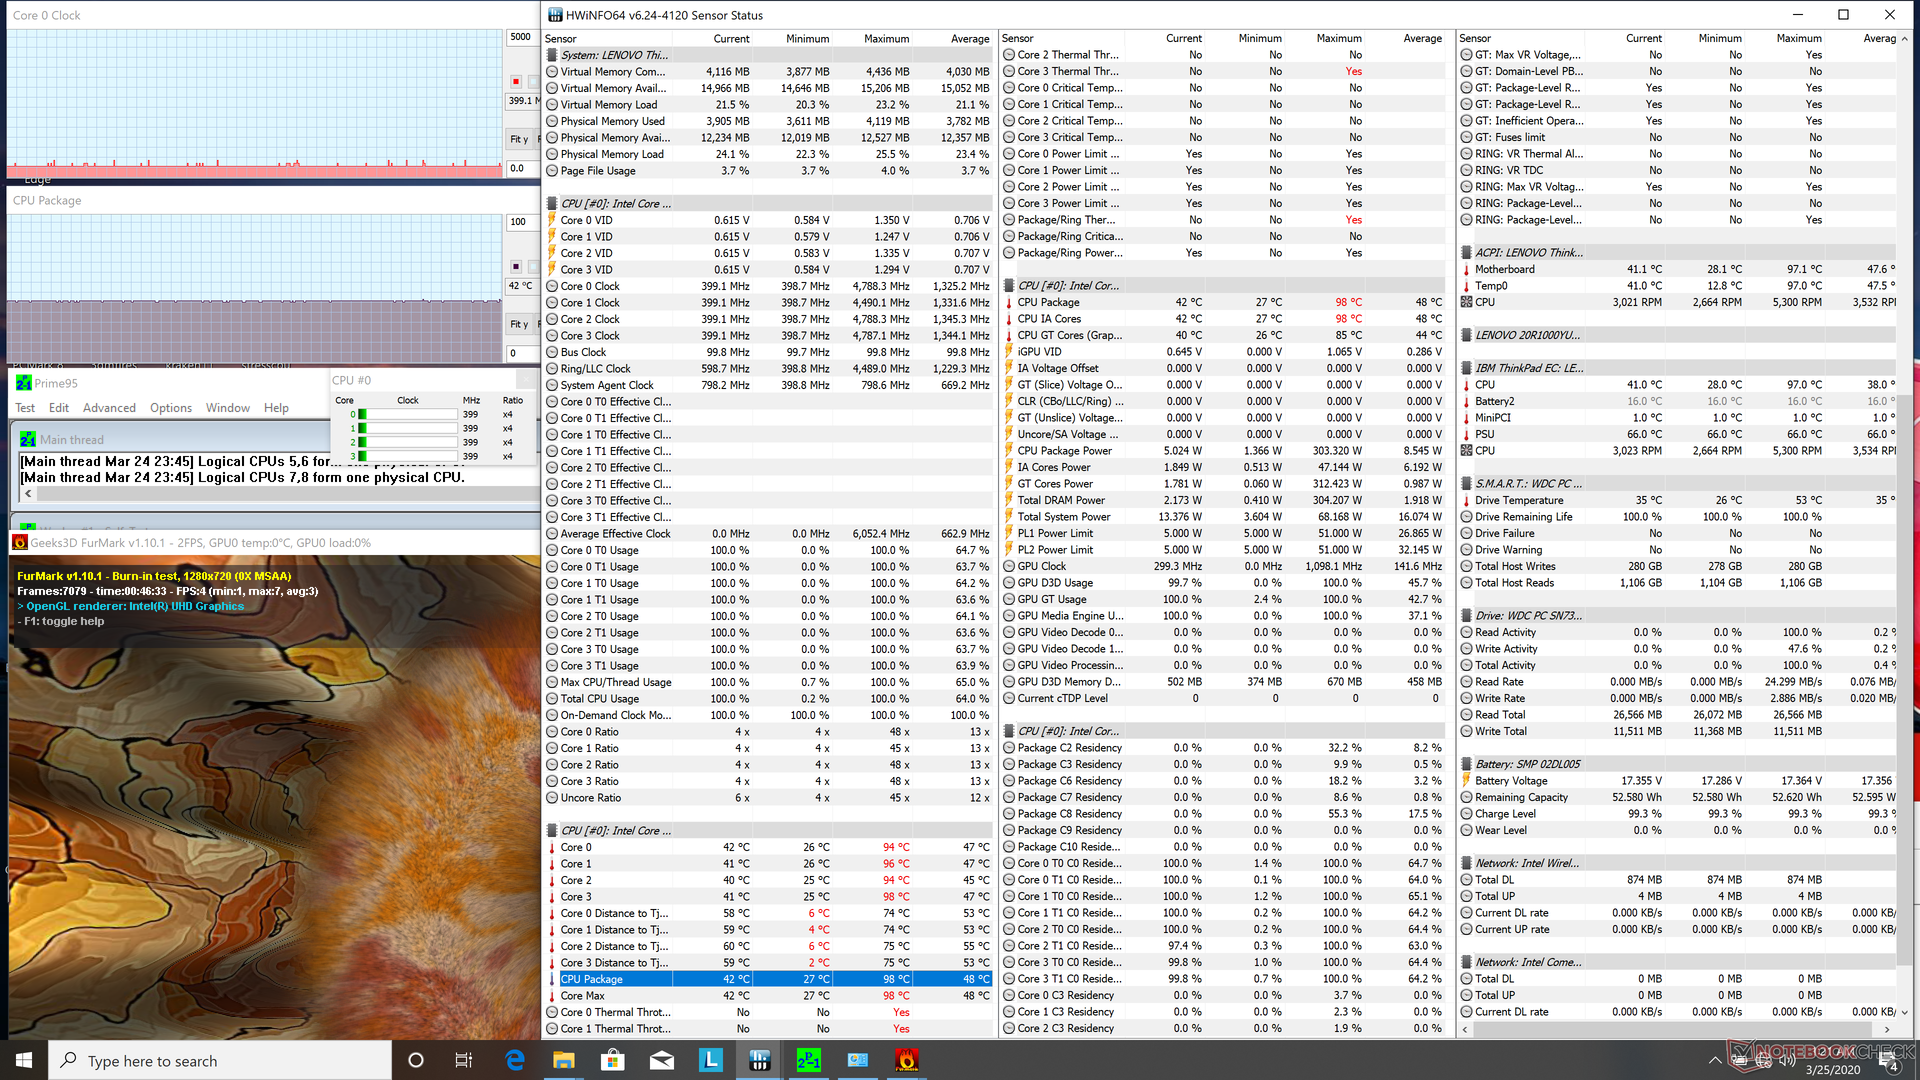
Heavy CPU throttling occurs when running both Prime95 and FurMark simultaneously. The CPU would run at just 400 MHz for a core temperature of 42 C. Surface temperatures would therefore be much warmer if you were to run any games or other demanding real-world loads where the CPU and GPU are not at 100 percent utilization.
Running on battery power will not impact performance. A 3DMark 11 test on batteries results in almost no changes to the final Physics and Graphics scores.
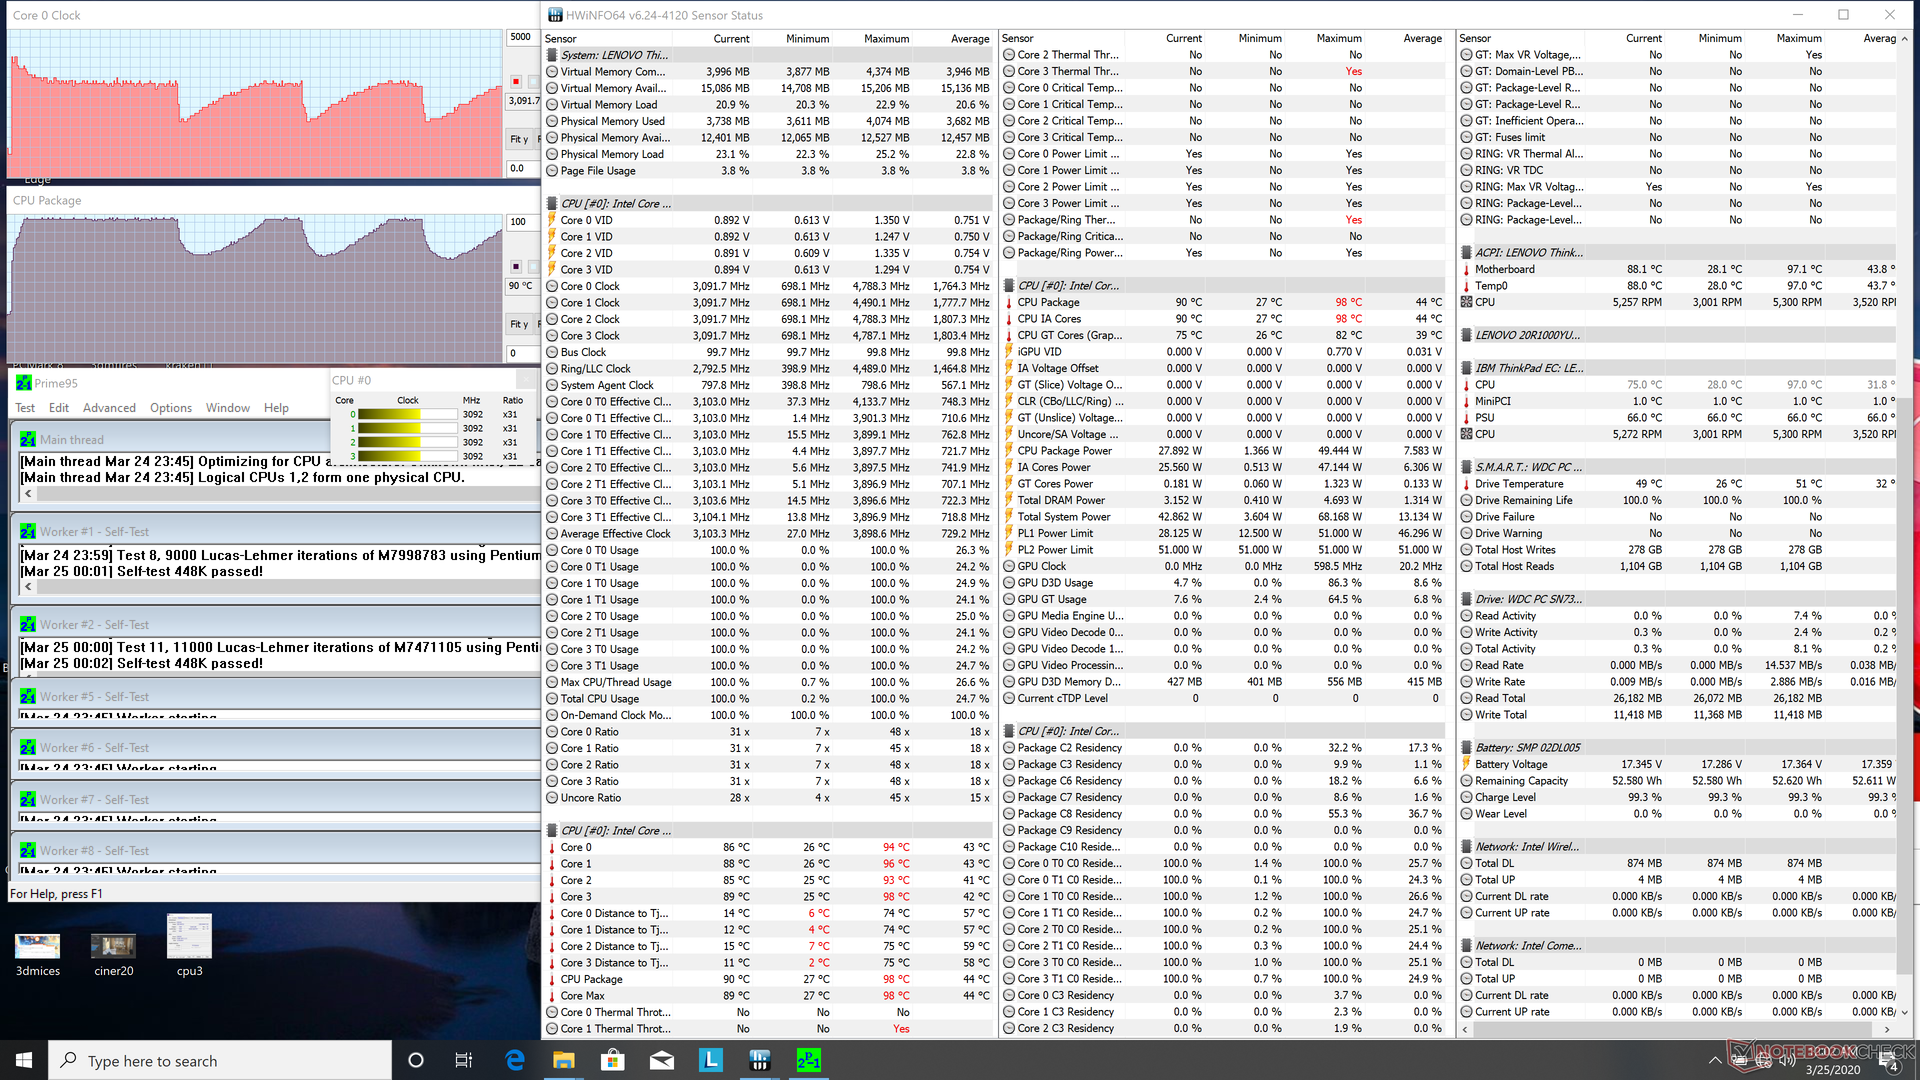
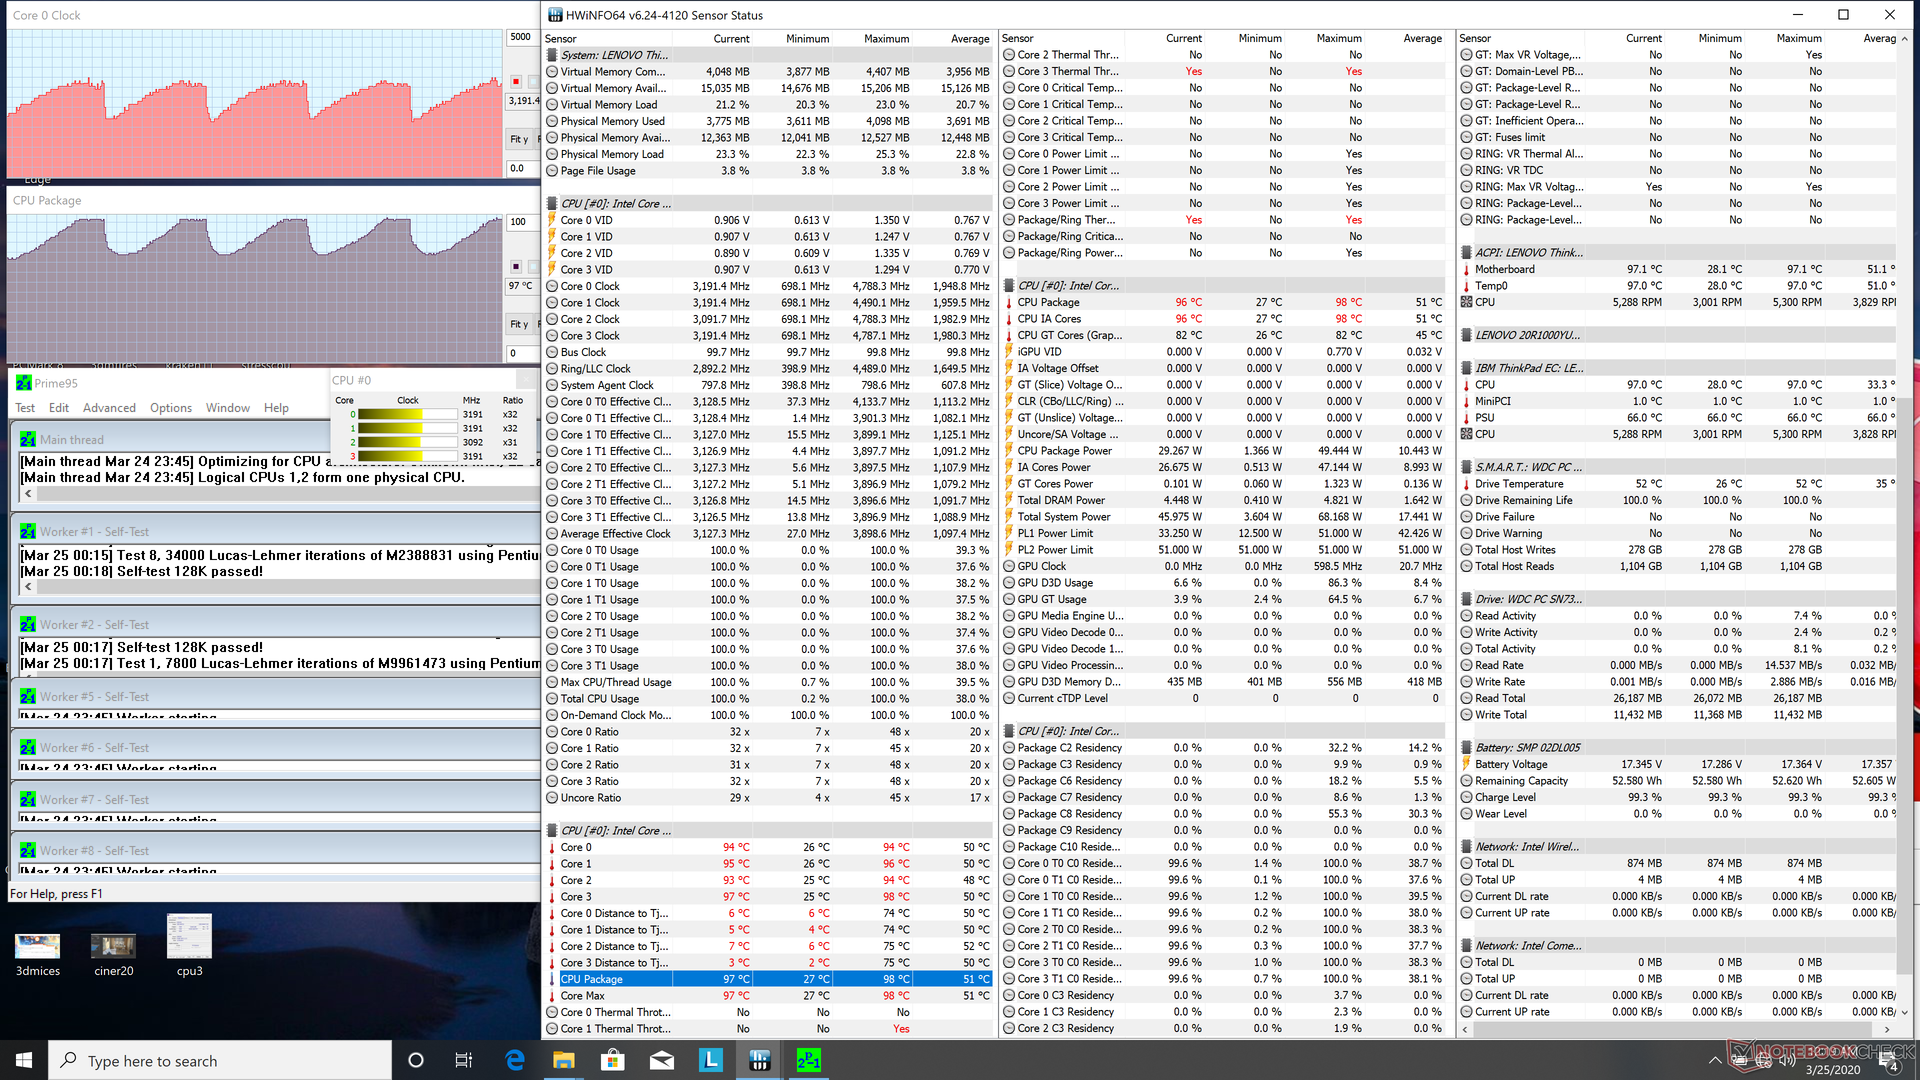
| CPU Clock (GHz) | GPU Clock (MHz) | Average CPU Temperature (°C) | |
| System Idle | -- | -- | 28 |
| Prime95 Stress | 2.0 - 3.2 | -- | 73 - 97 |
| Prime95 + FurMark Stress | 0.4 | -- | 42 |
Speakers


Energy Management
Power Consumption
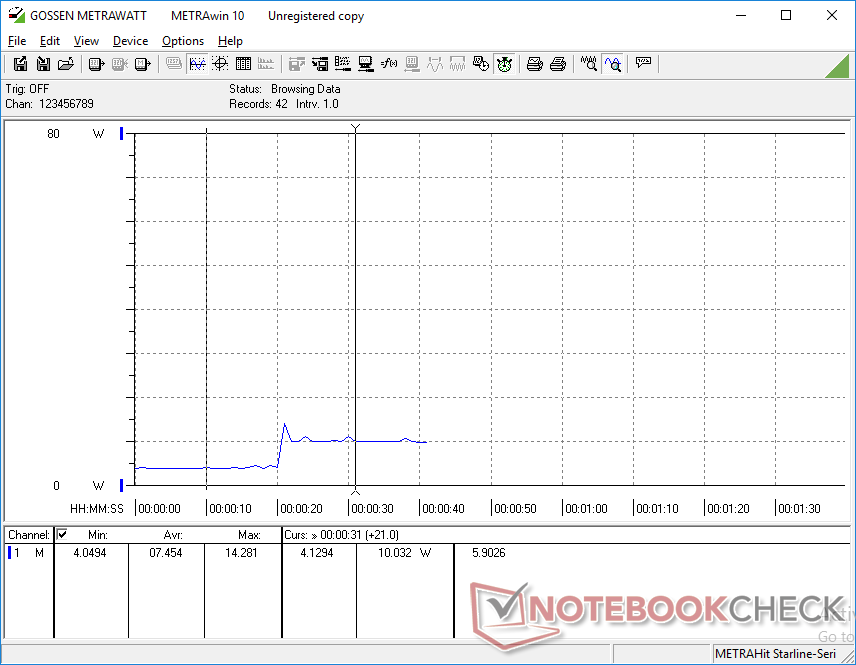
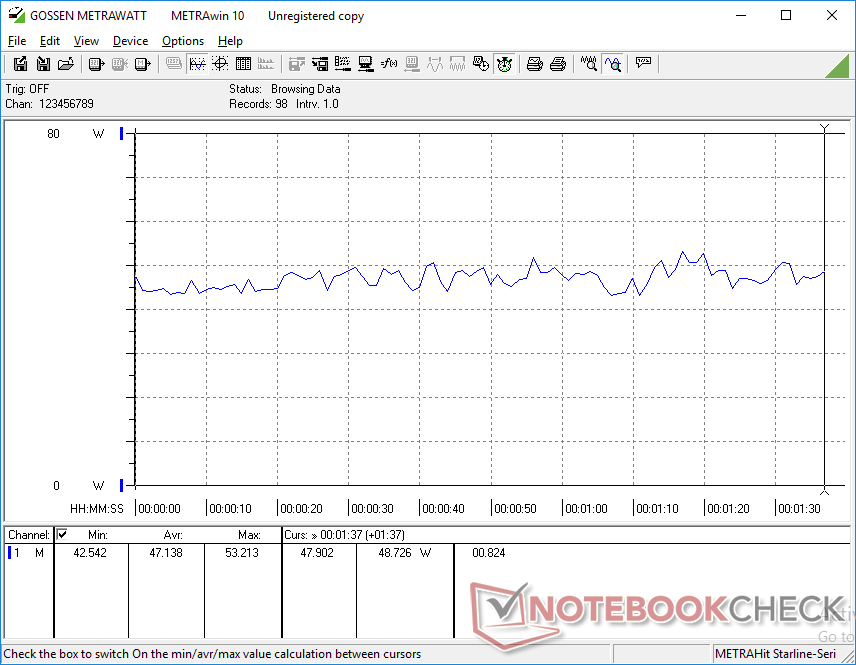
Idling on desktop will demand between 3 W and 13 W depending on the power profile and brightness level. In fact, jumping from zero percent brightness to 100 percent brightness will incur about 6 W. Overall power consumption remains very similar to last year's Whiskey Lake-U ThinkPad X1 Carbon albeit still a few Watts higher on average due to our more demanding 4K UHD display.
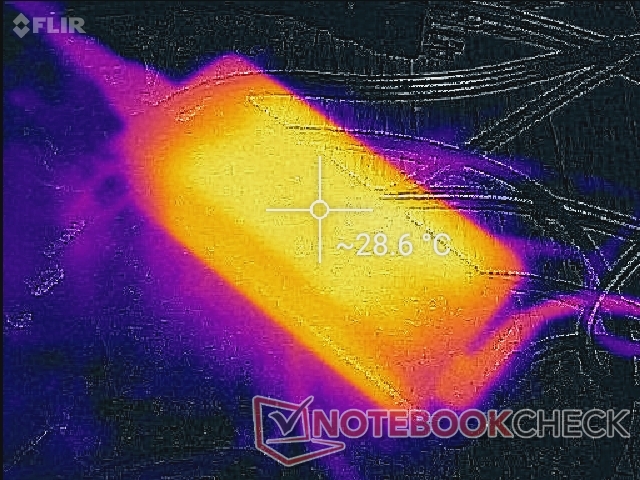
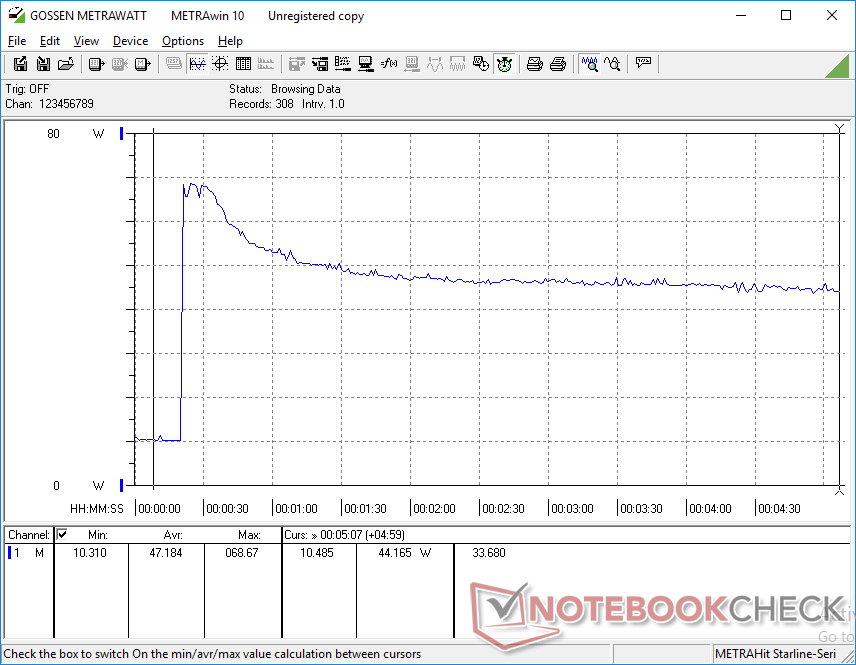
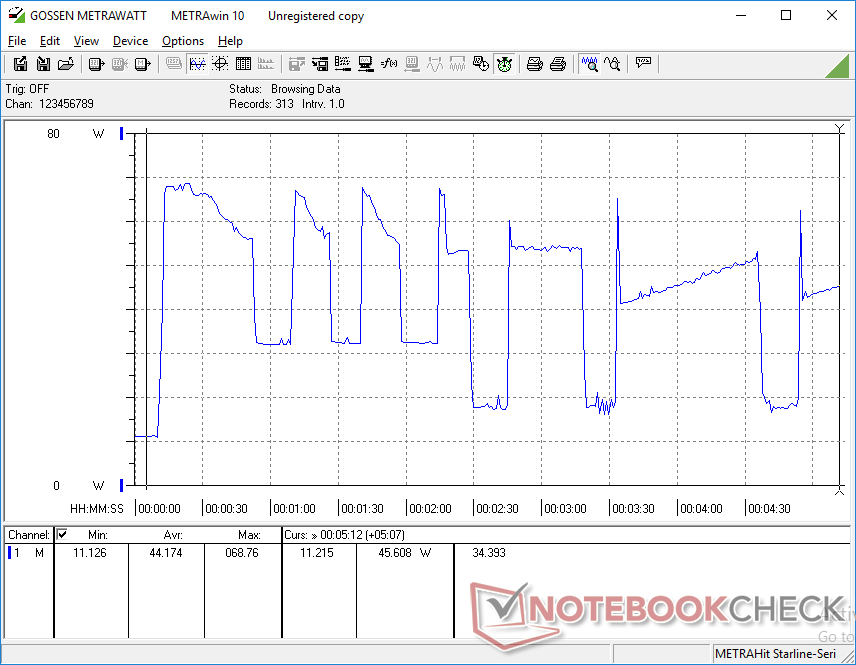
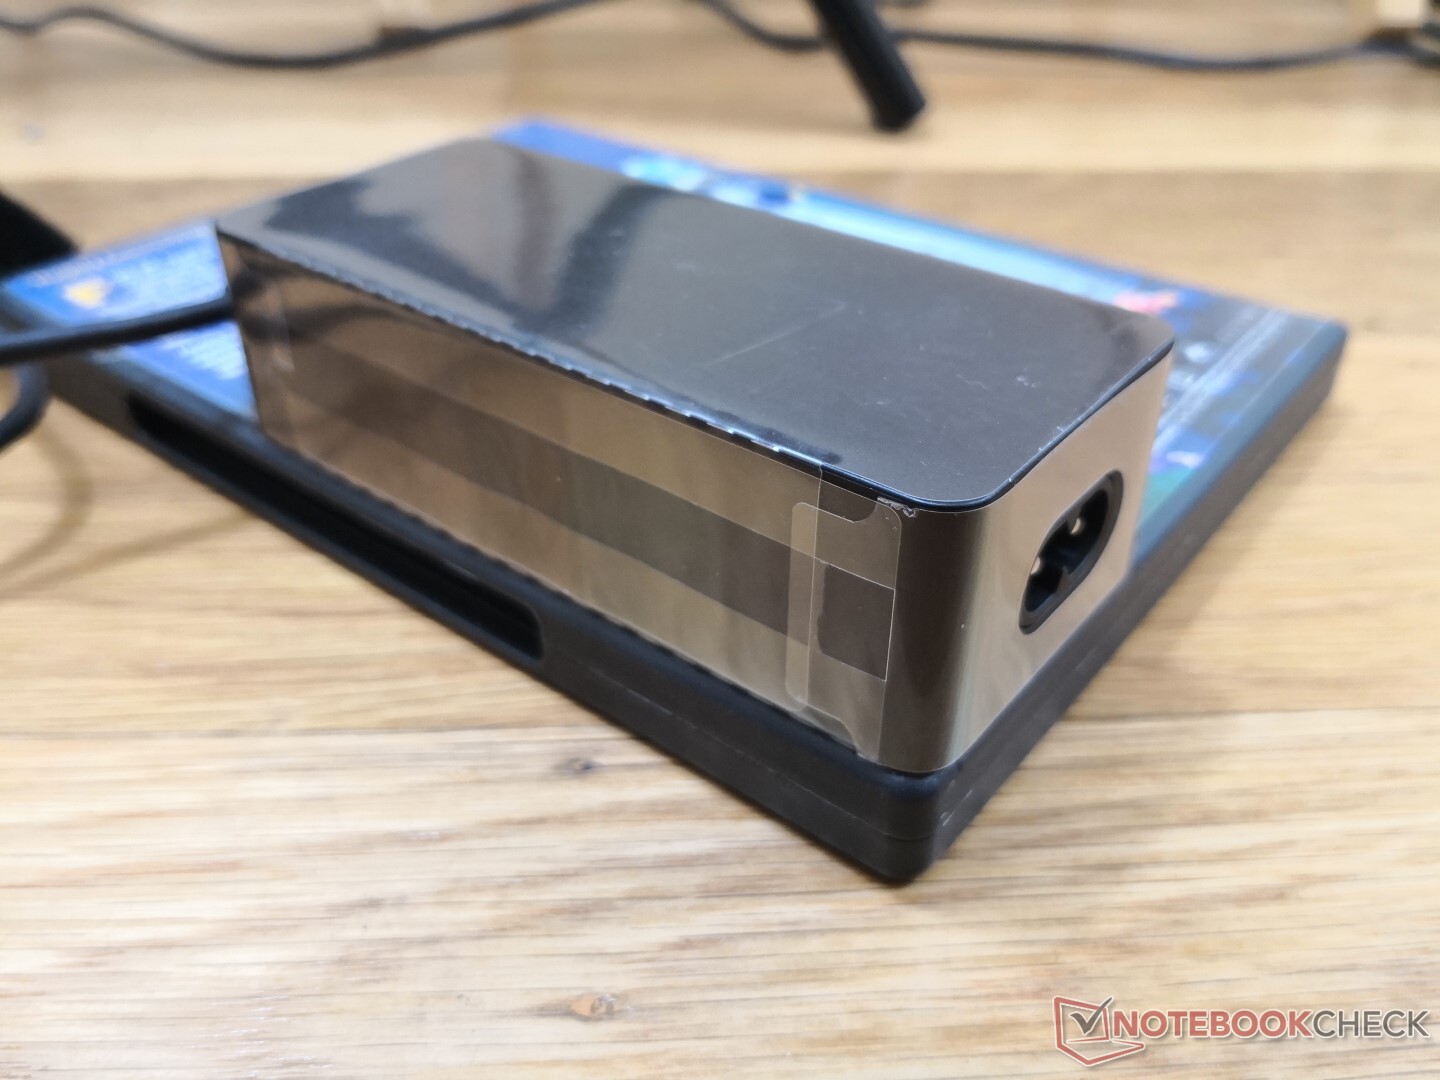
We're able to record a maximum consumption of 69 W from the small (~10.8 x 4.8 x 3 cm) 65 W AC adapter when running Prime95 and FurMark simultaneously. However, this high of a consumption is only temporary because of the extreme cycling behavior when running both benchmarks programs as shown by our graphs below.
| Off / Standby | |
| Idle | |
| Load |
|
Key:
min: | |
| Lenovo ThinkPad X1 Carbon G7 20R1-000YUS i7-10510U, UHD Graphics 620, WDC PC SN730 SDBPNTY-512G, IPS, 3840x2160, 14" | Lenovo ThinkPad X1 Extreme 2019 20QV000WGE i7-9750H, GeForce GTX 1650 Mobile, Samsung SSD PM981 MZVLB512HAJQ, IPS, 3840x2160, 15.6" | Lenovo ThinkPad X1 Carbon 2019-20QE000VGE i7-8665U, UHD Graphics 620, WDC PC SN720 SDAQNTW-512G, IPS, 2560x1440, 14" | Lenovo ThinkPad X1 Carbon G6-20KG0025UK i5-8350U, UHD Graphics 620, Lenovo LENSE20256GMSP34MEAT2TA, IPS, 1920x1080, 14" | Lenovo ThinkPad X1 Carbon 2017-20HR0021GE i5-7200U, HD Graphics 620, Toshiba THNSF5256GPUK, IPS, 1920x1080, 14" | Lenovo ThinkPad X1 Carbon Touch 20A7-002DGE 4550U, HD Graphics 5000, Samsung MZNTD512HAGL, IPS-Panel, 2560x1440, 14" | |
|---|---|---|---|---|---|---|
| Power Consumption | -83% | 20% | 25% | 25% | 25% | |
| Idle Minimum * (Watt) | 3.5 | 8.5 -143% | 3 14% | 4.7 -34% | 3.8 -9% | 4.1 -17% |
| Idle Average * (Watt) | 10.8 | 14.7 -36% | 6.3 42% | 7.3 32% | 7.1 34% | 8.7 19% |
| Idle Maximum * (Watt) | 12.5 | 19.4 -55% | 8.9 29% | 9.4 25% | 8.3 34% | 10.2 18% |
| Load Average * (Watt) | 47.2 | 89.6 -90% | 40.8 14% | 28 41% | 34.2 28% | 26.3 44% |
| Load Maximum * (Watt) | 68.8 | 129.8 -89% | 67.5 2% | 28.2 59% | 43.3 37% | 26.7 61% |
| Witcher 3 ultra * (Watt) | 96.1 |
* ... smaller is better
Battery Life
Runtimes are about one to two hours longer than what we recorded on last year's X1 Carbon with the WQHD display even though battery capacity remains the same. Almost any USB Type-C charger can be used to recharge the system, but recharge rate will differ depending on the charger.
Charging from empty to full capacity takes about 90 minutes with the included AC adapter after updating to system to the latest BIOS. Prior to updating, the recharge rate would be as slow as 5 to 6 hours.
| Lenovo ThinkPad X1 Carbon G7 20R1-000YUS i7-10510U, UHD Graphics 620, 51 Wh | Lenovo ThinkPad X1 Carbon 2019-20QD00M7GE i5-8265U, UHD Graphics 620, 51 Wh | Lenovo ThinkPad X1 Carbon 2018-20KGS5DU00 i5-8550U, UHD Graphics 620, 57 Wh | Lenovo ThinkPad X1 Carbon G6-20KG0025UK i5-8350U, UHD Graphics 620, 57 Wh | Lenovo ThinkPad X1 Carbon 2017-20HR0021GE i5-7200U, HD Graphics 620, 57 Wh | Lenovo ThinkPad X1 Carbon Touch 20A7-002DGE 4550U, HD Graphics 5000, 45 Wh | |
|---|---|---|---|---|---|---|
| Battery runtime | -24% | -10% | 4% | -9% | ||
| WiFi v1.3 (h) | 10 | 7.6 -24% | 9 -10% | 10.4 4% | 9.1 -9% | |
| Reader / Idle (h) | 24.5 | 13.7 | 12.1 | |||
| Load (h) | 1.9 | 2 | 1.8 | |||
| WiFi (h) | 6.5 |
Pros
Cons
Verdict

If you're in the market for a new Lenovo ThinkPad X1 Carbon, then selecting the best configuration is important especially because the model doesn't come cheap. We recommend skipping the Core i7-10510U since it performs about the same as the cheaper Core i5-8265U or Core i7-8565U. Only the hexa-core Core i7-10710U option will provide a noticeable boost in CPU performance over last gen options. Investing in RAM, 4G LTE, or the brighter display would be more worthwhile than the newer 10th gen CPU for day-to-day use.
Key drawbacks to the system will require a complete redesign to address. The lack of Wi-Fi 6, SD reader, and better graphics options dampen the office potential of the X1 Carbon. The presence of pulse-width modulation on this brighter display option is also a bummer as previous generation models did not exhibit the same phenomenon. The cycling CPU clock rates when under very high stress prevents performance users from exploiting the high Turbo Boost clock rates of the Intel CPU over long periods. It makes investing in the latest processors less appealing when you can't run them at their best.
Combine a slim Yoga laptop with a ThinkPad T series laptop and you have the ThinkPad X1 Carbon. It's definitely one of the more portable and attractive ThinkPad machines available, but be prepared for a few missing features. Going for last year's model will give you almost the same performance for a cheaper price.
Lenovo ThinkPad X1 Carbon G7 20R1-000YUS
- 06/22/2020 v7 (old)
Allen Ngo
Price comparison
