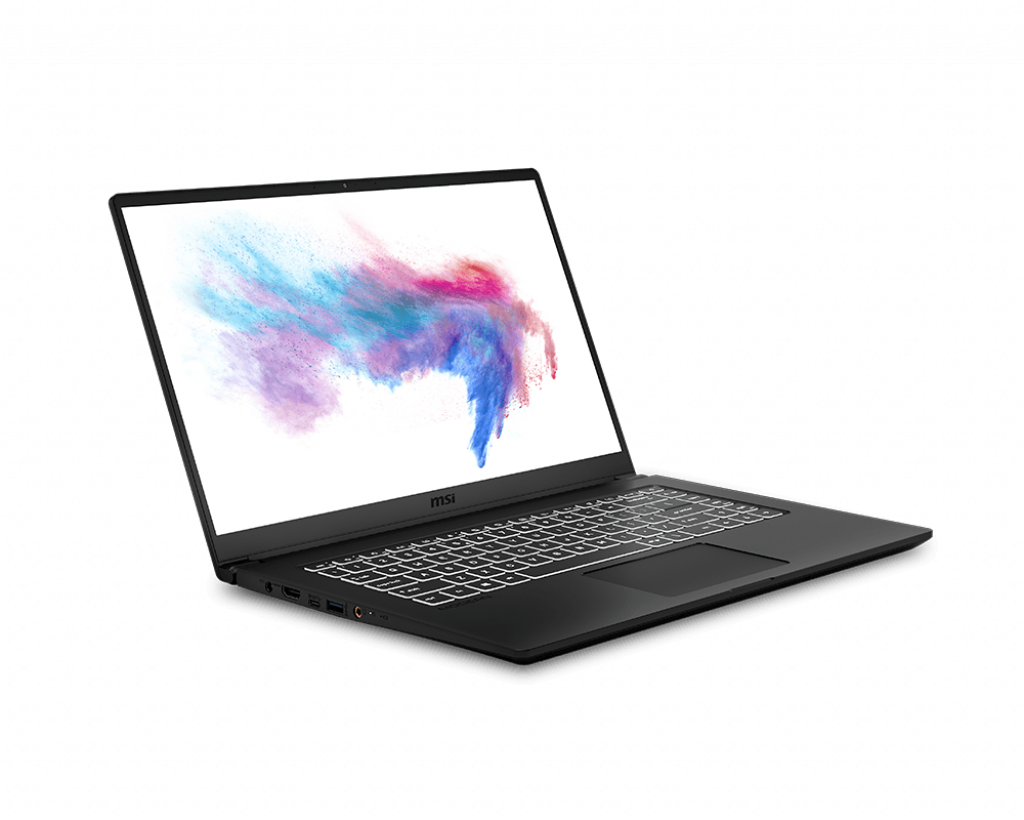
MSI Modern 15 A10RB Laptop Review: The Dell XPS 15 Lite
The MSI Modern 15 is the 15.6-inch version of the 14-inch Modern 14. Unlike the pricier MSI Prestige series, the more affordable Modern series targets office users and content creators on tighter budgets.
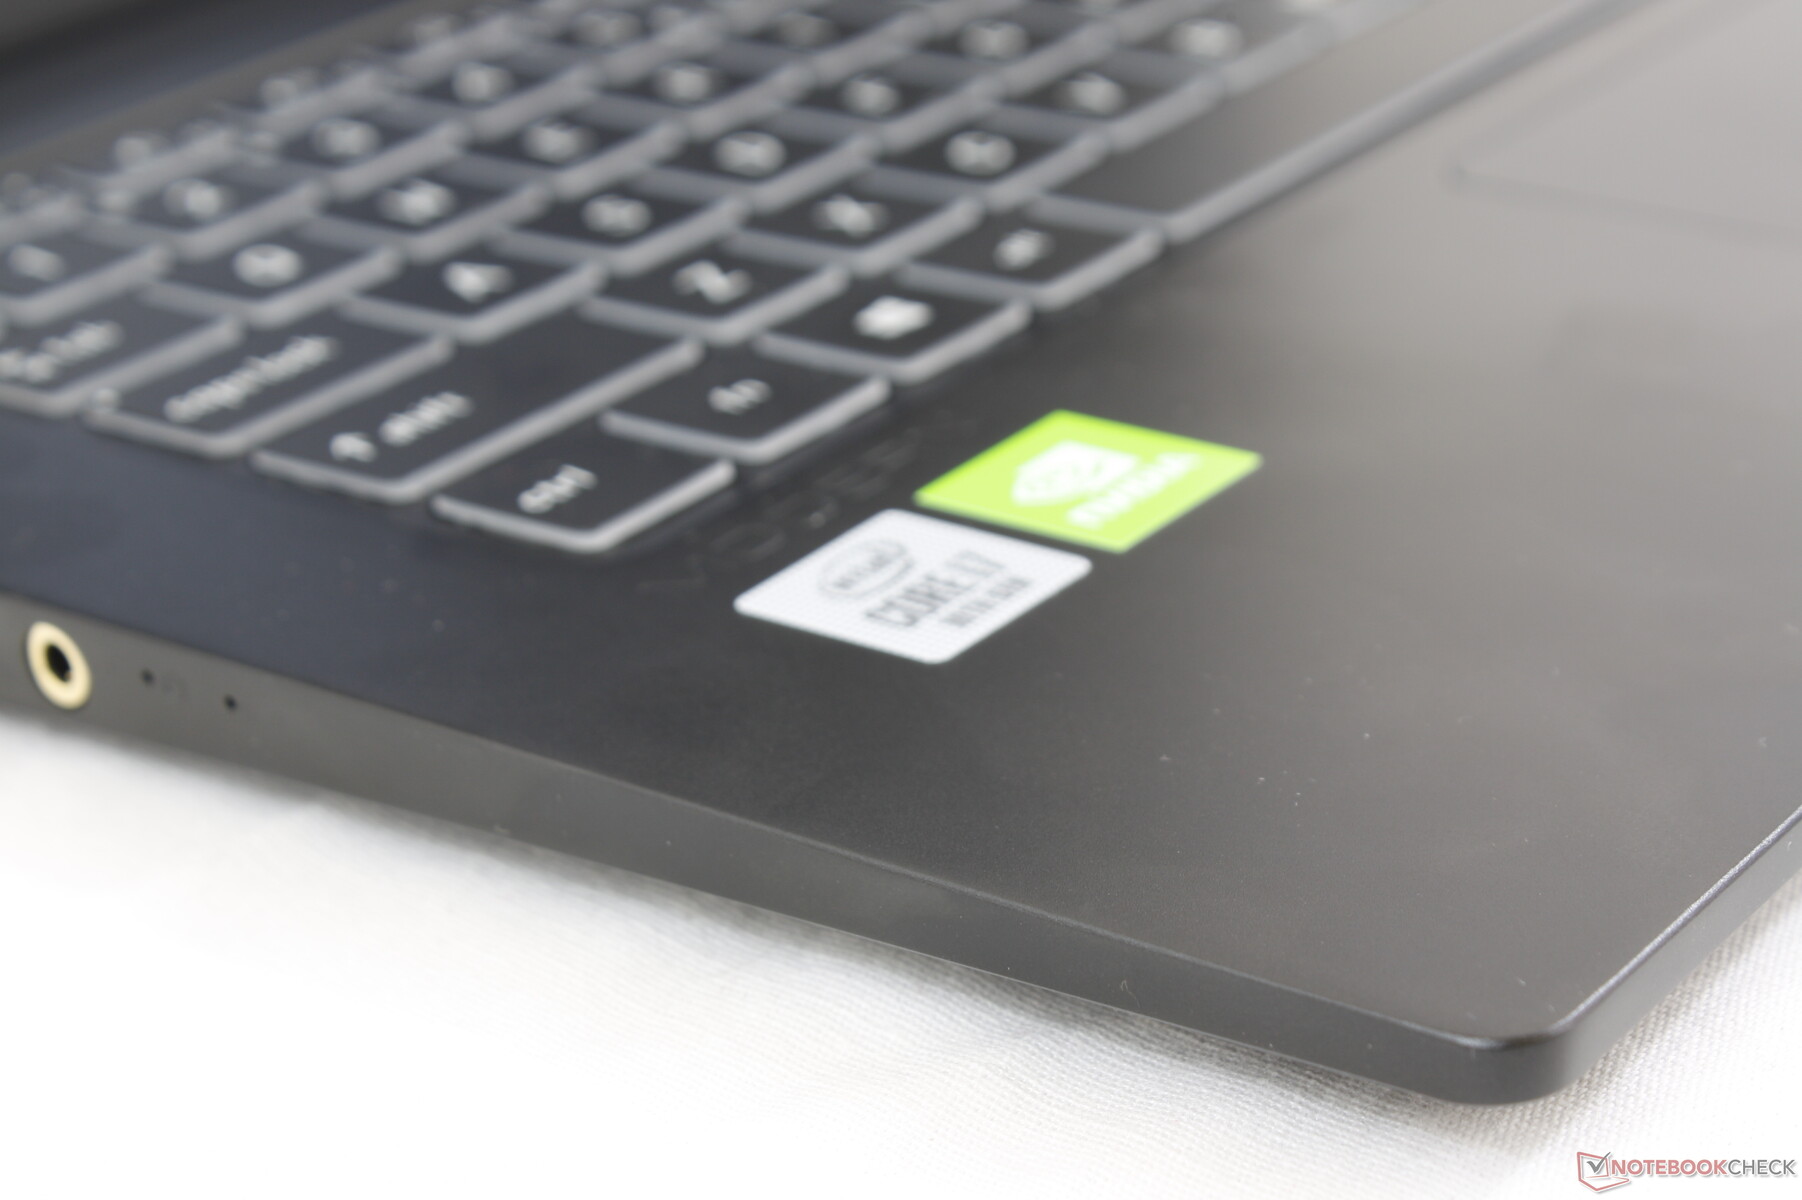
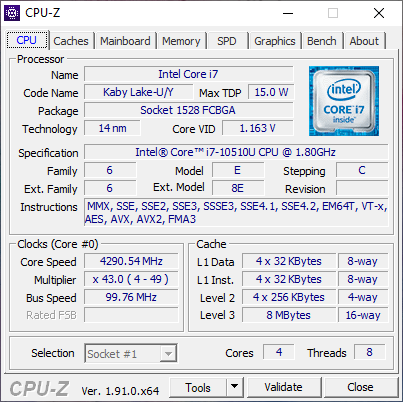
The unit we have here comes equipped with the quad-core Core i7-10510U Comet Lake-U CPU and Nvidia GeForce MX250 GPU for about $1100 USD. Lesser options with Core i5 and Intel UHD Graphics only are also available, but the 1080p display is fixed across the lineup. Though one may be quick to dismiss the Modern 15 as nothing more than an enlarged Modern 14, there are actually quite a few differences both inside and out that we will detail below.
The Modern 15 competes with mid-range business laptops and certain Ultrabooks including the Asus ZenBook 15, Dell XPS 15, HP Spectre x360 15, Microsoft Surface Laptop 3 15, Dell Latitude 5500, and the Lenovo ThinkPad T590 and X1 Carbon series.
More MSI reviews:
Rating | Date | Model | Weight | Height | Size | Resolution | Price |
|---|---|---|---|---|---|---|---|
| 80.1 % v7 (old) | 02 / 2020 | MSI Modern 15 A10RB i7-10510U, GeForce MX250 | 1.6 kg | 15.9 mm | 15.60" | 1920x1080 | |
| 83.1 % v7 (old) | 09 / 2019 | Asus ZenBook 15 UX534FT-DB77 i7-8565U, GeForce GTX 1650 Max-Q | 1.7 kg | 18.9 mm | 15.60" | 1920x1080 | |
| 86.6 % v7 (old) | 07 / 2019 | Lenovo ThinkPad T590-20N4002VGE i7-8565U, GeForce MX250 | 1.9 kg | 19.95 mm | 15.60" | 1920x1080 | |
| 85 % v7 (old) | 01 / 2020 | HP Spectre X360 15-5ZV31AV i7-10510U, GeForce MX250 | 2.1 kg | 19.3 mm | 15.60" | 3840x2160 | |
| 85.2 % v7 (old) | 11 / 2019 | MSI Prestige 15 A10SC i7-10710U, GeForce GTX 1650 Max-Q | 1.7 kg | 16 mm | 15.60" | 3840x2160 | |
| 83.9 % v7 (old) | 12 / 2019 | Microsoft Surface Laptop 3 15 i7-1065G7 i7-1065G7, Iris Plus Graphics G7 (Ice Lake 64 EU) | 1.5 kg | 14.7 mm | 15.00" | 2496x1664 |
Case
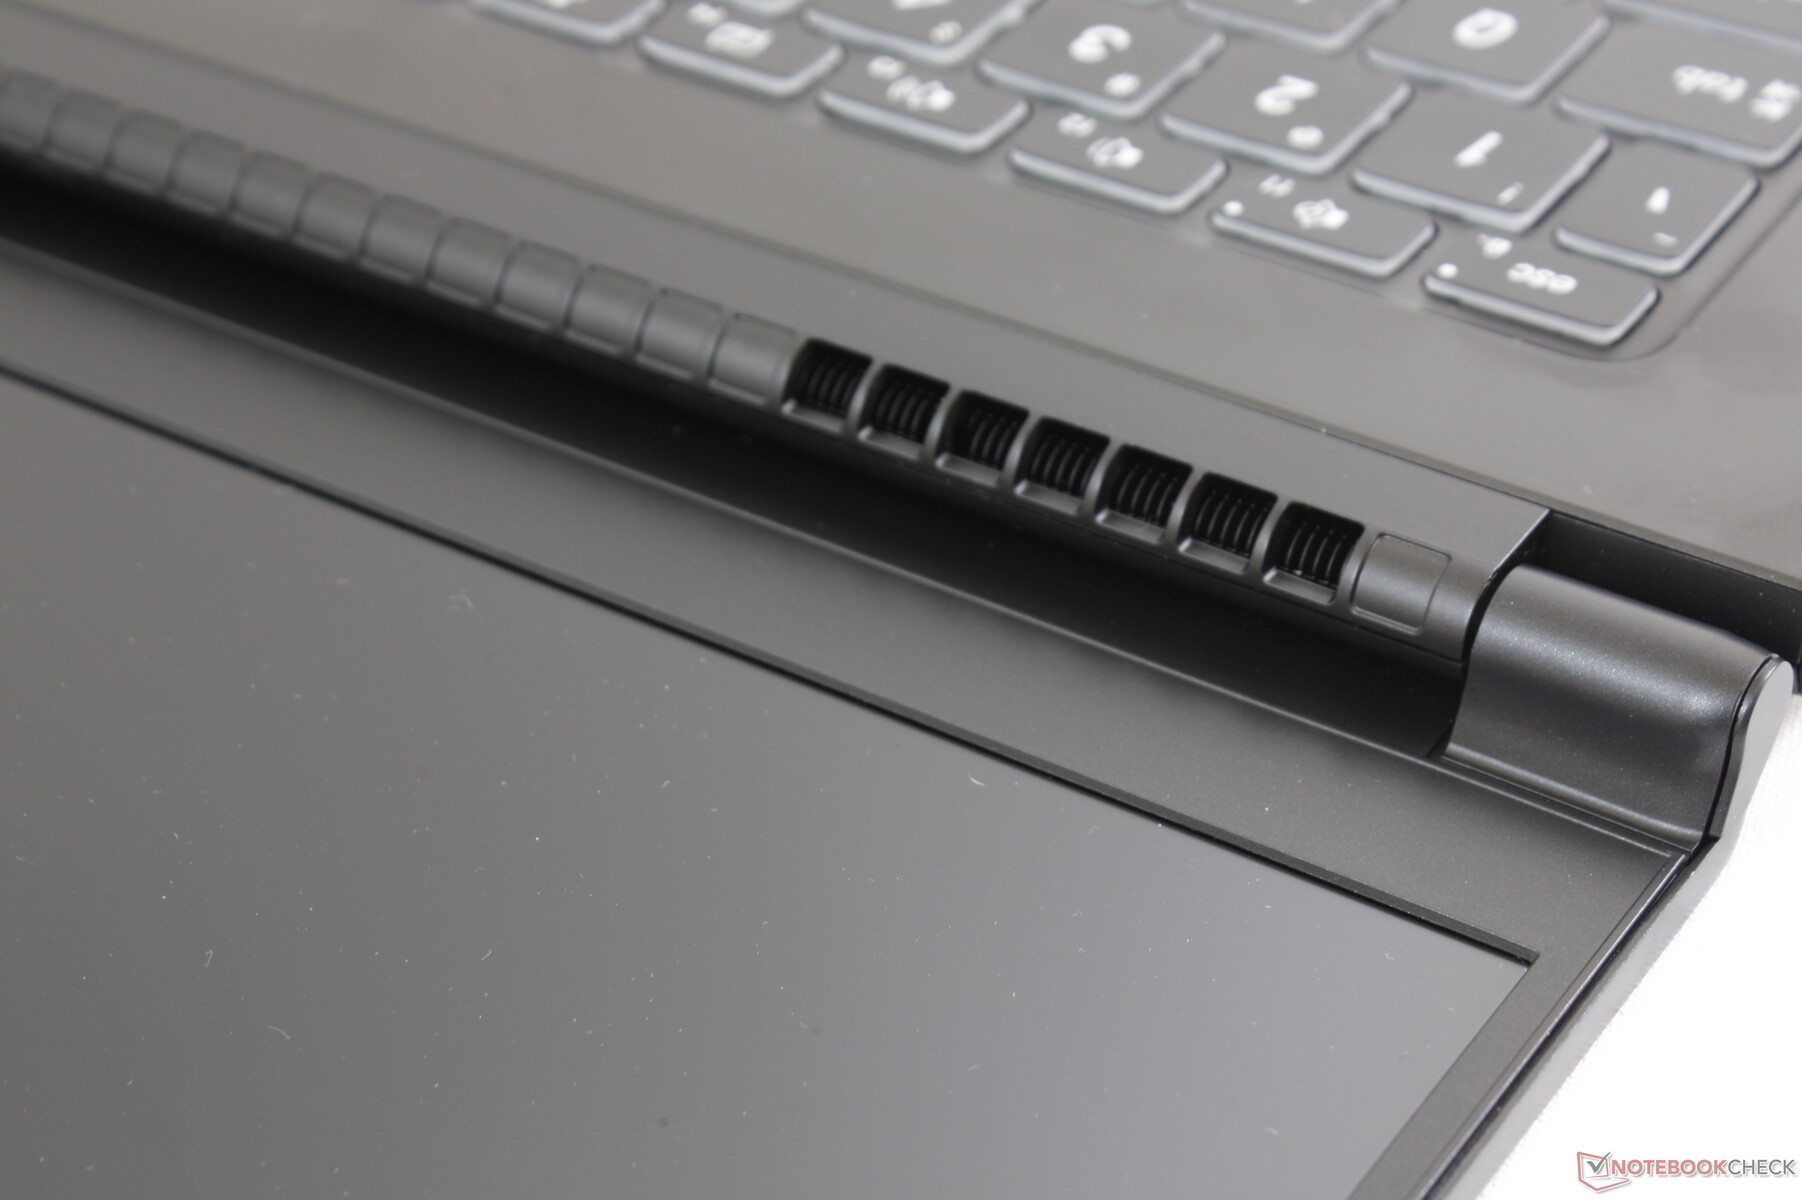
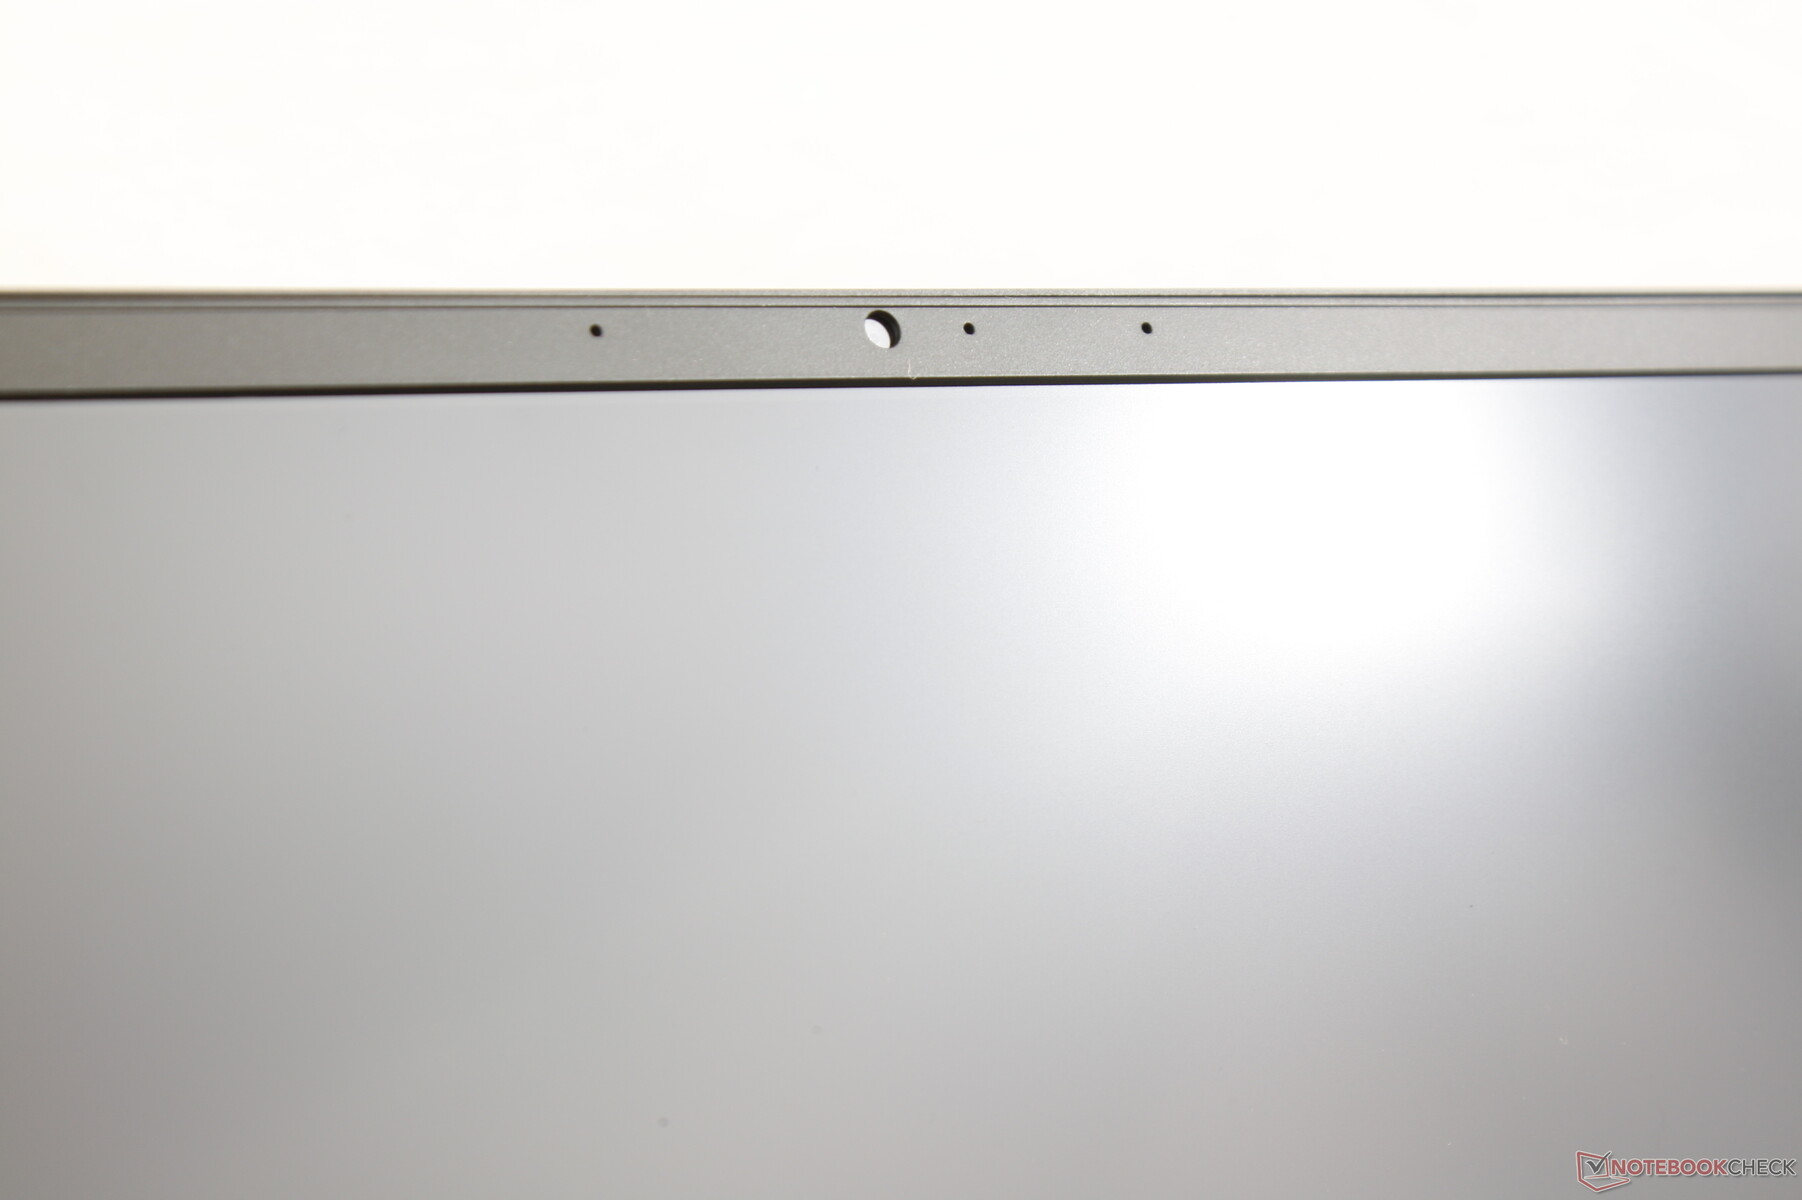
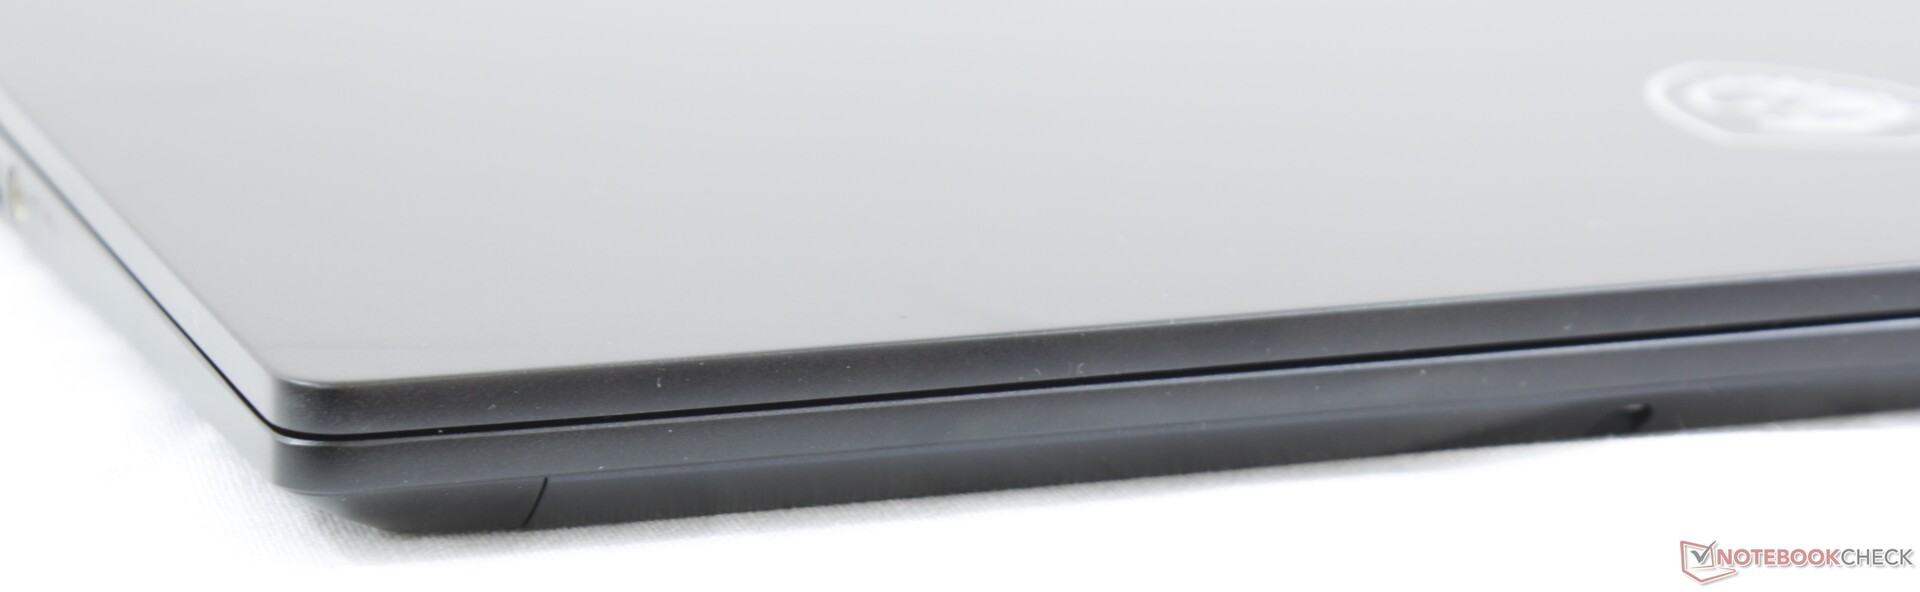
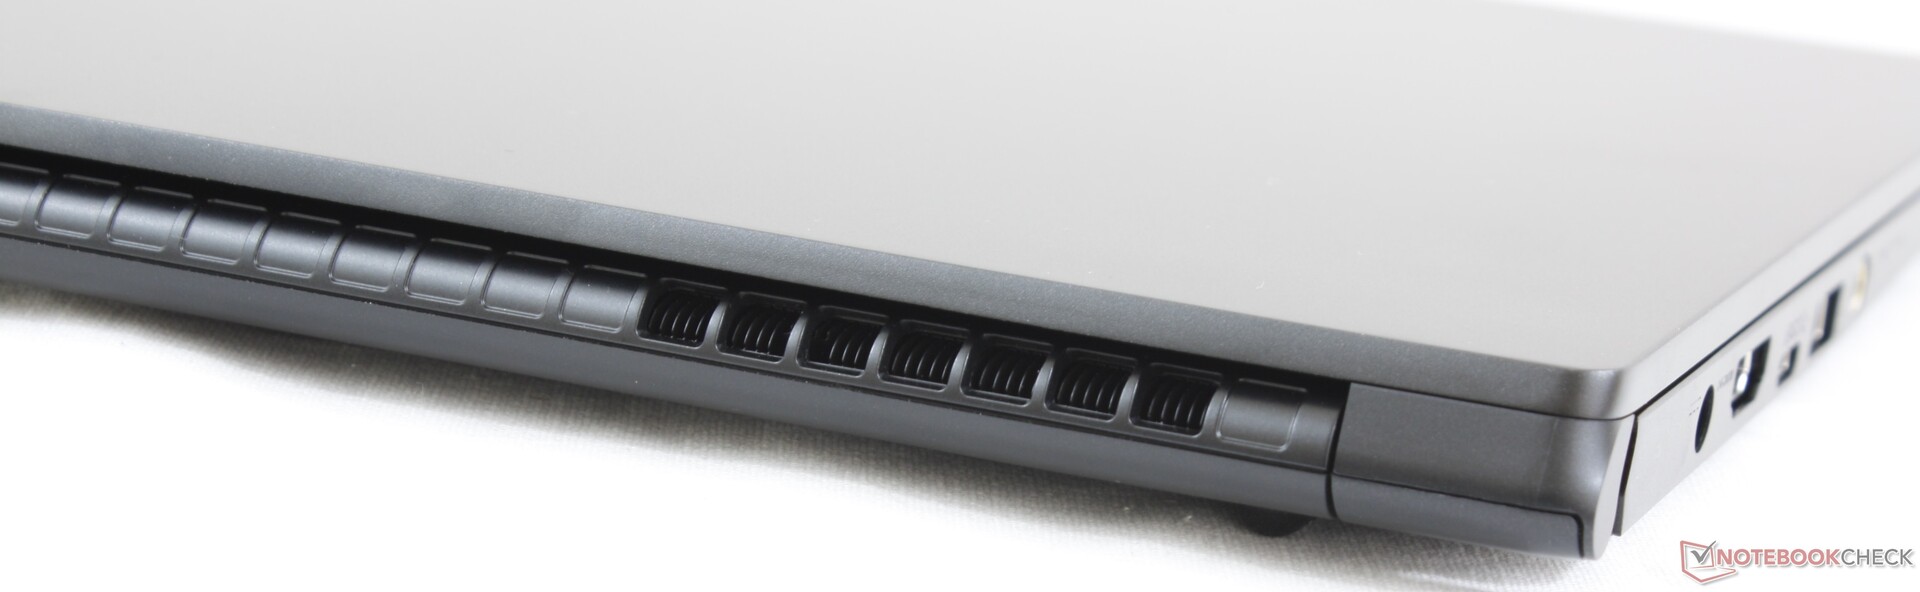
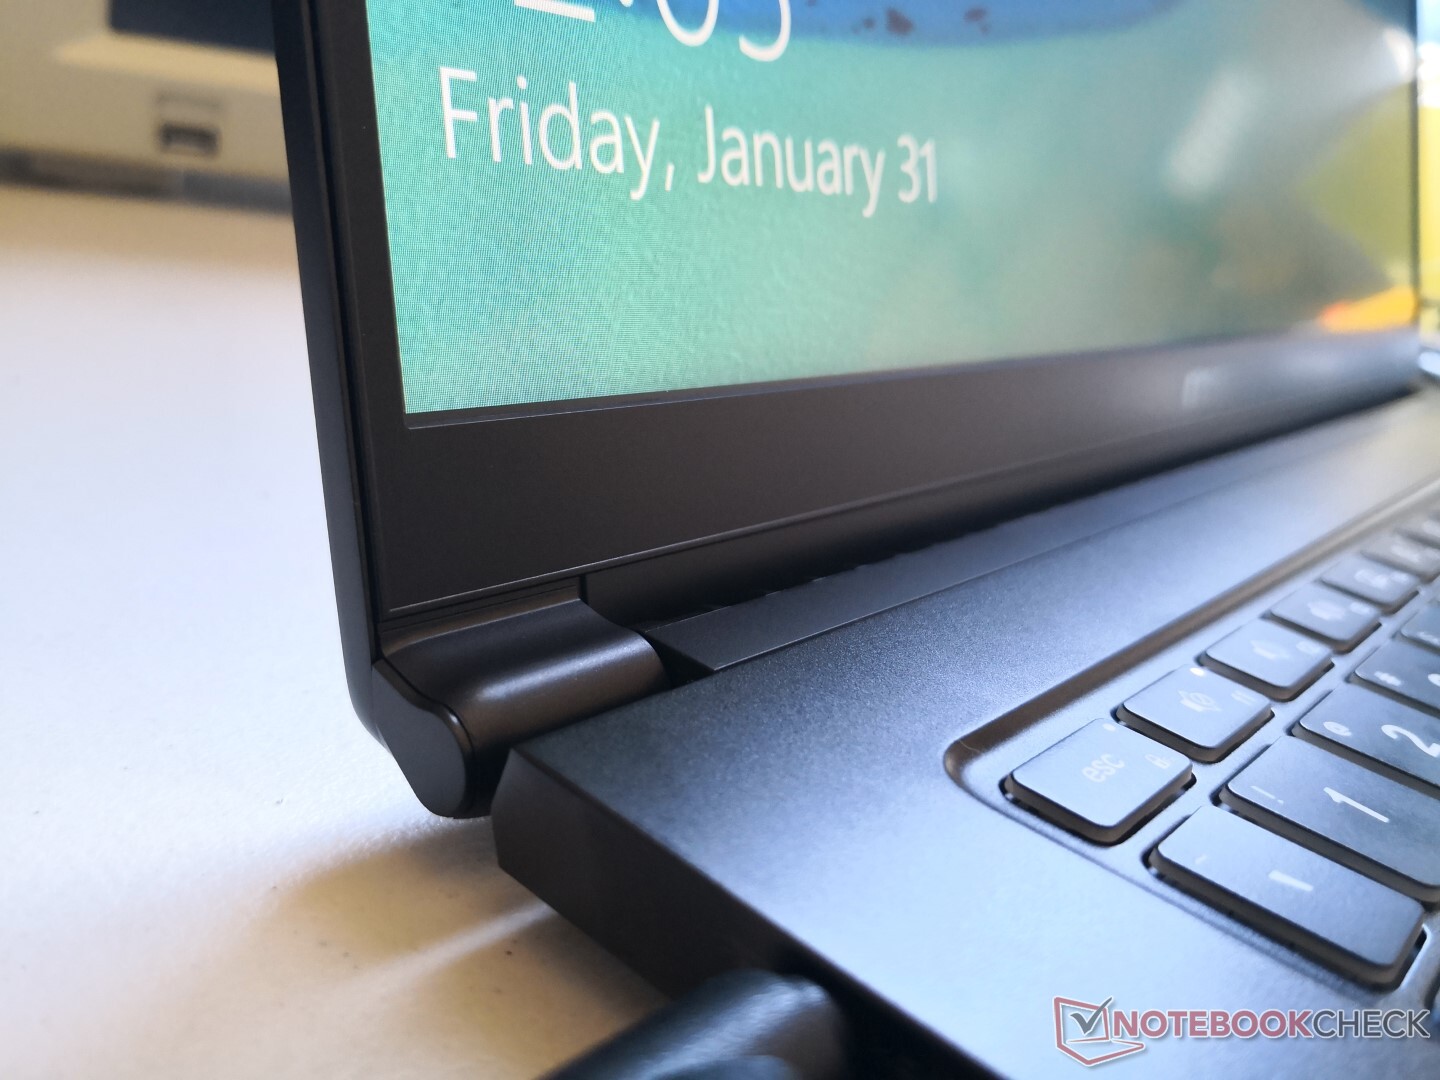
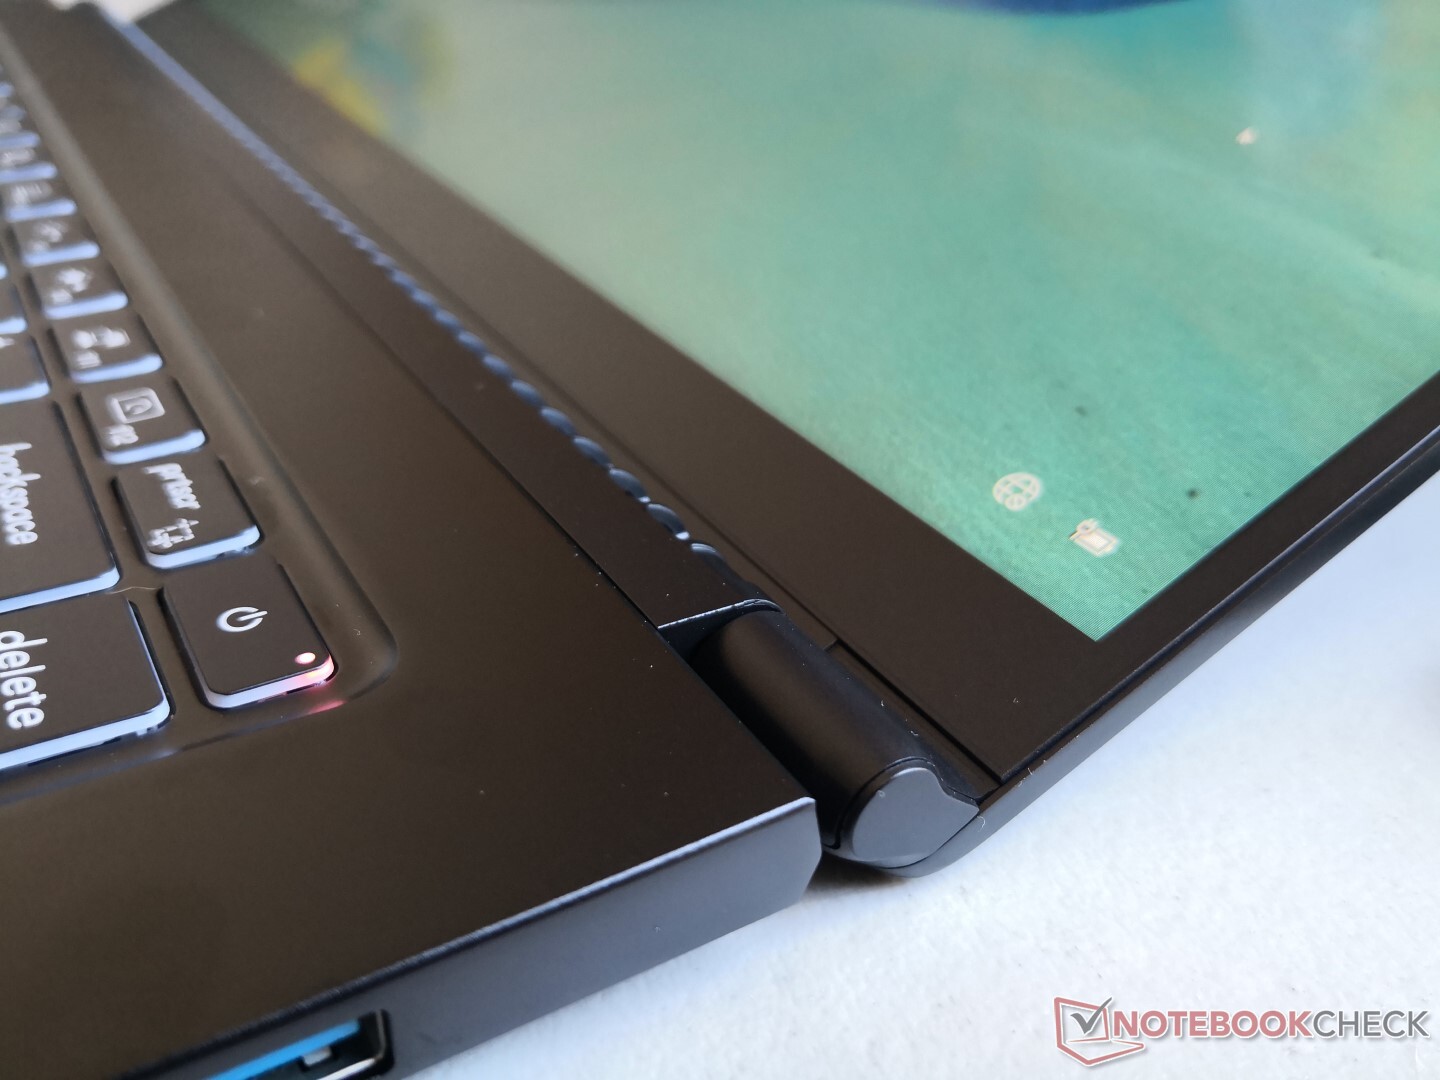
The Modern 15 shares the same matte aluminum alloy materials as the Modern 14 for the same smooth texture and impression. Nonetheless, there are several physical differences. The Power button, webcam placement, ventilation grilles, and ports are all different between the Modern 14 and Modern 15 even though they may look similar at first glance.
In terms of chassis rigidity, the MSI is not as as tough as competitors like the Dell XPS 15, HP Spectre x360 15, Asus ZenBook 15, Lenovo ThinkPad X1 Carbon, or most Dell Latitude laptops. The lid of the Modern 15 is more susceptible to flexing and pushing down on the center of the keyboard flexes the surface more so than on any of the aforementioned alternatives. It's not weak or fragile by any means, but the difference is noticeable.
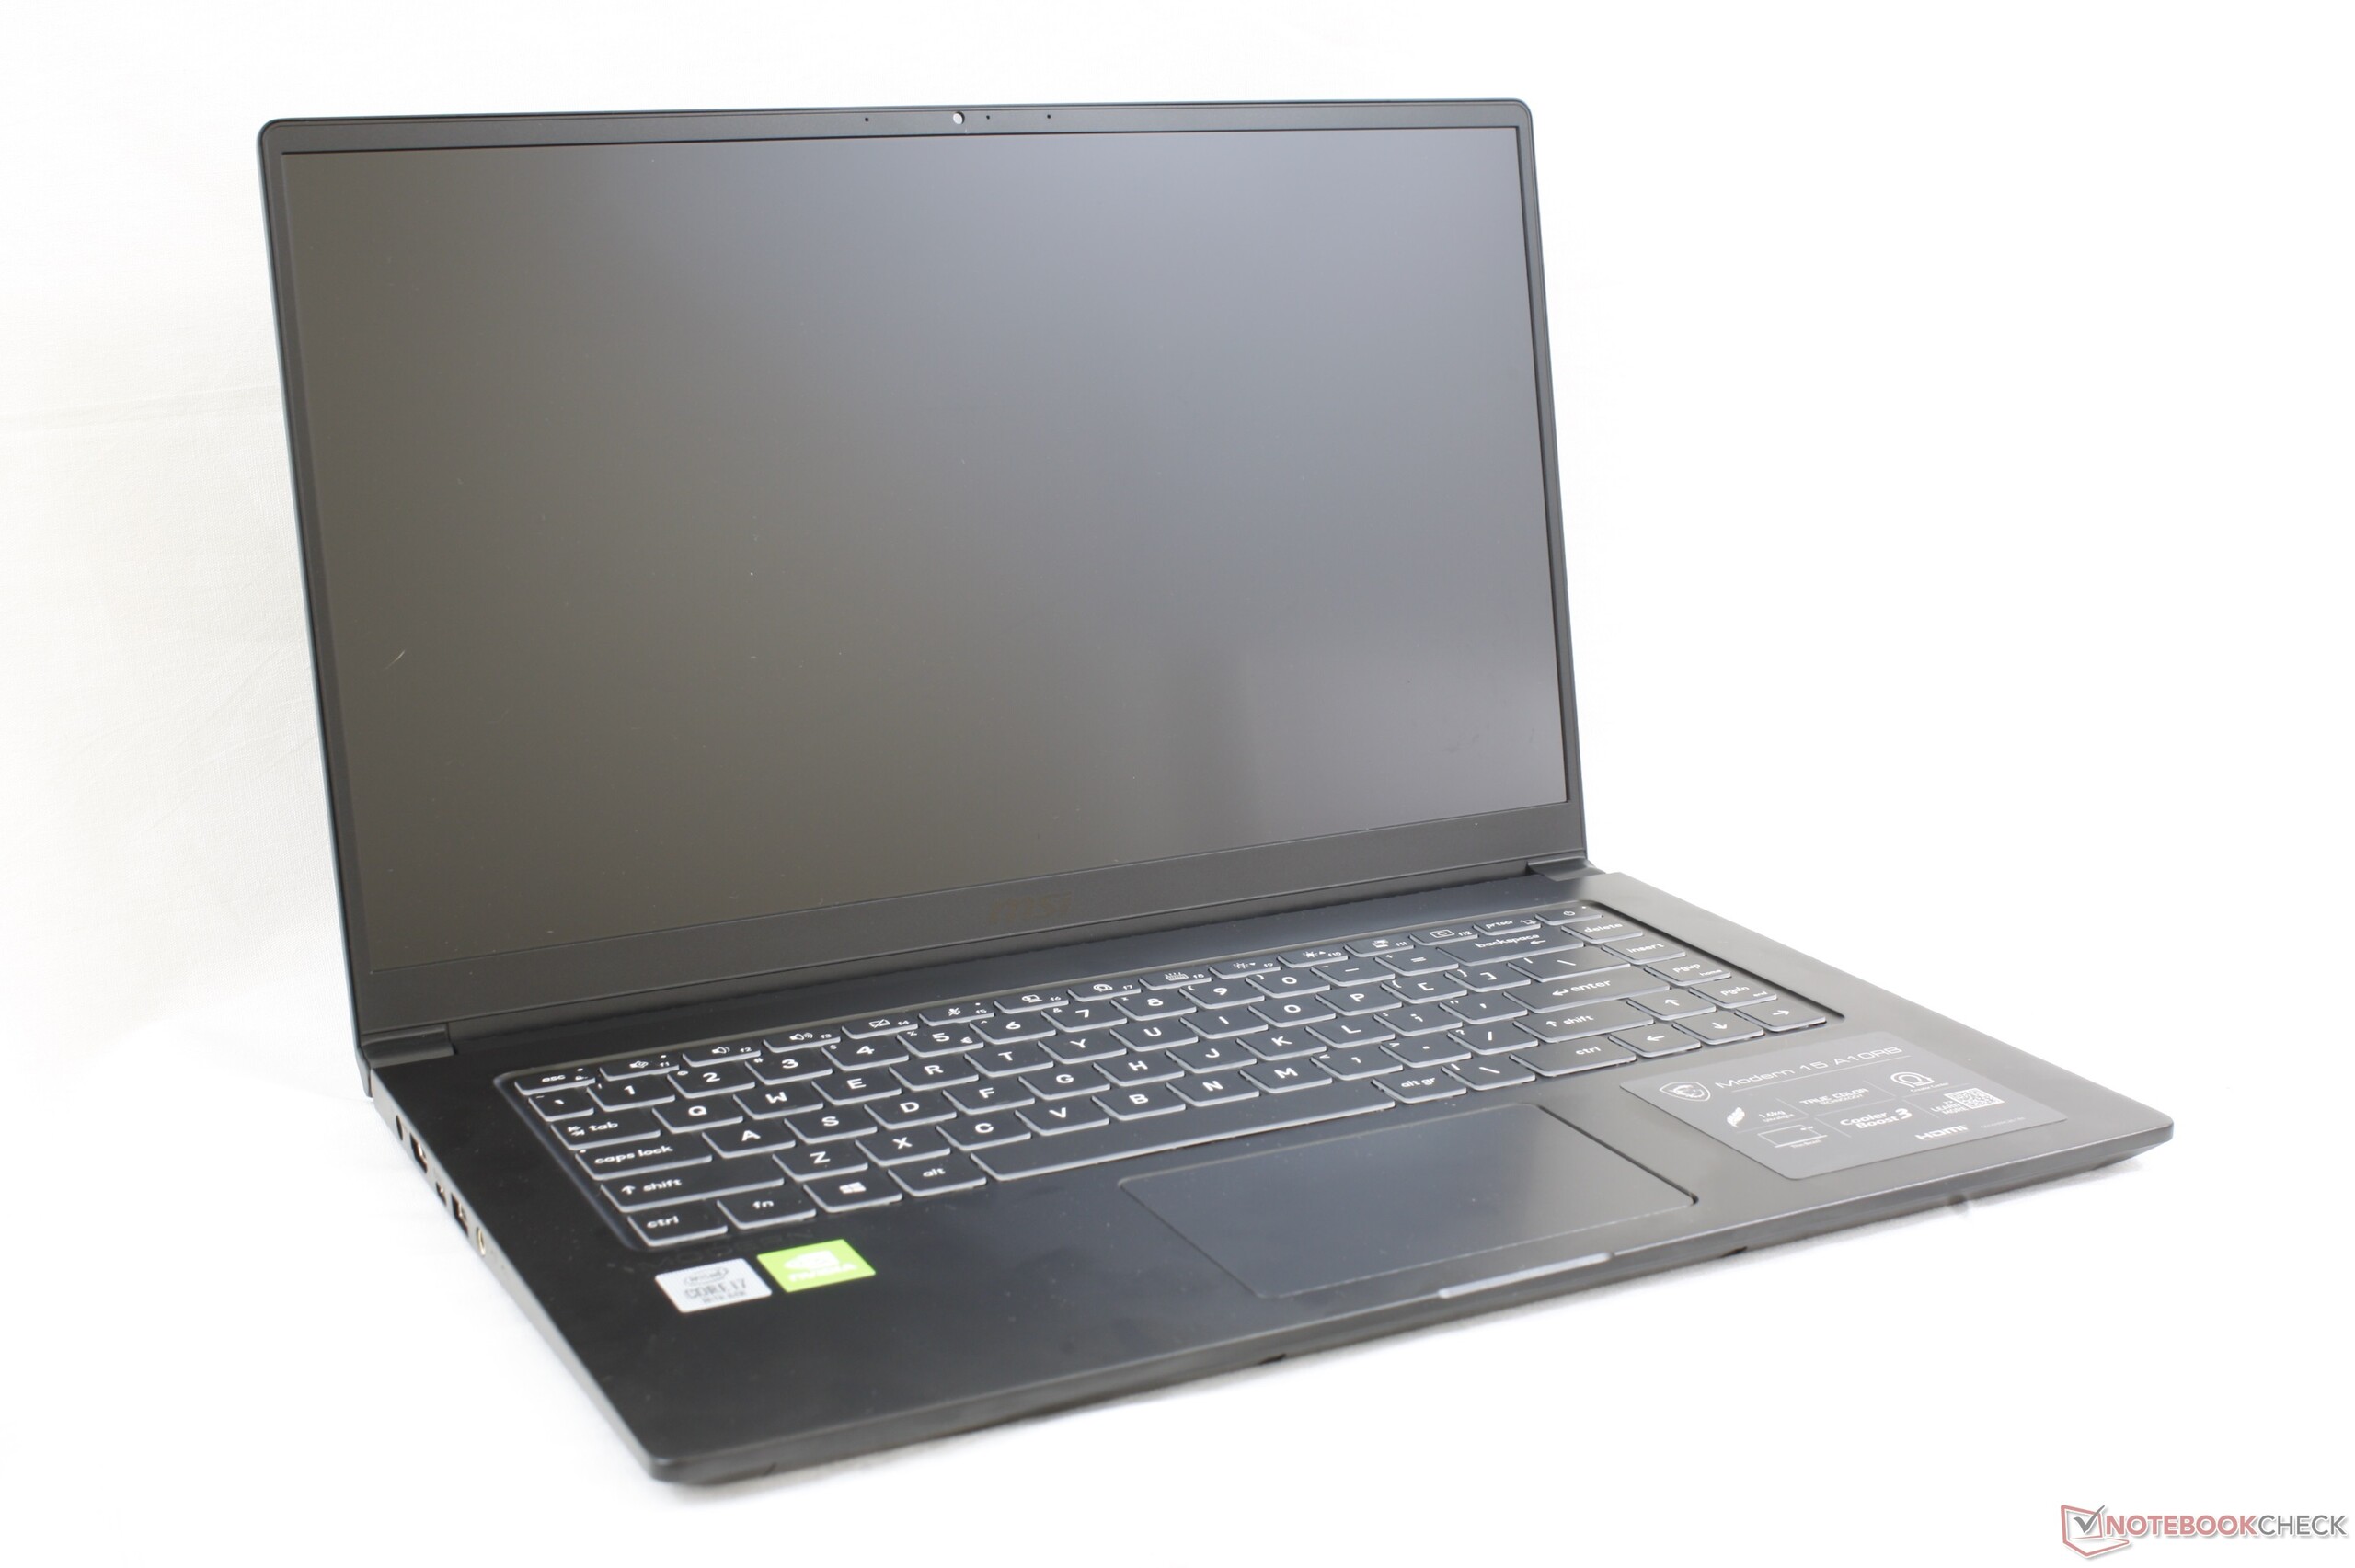
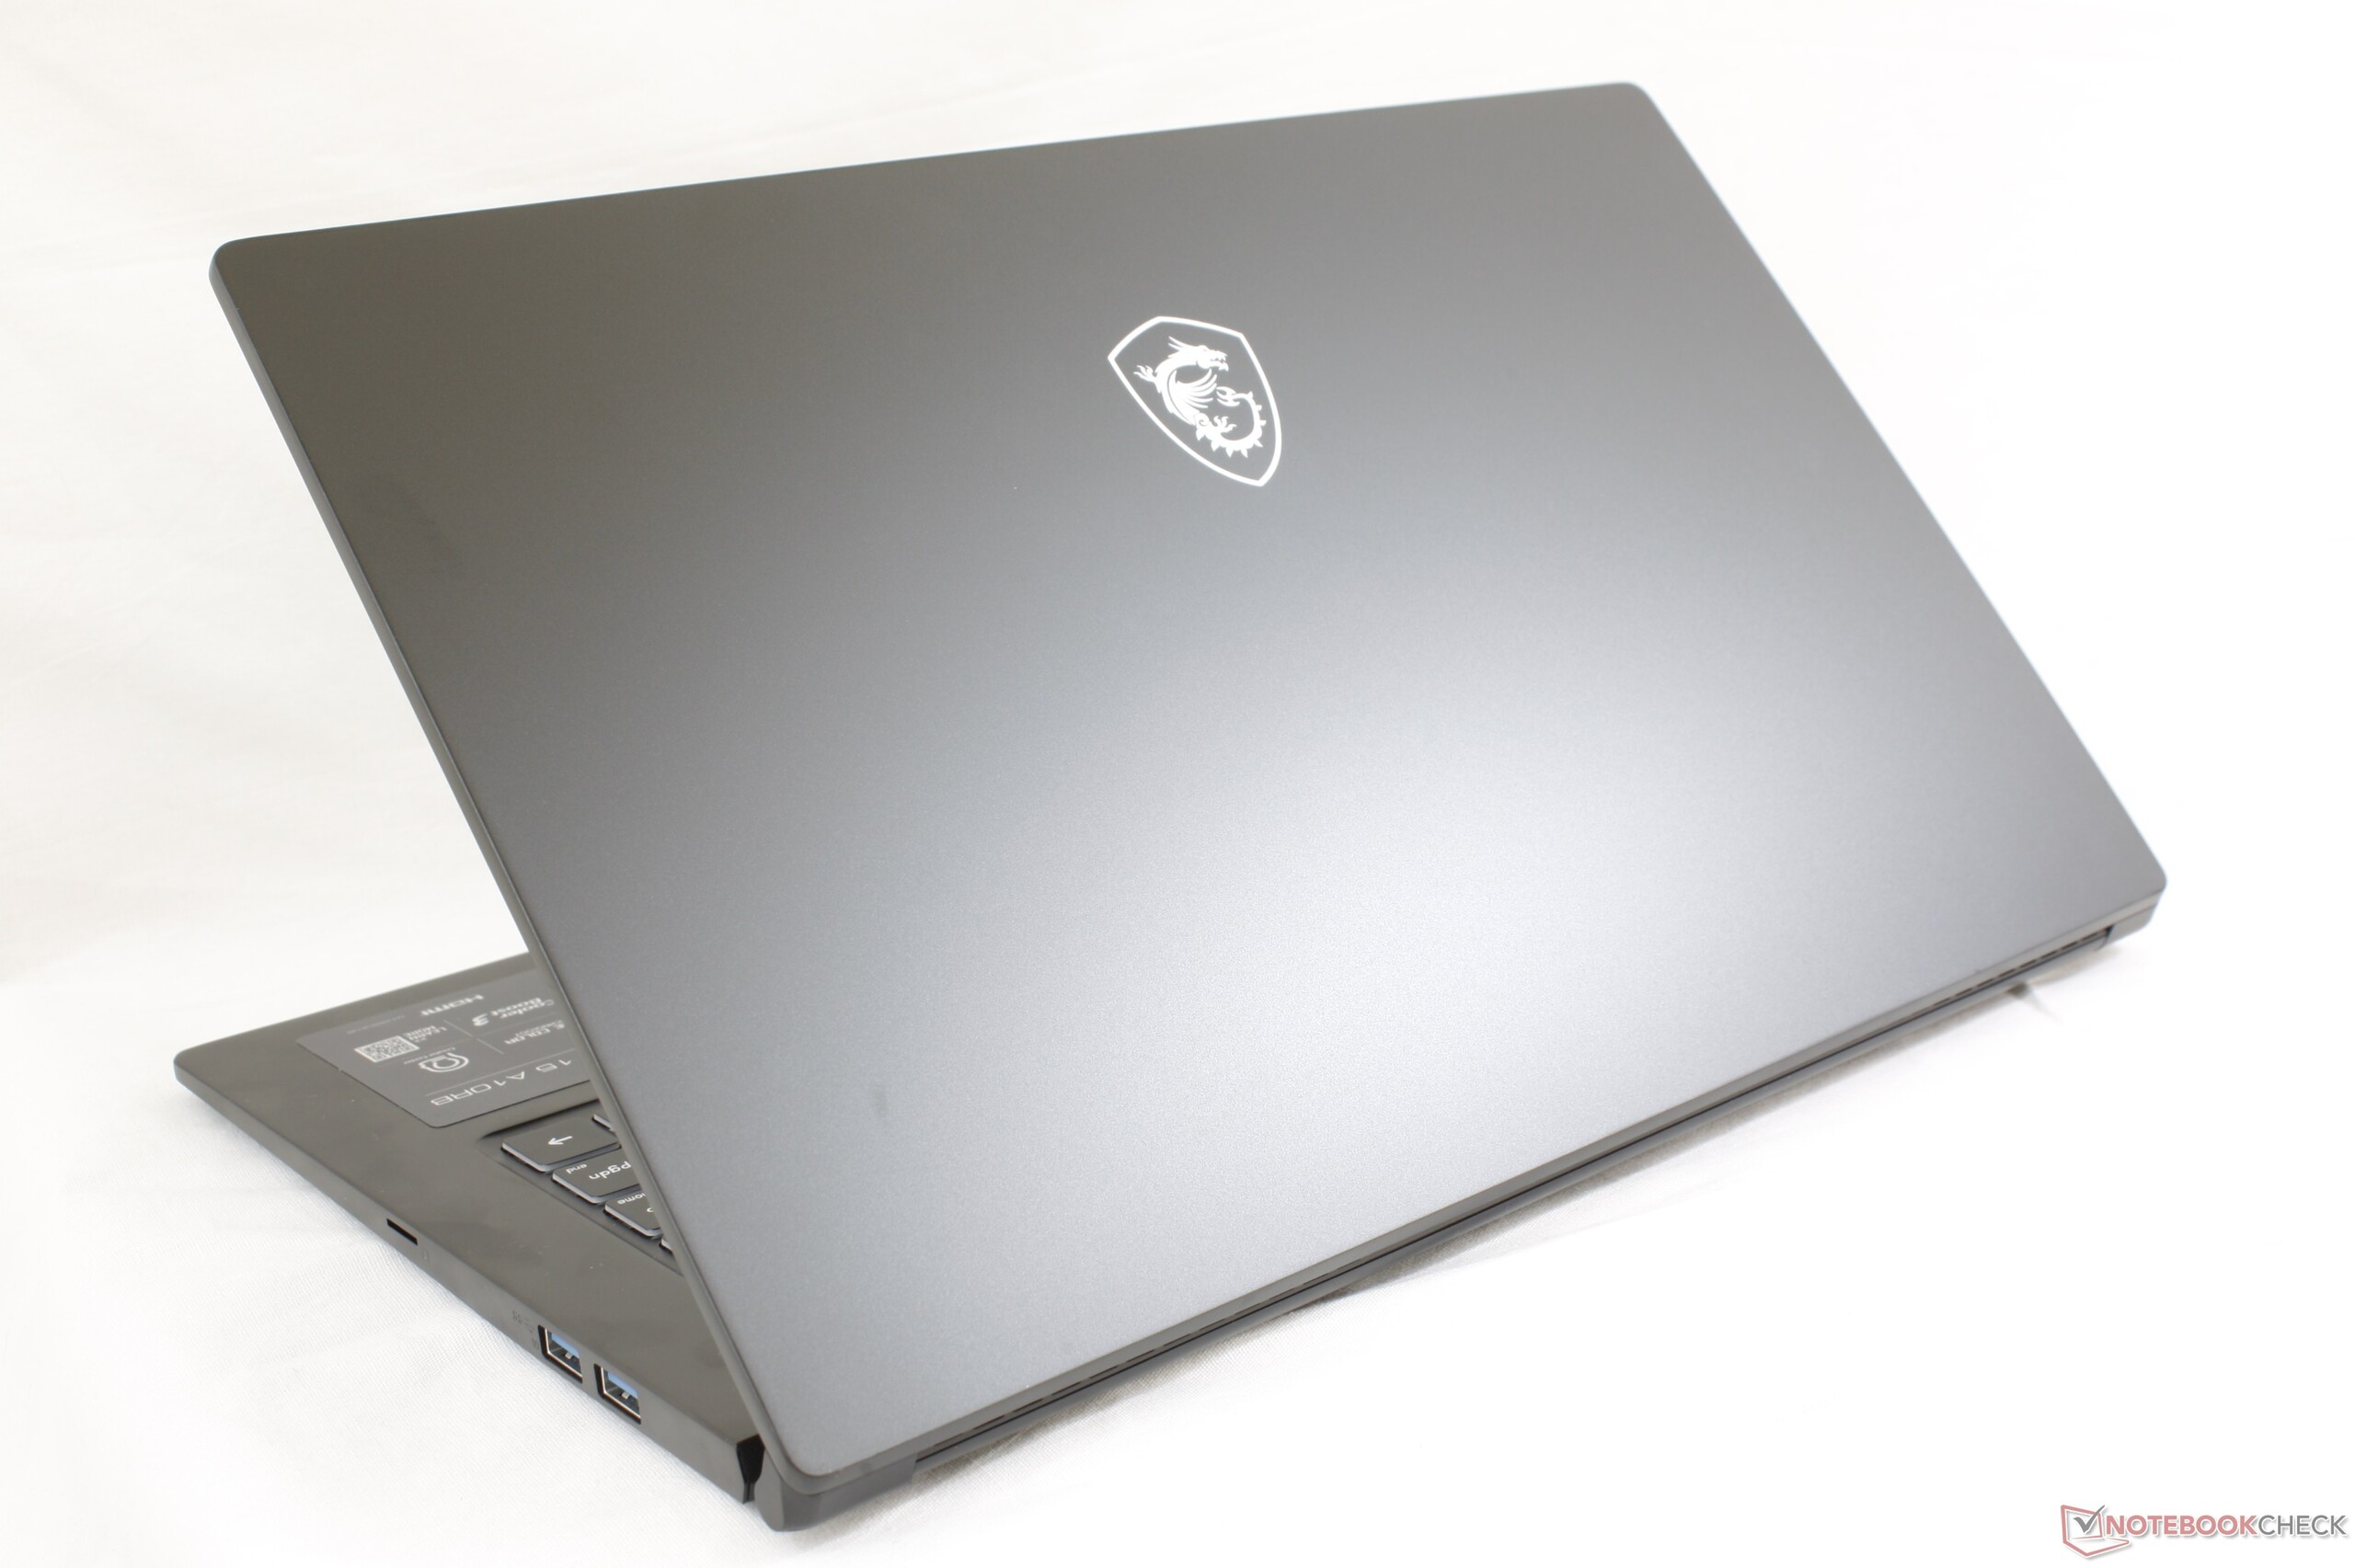
Dimensions are nearly the same as the Dell XPS 15 7590 albeit much lighter by about 300 g. In short, you'll be sacrificing chassis rigidity for a lighter laptop by going with the MSI Modern 15. This is one of the lightest 15.6-inch laptops available with dedicated GeForce graphics options.
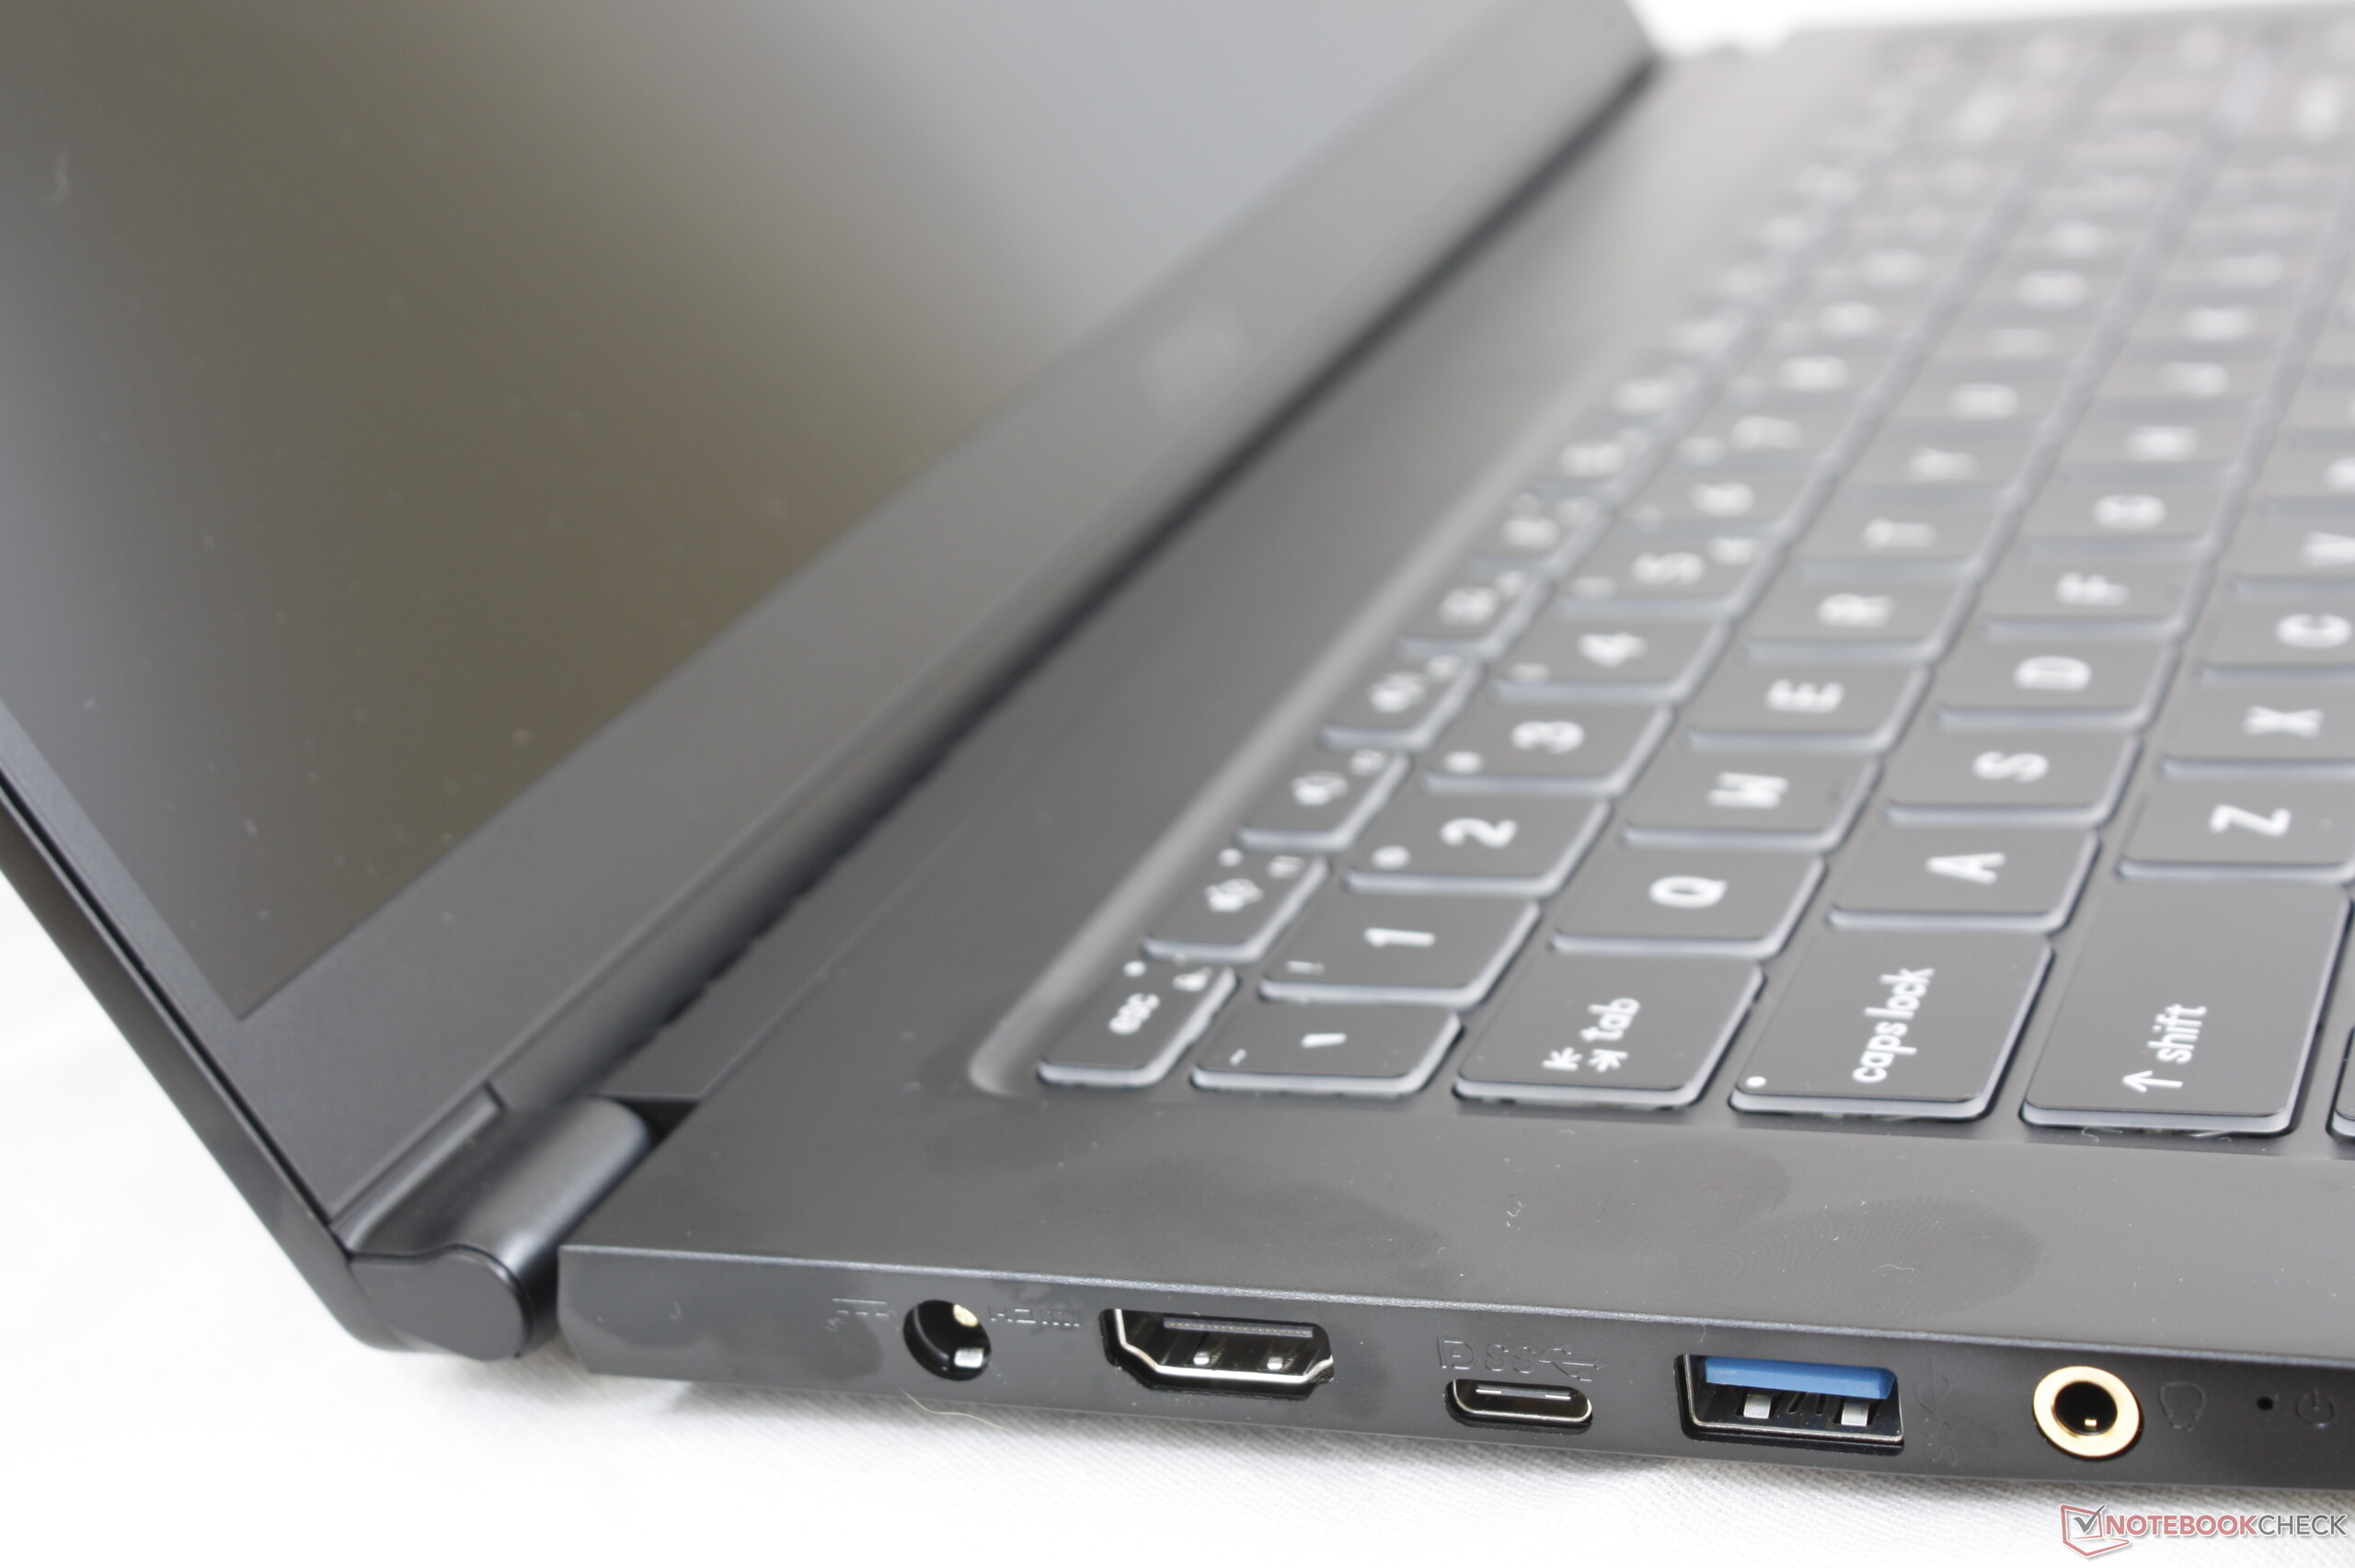
Connectivity
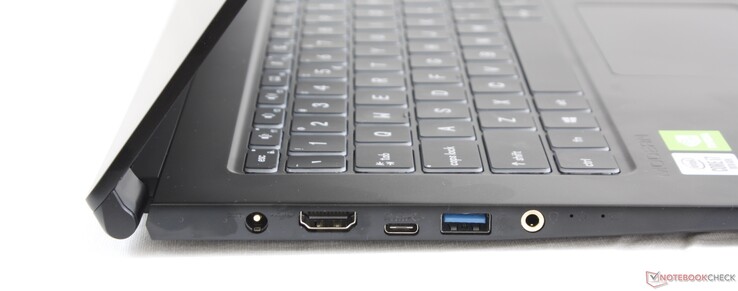
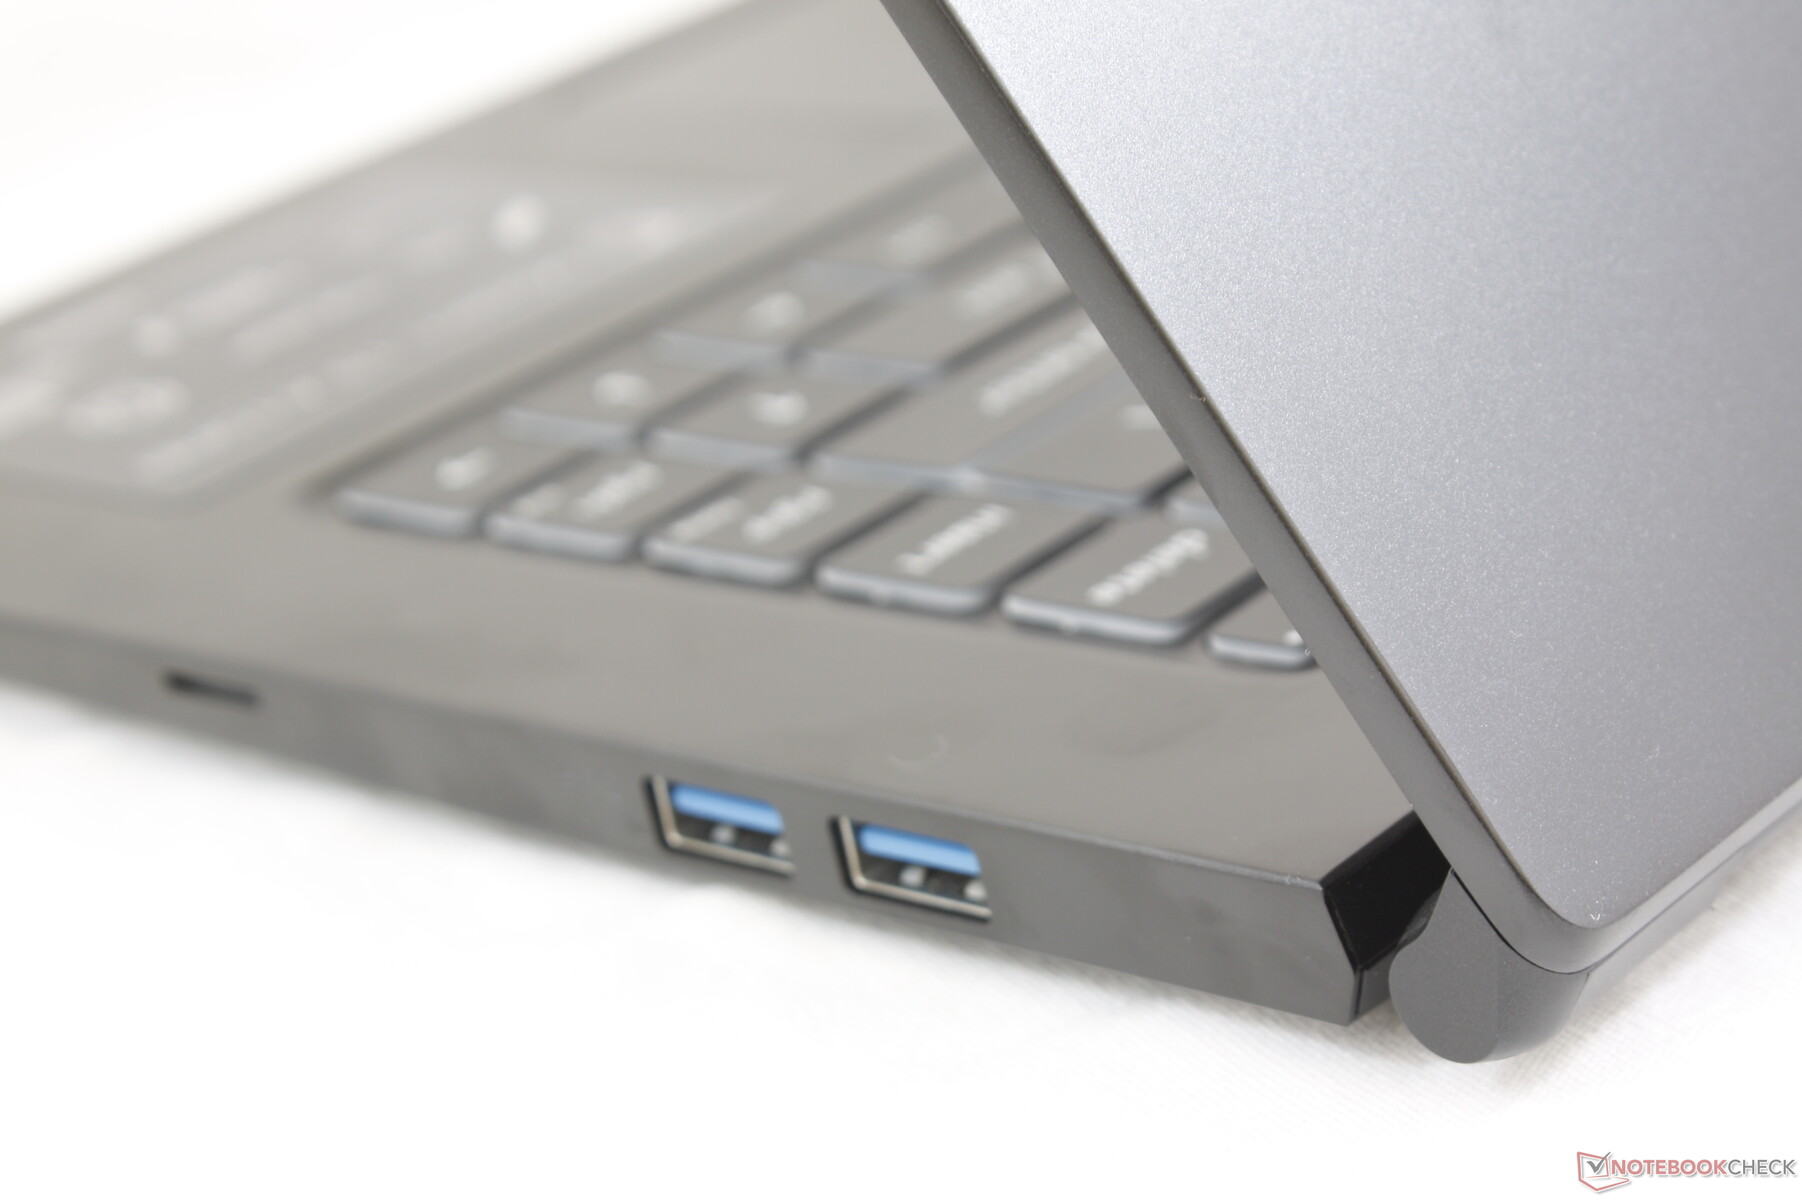
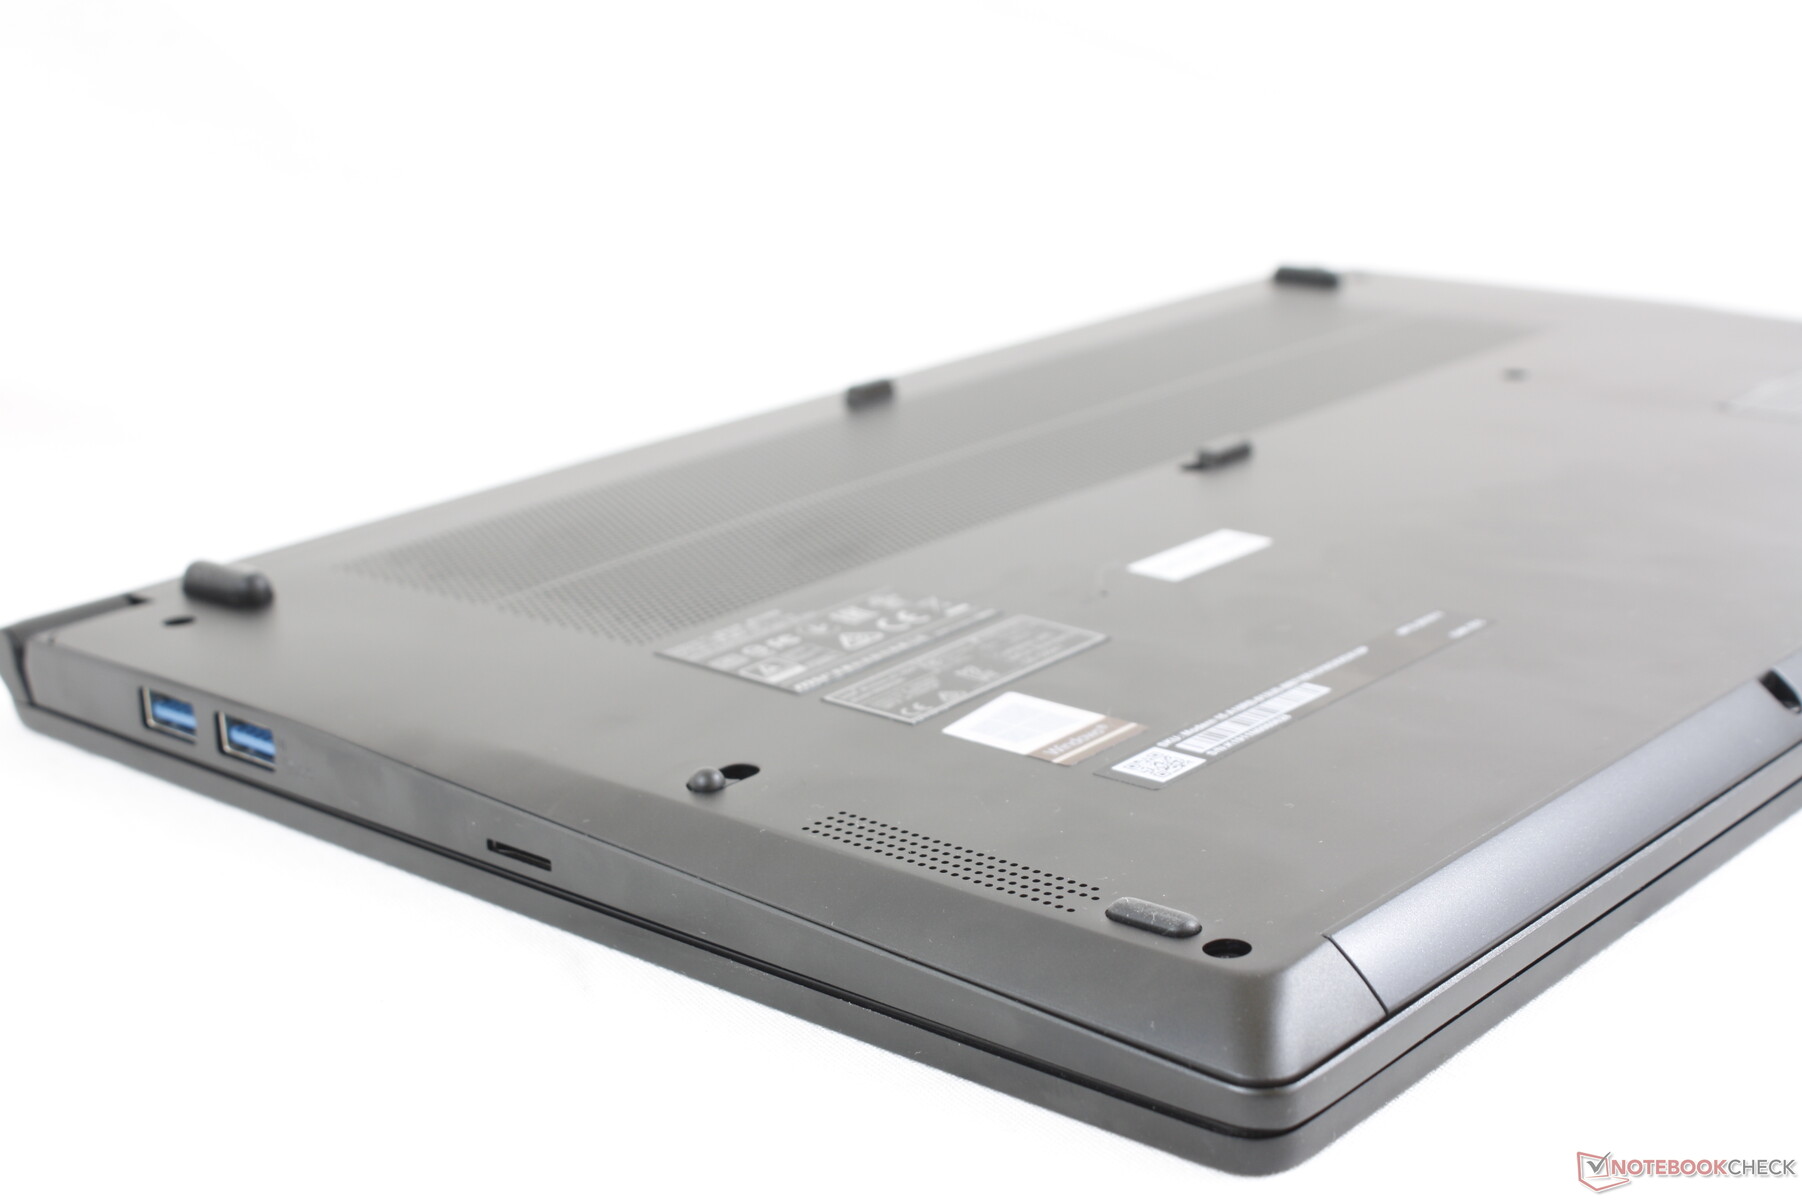
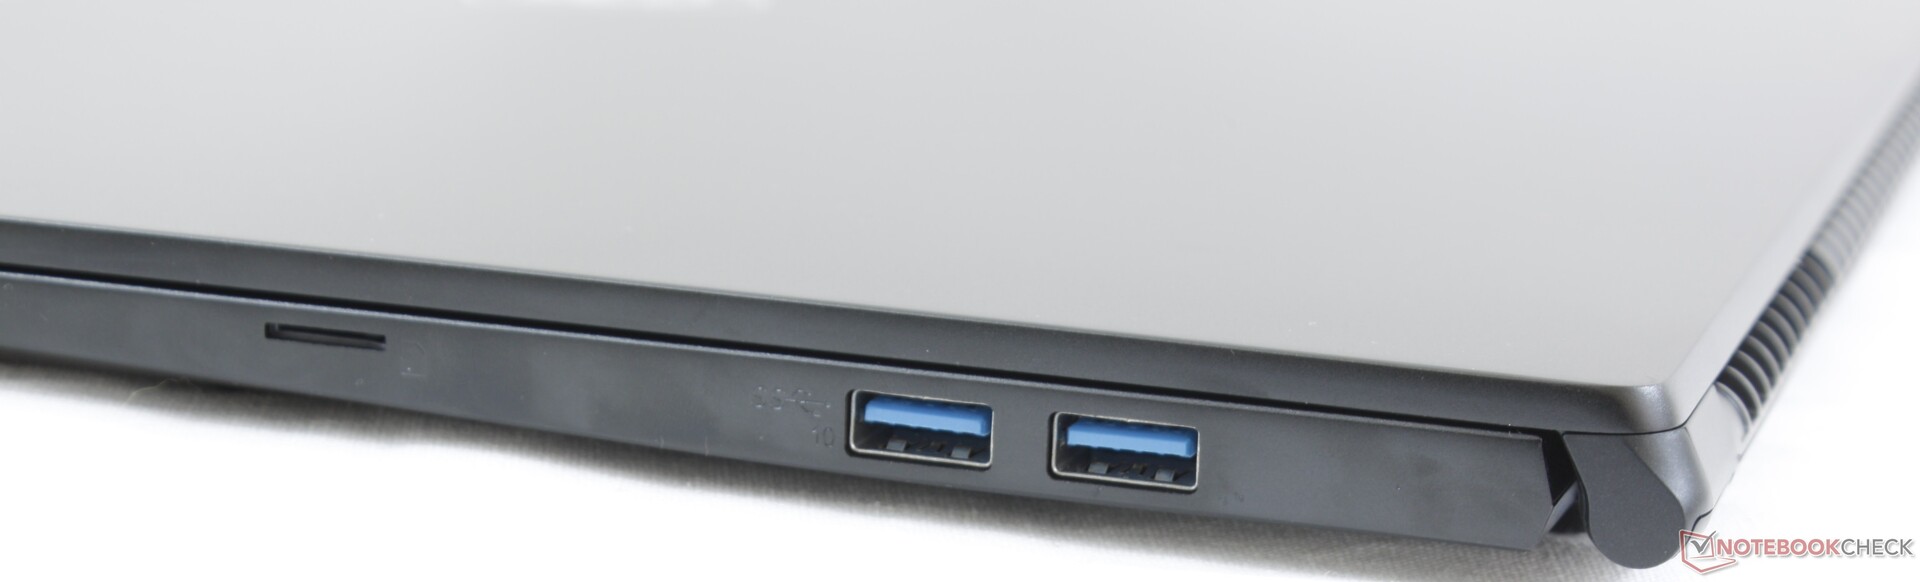
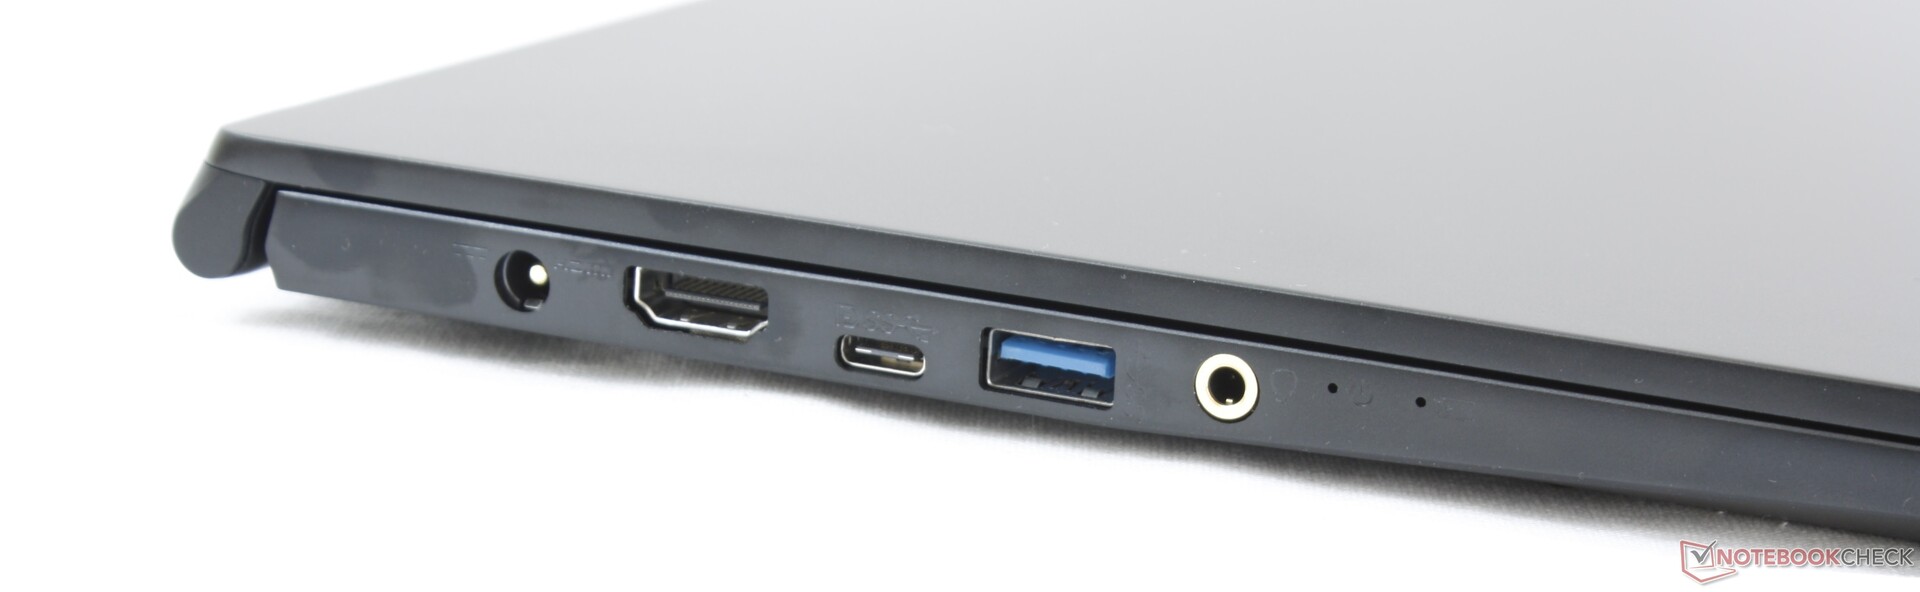
Port options are different from the Modern 14 and not necessarily better despite the fact that the Modern 15 is larger. The Modern 14, for example, comes with two USB Type-C ports and a full-size SD card reader whereas the Modern 15 has just one USB Type-C port and a MicroSD reader. In return, the Modern 15 has one additional USB Type-A port for a total of three.
Port positioning is not as tightly packed as on the smaller Modern 14. The omission of a Kensington Lock is strange considering the target audience.
SD Card Reader
Transfer rates from the spring-loaded MicroSD card reader are slow and not unlike on the smaller Modern 14. Moving 1 GB of pictures from our UHS-II test card to desktop takes about 38 seconds compared to less than 7 seconds on the Prestige 15.
| SD Card Reader | |
| average JPG Copy Test (av. of 3 runs) | |
| Dell XPS 15 7590 i5 iGPU FHD (Toshiba Exceria Pro SDXC 64 GB UHS-II) | |
| MSI Prestige 15 A10SC (Toshiba Exceria Pro M501 UHS-II) | |
| Lenovo ThinkPad T590-20N4002VGE (Toshiba Exceria Pro M501 UHS-II) | |
| Asus ZenBook 15 UX534FT-DB77 (Toshiba Exceria Pro SDXC 64 GB UHS-II) | |
| MSI Modern 15 A10RB (Toshiba Exceria Pro M501 UHS-II) | |
| maximum AS SSD Seq Read Test (1GB) | |
| MSI Prestige 15 A10SC (Toshiba Exceria Pro M501 UHS-II) | |
| Dell XPS 15 7590 i5 iGPU FHD (Toshiba Exceria Pro SDXC 64 GB UHS-II) | |
| Lenovo ThinkPad T590-20N4002VGE (Toshiba Exceria Pro M501 UHS-II) | |
| Asus ZenBook 15 UX534FT-DB77 (Toshiba Exceria Pro SDXC 64 GB UHS-II) | |
| MSI Modern 15 A10RB (Toshiba Exceria Pro M501 UHS-II) | |
Communication
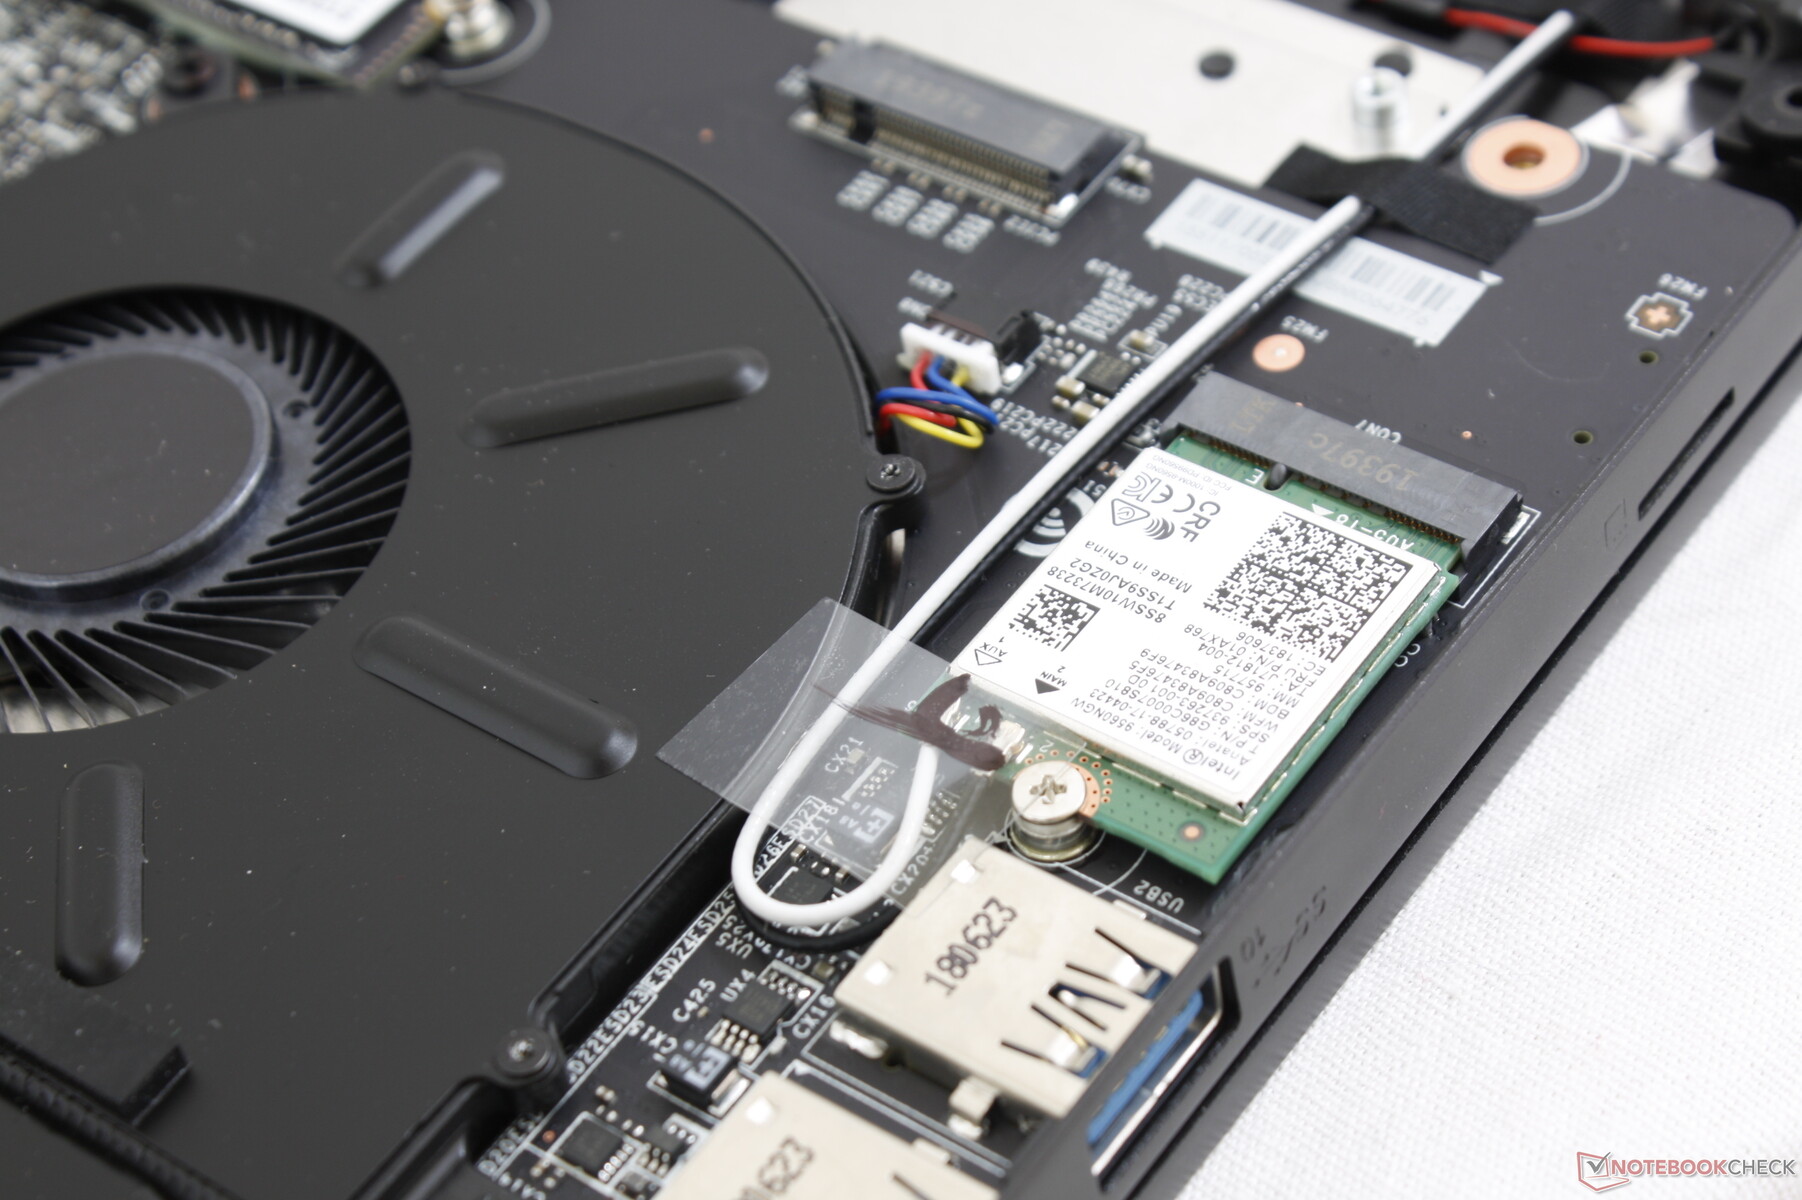
The Intel 9560 comes standard for Wi-Fi 5 or 802.11ac connectivity and integrated Bluetooth 5. We recently upgraded our wireless equipment with the Netgear RAX200 connected to a multi-gig server to more properly test 802.11ac speeds and faster. Transfer rates average about 1200 Mbps when standing one meter away from the router against a theoretical 1.73 Gbps. We didn't experience any notable connectivity issues during our time with the unit.
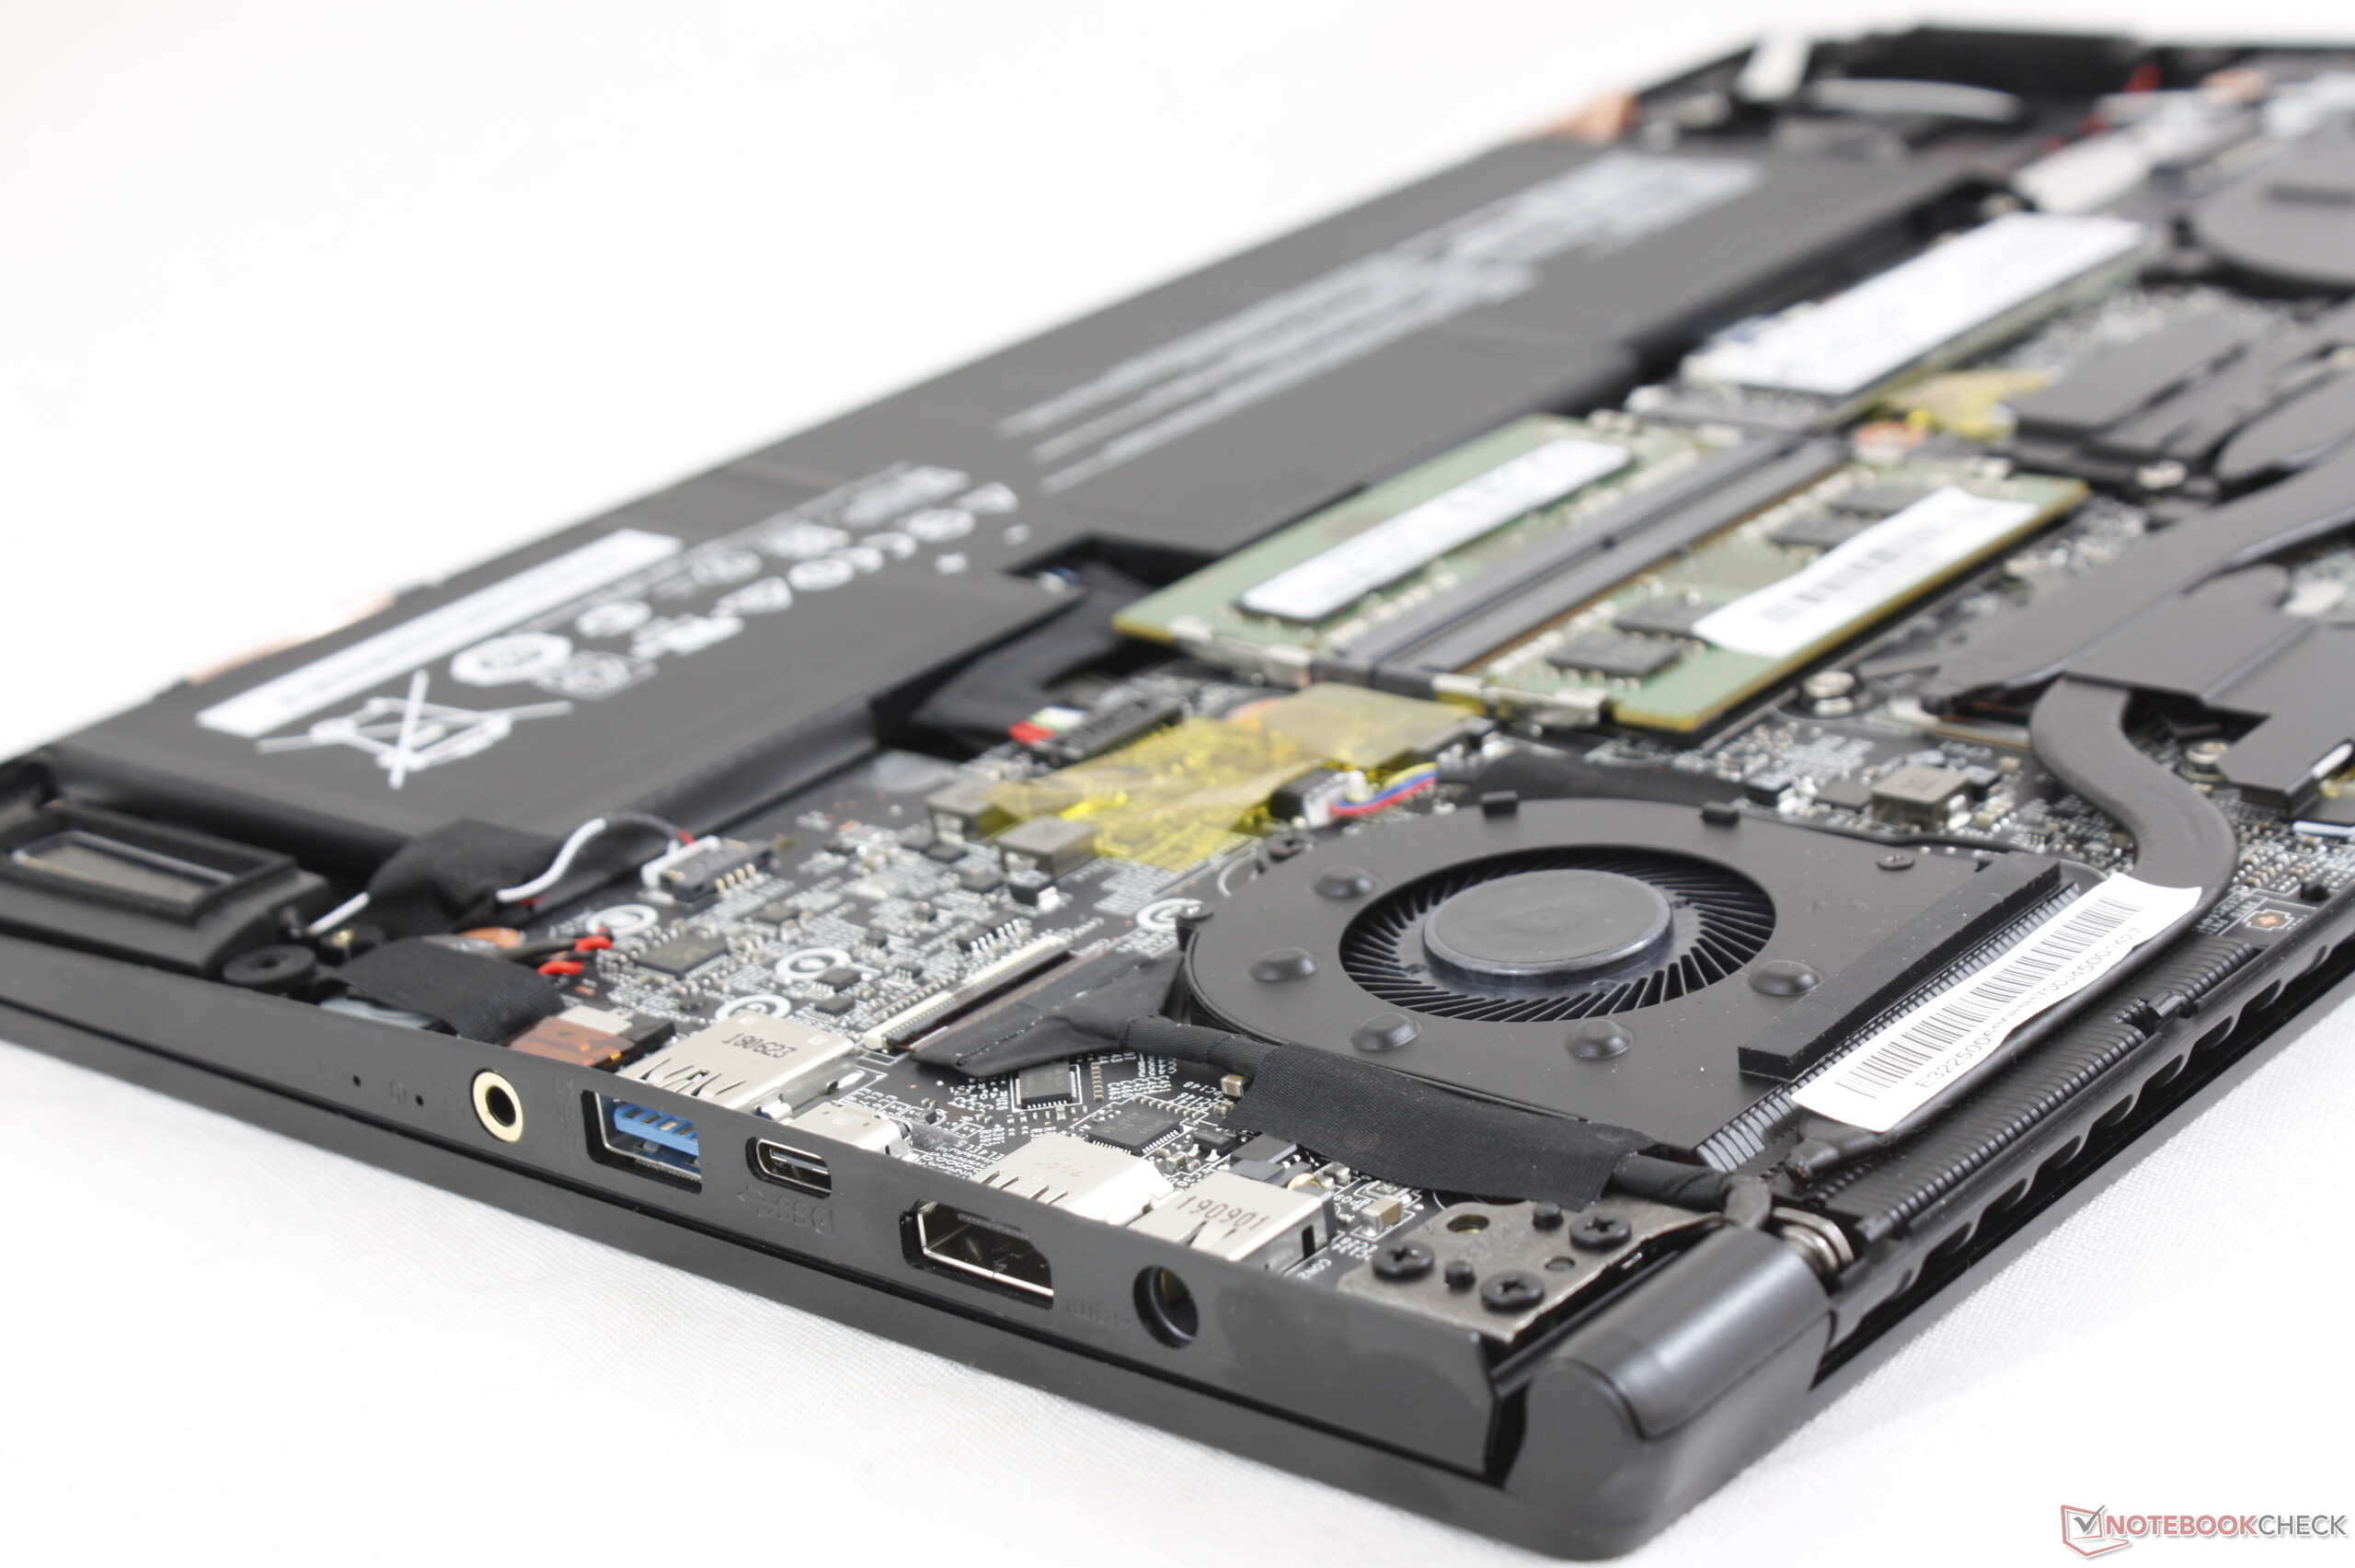
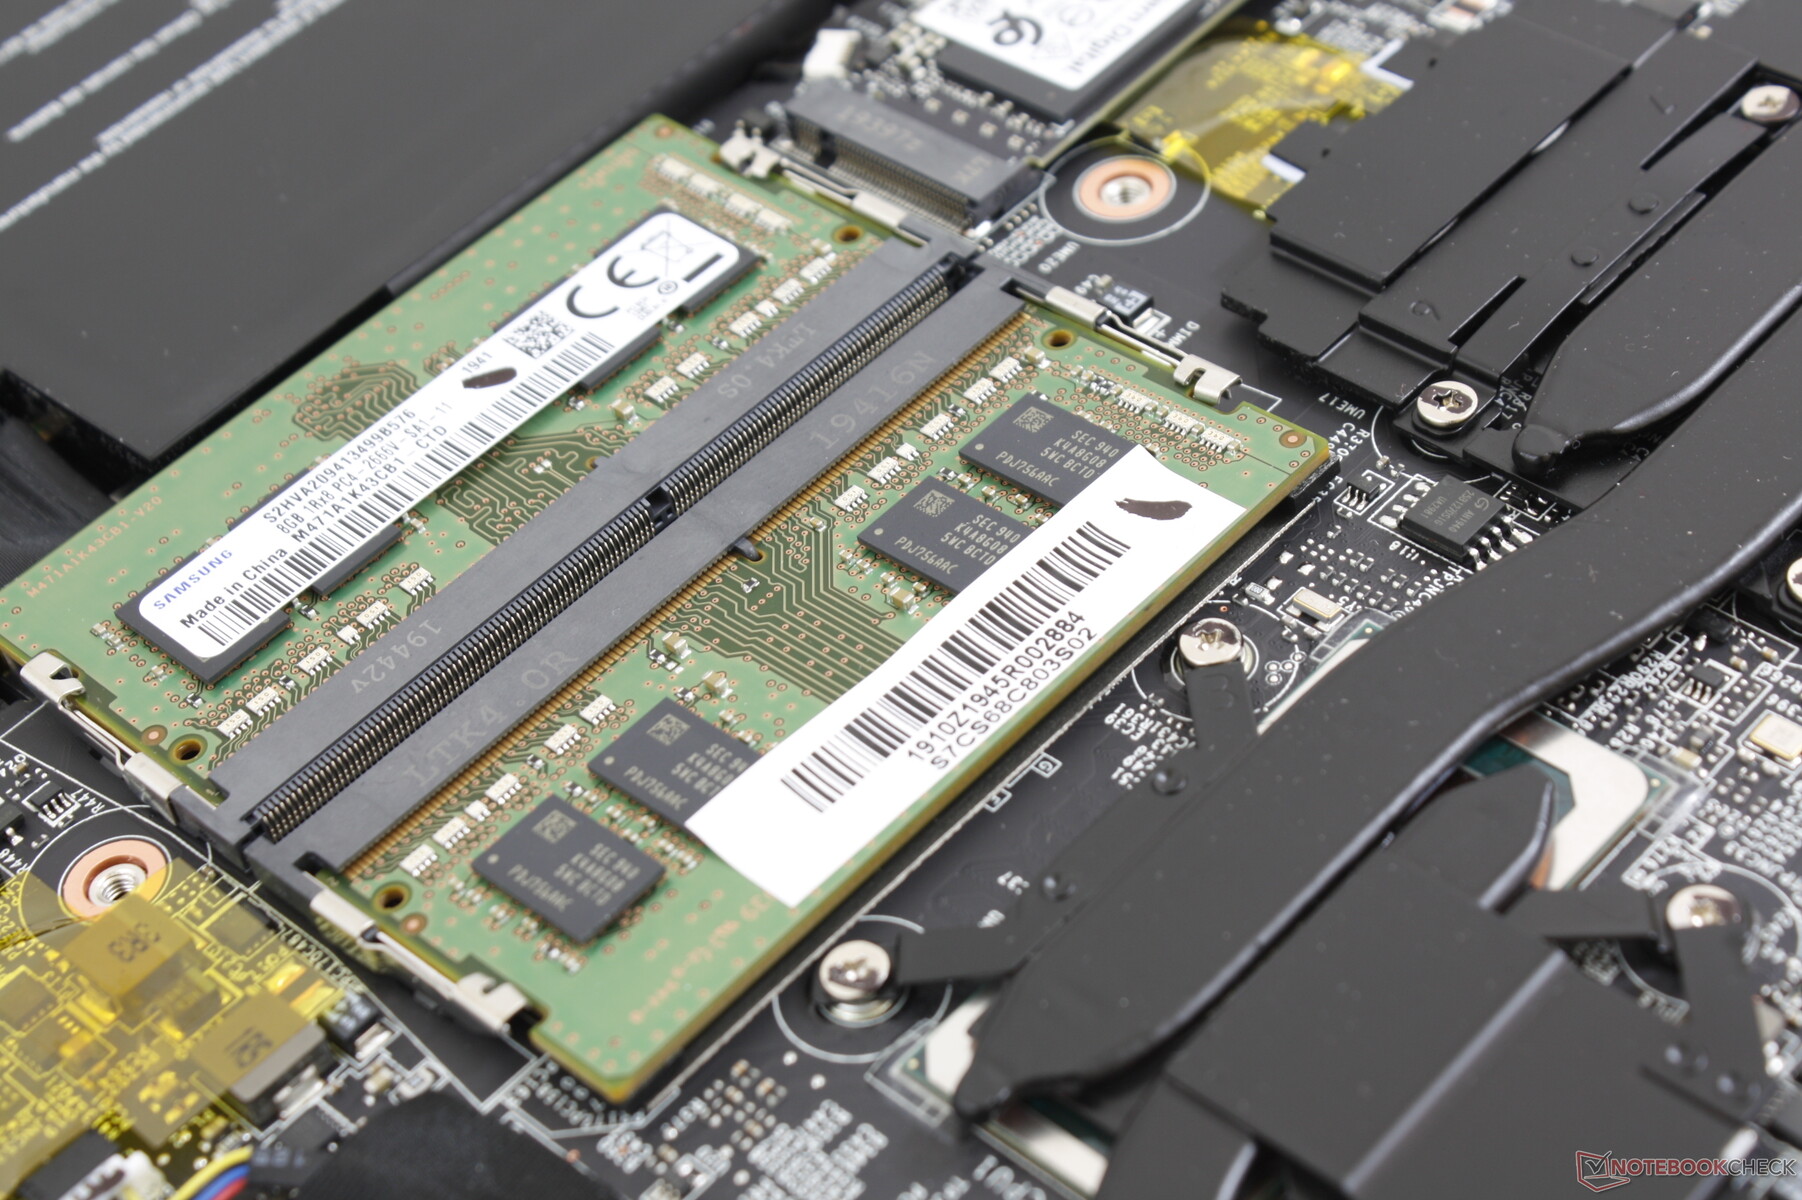
Maintenance
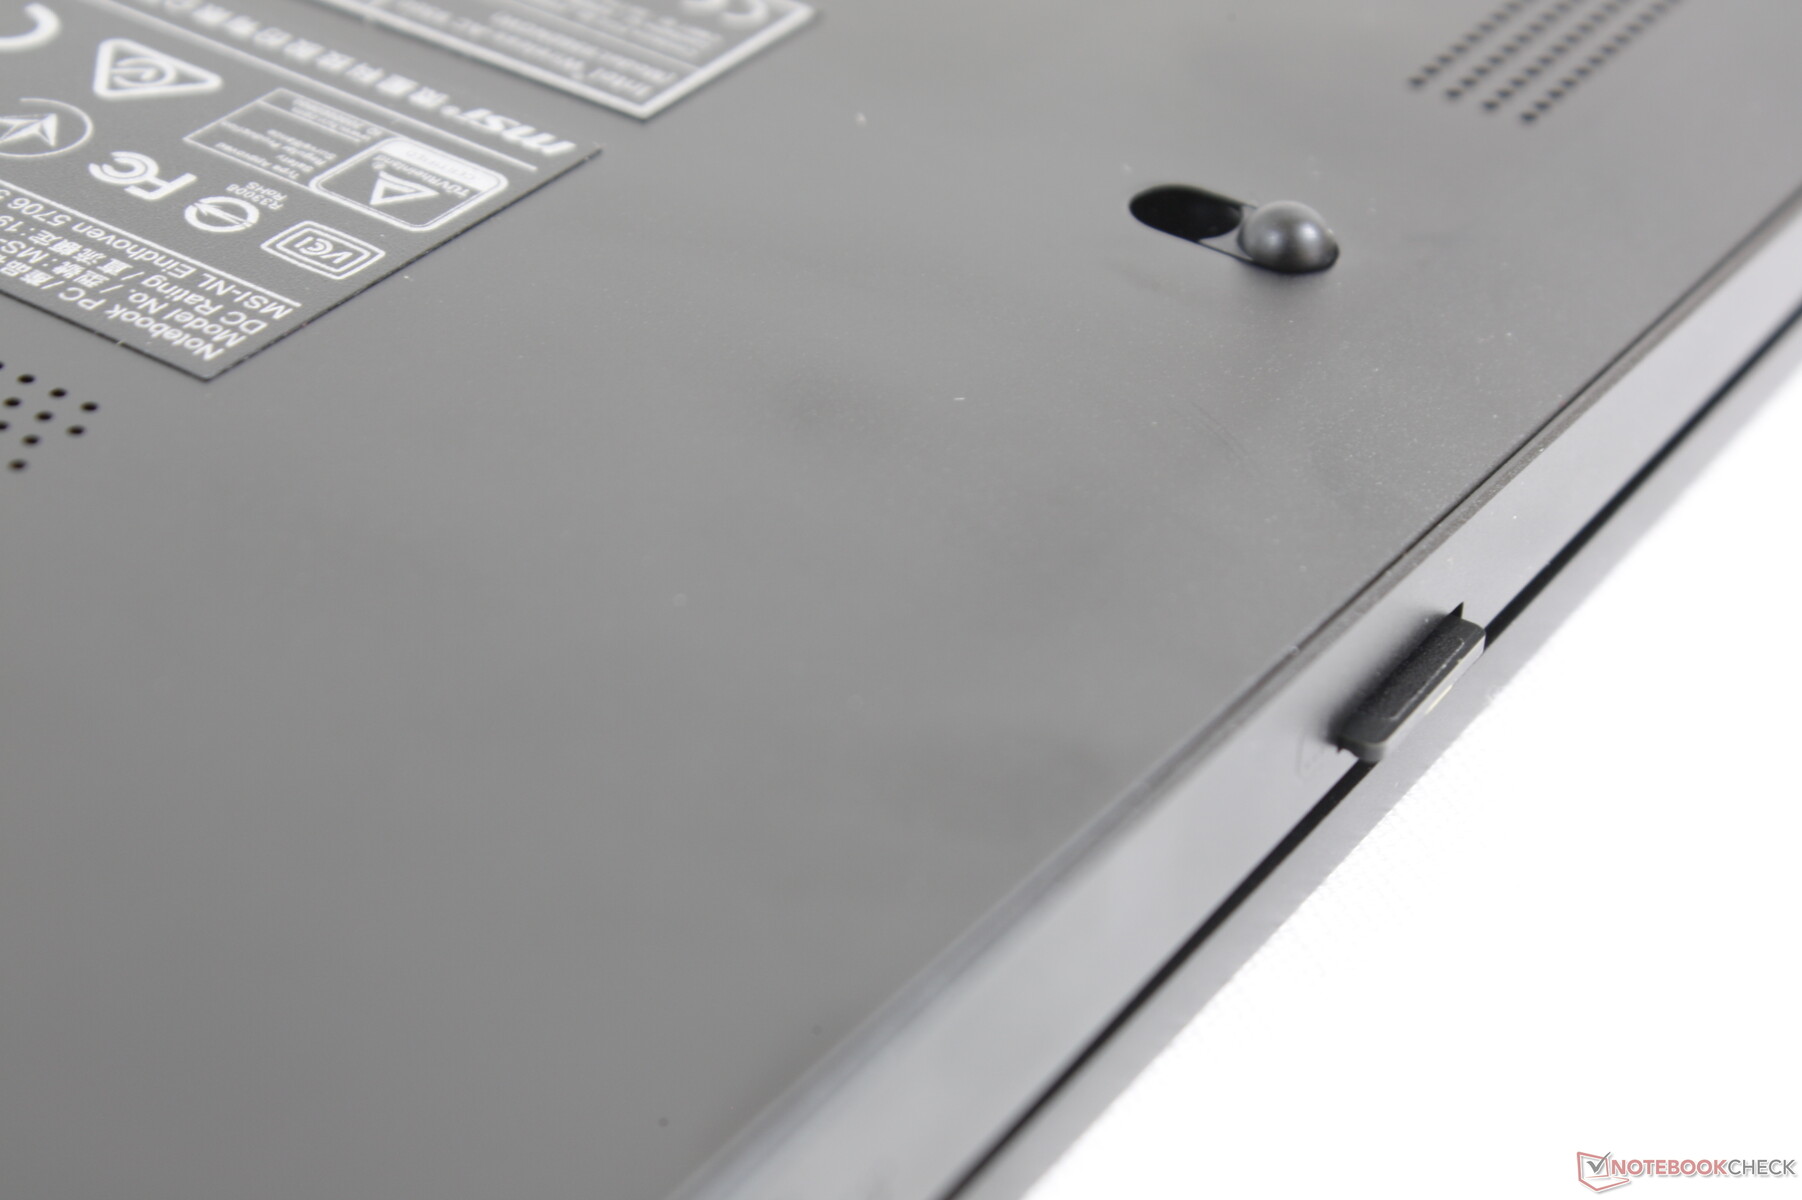
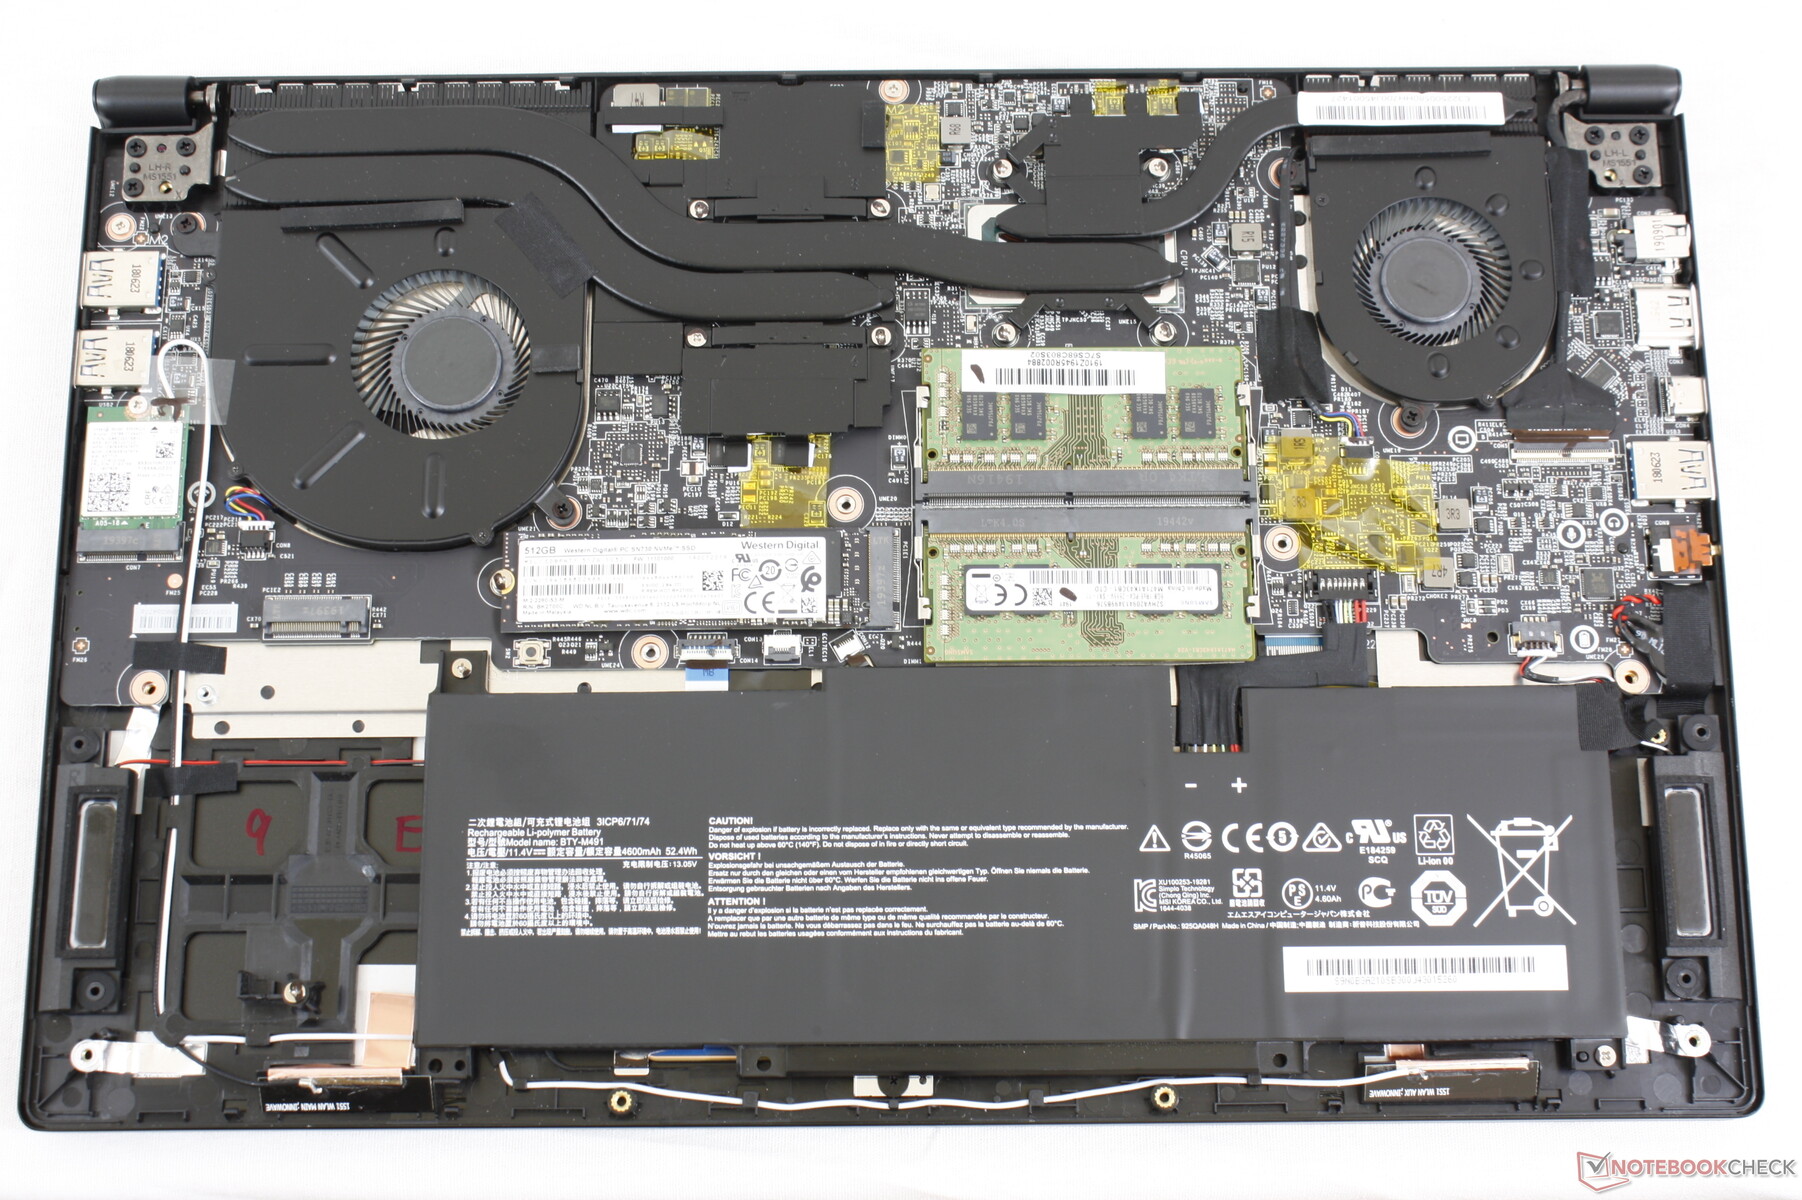
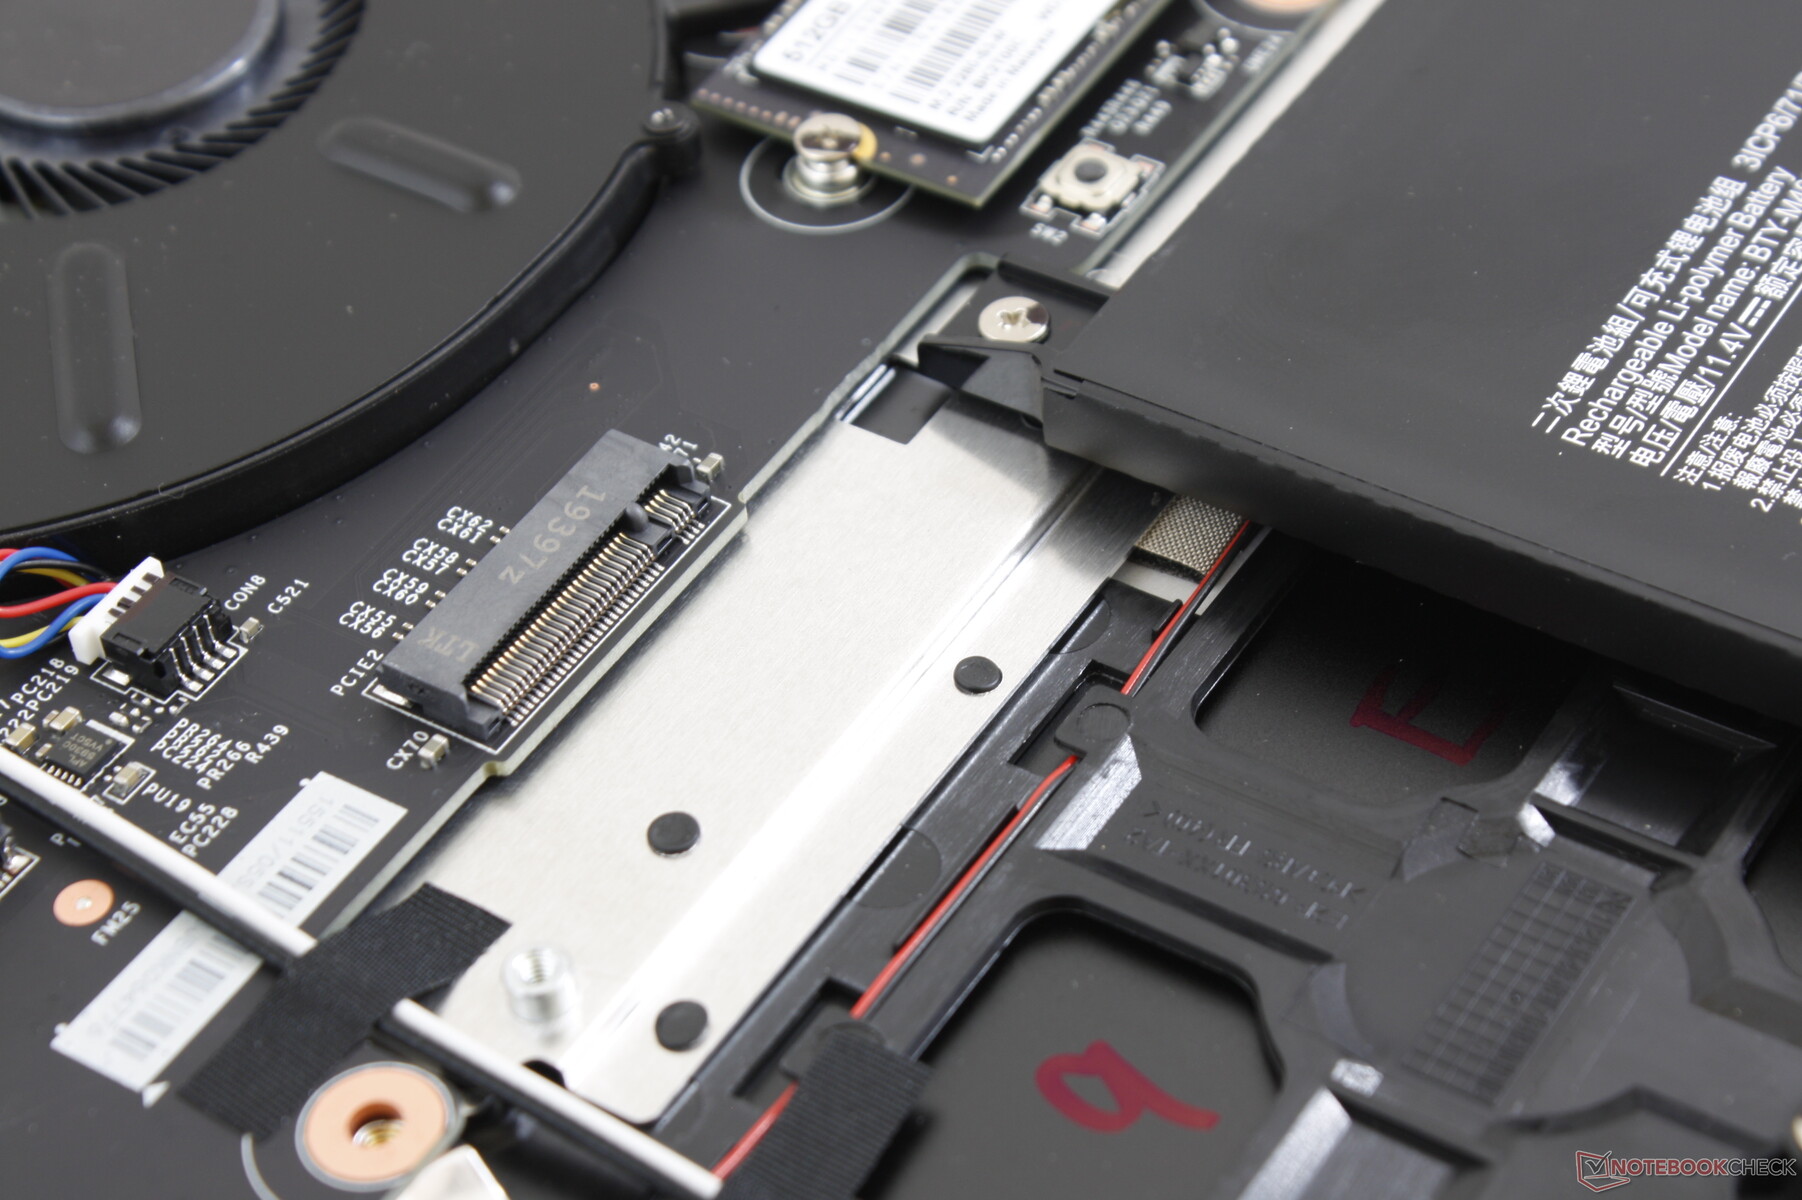
The bottom panel is secured by 11 Philips screws. Access is easy albeit it will require breaking a "Factory Seal" sticker. Once inside, users will have direct access to most motherboard components unlike on the Modern 14.
Accessories and Warranty
Included extras are a USB Type-A to RJ-45 adapter and a faux leather sleeve. Most other OEMs reserve these free accessories only for their higher-end flagship offerings and so it's nice to see them included here on a mid-range lineup.
The standard one-year limited warranty applies in the United States. Owners who register their purchases with MSI may receive a few more months of coverage or accidental damage protection at no extra charge.
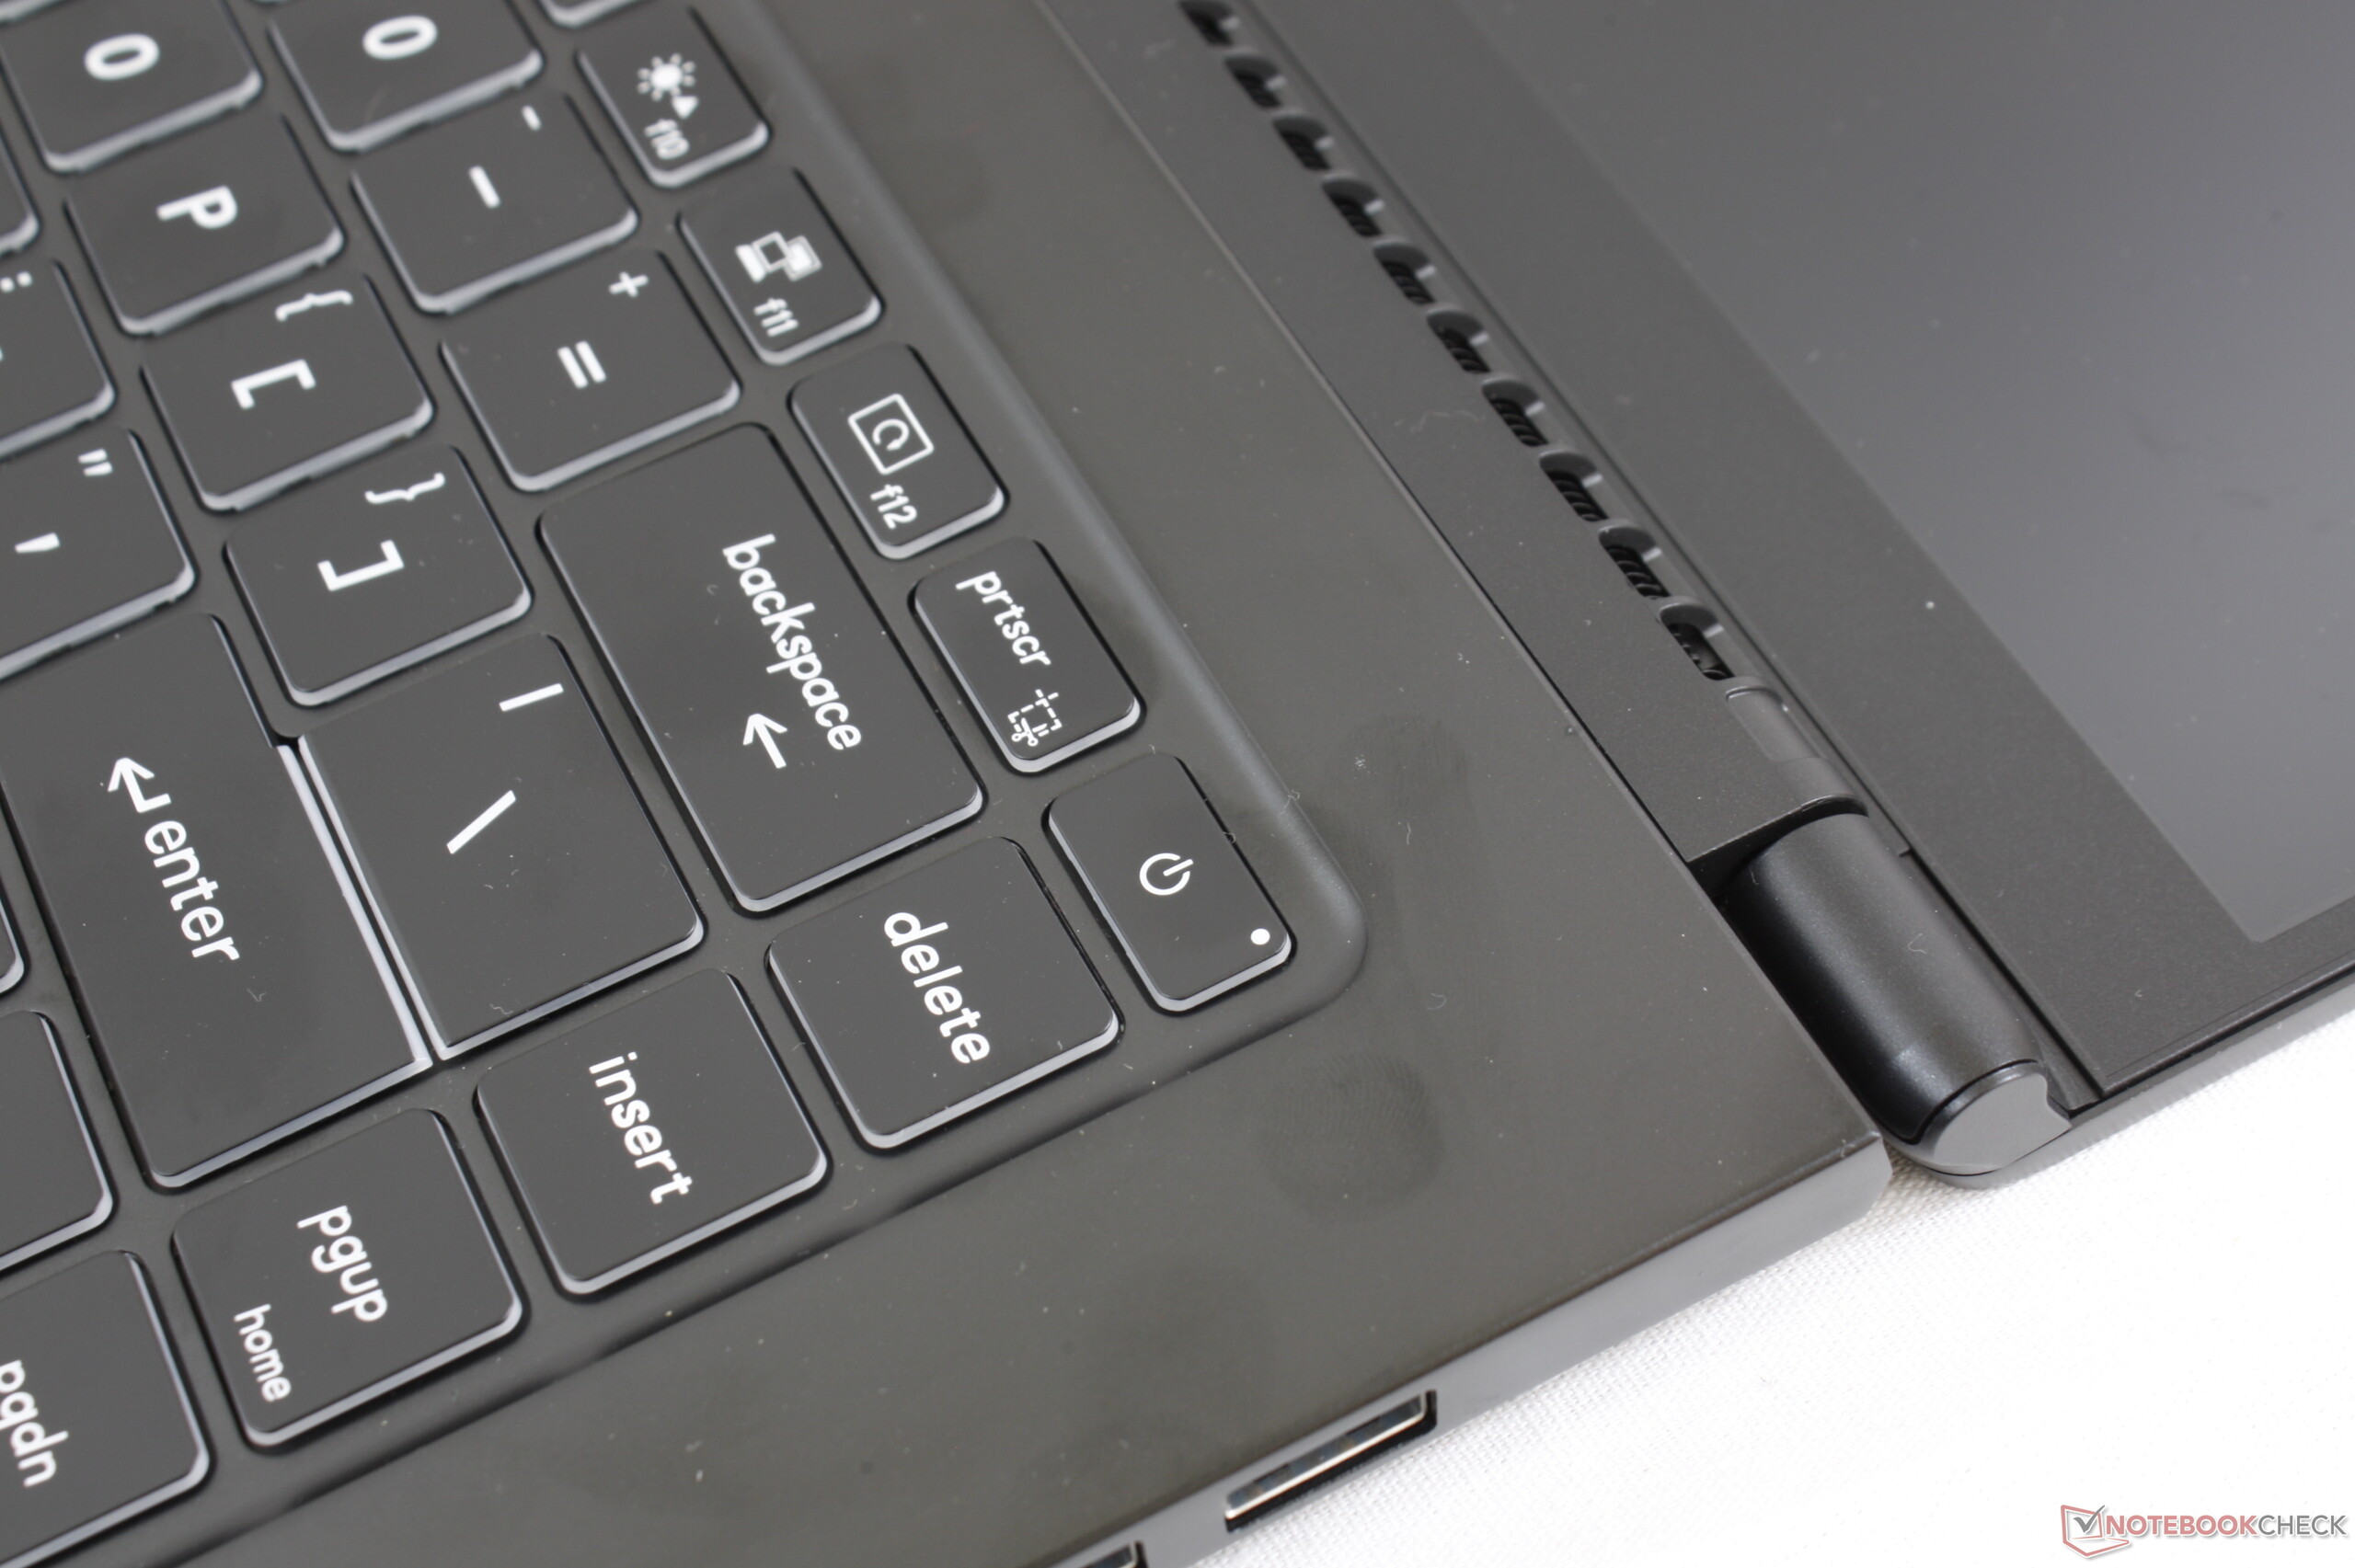
Input Devices
Keyboard
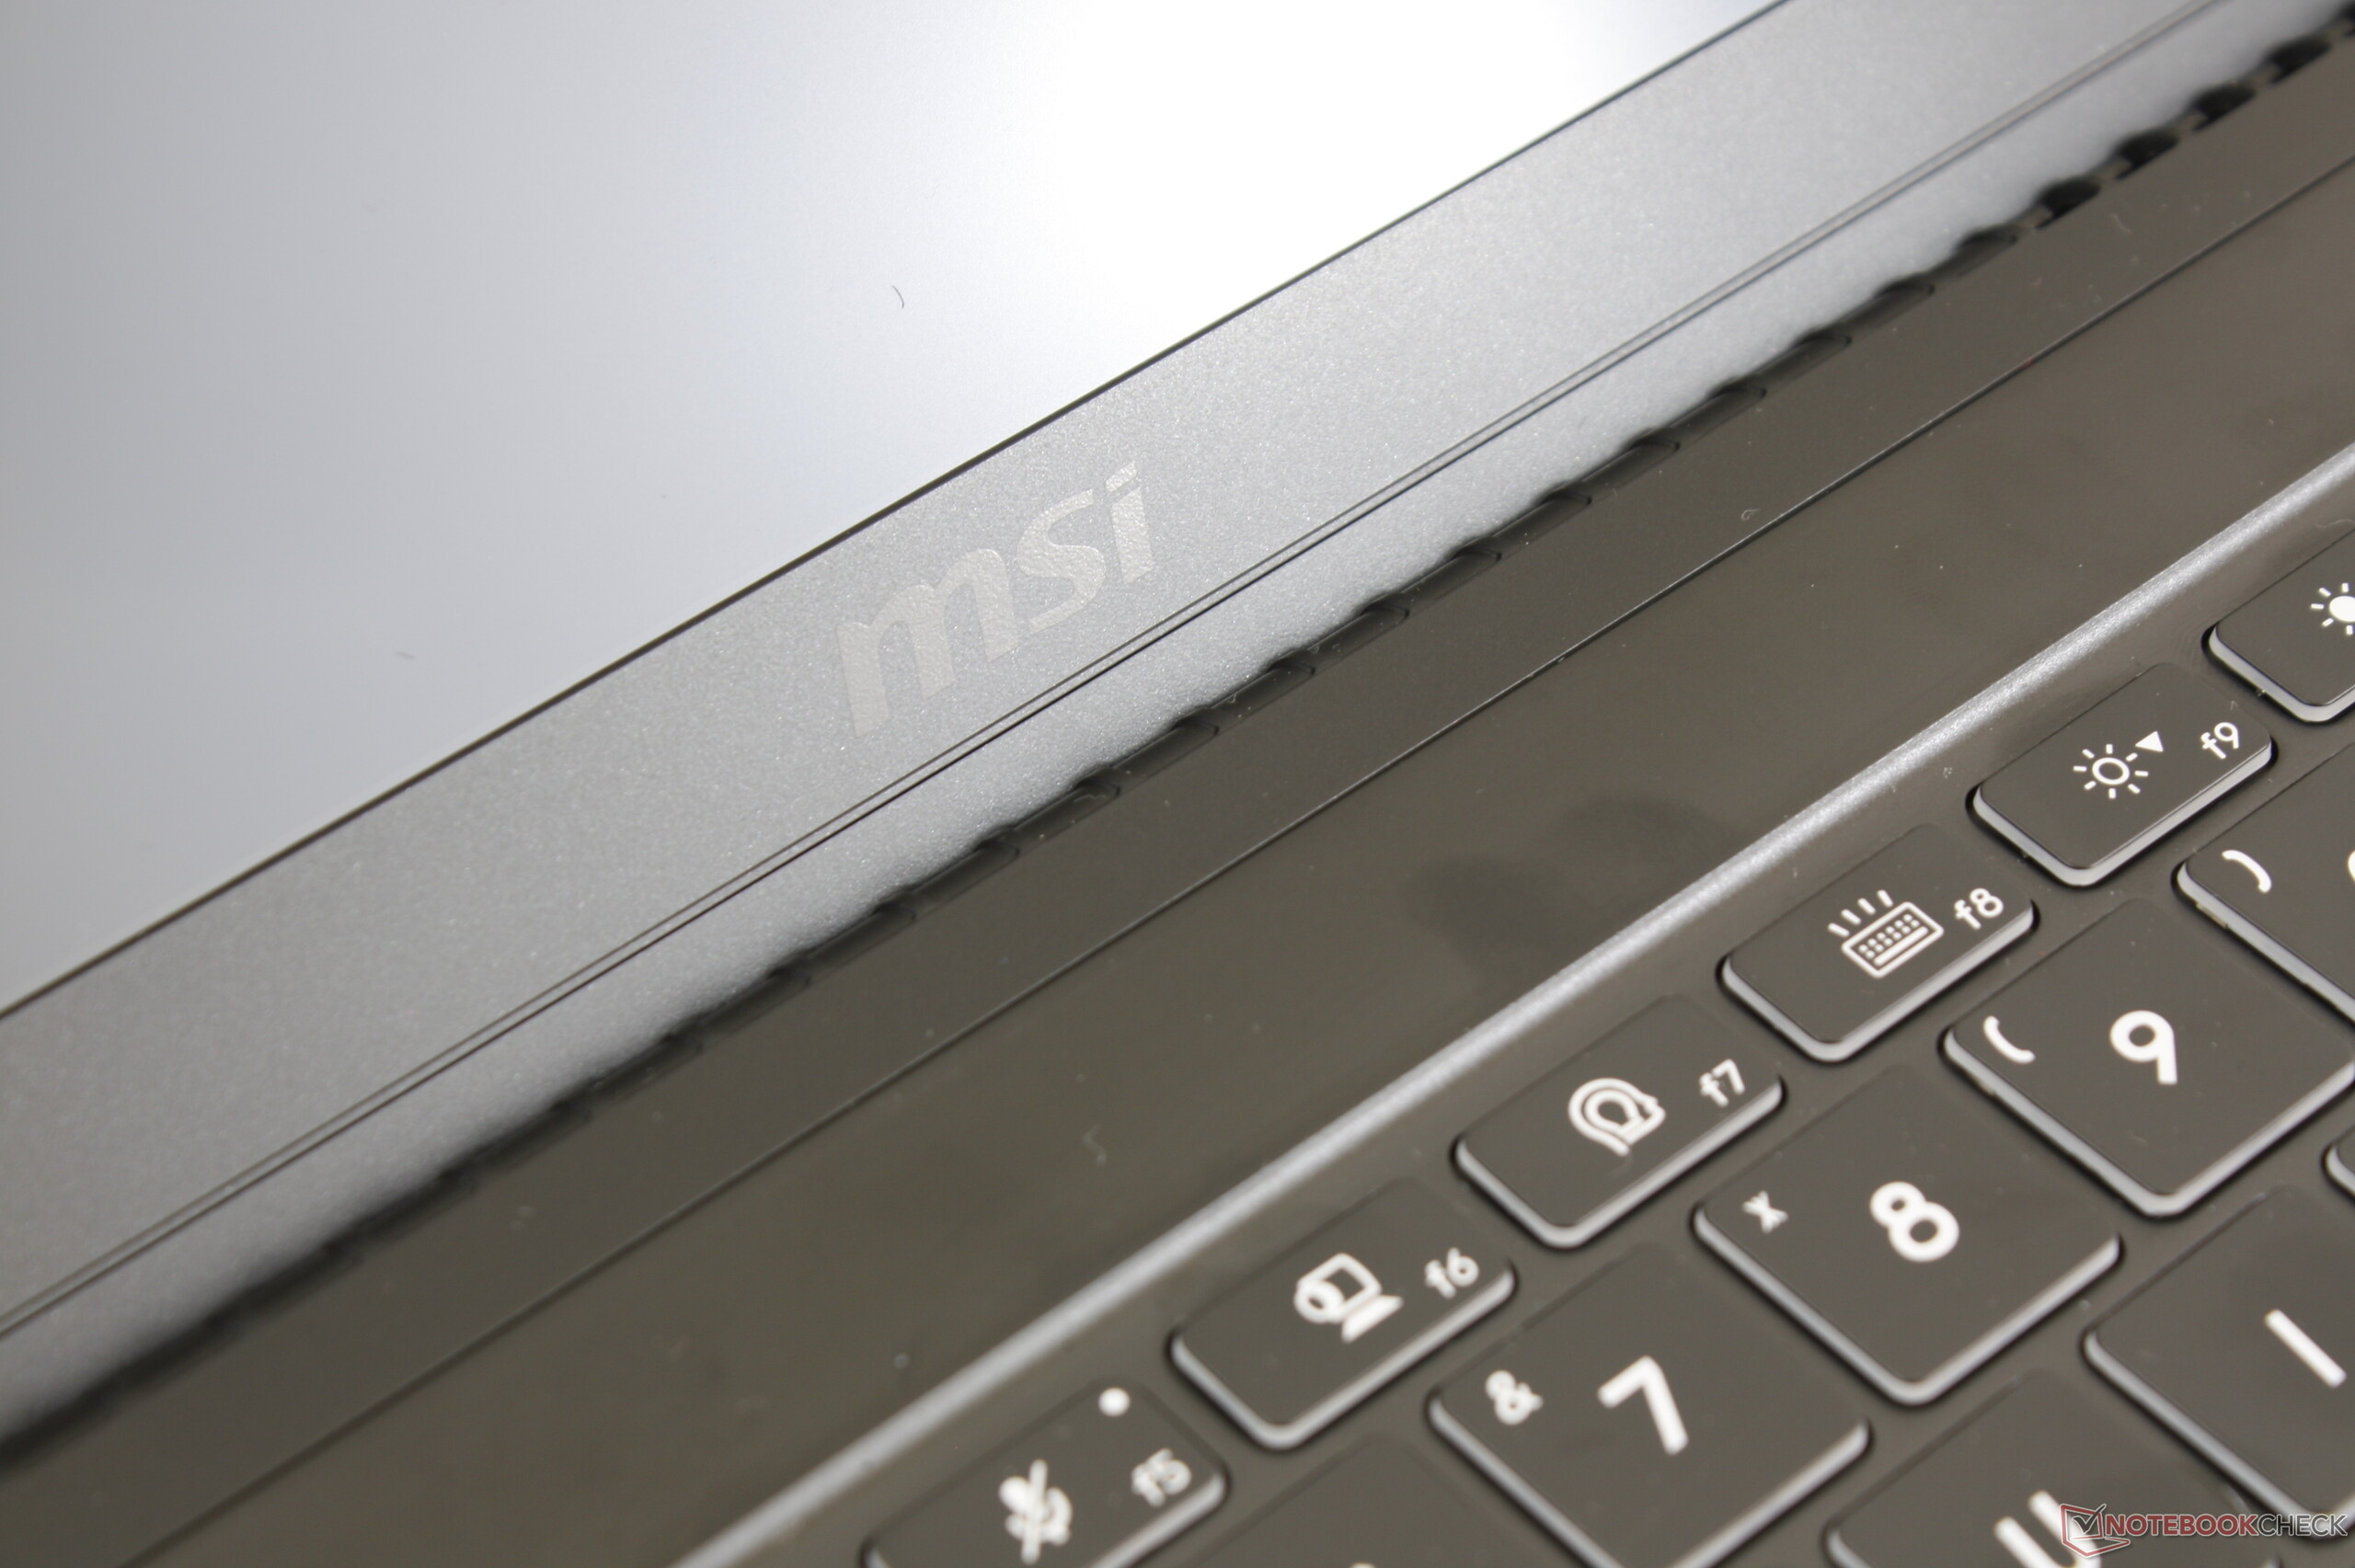
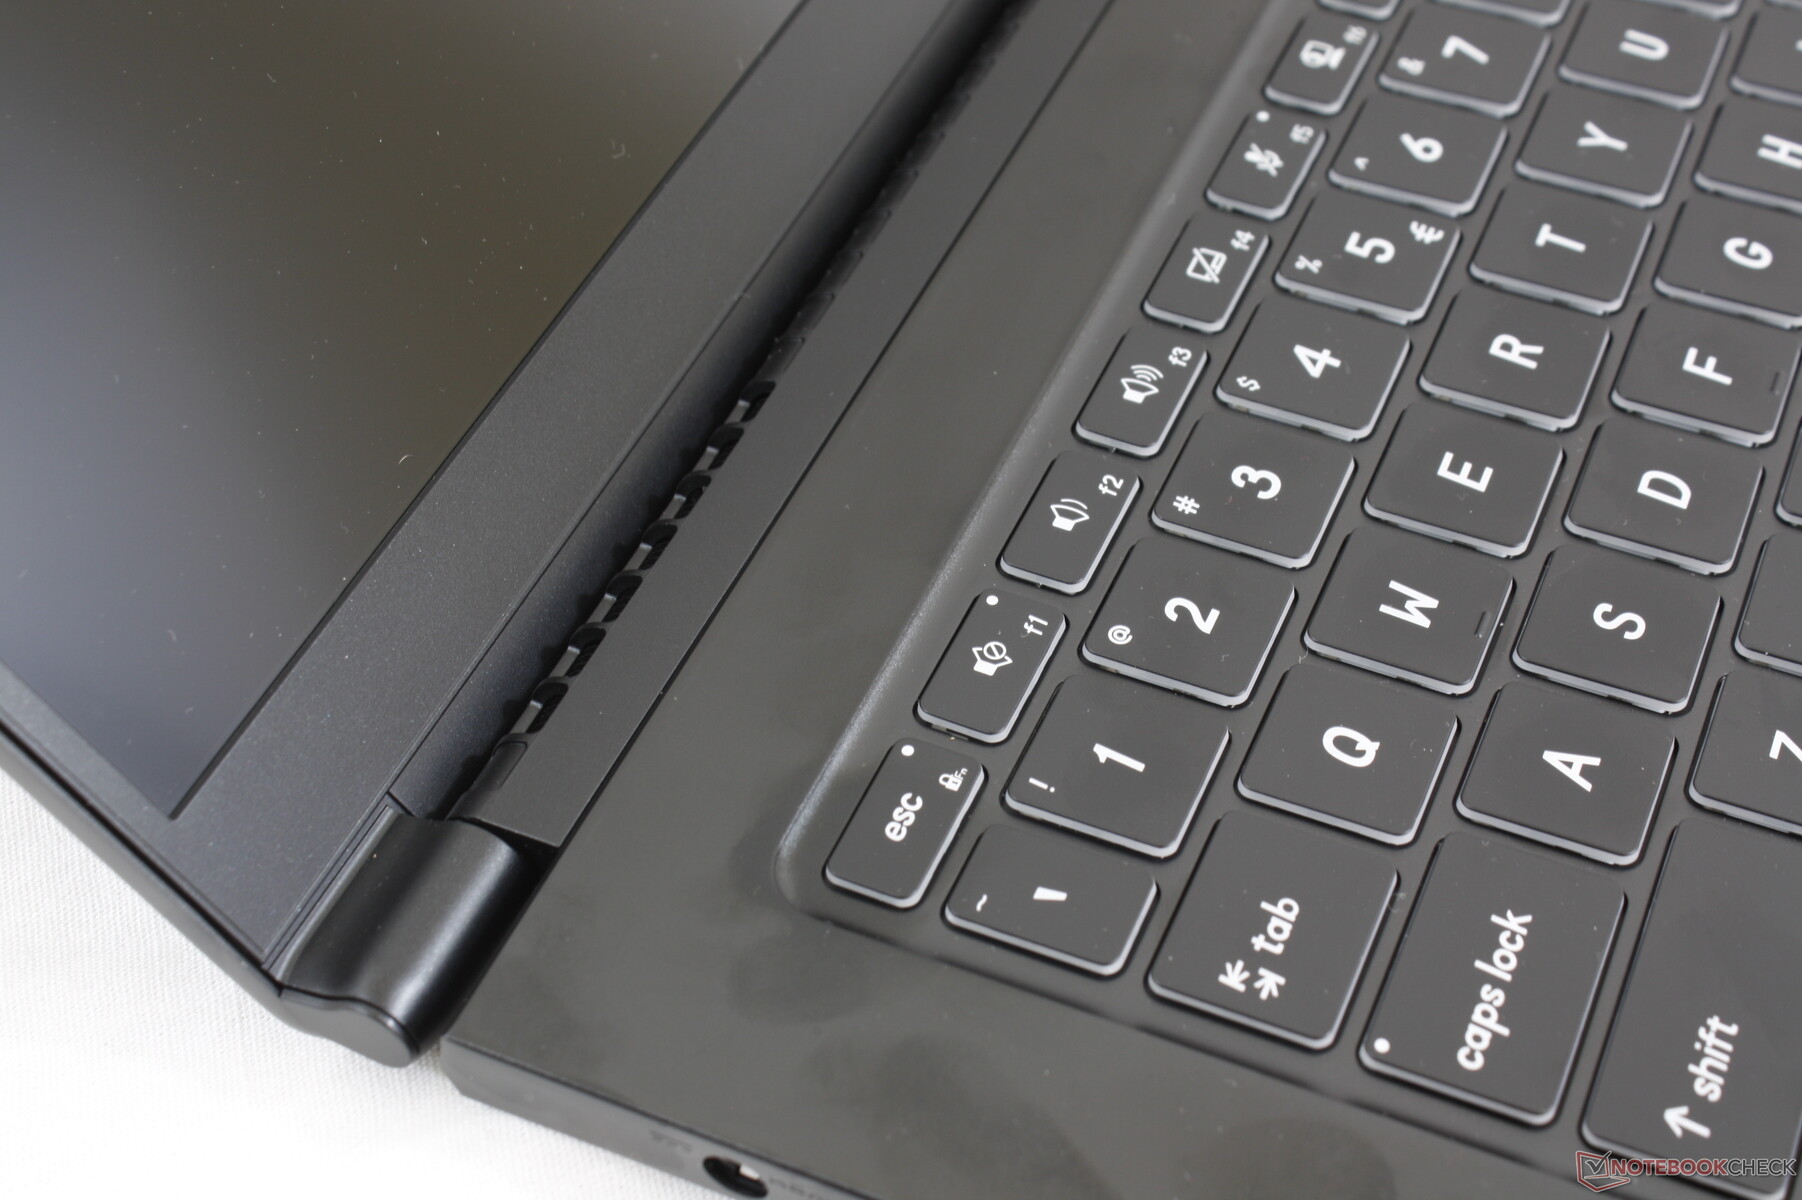
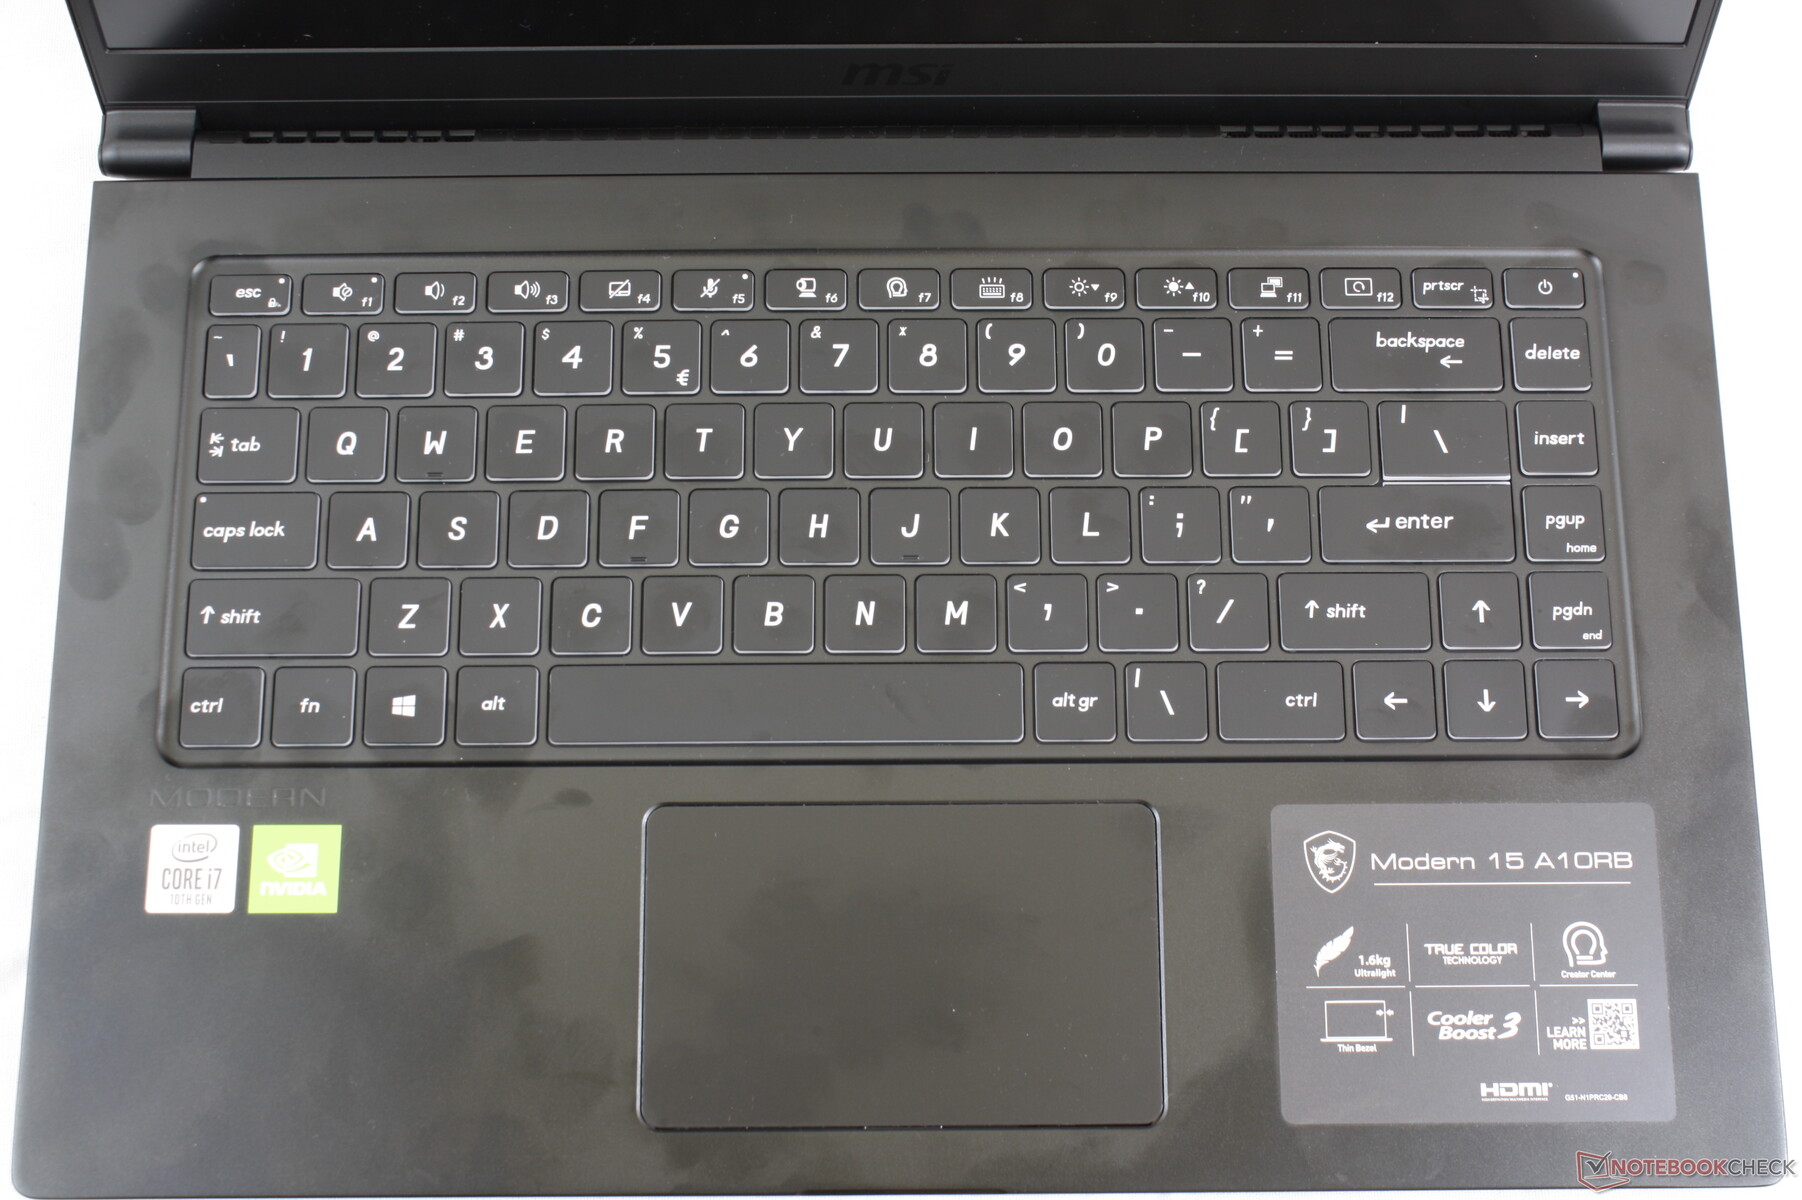
Key size and feedback are identical to the Modern 14 and so all our existing comments apply here. Key layout, however, is different in more ways than one. For example, the "End" key has been removed while the "fn" key is now on the left side of the keyboard instead of the right side. The Power button has been relocated to the top right corner and many of the secondary function keys are different than how they appear on the Modern 14. Strangely, the "F6" key has no LED light to show if the webcam has been toggled on or off unlike on the Modern 14.
Touchpad
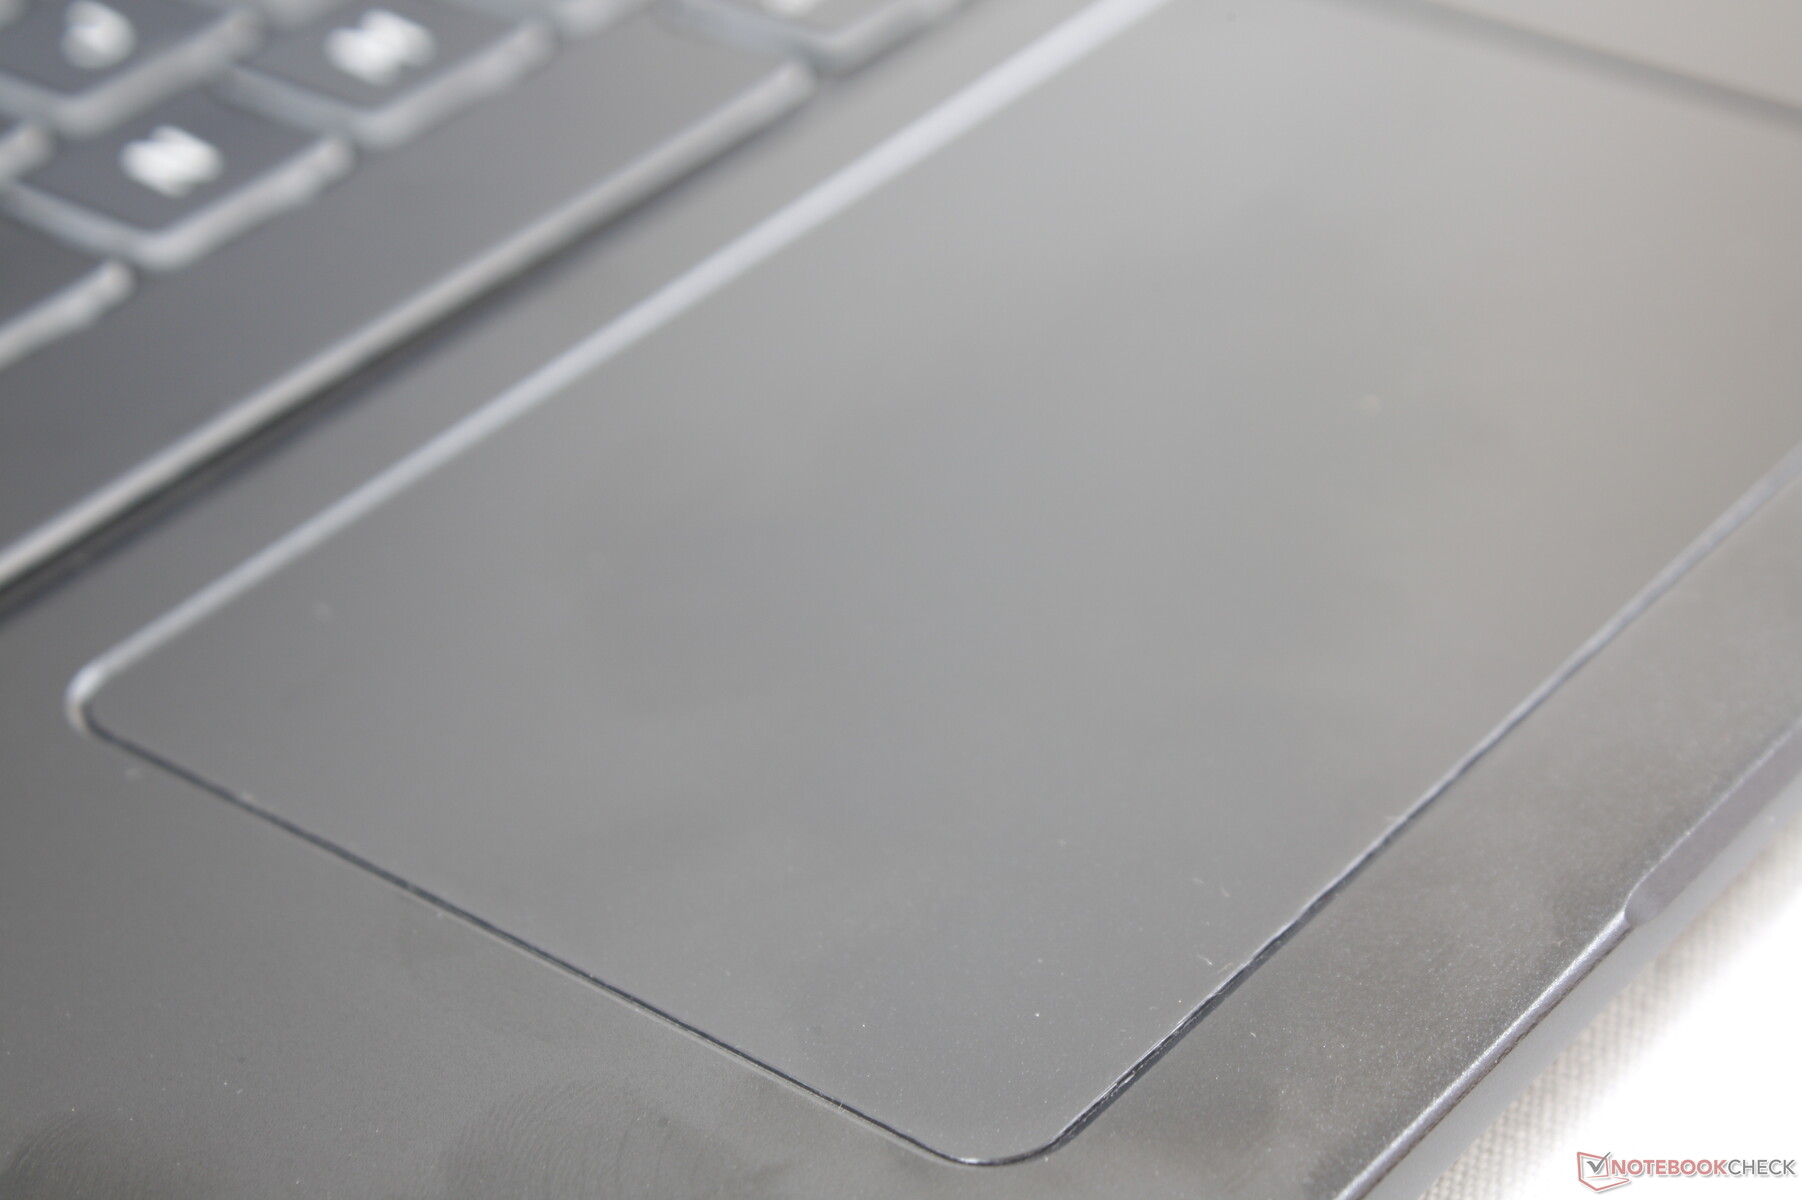
The Precision-enabled clickpad (10.5 x 6.5 cm) is slightly larger than the clickpad on the Modern 14 (10 x 5.7 cm) but still smaller than the clickpad on the XPS 15 (11.3 x 6.8 cm). Though cursor control is smooth and reliable even if gliding slowly, feedback from the integrated mouse keys could have been firmer despite the relatively loud clatter when pressed.


Display
The Modern 15 uses the same Chi Mei N156HCE-EN1 IPS panel as found on the 2017 Asus ZenBook Pro UX550 series, Lenovo Ideapad 720S-15IKB, and the Lenovo Yoga 720-15IKB. Thus, core characteristics like color coverage, response times, and contrast ratios are similar between these systems. When compared to the more expensive 4K UHD Prestige 15, the FHD Modern 15 has faster response times for less ghosting but with a dimmer backlight and narrower color spectrum. Interestingly, PWM is present on both the Modern 15 and Prestige 15 at the exact same frequency of 26040 Hz to imply that MSI is using very similar components between the two models.
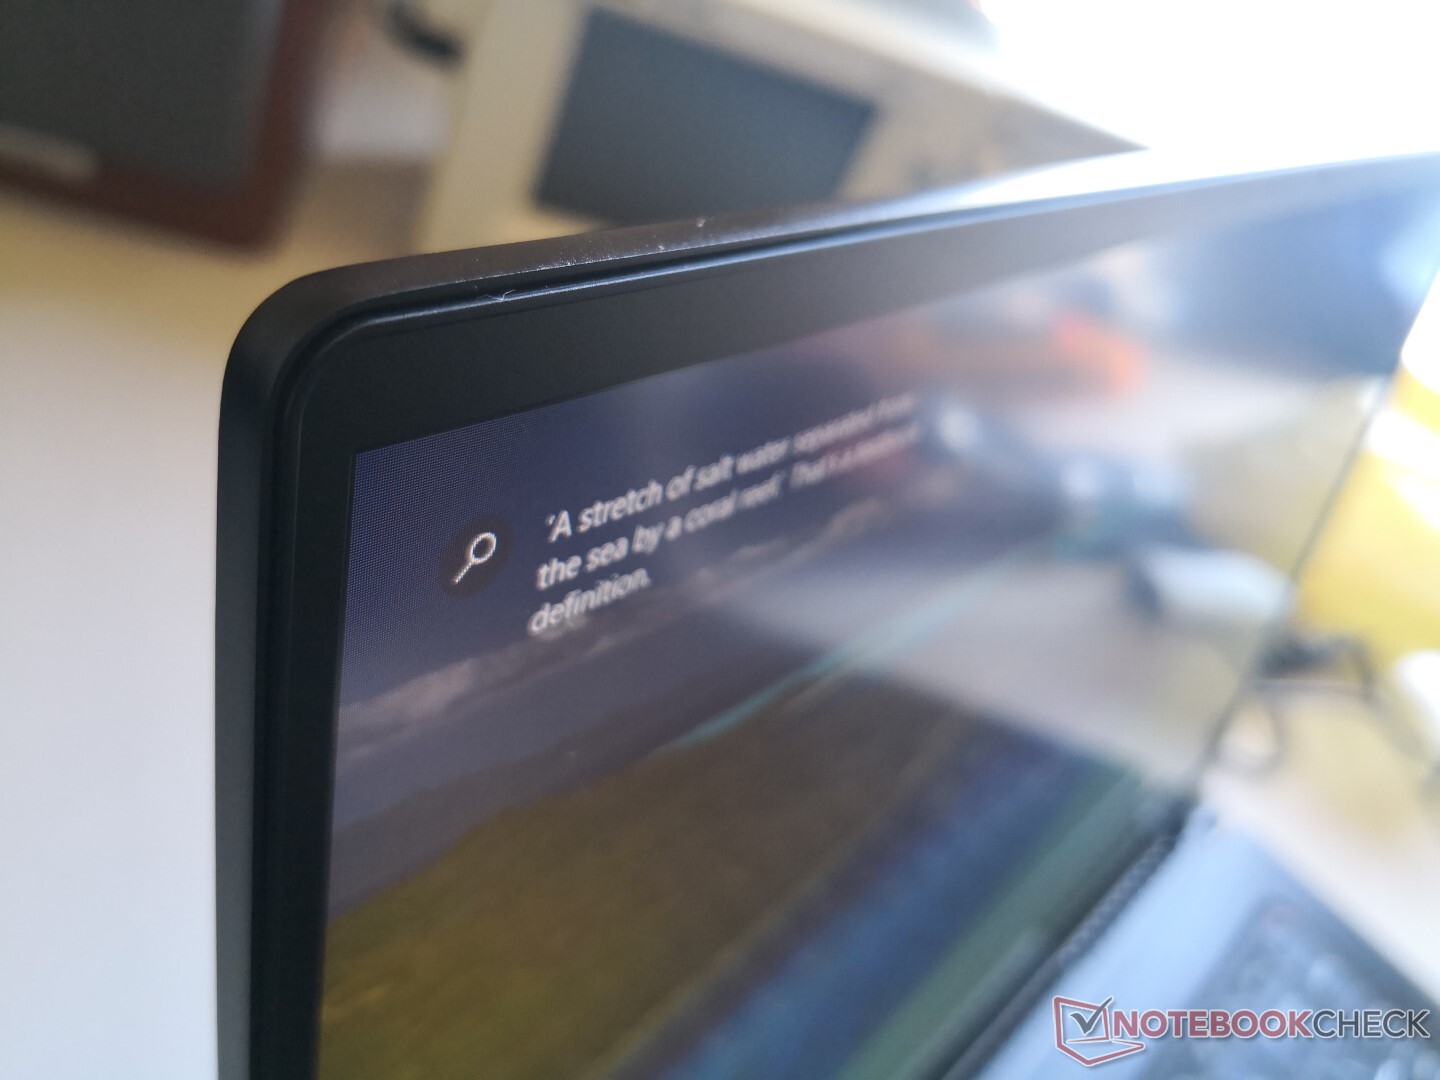
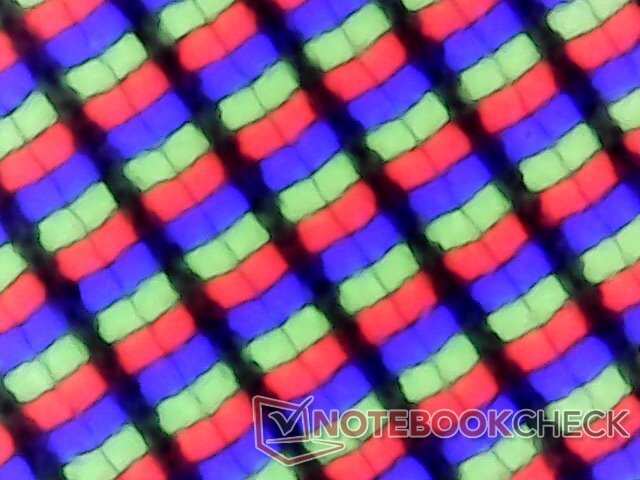
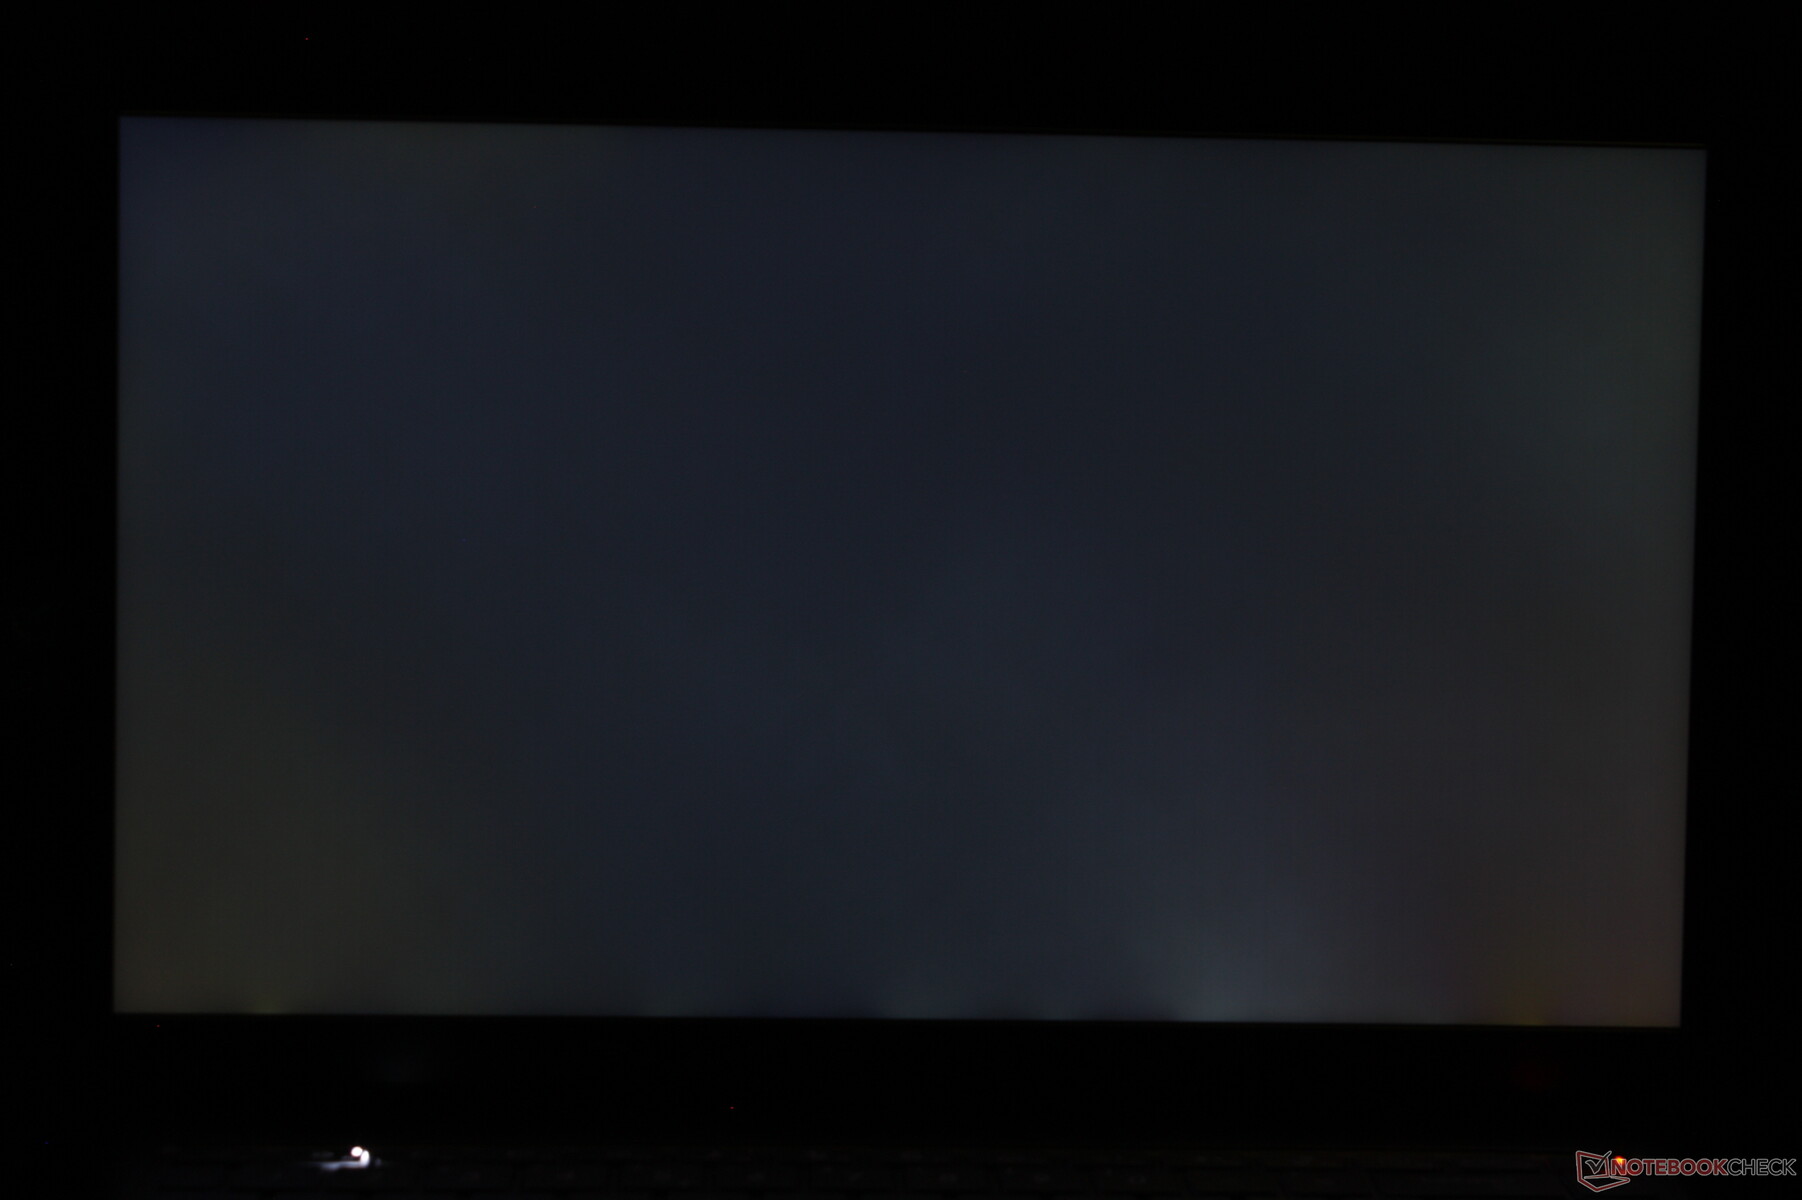
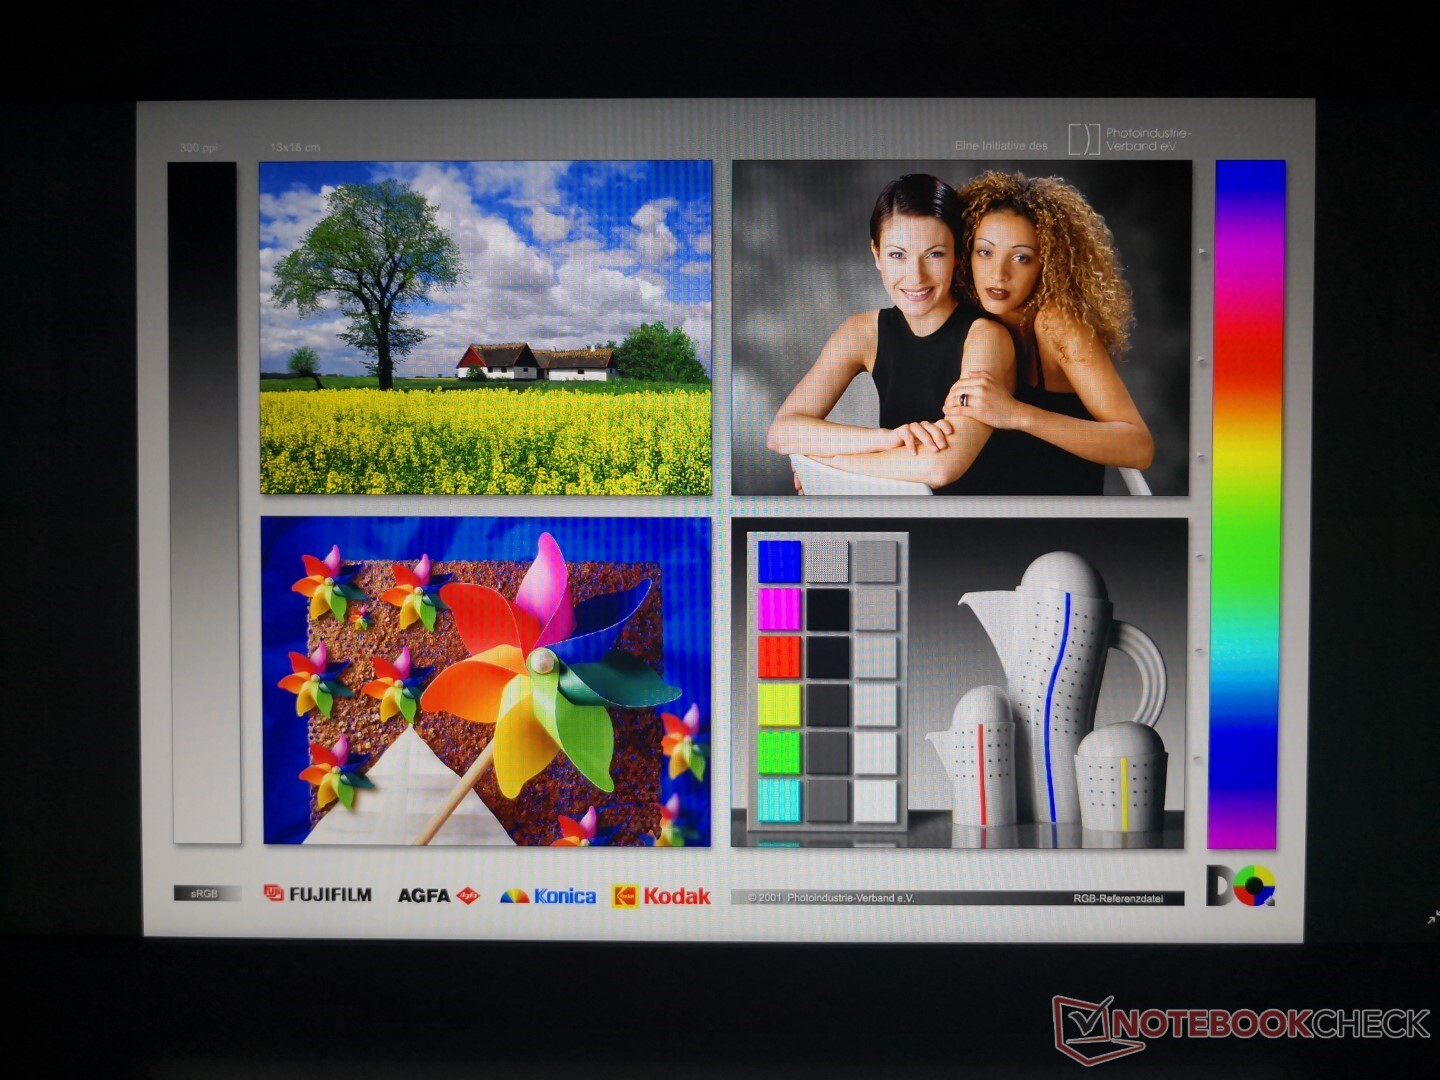
The panel here is a mid-range offering as it doesn't have the super-fast response times of most high-end gaming laptops or the brightness of some certain high-end alternatives like the XPS 15 or MacBook Pro. Texts and images still appear crisp with a slight layer of graininess that is common on matte panels. Uneven backlight bleeding is present but thankfully minimal and easy to overlook.

| |||||||||||||||||||||||||
Brightness Distribution: 82 %
Center on Battery: 289.4 cd/m²
Contrast: 1072:1 (Black: 0.27 cd/m²)
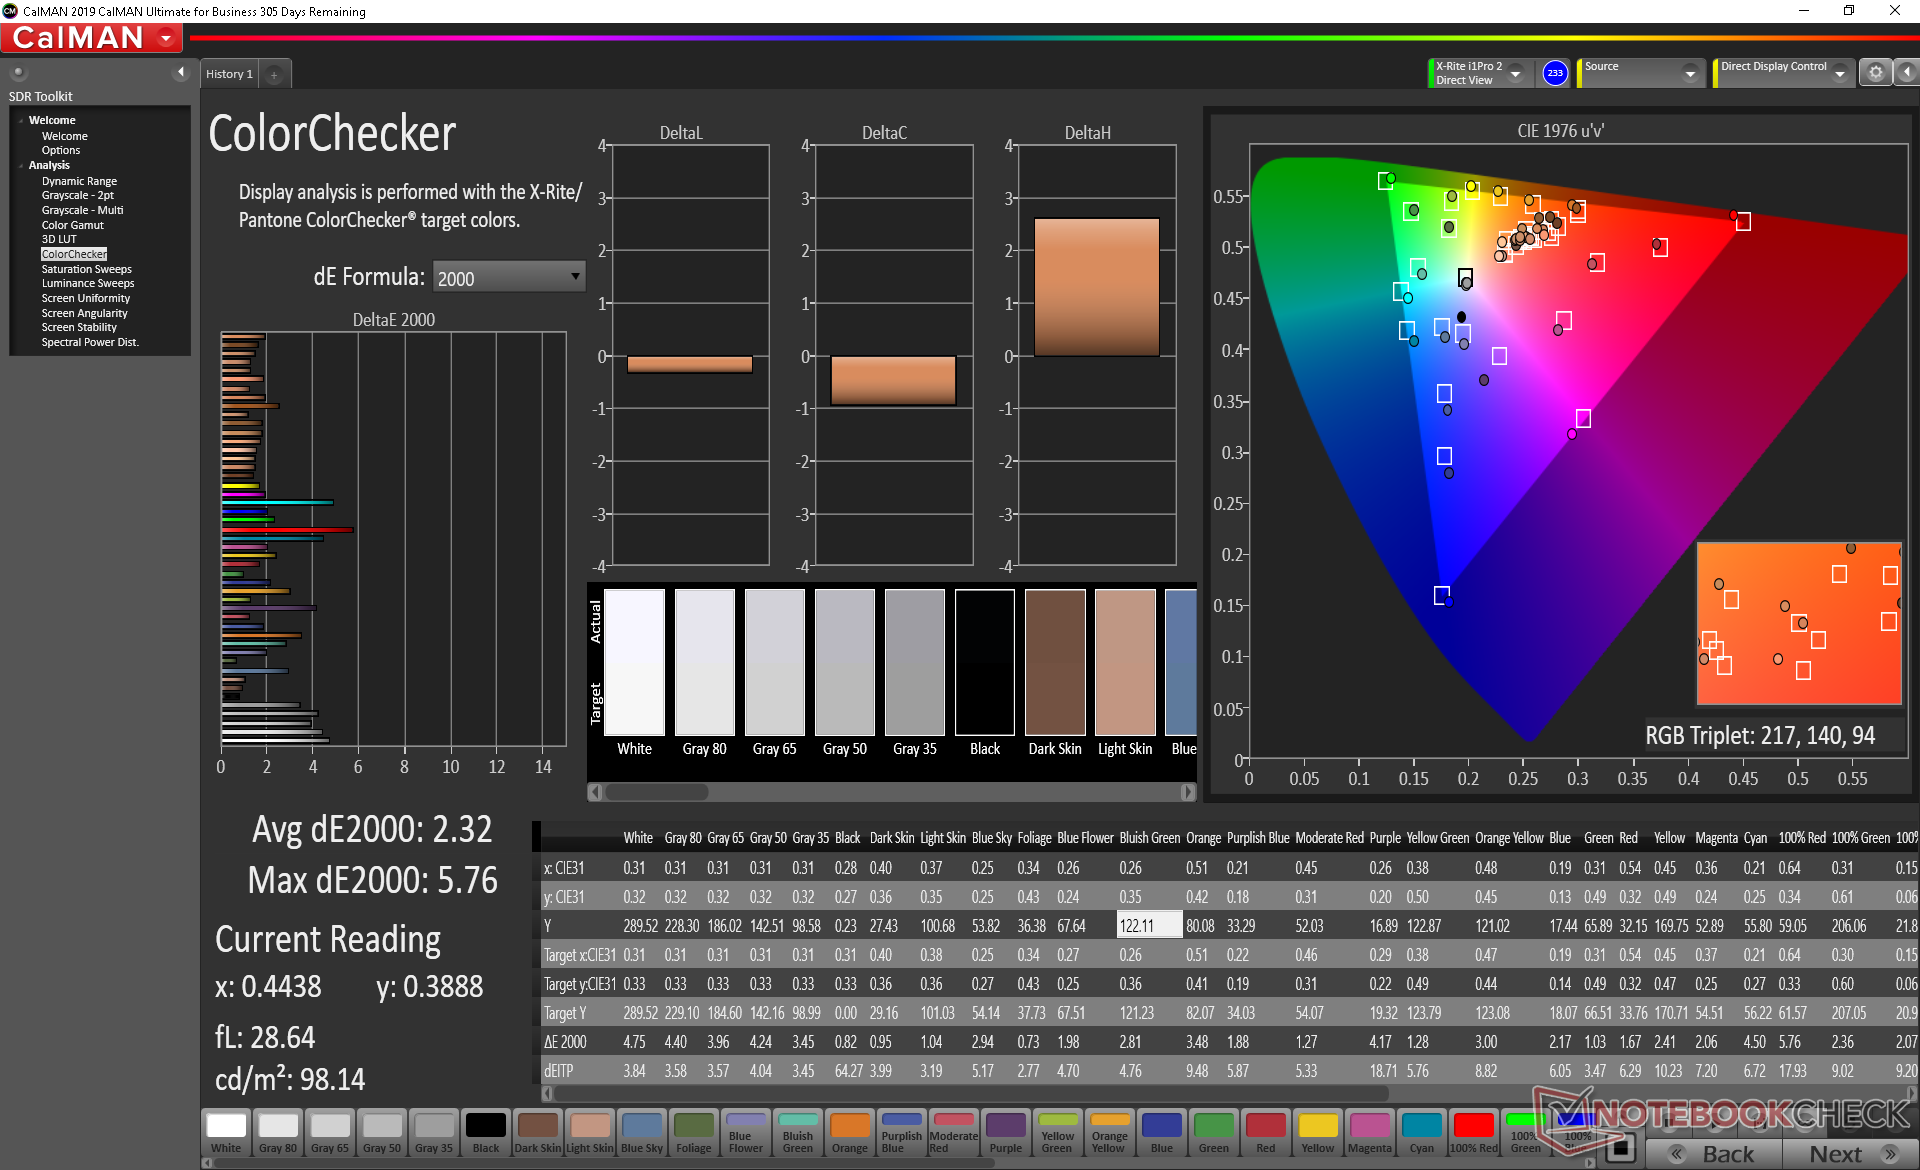
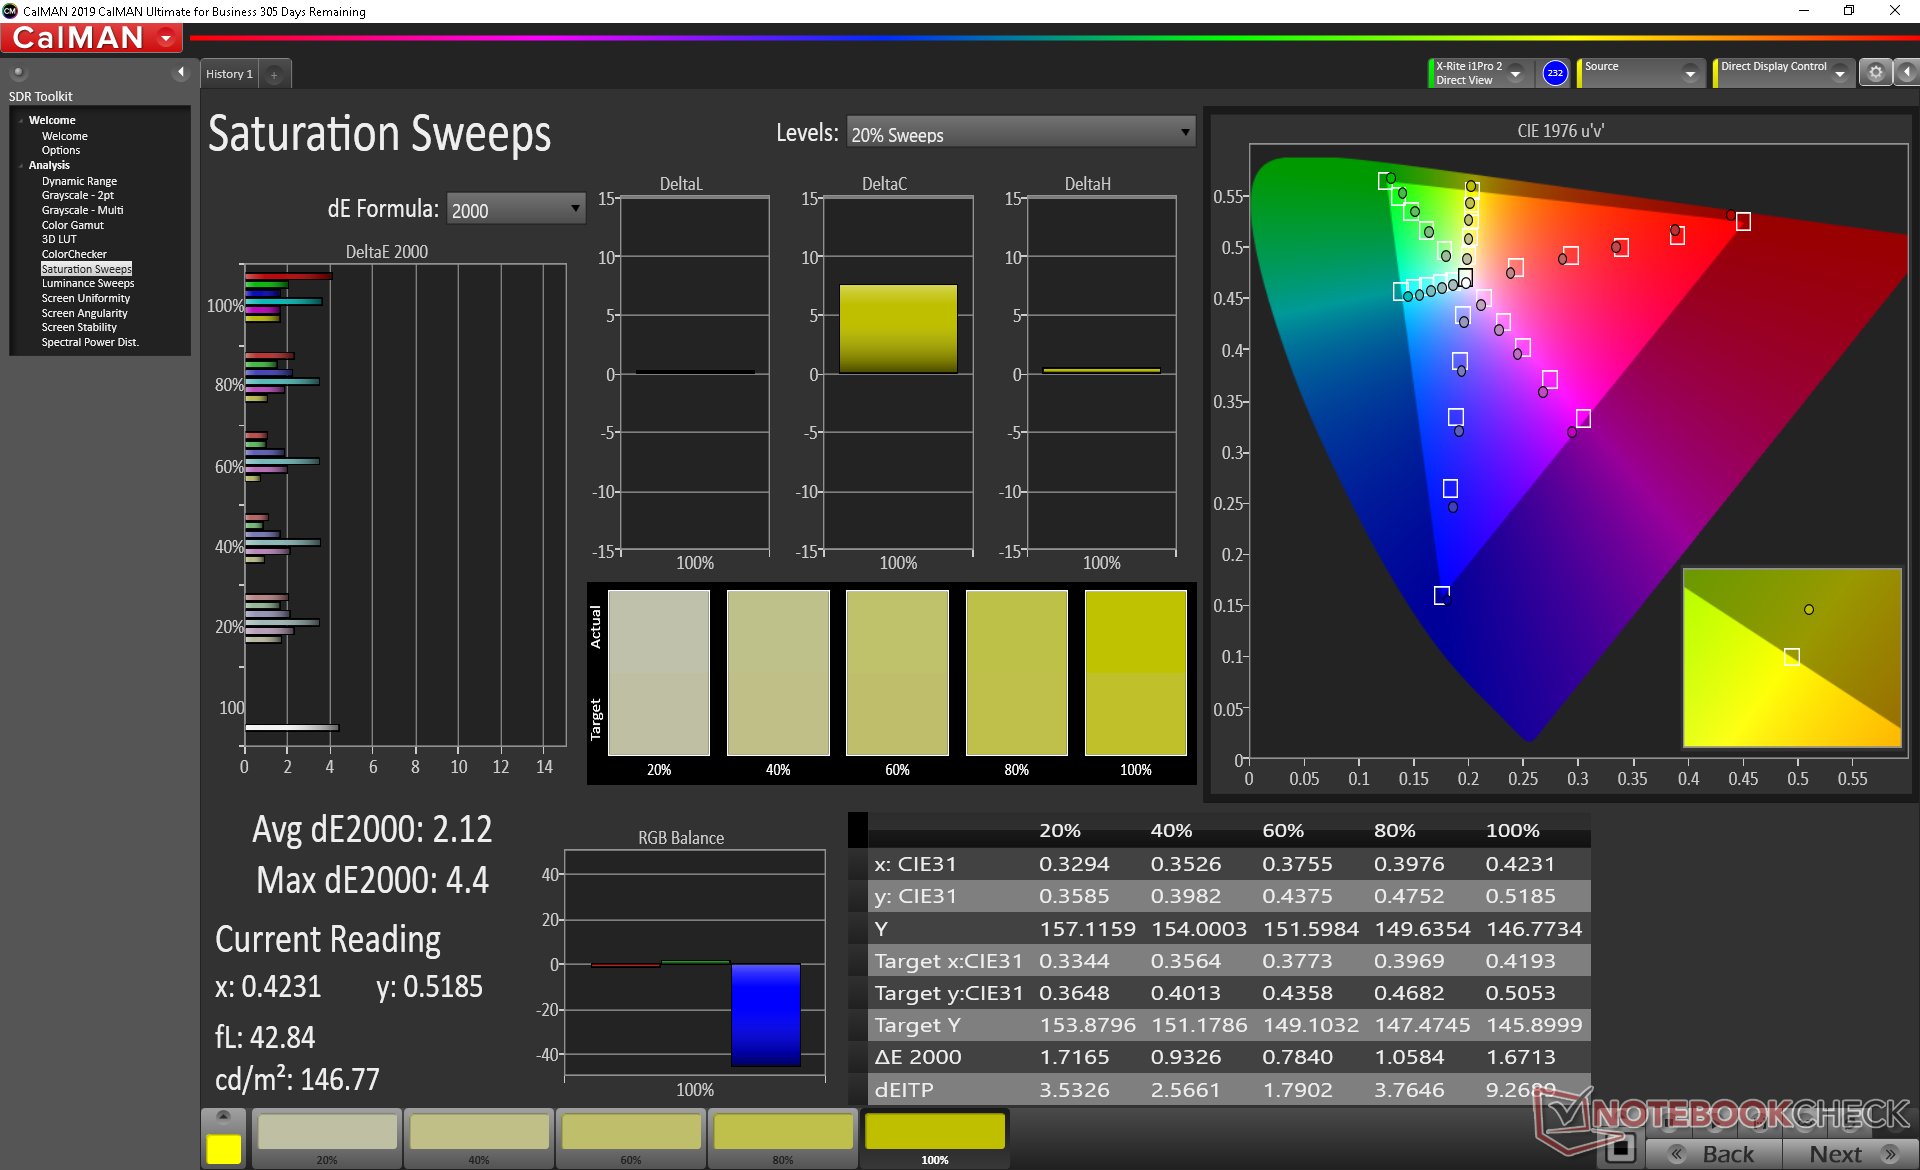
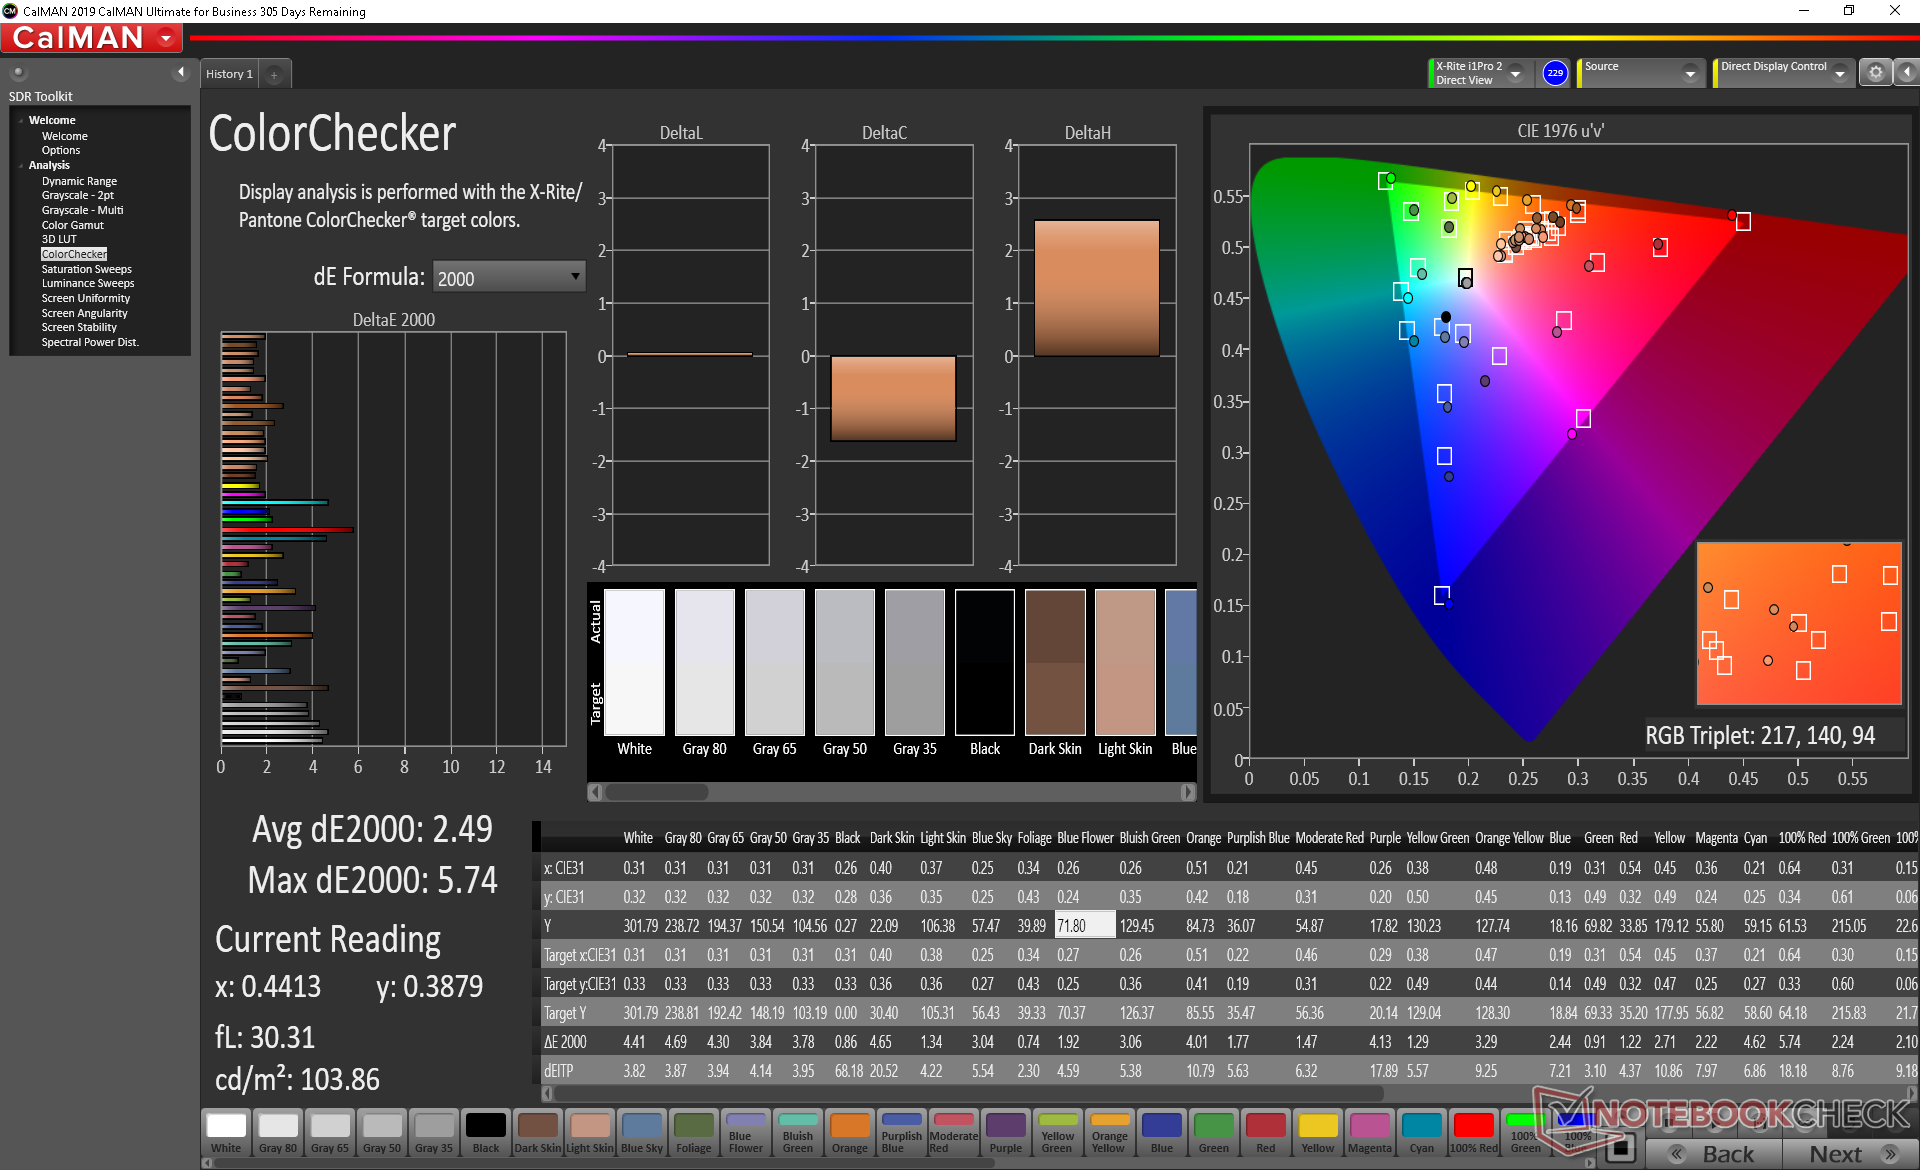
ΔE ColorChecker Calman: 2.32 | ∀{0.5-29.43 Ø4.71}
calibrated: 2.49
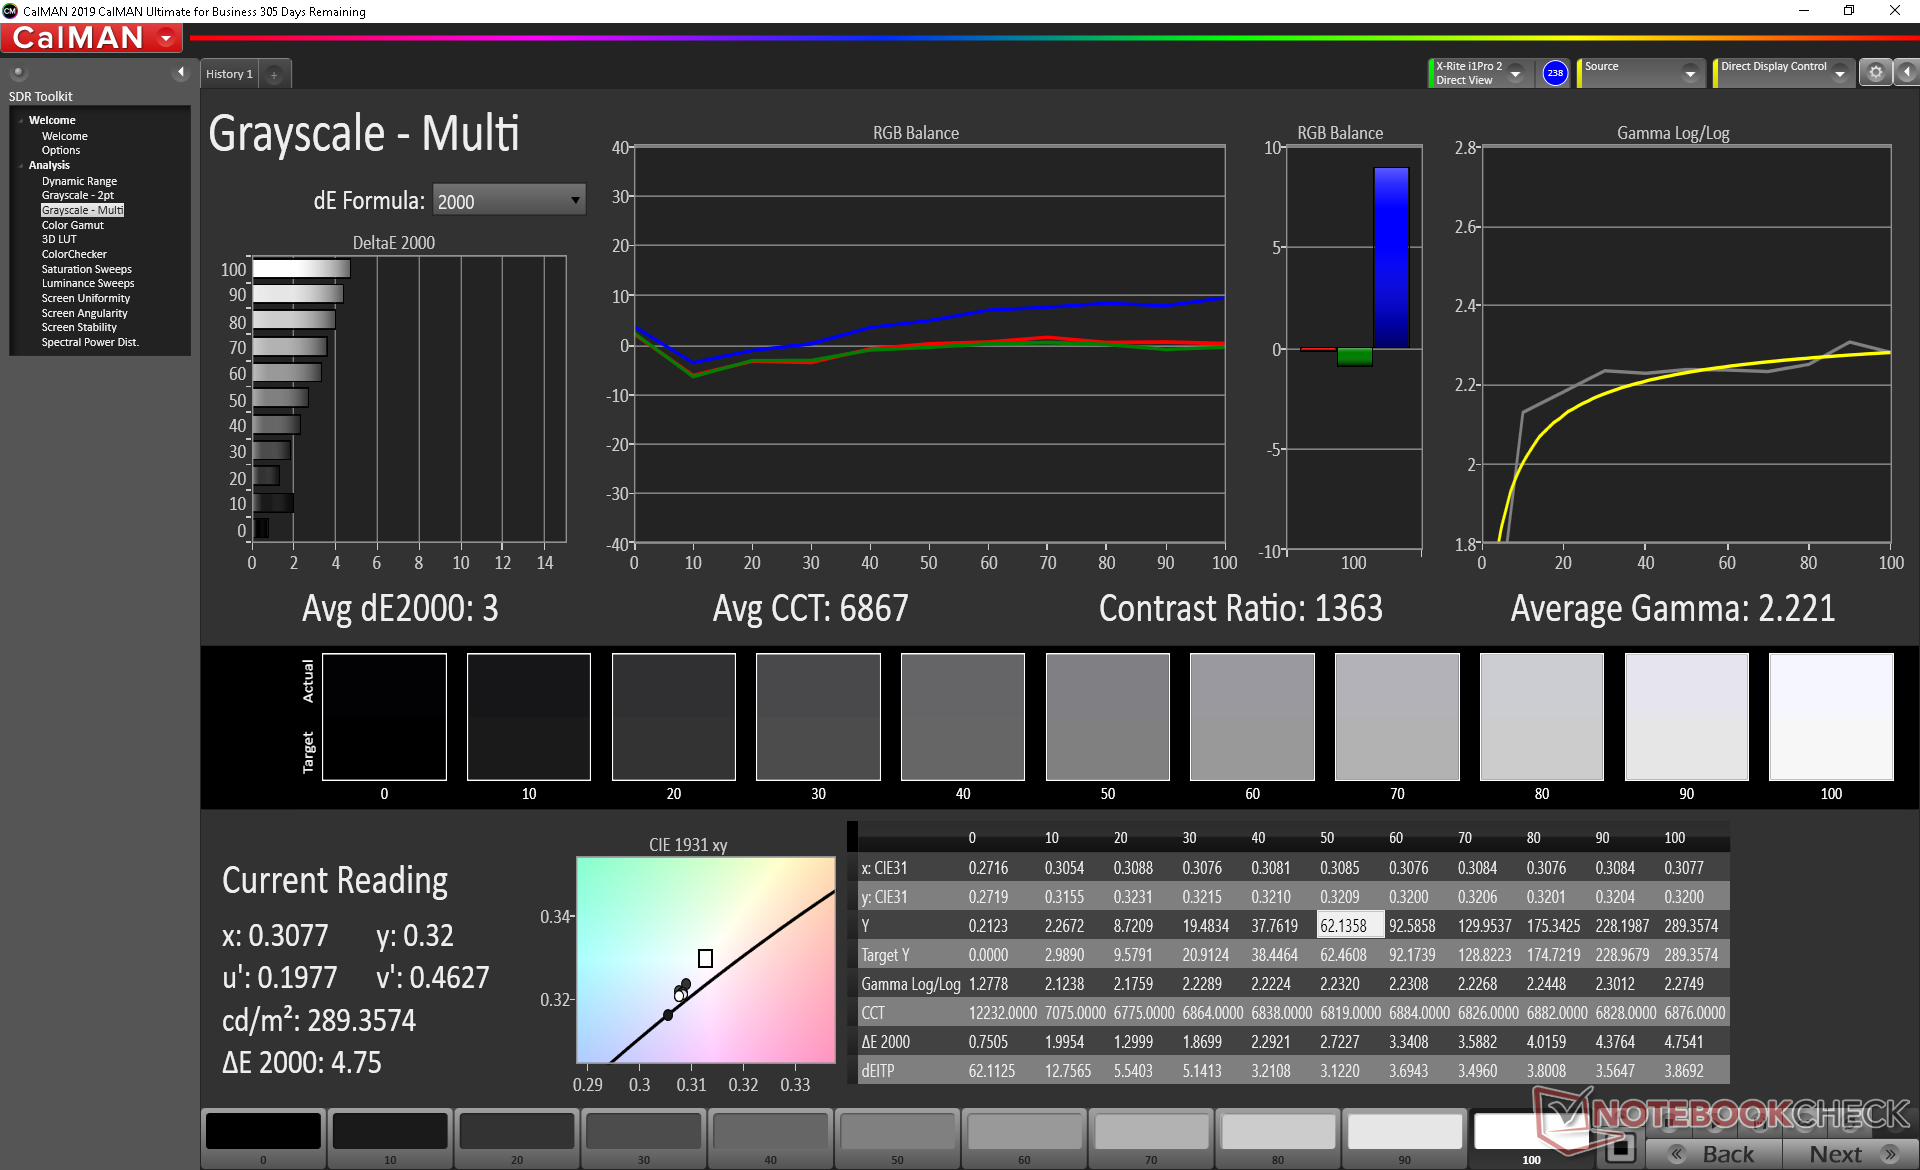
ΔE Greyscale Calman: 3 | ∀{0.09-98 Ø4.96}
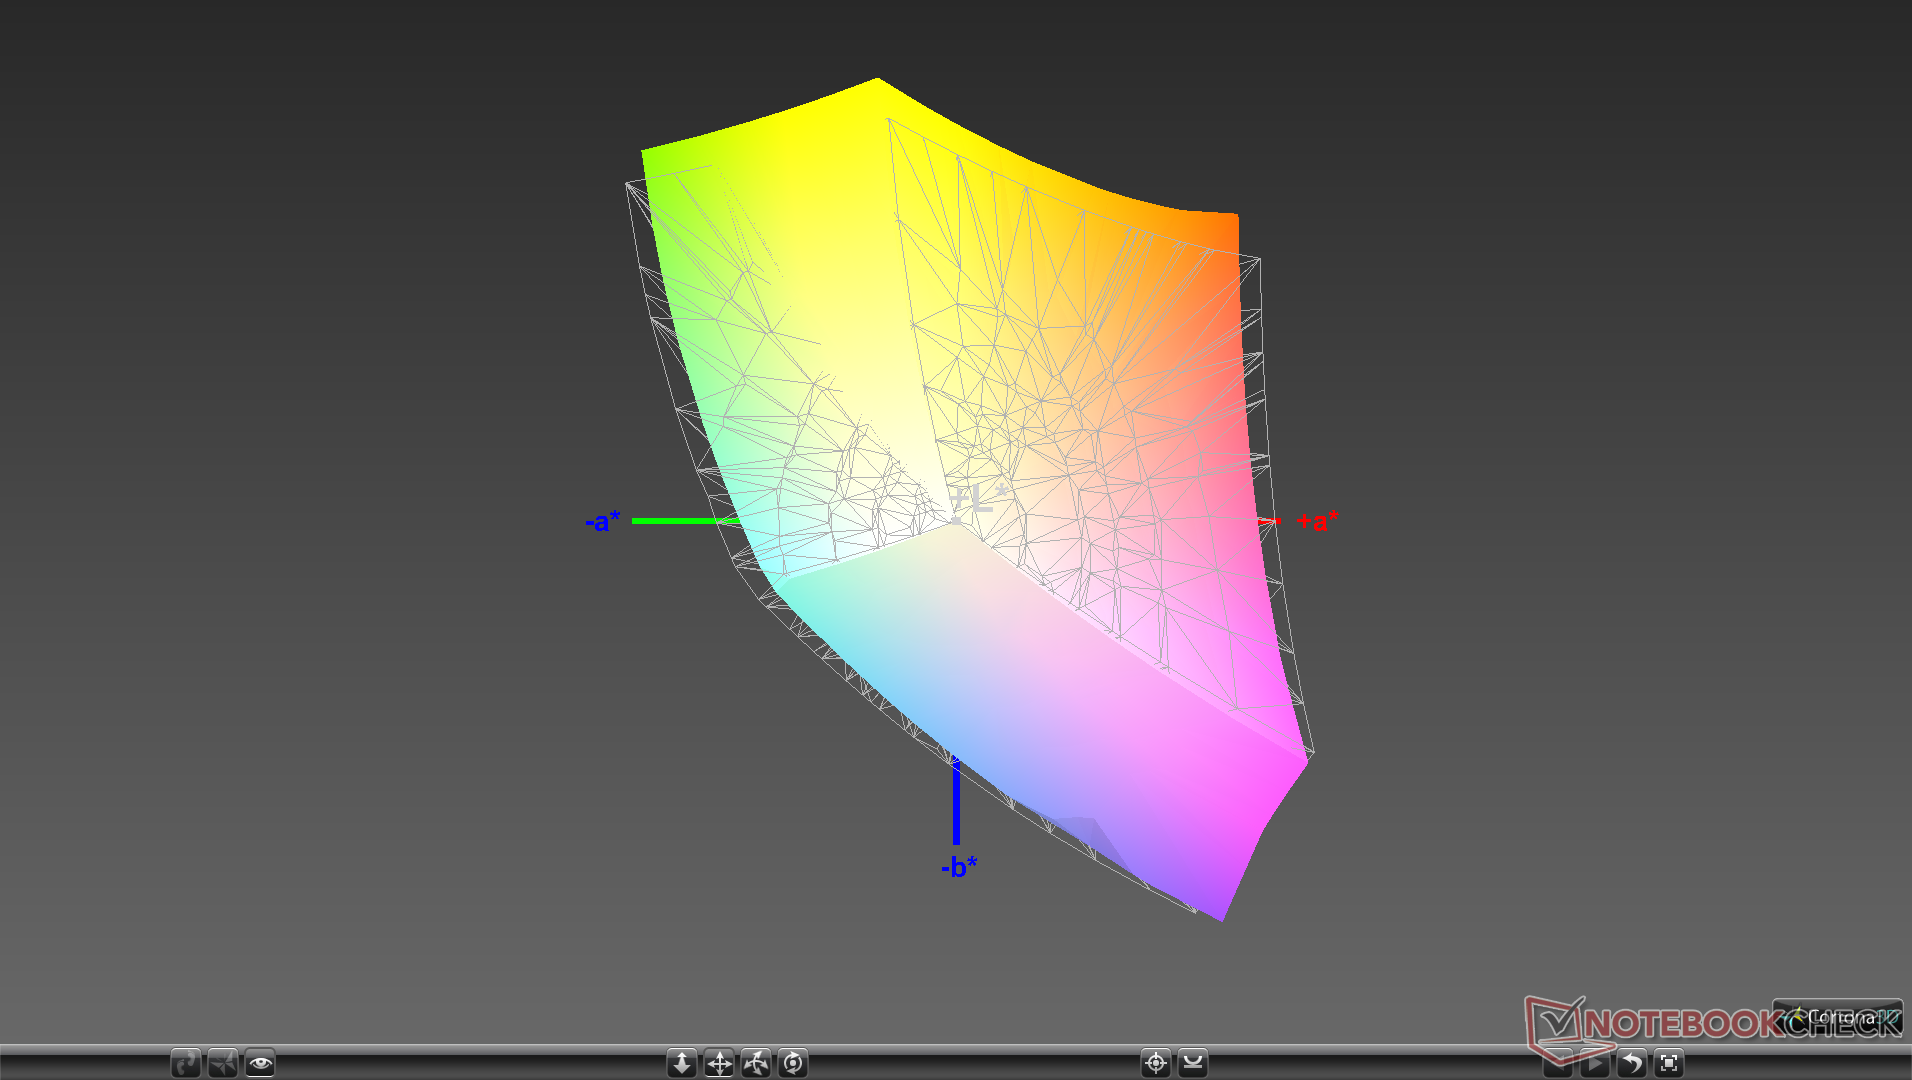
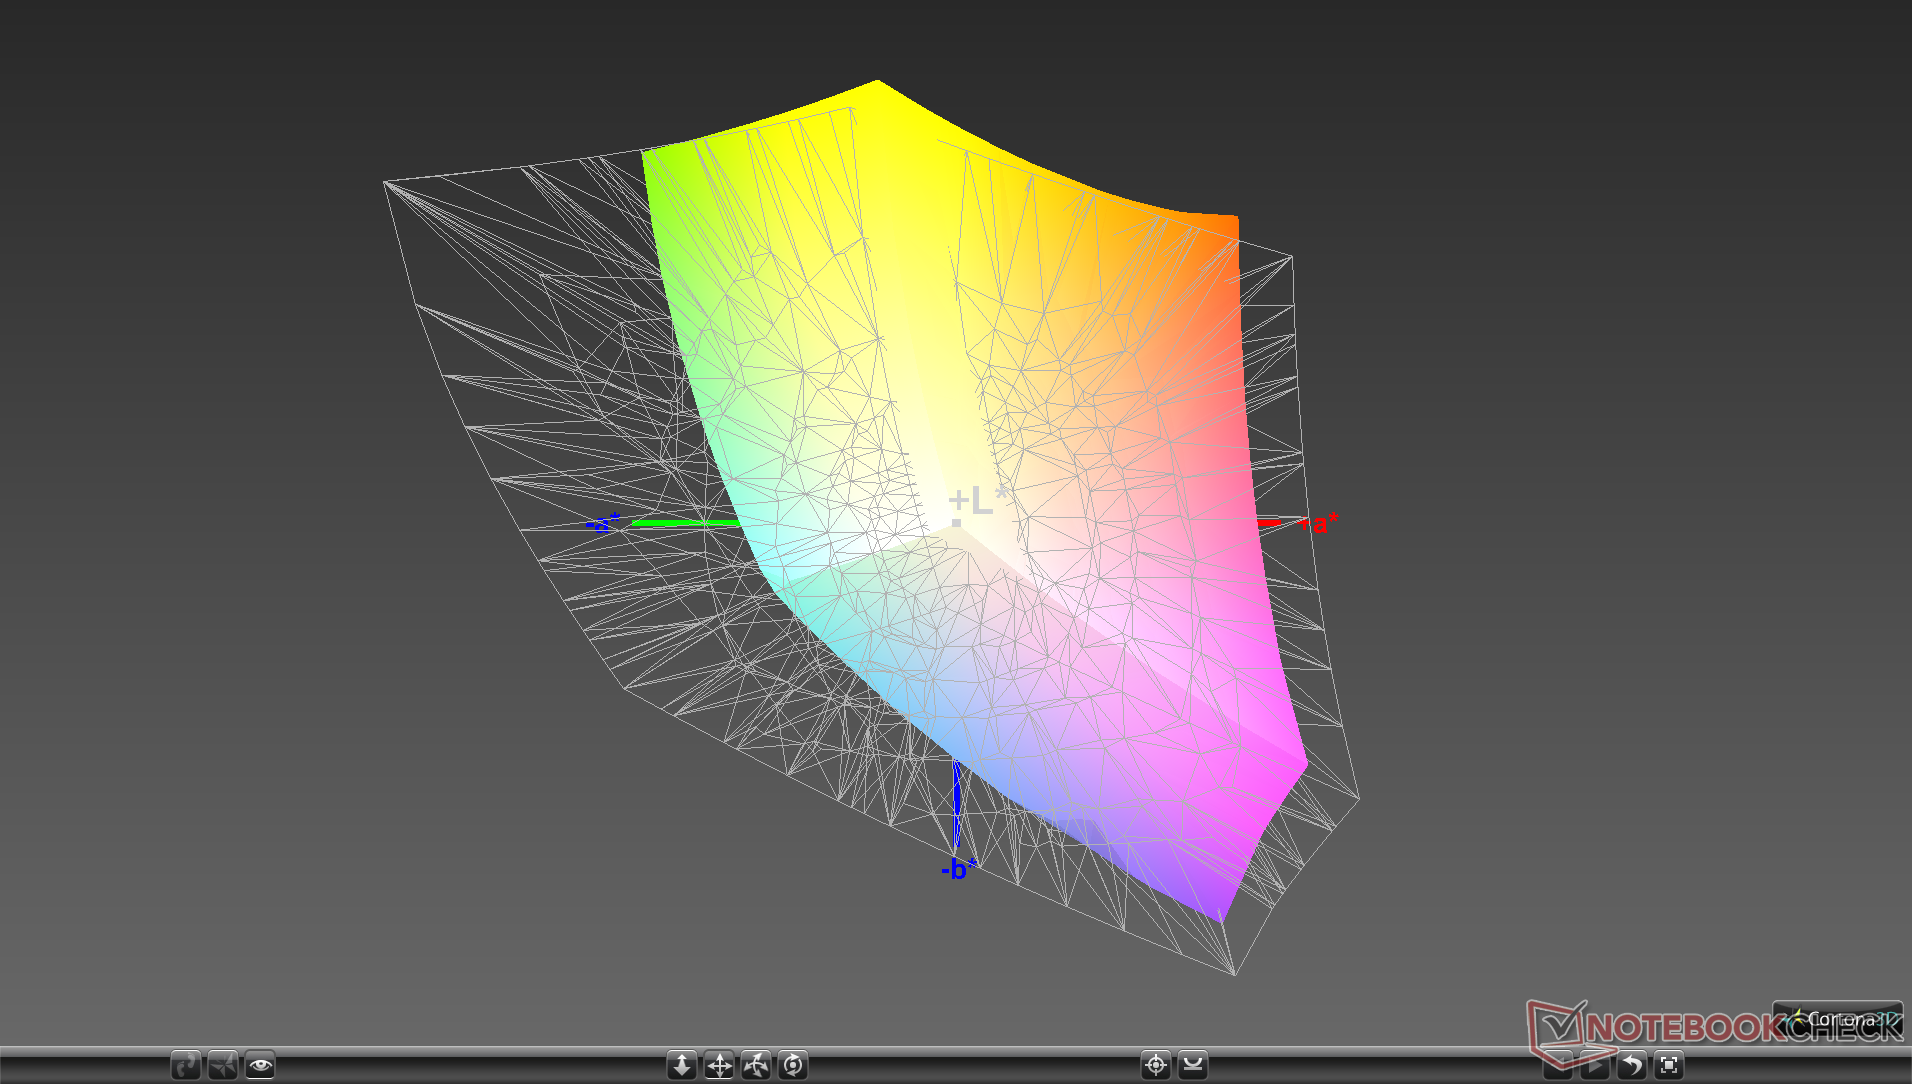
92% sRGB (Argyll 1.6.3 3D)
59.8% AdobeRGB 1998 (Argyll 1.6.3 3D)
66.5% AdobeRGB 1998 (Argyll 3D)
92.1% sRGB (Argyll 3D)
66% Display P3 (Argyll 3D)
Gamma: 2.22
CCT: 6867 K
| MSI Modern 15 A10RB Chi Mei N156HCE-EN1, IPS, 15.6", 1920x1080 | Asus ZenBook 15 UX534FT-DB77 BOE NV156FHM-N63, IPS, 15.6", 1920x1080 | Dell XPS 15 7590 i5 iGPU FHD LQ156M1, IPS, 15.6", 1920x1080 | Lenovo ThinkPad T590-20N4002VGE LP156WFC-SPD1, aSi IPS LED, 15.6", 1920x1080 | HP Spectre X360 15-5ZV31AV AU Optronics AUO30EB, IPS, 15.6", 3840x2160 | MSI Prestige 15 A10SC Sharp LQ156D1JW42, IPS, 15.6", 3840x2160 | |
|---|---|---|---|---|---|---|
| Display | -3% | 3% | -39% | 3% | 25% | |
| Display P3 Coverage (%) | 66 | 66.6 1% | 66.5 1% | 38.79 -41% | 68.3 3% | 82 24% |
| sRGB Coverage (%) | 92.1 | 87.7 -5% | 98 6% | 58.3 -37% | 94.3 2% | 98.3 7% |
| AdobeRGB 1998 Coverage (%) | 66.5 | 64.1 -4% | 68.4 3% | 40.11 -40% | 68.4 3% | 96.2 45% |
| Response Times | 4% | -8% | 18% | -25% | -30% | |
| Response Time Grey 50% / Grey 80% * (ms) | 43.2 ? | 41.2 ? 5% | 52.8 ? -22% | 37.2 ? 14% | 56.8 ? -31% | 60 ? -39% |
| Response Time Black / White * (ms) | 34.4 ? | 33.2 ? 3% | 32 ? 7% | 27.2 ? 21% | 40.8 ? -19% | 41.2 ? -20% |
| PWM Frequency (Hz) | 26040 ? | 1020 ? | 26040 ? | |||
| Screen | -32% | 21% | -42% | -5% | 4% | |
| Brightness middle (cd/m²) | 289.4 | 312.6 8% | 588 103% | 276 -5% | 284.6 -2% | 464.5 61% |
| Brightness (cd/m²) | 273 | 290 6% | 555 103% | 262 -4% | 285 4% | 451 65% |
| Brightness Distribution (%) | 82 | 85 4% | 89 9% | 88 7% | 85 4% | 92 12% |
| Black Level * (cd/m²) | 0.27 | 0.31 -15% | 0.4 -48% | 0.23 15% | 0.25 7% | 0.5 -85% |
| Contrast (:1) | 1072 | 1008 -6% | 1470 37% | 1200 12% | 1138 6% | 929 -13% |
| Colorchecker dE 2000 * | 2.32 | 5.78 -149% | 2.5 -8% | 5.6 -141% | 3.52 -52% | 3.36 -45% |
| Colorchecker dE 2000 max. * | 5.76 | 8.86 -54% | 6.3 -9% | 16.4 -185% | 5.56 3% | 7.06 -23% |
| Colorchecker dE 2000 calibrated * | 2.49 | 3.78 -52% | 0.6 76% | 4.7 -89% | 3 -20% | 3.42 -37% |
| Greyscale dE 2000 * | 3 | 5.4 -80% | 4.5 -50% | 3 -0% | 3.2 -7% | 1.3 57% |
| Gamma | 2.22 99% | 2.21 100% | 2.2 100% | 2.18 101% | 2.28 96% | 2.14 103% |
| CCT | 6867 95% | 7864 83% | 6836 95% | 7075 92% | 7070 92% | 6596 99% |
| Color Space (Percent of AdobeRGB 1998) (%) | 59.8 | 57.1 -5% | 63.2 6% | 36.9 -38% | 61.1 2% | 84.8 42% |
| Color Space (Percent of sRGB) (%) | 92 | 87.4 -5% | 98 7% | 58.1 -37% | 93.8 2% | 98.3 7% |
| Total Average (Program / Settings) | -10% /
-22% | 5% /
14% | -21% /
-34% | -9% /
-6% | -0% /
4% |
* ... smaller is better
Color space covers approximately 92 percent and 60 percent of sRGB and AdobeRGB, respectively, to be not unlike what we measured on the Modern 14. The Sharp 4K UHD panel on the pricier Prestige 15 is able to cover 85 percent of the 3D AdobeRGB space for deeper and more accurate colors.
Further measurements with an X-Rite colorimeter show a well-calibrated display out of the box with average grayscale and color DeltaE values of just 3 and 2.32, respectively. Attempting to calibrate the display even further ourselves resulted in no major improvements. Interestingly, the colors Red and Cyan and are represented slightly less accurately than the other primary and secondary colors.


Display Response Times
| ↔ Response Time Black to White | ||
|---|---|---|
| 34.4 ms ... rise ↗ and fall ↘ combined | ↗ 20.4 ms rise | 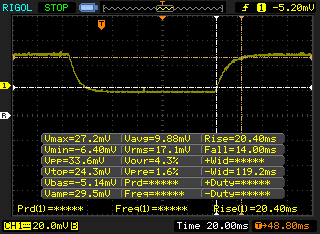 |
| ↘ 14 ms fall | ||
| The screen shows slow response rates in our tests and will be unsatisfactory for gamers. In comparison, all tested devices range from 0.1 (minimum) to 240 (maximum) ms. » 92 % of all devices are better. This means that the measured response time is worse than the average of all tested devices (19.8 ms). | ||
| ↔ Response Time 50% Grey to 80% Grey | ||
| 43.2 ms ... rise ↗ and fall ↘ combined | ↗ 22.8 ms rise | 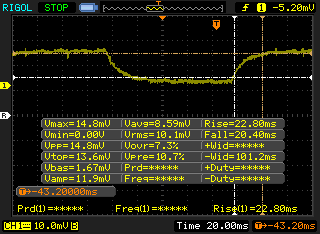 |
| ↘ 20.4 ms fall | ||
| The screen shows slow response rates in our tests and will be unsatisfactory for gamers. In comparison, all tested devices range from 0.165 (minimum) to 636 (maximum) ms. » 72 % of all devices are better. This means that the measured response time is worse than the average of all tested devices (30.9 ms). | ||
Screen Flickering / PWM (Pulse-Width Modulation)
| Screen flickering / PWM detected | 26040 Hz | ≤ 13 % brightness setting | 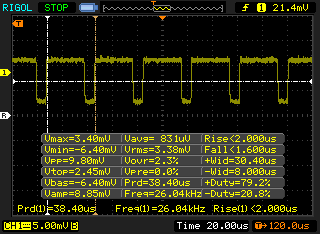 |
The display backlight flickers at 26040 Hz (worst case, e.g., utilizing PWM) Flickering detected at a brightness setting of 13 % and below. There should be no flickering or PWM above this brightness setting. The frequency of 26040 Hz is quite high, so most users sensitive to PWM should not notice any flickering. In comparison: 52 % of all tested devices do not use PWM to dim the display. If PWM was detected, an average of 7741 (minimum: 5 - maximum: 343500) Hz was measured. | |||
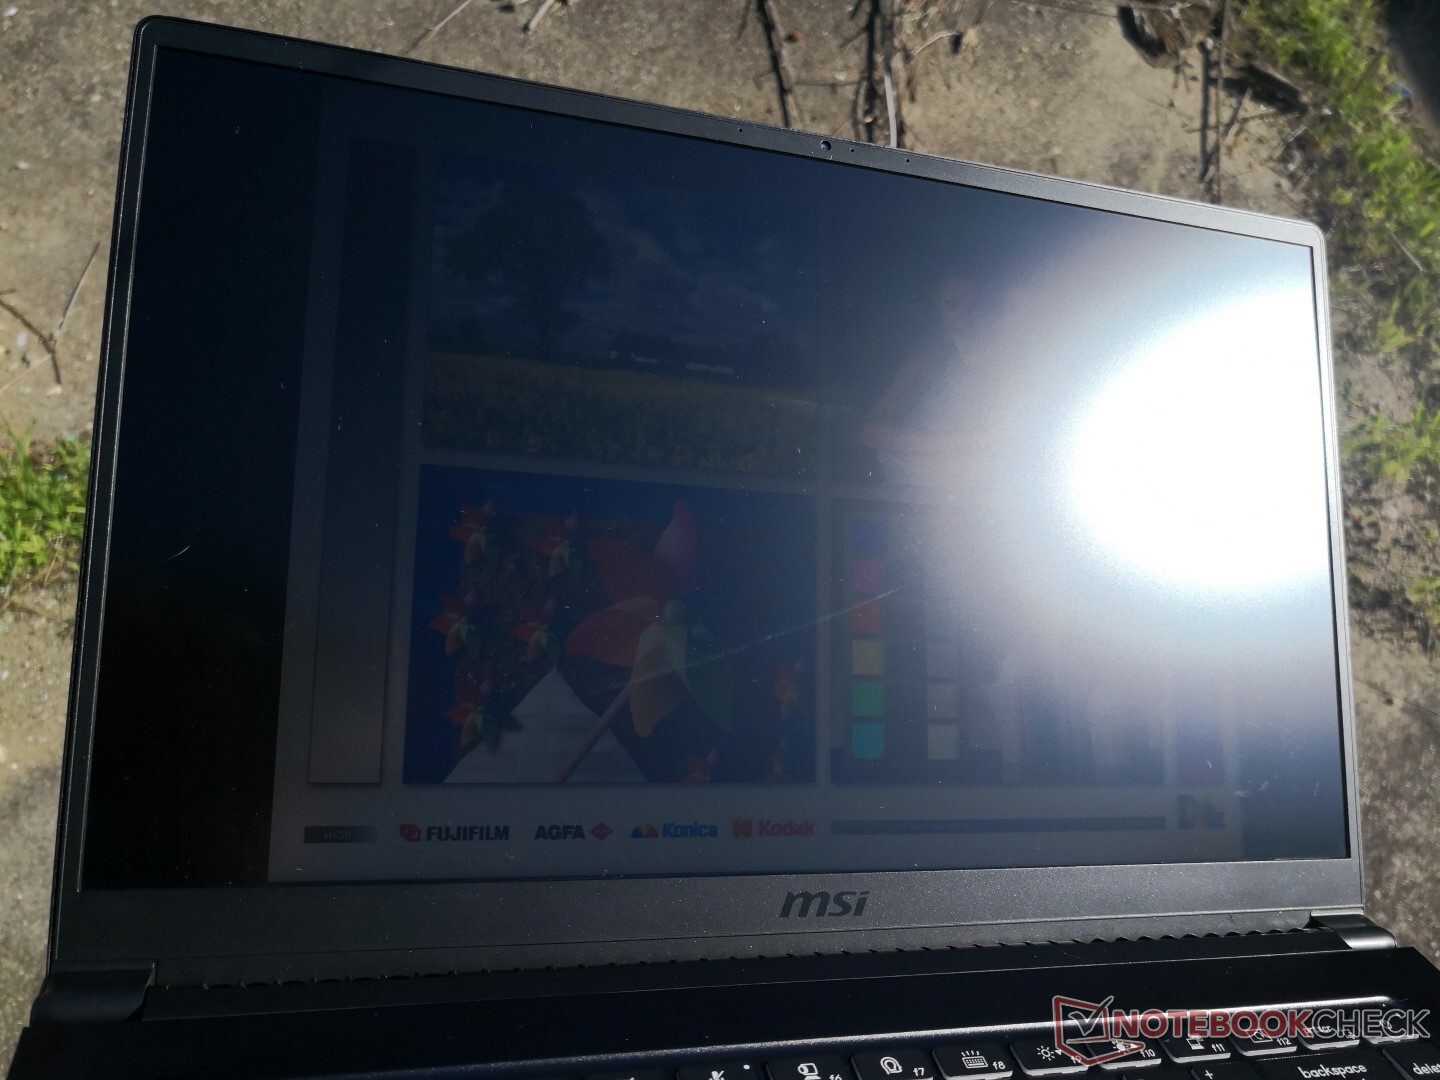
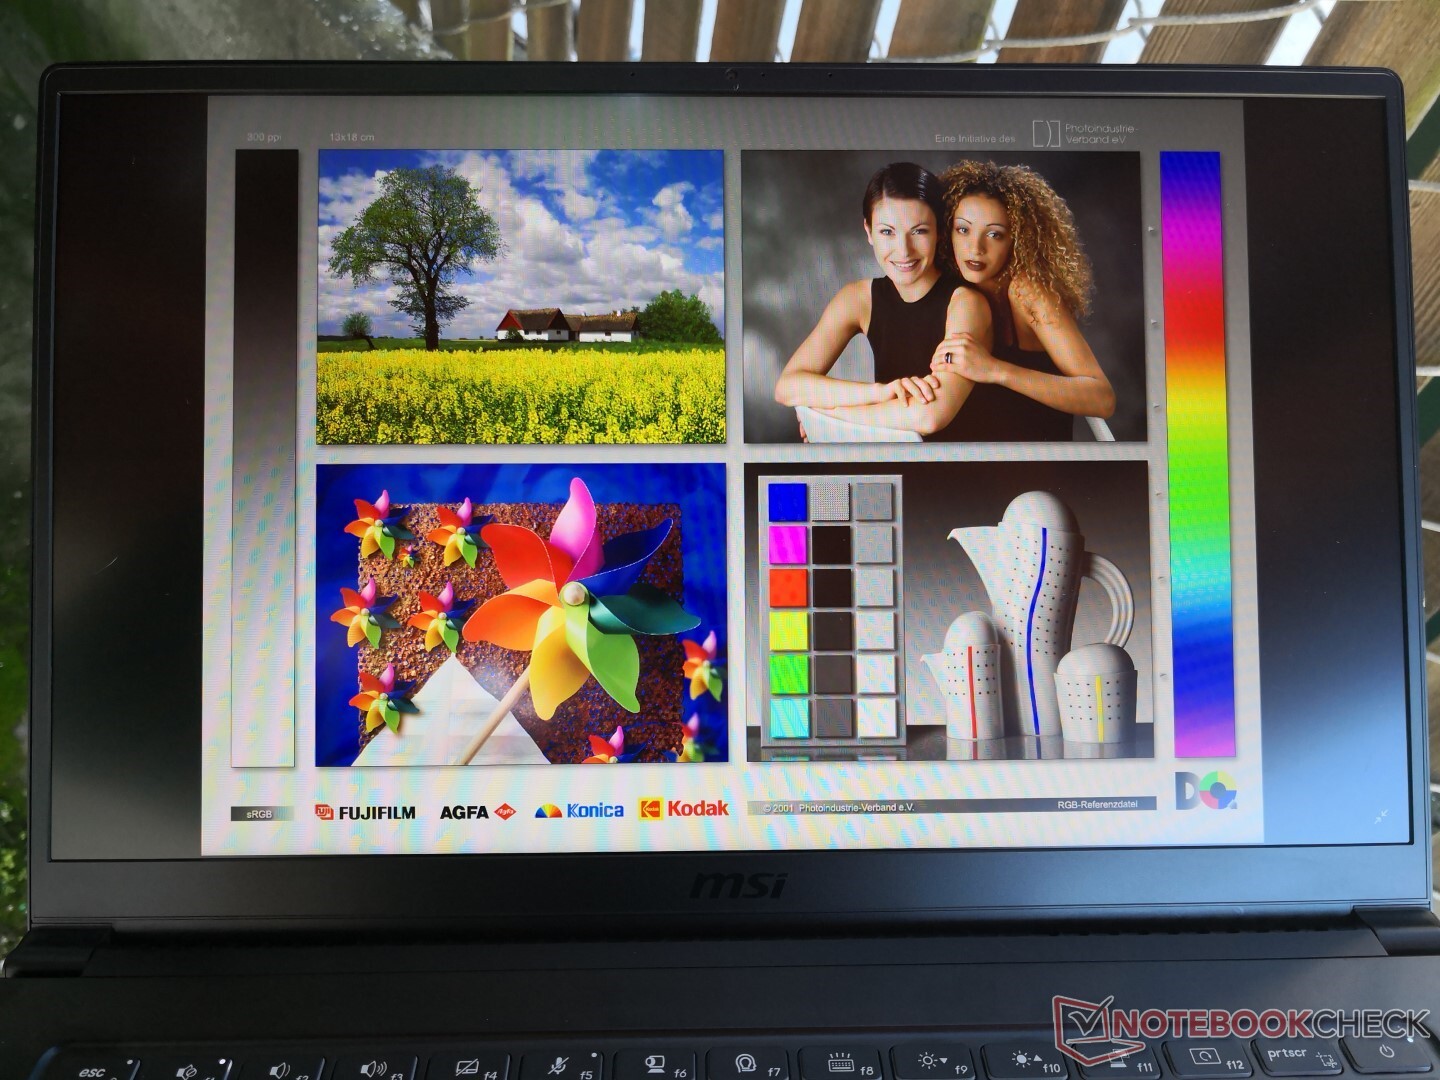
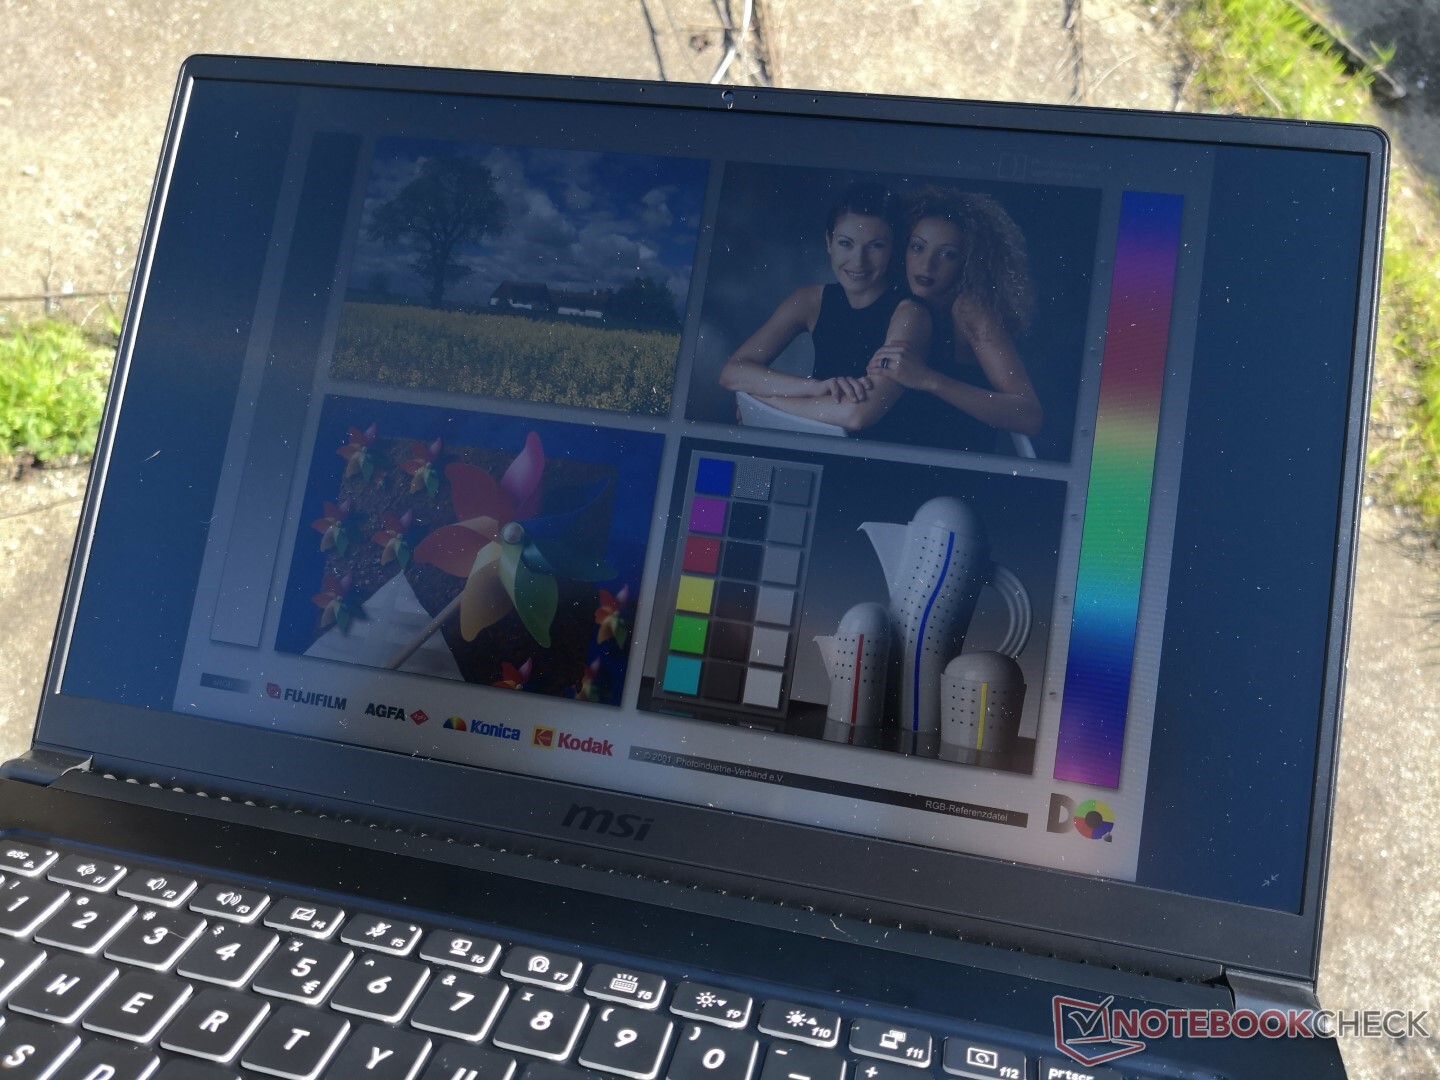
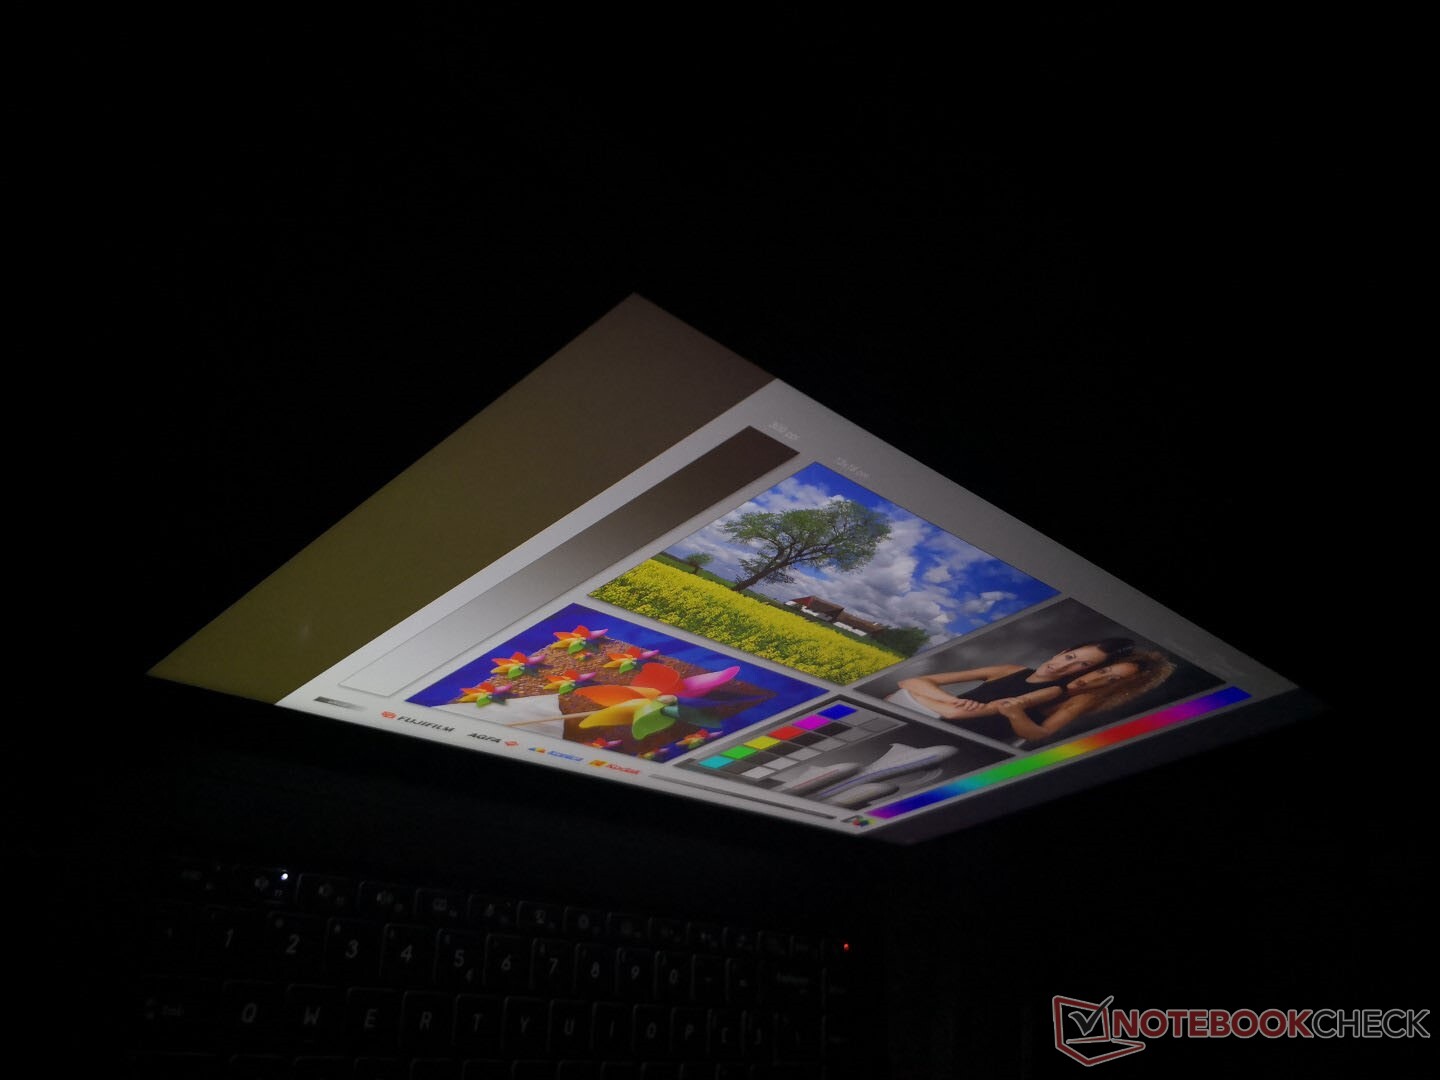
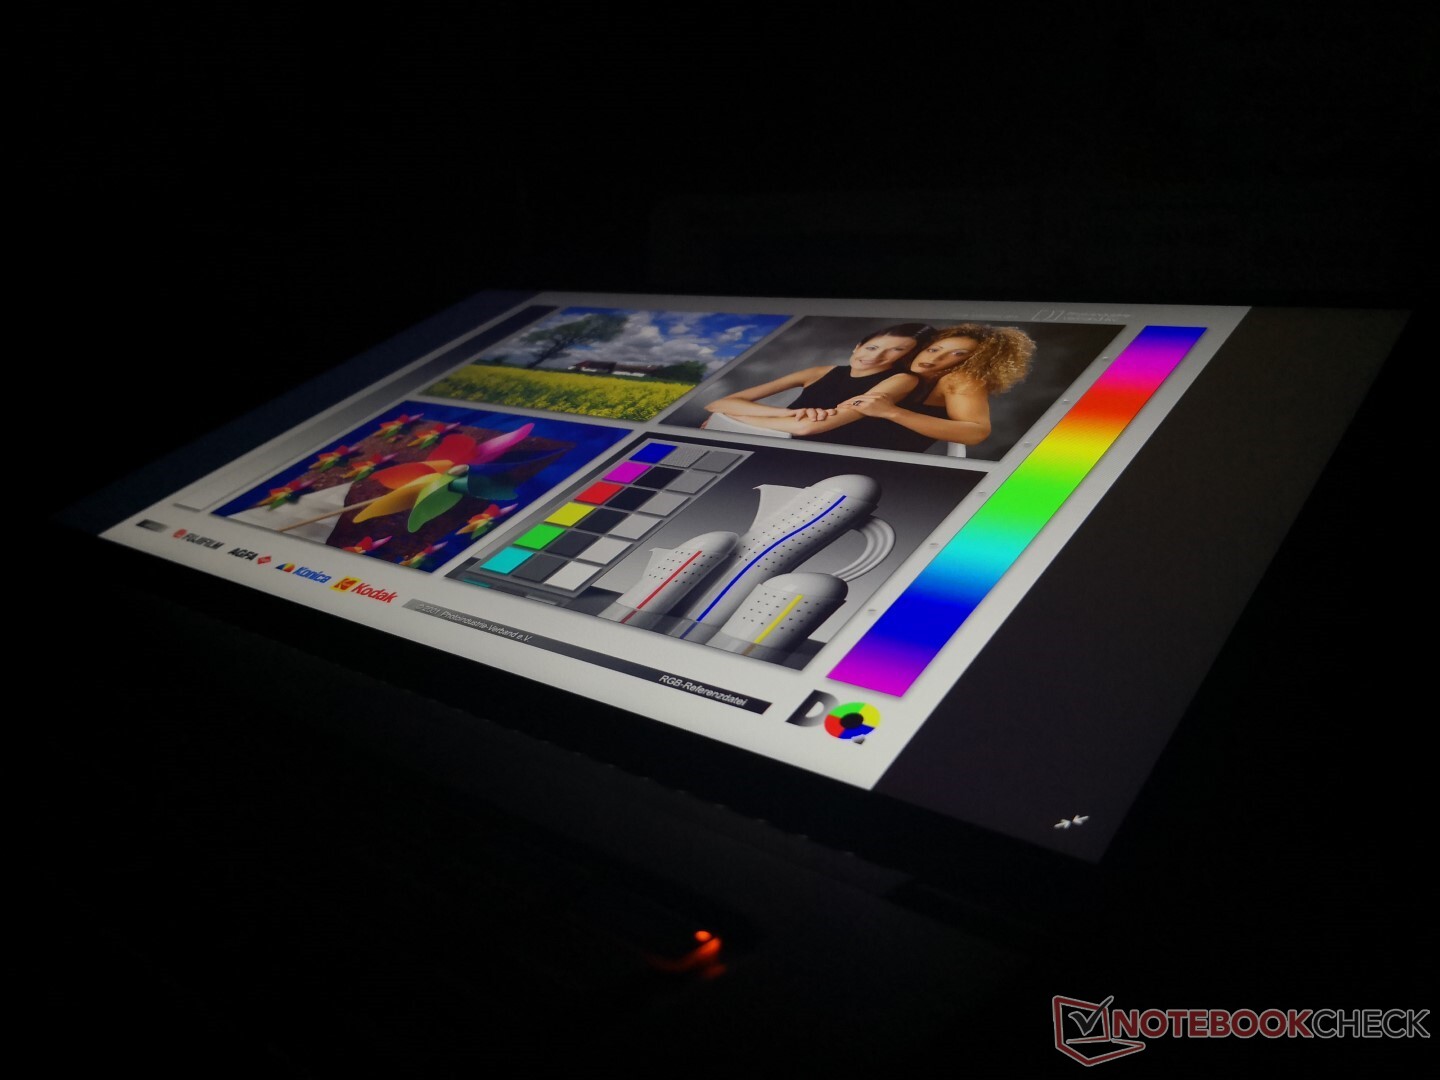
Outdoor visibility is not bad when under shade because of the matte overlay, wide viewing angles, and 180-degree hinges. Anything brighter, however, will wash out the screen. A brighter laptop is recommended like the XPS 15, MacBook Pro, or Prestige 15 if you plan on using your laptop outdoors frequently.
Performance
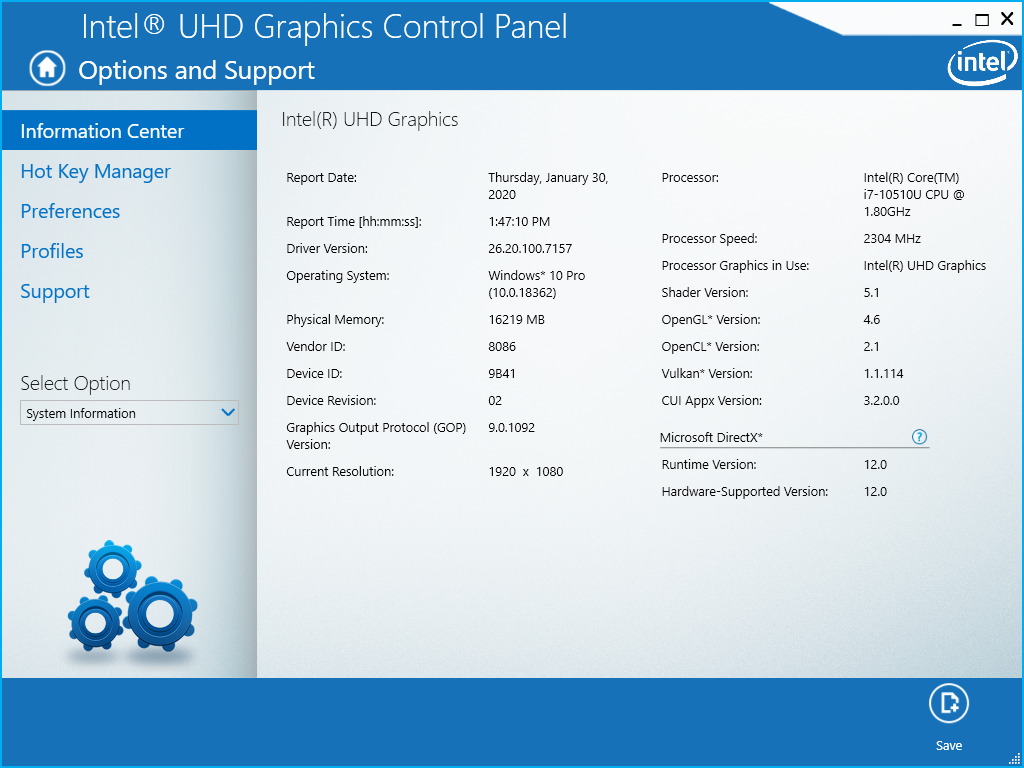
The Core i5/i7 and GeForce MX250 options of the Modern 15 target office users and content creators desiring more performance than the typical Ultrabook equipped with UMA graphics only. For even more power without sacrificing portability, MSI offers the pricier Prestige 14 and Prestige 15. Alternatives like the Dell XPS 15 or HP Spectre x360 15 have much faster Core H-series CPUs albeit in heavier and thicker form factors.
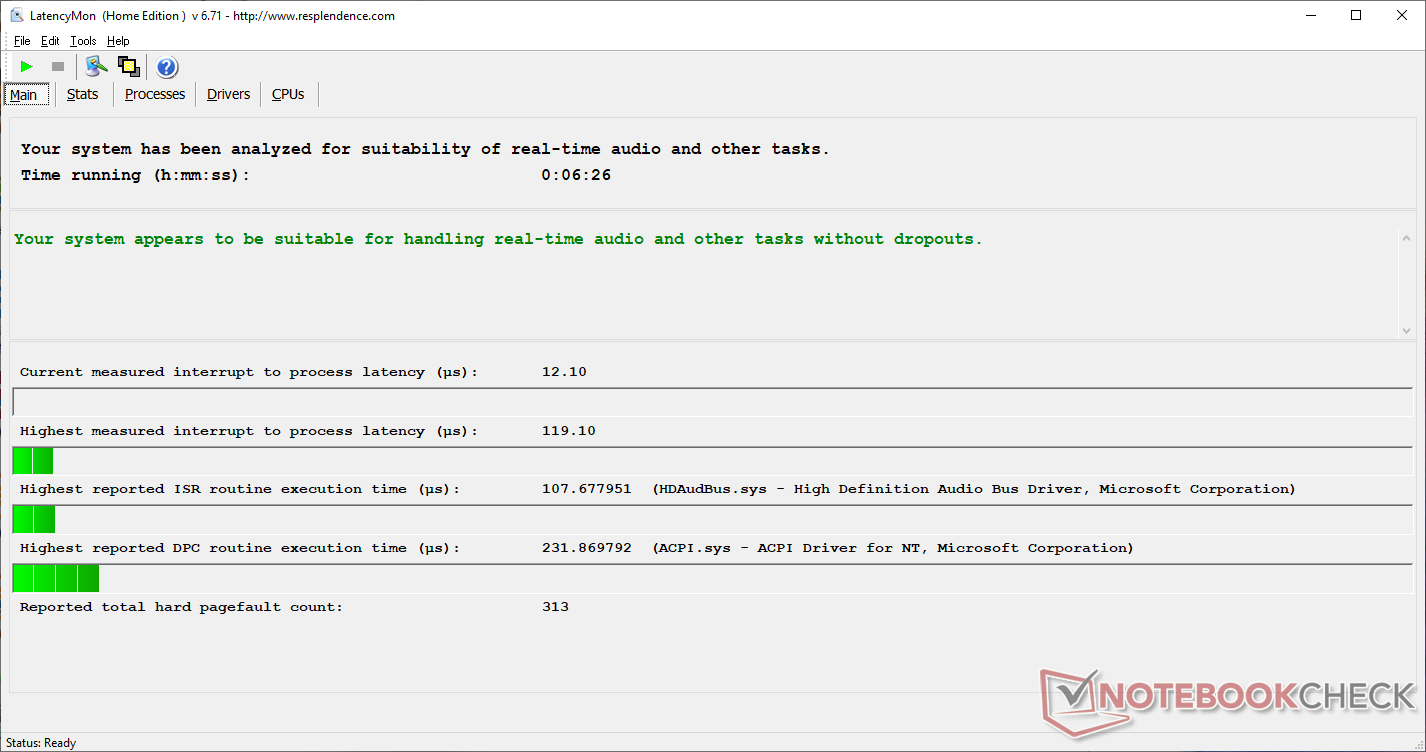
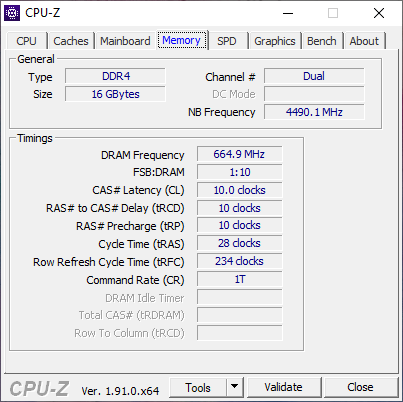
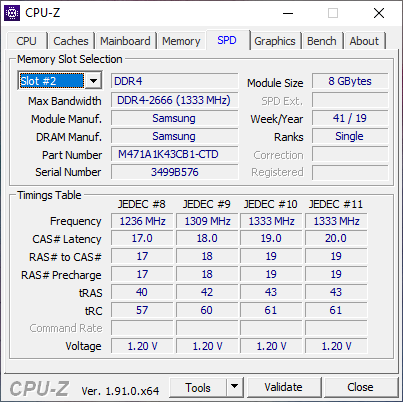
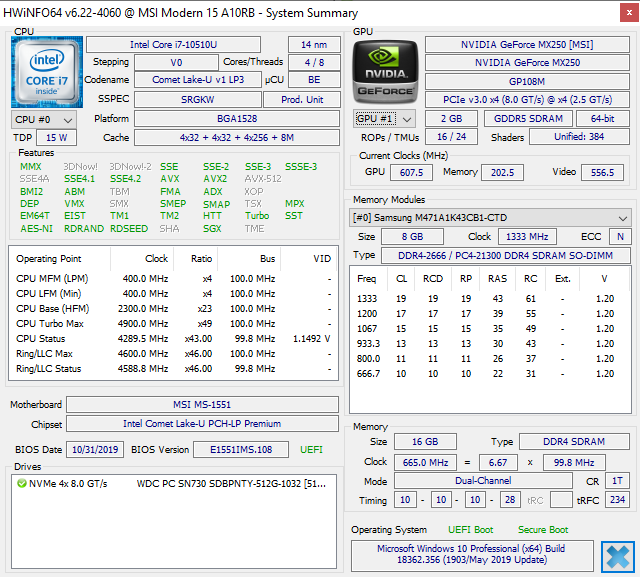
There are two SODIMM slots for dual-channel memory unlike the single-channel-only Modern 14 for up to 64 GB of DDR4-2666 RAM. LatencyMon shows no recurring DPC latency issues even when the wireless is enabled.
Processor
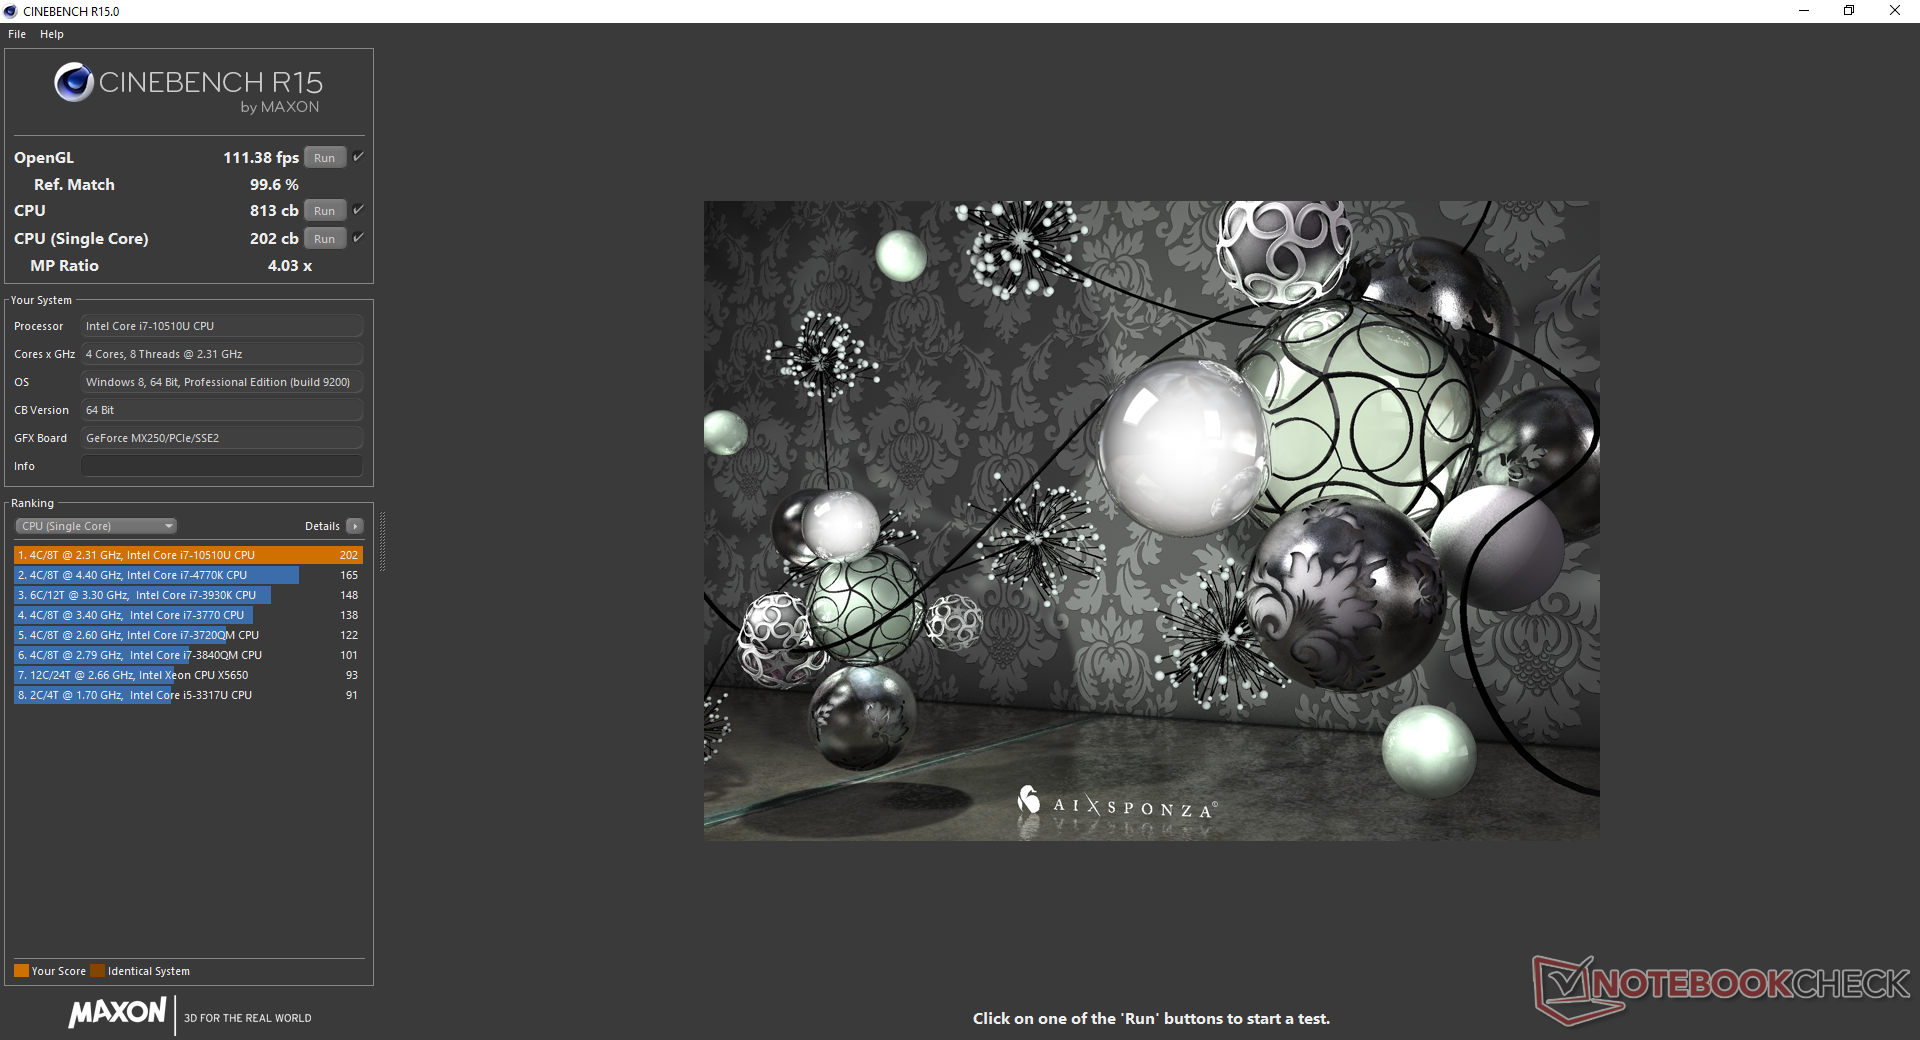
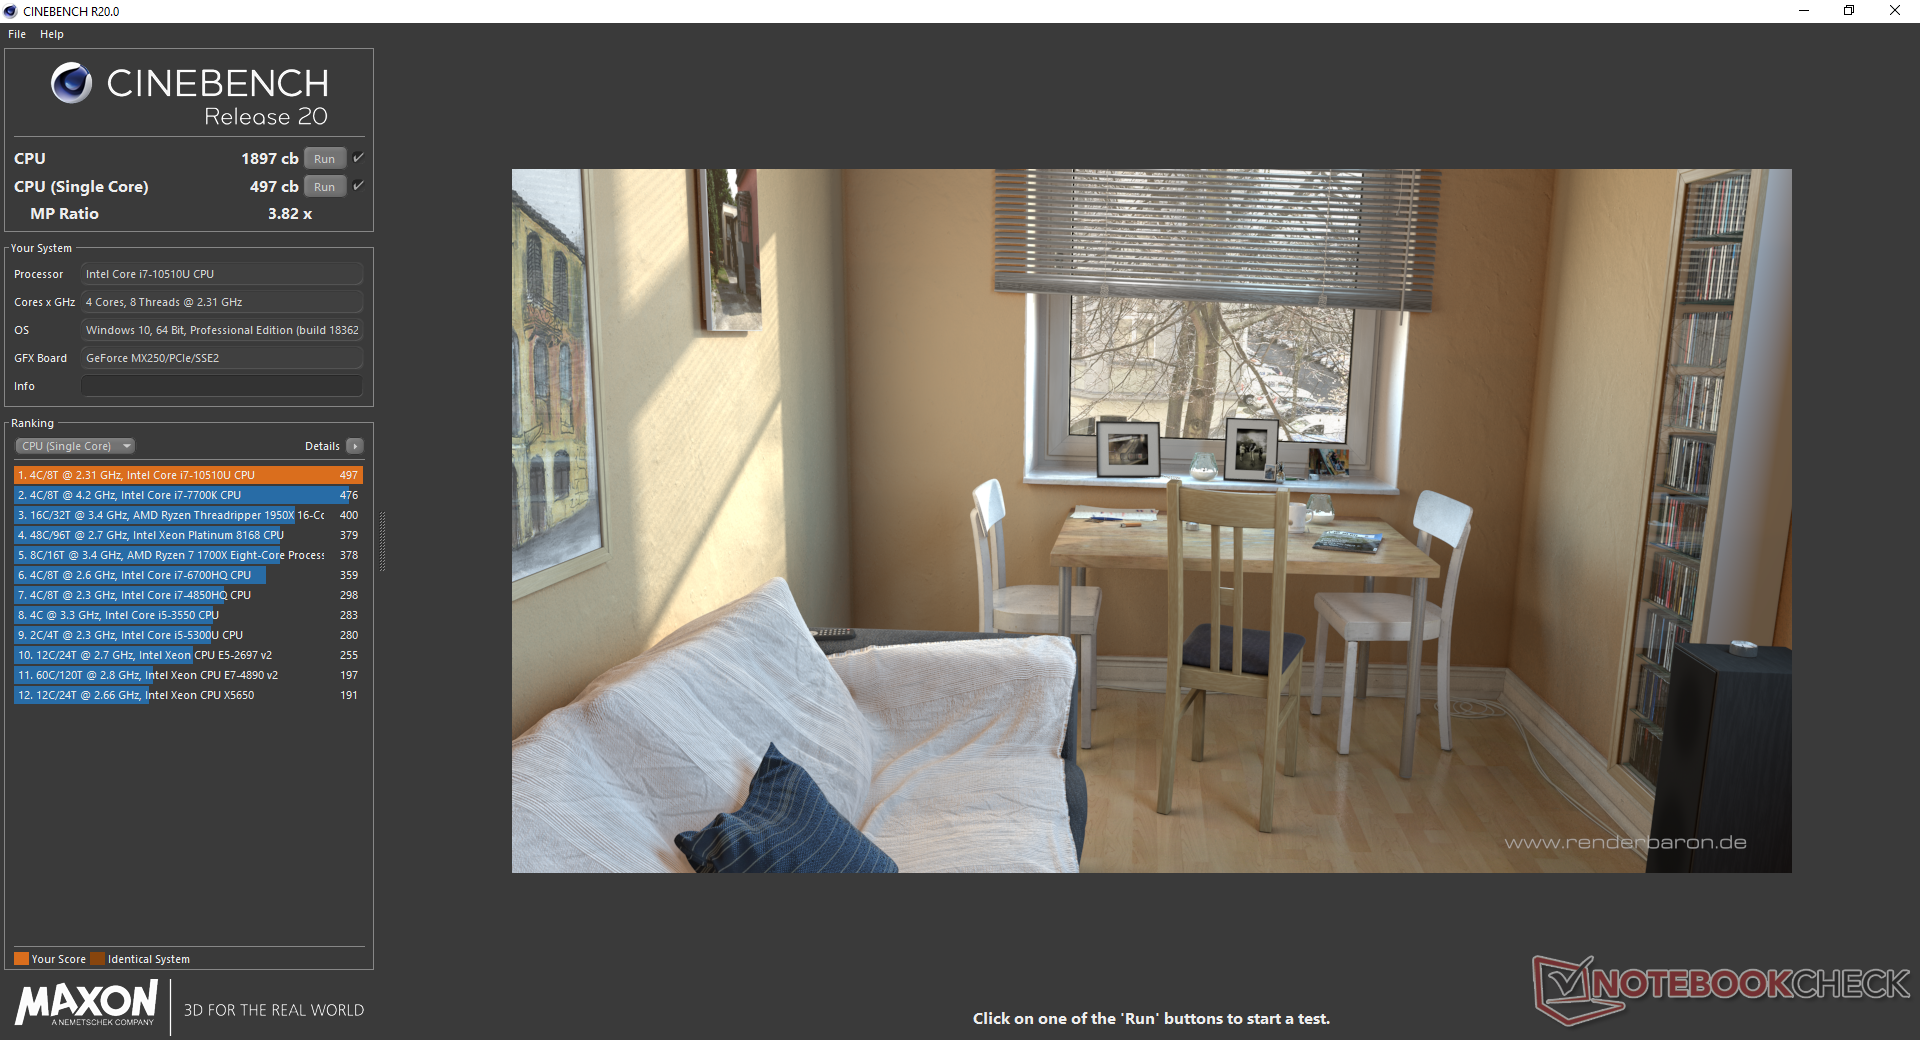
After being left disappointed by the Core i5-10210U in the Modern 14, we weren't expecting very much from the Core i7-10510U in the Modern 15. But to our surprise, the Core i7-10510U here performs better than expected with CineBench multi-thread scores that are 16 to 25 percent higher than the average Core i7-10510U in our database. Raw performance is faster than even the more demanding 35 W Ryzen 7 3750H while outperforming the Core i7-8565U in the older PS63 Modern by up to 25 percent. The hexa-core Core i7-10710U is faster still, but this particular processor is not available on the Modern series.
Performance sustainability is decent. When running CineBench R15 Multi-Thread in a loop, the initial score of 859 points drops and stabilizes at about 795 points by the second loop to represent a performance deficit of 7.5 percent over time.
See our dedicated page on the Core i7-10510U for more technical information and benchmark comparisons.
| wPrime 2.10 - 1024m | |
| Microsoft Surface Laptop 3 15 Ryzen 5 3580U | |
| Dell XPS 13 7390 2-in-1 Core i7 | |
| Dell XPS 13 7390 Core i7-10710U | |
* ... smaller is better
System Performance
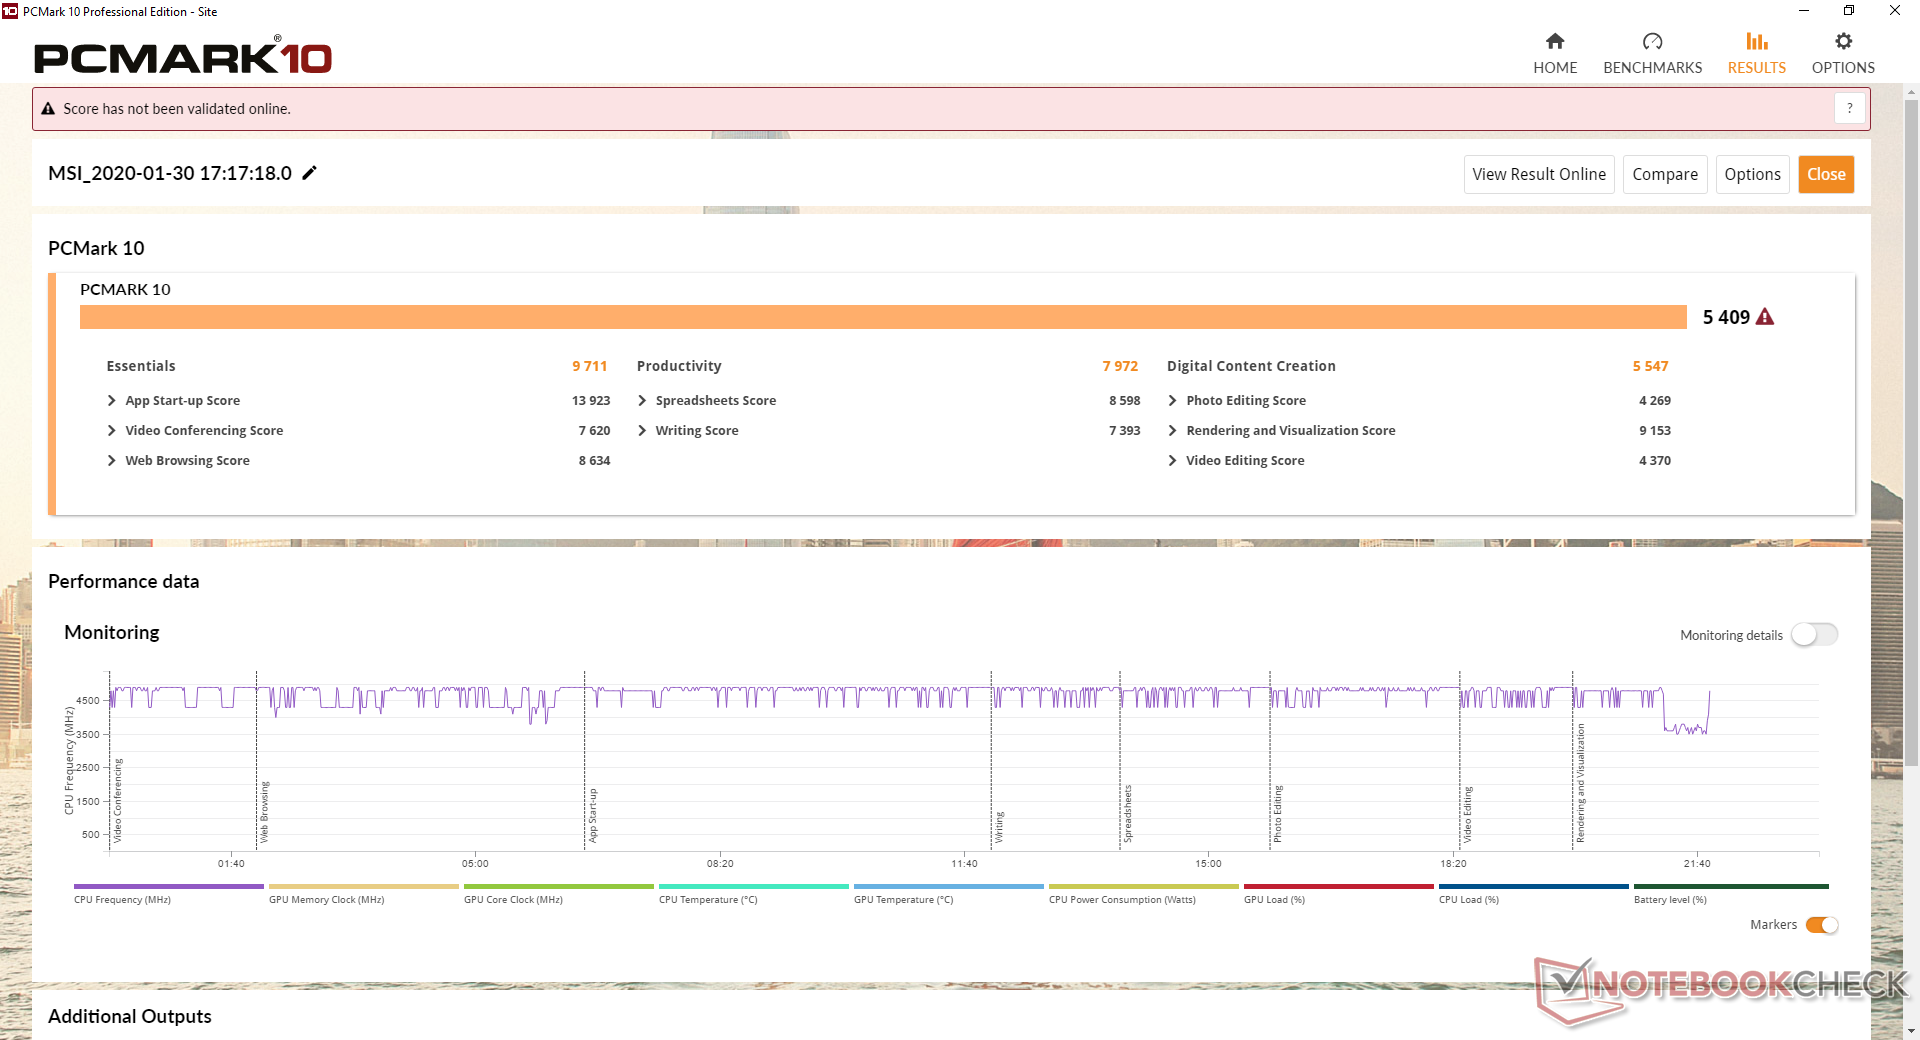
PCMark benchmarks rank our Modern 15 higher than expected. Our scores outpace even the higher-end Prestige 15 and its faster GTX 1650 Max-Q GPU. We can't pinpoint the likely cause of the discrepancy, but the higher native resolution of the Prestige 15 is probably partly responsible.
We experienced no software or hardware issues during our time with the test unit.
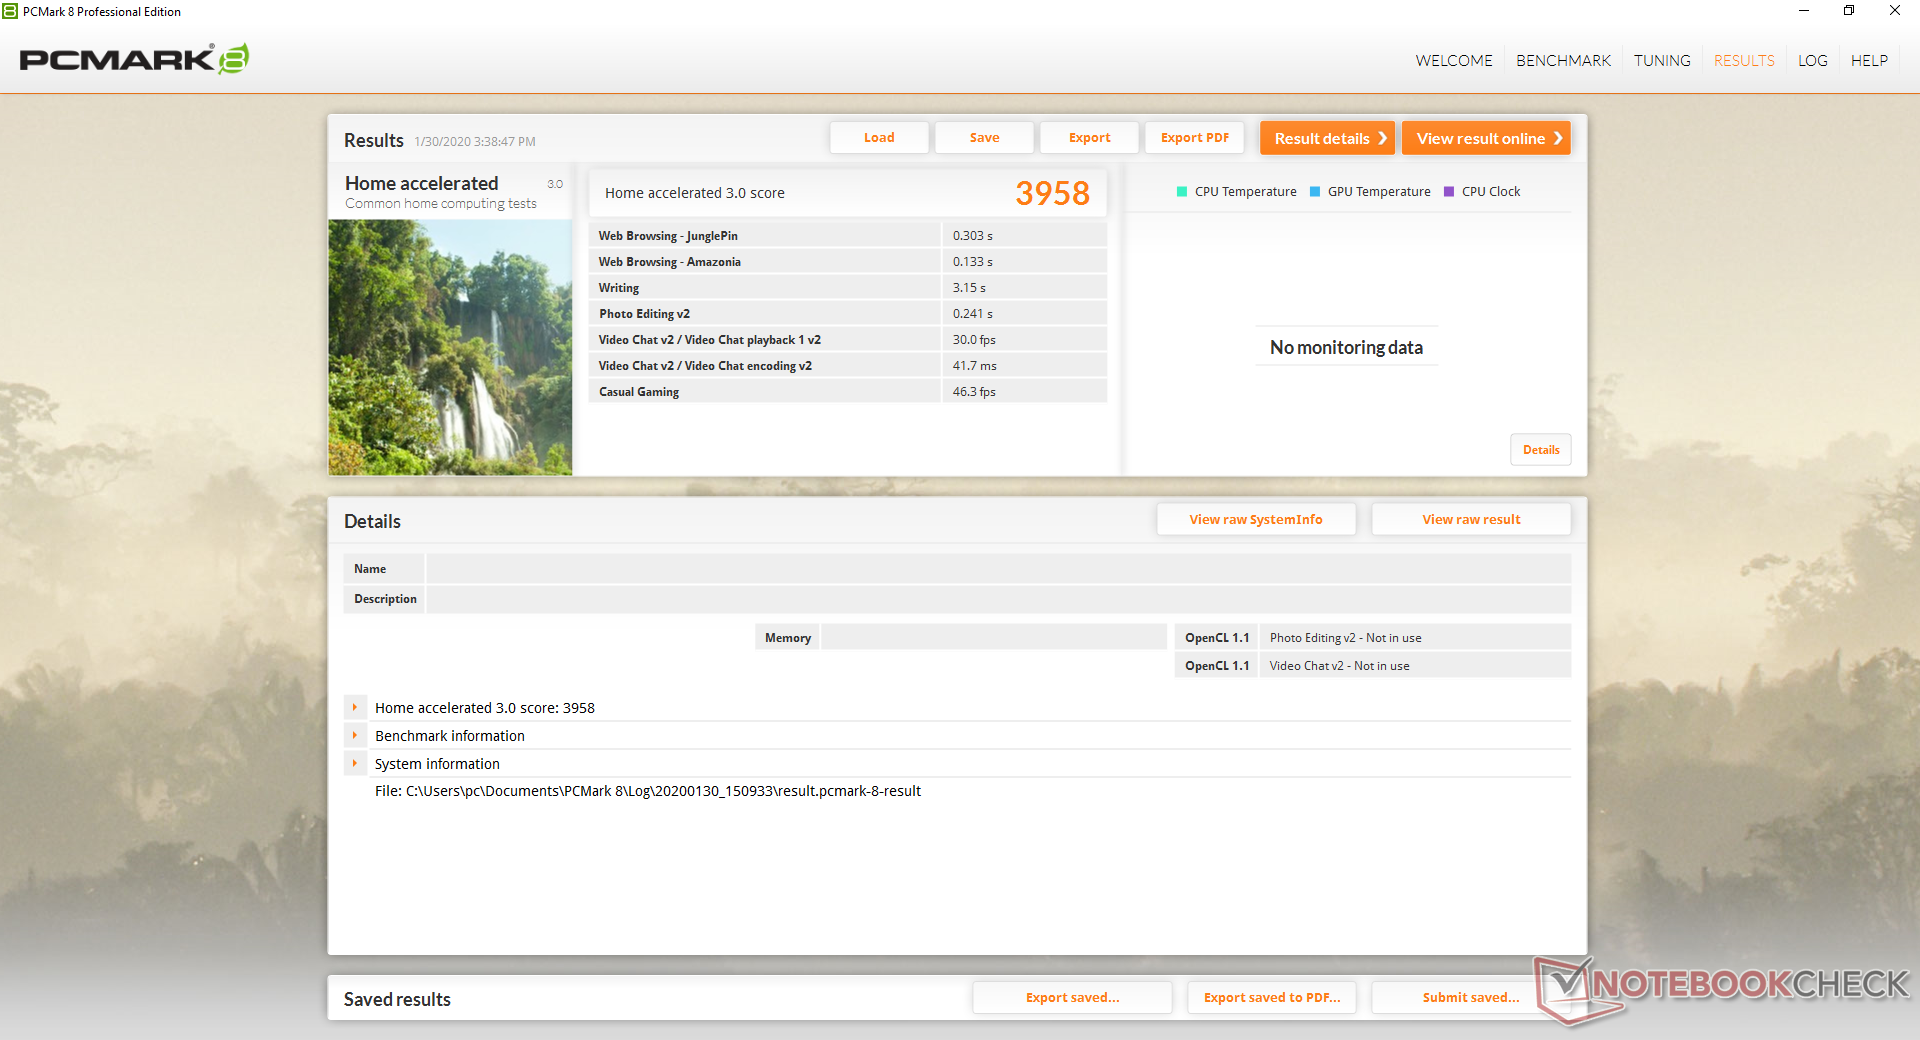
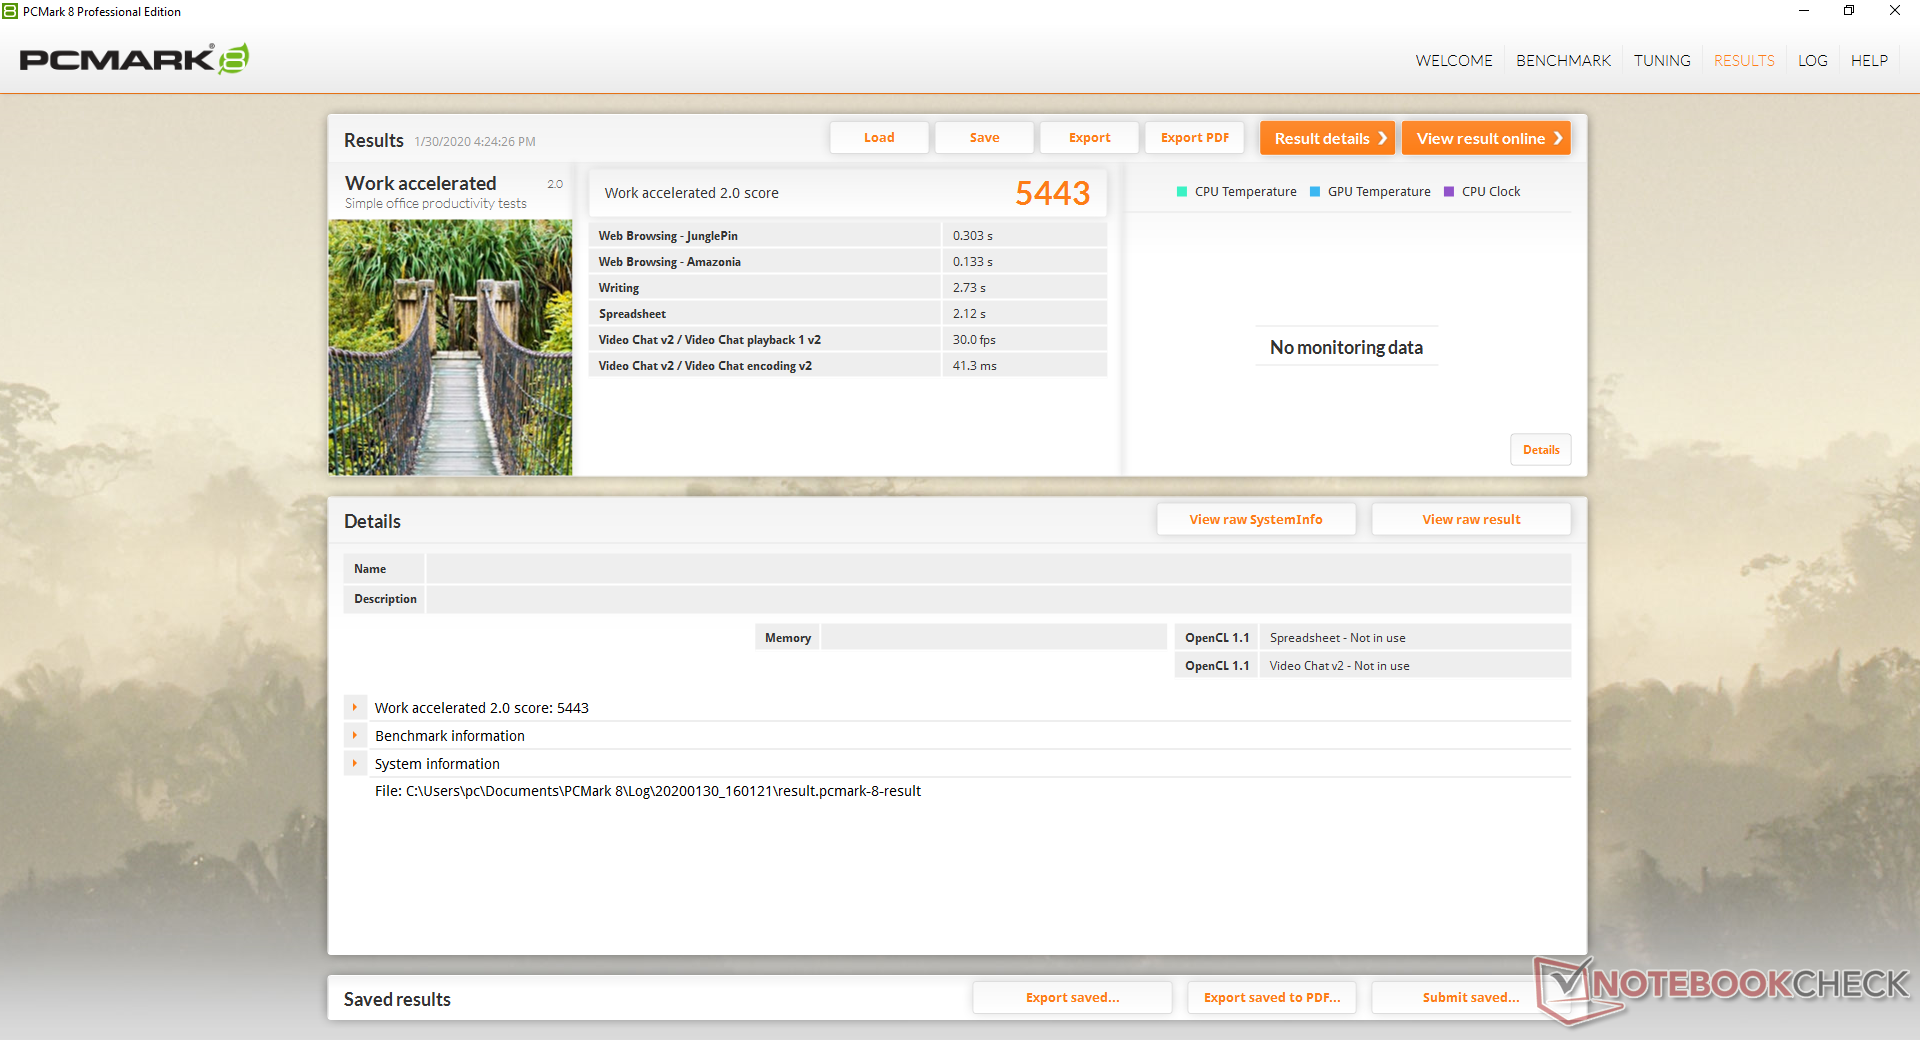
| PCMark 8 Home Score Accelerated v2 | 3958 points | |
| PCMark 8 Work Score Accelerated v2 | 5443 points | |
| PCMark 10 Score | 5409 points | |
Help | ||
Storage Devices
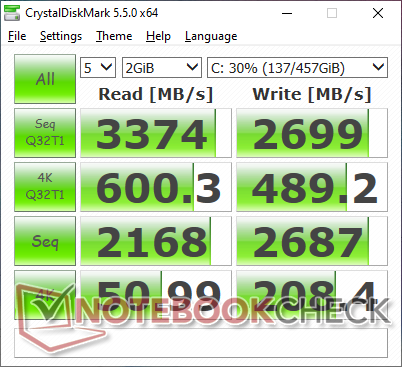
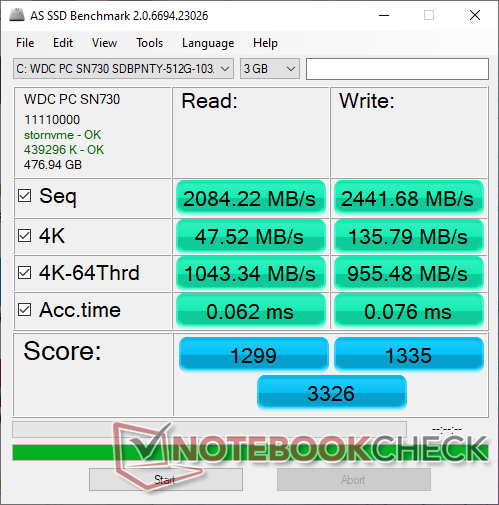
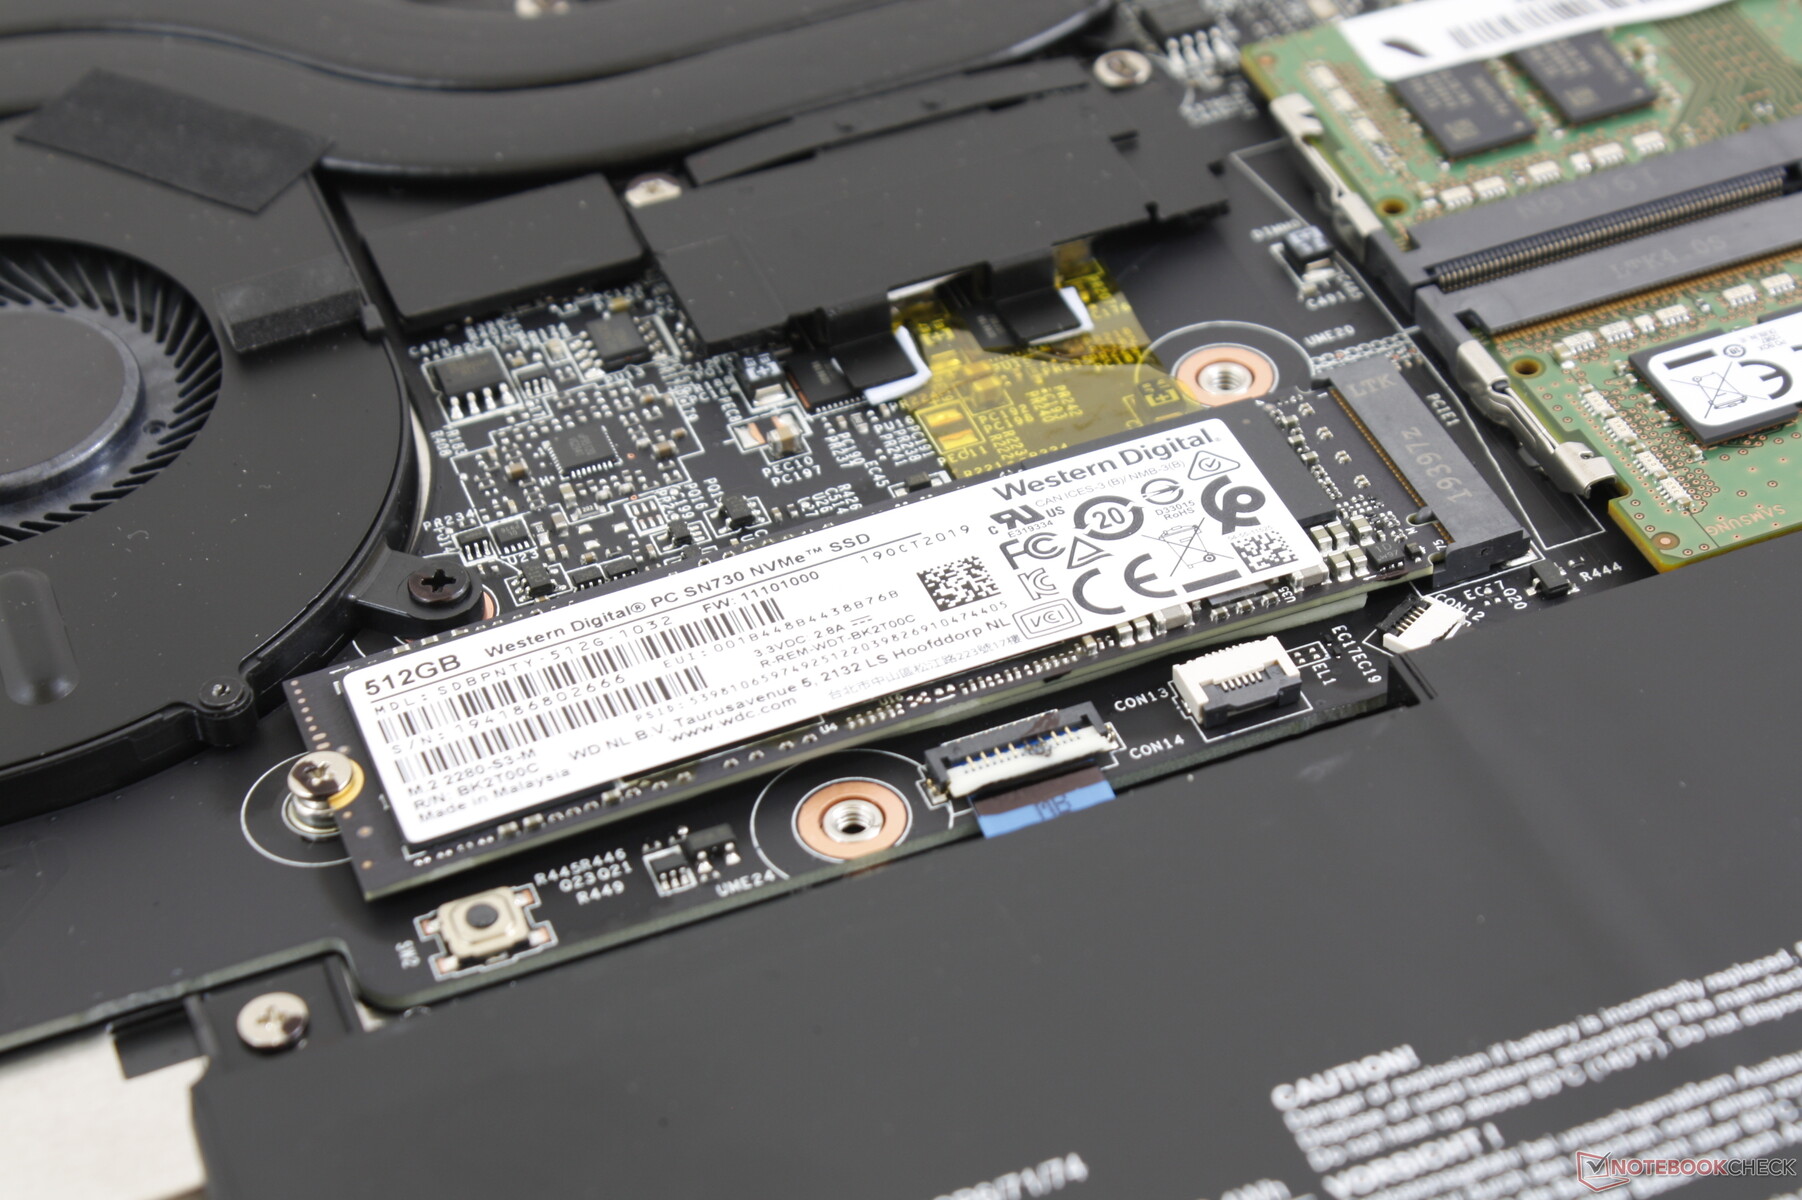
Two M.2 2280 NVMe PCIe slots are available. Our particular test model comes with the relatively new 512 GB Western Digital SN730 NVMe SSD with sequential read and write rates of over 2000 MB/s each. Performance is comparable to the Samsung SSD PM981 as found on most high-end laptops if not better at least according to AS SSD and CrystalDiskMark. Depending on where you purchase the Modern 15, however, different SSDs may be present.
See our table of HDDs and SSDs for more benchmark comparisons.
| MSI Modern 15 A10RB WDC PC SN730 SDBPNTY-512G | Asus ZenBook 15 UX534FT-DB77 Samsung SSD PM981 MZVLB1T0HALR | Lenovo ThinkPad T590-20N4002VGE Toshiba XG6 KXG60ZNV512G | HP Spectre X360 15-5ZV31AV Intel SSD 660p 2TB SSDPEKNW020T8 | MSI Prestige 15 A10SC Samsung SSD PM981 MZVLB1T0HALR | |
|---|---|---|---|---|---|
| AS SSD | 0% | 21% | -21% | 11% | |
| Seq Read (MB/s) | 2084 | 1887 -9% | 2551 22% | 1220 -41% | 1274 -39% |
| Seq Write (MB/s) | 2442 | 1432 -41% | 2376 -3% | 1152 -53% | 1395 -43% |
| 4K Read (MB/s) | 47.52 | 52.3 10% | 52.7 11% | 52.3 10% | 50.3 6% |
| 4K Write (MB/s) | 135.8 | 146 8% | 153 13% | 146.6 8% | 119.8 -12% |
| 4K-64 Read (MB/s) | 1043 | 969 -7% | 1406 35% | 652 -37% | 1599 53% |
| 4K-64 Write (MB/s) | 955 | 1375 44% | 1439 51% | 847 -11% | 1455 52% |
| Access Time Read * (ms) | 0.062 | 0.034 45% | 0.067 -8% | 0.077 -24% | 0.044 29% |
| Access Time Write * (ms) | 0.076 | 0.075 1% | 0.027 64% | 0.106 -39% | 0.092 -21% |
| Score Read (Points) | 1299 | 1210 -7% | 1714 32% | 826 -36% | 1777 37% |
| Score Write (Points) | 1335 | 1664 25% | 1829 37% | 1109 -17% | 1714 28% |
| Score Total (Points) | 3326 | 3483 5% | 4418 33% | 2371 -29% | 4411 33% |
| Copy ISO MB/s (MB/s) | 1926 | 1375 -29% | 2625 36% | 2070 7% | 2830 47% |
| Copy Program MB/s (MB/s) | 714 | 468 -34% | 495.9 -31% | 571 -20% | 609 -15% |
| Copy Game MB/s (MB/s) | 1425 | 1287 -10% | 1384 -3% | 1219 -14% | 1424 0% |
| CrystalDiskMark 5.2 / 6 | -14% | -22% | -27% | -33% | |
| Write 4K (MB/s) | 208.4 | 141.6 -32% | 126.2 -39% | 151.5 -27% | 150.8 -28% |
| Read 4K (MB/s) | 51 | 45.28 -11% | 48.93 -4% | 59.3 16% | 47.3 -7% |
| Write Seq (MB/s) | 2687 | 1975 -26% | 1345 -50% | 1424 -47% | 981 -63% |
| Read Seq (MB/s) | 2168 | 2272 5% | 1373 -37% | 1609 -26% | 976 -55% |
| Write 4K Q32T1 (MB/s) | 489.2 | 458.6 -6% | 383.8 -22% | 393.6 -20% | 442.7 -10% |
| Read 4K Q32T1 (MB/s) | 600 | 391.4 -35% | 434.8 -28% | 369.4 -38% | 499.7 -17% |
| Write Seq Q32T1 (MB/s) | 2699 | 2393 -11% | 2966 10% | 1946 -28% | 1706 -37% |
| Read Seq Q32T1 (MB/s) | 3374 | 3464 3% | 3230 -4% | 1934 -43% | 1758 -48% |
| Write 4K Q8T8 (MB/s) | 960 | ||||
| Read 4K Q8T8 (MB/s) | 1441 | ||||
| Total Average (Program / Settings) | -7% /
-5% | -1% /
5% | -24% /
-23% | -11% /
-5% |
* ... smaller is better

GPU Performance
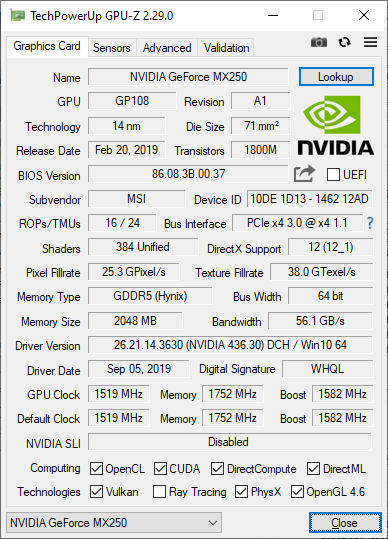
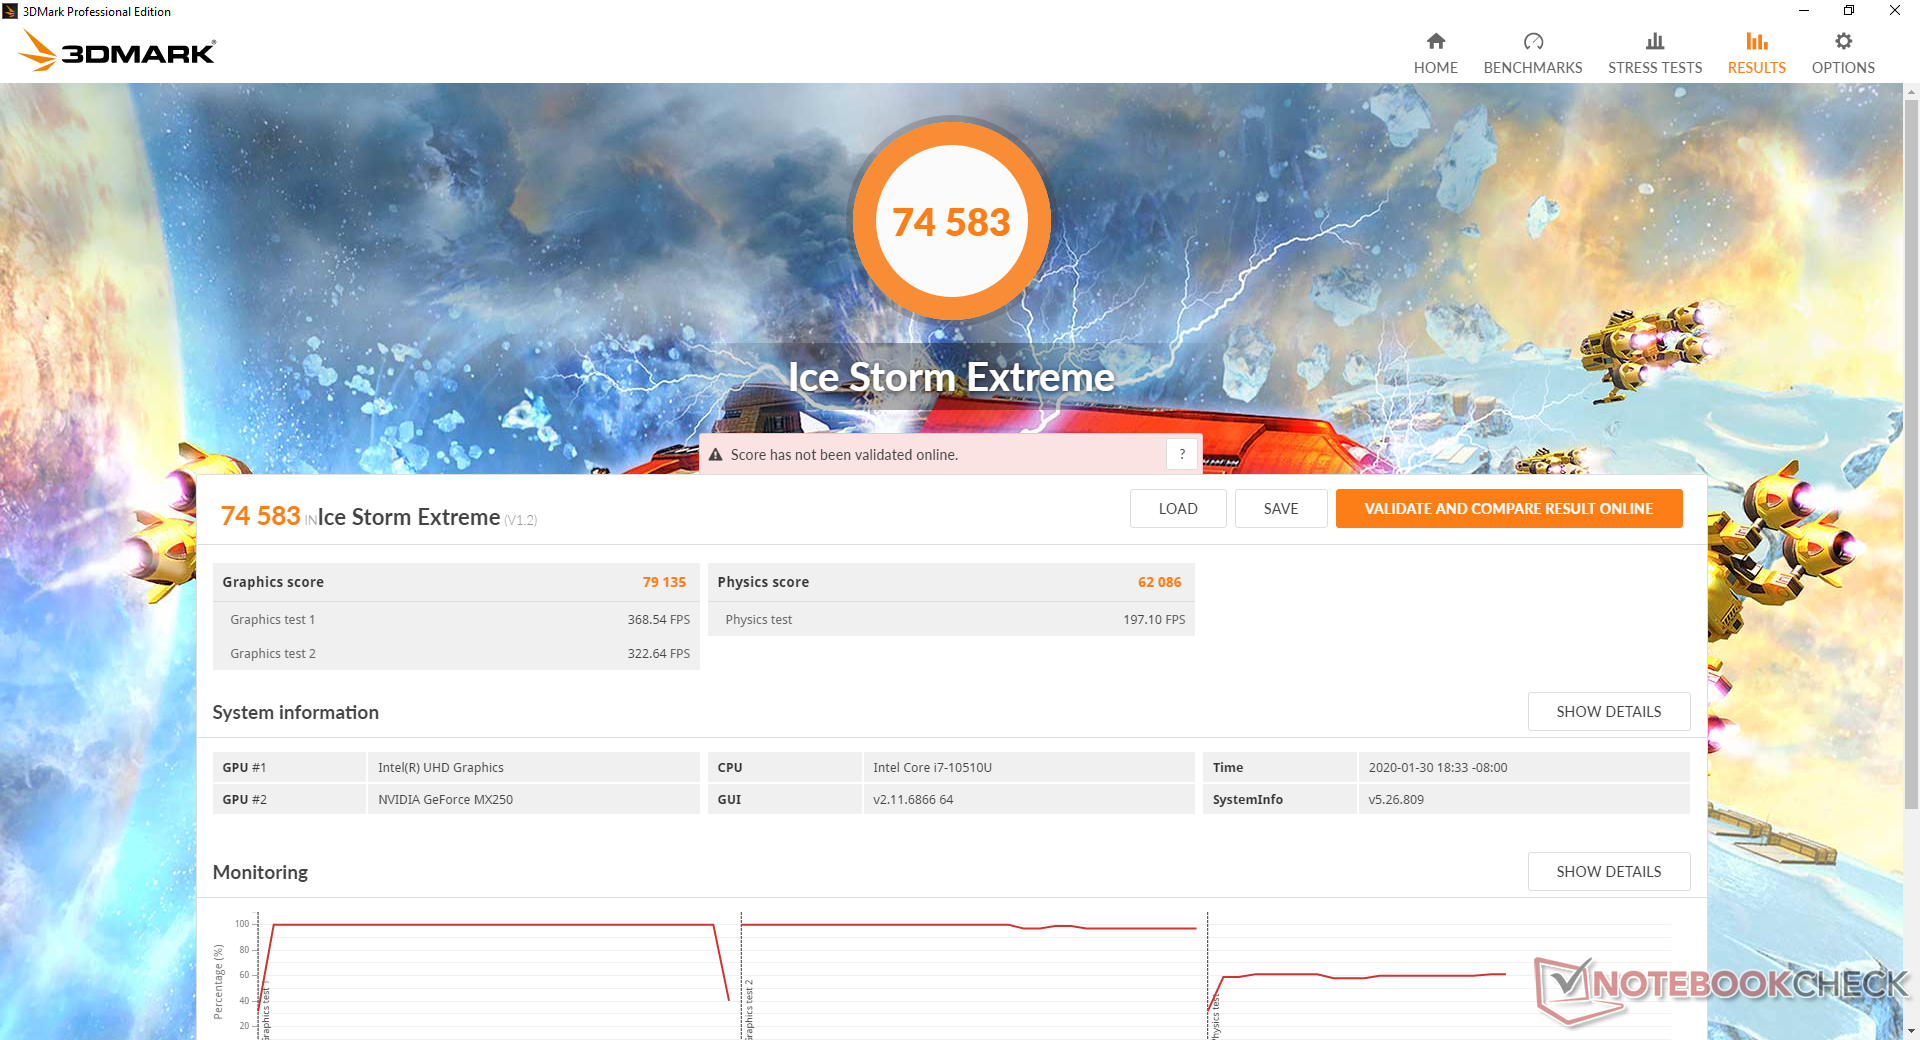
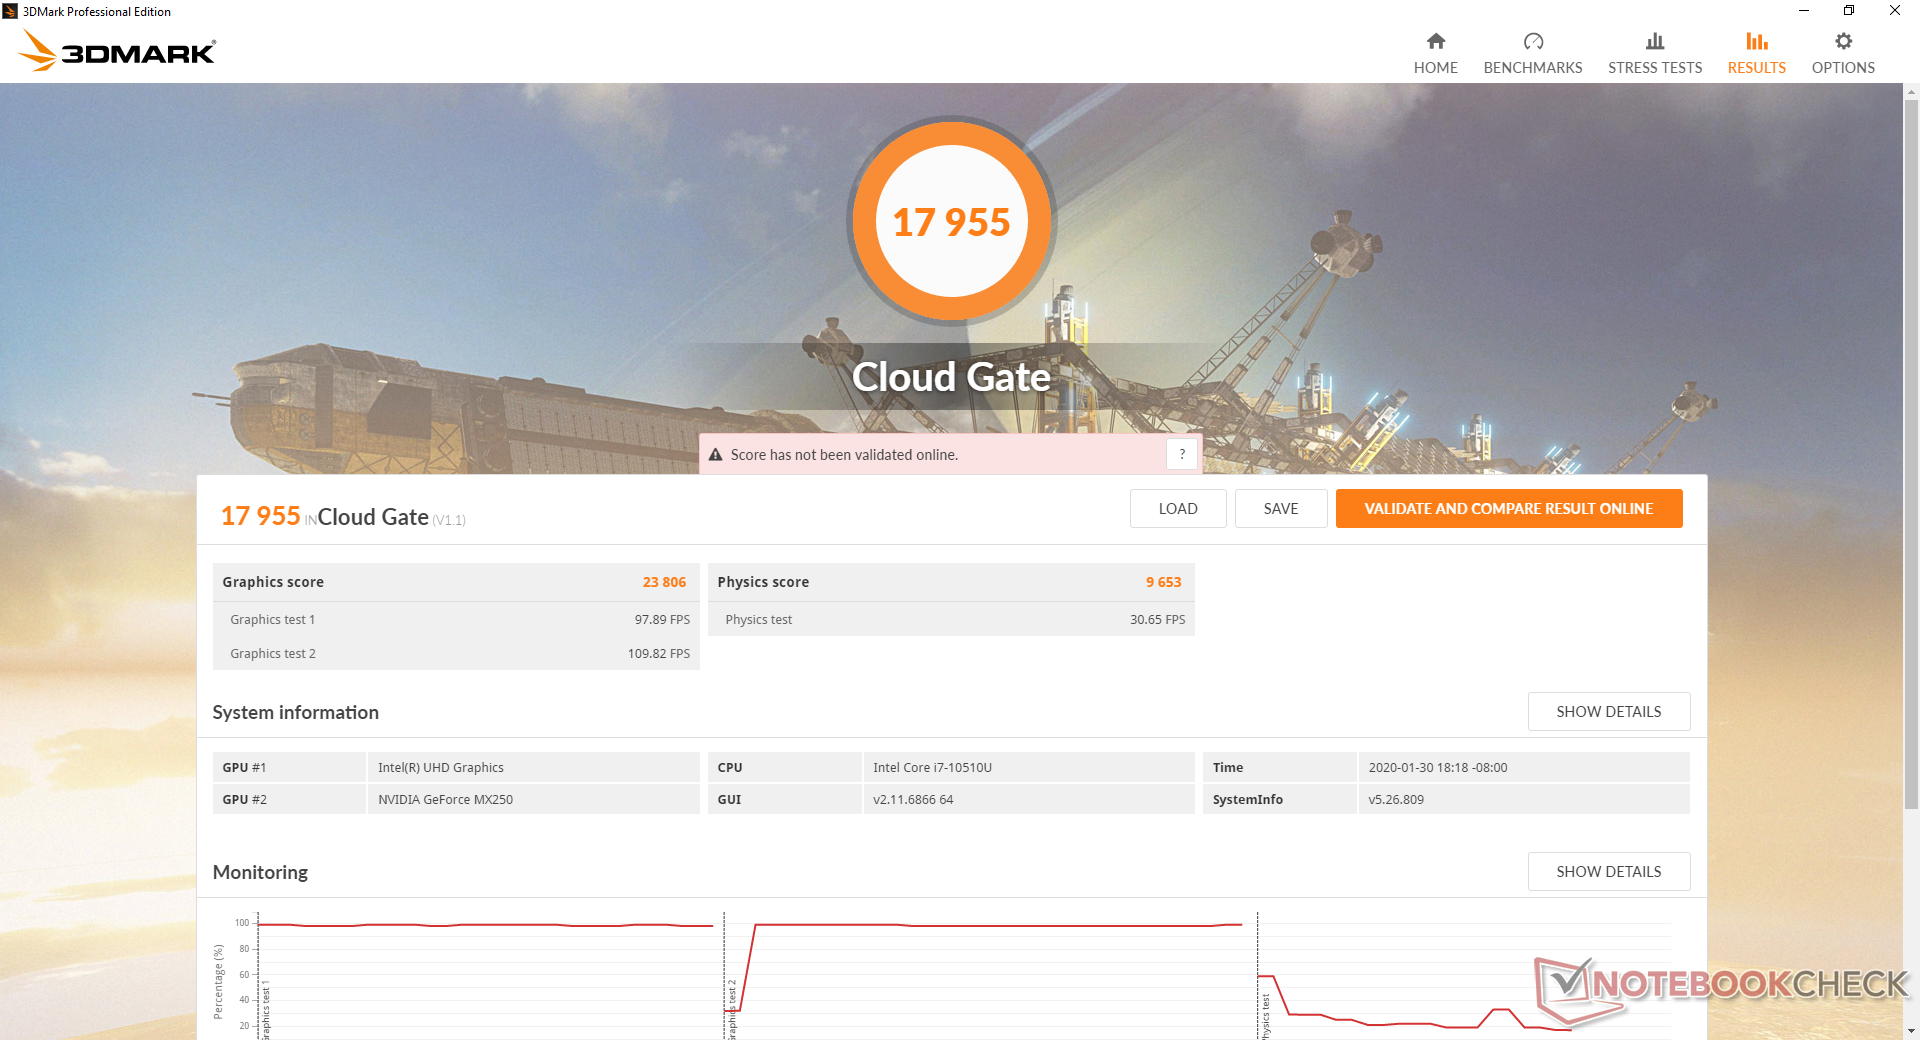
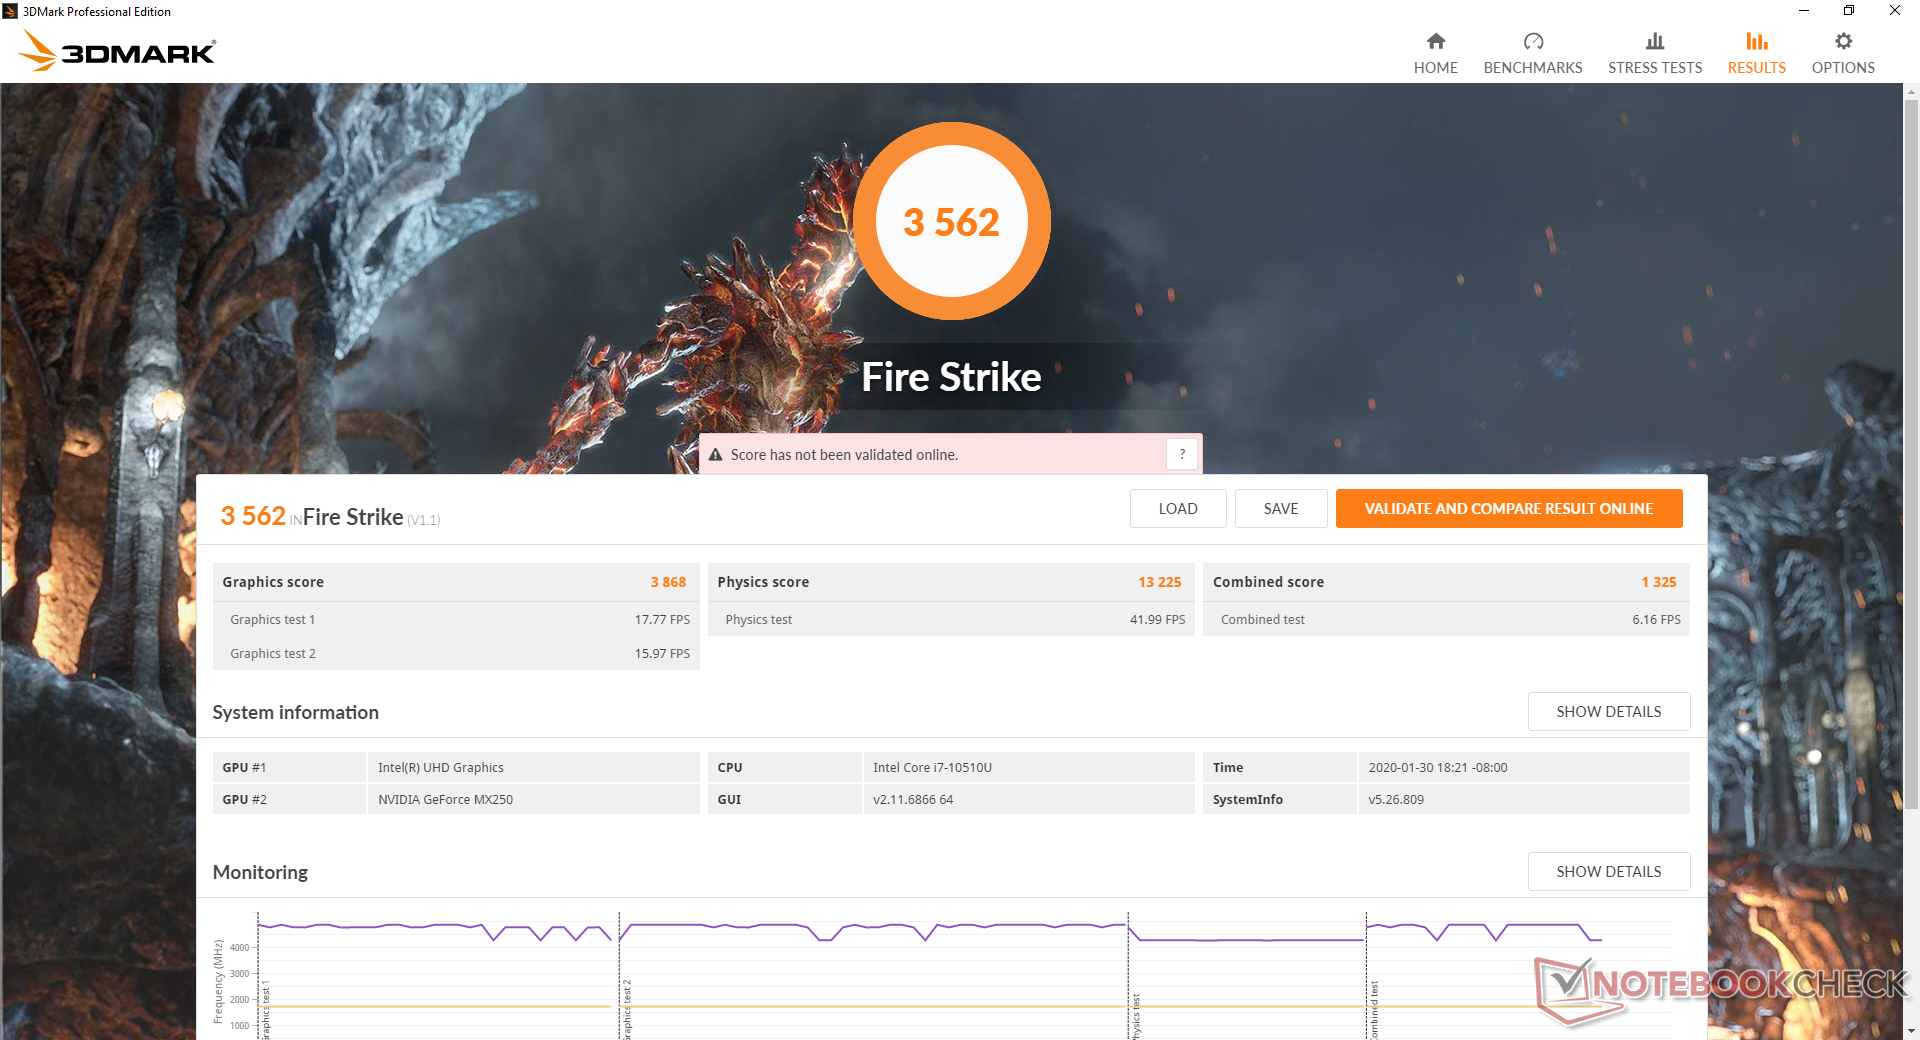
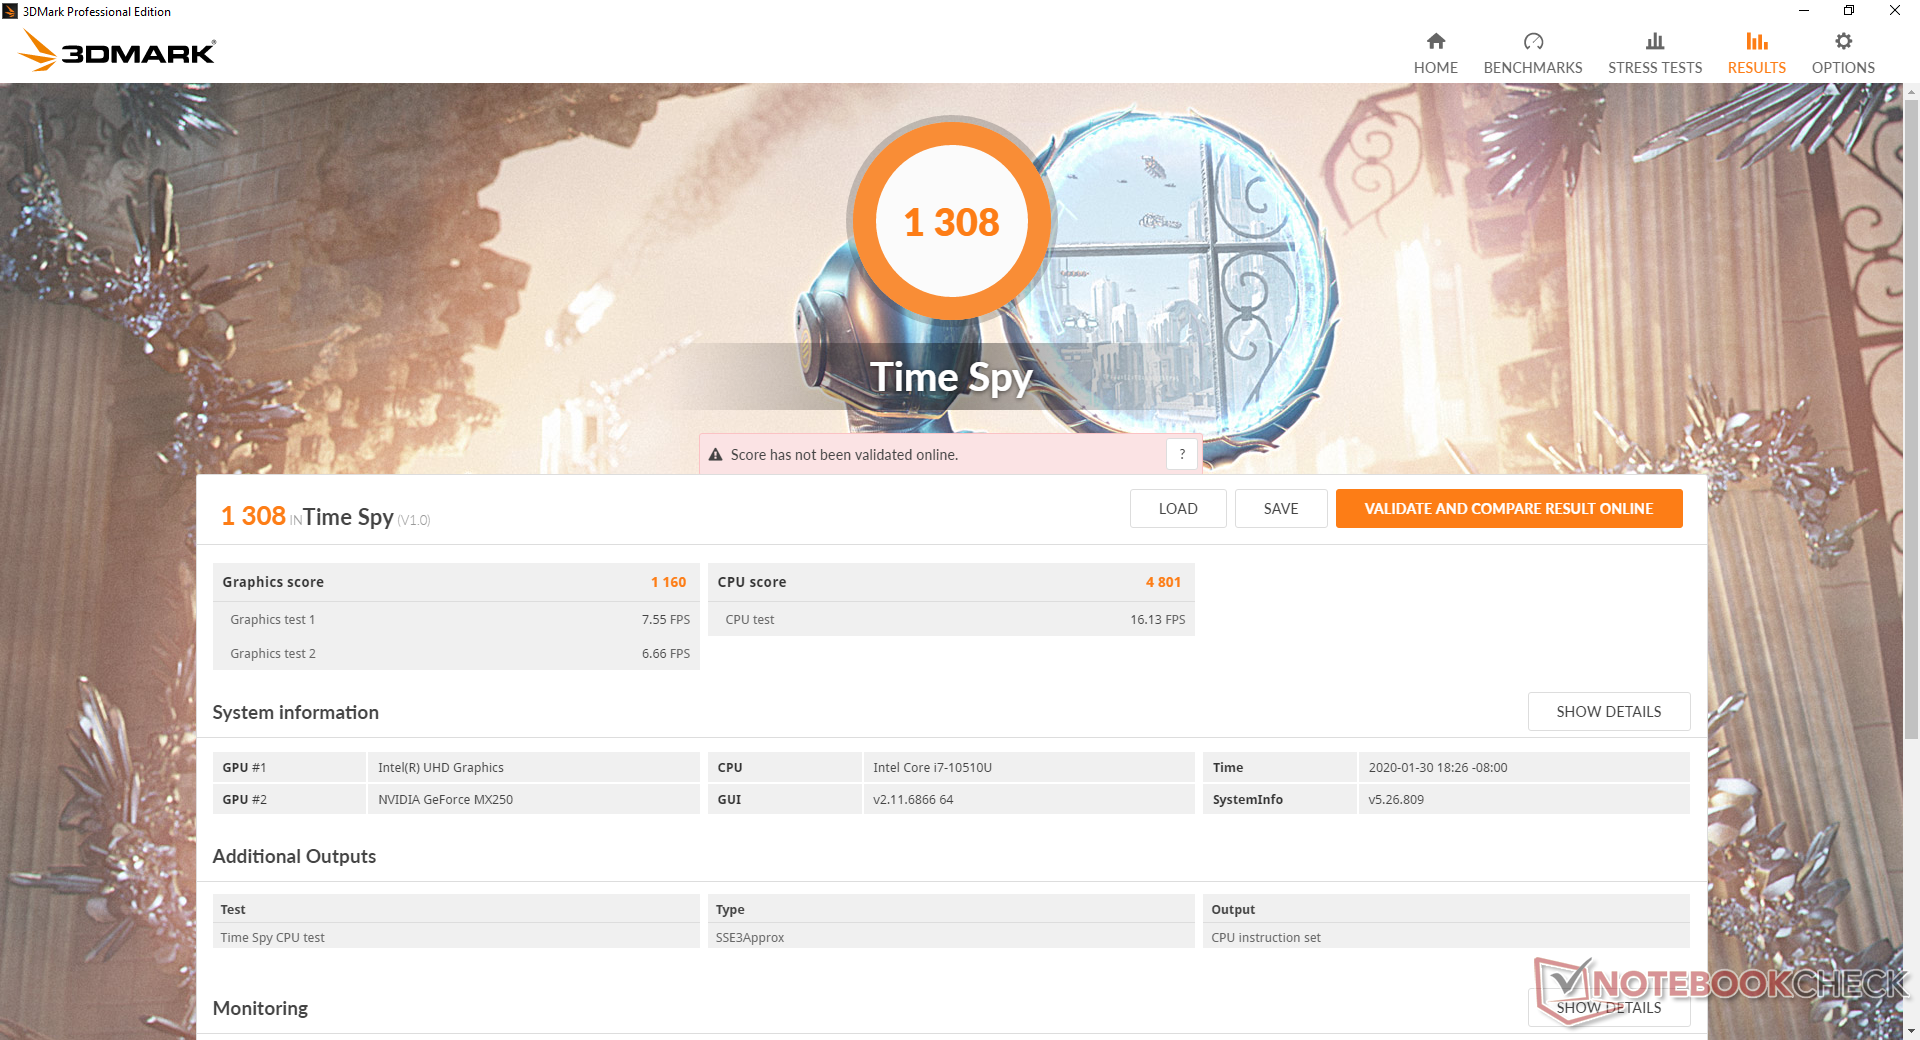
3DMark scores are where we expect them to be at just a few percentage points higher than the average GeForce MX250 in our database. Performance is about 35 percent faster than most MX150 laptops save for the Razer Blade Stealth and its impressive 25 W MX150. Upgrading to the Prestige 15 and its GTX 1650 Max-Q GPU will net a massive graphics boost by as much as 100 to 160 percent.
Gaming performance is also good considering than the Modern 15 isn't supposed to be a gaming machine. Demanding titles like Shadow of the Tomb Raider can run at native 1080p and 30 FPS so long as most graphics settings are on Low. Undemanding titles like DOTA 2, Fortnite, or Rocket League are able to reach 1080p60 more easily.
See our dedicated page on the GeForce MX250 for more technical information and benchmark comparisons.
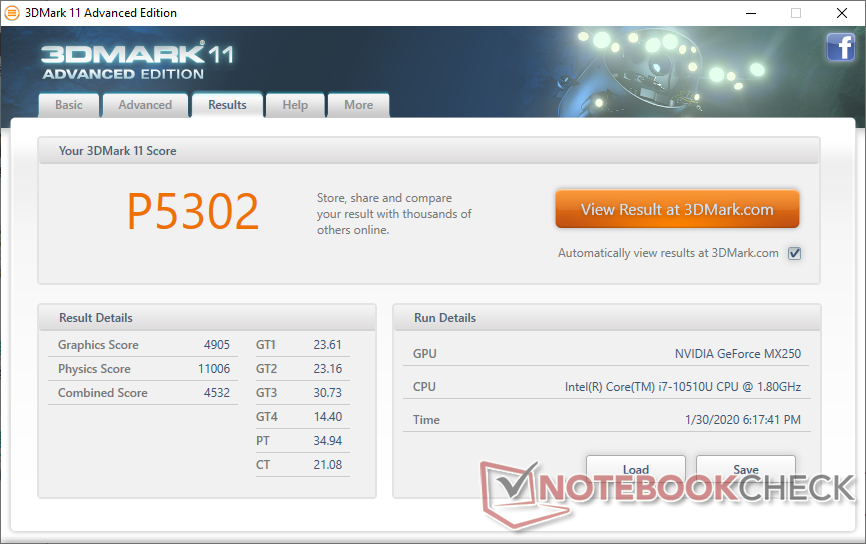
| 3DMark 11 Performance | 5302 points | |
| 3DMark Cloud Gate Standard Score | 17955 points | |
| 3DMark Fire Strike Score | 3562 points | |
| 3DMark Time Spy Score | 1308 points | |
Help | ||
| Shadow of the Tomb Raider | |
| 1280x720 Lowest Preset | |
| Lenovo IdeaPad S740-15IRH | |
| MSI GL72 7QF | |
| MSI Modern 15 A10RB | |
| Average NVIDIA GeForce MX250 (24 - 56, n=8) | |
| Xiaomi Mi Notebook Pro i7 | |
| Dell Inspiron 15 5000 5585 | |
| Microsoft Surface Laptop 3 15 i7-1065G7 | |
| Microsoft Surface Laptop 3 15 Ryzen 5 3580U | |
| 1920x1080 Medium Preset | |
| Lenovo IdeaPad S740-15IRH | |
| MSI GL72 7QF | |
| MSI Modern 15 A10RB | |
| Xiaomi Mi Notebook Pro i7 | |
| Average NVIDIA GeForce MX250 (7 - 19, n=8) | |
| Dell Inspiron 15 5000 5585 | |
| Microsoft Surface Laptop 3 15 Ryzen 5 3580U | |
| 1920x1080 High Preset AA:SM | |
| Asus TUF FX705GM | |
| Lenovo IdeaPad S740-15IRH | |
| MSI GL72 7QF | |
| Dell Inspiron 15 5000 5585 | |
| MSI Modern 15 A10RB | |
| Average NVIDIA GeForce MX250 (12 - 15, n=6) | |
| Xiaomi Mi Notebook Pro i7 | |
| 1920x1080 Highest Preset AA:T | |
| Asus TUF FX705GM | |
| Lenovo IdeaPad S740-15IRH | |
| MSI GL72 7QF | |
| MSI Modern 15 A10RB | |
| Average NVIDIA GeForce MX250 (9 - 10, n=5) | |
| Xiaomi Mi Notebook Pro i7 | |
| low | med. | high | ultra | |
|---|---|---|---|---|
| BioShock Infinite (2013) | 212.3 | 114.5 | 98.1 | 37.8 |
| The Witcher 3 (2015) | 70 | 40 | 23.1 | 12 |
| Rocket League (2017) | 182.9 | 91.2 | 60.8 | |
| Shadow of the Tomb Raider (2018) | 55 | 19 | 13 | 10 |
Emissions
System Noise
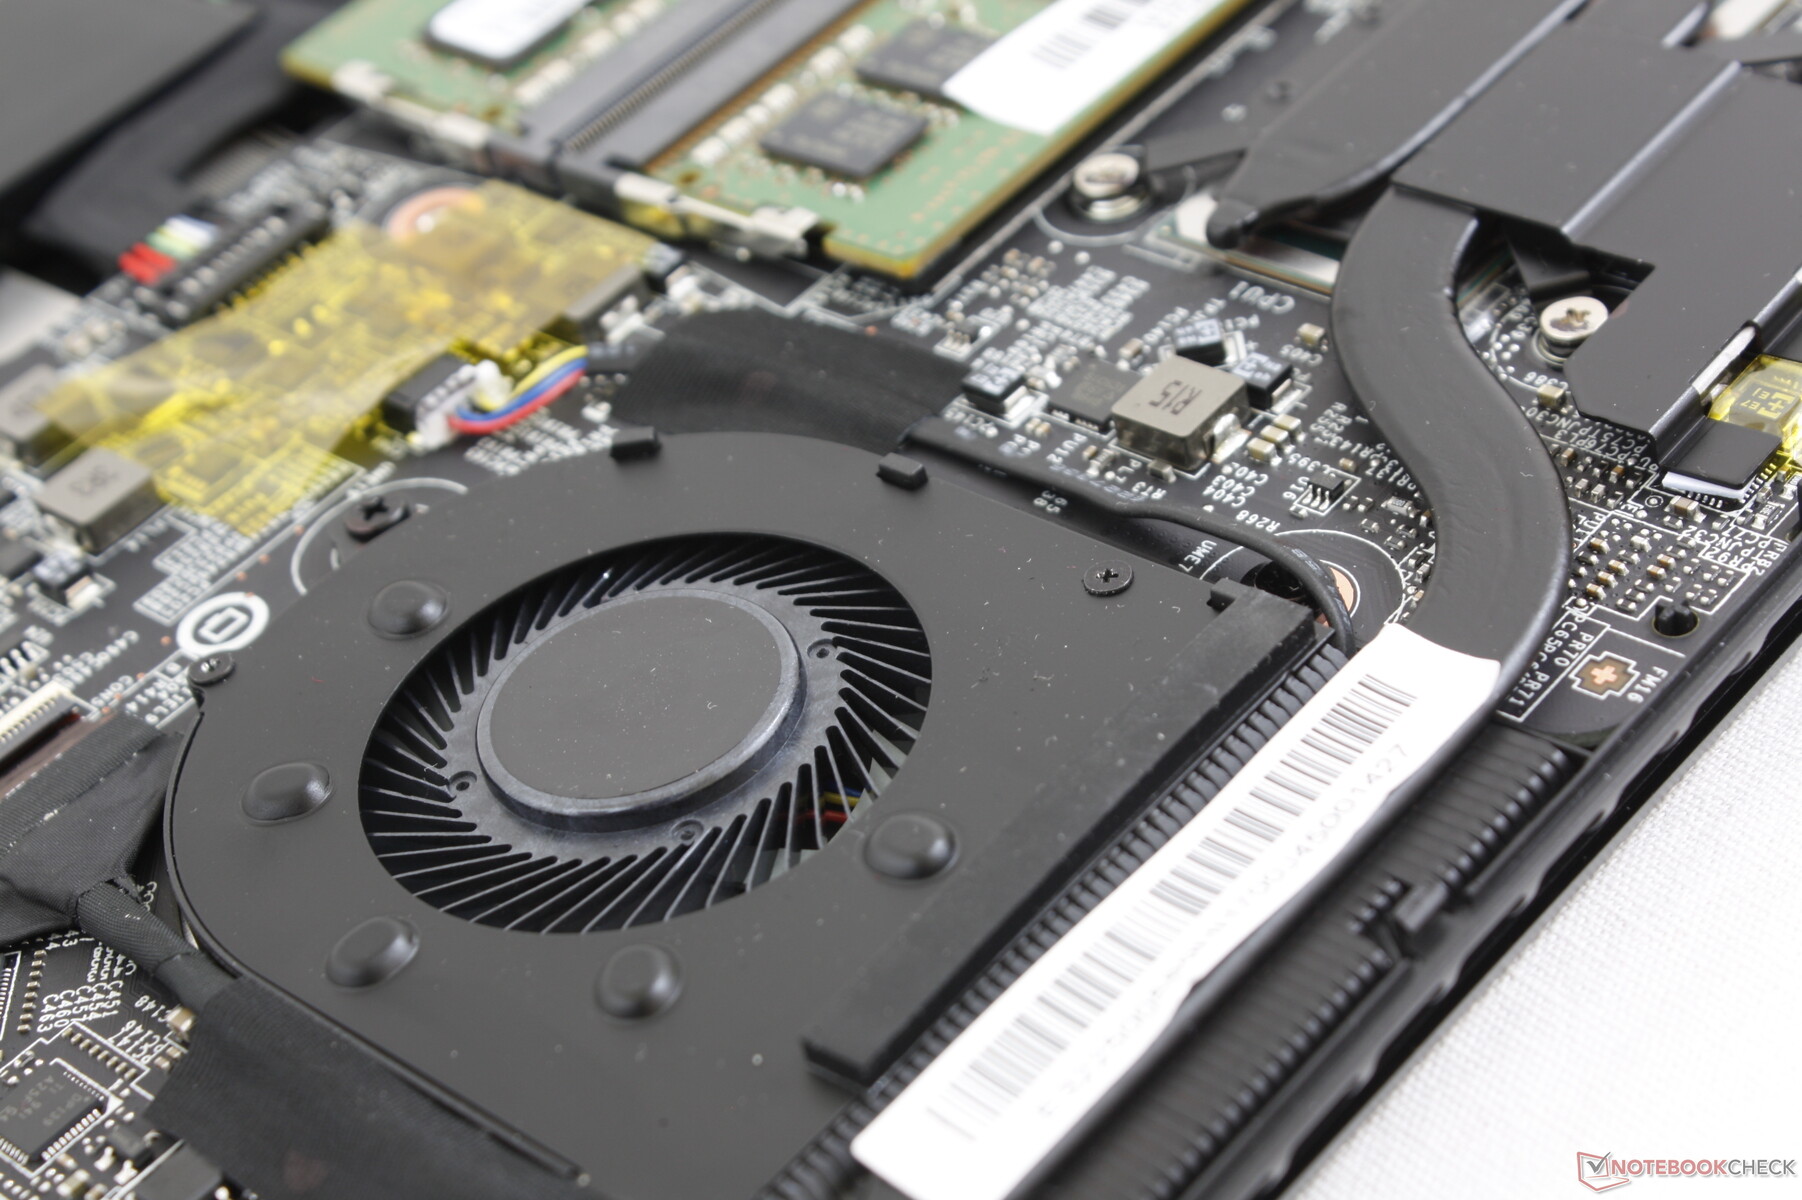
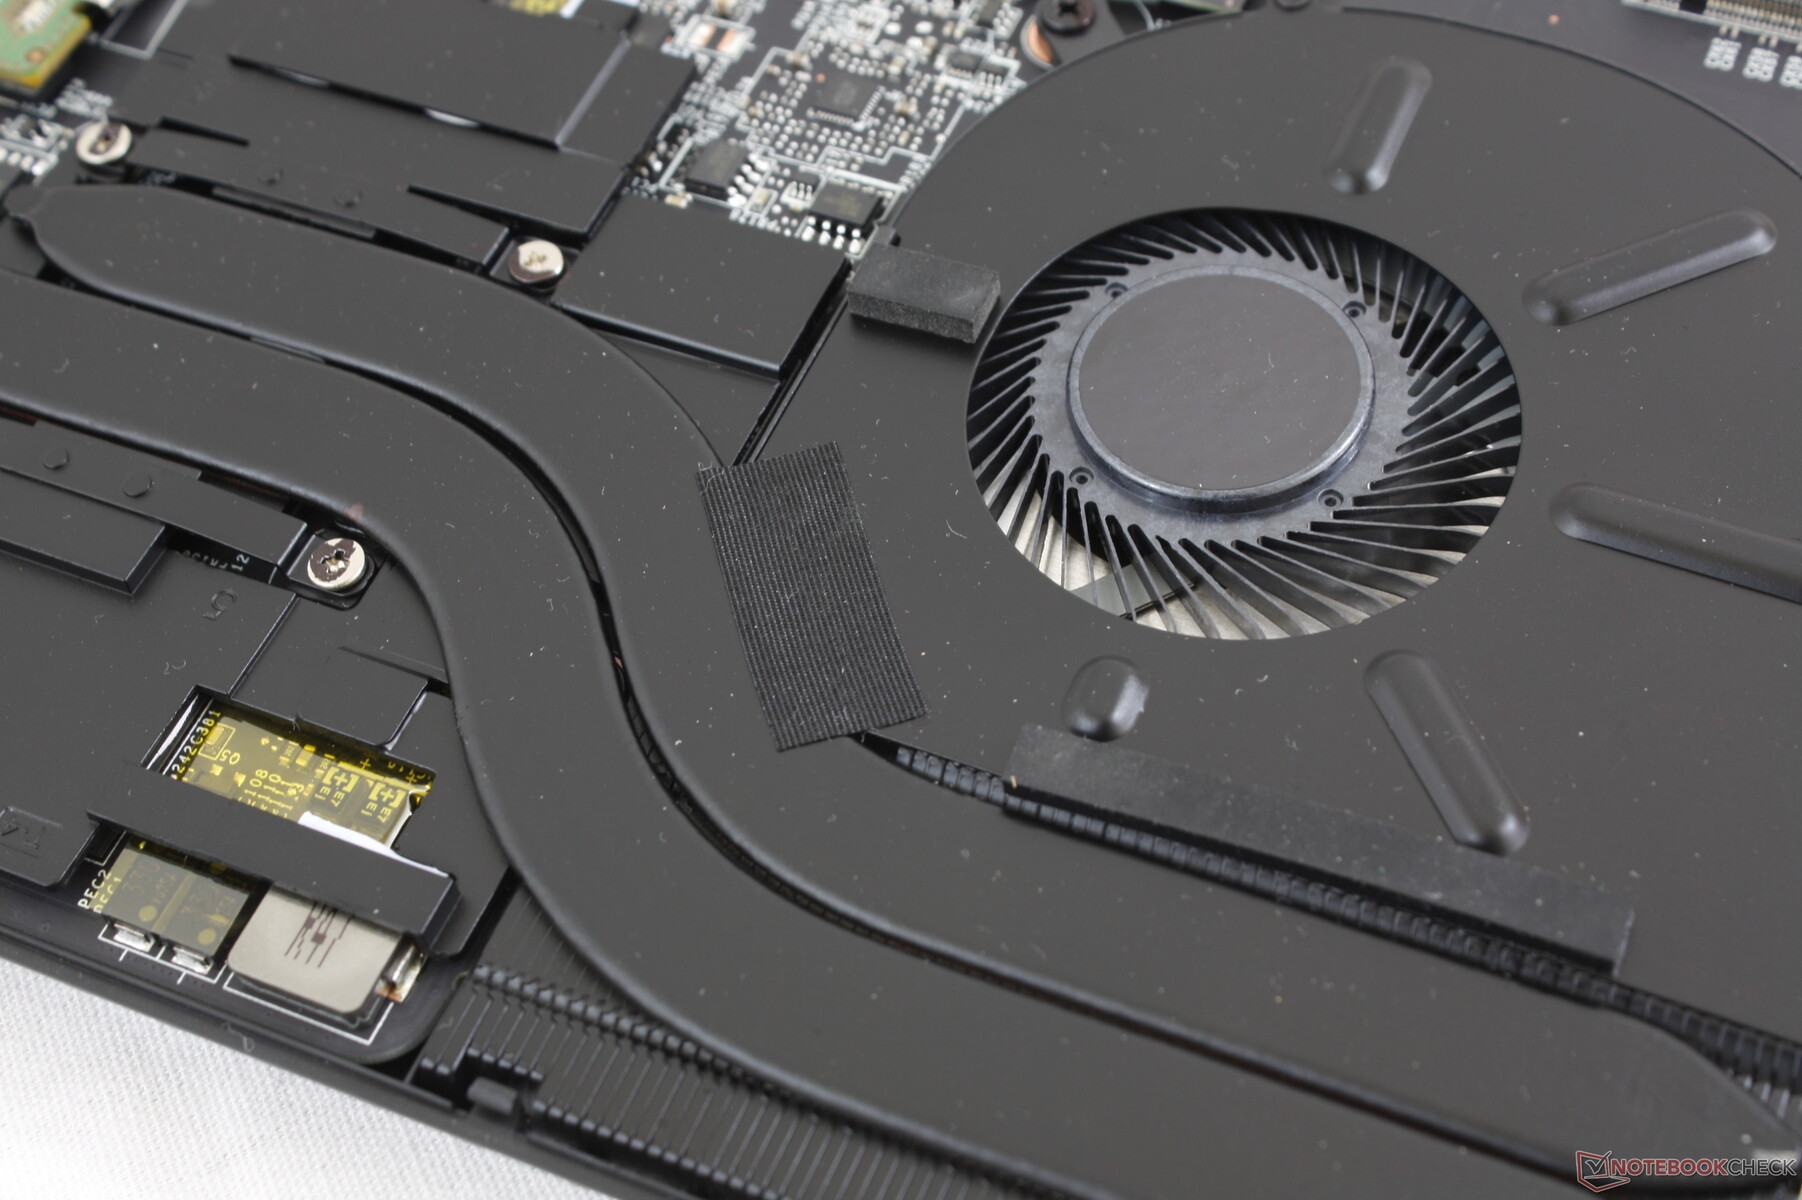
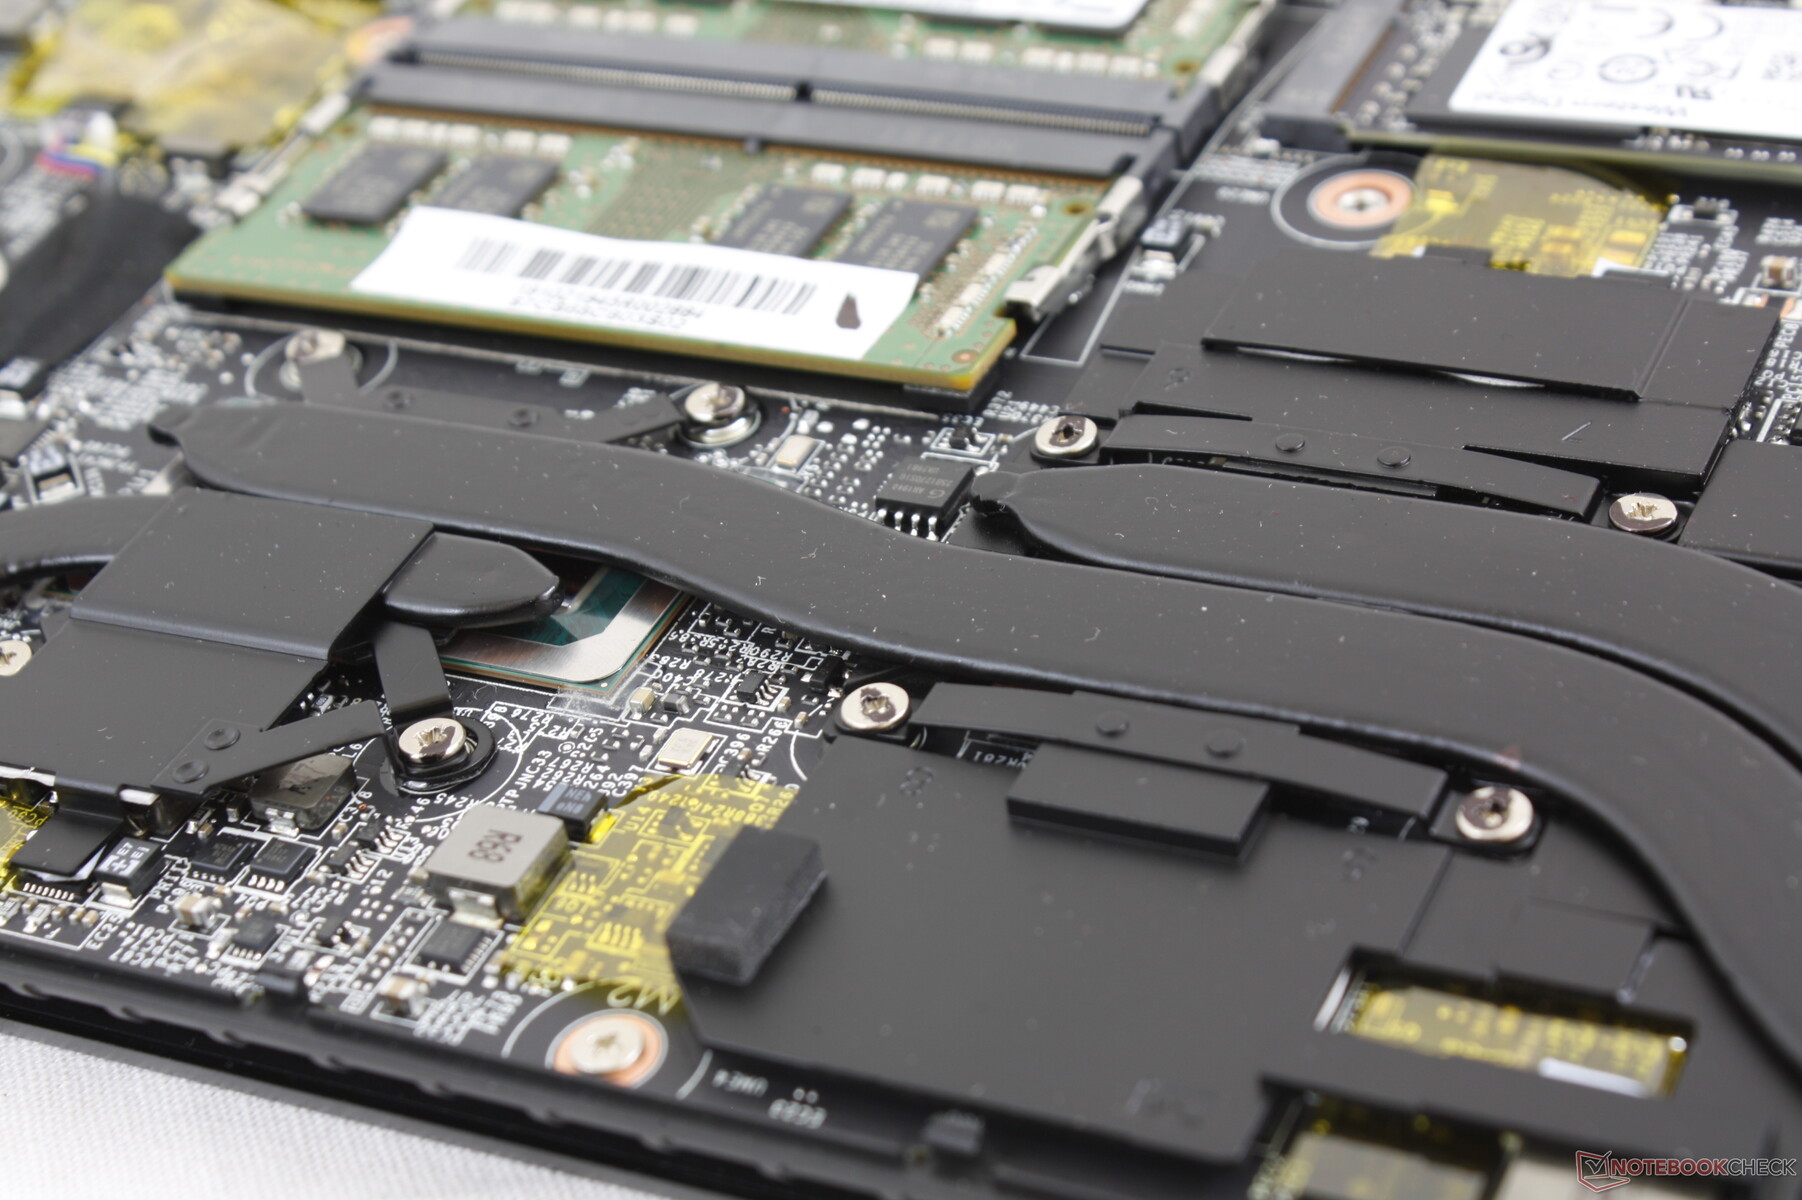
The cooling solution consists of two asymmetric fans and three heat pipes between them that are arranged differently than on the Modern 14. Unfortunately on the Modern 15, fan noise is always present even when on Windows Power Saver or the preset MSI Silent profile. Disconnecting the laptop from AC power causes no changes to the minimum fan noise. We're able to measure a minimum fan noise of 32 dB(A) against a background of 28.3 dB(A) to be audible when in quiet environments like classrooms or small conference rooms. It's a shame that the Modern 15 is never truly silent during low processing loads unlike on most other Ultrabooks. On the flip side, running medium loads will only bump up fan noise just marginally since the fans are already at relatively high RPMs to begin with.
Running Witcher 3 results in a stable fan noise of just under 40 dB(A) which is a common range on many laptops with dedicated GeForce GPUs including the HP Spectre X360 15. We're able to record a temporary maximum of almost 51 dB(A) when running Prime95 and FurMark simultaneously before fan noise falls and stabilizes at 45 dB(A). In general, expect the Modern 15 to be louder than the typical UMA graphics-only Ultrabook.
We can notice no electronic noise or coil whine from our test unit.
(August 2, 2020 update: According to a reader and owner of a Core i3 MSI Modern 15, It may be possible to completely stop the fans when on Super Battery mode whilst running low workloads like light browsing or Word. We're unable to confirm this with our Core i7 SKU, so results may vary.)
| MSI Modern 15 A10RB GeForce MX250, i7-10510U, WDC PC SN730 SDBPNTY-512G | Asus ZenBook 15 UX534FT-DB77 GeForce GTX 1650 Max-Q, i7-8565U, Samsung SSD PM981 MZVLB1T0HALR | Dell XPS 15 7590 i5 iGPU FHD UHD Graphics 630, i5-9300H, Toshiba XG6 KXG60ZNV512G | Lenovo ThinkPad T590-20N4002VGE GeForce MX250, i7-8565U, Toshiba XG6 KXG60ZNV512G | HP Spectre X360 15-5ZV31AV GeForce MX250, i7-10510U, Intel SSD 660p 2TB SSDPEKNW020T8 | MSI Prestige 15 A10SC GeForce GTX 1650 Max-Q, i7-10710U, Samsung SSD PM981 MZVLB1T0HALR | |
|---|---|---|---|---|---|---|
| Noise | 8% | 9% | 9% | 6% | 5% | |
| off / environment * (dB) | 28.3 | 28.4 -0% | 29.3 -4% | 29.4 -4% | 30.1 -6% | 29.3 -4% |
| Idle Minimum * (dB) | 32 | 28.4 11% | 29.3 8% | 29.3 8% | 30.1 6% | 30.1 6% |
| Idle Average * (dB) | 32 | 28.4 11% | 29.3 8% | 29.3 8% | 30.1 6% | 30.2 6% |
| Idle Maximum * (dB) | 32 | 28.4 11% | 29.8 7% | 31.8 1% | 30.1 6% | 30.2 6% |
| Load Average * (dB) | 34.5 | 33.9 2% | 32.4 6% | 33.5 3% | 30.1 13% | 31.5 9% |
| Witcher 3 ultra * (dB) | 39.5 | 39.8 -1% | 33.5 15% | 39.7 -1% | 37 6% | |
| Load Maximum * (dB) | 50.9 | 40.2 21% | 37.2 27% | 35.8 30% | 42 17% | 47 8% |
* ... smaller is better
Noise level
| Idle |
| 32 / 32 / 32 dB(A) |
| Load |
| 34.5 / 50.9 dB(A) |
 | ||
30 dB silent 40 dB(A) audible 50 dB(A) loud |
||
min: | ||
Temperature
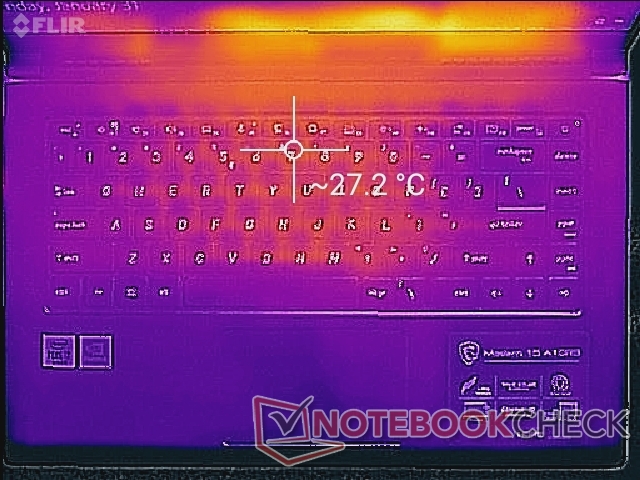
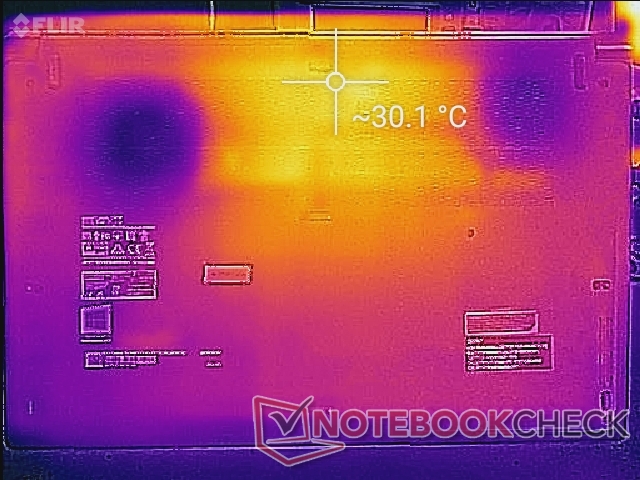
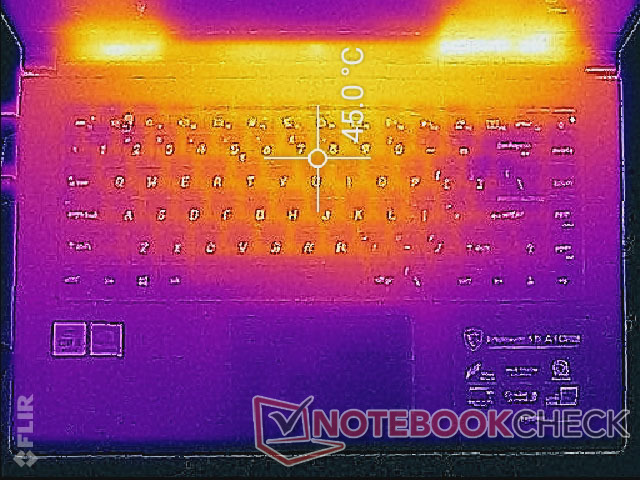
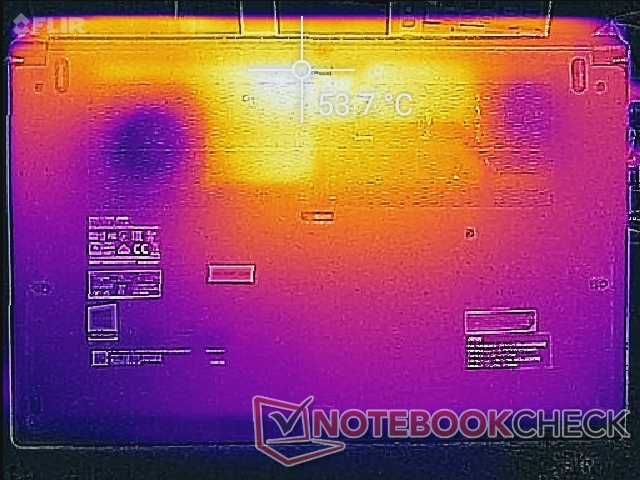
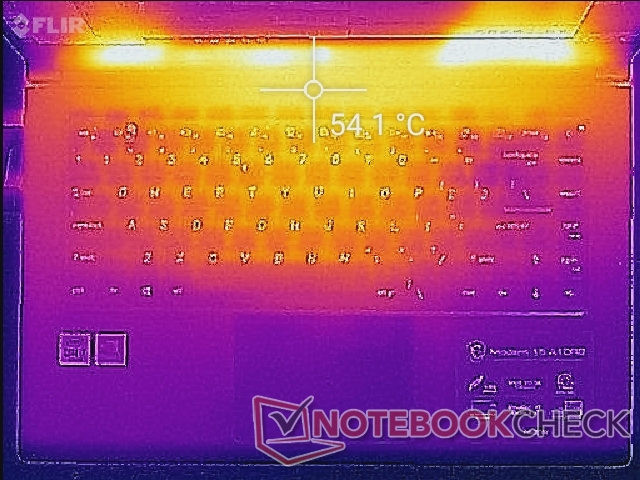
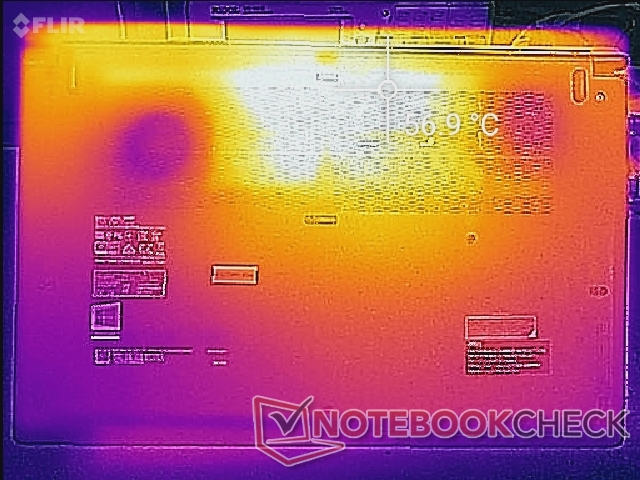
Surface temperatures when idling are generally flat with the warmer spots toward the center rear of the laptop closest to the processors. When gaming or running other intensive loads, these hot spots can become as warm as 45 C on the keyboard center to as much as 57 C on the bottom vents. The competing Asus ZenBook 15 with the faster GTX 1650 Max-Q runs much cooler at about 45 C to 47 C when under similar processing loads. Fortunately, the hot spots on the MSI are away from the palm rests, clickpad, and WASD keys to be unobtrusive.
We can observe no Modern Standby issues unlike what we discovered on the recent Lenovo IdeaPad S740.

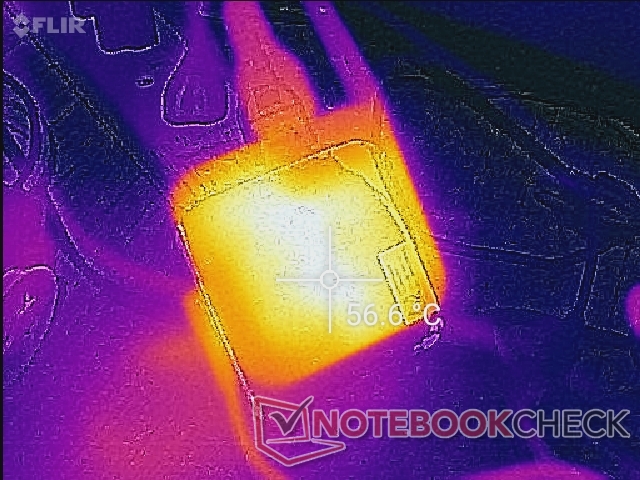
(-) The maximum temperature on the upper side is 54.2 °C / 130 F, compared to the average of 34.3 °C / 94 F, ranging from 21.2 to 62.5 °C for the class Office.
(-) The bottom heats up to a maximum of 59.4 °C / 139 F, compared to the average of 36.8 °C / 98 F
(+) In idle usage, the average temperature for the upper side is 26.2 °C / 79 F, compared to the device average of 29.5 °C / 85 F.
(-) Playing The Witcher 3, the average temperature for the upper side is 39.3 °C / 103 F, compared to the device average of 29.5 °C / 85 F.
(+) The palmrests and touchpad are reaching skin temperature as a maximum (33 °C / 91.4 F) and are therefore not hot.
(-) The average temperature of the palmrest area of similar devices was 27.5 °C / 81.5 F (-5.5 °C / -9.9 F).
Stress Test
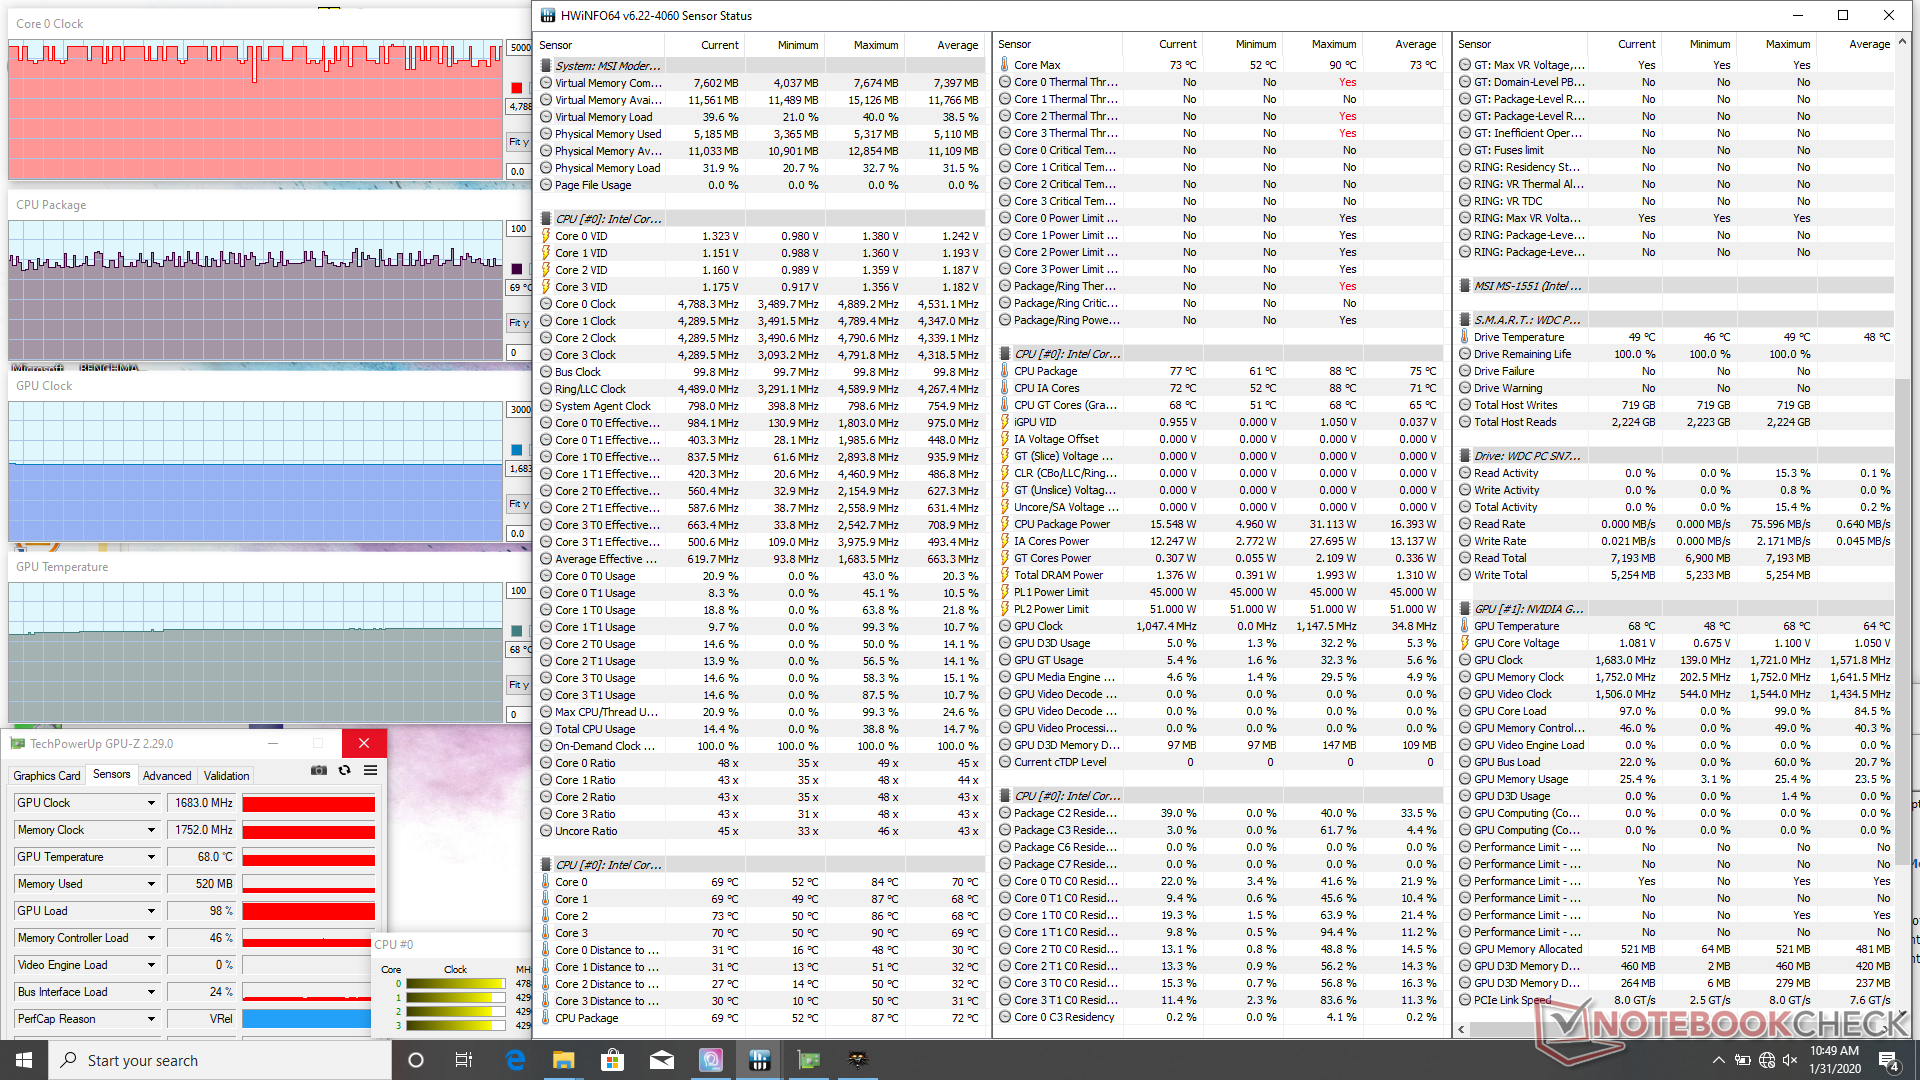
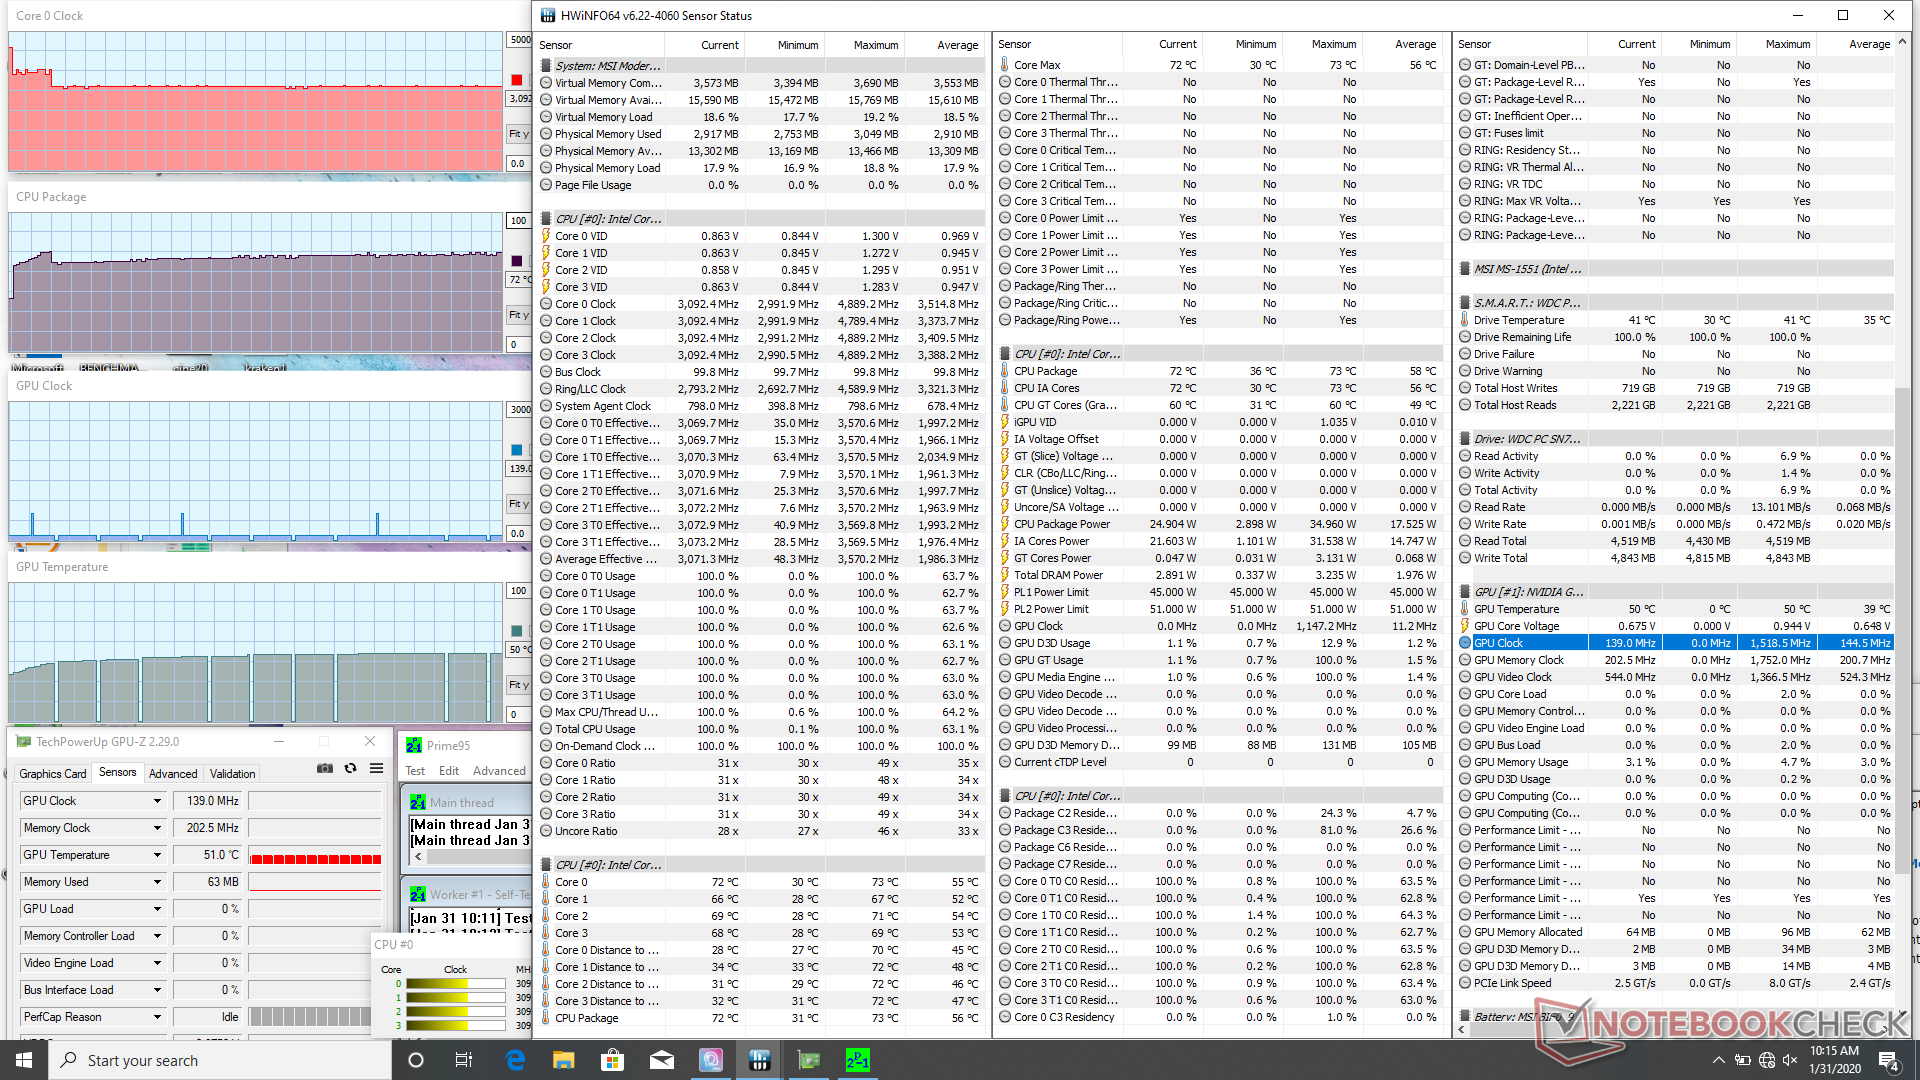
We stress the laptop to identify for any potential throttling or stability issues. When running Prime95, CPU clock rates would boost to around 3.7 GHz for the first 20 seconds or so until reaching a core temperature of 73 C. Thereafter, clock rates would drop and stabilize at 3.1 GHz in order to maintain a core temperature of around 73 C. In comparison, the Core i5-10210U in the Modern 14 would stabilize at only 2.3 to 2.5 GHz when subjected to the same conditions. Running both Prime95 and FurMark simultaneously would cause CPU and GPU temperatures to stabilize at 81 C and 70 C, respectively. Impressively, the CPU would never drop below 3.0 GHz.
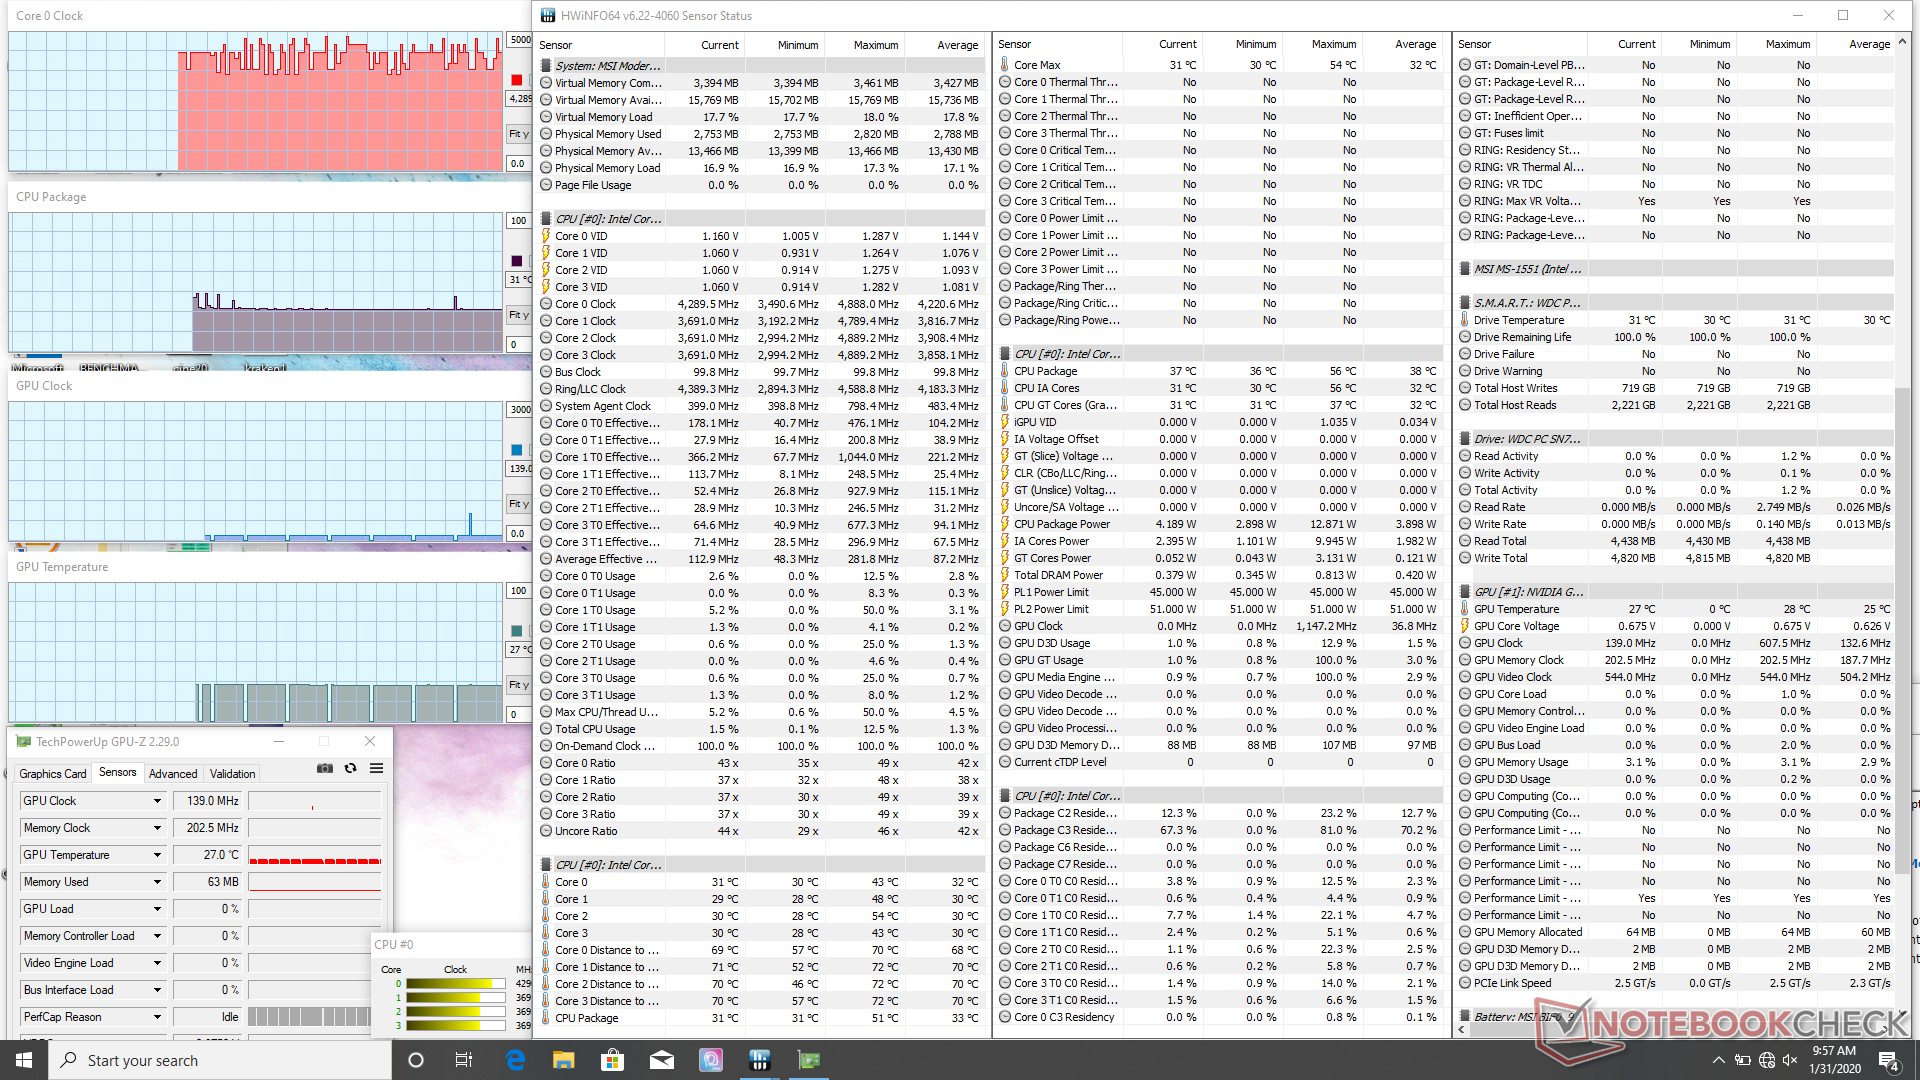
Running Witcher 3 results in a stable CPU and GPU temperature of 69 C each compared to 92 C and 79 C on the more powerful Asus ZenBook 15.
Running on batteries will limit CPU performance. A 3DMark 11 run on battery power returns Physics and Graphics scores of 7459 and 4840 points, respectively, compared to 11006 and 4905 points when on mains.
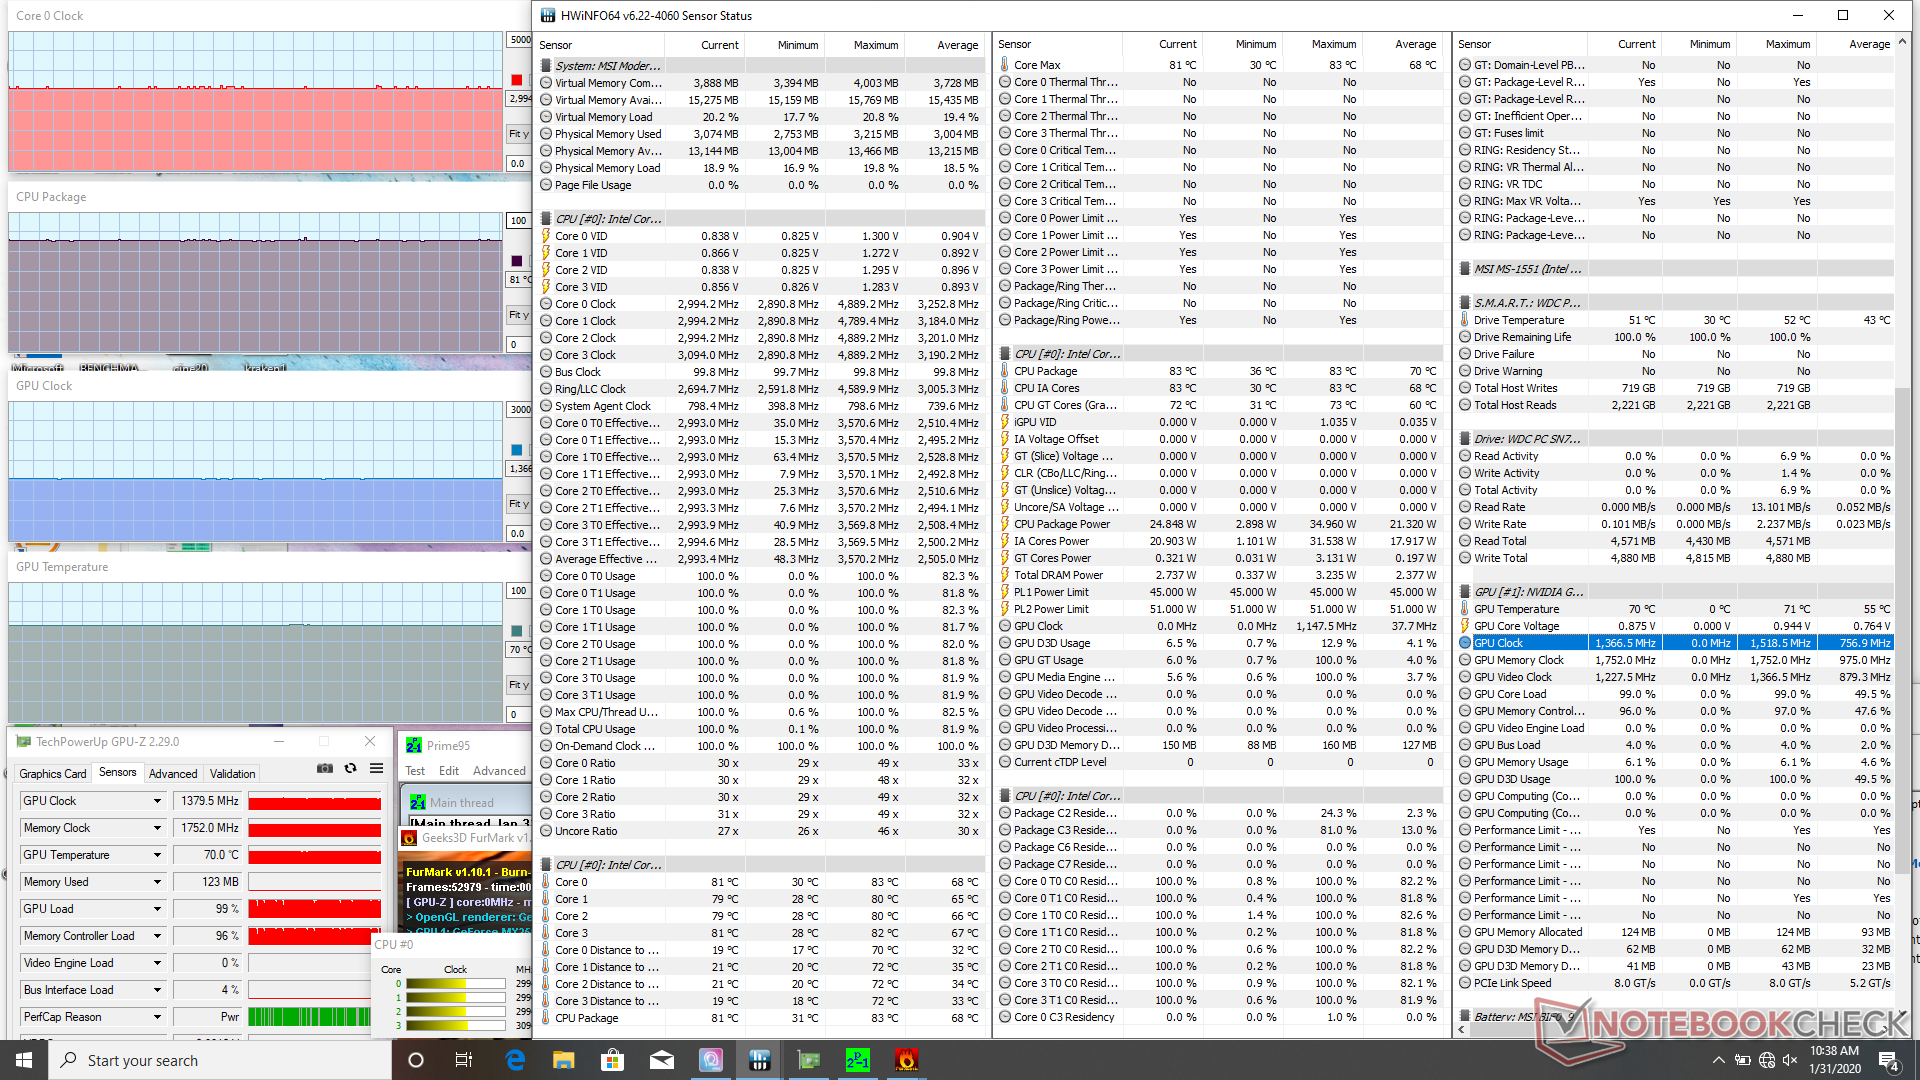
| CPU Clock (GHz) | GPU Clock (MHz) | Average CPU Temperature (°C) | Average GPU Temperature (°C) | |
| System Idle | -- | -- | 31 | 27 |
| Prime95 Stress | 3.1 | -- | 73 | 50 |
| Prime95 + FurMark Stress | 3.0 | 1380 | 81 | 70 |
| Witcher 3 Stress | ~4.7 | 1683 | ~69 | 68 |
Speakers
The stereo speakers are loud enough to fill a small-to-medium sized conference room , but they are lacking in bass. Our pink noise measurements show roll-off beginning at about 500 Hz compared to about 250 Hz on the HP Spectre series. Quality is good enough for voice calls or conference calls while multimedia playback will be better with earphones. Maximum volume introduces no static or vibrations on the palm rests.


MSI Modern 15 A10RB audio analysis
(+) | speakers can play relatively loud (82.1 dB)
Bass 100 - 315 Hz
(-) | nearly no bass - on average 19.1% lower than median
(±) | linearity of bass is average (12.2% delta to prev. frequency)
Mids 400 - 2000 Hz
(+) | balanced mids - only 4.4% away from median
(±) | linearity of mids is average (10.2% delta to prev. frequency)
Highs 2 - 16 kHz
(+) | balanced highs - only 1.3% away from median
(+) | highs are linear (6.8% delta to prev. frequency)
Overall 100 - 16.000 Hz
(±) | linearity of overall sound is average (20.6% difference to median)
Compared to same class
» 48% of all tested devices in this class were better, 9% similar, 43% worse
» The best had a delta of 7%, average was 21%, worst was 53%
Compared to all devices tested
» 55% of all tested devices were better, 8% similar, 37% worse
» The best had a delta of 4%, average was 23%, worst was 134%
Apple MacBook 12 (Early 2016) 1.1 GHz audio analysis
(+) | speakers can play relatively loud (83.6 dB)
Bass 100 - 315 Hz
(±) | reduced bass - on average 11.3% lower than median
(±) | linearity of bass is average (14.2% delta to prev. frequency)
Mids 400 - 2000 Hz
(+) | balanced mids - only 2.4% away from median
(+) | mids are linear (5.5% delta to prev. frequency)
Highs 2 - 16 kHz
(+) | balanced highs - only 2% away from median
(+) | highs are linear (4.5% delta to prev. frequency)
Overall 100 - 16.000 Hz
(+) | overall sound is linear (10.2% difference to median)
Compared to same class
» 7% of all tested devices in this class were better, 2% similar, 90% worse
» The best had a delta of 5%, average was 18%, worst was 53%
Compared to all devices tested
» 5% of all tested devices were better, 1% similar, 94% worse
» The best had a delta of 4%, average was 23%, worst was 134%
Energy Management
Power Consumption
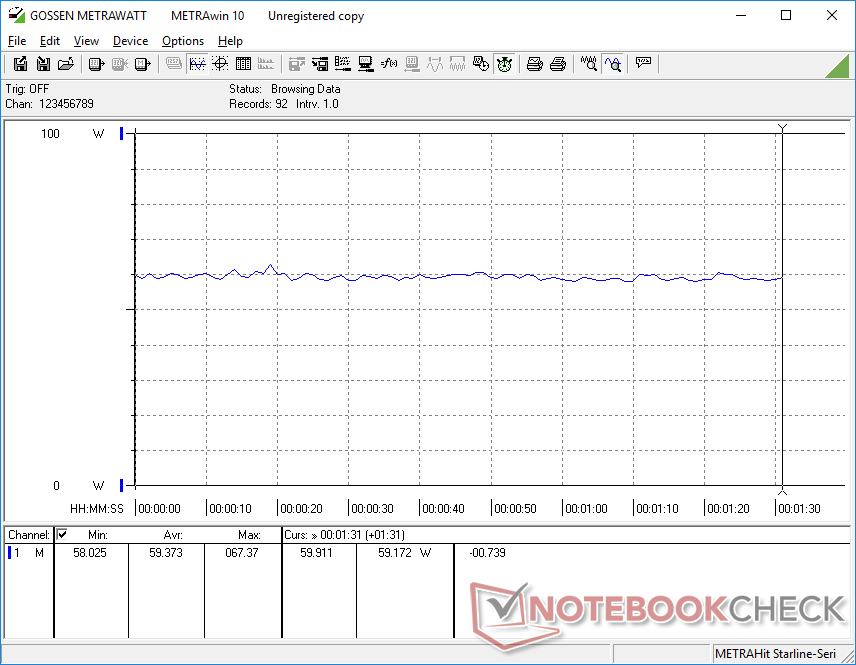
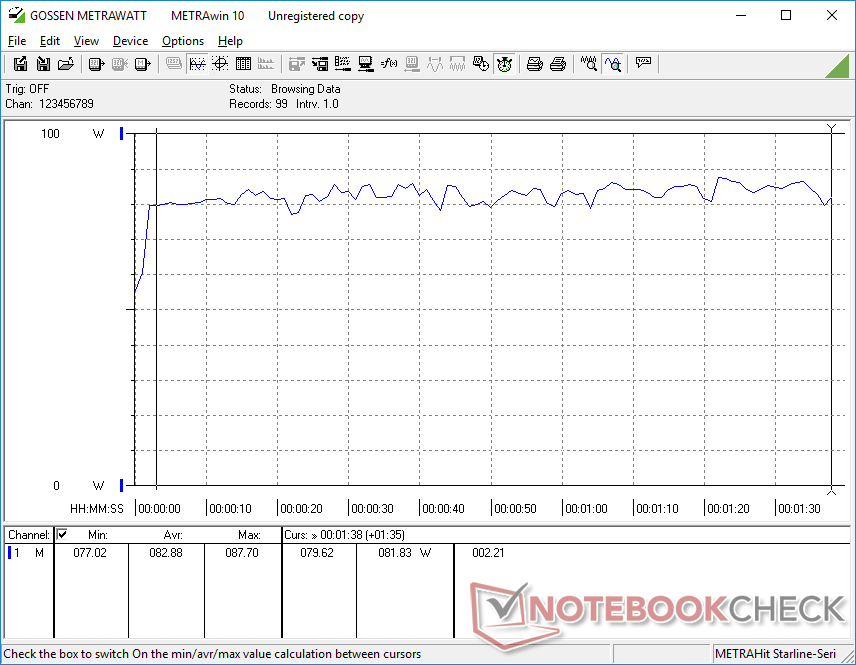
Idling on desktop demands between 6 W and 15 W depending on the brightness level and power profile. If gaming, expect consumption to be in the 59 W to 83 W range. It's worth noting that the MSI Prestige 15 is able to offer 100 to 160 percent faster graphics performance for a mere 25 percent increase in power consumption.
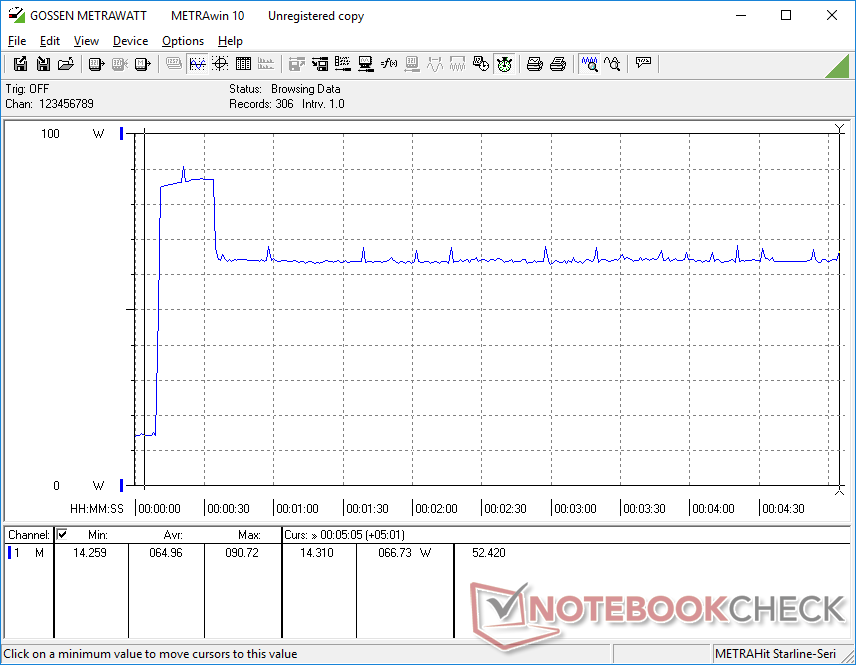
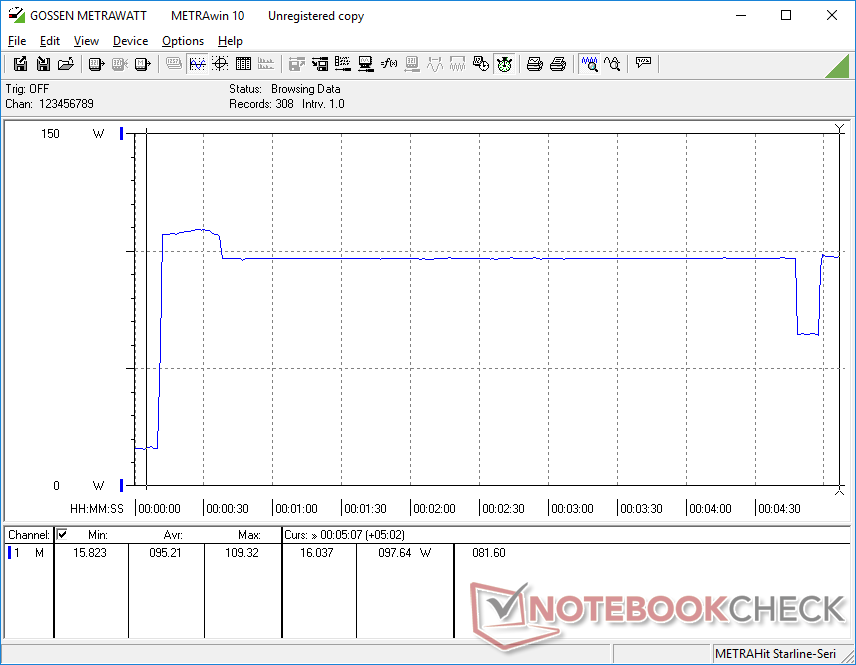
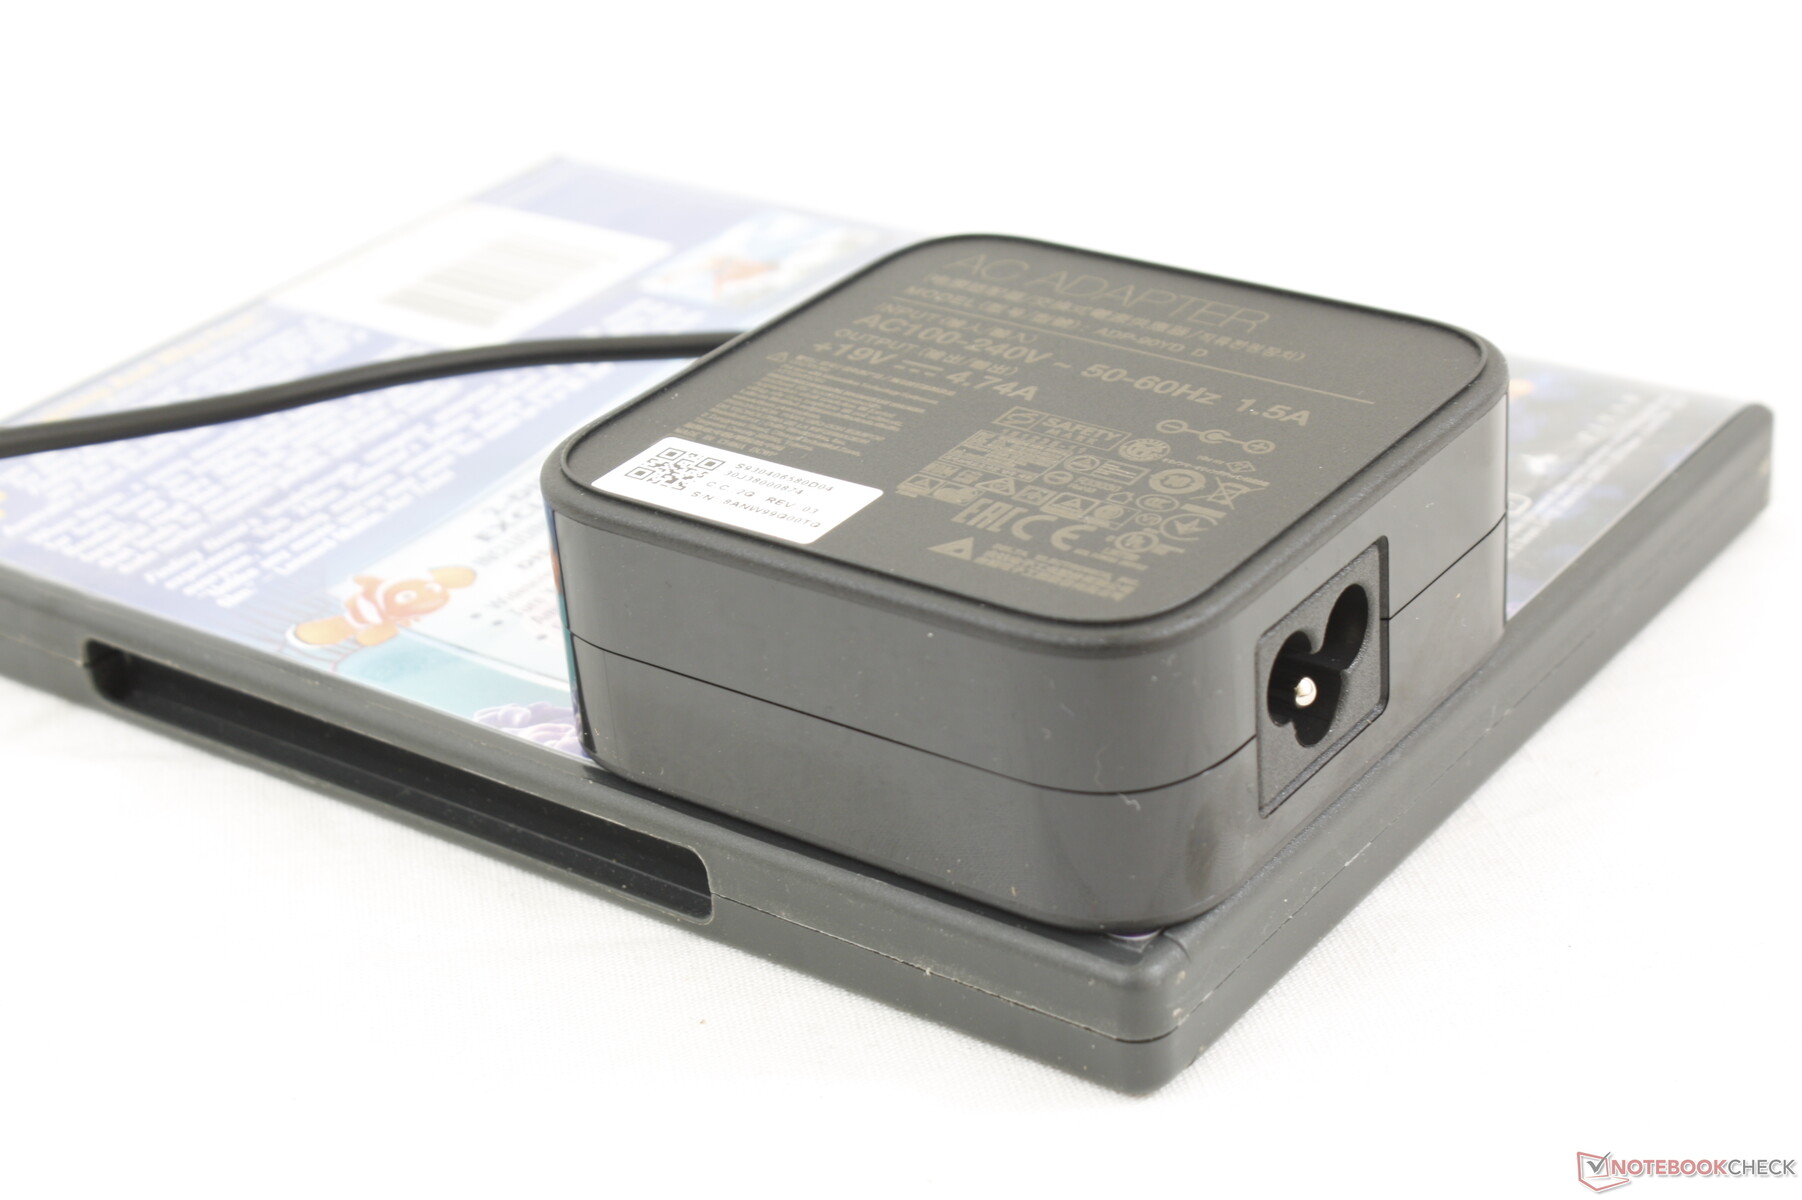
Running both Prime95 and FurMark simultaneously results in a temporary spike to about 109 W from the small (~7.5 x 7.5 x 3.0 cm) 90 W AC adapter. Power consumption would stabilize at 98 W as shown by our graphs below meaning that you will not be able to recharge the system at a decent rate when running demanding processing loads. A larger 120 W or 130 W AC adapter would have been appropriate. Note that the SKU with only UMA graphics comes with a smaller 65 W AC adapter.
| Off / Standby | |
| Idle | |
| Load |
|
Key:
min: | |
| MSI Modern 15 A10RB i7-10510U, GeForce MX250, WDC PC SN730 SDBPNTY-512G, IPS, 1920x1080, 15.6" | Asus ZenBook 15 UX534FT-DB77 i7-8565U, GeForce GTX 1650 Max-Q, Samsung SSD PM981 MZVLB1T0HALR, IPS, 1920x1080, 15.6" | Dell XPS 15 7590 i5 iGPU FHD i5-9300H, UHD Graphics 630, Toshiba XG6 KXG60ZNV512G, IPS, 1920x1080, 15.6" | Lenovo ThinkPad T590-20N4002VGE i7-8565U, GeForce MX250, Toshiba XG6 KXG60ZNV512G, aSi IPS LED, 1920x1080, 15.6" | HP Spectre X360 15-5ZV31AV i7-10510U, GeForce MX250, Intel SSD 660p 2TB SSDPEKNW020T8, IPS, 3840x2160, 15.6" | MSI Prestige 15 A10SC i7-10710U, GeForce GTX 1650 Max-Q, Samsung SSD PM981 MZVLB1T0HALR, IPS, 3840x2160, 15.6" | |
|---|---|---|---|---|---|---|
| Power Consumption | -11% | 27% | 24% | 20% | -9% | |
| Idle Minimum * (Watt) | 6.6 | 5 24% | 3.79 43% | 4.1 38% | 5.2 21% | 6.1 8% |
| Idle Average * (Watt) | 9.9 | 13.2 -33% | 6.9 30% | 8.3 16% | 8.5 14% | 13.2 -33% |
| Idle Maximum * (Watt) | 14.7 | 24 -63% | 9.2 37% | 11.8 20% | 8.7 41% | 19.2 -31% |
| Load Average * (Watt) | 82.9 | 70 16% | 62 25% | 61.6 26% | 65.6 21% | 75 10% |
| Witcher 3 ultra * (Watt) | 59.4 | 63.3 -7% | 54.4 8% | 56.5 5% | 74 -25% | |
| Load Maximum * (Watt) | 109.3 | 114 -4% | 108 1% | 69.4 37% | 92.4 15% | 89.7 18% |
* ... smaller is better
Battery Life
Battery capacity is 37 percent smaller than on the Prestige 15 (82 Wh vs. 52 Wh) for a 15 percent decrease in battery life when under similar WLAN loads. Still, at 6.5 hours, runtimes are about average for its category. Most other 15-inch laptops have larger batteries including the ZenBook 15, XPS 15, and Spectre x360 15 for longer runtimes.
We connected a USB Type-C charger but the system would not recharge.
| MSI Modern 15 A10RB i7-10510U, GeForce MX250, 52 Wh | Asus ZenBook 15 UX534FT-DB77 i7-8565U, GeForce GTX 1650 Max-Q, 71 Wh | Dell XPS 15 7590 i5 iGPU FHD i5-9300H, UHD Graphics 630, 97 Wh | Lenovo ThinkPad T590-20N4002VGE i7-8565U, GeForce MX250, 57 Wh | HP Spectre X360 15-5ZV31AV i7-10510U, GeForce MX250, 84 Wh | MSI Prestige 15 A10SC i7-10710U, GeForce GTX 1650 Max-Q, 82 Wh | |
|---|---|---|---|---|---|---|
| Battery runtime | 47% | 59% | 84% | 61% | 22% | |
| Reader / Idle (h) | 15.4 | 21.5 40% | 22.6 47% | 19.1 24% | ||
| WiFi v1.3 (h) | 6.5 | 8.4 29% | 14.1 117% | 10.5 62% | 10.8 66% | 7.6 17% |
| Load (h) | 1.7 | 2.9 71% | 1.7 0% | 3.5 106% | 2.9 71% | 2.1 24% |
Pros
Cons
Verdict
You'll want to consider the Modern 15 over more well-known laptops like the Dell XPS 15, HP Spectre x360 15, Microsoft Surface Laptop 3 15, or the MacBook Pro for its lighter weight, cheaper price, and easily upgradeable RAM and storage as these are the strengths of the MSI system. The Core i7-10510U CPU pairs well with the GeForce MX250 GPU and they each run at above average speeds on the Modern 15.
Main drawbacks to keep in mind are its slower CPU performance when compared to more powerful Core H Ultrabooks, softer keyboard keys, and lack of Thunderbolt 3 support. The chassis is more prone to flexing and damage while the display is not as bright as higher-end alternatives. The Modern series is supposed to be home to affordable mid-range laptops, after all.
An annoying aspect we think deserves more attention is fan behavior. There's no reason why the system fans shouldn't be silent when idling on desktop on Silent mode or Power Saver mode. Most laptops with Core U series CPUs are quieter when under such low-power conditions.
If you can live with the weaknesses, then the Modern 15 will prove to be a powerful laptop relative to its small size and light weight. If you want more performance or something more durable, however, then consider the Prestige 15 or "proper" business laptops like the HP EliteBook, ThinkPad X1 Carbon, or the Dell Latitude 7000 series.
MSI Modern 15 A10RB
- 05/20/2021 v7 (old)
Allen Ngo
Price comparison
