Dell Inspiron 15 5000 5585 Laptop Review: An Excellent Alternative to Intel
The Inspiron 15 5585 is the AMD version of the Intel-powered Inspiron 15 5584. This is more than just a CPU swap, however, as there are significant differences between the two models in relation to the chassis, motherboard, battery life, and overall performance as our review below will show. The series is meant to be an inexpensive alternative to fancier flagship models like those from the Dell XPS series, Asus ZenBook series, HP Spectre series, or the Lenovo Yoga 900 series.
All current Inspiron 5585 SKUs come equipped with AMD's latest Zen+ CPUs ranging from the Ryzen 3 3200U to the Ryzen 5 3500U and Ryzen 7 3700U with integrated Vega graphics. While storage and RAM will vary, the display remains fixed at 1080p IPS only. Our test unit today is the higher-end configuration retailing for about $780 to compete directly with other budget 15.6-inch multimedia laptops including the HP Pavilion 15, Lenovo IdeaPad 720s, Asus VivoBook S15, and the Acer Aspire 5.
More Dell Inspiron reviews:
Case
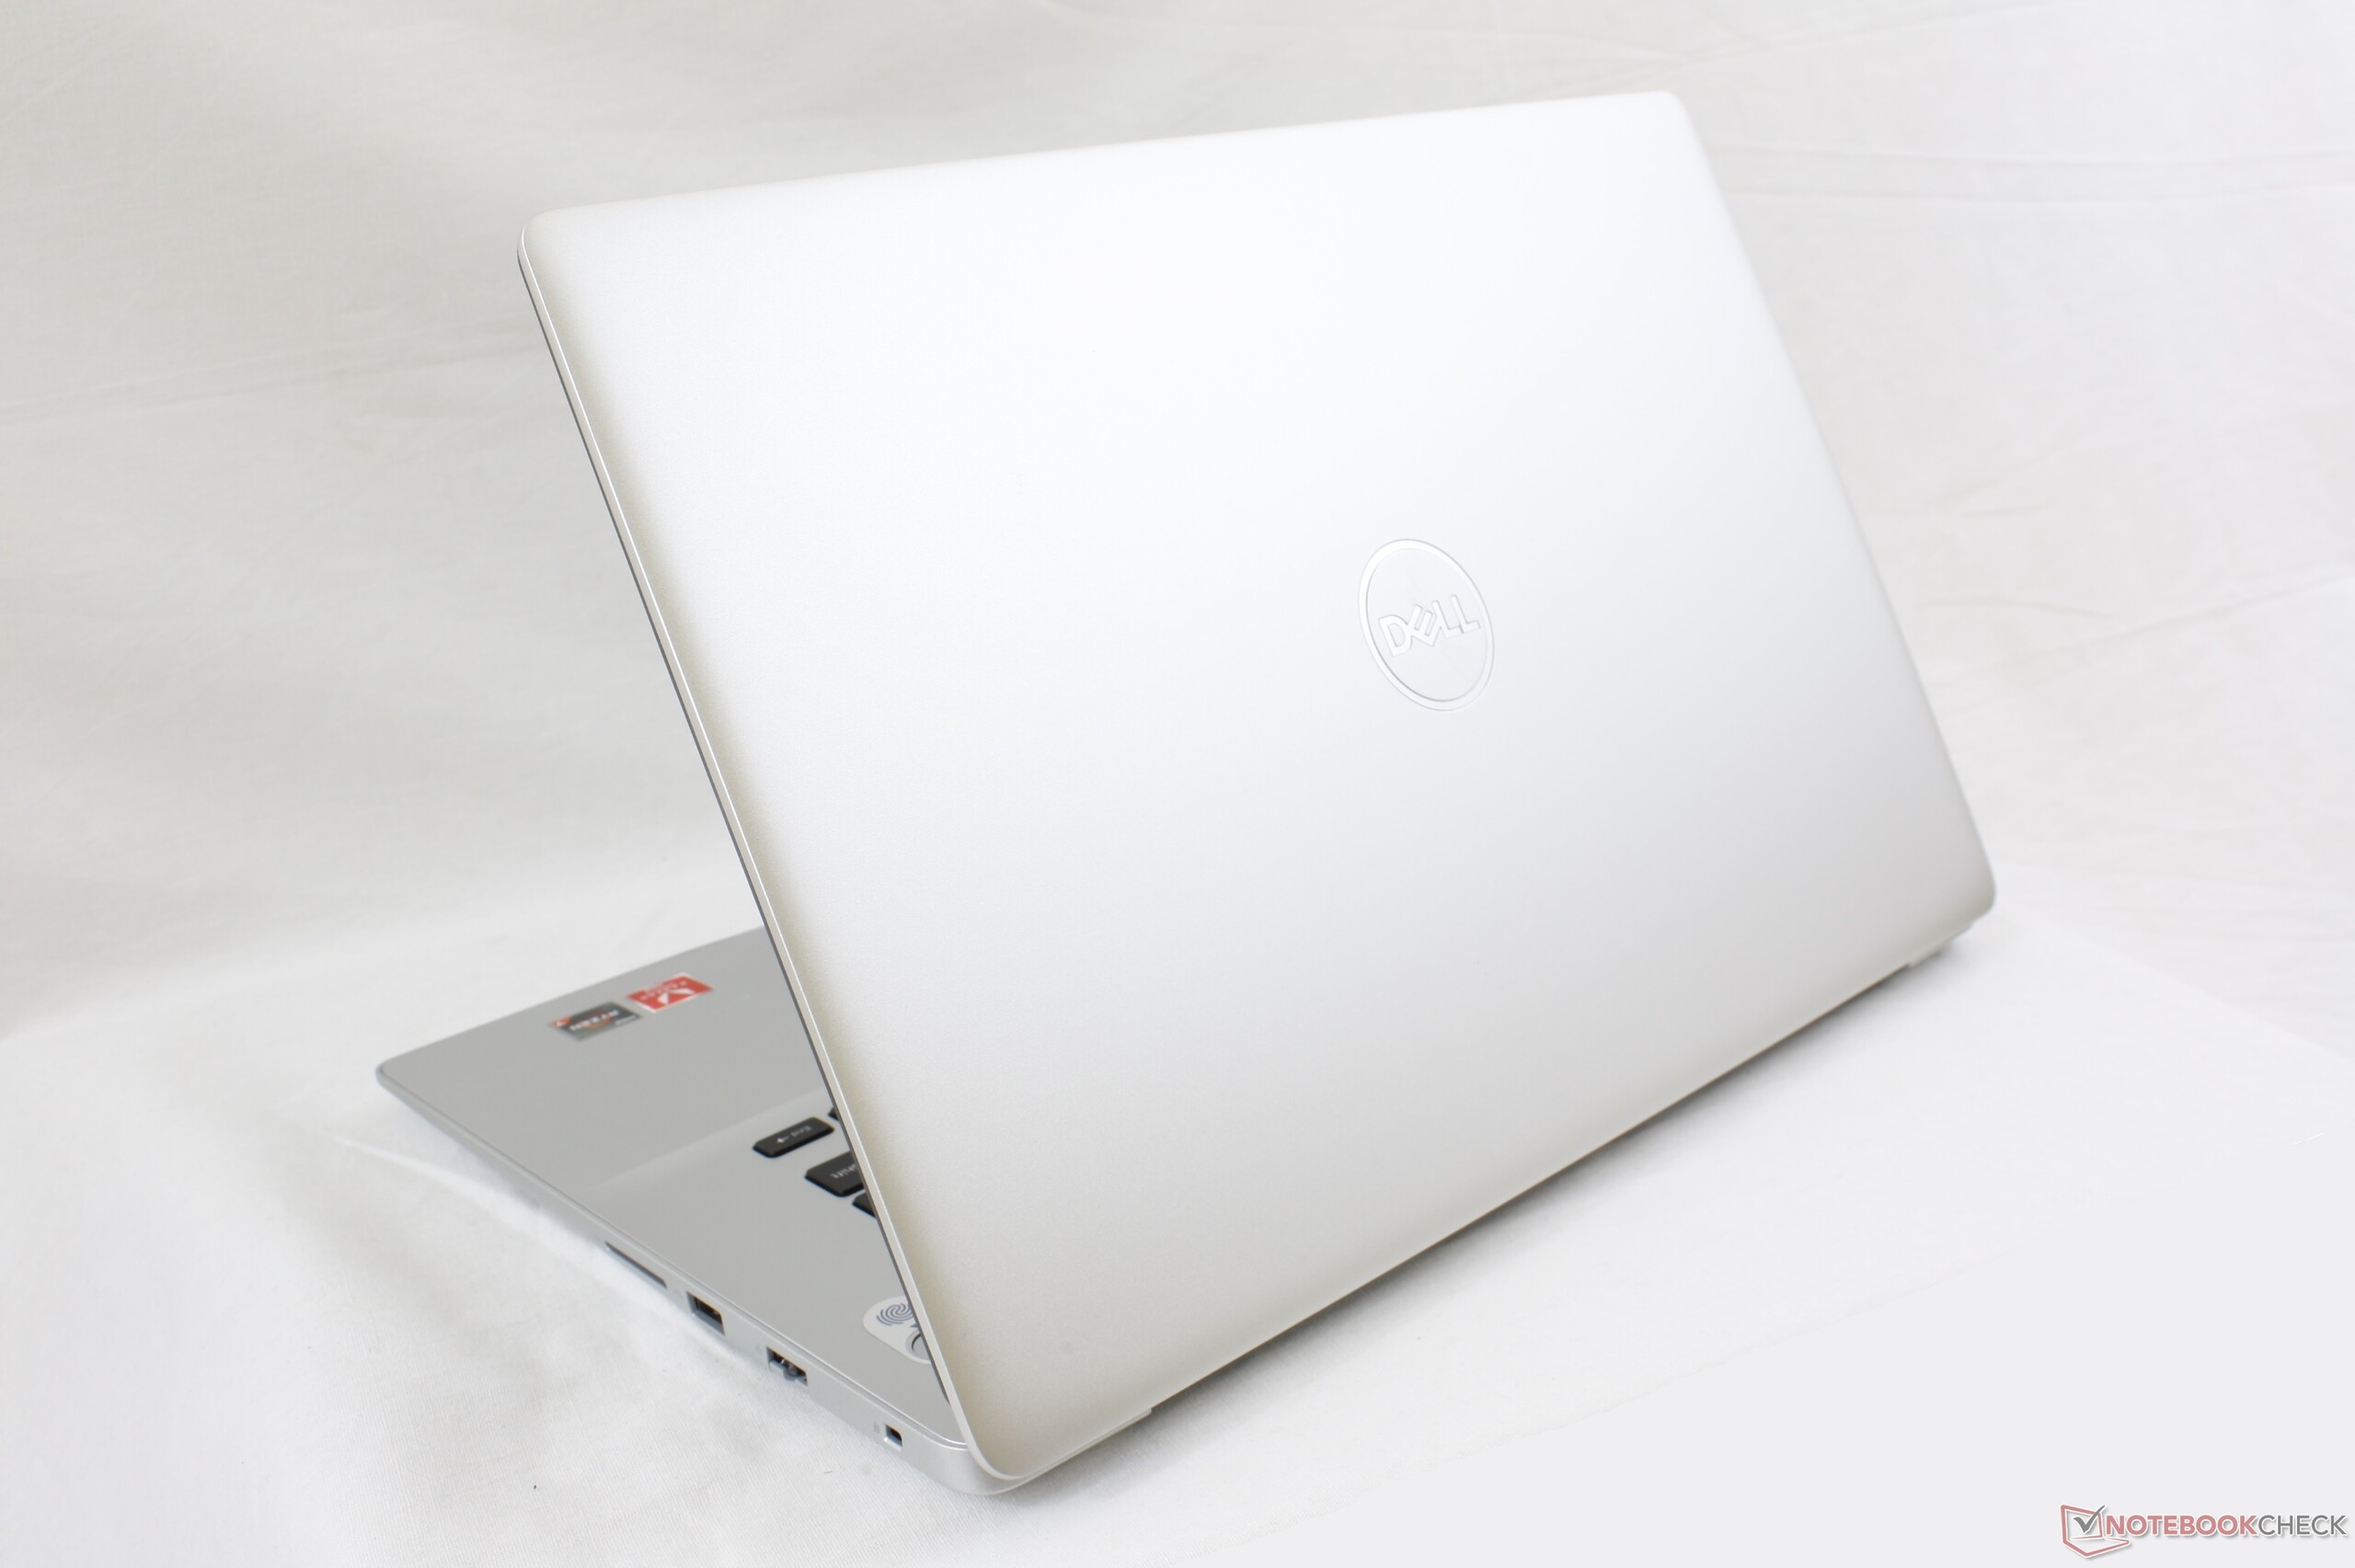
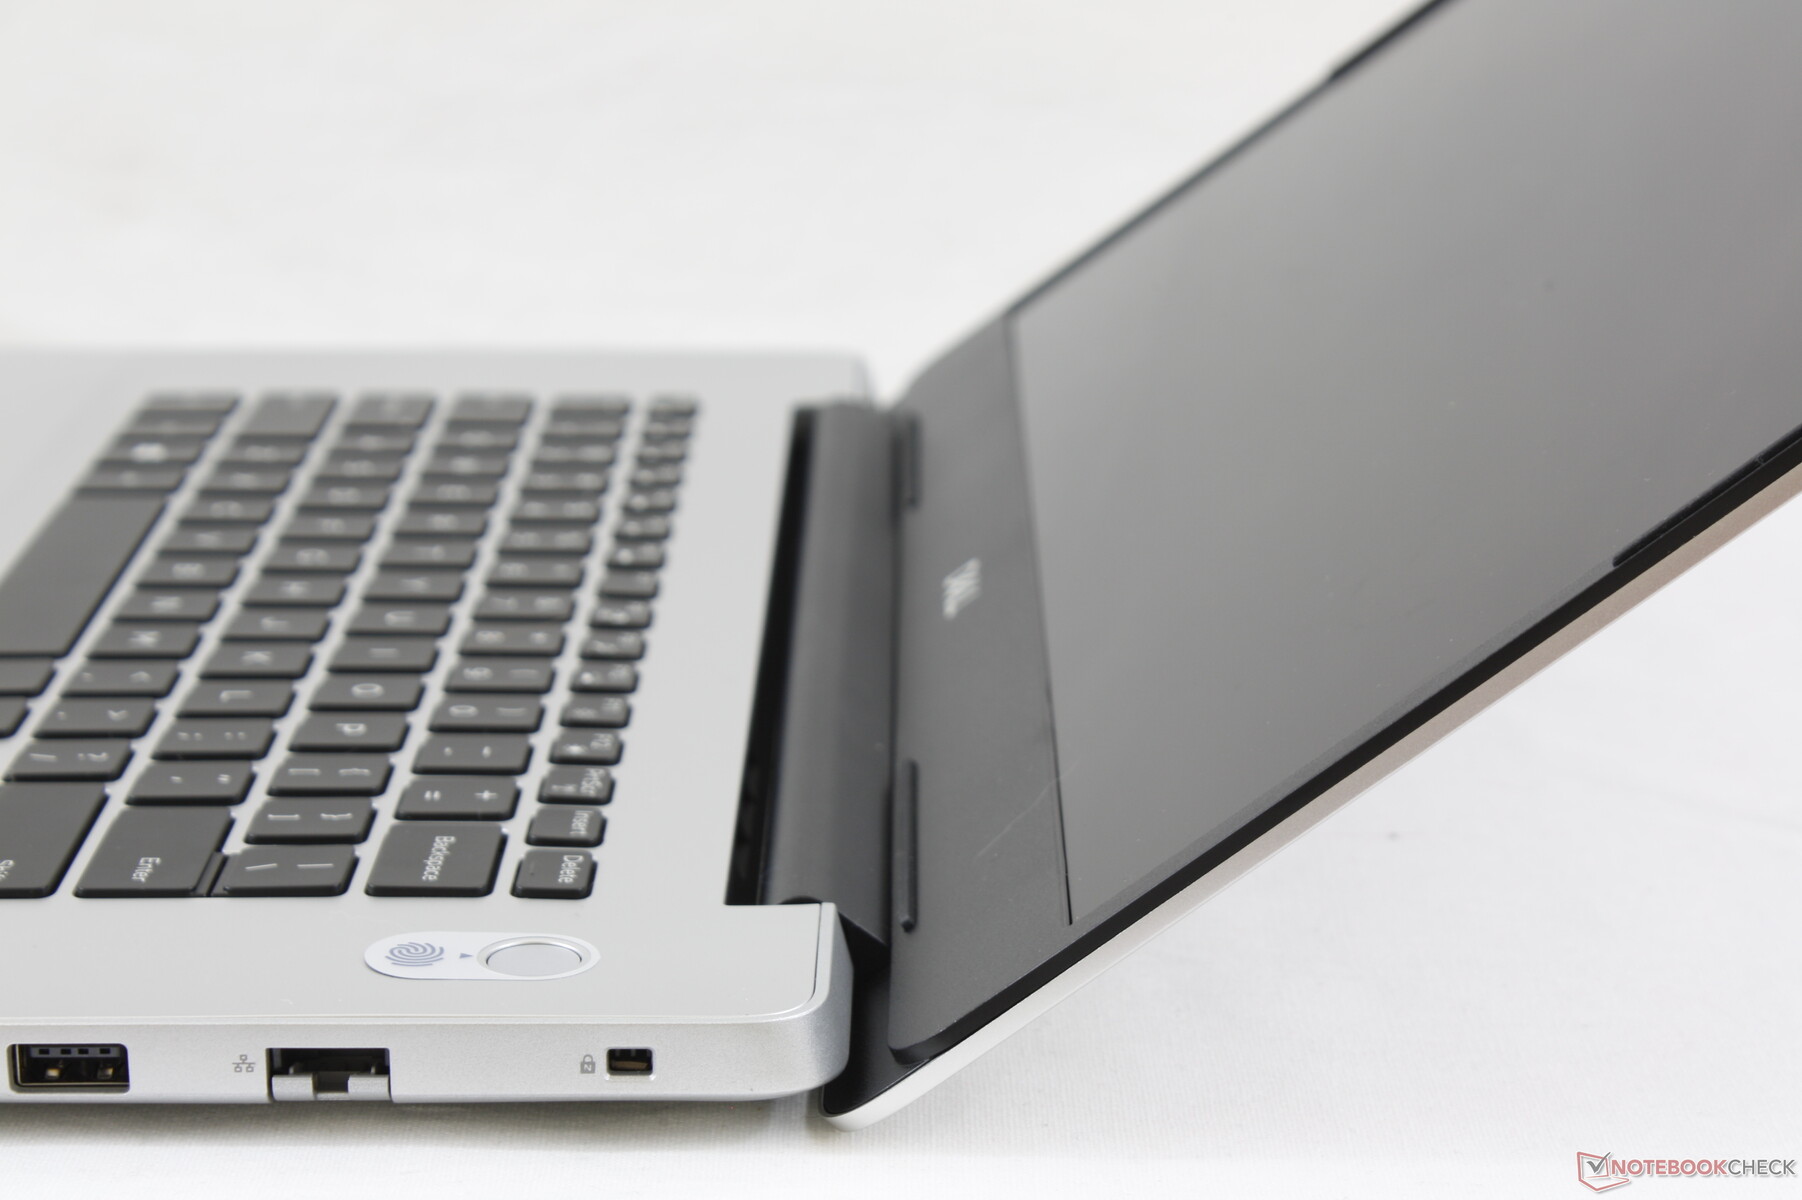
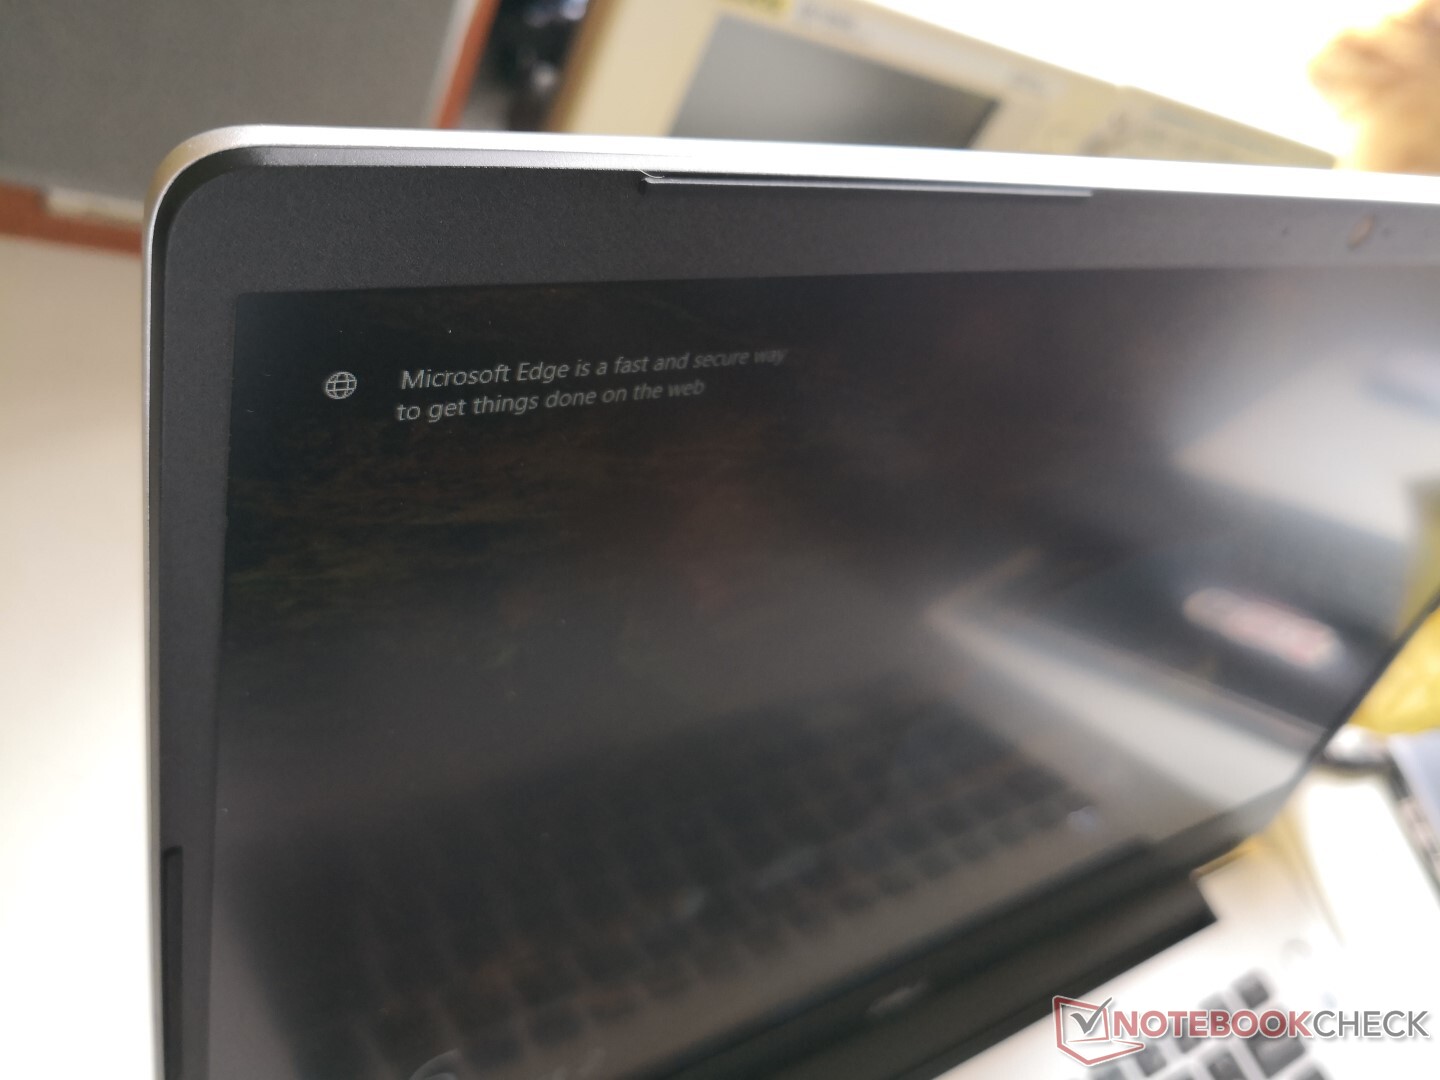
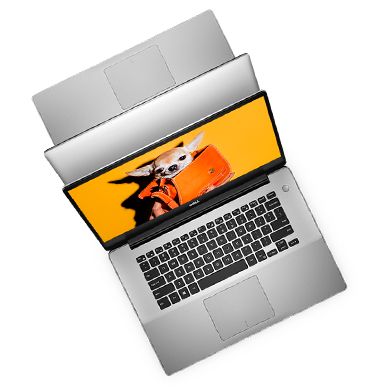
Inspiron laptops are looking more and more like XPS laptops these days. Even the silver coloring and smooth surface texture of the outer lid are essentially identical to the XPS 15. First impressions from a visual standpoint are more impressive when compared to an HP Pavilion 15 or a Lenovo IdeaPad 330.
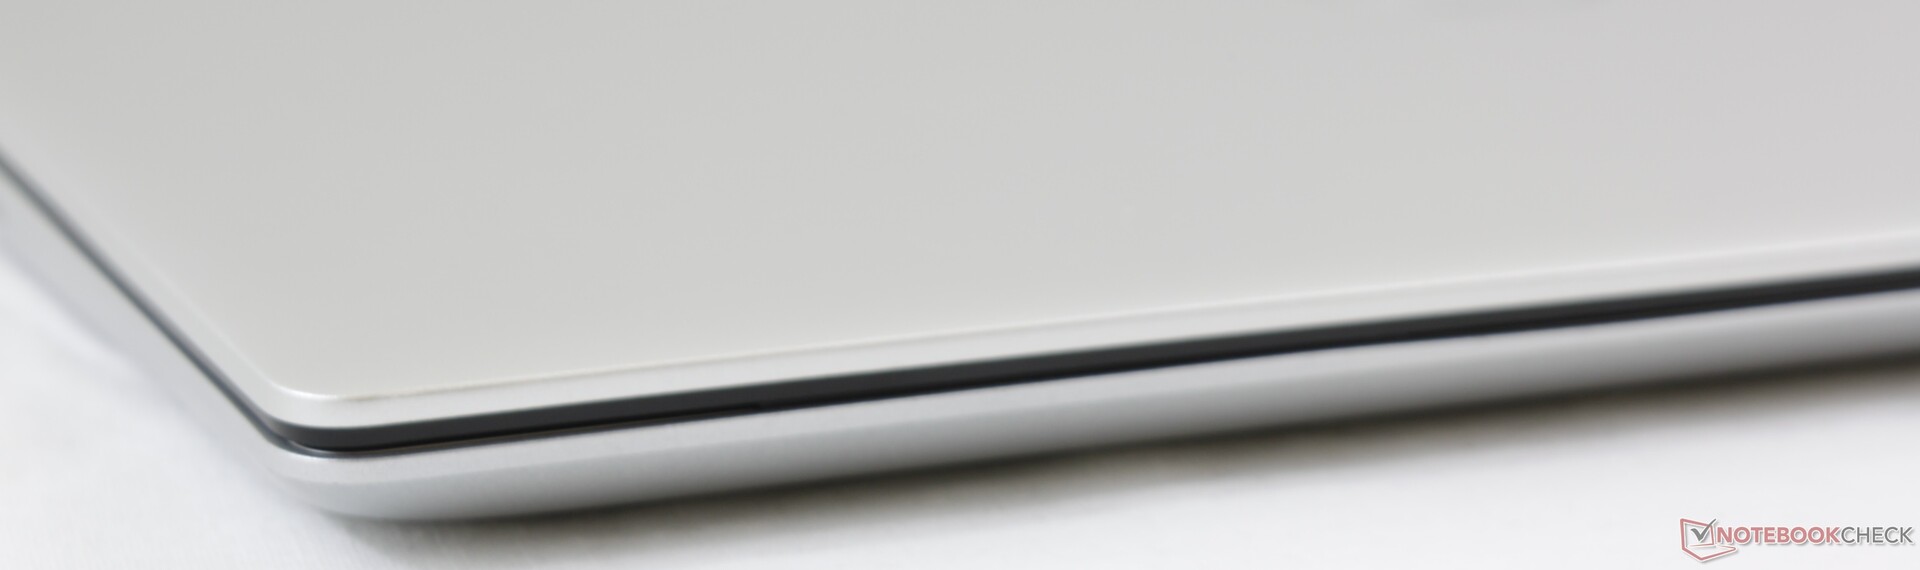
Once you open up the lid, however, all the signs of a budget laptop begin to show. The palm rests and keyboard deck are of cheaper plastic than the outer lid and the plastic bezels are not nearly as sleek as the edge-to-edge glass bezels of the XPS 15. The chassis feels hollow and not as firm as it could have been especially since there is slight-moderate flexing when pushing down on the center of the keyboard keys or outer lid. Construction quality is imperfect on our test unit as well as we can spot an uneven gap between the chassis and the hinge. On the bright side, creaking is minimal and the base is fairly rigid around the corners when considering its entry-level category. Older Asus VivoBook systems, for example, tend to creak and twist more easily.
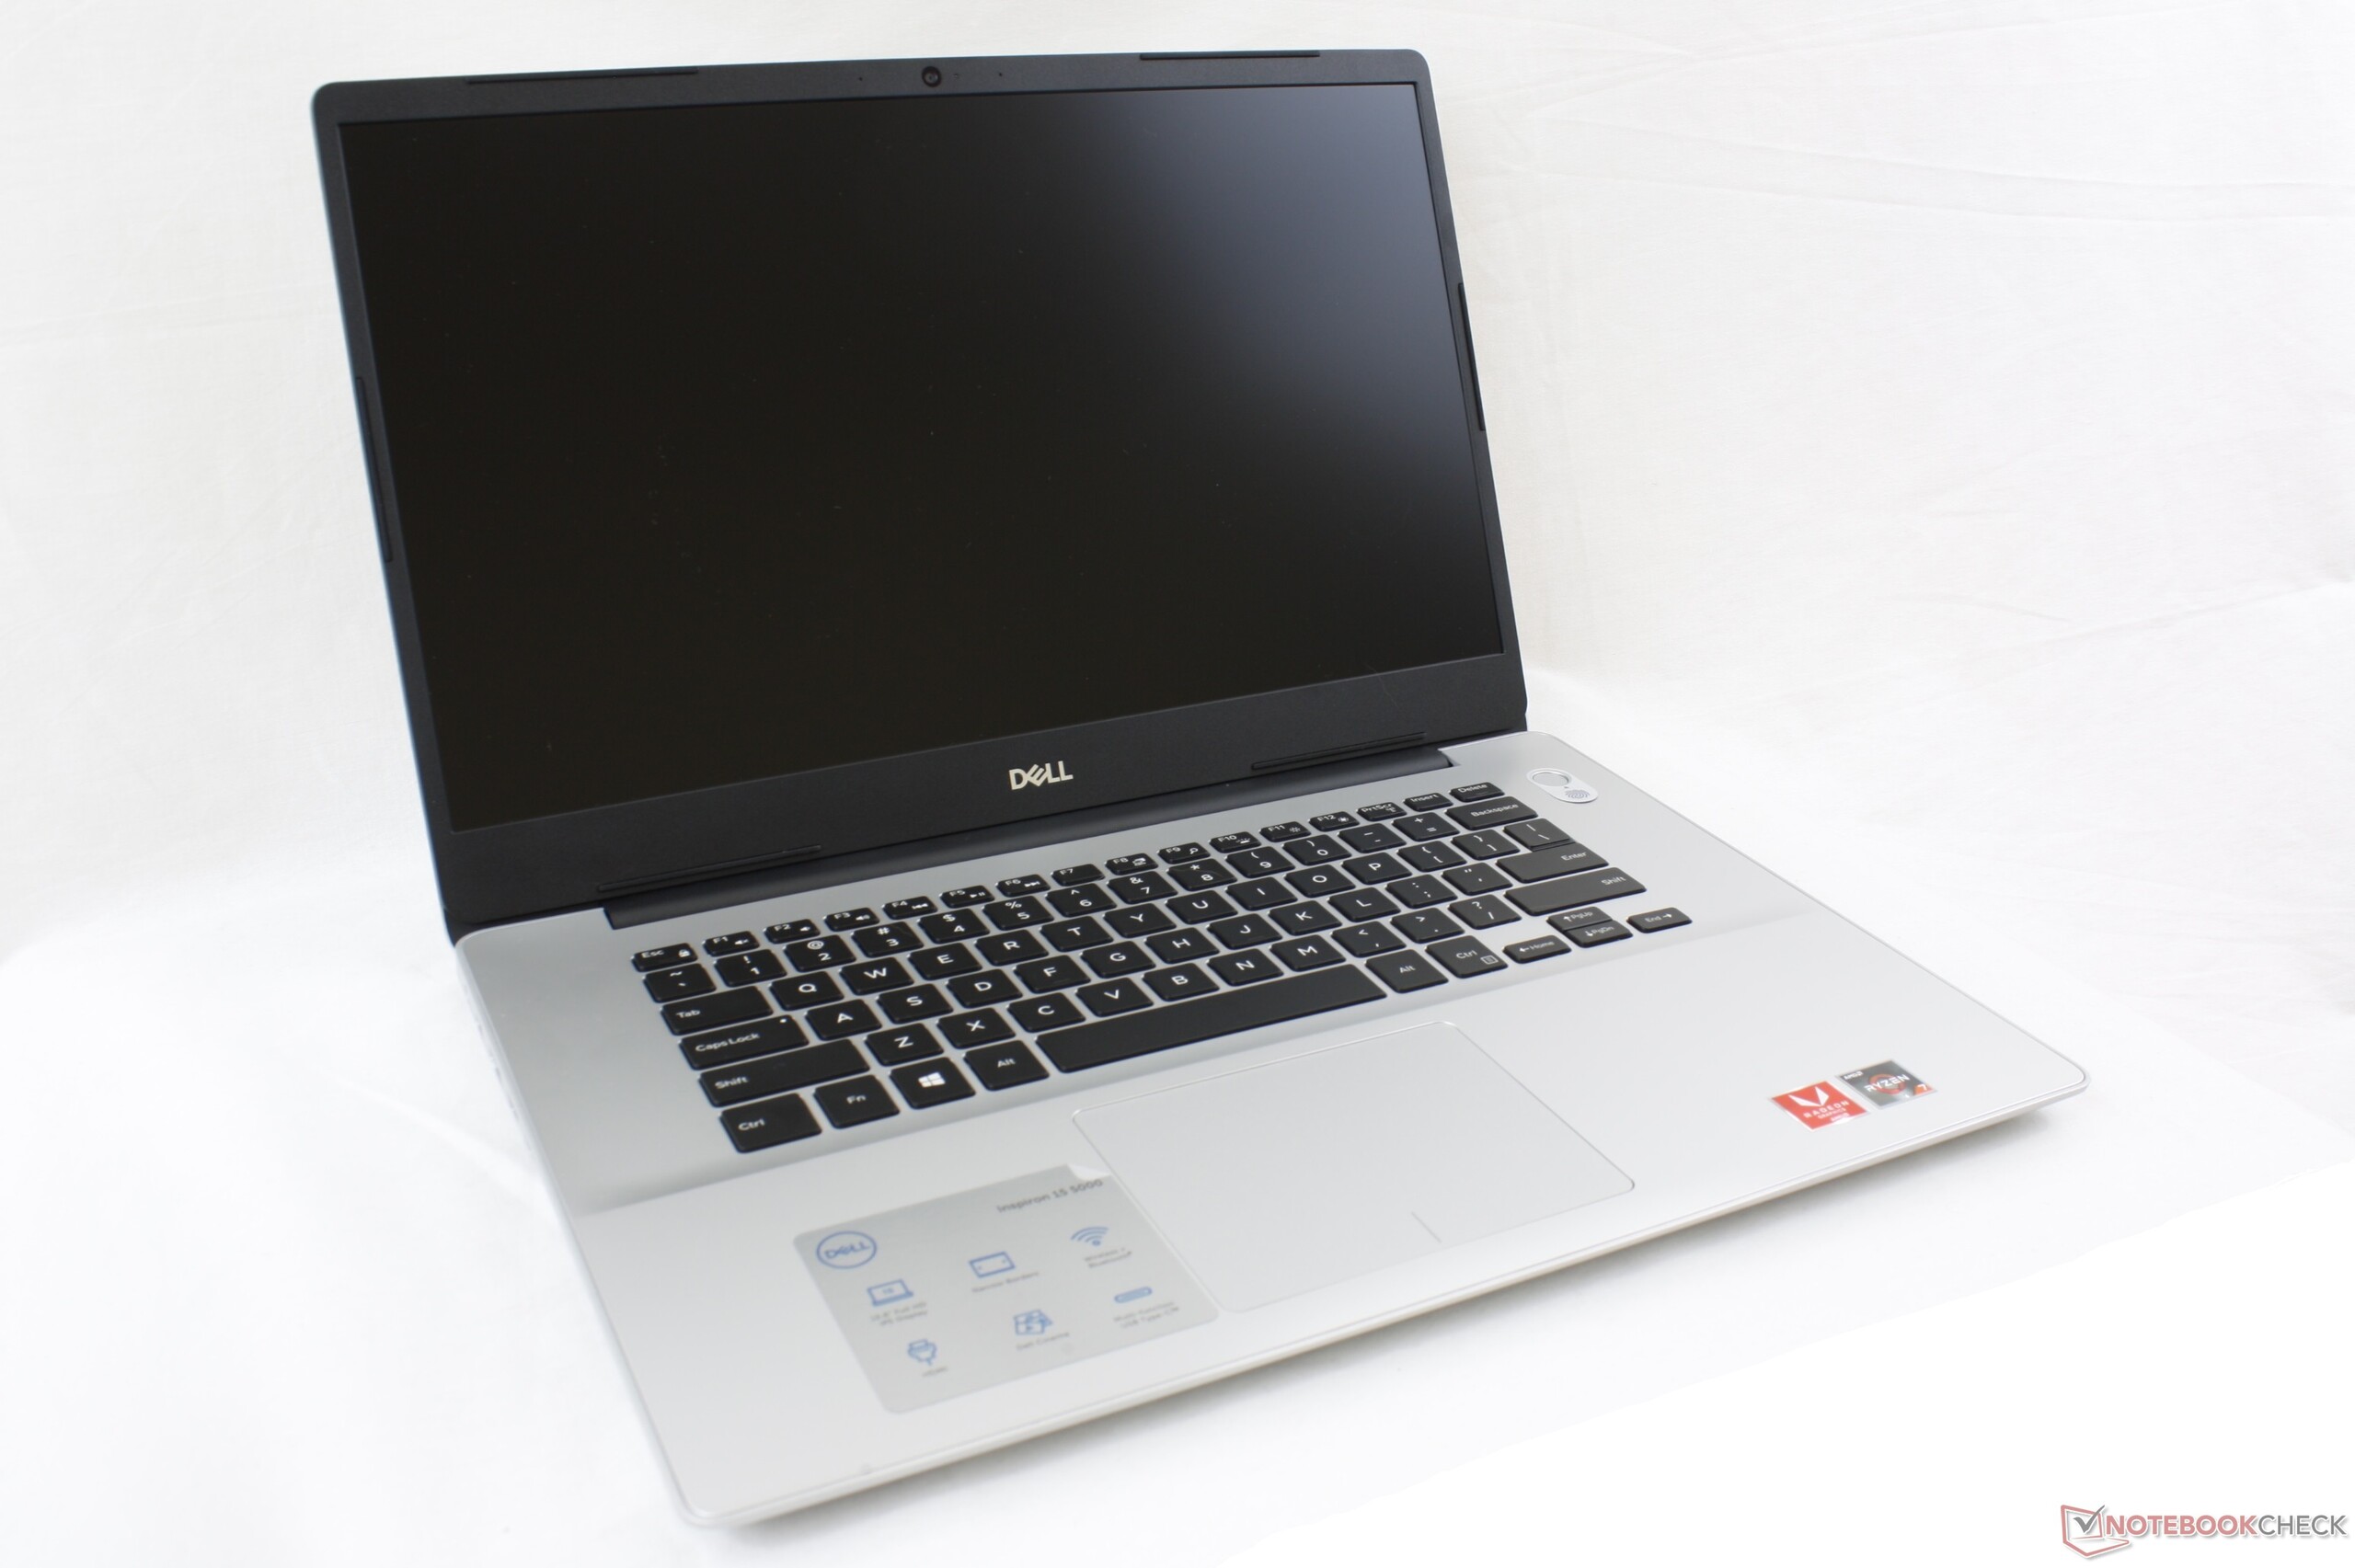
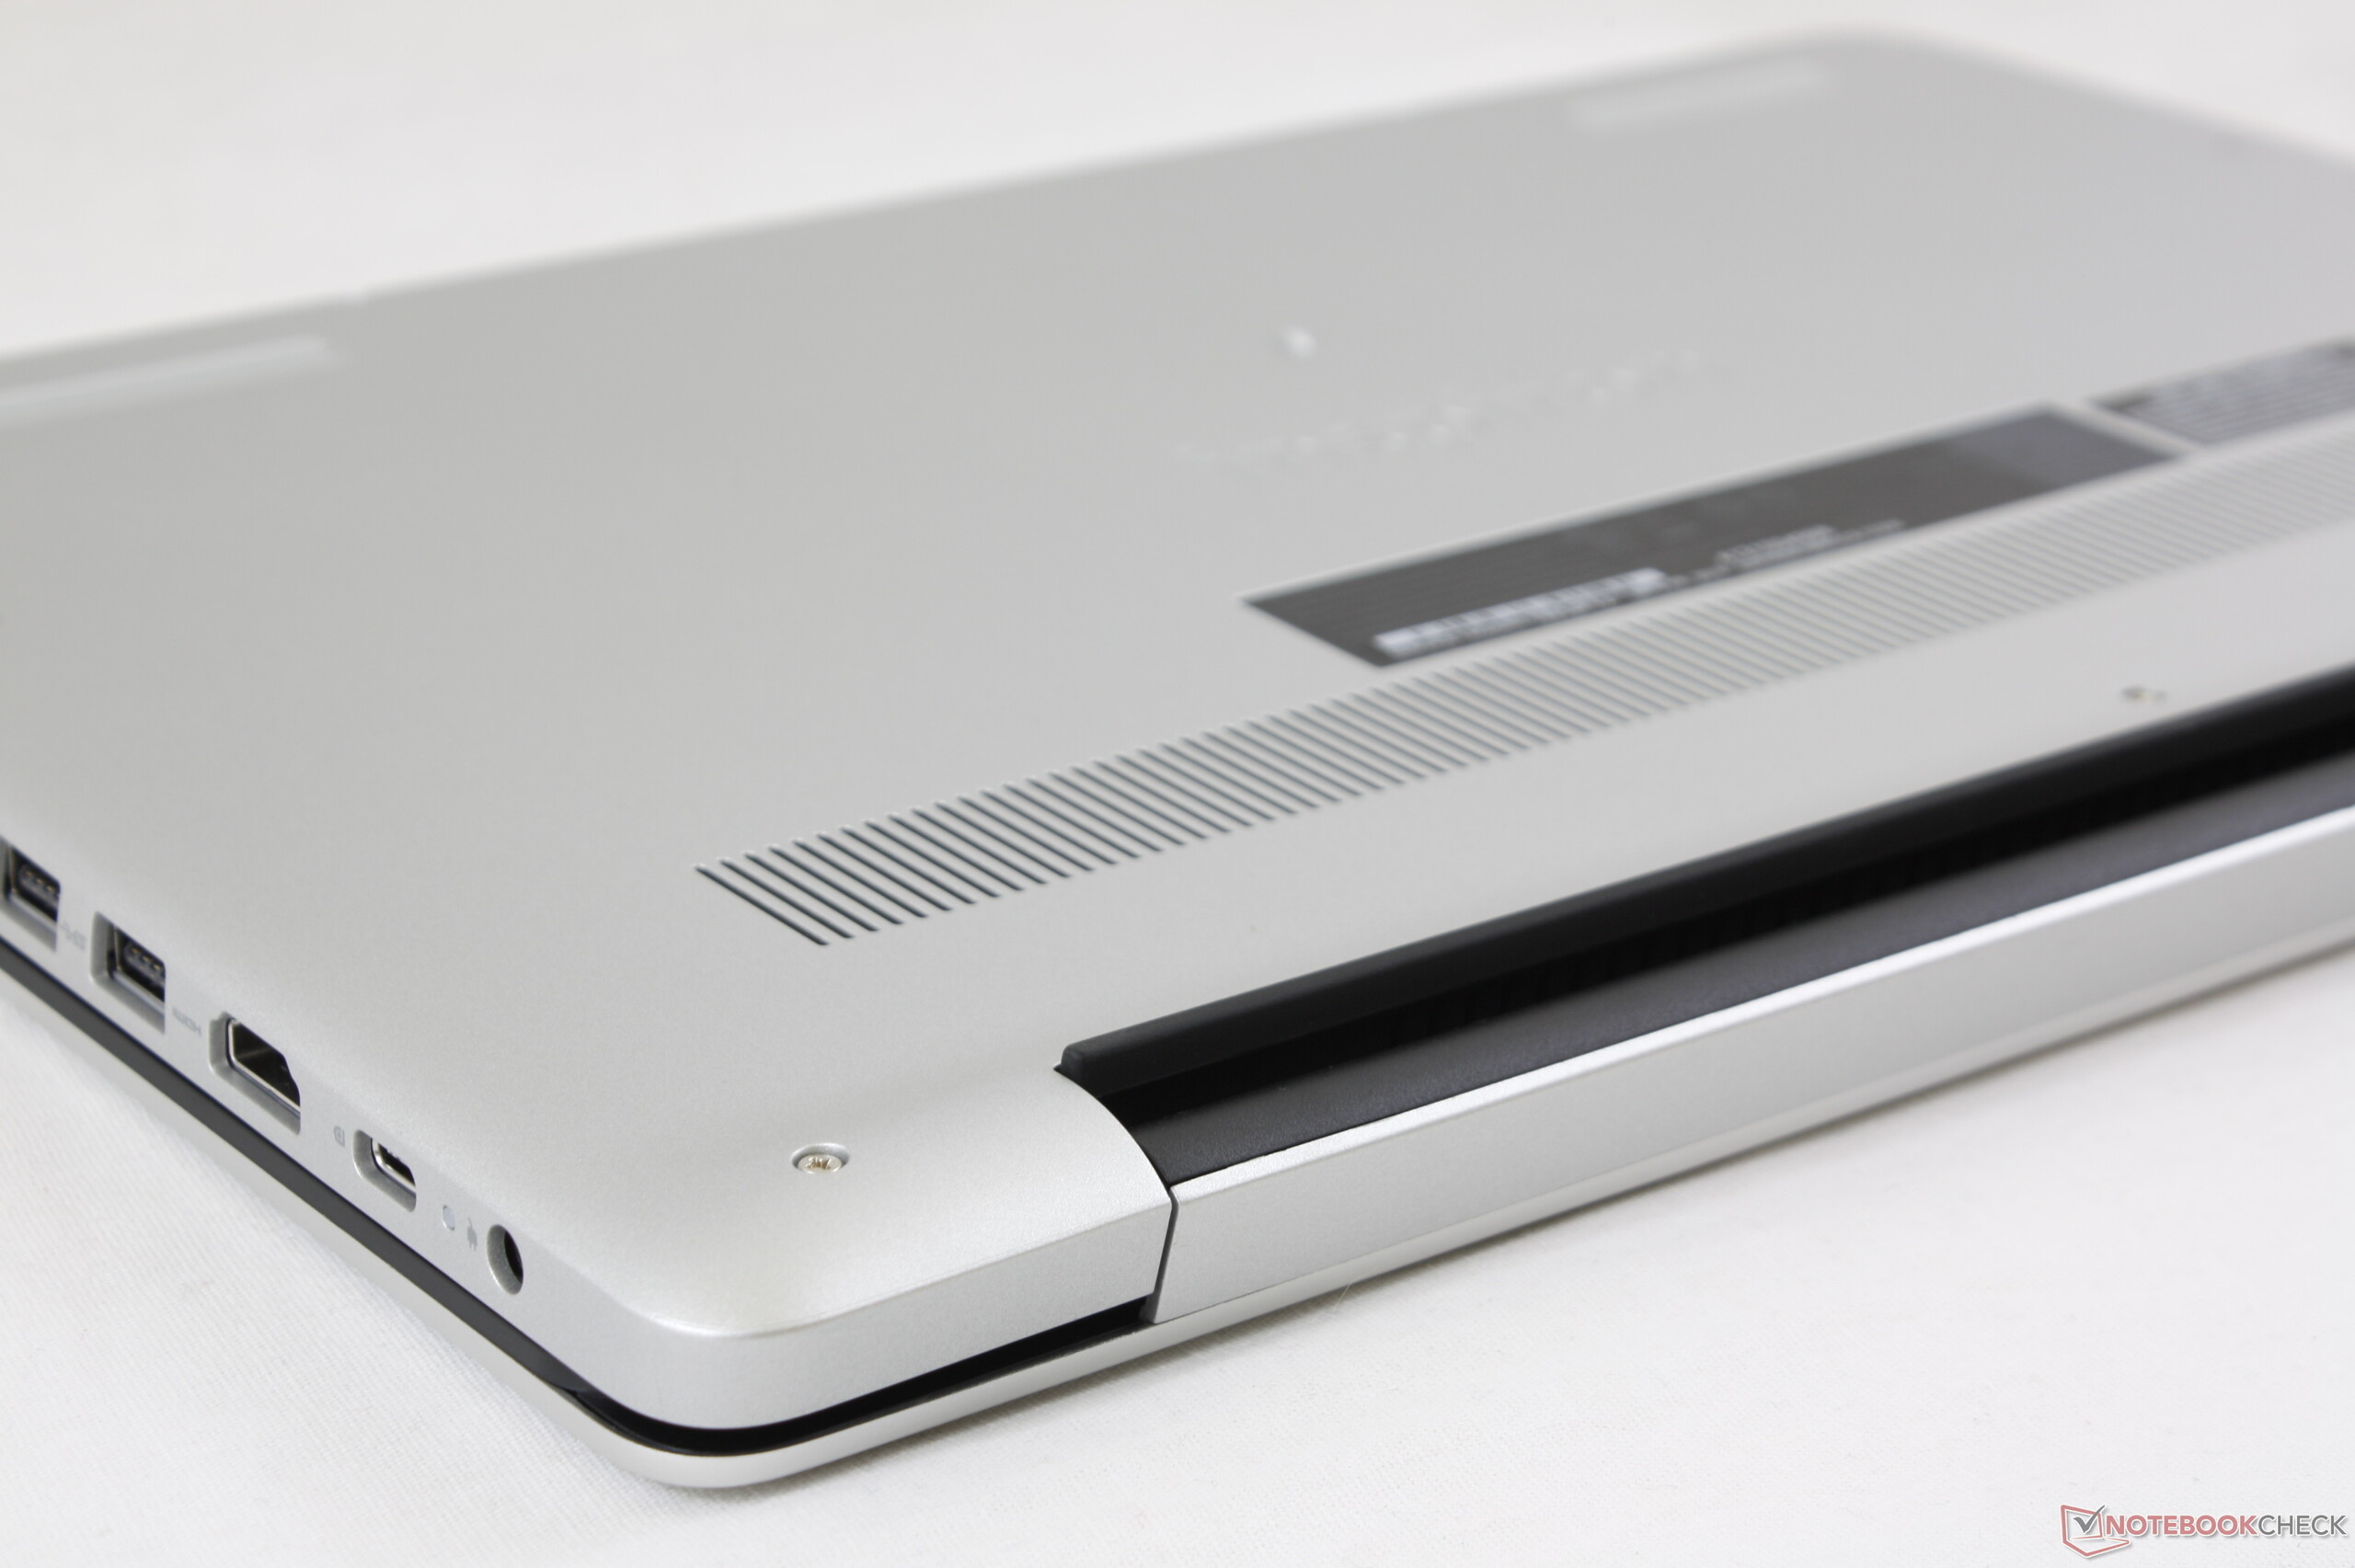
Despite its similarities to the Inspiron 15 5584, size and weight are different for the 5585. The AMD model is slightly thinner (19.5 vs. 22.5 mm), shorter (359 mm vs. 364 mm), and lighter (1.8 kg vs. 1.9 kg) than its Intel counterpart. It's still relatively long in depth due to the thicker top and bottom bezels of the display and so a number of other 15.6-inch laptops are smaller like the Asus VivoBook S15 S532.
Connectivity
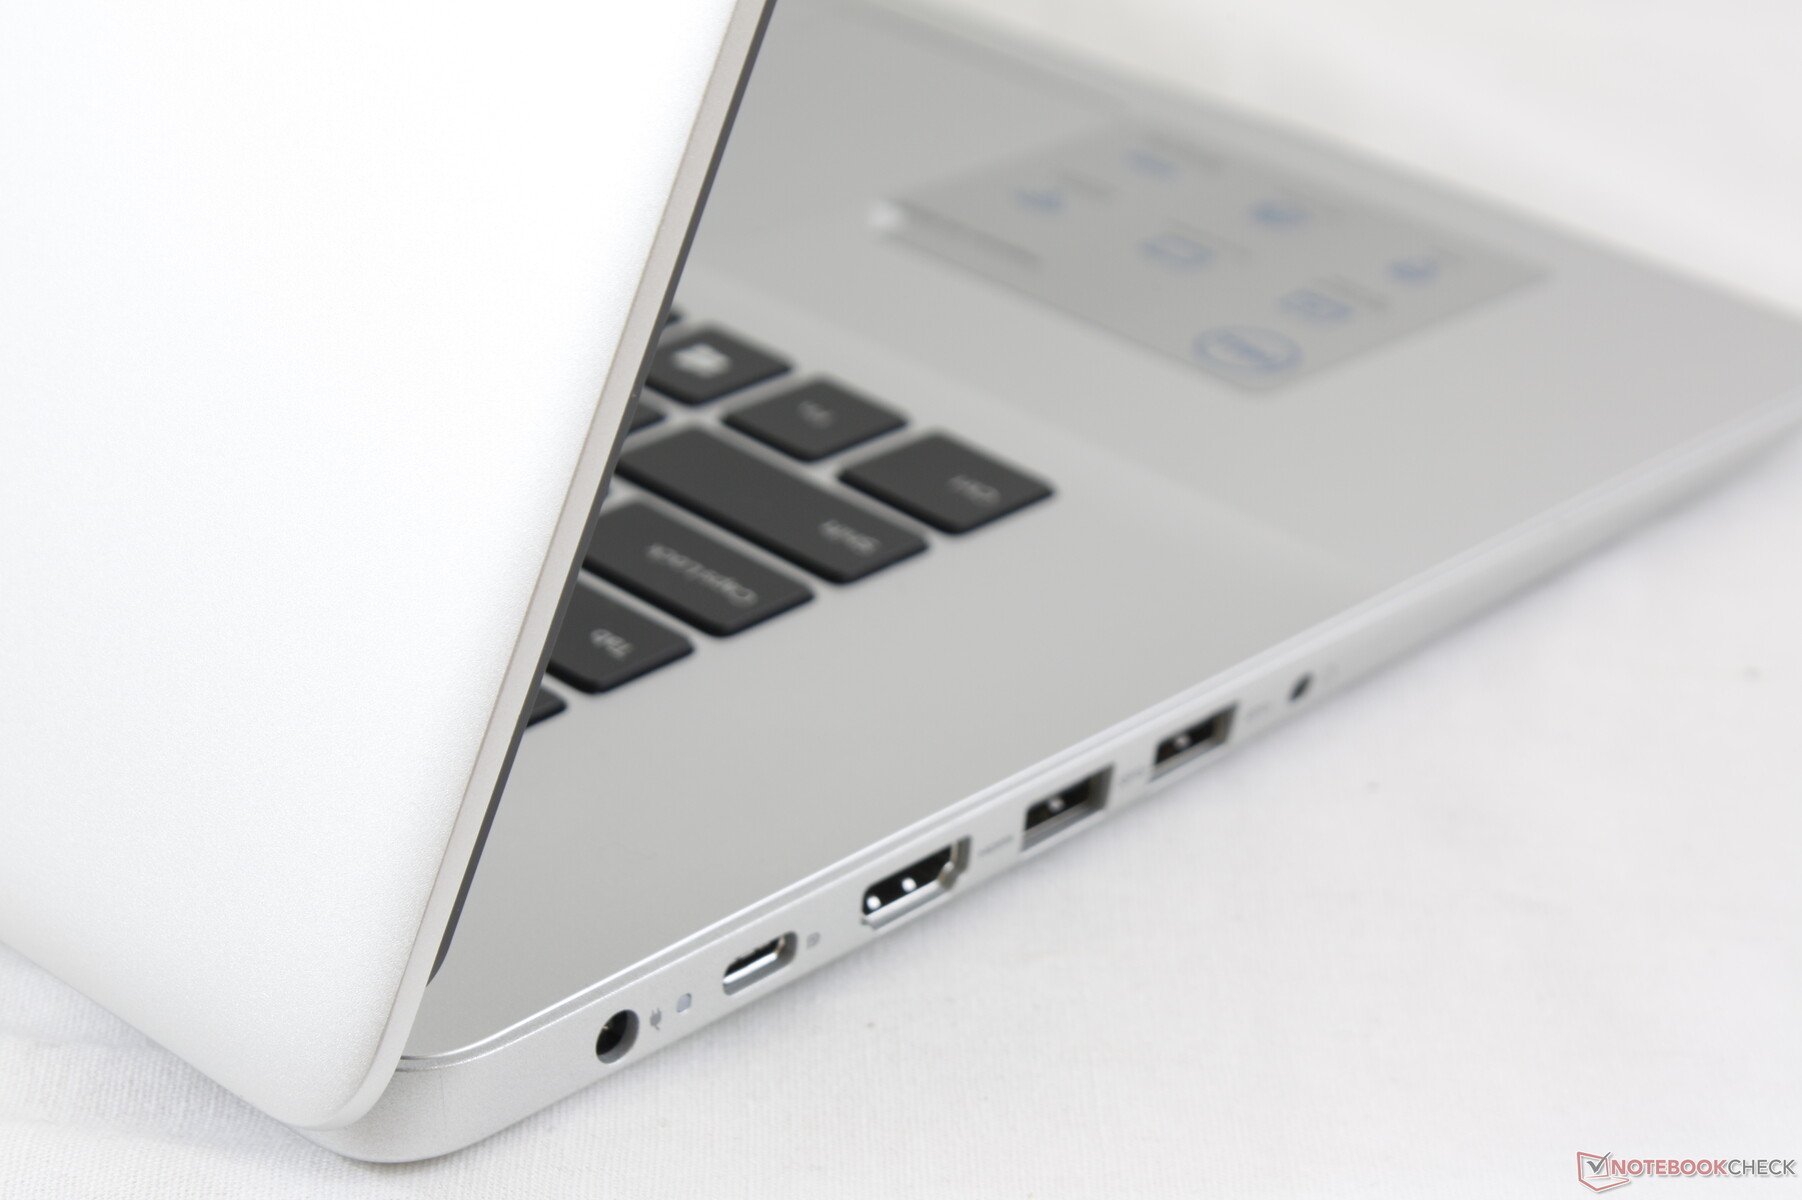
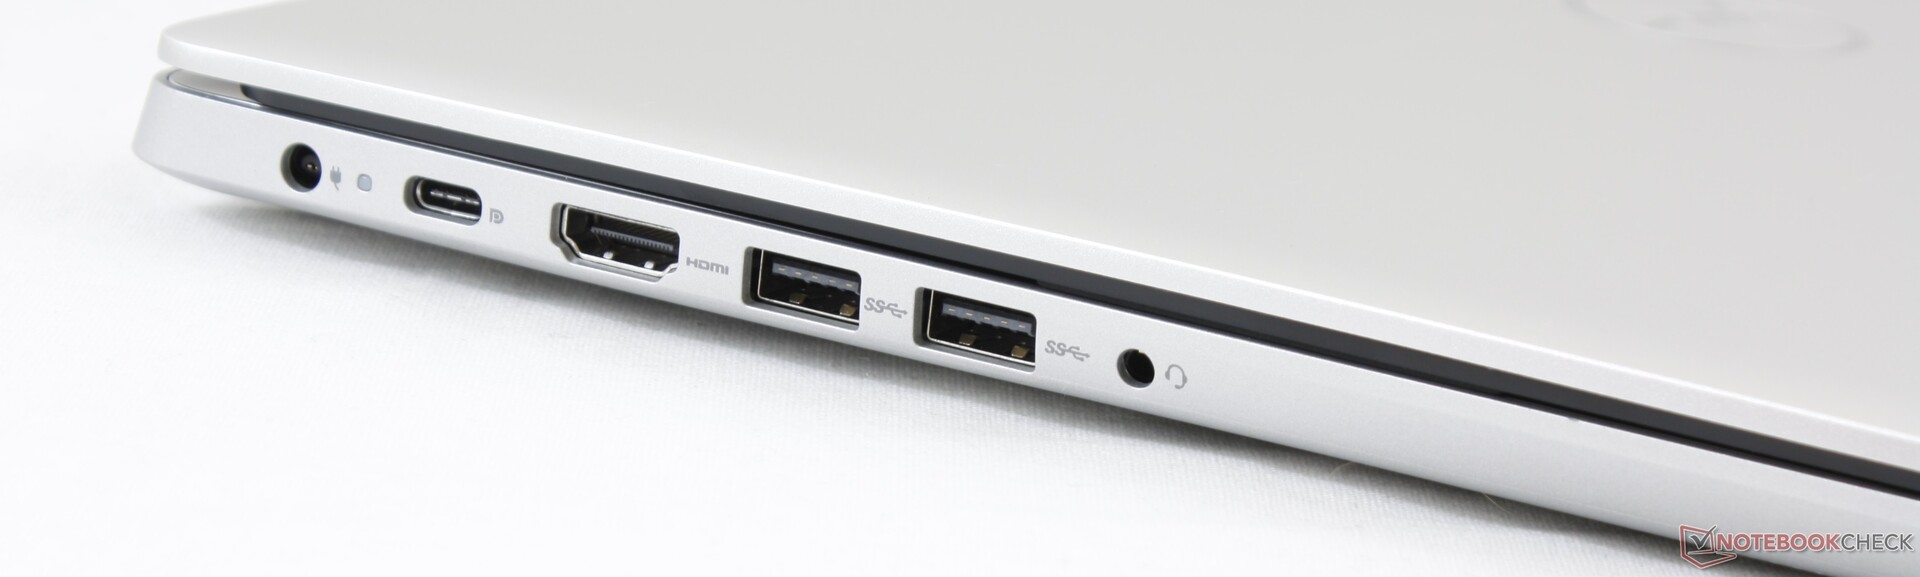
All the ports of the Inspiron 15 5584 are here but with a new USB Type-C port and a small change to port placement. All ports are easy to reach with most of them now tightly packed along the left edge. It's worth mentioning that the RJ-45 port is Fast Ethernet only and it does not support Gbps transfer rates.
Dell advertises Power Delivery via USB Type-C and we are able to confirm this as the system is compatible with our 130 W USB Type-C charger. The fact that the system can charge via the proprietary AC adapter port and the USB Type-C port makes the former superfluous.
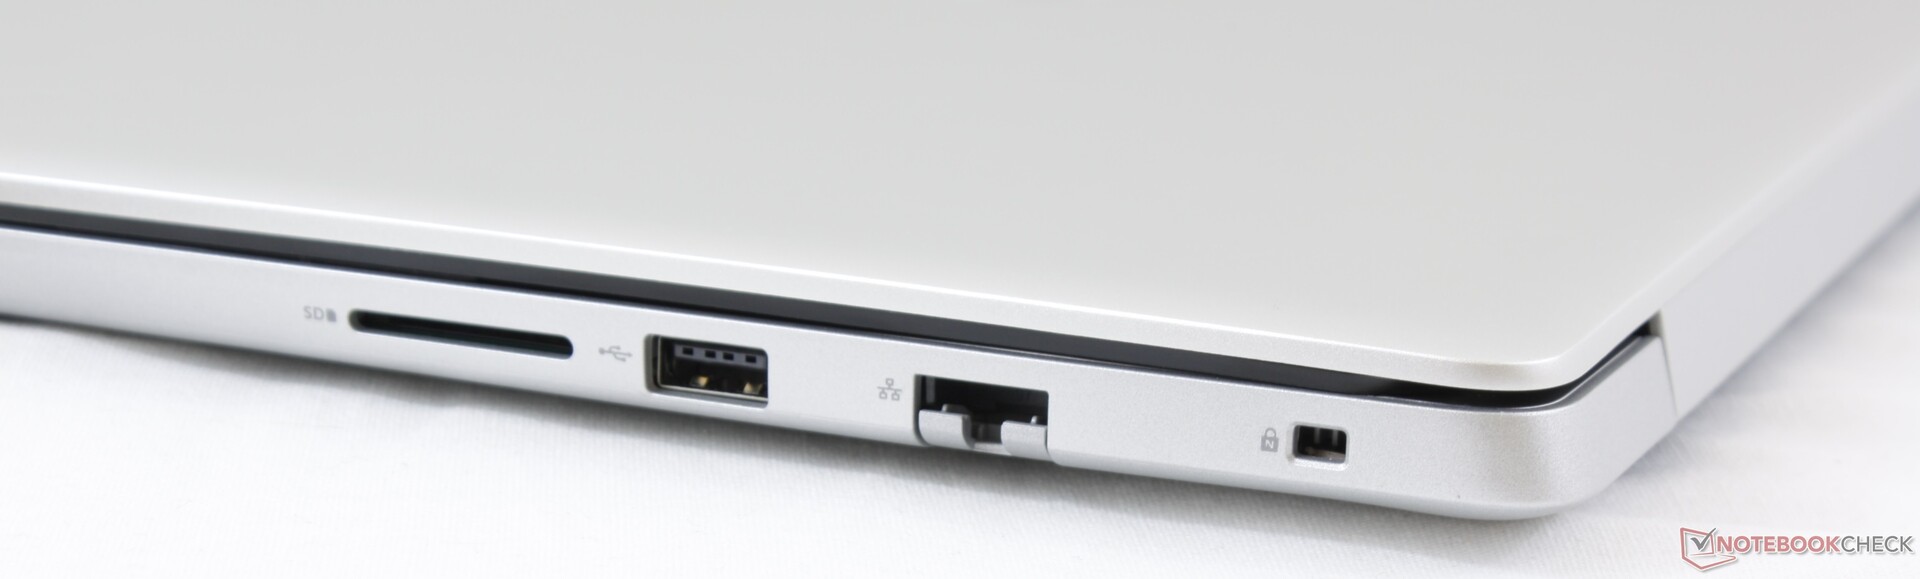
SD Card Reader
The integrated card reader is nowhere near as fast as on the pricier XPS series. Transferring 1 GB of pictures from our UHS-II SD card to desktop takes about 27 seconds compared to just 7 seconds on the XPS 15.
A fully inserted SD card still protrudes by about half its length unlike on the HP Pavilion Gaming 17 where the SD card sits flush against the edge for safer transporting.
| SD Card Reader | |
| average JPG Copy Test (av. of 3 runs) | |
| Dell XPS 15 9570 Core i9 UHD (Toshiba Exceria Pro SDXC 64 GB UHS-II) | |
| Lenovo Ideapad 330S-15ARR-81FB00C7GE (Toshiba Exceria Pro SDXC 64 GB UHS-II) | |
| Dell Inspiron 15 5000 5585 (Toshiba Exceria Pro SDXC 64 GB UHS-II) | |
| Dell Inspiron 15 3585 (2300U, Vega 6) (Toshiba Exceria Pro SDXC 64 GB UHS-II) | |
| Dell Inspiron 15 5000 5584 (Toshiba Exceria Pro SDXC 64 GB UHS-II) | |
| maximum AS SSD Seq Read Test (1GB) | |
| Dell XPS 15 9570 Core i9 UHD (Toshiba Exceria Pro SDXC 64 GB UHS-II) | |
| Lenovo Ideapad 330S-15ARR-81FB00C7GE (Toshiba Exceria Pro SDXC 64 GB UHS-II) | |
| Dell Inspiron 15 5000 5585 (Toshiba Exceria Pro SDXC 64 GB UHS-II) | |
| Dell Inspiron 15 3585 (2300U, Vega 6) (Toshiba Exceria Pro SDXC 64 GB UHS-II) | |
| Dell Inspiron 15 5000 5584 (Toshiba Exceria Pro SDXC 64 GB UHS-II) | |
Communication
As an AMD-powered laptop, it's understandable that the Inspiron 5585 ships with a non-Intel WLAN module by default. The 1x1 Qualcomm Atheros QCA9377 performs at only one-fourth the speed of the more common 2x2 Intel 9260. To the everyday home user, however, performance remains sufficient and reliable for day-to-day browsing or streaming.
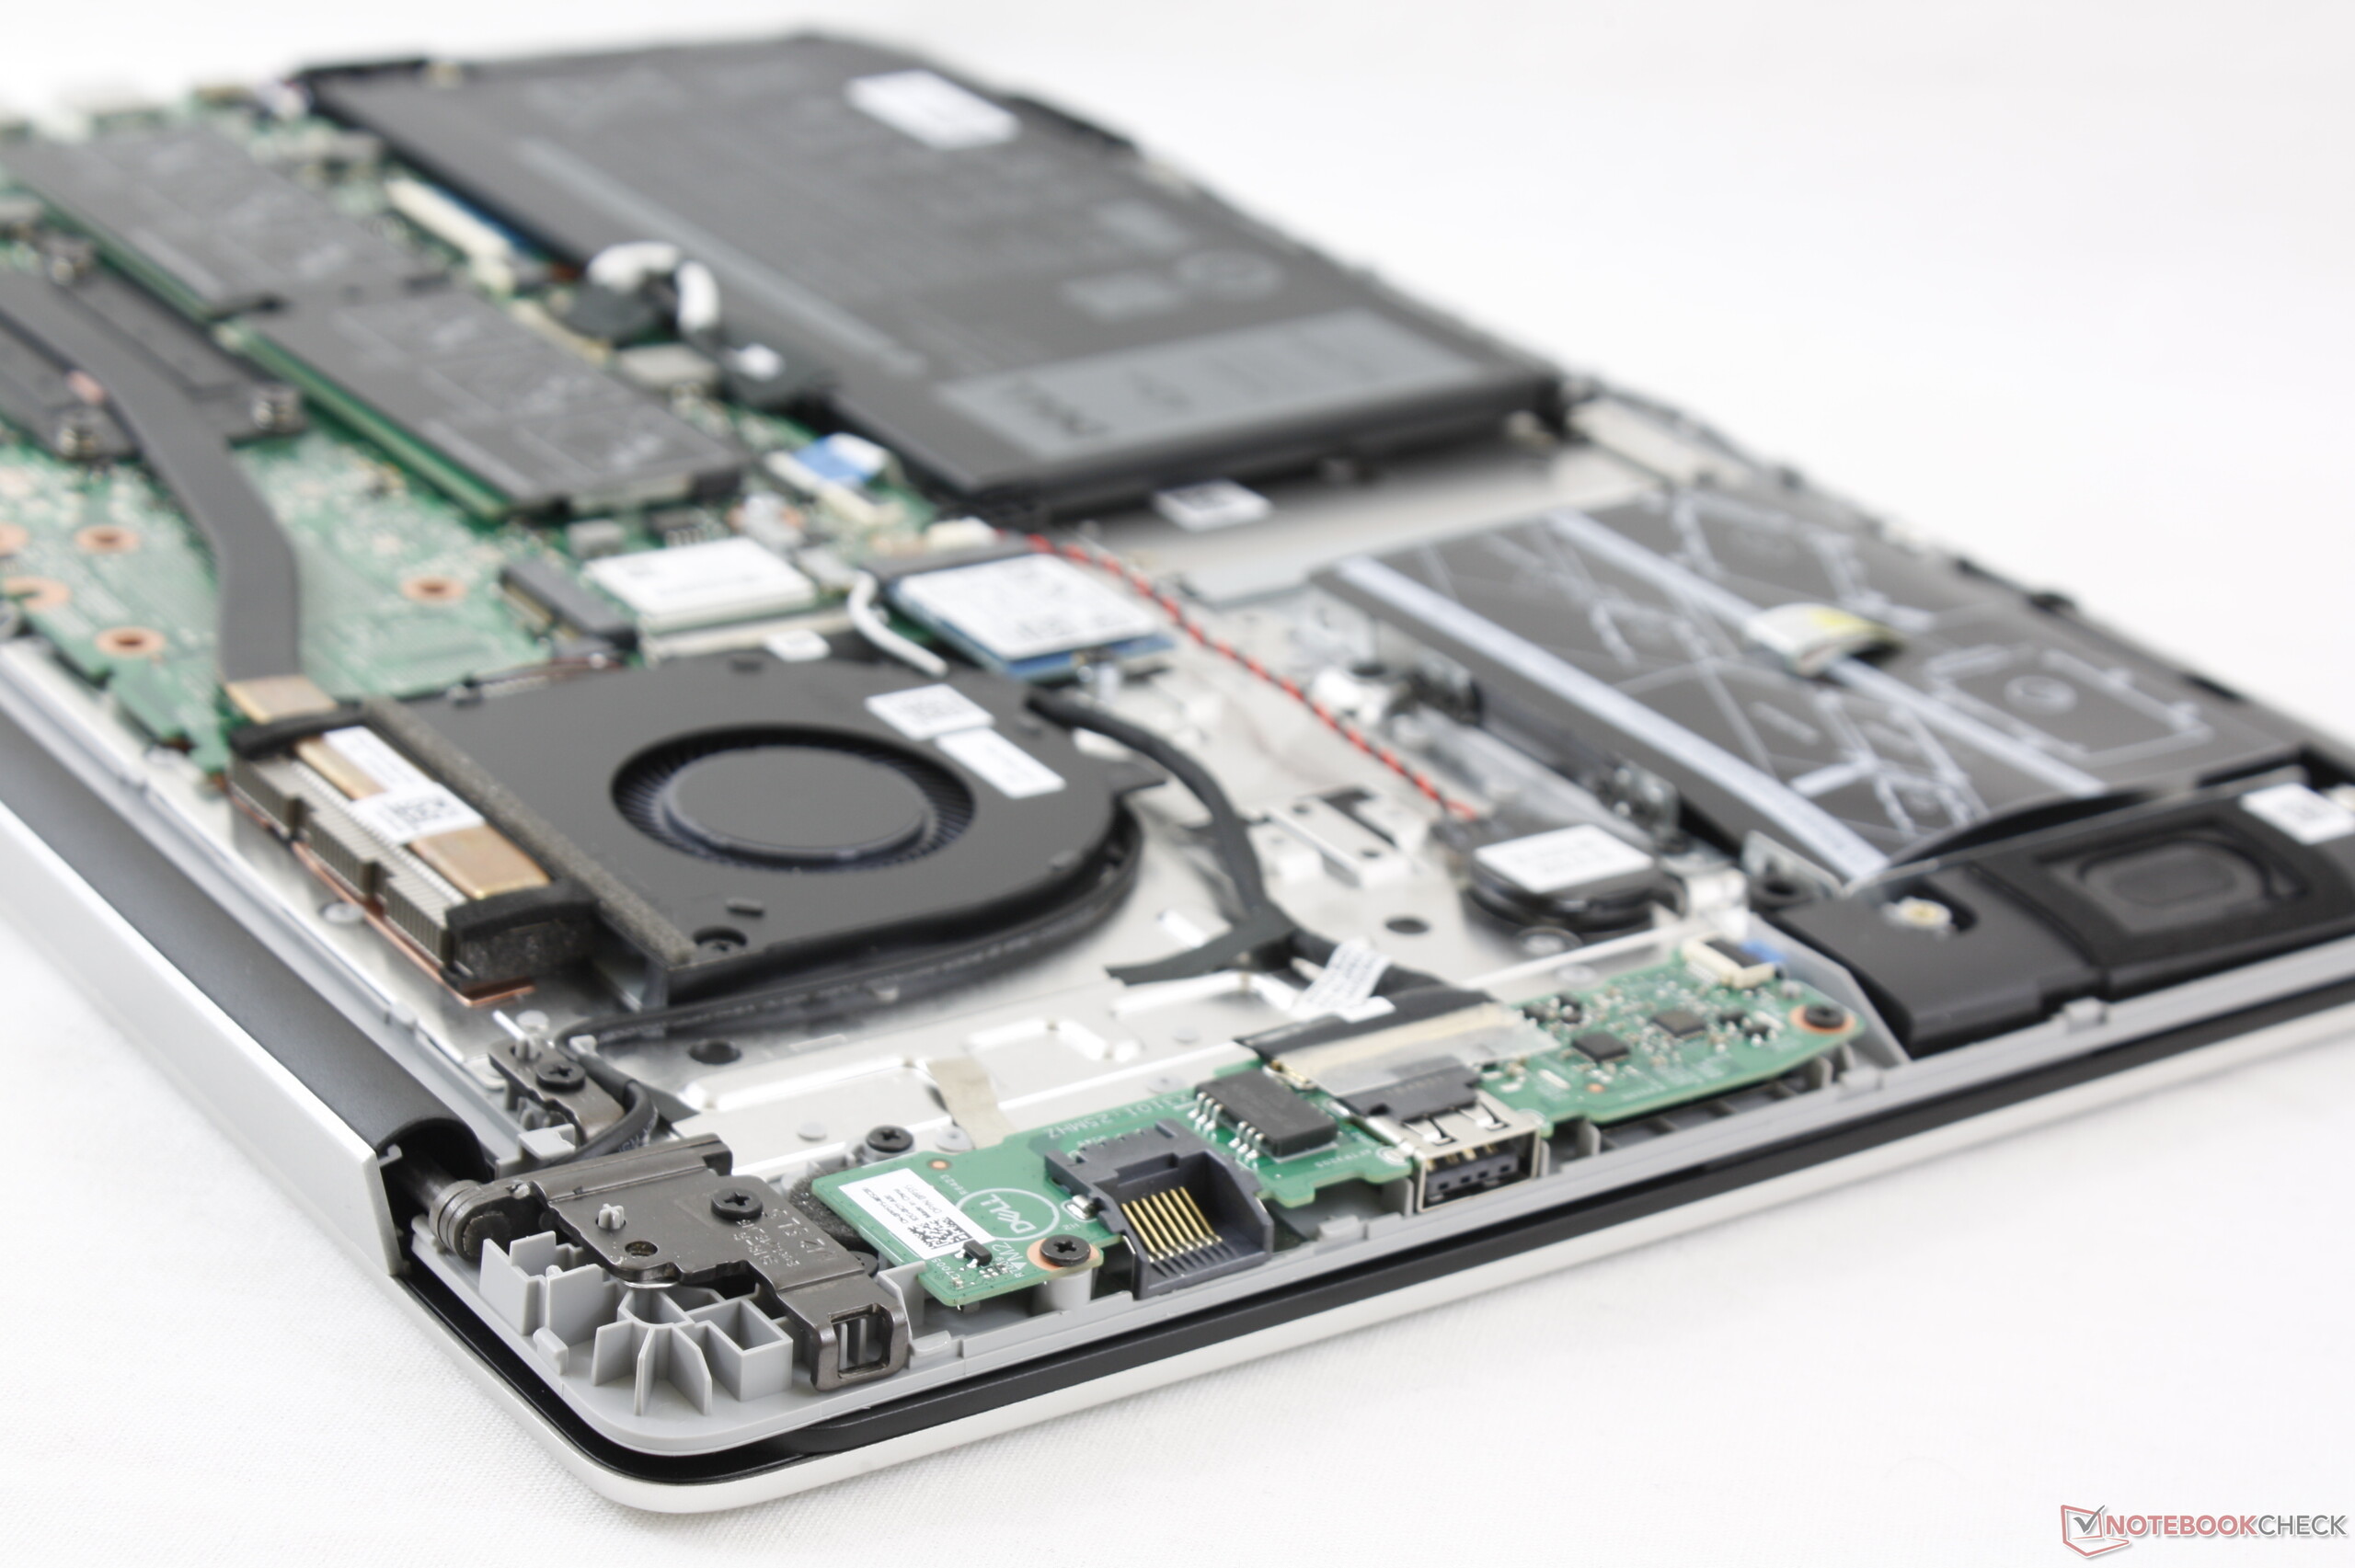
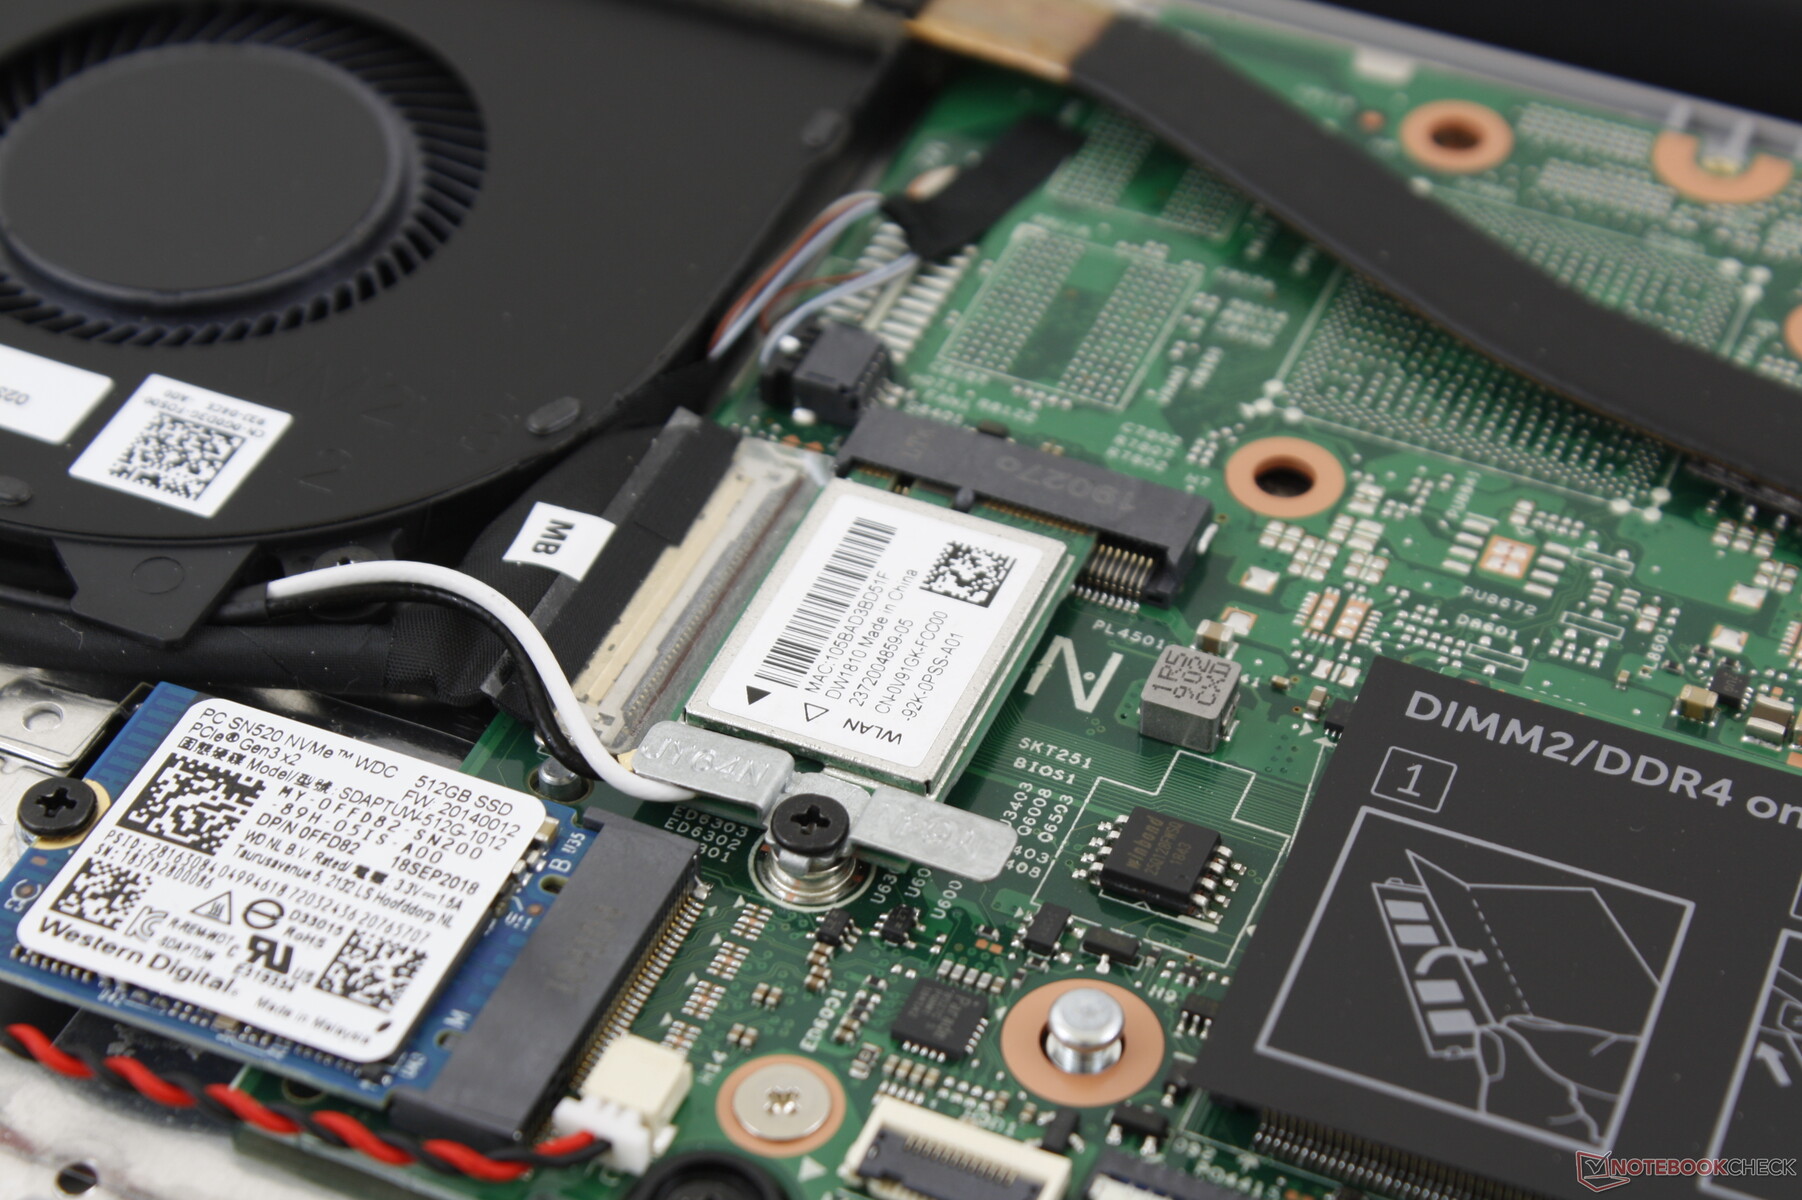
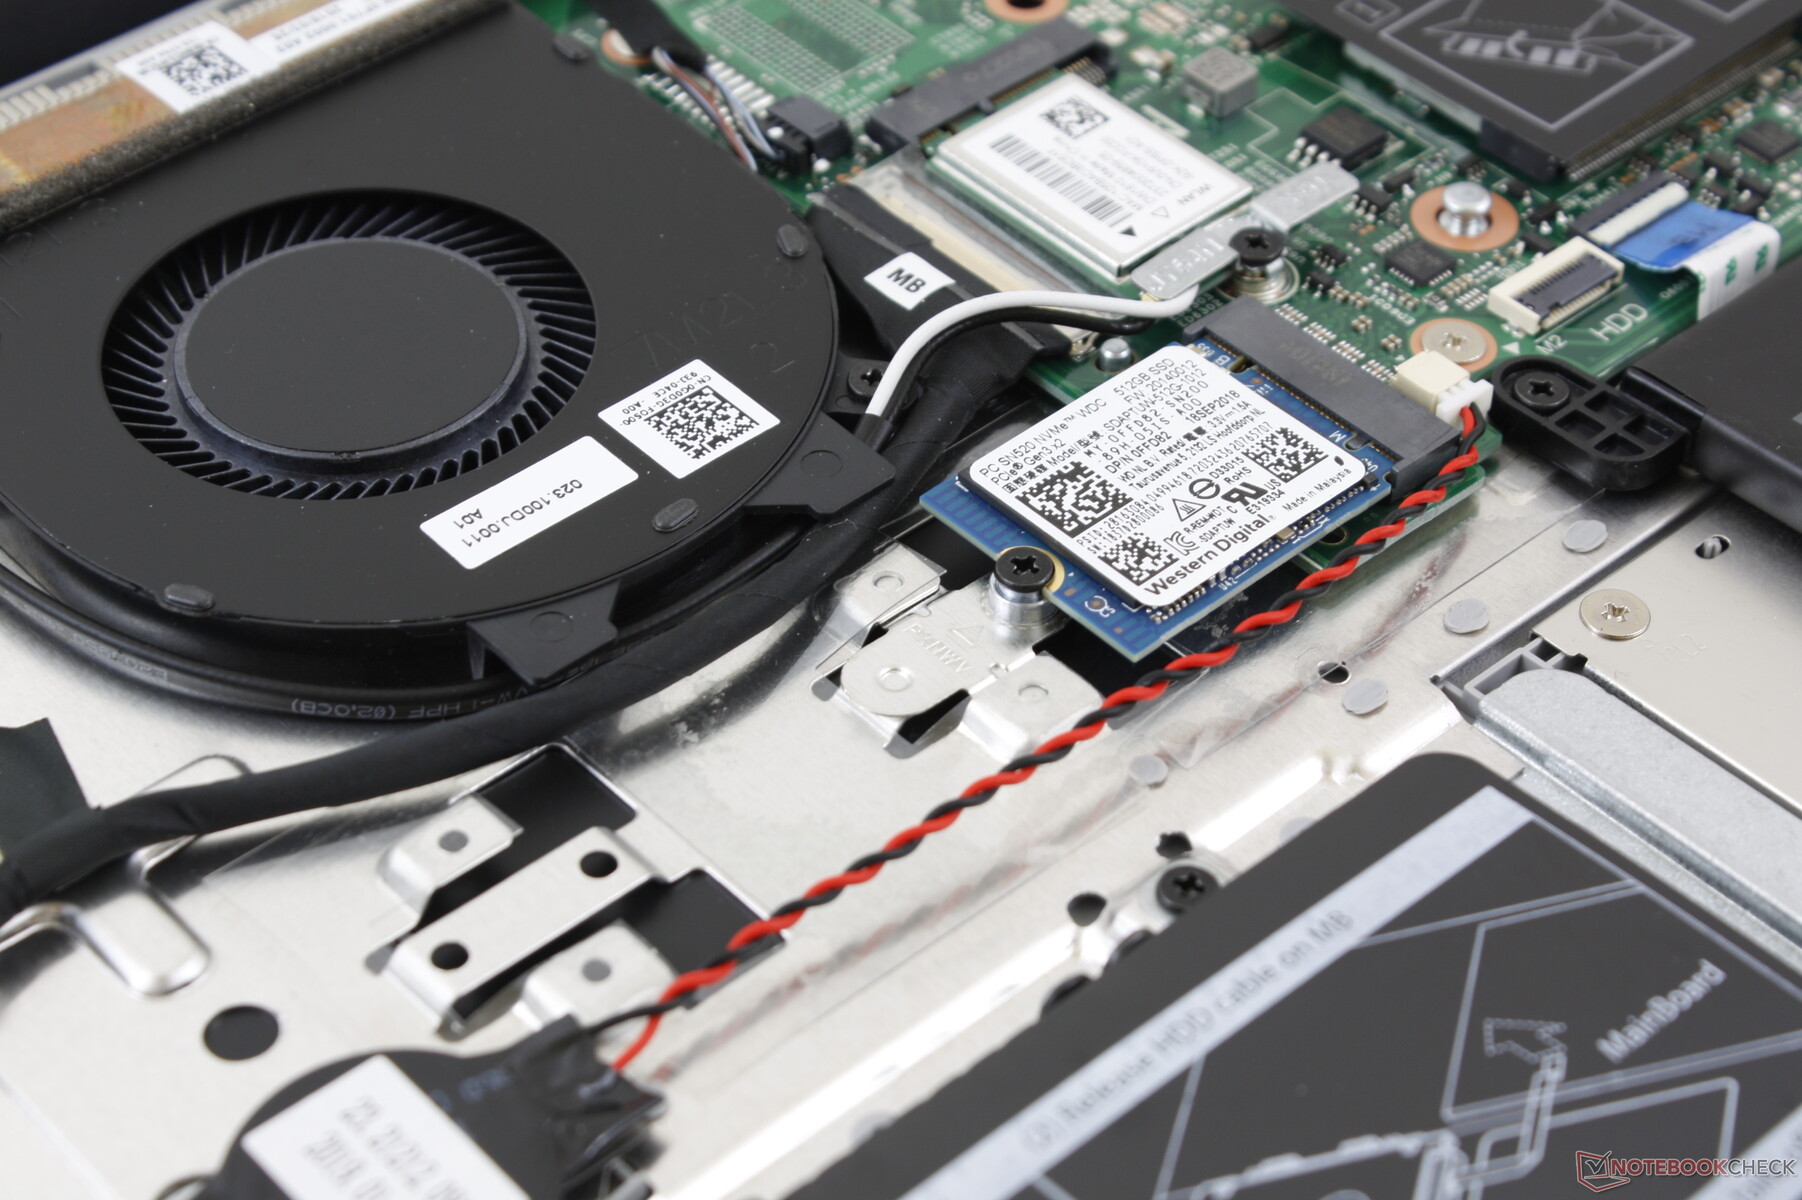
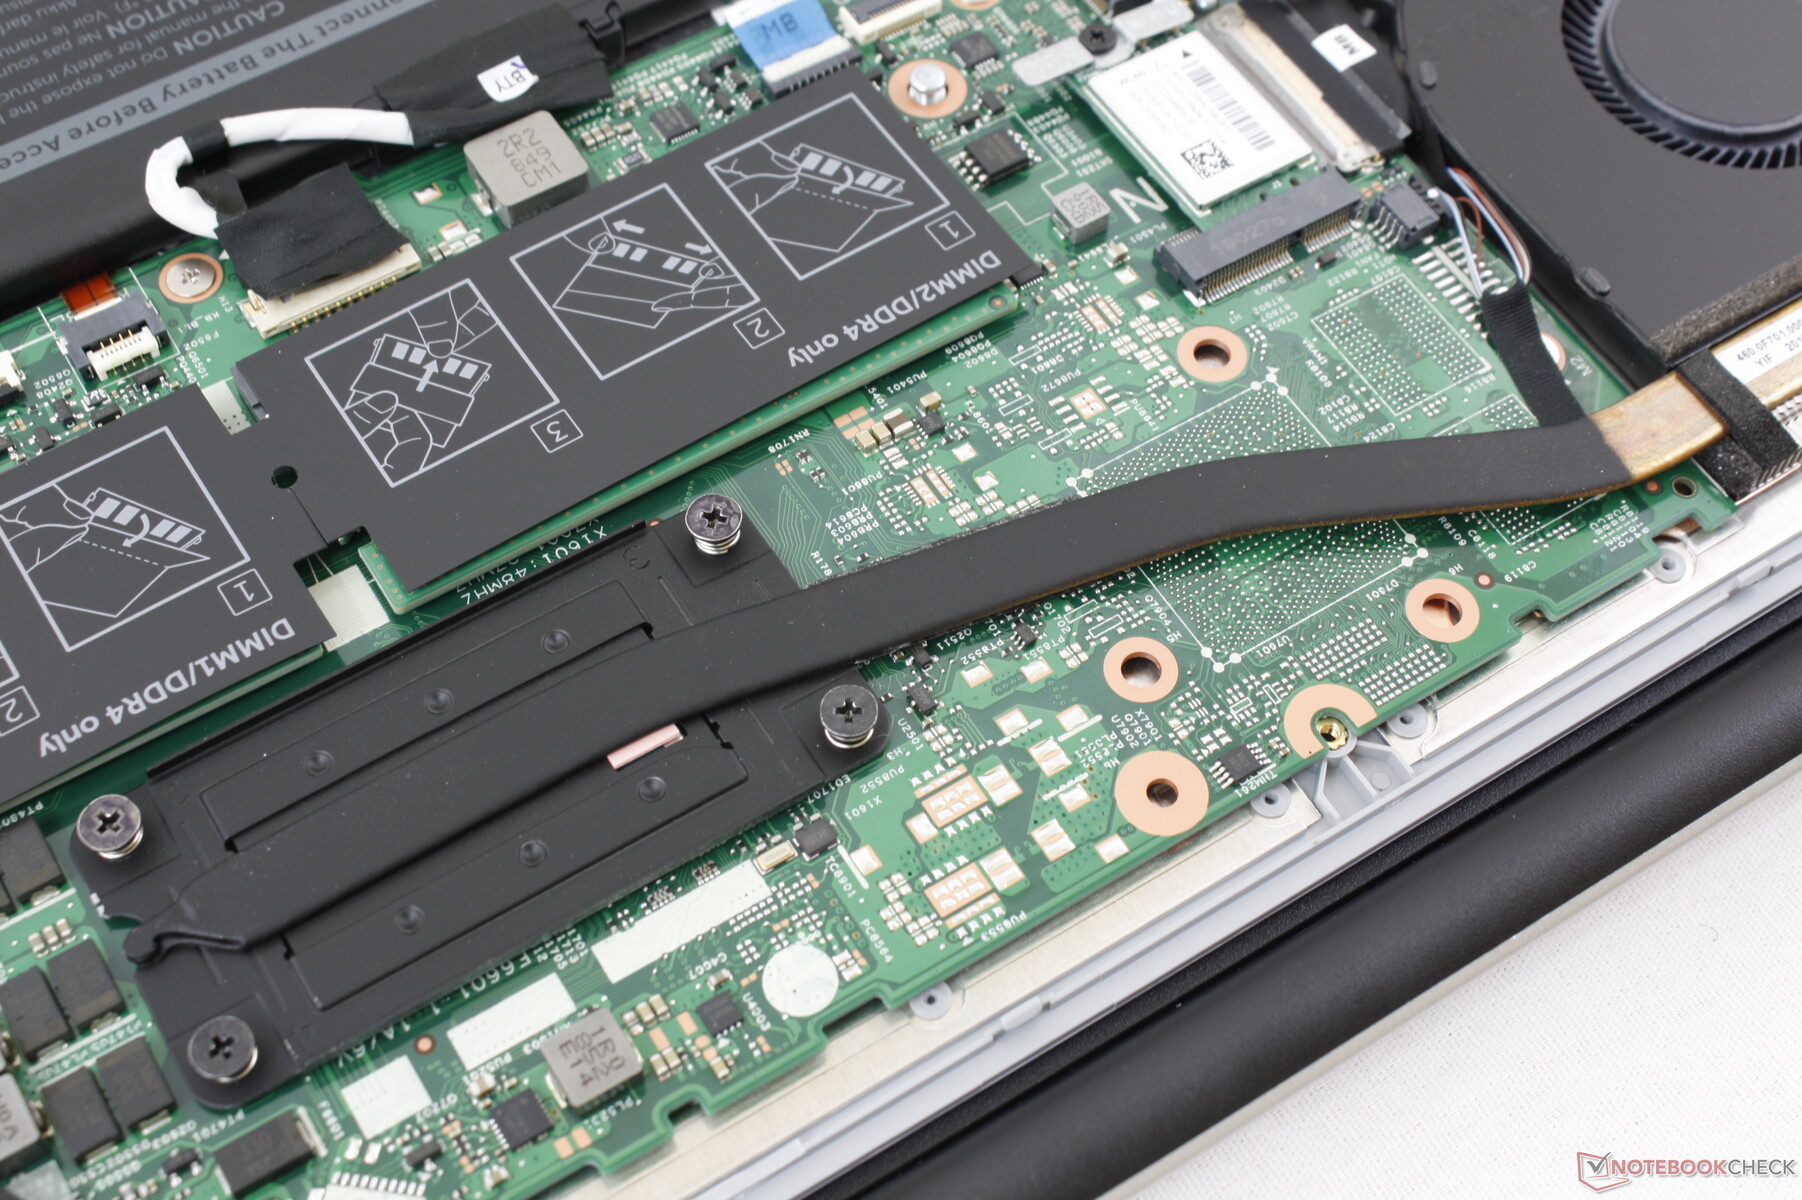
Note that the Qualcomm module is in the uncommon M.2 1630 form factor as shown below. The motherboard still supports M.2 2230 if users want to upgrade or swap WLAN modules.
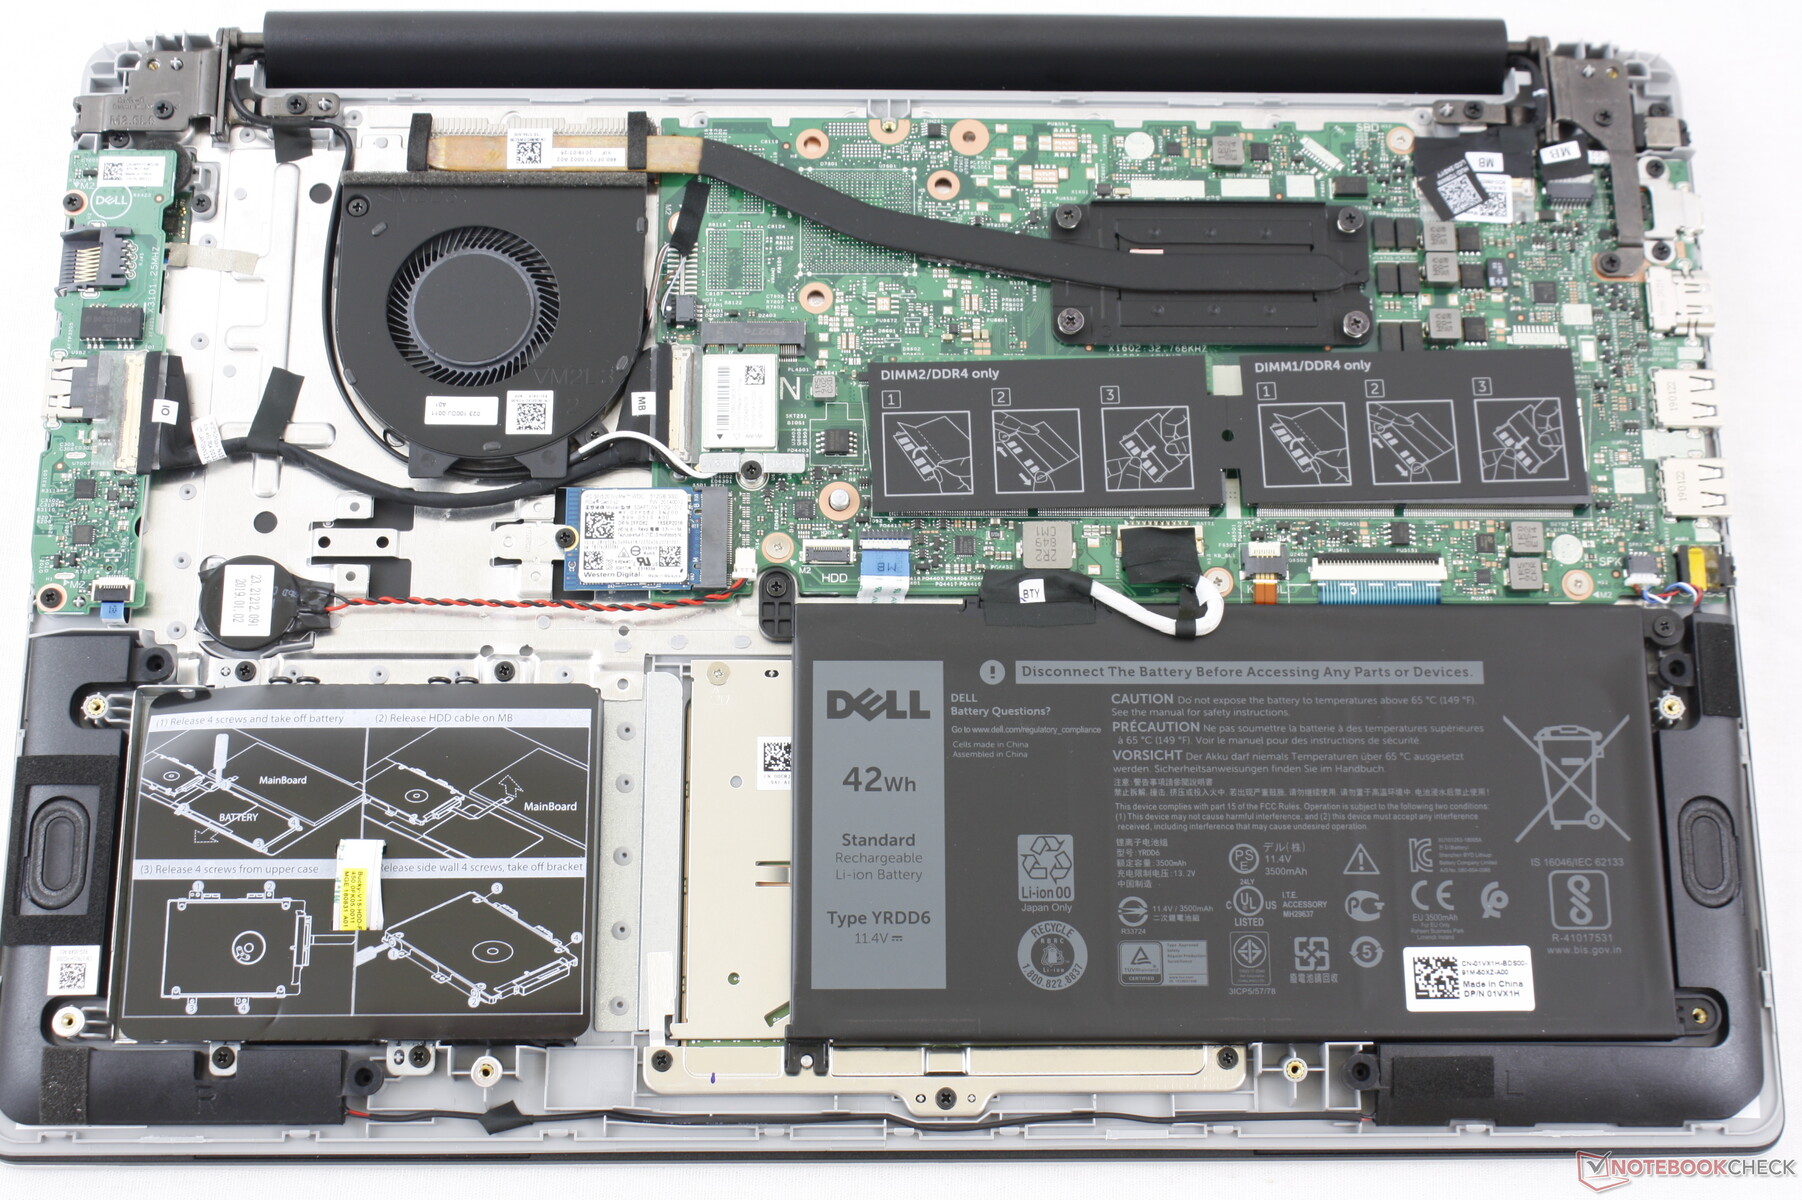
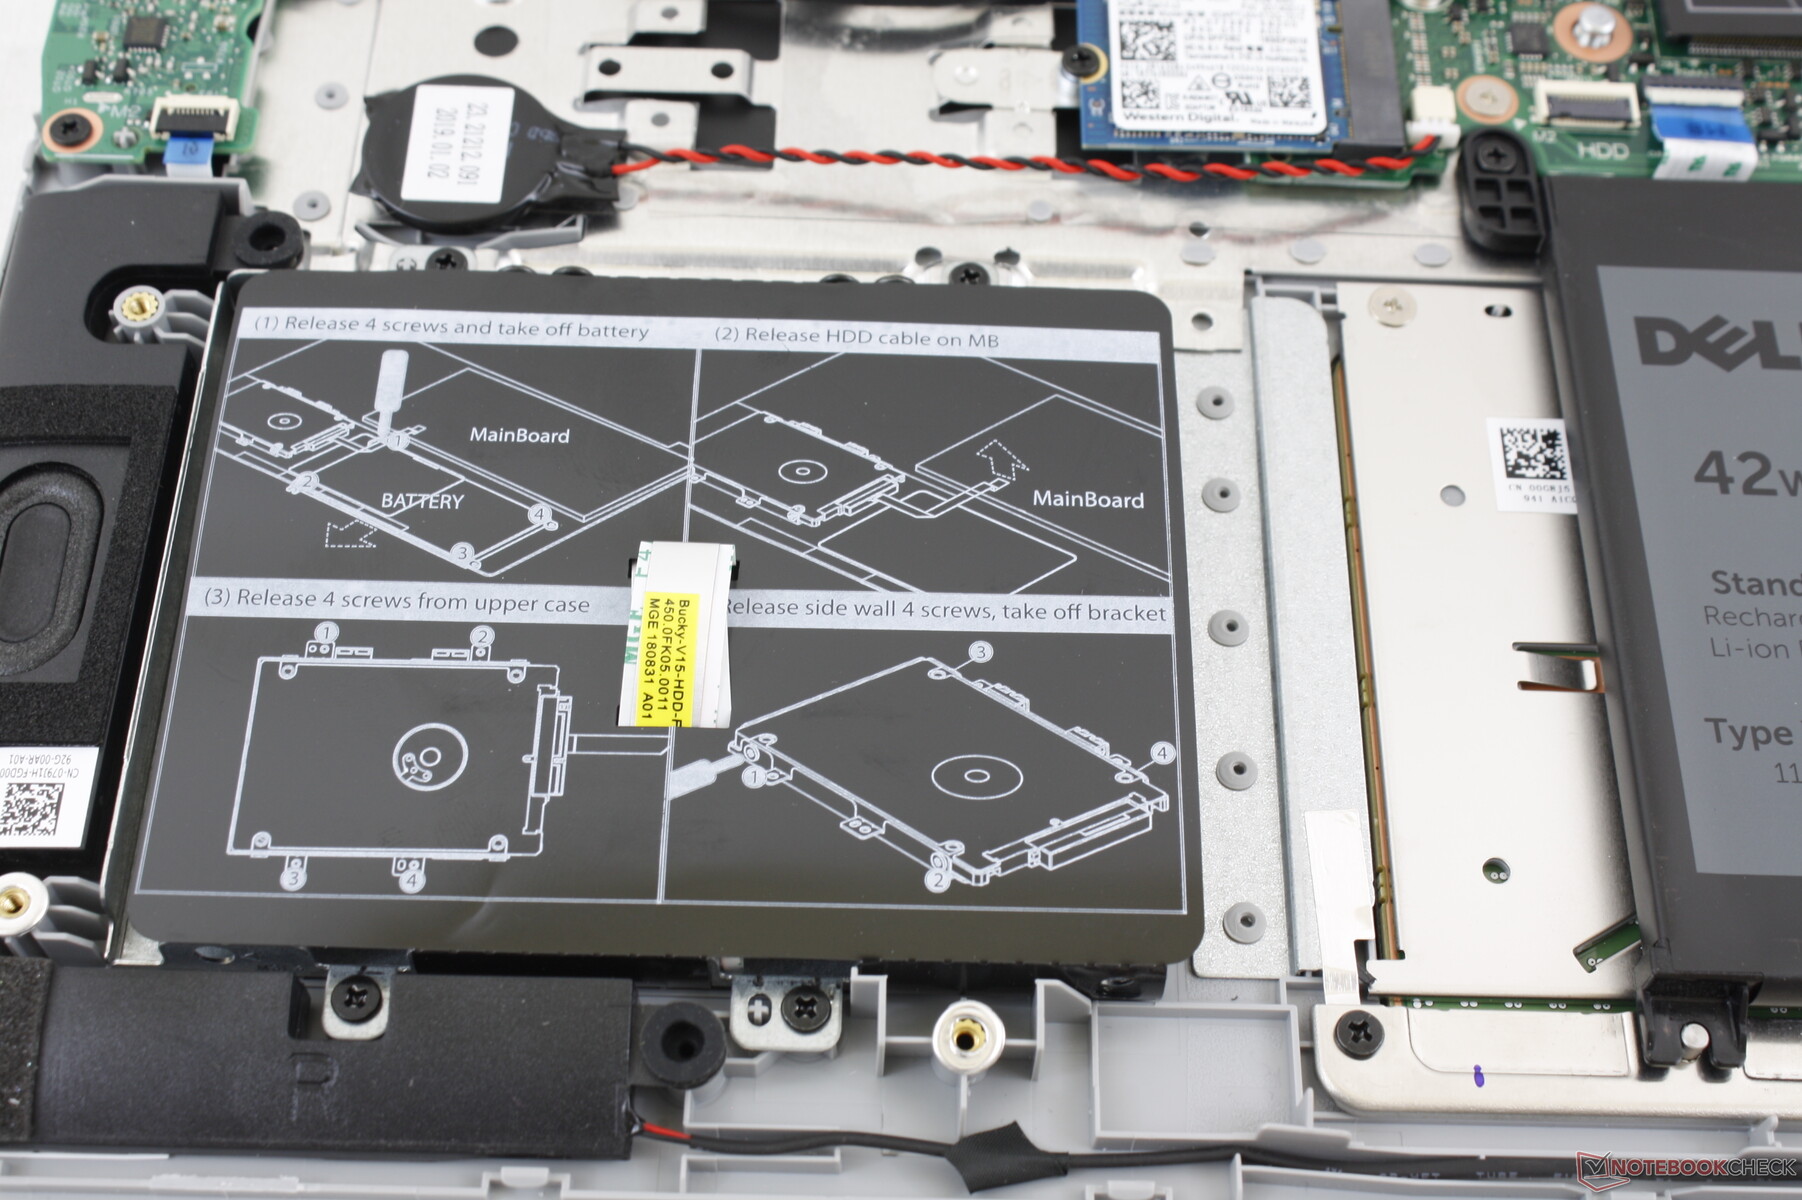
Maintenance
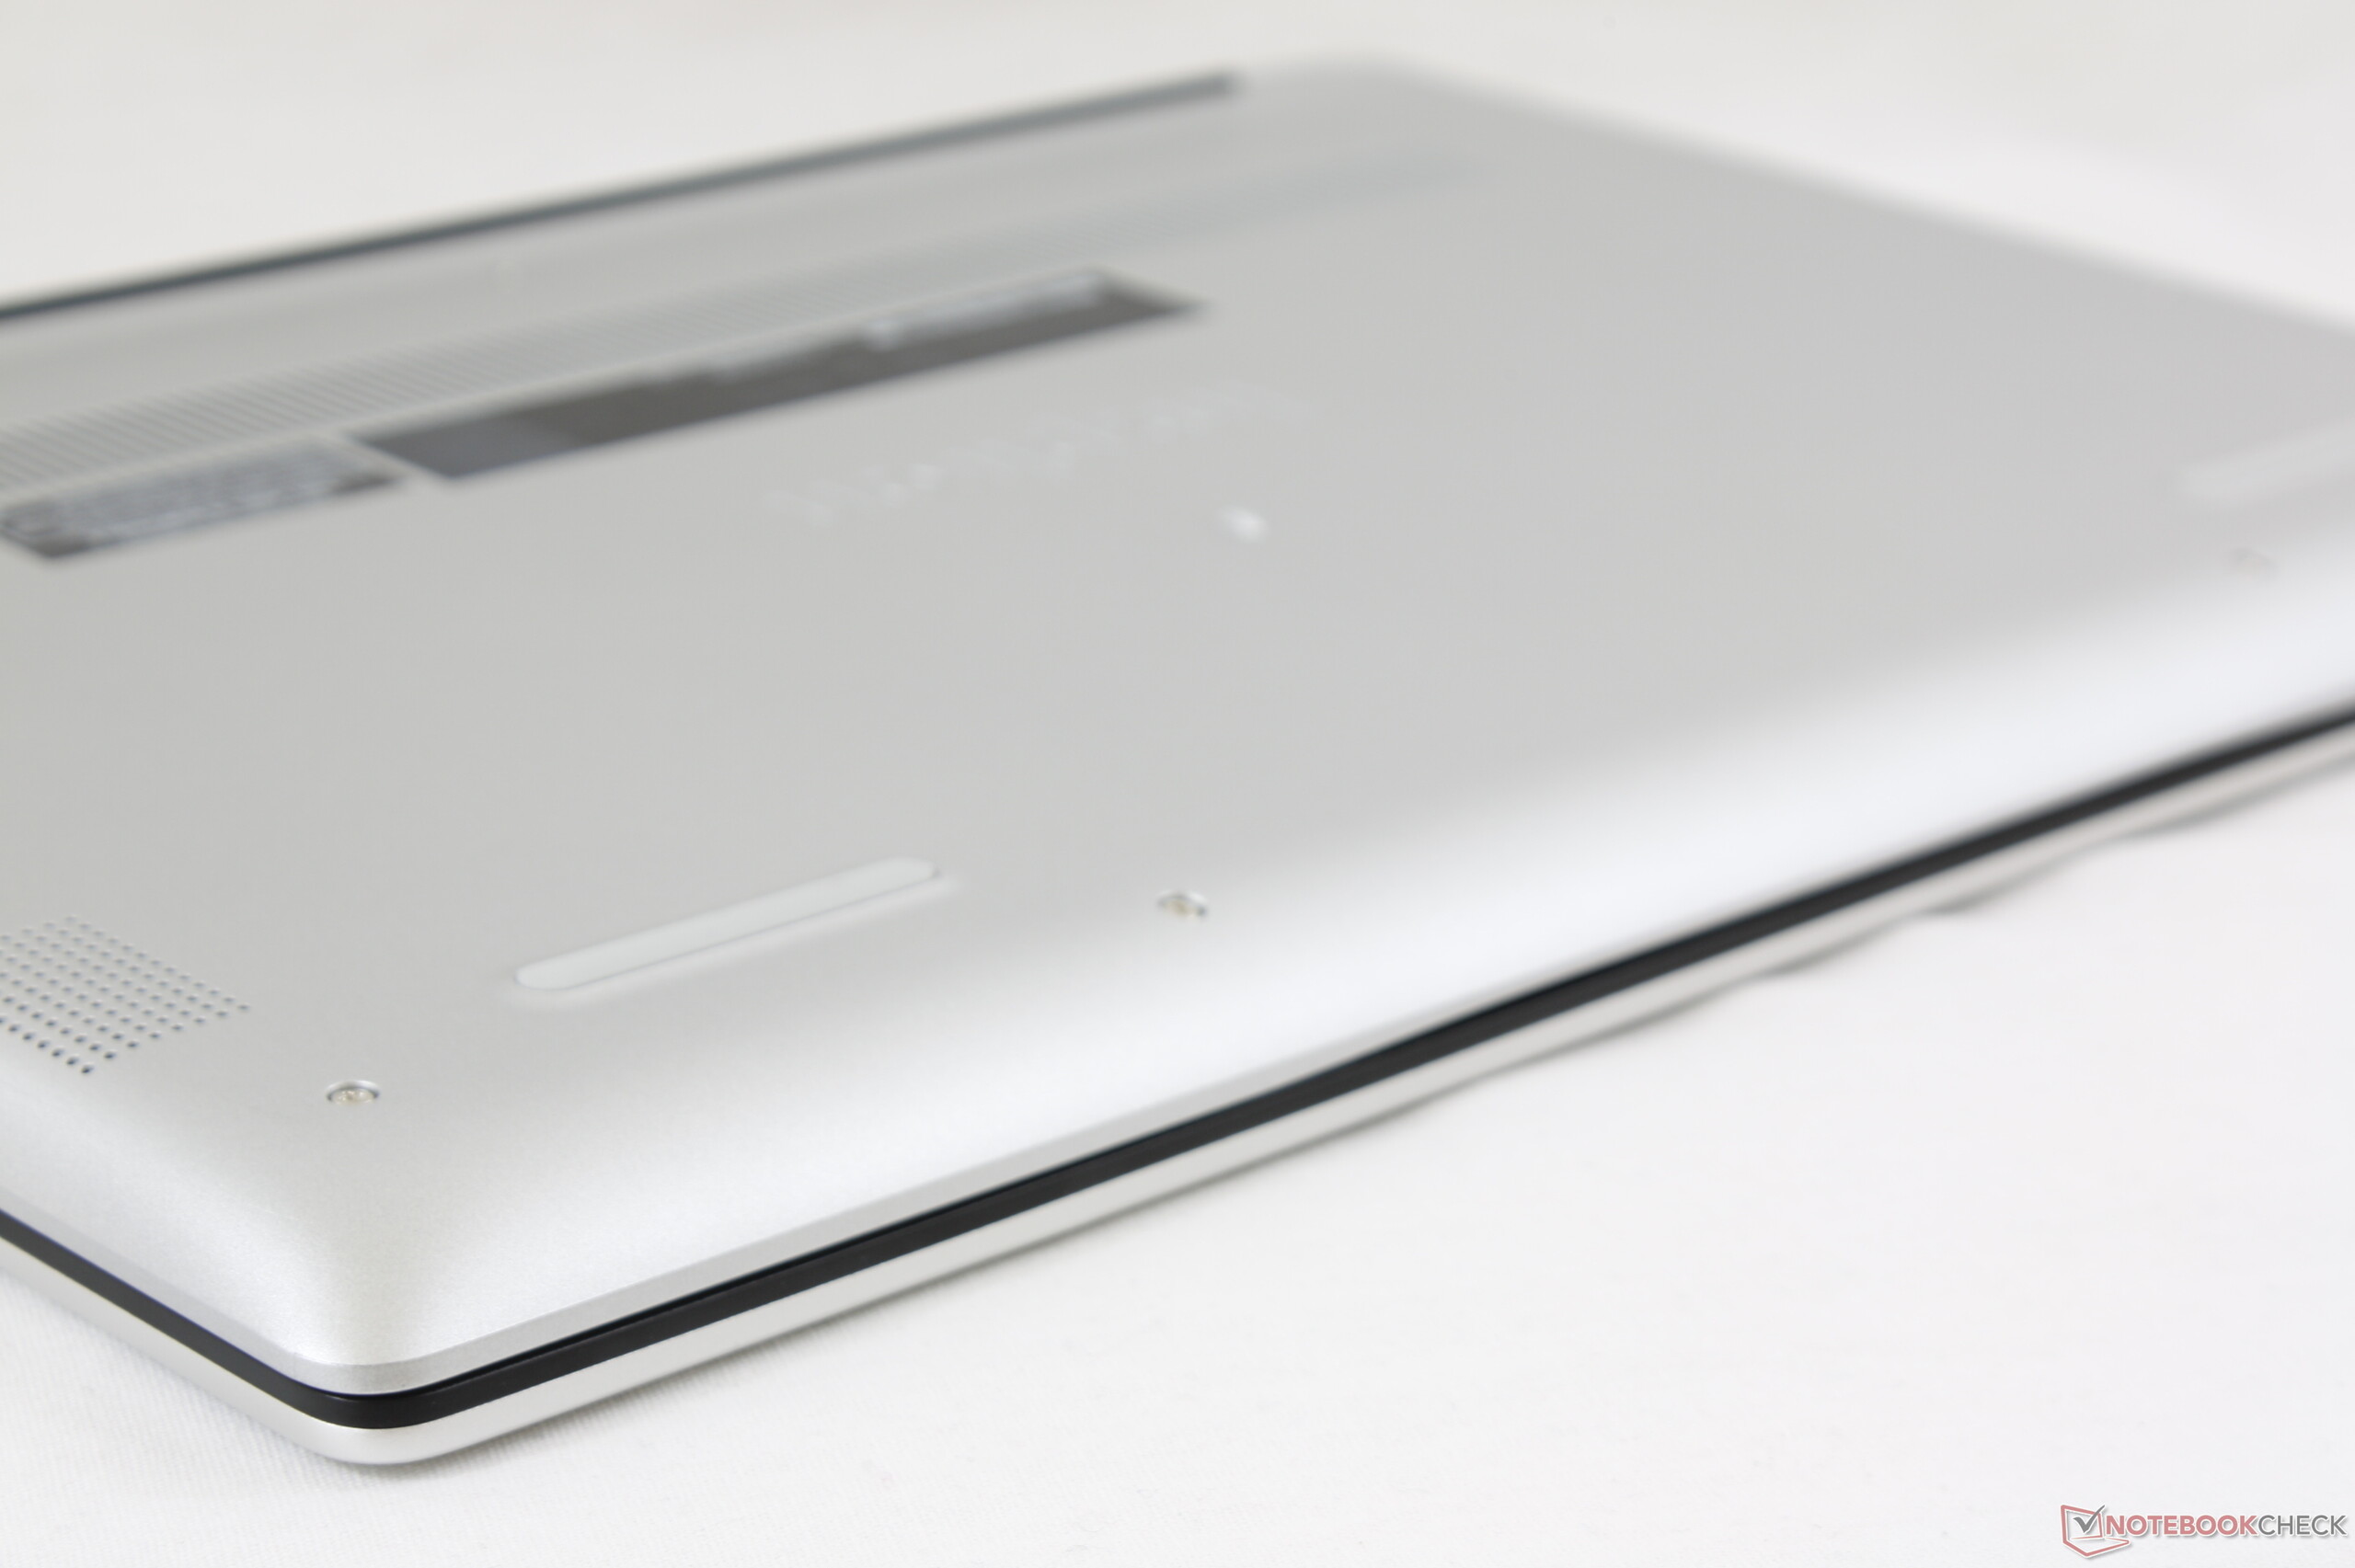
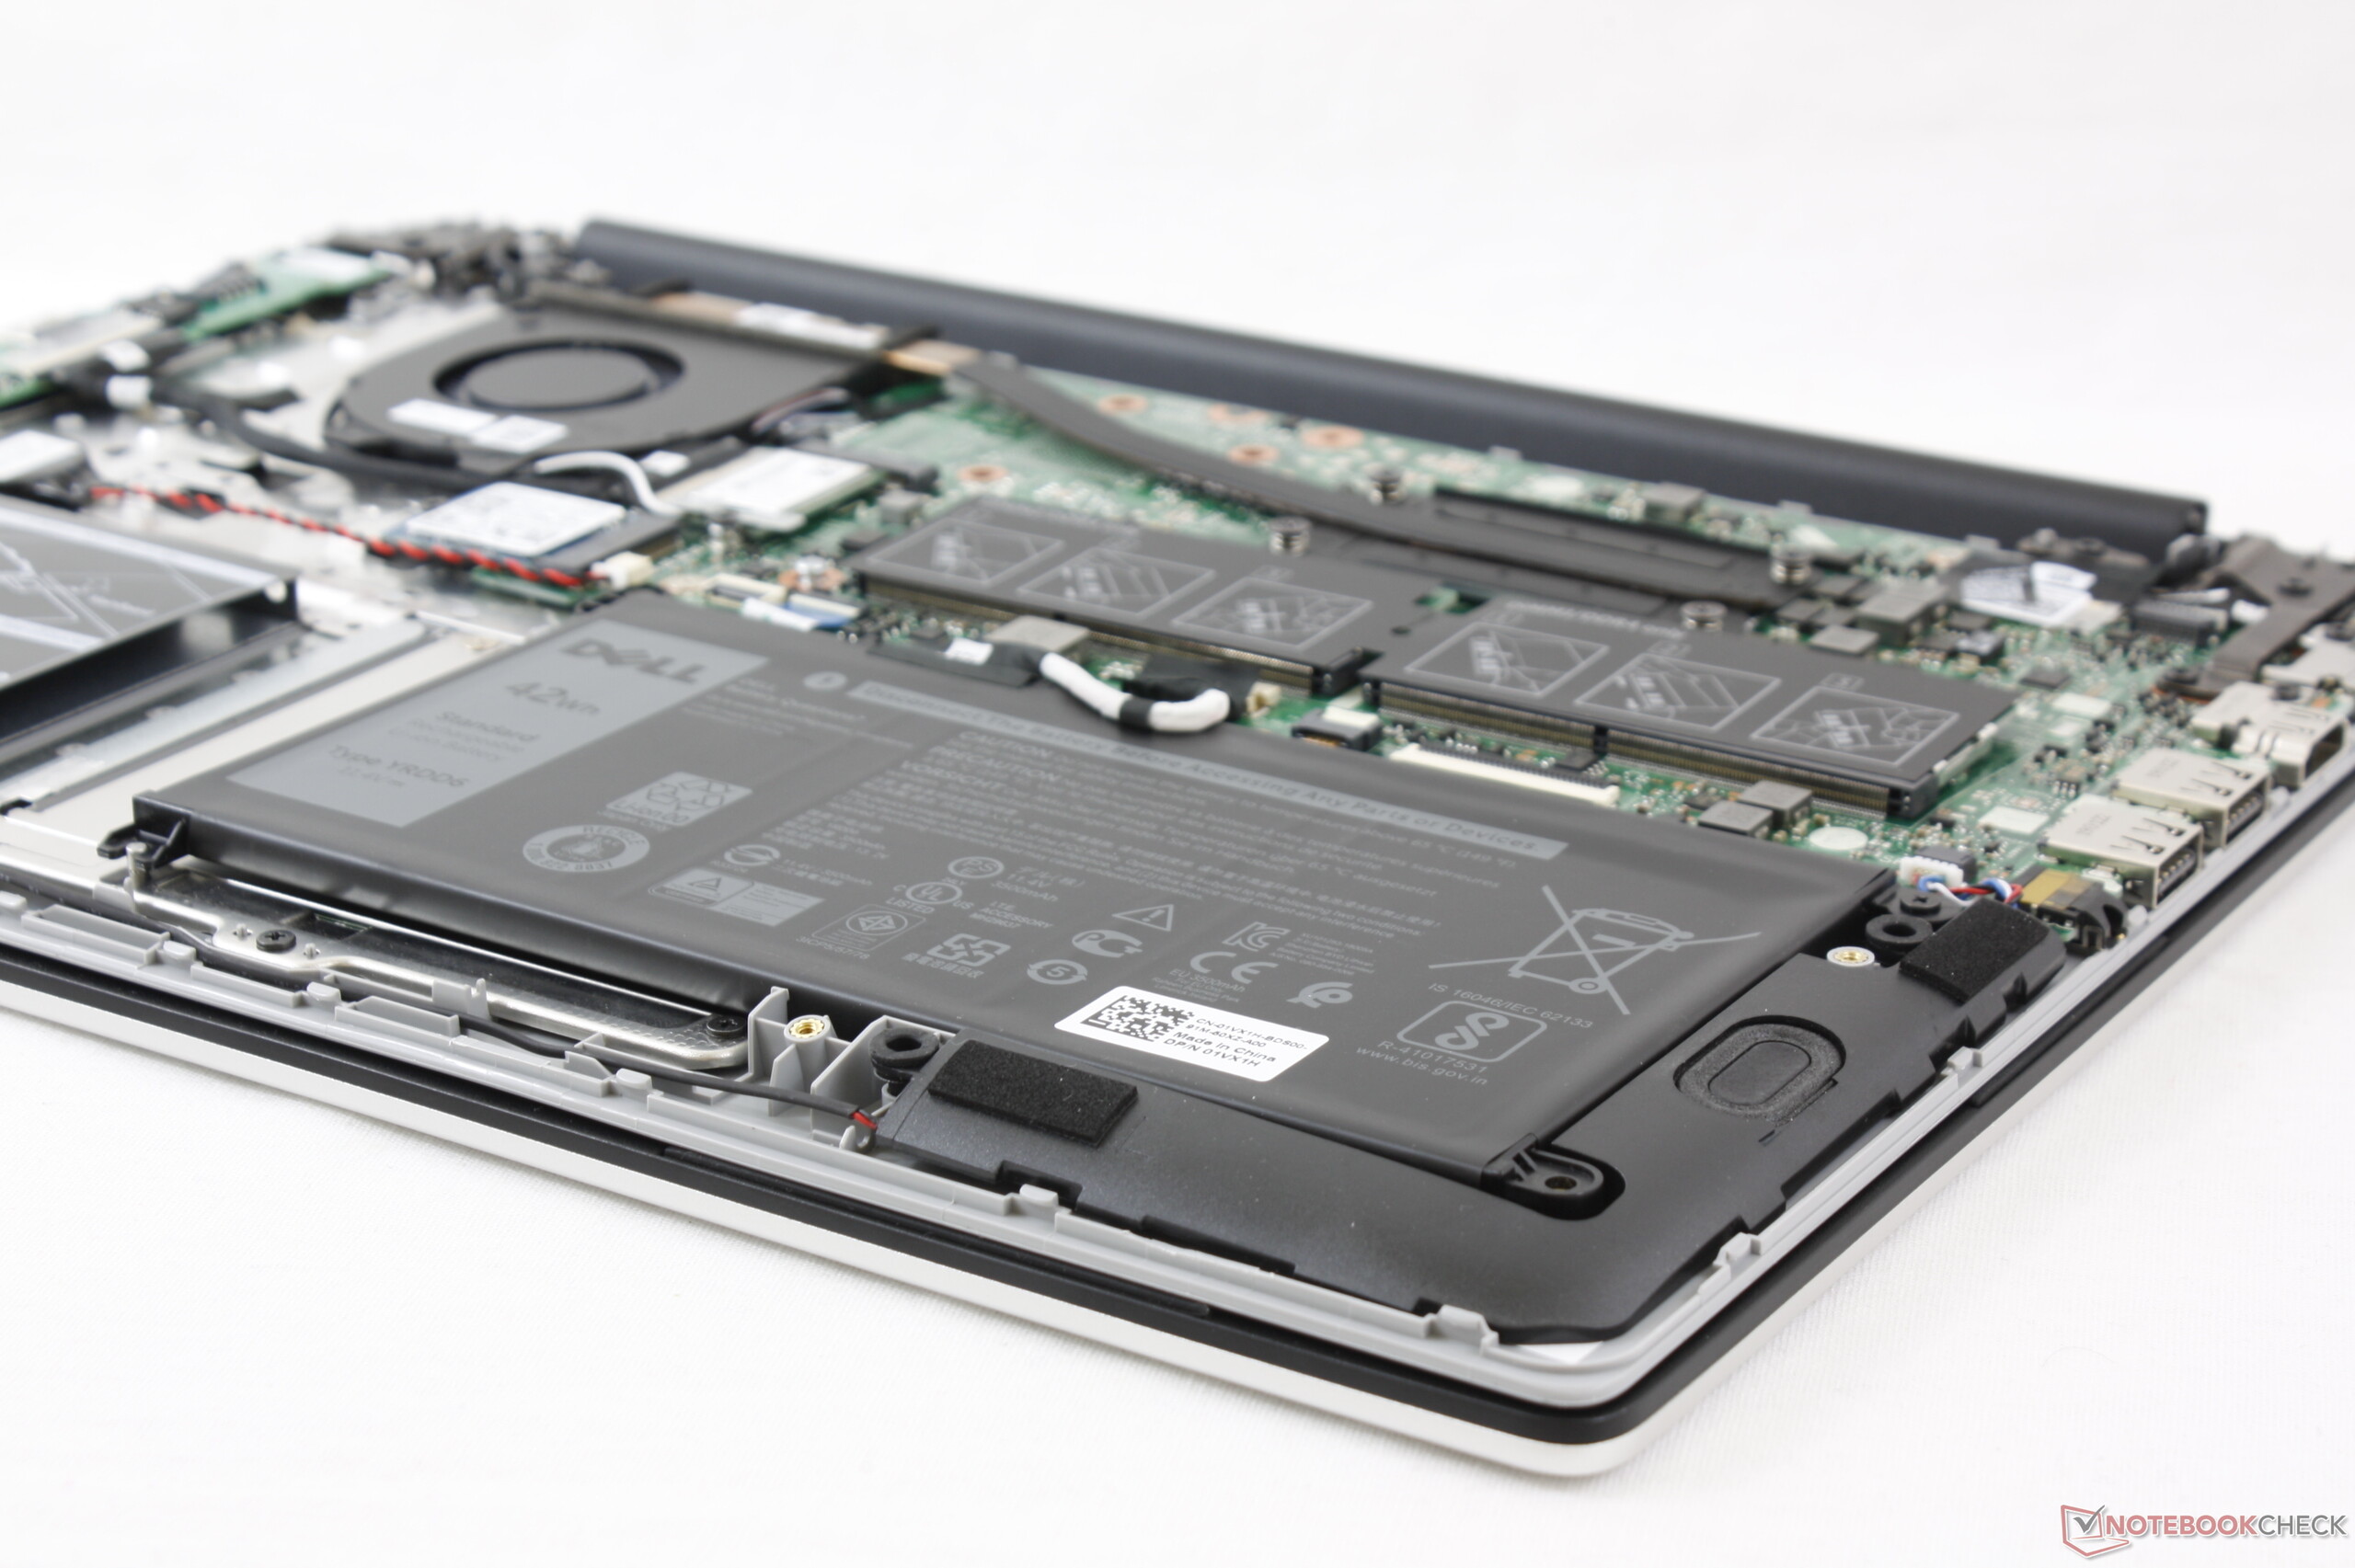
The bottom panel is secured by 9 Philips screws. It takes some practice to safely detach the panel from the edges and corners without damaging the surrounding plastic. Once inside, everything from RAM, batteries, storage, and WLAN can be easily swapped.
Accessories and Warranty
There are no included accessories in the box other than the standard manuals and AC adapter.
The usual one-year limited warranty applies. Much like HP and Lenovo, Dell also offers one of the widest warranty options extending up to four years.
Input Devices
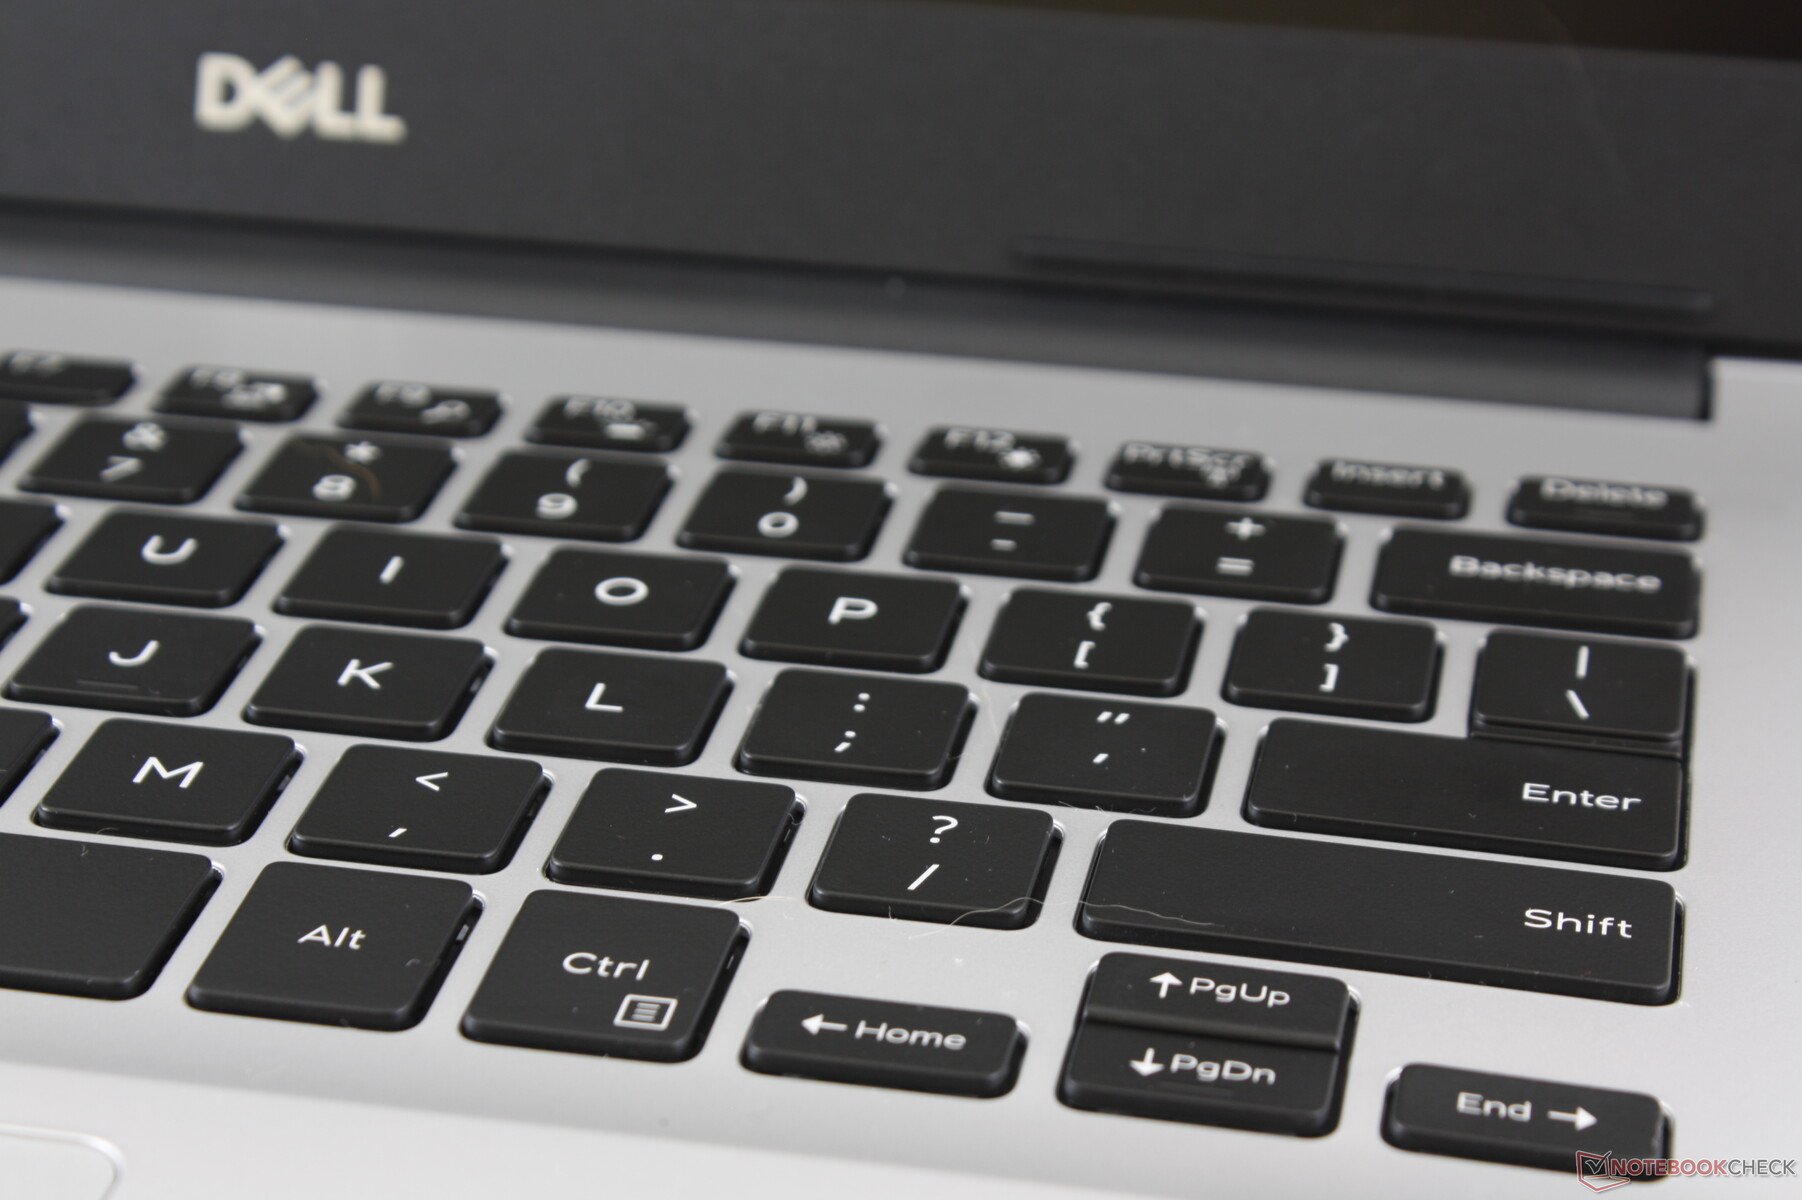
Keyboard
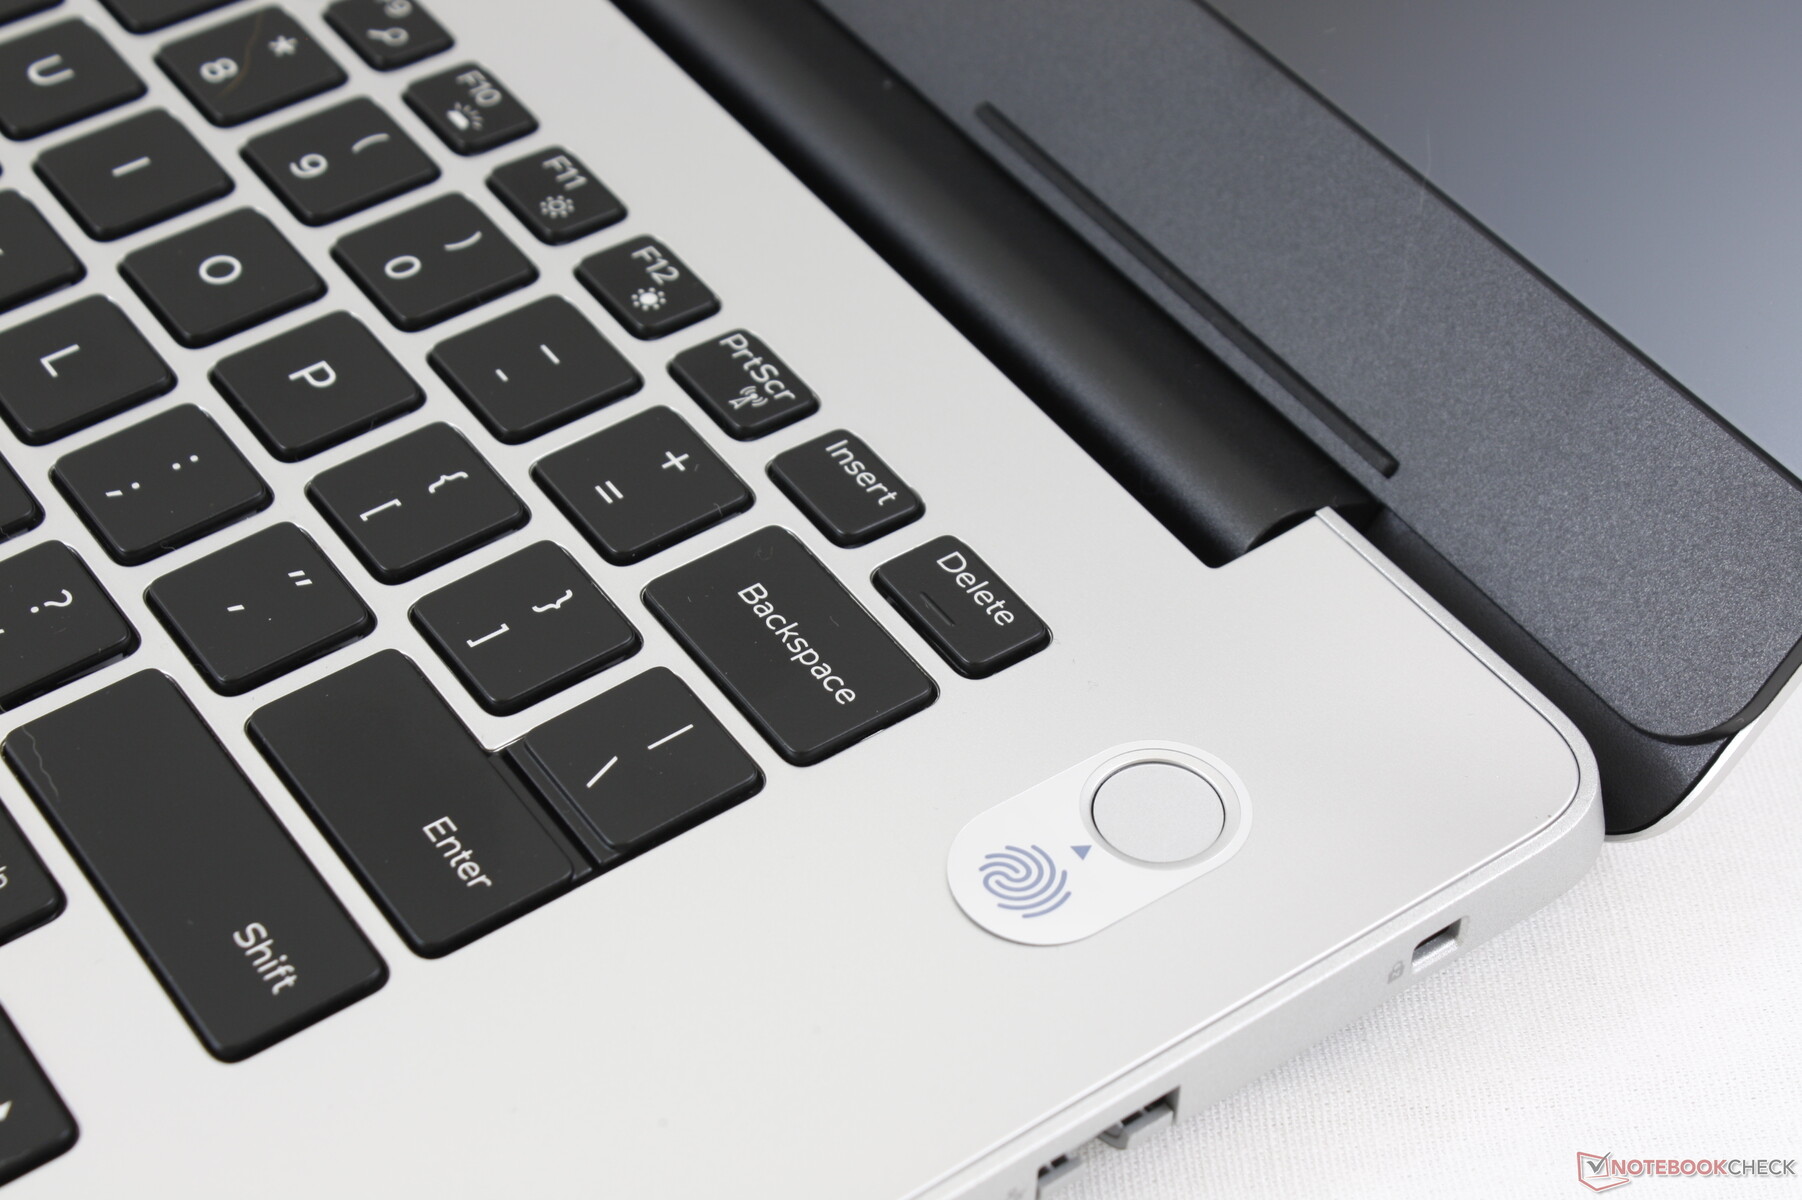
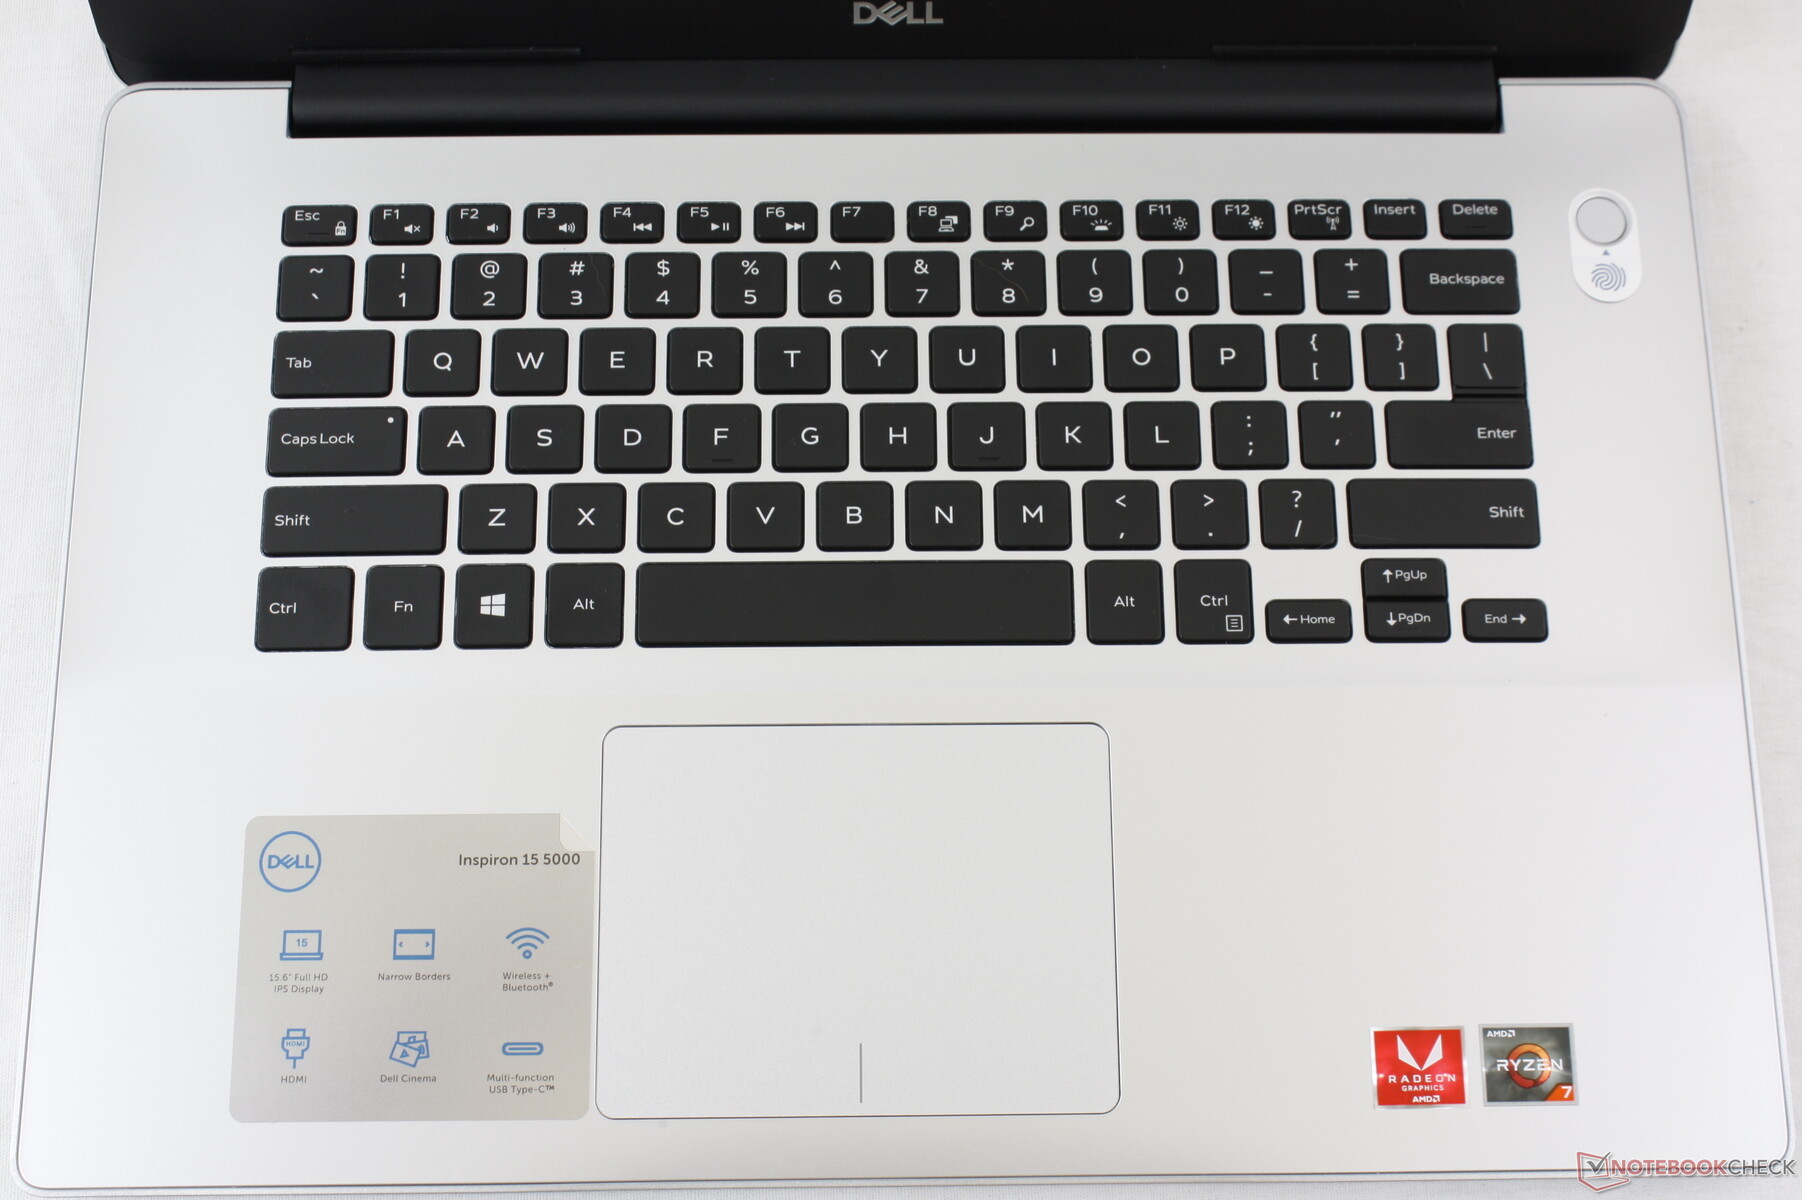
Key layout may be different from the Inspiron 15 5584, but the backlit keys here still feel about the same. Feddback is ever-so-slightly firmer than on the XPS 15 with clicky Enter and Space keys that typists can appreciate. The Arrow keys are unfortunately very small and the lack of dedicated PgUp and PgDn keys makes this laptop a poor choice for large spreadsheets when compared to the Intel Inspiron 15 5584.
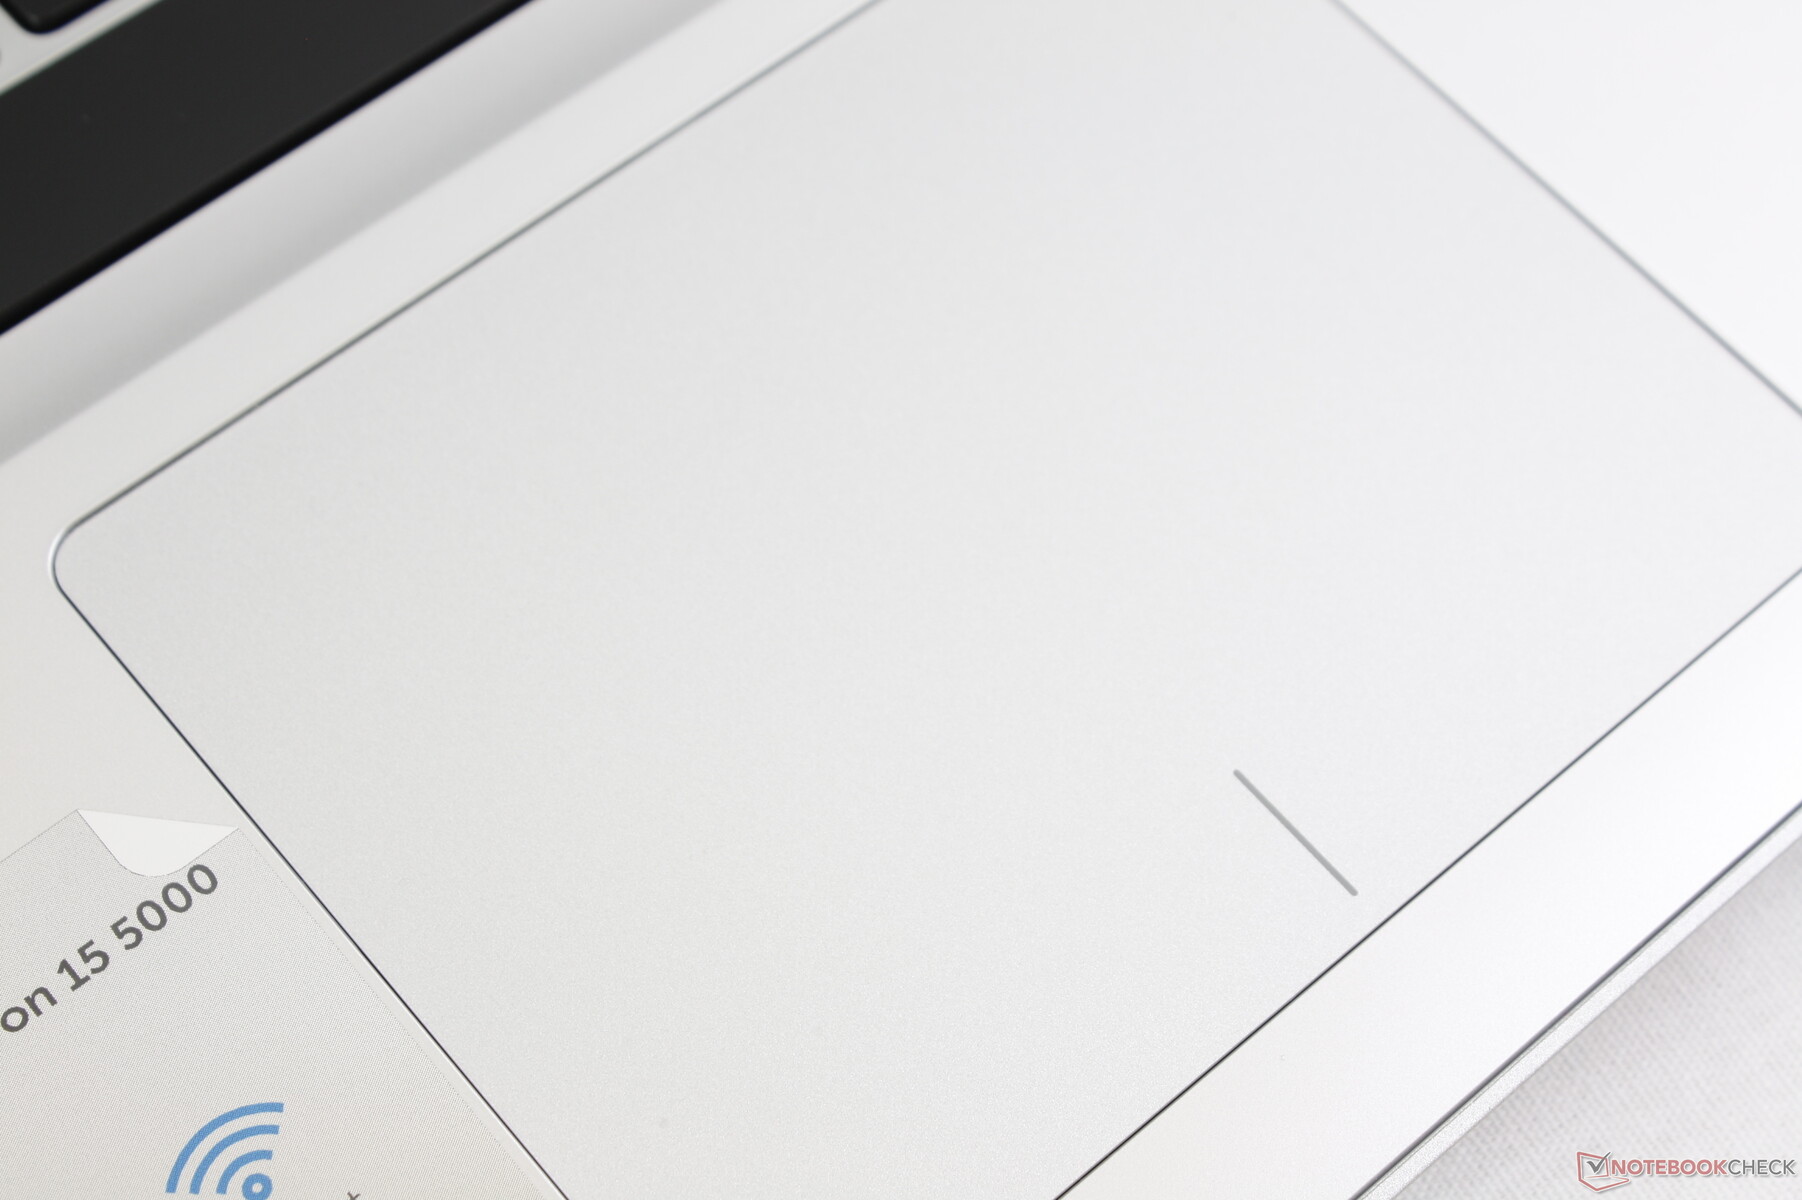
Touchpad
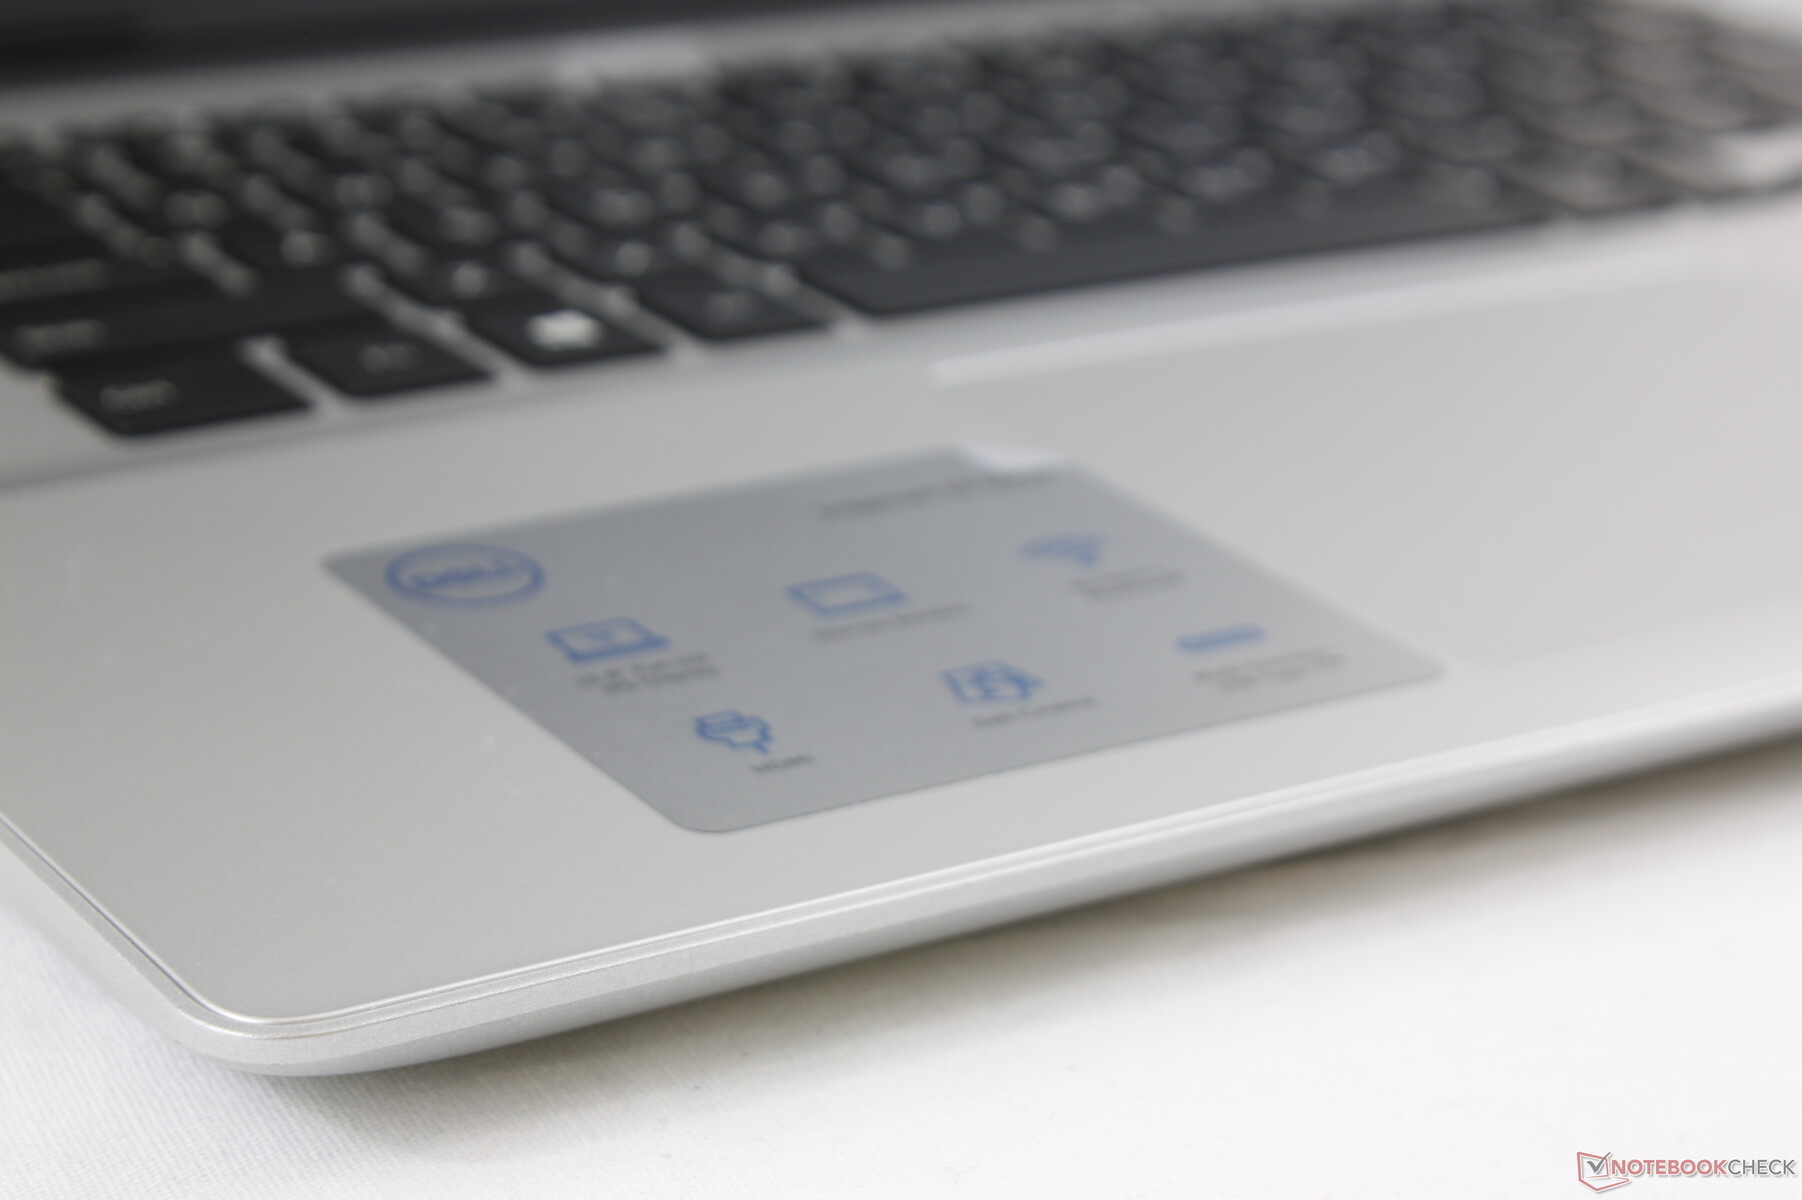
The clickpad is identical to the one on the Inspiron 15 5584 down to its large dimensions (10.5 x 8 cm) and textured plastic surface. We find cursor control to be smooth and accurate even if moving at slow speeds, but the feedback from clicking is still far too weak and could have been firmer.

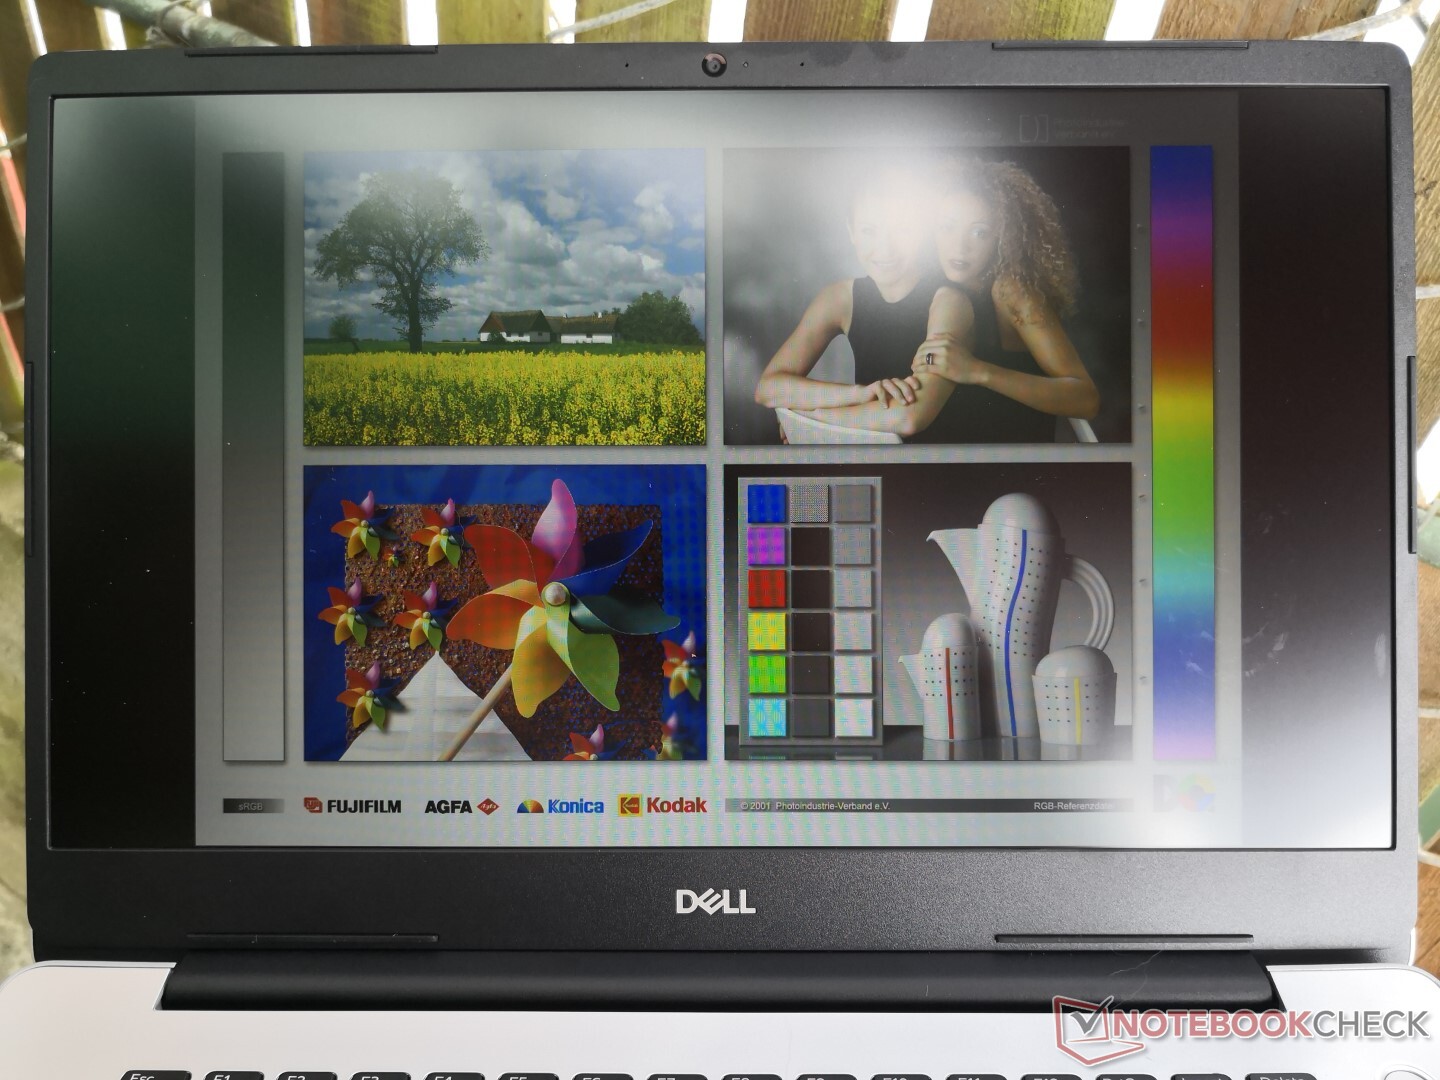
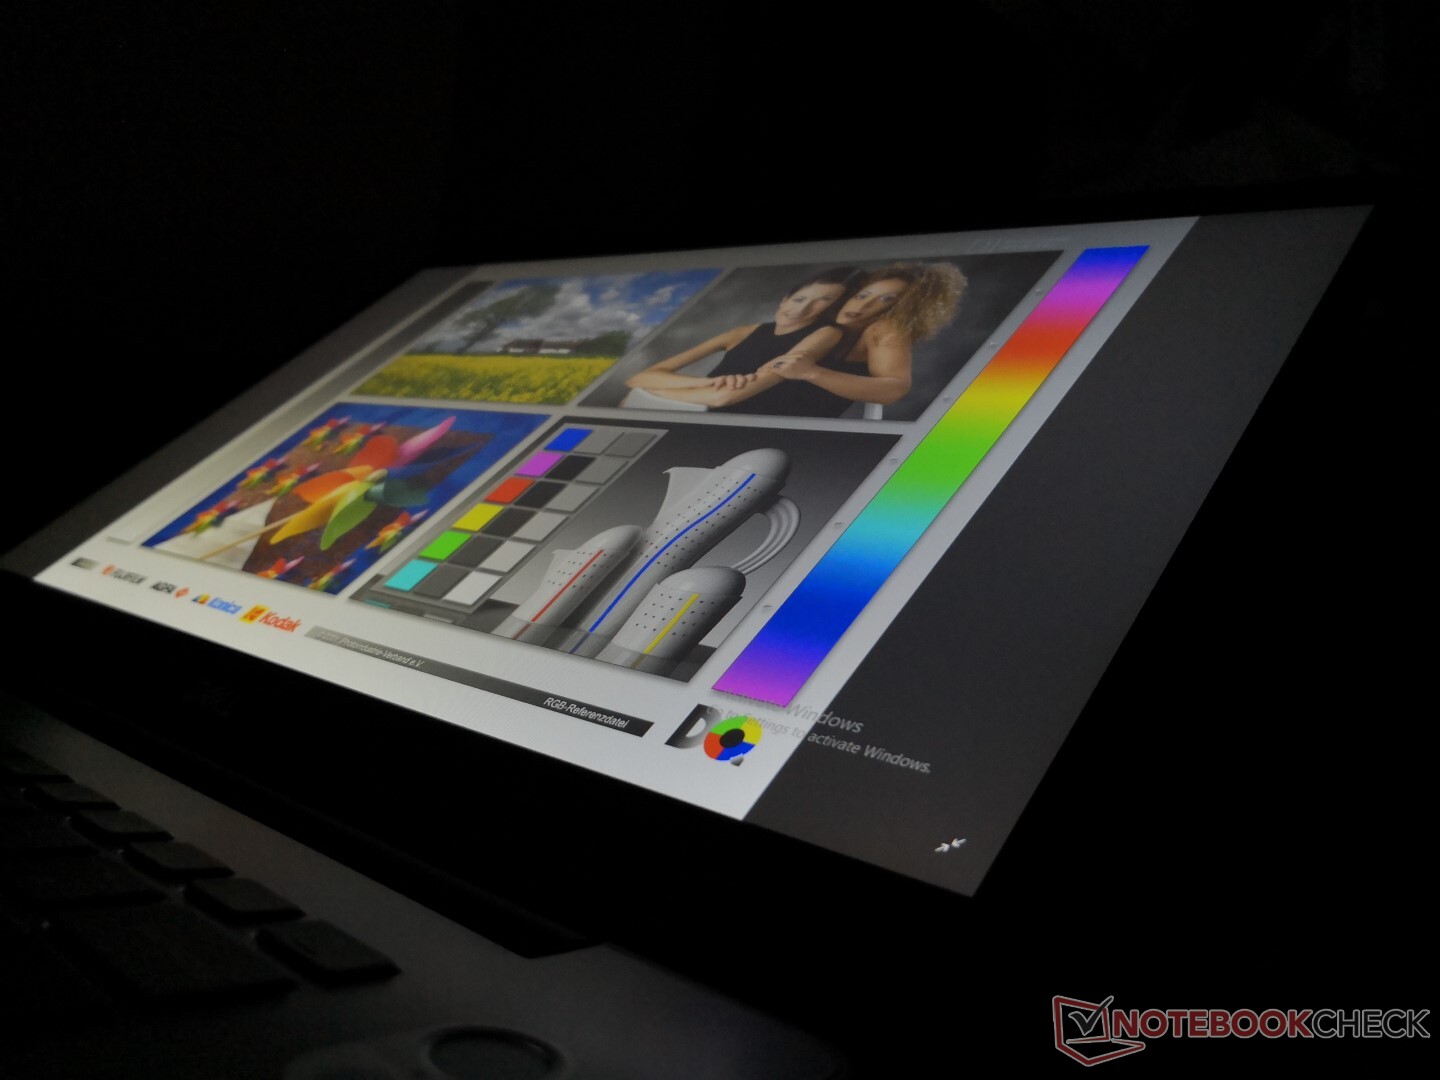
Display
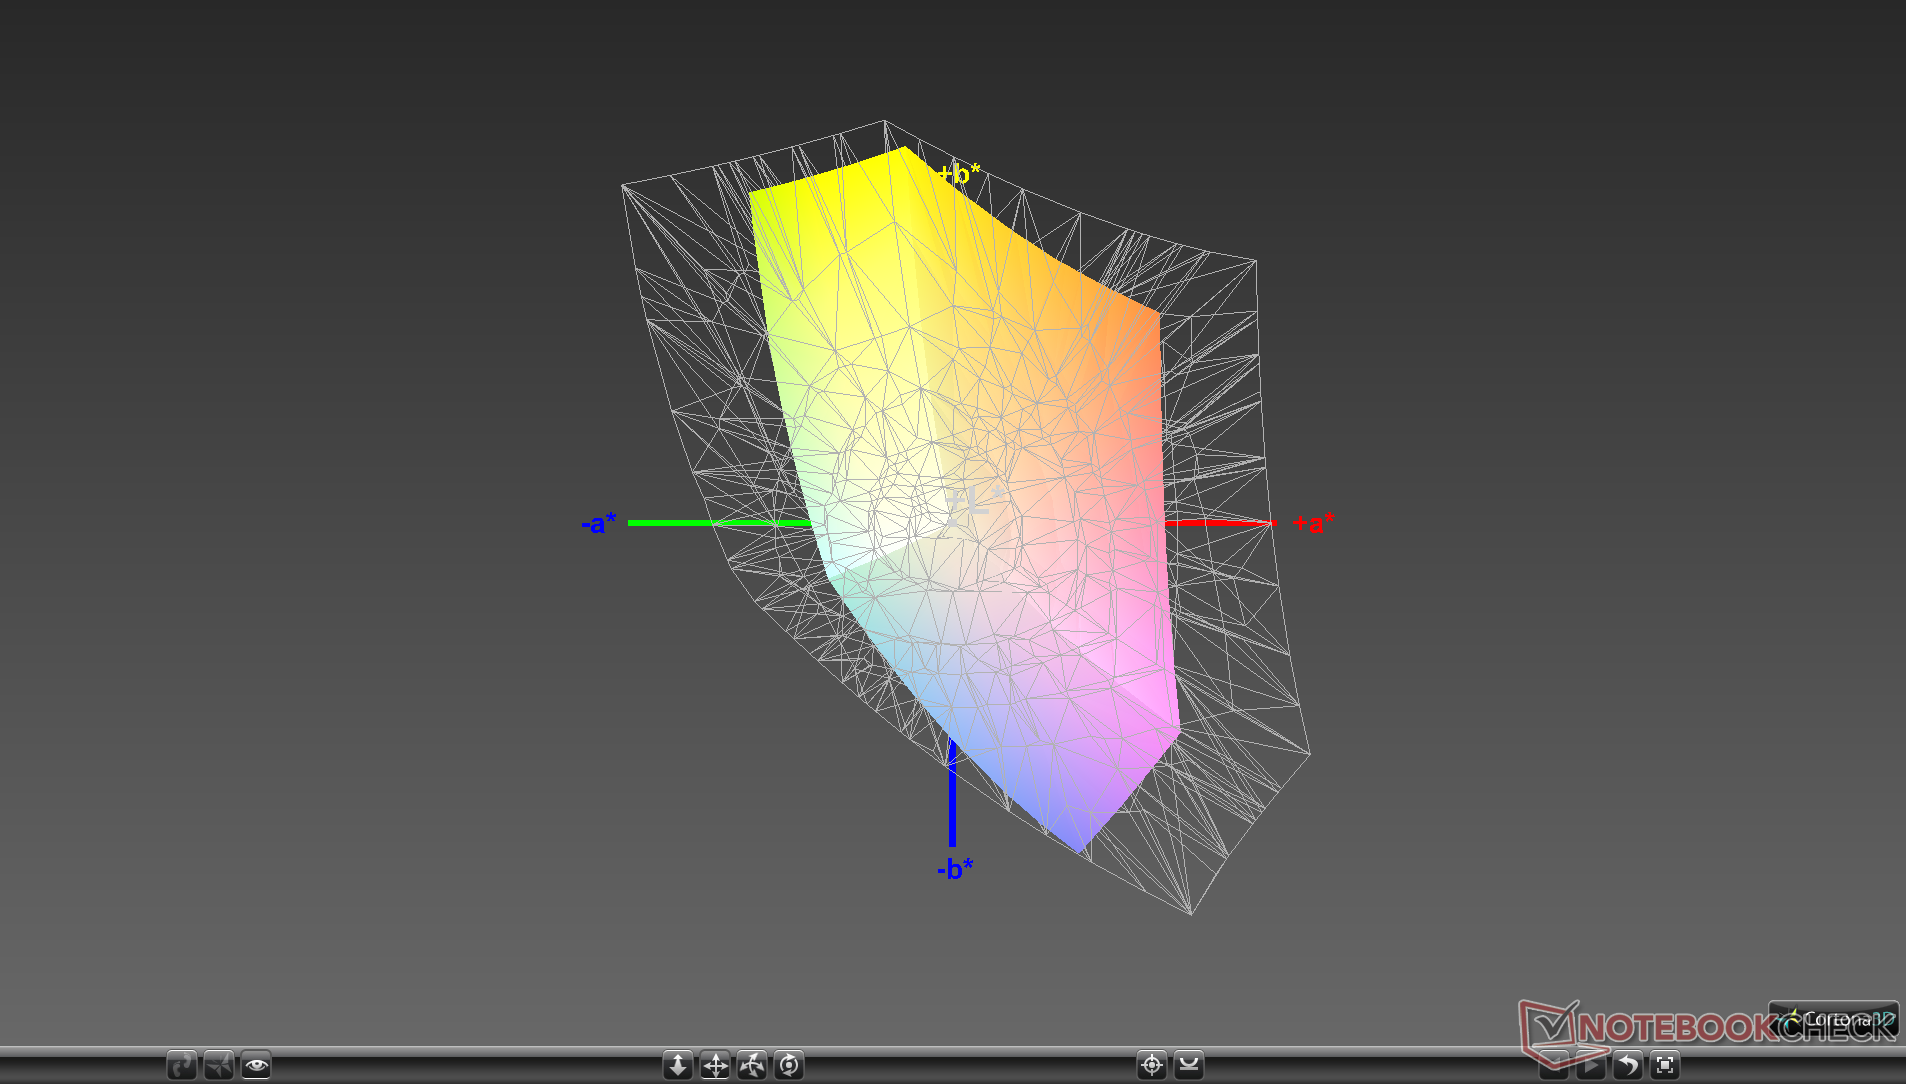
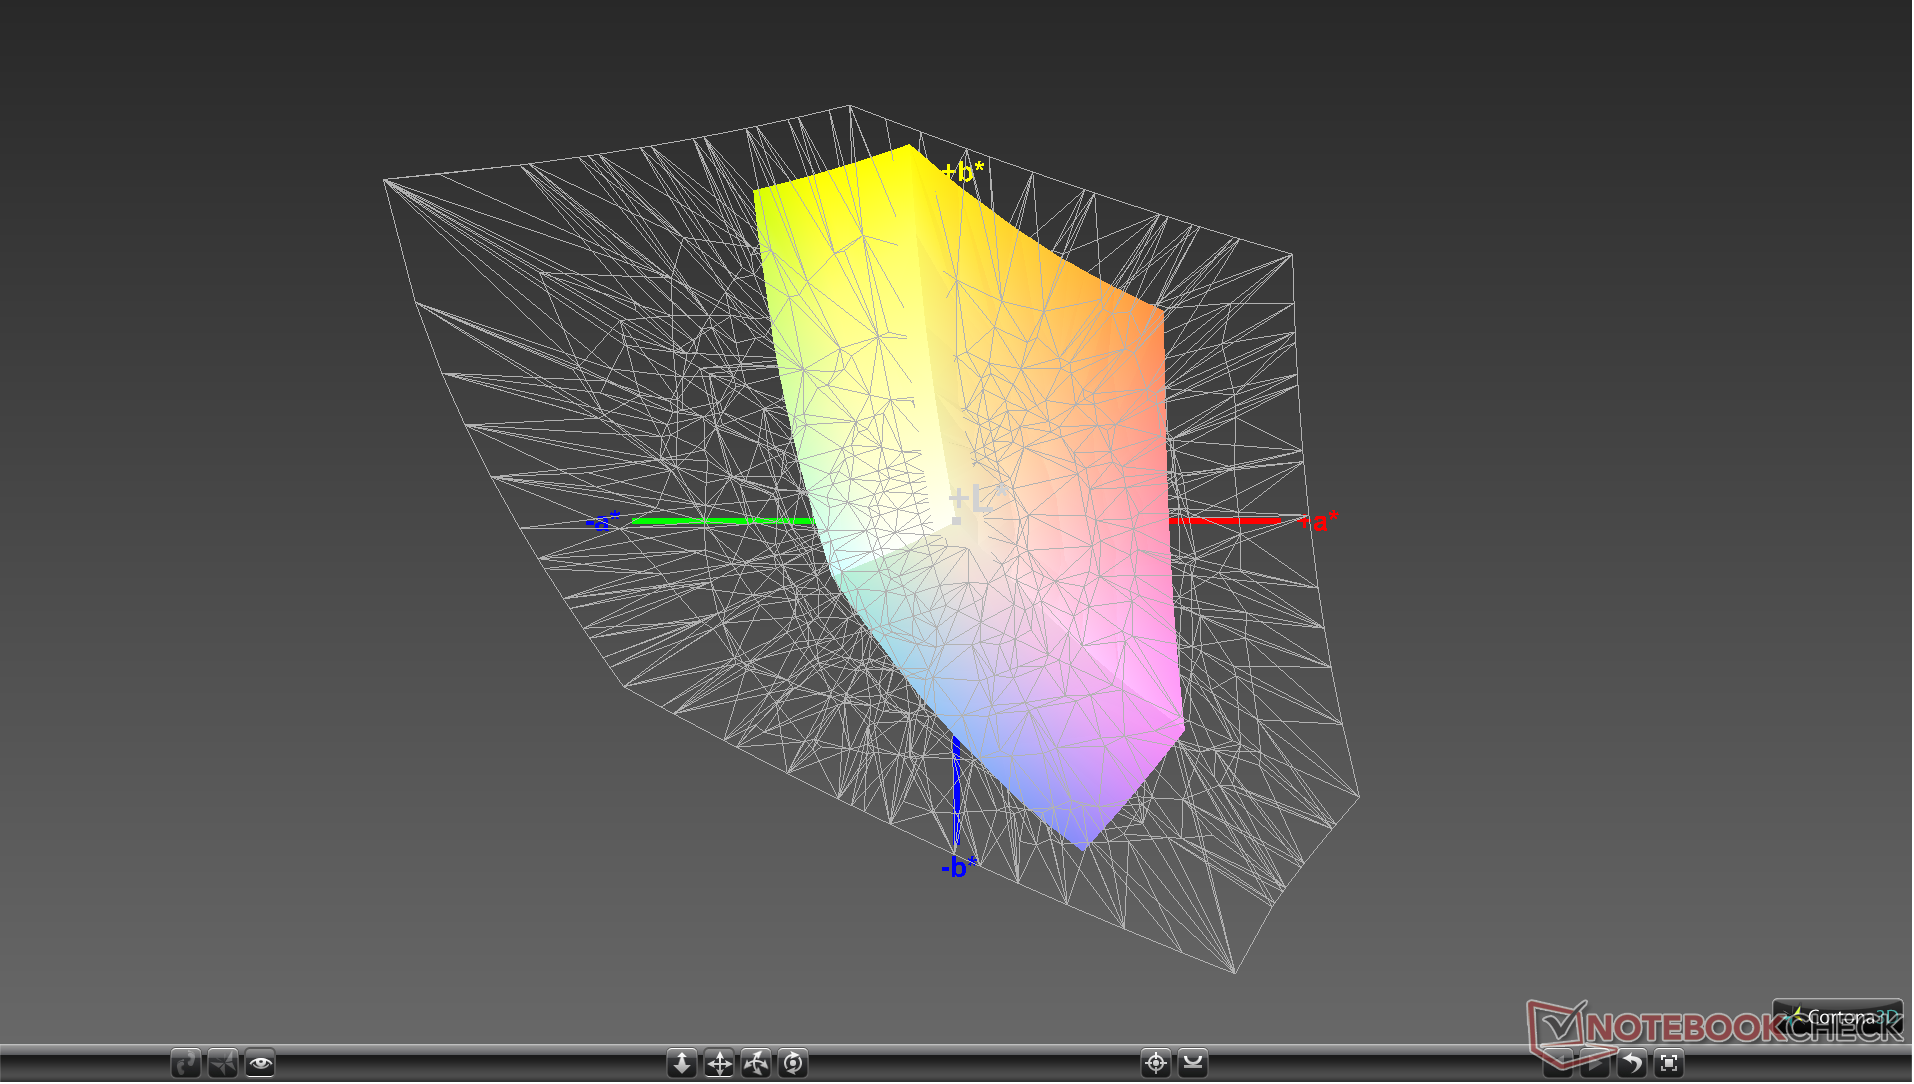
The Inspiron 15 5585 comes with the same LG Philips LP156WFC IPS panel as found on the recent Asus VivoBook S15 S532F. Thus, these two laptops share similar contrast levels, response times, and color spaces for a similar visual experience. The very narrow color space automatically ranks this panel as a budget offering fit for the inexpensive Inspiron family. Even subjectively, colors are not as vibrant as what you may find on an Asus ZenBook or Dell XPS.
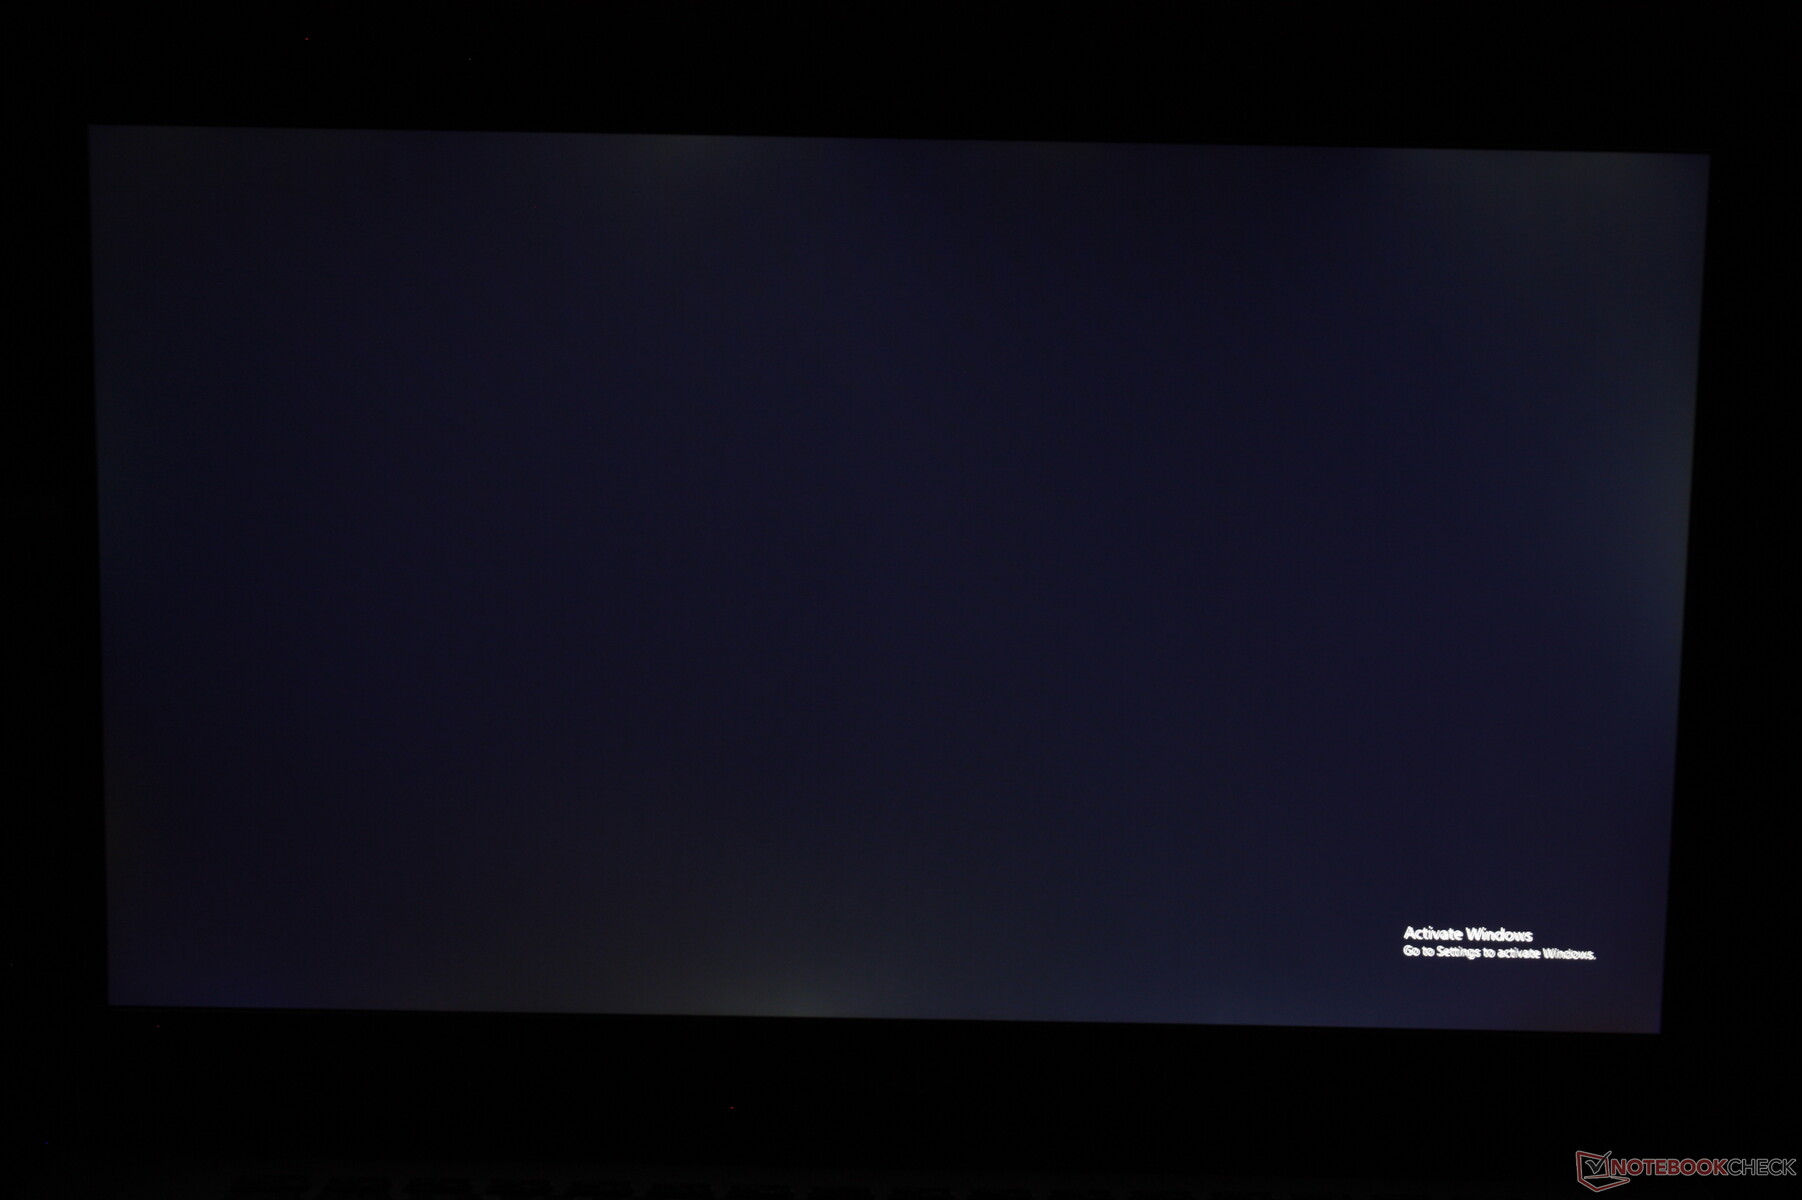
The backlight is about half as dim as on the XPS 15, but it's otherwise similar to other budget laptops like the Lenovo IdeaPad 330. While we appreciate the fact that there are no horrendous TN or 768p options, this is still an entry-level IPS display from top to bottom.


| |||||||||||||||||||||||||
Brightness Distribution: 84 %
Center on Battery: 179.5 cd/m²
Contrast: 939:1 (Black: 0.27 cd/m²)
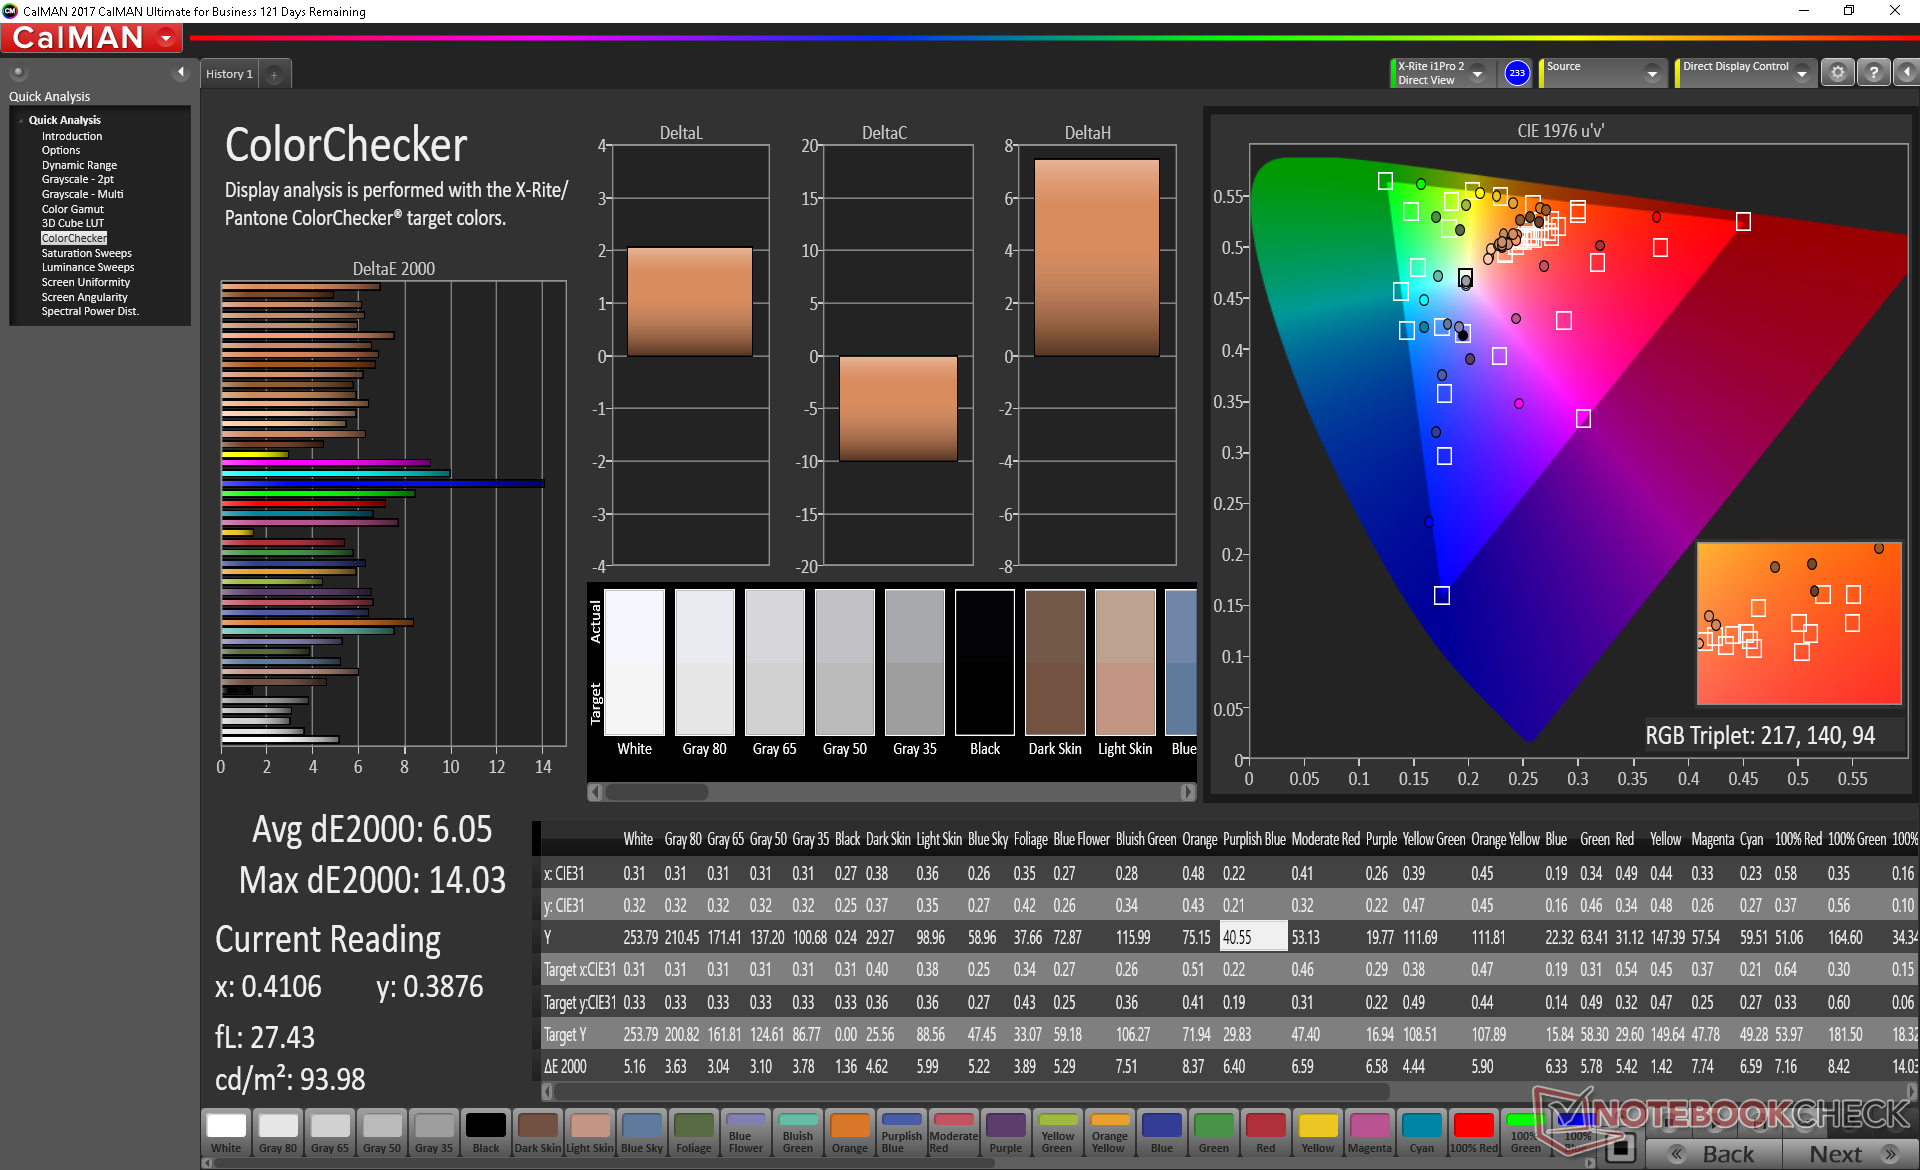
ΔE ColorChecker Calman: 6.05 | ∀{0.5-29.43 Ø4.73}
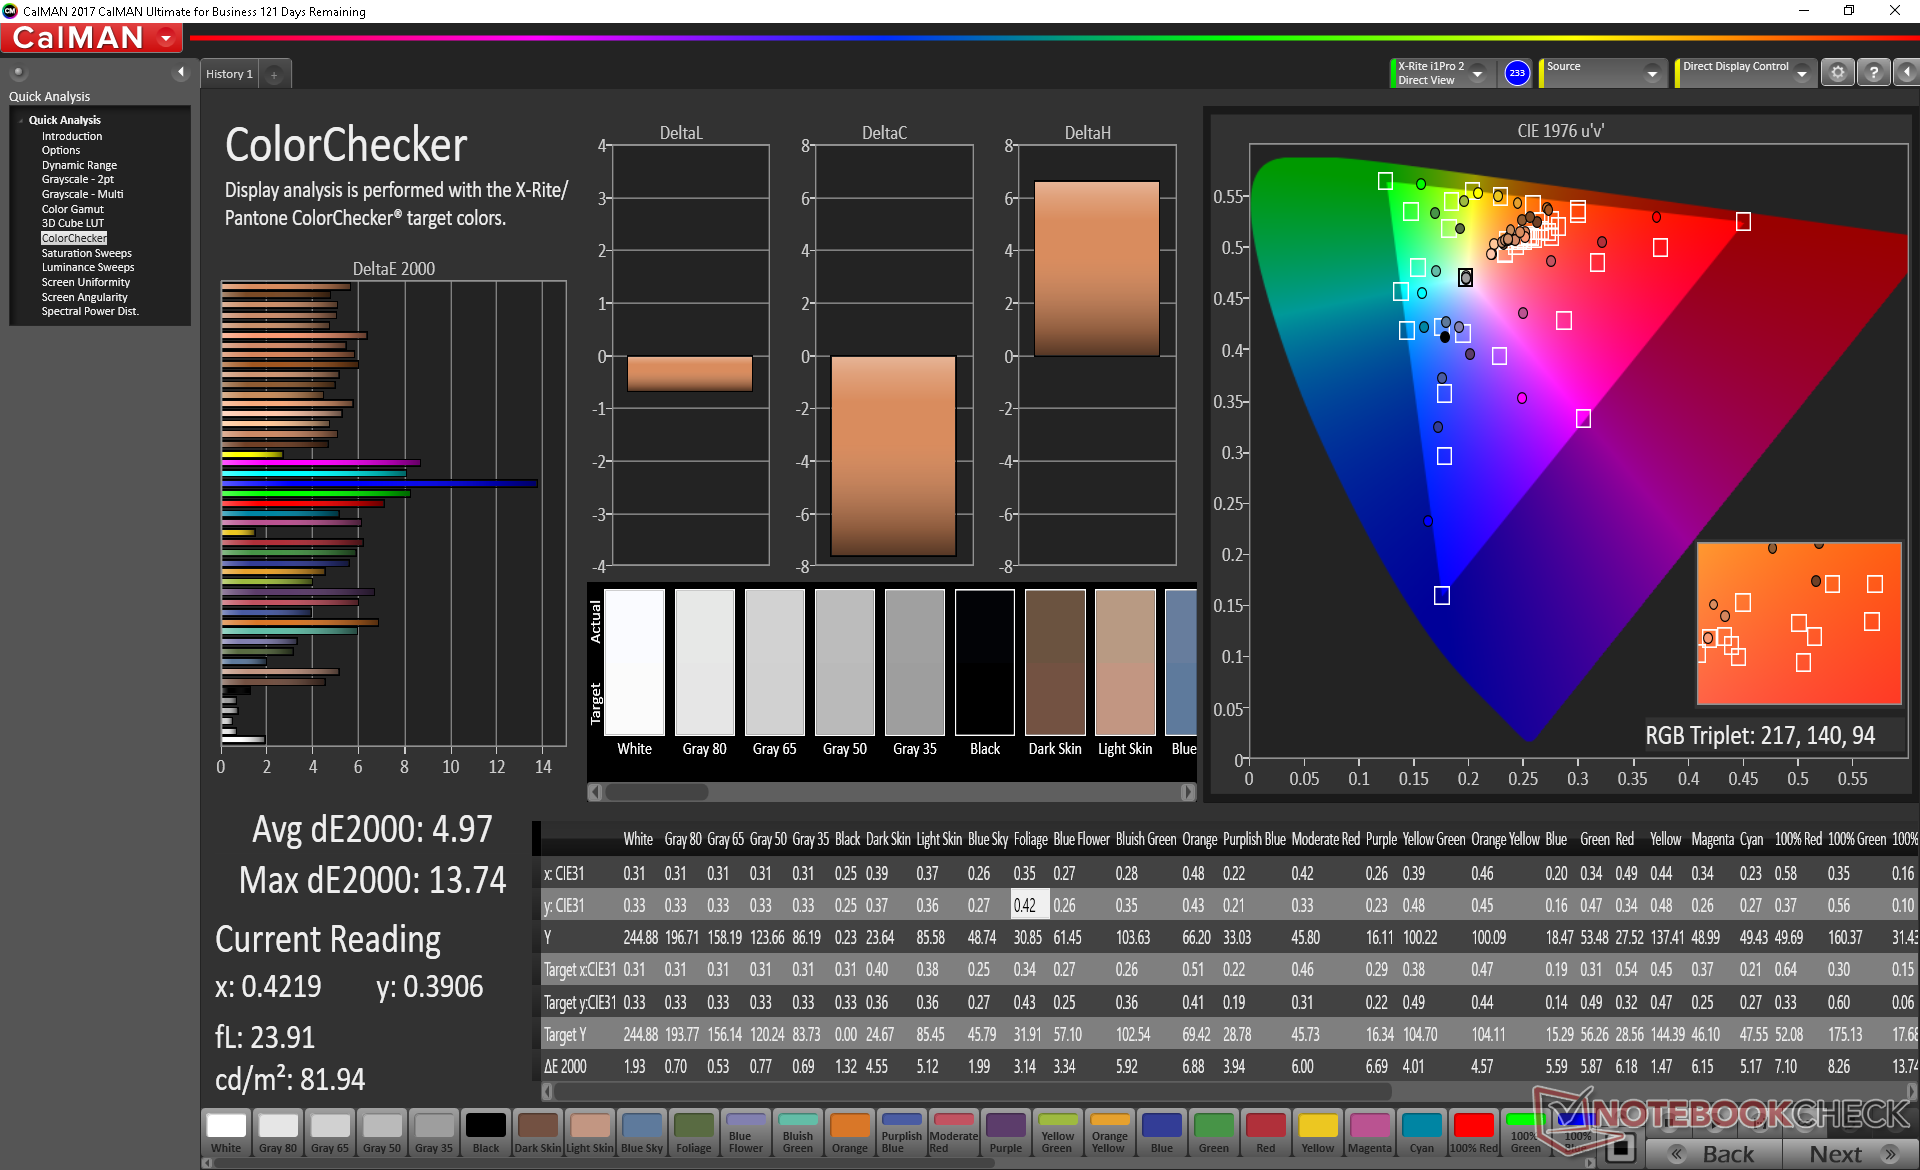
calibrated: 4.97
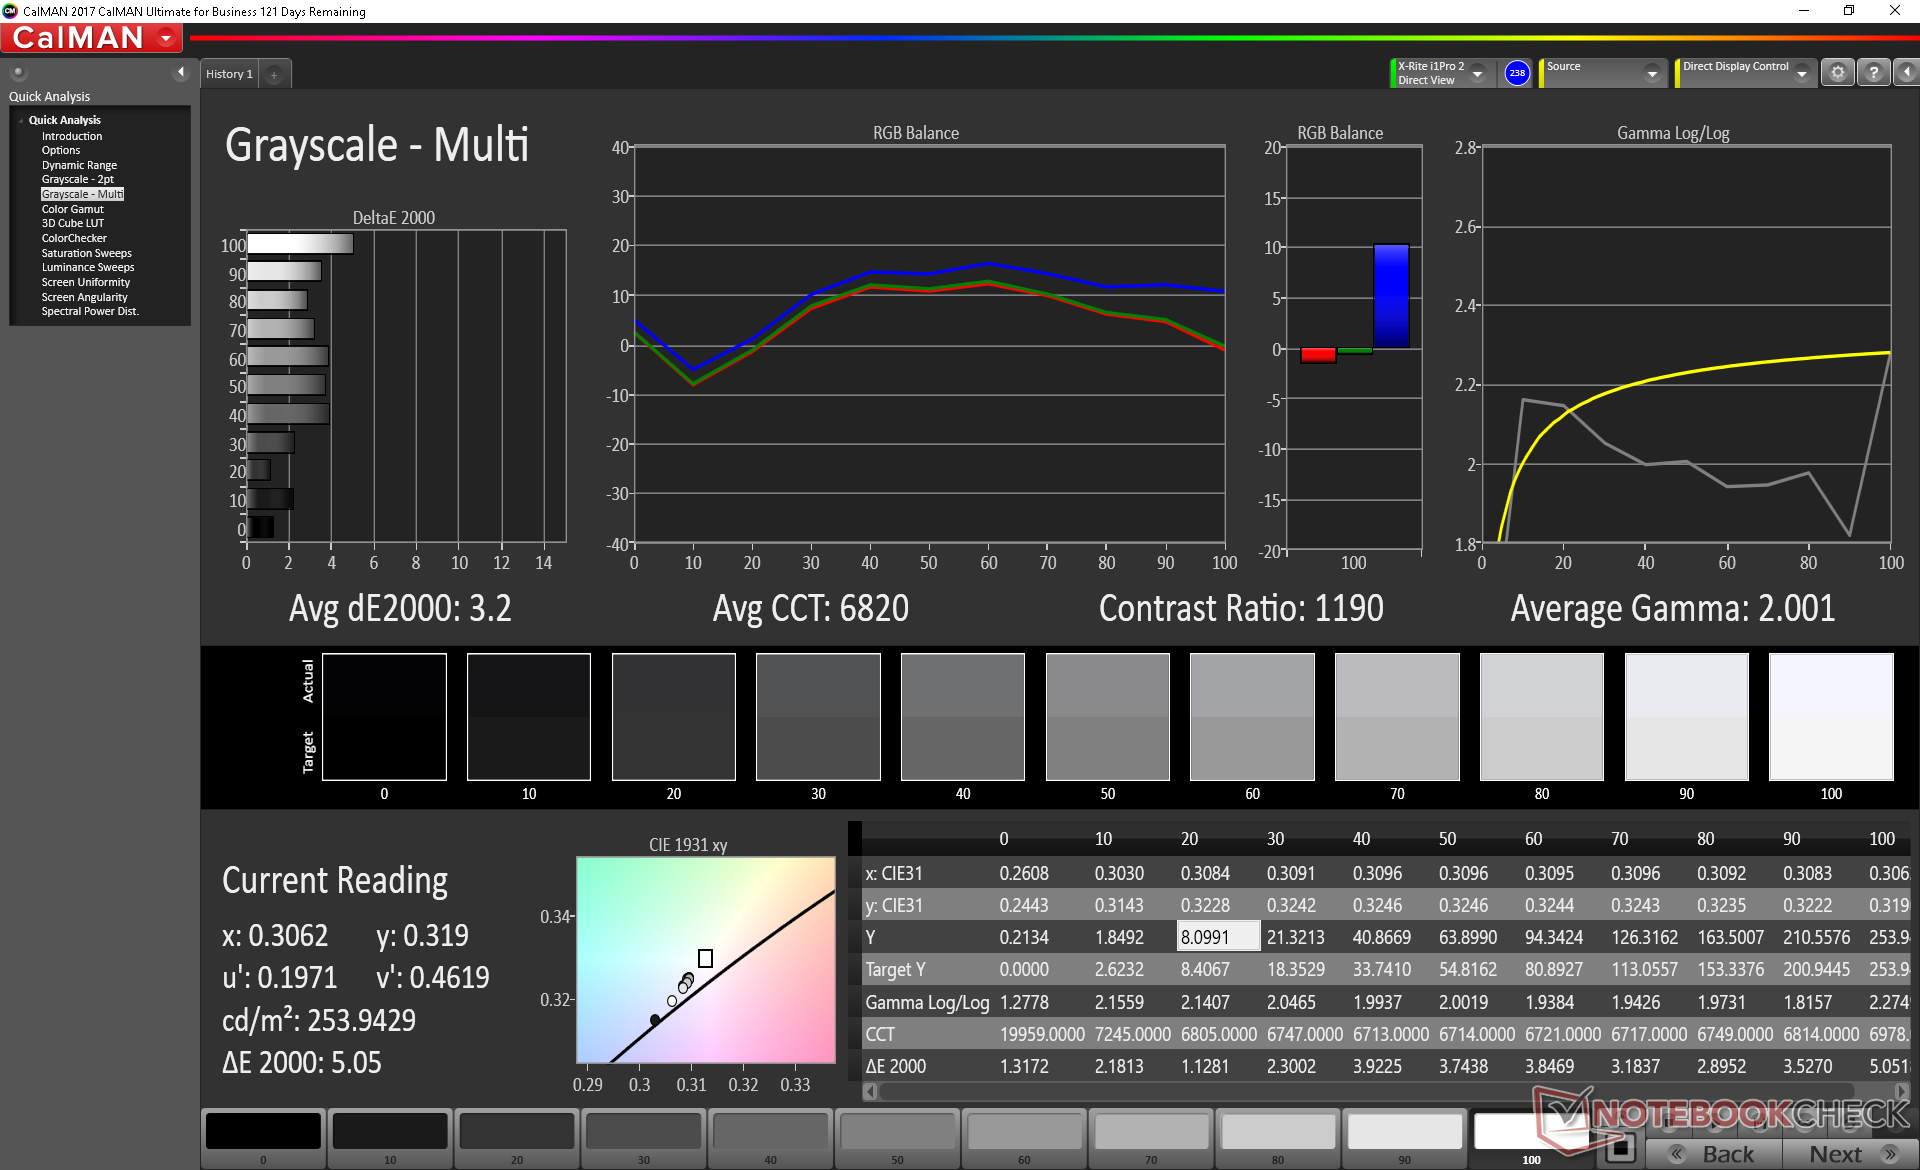
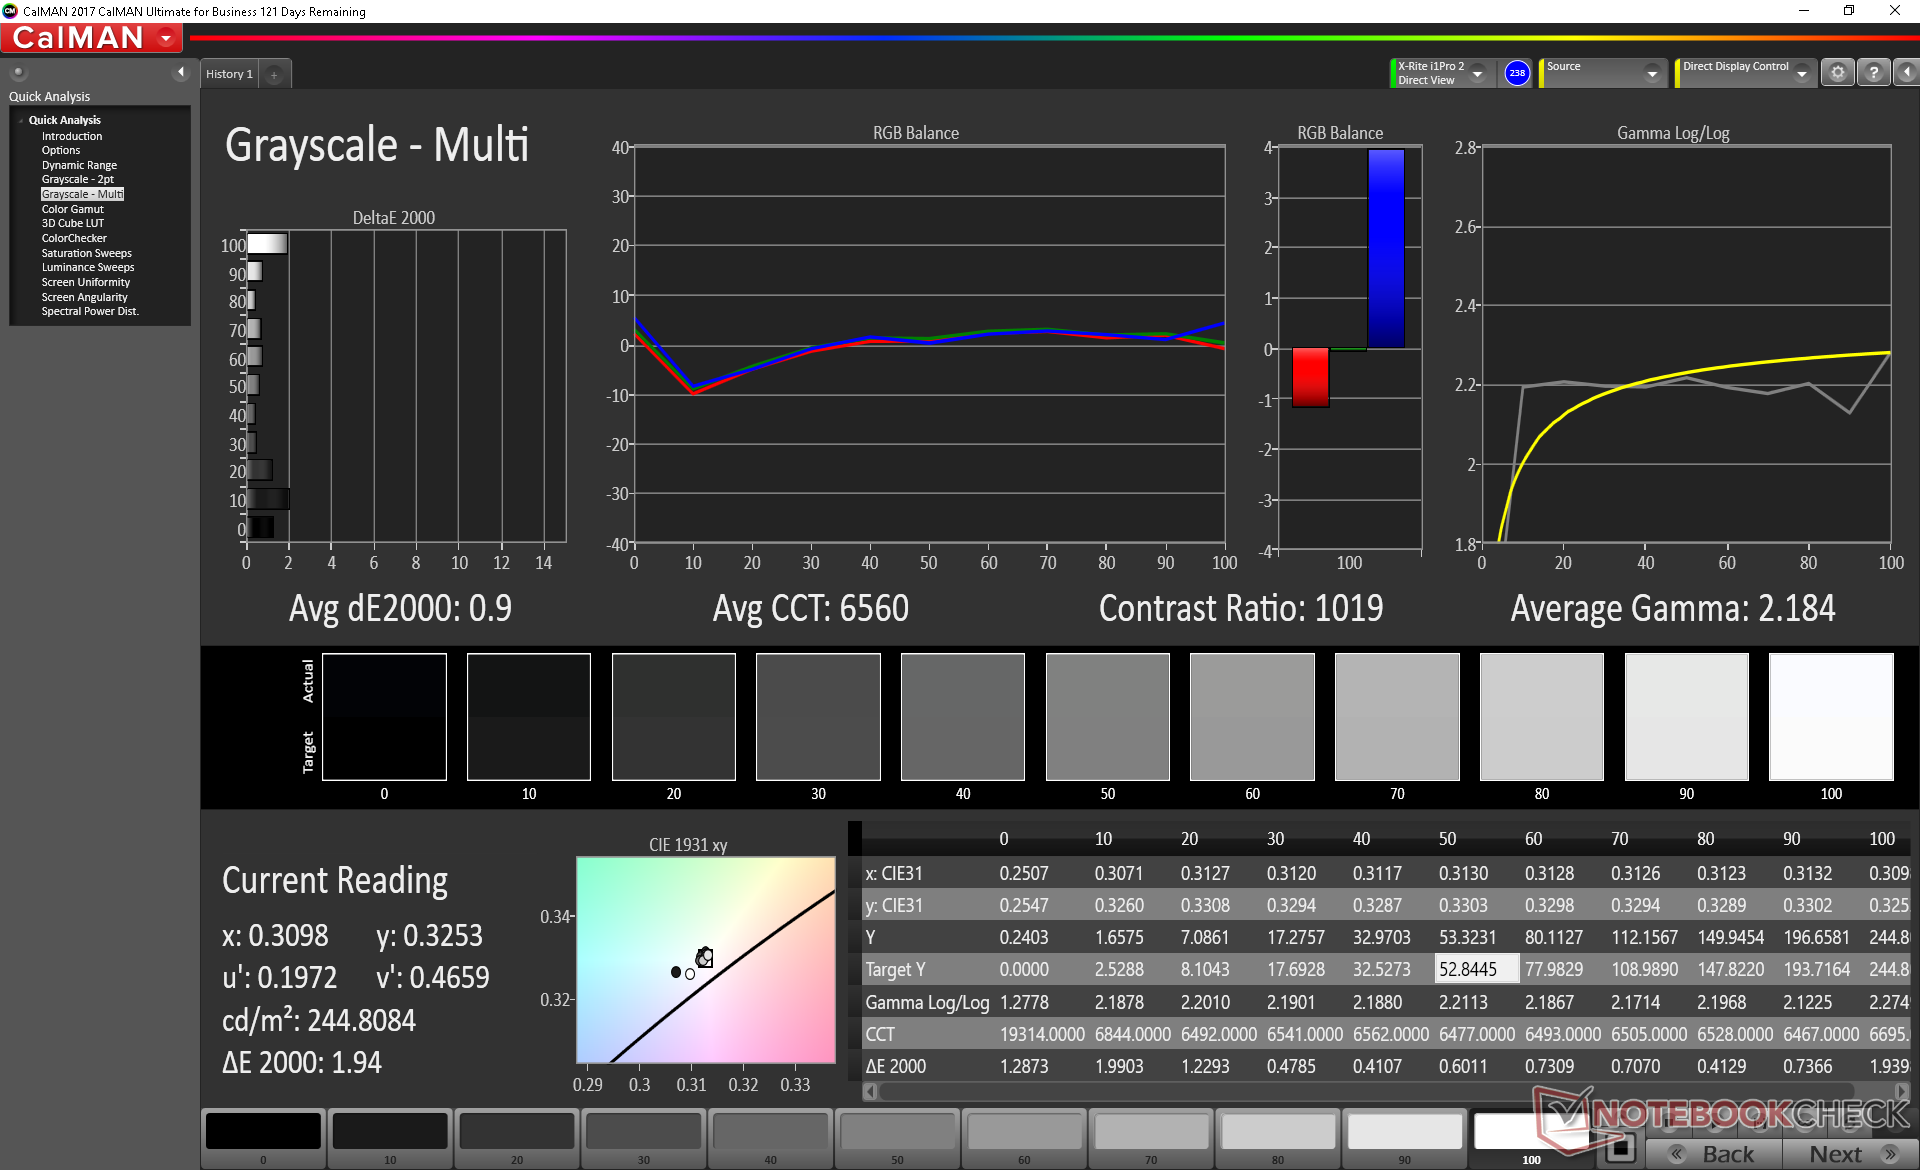
ΔE Greyscale Calman: 3.2 | ∀{0.09-98 Ø4.97}
55.6% sRGB (Argyll 1.6.3 3D)
35.5% AdobeRGB 1998 (Argyll 1.6.3 3D)
38.55% AdobeRGB 1998 (Argyll 3D)
56.2% sRGB (Argyll 3D)
37.31% Display P3 (Argyll 3D)
Gamma: 2
CCT: 6820 K
| Dell Inspiron 15 5000 5585 LG Philips 156WFC, IPS, 15.6", 1920x1080 | Dell Inspiron 15 3585 (2300U, Vega 6) BOE0802, TN, 15.6", 1920x1080 | Dell Inspiron 15 5000 5584 AU Optronics AUO22ED, B156HAK, IPS, 15.6", 1920x1080 | Dell XPS 15 9570 Core i9 UHD LQ156D1, IPS, 15.6", 3840x2160 | Asus VivoBook S15 S532F LG Philips LP156WFC-SPD1, IPS, 15.6", 1920x1080 | Lenovo Ideapad 330S-15ARR-81FB00C7GE LG Philips LP156WFC-SPD1, IPS, 15.6", 1920x1080 | |
|---|---|---|---|---|---|---|
| Display | 5% | 5% | 98% | -1% | 2% | |
| Display P3 Coverage (%) | 37.31 | 39.22 5% | 39.17 5% | 79.6 113% | 37.12 -1% | 38.1 2% |
| sRGB Coverage (%) | 56.2 | 58.9 5% | 58.8 5% | 98.4 75% | 55.9 -1% | 57.2 2% |
| AdobeRGB 1998 Coverage (%) | 38.55 | 40.52 5% | 40.48 5% | 79.7 107% | 38.35 -1% | 39.4 2% |
| Response Times | 10% | -40% | -51% | 13% | -4% | |
| Response Time Grey 50% / Grey 80% * (ms) | 28.4 ? | 39 ? -37% | 48.8 ? -72% | 52.4 ? -85% | 24.8 ? 13% | 34 ? -20% |
| Response Time Black / White * (ms) | 27.2 ? | 12 ? 56% | 29.2 ? -7% | 31.6 ? -16% | 24 ? 12% | 24 ? 12% |
| PWM Frequency (Hz) | 250 ? | 1000 ? | ||||
| Screen | -48% | -8% | 22% | -7% | -2% | |
| Brightness middle (cd/m²) | 253.6 | 225 -11% | 227 -10% | 451.9 78% | 262.3 3% | 265 4% |
| Brightness (cd/m²) | 227 | 213 -6% | 230 1% | 414 82% | 250 10% | 242 7% |
| Brightness Distribution (%) | 84 | 88 5% | 92 10% | 81 -4% | 89 6% | 74 -12% |
| Black Level * (cd/m²) | 0.27 | 0.535 -98% | 0.21 22% | 0.36 -33% | 0.43 -59% | 0.215 20% |
| Contrast (:1) | 939 | 421 -55% | 1081 15% | 1255 34% | 610 -35% | 1233 31% |
| Colorchecker dE 2000 * | 6.05 | 10.37 -71% | 6.55 -8% | 5.62 7% | 5.81 4% | 6.16 -2% |
| Colorchecker dE 2000 max. * | 14.03 | 19.75 -41% | 23.45 -67% | 19.1 -36% | 14.7 -5% | 18 -28% |
| Colorchecker dE 2000 calibrated * | 4.97 | 3.89 22% | 4.61 7% | 2.69 46% | 5.36 -8% | 6.18 -24% |
| Greyscale dE 2000 * | 3.2 | 12.09 -278% | 5.2 -63% | 6.9 -116% | 2.8 13% | 3.79 -18% |
| Gamma | 2 110% | 2.72 81% | 2.66 83% | 2.2 100% | 2.15 102% | 2.34 94% |
| CCT | 6820 95% | 13335 49% | 6434 101% | 6254 104% | 7016 93% | 7258 90% |
| Color Space (Percent of AdobeRGB 1998) (%) | 35.5 | 37 4% | 37 4% | 71.8 102% | 35.2 -1% | 36 1% |
| Color Space (Percent of sRGB) (%) | 55.6 | 59 6% | 58.2 5% | 98.5 77% | 55.6 0% | 57 3% |
| Total Average (Program / Settings) | -11% /
-31% | -14% /
-9% | 23% /
27% | 2% /
-3% | -1% /
-1% |
* ... smaller is better
Color space is narrow at just 56 percent of the sRGB standard whereas most mid-range to flagship Ultrabooks typically cover 90 percent or more. Colors are noticeably shallower on the Inspiron to make it a poor option for any sort of video editing or graphics work. Nevertheless, the limited color reproduction is common on inexpensive laptops.
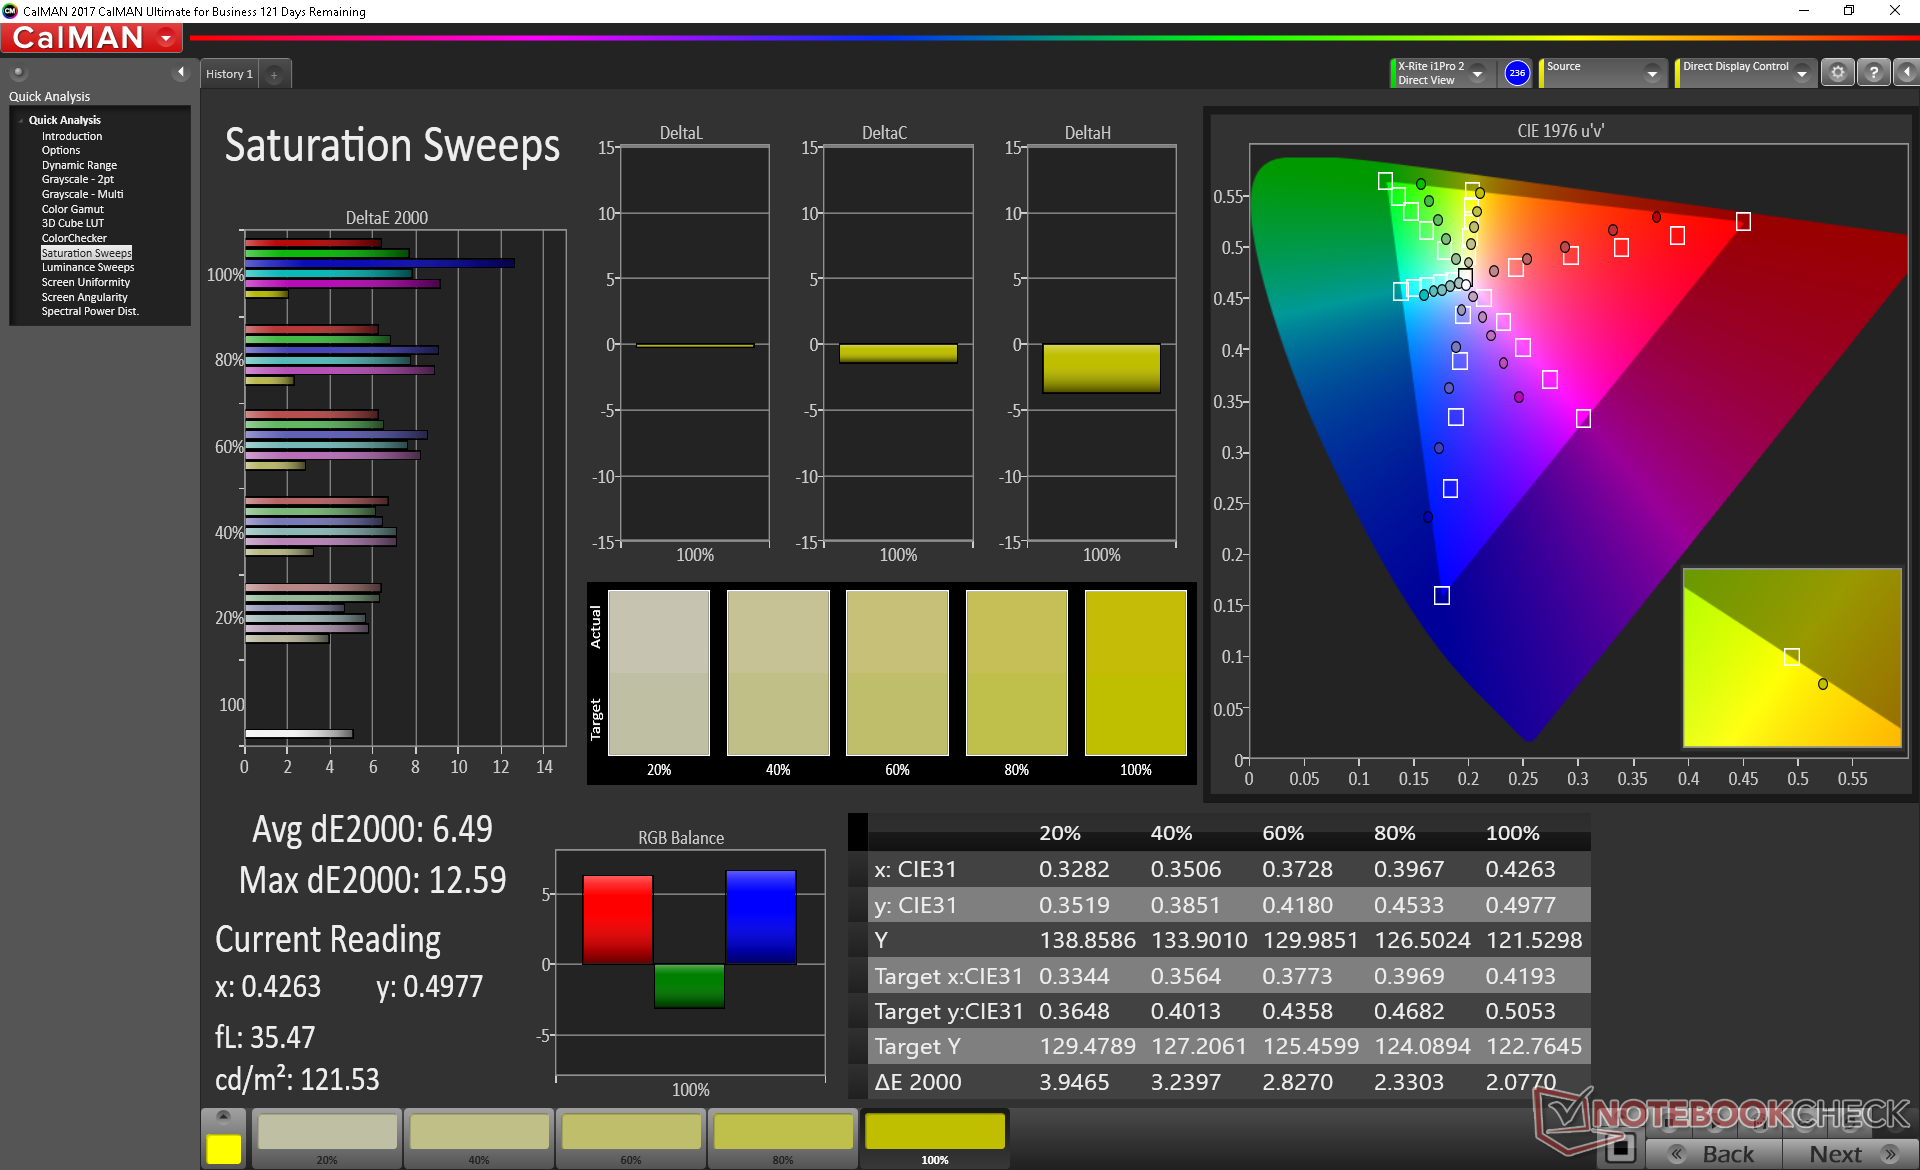
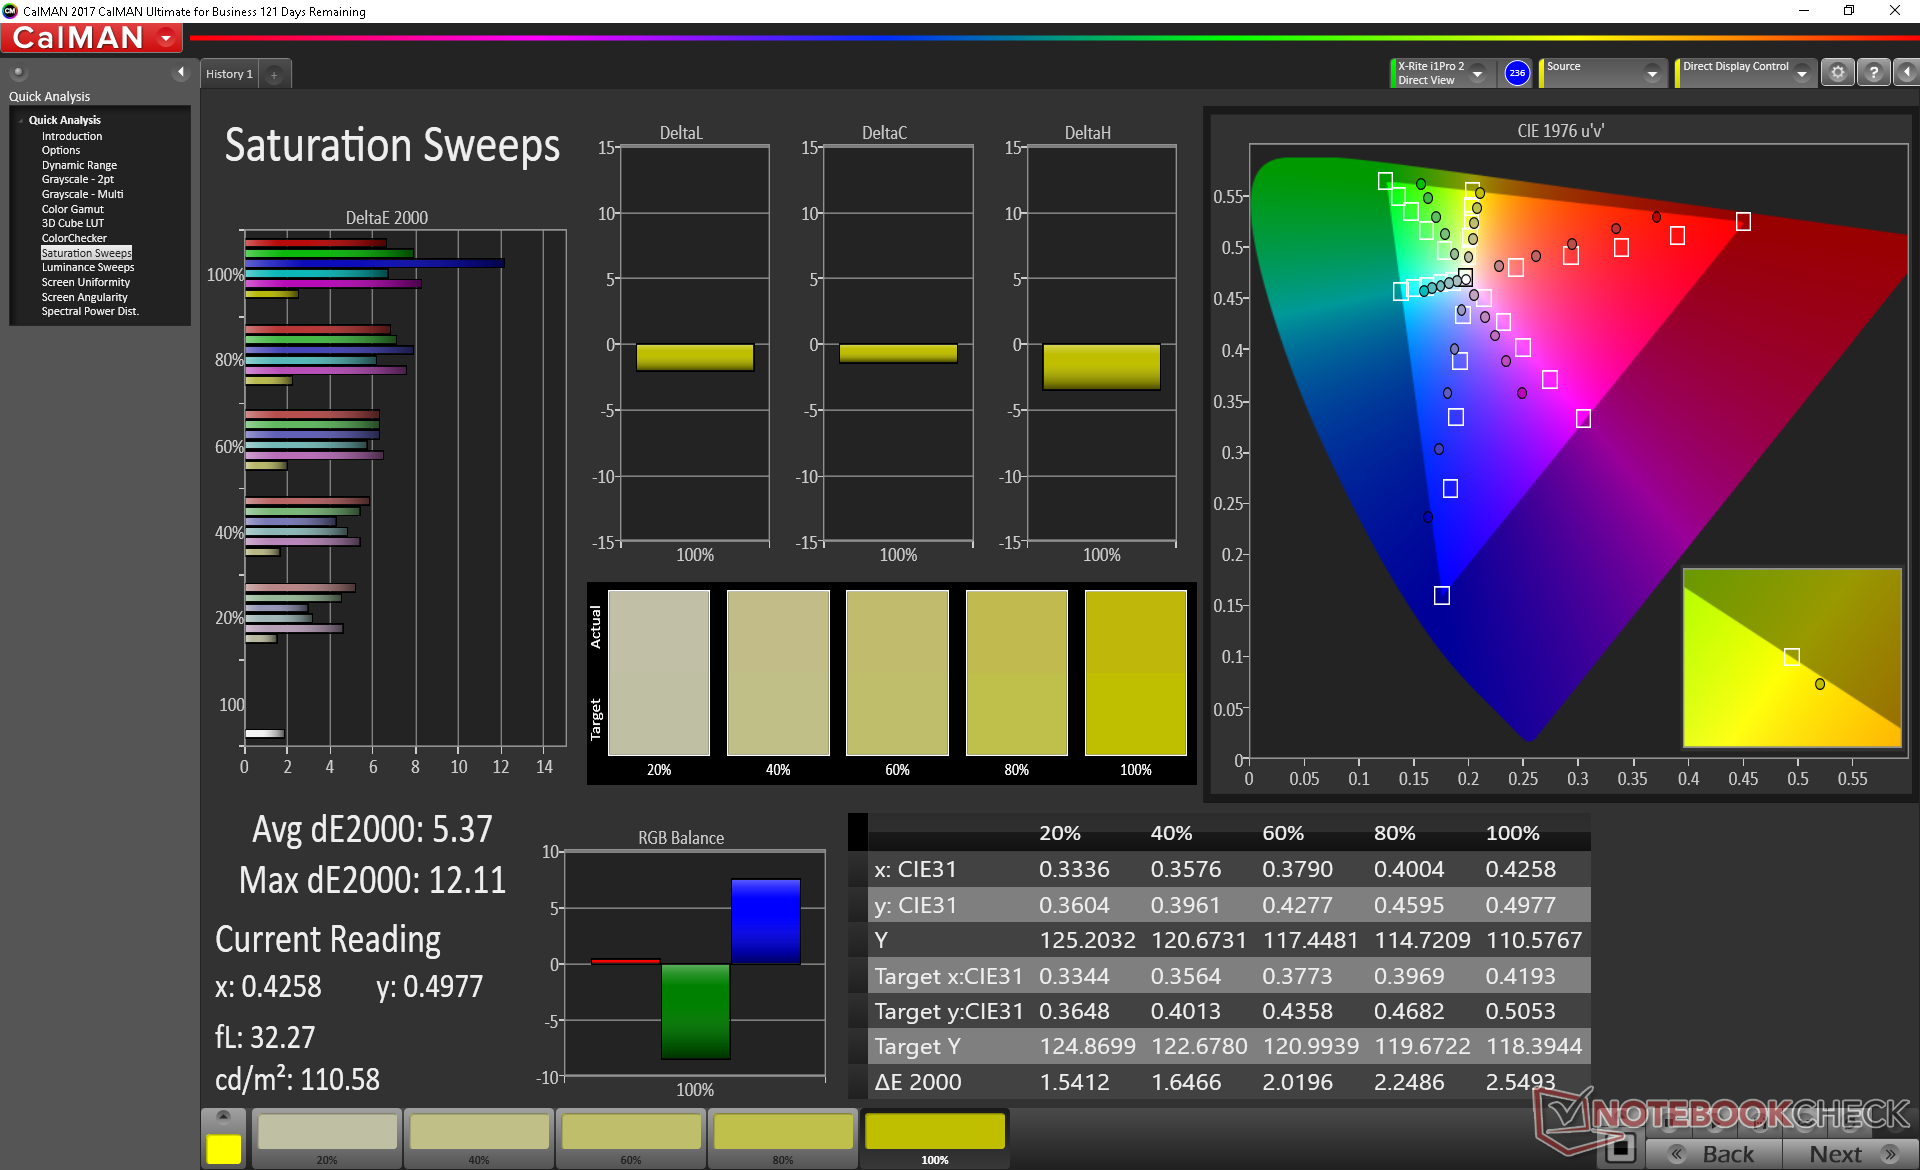
Grayscale is not bad out of the box with an average deltaE value of 3.2 and this only becomes better after calibration. Color accuracy, however, remains poor regardless of any calibration settings because of the narrow gamut mentioned above. Colors become increasingly more inaccurate at higher saturation levels with blue in particular being the most inaccurate.
Display Response Times
| ↔ Response Time Black to White | ||
|---|---|---|
| 27.2 ms ... rise ↗ and fall ↘ combined | ↗ 16.4 ms rise | 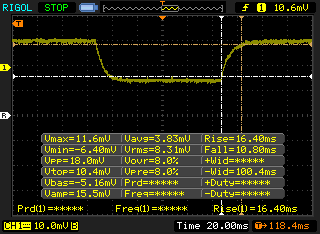 |
| ↘ 10.8 ms fall | ||
| The screen shows relatively slow response rates in our tests and may be too slow for gamers. In comparison, all tested devices range from 0.1 (minimum) to 240 (maximum) ms. » 69 % of all devices are better. This means that the measured response time is worse than the average of all tested devices (19.9 ms). | ||
| ↔ Response Time 50% Grey to 80% Grey | ||
| 28.4 ms ... rise ↗ and fall ↘ combined | ↗ 10.4 ms rise | 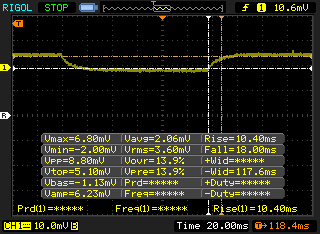 |
| ↘ 18 ms fall | ||
| The screen shows relatively slow response rates in our tests and may be too slow for gamers. In comparison, all tested devices range from 0.165 (minimum) to 636 (maximum) ms. » 38 % of all devices are better. This means that the measured response time is similar to the average of all tested devices (31.1 ms). | ||
Screen Flickering / PWM (Pulse-Width Modulation)
| Screen flickering / PWM not detected | 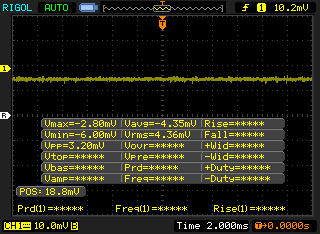 | ||
In comparison: 52 % of all tested devices do not use PWM to dim the display. If PWM was detected, an average of 7798 (minimum: 5 - maximum: 343500) Hz was measured. | |||
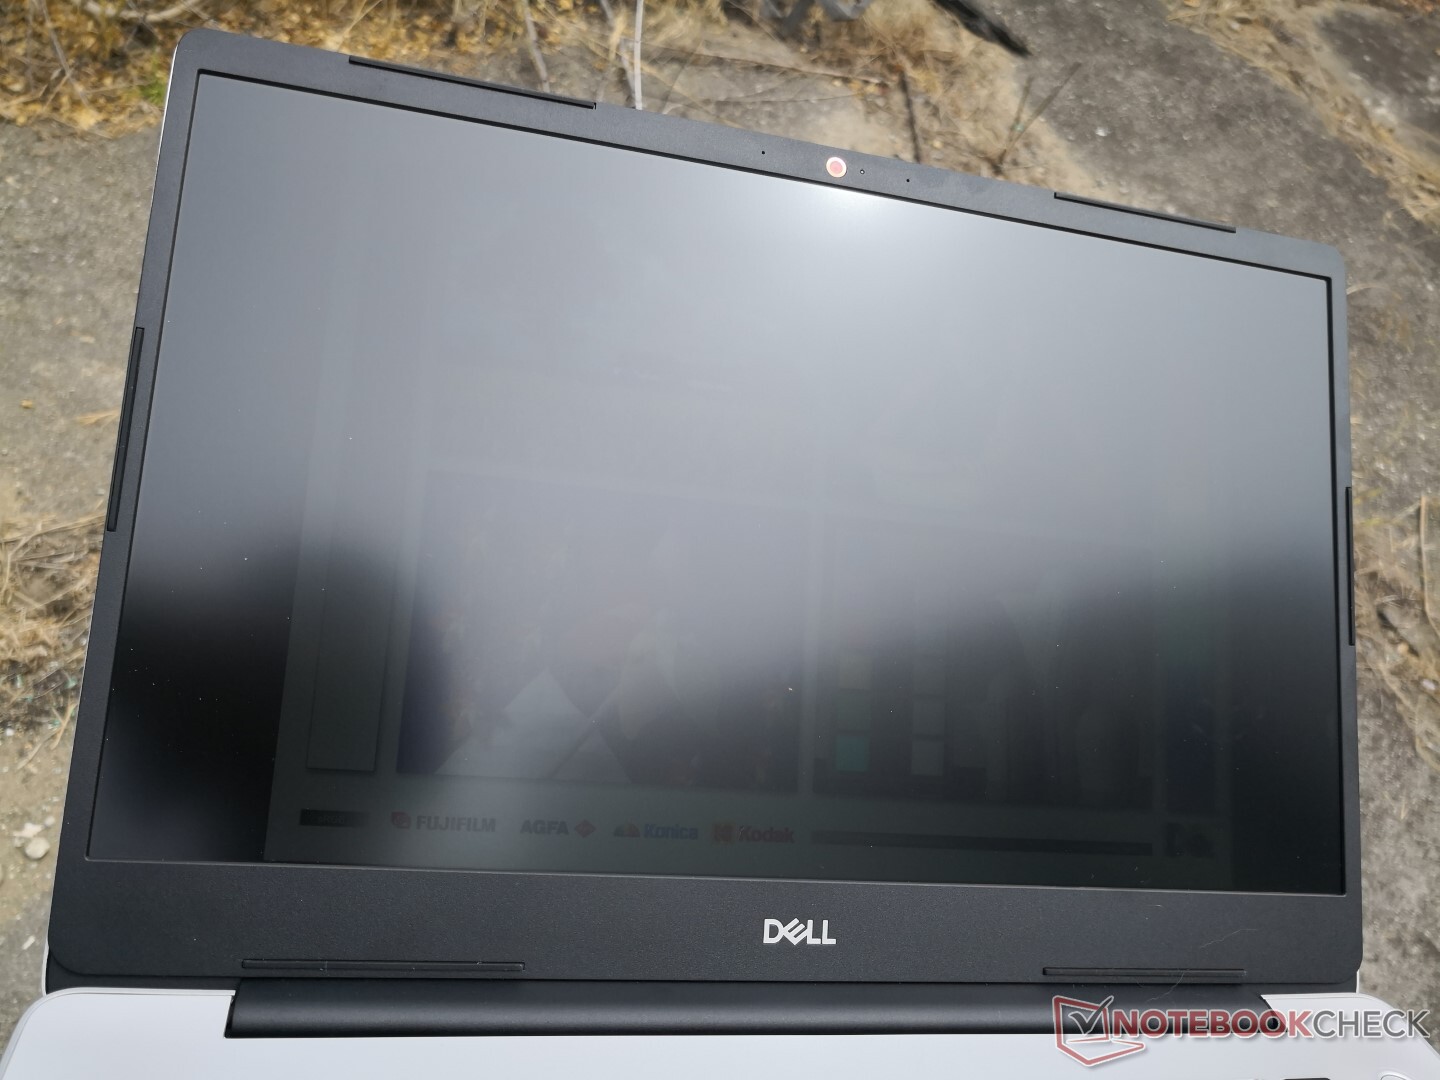
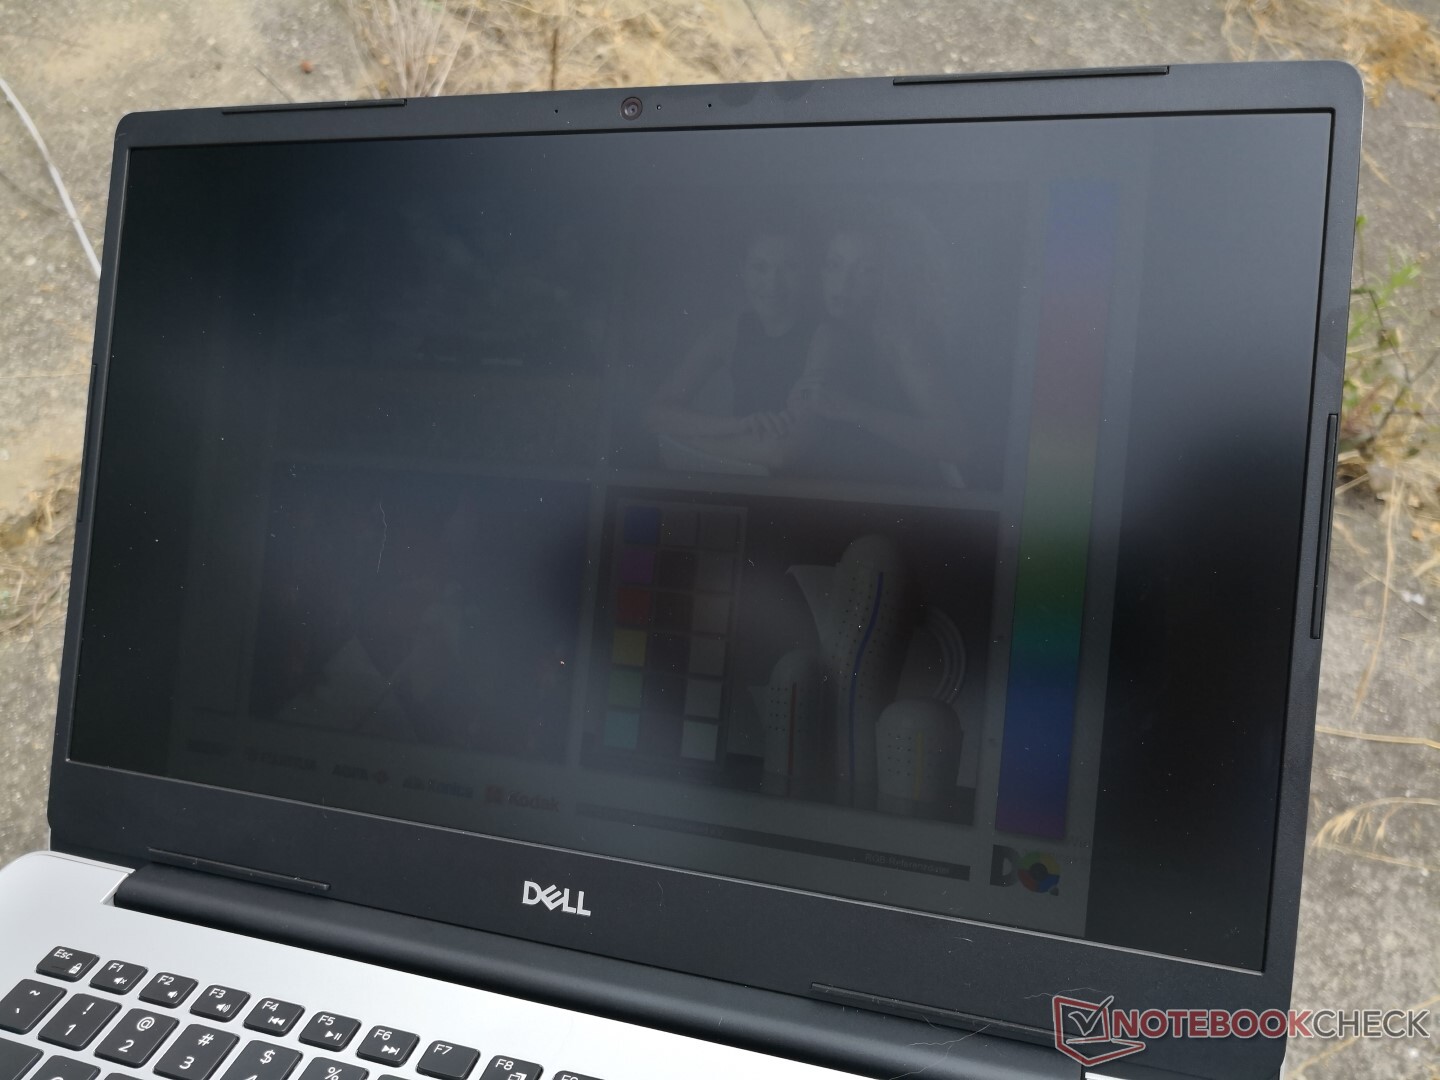
Outdoor visibility is below average. While the matte panel will reduce reflections, glare will still be prevalent because the display is simply too dim for comfortable outdoor use. Furthermore, maximum brightness will automatically drop to just 180 nits when running on batteries compared to 254 nits when on mains unless if the correct settings are toggled in the Radeon settings.
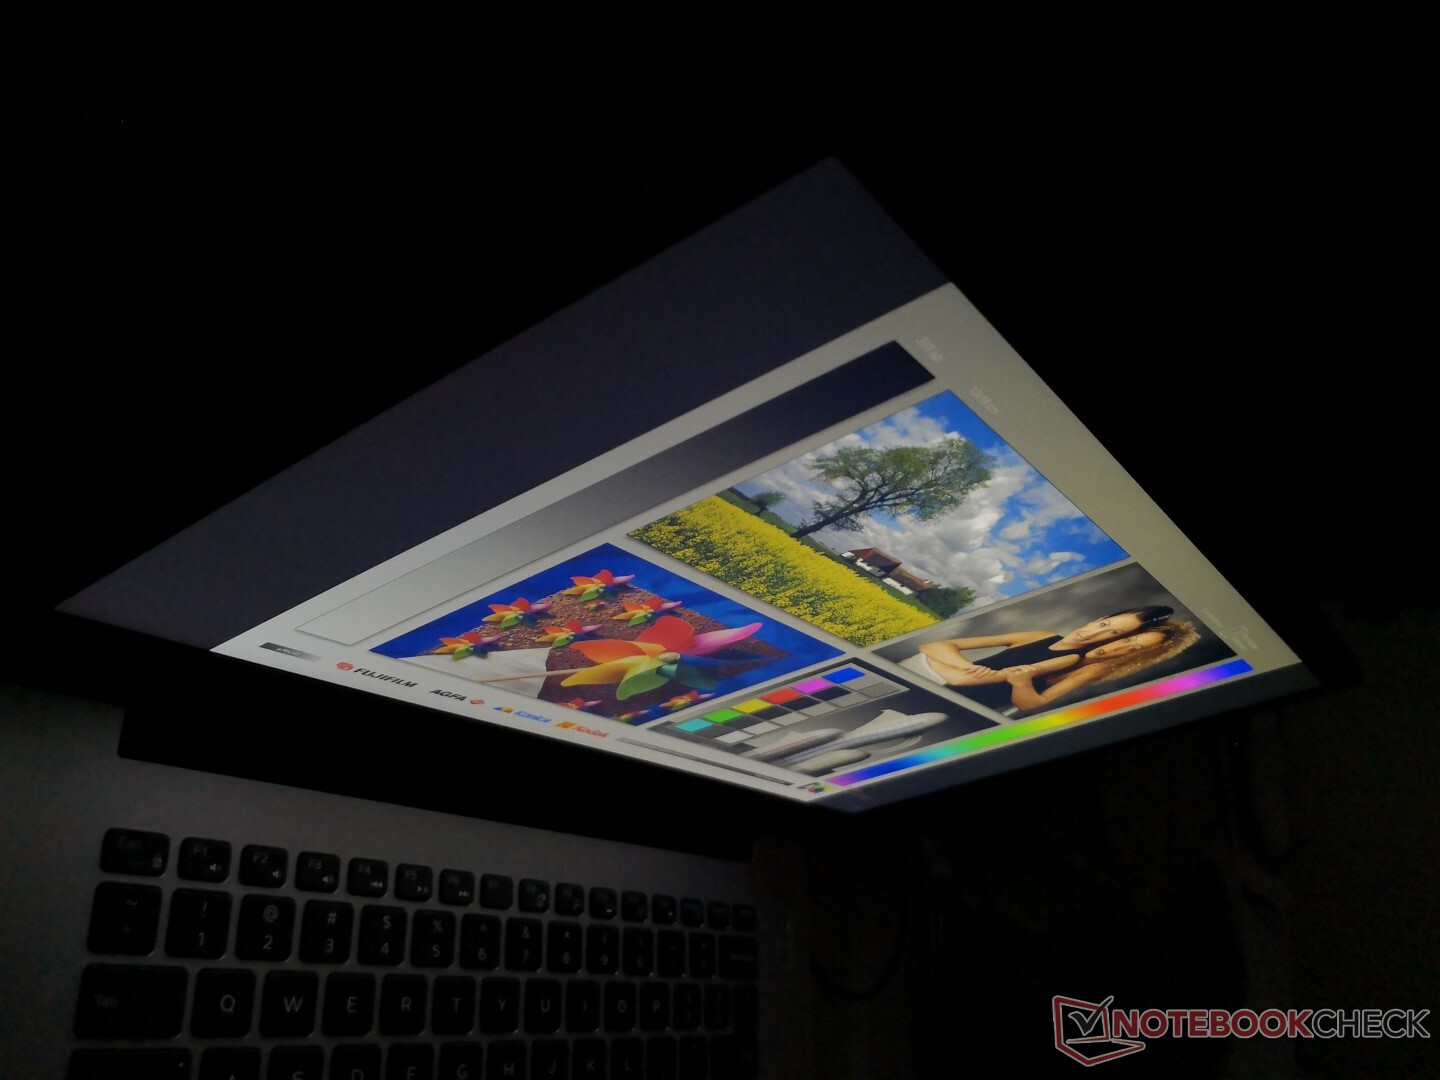
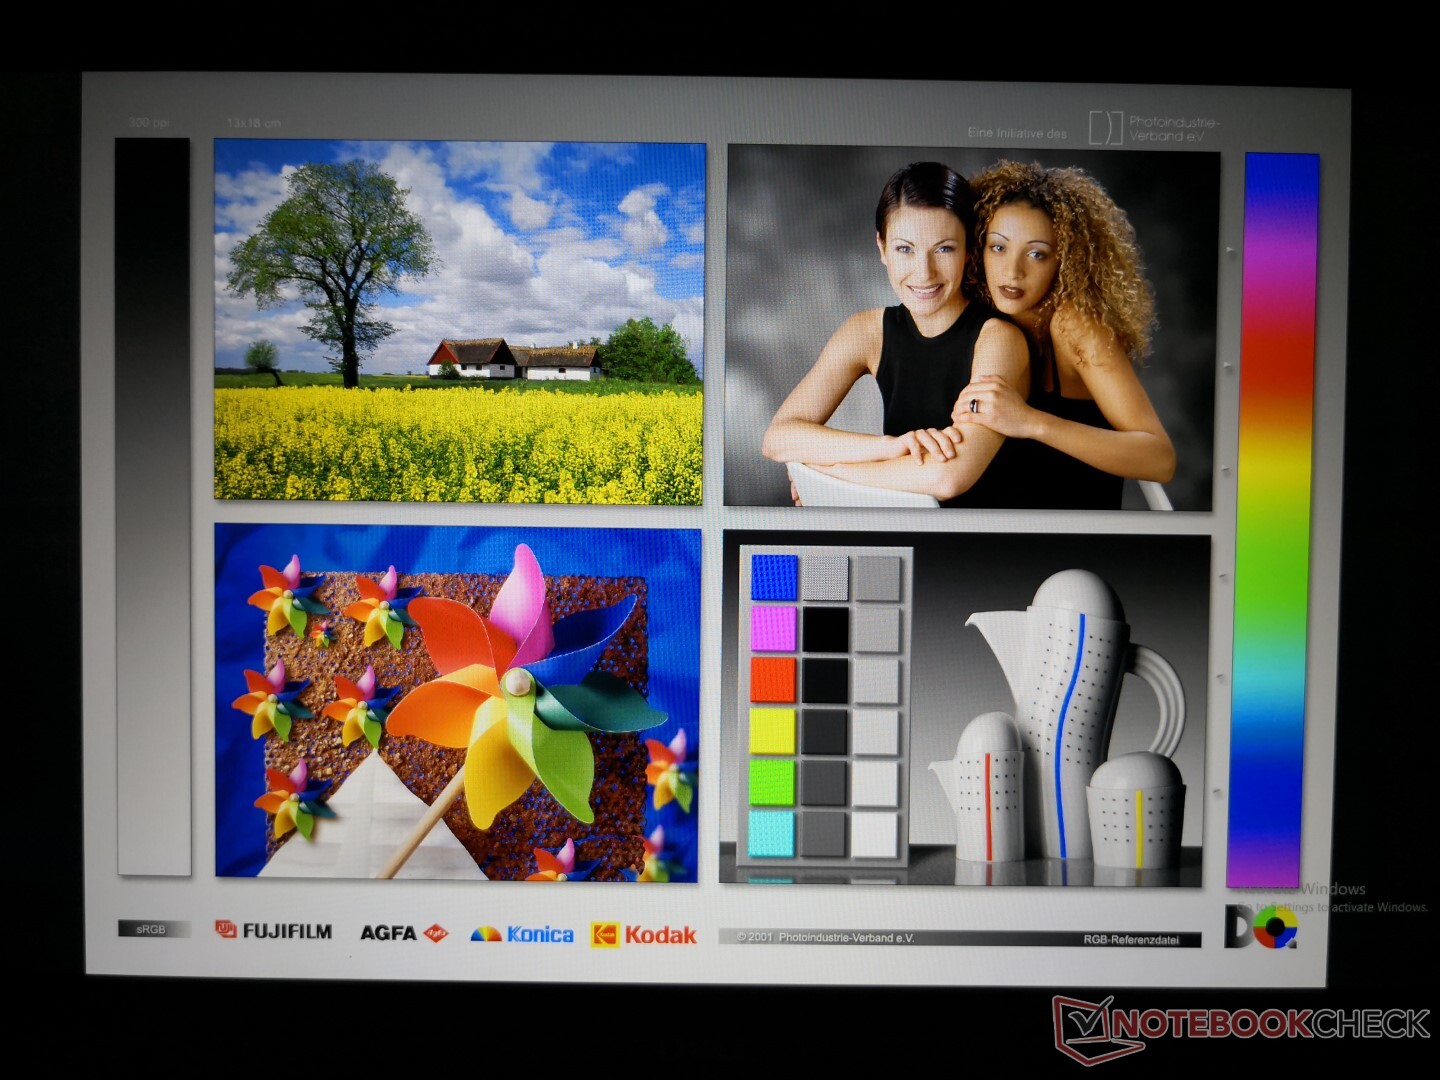
Viewing angles are otherwise excellent with wide color and contrast changes only if viewing from extreme and unrealistic angles.
Performance
The Ryzen 7 3700U is AMD's alternative to the 15 W Intel Core i7-8565U and Core i7-8550U. While it operates at a higher cTDP of up to 35 W, it brings significantly faster graphics performance than the aforementioned Intel equivalents.
No discrete graphics options are available for the Inspiron 15 5585 series even though the motherboard shows unoccupied space designed for a dedicated GPU.
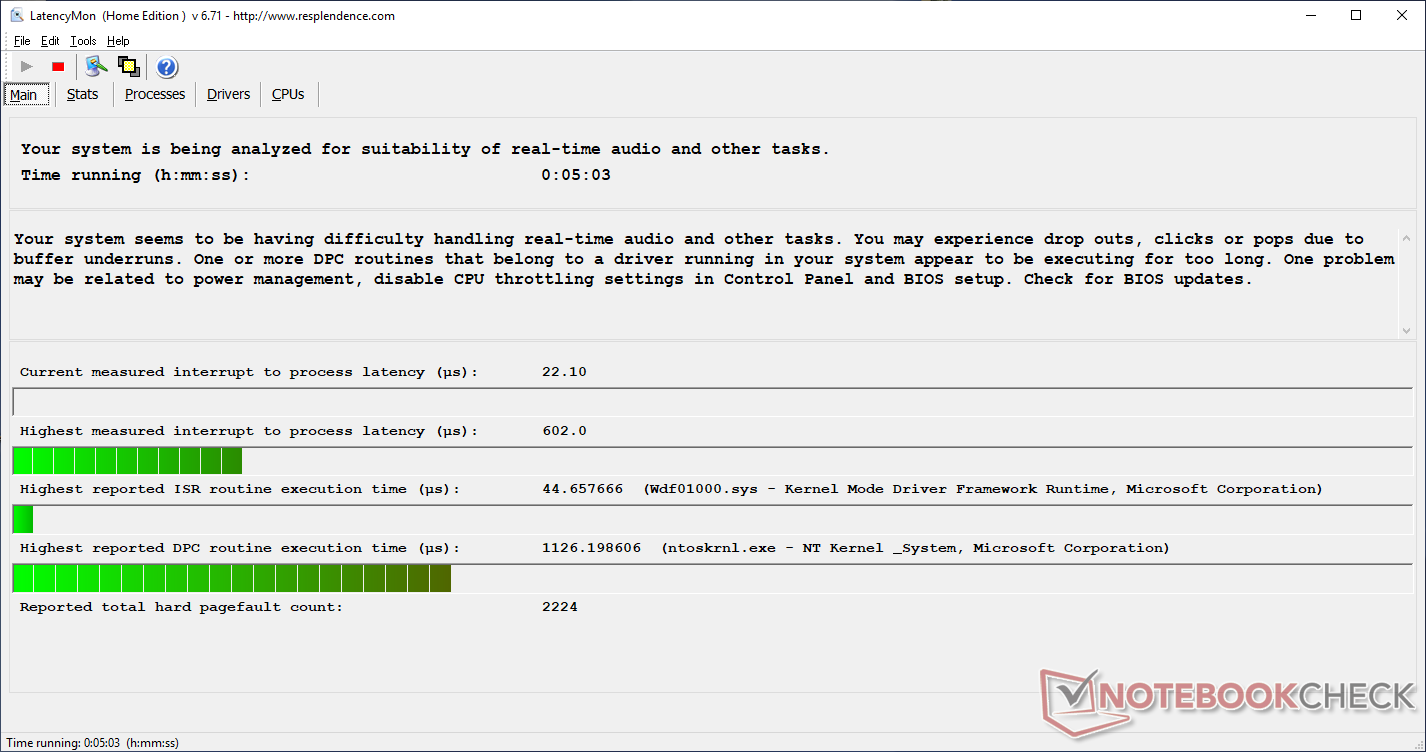
LatencyMon shows no issues with real-time audio recording regardless of the WiFi setting.
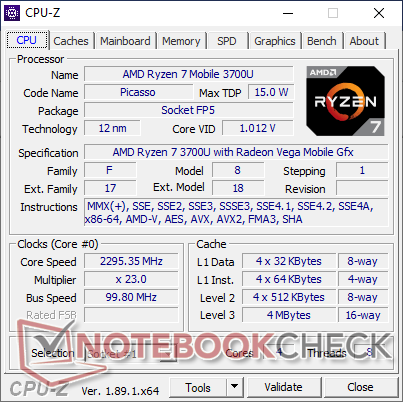
Processor
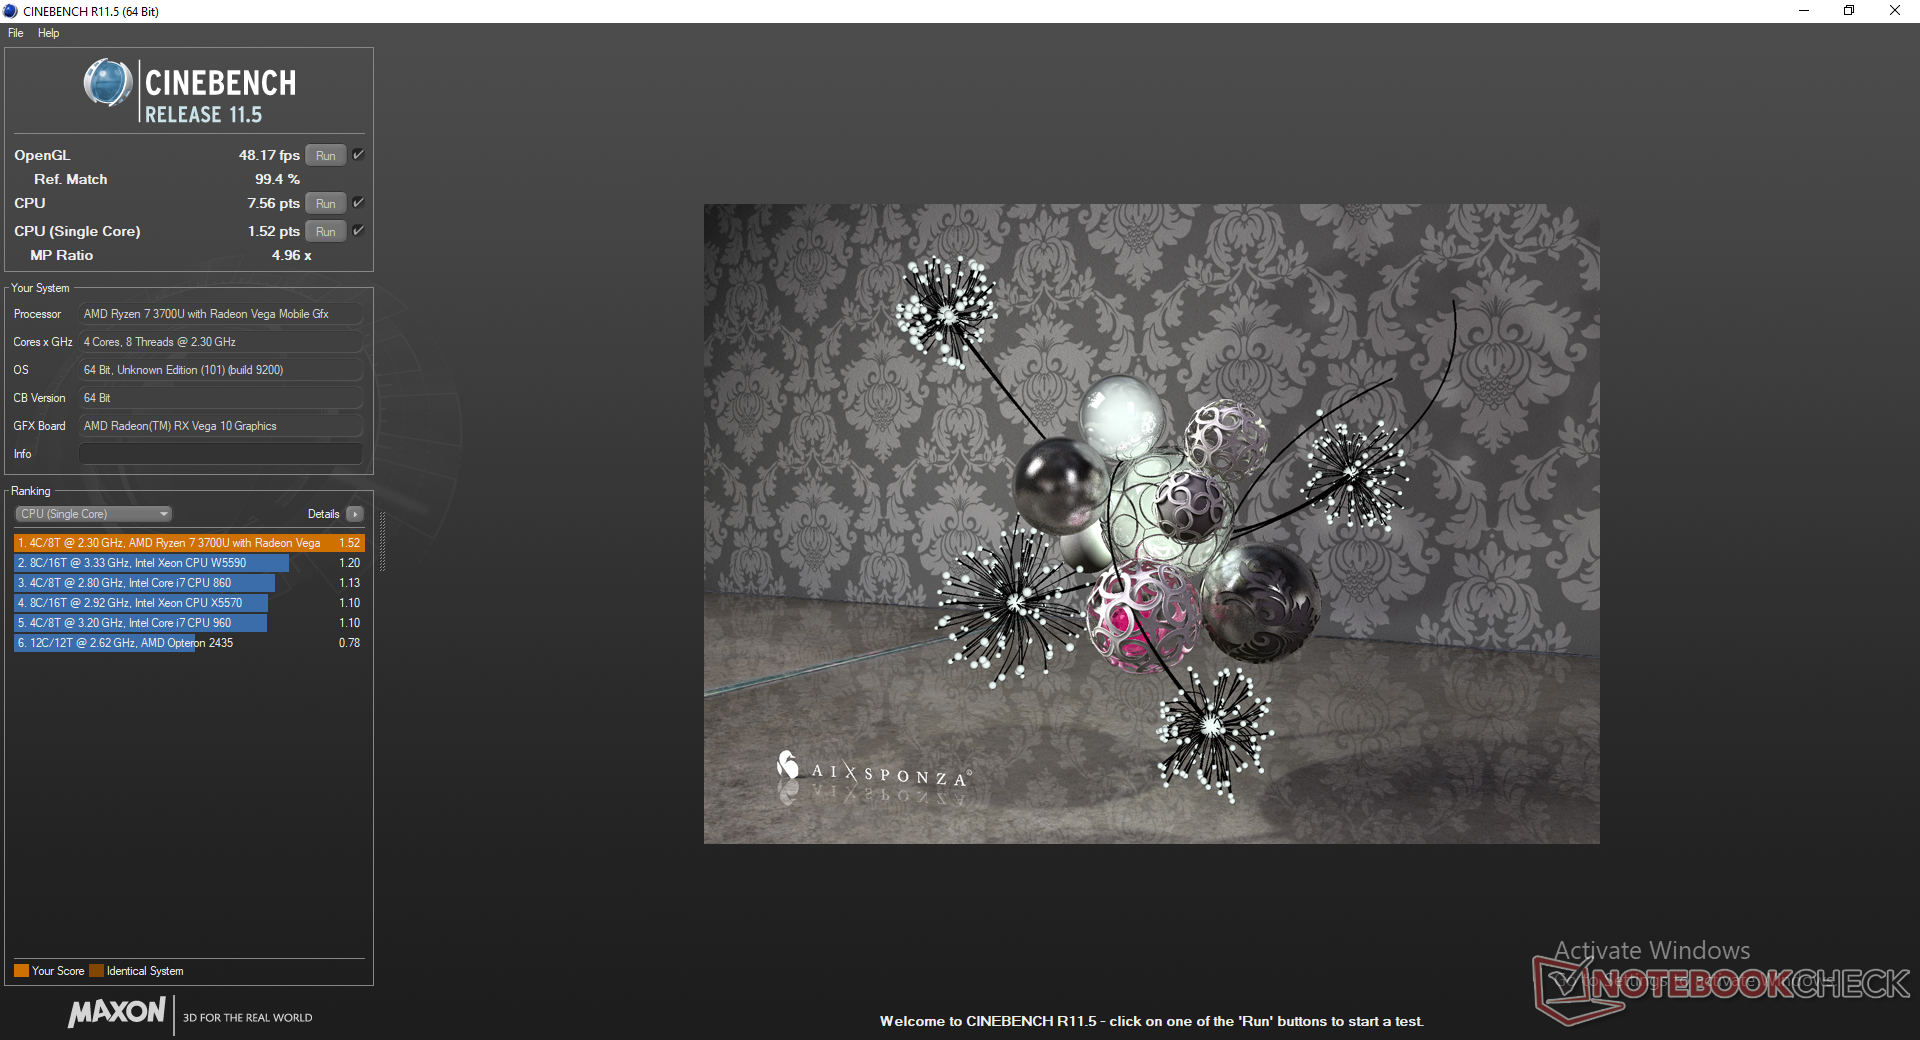
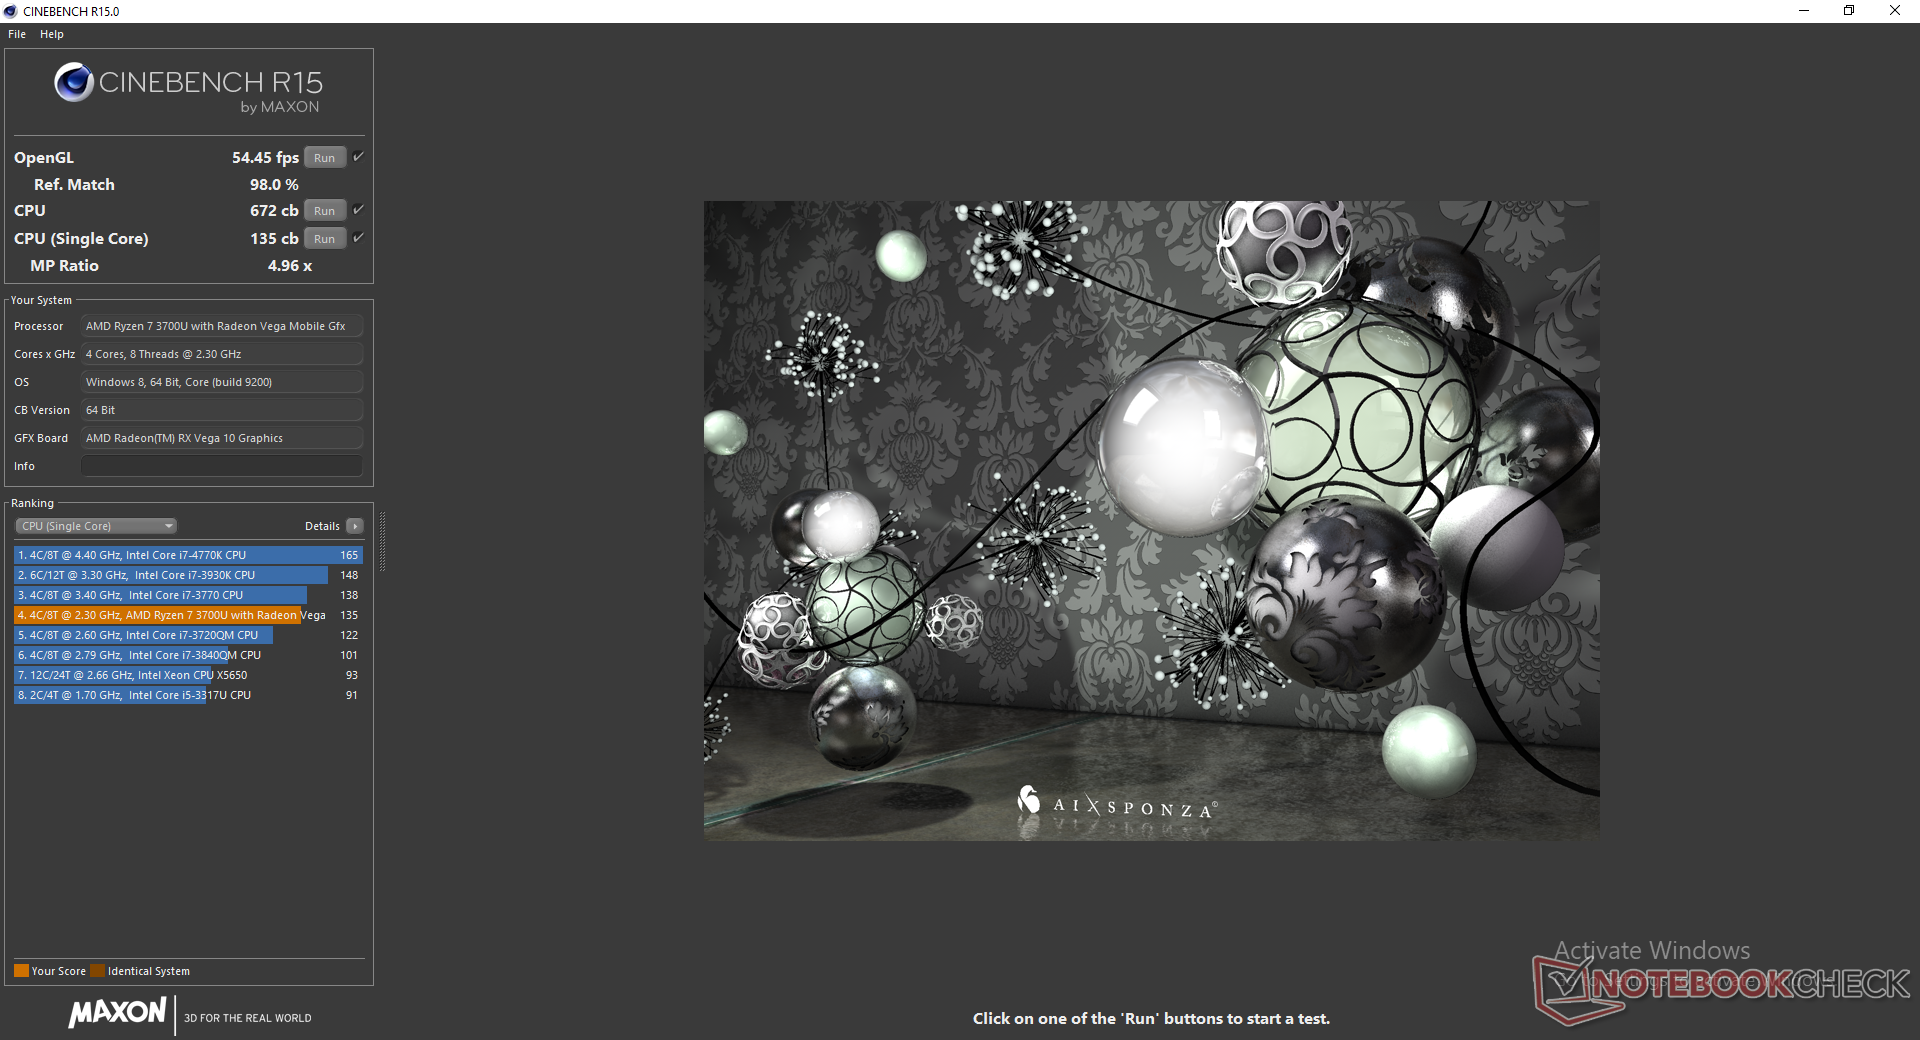
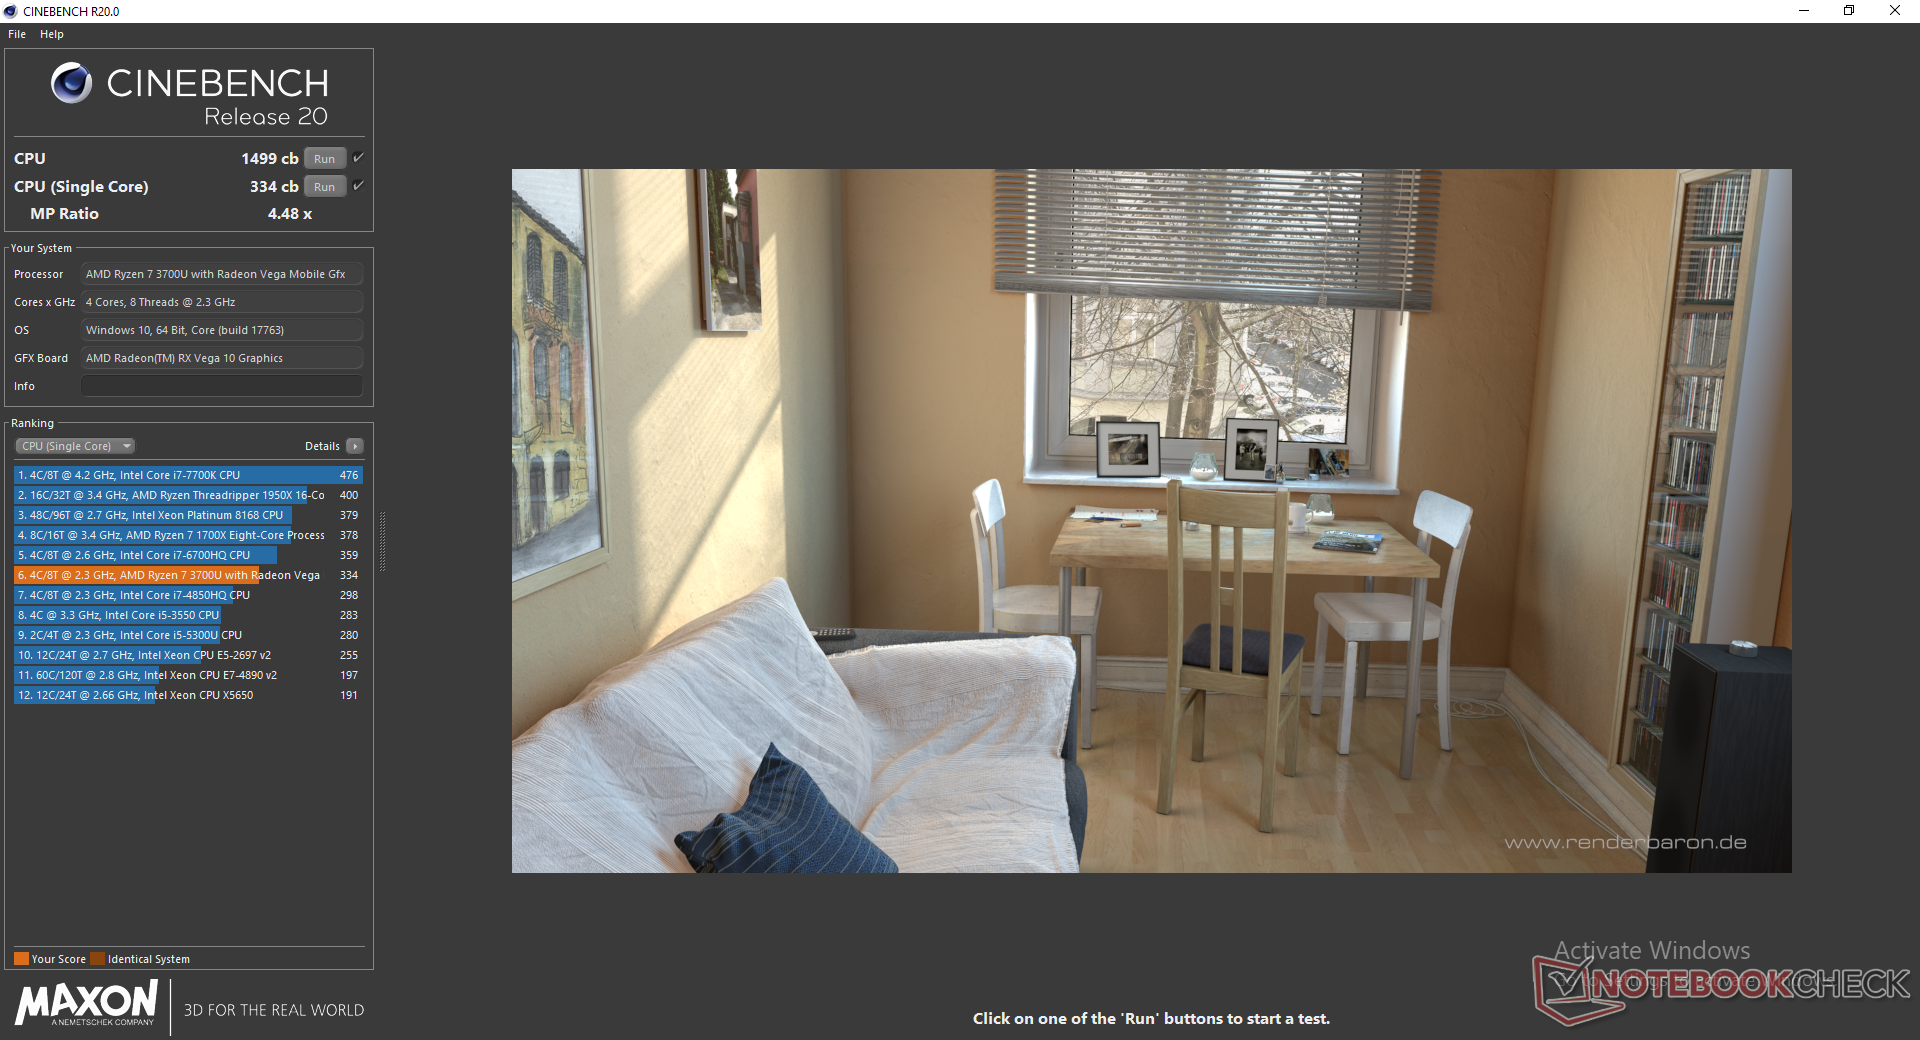
AMD says that its Zen+ Ryzen 7 3700U should be 10 percent faster than its older Zen Ryzen 7 2700U, but our independent observations are more of a mixed bag. CineBench results, for example, reveal almost no differences in multi-thread performance between the Ryzen 7 2700U in the Latitude 14 5495 and Ryzen 7 3700U in our Inspiron 15 5585. When running CineBench R15 Multi-Thread in a loop, however, the 3700U is able to maintain slightly faster clock rates for longer for a small 5 percent gain in performance. In real-world terms, the CPU performance advantages are so small that jumping from the Ryzen 7 2700U to the Ryzen 7 3700U will be trivial.
Despite the above, the Ryzen 7 3700U offers slightly more consistent clock rate performance than a Core i7-8565U or Core i7-8550U when under high processing loads as shown by our comparison graph below. Intel CPUs tend to drop in clock rate more quickly than an equivalent AMD CPU because of its shorter-lived Turbo Boost potential.
AMD Ryzen U series processors continue to offer noticeably poorer single-threaded performance compared to the Intel Core U series.
See our dedicated page on the Ryzen 7 3700U for more technical information and benchmark comparisons.
| Cinebench R10 | |
| Rendering Multiple CPUs 32Bit | |
| HP Omen 15-dc1020ng | |
| Lenovo Ideapad 330S-15ARR-81FB00C7GE | |
| Average AMD Ryzen 7 3700U (12881 - 18041, n=2) | |
| Rendering Single 32Bit | |
| HP Omen 15-dc1020ng | |
| Average AMD Ryzen 7 3700U (4045 - 4776, n=2) | |
| Lenovo Ideapad 330S-15ARR-81FB00C7GE | |
System Performance
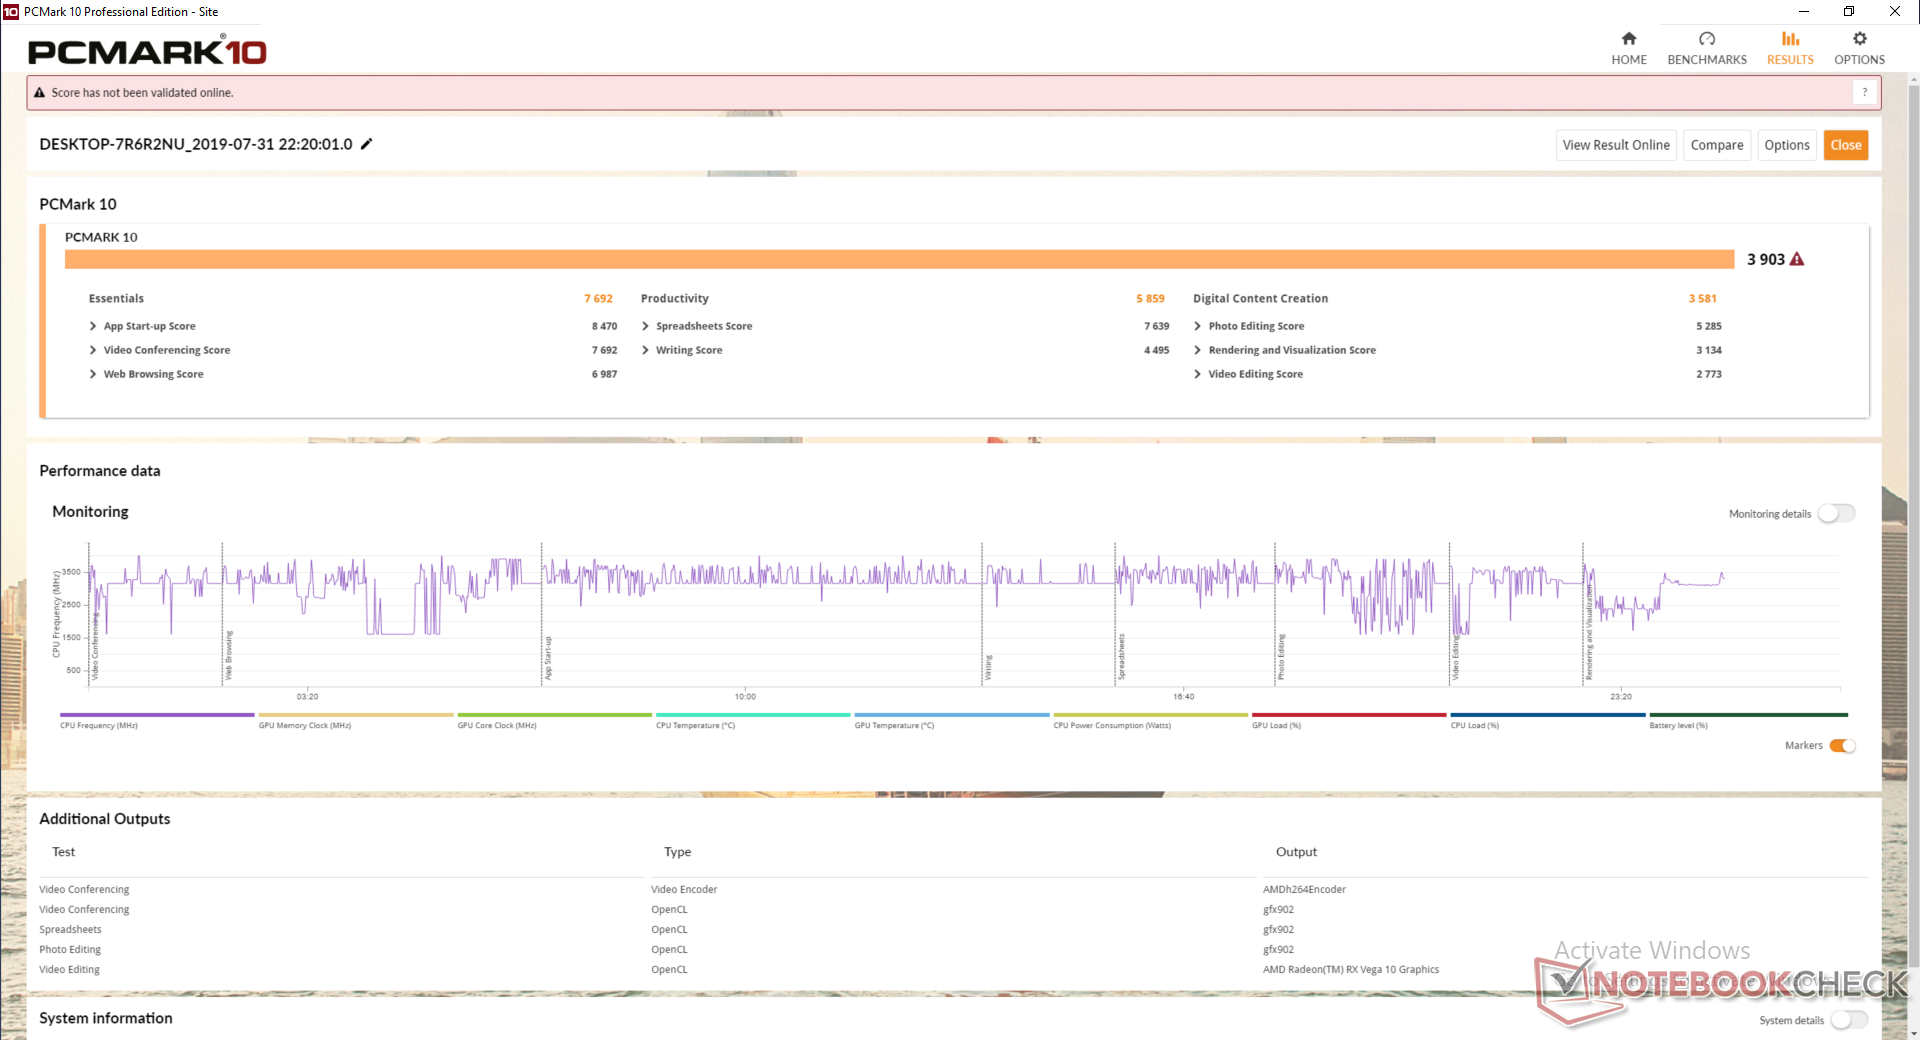
PCMark benchmarks rank our Inspiron 15 5585 below the competing Intel-powered Asus VivoBook S15 on nearly all accounts. When compared to other laptops powered by the Ryzen U series, however, our Dell is one of the faster performers in PCMark even if by only single-digit percentage points.
We experienced no issues on our test unit save for some infrequent sleep issues. Our unit would sometimes not wake from sleep and a hard reset would then be required.
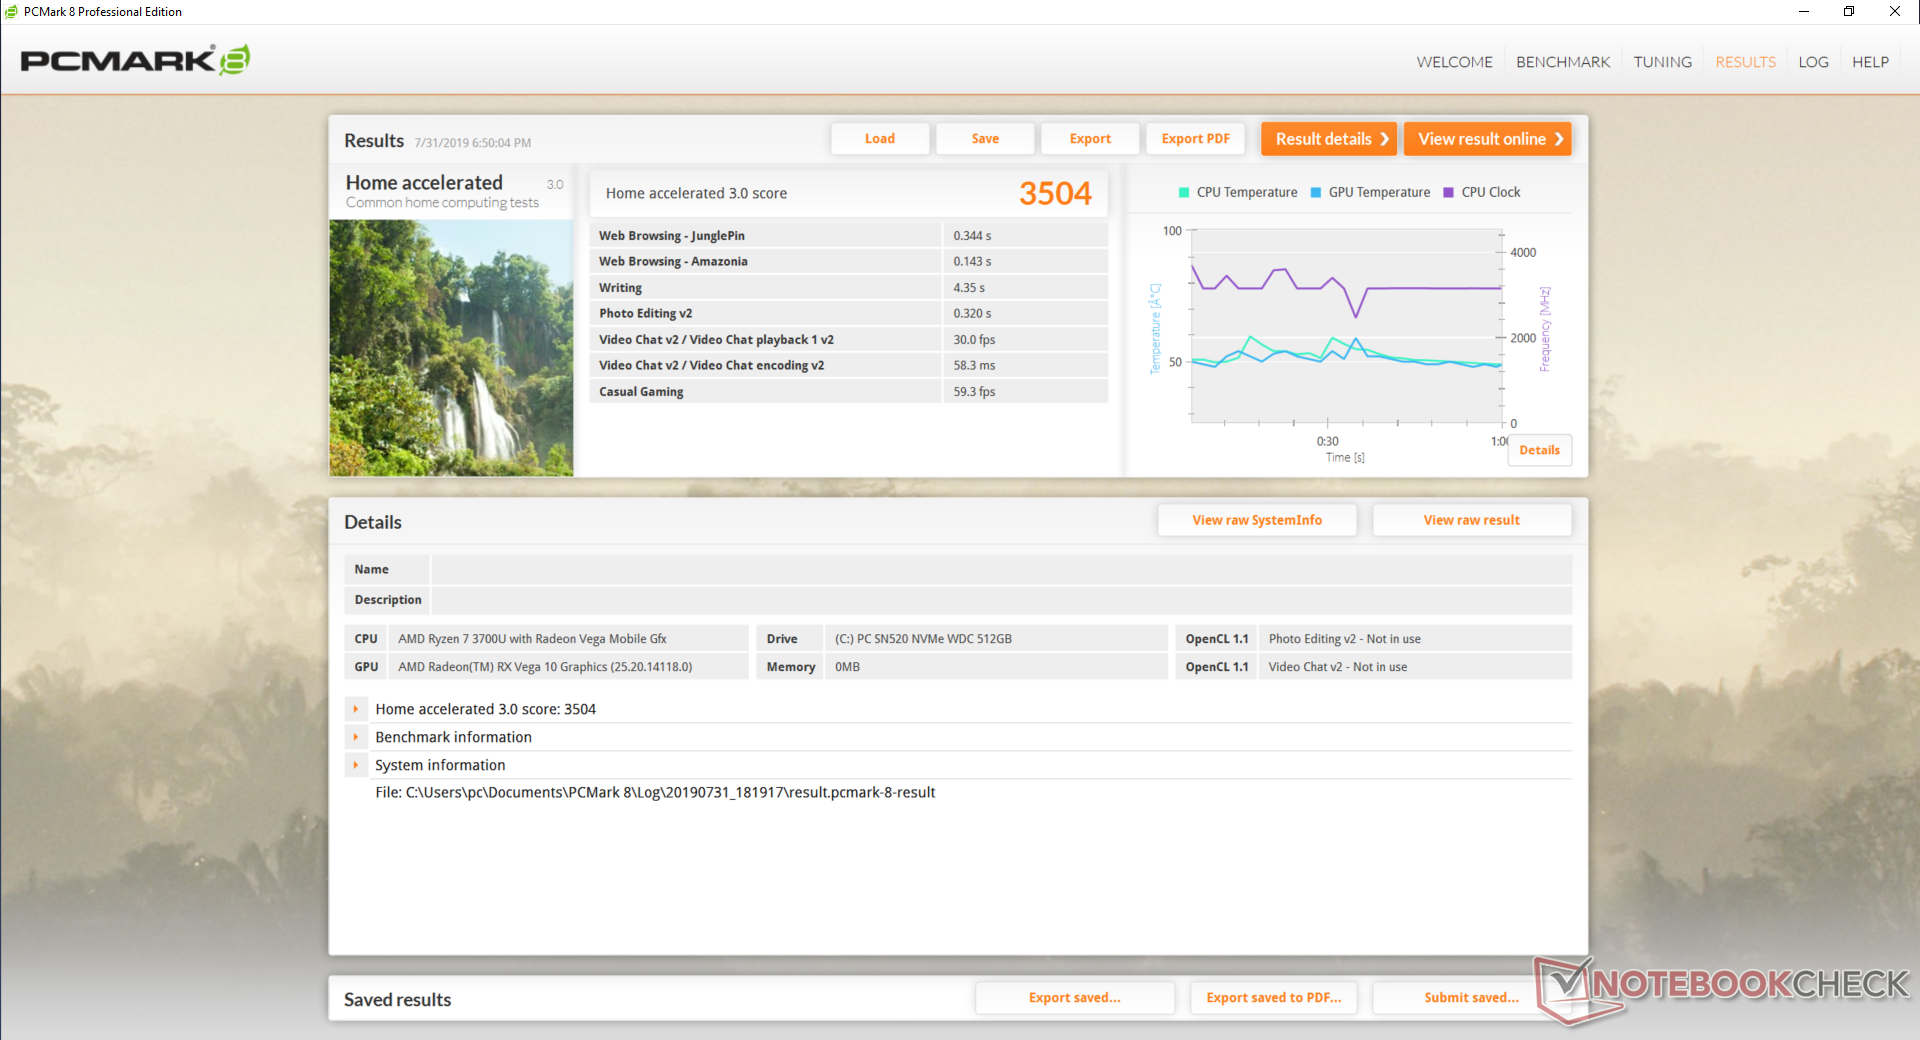
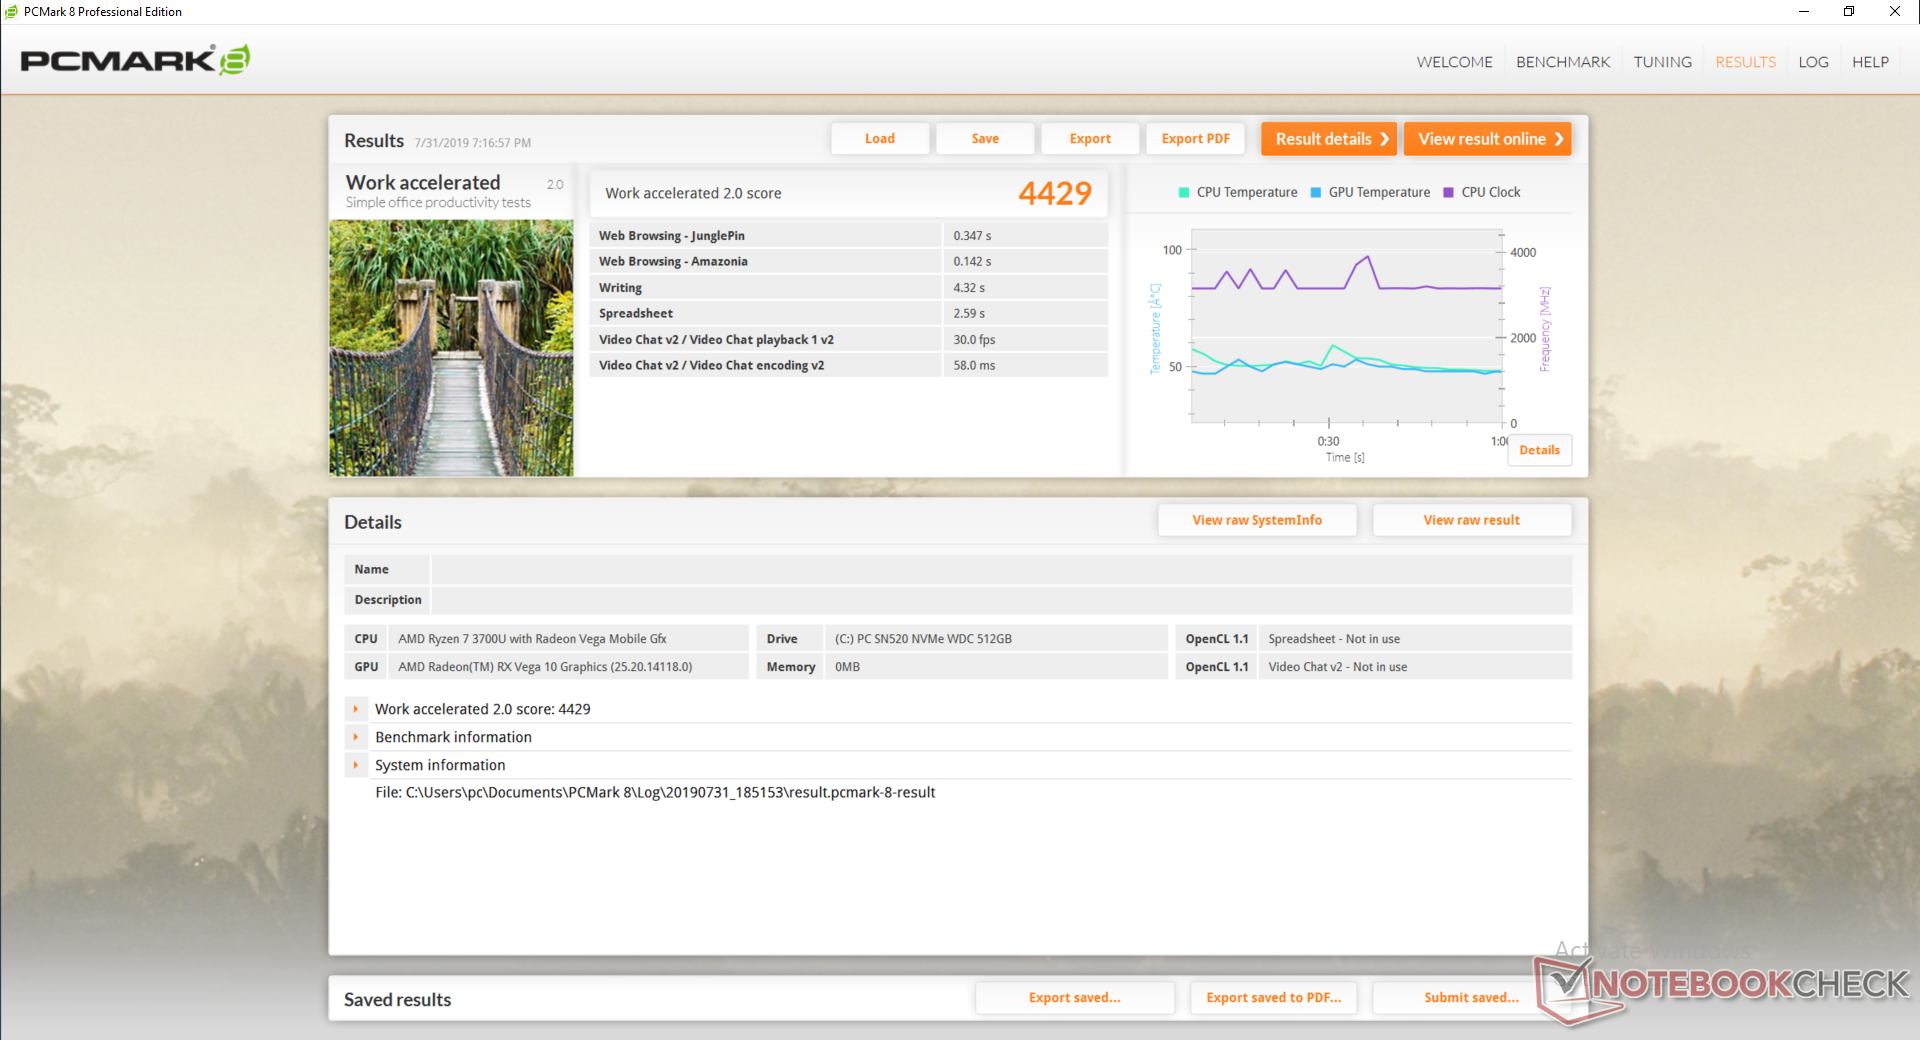
| PCMark 8 Home Score Accelerated v2 | 3504 points | |
| PCMark 8 Work Score Accelerated v2 | 4429 points | |
| PCMark 10 Score | 3903 points | |
Help | ||
Storage Devices
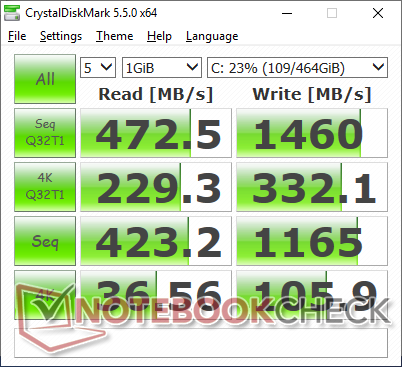
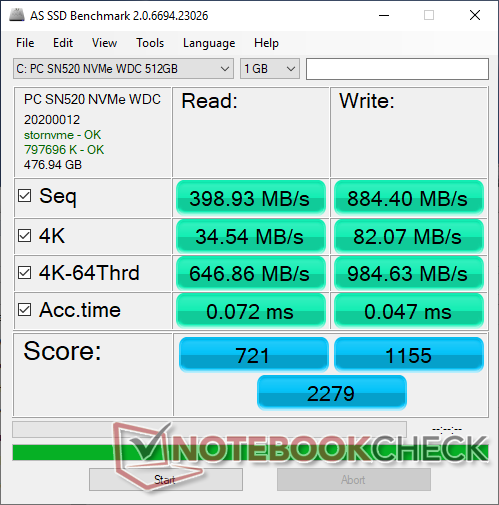
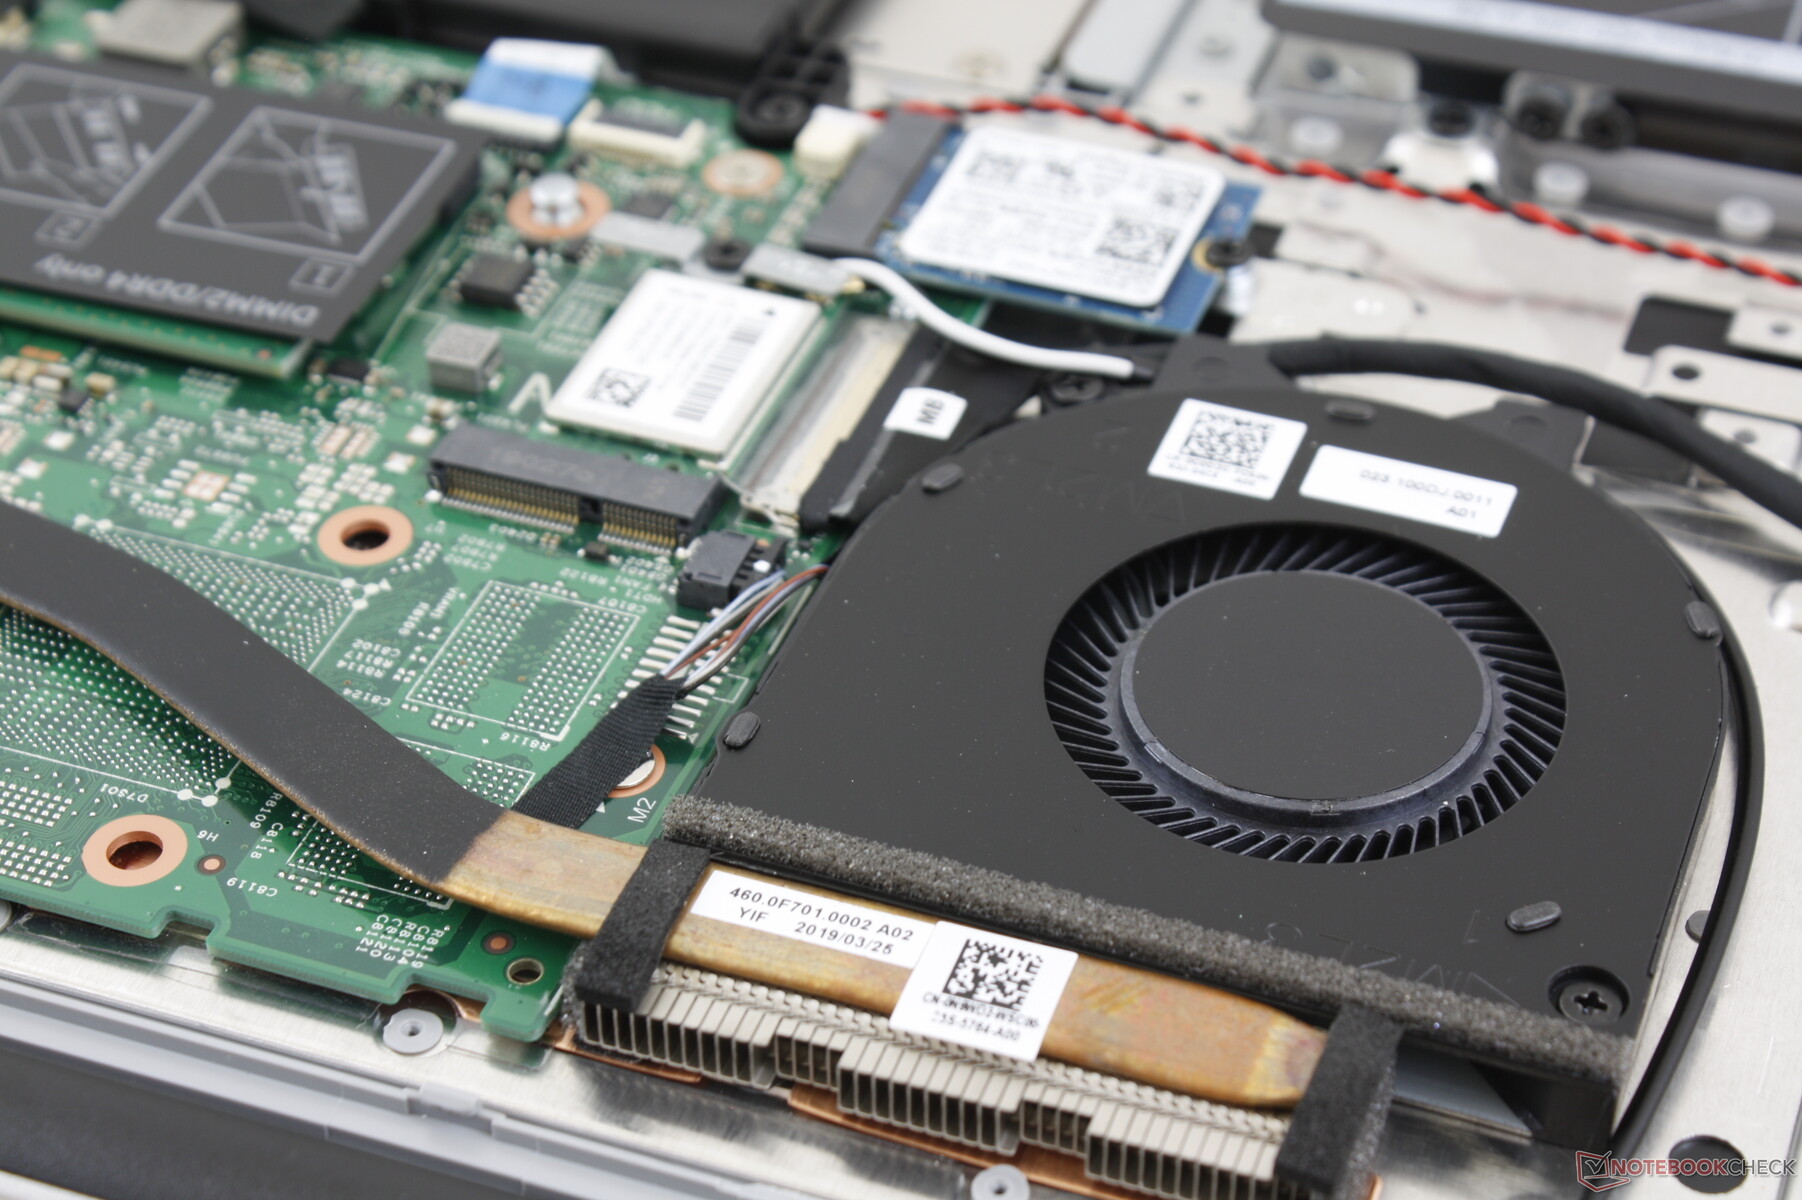
Two internal storage bays are available: One M.2 2280 slot and a 2.5-inch SATA III bay. Our specific test unit comes with a budget 512 GB WDC PC SN520 PCIe SSD in the uncommon M.2 2230 form factor.
Transfer rates are average at best as far as PCIe drives go. Sequential read and write rates average only 400 MB/s and 900 MB/s, respectively, compared to ~1000 MB/s each on the Toshiba BG3 or even faster on the more expensive Samsung PM981. Performance is good enough for home users where capacity usually takes precedence over extremely fast transfer rates.
See our table of HDDs and SSDs for more benchmark comparisons.
| Dell Inspiron 15 5000 5585 WDC PC SN520 SDAPNUW-512G | Dell Inspiron 15 3585 (2300U, Vega 6) Toshiba BG3 KBG30ZMS256G | Dell Inspiron 15 5000 5584 Toshiba BG3 KBG30ZMS512G | Dell XPS 15 9570 Core i9 UHD Samsung SSD PM981 MZVLB1T0HALR | Asus VivoBook S15 S532F WDC PC SN520 SDAPNUW-256G | Lenovo Ideapad 330S-15ARR-81FB00C7GE WDC PC SN520 SDAPNUW-256G | |
|---|---|---|---|---|---|---|
| AS SSD | -73% | -12% | 77% | 24% | -6% | |
| Seq Read (MB/s) | 398.9 | 1291 224% | 1115 180% | 1320 231% | 1147 188% | 1530 284% |
| Seq Write (MB/s) | 884 | 688 -22% | 841 -5% | 1500 70% | 752 -15% | 1087 23% |
| 4K Read (MB/s) | 34.54 | 21.87 -37% | 46.39 34% | 30.73 -11% | 41.52 20% | 34.7 0% |
| 4K Write (MB/s) | 82.1 | 35.62 -57% | 87.6 7% | 94.4 15% | 149.7 82% | 79.9 -3% |
| 4K-64 Read (MB/s) | 647 | 632 -2% | 904 40% | 1453 125% | 605 -6% | 464.7 -28% |
| 4K-64 Write (MB/s) | 985 | 221.2 -78% | 326.5 -67% | 1815 84% | 453.2 -54% | 326.1 -67% |
| Access Time Read * (ms) | 0.072 | 0.33 -358% | 0.048 33% | 0.061 15% | 0.073 -1% | 0.102 -42% |
| Access Time Write * (ms) | 0.047 | 0.234 -398% | 0.24 -411% | 0.044 6% | 0.025 47% | 0.047 -0% |
| Score Read (Points) | 721 | 783 9% | 1062 47% | 1616 124% | 761 6% | 652 -10% |
| Score Write (Points) | 1155 | 326 -72% | 498 -57% | 2059 78% | 678 -41% | 515 -55% |
| Score Total (Points) | 2279 | 1489 -35% | 2100 -8% | 4507 98% | 1821 -20% | 1489 -35% |
| Copy ISO MB/s (MB/s) | 862 | 432.6 -50% | 1090 26% | 2577 199% | 1093 27% | 690 -20% |
| Copy Program MB/s (MB/s) | 457 | 95.6 -79% | 618 35% | 515 13% | 775 70% | 153.9 -66% |
| Copy Game MB/s (MB/s) | 902 | 263.4 -71% | 750 -17% | 1120 24% | 1196 33% | 339.7 -62% |
* ... smaller is better

GPU Performance
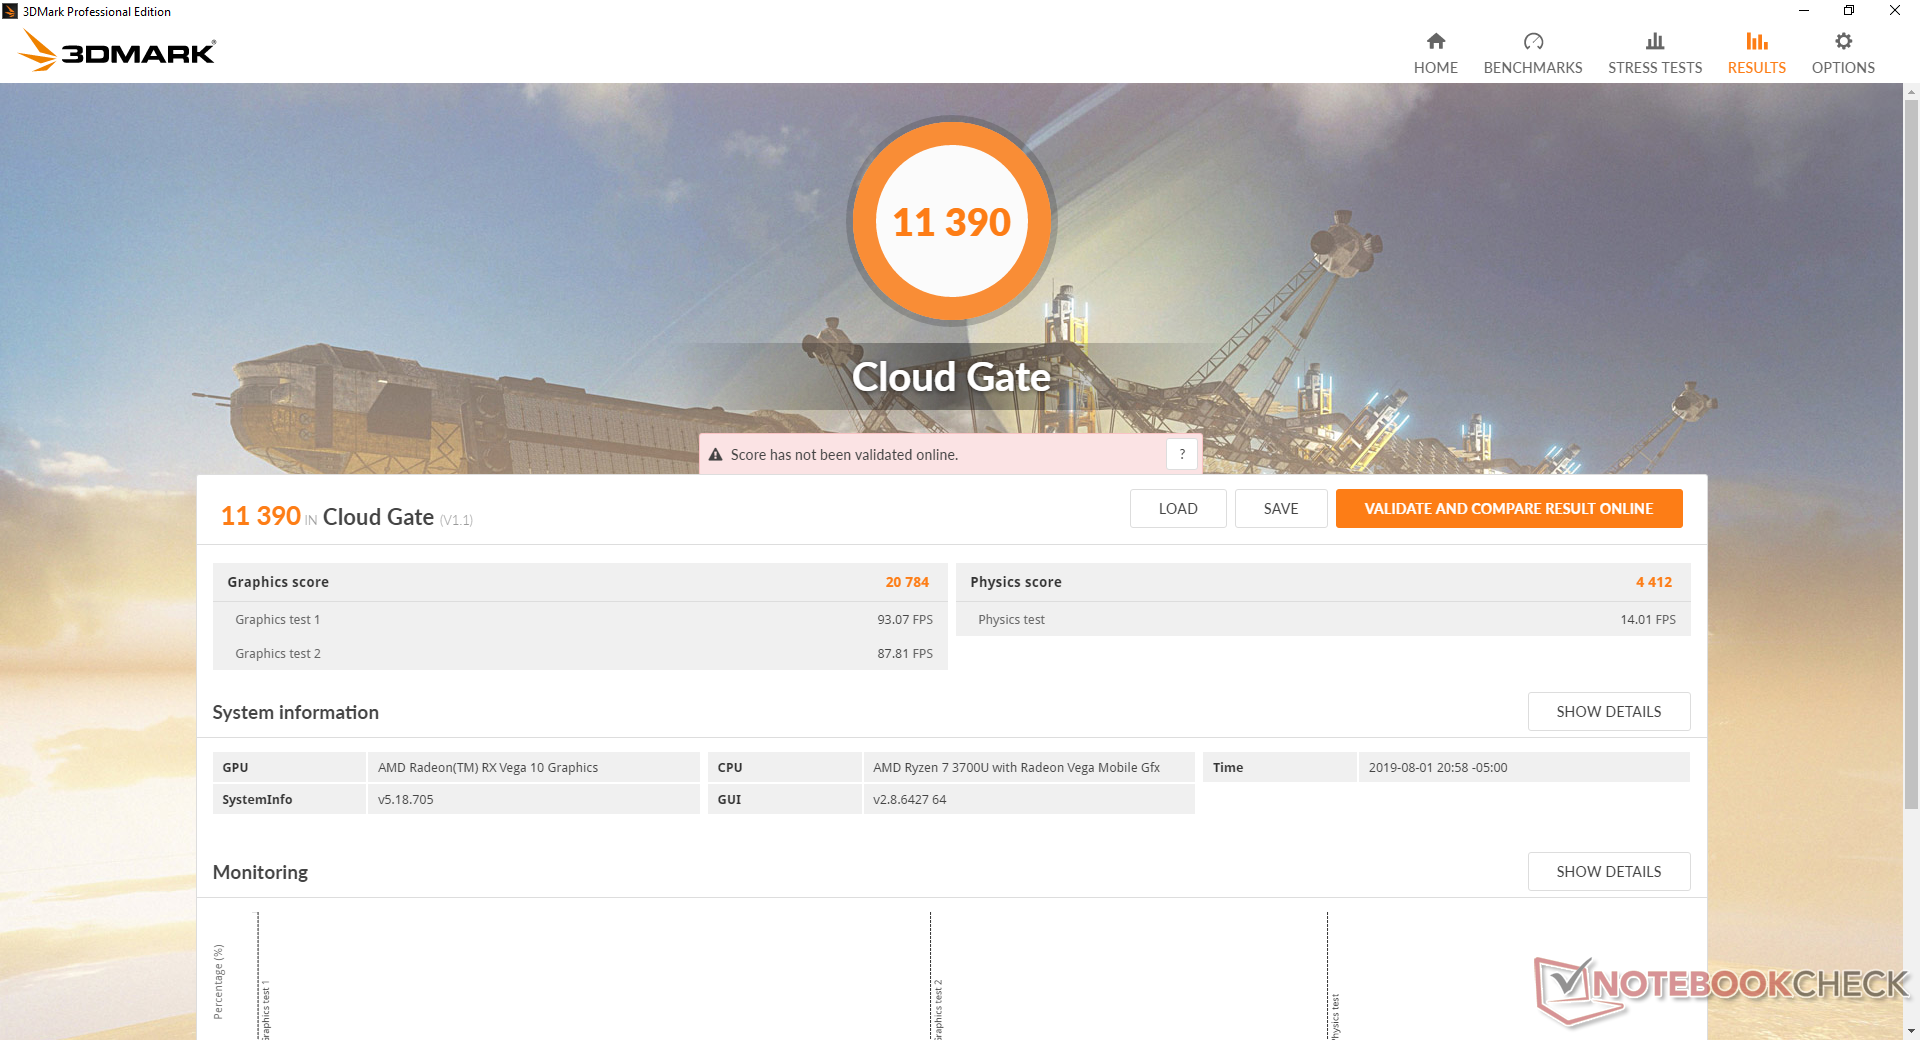
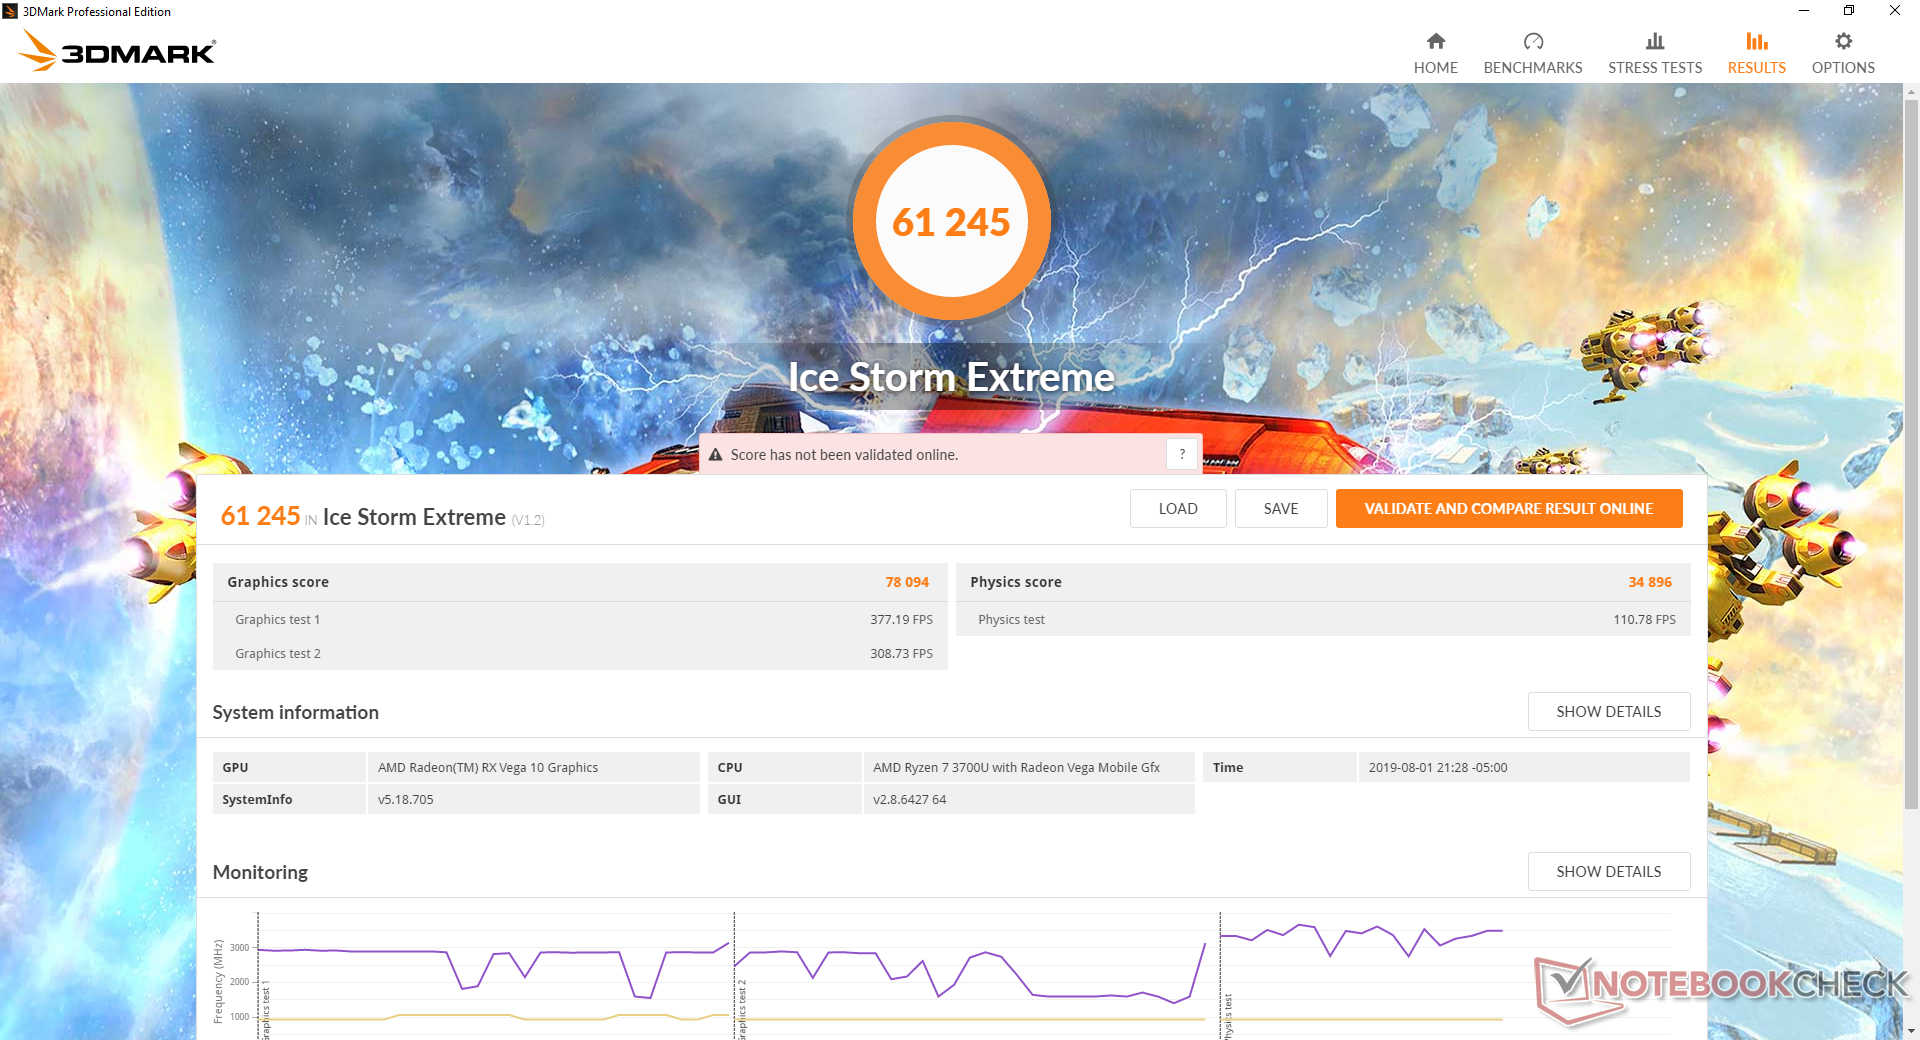
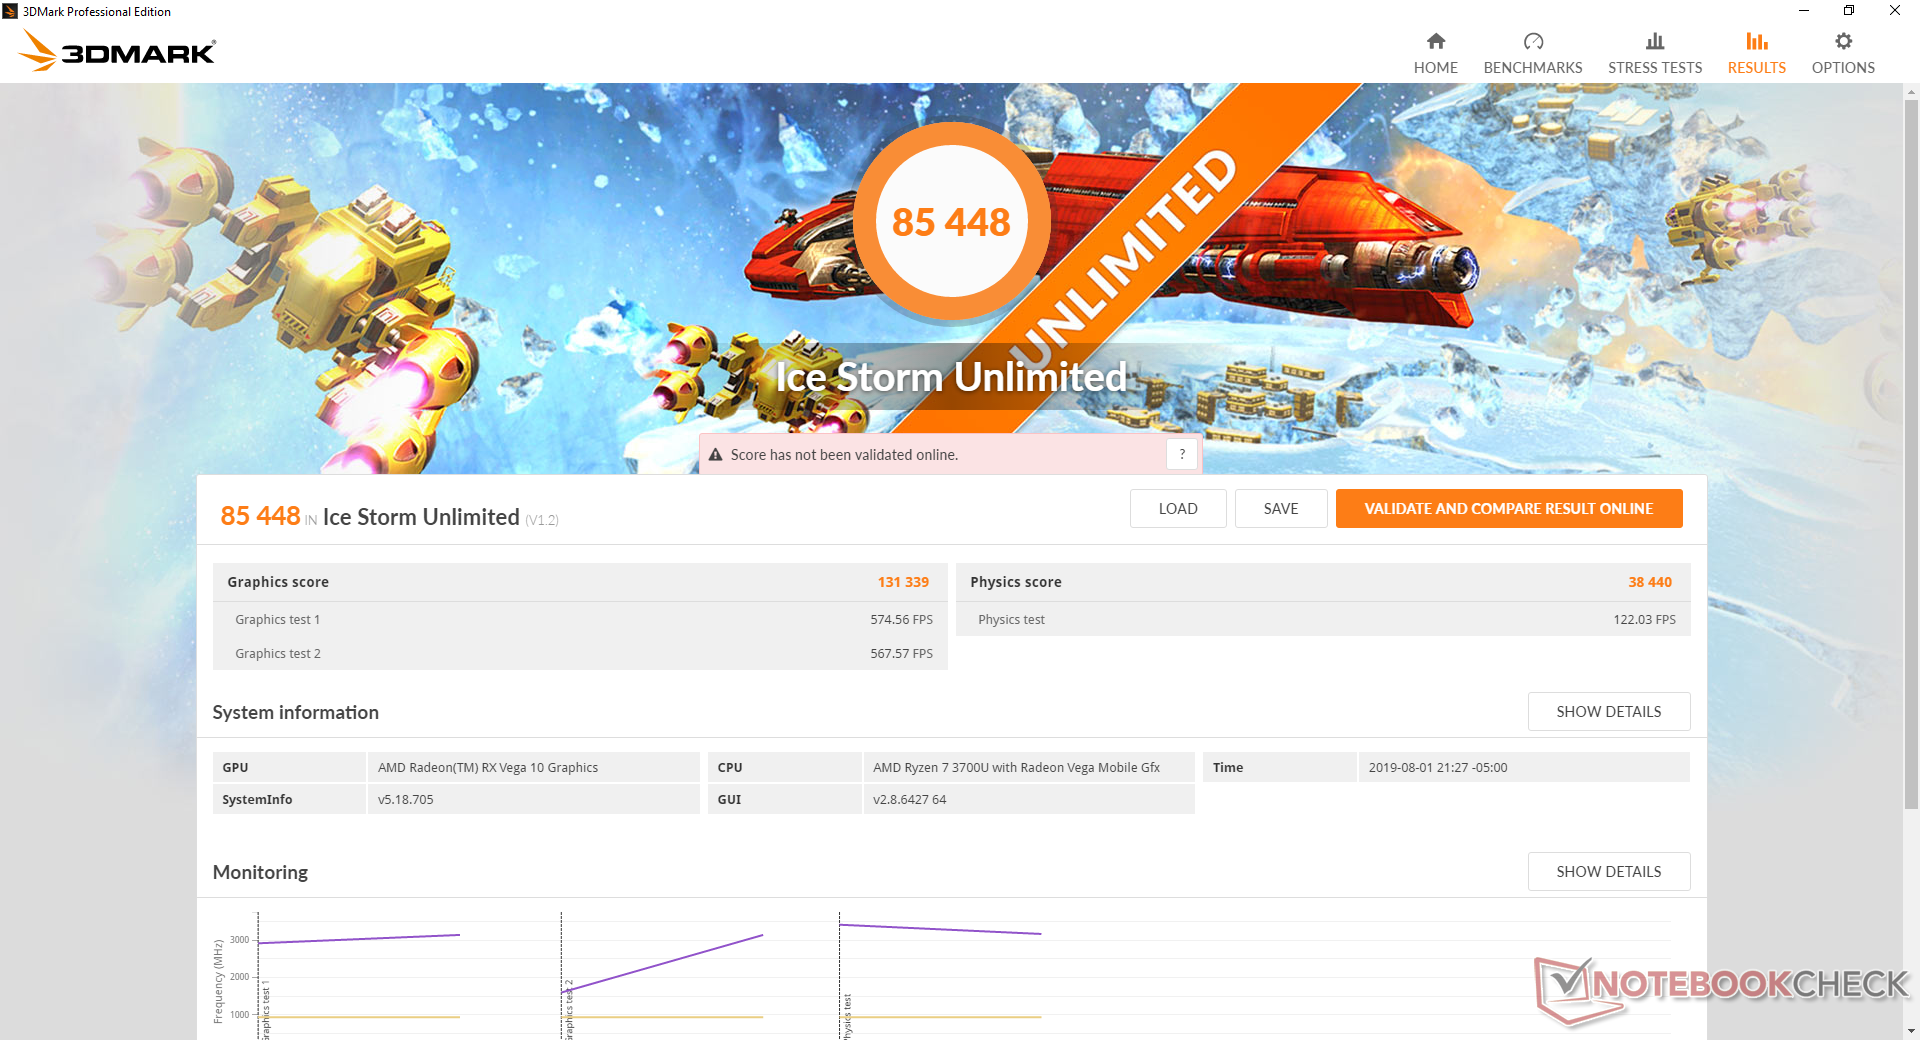
The Ryzen 7 3700U comes with the same integrated RX Vega 10 GPU as on the last generation Ryzen 7 2700U. Even so, 3DMark results are higher than expected with numbers that rival even the 10 W GeForce MX150 as found on the Asus VivoBook FX433. Scores are about 18 to 47 percent faster than the average RX Vega 10 in our database. If you want the best of what the RX Vega 10 has to offer, then this particular Dell configuration has the fastest implementation thus far.
Undemanding titles like DOTA 2, Fortnite, and Rocket League will run well at native 1080p on very low settings for sharp visuals even without all the post processing. Idling on Witcher 3 shows small but consistent frame dips over time to suggest that performance could be smoother.
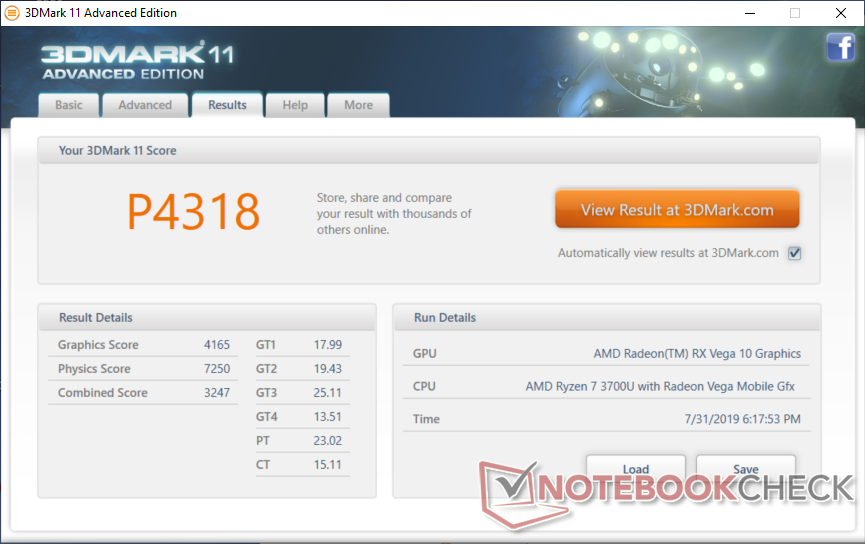
| 3DMark 11 Performance | 4318 points | |
| 3DMark Ice Storm Standard Score | 70349 points | |
| 3DMark Cloud Gate Standard Score | 11390 points | |
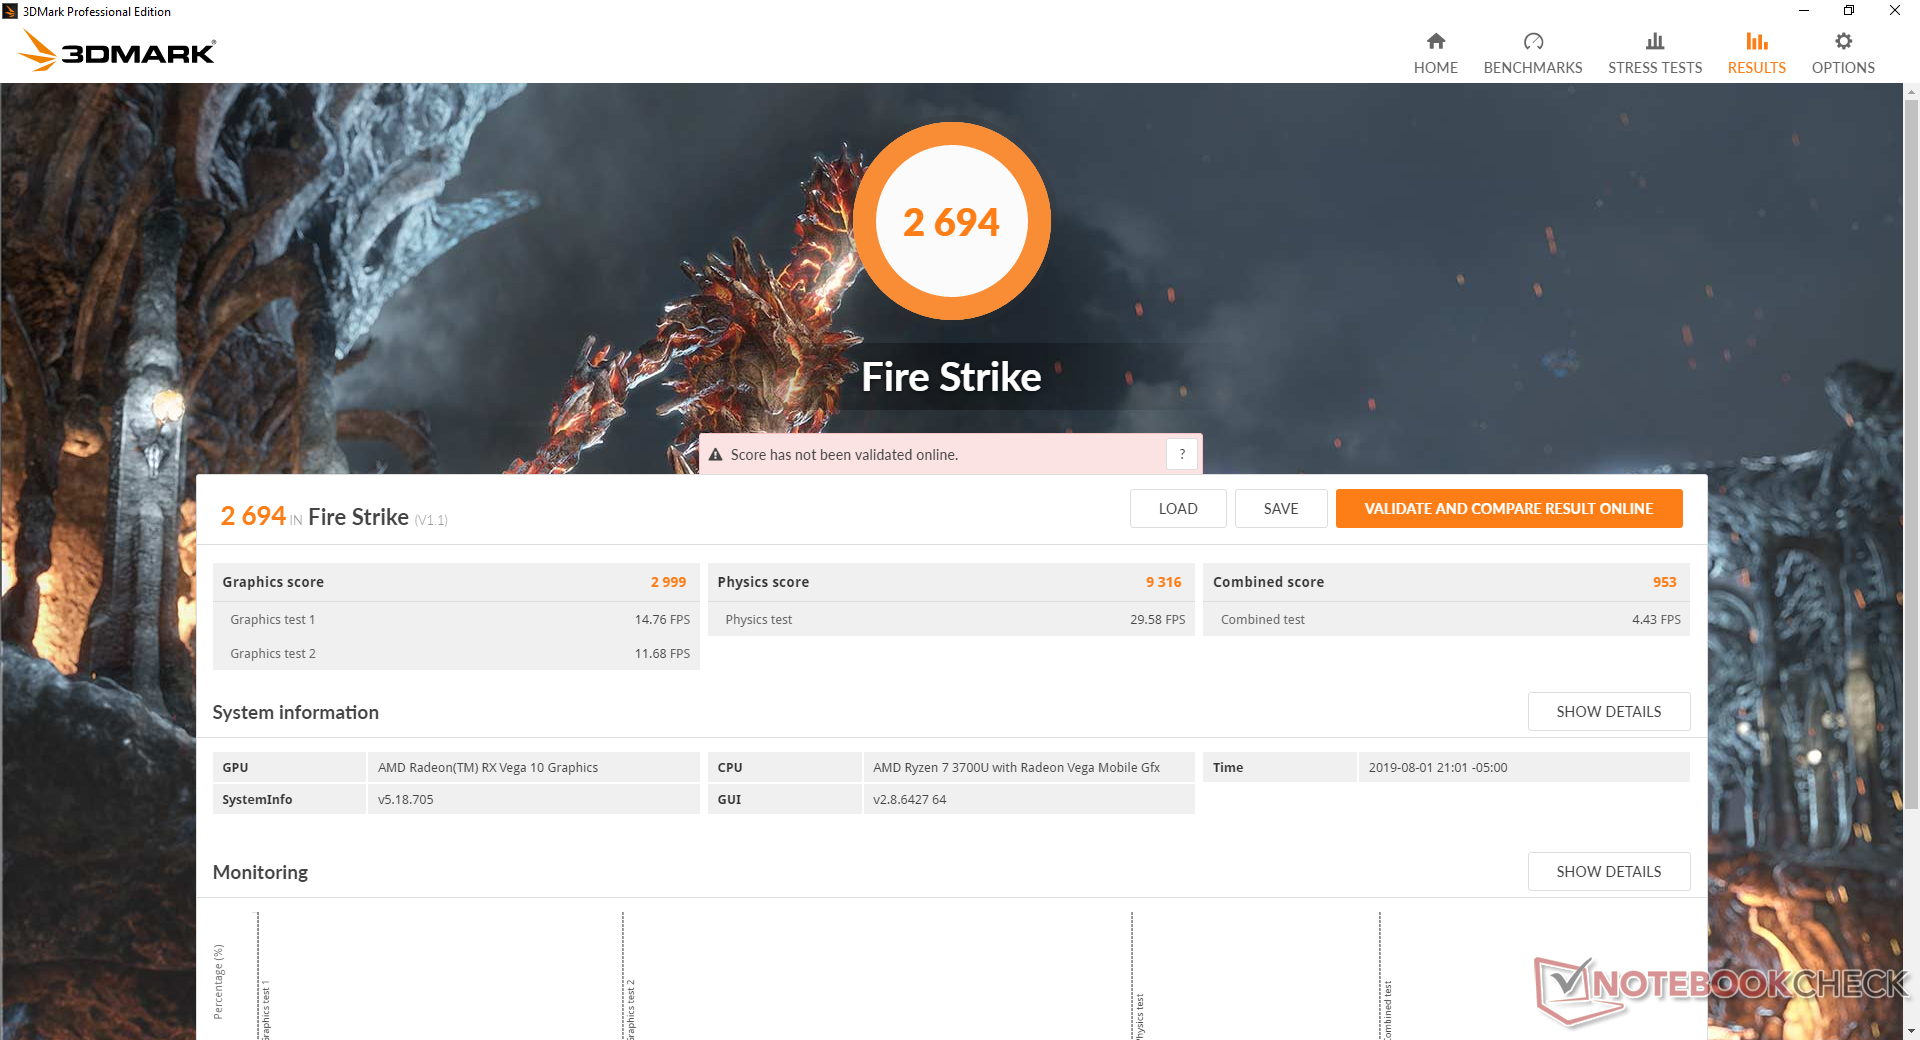
| 3DMark Fire Strike Score | 2694 points | |
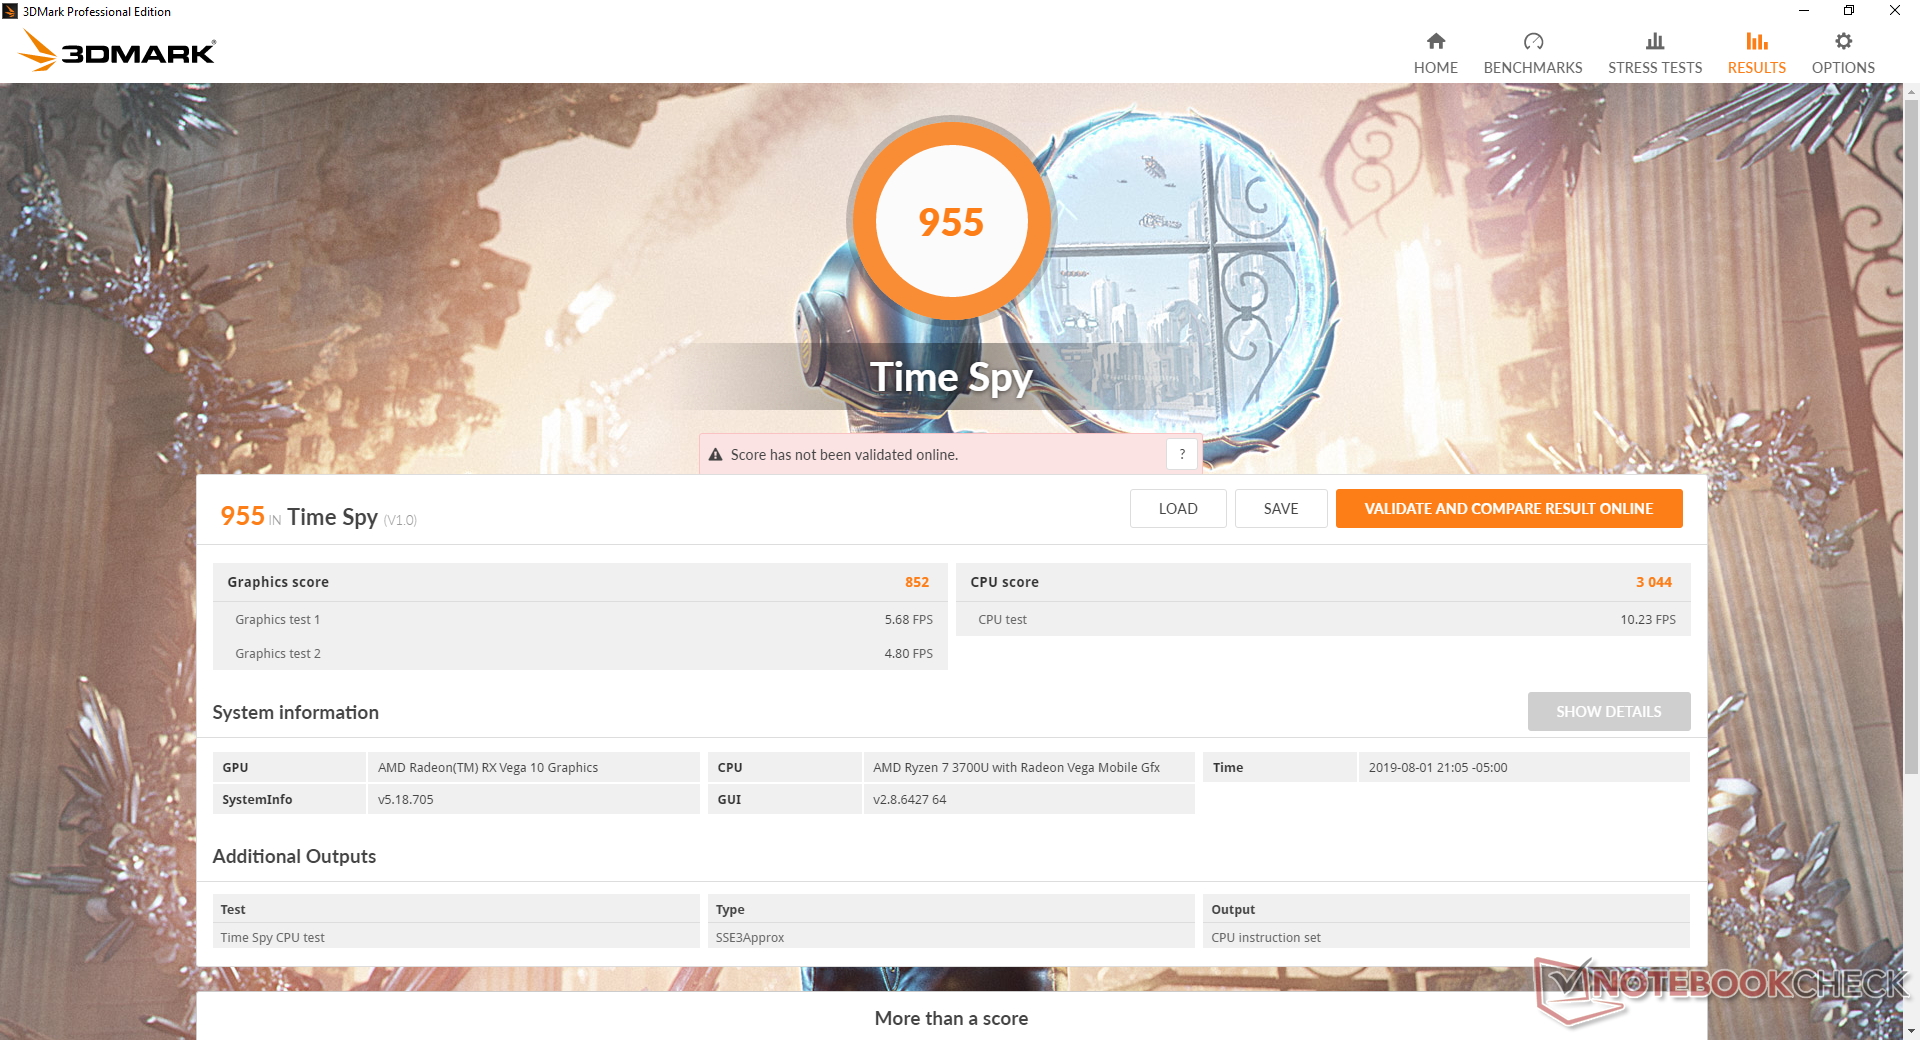
| 3DMark Time Spy Score | 955 points | |
Help | ||
| low | med. | high | ultra | |
|---|---|---|---|---|
| BioShock Infinite (2013) | 123.7 | 21.3 | ||
| The Witcher 3 (2015) | 53.8 | 18.8 | 11.5 | |
| Rocket League (2017) | 119.7 | 59.9 | 38.9 | |
| Shadow of the Tomb Raider (2018) | 38 | 15 | 13 |
Emissions
System Noise
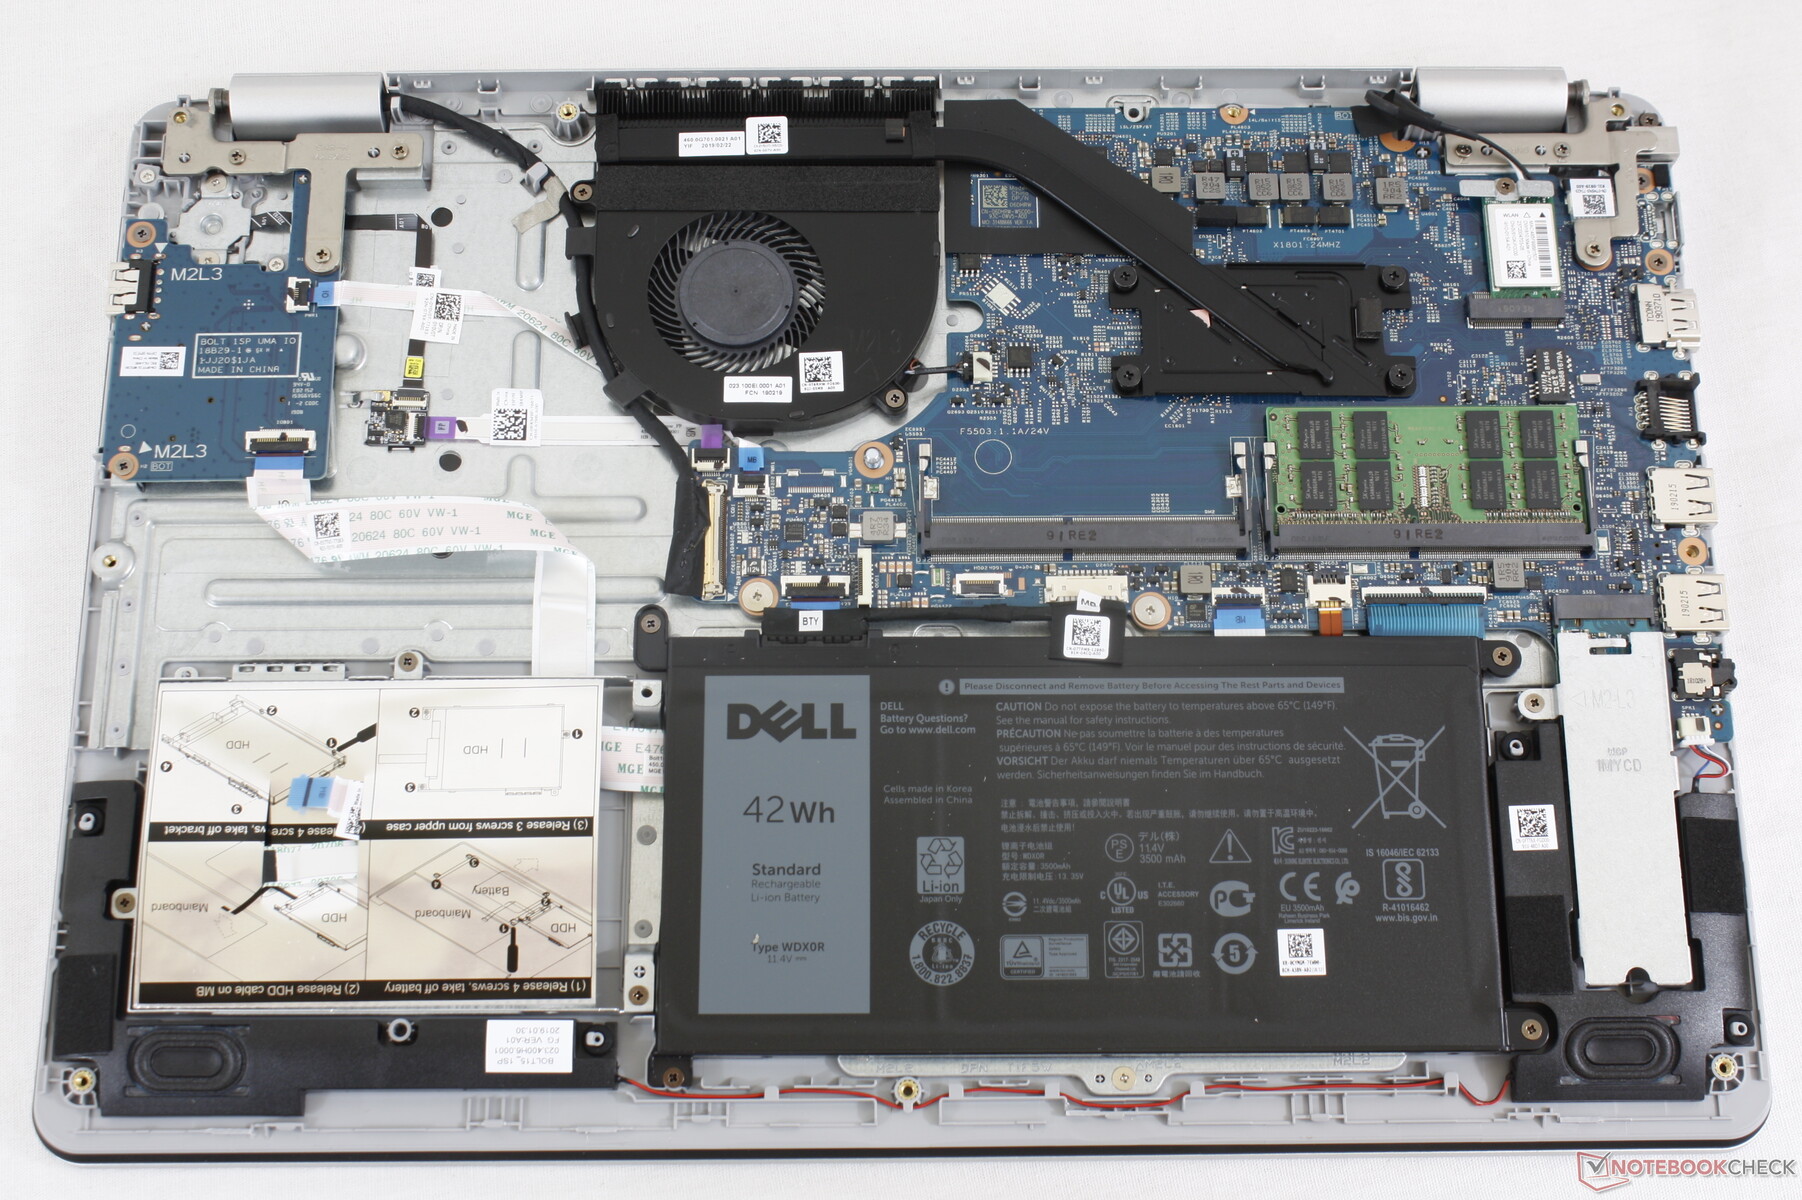
The cooling solution consists of a single fan and a short copper heat pipe over the CPU. The system is quiet and almost inaudible at under 30.4 dB(A) when video streaming or browsing. Fan noise will remain quiet at only 31.4 dB(A) even with heavy multi-tasking and browser tabs.
Gaming loads will kick the fan to maximum for a noise level of 41.4 dB(A). Results are louder than most Ultrabooks with slower integrated UHD Graphics but otherwise similar to the Asus VivoBook S15 S532F with faster GeForce MX250 graphics.
We can notice no coil whine or electronic noise from our specific unit.
| Dell Inspiron 15 5000 5585 Vega 10, R7 3700U, WDC PC SN520 SDAPNUW-512G | Dell Inspiron 15 3585 (2300U, Vega 6) Vega 6, R3 2300U, Toshiba BG3 KBG30ZMS256G | Dell Inspiron 15 5000 5584 UHD Graphics 620, i7-8565U, Toshiba BG3 KBG30ZMS512G | Dell XPS 15 9570 Core i9 UHD GeForce GTX 1050 Ti Max-Q, i9-8950HK, Samsung SSD PM981 MZVLB1T0HALR | Asus VivoBook S15 S532F GeForce MX250, i7-8565U, WDC PC SN520 SDAPNUW-256G | Lenovo Ideapad 330S-15ARR-81FB00C7GE Vega 8, R5 2500U, WDC PC SN520 SDAPNUW-256G | |
|---|---|---|---|---|---|---|
| Noise | -8% | 4% | -7% | -5% | -5% | |
| off / environment * (dB) | 28.3 | 30.6 -8% | 28.4 -0% | 28.2 -0% | 28 1% | 30.6 -8% |
| Idle Minimum * (dB) | 28.3 | 30.6 -8% | 28.4 -0% | 28.5 -1% | 28 1% | 30.6 -8% |
| Idle Average * (dB) | 28.3 | 30.6 -8% | 28.4 -0% | 28.6 -1% | 28 1% | 31.3 -11% |
| Idle Maximum * (dB) | 28.3 | 30.6 -8% | 28.4 -0% | 28.8 -2% | 30 -6% | 31.3 -11% |
| Load Average * (dB) | 31.4 | 36.7 -17% | 28.9 8% | 36.2 -15% | 41.4 -32% | 33.2 -6% |
| Witcher 3 ultra * (dB) | 41.4 | 47.6 -15% | 41.5 -0% | |||
| Load Maximum * (dB) | 41.4 | 41.1 1% | 36 13% | 47.6 -15% | 41.5 -0% | 35.2 15% |
* ... smaller is better
Noise level
| Idle |
| 28.3 / 28.3 / 28.3 dB(A) |
| Load |
| 31.4 / 41.4 dB(A) |
 | ||
30 dB silent 40 dB(A) audible 50 dB(A) loud |
||
min: | ||
Temperature
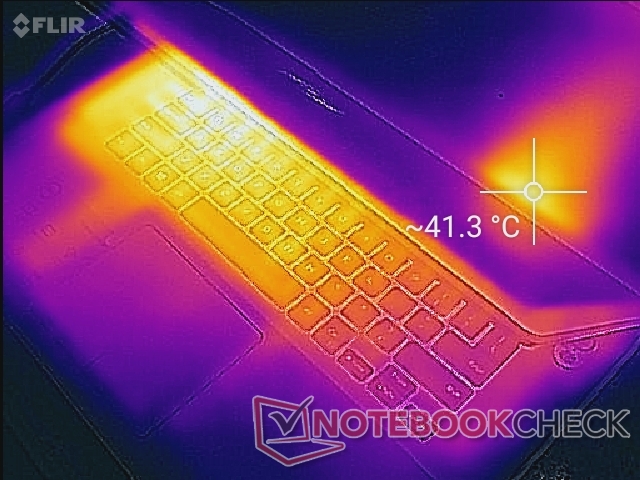
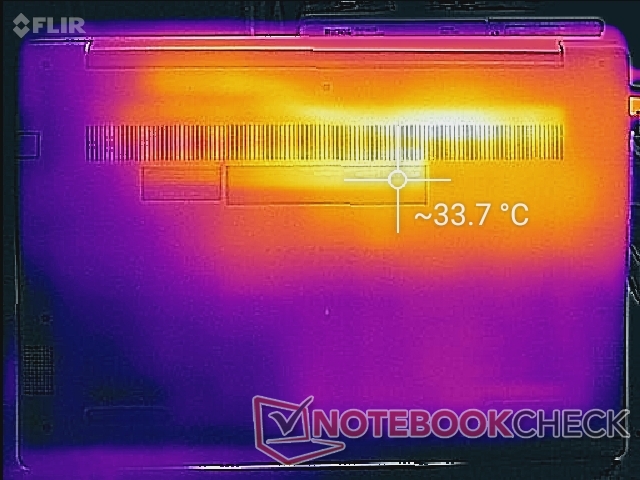
The left half of the keyboard will always be warmer than the right half since the processor and RAM are positioned closer to the WASD keys. Similarly, the right palm rest will always be warmer than the left palm rest if a 2.5-inch SATA drive is installed. The temperature difference between the two halves of the keyboard can be 4 C when idling to as much as 12 C when gaming. We don't find the temperature differences to be a bother when browsing or typing, but they are certainly noticeable to the skin.
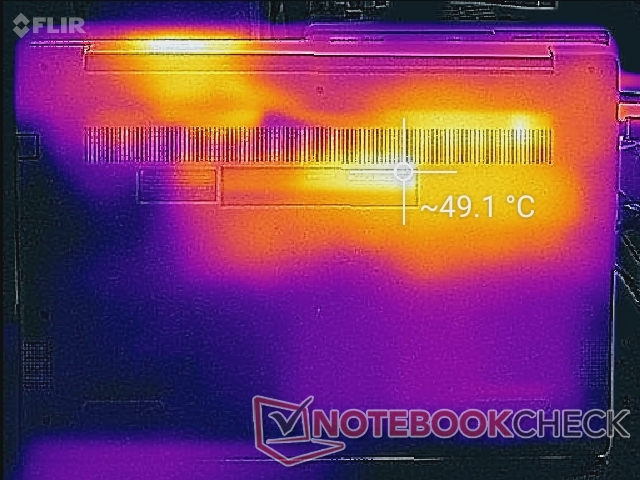
Surface temperatures are generally warmer than what we recorded on the Intel-powered Inspiron 15 5584 especially on the bottom where temperatures can reach 50 C.
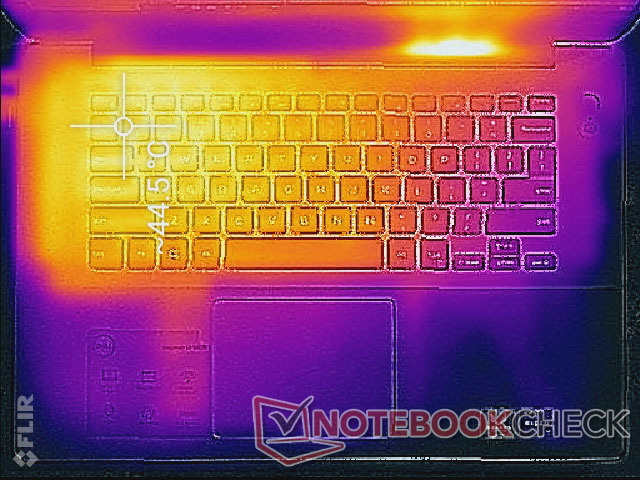
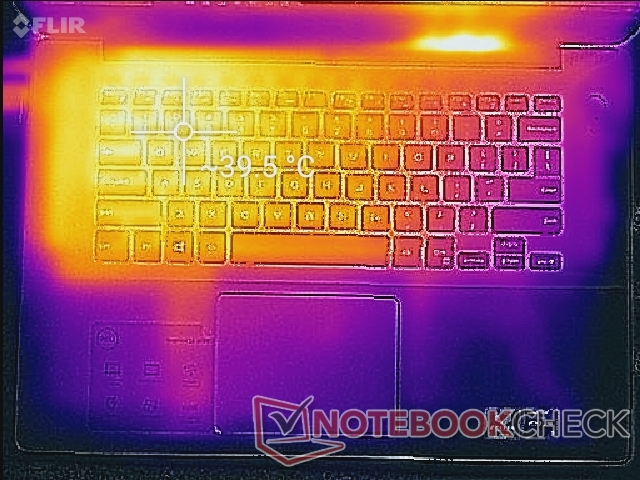
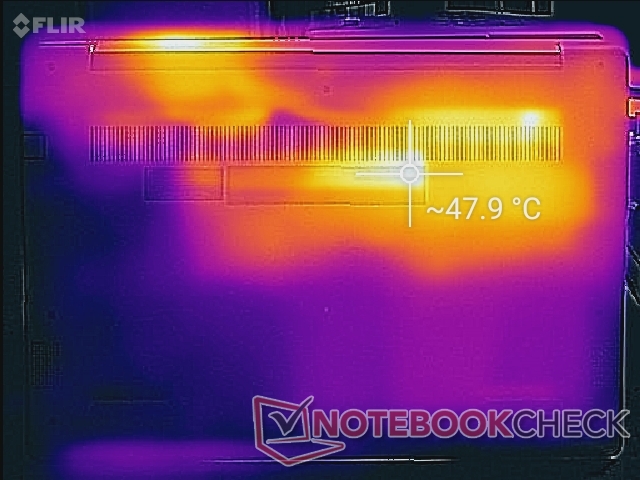
(±) The maximum temperature on the upper side is 41 °C / 106 F, compared to the average of 36.8 °C / 98 F, ranging from 21 to 71 °C for the class Multimedia.
(-) The bottom heats up to a maximum of 47 °C / 117 F, compared to the average of 39.1 °C / 102 F
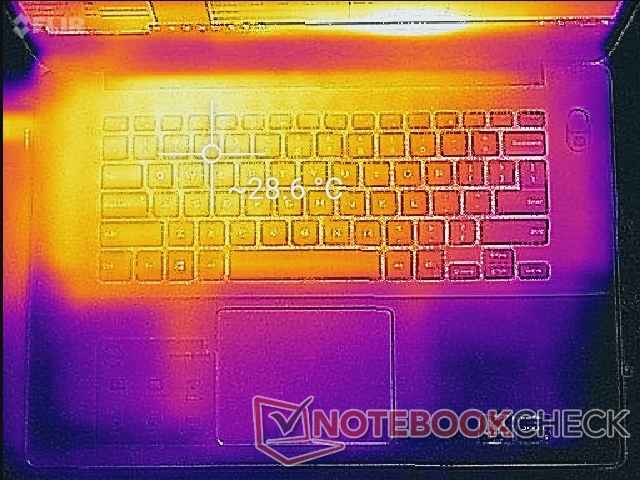
(+) In idle usage, the average temperature for the upper side is 25.6 °C / 78 F, compared to the device average of 31.3 °C / 88 F.
(±) Playing The Witcher 3, the average temperature for the upper side is 34.7 °C / 94 F, compared to the device average of 31.3 °C / 88 F.
(+) The palmrests and touchpad are cooler than skin temperature with a maximum of 28.6 °C / 83.5 F and are therefore cool to the touch.
(±) The average temperature of the palmrest area of similar devices was 28.7 °C / 83.7 F (+0.1 °C / 0.2 F).
Stress Test
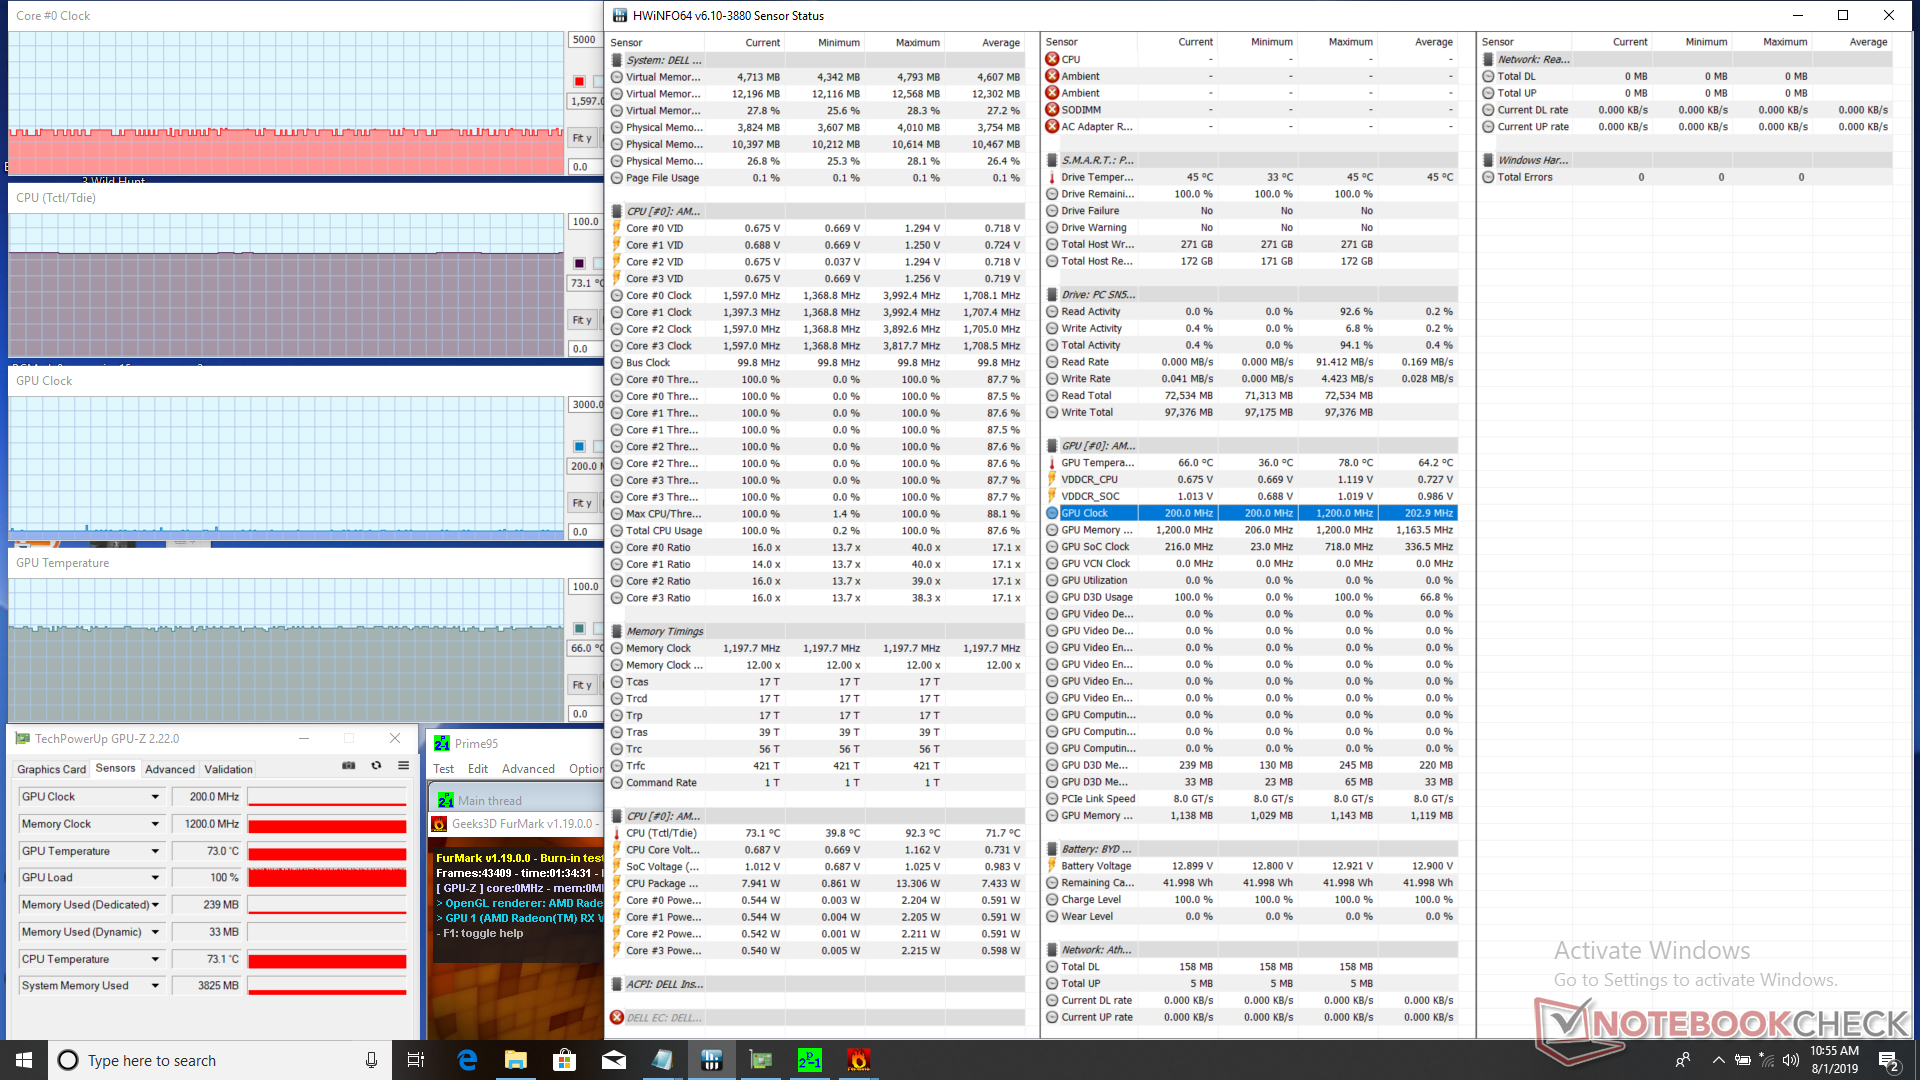
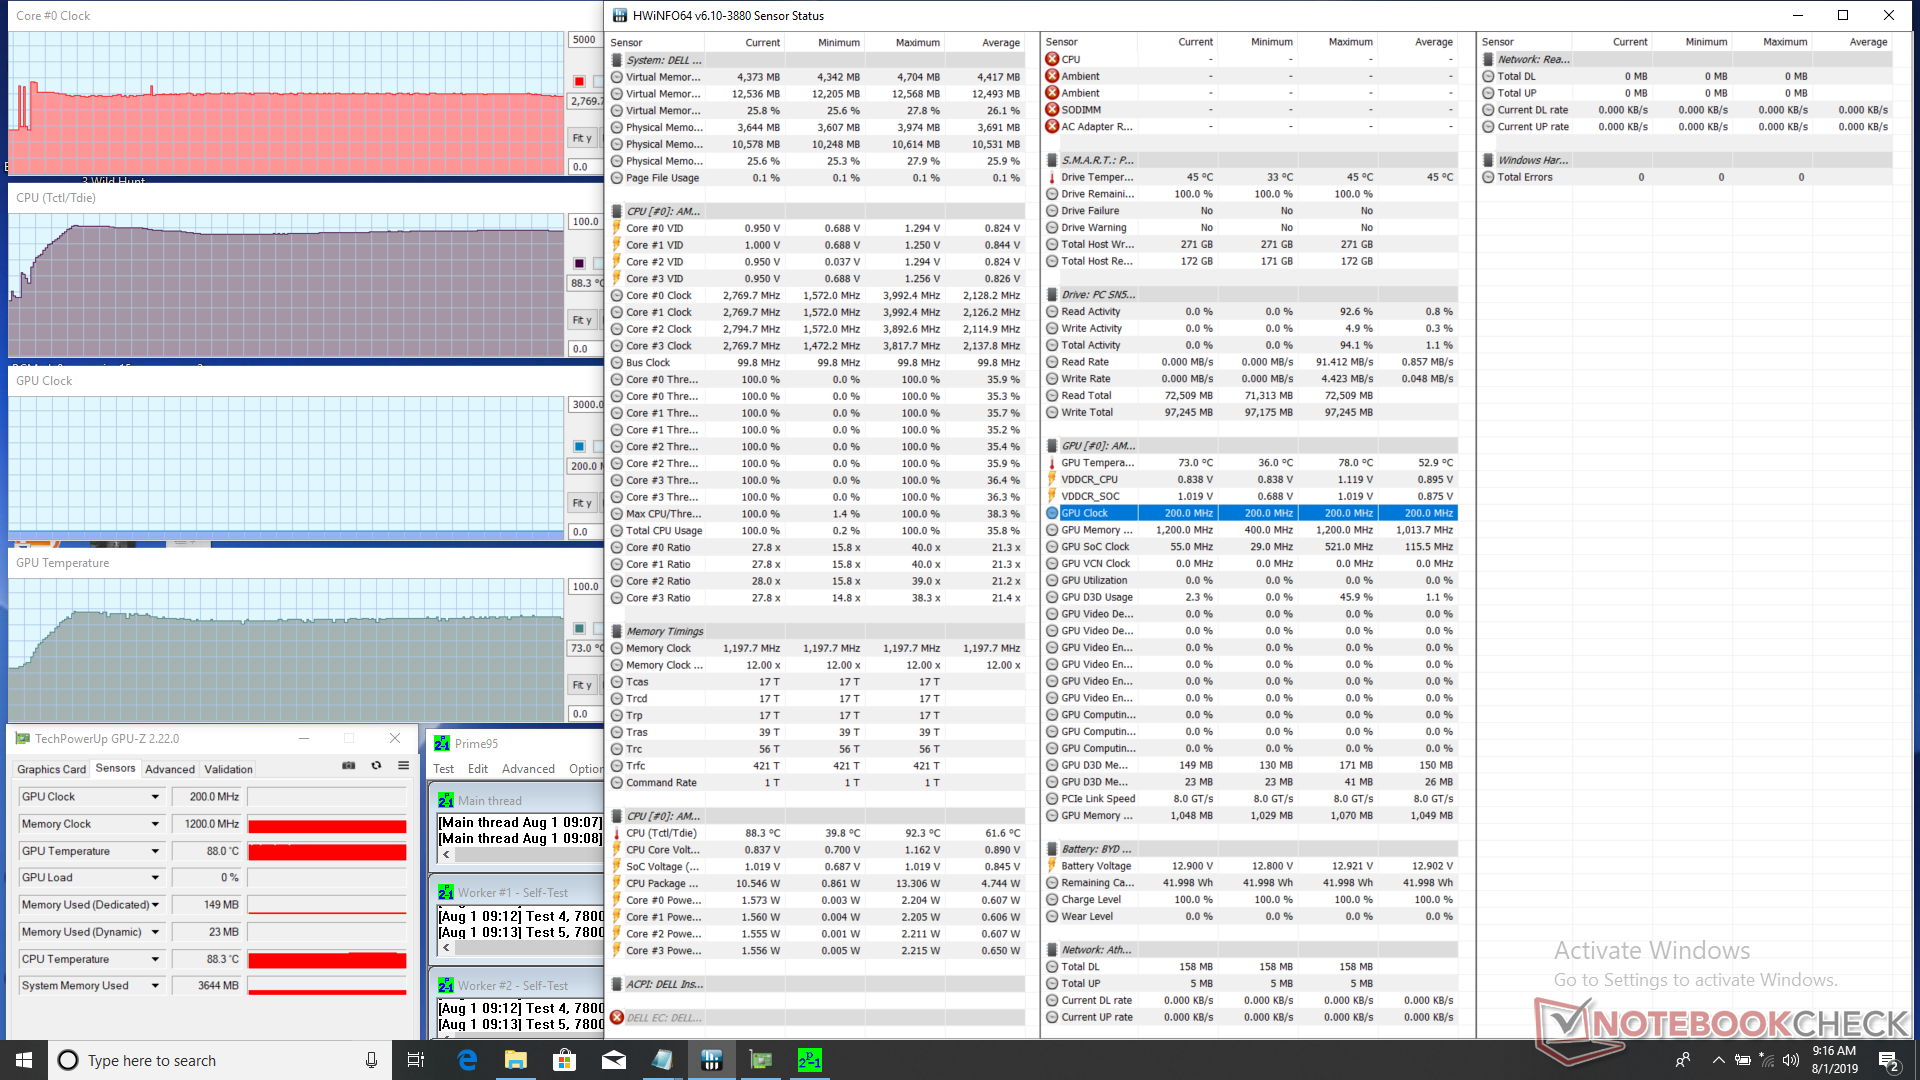
We stress the system to identify for any potential throttling or stability issues. When running Prime95, the CPU will spike up to 3.3 GHz for the first few seconds before dropping to 2.8 GHz in order to maintain a core temperature of 88 C. After about 10 minutes, however, clock rates continue to fall to 2.5 GHz for a slightly cooler core temperature of 82 C. This behavior mirrors our CineBench loop test above where performance drops at a relatively steady rate over time.
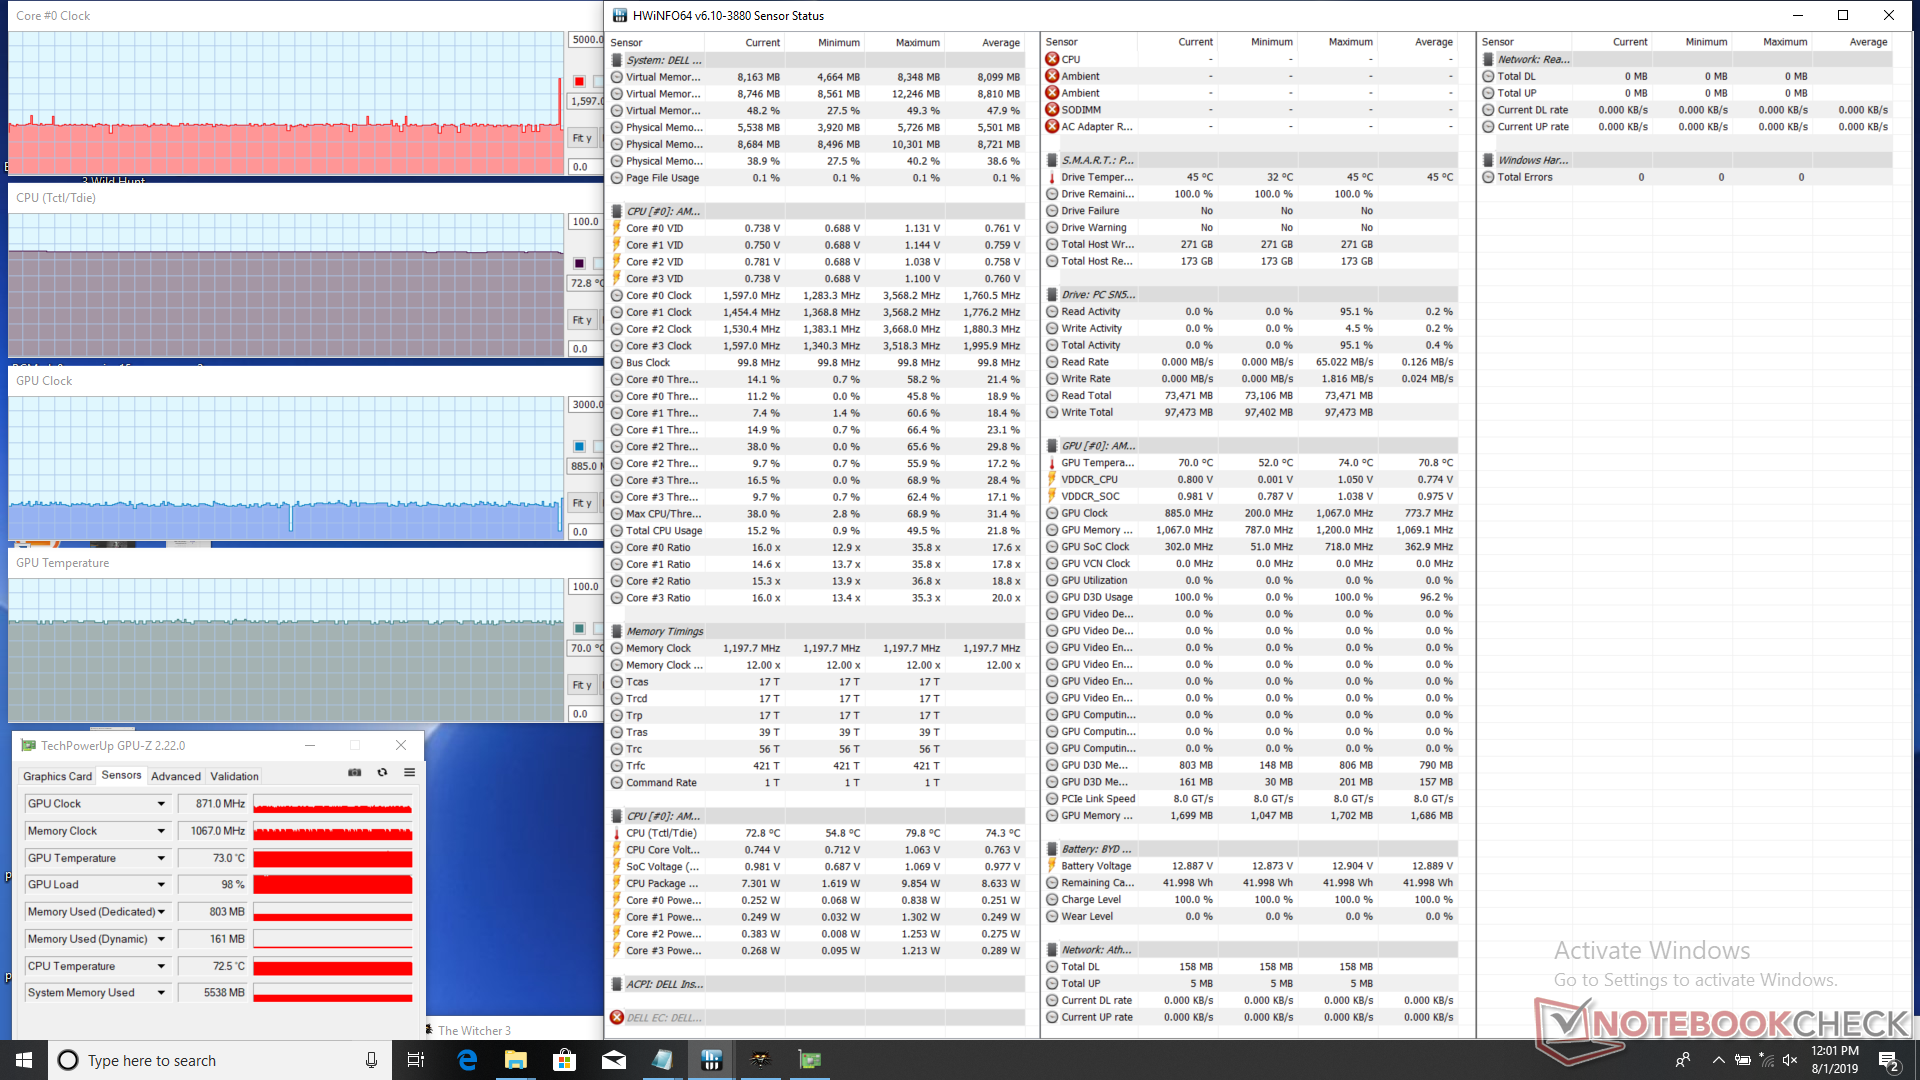
When running both Prime95 and FurMark, core temperature stabilizes at 73 C with a CPU clock in the 1.4 to 1.6 GHz range. Since the base clock rate of the CPU is 2.3 GHz, the CPU will throttle if fully stressed. The Intel CPU in the Inspiron 5584 is much cooler at about 60 C when under similar conditions which explains the warmer surface temperatures on our AMD variant as recorded above.
Running on batteries will limit CPU performance just slightly. A 3DMark 11 run on batteries returns Physics and Graphics scores of 6716 and 4349 points, respectively, compared to 7250 and 4165 points when on mains.
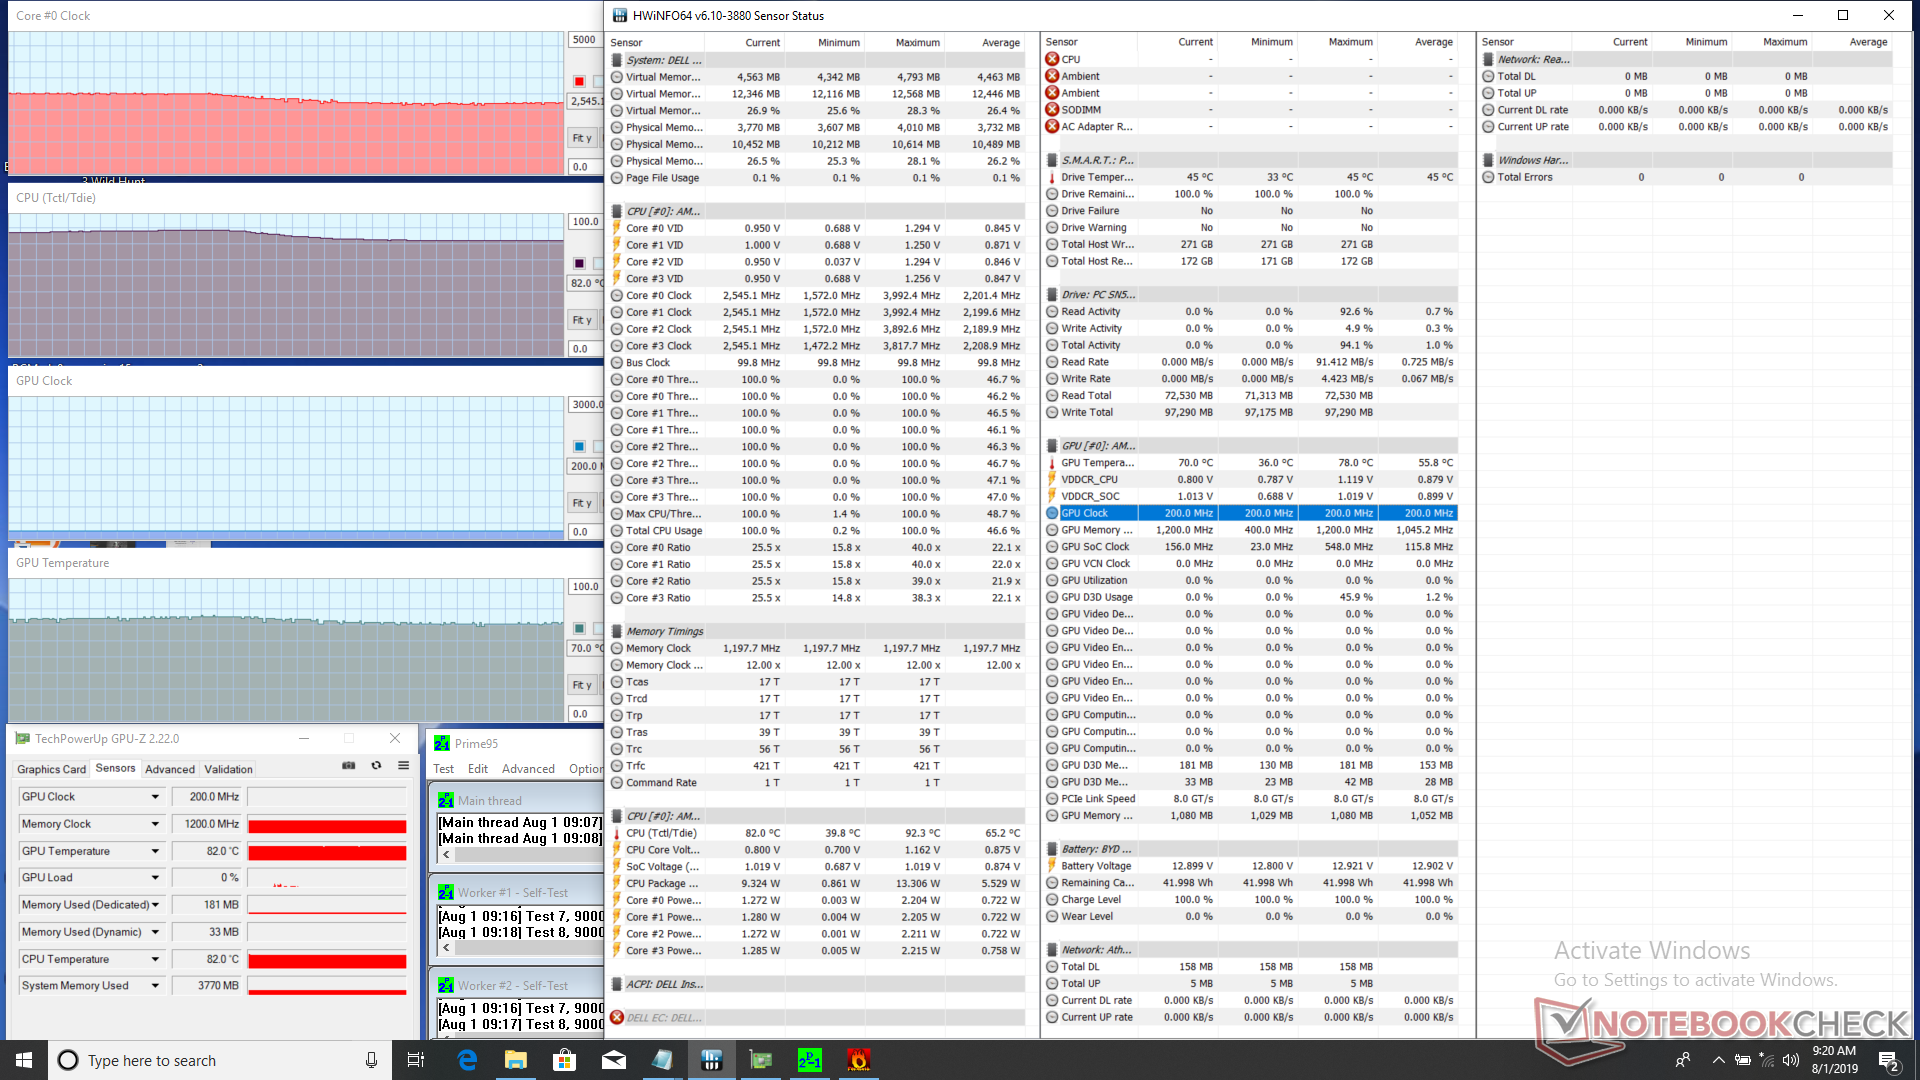
| CPU Clock (GHz) | GPU Clock (MHz) | Average CPU Temperature (°C) | |
| Prime95 Stress | 2.5 | -- | 82 |
| Prime95 + FurMark Stress | 1.4 - 1.6 | 200 | 73 |
| Witcher 3 Stress | 1.5 - 1.6 | 871 | 73 |
Speakers
The integrated speakers offer good sound quality for a budget laptop in regards to bass reproduction and balance. Our main complaint is that maximum volume is only average and could have been louder to fill a conference room if needed. For personal multimedia, however, volume is sufficient.


Dell Inspiron 15 5000 5585 audio analysis
(±) | speaker loudness is average but good (79.1 dB)
Bass 100 - 315 Hz
(±) | reduced bass - on average 12.4% lower than median
(±) | linearity of bass is average (13.1% delta to prev. frequency)
Mids 400 - 2000 Hz
(+) | balanced mids - only 3.5% away from median
(±) | linearity of mids is average (9.6% delta to prev. frequency)
Highs 2 - 16 kHz
(+) | balanced highs - only 2.4% away from median
(±) | linearity of highs is average (11.1% delta to prev. frequency)
Overall 100 - 16.000 Hz
(±) | linearity of overall sound is average (17.2% difference to median)
Compared to same class
» 49% of all tested devices in this class were better, 7% similar, 44% worse
» The best had a delta of 5%, average was 17%, worst was 45%
Compared to all devices tested
» 32% of all tested devices were better, 8% similar, 60% worse
» The best had a delta of 4%, average was 24%, worst was 134%
Apple MacBook 12 (Early 2016) 1.1 GHz audio analysis
(+) | speakers can play relatively loud (83.6 dB)
Bass 100 - 315 Hz
(±) | reduced bass - on average 11.3% lower than median
(±) | linearity of bass is average (14.2% delta to prev. frequency)
Mids 400 - 2000 Hz
(+) | balanced mids - only 2.4% away from median
(+) | mids are linear (5.5% delta to prev. frequency)
Highs 2 - 16 kHz
(+) | balanced highs - only 2% away from median
(+) | highs are linear (4.5% delta to prev. frequency)
Overall 100 - 16.000 Hz
(+) | overall sound is linear (10.2% difference to median)
Compared to same class
» 7% of all tested devices in this class were better, 2% similar, 91% worse
» The best had a delta of 5%, average was 18%, worst was 53%
Compared to all devices tested
» 5% of all tested devices were better, 1% similar, 94% worse
» The best had a delta of 4%, average was 24%, worst was 134%
Energy Management
Power Consumption
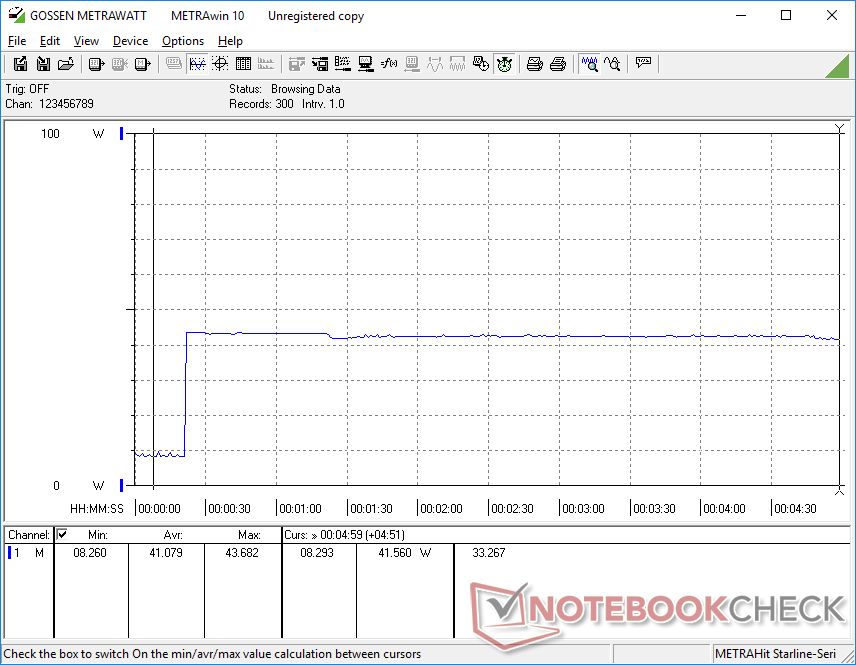
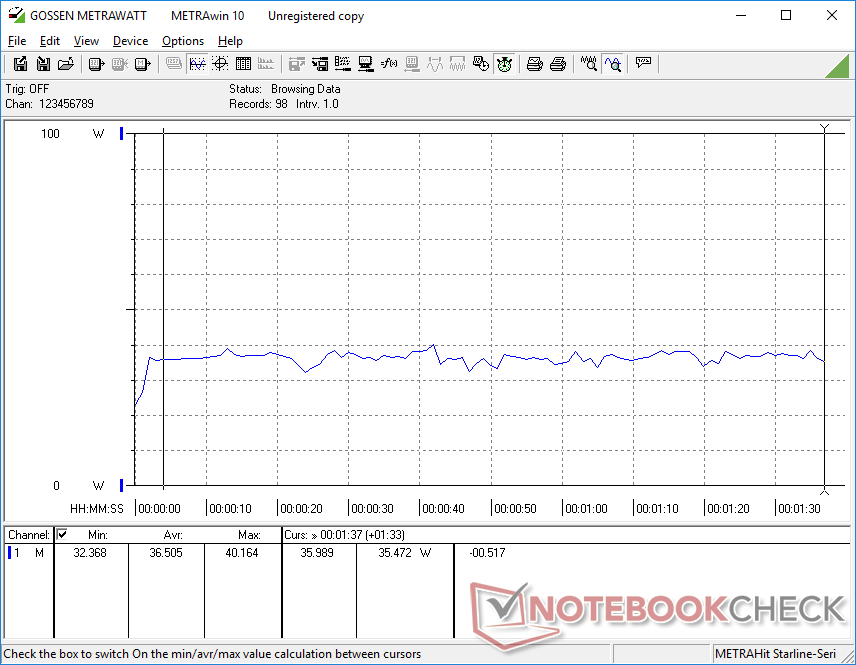
Overall power consumption is not unlike the Intel-powered Inspiron 15 5584. Idling on desktop demands between 4 W and 7 W while gaming loads will demand about 37 W. Since the RX Vega 10 is at least 100 percent faster than the UHD Graphics 620, however, the graphical performance-per-Watt outstrips any other laptop running on U-class Core i5 or Core i7 processors at the time of writing. Intel's integrated UHD Graphics series is embarrassingly far behind which is likely the key reason why the upcoming Intel Ice Lake series will focus extensively on improving graphics performance to catch up with the AMD Zen+ series.
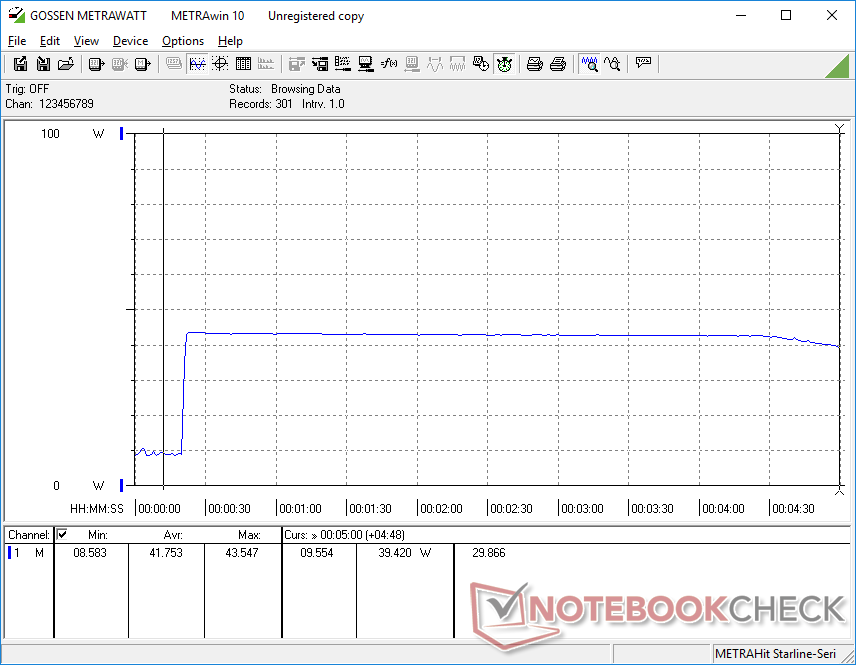
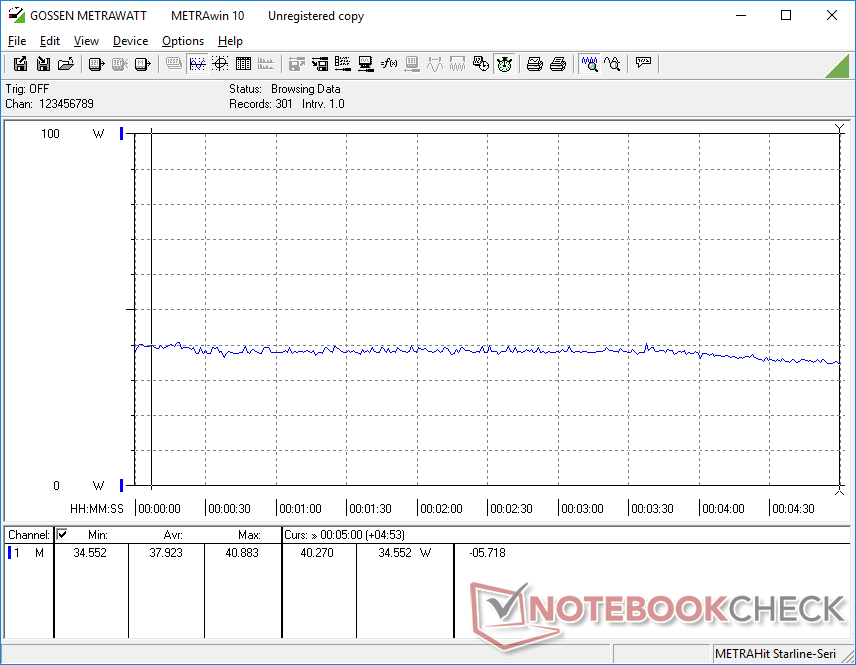
Power consumption when running Prime95 is steady for about 5 minutes before dropping slightly. The behavior matches our CineBench loop results above where scores would be relatively steady for the first few minutes before falling slightly.
We're able to record a maximum consumption of 44 W from the small (~9.4 x 4 x 2.6 cm) 45 W AC adapter when running both Prime95 and FurMark simultaneously. The recharge rate will therefore be much slower if running high loads like gaming. Like the above, the system is able to maintain this high of a demand for a few minutes before inevitably falling due to thermal limits.
| Off / Standby | |
| Idle | |
| Load |
|
Key:
min: | |
| Dell Inspiron 15 5000 5585 R7 3700U, Vega 10, WDC PC SN520 SDAPNUW-512G, IPS, 1920x1080, 15.6" | Dell Inspiron 15 3585 (2300U, Vega 6) R3 2300U, Vega 6, Toshiba BG3 KBG30ZMS256G, TN, 1920x1080, 15.6" | Dell Inspiron 15 5000 5584 i7-8565U, UHD Graphics 620, Toshiba BG3 KBG30ZMS512G, IPS, 1920x1080, 15.6" | Dell XPS 15 9570 Core i9 UHD i9-8950HK, GeForce GTX 1050 Ti Max-Q, Samsung SSD PM981 MZVLB1T0HALR, IPS, 3840x2160, 15.6" | Asus VivoBook S15 S532F i7-8565U, GeForce MX250, WDC PC SN520 SDAPNUW-256G, IPS, 1920x1080, 15.6" | Lenovo Ideapad 330S-15ARR-81FB00C7GE R5 2500U, Vega 8, WDC PC SN520 SDAPNUW-256G, IPS, 1920x1080, 15.6" | |
|---|---|---|---|---|---|---|
| Power Consumption | -26% | -5% | -138% | -64% | -15% | |
| Idle Minimum * (Watt) | 4.2 | 6.3 -50% | 3.6 14% | 7.1 -69% | 6 -43% | 5.2 -24% |
| Idle Average * (Watt) | 6.8 | 9.2 -35% | 7.4 -9% | 13.6 -100% | 10.3 -51% | 8.3 -22% |
| Idle Maximum * (Watt) | 7 | 9.6 -37% | 8.3 -19% | 14.1 -101% | 10.5 -50% | 8.2 -17% |
| Load Average * (Watt) | 36.5 | 38 -4% | 38 -4% | 103.9 -185% | 69.1 -89% | 38 -4% |
| Witcher 3 ultra * (Watt) | 37.9 | 103 -172% | 57.8 -53% | |||
| Load Maximum * (Watt) | 44 | 46 -5% | 47.9 -9% | 130.9 -198% | 88 -100% | 46.6 -6% |
* ... smaller is better
Battery Life
Although the 42 Wh battery is small, actual runtimes are longer than average on the Inspiron 15 5585 for its budget category. We're able to record a WLAN runtime of 7 hours compared to almost half that on the Inspiron 15 3585 or IdeaPad 330S when subjected to similar conditions.
Charging from empty to full capacity is slow at about 2 to 2.5 hours whereas most Ultrabooks can fully recharge in 1.5 hours.
| Dell Inspiron 15 5000 5585 R7 3700U, Vega 10, 42 Wh | Dell Inspiron 15 3585 (2300U, Vega 6) R3 2300U, Vega 6, 42 Wh | Dell Inspiron 15 5000 5584 i7-8565U, UHD Graphics 620, 42 Wh | Dell XPS 15 9570 Core i9 UHD i9-8950HK, GeForce GTX 1050 Ti Max-Q, 97 Wh | Asus VivoBook S15 S532F i7-8565U, GeForce MX250, 42 Wh | Lenovo Ideapad 330S-15ARR-81FB00C7GE R5 2500U, Vega 8, 30 Wh | |
|---|---|---|---|---|---|---|
| Battery runtime | -15% | -17% | -0% | -17% | -28% | |
| Reader / Idle (h) | 14.3 | 7.3 -49% | 15.3 7% | 15 5% | 10.9 -24% | 7.3 -49% |
| WiFi v1.3 (h) | 7 | 5.3 -24% | 3.5 -50% | 8.6 23% | 5.1 -27% | 4.1 -41% |
| Load (h) | 1.4 | 1.8 29% | 1.3 -7% | 1 -29% | 1.4 0% | 1.5 7% |
Pros
Cons
Verdict
We weren't expecting very much from an Inspiron going into this review, but we're pleasantly surprised by the performance of the system. The AMD processor in particular offers similar CPU performance to the Core i7-8565U all while being significantly faster in GPU performance. Casual gamers who like to throw in a game or two of Rocket League or LoL in between classes will find this AMD Inspiron to be much more powerful for their needs when compared to pricier XPS 13 or HP Spectre x360 13.
Unfortunately, the impressive processor is wrapped in a not-so-impressive chassis. This is a budget laptop after all meaning that the display is relatively dim, colors are shallow, and the plastics are anything but luxurious. Battery life is longer than on the Intel Inspiron 15 5584 and keyboard feedback is actually pretty good which we're sure the target budget-conscious audience will appreciate. Should Dell launch an eventual successor, we believe that the Inspiron could be improved by incorporating a brighter display and making the full jump to universal USB Type-C charging.
An AMD CPU worthy of an XPS but trapped in an Inspiron. In other words, you're getting flagship Ultrabook performance with surprisingly decent integrated graphics performance in an affordable budget chassis.
Dell Inspiron 15 5000 5585
- 08/08/2019 v6 (old)
Allen Ngo
Price comparison
