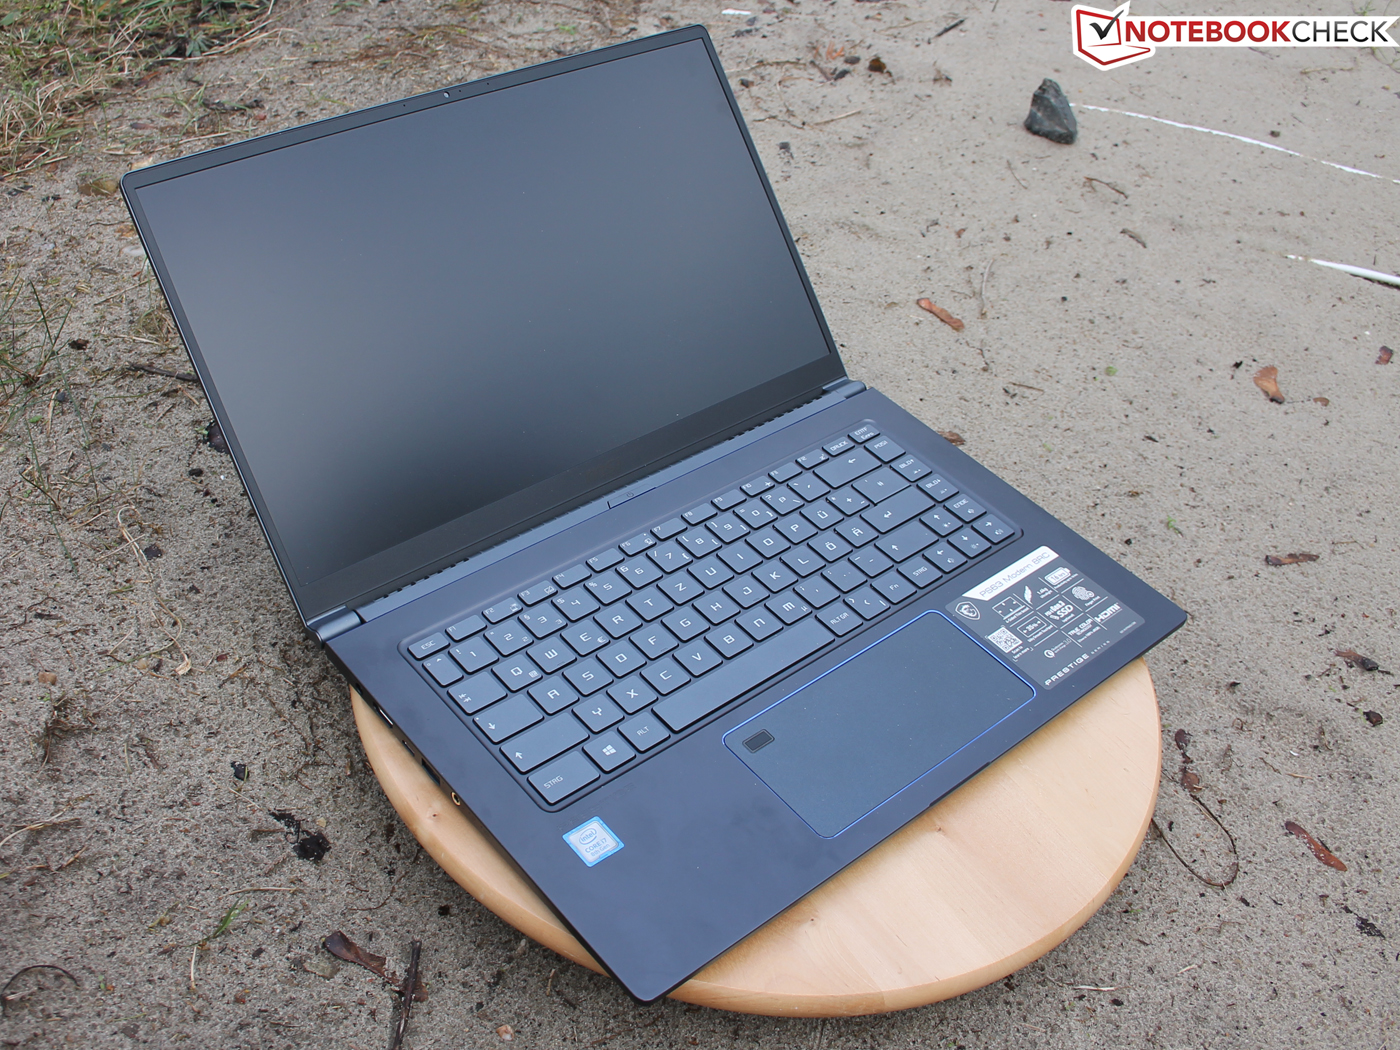
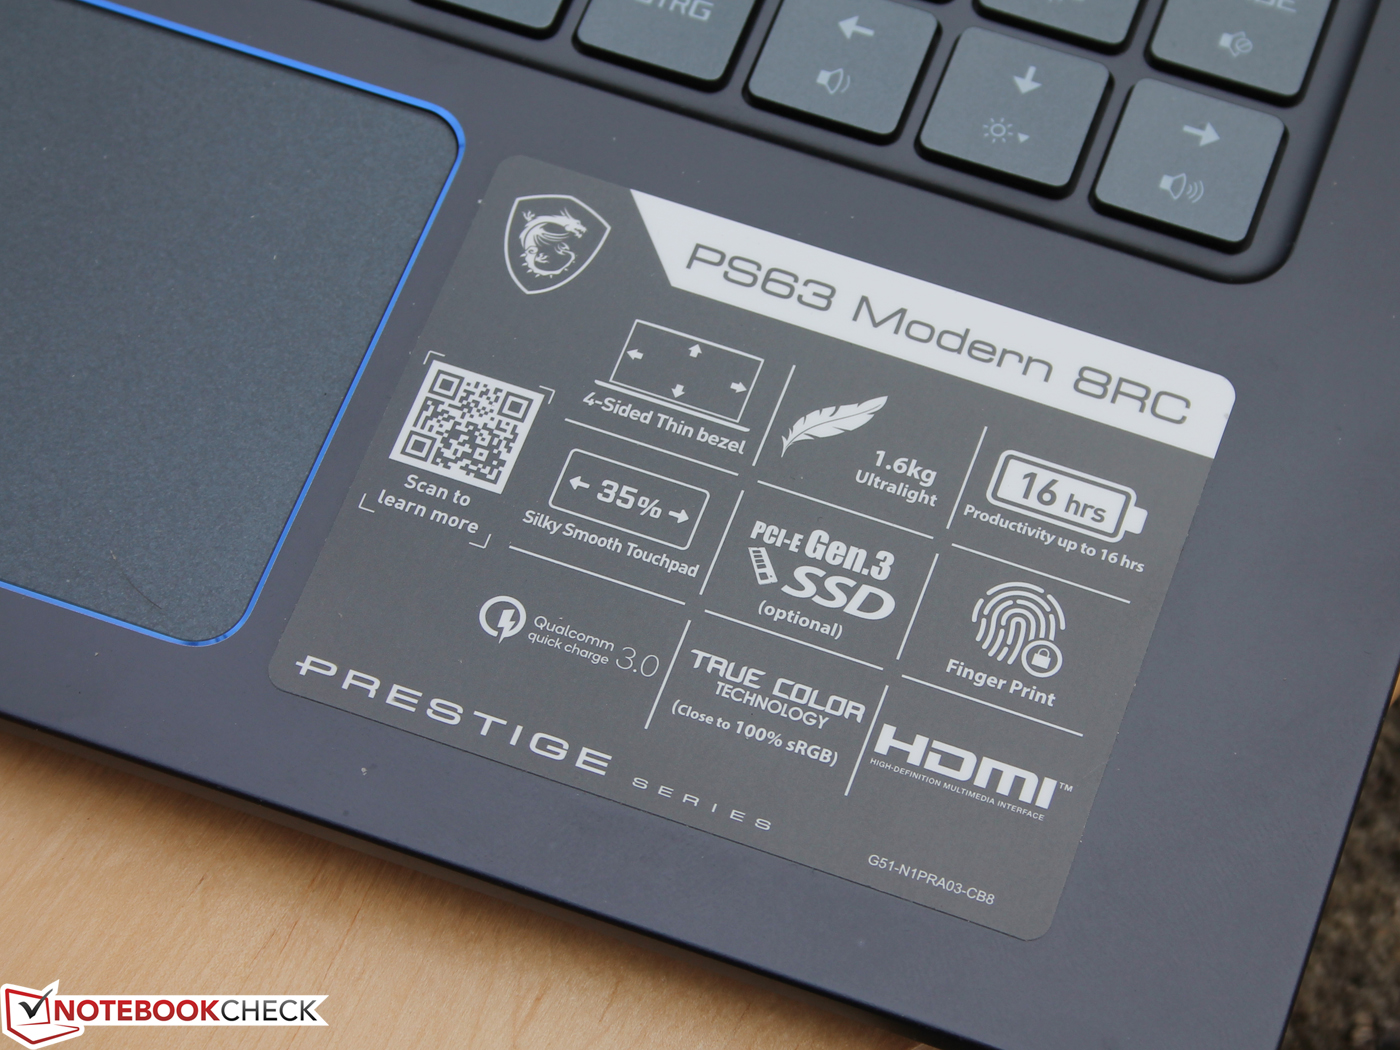
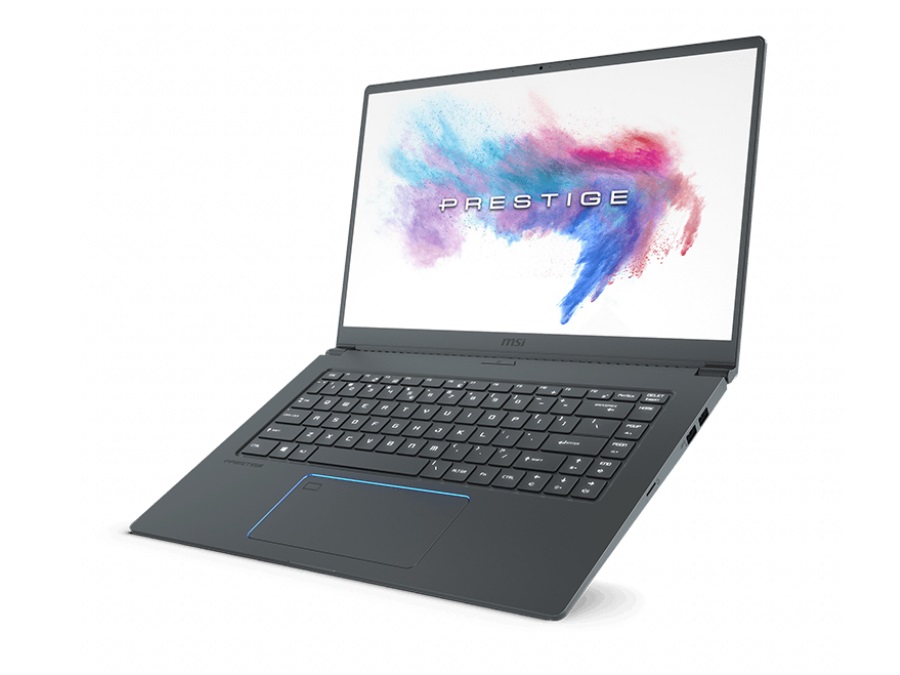
A true all-rounder: MSI PS63 Modern 8SC Laptop in Review

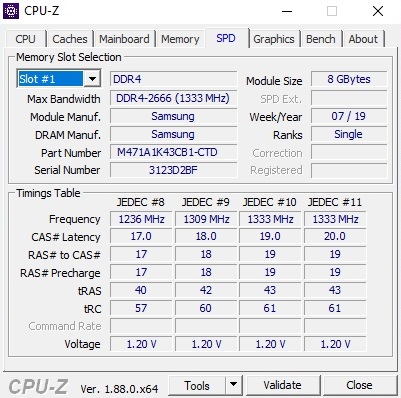
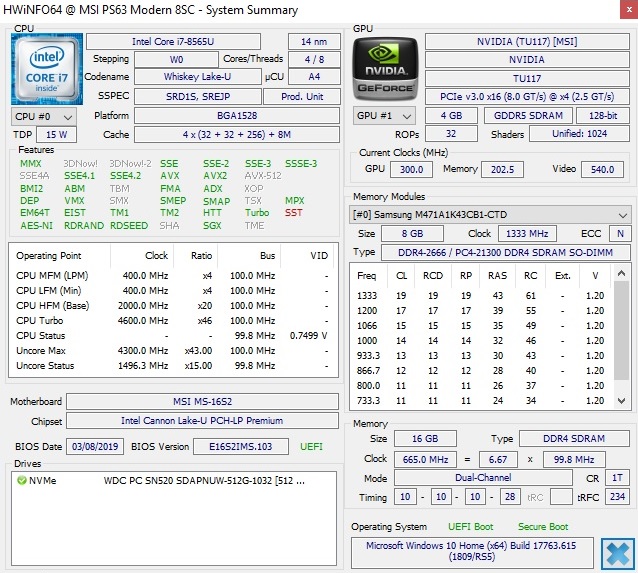
The PS63 8SC sits comfortably in the niche between office and gaming. The 15-inch laptop comes with the energy-efficient quad-core Intel Core i7-8565U CPU and currently costs around 1,700 Euros (~$1,906). The mid-range GeForce GTX 1650 from Nvidia's Turing generation handles complex graphics computation. Thanks to its Max-Q design, it is fairly energy efficient. Furthermore, the PS63 8SC contains 16 GB of RAM (2x 8GB DDR4). Data can be stored on a 512-GB PCIe M.2 SSD.
Its competition mainly consists of other multimedia notebooks from our top 10 list, which are also equipped with a Whiskey Lake-U processor. Other than the Acer Aspire 5 A515-52G (GeForce MX250), the Asus Zenbook 15 UX533FD (GeForce GTX 1050 Max-Q) also falls into that category.
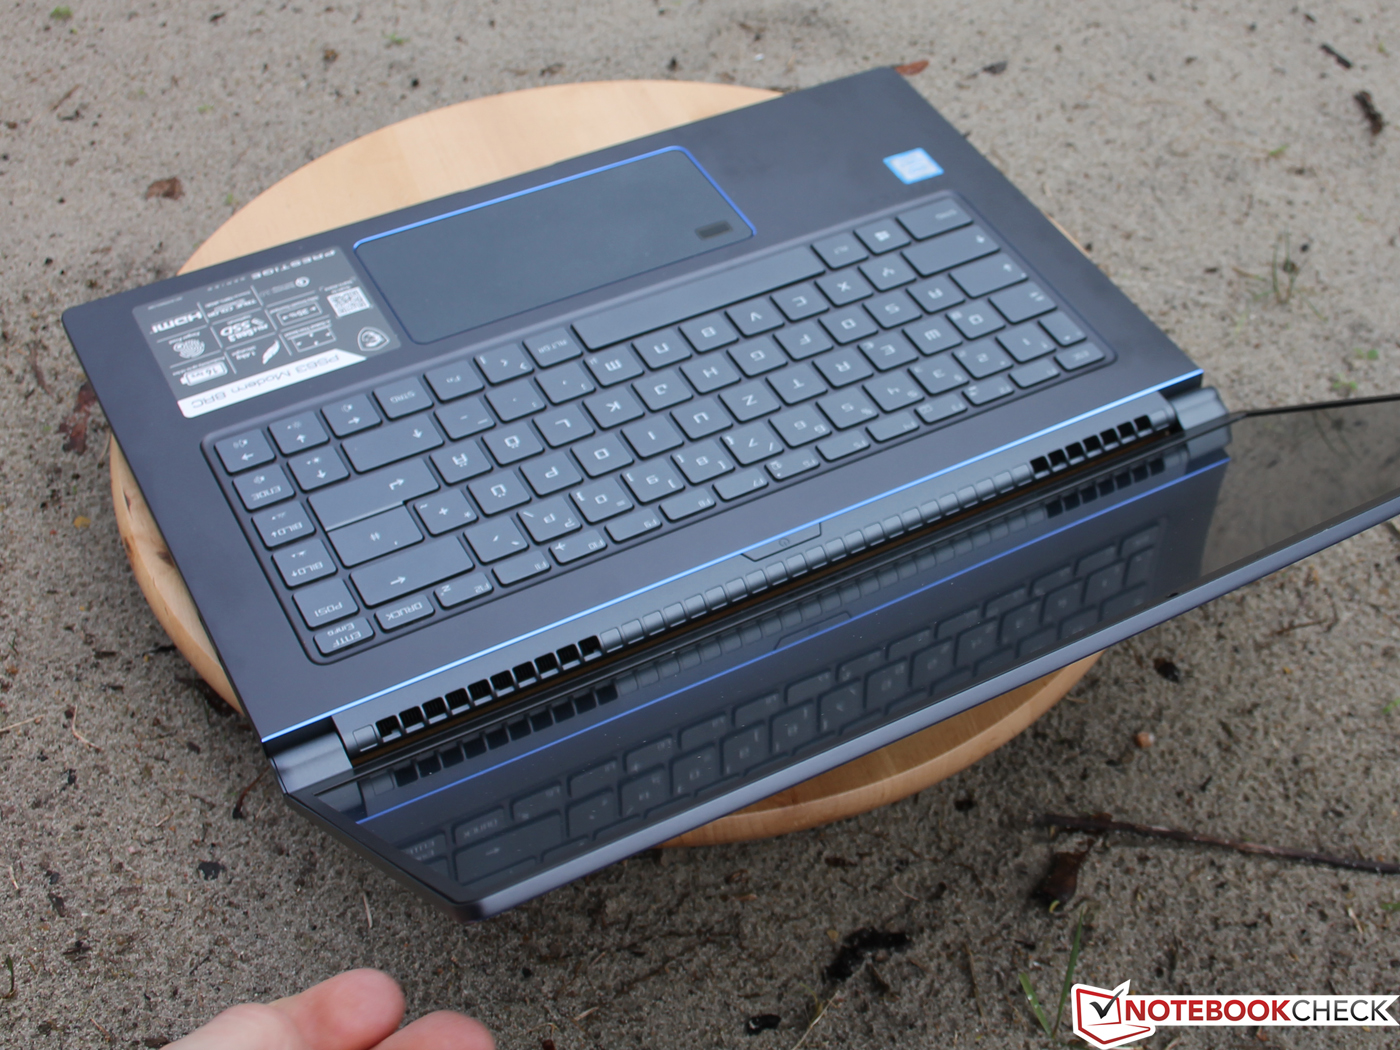
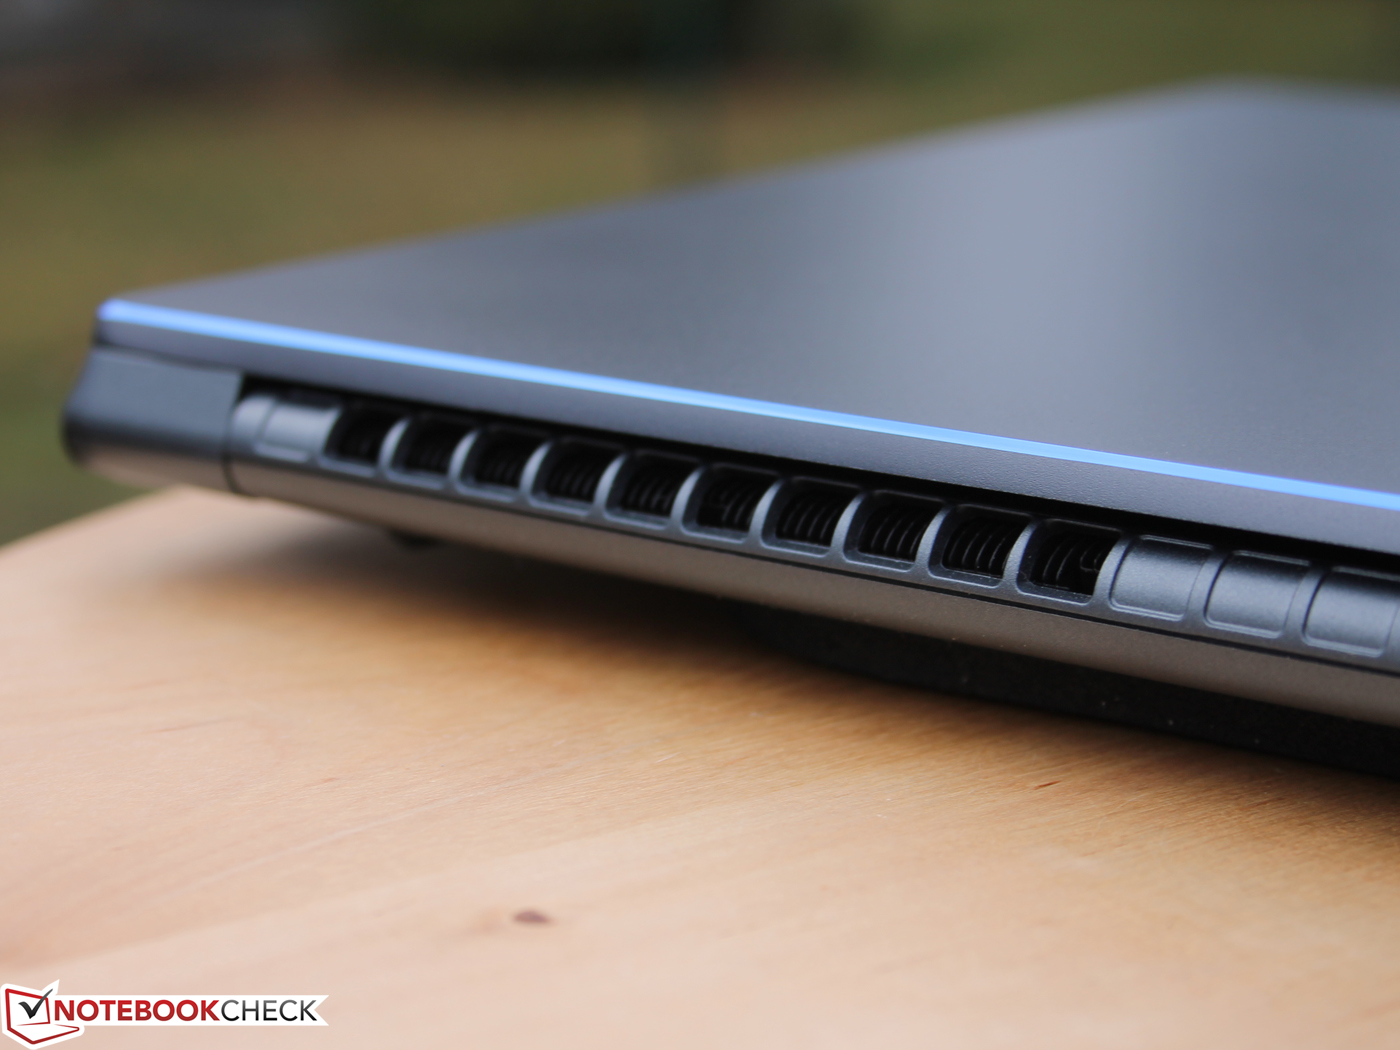
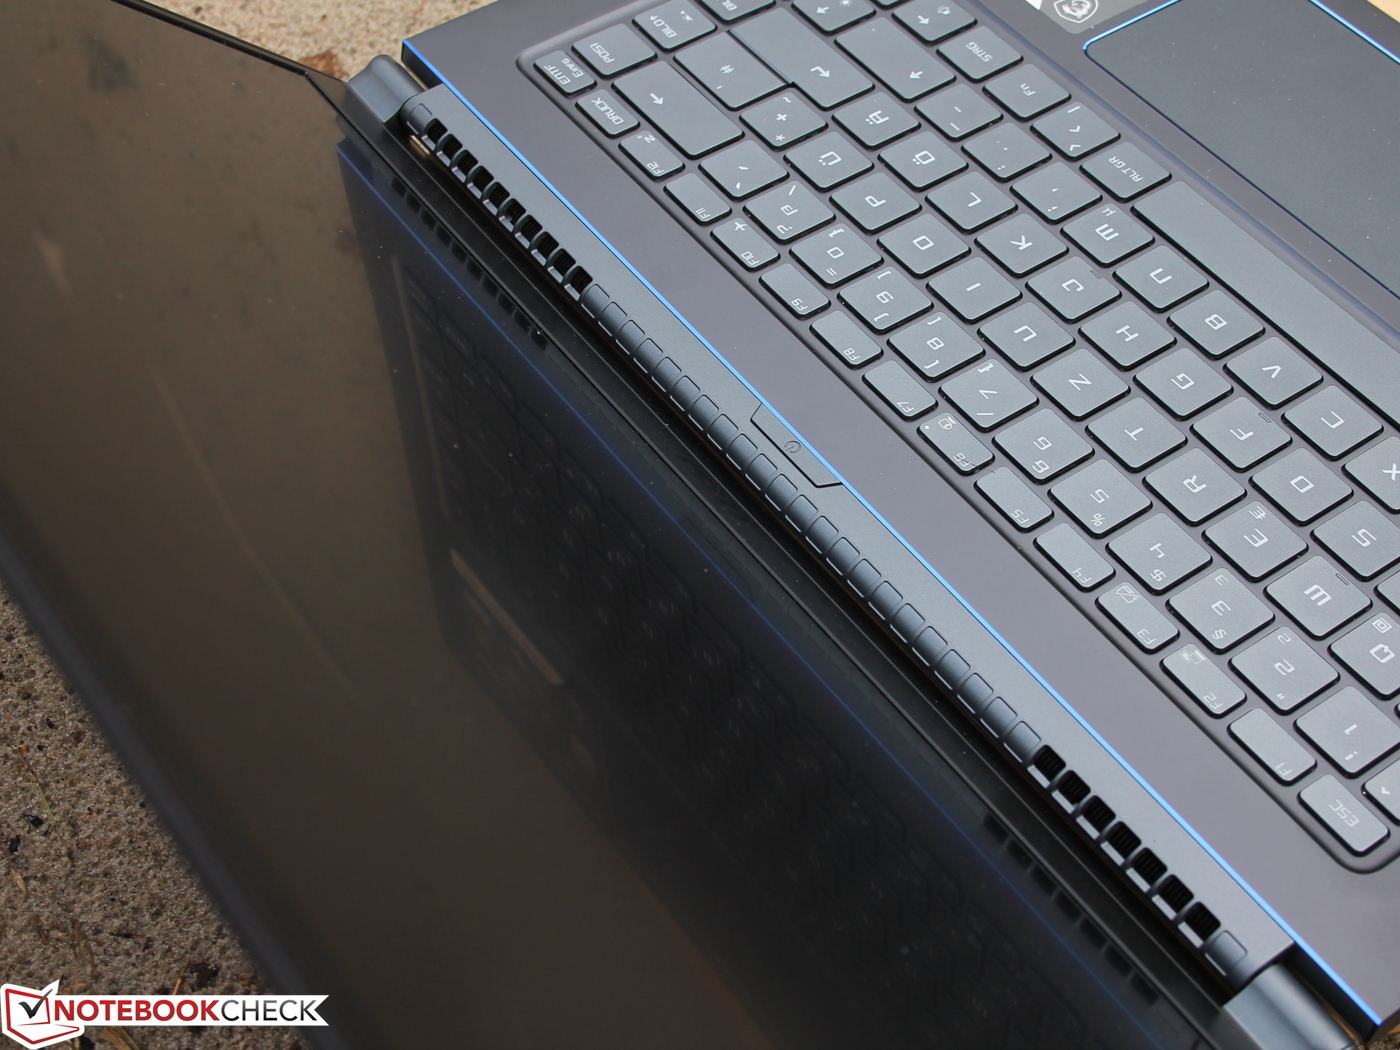
Since the case of the PS63 8SC is identical to the PS63 8RC, we will not delve deeper into the chassis, port selection, features and input devices in this review. Information regarding these topics can be found in the existing review.
| Networking | |
| iperf3 transmit AX12 | |
| MSI PS63 Modern 8SC | |
| Acer Aspire 5 A515-52G-723L | |
| Asus ZenBook 15 UX533FD | |
| MSI PS63 Modern 8RC | |
| iperf3 receive AX12 | |
| MSI PS63 Modern 8SC | |
| Asus ZenBook 15 UX533FD | |
| MSI PS63 Modern 8RC | |
| Acer Aspire 5 A515-52G-723L | |
Testing Conditions
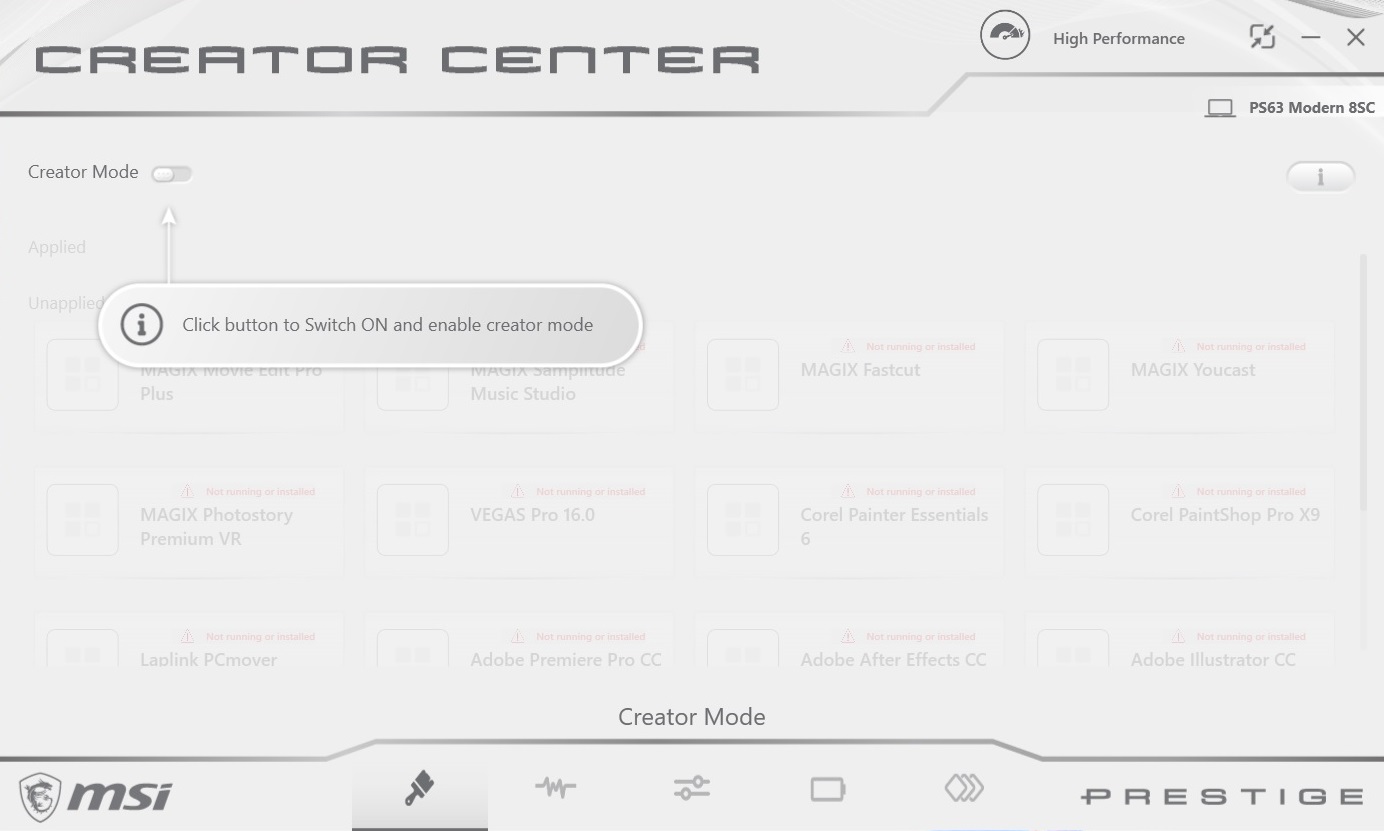
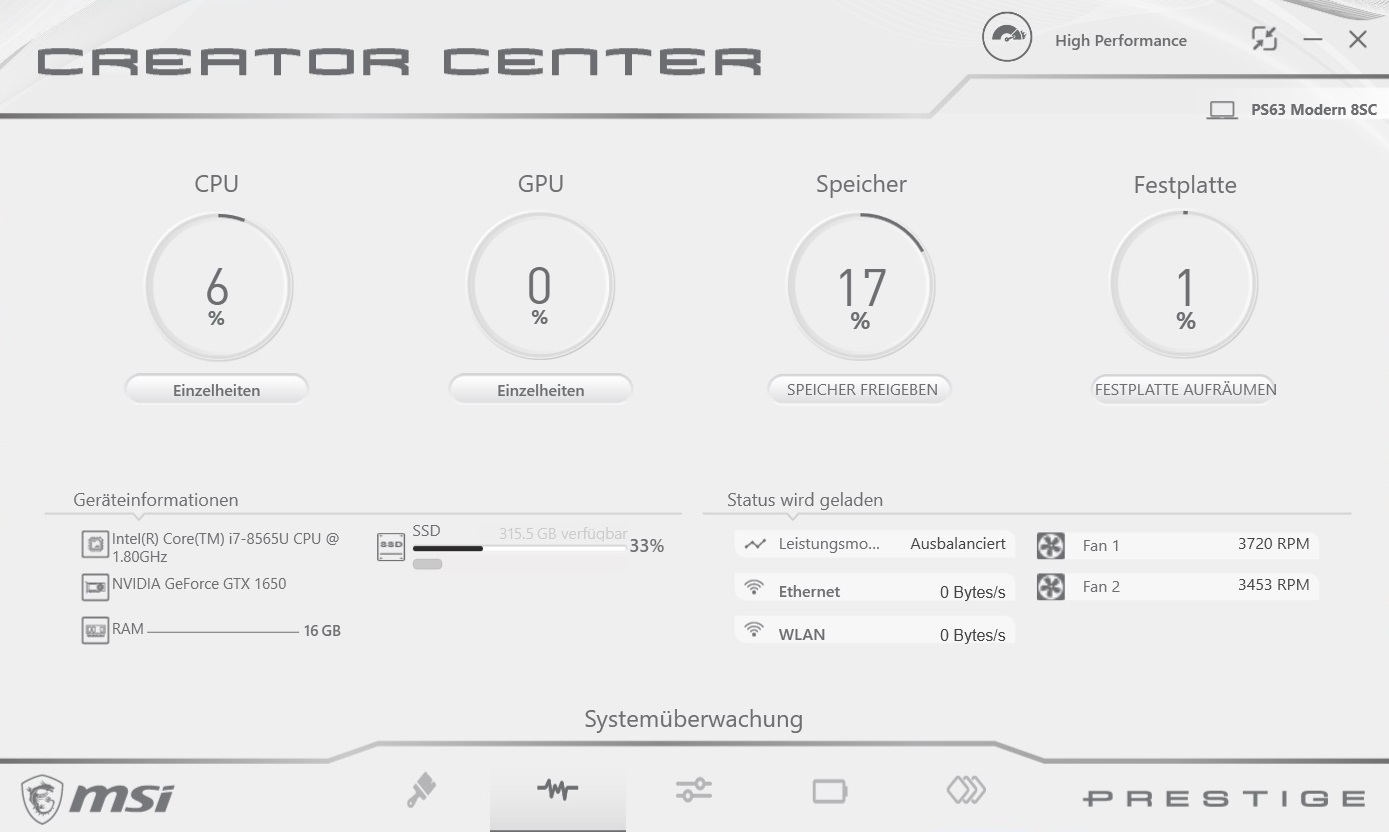
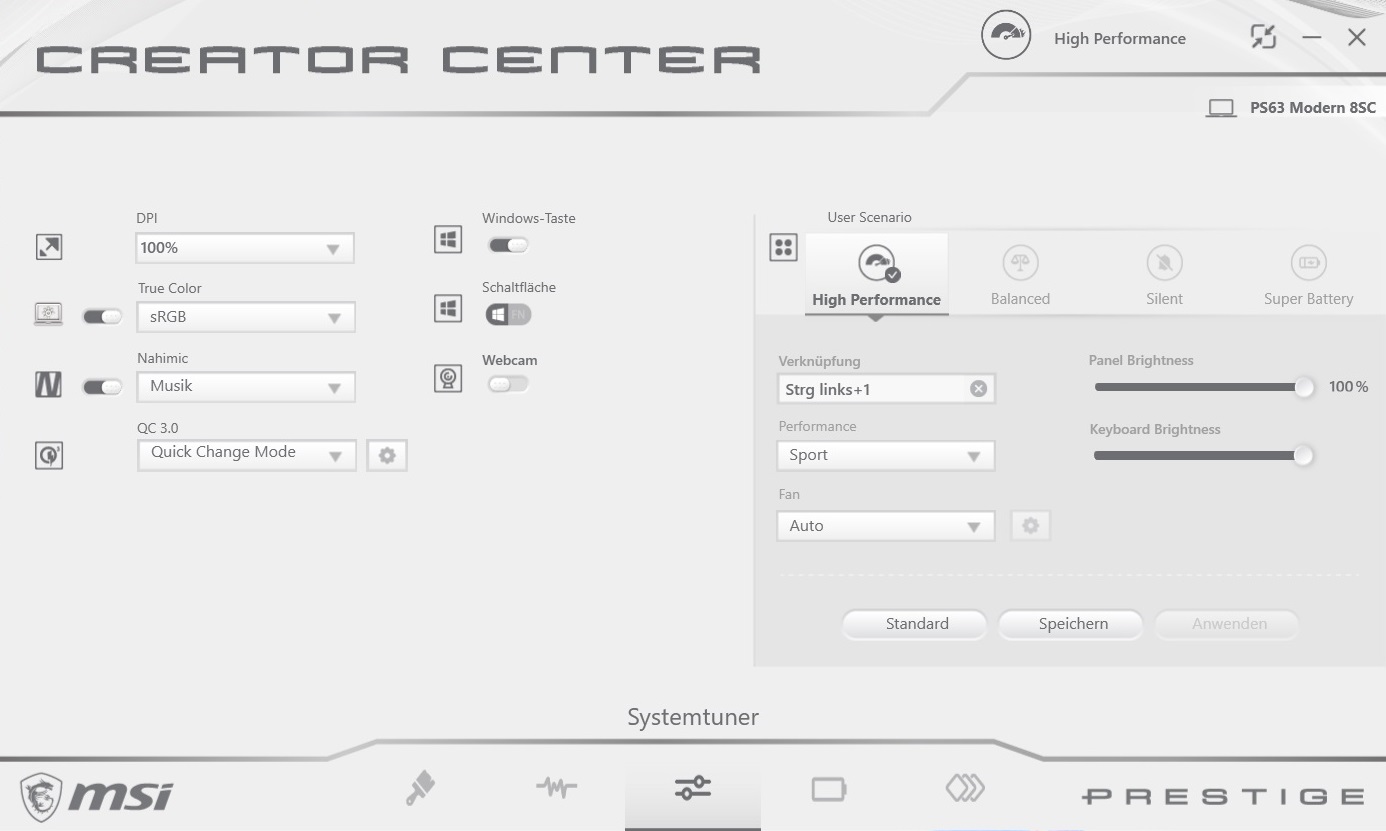
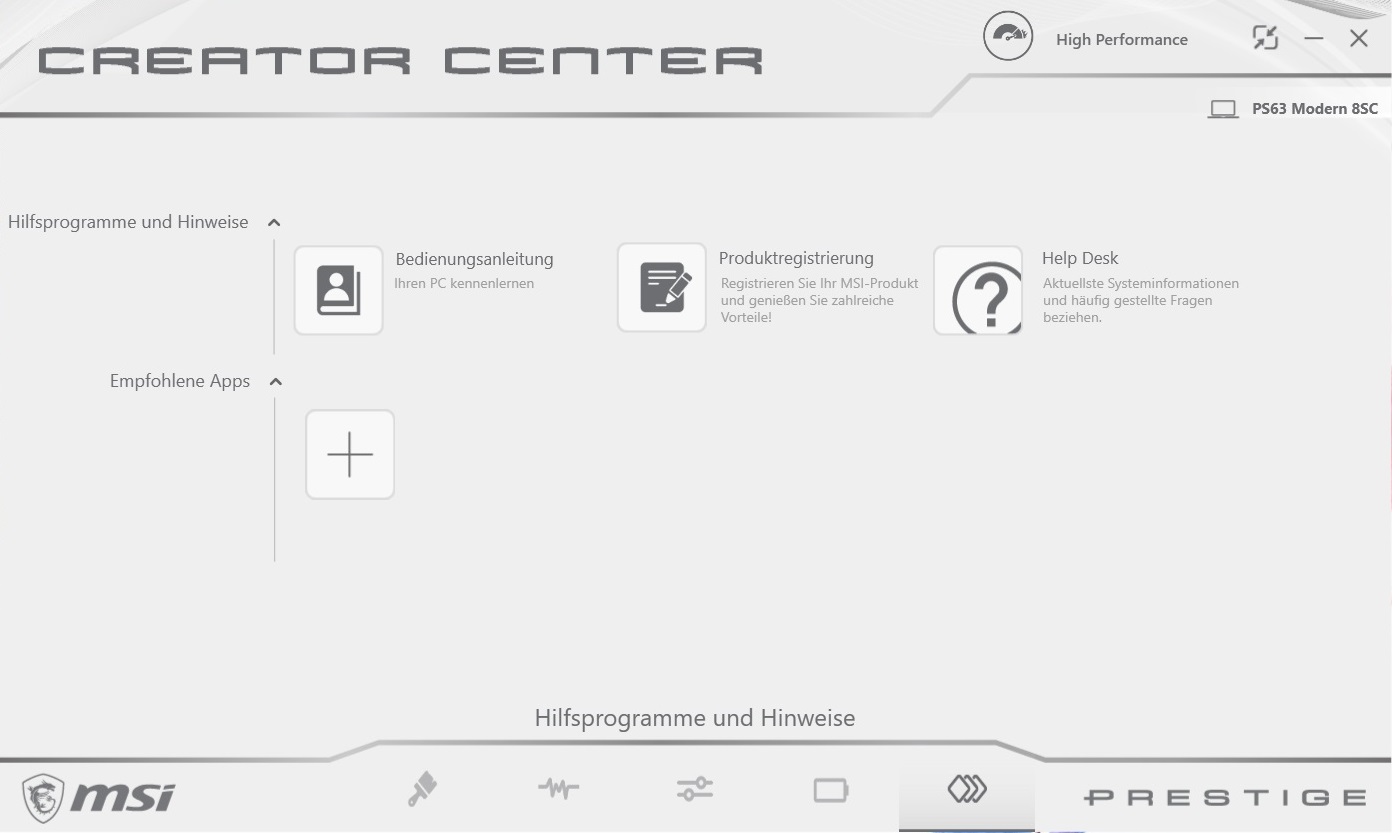
The preinstalled Creator Center offers several different usage scenarios (menu item "system tuner"). We used the profile silent for our idle measurements (= comfort mode & auto fan speed) and selected the profile High Performance (= sport mode & auto fan speed) for our 3D tests.
Display
Our impressions of the installed display are mixed. Even though the model number of the panel is identical to that of the PS63 8RC (CMN N156HCE-EN1), we measured a much lower luminance on our PS63 8SC.
| |||||||||||||||||||||||||
Brightness Distribution: 84 %
Center on Battery: 207 cd/m²
Contrast: 941:1 (Black: 0.22 cd/m²)
ΔE ColorChecker Calman: 3.77 | ∀{0.5-29.43 Ø4.71}
calibrated: 2.59
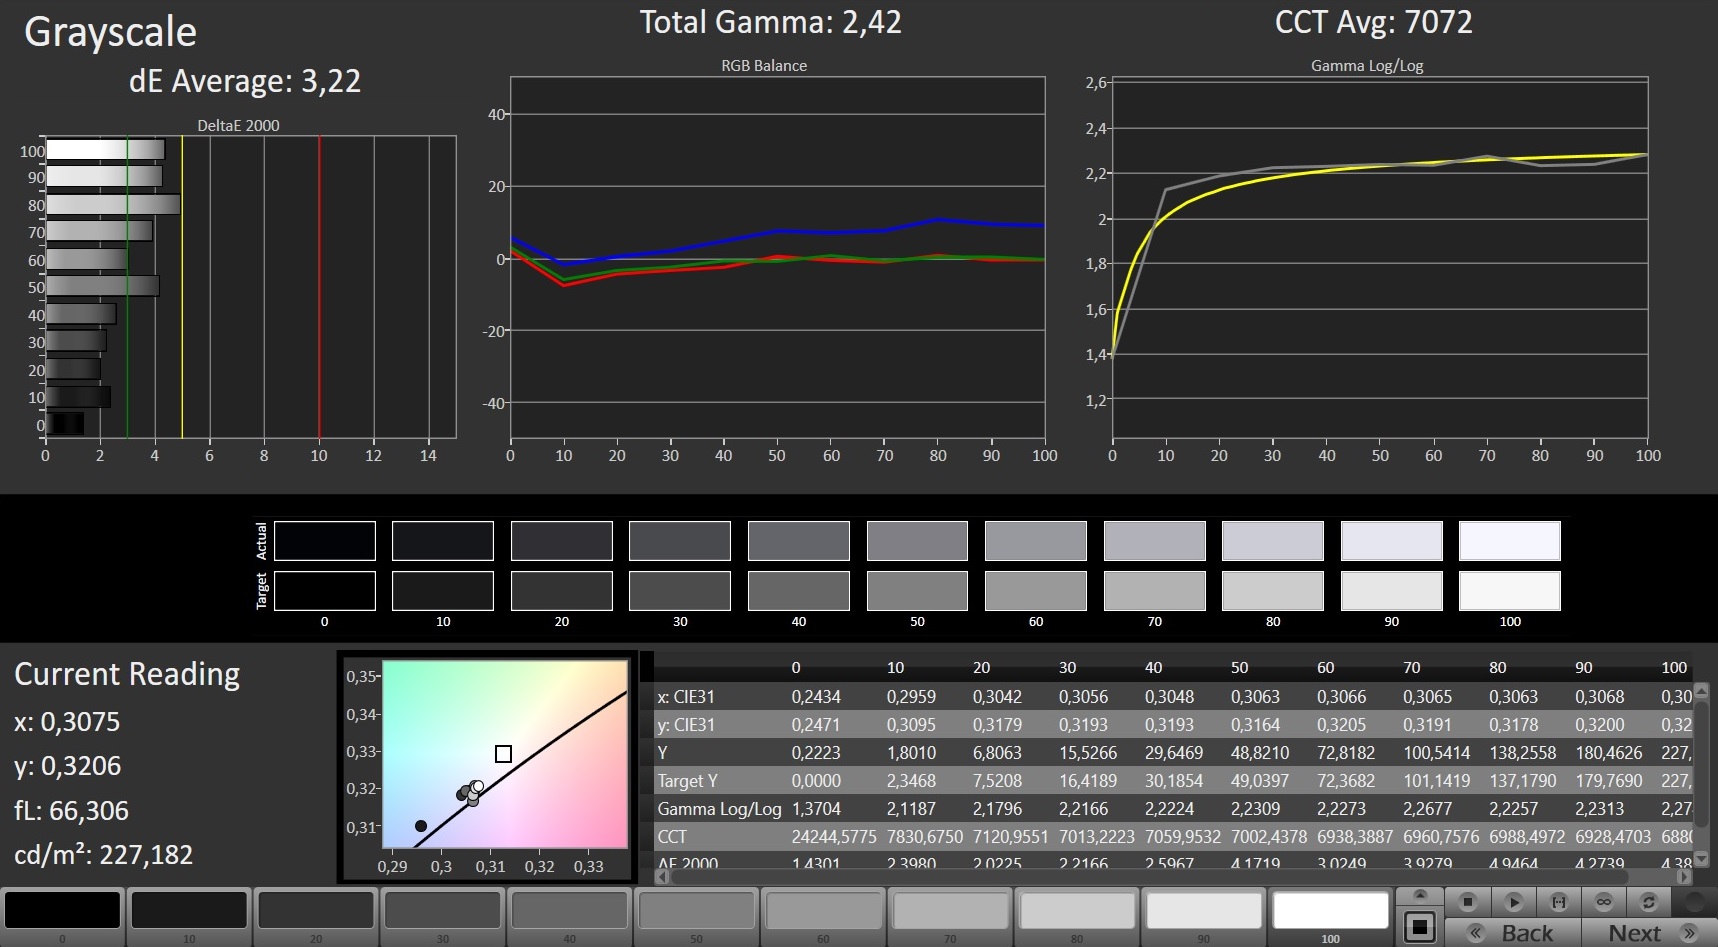
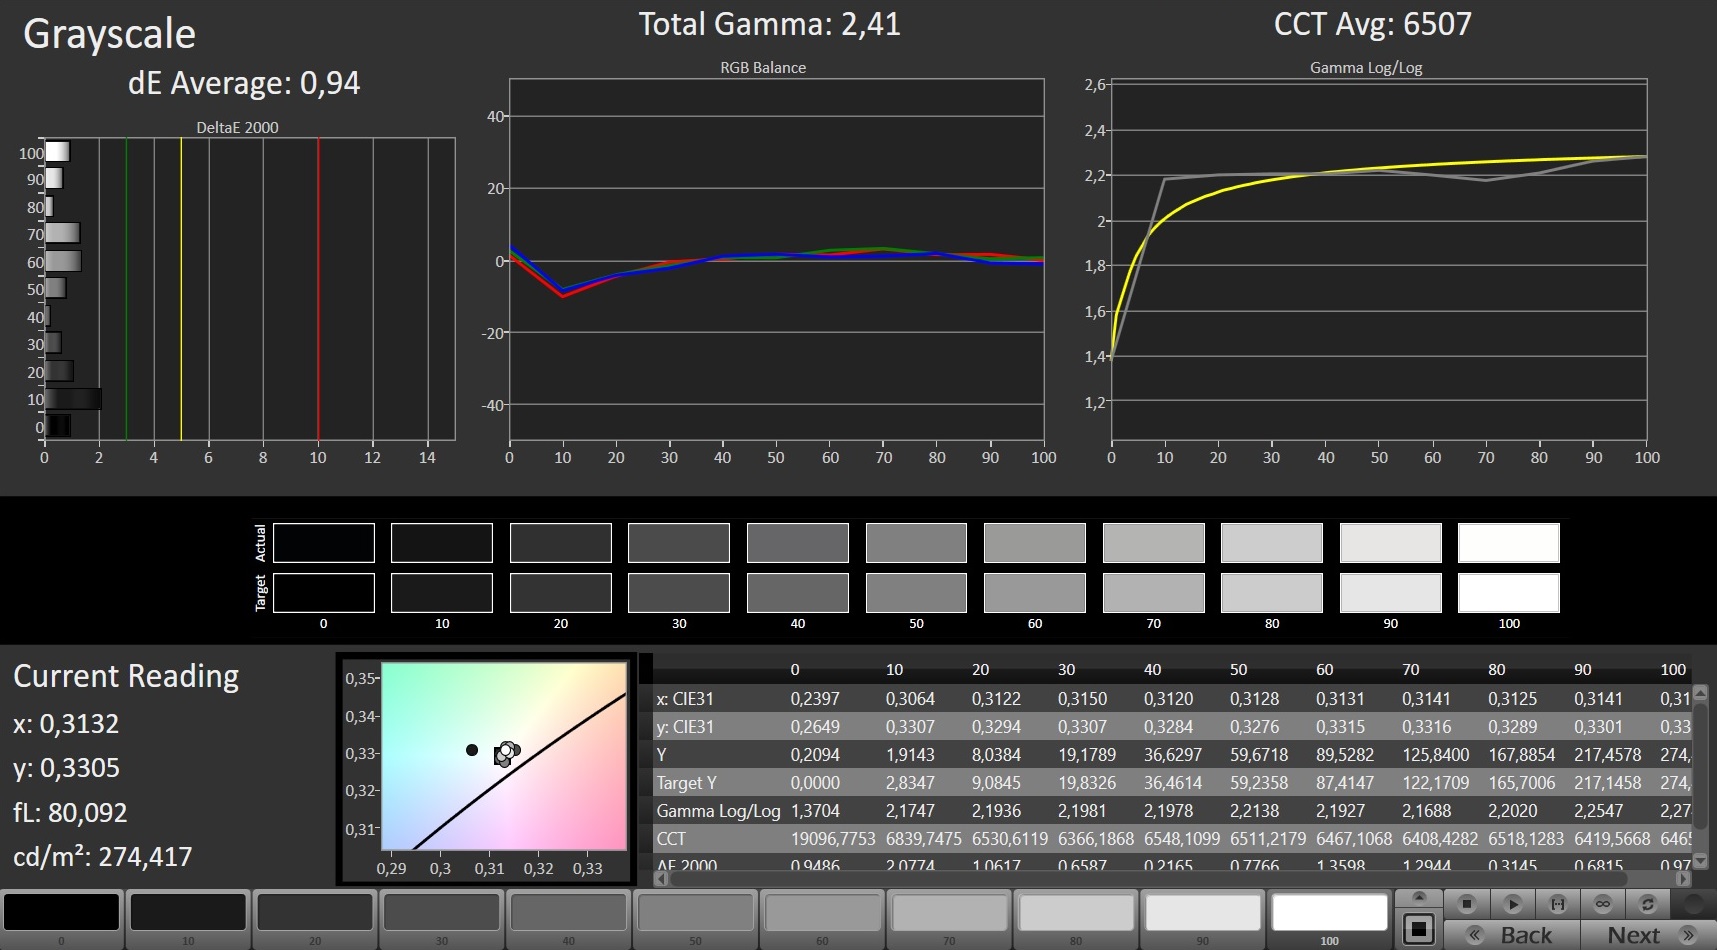
ΔE Greyscale Calman: 3.22 | ∀{0.09-98 Ø4.96}
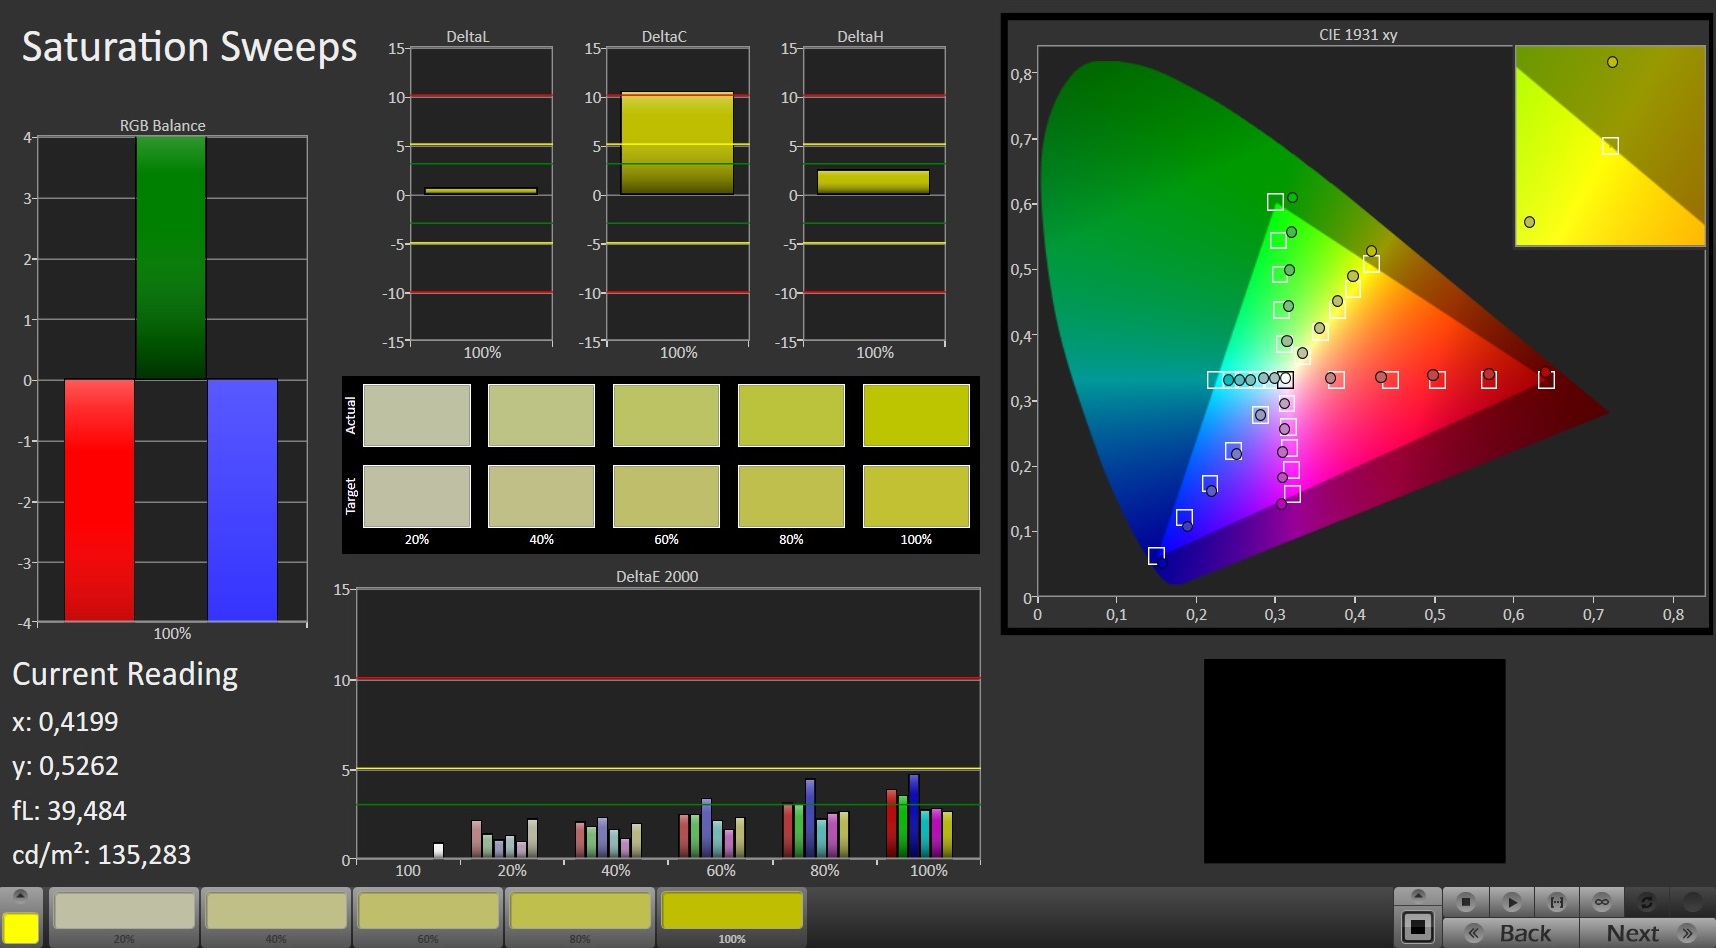
88% sRGB (Argyll 1.6.3 3D)
57% AdobeRGB 1998 (Argyll 1.6.3 3D)
64% AdobeRGB 1998 (Argyll 3D)
87.7% sRGB (Argyll 3D)
63.7% Display P3 (Argyll 3D)
Gamma: 2.42
CCT: 7072 K
| MSI PS63 Modern 8SC CMN N156HCE-EN1 (CMN15E8), IPS, 1920x1080 | MSI PS63 Modern 8RC Chi Mei CMN15E8 N156HCE/EN1, IPS, 1920x1080 | Asus ZenBook 15 UX533FD BOE07D8, IPS, 1920x1080 | Acer Aspire 5 A515-52G-723L BOE NV156FHM-N48, IPS, 1920x1080 | |
|---|---|---|---|---|
| Display | 0% | 2% | -35% | |
| Display P3 Coverage (%) | 63.7 | 63.5 0% | 67.2 5% | 40.02 -37% |
| sRGB Coverage (%) | 87.7 | 87.9 0% | 88.4 1% | 58.5 -33% |
| AdobeRGB 1998 Coverage (%) | 64 | 63.9 0% | 64.6 1% | 41.34 -35% |
| Response Times | 1% | -11% | -5% | |
| Response Time Grey 50% / Grey 80% * (ms) | 41.6 ? | 42 ? -1% | 45 ? -8% | 45 ? -8% |
| Response Time Black / White * (ms) | 32.8 ? | 32 ? 2% | 37 ? -13% | 33 ? -1% |
| PWM Frequency (Hz) | 25510 ? | 25000 ? | 250 ? | |
| Screen | 12% | -0% | -13% | |
| Brightness middle (cd/m²) | 207 | 289 40% | 311 50% | 278 34% |
| Brightness (cd/m²) | 199 | 262 32% | 303 52% | 271 36% |
| Brightness Distribution (%) | 84 | 75 -11% | 81 -4% | 89 6% |
| Black Level * (cd/m²) | 0.22 | 0.26 -18% | 0.24 -9% | 0.26 -18% |
| Contrast (:1) | 941 | 1112 18% | 1296 38% | 1069 14% |
| Colorchecker dE 2000 * | 3.77 | 2.9 23% | 5.1 -35% | 4.73 -25% |
| Colorchecker dE 2000 max. * | 5.98 | 5.71 5% | 8.91 -49% | 8.38 -40% |
| Colorchecker dE 2000 calibrated * | 2.59 | 2.88 -11% | 2.48 4% | 5.17 -100% |
| Greyscale dE 2000 * | 3.22 | 1.42 56% | 4.93 -53% | 2.59 20% |
| Gamma | 2.42 91% | 2.39 92% | 2.44 90% | 2.38 92% |
| CCT | 7072 92% | 6705 97% | 7641 85% | 6160 106% |
| Color Space (Percent of AdobeRGB 1998) (%) | 57 | 57 0% | 58 2% | 36 -37% |
| Color Space (Percent of sRGB) (%) | 88 | 87 -1% | 88 0% | 58 -34% |
| Total Average (Program / Settings) | 4% /
8% | -3% /
-1% | -18% /
-16% |
* ... smaller is better
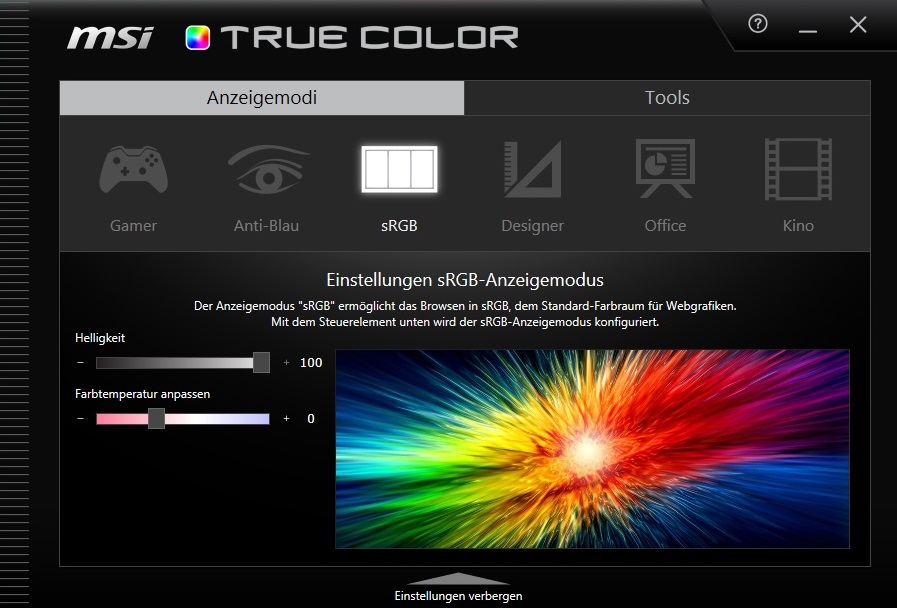
In this case, the MSI tool True Color, which has caused questionable results in the past due to altering not only color representation but also brightness levels. After the boot process, when the application's effects become apparent (tested with the standard mode sRGB), luminance drops by almost 50 nits, which heavily impairs its outdoor capabilities. The average value of 199 nits is only sufficient for indoor use.
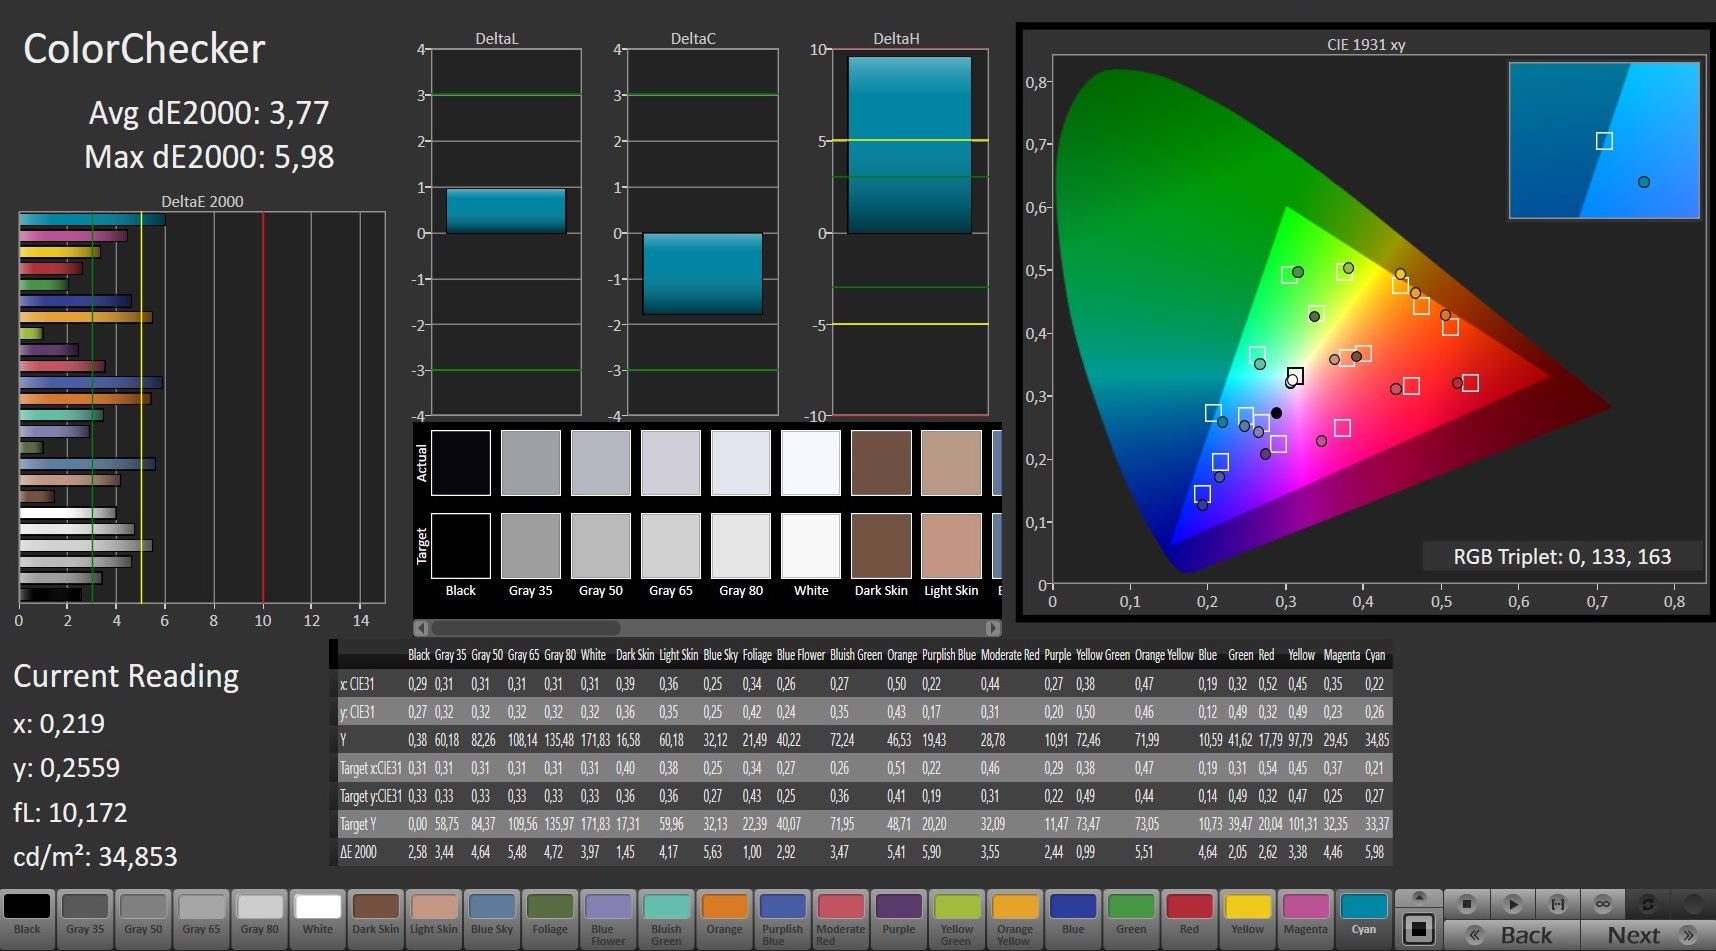
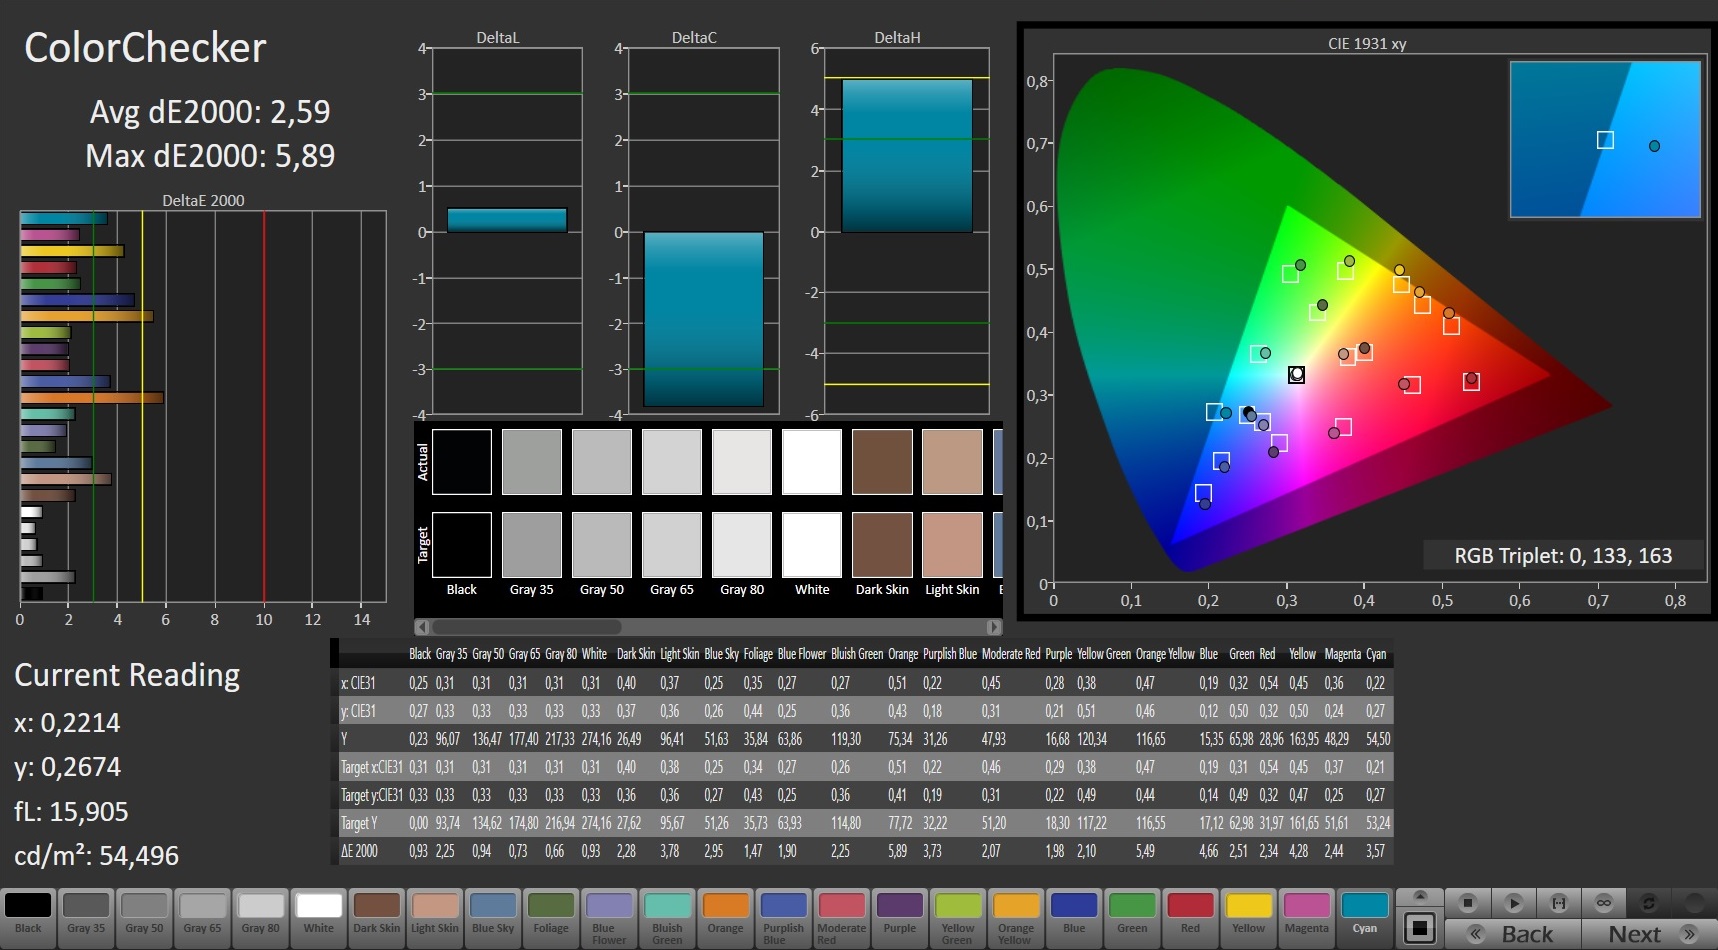
Possible solutions include uninstalling True Color (since just disabling the application had no effect on our test device) and installing our ICC profile, which can be found above to the right of the 9 brightness measurement fields. The latter has the additional advantage of improving color accuracy, although the PS63 is fairly close to ideal in that regard ex factory (DeltaE of less than 3).

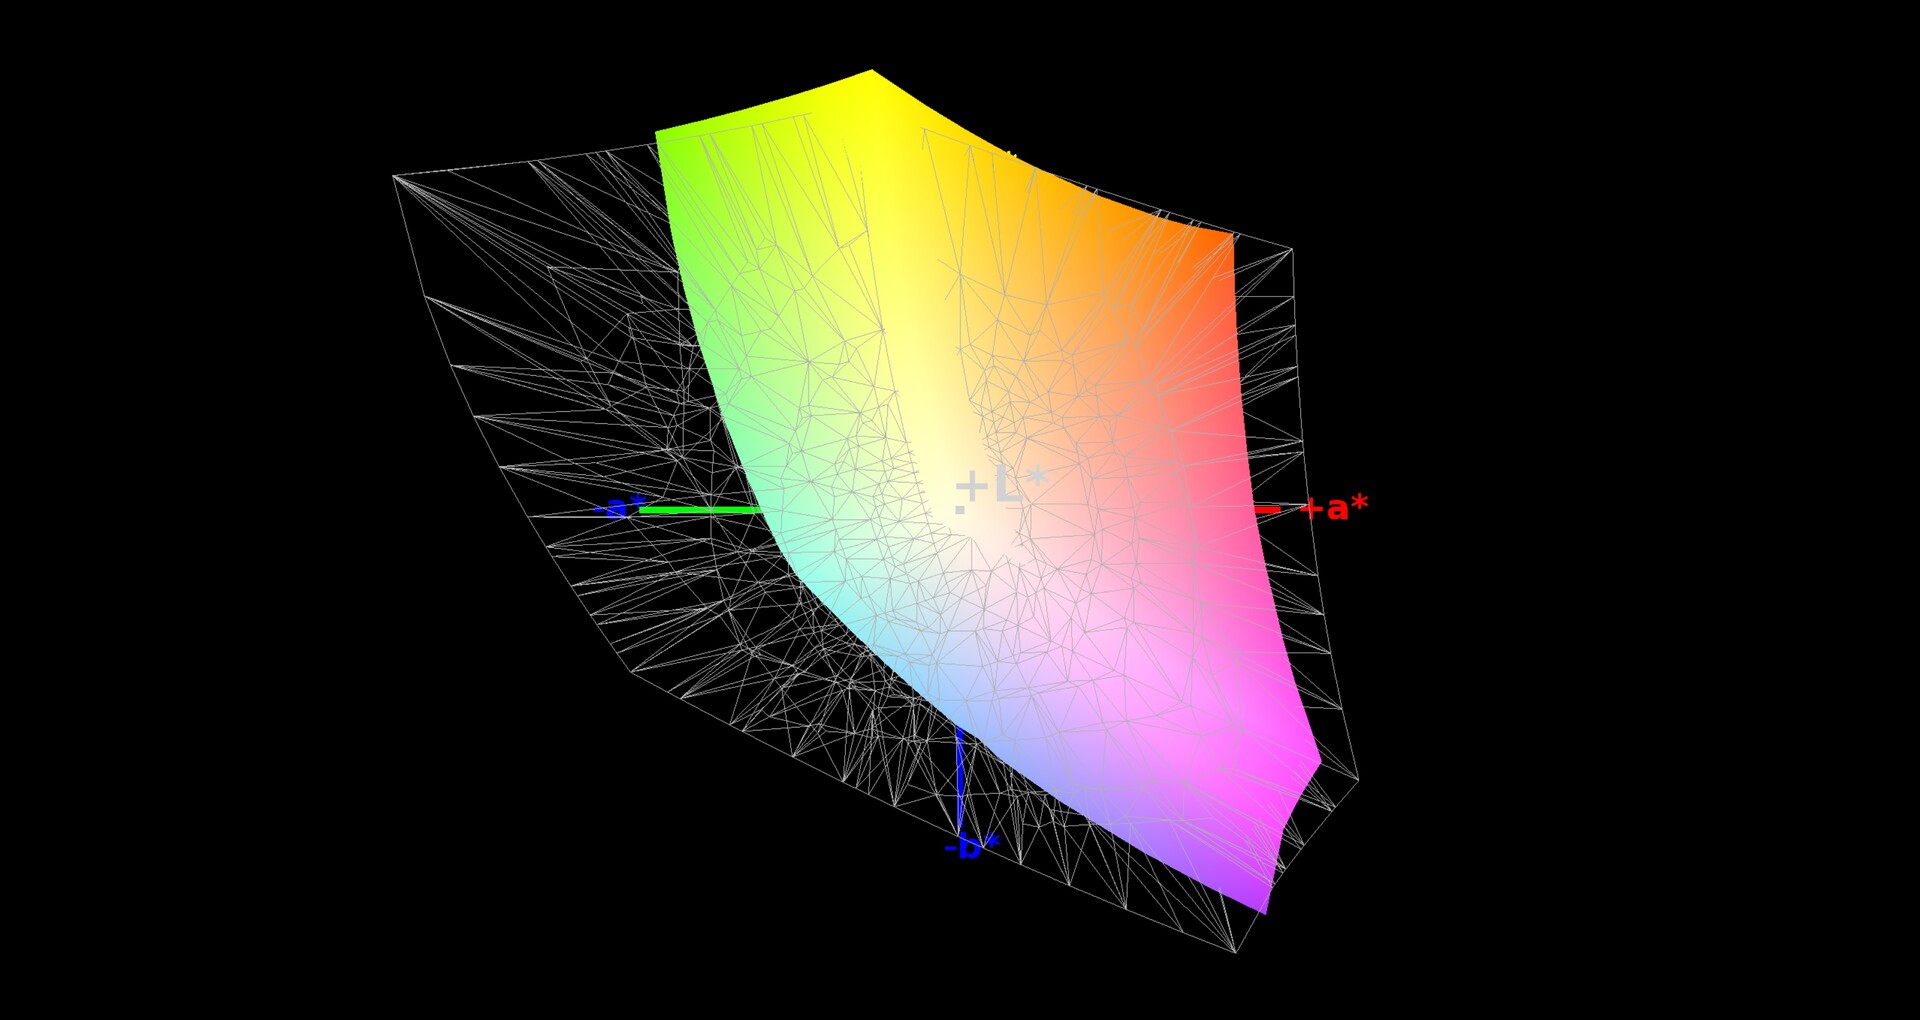
Color space coverage (88% sRGB, 57% AdobeRGB) is decent compared to the competition. We were able to measure a contrast ratio of 941:1 and a good black value of only 0.22 nits. There is room for improvement when it comes to the response times. With 144-Hz panels being fairly common these days, 33 ms black-to-white and 42 ms gray-to-gray seems slightly outdated. The PS63 Modern only supports 60 Hz.
Display Response Times
| ↔ Response Time Black to White | ||
|---|---|---|
| 32.8 ms ... rise ↗ and fall ↘ combined | ↗ 22.8 ms rise | 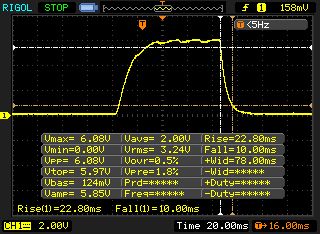 |
| ↘ 10 ms fall | ||
| The screen shows slow response rates in our tests and will be unsatisfactory for gamers. In comparison, all tested devices range from 0.1 (minimum) to 240 (maximum) ms. » 88 % of all devices are better. This means that the measured response time is worse than the average of all tested devices (19.8 ms). | ||
| ↔ Response Time 50% Grey to 80% Grey | ||
| 41.6 ms ... rise ↗ and fall ↘ combined | ↗ 23.6 ms rise | 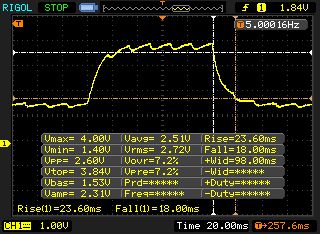 |
| ↘ 18 ms fall | ||
| The screen shows slow response rates in our tests and will be unsatisfactory for gamers. In comparison, all tested devices range from 0.165 (minimum) to 636 (maximum) ms. » 67 % of all devices are better. This means that the measured response time is worse than the average of all tested devices (31 ms). | ||
Screen Flickering / PWM (Pulse-Width Modulation)
| Screen flickering / PWM detected | 25510 Hz | ≤ 28 % brightness setting | 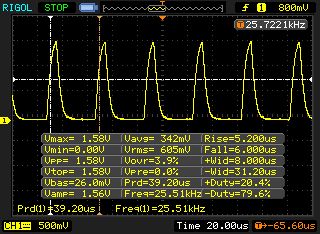 |
The display backlight flickers at 25510 Hz (worst case, e.g., utilizing PWM) Flickering detected at a brightness setting of 28 % and below. There should be no flickering or PWM above this brightness setting. The frequency of 25510 Hz is quite high, so most users sensitive to PWM should not notice any flickering. In comparison: 52 % of all tested devices do not use PWM to dim the display. If PWM was detected, an average of 7757 (minimum: 5 - maximum: 343500) Hz was measured. | |||
Performance
The performance falls into the upper mid-range segment. As long as detail and resolution are kept at a reasonable level, the combination of Core i7-8565U and GeForce GTX 1060 Max-Q handles most applications without issues.
Processor
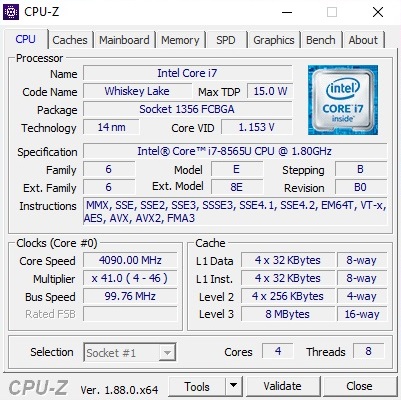
We applaud MSI's choice to rely on the Core i7-8565U. The quad-core Whiskey Lake model not only consumes less power thanks to its 15 Watt TDP but also requires less cooling than Intel's traditional 45-Watt CPUs (such as the i7-8750H), which in turn improves fan noise levels, battery life and allows for a thinner chassis design. Thanks to hyper threading (8 threads in parallel) and a high maximum clock rate (up to 4.6 GHz), the 8565U performs admirably compared to its big brothers.
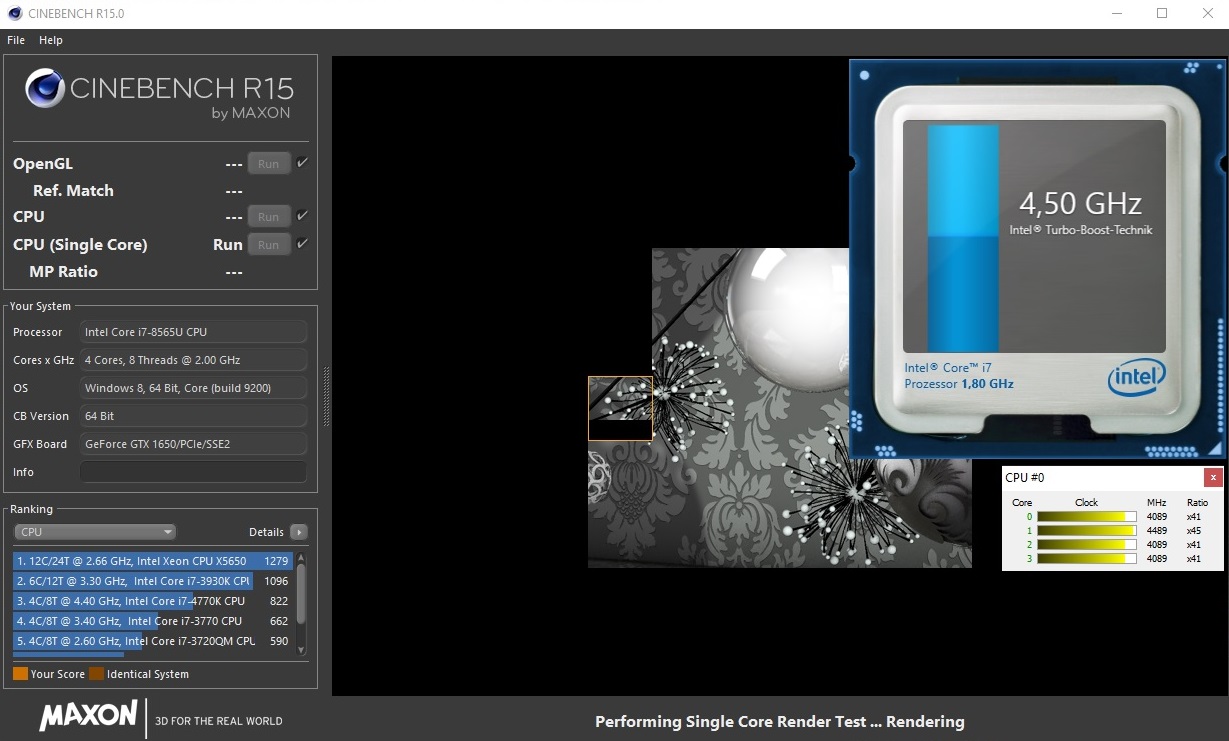
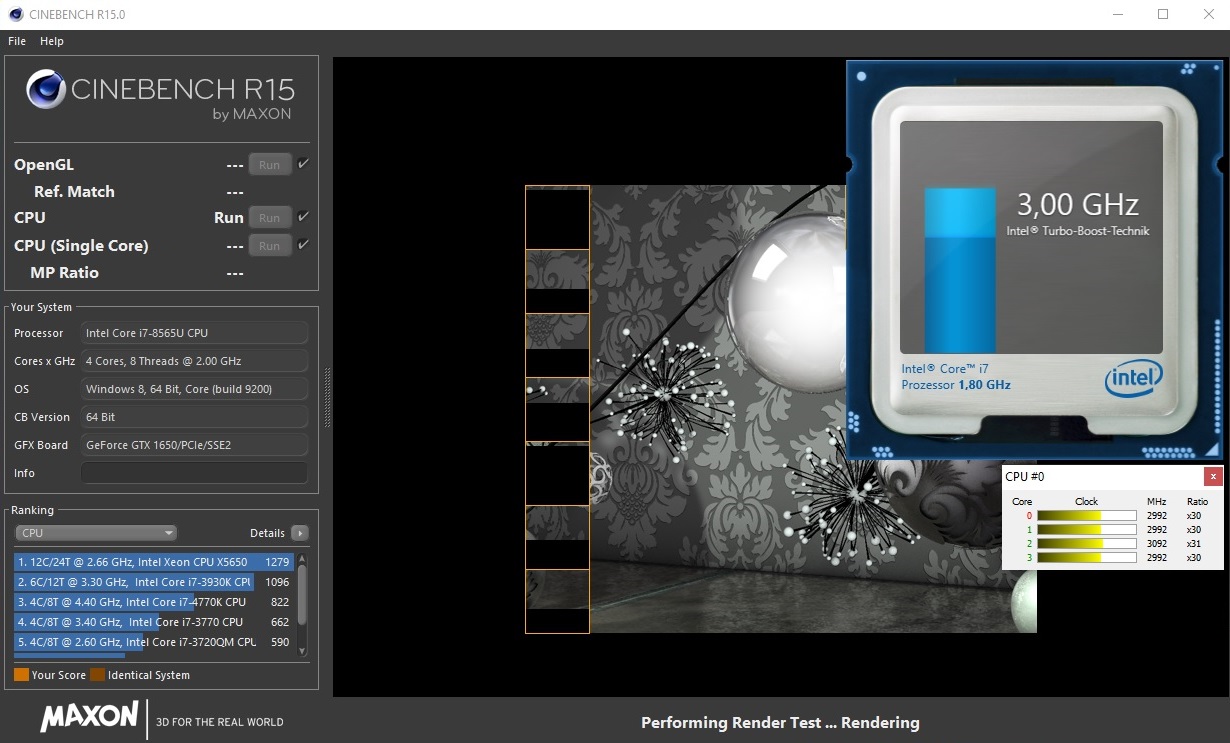
We used CineBench R15 to determine whether the automatic Turbo Boost performs adequately. The results are mixed. At 4.0 to 4.5 GHz, the CPU still operates quite close to the Turbo Boost limit during the single-core test, however it only reached 2.9 to 3.9 GHz during the multi-core test before stabilizing at around 3.0 GHz. In multi-core scenarios, this is about 1 GHz less from each core than the theoretical maximum.
Compared to the PS63 8SC's competition, this is not a bad result however. Both the Acer Aspire 5 A515 and the PS63 8RC achieve significantly worse results in the CineBench loop (see graph). Only the Asus ZenBook 15 is able to squeeze even more performance out of the i7-8565U.
| Cinebench R20 | |
| CPU (Single Core) | |
| Average of class Multimedia (425 - 853, n=59, last 2 years) | |
| MSI PS63 Modern 8SC | |
| Acer Aspire 5 A515-52G-723L | |
| CPU (Multi Core) | |
| Average of class Multimedia (1887 - 12912, n=59, last 2 years) | |
| MSI PS63 Modern 8SC | |
| Acer Aspire 5 A515-52G-723L | |
System Performance
The MSI laptop is able to claim first place in our system performance tests. With 4,851 points in PCMark 10, the 15-inch device outperforms the competition by 9 to 21%, although the practical differences should be small to non-existent.
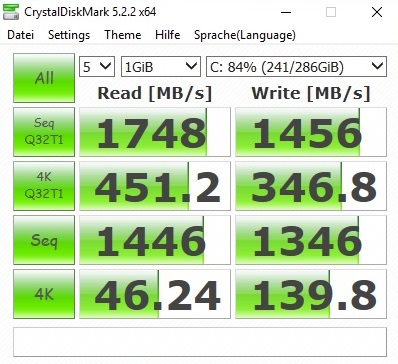
Storage Solution
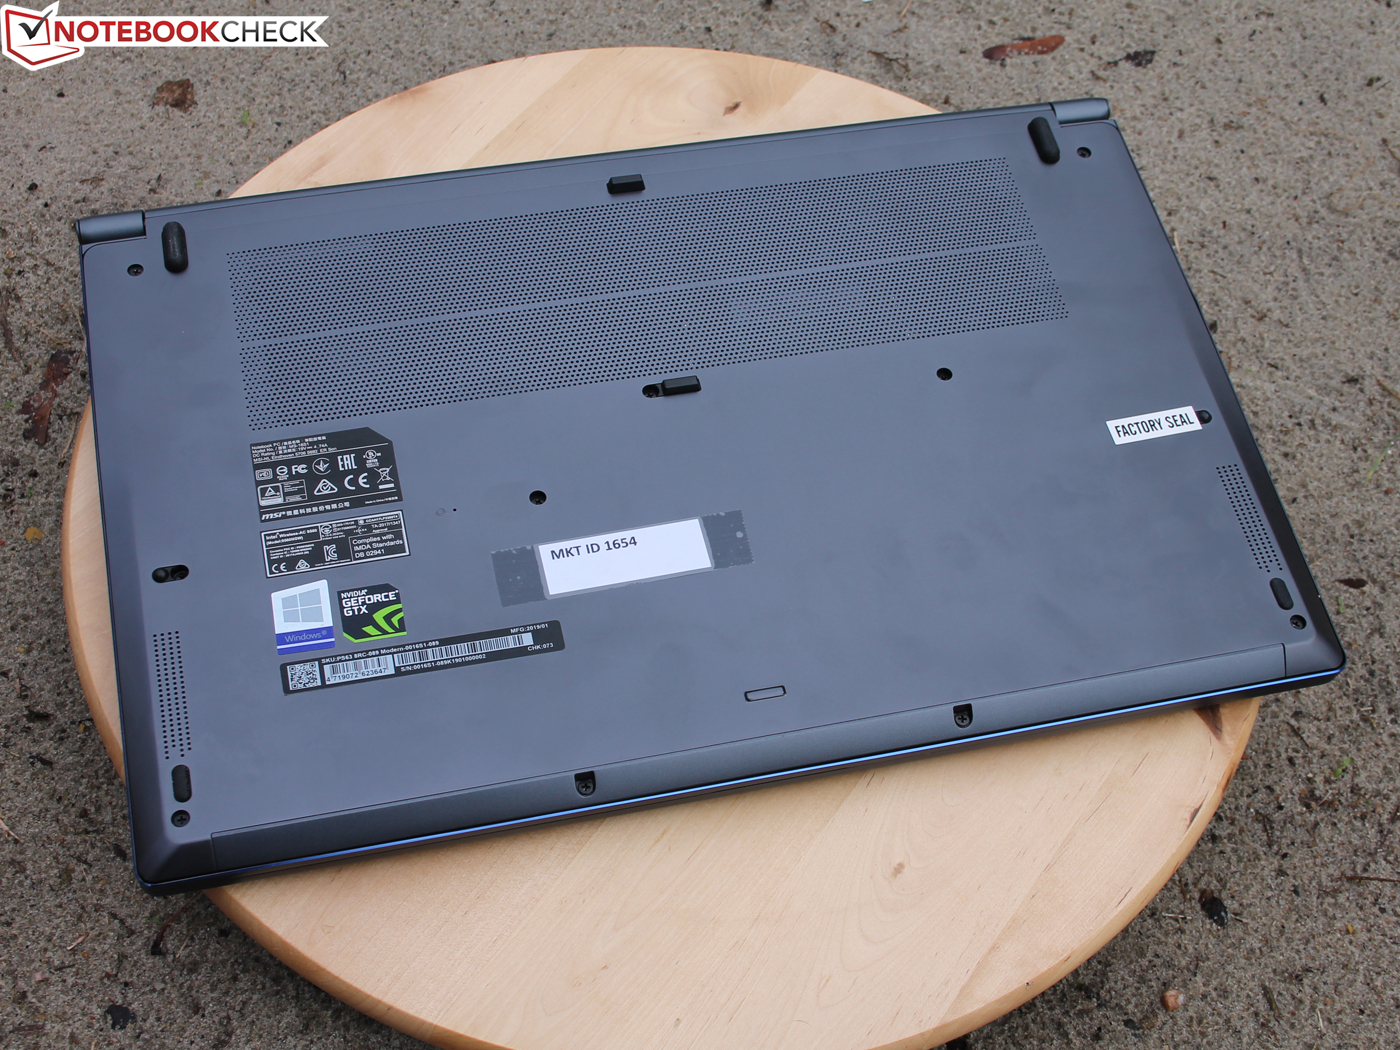
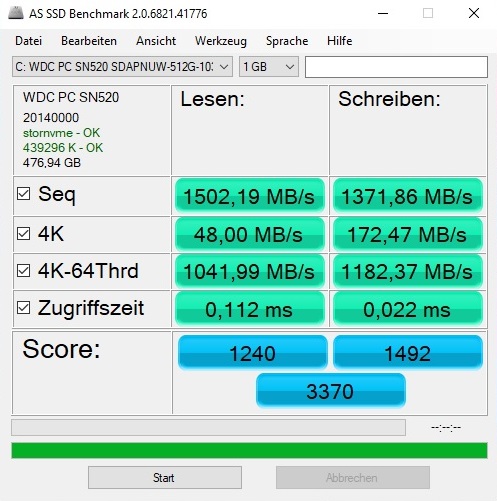
The storage solution is most definitely up to date. MSI equips the PS63 8SC with a PCIe-based M.2 SSD that effortlessly cracks the 1,000 Mb/s mark during sequential reading and writing operations. Since all of its competitors rely on the 512-GB model of the Western Digital PC SN520, the comparison table does not look very exciting. Big plus: Users who want to expand their storage space have access to another unoccupied M.2 slot below the hood.
| MSI PS63 Modern 8SC WDC PC SN520 SDAPNUW-512G | MSI PS63 Modern 8RC WDC PC SN520 SDAPNUW-512G | Asus ZenBook 15 UX533FD WDC PC SN520 SDAPNUW-512G | Acer Aspire 5 A515-52G-723L WDC PC SN520 SDAPNUW-512G | |
|---|---|---|---|---|
| CrystalDiskMark 5.2 / 6 | -13% | -10% | -10% | |
| Write 4K (MB/s) | 139.8 | 121.3 -13% | 126.2 -10% | 130.1 -7% |
| Read 4K (MB/s) | 46.24 | 44.07 -5% | 41.2 -11% | 27.64 -40% |
| Write Seq (MB/s) | 1346 | 1176 -13% | 1055 -22% | 1438 7% |
| Read Seq (MB/s) | 1446 | 1139 -21% | 884 -39% | 1319 -9% |
| Write 4K Q32T1 (MB/s) | 346.8 | 257.8 -26% | 445.5 28% | 323.3 -7% |
| Read 4K Q32T1 (MB/s) | 451.2 | 325.9 -28% | 338.8 -25% | 359.9 -20% |
| Write Seq Q32T1 (MB/s) | 1456 | 1455 0% | 1453 0% | 1454 0% |
| Read Seq Q32T1 (MB/s) | 1748 | 1741 0% | 1734 -1% | 1740 0% |

GPU Performance
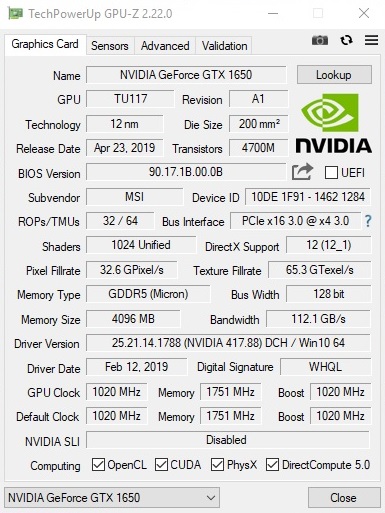
Much like the ULV CPU, the graphics card is designed to be efficient. Nvidia's Max-Q promises a particularly economical chip, which in turn offers less performance than its normal counterpart. The GeForce 1650 Max-Q specifically has a core clock of 1,020 MHz instead of 1,395 MHz (base) and a memory clock of 7,000 MHz instead of 8,000 MHz. Furthermore, there are small deviations in terms of shader units (1,024 unified) and the size of the VRAM (4GB GDDR5 @128-bit interface).
| 3DMark 06 Standard Score | 31487 points | |
| 3DMark Vantage P Result | 30957 points | |
| 3DMark 11 Performance | 10471 points | |
| 3DMark Ice Storm Standard Score | 78312 points | |
| 3DMark Cloud Gate Standard Score | 21701 points | |
| 3DMark Fire Strike Score | 6850 points | |
| 3DMark Time Spy Score | 3004 points | |
Help | ||
In synthetic benchmarks, the GTX 1650 Max-Q handily outclasses its predecessor, the GeForce GTX 1050 Max-Q. 3DMark 13 Fire Strike confirms a performance lead of +34 to +38%. In 3DMark 11, the lead grows to 50 to 57% (compared to the Asus Zenbook 15 and the MSI PS63 8RC).
| 3DMark | |
| 1920x1080 Fire Strike Graphics | |
| Average of class Multimedia (2328 - 48907, n=61, last 2 years) | |
| MSI PS63 Modern 8SC | |
| MSI PS63 Modern 8RC | |
| Asus ZenBook 15 UX533FD | |
| Acer Aspire 5 A515-52G-723L | |
| 2560x1440 Time Spy Graphics | |
| Average of class Multimedia (696 - 19403, n=62, last 2 years) | |
| MSI PS63 Modern 8SC | |
| Acer Aspire 5 A515-52G-723L | |
| 3DMark 11 - 1280x720 Performance GPU | |
| Average of class Multimedia (3749 - 60002, n=58, last 2 years) | |
| MSI PS63 Modern 8SC | |
| MSI PS63 Modern 8RC | |
| Asus ZenBook 15 UX533FD | |
| Acer Aspire 5 A515-52G-723L | |
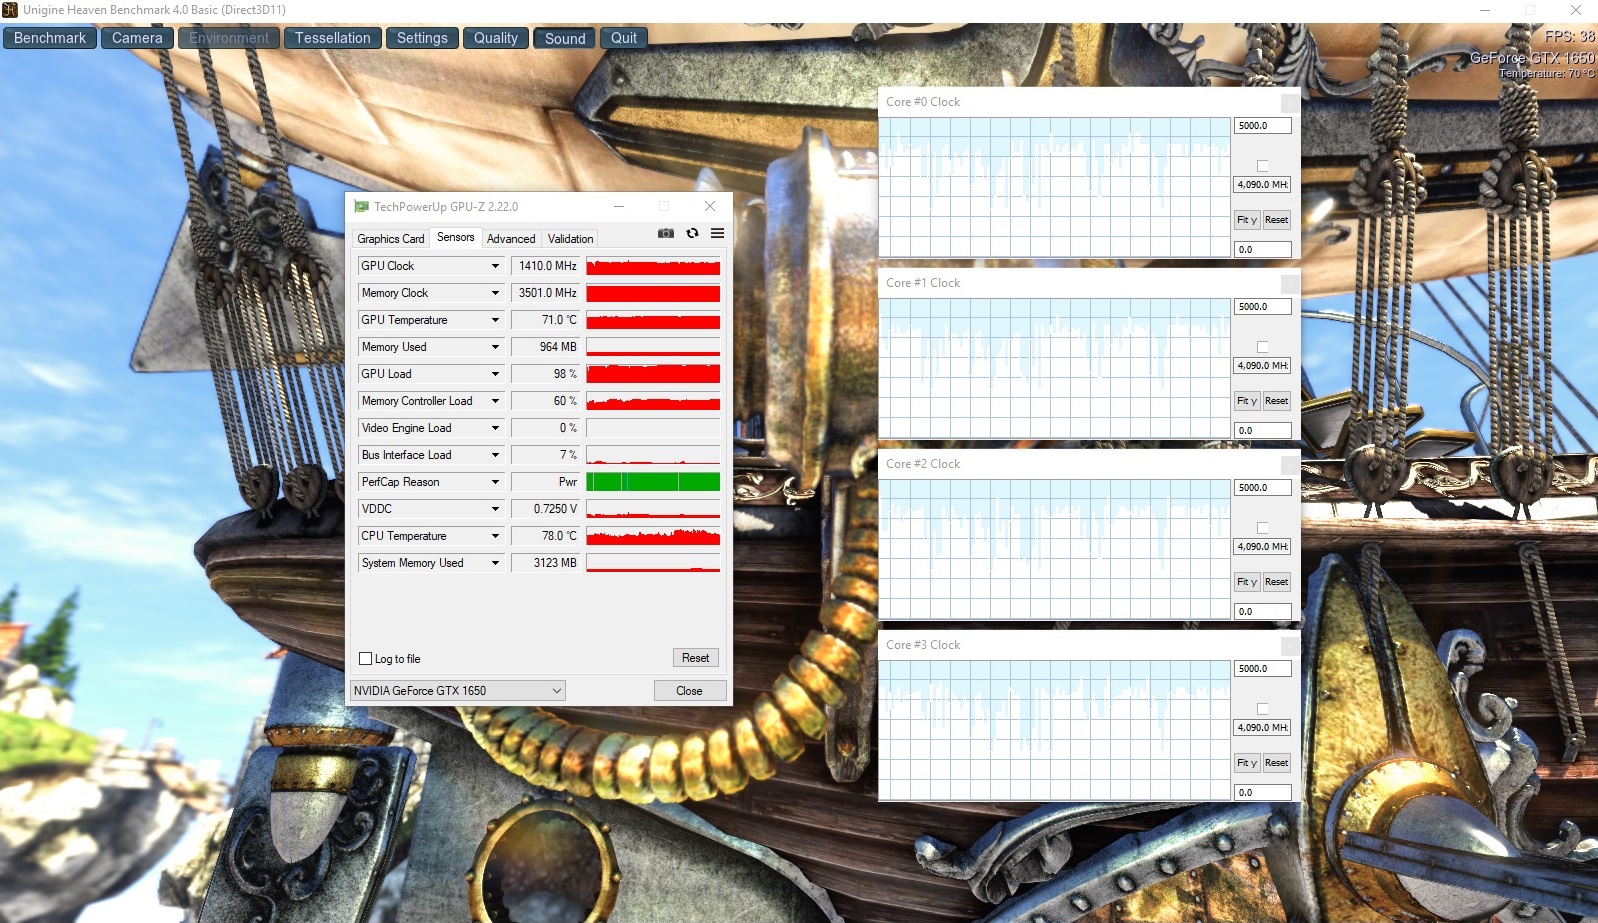
We ran the role play game The Witcher 3 (maximum details @1,920 x 1,080) for around 60 minutes in order to determine whether the PS63 8SC is able to maintain its 3D performance for a prolonged time. As the graph below shows very clearly, there are no dips in performance and/or fps drops.
Gaming Performance
Since the PS63 8SC is our first laptop with the GTX 1650 Max-Q, our gaming tests were particularly comprehensive. The 40 games from 2015 through 2019 should offer an accurate impression of the overall performance capabilities of the graphics card. The 15-inch laptop is able to run almost all titles at the native resolution and high or even very high detail settings. Only extremely demanding or poorly optimized games such as Metro Exodus and Final Fantasy 15 may require falling back to medium quality.
| The Witcher 3 | |
| 1920x1080 High Graphics & Postprocessing (Nvidia HairWorks Off) | |
| Average of class Multimedia (22 - 224, n=10, last 2 years) | |
| MSI PS63 Modern 8SC | |
| Asus ZenBook 15 UX533FD | |
| Acer Aspire 5 A515-52G-723L | |
| 1920x1080 Ultra Graphics & Postprocessing (HBAO+) | |
| Average of class Multimedia (11 - 121, n=10, last 2 years) | |
| Asus ZenBook 15 UX533FD | |
| MSI PS63 Modern 8SC | |
| Acer Aspire 5 A515-52G-723L | |
The GTX 1650 Max-Q was not made for QHD and 4K displays. At 2,560 x 1,440 or 3,840 x 2,160 pixels, the GPU quickly runs out of steam. Passionate gamers would be well-advised to choose at least a GeForce GTX 1660 Ti or a RTX 2060 to run games smoothly at these resolutions.
| low | med. | high | ultra | QHD | 4K | |
|---|---|---|---|---|---|---|
| The Witcher 3 (2015) | 48.1 | 28.8 | 17.6 | |||
| Rainbow Six Siege (2015) | 115 | 101 | 40 | |||
| Doom (2016) | 79.6 | 77.4 | 23.9 | |||
| Overwatch (2016) | 119 | 69.5 | 39.1 | |||
| Mirror's Edge Catalyst (2016) | 54.7 | 49.9 | 17.5 | |||
| Deus Ex Mankind Divided (2016) | 43 | 22.9 | 14.1 | |||
| Dishonored 2 (2016) | 53.9 | 44.8 | 21.2 | |||
| Resident Evil 7 (2017) | 146 | 78.8 | 65.2 | 21.5 | ||
| For Honor (2017) | 66.8 | 63.8 | 49.4 | 19.1 | ||
| Ghost Recon Wildlands (2017) | 48.5 | 44.4 | 21.7 | 14.6 | ||
| Prey (2017) | 97.5 | 77.3 | 67.1 | 23.6 | ||
| Rocket League (2017) | 128 | 86.5 | 42.7 | |||
| Playerunknown's Battlegrounds (PUBG) (2017) | 84.6 | 70.8 | 52.6 | 16.6 | ||
| Middle-earth: Shadow of War (2017) | 64 | 47 | 35 | 14 | ||
| ELEX (2017) | 61.1 | 48.6 | 37.3 | 24.5 | 12.2 | |
| Need for Speed Payback (2017) | 72.3 | 61.8 | 58.9 | 38.6 | 19.1 | |
| Star Wars Battlefront 2 (2017) | 72.2 | 62.3 | 46.5 | 29.4 | 5.6 | |
| Fortnite (2018) | 138 | 79.9 | 59.1 | 36.2 | 10.9 | |
| Final Fantasy XV Benchmark (2018) | 41.7 | 29.4 | 9.6 | |||
| Kingdom Come: Deliverance (2018) | 48.1 | 38 | 26.4 | 18.5 | 9.4 | |
| The Crew 2 (2018) | 59.3 | 49.1 | 42 | 26.4 | 13 | |
| Monster Hunter World (2018) | 46.3 | 40.1 | 31.4 | 19.2 | 8.9 | |
| Shadow of the Tomb Raider (2018) | 47 | 43 | 38 | 24 | 12 | |
| FIFA 19 (2018) | 195 | 179 | 173 | 124 | 64.8 | |
| Assassin´s Creed Odyssey (2018) | 49 | 41 | 20 | 17 | 8 | |
| Call of Duty Black Ops 4 (2018) | 62.7 | 58.5 | 50.9 | 32.7 | 10.9 | |
| Hitman 2 (2018) | 53.1 | 47.6 | 44.4 | 28.6 | 14.1 | |
| Battlefield V (2018) | 63.6 | 54.1 | 49.3 | 36.1 | 19.4 | |
| Farming Simulator 19 (2018) | 136 | 84 | 60.6 | 40.7 | ||
| Darksiders III (2018) | 67.4 | 53.4 | 47.1 | 29.3 | 9.7 | |
| Just Cause 4 (2018) | 59 | 42.6 | 39.7 | 26.2 | 13.2 | |
| Apex Legends (2019) | 69.7 | 57.6 | 54.3 | 39.7 | 21.9 | |
| Far Cry New Dawn (2019) | 53 | 50 | 46 | 32 | 16 | |
| Metro Exodus (2019) | 35.4 | 26.4 | 21.6 | 16.4 | 9.9 | |
| Anthem (2019) | 49.4 | 42.6 | 34.9 | 22.6 | 13.1 | |
| Dirt Rally 2.0 (2019) | 64 | 51.1 | 31.7 | 23.1 | ||
| The Division 2 (2019) | 51 | 41 | 30 | 20 | 9 | |
| Anno 1800 (2019) | 56.8 | 36.2 | 19.2 | 13.8 | 8.4 | |
| Rage 2 (2019) | 43 | 36.6 | 35.8 | 22.4 | 7.4 | |
| F1 2019 (2019) | 84 | 65 | 41 | 35 | 20 |
Emissions
System Noise
From our experience, the choice of the user scenario (Creator Center), at least during idle, does not affect fan noise. The fans of the PS63 8SC consistently produce between 32 and 34 db(A). We observed neither unnecessary pulsating behavior nor a complete standstill of the fans.
The 15-inch laptop is neither very quiet nor very loud under load. 41 to 45 dB(A) are typical values for a multimedia laptop in this performance class.
Noise level
| Idle |
| 32 / 33 / 34 dB(A) |
| Load |
| 44 / 45 dB(A) |
 | ||
30 dB silent 40 dB(A) audible 50 dB(A) loud |
||
min: | ||
| MSI PS63 Modern 8SC i7-8565U, GeForce GTX 1650 Max-Q | MSI PS63 Modern 8RC i7-8565U, GeForce GTX 1050 Max-Q | Asus ZenBook 15 UX533FD i7-8565U, GeForce GTX 1050 Max-Q | Acer Aspire 5 A515-52G-723L i7-8565U, GeForce MX250 | Average of class Multimedia | |
|---|---|---|---|---|---|
| Noise | 11% | 6% | 7% | 17% | |
| off / environment * (dB) | 30 | 30.4 -1% | 30.5 -2% | 29.9 -0% | 24.2 ? 19% |
| Idle Minimum * (dB) | 32 | 30.7 4% | 30.5 5% | 29.9 7% | 24.3 ? 24% |
| Idle Average * (dB) | 33 | 30.7 7% | 30.5 8% | 29.9 9% | 24.7 ? 25% |
| Idle Maximum * (dB) | 34 | 30.7 10% | 30.5 10% | 29.9 12% | 26.4 ? 22% |
| Load Average * (dB) | 44 | 34 23% | 40.8 7% | 41.7 5% | 37.4 ? 15% |
| Witcher 3 ultra * (dB) | 41 | ||||
| Load Maximum * (dB) | 45 | 33.7 25% | 41.8 7% | 41.7 7% | 46.2 ? -3% |
* ... smaller is better
Temperature
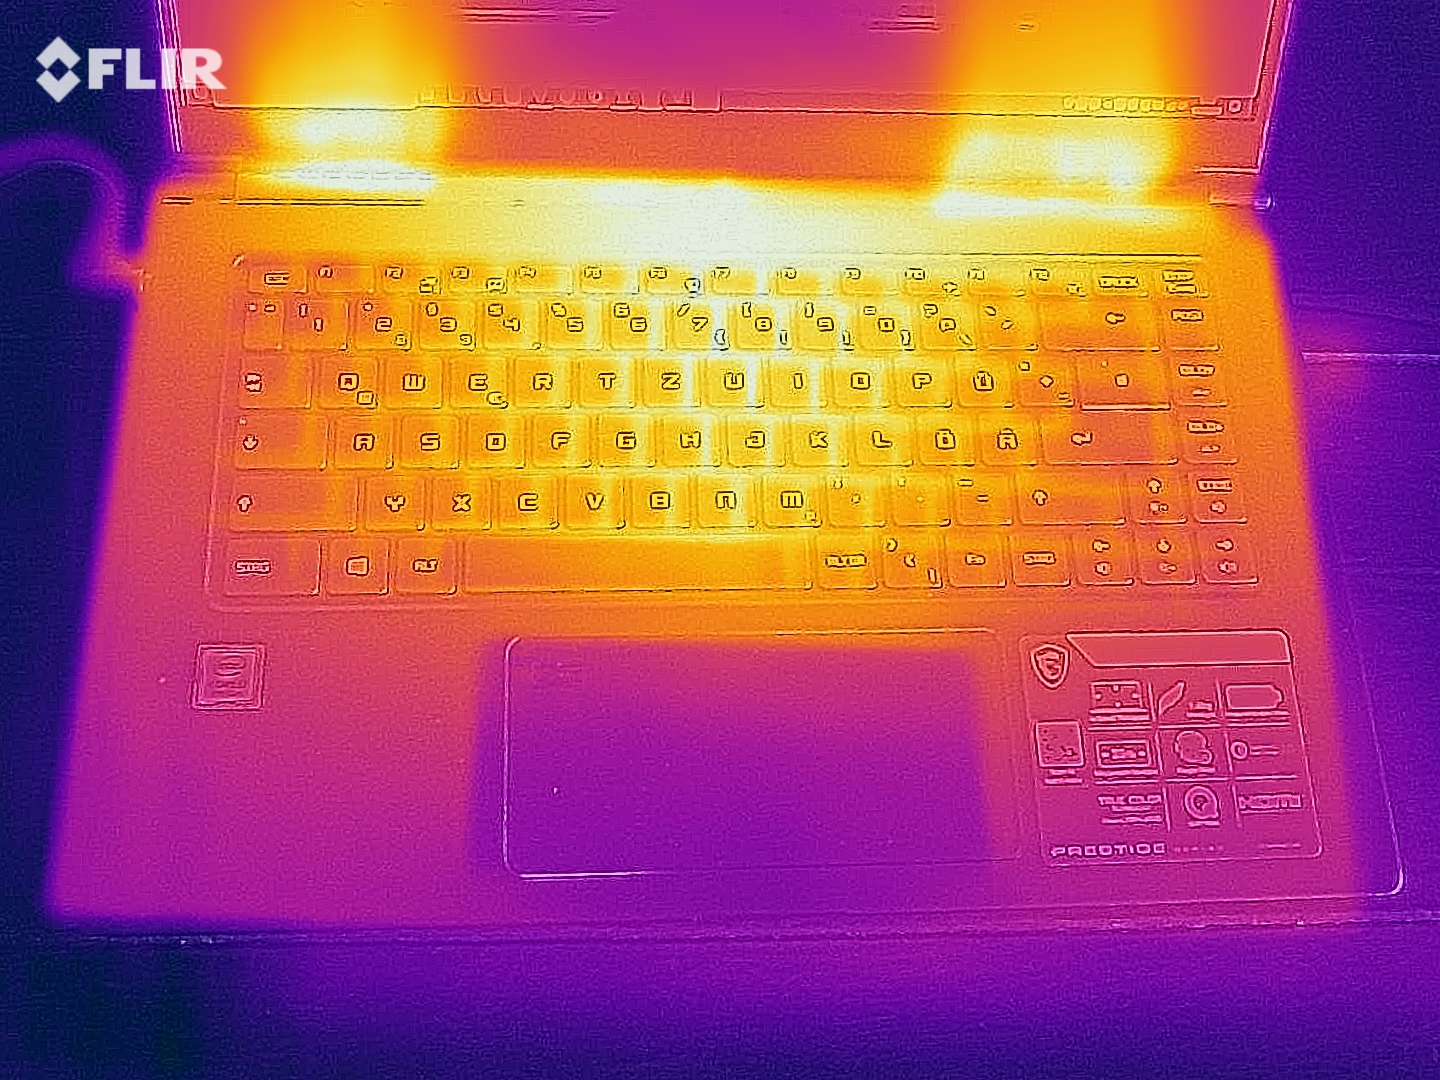
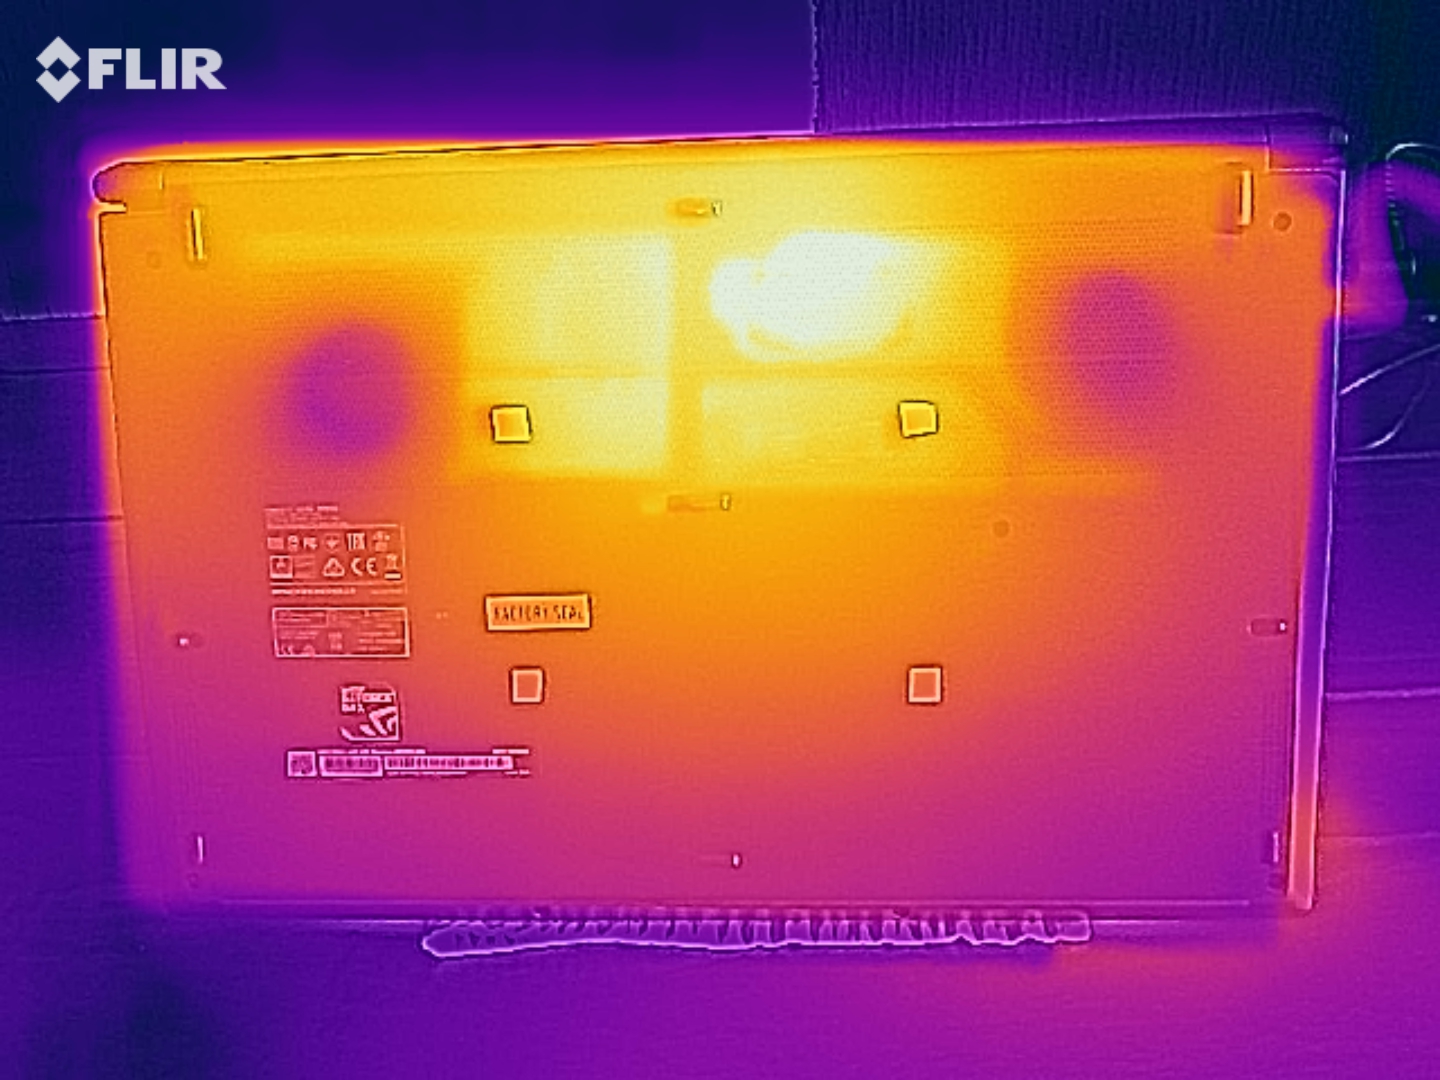
MSI has room for improvement when it comes to the surface temperatures. If the system load is at 100%, the top and bottom of the case become very warm at up to 56 °C (~133 °F) and 60 °C (140 °F), respectively. Thus, we do not recommend gaming while the device sits on your lap.
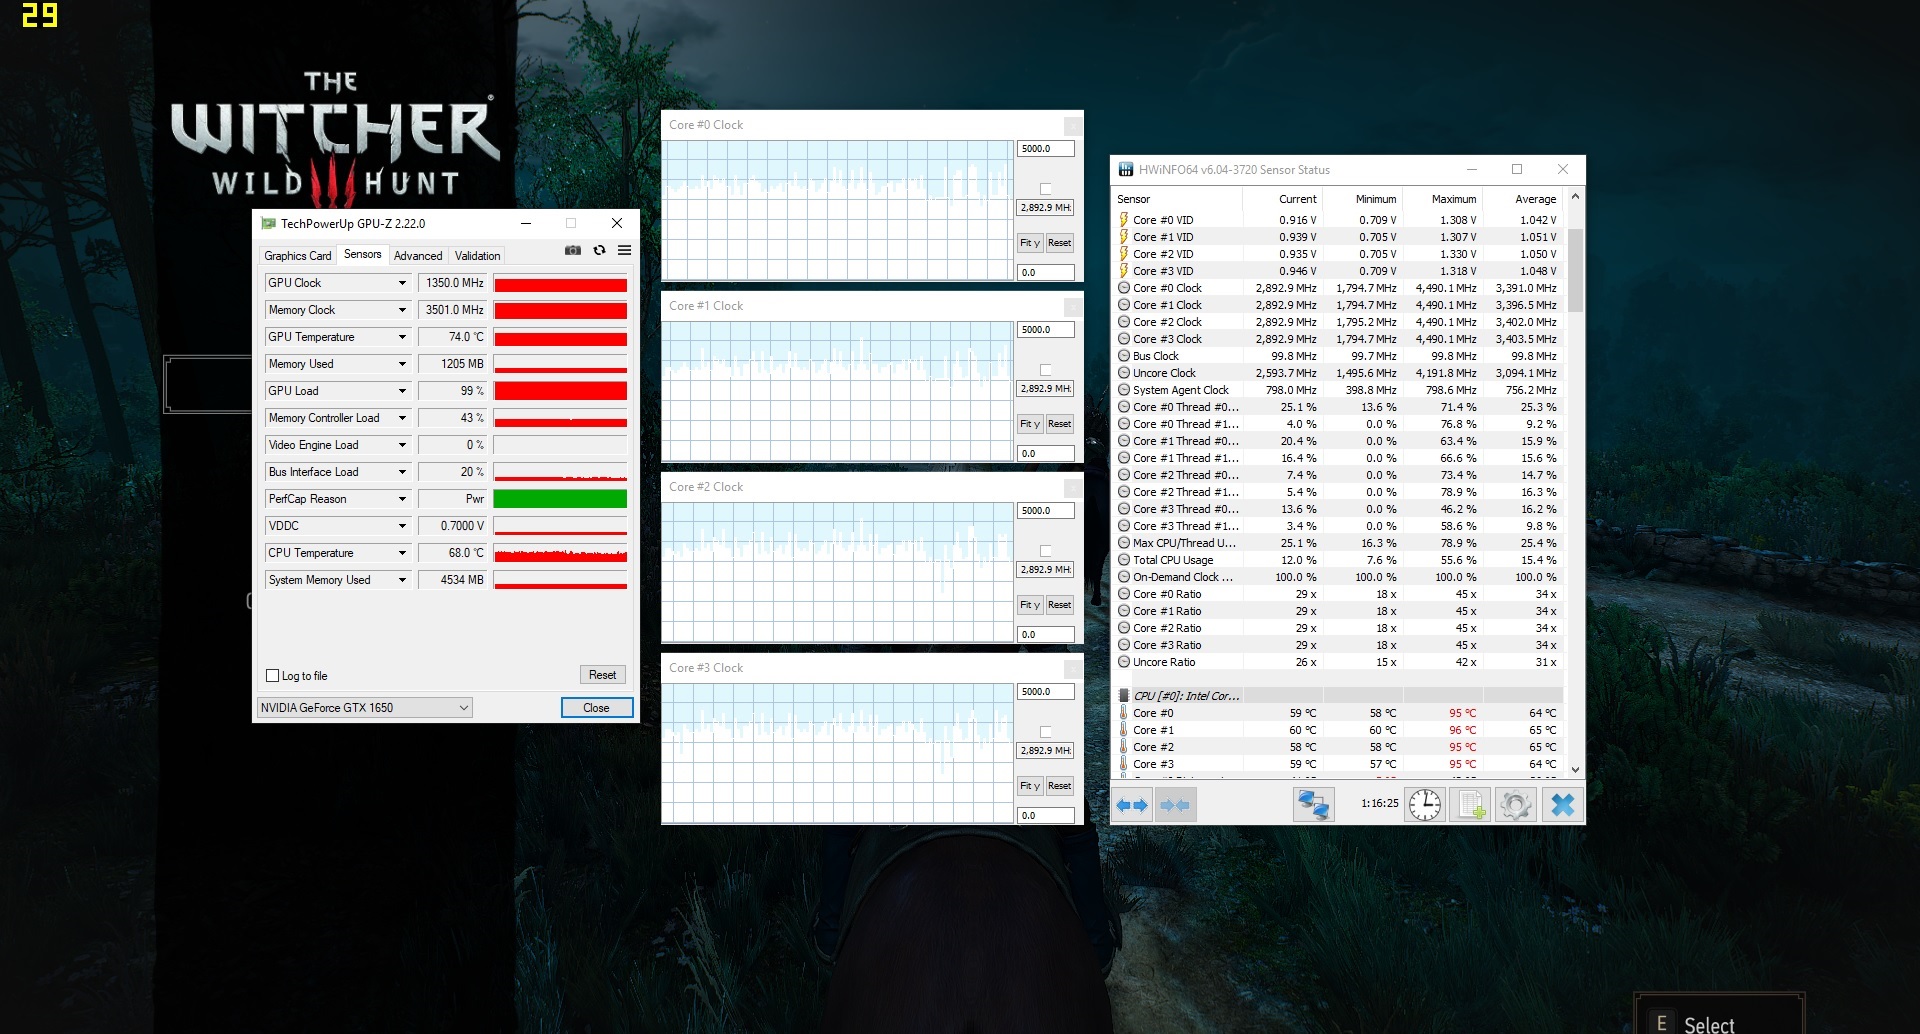
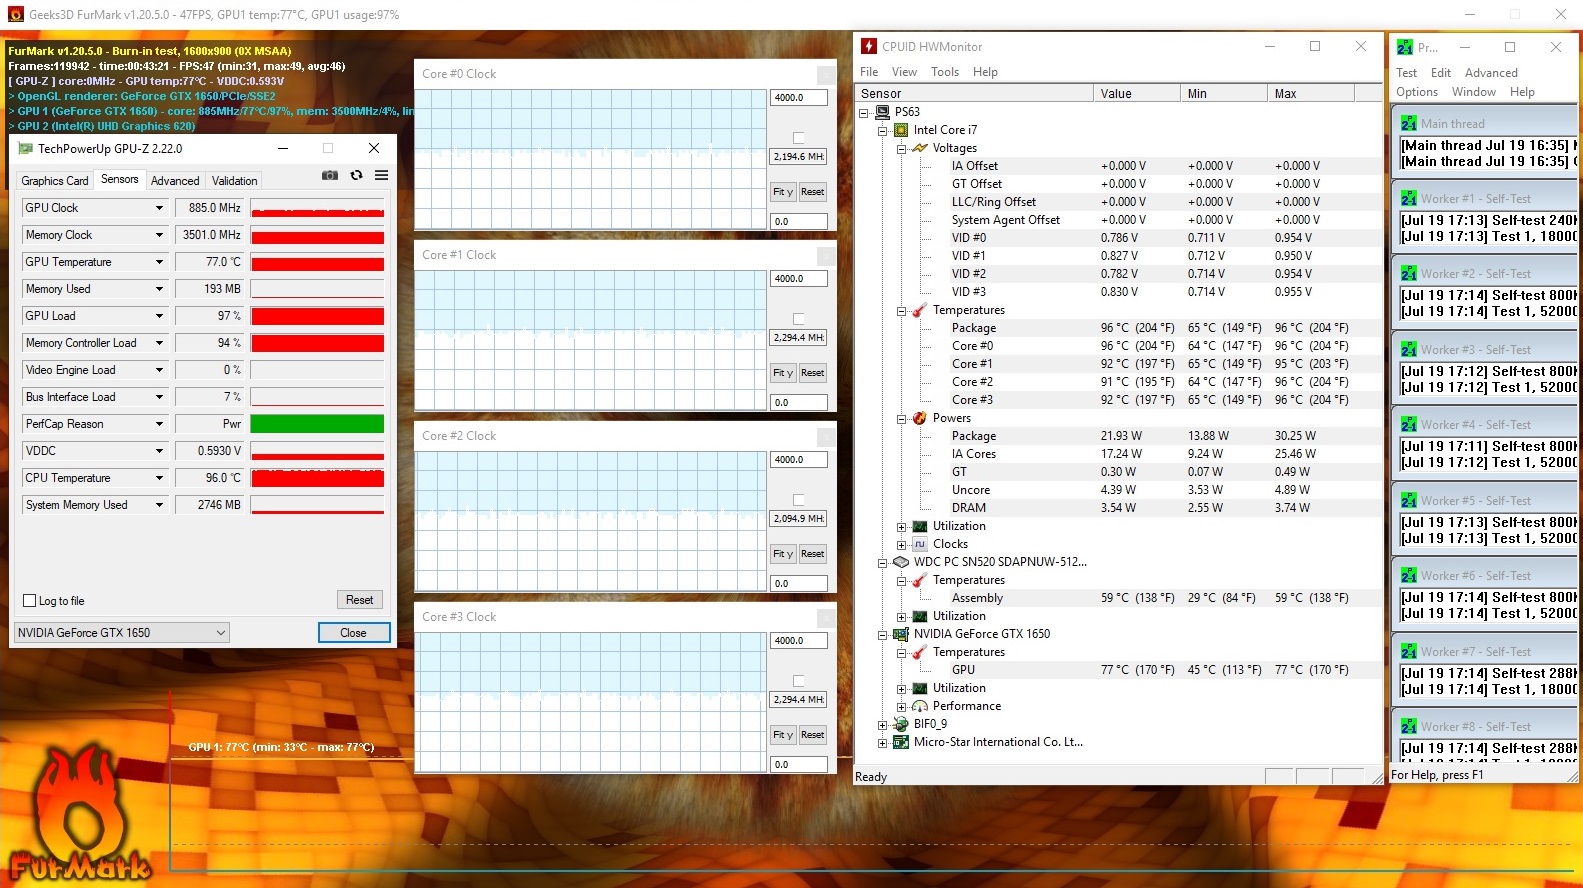
The hardware also reaches very high temperatures during our stress test with FurMark and Prime95. While a GPU temperature of 77 °C (~171 °F) is still acceptable, a CPU temperature of up to 96 °C (~205 °F) is uncomfortably high. However, there's no reason to worry: The CPU hovers around 60 °C in games that do not demand maximum performance from all cores (tested by running The Witcher 3).
(-) The maximum temperature on the upper side is 56 °C / 133 F, compared to the average of 36.8 °C / 98 F, ranging from 21 to 71 °C for the class Multimedia.
(-) The bottom heats up to a maximum of 60 °C / 140 F, compared to the average of 39.1 °C / 102 F
(+) In idle usage, the average temperature for the upper side is 27.2 °C / 81 F, compared to the device average of 31.3 °C / 88 F.
(-) Playing The Witcher 3, the average temperature for the upper side is 43 °C / 109 F, compared to the device average of 31.3 °C / 88 F.
(±) The palmrests and touchpad can get very hot to the touch with a maximum of 38 °C / 100.4 F.
(-) The average temperature of the palmrest area of similar devices was 28.7 °C / 83.7 F (-9.3 °C / -16.7 F).
| MSI PS63 Modern 8SC i7-8565U, GeForce GTX 1650 Max-Q | MSI PS63 Modern 8RC i7-8565U, GeForce GTX 1050 Max-Q | Asus ZenBook 15 UX533FD i7-8565U, GeForce GTX 1050 Max-Q | Acer Aspire 5 A515-52G-723L i7-8565U, GeForce MX250 | Average of class Multimedia | |
|---|---|---|---|---|---|
| Heat | 3% | 13% | 2% | 14% | |
| Maximum Upper Side * (°C) | 56 | 58.6 -5% | 47.2 16% | 53.7 4% | 41.1 ? 27% |
| Maximum Bottom * (°C) | 60 | 60 -0% | 43.2 28% | 56 7% | 43.7 ? 27% |
| Idle Upper Side * (°C) | 29 | 26 10% | 27.7 4% | 28.4 2% | 27 ? 7% |
| Idle Bottom * (°C) | 27 | 25.2 7% | 25.6 5% | 28.9 -7% | 28 ? -4% |
* ... smaller is better
Speakers
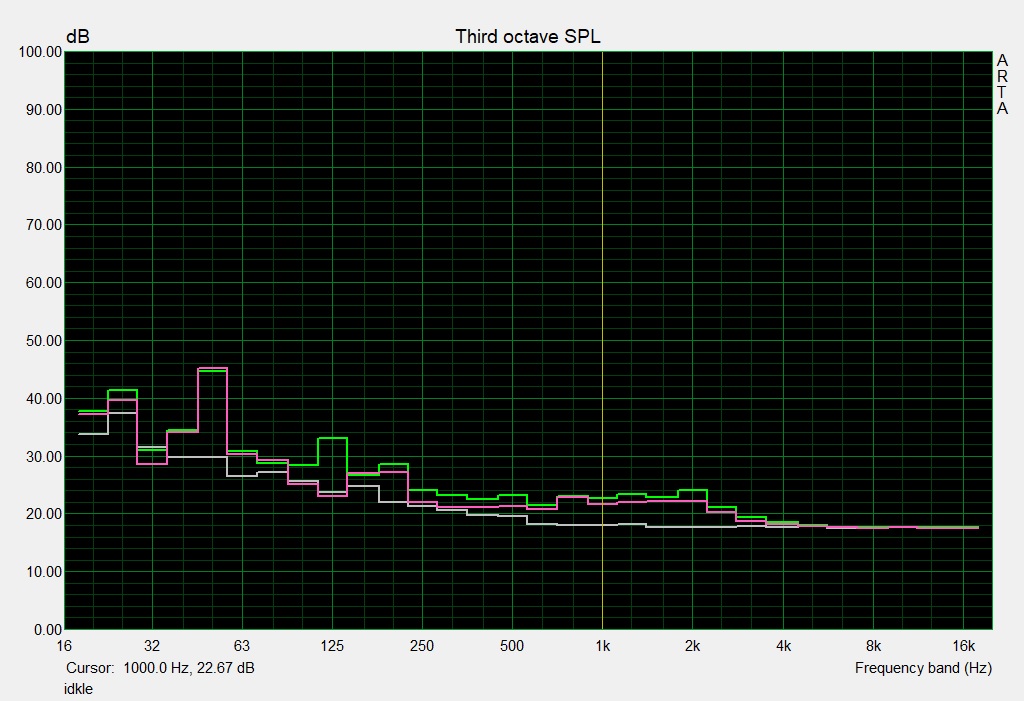
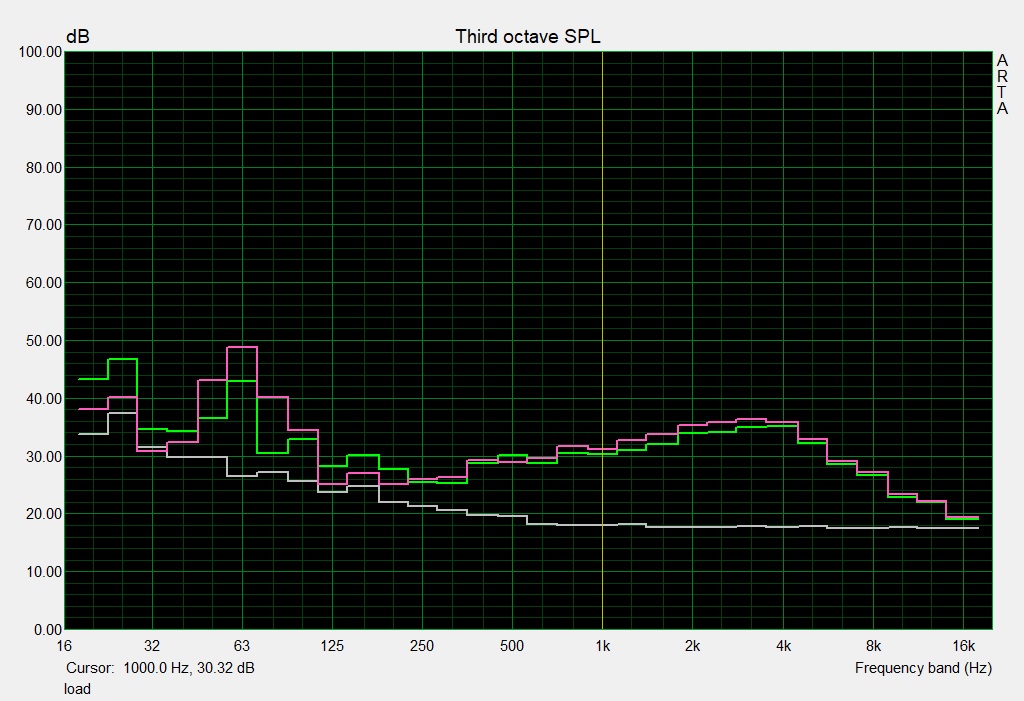
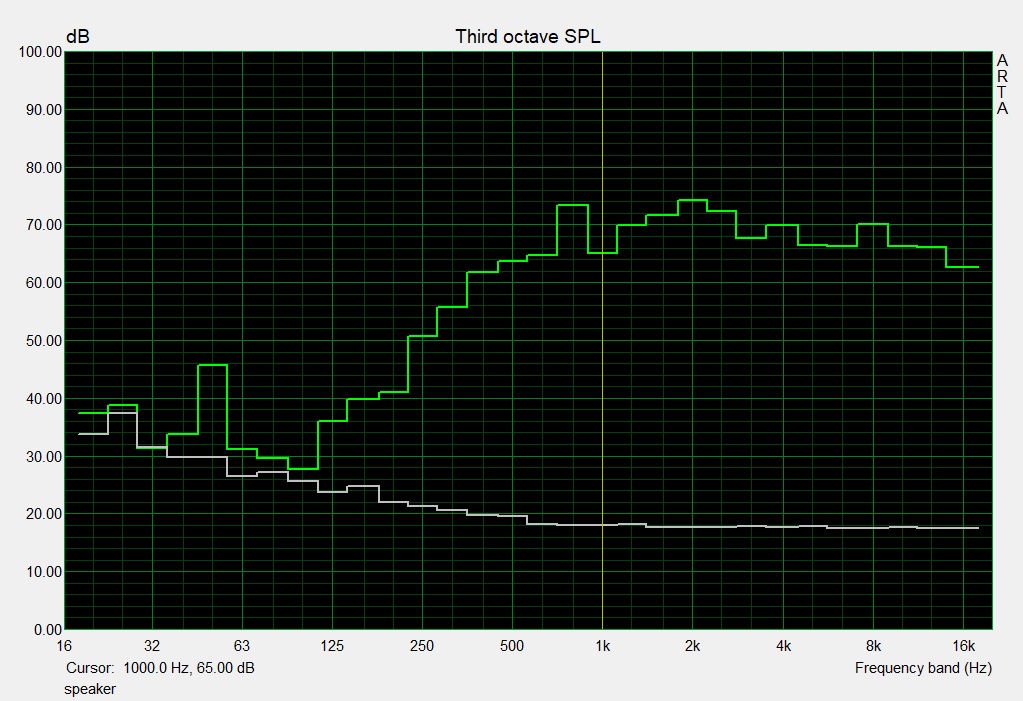
MSI PS63 Modern 8SC audio analysis
(+) | speakers can play relatively loud (82 dB)
Bass 100 - 315 Hz
(-) | nearly no bass - on average 24.3% lower than median
(±) | linearity of bass is average (10.3% delta to prev. frequency)
Mids 400 - 2000 Hz
(+) | balanced mids - only 4.2% away from median
(±) | linearity of mids is average (9.1% delta to prev. frequency)
Highs 2 - 16 kHz
(+) | balanced highs - only 2.3% away from median
(+) | highs are linear (5.9% delta to prev. frequency)
Overall 100 - 16.000 Hz
(±) | linearity of overall sound is average (19.1% difference to median)
Compared to same class
» 61% of all tested devices in this class were better, 7% similar, 32% worse
» The best had a delta of 5%, average was 17%, worst was 45%
Compared to all devices tested
» 46% of all tested devices were better, 7% similar, 47% worse
» The best had a delta of 4%, average was 23%, worst was 134%
MSI P65 Creator 9SF-657 audio analysis
(±) | speaker loudness is average but good (77.4 dB)
Bass 100 - 315 Hz
(-) | nearly no bass - on average 23.6% lower than median
(±) | linearity of bass is average (9.9% delta to prev. frequency)
Mids 400 - 2000 Hz
(±) | higher mids - on average 8.4% higher than median
(±) | linearity of mids is average (7.8% delta to prev. frequency)
Highs 2 - 16 kHz
(±) | higher highs - on average 6% higher than median
(±) | linearity of highs is average (9.3% delta to prev. frequency)
Overall 100 - 16.000 Hz
(±) | linearity of overall sound is average (28.3% difference to median)
Compared to same class
» 94% of all tested devices in this class were better, 2% similar, 5% worse
» The best had a delta of 5%, average was 17%, worst was 45%
Compared to all devices tested
» 86% of all tested devices were better, 3% similar, 12% worse
» The best had a delta of 4%, average was 23%, worst was 134%
Energy Management
Energy Consumption
The Energy Consumption is fairly low thanks to Nvidia's Optimus technology, which allows for dynamic swapping between the integrated GPU of the processor and the GeForce GPU. The consumption of 6 to 12 watts during idle promises long battery life when using less demanding applications (such as office, video, web, ...). According to our measurements, the laptop demands between 60 and 102 watts under load.
| Off / Standby | |
| Idle | |
| Load |
|
Key:
min: | |
| MSI PS63 Modern 8SC i7-8565U, GeForce GTX 1650 Max-Q | MSI PS63 Modern 8RC i7-8565U, GeForce GTX 1050 Max-Q | Asus ZenBook 15 UX533FD i7-8565U, GeForce GTX 1050 Max-Q | Acer Aspire 5 A515-52G-723L i7-8565U, GeForce MX250 | Average of class Multimedia | |
|---|---|---|---|---|---|
| Power Consumption | -4% | 17% | 25% | -5% | |
| Idle Minimum * (Watt) | 6 | 6.8 -13% | 2.7 55% | 4.4 27% | 5.72 ? 5% |
| Idle Average * (Watt) | 8 | 9.8 -23% | 8 -0% | 6.9 14% | 10.2 ? -27% |
| Idle Maximum * (Watt) | 12 | 11.4 5% | 10.6 12% | 9.9 17% | 12.4 ? -3% |
| Load Average * (Watt) | 76 | 76 -0% | 74 3% | 55 28% | 65.5 ? 14% |
| Witcher 3 ultra * (Watt) | 60 | ||||
| Load Maximum * (Watt) | 102 | 93 9% | 89 13% | 63.4 38% | 114 ? -12% |
* ... smaller is better
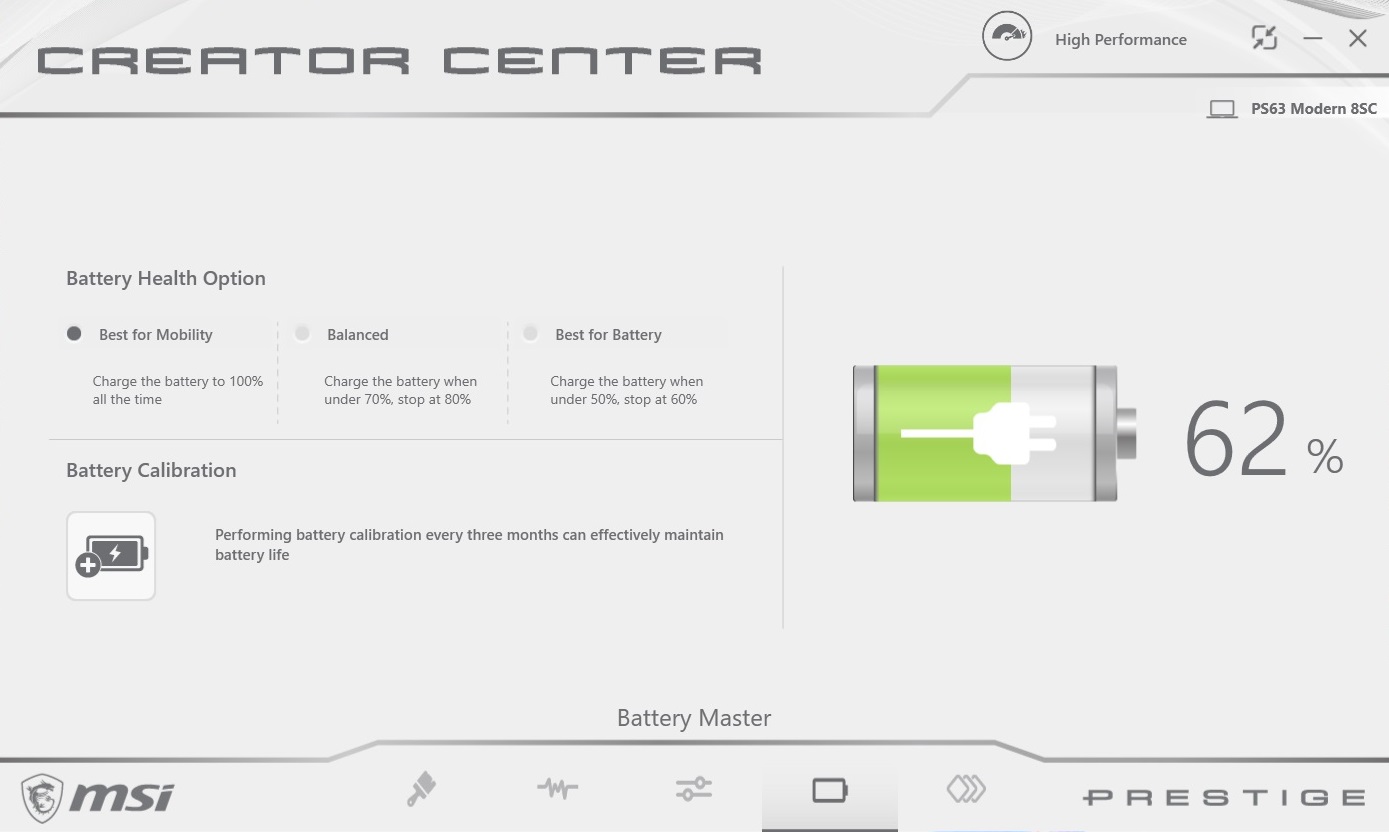
Battery Life
One of the biggest strengths of the PS63 8SC is its high portability. In our Wi-Fi test, which aims to mirror real-world conditions (brightness reduced to around 150 nits), the 82-watt battery lasted for almost exactly 9 hours. Its result of 12 hours in battery eater's readers test (minimum brightness) is similarly impressive.
| MSI PS63 Modern 8SC i7-8565U, GeForce GTX 1650 Max-Q, 82 Wh | MSI PS63 Modern 8RC i7-8565U, GeForce GTX 1050 Max-Q, 82 Wh | Asus ZenBook 15 UX533FD i7-8565U, GeForce GTX 1050 Max-Q, 73 Wh | Acer Aspire 5 A515-52G-723L i7-8565U, GeForce MX250, 48 Wh | Average of class Multimedia | |
|---|---|---|---|---|---|
| Battery runtime | 22% | 47% | -10% | 38% | |
| Reader / Idle (h) | 12.1 | 14 16% | 26.5 119% | 12.9 7% | 24.9 ? 106% |
| WiFi v1.3 (h) | 9 | 11.4 27% | 8.7 -3% | 6.9 -23% | 12.2 ? 36% |
| Load (h) | 2.3 | 2.8 22% | 2.9 26% | 2 -13% | 1.668 ? -27% |
| H.264 (h) | 6.5 | 16.4 ? |
Pros
Cons
Verdict
Looking past the suboptimal rigidity of the case and some drawbacks of the display (brightness, response time, ...), the MSI PS63 8SC is one of the best and most balanced multimedia laptops, while also being well-suited to content creators.
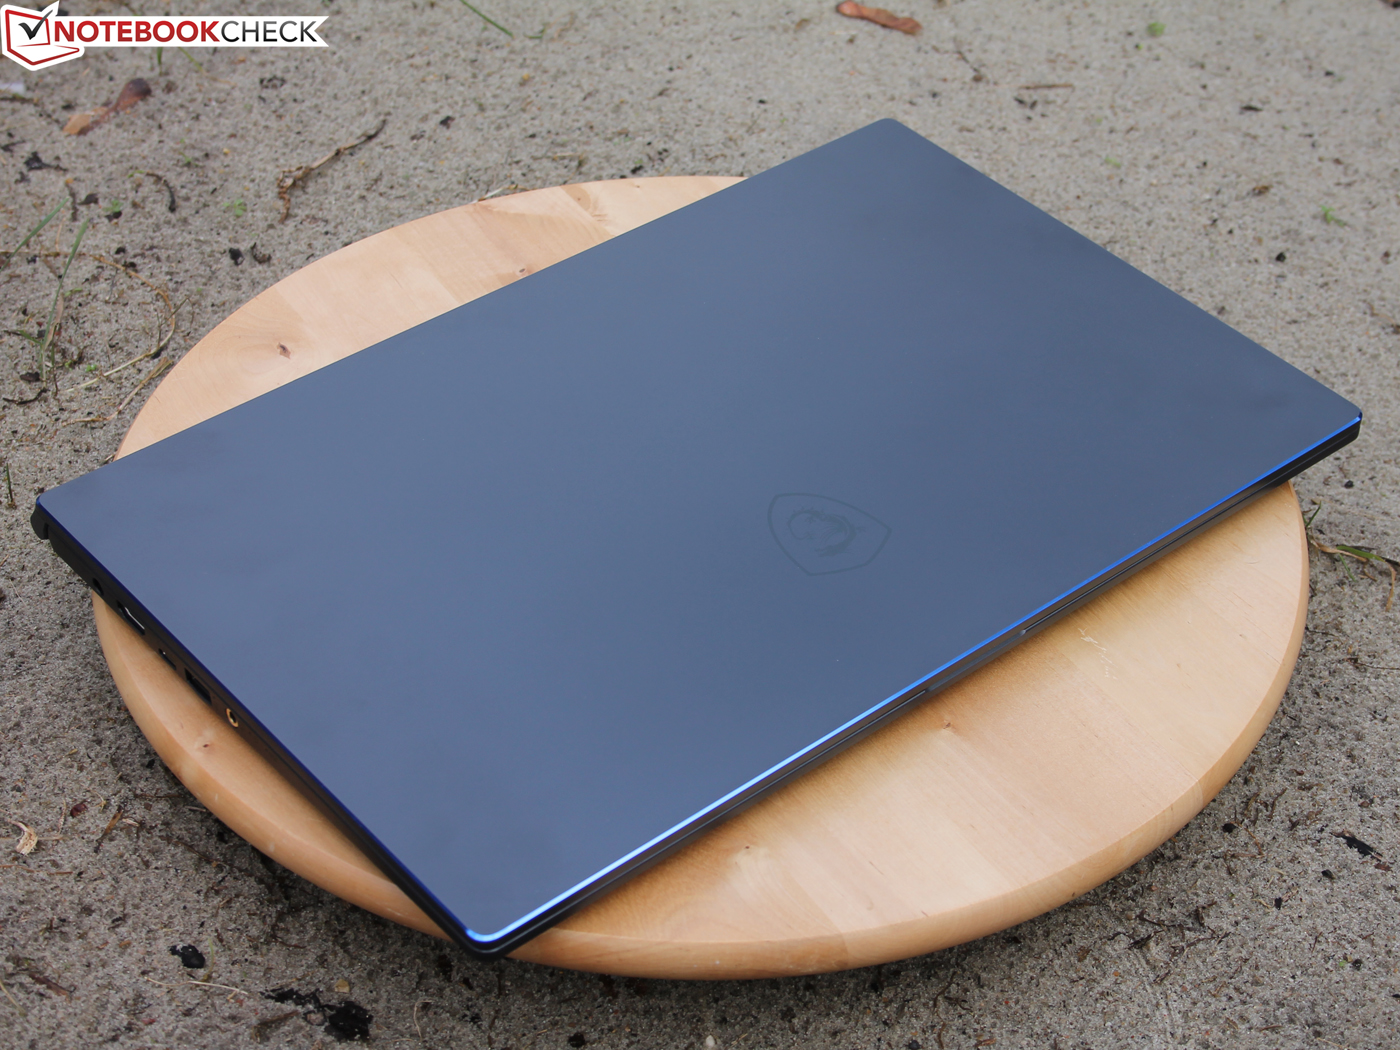
The ultra-thin and pleasantly lightweight chassis with slim-bezel design and the long battery life make the 15-inch system an ideal companion.
The PS63 8SC does not lack performance. The combination of a Core i7-8565U, GeForce GTX 1650 Max-Q, 16 GB RAM and PCIe-SSD performs very well overall.
MSI PS63 Modern 8SC
- 05/14/2020 v7 (old)
Florian Glaser
Price comparison

