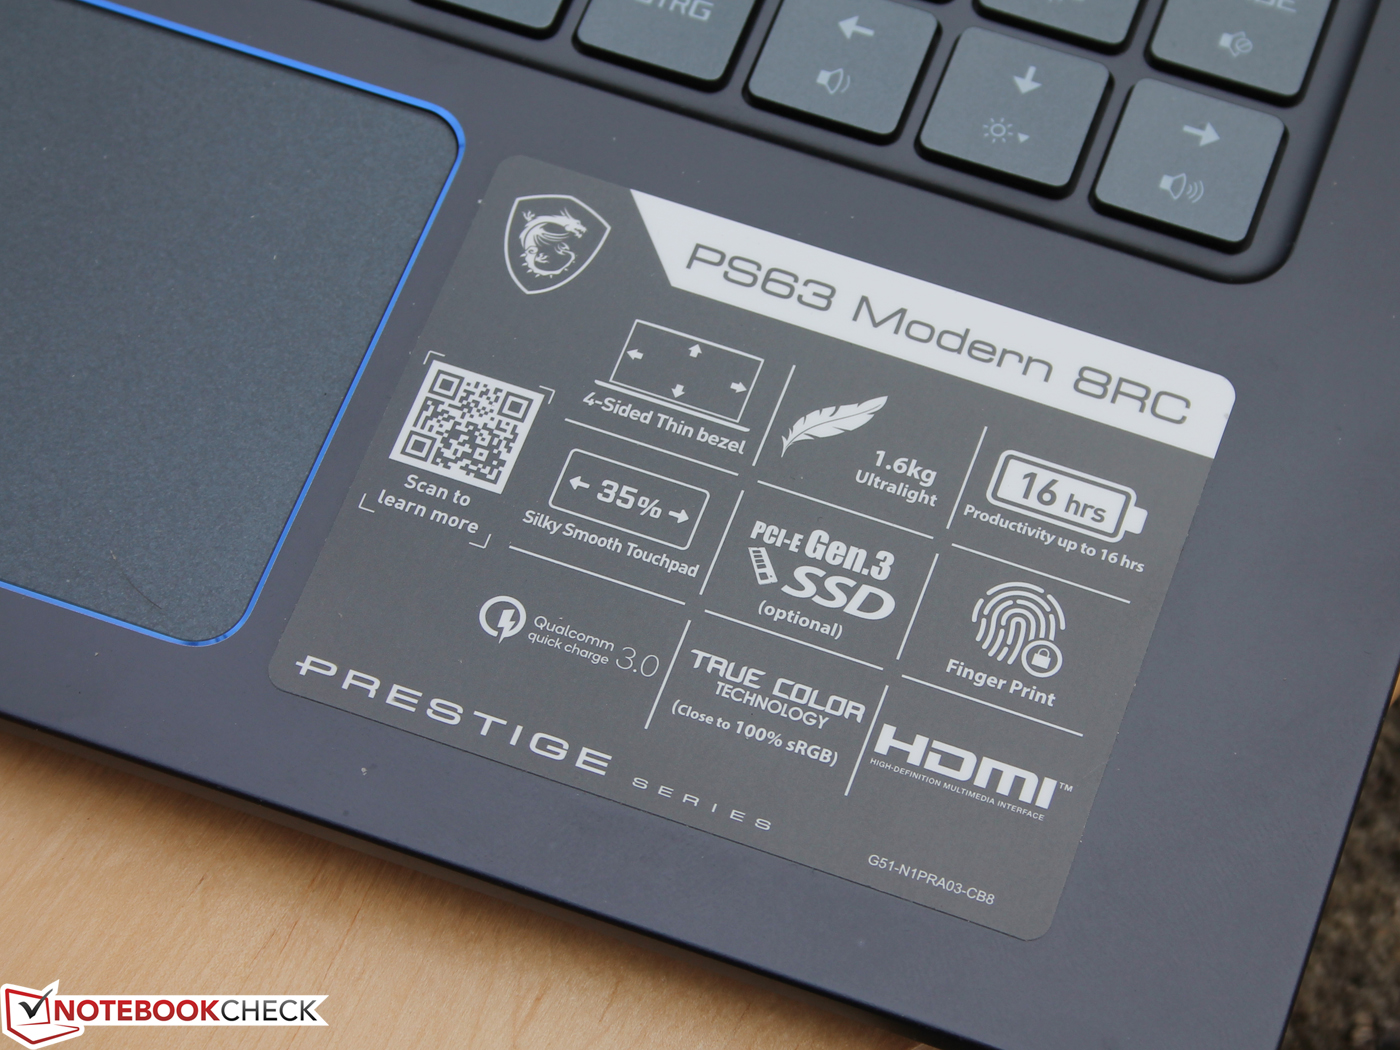
MSI PS63 Modern 8RC (Core i7-8565U, GTX 1050 Max-Q) Laptop Review

Sleek 15-inch laptops with midrange dedicated GPUs like the Nvidia GeForce GTX 1050 Max-Q are becoming more common. However, the MSI PS63 Modern stands out from the rest. The 15-incher is a workhorse for creatives who edit images, videos or who do some design work and 3D animation. The PS63 Modern is even suitable for music producers too. Beyond all the paper specifications, the PS63 Modern is a light and mobile 15-inch laptop that will meet the needs of its target audience.
MSI equips the laptop with an Intel Whiskey Lake quad-core processor that has a 15 W thermal design power (TDP). The U-series processors are theoretically weaker than the H-series chips that power many other 15-inch multimedia laptops, so our tests should reveal whether the U-series in the PS63 can keep up with its H-series counterparts. Moreover, we will focus on whether the laptop thermal throttles too, which has happened with many Kaby Lake R and Whiskey Lake U series-powered laptops that we have reviewed.
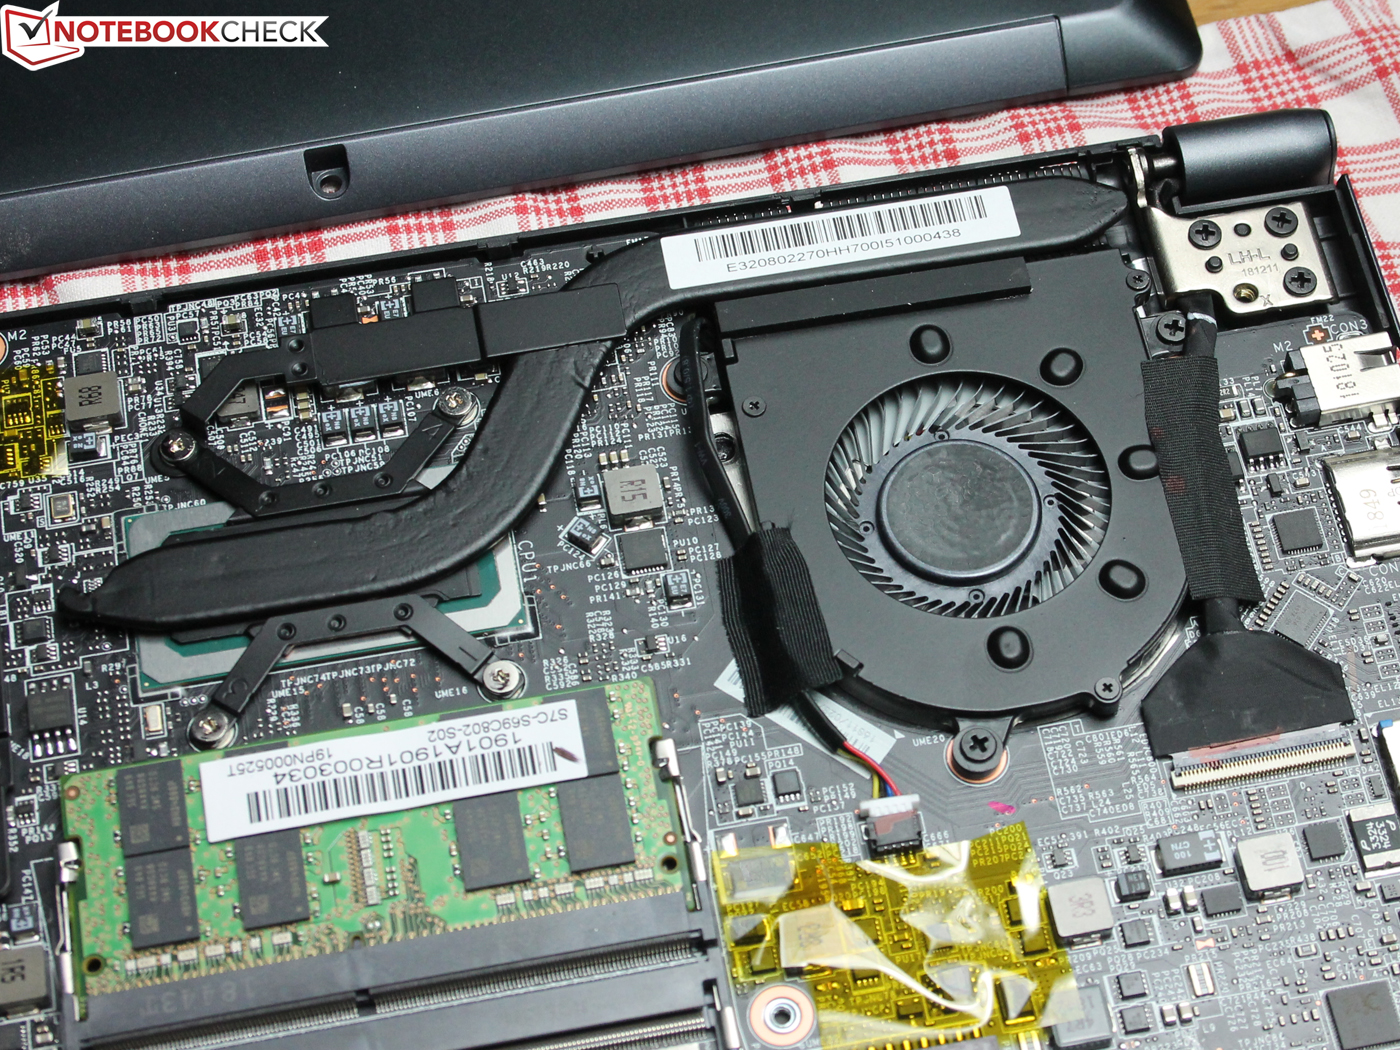
MSI also equipped the PS63 with its Cooler Boost 3 dual fan cooling system, which should provide efficient heat dissipation without becoming irritating. According to MSI, the PS63 has received a Quiet Mark certification for its quiet yet effective fans.
The PS63 finds itself in a saturated and competitive market. Our Top 10 multimedia laptops list is hotly contested with the Dell XPS 15 9570, Lenovo ThinkPad X1 Extreme and the Apple MacBook Pro 15 2018 currently holding the top three spots. The MSI P65 Creator is seventh on this list with an overall score of 87%, but all four of these devices either have a more powerful CPU or GPU. We suspect that the PS63 Modern 8RC will perform between these devices and the PS42 8RB Prestige, which MSI equipped with a U series processor and an Nvidia GeForce MX150 GPU that is weaker than the GeForce GTX 1050 Max-Q powering the PS63.
We will also compare our test unit against more powerful laptops like the Gigabyte Aero 15X v8, which has a 45 W Core i7-8750H processor and an Nvidia GeForce GTX 1070 Max-Q GPU. Please keep in mind that the Aero 15X v8 costs considerably more than the PS63 and has a higher resolution, but smaller, display. The Aero 14-K8 with its GeForce GTX 1050 Ti GPU is a fairer comparison, albeit it also has a 45 W CPU. The Aero 15X v8 was one of last year’s best thin and light gaming laptops, so we thought it would be good to see how the PS63 stacks up against it.
Another potential thorn in the PS63’s crown is the Microsoft Surface Book 2. Like the PS63, the Surface Book 2 is powered by a 15 W ultra-low voltage (ULV) processor and an Nvidia GeForce GTX 1050 GPU. However, it only has a 13.5-inch display, which could be too small for some people who are in the market for a 15-inch laptop. Microsoft also sells the Surface Book 2 15, that has not only a 15-inch screen as the name implies but also has an Nvidia GeForce GTX 1060 GPU, which is considerably more powerful than a GeForce GTX 1050 Max-Q. We will not be comparing the PS63 Modern 8RC against the Surface Book 2 15 though as the latter is over $1,000 more expensive.
Our final comparison devices are from Schenker. We will be considering the PS63 Modern against the Key 15 (Clevo P955ER) and the XMG Neo 15. Again, these are both gaming laptops, so it will be interesting to see how the PS63 stands up against laptops that are powered by 45 W processors with GeForce GTX 1060 and GeForce GTX 1070 Max-Q GPUs.
We should point out that we already suspect that the PS63 will not be able to compete against some of our comparison devices, like the Aero 15X v8 and the two Schenker laptops, on CPU and GPU performance. The PS63 could win out in other crucial areas though, like the quality of its input devices, its port selection or how easy it is to repair and maintain among others.
Case
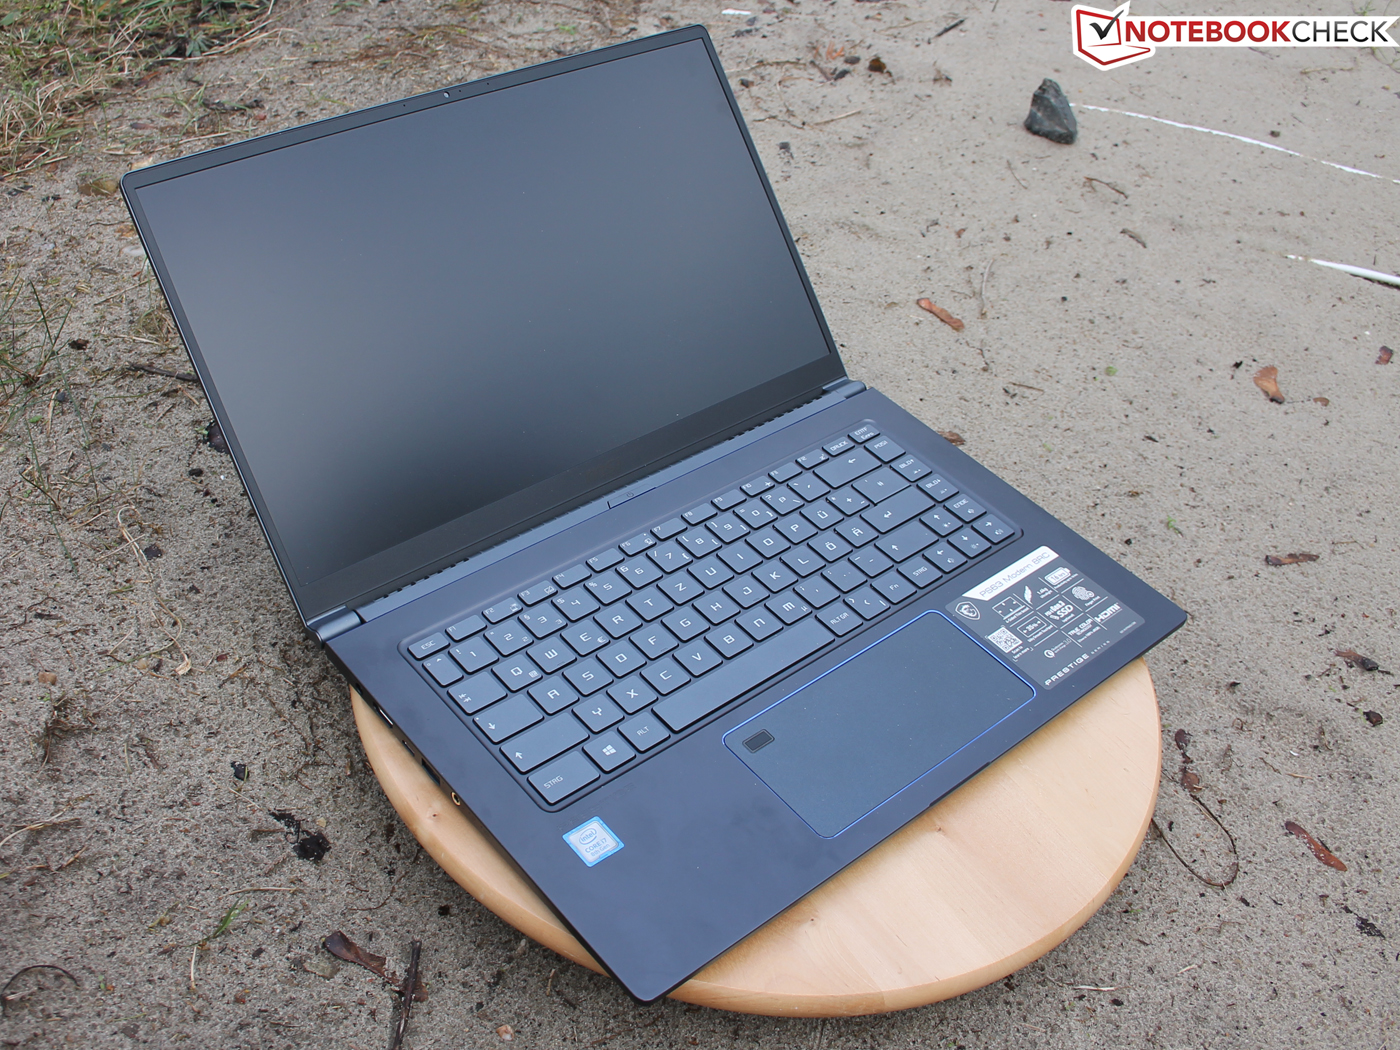
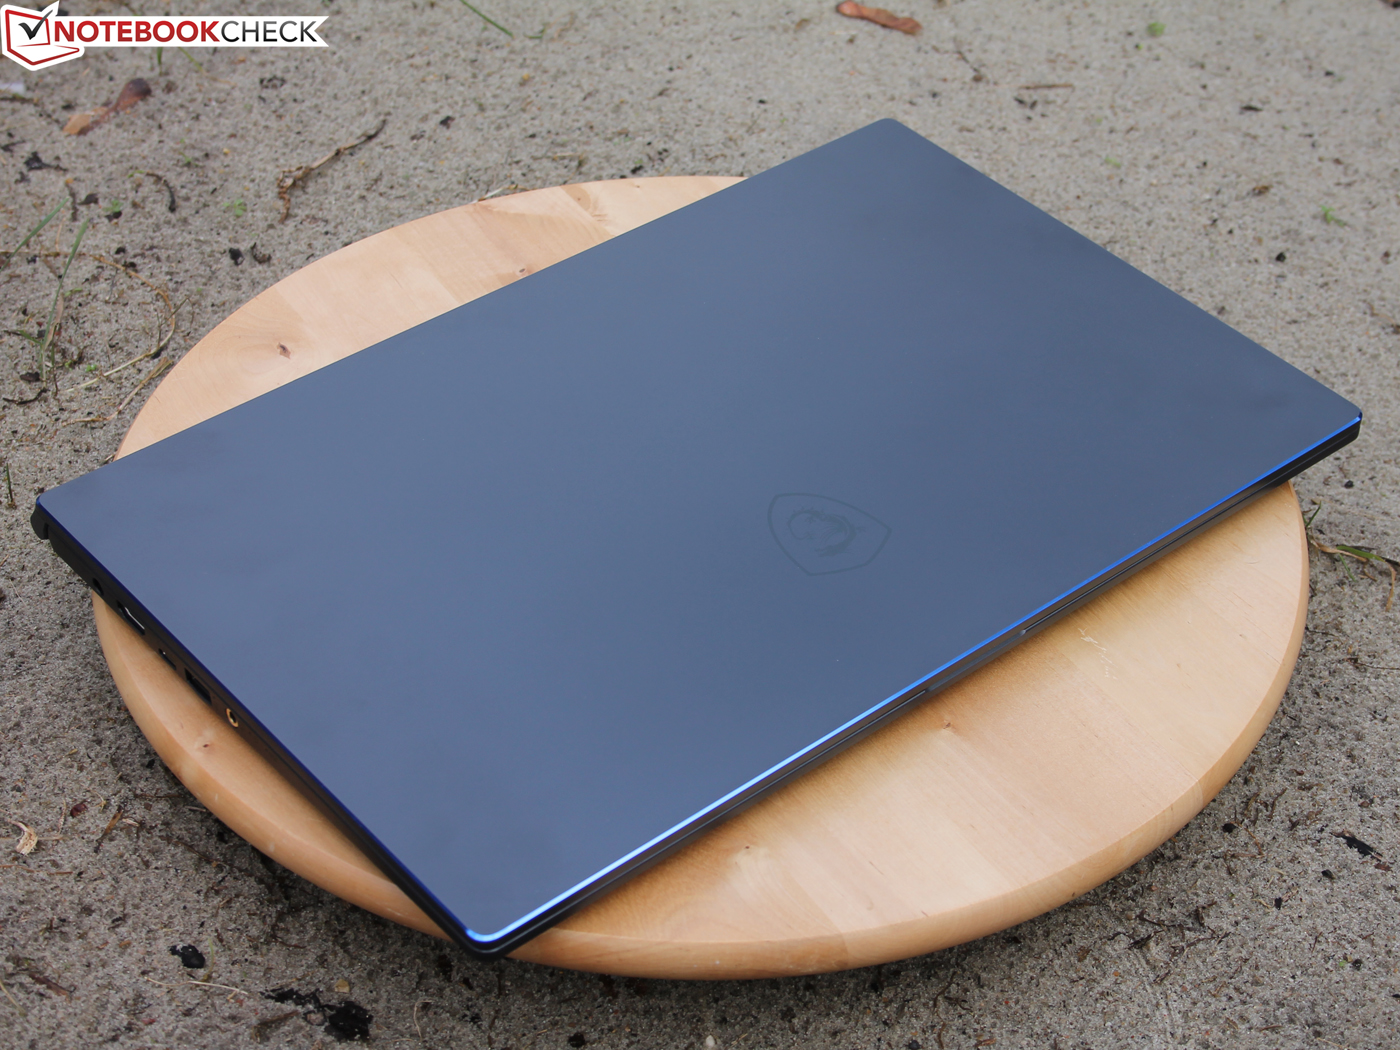
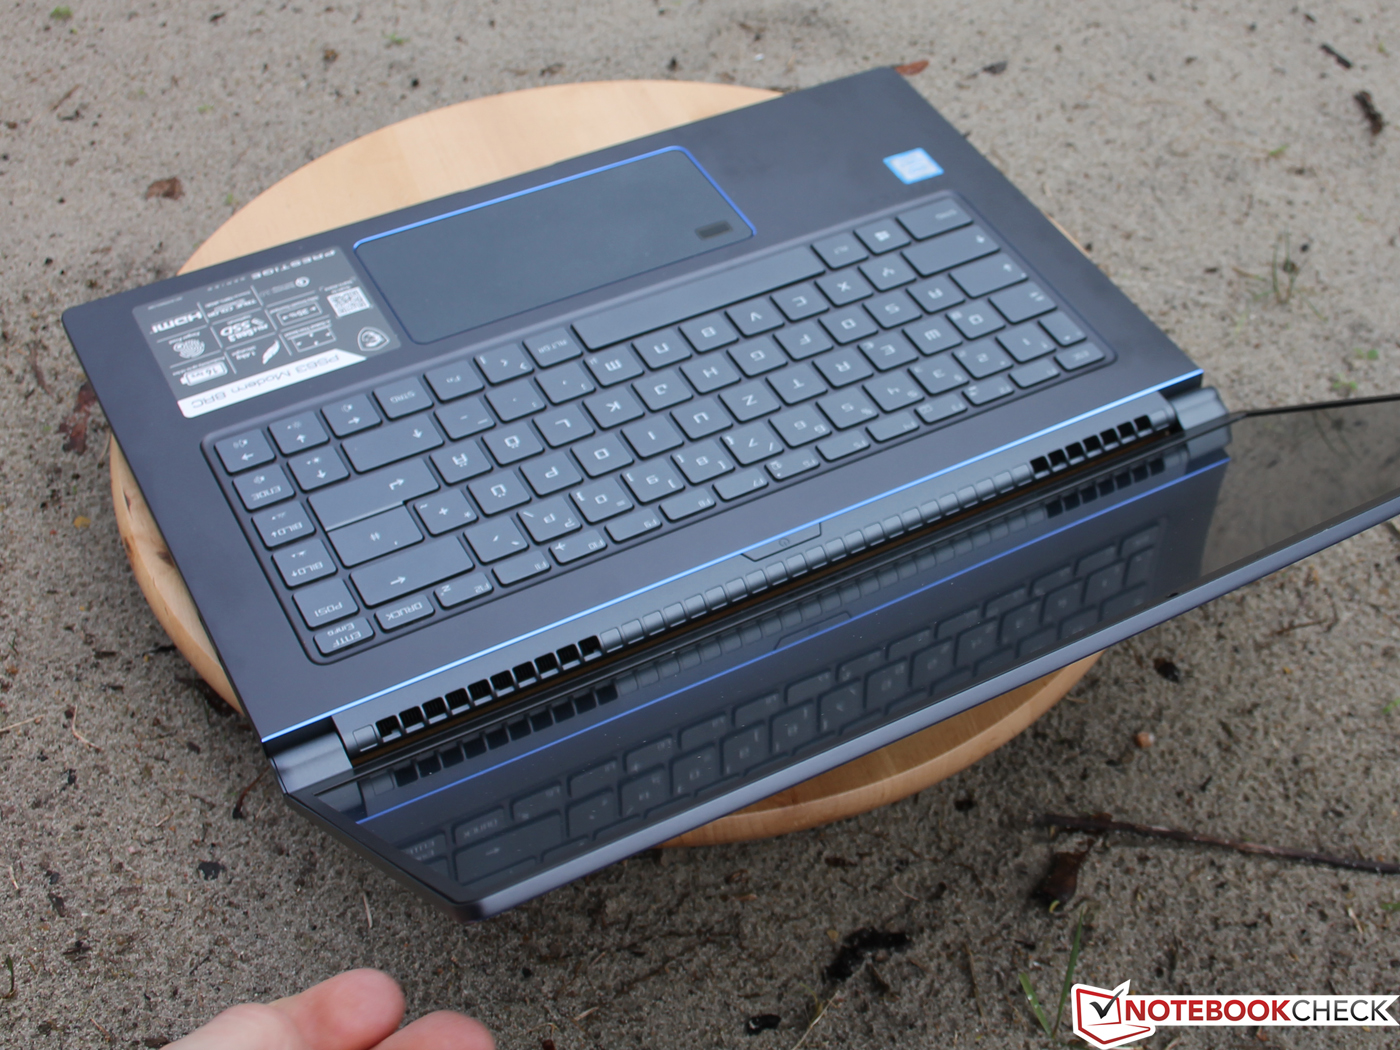
MSI has knuckled down to create a sleek and stylish-looking 15-inch case. The plastic that has dominated many MSI devices in recent years is a thing of the past and has been largely replaced with aluminium.
The keyboard deck and display cover are made from aluminium, with MSI still using plastic for the bottom plate, which is screwed into the frame. We can twist our test unit slightly, but it does not bend or bow if we hold it by one corner. The base plate is rather thin too, but this does not seem to affect the structural stability of the device.
The screen opens to 140° and is kept firmly in place by its hinges. The display does not rock back and forth like some laptops that we have tested. In short, MSI has done a great job at applying appropriate tension to the hinges so that the display does not wobble about when you are typing.
By contrast, the display lid and frame are comparatively weak and have more play then we would have liked. We could not get the display to deform by pressing on the lid though, which is a positive.
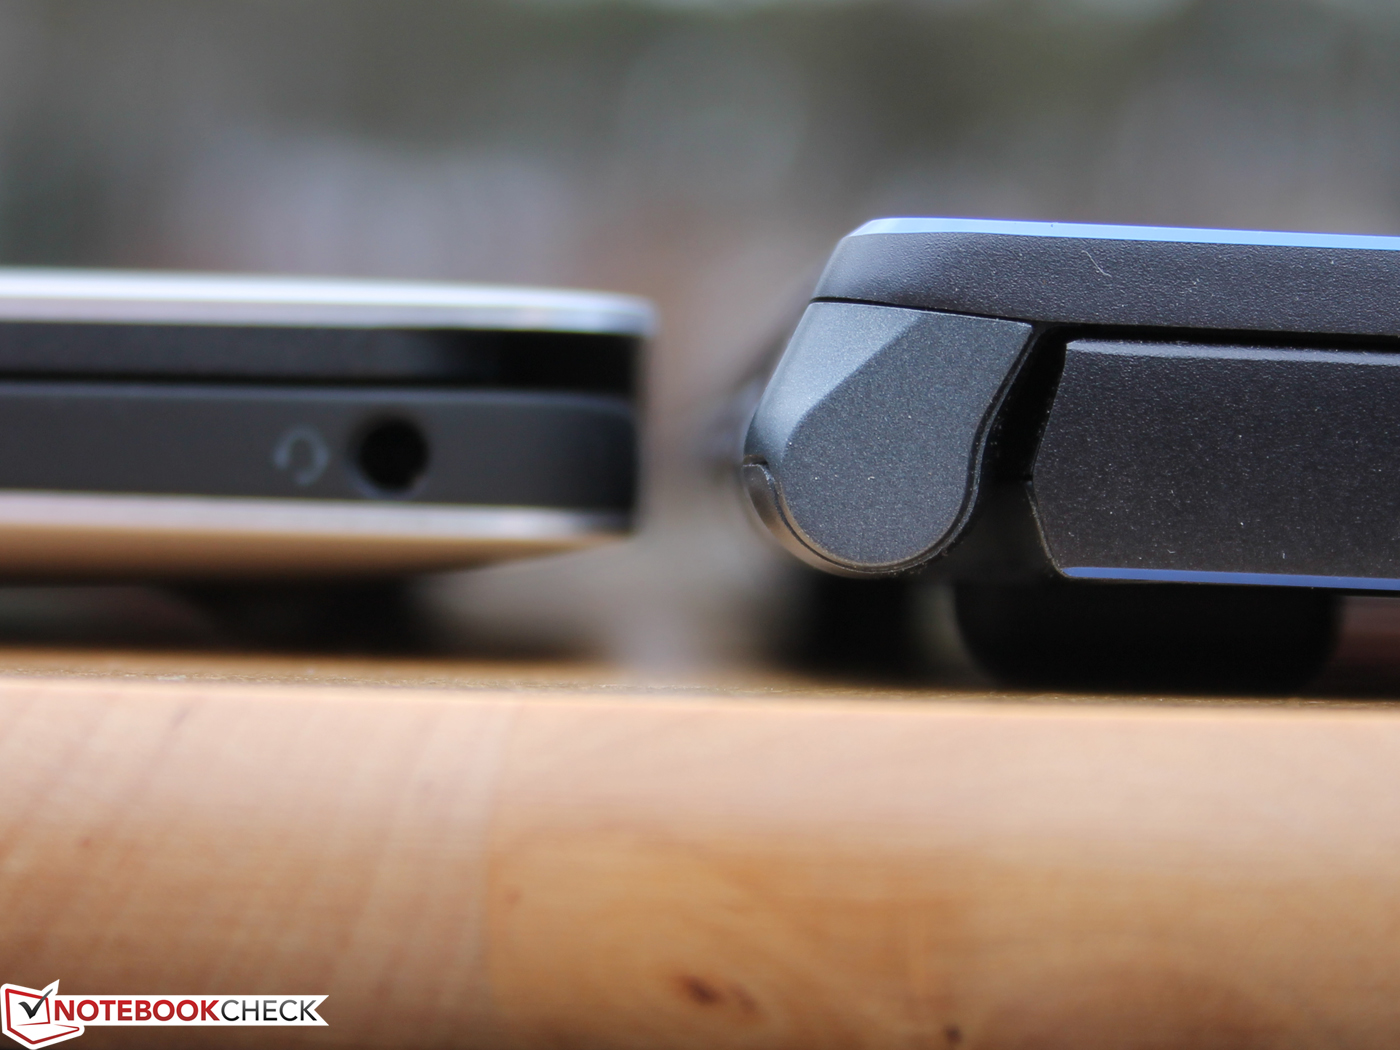
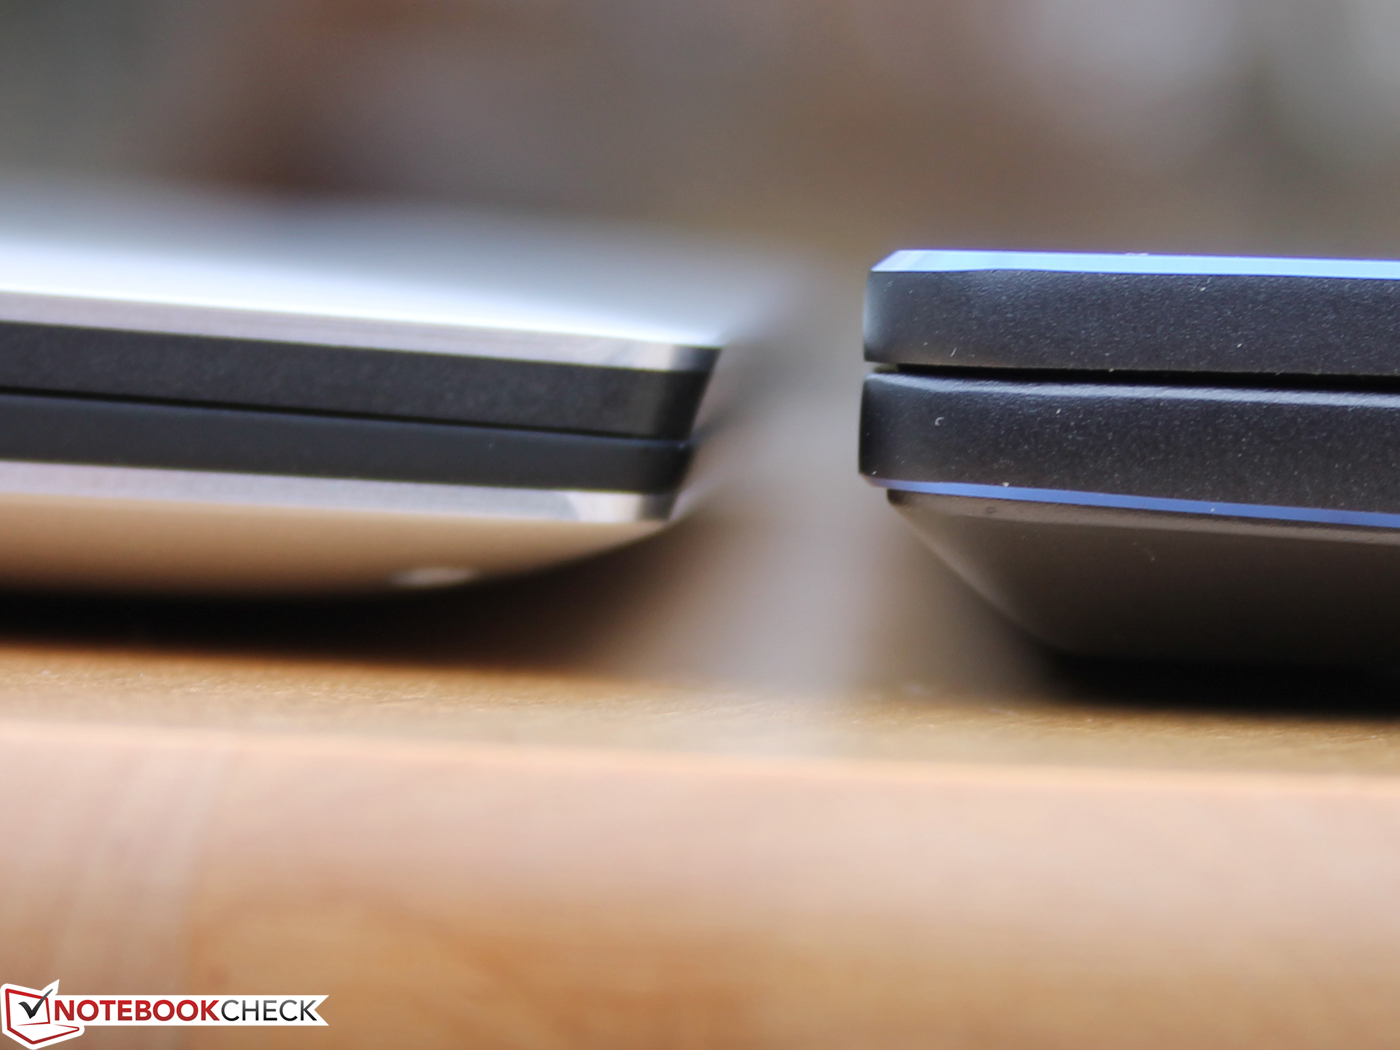
The PS63 weighs just 1.7 kg, which makes it lighter than most of our comparison devices. Our test unit weighs the same as the ThinkPad X1 Extreme and is lighter than all but the Surface Book 2 and the PS42 8RB Prestige. The PS63 is also a few hundred grams lighter than the XPS 15 9570 with a 97 Wh battery, the IdeaPad 720S-15IKB and the MacBook Pro 15 2018. The XPS 15 9570 and MacBook Pro 15 2018 have all-metal cases though, which makes them structurally sounder than our test device. The PS63 is also approximately 400 g lighter than the Aero 15X v8, which makes the former much easier to carry around.
The PS63 has a comparatively small footprint too compared to our comparison devices with 15-inch displays. The PS63 is practically the same size as the XPS 15 9570 and is marginally larger than the MacBook Pro 15 2018. The PS42 8RB Prestige and Surface Book 2 are considerably smaller than the PS63, but they both have smaller screens than the 15.6-inch display in the PS63. Our other comparison devices are much larger than the PS63, but this is primarily because of their thicker display bezels and the greater space needed for their more powerful graphics cards.
Connectivity
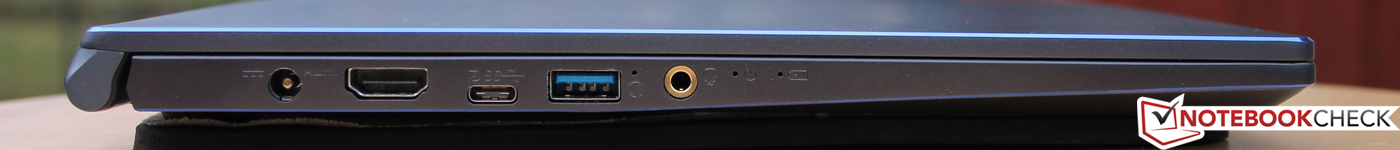
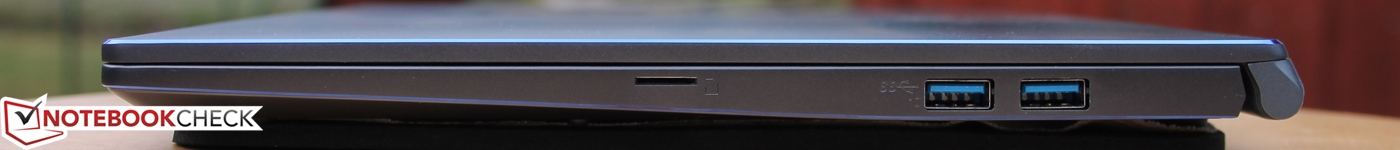
MSI has equipped the PS63 with seven ports, of which two are USB 3.1 Gen1 Type-A and one is USB 3.1 Gen 2 Type-A. There is also a USB 3.1 Gen 1 Type-C port that integrates DisplayPort-out, while one of the USB Type-A ports supports Qualcomm QuickCharge 3.0 and can charge a 2,750 mAh battery from 0% to 80% in just 35 minutes, according to Qualcomm.
We would have liked to have seen at least one Thunderbolt 3 port, which would have facilitated connecting an external GPU for improved graphics performance. Many comparable laptops like the XPS 15 9570 include one, so it feels like a missed opportunity here. There is also an HDMI port that can output at 4K in up to 30 Hz. We would recommend using a Type-C to DisplayPort adaptor instead though as the device can output video in 4K at 60 Hz via DisplayPort.
MicroSD Card Reader
The PS63 achieved disappointing transfer speeds in our microSD card tests. We conducted our tests with our Toshiba Exceria Pro SDXC 64 GB UHS-II reference SD card, which can theoretically achieve over 250 MB/s read and write speeds. Our test unit only averaged around 10% of the Exceria Pro’s potential, which suggests that MSI has equipped the PS63 with a USB 2.0 microSD card reader, which is much slower than the USB 3.0 readers in our comparison devices. By contrast, many of our comparison devices achieve between five and eight times the transfer speeds that the PS63 manages.
| SD Card Reader | |
| average JPG Copy Test (av. of 3 runs) | |
| Gigabyte Aero 15X v8 (Toshiba Exceria Pro SDXC 64 GB UHS-II) | |
| Lenovo ThinkPad X1 Extreme-20MF000RGE (Toshiba Exceria Pro SDXC 64 GB UHS-II) | |
| Schenker Key 15 Coffee Lake (Toshiba Exceria Pro SDXC 64 GB UHS-II) | |
| Microsoft Surface Book 2 (Toshiba Exceria Pro SDXC 64 GB UHS-II) | |
| Dell XPS 15 2018 i5 FHD 97Wh | |
| Average of class Multimedia (23 - 531, n=43, last 2 years) | |
| Lenovo Ideapad 720S-15IKB 81AC001AGE (Toshiba Exceria Pro M501) | |
| Schenker XMG Neo 15 (Toshiba Exceria Pro SDXC 64 GB UHS-II) | |
| MSI PS63 Modern 8RC (Toshiba Exceria Pro SDXC 64 GB UHS-II) | |
| MSI Prestige PS42 8RB-059 (Toshiba Exceria Pro SDXC 64 GB UHS-II) | |
| maximum AS SSD Seq Read Test (1GB) | |
| Gigabyte Aero 15X v8 (Toshiba Exceria Pro SDXC 64 GB UHS-II) | |
| Microsoft Surface Book 2 (Toshiba Exceria Pro SDXC 64 GB UHS-II) | |
| Lenovo ThinkPad X1 Extreme-20MF000RGE (Toshiba Exceria Pro SDXC 64 GB UHS-II) | |
| Schenker Key 15 Coffee Lake (Toshiba Exceria Pro SDXC 64 GB UHS-II) | |
| Dell XPS 15 2018 i5 FHD 97Wh | |
| Average of class Multimedia (27.9 - 1455, n=42, last 2 years) | |
| Lenovo Ideapad 720S-15IKB 81AC001AGE (Toshiba Exceria Pro M501) | |
| Schenker XMG Neo 15 (Toshiba Exceria Pro SDXC 64 GB UHS-II) | |
| MSI PS63 Modern 8RC (Toshiba Exceria Pro SDXC 64 GB UHS-II) | |
| MSI Prestige PS42 8RB-059 (Toshiba Exceria Pro SDXC 64 GB UHS-II) | |
Tools
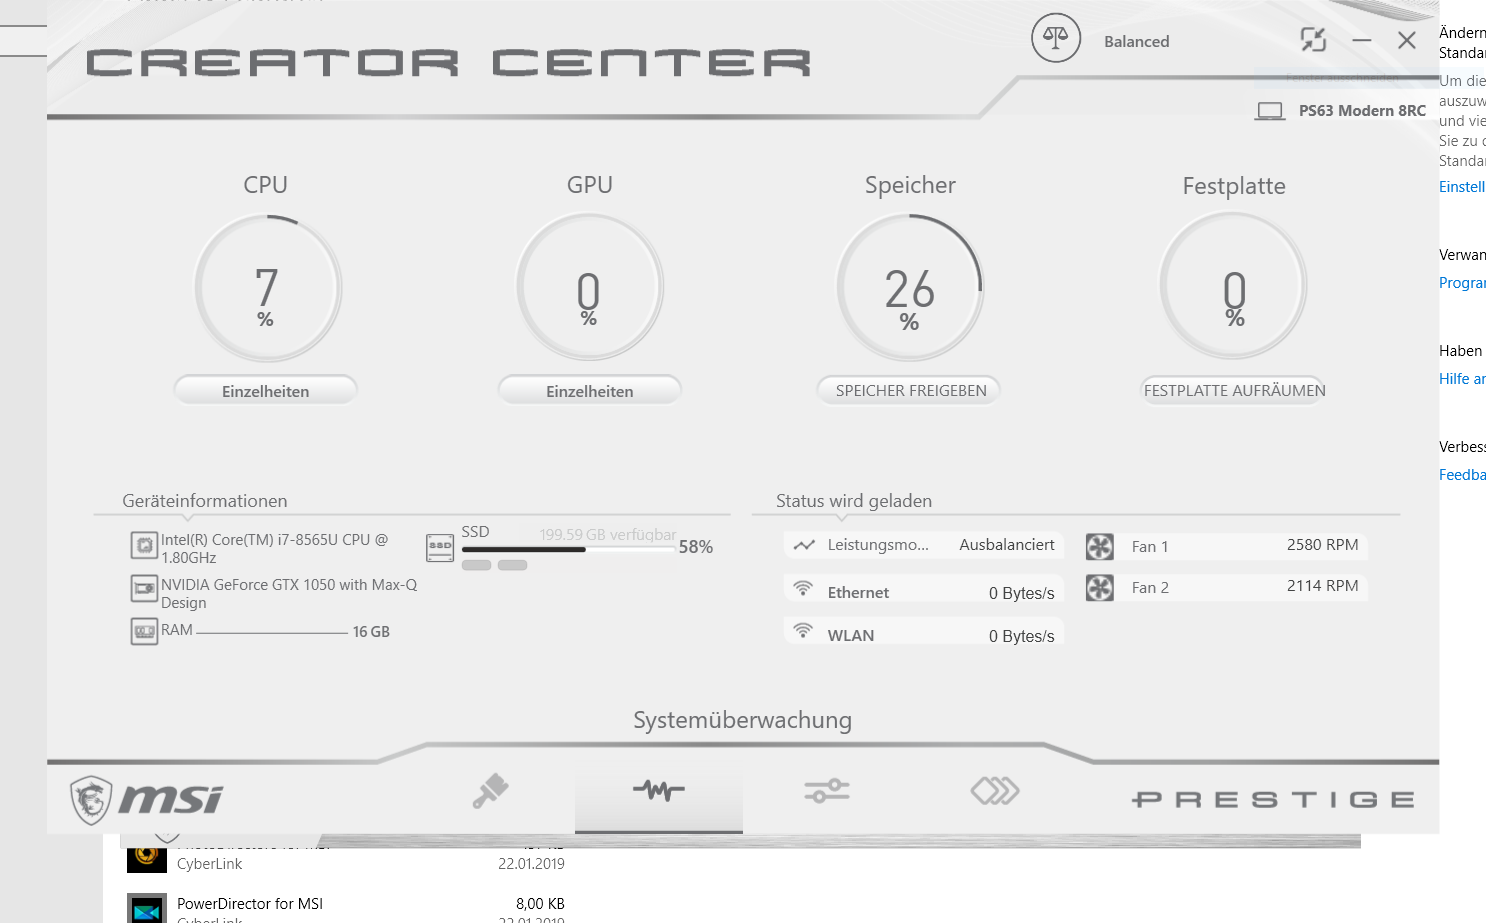
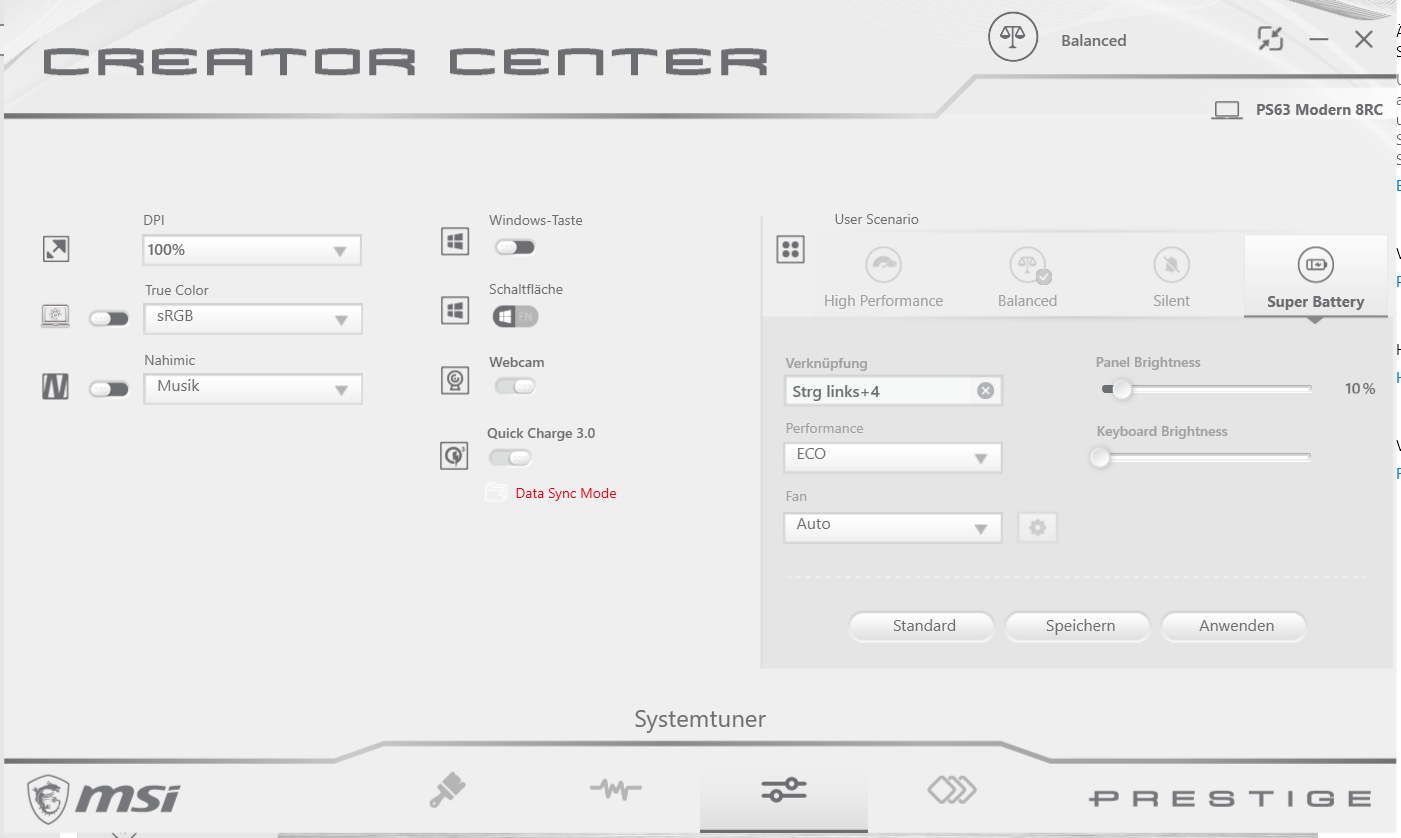
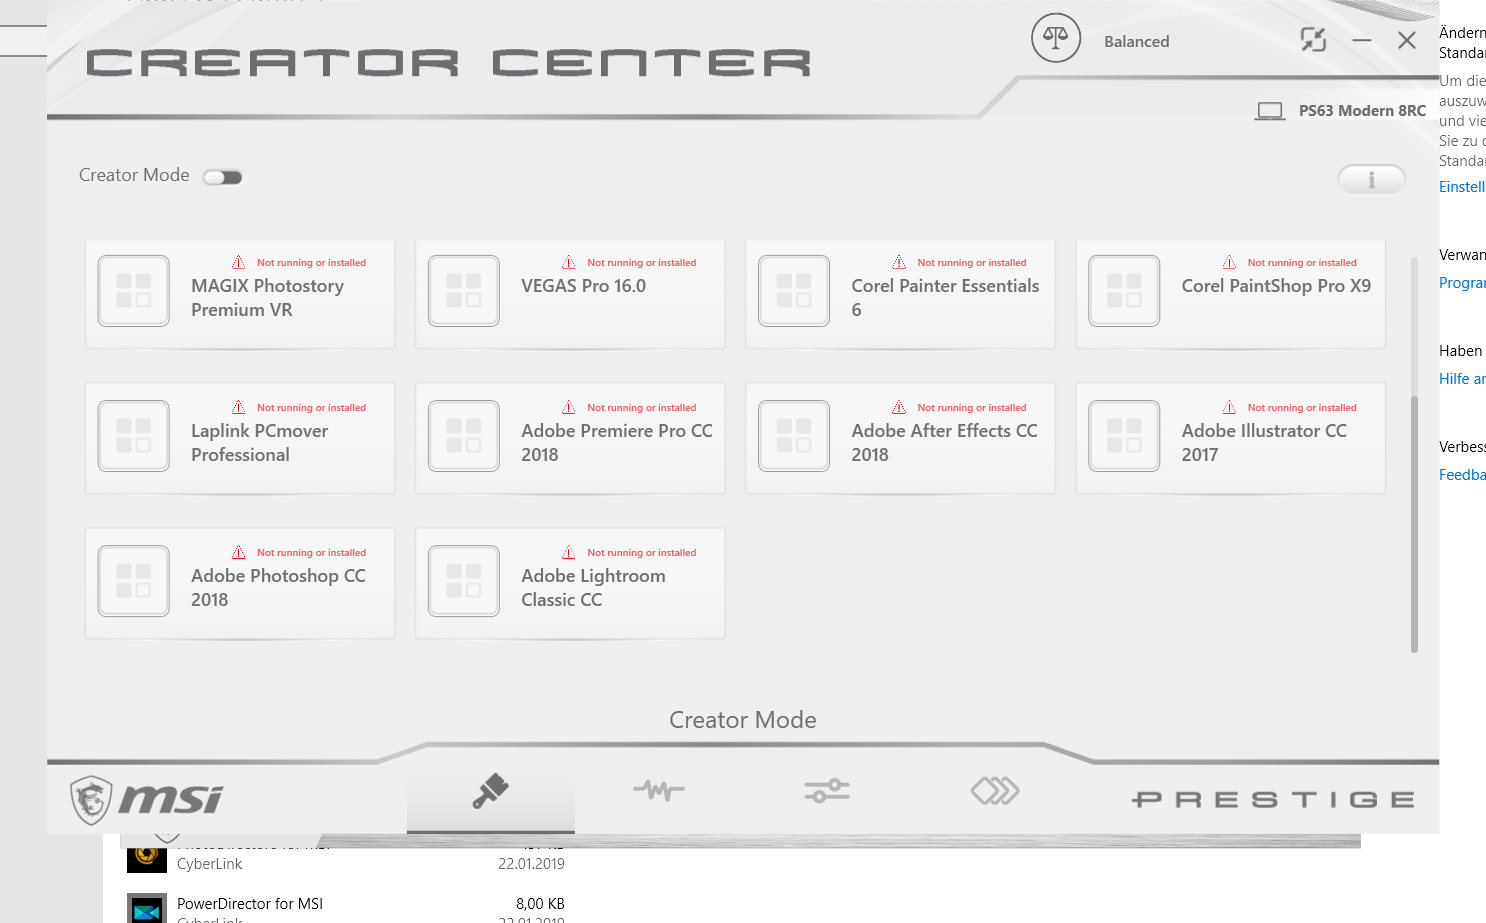
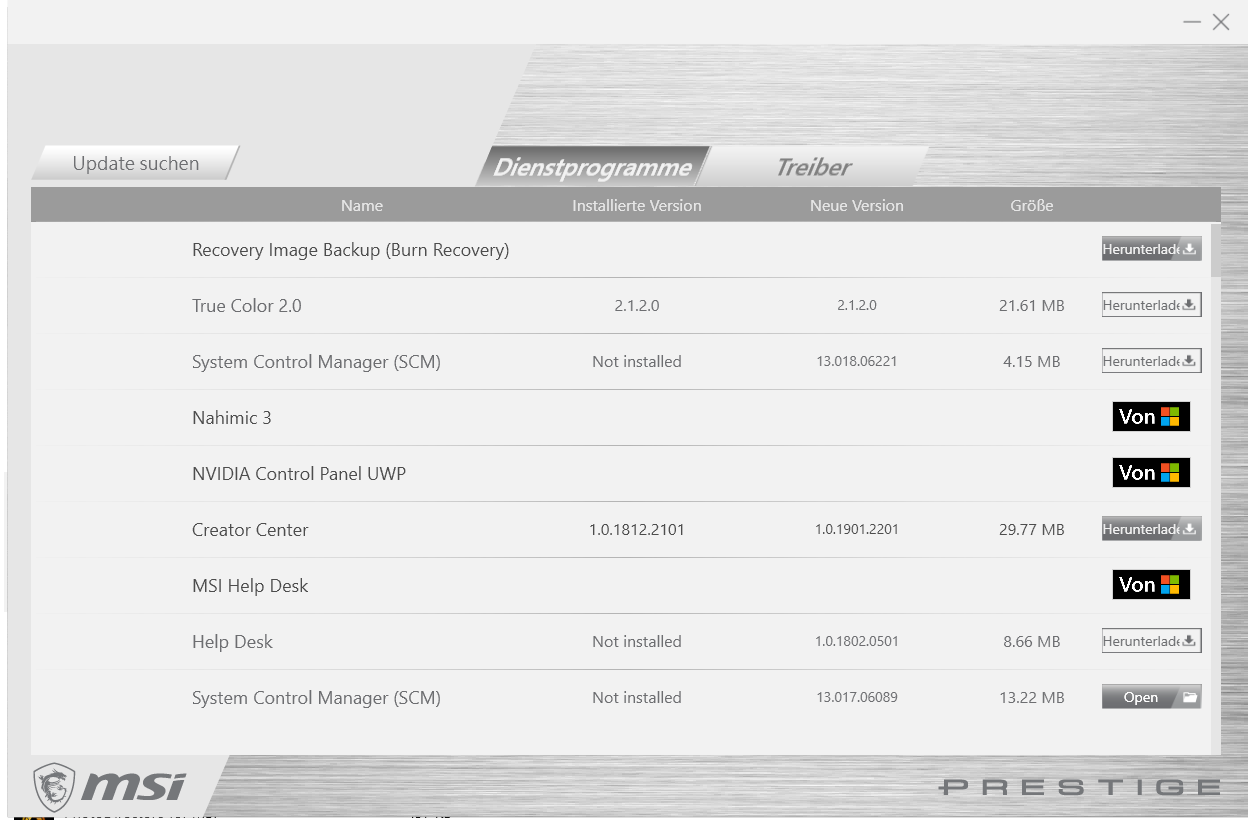
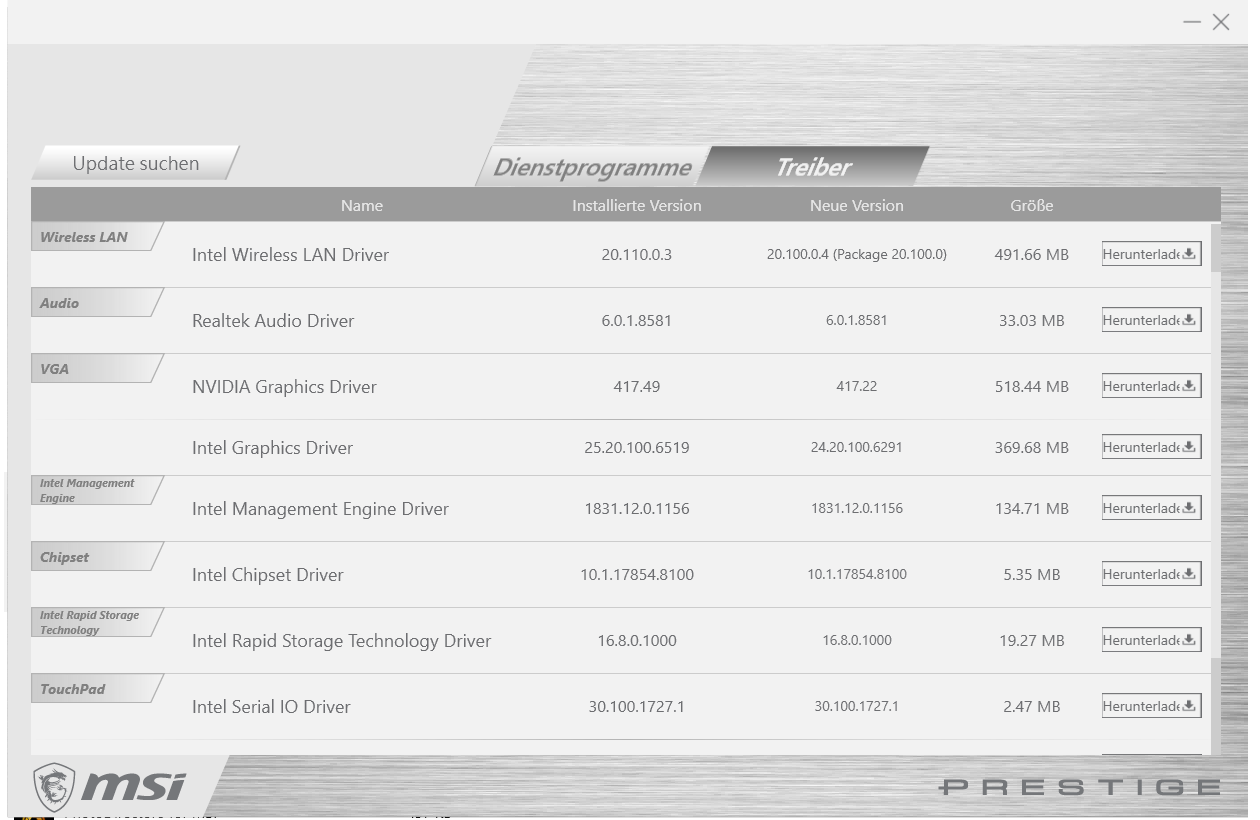
MSI preinstalls its Creator Center and Control Center programs on the PS63, the latter of which allows you to manage or download new drivers and programs. The Creator Center has numerous settings including integration with professional programs like Adobe CC and VEGAS Pro. The software also has options for customising the display’s DPI, and power modes among others. Creator Center can also offer an overview of your system and provides data that you could also view in Task Manager or third-party software like HWiNFO.
Communication
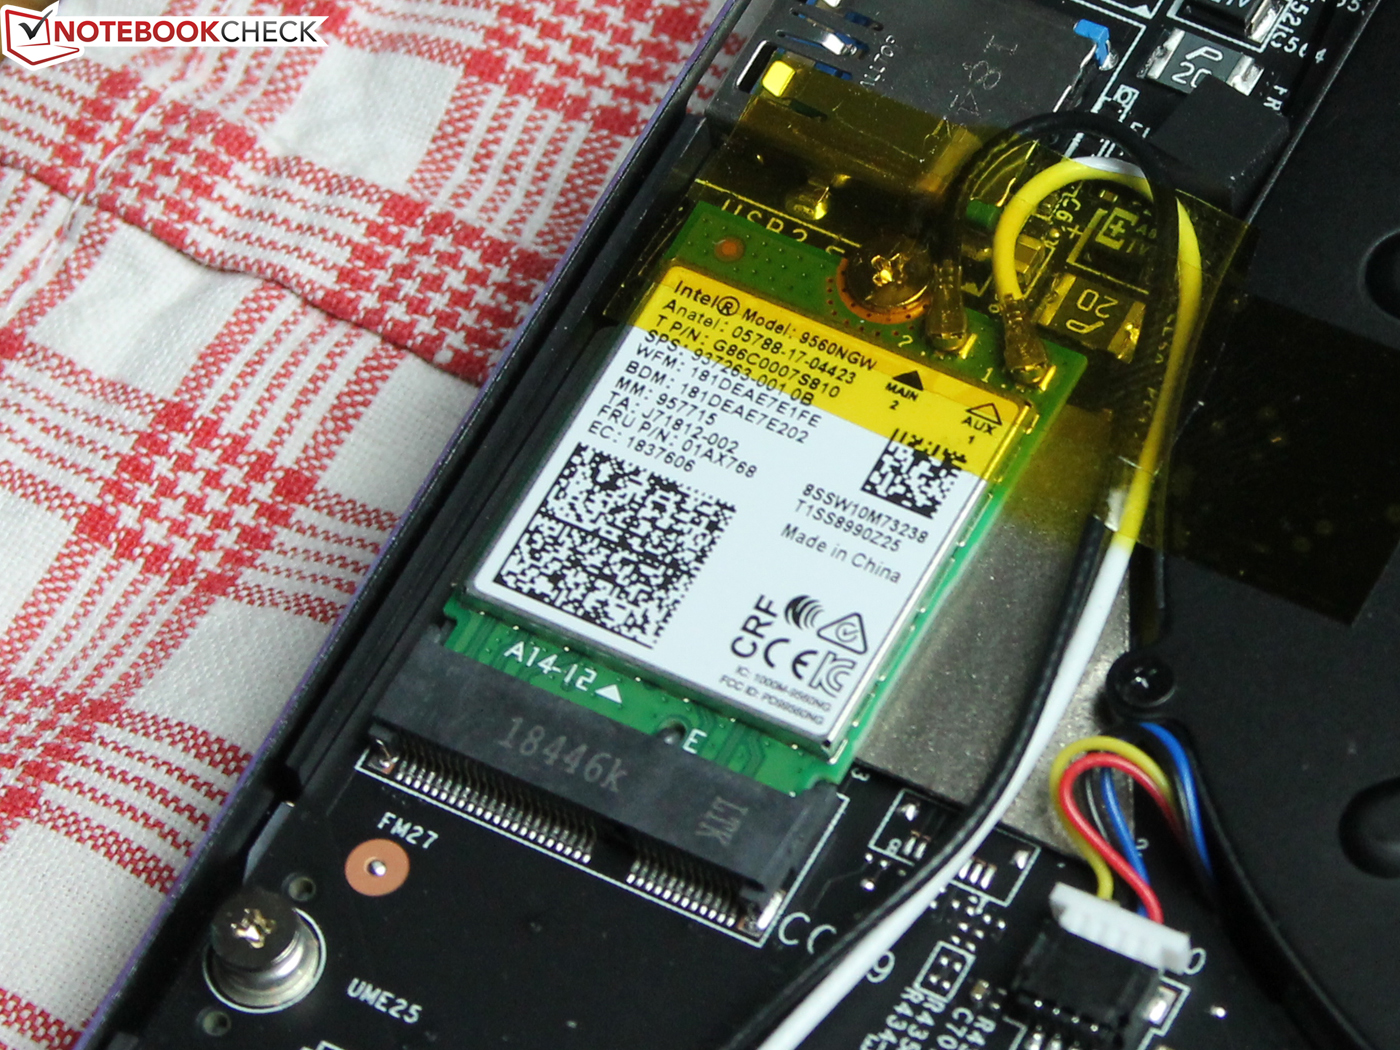
MSI has equipped our test unit with an Intel Dual Band Wireless-AC 9560 M.2 module, which also integrates Bluetooth 5.0. The latter technology should be more power-efficient and be capable of longer ranges than previous versions of Bluetooth.
The PS63 achieved impressive transfer speeds in iperf3 Client, averaging over 600 Mb/s in both tests that we conducted. These results put our test unit second behind the XMG Neo 15 in our comparison table and around 100 Mb/s ahead of the XPS 15 9570.
MSI has not equipped the PS63 with RJ45 LAN, but the port would have been too thick for the device’s thin case. You could use an Ethernet adaptor if you prefer or need a wired connection, but one must be bought separately as MSI does not include one in the box.
Webcam
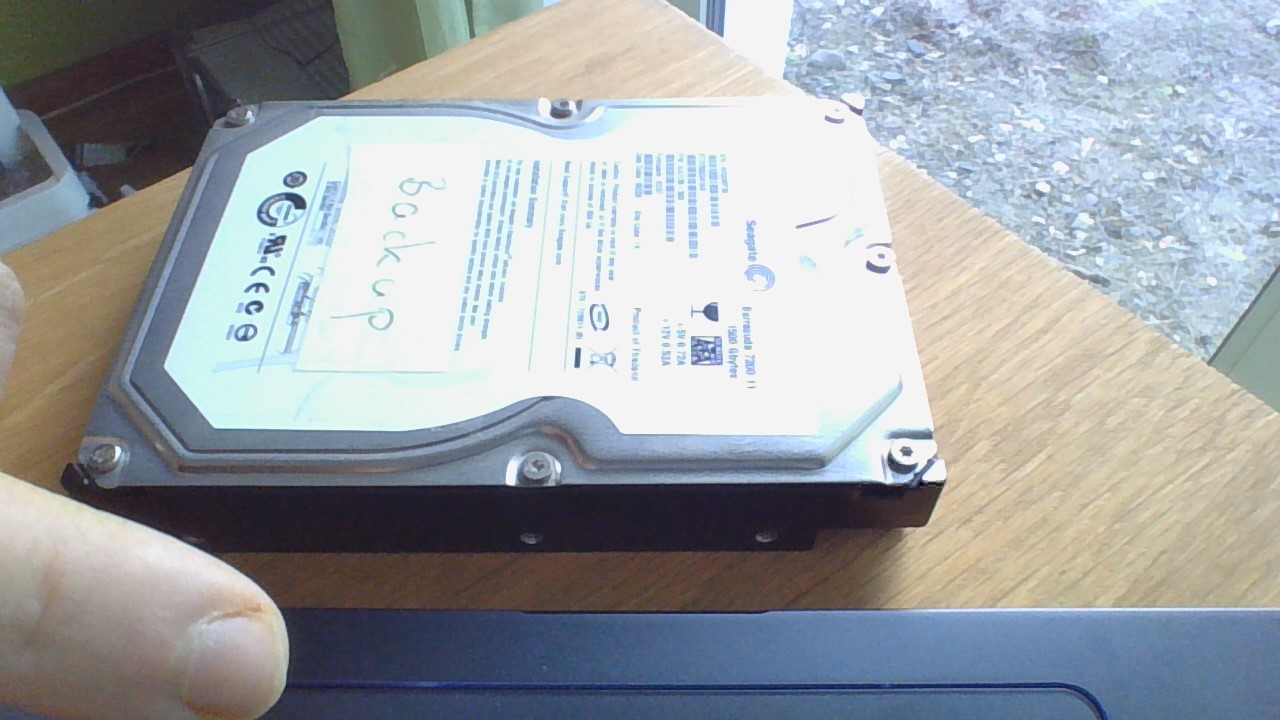
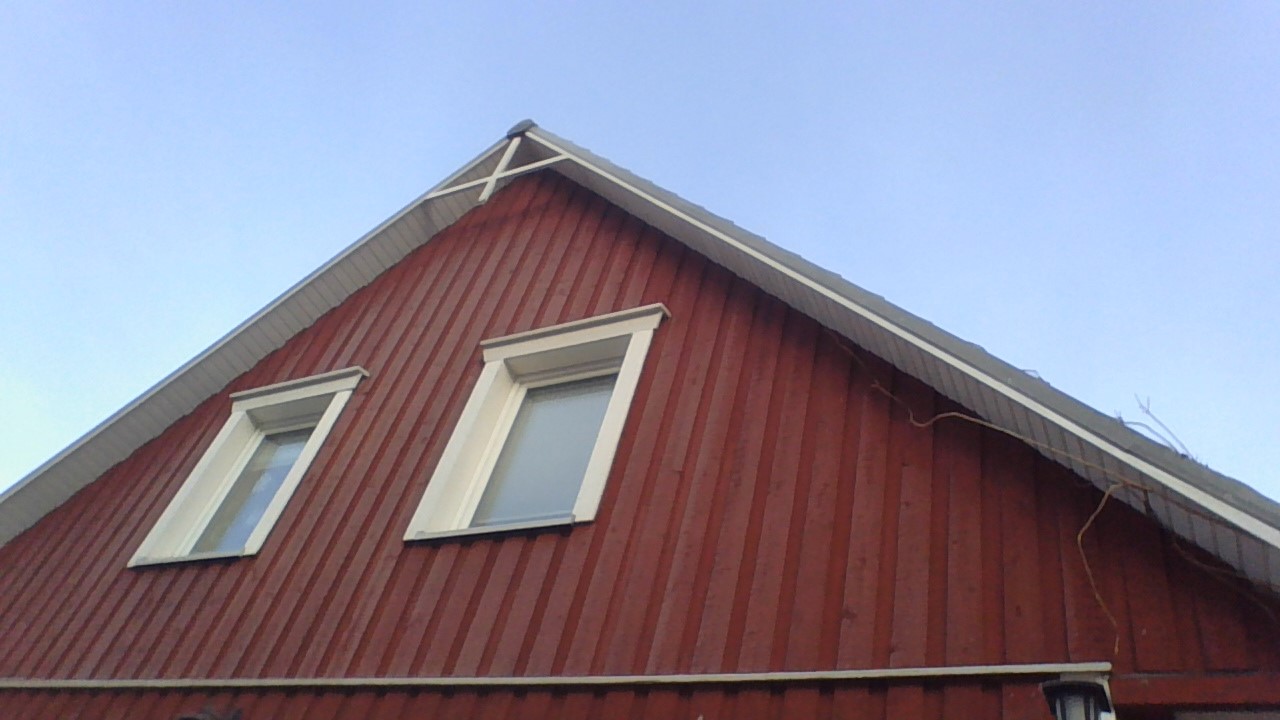
The PS63 has a 720p webcam that delivers unimpressive image quality. Image noise dominates the pictures that we took with the webcam, while large areas of colour look washed-out, as with the sky in the photo that we included below.
Colours look natural though, albeit a bit too pale for our liking. The webcam struggles to capture scenes with bright and dark areas, with the resulting photo looking blown out, as demonstrated by the photo of our HDD. In short, the image quality is good enough for the occasional Skype call, but we would suggest investing in an external webcam if you need something that can record in higher resolution.


Accessories
MSI includes just a 90 W charger in the box and does not sell any PS63-specific accessories. You may be able to find compatible third-party cases though should you need one.
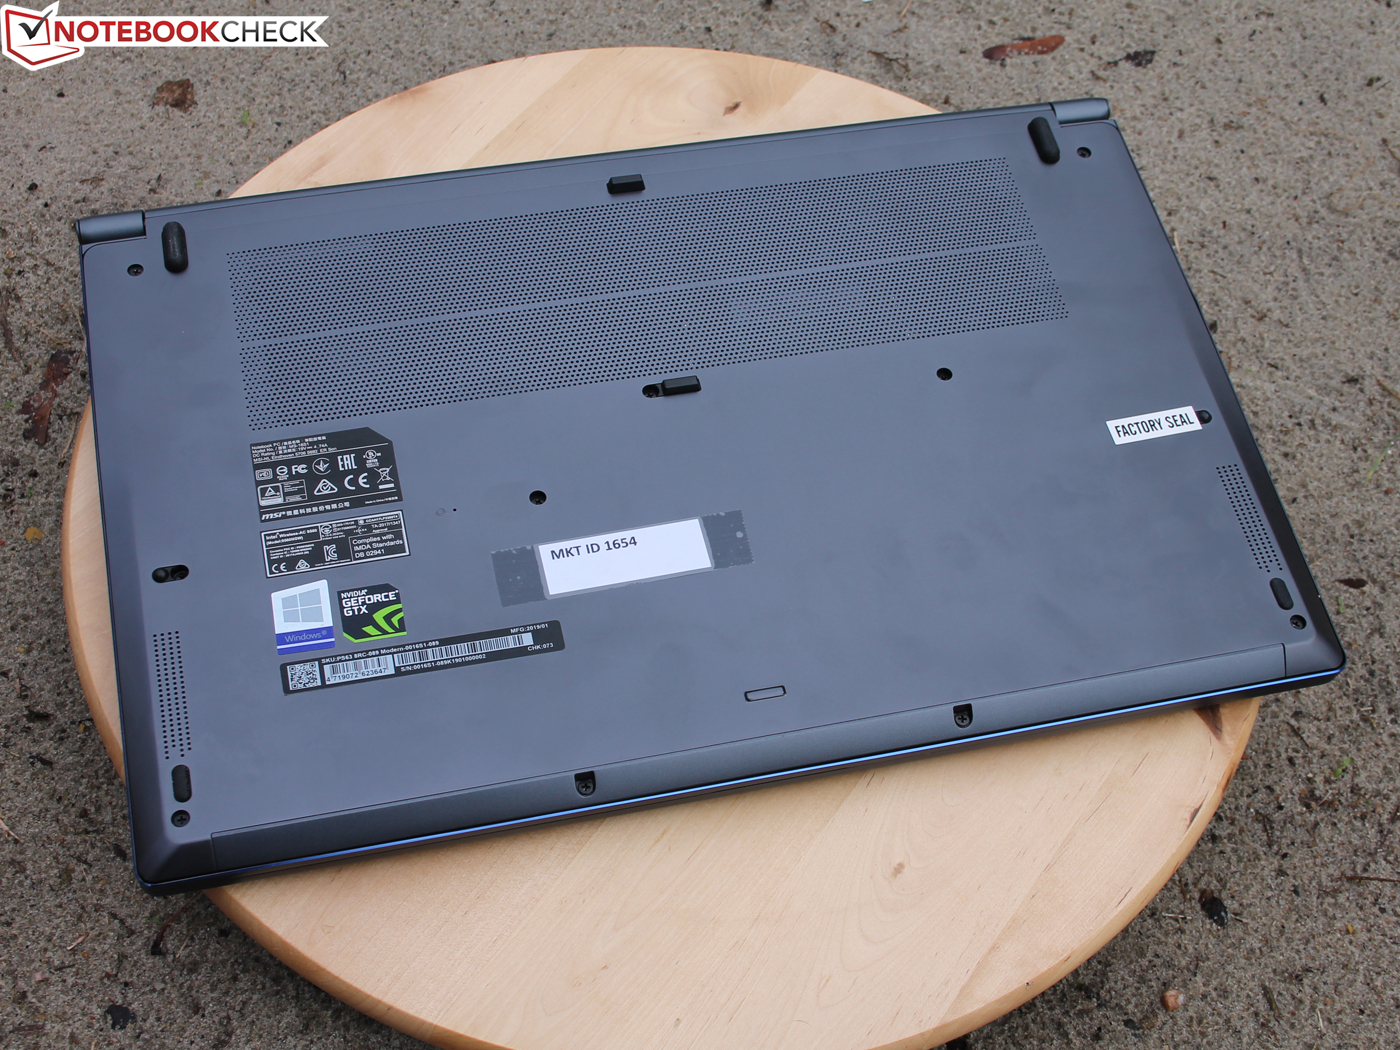
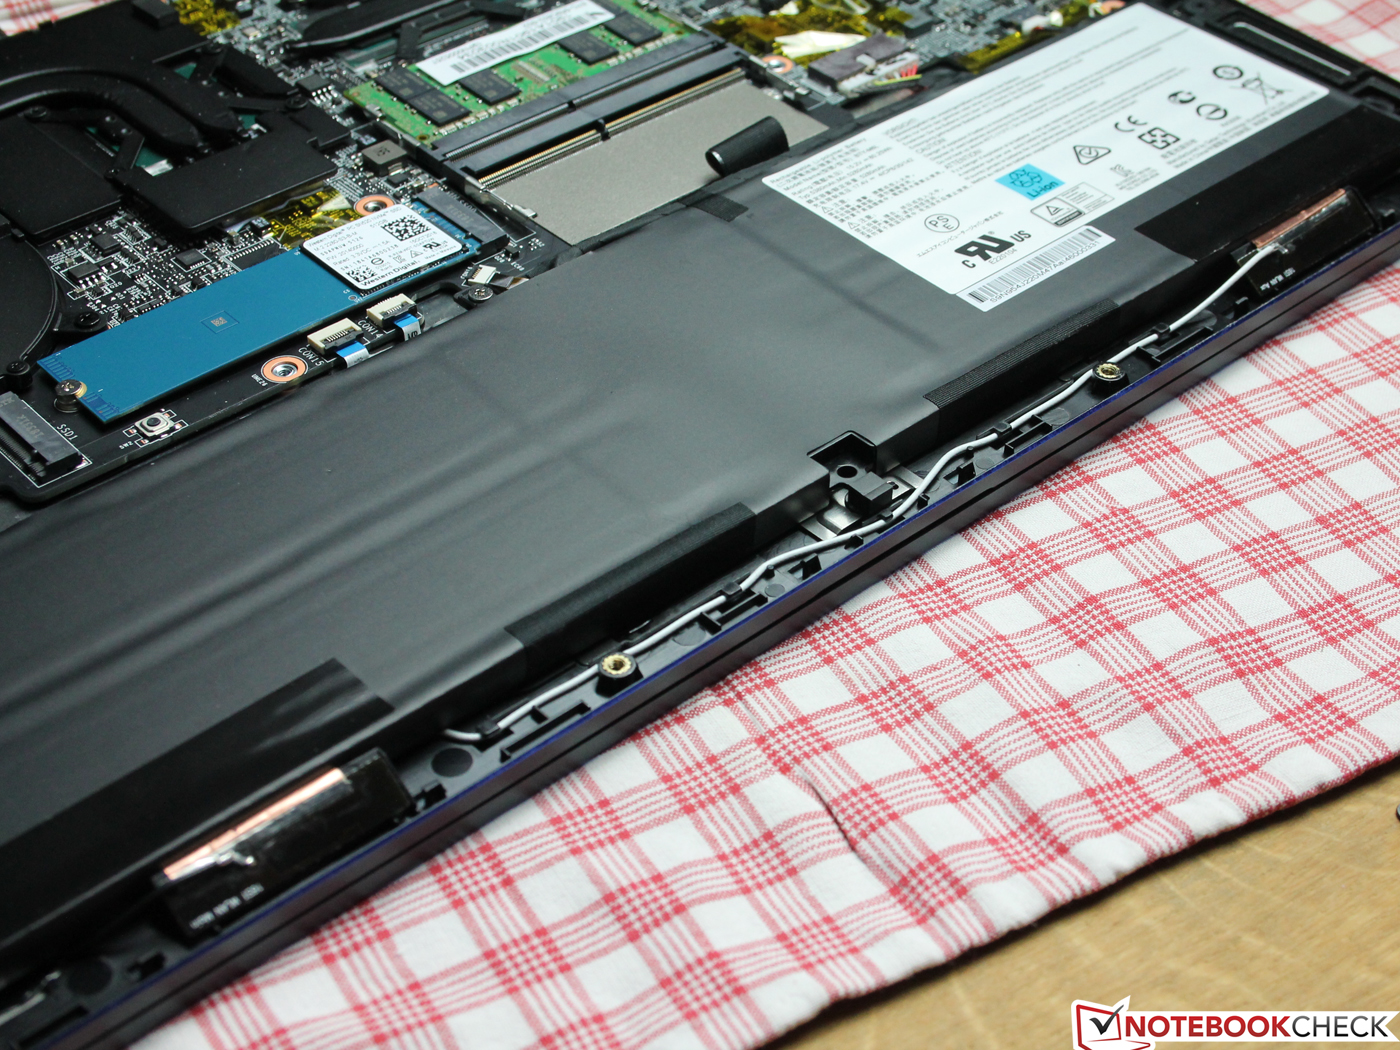
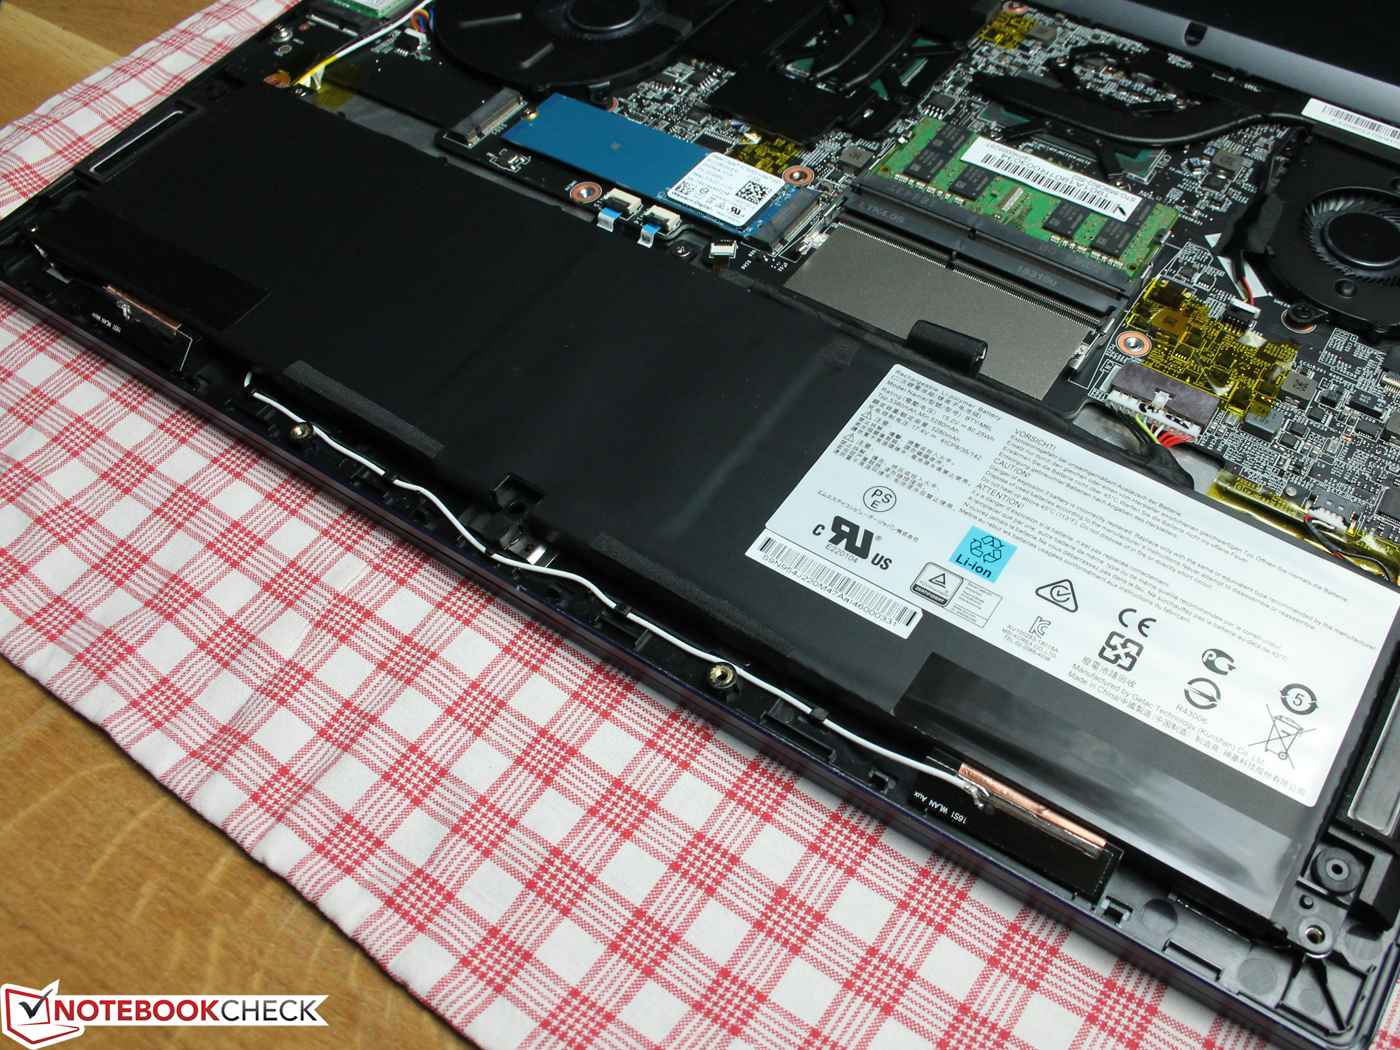
Maintenance
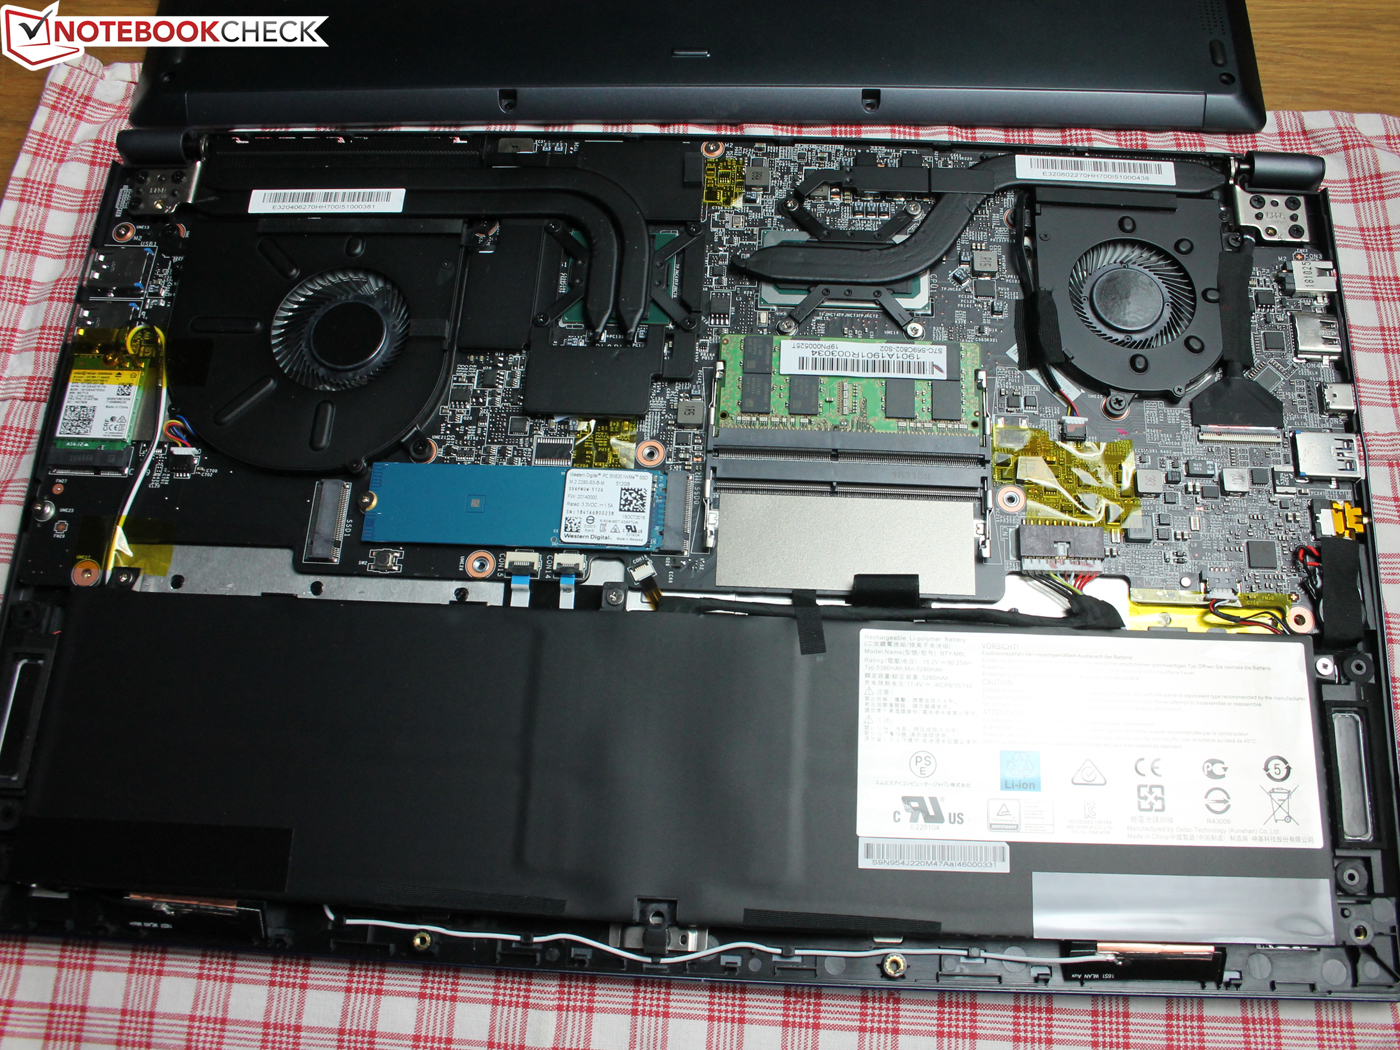
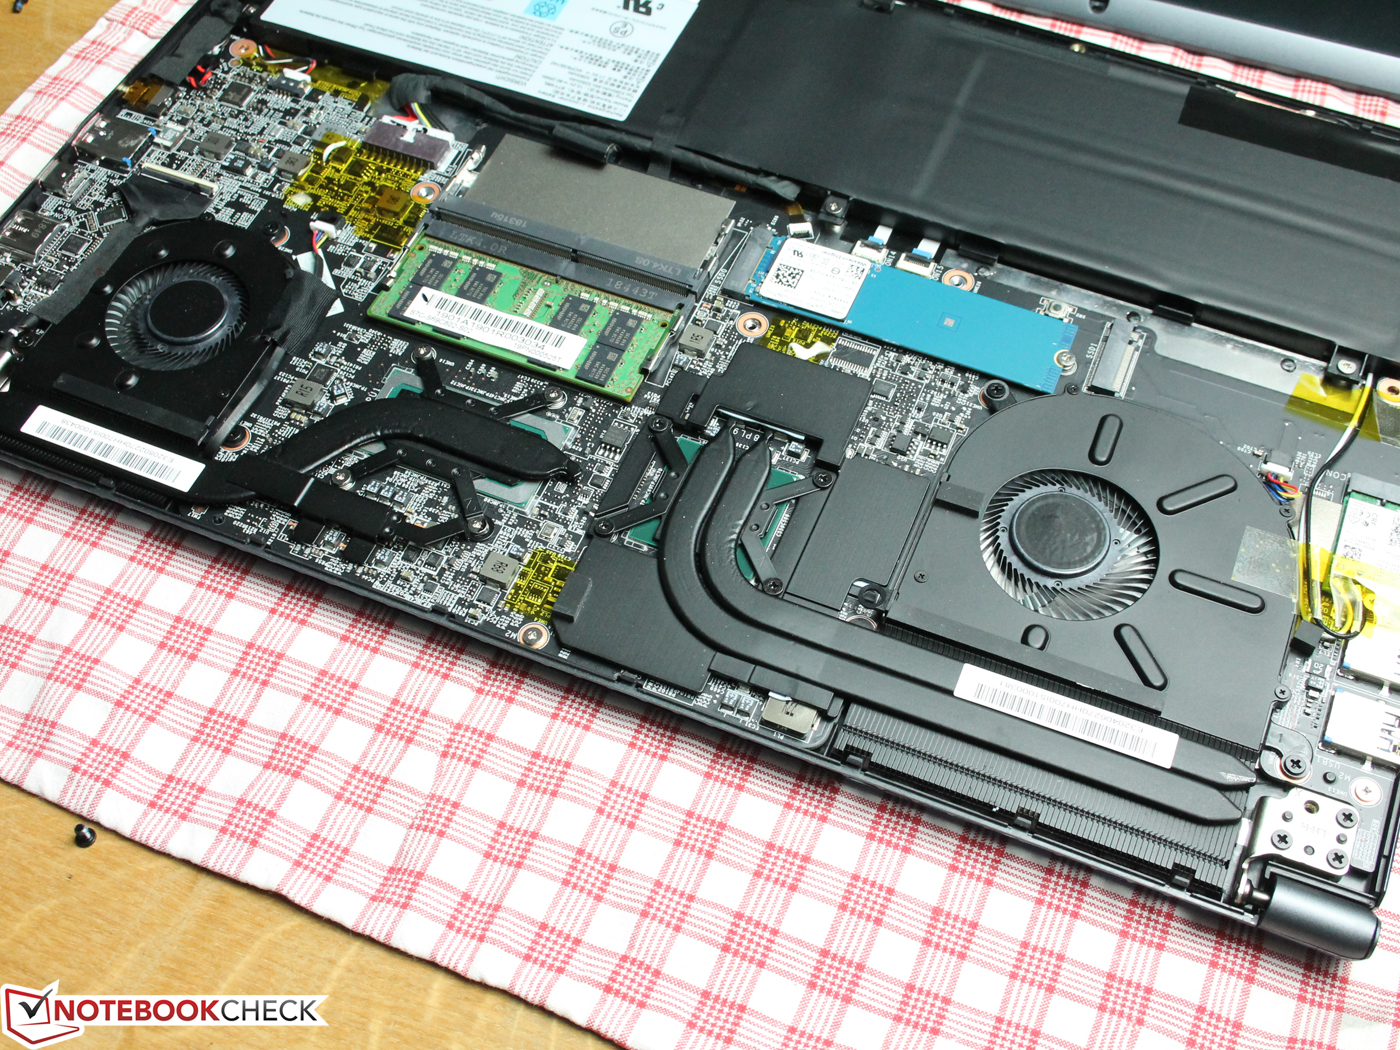
The PS63 is simple to repair and maintain thanks to its uncomplicated design. All internal components are accessible by removing the bottom plate, which is screwed in place by a few crosshead screws. We then pried the bottom plate away from the case with a flat plastic tool to prevent damaging the device.
Warranty
The PS63 comes with a two-year limited warranty. The warranty includes a free pick-up & return service. Please see our Guarantees, Return policies and Warranties article for country-specific information.
Input Devices
Keyboard
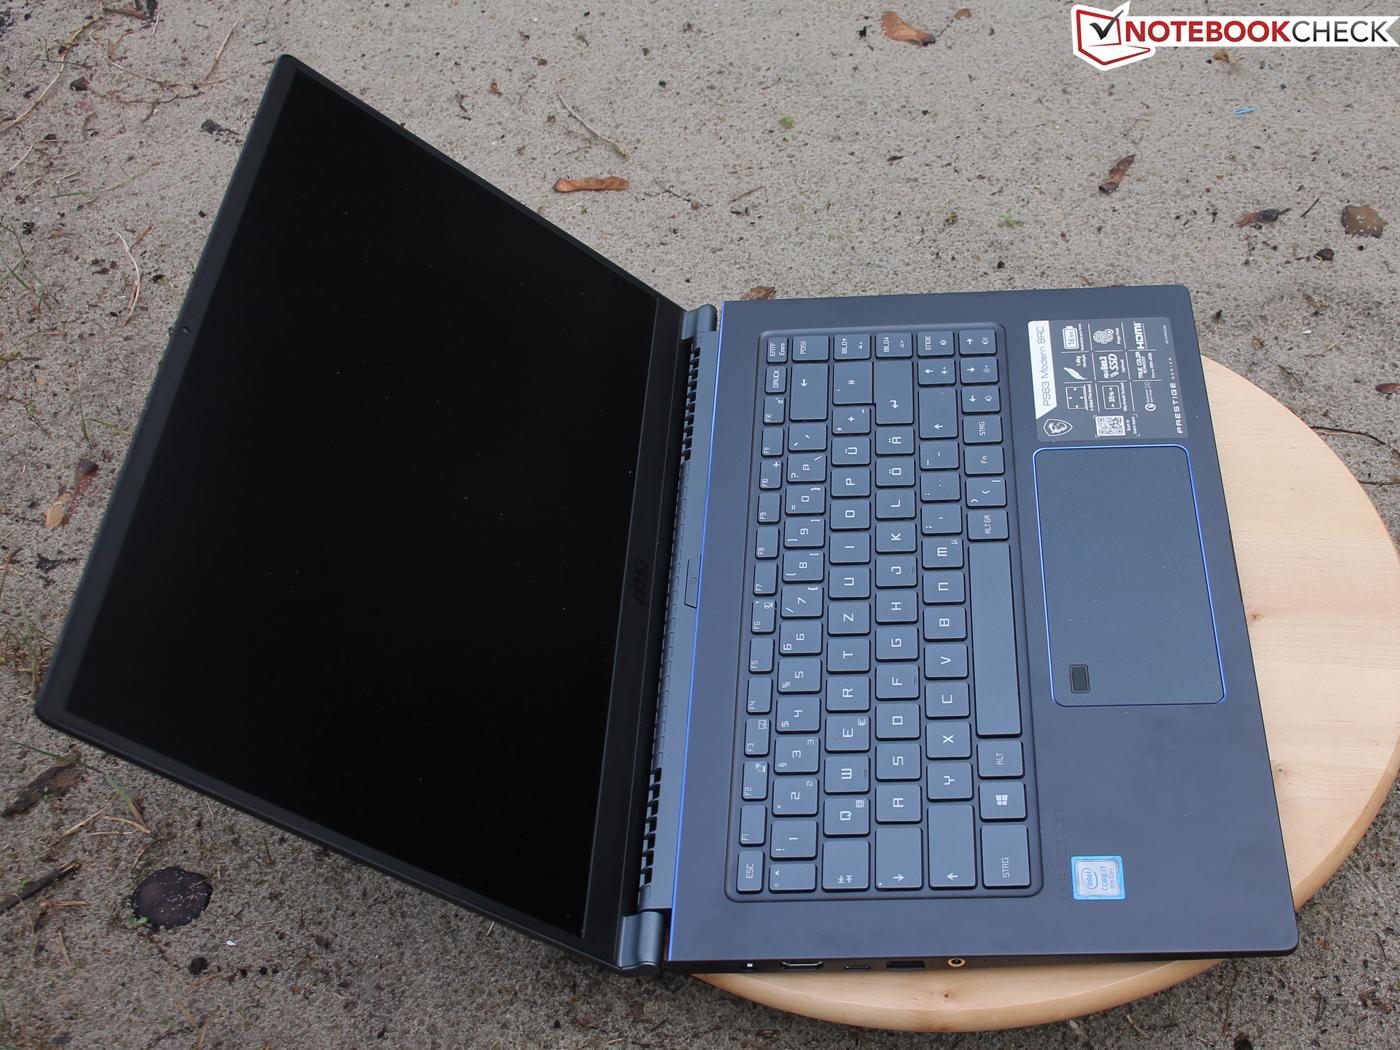
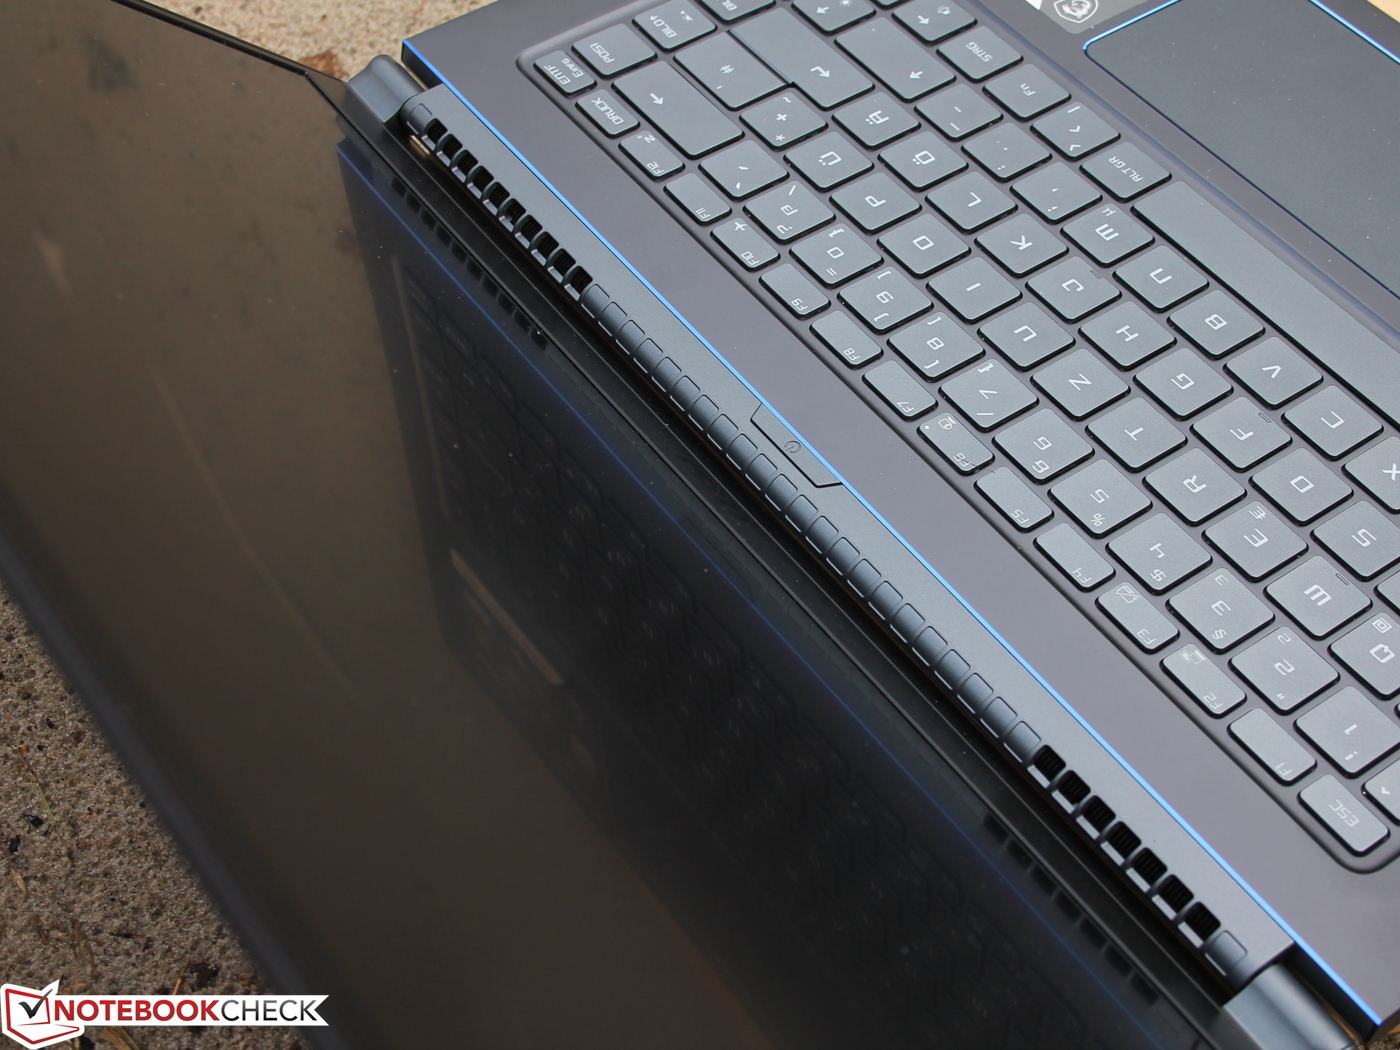
MSI laptops have not always had the best input devices. The company seems to have changed that now though because the keyboard on our test device is so good that we can recommend it even to those who are frequent typists. The keyboard deck is sturdy and does not bow while typing, which results in a satisfying stop when the keys are pressed. The keyboard is not too loud either, which is a bonus.
The keystroke should be good enough for most people too, but we would have preferred it to be a bit deeper. The keys have crisp pressure points though, which provides good acoustic and haptic feedback. Most people should not take too long to acclimatise to the keyboard either as its layout is typical for most 15-inch laptops without a dedicated number pad.
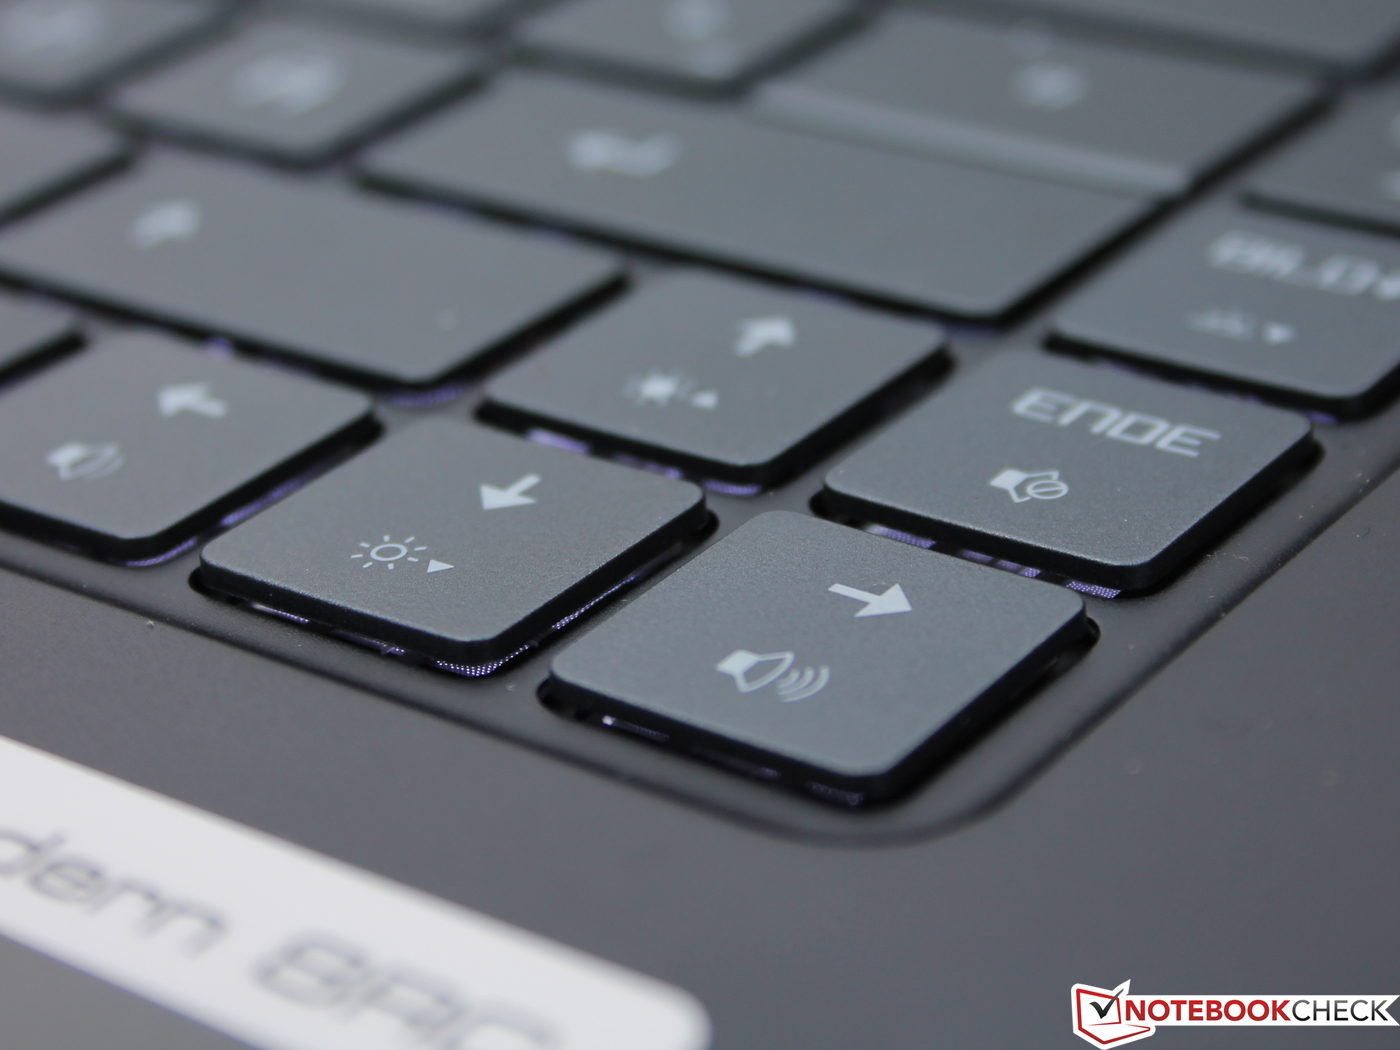
The keyboard has a few quirks though that are worth keeping in mind. MSI has decided to place the Function key to the right of the spacebar and three keys to the left of the spacebar, which pushes it further to the left than on the XPS 15 9570 or the MacBook Pro 15 2018. Moreover, MSI has distributed the brightness, keyboard backlight and volume shortcuts across the keyboard rather than assigning them to the function keys. This may throw some people initially, but we found their positioning useful in games because we could move with WASD using our left hand and control volume etc. with our right hand.
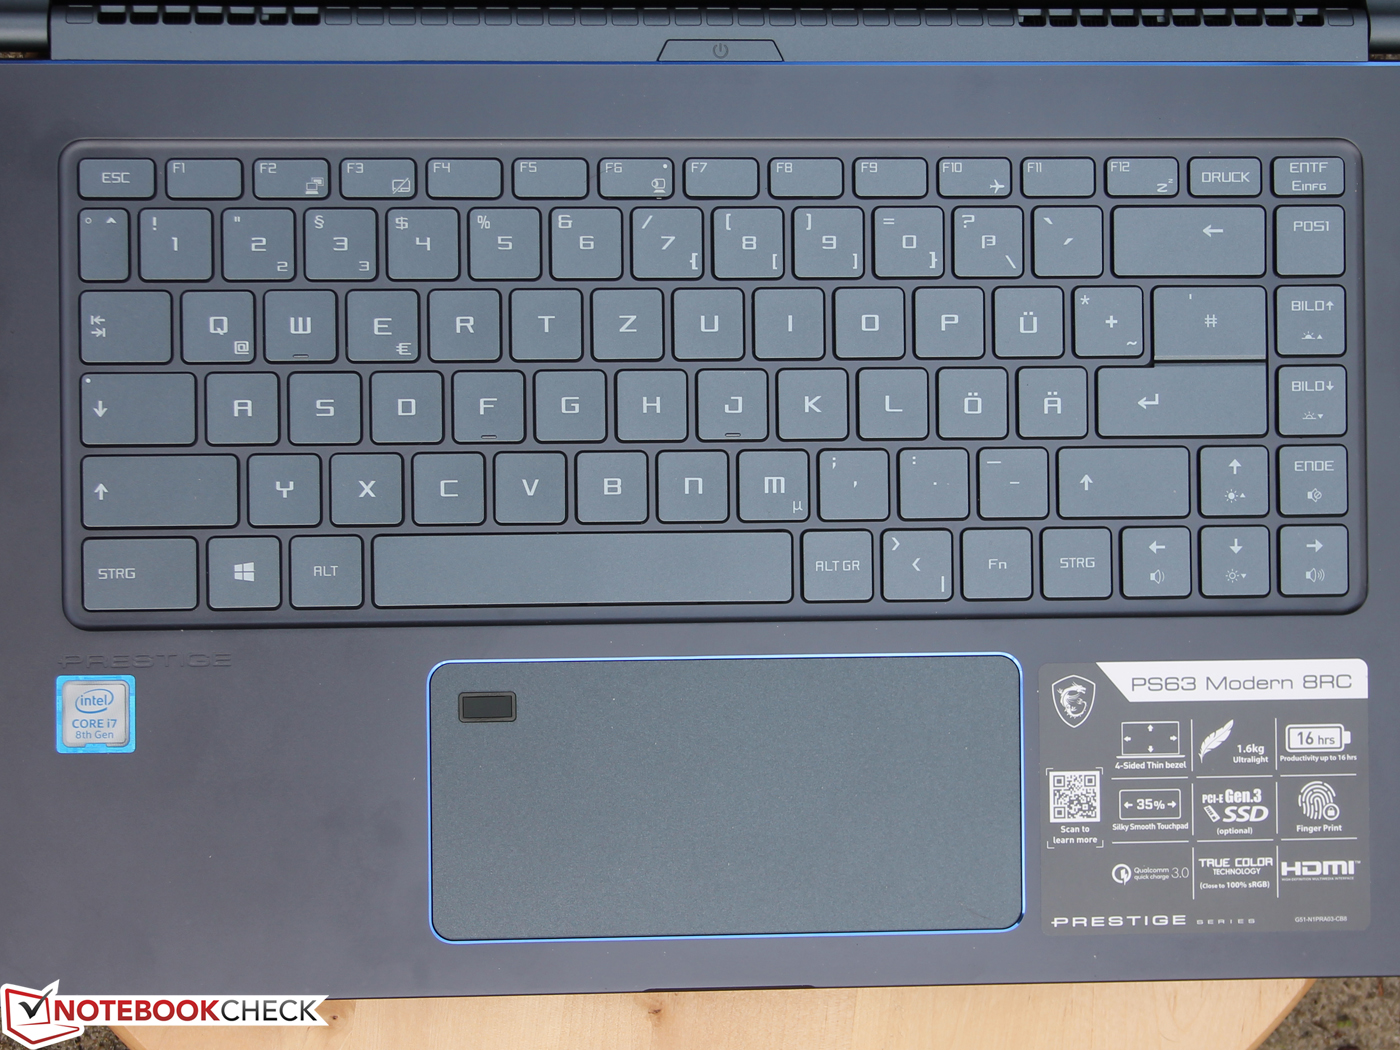
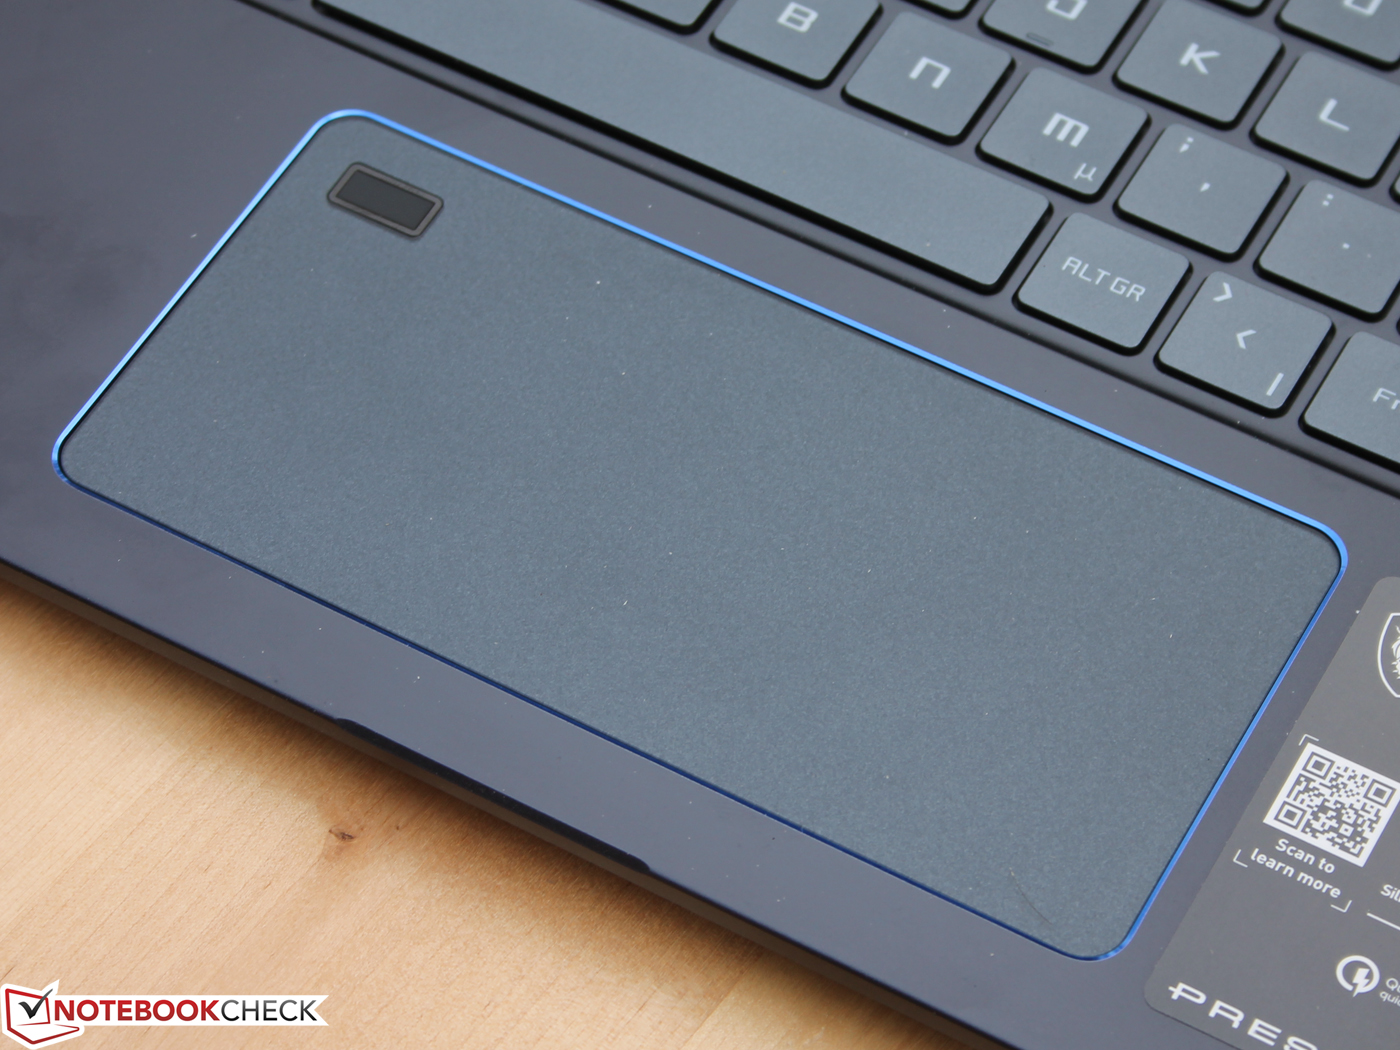
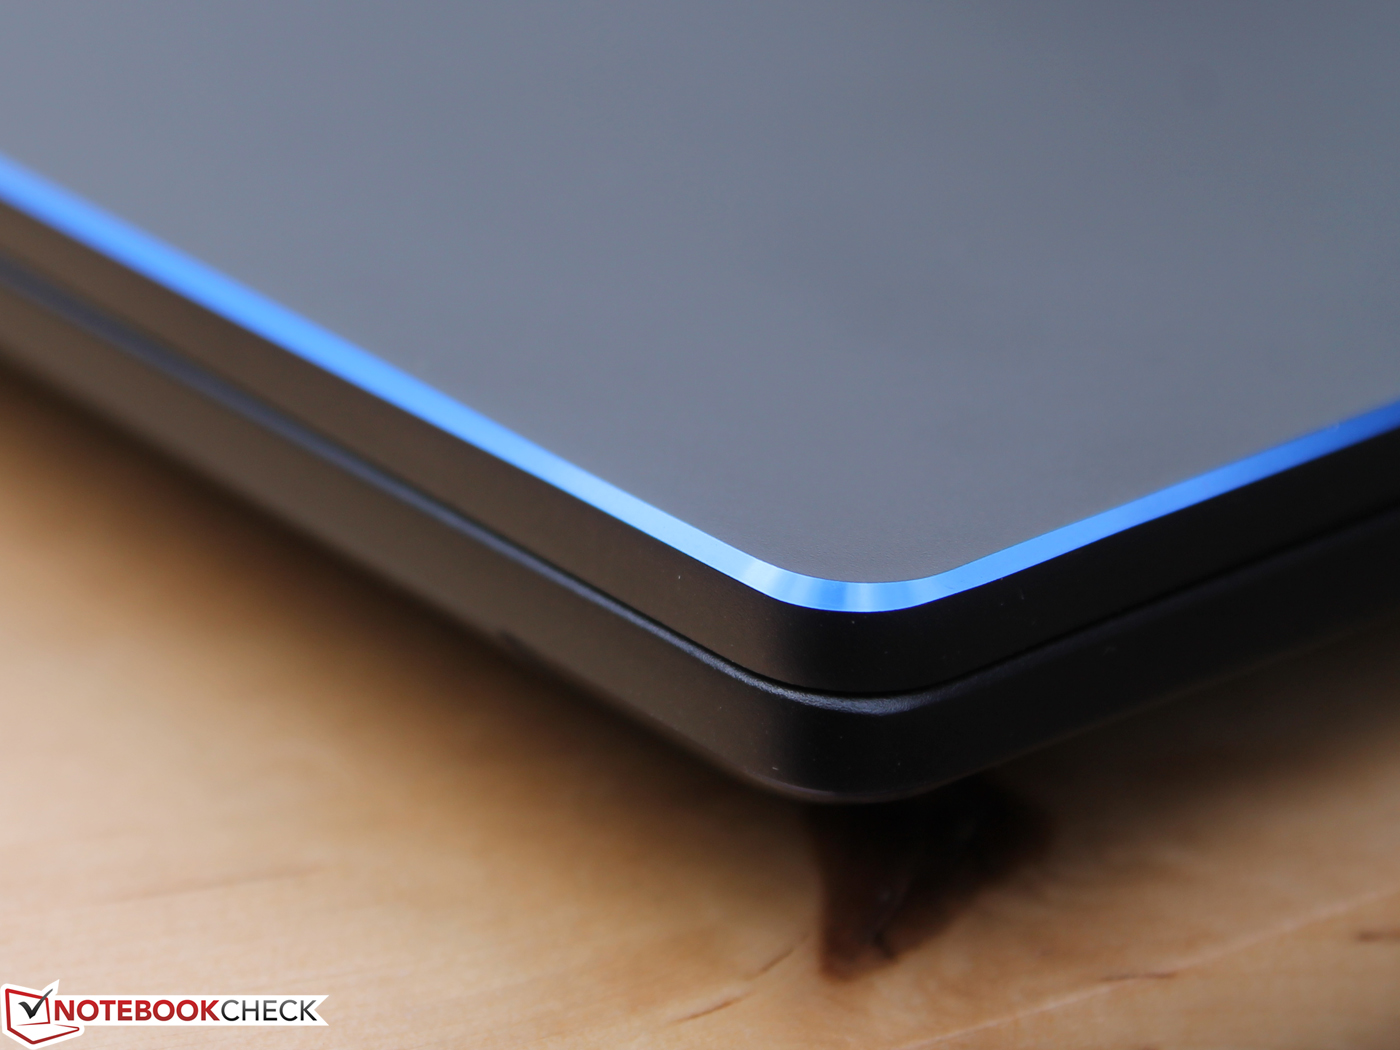
Trackpad
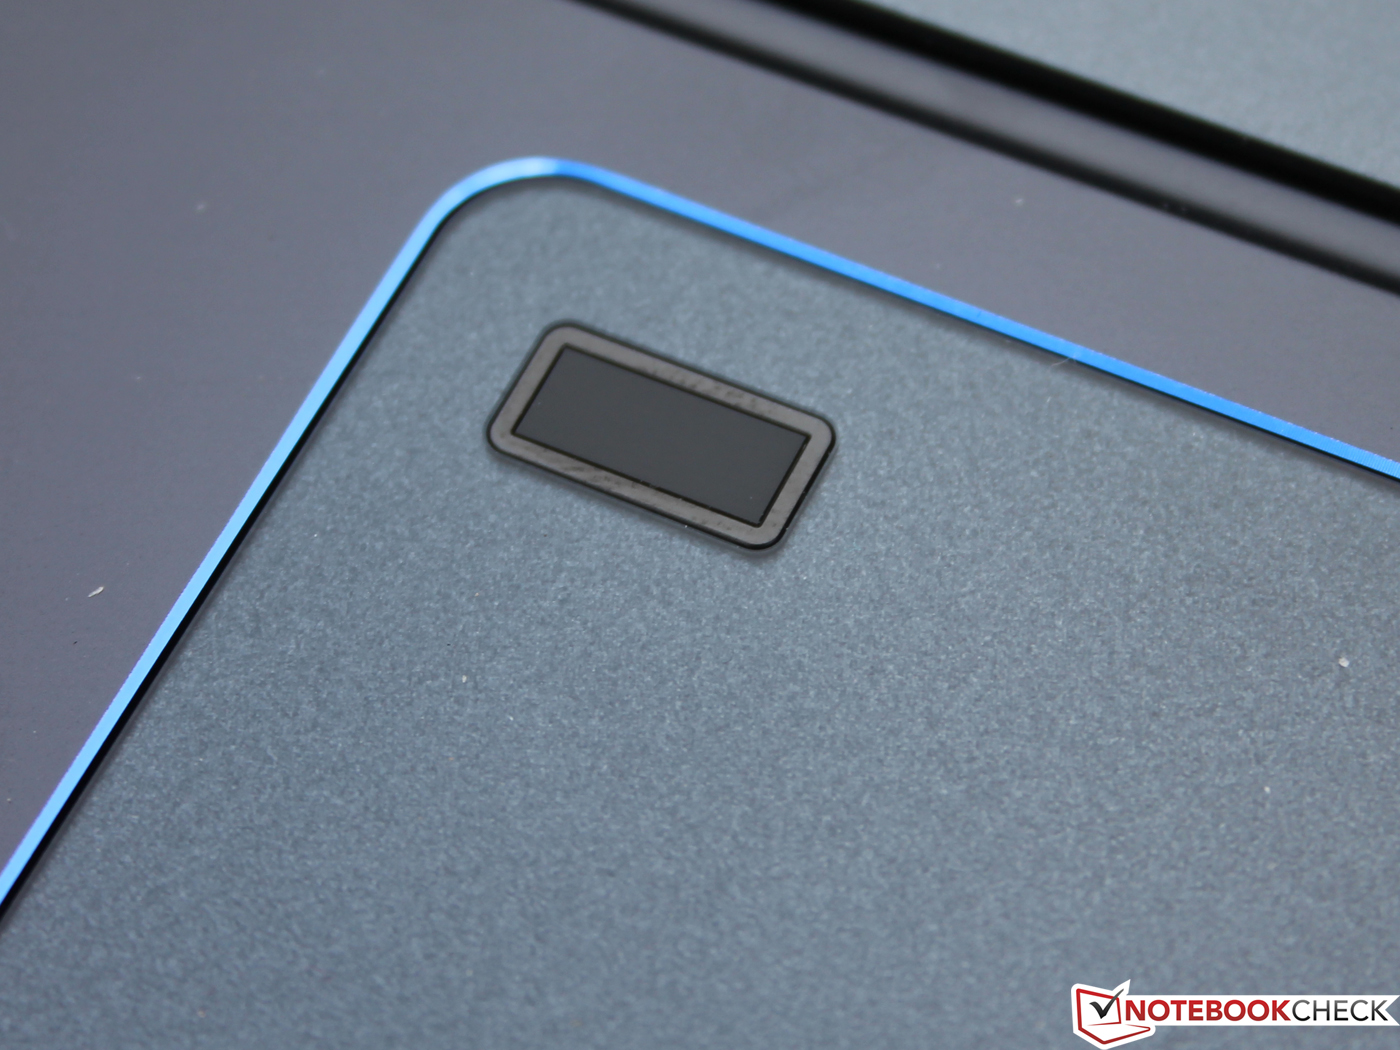
The PS63 has a 14 cm wide trackpad that is eye-catching not only because of its size but also because of its electric blue edging. The pointer speed is slower than most of our comparison devices upon delivery, but this could be adjusted in Control Panel or Settings to your preferences. The trackpad has a matte finish that is surprisingly slippery and a short stroke that we had to press hard to activate. Fortunately, the trackpad delivers soft acoustic feedback that sounds discreet. The integrated mouse buttons are disappointing though and do not offer an equivalent mechanical feel as the keyboard does.
Display
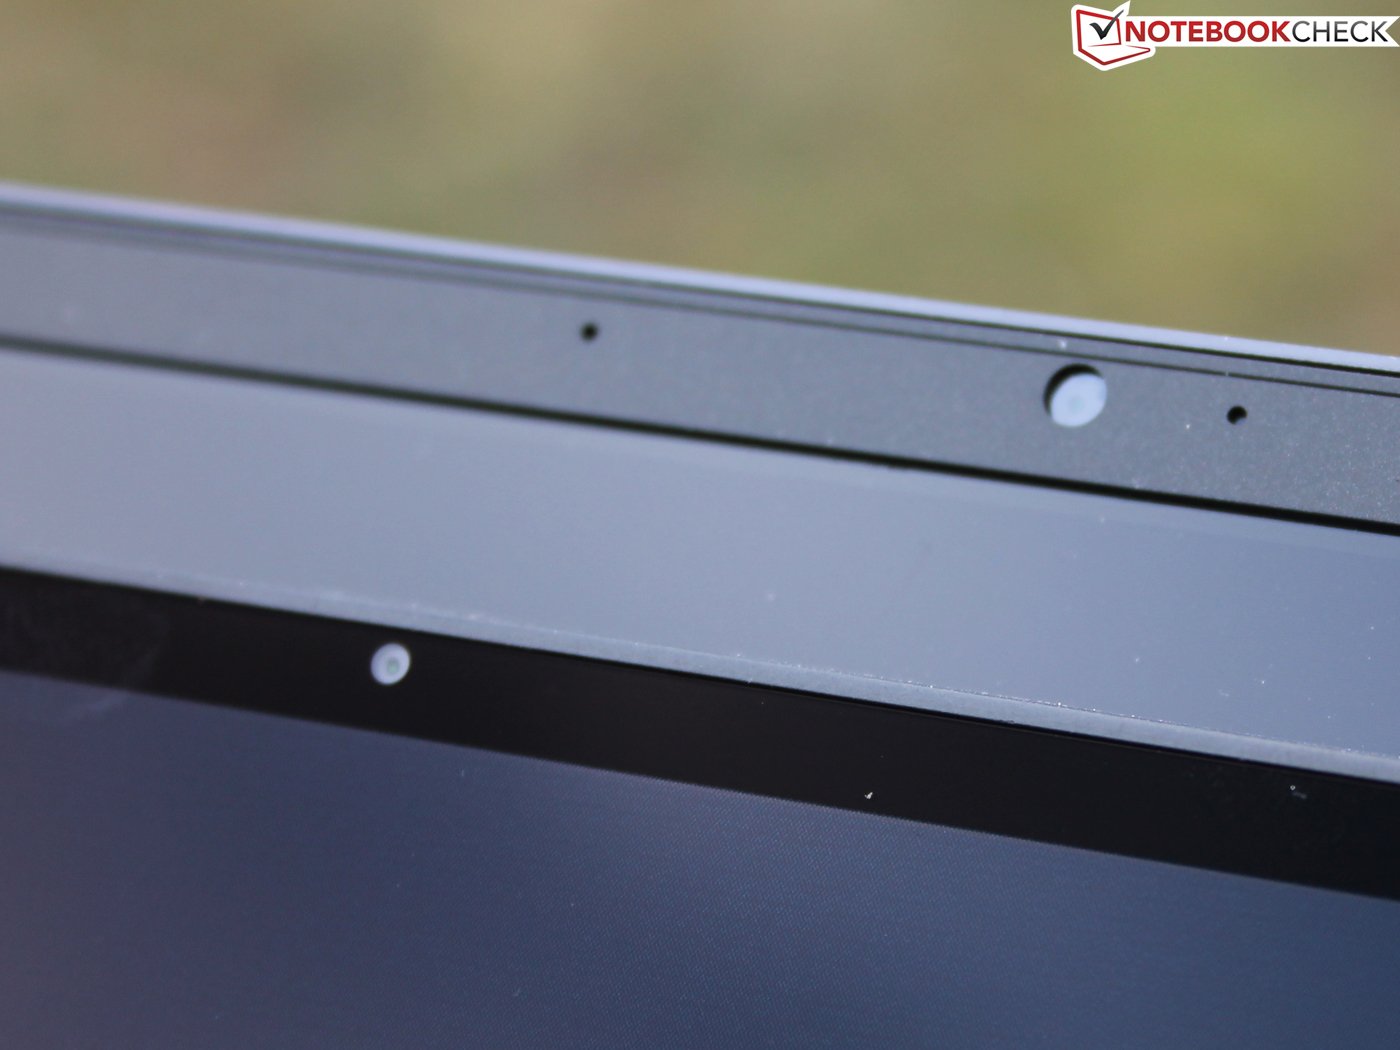
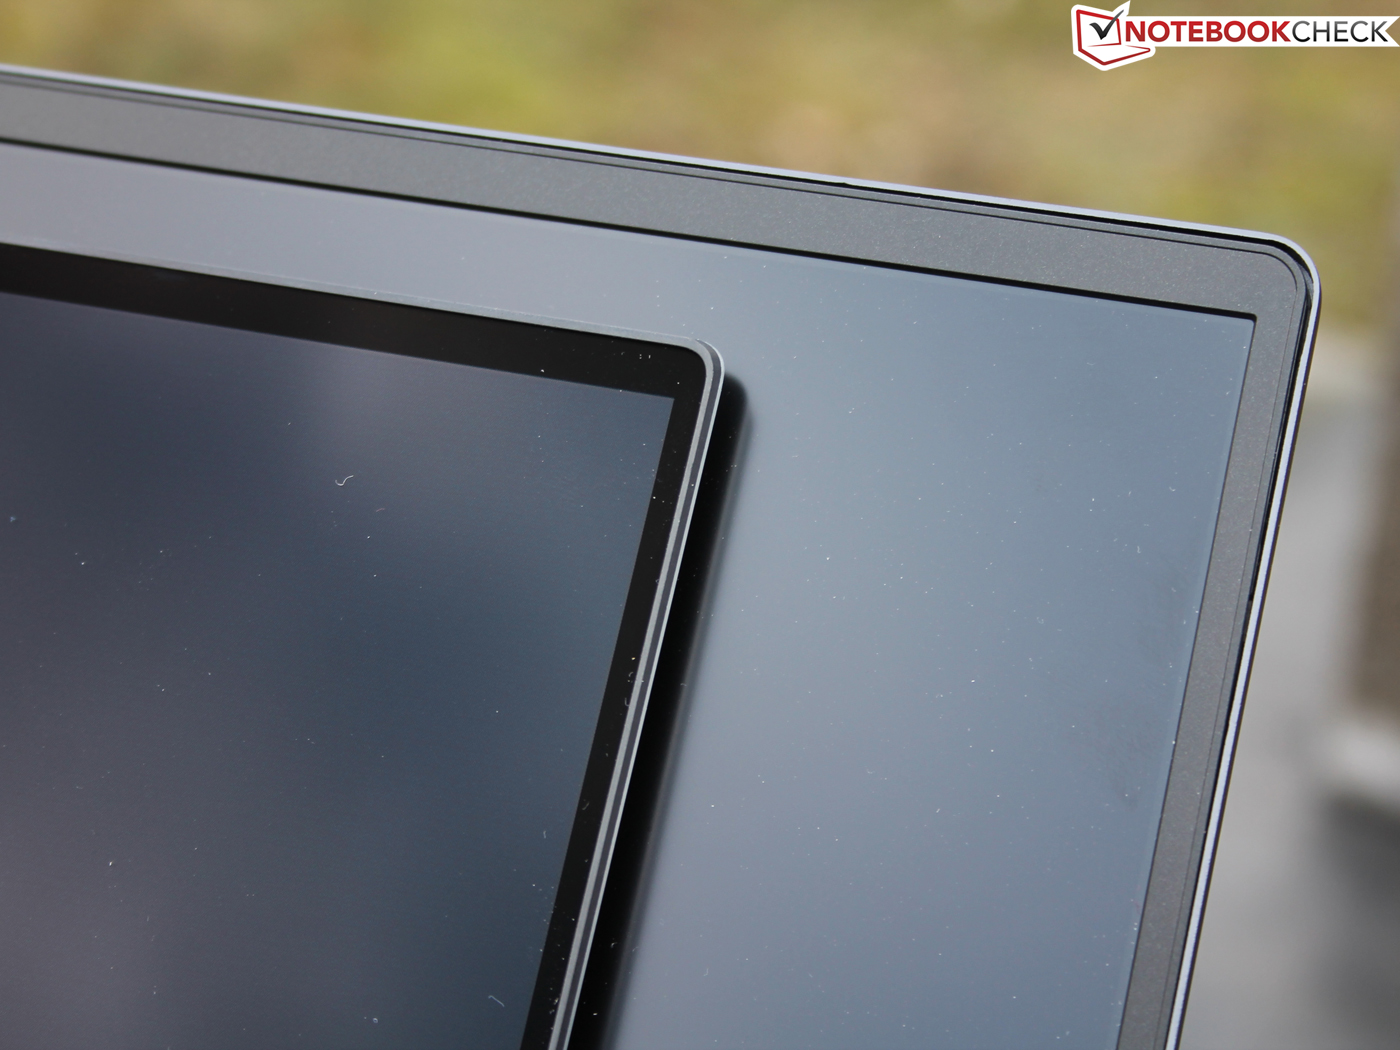
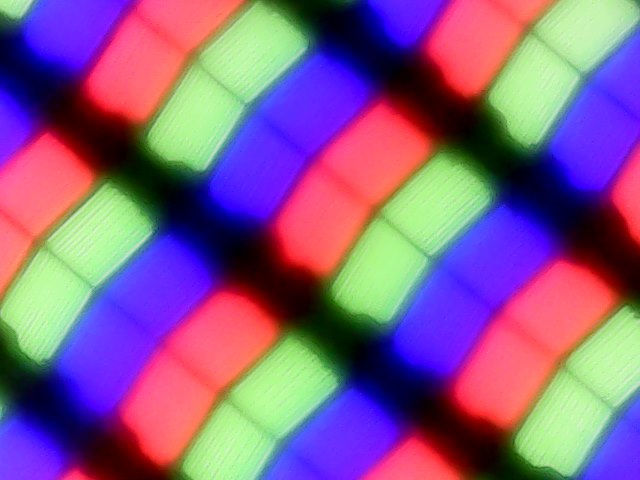
The PS63 has a 15.6-inch display that operates natively at 1920x1080. MSI has integrated an anti-reflective coating and houses the screen in a frame that has left and right-hand bezels that are around 6 mm thick. Our test device has a Chi Mei panel that carries the model number CMN15E8 N156HCE/EN1, which has a pixel density of 141 DPI. Please note that MSI may use multiple panel suppliers, so your PS63 could have a different display to the one in our test unit.
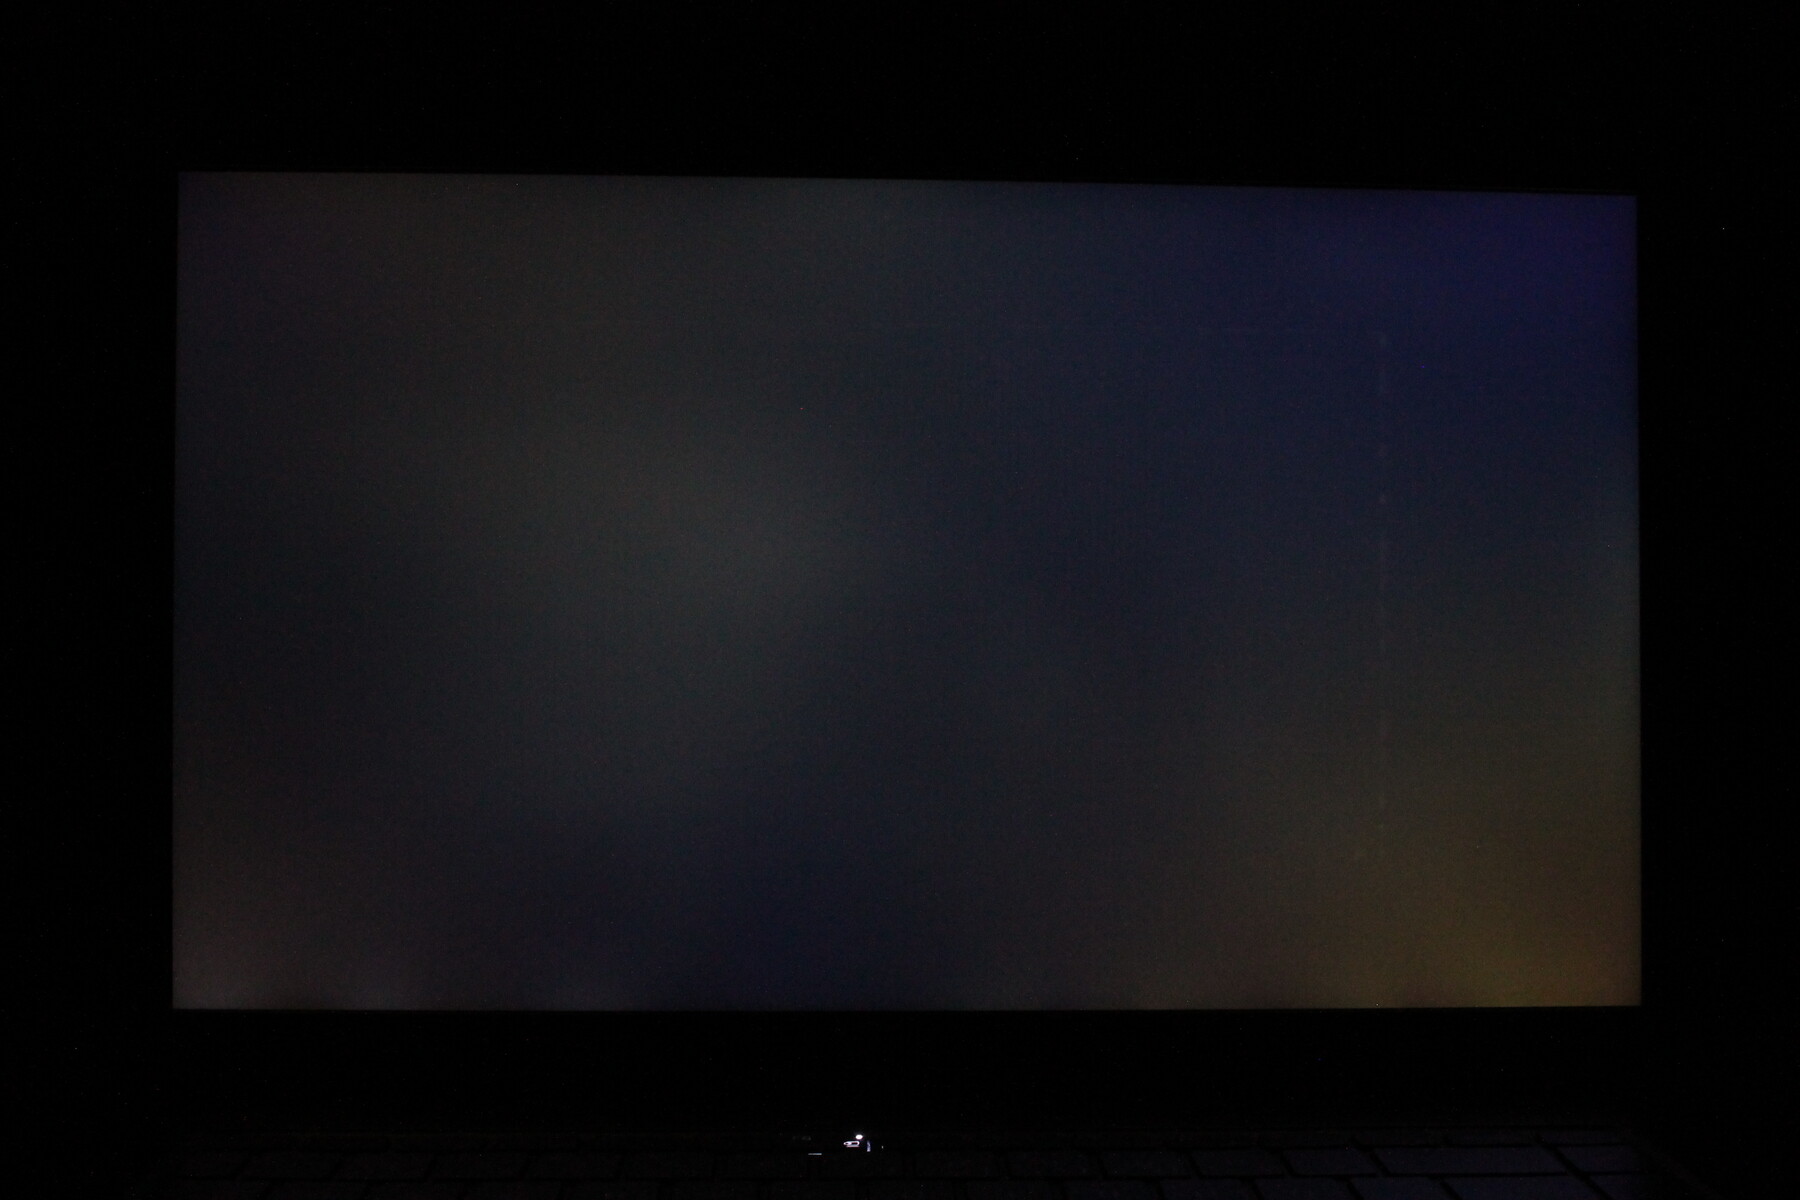
The PS63 achieved an average maximum brightness of 262 cd/m², according to X-Rite i1Pro 2, which is on par with the PS42 8RB Prestige but is considerably darker than our other comparison devices. Our test unit has a comparatively low black value though, which we measured at 0.26 cd/m² that helps the screen achieve a respectable 1,112:1 contrast ratio. The latter value puts the PS63 in the midfield of our comparison table, but it is around 24% less vibrant than the ThinkPad X1 Extreme, MacBook Pro 15 2018 and XPS 15 9570, while it is a whopping 65% short of the Surface Book 2. Disappointingly, our test device has only a 75% evenly lit display, which is considerably lower than most of our comparison devices; two areas of the screen are noticeably darker than the rest.
| |||||||||||||||||||||||||
Brightness Distribution: 75 %
Center on Battery: 289 cd/m²
Contrast: 1112:1 (Black: 0.26 cd/m²)
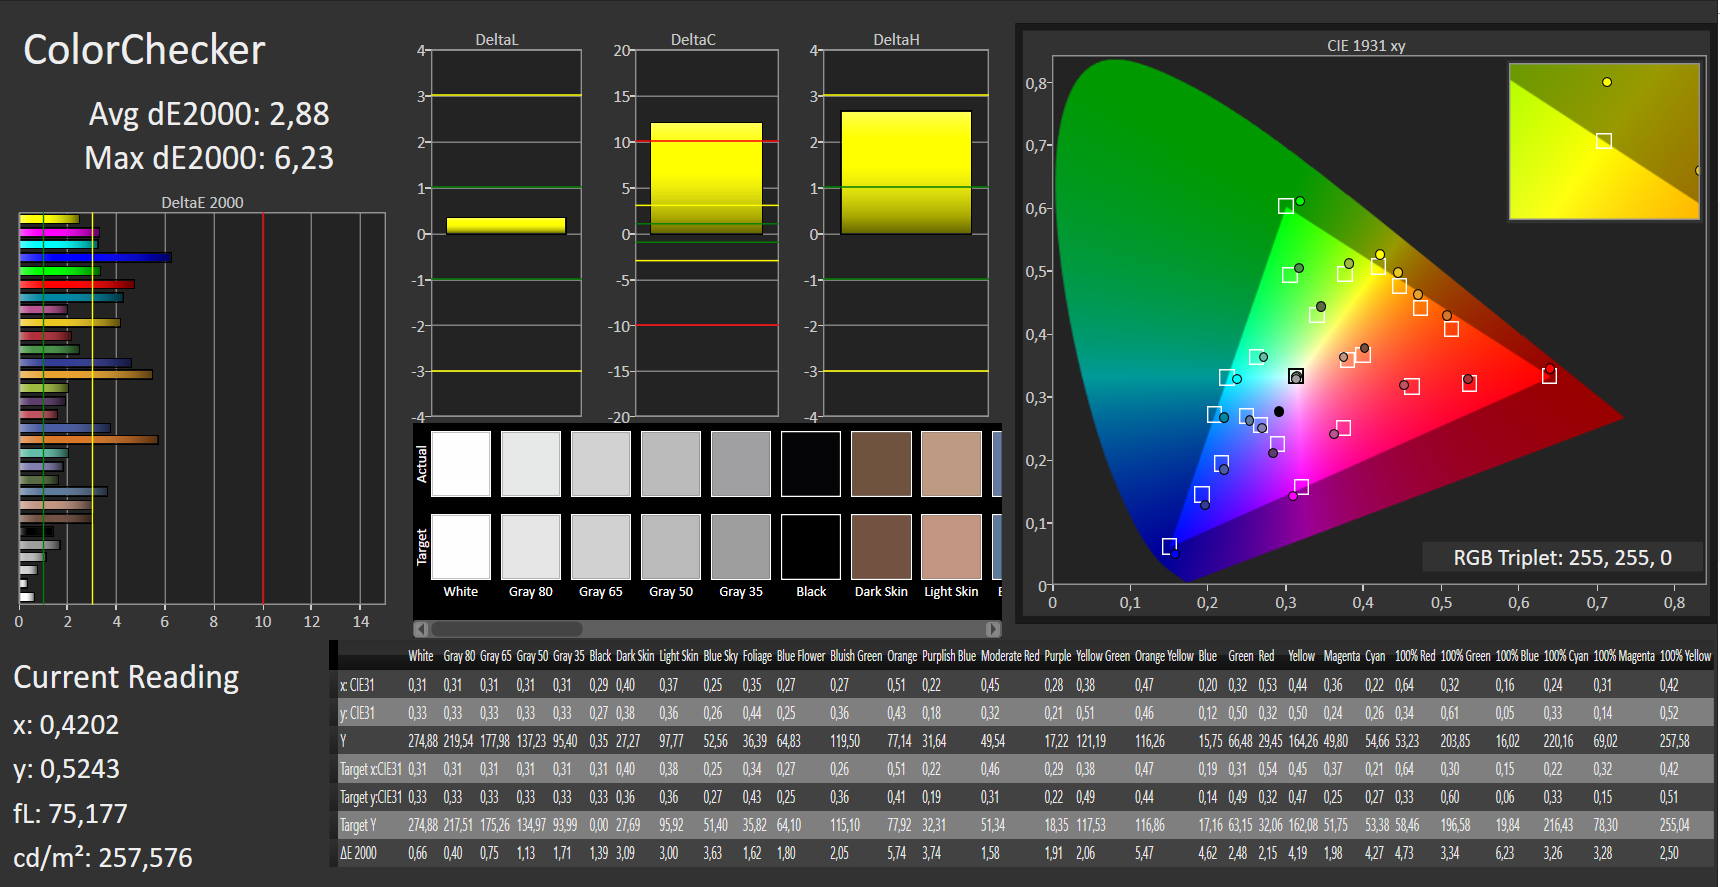
ΔE ColorChecker Calman: 2.9 | ∀{0.5-29.43 Ø4.73}
calibrated: 2.88
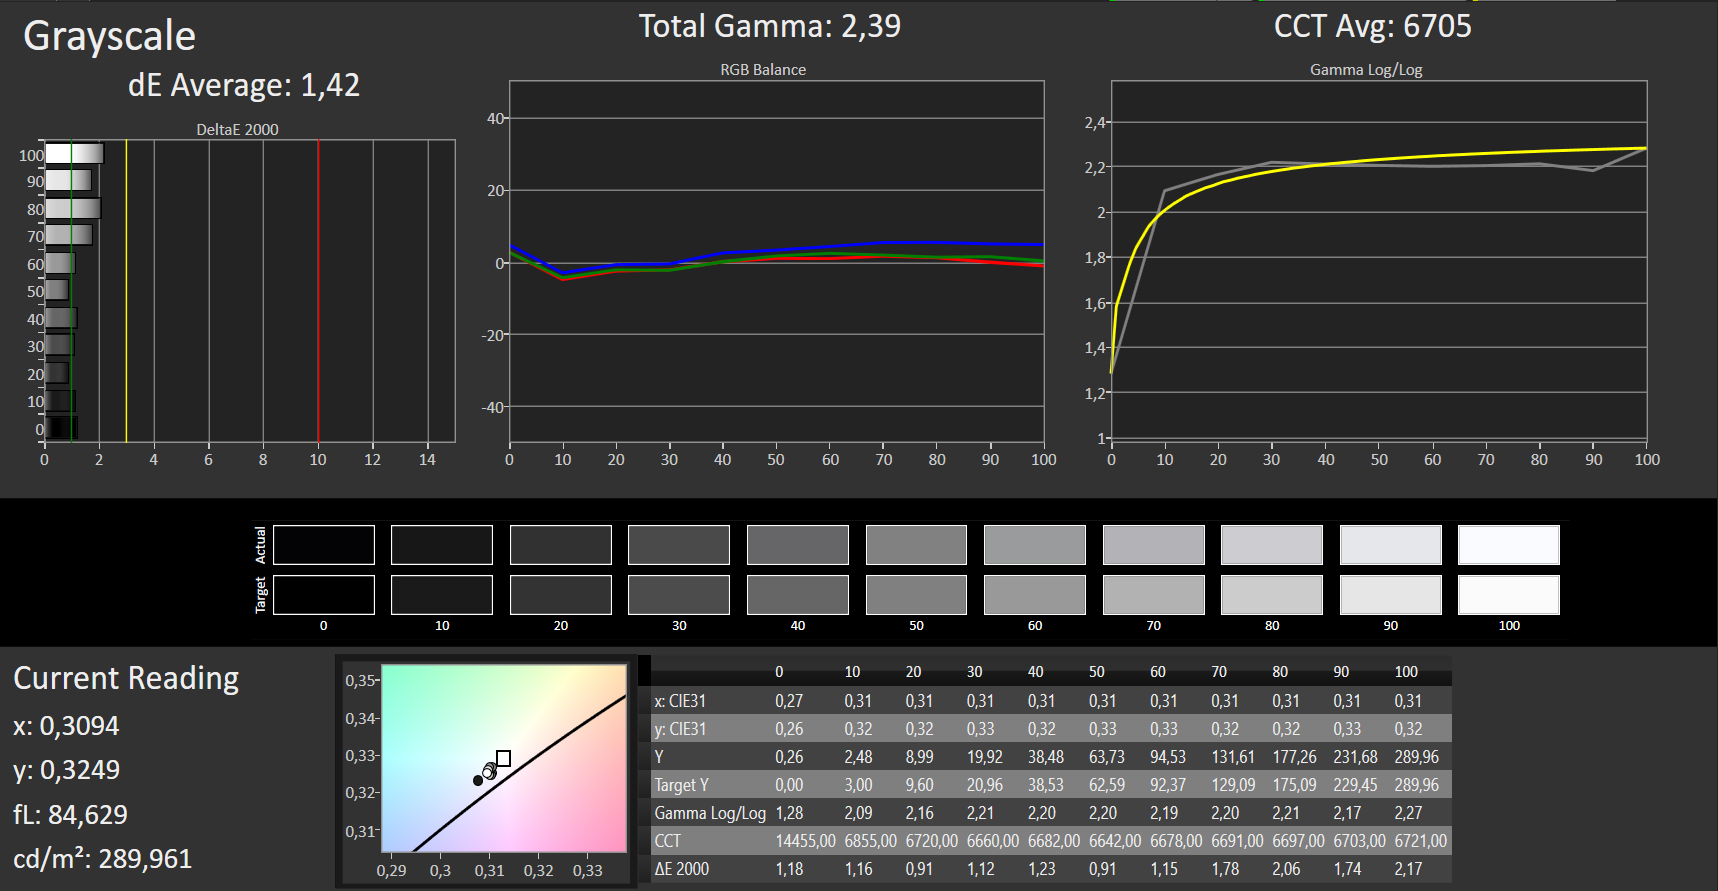
ΔE Greyscale Calman: 1.42 | ∀{0.09-98 Ø4.97}
87% sRGB (Argyll 1.6.3 3D)
57% AdobeRGB 1998 (Argyll 1.6.3 3D)
63.9% AdobeRGB 1998 (Argyll 3D)
87.9% sRGB (Argyll 3D)
63.5% Display P3 (Argyll 3D)
Gamma: 2.39
CCT: 6705 K
| MSI PS63 Modern 8RC Chi Mei CMN15E8 N156HCE/EN1, , 1920x1080, 15.6" | MSI Prestige PS42 8RB-059 CMN N140HCE-EN2, , 1920x1080, 14" | Schenker XMG Neo 15 LGD05C0, , 1920x1080, 15.6" | Gigabyte Aero 15X v8 LGD05C0, , 1920x1080, 15.6" | Schenker Key 15 Coffee Lake LGD05C0, , 1920x1080, 15.6" | Microsoft Surface Book 2 Panasonic MEI96A2 , , 3000x2000, 13.5" | Dell XPS 15 2018 i5 FHD 97Wh Sharp SHP149A LQ156M1, , 1920x1080, 15.6" | Lenovo ThinkPad X1 Extreme-20MF000RGE NV156FHM-N61, , 1920x1080, 15.6" | Apple MacBook Pro 15 2018 (2.6 GHz, 560X) APPA040, , 2880x1800, 15.4" | Lenovo Ideapad 720S-15IKB 81AC001AGE Chi Mei CMN15E8 / N156HCE-EN1 CMN, , 1920x1080, 15.6" | |
|---|---|---|---|---|---|---|---|---|---|---|
| Display | 9% | 3% | 3% | 2% | 8% | 6% | 3% | 35% | 1% | |
| Display P3 Coverage (%) | 63.5 | 67.5 6% | 64.3 1% | 63.6 0% | 63.4 0% | 67.9 7% | 66 4% | 68.6 8% | 98.7 55% | 63.6 0% |
| sRGB Coverage (%) | 87.9 | 98.6 12% | 94.1 7% | 93.8 7% | 93.3 6% | 95.7 9% | 96.5 10% | 88.7 1% | 99.9 14% | 89.4 2% |
| AdobeRGB 1998 Coverage (%) | 63.9 | 69.6 9% | 65.3 2% | 64.9 2% | 64.5 1% | 69.4 9% | 66.7 4% | 64.8 1% | 86.6 36% | 64.3 1% |
| Response Times | 20% | 66% | 63% | 65% | -10% | -6% | -20% | -1% | 21% | |
| Response Time Grey 50% / Grey 80% * (ms) | 42 ? | 34.4 ? 18% | 16 ? 62% | 16.8 ? 60% | 15.2 ? 64% | 52.8 ? -26% | 49 ? -17% | 52.8 ? -26% | 43.2 ? -3% | 34 ? 19% |
| Response Time Black / White * (ms) | 32 ? | 24.8 ? 22% | 9.6 ? 70% | 11.2 ? 65% | 11.2 ? 65% | 30 ? 6% | 30 ? 6% | 36 ? -13% | 31.2 ? 2% | 25 ? 22% |
| PWM Frequency (Hz) | 25000 ? | 25000 ? | 961 ? | 21370 ? | 117000 ? | 25000 ? | ||||
| Screen | 16% | 3% | 17% | -2% | 26% | 10% | -40% | 35% | -14% | |
| Brightness middle (cd/m²) | 289 | 285.4 -1% | 325 12% | 313 8% | 309 7% | 385 33% | 413 43% | 331 15% | 520 80% | 332 15% |
| Brightness (cd/m²) | 262 | 269 3% | 303 16% | 300 15% | 291 11% | 372 42% | 378 44% | 305 16% | 492 88% | 301 15% |
| Brightness Distribution (%) | 75 | 86 15% | 90 20% | 78 4% | 91 21% | 89 19% | 86 15% | 84 12% | 88 17% | 83 11% |
| Black Level * (cd/m²) | 0.26 | 0.31 -19% | 0.33 -27% | 0.33 -27% | 0.31 -19% | 0.21 19% | 0.29 -12% | 0.24 8% | 0.39 -50% | 0.29 -12% |
| Contrast (:1) | 1112 | 921 -17% | 985 -11% | 948 -15% | 997 -10% | 1833 65% | 1424 28% | 1379 24% | 1333 20% | 1145 3% |
| Colorchecker dE 2000 * | 2.9 | 1 66% | 2.69 7% | 1.29 56% | 2.96 -2% | 1.6 45% | 2.44 16% | 5.6 -93% | 1.2 59% | 3.73 -29% |
| Colorchecker dE 2000 max. * | 5.71 | 3.65 36% | 4.91 14% | 2.04 64% | 5.14 10% | 4.5 21% | 4.46 22% | 9.9 -73% | 2.3 60% | 6.6 -16% |
| Colorchecker dE 2000 calibrated * | 2.88 | 0.98 66% | 1.27 56% | 1.41 51% | 2.48 14% | 3 -4% | 2 31% | |||
| Greyscale dE 2000 * | 1.42 | 1.4 1% | 2.34 -65% | 0.69 51% | 2.88 -103% | 1.5 -6% | 2.48 -75% | 6.3 -344% | 1.3 8% | 3.96 -179% |
| Gamma | 2.39 92% | 2.25 98% | 2.38 92% | 2.43 91% | 2.33 94% | 2.22 99% | 2.43 91% | 2.33 94% | 2.18 101% | 2.4 92% |
| CCT | 6705 97% | 6699 97% | 6872 95% | 6550 99% | 6725 97% | 6502 100% | 7006 93% | 7152 91% | 6738 96% | 6921 94% |
| Color Space (Percent of AdobeRGB 1998) (%) | 57 | 63.82 12% | 60 5% | 60 5% | 60 5% | 64 12% | 62 9% | 58 2% | 58 2% | |
| Color Space (Percent of sRGB) (%) | 87 | 98.91 14% | 94 8% | 94 8% | 93 7% | 95.9 10% | 96 10% | 88.6 2% | 89 2% | |
| Total Average (Program / Settings) | 15% /
15% | 24% /
11% | 28% /
20% | 22% /
7% | 8% /
18% | 3% /
8% | -19% /
-29% | 23% /
30% | 3% /
-7% |
* ... smaller is better

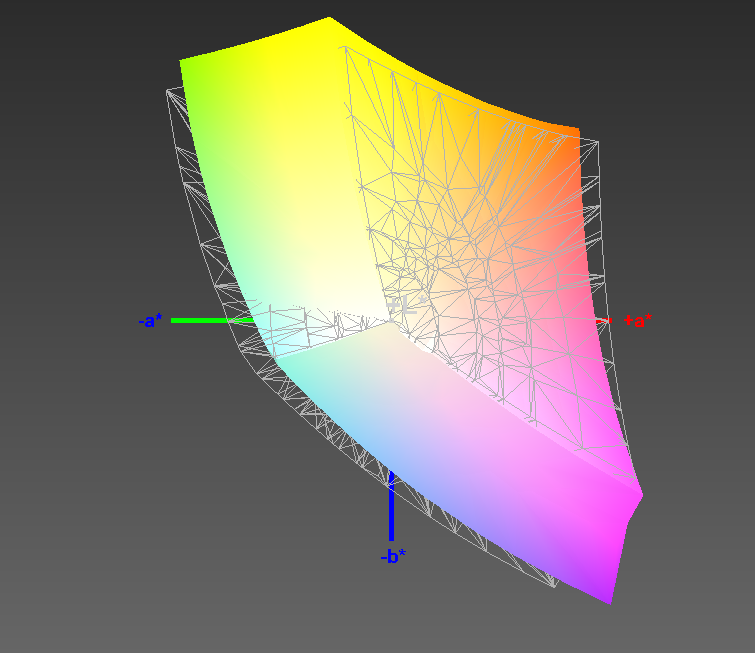
MSI markets the PS63 as having a True Color display, which should have almost 100% sRGB colour space coverage. Unfortunately, CalMAN reports that our test device achieves only 88% sRGB coverage, despite repeated attempts to better calibrate the display. By contrast, all but the ThinkPad X1 Extreme and the IdeaPad 720s-15IKB of our comparison devices achieved above 93% sRGB coverage.
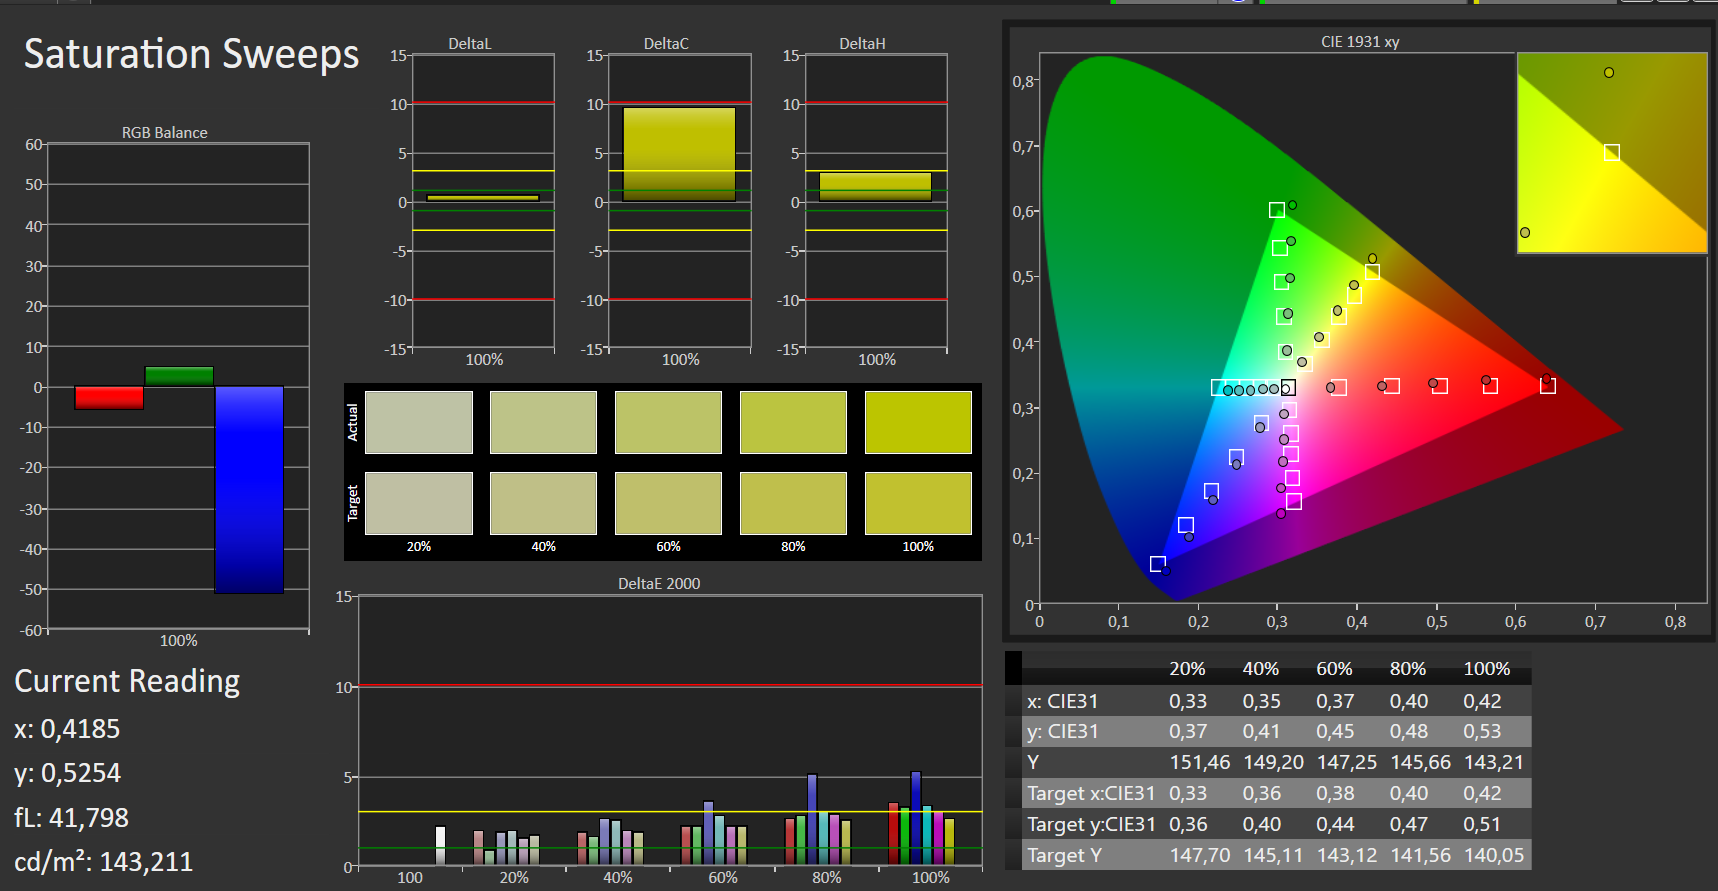
The display is otherwise colour accurate though and had almost ideal DeltaE values upon delivery. Many of our comparison devices achieved lower DeltaE divergences, but any value below 3 is imperceptible to the human eye, so the PS63 is colour accurate enough in that respect. We managed to reduce DeltaE deviations by calibrating the display, which caused DeltaE Grayscale to drop from 1.42 to 0.9, although DeltaE ColorChecker remained at 2.88. We have included our calibrated ICC profile in the box above our comparison table should you wish to use it. Please only apply this to your PS63 if it has the same Chi Mei display as our test unit does. Otherwise, the profile may worsen colour accuracy rather than improving it.
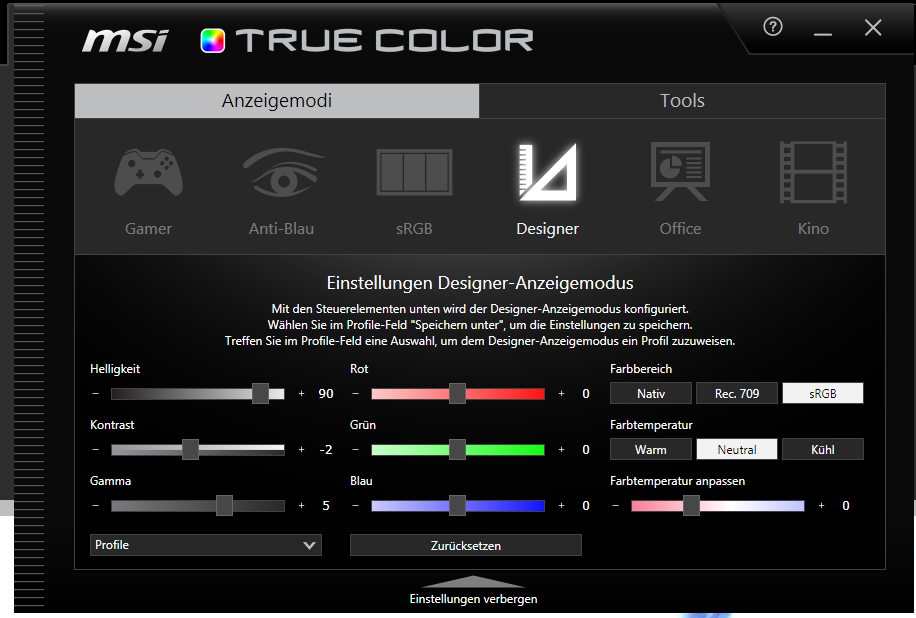
MSI preinstalls its True Color tool too, which allows you to fine-tune colour reproduction to your preferences. The company also includes presets for designers, cinema, gamers, office, and web image-processing (sRGB) should you rather not spend time tinkering with the various sliders and settings.
The colour modes made no difference to the results of our colour accuracy tests though as CalMAN measures the screen at native settings and disables any third-party software colour tweaks. In short, your experience using the MSI True Color may differ to what our results suggest.


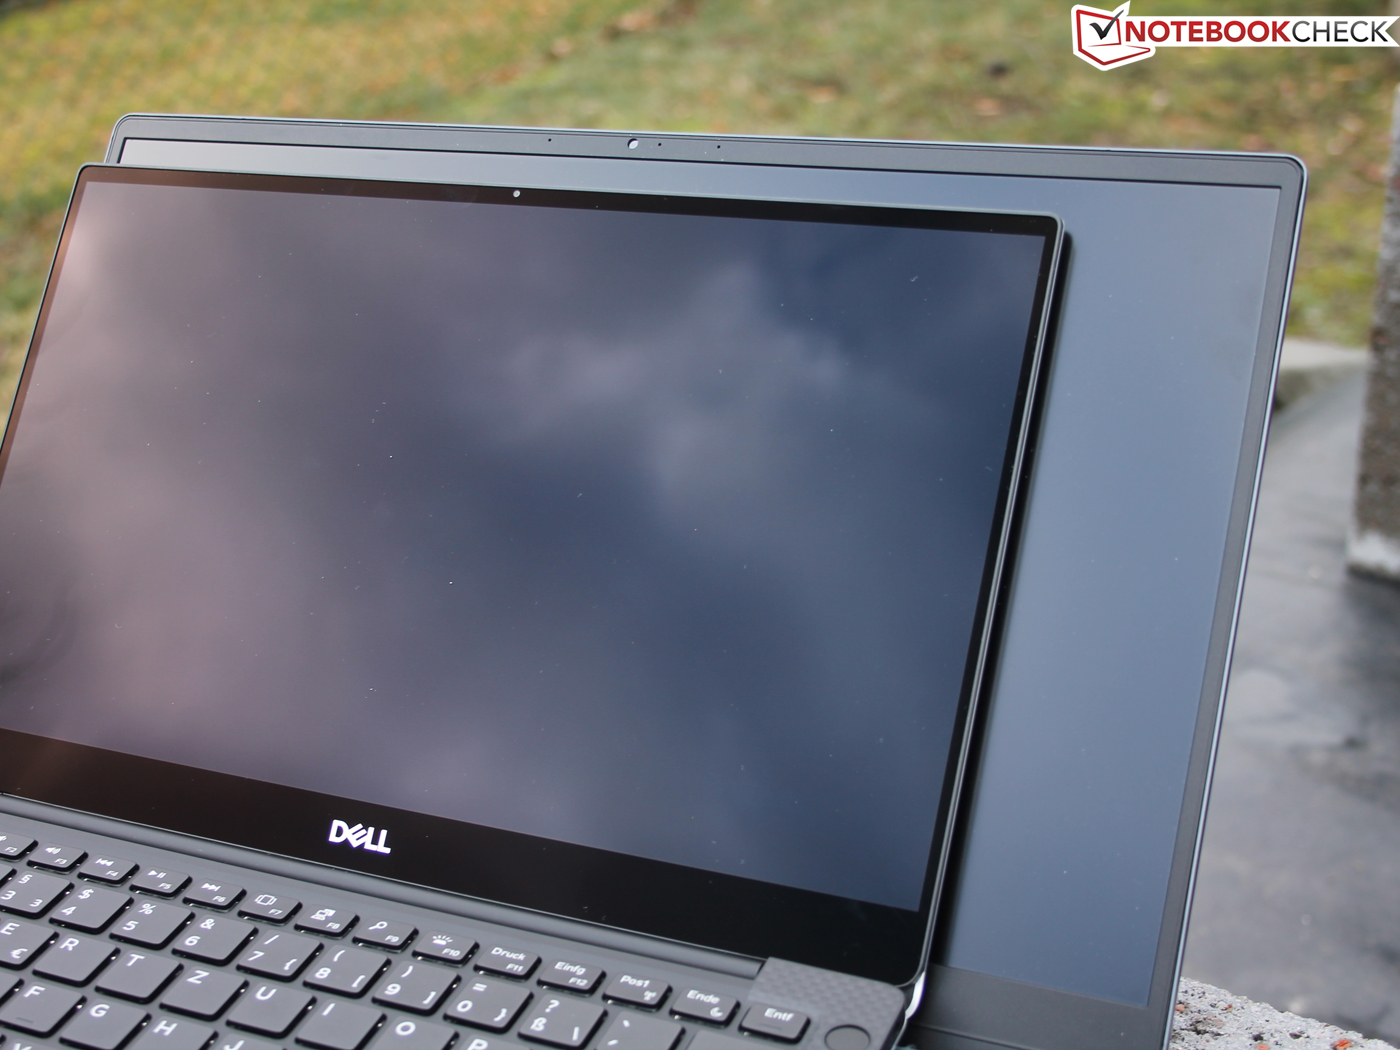
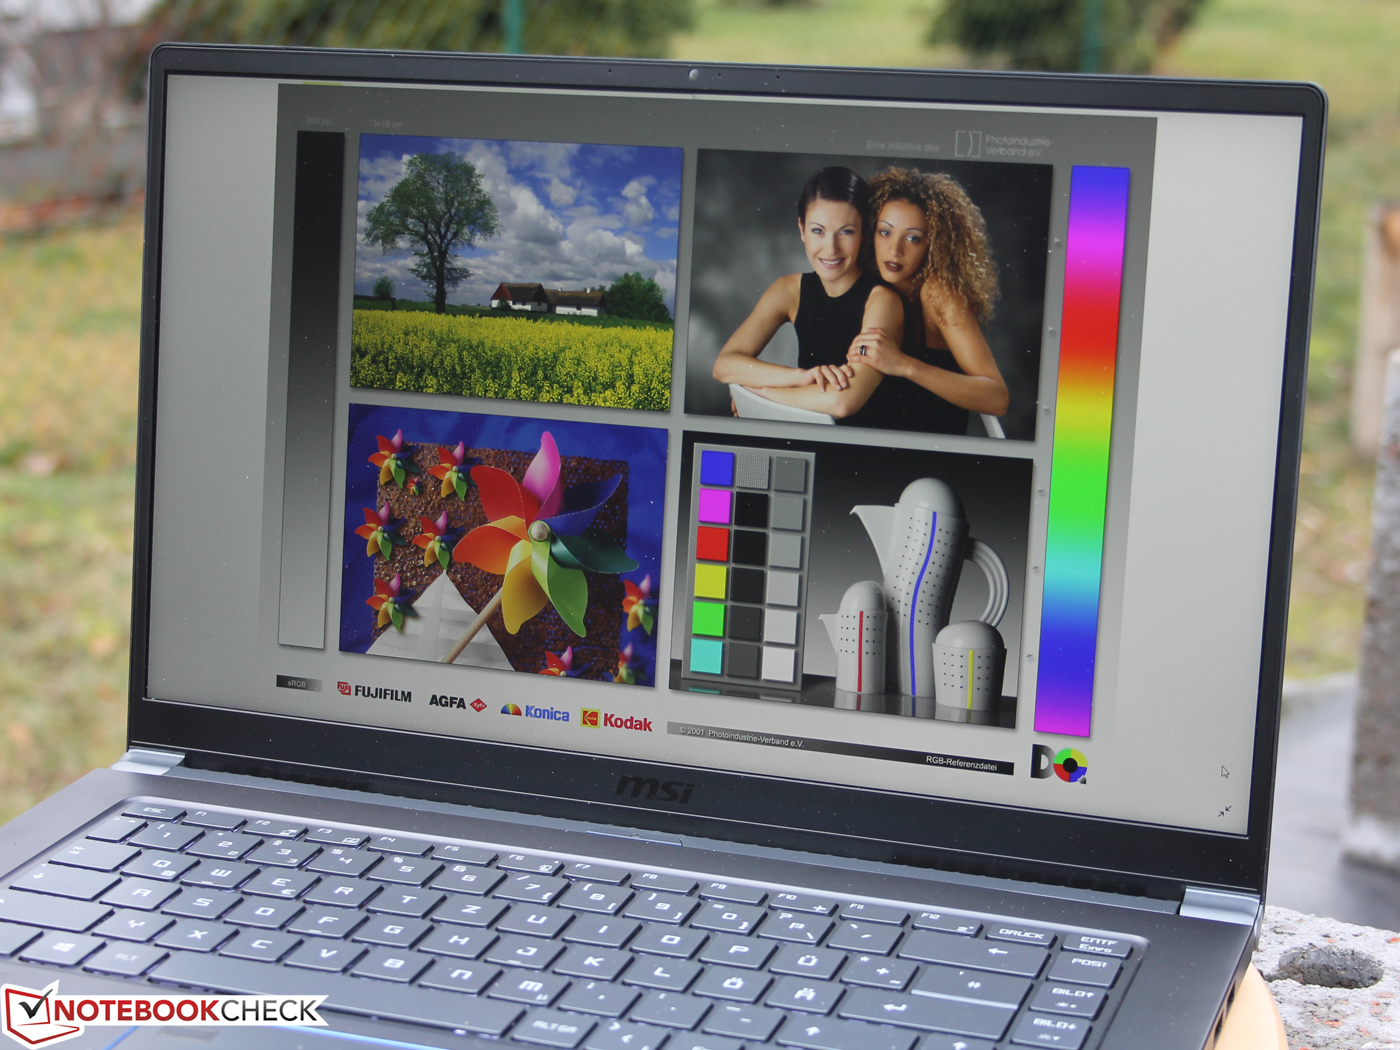
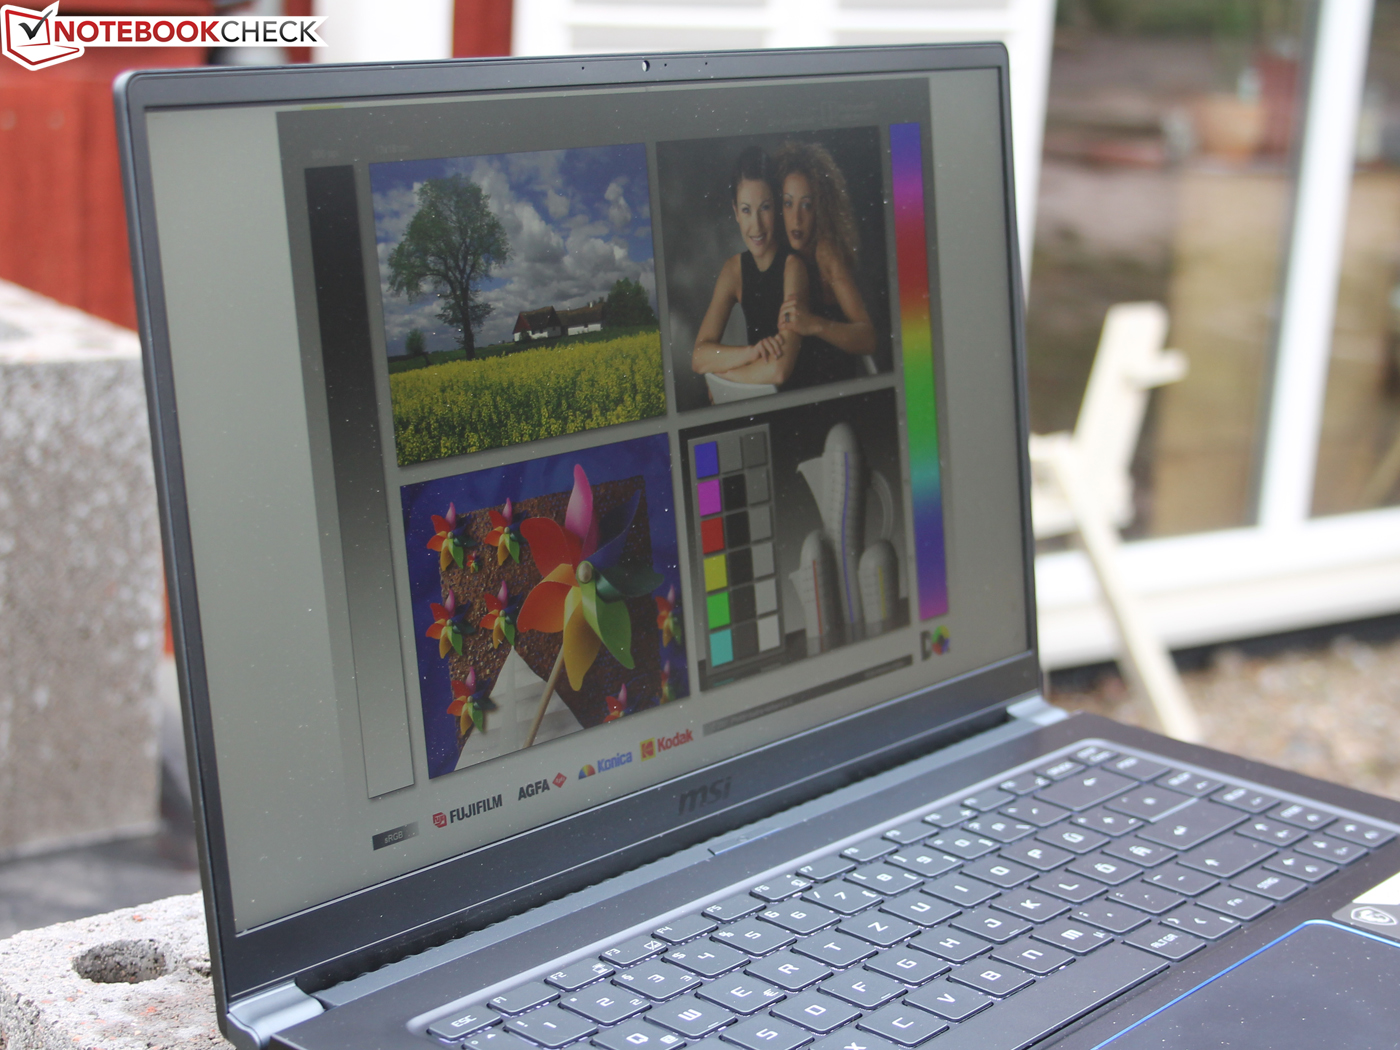
The PS63 is easy to use outdoors thanks to the display’s anti-reflective coating. The screen diffuses reflections in most conditions, but it will struggle in direct sunlight on a bright day. Our test unit maintains peak luminosity when running on battery power too, which is a bonus, even if it is comparatively low.
Display Response Times
| ↔ Response Time Black to White | ||
|---|---|---|
| 32 ms ... rise ↗ and fall ↘ combined | ↗ 20 ms rise | 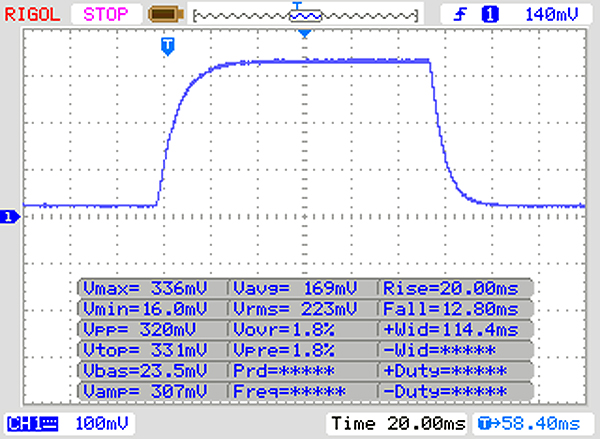 |
| ↘ 12 ms fall | ||
| The screen shows slow response rates in our tests and will be unsatisfactory for gamers. In comparison, all tested devices range from 0.1 (minimum) to 240 (maximum) ms. » 86 % of all devices are better. This means that the measured response time is worse than the average of all tested devices (19.9 ms). | ||
| ↔ Response Time 50% Grey to 80% Grey | ||
| 42 ms ... rise ↗ and fall ↘ combined | ↗ 23 ms rise | 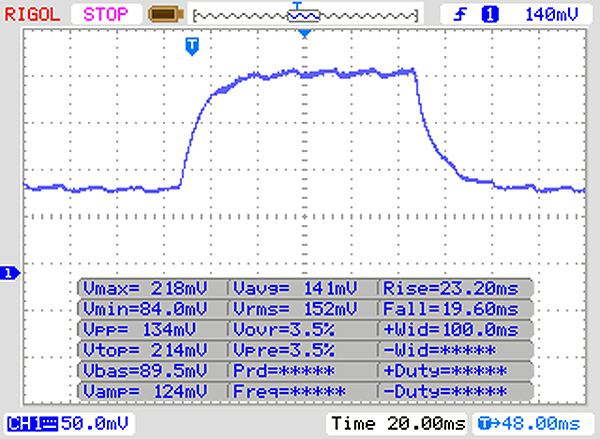 |
| ↘ 19 ms fall | ||
| The screen shows slow response rates in our tests and will be unsatisfactory for gamers. In comparison, all tested devices range from 0.165 (minimum) to 636 (maximum) ms. » 67 % of all devices are better. This means that the measured response time is worse than the average of all tested devices (31.1 ms). | ||
Screen Flickering / PWM (Pulse-Width Modulation)
| Screen flickering / PWM detected | 25000 Hz | ≤ 20 % brightness setting | 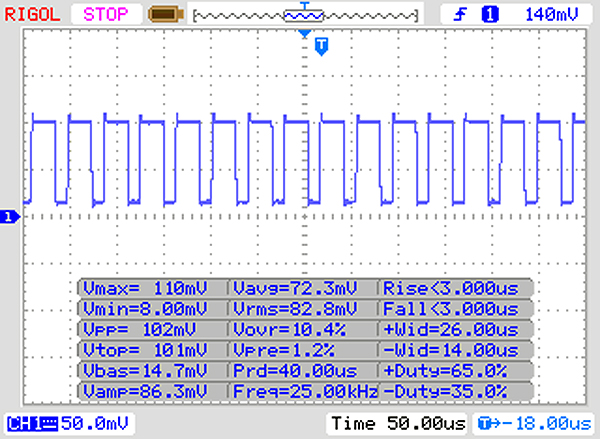 |
The display backlight flickers at 25000 Hz (worst case, e.g., utilizing PWM) Flickering detected at a brightness setting of 20 % and below. There should be no flickering or PWM above this brightness setting. The frequency of 25000 Hz is quite high, so most users sensitive to PWM should not notice any flickering. In comparison: 52 % of all tested devices do not use PWM to dim the display. If PWM was detected, an average of 7798 (minimum: 5 - maximum: 343500) Hz was measured. | |||
The PS63 has wide viewing angles that remained stable throughout our tests. We did not notice any brightness, colour, or image distortions even at acute viewing angles thanks to its IPS panel.

Performance
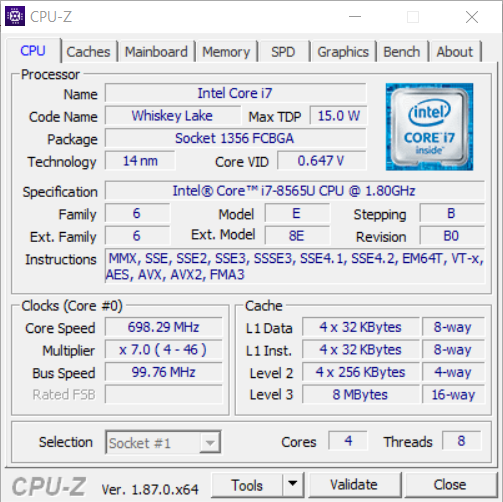
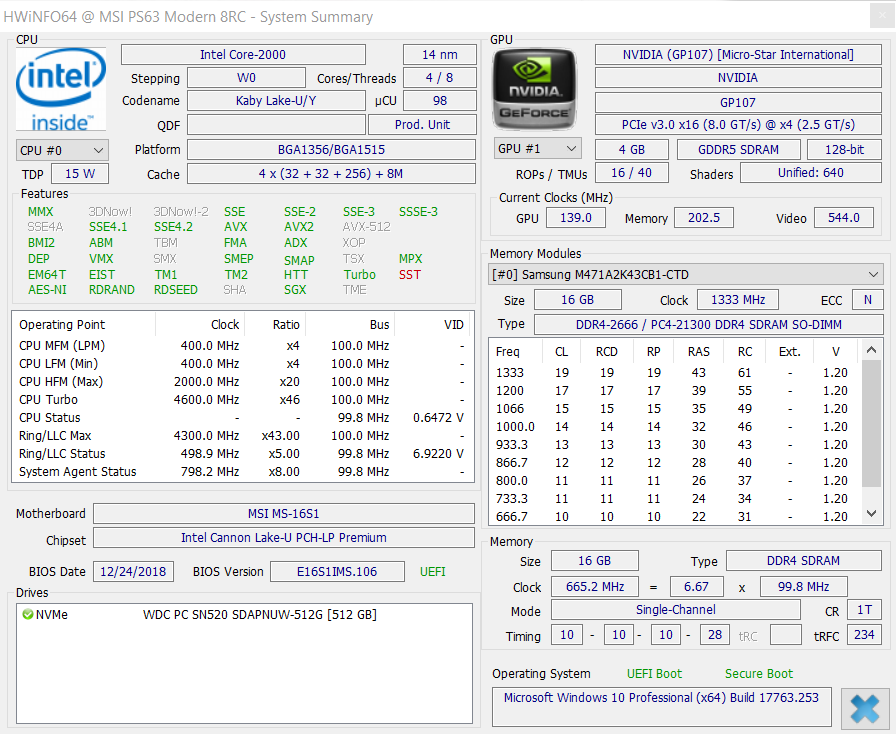
MSI has equipped our test unit with an Intel Core i7-8565U processor that is from the company’s Whiskey Lake U series. The CPU has a 1.8 GHz base clock that can utilise Intel Turbo Boost to achieve up to 4.60 GHz when required. We have also seen the Core i7-8565U in smaller laptops like the ASUS ZenBook UX433, so the PS63’s larger case should provide the CPU with better cooling.
The processor is designed for creatives and demanding users who do not need the power that a 45 W CPU like the Core i7-8750H provides. Many of our comparison devices are equipped with a Core i7-8750H but have more-powerful Core i9-8950HK configurations too.
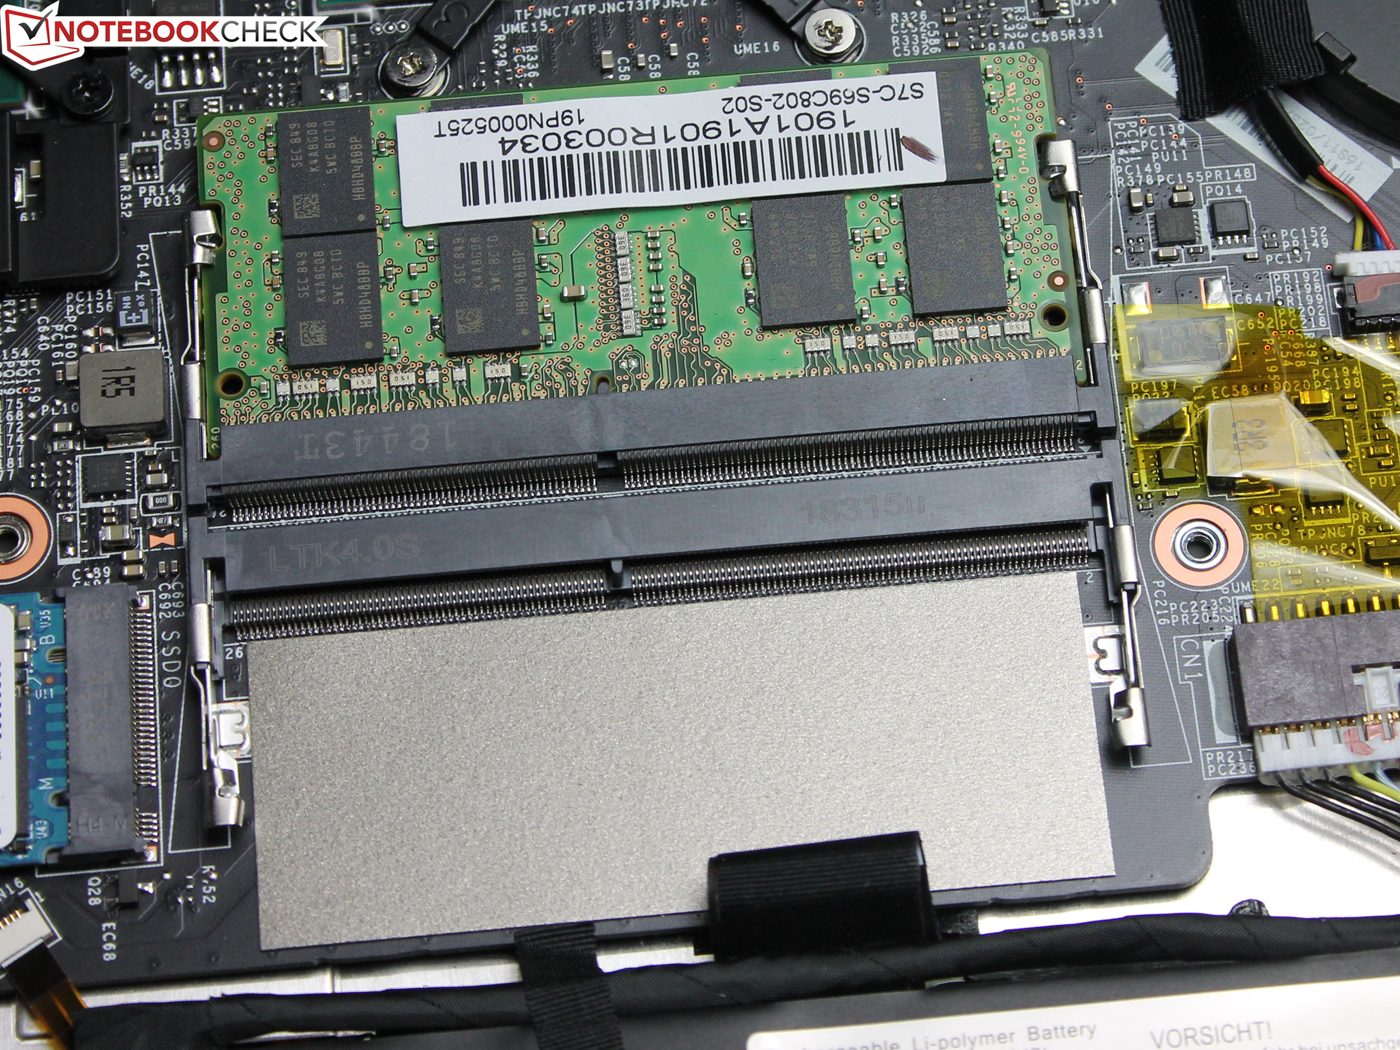
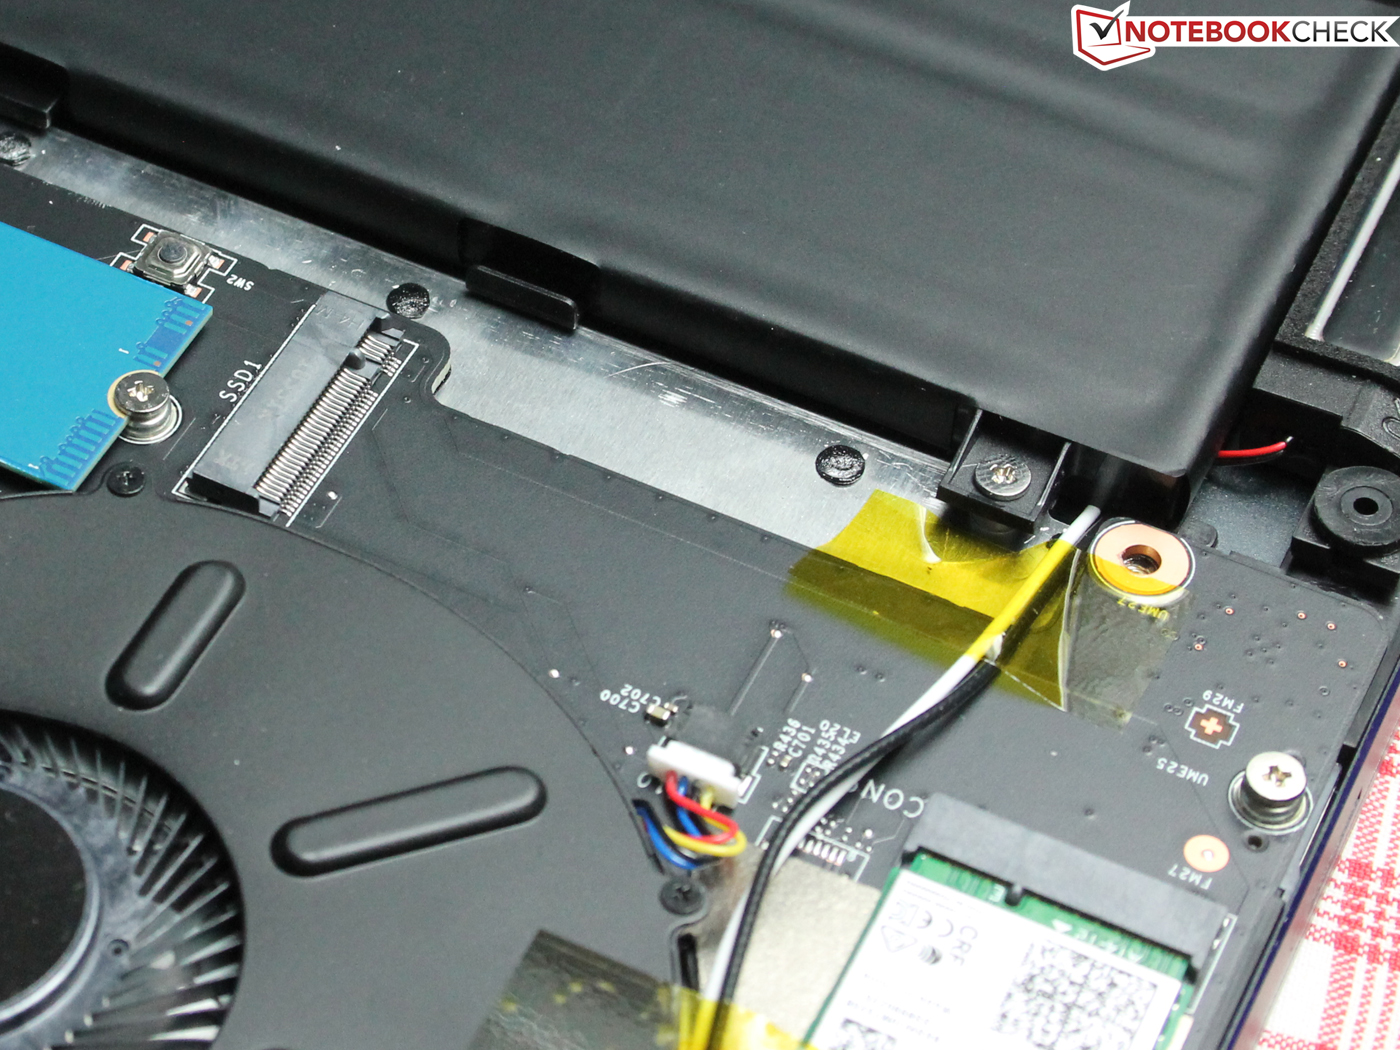
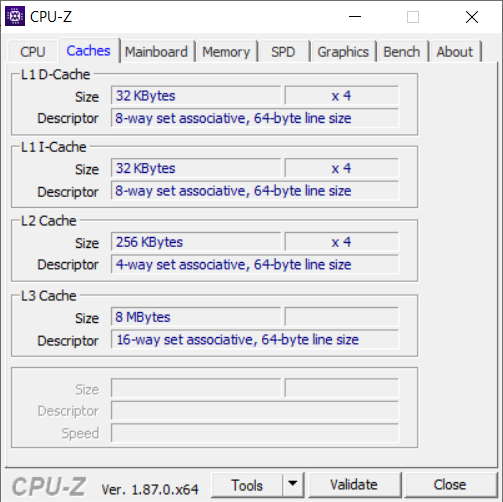
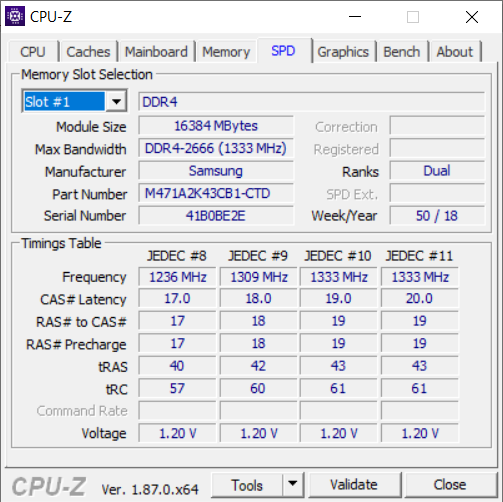
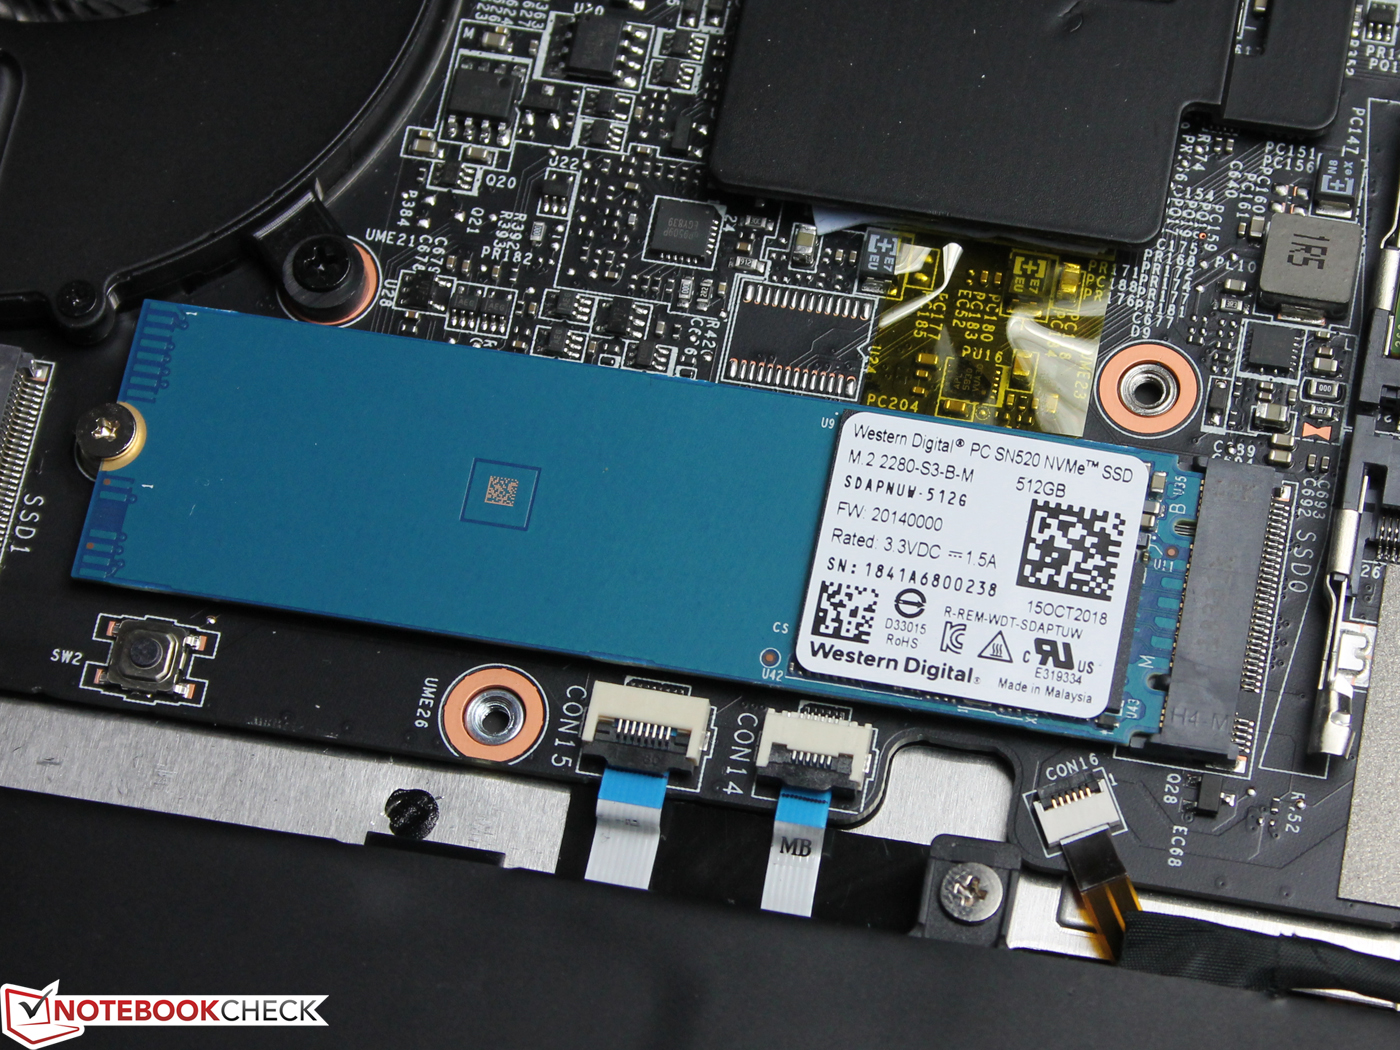
MSI pairs the Core i7-8565U with a single stick of 16 GB DDR4 RAM, which means that the system operates in single-channel mode. Hence, the company provides an easy upgrade path to more RAM should you need it. Our test unit also comes with a 512 GB Western Digital SSD and has a spare M.2 drive bay too. By contrast, many of our comparison devices like the XPS 15 9570 and the MacBook Pro 15 2018 do not have two M.2 drive bays, although the former has a 2.5-inch drive bay depending on the configuration.
The manufacturer sells the PS63 without an Nvidia GeForce GTX 1050 Max-Q GPU too, which it markets as the MSI PS63 Modern 8M. The device is otherwise identical to the Modern 8RC, except it comes with a 65 W charger rather than the 90 W adaptor that came with our test unit.

Processor
The CPU in our test device performs slightly below the average of Core i7-8565U-powered device that we currently tested, but only in multithreaded synthetic benchmarks. In short, the Core i7-8565U is not a workstation CPU and is efficient enough to function well in slim cases, in which more-powerful CPUs would struggle and potentially thermal throttle. Laptops like the Aero 15X v8 may only be 2 mm thicker than the PS63, but they also have larger overall footprints, so they have more surface area within which to dissipate heat.
The Core i7-8565U performs on par with the Core i5-8300H in single-core benchmarks like Cinebench R15 Single 64-bit, but it finished well short of our comparison devices in multithreaded benchmarks, especially those equipped with Core i7-8750H processors. The Core i7-8565U also scored 15% less than the Core i7-8650U in CB R15 Multi 64-bit, which is underwhelming.
We subjected our test unit to a looped CB R15 Multi 64-bit benchmark to determine how it managed its CPU performance under sustained load. The PS63 initially scored 572 points, but the score dropped to 528 points by the second benchmark run through, a level that it maintained for the rest of the loop. This represents a performance drop of 8% and corresponds to the length of time for which the system can maintain the CPU’s Turbo Boost. By contrast, the Surface Book 2 started the benchmark loop by scoring almost 676 points but throttled down to 503 points by the fourth pass through. Its benchmark scores then fluctuated between around 500 and 540, the average of which puts it on par with the PS63.
Please see our CPU benchmarks page for more information on the Core i7-8565U and how it compares against other processors.
System Performance
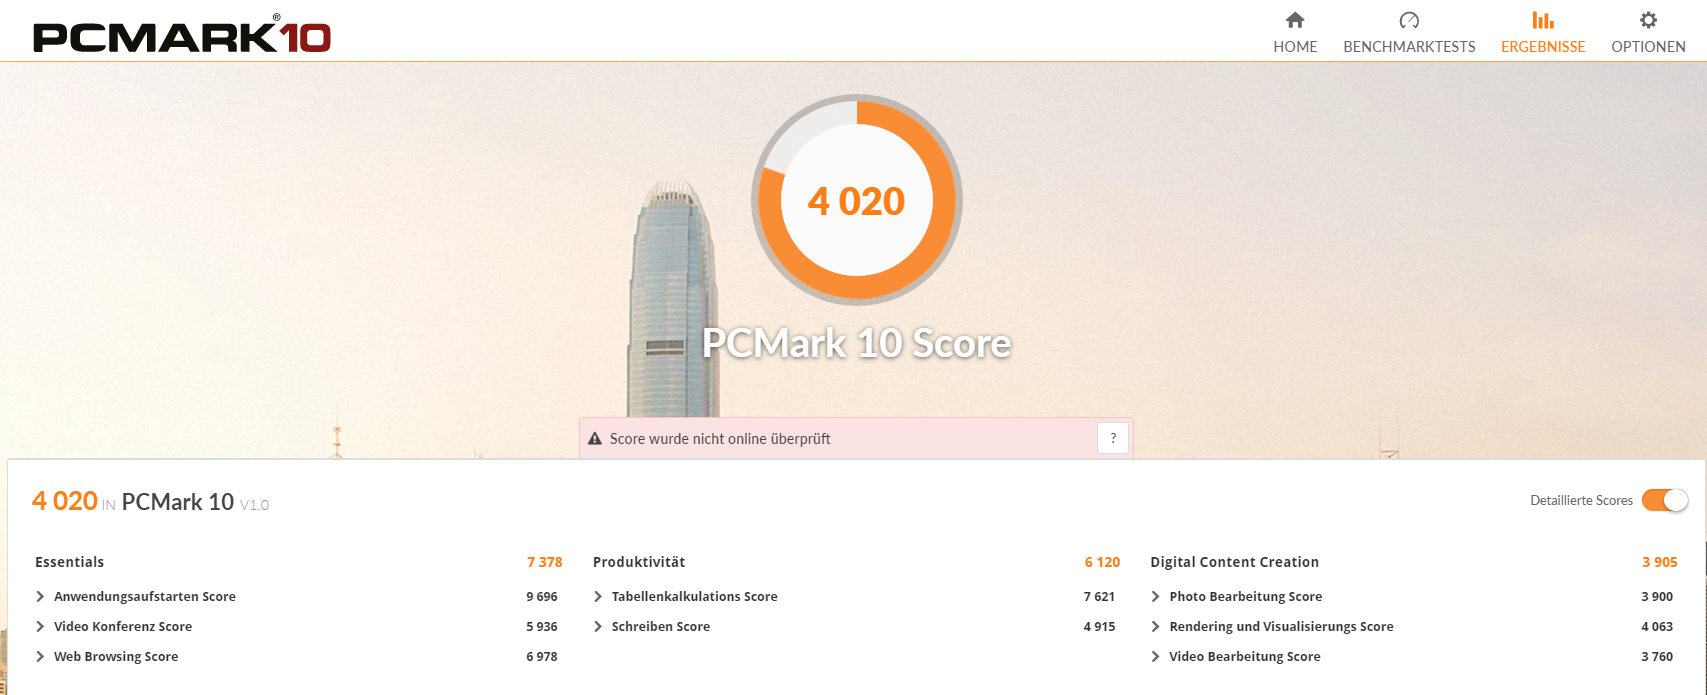
The PS63 also occupies the bottom of our PCMark comparison tables and is around 5% short of the average of Core i7-8565U and GeForce GTX 1050 Max-Q-powered devices that we have currently tested.
The PS63 is no lame duck, but it cannot compete with the faster CPUs, GPUs and SSDs in our comparison devices. The laptop trades blows with the Surface Book 2 in PCMark, demonstrating that it can keep pace with laptops that are also equipped with 15 W CPUs.
| PCMark 8 Home Score Accelerated v2 | 3801 points | |
| PCMark 8 Creative Score Accelerated v2 | 4844 points | |
| PCMark 8 Work Score Accelerated v2 | 4905 points | |
| PCMark 10 Score | 4020 points | |
Help | ||
Storage Devices
MSI has equipped our test unit with a fast Western Digital SSD that carries the model number WDC PC SN520 SDAPNUW-512G. The drive operates at PCIe NVMe speeds and fares well against the drives in our comparison devices. The WDC PC SN520 consistently achieves slower transfer speeds than the Samsung 970 EVO and PM981 in CrystalDiskMark 5.2/6 and AS SSD. However, it has solid 4K read speeds, which indicate that the system can read small blocks of data quickly that is useful for opening programs. The WDC PC SN520 has considerably slower sequential read Q32T1 speeds than the drives in our comparison devices, but this is not overly concerning.
| MSI PS63 Modern 8RC WDC PC SN520 SDAPNUW-512G | Gigabyte Aero 15X v8 Toshiba NVMe THNSN5512GPU7 | Schenker Key 15 Coffee Lake Samsung SSD 970 EVO 500GB | Microsoft Surface Book 2 Samsung PM961 MZVLW256HEHP | Dell XPS 15 2018 i5 FHD 97Wh Lite-On CA3-8D256-Q11 | Lenovo ThinkPad X1 Extreme-20MF000RGE Samsung SSD PM981 MZVLB256HAHQ | Apple MacBook Pro 15 2018 (2.6 GHz, 560X) Apple SSD AP0512 | Lenovo Ideapad 720S-15IKB 81AC001AGE Samsung SSD PM981 MZVLB512HAJQ | Average WDC PC SN520 SDAPNUW-512G | |
|---|---|---|---|---|---|---|---|---|---|
| CrystalDiskMark 5.2 / 6 | 7% | 29% | 4% | 4% | 20% | 3% | 46% | 15% | |
| Write 4K (MB/s) | 121.3 | 94.4 -22% | 113.5 -6% | 140.6 16% | 89.4 -26% | 109.4 -10% | 43.59 -64% 35.92 -70% | 139.3 15% | 138.5 ? 14% |
| Read 4K (MB/s) | 44.07 | 37.65 -15% | 43.49 -1% | 43.62 -1% | 44.64 1% | 41.5 -6% | 12.68 -71% 11.67 -74% | 46.78 6% | 44.2 ? 0% |
| Write Seq (MB/s) | 1176 | 1335 14% | 1466 25% | 343.3 -71% | 830 -29% | 1460 24% | 1605 36% 1522 29% | 2125 81% | 1265 ? 8% |
| Read Seq (MB/s) | 1139 | 1404 23% | 1200 5% | 1452 27% | 1774 56% | 1561 37% | 1595 40% 1528 34% | 2354 107% | 1237 ? 9% |
| Write 4K Q32T1 (MB/s) | 257.8 | 268.6 4% | 295.4 15% | 344.4 34% | 310.6 20% | 278.4 8% | 232.7 -10% 204.5 -21% | 298.4 16% | 404 ? 57% |
| Read 4K Q32T1 (MB/s) | 325.9 | 332.8 2% | 376.8 16% | 457.2 40% | 266.4 -18% | 354.9 9% | 404 24% 393.3 21% | 355.8 9% | 421 ? 29% |
| Write Seq Q32T1 (MB/s) | 1455 | 1375 -5% | 2498 72% | 344.3 -76% | 831 -43% | 1461 0% | 1770 22% 1756 21% | 2128 46% | 1491 ? 2% |
| Read Seq Q32T1 (MB/s) | 1741 | 2627 51% | 3549 104% | 2885 66% | 2962 70% | 3452 98% | 2993 72% 2805 61% | 3324 91% | 1741 ? 0% |
| Write 4K Q8T8 (MB/s) | 1415 | 715 ? | |||||||
| Read 4K Q8T8 (MB/s) | 572 | 1027 ? | |||||||
| AS SSD | -32% | 38% | -385% | 4% | -56% | 29% | -13% | ||
| Seq Read (MB/s) | 1372 | 2213 61% | 2685 96% | 1574 15% | 2612 90% | 2239 63% | 2469 80% | 1363 ? -1% | |
| Seq Write (MB/s) | 1244 | 1163 -7% | 2325 87% | 340.3 -73% | 1386 11% | 1644 32% | 1991 60% | 1227 ? -1% | |
| 4K Read (MB/s) | 43.34 | 23.36 -46% | 53.6 24% | 32.5 -25% | 53 22% | 9.46 -78% | 54.3 25% | 40.8 ? -6% | |
| 4K Write (MB/s) | 162.2 | 80.4 -50% | 131.9 -19% | 5.12 -97% | 119.4 -26% | 18.78 -88% | 99.8 -38% | 127.3 ? -22% | |
| 4K-64 Read (MB/s) | 1044 | 847 -19% | 1339 28% | 301.8 -71% | 764 -27% | 965 -8% | 1823 75% | 957 ? -8% | |
| 4K-64 Write (MB/s) | 1111 | 742 -33% | 1836 65% | 19.19 -98% | 1270 14% | 163.5 -85% | 1282 15% | 1081 ? -3% | |
| Access Time Read * (ms) | 0.058 | 0.119 -105% | 0.045 22% | 0.086 -48% | 0.062 -7% | 0.225 -288% | 0.042 28% | 0.07744 ? -34% | |
| Access Time Write * (ms) | 0.024 | 0.046 -92% | 0.029 -21% | 0.889 -3604% | 0.031 -29% | 0.039 -63% | 0.03671 ? -53% | ||
| Score Read (Points) | 1224 | 1092 -11% | 1661 36% | 492 -60% | 1078 -12% | 1199 -2% | 2125 74% | 1134 ? -7% | |
| Score Write (Points) | 1398 | 939 -33% | 2200 57% | 58 -96% | 1528 9% | 347 -75% | 1581 13% | 1331 ? -5% | |
| Score Total (Points) | 3249 | 2536 -22% | 4701 45% | 750 -77% | 3111 -4% | 2119 -35% | 4771 47% | 3046 ? -6% | |
| Copy ISO MB/s (MB/s) | 632 | 1637 | 1169 ? | ||||||
| Copy Program MB/s (MB/s) | 117.2 | 466.8 | 446 ? | ||||||
| Copy Game MB/s (MB/s) | 465.9 | 960 | 874 ? | ||||||
| Total Average (Program / Settings) | -13% /
-16% | 34% /
34% | 4% /
4% | -191% /
-221% | 12% /
11% | -27% /
-20% | 38% /
36% | 1% /
-1% |
* ... smaller is better

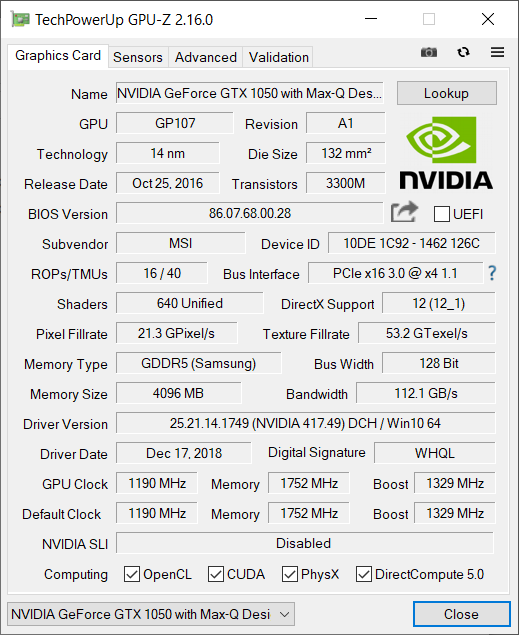
Graphics Card
The GeForce GTX 1050 Max-Q is a midrange GPU that we have seen OEMs using in many multimedia laptops like the XPS 15 9570. The Max-Q is a more power-efficient and less-powerful version of the GeForce GTX 1050 and the GeForce GTX 1050 Ti. Hence, the GeForce GTX 1050 Max-Q is ideal for thin and light laptops that cannot accommodate large cooling solutions that are needed to prevent more-powerful GPUs from overheating.
The GPU in our test device performs on par with other GeForce GTX 1050 Max-Q-powered devices that we have tested in 3DMark. The ThinkPad X1 Extreme scores around 23% more in 3DMark than the PS63 thanks to its more-powerful GeForce GTX 1050 Ti. The XPS 15 9570 finishes slightly ahead with the same GPU thanks too because of its higher-wattage CPU.
| 3DMark 11 Performance | 7299 points | |
| 3DMark Cloud Gate Standard Score | 18526 points | |
| 3DMark Fire Strike Score | 5292 points | |
Help | ||
Gaming Performance
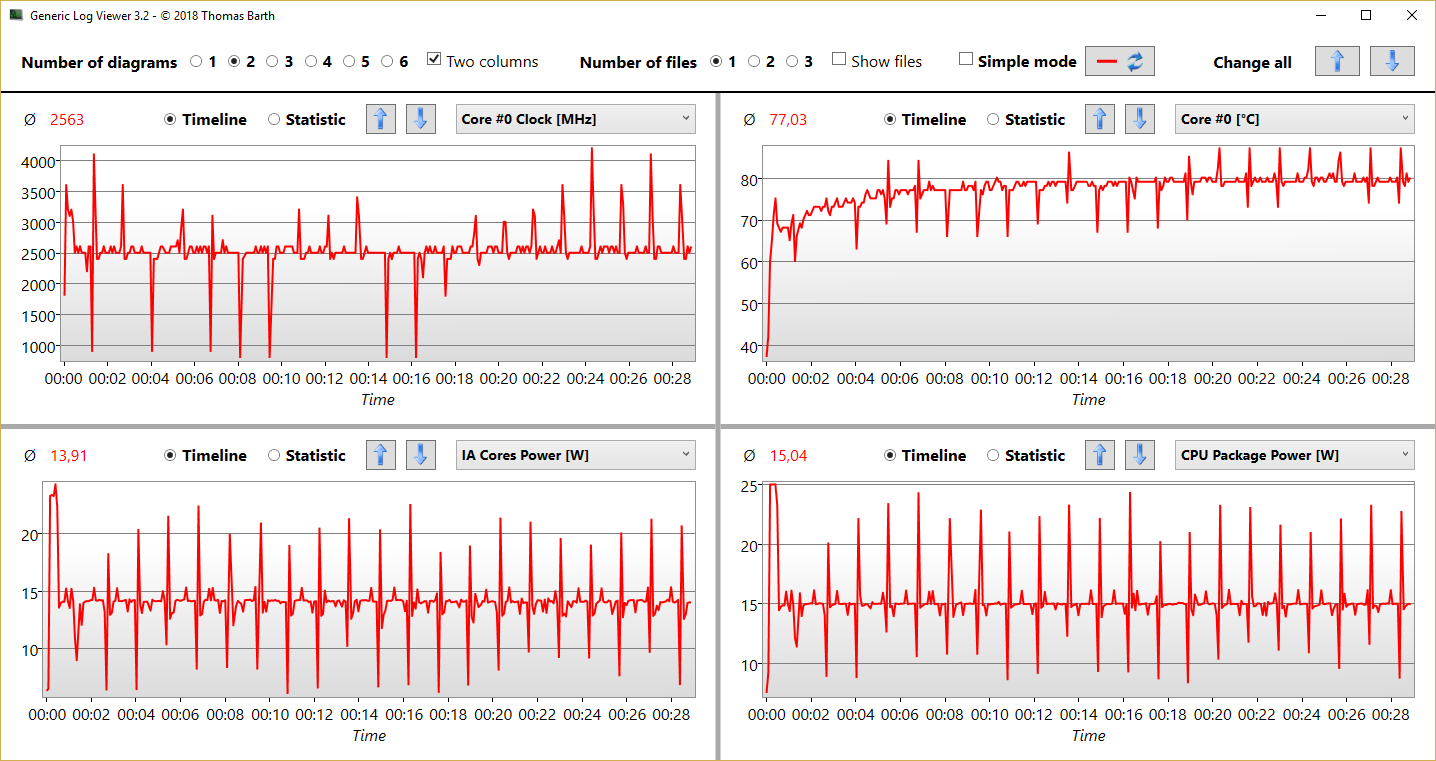
We subjected our test unit to a Battlefield V run through and recorded any changes in both clock speeds and core temperatures. The CPU averaged 2.9 GHz throughout our gaming tests, which is well above its 1.8 GHz core clock speed. Likewise, the GeForce GTX 1050 Max-Q operated between 1.05 GHz and 1.45 GHz and averaged around 1.18 GHz, which is several MHz above its base clock.
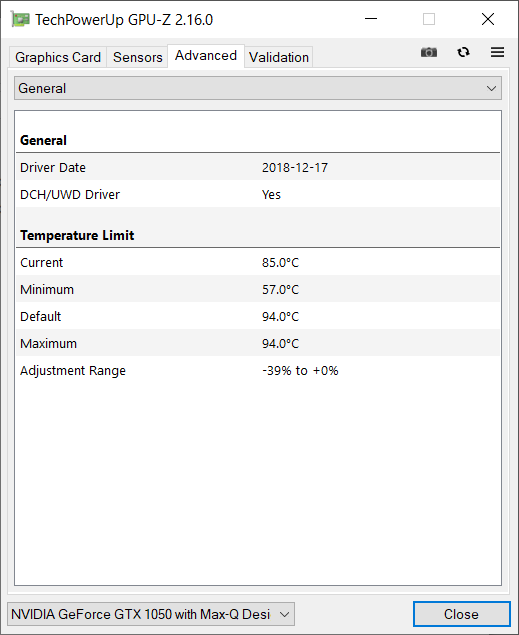
The Core i7-8565U rarely reached 90 °C during our gaming tests, but it averaged 83 °C, which is within safe limits.
In short, the GeForce GTX 1050 Max-Q is powerful enough to handle triple-A games but not always at high or even medium graphics settings. The GPU provided a smooth gaming experience with modern titles at 1080p when set to medium or low graphics. 4K gaming is out of the question though, as the GeForce GTX 1050 Max-Q reaches its limits in games like Shadow of the Tomb Raider and Darksiders III even at 1080p.
| Thief - 1920x1080 Very High Preset AA:FXAA & High SS AF:8x | |
| MSI PS63 Modern 8RC | |
| Average NVIDIA GeForce GTX 1050 Max-Q (38 - 38.8, n=2) | |
| Shadow of the Tomb Raider - 1920x1080 Medium Preset | |
| Average of class Multimedia (28 - 167, n=8, last 2 years) | |
| MSI P65 8RF-451 - Creator | |
| MSI PS63 Modern 8RC | |
| Apple MacBook Pro 15 2018 (2.6 GHz, 560X) | |
| Average NVIDIA GeForce GTX 1050 Max-Q (27 - 33, n=2) | |
| Battlefield V - 1920x1080 Ultra Preset | |
| MSI PS63 Modern 8RC | |
| Average NVIDIA GeForce GTX 1050 Max-Q (n=1) | |
| Apple MacBook Pro 15 2018 (2.6 GHz, 560X) | |
| Darksiders III - 1920x1080 High | |
| MSI PS63 Modern 8RC | |
| Average NVIDIA GeForce GTX 1050 Max-Q (n=1) | |
| Apple MacBook Pro 15 2018 (2.6 GHz, 560X) | |
| low | med. | high | ultra | |
|---|---|---|---|---|
| BioShock Infinite (2013) | 147.7 | 62.1 | ||
| Thief (2014) | 56.5 | 57.2 | 38.8 | |
| Rise of the Tomb Raider (2016) | 41.4 | 34.6 | 28.7 | |
| Shadow of the Tomb Raider (2018) | 57 | 33 | 26 | 22 |
| FIFA 19 (2018) | 96.5 | 100.8 | ||
| Battlefield V (2018) | 46.1 | 39.7 | 36.5 | |
| Darksiders III (2018) | 33.6 | 37.2 | 31.5 |
Emissions
Fan Noise
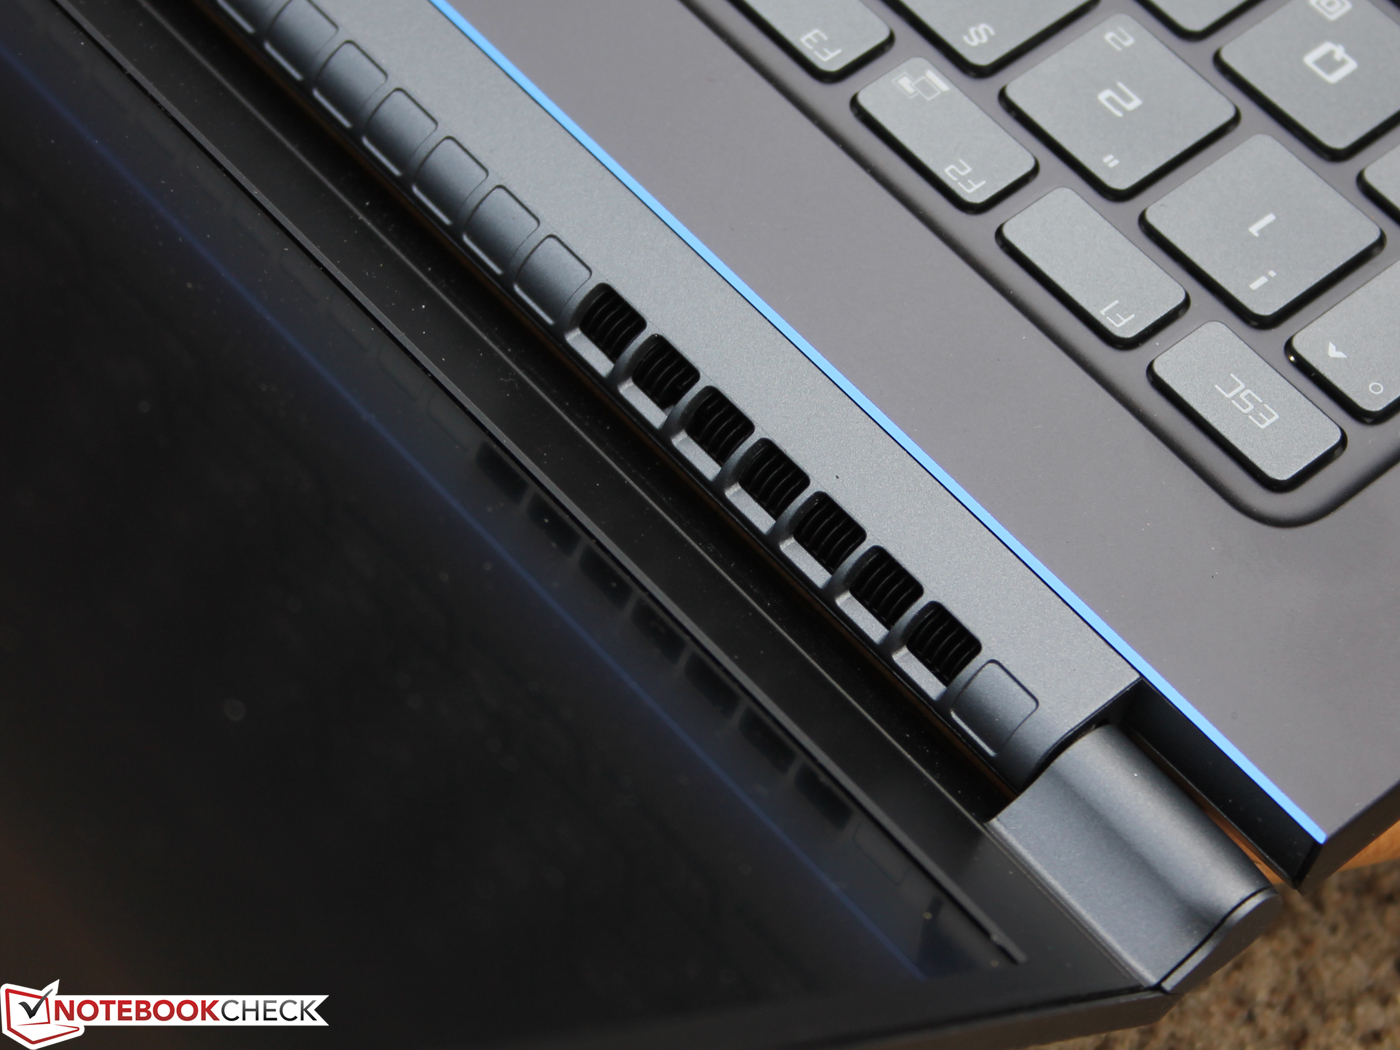
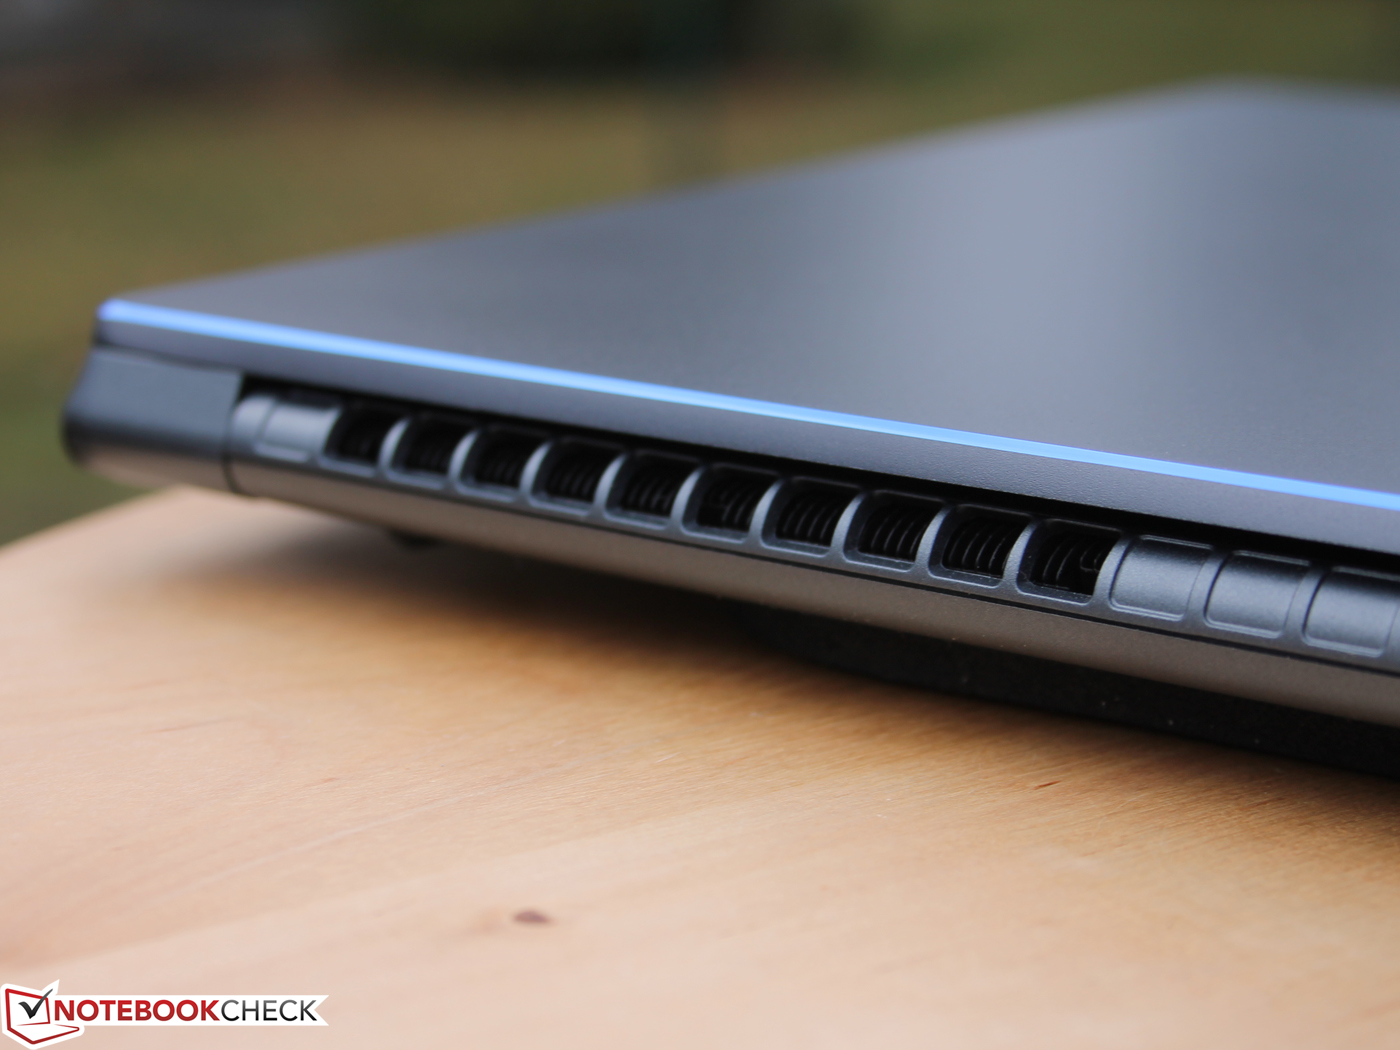
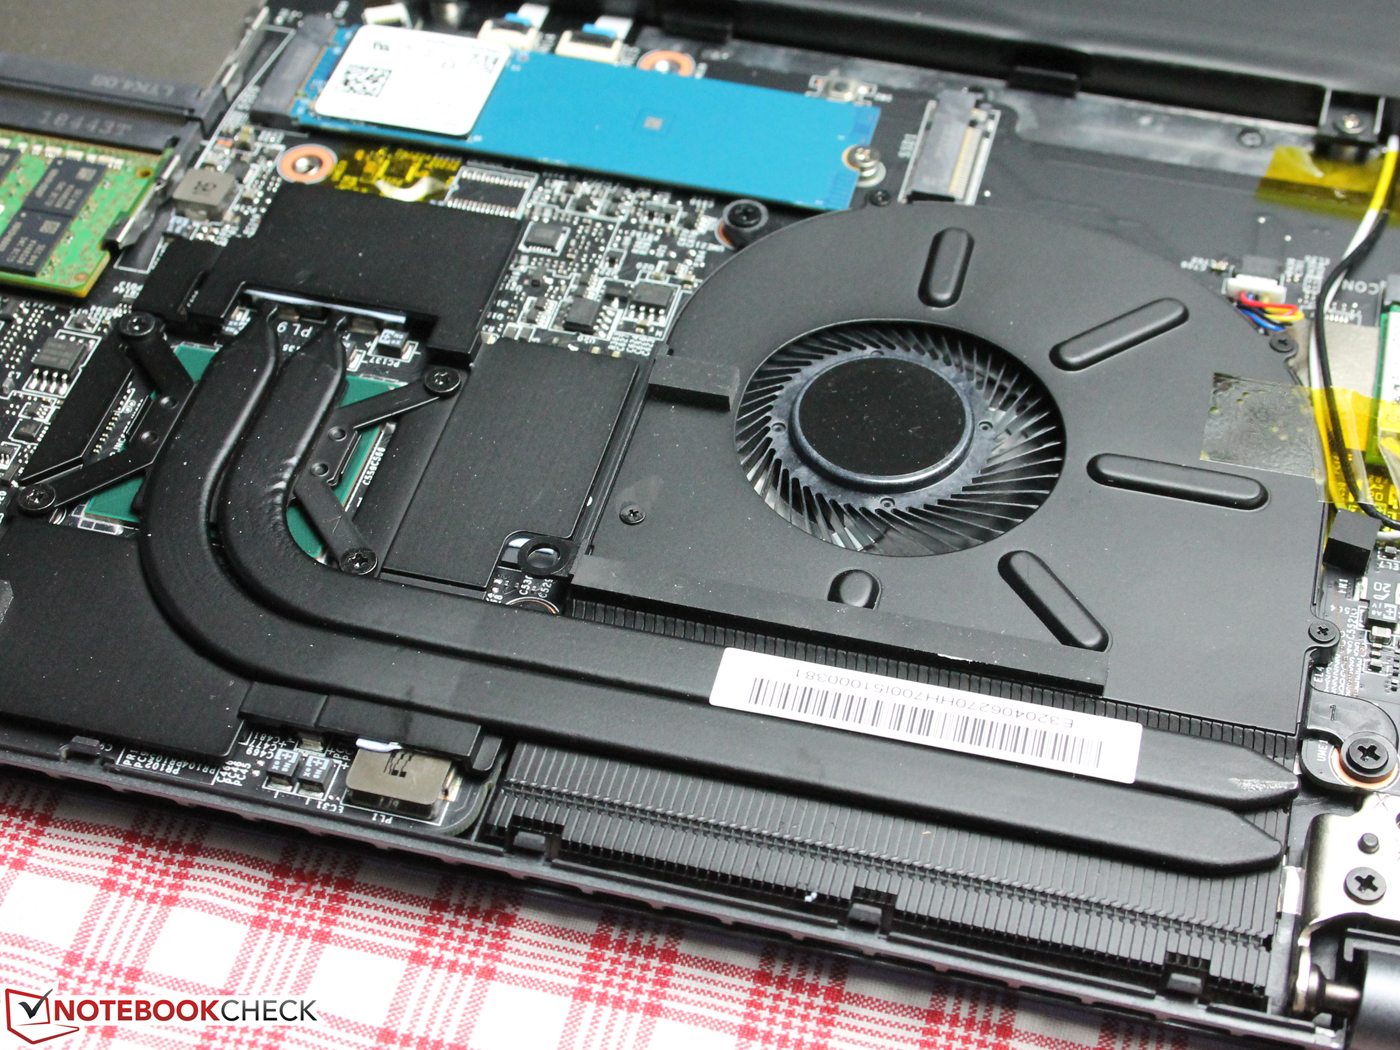
The PS63 is an impressively quiet laptop. MSI has equipped the CPU and GPU with dedicated cooling solutions that have their own heatpipes and fan, but out test unit reaches 30.7 dB(A) at idle, which is almost whisper quiet. We doubt that you could hear the PS63 if you were using it in an office with background noise from people talking or traffic. The two fans also reach just 34 dB(A) under sustained load, which is much quieter than some of our comparison devices.
Noise level
| Idle |
| 30.7 / 30.7 / 30.7 dB(A) |
| Load |
| 34 / 33.7 dB(A) |
 | ||
30 dB silent 40 dB(A) audible 50 dB(A) loud |
||
min: | ||
Temperature
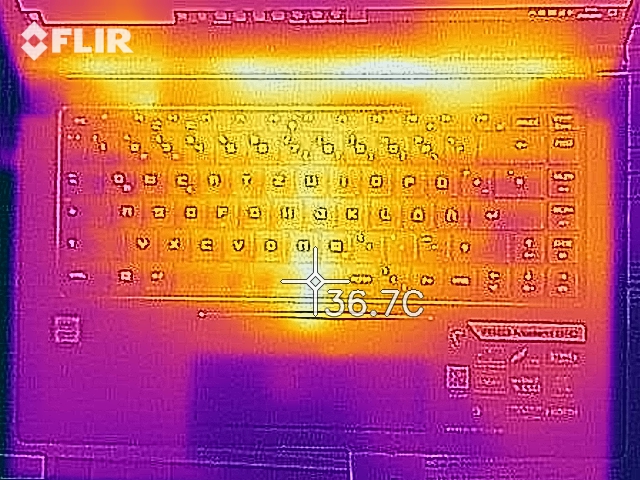
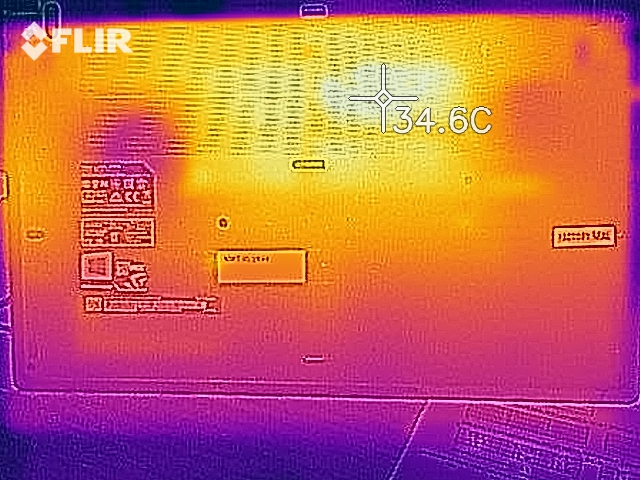
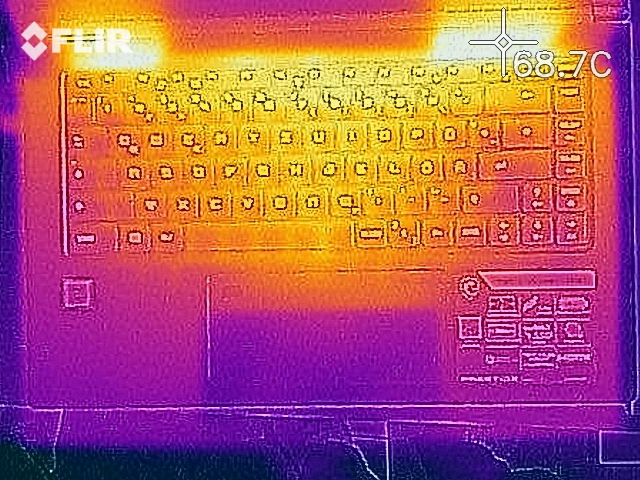
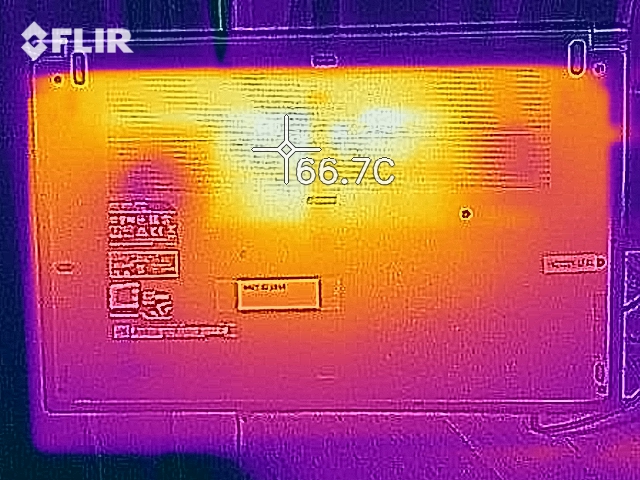
Our surface temperature tests reveal how MSI keeps the PS63 so quiet. The company has favoured low fan noise over high case temperatures, with the surfaces around the CPU and GPU reaching up to 60 °C under sustained load. The palm rest remains comparatively cool, but we would not recommend having the PS63 on your lap if you are pushing it hard. Conversely, our test device averages 25.6 °C at idle, which should feel cool to the touch.
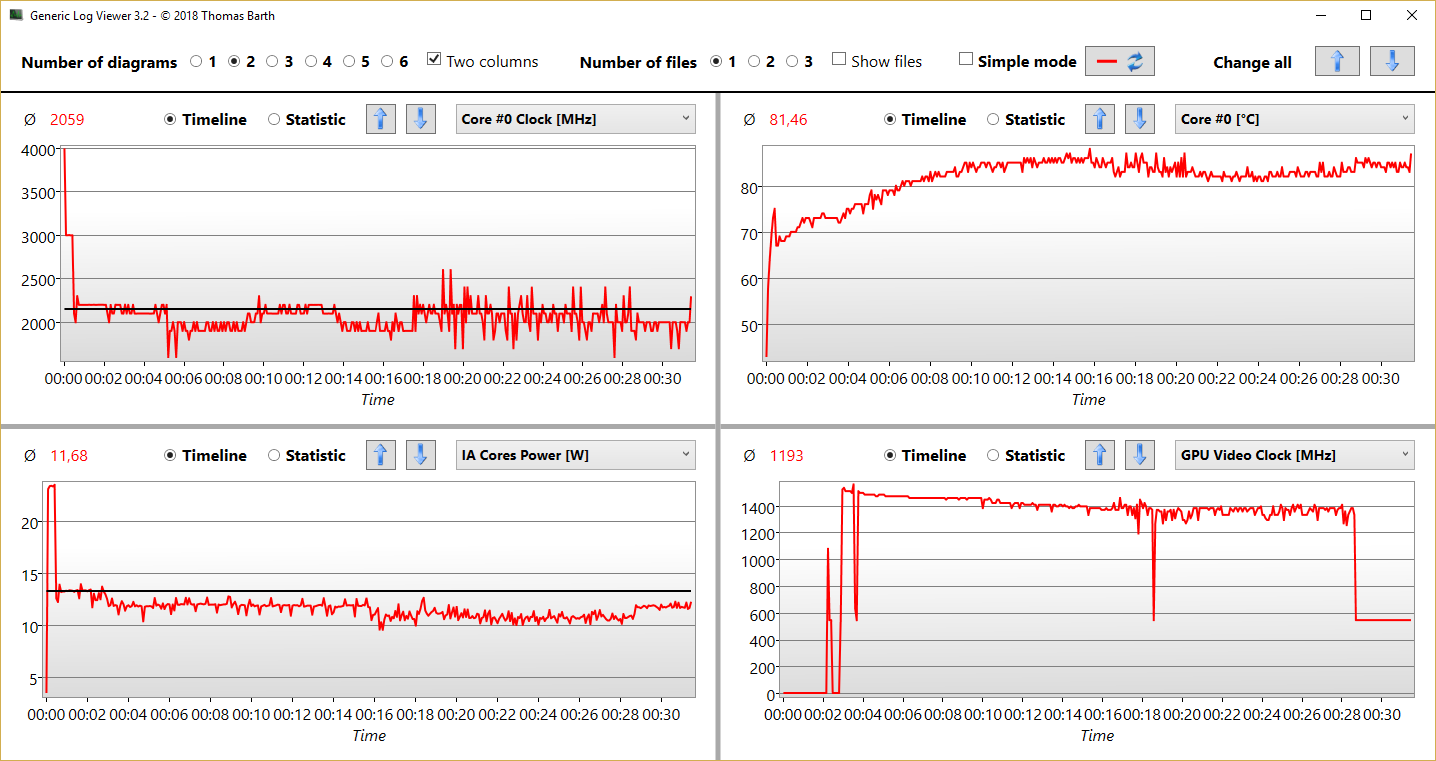
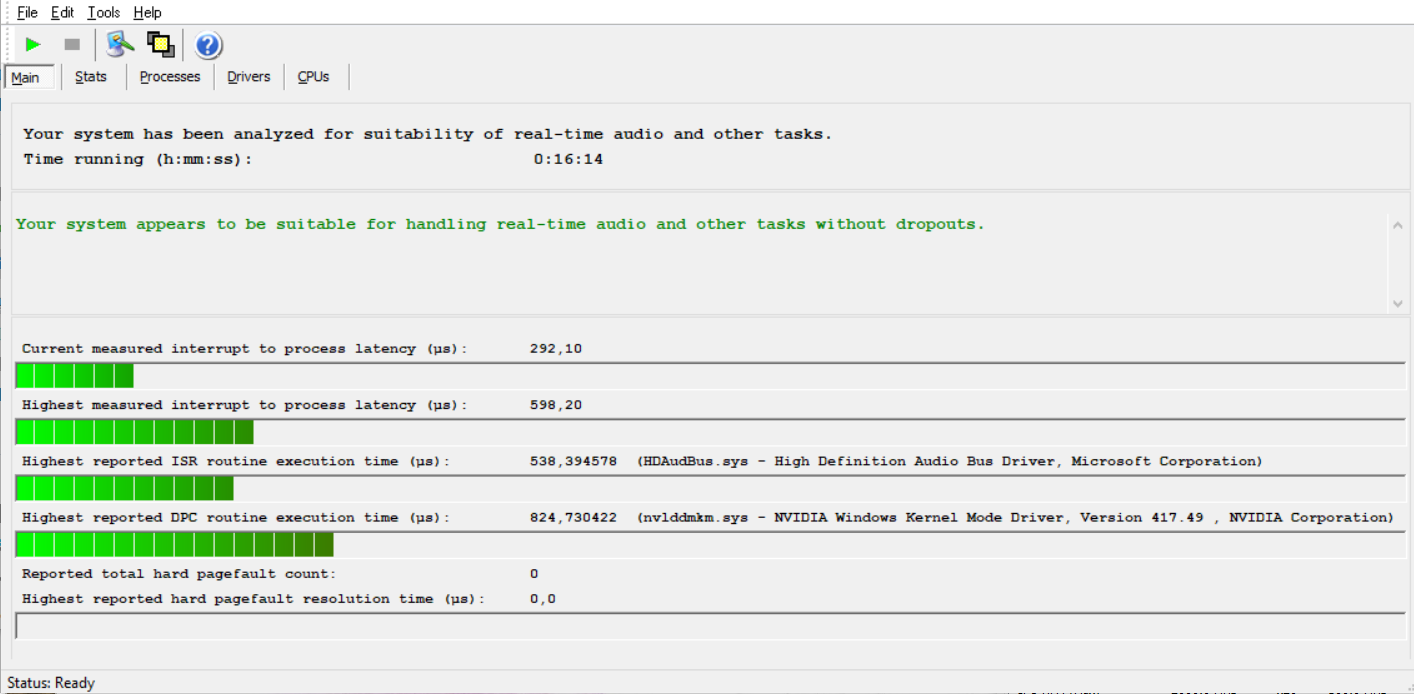
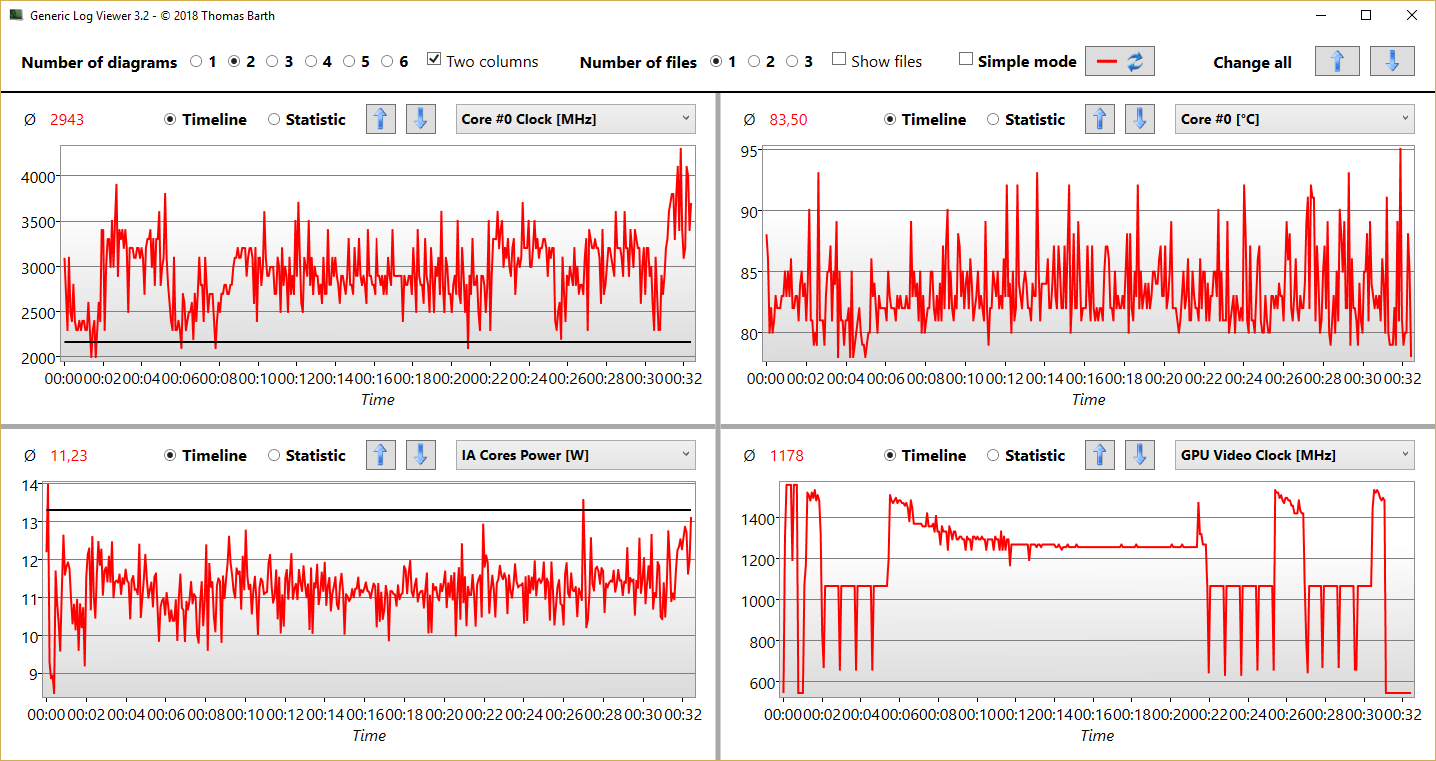
We also performed a stress test to determine the effectiveness of the PS63’s cooling solutions under continuous load. We conduct our stress tests by running FurMark and Prime95, but we only start FurMark after the first three minutes, as demonstrated by the screenshots above.
The CPU initially operated at around 4 GHz but then the clock speed dropped first to 3 GHz and then to 2.2 GHz, which is only 400 MHz above its base clock speed. We only had Prime95 active at this point, but the CPU already reached 75 °C, at which point it throttled to cool itself to 73 °C, a core temperature that it maintained until we started FurMark.
The CPU then shot back up to 87 °C, which caused it to further throttle to between 1.9 GHz and 2 GHz. By contrast, the GPU manages to maintain its turbo speeds of between 1.35 GHz and 1.45 GHz.
In short, the PS63 deserves its Quiet Mark certification, but it comes at the cost of thermal throttling, about which we are disappointed. The CPU does not thermal throttle below its base clock like some laptops do, but we suspect that the PS63 could have better maintained its CPU performance if MSI allowed its fans to get louder, although probably at a cost to its Quiet Mark certification.
(-) The maximum temperature on the upper side is 58.6 °C / 137 F, compared to the average of 36.8 °C / 98 F, ranging from 21 to 71 °C for the class Multimedia.
(-) The bottom heats up to a maximum of 60 °C / 140 F, compared to the average of 39.1 °C / 102 F
(+) In idle usage, the average temperature for the upper side is 24.3 °C / 76 F, compared to the device average of 31.3 °C / 88 F.
(+) The palmrests and touchpad are reaching skin temperature as a maximum (33 °C / 91.4 F) and are therefore not hot.
(-) The average temperature of the palmrest area of similar devices was 28.7 °C / 83.7 F (-4.3 °C / -7.7 F).
Speakers
The PS63 has downward-firing stereo speakers that are located underneath the palm rest. Their positioning means that audio deflects off surfaces to reach your ears rather than directly at you. The downside of this is that the audio sounds muffled when the PS63 is placed on soft surfaces like a bed. This is a problem with all laptops that have downward-firing speakers though.
The small drivers overrepresent mid tones but cannot reproduce bass. The included Nahimic audio tool cannot correct this, but a lack of bass is a problem for most laptops. High-pitched tones sound more balanced by comparison, which is why voices are clearly reproduced while listening to music, for example. The speakers get loud enough to fill a medium-sized room too, but they are especially loud by laptop standards.
We liked the Nahimic audio tool, which allows audio to be adjusted easily. Any changes made are audible too, which is encouraging.
The dual-array microphones reproduce audio cleanly too. Our test unit can capture our voice clearly regardless of whether we sat several feet away or right next to the device. The audio is free of background noise too, which should help during video calls.
However, audio recordings sound tinny to our ears, but thankfully you can use Nahimic to make adjustments. The program has microphone settings specifically for chat and video conferences that can compensate for volume fluctuations and filter out other sounds.
MSI PS63 Modern 8RC audio analysis
(±) | speaker loudness is average but good (72 dB)
Bass 100 - 315 Hz
(-) | nearly no bass - on average 24.4% lower than median
(±) | linearity of bass is average (10.3% delta to prev. frequency)
Mids 400 - 2000 Hz
(±) | higher mids - on average 6% higher than median
(±) | linearity of mids is average (10.9% delta to prev. frequency)
Highs 2 - 16 kHz
(+) | balanced highs - only 3.2% away from median
(±) | linearity of highs is average (7.8% delta to prev. frequency)
Overall 100 - 16.000 Hz
(±) | linearity of overall sound is average (26.5% difference to median)
Compared to same class
» 92% of all tested devices in this class were better, 1% similar, 6% worse
» The best had a delta of 5%, average was 17%, worst was 45%
Compared to all devices tested
» 81% of all tested devices were better, 4% similar, 15% worse
» The best had a delta of 4%, average was 24%, worst was 134%
Dell XPS 15 2018 i5 FHD 97Wh audio analysis
(±) | speaker loudness is average but good (73 dB)
Bass 100 - 315 Hz
(±) | reduced bass - on average 10.9% lower than median
(+) | bass is linear (4.9% delta to prev. frequency)
Mids 400 - 2000 Hz
(±) | higher mids - on average 6.8% higher than median
(+) | mids are linear (6.8% delta to prev. frequency)
Highs 2 - 16 kHz
(+) | balanced highs - only 3.7% away from median
(+) | highs are linear (6.9% delta to prev. frequency)
Overall 100 - 16.000 Hz
(±) | linearity of overall sound is average (16.6% difference to median)
Compared to same class
» 44% of all tested devices in this class were better, 7% similar, 49% worse
» The best had a delta of 5%, average was 17%, worst was 45%
Compared to all devices tested
» 29% of all tested devices were better, 6% similar, 66% worse
» The best had a delta of 4%, average was 24%, worst was 134%
Microsoft Surface Book 2 audio analysis
(±) | speaker loudness is average but good (74.2 dB)
Bass 100 - 315 Hz
(±) | reduced bass - on average 12.4% lower than median
(±) | linearity of bass is average (12.3% delta to prev. frequency)
Mids 400 - 2000 Hz
(+) | balanced mids - only 1.9% away from median
(+) | mids are linear (3.6% delta to prev. frequency)
Highs 2 - 16 kHz
(+) | balanced highs - only 4.8% away from median
(±) | linearity of highs is average (9.3% delta to prev. frequency)
Overall 100 - 16.000 Hz
(±) | linearity of overall sound is average (18.2% difference to median)
Compared to same class
» 39% of all tested devices in this class were better, 7% similar, 54% worse
» The best had a delta of 6%, average was 20%, worst was 57%
Compared to all devices tested
» 39% of all tested devices were better, 8% similar, 53% worse
» The best had a delta of 4%, average was 24%, worst was 134%
Power Management
Power Consumption
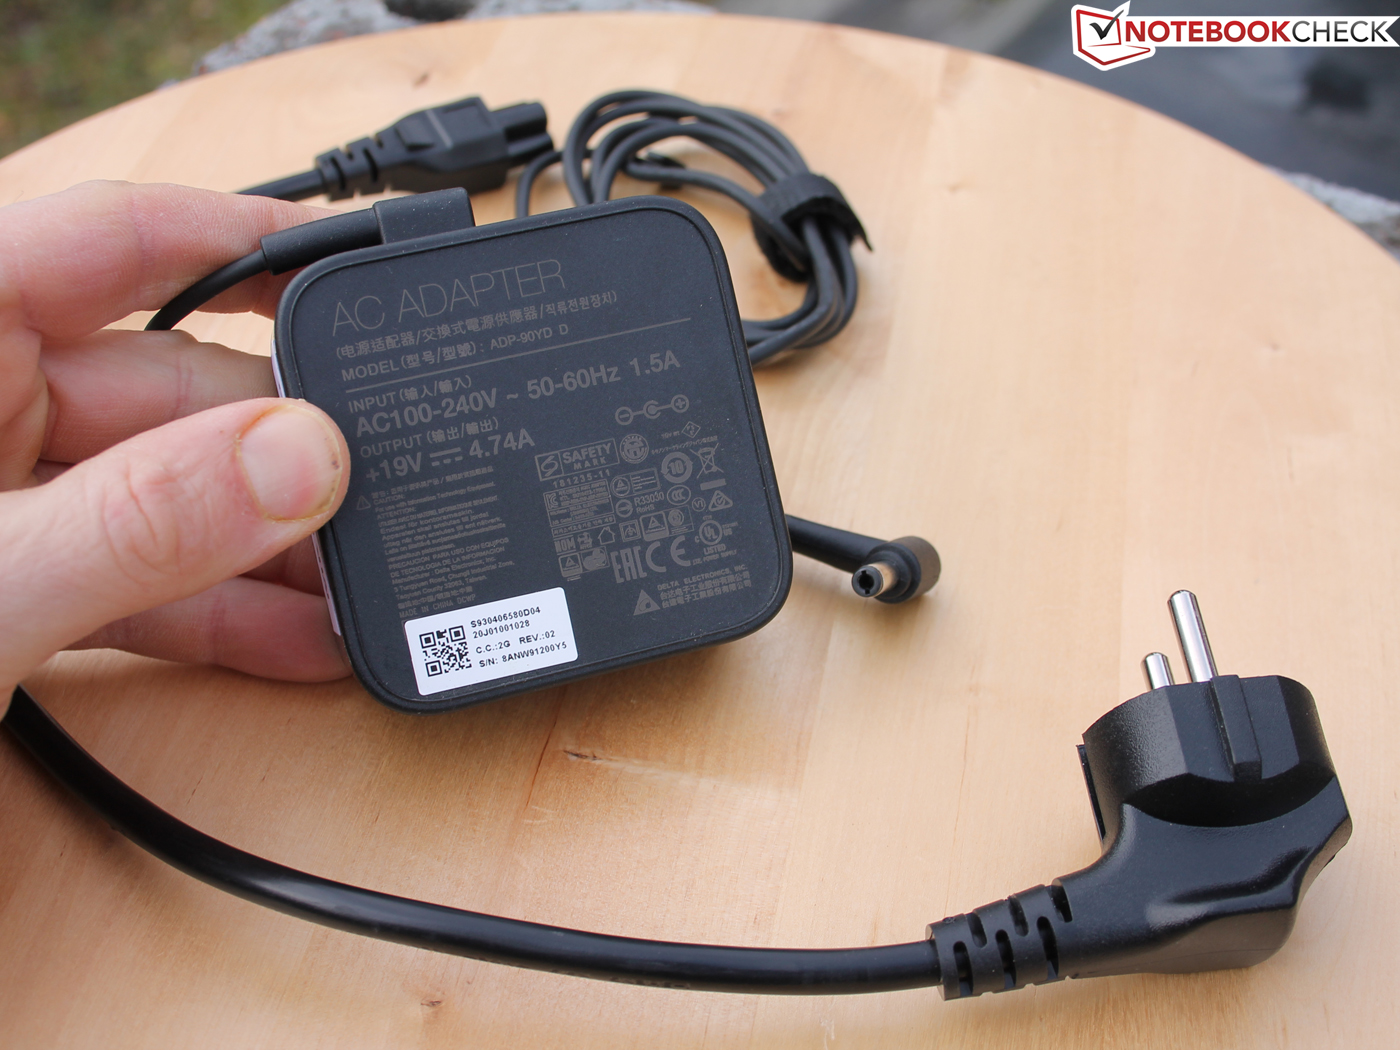
The PS63 Modern 8RC comes with a 90 W charger, which is unusually compact at 7.4 cm² for such a high-wattage power supply. Our test unit consumed a maximum of 93 W during our tests though, so it is slightly smaller than it should be in our opinion. The PS63 started consuming around 84 W 60 seconds into our stress test, so the high power consumption should not be an issue even if you push the device hard.
Predictably, the PS63 consumes less than our more-powerful comparison devices like the Aero 15X v8. However, our test unit consumes considerably more at idle than the Surface Book 2 and even both the ThinkPad X1 Extreme and Core i5-8300H version of the XPS 15 9570, despite the latter being equipped with more-powerful CPUs. In short, the PS63 has disappointingly high power consumption even with its U series processor.
| Off / Standby | |
| Idle | |
| Load |
|
Key:
min: | |
| MSI PS63 Modern 8RC i7-8565U, GeForce GTX 1050 Max-Q, WDC PC SN520 SDAPNUW-512G, IPS, 1920x1080, 15.6" | Schenker XMG Neo 15 i7-8750H, GeForce GTX 1060 Mobile, Samsung SSD 970 Pro 1TB, IPS, 1920x1080, 15.6" | Gigabyte Aero 15X v8 i7-8750H, GeForce GTX 1070 Max-Q, Toshiba NVMe THNSN5512GPU7, IPS, 1920x1080, 15.6" | Schenker Key 15 Coffee Lake i7-8750H, GeForce GTX 1070 Max-Q, Samsung SSD 970 EVO 500GB, IPS, 1920x1080, 15.6" | Microsoft Surface Book 2 i7-8650U, GeForce GTX 1050 Mobile, Samsung PM961 MZVLW256HEHP, IPS, 3000x2000, 13.5" | Dell XPS 15 2018 i5 FHD 97Wh i5-8300H, GeForce GTX 1050 Mobile, Lite-On CA3-8D256-Q11, LED IGZO IPS InfinityEdge, 1920x1080, 15.6" | Lenovo ThinkPad X1 Extreme-20MF000RGE i5-8300H, GeForce GTX 1050 Ti Max-Q, Samsung SSD PM981 MZVLB256HAHQ, IPS LED, 1920x1080, 15.6" | Average NVIDIA GeForce GTX 1050 Max-Q | Average of class Multimedia | |
|---|---|---|---|---|---|---|---|---|---|
| Power Consumption | -51% | -78% | -75% | 0% | 23% | 7% | 4% | -1% | |
| Idle Minimum * (Watt) | 6.8 | 10 -47% | 14 -106% | 14 -106% | 4.7 31% | 2.9 57% | 4.14 39% | 4.48 ? 34% | 5.71 ? 16% |
| Idle Average * (Watt) | 9.8 | 13 -33% | 18 -84% | 17 -73% | 10.6 -8% | 5.8 41% | 7.3 26% | 9.58 ? 2% | 10.1 ? -3% |
| Idle Maximum * (Watt) | 11.4 | 18 -58% | 22 -93% | 22 -93% | 12.3 -8% | 7.5 34% | 11.5 -1% | 11.6 ? -2% | 12.4 ? -9% |
| Load Average * (Watt) | 76 | 95 -25% | 91 -20% | 102 -34% | 81 -7% | 77.5 -2% | 78.8 -4% | 77.3 ? -2% | 65 ? 14% |
| Load Maximum * (Watt) | 93 | 179 -92% | 173 -86% | 157 -69% | 100.3 -8% | 107 -15% | 118 -27% | 105.5 ? -13% | 112.2 ? -21% |
| Witcher 3 ultra * (Watt) | 114 | 142 | 130 | 97 | 84 | 82 |
* ... smaller is better
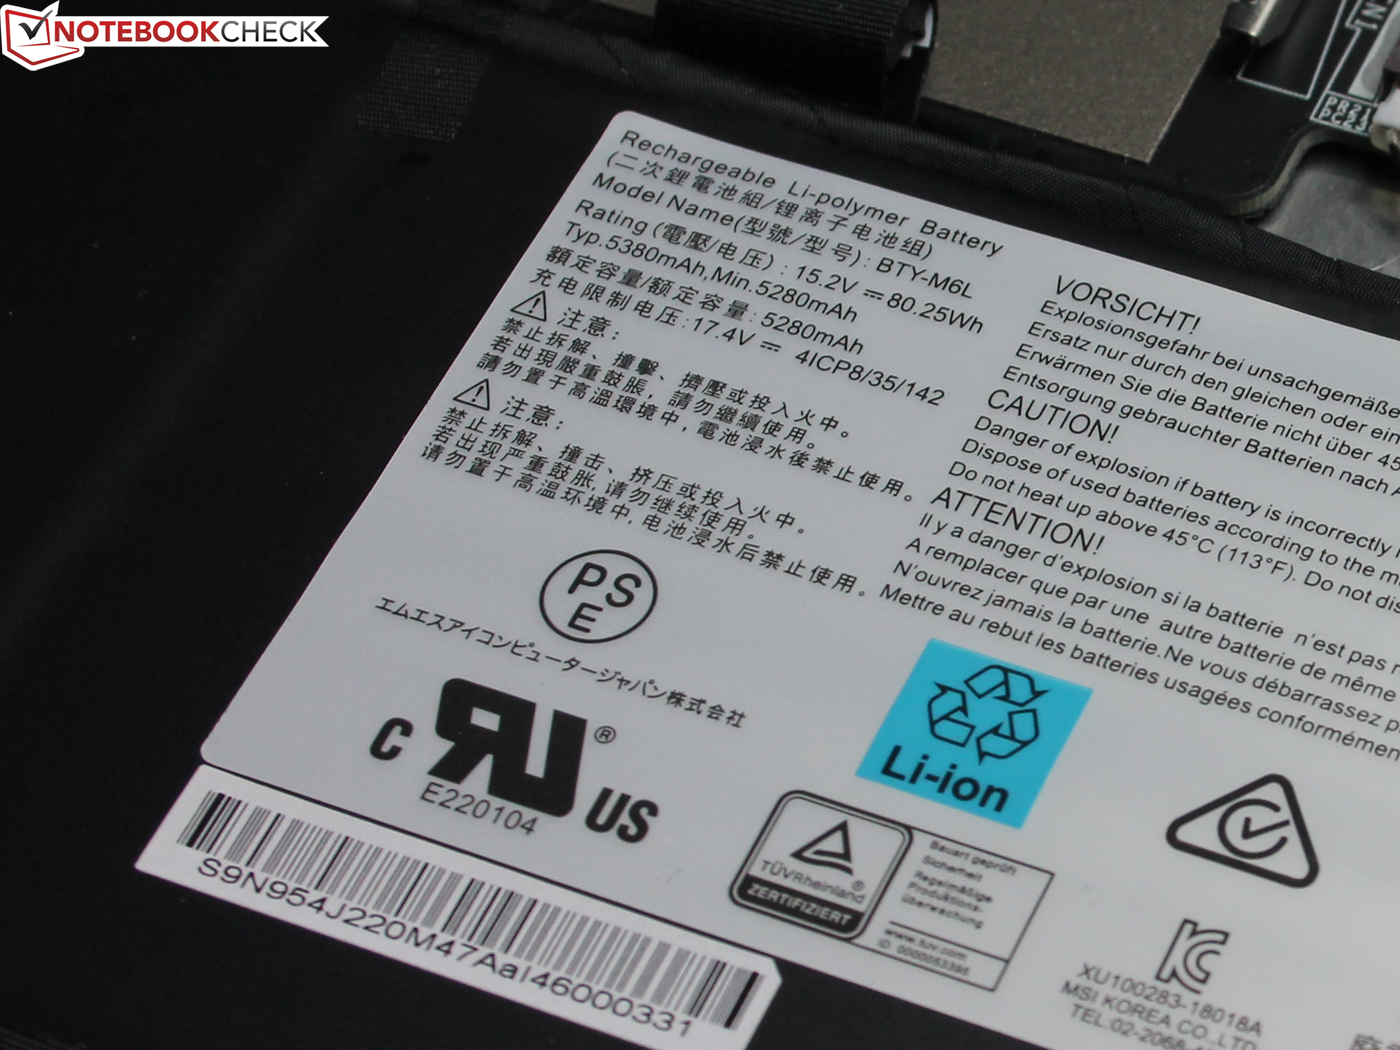
Battery Life
The PS63 has an 80 Wh battery that we subjected to three battery-life tests. We first saw how long the device would last when idling in aeroplane mode, then its runtime while connected to Wi-Fi before determining its battery life under continuous load.
We conducted our first test using Battery Eater, in which our test device lasted for 13:58 hours. This is a decent runtime, but it is beaten by the PS42 8RB Prestige, while it is left in the dust by the IdeaPad 720S-15IKB and the Surface Book 2.
The PS63 performed comparatively better in our Wi-Fi battery life test though. We conducted the test by setting the Windows 10 Power Mode to Balanced and adjusting the brightness to about 150 cd/m². We then ran a script that browses different websites and loads a new page every 60 seconds. Our test unit lasted 11:30 hours in this test, which is around 20 minutes longer than the Surface Book 2 and 95 minutes longer than the IdeaPad 720S-15IKB manage. Likewise, the PS63 lasted between 37% and 68% longer than our more-powerful comparison devices. The only outliers in this test are the PS42 8RB Prestige and the XPS 15 9570, which lasted 31% and 38% longer than the PS63, respectively. In short, the PS63 should last a full workday.
While the laptop will last a whole day of web browsing, it will need recharging after less than 3 hours if you subject it to continuous load. The PS63 is only beaten by the Surface Book 2 in this test, with our 45 W CPU comparison devices falling well behind, except for the Aero 15X v8.
In short, the PS63 has decent battery life that is eclipsed by the Surface Book 2 and the PS42 8RB Prestige. The device also occasionally loses out to some 45 W CPU comparison devices that have larger batteries like the XPS 15 9570.
| MSI PS63 Modern 8RC i7-8565U, GeForce GTX 1050 Max-Q, 82 Wh | MSI P65 8RF-451 - Creator i7-8750H, GeForce GTX 1070 Max-Q, 82 Wh | MSI GS65 Stealth Thin 8RE-051US i7-8750H, GeForce GTX 1060 Mobile, 82 Wh | Schenker Key 15 Coffee Lake i7-8750H, GeForce GTX 1070 Max-Q, 55 Wh | Microsoft Surface Book 2 i7-8650U, GeForce GTX 1050 Mobile, 75 Wh | MSI Prestige PS42 8RB-059 i5-8550U, GeForce MX150, 50 Wh | Schenker XMG Neo 15 i7-8750H, GeForce GTX 1060 Mobile, 46.7 Wh | Gigabyte Aero 15X v8 i7-8750H, GeForce GTX 1070 Max-Q, 94.24 Wh | Lenovo Ideapad 720S-15IKB 81AC001AGE i7-7700HQ, GeForce GTX 1050 Ti Max-Q, 79 Wh | Dell XPS 15 2018 i5 FHD 97Wh i5-8300H, GeForce GTX 1050 Mobile, 97 Wh | Apple MacBook Pro 15 2018 (2.6 GHz, 560X) i7-8850H, Radeon Pro 560X, 83 Wh | Lenovo ThinkPad X1 Extreme-20MF000RGE i5-8300H, GeForce GTX 1050 Ti Max-Q, 80 Wh | Average of class Multimedia | |
|---|---|---|---|---|---|---|---|---|---|---|---|---|---|
| Battery runtime | -45% | -52% | -59% | 29% | 7% | -48% | -14% | 3% | 3% | -11% | -1% | 15% | |
| Reader / Idle (h) | 14 | 7.5 -46% | 5 -64% | 24.5 75% | 16.8 20% | 6.7 -52% | 12.7 -9% | 22.6 61% | 21 50% | 25.2 ? 80% | |||
| WiFi v1.3 (h) | 11.4 | 7.1 -38% | 6.2 -46% | 3.7 -68% | 11.1 -3% | 14.9 31% | 4.4 -61% | 8.6 -25% | 9.8 -14% | 15.7 38% | 10.2 -11% | 9.4 -18% | 12 ? 5% |
| Load (h) | 2.8 | 1.4 -50% | 1.2 -57% | 1.5 -46% | 3.2 14% | 2 -29% | 1.9 -32% | 2.6 -7% | 1.7 -39% | 1.9 -32% | 1.8 -36% | 1.675 ? -40% | |
| H.264 (h) | 5.9 | 15.6 | 4.8 | 8.4 | 11.1 | 11.7 | 9.6 | 16.4 ? | |||||
| Witcher 3 ultra (h) | 3.8 | 1 | 1.5 |
Verdict
Pros
Cons
The MSI PS63 Modern 8RC is an impressive midrange multimedia laptop. It won't win any awards for its CPU, GPU and SSD combination, but the device shows its strengths in other areas. The PS63 is light, compact and easy to repair or maintain. Moreover, the device is stylish, well-built and sturdy thanks to its largely aluminium design.
The MSI PS63 Modern 8RC is a great choice if you are looking for a multimedia laptop but do not need the power of a 45 W CPU. It delivers solid performance and runs quietly, while its 80 Wh will easily last a full workday.
The device also generally runs coolly too, but it gets hotter than most comparable laptops when operating under sustained load, which could be a concern for some people. The only issue we have with the PS63’s quiet fans is that the device does not get the most from its Core i7-8565U processor, which throttles heavily when it reaches 75 °C, which could impact render times, for example. The GeForce GTX 1050 Max-Q is unaffected though.
MSI has also packed in two M.2 slots, which not all multimedia laptops have, and the manufacturer has left one RAM slot free, making it easy to upgrade to 32 GB RAM if you need it. It is a shame that MSI did not include a Thunderbolt 3 port, but USB 3.1 Gen2 Type-C with DisplayPort-out is a welcome addition.
The PS63 Modern costs around 1,700 Euros (~$1,938), which is not exactly easy on your wallet, especially as you can get a more-powerful laptop like the Aero 15X V8 or the XPS 15 9570 for the same money. You will sacrifice some mobility with either of those laptops though.
If mobility is a secondary factor, then the hexa-core Core i7-8850H or the quad-core Core i5-8300H will be better choices than the Core i7-8565U. Dell sells configurations for either CPU with its XPS 15 9570, while MSI has the P65 Creator or the GS65 Stealth Thin. Deciding between a 15 W and 45 W CPU ultimately comes down to preference and whether you need the added horsepower that an H series processor brings. Let us use the VEGAS Pro 16 system requirements as a working example:
| Minimum | Recommended | |
|---|---|---|
| Processor | 2.5 GHz, quad-core | 3 GHz, octa-core for 4K rendering |
| RAM | 8 GB RAM | 16 GB, 32 GB for 4K rendering |
| Graphics card | GeForce 9XX series or higher with 4 GB VRAM | N/A |
If you render at 4K, then you should look at buying an H series or HK series CPU. The PS63 will run out of steam with its 15 W CPU despite having enough RAM and a sufficiently powerful GPU. In short, the MSI PS63 Modern 8RC is an excellent ultramobile 15.6-inch laptop that can compete with the best multimedia laptops on the market despite compromising on CPU performance.
MSI PS63 Modern 8RC
- 10/25/2019 v7 (old)
Sebastian Jentsch
Price comparison

