Notebook reviews with NVIDIA GeForce GTX 1070 Max-Q graphics card
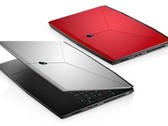
Alienware m15 (i7-8750H, GTX 1070 Max-Q) Laptop Review
Alienware's first ultra-thin laptop maintains the spirit of the original Alienware 15 R4 while propelling the series forward into the super-light gaming category. Of course, some sacrifices had to be made when moving to a smaller design, but it's mostly a success especially in terms of Turbo Boost performance and chassis rigidity.
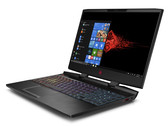
Intel Core i7-8750H, NVIDIA GeForce GTX 1070 Max-Q, 15.6", 2.2 kgHP Omen 15 (i7-8750H, GTX 1070 Max-Q, SSD, FHD) Laptop Review
The Omen 15 brings all the current computer games smoothly to the matte Full HD display. Hewlett-Packard uses a very responsive 144-Hz IPS panel here, and the rest of the equipment is also all right: NVMe SSD, 32 GB of working memory, Thunderbolt 3.
Intel Core i7-8750H, NVIDIA GeForce GTX 1070 Max-Q, 15.6", 2.5 kgMSI P65 Creator 8RF (i7-8750H, GTX 1070 Max-Q, 512 GB SSD, 144 Hz) Laptop Review
MSI's Prestige series promises desktop-level performance while maintaining maximum mobility at the same time. We have decided to take a closer look at whether MSI managed to keep its promises. At first glance, the device seems to keep its word, and a hexa-core CPU and GTX 1070 are great for much more than just working.
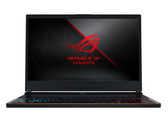
Intel Core i7-8750H, NVIDIA GeForce GTX 1070 Max-Q, 15.6", 1.9 kgAsus ROG Zephyrus S GX531GS (i7-8750H, GTX 1070 Max-Q, FHD) Laptop Review
After the GX501 that was only mobile to a limited extent in favor of incorporating G-Sync, the brand-new GX531 is able to score with Nvidia's Optimus graphics switching. Find out in this extensive review why the overall evaluation is still worse than its predecessor's. Update: CPU and GPU Turbo mode benchmarks added.
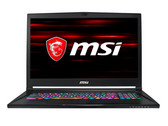
Intel Core i7-8750H, NVIDIA GeForce GTX 1070 Max-Q, 15.6", 2.1 kgMSI GS73 8RF Stealth (i7-8750H, GTX 1070 Max-Q, FHD) Laptop Review
Washboard belly. With a height of just 19.6 mm (~0.77 in), the GS73 Stealth belongs to the slimmest gaming laptops on the market. Despite the compact dimensions, MSI has managed to squeeze powerful hardware under the hood. You can find out in our test, whether this concept is working or the cooling system is overtaxed.
Intel Core i7-8750H, NVIDIA GeForce GTX 1070 Max-Q, 17.3", 2.4 kgRazer Blade 15 2018: Intel Core i7-8750H, 15.60", 2.1 kg
Review » Razer Blade 15 (i7-8750H, GTX 1070 Max-Q, FHD) Laptop Review
Eurocom Q6: Intel Core i7-8750H, 15.60", 2.2 kg
Review » Eurocom Q6 (i7-8750H, GTX 1070 Max-Q, FHD) Laptop Review
MSI GS65 8RF-019DE Stealth Thin: Intel Core i7-8750H, 15.60", 1.8 kg
Review » MSI GS65 8RF Stealth Thin (i7-8750H, GTX 1070 Max-Q, Full HD) Laptop Review
Gigabyte Aero 15X v8: Intel Core i7-8750H, 15.60", 2.1 kg
Review » Gigabyte Aero 15X v8 (i7-8750H, GTX 1070 Max-Q, Full-HD) Laptop Review
MSI GS63VR 7RG-005: Intel Core i7-7700HQ, 15.60", 1.9 kg
Review » MSI GS63VR 7RG Stealth Pro (i7-7700HQ, GTX 1070 Max-Q, Full HD) Laptop Review
Gigabyte Aero 15X: Intel Core i7-7700HQ, 15.60", 2.2 kg
Review » Gigabyte Aero 15X (i7-7700HQ, GTX 1070 Max-Q, FHD) Laptop Review
MSI GS73VR 7RG: Intel Core i7-7700HQ, 17.30", 2.4 kg
Review » MSI GS73VR 7RG (i7-7700HQ, GTX 1070 Max-Q, FHD) Laptop Review
Eurocom Q5: Intel Core i7-7700HQ, 15.60", 2.2 kg
Review » Eurocom Q5 (Clevo P957HR, i7-7700HQ, GTX 1070 Max-Q) Laptop Review
Asus Zephyrus GX501VS: Intel Core i7-7700HQ, 15.60", 2.3 kg
Review » Asus Zephyrus GX501VS (i7-7700HQ, GTX 1070 Max-Q) Laptop Review
HP Omen 15-dc0010ng: Intel Core i7-8750H, 15.60", 2.5 kg
External Review » HP Omen 15-dc0010ng
MSI Creator P65 8RF-453NE: Intel Core i7-8750H, 15.60", 1.9 kg
External Review » MSI Creator P65 8RF-453NE
Alienware m15 GTX 1070 Max-Q: Intel Core i7-8750H, 15.60", 2.2 kg
External Review » Alienware m15 GTX 1070 Max-Q
MSI P65 8RF-451 - Creator: Intel Core i7-8750H, 15.60", 1.9 kg
External Review » MSI P65 8RF-451 - Creator
MSI GS65 8RF-233NL: Intel Core i7-8750H, 15.60", 1.9 kg
External Review » MSI GS65 8RF-233NL
MSI P65 Creator 8RF-456NL: Intel Core i7-8750H, 15.60", 1.9 kg
External Review » MSI P65 Creator 8RF-456NL
MSI P65 Creator 8RF-445ES: Intel Core i7-8750H, 15.60", 1.9 kg
External Review » MSI P65 Creator 8RF-445ES
Alienware m15, GTX 1070 Max-Q: Intel Core i7-8750H, 15.60", 2.2 kg
External Review » Alienware m15, GTX 1070 Max-Q
MSI GS65 Stealth Thin 8RF-038NL: Intel Core i7-8750H, 15.60", 1.9 kg
External Review » MSI GS65 Stealth Thin 8RF-038NL
Asus Zephyrus S GX531GS: Intel Core i7-8750H, 15.60", 2.1 kg
External Review » Asus GX531GS (Zephyrus S)
Origin PC EVO15-S 2018, 8750H: Intel Core i7-8750H, 15.60", 2 kg
External Review » Origin PC EVO15-S 2018, 8750H
Hyperbook SL950VR2: Intel Core i7-8750H, 15.60", 1.9 kg
External Review » Hyperbook SL950VR2
Razer Blade 15 2018: Intel Core i7-8750H, 15.60", 2.1 kg
External Review » Razer Blade 15 2018
MSI GS65 8RF-019DE Stealth Thin: Intel Core i7-8750H, 15.60", 1.8 kg
External Review » MSI GS65 8RF-019DE Stealth Thin
MSI GS65 8RF-078 Stealth Thin: Intel Core i7-8750H, 15.60", 1.8 kg
External Review » MSI GS65 8RF-078 Stealth Thin
Gigabyte Aero 15X v8: Intel Core i7-8750H, 15.60", 2.1 kg
External Review » Gigabyte Aero 15X v8
MSI GS73VR 7RG-003 Stealth Pro: Intel Core i7-7700HQ, 17.30", 2.4 kg
External Review » MSI GS73VR 7RG-003 Stealth Pro
MSI GS63VR 7RG: Intel Core i7-7700HQ, 15.60", 1.9 kg
External Review » MSI GS63VR 7RG
MSI GS63VR Stealth Pro-002: Intel Core i7-7700HQ, 15.60", 1.8 kg
External Review » MSI GS63VR Stealth Pro-002
Gigabyte Aero 15X: Intel Core i7-7700HQ, 15.60", 2.2 kg
External Review » Gigabyte Aero 15X
Gigabyte Aero 15X v8: Intel Core i7-8750H, 15.60", 2.1 kg
Article » Intel 'Coffee Lake-H' Performance Comparison: A worthy upgrade from 'Kaby Lake'?