Eurocom Q6 (i7-8750H, GTX 1070 Max-Q, FHD) Laptop Review
Coffee Lake-H is now widely available and so manufacturers have been updating their existing Intel 7th gen SKUs to the latest 8th gen CPUs. Aside from the obvious CPU swap, this year's Eurocom Q6 offers small superficial changes over the 2017 Q5. Users can otherwise expect an identical experience between the Q5 the Q6 when it comes to chassis rigidity, keyboard feel, speakers, serviceability, and connectivity features. We recommend checking out our existing review on the Eurocom Q5 for more information since the Q6 is very similar.
Core options for the 15.6-inch Q6 include the quad-core i5-8300H or hexa-core i7-8750H CPUs, FHD or 4K UHD displays, and a fixed GTX 1070 Max-Q GPU. New to the Q6 is the addition of a 144 Hz FHD panel for ultra-smooth gameplay. Judging by the specifications and ultrathin design alone, it's clear that the Q6 is intended to compete directly with ultraportable gaming notebooks like the MSI GS63/GS65, Gigabyte Aero 15/15X, Aorus X5, Asus Zephyrus, and the upcoming Razer Blade 15.
Case
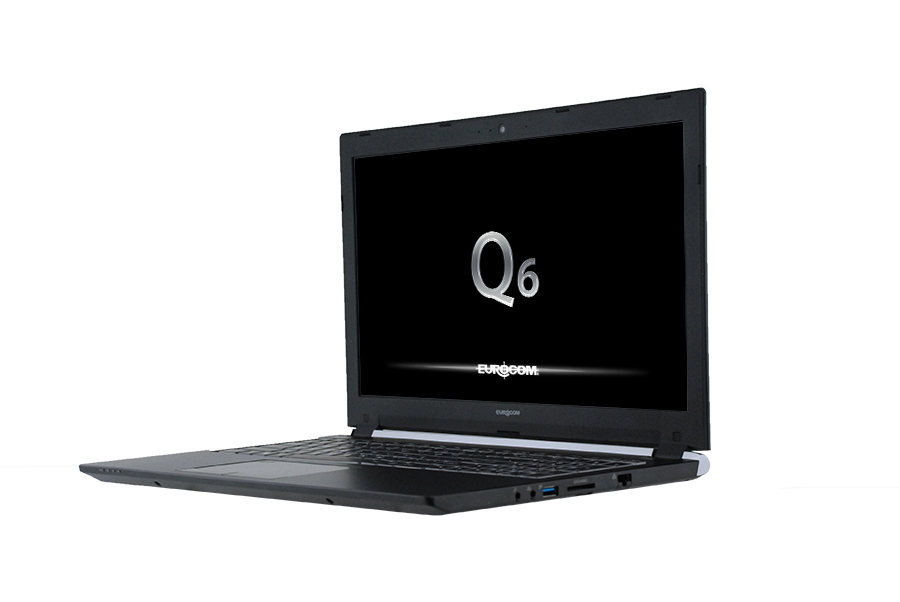
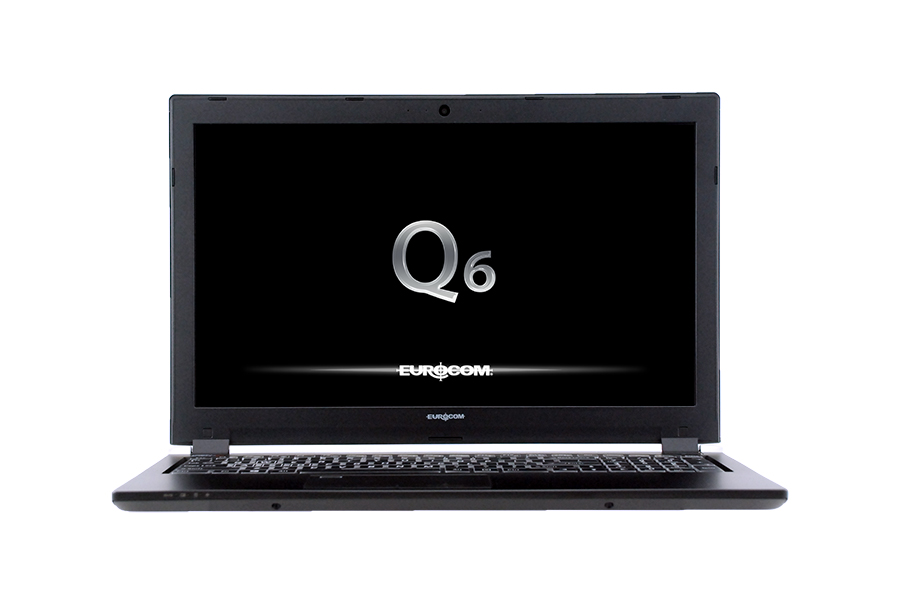
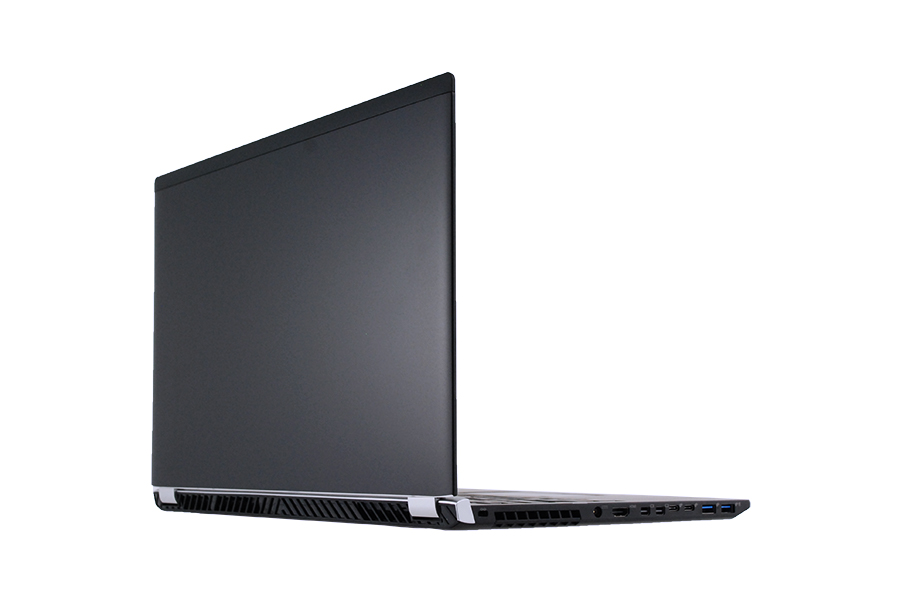
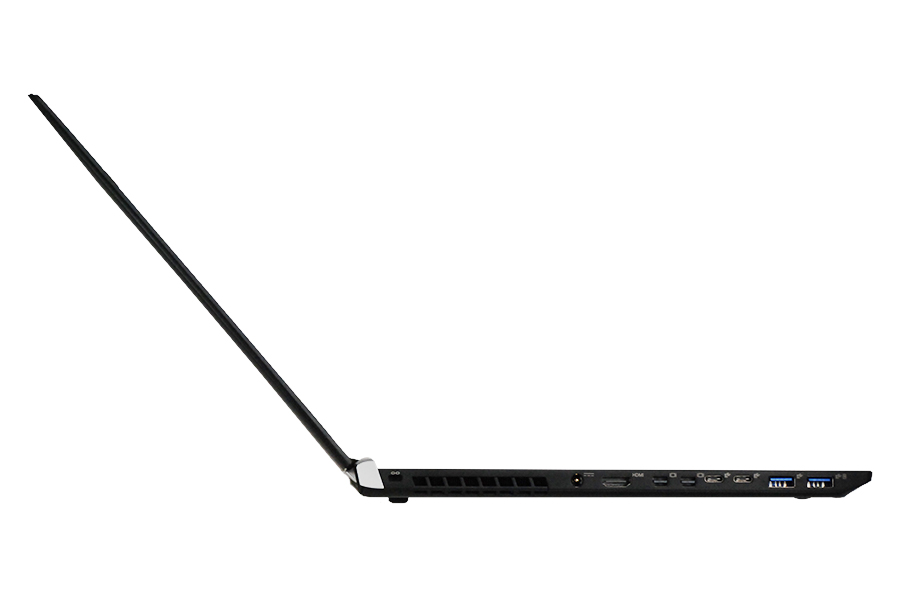
In terms of design, changes from the Q5 to the Q6 are largely skin deep. The accent marks on the outer lid and red ventilation grilles on the rear have been dropped in favor of completely smooth surfaces and matte gray hinges, respectively. The Power button has also been moved to the more common top right corner location. Its dimensions, internal slots, and weight are otherwise identical to the Q5.
Connectivity
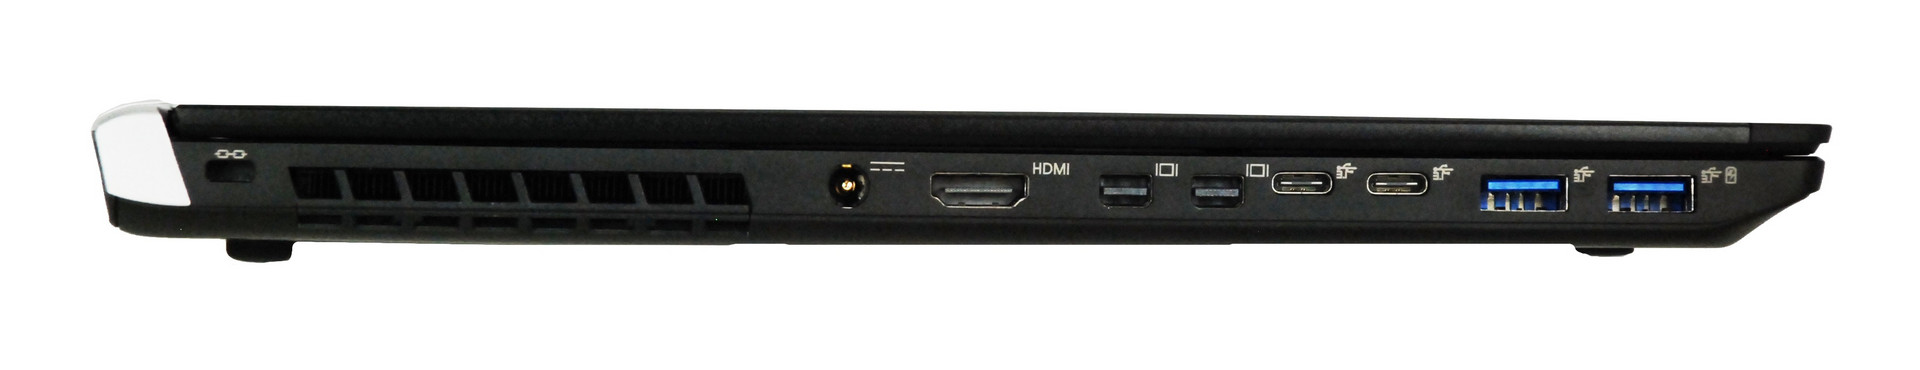
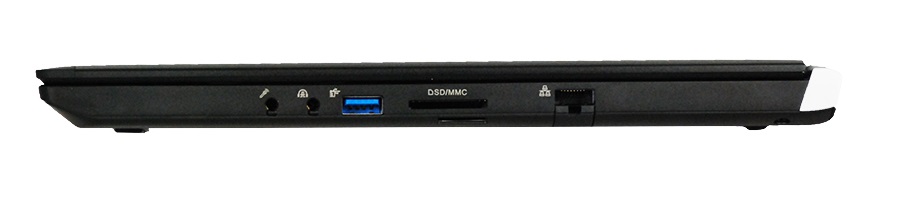
The Q6 is one of the few gaming laptops shipping with dedicated mini-DisplayPort ports and even a mini SIM slot. Still, it's disappointing to see no Thunderbolt 3 ports yet again. Ports are easy to reach but they are positioned too closely to the front edges.
SD Card Reader
| SD Card Reader | |
| average JPG Copy Test (av. of 3 runs) | |
| Aorus X5 v8 (Toshiba Exceria Pro SDXC 64 GB UHS-II) | |
| Gigabyte Aero 15X v8 (Toshiba Exceria Pro SDXC 64 GB UHS-II) | |
| Eurocom Q6 (Toshiba Exceria Pro SDXC 64 GB UHS-II) | |
| maximum AS SSD Seq Read Test (1GB) | |
| Gigabyte Aero 15X v8 (Toshiba Exceria Pro SDXC 64 GB UHS-II) | |
| Aorus X5 v8 (Toshiba Exceria Pro SDXC 64 GB UHS-II) | |
| Eurocom Q6 (Toshiba Exceria Pro SDXC 64 GB UHS-II) | |
Communication
| Networking | |
| iperf3 transmit AX12 | |
| MSI GS65 8RF-019DE Stealth Thin | |
| Eurocom Q6 | |
| Aorus X5 v8 | |
| iperf3 receive AX12 | |
| Aorus X5 v8 | |
| MSI GS65 8RF-019DE Stealth Thin | |
| Eurocom Q6 | |
Maintenance
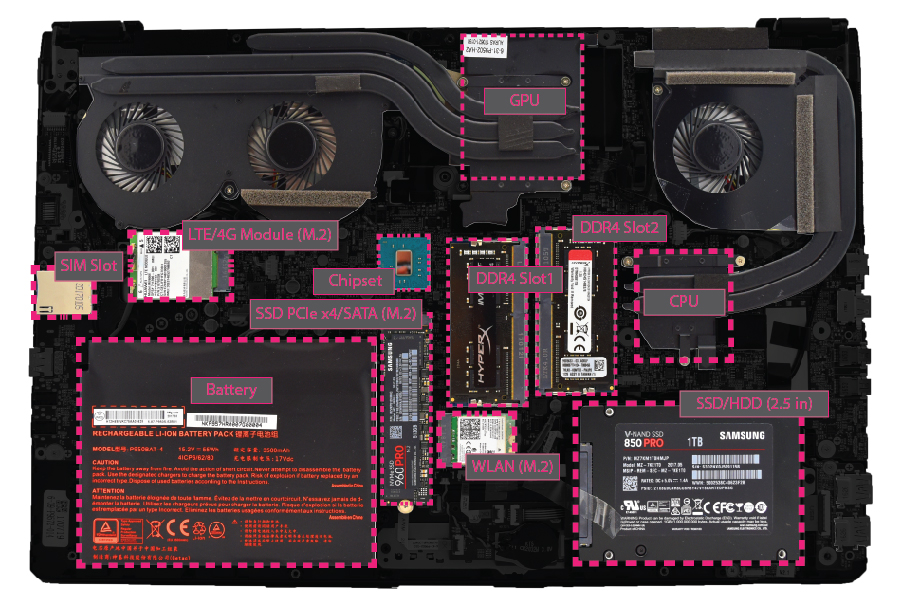
Serviceability continues to be a strong point for Eurocom when compared to competitors. Support for 4G LTE is a notable feature not commonly found on most other gaming laptops.
Eurocom says existing Q5 owners can replace and upgrade the motherboard to CFL-H to support all the new hardware features of the Q6 series. The option is an excellent demonstration of the versatility of a Clevo chassis even though it will still require a bit of technical skill in practice.
Software
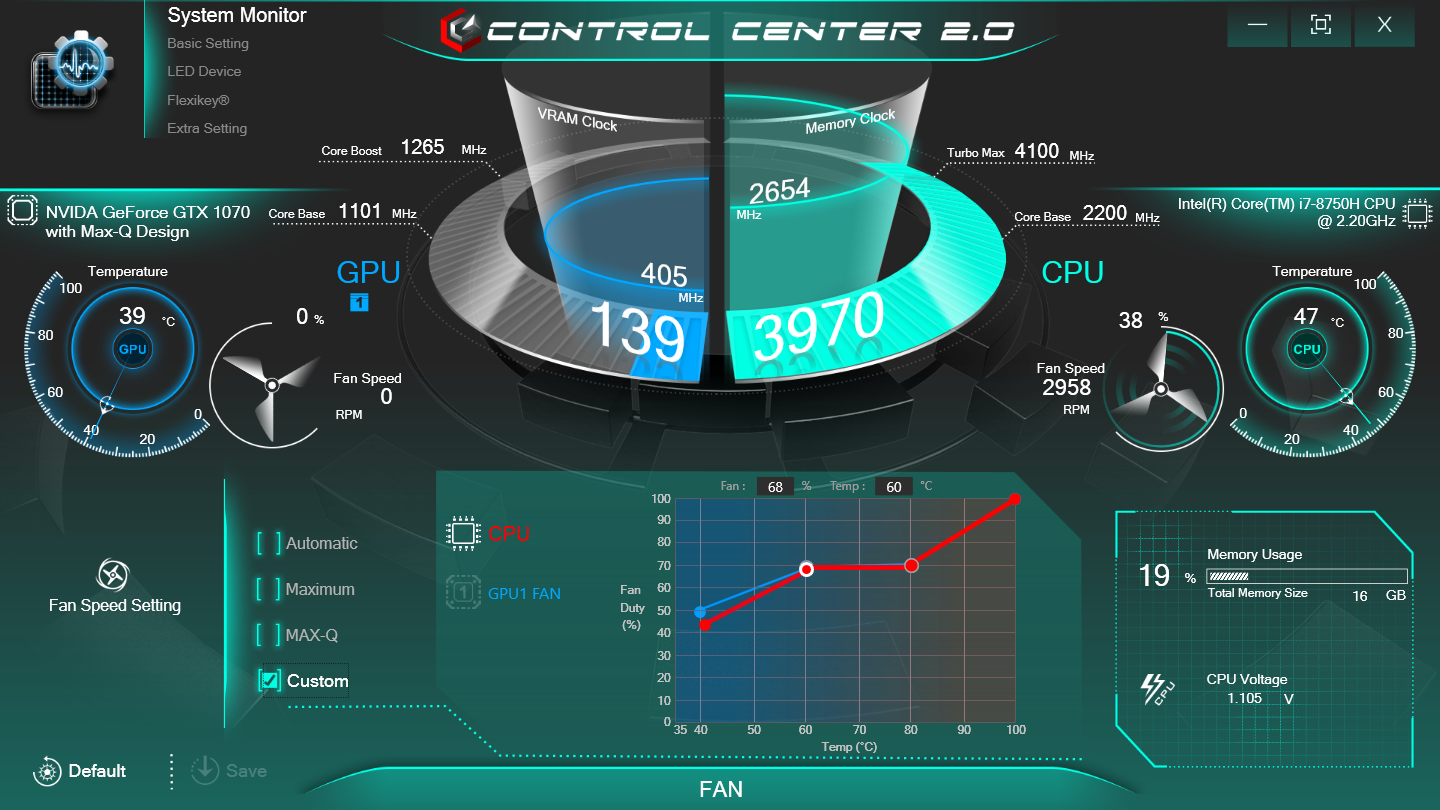
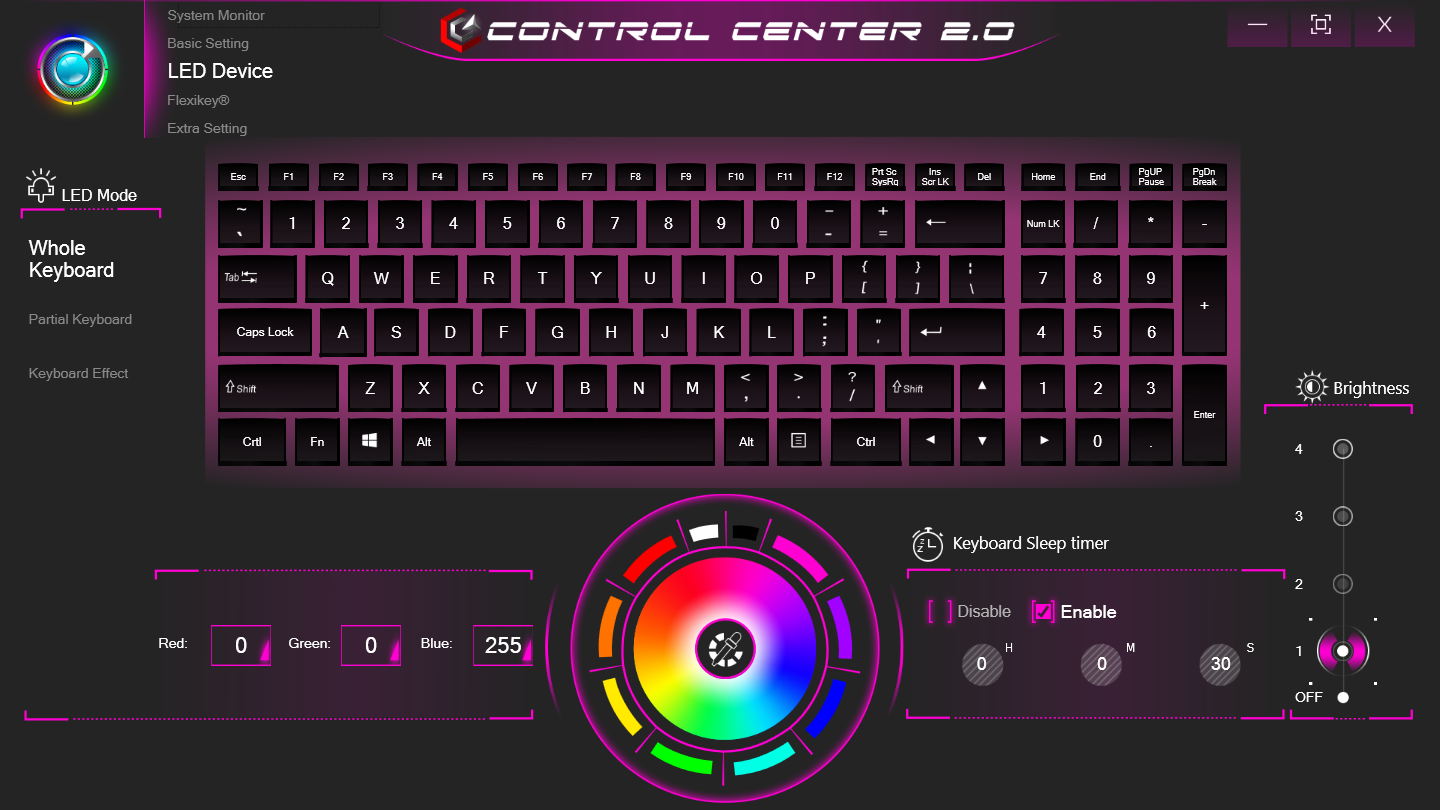
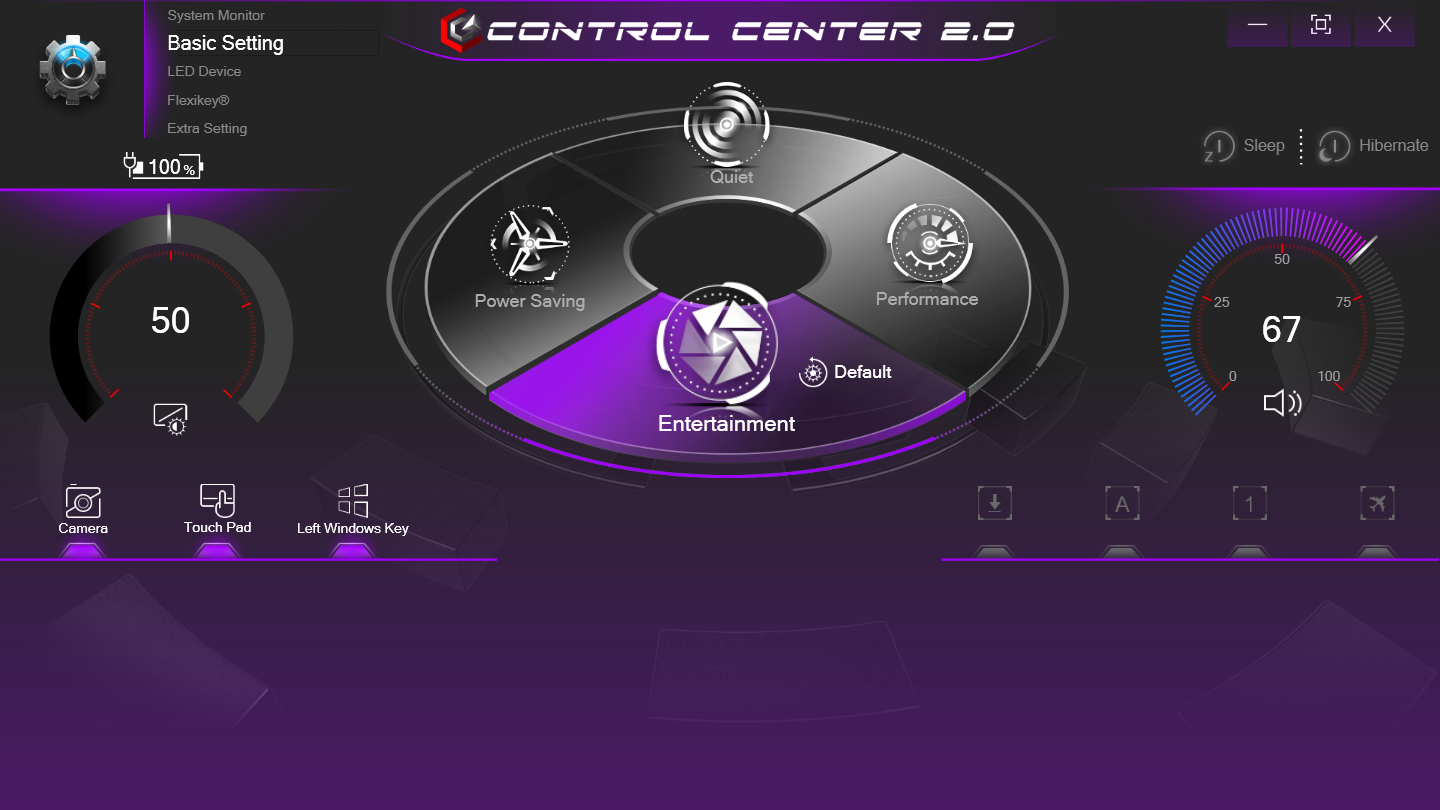
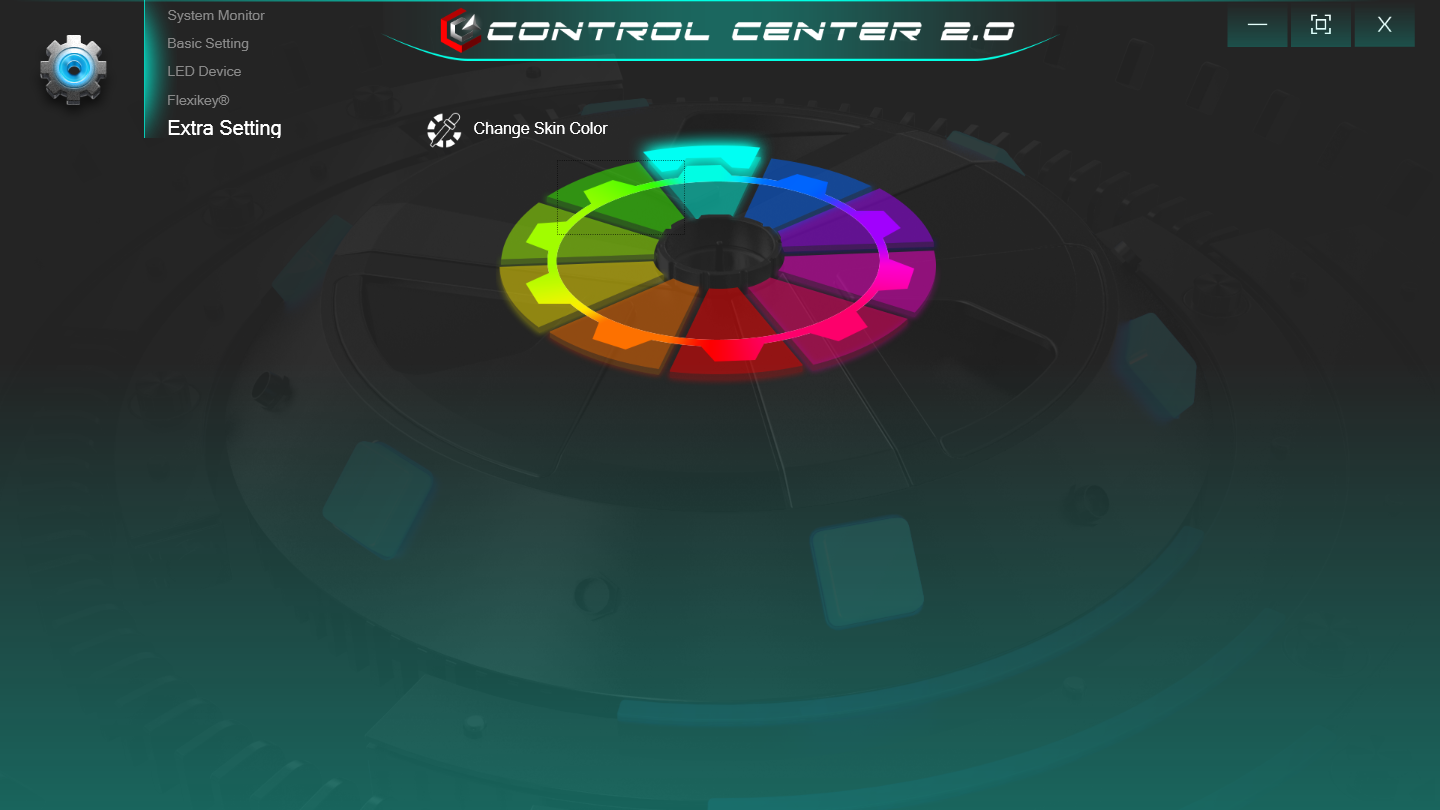
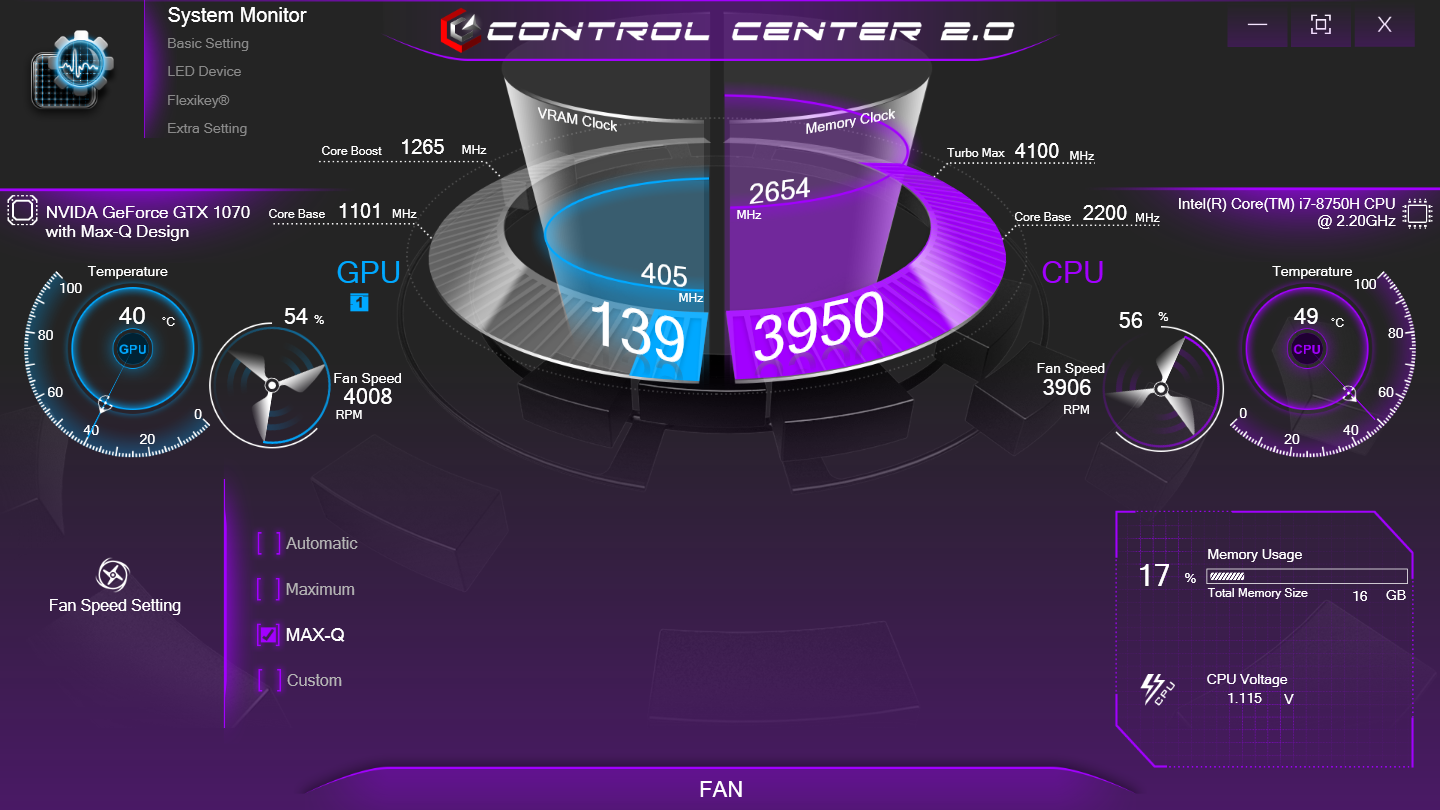
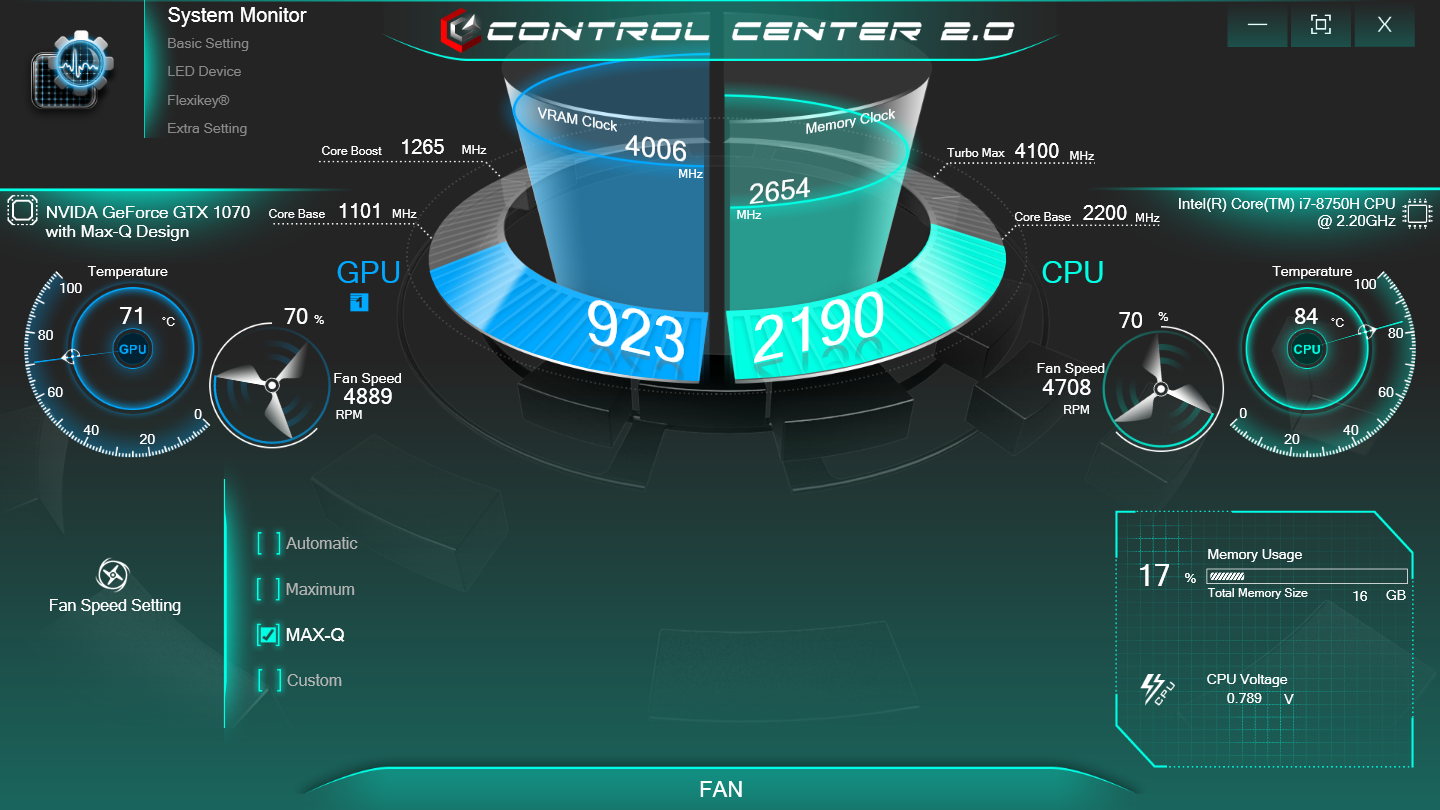
Clevo has overhauled the Control Center software to be easier to use while showing users more information at a time. We like the new approach especially since owners of Clevo systems tend to be enthusiasts who can understand and appreciate the real-time analytics. Our main complaints are that the window is rather big with lots of empty space, cannot be resized, and lacks both real-time recording and overlay features when gaming in full-screen mode.
Warranty
The one-year limited warranty applies with options to extend up to three years.
Input Devices
Keyboard and Touchpad
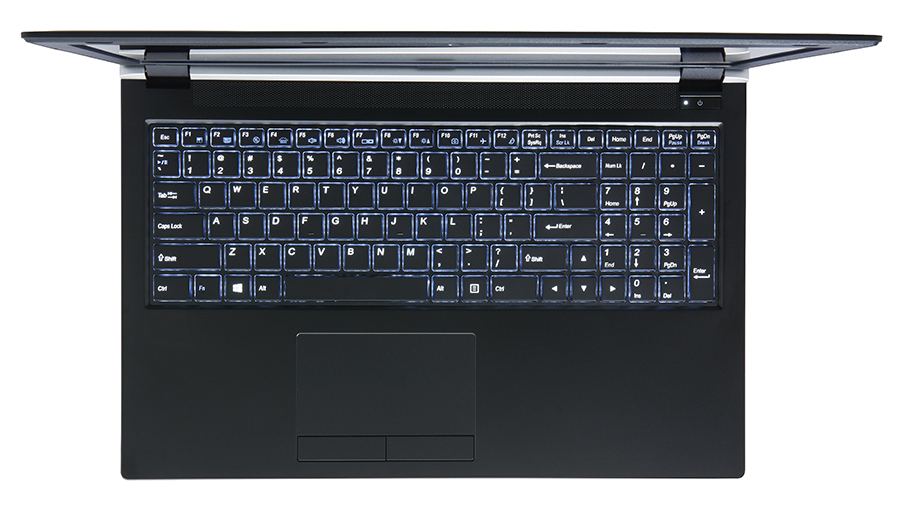
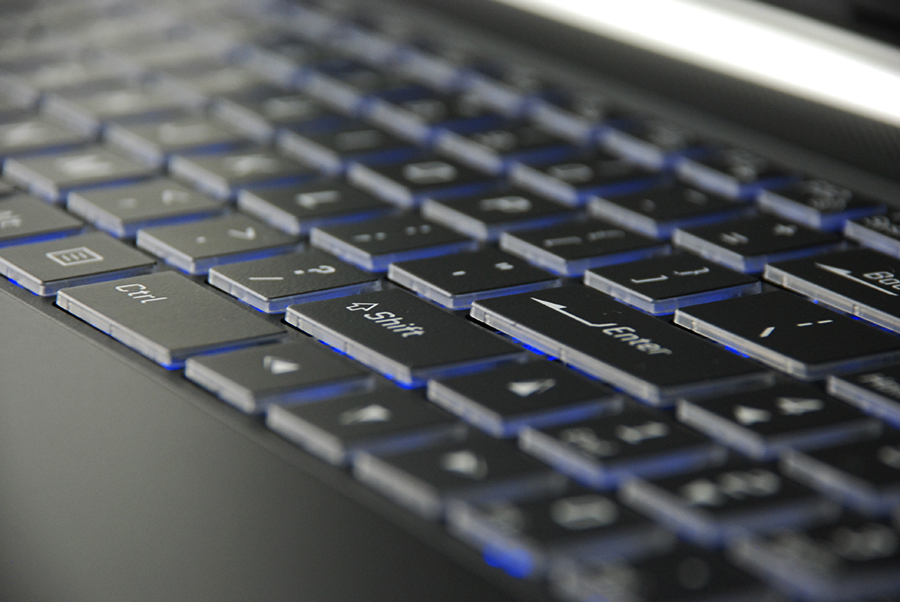
The perimeter of the keyboard is slightly different, but keys and feedback are otherwise the same as on the Q5. Users accustomed to the SteelSeries keyboard of the MSI GS series will find a very similar experience on the Q6.
More gaming laptops from MSI, Aorus, and Razer have already moved on to per-key RGB lighting and we're hoping to see the same from Clevo and Eurocom in the future.
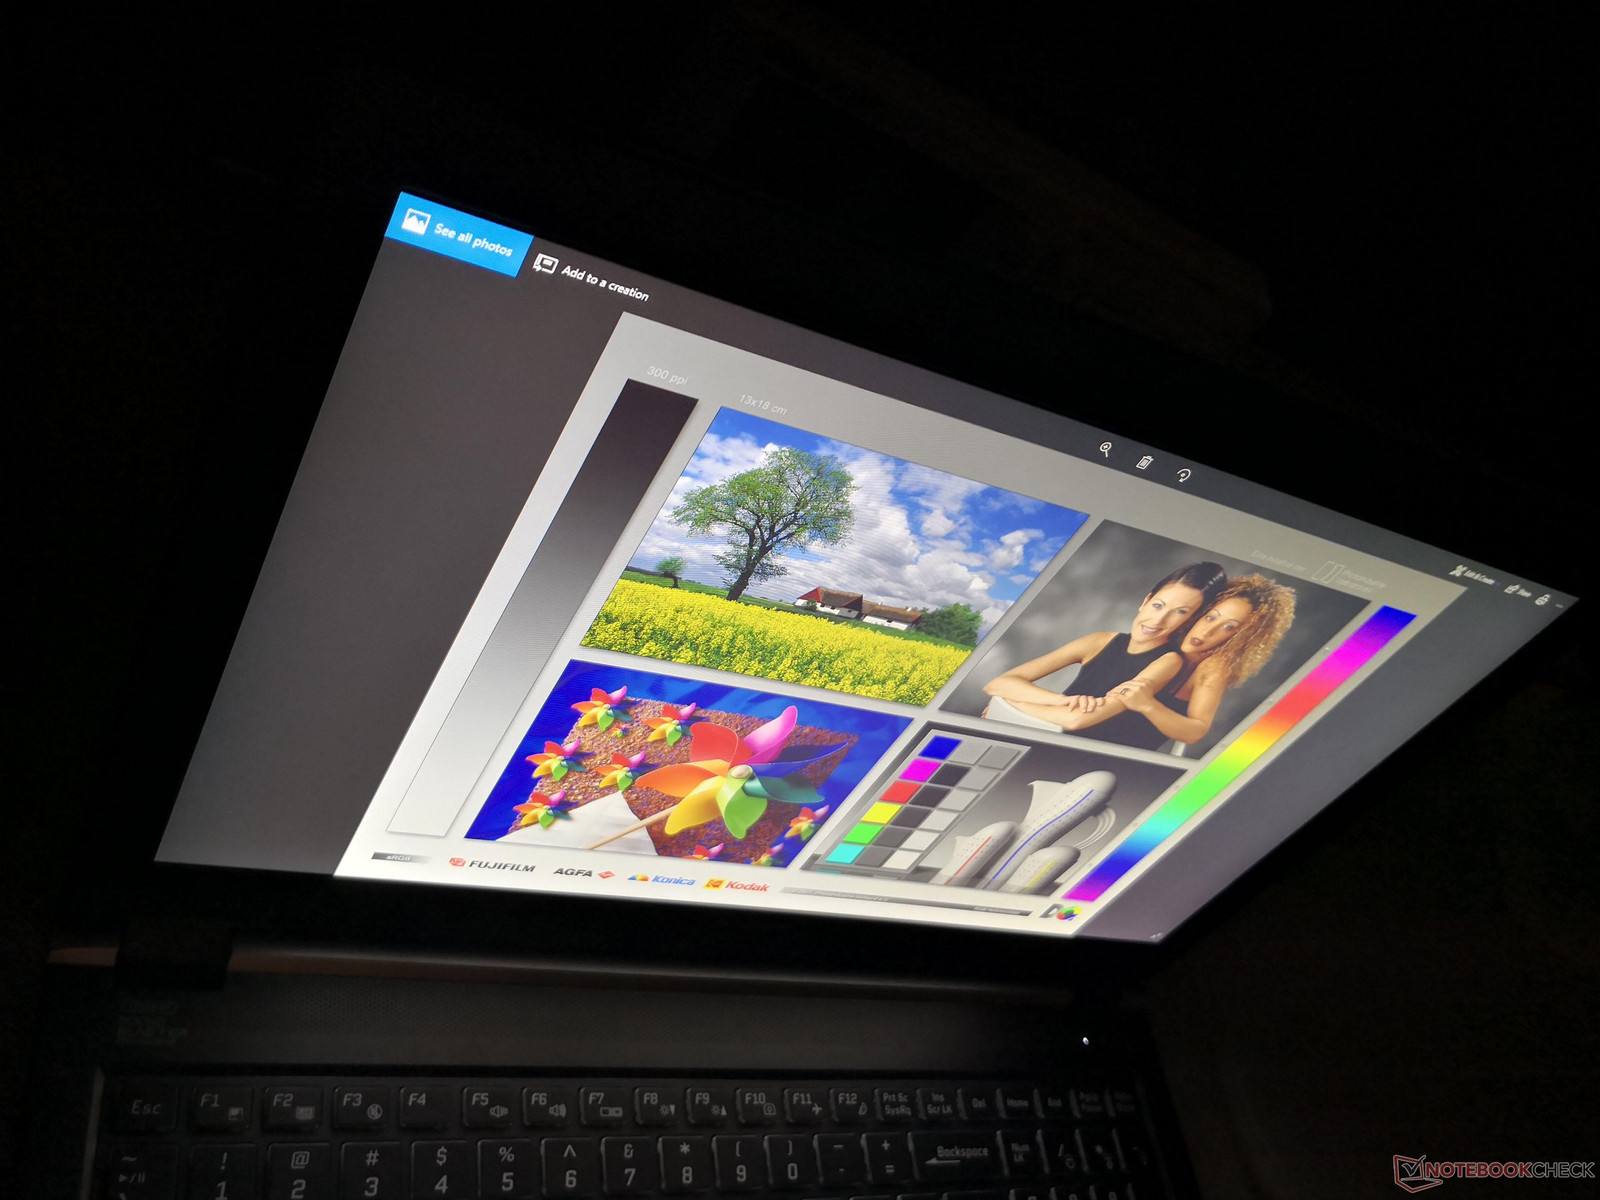
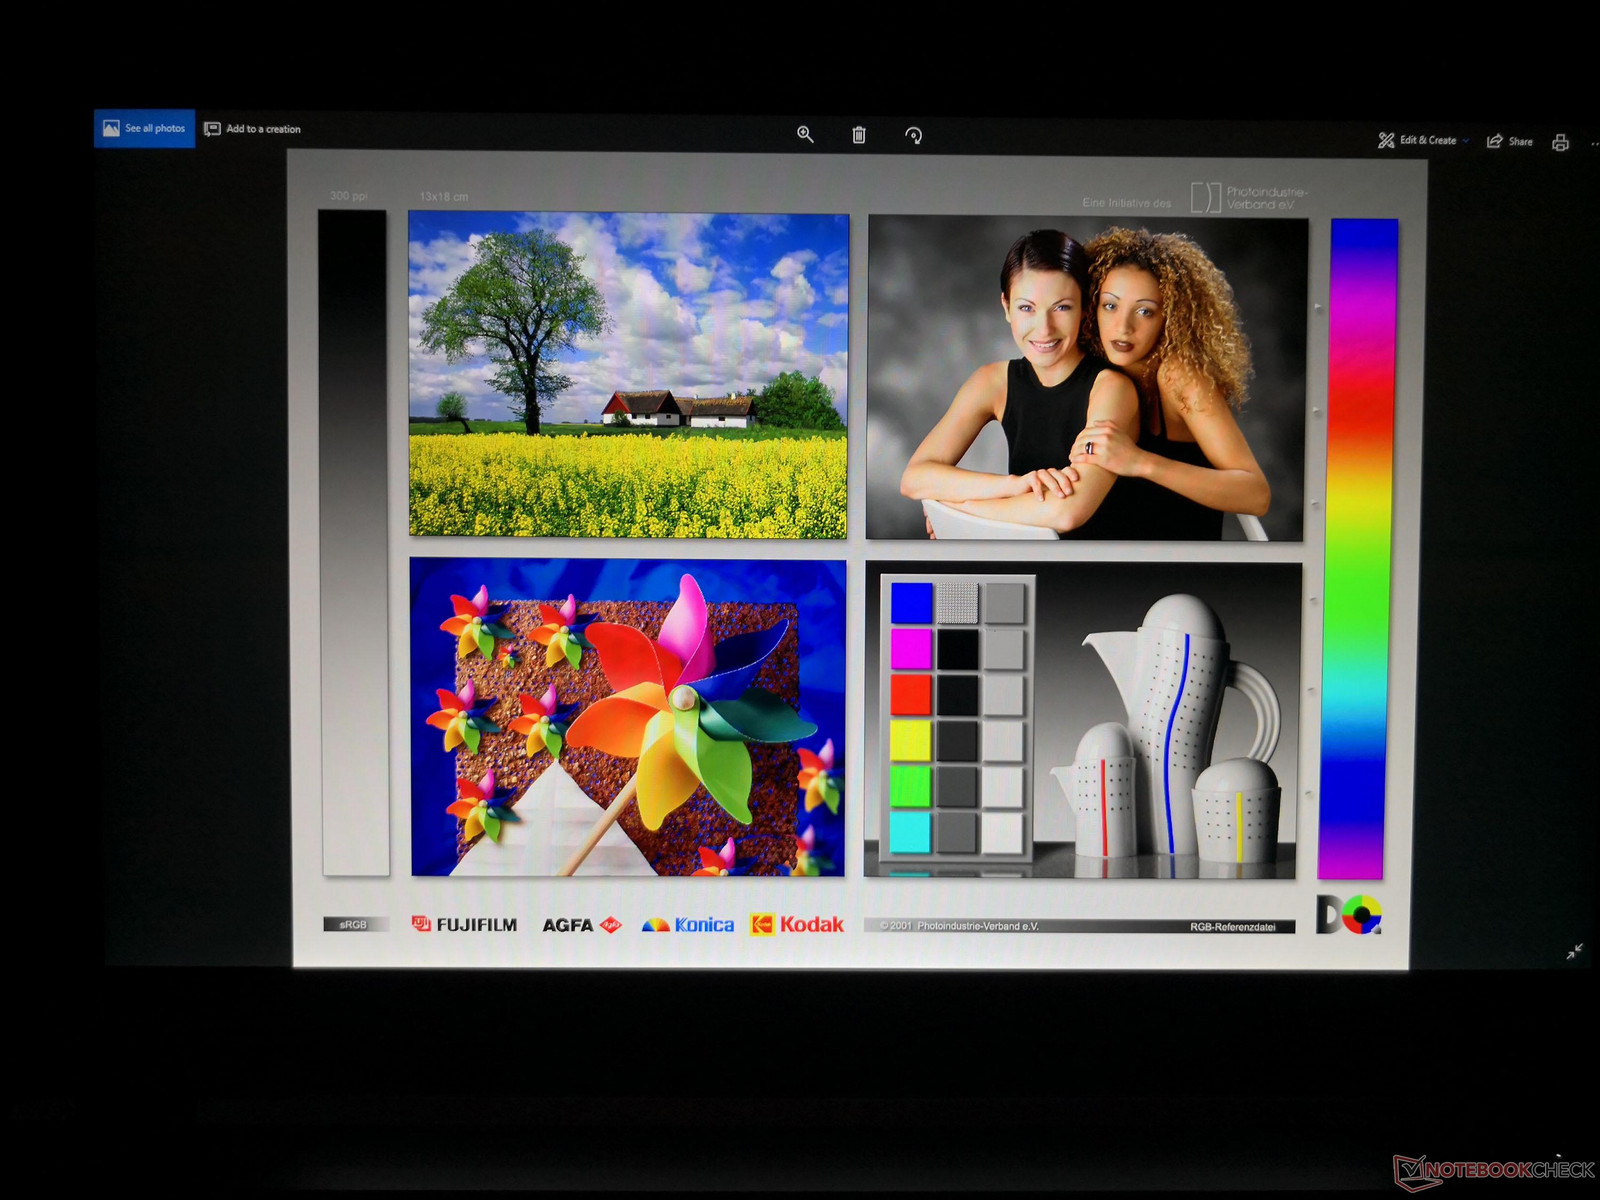
Display
Panel options include FHD at 60 Hz, 120 Hz, or 144 Hz and 4K UHD at 60 Hz. Our test unit is equipped with the new 144 Hz FHD panel that exhibits noticeably smoother cursor control and frame rates during everyday use when compared to a standard 60 Hz panel. In fact, the LG Philips LGD05C0 panel on our Eurocom demo is the same 144 Hz panel as found on the Gigabyte Aero 15X v8. Unsurprisingly, both are very similar in terms of colors and response times. The backlight on our Eurocom is a bit brighter but at the cost of a slightly lower contrast ratio.
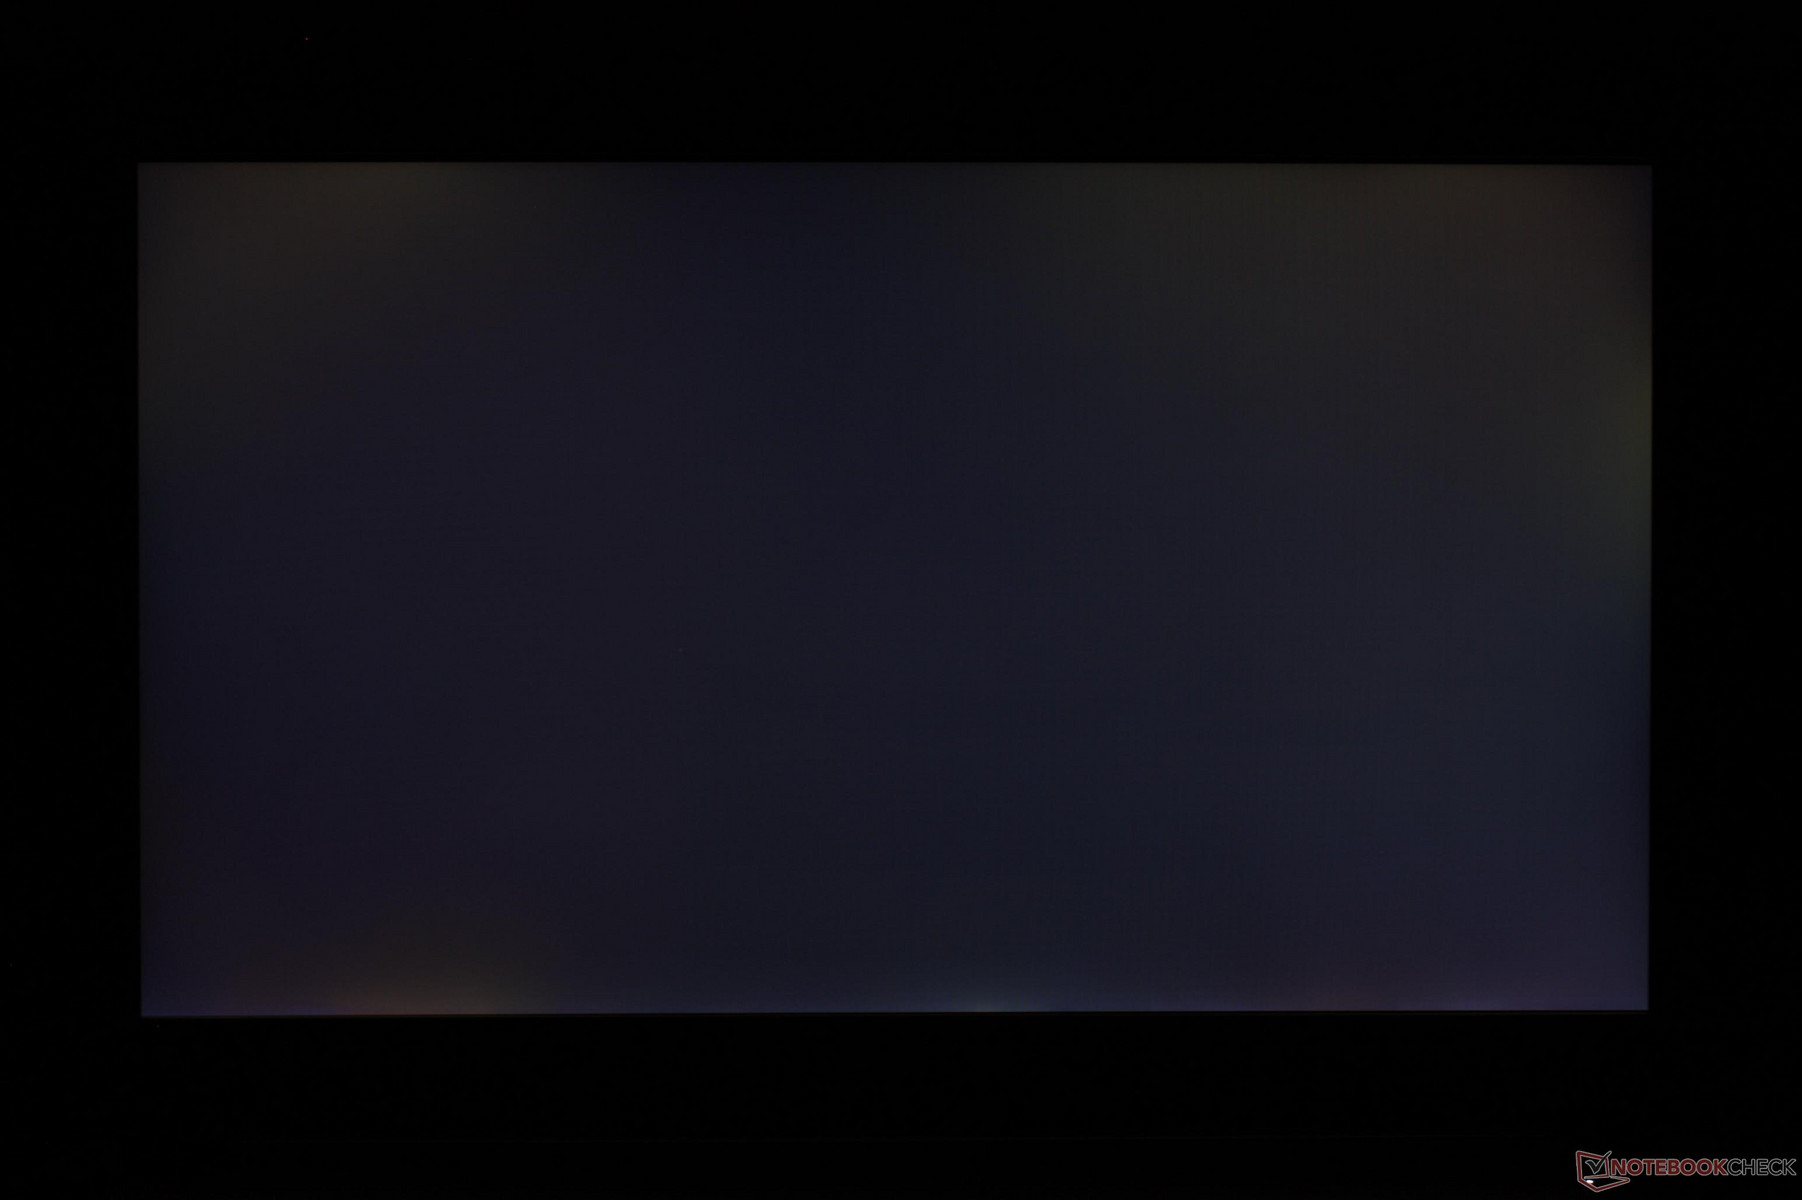
Subjectively, texts and images are crisp without any major graininess issues common on many matte panels. There is unfortunately some light-moderate uneven backlight bleeding along the bottom edge of our unit that is noticeable during movie playback.
It's worth noting that the 4K UHD panel for the Q6 (AU Optronics B156ZAN02.2) is different than the one on the Q5 (LG Philips LP156UD1-SPB1). We lamented the fact that the Q5 made use of a WRGB panel instead of a standard RGB pixel array and so we're glad to see Eurocom switch over to the more traditional RGB option for the Q6.

| |||||||||||||||||||||||||
Brightness Distribution: 88 %
Center on Battery: 326.6 cd/m²
Contrast: 778:1 (Black: 0.42 cd/m²)
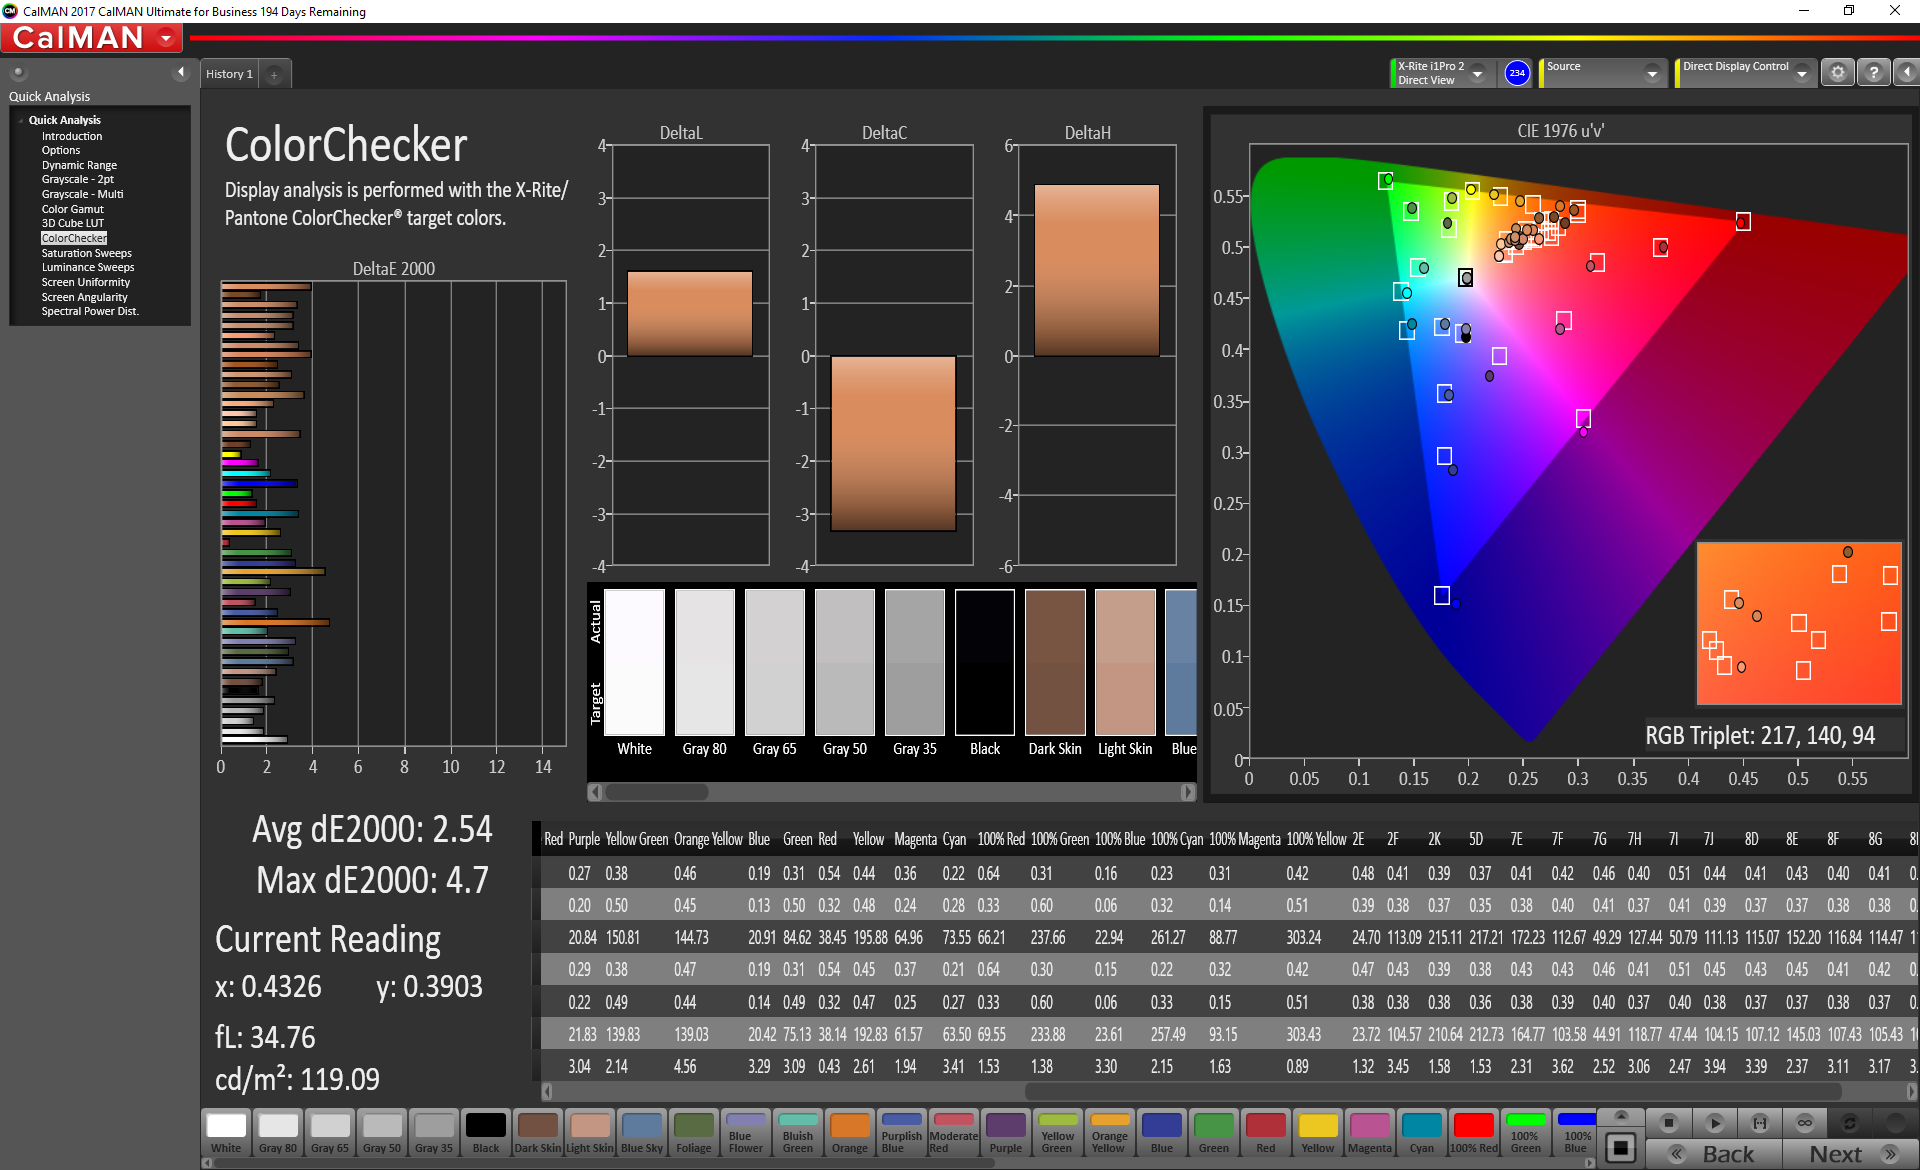
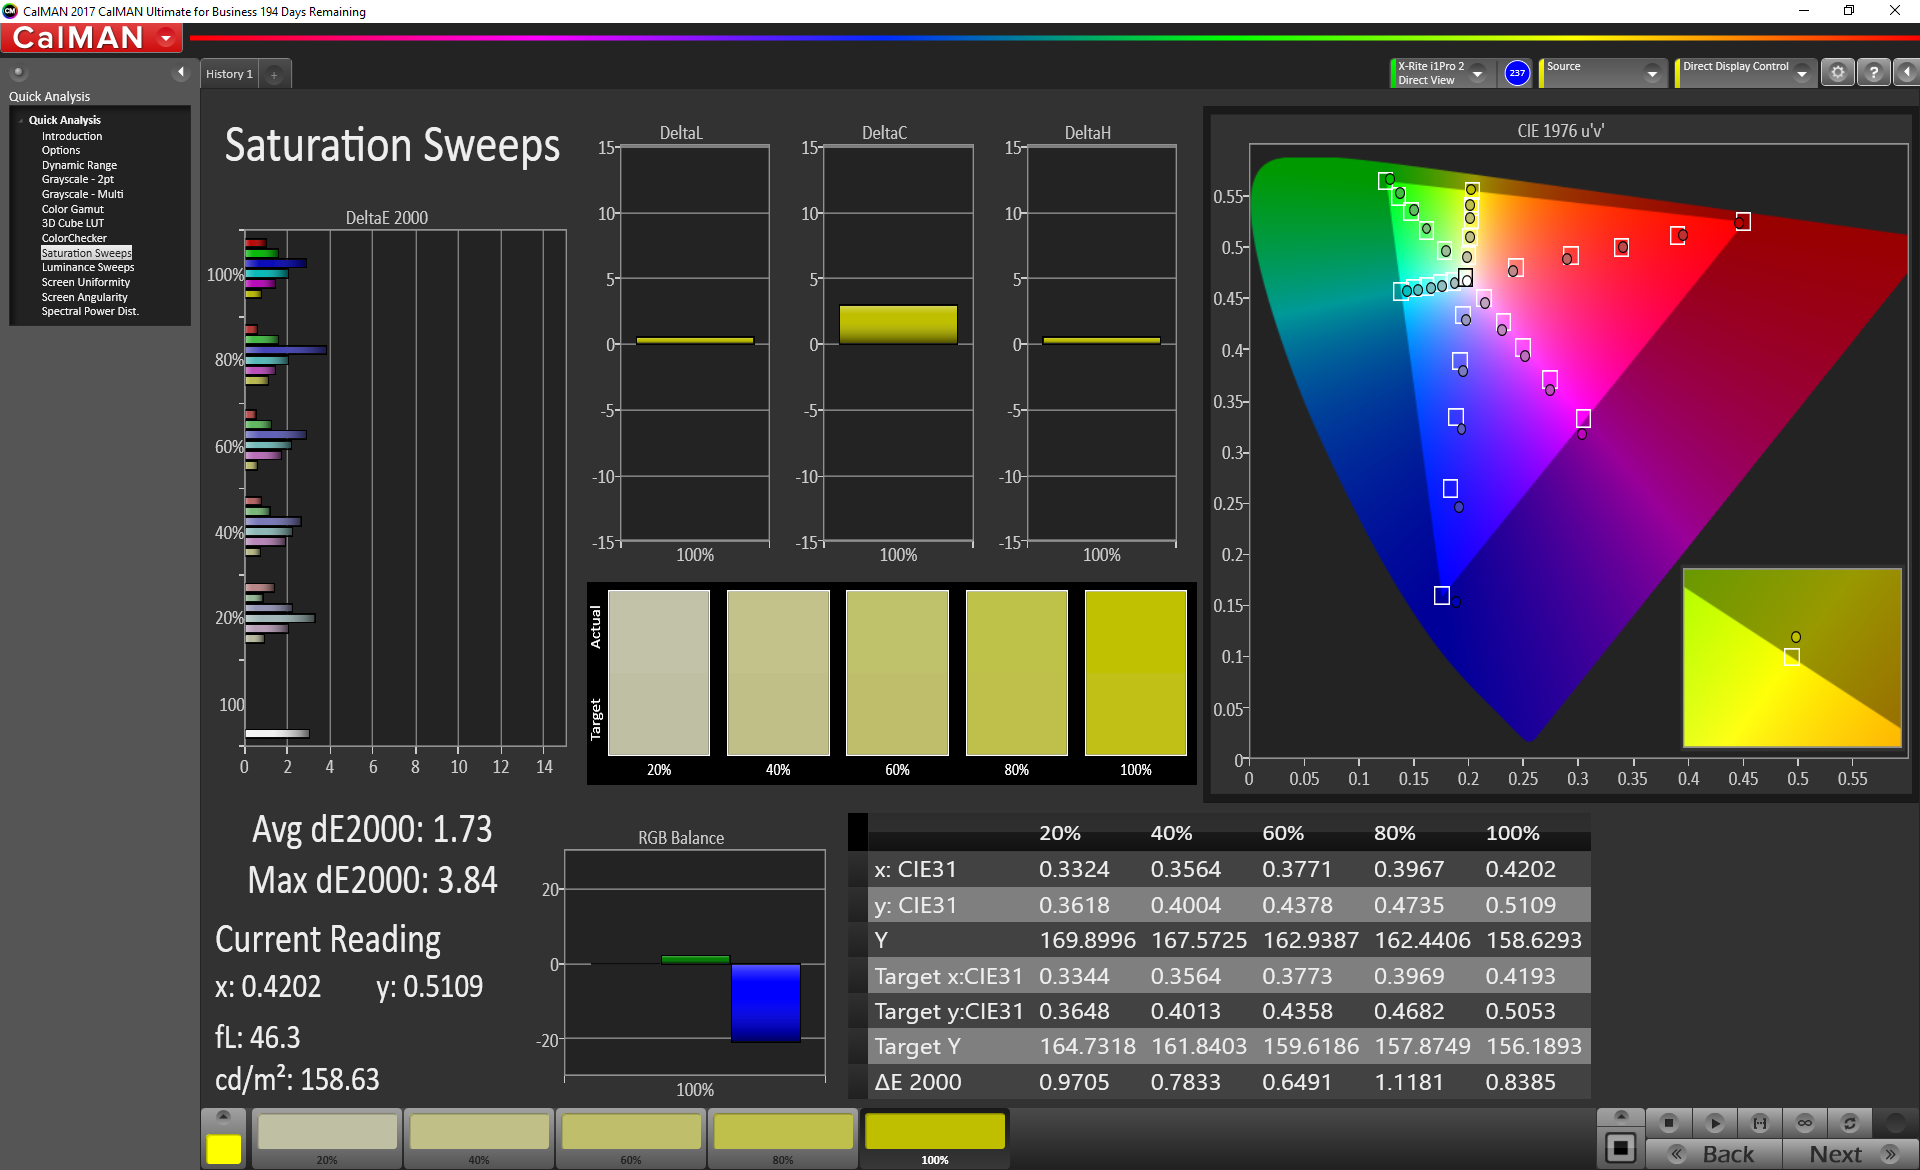
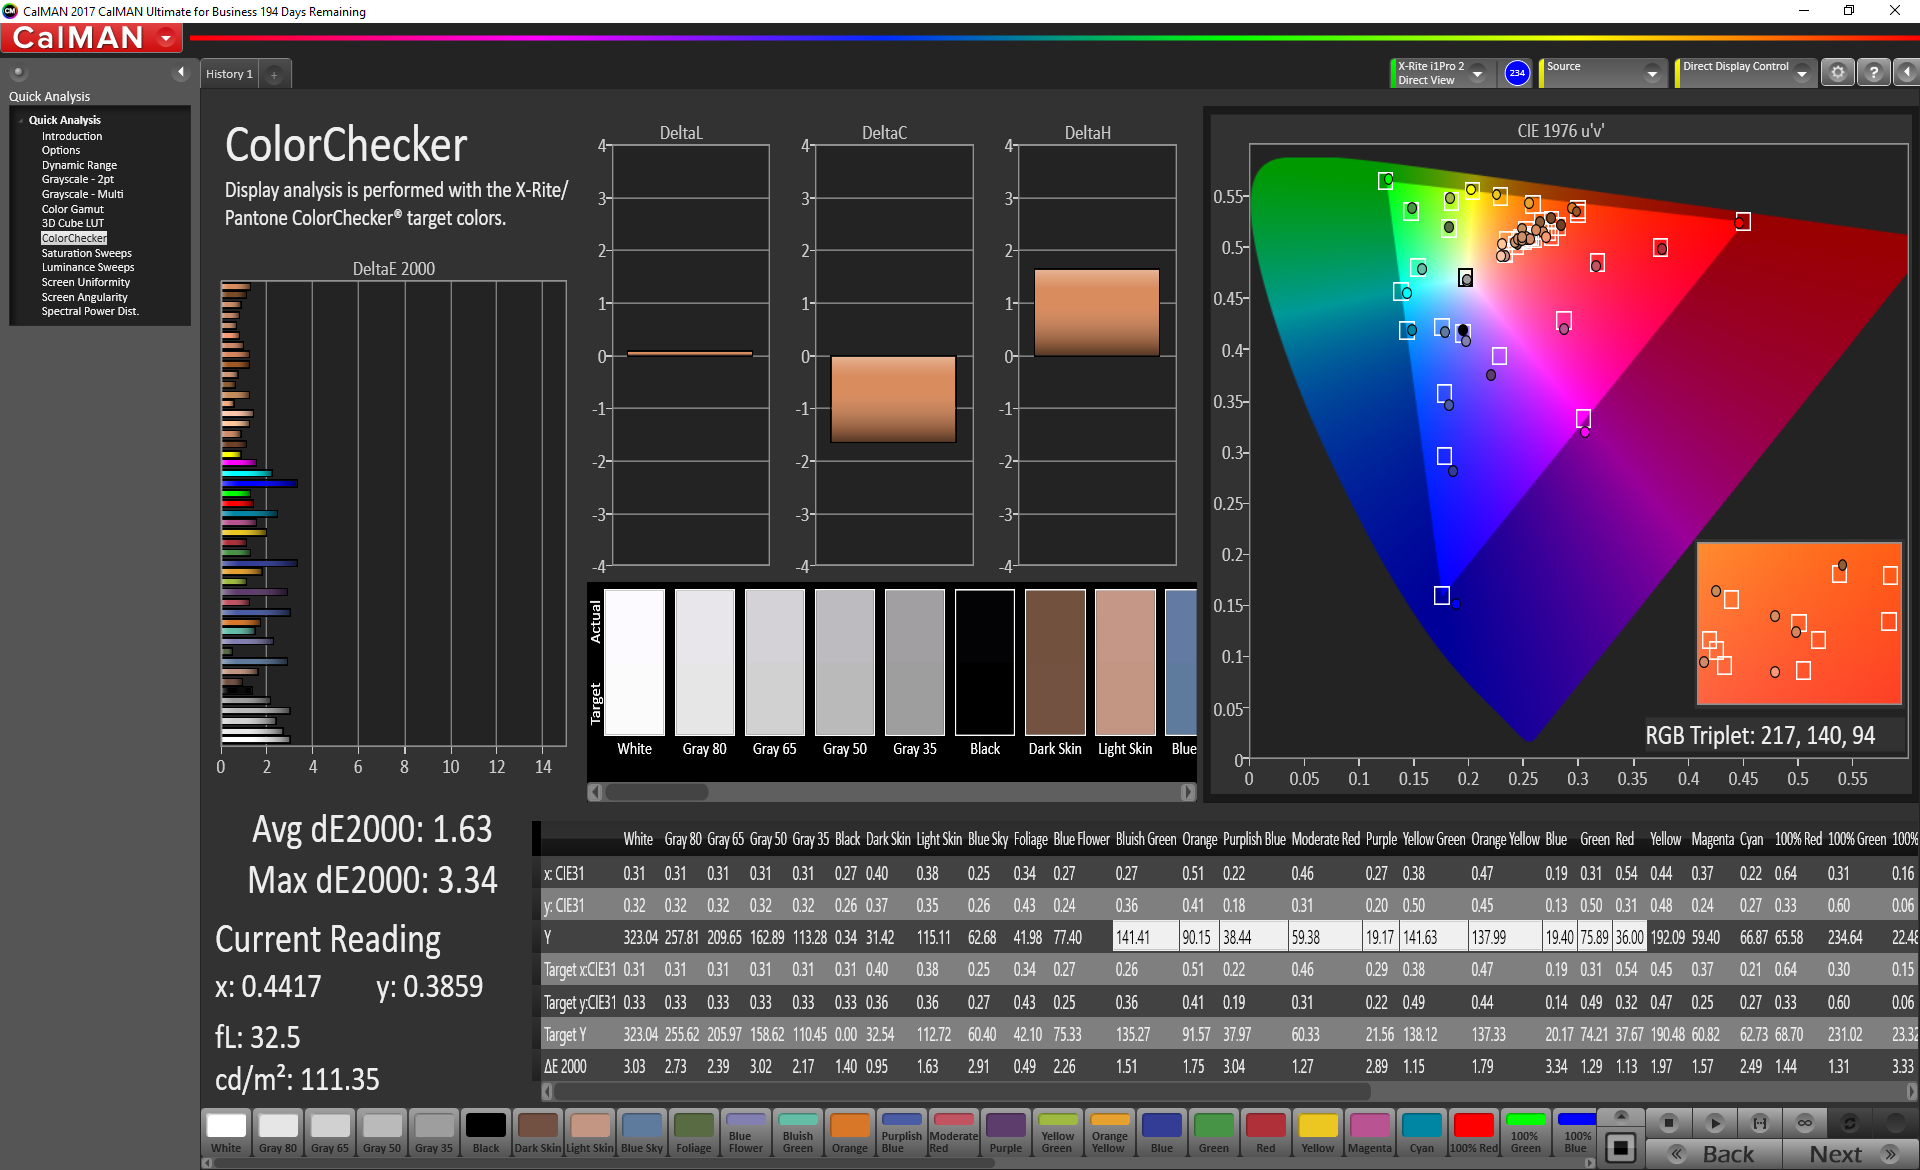
ΔE ColorChecker Calman: 2.54 | ∀{0.5-29.43 Ø4.71}
calibrated: 1.63
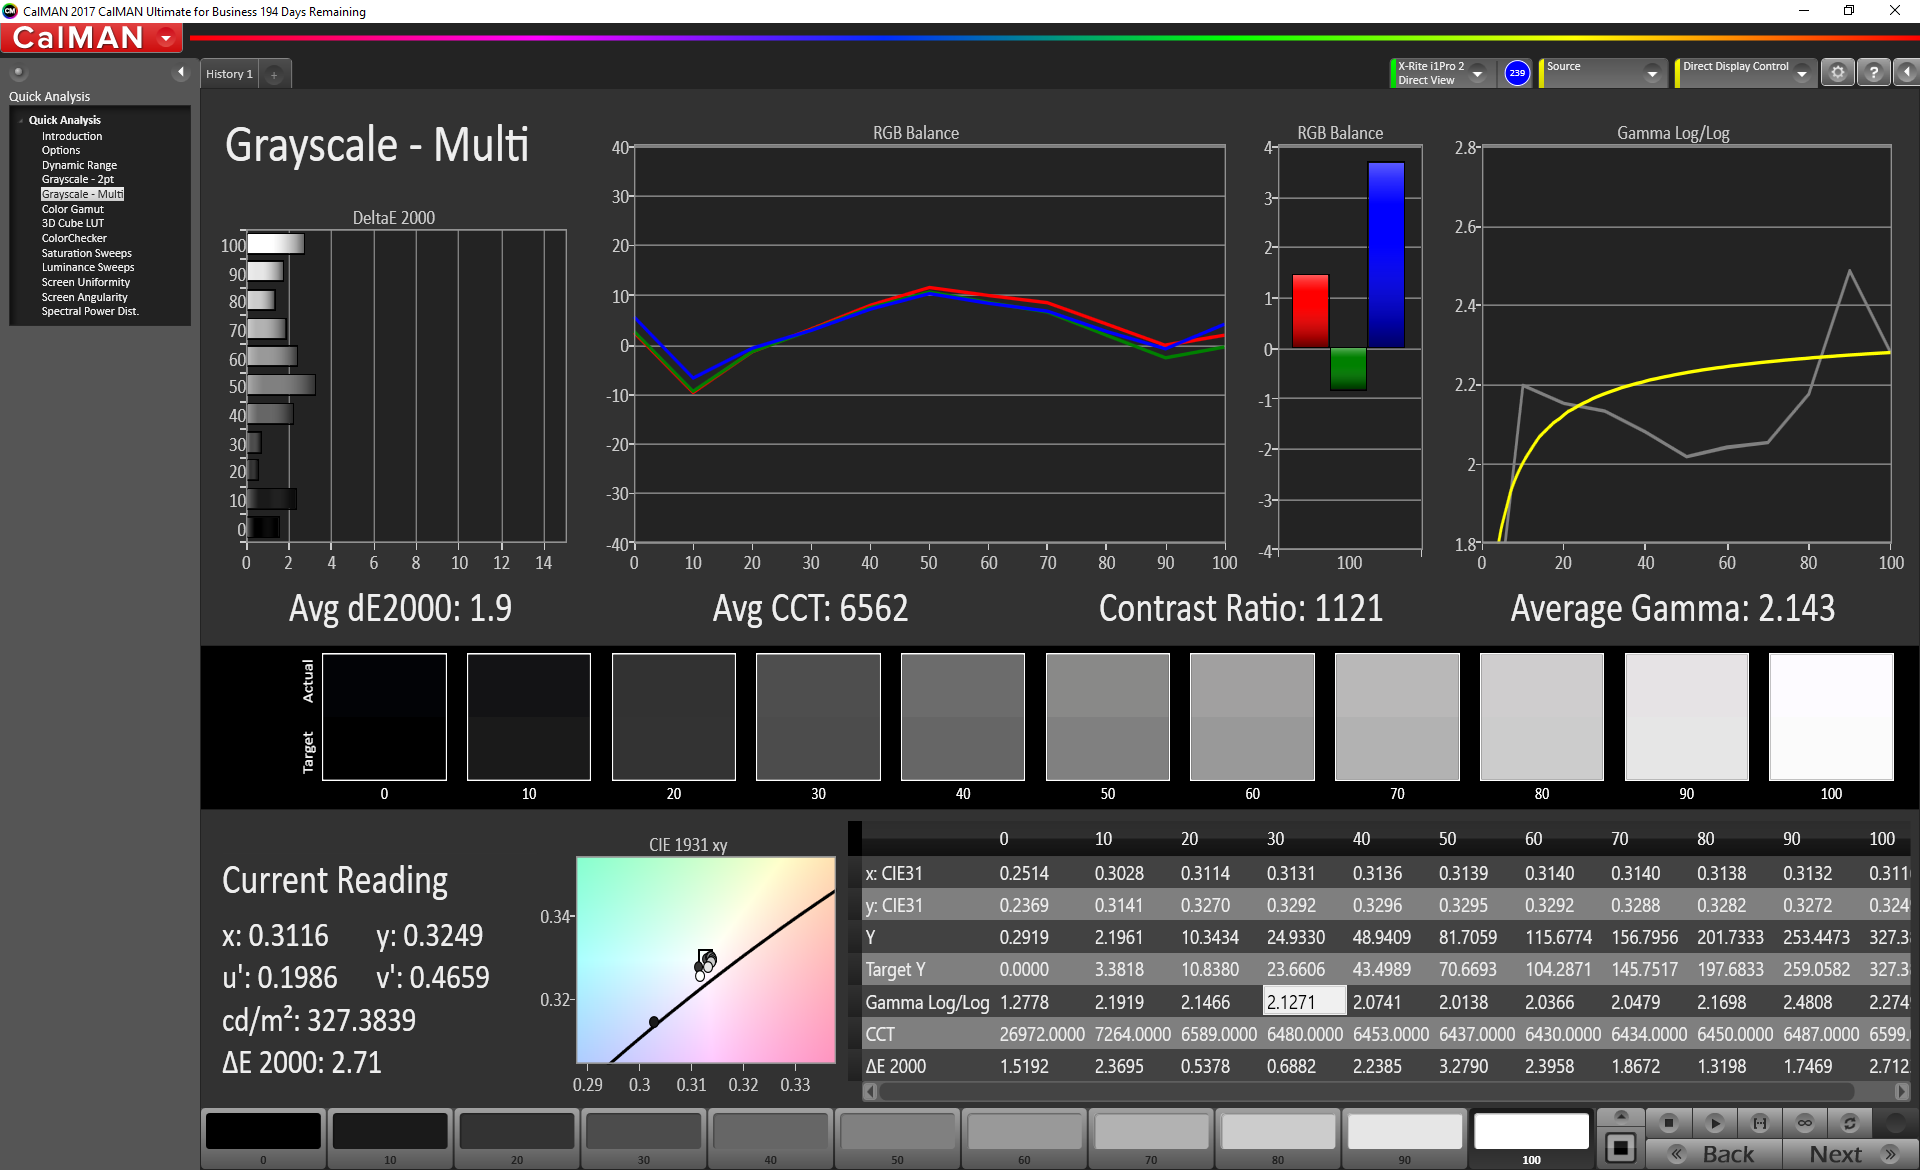
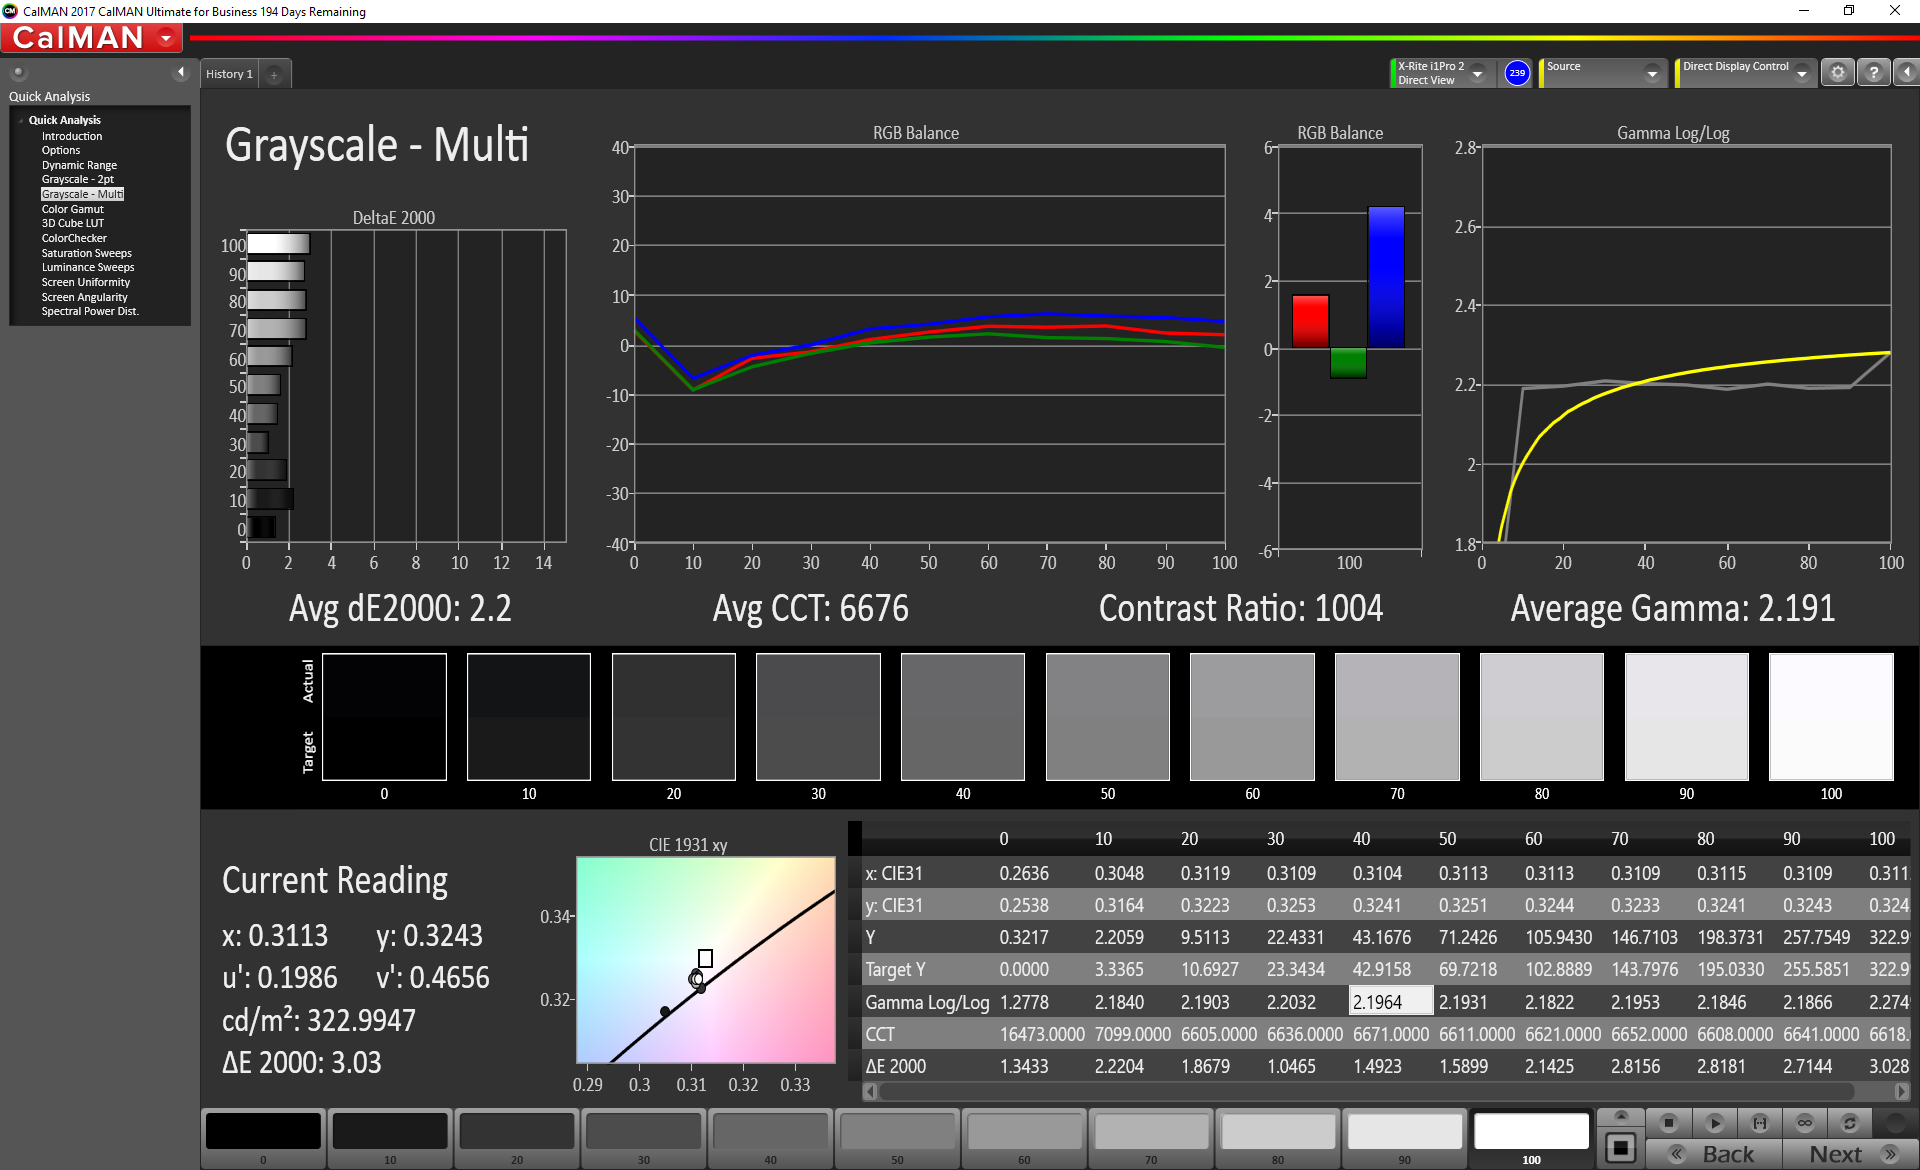
ΔE Greyscale Calman: 1.9 | ∀{0.09-98 Ø4.96}
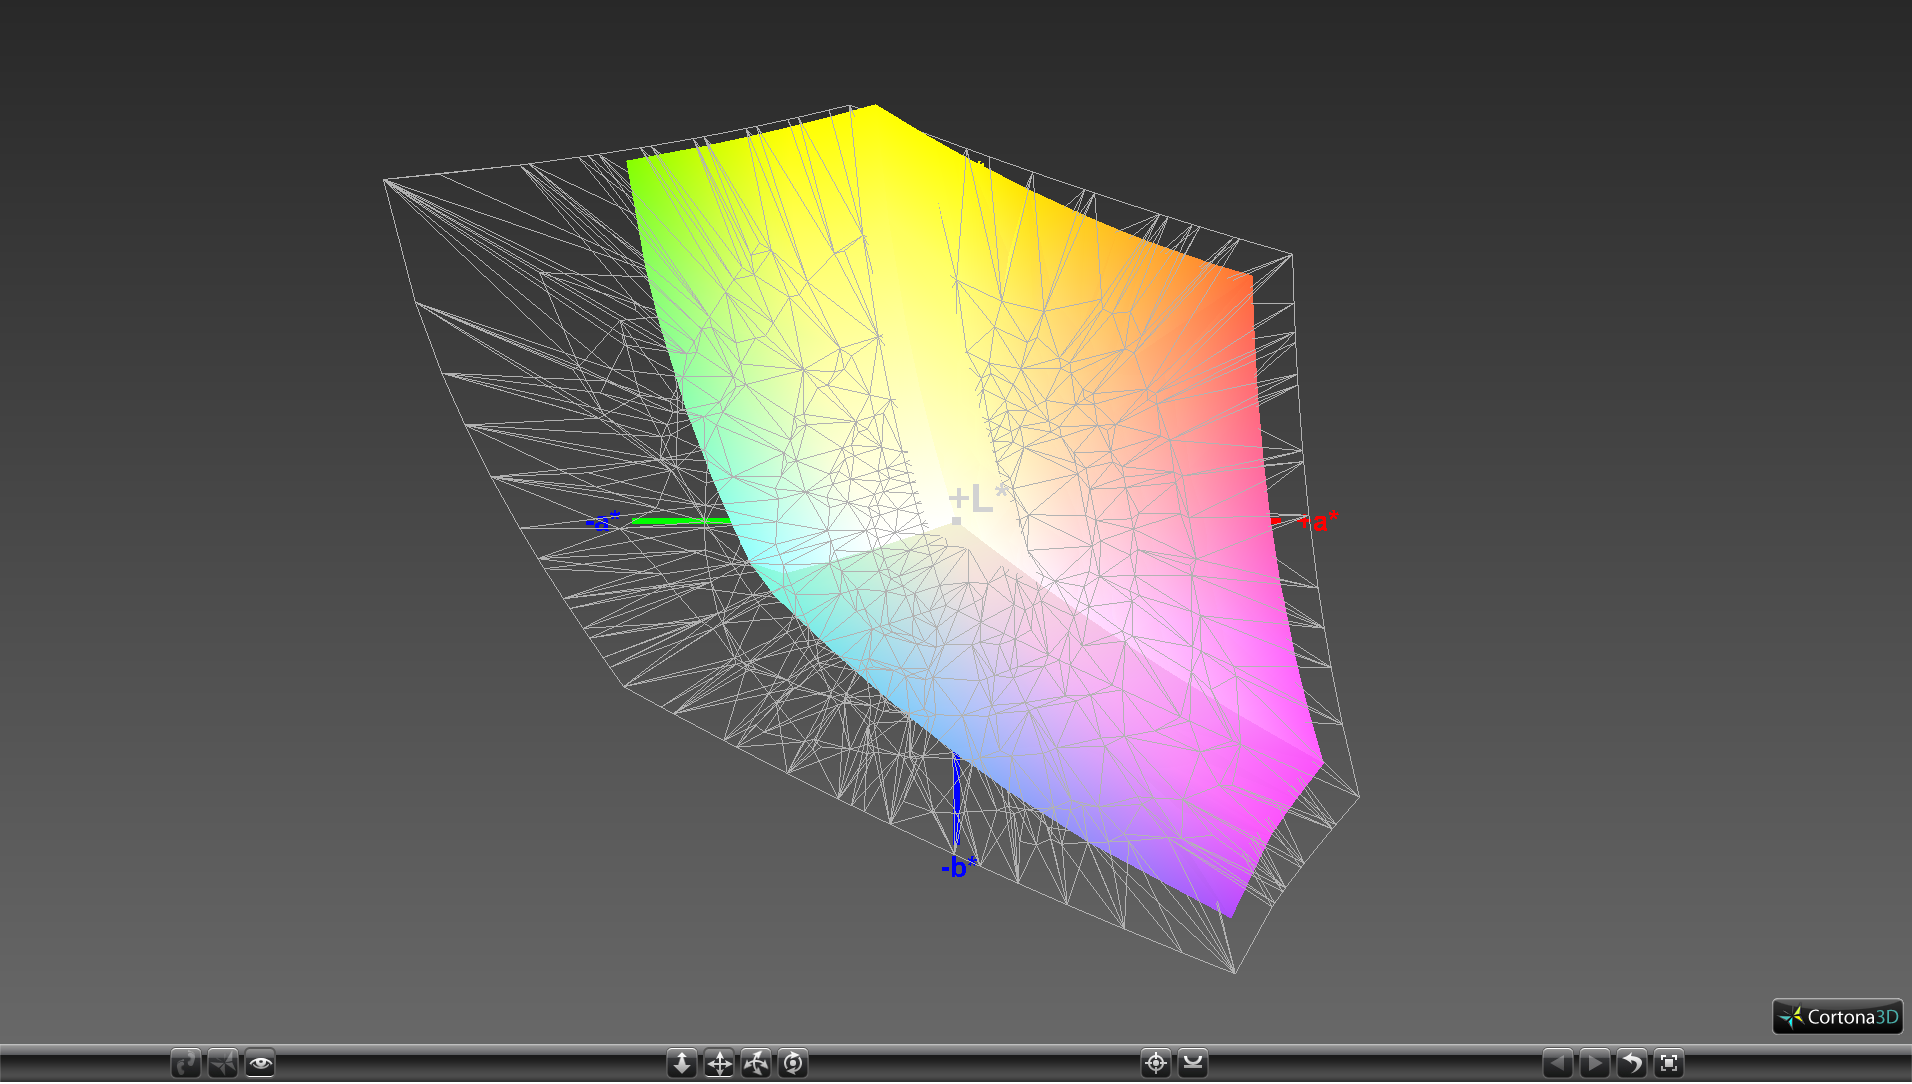
94.5% sRGB (Argyll 1.6.3 3D)
60.9% AdobeRGB 1998 (Argyll 1.6.3 3D)
66.2% AdobeRGB 1998 (Argyll 3D)
94.4% sRGB (Argyll 3D)
65.1% Display P3 (Argyll 3D)
Gamma: 2.14
CCT: 6562 K
| Eurocom Q6 LG Philips LGD05C0, IPS, 15.6", 1920x1080 | Eurocom Q5 ID: LGD04D4, Name: LG Philips LP156UD1-SPB1, IPS, 15.6", 3840x2160 | Aorus X5 v8 AU Optronics B156HAN07.0 (AUO70ED), IPS, 15.6", 1920x1080 | Apple MacBook Pro 15 2017 (2.9 GHz, 560) 15.4", 2880x1800 | MSI GS65 8RF-019DE Stealth Thin AU Optronics B156HAN08.0 (AUO80ED), IPS, 15.6", 1920x1080 | Gigabyte Aero 15X v8 LGD05C0, IPS, 15.6", 1920x1080 | |
|---|---|---|---|---|---|---|
| Display | -3% | 2% | 1% | -2% | ||
| Display P3 Coverage (%) | 65.1 | 63 -3% | 67.1 3% | 66.2 2% | 63.6 -2% | |
| sRGB Coverage (%) | 94.4 | 92.7 -2% | 93.4 -1% | 92.1 -2% | 93.8 -1% | |
| AdobeRGB 1998 Coverage (%) | 66.2 | 64.4 -3% | 68.1 3% | 67.2 2% | 64.9 -2% | |
| Response Times | -145% | -20% | -174% | -20% | -10% | |
| Response Time Grey 50% / Grey 80% * (ms) | 15.2 ? | 32.4 ? -113% | 18.8 ? -24% | 42.4 ? -179% | 17.6 ? -16% | 16.8 ? -11% |
| Response Time Black / White * (ms) | 10.4 ? | 28.8 ? -177% | 12 ? -15% | 28 ? -169% | 12.8 ? -23% | 11.2 ? -8% |
| PWM Frequency (Hz) | ||||||
| Screen | -44% | 13% | 33% | 6% | 19% | |
| Brightness middle (cd/m²) | 326.6 | 287.5 -12% | 271 -17% | 534 64% | 254 -22% | 313 -4% |
| Brightness (cd/m²) | 312 | 279 -11% | 259 -17% | 502 61% | 262 -16% | 300 -4% |
| Brightness Distribution (%) | 88 | 87 -1% | 87 -1% | 86 -2% | 89 1% | 78 -11% |
| Black Level * (cd/m²) | 0.42 | 0.65 -55% | 0.27 36% | 0.31 26% | 0.22 48% | 0.33 21% |
| Contrast (:1) | 778 | 442 -43% | 1004 29% | 1723 121% | 1155 48% | 948 22% |
| Colorchecker dE 2000 * | 2.54 | 4.5 -77% | 1.81 29% | 1.8 29% | 2.37 7% | 1.29 49% |
| Colorchecker dE 2000 max. * | 4.7 | 8.9 -89% | 3.33 29% | 3.8 19% | 4.71 -0% | 2.04 57% |
| Colorchecker dE 2000 calibrated * | 1.63 | 1.84 -13% | ||||
| Greyscale dE 2000 * | 1.9 | 4.6 -142% | 1.09 43% | 2.4 -26% | 1.58 17% | 0.69 64% |
| Gamma | 2.14 103% | 2.39 92% | 2.45 90% | 2.27 97% | 2.48 89% | 2.43 91% |
| CCT | 6562 99% | 7393 88% | 6435 101% | 6563 99% | 6785 96% | 6550 99% |
| Color Space (Percent of AdobeRGB 1998) (%) | 60.9 | 59 -3% | 61 0% | 77.92 28% | 60 -1% | 60 -1% |
| Color Space (Percent of sRGB) (%) | 94.5 | 92.3 -2% | 93 -2% | 99.94 6% | 92 -3% | 94 -1% |
| Total Average (Program / Settings) | -64% /
-49% | -2% /
6% | -71% /
-2% | -4% /
2% | 2% /
11% |
* ... smaller is better
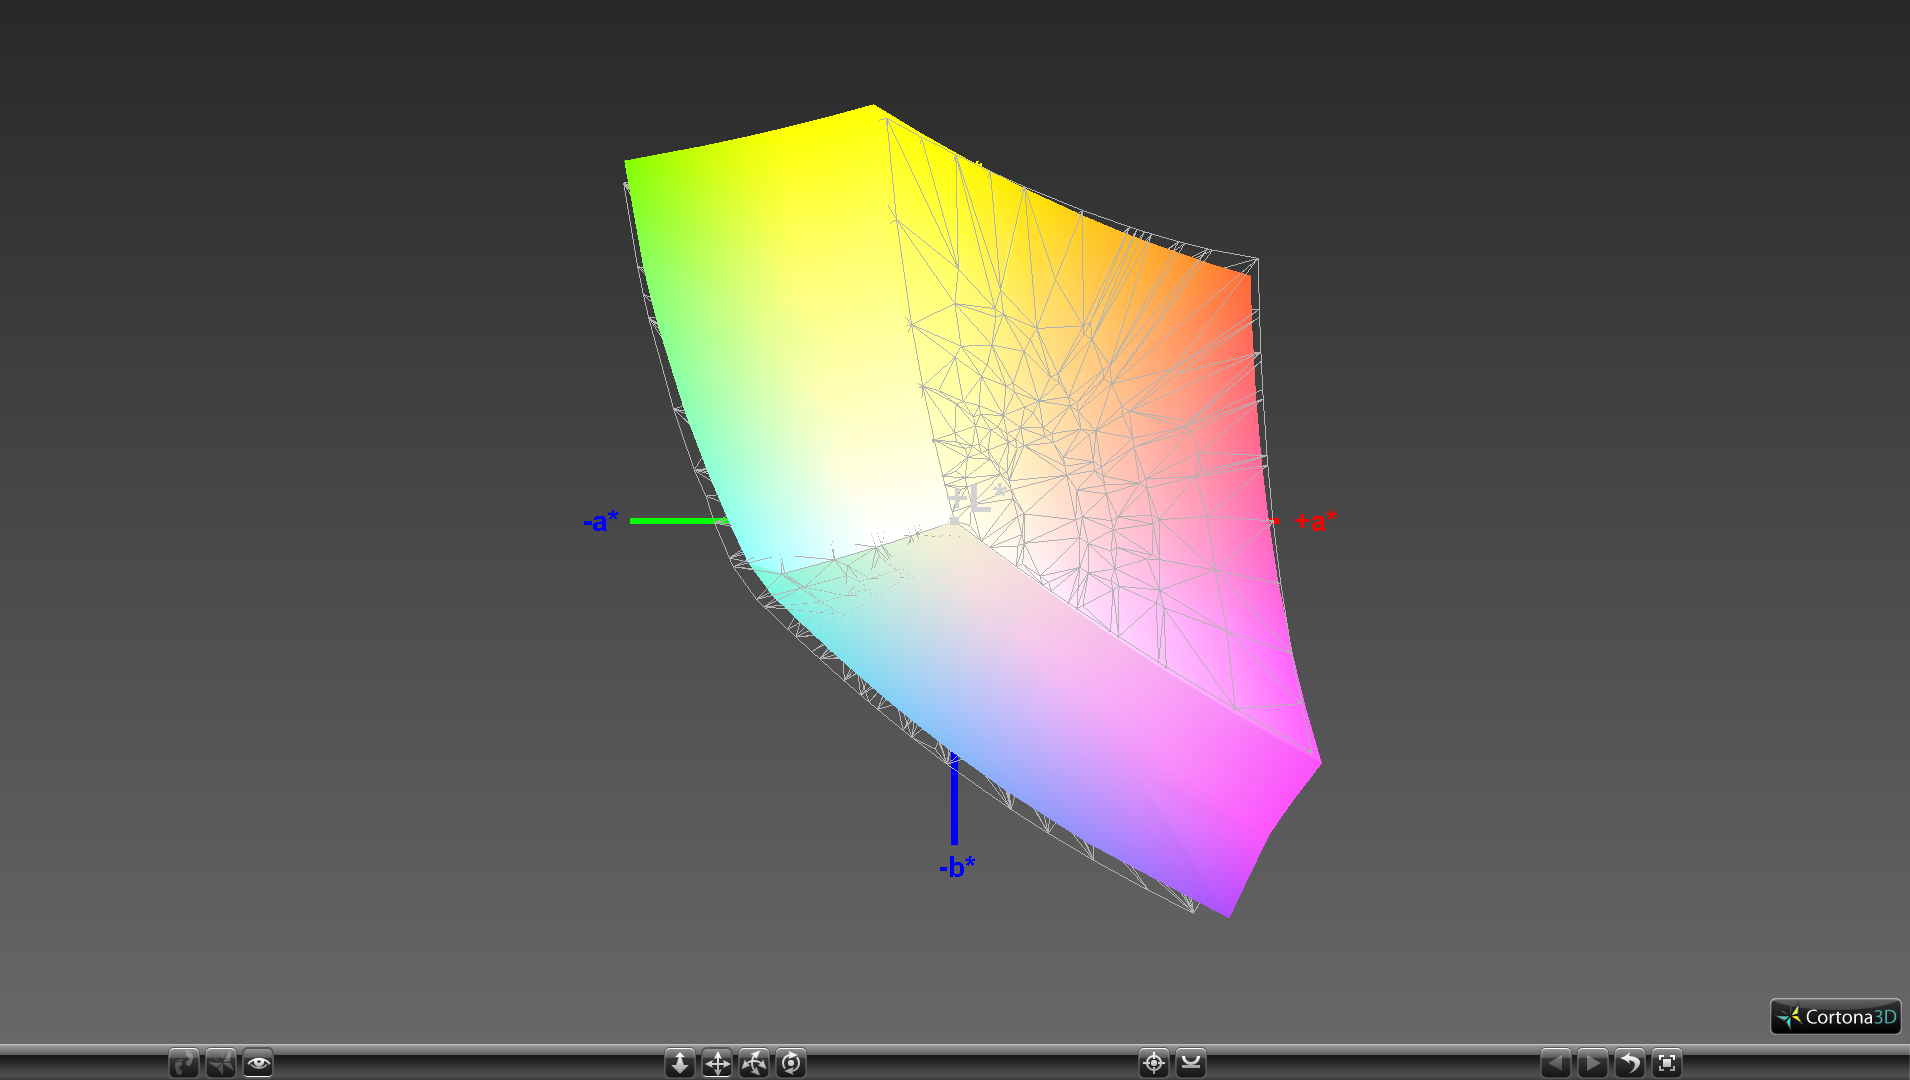
Color space covers almost the entire sRGB spectrum and about 61 percent of AdobeRGB to be similar to the 4K UHD panel on the Q5. This is comparable to other enthusiast-level gaming laptops but narrower than on the MacBook Pro 15.
Additional measurements with a X-Rite spectrophotometer reveal very accurate grayscale and colors out of the box. Our calibration efforts improve colors even further, but the change is minimal at best.

Display Response Times
| ↔ Response Time Black to White | ||
|---|---|---|
| 10.4 ms ... rise ↗ and fall ↘ combined | ↗ 6 ms rise | 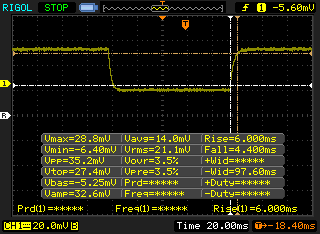 |
| ↘ 4.4 ms fall | ||
| The screen shows good response rates in our tests, but may be too slow for competitive gamers. In comparison, all tested devices range from 0.1 (minimum) to 240 (maximum) ms. » 28 % of all devices are better. This means that the measured response time is better than the average of all tested devices (19.8 ms). | ||
| ↔ Response Time 50% Grey to 80% Grey | ||
| 15.2 ms ... rise ↗ and fall ↘ combined | ↗ 8.4 ms rise | 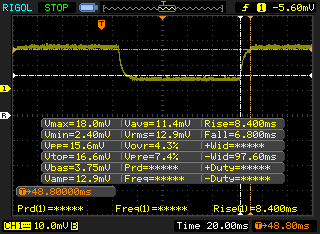 |
| ↘ 6.8 ms fall | ||
| The screen shows good response rates in our tests, but may be too slow for competitive gamers. In comparison, all tested devices range from 0.165 (minimum) to 636 (maximum) ms. » 29 % of all devices are better. This means that the measured response time is better than the average of all tested devices (31 ms). | ||
Screen Flickering / PWM (Pulse-Width Modulation)
| Screen flickering / PWM not detected | 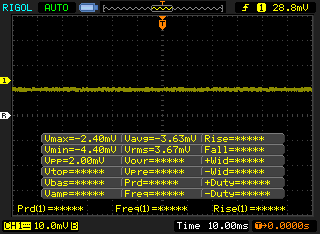 | ||
In comparison: 52 % of all tested devices do not use PWM to dim the display. If PWM was detected, an average of 7747 (minimum: 5 - maximum: 343500) Hz was measured. | |||
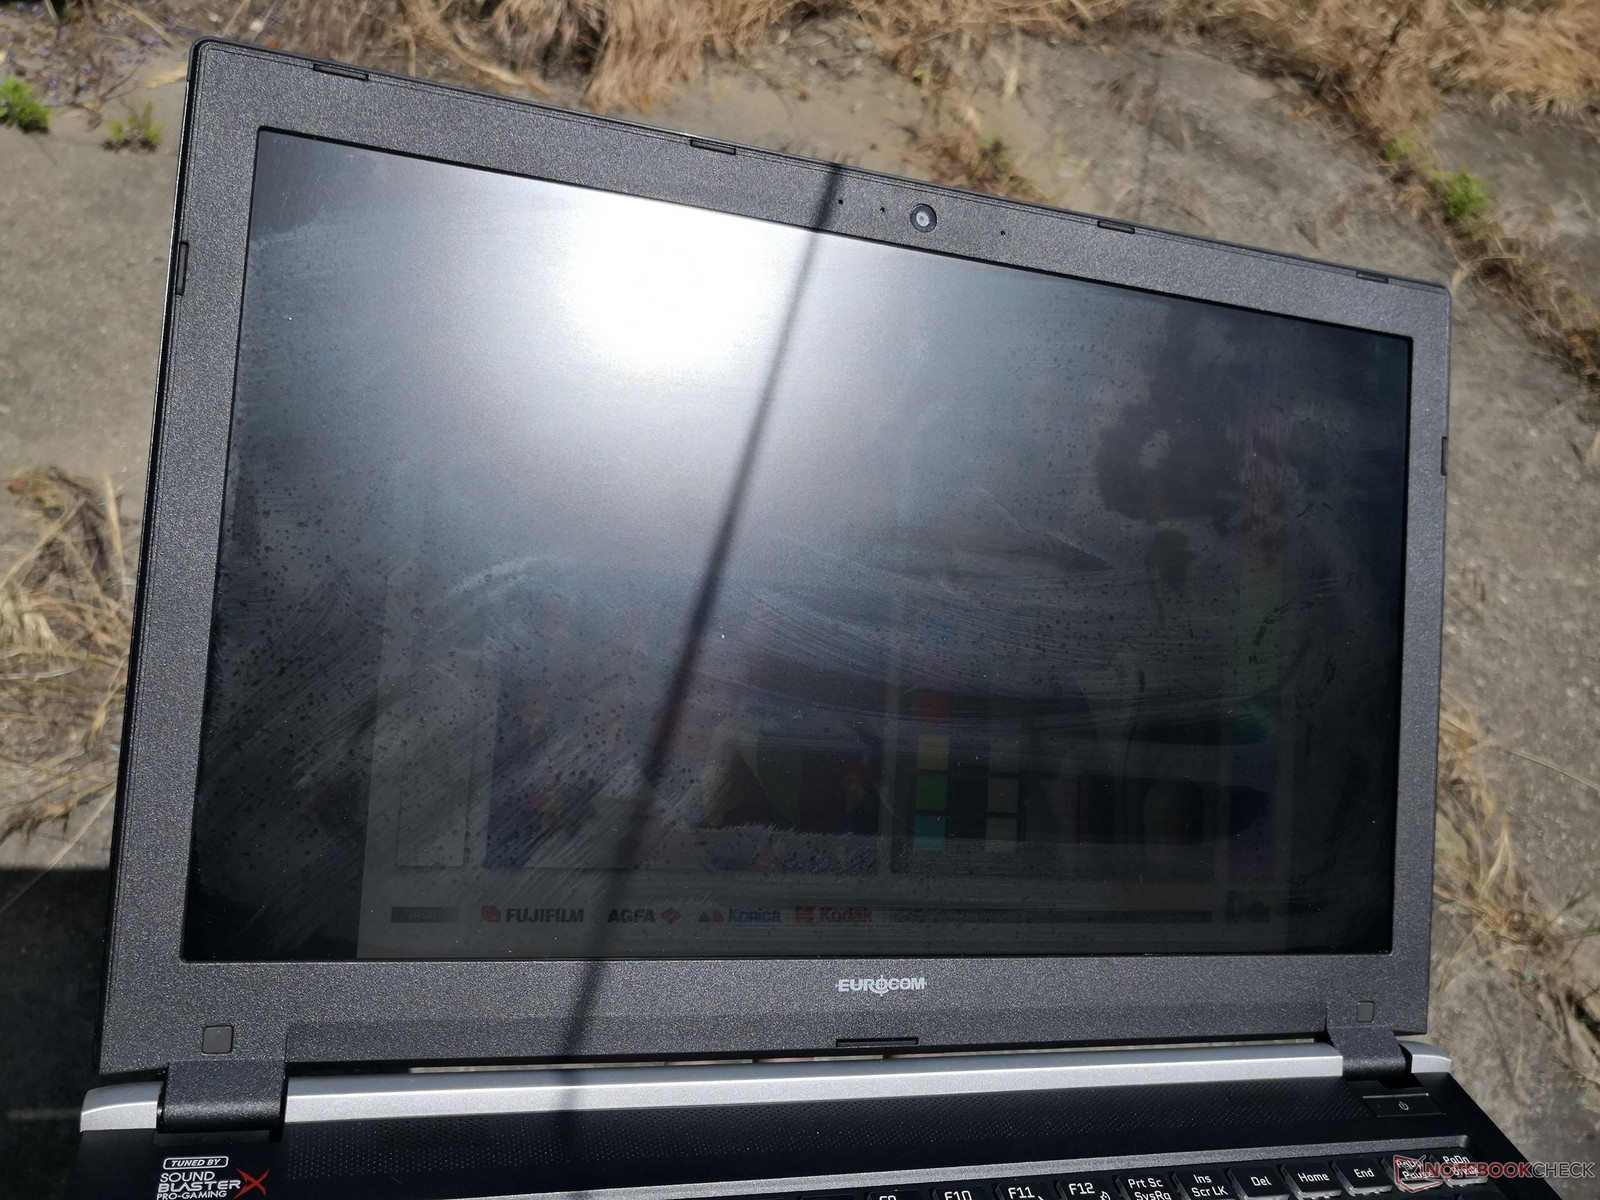
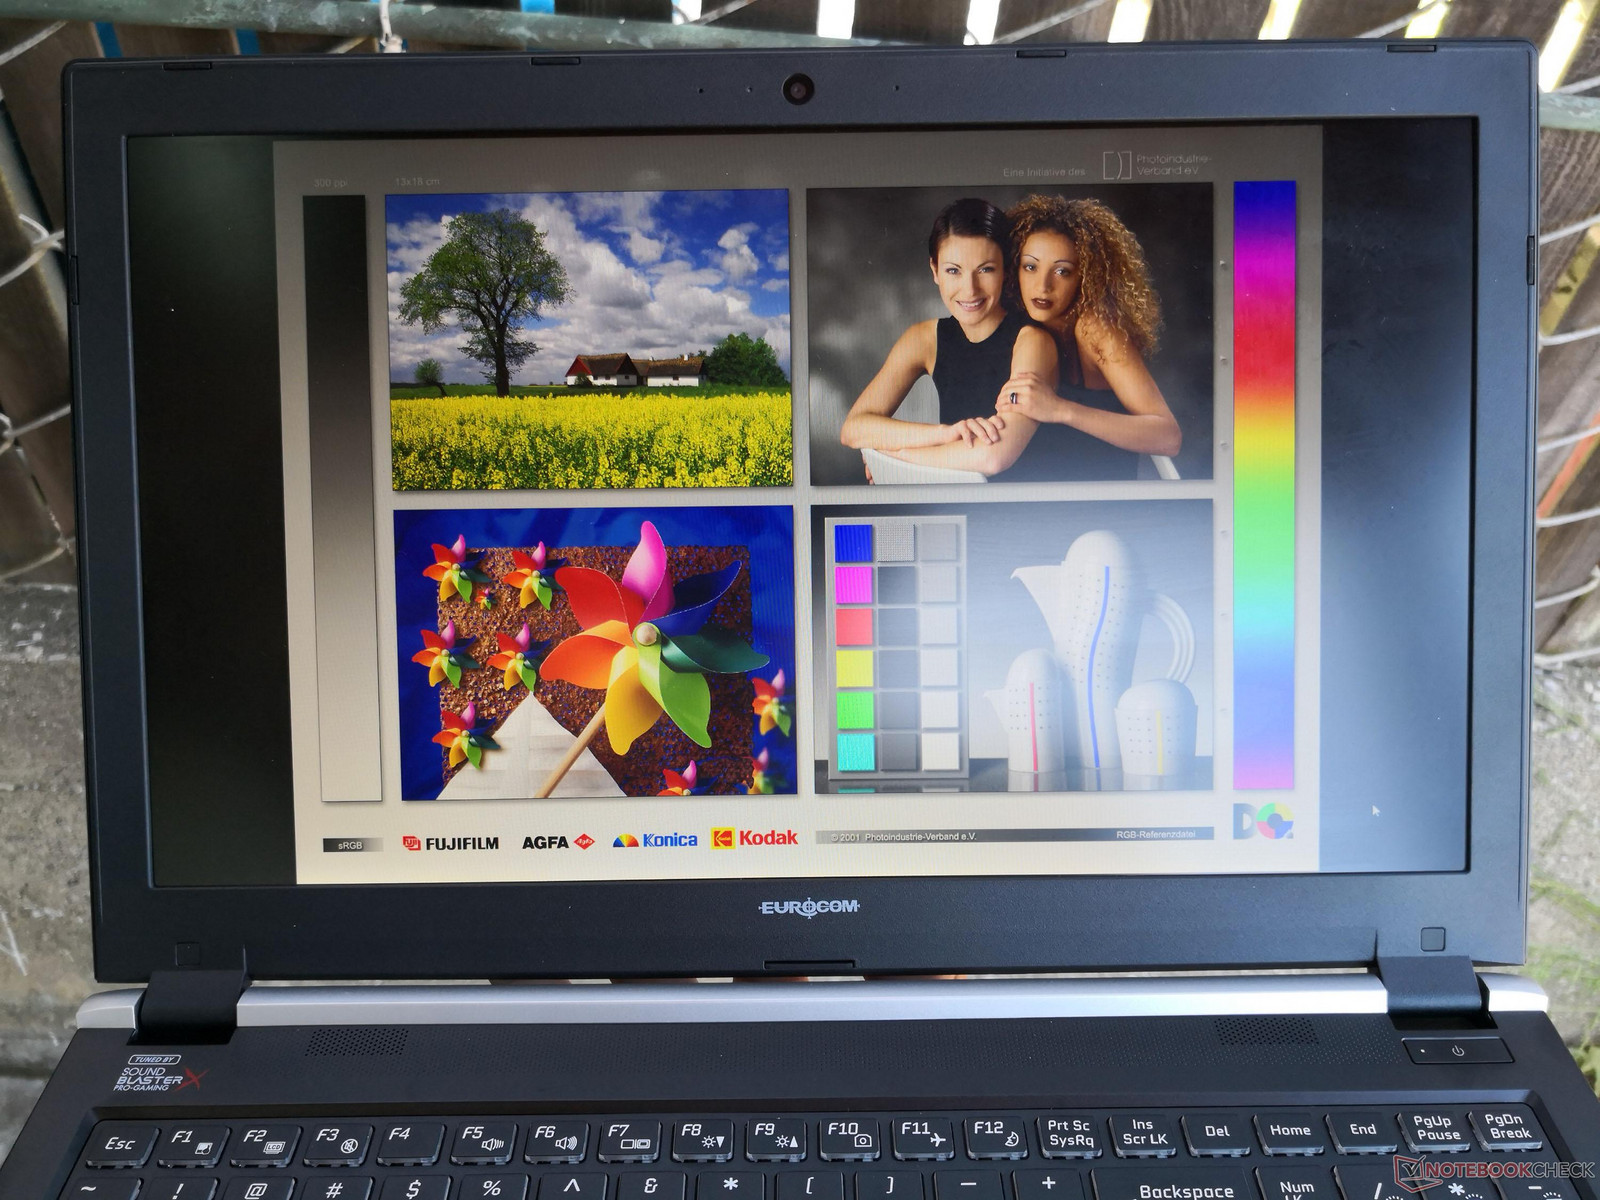
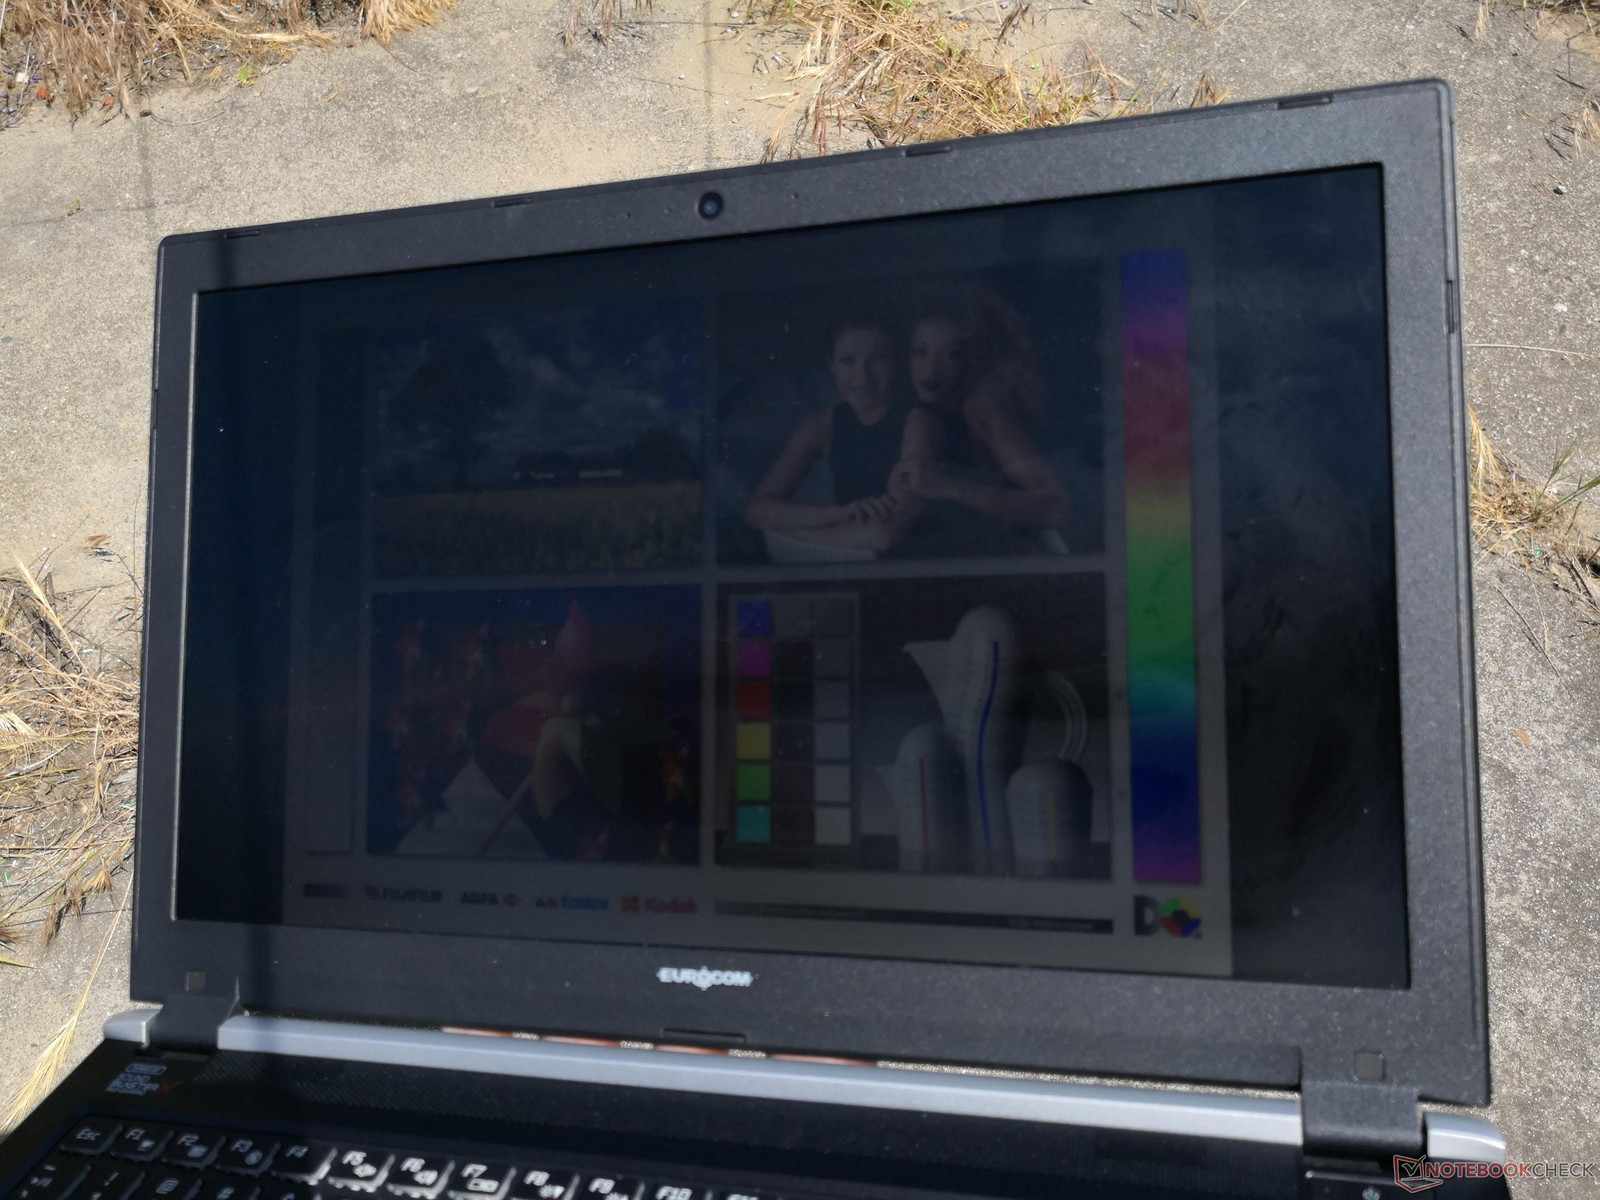
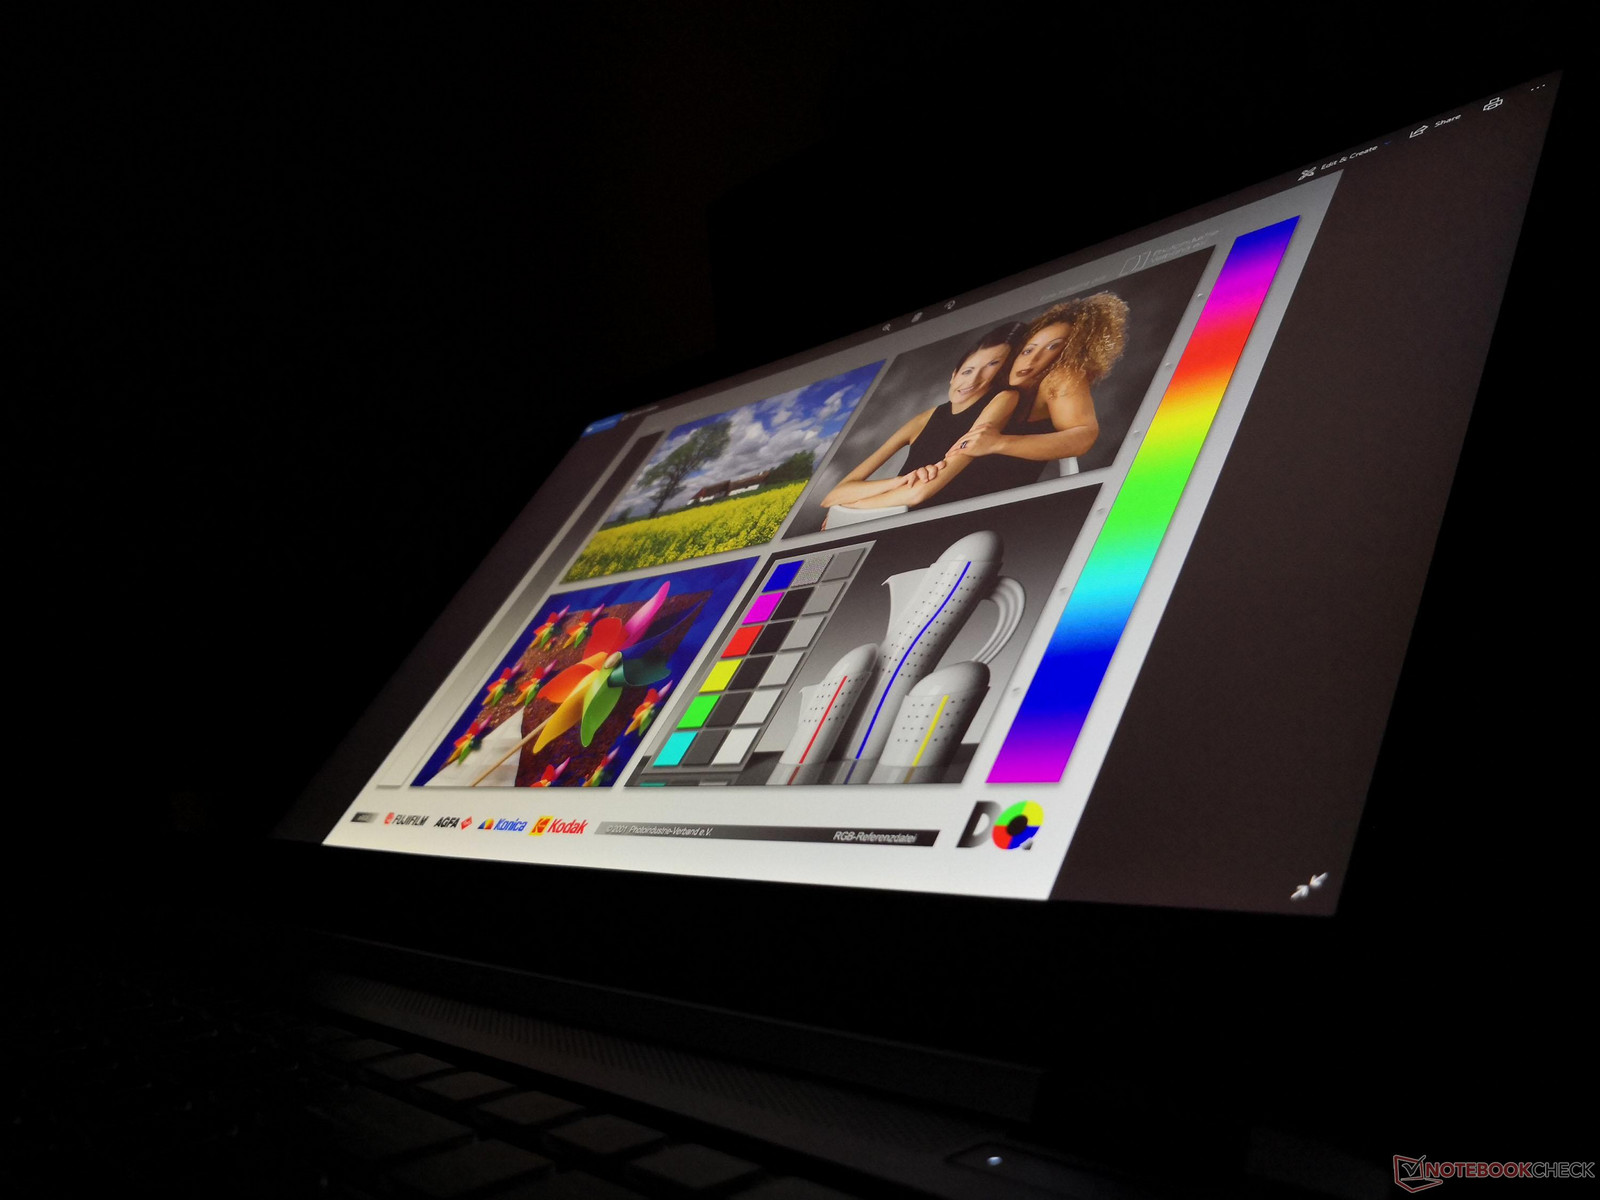
Outdoor visibility is acceptable when under shade and with the brightness setting on maximum. Direct sunlight will still overwhelm the backlight and wash out onscreen content. Viewing angles are thankfully wide as one would expect from an IPS panel. Users opting for the 120 Hz TN option will not have the same luxury.
Performance
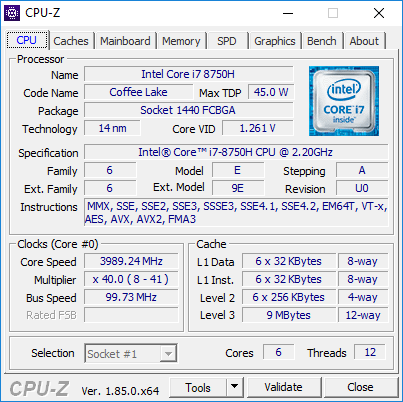
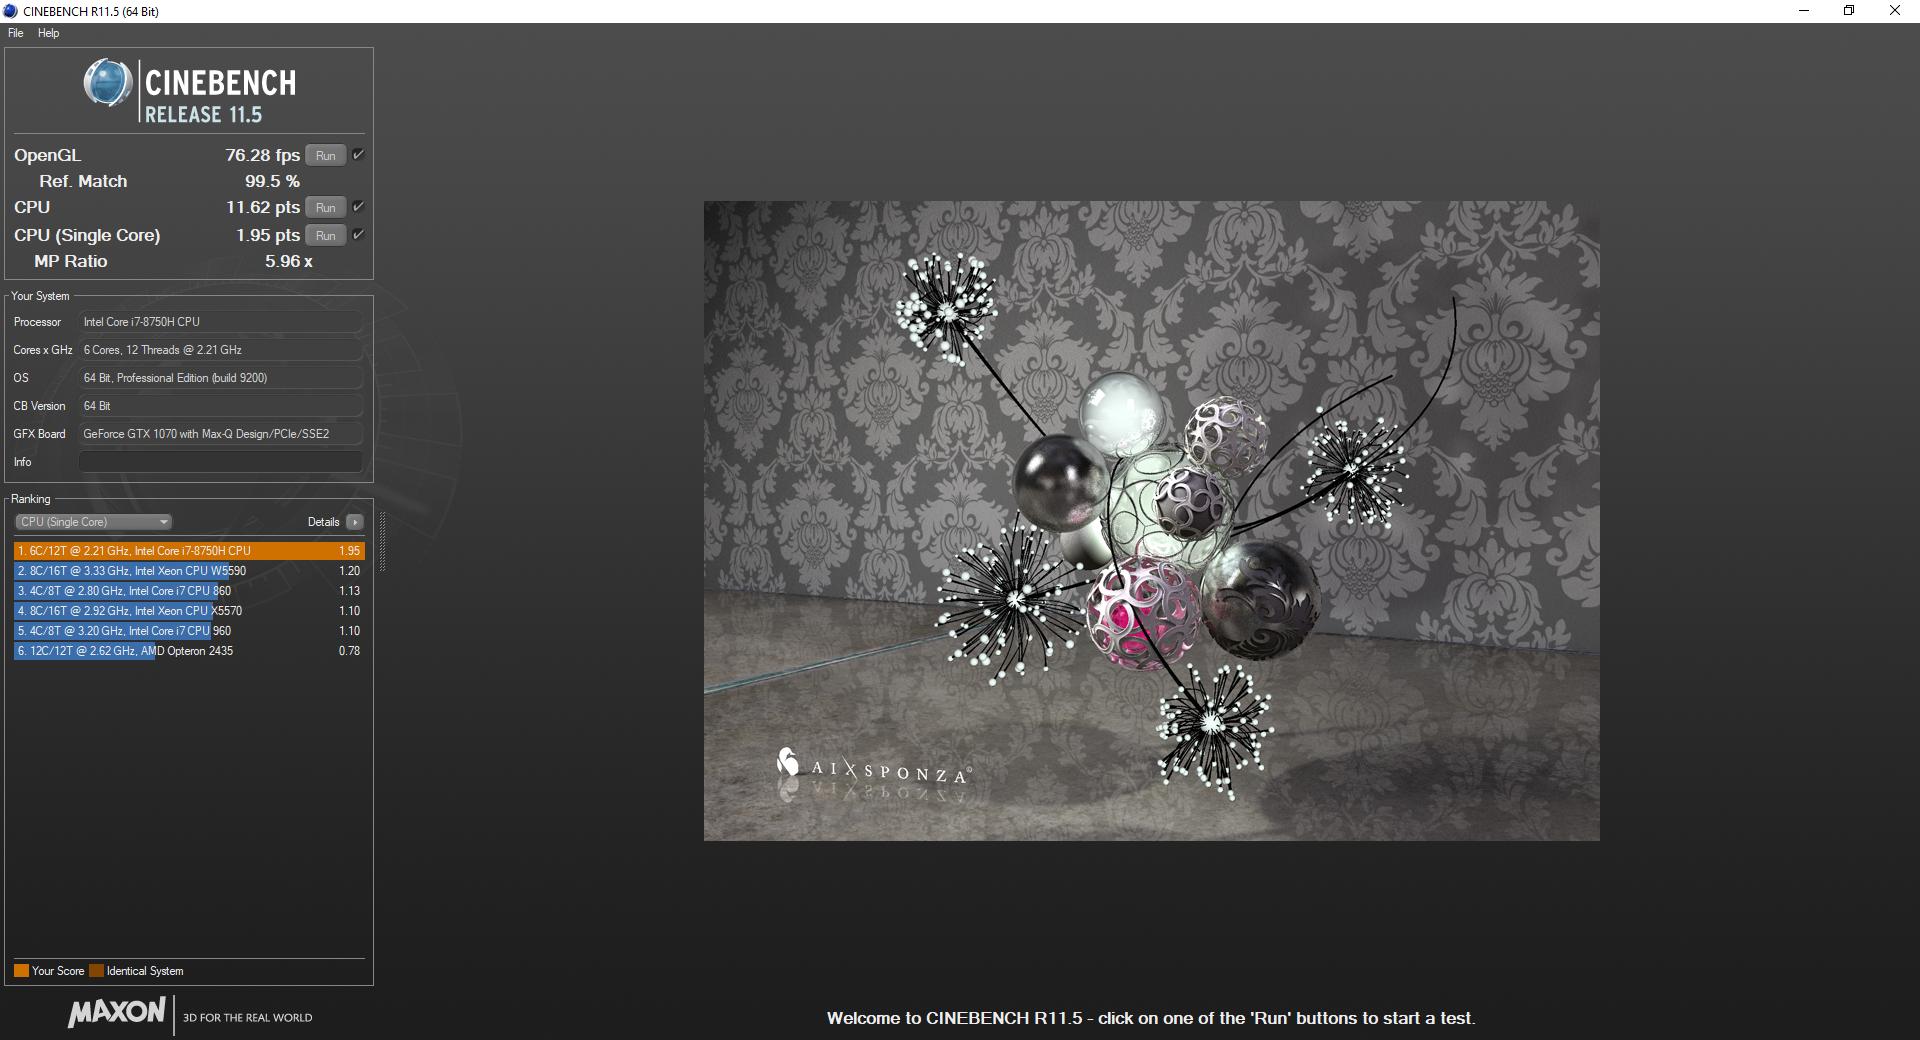
Processor
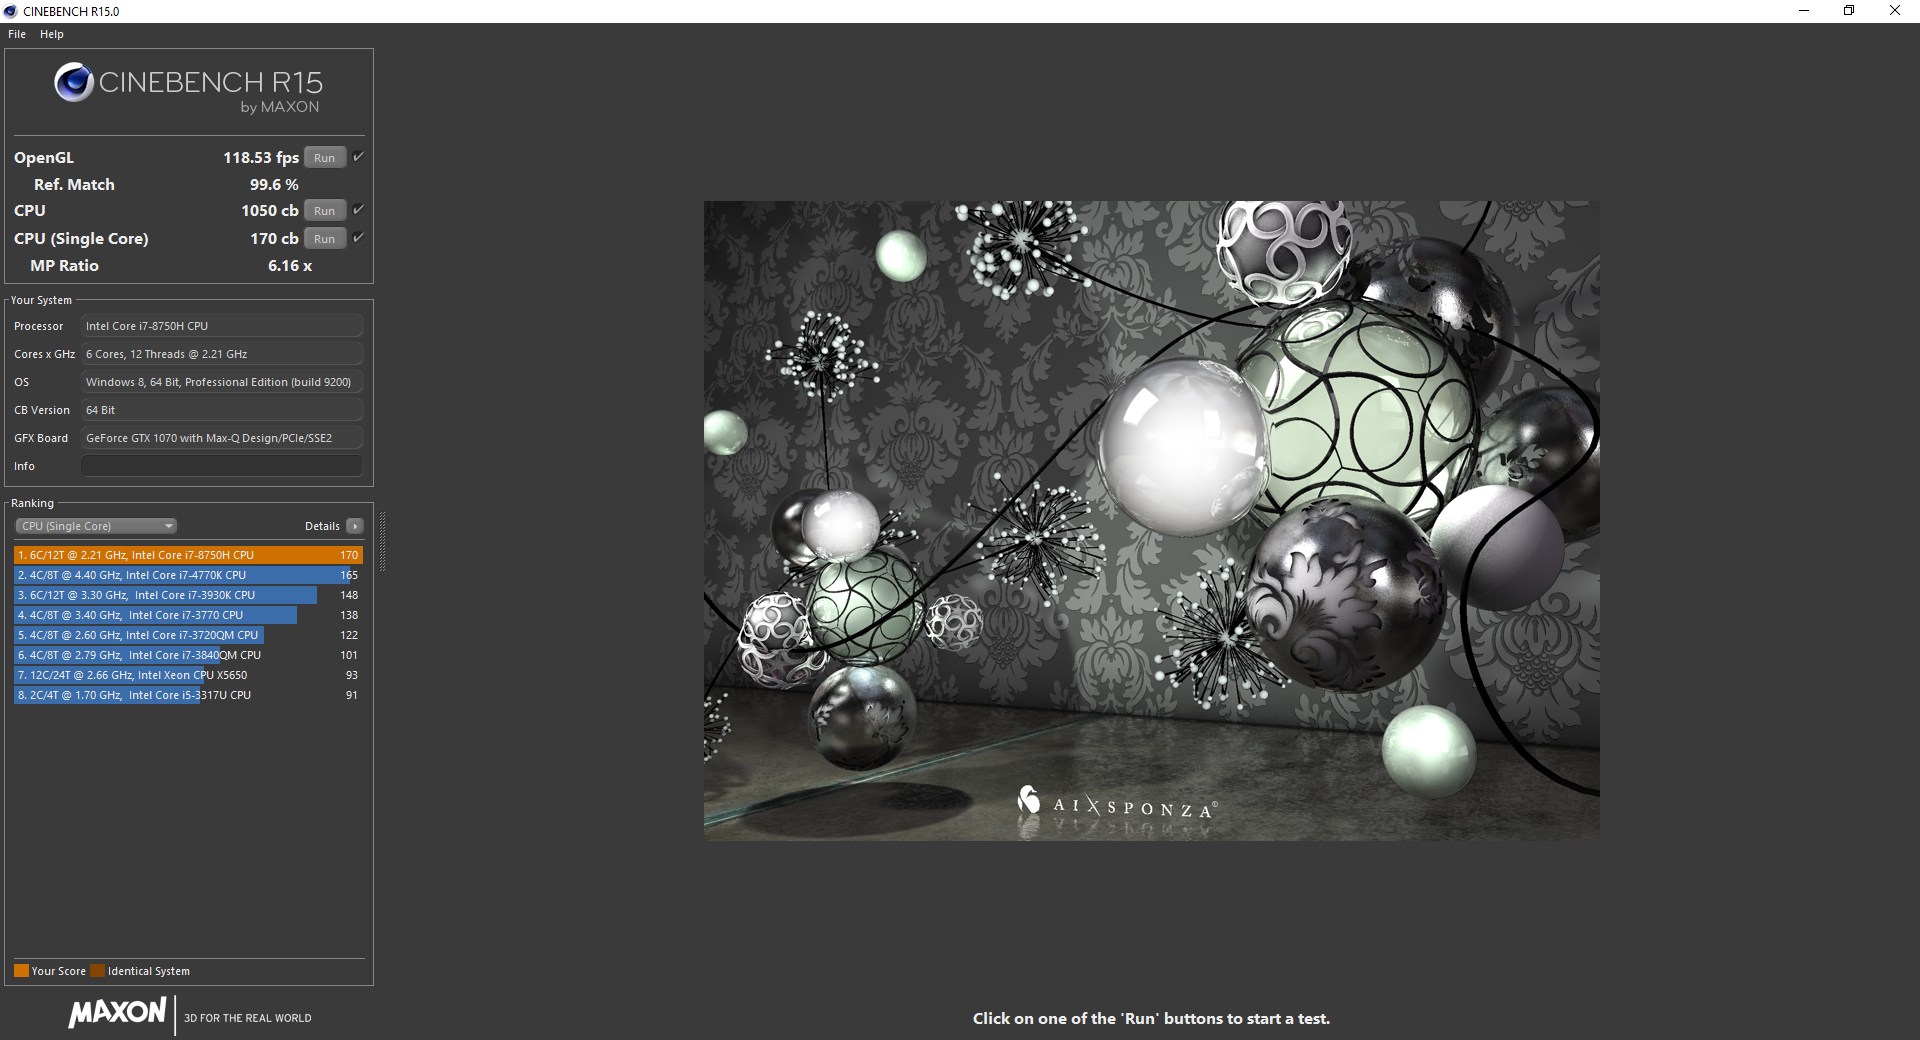
Much like the 8th gen i7-8550U and 7th gen i7-7500U, the 8th gen i7-8750H provides a large performance boost over the 7th gen i7-7700HQ that it supplants. CineBench benchmarks show the Q6 to be 10 to 40 percent faster than the Q5 depending on the workload. Performance is within 1 to 2 percentage points from the average of ten i7-8750H CPUs in our database.
Turbo Boost sustainability is good but not perfect. As shown by our graph below, running CineBench R15 Multi-Thread in a loop results in an initial highest score before quickly falling in subsequent runs. Its initial score of 1069 stabilizes to around 960 points for a performance drop of about 10 percent. In comparison, the i7-7700HQ in the Q5 drops by about 5 percent when running the same CineBench loop test.
See our CPU page on the Core i7-8750H for more technical information and benchmark comparisons.
* ... smaller is better
System Performance
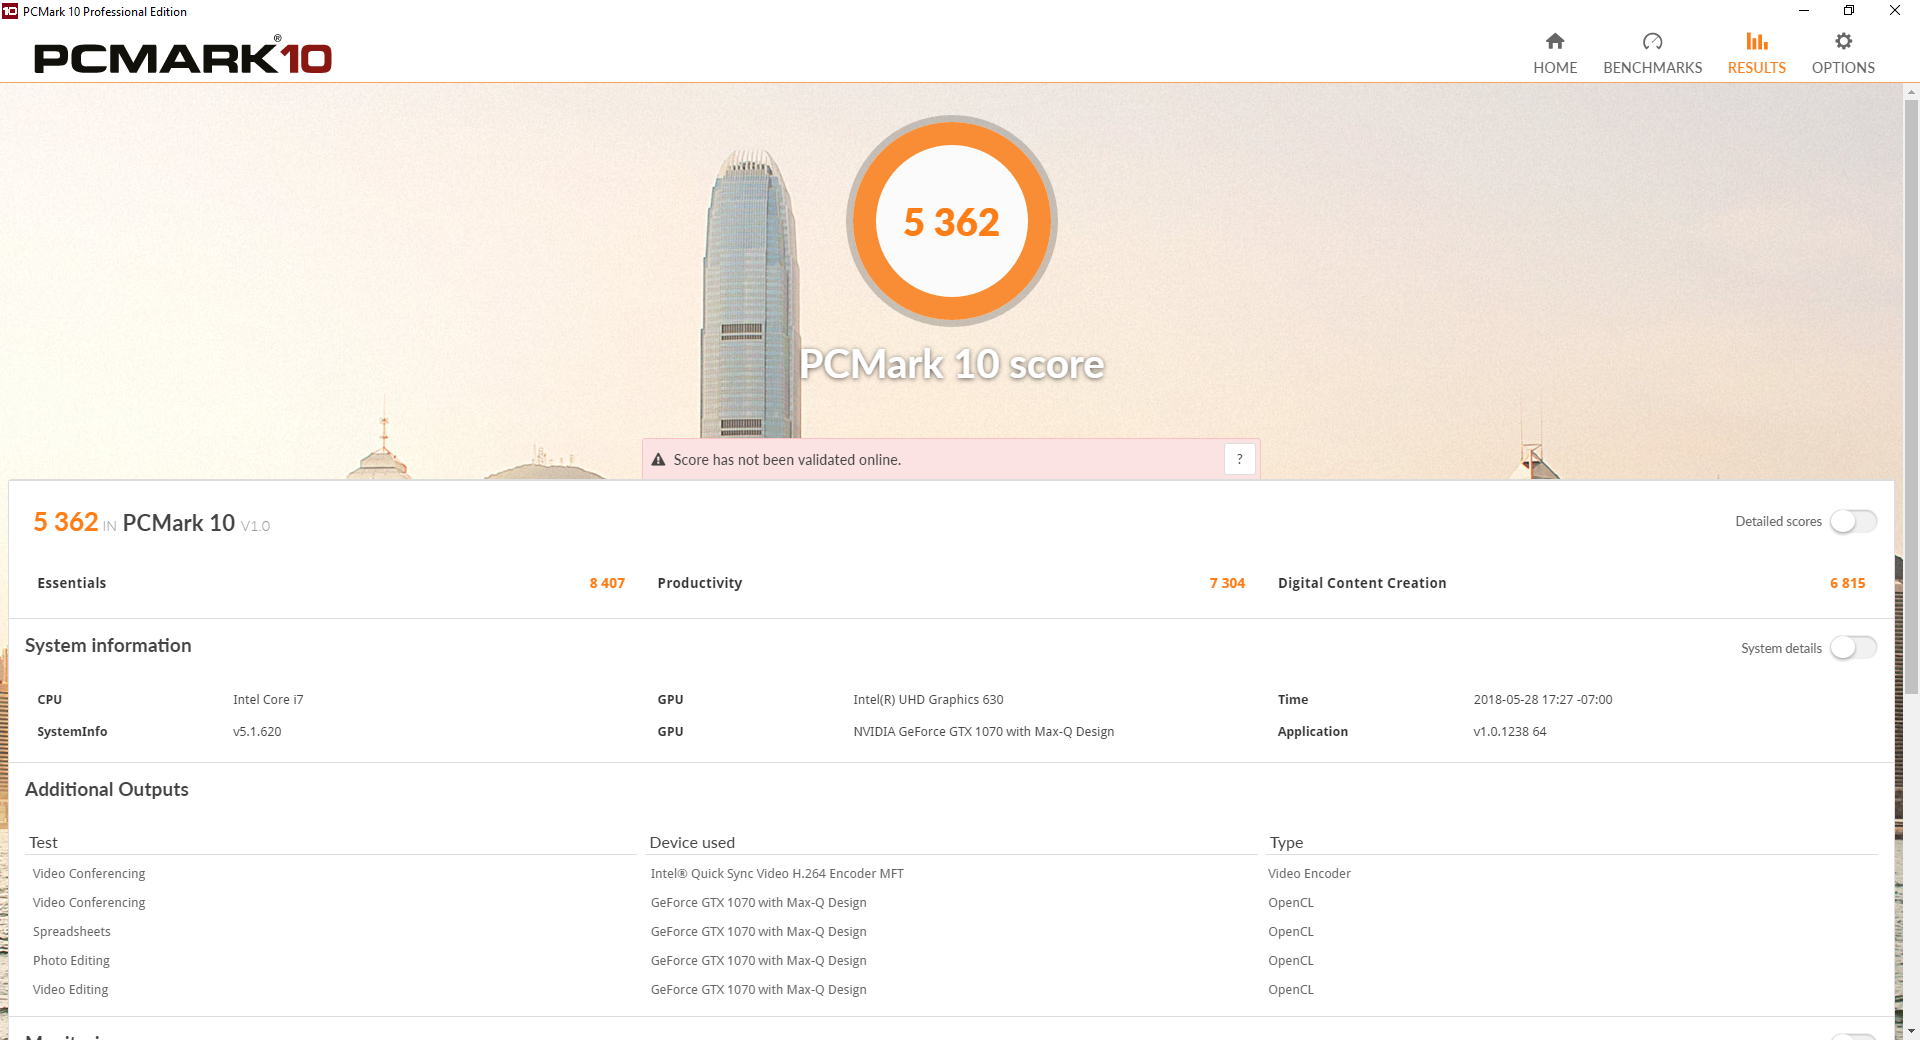
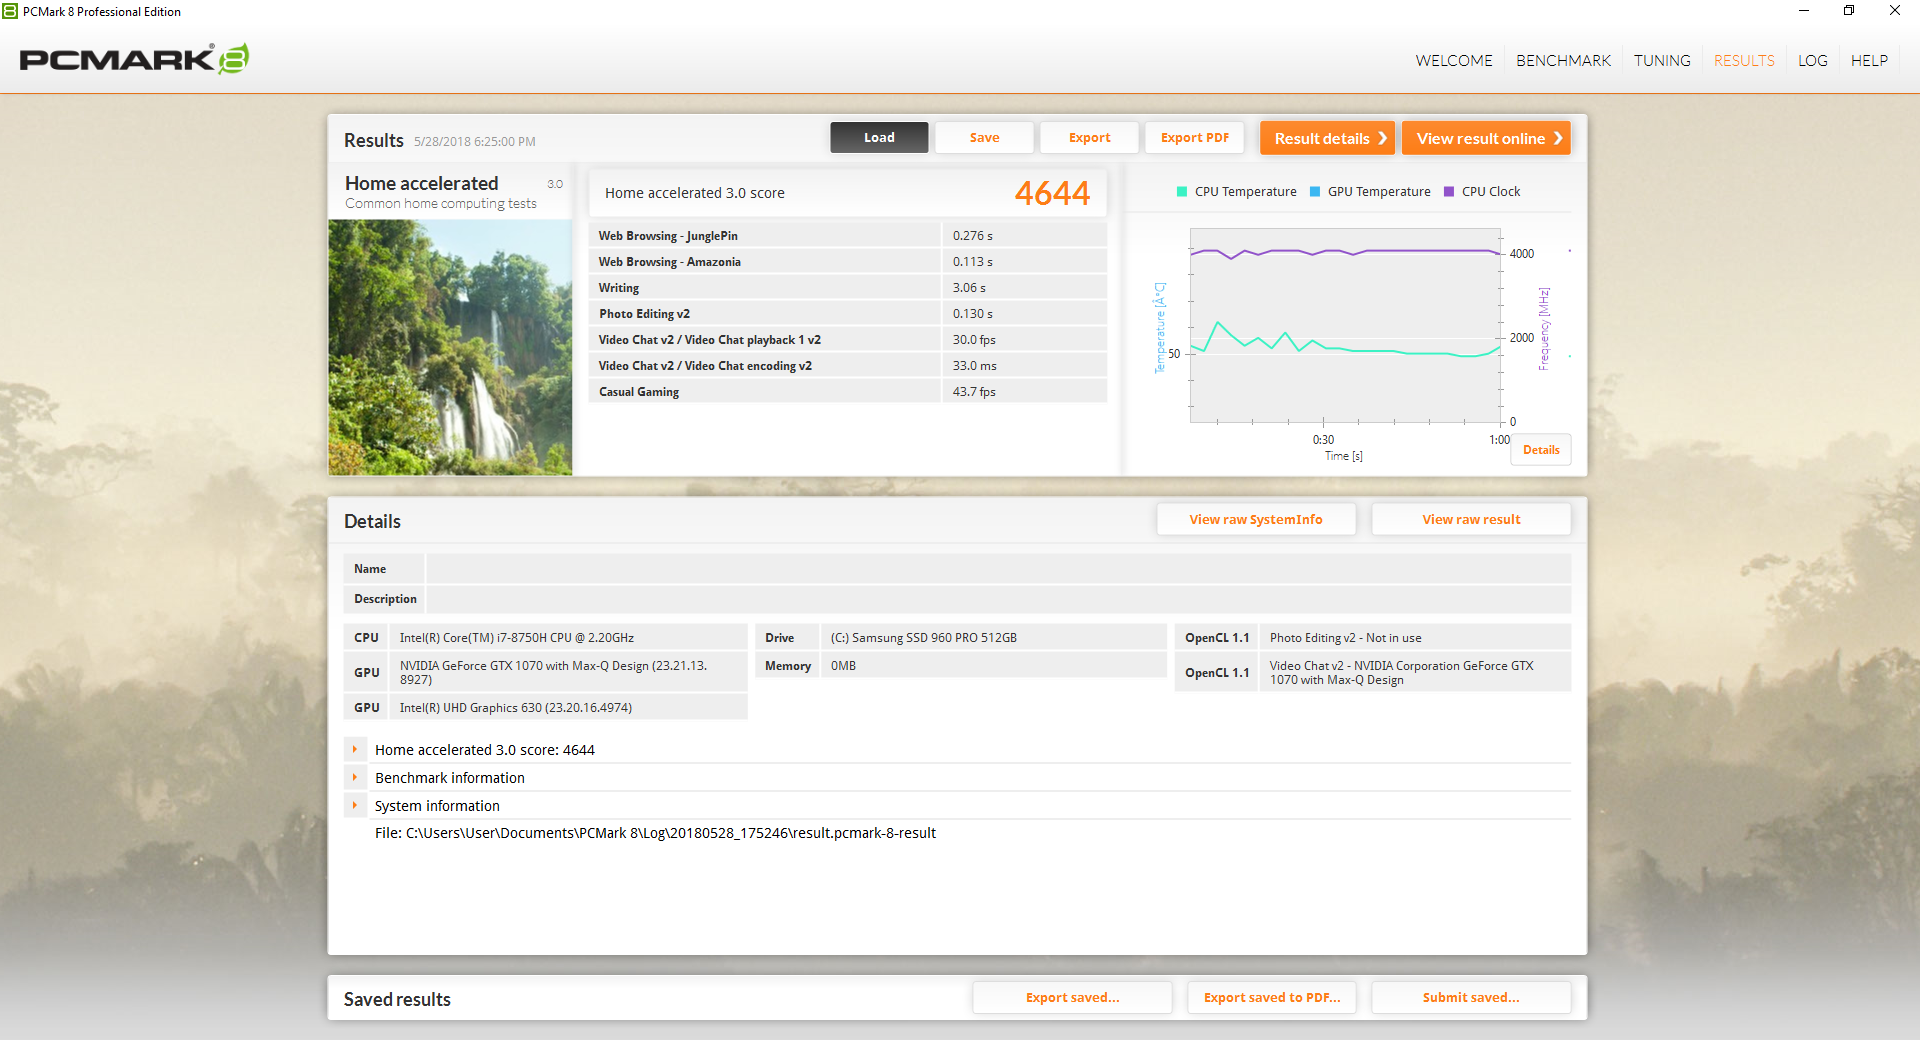
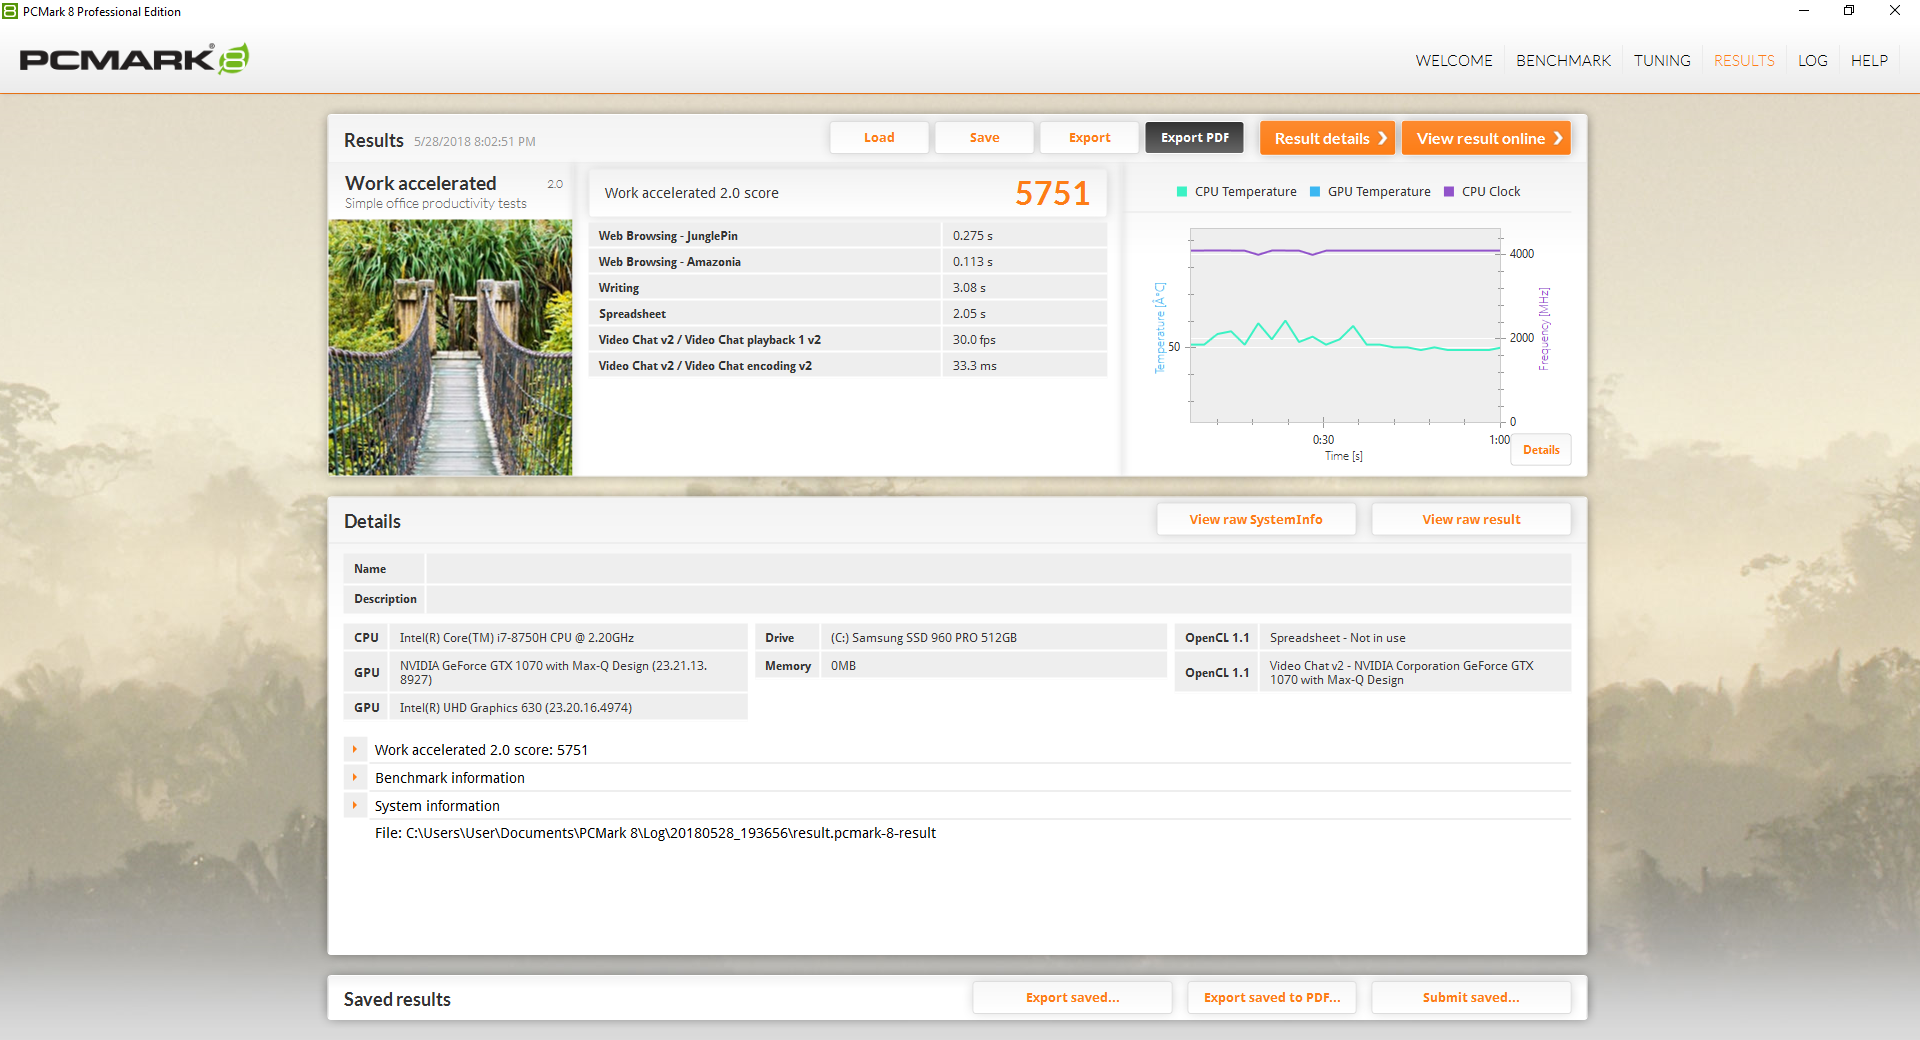
PCMark scores are about 5 to 20 percent higher than the Q5 due to the processor update alone. However, PCMark scores may also be affected by the difference in display resolution as well since our Q5 was equipped with a 4K panel. Competing systems equipped with the GTX 1070 Max-Q score similarly to our Eurocom.
We experienced no notable software issues during our time with the test unit.
| PCMark 10 - Score | |
| Eurocom Sky X4C | |
| Aorus X5 v8 | |
| Eurocom Q6 | |
| Eurocom Q5 | |
| MSI GS65 8RF-019DE Stealth Thin | |
| PCMark 8 | |
| Home Score Accelerated v2 | |
| Aorus X5 v8 | |
| Eurocom Sky X4C | |
| MSI GS65 8RF-019DE Stealth Thin | |
| Eurocom Q6 | |
| Eurocom Q5 | |
| Work Score Accelerated v2 | |
| Aorus X5 v8 | |
| Eurocom Q6 | |
| MSI GS65 8RF-019DE Stealth Thin | |
| Eurocom Sky X4C | |
| Eurocom Q5 | |
| PCMark 8 Home Score Accelerated v2 | 4644 points | |
| PCMark 8 Work Score Accelerated v2 | 5751 points | |
| PCMark 10 Score | 5362 points | |
Help | ||
Storage Devices
The M.2 2280 and SATA III storage bays return from the Q5 and so does the 512 GB Samsung SSD 960 Pro for our particular test unit. In comparison, competing models like the MSI GS65 and Gigabyte Aero 15X have two M.2 2280 slots and one M.2 2280 slot, respectively. As usual, Eurocom offers a very wide range of storage options between the M.2 and 2.5-inch SATA III drives should users want to configure with less or more storage.
See our table of HDDs and SSDs for more benchmark comparisons.
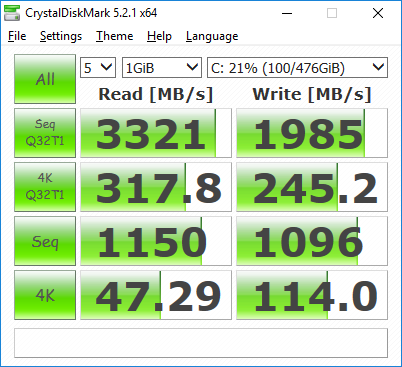
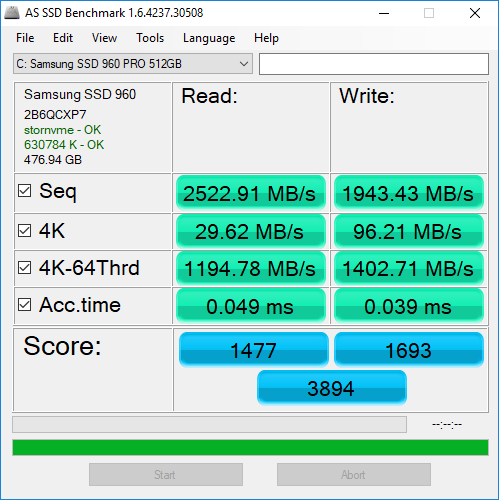
| Eurocom Q6 Samsung SSD 960 Pro 512 GB m.2 | Gigabyte Aero 15X v8 Toshiba NVMe THNSN5512GPU7 | Eurocom Q5 Samsung SSD 960 Pro 512 GB m.2 | Eurocom Sky X4C Samsung SSD 960 Pro 1TB m.2 NVMe | MSI GS65 8RF-019DE Stealth Thin Samsung SSD PM981 MZVLB512HAJQ | |
|---|---|---|---|---|---|
| AS SSD | -39% | 13% | 24% | 2% | |
| Copy Game MB/s (MB/s) | 633 | 682 8% | 1055 67% | ||
| Copy Program MB/s (MB/s) | 363.4 | 301.5 -17% | 467.2 29% | ||
| Copy ISO MB/s (MB/s) | 1768 | 1967 11% | 1908 8% | ||
| Score Total (Points) | 3894 | 2536 -35% | 4001 3% | 4615 19% | 4122 6% |
| Score Write (Points) | 1693 | 939 -45% | 1705 1% | 1703 1% | 2051 21% |
| Score Read (Points) | 1477 | 1092 -26% | 1529 4% | 1945 32% | 1346 -9% |
| Access Time Write * (ms) | 0.039 | 0.046 -18% | 0.028 28% | 0.03 23% | 0.035 10% |
| Access Time Read * (ms) | 0.049 | 0.119 -143% | 0.036 27% | 0.032 35% | 0.073 -49% |
| 4K-64 Write (MB/s) | 1403 | 742 -47% | 1366 -3% | 1375 -2% | 1760 25% |
| 4K-64 Read (MB/s) | 1195 | 847 -29% | 1231 3% | 1646 38% | 1170 -2% |
| 4K Write (MB/s) | 96.2 | 80.4 -16% | 136.2 42% | 129.6 35% | 107.2 11% |
| 4K Read (MB/s) | 29.62 | 23.36 -21% | 49.3 66% | 44.83 51% | 48.94 65% |
| Seq Write (MB/s) | 1943 | 1163 -40% | 2029 4% | 1989 2% | 1834 -6% |
| Seq Read (MB/s) | 2523 | 2213 -12% | 2493 -1% | 2541 1% | 1266 -50% |
* ... smaller is better

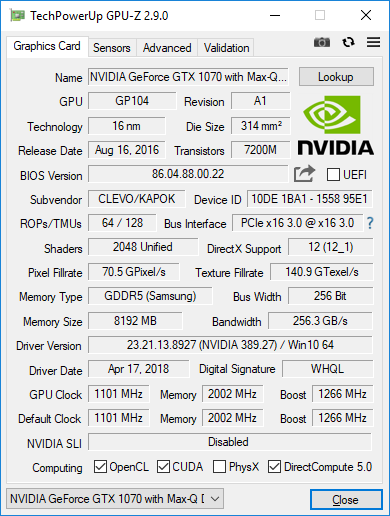
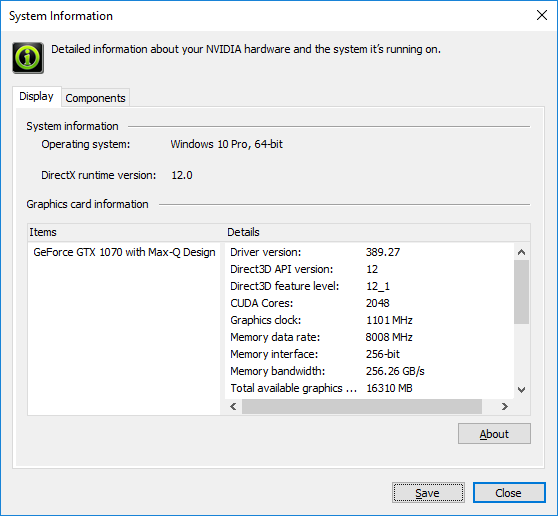
GPU Performance
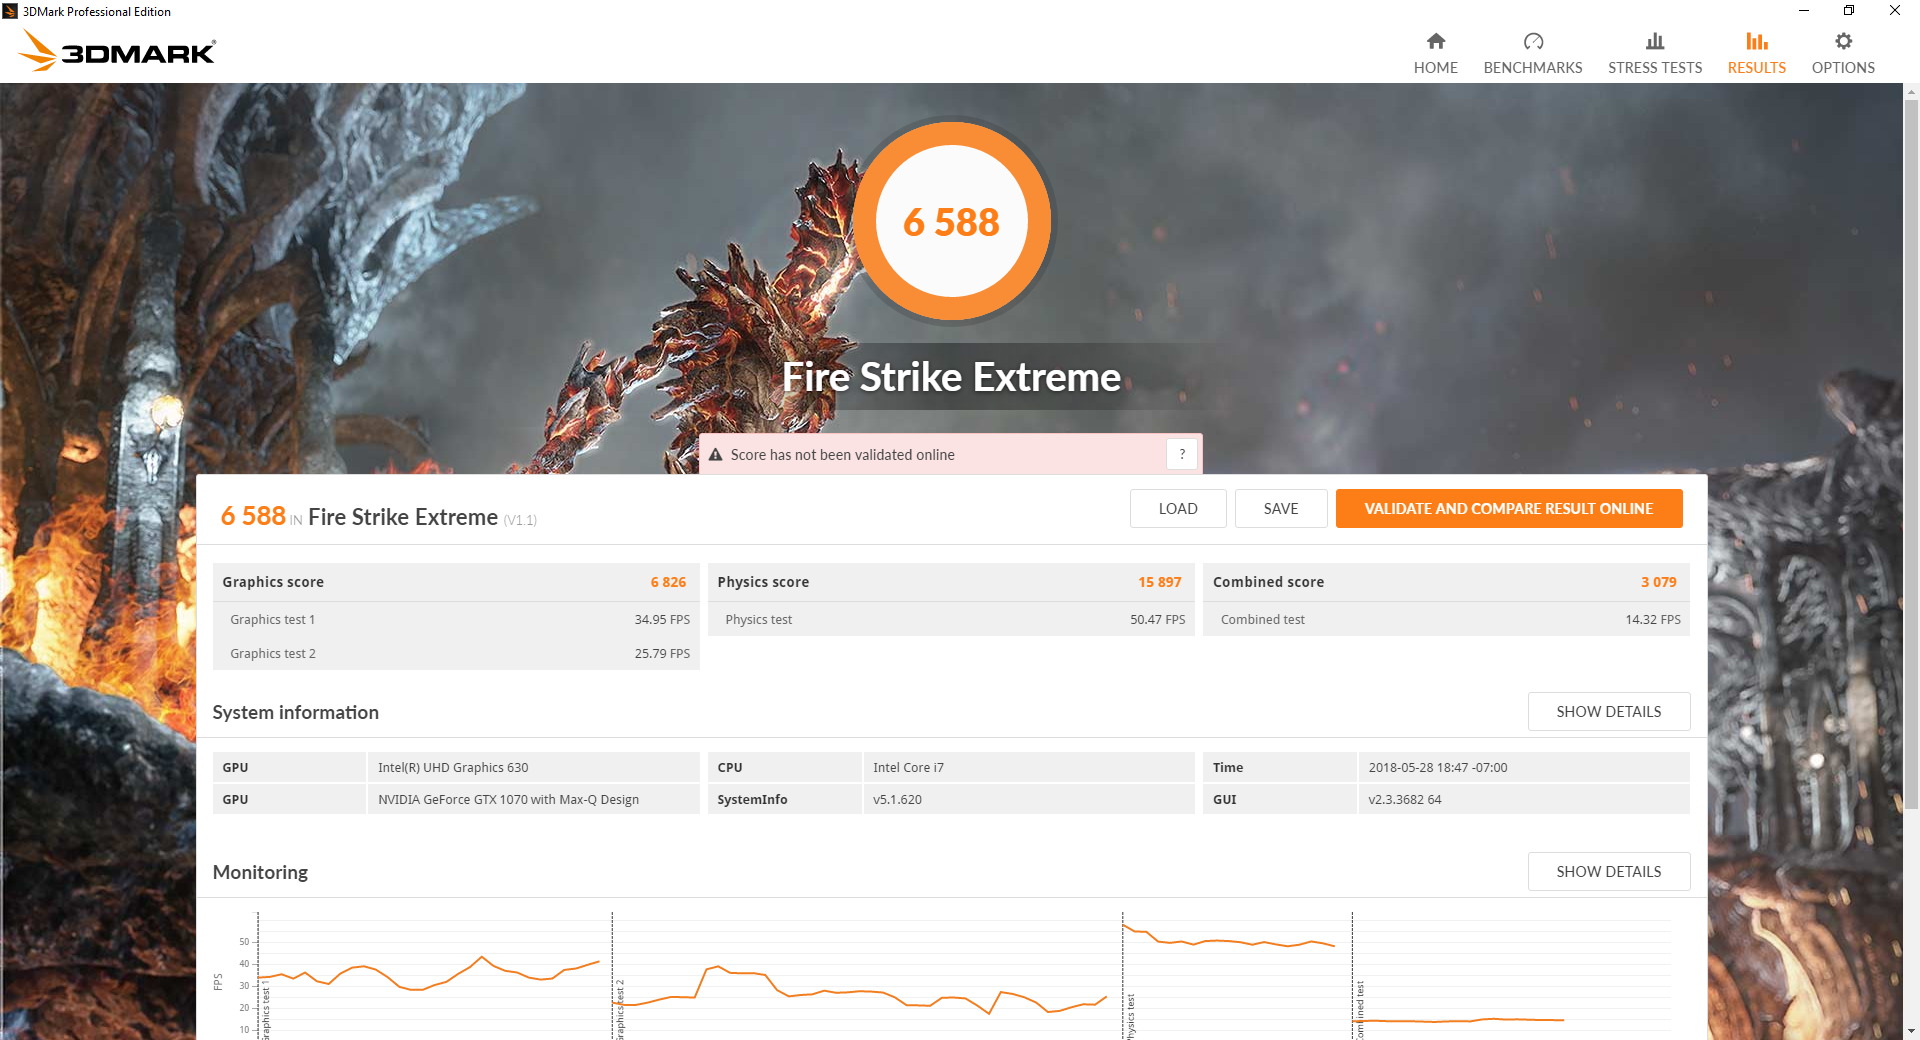
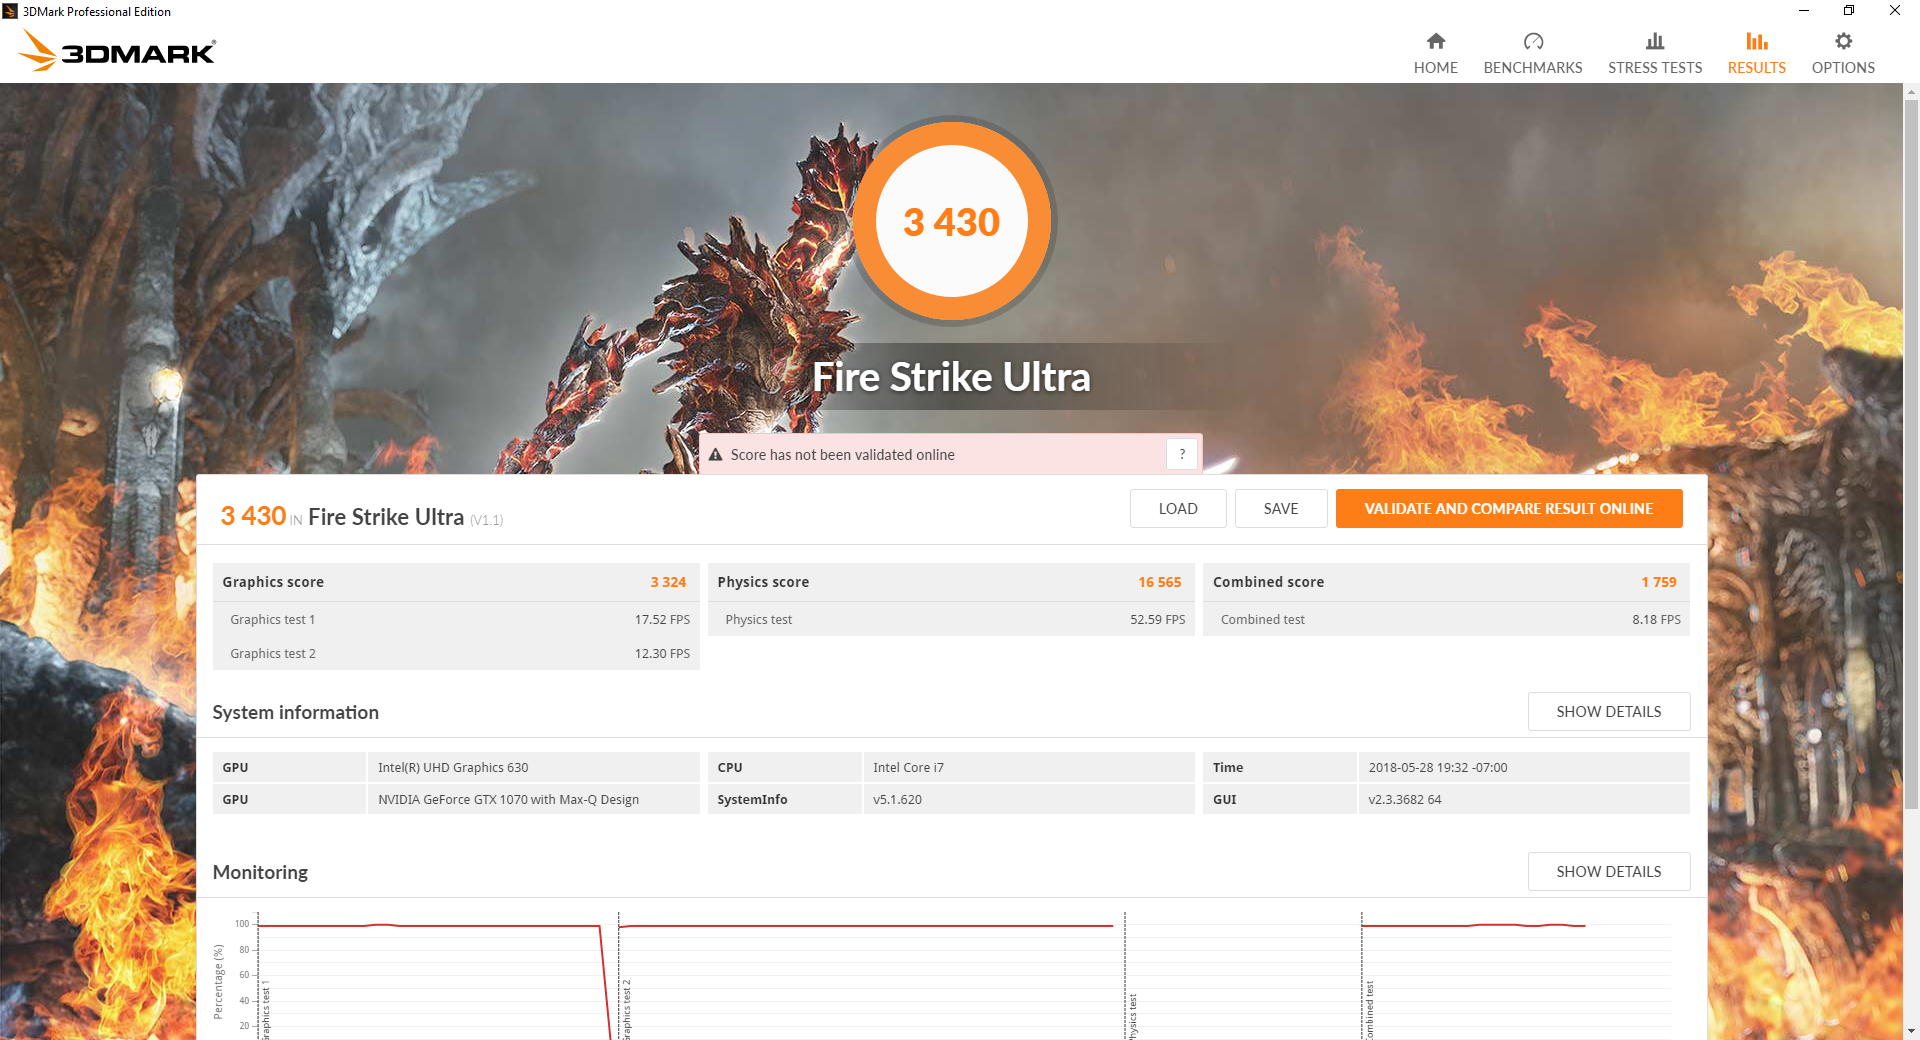
Despite being paired with a faster 8th gen Core CPU, the GTX 1070 Max-Q in the Q6 is not suddenly any faster than the same GPU in last year's Q5. 3DMark benchmarks place the Q6 within 1 to 2 percentage points from the GTX 1070 Max-Q in the Q5. Users can expect raw performance to be 25 percent faster than the standard GTX 1060 but 15 percent slower than the standard GTX 1070.
Gaming performance is excellent and where we expect it to be for a system with GTX 1070 Max-Q graphics. In order to take full advantage of the native 144 Hz refresh rate, however, settings will need to be turned down to basic levels to reach those high frame rates.
See our page on the GeForce GTX 1070 Max-Q GPU for more technical information and benchmark comparisons.
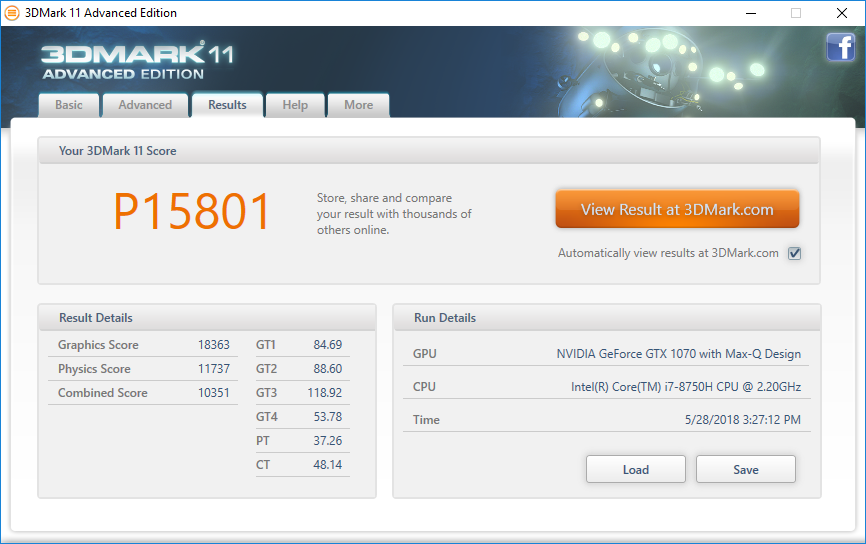
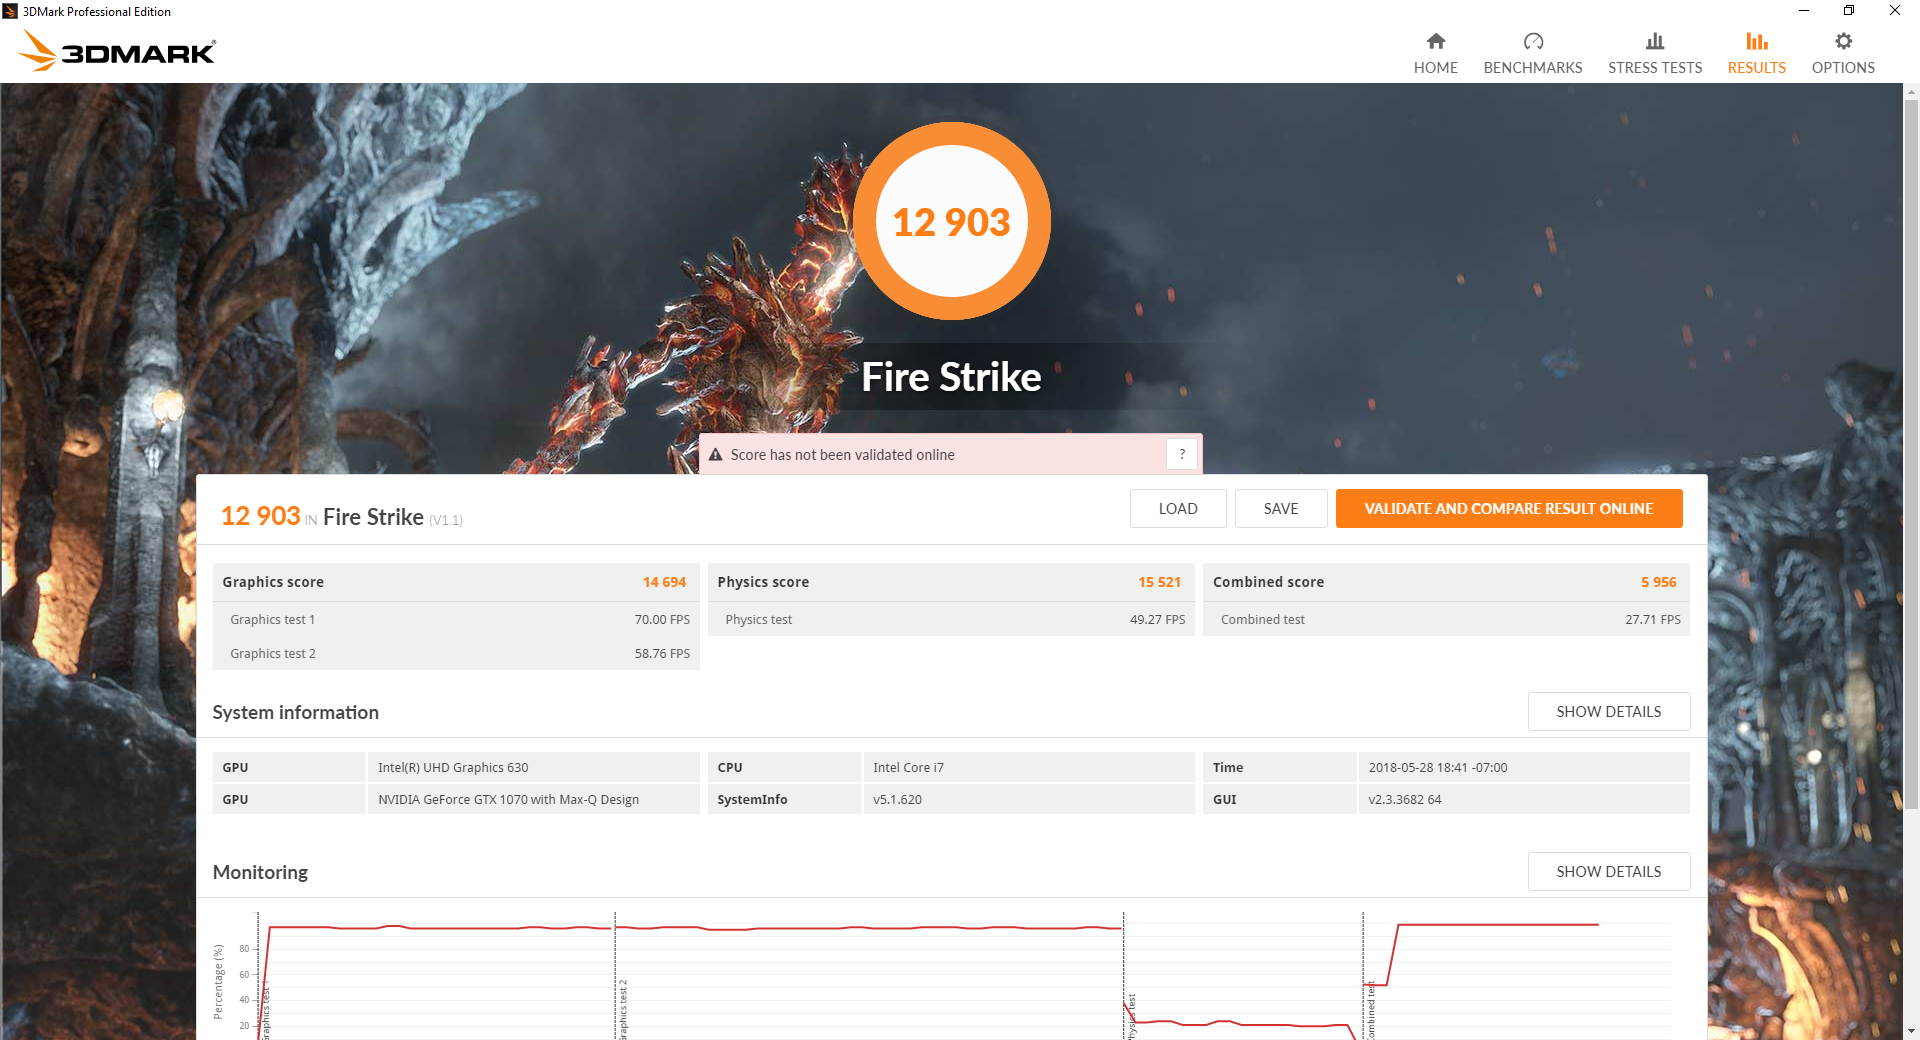
| 3DMark 11 Performance | 15801 points | |
| 3DMark Cloud Gate Standard Score | 34682 points | |
| 3DMark Fire Strike Score | 12903 points | |
| 3DMark Fire Strike Extreme Score | 6588 points | |
Help | ||
| low | med. | high | ultra | |
|---|---|---|---|---|
| BioShock Infinite (2013) | 327.9 | 246.7 | 230.8 | 132.1 |
| The Witcher 3 (2015) | 236.2 | 165.2 | 97 | 48.9 |
| Rise of the Tomb Raider (2016) | 202.7 | 166.2 | 97.8 | 82.4 |
| The Witcher 3 - 1920x1080 Ultra Graphics & Postprocessing (HBAO+) | |
| MSI GT75 8RG-090 Titan | |
| Alienware 15 R3 Max-Q | |
| Aorus X5 v8 | |
| Average NVIDIA GeForce GTX 1070 Max-Q (46 - 55.3, n=19) | |
| Eurocom Q6 | |
| Eurocom Q5 | |
| Asus FX503VM-EH73 | |
| Dell Inspiron 15 7000 7577 4K | |
| BioShock Infinite - 1920x1080 Ultra Preset, DX11 (DDOF) | |
| Alienware 15 R3 Max-Q | |
| Eurocom Q6 | |
| Eurocom Q5 | |
| Average NVIDIA GeForce GTX 1070 Max-Q (109.6 - 139.4, n=10) | |
| Dell Inspiron 15 7000 7577 4K | |
| Rise of the Tomb Raider - 1920x1080 Very High Preset AA:FX AF:16x | |
| Eurocom Q6 | |
| Average NVIDIA GeForce GTX 1070 Max-Q (77.1 - 85.9, n=7) | |
| Eurocom Q5 | |
| Asus FX503VM-EH73 | |
| Dell Inspiron 15 7000 7577 4K | |
Stress Test
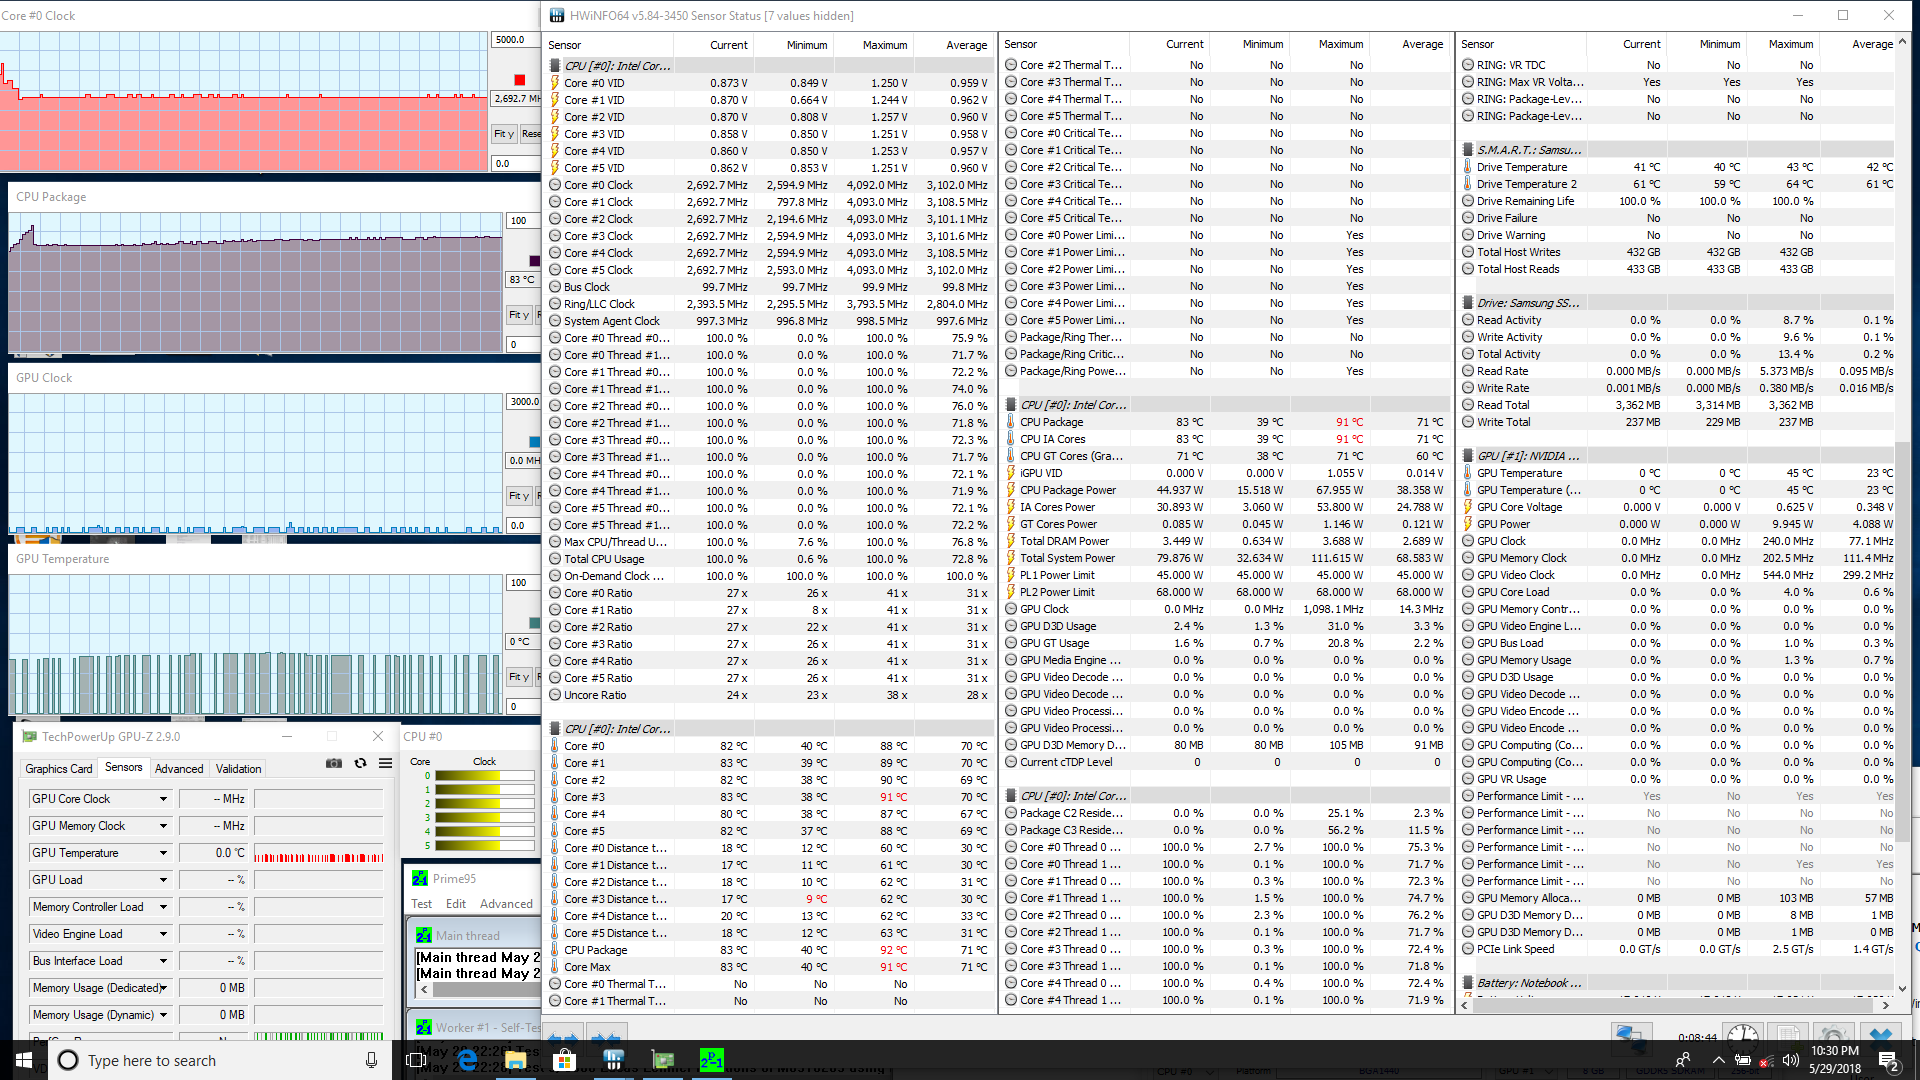
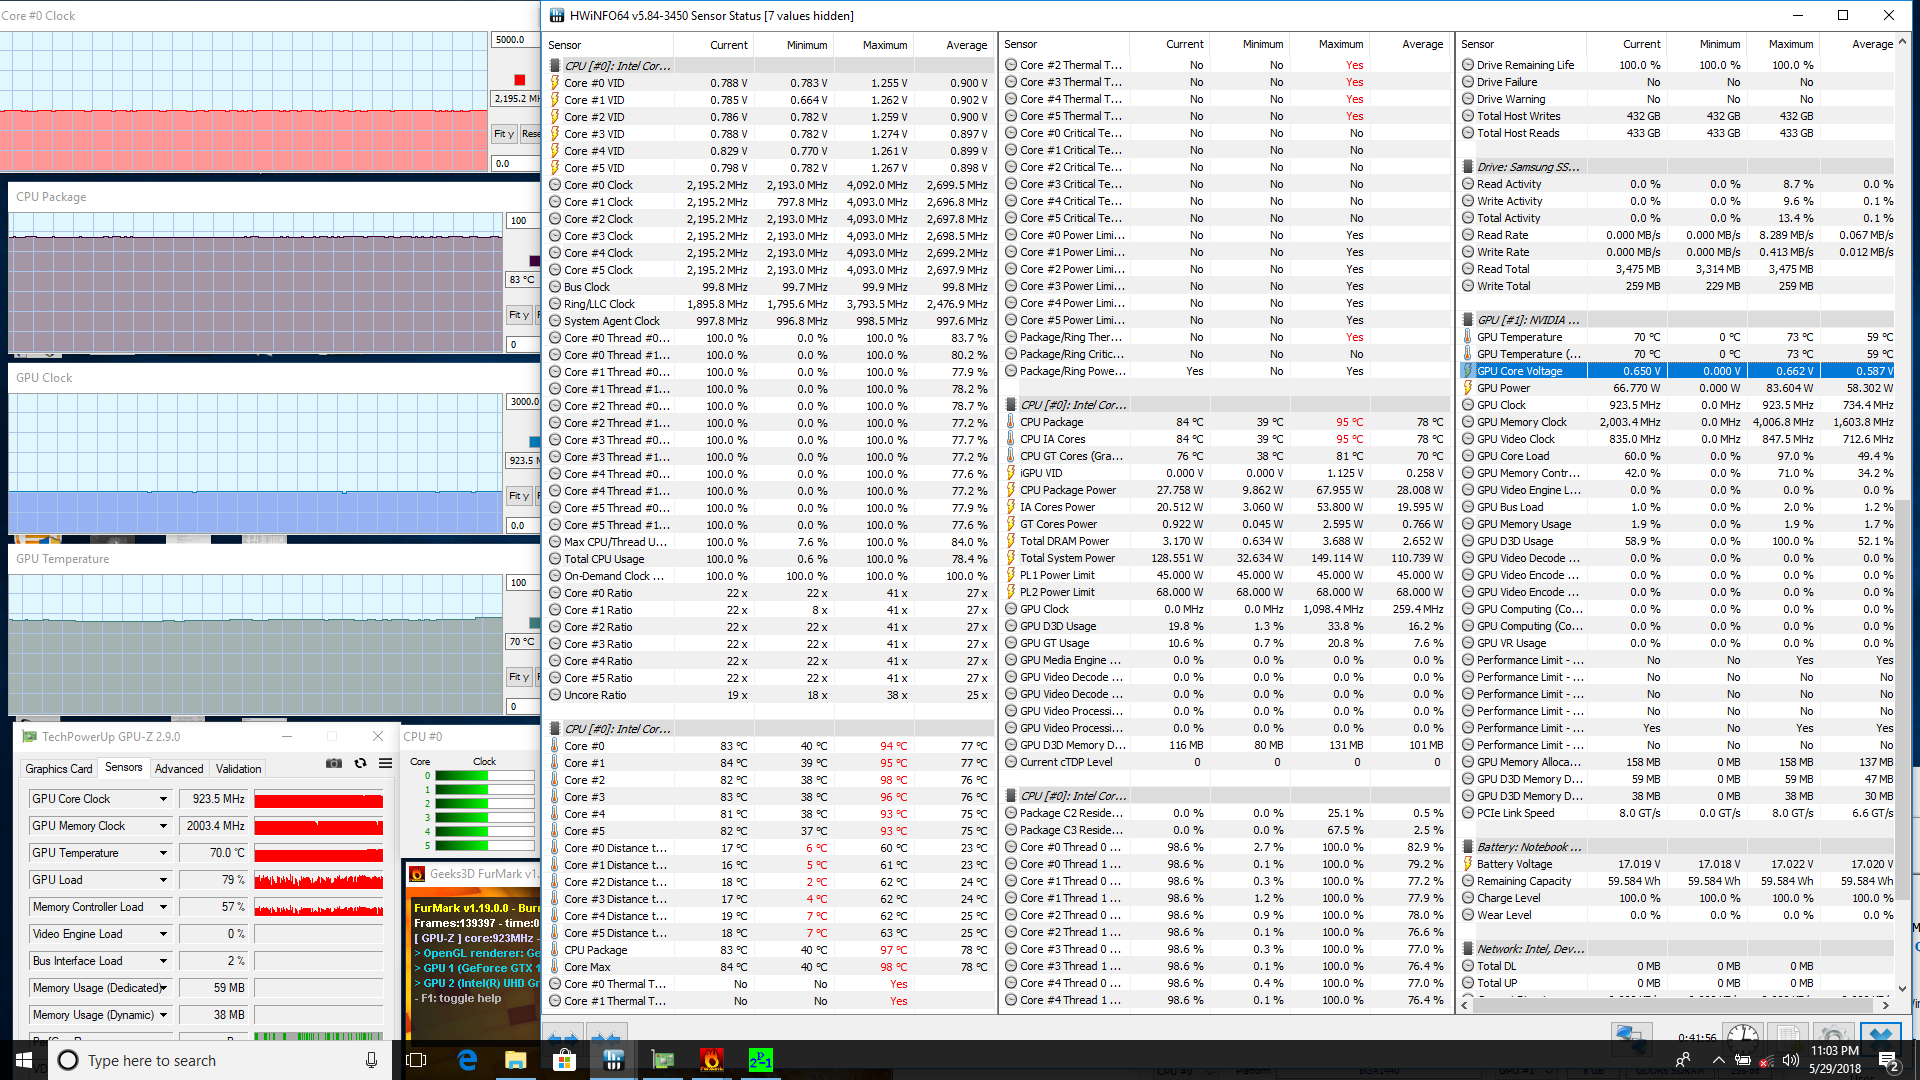
We stress the system to identify for any potential throttling or stability issues. When running Prime95 to stress the CPU, the processor can be observed running stably at 2.7 GHz (or 500 MHz above the base clock rate of the i7-8750H) but at a relatively high core temperature of 83 C. Higher Turbo Boost clock rates are only possible within the first few seconds of initiating Prime95 because once the CPU reaches 92 C, it automatically throttles to 2.7 GHz in order to maintain safer core temperatures. Running both Prime95 and FurMark simultaneously to stress the CPU and GPU will throttle the CPU even further to its base clock rate of 2.2 GHz. Fortunately, this never dips any slower which would have been unfavorable especially for a performance laptop.
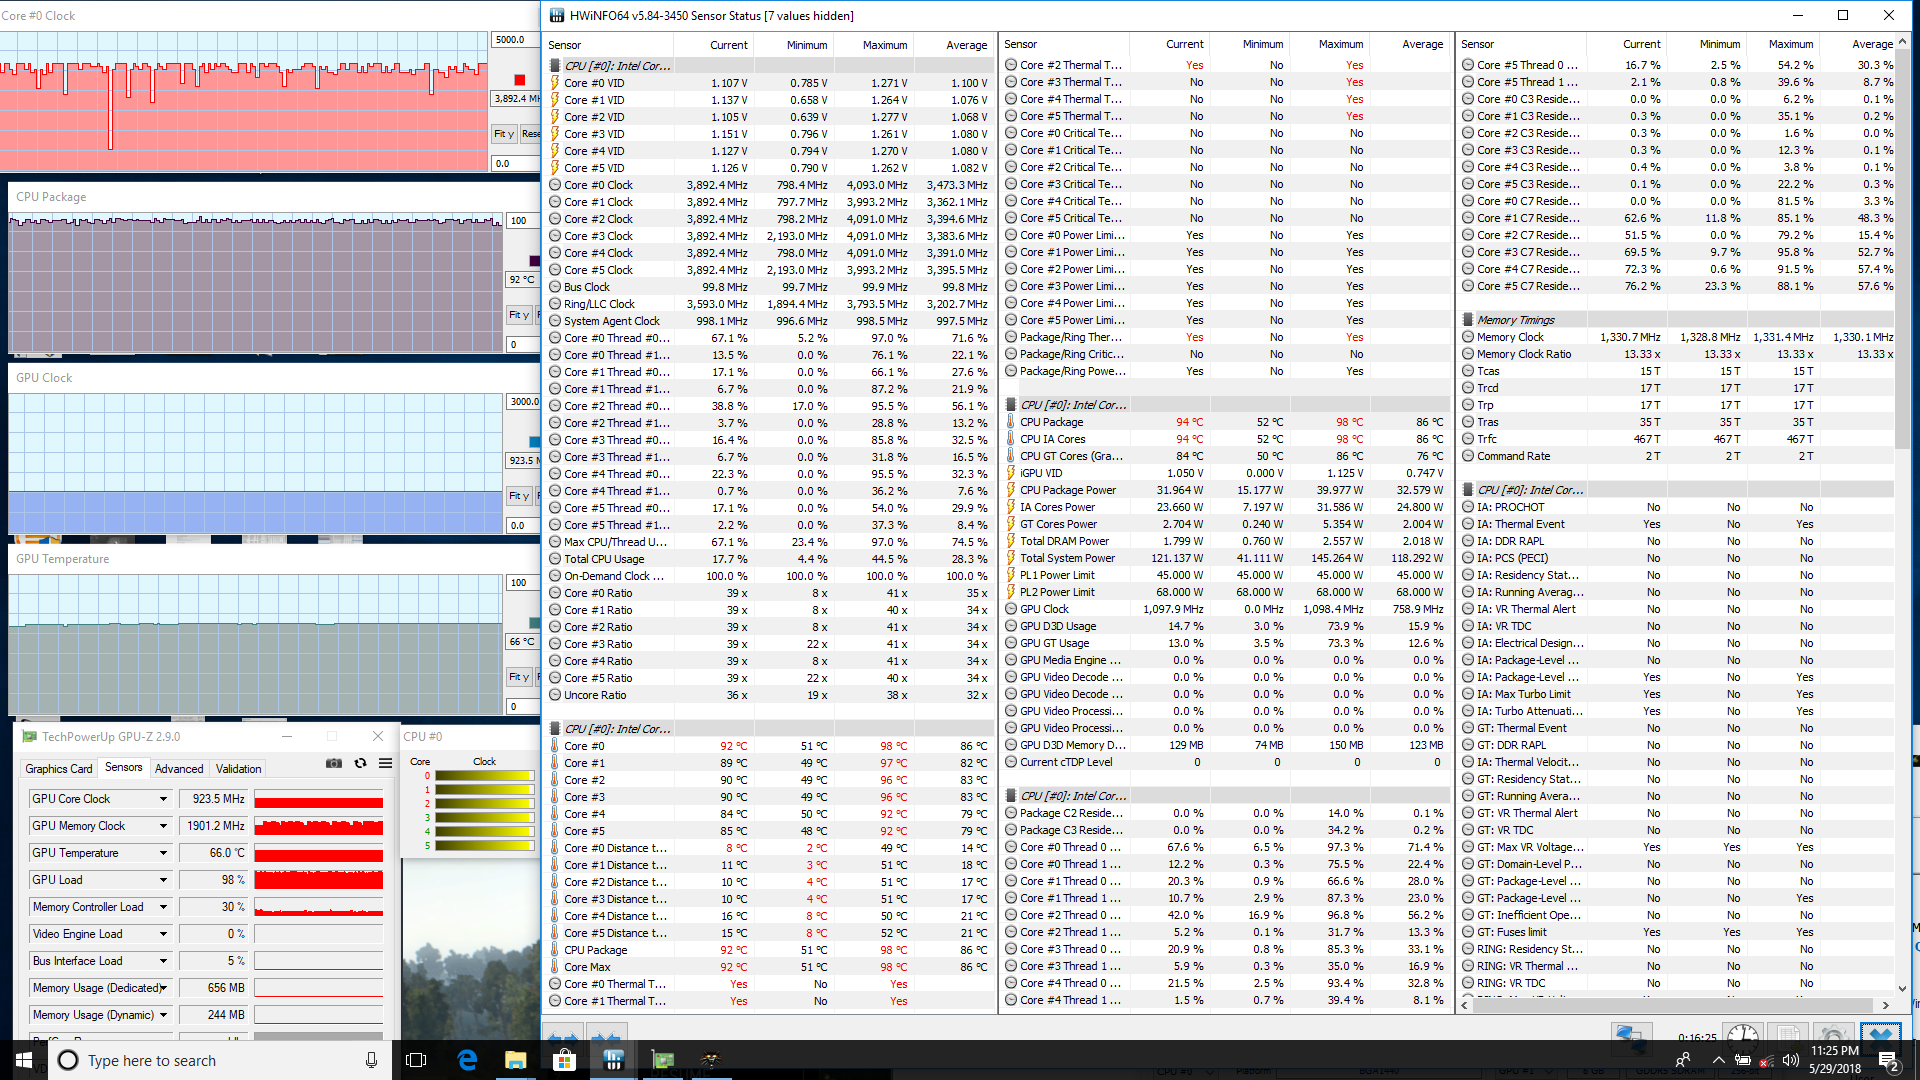
Running Witcher 3 is more representative of real-world gaming loads. Interestingly, results here are very different from the Prime95 test above. CPU temperature can be as warm as 98 C with much higher clock rates of up to 3.9 GHz when the game demands it. GPU clock rate remains stable at 923.5 MHz whereas a standard GTX 1070 can be significantly faster at 1468 MHz. We believe that the GPU in the Q6 can run faster since its core temperature is relatively cool at 66 C when gaming compared to the very warm CPU, but it may be limited by the 150 W AC adapter.
Running on batteries limits CPU and GPU potential. A 3DMark 11 run on battery power returns Physics and Graphics scores of 6769 and 11144 points, respectively, compared to 11737 and 18363 points when on mains.
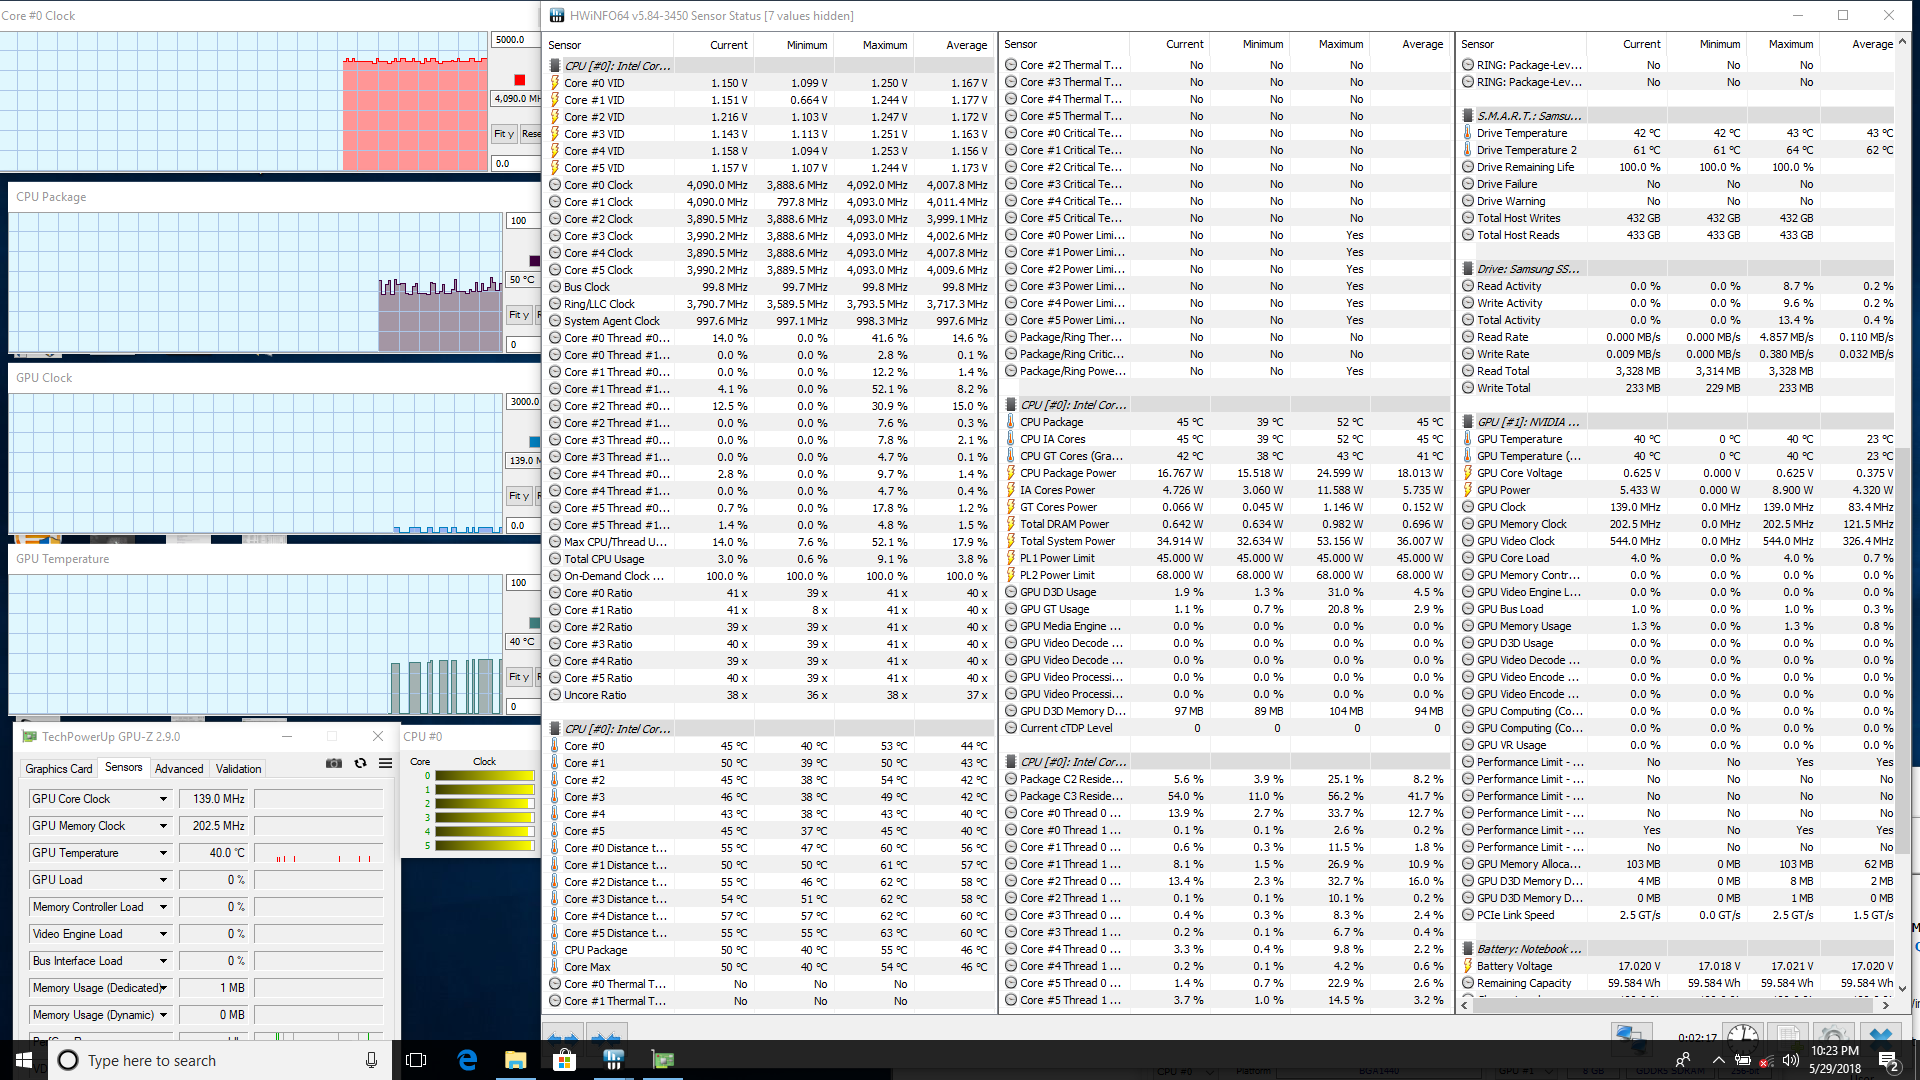
| CPU Clock (GHz) | GPU Clock (MHz) | Average CPU Temperature (°C) | Average GPU Temperature (°C) | |
| Prime95 Stress | 2.7 | -- | 83 | 42 |
| FurMark Stress | -- | 847.5 | 70 | 73 |
| Prime95 + FurMark Stress | 2.2 | 923.5 | 83 | 70 |
| Witcher 3 Stress | ~3.8 | 923.5 | 92 | 66 |
Emissions
System Noise
Fan noise is unsurprisingly nearly the same as on the Q5. We recommend running the system on Power Saver mode if word processing or streaming to keep fan noise as low as possible. The fans become sensitive to speed changes when on the High Performance profile.
If gaming, fan noise become stable at about 43 dB(A) to be similar to the GS65 yet significantly quieter than the Zephyrus M GM501 under similar conditions. Of course, the drawback is that the CPU in the Eurocom will be running much warmer as shown by our Stress Test section above.
The manual "Maximum" fan setting will bump both systems fans to their maximum RPMs to almost 51 dB(A). This will help in cooling the very warm CPU temperatures when gaming albeit at the obvious cost of even louder fan noise.
We can notice no coil whine or electronic noise on our unit.
Noise level
| Idle |
| 30.4 / 30.5 / 33.3 dB(A) |
| Load |
| 42.3 / 50.8 dB(A) |
 | ||
30 dB silent 40 dB(A) audible 50 dB(A) loud |
||
min: | ||
| Eurocom Q6 GeForce GTX 1070 Max-Q, i7-8750H, Samsung SSD 960 Pro 512 GB m.2 | Eurocom Q5 GeForce GTX 1070 Max-Q, i7-7700HQ, Samsung SSD 960 Pro 512 GB m.2 | Aorus X5 v8 GeForce GTX 1070 Mobile, i7-8850H, Toshiba NVMe THNSN5512GPU7 | Gigabyte Aero 15X v8 GeForce GTX 1070 Max-Q, i7-8750H, Toshiba NVMe THNSN5512GPU7 | MSI GS65 8RF-019DE Stealth Thin GeForce GTX 1070 Max-Q, i7-8750H, Samsung SSD PM981 MZVLB512HAJQ | Asus Zephyrus M GM501 GeForce GTX 1070 Mobile, i7-8750H, Samsung SM961 MZVKW512HMJP m.2 PCI-e | |
|---|---|---|---|---|---|---|
| Noise | -3% | -11% | -7% | 1% | -5% | |
| off / environment * (dB) | 28.3 | 29 -2% | 30 -6% | 29 -2% | 30 -6% | 29 -2% |
| Idle Minimum * (dB) | 30.4 | 31.5 -4% | 33 -9% | 30 1% | 30 1% | 30 1% |
| Idle Average * (dB) | 30.5 | 33.8 -11% | 35 -15% | 31 -2% | 31 -2% | 31 -2% |
| Idle Maximum * (dB) | 33.3 | 33.8 -2% | 40 -20% | 35 -5% | 34 -2% | 33 1% |
| Load Average * (dB) | 42.3 | 41.7 1% | 45 -6% | 49 -16% | 43 -2% | 49 -16% |
| Witcher 3 ultra * (dB) | 43.3 | 41.7 4% | 50 -15% | 51 -18% | 42 3% | 50 -15% |
| Load Maximum * (dB) | 50.8 | 54.2 -7% | 55 -8% | 54 -6% | 44 13% | 52 -2% |
* ... smaller is better
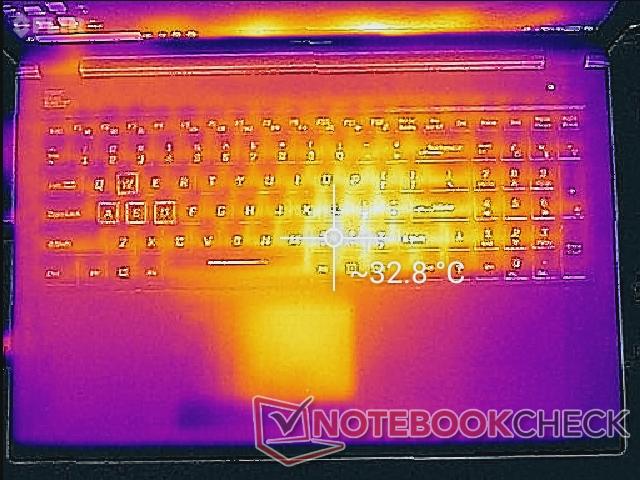
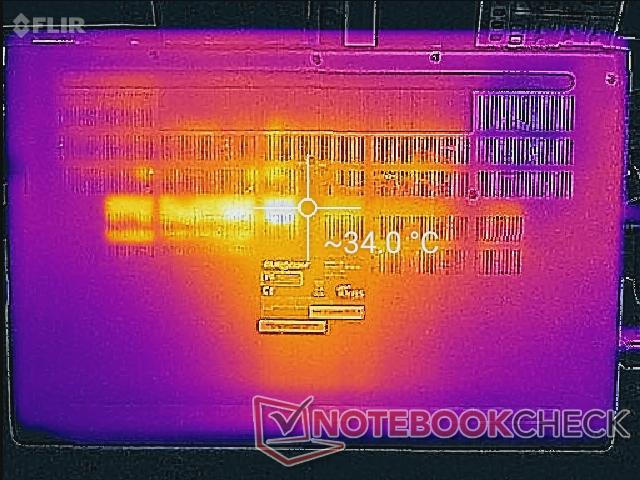
Temperature
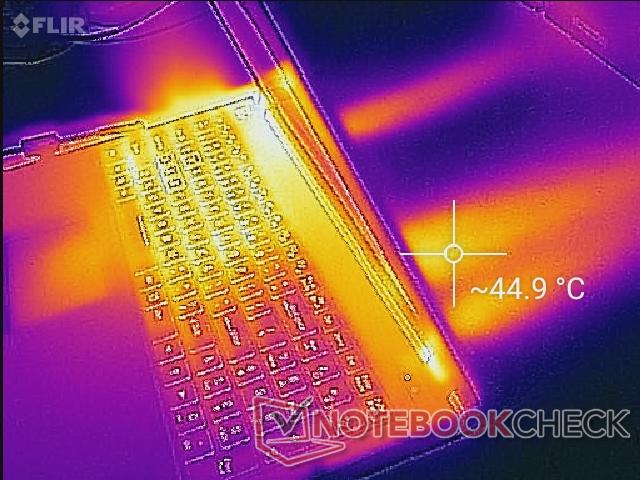
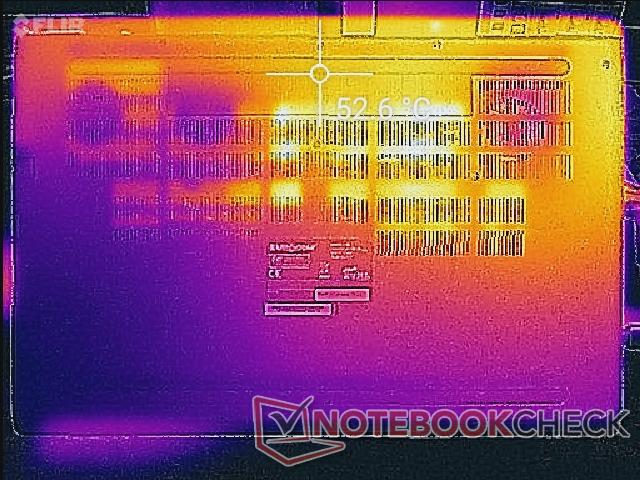
Surface temperatures are flat in the low 30 C range when idling on desktop. When gaming, hot spots can grow to as warm as 53 C. While still warmer than we would like, it is at least comparatively cooler than on the GS65 which can be as warm as 63 C under similar gaming loads.
Temperature development is unfortunately concentrated on the left half of the Q6 due to the positioning of the CPU inside. Thus, the left side of the keyboard and palm rest will always be noticeably warmer than the right. This is unfavorable for gaming purposes since the commonly used WASD keys should be as cool as possible for maximum comfort. The Asus FX504 does a better job at keeping these important keys cool under load while the Asus GM501 provides a more symmetrical and agreeable temperature gradient.
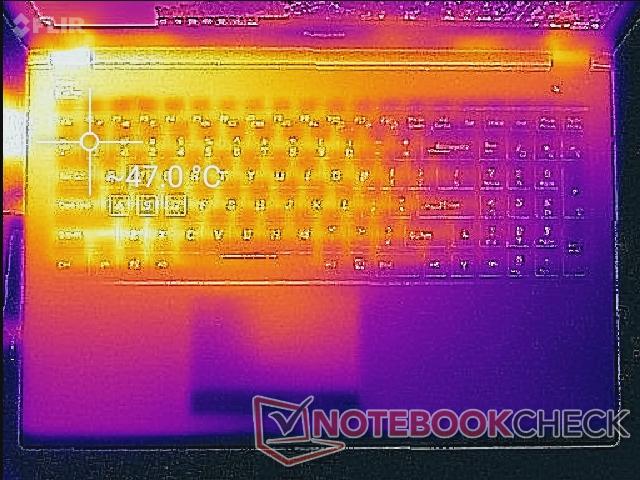
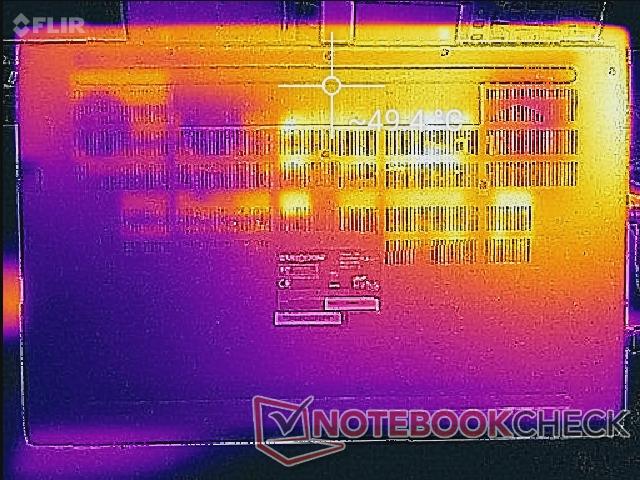
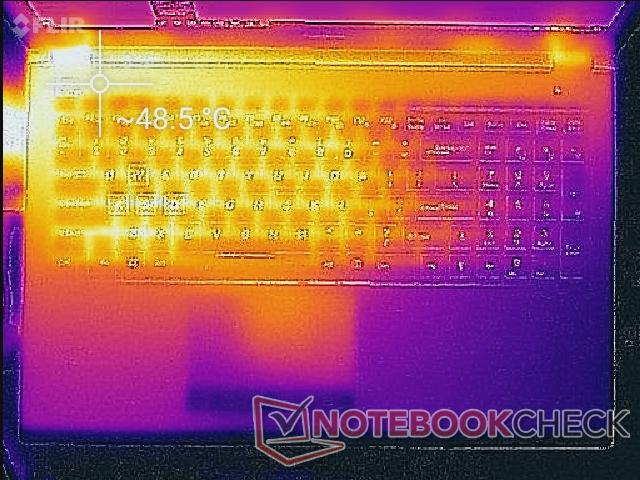
(-) The maximum temperature on the upper side is 49 °C / 120 F, compared to the average of 40.4 °C / 105 F, ranging from 21.2 to 68.8 °C for the class Gaming.
(-) The bottom heats up to a maximum of 53 °C / 127 F, compared to the average of 43.2 °C / 110 F
(+) In idle usage, the average temperature for the upper side is 28.5 °C / 83 F, compared to the device average of 33.9 °C / 93 F.
(-) Playing The Witcher 3, the average temperature for the upper side is 41.6 °C / 107 F, compared to the device average of 33.9 °C / 93 F.
(±) The palmrests and touchpad can get very hot to the touch with a maximum of 37.6 °C / 99.7 F.
(-) The average temperature of the palmrest area of similar devices was 28.8 °C / 83.8 F (-8.8 °C / -15.9 F).
Energy Management
Power Consumption
Idling on desktop demands anywhere between 11 W and 22 W depending on the brightness and Power Profile while gaming will draw about 140 W. Power consumption is very similar to the MSI GS65 since they both share the same CPU, GPU, and display resolution. Systems with "proper" GTX 1070 GPUs will be more power hungry when gaming by as much as 25 W or more.
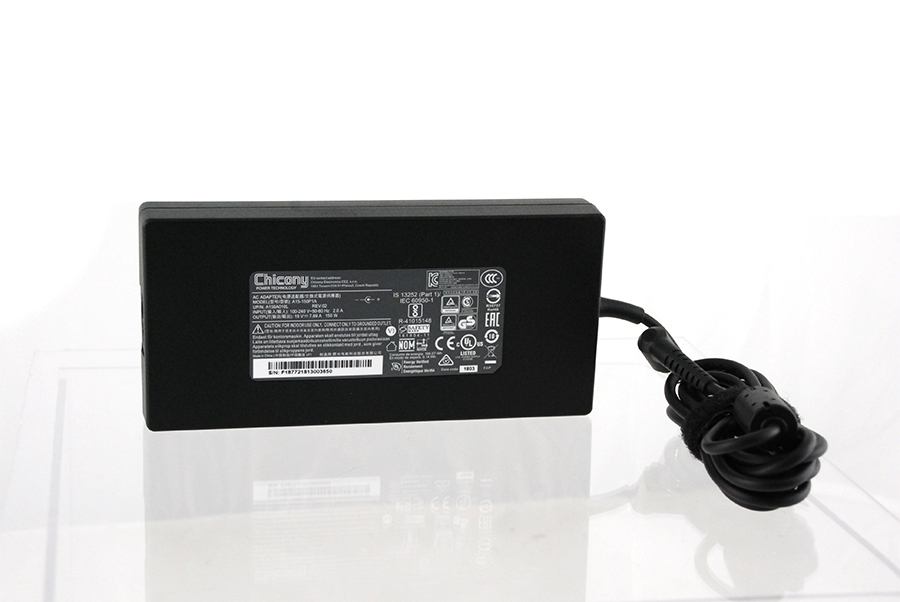
Maximum load draws 150 W from the medium-sized (~16 x 7.5 x 2.5 cm) 150 W AC adapter. In other words, there is no overhead available from the adapter. We would have preferred a more capable 180 W or 200 W AC adapter for the 10 to 20 percent power overhead as is common practice from most manufacturers. In fact, the Q5 actually ships with the more capable 180 W adapter and so we're not sure why Eurocom downgraded it to 150 W this time around.
(June 21, 2018 Update: Eurocom has informed us that the 150 W AC adapter with our test unit was shipped by mistake. All Q6 SKUs ship with 180 W AC adapters. Future SKUs will have the option for 200 W AC adapters to potentially boost performance even further.)
| Off / Standby | |
| Idle | |
| Load |
|
Key:
min: | |
| Eurocom Q6 i7-8750H, GeForce GTX 1070 Max-Q, Samsung SSD 960 Pro 512 GB m.2, IPS, 1920x1080, 15.6" | Eurocom Q5 i7-7700HQ, GeForce GTX 1070 Max-Q, Samsung SSD 960 Pro 512 GB m.2, IPS, 3840x2160, 15.6" | Aorus X5 v8 i7-8850H, GeForce GTX 1070 Mobile, Toshiba NVMe THNSN5512GPU7, IPS, 1920x1080, 15.6" | MSI GS65 8RF-019DE Stealth Thin i7-8750H, GeForce GTX 1070 Max-Q, Samsung SSD PM981 MZVLB512HAJQ, IPS, 1920x1080, 15.6" | HP Omen 15t-ce000 i7-7700HQ, GeForce GTX 1060 Max-Q, Samsung PM961 NVMe MZVLW128HEGR, IPS, 3840x2160, 15.6" | Asus Zephyrus M GM501 i7-8750H, GeForce GTX 1070 Mobile, Samsung SM961 MZVKW512HMJP m.2 PCI-e, IPS, 1920x1080, 15.6" | |
|---|---|---|---|---|---|---|
| Power Consumption | 15% | -60% | 11% | -2% | -24% | |
| Idle Minimum * (Watt) | 11.6 | 9 22% | 25 -116% | 7 40% | 15.4 -33% | 16 -38% |
| Idle Average * (Watt) | 16.3 | 13.5 17% | 31 -90% | 11 33% | 22.4 -37% | 19 -17% |
| Idle Maximum * (Watt) | 21.5 | 13.7 36% | 33 -53% | 20 7% | 22.4 -4% | 26 -21% |
| Load Average * (Watt) | 100.7 | 87.8 13% | 102 -1% | 98 3% | 78.1 22% | 103 -2% |
| Witcher 3 ultra * (Watt) | 140.1 | 129 8% | 194 -38% | 132 6% | 97.5 30% | 164 -17% |
| Load Maximum * (Watt) | 150.3 | 158.6 -6% | 239 -59% | 182 -21% | 133.52 11% | 223 -48% |
* ... smaller is better
Battery Life
Battery life is shorter than on the Q5 when subjected to similar WLAN loads despite both carrying identical 55 Wh internal battery packs. The delta could be attributed to unforeseen background activity or even differences in resolution and refresh rate between our Q5 and Q6 units. Even so, 3.5 to 4 hours of real-world browsing is about average for a gaming notebook.
Charging from near empty to full capacity still takes between 1.5 to 2 hours.
| Eurocom Q6 i7-8750H, GeForce GTX 1070 Max-Q, 55 Wh | Eurocom Q5 i7-7700HQ, GeForce GTX 1070 Max-Q, 55 Wh | Aorus X5 v8 i7-8850H, GeForce GTX 1070 Mobile, 92.24 Wh | MSI GS65 8RF-019DE Stealth Thin i7-8750H, GeForce GTX 1070 Max-Q, 82 Wh | Gigabyte Aero 15X v8 i7-8750H, GeForce GTX 1070 Max-Q, 94.24 Wh | HP Omen 15t-ce000 i7-7700HQ, GeForce GTX 1060 Max-Q, 70 Wh | |
|---|---|---|---|---|---|---|
| Battery runtime | 12% | 11% | 49% | 133% | 3% | |
| Reader / Idle (h) | 5.1 | 7.8 53% | 4.9 -4% | 8.5 67% | 12.7 149% | 5 -2% |
| WiFi v1.3 (h) | 3.7 | 4.3 16% | 6 62% | 8.6 132% | 3.5 -5% | |
| Load (h) | 1.2 | 0.8 -33% | 1.5 25% | 1.4 17% | 2.6 117% | 1.4 17% |
Pros
Cons
Verdict
Our general comments for the Q5 still apply here for the Q6. Potential users interested in the Q6 should make the most of the system by utilizing its accessible 2.5-inch SATA III bay and 4G LTE connectivity as these are uncommon in the world of super-thin gaming notebooks.
The biggest challenge for the Q6 is that it doesn't offer all that much more over the Q5 in terms of features and gaming performance. This isn't necessarily bad because the Q5 is a respectable gaming system to begin with, but the Q6 is launching in the same quarter as heavy-hitters like the MSI GS65 and Gigabyte Aero 15X. Both alternatives offer narrow bezels, the same CPU and GPU options, and similar 144 Hz panels all while being significantly lighter and more portable for the same ~$2000 price point. Even "thick bezel" newcomers like the Asus Zephyrus M GM501 or Aorus X5 v8 offer Thunderbolt 3, per-key RGB lighting, or both. In short, the Eurocom Q series is beginning to show its age and it risks falling behind even further should next year's refresh be yet another minor update. The Q6 will have to come down in price if it hopes to be more competitive against the latest models from MSI, Asus, Aorus, and Razer.
Performance is solid if not a little too warm. For the price, however, the Q6 is sorely missing modern luxuries that alternatives are offering like Thunderbolt 3, per-key RGB lighting, and narrow bezels. The series is at a standstill for the moment while competitors are zooming by with fresher designs and more features.
Eurocom Q6
- 06/22/2018 v6 (old)
Allen Ngo
Price comparison
