Eurocom Sky X9C (i7-8700K, GTX 1080 SLI, Clevo P870TM1-G) Laptop Review

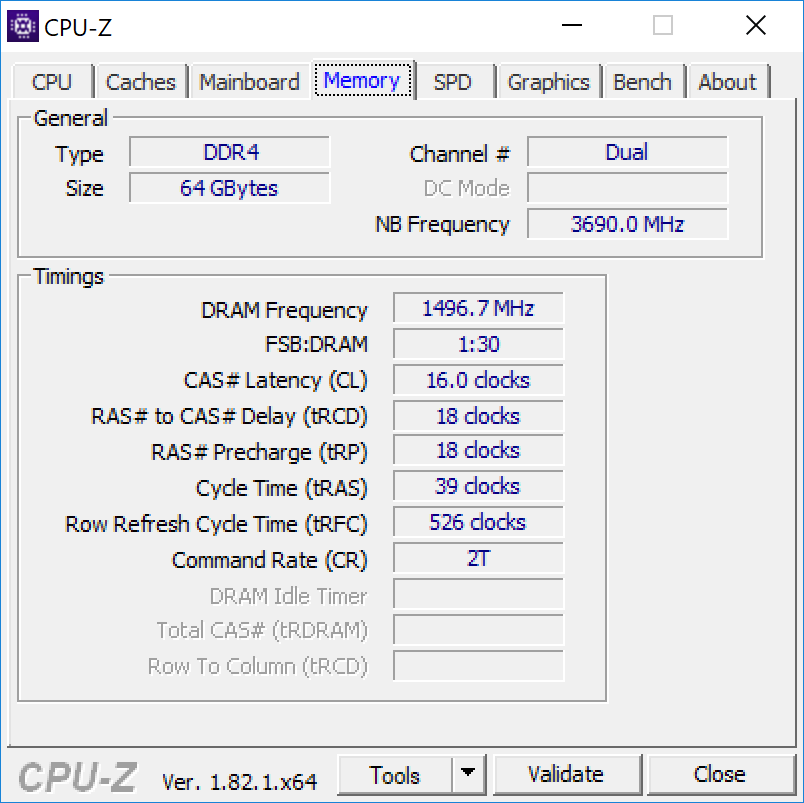
Eurocom notebooks have always prioritized serviceability, customization, and extreme performance even if it means higher costs, louder fans, and warmer temperatures. The 17.3-inch Sky X9C continues this trend with no regrets whatsoever as evident by its Coffee Lake Core i7-8700K CPU, GeForce GTX 1080 SLI graphics, 64 GB of DDR4-2666 RAM, and 4K UHD IPS display. Needless to say, it's one of the most powerful and expensive gaming notebooks available besting even the $5000 USD 18.4-inch MSI GT83VR.
Visually, the Clevo P870TM1-G chassis is essentially identical to the Schenker XMG U727 (Clevo P870KM-GS) that we've already published earlier this year and we recommend checking out our existing review here for more information on case quality and its wide array of features. Instead, the main focus of our Sky X9C review page will be on the desktop Core i7-8700K CPU and how it translates to a notebook form factor. Clevo systems have been incorporating traditional LGA CPU sockets over the past few years and it was certainly inevitable for resellers like Eurocom to jump in on Coffee Lake as soon as its processors became available. Is the hexa-core i7-8700K really any better than the quad-core Kaby Lake i7-7700K or Skylake i7-6700K?
Direct competitors in this enthusiast market segment are hard to come by since major manufacturers like MSI, Dell, Gigabyte, and Aorus do not yet offer gaming notebooks with desktop processors. If users can overlook this particular feature, however, then there are a small handful of SLI-powered Pascal alternatives including the MSI GT75VR, GT83VR, Aorus X9, and Asus GX800. Professional users can equip the system with a primary Quadro P5000 GPU, secondary GTX 1080 for PhysX, and up to 22 TB of internal storage to tuen the Sky X9C into one of the most versatile mobile workstations available.
Users from North America or Europe can begin browsing and configuring the Sky X9C via its official product page here. The Schenker XMG U727 is not completely identical to the Sky X9C, but the similarities are inarguable and so our existing pages below can give more insight on the what the Eurocom version has to offer.
The Sky X9C starts at $2900 USD while our configuration as tested is $7500 USD.
Case

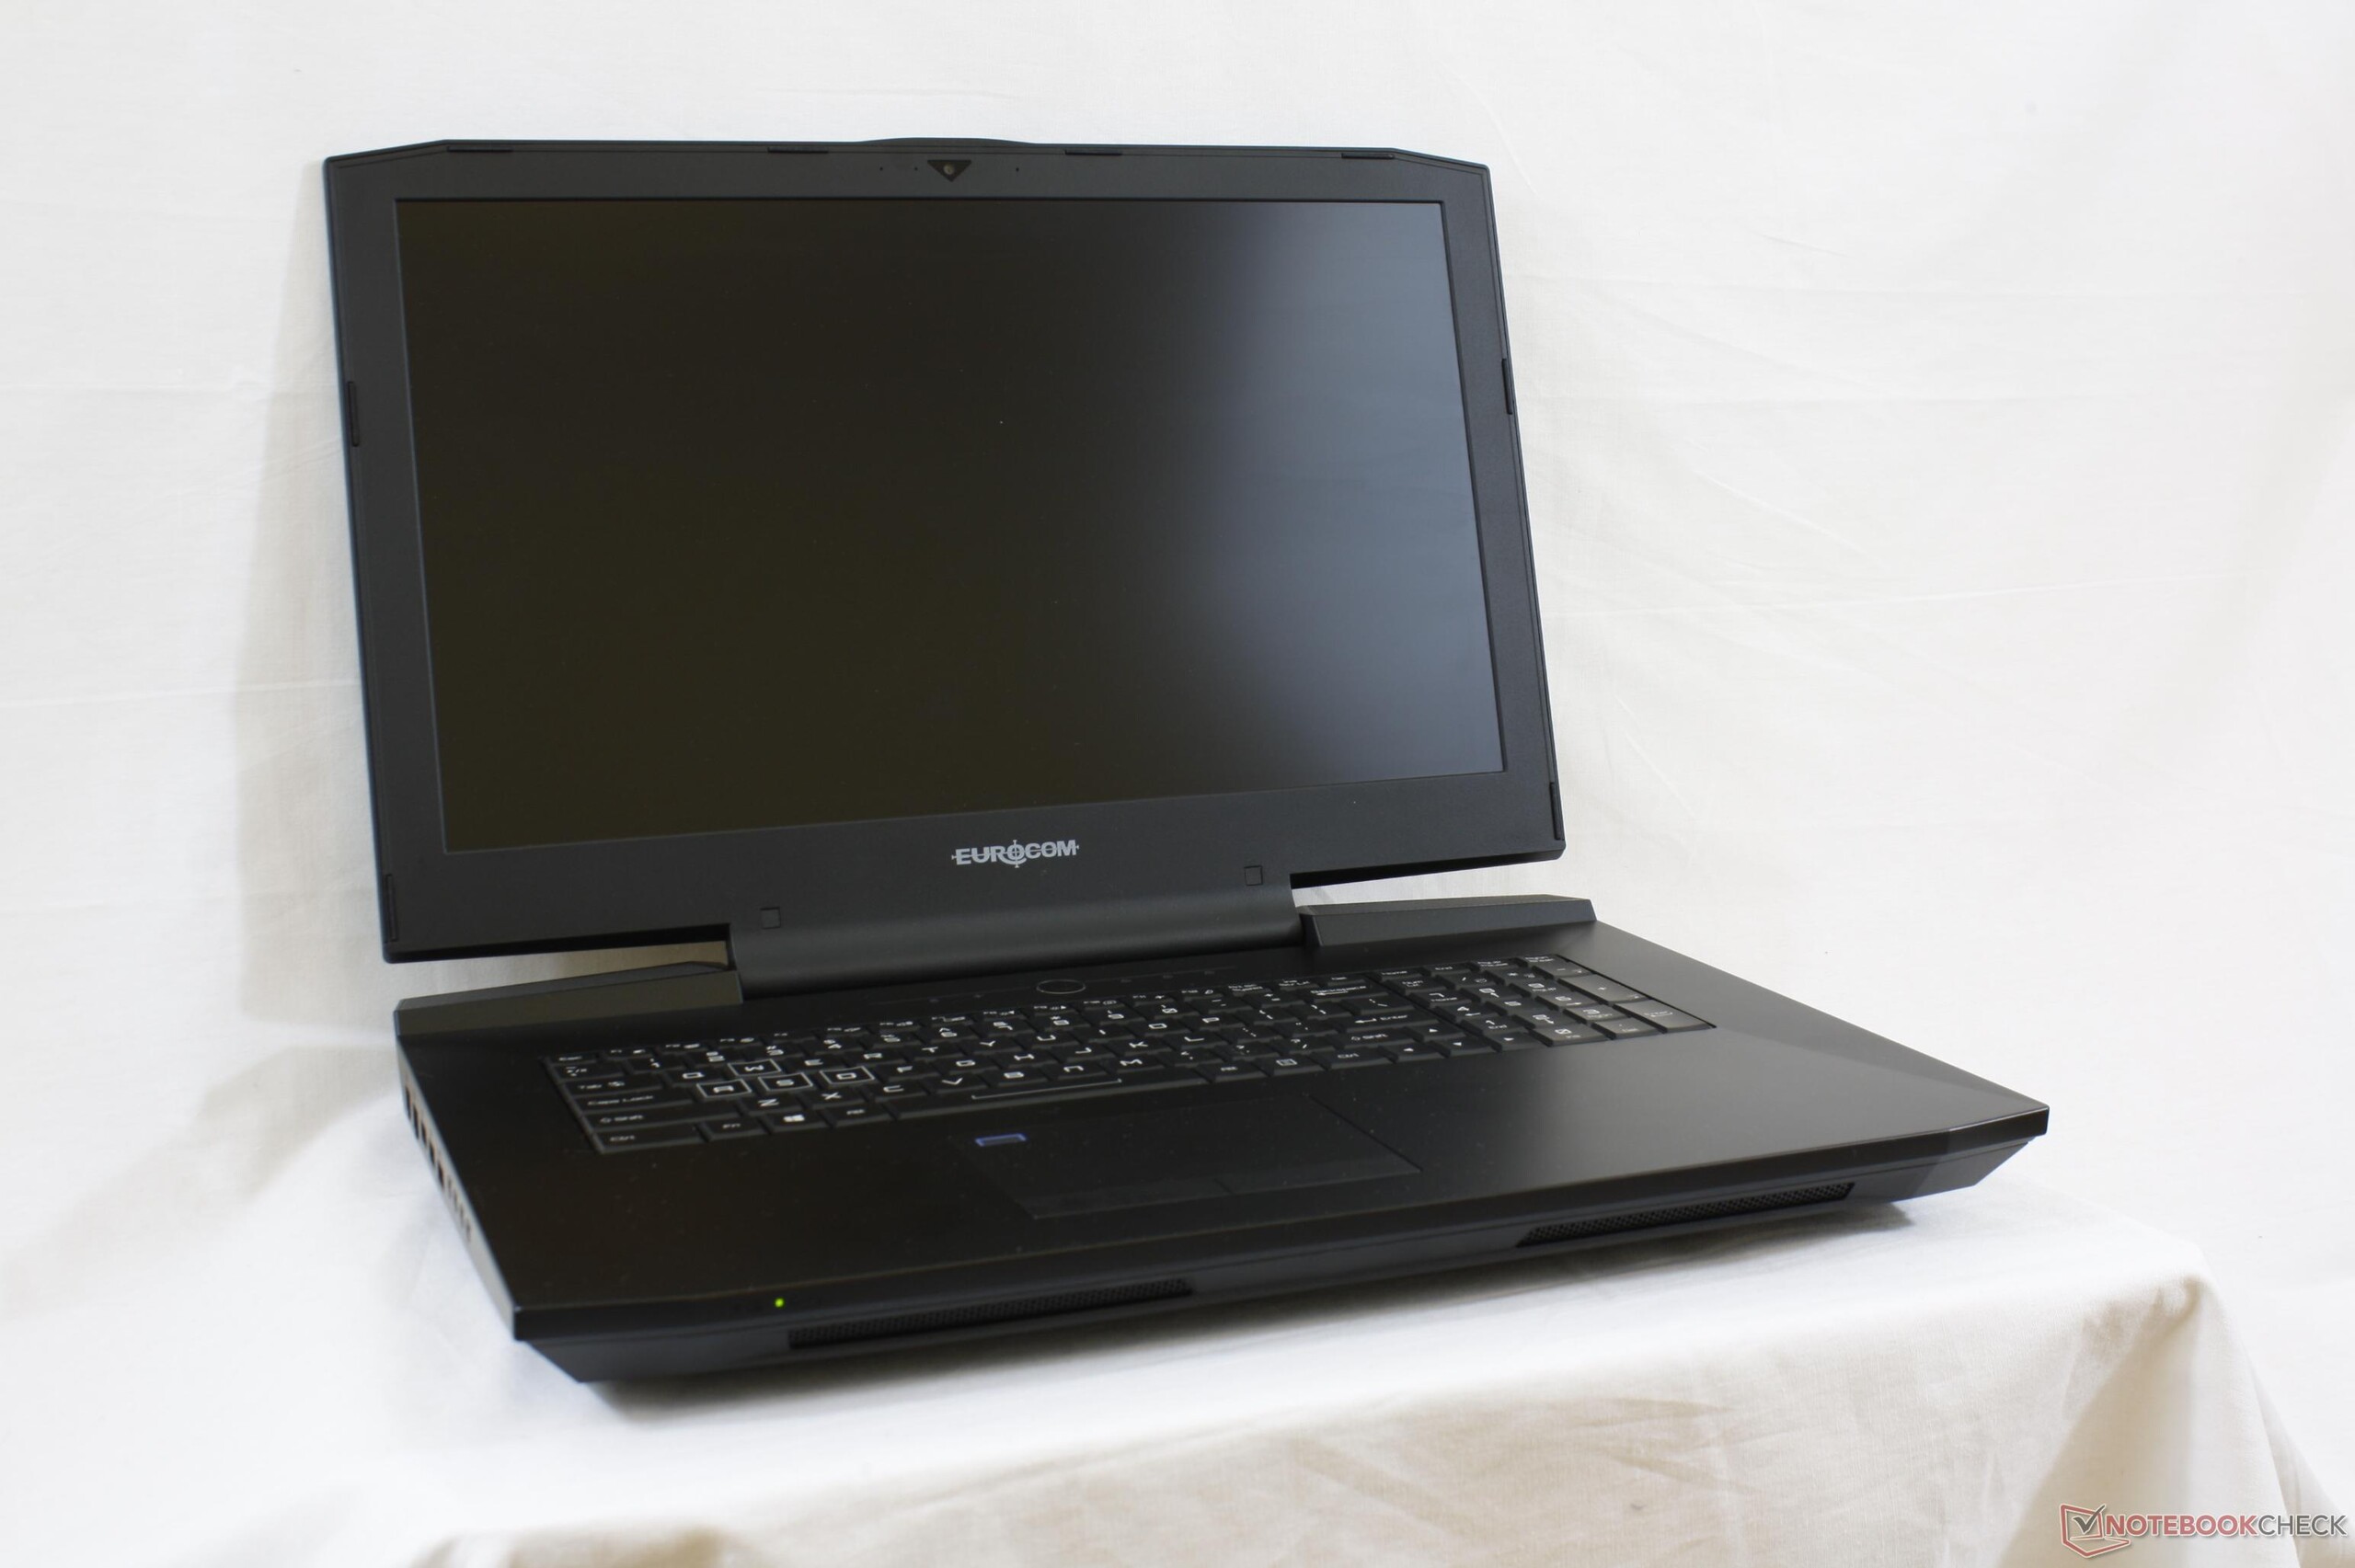
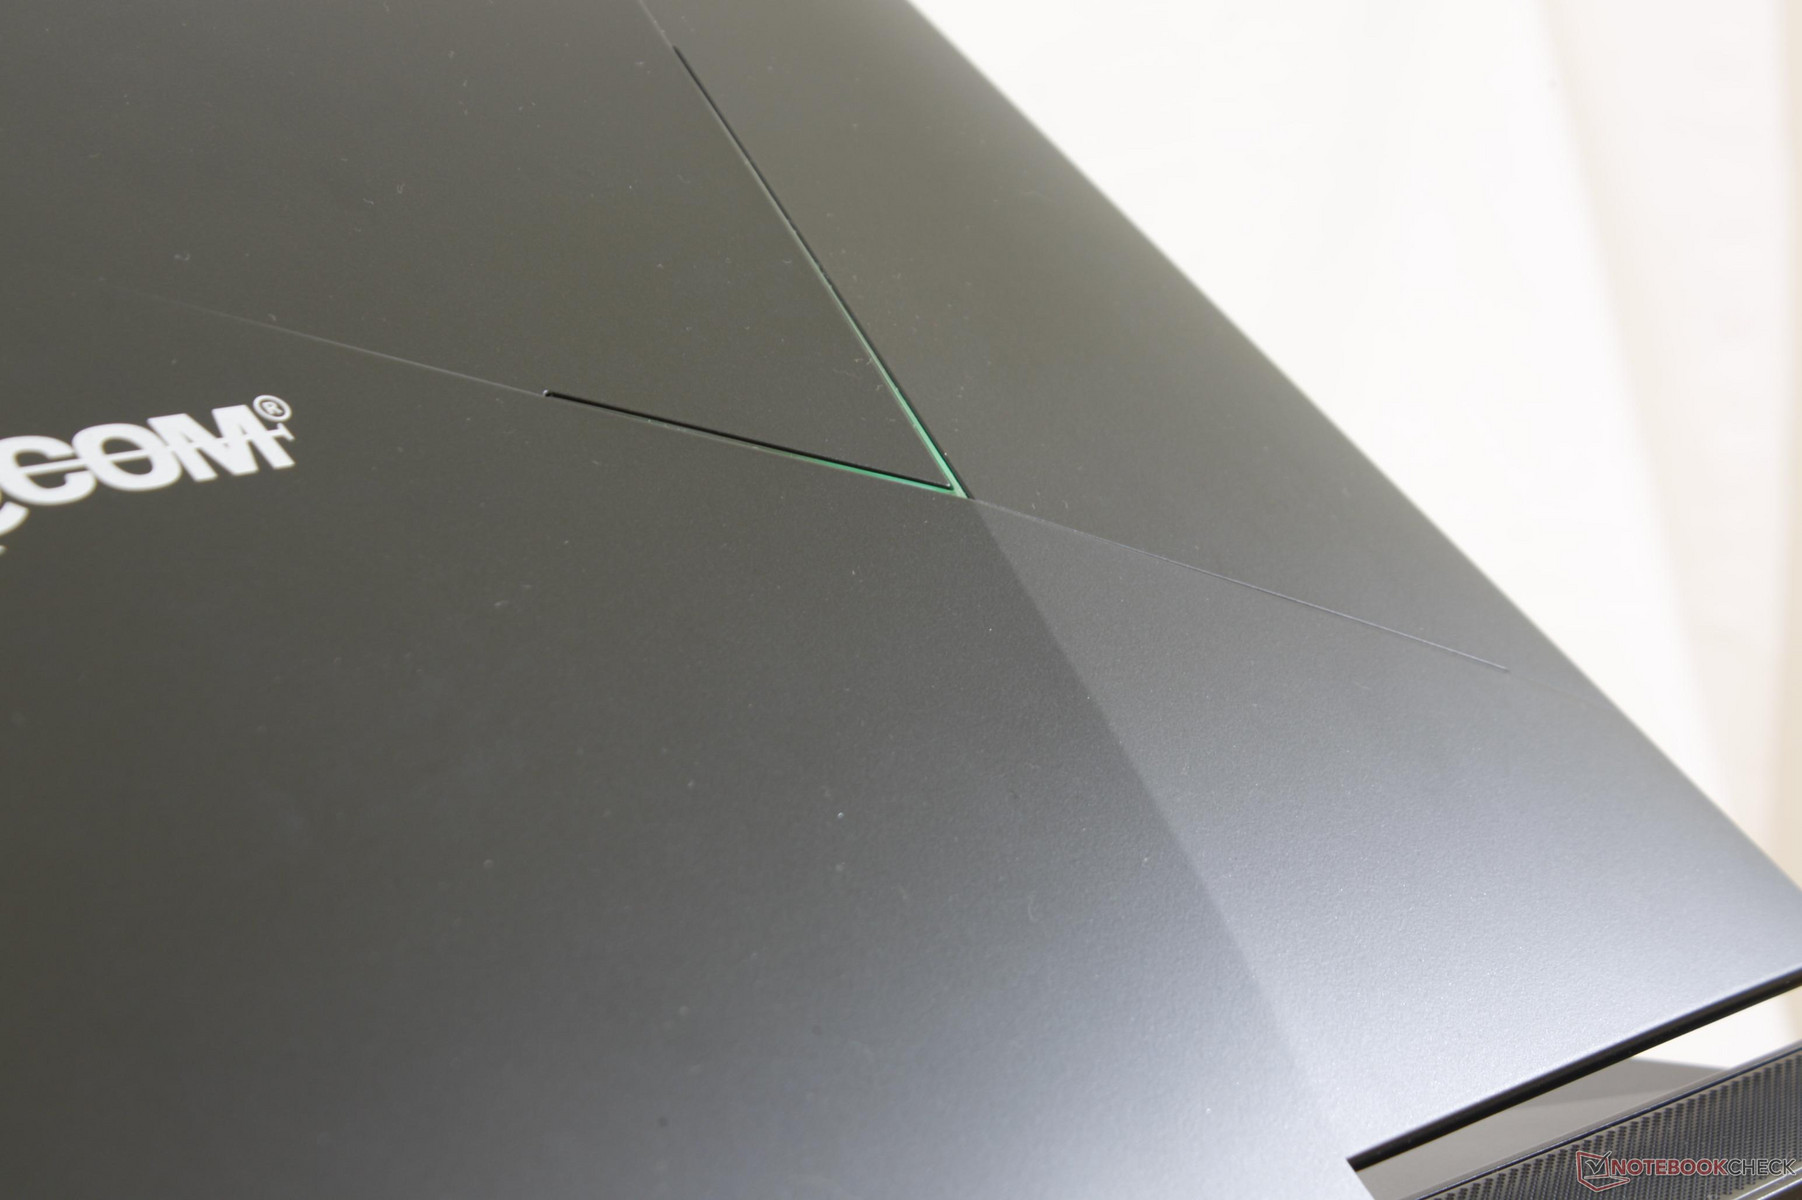
Chassis design has not changed dramatically from the older Clevo P870DM back in 2015. Both aluminum and ABS plastic still make up the outer lid and bottom base, respectively, with the same LED-lit accent marks on the outer cover and row of LED indicators surrounding the Power button. Rigidity is excellent from top to bottom as pushing down on the palm rests or center of the keyboard results in almost no visible warping. Attempting to twist the base from its sides results in no bending or audible creaking as well. The lid is more susceptible to warping along its corners and outer center as is typical of large 17.3-inch notebooks. In terms of rigidity, the lid feels weaker than on the Alienware 17 but stronger than on the MSI GT72 series and Aorus X7 series.
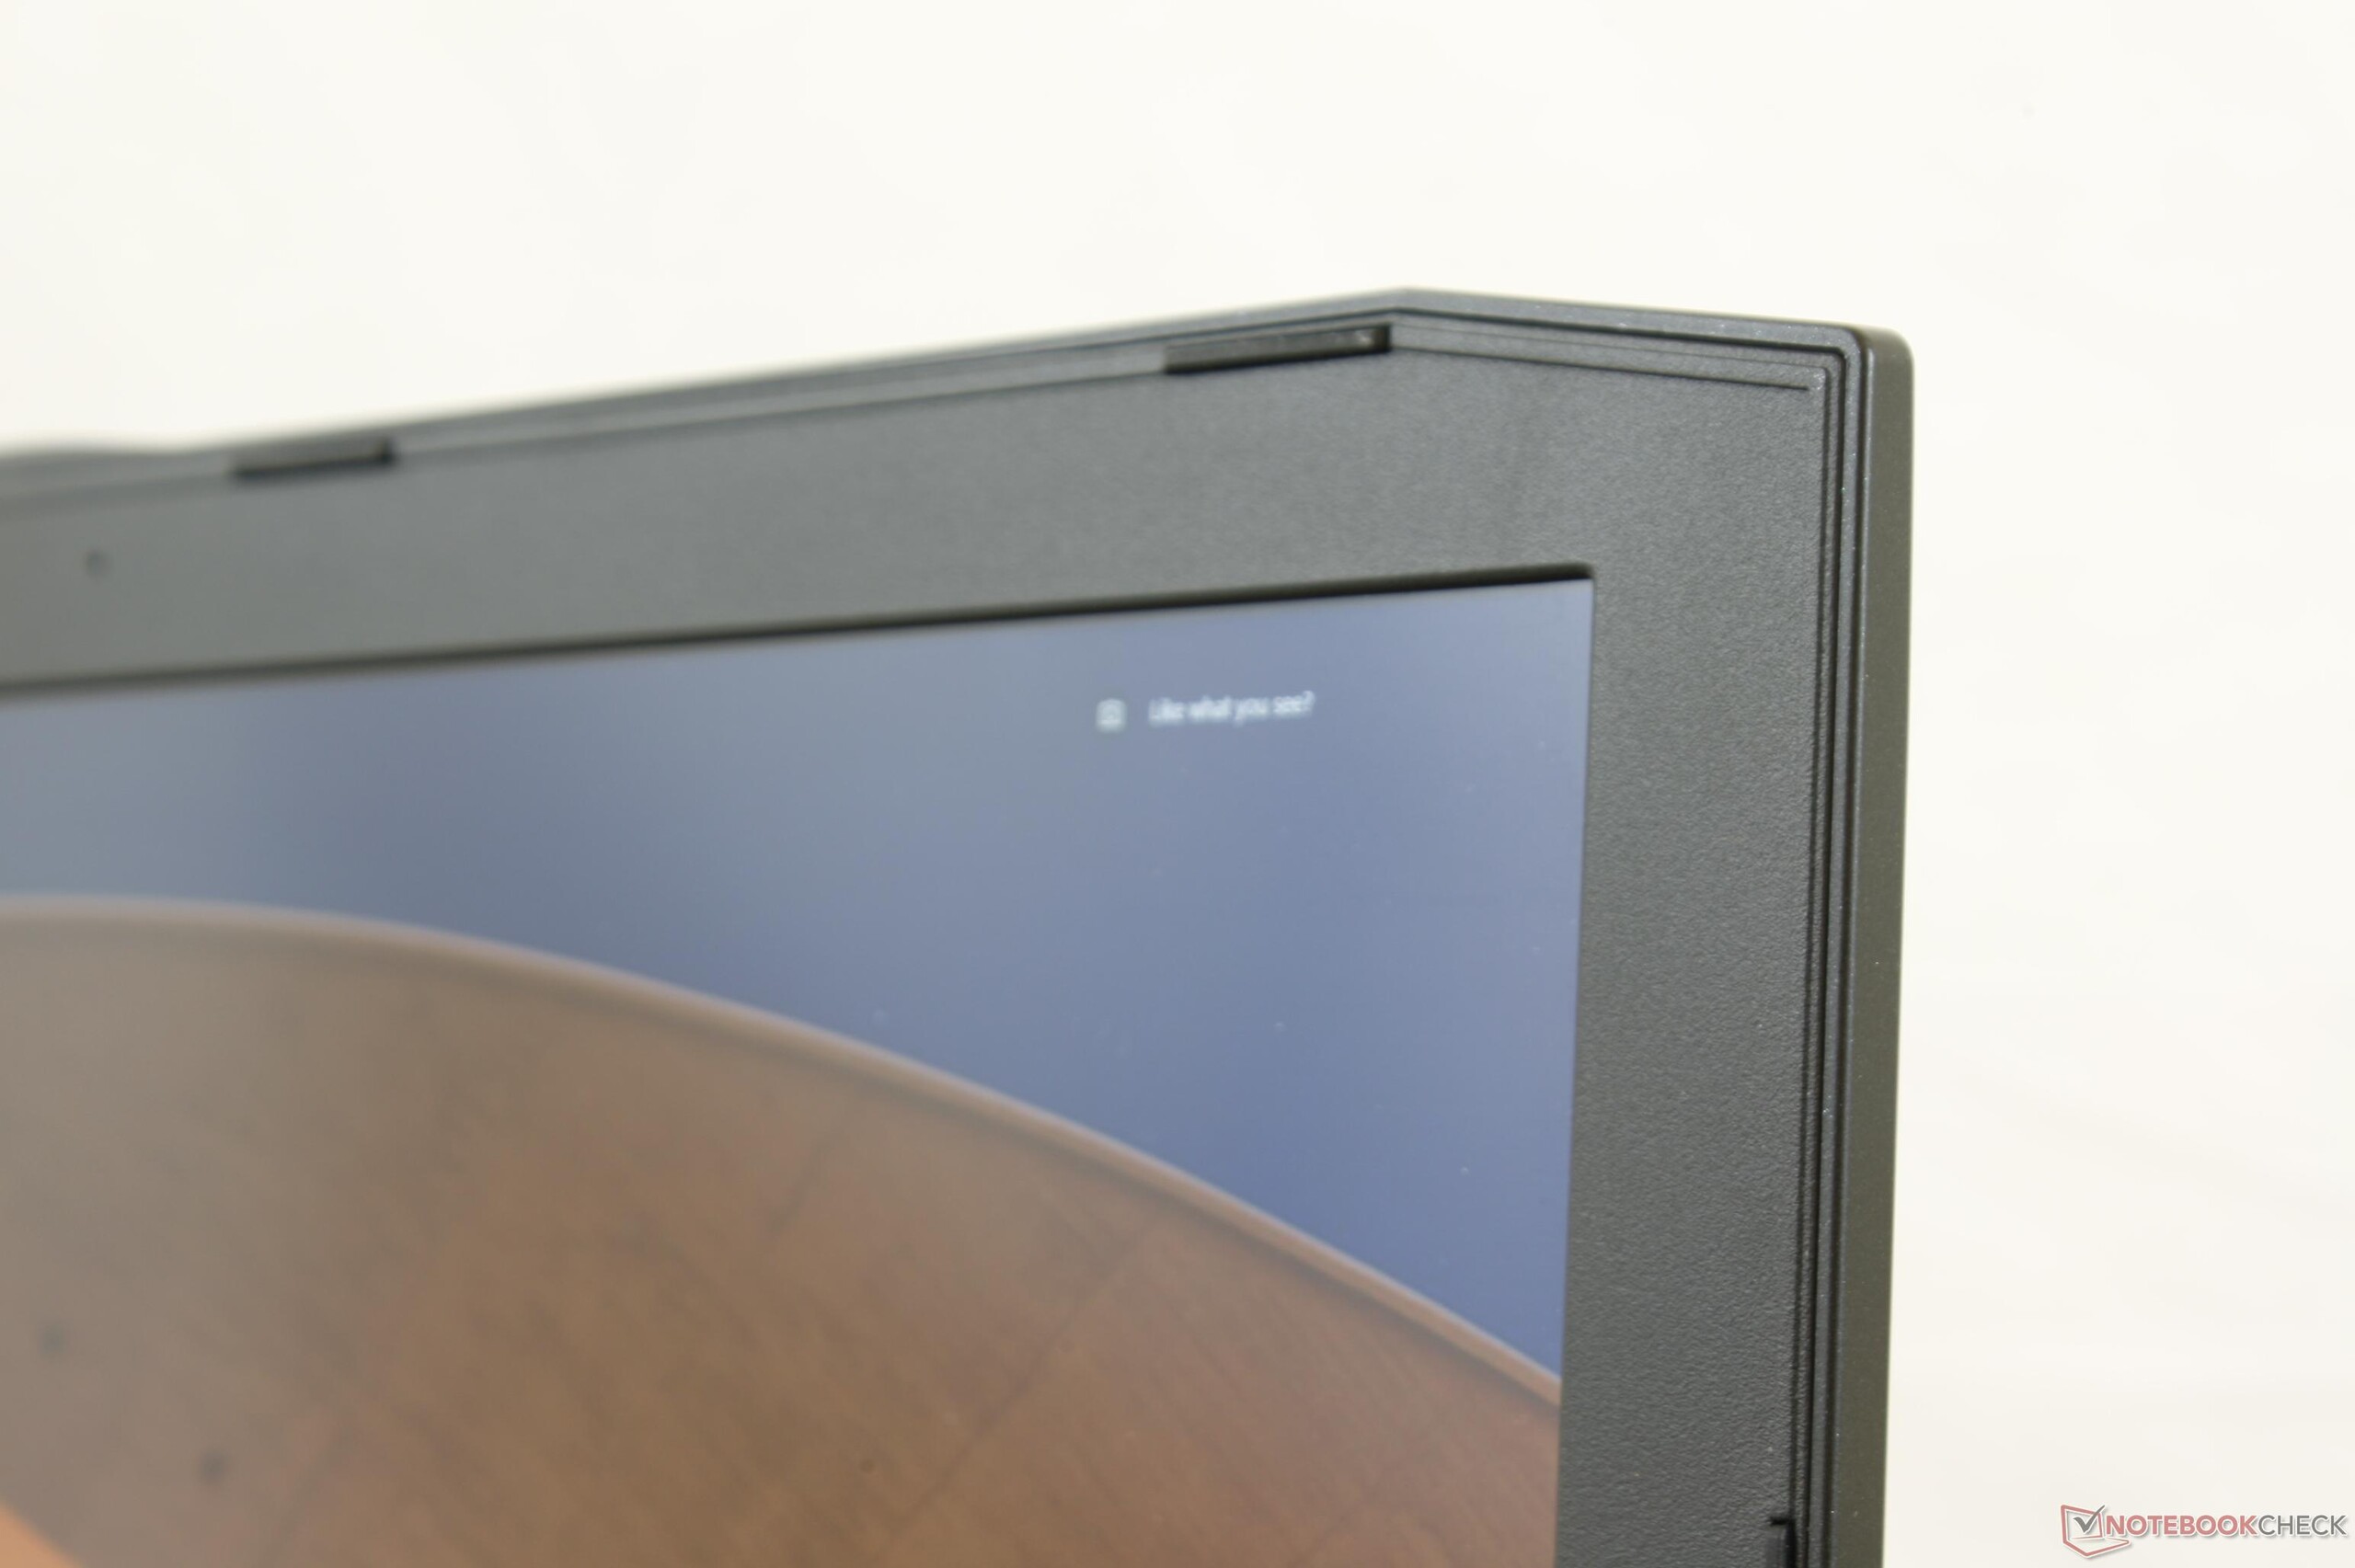
Construction quality is excellent with only one minor flaw on our test unit. As shown by the picture on the right, the inner bezel does not sit perfectly flat against the edge of the screen and a small gap is visible. It's relatively common on MSI and Clevo notebooks, but it almost never occurs on an Alienware notebook. The gap is thankfully superficial and with no impact to the rigidity of the system.
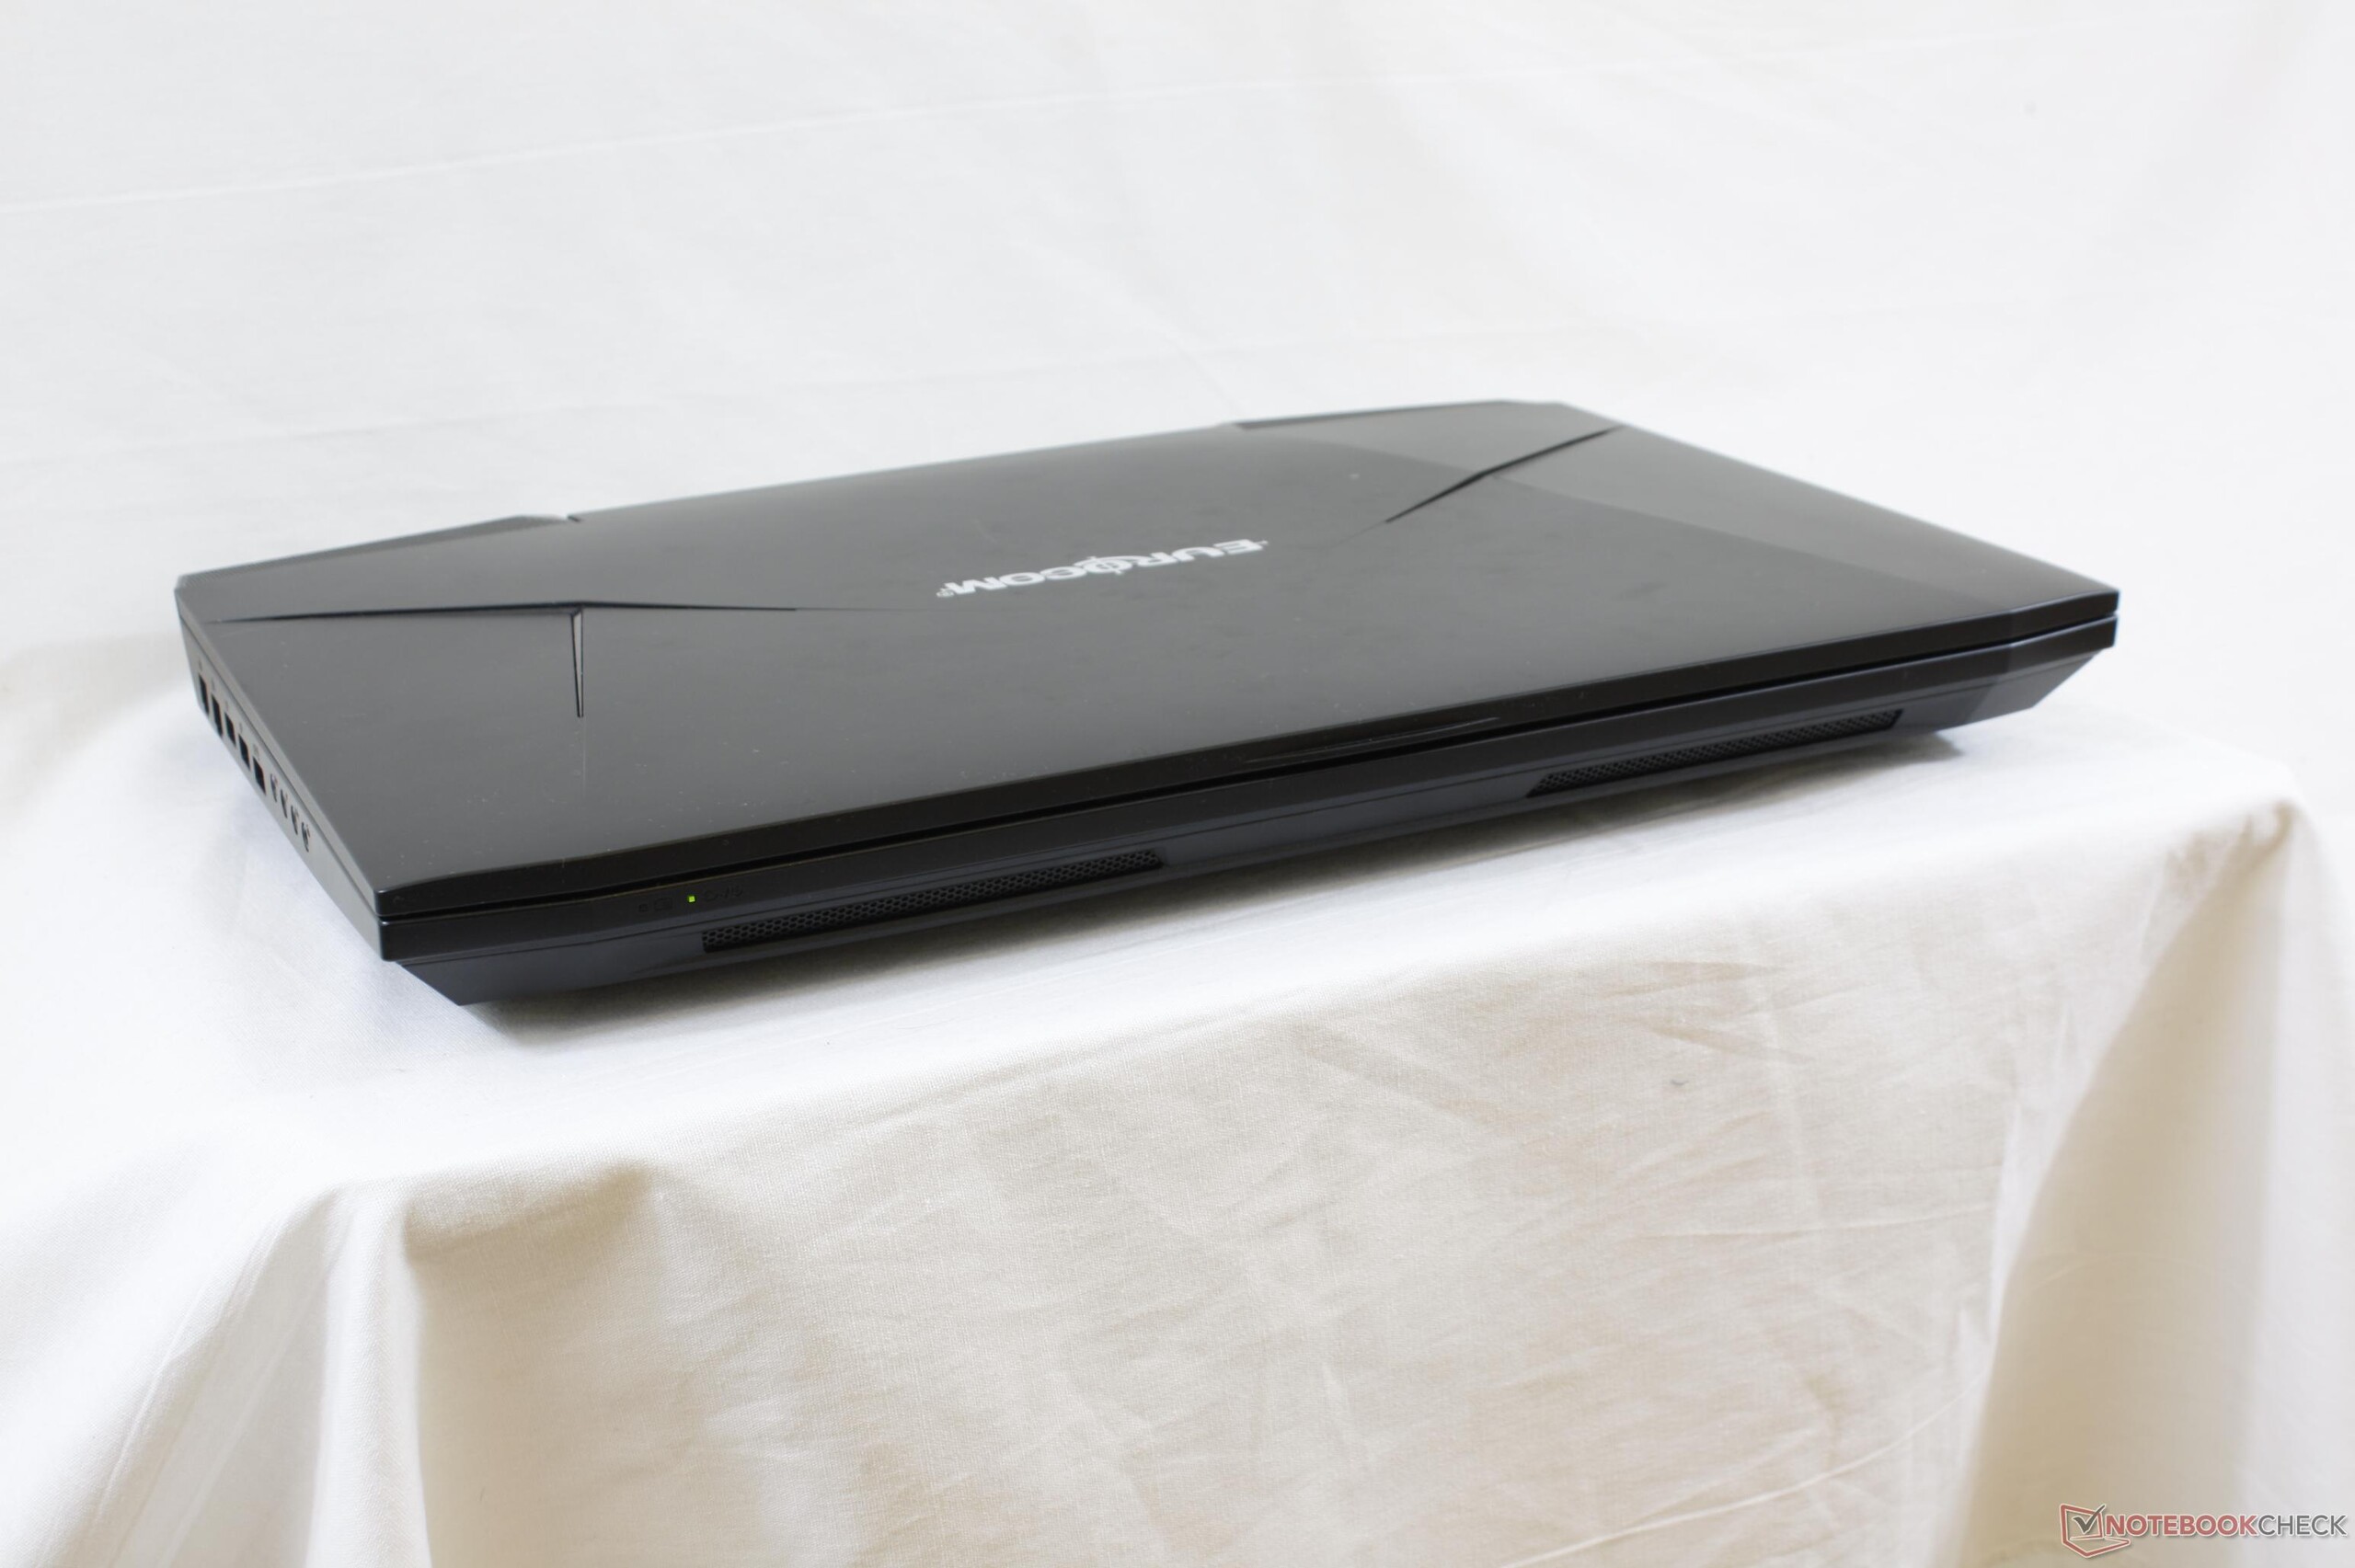
In terms of size and weight, the Sky X9C is as heavy or slightly heavier than the MSI GT83VR despite the latter being a much larger 18.3-inch notebook. Its footprint is very similar to the Asus G701VI and MSI GT75VR even though these alternatives are less powerful in comparison. There's no denying that the Sky X9C is a very a densely packed system without needing any novelty cooling methods a la the bulky GX800 cooling dock.
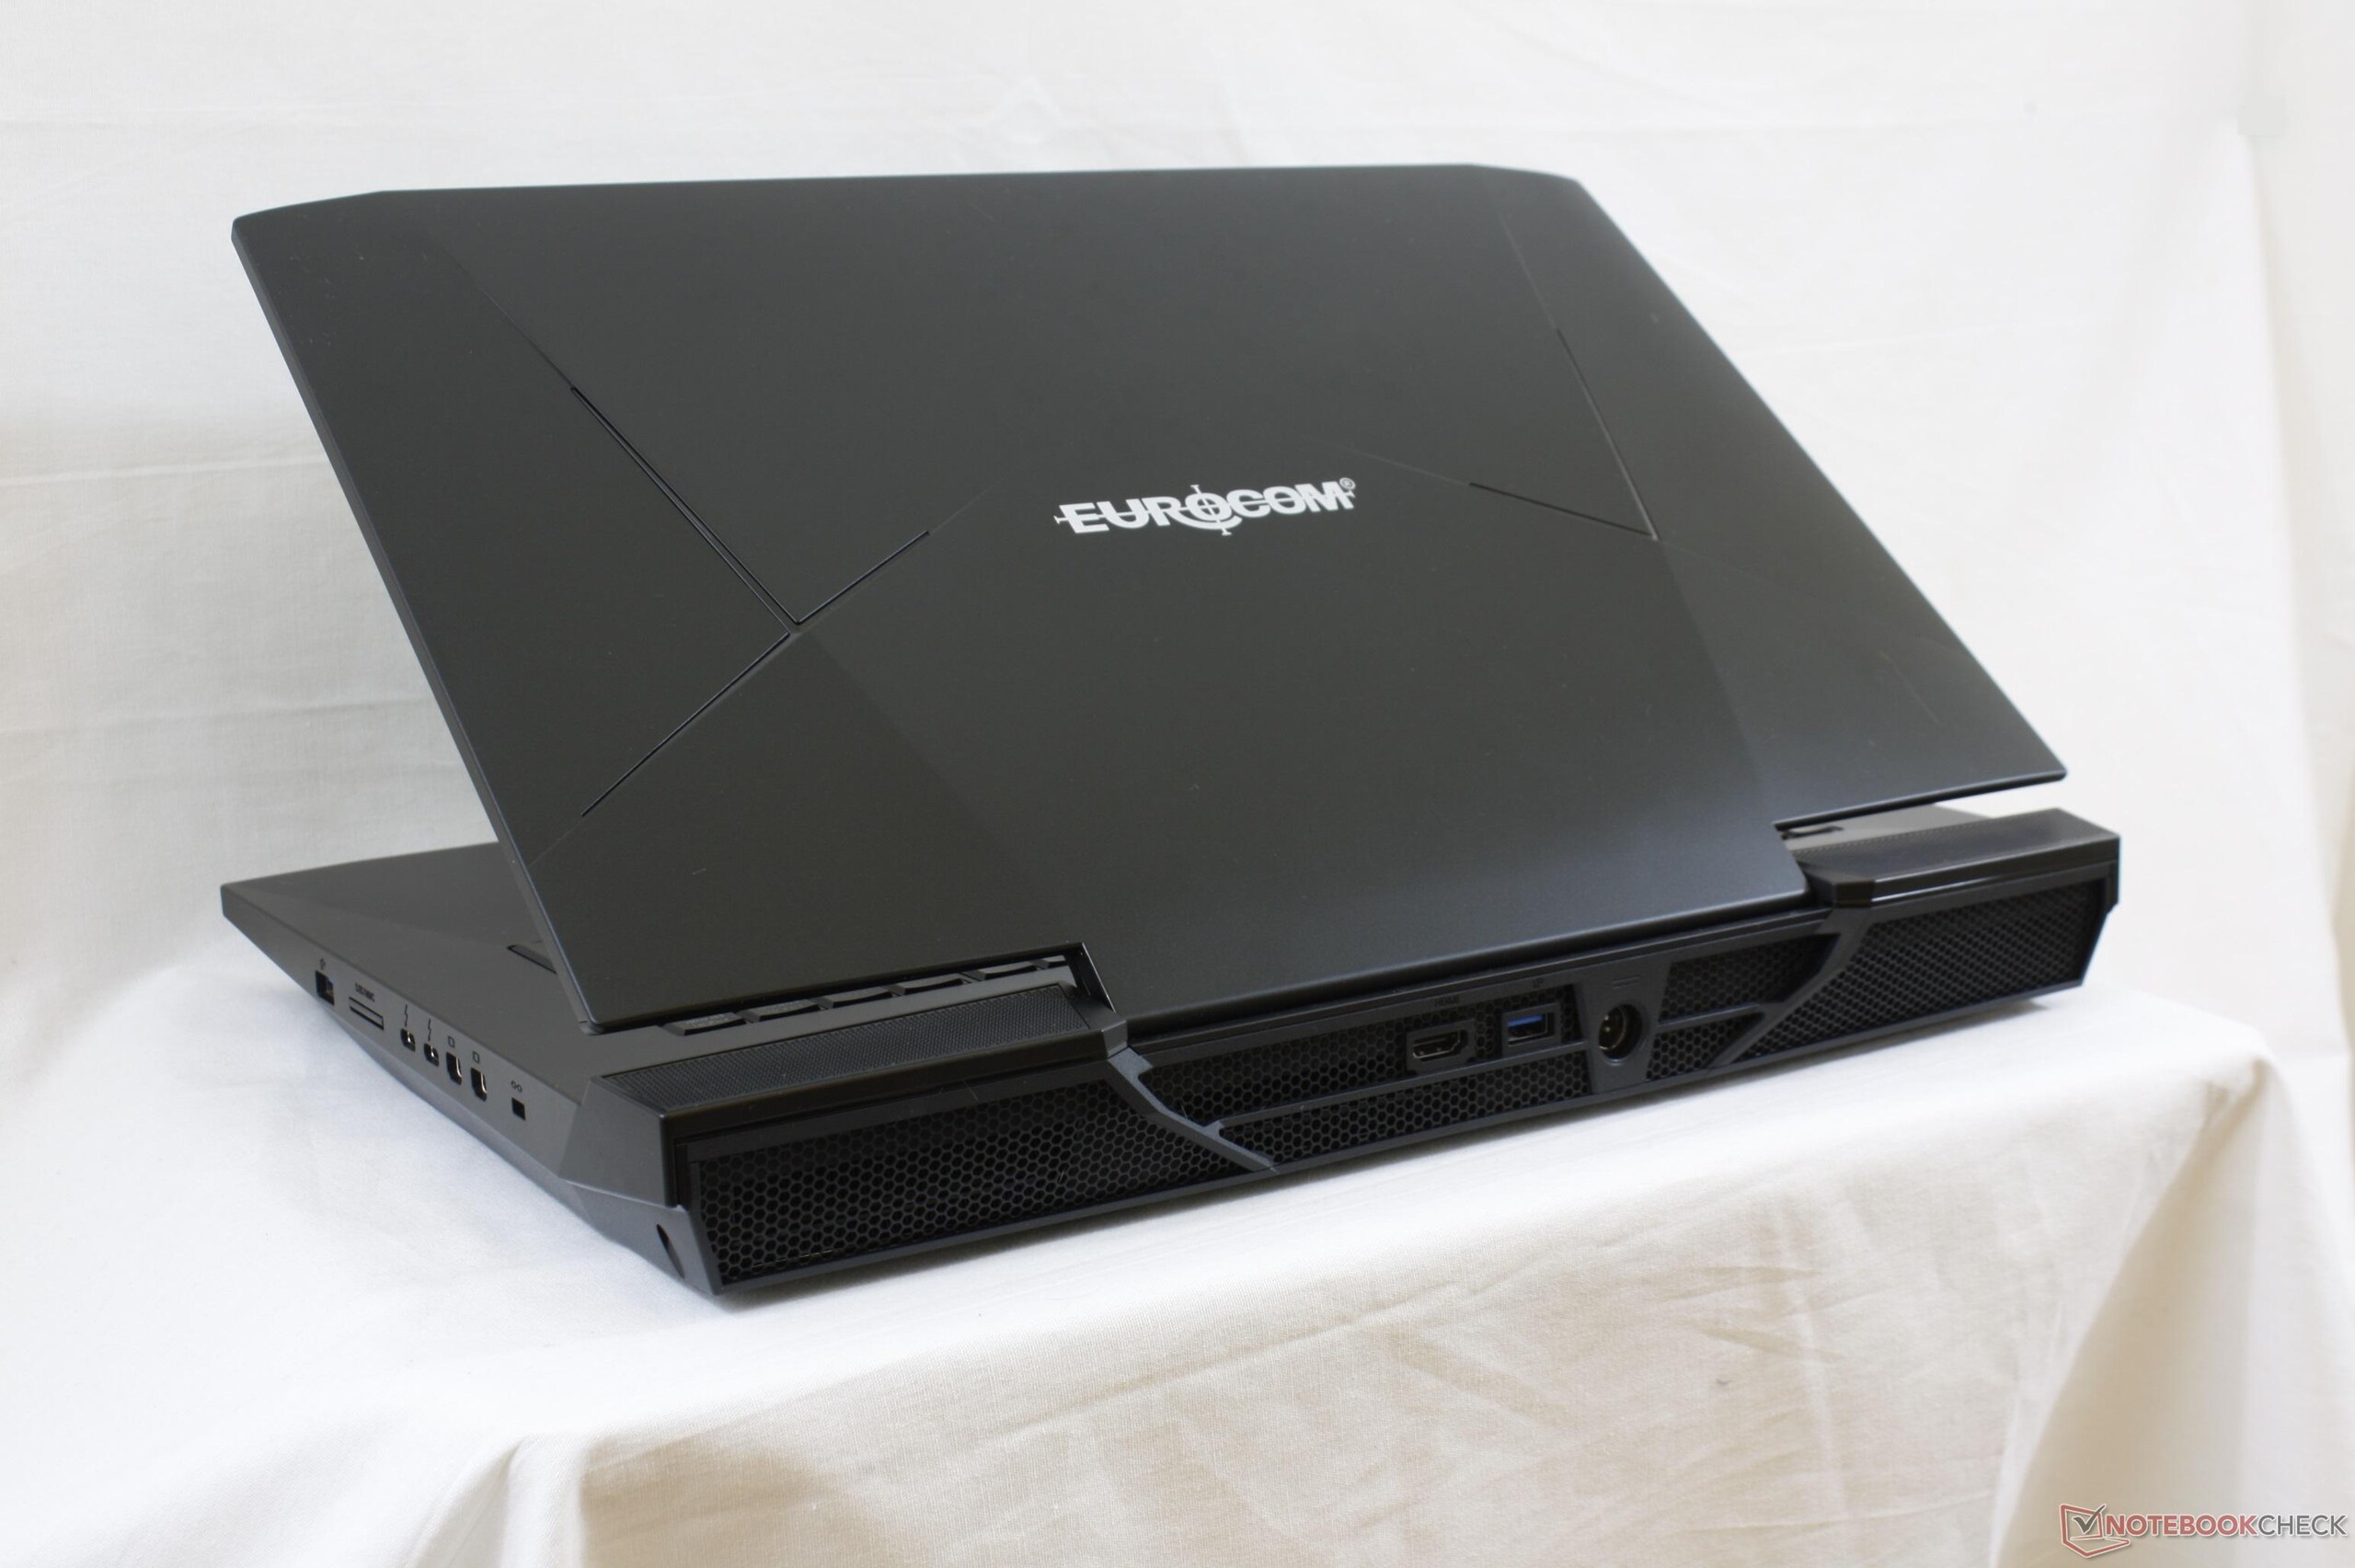

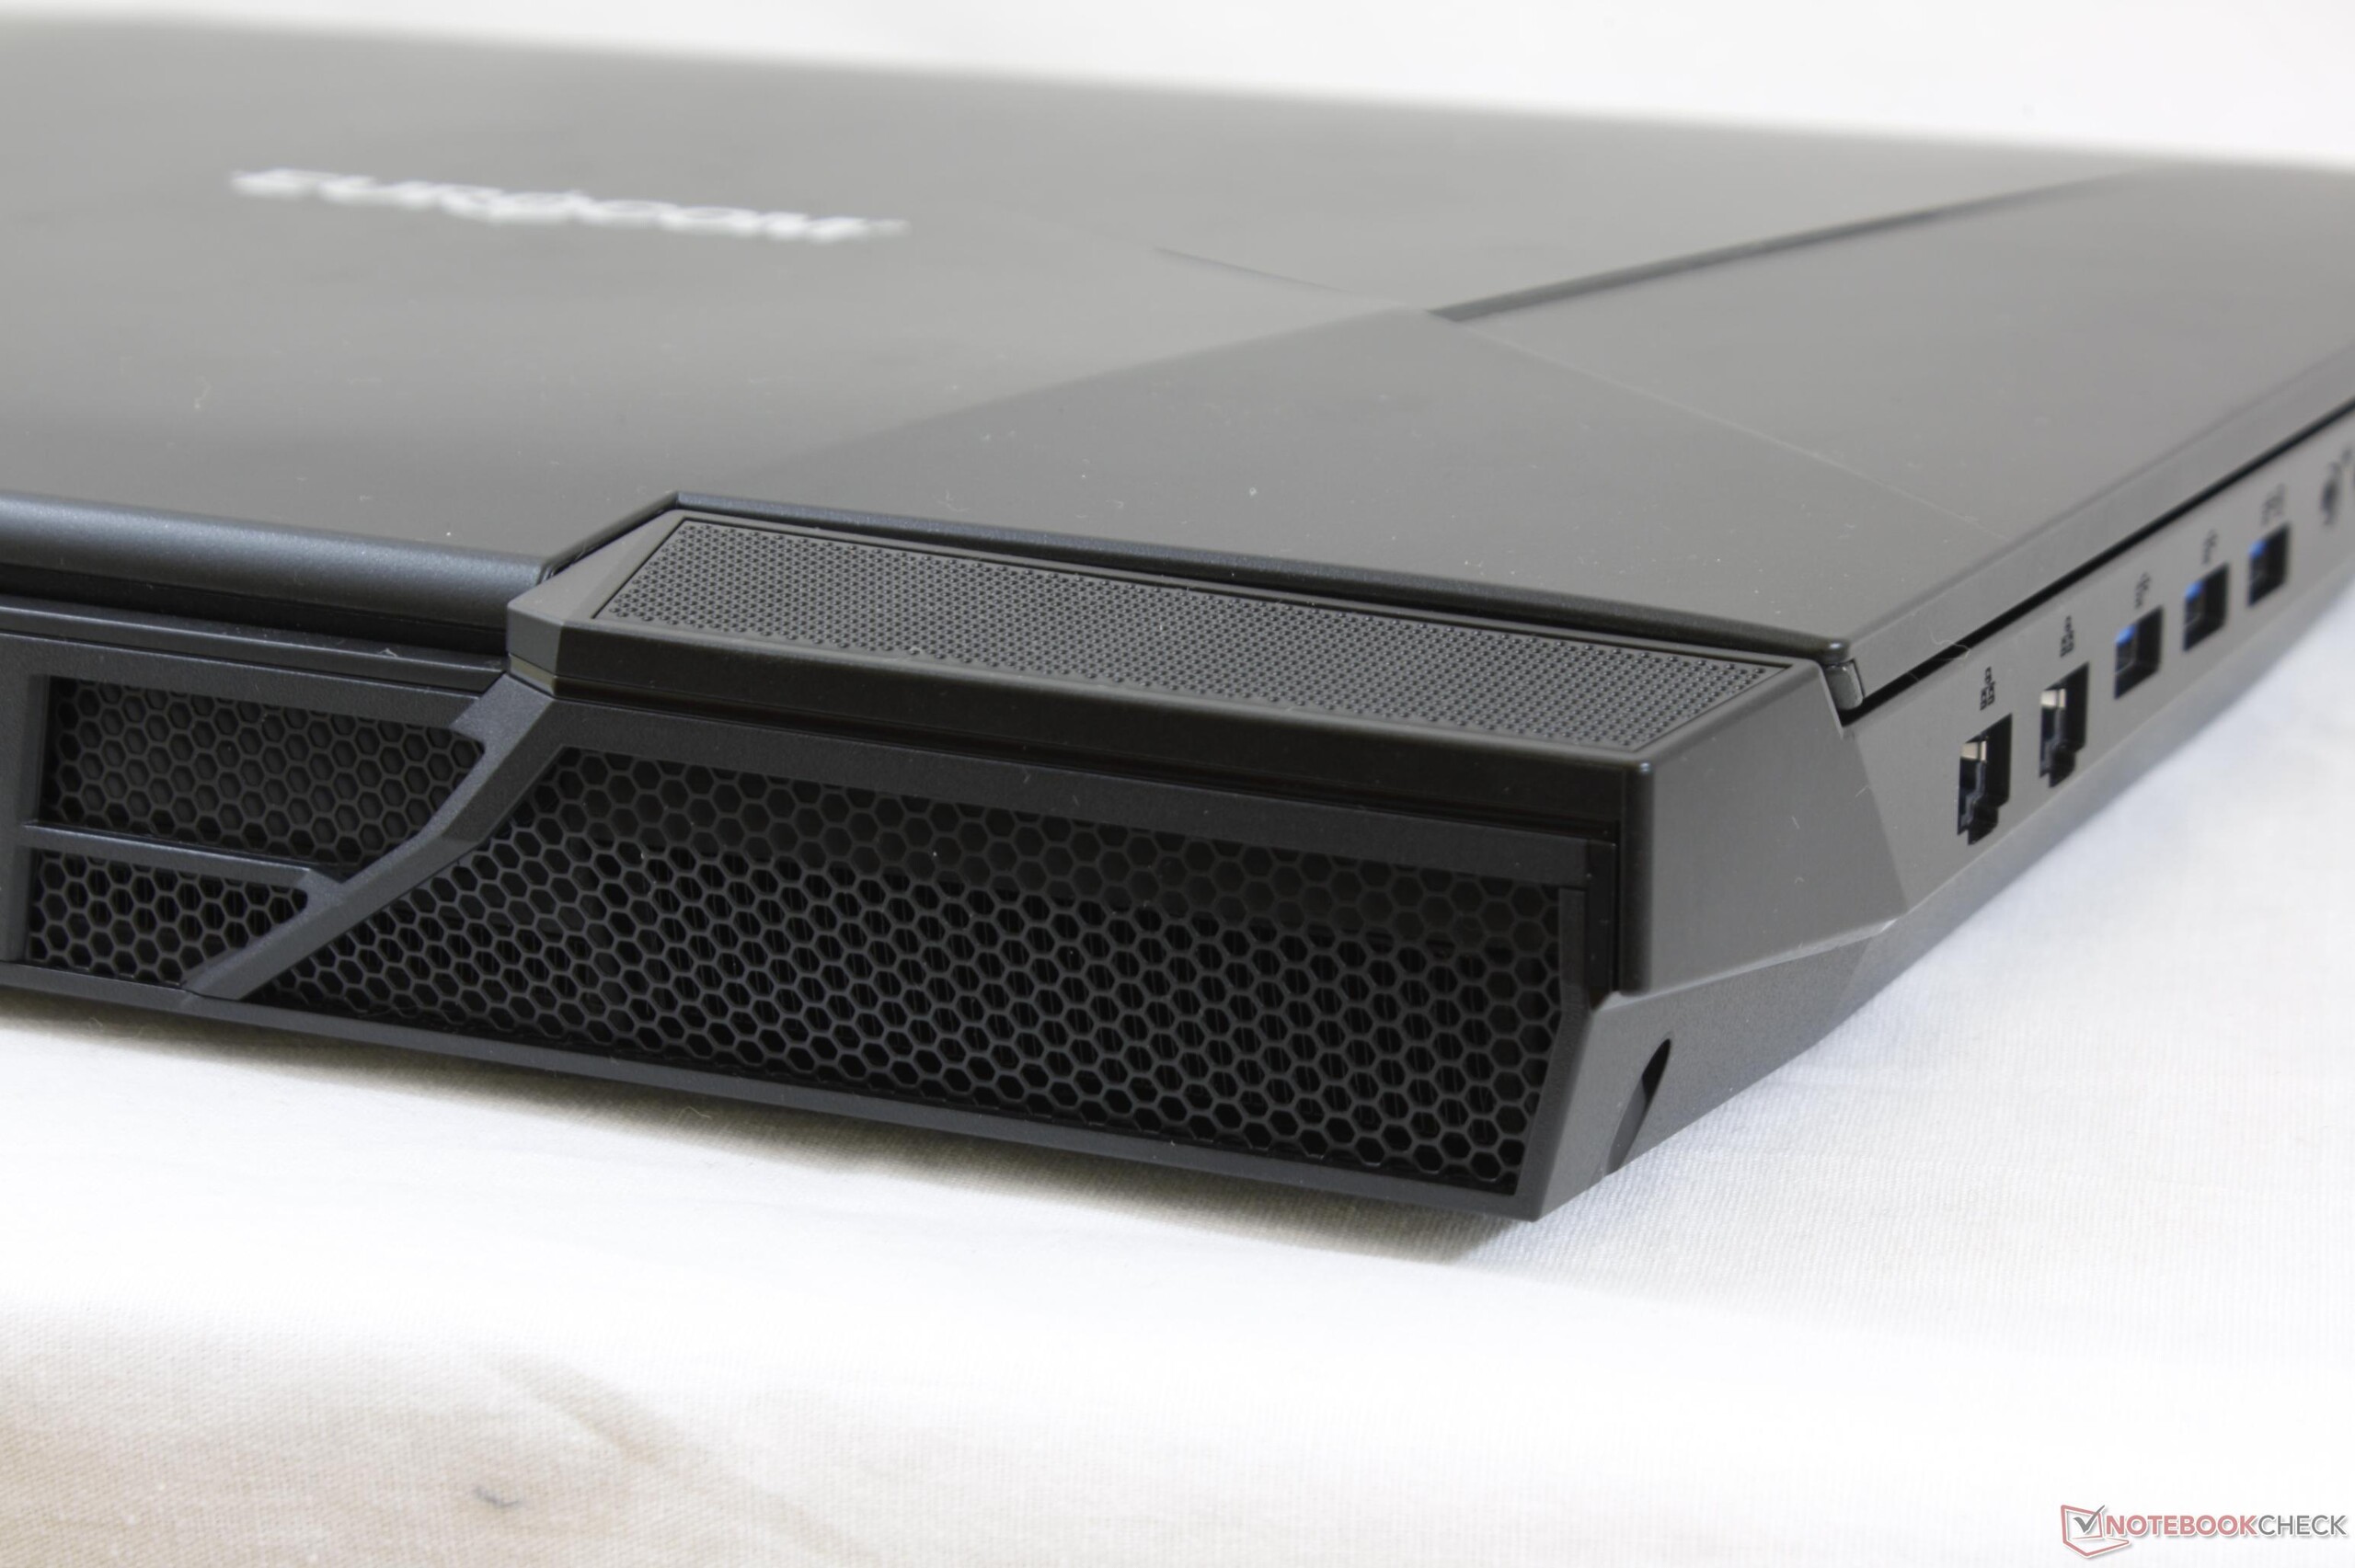
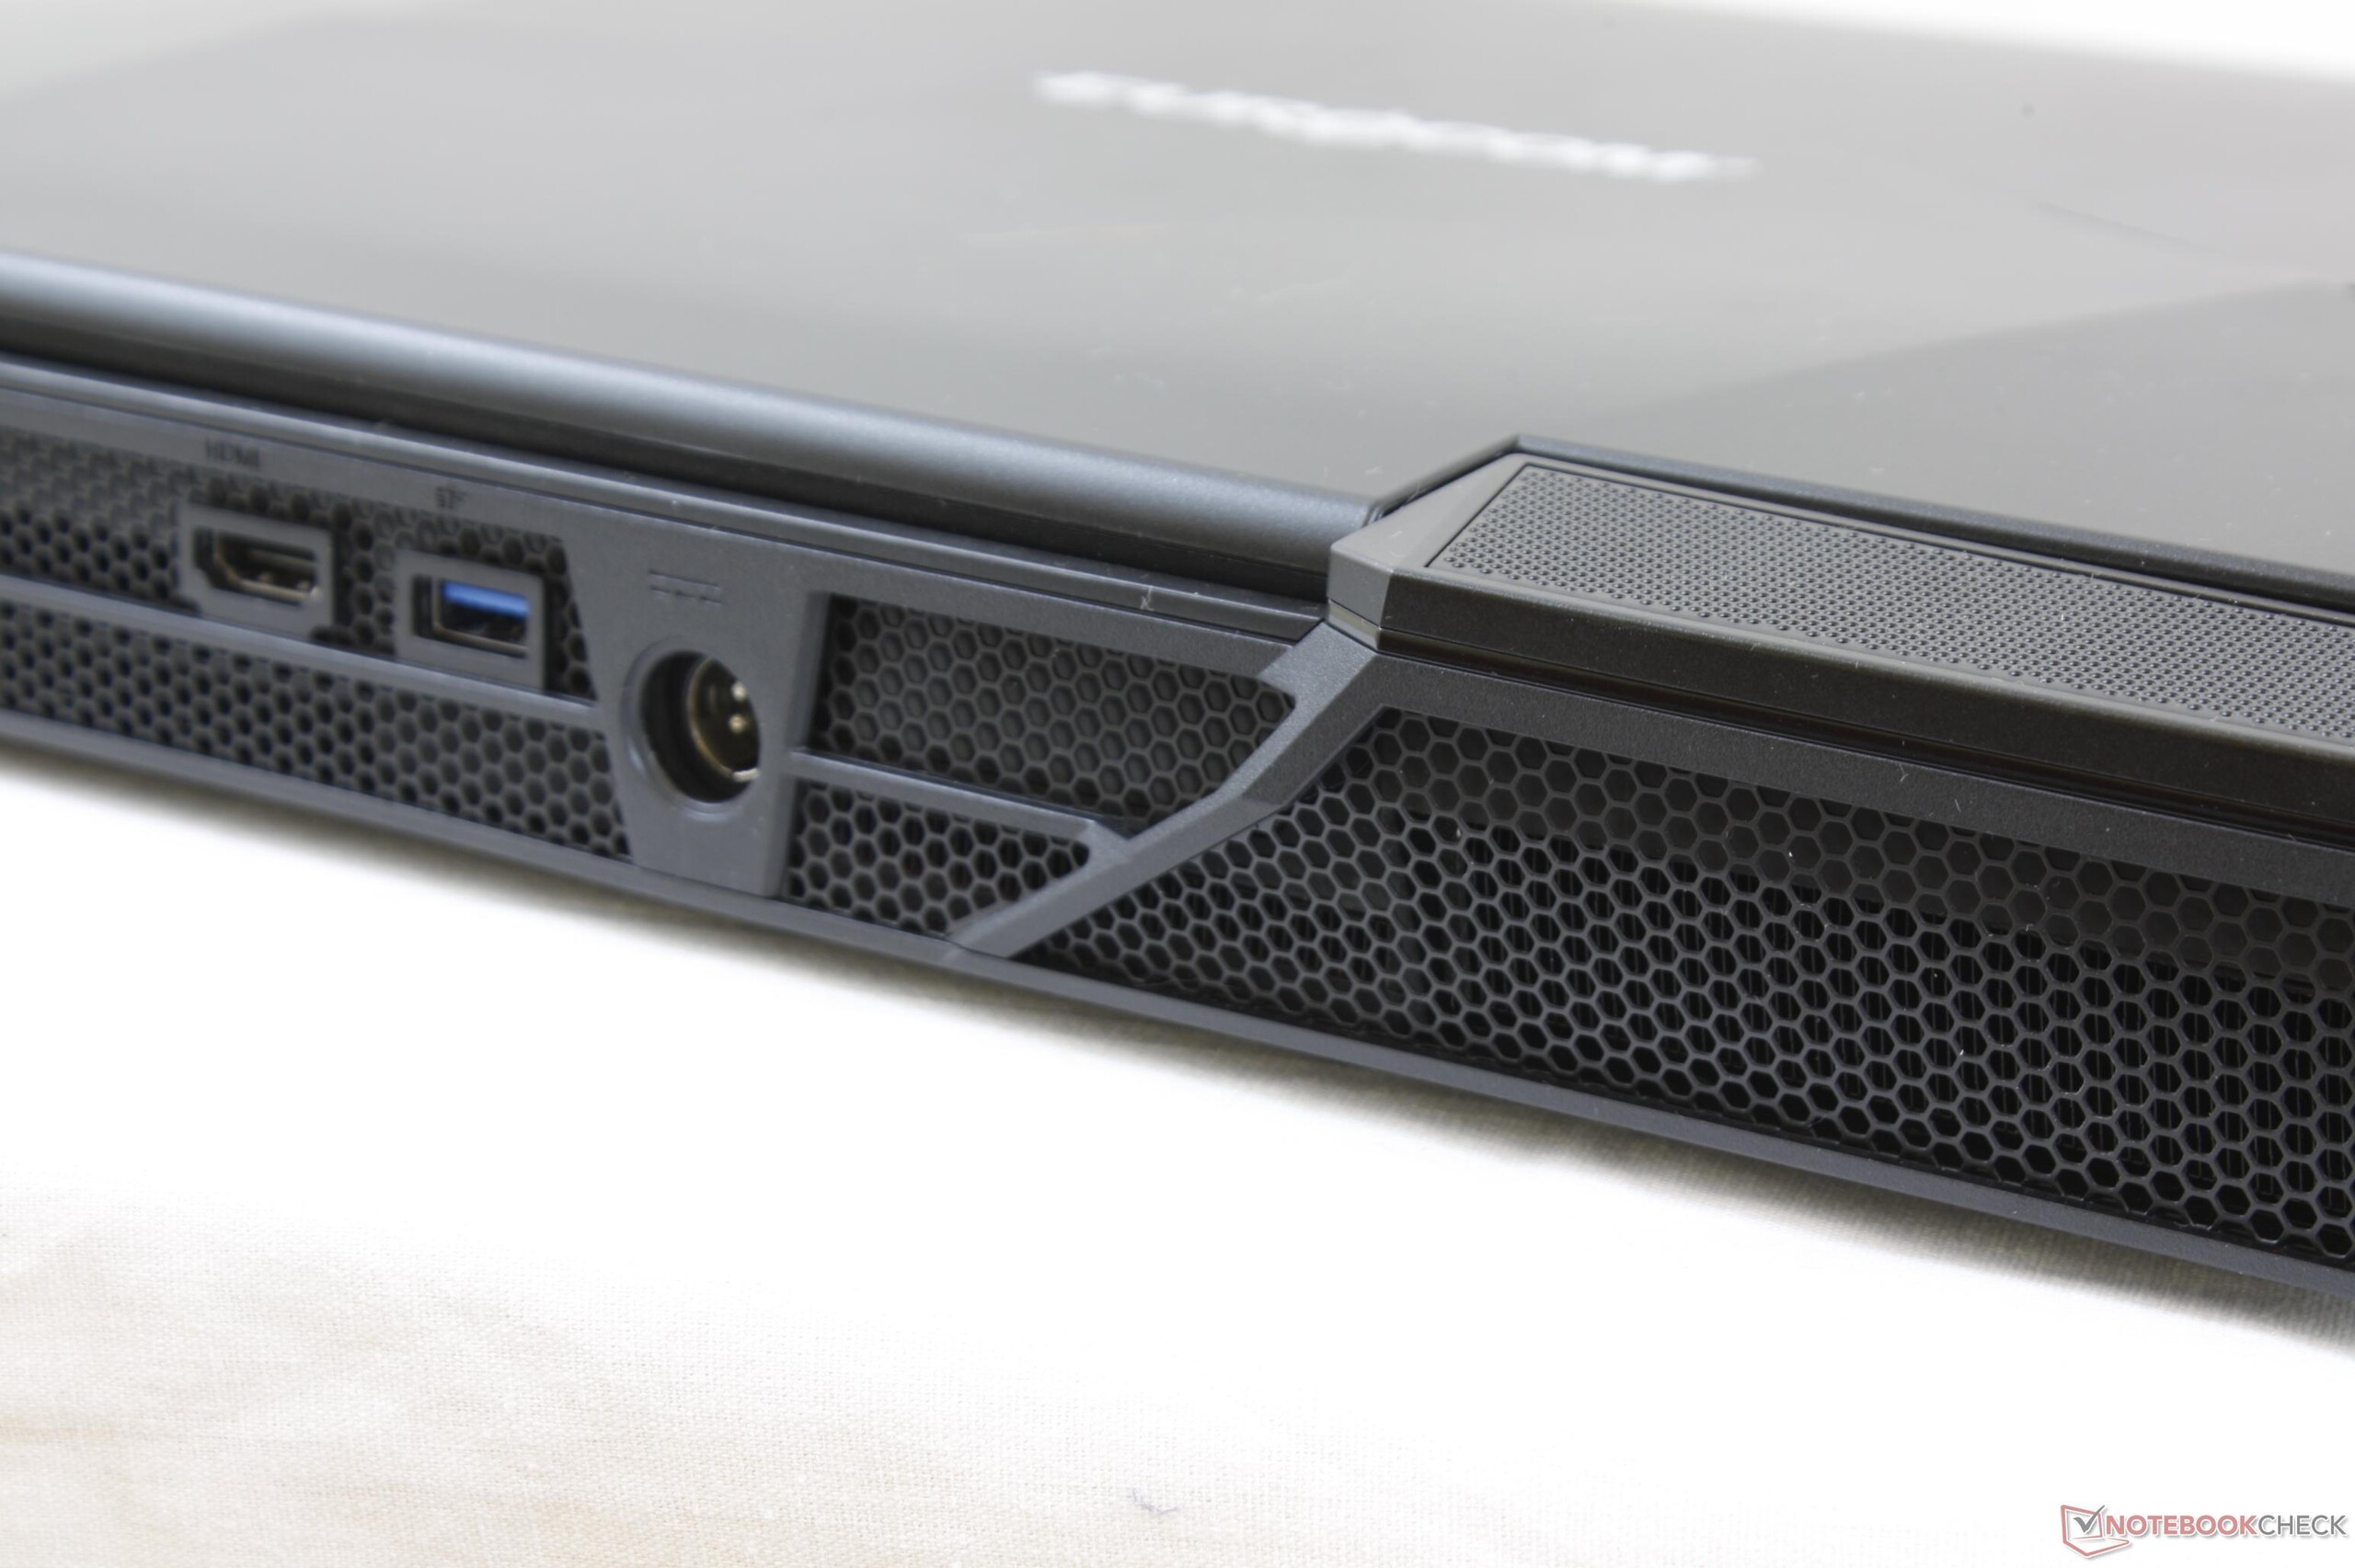
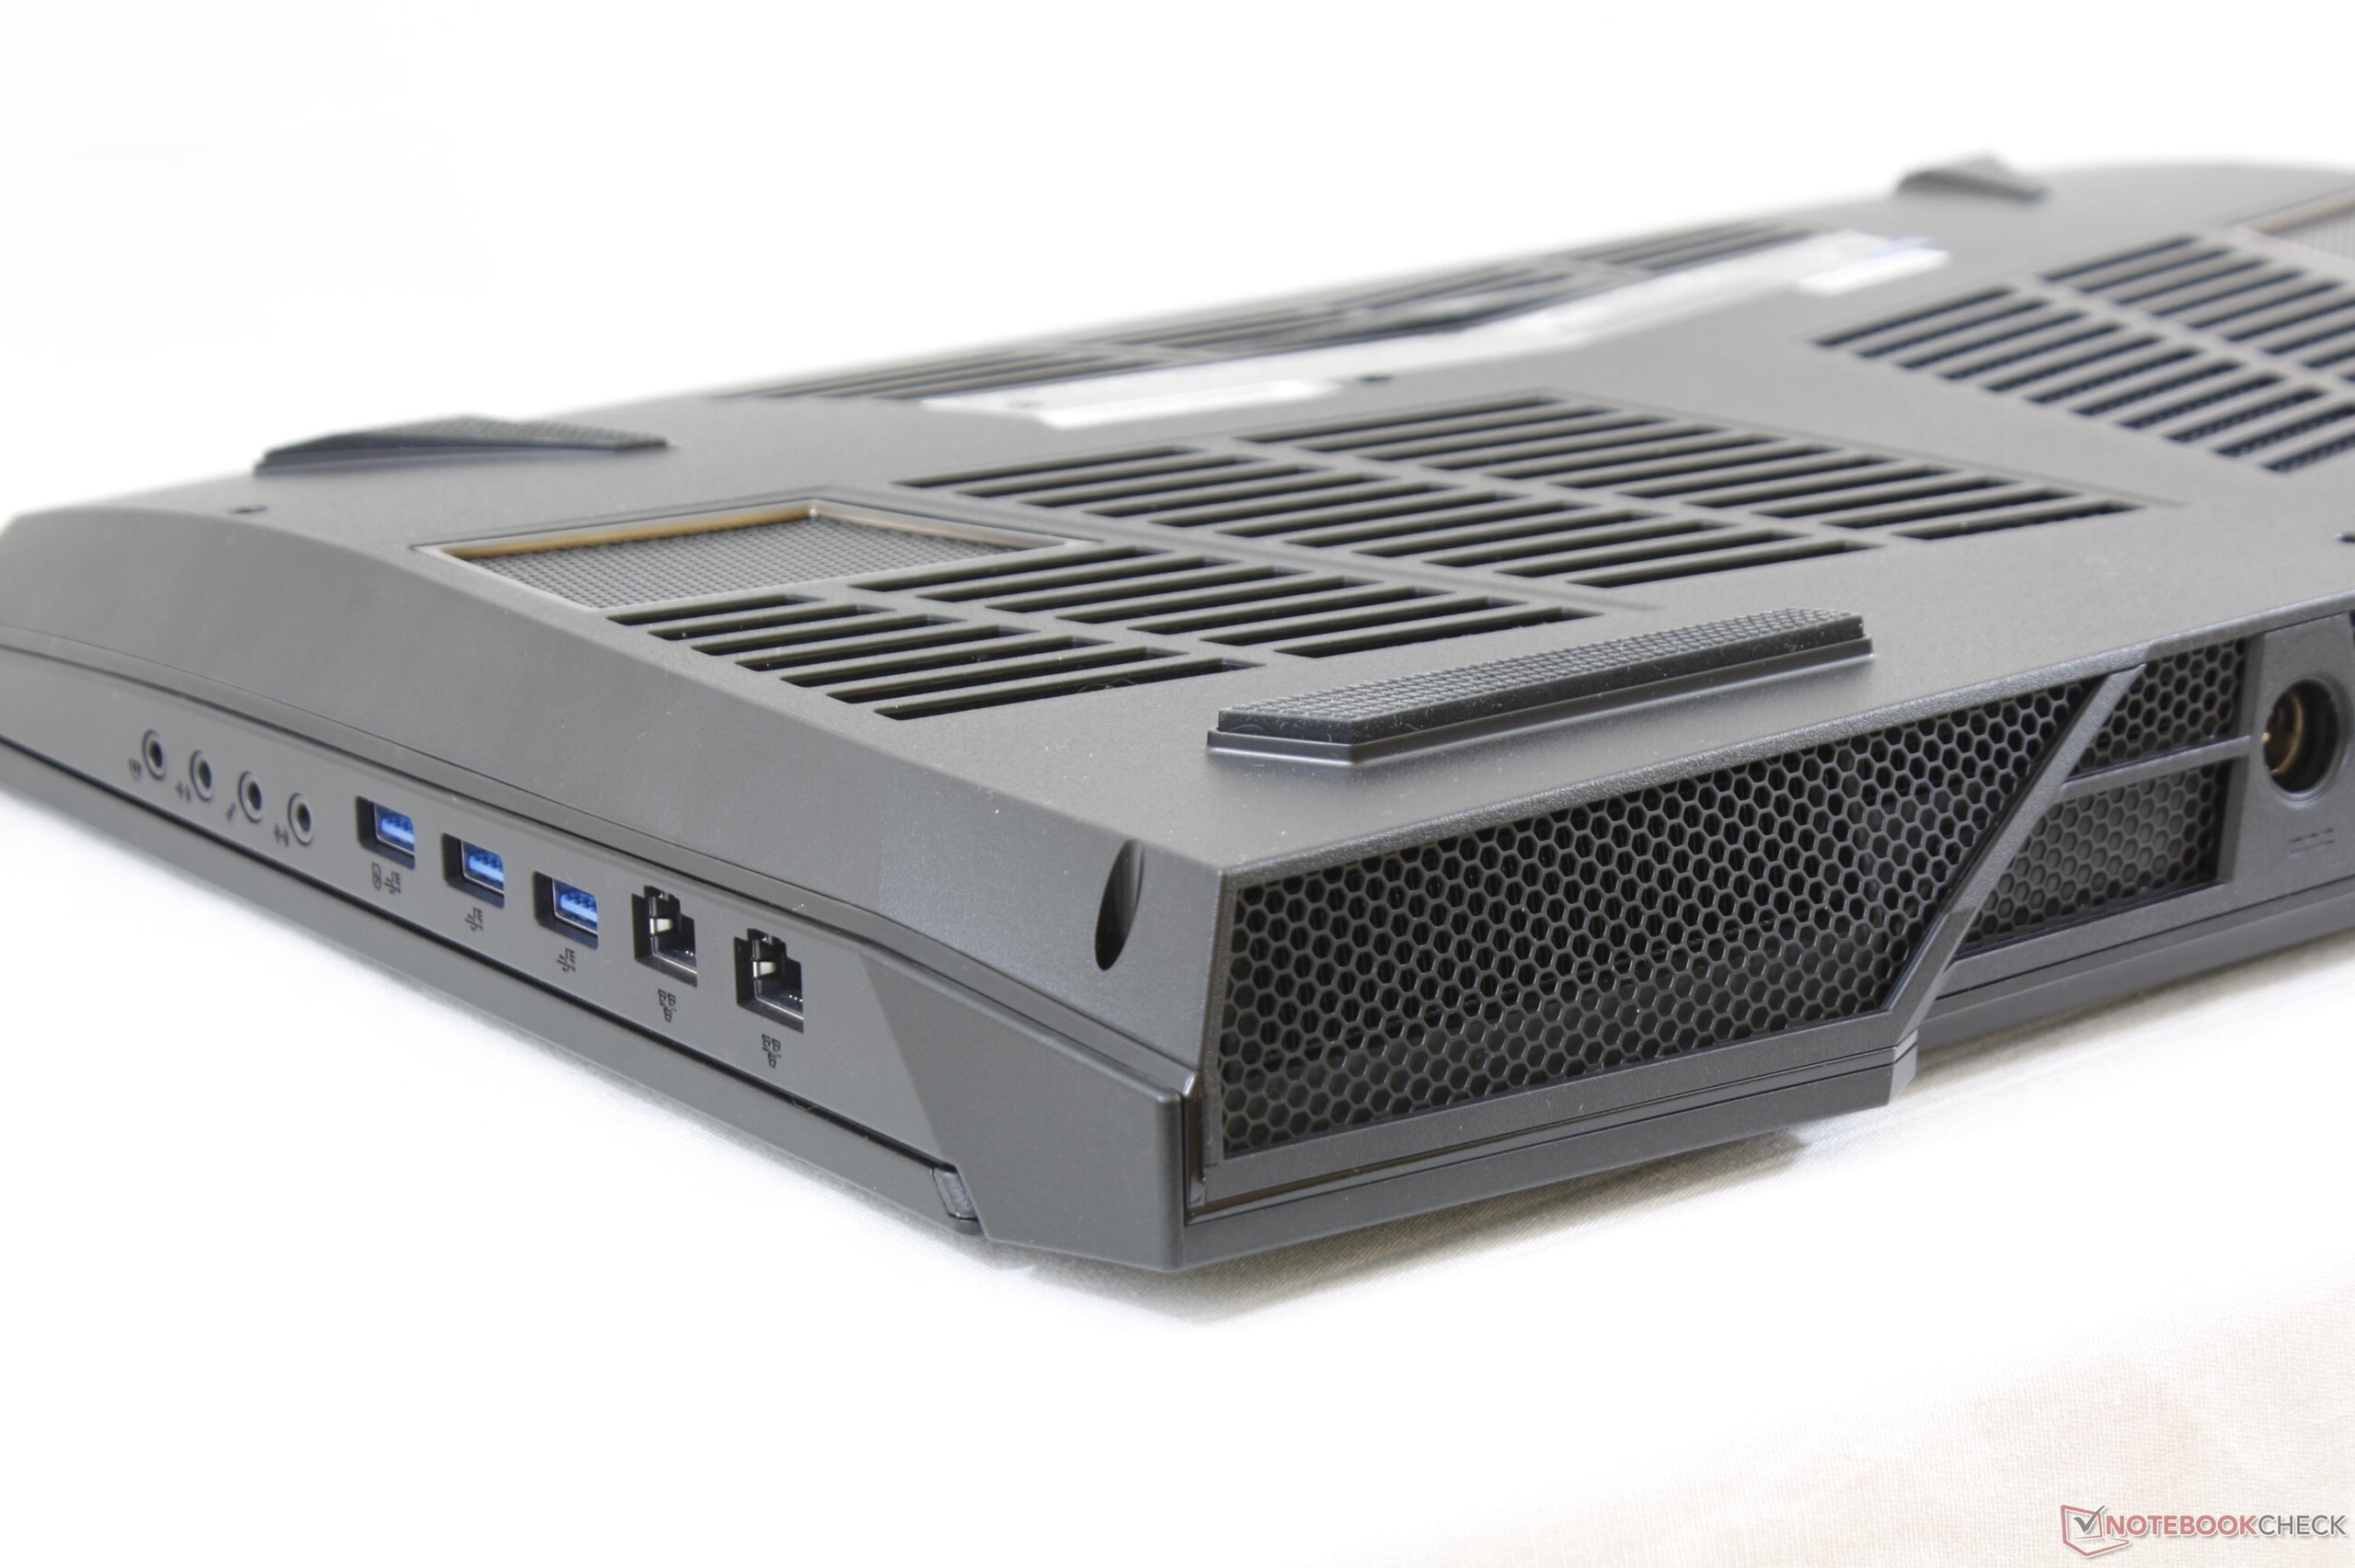
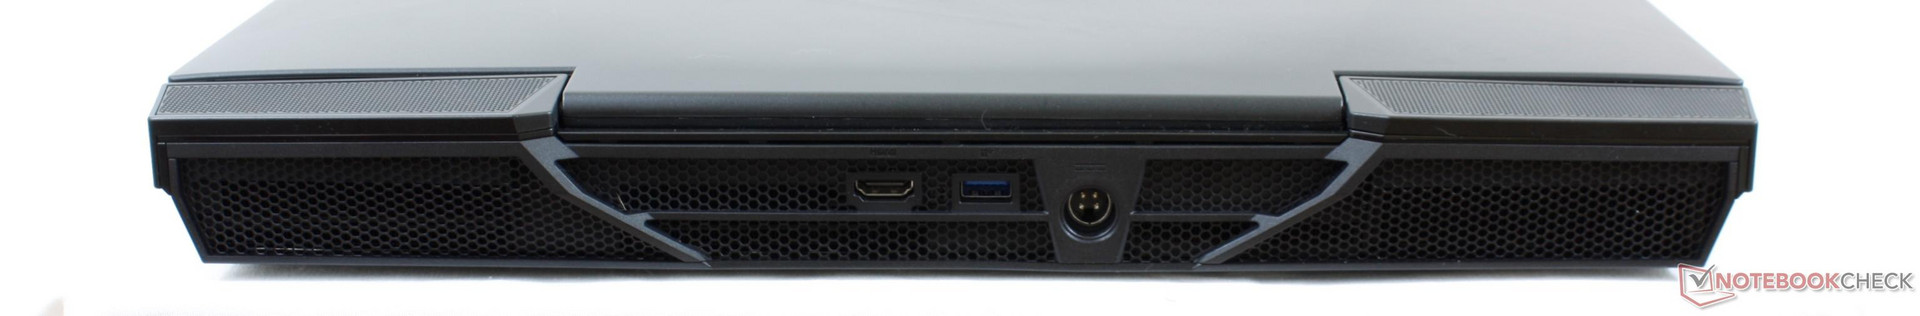
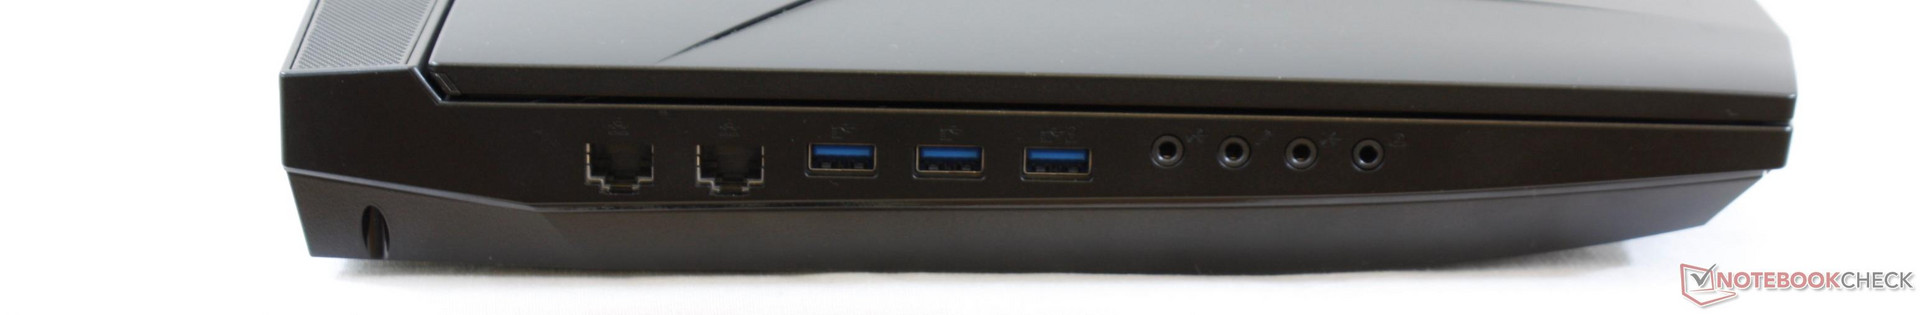
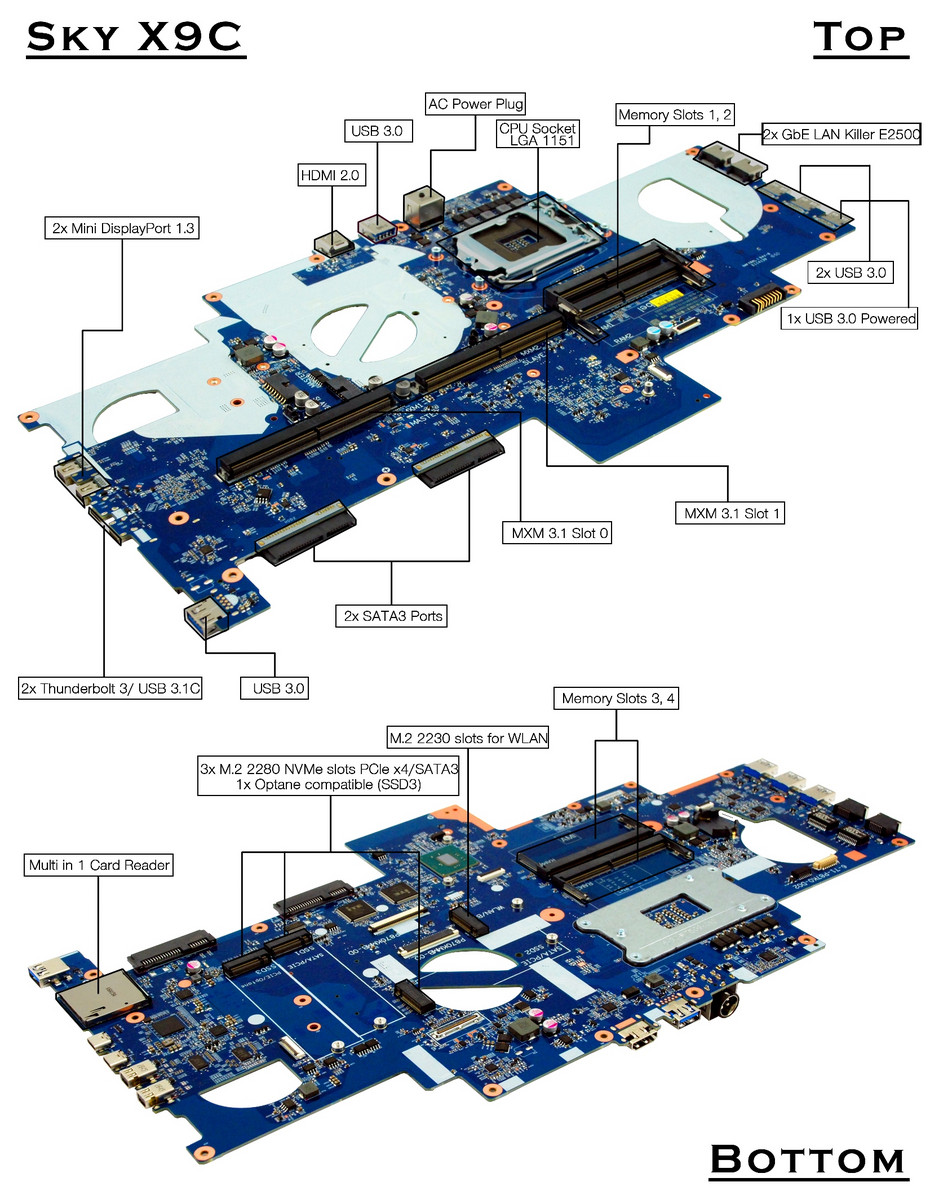
Connectivity
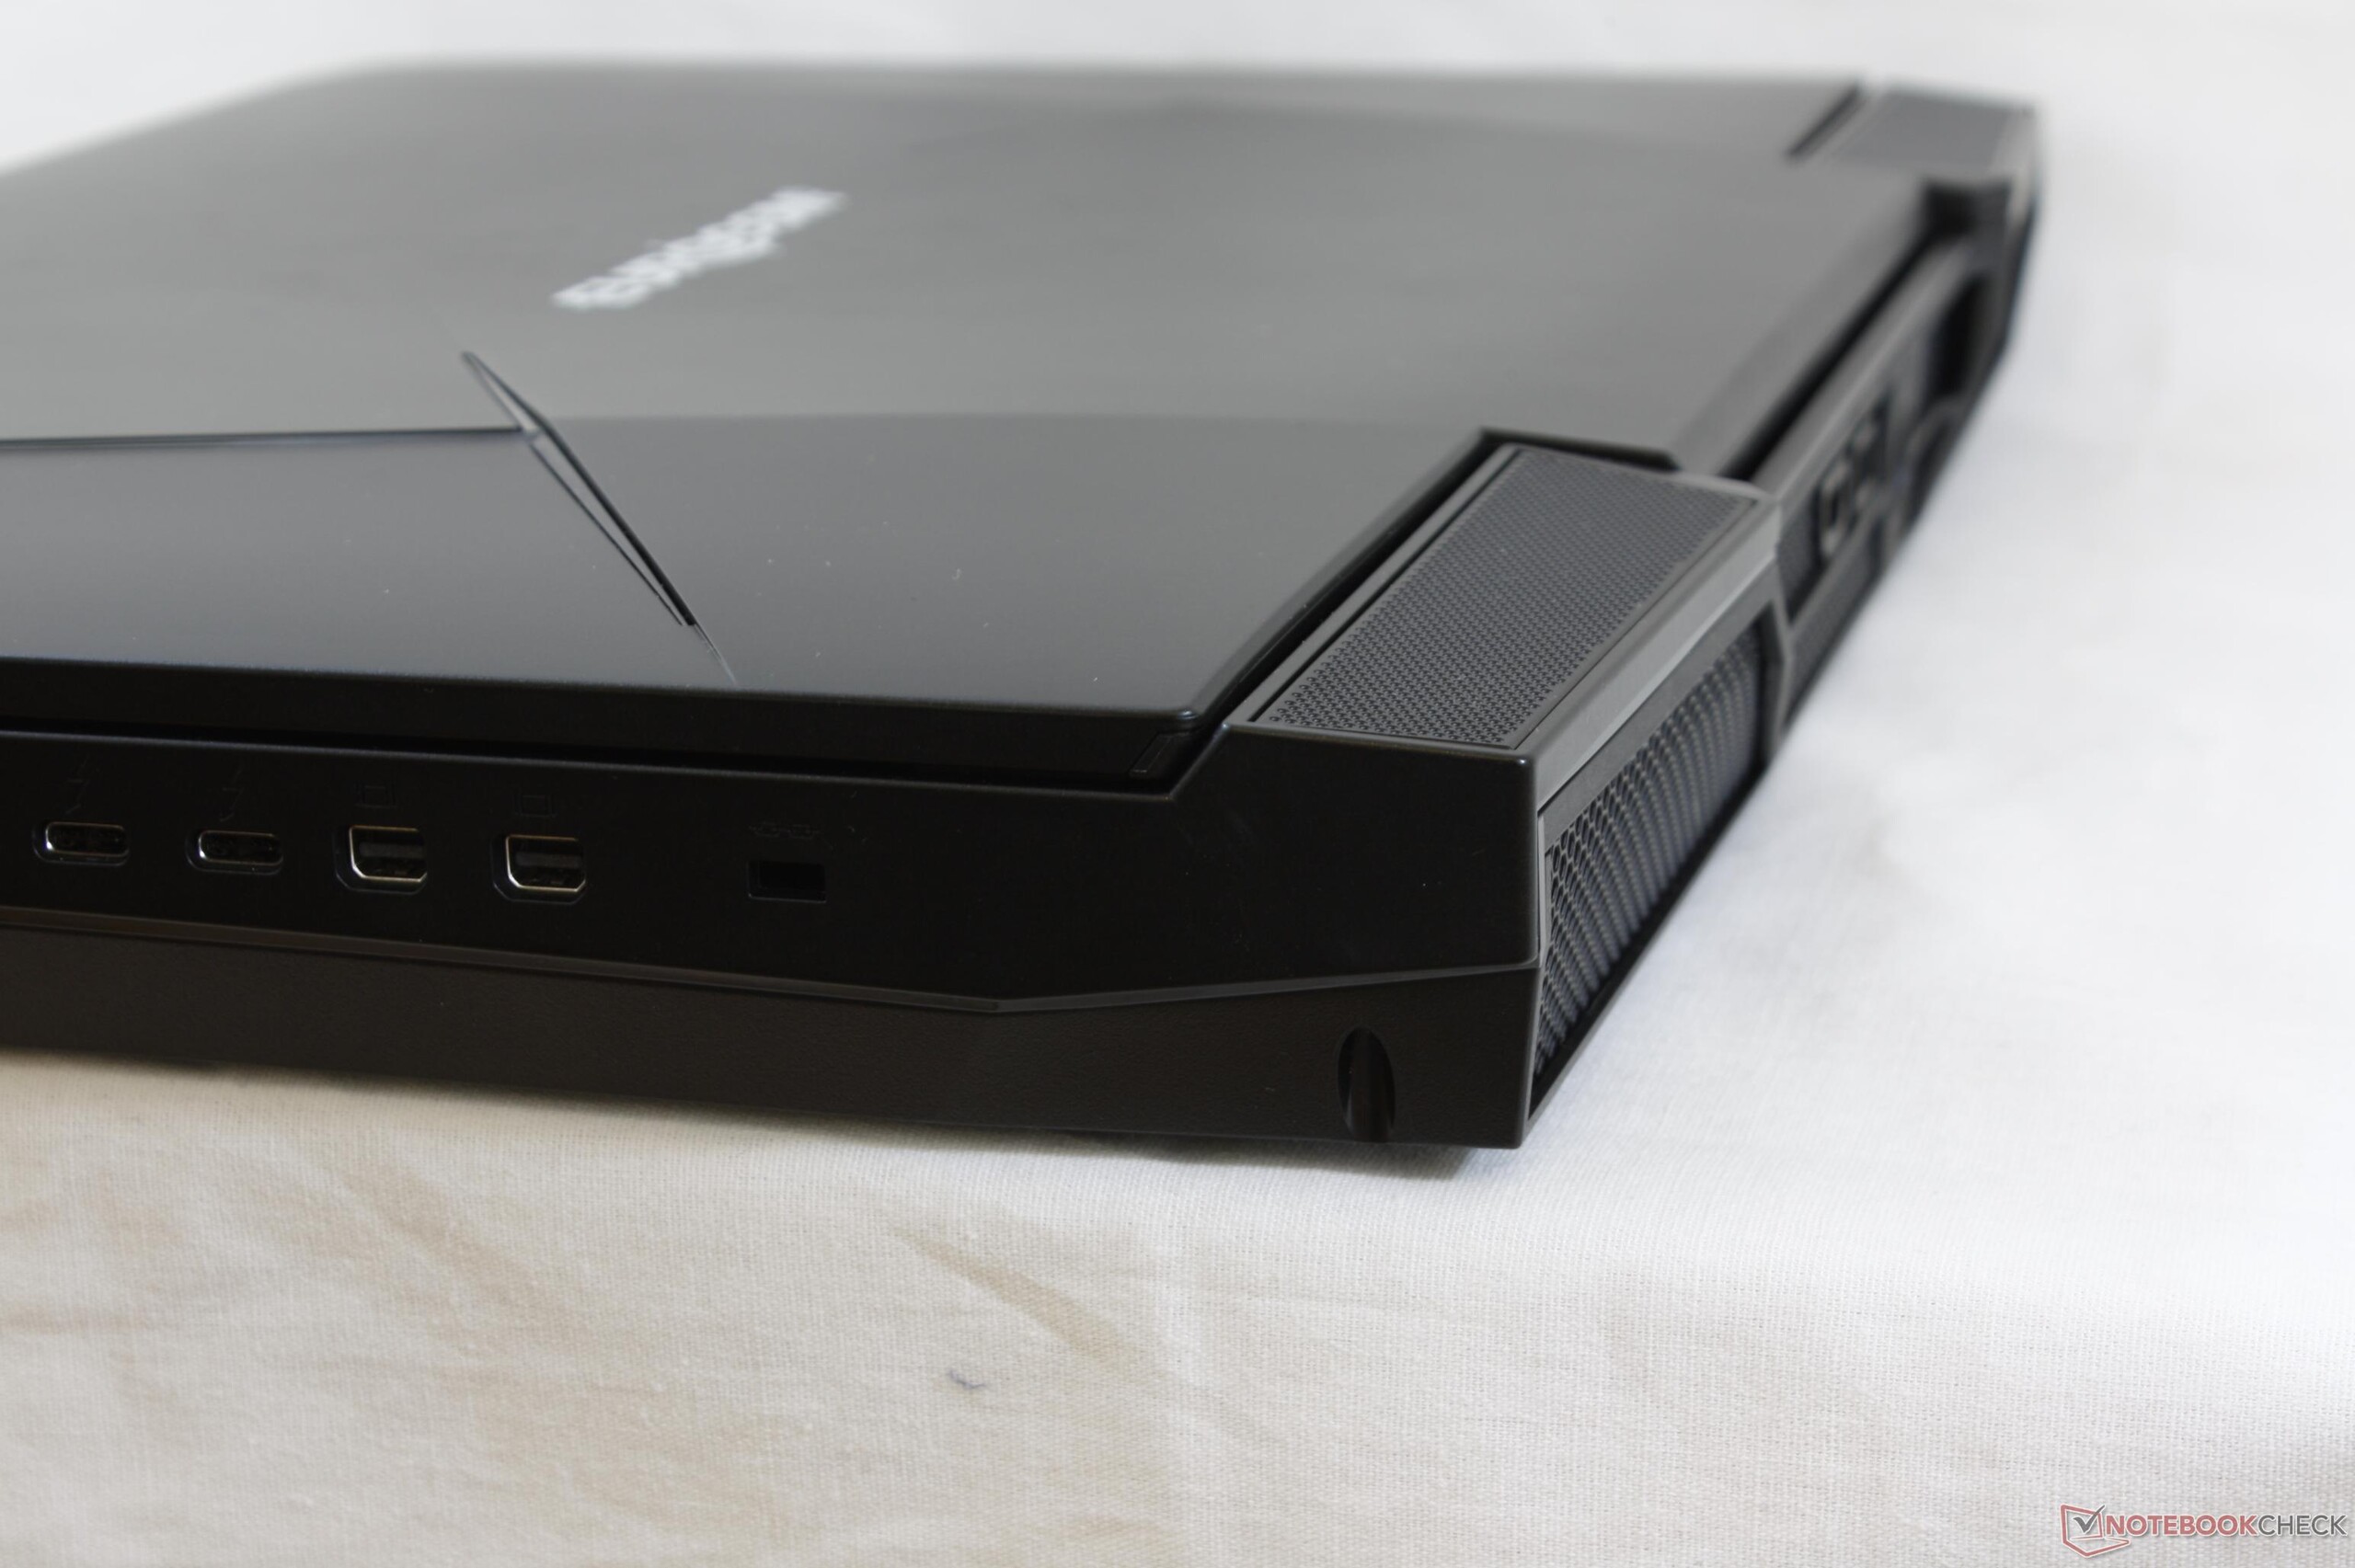
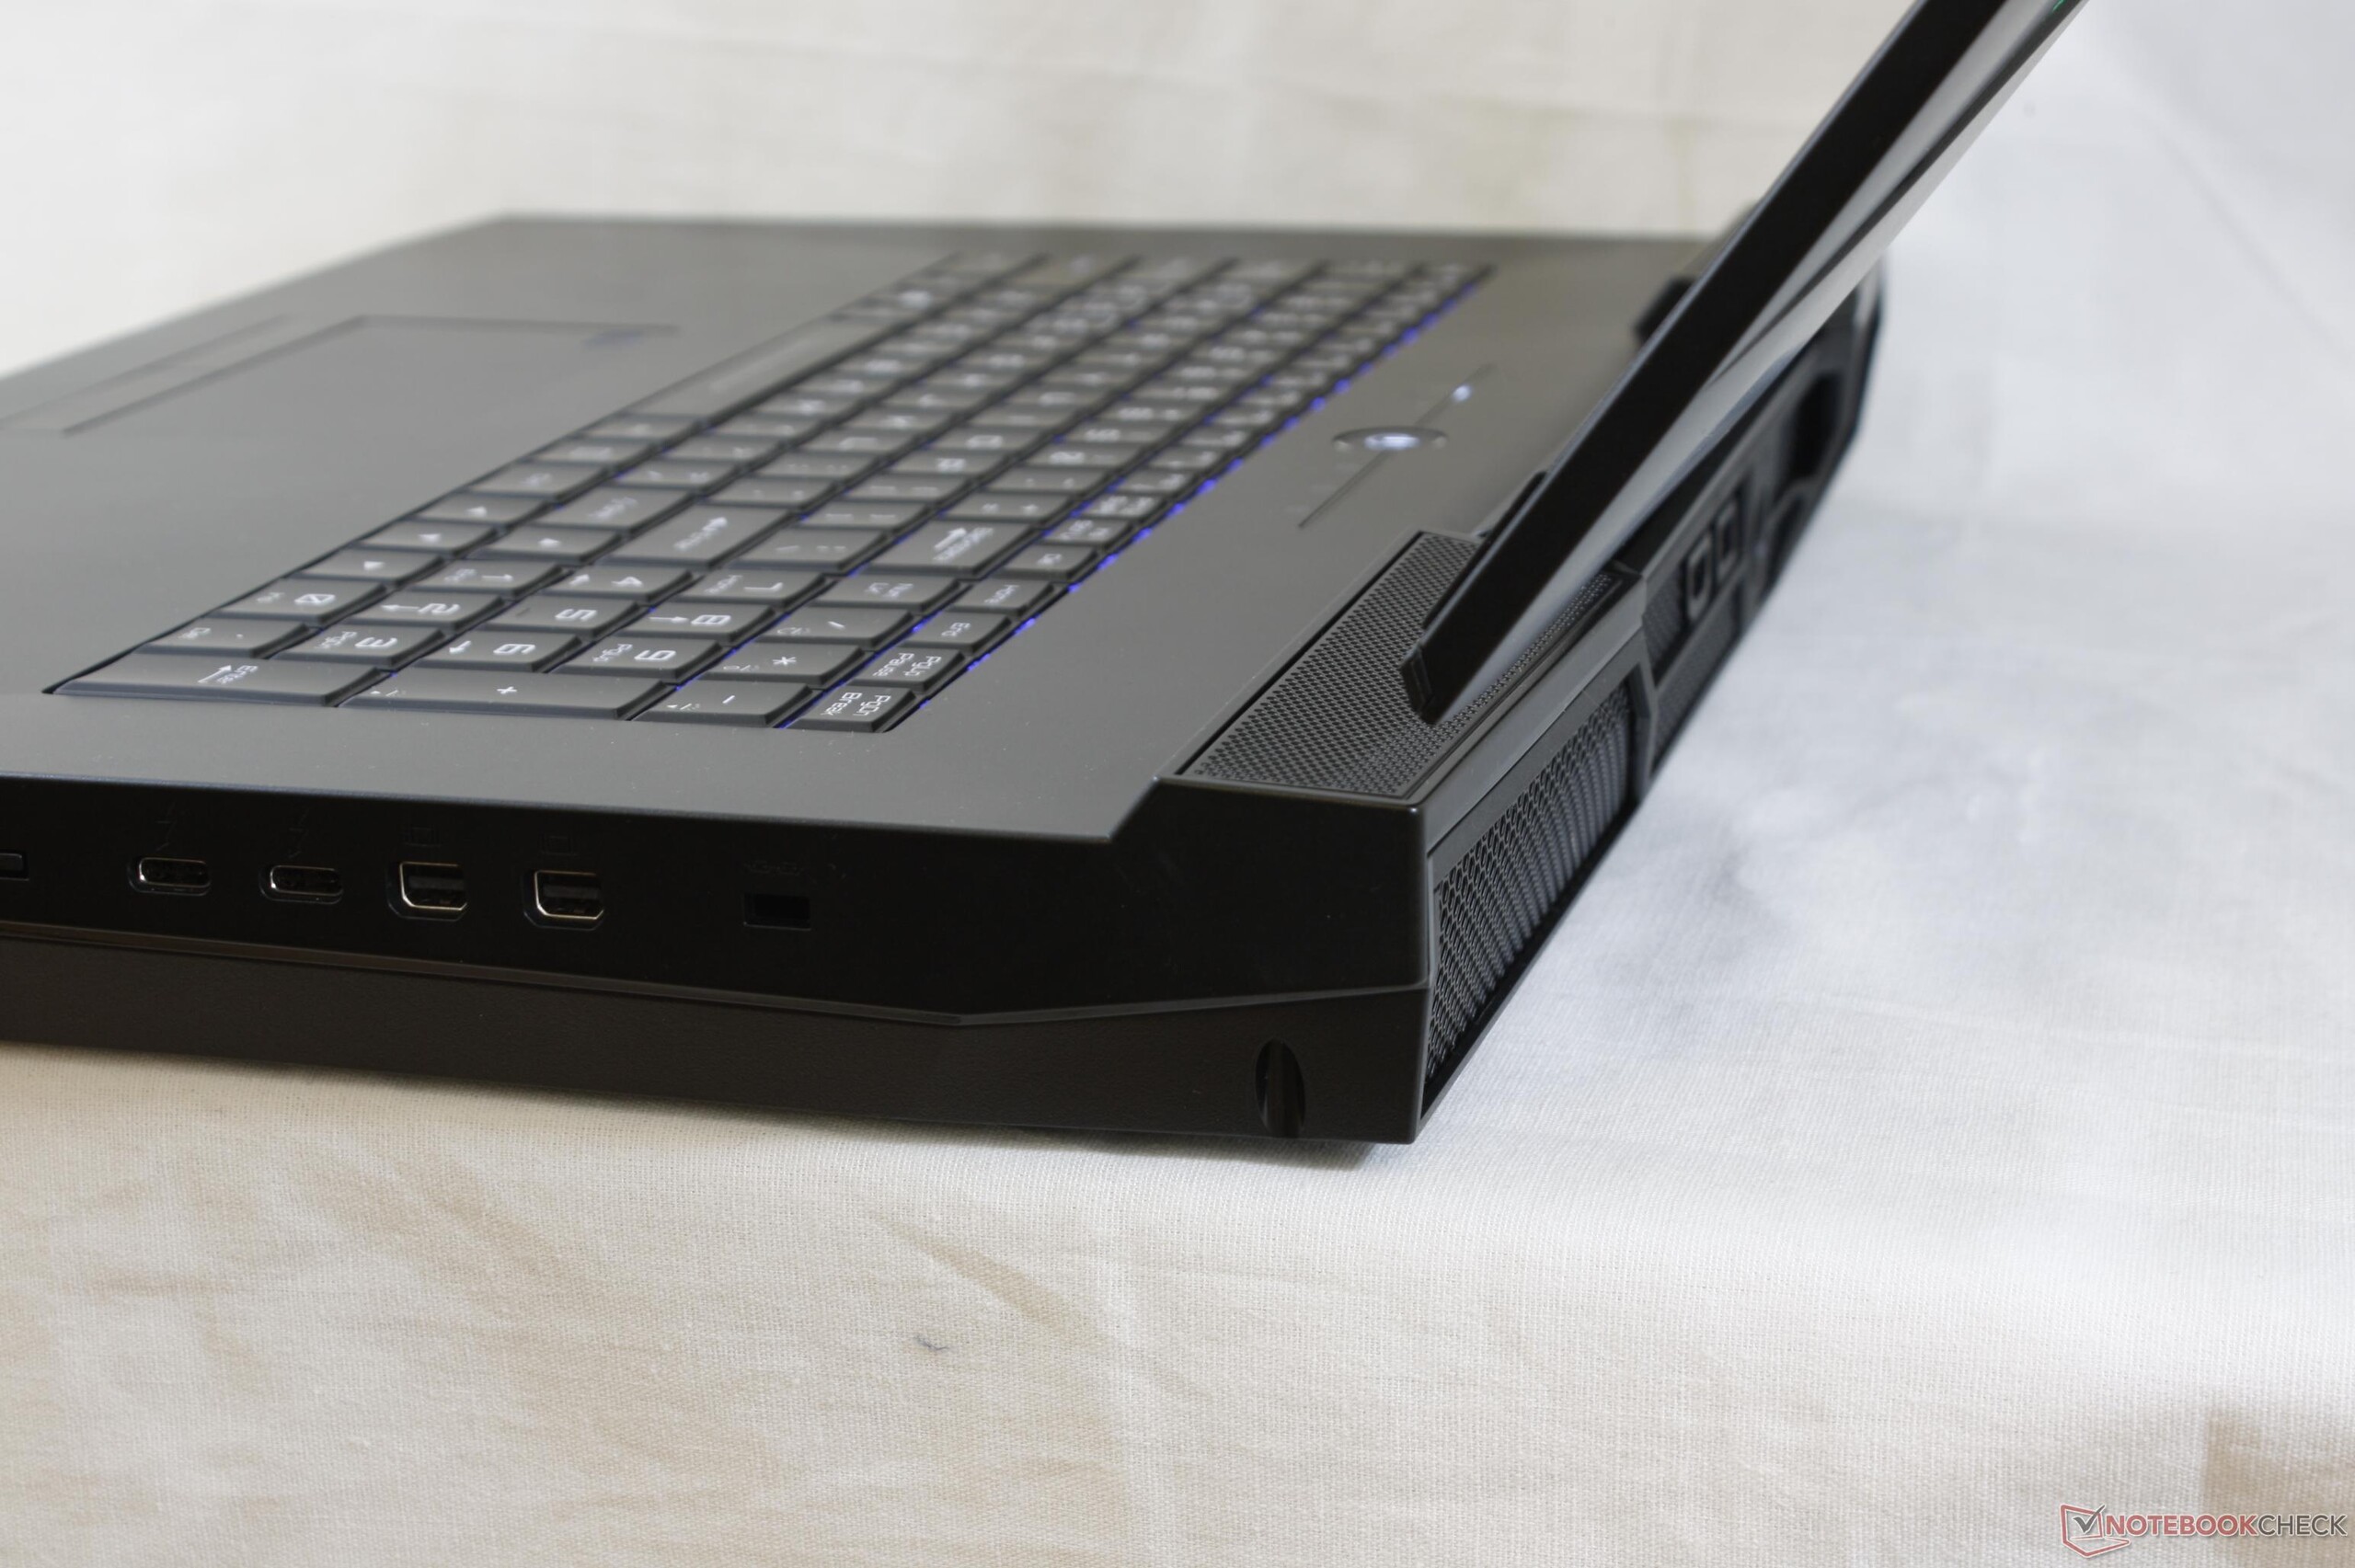
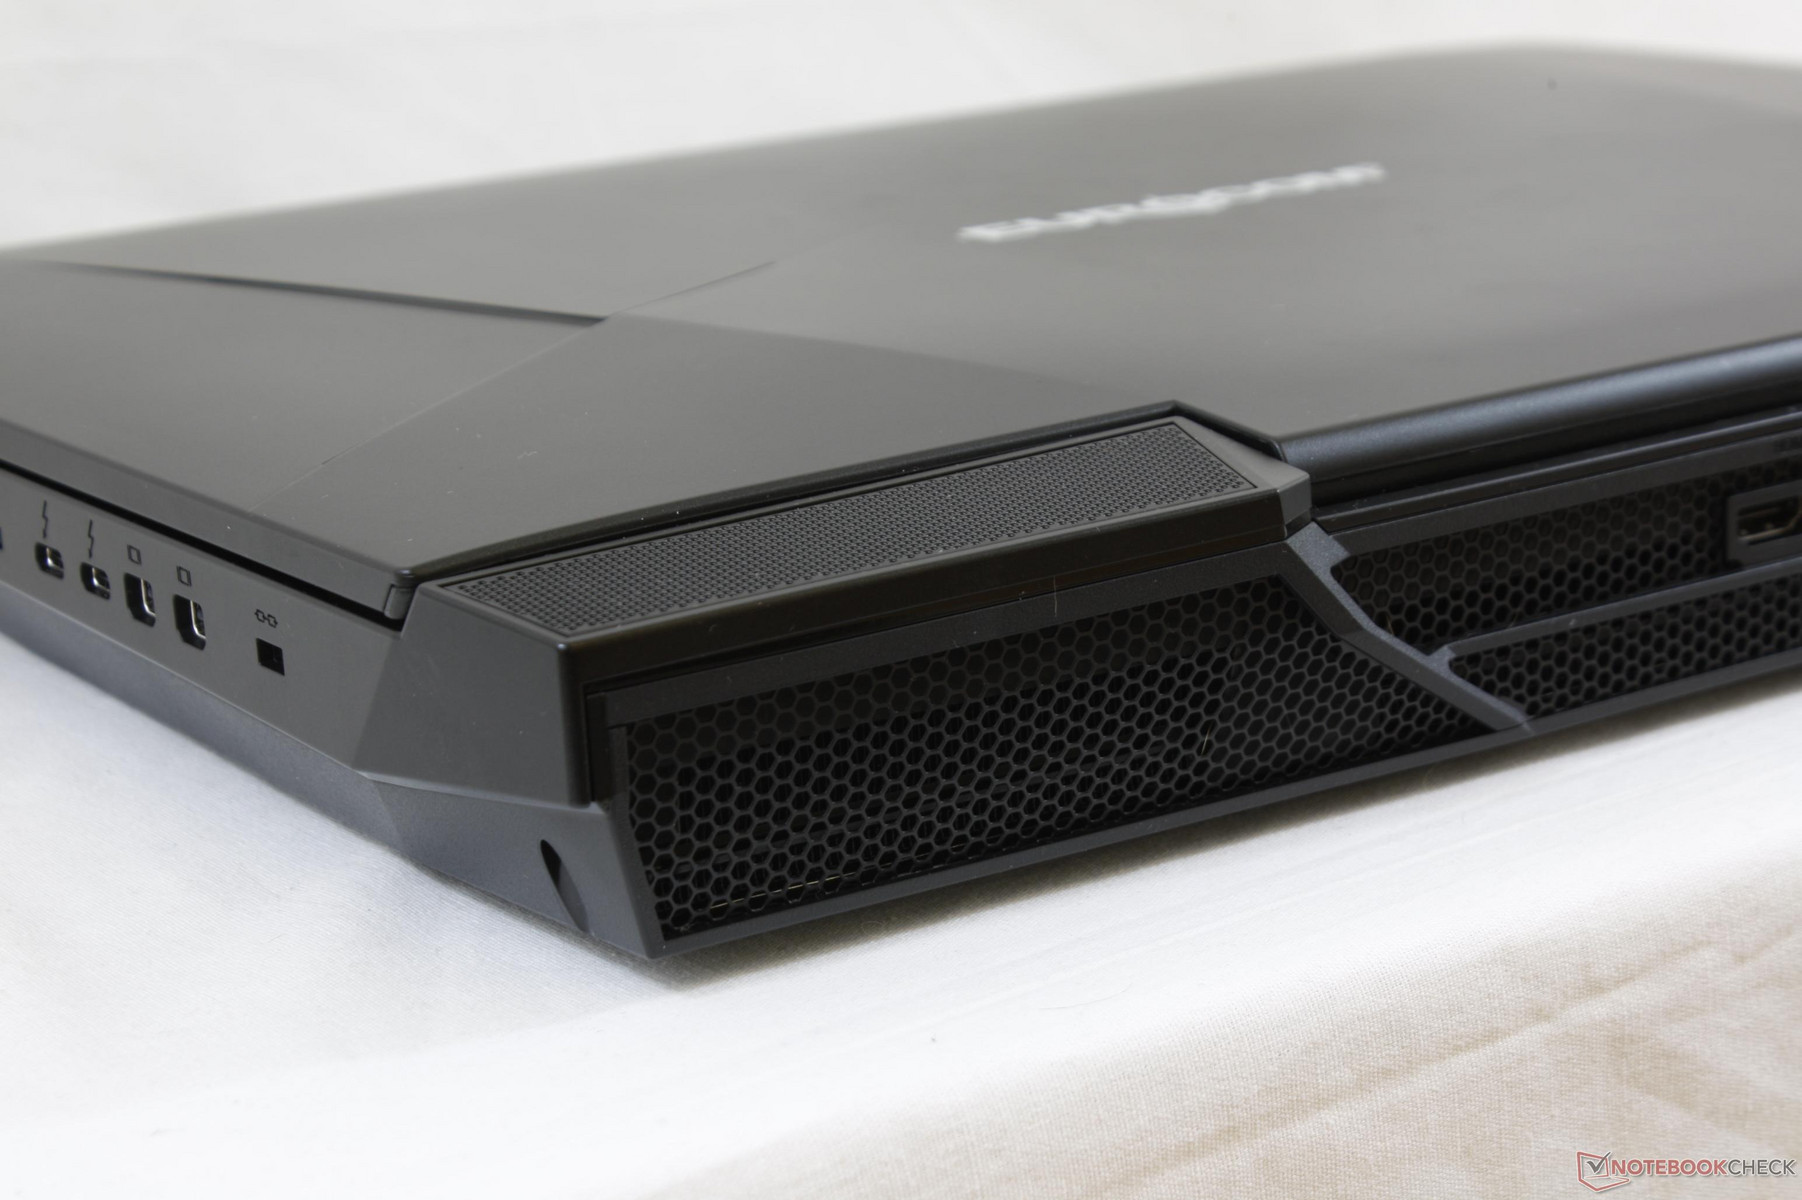
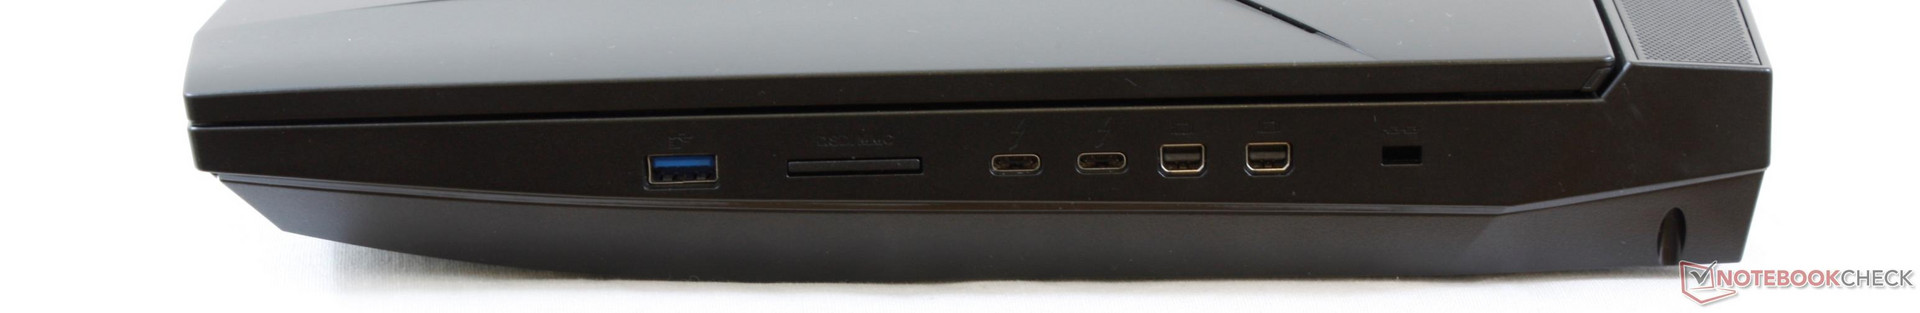
Ports have remained identical to the Clevo P870DM. We commend the manufacturer for having at least one USB Type-A port on each side whereas other gaming systems like the Eurocom Tornado F5 have USB TYpe-A ports along one side only. The dual Gigabit Ethernet ports are quite rare on notebooks but should prove useful for the target enthusiast crowd.
SD Card Reader
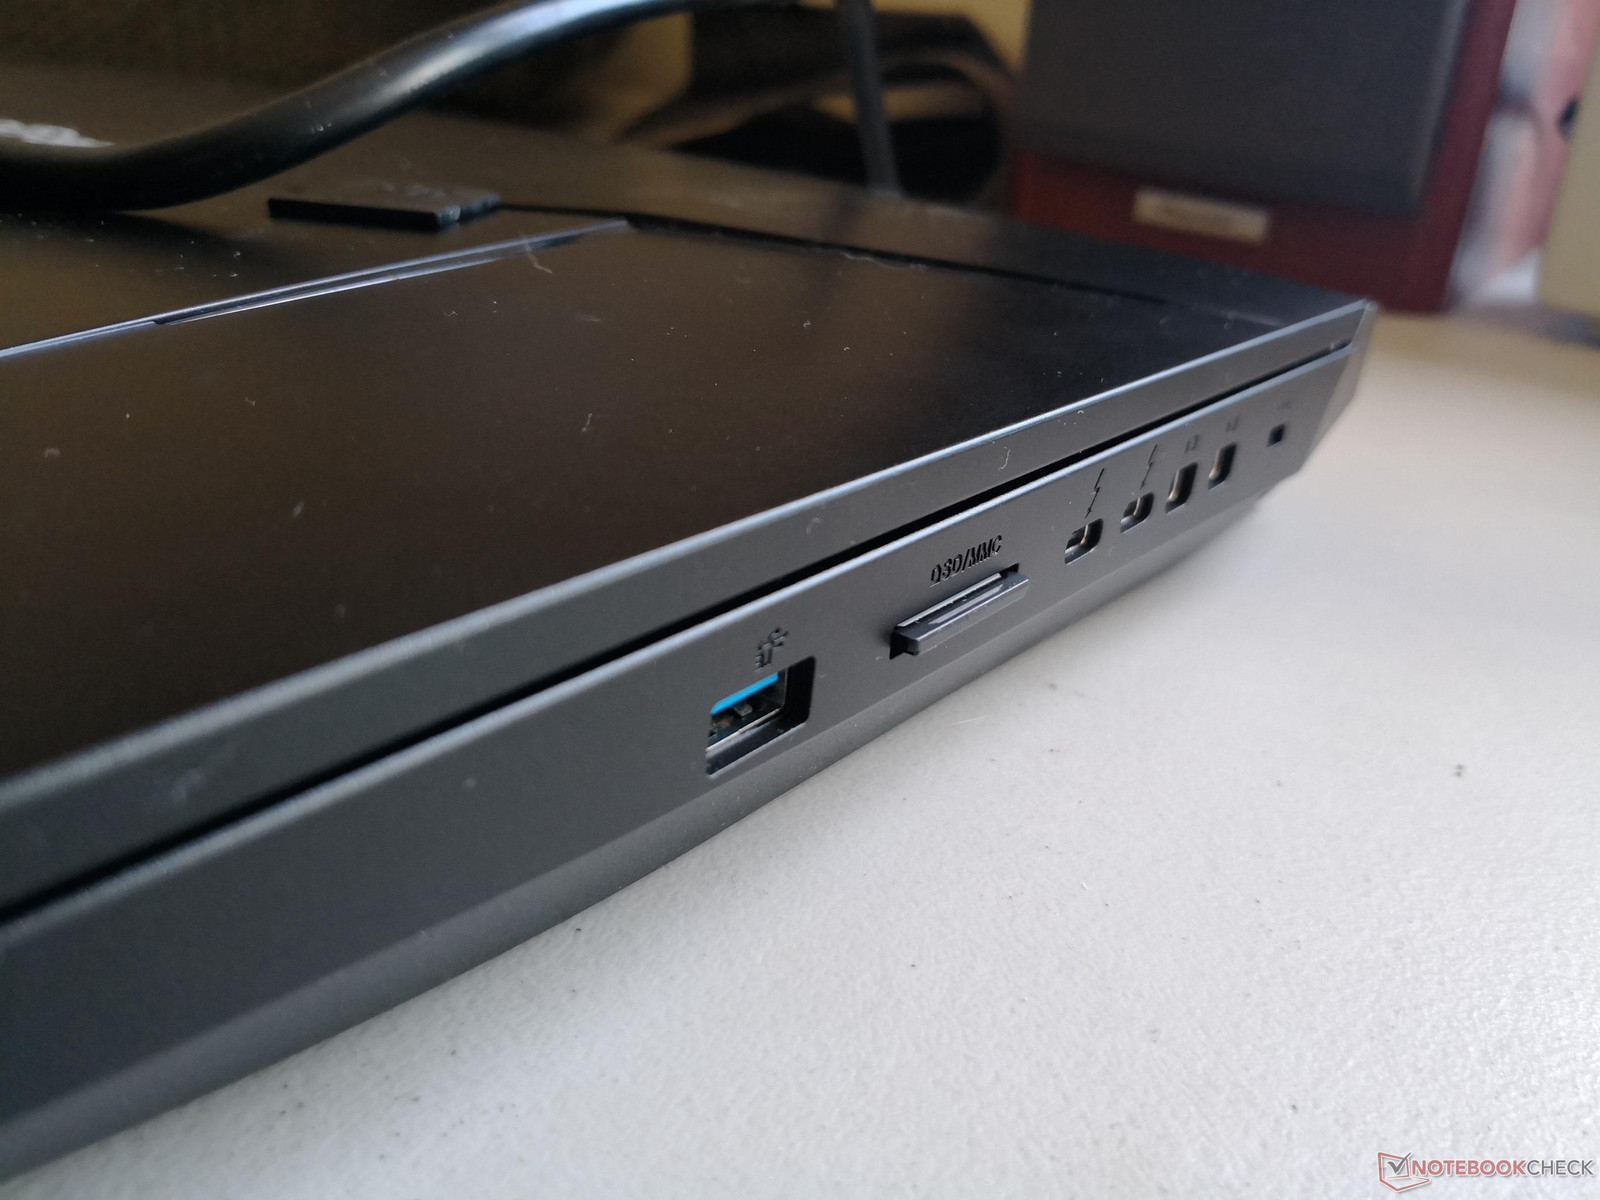
The spring-loaded SDXC card reader returns an average transfer rate of 208 MB/s from our Toshiba Exceria Pro UHS-II card capable of up to 260 MB/s. Moving 1 GB worth of images from card to desktop takes about 5.5 seconds compared to 13 seconds on the MSI GT75VR.
A fully inserted SD card will protrude by about 1 to 2 mm for safe transporting and easy ejecting.
| SD Card Reader | |
| average JPG Copy Test (av. of 3 runs) | |
| Eurocom Sky X9C | |
| Eurocom Tornado F5 Killer Edition | |
| MSI GT75VR 7RF-012 Titan Pro | |
| maximum AS SSD Seq Read Test (1GB) | |
| Eurocom Tornado F5 Killer Edition | |
| Eurocom Sky X9C | |
| MSI GT75VR 7RF-012 Titan Pro | |
Communication
WLAN is provided by a removable M.2 2230 module with RealTek, Killer, and Intel options. The 2x2 Intel 9260 module in our unit is the priciest selection with a real-world average transfer rate of 668 Mbps when standing one meter away from our Linksys EA8500 test router. Raw throughput is not noticeably different from the older Intel 8260 or Killer 1535 and some users may want the Killer module instead due to its more developed software features. The main advantage of the Intel 9260 is its compatibility with the Bluetooth 5 standard whereas WiFi modules integrate Bluetooth 4.1 or 4.2 only.
GPS and 4G LTE options are understandably omitted.
| Networking | |
| iperf3 transmit AX12 | |
| Eurocom Sky X9C | |
| Alienware 17 R4 | |
| MSI GT75VR 7RF-012 Titan Pro | |
| iperf3 receive AX12 | |
| MSI GT75VR 7RF-012 Titan Pro | |
| Eurocom Sky X9C | |
| Alienware 17 R4 | |
Accessories
Included extras are a User's Manual, USB drive with drivers, and additional screws and thermal pads for the storage bays. A large cleaning cloth would have been appreciated as most Ultrabooks and gaming notebooks throw one in for free. Users will have to supply their own thermal paste and Thunderbolt 3 docking stations.
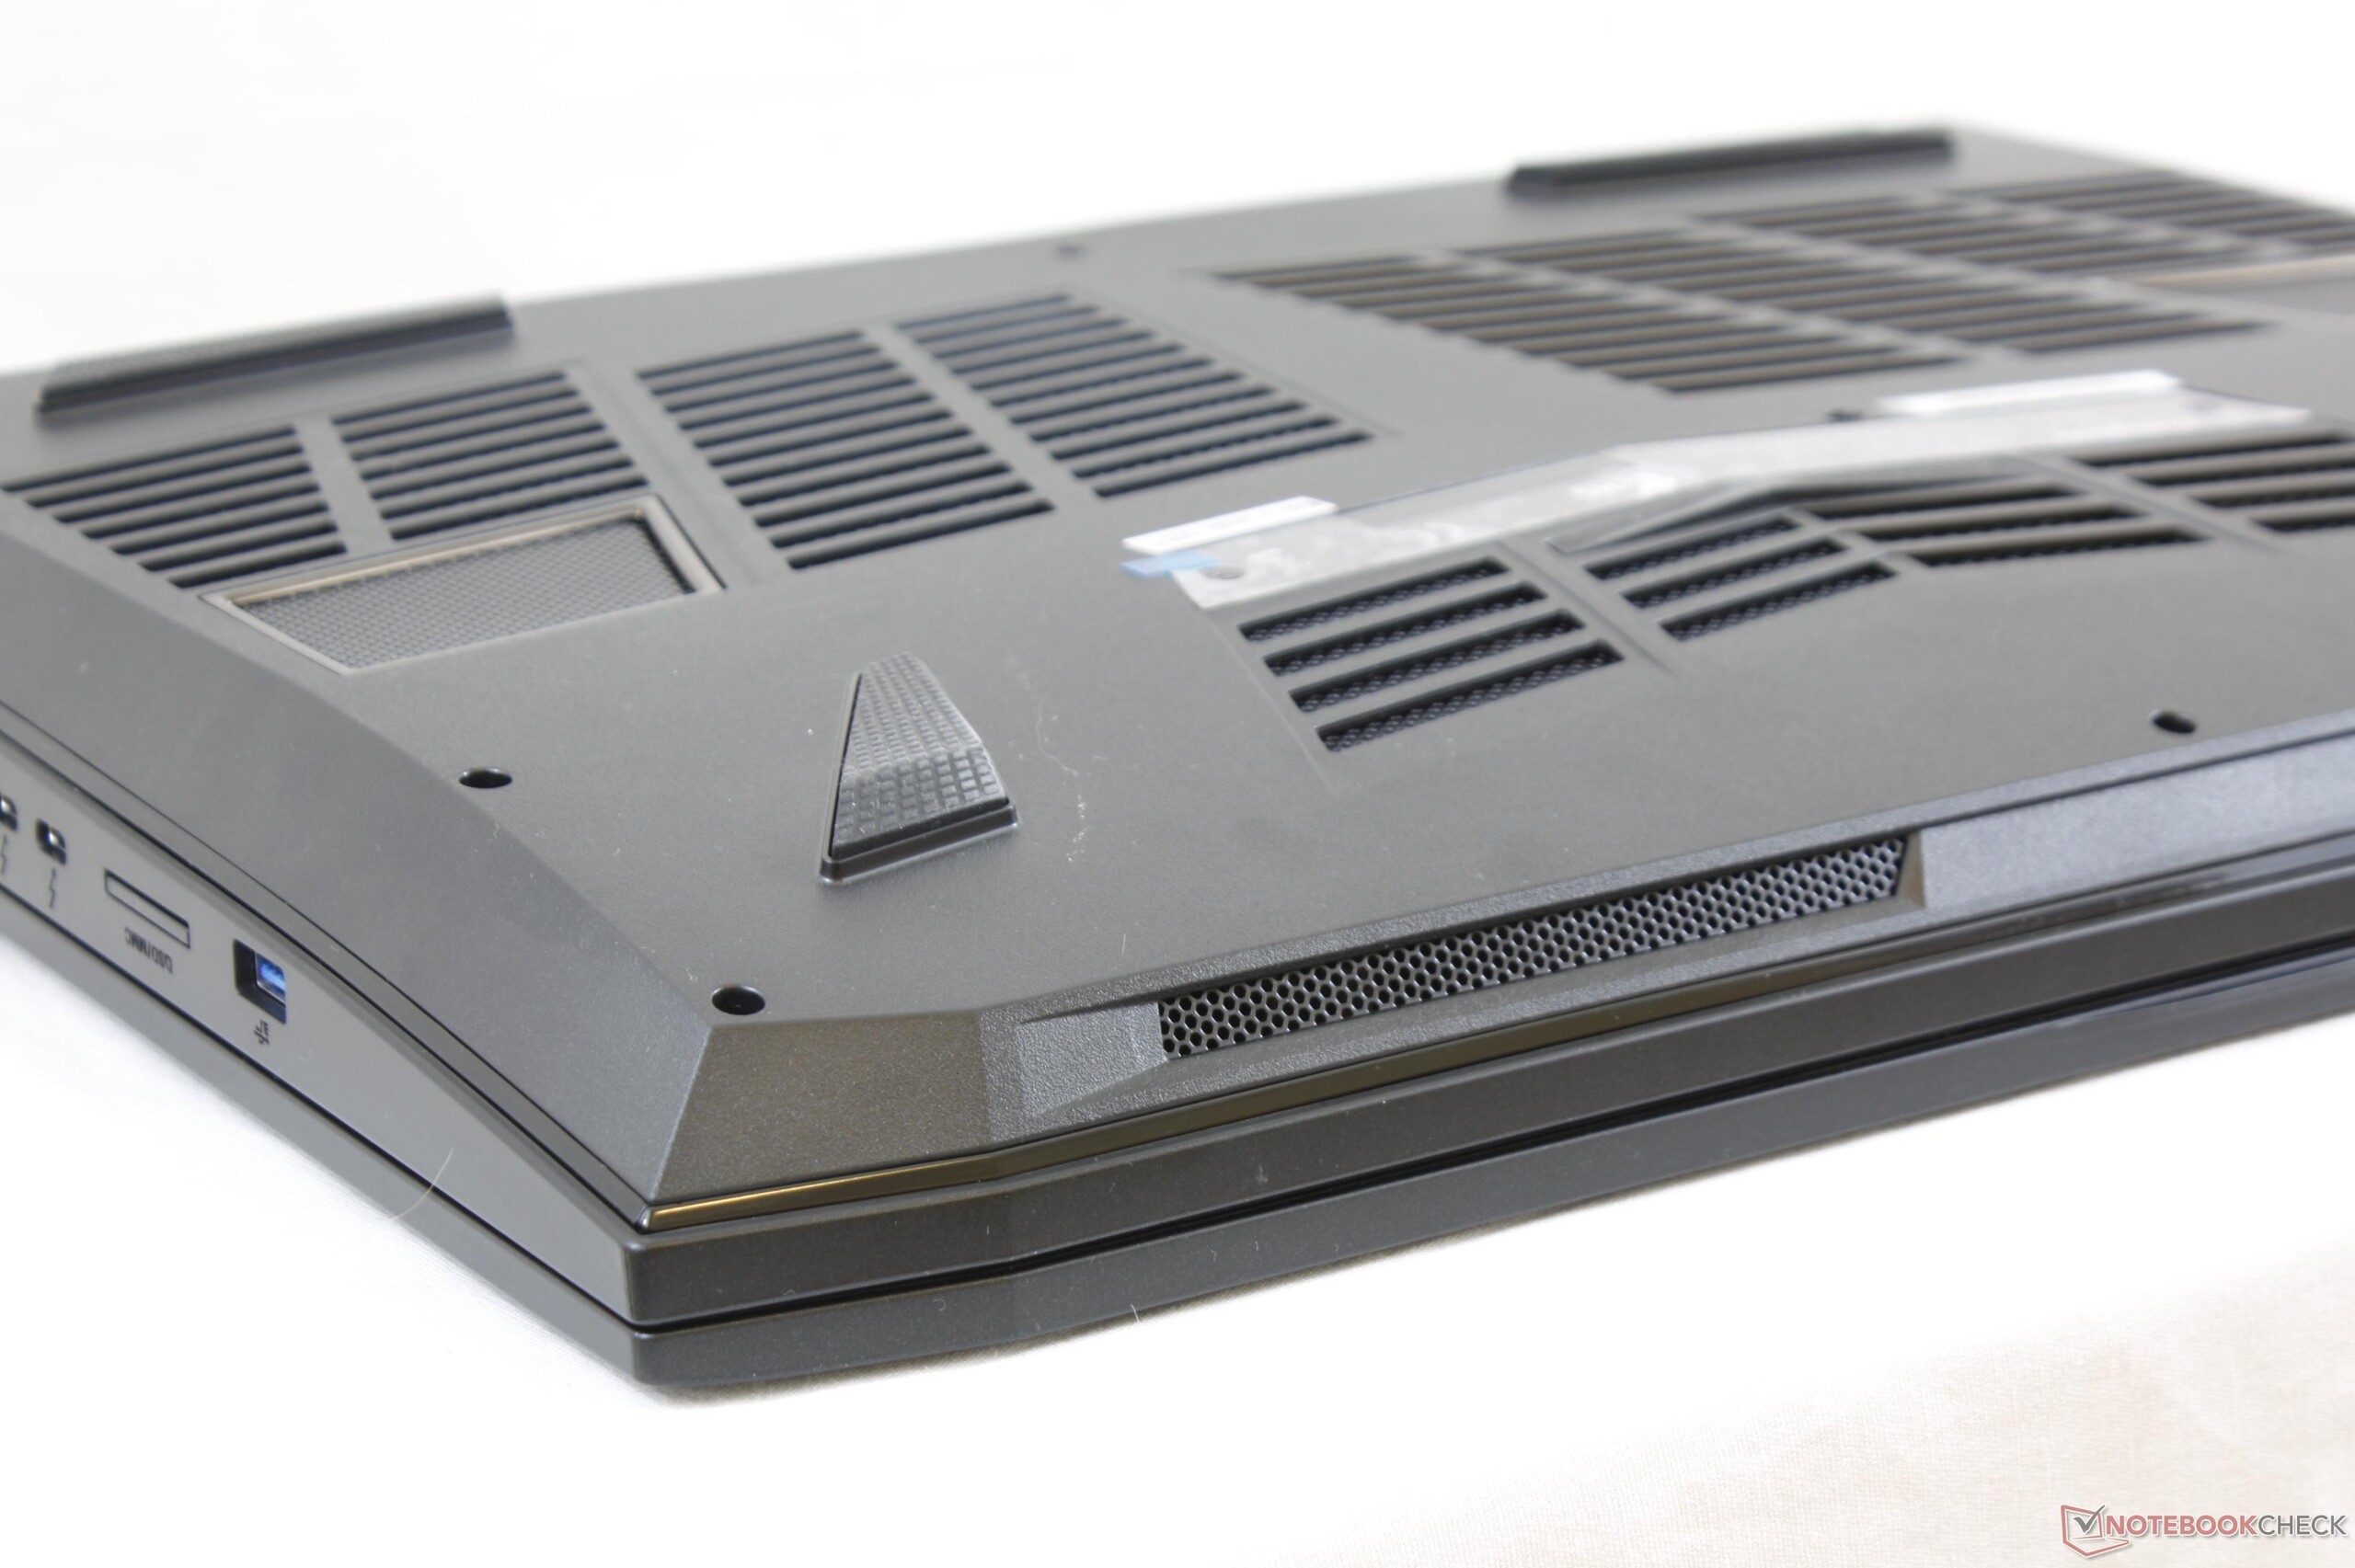
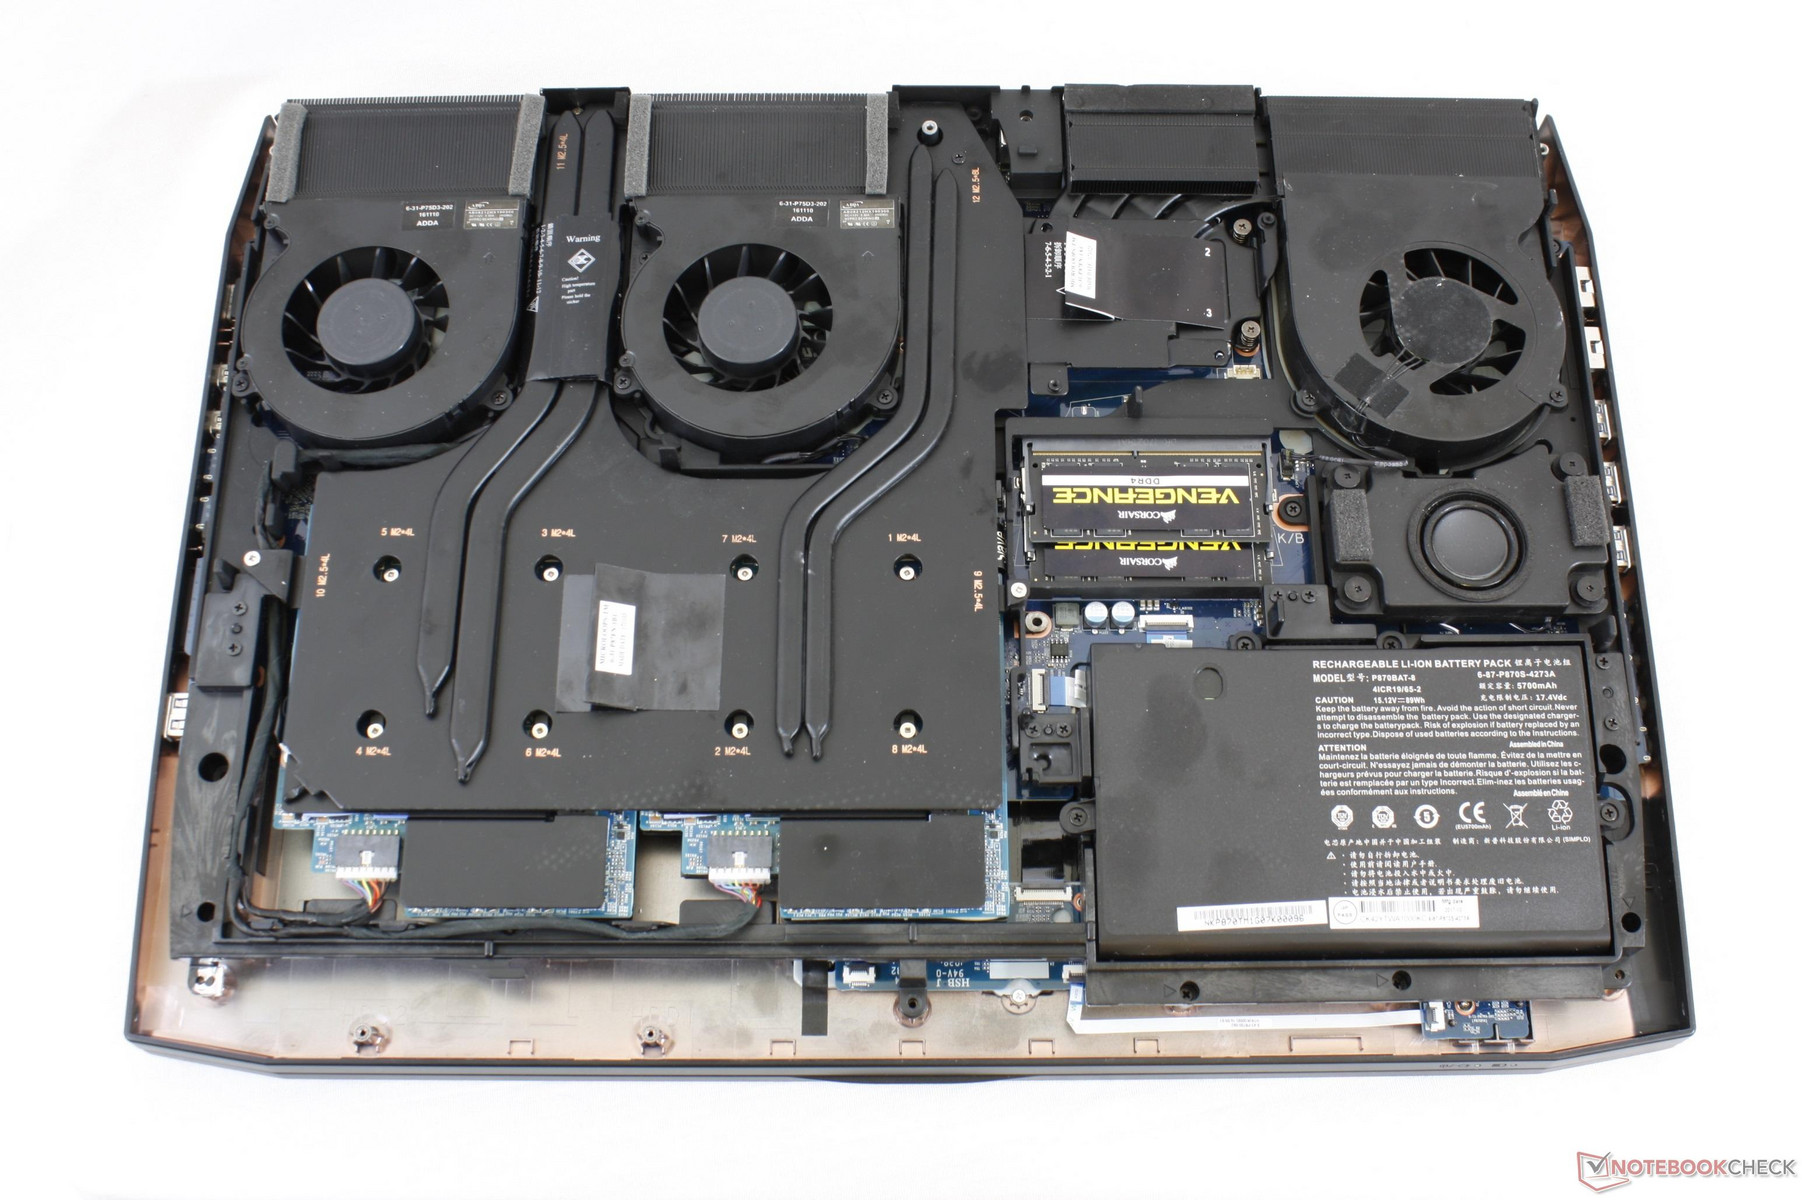
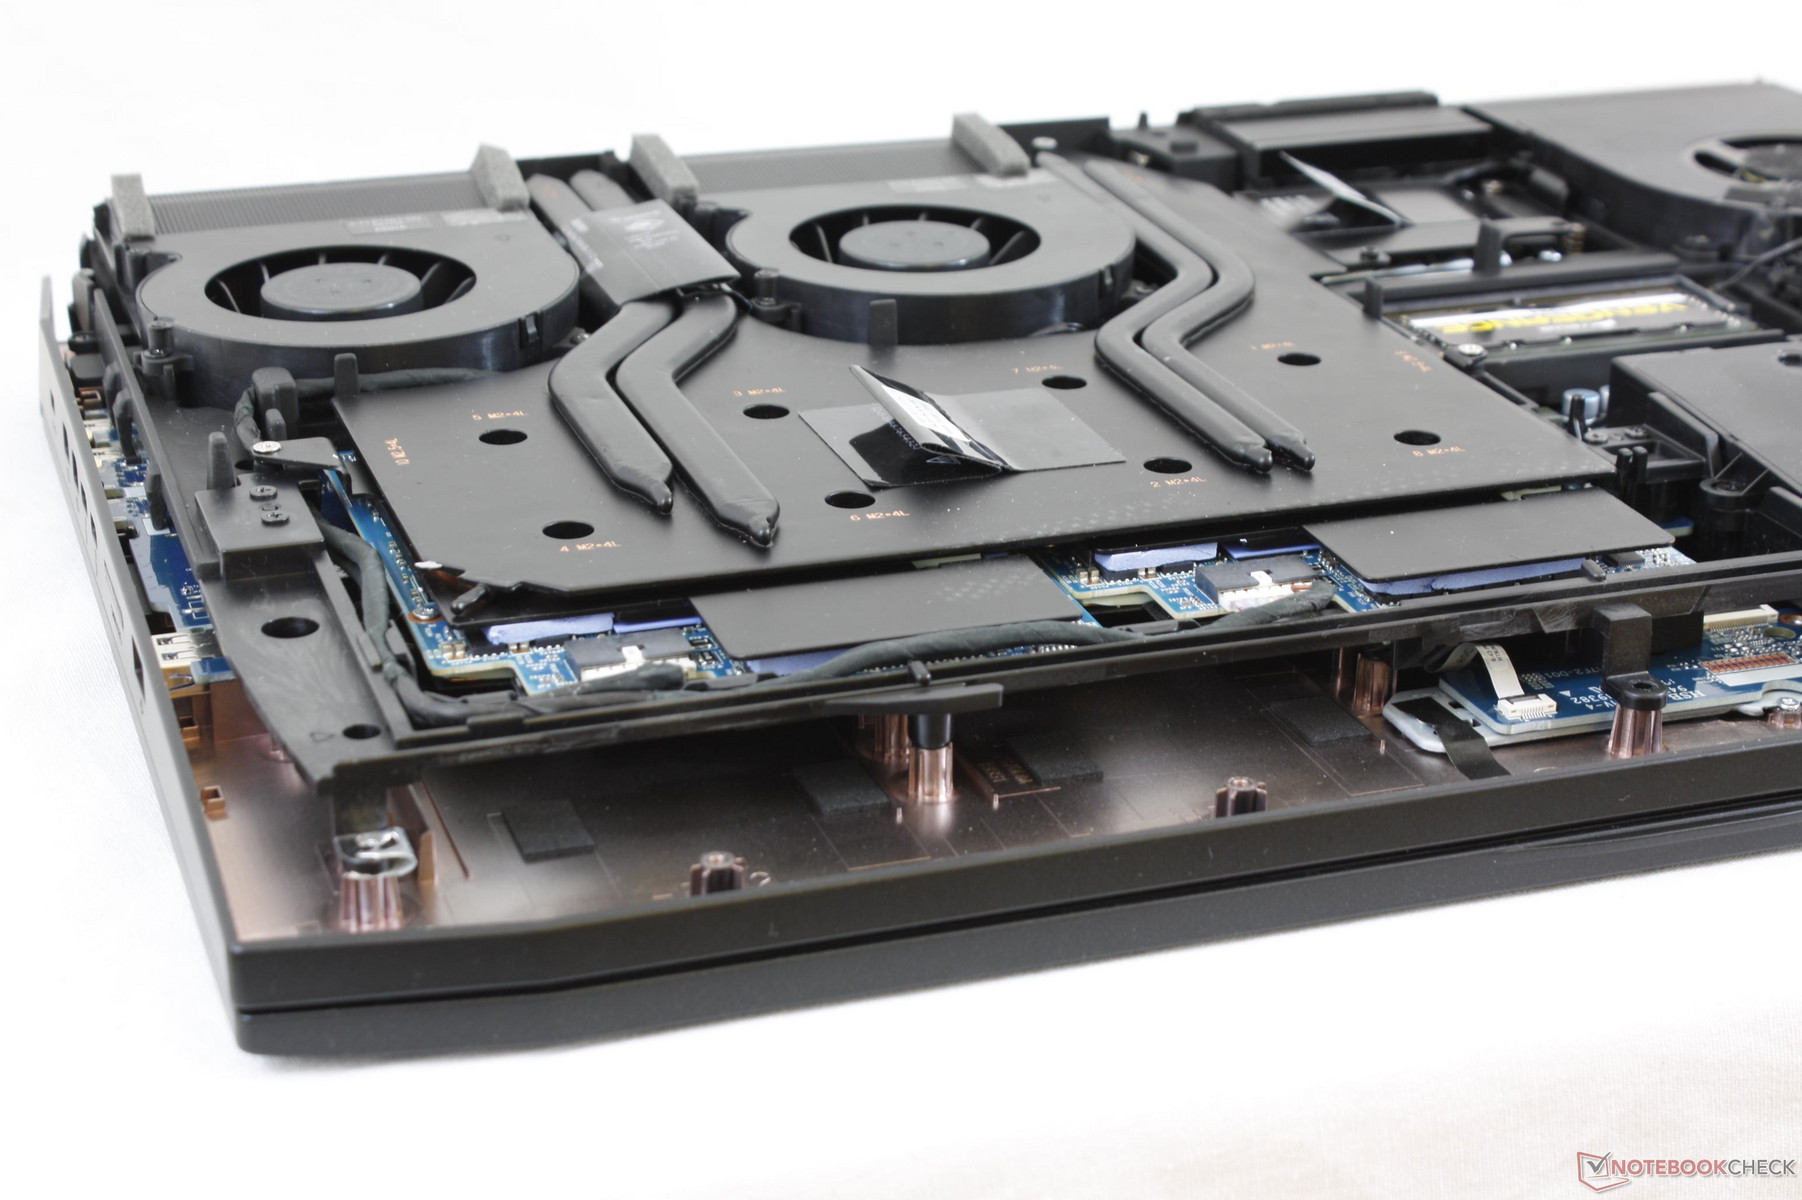
Maintenance
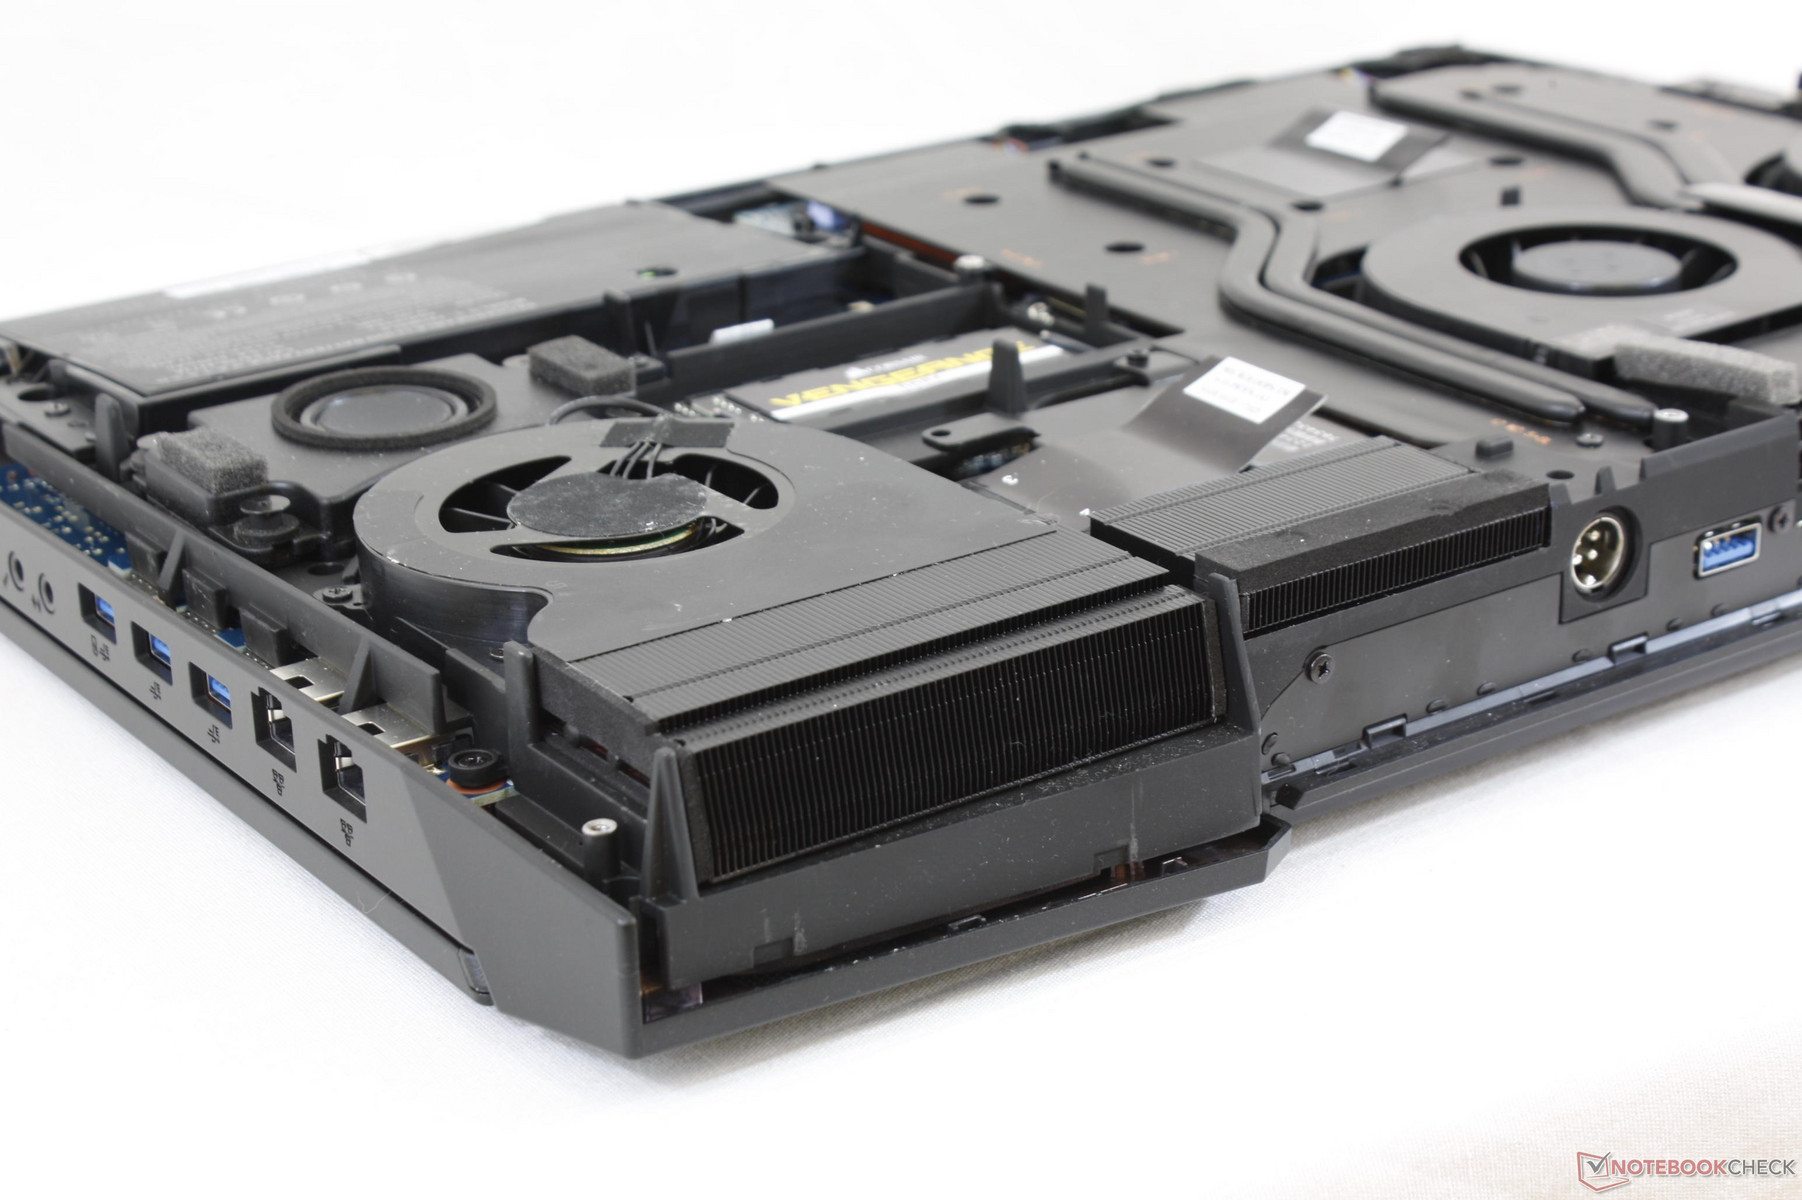
The bottom panel can be easily removed with a Philips screwdriver to expose the cooling system, battery, subwoofer, and two of the four DDR4 SODIMM slots. The entire cooling plate and keyboard will have to be unscrewed if there is need to access the storage bays or any of the LGA 1151 or 190 W MXM 3.0 slots. As a result, a simple HDD or SSD swap can be more of a hassle than on most other gaming notebooks. Perhaps unsurprisingly, more than half of the area is dedicated to cooling both GPUs efficiently.
The online version of the User's Manual can be found here.
Warranty
The standard one-year limited warranty applies with options to extend up to three years. Competing manufacturers like Aorus and EVGA tend to offer two-year warranty as standard while larger makers like Lenovo and Dell have much wider protection and coverage options. Considering the high base price of the Sky X9C, we would've preferred a similar two-year base warranty as standard as well.
Please see our Guarantees, Return Policies and Warranties FAQ for country-specific information.
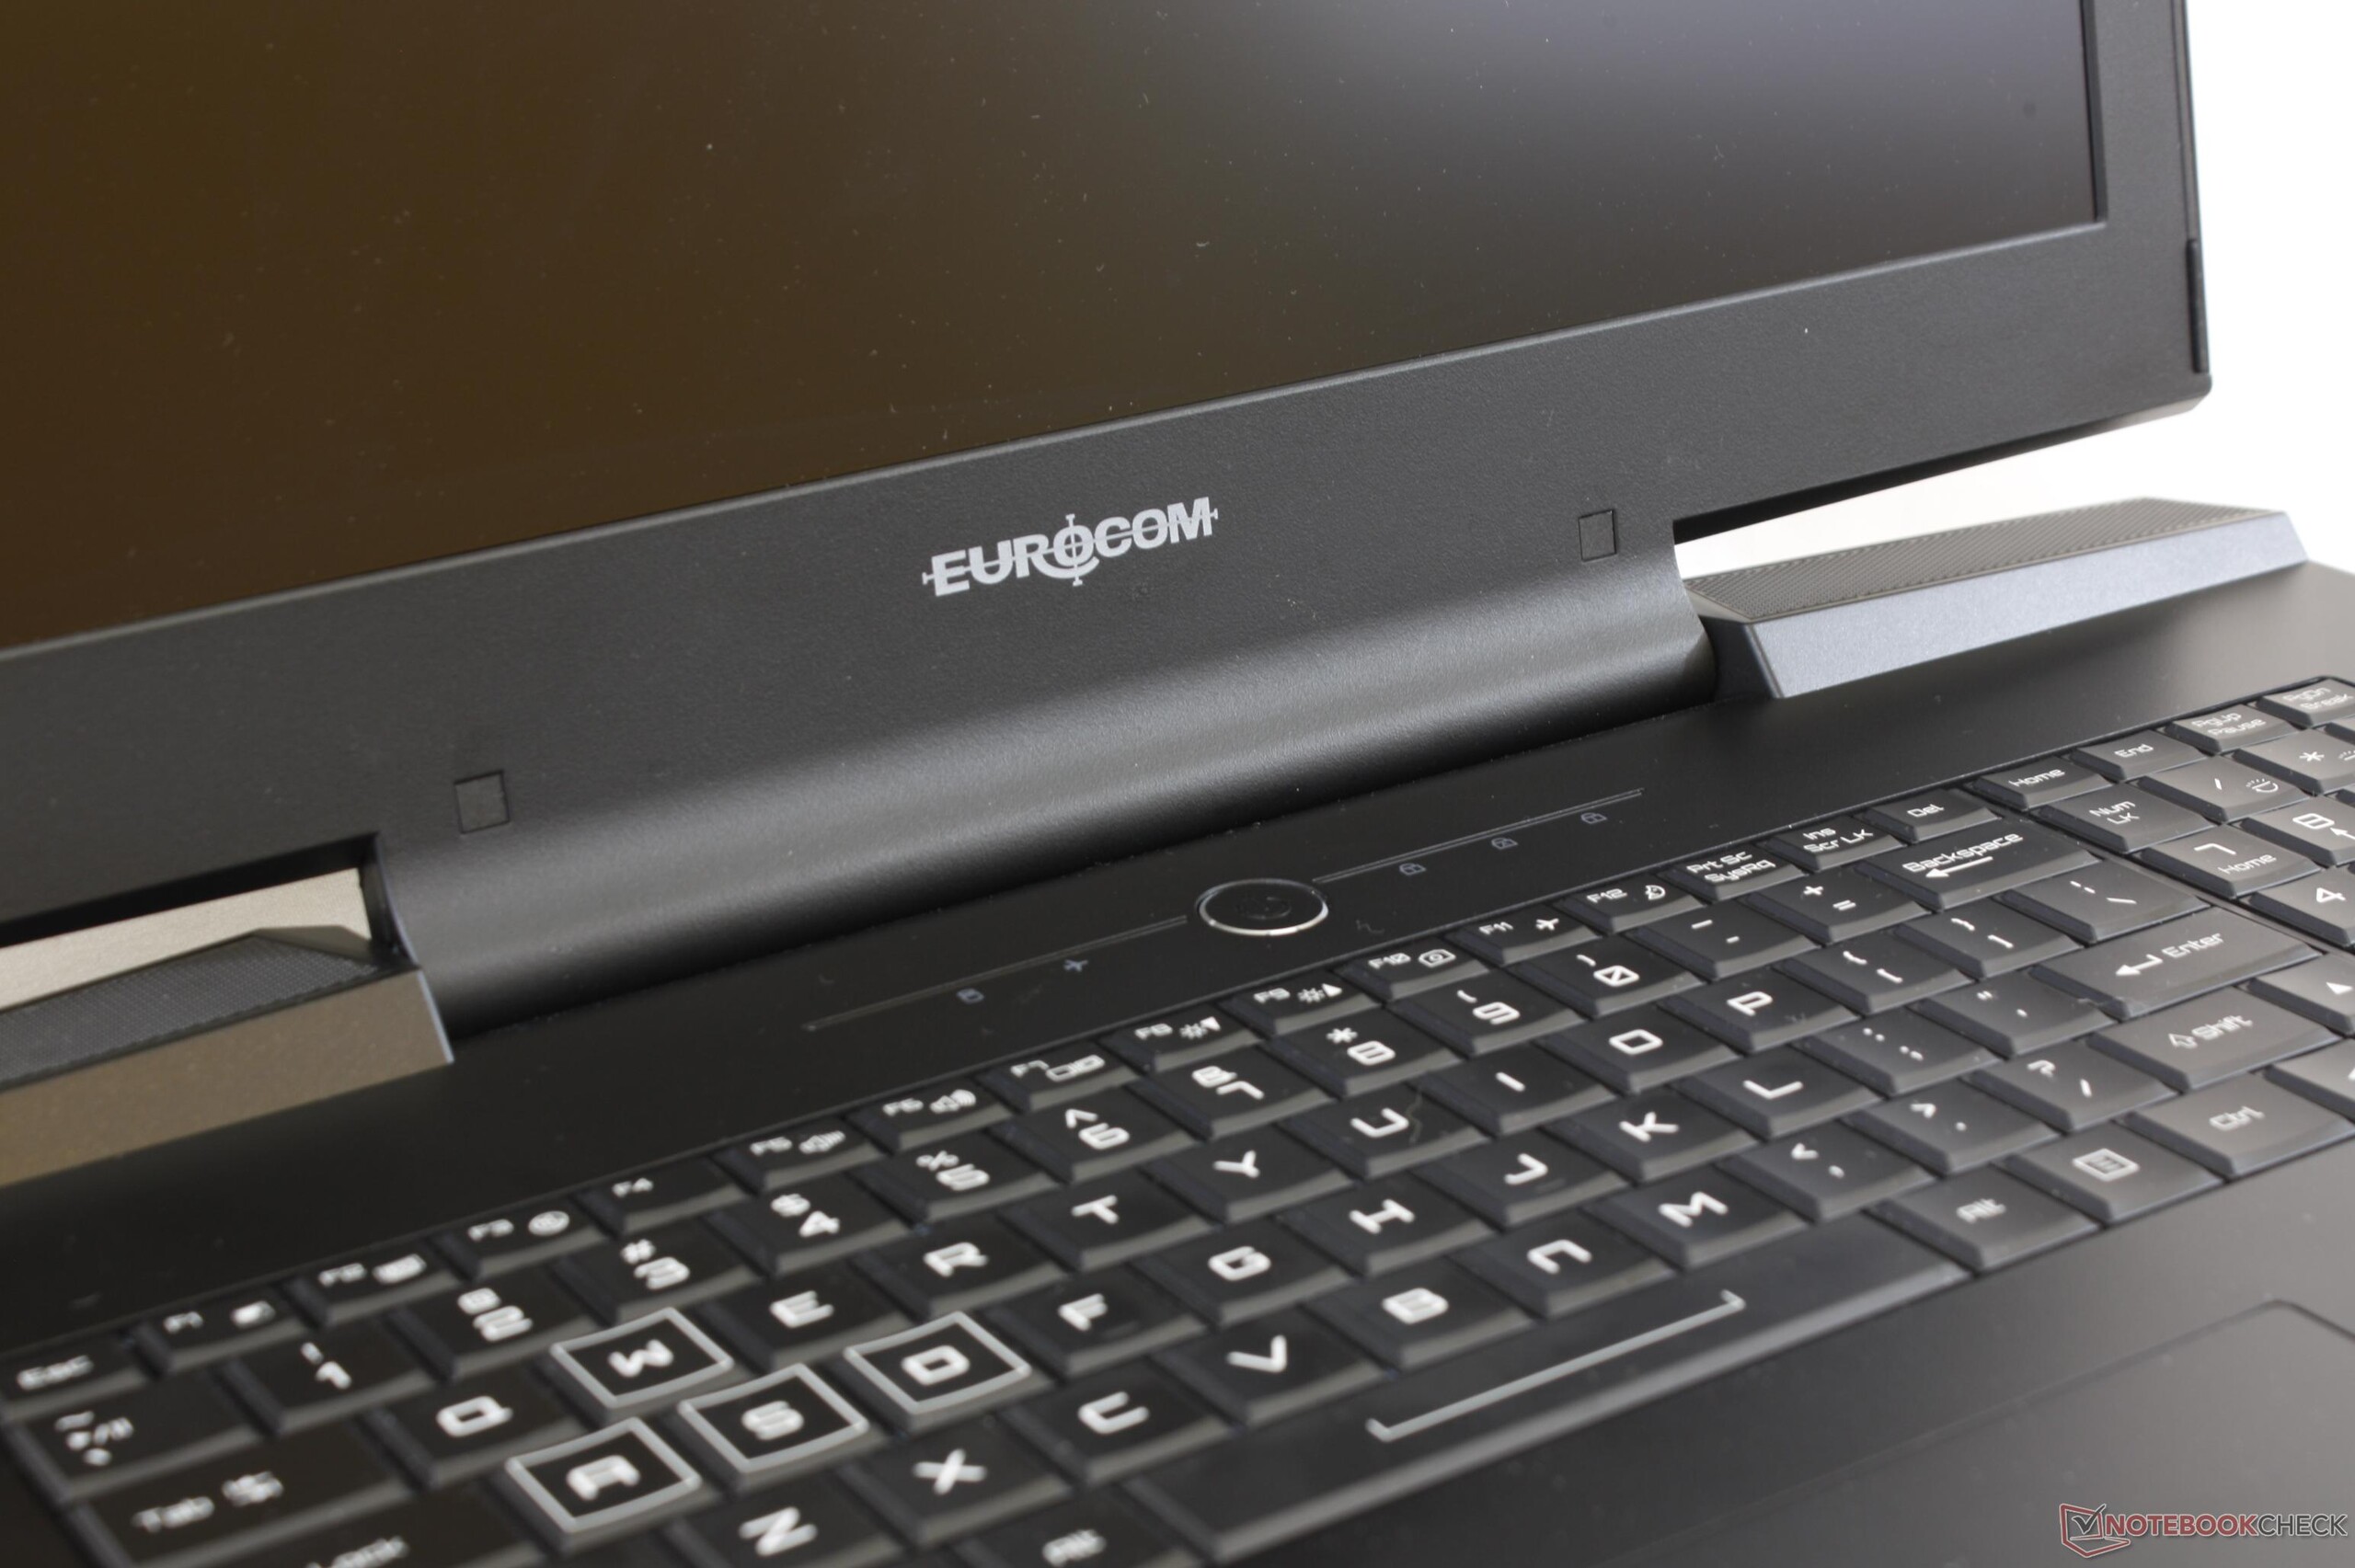
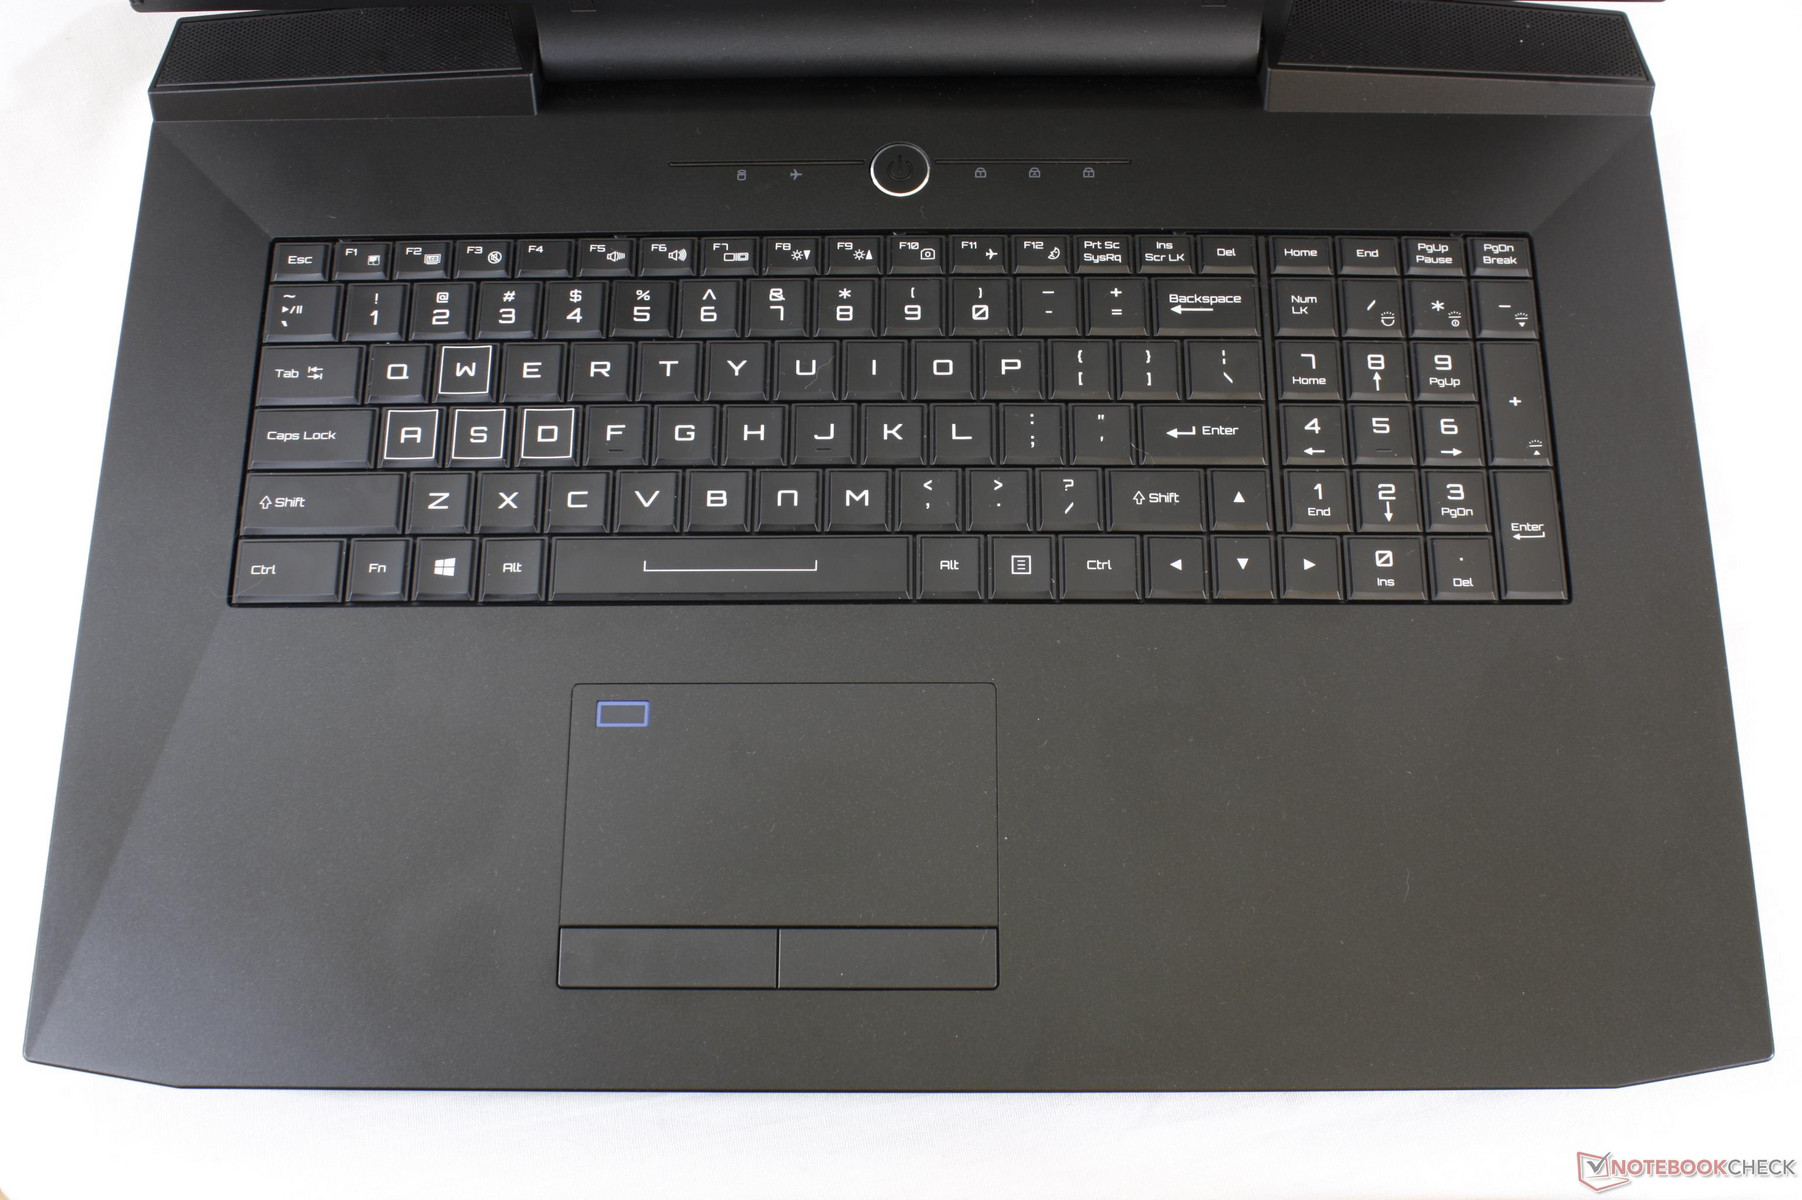
Input Devices
Keyboard and Touchpad
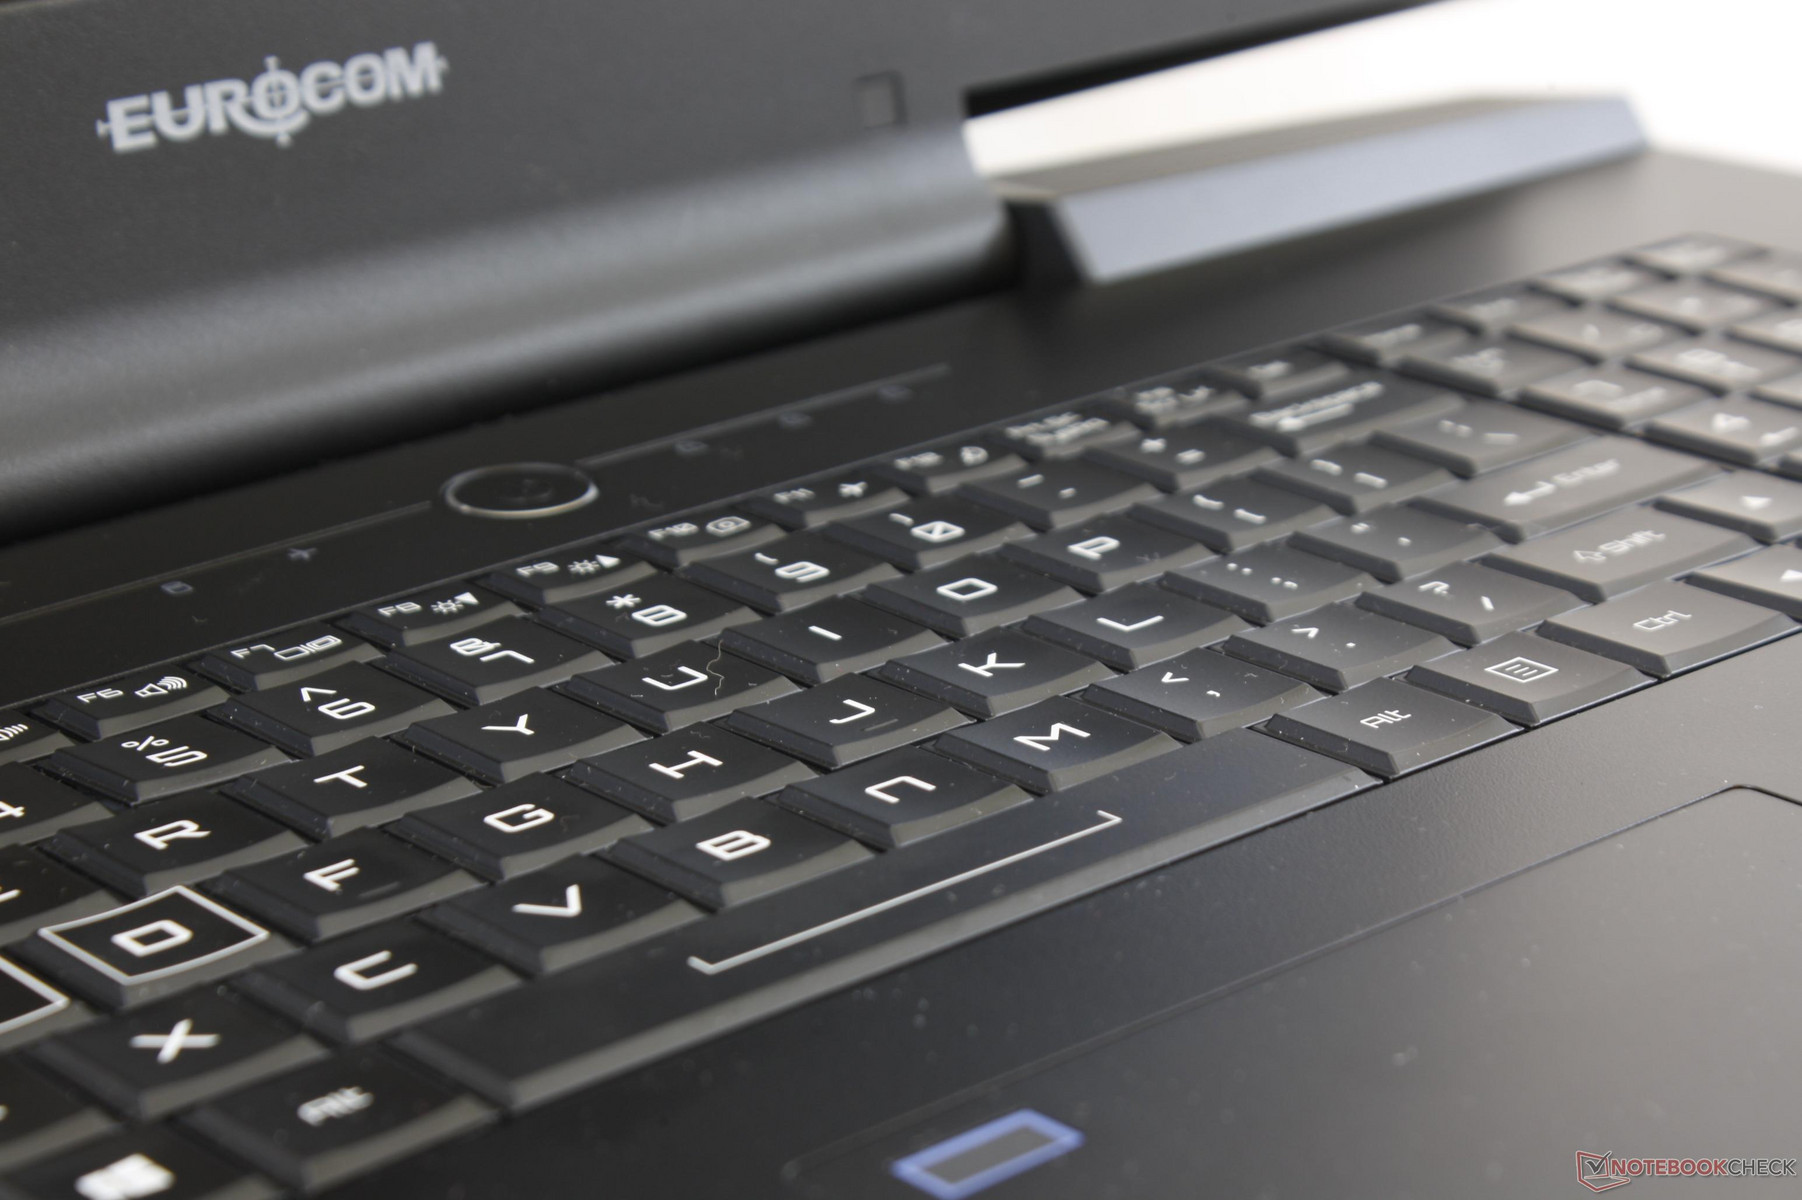
No changes have been made to the beveled keyboard (35 x 11 cm) or trackpad (~10.8 x 6.2 cm). We hope that future revisions will incorporate individually-lit RGB keys and expand on the total width of the keyboard for a less cramped typing experience.
Display
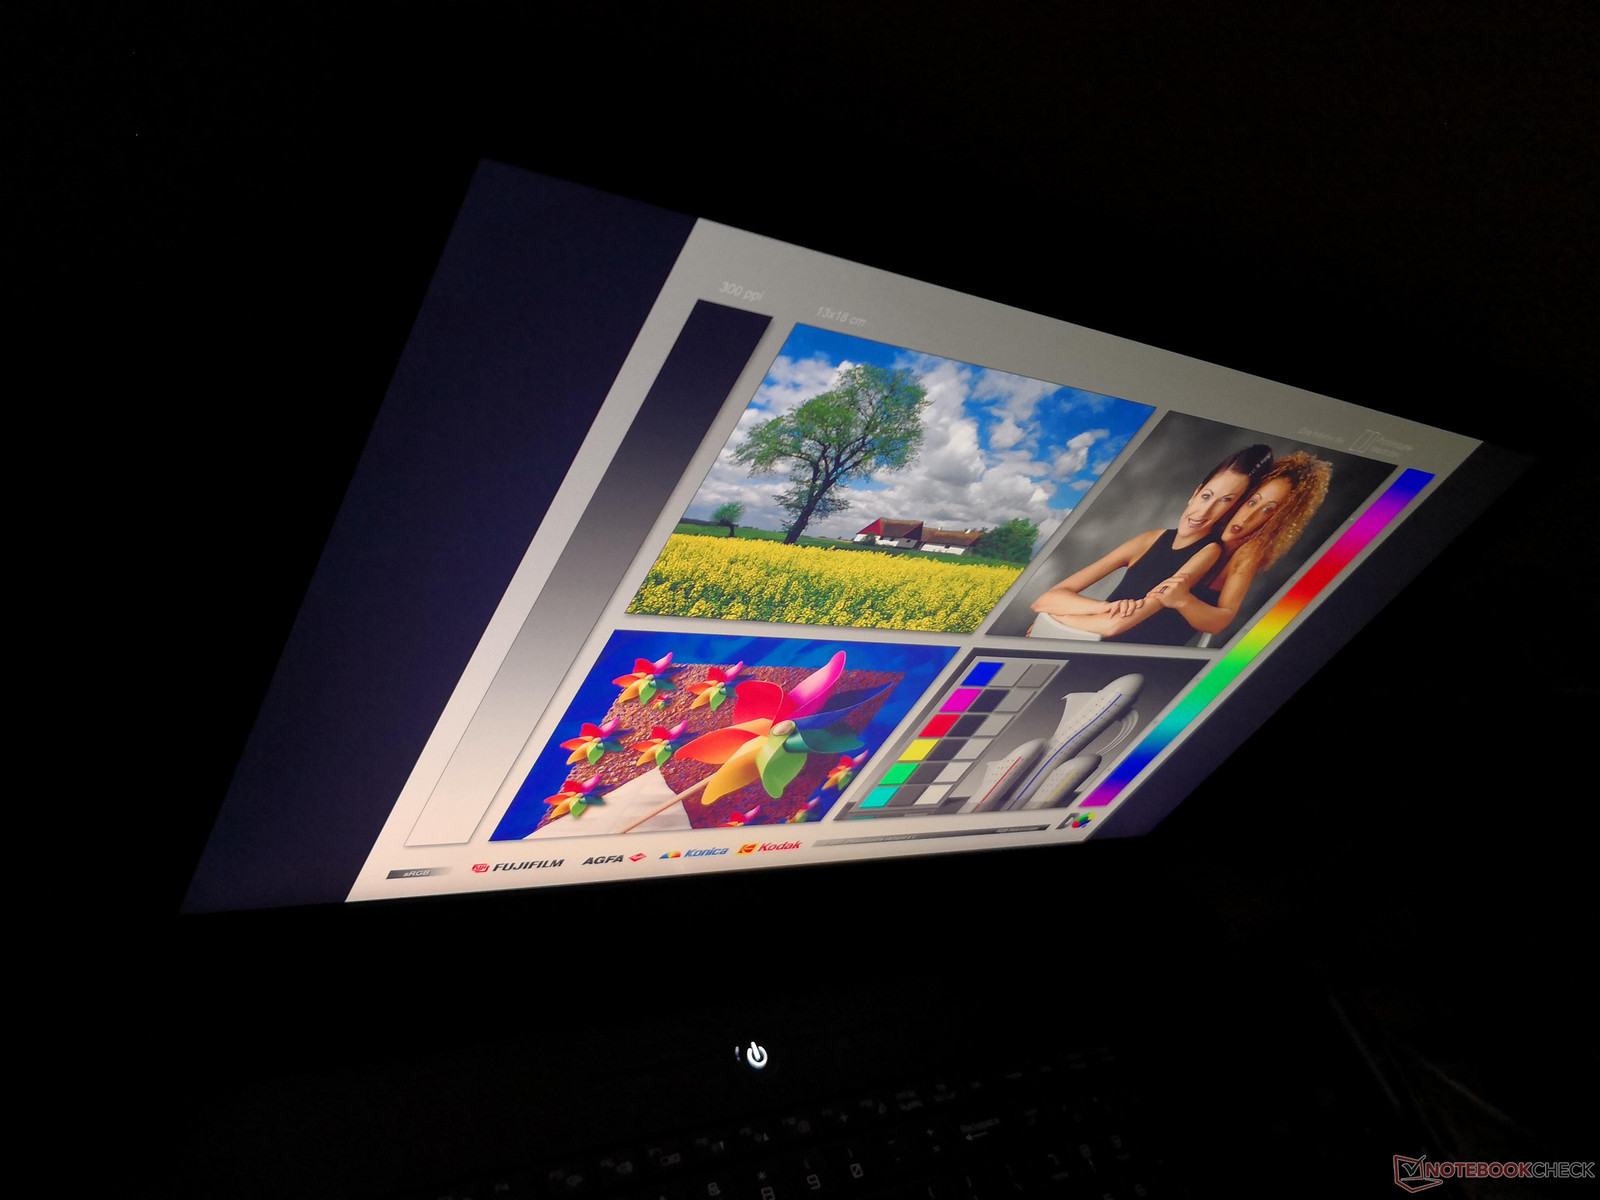
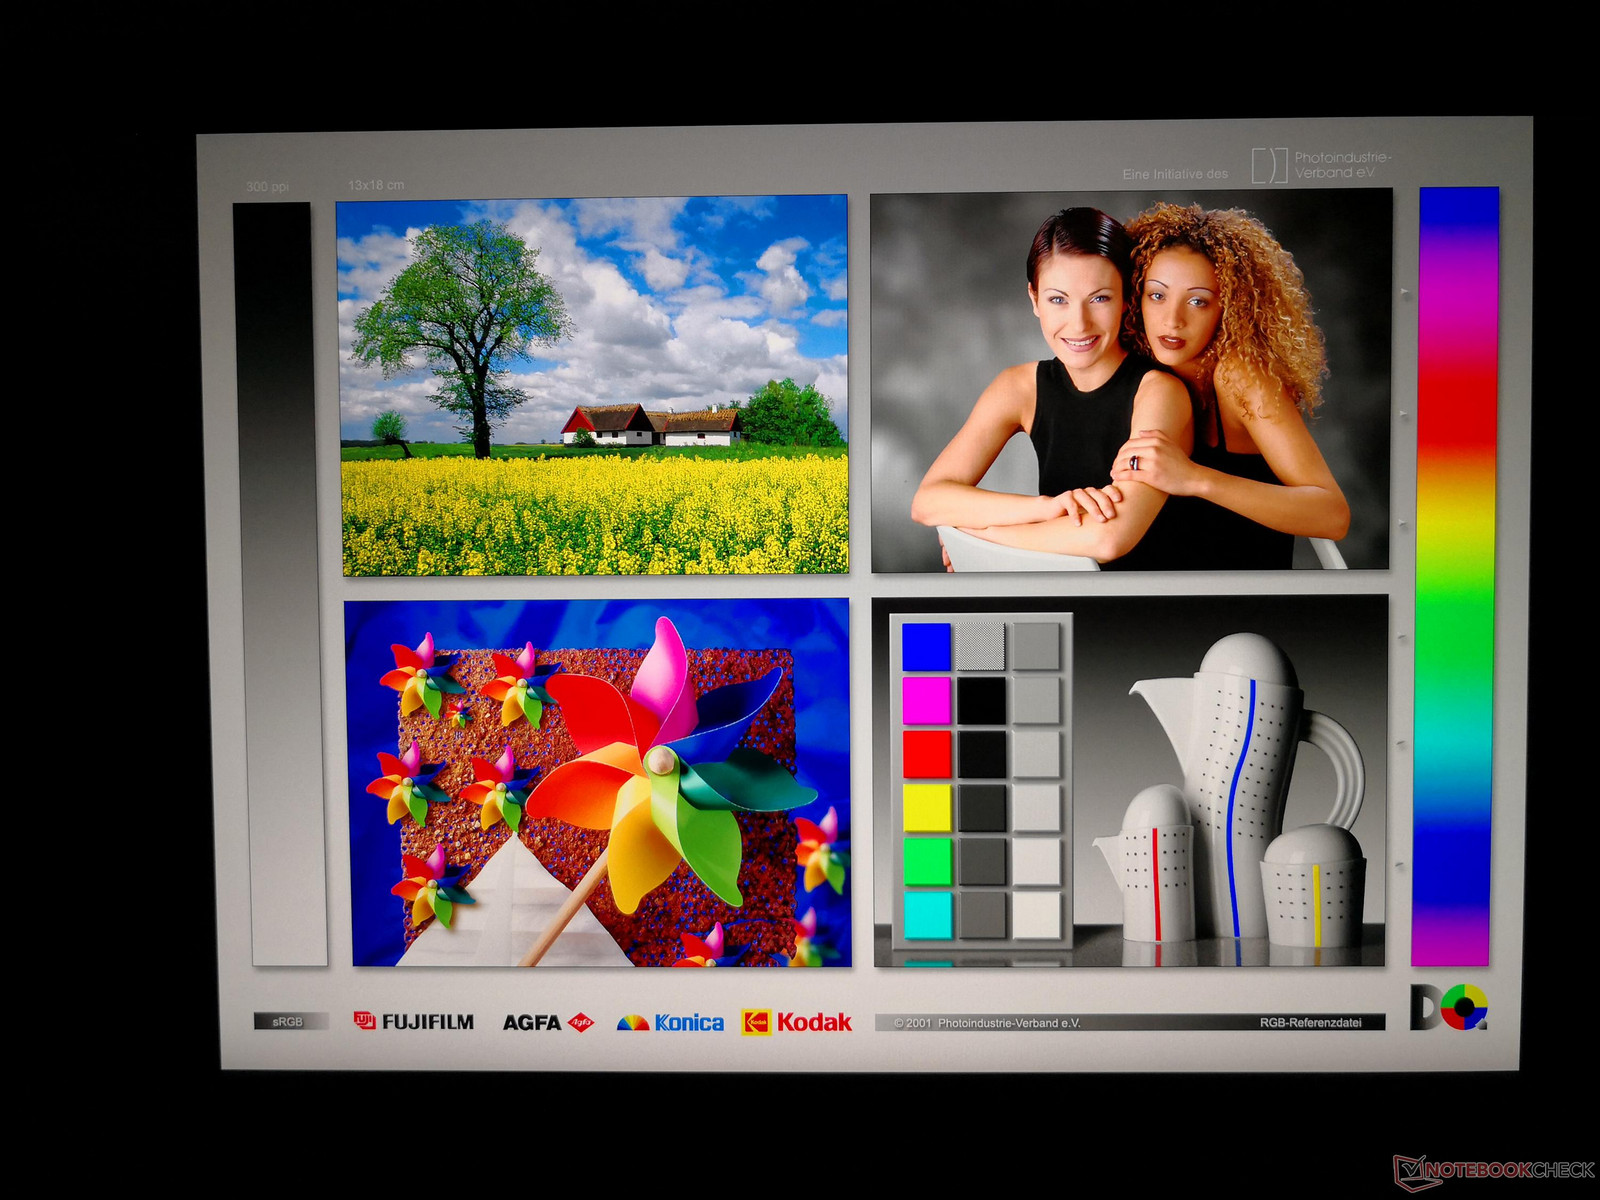
The Sky X9C can be configured with IPS FHD 60 Hz, IPS FHD 120 Hz, TN QHD 120 Hz, or IPS 4K UHD 60 Hz matte options. Our unit today is equipped with the 4K UHD option utilizing the same AU Optronics B173ZAN01.0 panel as on the Schenker XMG U727. Consequently, both displays exhibit very similar characteristics as confirmed by our measurements below. Brightness, contrast, colors, and response times are all where we expect them to be for a high-end gaming machine. Note that the TN panels on the MSI GT75VR and Alienware 17 R4 have faster response times and thus fewer ghosting issues at the cost of narrower viewing angles, more limited colors, and lower native resolutions. Higher resolutions aren't always better depending on the demands of the user.
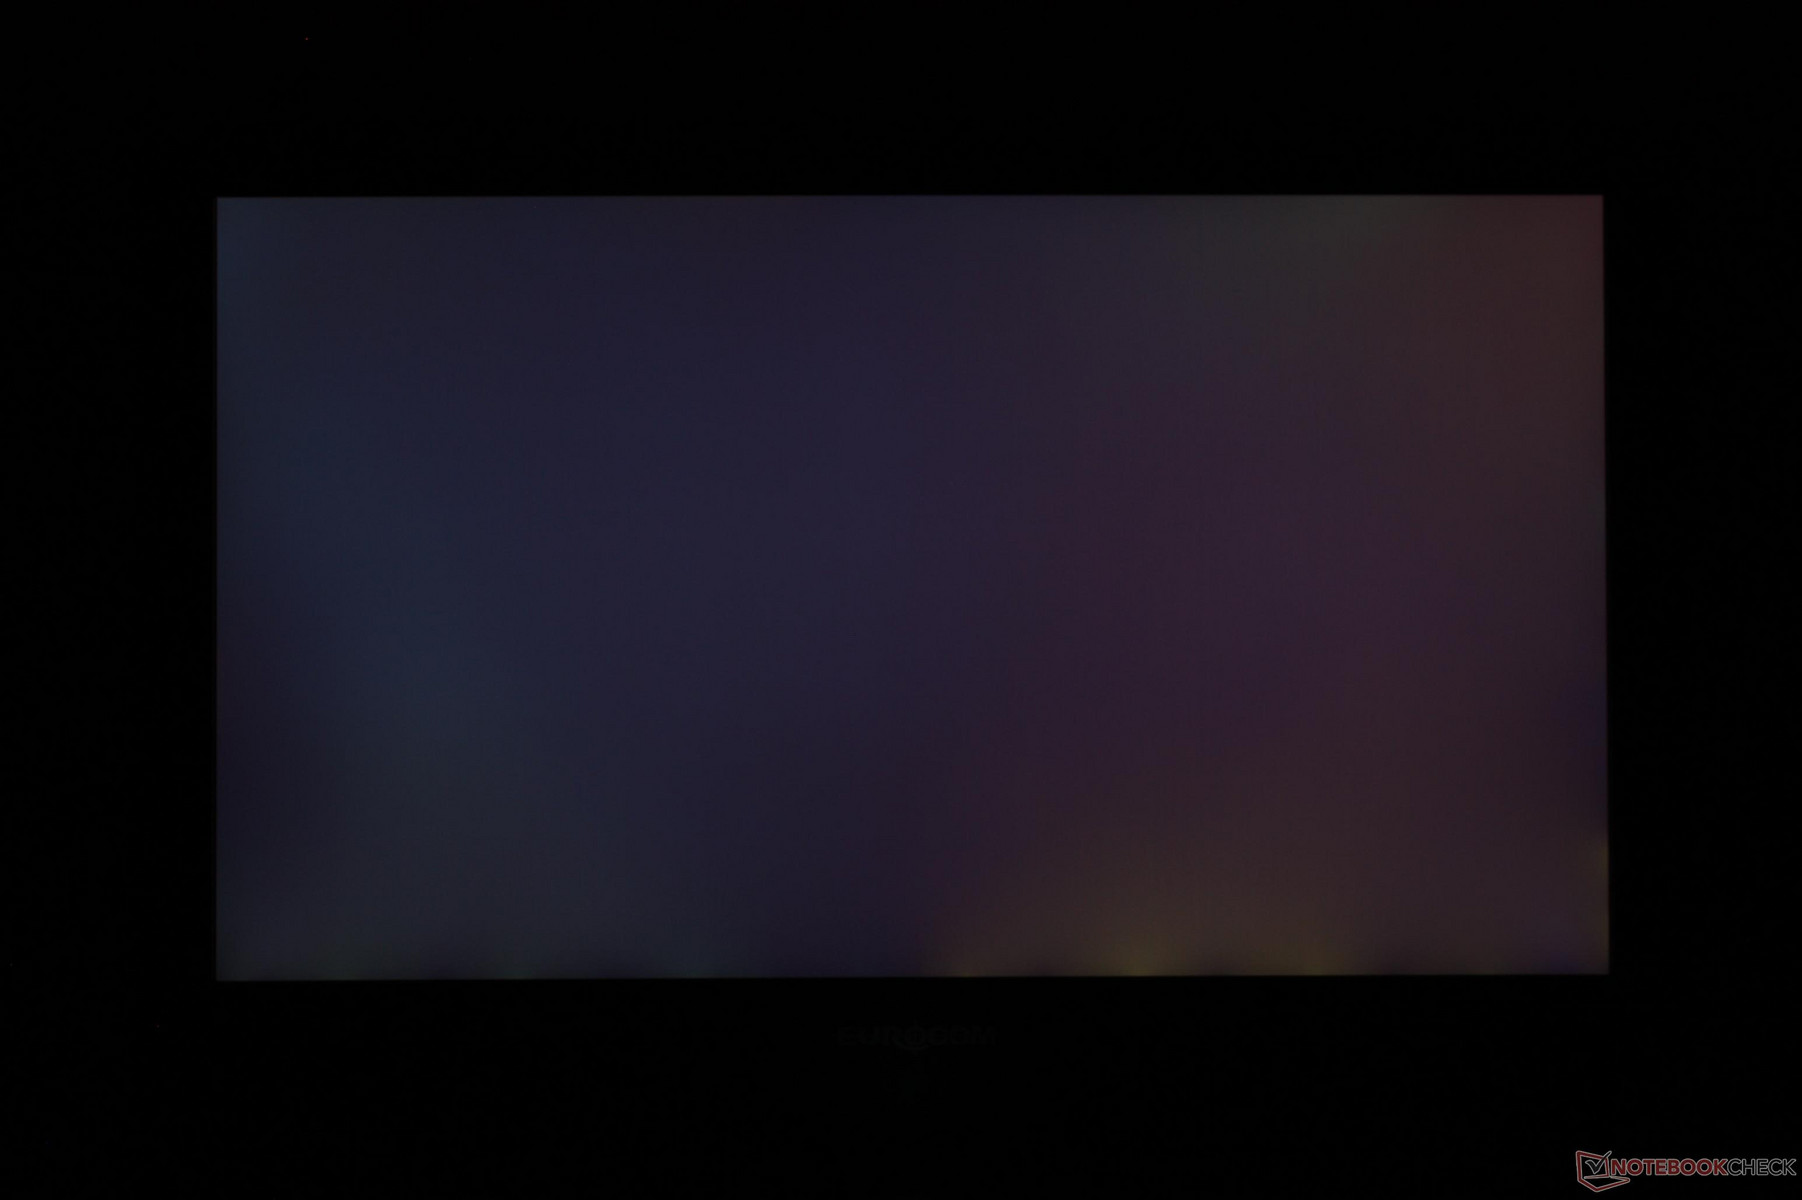
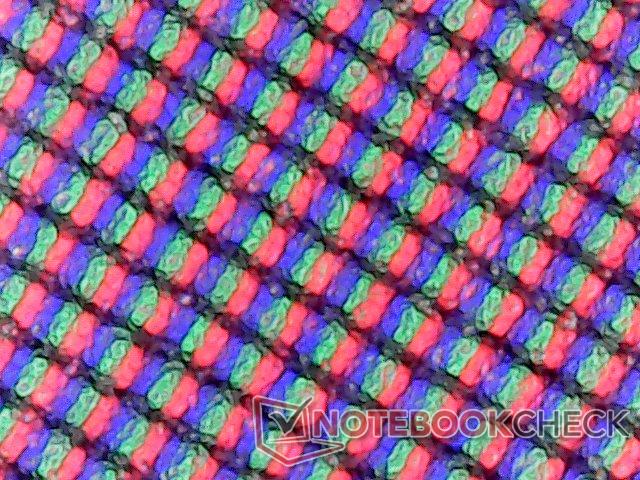
There is a slight graininess to the display that becomes more apparent when on higher brightness levels with white backgrounds. This phenomenon is common amongst matte panels whereas most glossy displays appear sharper and cleaner in comparison. Our particular test unit also exhibits moderate uneven backlight bleeding that we find to be noticeable during video payback or gameplay with darkened scenes. While not distracting, it's still disappointing considering the enthusiast category of the system.
| |||||||||||||||||||||||||
Brightness Distribution: 87 %
Center on Battery: 347.7 cd/m²
Contrast: 869:1 (Black: 0.4 cd/m²)
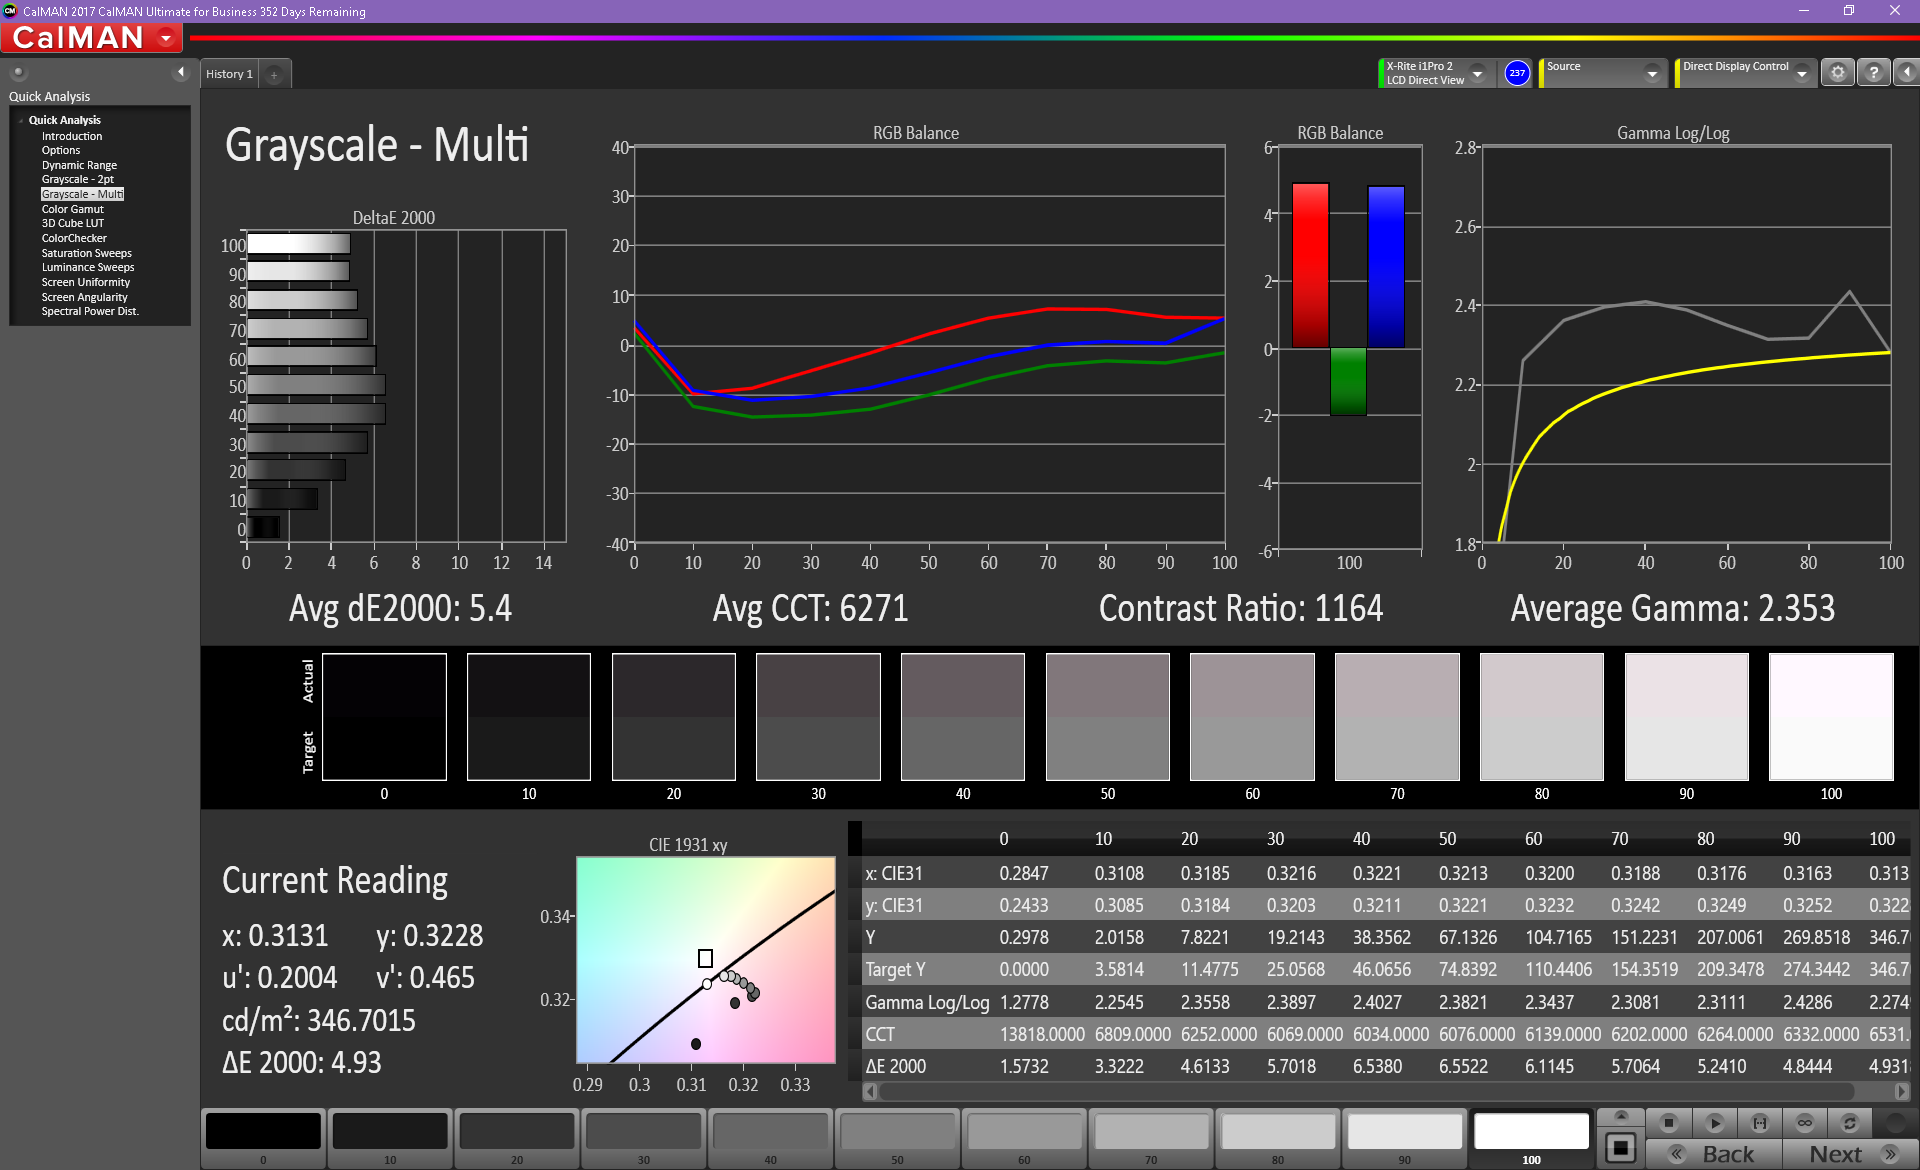
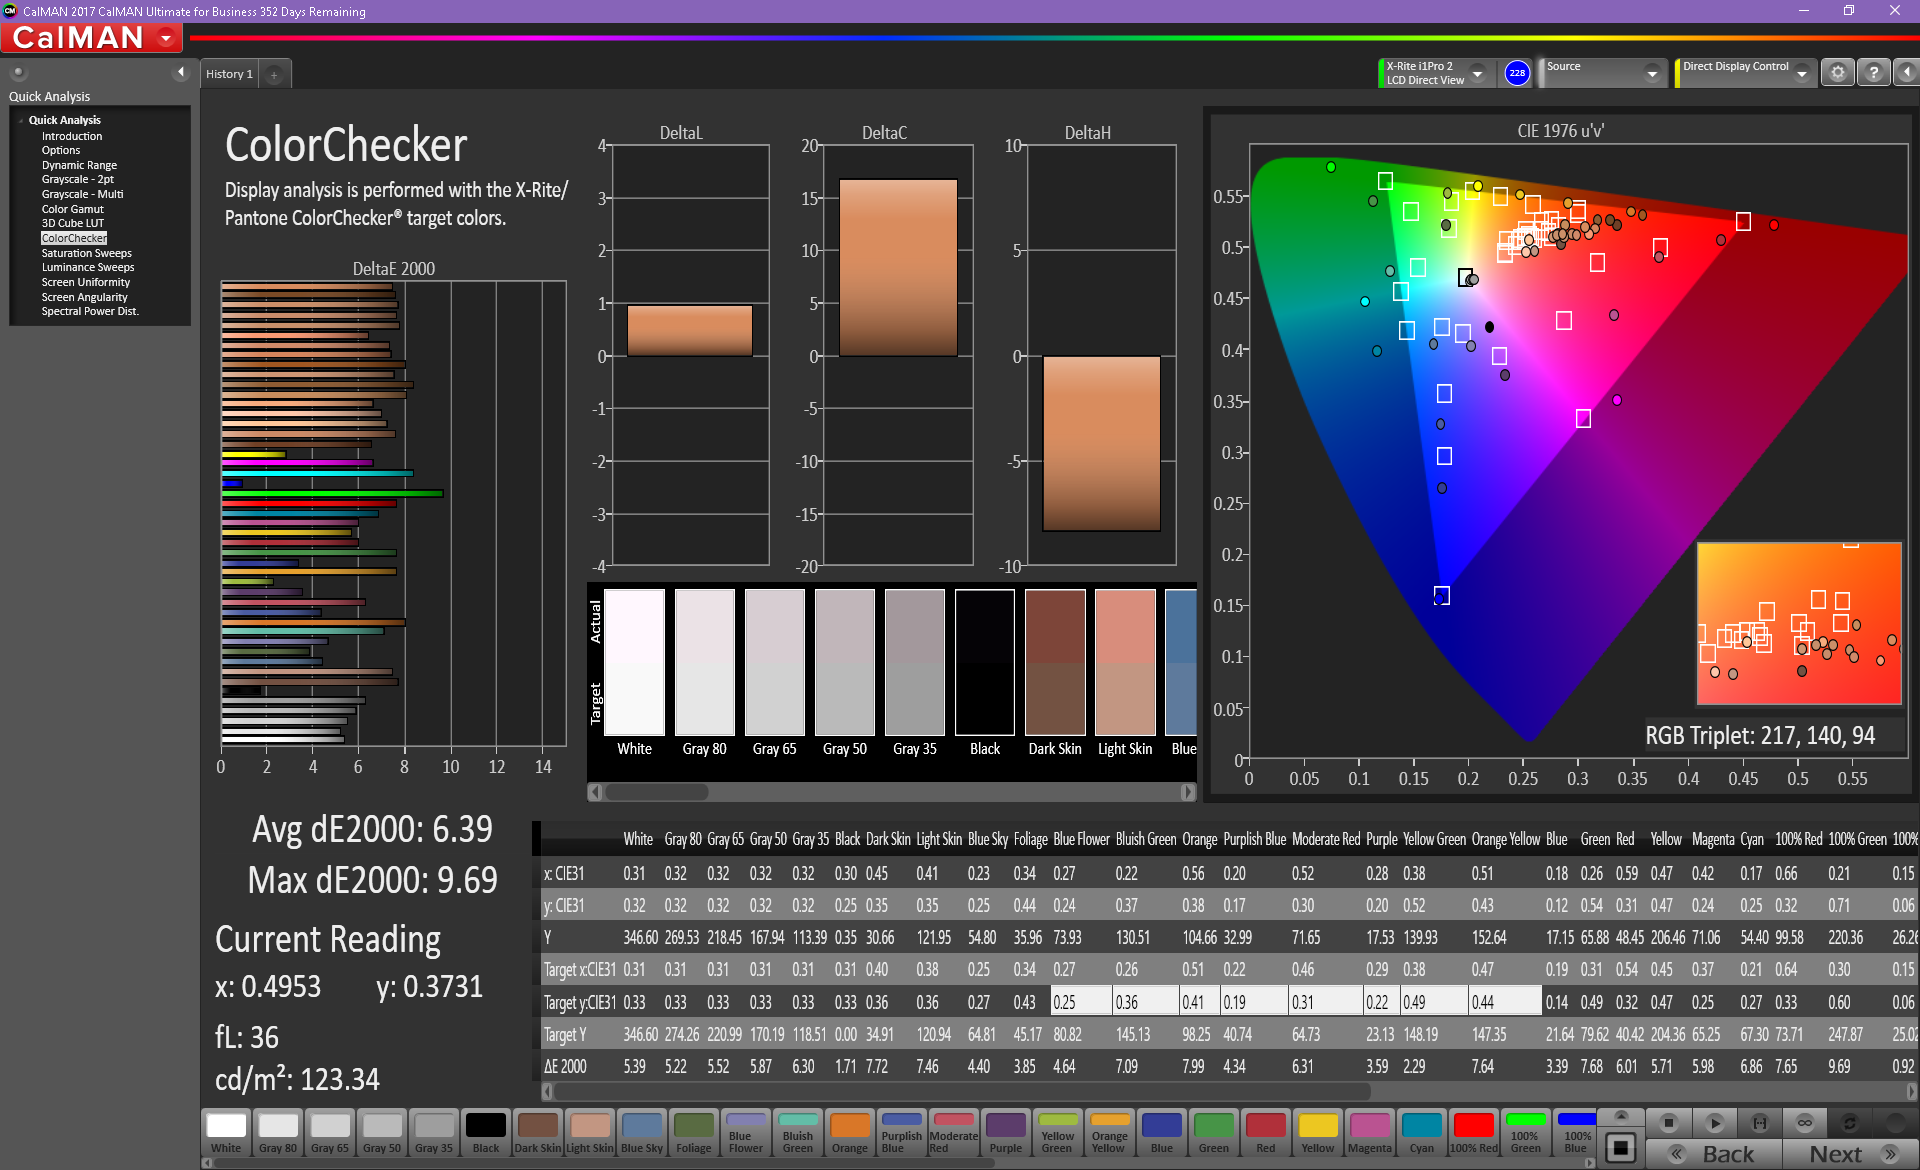
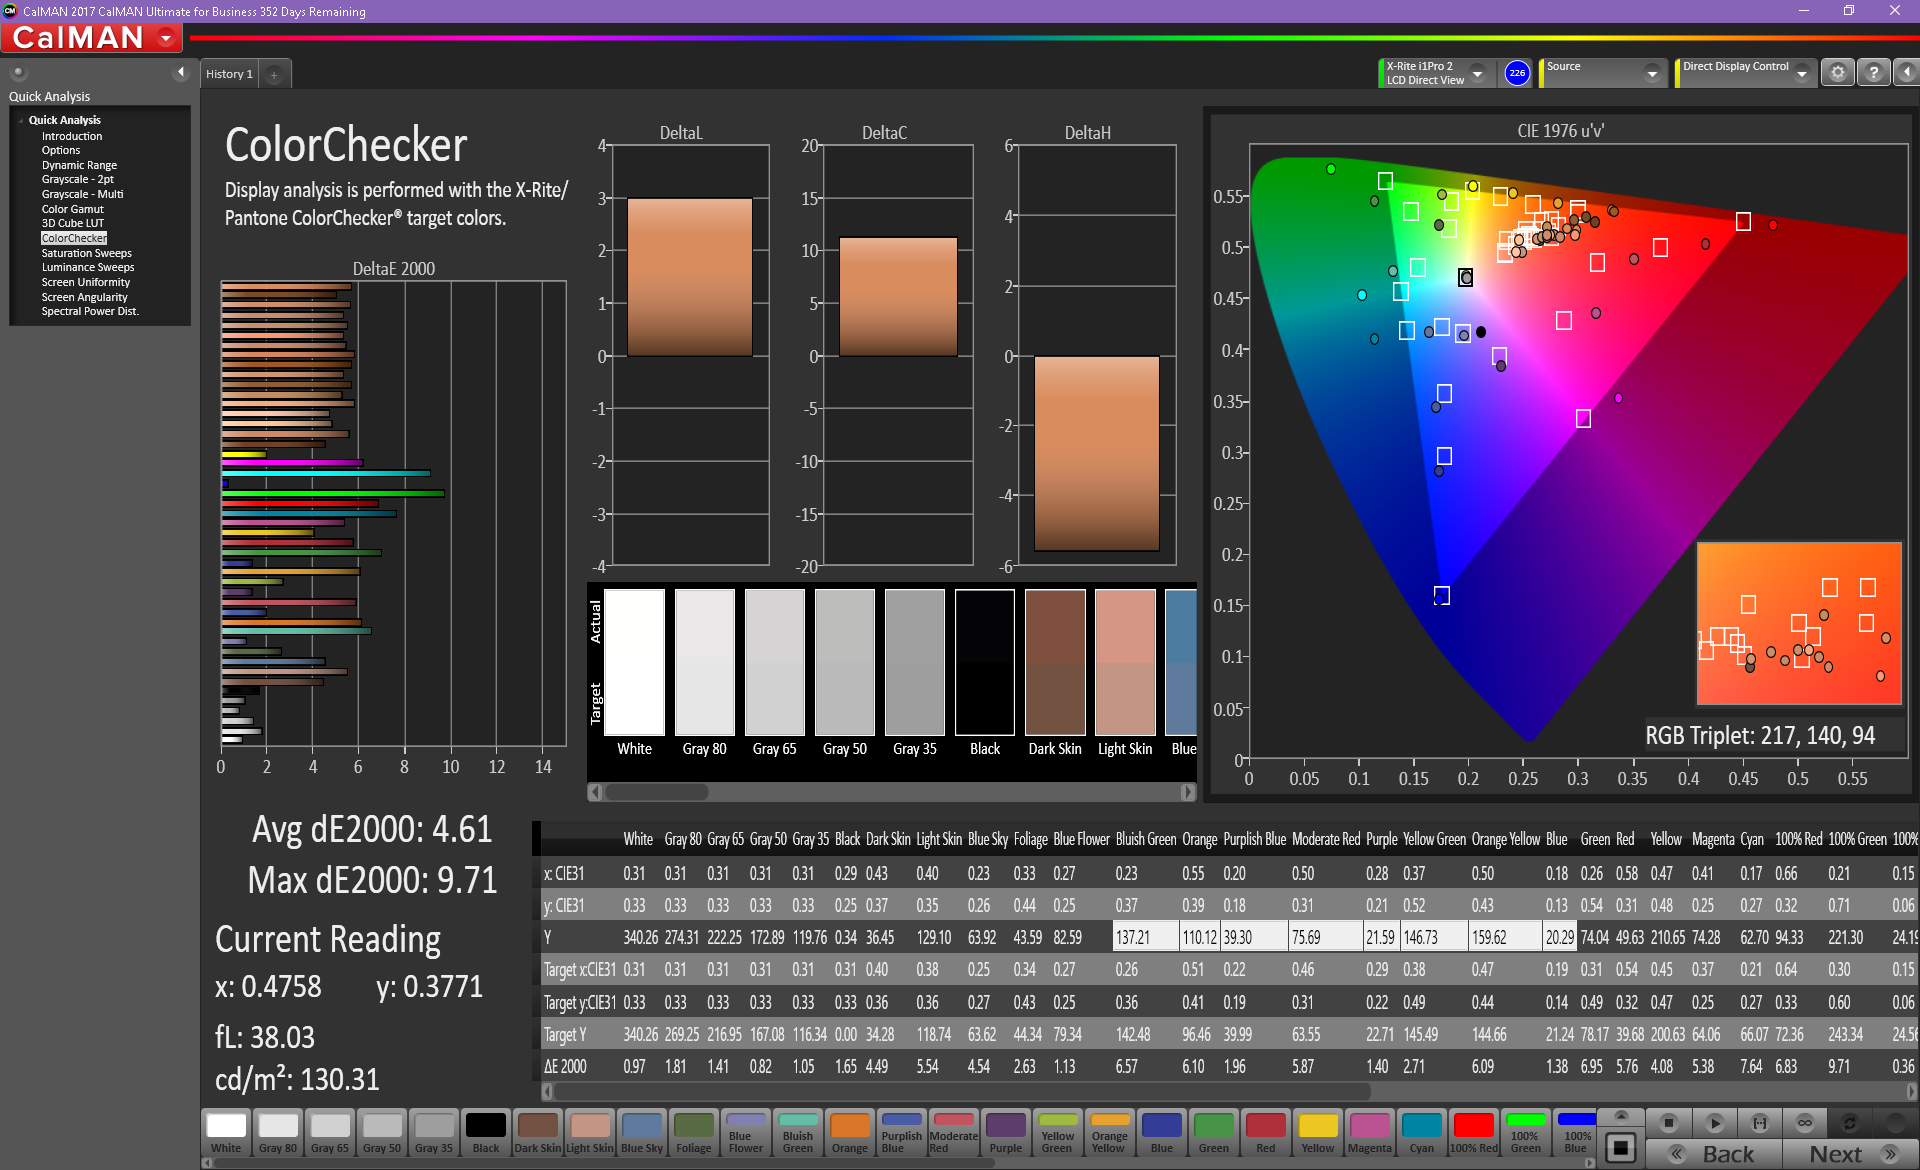
ΔE ColorChecker Calman: 6.39 | ∀{0.5-29.43 Ø4.73}
ΔE Greyscale Calman: 5.4 | ∀{0.09-98 Ø4.97}
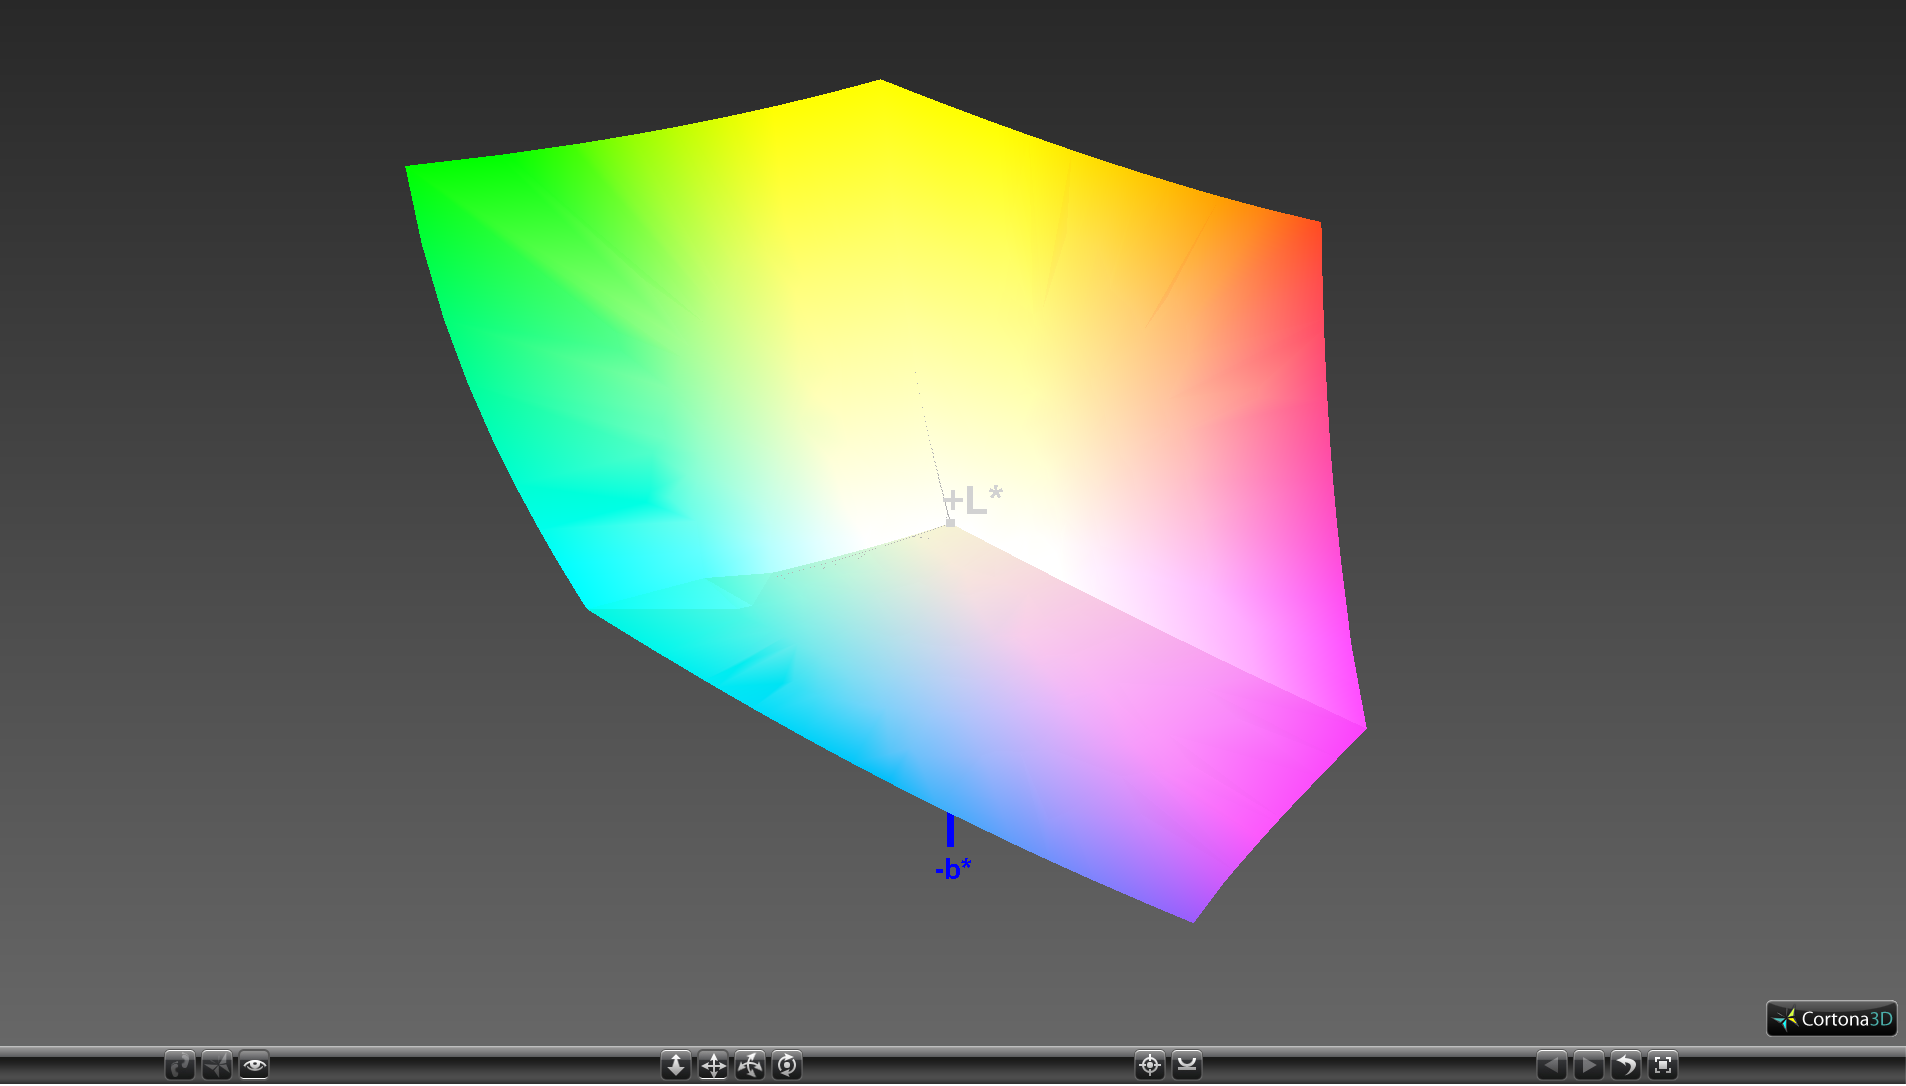
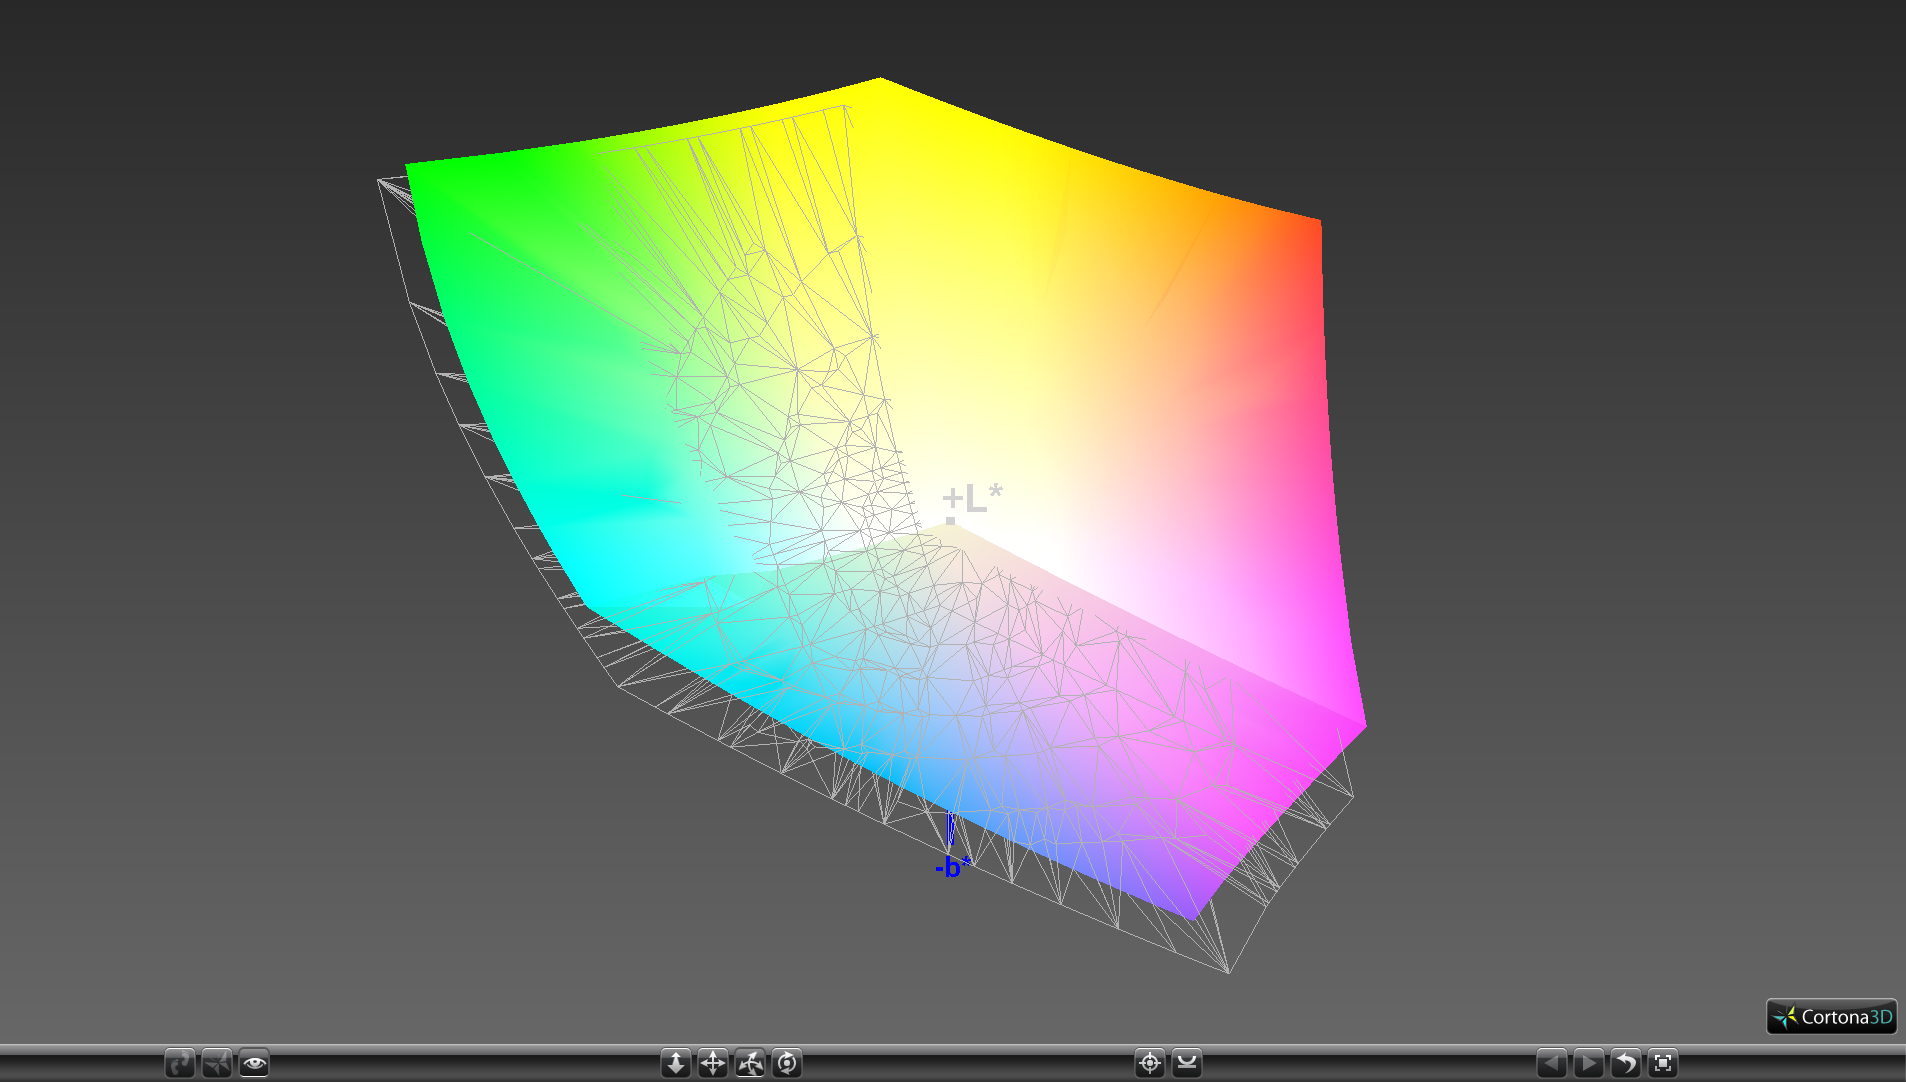
100% sRGB (Argyll 1.6.3 3D)
87.8% AdobeRGB 1998 (Argyll 1.6.3 3D)
99.4% AdobeRGB 1998 (Argyll 3D)
100% sRGB (Argyll 3D)
86.6% Display P3 (Argyll 3D)
Gamma: 2.4
CCT: 6271 K
| Eurocom Sky X9C ID: AUO109B, Name: AU Optronics B173ZAN01.0, IPS, 17.3", 3840x2160 | Alienware 17 R4 TN LED, 17.3", 2560x1440 | MSI GT75VR 7RF-012 Titan Pro CMN N173HHE-G32 (CMN1747), TN LED, 17.3", 1920x1080 | Asus G701VIK-BA049T B173HAN01.1 (AUO119D), IPS, 17.3", 1920x1080 | Razer Blade Pro 2017 Sharp LQ173D1JW33 (SHP145A), IGZO, 17.3", 3840x2160 | Schenker XMG U727 2017 AU Optronics B173ZAN01.0 (AUO109B), AHVA, 17.3", 3840x2160 | |
|---|---|---|---|---|---|---|
| Display | -28% | -3% | -23% | 1% | 0% | |
| Display P3 Coverage (%) | 86.6 | 61.2 -29% | 90.3 4% | 68.8 -21% | 88.9 3% | 86.6 0% |
| sRGB Coverage (%) | 100 | 82.9 -17% | 99.6 0% | 87.7 -12% | 100 0% | 99.9 0% |
| AdobeRGB 1998 Coverage (%) | 99.4 | 60.5 -39% | 86.8 -13% | 64.1 -36% | 99.7 0% | 99.5 0% |
| Response Times | 44% | 75% | 22% | -36% | 1% | |
| Response Time Grey 50% / Grey 80% * (ms) | 43.6 ? | 30 ? 31% | 11.6 ? 73% | 38 ? 13% | 60.8 ? -39% | 44 ? -1% |
| Response Time Black / White * (ms) | 28.8 ? | 12.8 ? 56% | 6.8 ? 76% | 20 ? 31% | 38.4 ? -33% | 28 ? 3% |
| PWM Frequency (Hz) | 25000 ? | 204.9 ? | ||||
| Screen | -8% | 23% | 9% | 3% | 20% | |
| Brightness middle (cd/m²) | 347.7 | 402.3 16% | 274 -21% | 306 -12% | 230 -34% | 362 4% |
| Brightness (cd/m²) | 324 | 372 15% | 262 -19% | 299 -8% | 207 -36% | 344 6% |
| Brightness Distribution (%) | 87 | 86 -1% | 87 0% | 91 5% | 83 -5% | 85 -2% |
| Black Level * (cd/m²) | 0.4 | 0.62 -55% | 0.26 35% | 0.27 32% | 0.2 50% | 0.35 13% |
| Contrast (:1) | 869 | 649 -25% | 1054 21% | 1133 30% | 1150 32% | 1034 19% |
| Colorchecker dE 2000 * | 6.39 | 5.6 12% | 1.36 79% | 3.98 38% | 5.62 12% | 2.46 62% |
| Colorchecker dE 2000 max. * | 9.69 | 9.8 -1% | 4.1 58% | 7.29 25% | 10.24 -6% | 4.26 56% |
| Greyscale dE 2000 * | 5.4 | 4.7 13% | 0.64 88% | 4.15 23% | 4.54 16% | 2.9 46% |
| Gamma | 2.4 92% | 2.14 103% | 2.19 100% | 2.45 90% | 2.36 93% | 2.31 95% |
| CCT | 6271 104% | 7519 86% | 6551 99% | 7386 88% | 6625 98% | 6120 106% |
| Color Space (Percent of AdobeRGB 1998) (%) | 87.8 | 53.7 -39% | 77 -12% | 58 -34% | 88 0% | 88 0% |
| Color Space (Percent of sRGB) (%) | 100 | 82.2 -18% | 100 0% | 89 -11% | 100 0% | 100 0% |
| Total Average (Program / Settings) | 3% /
-5% | 32% /
25% | 3% /
4% | -11% /
-3% | 7% /
14% |
* ... smaller is better
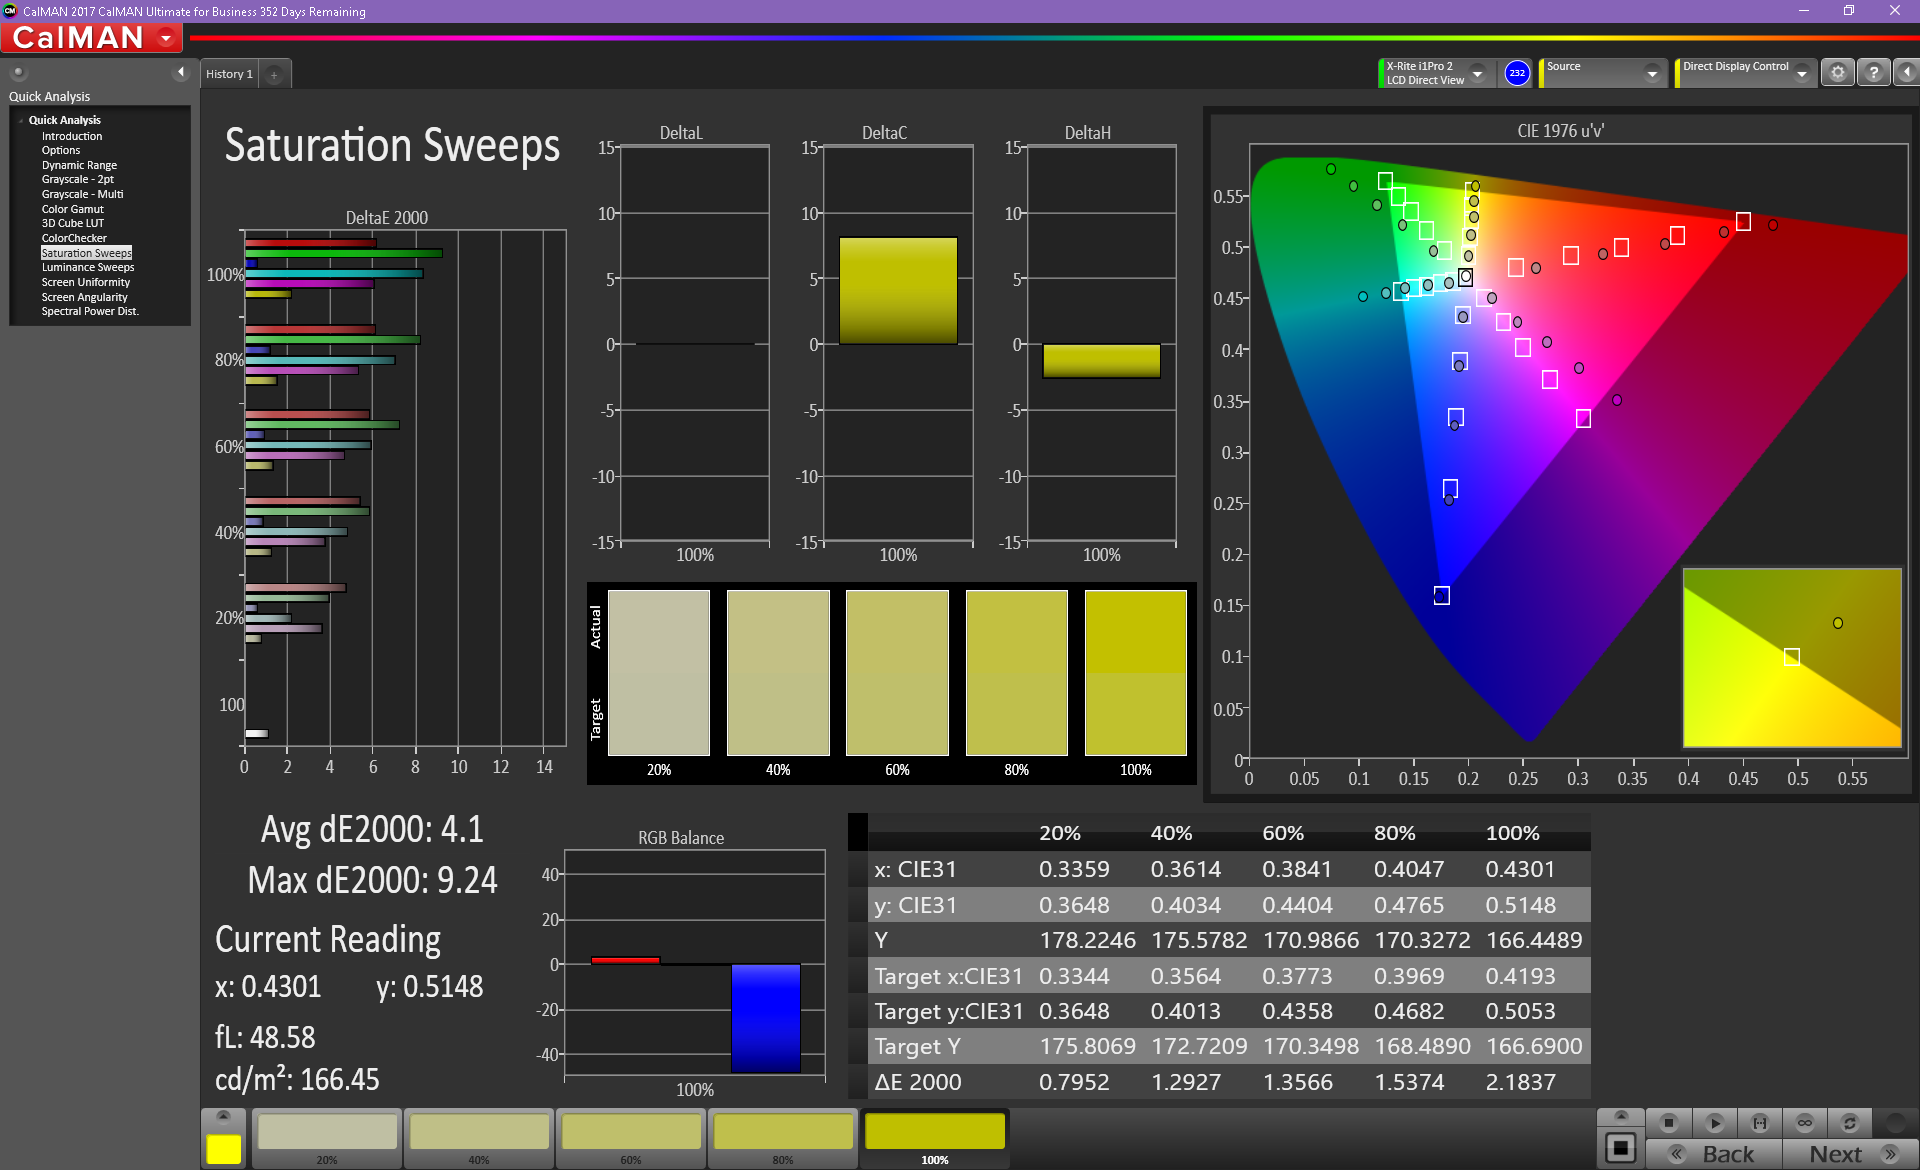
Color space covers the full sRGB spectrum and 88 percent of the AdobeRGB standard. Results are again very similar to the Schenker XMG U727 since both share the same AU Optronics panel. The Sharp IGZO panel on the Razer Blade Pro offers similar colors as well but with slower response times. Graphic artists can exploit the deeper and more accurate colors of the panel assuming a proper calibration.

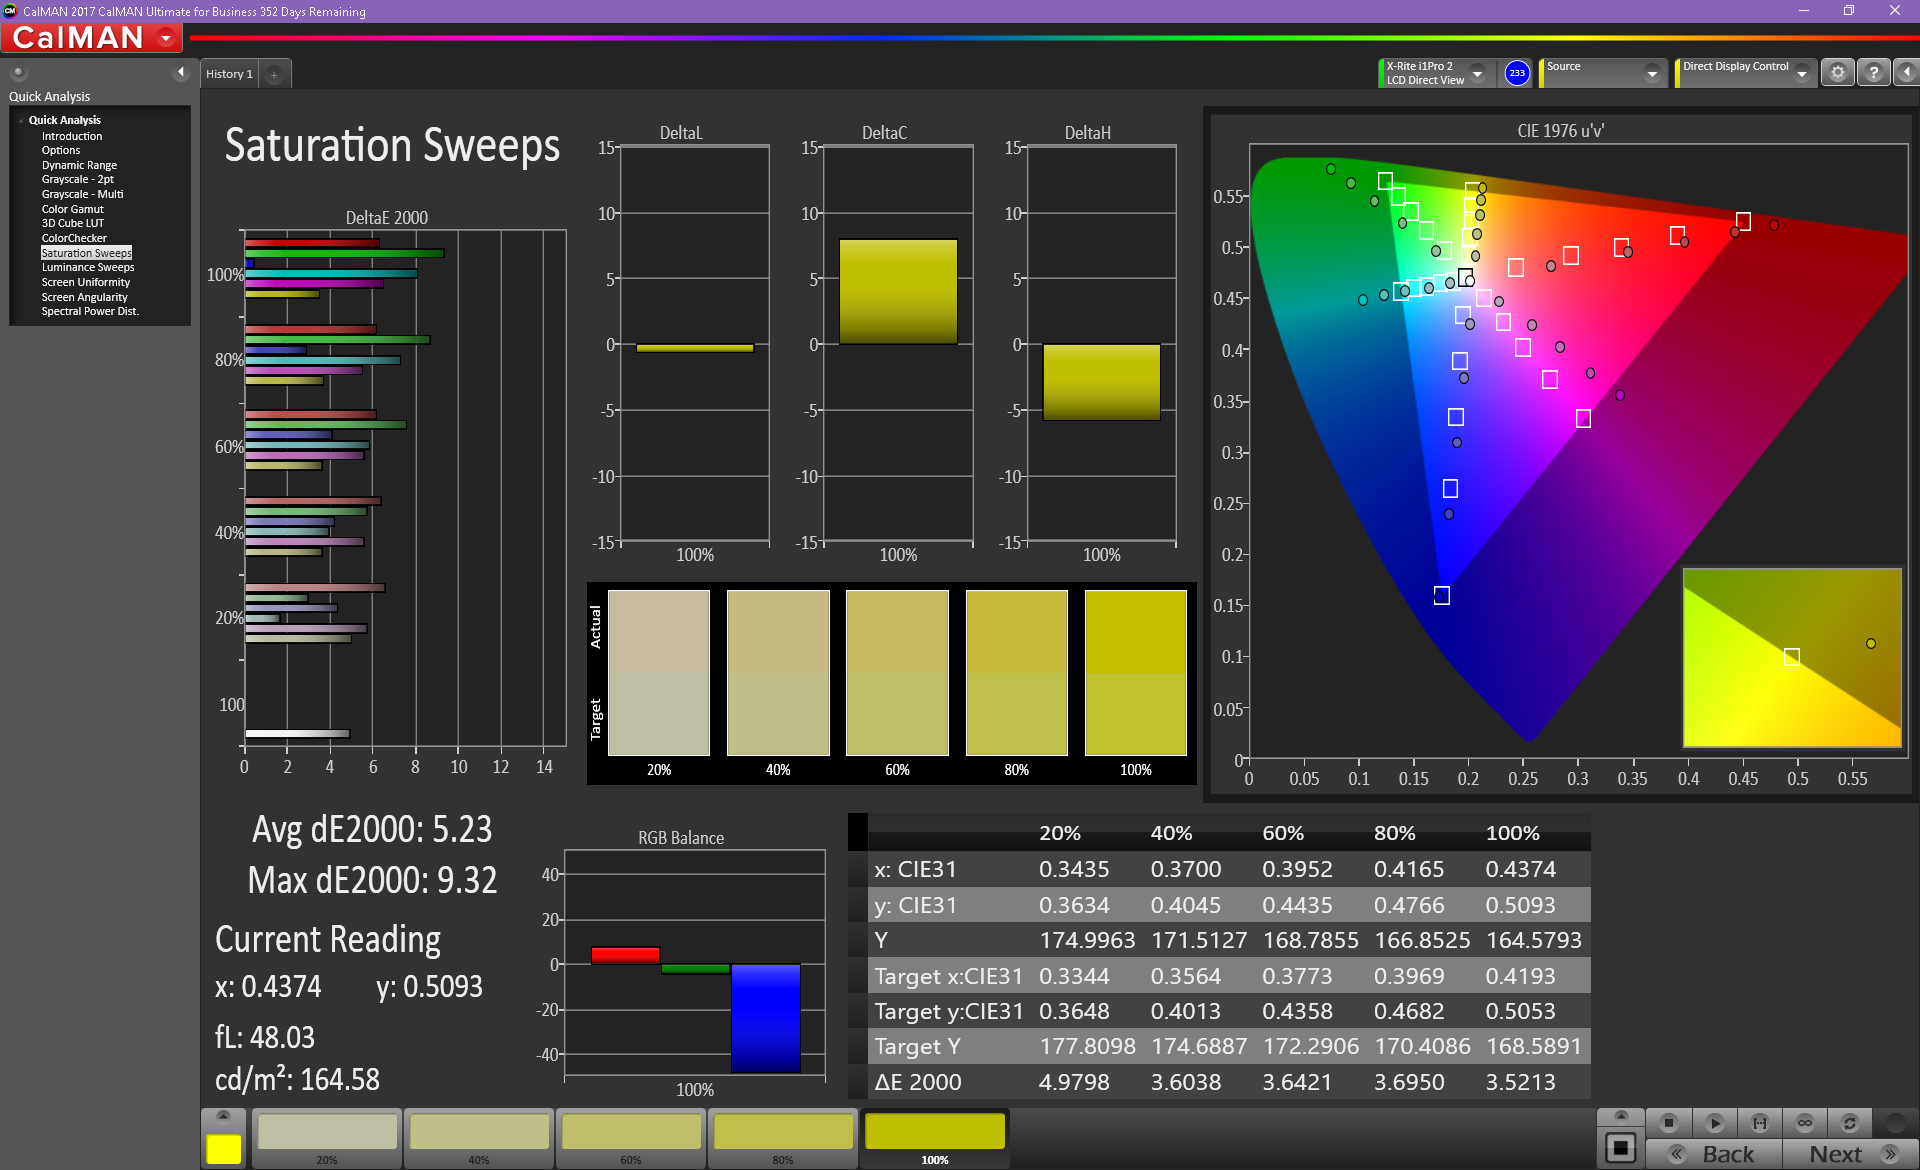
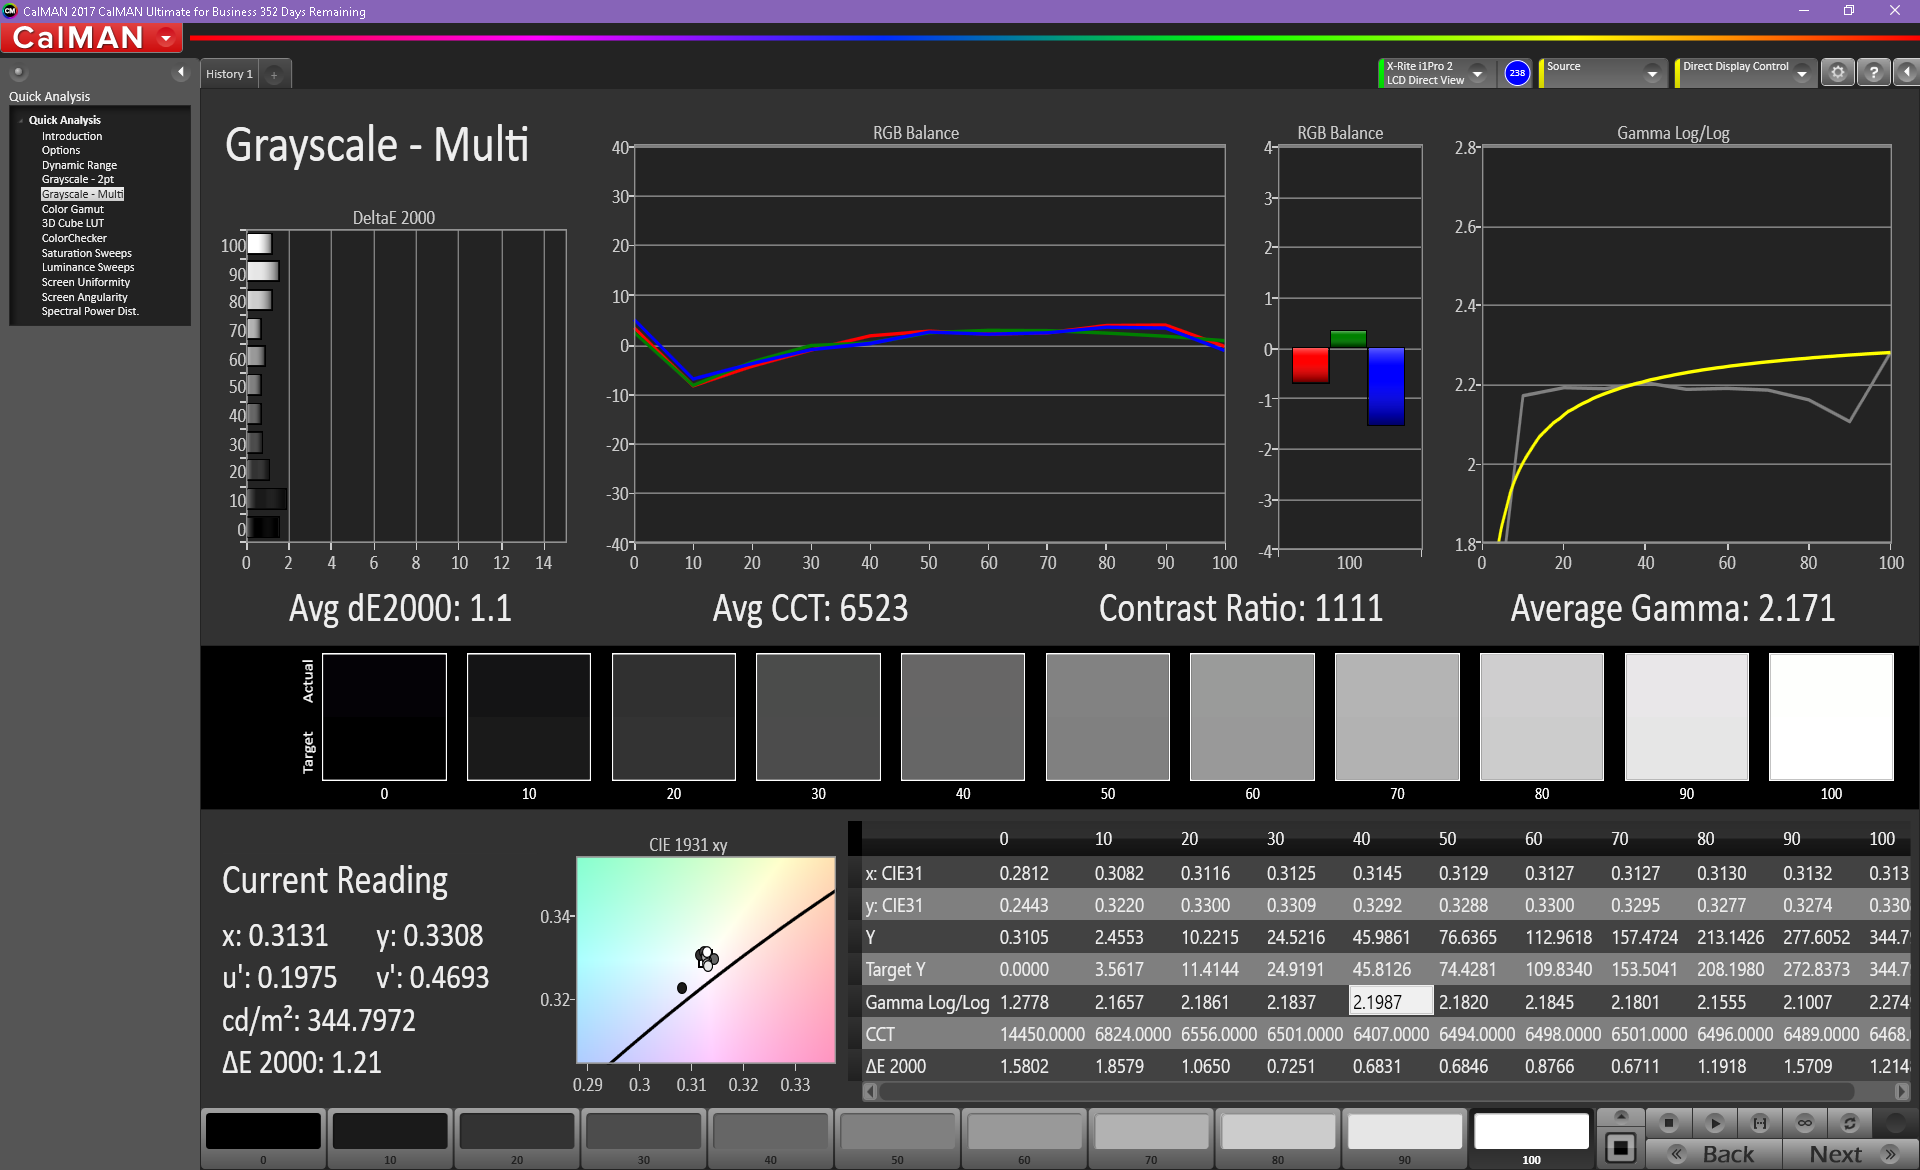
Further measurements with a X-Rite spectrophotometer reveal average grayscale and colors and a slightly warm color temperature. Our calibration efforts improve grayscale and RGB balance by wide margins, but colors remain relatively inaccurate at higher saturation levels. The AU Optronics panel is capable of reproducing the full sRGB spectrum and so further calibration is likely required for refinement. Eurocom offers professional calibration for each notebook at an additional cost. Green, Violet, Teal, and Red in particular appear to be more inaccurate than Blue or Yellow in our saturation tests.
Display Response Times
| ↔ Response Time Black to White | ||
|---|---|---|
| 28.8 ms ... rise ↗ and fall ↘ combined | ↗ 17.2 ms rise | 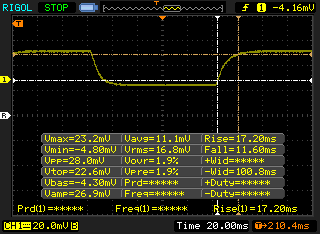 |
| ↘ 11.6 ms fall | ||
| The screen shows relatively slow response rates in our tests and may be too slow for gamers. In comparison, all tested devices range from 0.1 (minimum) to 240 (maximum) ms. » 76 % of all devices are better. This means that the measured response time is worse than the average of all tested devices (19.9 ms). | ||
| ↔ Response Time 50% Grey to 80% Grey | ||
| 43.6 ms ... rise ↗ and fall ↘ combined | ↗ 24 ms rise | 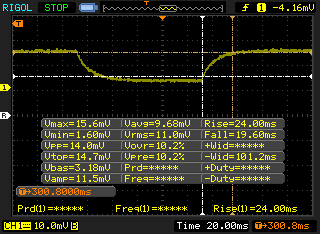 |
| ↘ 19.6 ms fall | ||
| The screen shows slow response rates in our tests and will be unsatisfactory for gamers. In comparison, all tested devices range from 0.165 (minimum) to 636 (maximum) ms. » 73 % of all devices are better. This means that the measured response time is worse than the average of all tested devices (31.1 ms). | ||
Screen Flickering / PWM (Pulse-Width Modulation)
| Screen flickering / PWM not detected | 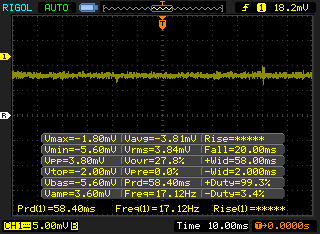 | ||
In comparison: 52 % of all tested devices do not use PWM to dim the display. If PWM was detected, an average of 7798 (minimum: 5 - maximum: 343500) Hz was measured. | |||
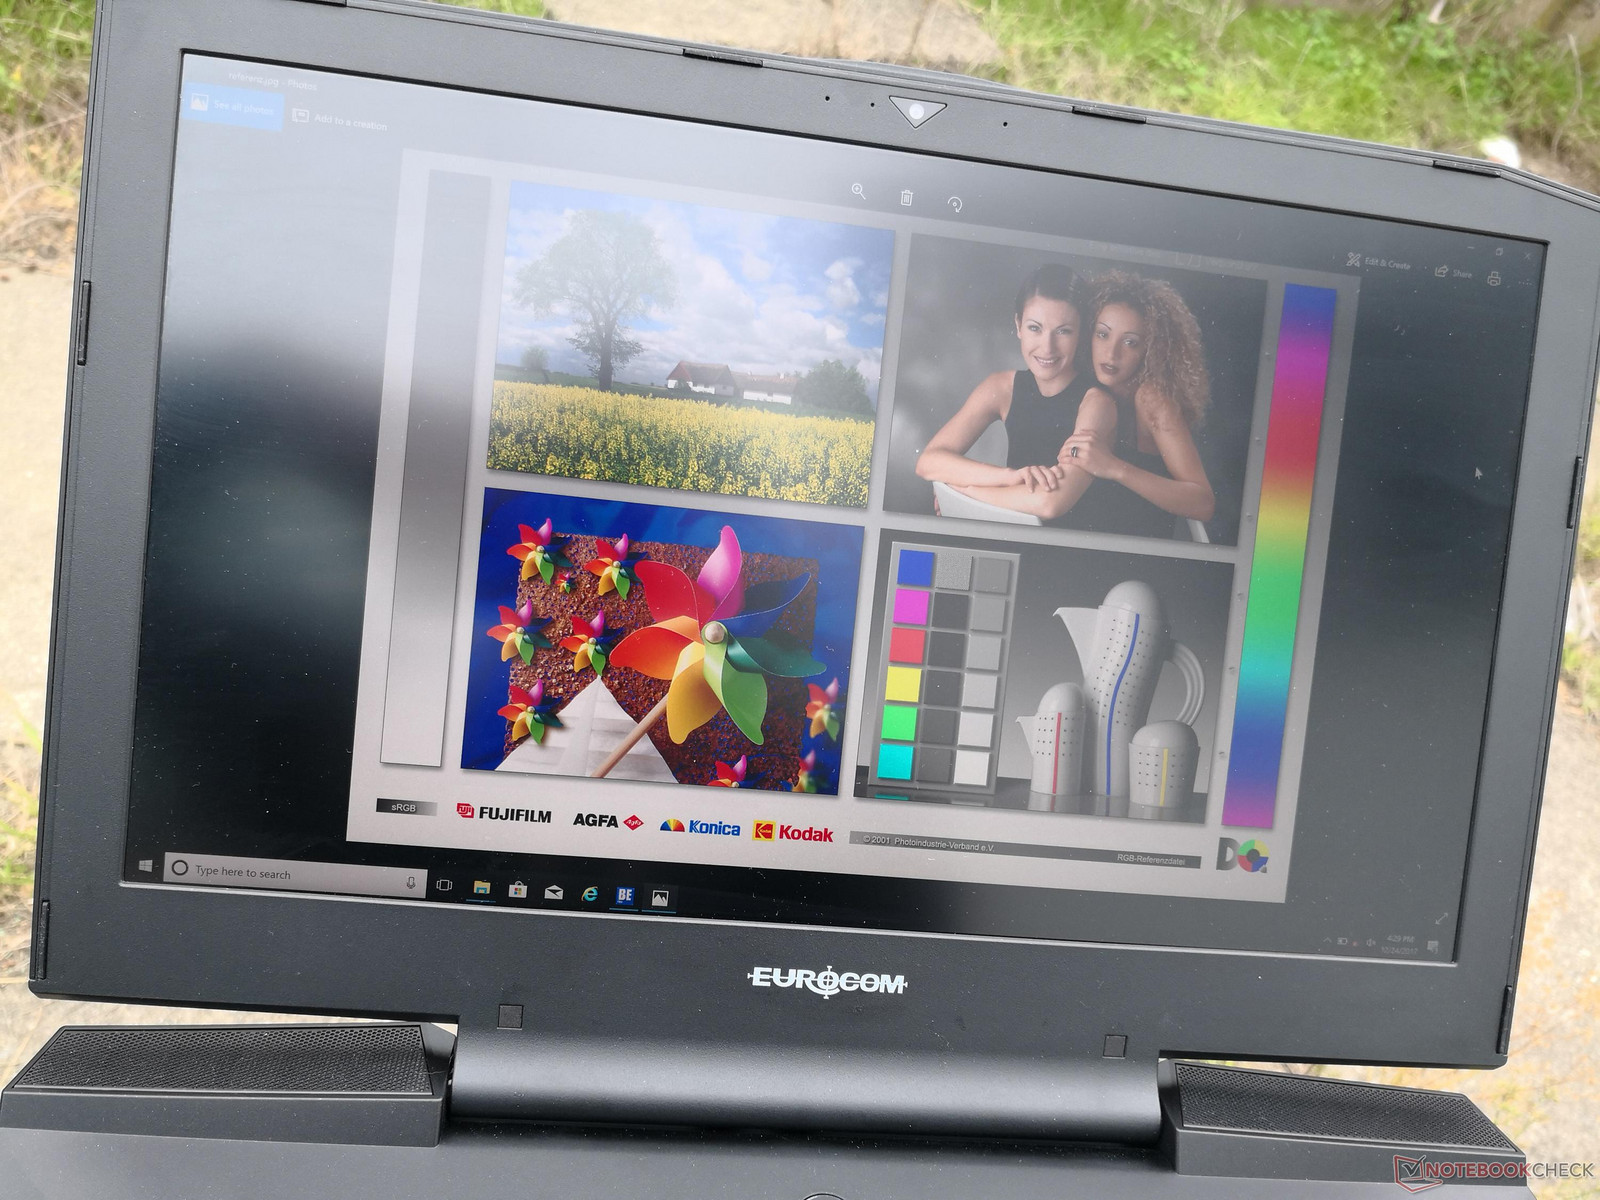
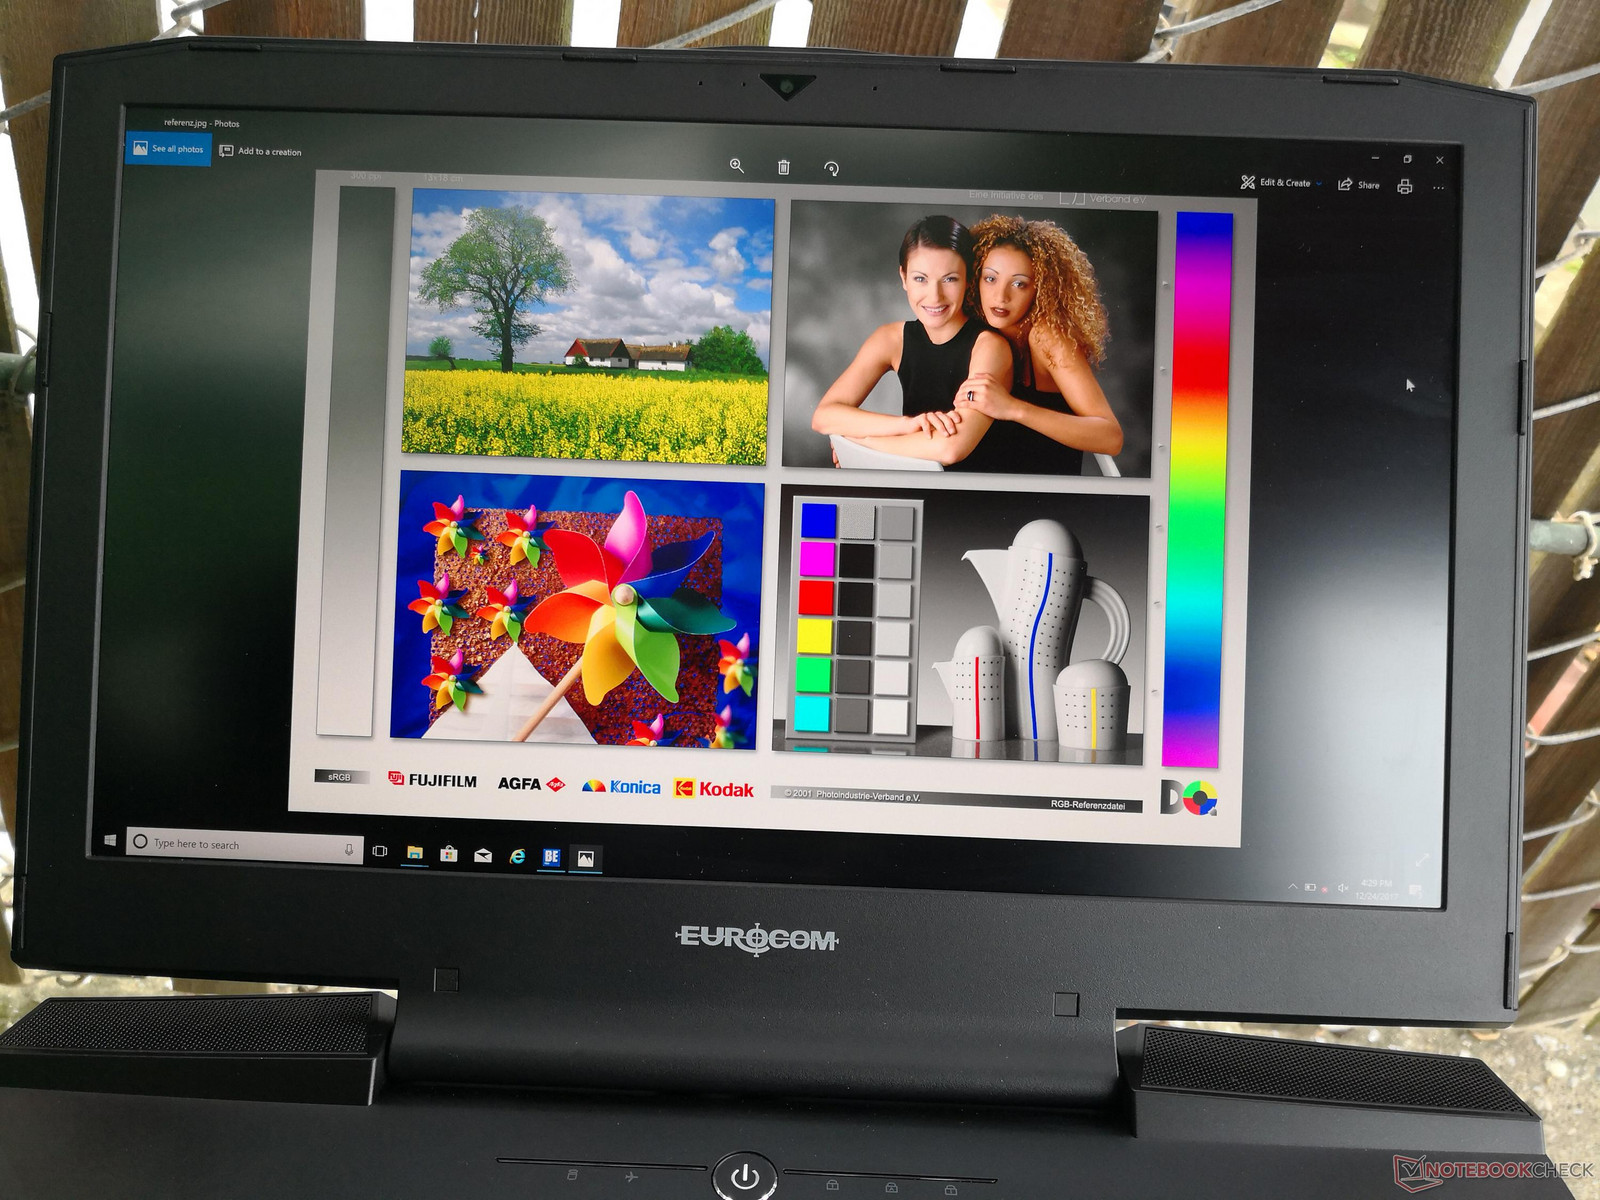
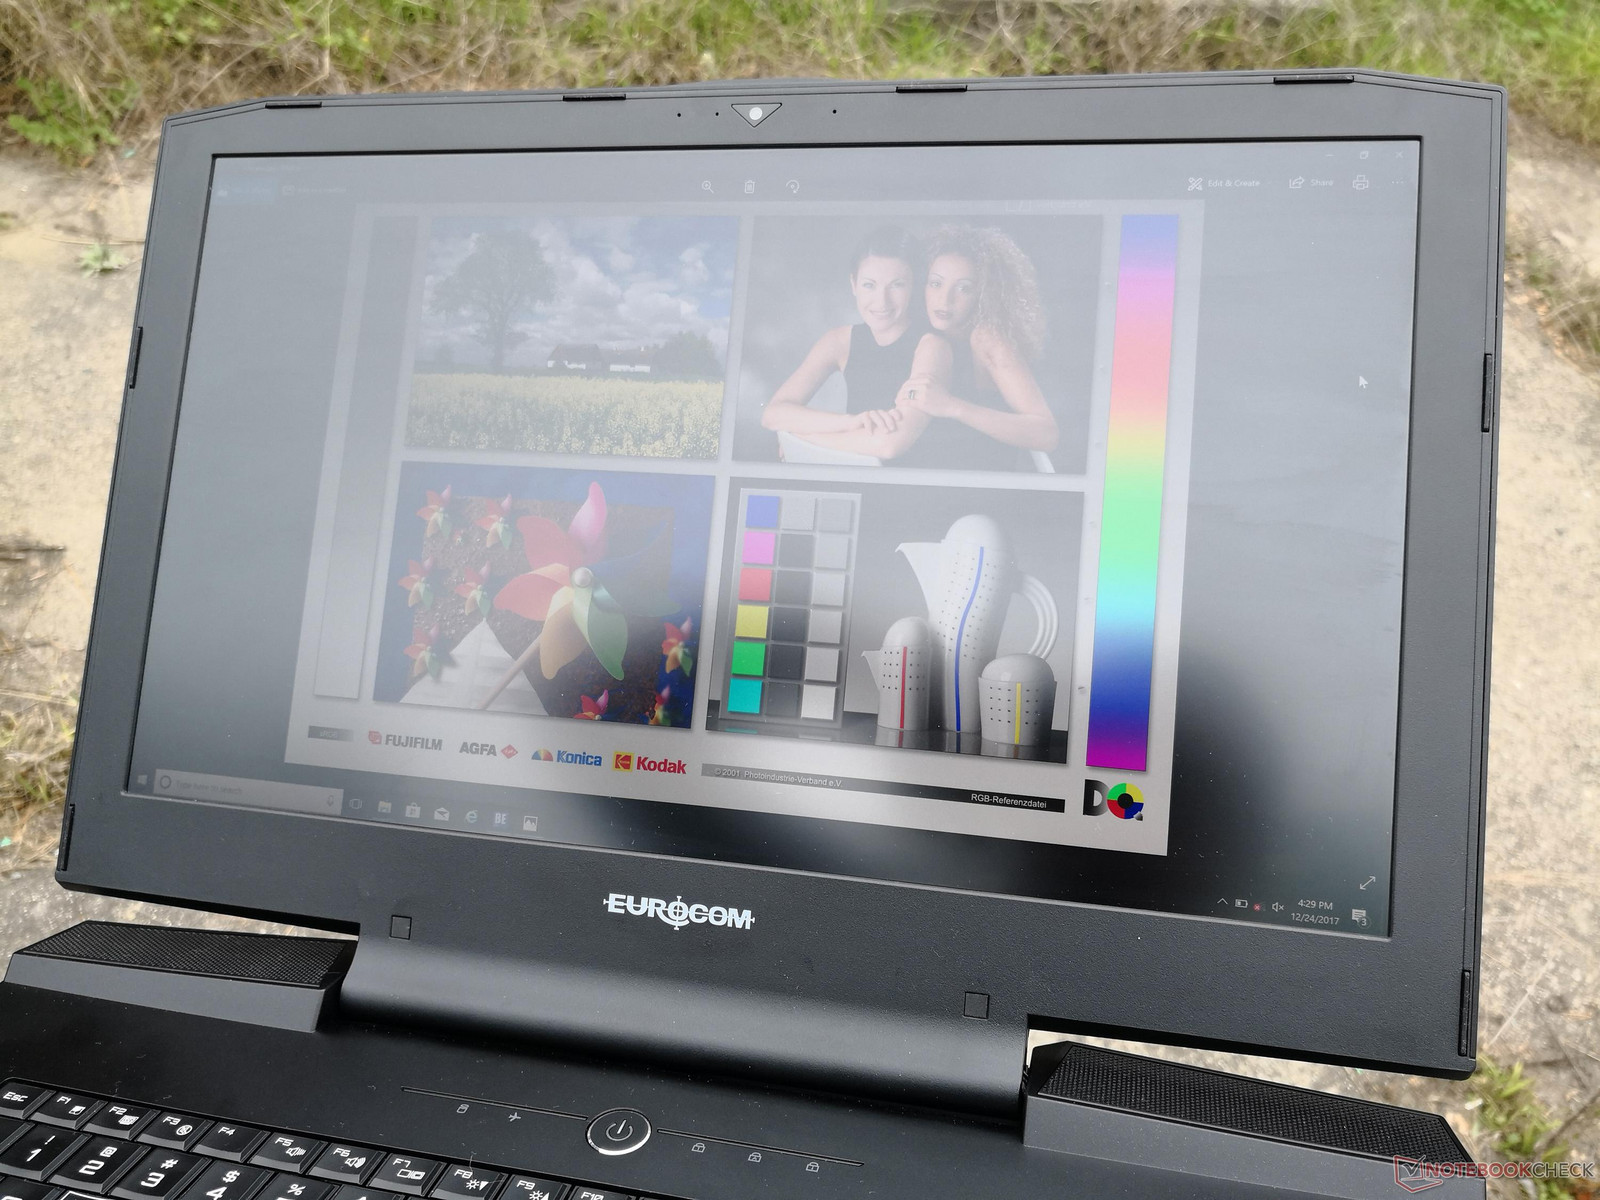
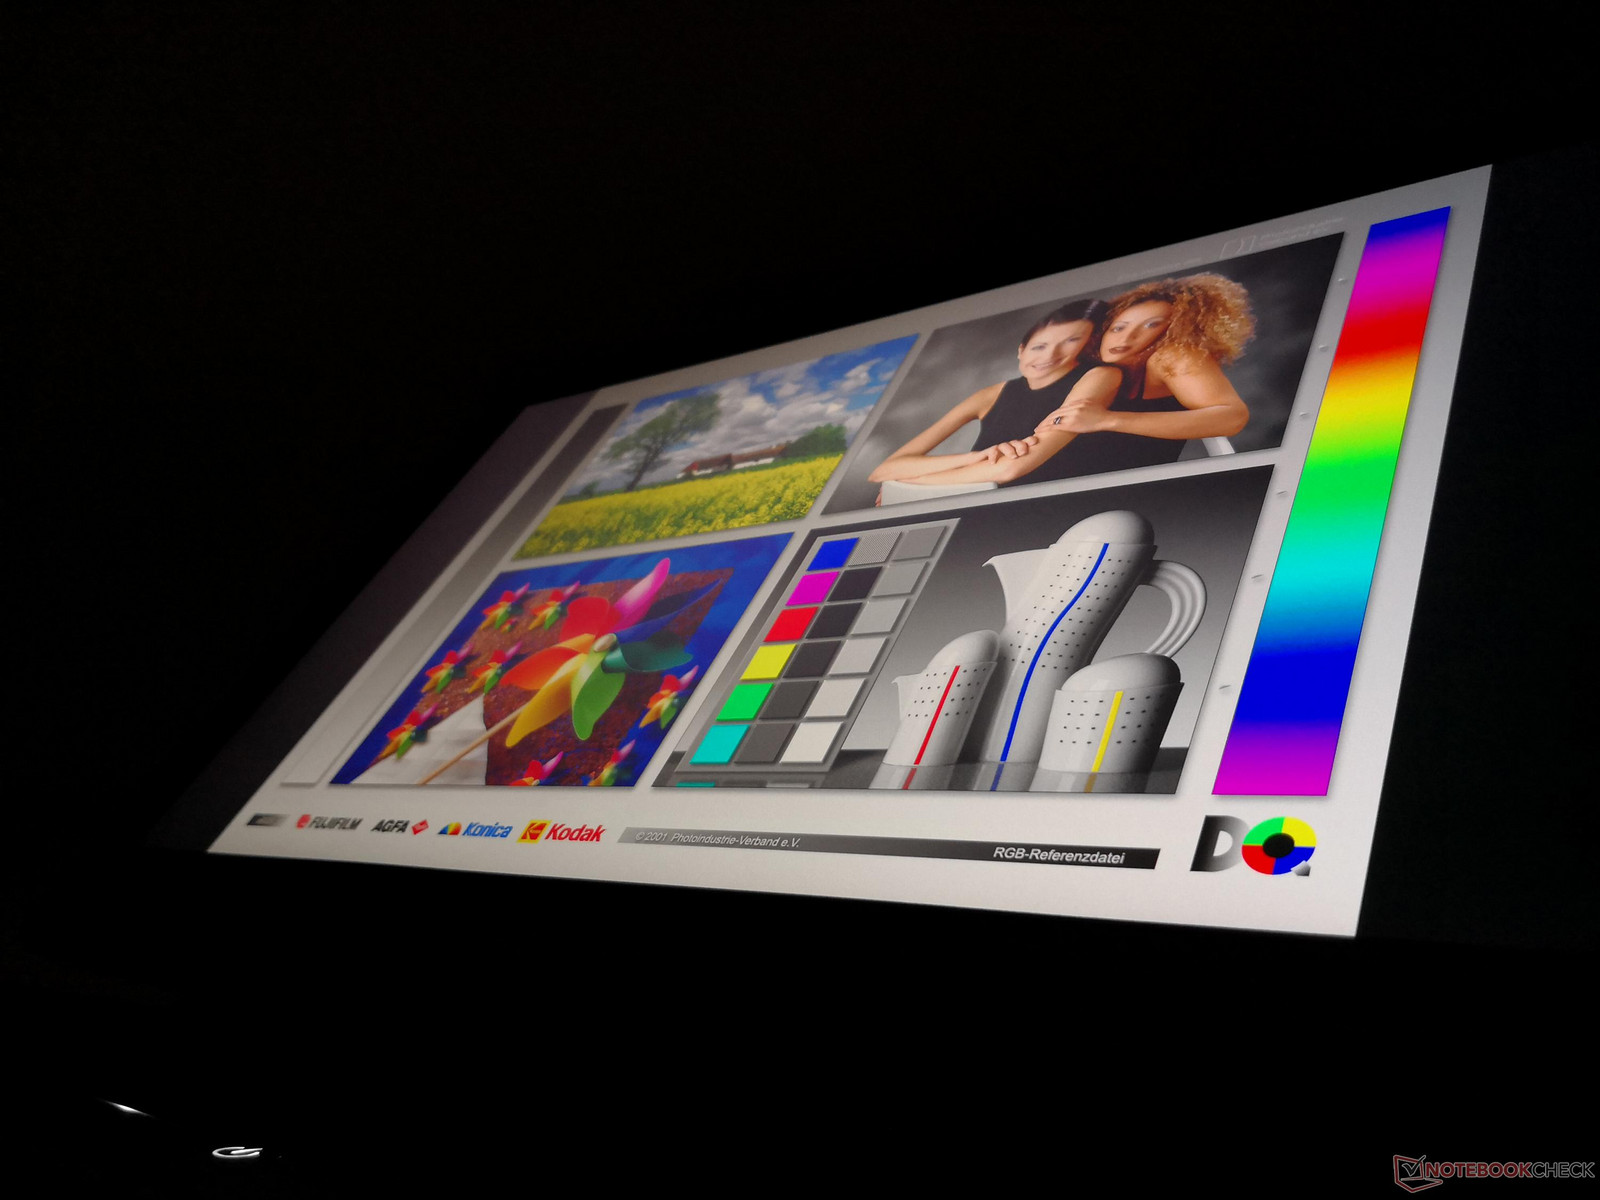
Outdoor visibility is average at best as the backlight will have to be much more powerful to overcome any glare or direct sunlight. It's not too bad under shade and both the wide viewing angles and matte panel help to improve visibility. Still, users will be fighting against the enormous weight and short battery life more so than the display itself.
Performance
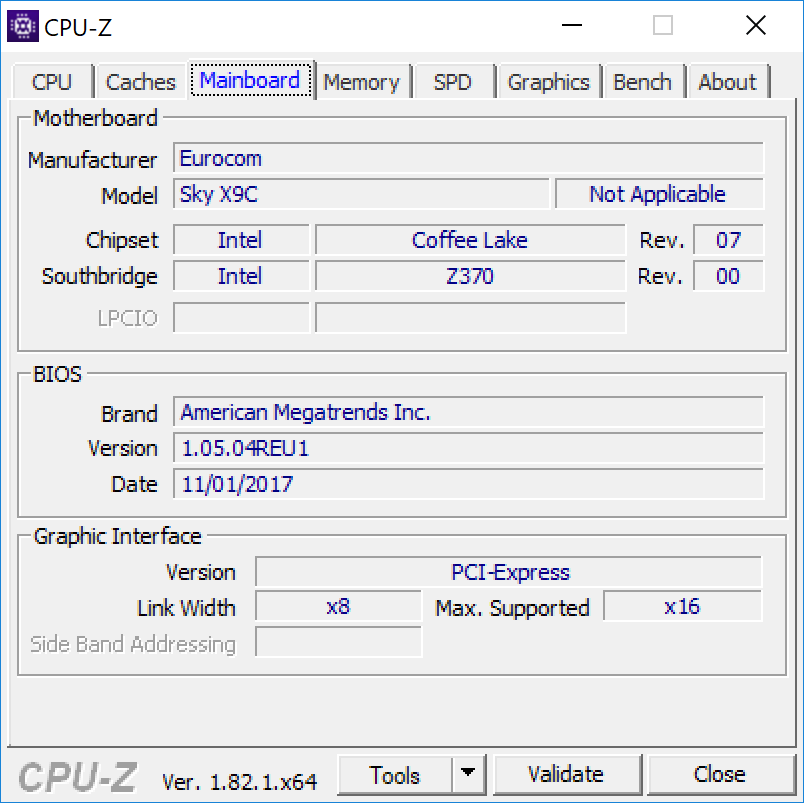
Eurocom configures its Sky X9C with the unlocked Core i7-8600K, i7-8700, and unlocked i7-8700K. Since the Z370 chipset is not backwards compatible with Kaby Lake processors to the chagrin of most enthusiasts, owners will be stuck with the currently small selection of Intel 8th gen core CPUs. This limitation shouldn't be a nuisance for the target audience, however, as Coffee Lake is one of the biggest draws of the Sky X9C. Proper Coffee Lake mobile chips to supplant the current HQ series have not yet been officially announced as of this writing.
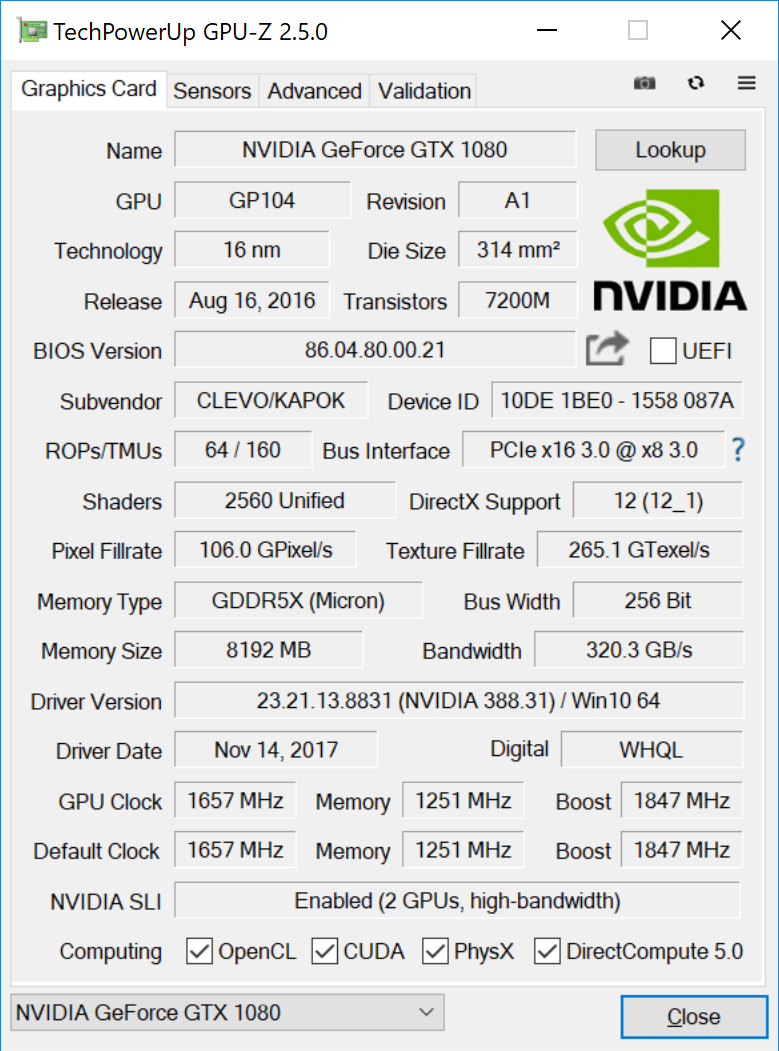
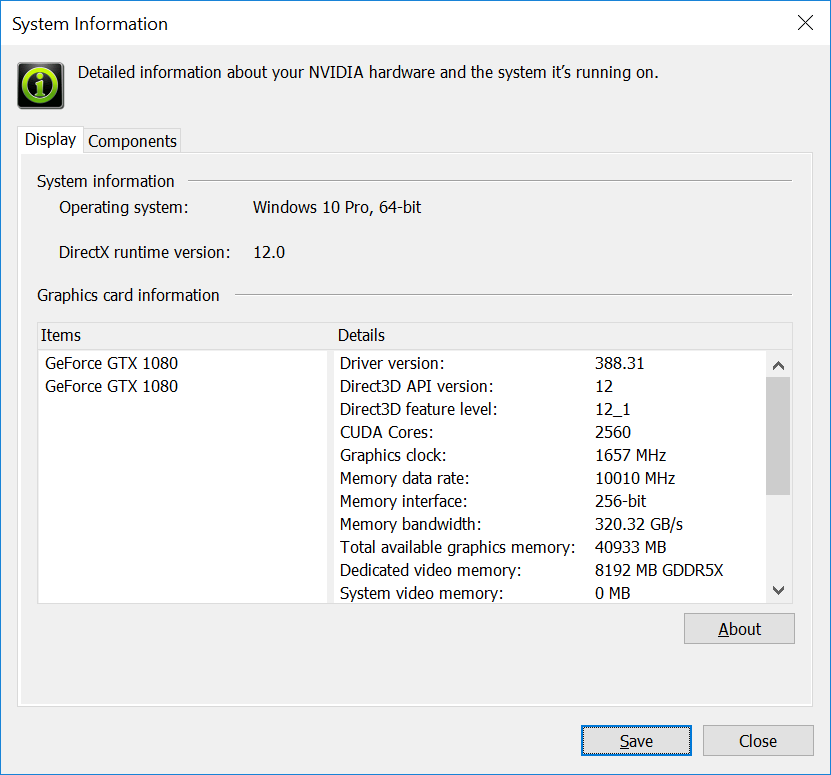
Meanwhile, GPU options range from a single GTX 1060 up to the dual GTX 1080 we have on hand. The combined 380 W TDP of the two GTX 1080 GPUs alone is already about 10x more demanding than a standard Ultrabook with integrated graphics. No Radeon options are available and we don't expect this to change in the near future judging by the performance of the desktop Vega GPUs.
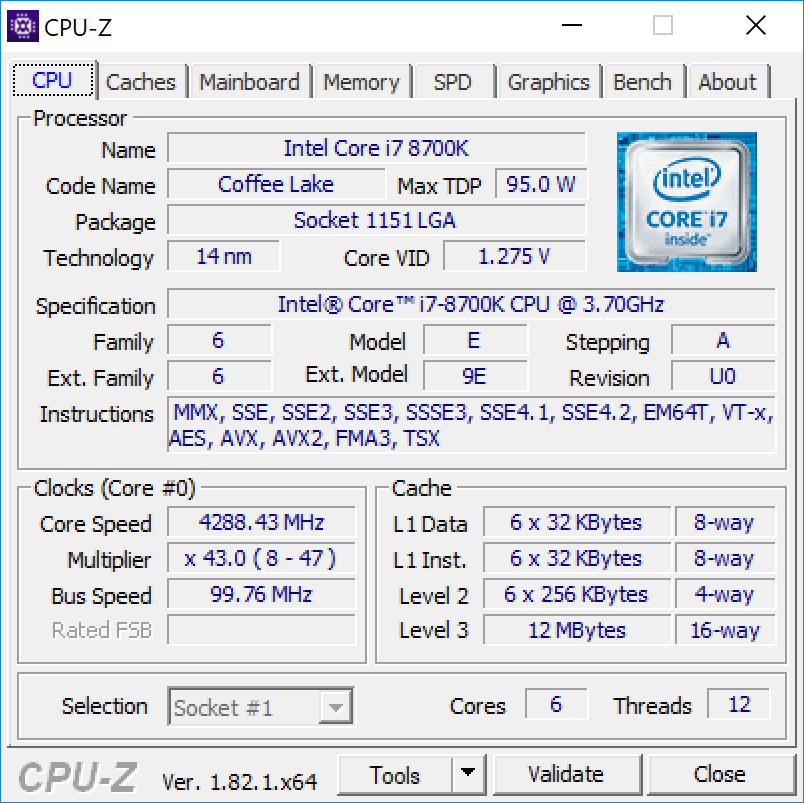
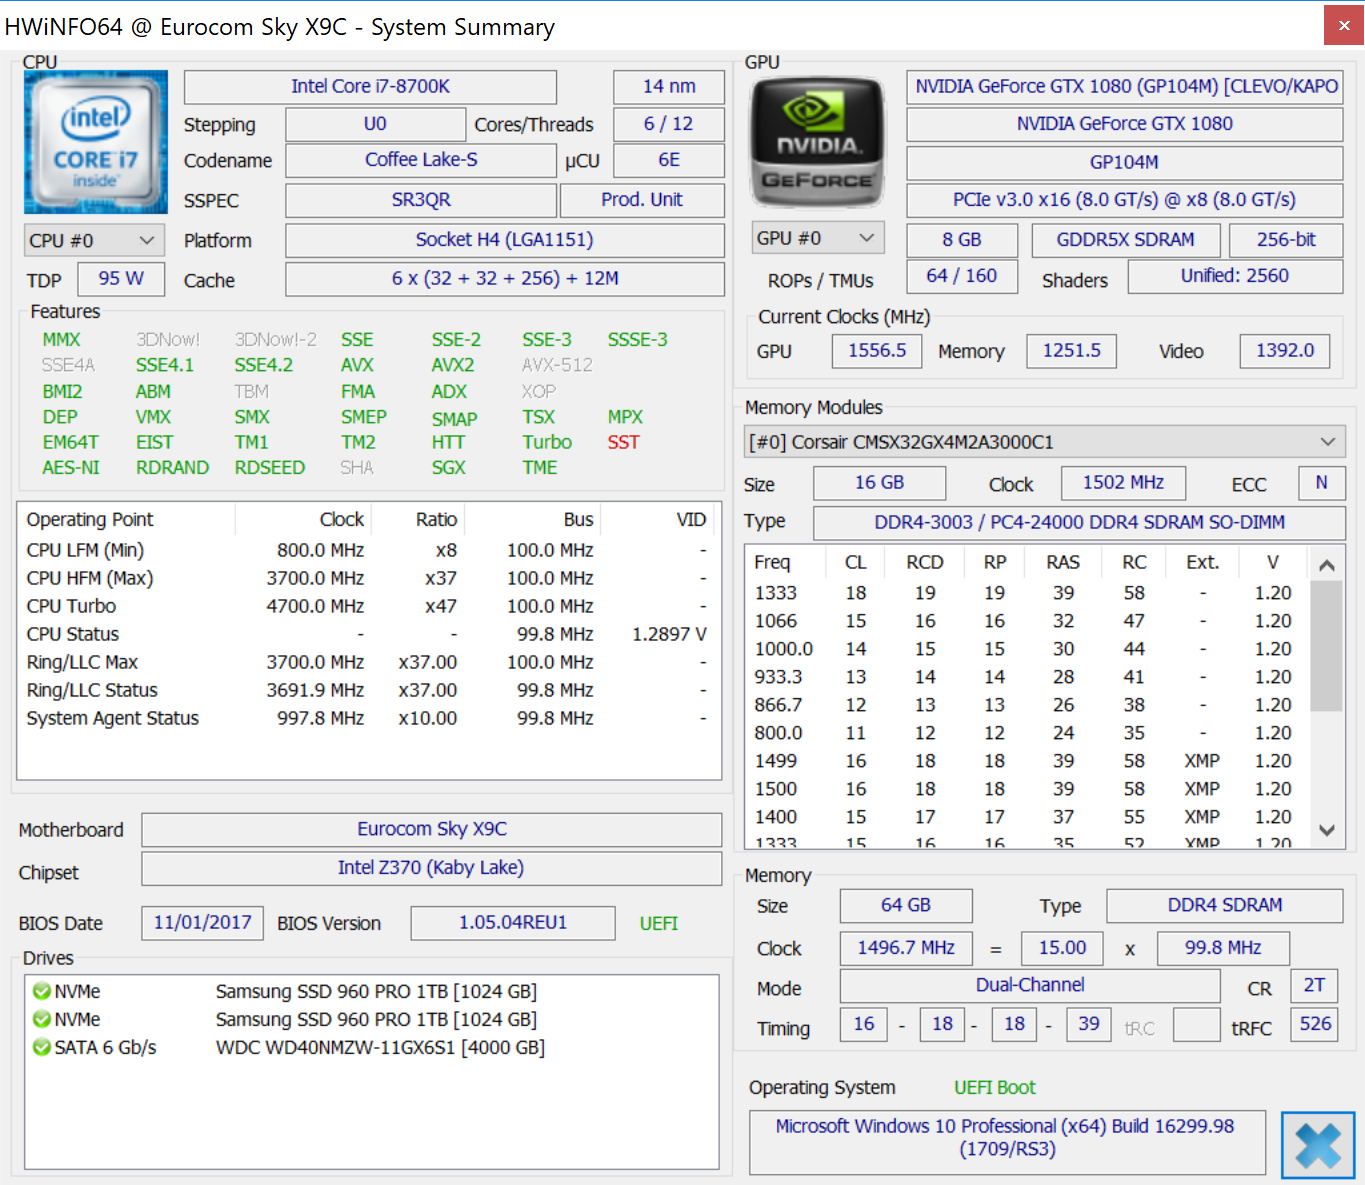
Processor
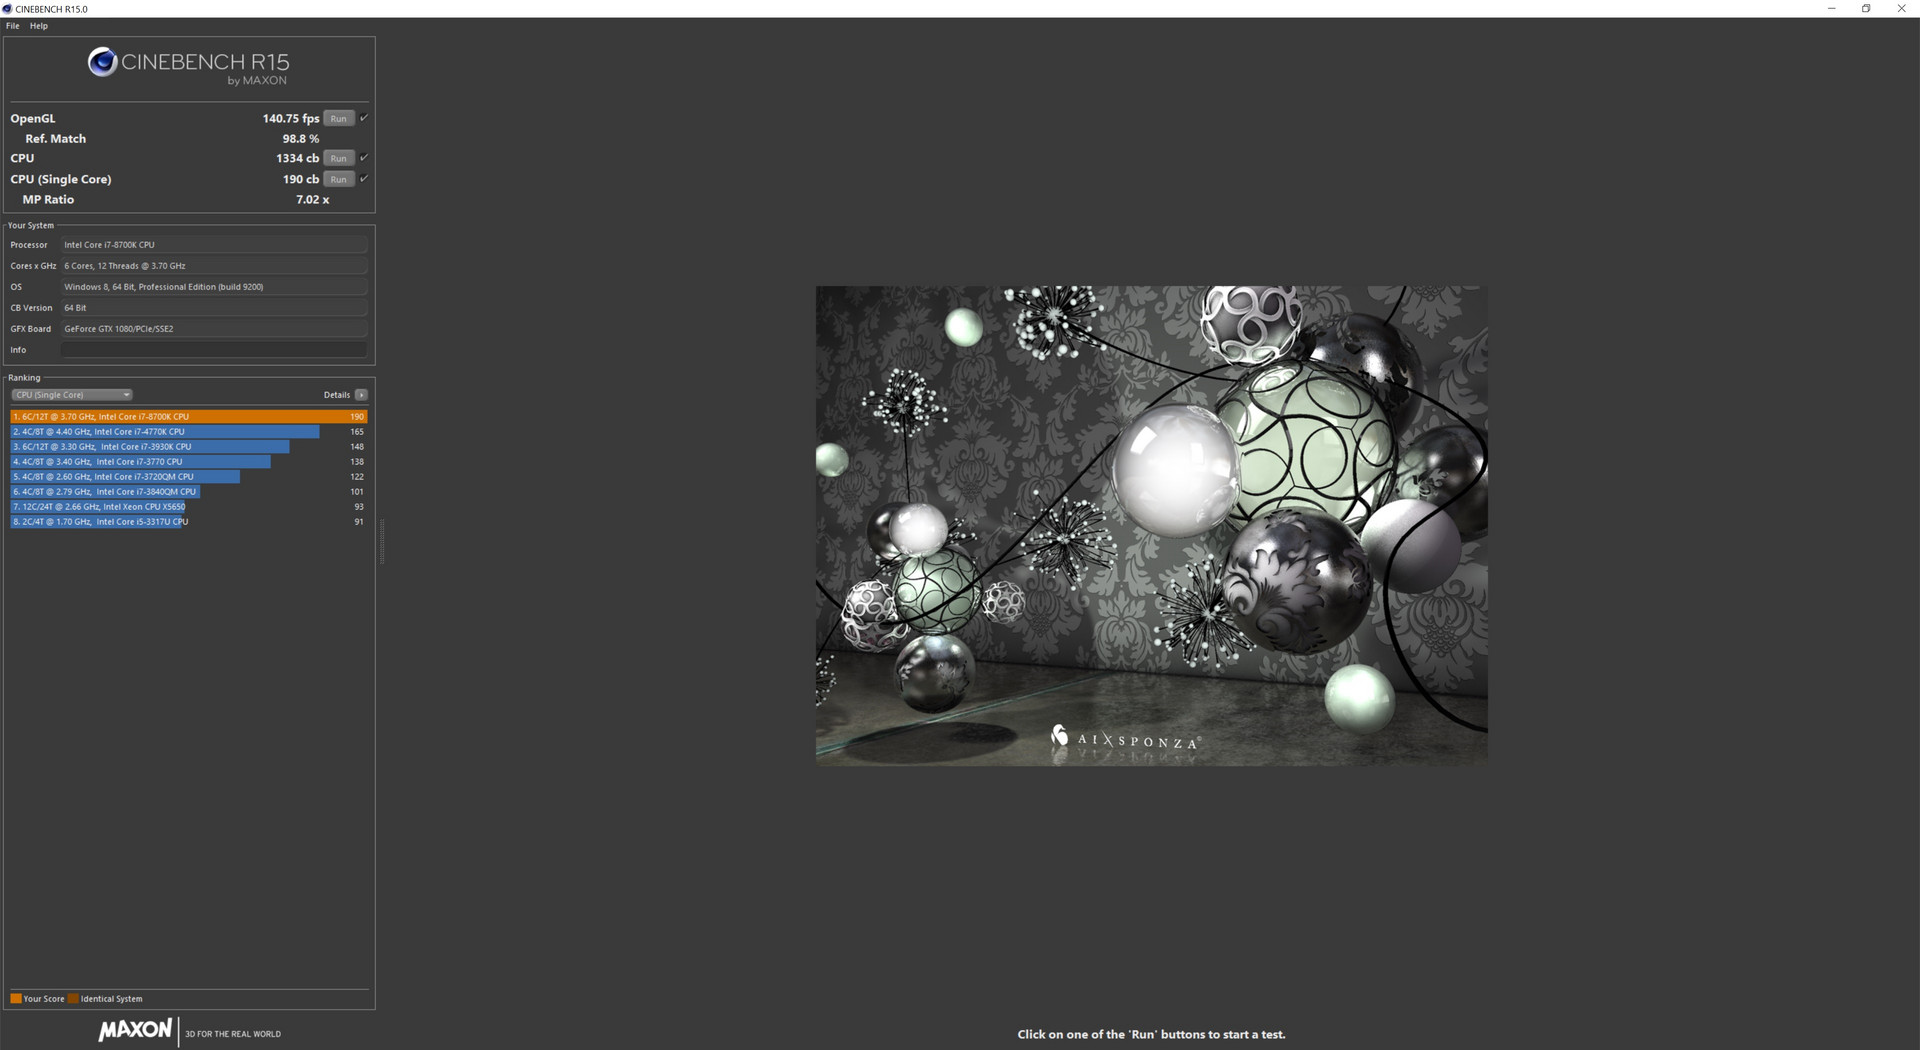
Raw processor benefits from the i7-8700K mirror that of the recent i7-8550U. In other words, users can expect a 50 percent faster boost in multi-thread performance over the i7-7700K similar to how the quad-core i7-8550U provides a rough 50 percent boost over the dual-core i7-7500U. The 8th gen Core family as a whole offers the largest generational leap in CPU power that the series has seen in years and the i7-8700K is no exception.
As powerful as the 95 W i7-8700K may be, the less demanding 65 W octa-core Ryzen 7 1700 in the recent Asus GL702ZC is still faster by 6 percent in multi-threaded workloads according to CineBench R15. AMD is able to achieve this through more simultaneous threads than the Intel i7-8700K (16 vs. 12) in order to make up for the slower clock rates of each core (3.2 GHz vs. 3.7+ GHz). Of course, applications must be specifically optimized in the first place to exploit the various numbers of cores properly.
Single-threaded operations remain virtually identical to the Kaby Lake i7-7700K. While still ahead of the Ryzen 7 1700 by a notable 32 percent, Intel fans hoping for a significant single-thread boost over the i7-7700K will be disappointed. Indeed, the maximum Turbo Boost clock rate is only 200 MHz faster on the i7-8700K and that is only if the supporting hardware can maintain such speeds.
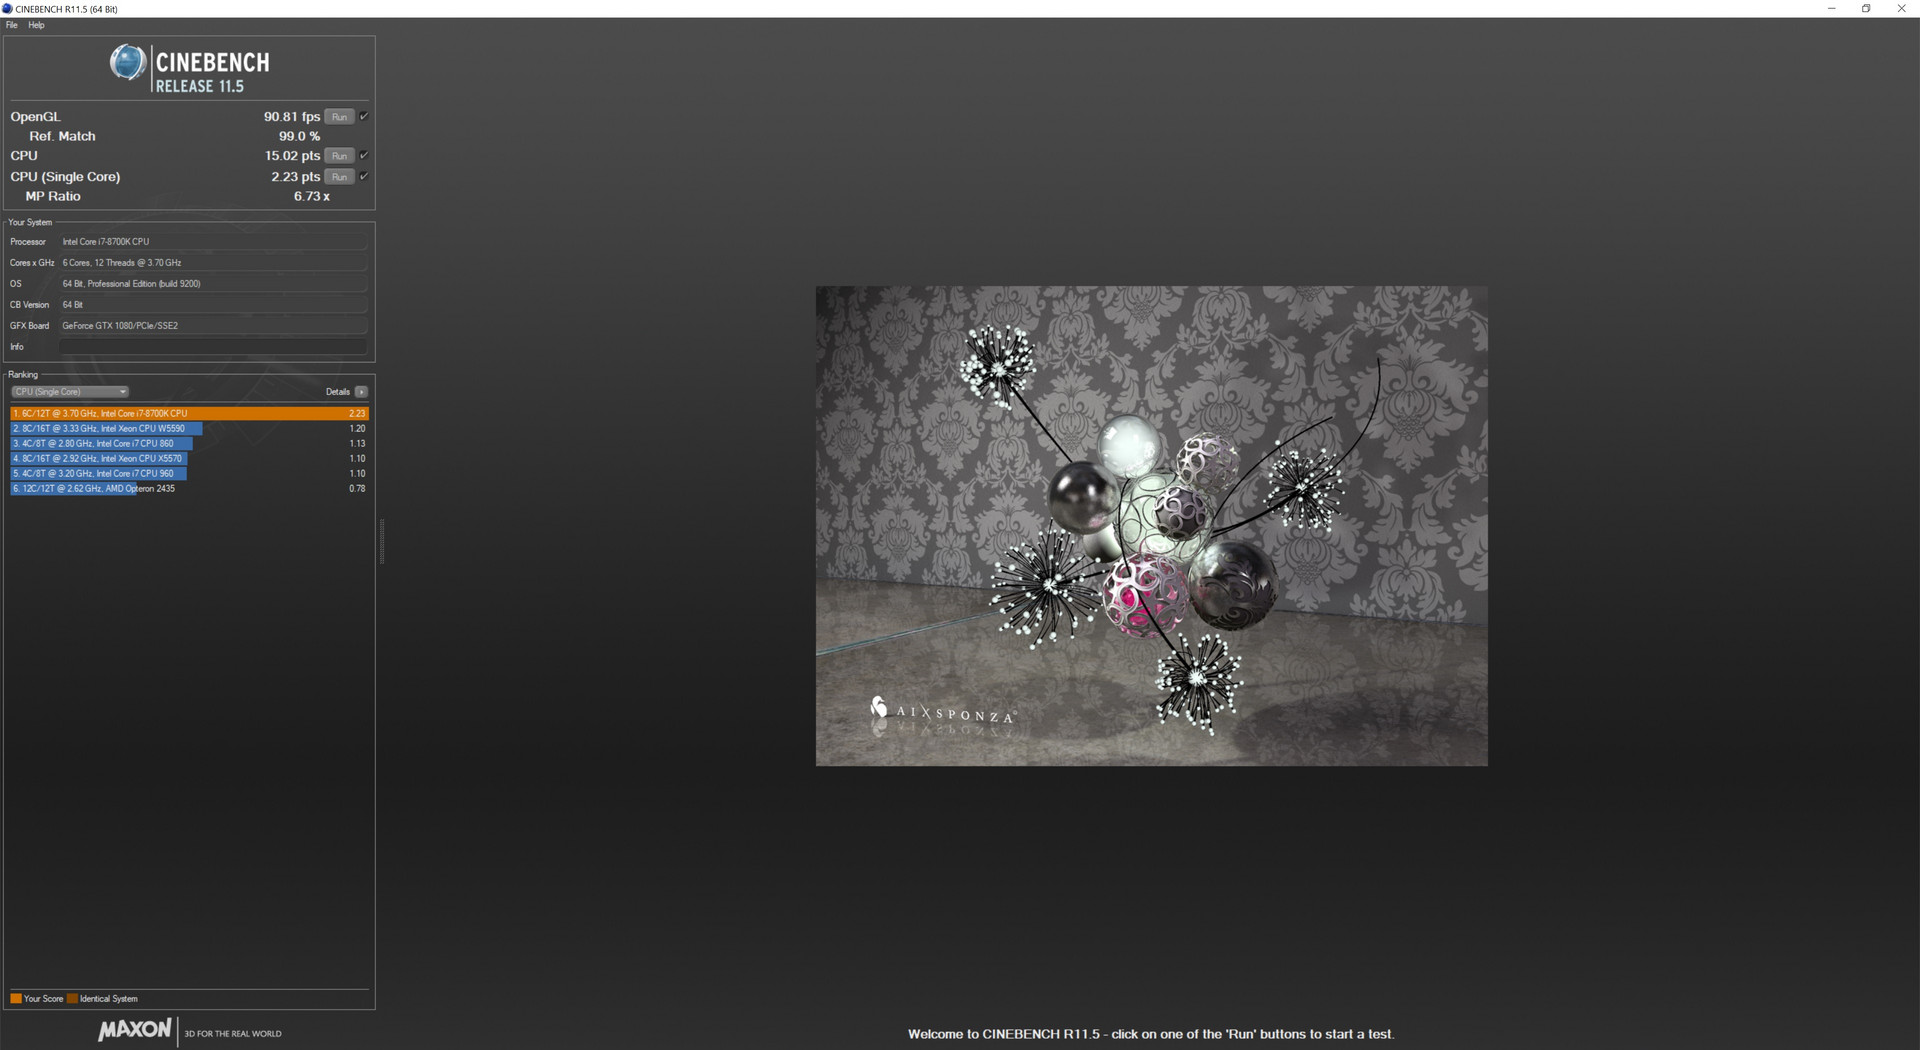
Running CineBench R15 Multi-Thread in a loop results in very steady scores from beginning to end. Turbo Boost potential is small but consistent which is impressive considering that this is a desktop CPU in a notebook chassis.
See our dedicated page on the Core i7-8700K and full review on the processor for more technical information and benchmark comparisons. Our reference desktop Core i7-8700K outscores our Eurocom Core i7-8700K by only a few percentage points.
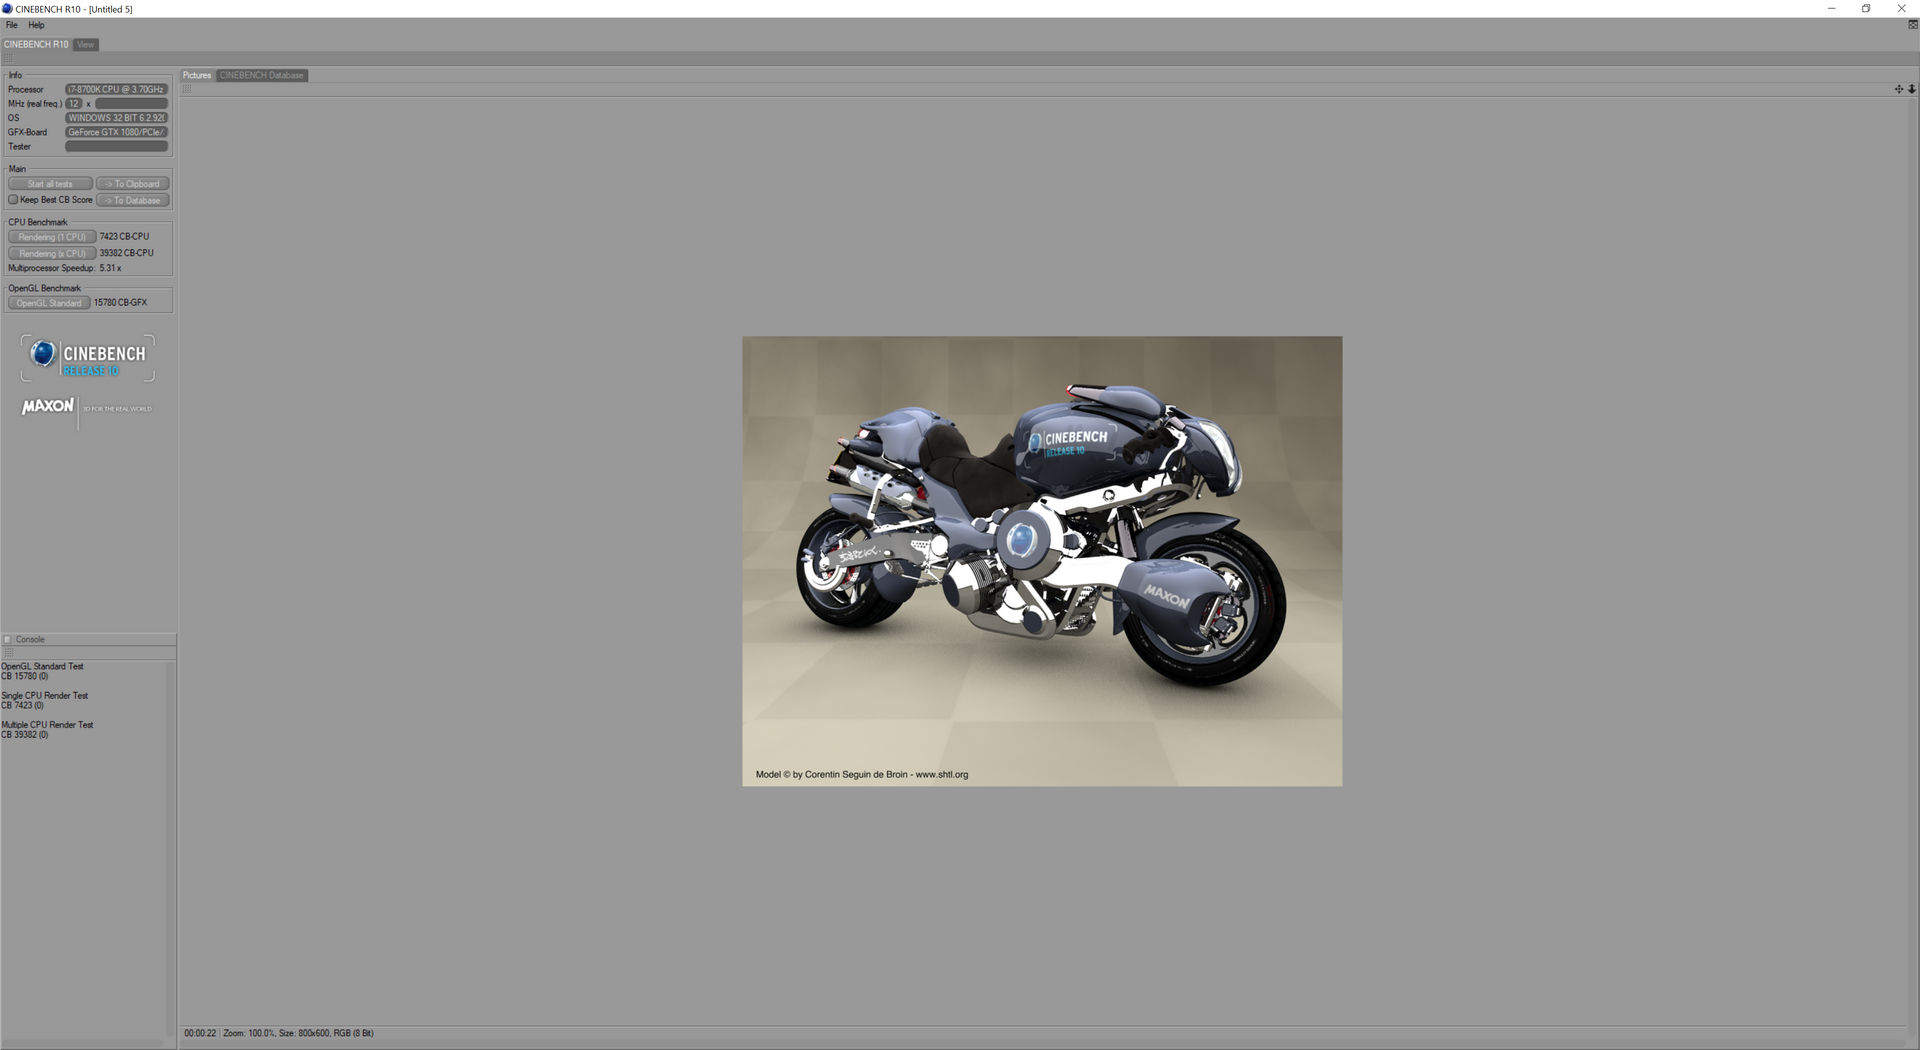
| Cinebench R10 | |
| Rendering Multiple CPUs 32Bit | |
| no name | |
| Eurocom Sky X9C | |
| Asus GL702ZC-GC104T | |
| Eurocom Tornado F5 | |
| Eurocom Sky X7E2 | |
| MSI GT80 Titan SLI | |
| Razer Blade Pro RZ09-0220 | |
| Razer Blade (2016) FHD | |
| HP Spectre x360 15t-bl100 | |
| Rendering Single 32Bit | |
| Eurocom Sky X9C | |
| no name | |
| Eurocom Tornado F5 | |
| HP Spectre x360 15t-bl100 | |
| Eurocom Sky X7E2 | |
| MSI GT80 Titan SLI | |
| Razer Blade (2016) FHD | |
| Razer Blade Pro RZ09-0220 | |
| Asus GL702ZC-GC104T | |
| wPrime 2.10 - 1024m | |
| HP Spectre x360 15t-bl100 | |
| Razer Blade Pro RZ09-0220 | |
| Eurocom Sky X7E2 | |
| Eurocom Tornado F5 | |
| no name | |
| Eurocom Sky X9C | |
* ... smaller is better
System Performance
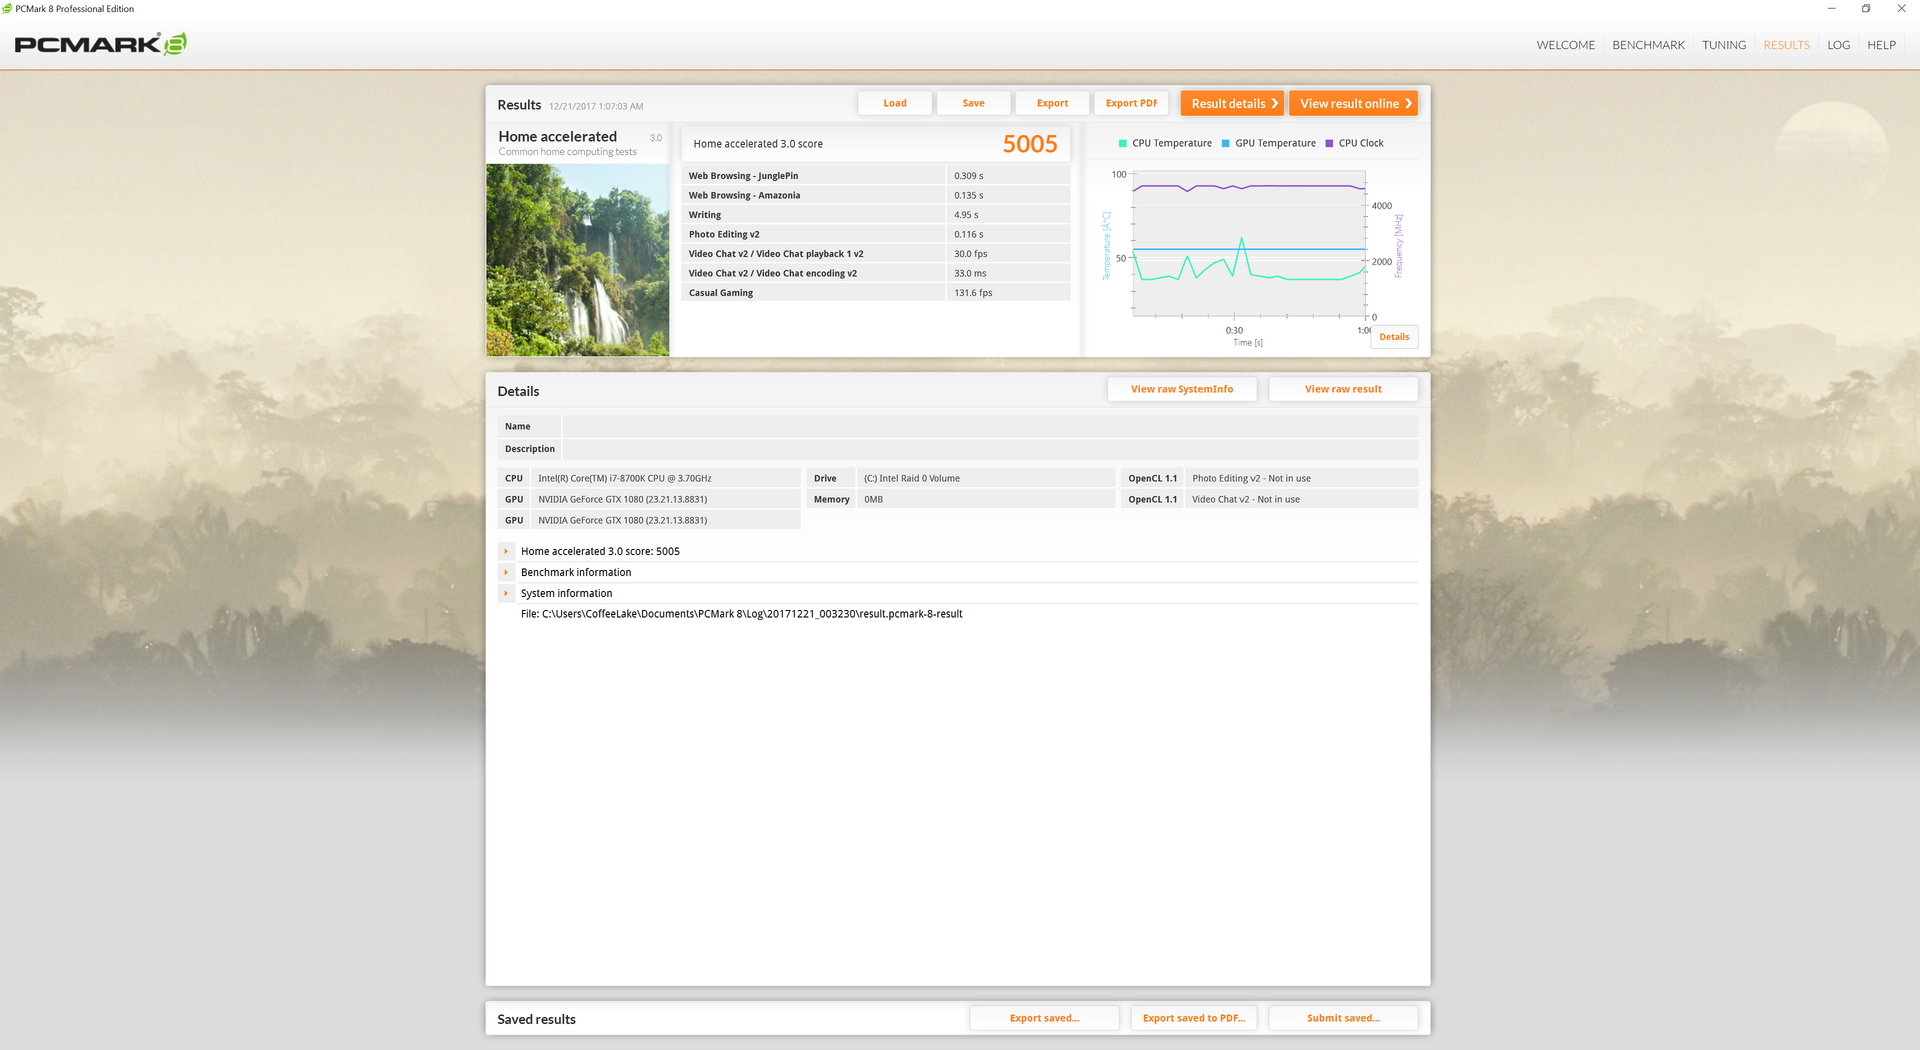
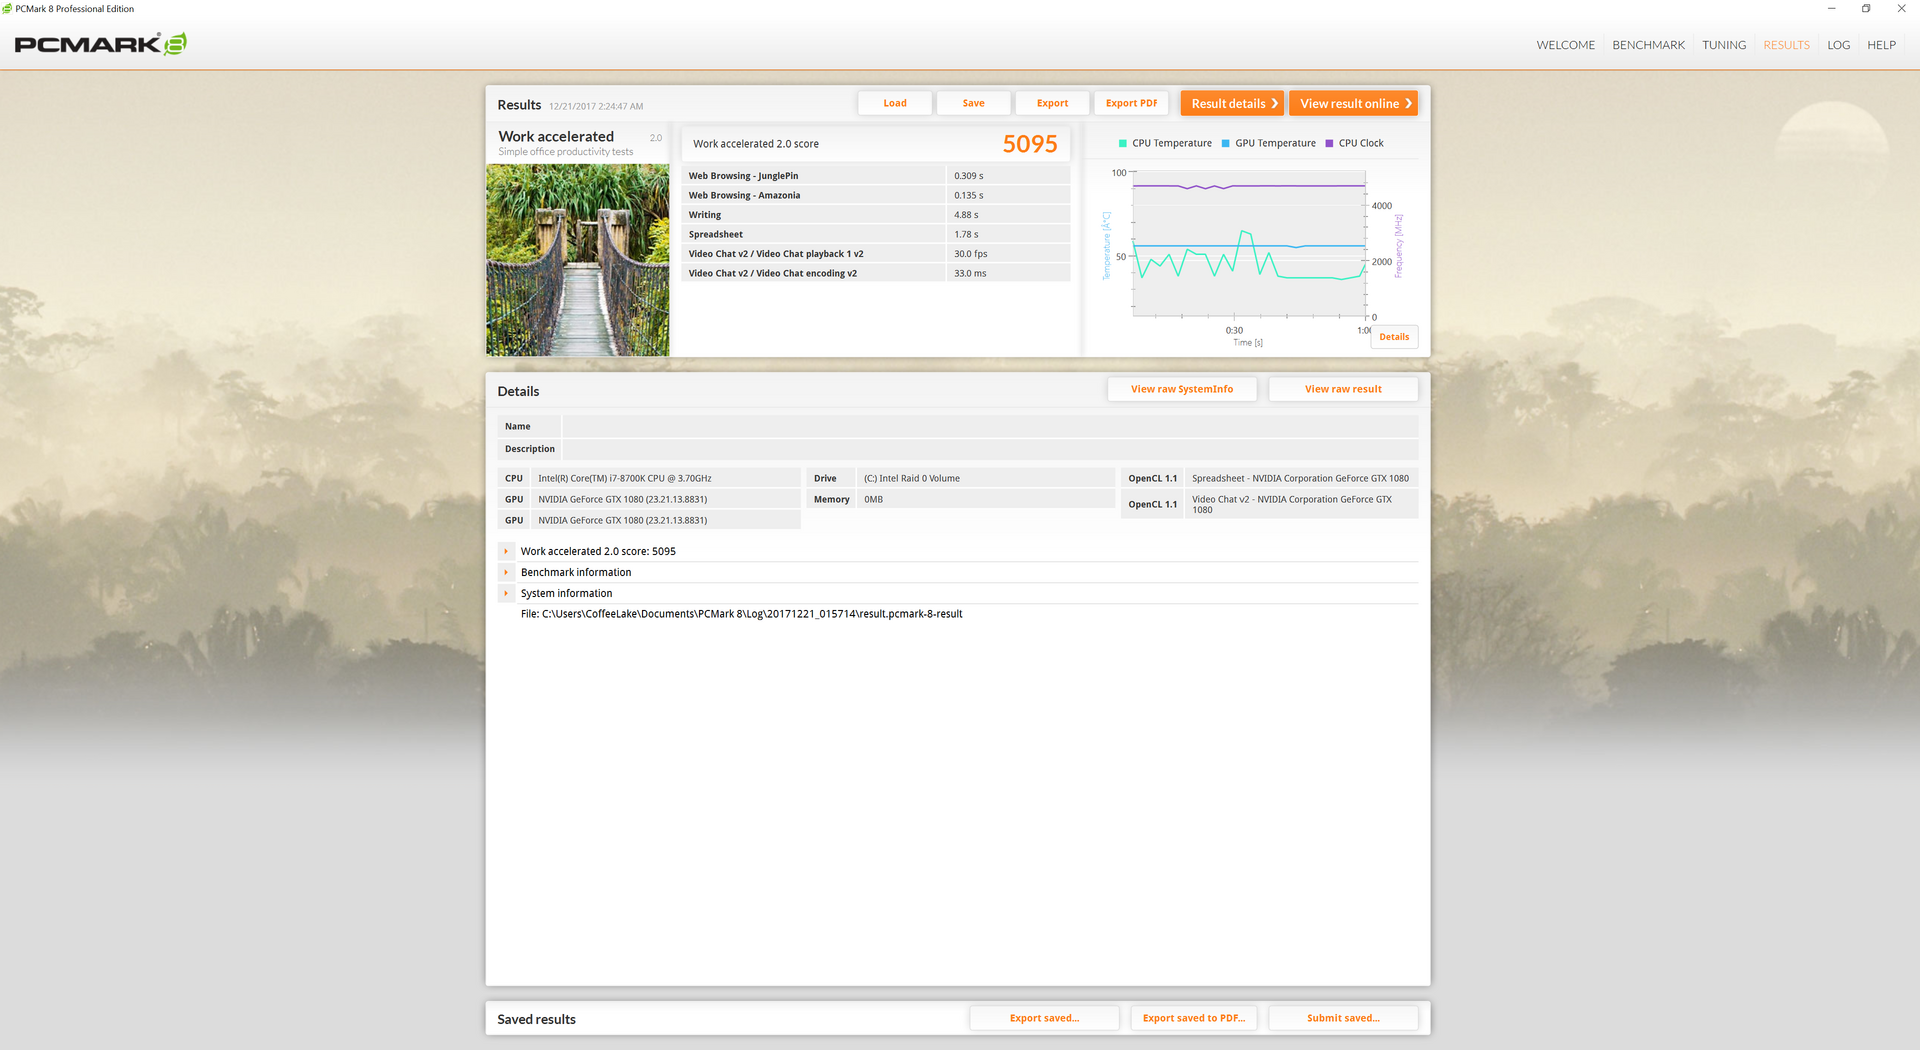
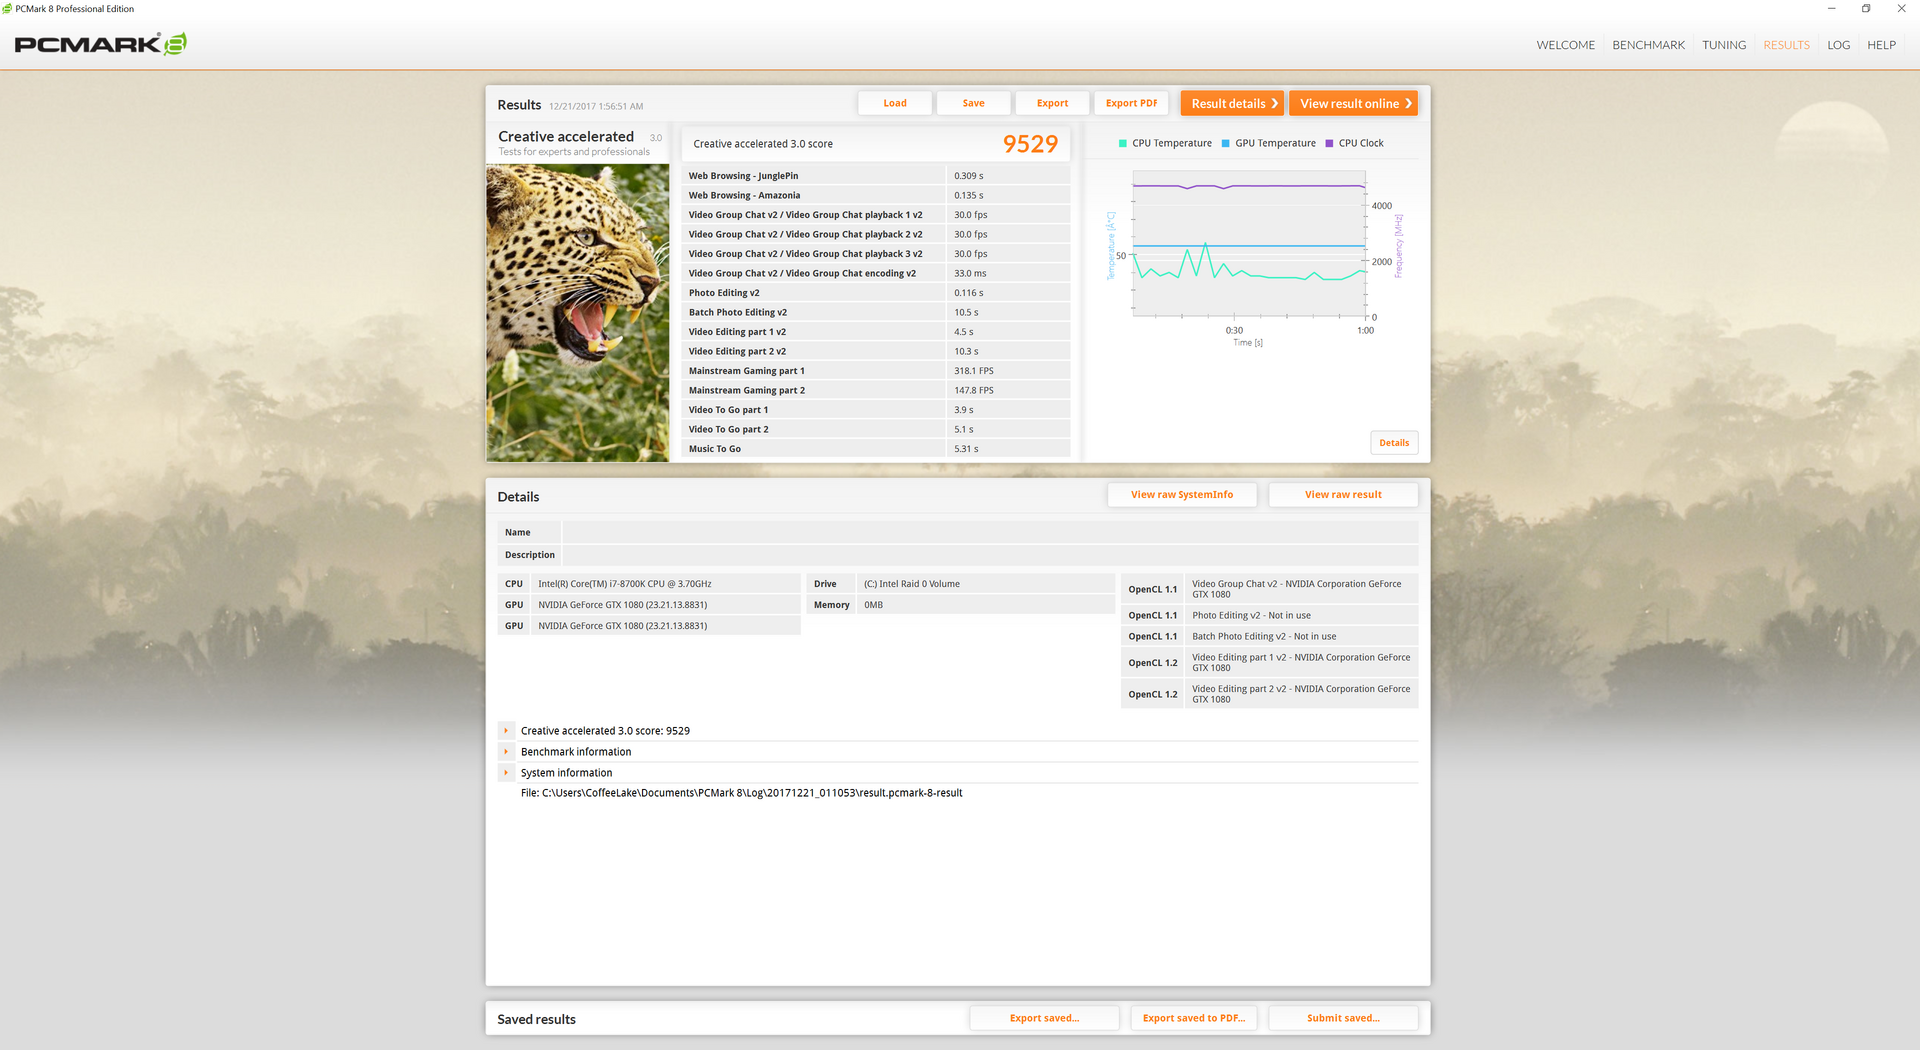
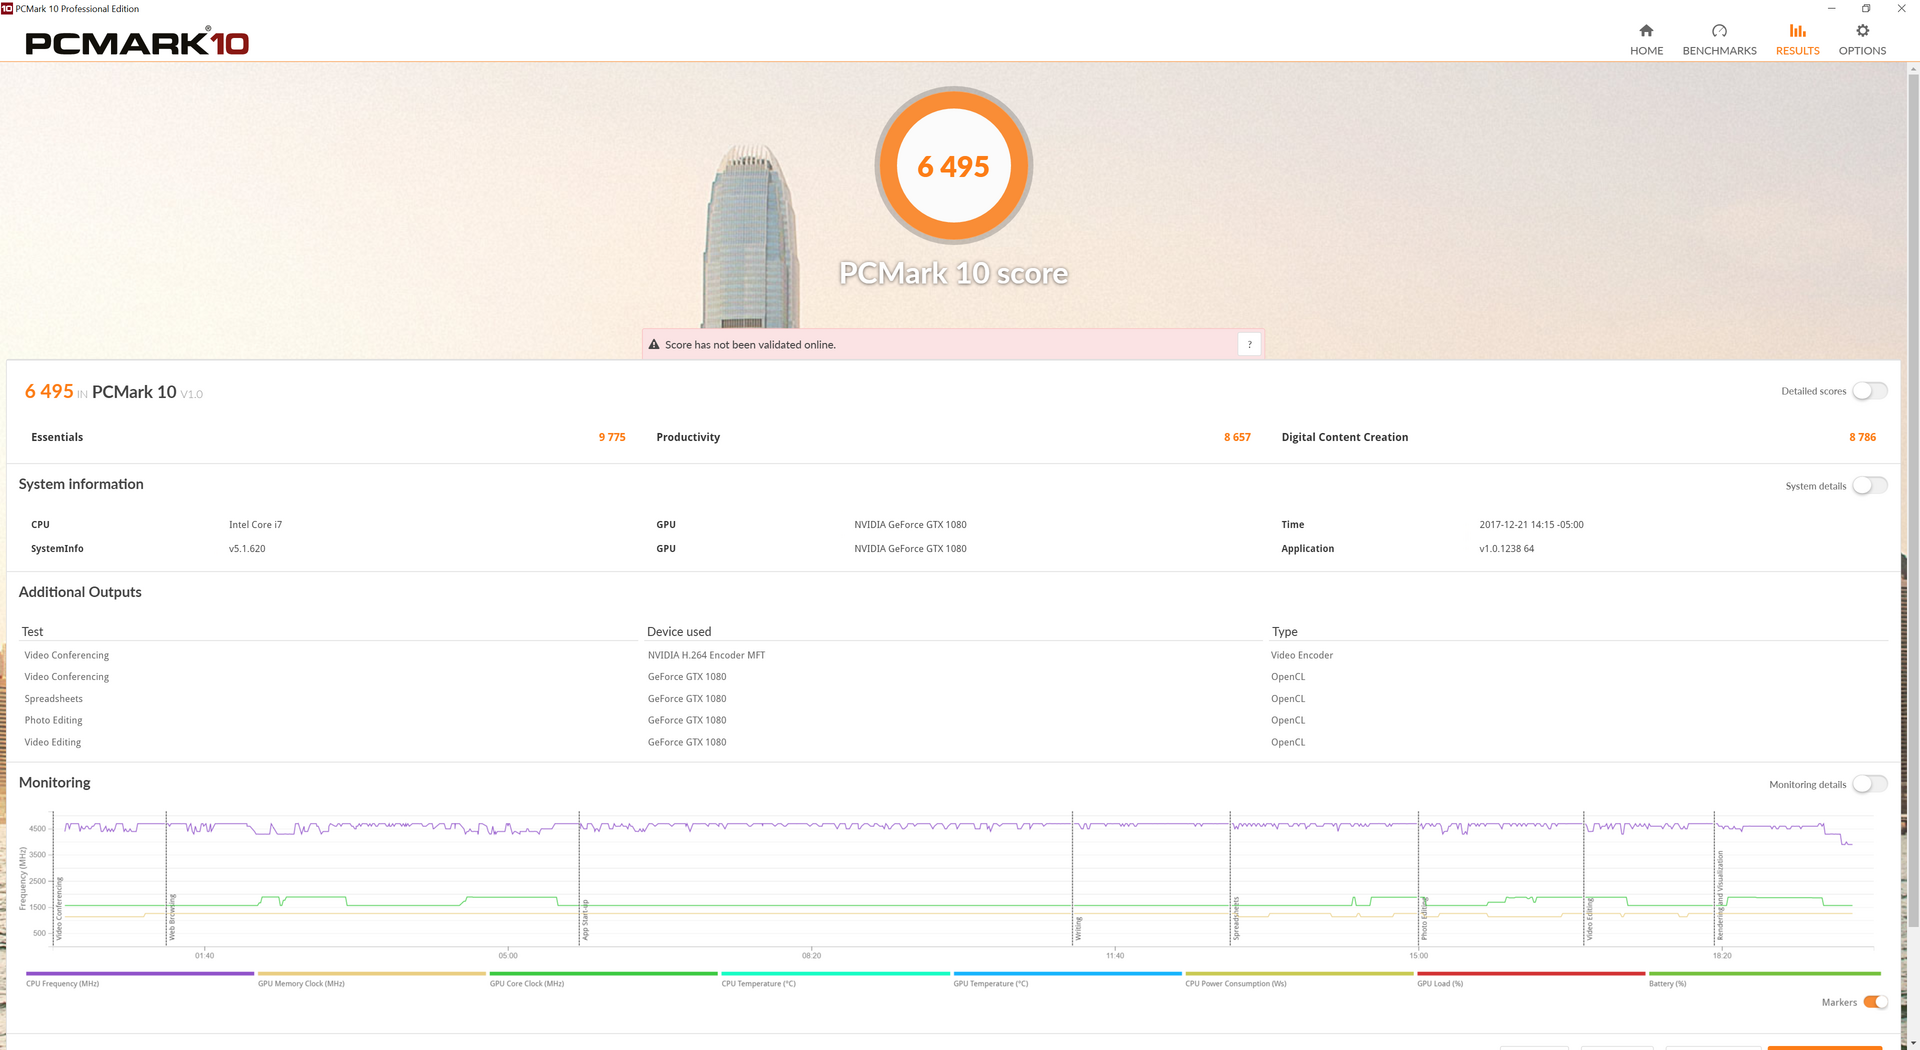
PCMark 10 results are currently the highest in our database beating the MSI GT83VR by about 20 percent in each category. PCMark 8 results are more mixed likely due to the 4K UHD panel of the Eurocom compared to the FHD panel of the MSI.
Subjectively, our Eurocom system was free of any hardware or software issues during the testing duration. Pre-installed applications are kept to a minimum with Flexikey, Control Center, and CPU/GPU/RAM overclocking features all readily available. Certain key drivers for various features (SD reader, etc.) have been omitted and so users will need to install them manually.
| PCMark 8 | |
| Home Score Accelerated v2 | |
| Eurocom Tornado F5 | |
| MSI GT83VR 7RF-206 Titan SLI | |
| Eurocom Sky X9C | |
| Eurocom Sky X7E2 | |
| Razer Blade Pro RZ09-0220 | |
| Work Score Accelerated v2 | |
| Eurocom Tornado F5 | |
| MSI GT83VR 7RF-206 Titan SLI | |
| Razer Blade Pro RZ09-0220 | |
| Eurocom Sky X9C | |
| Eurocom Sky X7E2 | |
| Creative Score Accelerated v2 | |
| Eurocom Sky X9C | |
| Eurocom Tornado F5 | |
| Eurocom Sky X7E2 | |
| Razer Blade Pro RZ09-0220 | |
| PCMark 8 Home Score Accelerated v2 | 5005 points | |
| PCMark 8 Creative Score Accelerated v2 | 9529 points | |
| PCMark 8 Work Score Accelerated v2 | 5095 points | |
| PCMark 10 Score | 6495 points | |
Help | ||
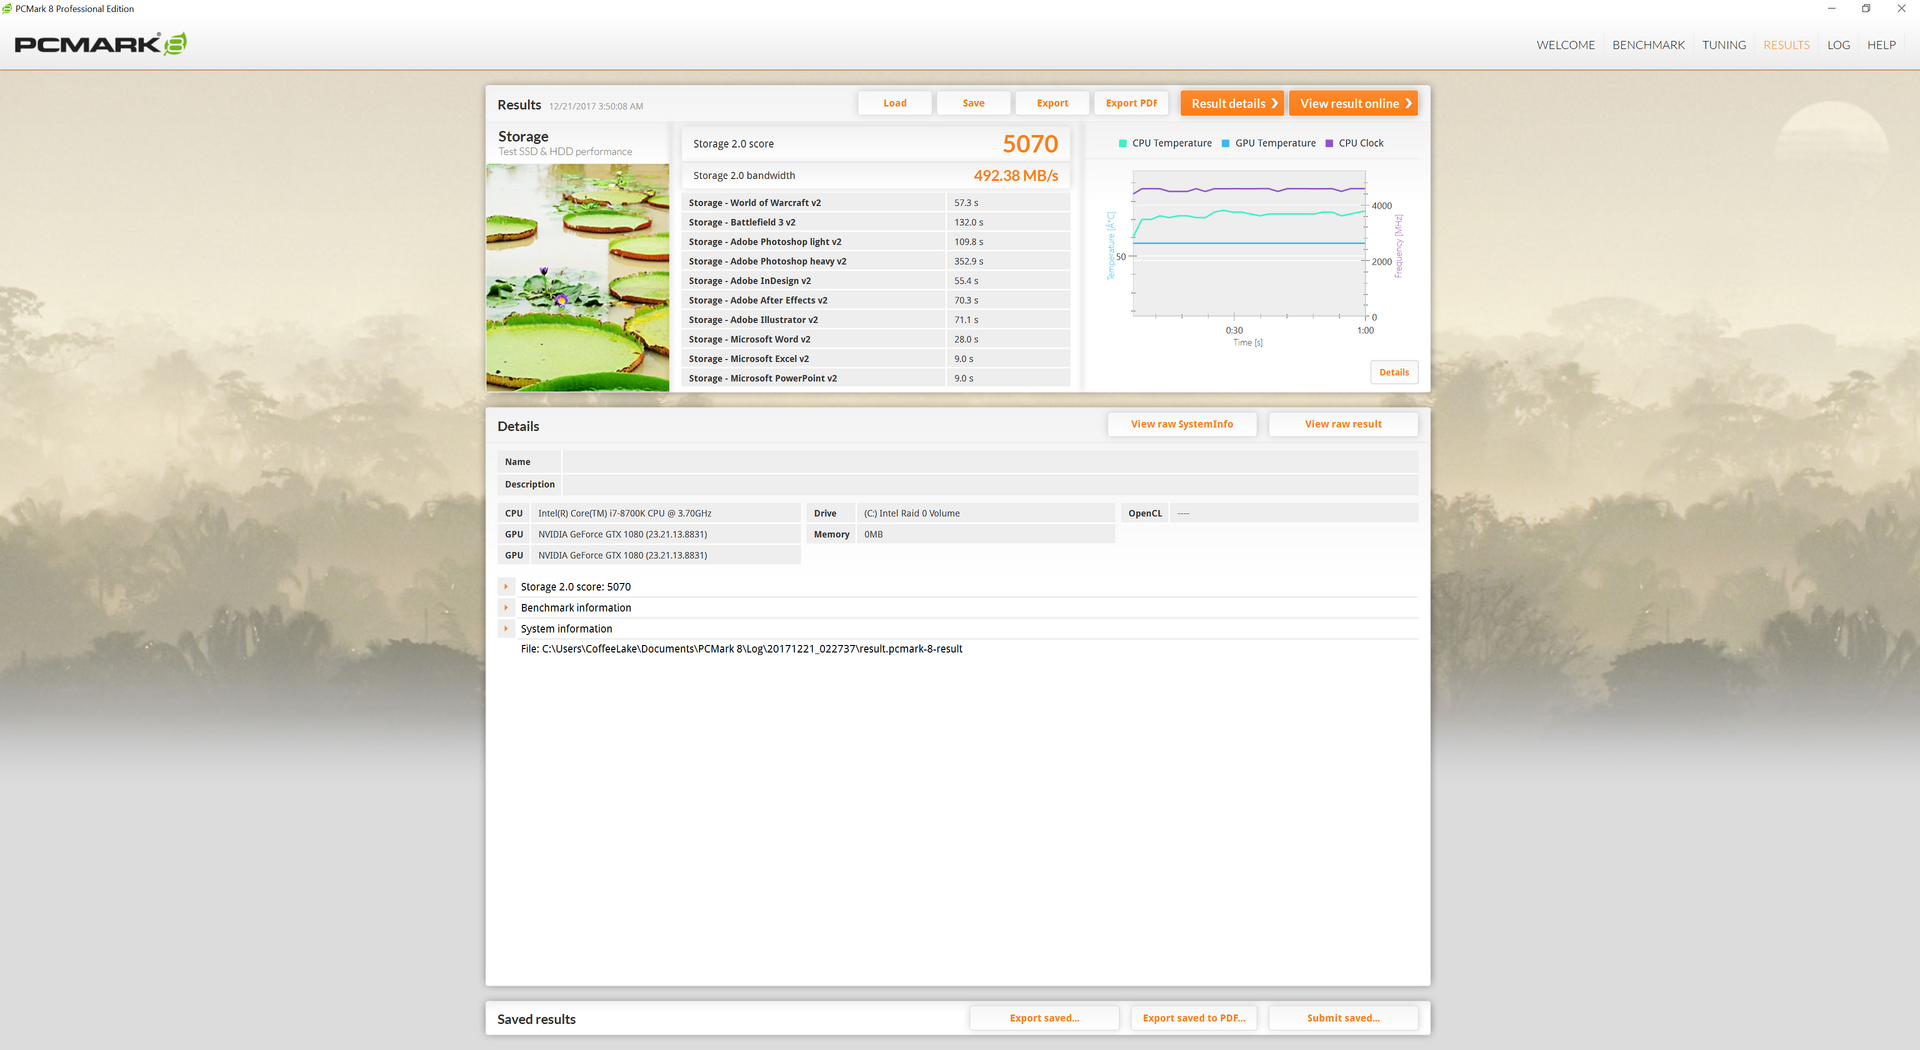
Storage Devices
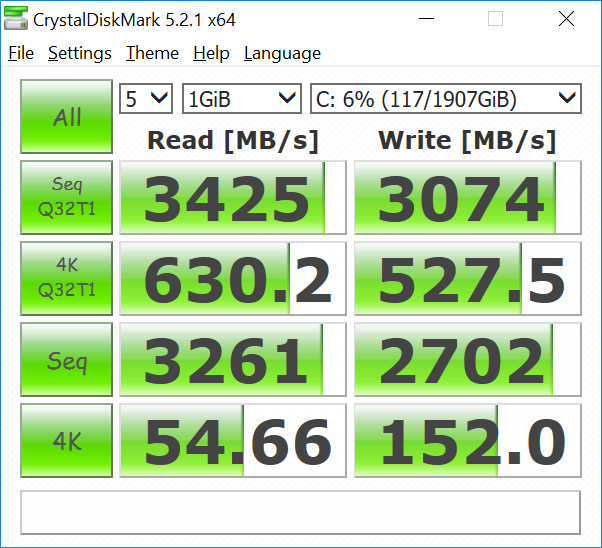
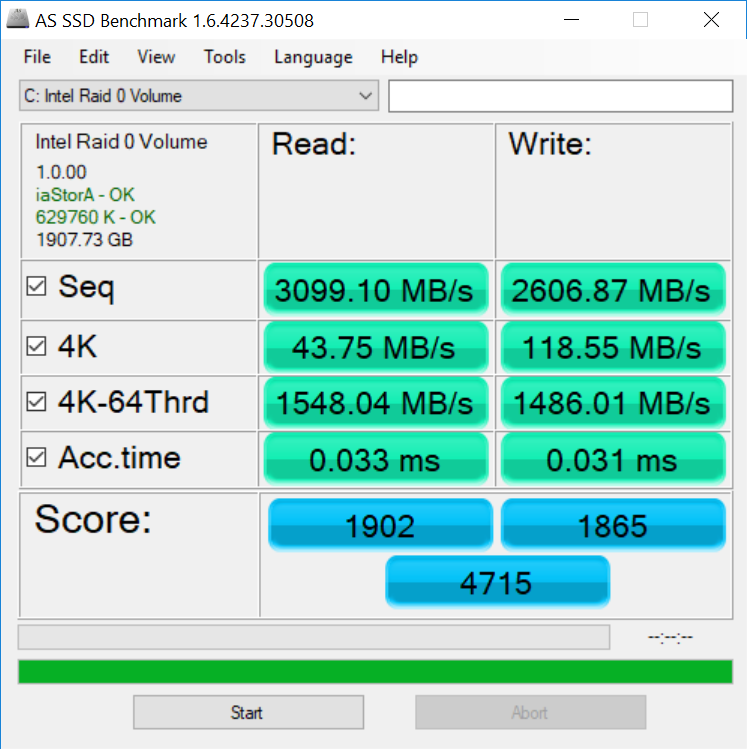
A total of five internal storage bays are available via 3x M.2 2280 PCIe x4 slots and 2x 2.5-inch SATA III bays all capable of RAID configurations. The Z370 chipset supports Optane drives as well to accelerate HDDs. As mentioned earlier, direct access to these drives can be tedious since they are positioned under layers of screws and other critical components. Our particular test model is equipped with two 1 TB Samsung 960 Pro SSDs in RAID 0 configuration.
Transfer rates from our 2x Samsung 960 Pro are very similar to the 2x Samsung SM961 in our MSI GT83VR comparison unit. Its sequential write speed of over 3000 MB/s is almost 50 percent faster than the maximum theoretical (2100 MB/s) for a single Samsung 960 Pro SSD. Sequential read speeds, however, are still limited by the 3500 MB/s maximum of a single Samsung 960 Pro. Two Samsung 960 Pro SSDs in RAID 0 do not provide as great of a benefit as one would expect and it's arguably more cost efficient to run both in SPAN for double the capacity.
See our growing table of SSDs and HDDs for more benchmark comparisons.
| Eurocom Sky X9C 2x Samsung SSD 960 Pro 1TB m.2 NVMe (RAID 0) | MSI GT75VR 7RF-012 Titan Pro 2x Samsung SM961 MZVPW256HEGL NVMe (RAID 0) | Razer Blade Pro RZ09-0220 Samsung SSD PM951 MZVLV256HCHP | Asus GL702ZC-GC104T SanDisk SD8SN8U256G1002 | HP Spectre x360 15t-bl100 Samsung PM961 NVMe MZVLW512HMJP | |
|---|---|---|---|---|---|
| CrystalDiskMark 5.2 / 6 | 1% | -46% | -67% | -22% | |
| Write 4K (MB/s) | 152 | 165 9% | 155.1 2% | 96.1 -37% | 174.1 15% |
| Read 4K (MB/s) | 54.7 | 55.9 2% | 44.22 -19% | 38.91 -29% | 48.07 -12% |
| Write Seq (MB/s) | 2702 | 2612 -3% | 311.2 -88% | 467.9 -83% | 1444 -47% |
| Read Seq (MB/s) | 3261 | 3377 4% | 1247 -62% | 494.2 -85% | 1008 -69% |
| Write 4K Q32T1 (MB/s) | 528 | 548 4% | 310.3 -41% | 188.9 -64% | 512 -3% |
| Read 4K Q32T1 (MB/s) | 630 | 625 -1% | 551 -13% | 205.9 -67% | 632 0% |
| Write Seq Q32T1 (MB/s) | 3074 | 2944 -4% | 311.5 -90% | 461.2 -85% | 1522 -50% |
| Read Seq Q32T1 (MB/s) | 3425 | 3407 -1% | 1560 -54% | 450.8 -87% | 3111 -9% |

GPU Performance
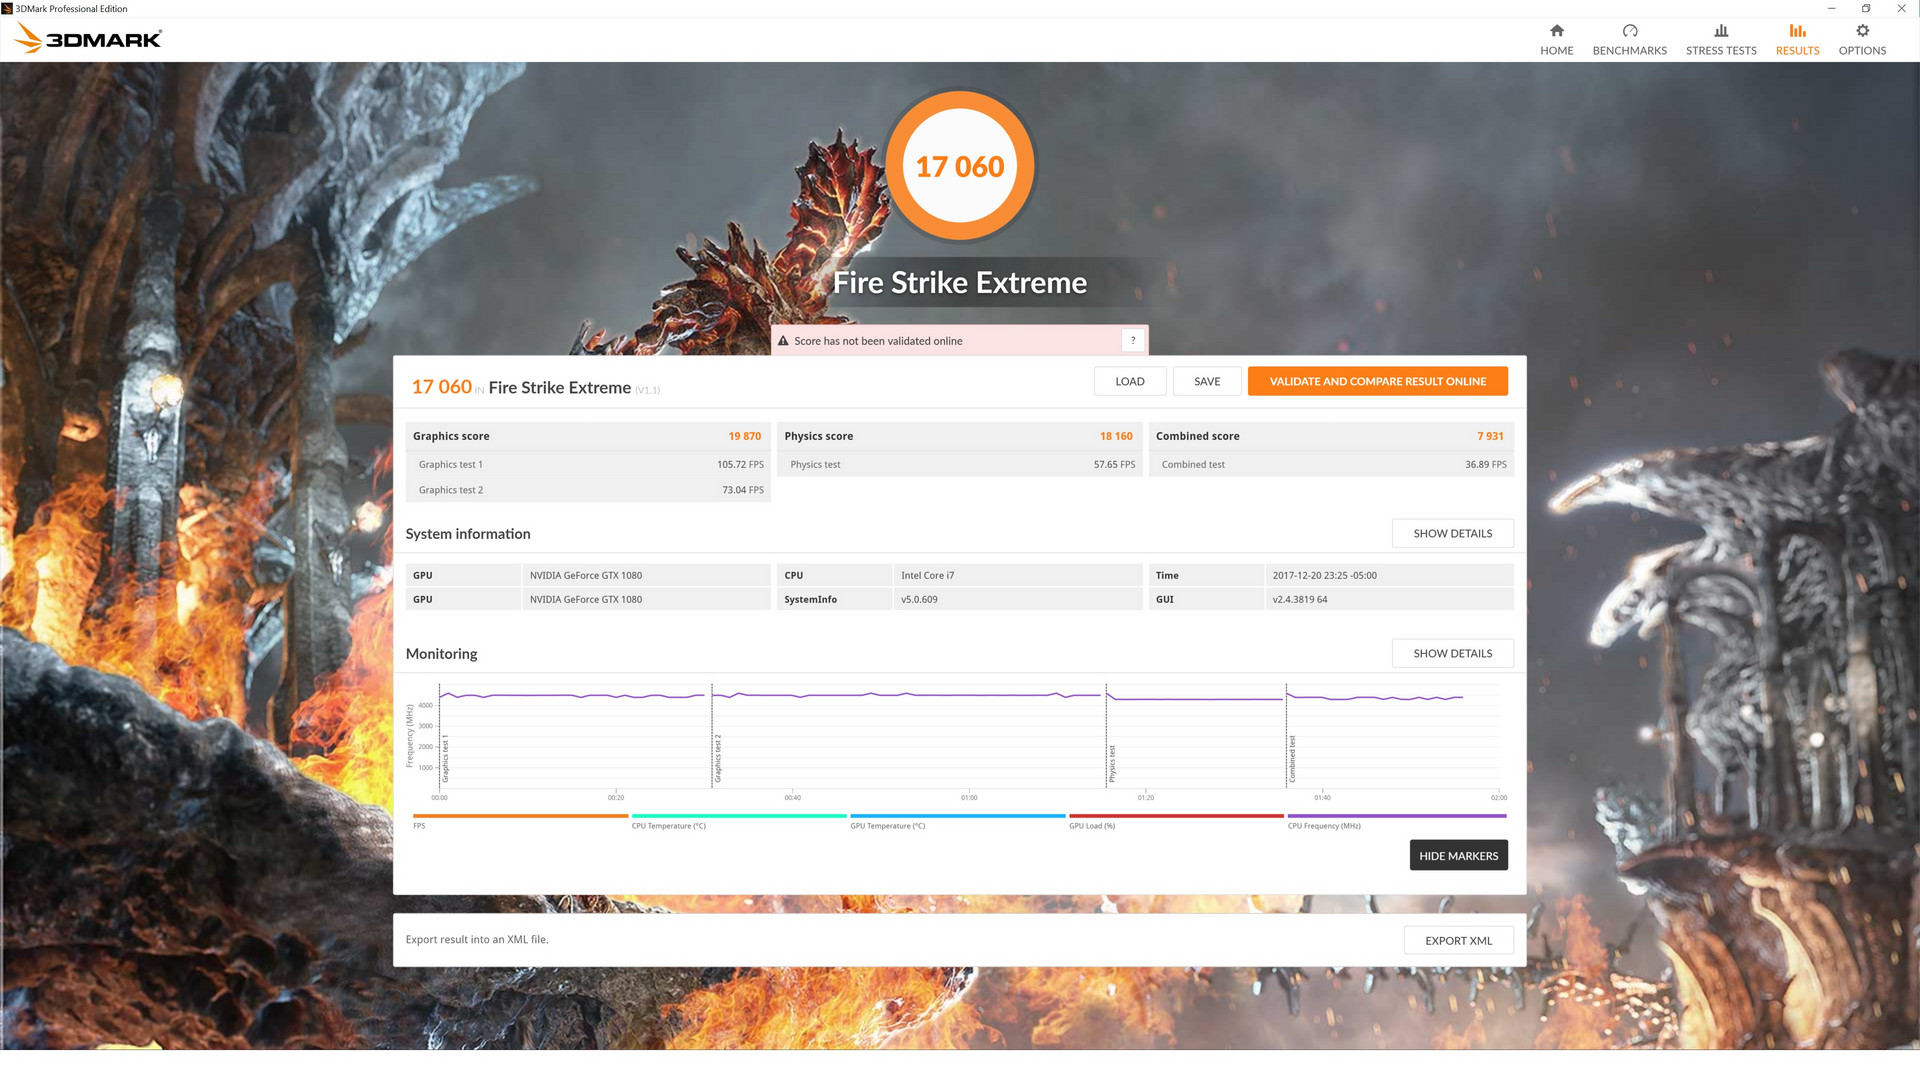
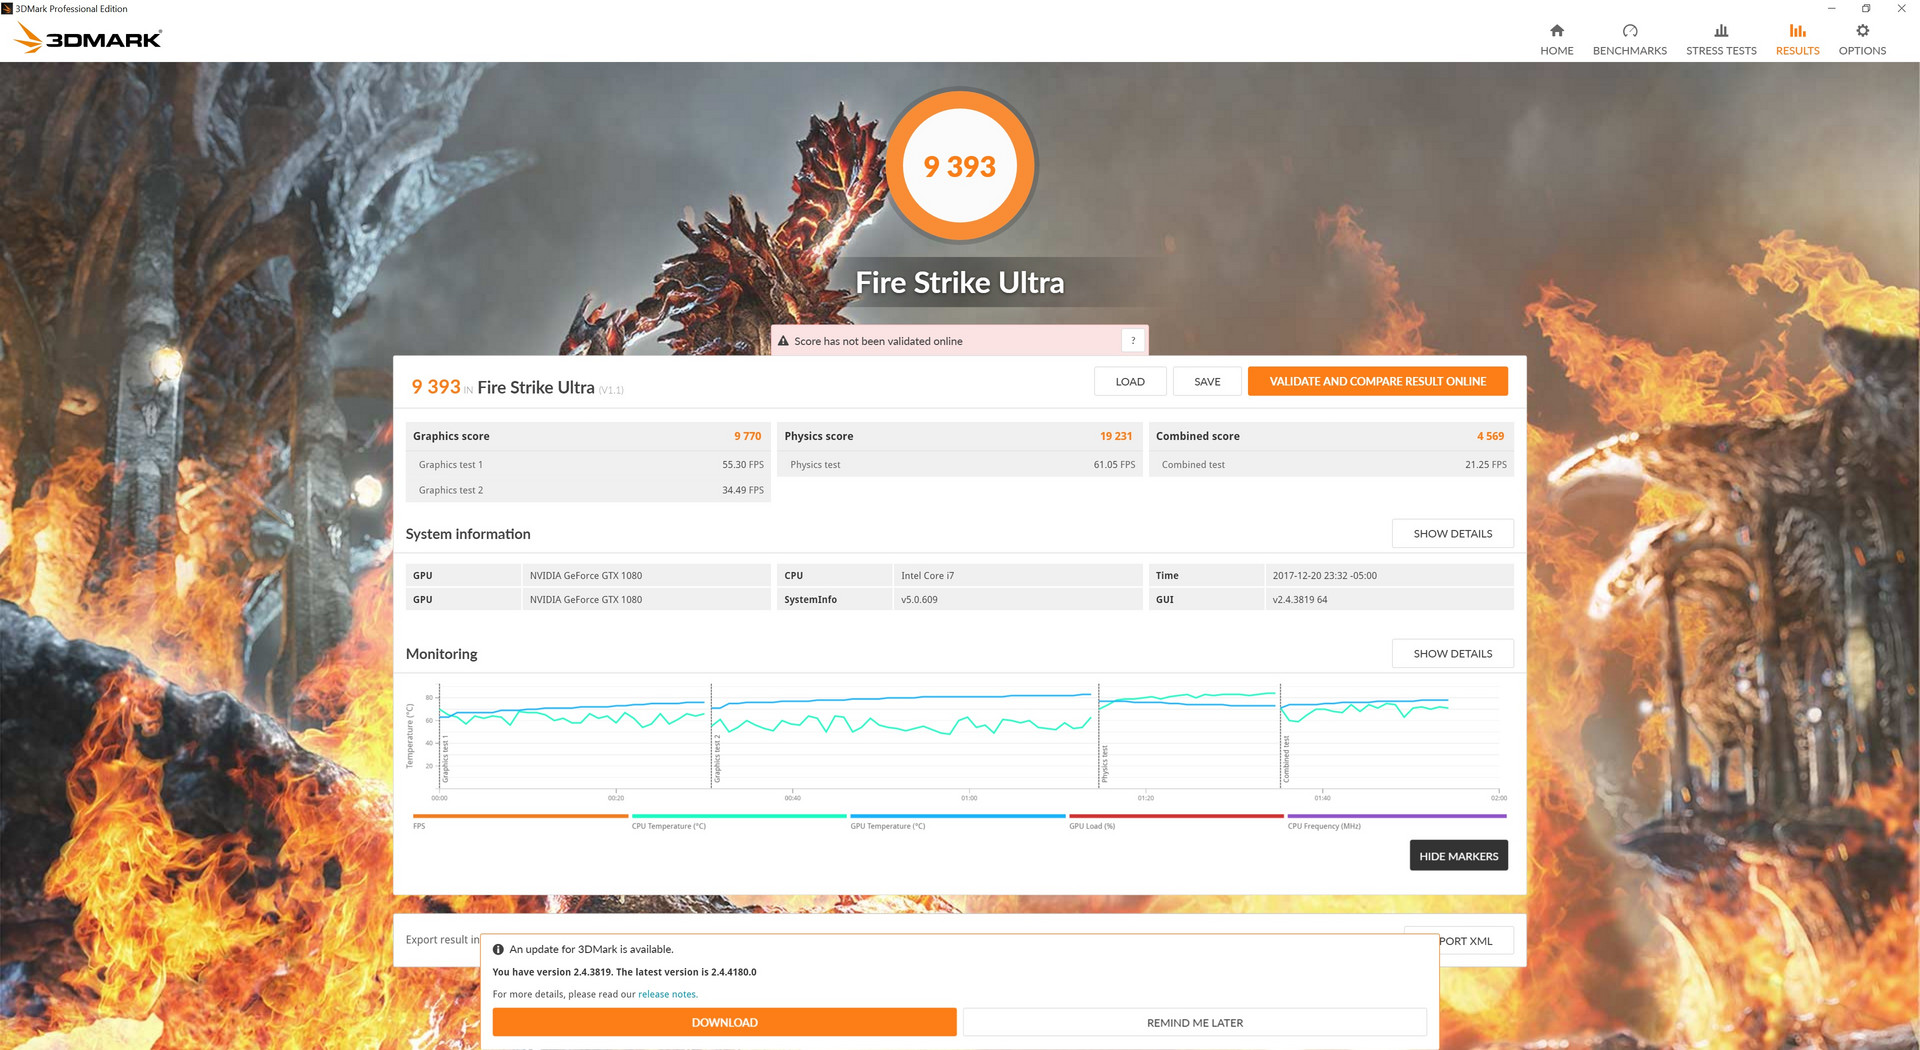
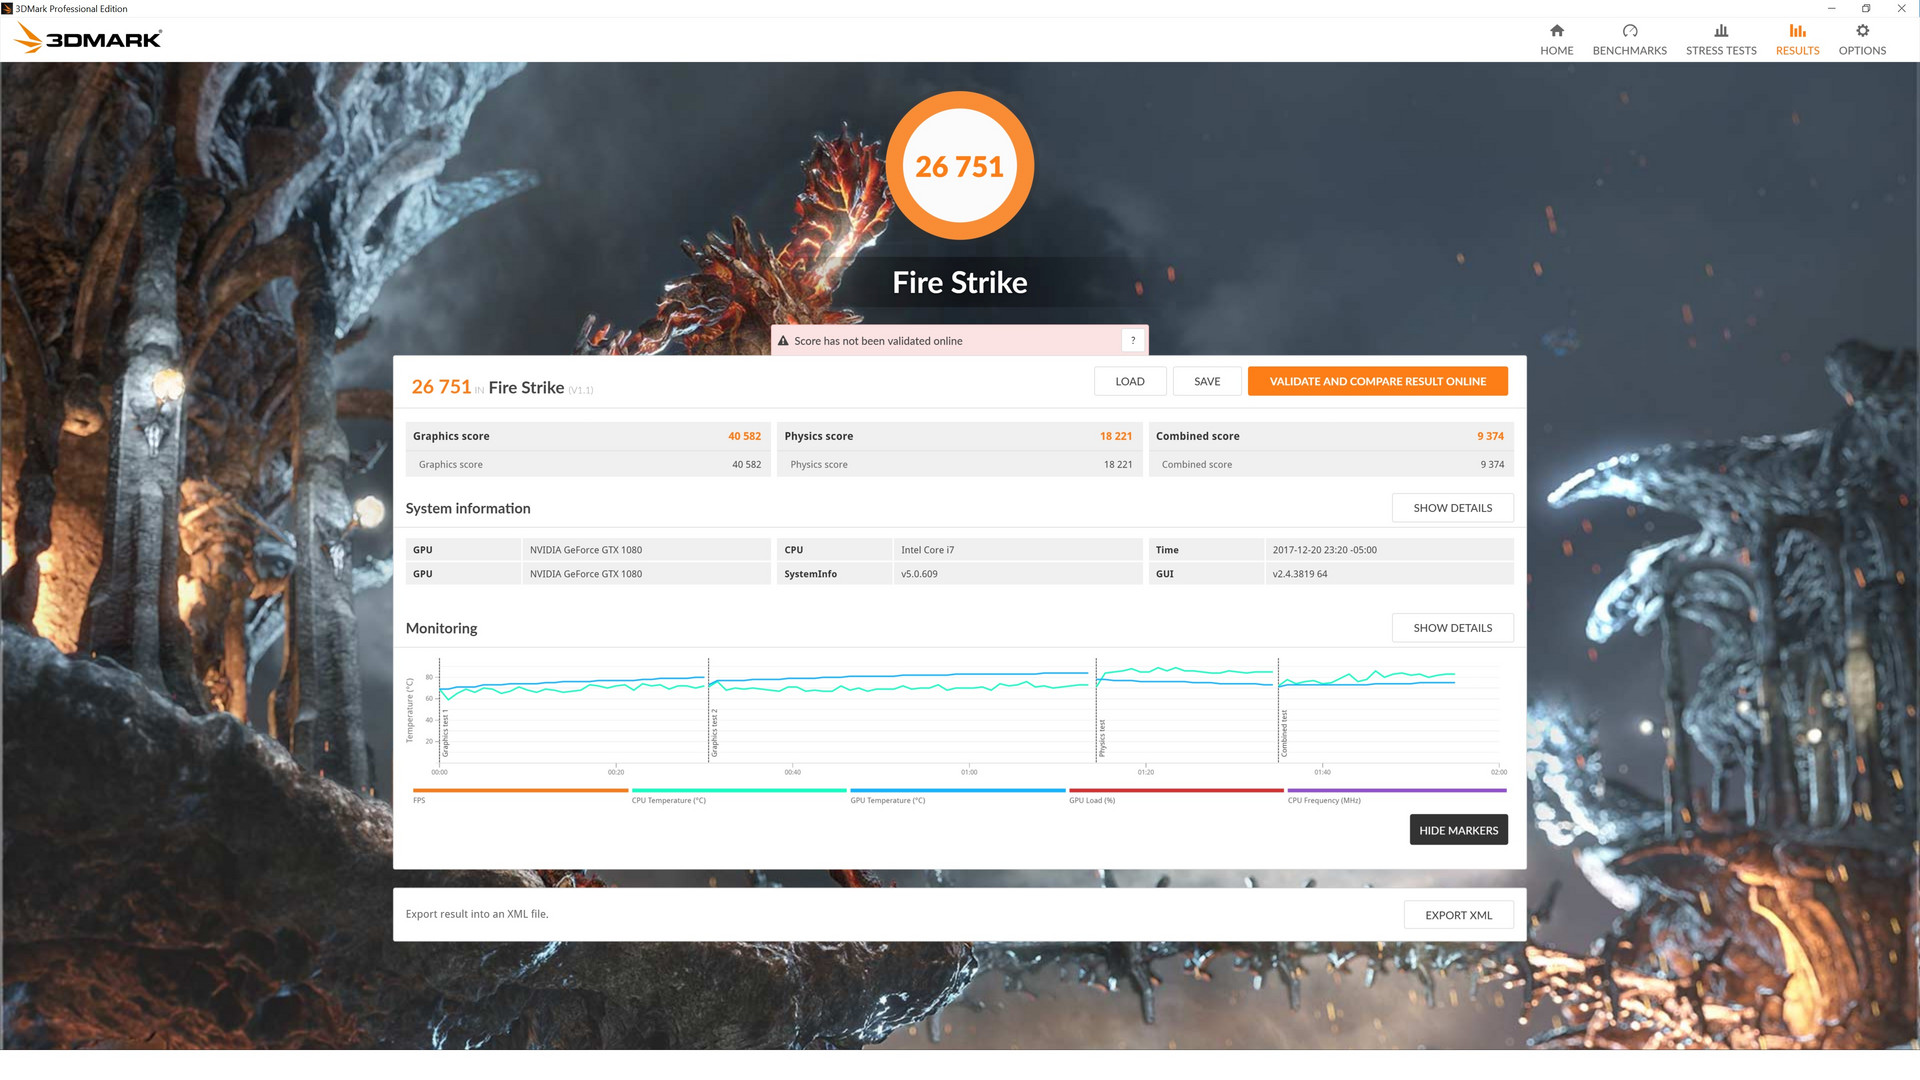
Nvidia SLI has always scaled well when running synthetic benchmarks like 3DMark. Fire Strike results are 90 to 100 percent greater than a single mobile GTX 1080 or desktop GTX 1080 and 40 percent greater than a single GTX 1080 Ti. Graphics Scores are essentially the same as our GT83VR with a similar GTX 1080 SLI setup, but combined scores are notably higher for the Sky X9C due to its faster i7-8700K processor over the i7-7920HQ. Our reference desktop with the i7-4790K and GTX 1080 Ti is behind by about 12 percent against a notebook less than a quarter of its size.
See our dedicated page on the GeForce GTX 1080 SLI for more technical information and benchmark comparisons.
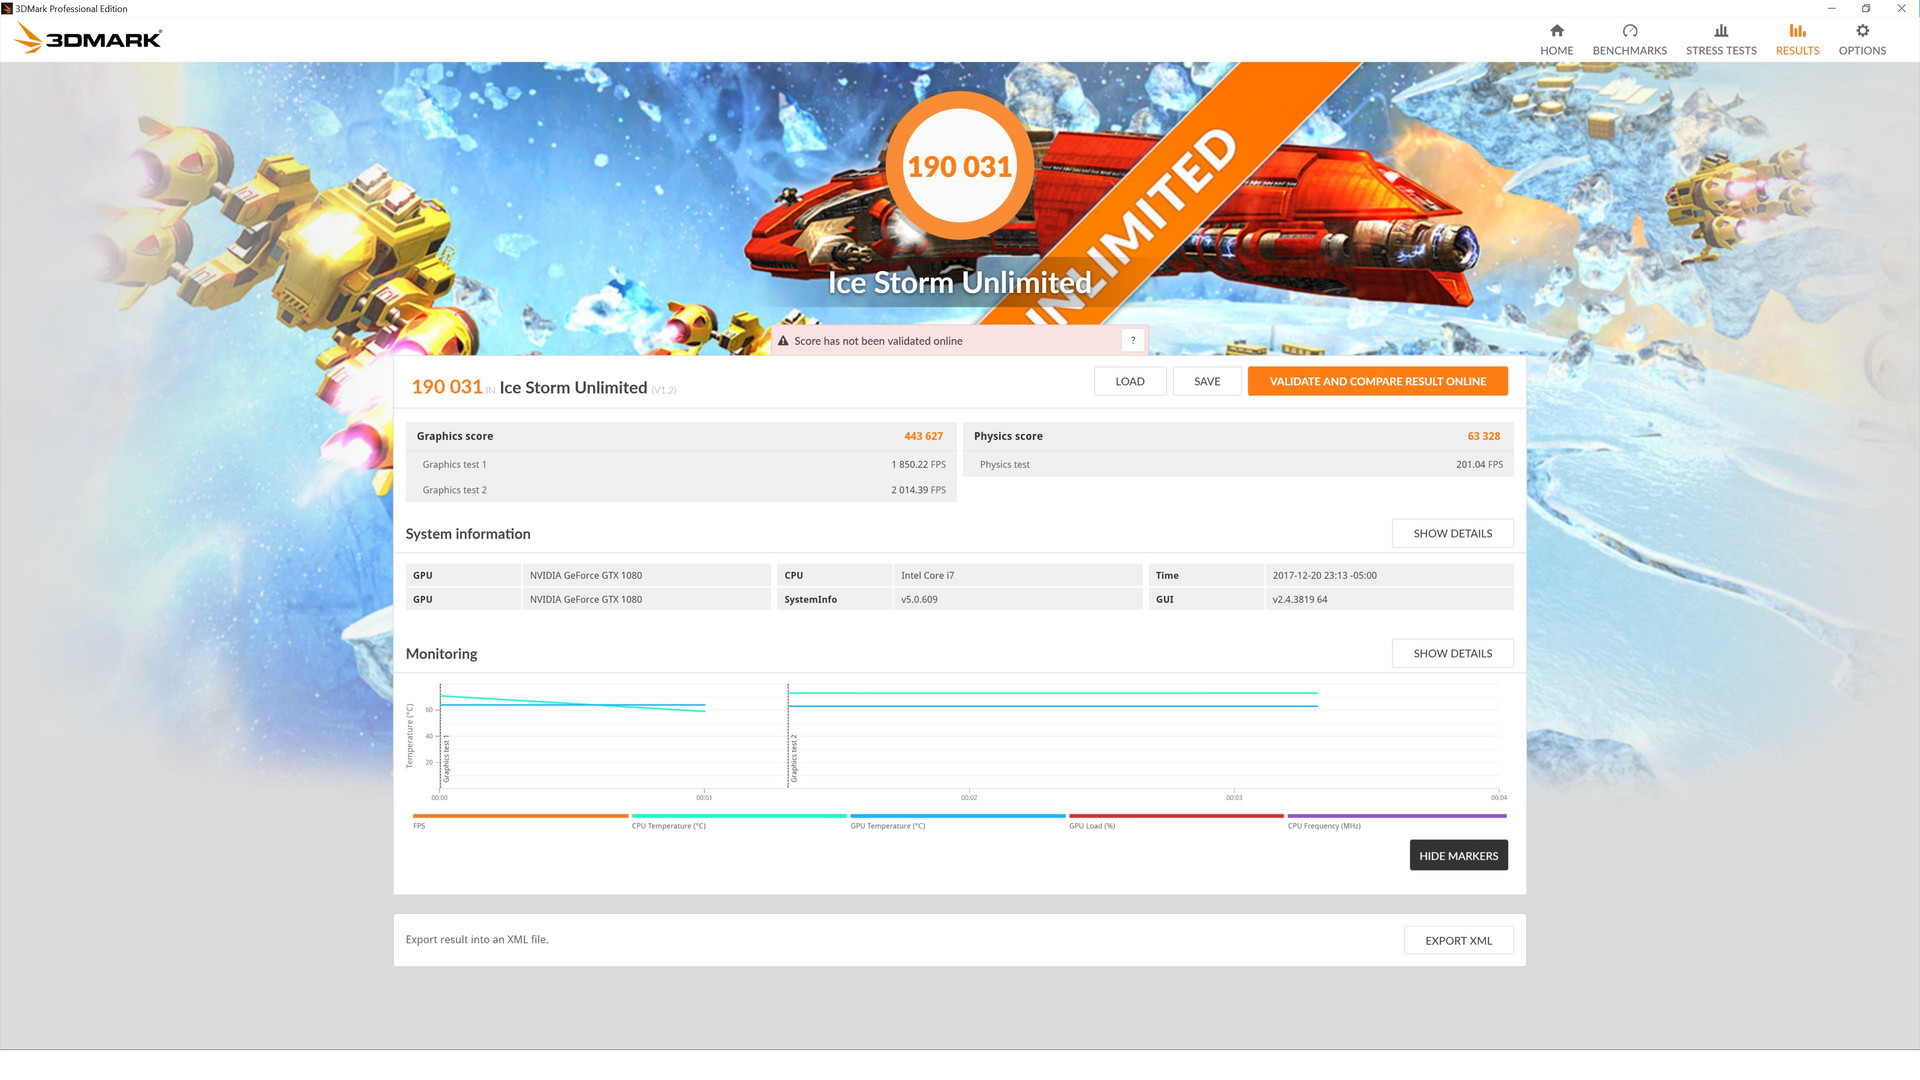
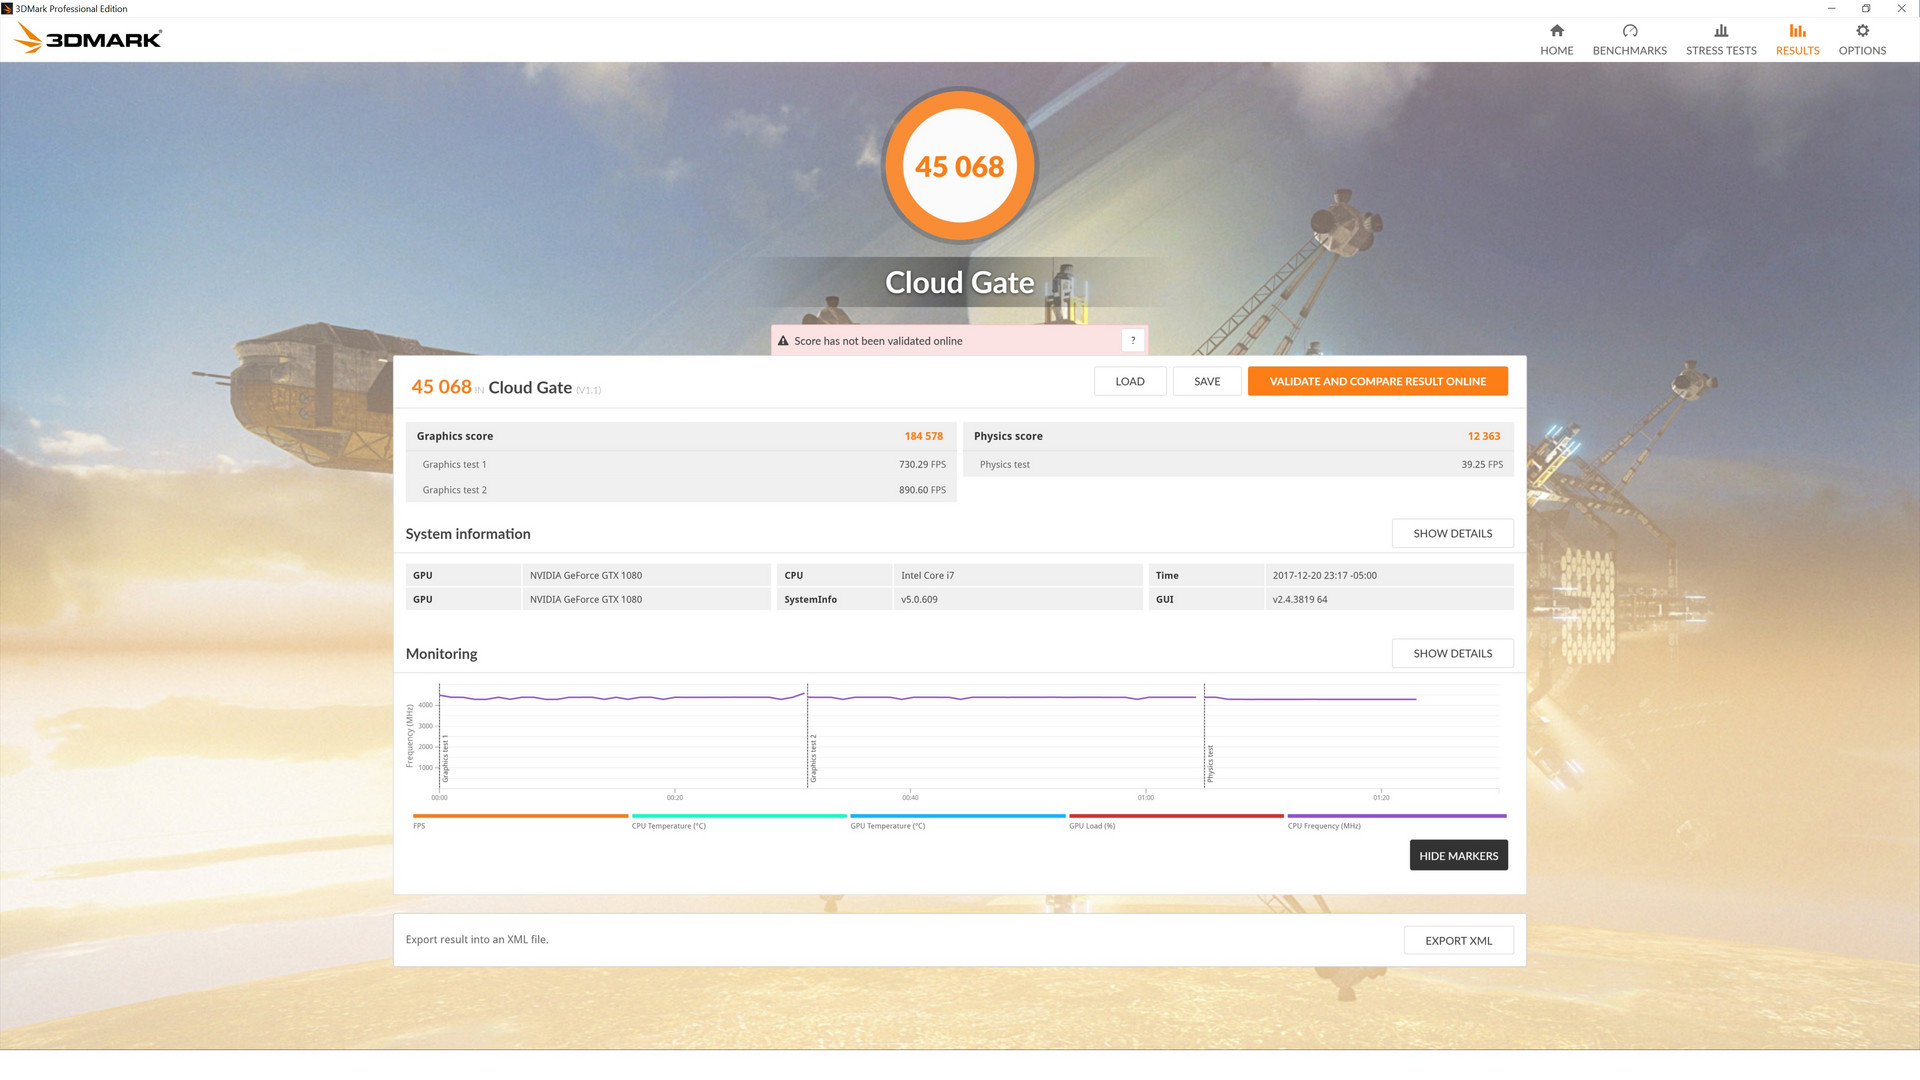
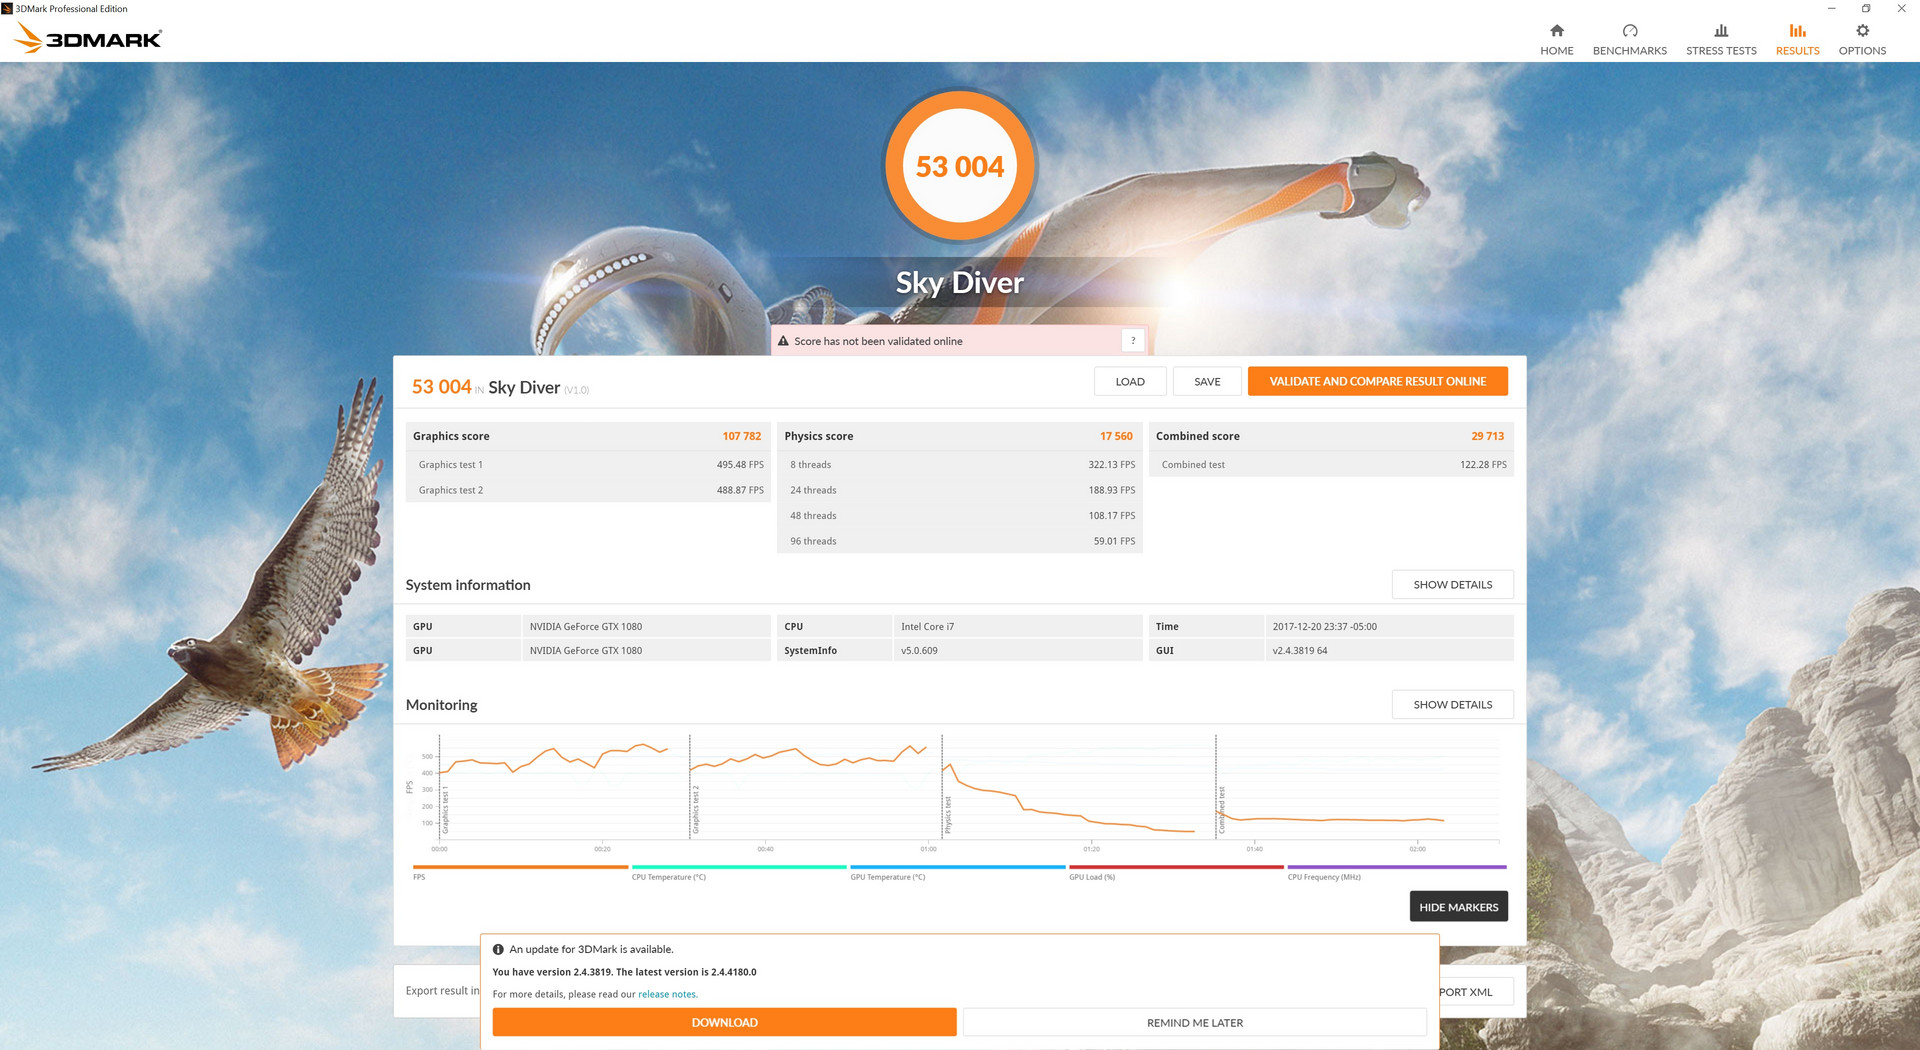
| 3DMark 11 Performance | 30042 points | |
| 3DMark Ice Storm Standard Score | 192638 points | |
| 3DMark Cloud Gate Standard Score | 45068 points | |
| 3DMark Fire Strike Score | 26751 points | |
| 3DMark Fire Strike Extreme Score | 17060 points | |
Help | ||
Gaming Performance
As impressive as its raw graphical output may be, SLI support is splintering in the wake of DX12 games. Newer DX12 titles like Middle-earth: Shadow of War show very marginal performance benefits from running a GTX 1080 SLI setup versus a single GTX 1080 Ti while results are actually worse for some games such as Ashes of the Singularity. Destiny 2 shows a promising 38 percent boost over the GTX 1070 SLI, but this is more of an exception than the rule. G-Sync is highly recommended when gaming in 4K UHD since many newer titles still hover in the 50 to 60 FPS range where adaptive sync is effective.
| Destiny 2 - 3840x2160 Highest Preset AA:SM AF:16x | |
| Eurocom Sky X9C | |
| Desktop PC Ryzen 7 1800X + Zotac GeForce GTX 1070 SLI | |
| Nvidia GeForce GTX 1080 Ti Founders Edition | |
| Middle-earth: Shadow of War - 3840x2160 Ultra Preset AA:T | |
| Eurocom Sky X9C | |
| Nvidia GeForce GTX 1080 Ti Founders Edition | |
| Desktop PC Ryzen 7 1800X + Zotac GeForce GTX 1070 SLI | |
| Nvidia GeForce GTX 1070 Ti Founders Edition | |
| Ashes of the Singularity - 3840x2160 crazy | |
| Nvidia GeForce GTX 1080 Ti Founders Edition | |
| Eurocom Sky X9C | |
| Mafia 3 - 3840x2160 High Preset | |
| Nvidia GeForce GTX 1080 Ti Founders Edition | |
| Eurocom Sky X9C | |
| MSI Gaming X GeForce GTX 1080 Desktop PC | |
| low | med. | high | ultra | 4K | |
|---|---|---|---|---|---|
| Guild Wars 2 (2012) | 150.3 | 84.3 | 77.8 | ||
| BioShock Infinite (2013) | 398.4 | 347.3 | 295.5 | 265.6 | |
| Metro: Last Light (2013) | 196 | 194.8 | 192.8 | 172.1 | |
| Thief (2014) | 150.1 | 147.5 | 144.5 | 141.9 | |
| The Witcher 3 (2015) | 357 | 229.8 | 184.3 | 106.4 | 87.1 |
| Batman: Arkham Knight (2015) | 202 | 186 | 150 | 99 | 57 |
| Metal Gear Solid V (2015) | 60 | 60 | 60 | 60 | 60 |
| Fallout 4 (2015) | 212.9 | 219.5 | 174.5 | 167.6 | 100 |
| Rise of the Tomb Raider (2016) | 122.8 | 110.6 | 99.8 | 103.5 | 87.4 |
| Ashes of the Singularity (2016) | 109.8 | 105.9 | 100.6 | 46.7 | |
| Overwatch (2016) | 300 | 300 | 300 | 300 | 216.3 |
| Mafia 3 (2016) | 134.4 | 115 | 79.9 | 33.4 | |
| Prey (2017) | 144 | 144 | 144 | 143 | 84 |
| Dirt 4 (2017) | 360.8 | 245.7 | 122.5 | 82.6 | 54.9 |
| F1 2017 (2017) | 237 | 178 | 152 | 109 | 56 |
| Middle-earth: Shadow of War (2017) | 98 | 123 | 106 | 92 | 55 |
| Destiny 2 (2017) | 148.4 | 121.9 | 116.2 | 113.1 | 80.3 |
Stress Test
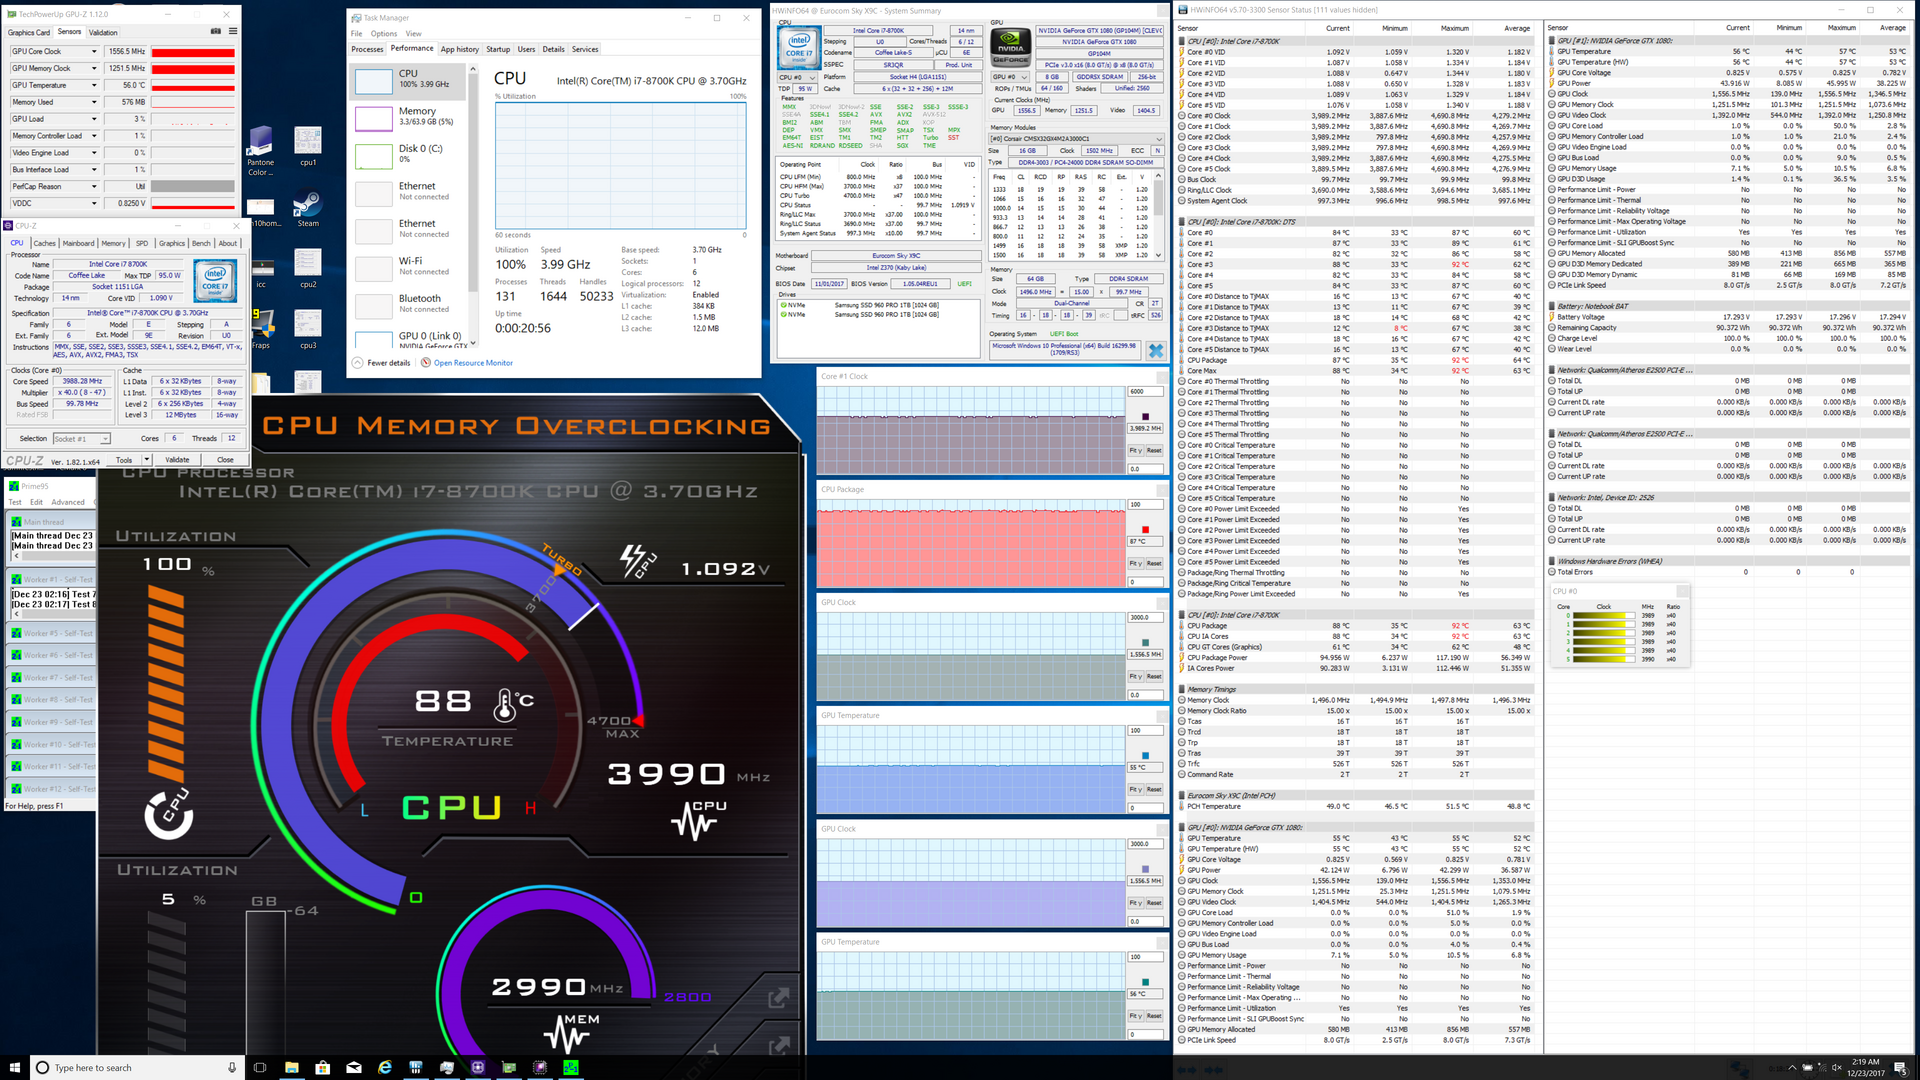
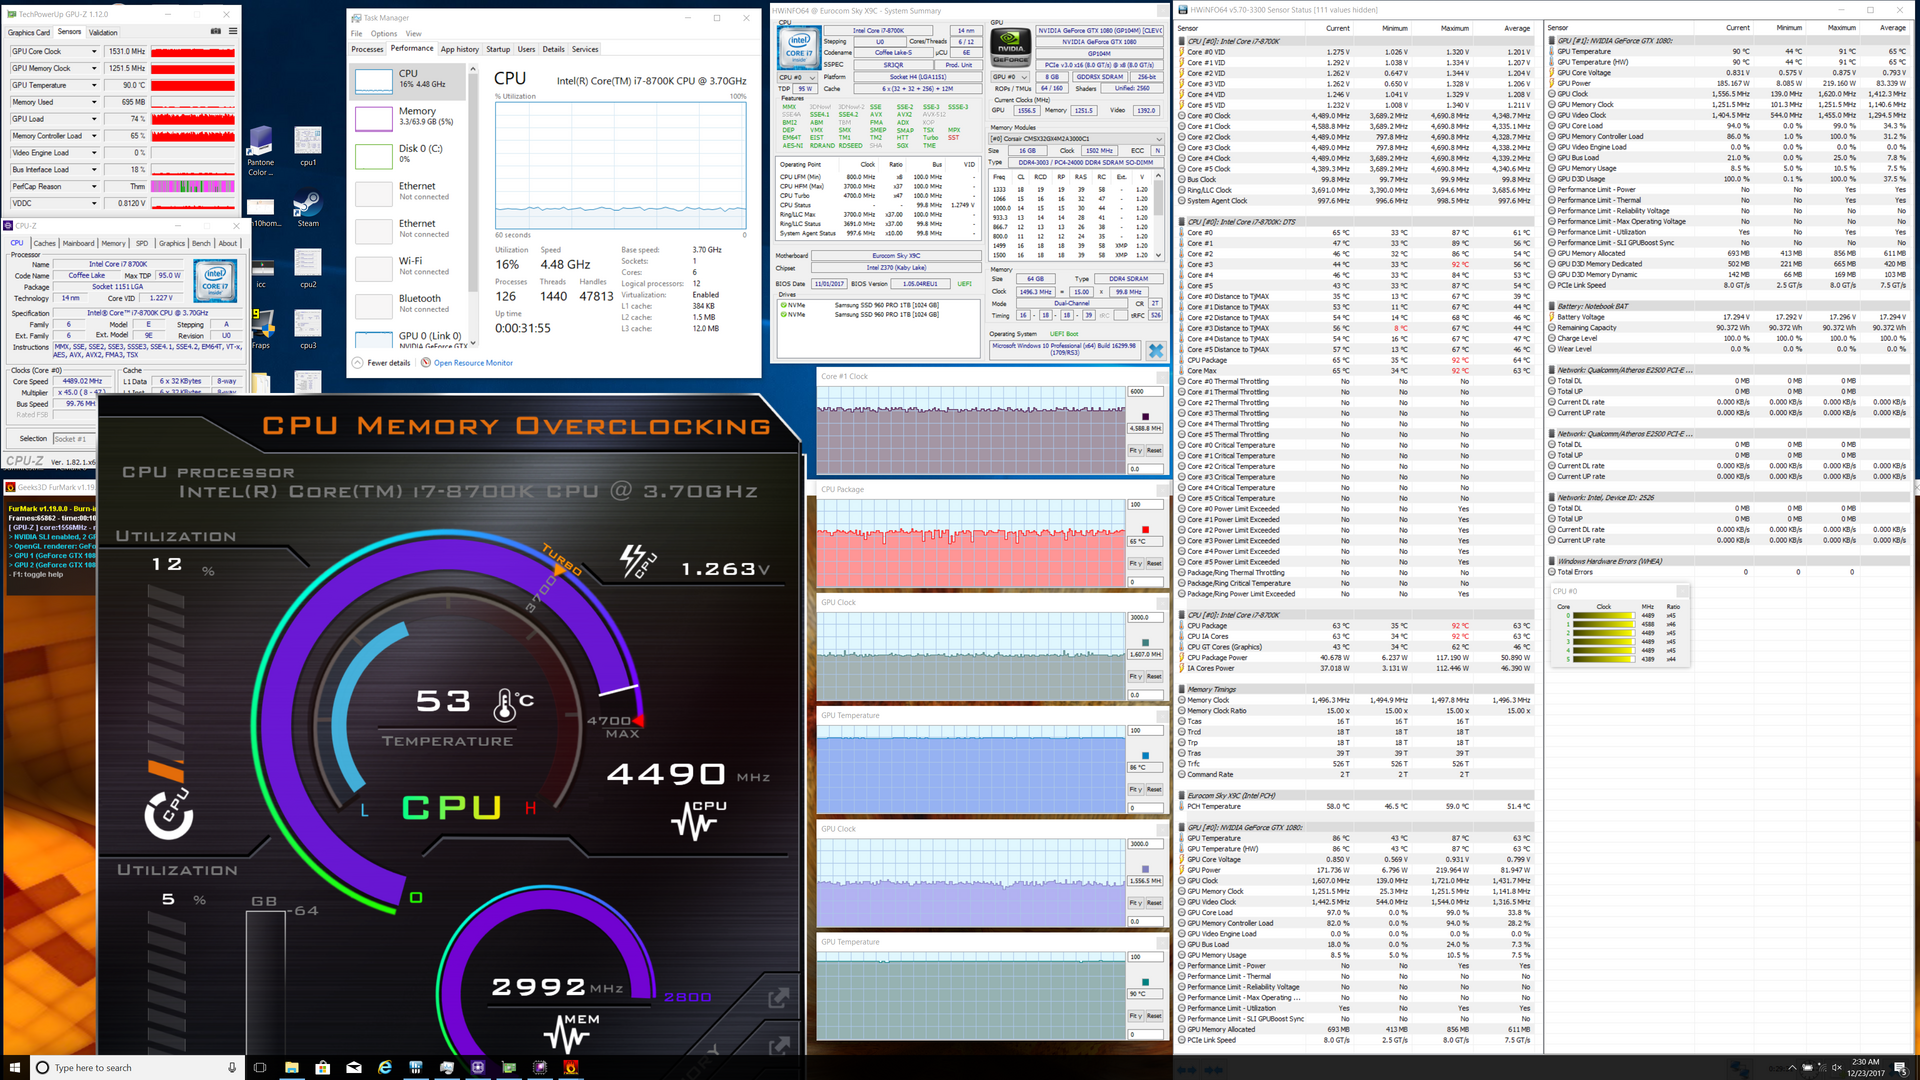
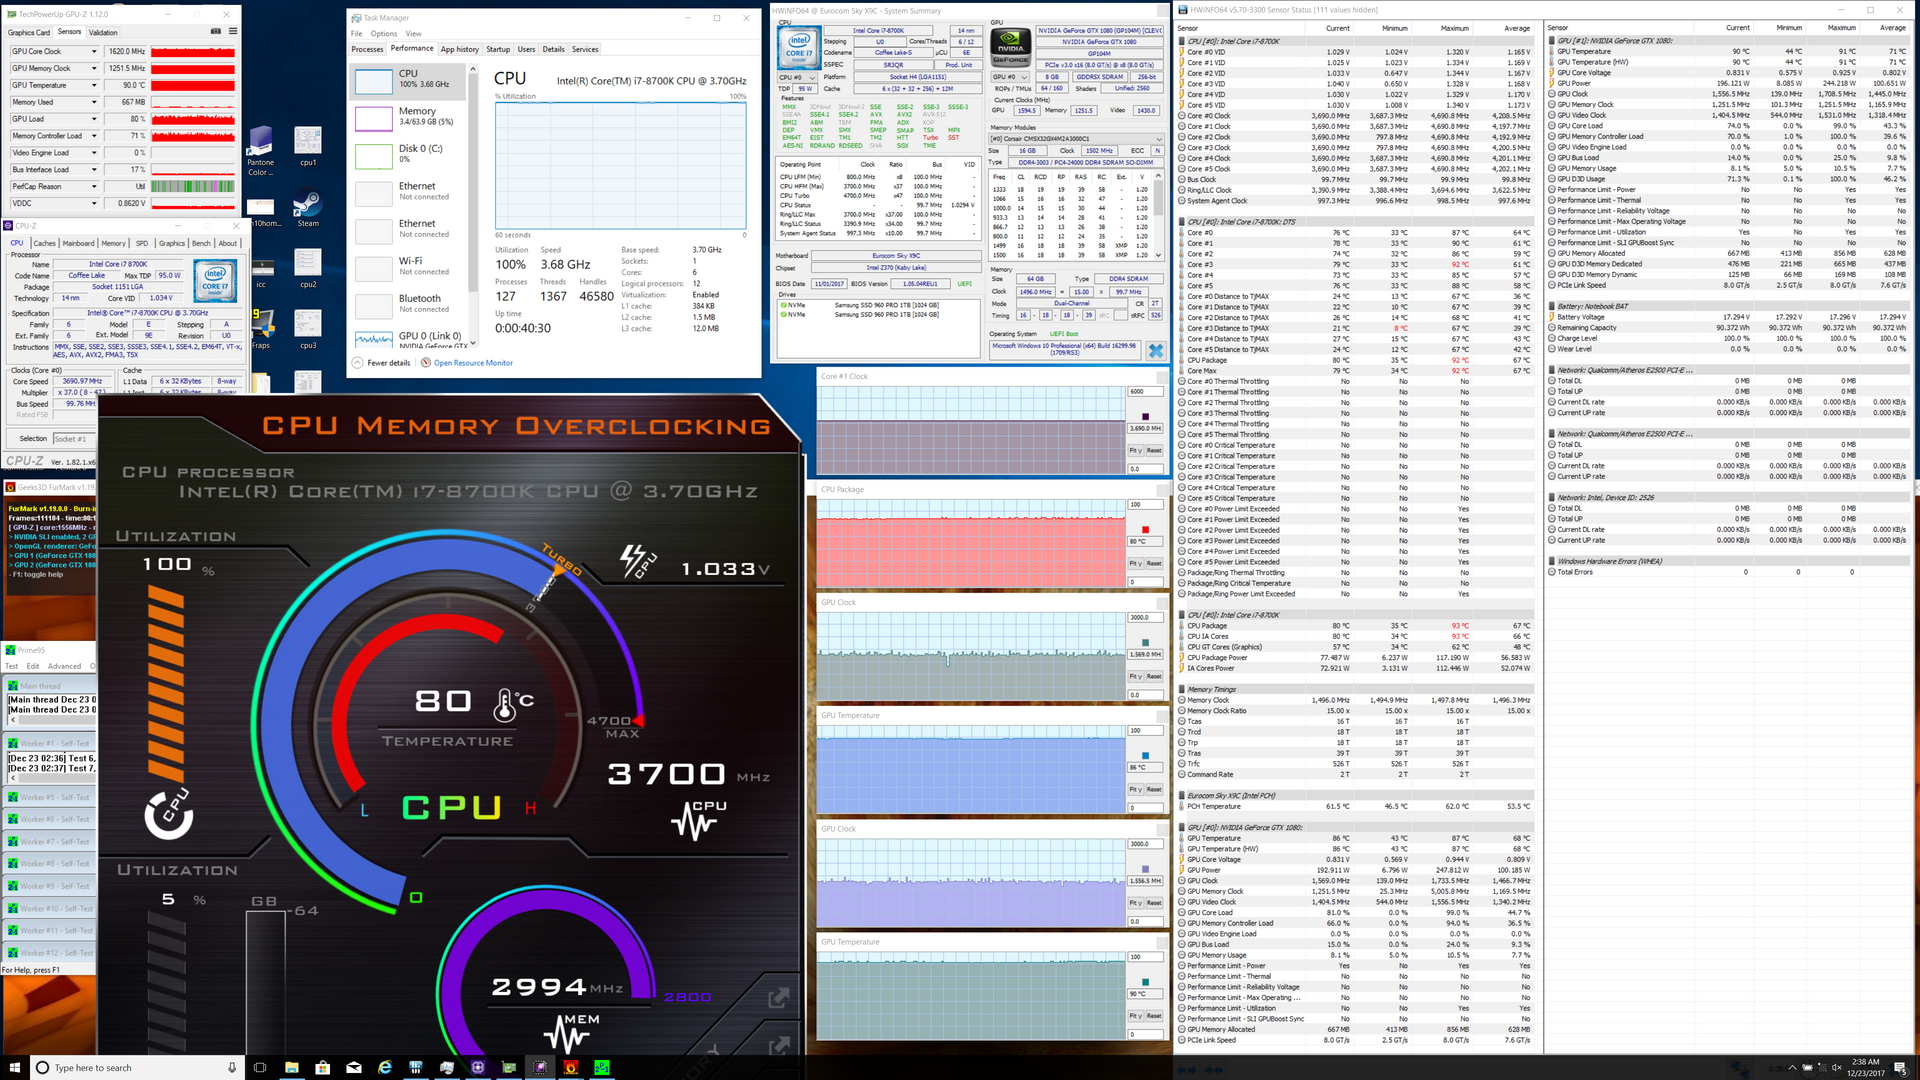
We stress the notebook with synthetic benchmarks to identify for any potential throttling or hardware issues. When running Prime95, the i7-8700K can be observed operating at a stable 4.0 GHz for all six cores or 300 MHz above its base 3.7 GHz clock rate. Turbo Boost clock rates above 4.0 GHz are thus very short-lived when executing multi-threaded tasks. Core temperature flatlines at 87 C to be slightly cooler than the i7-6700K (91 C) and i7-7820HK (94 C) in the Eurocom X7E2 and Aorus X9, respectively, when subjected to similar loads. Maximum stress with Prime95 and FurMark will strip the CPU of any Turbo Boost in order to maintain a more respectable temperature of 80 C while both GPUs operate in the upper-end of the 80 C range. In comparison, the GTX 1070 SLI in the Aorus X9 settles at 72 C while the GTX 1080 SLI in the GT83VR is even warmer in the lower 90 C range. Overclocking potential is unsurprisingly limited because of the already high temperatures when under extreme loads.
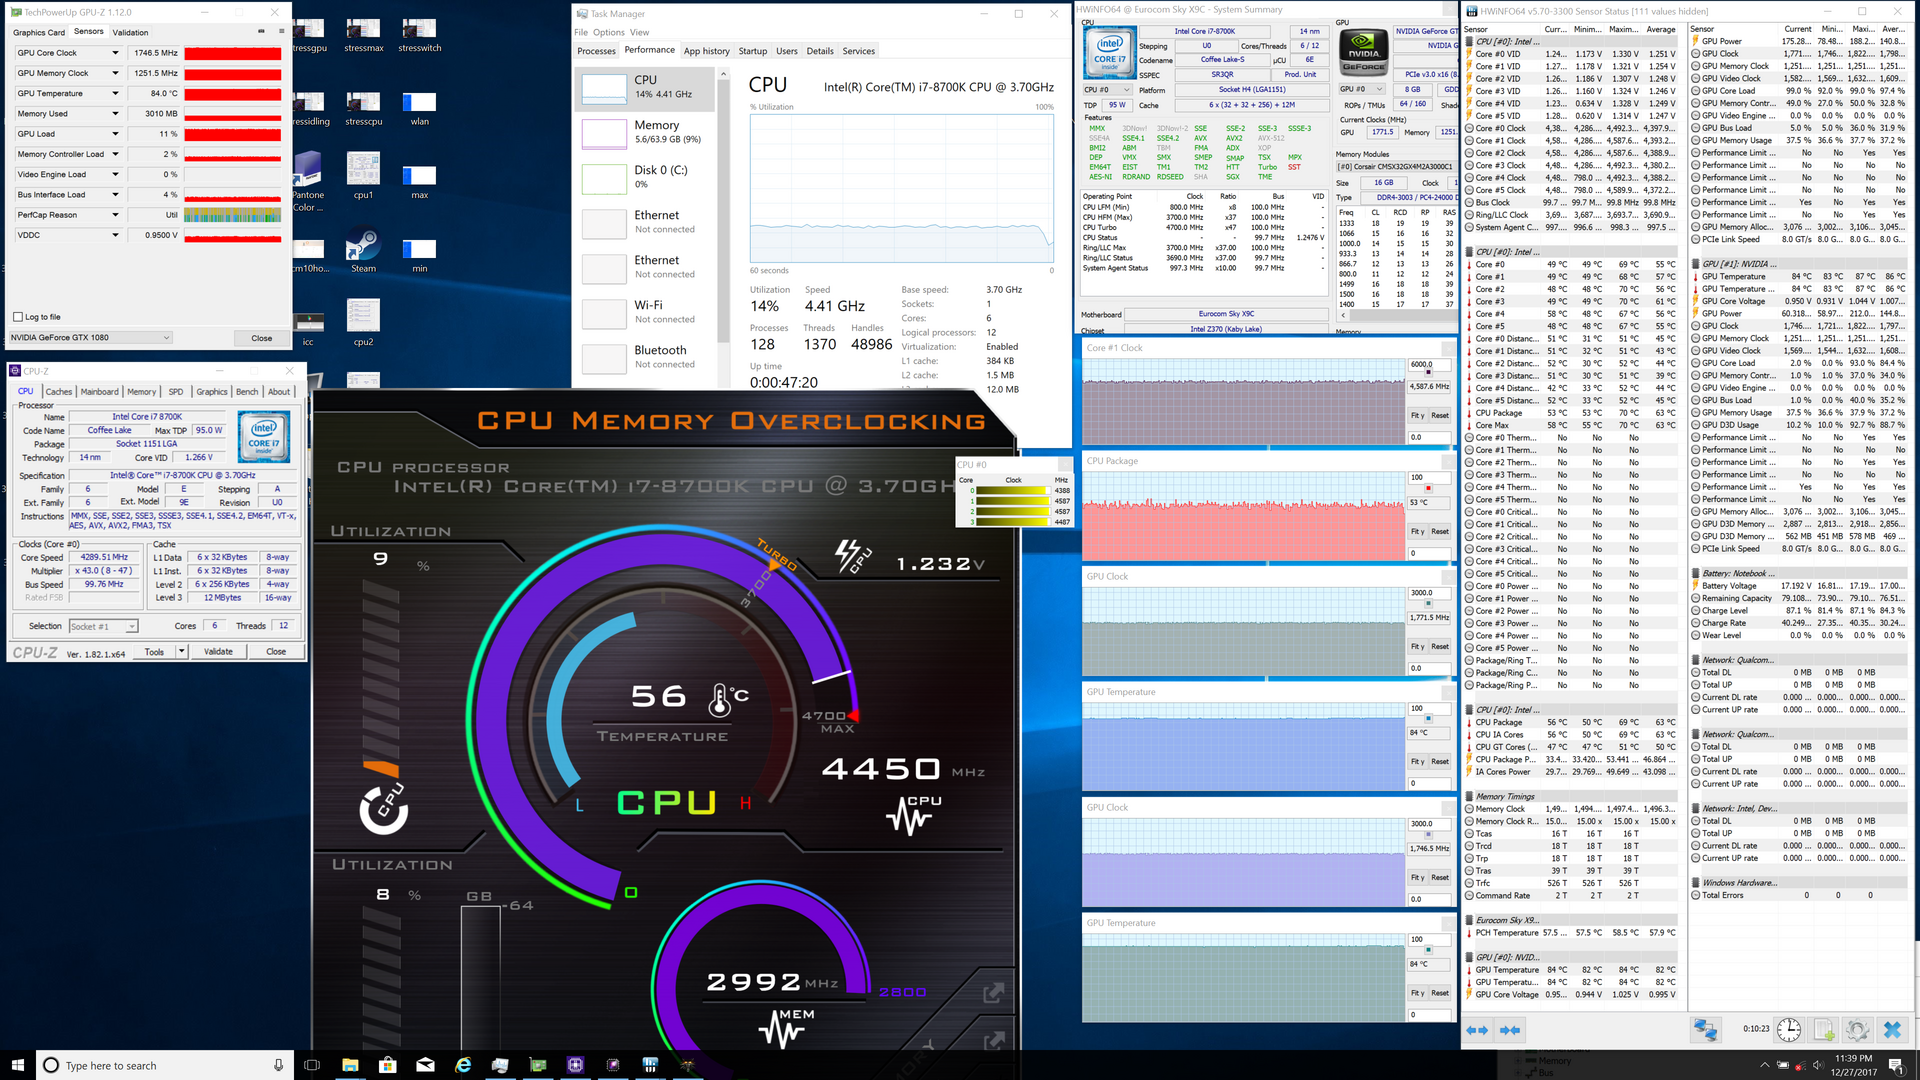
Running Witcher 3 is more representative of real-world stress. When under these conditions, the CPU drops to as low as 53 C whereas both GPU cores remain steady at 84 C. Frame rates fluctuate more wildly over time as shown by our graph below as is expected from any SLI system.
Running on battery power will limit both CPU and GPU performances. A Fire Strike run on batteries returns Physics and Graphics scores of 9512 and 6265 points, respectively, compared to 18221 and 40582 points when on mains. The CPU in particular can be observed operating at just 2 GHz when on batteries and the frame rate limiter is automatically engaged.
| CPU Clock (GHz) | GPU Clock (MHz) | Average CPU Temperature (°C) | Average GPU Temperature (°C) | |
| Prime95 Stress | 4.0 | -- | 87 | 55 |
| FurMark Stress | -- | ~1607 | 65 | 86 - 90 |
| Prime95 + FurMark Stress | 3.7 | ~1557 | 80 | 86 - 90 |
| Witcher 3 Stress | 4.6 | ~1772 | 53 | 84 |
Emissions
System Noise
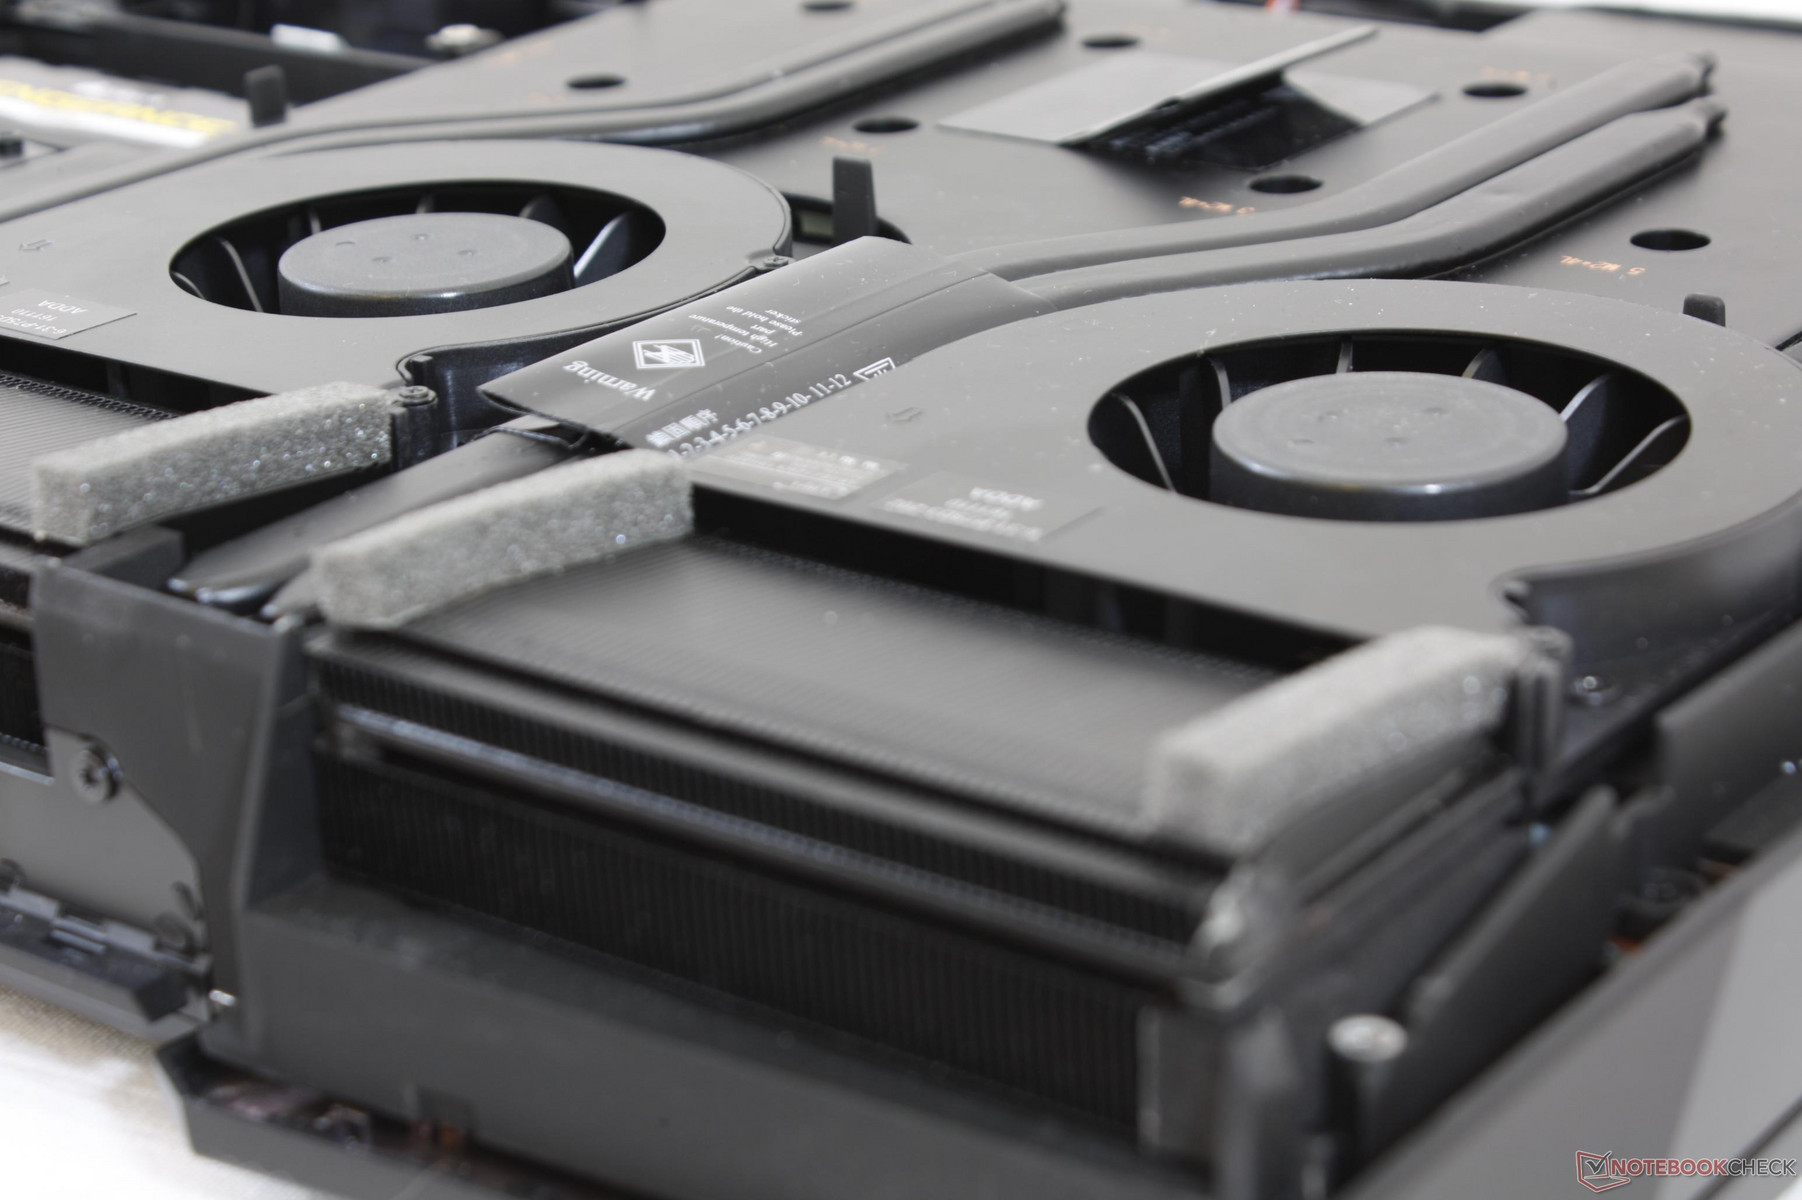
The cooling solution consists of three identical ~60 mm fans and 8 heat pipes between the CPU and two GPUs. Thinner and lighter gaming notebooks like the MSI GS73VR or Aorus x7 tend to utilize as few as 2 to 4 heat pipes and smaller fans in comparison. The arrangement of the heat pipes is slightly different from the last Clevo P870KM-GS we had checked out earlier in the year.
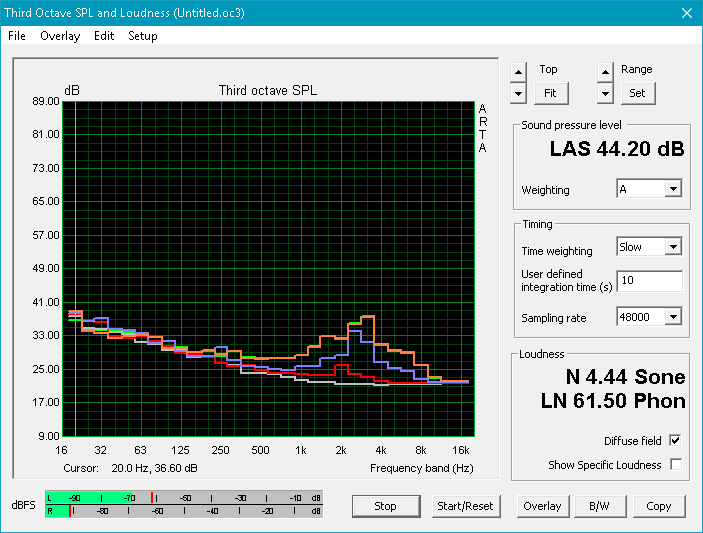
Measuring fan noise is a bit more complicated on the Sky X9C since its high capacity AC adapter is actively cooled by twin ~35 mm fans. The noise from the adapter alone is already quite loud at 36.3 dB(A) when situated 15 cm in front of the microphone against a background of 28.4 dB(A). While the adapter fans lead to cooler surface temperatures as shown in our next section, its loud operating noise is the price to pay. The fans automatically shutdown when the notebook is off or in Sleep mode.
We are able to measure a system fan noise of 34.2 dB(A) when the notebook is set to the Power Saver profile and with Quiet mode active. This minimum is not unlike both the Alienware 17 R4 and Aorus X9 when under similar conditions. The fans remain relatively stable under these conditions and do not pulsate during video playback or word processing loads.
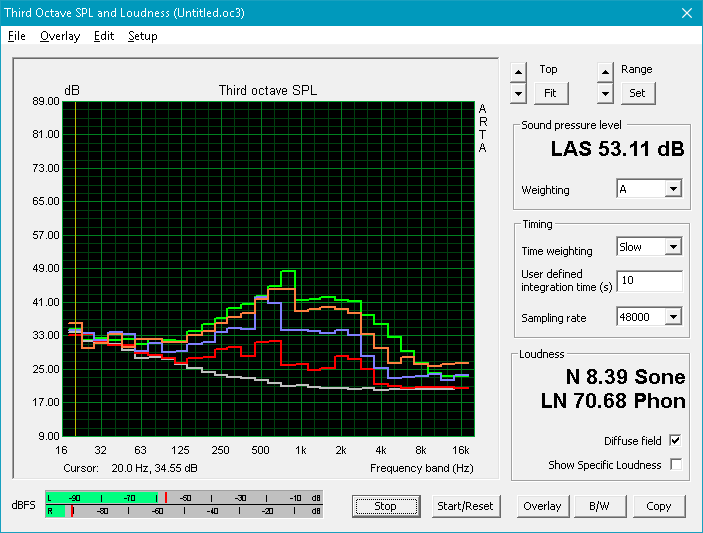
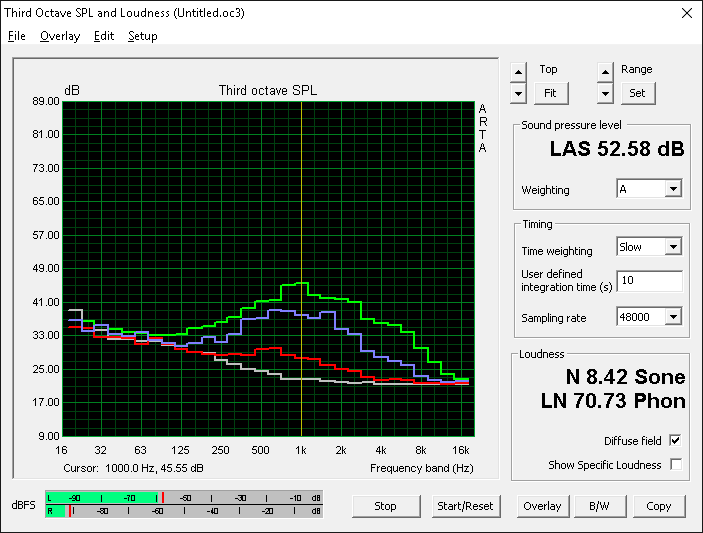
When the High Performance profile is active, the notebook can be as loud as 39 dB(A) simply from idling on desktop. In comparison, ultrabooks like the Samsung Notebook 9 top out at 38 dB(A) when subjected to extreme loads to be quieter than an idling Sky X9C. Pulsing becomes more frequent as fan noise can jump from 39 dB(A) to 44.6 dB(A) when launching applications. Thankfully, the fans remain constant at 54 dB(A) when running Witcher 3 to be very close to other enthusiast gaming notebooks like the GT83VR, Aorus X9, or Razer Blade Pro under similar conditions. On one hand, this can be viewed as an impressive feat since the Sky X9C is significantly more powerful than both the Aorus X9 and Blade Pro without necessarily running louder, but there's still no denying that these are all very loud notebooks. Headphones are essentially required to drown out the noise when gaming.
The sound frequency of the fans is lower-pitched compared to the Razer Blade Pro or GS73VR since the Sky X9C can afford comparatively thicker and larger fans with fewer fins. Microphone measurements show a frequency peak of about 900 Hz on our Eurocom compared to ~3.5 kHz on the GS73VR to be less conspicuous given the same decibel reading.
Coil whine or electronic noise was audible on both our review notebook and AC adapter during the first few hours of testing. After running more benchmarks to "break in" our system, however, the electronic noise ceased. Nonetheless, it's possible that it may pop up again during the lifespan of the notebook.
Noise level
| Idle |
| 34.2 / 39.6 / 39.6 dB(A) |
| Load |
| 48.5 / 56.5 dB(A) |
 | ||
30 dB silent 40 dB(A) audible 50 dB(A) loud |
||
min: | ||
| Eurocom Sky X9C GeForce GTX 1080 SLI (Laptop), i7-8700K, 2x Samsung SSD 960 Pro 1TB m.2 NVMe (RAID 0) | Alienware 17 R4 GeForce GTX 1080 Mobile, i7-7820HK, SK Hynix PC300 NVMe 512 GB | MSI GT83VR 7RF-206 Titan SLI GeForce GTX 1080 SLI (Laptop), i7-7920HQ, 2x Toshiba NVMe THNSN5256GPU7 (RAID 0) | Eurocom Sky X7E2 GeForce GTX 1080 Mobile, 6700K, Samsung SM951 MZVPV512HDGL m.2 PCI-e | Aorus X9 GeForce GTX 1070 SLI (Laptop), i7-7820HK, Samsung SM961 MZVKW512HMJP m.2 PCI-e | Razer Blade Pro 2017 GeForce GTX 1080 Mobile, i7-7820HK, 2x Samsung SSD PM951 MZVLV256HCHP (RAID 0) | |
|---|---|---|---|---|---|---|
| Noise | 4% | -3% | 8% | -3% | 7% | |
| off / environment * (dB) | 28.4 | 28.2 1% | 31 -9% | 28.9 -2% | 30 -6% | 30 -6% |
| Idle Minimum * (dB) | 34.2 | 35.6 -4% | 35 -2% | 28.9 15% | 35 -2% | 30 12% |
| Idle Average * (dB) | 39.6 | 35.6 10% | 38 4% | 30.6 23% | 37 7% | 31 22% |
| Idle Maximum * (dB) | 39.6 | 35.7 10% | 41 -4% | 35.7 10% | 43 -9% | 33 17% |
| Load Average * (dB) | 48.5 | 50.2 -4% | 52 -7% | 49 -1% | 49 -1% | 43 11% |
| Witcher 3 ultra * (dB) | 54 | 50.2 7% | 53 2% | 56 -4% | 55 -2% | |
| Load Maximum * (dB) | 56.5 | 50.2 11% | 59 -4% | 55 3% | 60 -6% | 58 -3% |
* ... smaller is better
Temperature
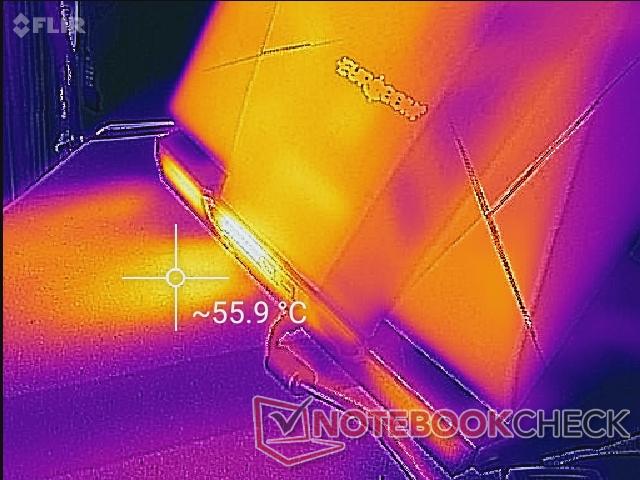
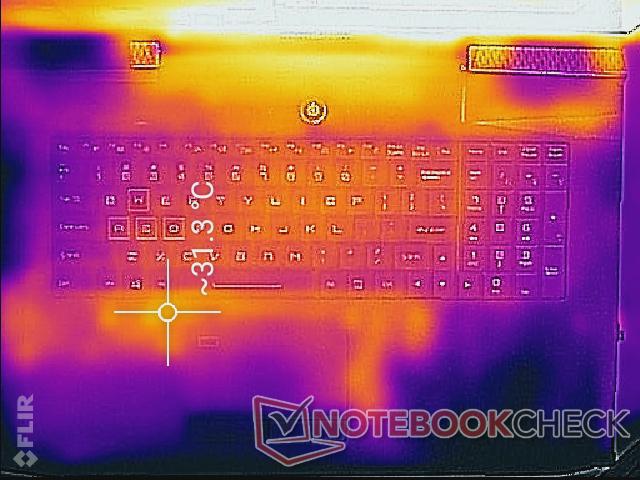
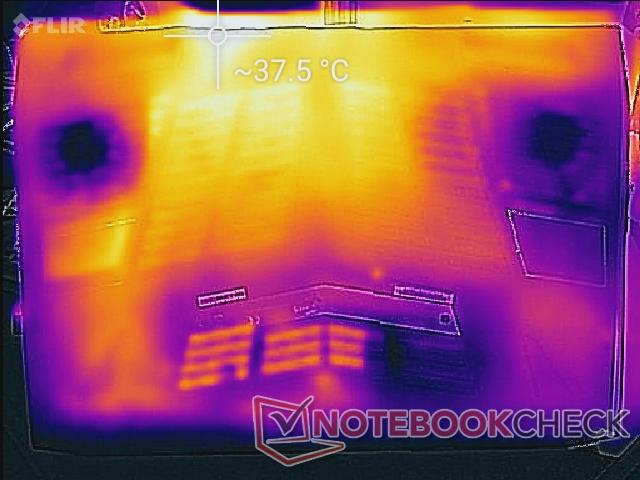
Surface temperatures when idling are cool around the palm rests before becoming steadily warmer towards the center quadrants. The range can be as wide as 22.8 C on the palm rests to 37 C on the bottom rear of the notebook simply from standing idle. More extreme loads like gaming will see temperatures as high as 45 C or 48 C near the rear ventilation. Thankfully, the keyboard keys and palm rests remain relatively cool for comfortable operation no matter the onscreen workload. The Aorus X9 runs much warmer across both its front and back with temperatures as high as the 55 to 60 C range.
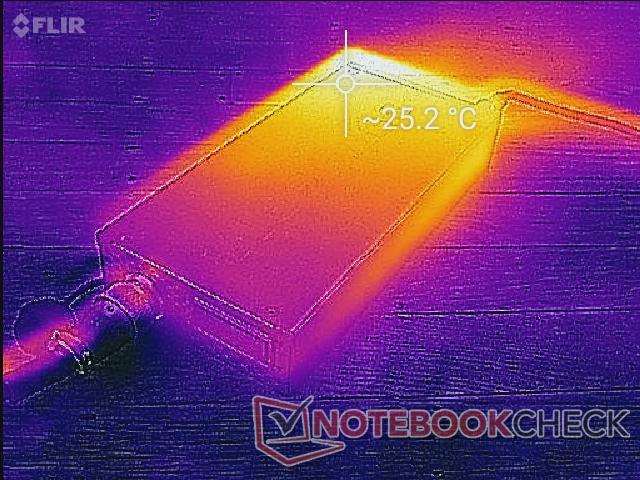
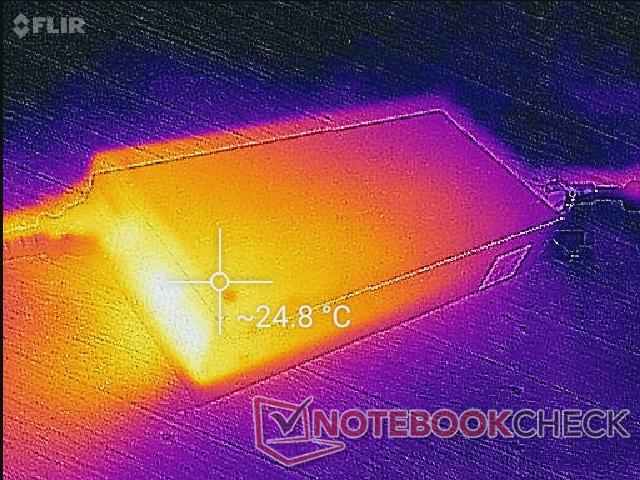
The redesigned AC adapter runs cooler than we had anticipated at just 25 C when under load. In comparison, the AC adapters of most gaming notebooks can be 40 C or warmer under load with the Razer Blade Pro adapter in particular reaching as high as 69 C.
It's worth noting that surface temperature readings on our Sky X9C are significantly cooler than on our Schenker XMG U727 with the same GTX 1080 SLI setup despite running the same Witcher 3 load for over an hour. It's possible that differences in environmental temperature may be the cause for the discrepancy.
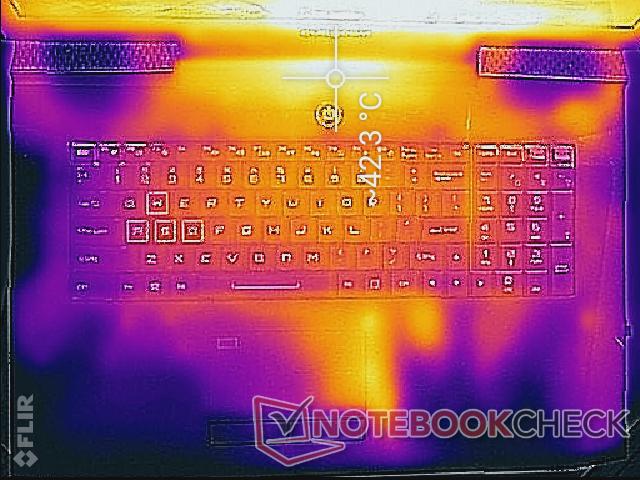
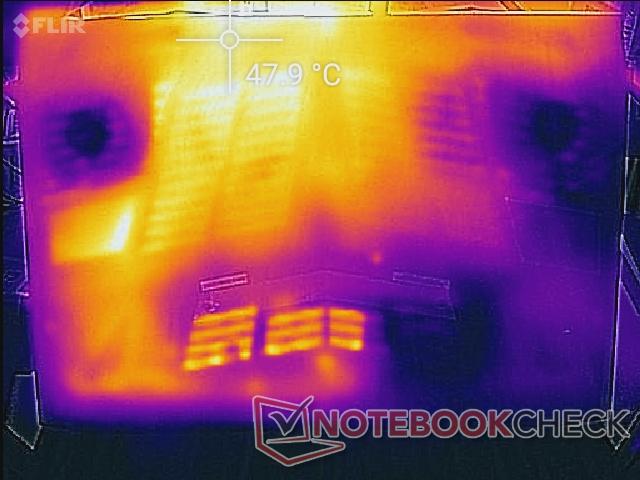
(±) The maximum temperature on the upper side is 44.6 °C / 112 F, compared to the average of 40.4 °C / 105 F, ranging from 21.2 to 68.8 °C for the class Gaming.
(-) The bottom heats up to a maximum of 48 °C / 118 F, compared to the average of 43.2 °C / 110 F
(+) In idle usage, the average temperature for the upper side is 27.9 °C / 82 F, compared to the device average of 33.9 °C / 93 F.
(+) Playing The Witcher 3, the average temperature for the upper side is 30.6 °C / 87 F, compared to the device average of 33.9 °C / 93 F.
(±) The palmrests and touchpad can get very hot to the touch with a maximum of 38.4 °C / 101.1 F.
(-) The average temperature of the palmrest area of similar devices was 28.8 °C / 83.8 F (-9.6 °C / -17.3 F).
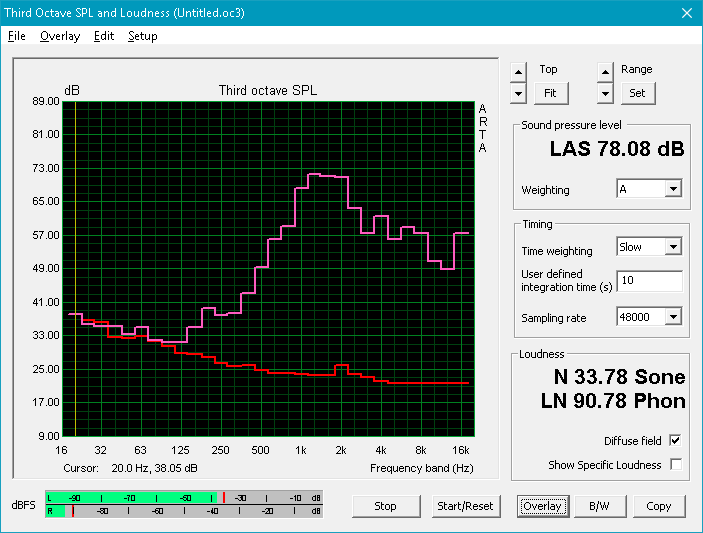
Speakers

Sound quality from the 2 W stereo speakers and 2.5 W subwoofer is excellent and louder than on the Sky X7E2. Its pink graph is broader than on the MSI GS73VR to indicate a wider range of frequencies and stronger bass reproduction for a more balanced audio experience. The palm rests and keyboard surface will reverberate slightly even when at the 50 percent volume mark. There are otherwise no heavy imbalances between treble and bass no matter the volume setting.
External 7.1, SPDIF, and Line-in options are supported. There is no dedicated ESS Sabre DAC for higher-end headphones unlike on the Eurocom Sky X7E2 or the MSI GS63/73VR series.
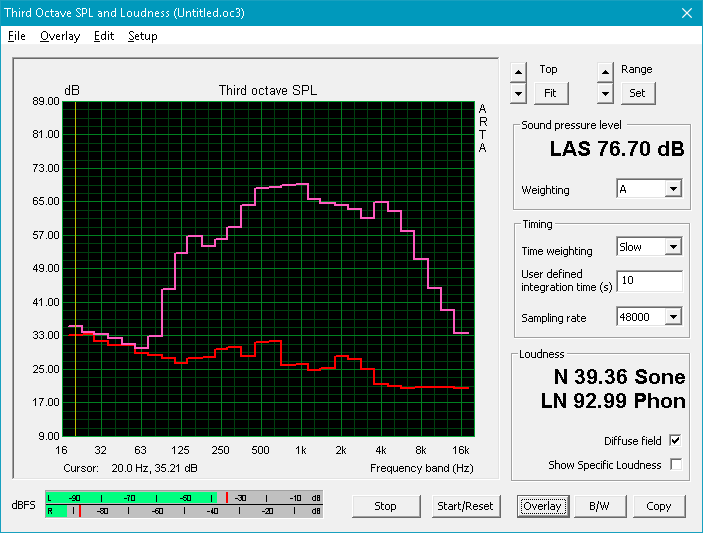
Eurocom Sky X9C audio analysis
(-) | not very loud speakers (69.1 dB)
Bass 100 - 315 Hz
(±) | reduced bass - on average 7.2% lower than median
(±) | linearity of bass is average (14.7% delta to prev. frequency)
Mids 400 - 2000 Hz
(±) | higher mids - on average 5.6% higher than median
(+) | mids are linear (5.5% delta to prev. frequency)
Highs 2 - 16 kHz
(±) | reduced highs - on average 5.3% lower than median
(±) | linearity of highs is average (11.4% delta to prev. frequency)
Overall 100 - 16.000 Hz
(±) | linearity of overall sound is average (24.4% difference to median)
Compared to same class
» 88% of all tested devices in this class were better, 3% similar, 8% worse
» The best had a delta of 6%, average was 18%, worst was 132%
Compared to all devices tested
» 74% of all tested devices were better, 6% similar, 20% worse
» The best had a delta of 4%, average was 24%, worst was 134%
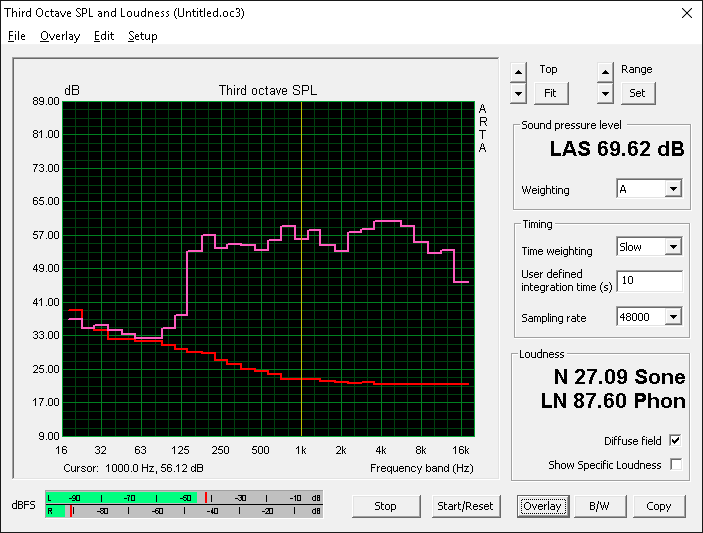
Apple MacBook 12 (Early 2016) 1.1 GHz audio analysis
(+) | speakers can play relatively loud (83.6 dB)
Bass 100 - 315 Hz
(±) | reduced bass - on average 11.3% lower than median
(±) | linearity of bass is average (14.2% delta to prev. frequency)
Mids 400 - 2000 Hz
(+) | balanced mids - only 2.4% away from median
(+) | mids are linear (5.5% delta to prev. frequency)
Highs 2 - 16 kHz
(+) | balanced highs - only 2% away from median
(+) | highs are linear (4.5% delta to prev. frequency)
Overall 100 - 16.000 Hz
(+) | overall sound is linear (10.2% difference to median)
Compared to same class
» 7% of all tested devices in this class were better, 2% similar, 91% worse
» The best had a delta of 5%, average was 18%, worst was 53%
Compared to all devices tested
» 5% of all tested devices were better, 1% similar, 94% worse
» The best had a delta of 4%, average was 24%, worst was 134%
Frequency Comparison (Checkbox selectable!)
Graph 1: Pink Noise 100% Vol.; Graph 2: Audio off
Energy Management
Power Consumption
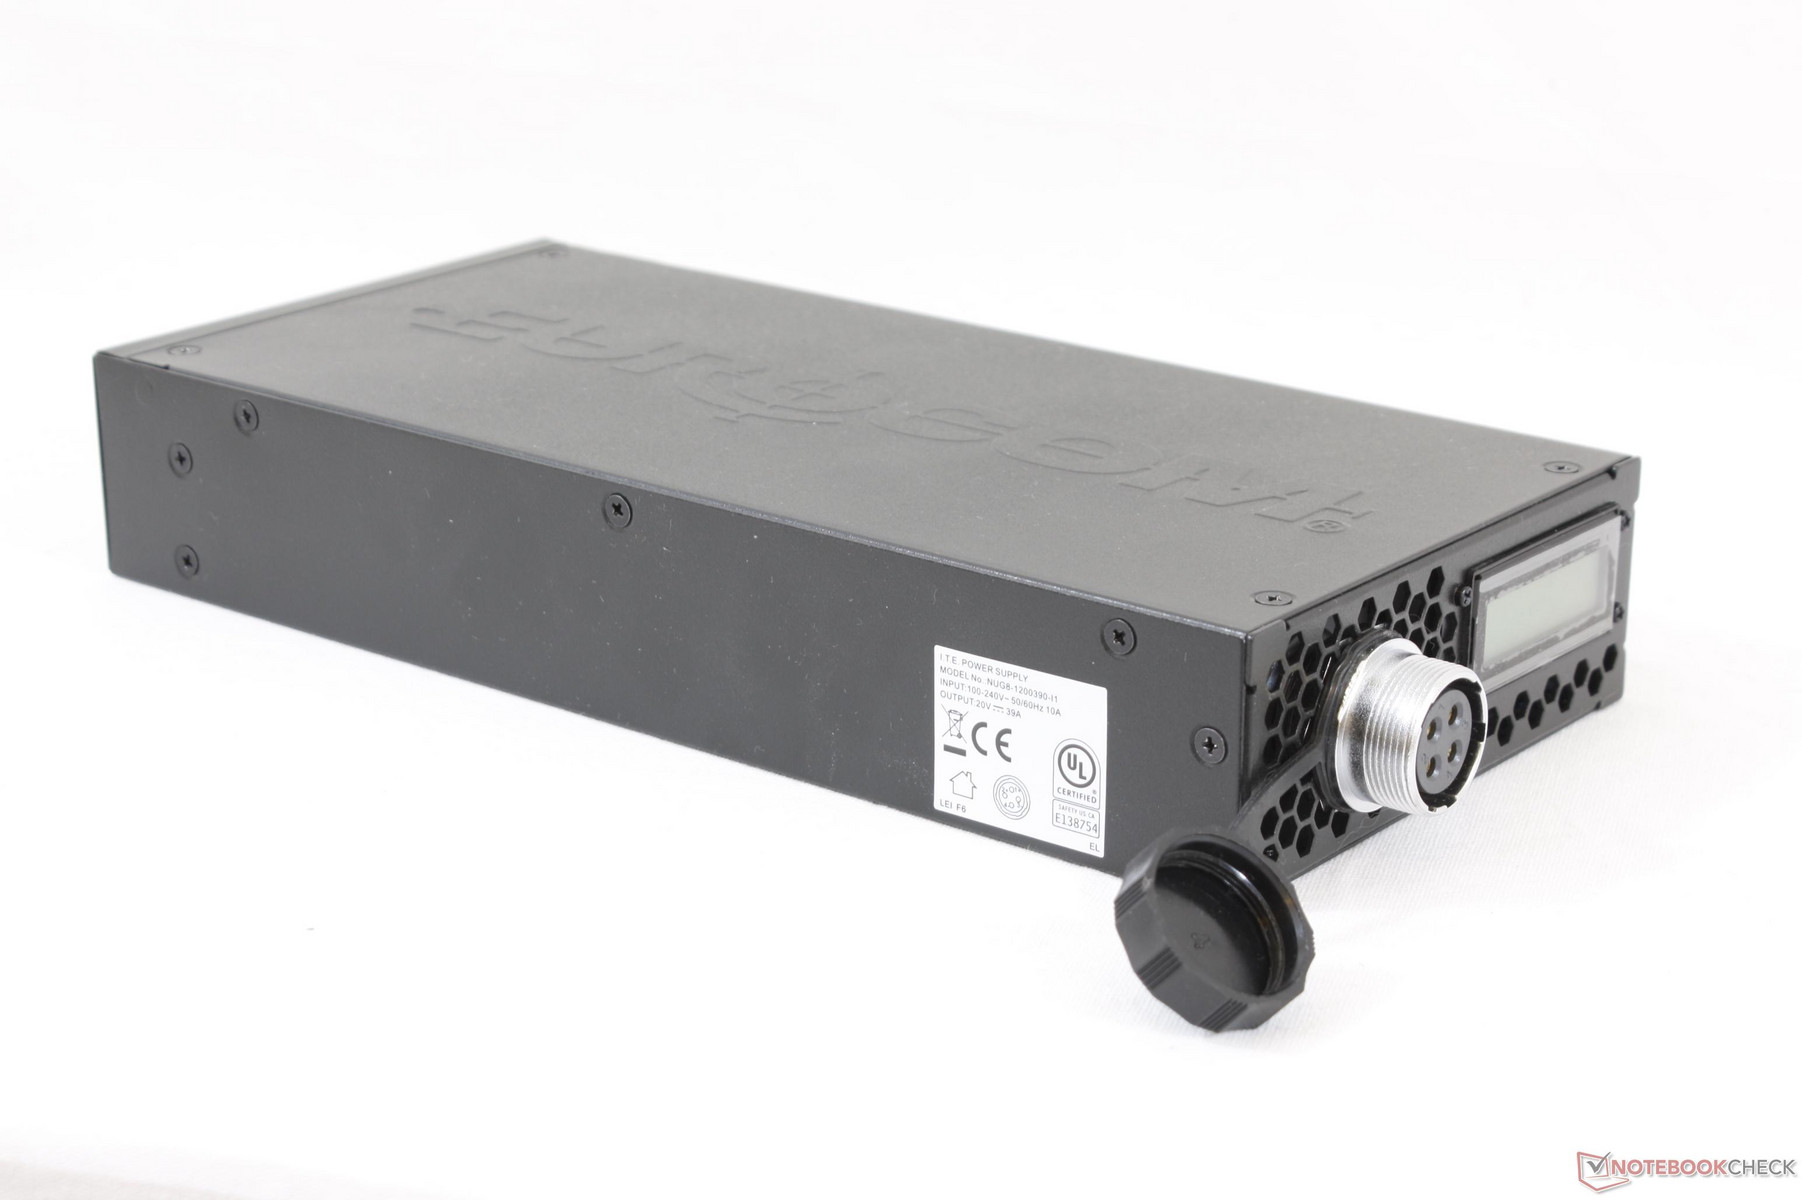
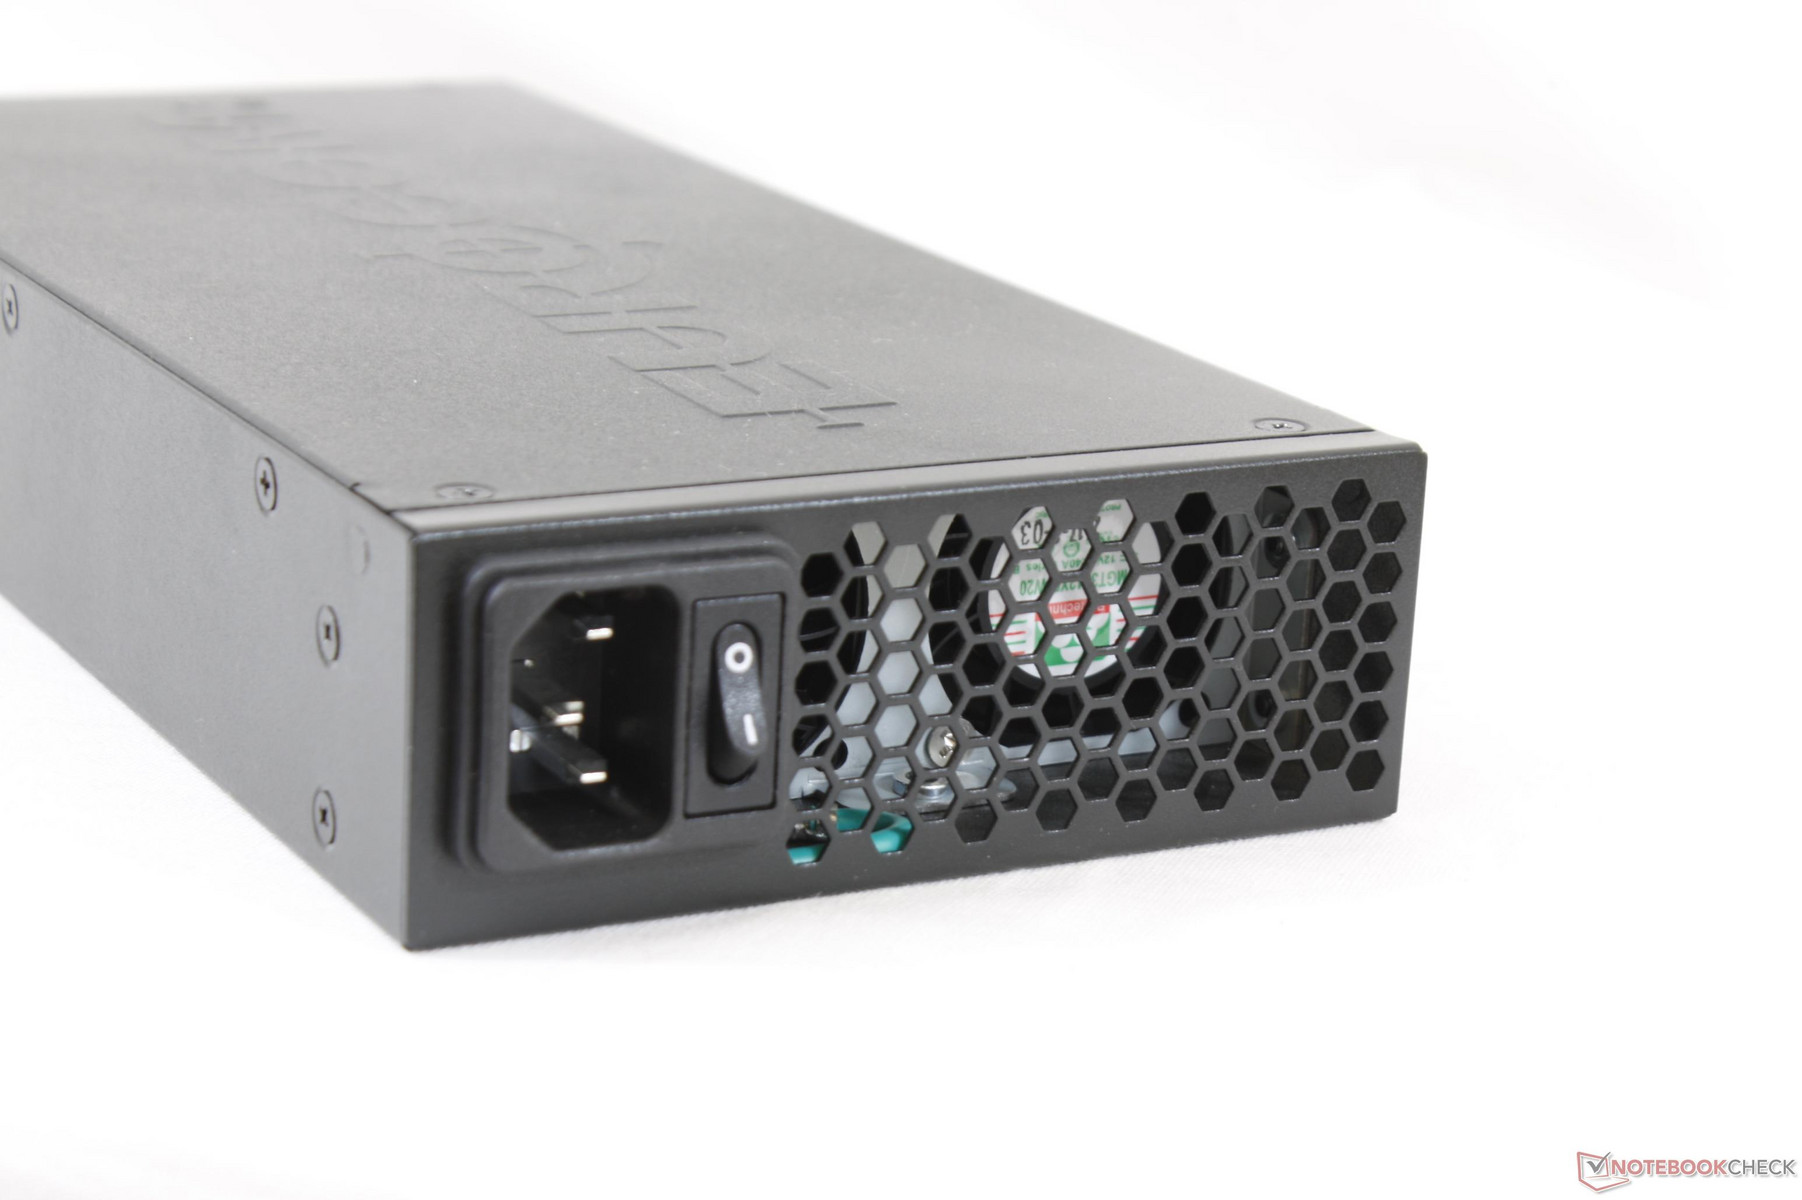
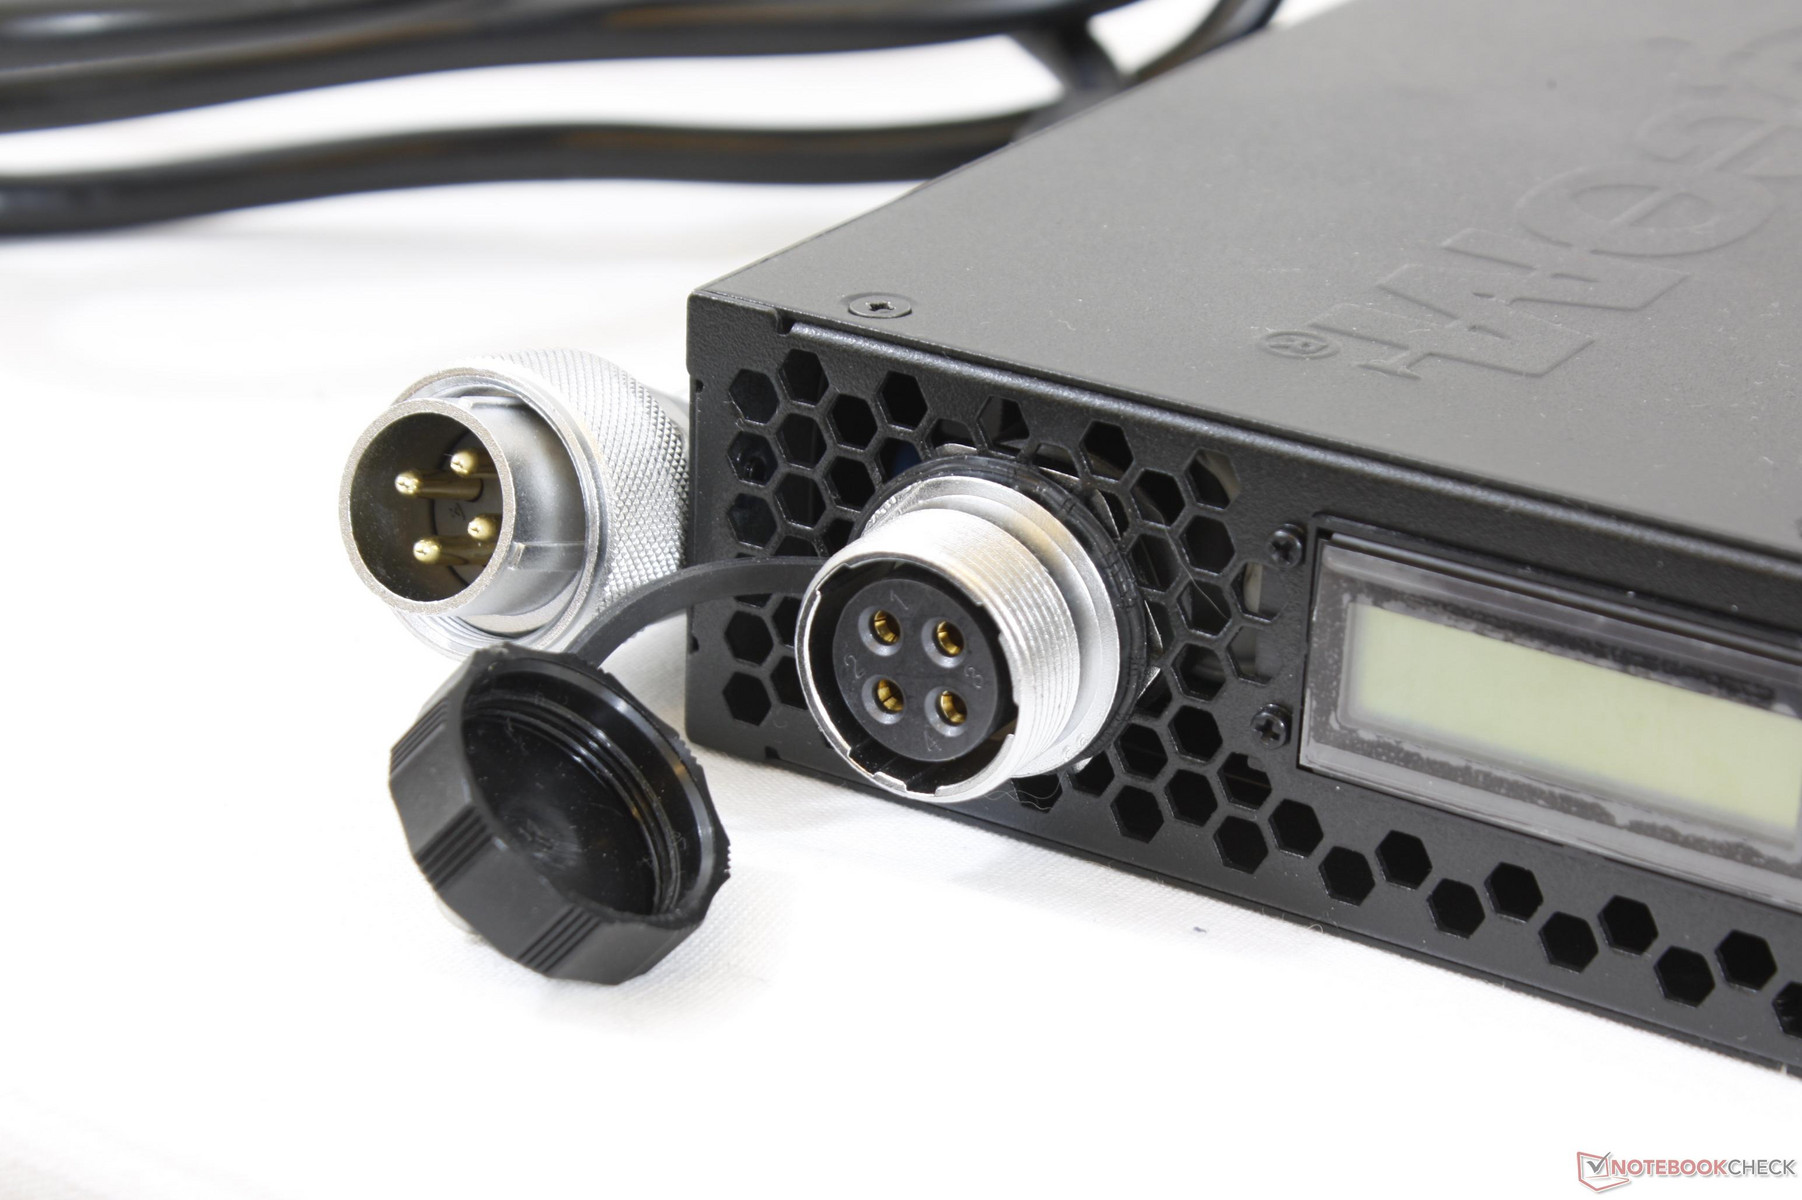
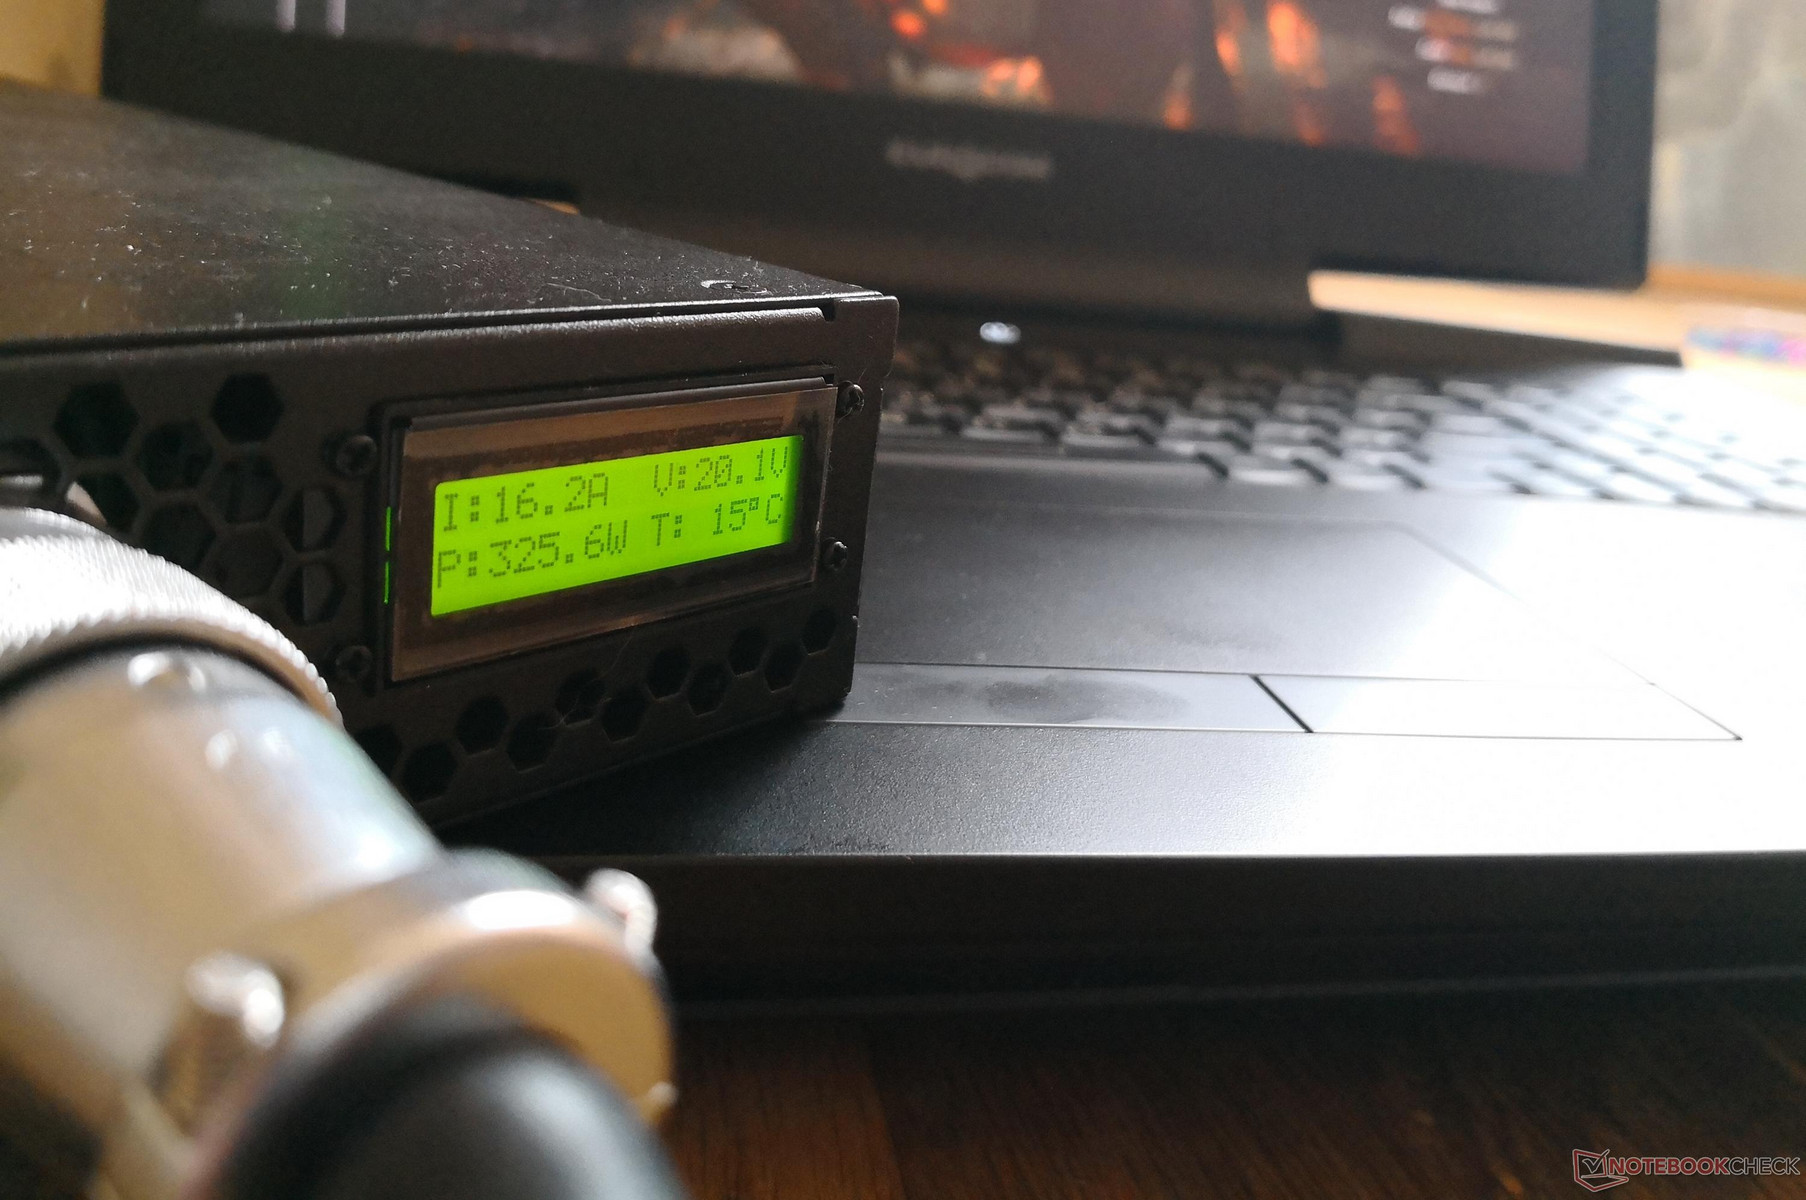
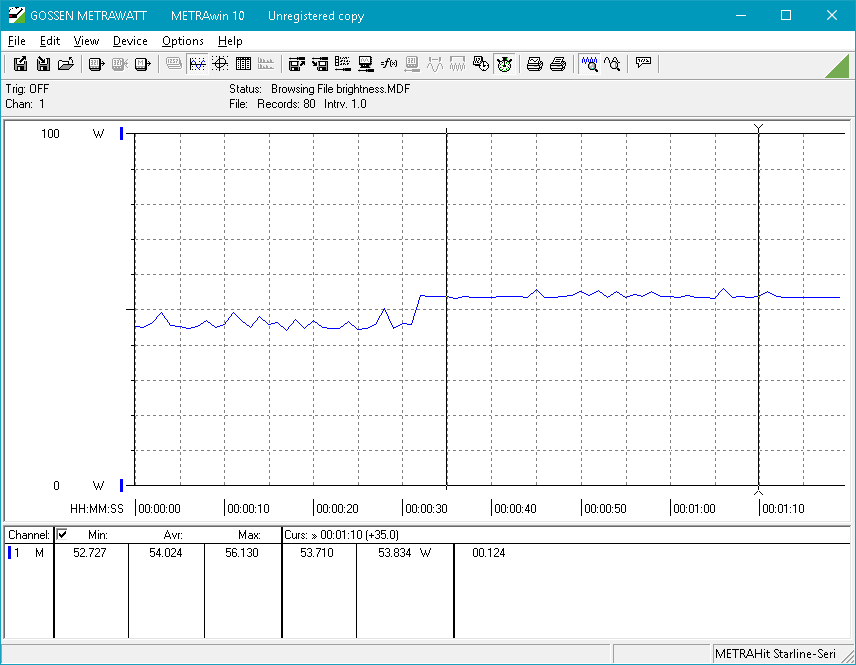
The most powerful notebook available demands the most powerful AC adapter to go along with it. Introduced earlier this year, our Sky X9C configuration appropriately ships with a 780 W (!) AC adapter weighing about 1.8 kg or as much as a 14-inch Lenovo Yoga 520. The adapter includes a power switch on the back not unlike most PSUs for desktops and a real-time readout for current (I), Voltage (V), and Power (W). Unfortunately, there are no built-in USB ports like on the AC adapter for the Aorus X5 or any data recording features.
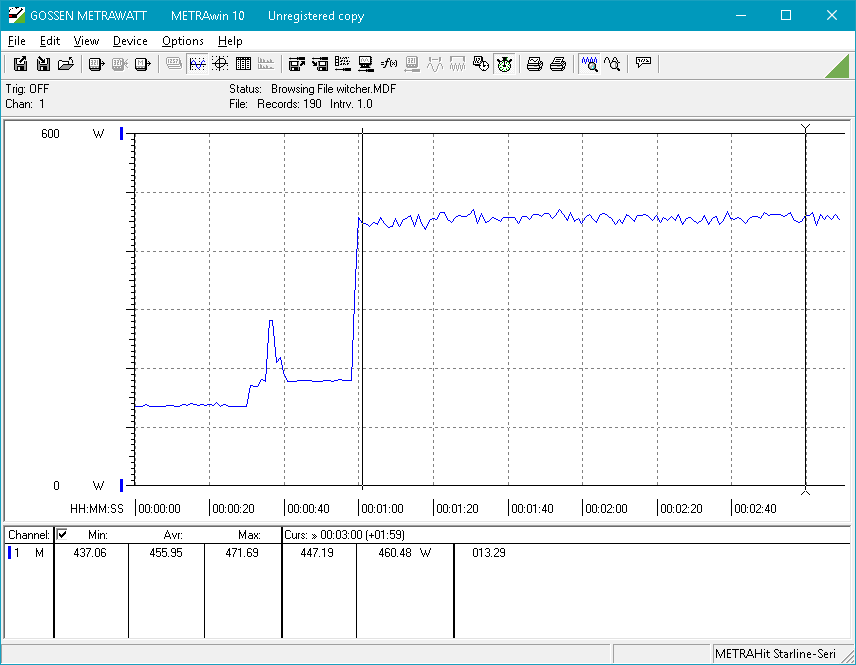
Idling on desktop will draw anywhere from 54 W to 57 W depending on the brightness setting while medium load with 3DMark06 will draw about 184 W. Running Witcher 3 will demand 455 W compared to 380 W on the MSI GT83VR with the same GTX 1080 SLI graphics or 180 W on the Alienware 17 R4 with a single GTX 1080 GPU. A significant differentiating factor between our Sky X9C and the GT83VR is the 95 W i7-8700K desktop CPU compared to the 45 W i7-7920HQ CPU in the MSI designed specifically for laptops.
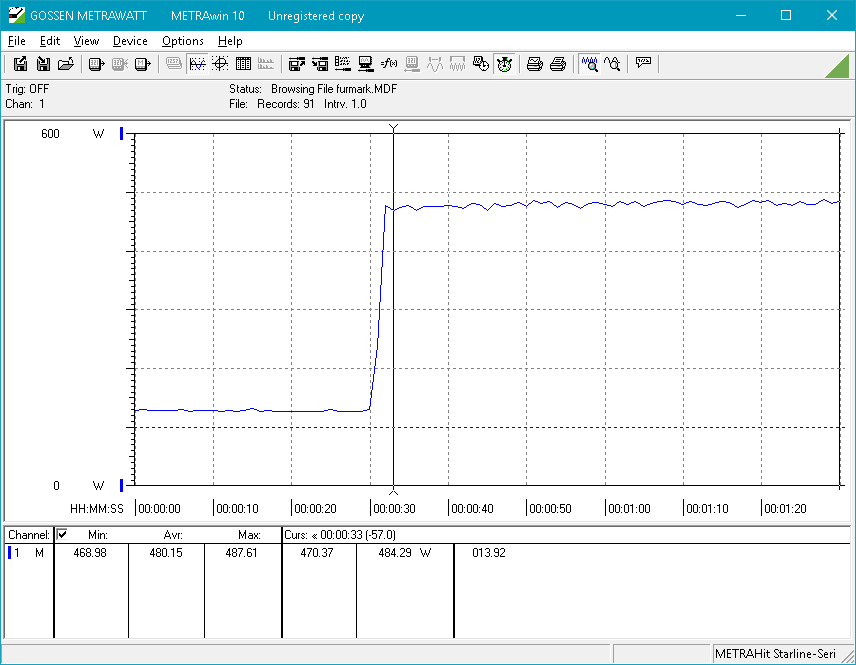
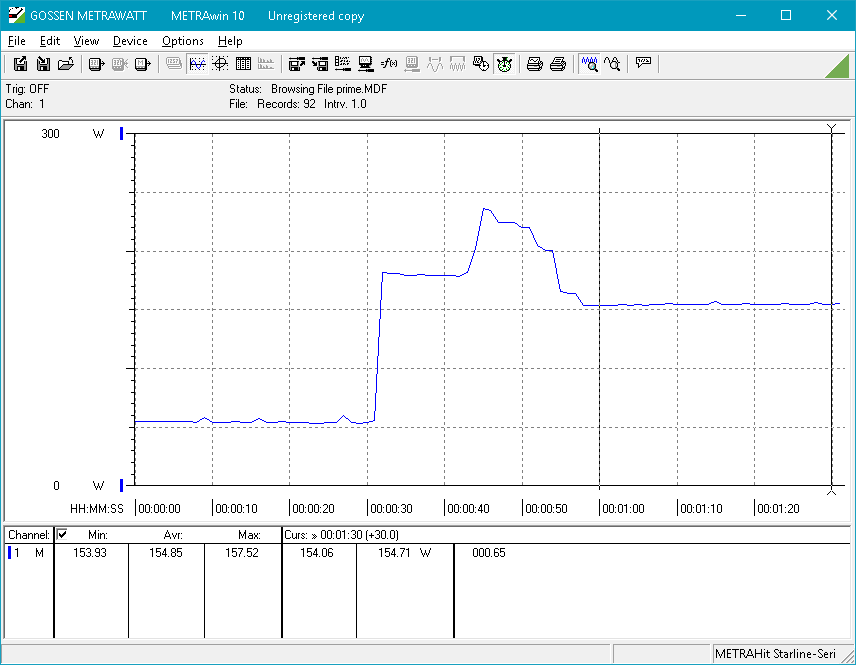
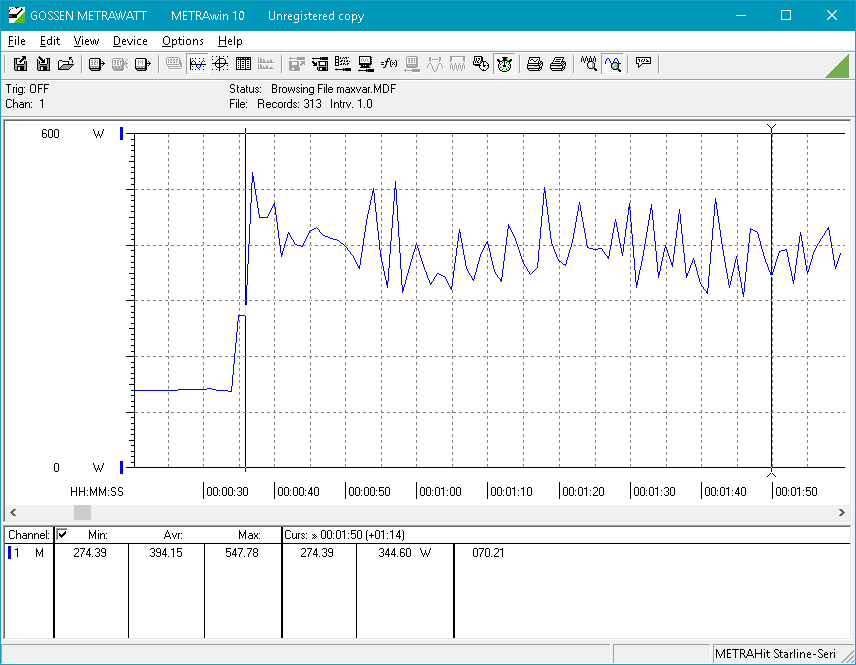
Maximum load with Prime95 and FurMark running simultaneously yields unexpected results. Power consumption is not steady over time as shown by our graphs below where readings would constantly fluctuate from values as low as 304 W to as high as 549 W. In comparison, consumption readings would become much more steady when running Prime95, FurMark, or Witcher 3 separately. This suggests that there may be some power management issues between the CPU and GPU when both are stressed to their respective extremes simultaneously. In fact, average consumption is significantly higher when running Witcher 3 compared to running both Prime95 and FurMark together while the opposite is true for nearly all other gaming notebooks.
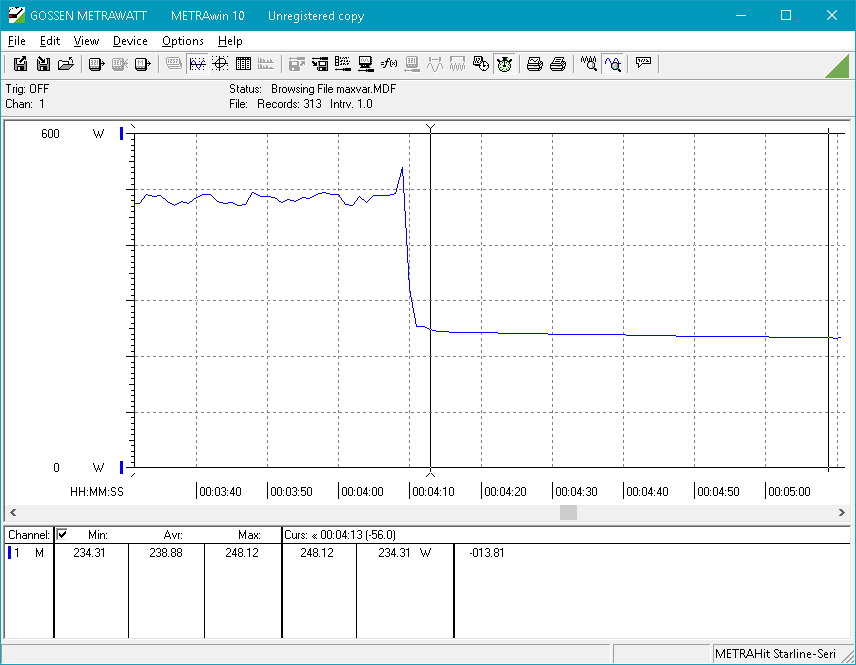
Furthermore, the real-time readings from the AC adapter do not appear to be very accurate and they would often underestimate actual results. When running Witcher 3, for example, our independent readings with Metrahit are steady at about 458 W while the adapter would occasionally record 326 W with jumps to the 400+ W range. We're unsure what is going on here, but we suggest that users double-check with their own independent instruments if accurate power consumption is of concern.
| Off / Standby | |
| Idle | |
| Load |
|
Key:
min: | |
| Eurocom Sky X9C i7-8700K, GeForce GTX 1080 SLI (Laptop), 2x Samsung SSD 960 Pro 1TB m.2 NVMe (RAID 0), IPS, 3840x2160, 17.3" | Alienware 17 R4 i7-7820HK, GeForce GTX 1080 Mobile, SK Hynix PC300 NVMe 512 GB, TN LED, 2560x1440, 17.3" | MSI GT83VR 7RF-206 Titan SLI i7-7920HQ, GeForce GTX 1080 SLI (Laptop), 2x Toshiba NVMe THNSN5256GPU7 (RAID 0), IPS, 1920x1080, 18.4" | Aorus X9 i7-7820HK, GeForce GTX 1070 SLI (Laptop), Samsung SM961 MZVKW512HMJP m.2 PCI-e, TN, 2560x1440, 17.3" | MSI GT80-2QES32SR311BW 4980HQ, GeForce GTX 980M SLI, 4x Toshiba HG6 THNSNJ256G8NU (RAID 0), Wide View, Super PLS, 1920x1080, 18.4" | |
|---|---|---|---|---|---|
| Power Consumption | 34% | -9% | 28% | 19% | |
| Idle Minimum * (Watt) | 54.7 | 37.5 31% | 45 18% | 29 47% | 34.3 37% |
| Idle Average * (Watt) | 55.7 | 37.6 32% | 54 3% | 35 37% | 41.9 25% |
| Idle Maximum * (Watt) | 56.8 | 37.6 34% | 62 -9% | 42 26% | 49.3 13% |
| Load Average * (Watt) | 183.7 | 122.4 33% | 178 3% | 140 24% | 140.2 24% |
| Witcher 3 ultra * (Watt) | 454.8 | 180.3 60% | 380 16% | 295 35% | |
| Load Maximum * (Watt) | 321.8 | 277.4 14% | 586 -82% | 334 -4% | 328.6 -2% |
* ... smaller is better
Battery Life
Unsurprisingly, runtimes are very poor. Owners would be lucky to get 1.5 hours out of the machine even with SLI disabled and on the lowest brightness setting with the Power Saver profile active. The MSI GT83VR can pull in closer to 2 hours of WLAN runtime despite its larger screen size and smaller battery due in part to its less demanding HQ-class processor.
Charging from empty to full capacity will take upwards of 2.5 hours compared to 1.5 to 2 hours on most Ultrabooks and less powerful gaming notebooks. We were hoping that the specialized AC adapter would have meant faster charging potential, but that is unfortunately not the case.
| Eurocom Sky X9C i7-8700K, GeForce GTX 1080 SLI (Laptop), 89 Wh | Alienware 17 R4 i7-7820HK, GeForce GTX 1080 Mobile, 99 Wh | MSI GT83VR 7RF-206 Titan SLI i7-7920HQ, GeForce GTX 1080 SLI (Laptop), 75.24 Wh | Aorus X9 i7-7820HK, GeForce GTX 1070 SLI (Laptop), 94.24 Wh | Eurocom Sky X7E2 6700K, GeForce GTX 1080 Mobile, 89 Wh | Asus GL702ZC-GC104T R7 1700, Radeon RX 580 (Laptop), 76 Wh | |
|---|---|---|---|---|---|---|
| Battery runtime | 137% | 50% | 75% | 57% | 16% | |
| Reader / Idle (h) | 1.4 | 4.6 229% | 2.4 71% | 2.9 107% | 2.3 64% | 1.7 21% |
| WiFi v1.3 (h) | 1.3 | 3 131% | 2 54% | 2.2 69% | 1.7 31% | 1.5 15% |
| Load (h) | 0.8 | 1.2 50% | 1 25% | 1.2 50% | 1.4 75% | 0.9 13% |
Pros
Cons
Verdict
We've made our thoughts on SLI clear in the past. For gaming purposes, SLI has always been a mixed bag. The advent of DX12 in particular has made SLI even more difficult to recommend as the API now relegates multi-GPU optimization to the hands of the individual developers rather than Nvidia. Reliable SLI support is becoming very spotty as a result and the tepid benchmark numbers reinforce this notion. Users who want SLI in a notebook should have very specific reasons for owning the technology because the extra GPU can be worse than paperweight in many cases.
With that out of the way, the Eurocom Sky X9C has swiftly topped most of the benchmarks in our database due to its extreme configuration and Core i7-8700K. Its modular components and wide range of supported hardware features continue to be the highlight of owning a Eurocom over alternatives from more well-known manufacturers.
The same disadvantages remain as with nearly all Eurocom notebooks we've tested. The very dense performance profile entails loud fan noise (54 dB(A)), very warm core temperatures (>85 C), heavy weight (5.6 kg), and a short battery life that may as well be measured in minutes. While weight and runtimes aren't huge factors for gaming notebooks, the hot core temperatures significantly limit overclocking potential and the loud noise is as much of an enemy as any onscreen obstacle when gaming. We can't help but to wonder how this system could have performed by removing SLI and doubling down on the number of heat pipes for both the CPU and GPU. We're willing to bet that the resulting lower temperatures, quieter fans, higher Boost clock rates, and wider overclocking potential would lead to better gaming performance even if the synthetic benchmark scores would be lower than a SLI configuration.
A few aspects of the chassis and software seem stuck in the past. The lack of individually-lit RGB keys is becoming more difficult to forgive and the inner plastic bezel of the display still feels cheap compared to an Alienware design. The Control Center and overclocking utilities are more focused on creating an attractive "Fisher-Price" GUI with large font sizes instead of a clean interface with easily accessible options that aren't buried in multiple windows. Features that are actually more useful to gamers like data recording, video recording, direct RPM adjustments/readings for each fan, and performance overlays are still missing in the pre-installed software.
For the best overall gaming experience, users are better off configuring the Sky X9C with a single GTX 1080 and then overclocking from there. More budget-conscious gamers can get essentially the same gaming performance from a less demanding 45 W HQ-class processor since most titles are not bound by the CPU. Make sure to have a good pair of headphones when gaming!
Eurocom Sky X9C
- 12/29/2017 v6 (old)
Allen Ngo
