MSI GT83VR 7RF (7920HQ, GTX 1080 SLI, Full HD) Laptop Review

For the original German review, see here.
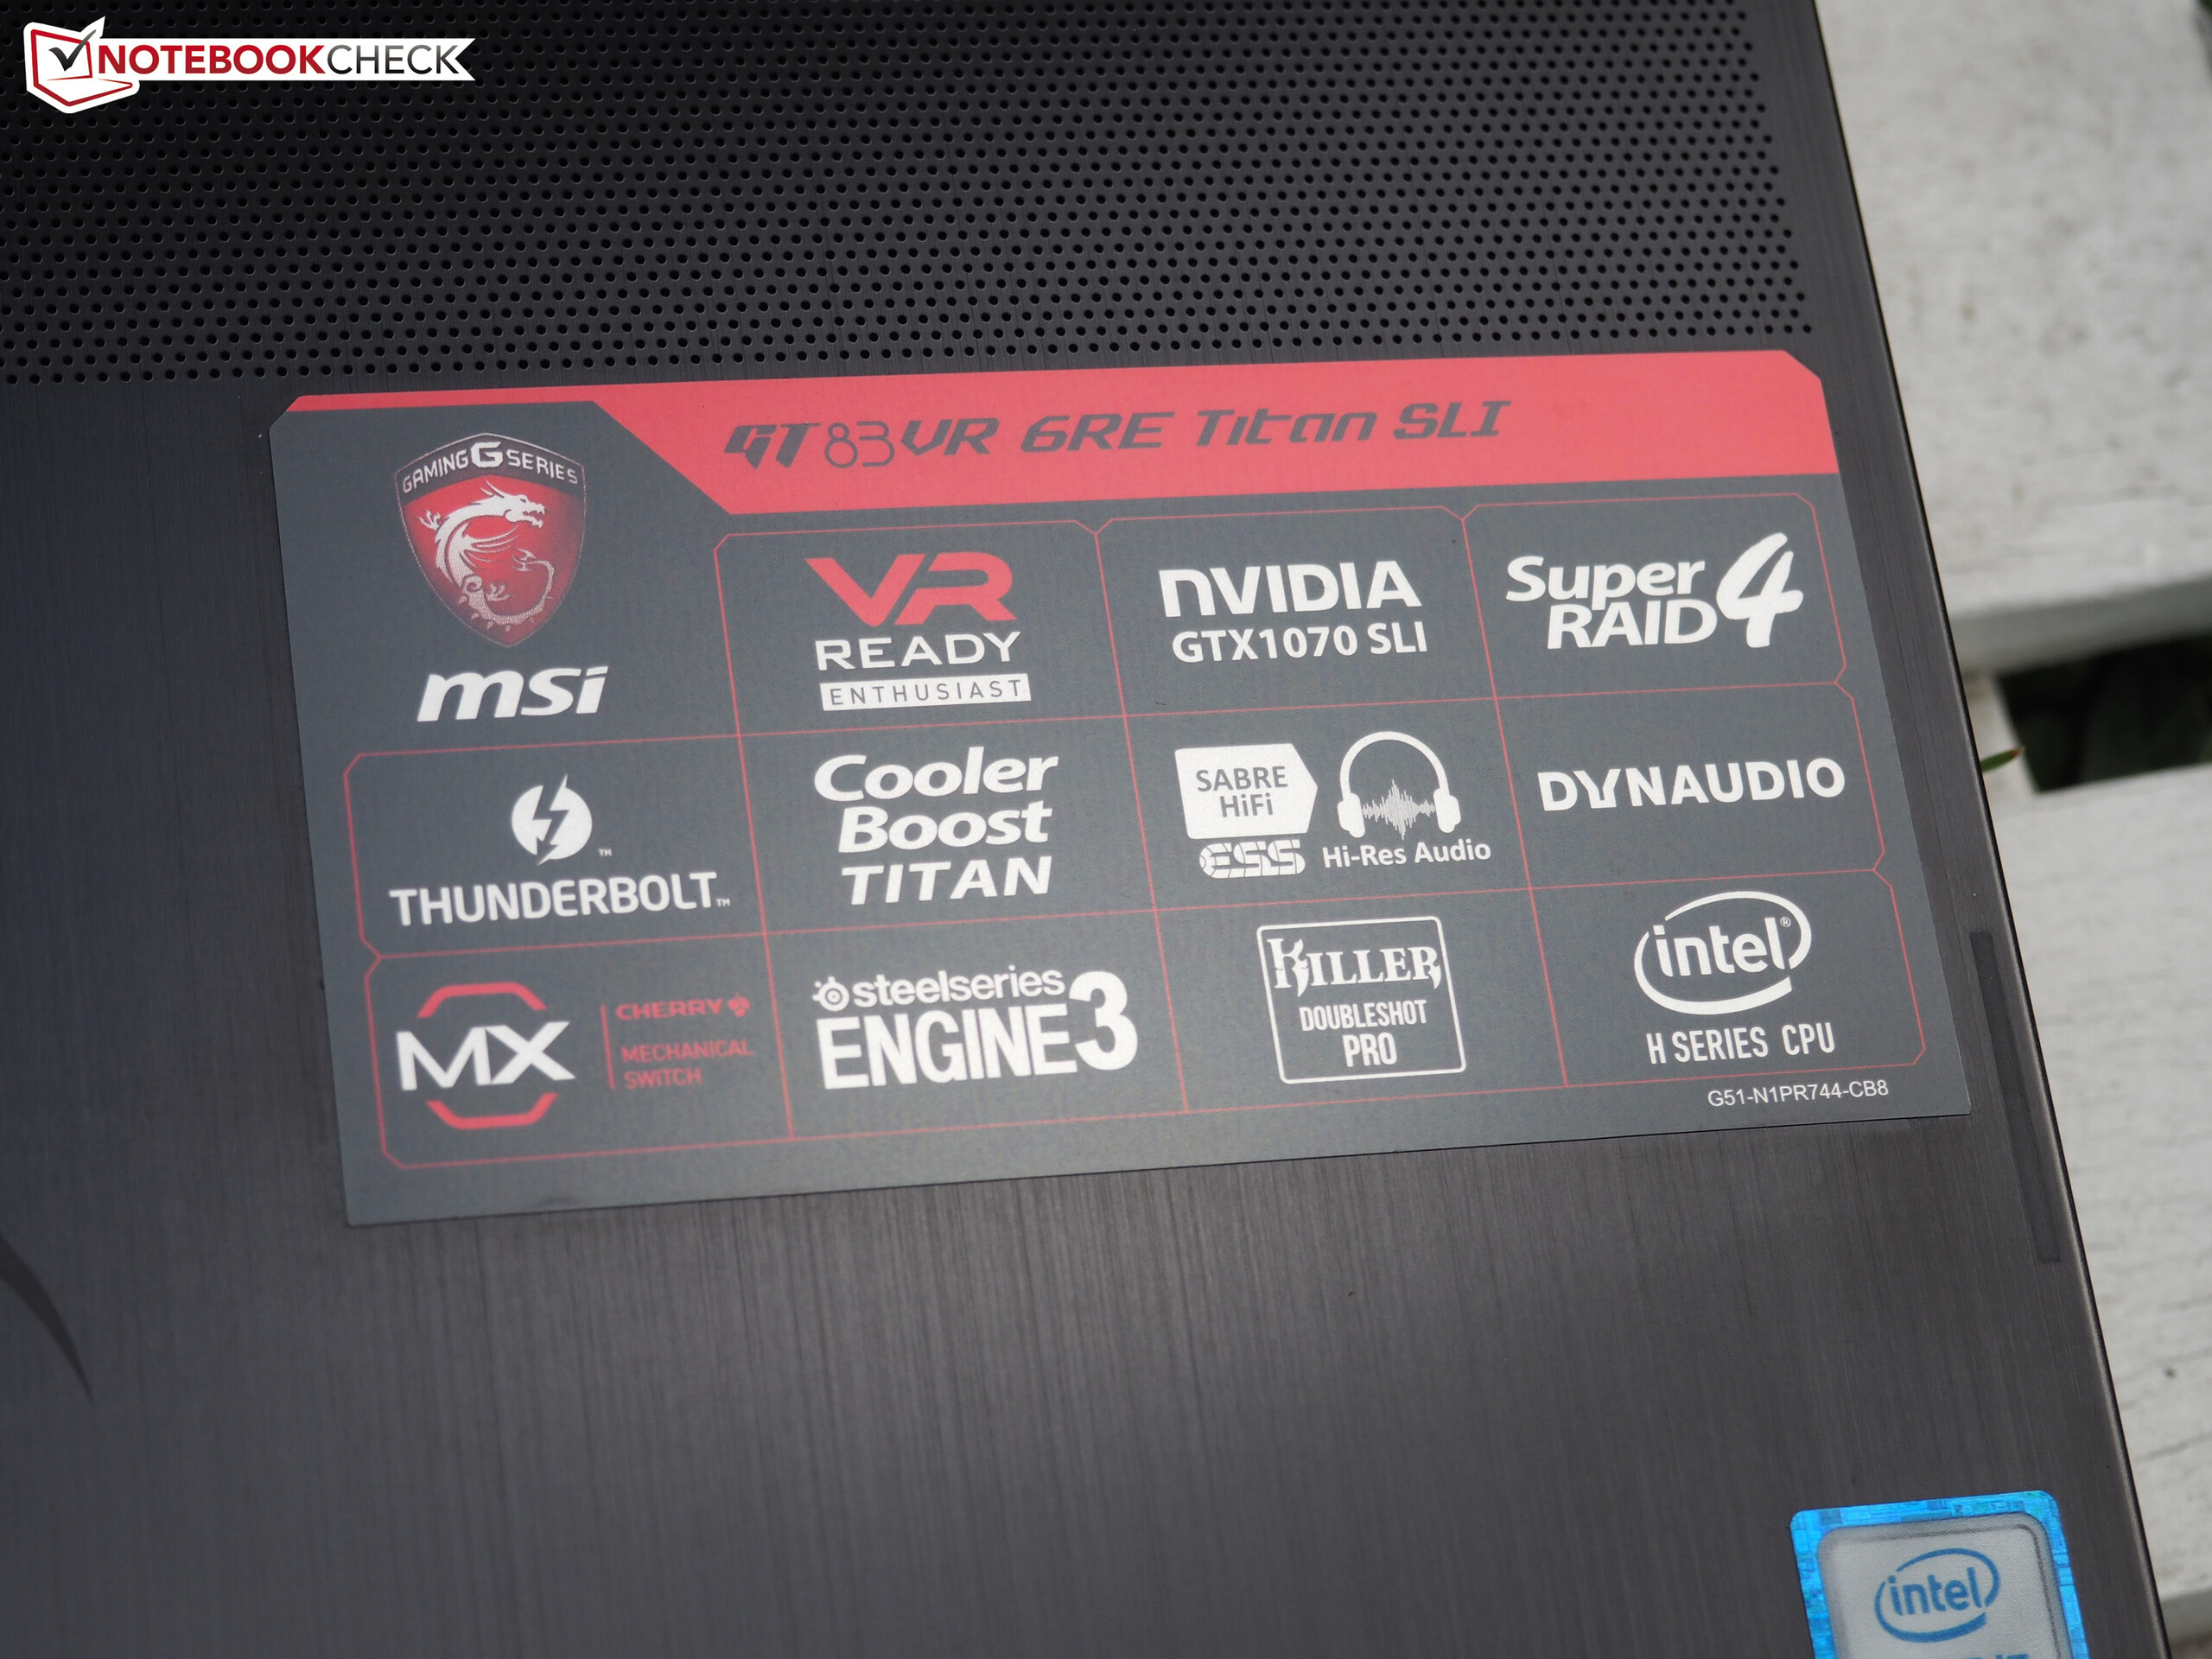
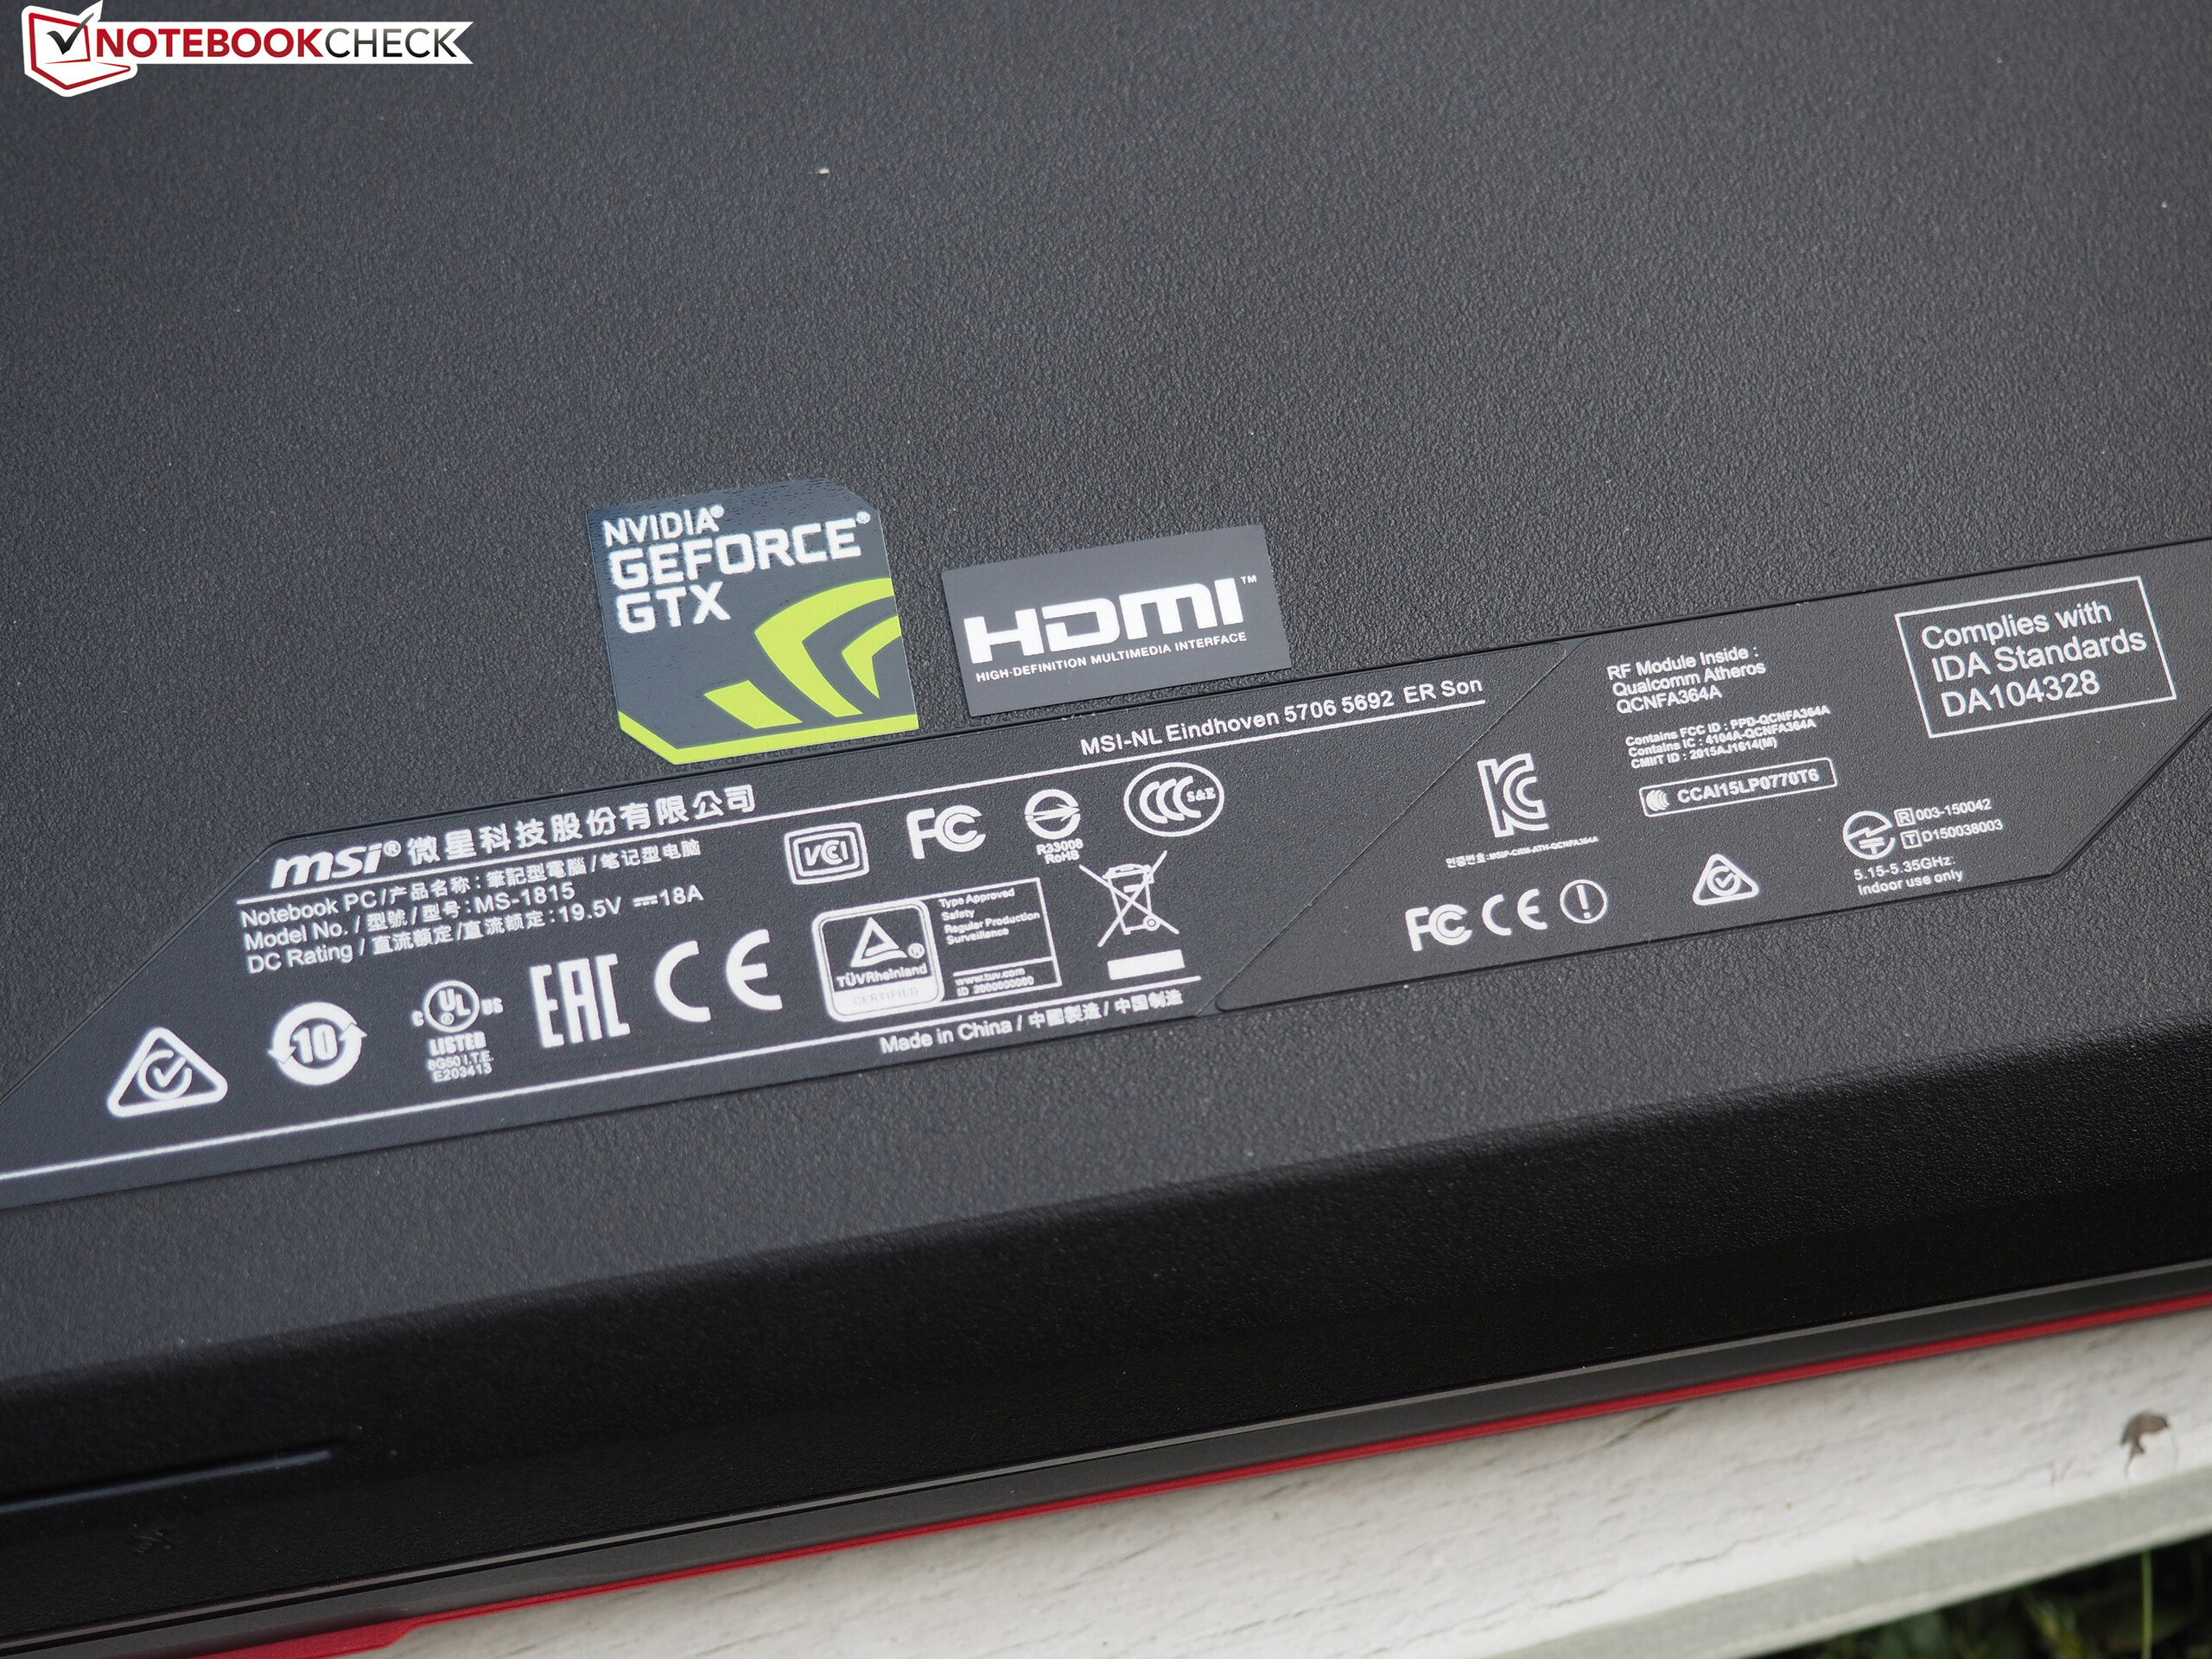
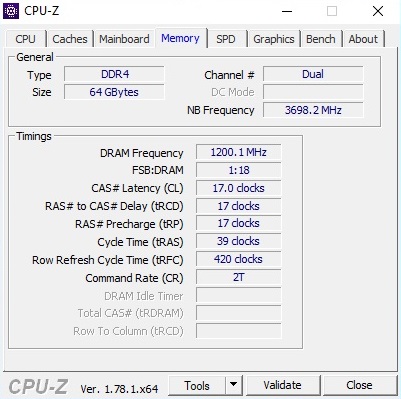
Cyberport.de, who provided our test unit, sells the 18-inch monster currently in two versions. One is the GT83VR 7RE-094 which costs 3700 Euros (~$4144) and is equipped with a Core i7-7820HK (3.9 GHz maximum), 32 GB DDR4-RAM, 1.25 TB hard drive capacity, and two GTX-1070 chips. The other version, the GT83VR 7RF-206, is even more expensive. For the exorbitant price of 5500 Euros (~$6160), the buyer receives a combination of Core i7-7920HQ (4.1 GHz maximum), 64 GB DDR4-RAM, 1.5 TB storage space, and two GTX-1080 chips.
(Depending on the equipment, in the US the price, for example, for the MSI GT83VR Titan SLI-253, i7-7920HQ, 32GB RAM, 1TB HDD, Nvidia GTX 1070 SLI 16GB, 18.4-inch Full HD is $3685. Prices can go up to $7500 with a 2 TB SSD. Note that the model numbering of the GT83VR versions is different in the US.)
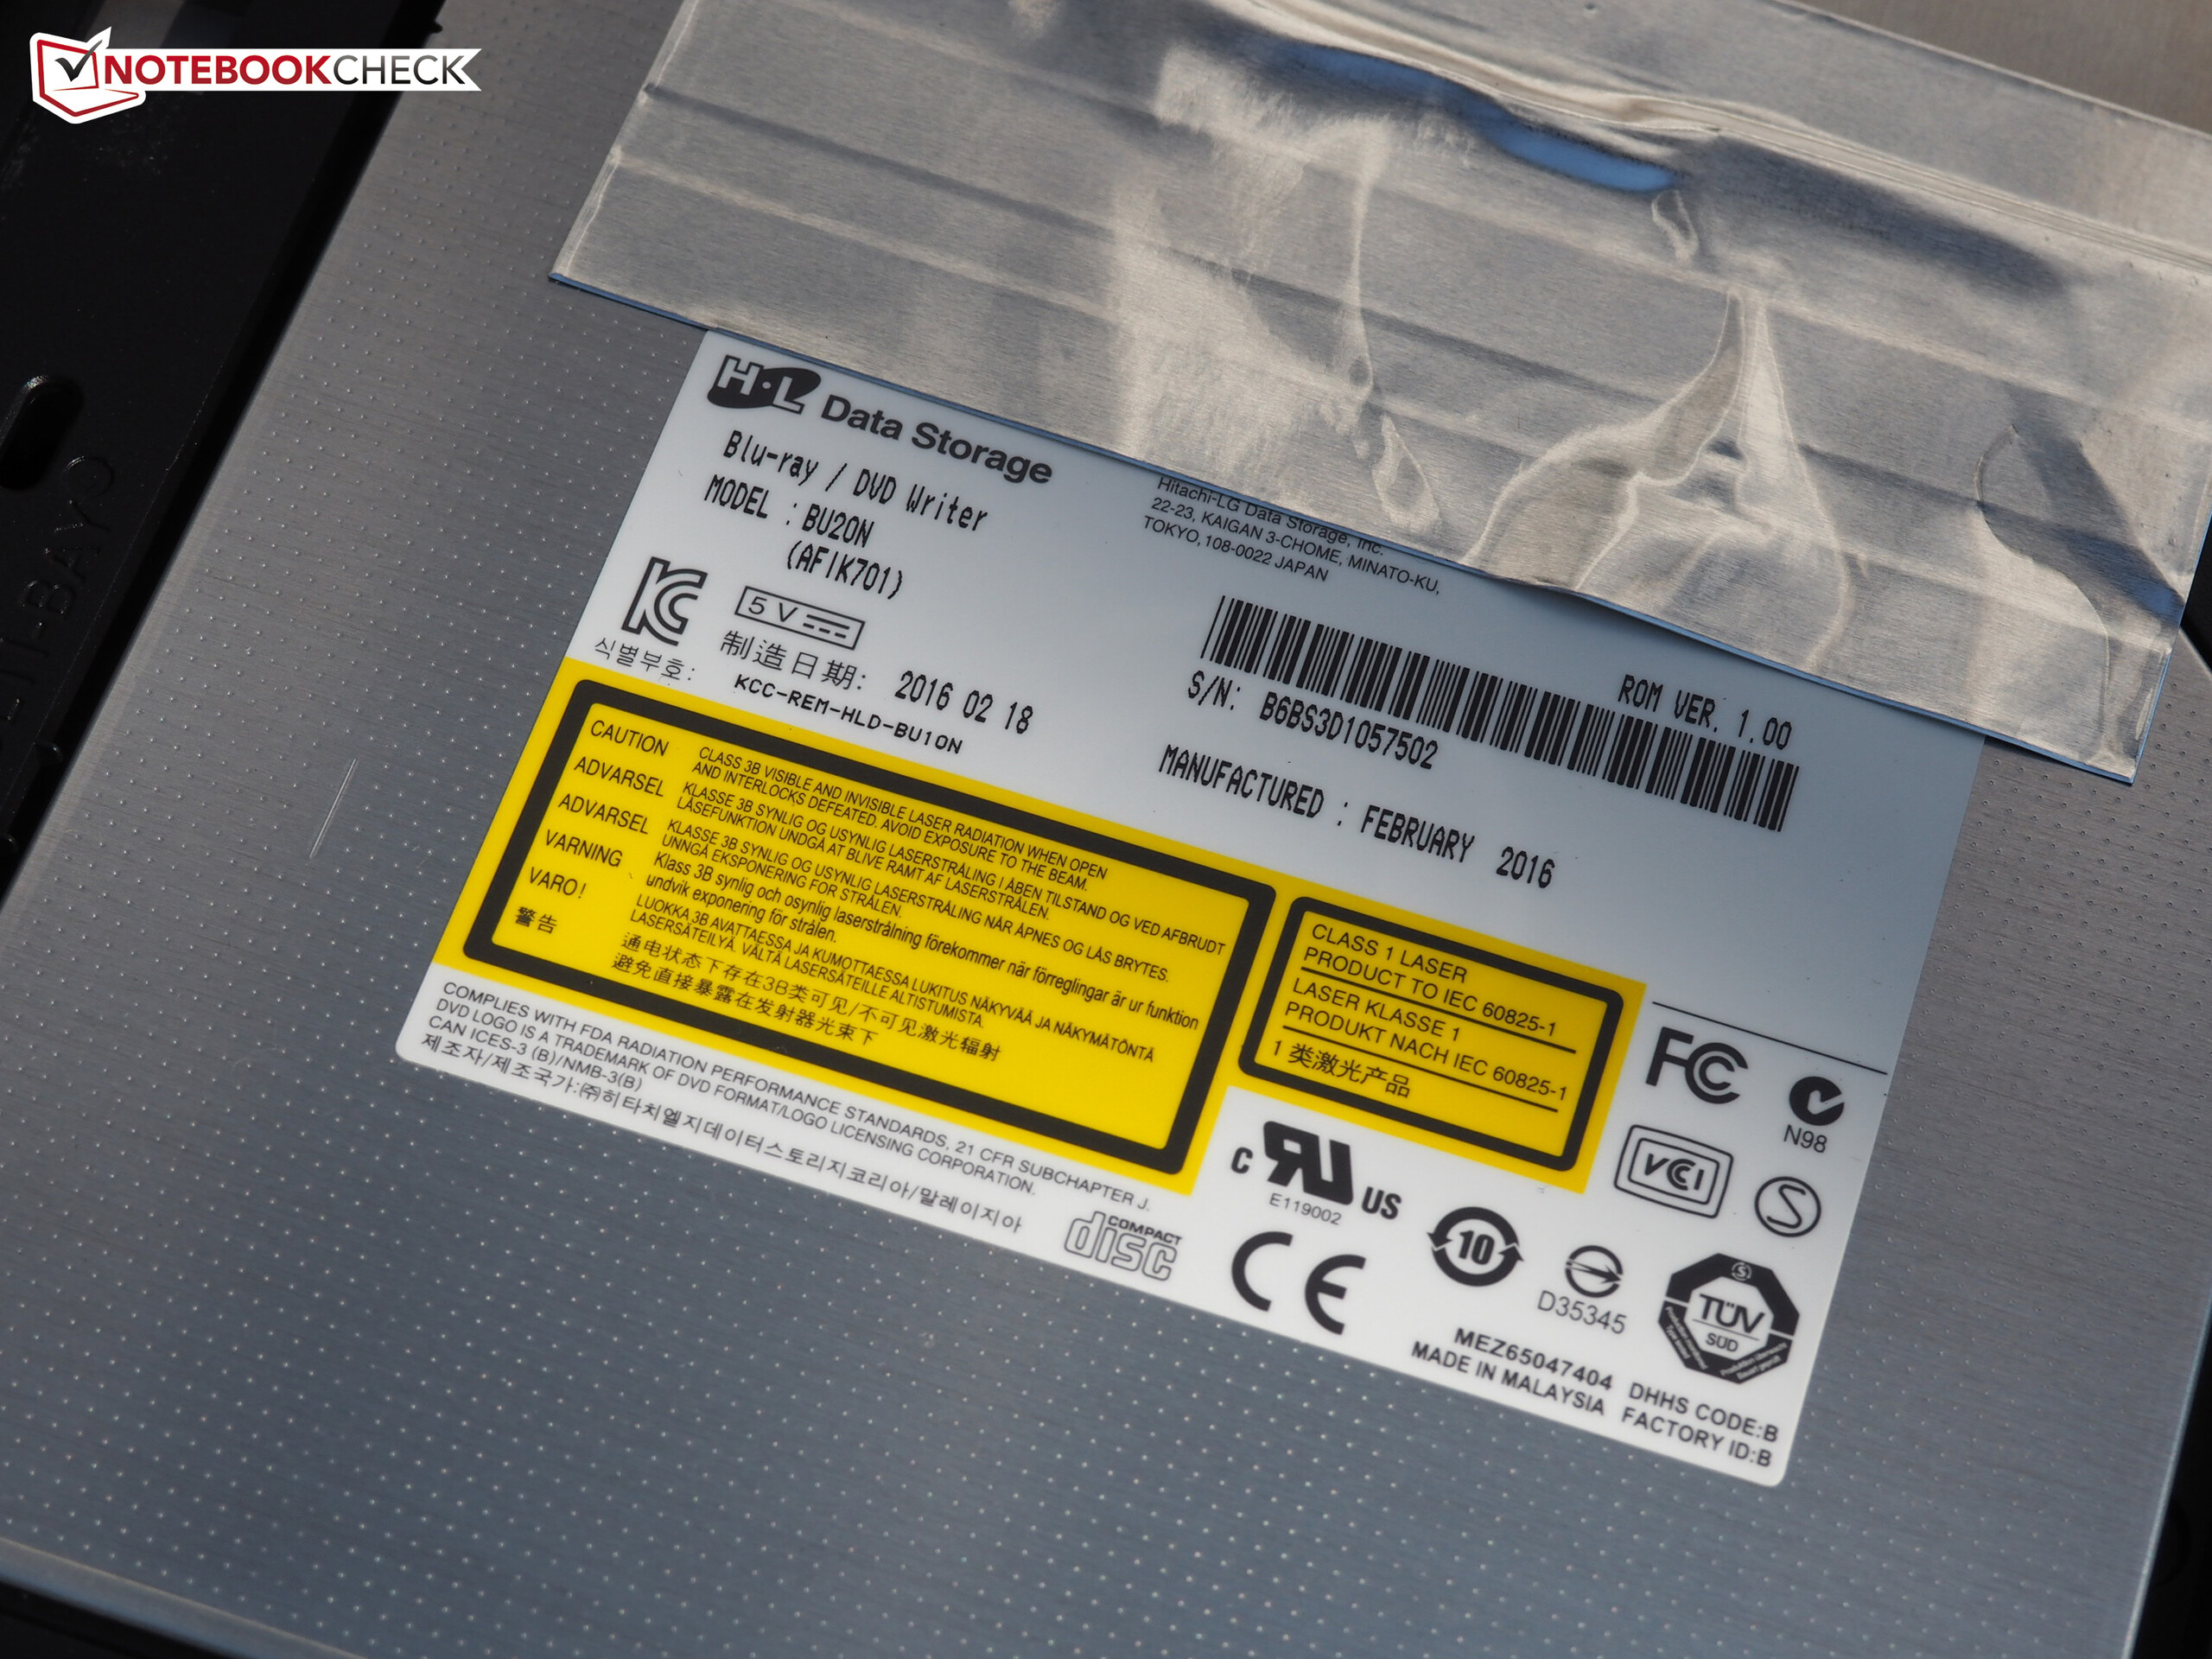
Both models have the matte Full HD panel with wide-view technology in common, which does not fit at all to the rest of the equipment as we will explain later. Also on board are a Blu-ray drive and Windows 10 Home 64-bit as the operating system.
Improvements
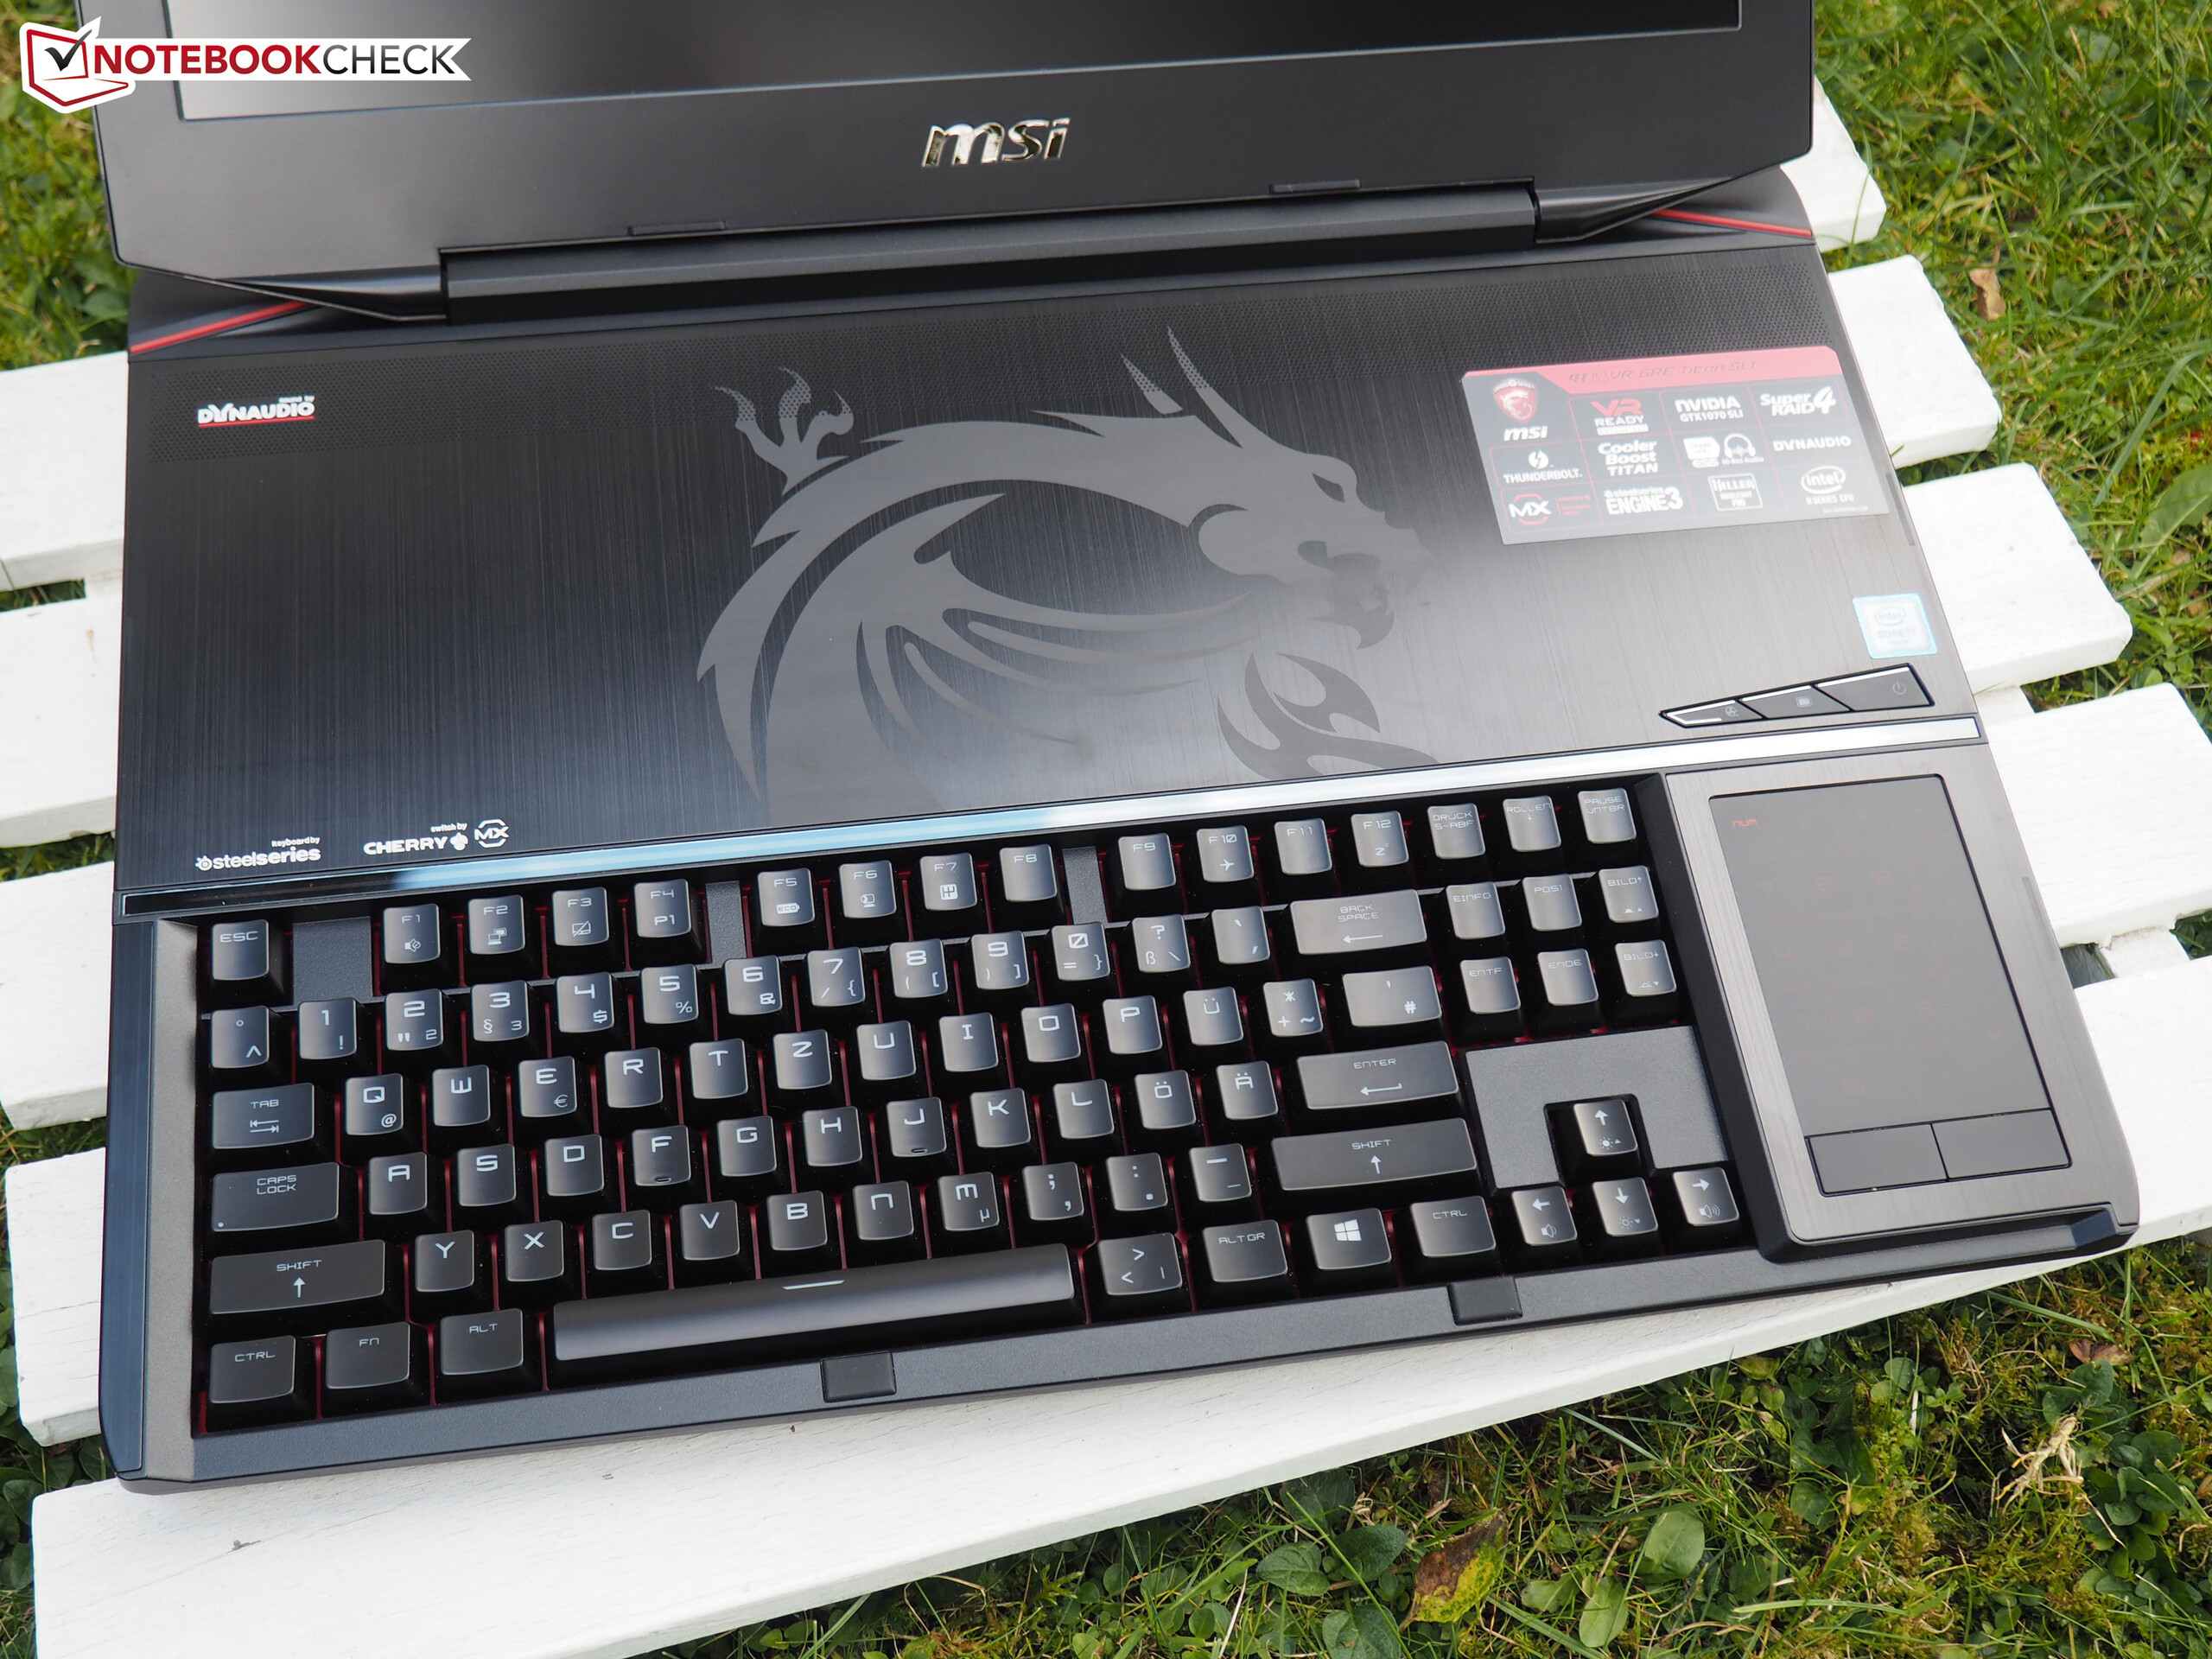
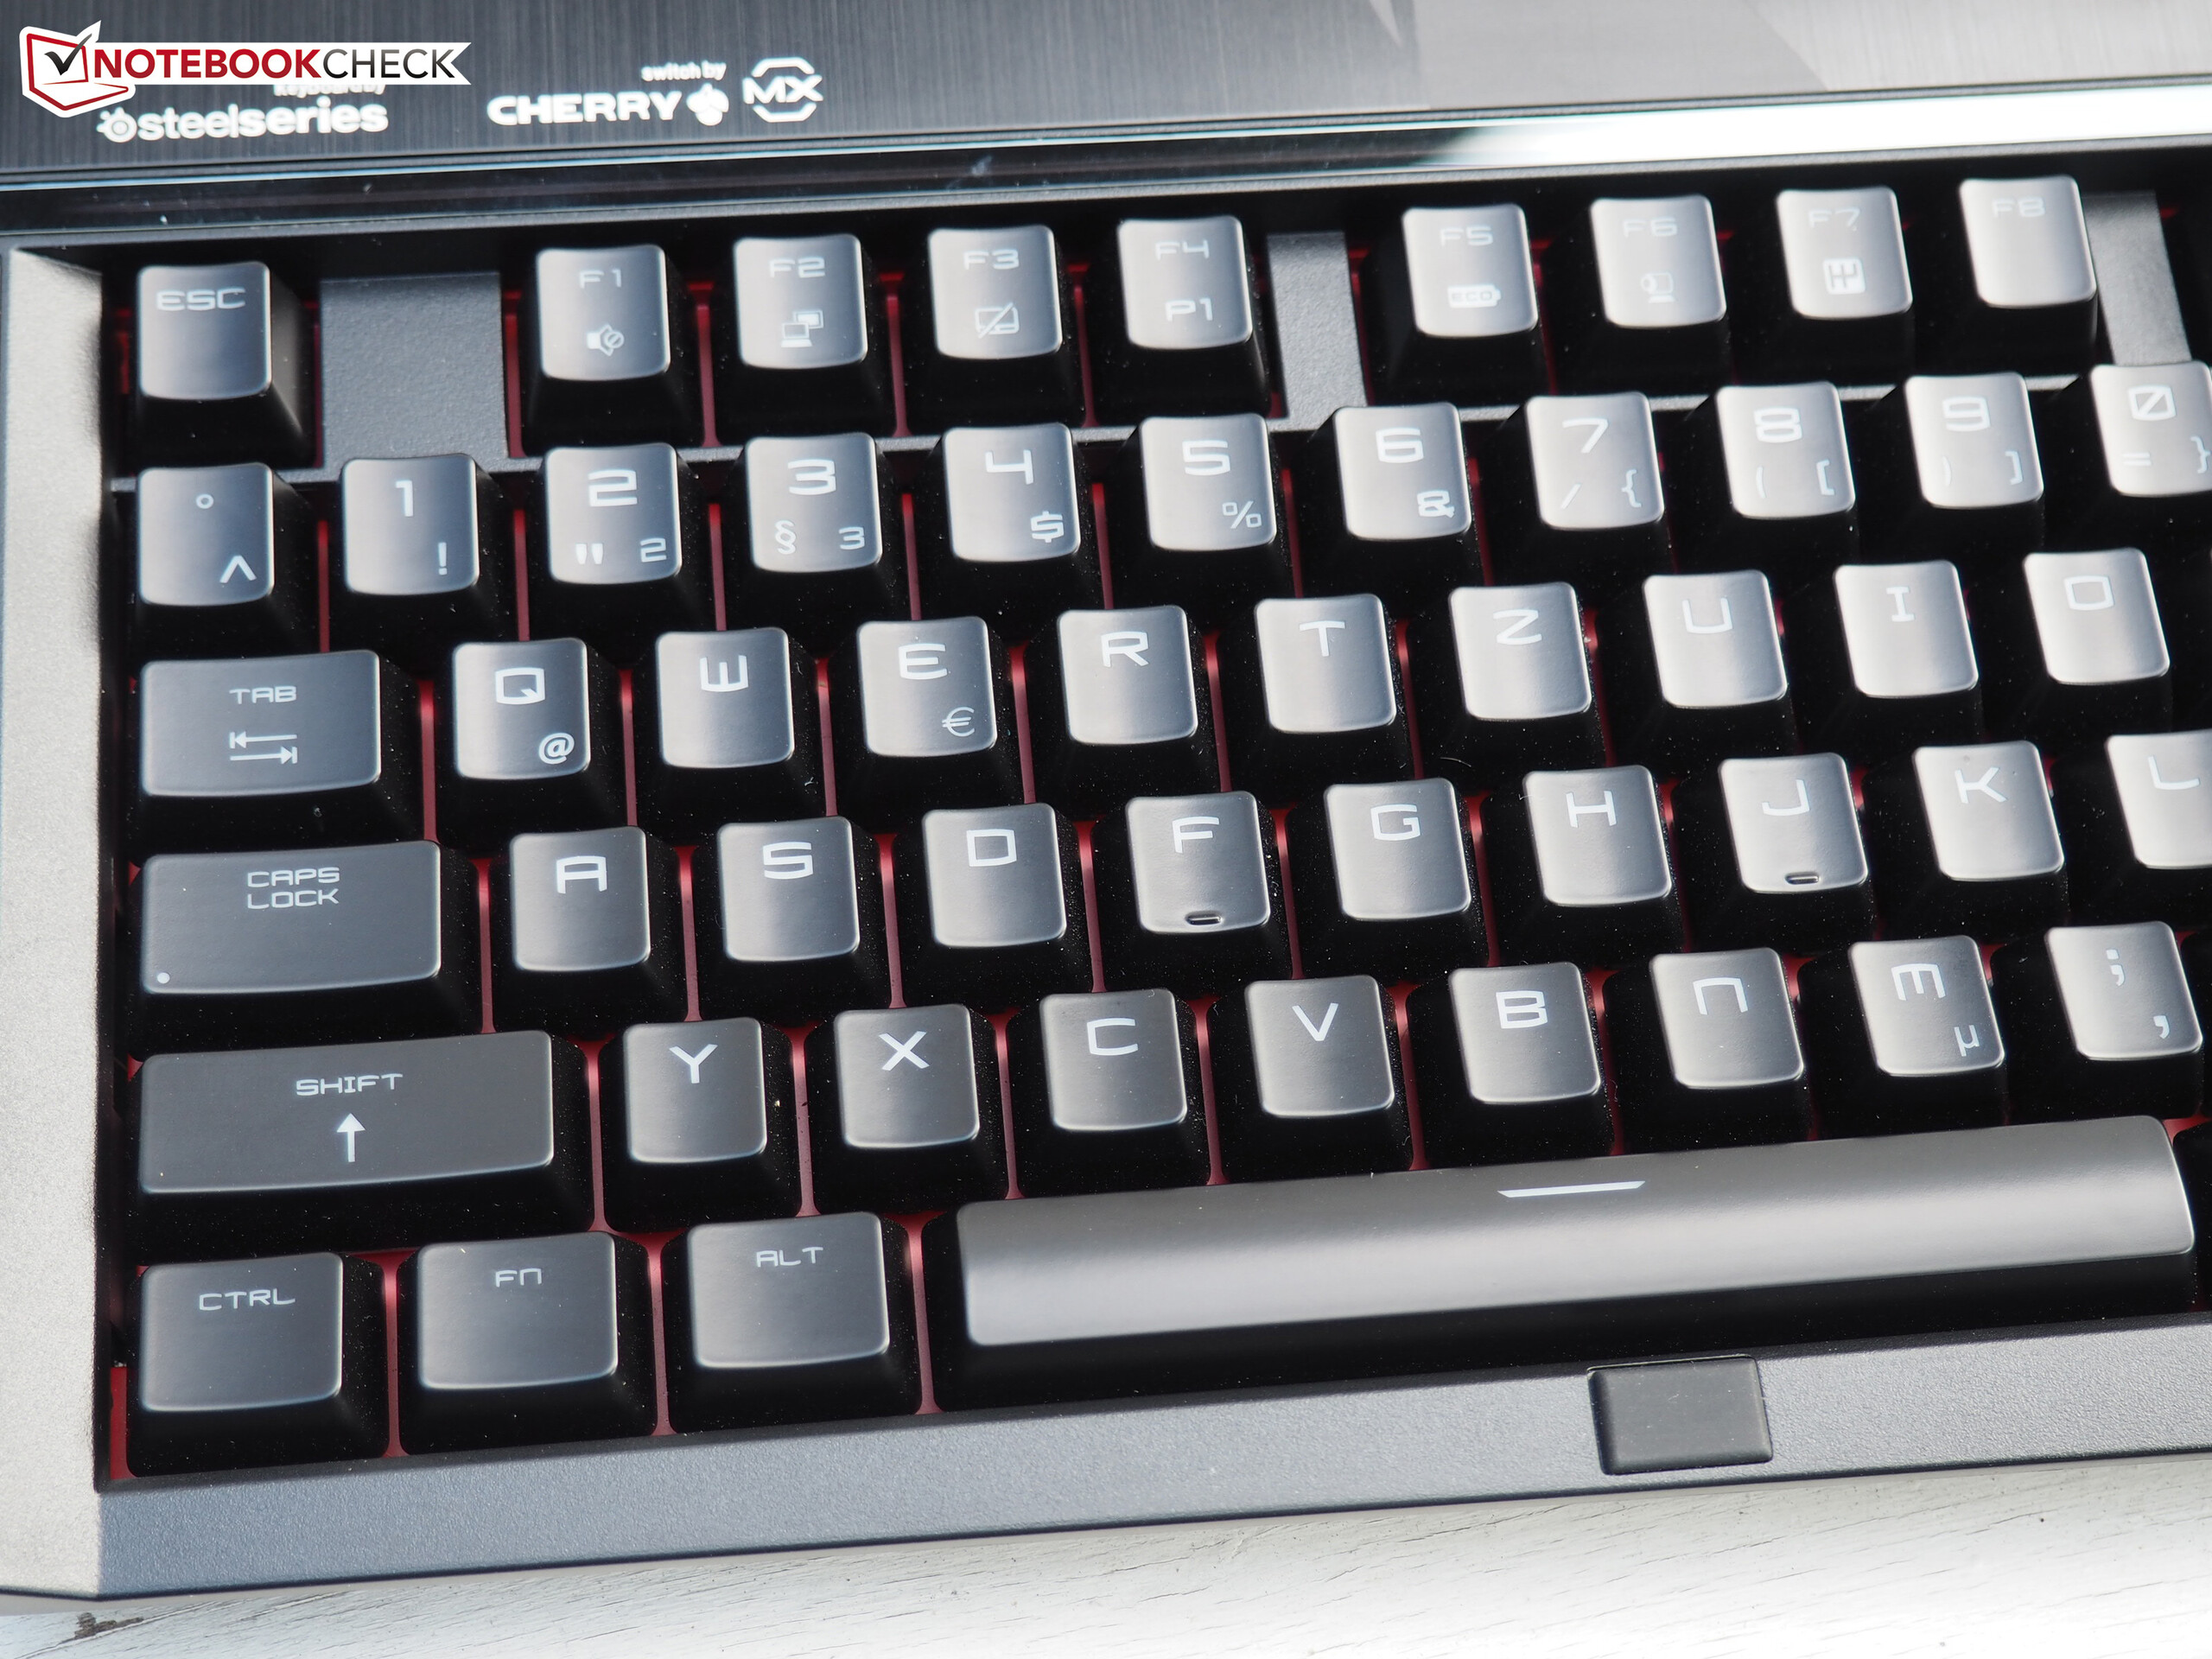
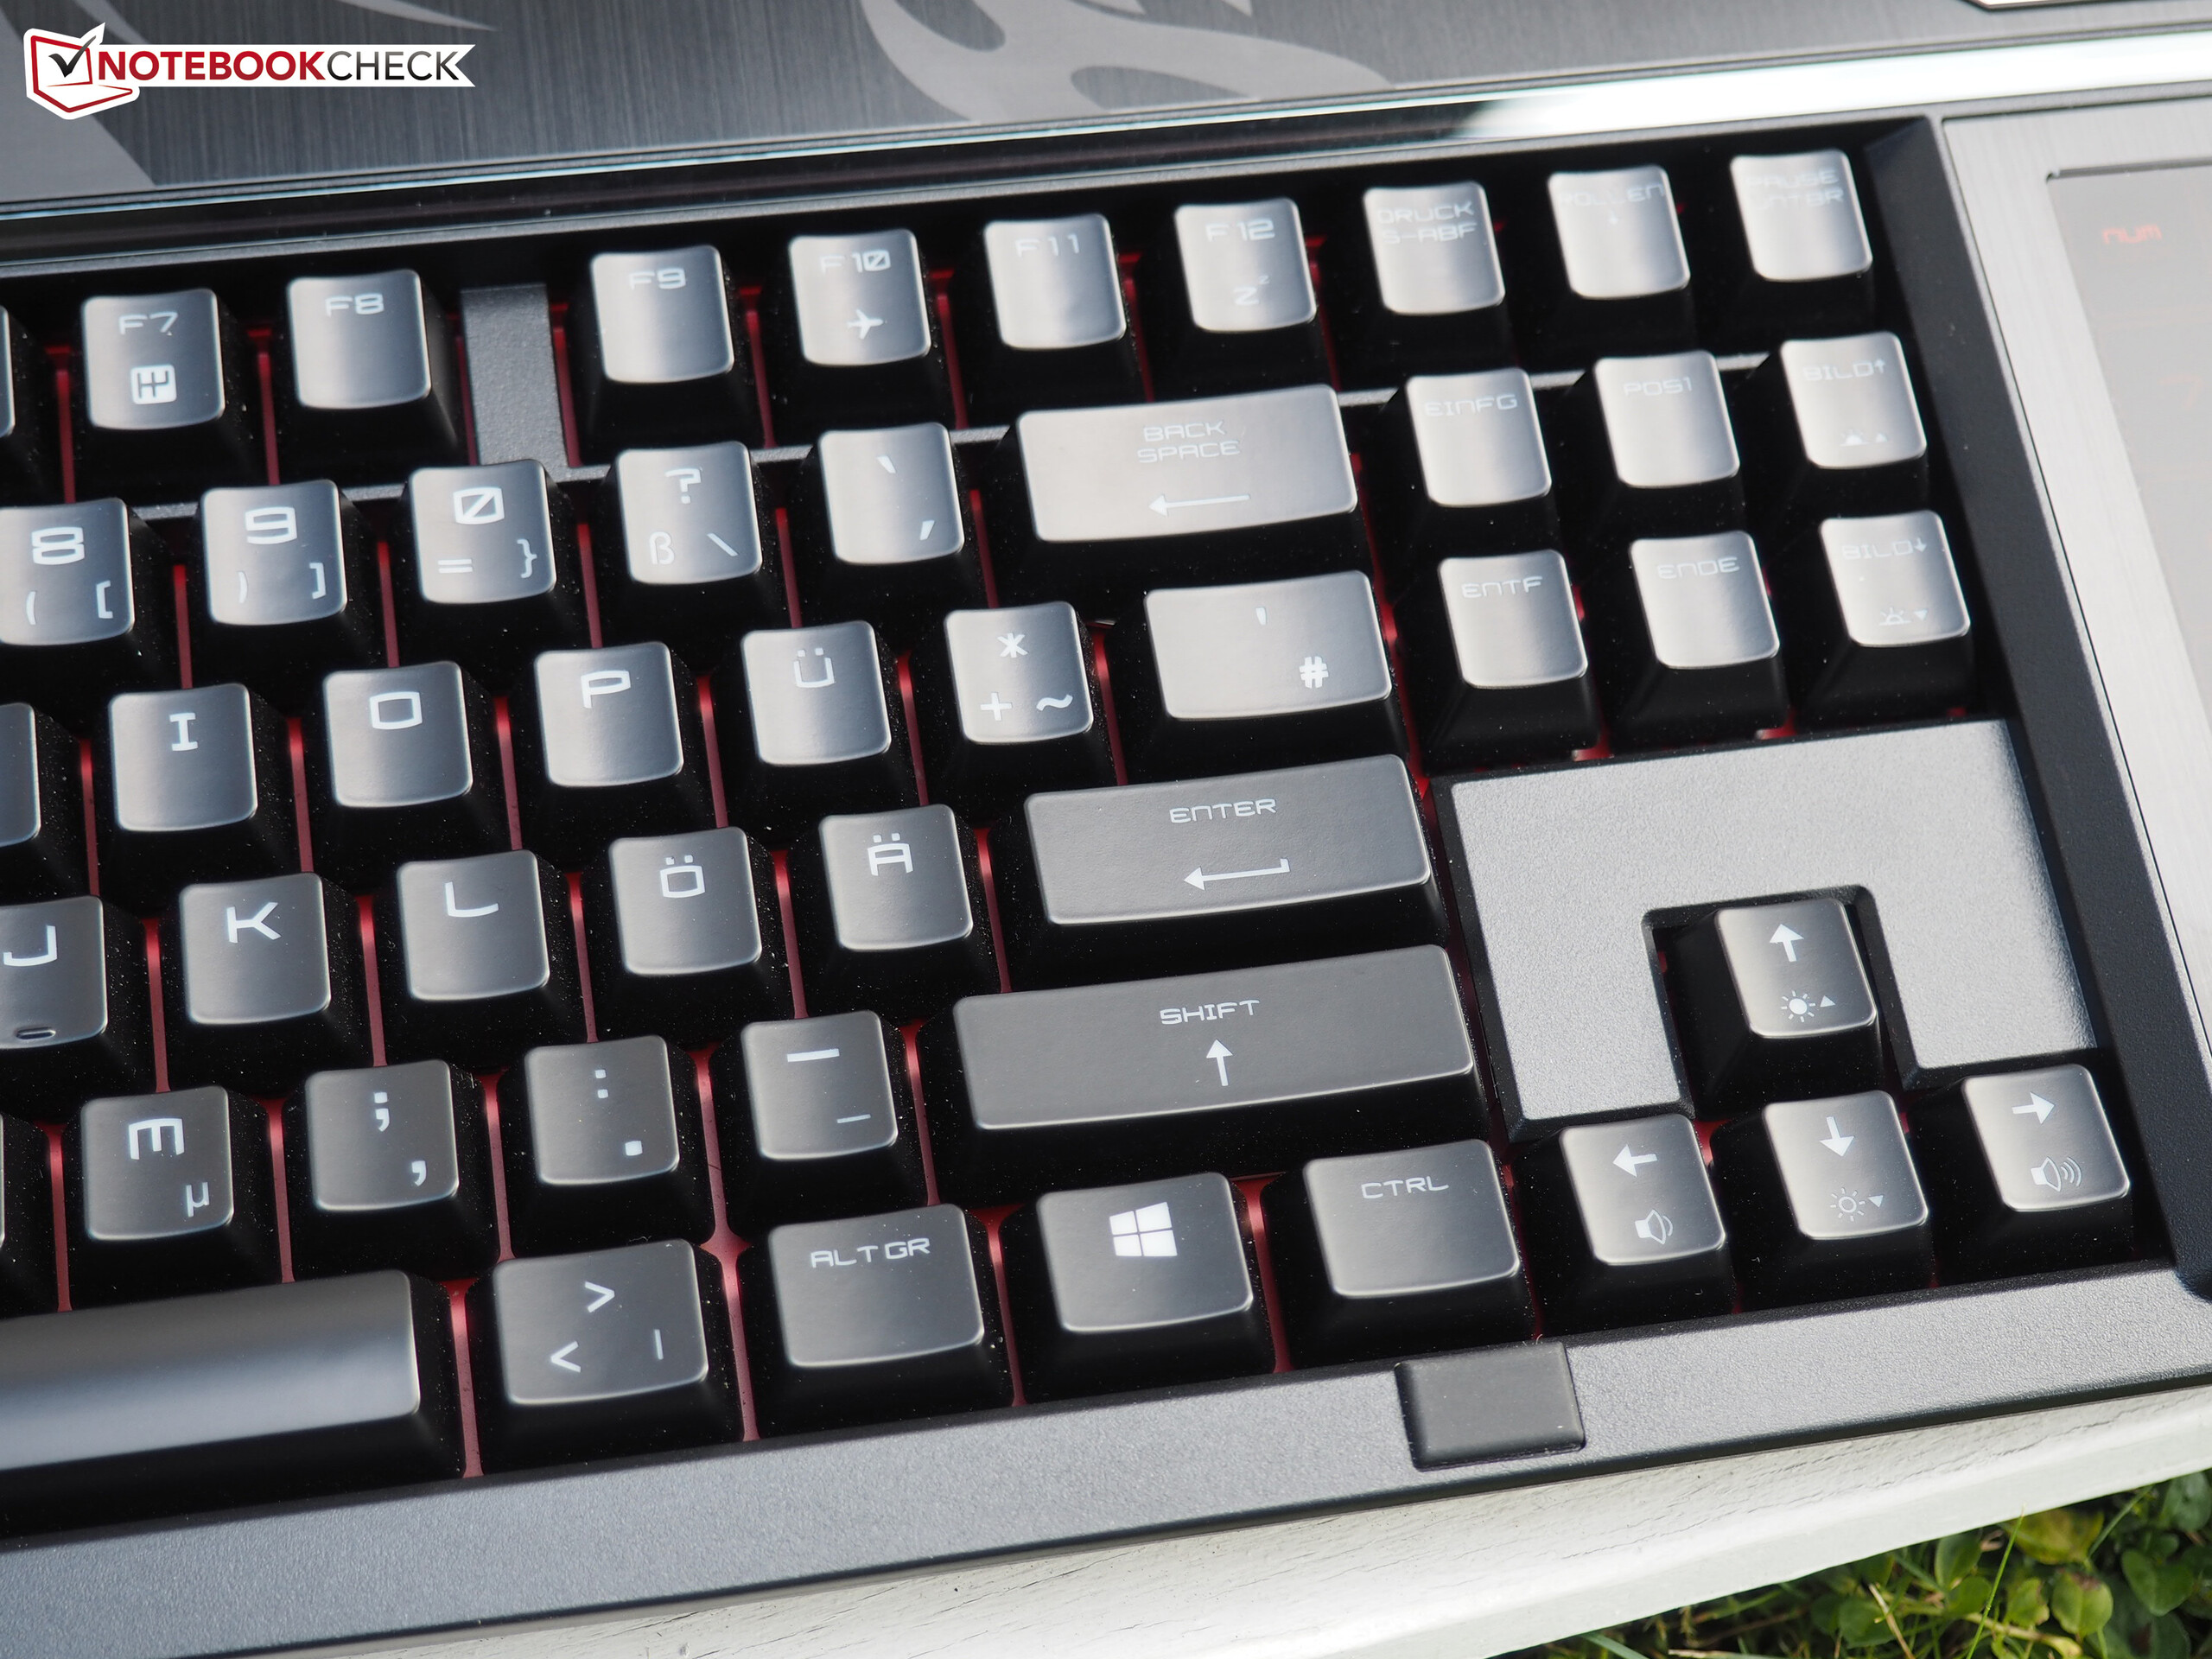
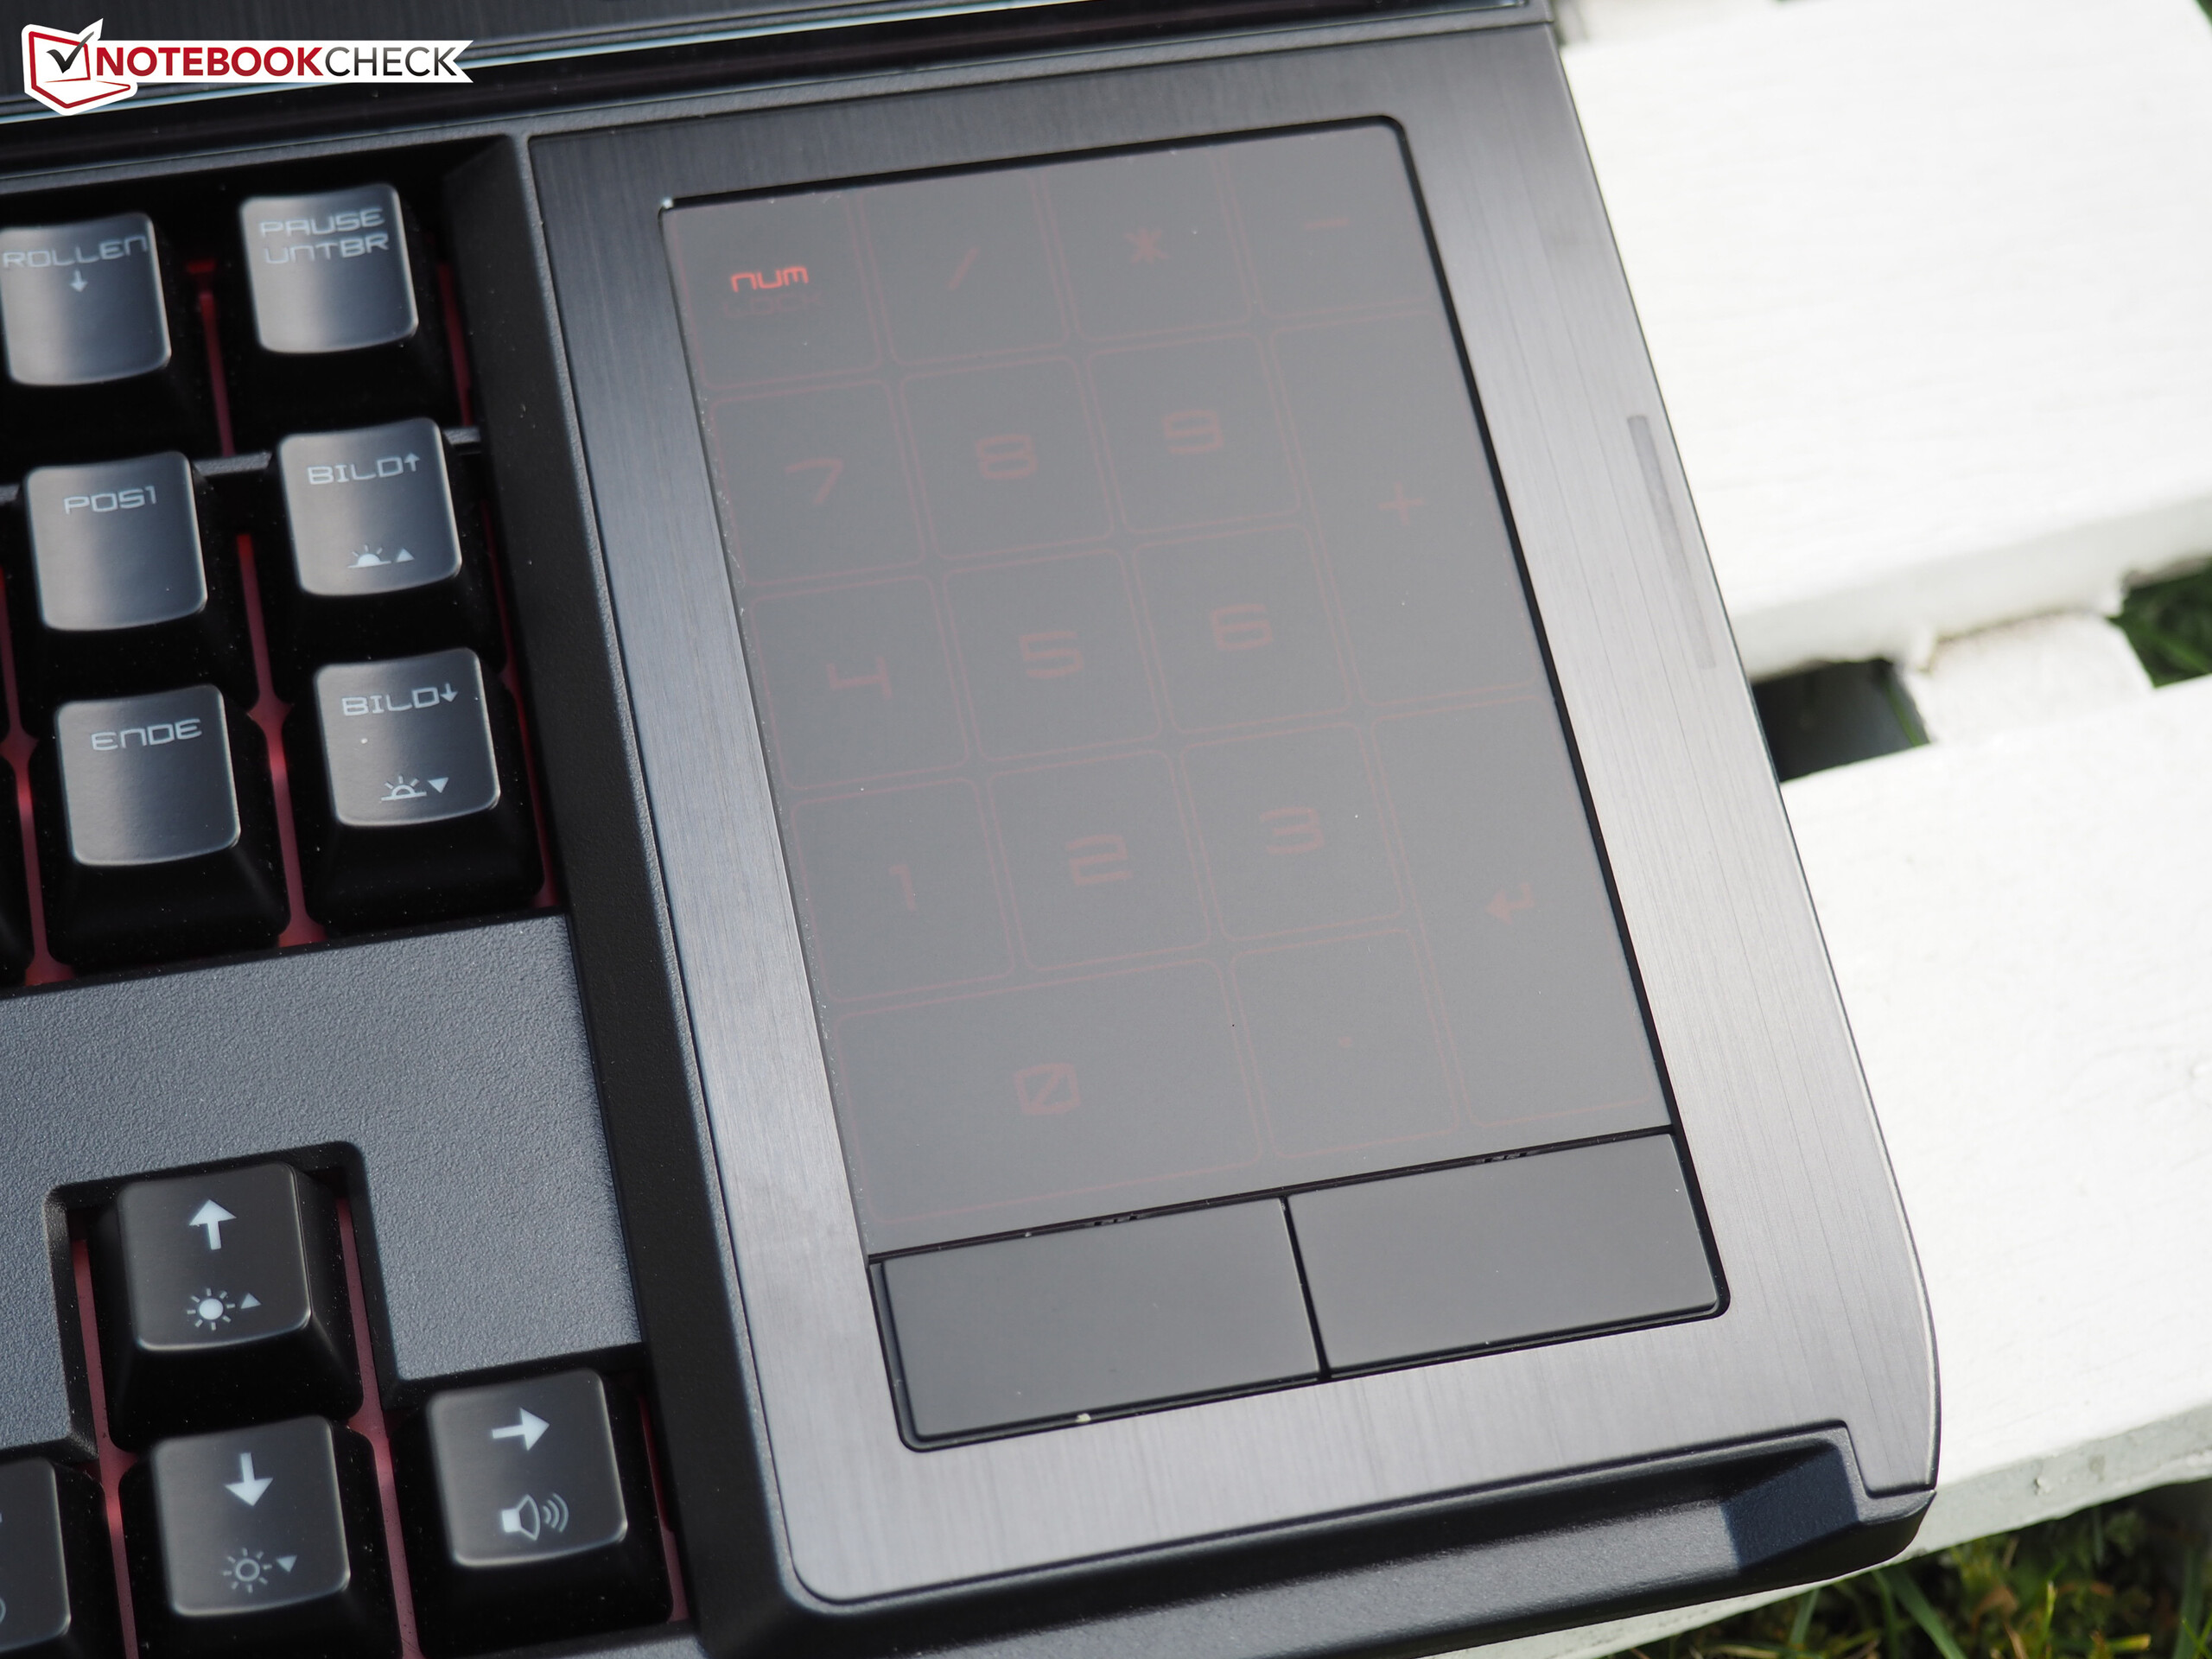
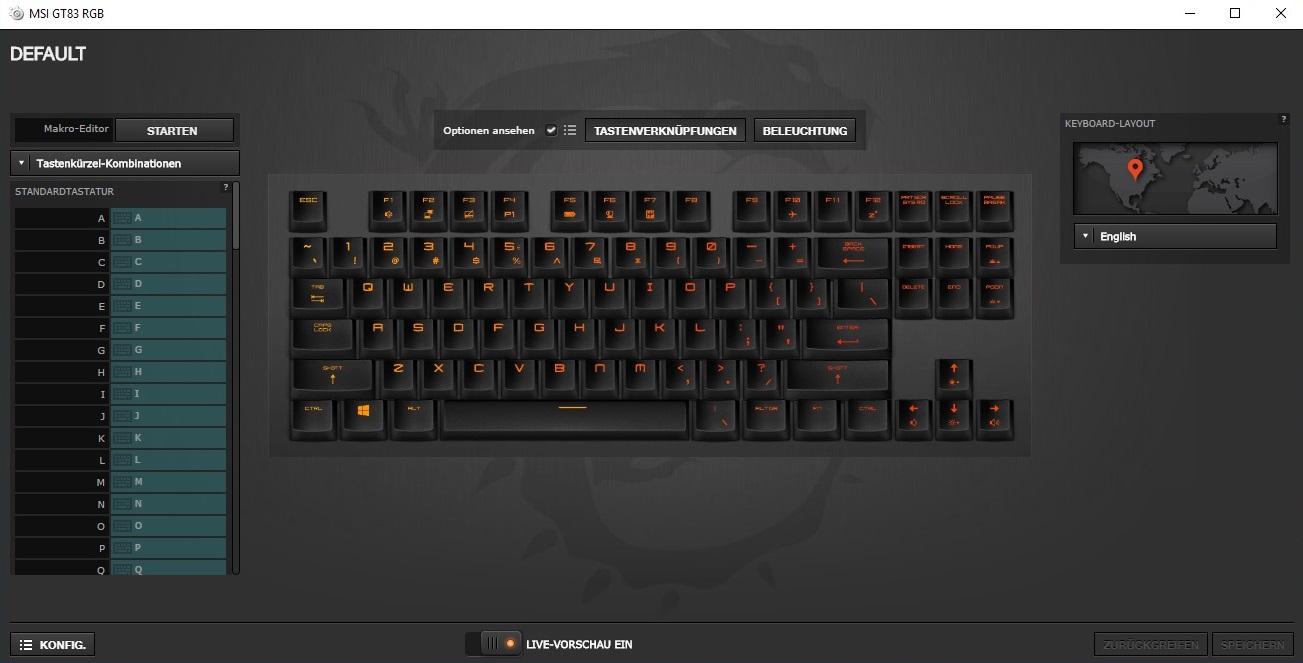
Even though on the outside, the GT83VR 7RF is identical to the GT83VR 6RE predecessor we tested in 2016, MSI made improvements in several places. Besides the upgrade from the Skylake to a similarly fast Kaby Lake CPU, mainly the mechanical keyboard which does not merely light up in red but now also masters RGB, should be mentioned. Compared to the gaming competition which became thinner and lighter in the last few years (Alienware 13 R3, Gigabyte Aero 14, etc.), this design with the 6.9 cm (~2.72 in) thick and 5.5 kg (~12 lb) heavy 18-inch case does not seem particularly contemporary anymore.
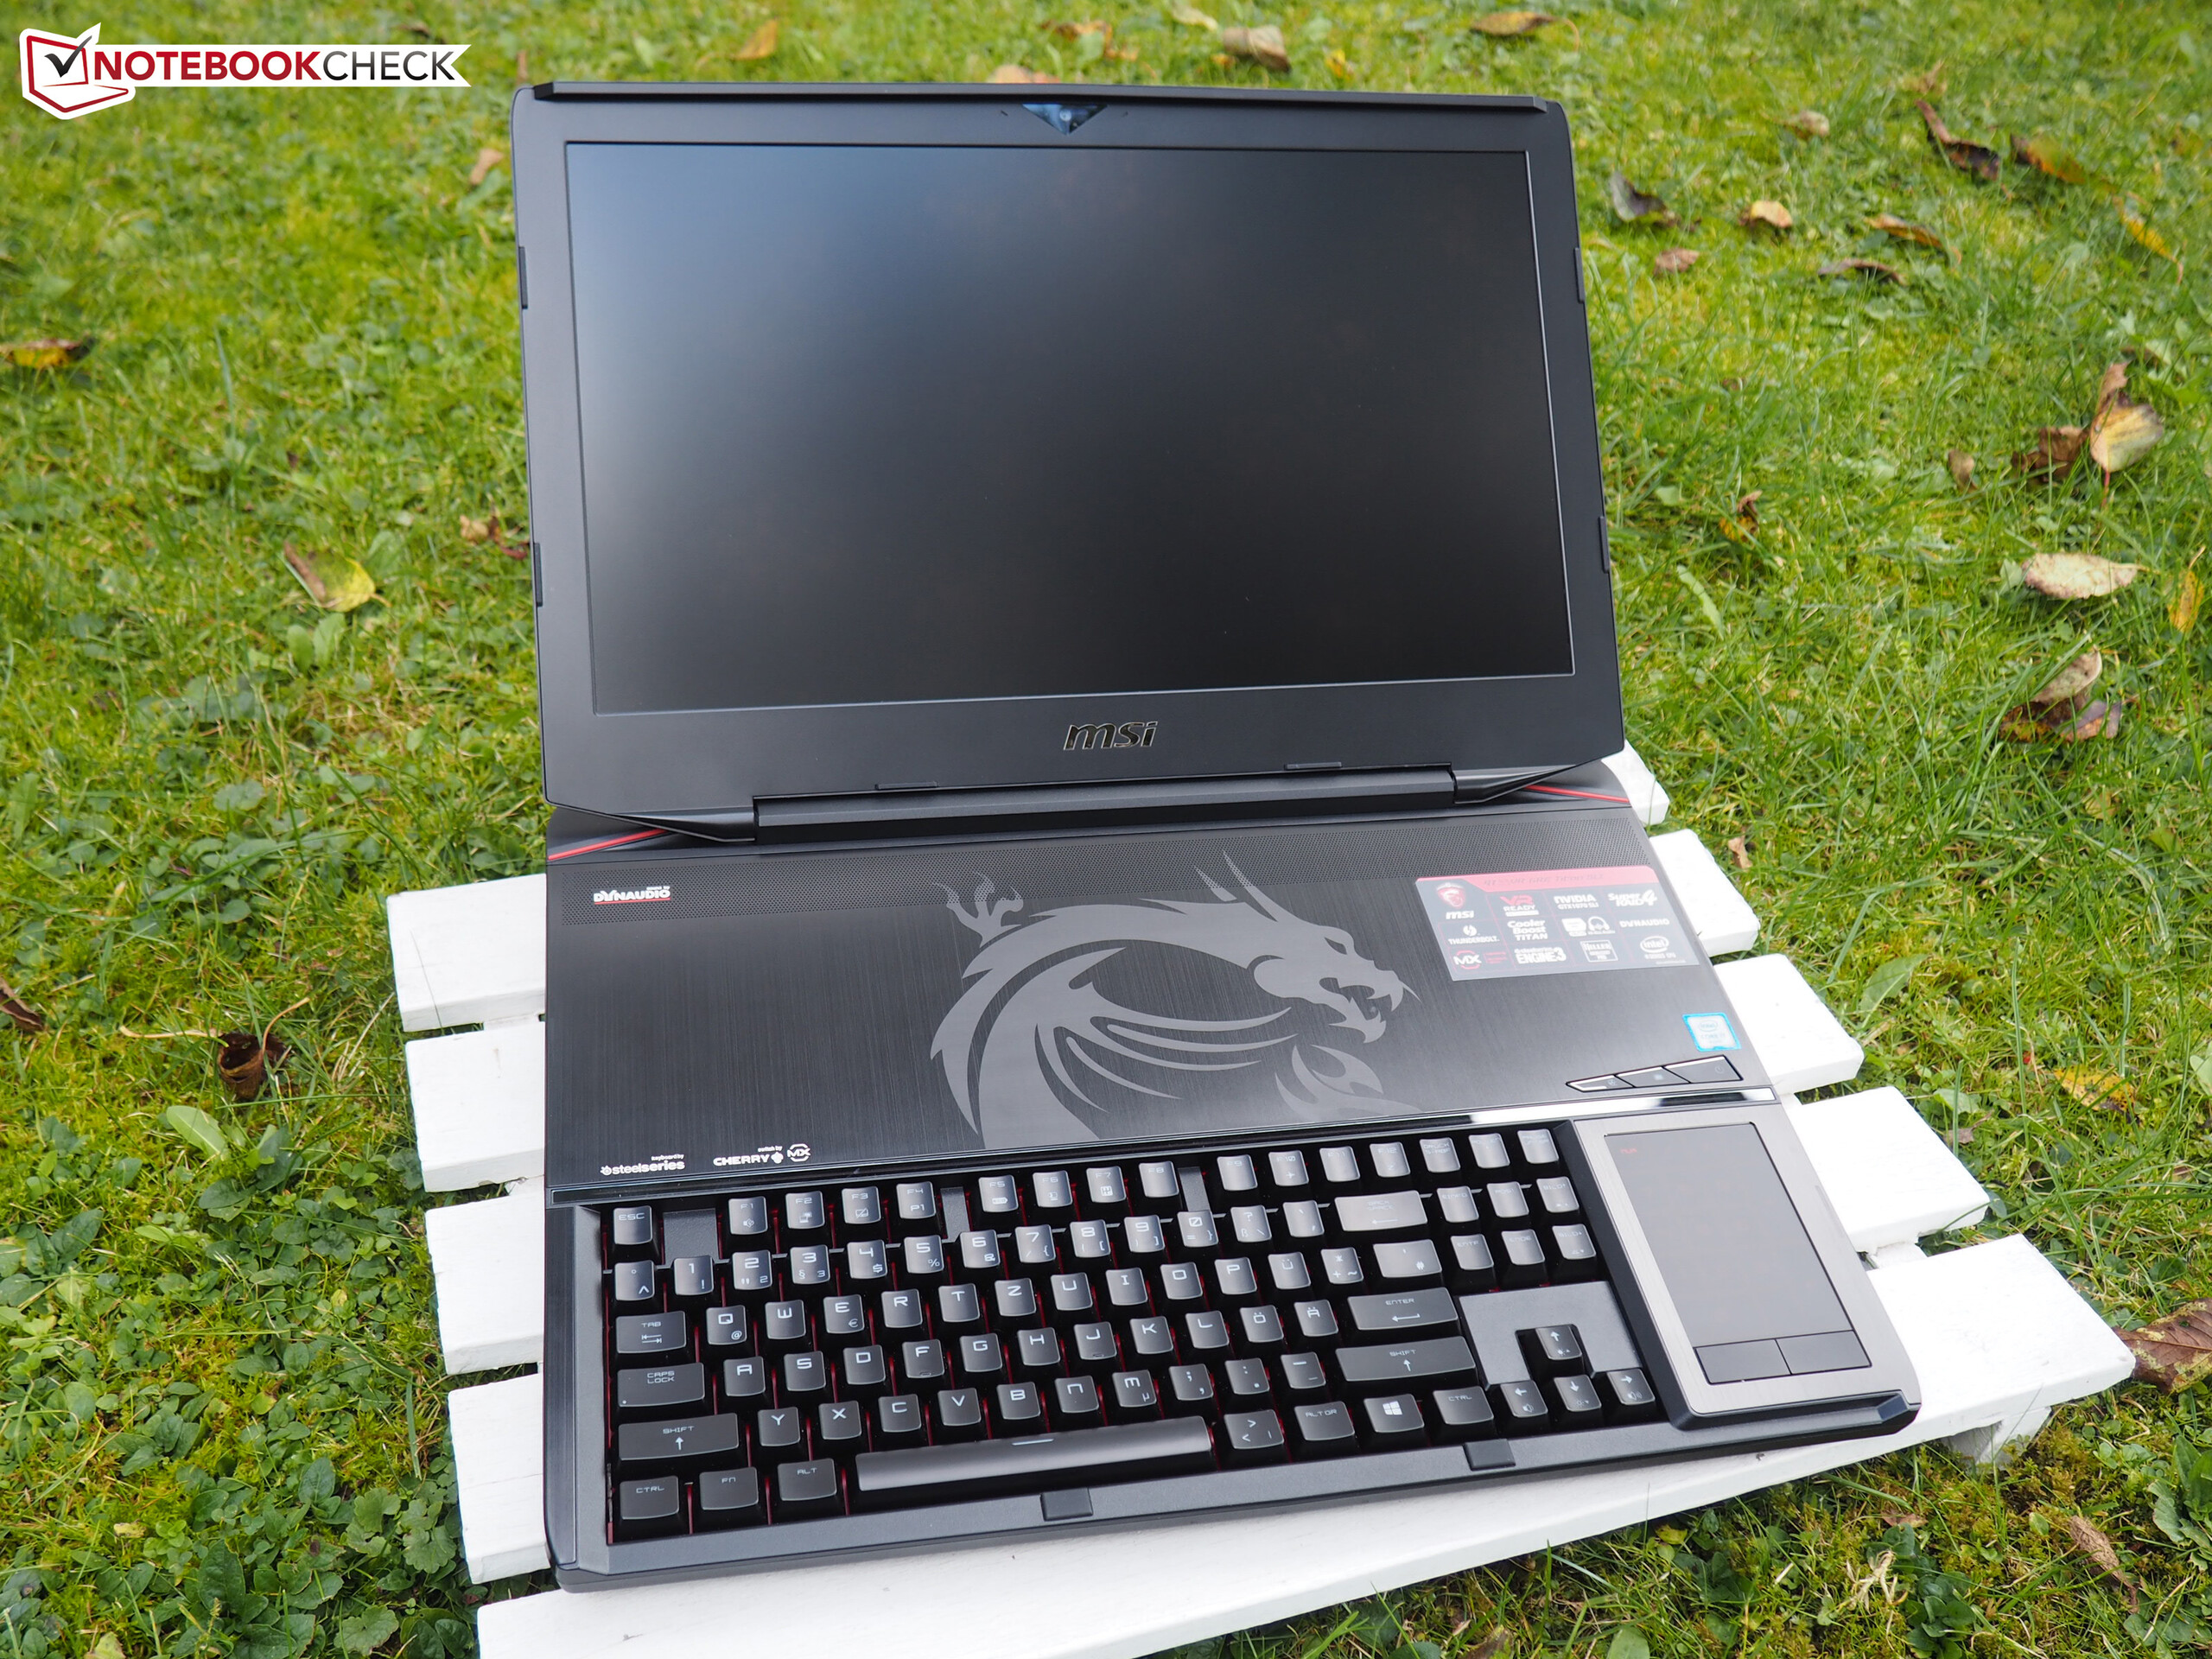
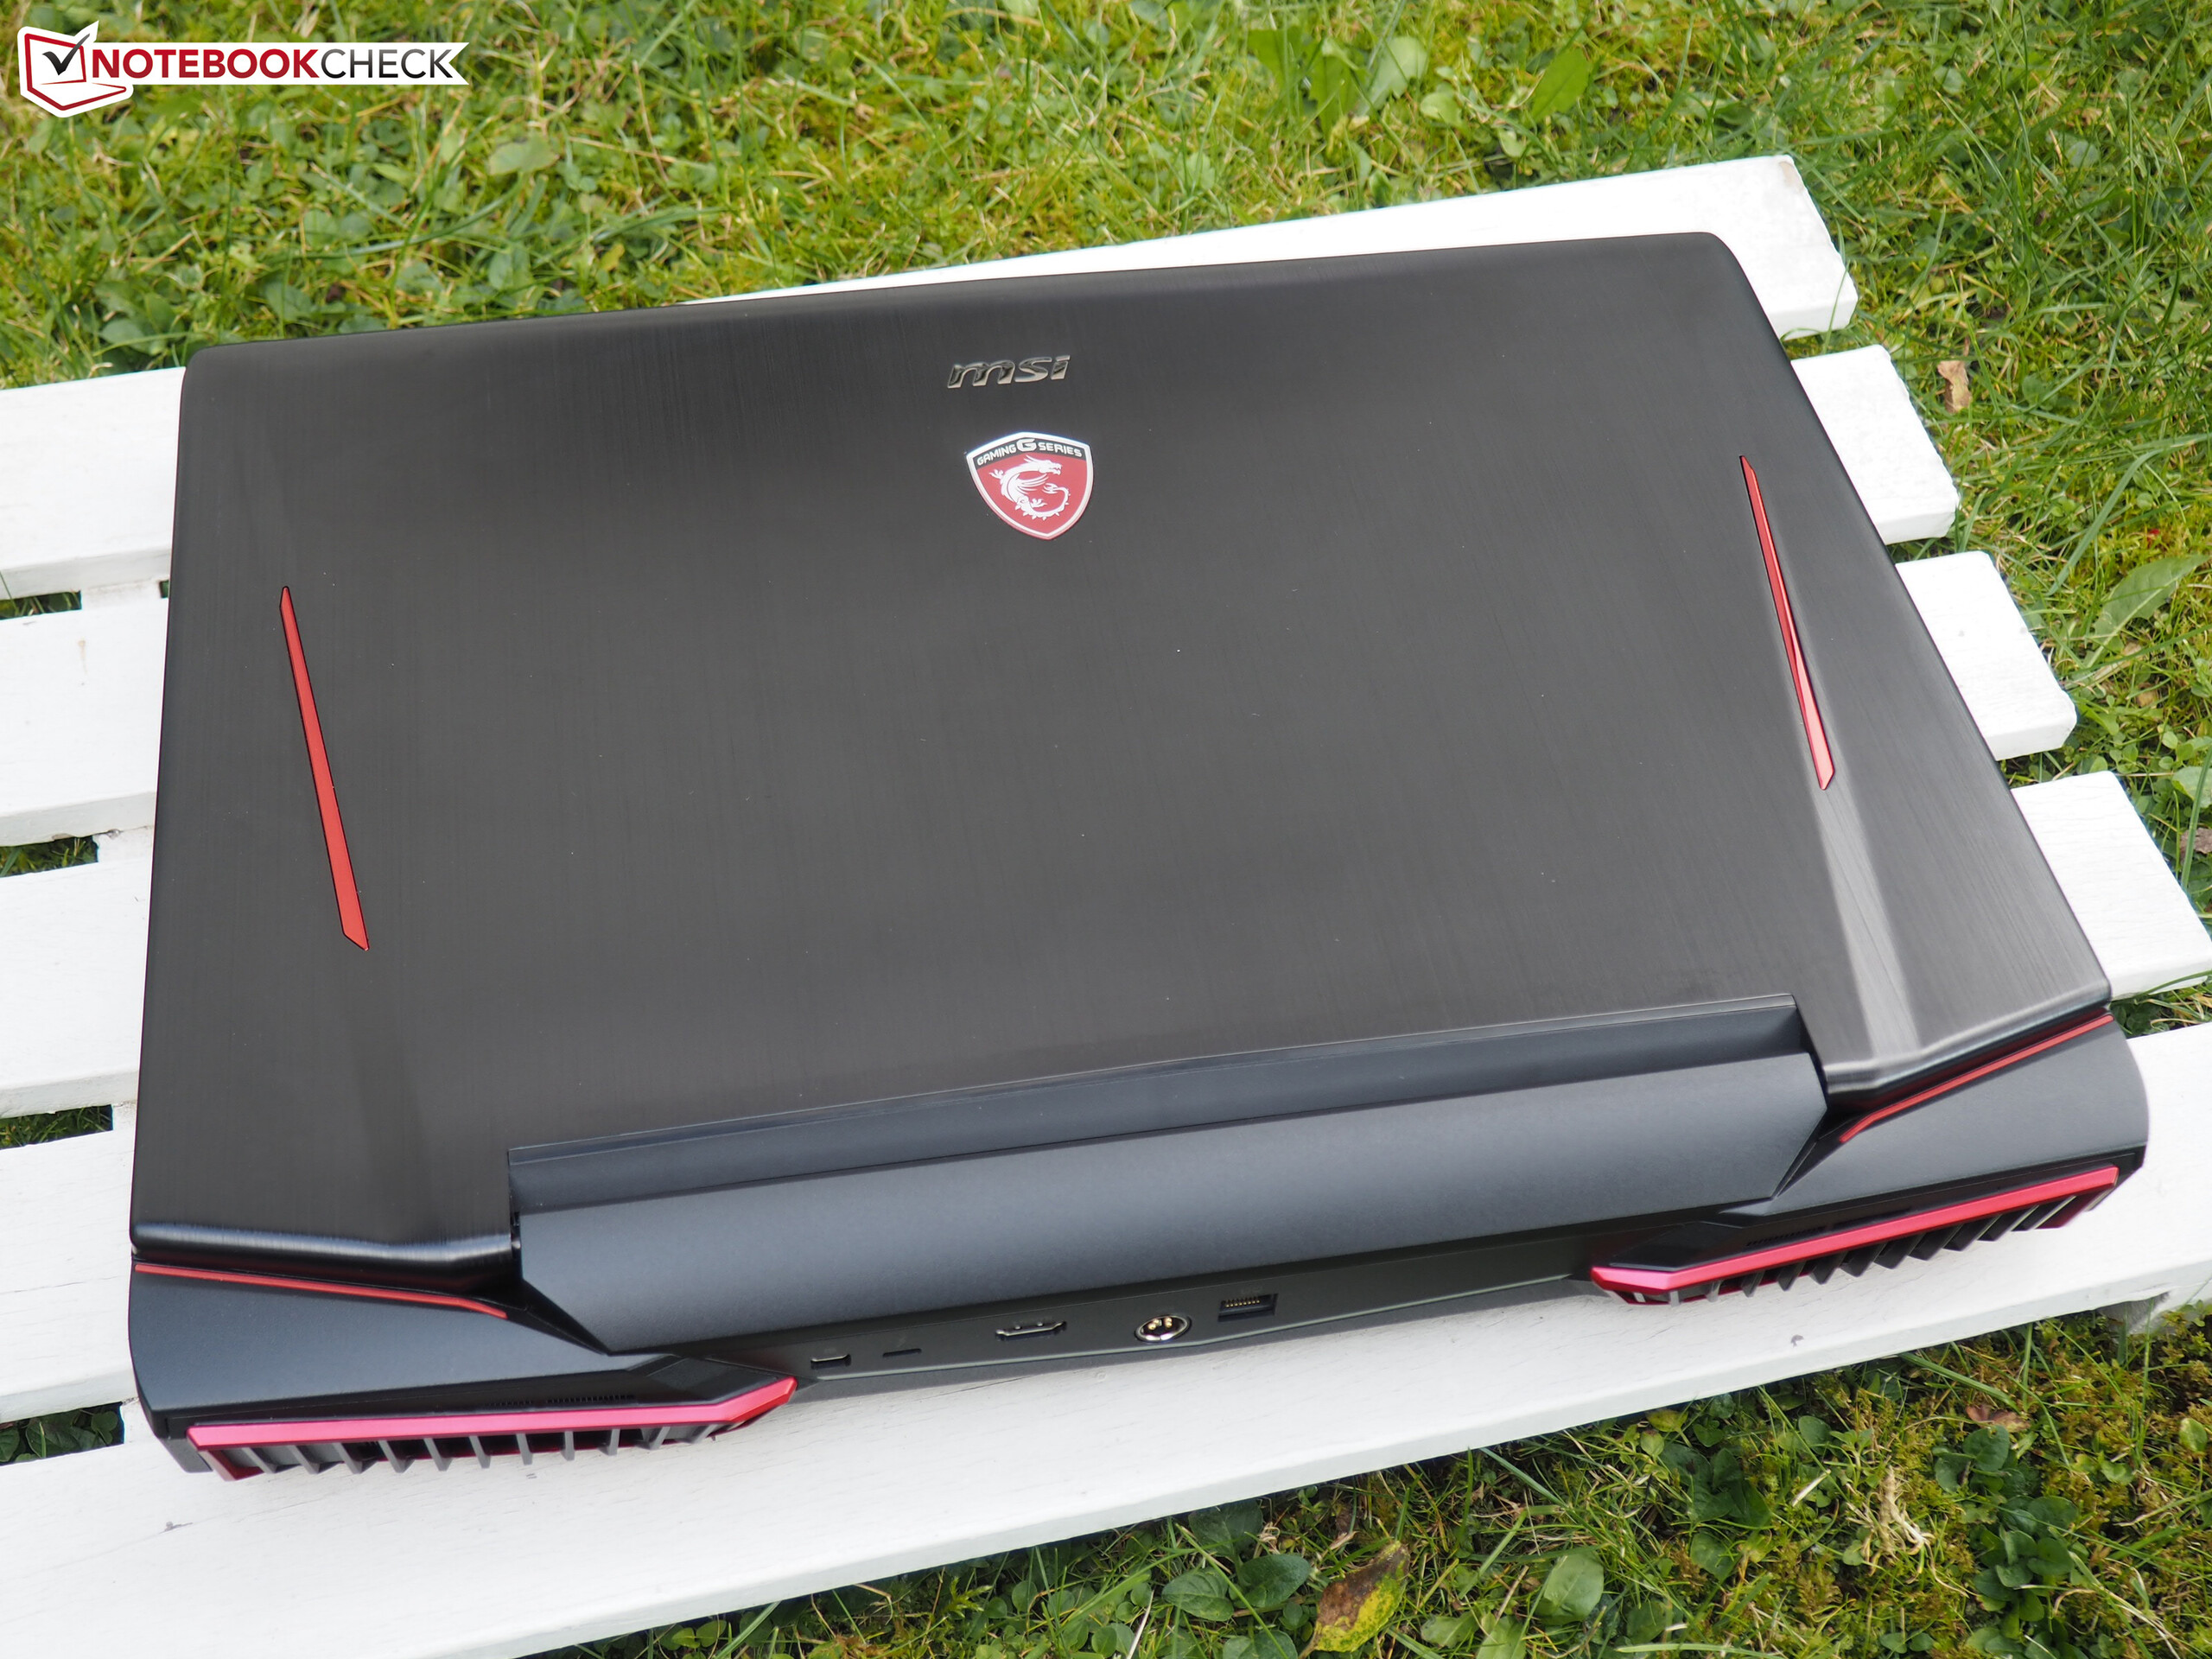
Yes, due to their single-GPU solution with GeForce GTX 1050 Ti, GTX 1060, or GTX 1070, smaller devices will offer considerably less performance, but it is debatable whether it is still necessary to be such a giant in 2017. After all, most demands will be satisfied by a single GTX 1080. The corresponding 17-inch notebooks such as the Acer Predator 17 X, Asus G701VIK, MSI GT73VR, and Schenker XMG U727 models listed in the article don't quite scream "tower PC" as loudly. The latter even needs only one power supply, instead of two. In short, the GT83VR is only suited as a desktop replacement that is operated stationary.
Note: Apparently our test unit was a dud. First, the card reader died during the SD-card test and only worked sporadically after that. Then during idle mode, there was an extremely annoying coil whine, which might however affect the whole model series. Because of those problems, the final grade of the GT83VR is lowered by 1% and the grade for the volume segment by 5%.
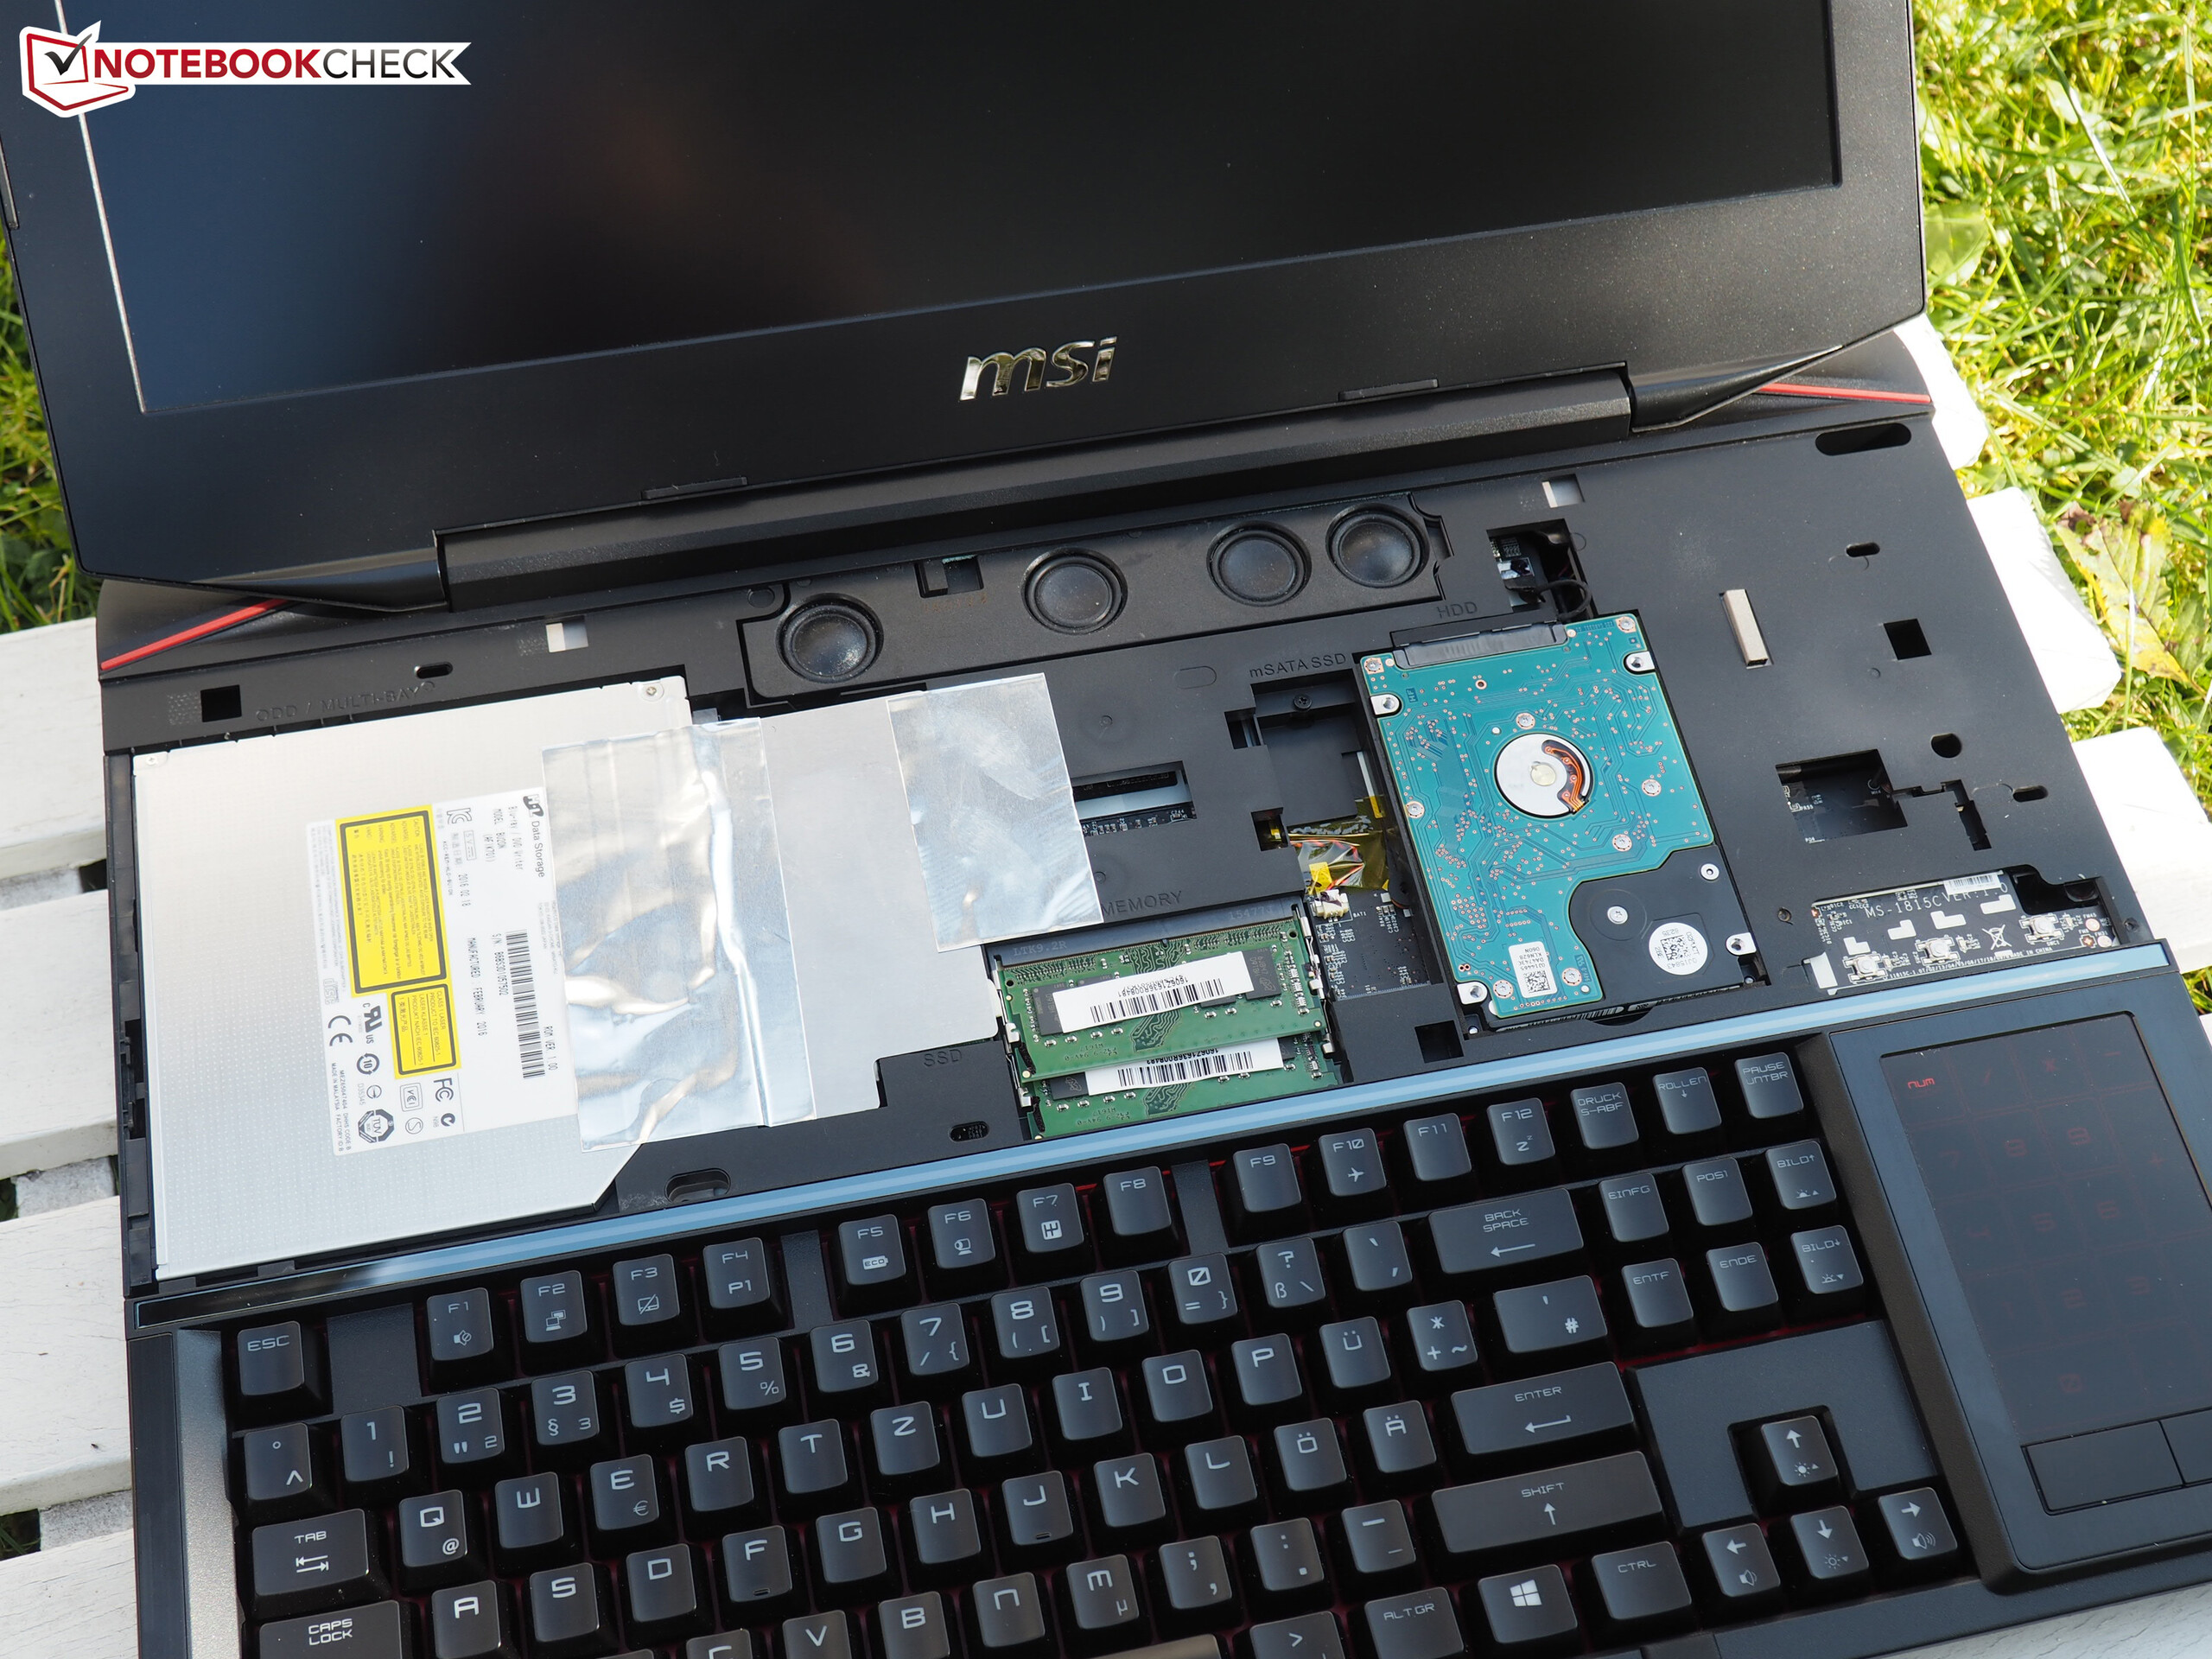
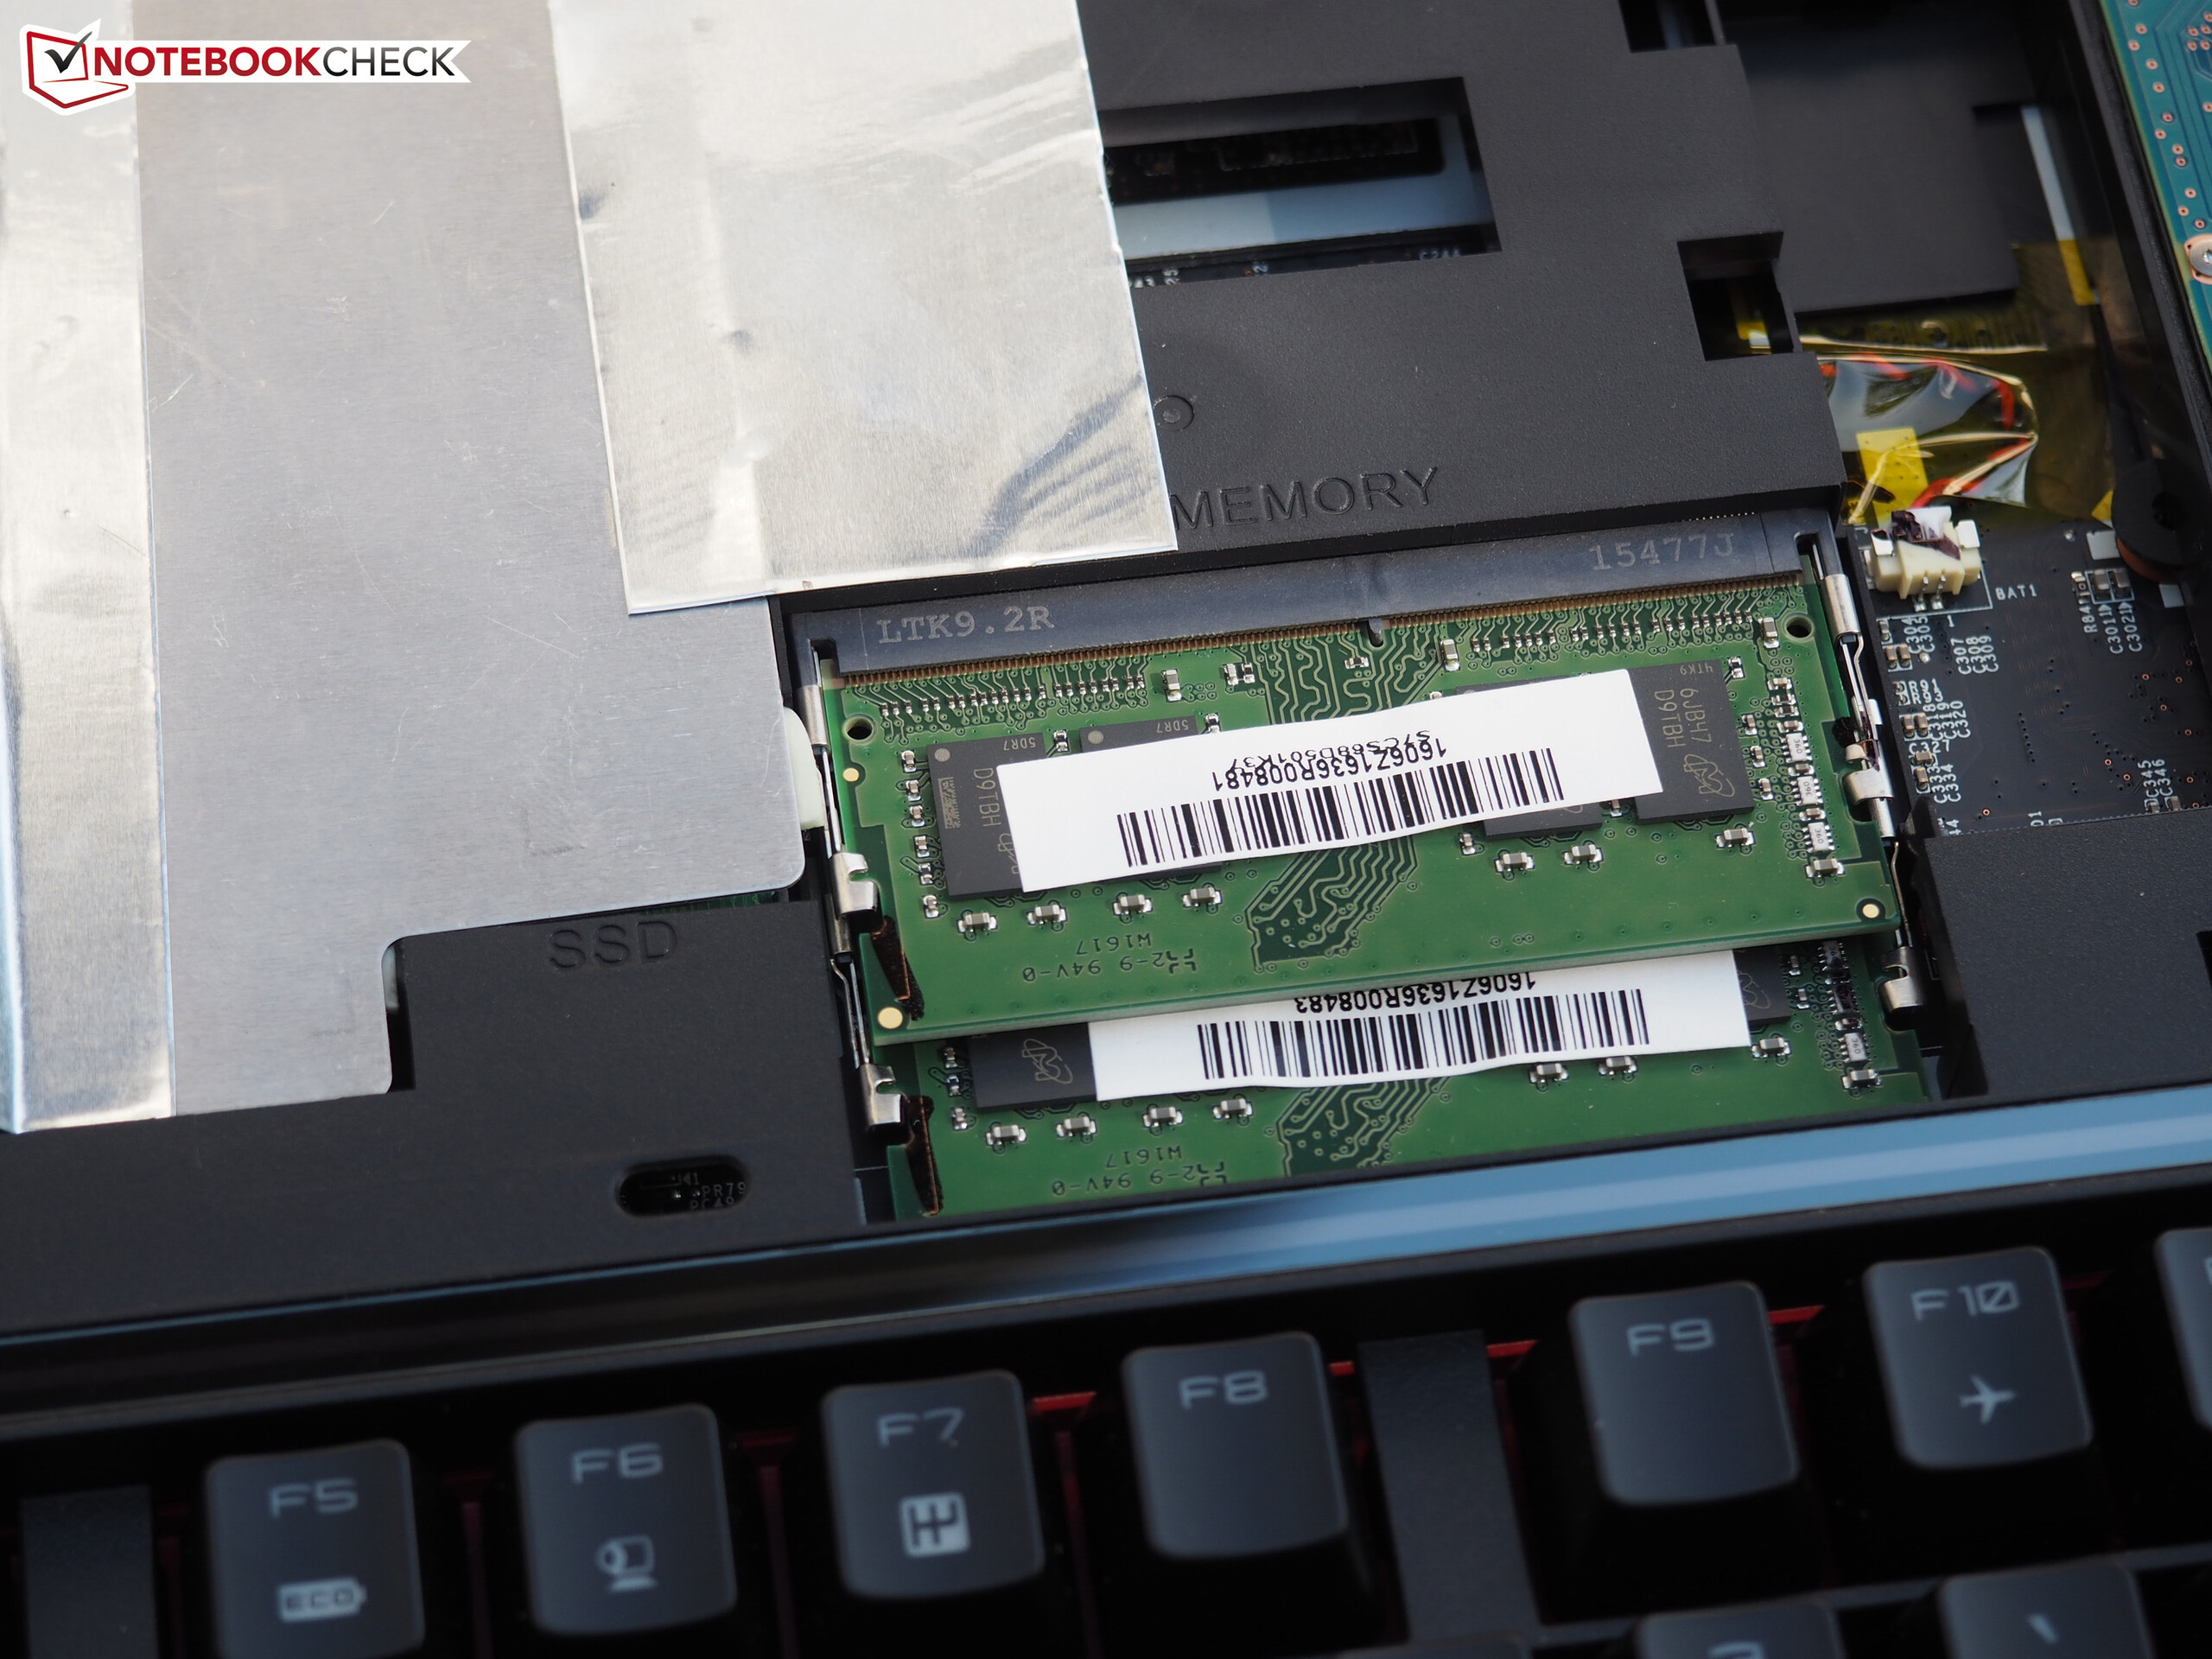
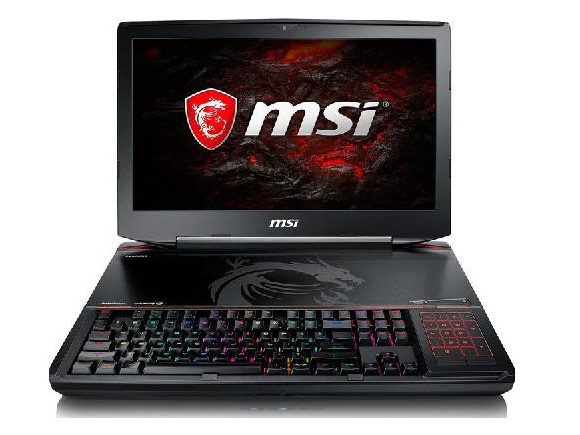
By the way, we took the pictures from the predecessor. Due to their similarity, we also did not evaluate the case, features, input devices, and speakers. You can find that information in the review of the GT83VR 6RE.
| SD Card Reader | |
| average JPG Copy Test (av. of 3 runs) | |
| Asus G701VIK-BA049T | |
| MSI GT73VR 7RF-296 | |
| Schenker XMG U727 2017 | |
| MSI GT83VR-6RE32SR451 | |
| MSI GT83VR 7RF-206 Titan SLI | |
| Acer Predator 17 X GX-792-76DL | |
| maximum AS SSD Seq Read Test (1GB) | |
| Asus G701VIK-BA049T | |
| MSI GT73VR 7RF-296 | |
| Schenker XMG U727 2017 | |
| MSI GT83VR 7RF-206 Titan SLI | |
| MSI GT83VR-6RE32SR451 | |
| Acer Predator 17 X GX-792-76DL | |
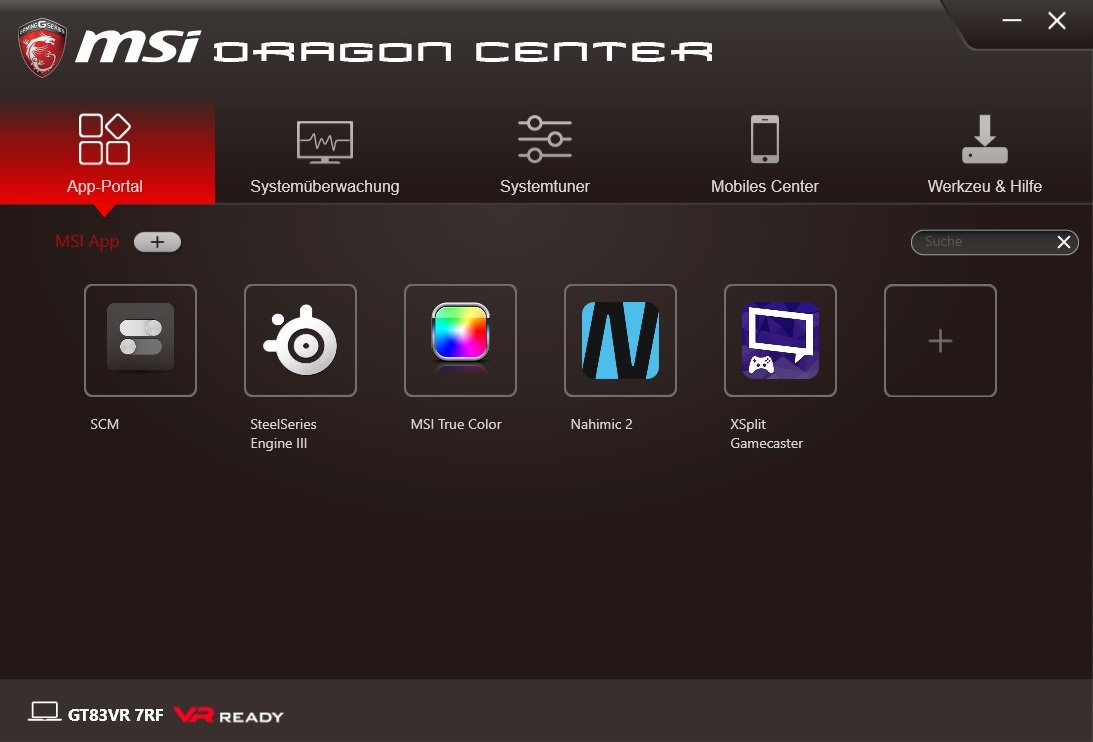
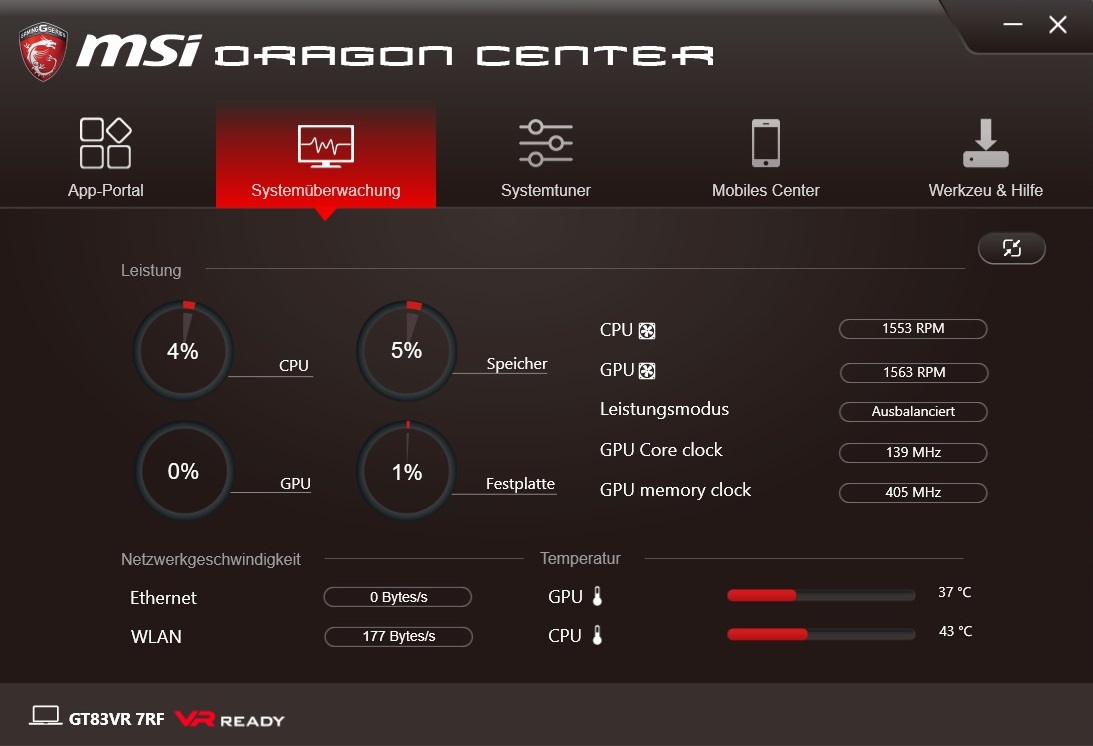
Software
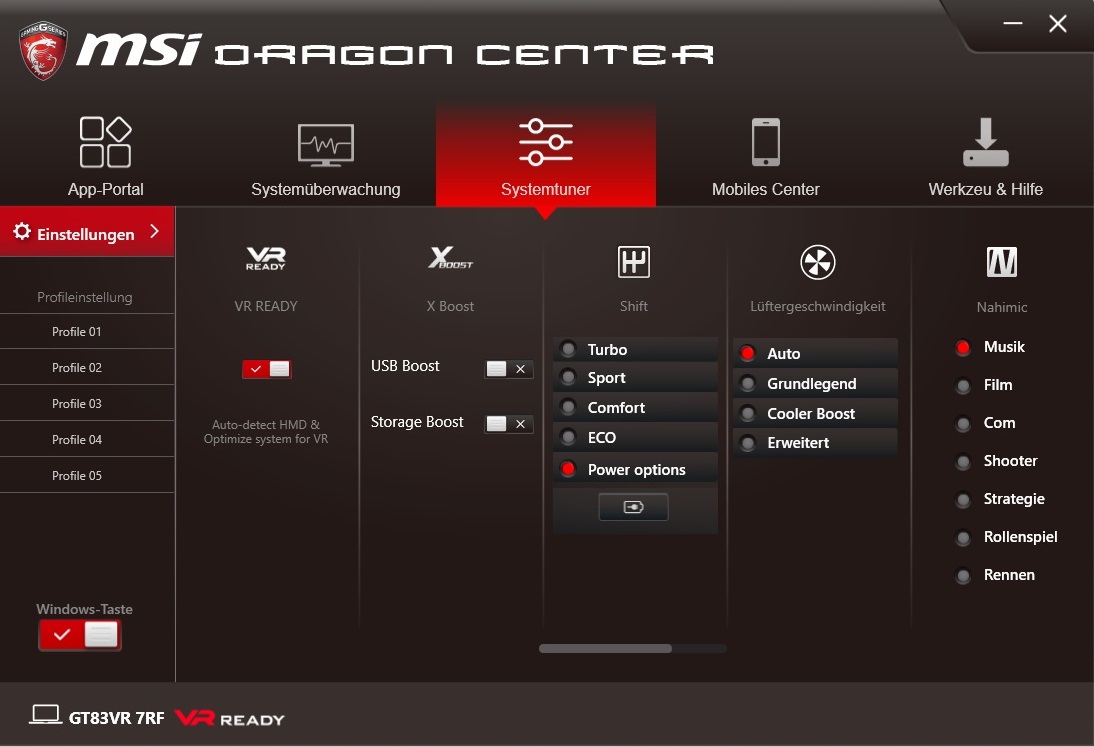
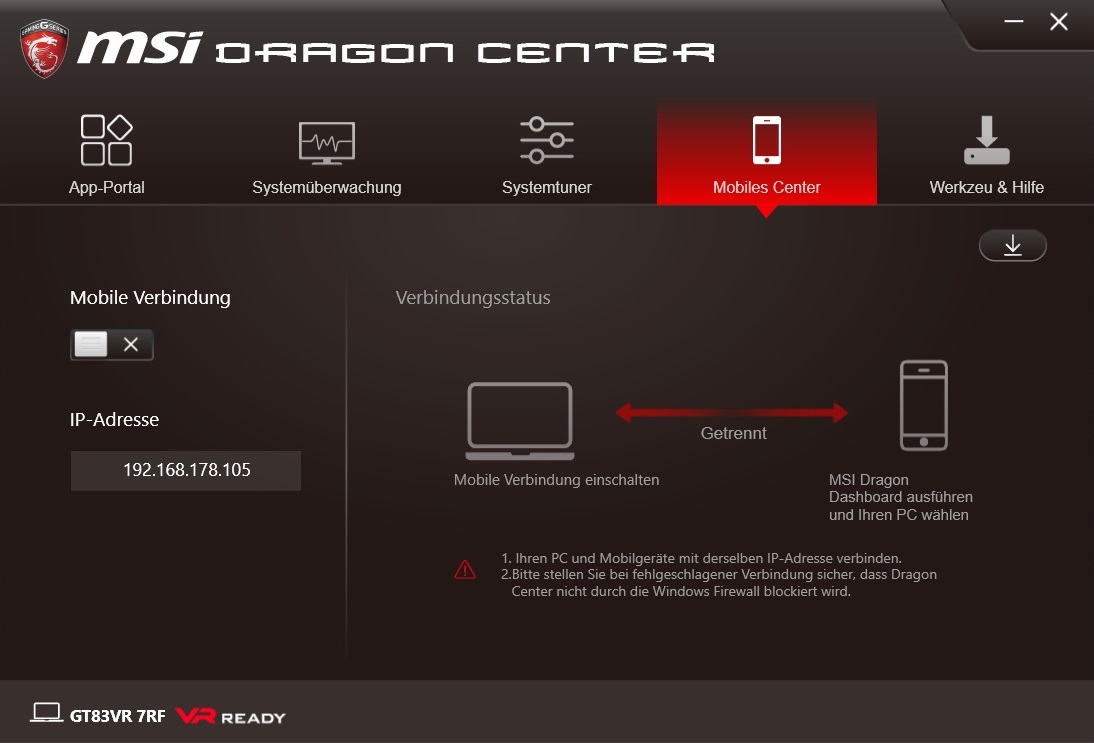
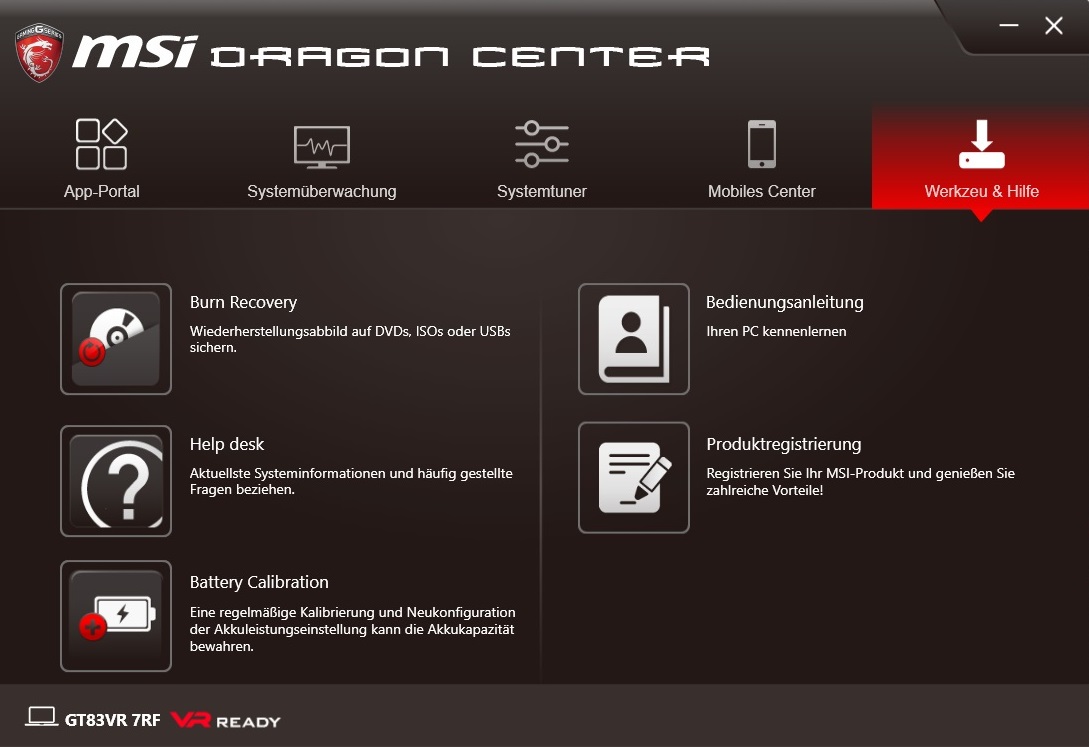
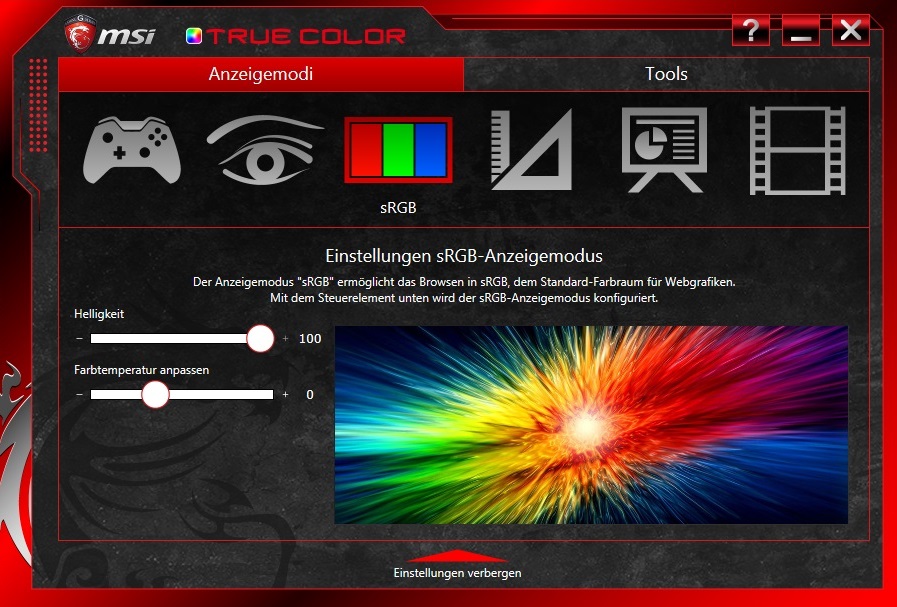
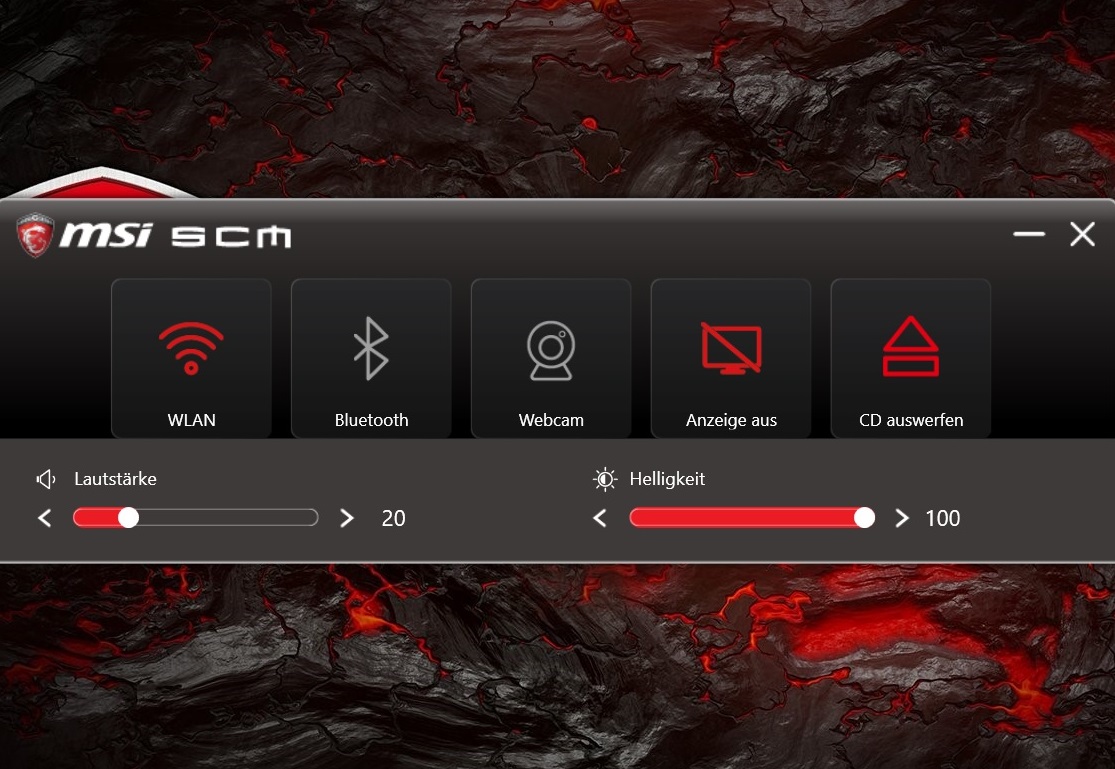
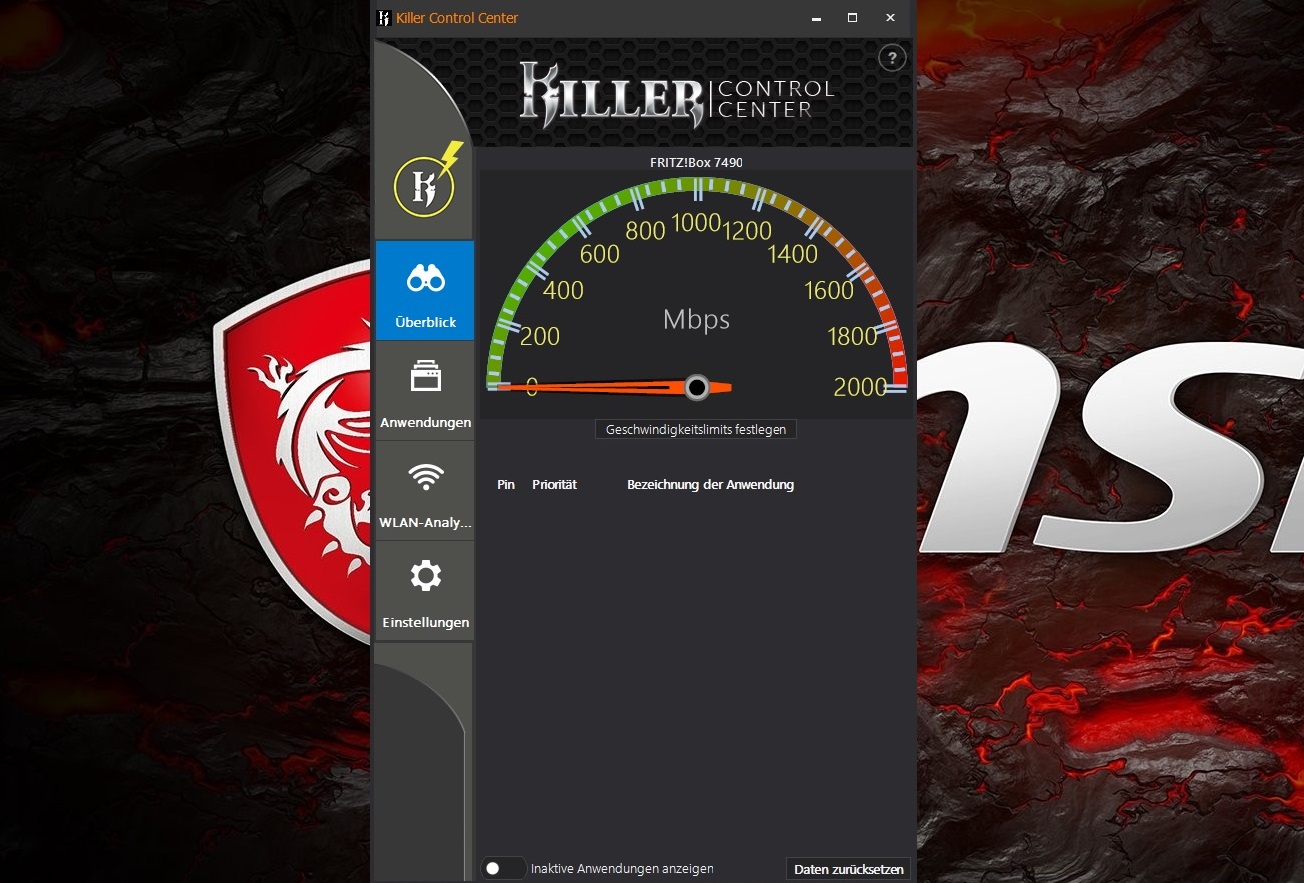
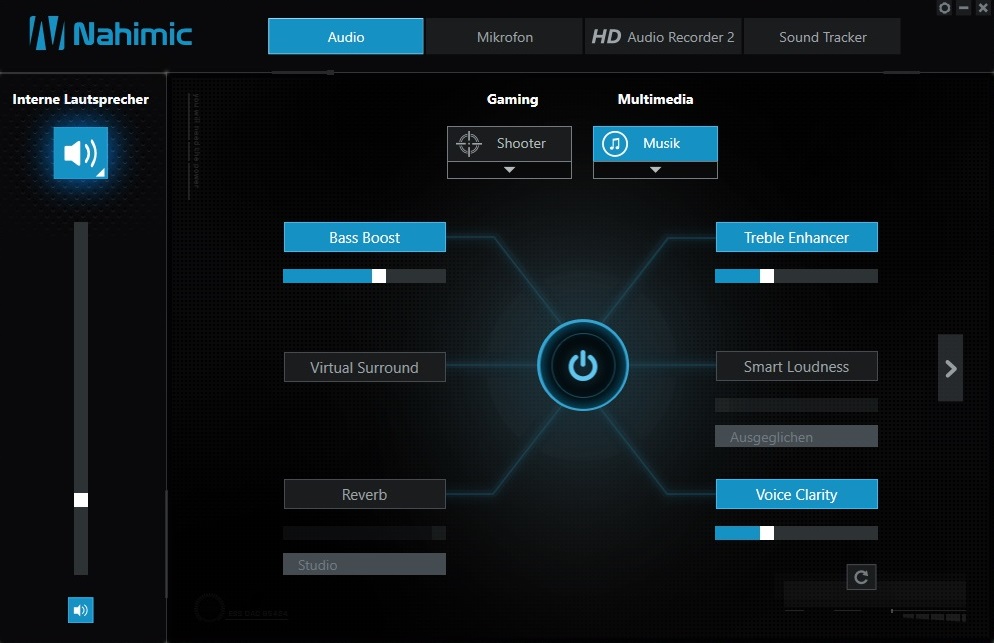
As is customary for MSI laptops, the software offerings are ample. Dragon Center, which unites various features, is once again the hub. Gamers will be particularly happy about the System Tuner tab whose Turbo mode allows overclocking the GPU (Standard OC: +100 MHz @core, +200 MHz @VRAM).
All of our tests were done with the "Power Options" Shift setting, which uses the Windows settings. SLI was active, but the optional fan button (which increases the rpm to benefit the temperatures) was off. The sRGB preset mode was used as display setting (True Color), which noticeably lowers the maximum brightness of the panel.
Display
One of the greatest weaknesses of the GT83VR is the Full HD display in our opinion. With that, we do not primarily mean that 1920x1080 pixels is not that much on the 18.4-inch display (120 ppi), but the fact that the two GTX-1080 GPUs are not challenged enough at all with this resolution. For this amount of pixels, even a single GTX-1080 is more than enough, as long as there is only a 60-Hz panel under the frame, as is the case for the GT83VR.
| |||||||||||||||||||||||||
Brightness Distribution: 83 %
Center on Battery: 266 cd/m²
Contrast: 760:1 (Black: 0.35 cd/m²)
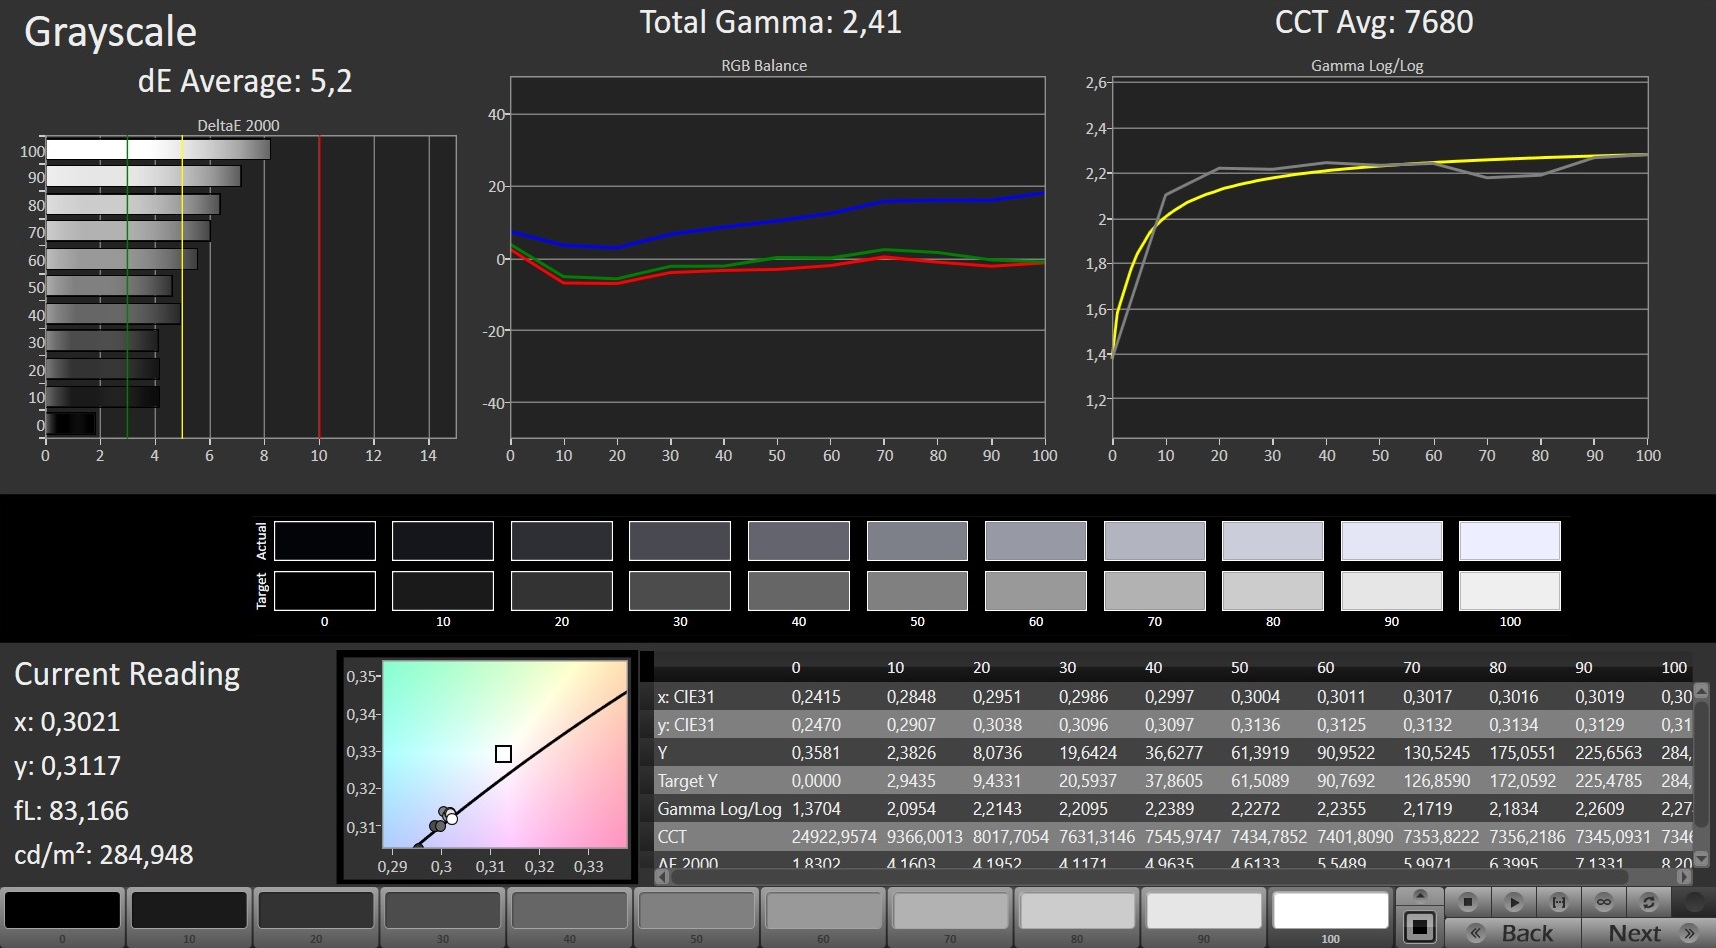
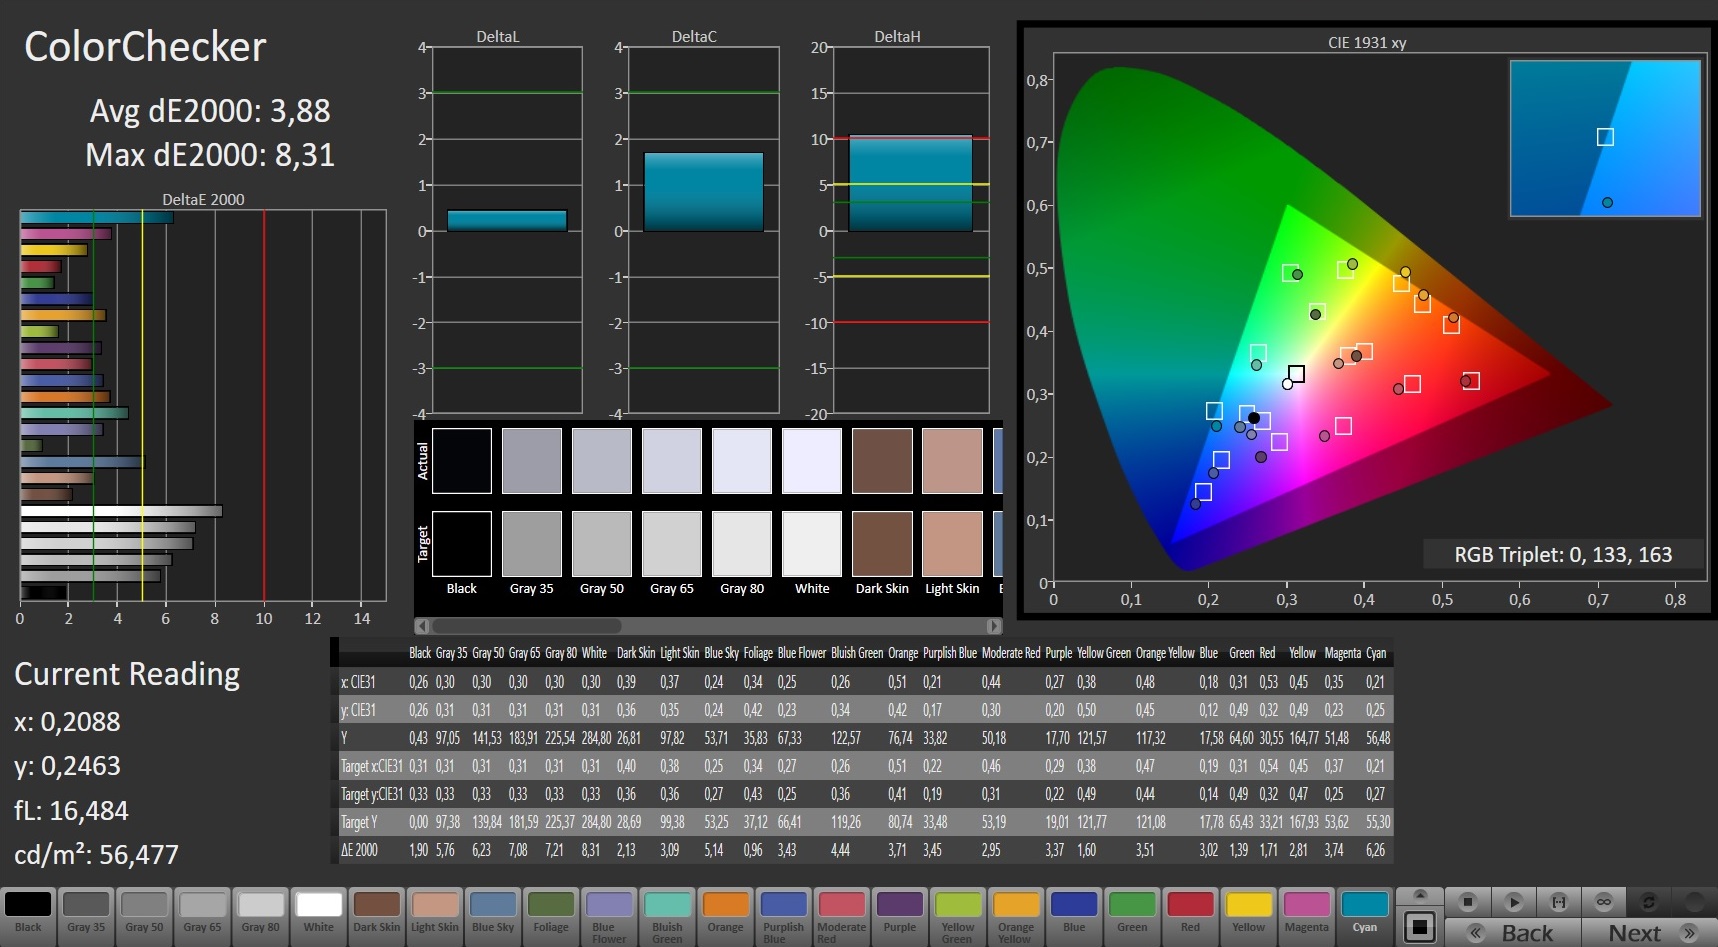
ΔE ColorChecker Calman: 3.88 | ∀{0.5-29.43 Ø4.71}
ΔE Greyscale Calman: 5.2 | ∀{0.09-98 Ø4.96}
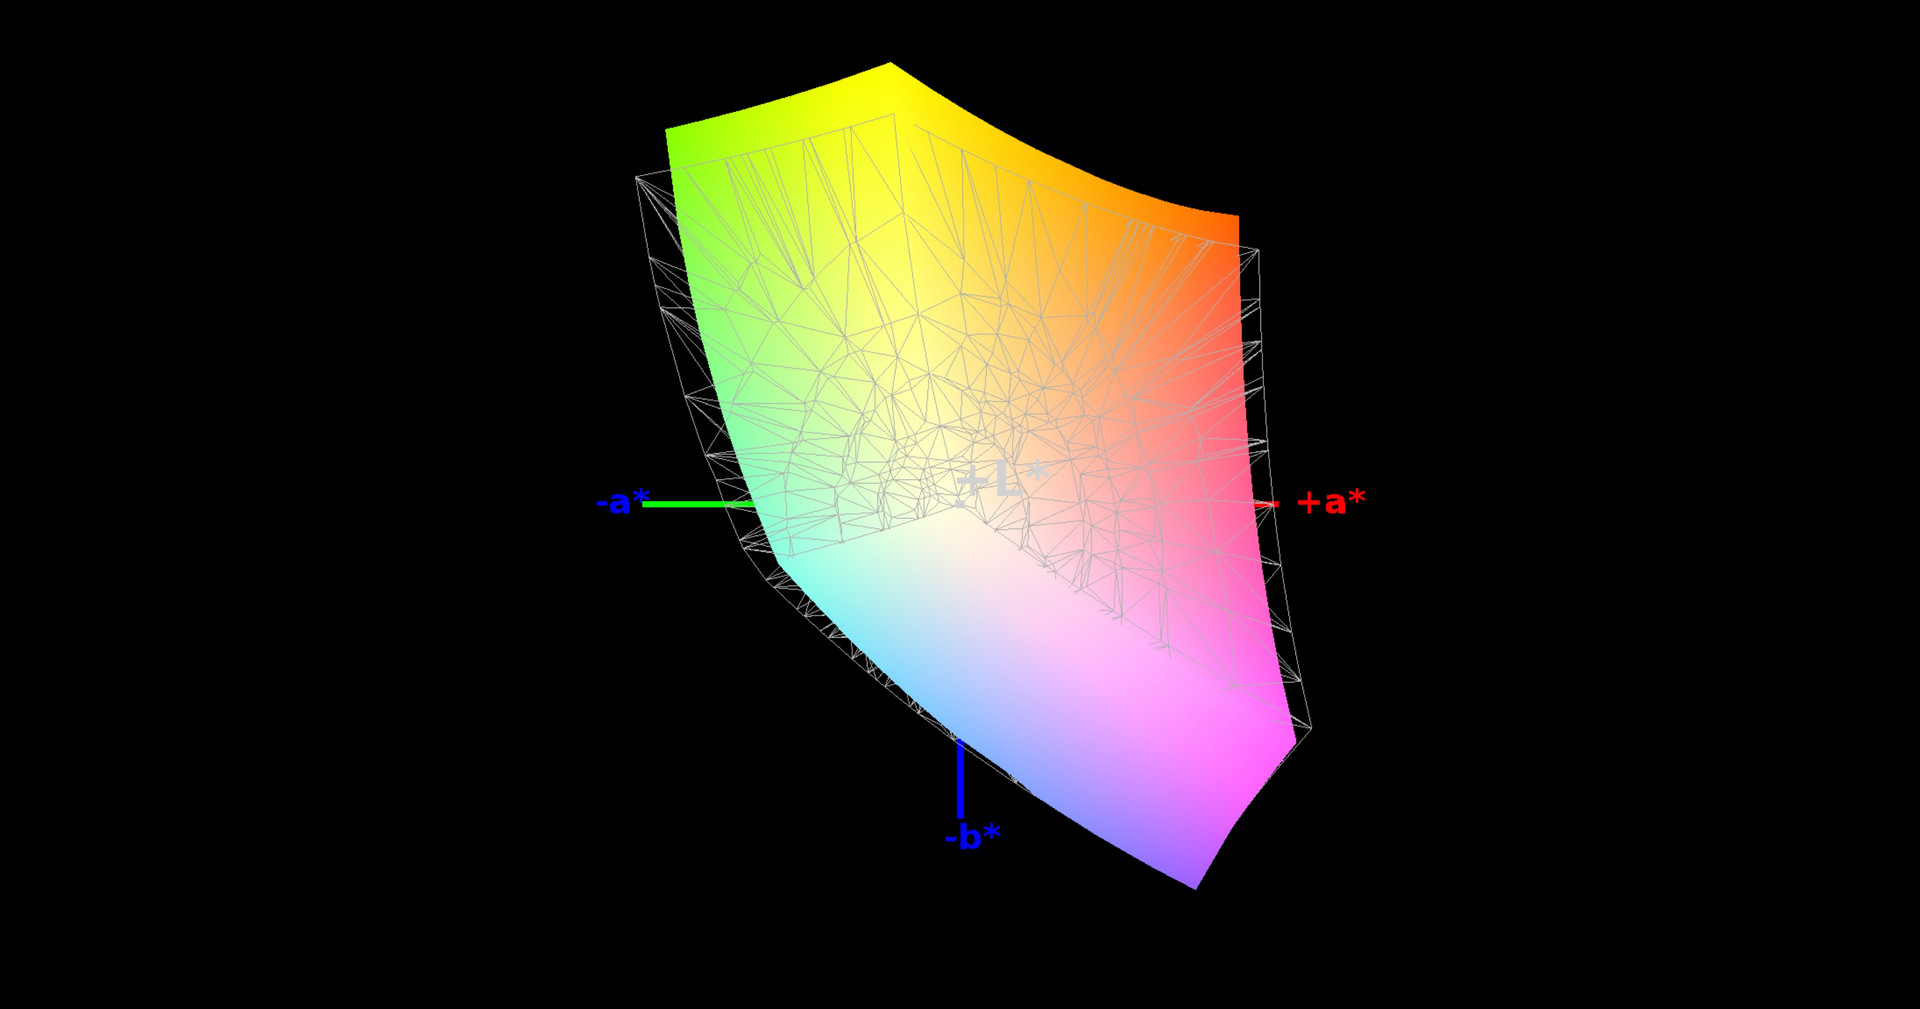
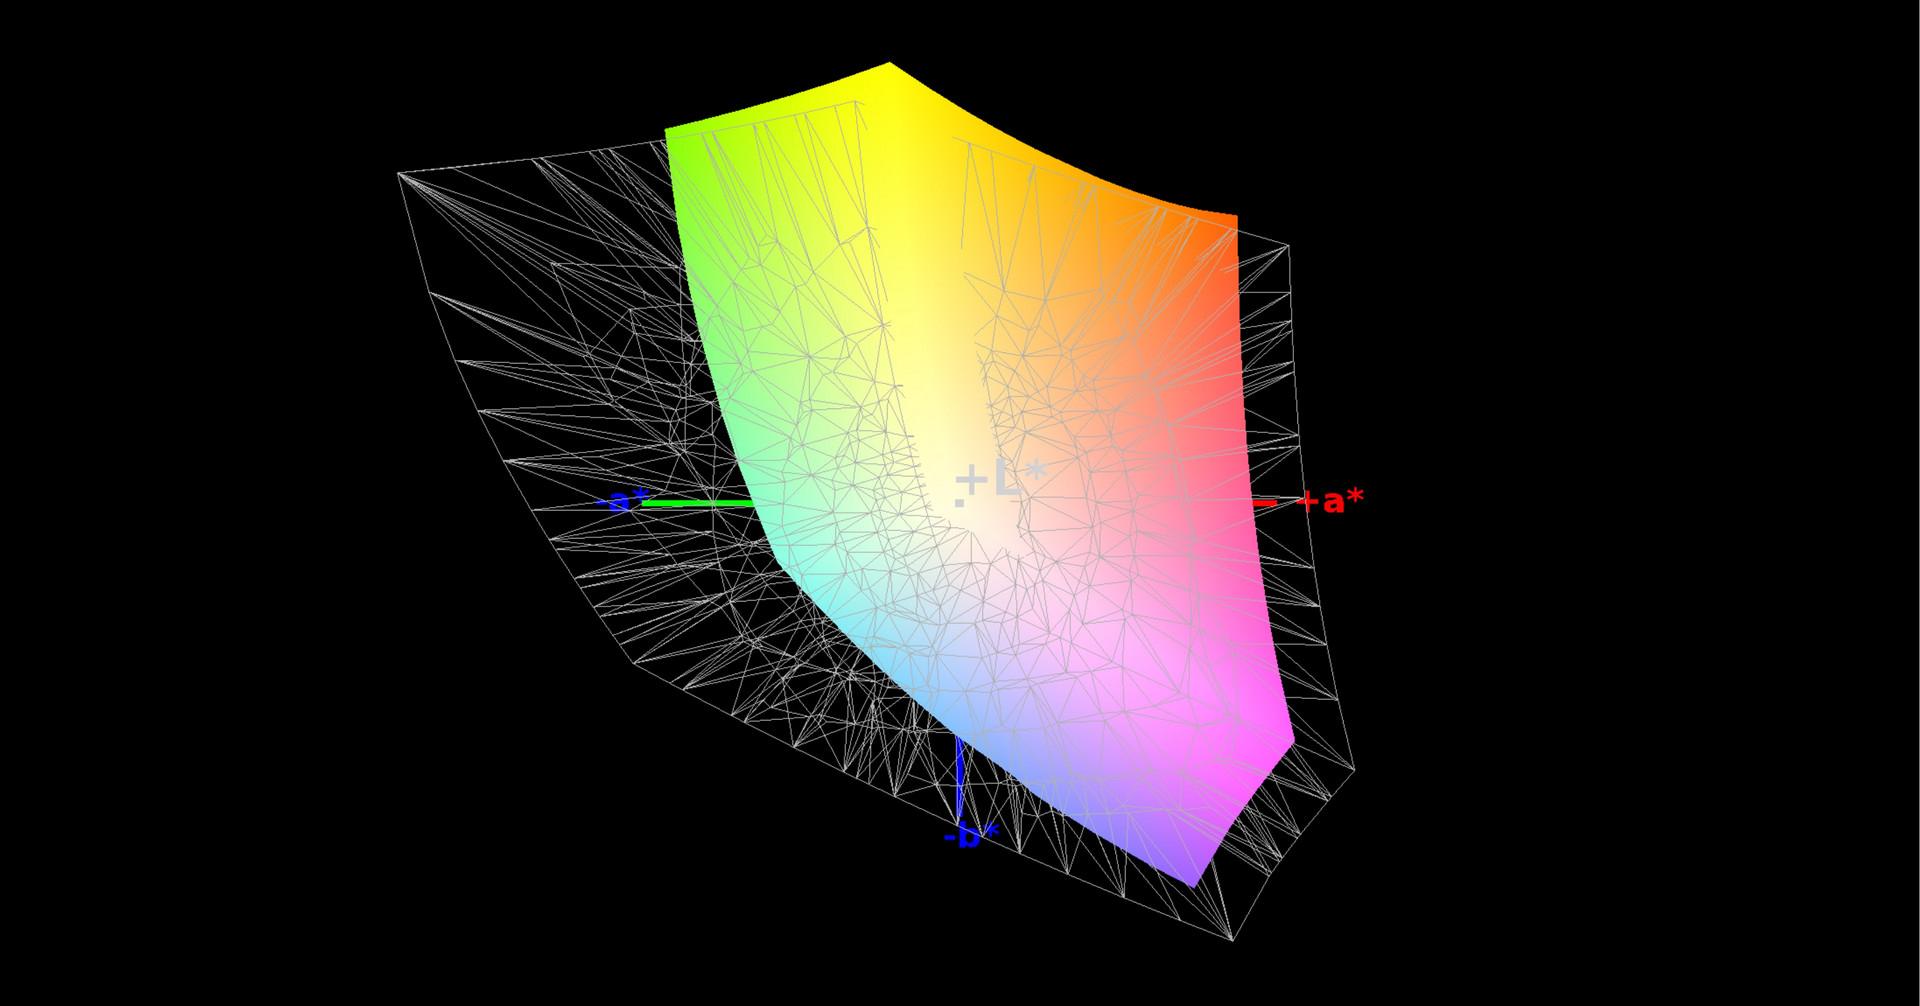
91% sRGB (Argyll 1.6.3 3D)
59% AdobeRGB 1998 (Argyll 1.6.3 3D)
66.4% AdobeRGB 1998 (Argyll 3D)
90.8% sRGB (Argyll 3D)
65.7% Display P3 (Argyll 3D)
Gamma: 2.41
CCT: 7680 K
| MSI GT83VR 7RF-206 Titan SLI Samsung 184HL (SDC4C48), 1920x1080, 18.4" | MSI GT83VR-6RE32SR451 Samsung 184HL (SDC4C48), 1920x1080, 18.4" | Schenker XMG U727 2017 AU Optronics B173ZAN01.0 (AUO109B), 3840x2160, 17.3" | Acer Predator 17 X GX-792-76DL LP173WF4-SPF5 (LGD056D), 1920x1080, 17.3" | Asus G701VIK-BA049T B173HAN01.1 (AUO119D), 1920x1080, 17.3" | MSI GT73VR 7RF-296 N173HHE-G32 (CMN1747), 1920x1080, 17.3" | |
|---|---|---|---|---|---|---|
| Display | -0% | 31% | -5% | -0% | 25% | |
| Display P3 Coverage (%) | 65.7 | 65.8 0% | 86.6 32% | 66 0% | 68.8 5% | 90.6 38% |
| sRGB Coverage (%) | 90.8 | 90.3 -1% | 99.9 10% | 83.7 -8% | 87.7 -3% | 99.9 10% |
| AdobeRGB 1998 Coverage (%) | 66.4 | 66.1 0% | 99.5 50% | 61.2 -8% | 64.1 -3% | 84.7 28% |
| Response Times | 8% | -16% | -17% | 9% | 52% | |
| Response Time Grey 50% / Grey 80% * (ms) | 38.4 ? | 37 ? 4% | 44 ? -15% | 45 ? -17% | 38 ? 1% | 26 ? 32% |
| Response Time Black / White * (ms) | 24 ? | 21 ? 12% | 28 ? -17% | 28 ? -17% | 20 ? 17% | 7 ? 71% |
| PWM Frequency (Hz) | 250 ? | 250 ? | ||||
| Screen | 20% | 31% | 14% | 15% | -18% | |
| Brightness middle (cd/m²) | 266 | 310 17% | 362 36% | 380 43% | 306 15% | 307 15% |
| Brightness (cd/m²) | 243 | 277 14% | 344 42% | 362 49% | 299 23% | 284 17% |
| Brightness Distribution (%) | 83 | 84 1% | 85 2% | 91 10% | 91 10% | 85 2% |
| Black Level * (cd/m²) | 0.35 | 0.4 -14% | 0.35 -0% | 0.37 -6% | 0.27 23% | 0.25 29% |
| Contrast (:1) | 760 | 775 2% | 1034 36% | 1027 35% | 1133 49% | 1228 62% |
| Colorchecker dE 2000 * | 3.88 | 1.83 53% | 2.46 37% | 4.12 -6% | 3.98 -3% | 9.65 -149% |
| Colorchecker dE 2000 max. * | 8.31 | 3.92 53% | 4.26 49% | 8.19 1% | 7.29 12% | 16.36 -97% |
| Greyscale dE 2000 * | 5.2 | 1.38 73% | 2.9 44% | 3.95 24% | 4.15 20% | 10.07 -94% |
| Gamma | 2.41 91% | 2.44 90% | 2.31 95% | 2.47 89% | 2.45 90% | 2.12 104% |
| CCT | 7680 85% | 6723 97% | 6120 106% | 6539 99% | 7386 88% | 12145 54% |
| Color Space (Percent of AdobeRGB 1998) (%) | 59 | 59 0% | 88 49% | 55 -7% | 58 -2% | 75 27% |
| Color Space (Percent of sRGB) (%) | 91 | 90 -1% | 100 10% | 84 -8% | 89 -2% | 100 10% |
| Total Average (Program / Settings) | 9% /
14% | 15% /
24% | -3% /
6% | 8% /
11% | 20% /
0% |
* ... smaller is better
Nvidia's G-Sync technology, which ensures a smoother image without line displacement, is also missing. With the micro-stutters typical for dual GPUs, the image seems noticeably less homogeneous (or you could say "smooth") than in a classical single-chip notebook with G-Sync and/or 120 Hz. However, MSI can only be blamed to a limited extent, since the market probably does not currently offer any suitable 18-inch displays.
Personally, the author would like to retire the 18-inch concept and - if it should be an SLI system - in light of the imminent introduction of Nvidia's Max-Q graphics card, move to a 17-inch case which perhaps MSI is planning anyway.
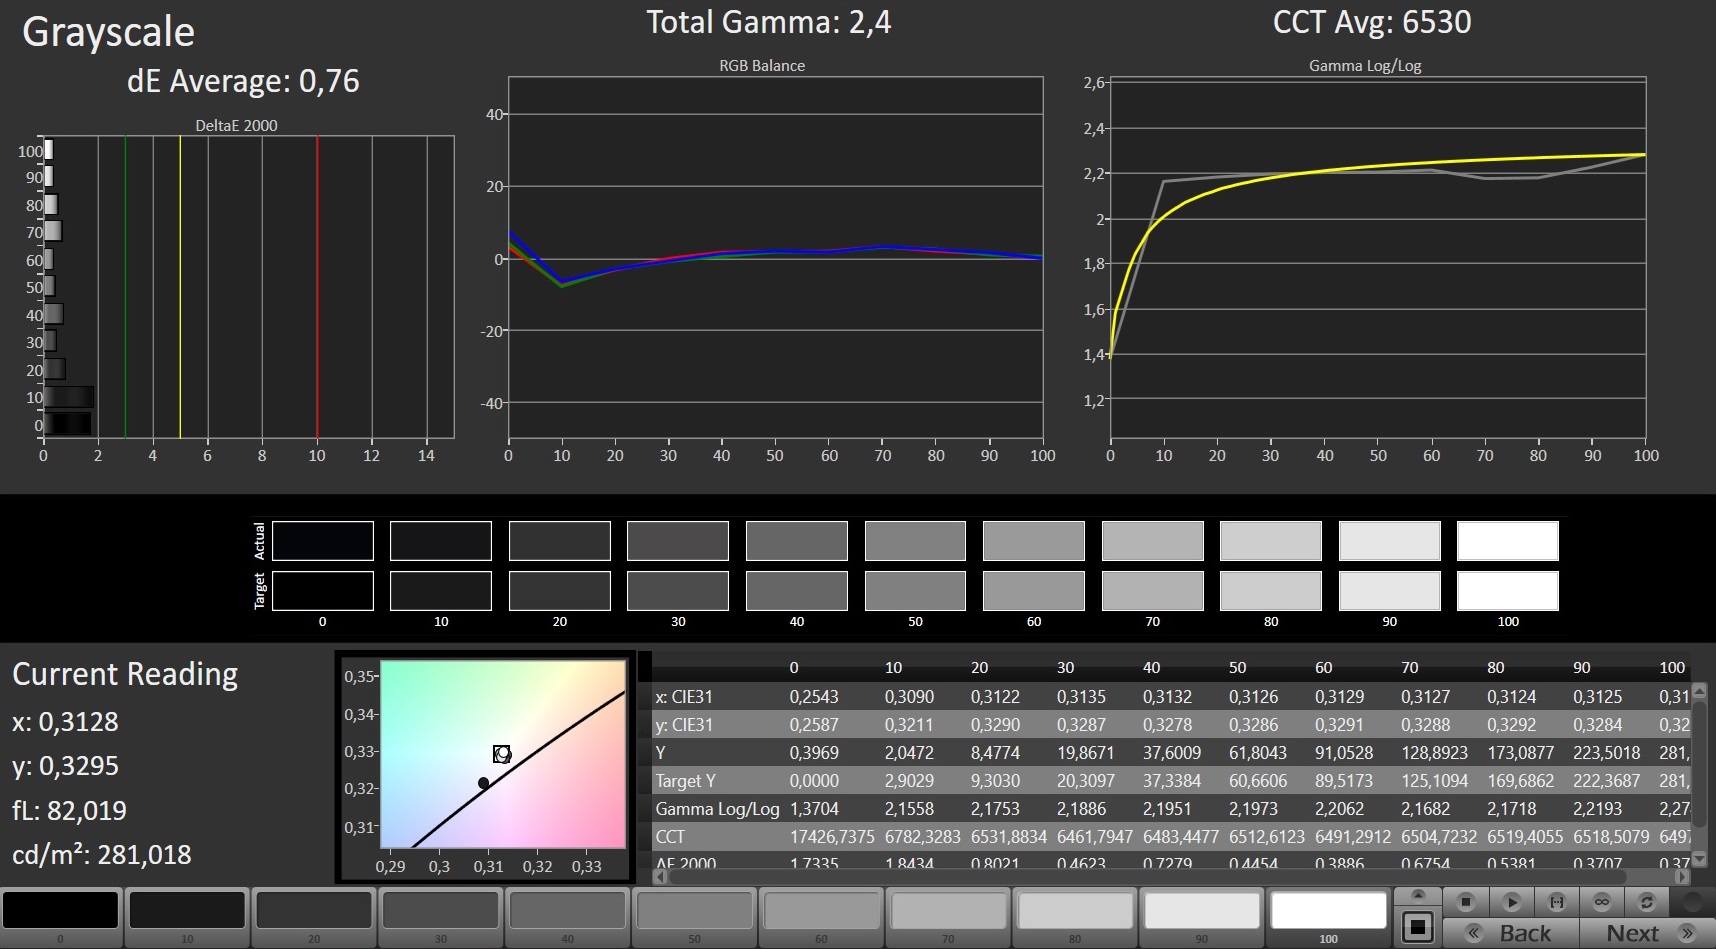
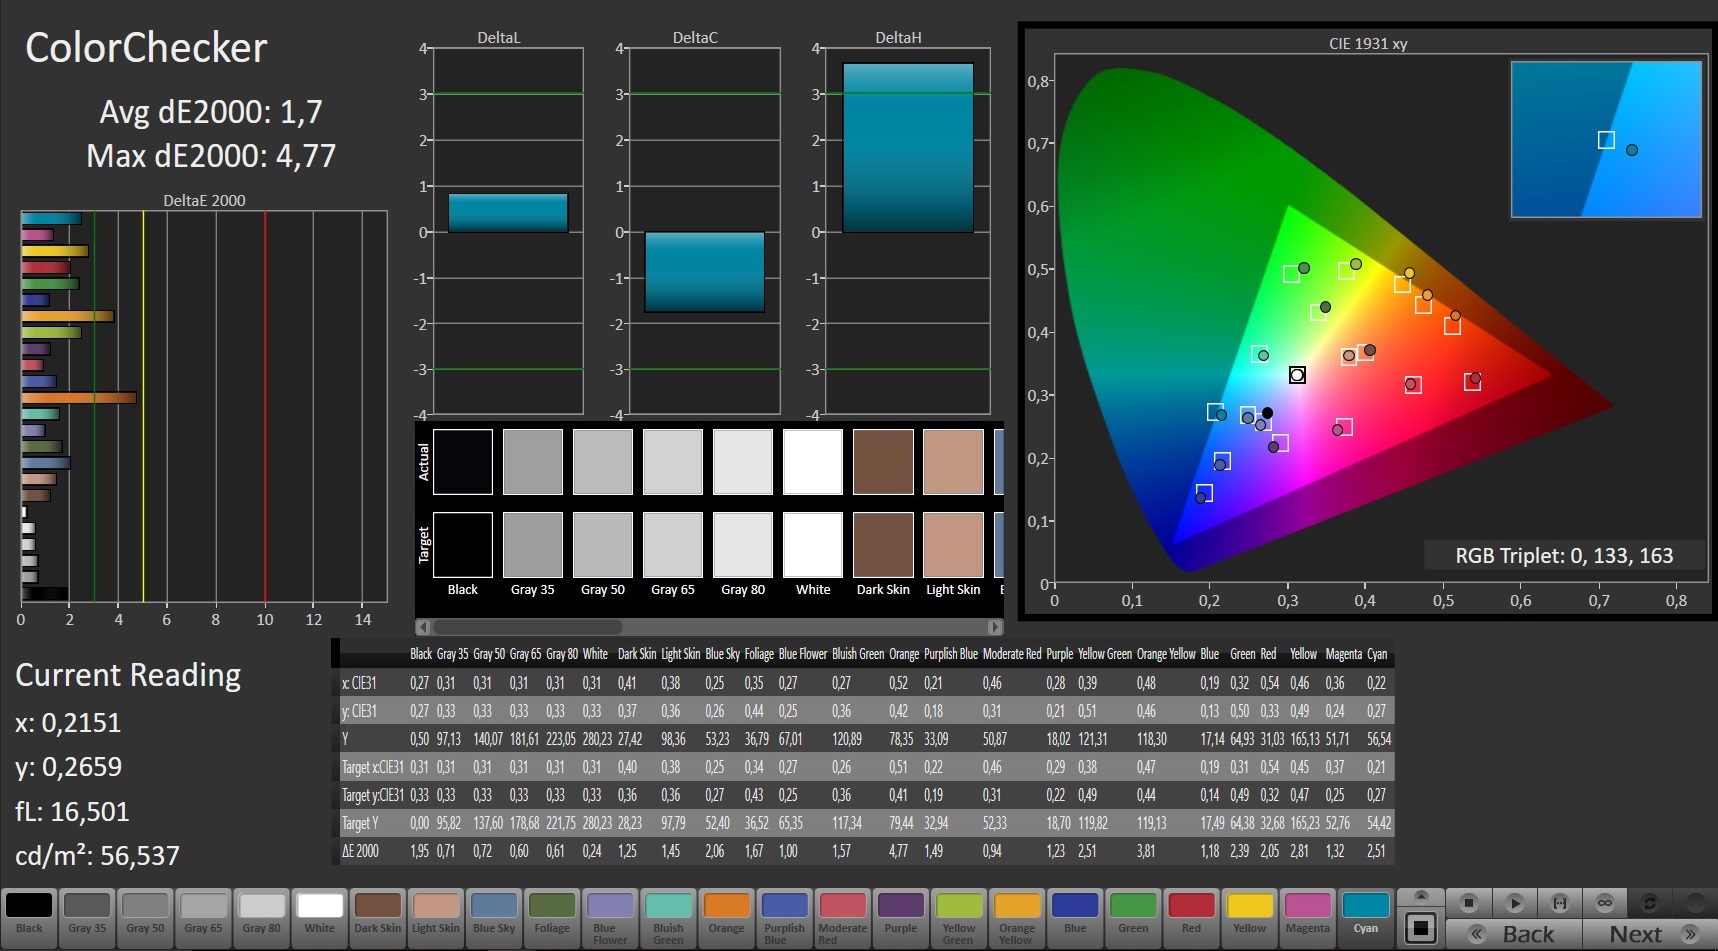
Since in the GT83VR 7RF the panel of the predecessor is used (Samsung 184HL), most of the display values are similar to the GT83VR 6RE, considering that there are always some manufacturing variations. The average brightness of 243 cd/m² is just as mediocre as the contrast of 760:1 and the black value of 0.35 cd/m². The slight blue tint of the panel can be removed through calibration. Our icc file is linked above. You can look up the rest of the advantages and disadvantages of the display in the previous review.
Display Response Times
| ↔ Response Time Black to White | ||
|---|---|---|
| 24 ms ... rise ↗ and fall ↘ combined | ↗ 14.8 ms rise | 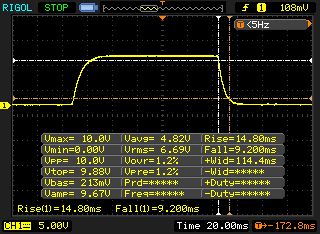 |
| ↘ 9.2 ms fall | ||
| The screen shows good response rates in our tests, but may be too slow for competitive gamers. In comparison, all tested devices range from 0.1 (minimum) to 240 (maximum) ms. » 54 % of all devices are better. This means that the measured response time is worse than the average of all tested devices (19.8 ms). | ||
| ↔ Response Time 50% Grey to 80% Grey | ||
| 38.4 ms ... rise ↗ and fall ↘ combined | ↗ 18.8 ms rise | 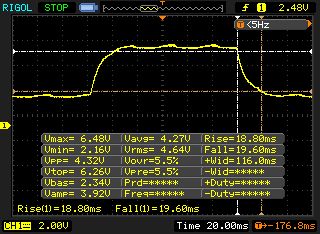 |
| ↘ 19.6 ms fall | ||
| The screen shows slow response rates in our tests and will be unsatisfactory for gamers. In comparison, all tested devices range from 0.165 (minimum) to 636 (maximum) ms. » 58 % of all devices are better. This means that the measured response time is worse than the average of all tested devices (30.9 ms). | ||
Screen Flickering / PWM (Pulse-Width Modulation)
| Screen flickering / PWM detected | 250 Hz | ≤ 90 % brightness setting | 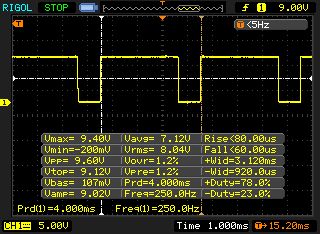 |
The display backlight flickers at 250 Hz (worst case, e.g., utilizing PWM) Flickering detected at a brightness setting of 90 % and below. There should be no flickering or PWM above this brightness setting. The frequency of 250 Hz is relatively low, so sensitive users will likely notice flickering and experience eyestrain at the stated brightness setting and below. In comparison: 52 % of all tested devices do not use PWM to dim the display. If PWM was detected, an average of 7741 (minimum: 5 - maximum: 343500) Hz was measured. | |||
Performance
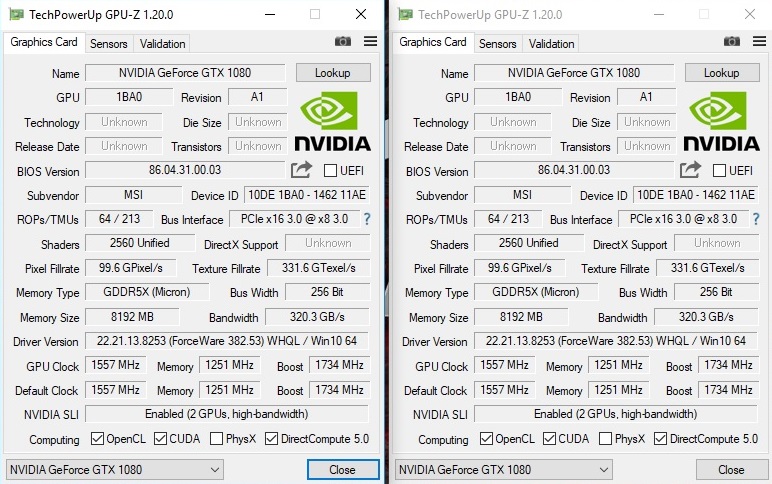
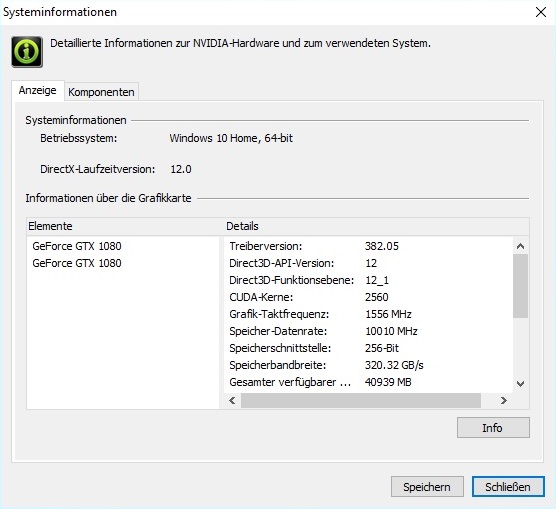
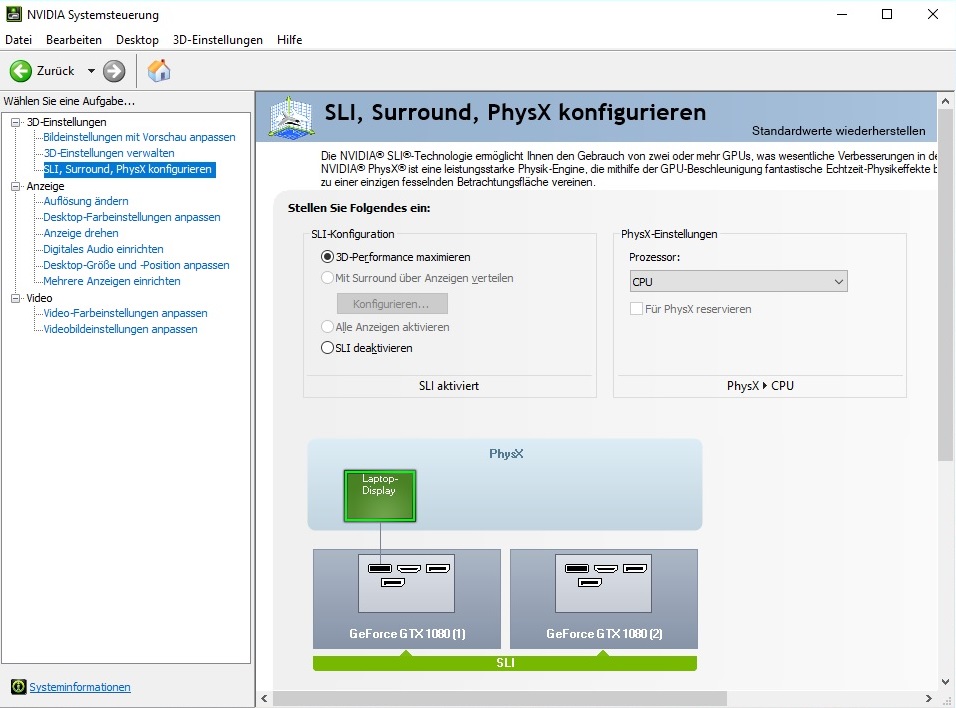
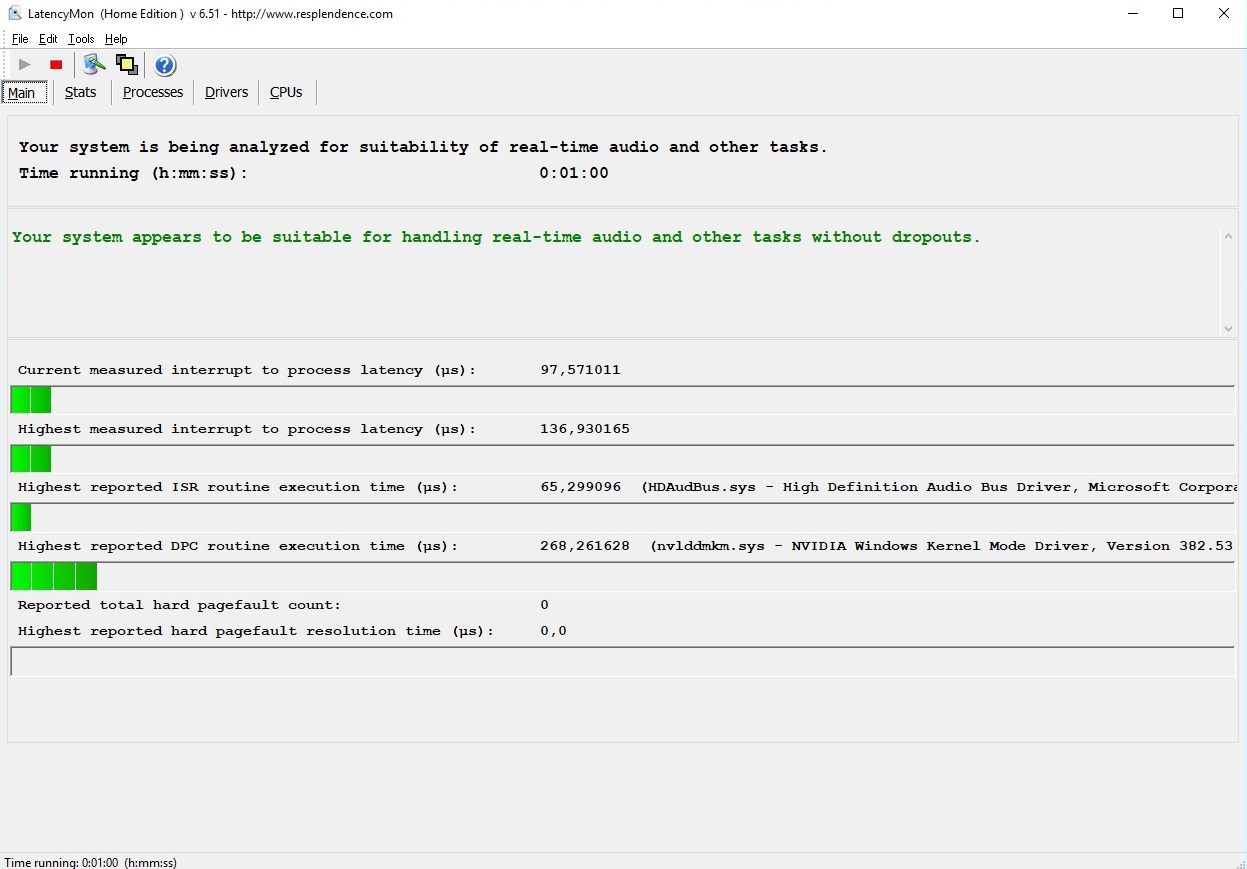
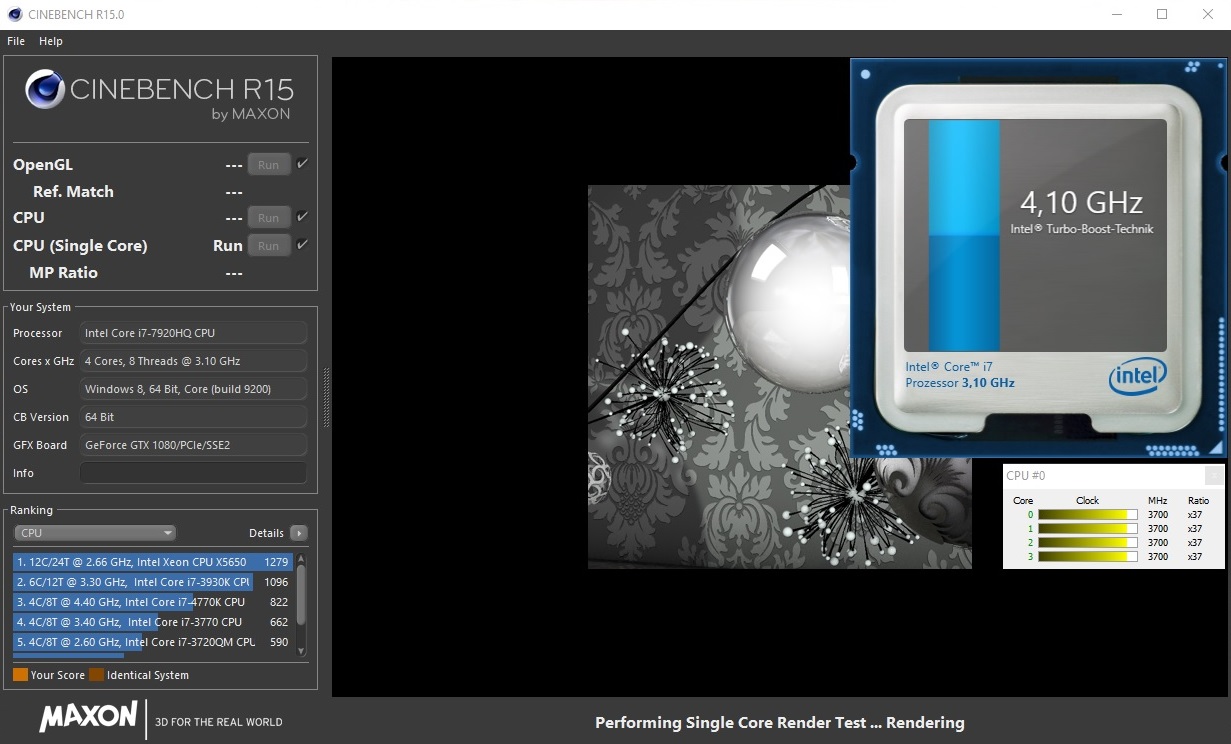
The performance section begins with a sequence of system screenshots.
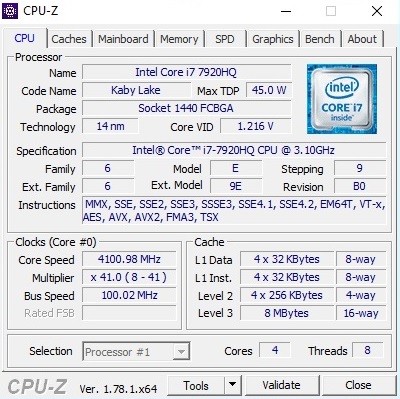
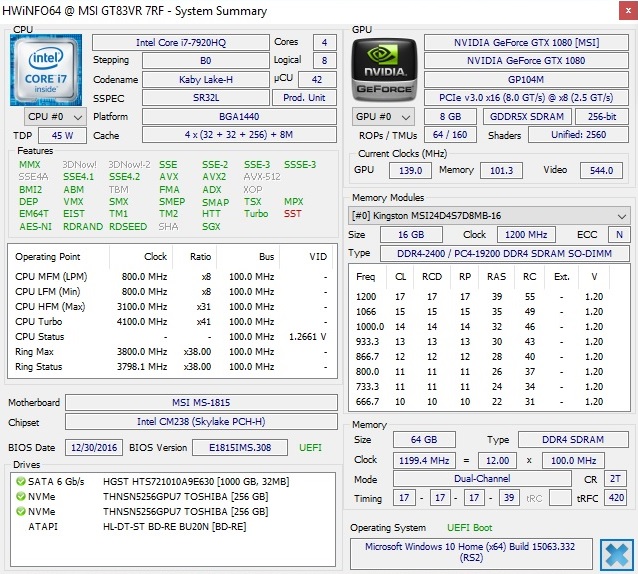
Processor
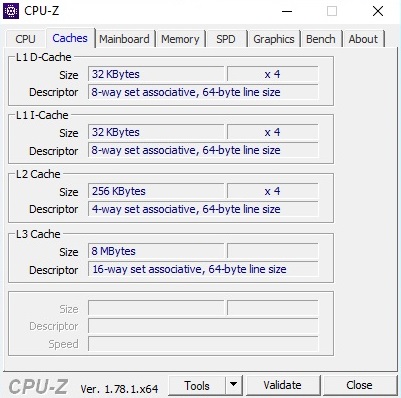
While the Core i7-7820HK Kaby Lake chip popular with high-end notebooks reaches 2.9 to 3.9 GHz under load, with the Core i7-7920HQ top model, it is between 3.1 and 4.1 GHz. Both quad-cores have 45 Watts TDP, 8 MB L3 cache, and the Hyper-Threading technology in common.

In contrast to other notebooks, MSI foregoes additional overclocking of the processor via the Shift function here. Because of this, the GT83VR comes out in the lower range of the field of competitors in the Cinebench tests. The competitors either have a powerful factory OC (4.3 GHz @Acer Predator 17 X and Asus G701VIK) or a real desktop CPU (Schenker XMG U727). During actual gaming you cannot notice any differences, however. All the devices master even demanding games, passing with flying colors.
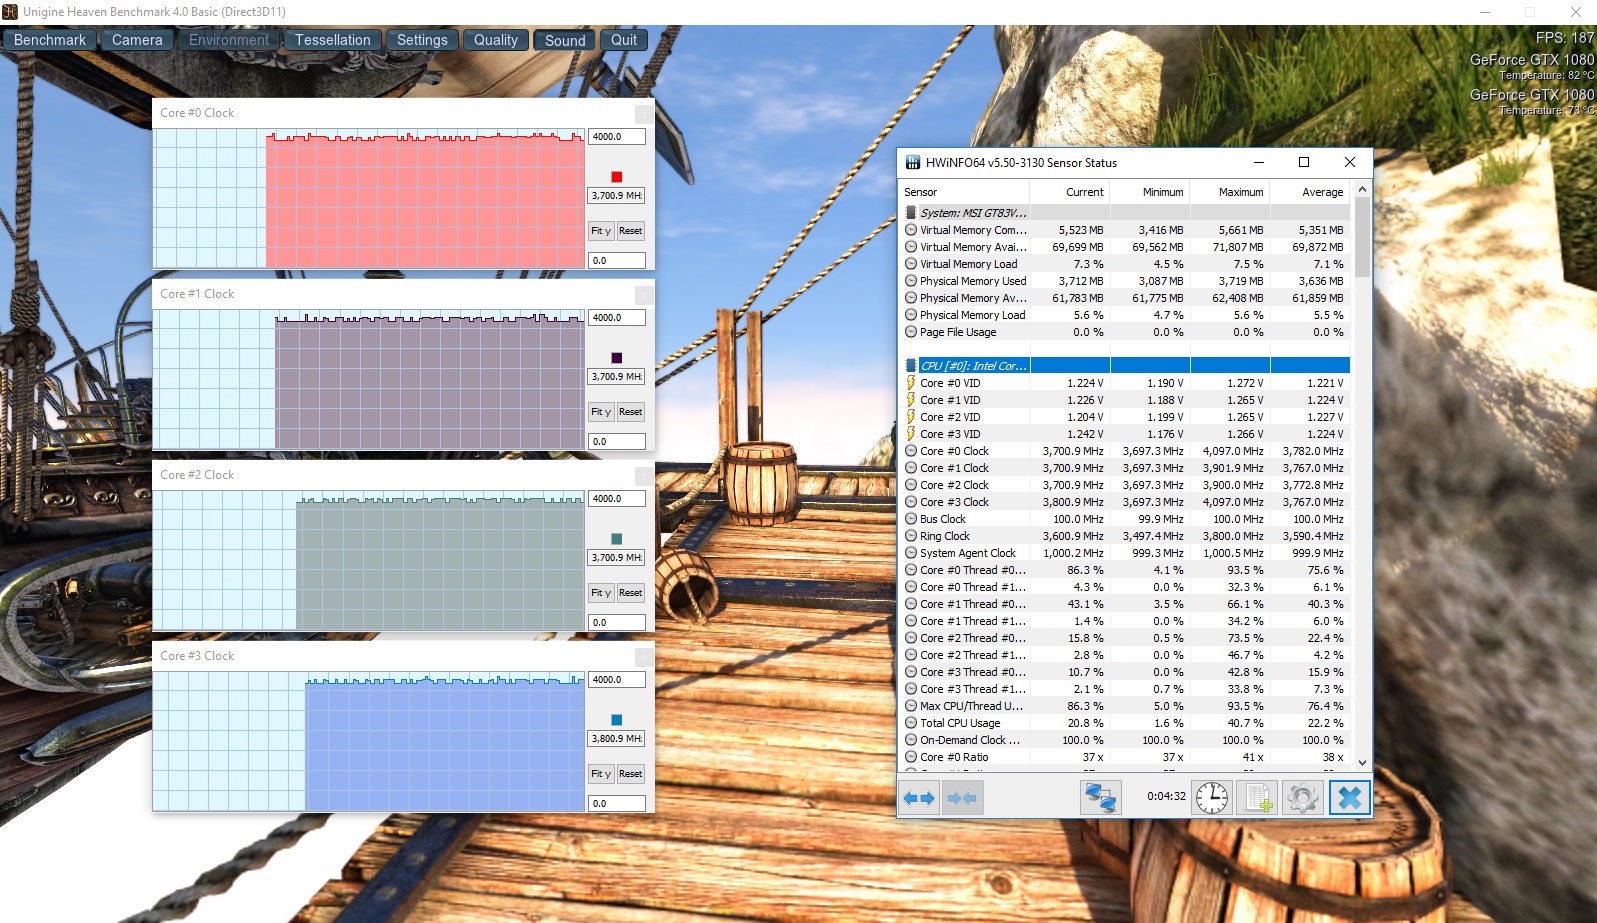
We test with Cinebench R15 whether the performance can be maintained for a longer duration. In the 30-minute test, the results were very constant, so that there are no concerns of performance drops in the CPU area.
System Performance
Despite the hefty price, in the system benchmarks it only suffices for one of the places at the bottom. With 5159 points (Home Score) and 5487 points (Work Score) in PCMark 8, the GT83VR 7RF settles between the predecessor and the Schenker XMG U727. However, these results are not very meaningful, since the PCMarks benchmarks depend strongly on the storage, which hardly plays any role during gaming asides from the load times. The results are more interesting for professional users (keyword: data transfers, etc.).
| PCMark 8 | |
| Home Score Accelerated v2 | |
| Acer Predator 17 X GX-792-76DL | |
| Asus G701VIK-BA049T | |
| MSI GT83VR-6RE32SR451 | |
| MSI GT83VR 7RF-206 Titan SLI | |
| Schenker XMG U727 2017 | |
| Work Score Accelerated v2 | |
| Acer Predator 17 X GX-792-76DL | |
| Asus G701VIK-BA049T | |
| MSI GT83VR-6RE32SR451 | |
| MSI GT83VR 7RF-206 Titan SLI | |
| Schenker XMG U727 2017 | |
| PCMark 8 Home Score Accelerated v2 | 5159 points | |
| PCMark 8 Work Score Accelerated v2 | 5487 points | |
| PCMark 10 Score | 5489 points | |
Help | ||
Storage Solution
As high-end notebooks are supposed to, all the competitors in our test field offer the extremely fast PCIe/NVMe-SSD in the M.2 format. To justify the sales price somewhat, MSI combines two Toshiba 256-GB drives in a RAID-0 system.
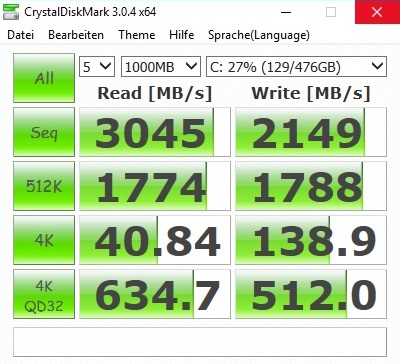
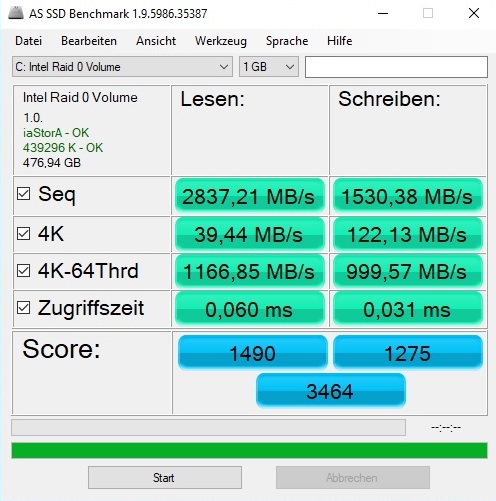
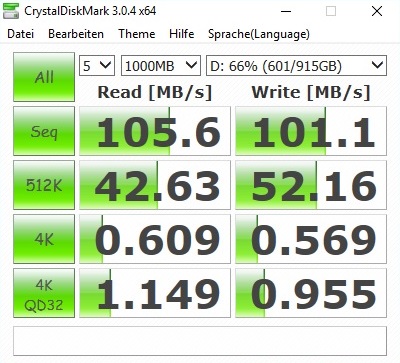
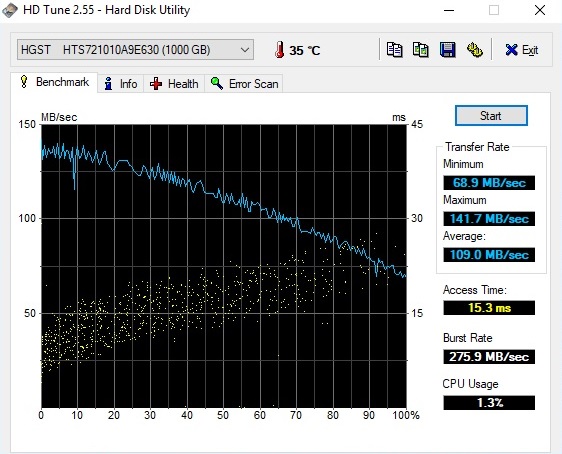
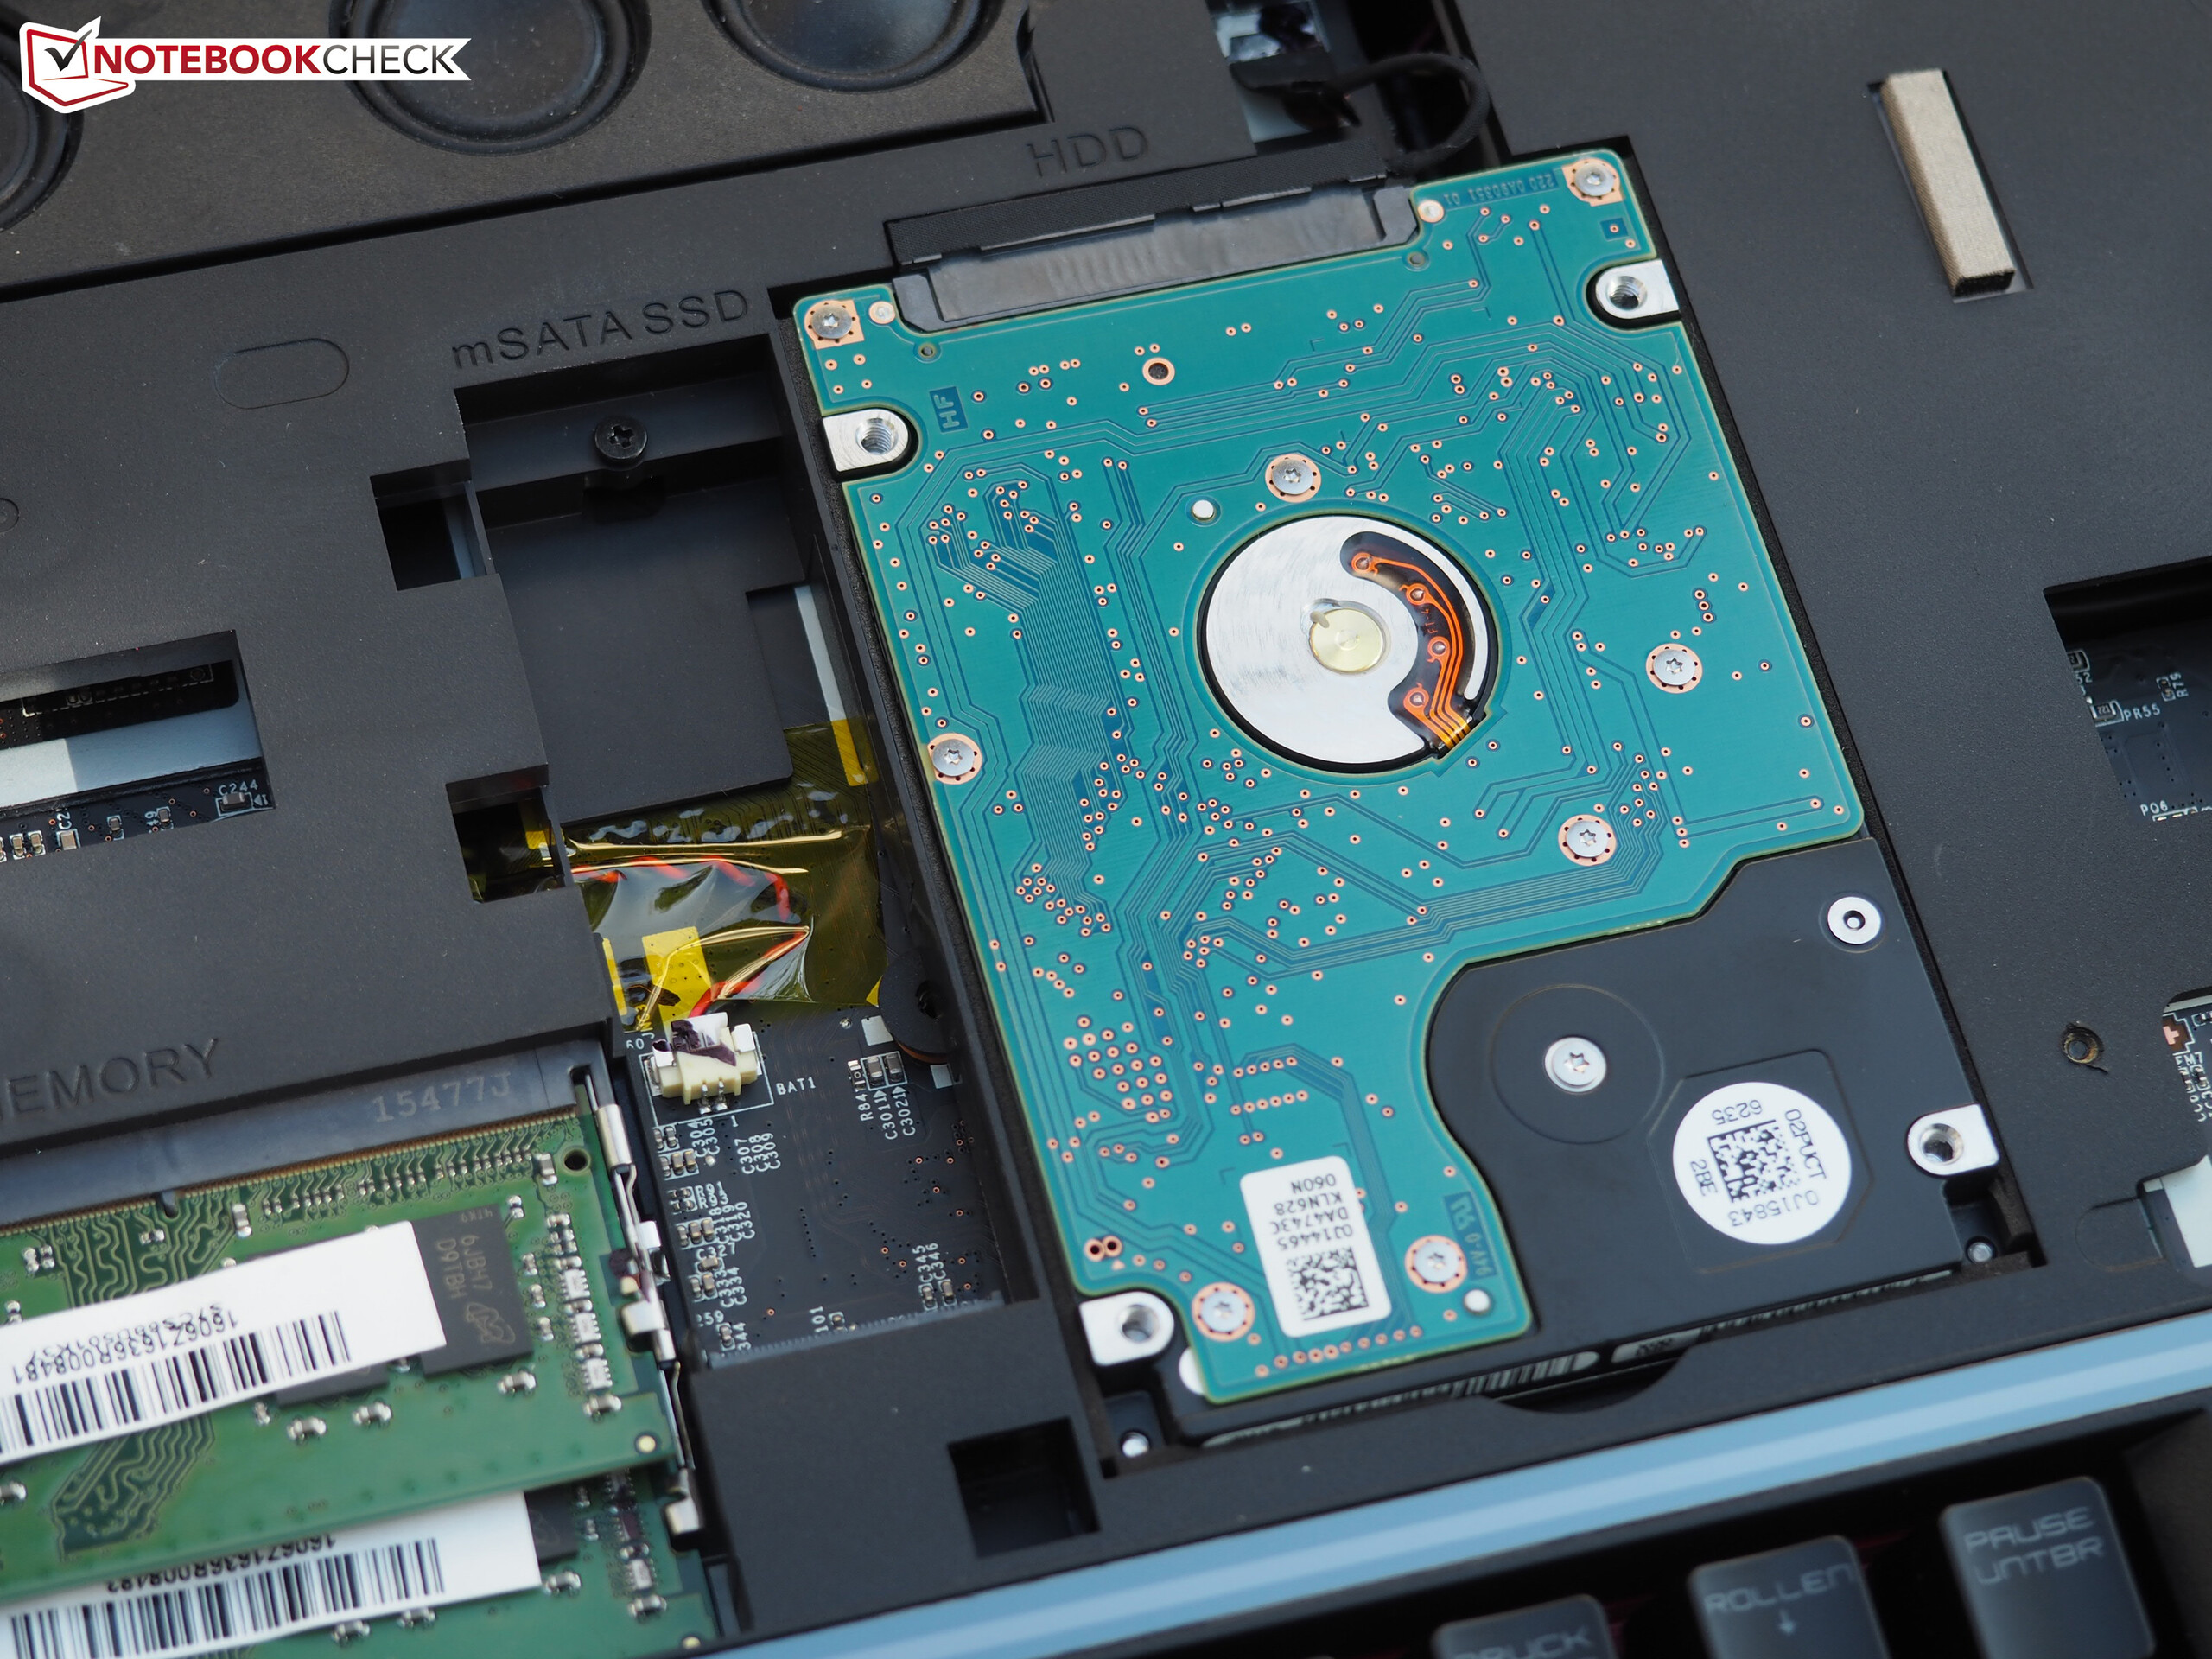
Although 2837 MB/s in the sequential reads (AS SSD benchmark) and 1530 MB/s in the sequential writes are first-class, some single SSDs such as the 960 EVO (Schenker XMG P507) also achieve comparable values. In CrystalDiskMark the differences are considerably larger. Here, the GT83VR is miles ahead. The package is rounded by a 1 TB 2.5-inch HDD that spins at 7200 rpm and is manufactured by HGST.
| MSI GT83VR 7RF-206 Titan SLI 2x Toshiba NVMe THNSN5256GPU7 (RAID 0) | MSI GT83VR-6RE32SR451 2x Samsung SM951 MZVPV256HDGL (RAID 0) | Schenker XMG U727 2017 Samsung SM961 MZVPW256 m.2 PCI-e | Acer Predator 17 X GX-792-76DL Toshiba NVMe THNSN5512GPU7 | Asus G701VIK-BA049T 2x Samsung SM961 MZVPW256HEGL NVMe (RAID 0) | MSI GT73VR 7RF-296 2x Samsung SM951 MZVPV256HDGL (RAID 0) | |
|---|---|---|---|---|---|---|
| CrystalDiskMark 3.0 | 5% | -7% | -16% | 19% | 13% | |
| Read Seq (MB/s) | 3045 | 3284 8% | 1781 -42% | 1494 -51% | 3487 15% | 3219 6% |
| Write Seq (MB/s) | 2149 | 2548 19% | 1515 -30% | 1371 -36% | 2690 25% | 2572 20% |
| Read 512 (MB/s) | 1774 | 1728 -3% | 371.4 -79% | 898 -49% | 1499 -16% | 1776 0% |
| Write 512 (MB/s) | 1788 | 2352 32% | 1073 -40% | 1273 -29% | 2493 39% | 2445 37% |
| Read 4k (MB/s) | 40.84 | 50.1 23% | 61.5 51% | 43.82 7% | 53.7 31% | 51.1 25% |
| Write 4k (MB/s) | 138.9 | 137.6 -1% | 195.6 41% | 161.6 16% | 133.2 -4% | 141.3 2% |
| Read 4k QD32 (MB/s) | 635 | 506 -20% | 755 19% | 669 5% | 795 25% | 658 4% |
| Write 4k QD32 (MB/s) | 512 | 435.4 -15% | 642 25% | 552 8% | 699 37% | 554 8% |

Graphics Card
Following the motto "two are better than one," MSI is not satisfied with a single GPU but incorporates two Pascal chips forming an SLI combination.
In the synthetic graphics tests such as 3DMark 13, the GT83VR 7RF wipes the floor with the single-GTX-1080 notebooks. It is 76% to 93% better in the Fire-Strike run and still 62% to 78% in 3DMark 11.
| 3DMark - 1920x1080 Fire Strike Graphics | |
| MSI GT83VR 7RF-206 Titan SLI | |
| MSI GT83VR-6RE32SR451 | |
| Asus G701VIK-BA049T | |
| Acer Predator 17 X GX-792-76DL | |
| Schenker XMG U727 2017 | |
| MSI GT73VR 7RF-296 | |
| 3DMark 11 - 1280x720 Performance GPU | |
| MSI GT83VR 7RF-206 Titan SLI | |
| MSI GT83VR-6RE32SR451 | |
| Asus G701VIK-BA049T | |
| Schenker XMG U727 2017 | |
| MSI GT73VR 7RF-296 | |
| Acer Predator 17 X GX-792-76DL | |
| 3DMark 11 Performance | 25018 points | |
| 3DMark Ice Storm Standard Score | 161549 points | |
| 3DMark Cloud Gate Standard Score | 32233 points | |
| 3DMark Fire Strike Score | 22192 points | |
Help | ||
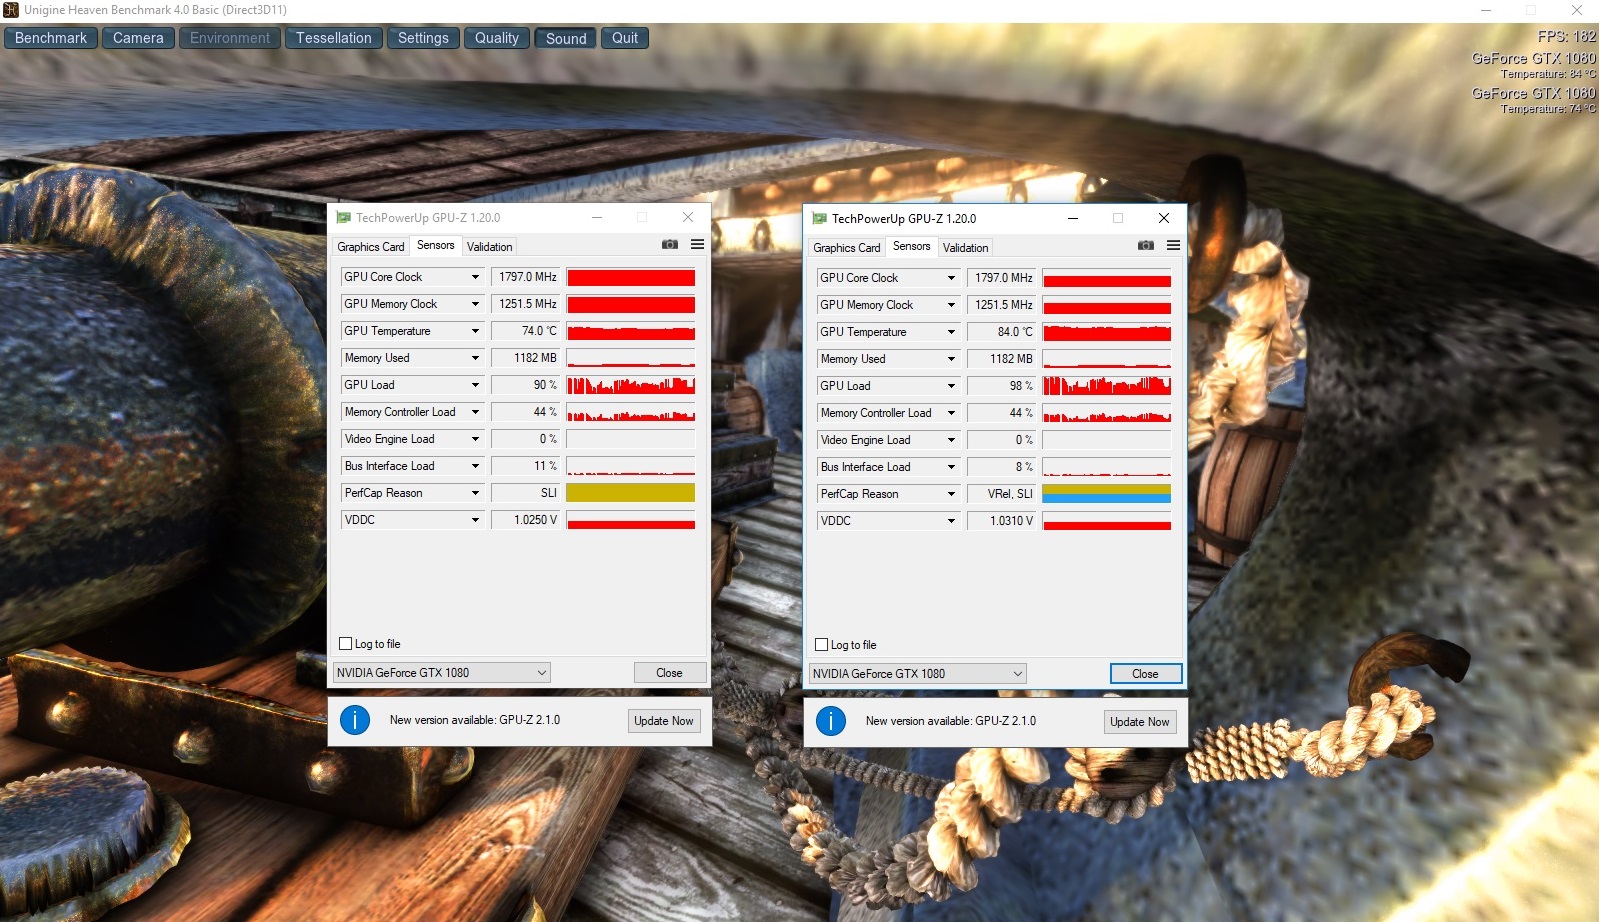
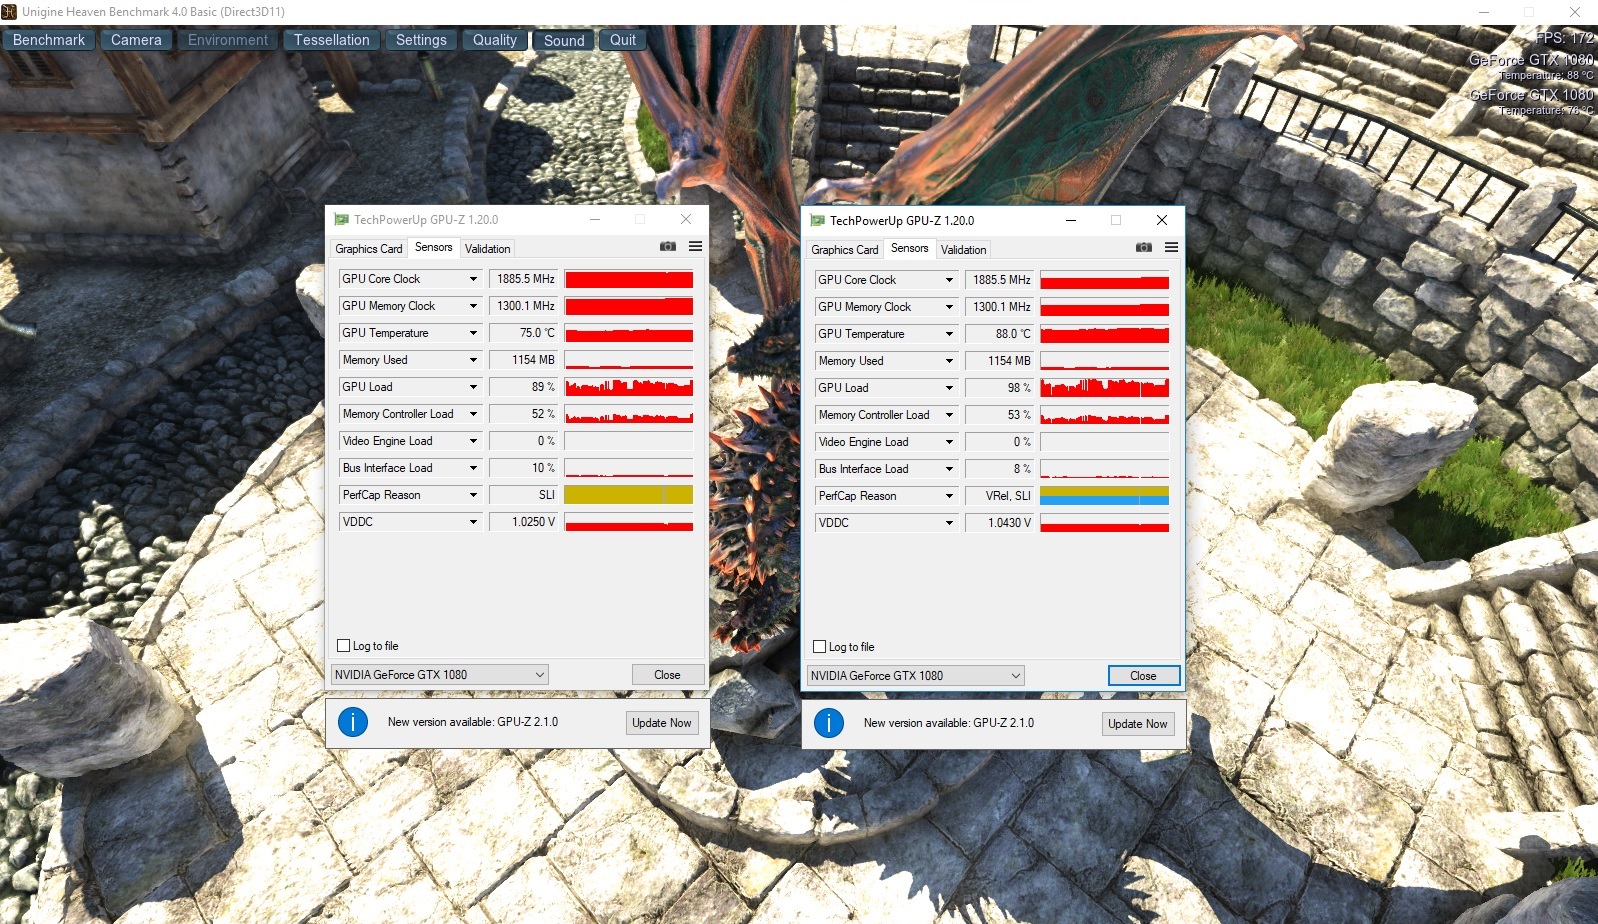
There is also nothing to complain about the clocking behavior. Our 60-minute test with The Witcher 3 listed in the appendix shows slight performance drops at a certain time (100 - 108 instead of 107 - 118 FPS @Full HD/Ultra), but we did not observe real throttling during the game operation. Depending on the Shift mode, both graphics chips achieve around 1800 MHz (Sport/Power Options) or 1890 MHz (Turbo).
Gaming Performance
The advantage in the gaming runs is not quite as compelling. If we base it on the native resolution of the display and take the average of the 15 games tested (Ultra-Preset), the dual GTX-1080 performs only a meager 7% faster than a system without SLI – and that at an additional charge of about 2500 Euros (~$2800) compared to the Acer Predator 17 X and Asus G701VIK. One reason for that is that the 18-inch device runs into the CPU limits below particular pixel amounts.
| The Witcher 3 | |
| 3840x2160 High Graphics & Postprocessing (Nvidia HairWorks Off) | |
| MSI GT83VR 7RF-206 Titan SLI | |
| Schenker XMG U727 2017 | |
| 1920x1080 Ultra Graphics & Postprocessing (HBAO+) | |
| MSI GT83VR 7RF-206 Titan SLI | |
| Schenker XMG U727 2017 | |
| Deus Ex Mankind Divided - 1920x1080 Ultra Preset AA:2xMS AF:8x | |
| MSI GT83VR 7RF-206 Titan SLI | |
| Battlefield 1 | |
| 3840x2160 High Preset AA:T | |
| MSI GT83VR 7RF-206 Titan SLI | |
| Schenker XMG U727 2017 | |
| 1920x1080 Ultra Preset AA:T | |
| MSI GT83VR 7RF-206 Titan SLI | |
| Schenker XMG U727 2017 | |
| Titanfall 2 | |
| 3840x2160 High / Enabled AA:TS AF:8x | |
| MSI GT83VR 7RF-206 Titan SLI | |
| Schenker XMG U727 2017 | |
| 1920x1080 Very High (Insane Texture Quality) / Enabled AA:TS AF:16x | |
| MSI GT83VR 7RF-206 Titan SLI | |
| Schenker XMG U727 2017 | |
| Call of Duty Infinite Warfare | |
| 3840x2160 High / On AA:FX | |
| MSI GT83VR 7RF-206 Titan SLI | |
| Schenker XMG U727 2017 | |
| 1920x1080 Ultra / On AA:T2X SM | |
| MSI GT83VR 7RF-206 Titan SLI | |
| Schenker XMG U727 2017 | |
| Dishonored 2 | |
| 3840x2160 High Preset AA:TX | |
| MSI GT83VR 7RF-206 Titan SLI | |
| Schenker XMG U727 2017 | |
| 1920x1080 Ultra Preset AA:TX | |
| Schenker XMG U727 2017 | |
| MSI GT83VR 7RF-206 Titan SLI | |
| Watch Dogs 2 | |
| 3840x2160 High Preset | |
| MSI GT83VR 7RF-206 Titan SLI | |
| Schenker XMG U727 2017 | |
| 1920x1080 Ultra Preset | |
| MSI GT83VR 7RF-206 Titan SLI | |
| Schenker XMG U727 2017 | |
| Resident Evil 7 | |
| 3840x2160 High / On AA:FXAA+T | |
| Desktop PC | |
| MSI GT83VR 7RF-206 Titan SLI | |
| Schenker XMG U727 2017 | |
| 1920x1080 Very High / On AA:FXAA+T | |
| Desktop PC | |
| Schenker XMG U727 2017 | |
| MSI GT83VR 7RF-206 Titan SLI | |
| For Honor | |
| 3840x2160 High Preset AA:T AF:8x | |
| MSI GT83VR 7RF-206 Titan SLI | |
| Desktop PC | |
| Schenker XMG U727 2017 | |
| 1920x1080 Extreme Preset AA:T AF:16x | |
| MSI GT83VR 7RF-206 Titan SLI | |
| Desktop PC | |
| Schenker XMG U727 2017 | |
| Ghost Recon Wildlands | |
| 3840x2160 Very High Preset AA:T AF:8x | |
| MSI GT83VR 7RF-206 Titan SLI | |
| Desktop PC | |
| 1920x1080 Ultra Preset AA:T AF:16x | |
| MSI GT83VR 7RF-206 Titan SLI | |
| Desktop PC | |
| Mass Effect Andromeda | |
| 3840x2160 High Preset (Resolution Scale Mode off) AA:T | |
| MSI GT83VR 7RF-206 Titan SLI | |
| Desktop PC | |
| 1920x1080 Ultra Preset (Resolution Scale Mode off) AA:T | |
| Desktop PC | |
| MSI GT83VR 7RF-206 Titan SLI | |
| Warhammer 40.000: Dawn of War III | |
| 3840x2160 High / On (100 % Gameplay Resolution) AA:High | |
| MSI GT83VR 7RF-206 Titan SLI | |
| Desktop PC | |
| 1920x1080 Maximum / On (100 % Gameplay Resolution) AA:High | |
| MSI GT83VR 7RF-206 Titan SLI | |
| Desktop PC | |
| Prey | |
| 3840x2160 High Preset AA:2TX SM AF:8x | |
| MSI GT83VR 7RF-206 Titan SLI | |
| Desktop PC | |
| 1920x1080 Very High Preset AA:2TX SM AF:16x | |
| Desktop PC | |
| MSI GT83VR 7RF-206 Titan SLI | |
| Rocket League | |
| 3840x2160 High Quality AA:High FX | |
| MSI GT83VR 7RF-206 Titan SLI | |
| Desktop PC | |
| 1920x1080 High Quality AA:High FX | |
| Desktop PC | |
| MSI GT83VR 7RF-206 Titan SLI | |
| Dirt 4 - 1920x1080 Ultra Preset AA:4xMS AF:16x | |
| Desktop PC | |
| MSI GT83VR 7RF-206 Titan SLI | |
Only above 3840x2160 pixels, that is to say UHD, does the second GTX 1080 really makes sense. Here the advantage grows to a decent 40%. That it is not more has to do with the lacking dual-GPU support in some games. For example, Dirt 4, Resident Evil 7, and Call of Duty Infinite Warfare did not profit much from the secondary GPU, despite the brand new driver (ForceWare 382.53). Accordingly, even in 2017 the dual-GPU notebooks remain a niche product for a small clientele with a large budget.
| low | med. | high | ultra | 4K | |
|---|---|---|---|---|---|
| The Witcher 3 (2015) | 181 | 115 | 89.2 | ||
| Deus Ex Mankind Divided (2016) | 79.7 | 73.3 | |||
| Battlefield 1 (2016) | 157 | 145 | 76.7 | ||
| Titanfall 2 (2016) | 144 | 143 | 74.2 | ||
| Call of Duty Infinite Warfare (2016) | 124 | 124 | 76.1 | ||
| Dishonored 2 (2016) | 88.1 | 77.4 | 71.2 | ||
| Watch Dogs 2 (2016) | 118 | 102 | 75.6 | ||
| Resident Evil 7 (2017) | 192 | 162 | 56.3 | ||
| For Honor (2017) | 194 | 182 | 108 | ||
| Ghost Recon Wildlands (2017) | 122 | 82.7 | 65.4 | ||
| Mass Effect Andromeda (2017) | 89 | 83.6 | 60 | ||
| Warhammer 40.000: Dawn of War III (2017) | 100 | 97.4 | 79.8 | ||
| Prey (2017) | 143 | 141 | 83.9 | ||
| Rocket League (2017) | 232 | 169 | |||
| Dirt 4 (2017) | 134 | 84.1 |
Emissions
Noise Development
Besides the mismatched display, we mainly need to criticize the noise development. Even though the GT83VR contains a powerful cooling system, the 18-inch device becomes extremely loud under load. Almost 53 dB during the gaming test (The Witcher 3) and up to 59 dB in the stress test with the FurMark and Prime95 tools are not suited for sensitive ears and can even become annoying with a headset or external speakers turned up high – even for "regular" users.
To a large extent, the competition is considerably quieter – be it in 3D operation or idle mode. Apropos idle: The fans are constantly running (at least 35 dB) and depending on the power-saving settings, they tend to rev up towards 40 dB.
Noise level
| Idle |
| 35 / 38 / 41 dB(A) |
| DVD |
| 38 / dB(A) |
| Load |
| 52 / 59 dB(A) |
 | ||
30 dB silent 40 dB(A) audible 50 dB(A) loud |
||
min: | ||
| MSI GT83VR 7RF-206 Titan SLI GeForce GTX 1080 SLI (Laptop), i7-7920HQ | MSI GT83VR-6RE32SR451 GeForce GTX 1070 SLI (Laptop), 6820HK | Schenker XMG U727 2017 GeForce GTX 1080 Mobile, i7-7700K | Acer Predator 17 X GX-792-76DL GeForce GTX 1080 Mobile, i7-7820HK | Asus G701VIK-BA049T GeForce GTX 1080 Mobile, i7-7820HK | MSI GT73VR 7RF-296 GeForce GTX 1080 Mobile, i7-7820HK | |
|---|---|---|---|---|---|---|
| Noise | 8% | 9% | 11% | 10% | 9% | |
| off / environment * (dB) | 31 | 30 3% | 30 3% | 30 3% | 30 3% | 30 3% |
| Idle Minimum * (dB) | 35 | 33 6% | 31 11% | 33 6% | 30 14% | 34 3% |
| Idle Average * (dB) | 38 | 34 11% | 34 11% | 35 8% | 31 18% | 35 8% |
| Idle Maximum * (dB) | 41 | 35 15% | 37 10% | 37 10% | 36 12% | 37 10% |
| Load Average * (dB) | 52 | 48 8% | 44 15% | 40 23% | 47 10% | 39 25% |
| Witcher 3 ultra * (dB) | 53 | 51 4% | ||||
| Load Maximum * (dB) | 59 | 57 3% | 52 12% | 50 15% | 56 5% | 56 5% |
* ... smaller is better
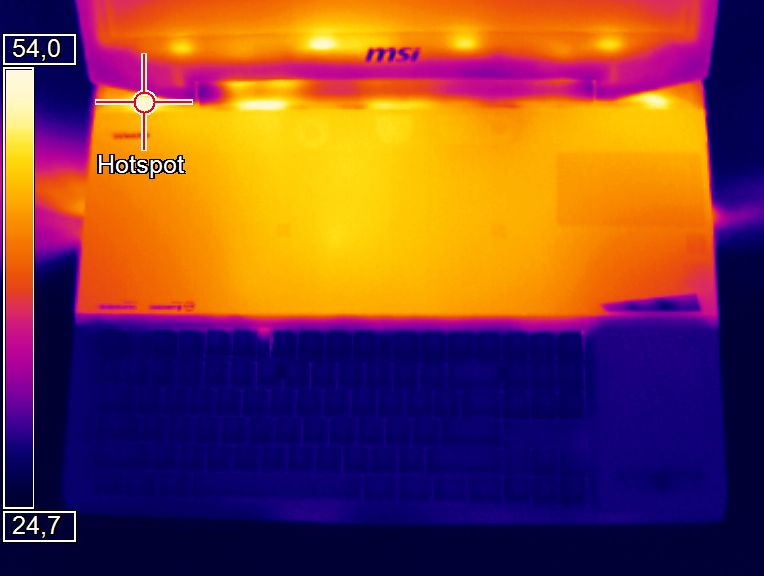
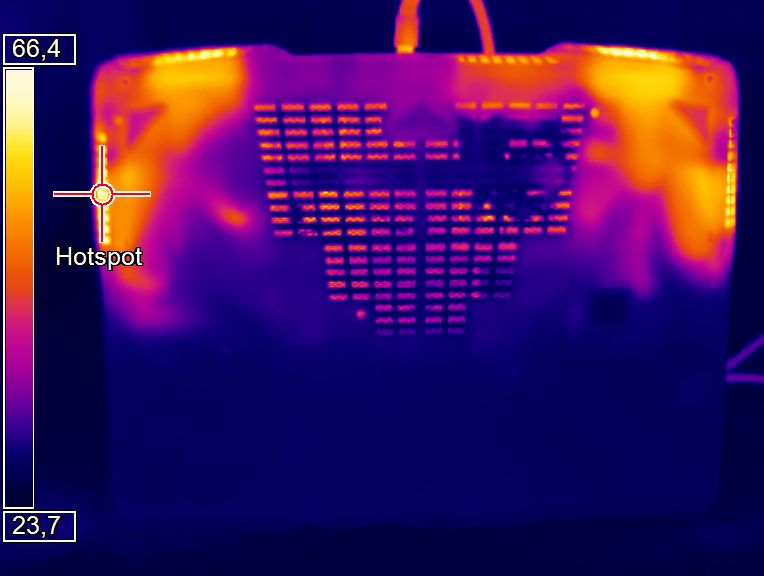
Temperatures
For the temperatures, we cannot give an overall judgment. While the keyboard remains pleasantly cool in any situation (26 °C, 79 °F maximum), the case warms up to 46 °C (115 °F, top) and 53 °C (127 °F, bottom). As usual, during idle operation the situation is more relaxed. The case levels out at a moderate 25 to 33 °C (77 - 91 °F).
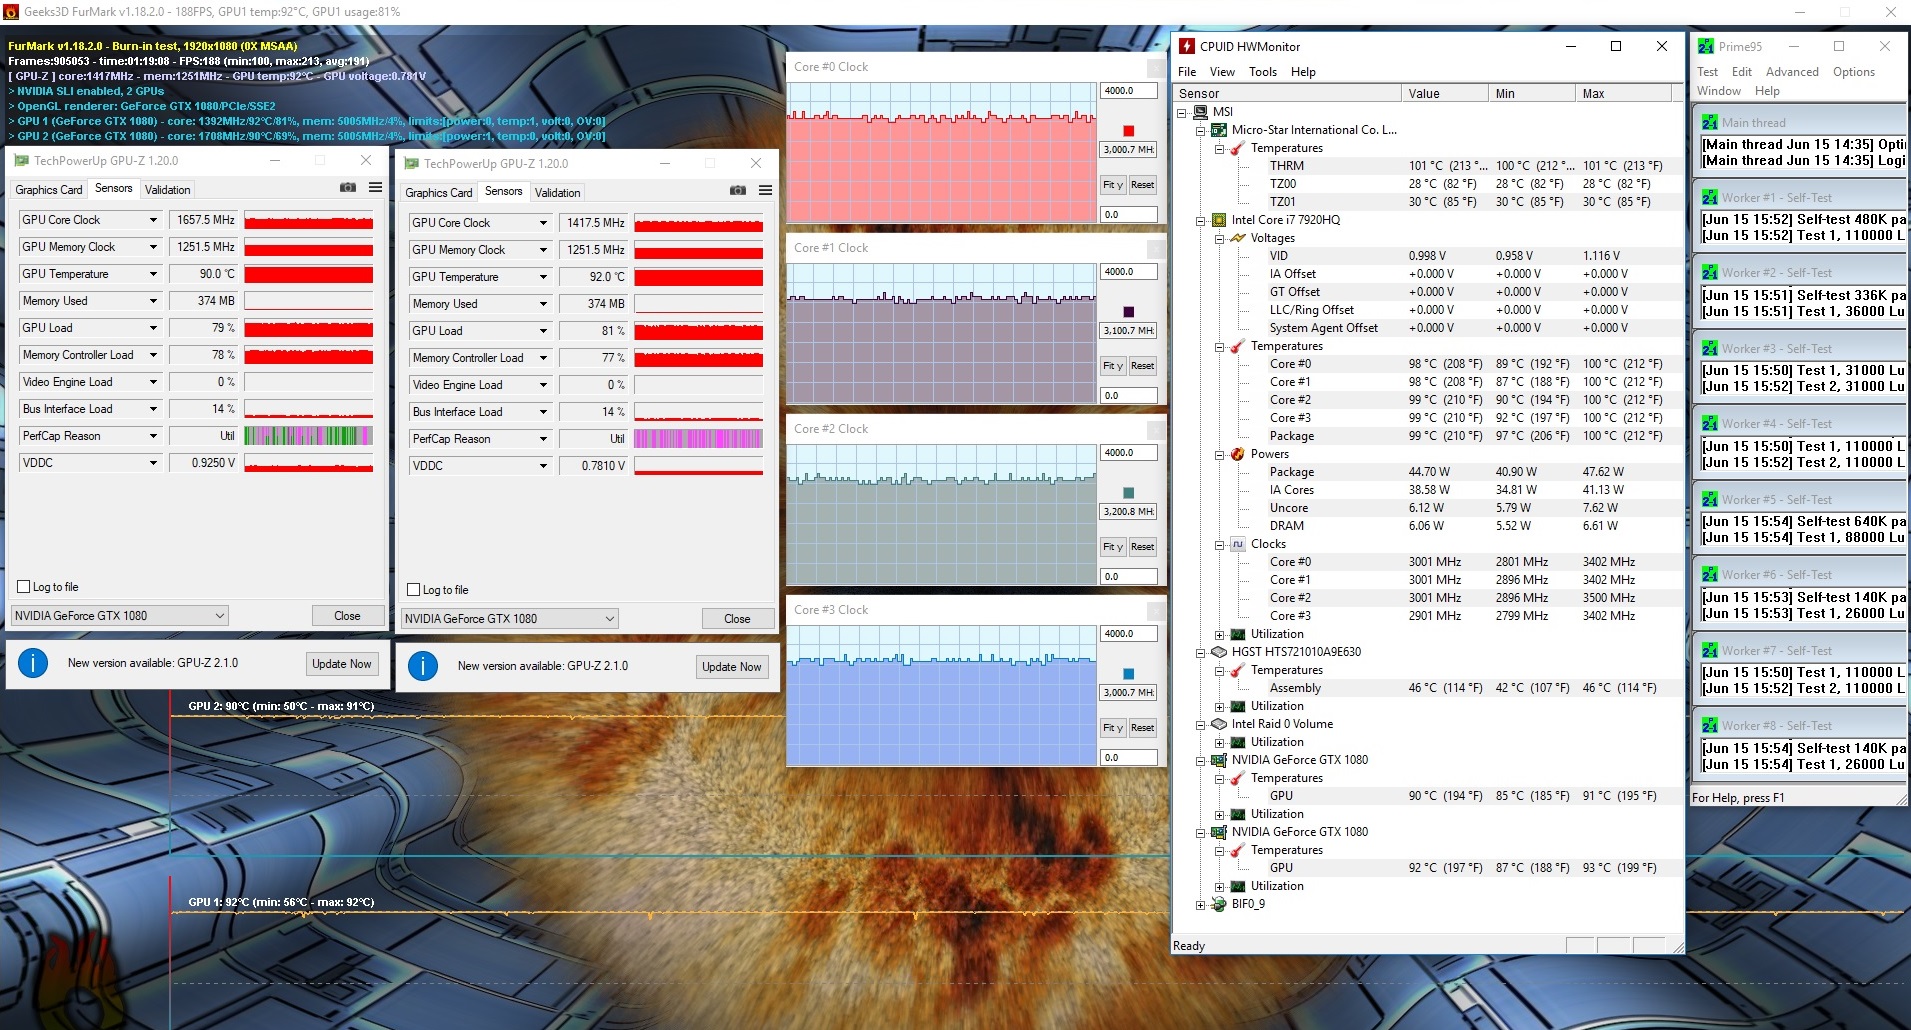
The values of the components are not restrained at all. In the stress test, the Core i7-7920HQ heated up to a maximum of 100 °C (212 °F) and the two GPUs reached up to 93 °C (199 °F). One of them throttled down slightly to about 1400 MHz (basic value of the GTX 1080: 1557 MHz). The CPU was spared from any throttling.
(-) The maximum temperature on the upper side is 46 °C / 115 F, compared to the average of 40.4 °C / 105 F, ranging from 21.2 to 68.8 °C for the class Gaming.
(-) The bottom heats up to a maximum of 53 °C / 127 F, compared to the average of 43.2 °C / 110 F
(+) In idle usage, the average temperature for the upper side is 29.7 °C / 85 F, compared to the device average of 33.9 °C / 93 F.
(±) Playing The Witcher 3, the average temperature for the upper side is 35.7 °C / 96 F, compared to the device average of 33.9 °C / 93 F.
(+) The palmrests and touchpad are cooler than skin temperature with a maximum of 26 °C / 78.8 F and are therefore cool to the touch.
(+) The average temperature of the palmrest area of similar devices was 28.8 °C / 83.8 F (+2.8 °C / 5 F).
| MSI GT83VR 7RF-206 Titan SLI GeForce GTX 1080 SLI (Laptop), i7-7920HQ | MSI GT83VR-6RE32SR451 GeForce GTX 1070 SLI (Laptop), 6820HK | Schenker XMG U727 2017 GeForce GTX 1080 Mobile, i7-7700K | Acer Predator 17 X GX-792-76DL GeForce GTX 1080 Mobile, i7-7820HK | Asus G701VIK-BA049T GeForce GTX 1080 Mobile, i7-7820HK | MSI GT73VR 7RF-296 GeForce GTX 1080 Mobile, i7-7820HK | |
|---|---|---|---|---|---|---|
| Heat | 22% | -8% | 3% | 4% | 12% | |
| Maximum Upper Side * (°C) | 46 | 35.8 22% | 47.5 -3% | 44.2 4% | 50.9 -11% | 39.8 13% |
| Maximum Bottom * (°C) | 53 | 42.8 19% | 56 -6% | 43 19% | 44.6 16% | 47.8 10% |
| Idle Upper Side * (°C) | 33 | 24.7 25% | 34.5 -5% | 32.4 2% | 29.9 9% | 27.1 18% |
| Idle Bottom * (°C) | 29 | 22.8 21% | 33.6 -16% | 32.8 -13% | 28.8 1% | 27.4 6% |
* ... smaller is better
Speakers
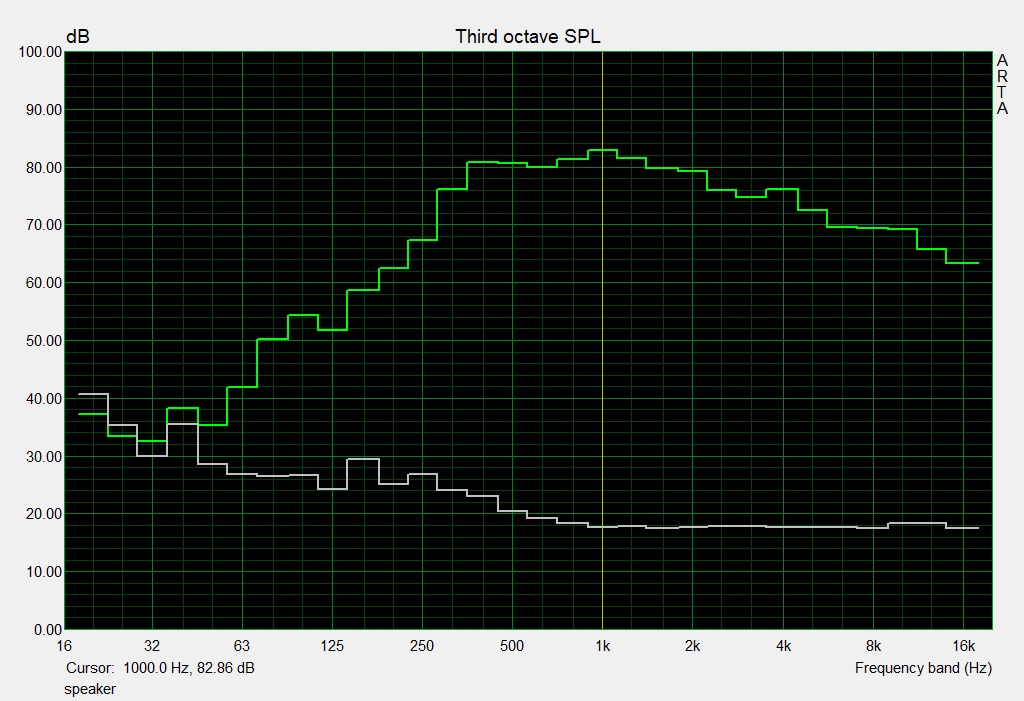
MSI GT83VR 7RF-206 Titan SLI audio analysis
(+) | speakers can play relatively loud (90 dB)
Bass 100 - 315 Hz
(±) | reduced bass - on average 14.3% lower than median
(±) | linearity of bass is average (9% delta to prev. frequency)
Mids 400 - 2000 Hz
(+) | balanced mids - only 4.8% away from median
(+) | mids are linear (2.6% delta to prev. frequency)
Highs 2 - 16 kHz
(+) | balanced highs - only 3.6% away from median
(+) | highs are linear (3.2% delta to prev. frequency)
Overall 100 - 16.000 Hz
(+) | overall sound is linear (13.7% difference to median)
Compared to same class
» 21% of all tested devices in this class were better, 7% similar, 72% worse
» The best had a delta of 6%, average was 18%, worst was 132%
Compared to all devices tested
» 15% of all tested devices were better, 4% similar, 81% worse
» The best had a delta of 4%, average was 23%, worst was 134%
Schenker XMG U727 2017 audio analysis
(+) | speakers can play relatively loud (89 dB)
Bass 100 - 315 Hz
(±) | reduced bass - on average 7.9% lower than median
(±) | linearity of bass is average (10.7% delta to prev. frequency)
Mids 400 - 2000 Hz
(+) | balanced mids - only 4.3% away from median
(+) | mids are linear (4.4% delta to prev. frequency)
Highs 2 - 16 kHz
(+) | balanced highs - only 2.3% away from median
(+) | highs are linear (4.6% delta to prev. frequency)
Overall 100 - 16.000 Hz
(+) | overall sound is linear (11.4% difference to median)
Compared to same class
» 9% of all tested devices in this class were better, 3% similar, 88% worse
» The best had a delta of 6%, average was 18%, worst was 132%
Compared to all devices tested
» 7% of all tested devices were better, 2% similar, 90% worse
» The best had a delta of 4%, average was 23%, worst was 134%
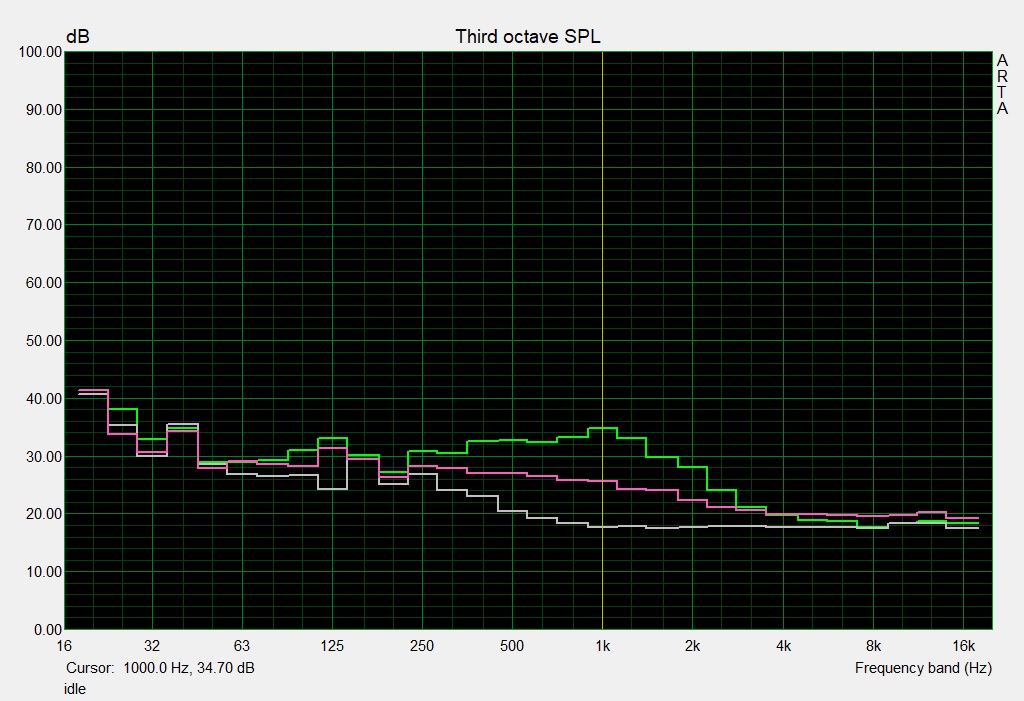
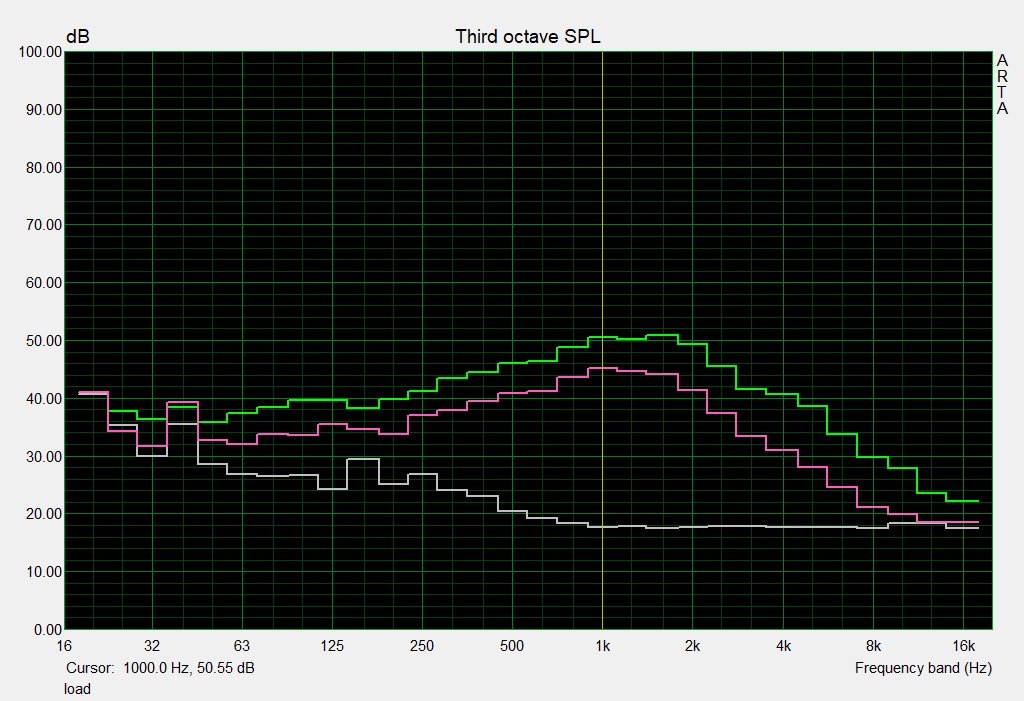
Frequency comparison (checkboxes selectable!)
Power Management
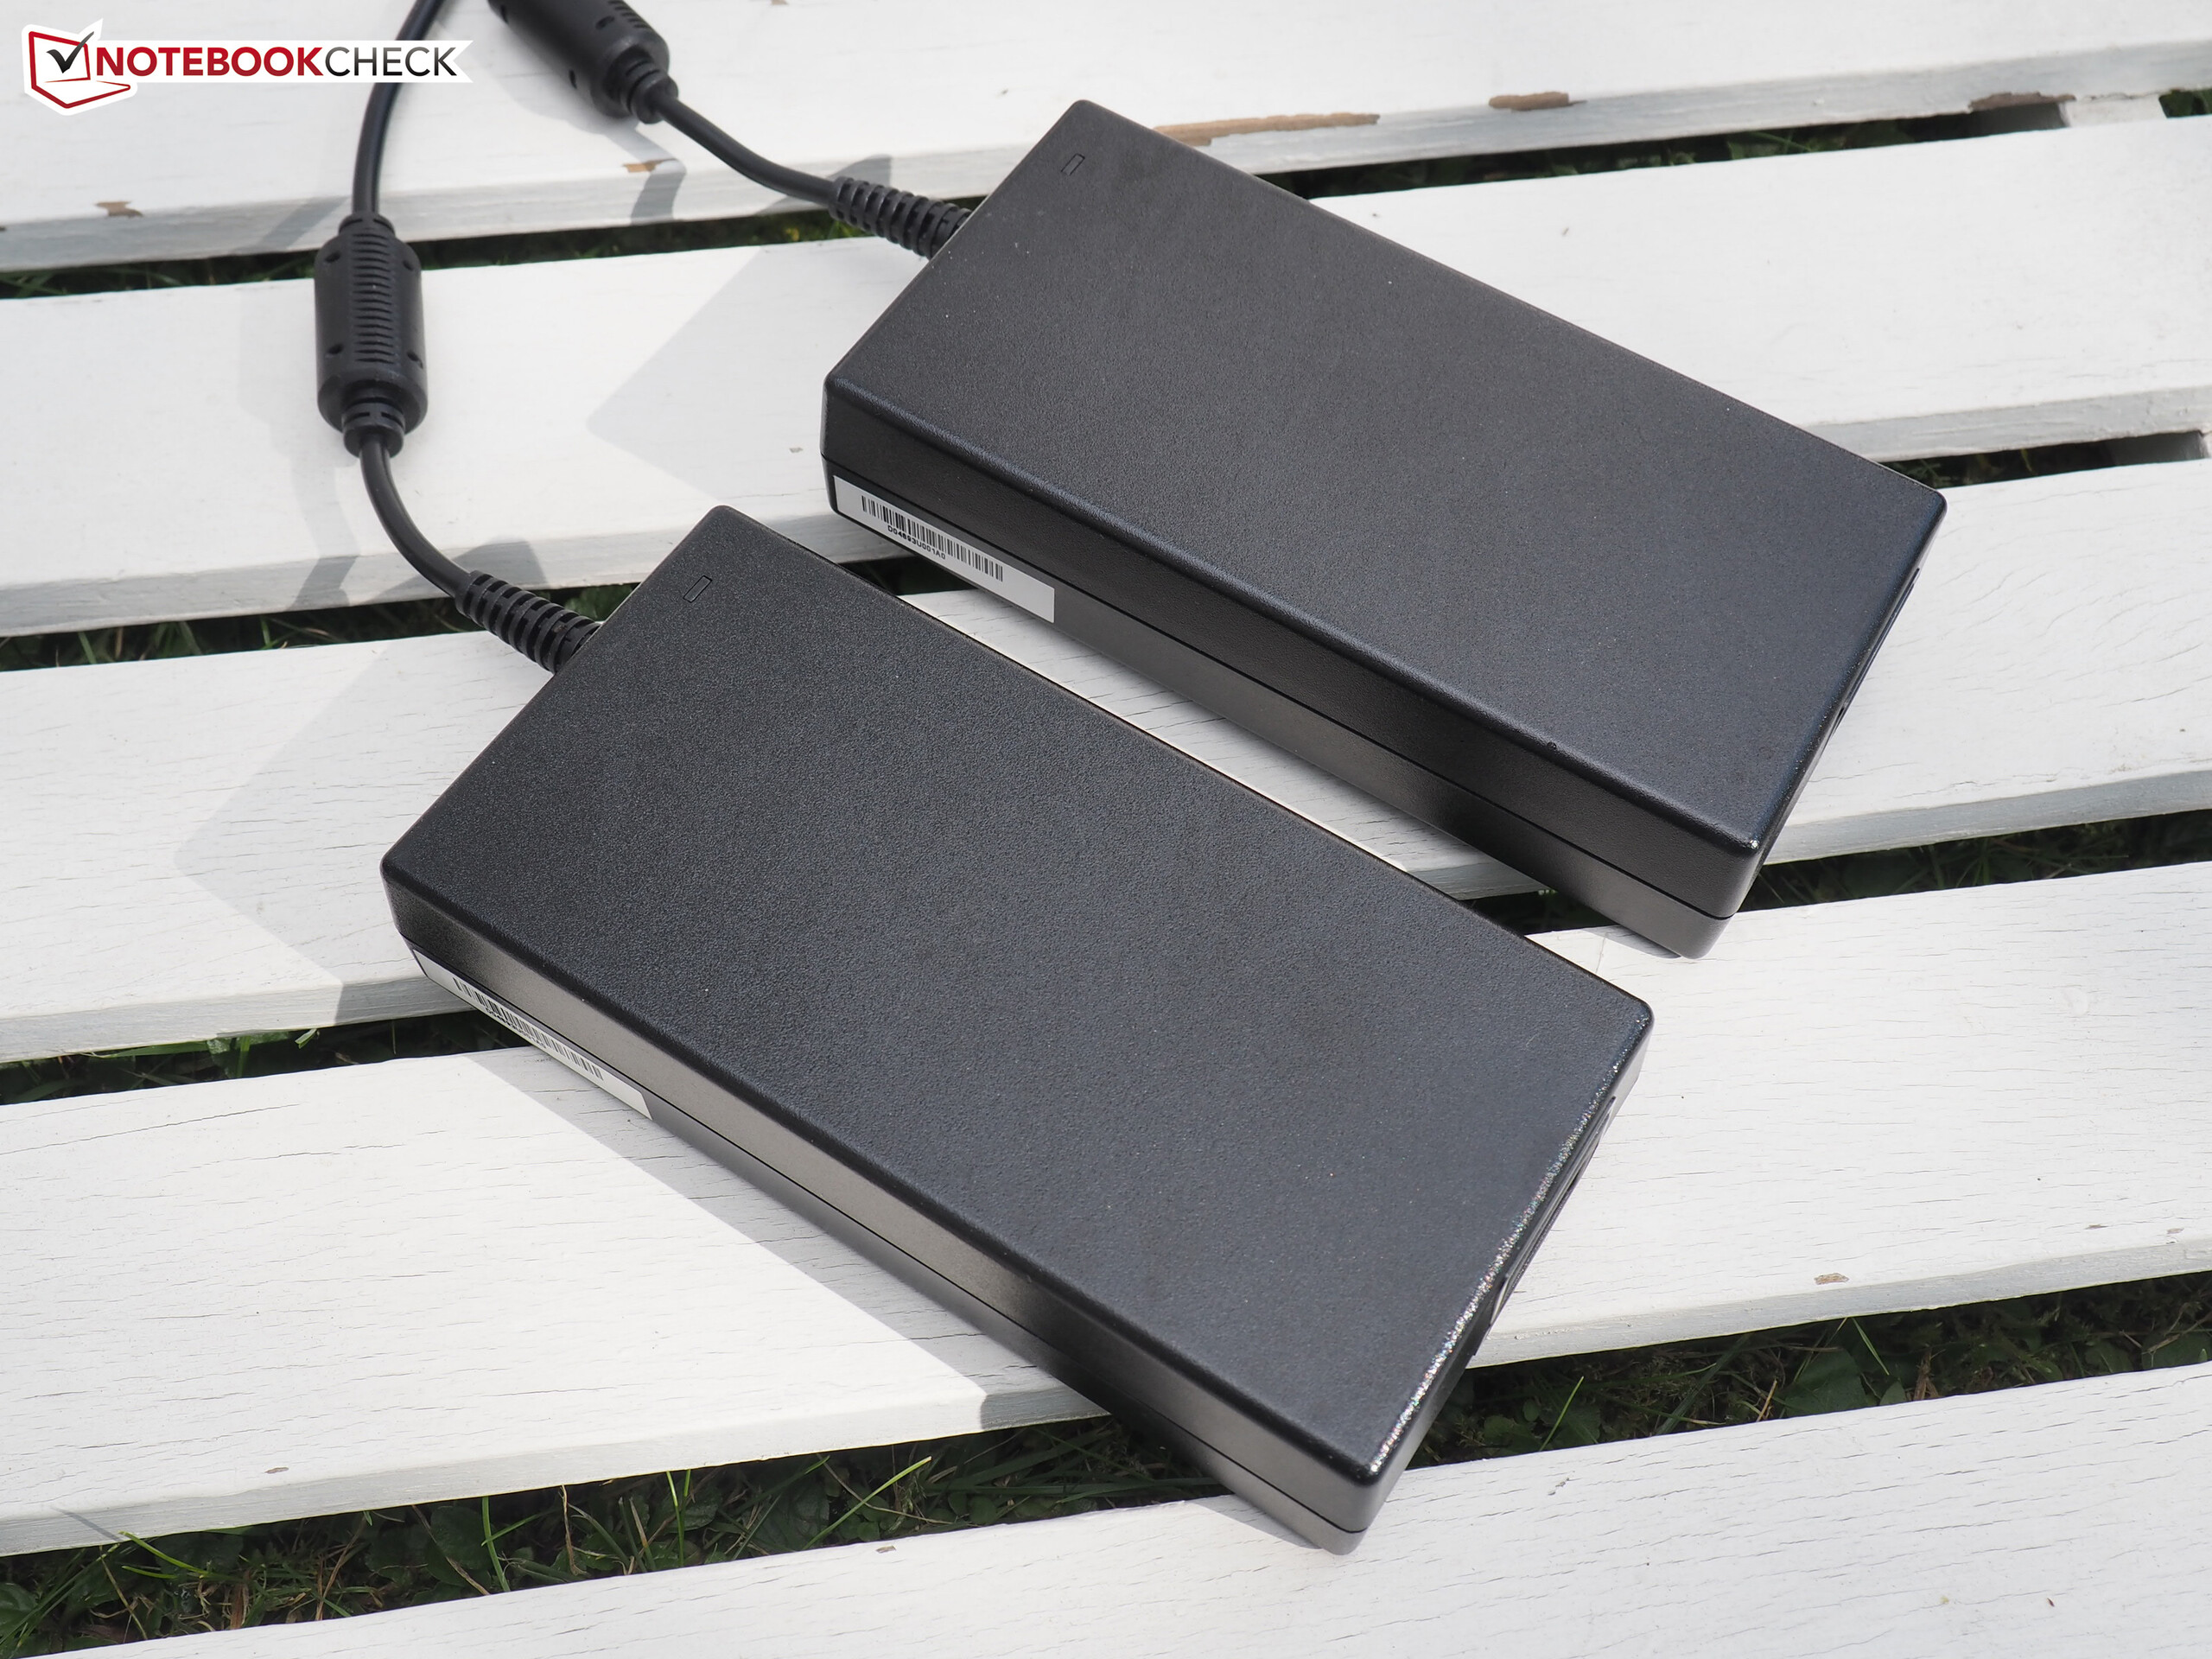
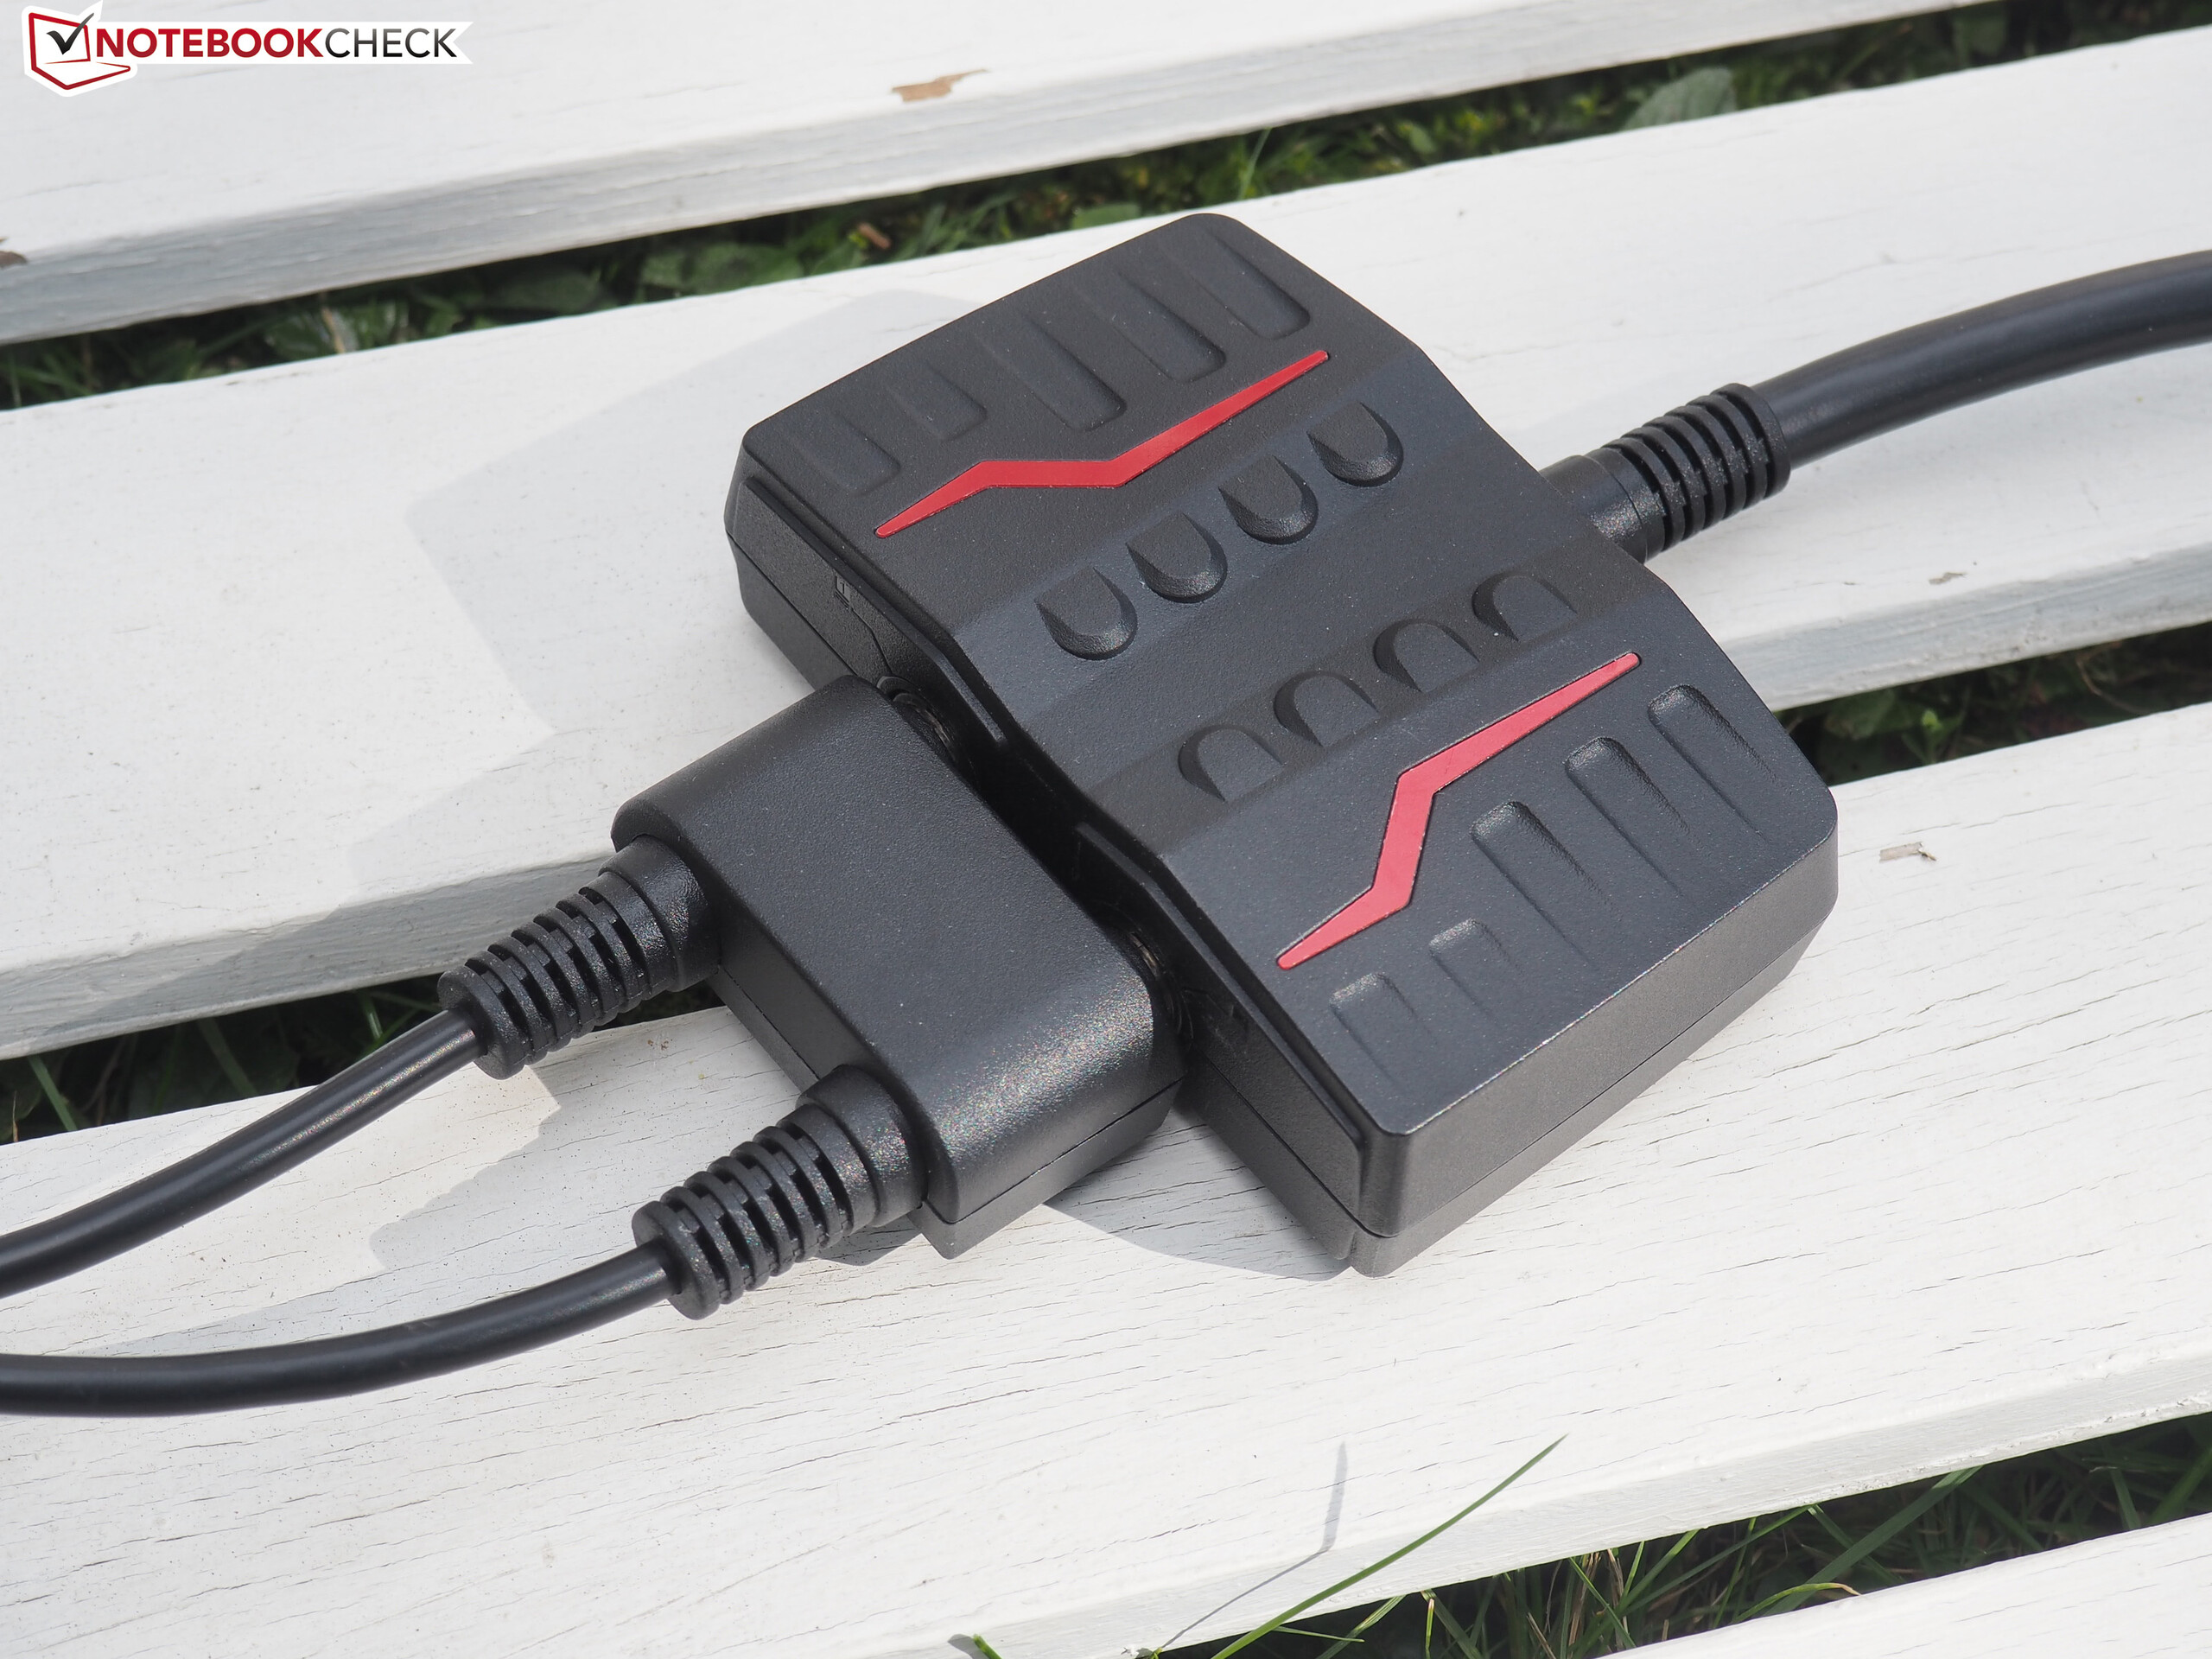
The power consumption is more reminiscent of a tower PC. Most of the notebooks use much less than 45 - 62 Watts in idle mode. For example, the Asus G701VIK only indulges in 24 - 38 Watts. In the 3D applications, the GT83VR mutates into a power hog. Depending on the program, we measured between 178 Watts (3DMark06), 380 Watts (The Witcher 3) and 586 Watts (FurMark + Prime). Thus it is not surprising that two 330-Watt power supplies (together 2.5 kg, 5.5 lb), which are connected via adapter, are included with the 18-inch device.
Power Consumption
| Off / Standby | |
| Idle | |
| Load |
|
Key:
min: | |
| MSI GT83VR 7RF-206 Titan SLI GeForce GTX 1080 SLI (Laptop), i7-7920HQ | MSI GT83VR-6RE32SR451 GeForce GTX 1070 SLI (Laptop), 6820HK | Schenker XMG U727 2017 GeForce GTX 1080 Mobile, i7-7700K | Acer Predator 17 X GX-792-76DL GeForce GTX 1080 Mobile, i7-7820HK | Asus G701VIK-BA049T GeForce GTX 1080 Mobile, i7-7820HK | MSI GT73VR 7RF-296 GeForce GTX 1080 Mobile, i7-7820HK | |
|---|---|---|---|---|---|---|
| Power Consumption | 22% | 26% | 43% | 44% | 40% | |
| Idle Minimum * (Watt) | 45 | 32 29% | 32 29% | 27 40% | 24 47% | 29 36% |
| Idle Average * (Watt) | 54 | 47 13% | 43 20% | 32 41% | 31 43% | 35 35% |
| Idle Maximum * (Watt) | 62 | 52 16% | 51 18% | 41 34% | 38 39% | 40 35% |
| Load Average * (Watt) | 178 | 152 15% | 138 22% | 102 43% | 98 45% | 94 47% |
| Witcher 3 ultra * (Watt) | 380 | 279 27% | ||||
| Load Maximum * (Watt) | 586 | 366 38% | 350 40% | 248 58% | 320 45% | 315 46% |
* ... smaller is better
Battery Life
It is not surprising that the battery life does not receive a good grade. Even with minimal brightness, the GT83VR lasts for 2.5 hours at most. The 2 hours in our WLAN test (display brightness at 150 cd/m²) is modest as well. With a combination of maximum brightness and high load, the battery gives up after one hour. By the way, it is not a good idea to play a game without the power supply: In The Witcher 3 the performance dropped by about 80% to 90%!
| MSI GT83VR 7RF-206 Titan SLI GeForce GTX 1080 SLI (Laptop), i7-7920HQ, 75.24 Wh | MSI GT83VR-6RE32SR451 GeForce GTX 1070 SLI (Laptop), 6820HK, 75 Wh | Schenker XMG U727 2017 GeForce GTX 1080 Mobile, i7-7700K, 89 Wh | Acer Predator 17 X GX-792-76DL GeForce GTX 1080 Mobile, i7-7820HK, 88.8 Wh | Asus G701VIK-BA049T GeForce GTX 1080 Mobile, i7-7820HK, 93 Wh | MSI GT73VR 7RF-296 GeForce GTX 1080 Mobile, i7-7820HK, 75.2 Wh | |
|---|---|---|---|---|---|---|
| Battery runtime | -2% | 51% | 92% | 93% | 35% | |
| Reader / Idle (h) | 2.4 | 2.5 4% | 3.7 54% | 5.2 117% | 5.7 138% | |
| WiFi v1.3 (h) | 2 | 2 0% | 2.8 40% | 4.2 110% | 4 100% | 2.7 35% |
| Load (h) | 1 | 0.9 -10% | 1.6 60% | 1.5 50% | 1.4 40% | |
| H.264 (h) | 3.4 | 2.4 |
Verdict
Pros
Cons
If it is only about performance, what the MSI GT83VR delivers is excellent.
There is hardly any high-end notebook that has as many reserves for modern games – be it in terms of CPU, GPU, or RAM. However, the price of this almost unrivaled performance is not only a huge hole in the pocketbook (the test model costs more than 5000 Euros, ~$5600), but it also has quite a massive and heavy case that can only be moved with some effort.
Our main complaints are the display and noise development. At 1920x1080 pixels and 60 Hz, even a single GTX-1080 calculates very quickly, so that the extra charge for an SLI system stands in no relation to the FPS benefit. For that, the GT83VR would need to provide a 4K panel. The uncomfortable noise in the 3D operation and the annoying coil whine in idle mode prevent it from entry into the Gaming Top 10.
For the successor, we would wish for a 17-inch case (there are enough 120 Hz and UHD panels in this size) with – hopefully quieter – Max-Q-Graphics chips and G-Sync support. A thin 18-inch notebook with a single GPU would also be an interesting solution for users who prefer their displays to be as large as possible.
MSI GT83VR 7RF-206 Titan SLI
- 06/17/2017 v6 (old)
Florian Glaser
Price comparison
