

MSI GT73VR 7RF Titan Pro Notebook Review
For the original German review, see here.
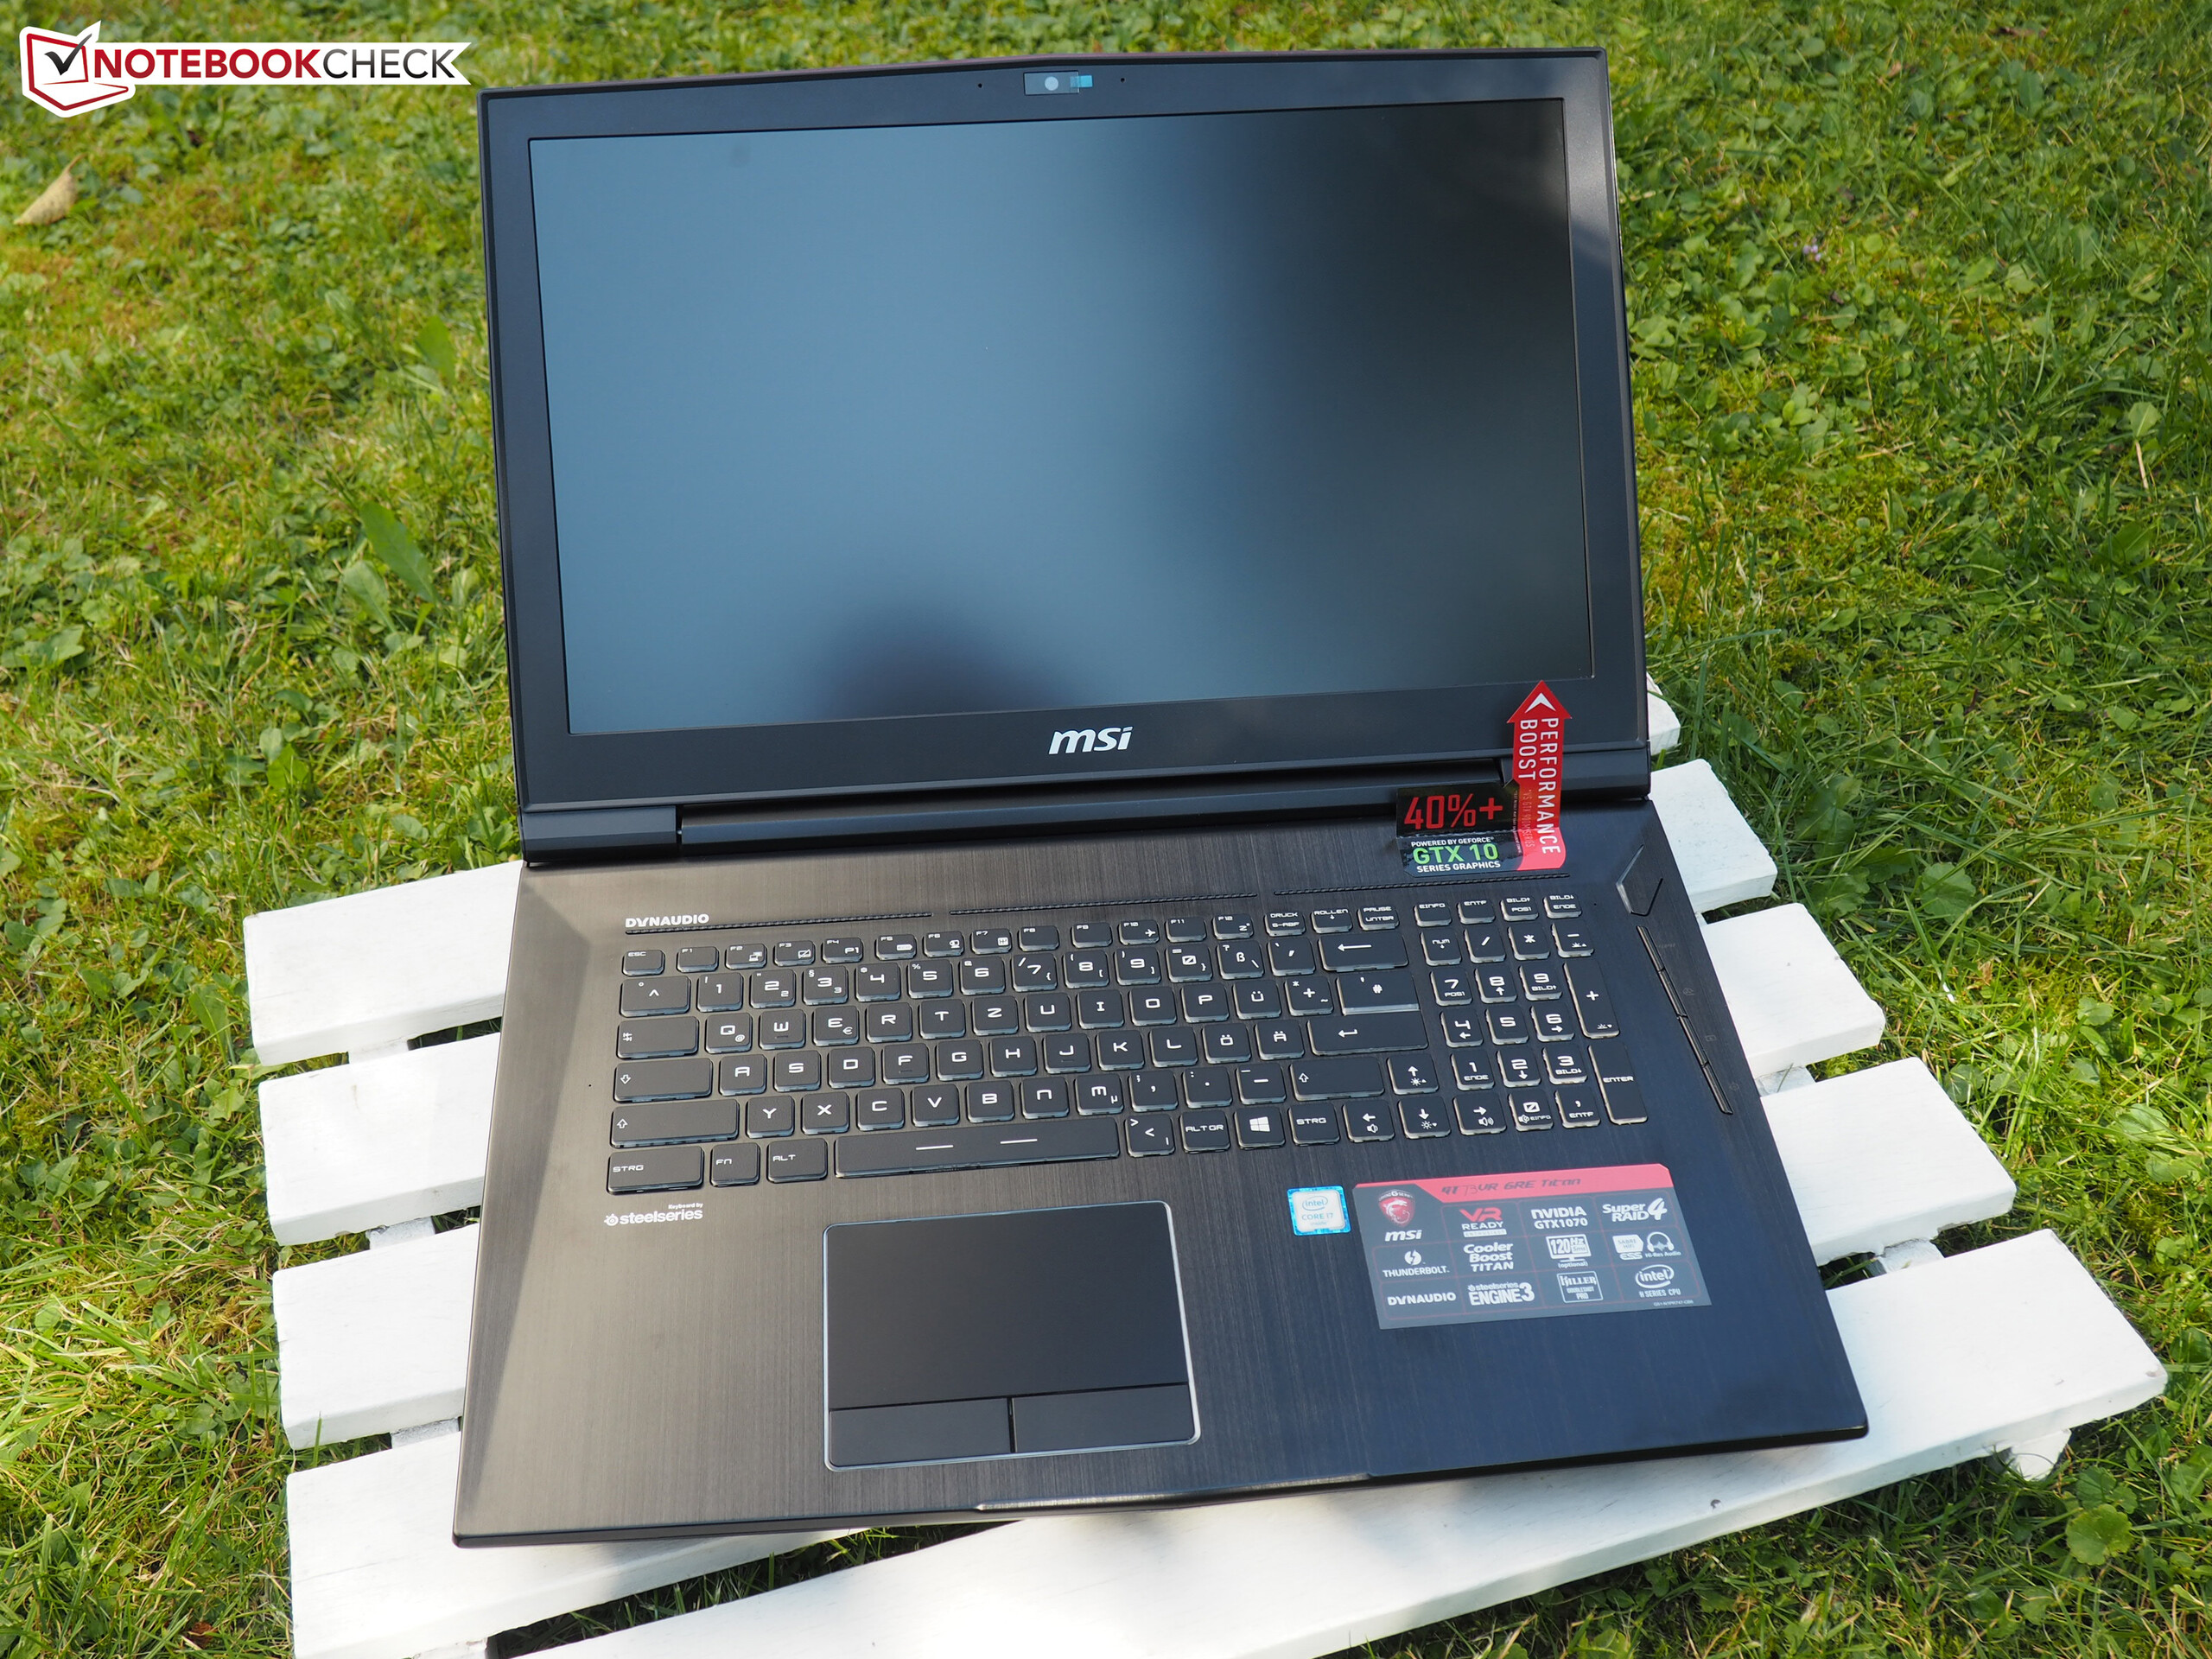
The biggest change of the brand-new MSI GT73, which – depending on the GPU – ends with the designations 7RF (GTX 1080) or 7RE (GTX 1070), is the processor. Even though Intel's optimizations have been rather cautious in the last couple of years (especially in terms of performance), passionate gamers will probably wait for Kaby Lake when they get a new notebook, although the old GT73VR 6RF or 6RE, respectively, could have a much better price-performance ratio.
The 7RF-296 we review today is the latest top model. This is not only the case for MSI but also for the whole mobile-gaming segment. Nvidia's GeForce GTX 1080 costs a whole lot of money, but the performance is excellent and even dwarfs the Maxwell top model GTX 980.
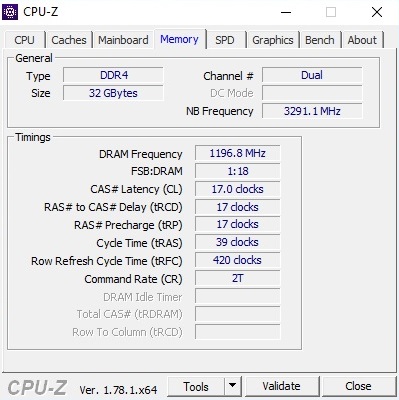
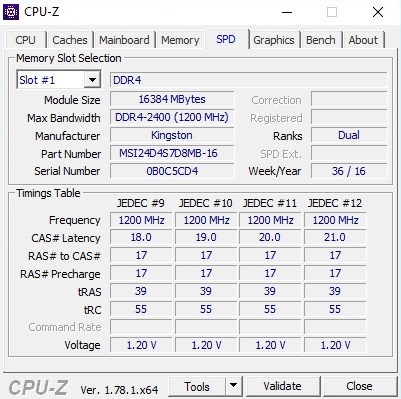
The other specs are not bad either: MSI integrates 32 GB DDR4-RAM (2x 16 GB @2400 MHz) and a combination of SSD-RAID (2x 256 GB) and 1 TB HDD, so you should be covered in this respect. The display is once again a fast 120 Hz panel with G-Sync support, but it is based on the TN technology and only has a resolution of 1920x1080 pixels – not a lot when you consider the screen size and the GPU performance. We expect more in 2017.
New Features
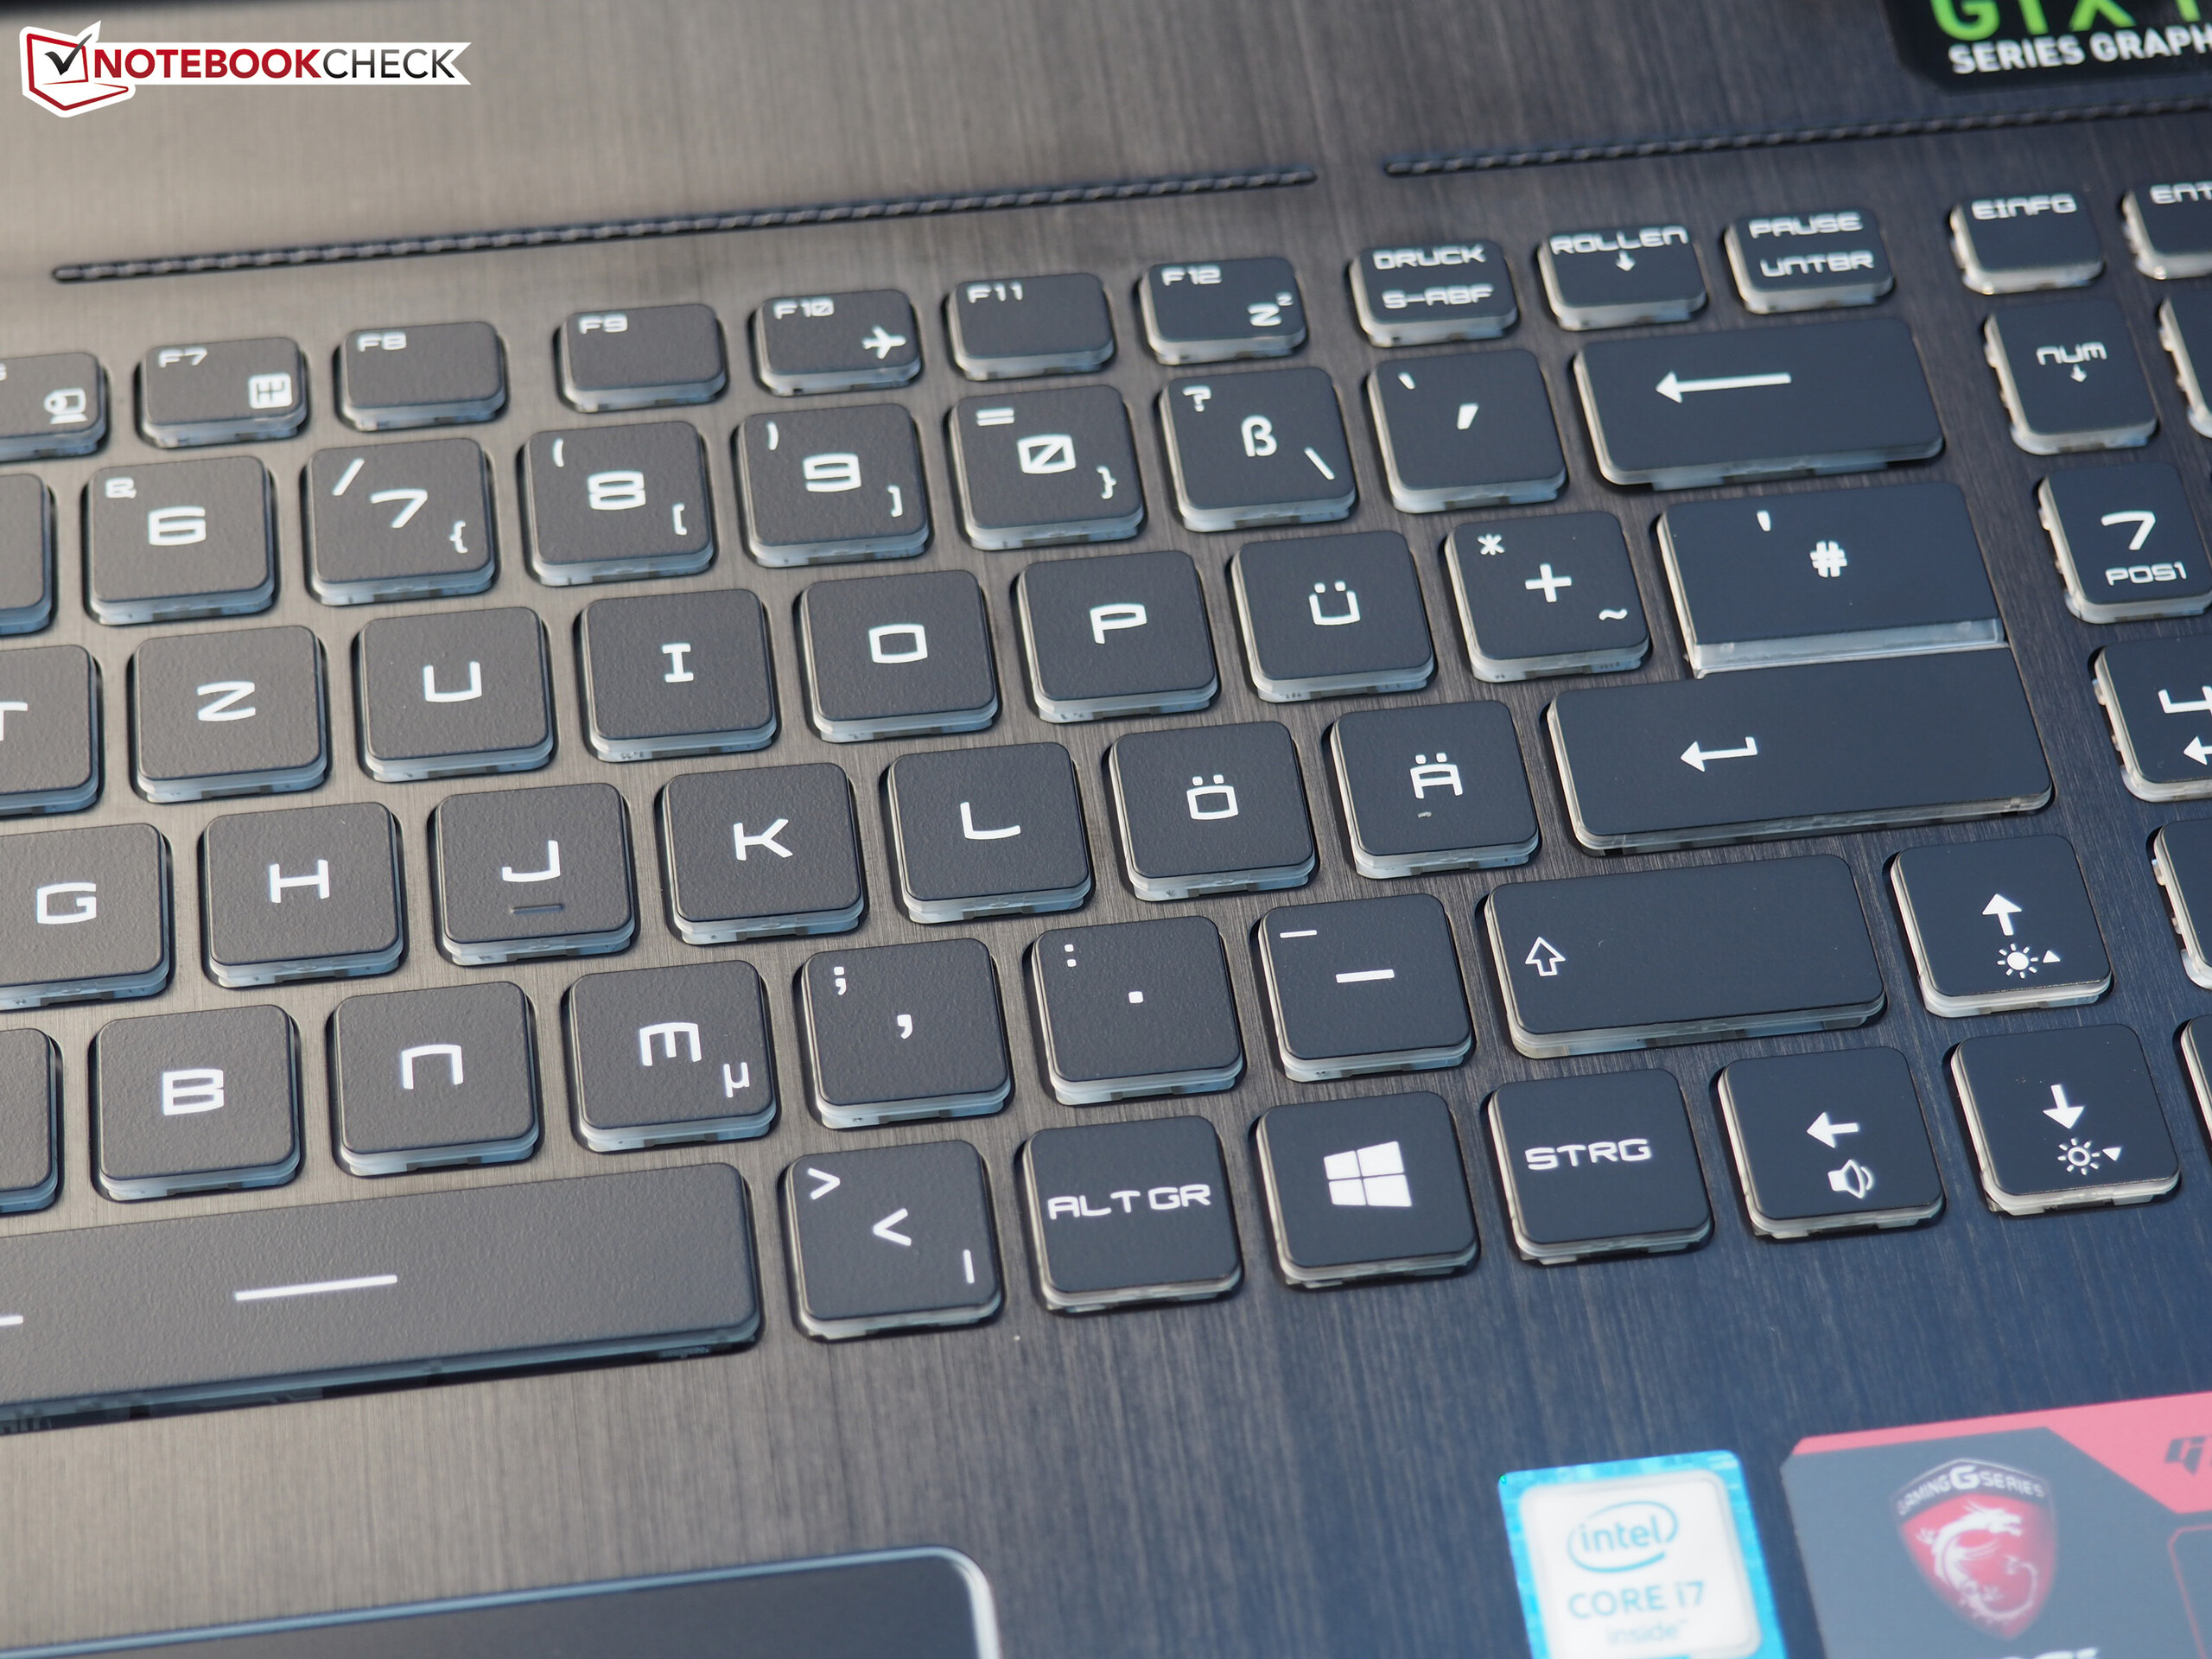
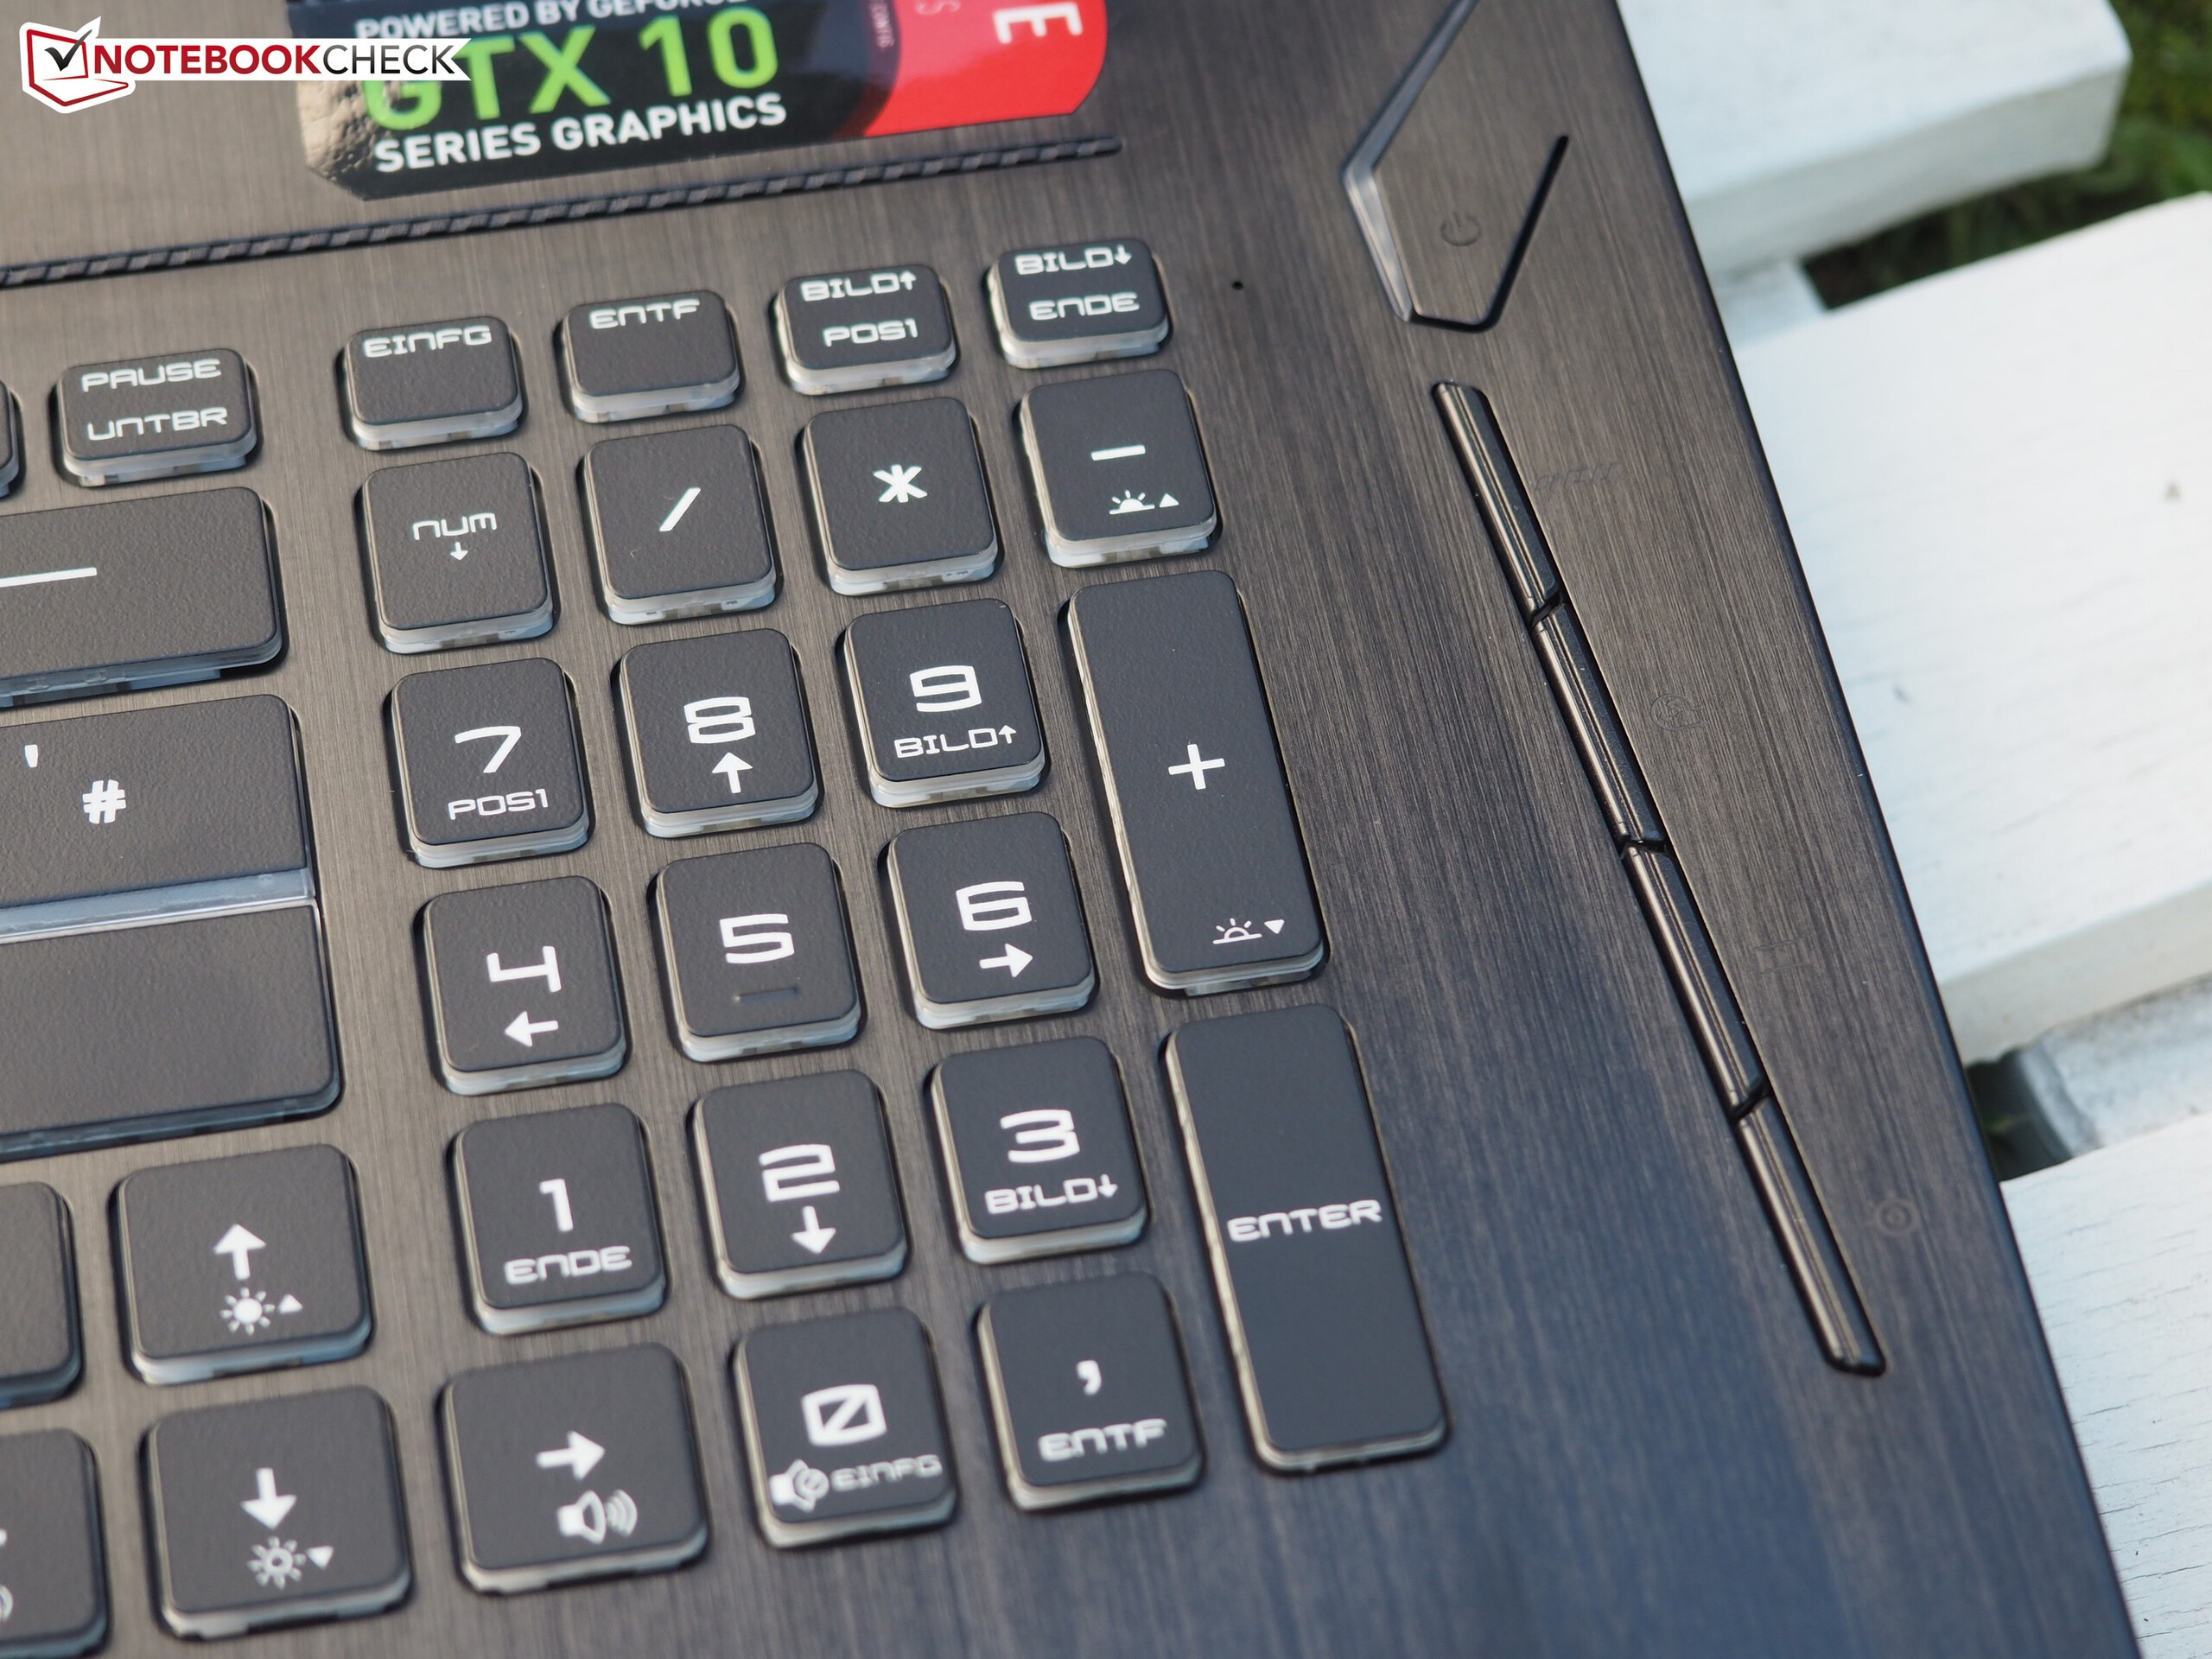
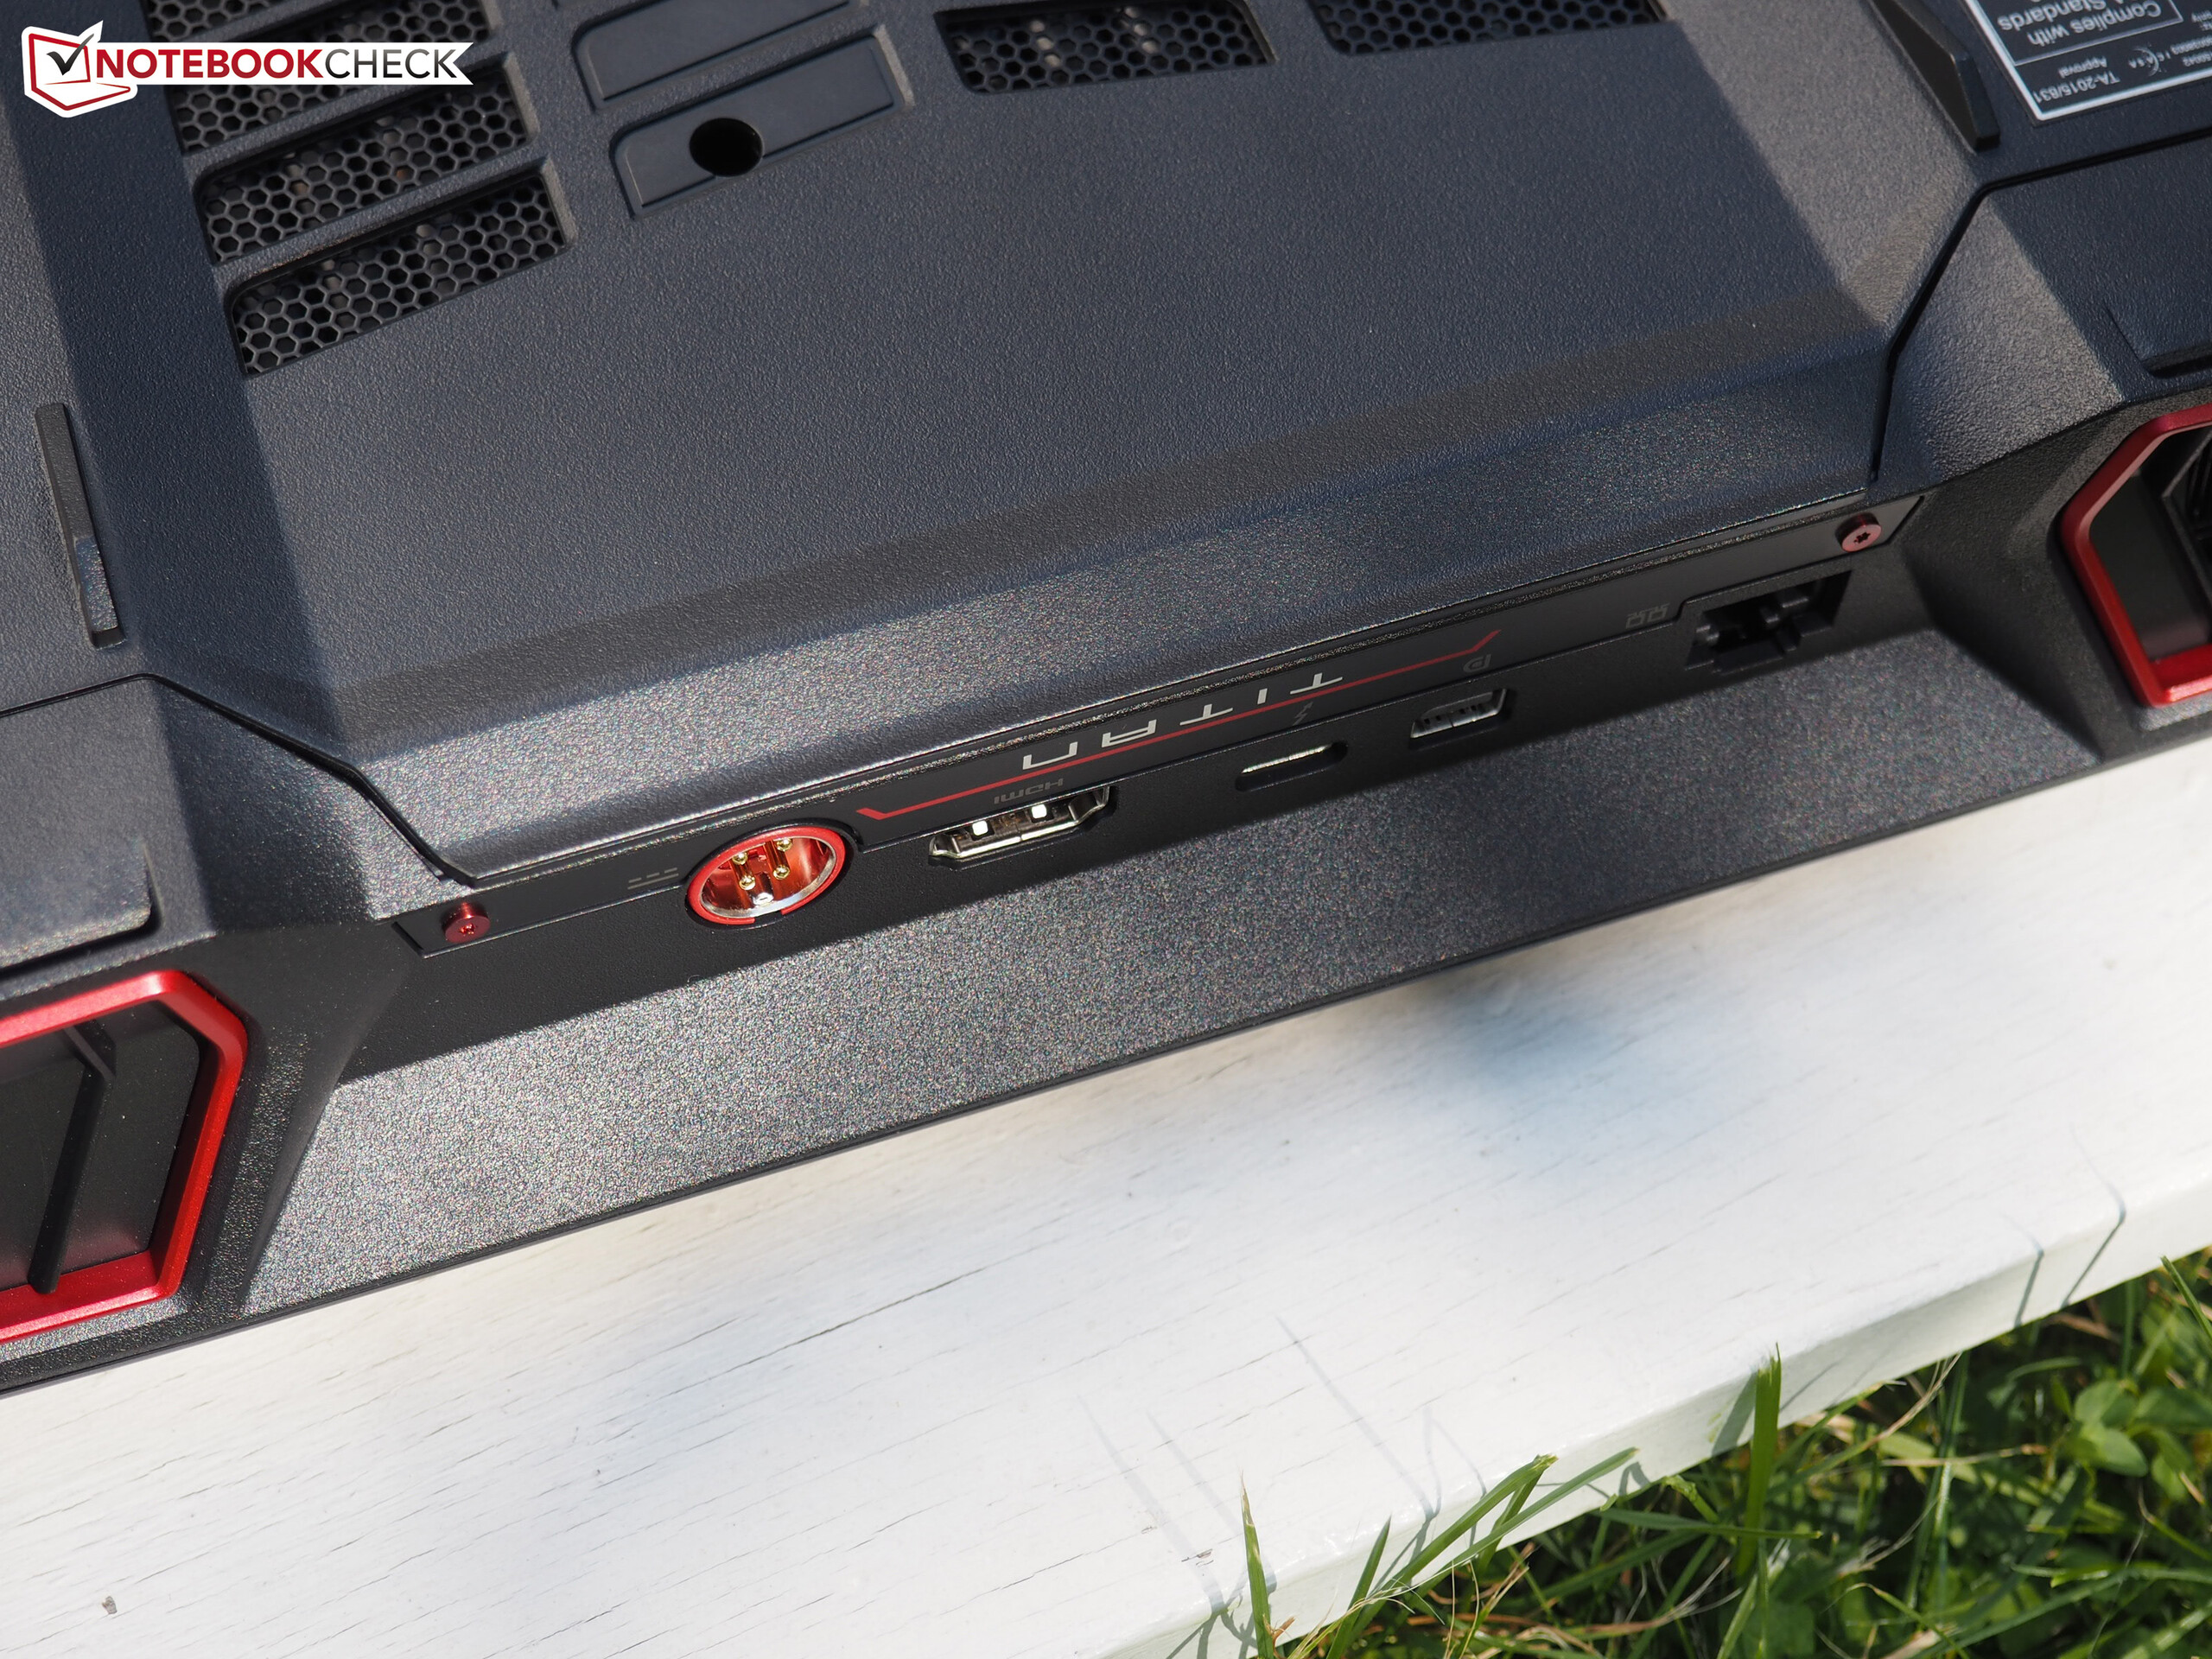
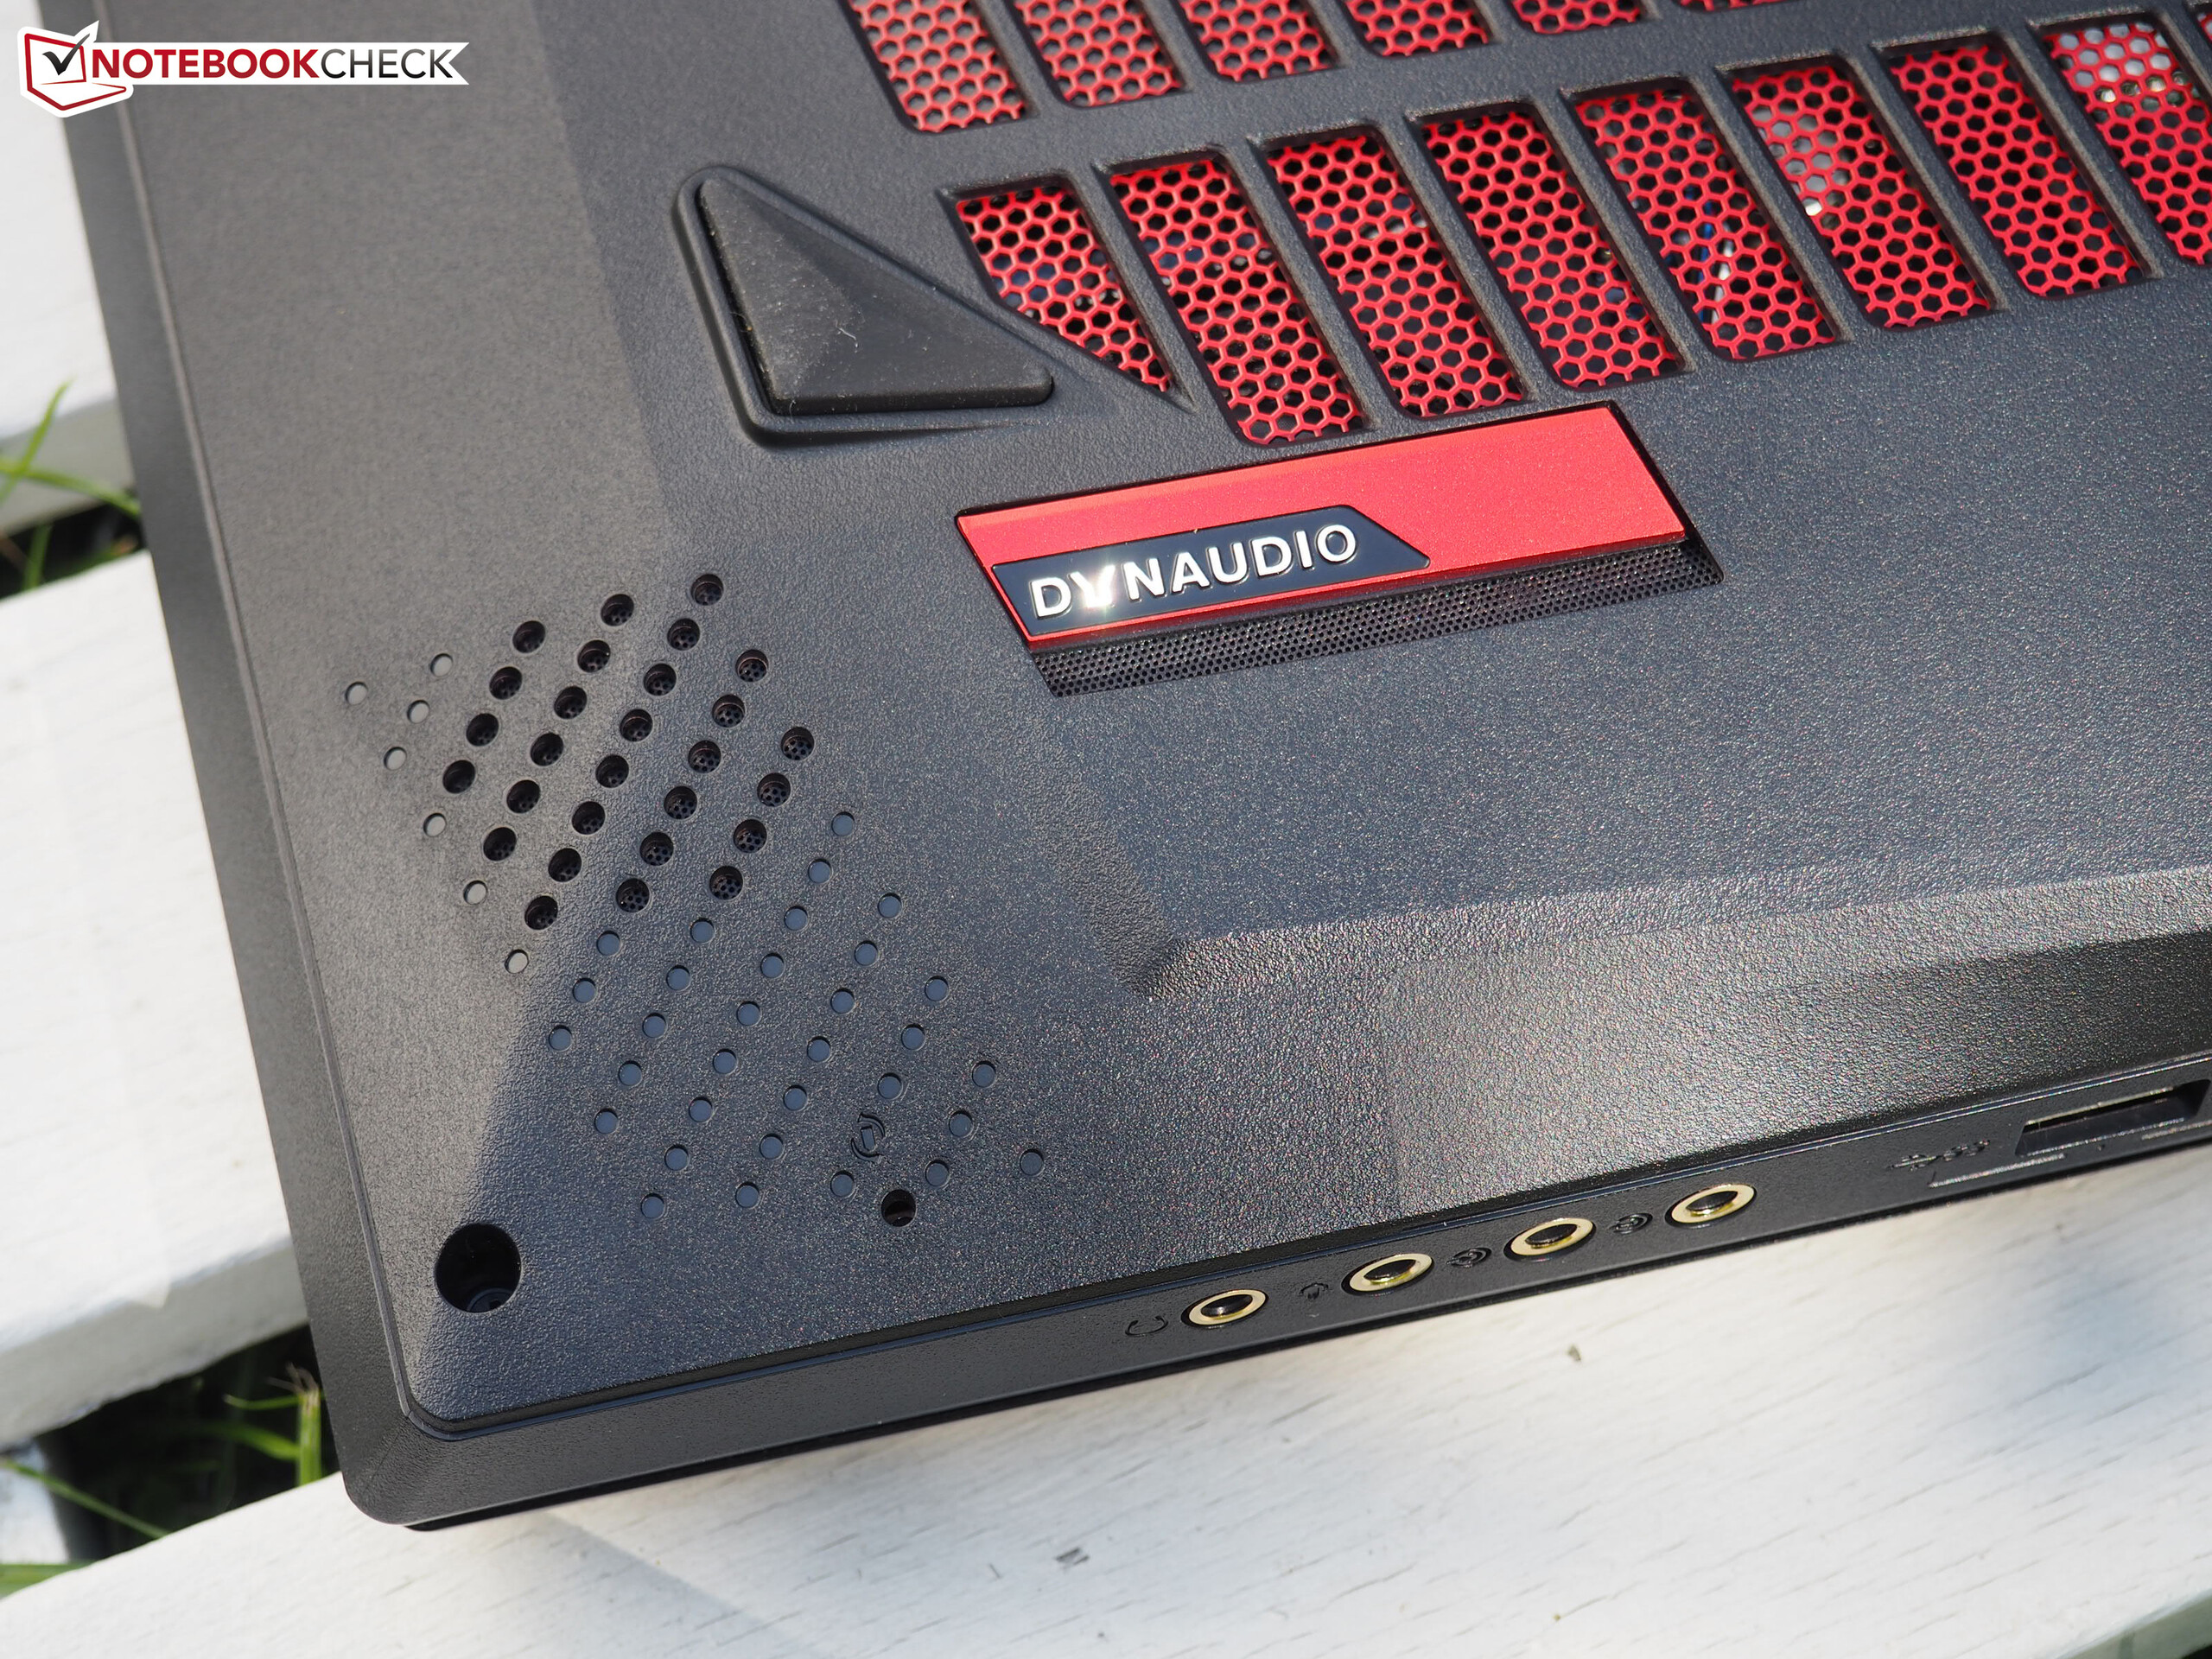
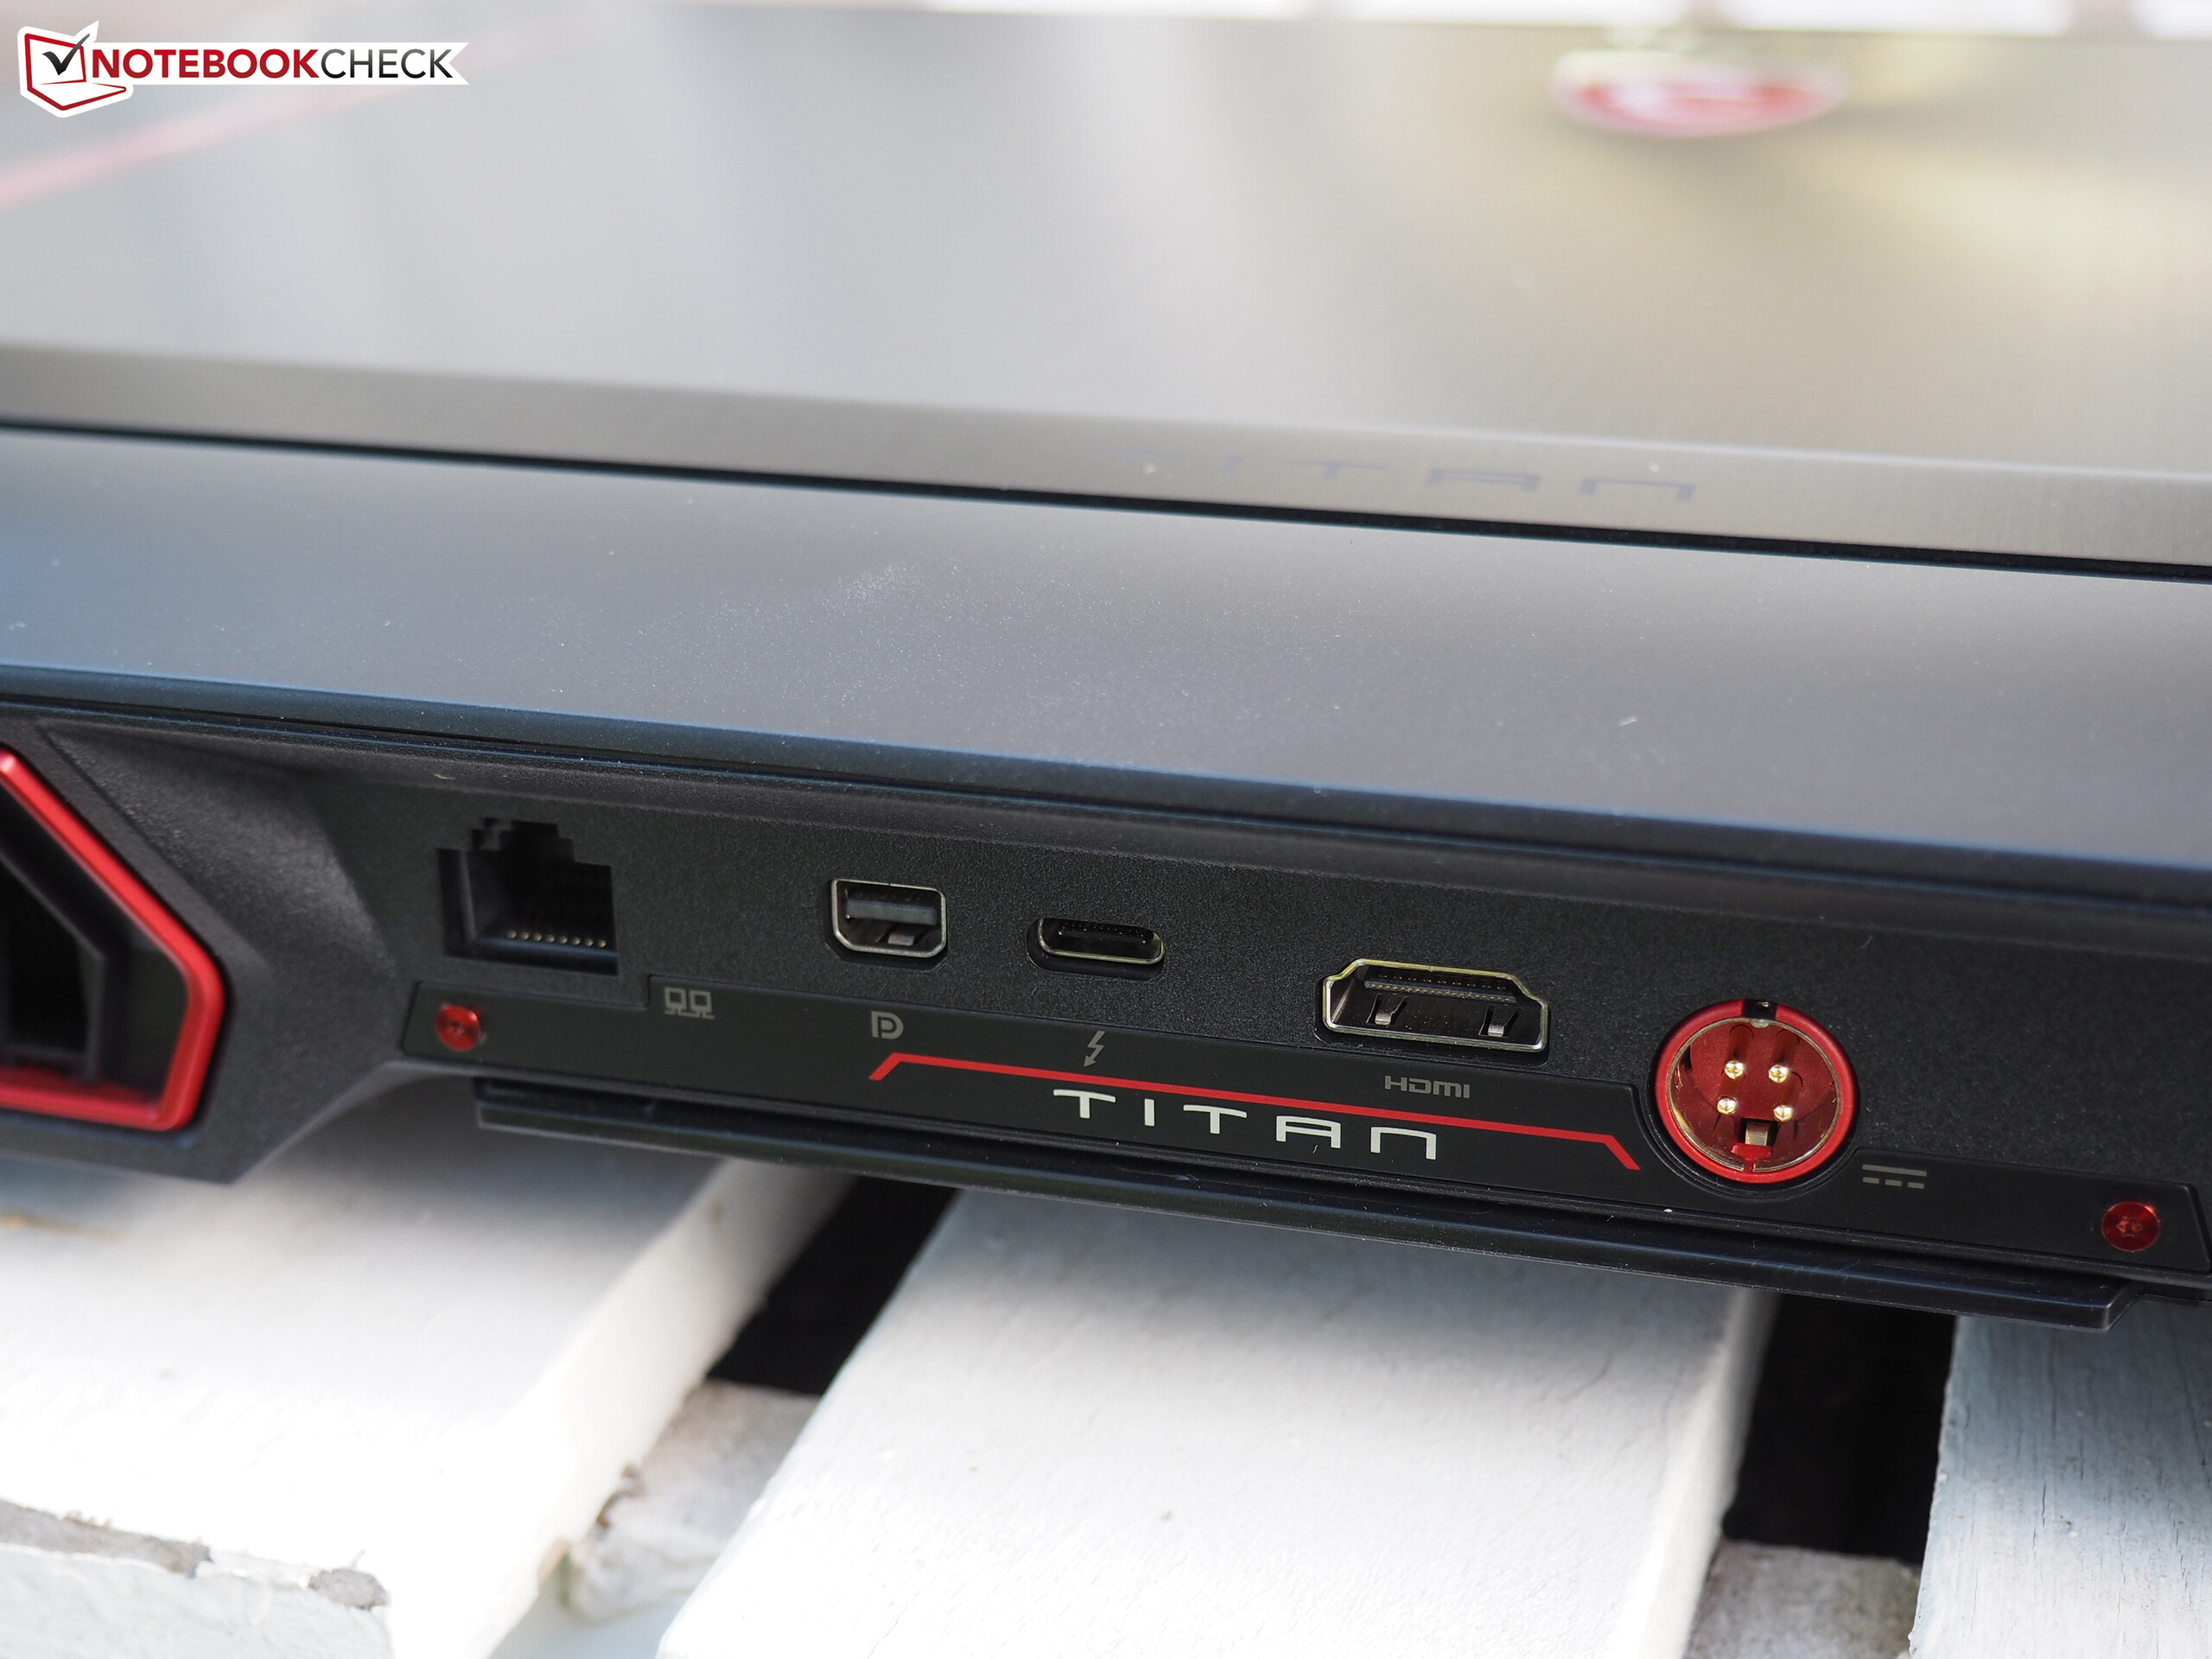
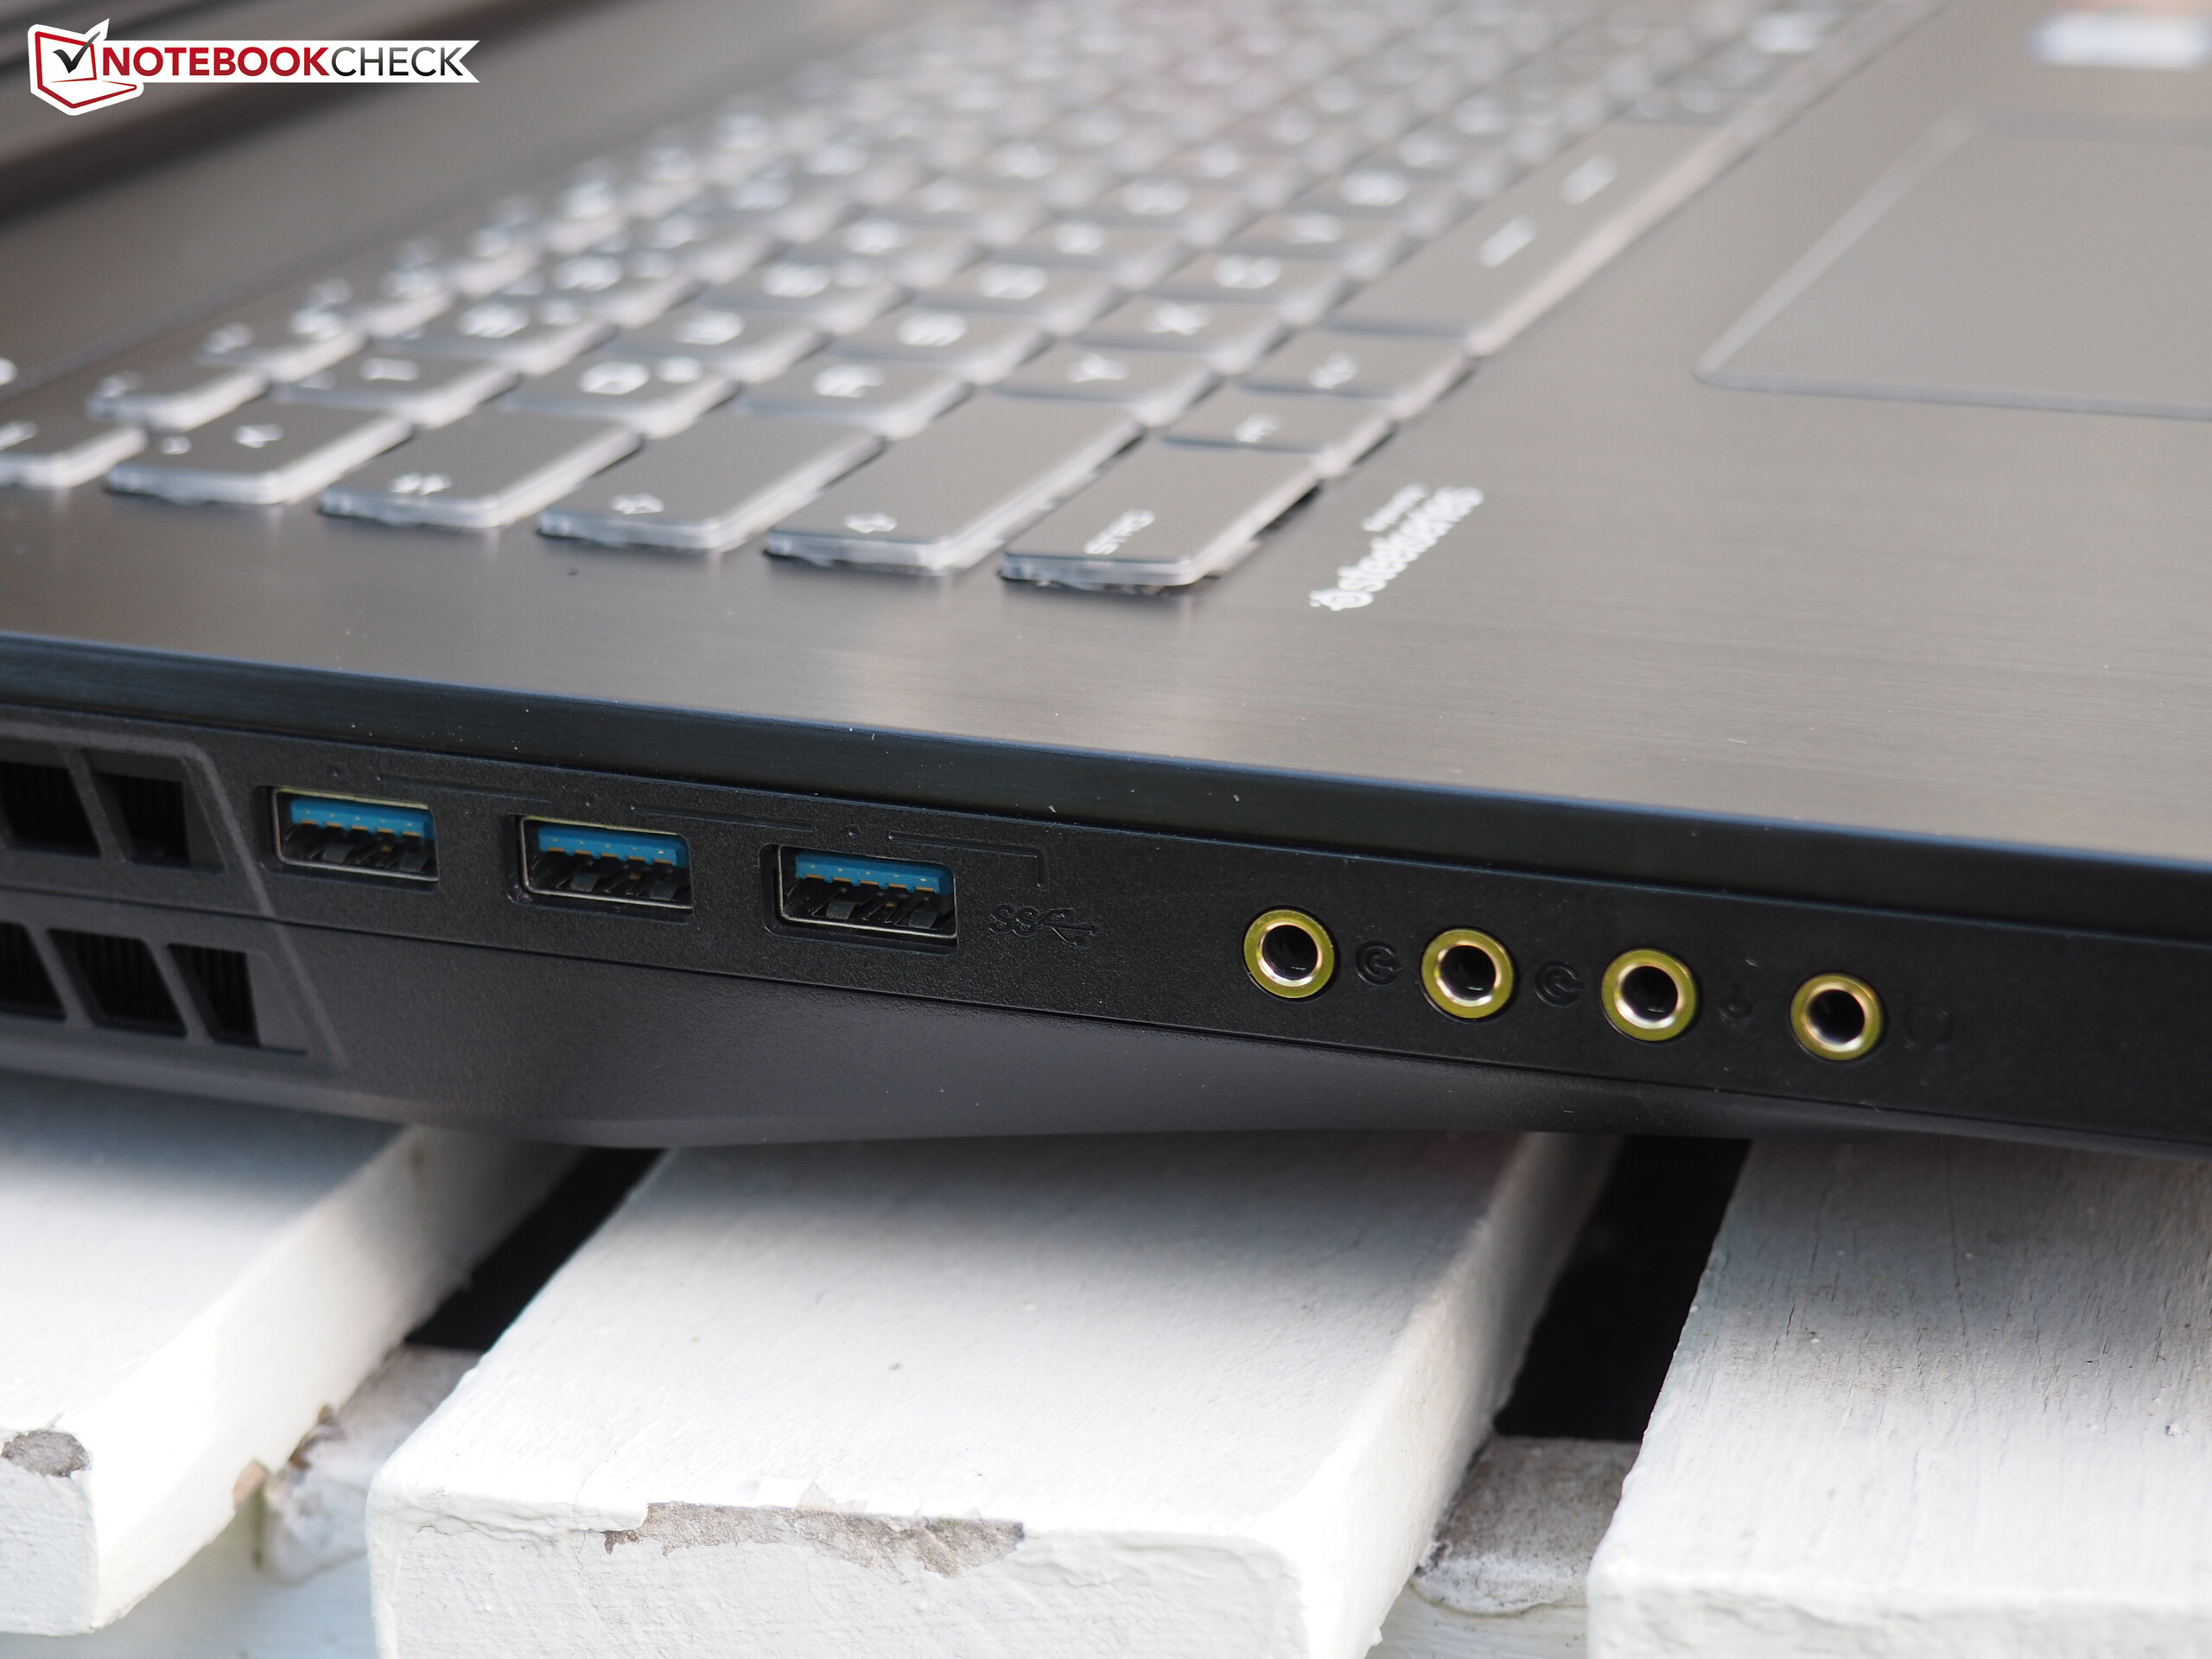
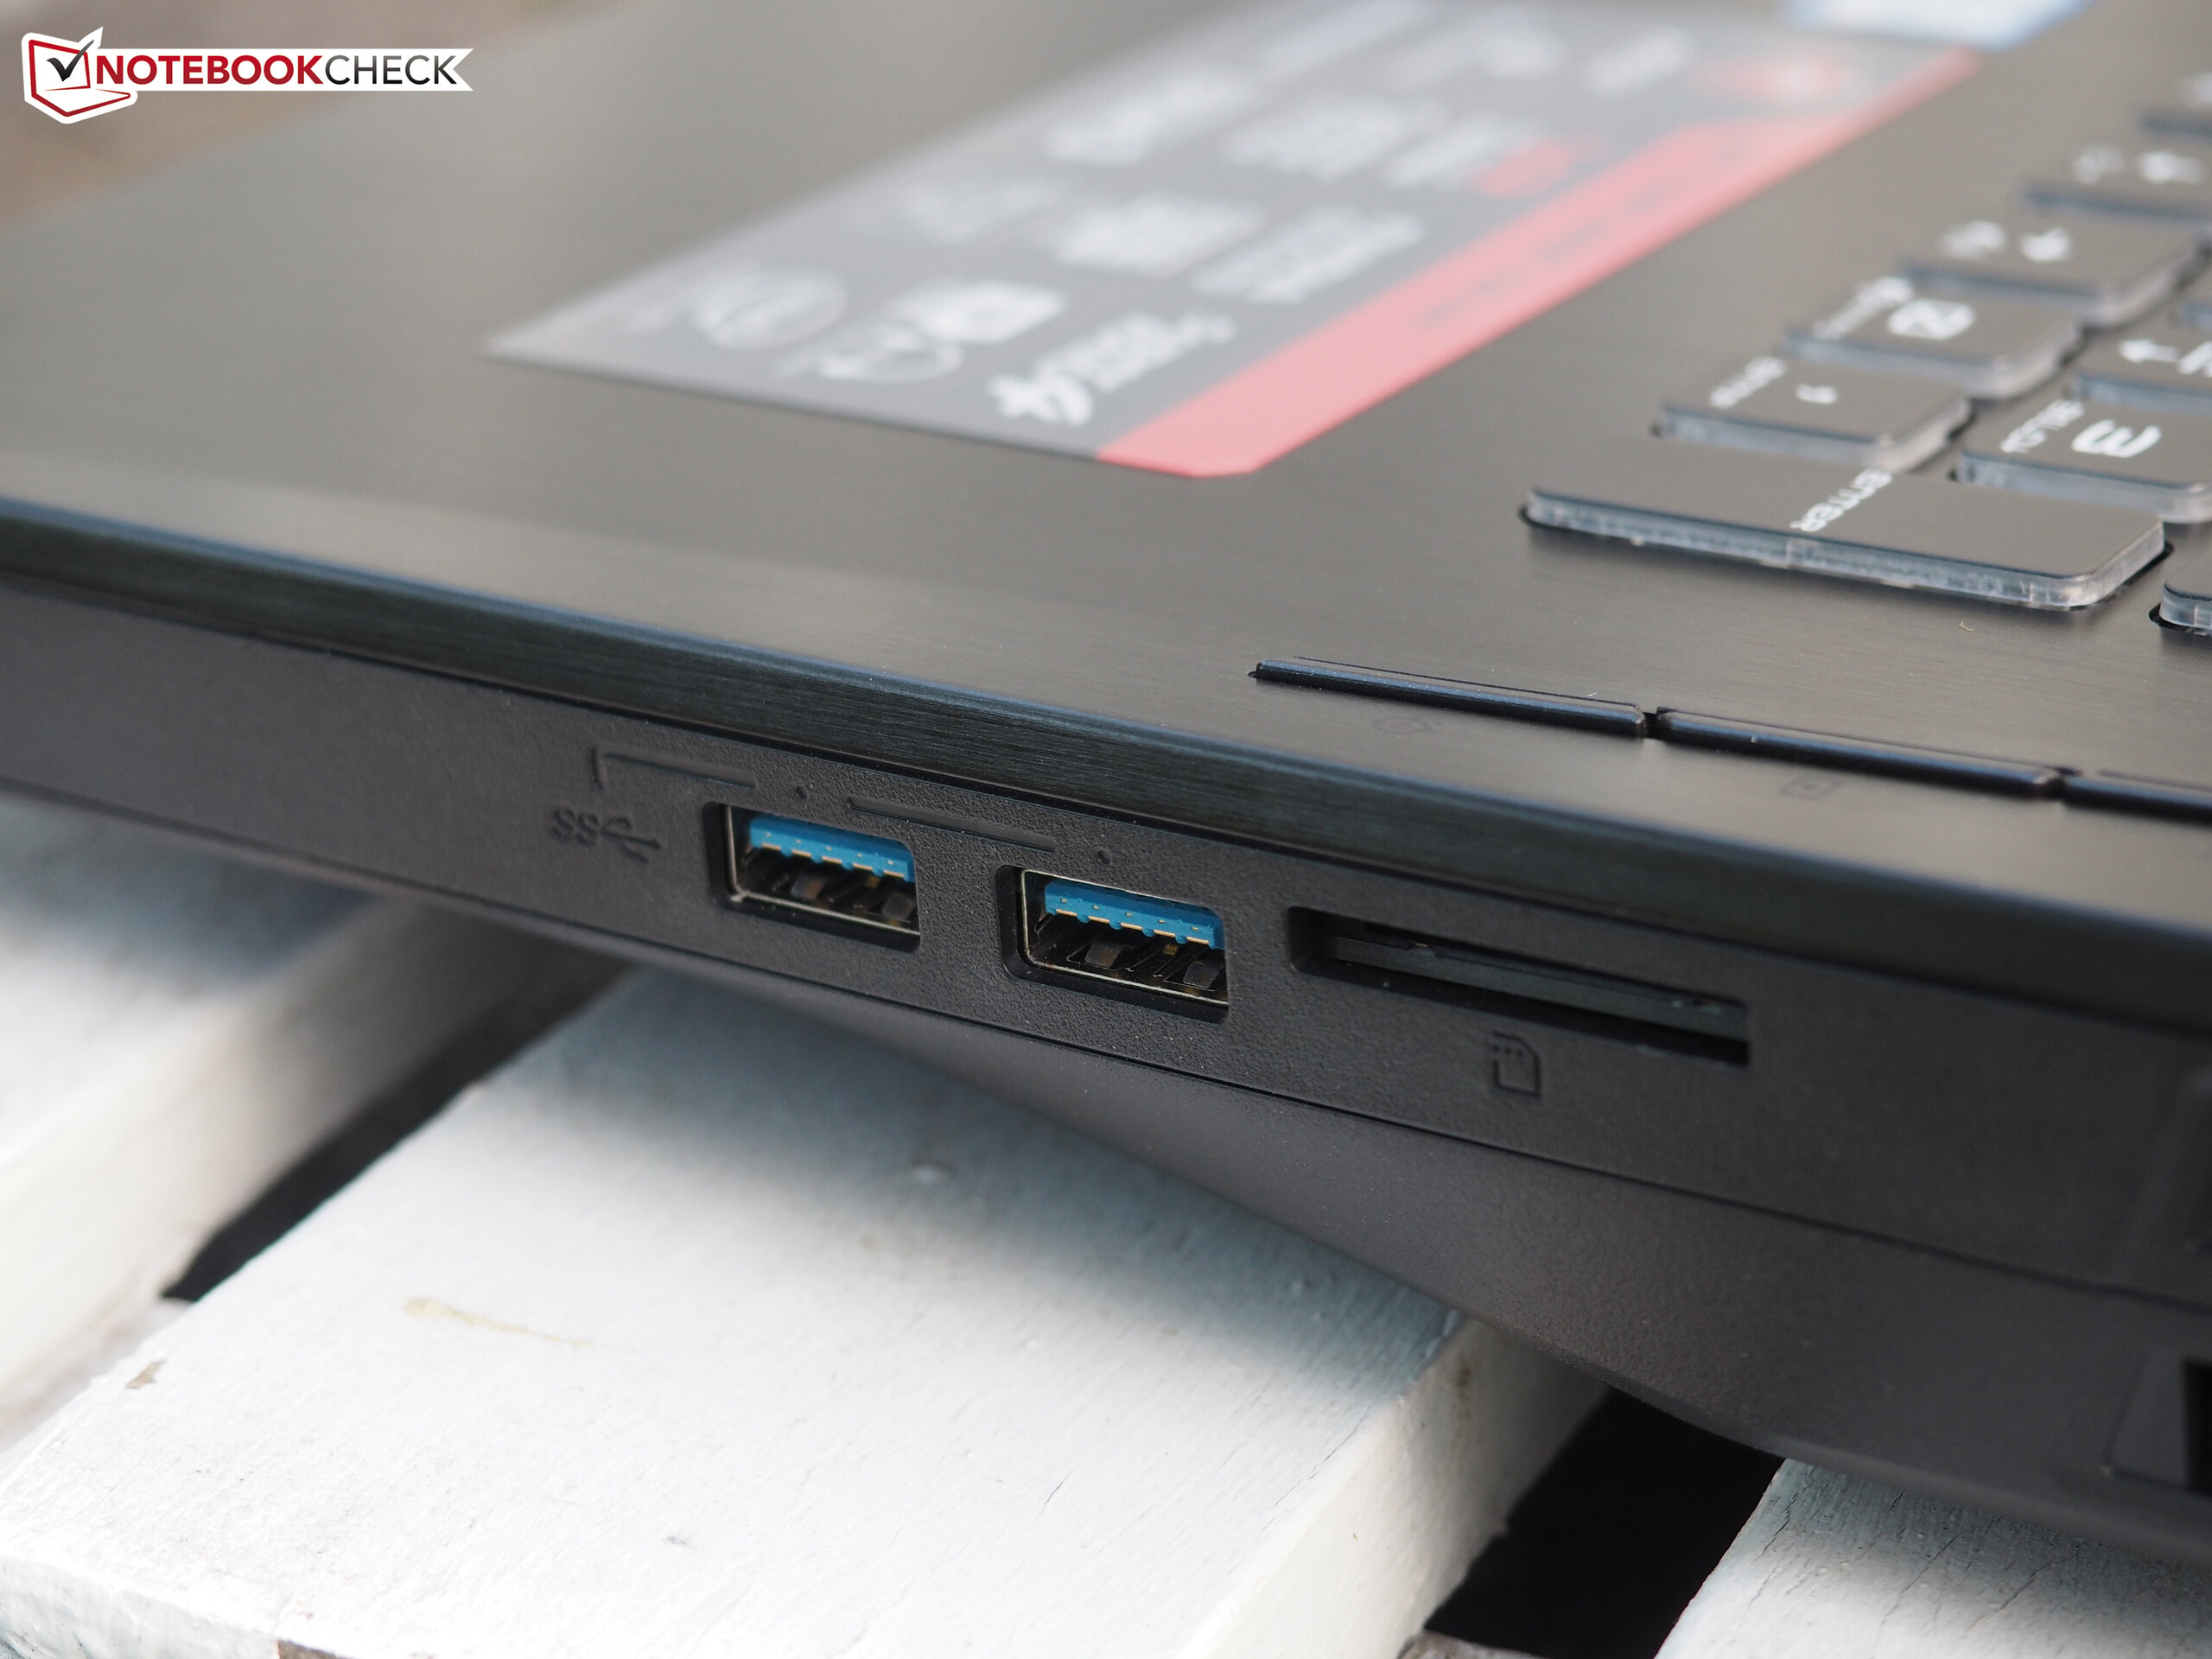
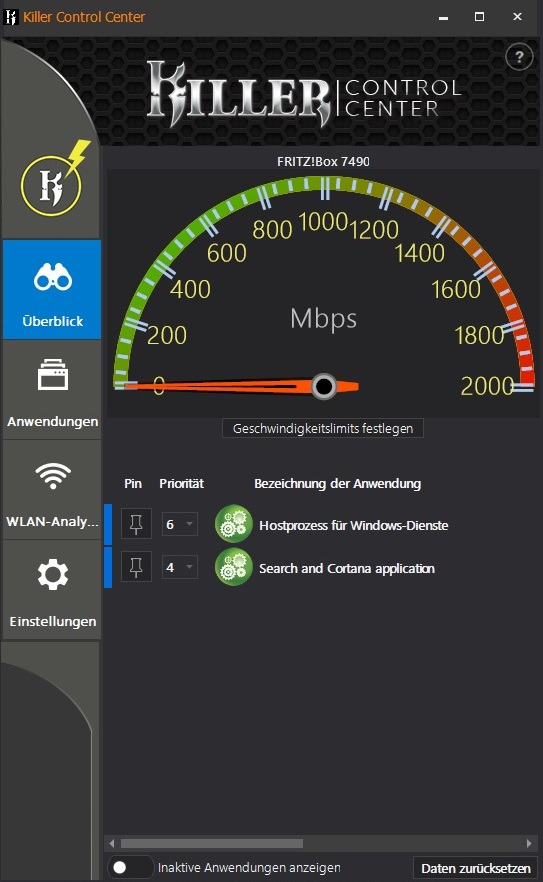
We skip the sections Case, Connectivity and Input Devices, because not a lot has changed except for the processor. The GT73VR leaves a pretty good impression in these sections, and all the corresponding information is available in the review of the predecessor. We only repeated the measurements for the SD-card reader as well as the wireless module (see below), which are once again excellent and much higher compared to some rivals.
Speaking of rivals: Besides the GT83VR 6RE and GT72VR 7RE from MSI, we also use the bulky 17-inch gaming systems Asus G752VS and Acer Predator 17 G9-793 as comparison devices, which are "only" equipped with a GTX 1070 (SLI @GT83VR). The last model is the much thinner and therefore more portable Aorus X7 v6.


| SD Card Reader | |
| average JPG Copy Test (av. of 3 runs) | |
| MSI GT73VR 7RF-296 | |
| MSI GT83VR-6RE32SR451 | |
| MSI GT72VR 7RE-433 | |
| Acer Predator 17 G9-793-77LG | |
| Aorus X7 v6 | |
| Asus G752VS-XB78K | |
| maximum AS SSD Seq Read Test (1GB) | |
| MSI GT73VR 7RF-296 | |
| MSI GT72VR 7RE-433 | |
| MSI GT83VR-6RE32SR451 | |
| Acer Predator 17 G9-793-77LG | |
| Aorus X7 v6 | |
| Asus G752VS-XB78K | |
| Networking | |
| iperf3 transmit AX12 | |
| MSI GT73VR 7RF-296 | |
| MSI GT72VR 7RE-433 | |
| MSI GT83VR-6RE32SR451 | |
| Aorus X7 v6 | |
| iperf3 receive AX12 | |
| MSI GT73VR 7RF-296 | |
| MSI GT83VR-6RE32SR451 | |
| MSI GT72VR 7RE-433 | |
| Aorus X7 v6 | |
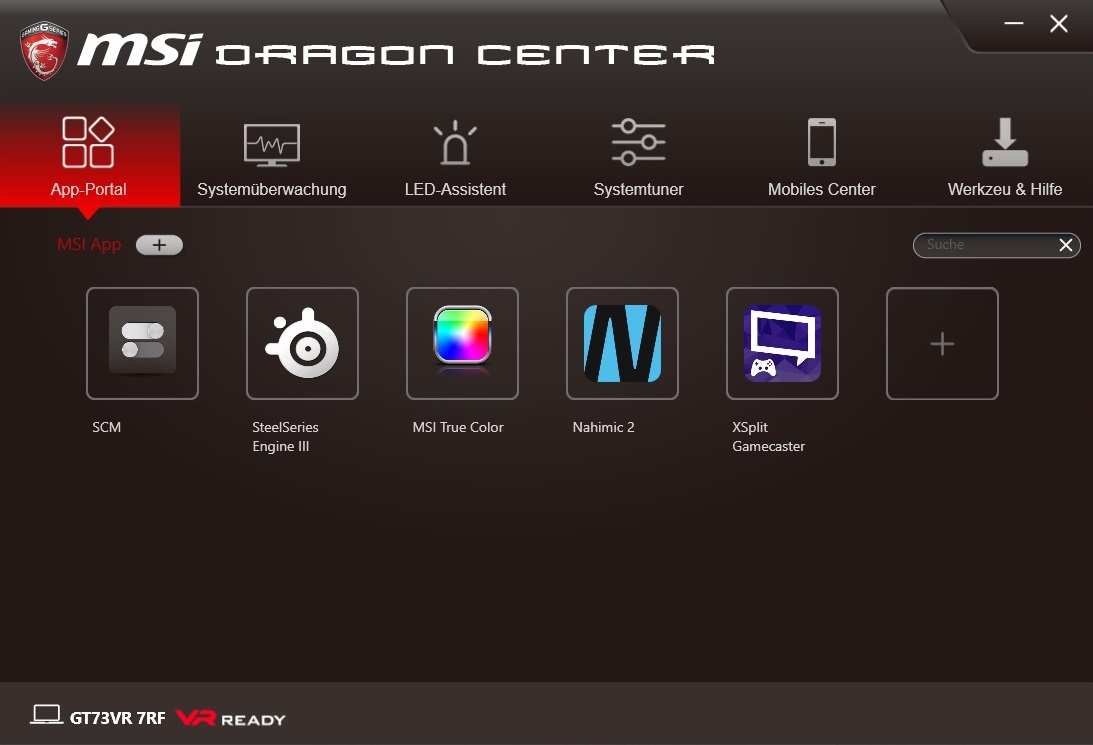
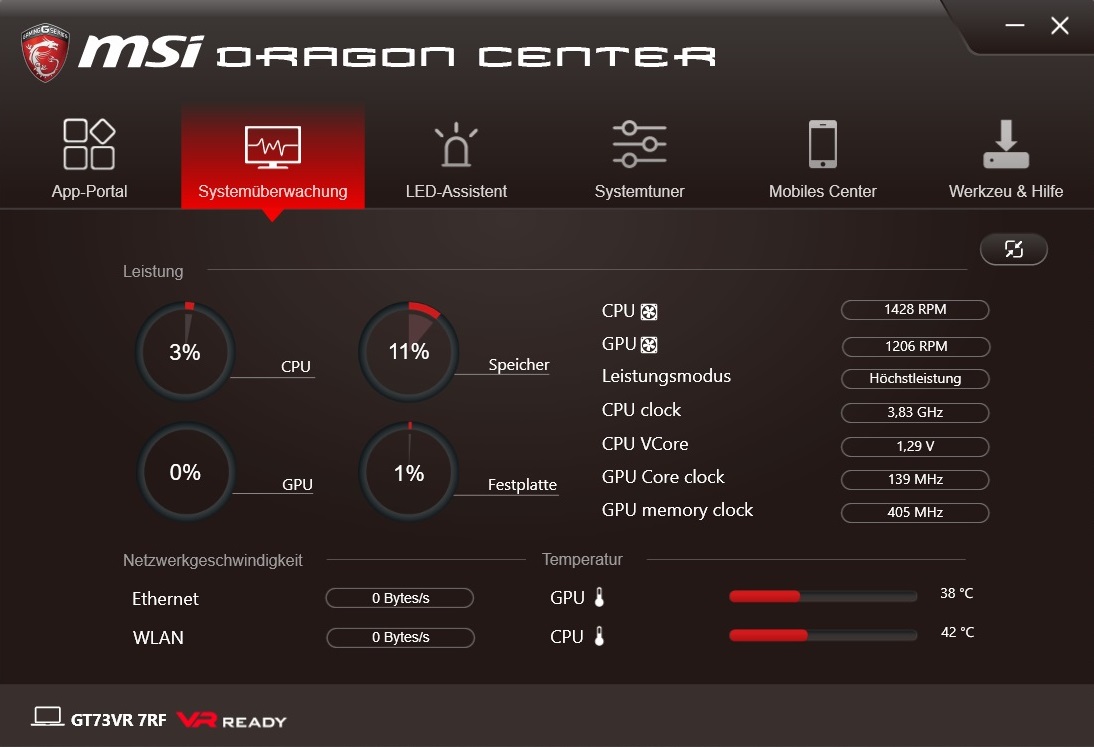
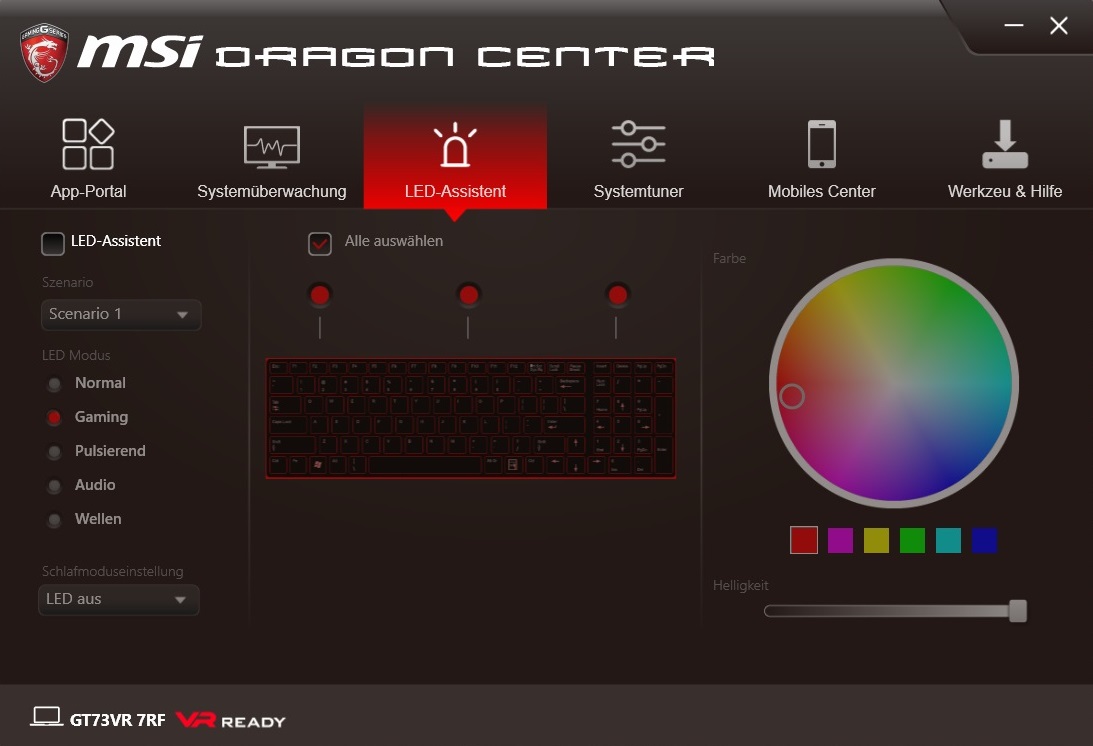
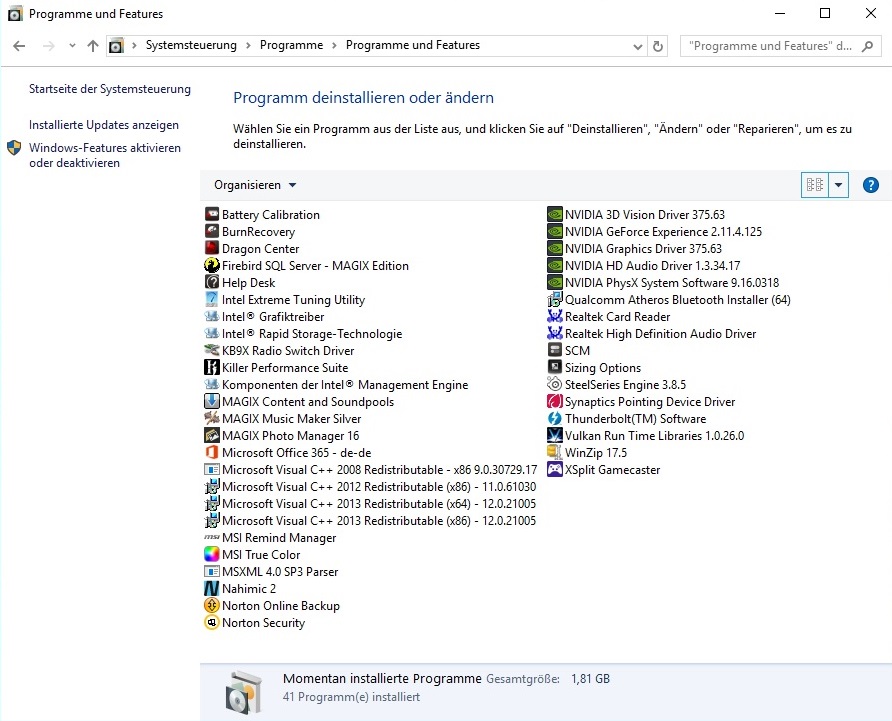
Software
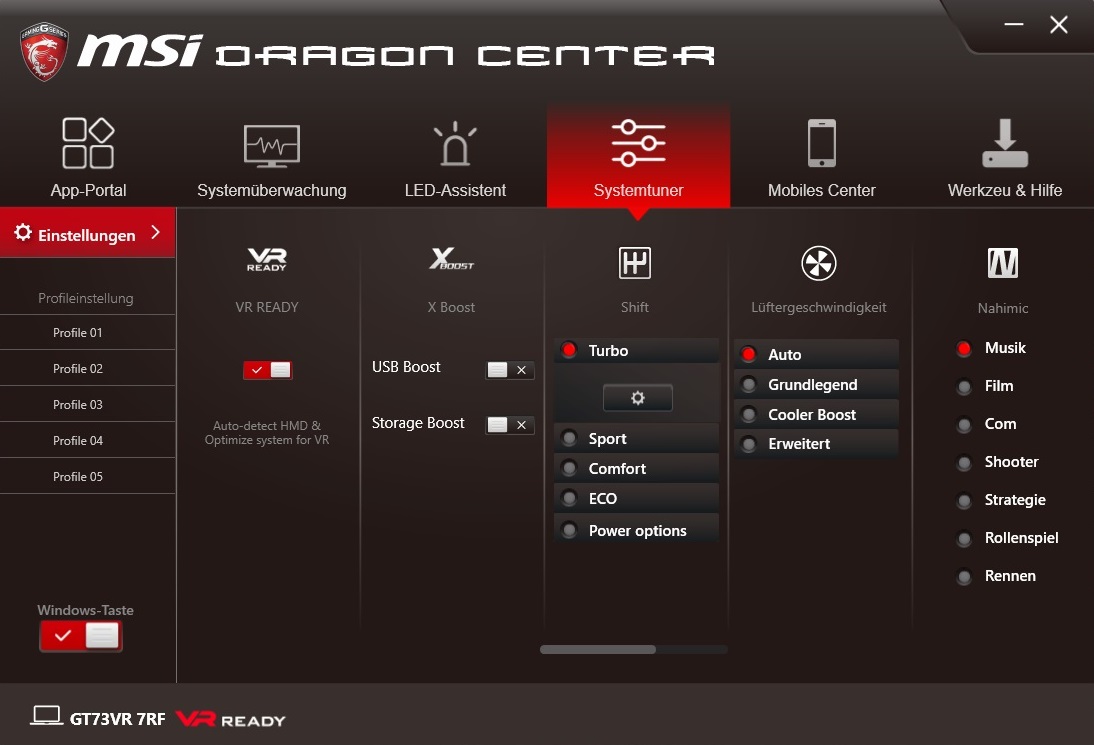
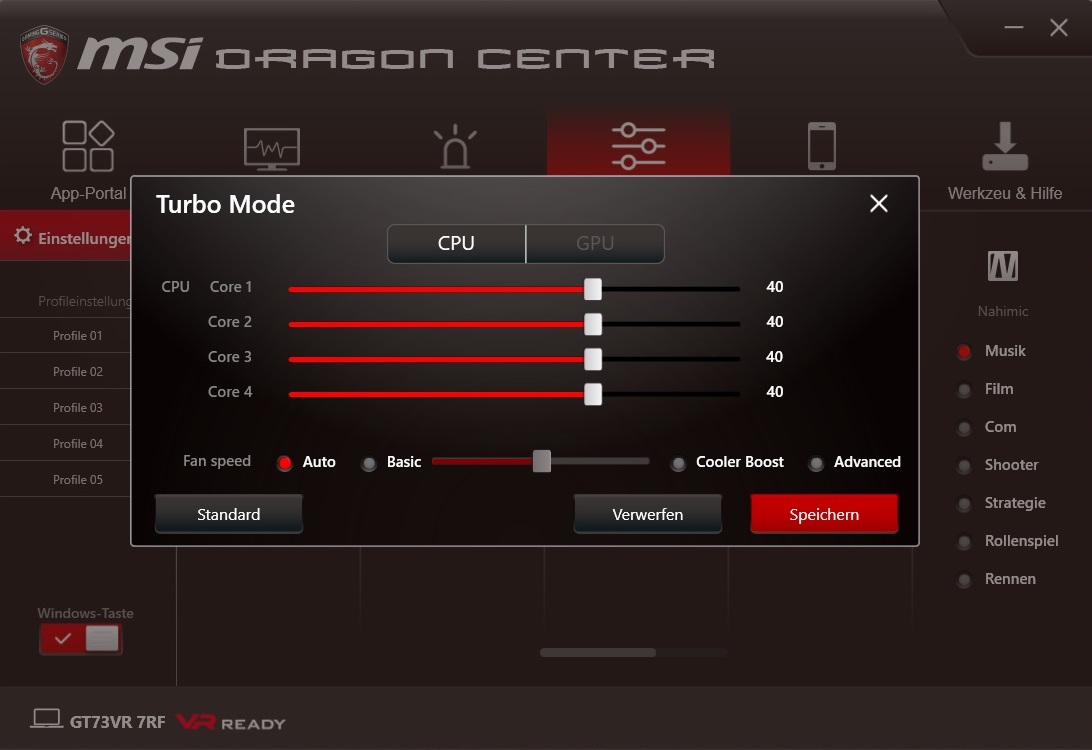
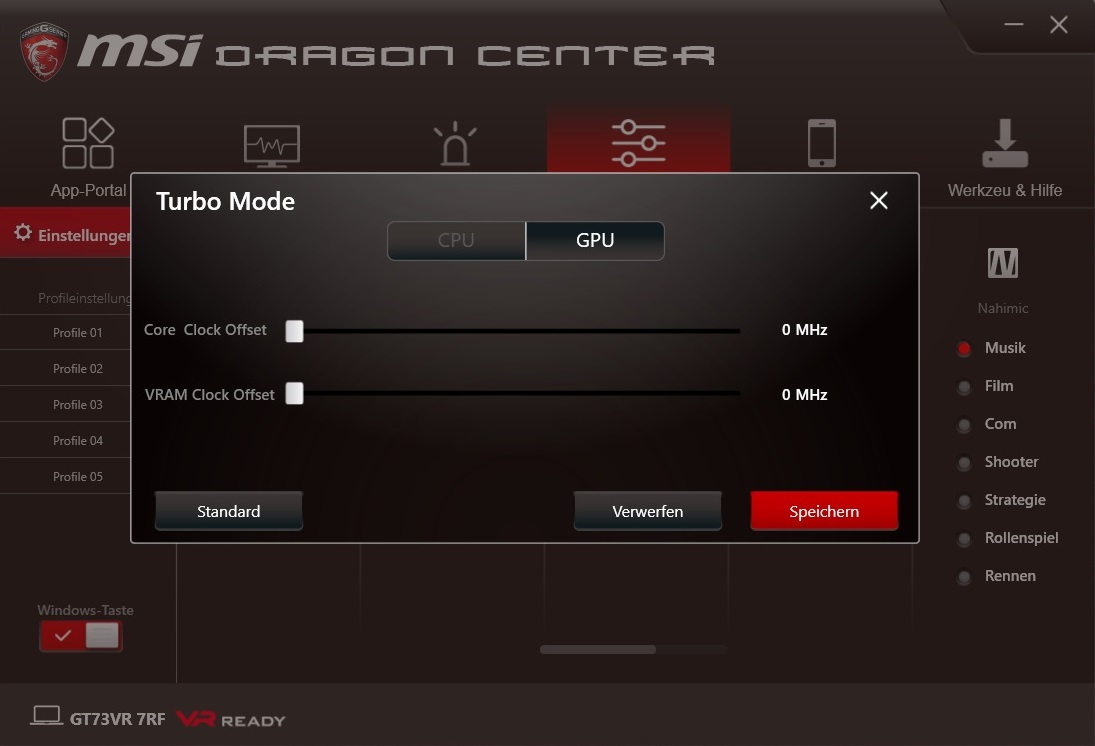
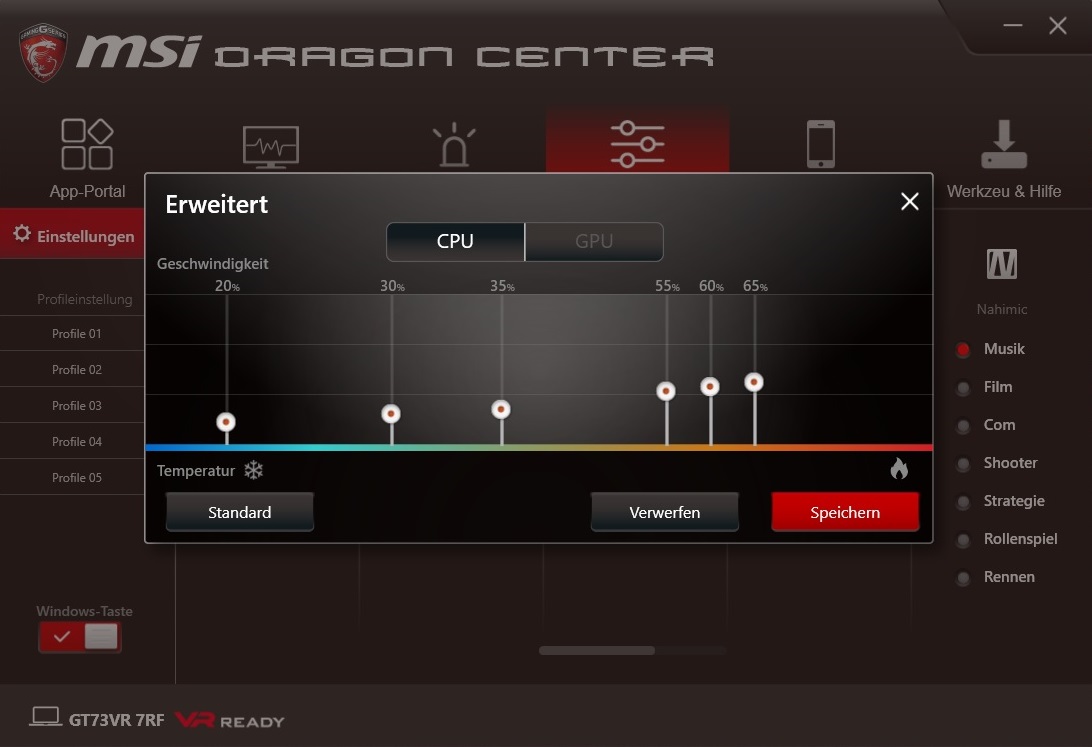
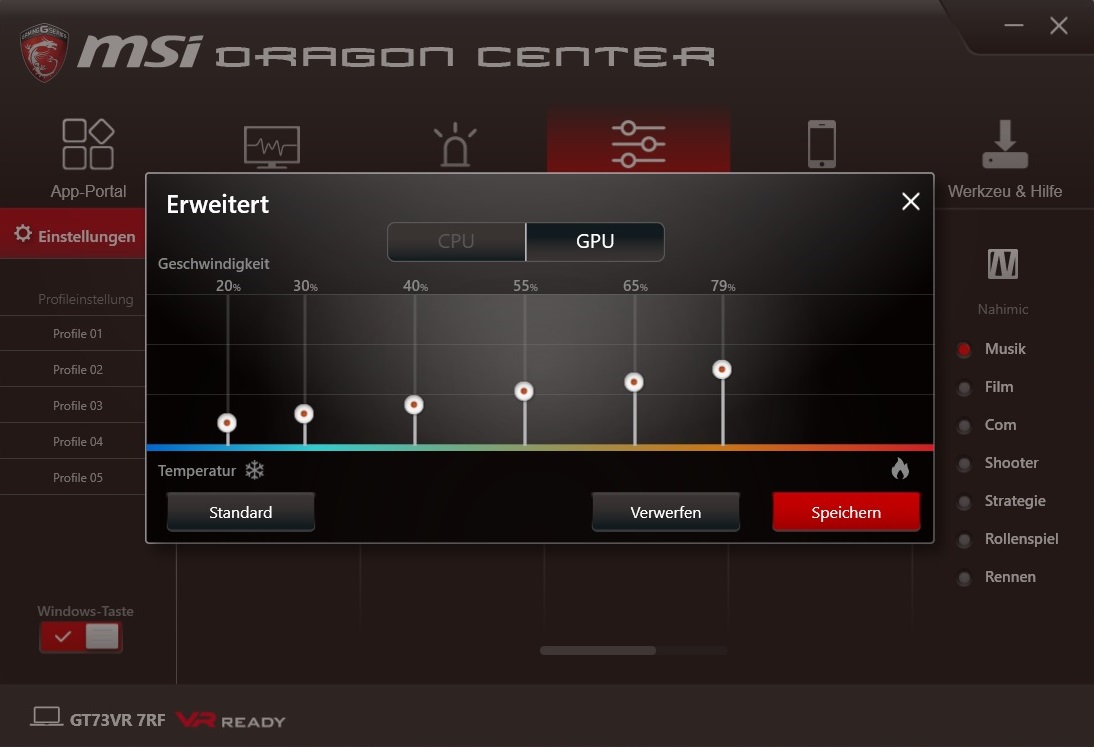
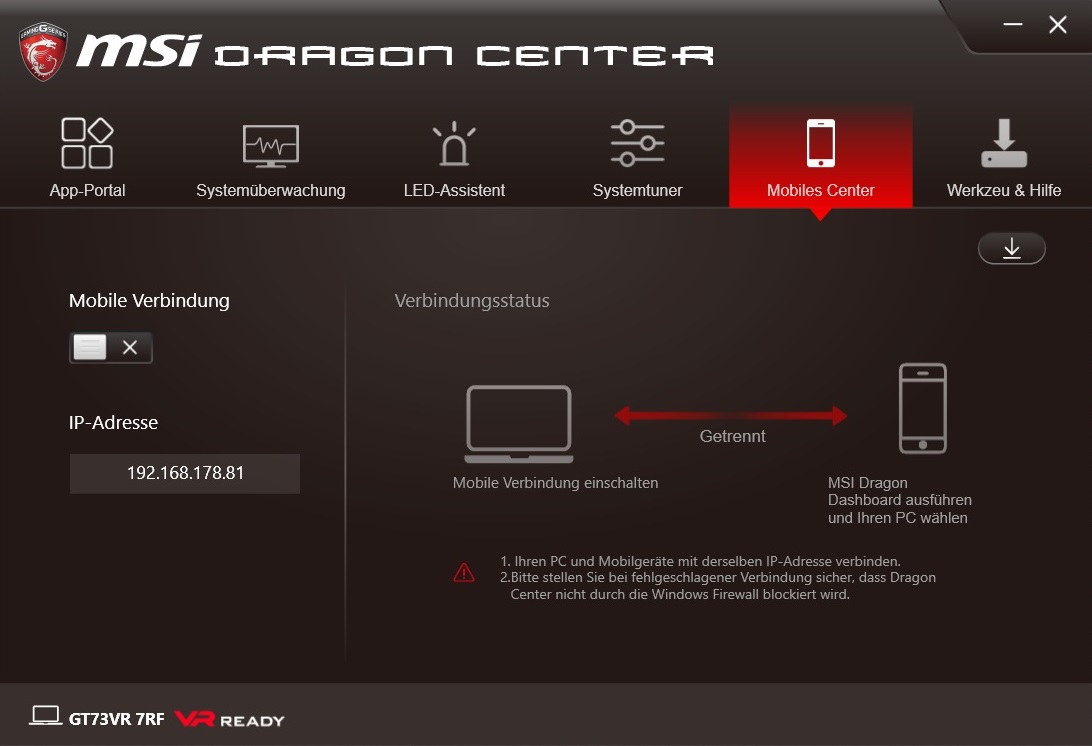
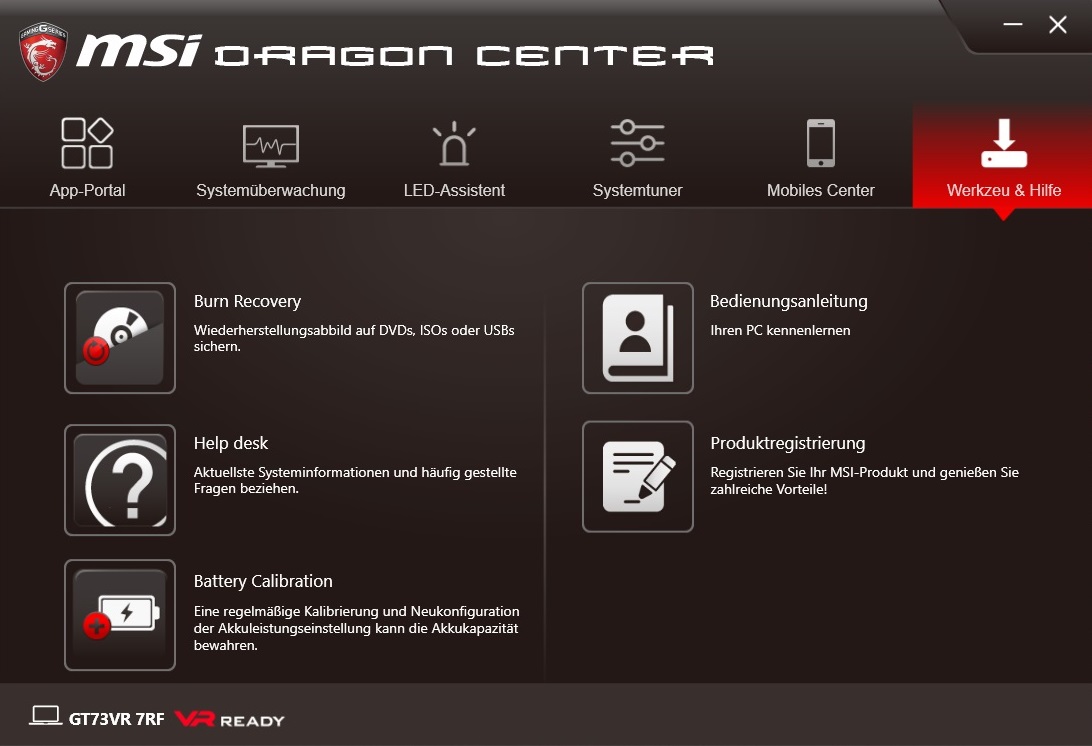
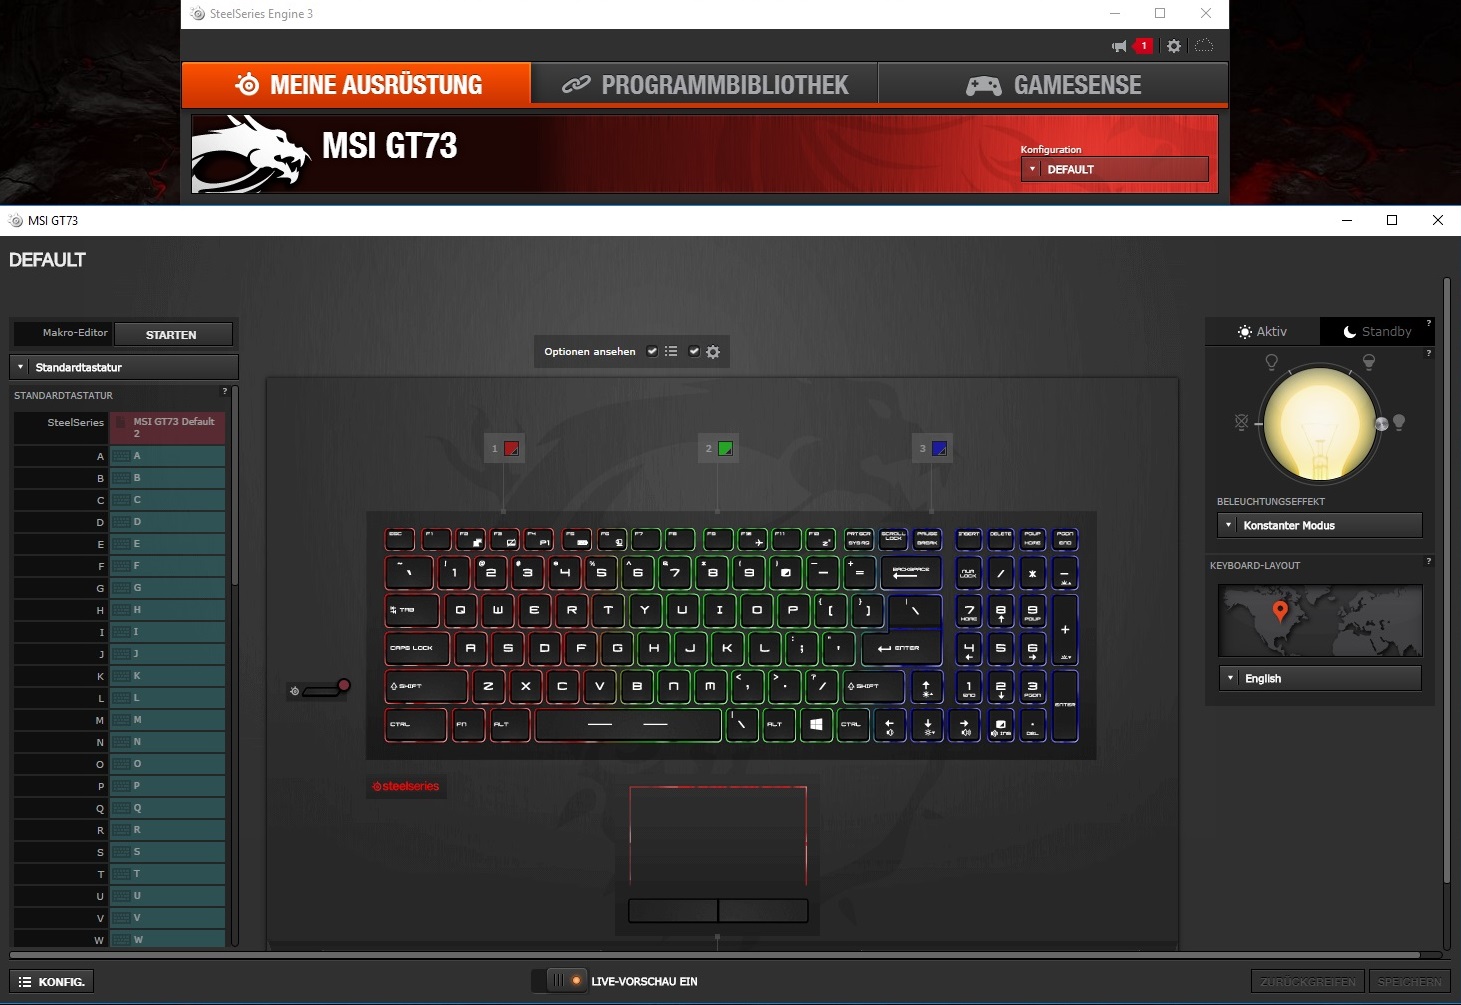
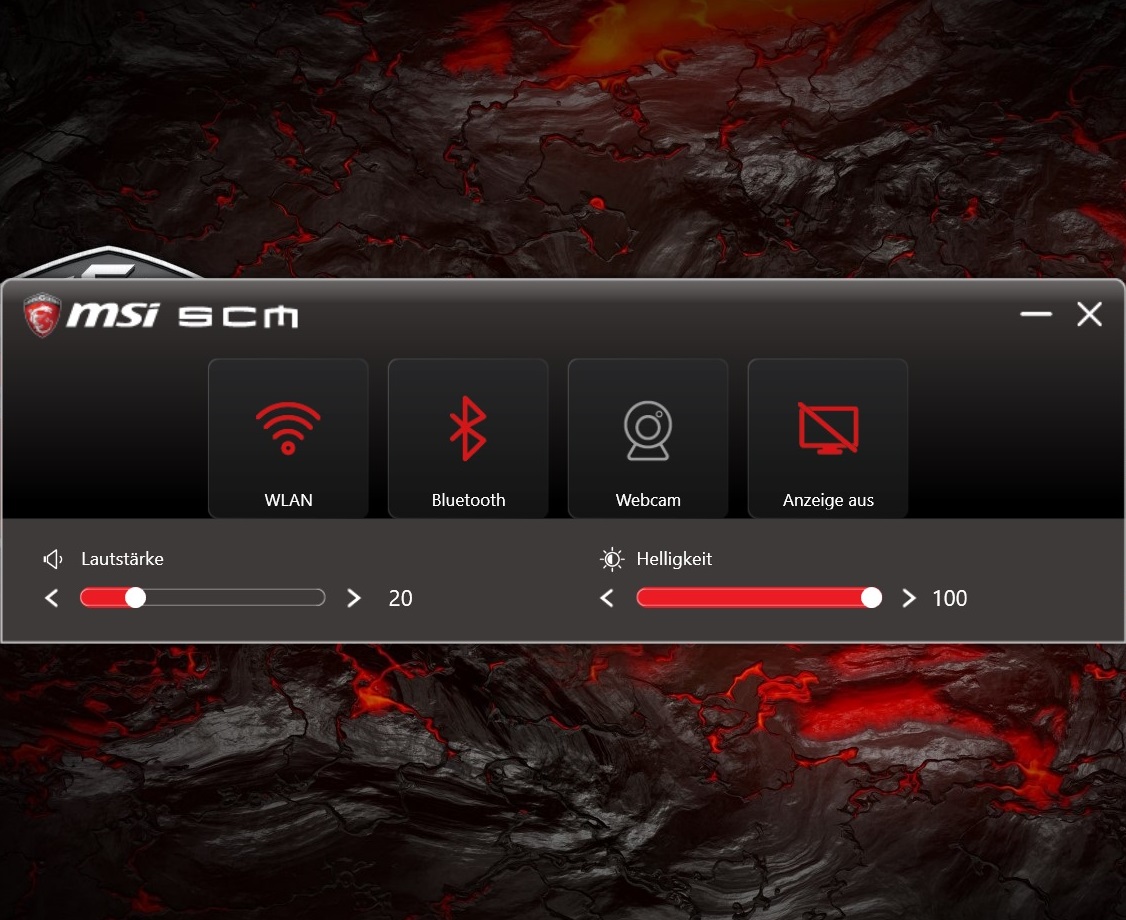
MSI does not make any experiments in terms of software, either. The central hub is once again the Dragon Center, which combines many comfort, control, and tuning options in one nice and simple interface. Core gamers will be happy about the comprehensive customizability of the keyboard as well as the fan control and the Turbo. The CPU is overclocked to 4.0 GHz by default, which was already the case for the previous model.
We performed all the benchmarks with the Turbo Mode, but we used the Shift mode "Power Options" for all the other measurements. This setting uses the Windows power profile and therefore reduces the possibility of measurement errors (especially while idling). Our test sample unfortunately had a problem with the clocks, and we already know similar issues from earlier MSI notebooks. The CPU was often stuck at 3.5 GHz in the majority of Shift and Windows settings, which represents the multi-core level of the i7-7820HK. In the past, this problem was usually fixed by an update for the Dragon Center. The fan control setting was always the default option "Auto".
Display
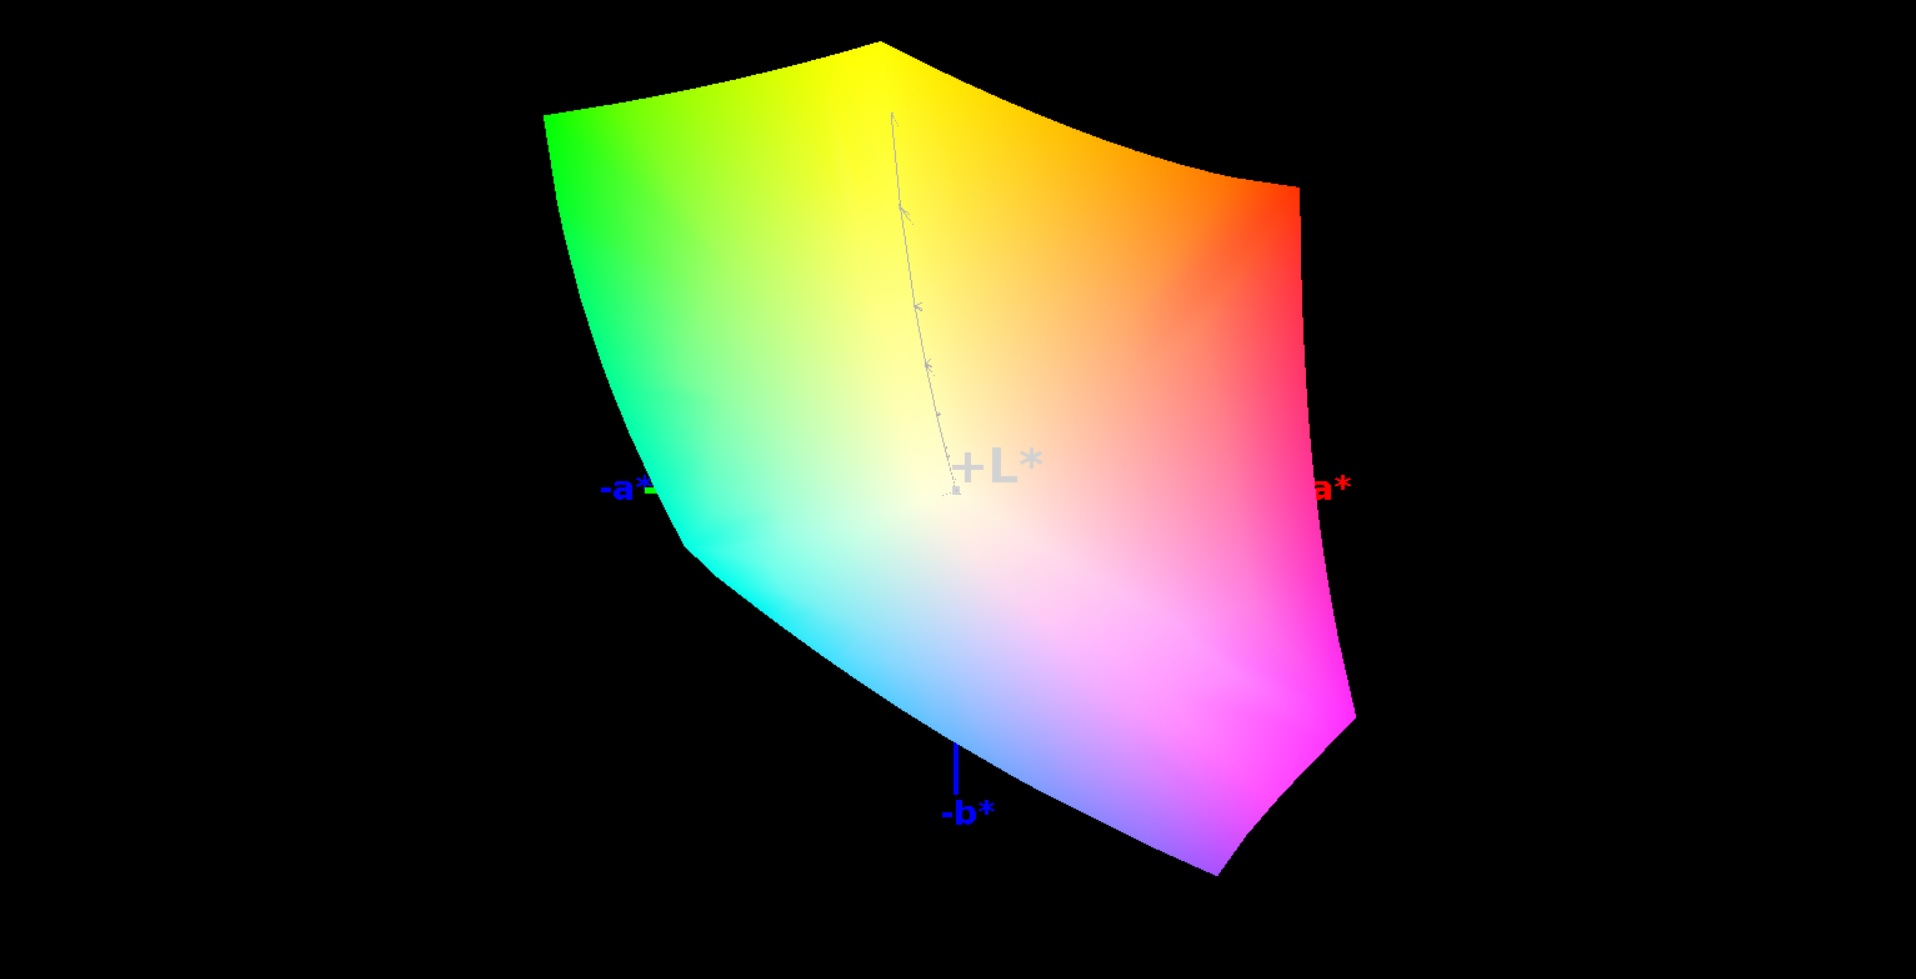
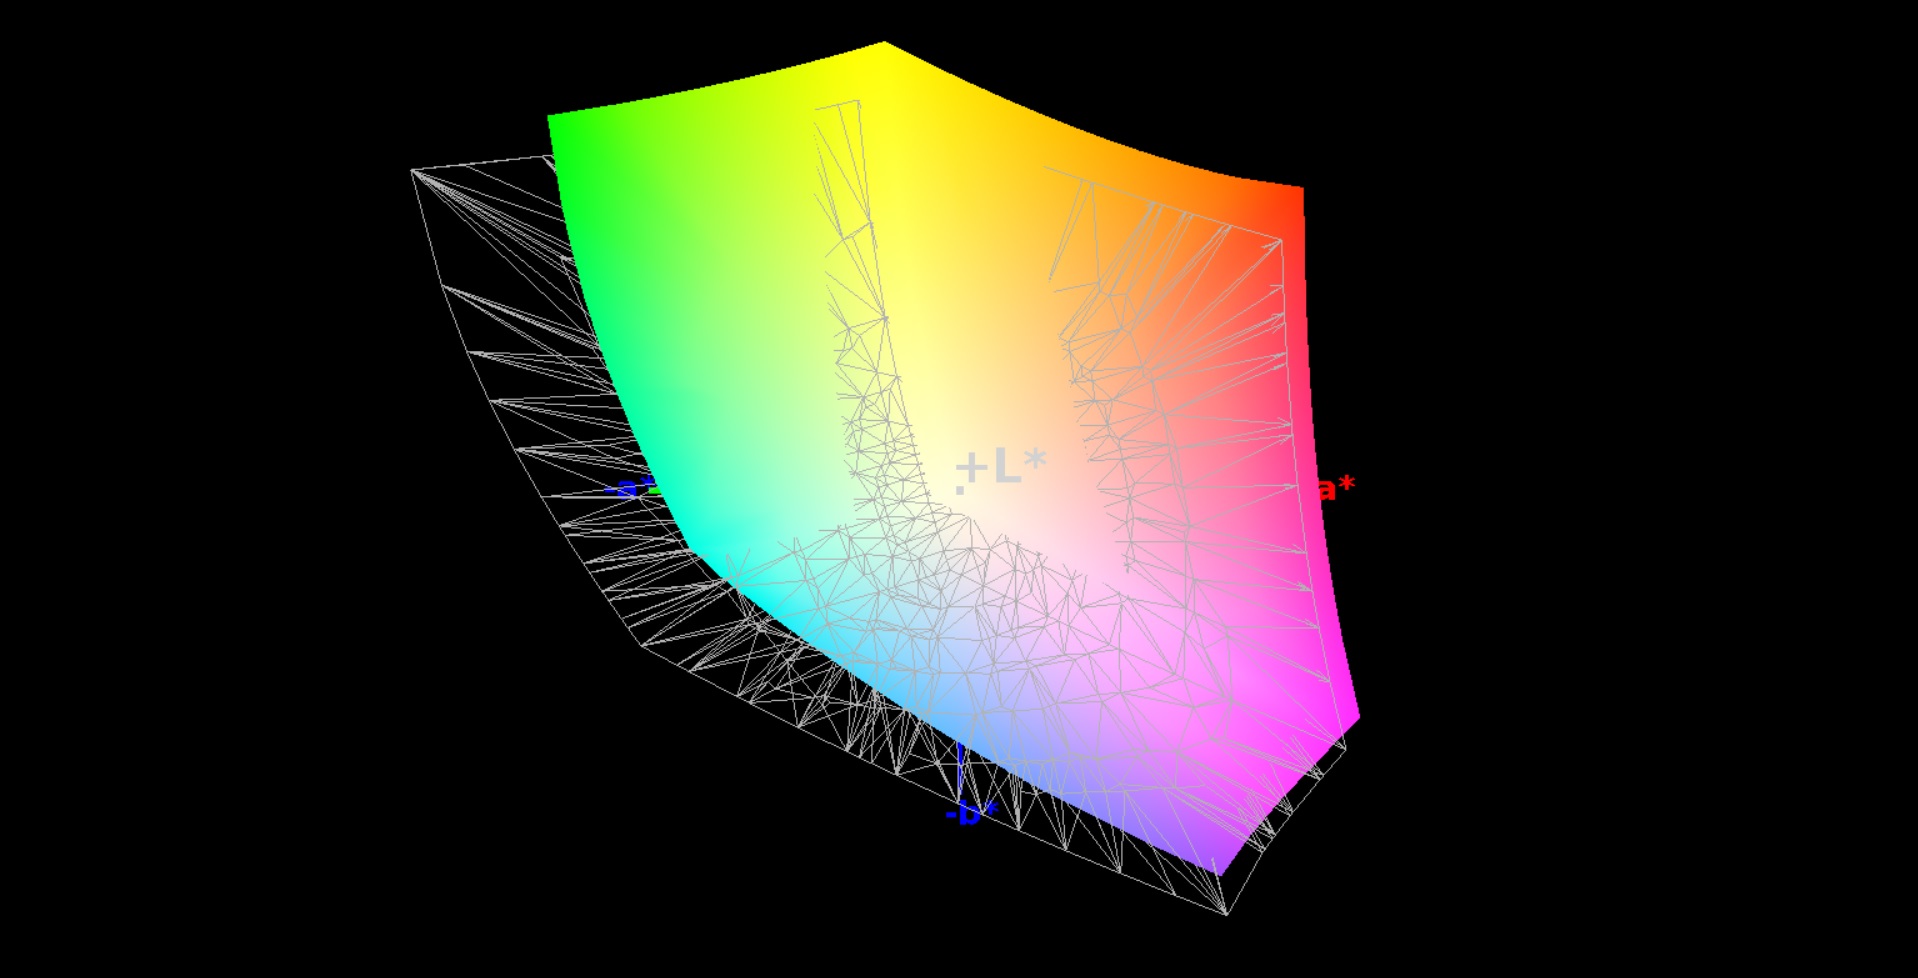
We can see similarities to the GT73VR 6RE we reviewed about four months ago. The 120 Hz panel still convinces with a generous contrast ratio (1228:1), a pretty low black value (0.25 cd/m²) and a surprising wide color gamut. 100% sRGB and 75% AdobeRGB are usually reserved for workstations and other professional devices. The response times are also very good for a notebook. 7 ms black-to-white and 26 ms gray-to-gray would be tough to achieve with an IPS panel.
| |||||||||||||||||||||||||
Brightness Distribution: 85 %
Center on Battery: 307 cd/m²
Contrast: 1228:1 (Black: 0.25 cd/m²)
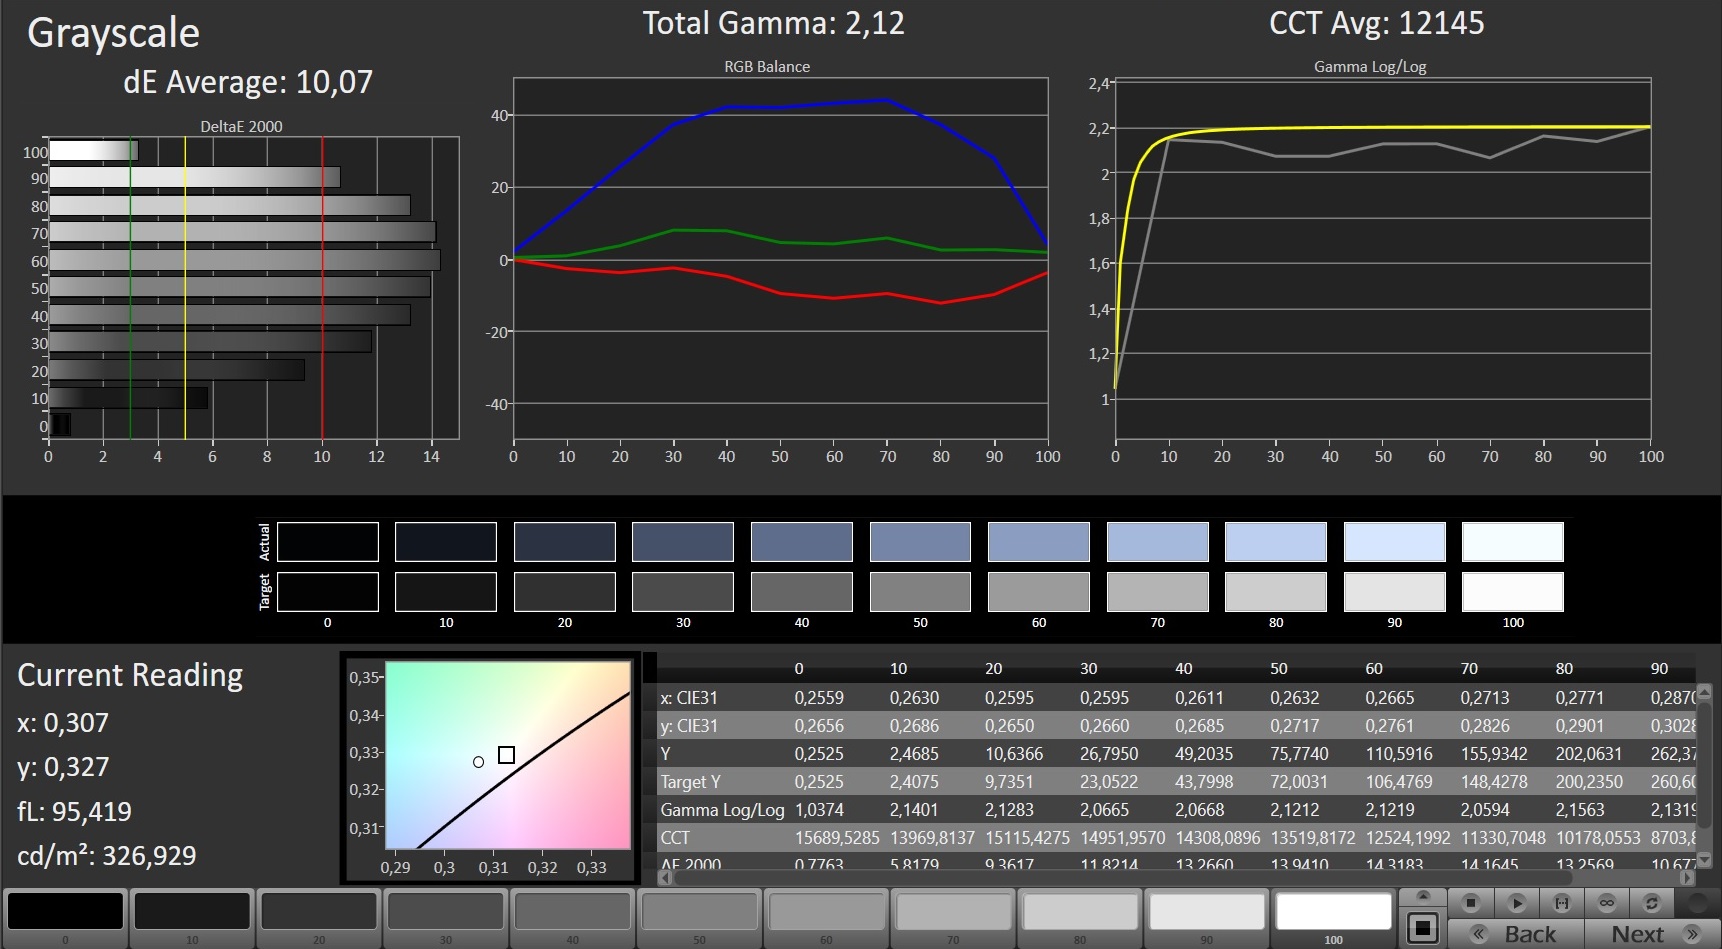
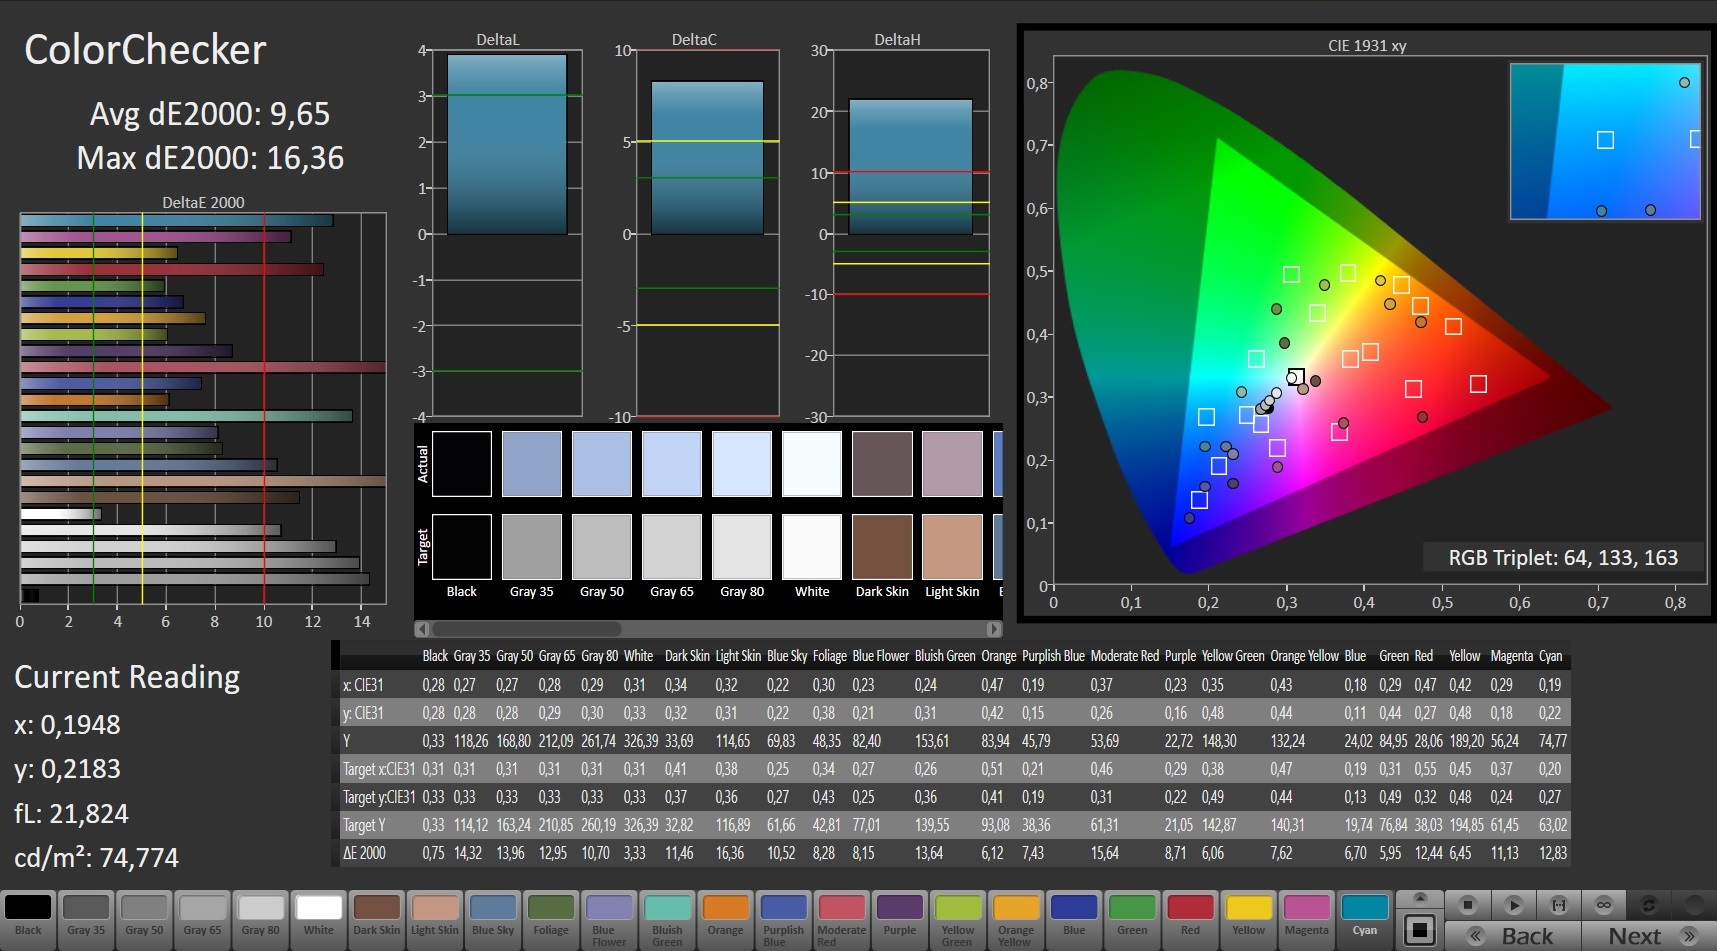
ΔE ColorChecker Calman: 9.65 | ∀{0.5-29.43 Ø4.78}
ΔE Greyscale Calman: 10.07 | ∀{0.09-98 Ø5}
100% sRGB (Argyll 1.6.3 3D)
75% AdobeRGB 1998 (Argyll 1.6.3 3D)
84.7% AdobeRGB 1998 (Argyll 3D)
99.9% sRGB (Argyll 3D)
90.6% Display P3 (Argyll 3D)
Gamma: 2.12
CCT: 12145 K
| MSI GT73VR 7RF-296 N173HHE-G32 (CMN1747), 1920x1080 | Acer Predator 17 G9-793-77LG AU Optronics B173ZAN01.0 (AUO109B), 3840x2160 | Aorus X7 v6 B173QTN01.0 (AUO1096), 2560x1440 | Asus G752VS-XB78K LG Philips LP173WF4-SPF3 (LGD04E8), 1920x1080 | MSI GT72VR 7RE-433 Chi Mei N173HHE-G32 (CMN1747), 1920x1080 | MSI GT83VR-6RE32SR451 Samsung 184HL (SDC4C48), 1920x1080 | |
|---|---|---|---|---|---|---|
| Display | 4% | -26% | -22% | -21% | -20% | |
| Display P3 Coverage (%) | 90.6 | 86.9 -4% | 60.9 -33% | 66.9 -26% | 68.3 -25% | 65.8 -27% |
| sRGB Coverage (%) | 99.9 | 100 0% | 84.2 -16% | 85.2 -15% | 86.7 -13% | 90.3 -10% |
| AdobeRGB 1998 Coverage (%) | 84.7 | 99.4 17% | 61.2 -28% | 62.3 -26% | 63.4 -25% | 66.1 -22% |
| Response Times | -143% | -31% | -130% | -6% | -121% | |
| Response Time Grey 50% / Grey 80% * (ms) | 26 ? | 37 ? -42% | 31 ? -19% | 38 ? -46% | 29 ? -12% | 37 ? -42% |
| Response Time Black / White * (ms) | 7 ? | 24 ? -243% | 10 ? -43% | 22 ? -214% | 7 ? -0% | 21 ? -200% |
| PWM Frequency (Hz) | 250 ? | |||||
| Screen | 23% | -9% | 13% | -1% | 11% | |
| Brightness middle (cd/m²) | 307 | 336 9% | 343 12% | 328 7% | 299 -3% | 310 1% |
| Brightness (cd/m²) | 284 | 320 13% | 312 10% | 317 12% | 277 -2% | 277 -2% |
| Brightness Distribution (%) | 85 | 88 4% | 80 -6% | 88 4% | 87 2% | 84 -1% |
| Black Level * (cd/m²) | 0.25 | 0.25 -0% | 0.5 -100% | 0.3 -20% | 0.27 -8% | 0.4 -60% |
| Contrast (:1) | 1228 | 1344 9% | 686 -44% | 1093 -11% | 1107 -10% | 775 -37% |
| Colorchecker dE 2000 * | 9.65 | 3.61 63% | 7.33 24% | 3.74 61% | 9.65 -0% | 1.83 81% |
| Colorchecker dE 2000 max. * | 16.36 | 6.02 63% | 10.79 34% | 8.97 45% | 15.43 6% | 3.92 76% |
| Greyscale dE 2000 * | 10.07 | 4.78 53% | 7.6 25% | 2.67 73% | 9.68 4% | 1.38 86% |
| Gamma | 2.12 104% | 2.32 95% | 2.19 100% | 2.41 91% | 1.89 116% | 2.44 90% |
| CCT | 12145 54% | 6185 105% | 9024 72% | 6861 95% | 11652 56% | 6723 97% |
| Color Space (Percent of AdobeRGB 1998) (%) | 75 | 88 17% | 55 -27% | 56 -25% | 75 0% | 59 -21% |
| Color Space (Percent of sRGB) (%) | 100 | 100 0% | 84 -16% | 85 -15% | 100 0% | 90 -10% |
| Total Average (Program / Settings) | -39% /
-3% | -22% /
-15% | -46% /
-13% | -9% /
-6% | -43% /
-13% |
* ... smaller is better
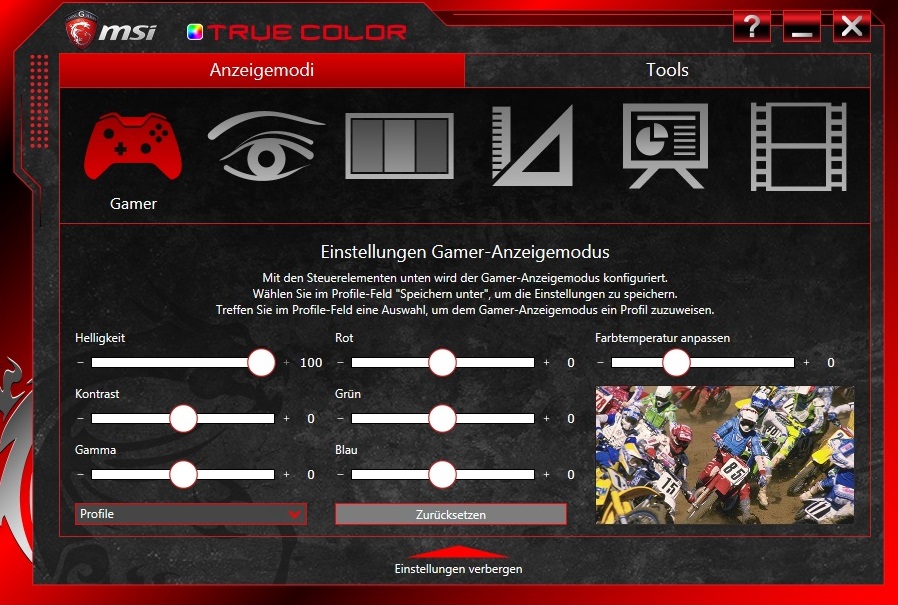
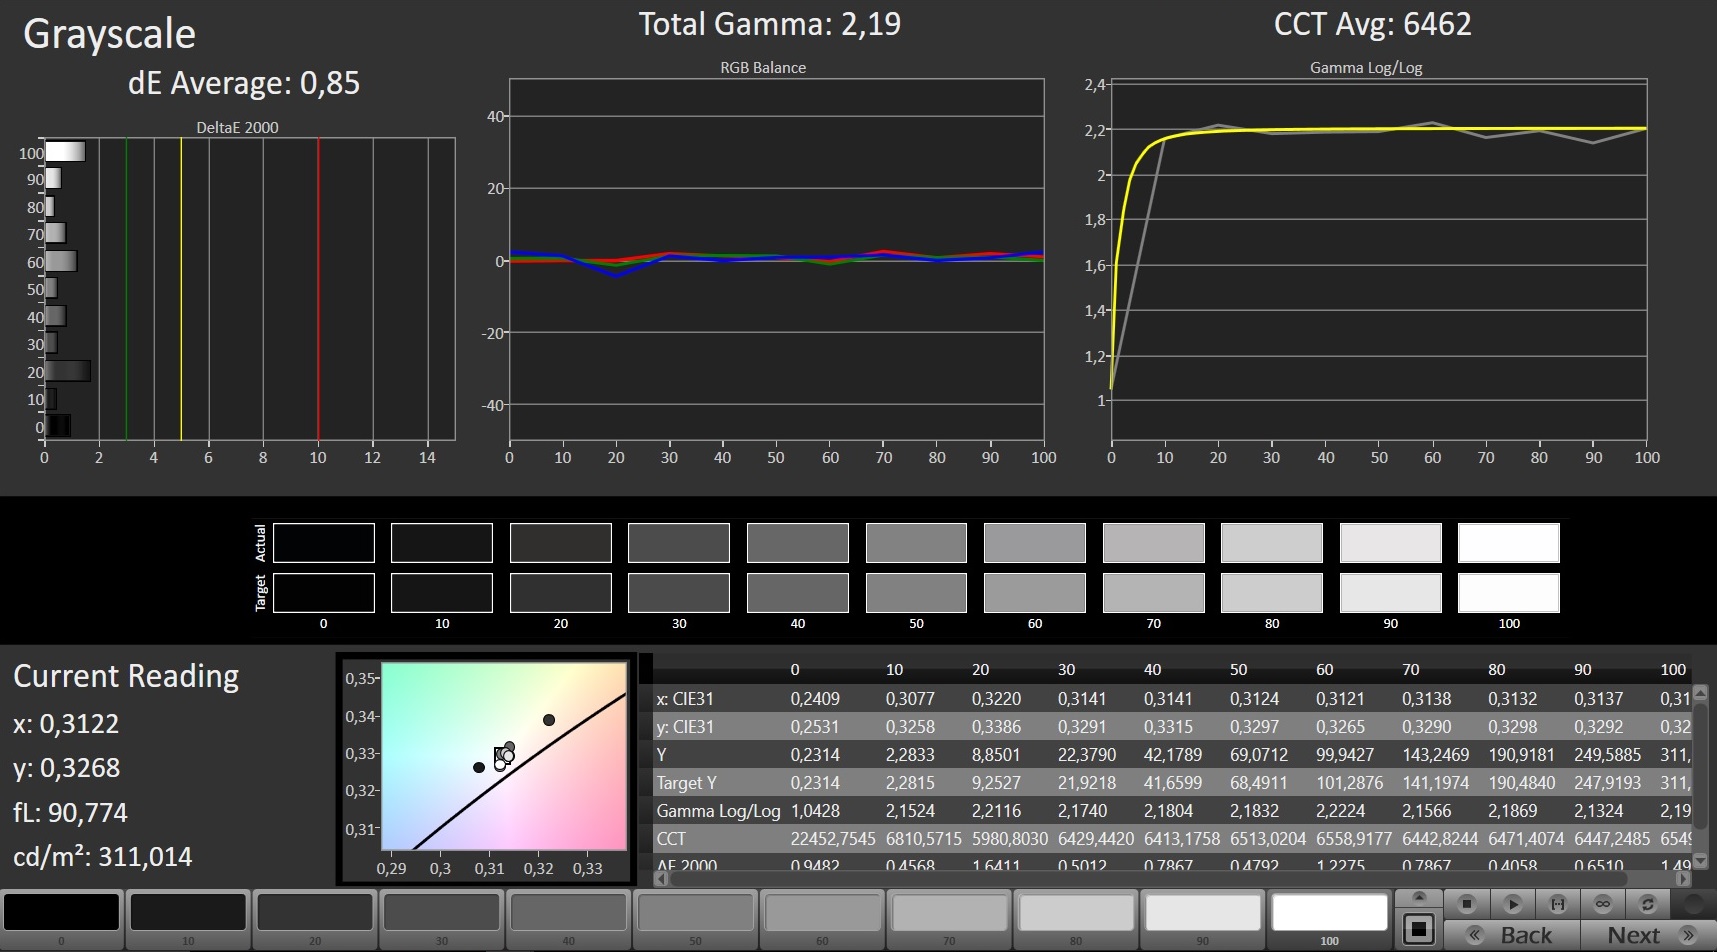
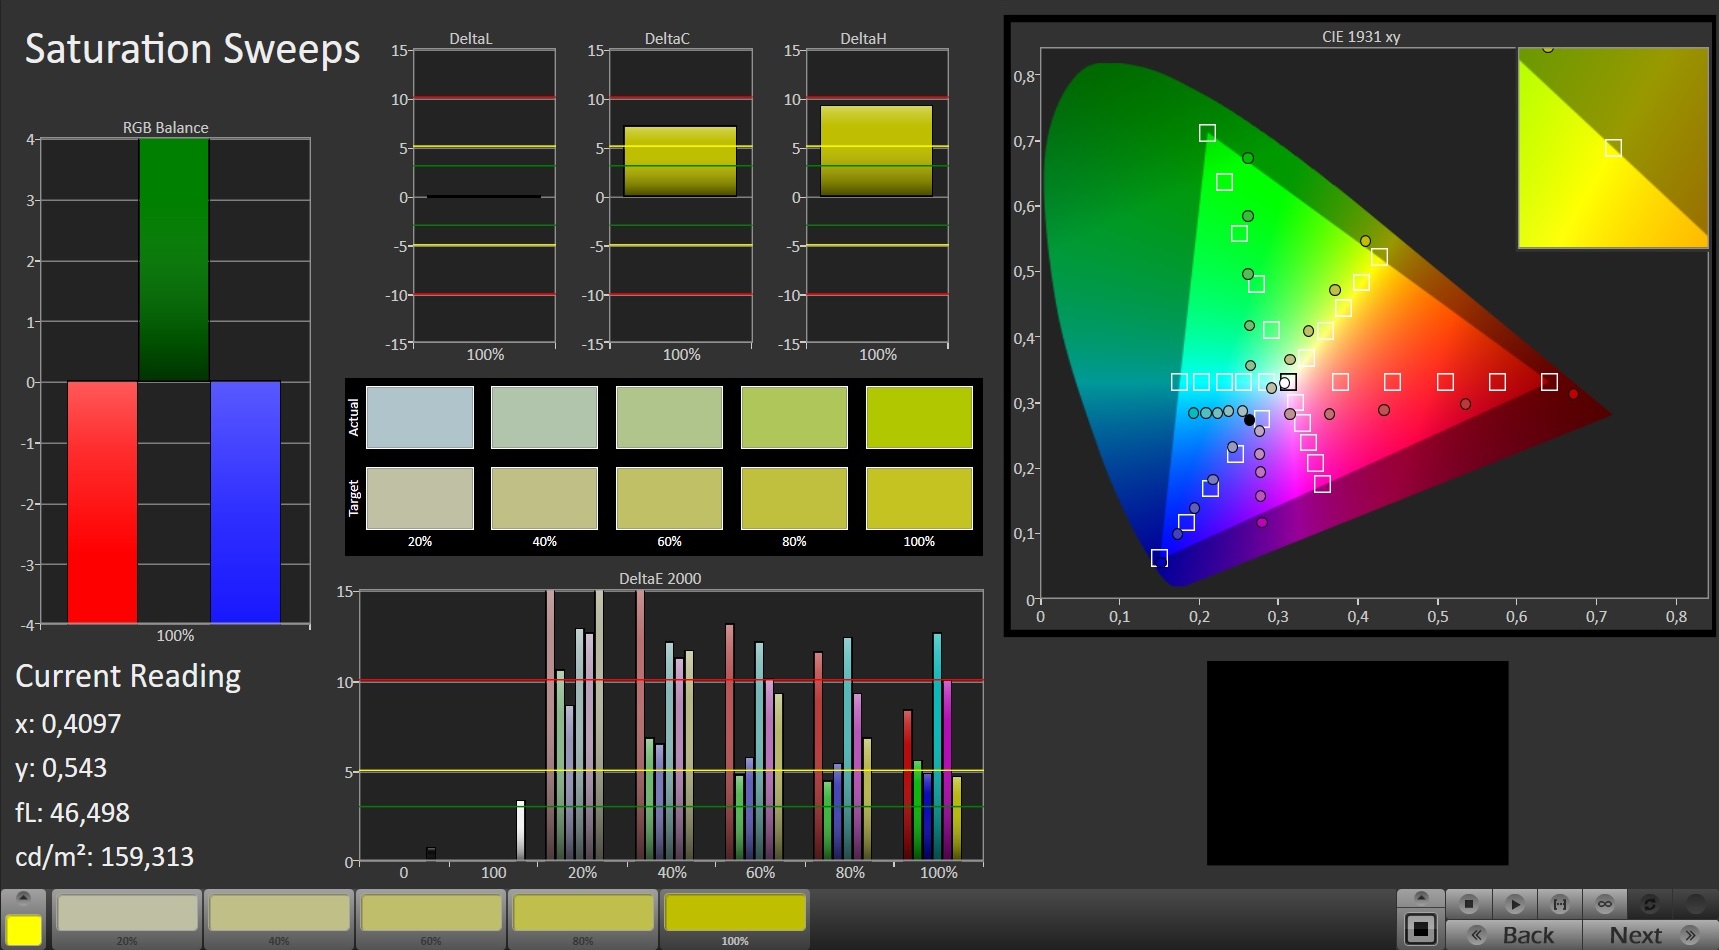
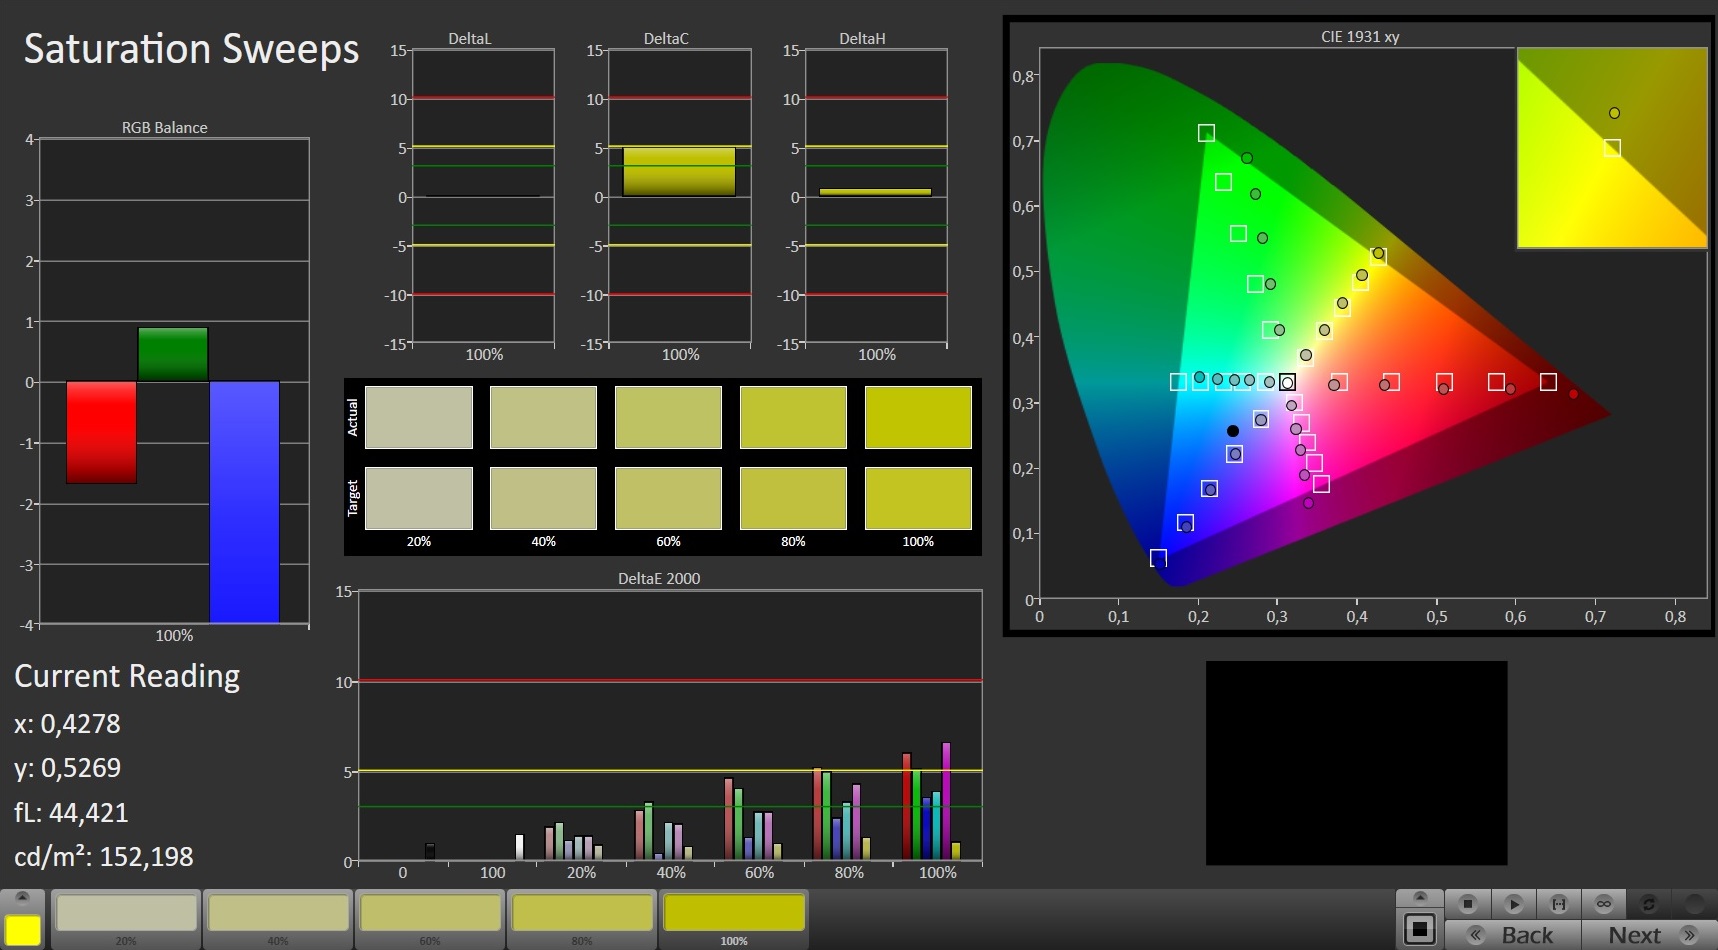
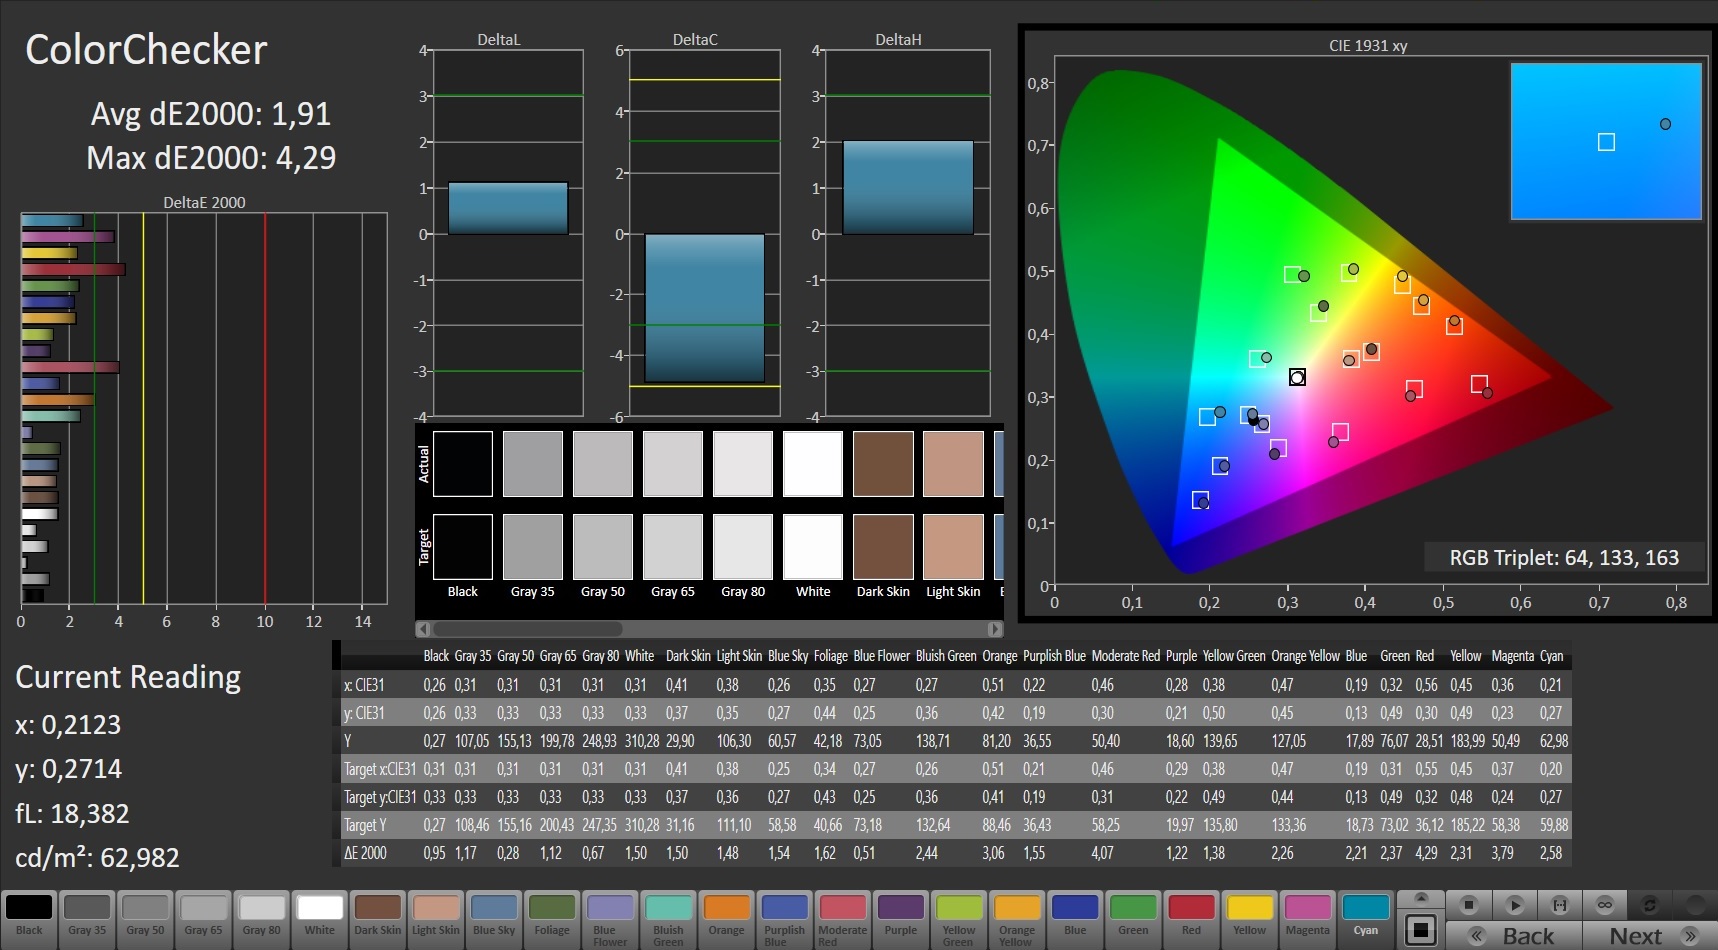
The TN panel unfortunately suffers in respect to the viewing angles and the color accuracy. It does not matter if you select the mode sRGB or Gamer in the True-Color software: The 17-inch system shows a strong blue cast. Fortunately, the deviations can be reduced via calibration. We managed to drop the Grayscale and ColorChecker values below 1 and 2, respectively. Luminance (284 nits) and brightness distribution (85%) are on an upper mainstream level.
In short: The panel N173HHE-G32, which can also be found in other MSI notebooks (like the GS73VR, for example) manages a pretty decent performance overall, despite some drawbacks, which can probably be fixed by an update of the True Color software. 120 Hz and G-Sync are important arguments for gaming enthusiasts.
Display Response Times
| ↔ Response Time Black to White | ||
|---|---|---|
| 7 ms ... rise ↗ and fall ↘ combined | ↗ 4 ms rise | 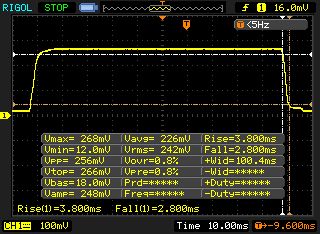 |
| ↘ 3 ms fall | ||
| The screen shows very fast response rates in our tests and should be very well suited for fast-paced gaming. In comparison, all tested devices range from 0.1 (minimum) to 240 (maximum) ms. » 20 % of all devices are better. This means that the measured response time is better than the average of all tested devices (20.2 ms). | ||
| ↔ Response Time 50% Grey to 80% Grey | ||
| 26 ms ... rise ↗ and fall ↘ combined | ↗ 12 ms rise | 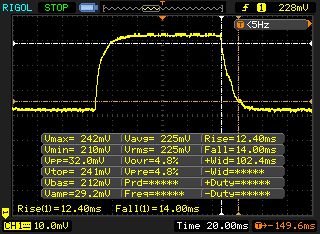 |
| ↘ 14 ms fall | ||
| The screen shows relatively slow response rates in our tests and may be too slow for gamers. In comparison, all tested devices range from 0.165 (minimum) to 636 (maximum) ms. » 35 % of all devices are better. This means that the measured response time is better than the average of all tested devices (31.6 ms). | ||
Screen Flickering / PWM (Pulse-Width Modulation)
| Screen flickering / PWM not detected | 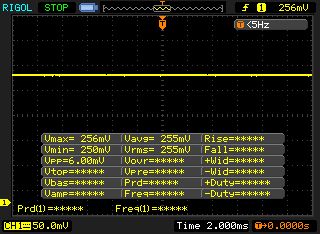 | ||
In comparison: 53 % of all tested devices do not use PWM to dim the display. If PWM was detected, an average of 8101 (minimum: 5 - maximum: 343500) Hz was measured. | |||
Performance
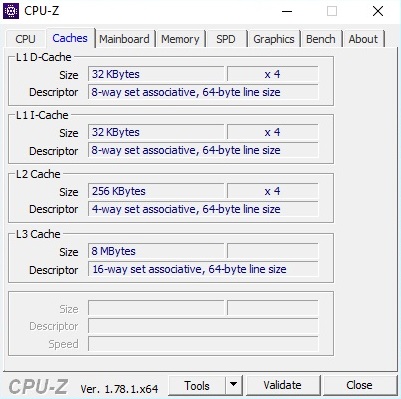
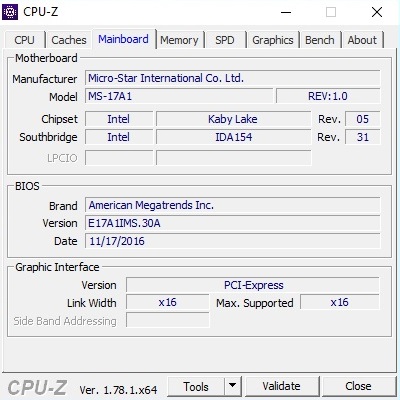
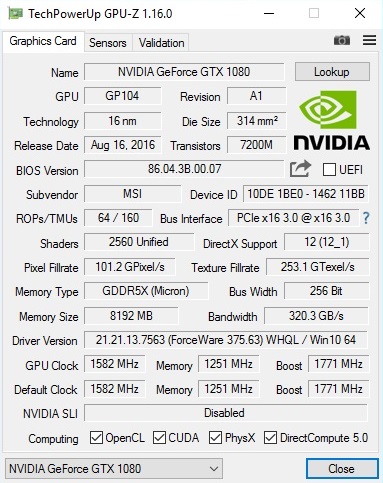
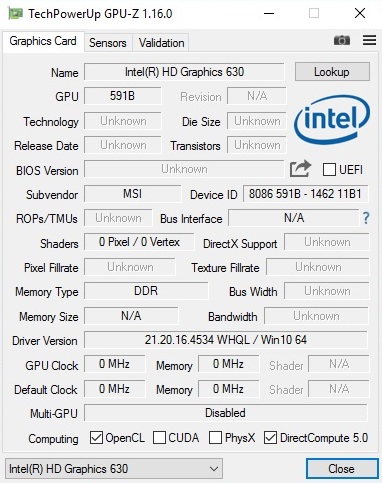
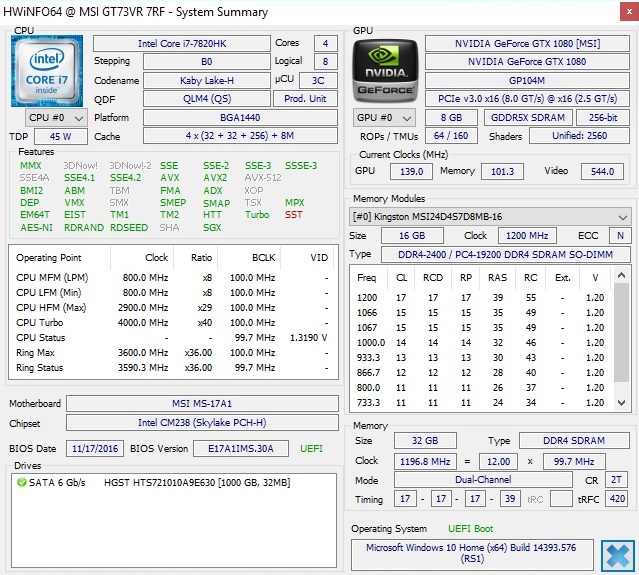
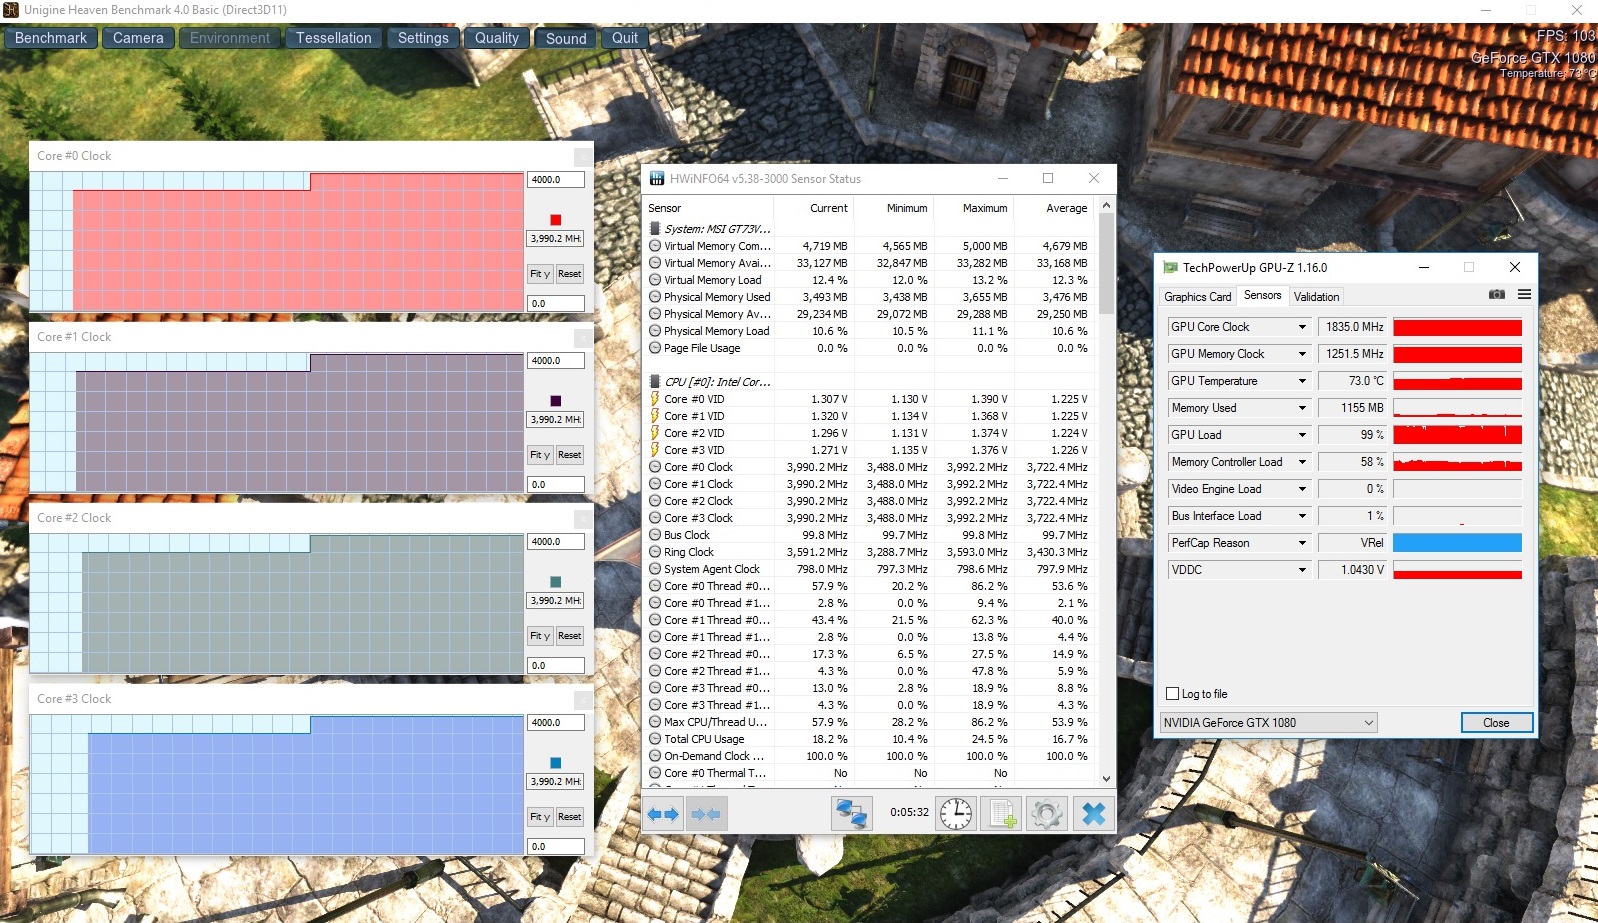
We added a couple of system screenshots with an overview about the components below.
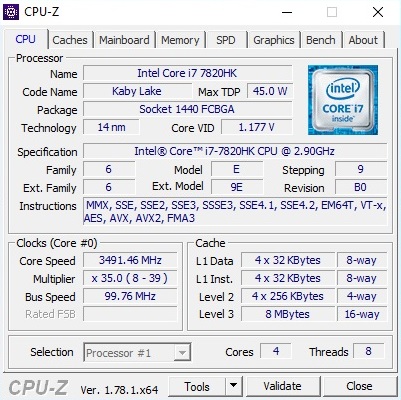
Processor
The benchmark results of the new Kaby Lake chip are primarily unspectacular. The Skylake successor has the same clocks and is only ahead by a couple of percentage points. Both the GT73VR 7RF and the GT83VR 6RE (see table) executed Cinebench R15 and Cinebench R11.5 at 4.0 GHz. The new Core i7-7820HK is 3% faster than the Core i7-6820HK at best, which is already within measuring tolerances.

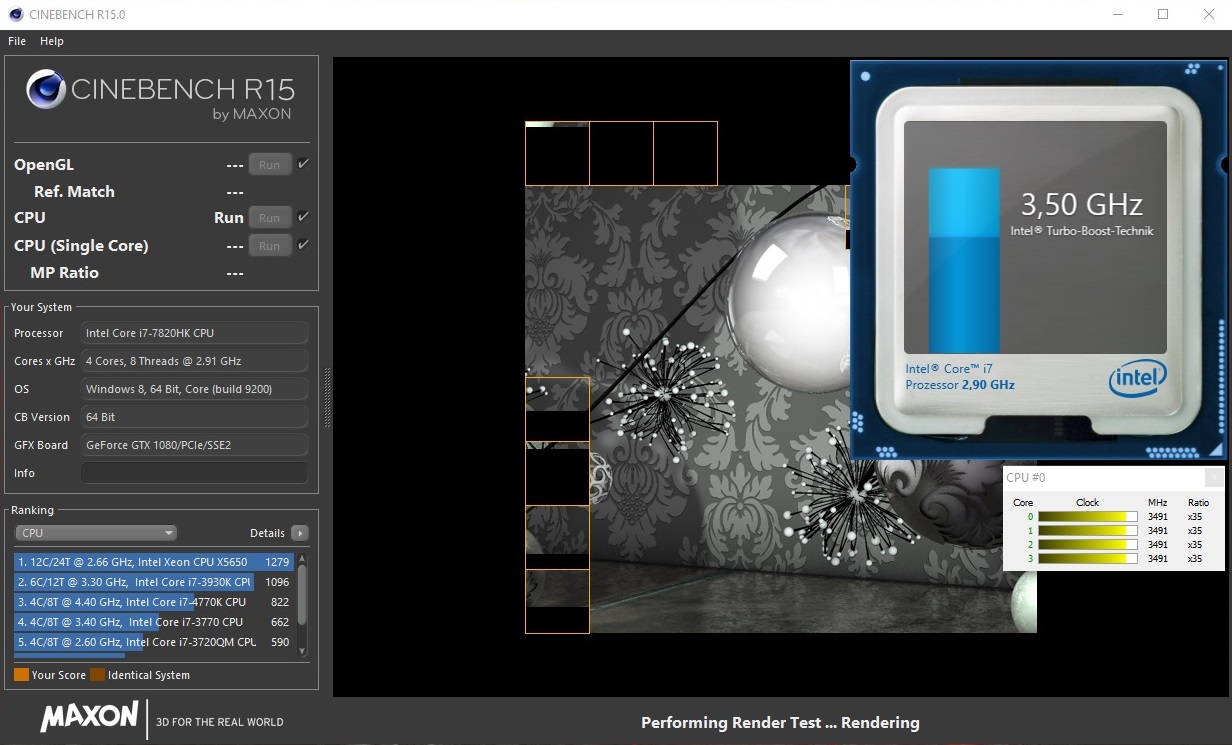
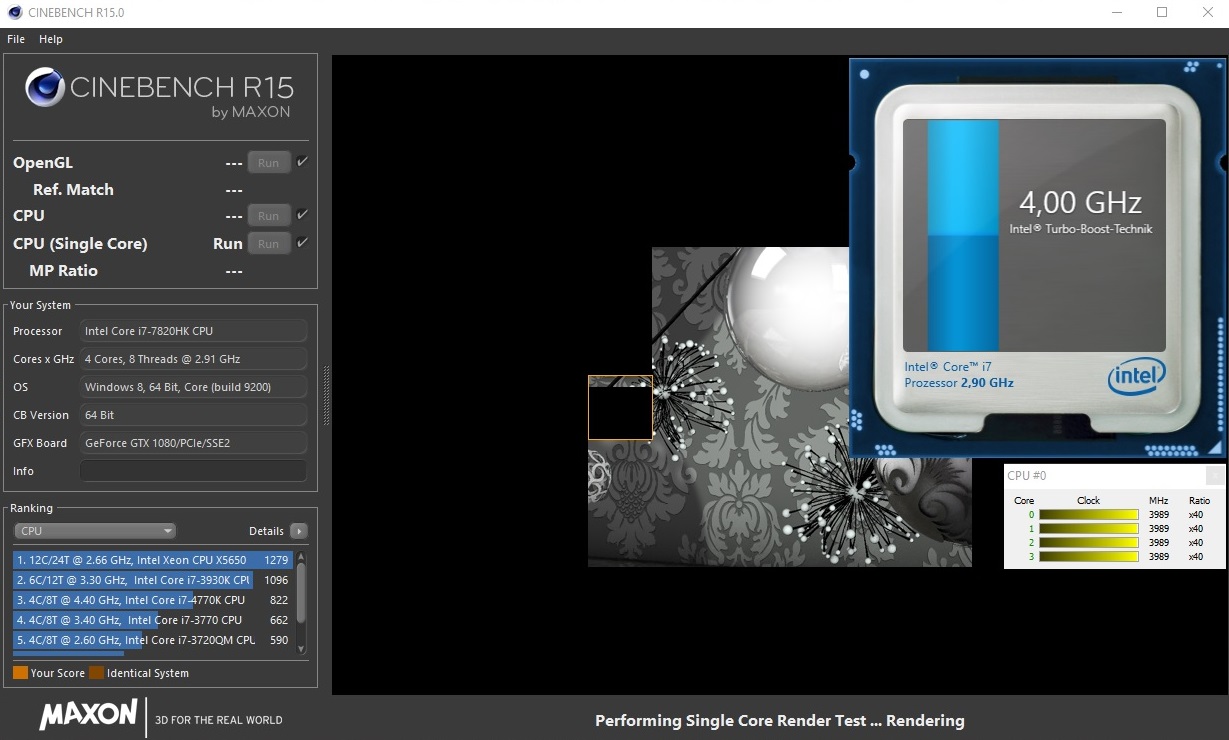

The difference will be bigger in notebooks without additional overclocking, since Kaby Lake models are clocked a couple of hundred megahertz higher than their Skylake counterparts. However, we do not think you are making a mistake if you get an older (used) notebook for price-performance reasons. The majority of games are limited by the GPU, so even a Core i7-6700HQ should easily be sufficient for the next couple of years.
| Cinebench R11.5 | |
| CPU Single 64Bit | |
| MSI GT73VR 7RF-296 | |
| Aorus X7 v6 | |
| MSI GT83VR-6RE32SR451 | |
| MSI GT72VR 7RE-433 | |
| Asus G752VS-XB78K | |
| CPU Multi 64Bit | |
| MSI GT73VR 7RF-296 | |
| MSI GT83VR-6RE32SR451 | |
| Aorus X7 v6 | |
| Asus G752VS-XB78K | |
| MSI GT72VR 7RE-433 | |
System Performance
The system performance did not really change, either. However, this is not a surprise, because most components are identical. The GT73VR 7RF scores 7635 points in PCMark 7 and is only 9% faster than the GT73VR 6RE (7024 points). Both devices are subjectively basically identical in practice.
| PCMark 7 Score | 7635 points | |
Help | ||
Storage Devices
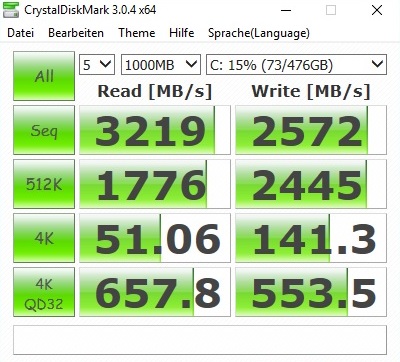
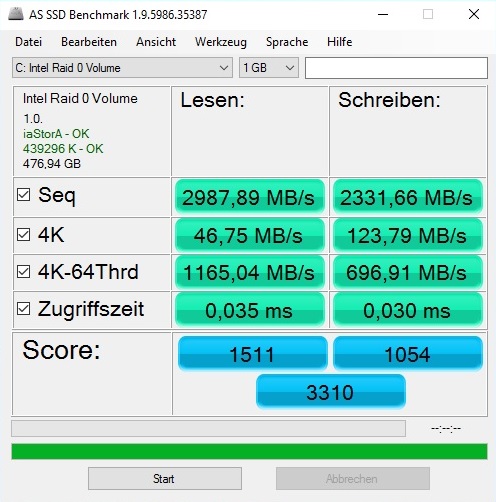
The high retail price of 3,500 Euros (~$3666) has to be justified, so MSI equips our test model of the GT73 with two M.2 NVMe-SSDs from Samsung in a RAID configuration. Average results of 3219 MB/s for sequential read and 2572 MB/s for sequential write operations (CrystalDiskMark) show quite impressively what is possible right now. Classic SATA-III SSDs on the other hand are limited to around 500 MB/s.
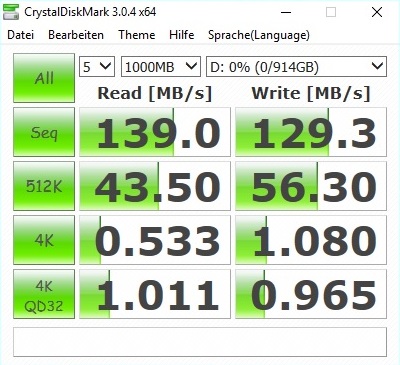
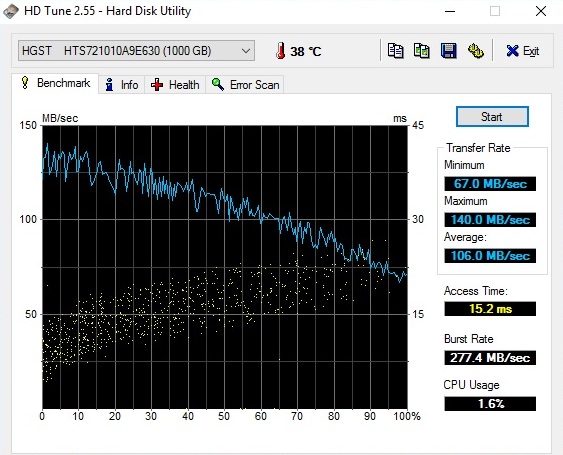
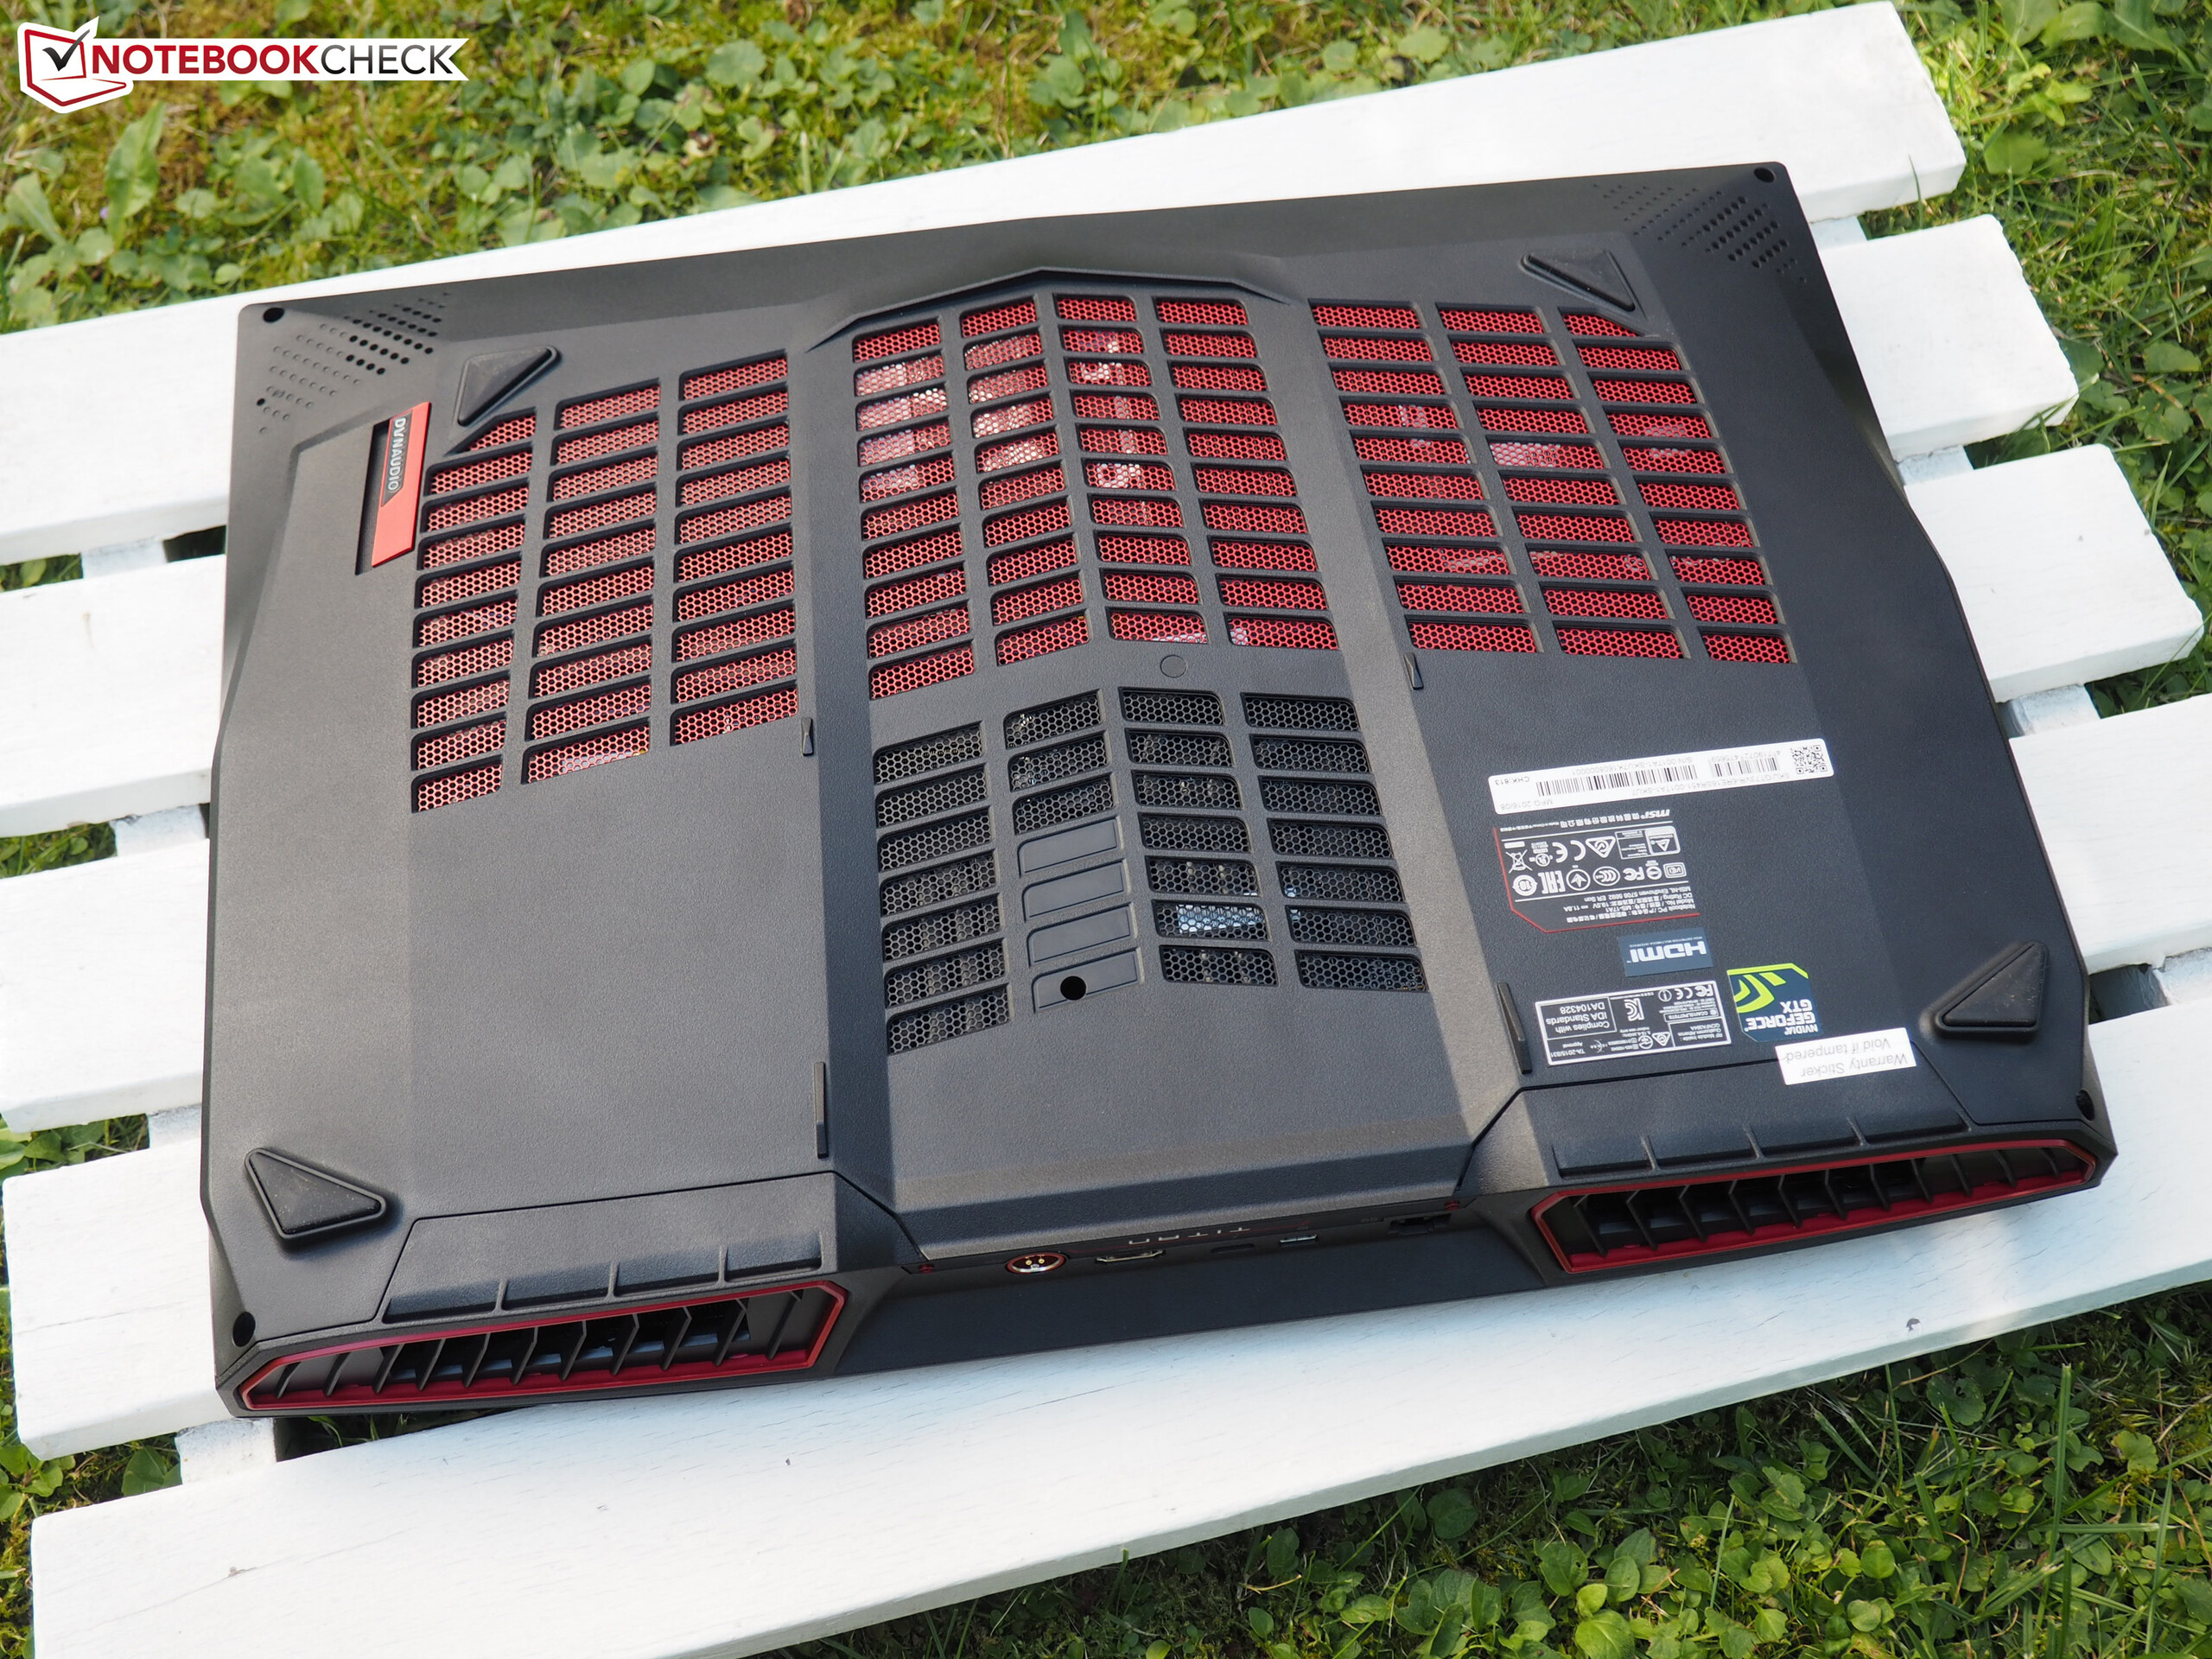
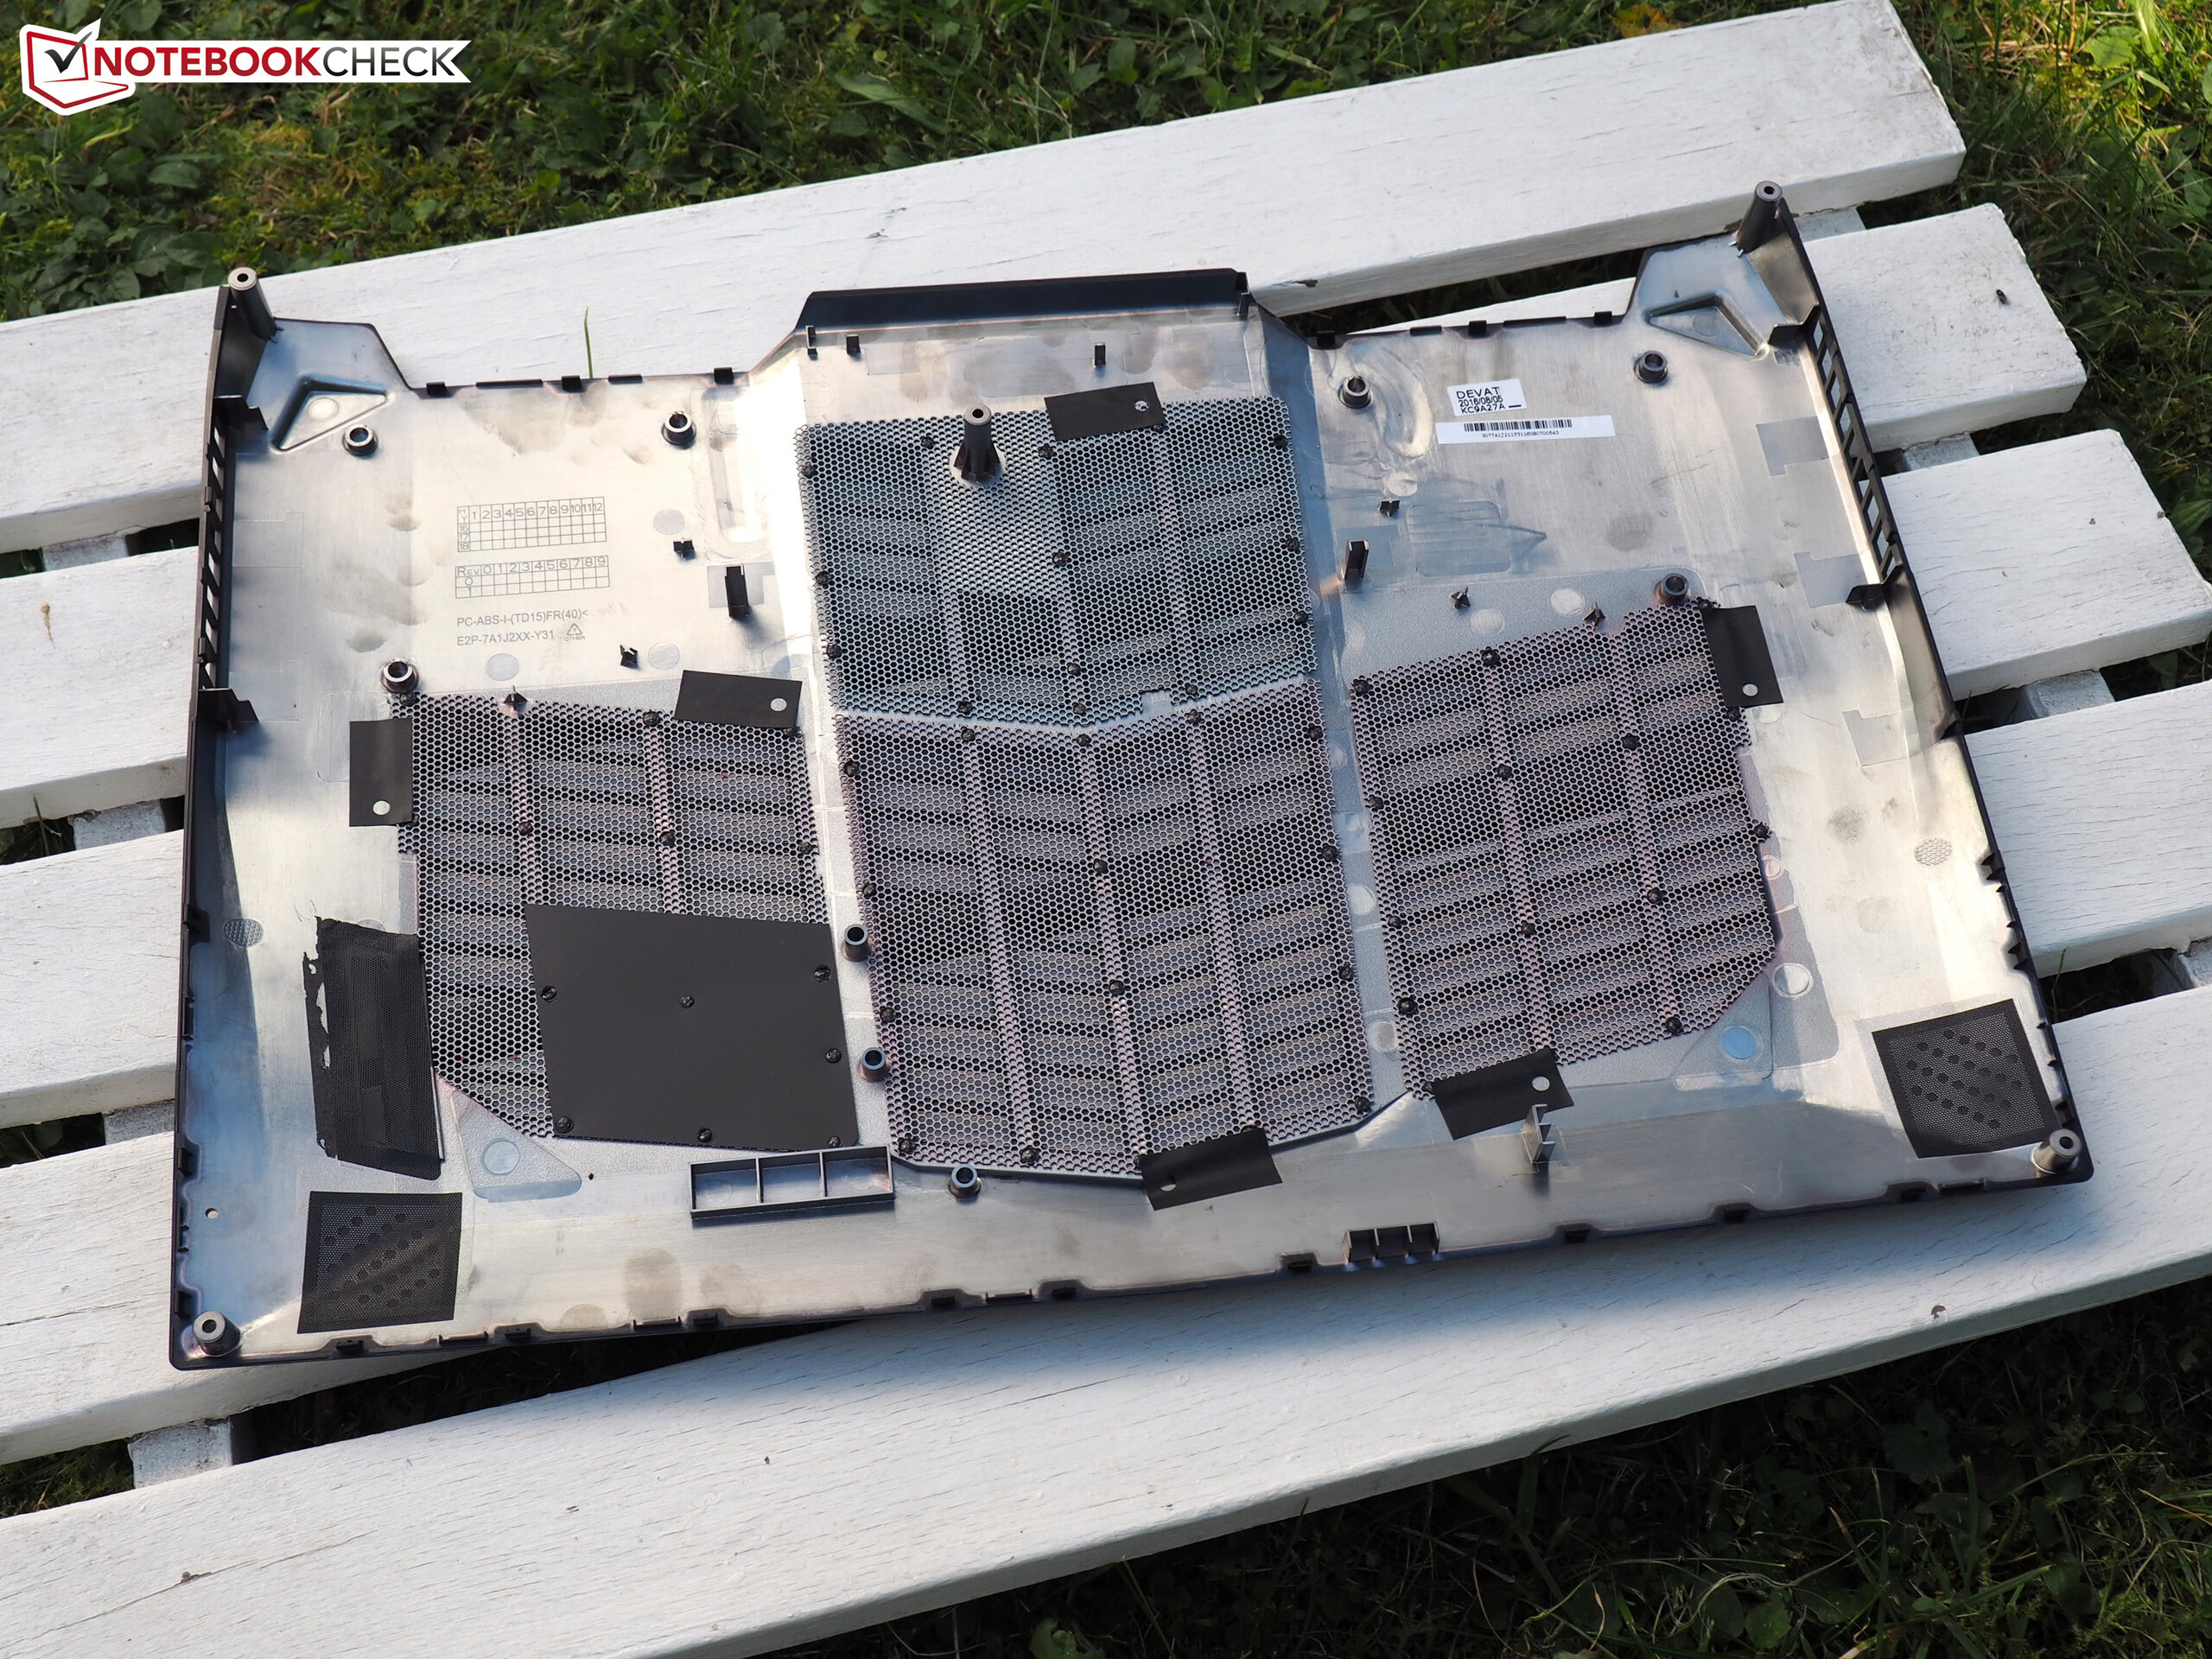
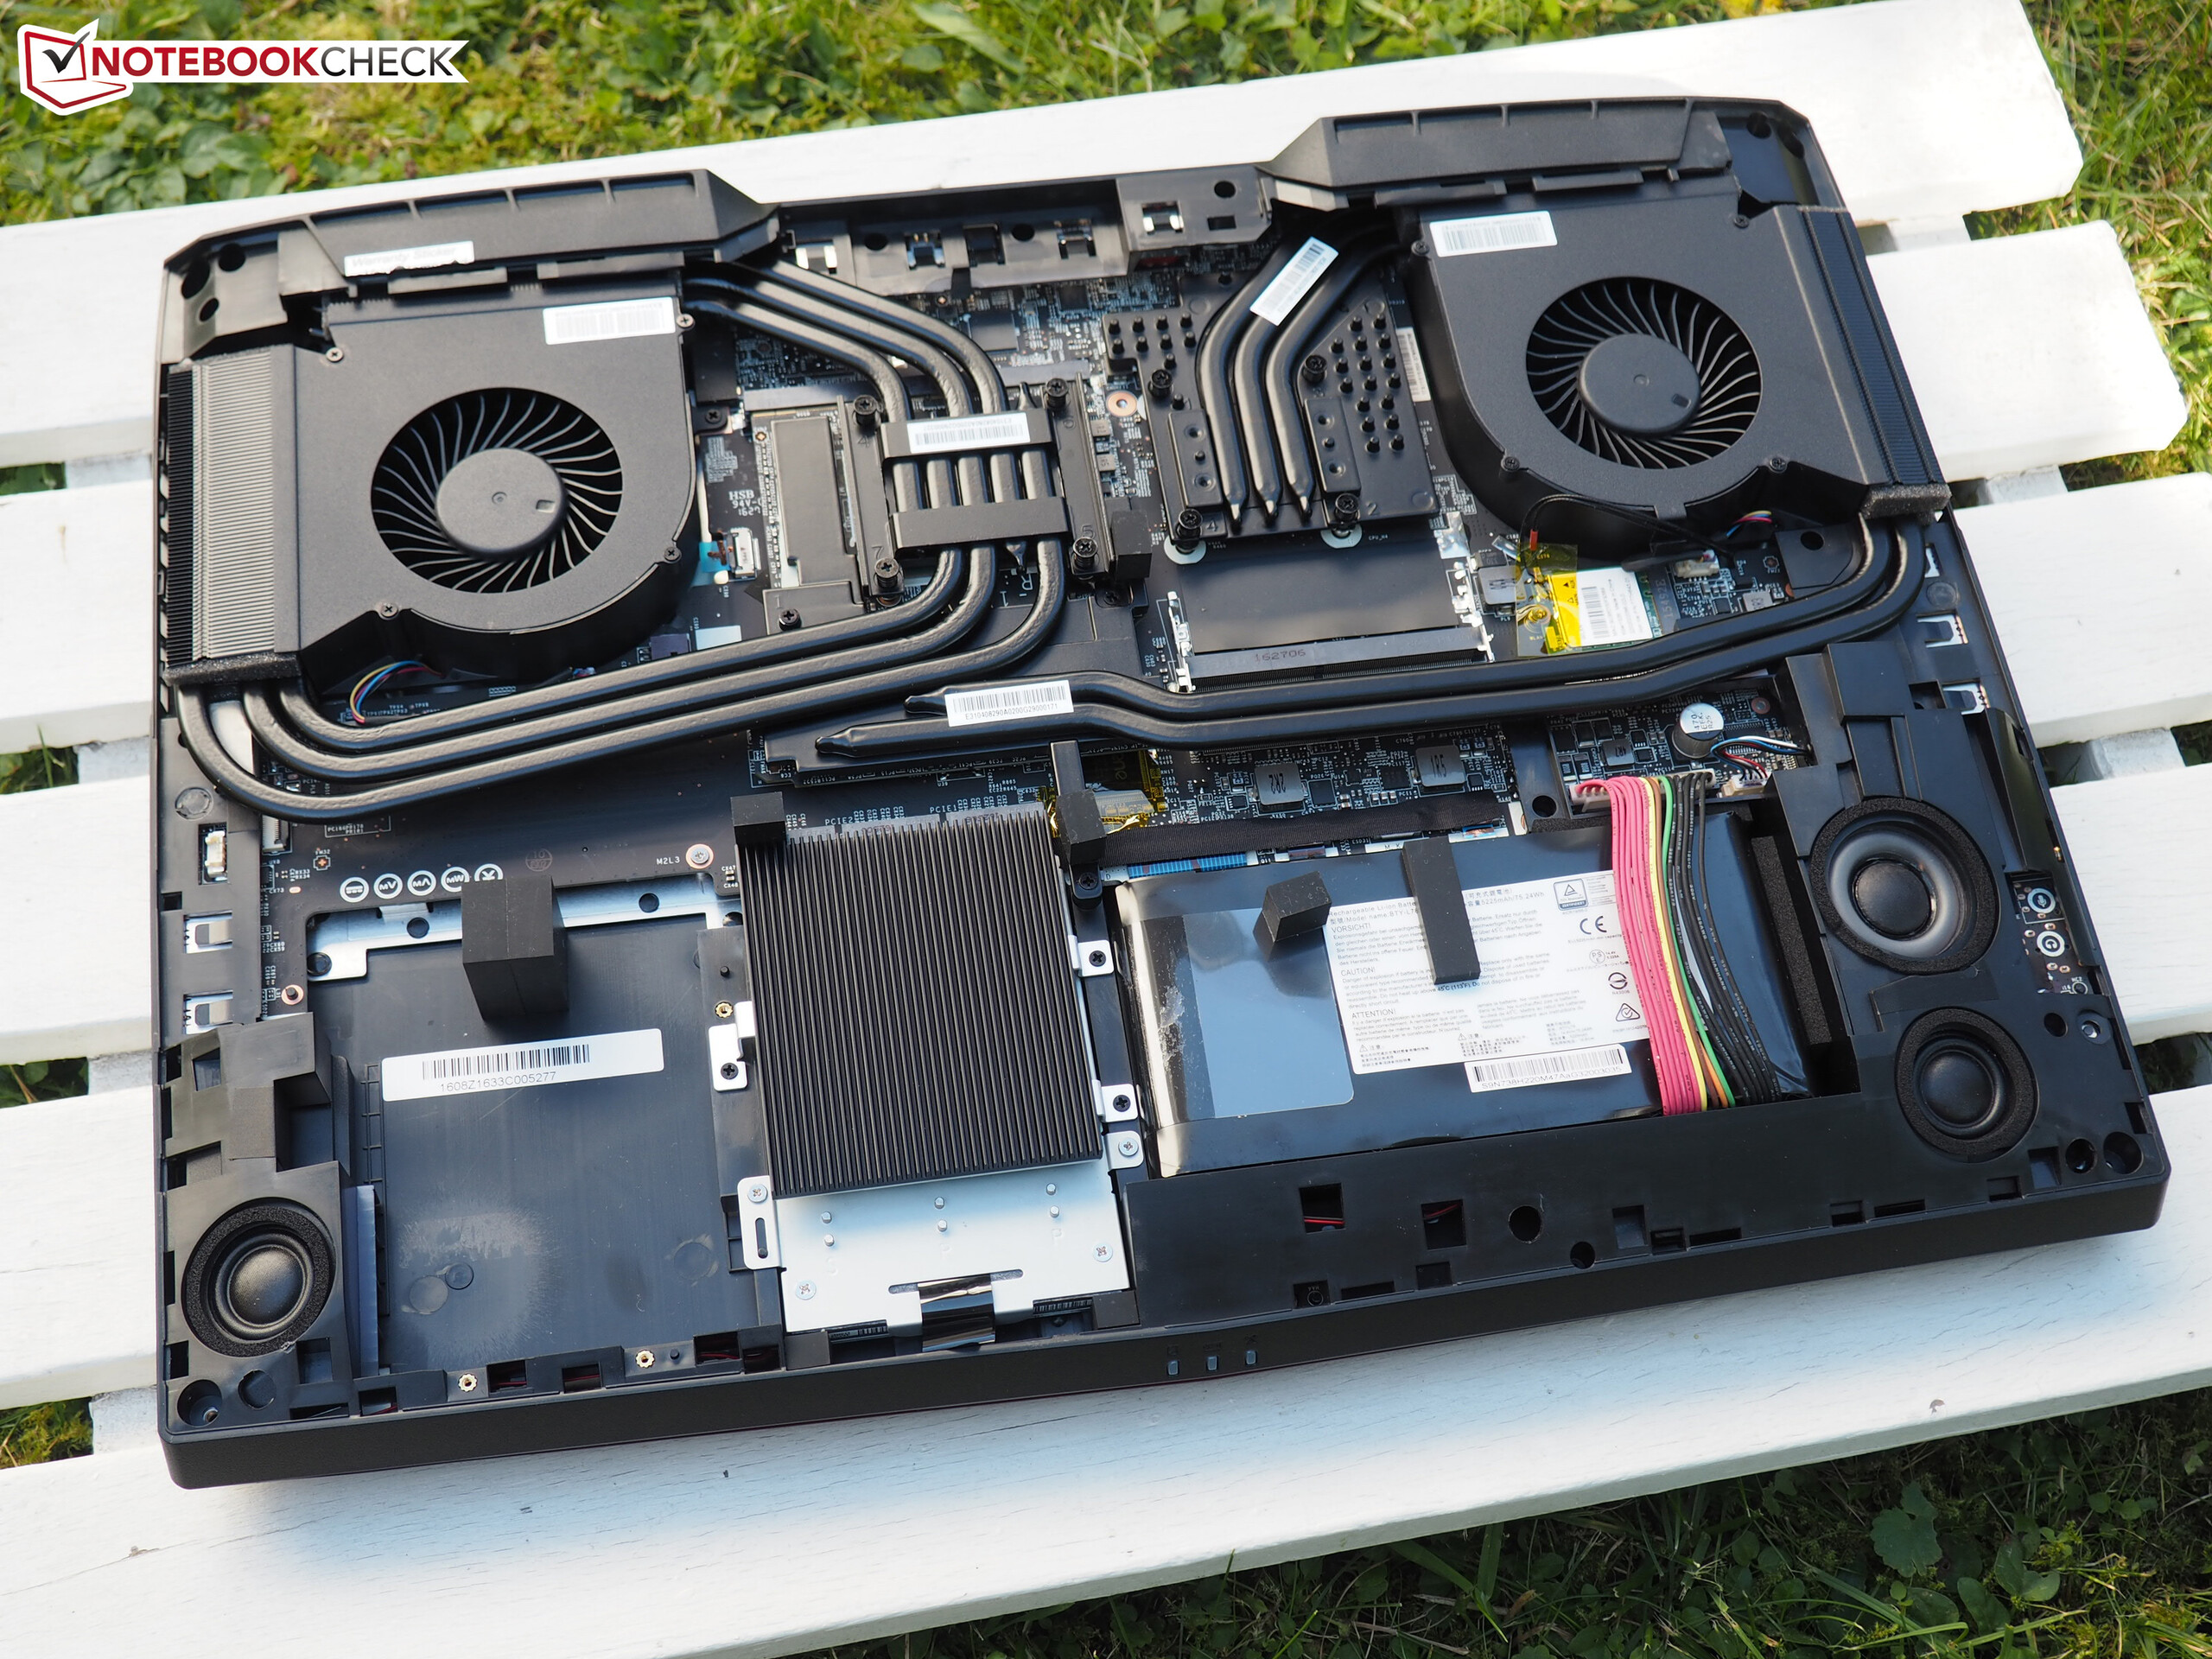
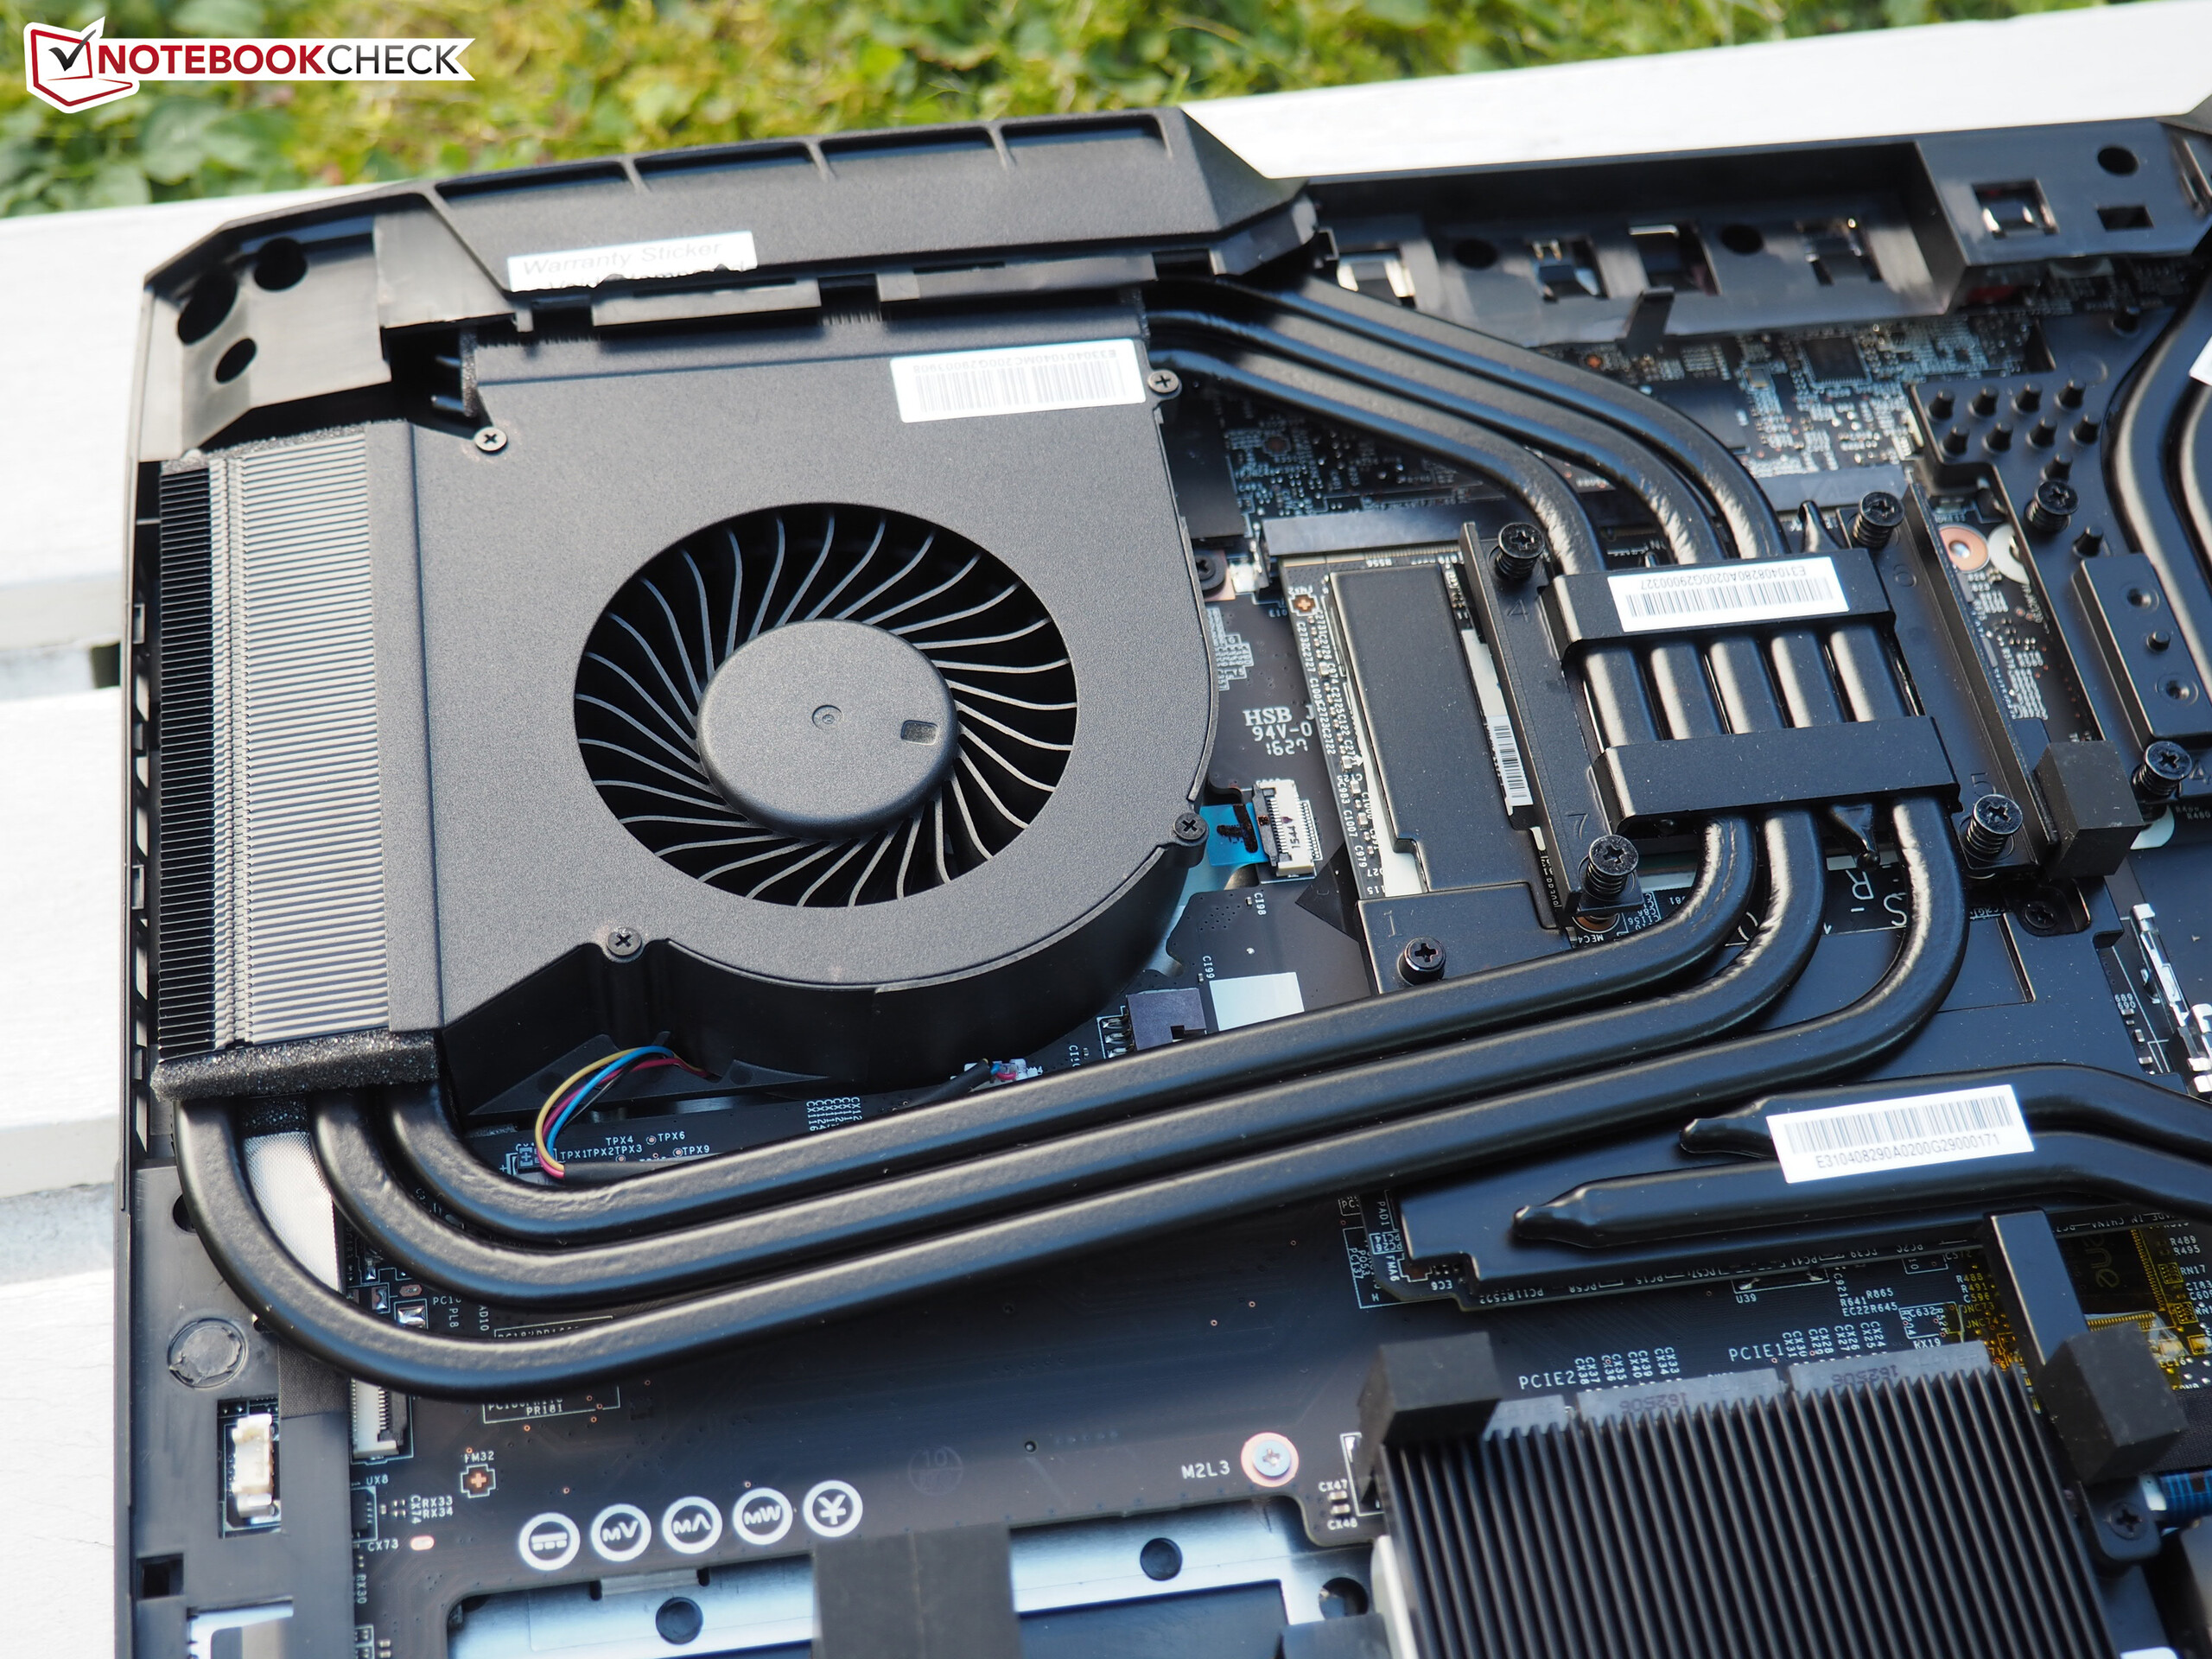
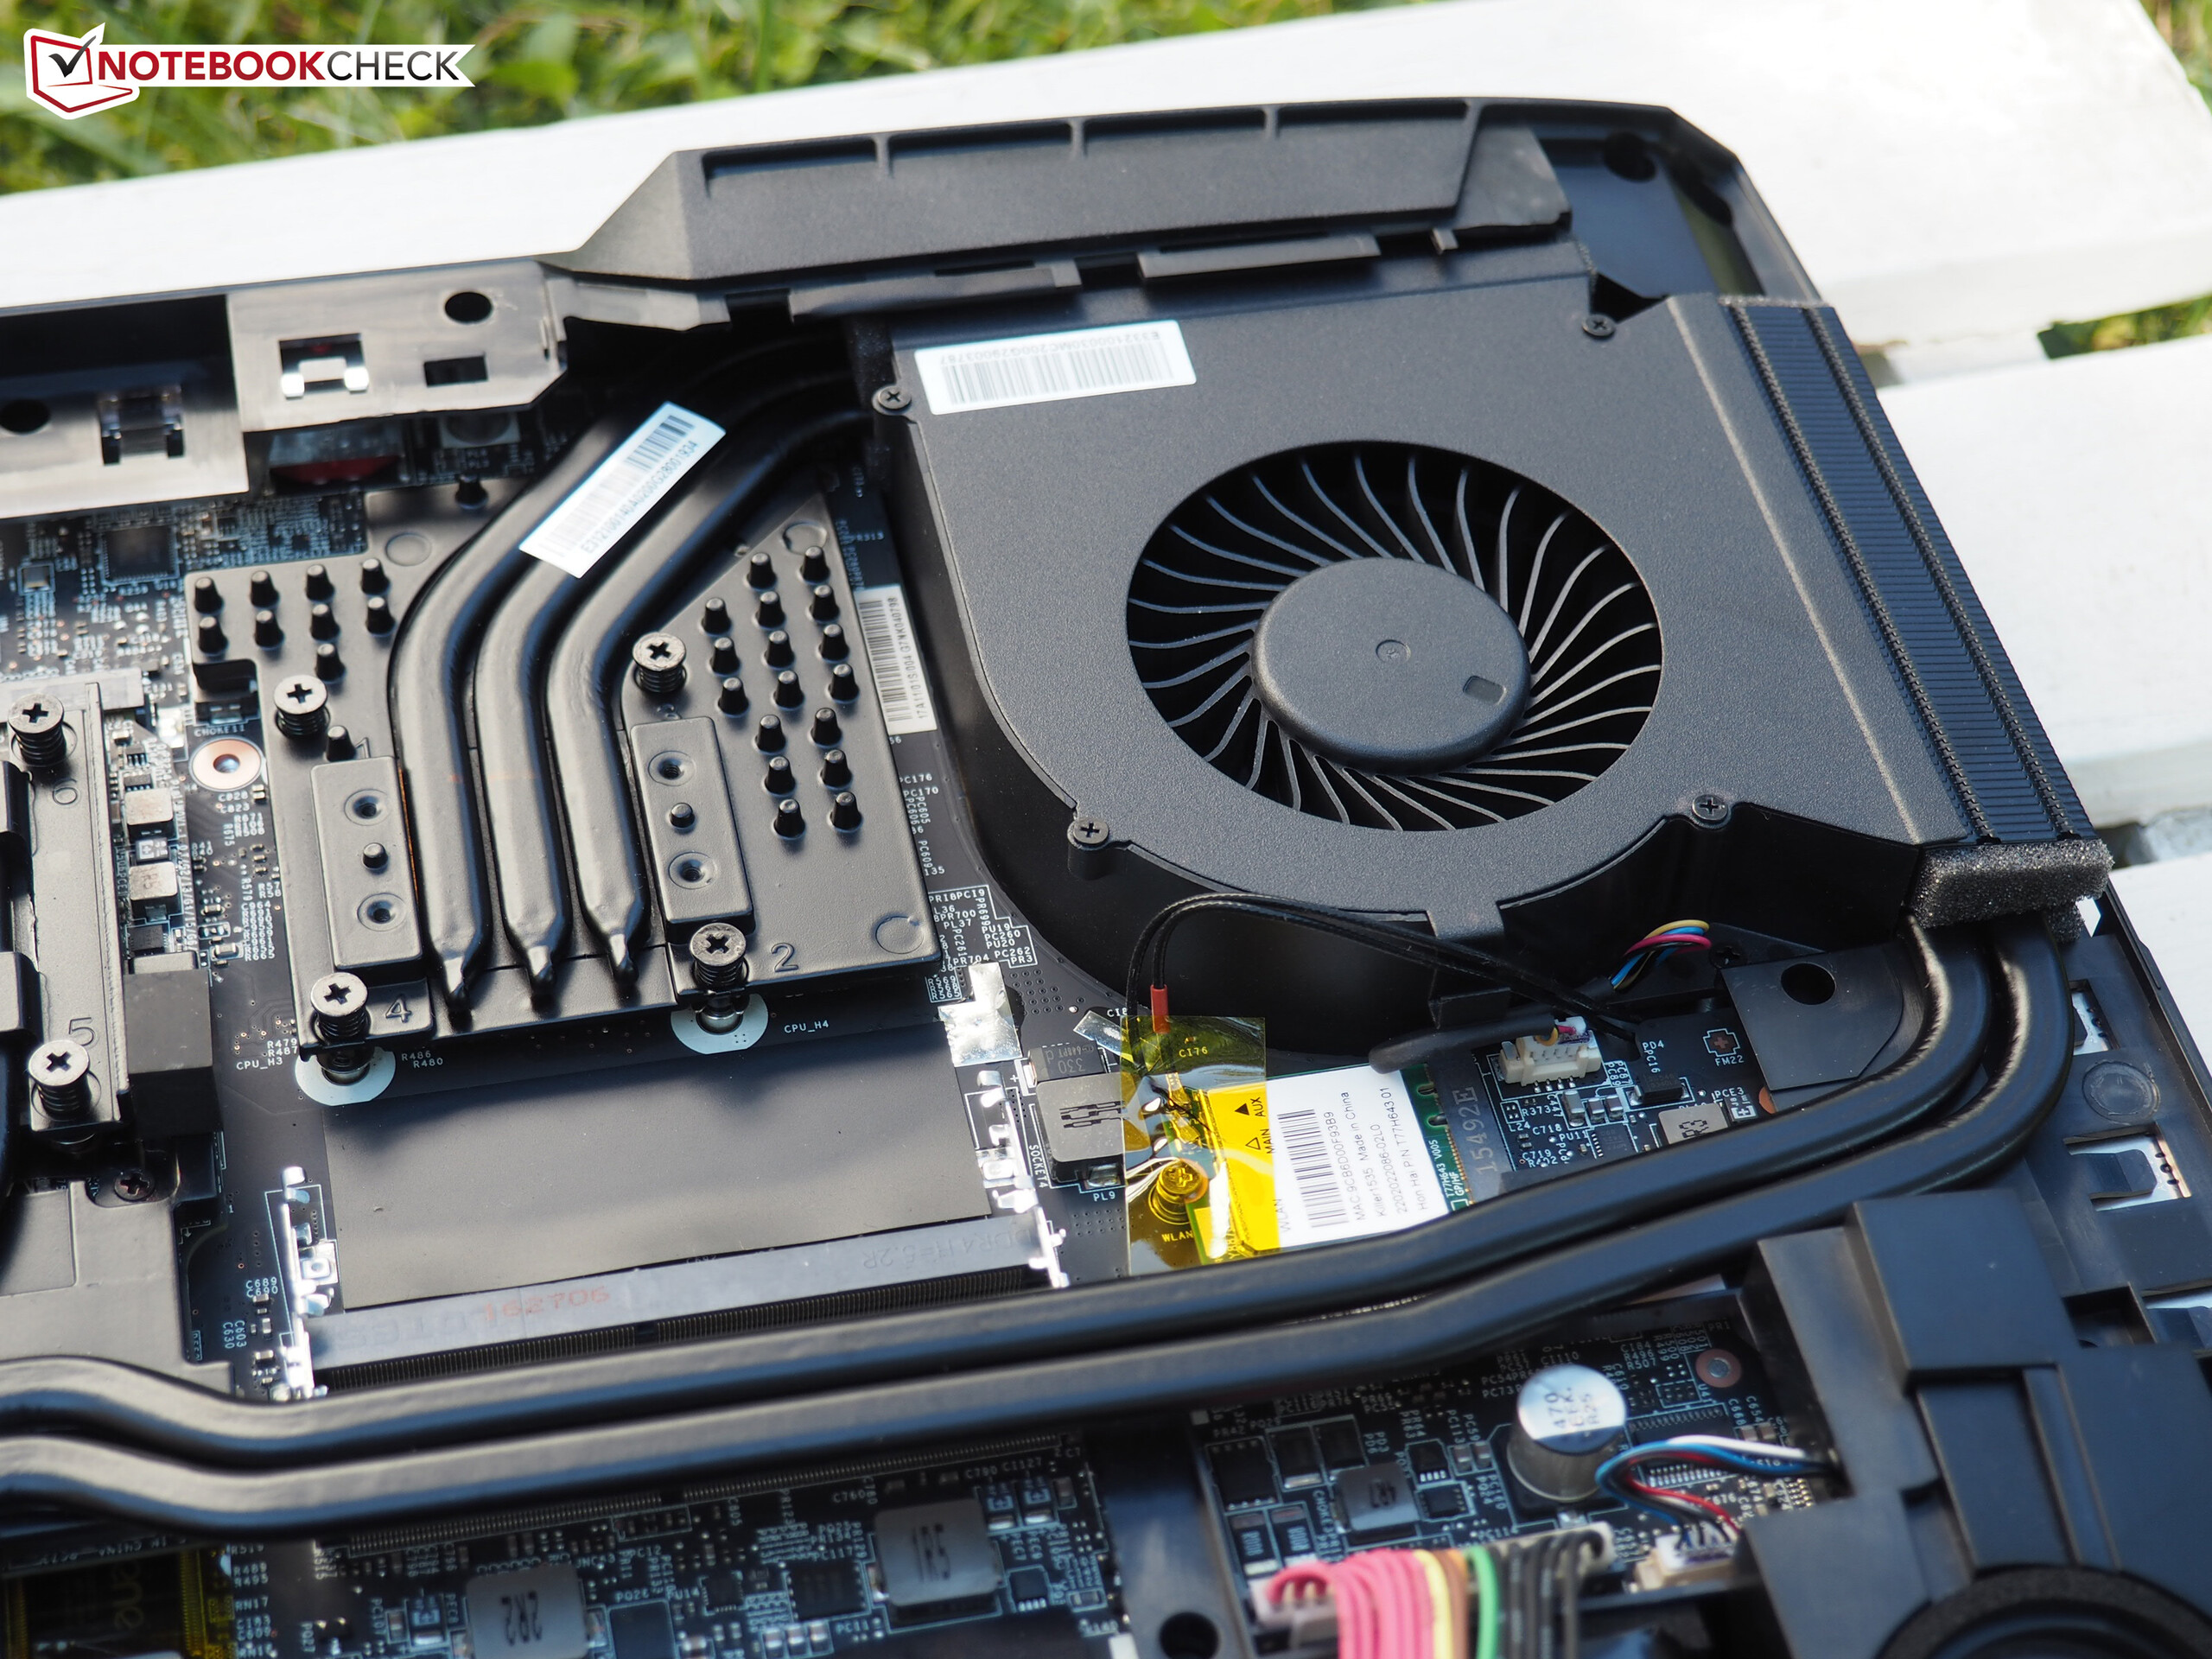
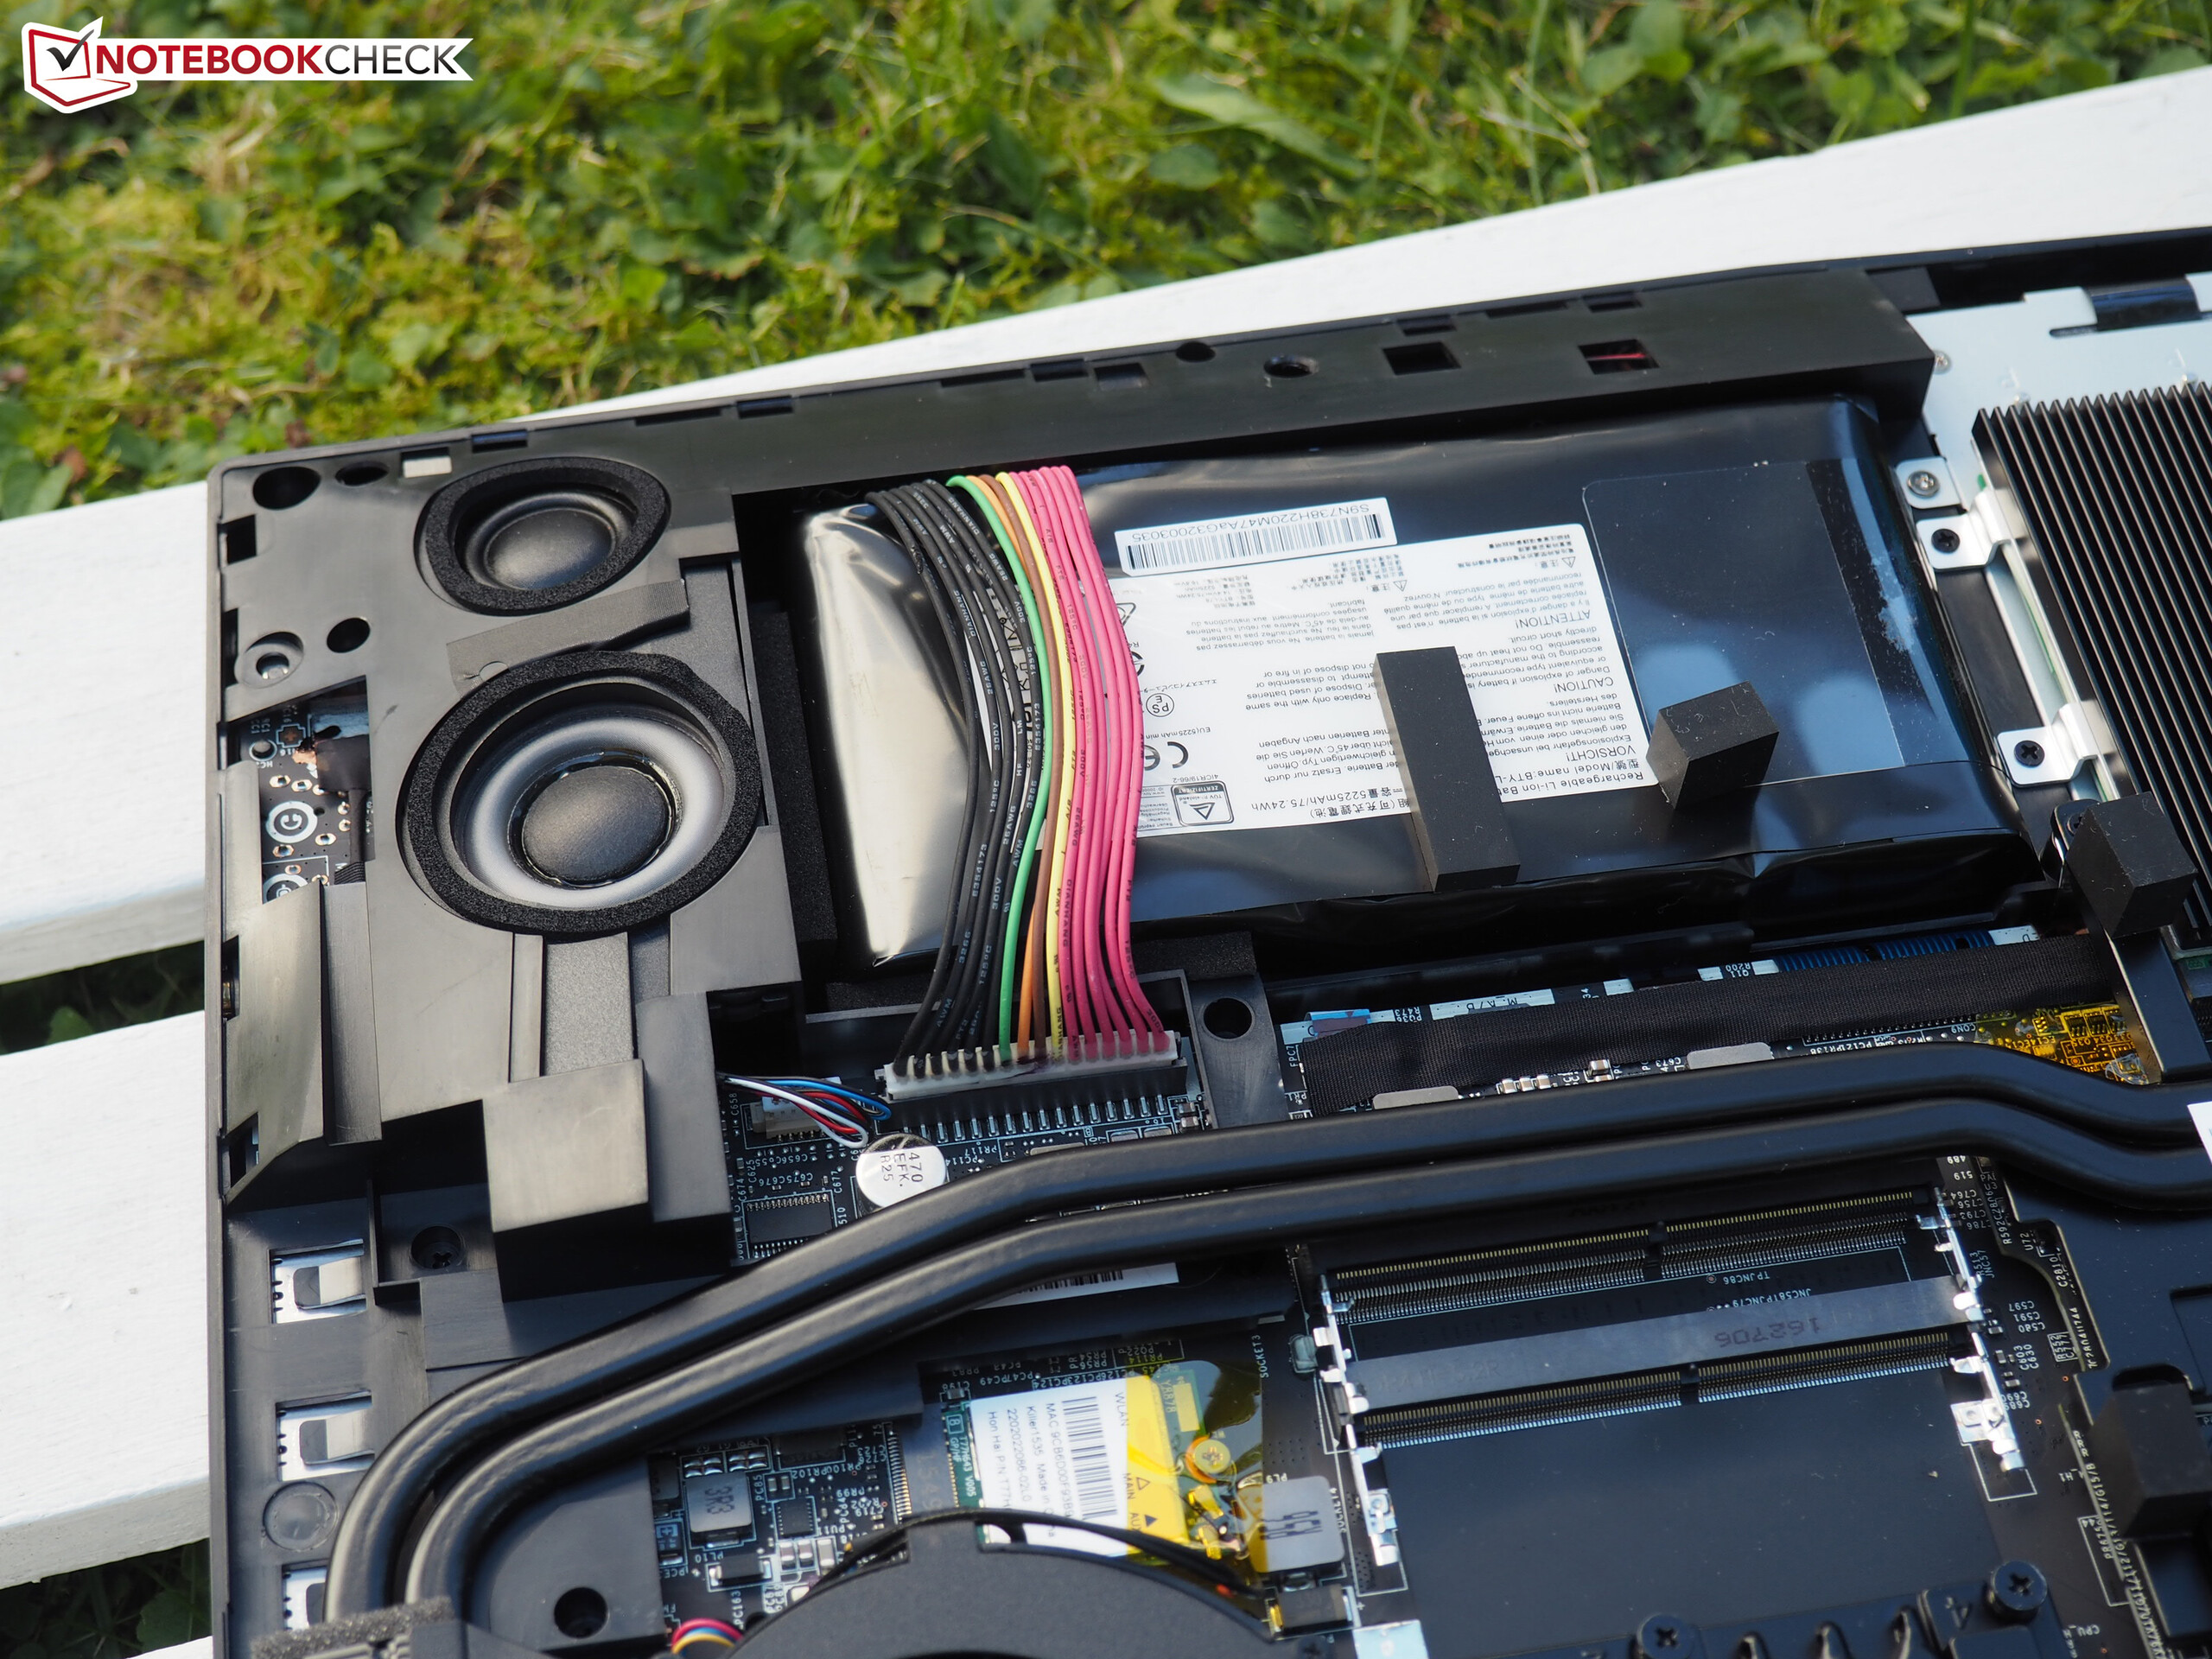
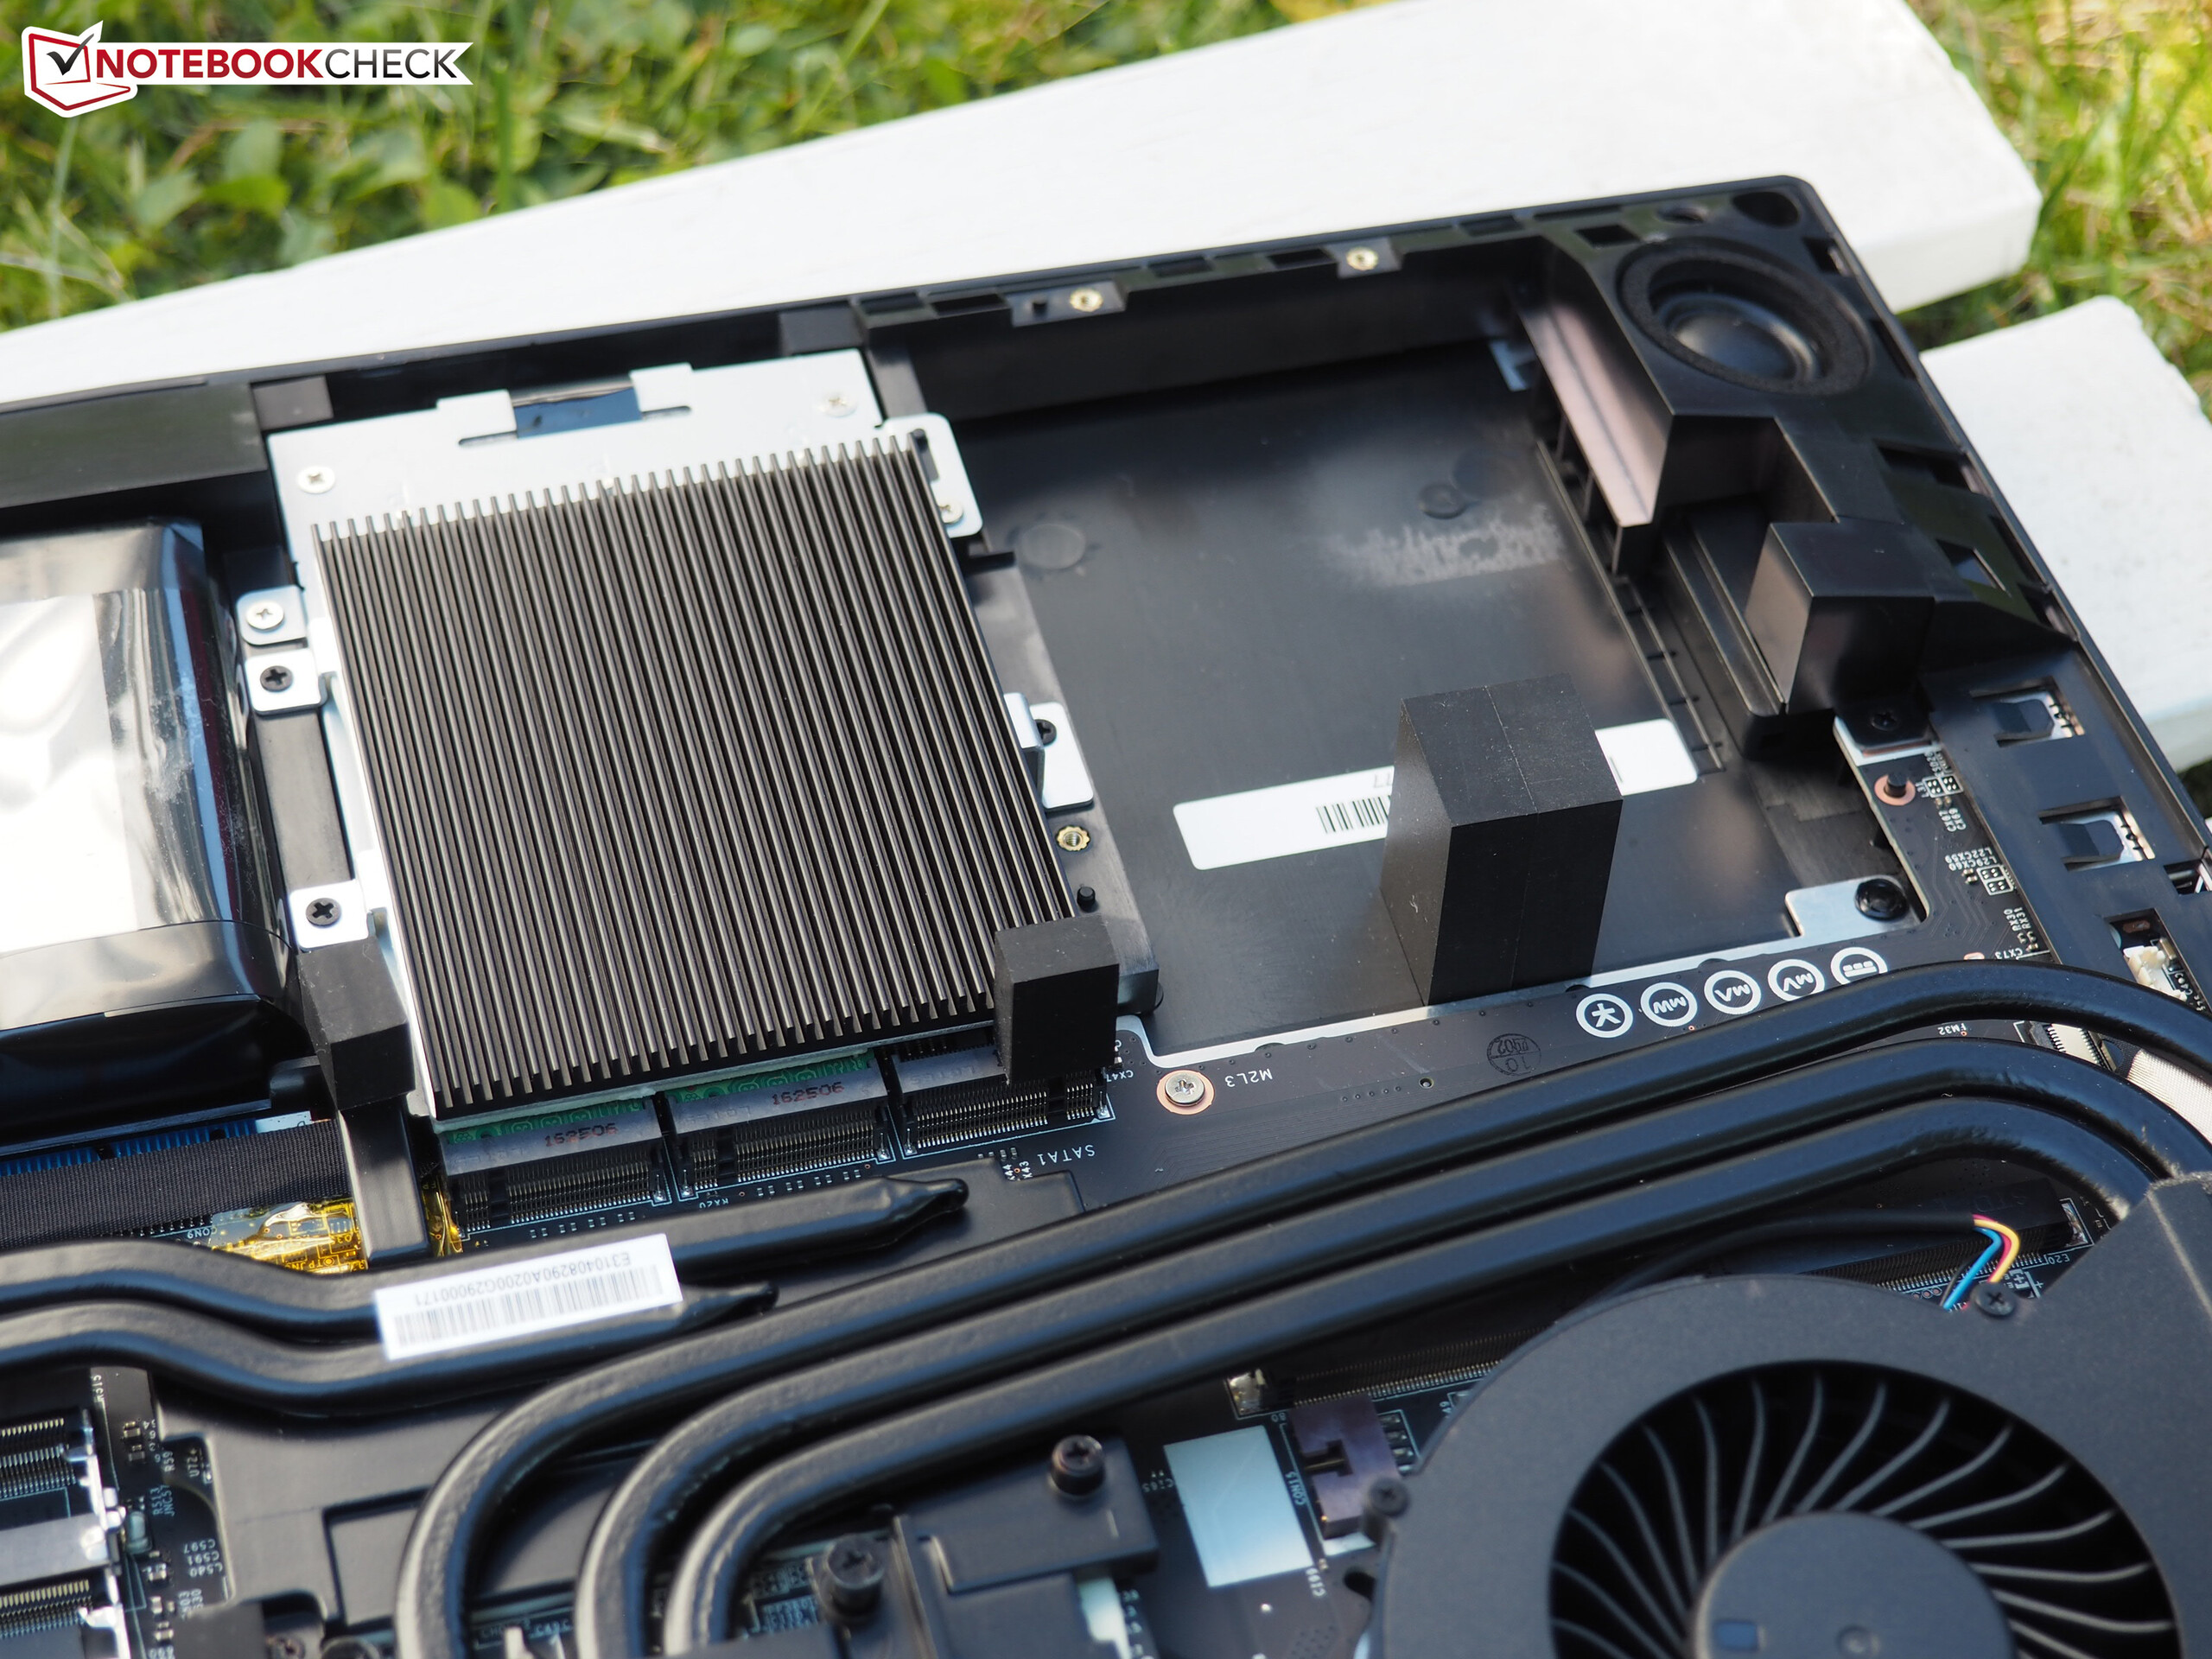
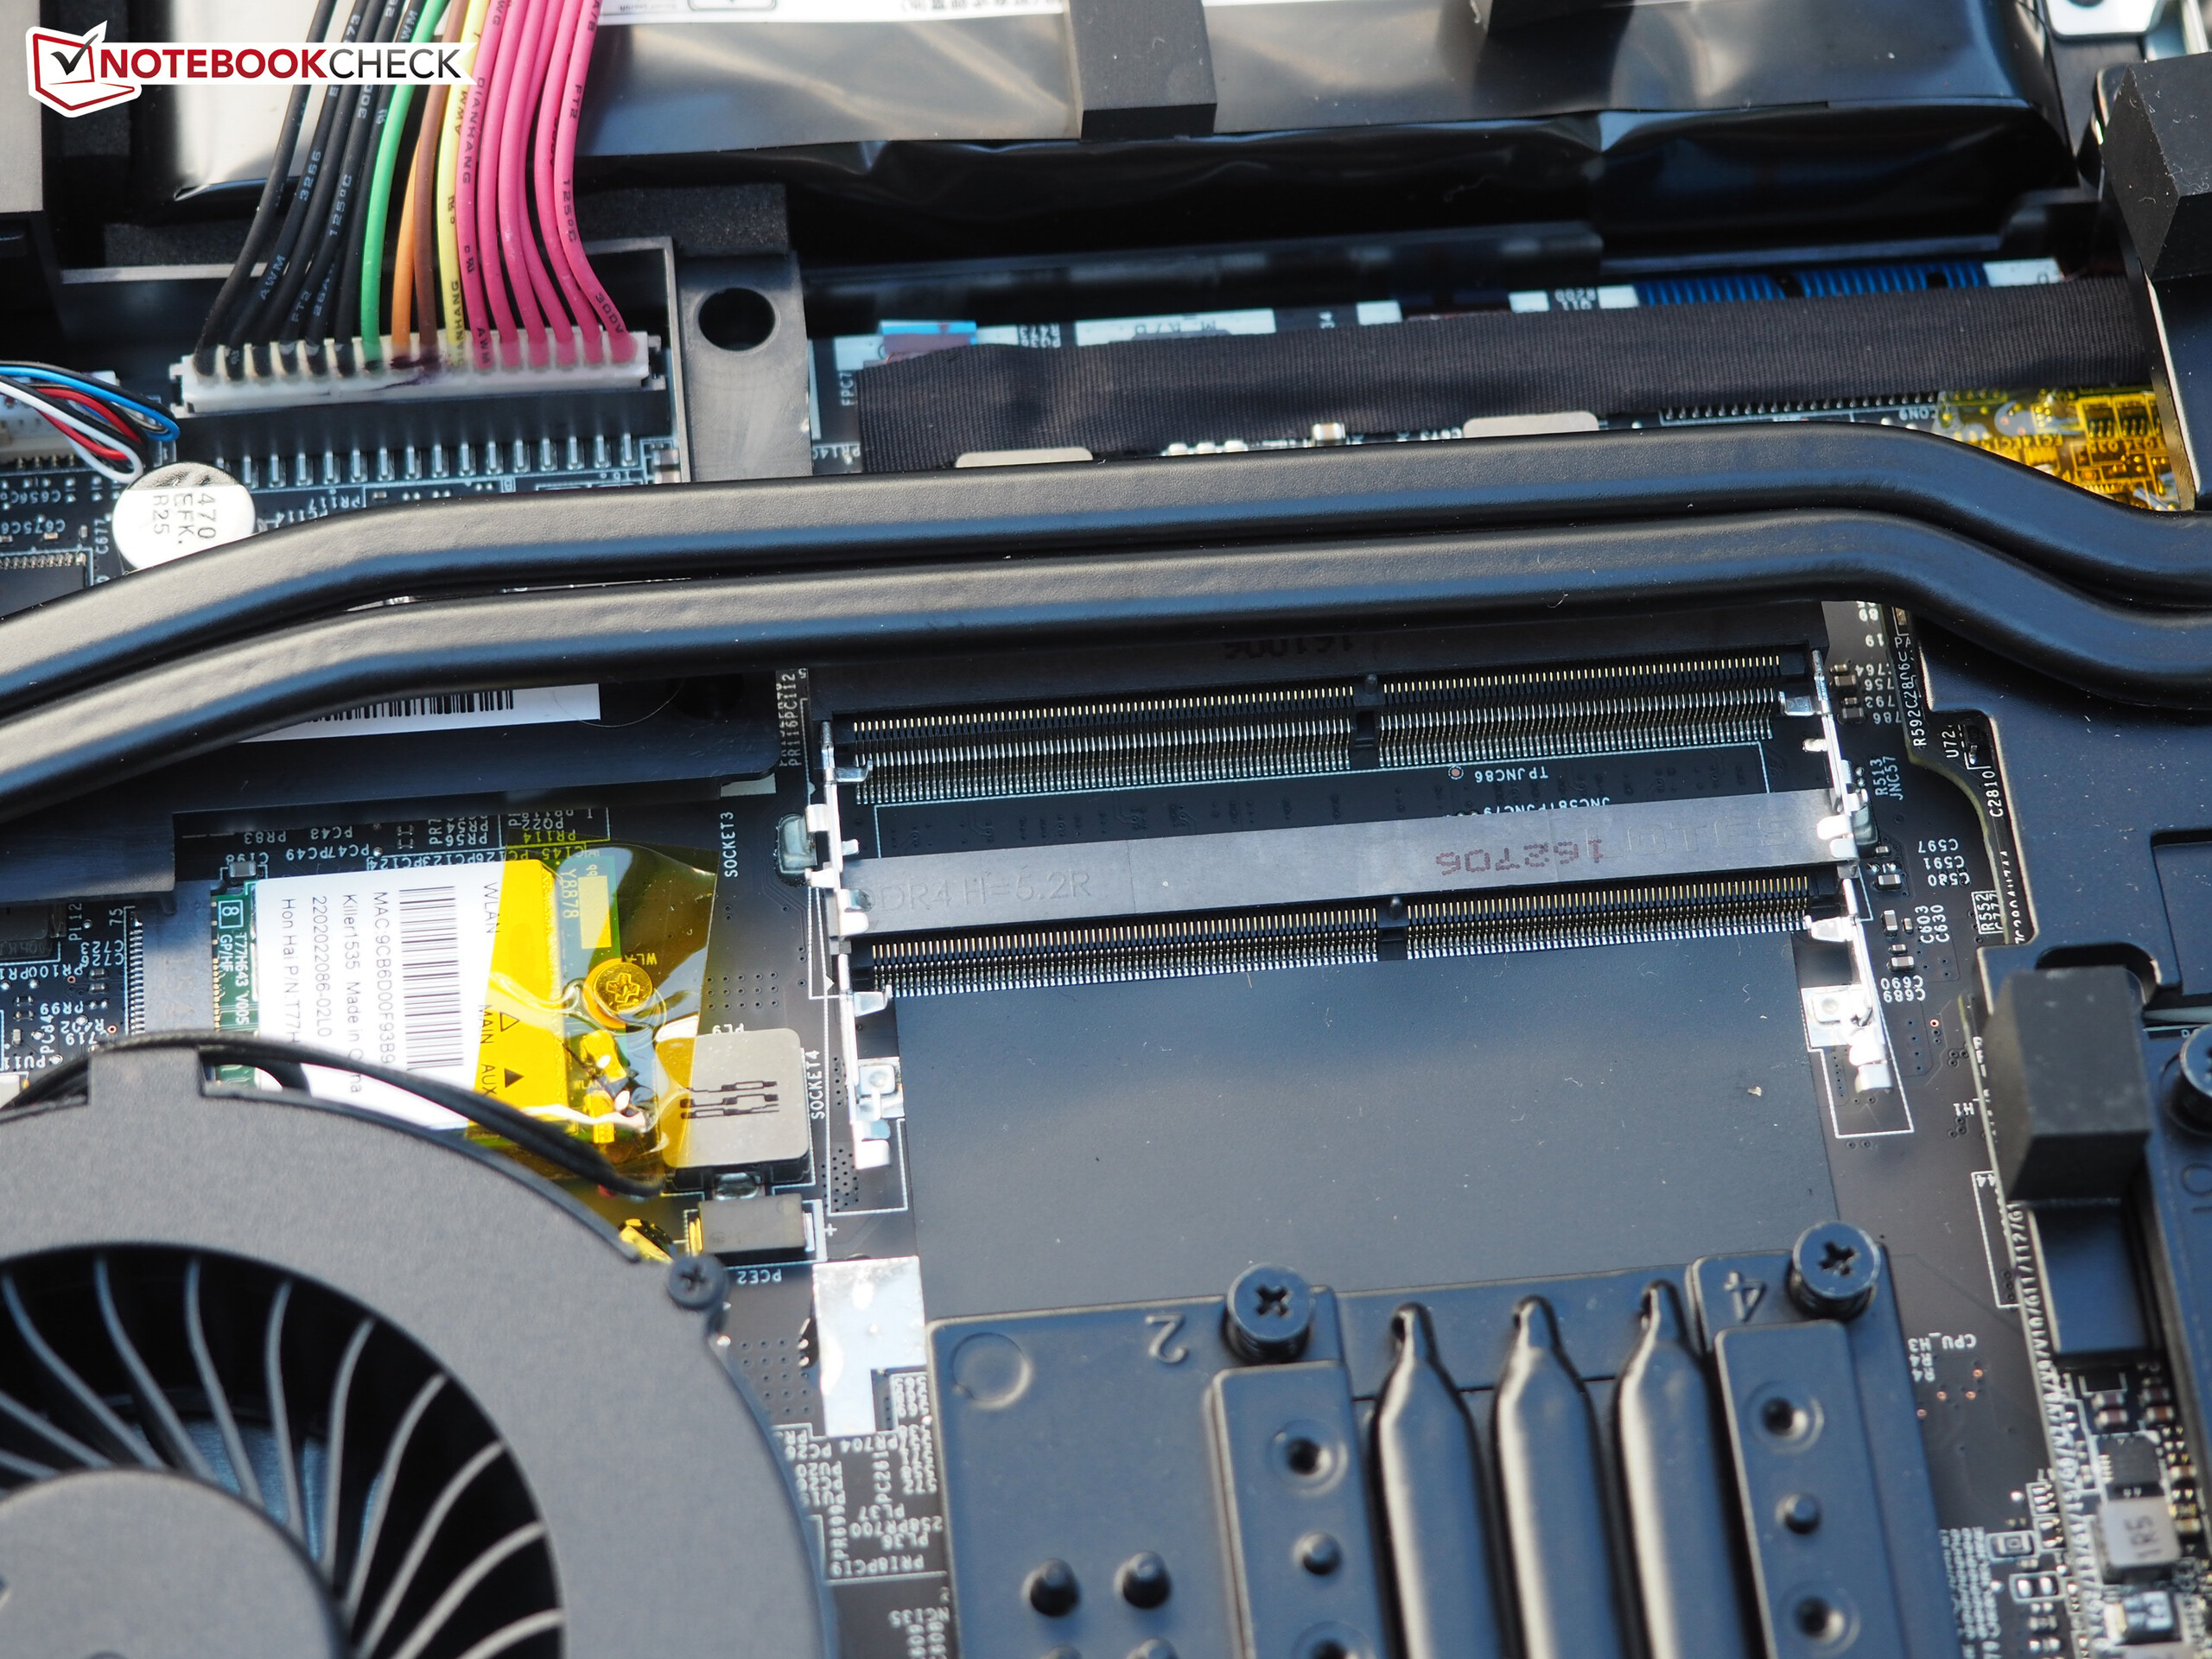
There is also an additional hard drive from HGST to ensure sufficient storage capacity for gamers. It is a 7200-rpm drive with a capacity of 1 TB. Thanks to the great maintainability, you can replace the storage drives (3x M.2 + 1x 2.5-inch), the RAM modules (4x DDR4 SO-DIMM), the wireless adapter and even the GPU (MXM module). More pictures of the internal layout, which is dominated by the gigantic cooling construction, are available in our review of the old GT73VR.
| MSI GT73VR 7RF-296 2x Samsung SM951 MZVPV256HDGL (RAID 0) | Aorus X7 v6 Toshiba NVMe THNSN5512GPU7 | Asus G752VS-XB78K Toshiba NVMe THNSN5512GPU7 | MSI GT72VR 7RE-433 Kingston RBU-SNS8152S3256GG5 | MSI GT83VR-6RE32SR451 2x Samsung SM951 MZVPV256HDGL (RAID 0) | |
|---|---|---|---|---|---|
| CrystalDiskMark 3.0 | -34% | -29% | -65% | -2% | |
| Read Seq (MB/s) | 3219 | 1499 -53% | 1718 -47% | 521 -84% | 3284 2% |
| Write Seq (MB/s) | 2572 | 1411 -45% | 1305 -49% | 311.8 -88% | 2548 -1% |
| Read 512 (MB/s) | 1776 | 966 -46% | 1250 -30% | 403.1 -77% | 1728 -3% |
| Write 512 (MB/s) | 2445 | 1103 -55% | 1438 -41% | 332.3 -86% | 2352 -4% |
| Read 4k (MB/s) | 51.1 | 44.33 -13% | 44.42 -13% | 33.35 -35% | 50.1 -2% |
| Write 4k (MB/s) | 141.3 | 155.5 10% | 154.4 9% | 111.1 -21% | 137.6 -3% |

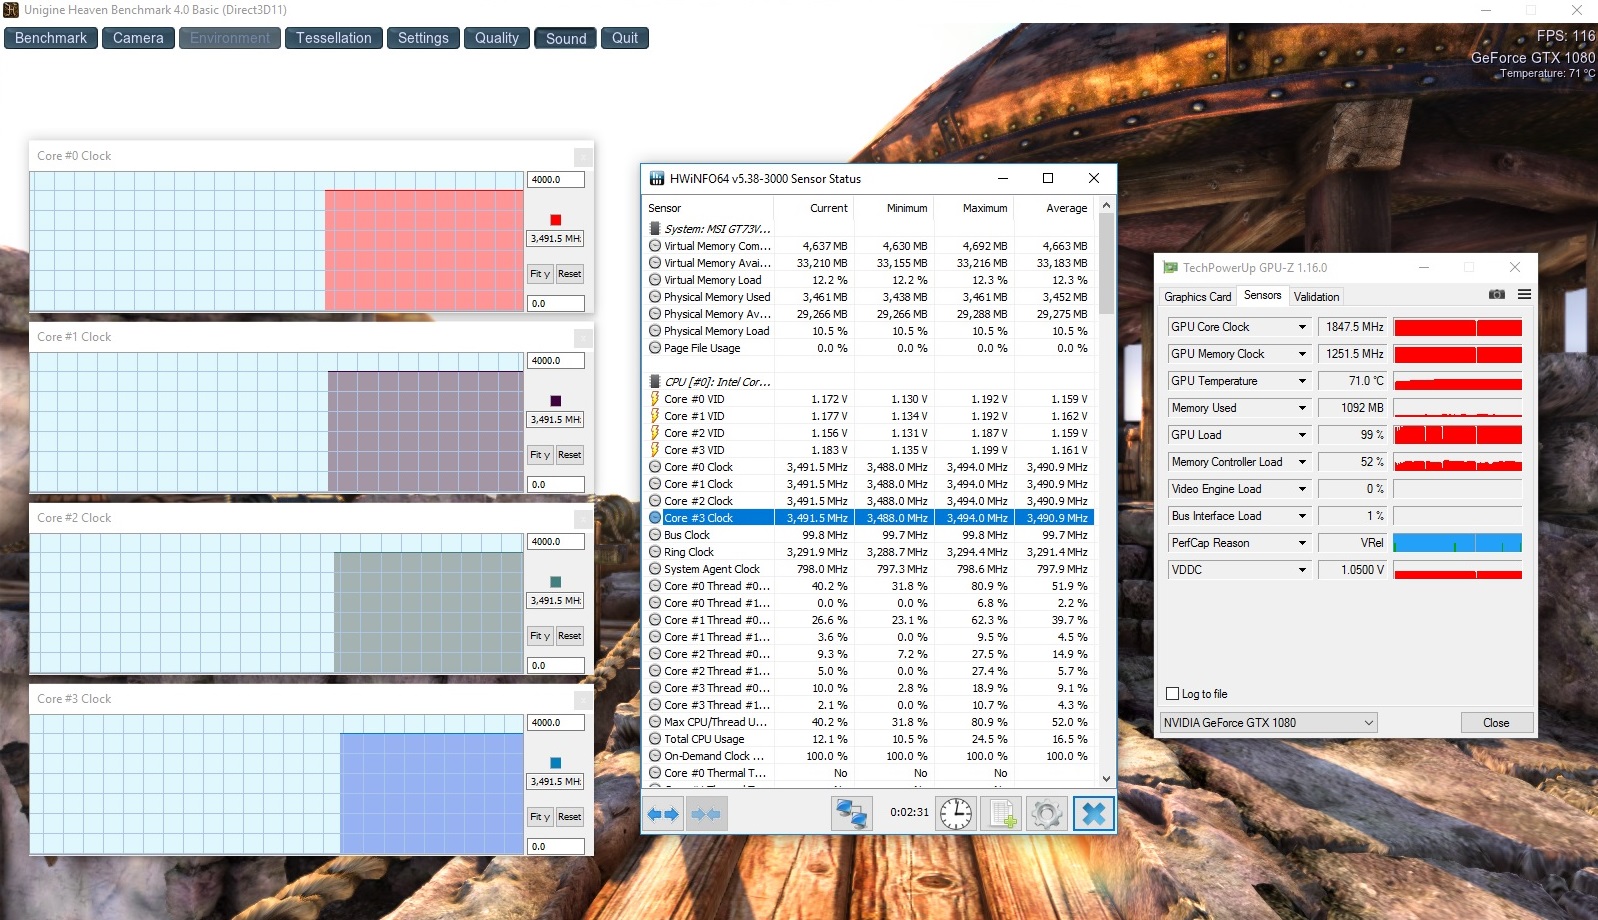
GPU Performance
The word dominating is also a suitable description for the GPU. Nvidia's GeForce GTX 1080 is currently the fastest mobile graphics adapter. It is equipped with 2560 shaders as well as 8 GB GDDR5X-VRAM, so every modern title runs smoothly at the highest settings and with anti-aliasing. Only extreme resolutions towards 4K could be a challenge, where the frame rate sometimes drops below 40 fps.
| 3DMark 11 Performance | 20510 points | |
| 3DMark Ice Storm Standard Score | 181787 points | |
| 3DMark Cloud Gate Standard Score | 31711 points | |
| 3DMark Fire Strike Score | 16478 points | |
Help | ||
Synthetic benchmarks like the Fire Strike Test from the latest 3DMark determine excellent scores for the GeForce GTX 1080. 21,026 points (GPU score) is out of reach for the GTX 1070. The competition is between 19 (Aorus X7 v6) and 25% (Acer Predator 17 G9-793) slower. The G73VR 7RF is only beaten by the 18-inch monster GT83VR, but it is much bigger, heavier and more expensive in return. SLI systems are also quite special due to several details (micro stutters, driver dependency, etc.). The clocks of the GTX 1080 did not cause any criticism. The Pascal chip leveled off at a very high 1850 MHz during Unigine Heaven 4.0, and up to 1911 MHz in the GPU-Z Render Test.
| 3DMark - 1920x1080 Fire Strike Graphics | |
| MSI GT83VR-6RE32SR451 | |
| MSI GT73VR 7RF-296 | |
| MSI GT72VR 7RE-433 | |
| Aorus X7 v6 | |
| Asus G752VS-XB78K | |
| Acer Predator 17 G9-793-77LG | |
| 3DMark 11 - 1280x720 Performance GPU | |
| MSI GT83VR-6RE32SR451 | |
| MSI GT73VR 7RF-296 | |
| Aorus X7 v6 | |
| MSI GT72VR 7RE-433 | |
| Asus G752VS-XB78K | |
| Acer Predator 17 G9-793-77LG | |
Gaming Performance
We already mentioned that the 17-inch system usually has no performance problems. You can max out all graphics settings in almost every game when you play on the internal FHD screen. Even poorly optimized AAA-games like Deus Ex Mankind Divided or Dishonored 2 can be enjoyed in their full splendor. The GTX 1080 even passes the maximum display frequency quite often. Our benchmark sequence of Battlefield 1, for example, ran at a buttery-smooth 135 fps (Ultra preset) at 1920x1080 pixels.
| Battlefield 1 - 1920x1080 Ultra Preset AA:T | |
| MSI GT73VR 7RF-296 | |
| Aorus X7 v6 | |
| MSI GT72VR 7RE-433 | |
| Titanfall 2 - 1920x1080 Very High (Insane Texture Quality) / Enabled AA:TS AF:16x | |
| MSI GT73VR 7RF-296 | |
| MSI GT72VR 7RE-433 | |
| Call of Duty Infinite Warfare - 1920x1080 Ultra / On AA:T2X SM | |
| MSI GT73VR 7RF-296 | |
| Dishonored 2 - 1920x1080 Ultra Preset AA:TX | |
| MSI GT73VR 7RF-296 | |
| Watch Dogs 2 - 1920x1080 Ultra Preset | |
| MSI GT73VR 7RF-296 | |
| Deus Ex Mankind Divided - 1920x1080 Ultra Preset AA:2xMS AF:8x | |
| MSI GT73VR 7RF-296 | |
| MSI GT83VR-6RE32SR451 | |
| MSI GT72VR 7RE-433 | |
| Aorus X7 v6 | |
| FIFA 17 - 1920x1080 Ultra Preset AA:4xMS | |
| MSI GT73VR 7RF-296 | |
| MSI GT83VR-6RE32SR451 | |
| low | med. | high | ultra | 4K | |
|---|---|---|---|---|---|
| Deus Ex Mankind Divided (2016) | 103 | 57.1 | 35.5 | ||
| FIFA 17 (2016) | 378 | 360 | 208 | ||
| Battlefield 1 (2016) | 152 | 135 | 57.9 | ||
| Titanfall 2 (2016) | 144 | 141 | 58.4 | ||
| Call of Duty Infinite Warfare (2016) | 125 | 125 | 75.7 | ||
| Dishonored 2 (2016) | 100 | 79.9 | 49.2 | ||
| Watch Dogs 2 (2016) | 105 | 71.7 | 41.4 |
Emissions
System Noise
The noise development leaves mixed impressions. While the GT73VR 7RF is not too loud in 3DMark06 at 37-40 dB(A), you will soon want headphones when it comes to maximum load. The fans are extremely loud at 56 dB(A) after our one-hour stress test with the tools FurMark and Prime95. Only the SLI-combination of the MSI GT83VR is even louder (up to 57 dB(A)).
The cooling solution is quite restrained while idling. Almost 34-35 dB(A) is common for a gaming notebook with an Nvidia GPU running in it. We could not notice any annoying pulsating. The 37 dB(A) in the table was recorded during the boot sequence.
Noise level
| Idle |
| 34 / 35 / 37 dB(A) |
| Load |
| 39 / 56 dB(A) |
 | ||
30 dB silent 40 dB(A) audible 50 dB(A) loud |
||
min: | ||
| MSI GT73VR 7RF-296 i7-7820HK, GeForce GTX 1080 Mobile | Acer Predator 17 G9-793-77LG 6700HQ, GeForce GTX 1070 Mobile | Aorus X7 v6 6820HK, GeForce GTX 1070 Mobile | Asus G752VS-XB78K 6820HK, GeForce GTX 1070 Mobile | MSI GT72VR 7RE-433 i7-7700HQ, GeForce GTX 1070 Mobile | MSI GT83VR-6RE32SR451 6820HK, GeForce GTX 1070 SLI (Laptop) | |
|---|---|---|---|---|---|---|
| Noise | -1% | -2% | 7% | 4% | -2% | |
| off / environment * (dB) | 30 | 31 -3% | 30 -0% | 30 -0% | 31 -3% | 30 -0% |
| Idle Minimum * (dB) | 34 | 33 3% | 33 3% | 31 9% | 34 -0% | 33 3% |
| Idle Average * (dB) | 35 | 34 3% | 35 -0% | 32 9% | 35 -0% | 34 3% |
| Idle Maximum * (dB) | 37 | 40 -8% | 40 -8% | 33 11% | 37 -0% | 35 5% |
| Load Average * (dB) | 39 | 44 -13% | 43 -10% | 40 -3% | 37 5% | 48 -23% |
| Load Maximum * (dB) | 56 | 50 11% | 54 4% | 47 16% | 44 21% | 57 -2% |
* ... smaller is better
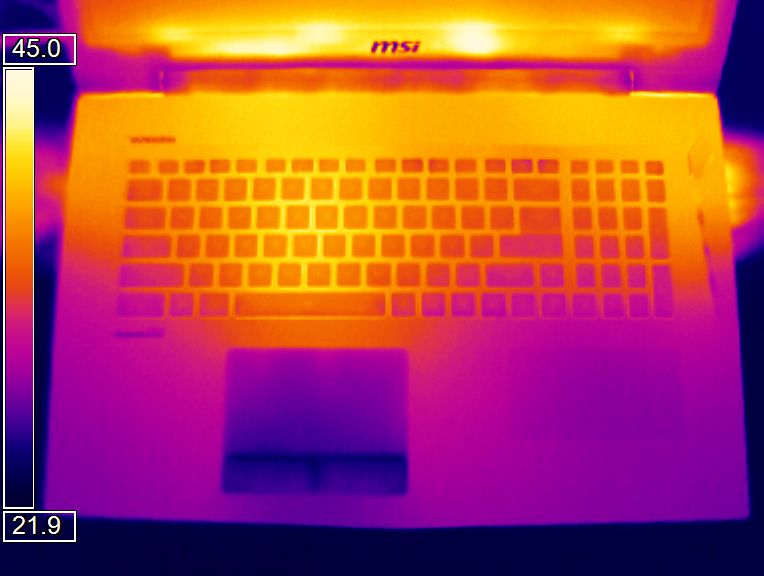
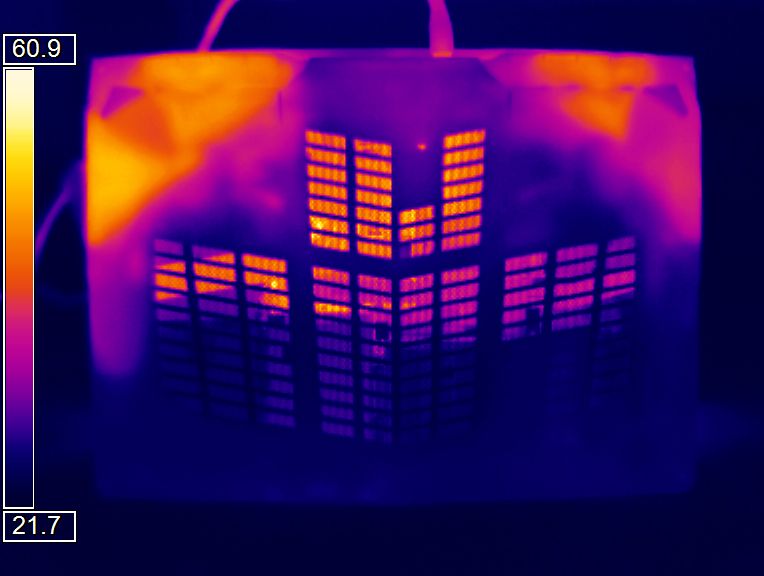
Temperature
The surface temperatures are also on par with the competition, although the GT73VR is a bit cooler than the majority of high-end notebooks. Around 25 °C while idling and up to 40 °C (top) and 48 °C (bottom) during the stress test are not concerning. The WASD area and the palm rest are also very comfortable while gaming thanks to the clever temperature distribution.
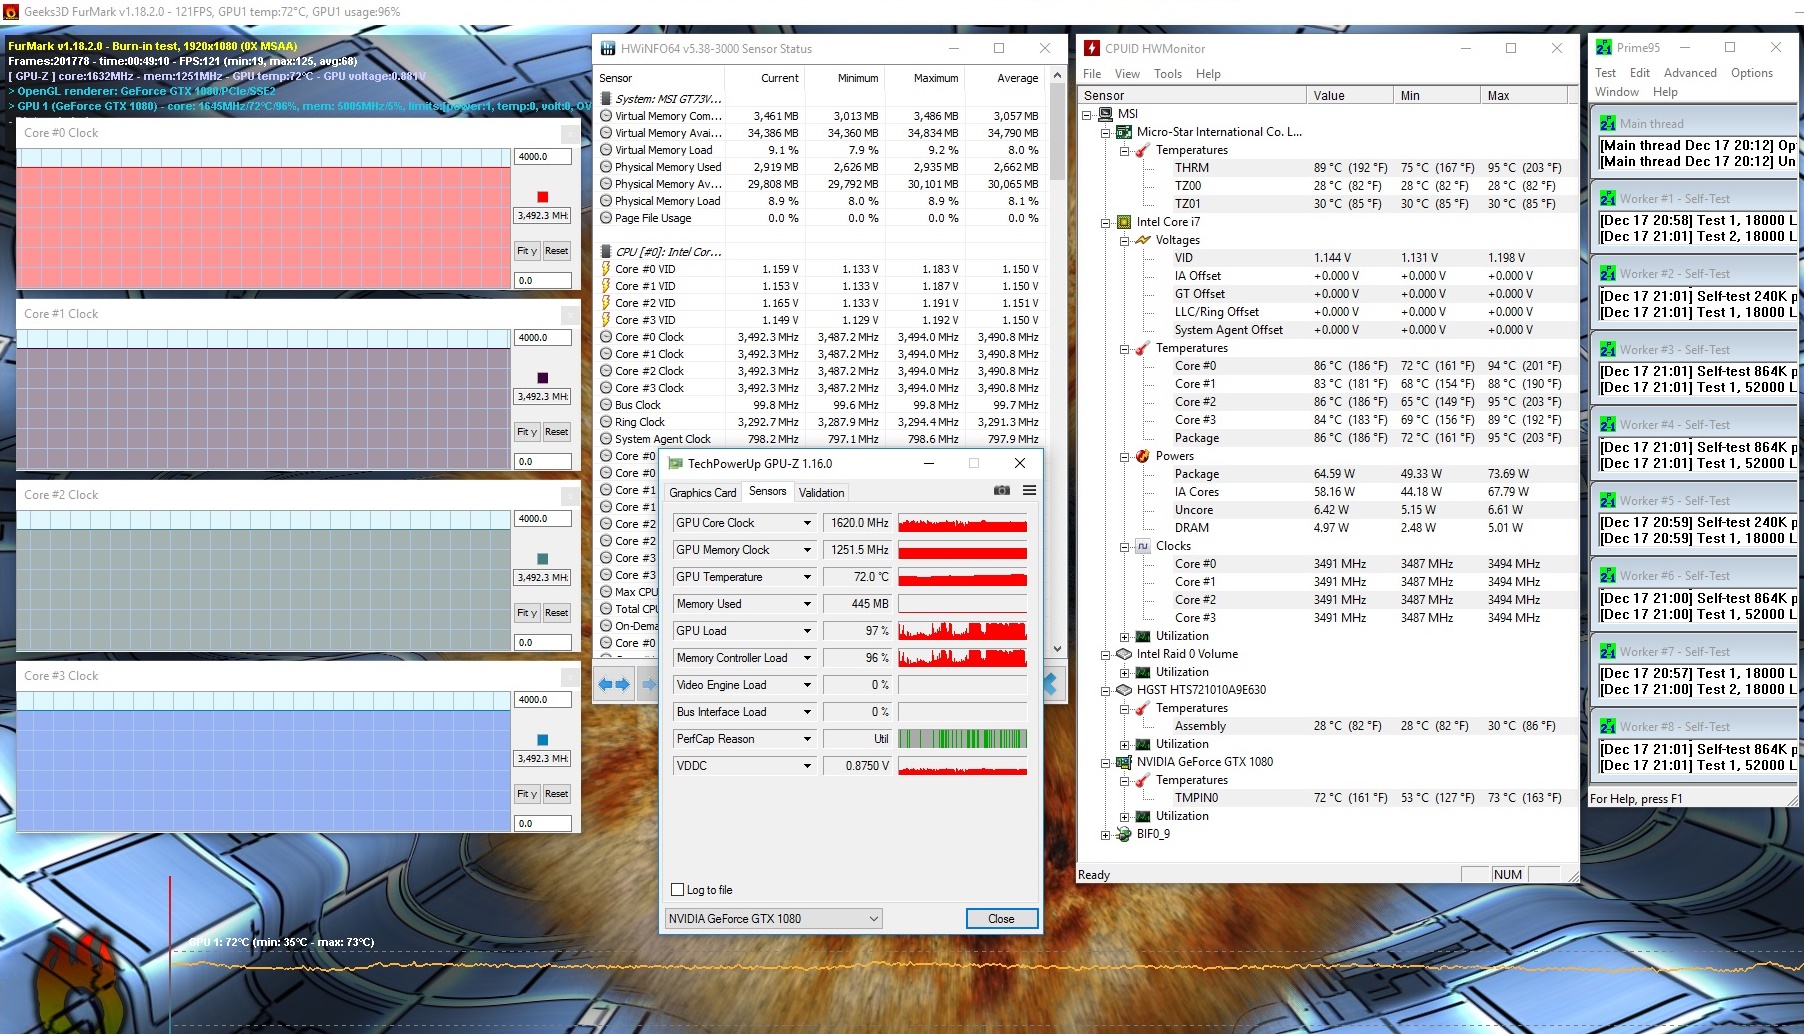
We cannot criticize MSI for the internal temperatures, either. The CPU reaches around 90 °C in extreme scenarios, but we never noticed any throttling, even in unrealistic stress situations. The same applies for the graphics card, which warmed up to 73 °C – a great result.
(+) The maximum temperature on the upper side is 39.8 °C / 104 F, compared to the average of 40.4 °C / 105 F, ranging from 21.2 to 68.8 °C for the class Gaming.
(-) The bottom heats up to a maximum of 47.8 °C / 118 F, compared to the average of 43.3 °C / 110 F
(+) In idle usage, the average temperature for the upper side is 25.4 °C / 78 F, compared to the device average of 33.9 °C / 93 F.
(+) The palmrests and touchpad are cooler than skin temperature with a maximum of 28.4 °C / 83.1 F and are therefore cool to the touch.
(±) The average temperature of the palmrest area of similar devices was 28.9 °C / 84 F (+0.5 °C / 0.9 F).
| MSI GT73VR 7RF-296 i7-7820HK, GeForce GTX 1080 Mobile | Acer Predator 17 G9-793-77LG 6700HQ, GeForce GTX 1070 Mobile | Aorus X7 v6 6820HK, GeForce GTX 1070 Mobile | Asus G752VS-XB78K 6820HK, GeForce GTX 1070 Mobile | MSI GT72VR 7RE-433 i7-7700HQ, GeForce GTX 1070 Mobile | MSI GT83VR-6RE32SR451 6820HK, GeForce GTX 1070 SLI (Laptop) | |
|---|---|---|---|---|---|---|
| Heat | -7% | -11% | -5% | 0% | 12% | |
| Maximum Upper Side * (°C) | 39.8 | 42.6 -7% | 47.5 -19% | 42.9 -8% | 41.5 -4% | 35.8 10% |
| Maximum Bottom * (°C) | 47.8 | 44.9 6% | 54.5 -14% | 41.5 13% | 50.6 -6% | 42.8 10% |
| Idle Upper Side * (°C) | 27.1 | 33.1 -22% | 28.6 -6% | 31.6 -17% | 26.4 3% | 24.7 9% |
| Idle Bottom * (°C) | 27.4 | 28.9 -5% | 28.8 -5% | 29.5 -8% | 25.4 7% | 22.8 17% |
* ... smaller is better
Speakers
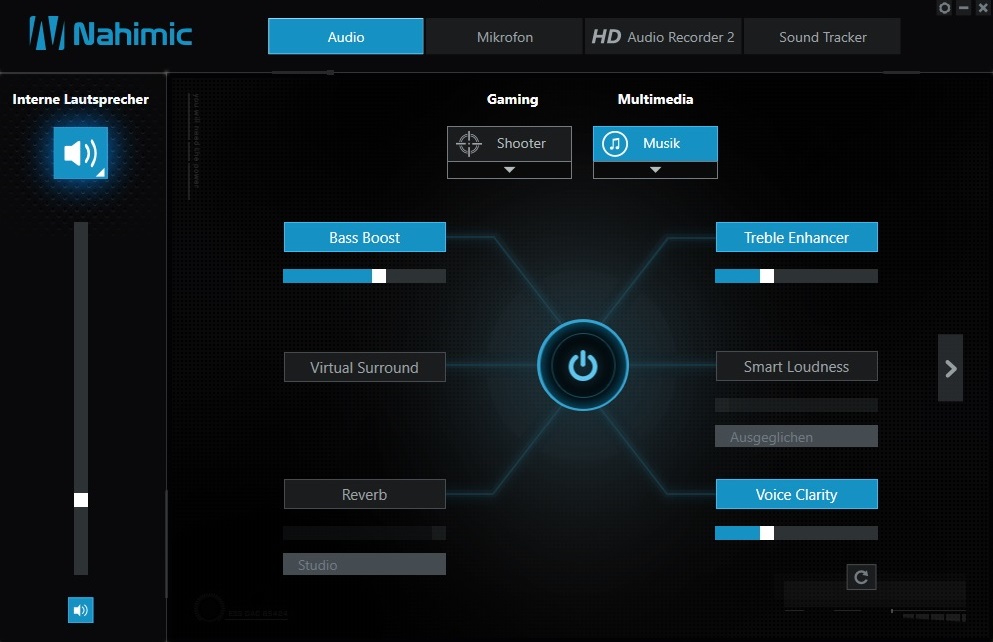
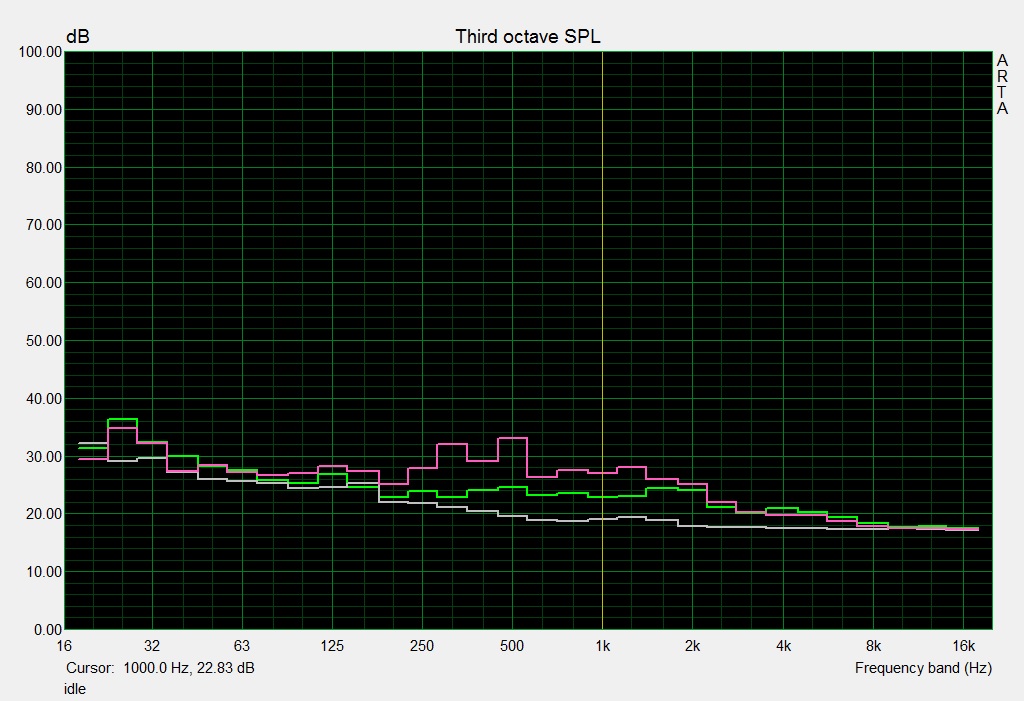
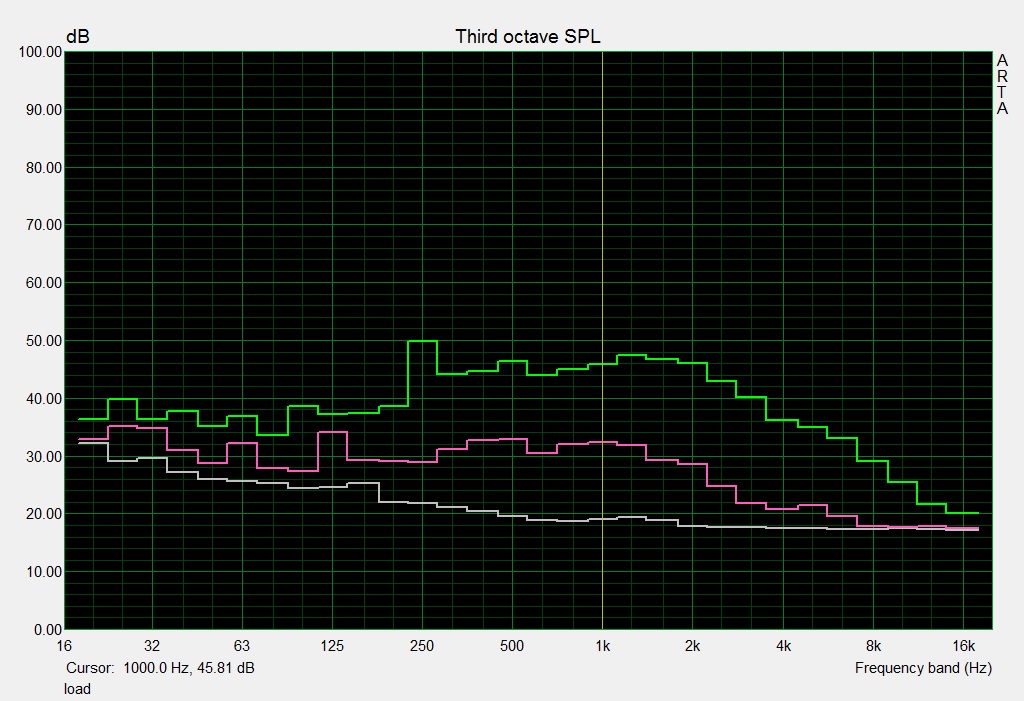
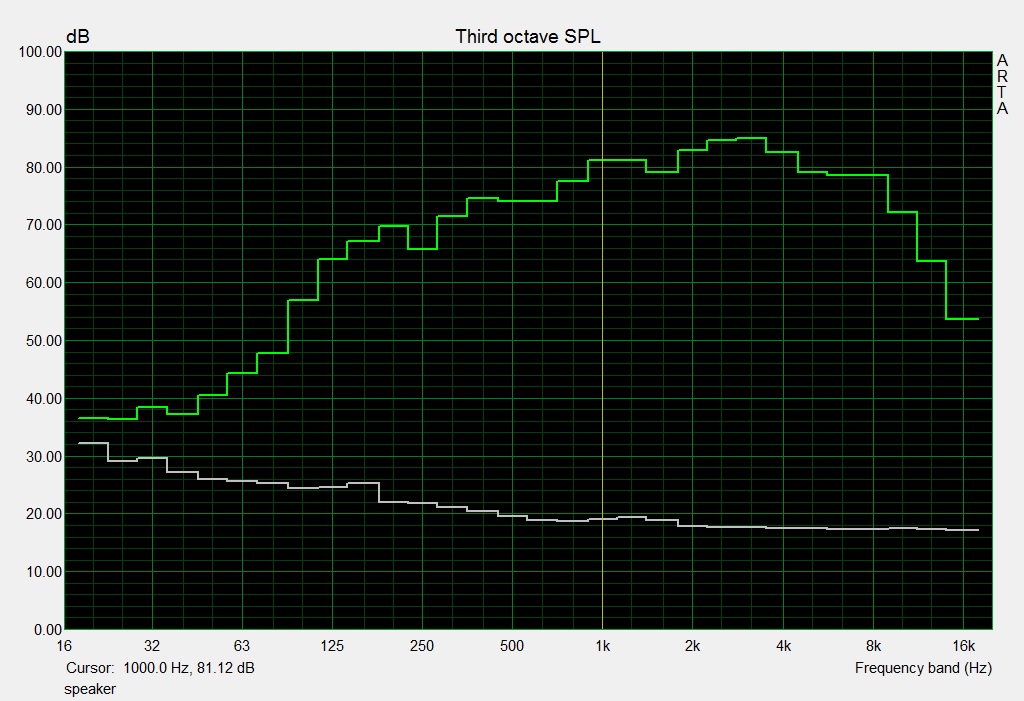
MSI GT73VR 7RF-296 audio analysis
(+) | speakers can play relatively loud (93 dB)
Bass 100 - 315 Hz
(±) | reduced bass - on average 11.7% lower than median
(±) | linearity of bass is average (9% delta to prev. frequency)
Mids 400 - 2000 Hz
(+) | balanced mids - only 3% away from median
(+) | mids are linear (3.6% delta to prev. frequency)
Highs 2 - 16 kHz
(+) | balanced highs - only 4% away from median
(+) | highs are linear (3.5% delta to prev. frequency)
Overall 100 - 16.000 Hz
(+) | overall sound is linear (13.6% difference to median)
Compared to same class
» 20% of all tested devices in this class were better, 7% similar, 73% worse
» The best had a delta of 6%, average was 18%, worst was 132%
Compared to all devices tested
» 14% of all tested devices were better, 4% similar, 82% worse
» The best had a delta of 4%, average was 24%, worst was 134%
Asus G752VS-XB78K audio analysis
(±) | speaker loudness is average but good (76 dB)
Bass 100 - 315 Hz
(±) | reduced bass - on average 9.6% lower than median
(±) | linearity of bass is average (10.7% delta to prev. frequency)
Mids 400 - 2000 Hz
(+) | balanced mids - only 4.7% away from median
(±) | linearity of mids is average (10.3% delta to prev. frequency)
Highs 2 - 16 kHz
(±) | reduced highs - on average 8.3% lower than median
(±) | linearity of highs is average (9.7% delta to prev. frequency)
Overall 100 - 16.000 Hz
(±) | linearity of overall sound is average (22.4% difference to median)
Compared to same class
» 80% of all tested devices in this class were better, 6% similar, 15% worse
» The best had a delta of 6%, average was 18%, worst was 132%
Compared to all devices tested
» 65% of all tested devices were better, 6% similar, 29% worse
» The best had a delta of 4%, average was 24%, worst was 134%
Frequency comparison (checkboxes are selectable)
Energy Management
Power Consumption
You should force the GT73VR to use the integrated graphics adapter via the GPU button if you want long battery runtimes. This action requires a restart though, so not every user will want to switch all the time. We performed our measurements with the Nvidia GPU, so the consumption values are higher compared to laptops with dynamic graphics switching (Optimus).
29-40 Watts while idling remind us of the Acer Predator 17 and Aorus X7 v6. We can measure between 94 Watts (average 3DMark06) and 315 Watts (stress test) for the GT73VR under load, so the provided 330-Watt power adapter (1.2 kg) is not oversized. Devices with the GTX 1070 only require a 240-Watt model.
| Off / Standby | |
| Idle | |
| Load |
|
Key:
min: | |
| MSI GT73VR 7RF-296 i7-7820HK, GeForce GTX 1080 Mobile | Acer Predator 17 G9-793-77LG 6700HQ, GeForce GTX 1070 Mobile | Aorus X7 v6 6820HK, GeForce GTX 1070 Mobile | Asus G752VS-XB78K 6820HK, GeForce GTX 1070 Mobile | MSI GT72VR 7RE-433 i7-7700HQ, GeForce GTX 1070 Mobile | MSI GT83VR-6RE32SR451 6820HK, GeForce GTX 1070 SLI (Laptop) | |
|---|---|---|---|---|---|---|
| Power Consumption | 4% | 4% | 15% | 25% | -30% | |
| Idle Minimum * (Watt) | 29 | 25 14% | 29 -0% | 24 17% | 20 31% | 32 -10% |
| Idle Average * (Watt) | 35 | 35 -0% | 31 11% | 31 11% | 27 23% | 47 -34% |
| Idle Maximum * (Watt) | 40 | 46 -15% | 38 5% | 36 10% | 31 22% | 52 -30% |
| Load Average * (Watt) | 94 | 103 -10% | 111 -18% | 94 -0% | 86 9% | 152 -62% |
| Load Maximum * (Watt) | 315 | 223 29% | 253 20% | 204 35% | 184 42% | 366 -16% |
* ... smaller is better
Battery Runtime
You will soon reach the limits of the 17-inch system when the GeForce GTX 1080 is active. 2:25 hours of video playback and 2:40 hours of web browsing (display luminance @150 nits) will not impress anyone. However, the battery capacity of the 8-cell module is not very generous at 75 Wh, either. Other manufacturers equip their gaming notebooks with 90-Wh modules.
| MSI GT73VR 7RF-296 75.2 Wh | Acer Predator 17 G9-793-77LG 88 Wh | Aorus X7 v6 94 Wh | Asus G752VS-XB78K 90 Wh | MSI GT72VR 7RE-433 83 Wh | MSI GT83VR-6RE32SR451 75 Wh | |
|---|---|---|---|---|---|---|
| Battery runtime | 22% | 11% | 30% | 50% | -26% | |
| H.264 (h) | 2.4 | 3.1 29% | 3.8 58% | |||
| WiFi v1.3 (h) | 2.7 | 3.3 22% | 3 11% | 3.5 30% | 3.8 41% | 2 -26% |
Pros
Cons
Verdict
The verdict is pretty sobering if you expected big improvements from Kaby Lake. Intel's new CPU architecture does not really seem to reduce temperature or noise development according to initial reviews. The consumption measurements and the performances with identical clocks hardly differ from comparable Skylake notebooks, either.
The current version of the GT73VR is once again a very successful (although quite heavy and bulky) desktop replacement, which does not reveal serious drawbacks in any section. It also handles the most demanding games without breaking a sweat.
MSI GT73VR 7RF-296
- 12/27/2016 v6 (old)
Florian Glaser
Price comparison

