MSI GS63VR 7RG Stealth Pro (i7-7700HQ, GTX 1070 Max-Q, Full HD) Laptop Review
For the original German review, click here.
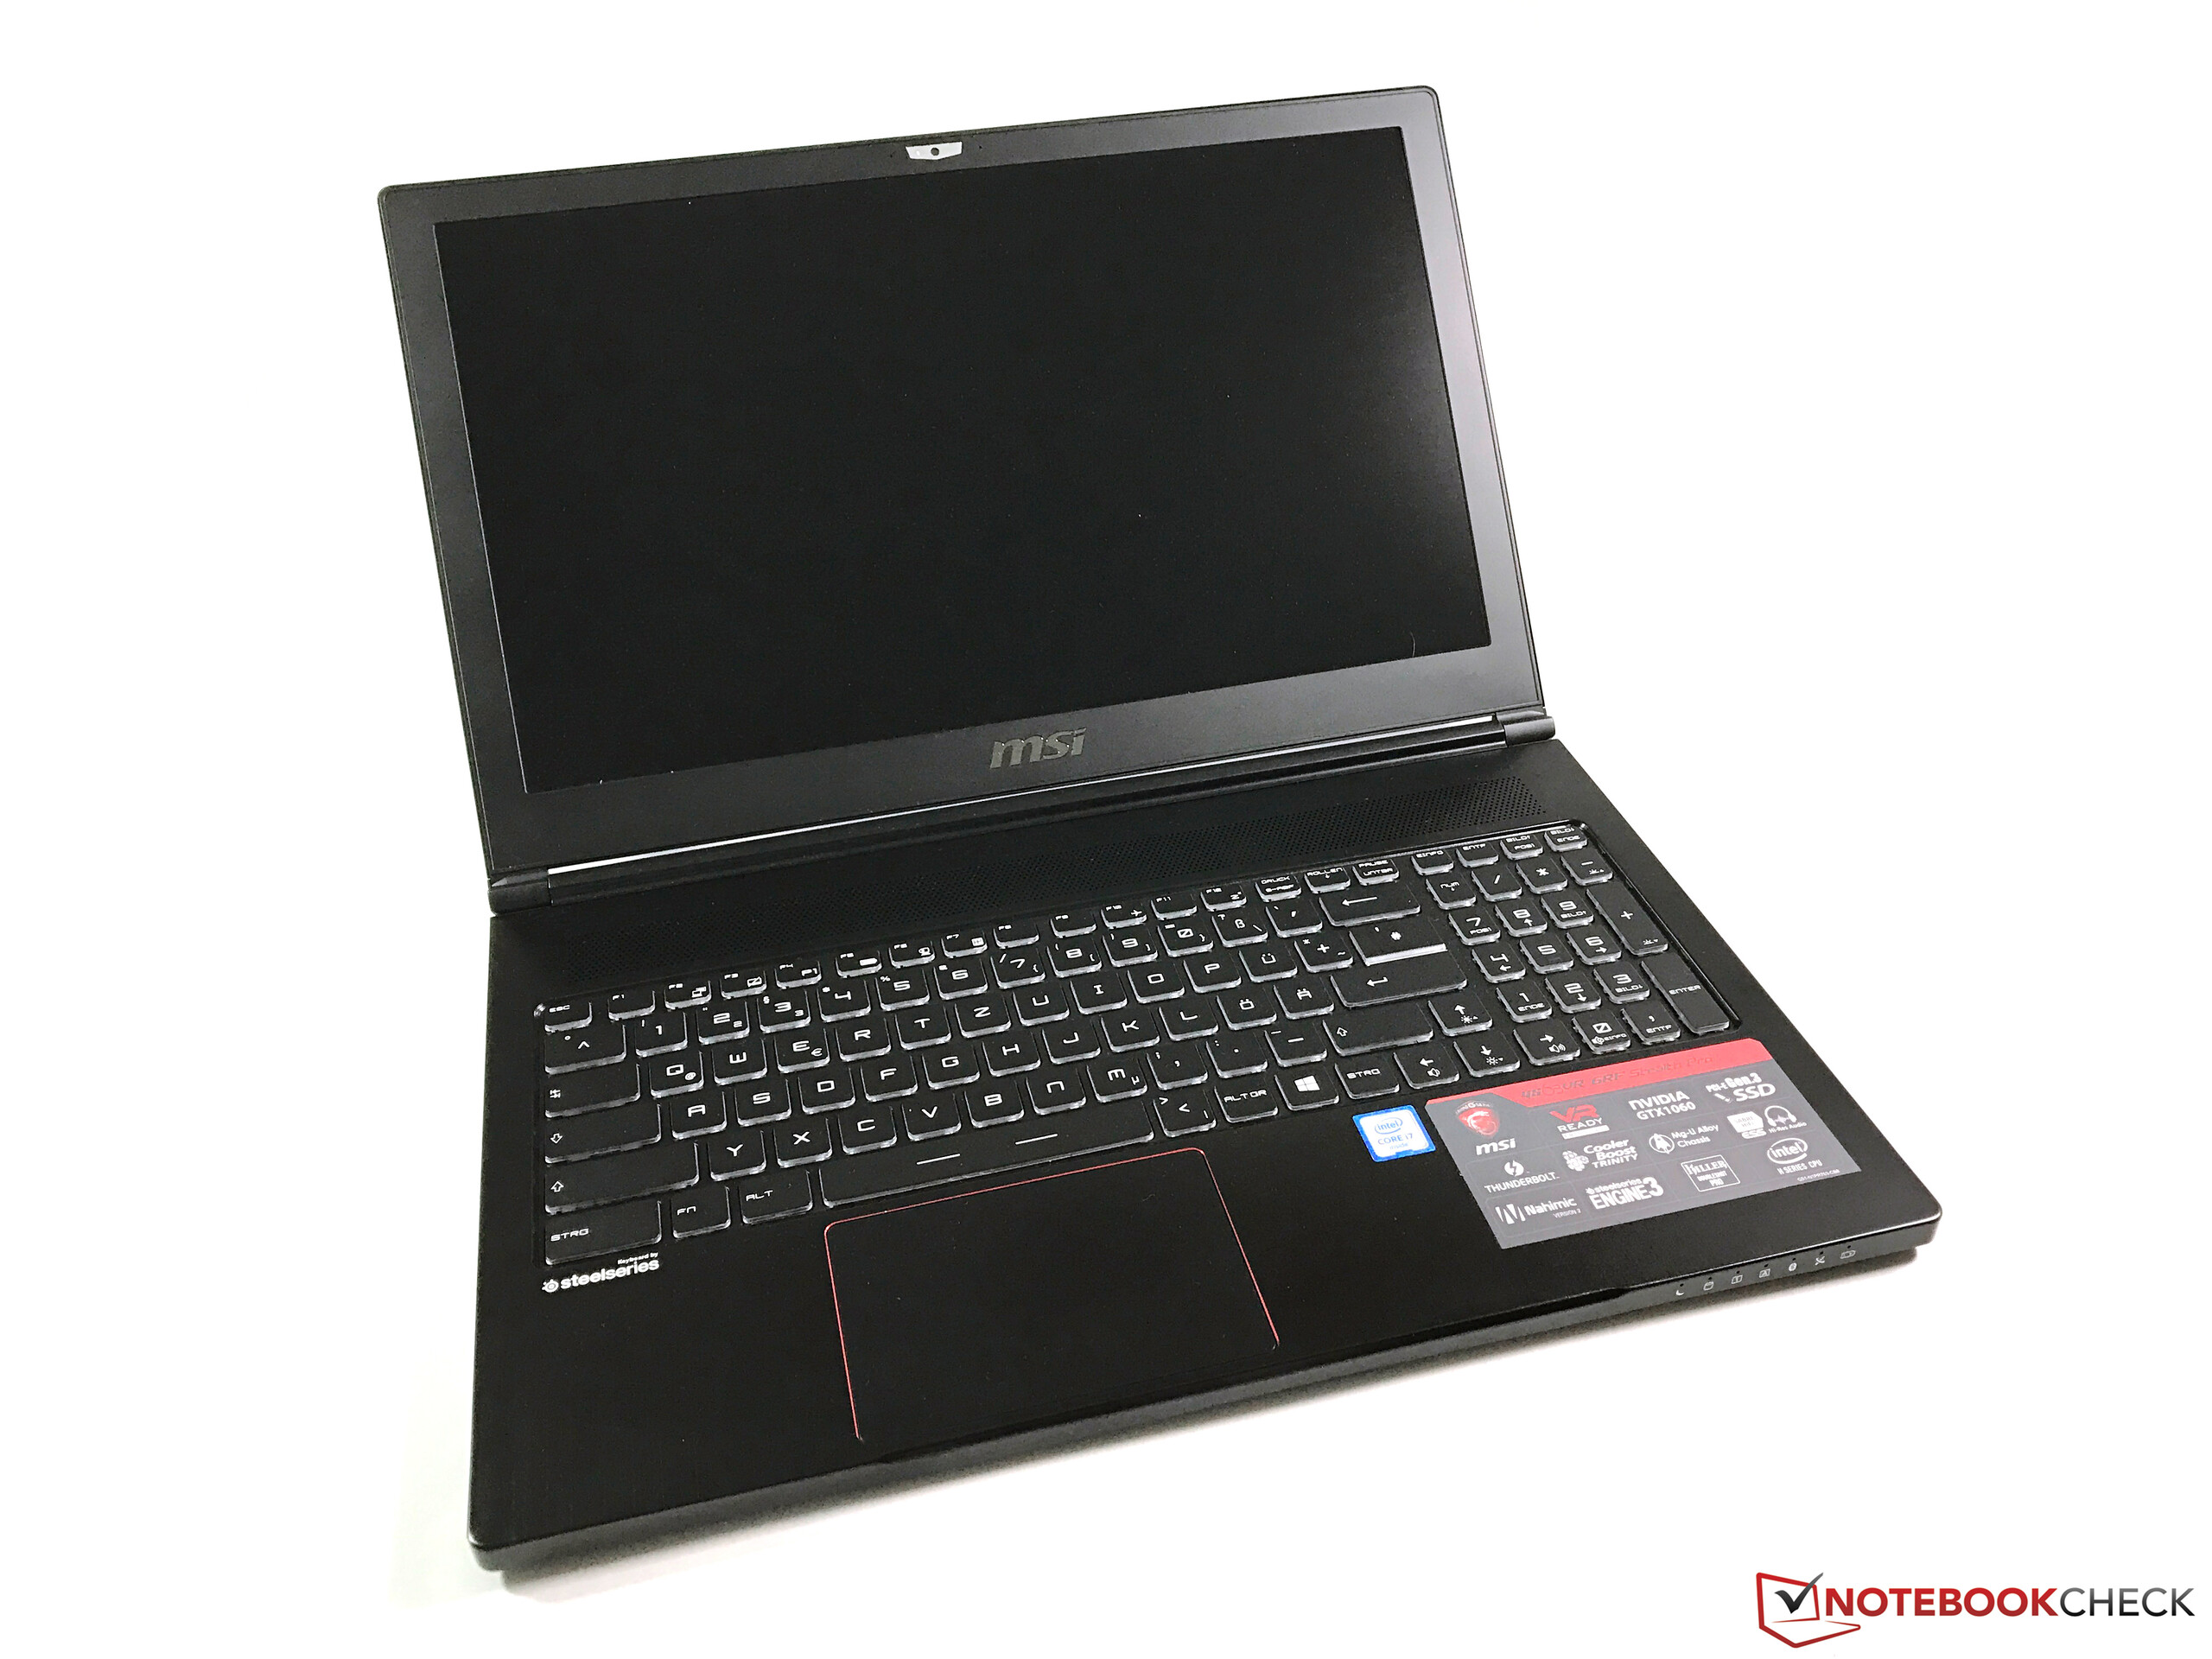
The light and thin MSI GS63VR 7RG Stealth Pro is no stranger to us. We have already reviewed two sibling models: the GS63VR 6RF-16H22 (6700HQ, GTX 1060) and the GS63VR 7RF-228US (7700HQ, GTX 1060). Our review device comes equipped with a quad-core Kaby Lake processor and a GeForce GTX 1070 Max-Q GPU. Therefore the laptop should be more powerful than its siblings. The competitors of the device include: the Gigabyte Aero 15X, the Eurocom Q5 and the Asus Zephyrus GX501VS.
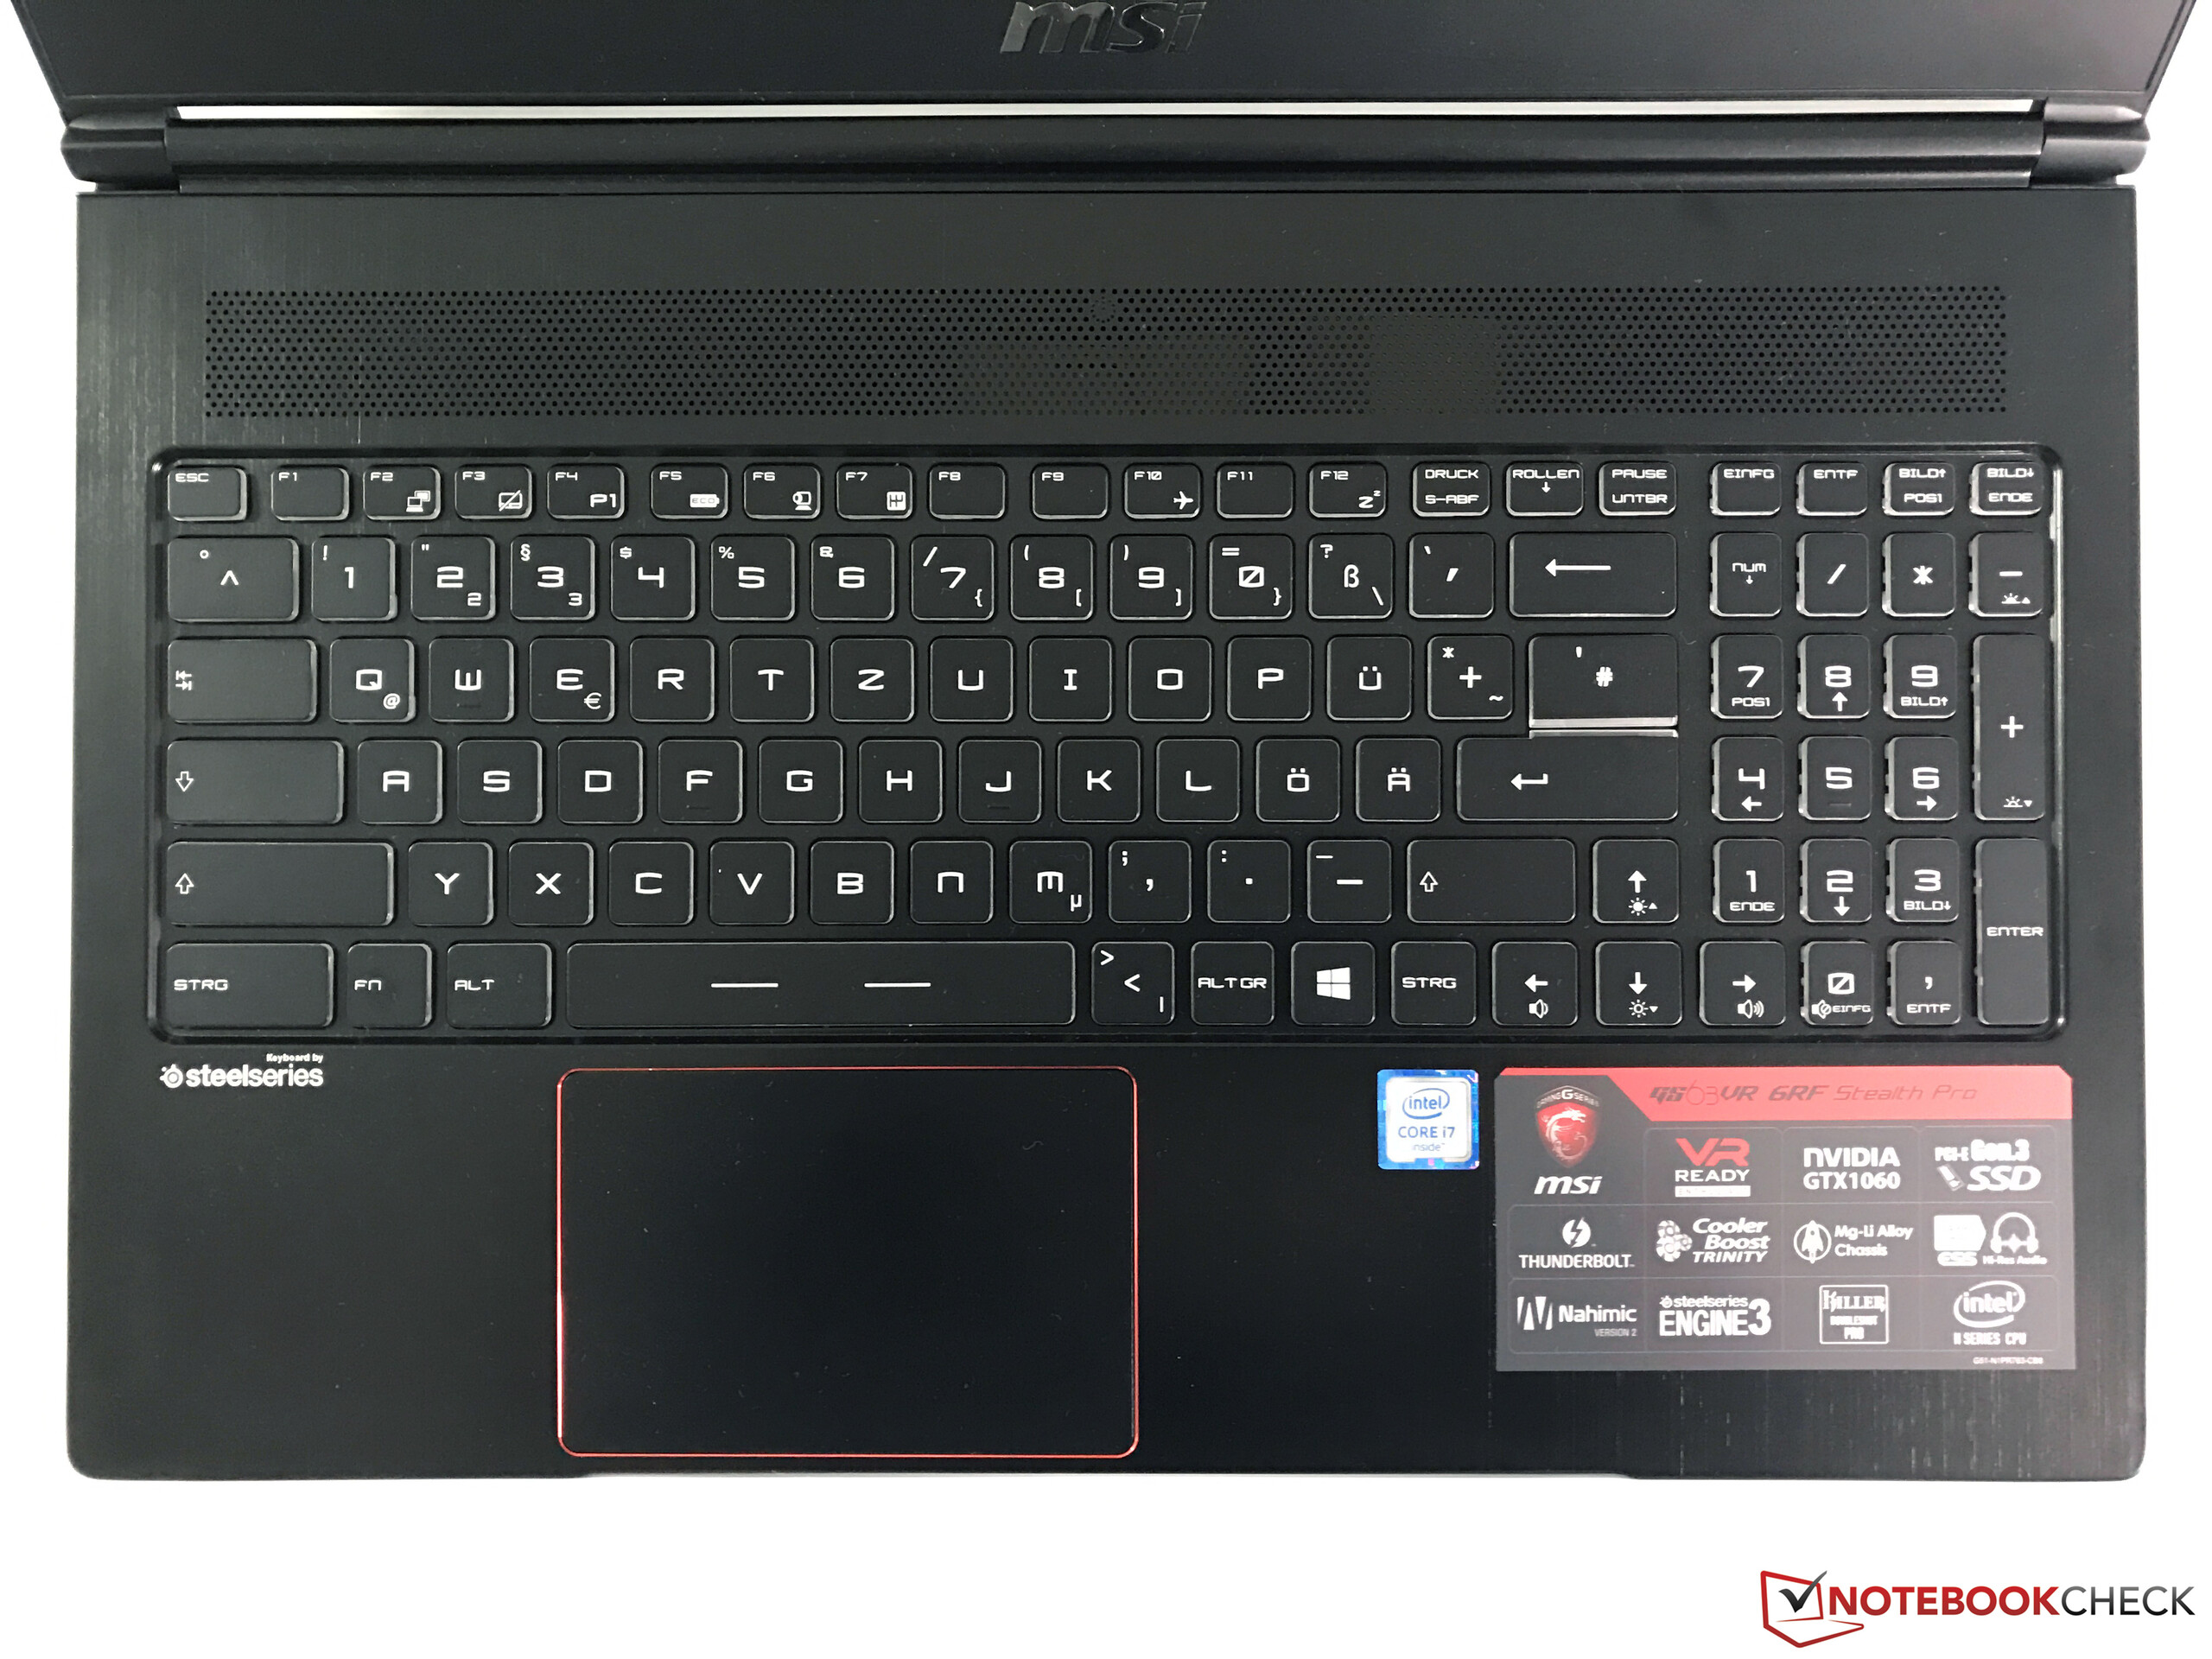
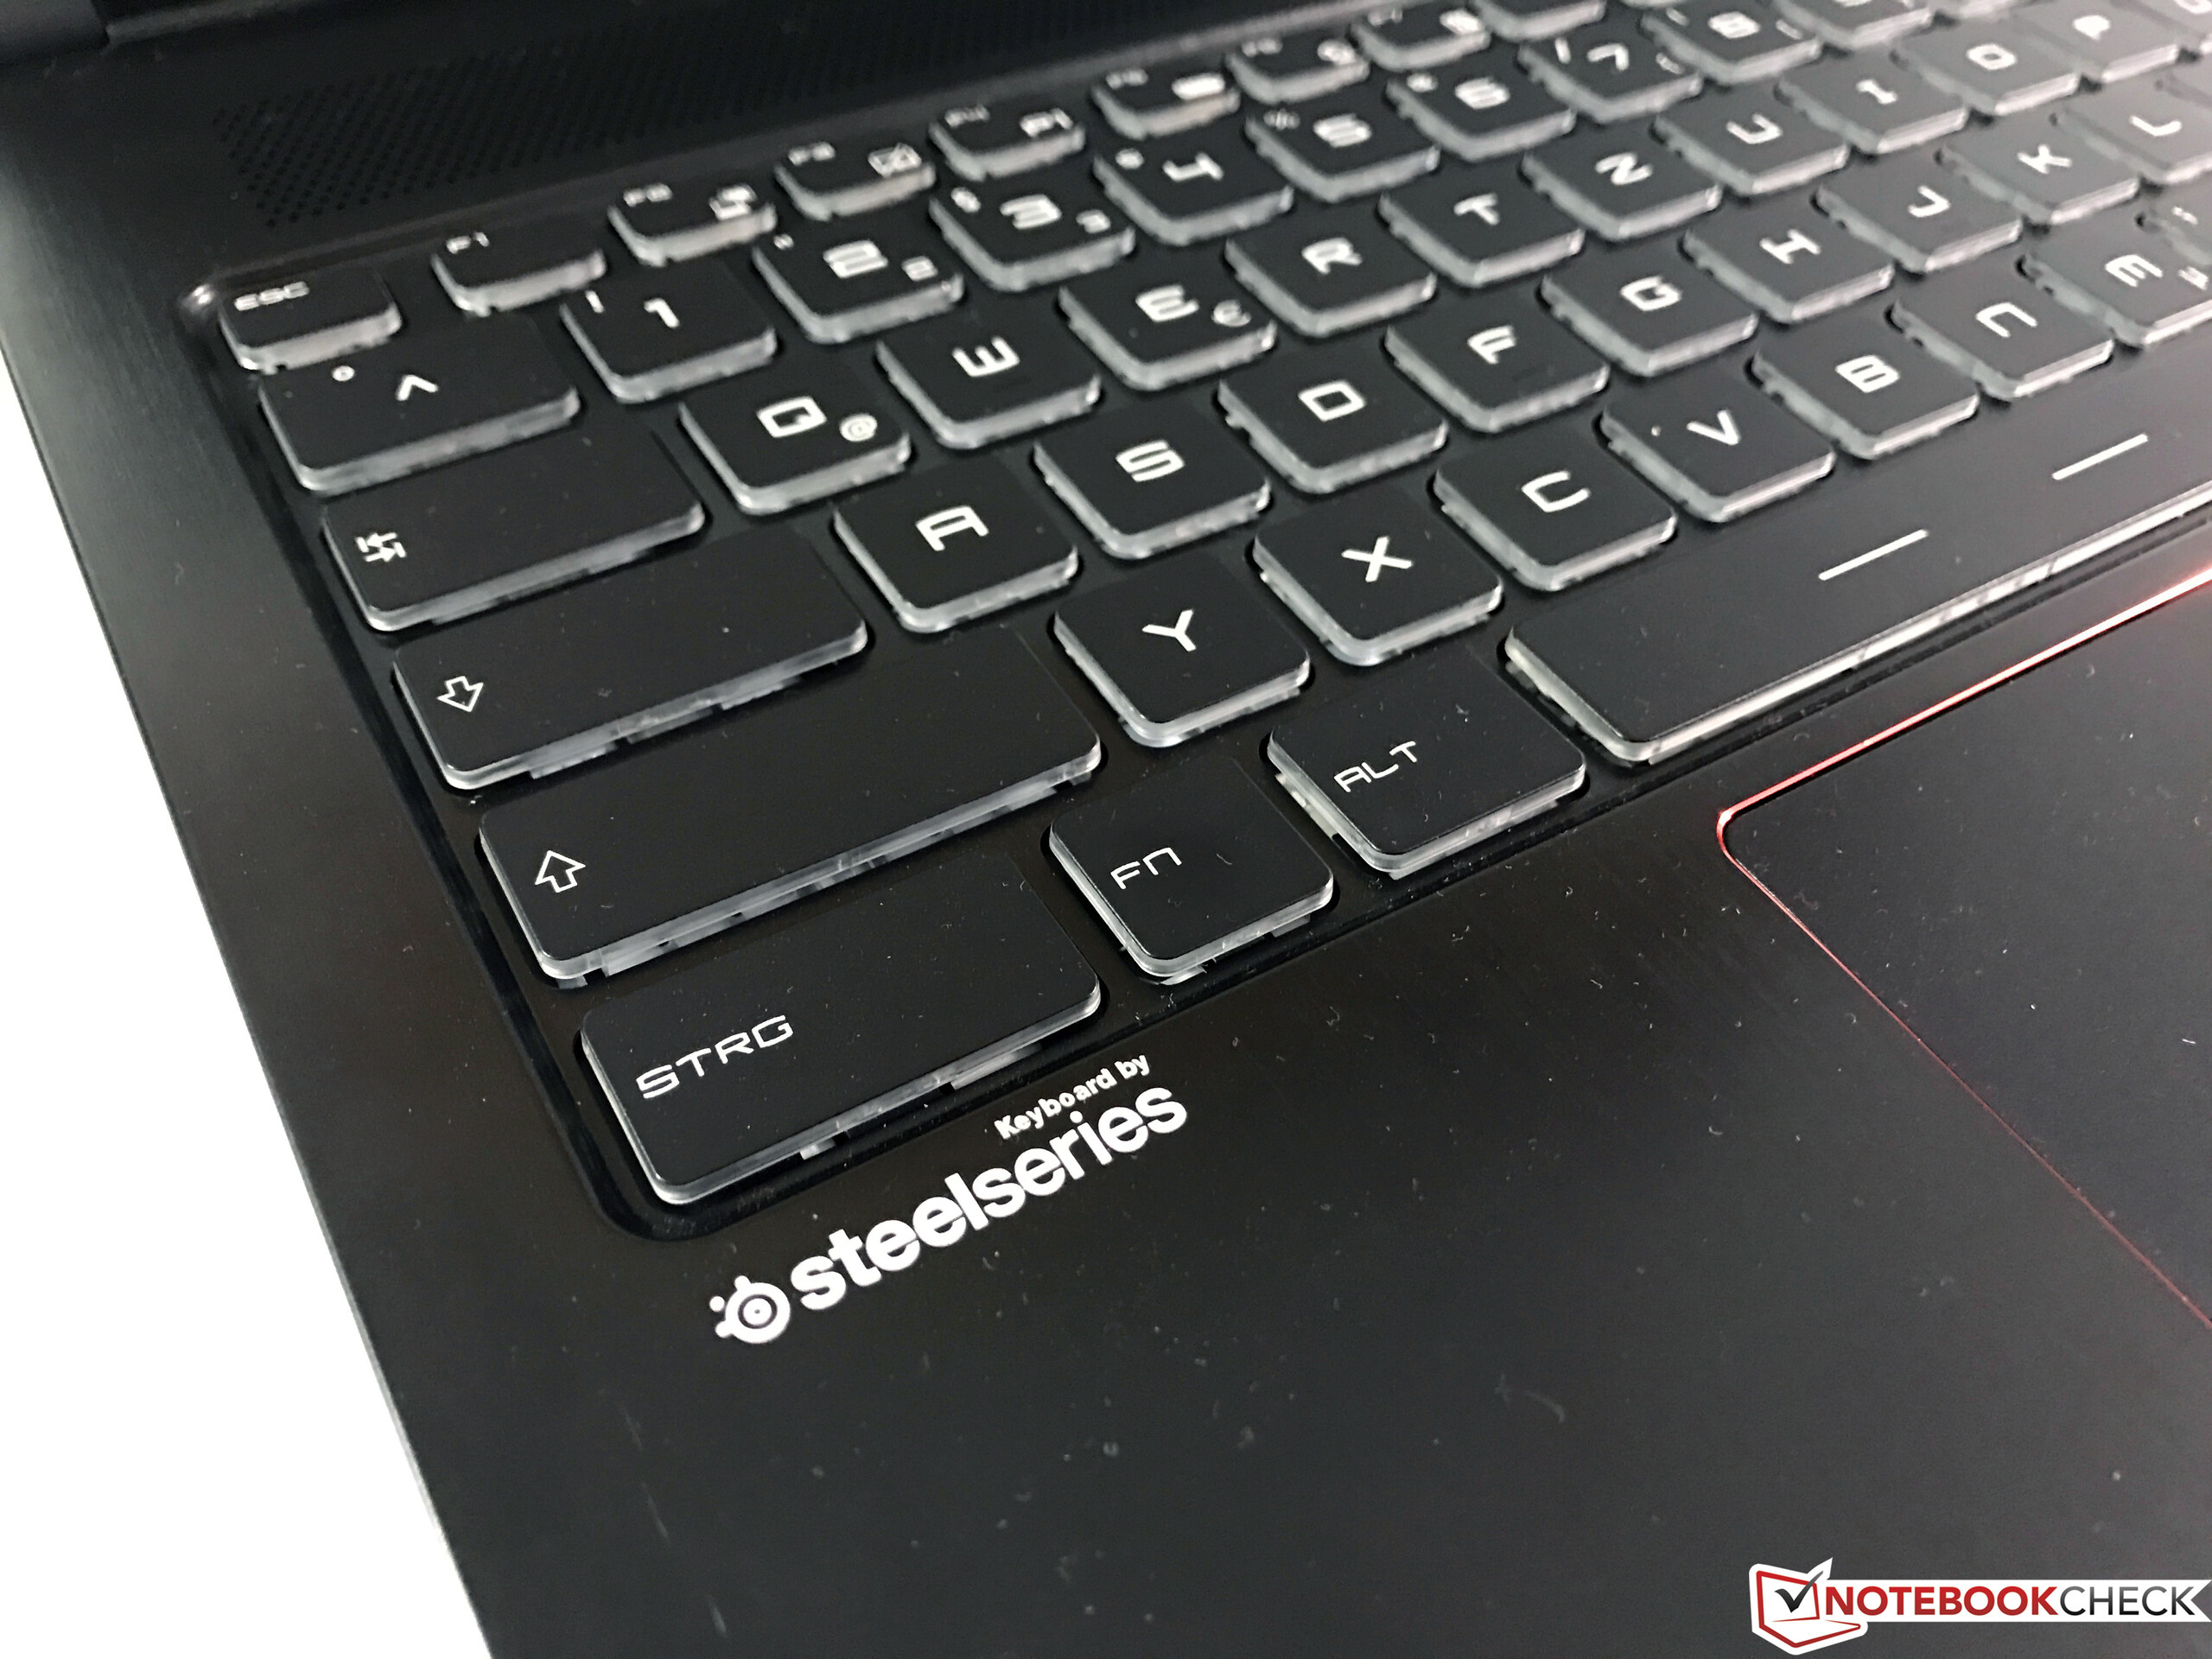
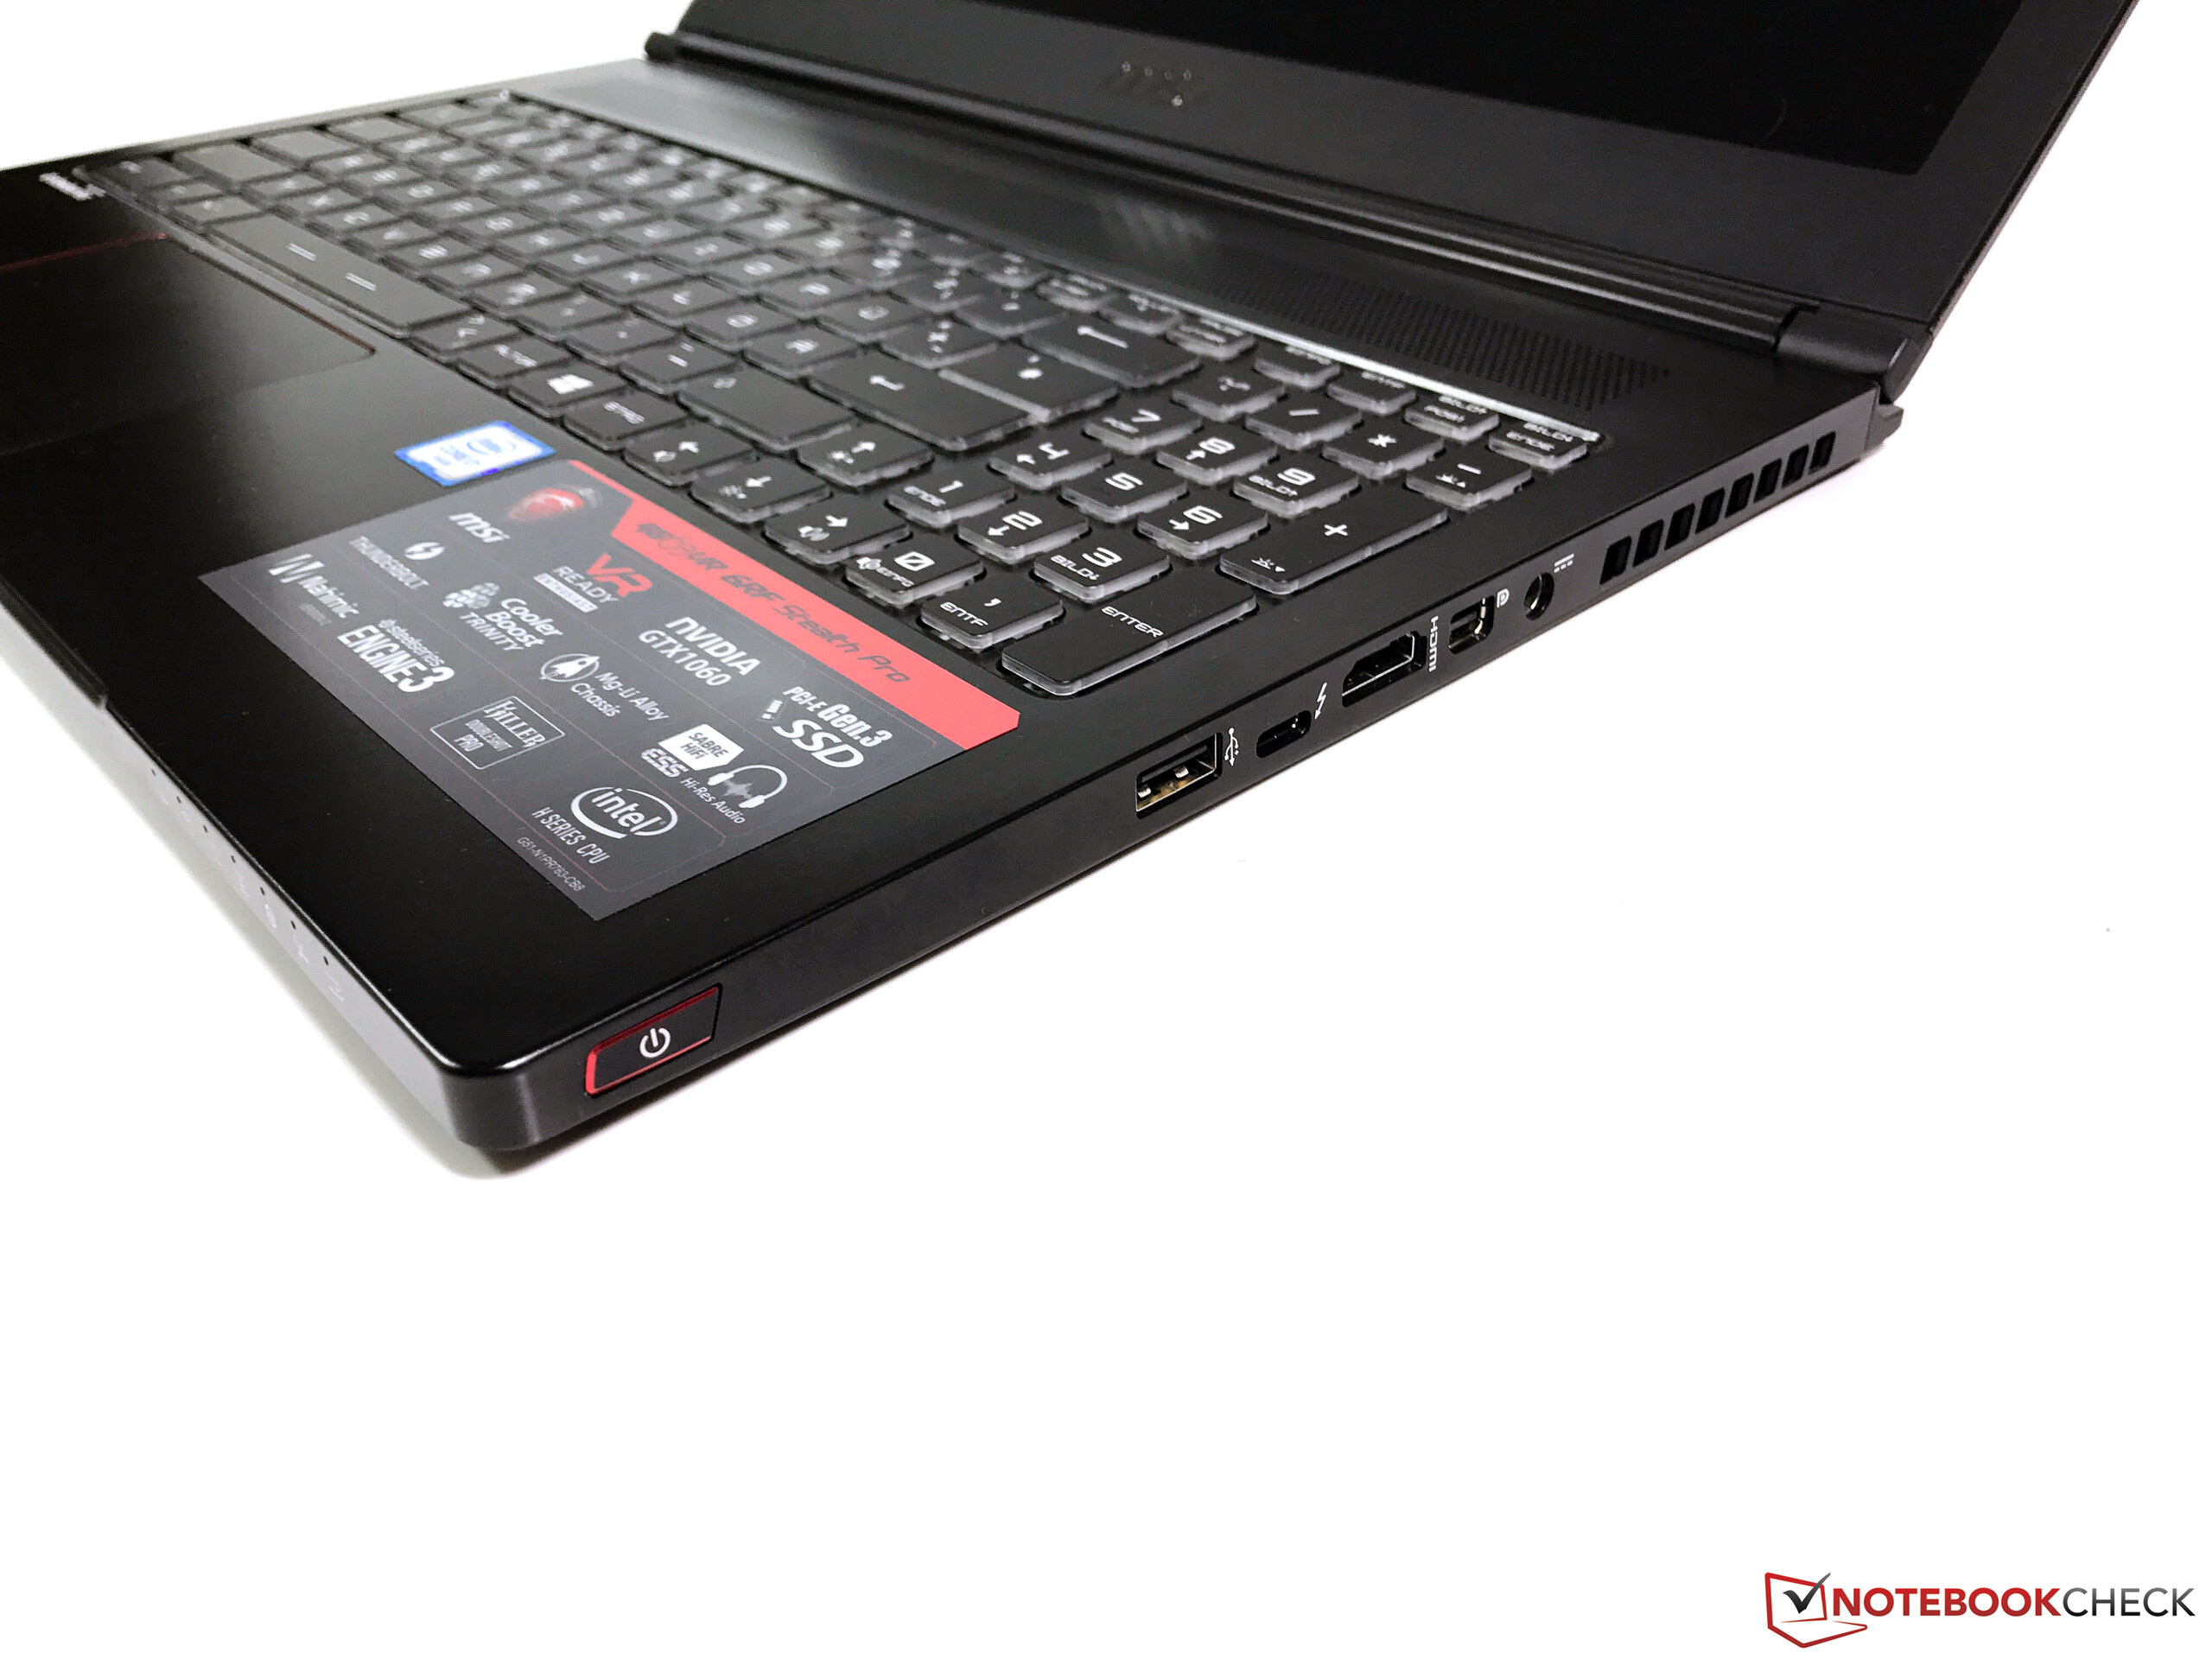
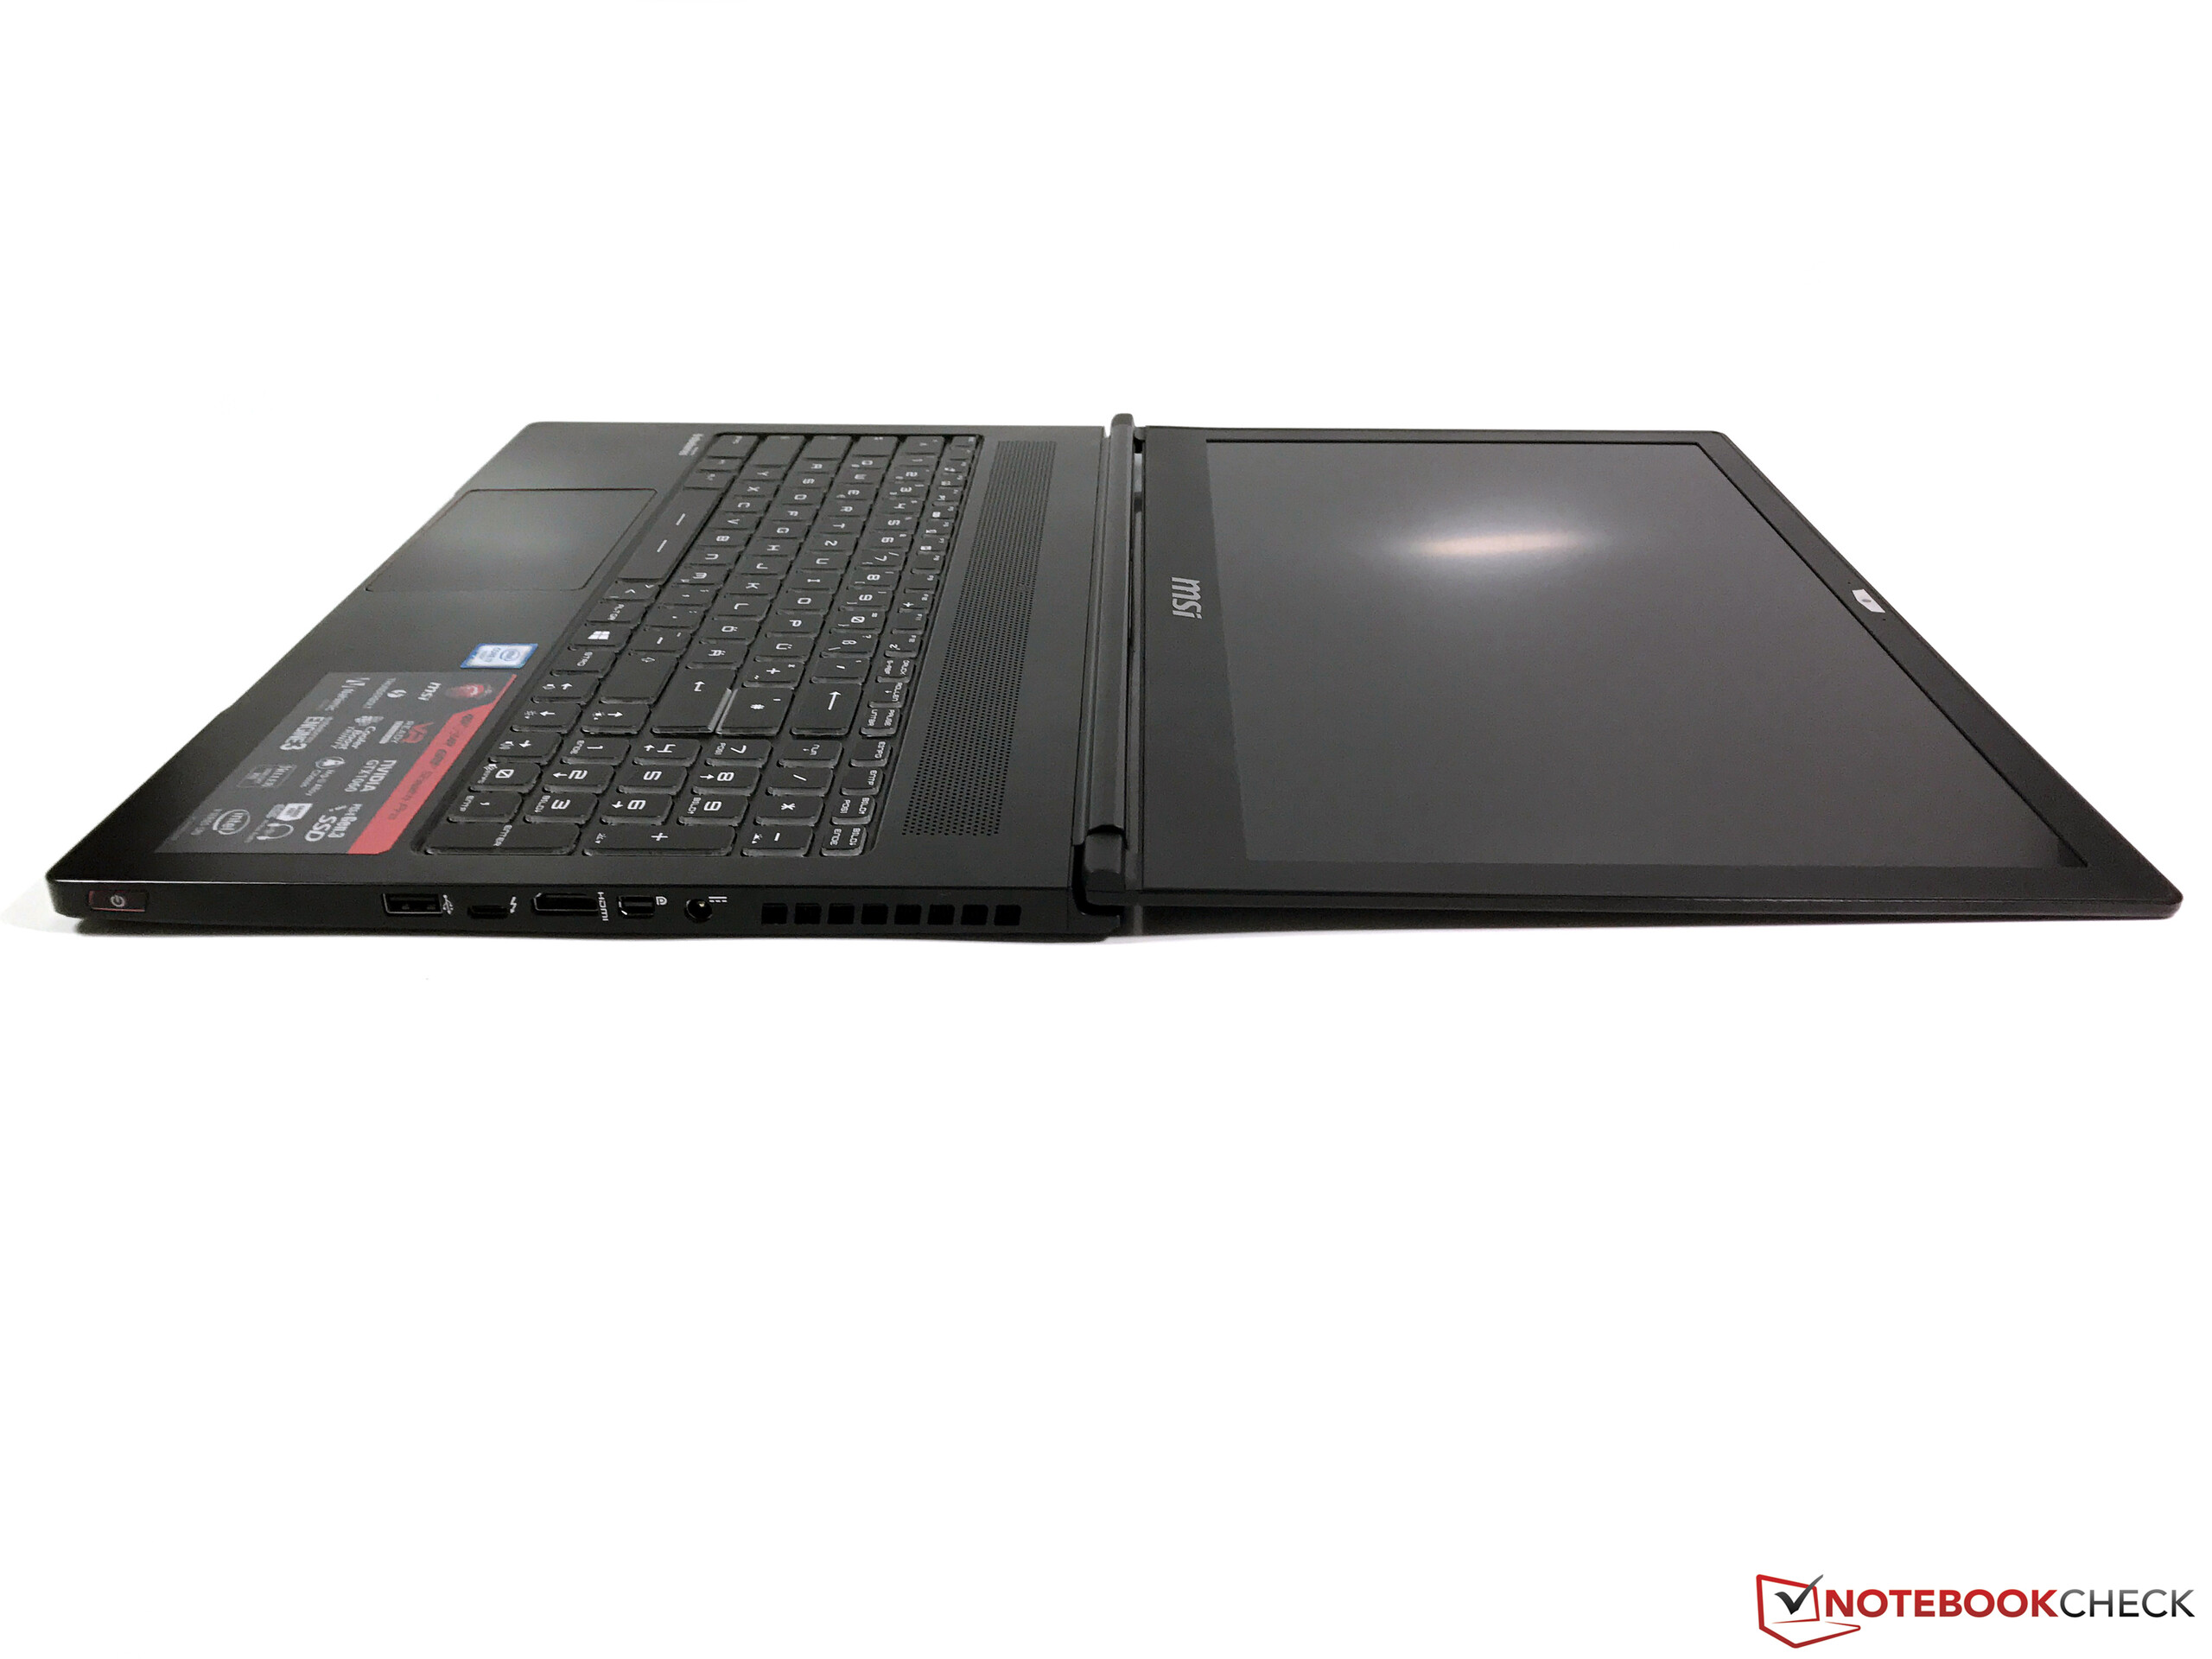
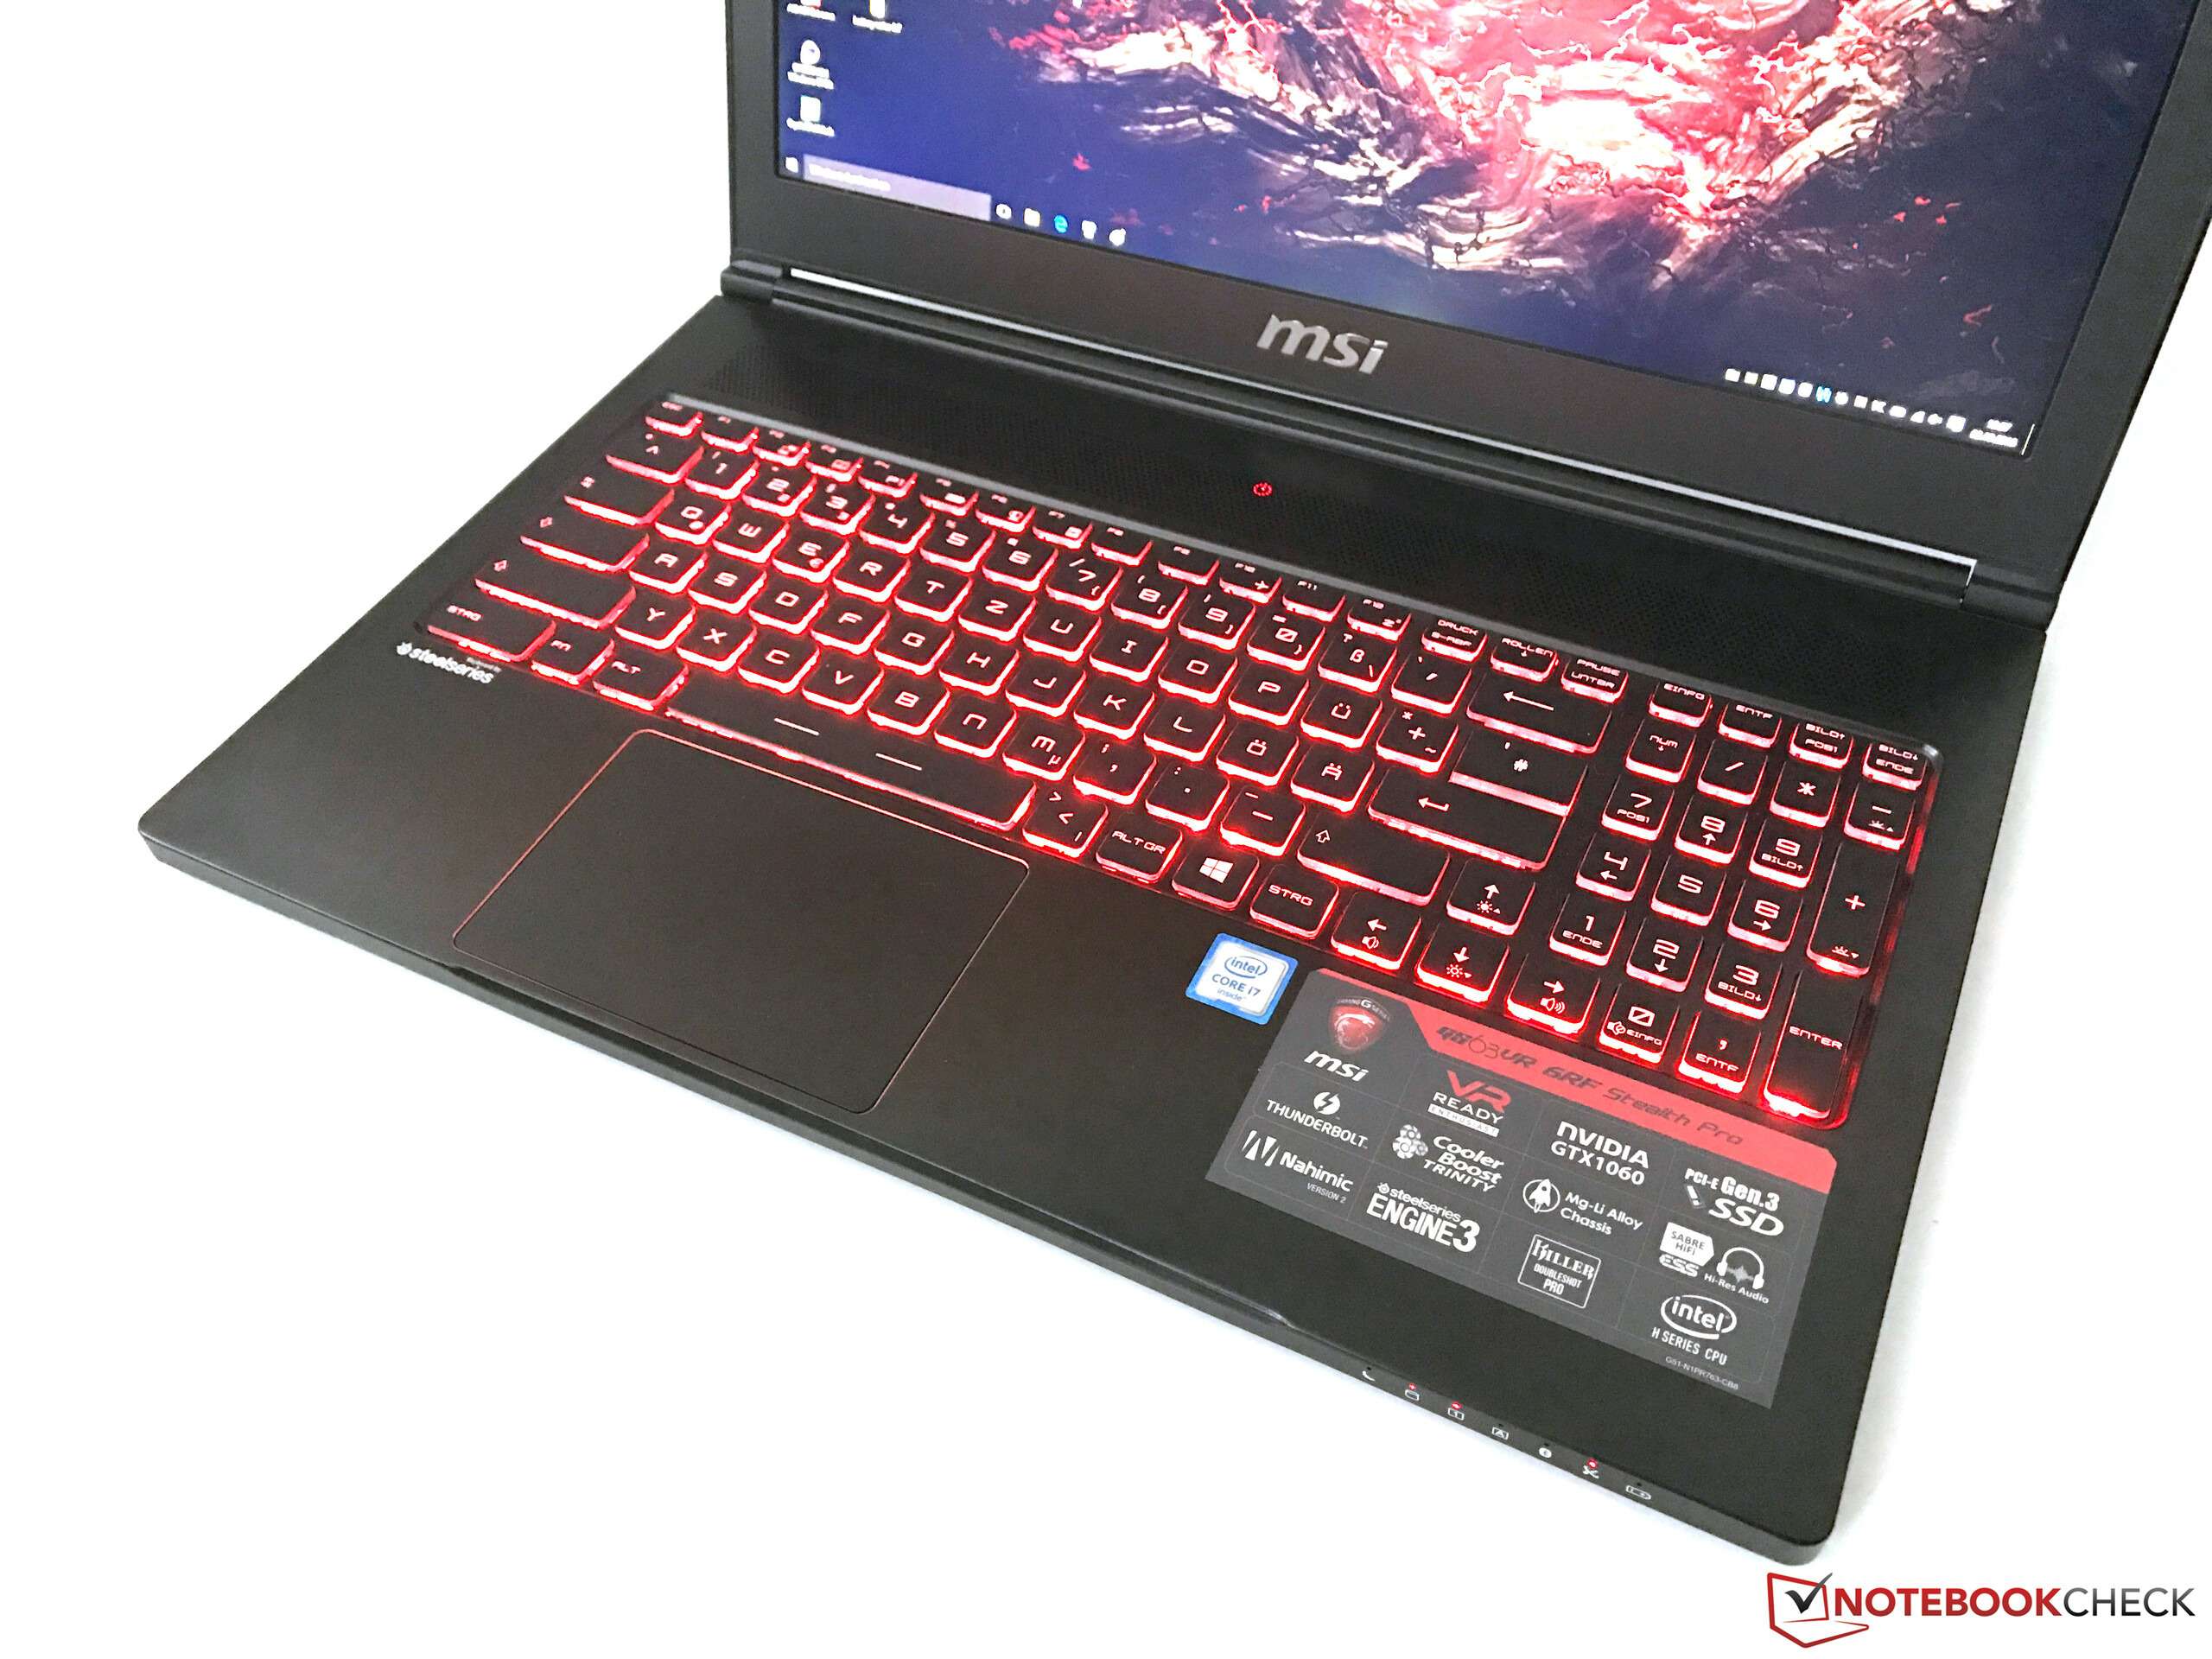
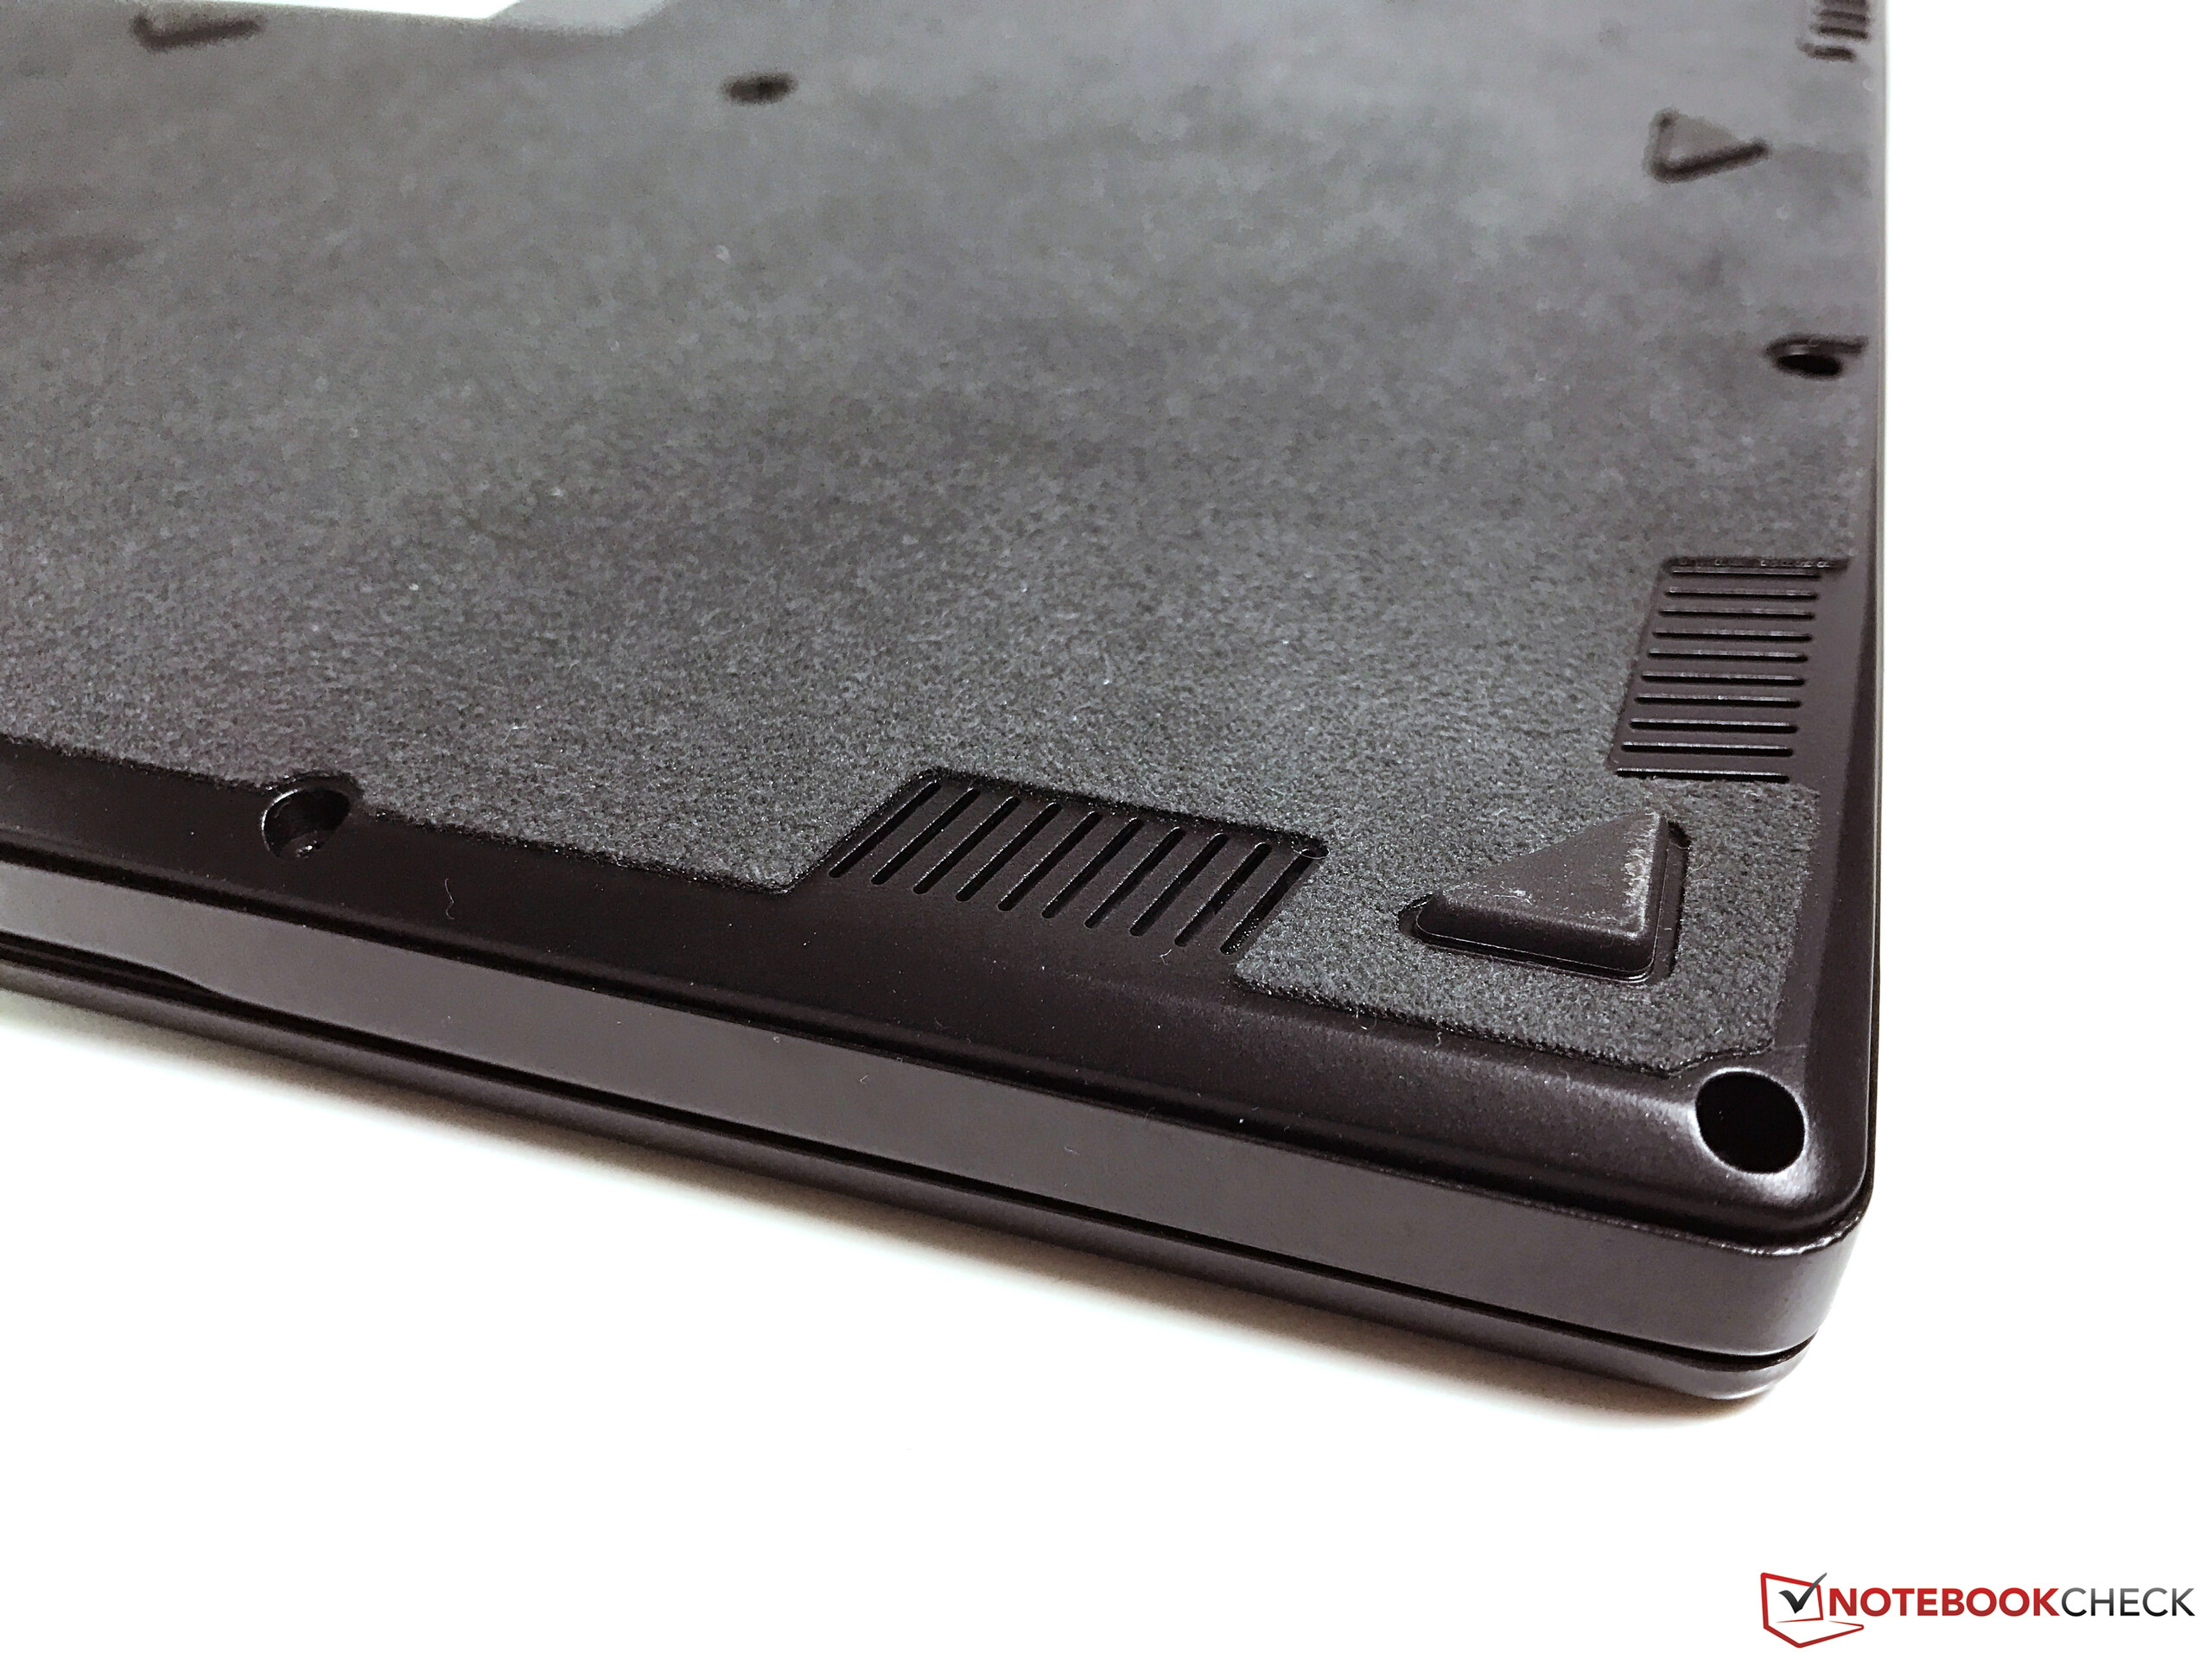
Because the three GS63VR models are identically built, we will skip over the case, the interface, the input devices and the speakers. You can find the missing information in the reviews of the GS63VR 6RF-16H22 and the GS63VR 7RF-228US.
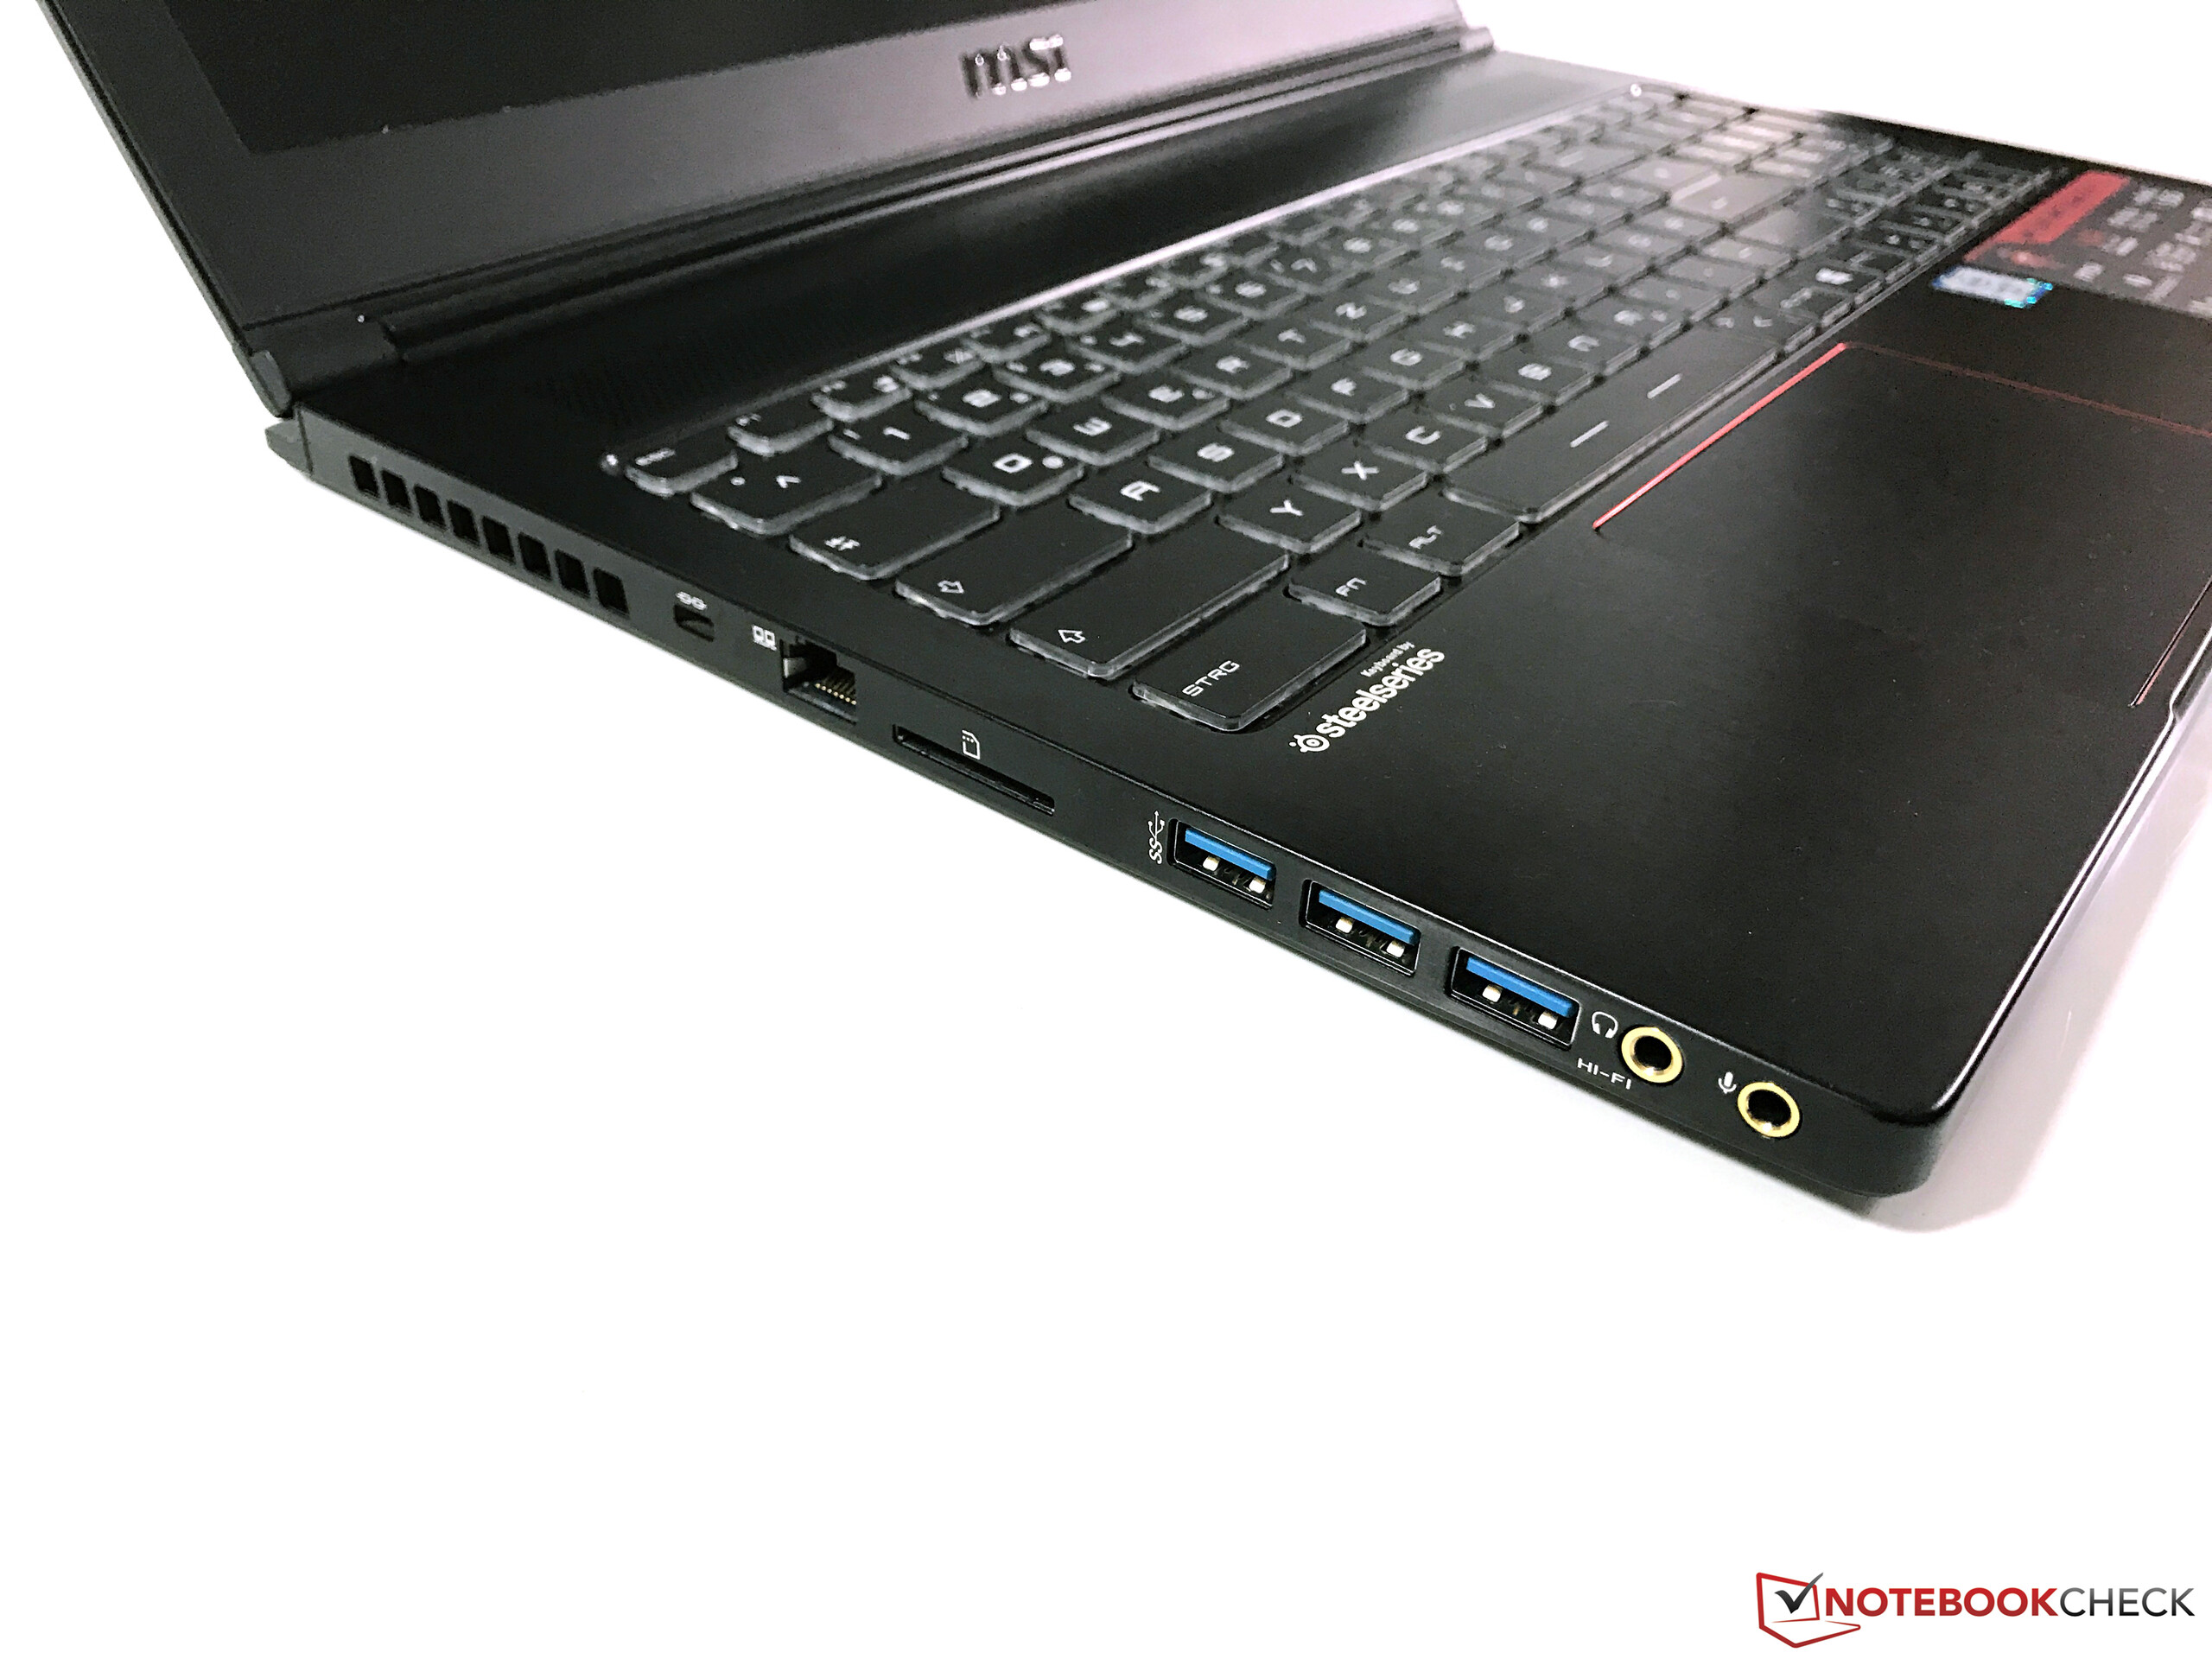
SD card reader
Some changes have been made to the SD card reader: While the SD card readers of the predecessors were connected via USB 2.0 and, as a result, offered very slow transfer rates, with our current device the SD card reader is connected through SATA. Therefore the transfer speeds are significantly increased. When copying large chunks of data, a maximum transfer speed of 204 MB/s was achieved. The transfer of 250 JPG image files was completed with a transfer speed of 181 MB/s. We test the SD card reader by means of a reference SD card (Toshiba Exceria Pro SDXC 64 GB UHS-II).
| SD Card Reader | |
| average JPG Copy Test (av. of 3 runs) | |
| Aorus X5 v7 (Toshiba Exceria Pro SDXC 64 GB UHS-II) | |
| Eurocom Q5 | |
| MSI GS63VR 7RG-005 (Toshiba Exceria Pro SDXC 64 GB UHS-II) | |
| Gigabyte Aero 15X (Toshiba Exceria Pro SDXC 64 GB UHS-II) | |
| MSI GS63VR-6RF16H22 Stealth Pro (Toshiba Exceria Pro SDXC 64 GB UHS-II) | |
| MSI GS63VR 7RF-228US (Toshiba Exceria Pro SDXC 64 GB UHS-II) | |
| maximum AS SSD Seq Read Test (1GB) | |
| Aorus X5 v7 (Toshiba Exceria Pro SDXC 64 GB UHS-II) | |
| Eurocom Q5 | |
| MSI GS63VR 7RG-005 (Toshiba Exceria Pro SDXC 64 GB UHS-II) | |
| Gigabyte Aero 15X (Toshiba Exceria Pro SDXC 64 GB UHS-II) | |
| MSI GS63VR-6RF16H22 Stealth Pro (Toshiba Exceria Pro SDXC 64 GB UHS-II) | |
| MSI GS63VR 7RF-228US (Toshiba Exceria Pro SDXC 64 GB UHS-II) | |
| Networking | |
| iperf3 transmit AX12 | |
| MSI GS63VR 7RF-228US | |
| MSI GS63VR 7RG-005 | |
| Aorus X5 v7 | |
| Eurocom Q5 | |
| Asus Zephyrus GX501VS | |
| Gigabyte Aero 15X | |
| iperf3 receive AX12 | |
| MSI GS63VR 7RG-005 | |
| Gigabyte Aero 15X | |
| Eurocom Q5 | |
| MSI GS63VR 7RF-228US | |
| Asus Zephyrus GX501VS | |
| Aorus X5 v7 | |
Display
While both of the previously reviewed sibling models of the GS63VR came with IPS screens, our current review device utilizes a 120 Hz TN panel. It offers much better response times than the IPS models.
The matte 15.6-inch display operates with a native resolution of 1920x1080. The contrast ratio (1281:1) is in good order. The brightness (254 cd/m²) leaves a lot to be desired. A 2300-Euro (~$2740) notebook should offer a brightness of at least 300 cd/m².
Unfortunately, at 25% brightness and below, the screen exhibits PWM-flickering with a frequency of 25,510 Hz. Because of such a high frequency, even susceptible individuals should not experience any adverse effects like headaches and eyestrain.
| |||||||||||||||||||||||||
Brightness Distribution: 85 %
Center on Battery: 269 cd/m²
Contrast: 1281:1 (Black: 0.21 cd/m²)
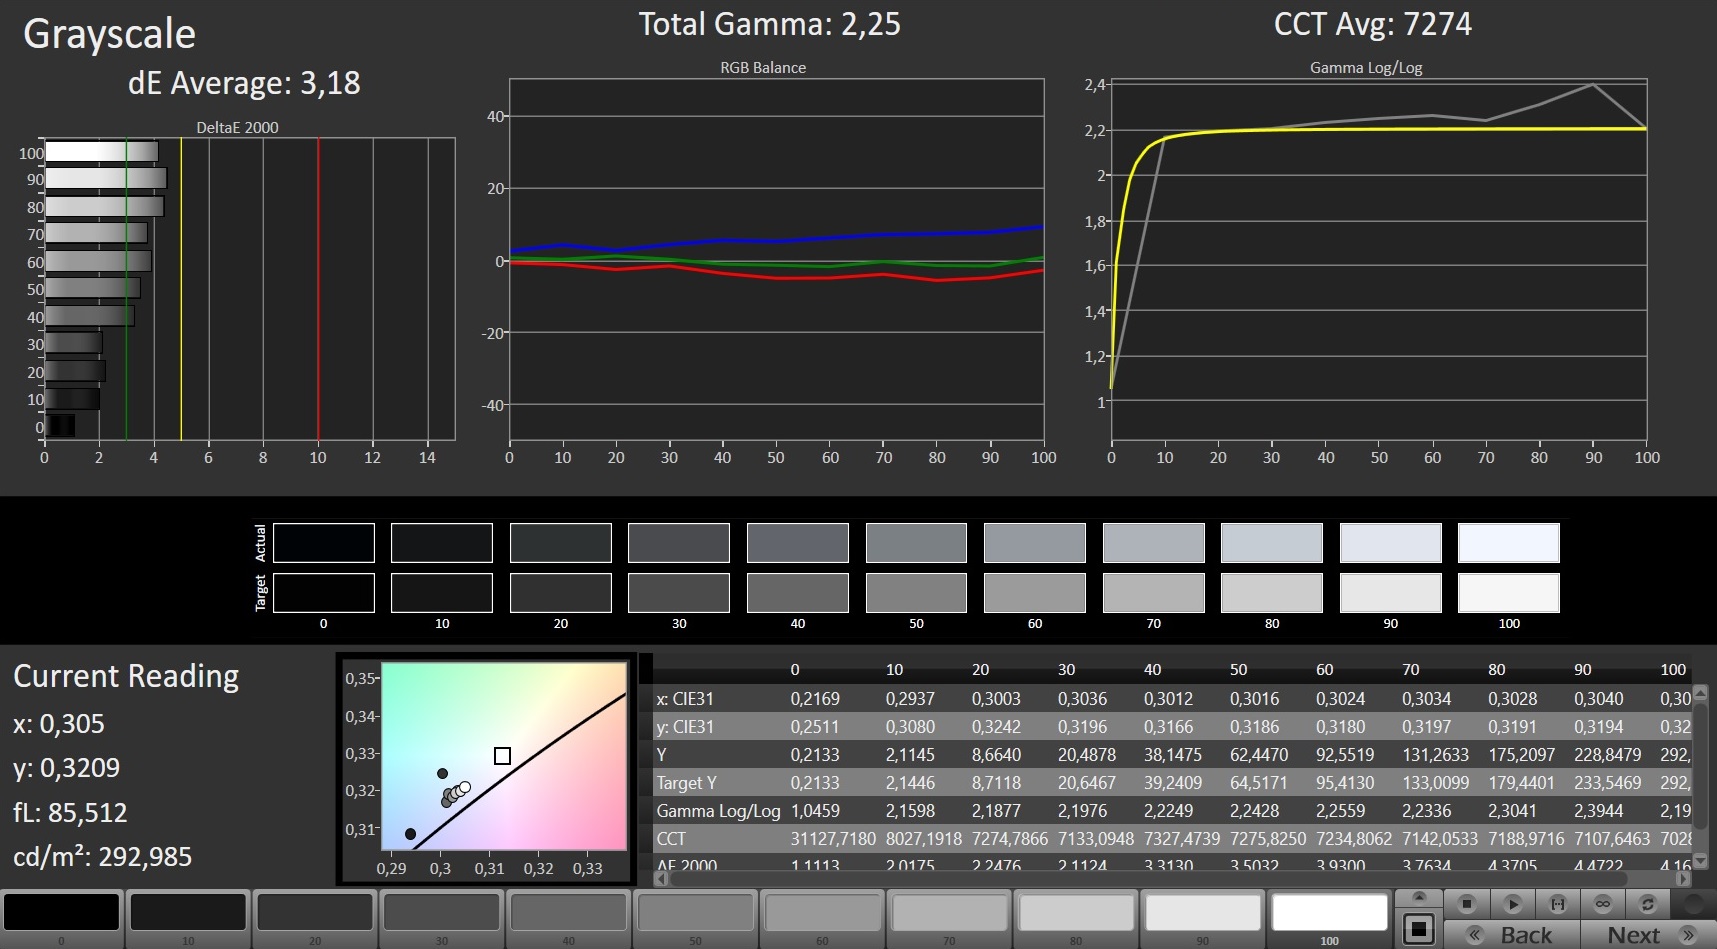
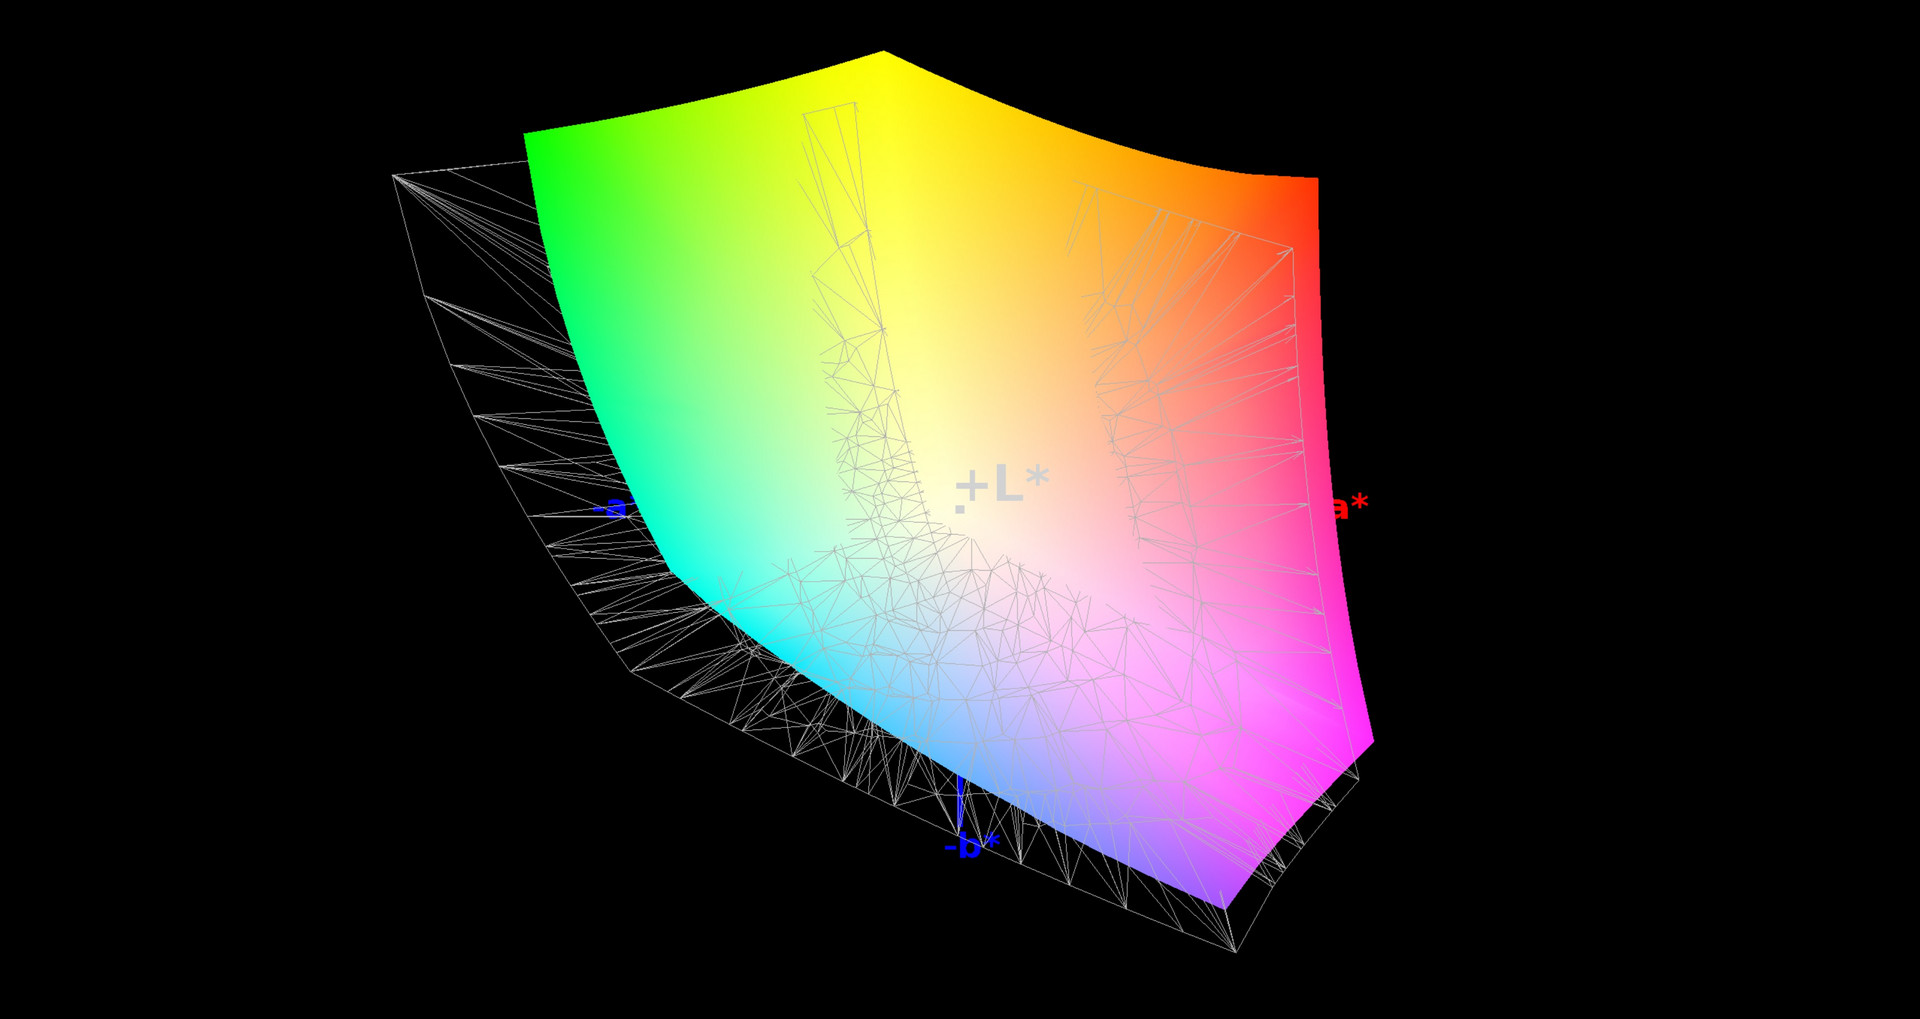
ΔE ColorChecker Calman: 3 | ∀{0.5-29.43 Ø4.73}
ΔE Greyscale Calman: 3.18 | ∀{0.09-98 Ø4.97}
100% sRGB (Argyll 1.6.3 3D)
77% AdobeRGB 1998 (Argyll 1.6.3 3D)
86.6% AdobeRGB 1998 (Argyll 3D)
100% sRGB (Argyll 3D)
91.6% Display P3 (Argyll 3D)
Gamma: 2.25
CCT: 7274 K
| MSI GS63VR 7RG-005 Chi Mei N156HHE-GA1 (CMN15F4), 1920x1080, 15.6" | Gigabyte Aero 15X Chi Mei N156HCA-EA1 (CMN15D7), 1920x1080, 15.6" | Asus Zephyrus GX501VS ID: AUO42ED, Name: AU Optronics B156HAN04.2, 1920x1080, 15.6" | Eurocom Q5 ID: LGD04D4, Name: LG Philips LP156UD1-SPB1, 3840x2160, 15.6" | Aorus X5 v7 AU Optronics B156ZAN02.3 (AUO23EB), 3840x2160, 15.6" | MSI GS63VR 7RF-228US 3840x2160, 15.6" | MSI GS63VR-6RF16H22 Stealth Pro Samsung 156HL01-104 (SDC324C) , 1920x1080, 15.6" | |
|---|---|---|---|---|---|---|---|
| Display | -21% | -25% | -21% | -20% | -39% | -16% | |
| Display P3 Coverage (%) | 91.6 | 64.7 -29% | 62.1 -32% | 63 -31% | 65.3 -29% | 48.21 -47% | 67.8 -26% |
| sRGB Coverage (%) | 100 | 90.4 -10% | 85.6 -14% | 92.7 -7% | 91.9 -8% | 72.6 -27% | 97.4 -3% |
| AdobeRGB 1998 Coverage (%) | 86.6 | 65.7 -24% | 62.4 -28% | 64.4 -26% | 66.3 -23% | 49.81 -42% | 69.7 -20% |
| Response Times | -323% | -272% | -274% | -312% | -214% | -294% | |
| Response Time Grey 50% / Grey 80% * (ms) | 10.4 ? | 43.2 ? -315% | 33.2 ? -219% | 32.4 ? -212% | 44 ? -323% | 28 ? -169% | |
| Response Time Black / White * (ms) | 6.6 ? | 28.4 ? -330% | 28 ? -324% | 28.8 ? -336% | 26.4 ? -300% | 23.6 ? -258% | 26 ? -294% |
| PWM Frequency (Hz) | 25510 ? | 26000 ? | 1351 ? | 202 ? | |||
| Screen | -40% | -11% | -44% | -21% | -73% | -14% | |
| Brightness middle (cd/m²) | 269 | 338 26% | 307.1 14% | 287.5 7% | 307 14% | 274.2 2% | 293 9% |
| Brightness (cd/m²) | 254 | 324 28% | 309 22% | 279 10% | 297 17% | 263 4% | 279 10% |
| Brightness Distribution (%) | 85 | 88 4% | 86 1% | 87 2% | 92 8% | 92 8% | 84 -1% |
| Black Level * (cd/m²) | 0.21 | 0.34 -62% | 0.35 -67% | 0.65 -210% | 0.3 -43% | 0.44 -110% | 0.33 -57% |
| Contrast (:1) | 1281 | 994 -22% | 877 -32% | 442 -65% | 1023 -20% | 623 -51% | 888 -31% |
| Colorchecker dE 2000 * | 3 | 5.92 -97% | 3.4 -13% | 4.5 -50% | 4.72 -57% | 8 -167% | 3.59 -20% |
| Colorchecker dE 2000 max. * | 5.62 | 11.77 -109% | 8.2 -46% | 8.9 -58% | 8.07 -44% | 14.6 -160% | 5.79 -3% |
| Greyscale dE 2000 * | 3.18 | 7.45 -134% | 1.4 56% | 4.6 -45% | 4.79 -51% | 9.1 -186% | 3.86 -21% |
| Gamma | 2.25 98% | 2.58 85% | 2.19 100% | 2.39 92% | 2.42 91% | 2.24 98% | 2.53 87% |
| CCT | 7274 89% | 6366 102% | 6558 99% | 7393 88% | 7690 85% | 5020 129% | 7229 90% |
| Color Space (Percent of AdobeRGB 1998) (%) | 77 | 59 -23% | 55.6 -28% | 59 -23% | 60 -22% | 45.7 -41% | 63 -18% |
| Color Space (Percent of sRGB) (%) | 100 | 90 -10% | 85 -15% | 92.3 -8% | 92 -8% | 72.1 -28% | 97 -3% |
| Total Average (Program / Settings) | -128% /
-74% | -103% /
-48% | -113% /
-70% | -118% /
-59% | -109% /
-85% | -108% /
-34% |
* ... smaller is better
Screen Flickering / PWM (Pulse-Width Modulation)
| Screen flickering / PWM detected | 25510 Hz | ≤ 25 % brightness setting | 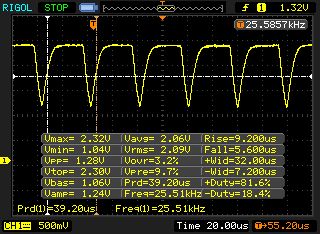 |
The display backlight flickers at 25510 Hz (worst case, e.g., utilizing PWM) Flickering detected at a brightness setting of 25 % and below. There should be no flickering or PWM above this brightness setting. The frequency of 25510 Hz is quite high, so most users sensitive to PWM should not notice any flickering. In comparison: 52 % of all tested devices do not use PWM to dim the display. If PWM was detected, an average of 7798 (minimum: 5 - maximum: 343500) Hz was measured. | |||
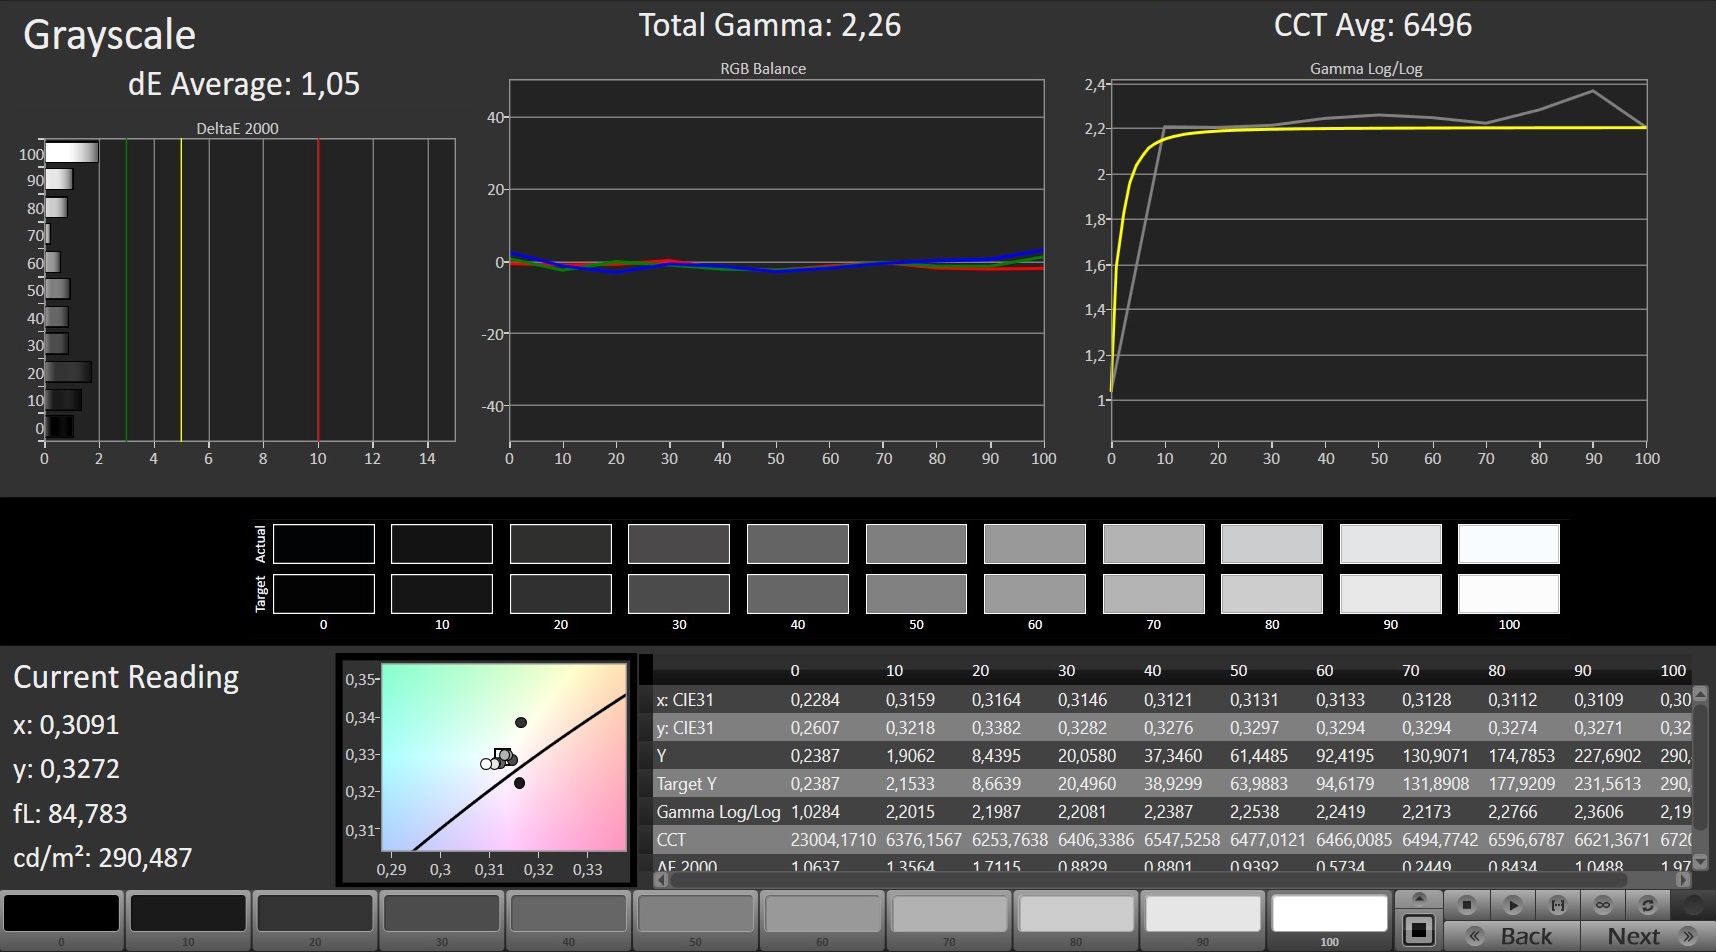
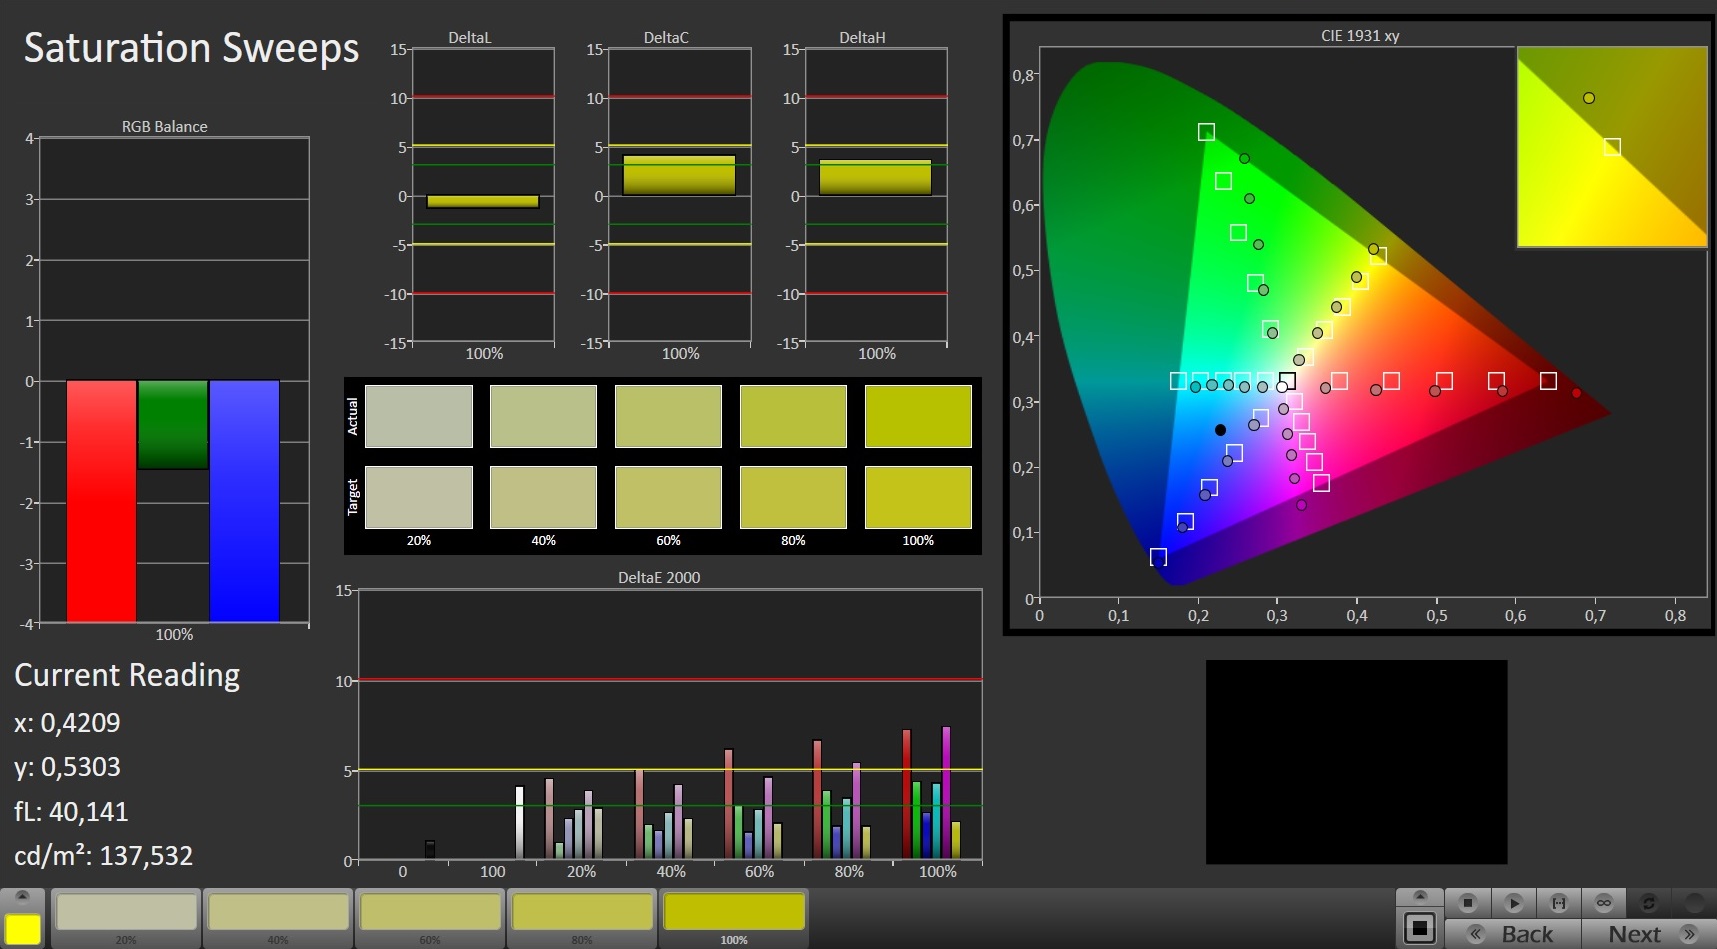
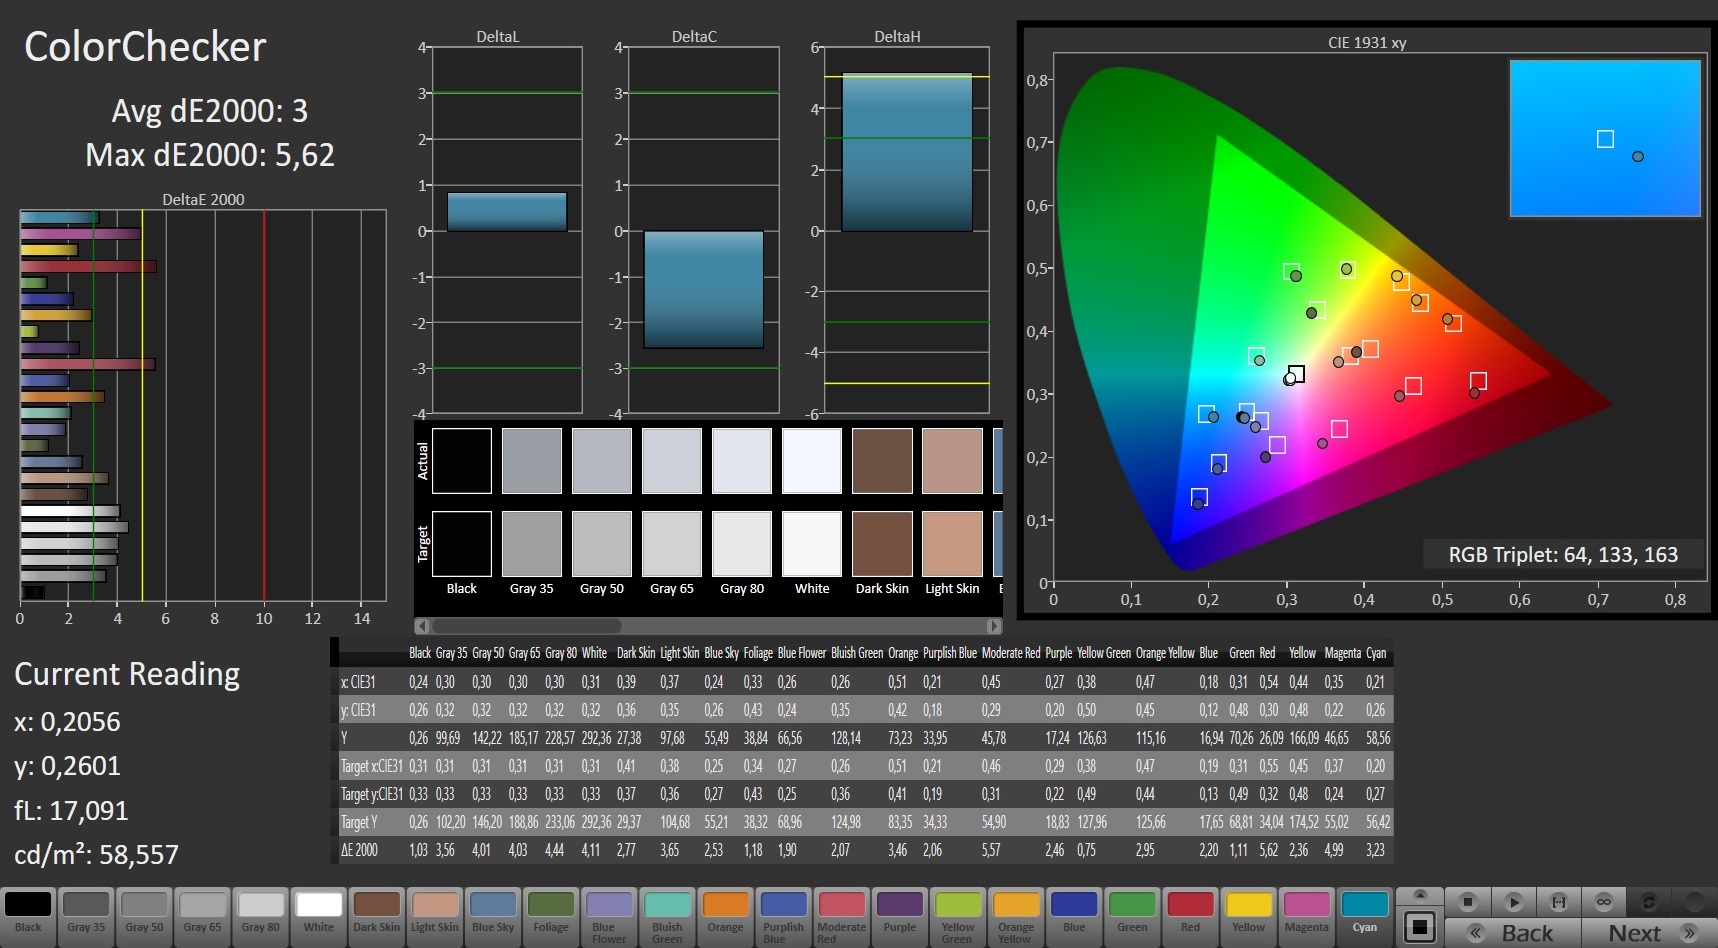
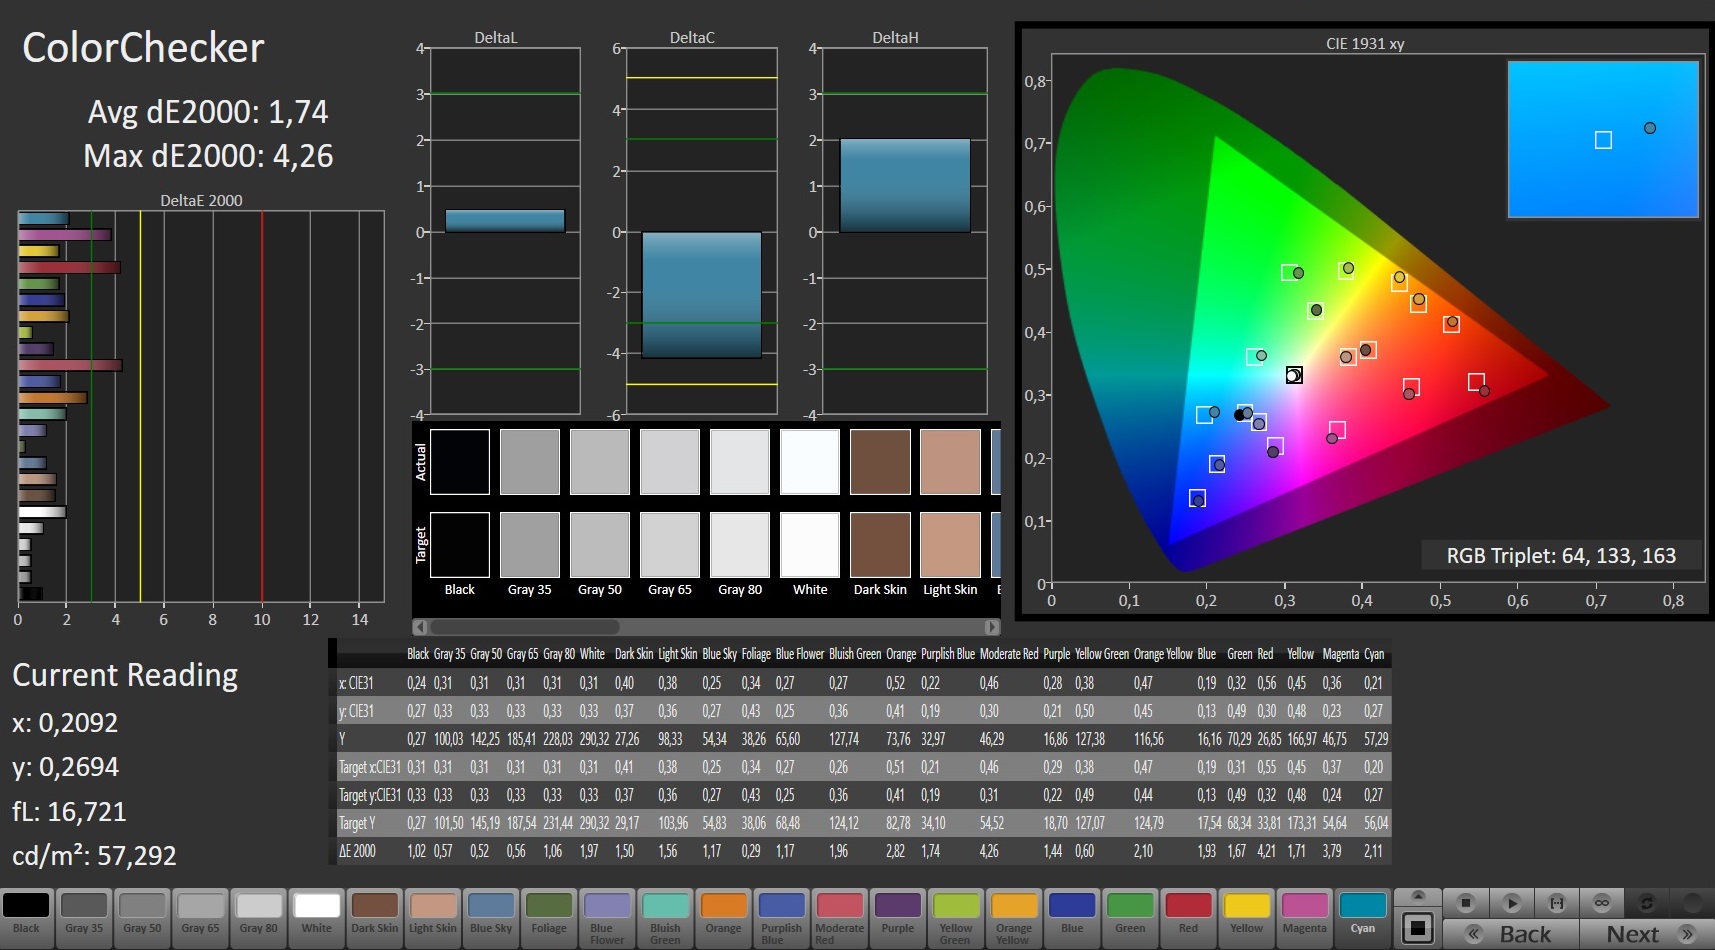
Right out of the box, the color reproduction of the display is in very good order. With a DeltaE-2000 color deviation of 3, it almost manages to hit the target value (DeltaE lower than 3). Furthermore, the display does not suffer from a bluish cast. By means of calibration, the color reproduction can be further improved. After calibration, the DeltaE drops to 1.74. In addition, a more balanced representation of the grayscale has also been achieved. Positive: The display covers 100% of the sRGB color space. However, it is only able to cover 77% of the AdobeRGB color space. We conducted our measurements with the "sRGB" profile selected in the "True Color" application.
By means of our color profile, the color reproduction can be improved. However before downloading it, you should make sure that your laptop has the same display model (manufacturer + model number) as our review device, because otherwise our color profile can result in worse color reproduction. Displays from different manufacturers can often be found within notebooks from the same model range.

Display Response Times
| ↔ Response Time Black to White | ||
|---|---|---|
| 6.6 ms ... rise ↗ and fall ↘ combined | ↗ 4.4 ms rise | 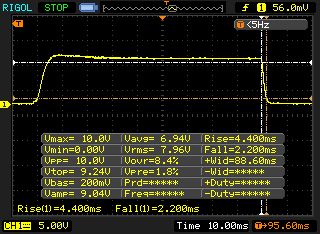 |
| ↘ 2.2 ms fall | ||
| The screen shows very fast response rates in our tests and should be very well suited for fast-paced gaming. In comparison, all tested devices range from 0.1 (minimum) to 240 (maximum) ms. » 20 % of all devices are better. This means that the measured response time is better than the average of all tested devices (19.9 ms). | ||
| ↔ Response Time 50% Grey to 80% Grey | ||
| 10.4 ms ... rise ↗ and fall ↘ combined | ↗ 6 ms rise | 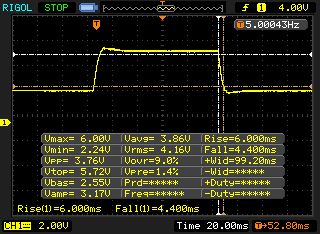 |
| ↘ 4.4 ms fall | ||
| The screen shows good response rates in our tests, but may be too slow for competitive gamers. In comparison, all tested devices range from 0.165 (minimum) to 636 (maximum) ms. » 24 % of all devices are better. This means that the measured response time is better than the average of all tested devices (31.1 ms). | ||
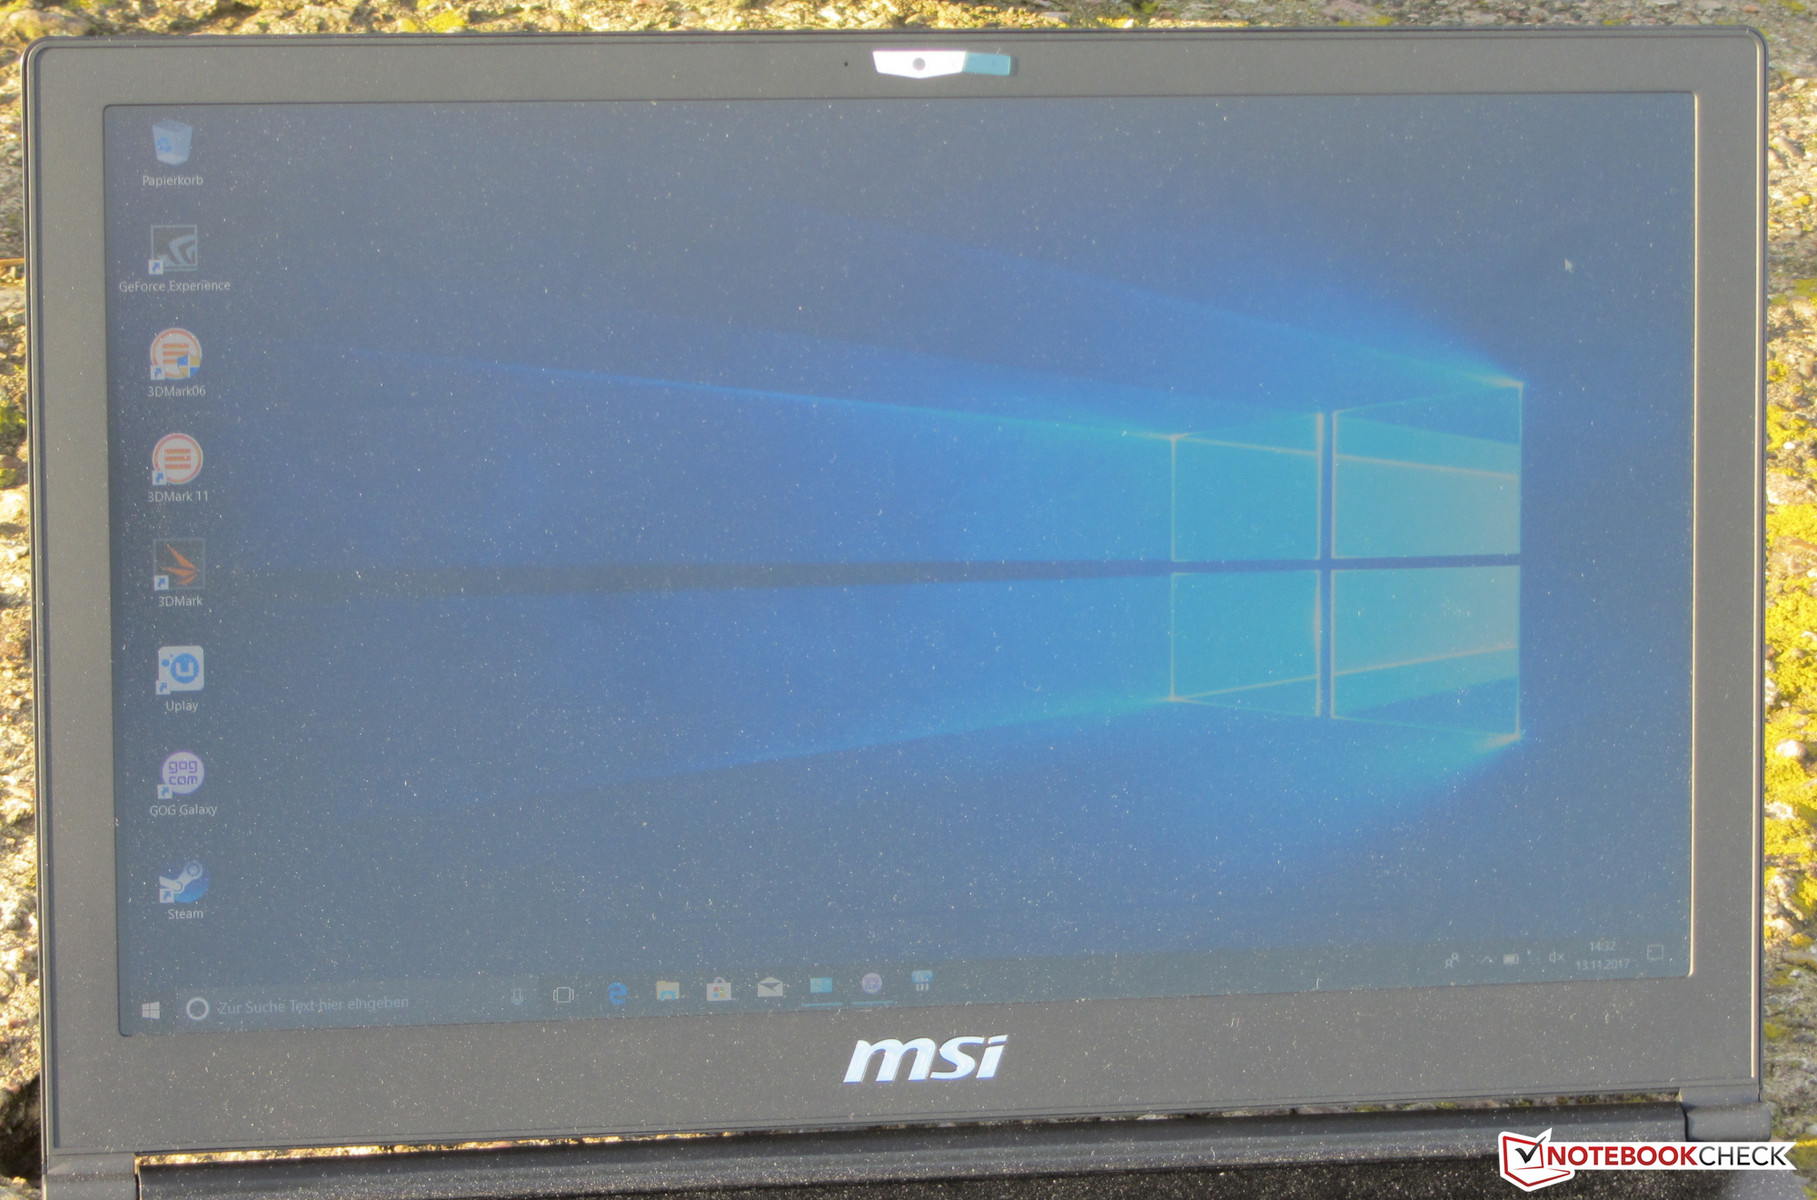
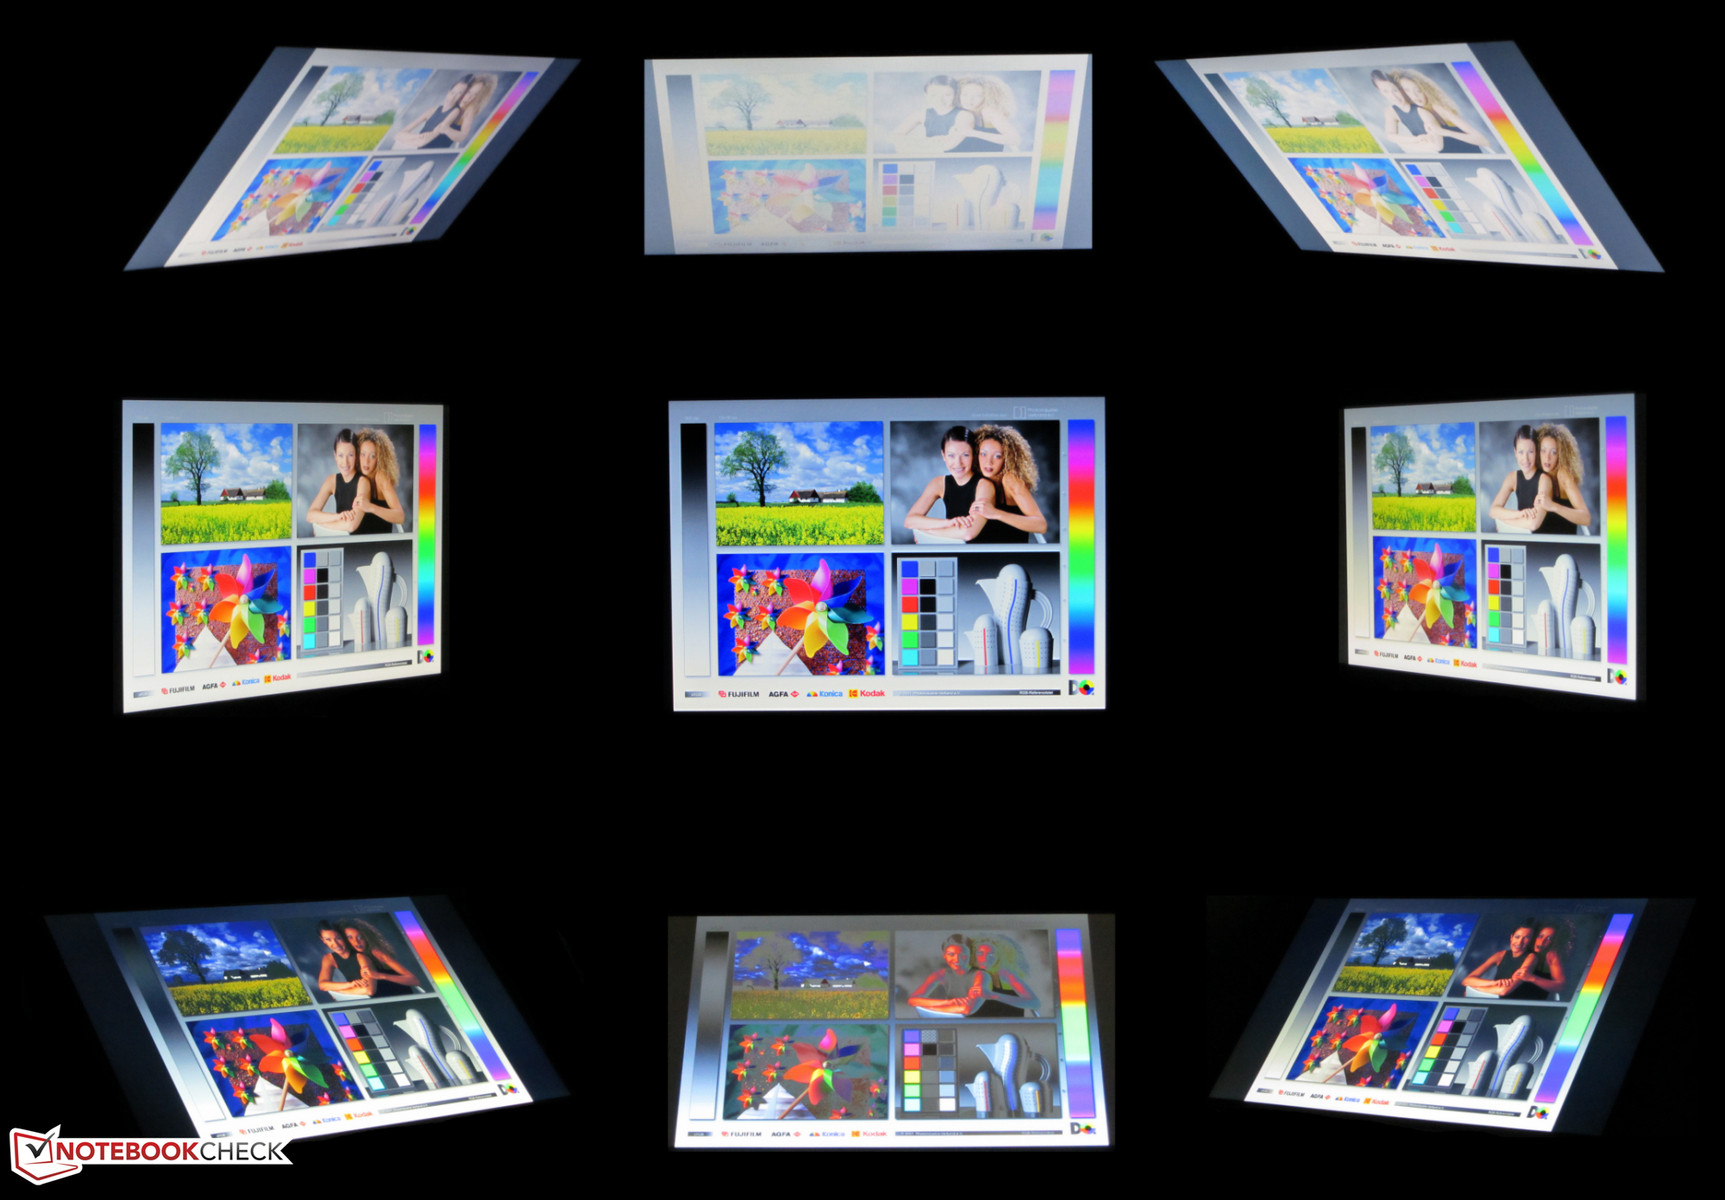
MSI equips the laptop with a TN panel with poor viewing angles. Consequently, the display is not legible from every position. However, what we are dealing with here is a TN panel of a better kind that has better viewing angles than a lot of the TN panels that can be found in low-priced notebooks. However, it falls far short of an IPS panel. Outdoors, the notebook can only be used when the sun is not shining too brightly.
Performance
With the GS63VR 7RG, MSI has a slim 15.6-inch gaming notebook in its product range. It can run all the modern games smoothly on its screen and hands in great results in all other applications. Our review device can be had for 2300 Euros ($2740). Other hardware configurations are also available.


Review Conditions
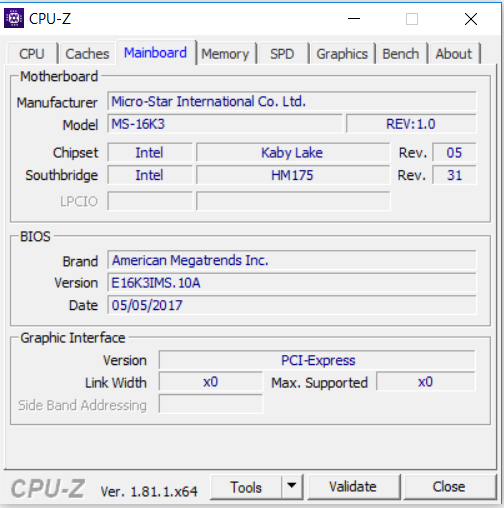
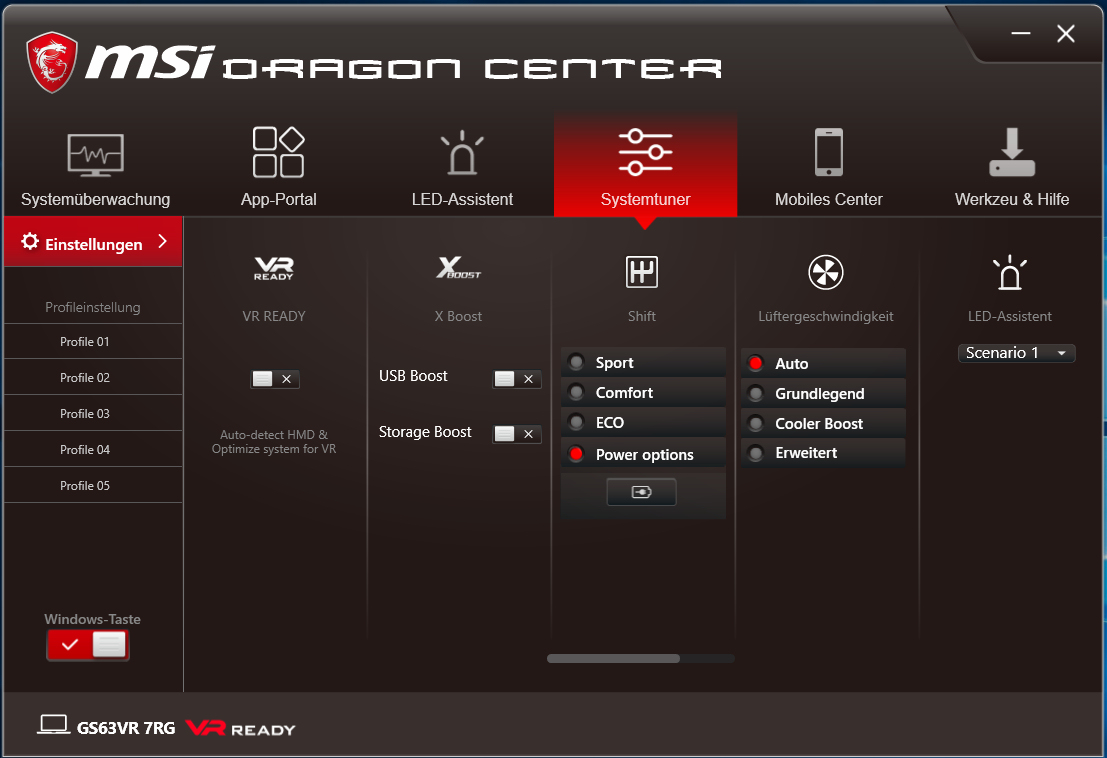
The preinstalled “Dragon Center” utility offers options for the customization of the fan’s speed and the energy profile. We have conducted all of our benchmarks with the fan speed set to “Auto”. Moreover, in the “Shift” tab, we selected "Power options", meaning that Windows 10’s energy profiles will be utilized.
Processor
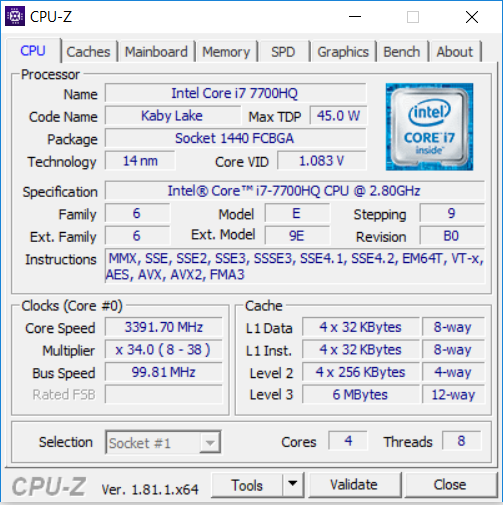
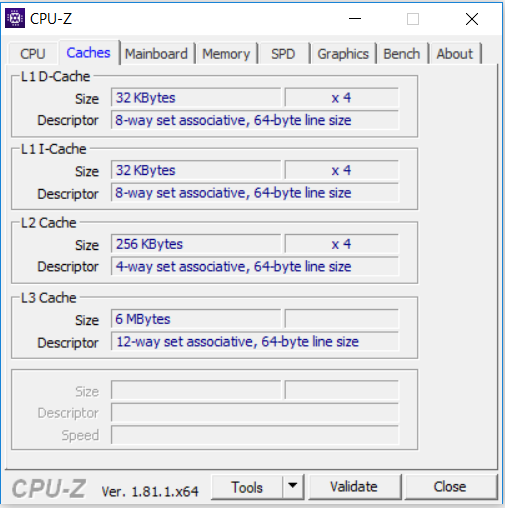
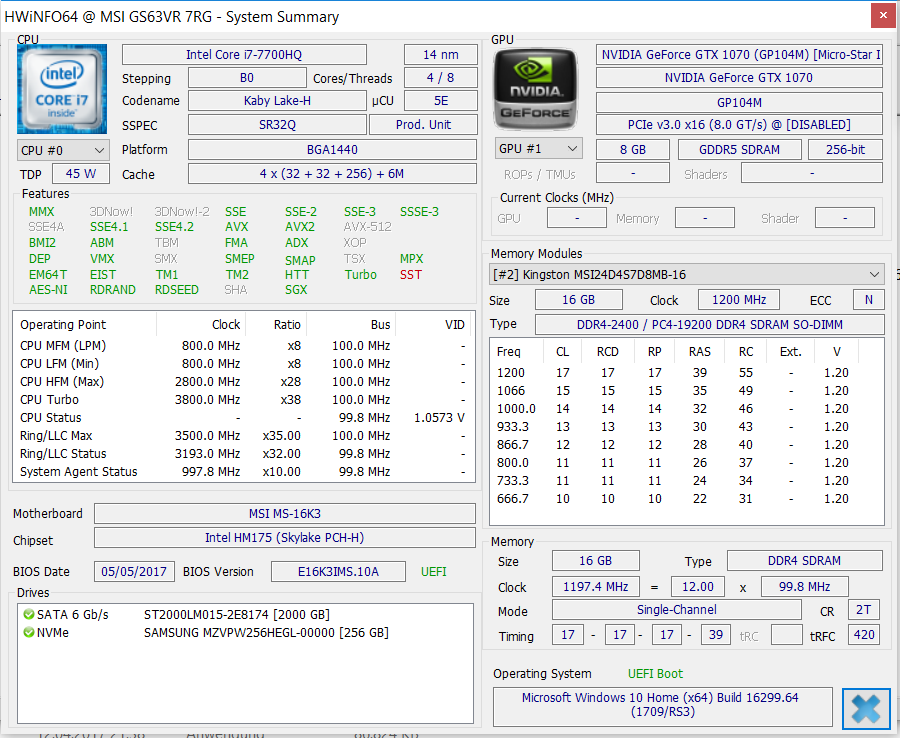
The GS63VR comes equipped with a quad-core Kaby Lake CPU (Core i7-7700HQ). This processor is found mostly in gaming laptops, because it represents a good compromise between performance and energy consumption. The processor has a base clock of 2.8 GHz. Via Intel’s Turbo Boost technology, the clock rate can be increased to 3.4 GHz for four cores, 3.6 GHz for two cores and 3.8 GHz for one core.
In our single-core CPU benchmarks, both when plugged in and when running off of battery power, the CPU operates at 3.4 to 3.8 GHz. In the multi-core benchmarks, the CPU operates at 3.4 GHz when plugged in and at 3.1 to 3.3 GHz when running off of battery power. However, the CPU consistently throttles down to 1.4 to 1.5 GHz as well as 800 MHz.
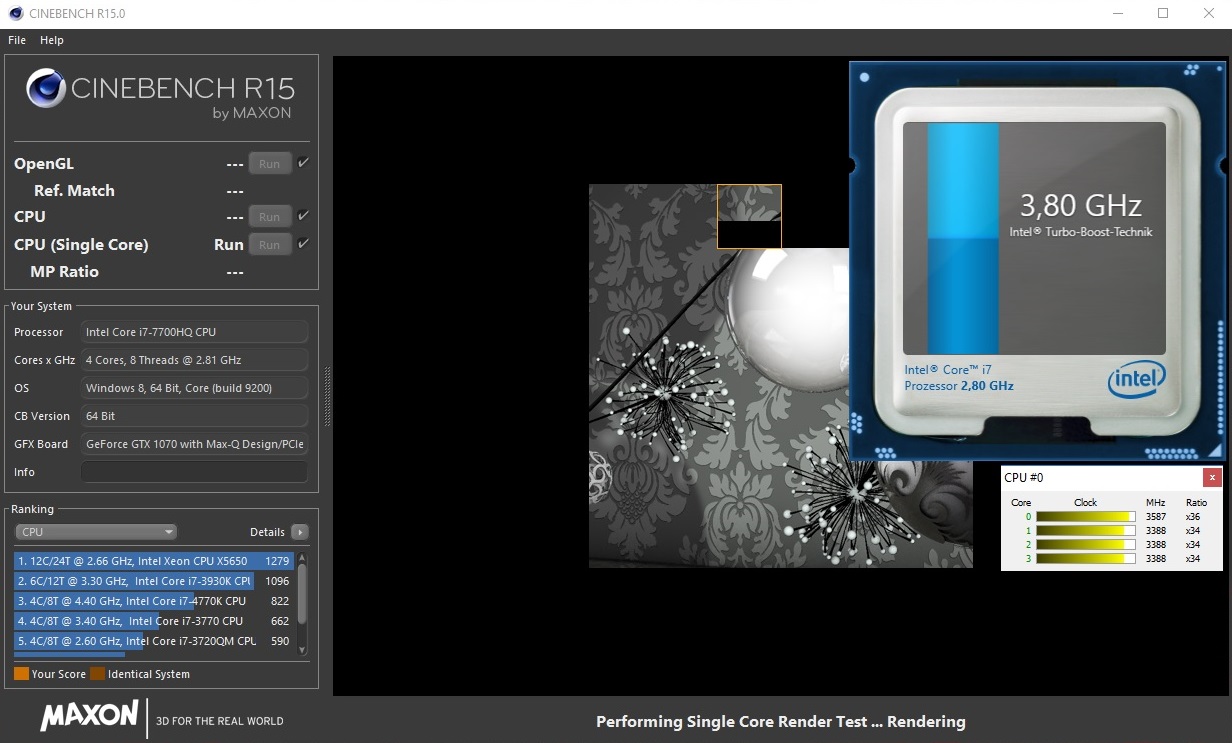
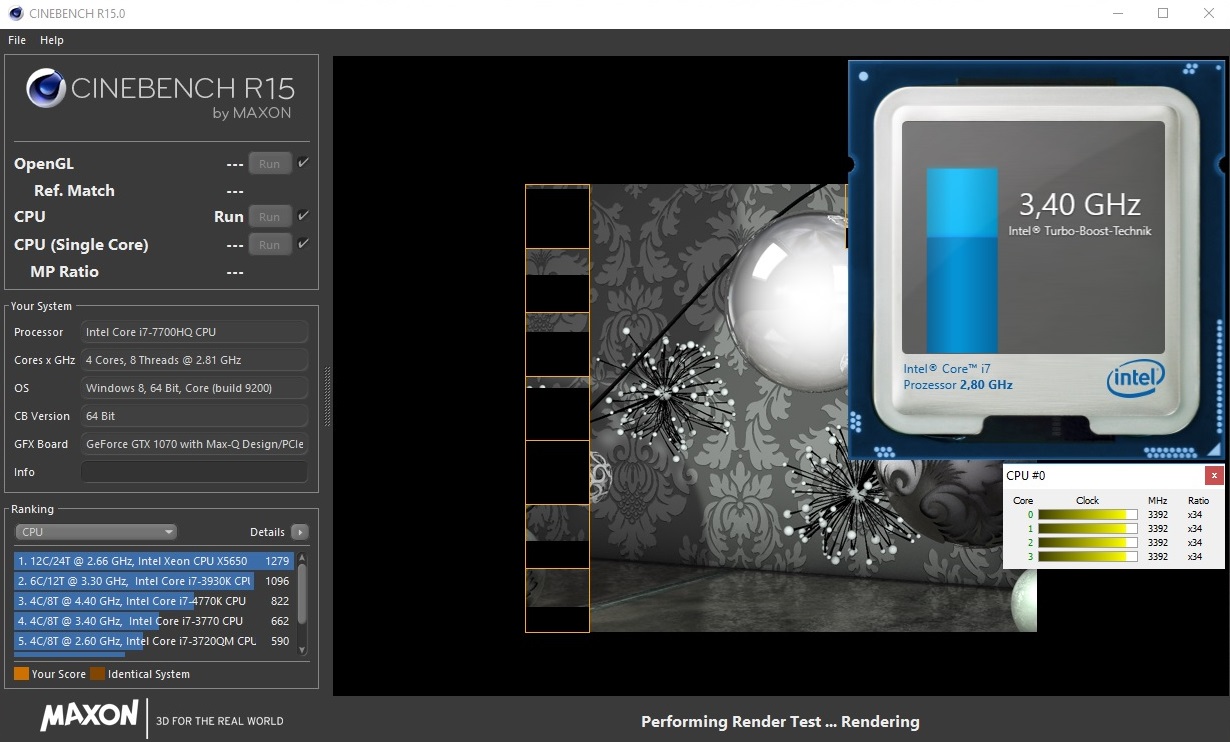
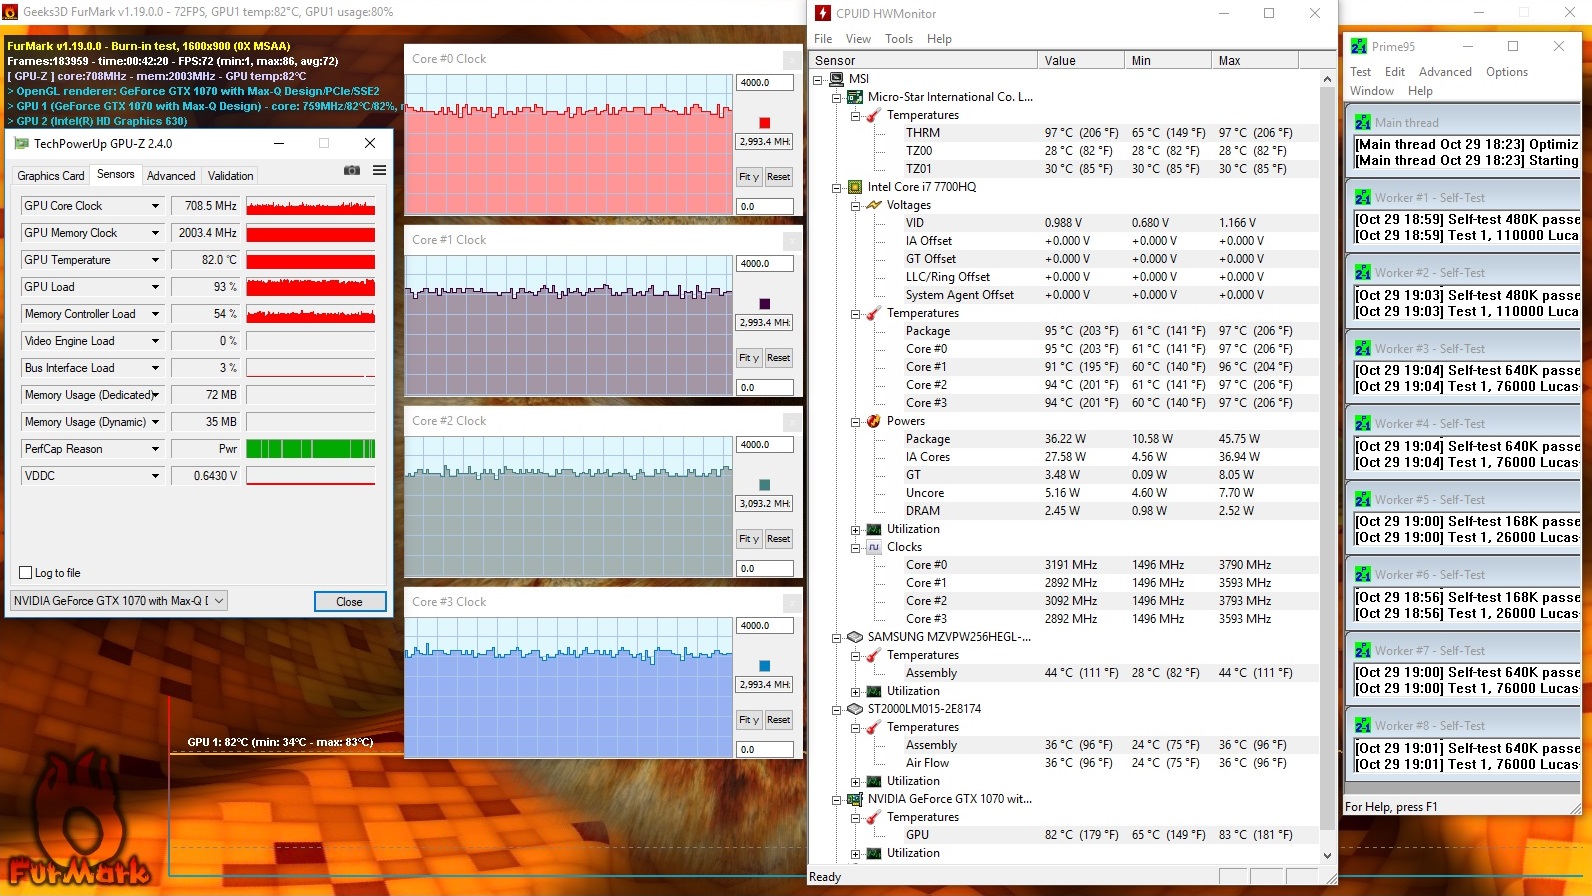
We check if the Turbo boost can be used continuously by running the Cinebench R15 Multi-Core benchmark in a continuous loop for 30 minutes. The results of the GS63VR stay consistently on the same level. There are no drops in performance to report.
The results in the Cinebench benchmarks are consistent with those of other 7700HQ-based notebooks. However, in the Geekbench benchmarks, the MSI laptop falls behind. The reason: The notebook’s RAM runs in single-channel mode.
| Cinebench R10 | |
| Rendering Multiple CPUs 32Bit | |
| Gigabyte Aero 15X | |
| MSI GS63VR 7RG-005 | |
| Asus Zephyrus GX501VS | |
| MSI GS63VR 7RF-228US | |
| Eurocom Q5 | |
| Rendering Single 32Bit | |
| Gigabyte Aero 15X | |
| MSI GS63VR 7RG-005 | |
| Eurocom Q5 | |
| Asus Zephyrus GX501VS | |
| MSI GS63VR 7RF-228US | |
| Geekbench 3 | |
| 32 Bit Multi-Core Score | |
| Gigabyte Aero 15X | |
| MSI GS63VR 7RG-005 | |
| 32 Bit Single-Core Score | |
| Gigabyte Aero 15X | |
| MSI GS63VR 7RG-005 | |
| Geekbench 4.0 | |
| 64 Bit Multi-Core Score | |
| Gigabyte Aero 15X | |
| MSI GS63VR 7RG-005 | |
| 64 Bit Single-Core Score | |
| Gigabyte Aero 15X | |
| MSI GS63VR 7RG-005 | |
| Geekbench 4.4 | |
| 64 Bit Multi-Core Score | |
| Gigabyte Aero 15X | |
| MSI GS63VR 7RG-005 | |
| 64 Bit Single-Core Score | |
| Gigabyte Aero 15X | |
| MSI GS63VR 7RG-005 | |
| JetStream 1.1 - 1.1 Total | |
| Gigabyte Aero 15X (Edge 41) | |
| MSI GS63VR 7RG-005 (Edge 41) | |
| Eurocom Q5 (Edge 40.15063.0.0) | |
| MSI GS63VR 7RF-228US (Edge 38.14393.0.0) | |
| MSI GS63VR-6RF16H22 Stealth Pro (Edge 25.10586.0.0) | |
| Asus Zephyrus GX501VS (Edge 40.15063.0.0) | |
System Performance
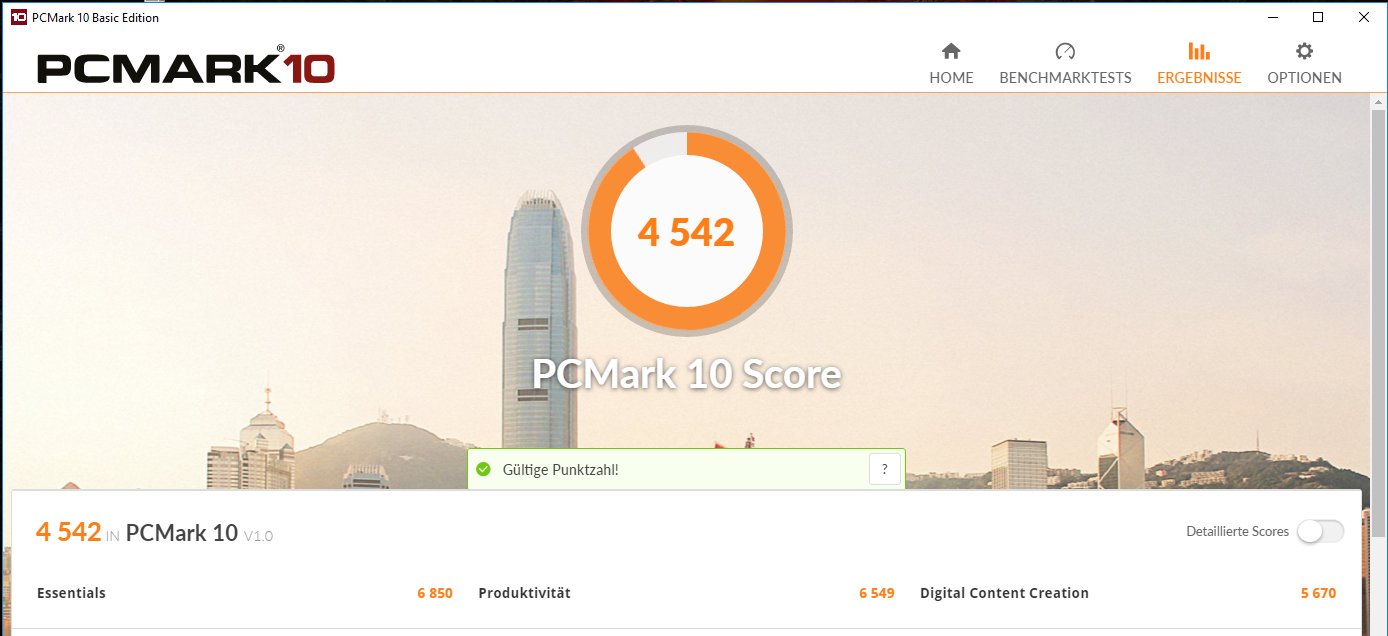
A lightning-fast NVMe SSD and a powerful processor create a very responsive system. The very good results in various PCMark benchmarks attest to the fact that the GS63VR has more than enough performance for gaming and image/video-editing applications. A small increase in the overall performance is possible. For this, one must install a second RAM module in order to enable dual-channel mode.
| PCMark 7 Score | 5755 points | |
| PCMark 8 Home Score Accelerated v2 | 4193 points | |
| PCMark 8 Creative Score Accelerated v2 | 5362 points | |
| PCMark 8 Work Score Accelerated v2 | 5176 points | |
| PCMark 10 Score | 4542 points | |
Help | ||
Storage Space
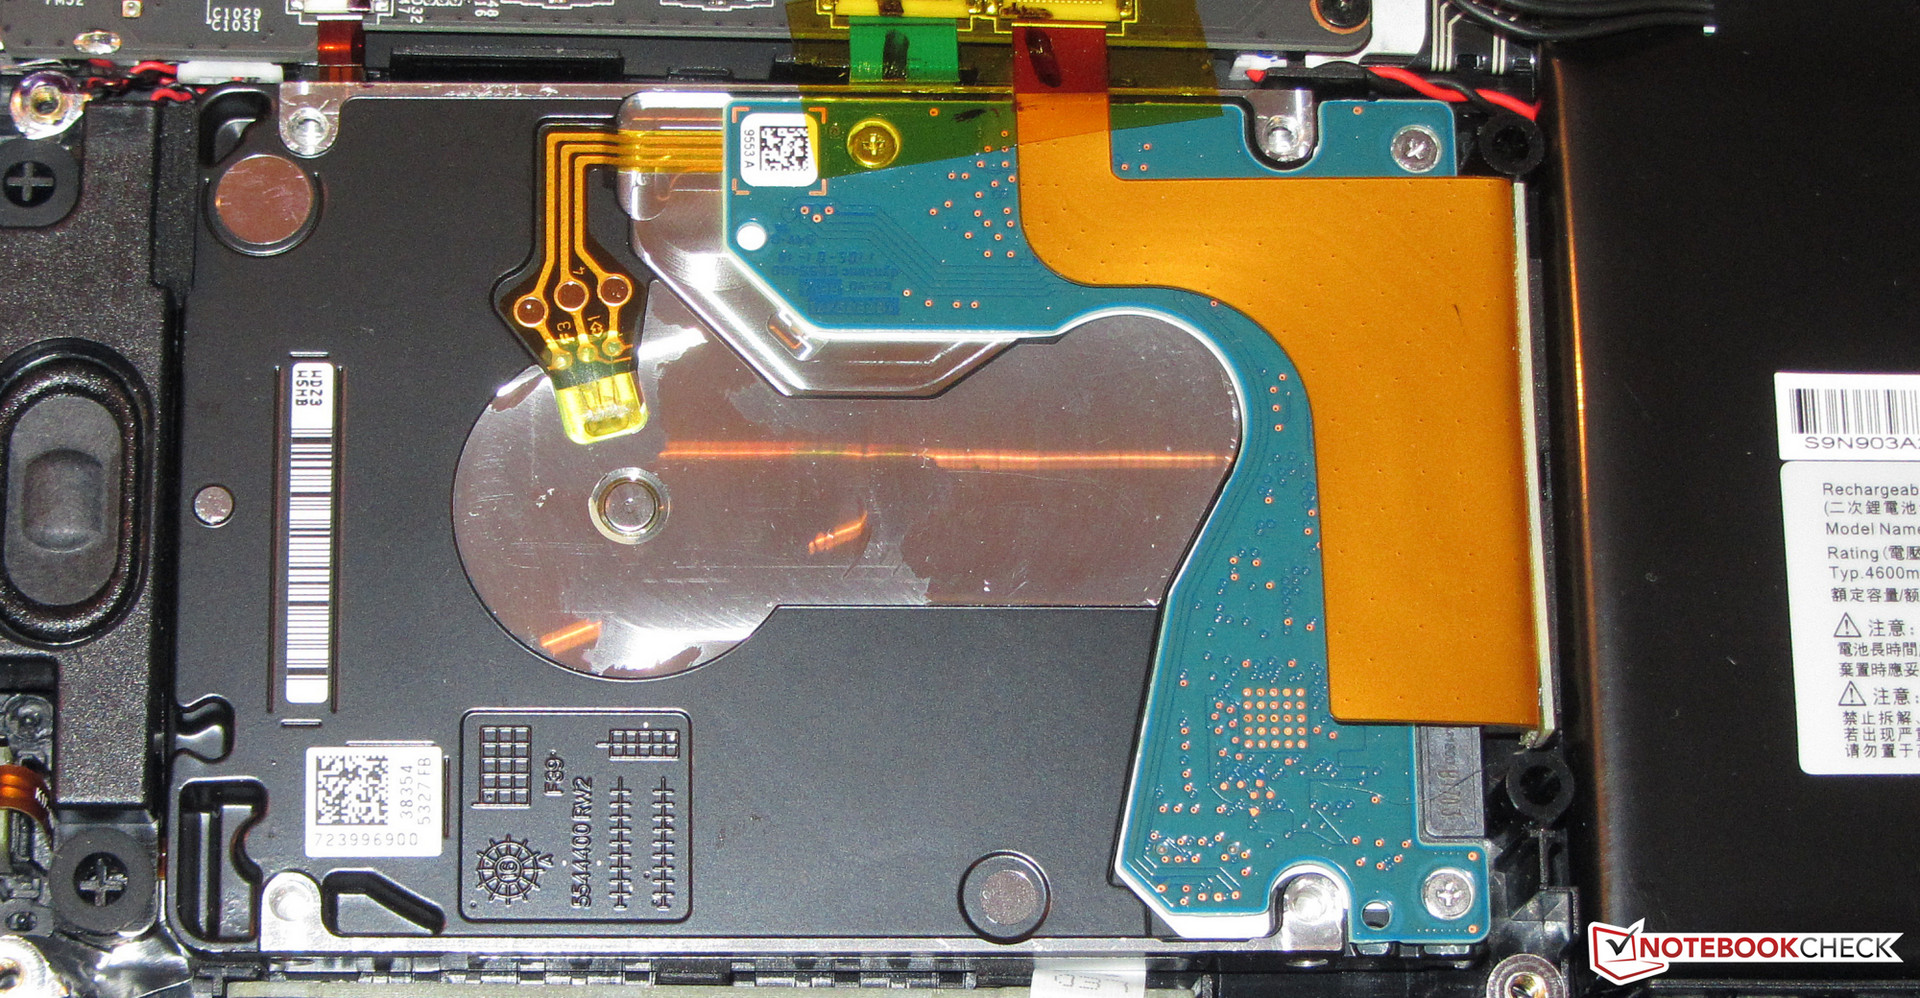
An M.2-2280 SSD from Samsung serves as the system drive. Because such SSDs are connected via PCI Express 3.0 x4, they achieve significantly higher transfer rates than the SSDs that are connected via SATA III. The transfer rates of the built-in SSD are superb. The SSD offers a capacity of 256 GB. However, there is no dearth of storage space. Besides the SSD, there is also a 2 TB HDD (2.5-in, 5400 RPM) inside the device.

| MSI GS63VR 7RG-005 Samsung SM961 MZVPW256HEGL | Gigabyte Aero 15X Samsung SM961 MZVKW512HMJP m.2 PCI-e | Aorus X5 v7 Toshiba NVMe THNSN5256GPU7 | MSI GS63VR 7RF-228US Samsung SM961 MZVKW512HMJP m.2 PCI-e | MSI GS63VR-6RF16H22 Stealth Pro Samsung SM951 MZVPV256HDGL m.2 PCI-e | |
|---|---|---|---|---|---|
| CrystalDiskMark 3.0 | -7% | 11% | 9% | 17% | |
| Read Seq (MB/s) | 2065 | 1381 -33% | 1479 -28% | 2141 4% | 1973 -4% |
| Write Seq (MB/s) | 1459 | 1546 6% | 1076 -26% | 1621 11% | 1292 -11% |
| Read 512 (MB/s) | 439.4 | 418 -5% | 1086 147% | 499.7 14% | 1279 191% |
| Write 512 (MB/s) | 1283 | 1277 0% | 1101 -14% | 1531 19% | 1288 0% |
| Read 4k (MB/s) | 56.6 | 51.3 -9% | 44 -22% | 54.2 -4% | 52.3 -8% |
| Write 4k (MB/s) | 148.4 | 131 -12% | 137.8 -7% | 158.2 7% | 153.2 3% |
| Read 4k QD32 (MB/s) | 576 | 544 -6% | 697 21% | 632 10% | 464.4 -19% |
| Write 4k QD32 (MB/s) | 480.6 | 480.2 0% | 556 16% | 527 10% | 384.4 -20% |
Graphics Card
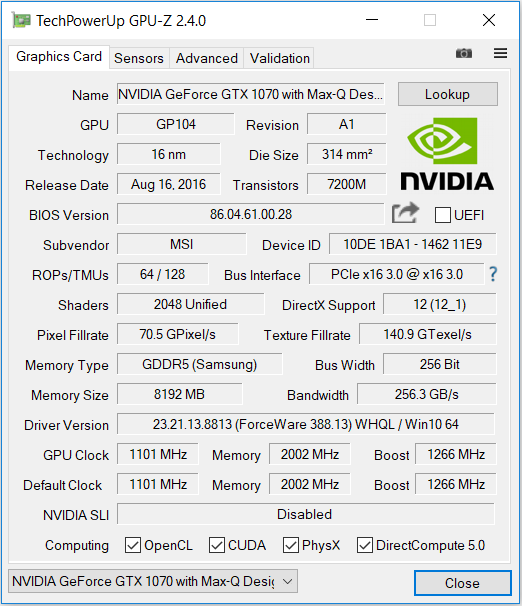
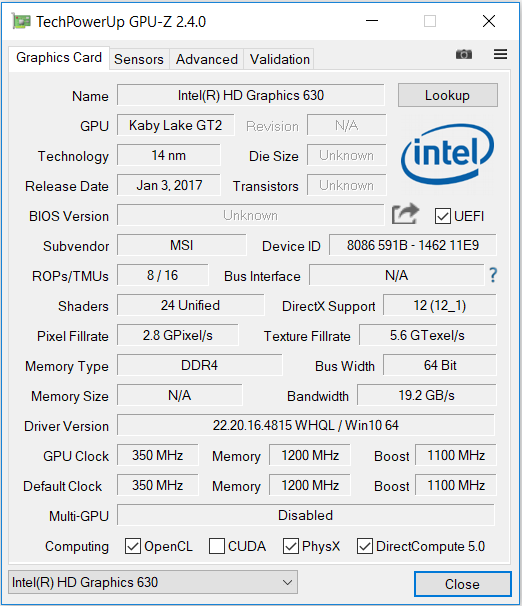
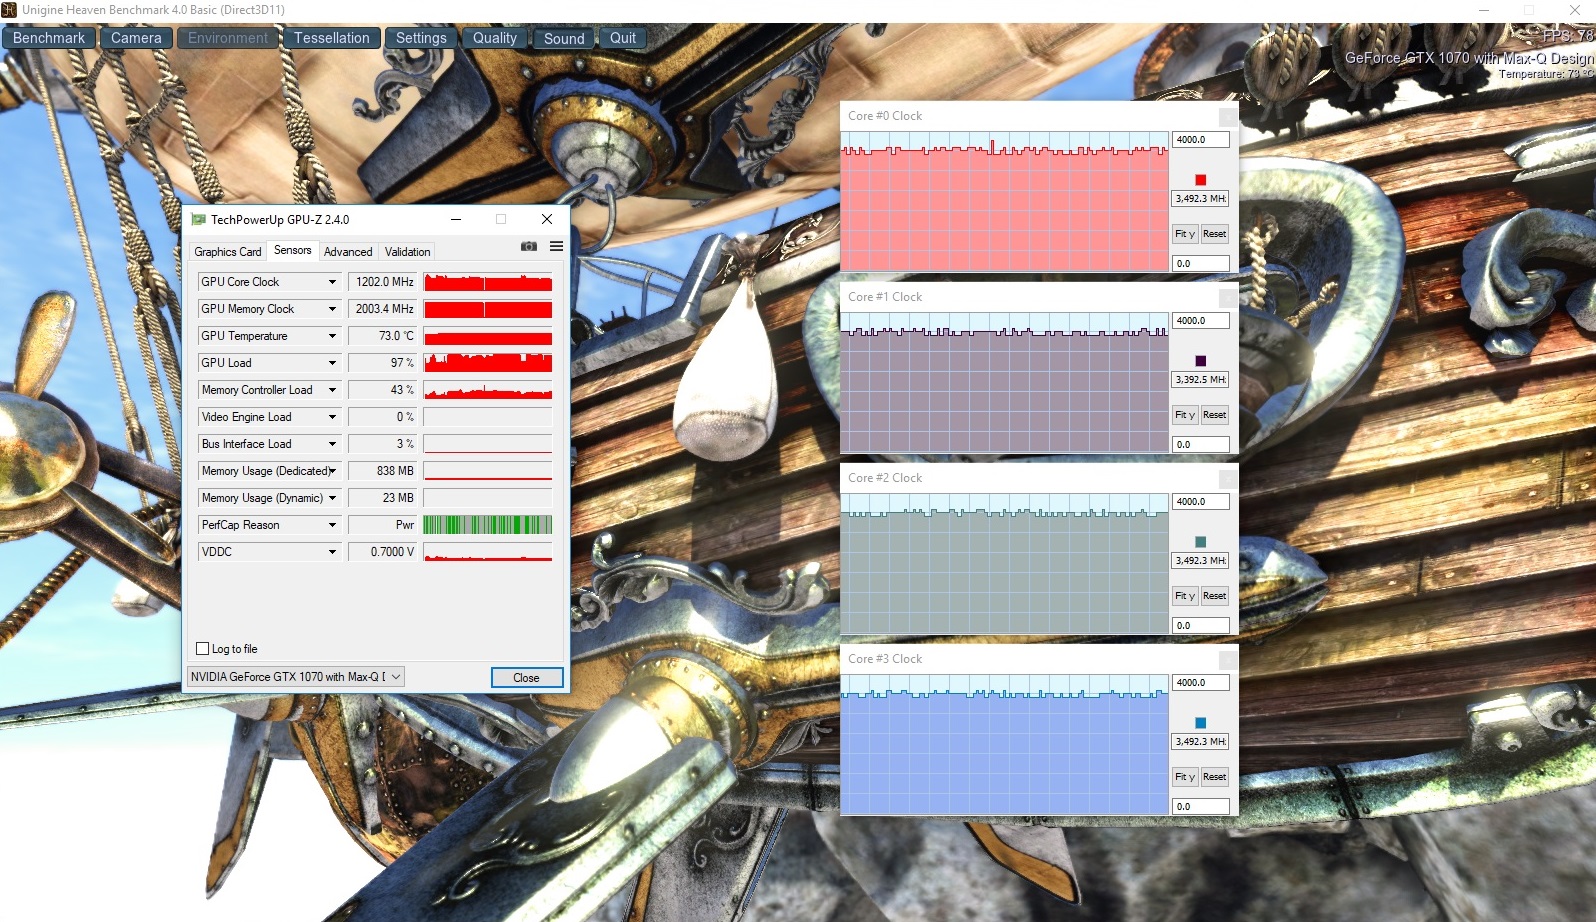
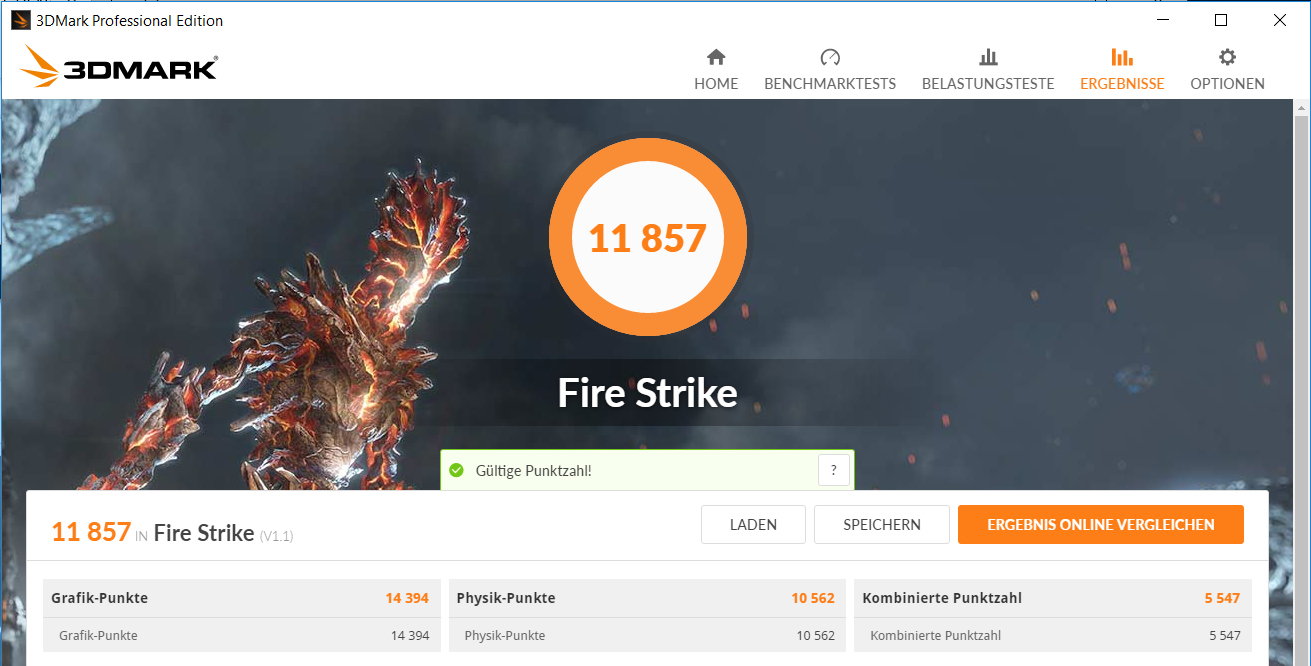
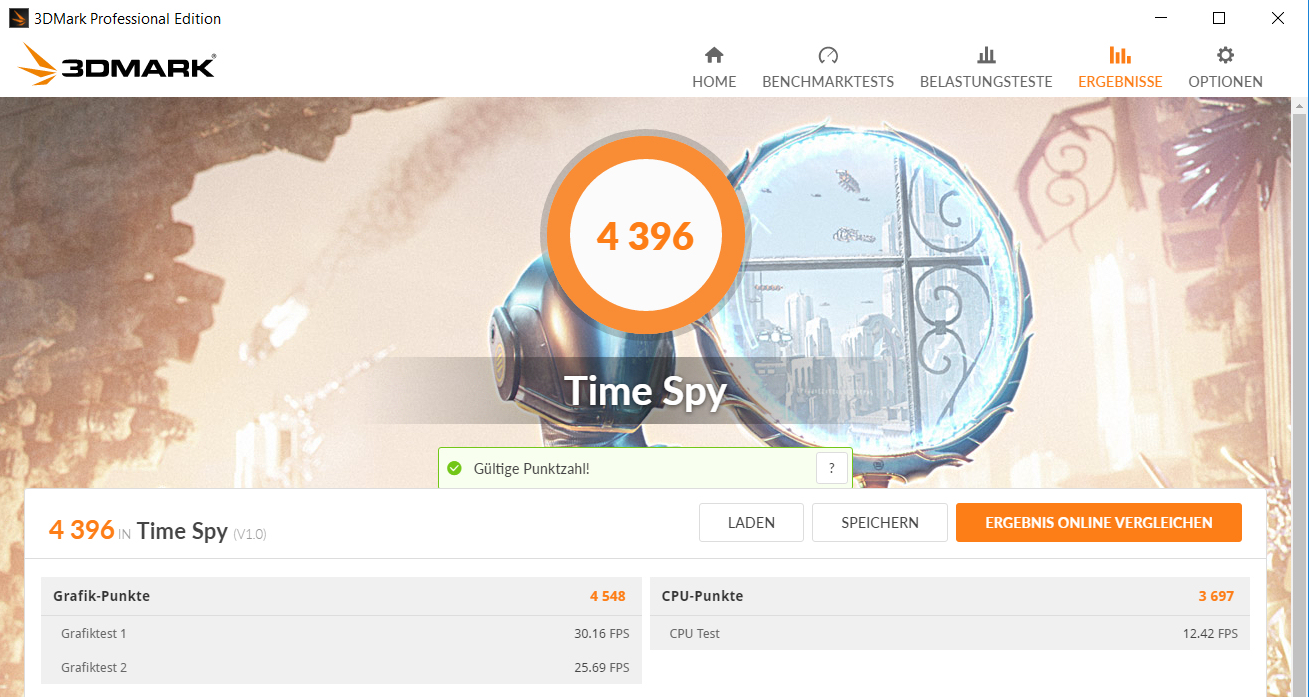
With the MSI GS63VR, Nvidia’s Optimus technology is enabled straight out of the box (this technology allows automatic switching between a discrete and an integrated graphics adapter). Here, it encompasses Intel’s HD Graphics 630 and Nvidia’s GeForce GTX 1070 Max-Q. The latter GPU represents a trimmed-down version of the normal GTX 1070, which is intended for thin and light notebooks. The model used in our review device has a base clock of 1101 MHz and a boost clock of up to 1544 MHz. However, the boost clock cannot be maintained under continuous load. During our benchmarks, we observed an average core clock of 1200 MHz. The GPU has 8192 MB of fast GDDR5 video memory at its disposal.
In the 3DMark benchmarks, the GS63VR achieves results which are similar to those of the competitors. Only the Asus Zephyrus GX501VS performs better. Presumably, this is because the GPU of the Asus laptop can achieve higher average core clocks.
| 3DMark 06 Standard Score | 26805 points | |
| 3DMark 11 Performance | 13513 points | |
| 3DMark Ice Storm Standard Score | 121077 points | |
| 3DMark Cloud Gate Standard Score | 25810 points | |
| 3DMark Fire Strike Score | 11857 points | |
| 3DMark Fire Strike Extreme Score | 6272 points | |
| 3DMark Time Spy Score | 4396 points | |
Help | ||
| 3DMark - 1920x1080 Fire Strike Graphics | |
| Aorus X5 v7 | |
| Asus Zephyrus GX501VS | |
| Gigabyte Aero 15X | |
| Eurocom Q5 | |
| MSI GS63VR 7RG-005 | |
| MSI GS63VR-6RF16H22 Stealth Pro | |
| MSI GS63VR 7RF-228US | |
| 3DMark 11 - 1280x720 Performance GPU | |
| Aorus X5 v7 | |
| Asus Zephyrus GX501VS | |
| Gigabyte Aero 15X | |
| Eurocom Q5 | |
| MSI GS63VR 7RG-005 | |
| MSI GS63VR-6RF16H22 Stealth Pro | |
| MSI GS63VR 7RF-228US | |
Gaming Performance
The 15.6-incher has enough performance at its disposal to run all the latest games smoothly at Full HD resolution with high to maximum graphical settings. However, the frame rates fall behind other notebooks with GTX 1070 Max-Q GPUs. The reasons: The core clock of the GPU lies below those of other notebooks with GTX 1070 Max-Q GPUs, plus the laptop’s RAM runs in single-channel mode.
We use the video game The Witcher 3 to check if the frame rates can be maintained consistently over a longer period of time. For this, we run the game with the maximum graphics settings in Full HD resolution (1920x1080) for one hour. Over the entire run of gameplay, the player-controlled character just stands still. The frame rates drop from an initial 49 to 50 FPS down to 44 to 47 FPS. Therefore, there are no massive performance drops (=throttling) to report. The frame rates are always in playable territory.
| The Witcher 3 - 1920x1080 Ultra Graphics & Postprocessing (HBAO+) | |
| Aorus X5 v7 | |
| Gigabyte Aero 15X | |
| Asus Zephyrus GX501VS | |
| MSI GS63VR 7RG-005 | |
| Eurocom Q5 | |
| MSI GS63VR-6RF16H22 Stealth Pro | |
| MSI GS63VR 7RF-228US | |
| BioShock Infinite - 1920x1080 Ultra Preset, DX11 (DDOF) | |
| Asus Zephyrus GX501VS | |
| Eurocom Q5 | |
| Gigabyte Aero 15X | |
| MSI GS63VR 7RG-005 | |
| MSI GS63VR-6RF16H22 Stealth Pro | |
| MSI GS63VR 7RF-228US | |
| ELEX - 1920x1080 Ultra / On AA:SM AF:16x | |
| Gigabyte Aero 15X | |
| MSI GS63VR 7RG-005 | |
| Middle-earth: Shadow of War - 1920x1080 Ultra Preset AA:T | |
| Gigabyte Aero 15X | |
| MSI GS63VR 7RG-005 | |
| low | med. | high | ultra | |
|---|---|---|---|---|
| Tomb Raider (2013) | 407.5 | 376.4 | 339.3 | 179.1 |
| BioShock Infinite (2013) | 239.4 | 173.8 | 161.5 | 109.6 |
| The Witcher 3 (2015) | 175.7 | 140.8 | 90.3 | 50.2 |
| Middle-earth: Shadow of War (2017) | 91 | 82 | 74 | 62 |
| ELEX (2017) | 120.5 | 87.7 | 77.9 | 63.3 |
| Assassin´s Creed Origins (2017) | 63 | 53 | 52 | 44 |
| Call of Duty WWII (2017) | 163.3 | 133.5 | 97.2 | 86 |
| Need for Speed Payback (2017) | 112.4 | 95.9 | 89.9 | 87.2 |
Emissions
System Noise
MSI equips the slender laptop with a total of three fans. Despite that, the GS63VR can run nearly silently - at least at idle. During idle operation, only the right fan (as seen from the user's POV) is usually engaged. However, it operates with such a low speed that it is only audible in quiet environments. The 2.5-inch hard drive easily drowns out the fan when it is being accessed. None of the three fans spin up during idle operation. Under load, the fans start to speed up considerably. During our stress test, we measured a sound pressure level of 46 dB(A). During gaming, it is not so loud: Here one can expect 42 dB(A).
As was mentioned previously, during our stress test, we use automatic fan control. Alternatively, the fan operation can be controlled manually. Those who can be bothered with this can lower the fan noise further.
Occasionally, one can hear a crackling sound coming from the inside of the device. However, it can only be heard if one places one’s ear close to the keyboard.
Noise level
| Idle |
| 31 / 34 / 35 dB(A) |
| HDD |
| 34 dB(A) |
| Load |
| 42 / 46 dB(A) |
 | ||
30 dB silent 40 dB(A) audible 50 dB(A) loud |
||
min: | ||
| MSI GS63VR 7RG-005 i7-7700HQ, GeForce GTX 1070 Max-Q | Gigabyte Aero 15X i7-7700HQ, GeForce GTX 1070 Max-Q | Asus Zephyrus GX501VS i7-7700HQ, GeForce GTX 1070 Max-Q | Eurocom Q5 i7-7700HQ, GeForce GTX 1070 Max-Q | Aorus X5 v7 i7-7820HK, GeForce GTX 1070 Mobile | MSI GS63VR 7RF-228US i7-7700HQ, GeForce GTX 1060 Mobile | MSI GS63VR-6RF16H22 Stealth Pro 6700HQ, GeForce GTX 1060 Mobile | |
|---|---|---|---|---|---|---|---|
| Noise | -0% | 8% | -1% | -9% | 1% | 3% | |
| off / environment * (dB) | 30 | 30 -0% | 28.5 5% | 29 3% | 30 -0% | 28.8 4% | 30 -0% |
| Idle Minimum * (dB) | 31 | 31 -0% | 28.5 8% | 31.5 -2% | 35 -13% | 33.1 -7% | 32 -3% |
| Idle Average * (dB) | 34 | 32 6% | 28.5 16% | 33.8 1% | 36 -6% | 33.1 3% | 33 3% |
| Idle Maximum * (dB) | 35 | 36 -3% | 30.1 14% | 33.8 3% | 40 -14% | 34 3% | 34 3% |
| Load Average * (dB) | 42 | 39 7% | 35.2 16% | 41.7 1% | 43 -2% | 37.2 11% | 37 12% |
| Witcher 3 ultra * (dB) | 44 | 44 -0% | 41.7 5% | 41.7 5% | 49 -11% | 46.1 -5% | |
| Load Maximum * (dB) | 46 | 52 -13% | 48.8 -6% | 54.2 -18% | 55 -20% | 47.1 -2% | 46 -0% |
* ... smaller is better
Temperature
The GS63VR performs differently in our stress test when plugged in and when running off of battery power. When running on battery power, after two minutes the CPU and the GPU operate at their minimum clock speeds (CPU: 800 MHz, GPU: 140 MHz). When plugged in, the processor operates at 3 to 3.4 GHz, the graphics card at 700 to 1000 MHz.
During the stress test, the laptop gets considerably hot. At two measurement points, the 60 °C (140 °F) mark has been exceeded. The temperatures turn out to be somewhat lower during our The Witcher 3 stress test (the game runs for one hour in Full HD resolution with the maximum graphics settings).
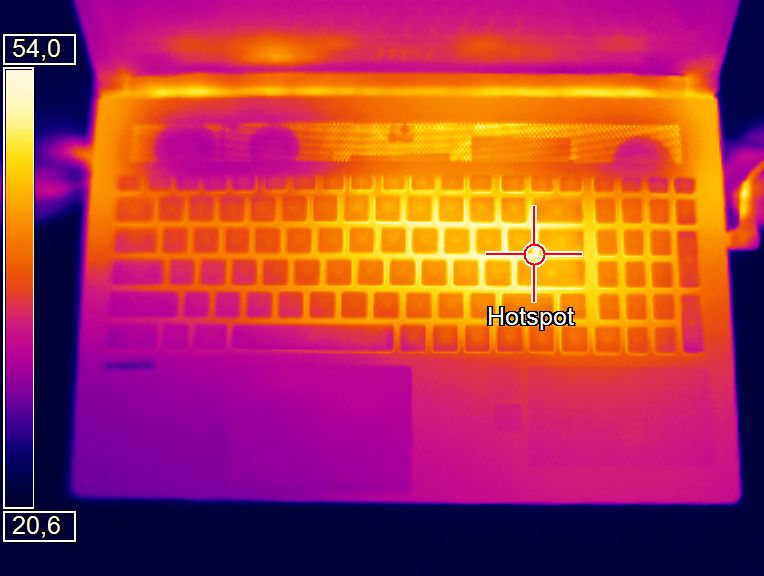
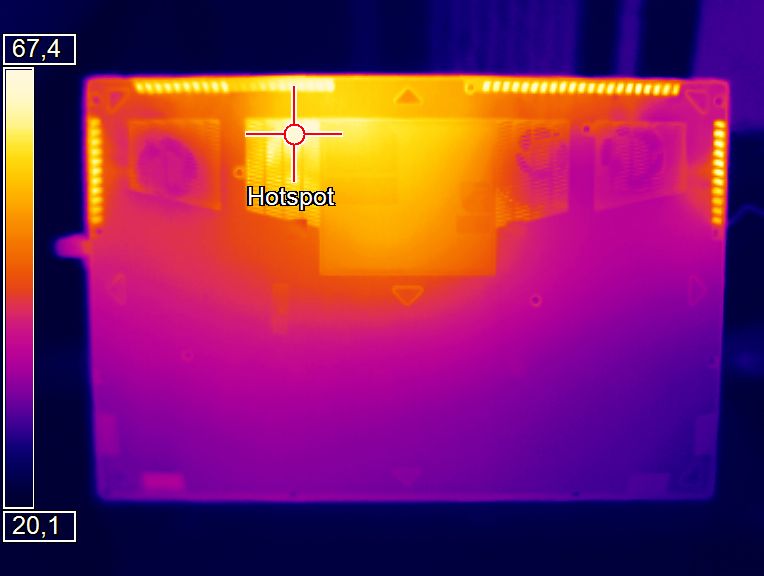
(-) The maximum temperature on the upper side is 47 °C / 117 F, compared to the average of 40.4 °C / 105 F, ranging from 21.2 to 68.8 °C for the class Gaming.
(-) The bottom heats up to a maximum of 63 °C / 145 F, compared to the average of 43.2 °C / 110 F
(+) In idle usage, the average temperature for the upper side is 24.1 °C / 75 F, compared to the device average of 33.9 °C / 93 F.
(±) Playing The Witcher 3, the average temperature for the upper side is 37.9 °C / 100 F, compared to the device average of 33.9 °C / 93 F.
(±) The palmrests and touchpad can get very hot to the touch with a maximum of 38 °C / 100.4 F.
(-) The average temperature of the palmrest area of similar devices was 28.8 °C / 83.8 F (-9.2 °C / -16.6 F).
| MSI GS63VR 7RG-005 i7-7700HQ, GeForce GTX 1070 Max-Q | Gigabyte Aero 15X i7-7700HQ, GeForce GTX 1070 Max-Q | Asus Zephyrus GX501VS i7-7700HQ, GeForce GTX 1070 Max-Q | Eurocom Q5 i7-7700HQ, GeForce GTX 1070 Max-Q | Aorus X5 v7 i7-7820HK, GeForce GTX 1070 Mobile | MSI GS63VR 7RF-228US i7-7700HQ, GeForce GTX 1060 Mobile | MSI GS63VR-6RF16H22 Stealth Pro 6700HQ, GeForce GTX 1060 Mobile | |
|---|---|---|---|---|---|---|---|
| Heat | 2% | -2% | -10% | -13% | -12% | 1% | |
| Maximum Upper Side * (°C) | 47 | 51 -9% | 54.4 -16% | 56.2 -20% | 64 -36% | 45.3 4% | |
| Maximum Bottom * (°C) | 63 | 58 8% | 41.2 35% | 61.2 3% | 56 11% | 62.6 1% | |
| Idle Upper Side * (°C) | 25 | 25 -0% | 31.2 -25% | 27.8 -11% | 29 -16% | 28.4 -14% | 25.3 -1% |
| Idle Bottom * (°C) | 27 | 25 7% | 27.6 -2% | 29.6 -10% | 30 -11% | 29.6 -10% | 27.3 -1% |
* ... smaller is better
Speakers
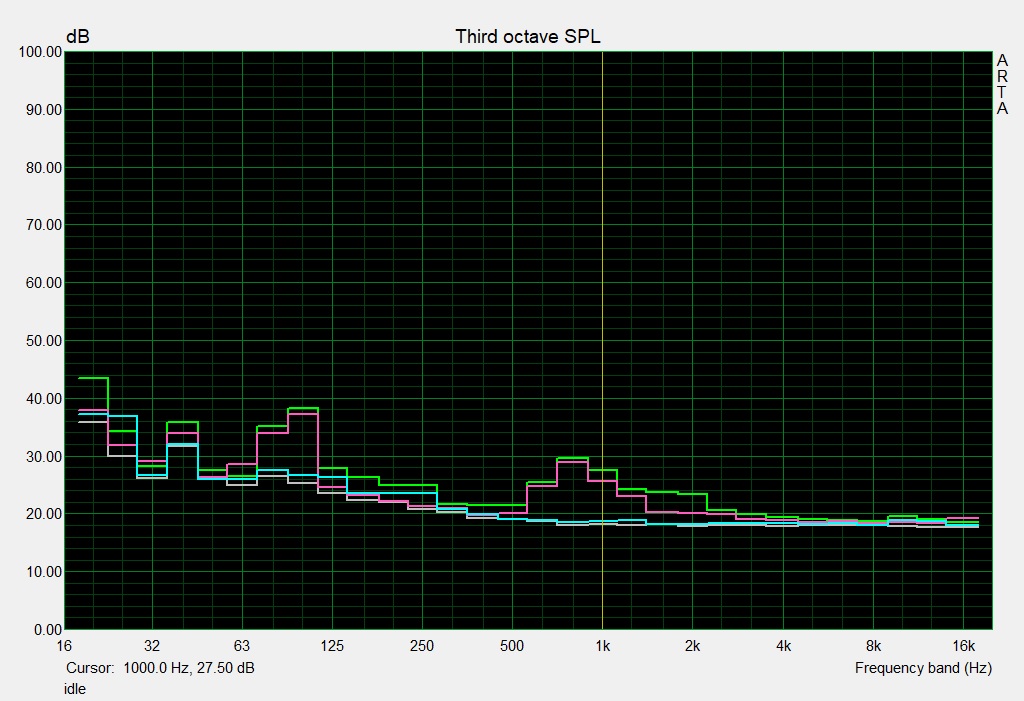
MSI GS63VR 7RG-005 audio analysis
(+) | speakers can play relatively loud (90 dB)
Bass 100 - 315 Hz
(-) | nearly no bass - on average 21.3% lower than median
(-) | bass is not linear (15.2% delta to prev. frequency)
Mids 400 - 2000 Hz
(±) | higher mids - on average 11% higher than median
(±) | linearity of mids is average (10% delta to prev. frequency)
Highs 2 - 16 kHz
(+) | balanced highs - only 3.4% away from median
(±) | linearity of highs is average (9.2% delta to prev. frequency)
Overall 100 - 16.000 Hz
(±) | linearity of overall sound is average (24.2% difference to median)
Compared to same class
» 87% of all tested devices in this class were better, 4% similar, 9% worse
» The best had a delta of 6%, average was 18%, worst was 132%
Compared to all devices tested
» 73% of all tested devices were better, 6% similar, 21% worse
» The best had a delta of 4%, average was 24%, worst was 134%
Aorus X5 v7 audio analysis
(±) | speaker loudness is average but good (78 dB)
Bass 100 - 315 Hz
(-) | nearly no bass - on average 19% lower than median
(±) | linearity of bass is average (10.6% delta to prev. frequency)
Mids 400 - 2000 Hz
(+) | balanced mids - only 4.2% away from median
(+) | mids are linear (5.8% delta to prev. frequency)
Highs 2 - 16 kHz
(+) | balanced highs - only 2.1% away from median
(+) | highs are linear (5.4% delta to prev. frequency)
Overall 100 - 16.000 Hz
(±) | linearity of overall sound is average (18.7% difference to median)
Compared to same class
» 61% of all tested devices in this class were better, 8% similar, 31% worse
» The best had a delta of 6%, average was 18%, worst was 132%
Compared to all devices tested
» 43% of all tested devices were better, 8% similar, 50% worse
» The best had a delta of 4%, average was 24%, worst was 134%
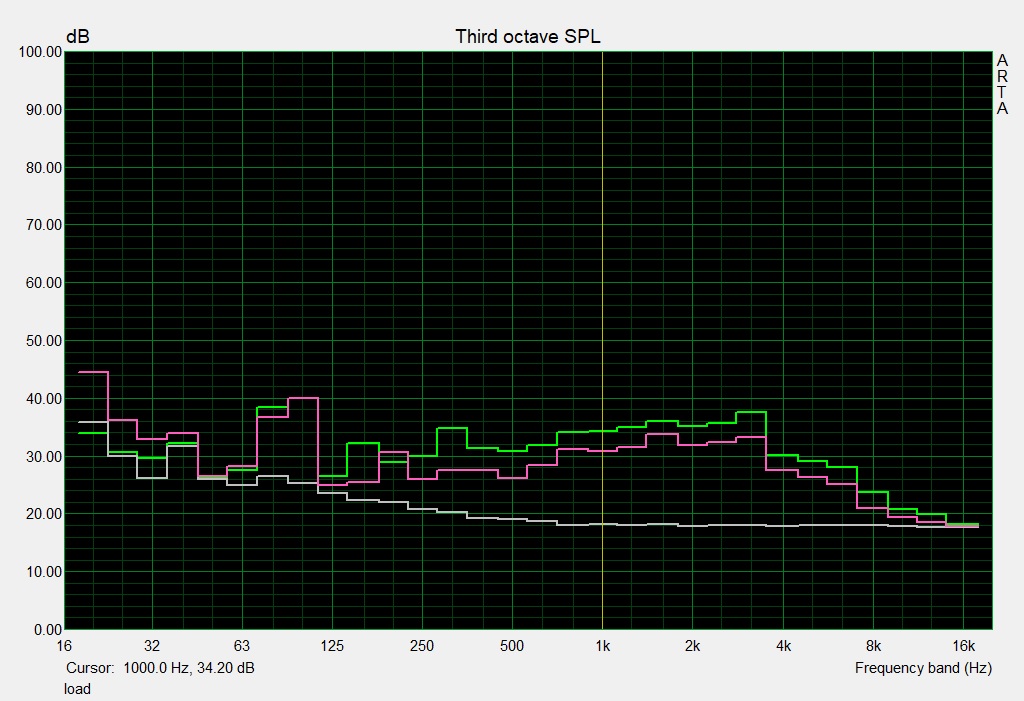
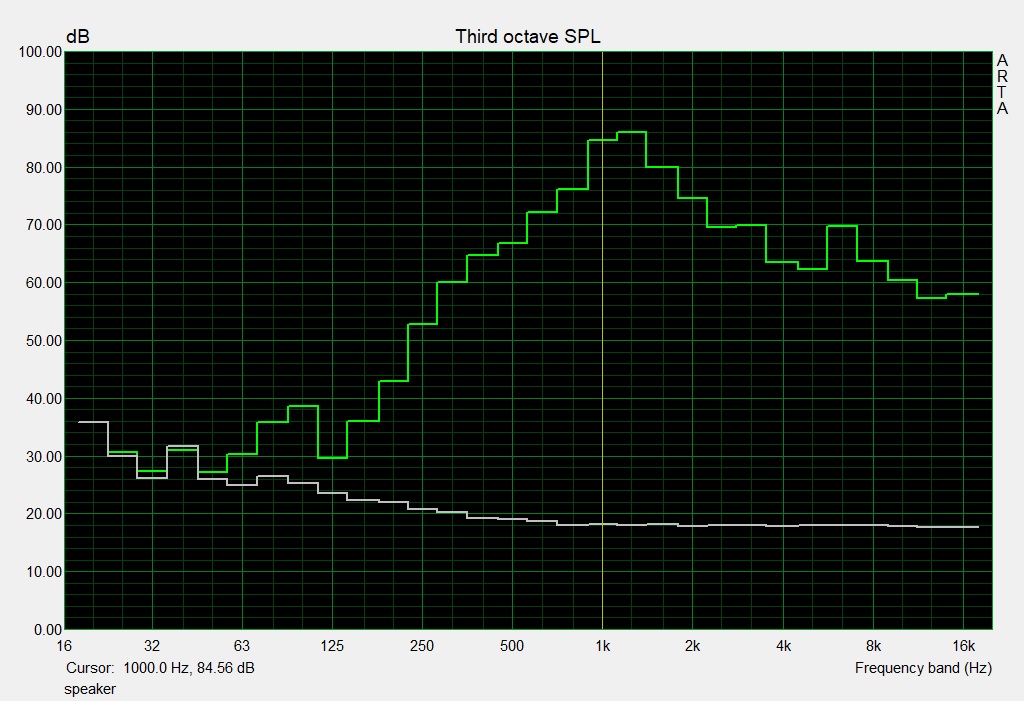
Frequency diagram in comparison (checkboxes can be checked and unchecked!)
Energy Management
Energy Consumption
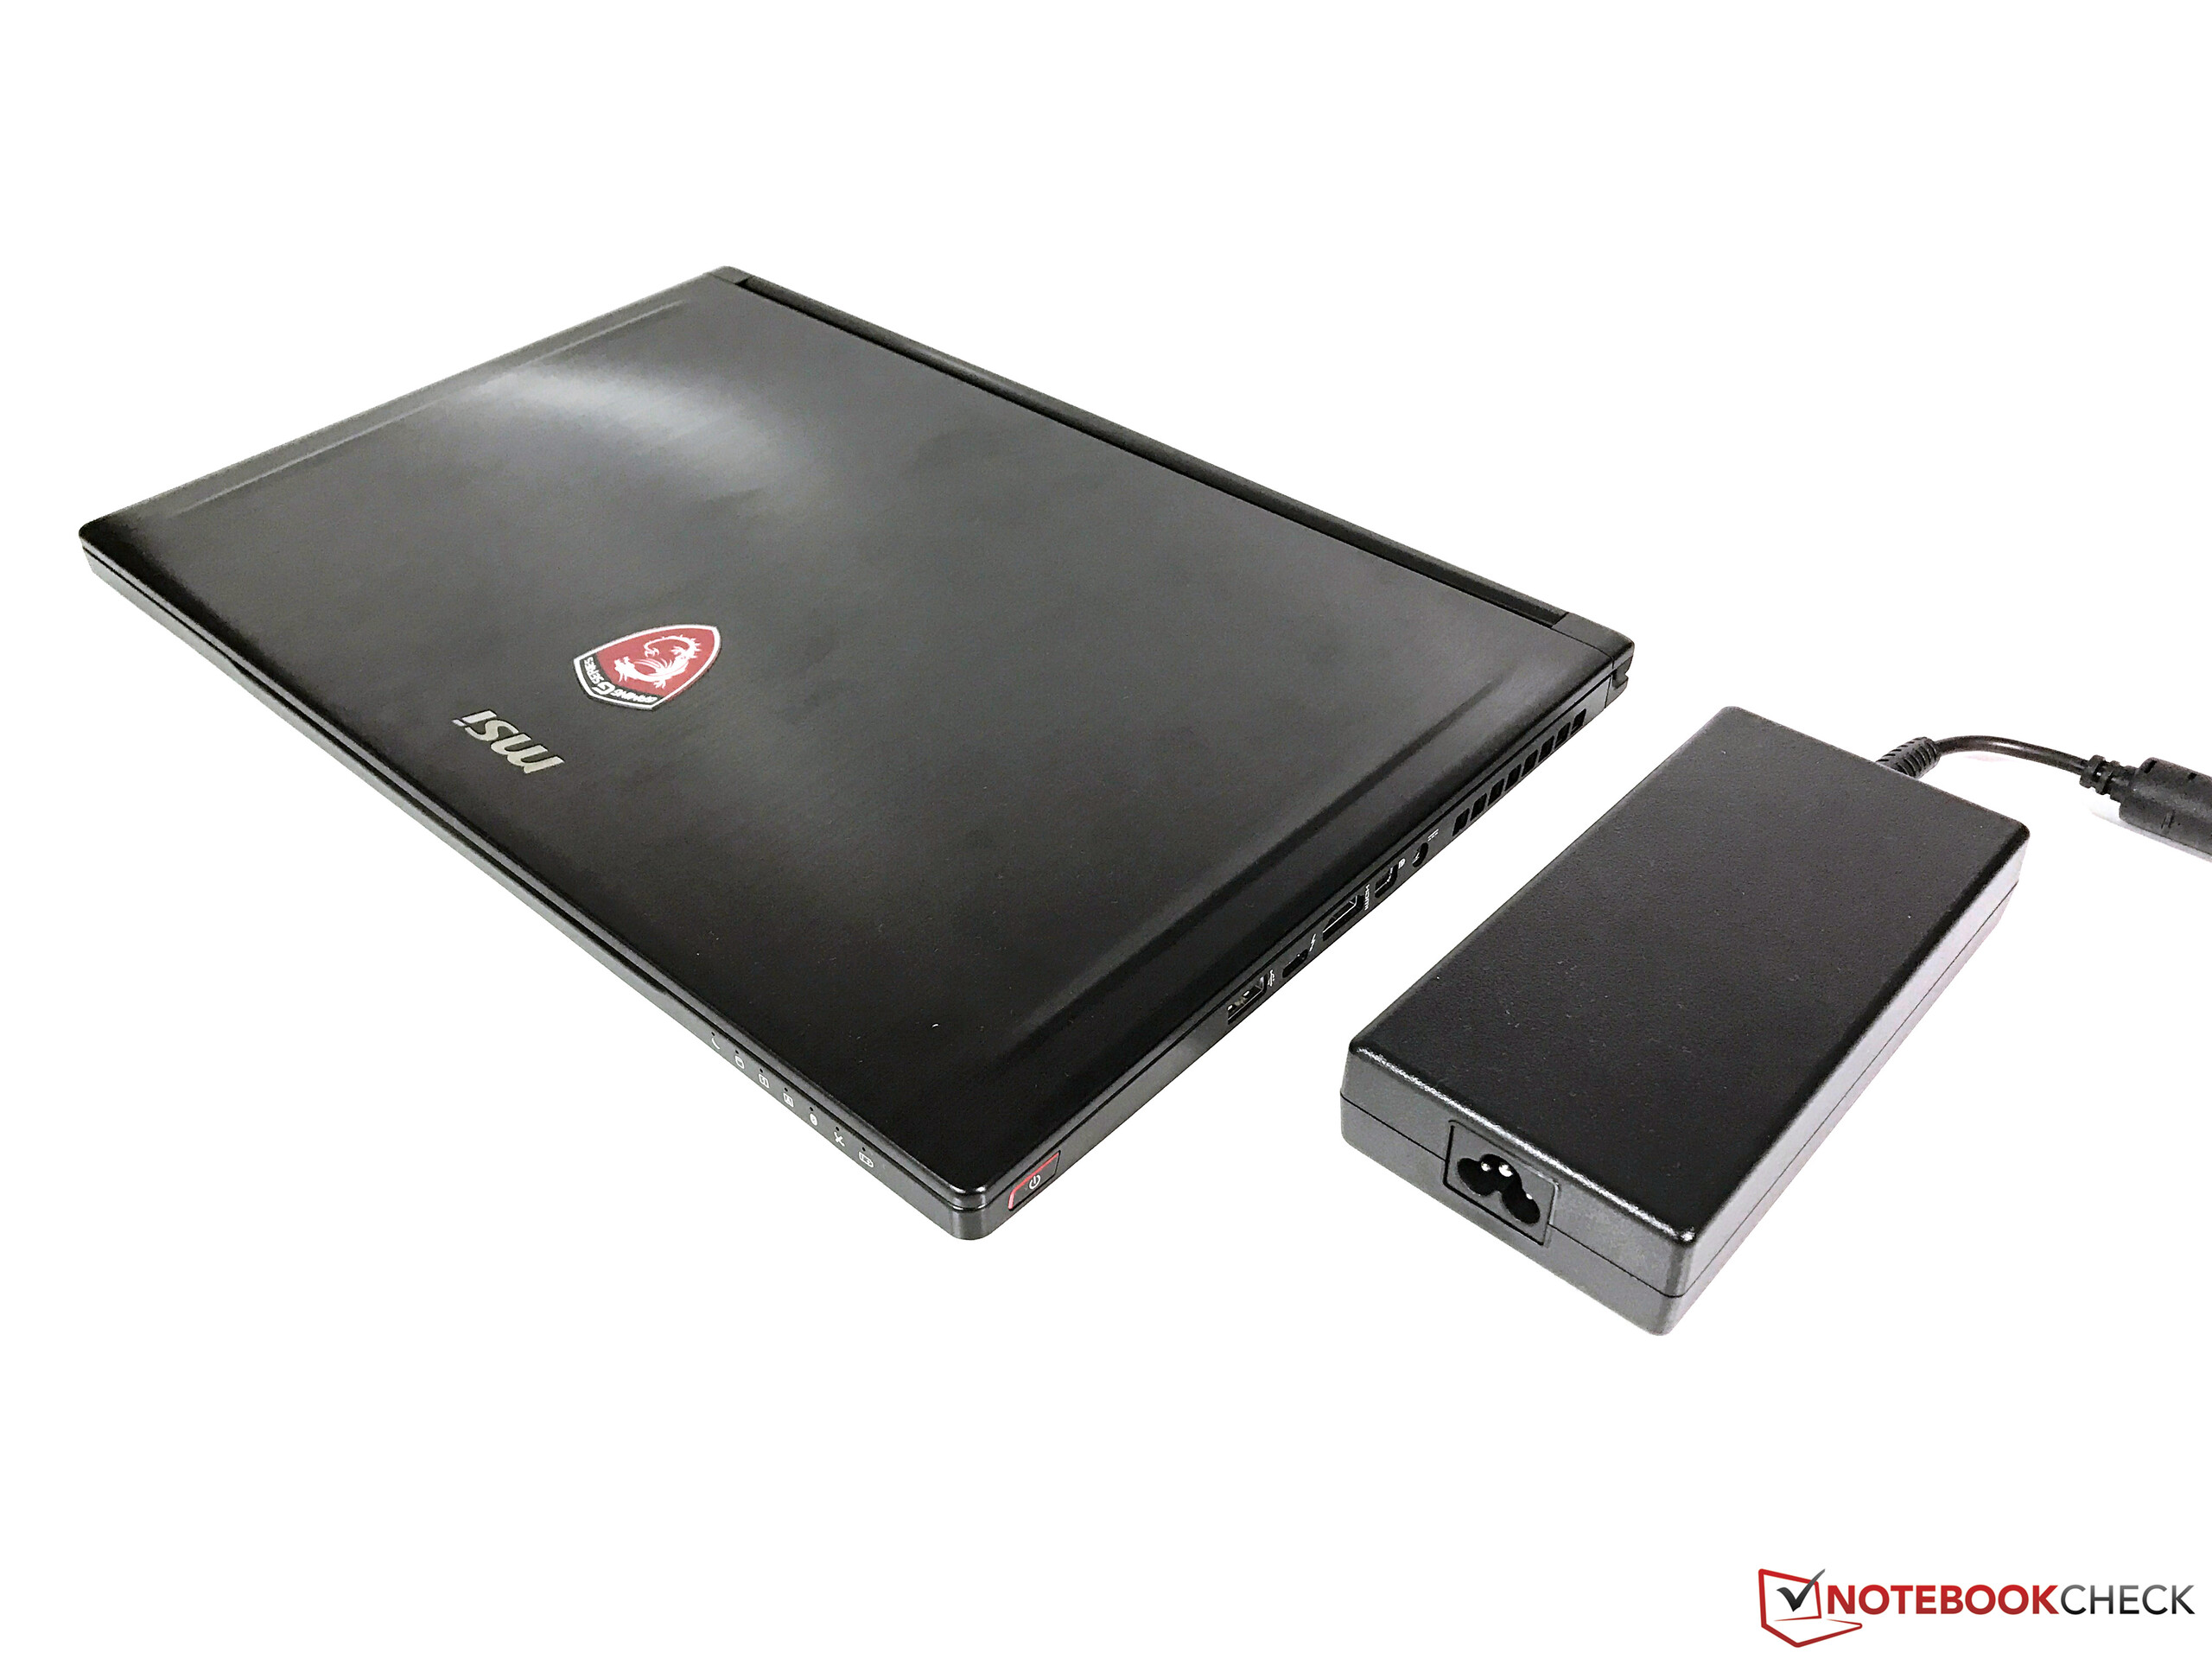
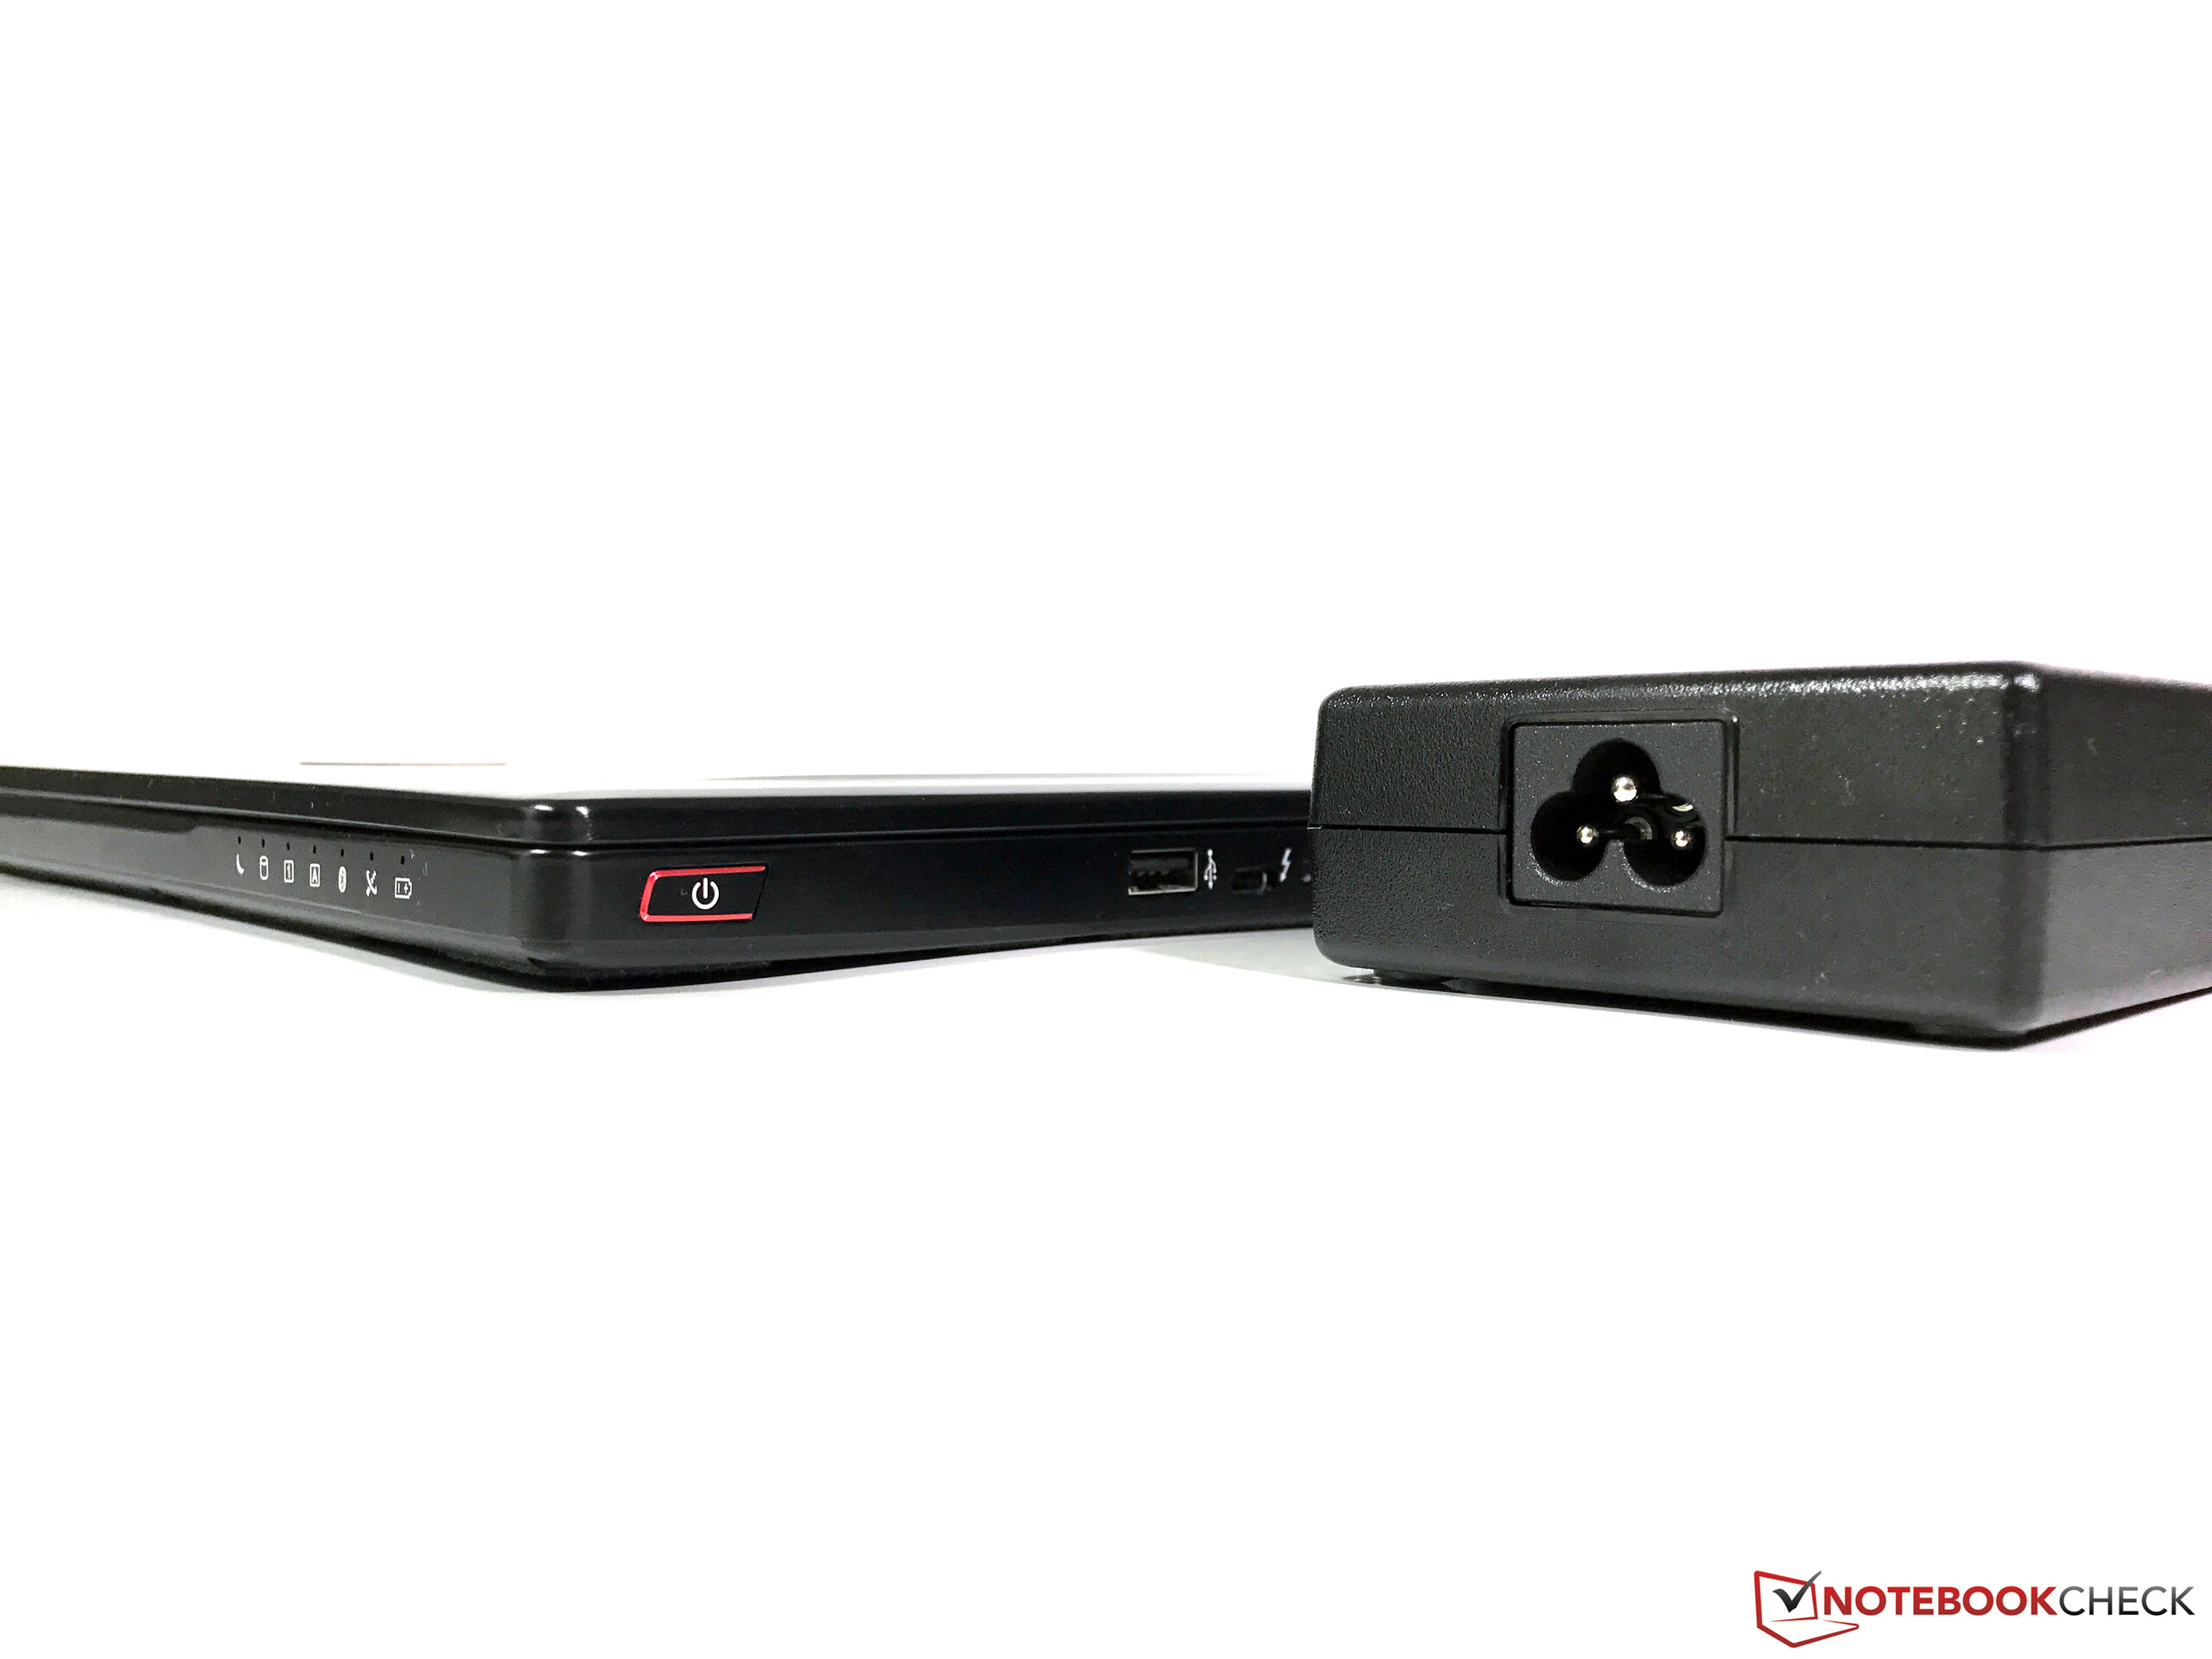
Thanks to Nvidia’s Optimus technology, the energy consumption at idle reaches “only” 21 watts. Notebooks with Nvidia’s Optimus technology disabled draw about 10 watts more. During our stress test, the energy consumption reached 162 watts. During gaming, the power consumption turned out to be somewhat lower. It reached 128 watts during our The Witcher 3 stress test. The nominal power draw of the AC adapter amounts to 180 watts.
| Off / Standby | |
| Idle | |
| Load |
|
Key:
min: | |
| MSI GS63VR 7RG-005 i7-7700HQ, GeForce GTX 1070 Max-Q | Gigabyte Aero 15X i7-7700HQ, GeForce GTX 1070 Max-Q | Asus Zephyrus GX501VS i7-7700HQ, GeForce GTX 1070 Max-Q | Eurocom Q5 i7-7700HQ, GeForce GTX 1070 Max-Q | Aorus X5 v7 i7-7820HK, GeForce GTX 1070 Mobile | MSI GS63VR 7RF-228US i7-7700HQ, GeForce GTX 1060 Mobile | MSI GS63VR-6RF16H22 Stealth Pro 6700HQ, GeForce GTX 1060 Mobile | |
|---|---|---|---|---|---|---|---|
| Power Consumption | 9% | -15% | 12% | -63% | -4% | -25% | |
| Idle Minimum * (Watt) | 12 | 10 17% | 19.1 -59% | 9 25% | 26 -117% | 14.5 -21% | 18 -50% |
| Idle Average * (Watt) | 16 | 13 19% | 20.8 -30% | 13.5 16% | 31 -94% | 17.3 -8% | 22 -38% |
| Idle Maximum * (Watt) | 21 | 20 5% | 21.8 -4% | 13.7 35% | 36 -71% | 17.4 17% | 30 -43% |
| Load Average * (Watt) | 85 | 79 7% | 73.7 13% | 87.8 -3% | 93 -9% | 93 -9% | 77 9% |
| Witcher 3 ultra * (Watt) | 128 | 120 6% | 130.2 -2% | 129 -1% | 176 -38% | 128.8 -1% | |
| Load Maximum * (Watt) | 162 | 165 -2% | 173.1 -7% | 158.6 2% | 240 -48% | 165 -2% |
* ... smaller is better
Battery Life
The GS63VR completes our practically-oriented Wi-Fi test after 3 hours and 52 minutes. Here we run a script that simulates loads that are consistent with web-browsing. The test runs with the “balanced” profile selected, the brightness set to 150 cd/m² and power-saving functions switched off. With a single battery charge, the MSI laptop achieves a runtime of 3 hours and 49 minutes in our video test. In this test, we play the short film Big Buck Bunny (H.264, 1920x1080) in a continuous loop. The communications modules as well as the energy-saving functions are switched off, and the brightness is set to 150 cd/m².
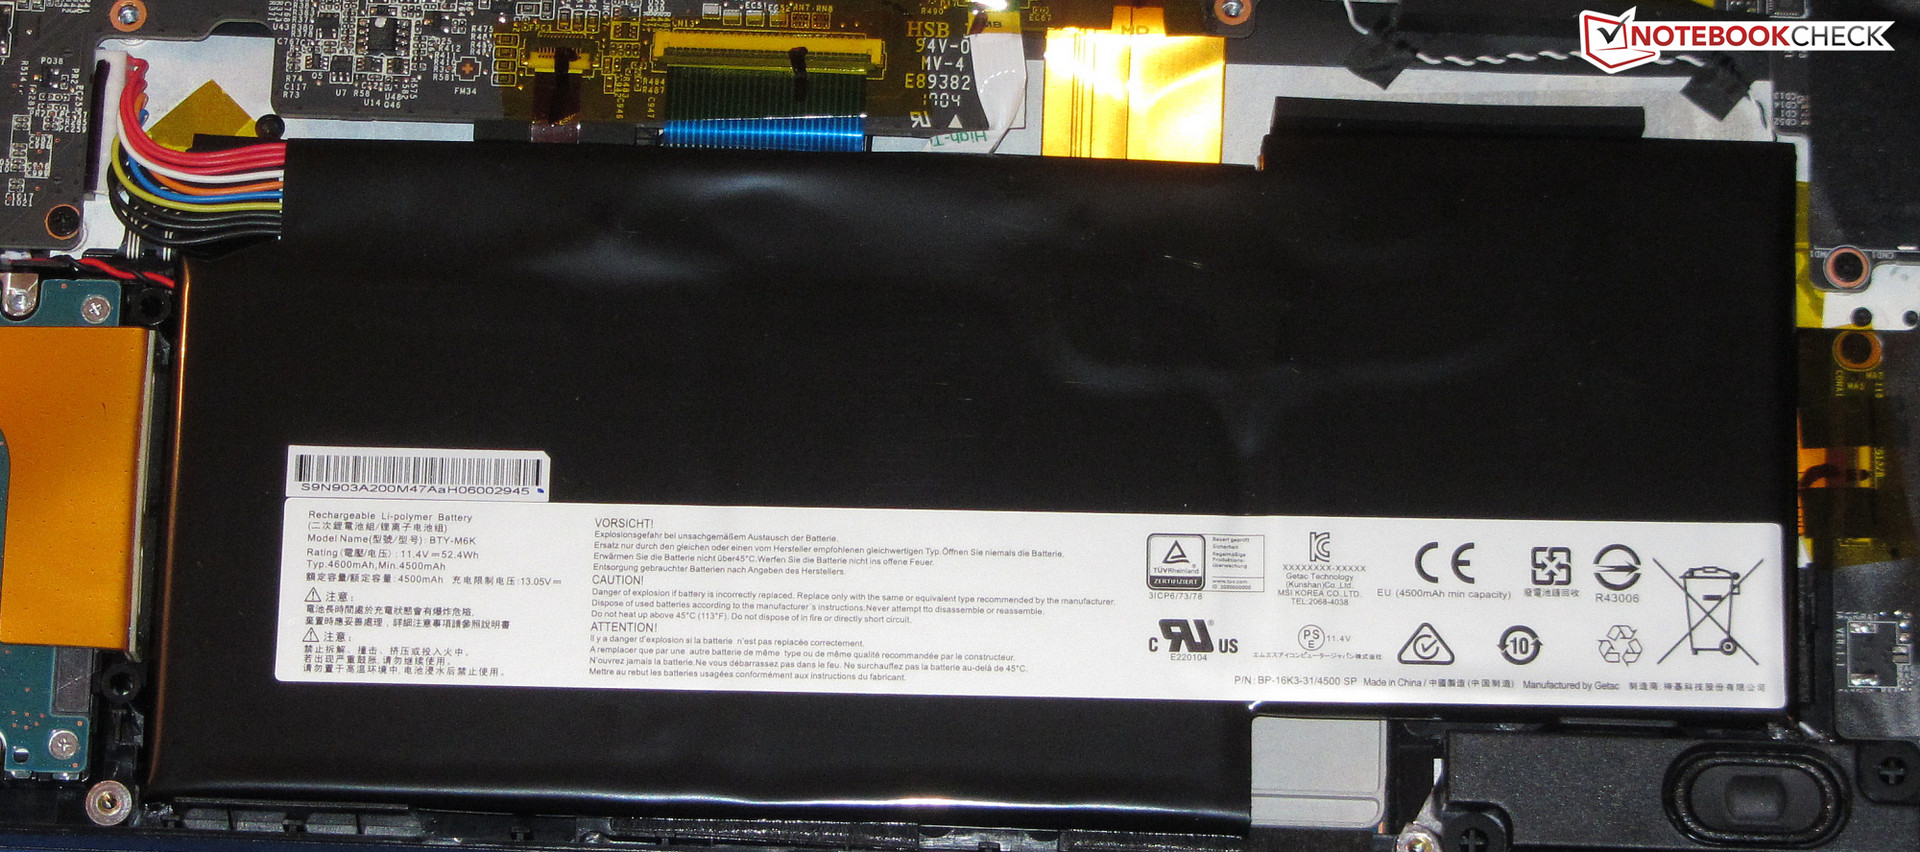
The MSI GS63VR delivers somewhat worse battery runtimes than its previously reviewed siblings. The reason for this: The battery of our current device has a lower capacity (52.4 Wh) than the batteries of the sibling models (65 Wh). All in all, the battery runtimes are in good order, for a gaming notebook. Most of the competitors deliver similar results. In terms of battery life, only the Gigabyte Aero 15X sticks out from the crowd. It delivers battery runtimes that many simple office notebooks cannot achieve.
| MSI GS63VR 7RG-005 i7-7700HQ, GeForce GTX 1070 Max-Q, 52.4 Wh | Gigabyte Aero 15X i7-7700HQ, GeForce GTX 1070 Max-Q, 94.2 Wh | Asus Zephyrus GX501VS i7-7700HQ, GeForce GTX 1070 Max-Q, 50 Wh | Eurocom Q5 i7-7700HQ, GeForce GTX 1070 Max-Q, 55 Wh | Aorus X5 v7 i7-7820HK, GeForce GTX 1070 Mobile, 94 Wh | MSI GS63VR 7RF-228US i7-7700HQ, GeForce GTX 1060 Mobile, 65 Wh | MSI GS63VR-6RF16H22 Stealth Pro 6700HQ, GeForce GTX 1060 Mobile, 65 Wh | |
|---|---|---|---|---|---|---|---|
| Battery runtime | 125% | -30% | 9% | -16% | 14% | 11% | |
| Reader / Idle (h) | 5.7 | 13 128% | 3.8 -33% | 7.8 37% | 3.5 -39% | 6.4 12% | 6 5% |
| H.264 (h) | 3.8 | 7.6 100% | 2.7 -29% | 4.5 18% | |||
| WiFi v1.3 (h) | 3.9 | 8.2 110% | 2.5 -36% | 4.3 10% | 2.5 -36% | 3.9 0% | 3.5 -10% |
| Load (h) | 1 | 2.6 160% | 0.8 -20% | 0.8 -20% | 1.4 40% | 1.3 30% | 1.3 30% |
Verdict
Pros
Cons
If you hold the MSI GS63VR in your hands, you will not get the impression that this is a gaming laptop. The slender, light device bears more resemblance to a mobile office notebook. Far from it - the device’s hardware can run all the latest games smoothly on the matte Full HD screen with high or even maximum graphical settings. However, the frame rates fall somewhat behind those of the comparable notebooks.
A lightning-fast NVMe SSD makes for a very responsive system. The SSD cannot be easily replaced. For this, one will have to remove the entire motherboard. Replacing the supplied 2.5-inch HDD is much easier. The good keyboard should satisfy anyone who has to type a lot. The battery is in good order. The fast SD card reader and the Thunderbolt 3 port are also worth mentioning.
MSI goes for fast response times instead of viewing-angle stability.
The matte Full HD screen delights with a great contrast ratio and fast response times. The brightness of a notebook with this price tag should have been higher. What we are dealing with here is a TN display with poor viewing angles. However, MSI uses a TN panel of a better kind, which has better viewing angles than many models that can be found in low-priced notebooks.
MSI GS63VR 7RG-005
- 11/17/2017 v6 (old)
Sascha Mölck
Price comparison
