MSI GP63 Leopard 8RE (i7-8750H, GTX 1060, FHD) Xotic PC Edition Laptop Review
We've reviewed MSI's budget and thus more affordable GP series of gaming notebooks several times in the past. Last year's 15.6-inch MSI GP62 Xotic PC Edition packed a more entry-level Nvidia GeForce GTX 1050 Ti alongside a quad-core Intel Core i7-7700HQ CPU; our review notebook this time features an Nvidia GeForce GTX 1060 with 6 GB of RAM and the new hexa-core Intel Coffee Lake Core i7-8750H CPU. Otherwise, the two systems are very similar: 120 Hz FHD TN display panel, 16 GB of RAM, and a 128 GB primary SSD alongside a 1 TB mechanical hard drive.
At a first glance, the new GP63 looks very similar to the predecessor, but the new model has been revised in several key areas:
- no DVD+/-RW drive
- one additional USB 3.1 Gen1 port
- different motherboard layout
- additional M.2 slot
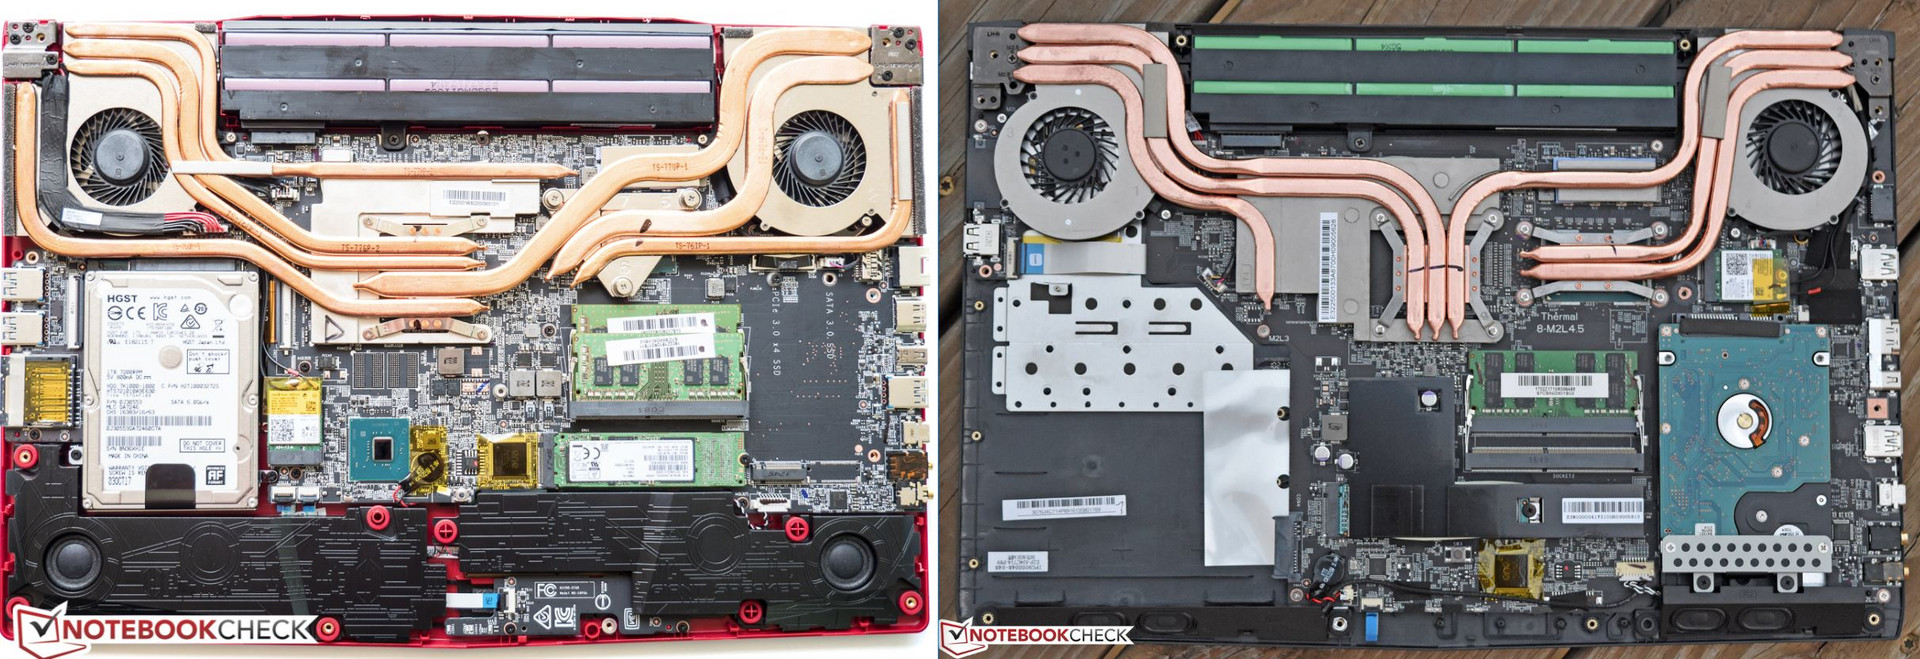
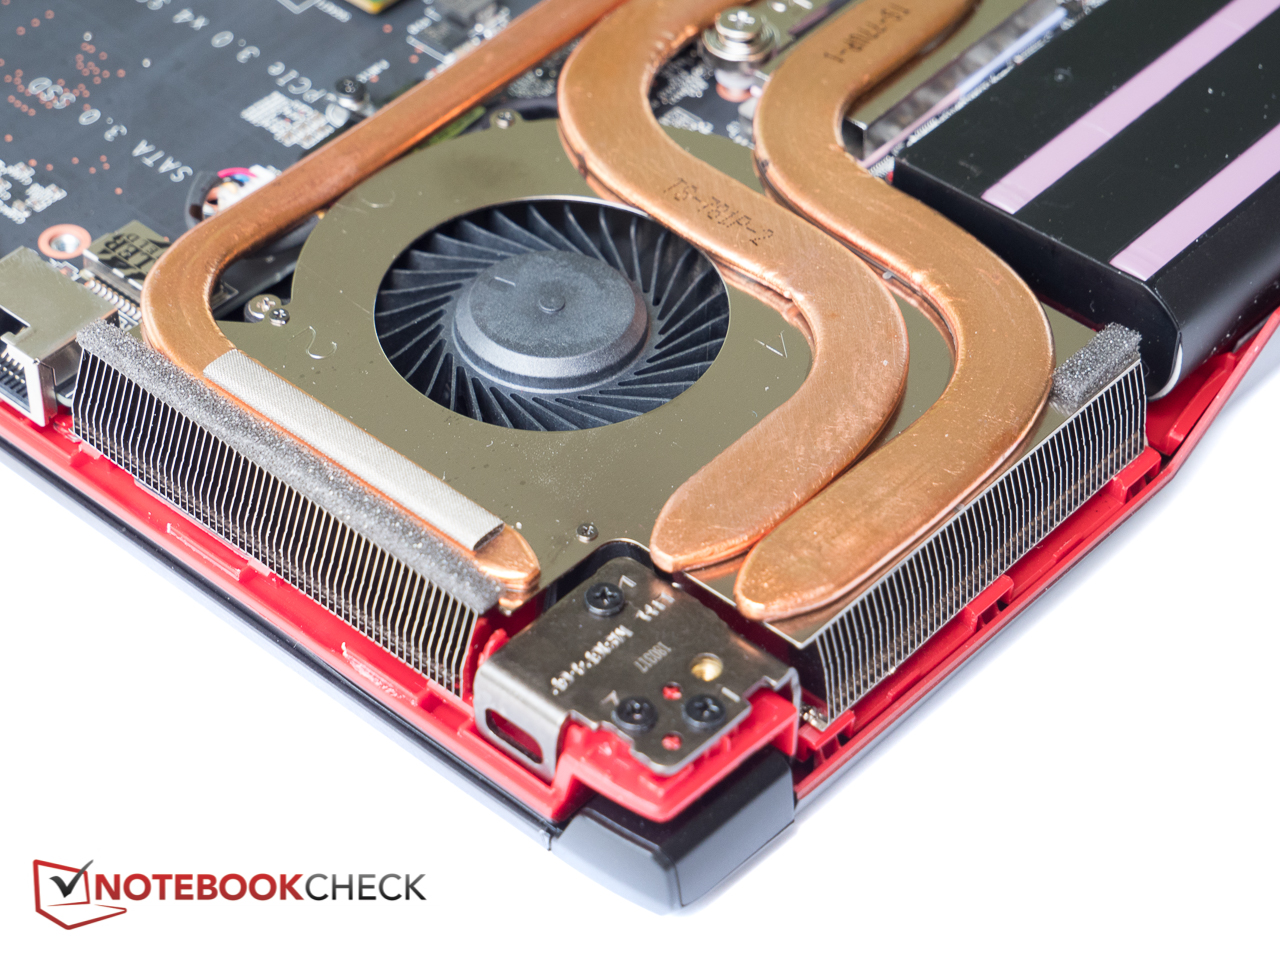
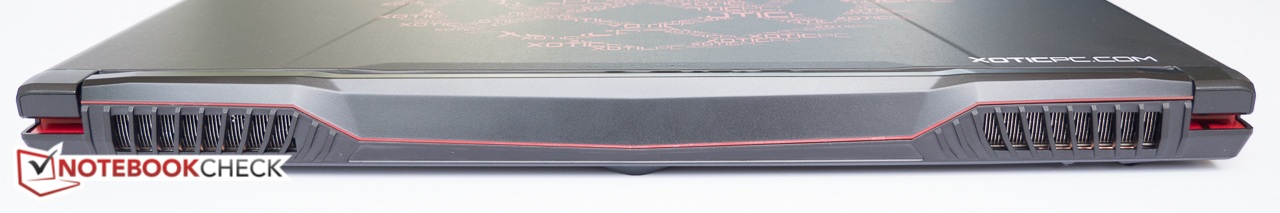
- revamped cooling system with seven heat pipes instead of six
- two additional exhaust outlets
- increased battery capacity
Our supplier Xotic PC offers the GP63 Leopard with Nvidia Gefore GTX 1050TI and FHD IPS display for $1300; our model with Nvidia Gefore GTX 1060 and 120 Hz FHD TN display sells for $1500. The sole processor available at this time is the hexa-core i7-8750H CPU.
Competitors in this realm are not hard to find and range from the more affordable HP Omen 15-ce002ng, the Lenovo Legion Y720, or the Acer Aspire V15 Nitro, among numerous others. Of particular interest is the fact that many of the currently available gaming systems are equipped with the same Nvidia GPU, but older Intel quad-core CPUs and are therefore sold at what could be considered bargain prices.
Case
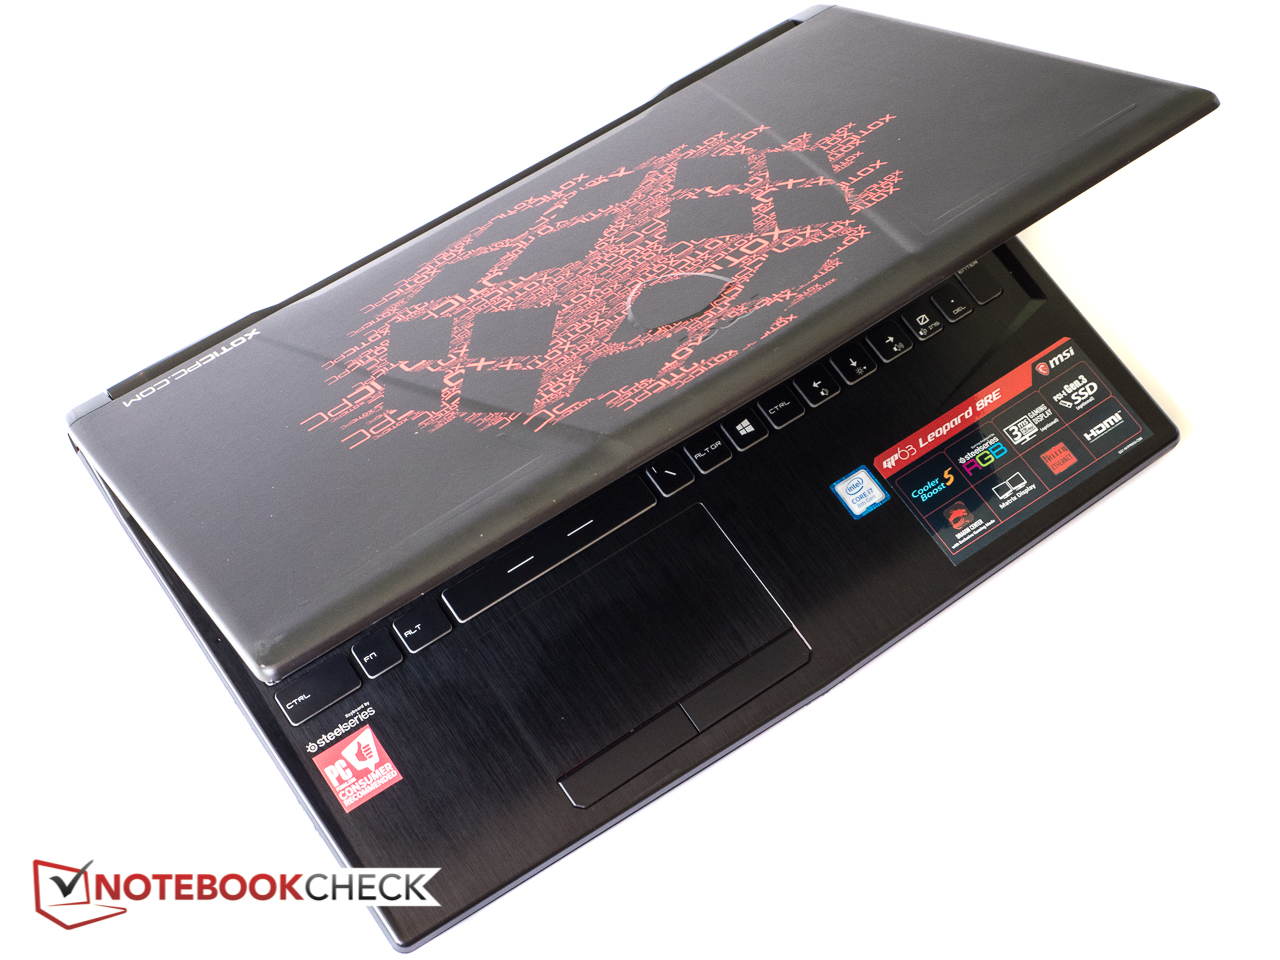
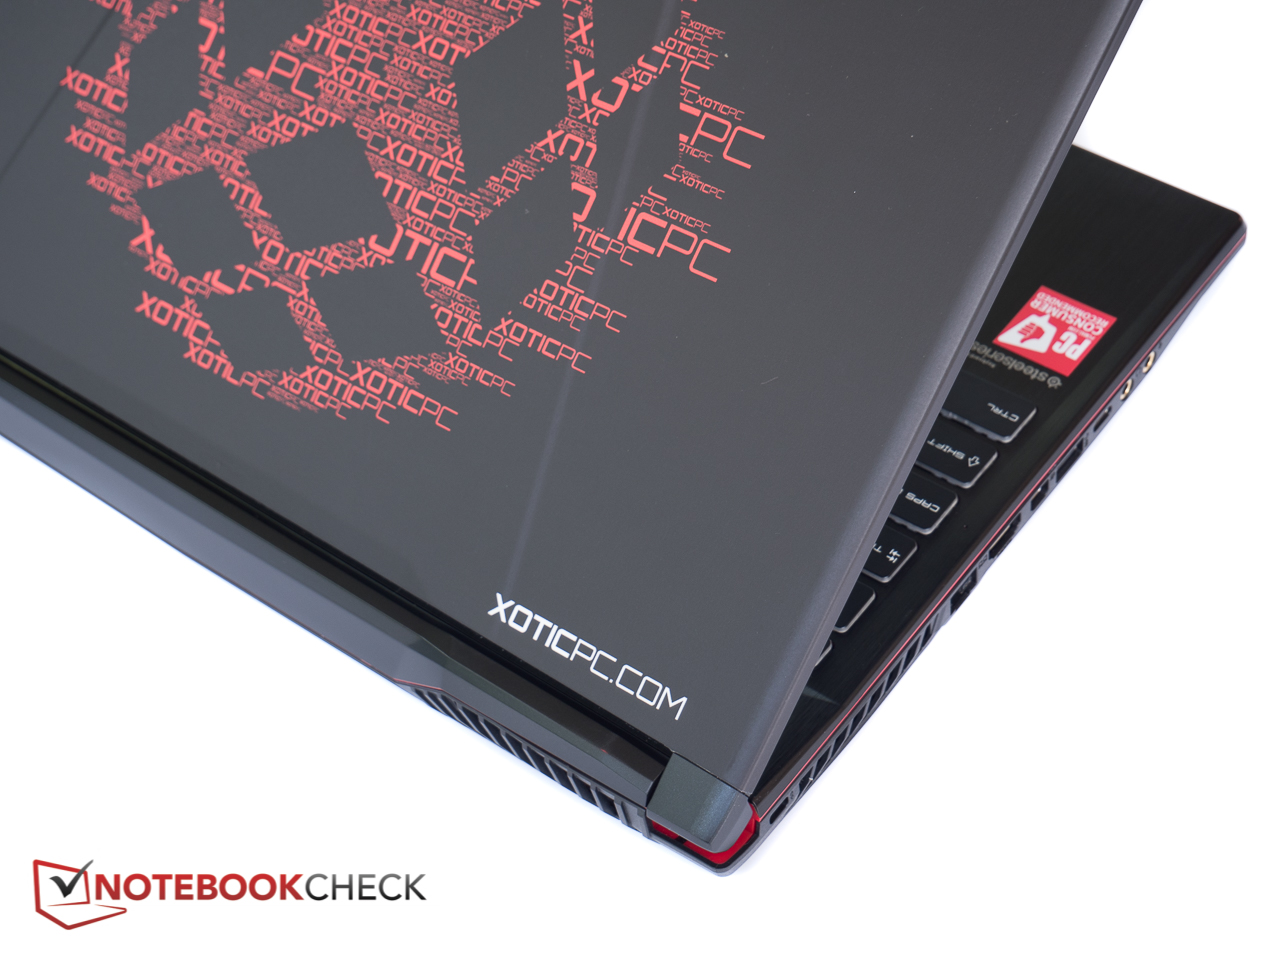
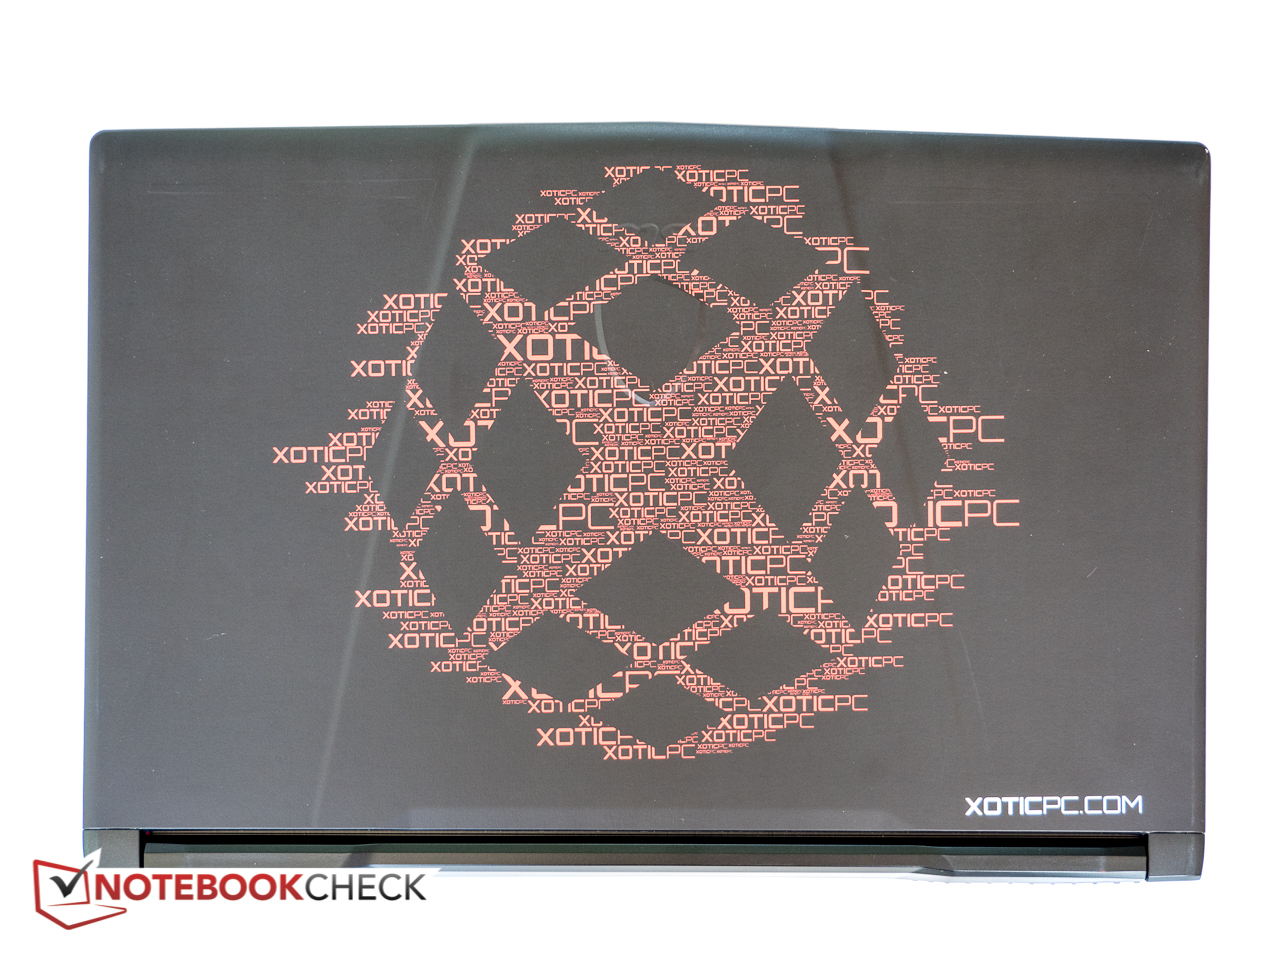
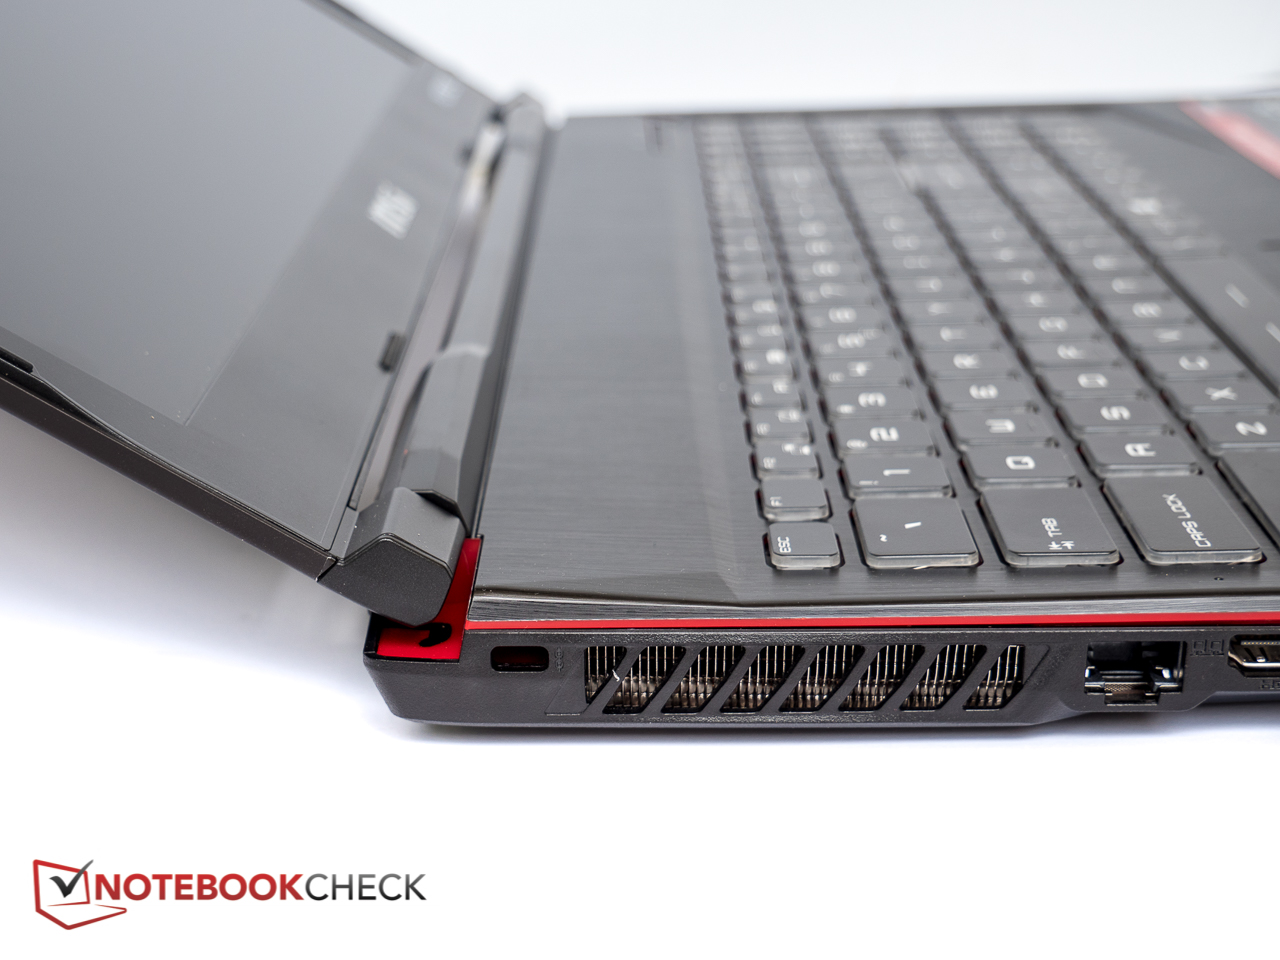
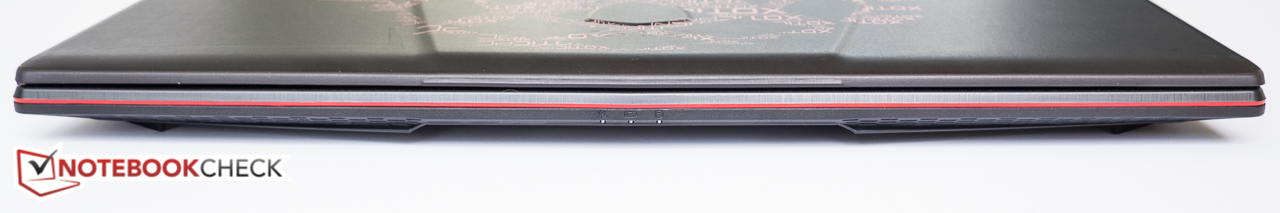
As expected given its budget status, the chassis of the GP63 doesn't look particularly upscale, nor does it feel that way. The bottom unit consists of black plastic with the palm rest featuring a faux brushed-metal finish. For the GP series, MSI normally uses brushed aluminum on the back of the display lid, but Xotic PC customizes the design with the lid now covered in what appears to be a matte black "skin", which is adorned with a massive red Xotic PC logo.
The base unit is decently sturdy with acceptable rigidity and flex across the width of the keyboard and the palm rests. Even during more vigorous twisting attempts there's very little creaking. The lid is very flexible when twisting and bending (particularly between the hinges) and localized pressure induces ripples up front. The hinges, which allow for a very generous opening angle of about 150 degrees, are stiff enough to prevent the display from teetering during normal use.
With the laptop sitting on a glass table or a similar hard and smooth surface, placing a hand on the palm rests produces a touchpad-like clicking sound. Closer examination of the bottom corners reveals that the outermost contact point is actually a triangular piece of plastic and not the rubber foot located more towards the center. This plastic foot hovers a fraction of a millimeter above the surface the laptop is sitting on and makes contact only when pressure is applied from above. Although not detrimental in the least and more or less inaudible on other surfaces, this still seems like a peculiar design choice on MSI's part.
At 383 x 260 x 29 and tipping the scale at just over 2.3 kg, the dimensions remain unchanged compared to the MSI GP62 7REX. The GP63 thus features an average footprint, thickness and weight for the class. The Gigabyte Aero 15X is a lot slimmer and not as deep or wide, but costs a lot more.
Connectivity
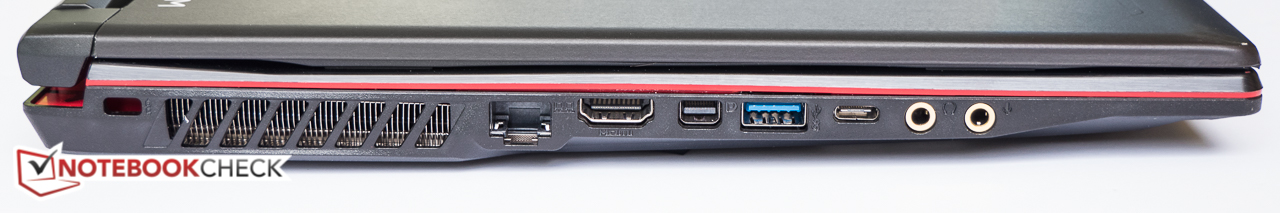
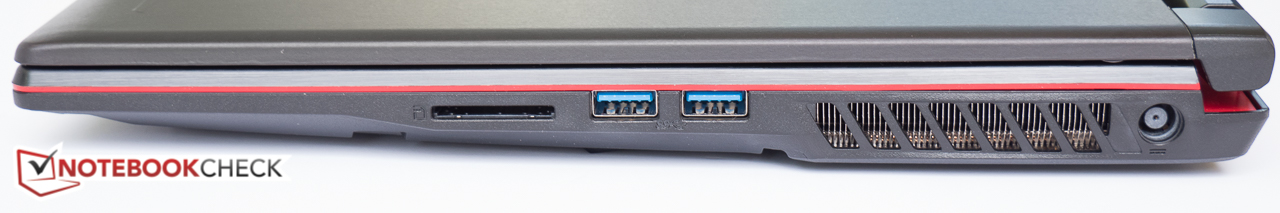
The port selection has been updated as well with the system losing the DVD+/-RW drive in favor of another USB port. The GP63 now features a single Type-C Gen2 USB 3.1 port in addition to 3x Type-A USB 3.1 Gen1 ports. The GP63's GTX 1060 GPU allows 4k60 output through both the HDMI and mDP ports. As before, the GP63 lacks a genuine Tunderbolt 3 port, even though competitors like the Lenovo Legion Y720 are already equipped with one. All physical ports are located somewhat closer to the front edge, which could potentially interfere with the operation of a mouse when a lot of peripherals and cables are plugged in.
SD Card Reader
The SD Card reader results of 32 MB/s and 26.3 MB/s for our AS SSD read and JPG Copy tests are an improvement, but performance remains unimpressive even when compared to other, lower-end gaming laptops. A fully inserted card still sticks out a bit, so care needs to be taken during transport to avoid potential damage.
| SD Card Reader | |
| average JPG Copy Test (av. of 3 runs) (sort by value) | |
| MSI GP63 Leopard 8RE-013US (Toshiba Exceria Pro SDXC 64 GB UHS-II) | |
| HP Omen 15-ce002ng (Toshiba Exceria Pro SDXC 64 GB UHS-II) | |
| Acer Aspire VN7-593G-73HP V15 Nitro BE | |
| Asus Strix GL703VM-DB74 (Toshiba Exceria Pro SDXC 64 GB UHS-II) | |
| Eurocom Q6 (Toshiba Exceria Pro SDXC 64 GB UHS-II) | |
| maximum AS SSD Seq Read Test (1GB) (sort by value) | |
| MSI GP63 Leopard 8RE-013US (Toshiba Exceria Pro SDXC 64 GB UHS-II) | |
| HP Omen 15-ce002ng (Toshiba Exceria Pro SDXC 64 GB UHS-II) | |
| Acer Aspire VN7-593G-73HP V15 Nitro BE | |
| Asus Strix GL703VM-DB74 (Toshiba Exceria Pro SDXC 64 GB UHS-II) | |
| Eurocom Q6 (Toshiba Exceria Pro SDXC 64 GB UHS-II) | |
Communication
The GP63 features an upgraded high-performance Killer E2400 chipset for cable-based connectivity and an Intel Wireless-AC 9560 module for wireless access. With transmit and receive rates of 660 and 626 Mbps, respectively, the GP63 Leopard can certainly hold its own even when compared to some of the pricier competitors. We experienced no random disconnects or other issues during the review period.
Software
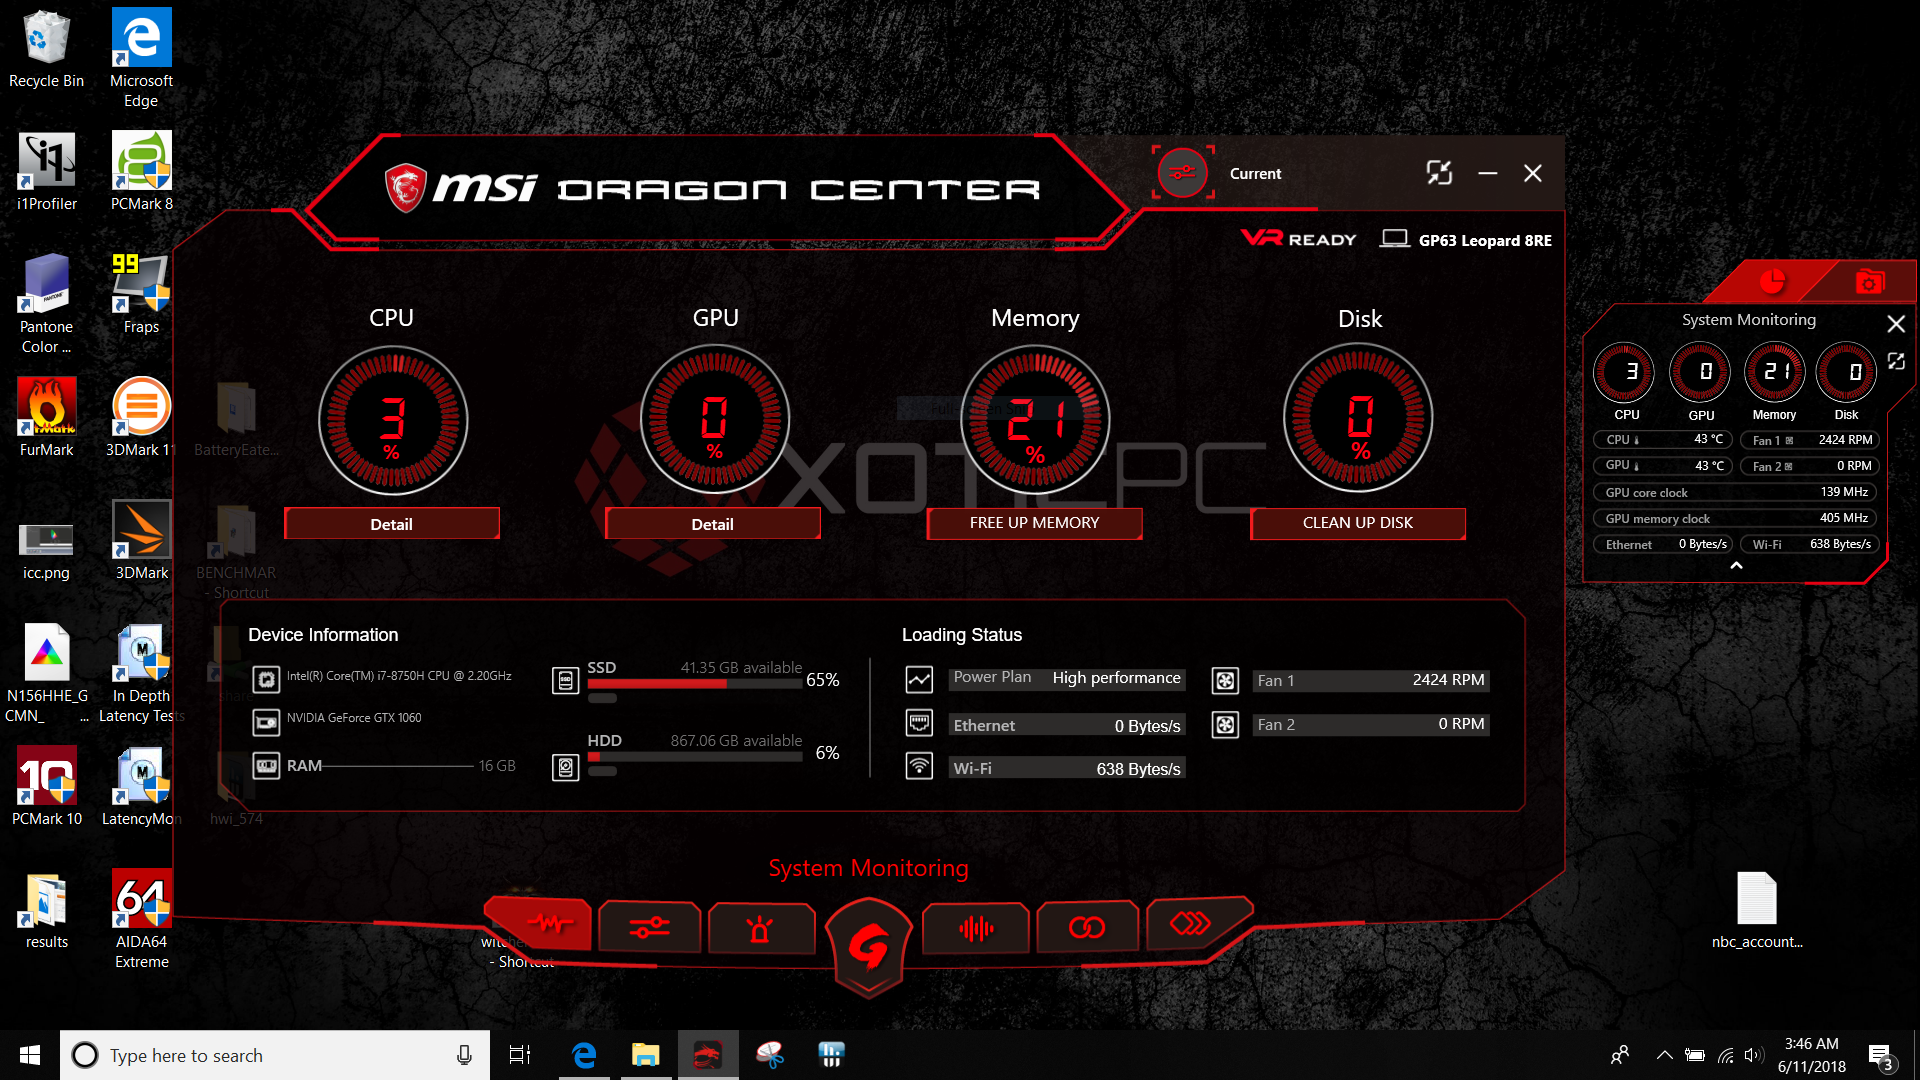
MSI includes their Dragon Center 2.0 software, which provides system monitoring and tuning via customizable profiles, an LED wizard for the RGB keyboard, a gaming mode with auto-tuning functionality, a voice wizard, a mobil connection center, as well as a section for tools and help. The window is semi-transparent and cannot be resized. A mini-mode allows for a separate display of various applets, which remain on top at all times.
Accessories
Aside from the 180 W power adapter, the notebook itself and a few pamphlets, the shipping box is empty.
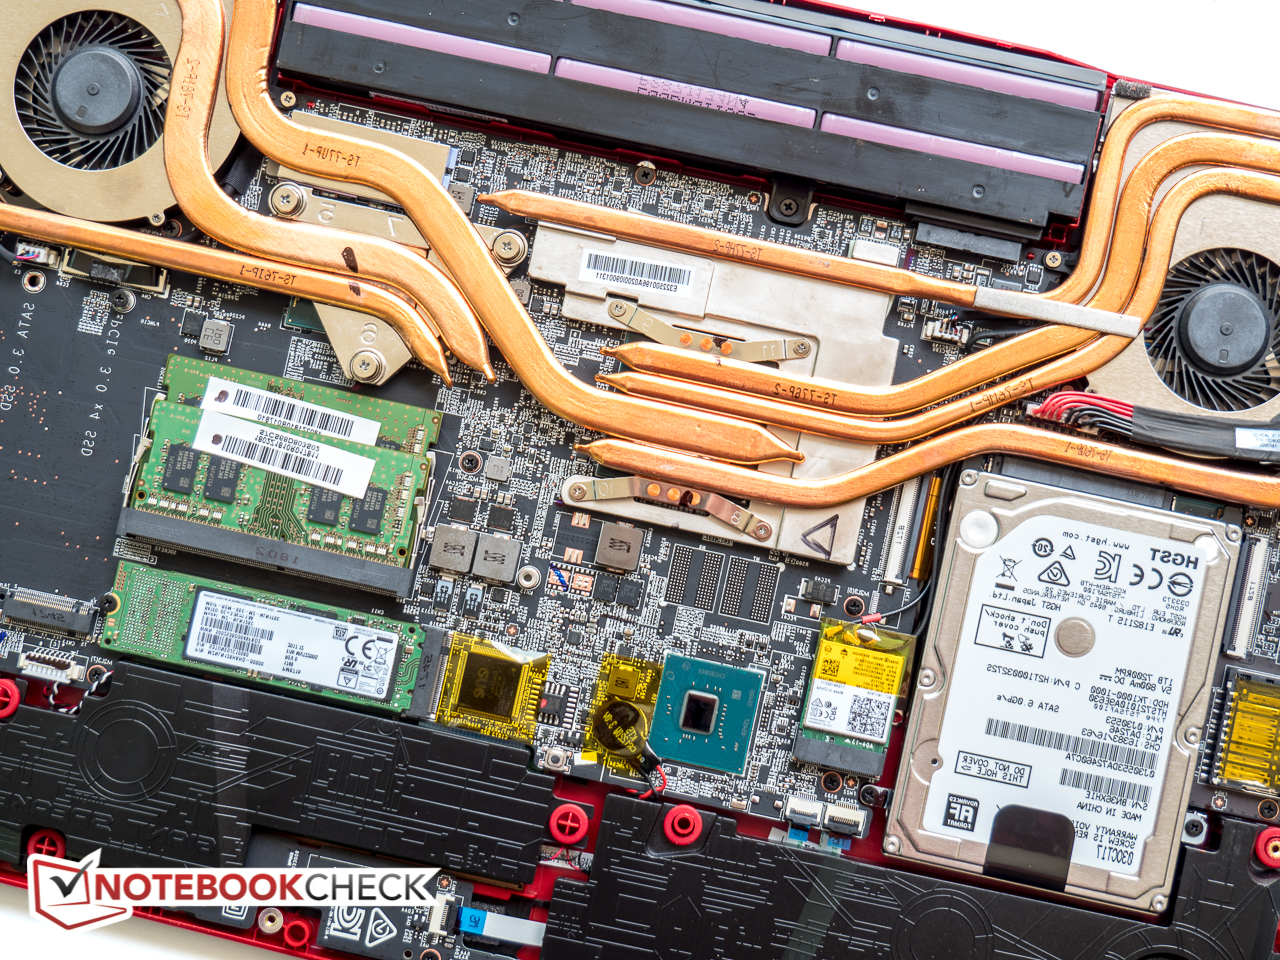
Maintenance
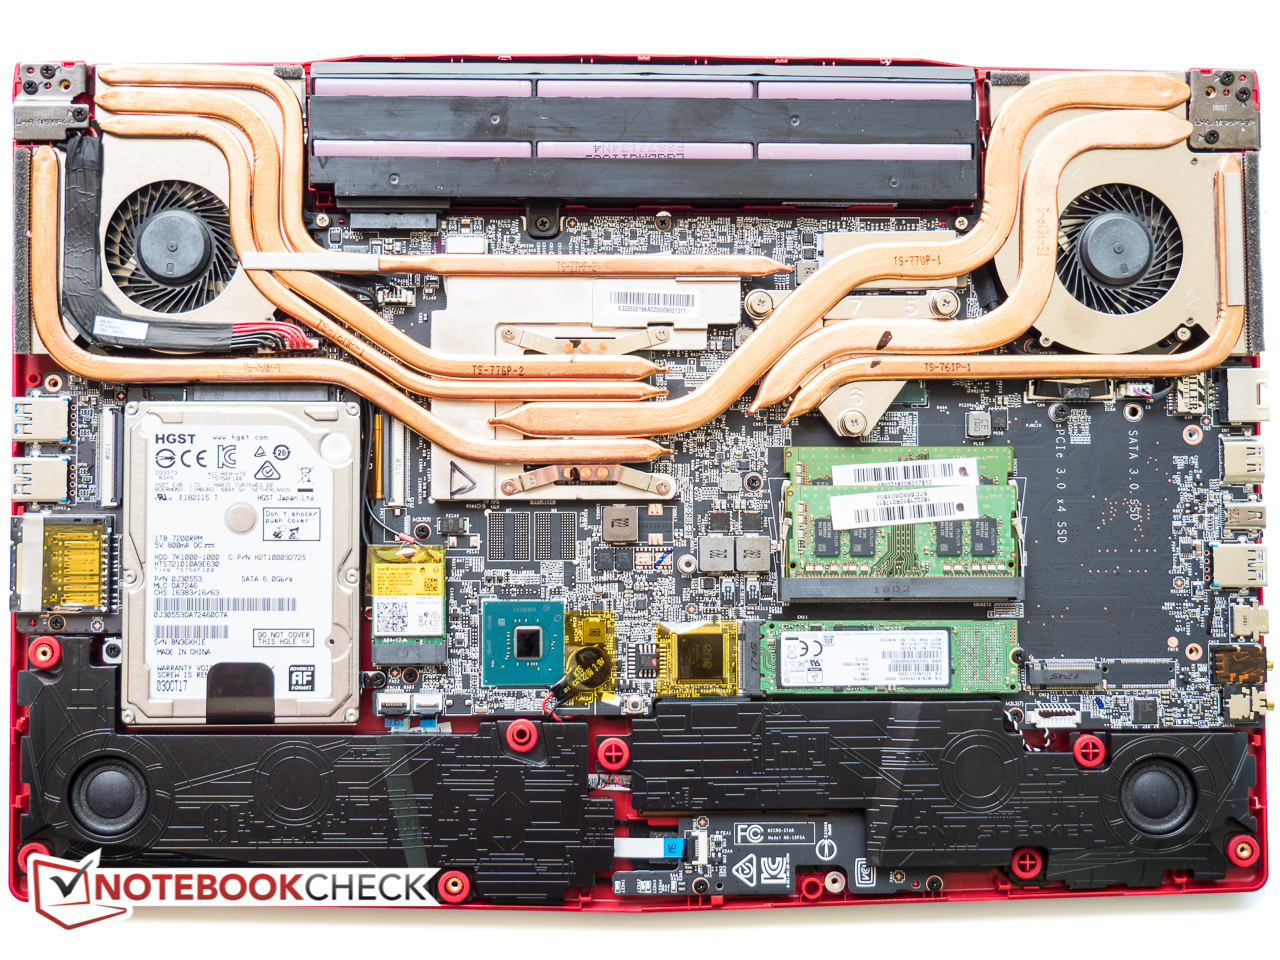
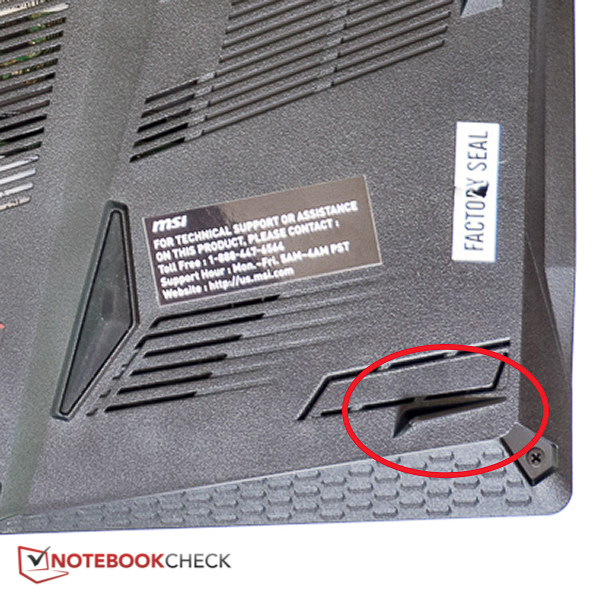
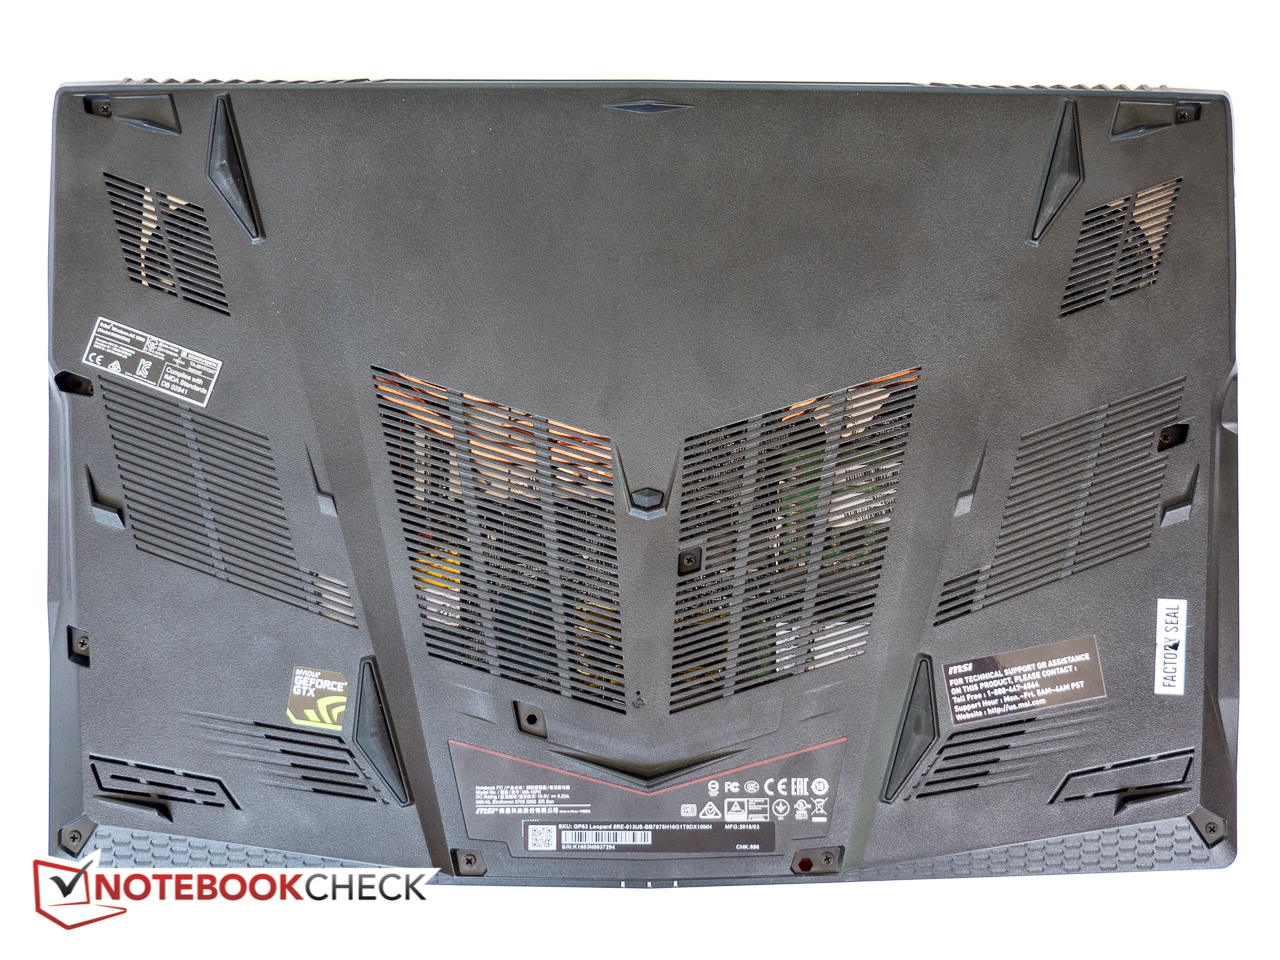
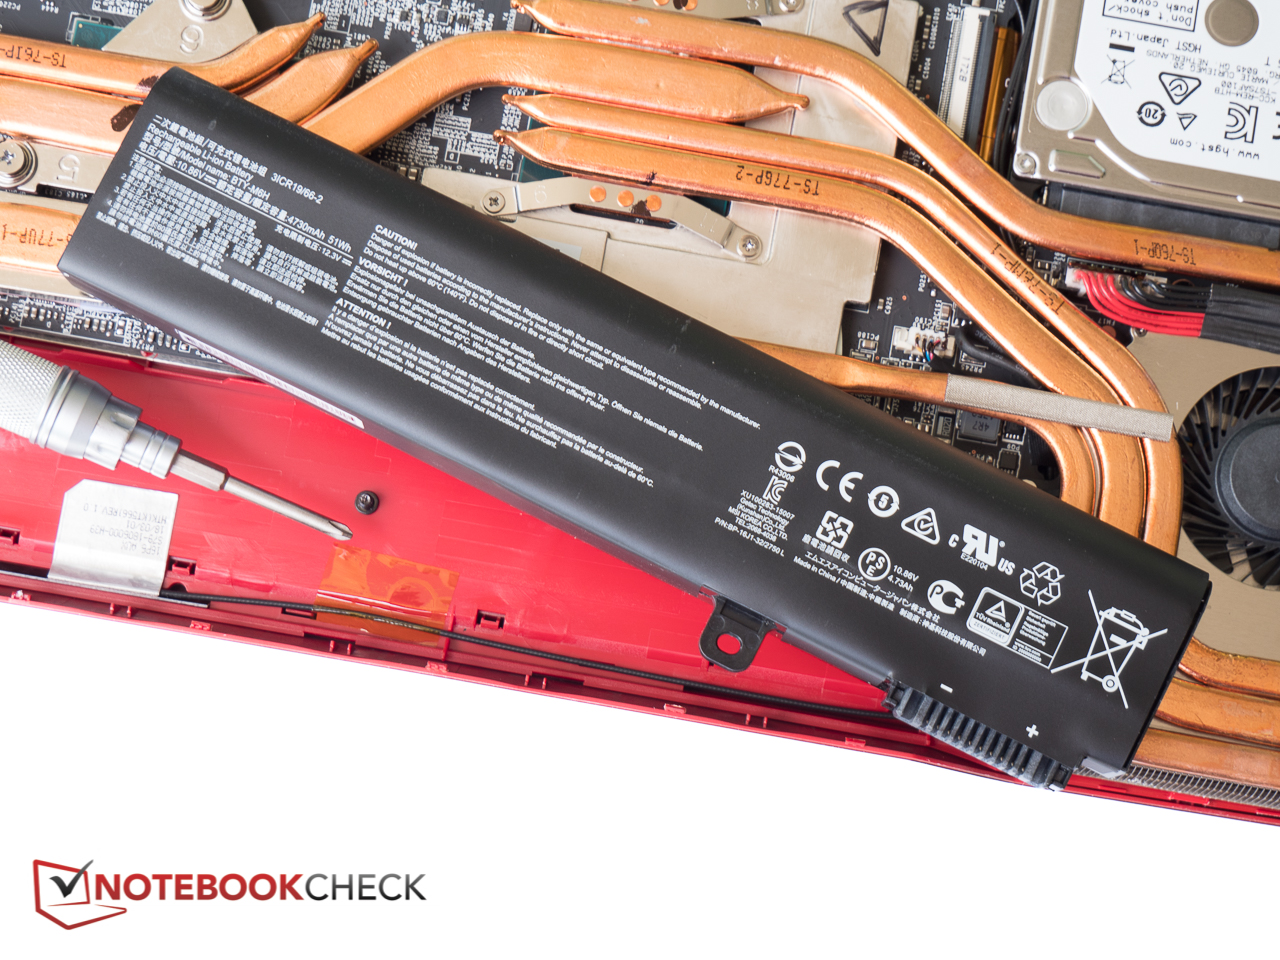
Maintenance is not overly difficult and requires the removal of eleven screws – one of which is hidden under the “factory seal” sticker – before the bottom can be pried off with a guitar pick or a similar plastic tool. Once the panel has been removed, all of the major internal parts - both RAM slots, the two M.2 NVMe slot and the 2.5-inch bay, the dual cooling fans, and the WLAN module are all easily accessible, so upgrades are very easy indeed. Kudos to MSI: the battery is attached with a single screw and easily replaceable should it become necessary.
Warranty
Just like its predecessor, the GP63 features a 12-month depot warranty with lifetime technical support. A one-year Accidental Damage Warranty applies only if the product is registered within 30 days of the ship date. A one-year Xotic PC warranty is provided on all customized components as well. Please see our Guarantees, Return policies and Warranties FAQ for country-specific information.
Input Devices
Keyboard
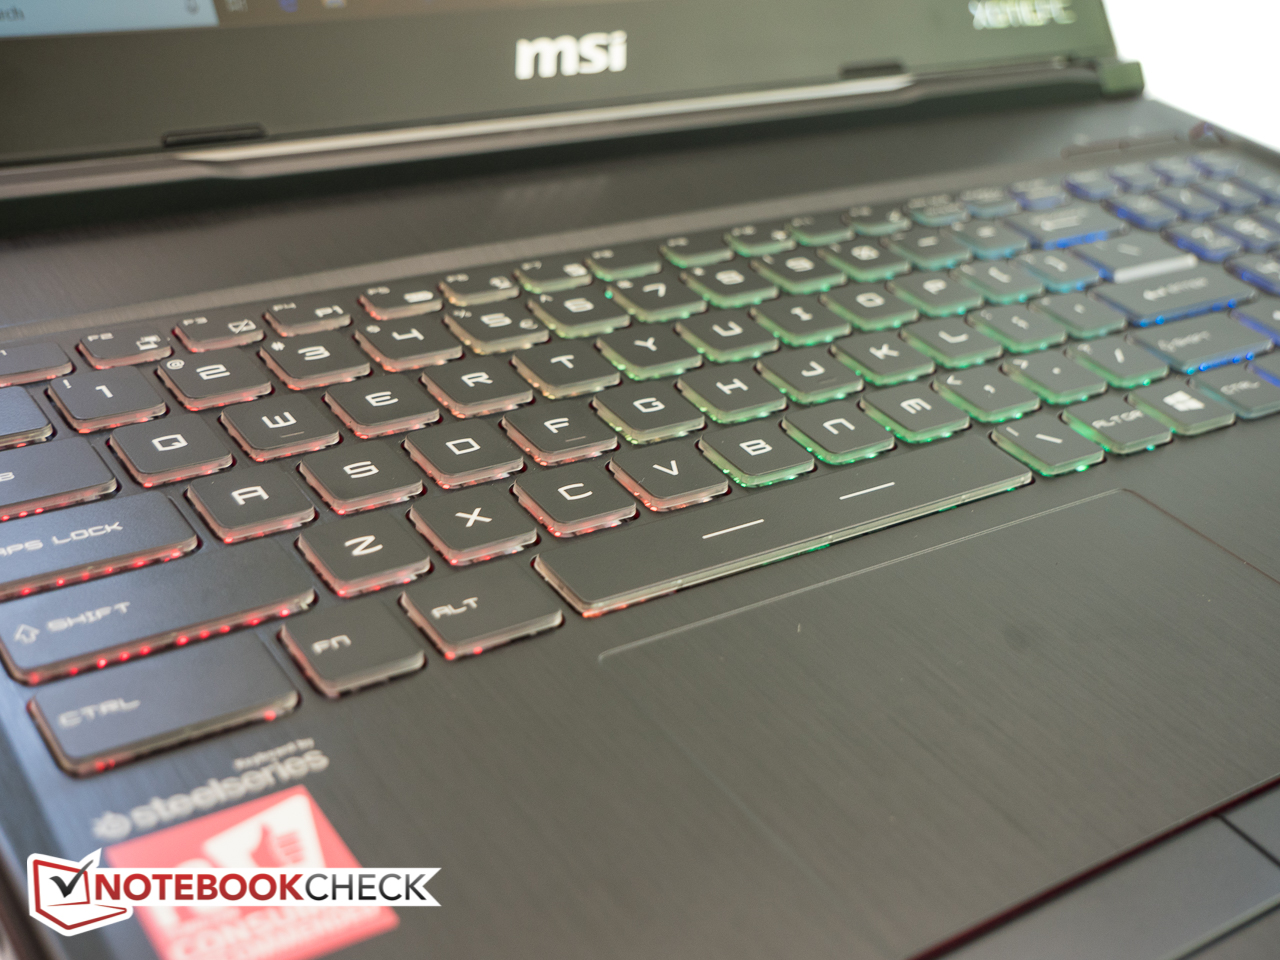
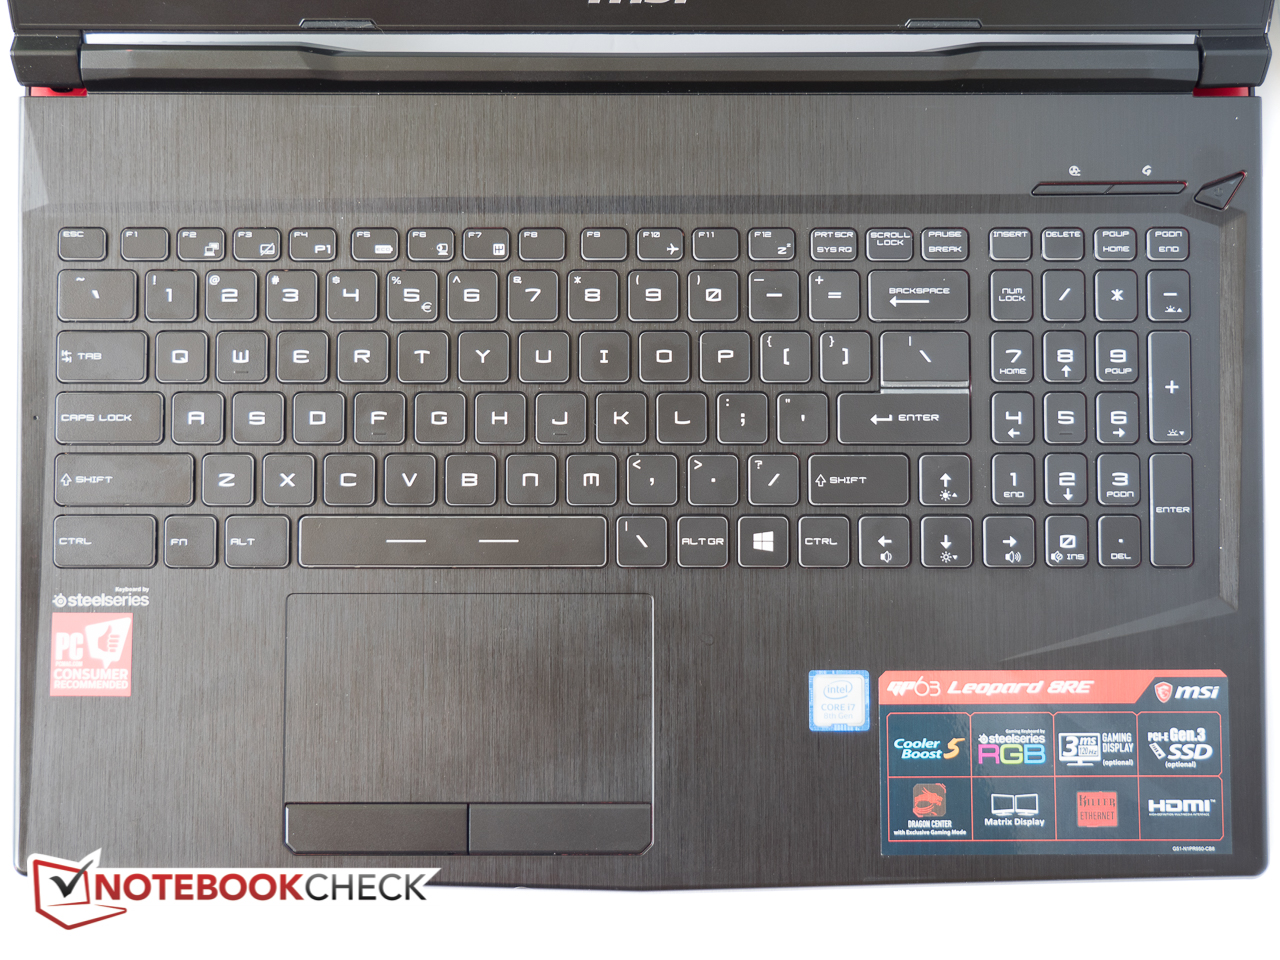
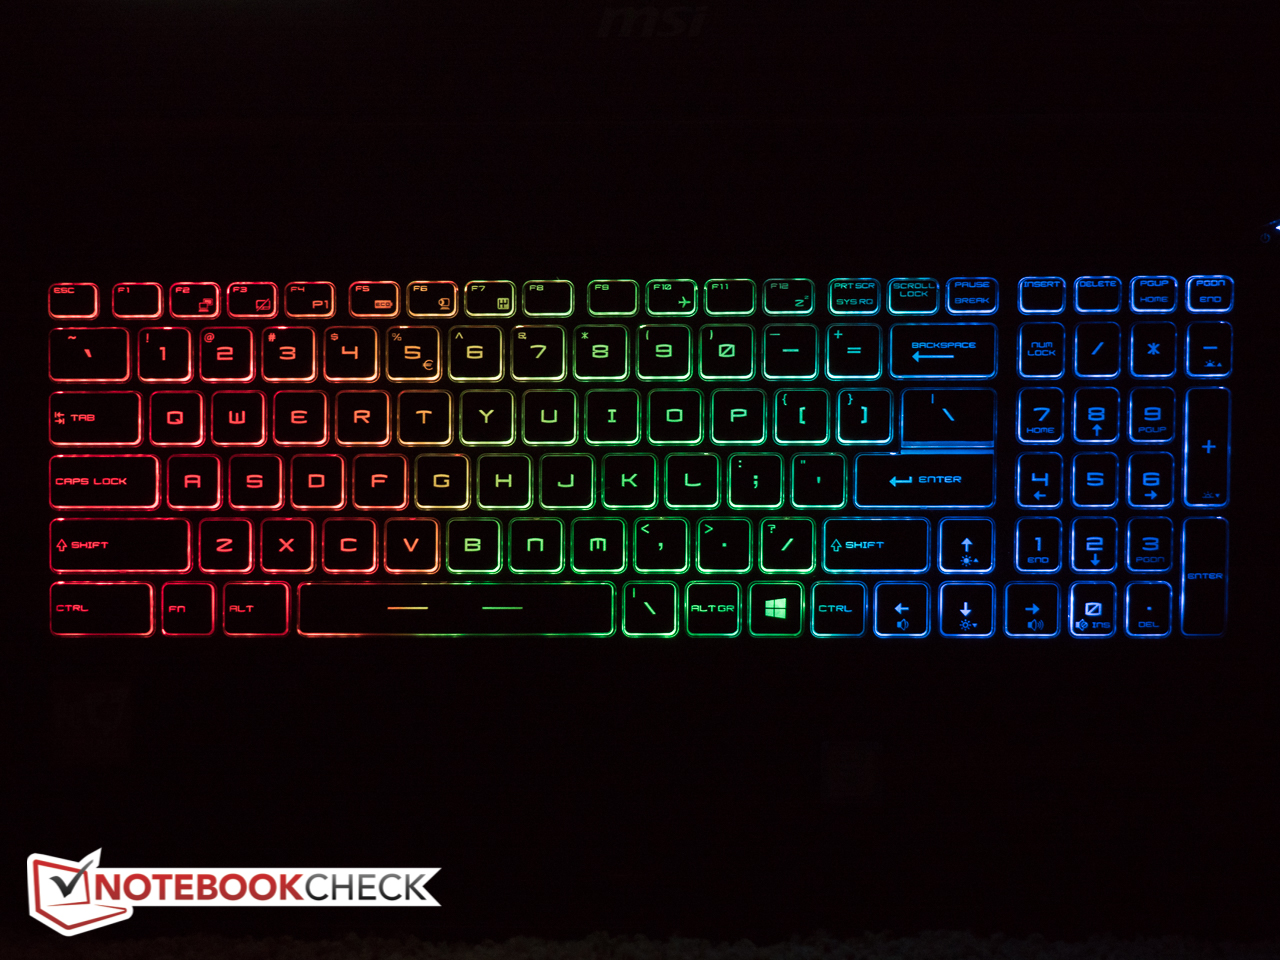
As before, MSI includes their SteelSeries RGB Gaming Keyboard with full color backlighting. Most users won't have a problem with the keyboard - on the contrary: the key travel is adequate, the tactile feedback is good and the keys themselves are reasonably large with good spacing. The layout is decent as well, although we don't really care for the position of the delete key in the row above the dedicated number block - the position above the backspace key would make more sense in our opinion. The keyboard backlight is configurable in three different zones and features three brightness levels plus off. Visibility is very good and the "Exclusive Silver Lining Printed keys", as MSI calls them, are clearly visible in all environments regardless of the ambient brightness.
Touchpad
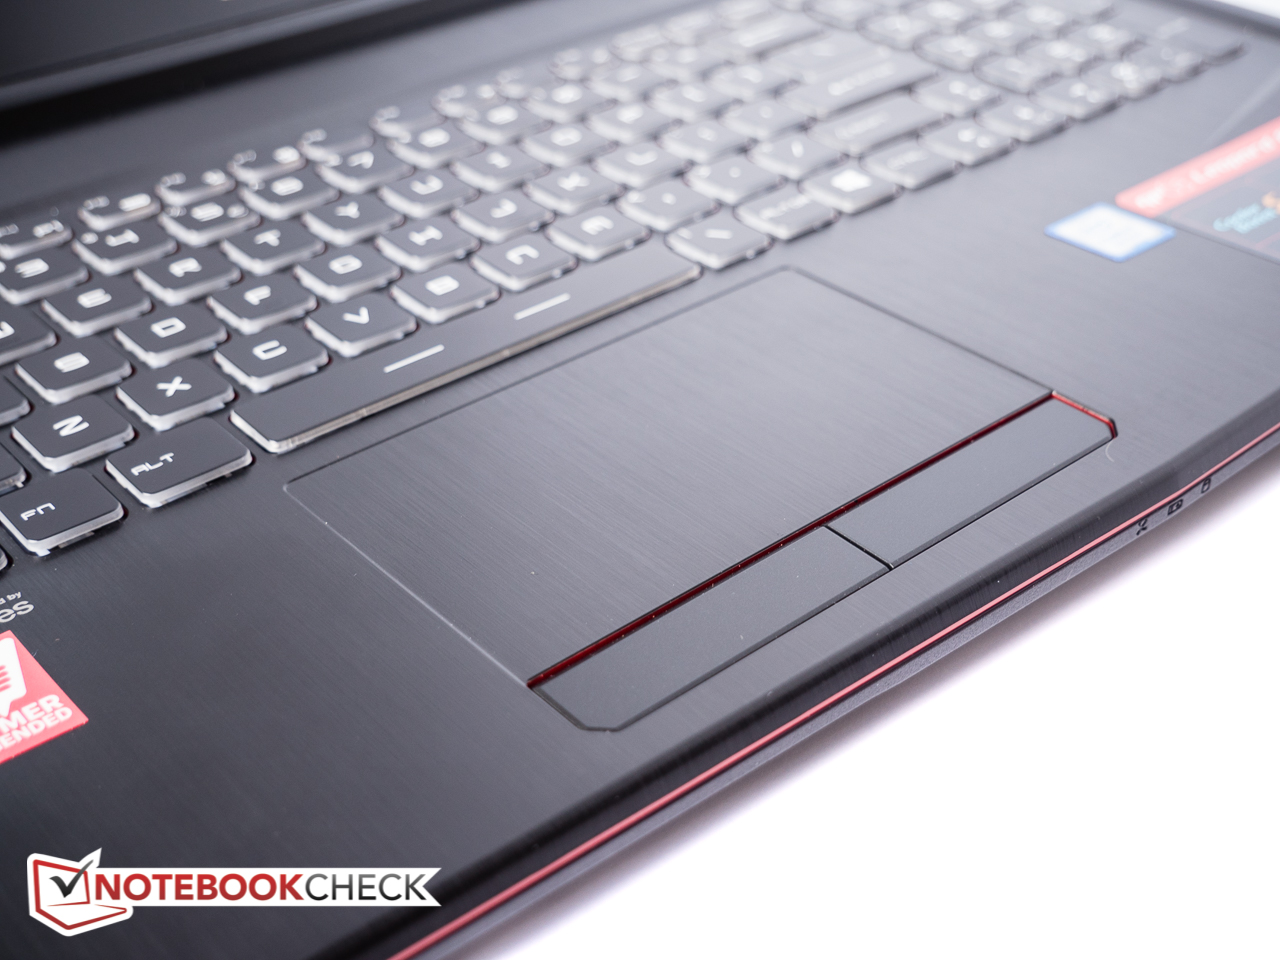
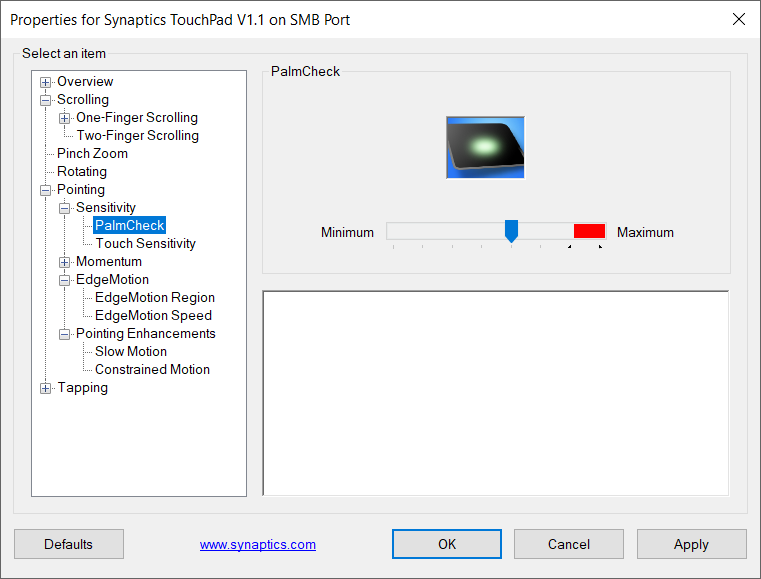
The touchpad surface is acceptably large at 11 x 6.2 cm and continues the faux brushed aluminum look, but is recessed slightly so the edges can be felt when operating in the dark. The Synaptics touchpad allows for smooth control even when operating it with sweaty fingers - the surface is better than most in this regard - and the dedicated buttons are less error-prone than clickpad-integrated buttons while providing good feedback, although they do require a fair amount of pressure.
Display
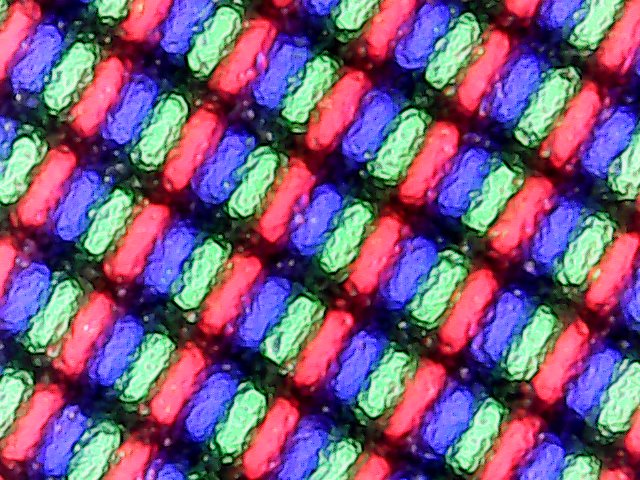
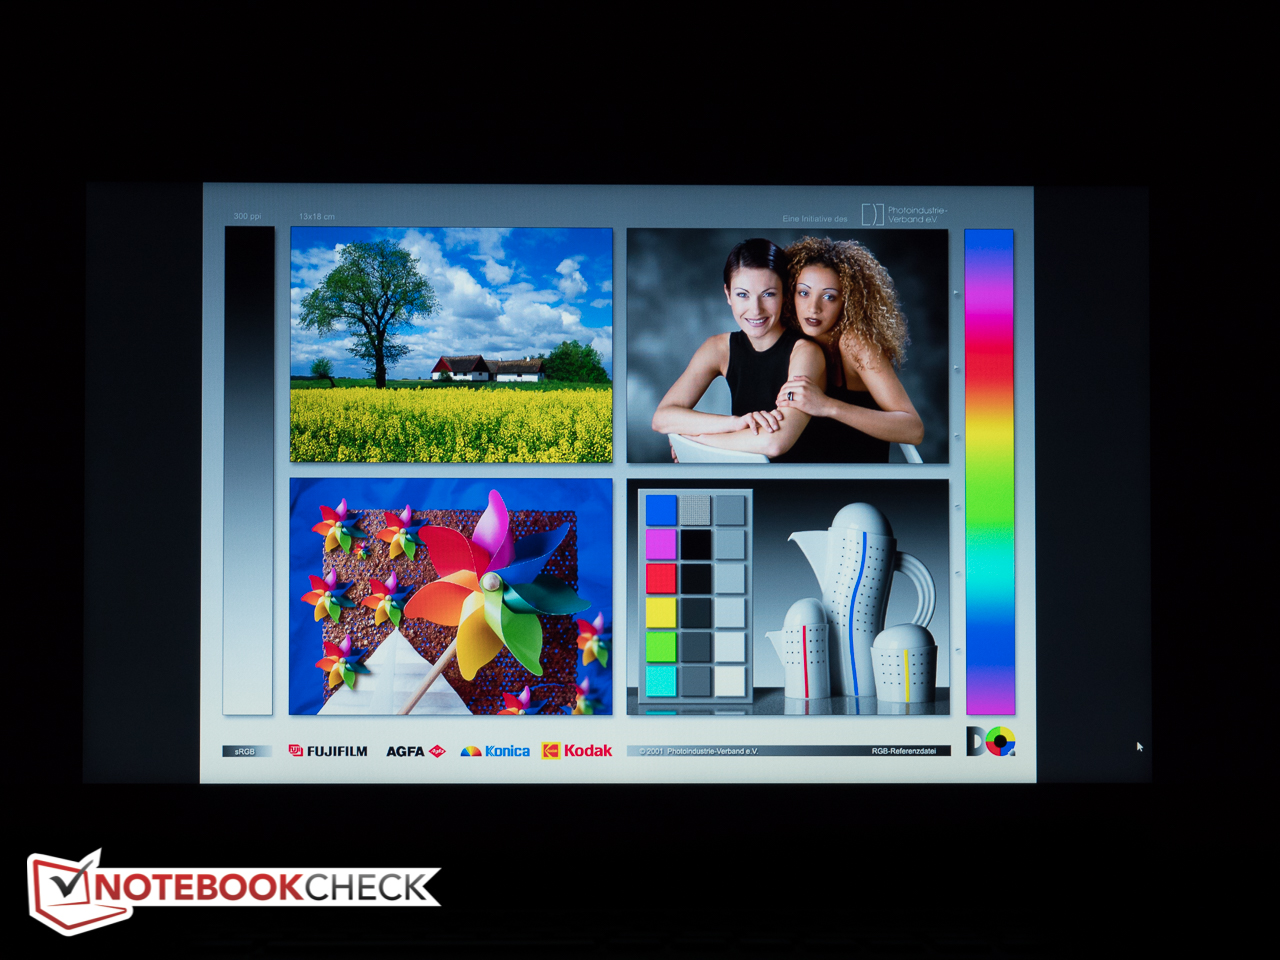
MSI offers two different FHD panels clocked at 60 Hz and 120 Hz, respectively; G-Sync is not available. Our review notebook is equipped with the latter panel (Chi Mei CMN15F4 / N156HHE-GA1), which is based on TN and not the more common IPS technology. Cursor control is much smoother thanks to the higher refresh rate. The average brightness is quite decent at 340 nits and the contrast is also quite good. Despite the anti-glare treatment, the display appears less grainy than most and both text as well as the icons are very sharp.
| |||||||||||||||||||||||||
Brightness Distribution: 87 %
Center on Battery: 368.5 cd/m²
Contrast: 1084:1 (Black: 0.34 cd/m²)
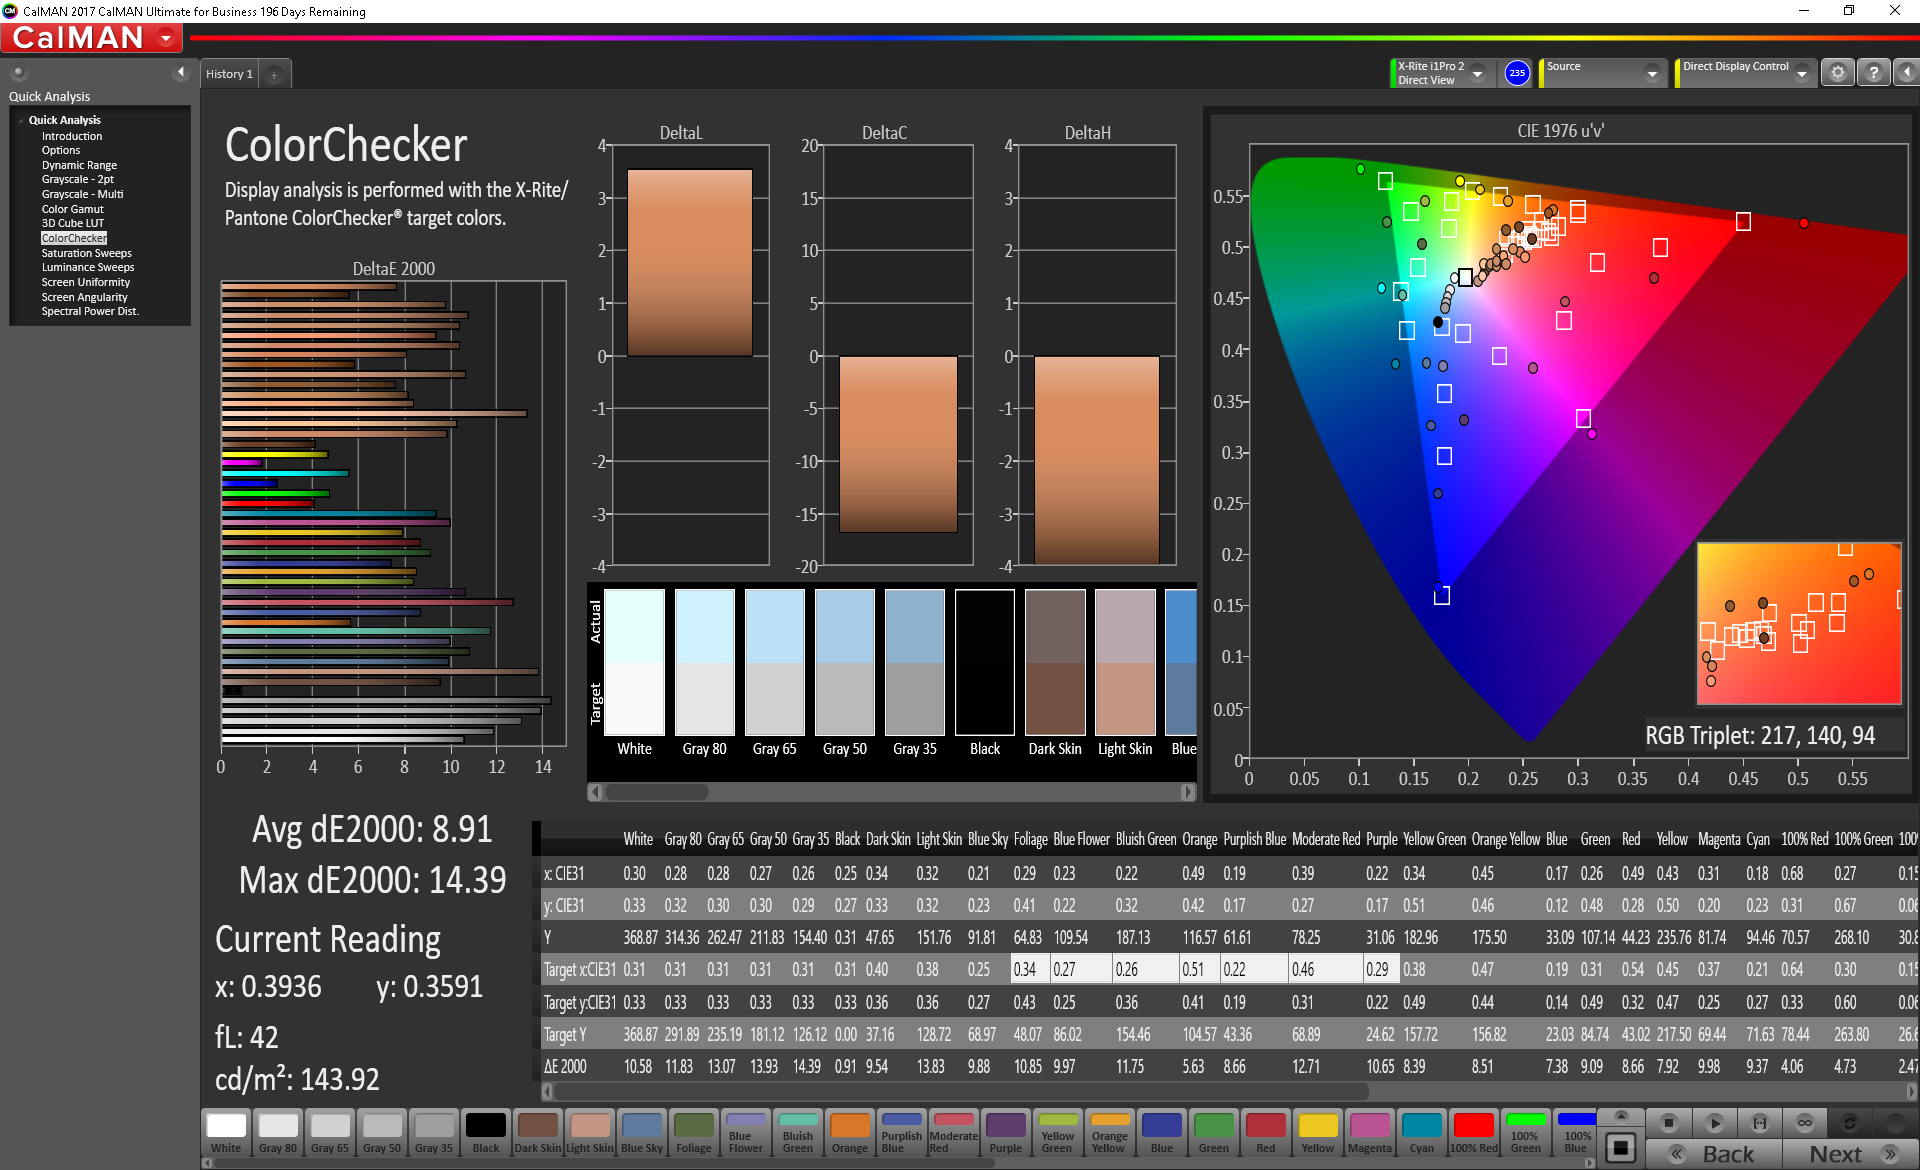
ΔE ColorChecker Calman: 8.91 | ∀{0.5-29.43 Ø4.71}
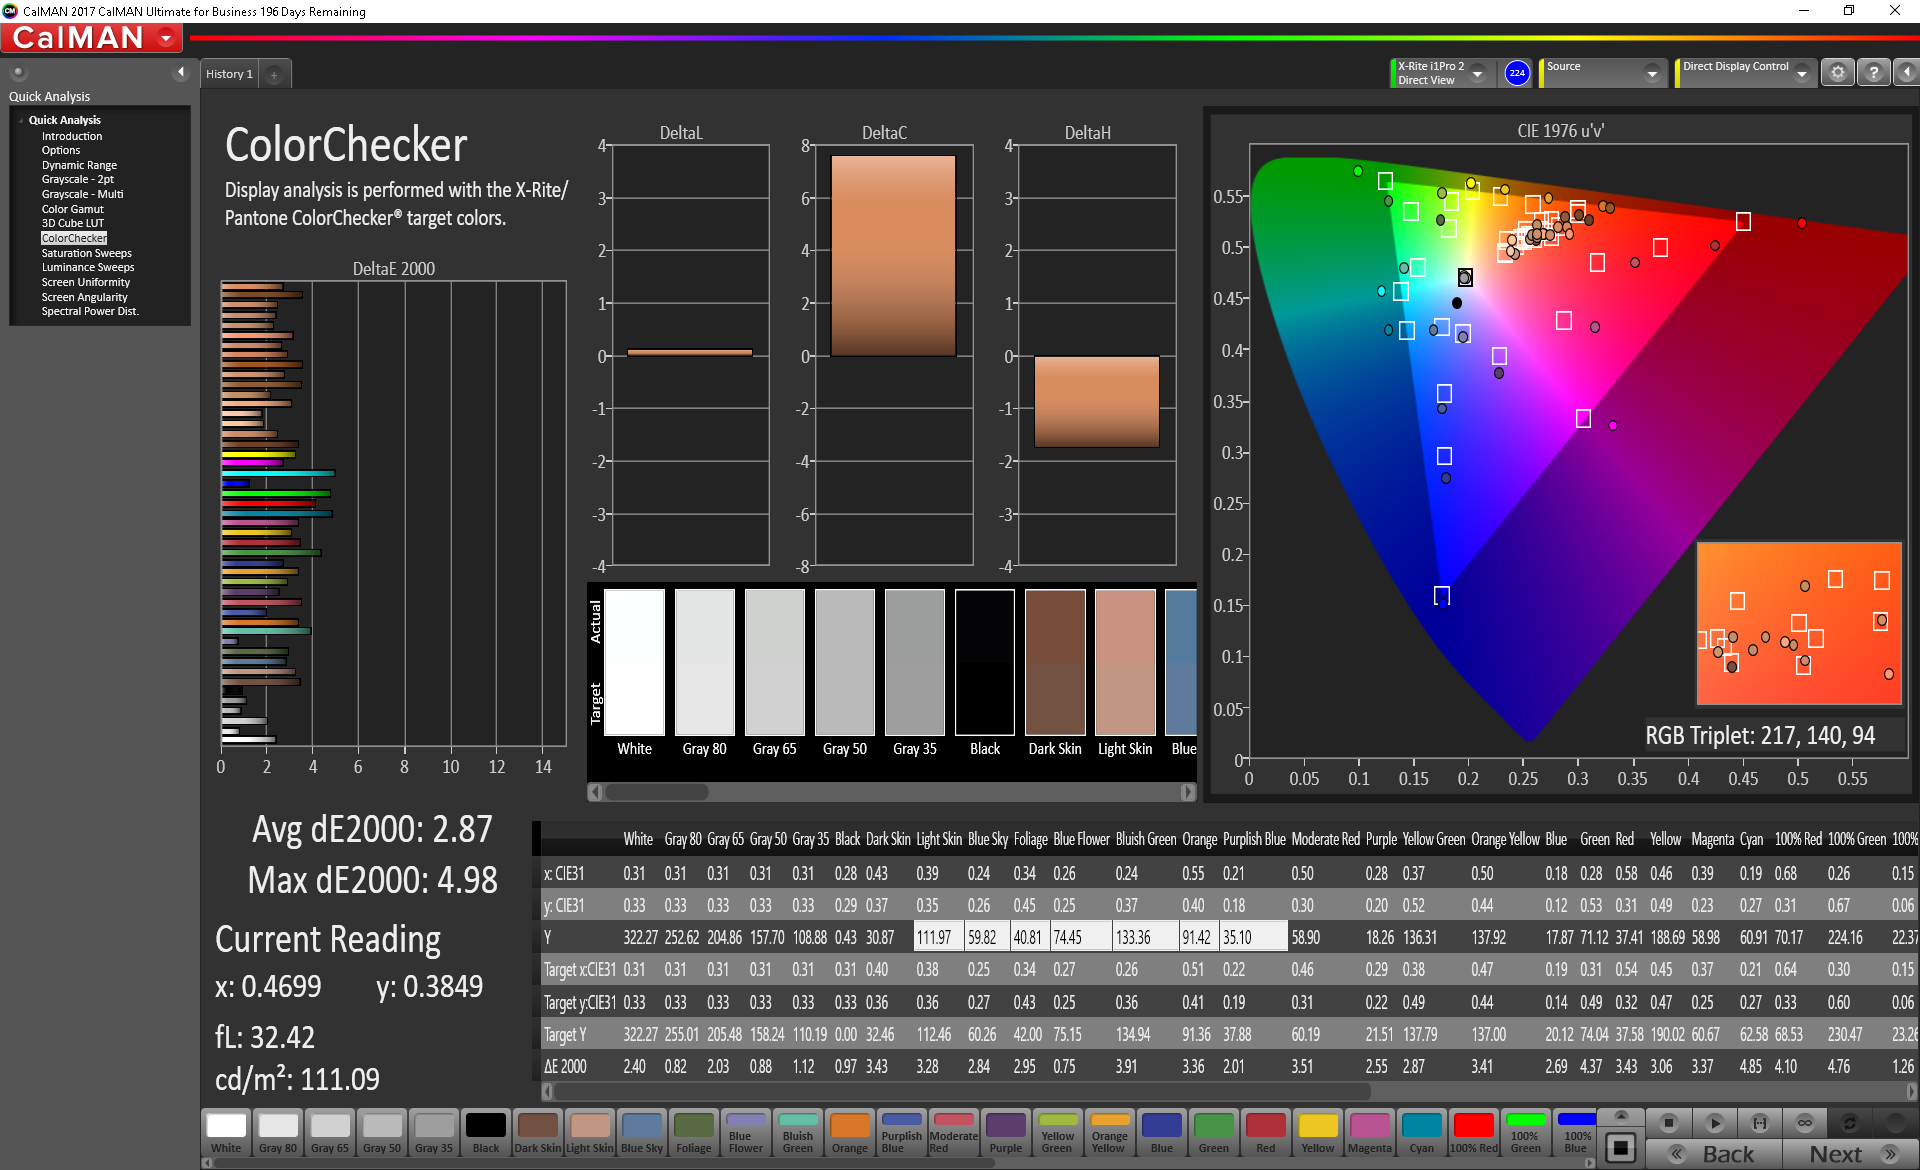
calibrated: 2.87
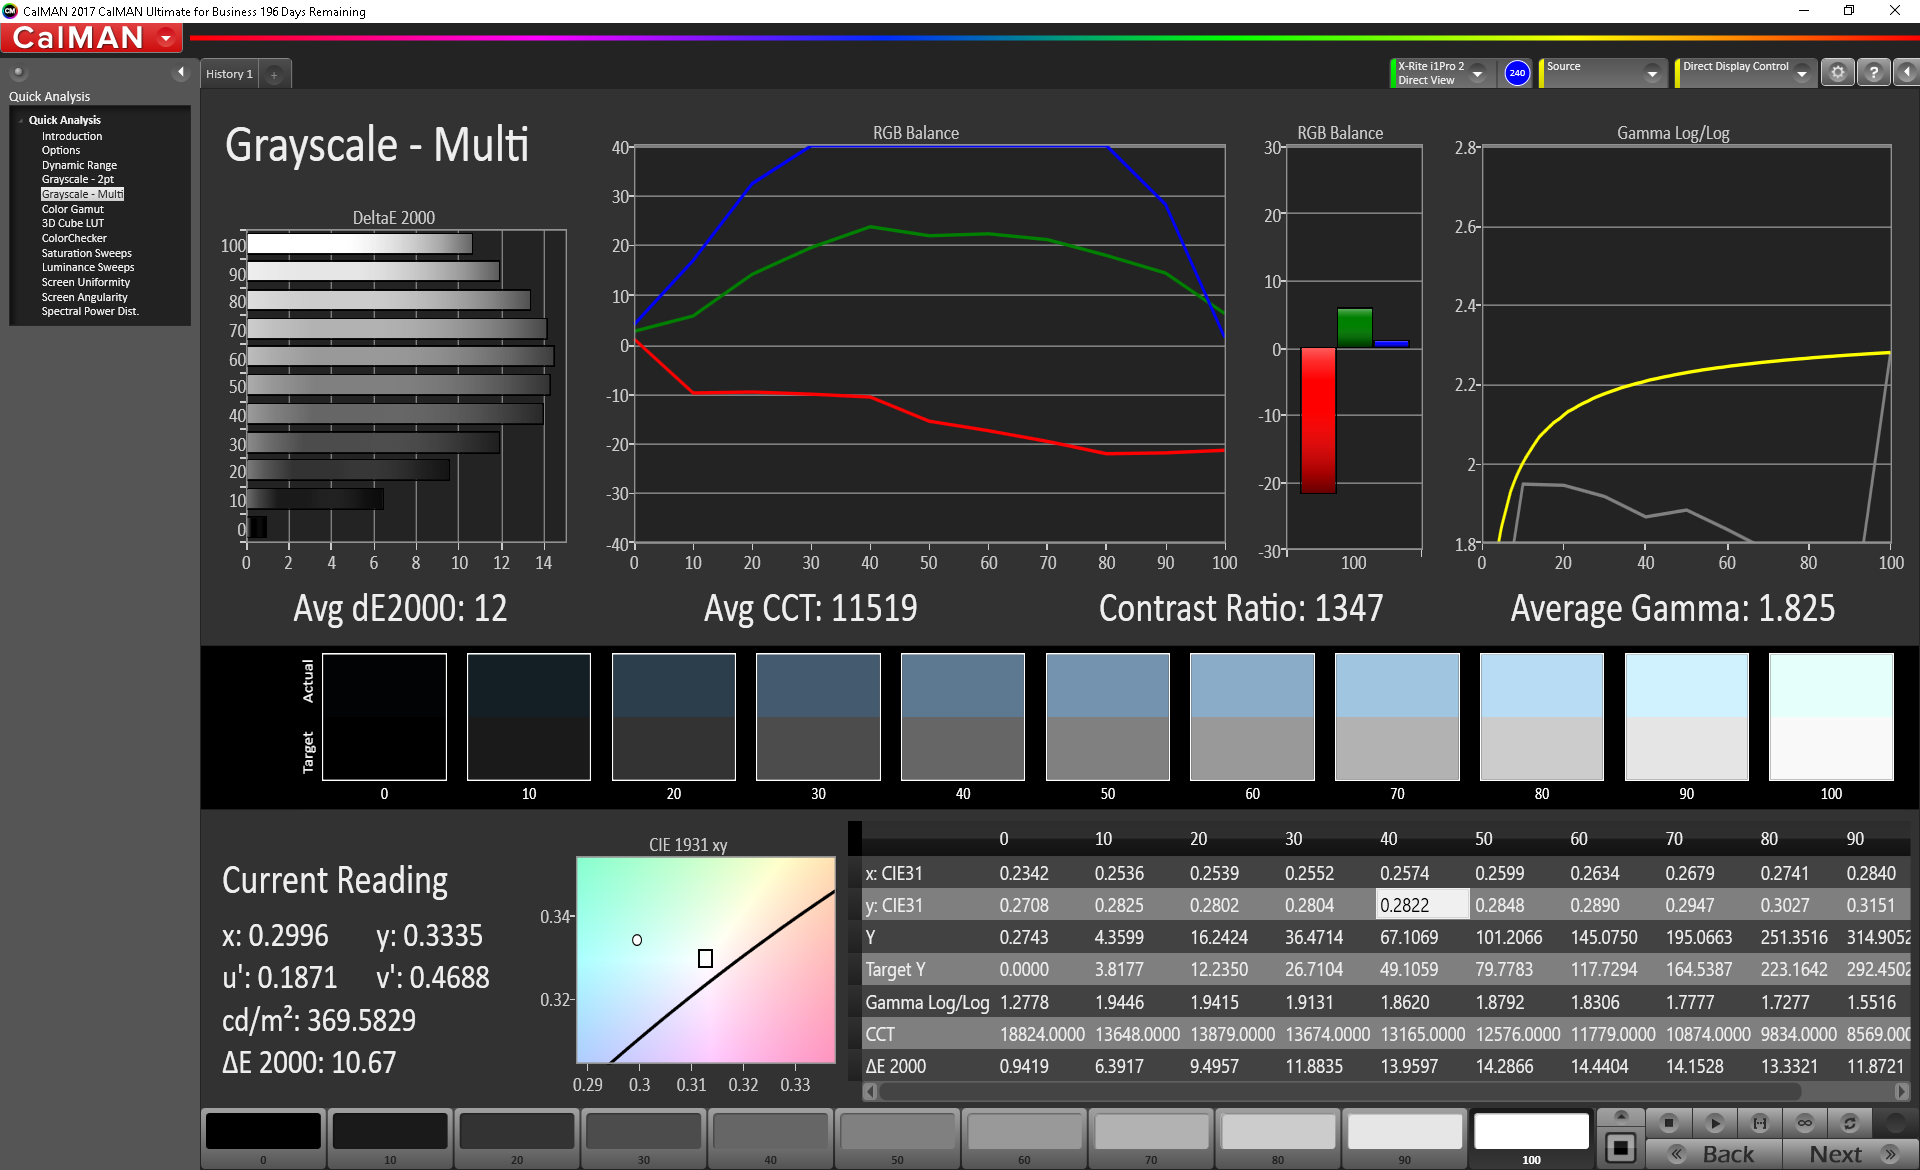
ΔE Greyscale Calman: 12 | ∀{0.09-98 Ø4.96}
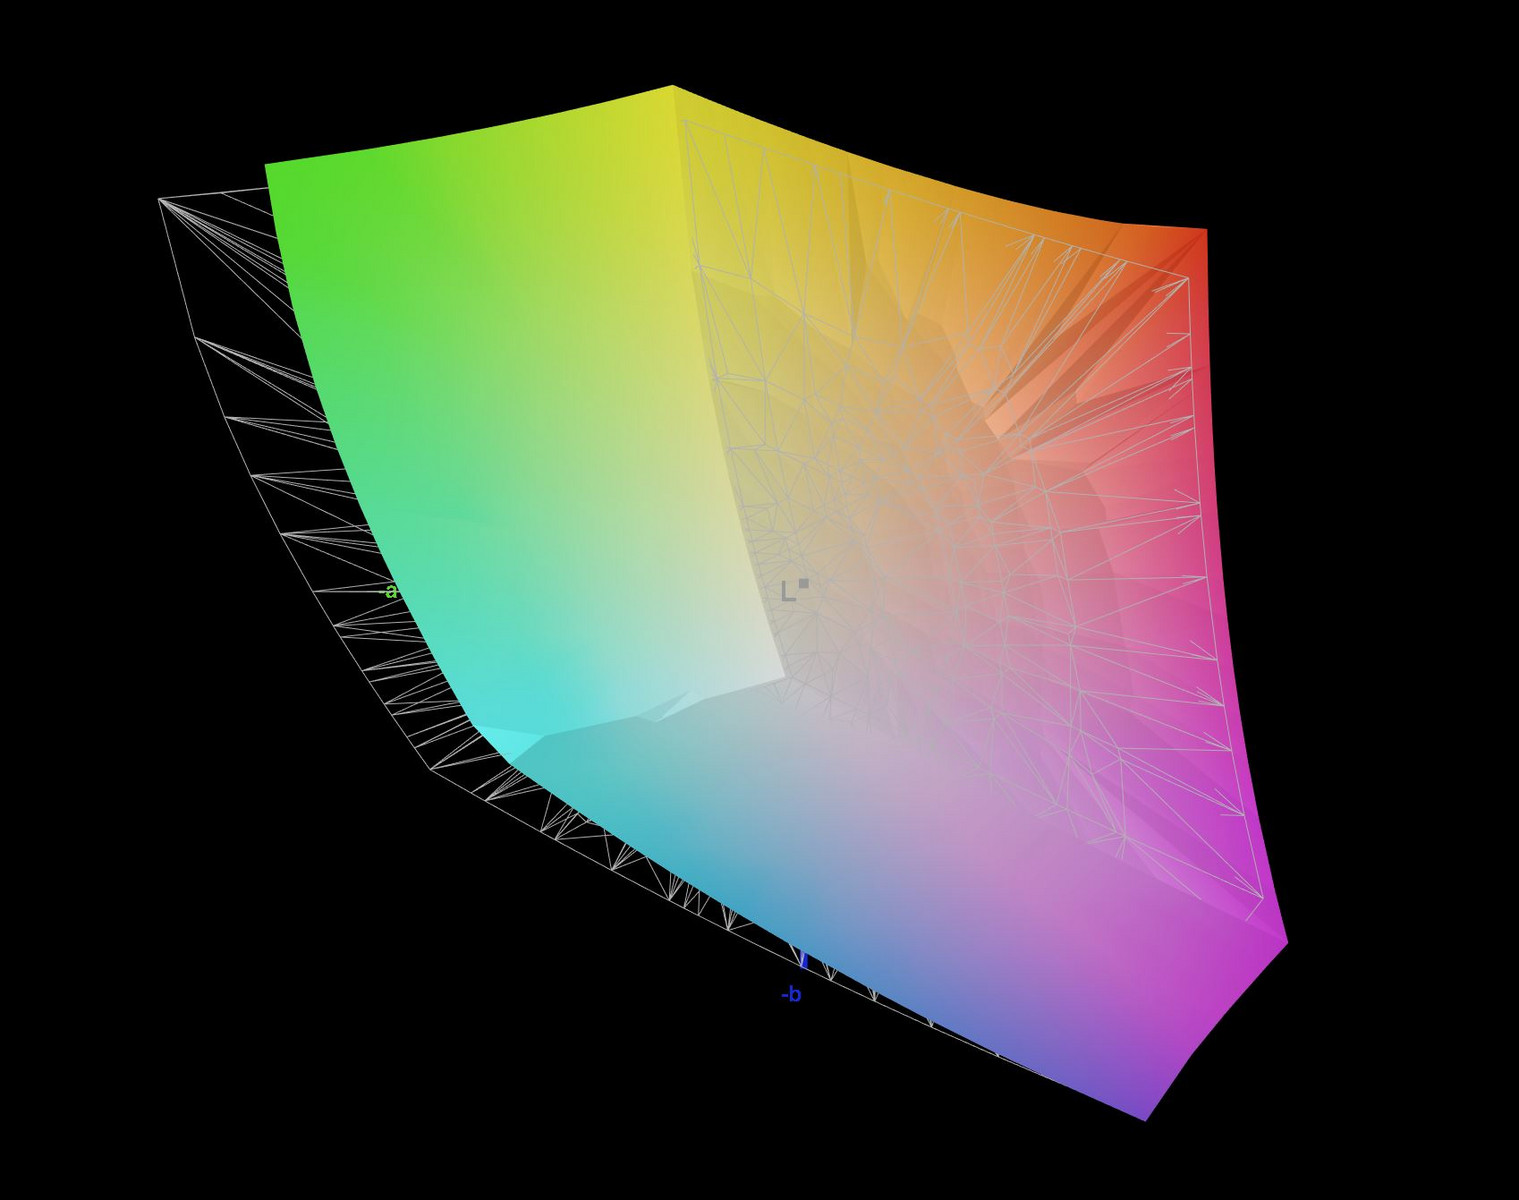
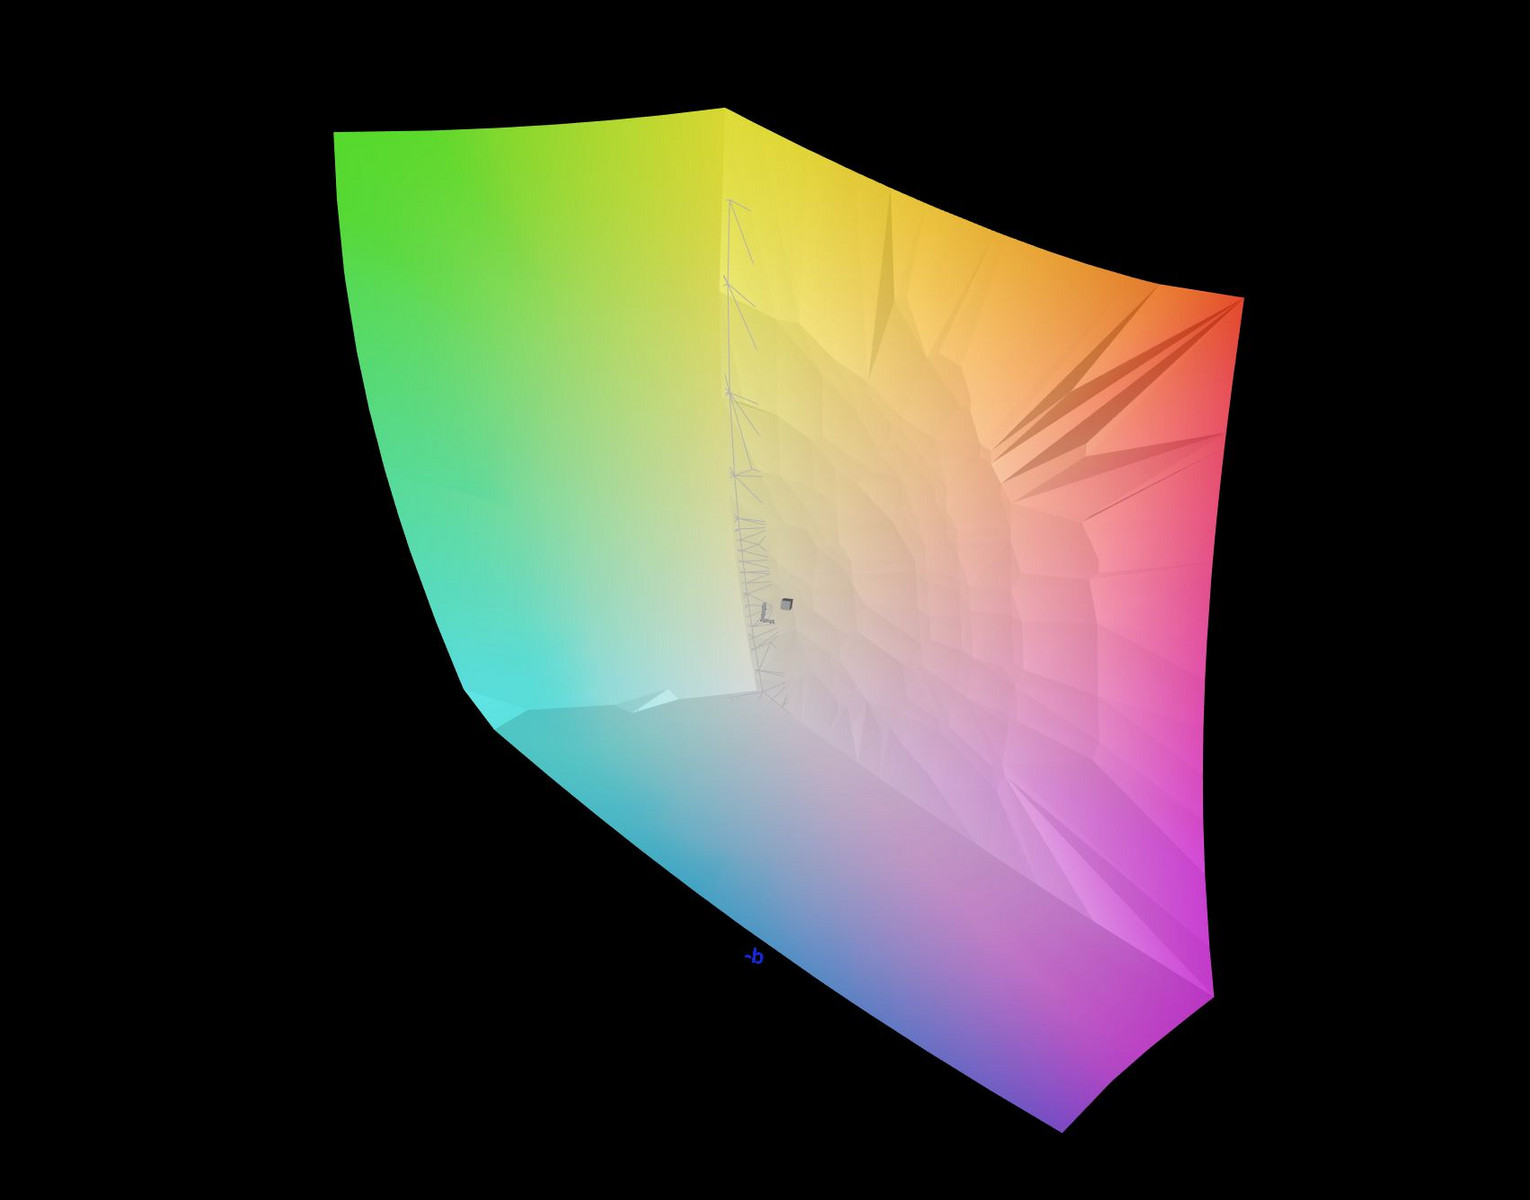
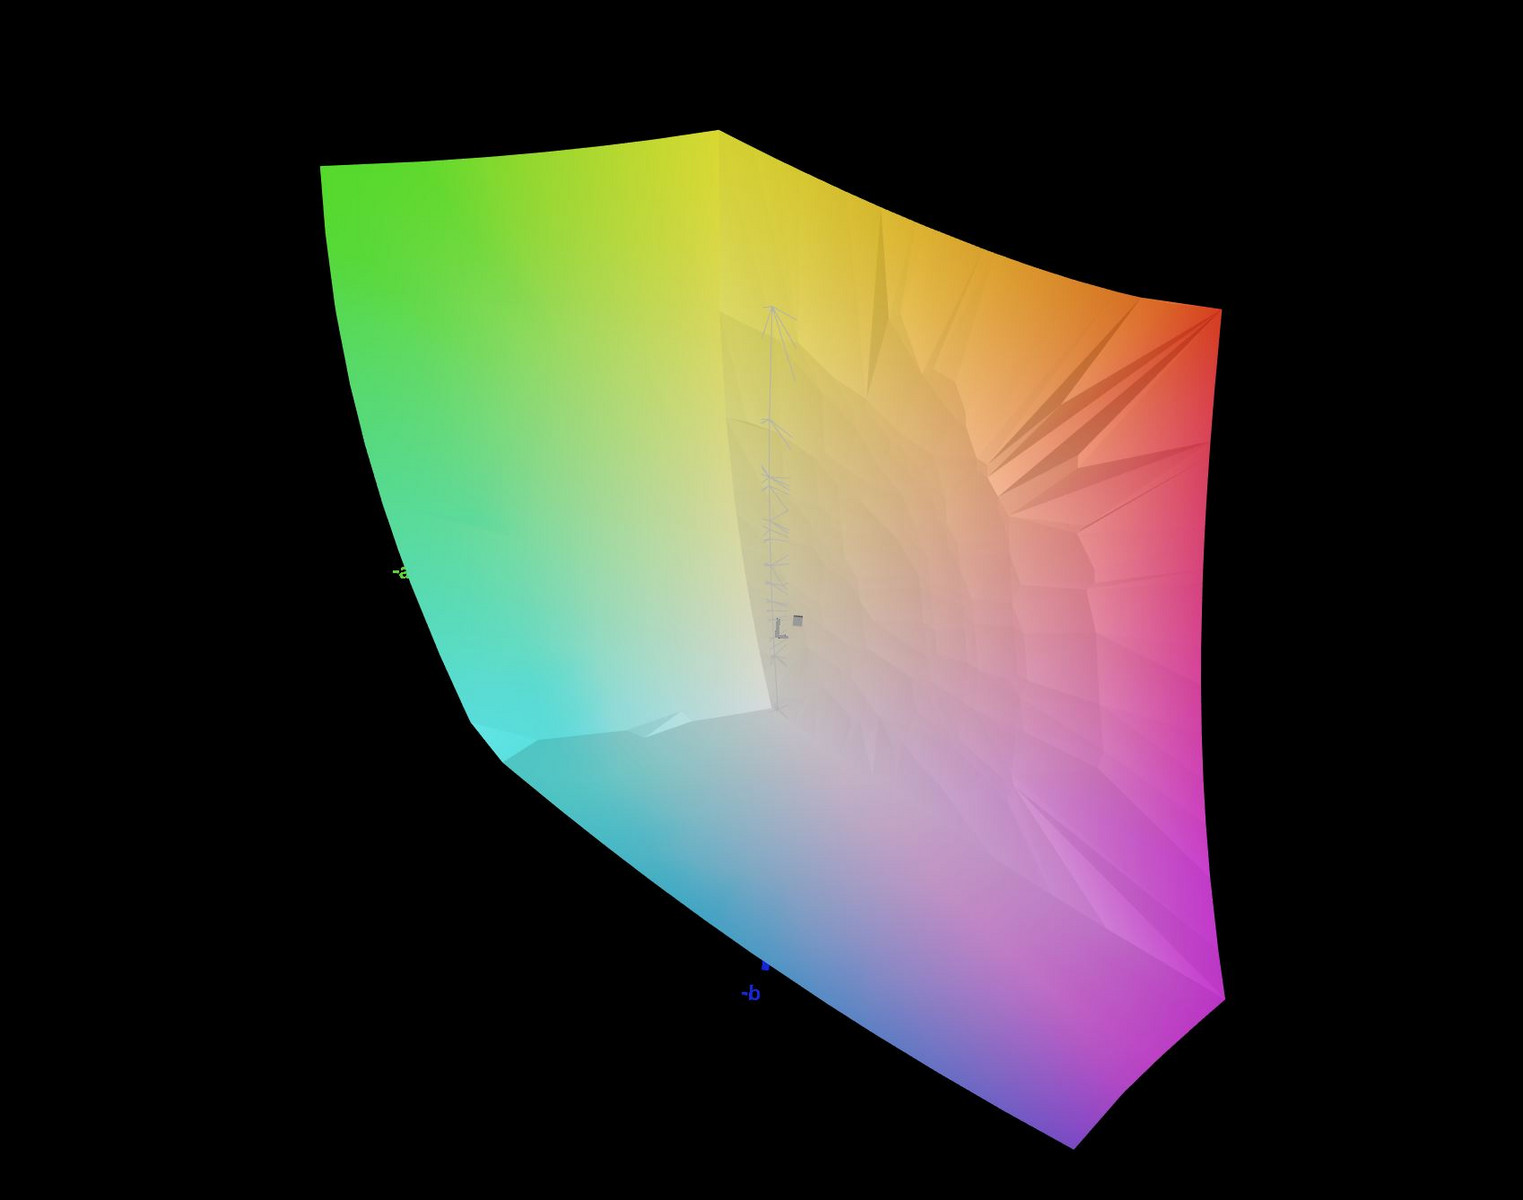
99.98% sRGB (Argyll 1.6.3 3D)
85.94% AdobeRGB 1998 (Argyll 1.6.3 3D)
85.9% AdobeRGB 1998 (Argyll 3D)
100% sRGB (Argyll 3D)
91.5% Display P3 (Argyll 3D)
Gamma: 1.825
CCT: 11519 K
| MSI GP63 Leopard 8RE-013US Chi Mei CMN15F4 (N156HHE-GA1 CMN), TN LED, 120 Hz, 15.6", 1920x1080 | HP Omen 15-ce002ng AUO42ED, IPS, 15.6", 1920x1080 | Lenovo Legion Y720 80VR002XGE LG Philips LGD0533 LP156WF6-SPK3, IPS, 15.6", 1920x1080 | Acer Aspire VN7-593G-73HP V15 Nitro BE LG Display LP156WF6-SPP1, AH-IPS, Normally Black, Transmissive, 15.6", 1920x1080 | MSI GE63VR 7RF Raider Chi Mei N156HHE-GA1 (CMN15F4), TN LED, 15.6", 1920x1080 | |
|---|---|---|---|---|---|
| Display | -20% | -52% | -24% | 0% | |
| Display P3 Coverage (%) | 91.5 | 65.8 -28% | 38.43 -58% | 65.8 -28% | 91.3 0% |
| sRGB Coverage (%) | 100 | 90.9 -9% | 57.5 -43% | 85.1 -15% | 100 0% |
| AdobeRGB 1998 Coverage (%) | 85.9 | 66.5 -23% | 39.75 -54% | 62.2 -28% | 86.7 1% |
| Response Times | -176% | -133% | -188% | 37% | |
| Response Time Grey 50% / Grey 80% * (ms) | 24 ? | 43.2 ? -80% | 43 ? -79% | 41 ? -71% | 9.6 ? 60% |
| Response Time Black / White * (ms) | 8.4 ? | 31.2 ? -271% | 24 ? -186% | 34 ? -305% | 7.2 ? 14% |
| PWM Frequency (Hz) | 26040 ? | 21000 ? | 26000 ? | ||
| Screen | 14% | -4% | 6% | 19% | |
| Brightness middle (cd/m²) | 368.5 | 304 -18% | 288 -22% | 322 -13% | 285 -23% |
| Brightness (cd/m²) | 341 | 289 -15% | 275 -19% | 297 -13% | 273 -20% |
| Brightness Distribution (%) | 87 | 86 -1% | 86 -1% | 86 -1% | 84 -3% |
| Black Level * (cd/m²) | 0.34 | 0.26 24% | 0.36 -6% | 0.31 9% | 0.23 32% |
| Contrast (:1) | 1084 | 1169 8% | 800 -26% | 1039 -4% | 1239 14% |
| Colorchecker dE 2000 * | 8.91 | 3.46 61% | 5.29 41% | 4.73 47% | 3.52 60% |
| Colorchecker dE 2000 max. * | 14.39 | 7.72 46% | 9.97 31% | 12.37 14% | 5.18 64% |
| Colorchecker dE 2000 calibrated * | 2.87 | ||||
| Greyscale dE 2000 * | 12 | 2.46 79% | 4.5 62% | 2.99 75% | 3.41 72% |
| Gamma | 1.825 121% | 2.38 92% | 2.39 92% | 2.32 95% | 2.05 107% |
| CCT | 11519 56% | 6915 94% | 6839 95% | 6905 94% | 7077 92% |
| Color Space (Percent of AdobeRGB 1998) (%) | 85.94 | 59 -31% | 37 -57% | 56 -35% | 77 -10% |
| Color Space (Percent of sRGB) (%) | 99.98 | 91 -9% | 57 -43% | 85 -15% | 100 0% |
| Total Average (Program / Settings) | -61% /
-18% | -63% /
-31% | -69% /
-26% | 19% /
17% |
* ... smaller is better
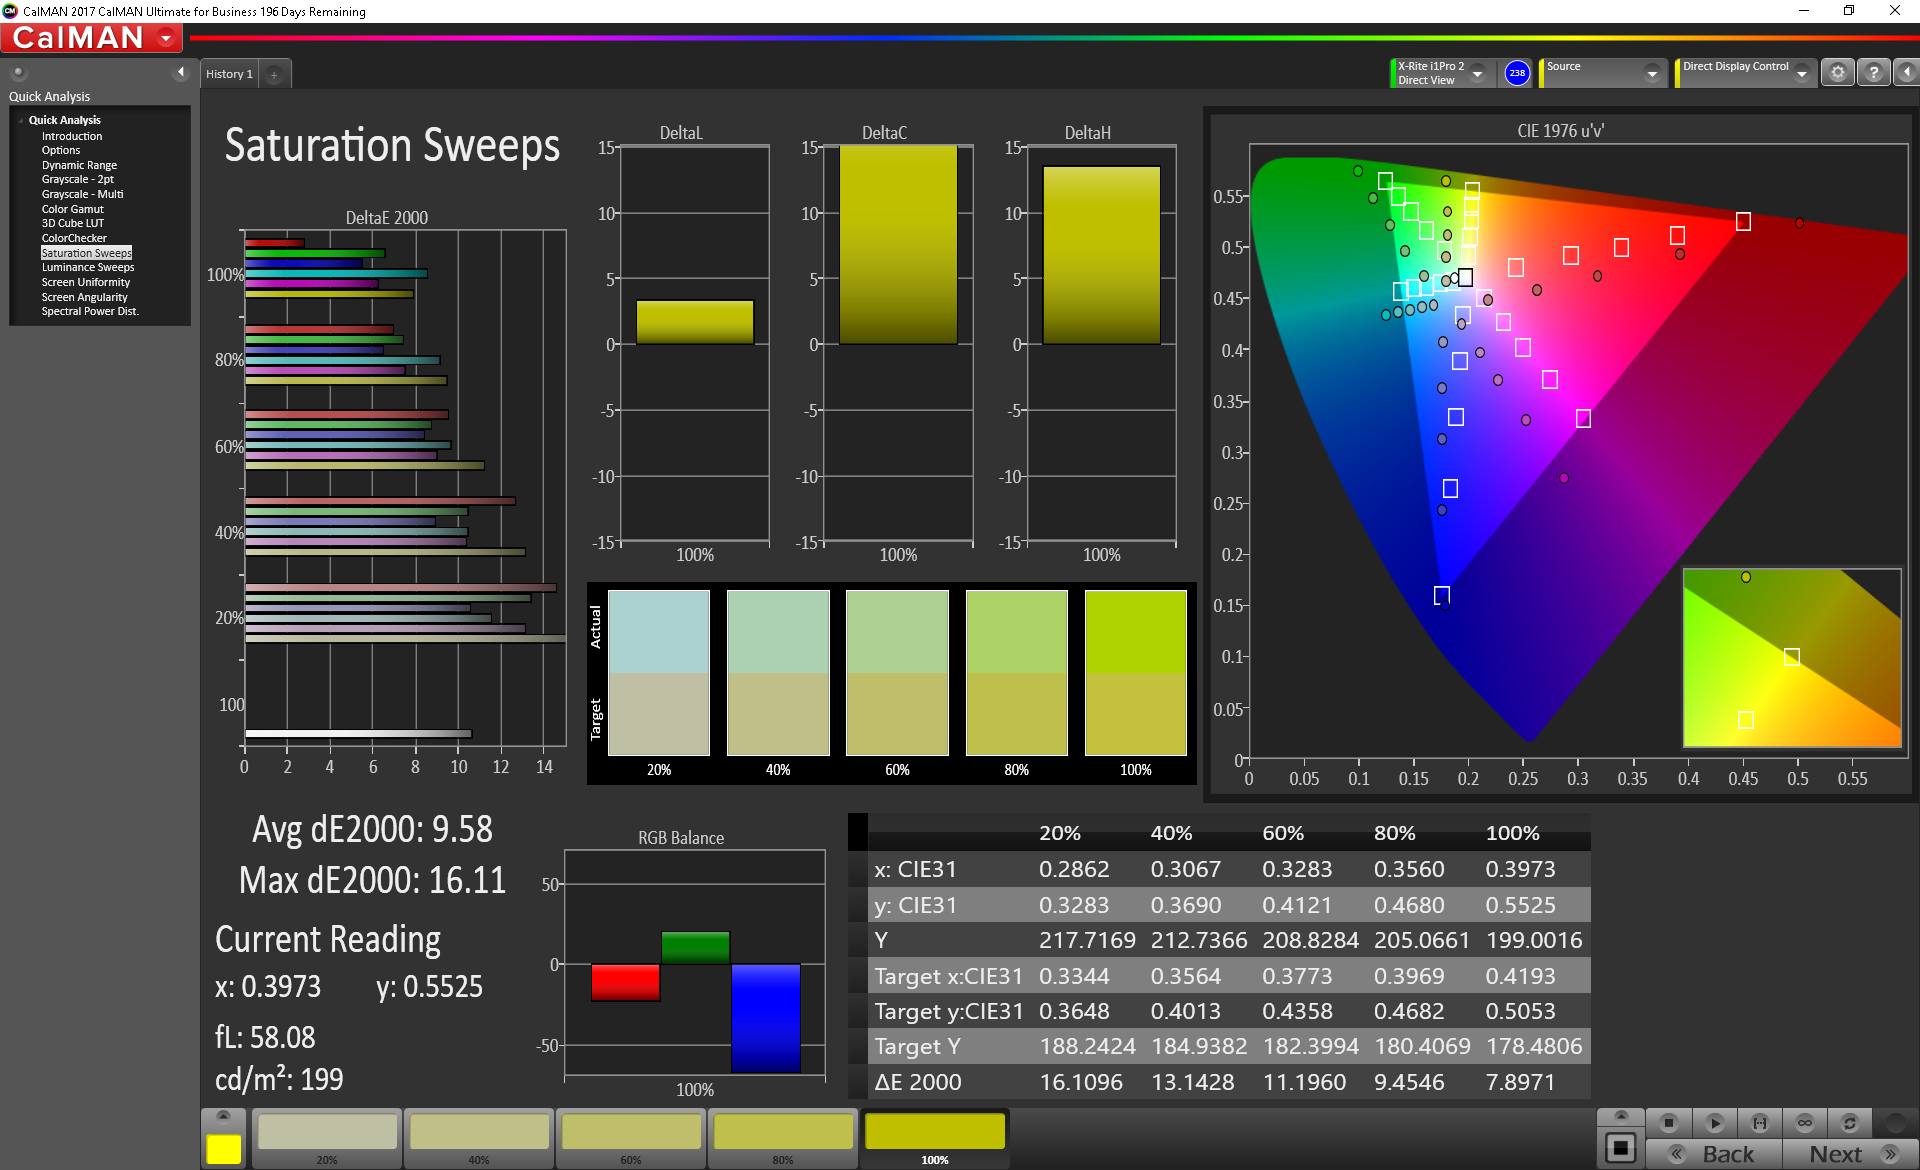
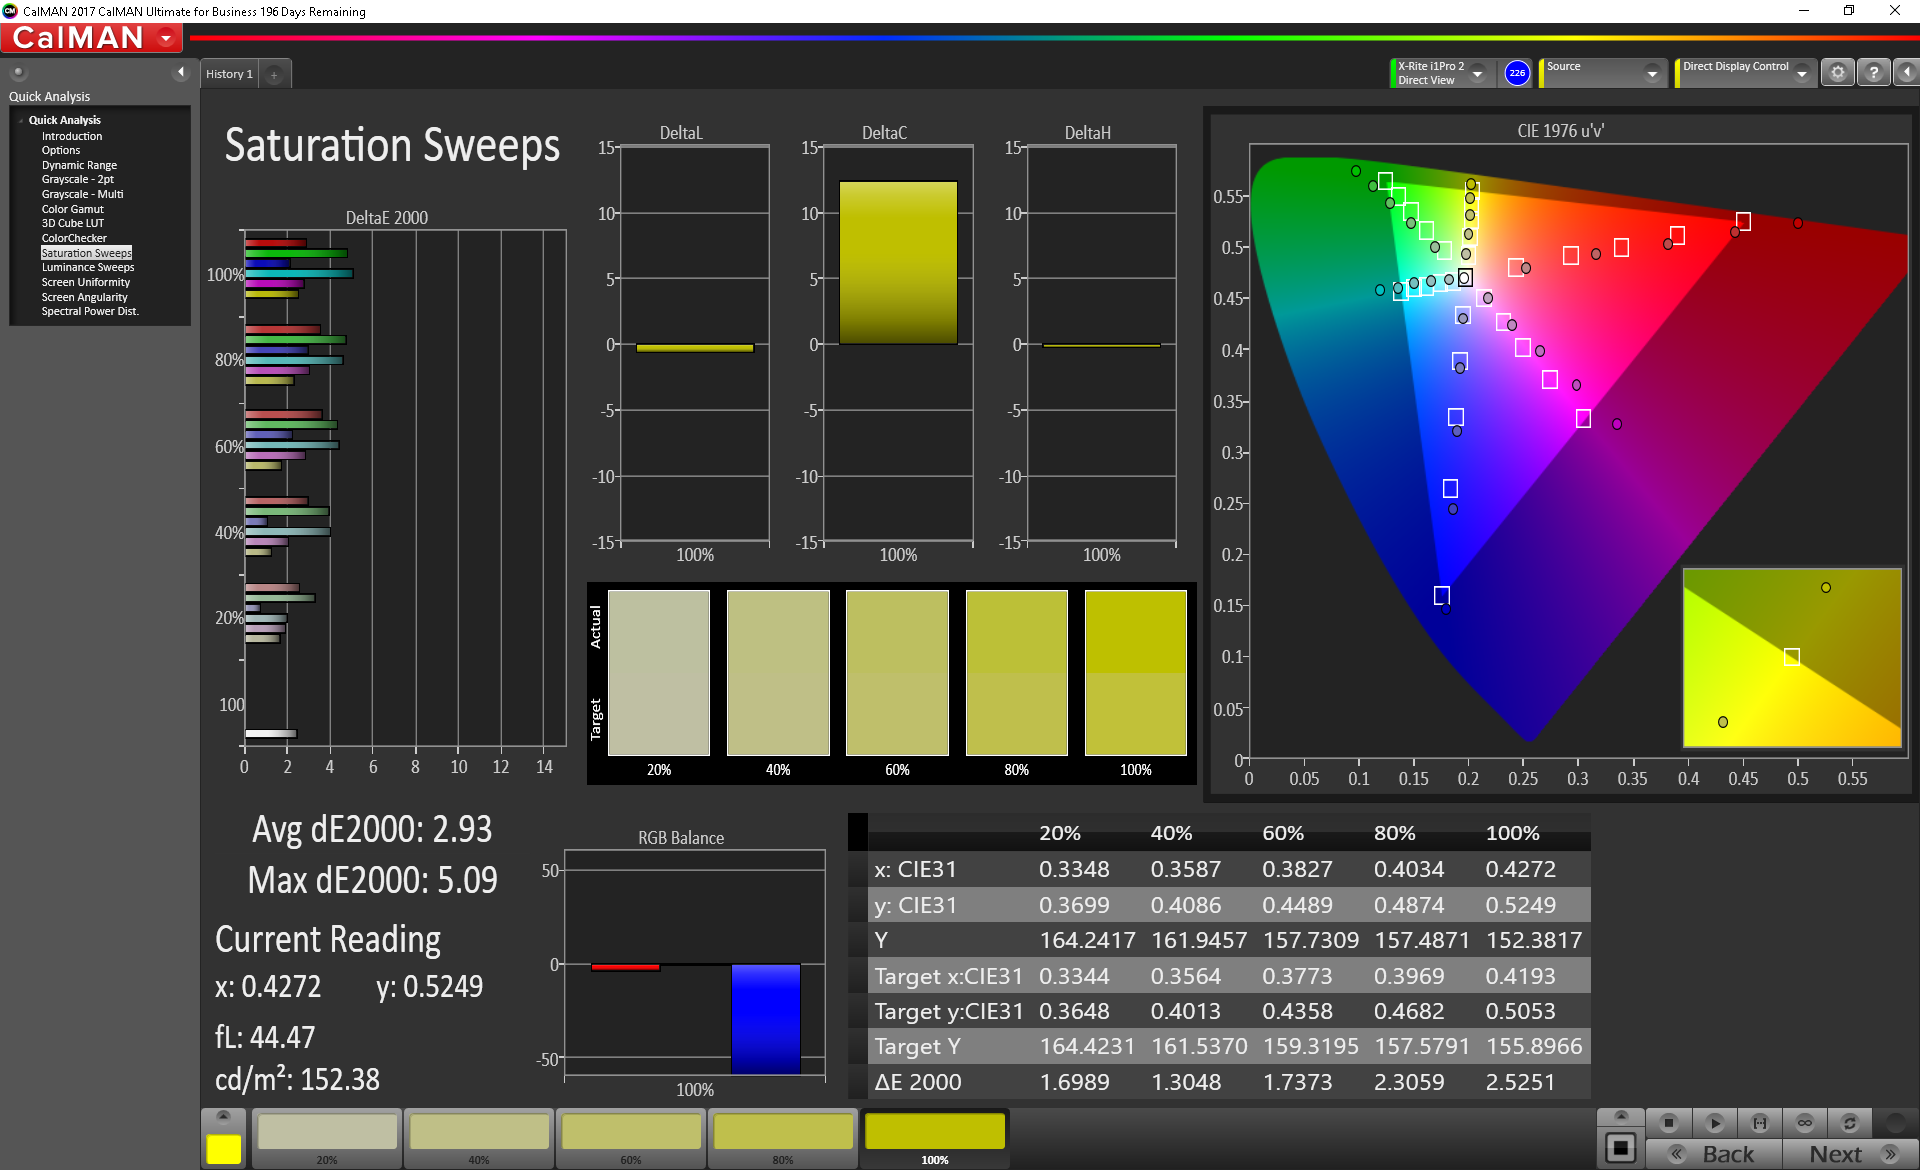
Color space coverage is very good at 86 % for Adobe RGB and 100 % for sRGB, so with the right color profile (see caveat below), photo editing is not out of the question. Of course, the color space coverage will be of lower importance to most users - this is a gaming notebook, after all.
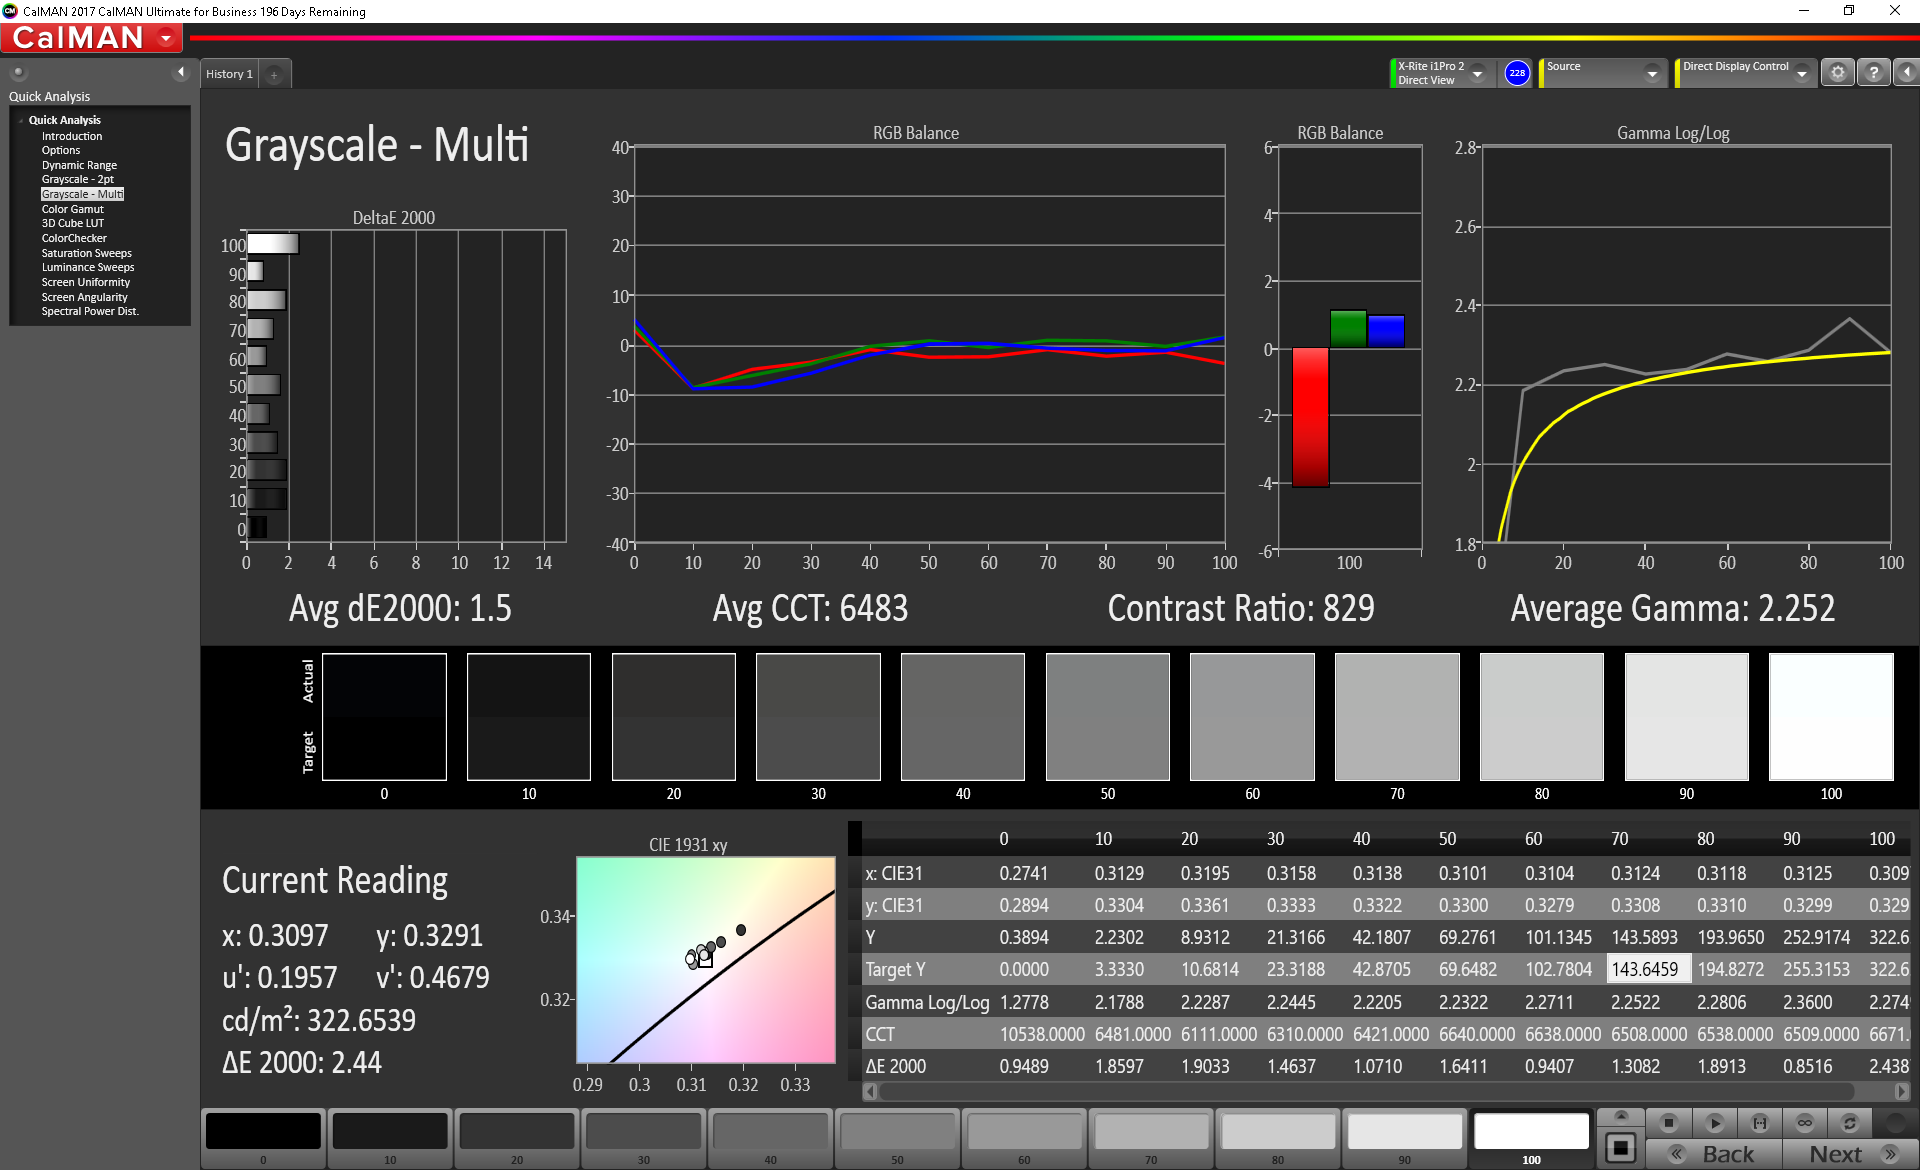
At a first glance, the result of our X-Rite spectrophotometer measurements appear to be downright dismal out of the box with grayscale and color DeltaE-deviations of 12 and 9, respectively and an average CCT north of 11K. We should point out here that the results are often skewed when there's special color profile software installed beyond the built-in software for Windows, as it is in this case. Our measurements are always performed at the out-of-the-box default settings, which in turn can help explain why the very same panel does much better in other implementations, including the predecessor GP62. A calibration improves the accuracy markedly with the average DeltaE values dropping to 1.5 for grayscale and to under 3 for color.
Display Response Times
| ↔ Response Time Black to White | ||
|---|---|---|
| 8.4 ms ... rise ↗ and fall ↘ combined | ↗ 6 ms rise | 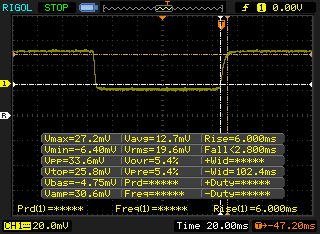 |
| ↘ 2.4 ms fall | ||
| The screen shows fast response rates in our tests and should be suited for gaming. In comparison, all tested devices range from 0.1 (minimum) to 240 (maximum) ms. » 24 % of all devices are better. This means that the measured response time is better than the average of all tested devices (19.8 ms). | ||
| ↔ Response Time 50% Grey to 80% Grey | ||
| 24 ms ... rise ↗ and fall ↘ combined | ↗ 12.8 ms rise | 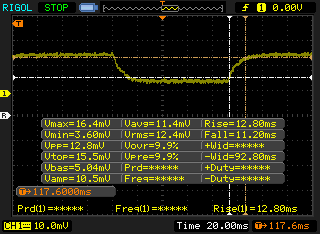 |
| ↘ 11.2 ms fall | ||
| The screen shows good response rates in our tests, but may be too slow for competitive gamers. In comparison, all tested devices range from 0.165 (minimum) to 636 (maximum) ms. » 35 % of all devices are better. This means that the measured response time is better than the average of all tested devices (30.9 ms). | ||
Screen Flickering / PWM (Pulse-Width Modulation)
| Screen flickering / PWM detected | 26040 Hz | ≤ 19 % brightness setting | 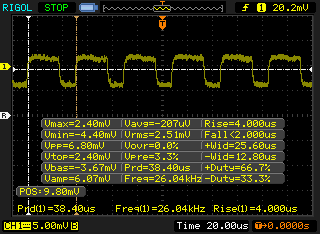 |
The display backlight flickers at 26040 Hz (worst case, e.g., utilizing PWM) Flickering detected at a brightness setting of 19 % and below. There should be no flickering or PWM above this brightness setting. The frequency of 26040 Hz is quite high, so most users sensitive to PWM should not notice any flickering. In comparison: 52 % of all tested devices do not use PWM to dim the display. If PWM was detected, an average of 7748 (minimum: 5 - maximum: 343500) Hz was measured. | |||
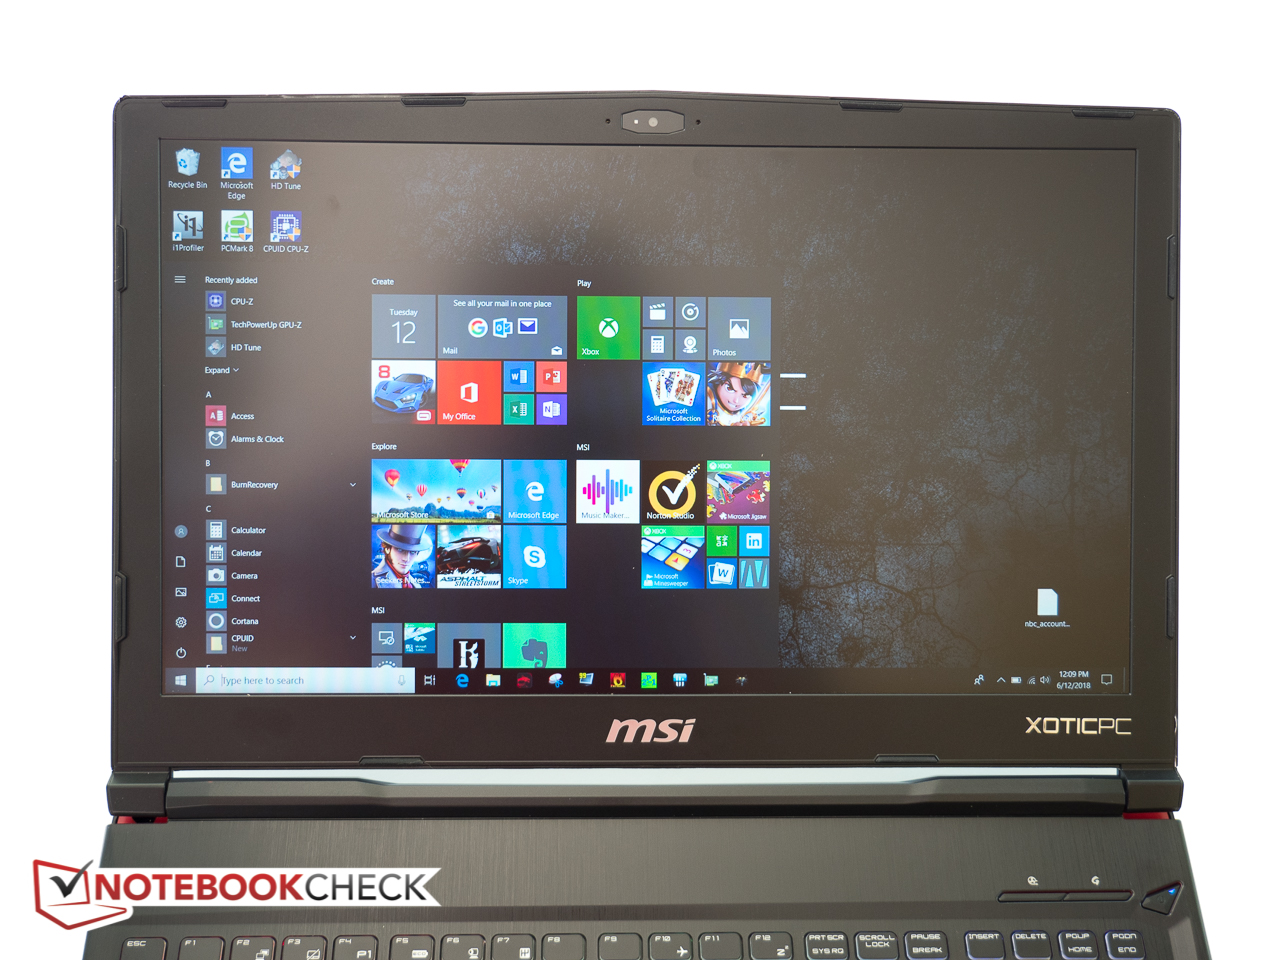
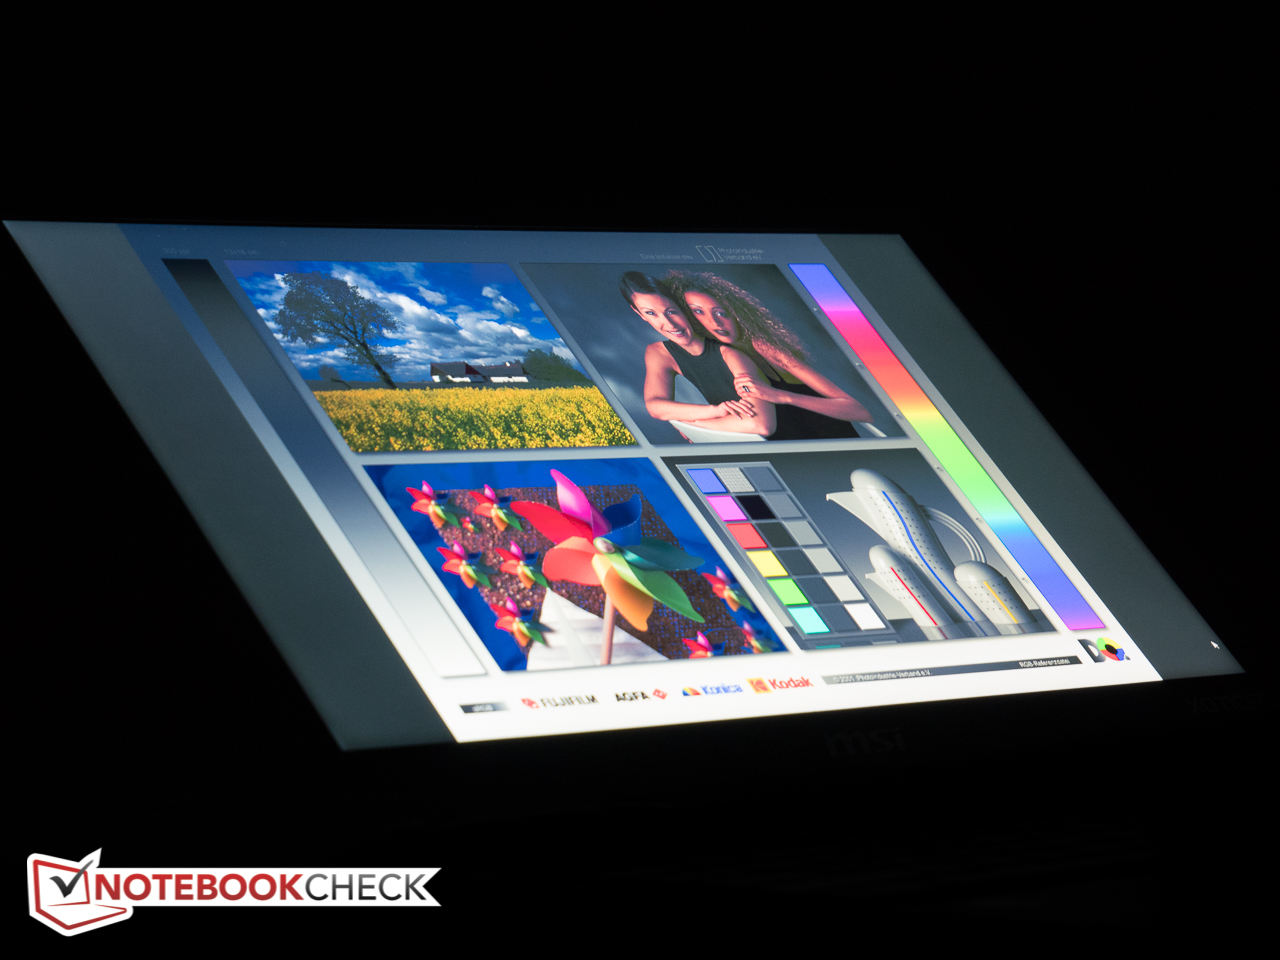
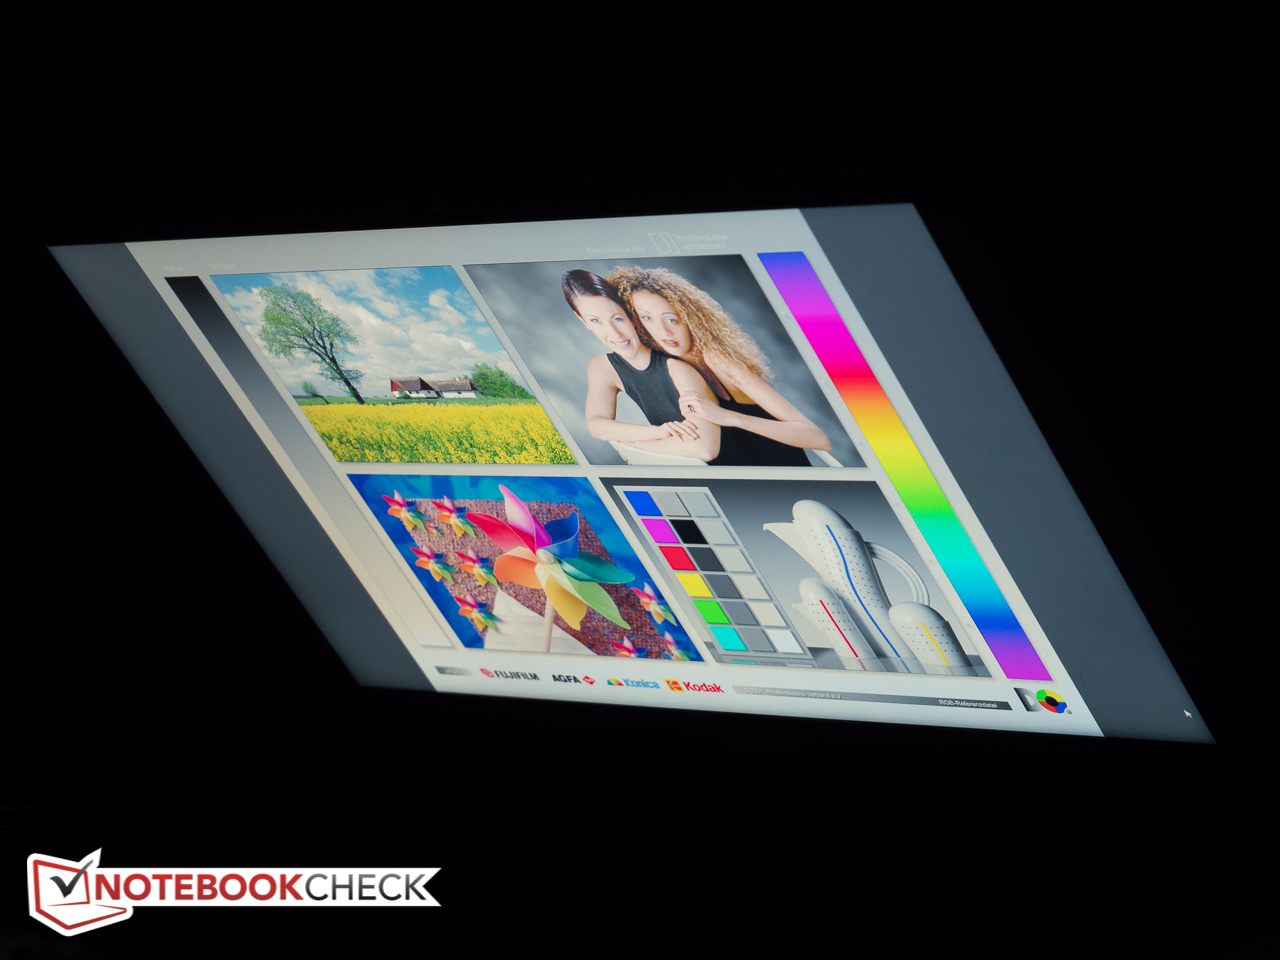
Since this is a TN panel, the viewing angles are more restricted than they would be with IPS displays. Horizontally there aren't any issues, but particularly when tilting the panel back, clouding and color inversions occur rather rapidly.
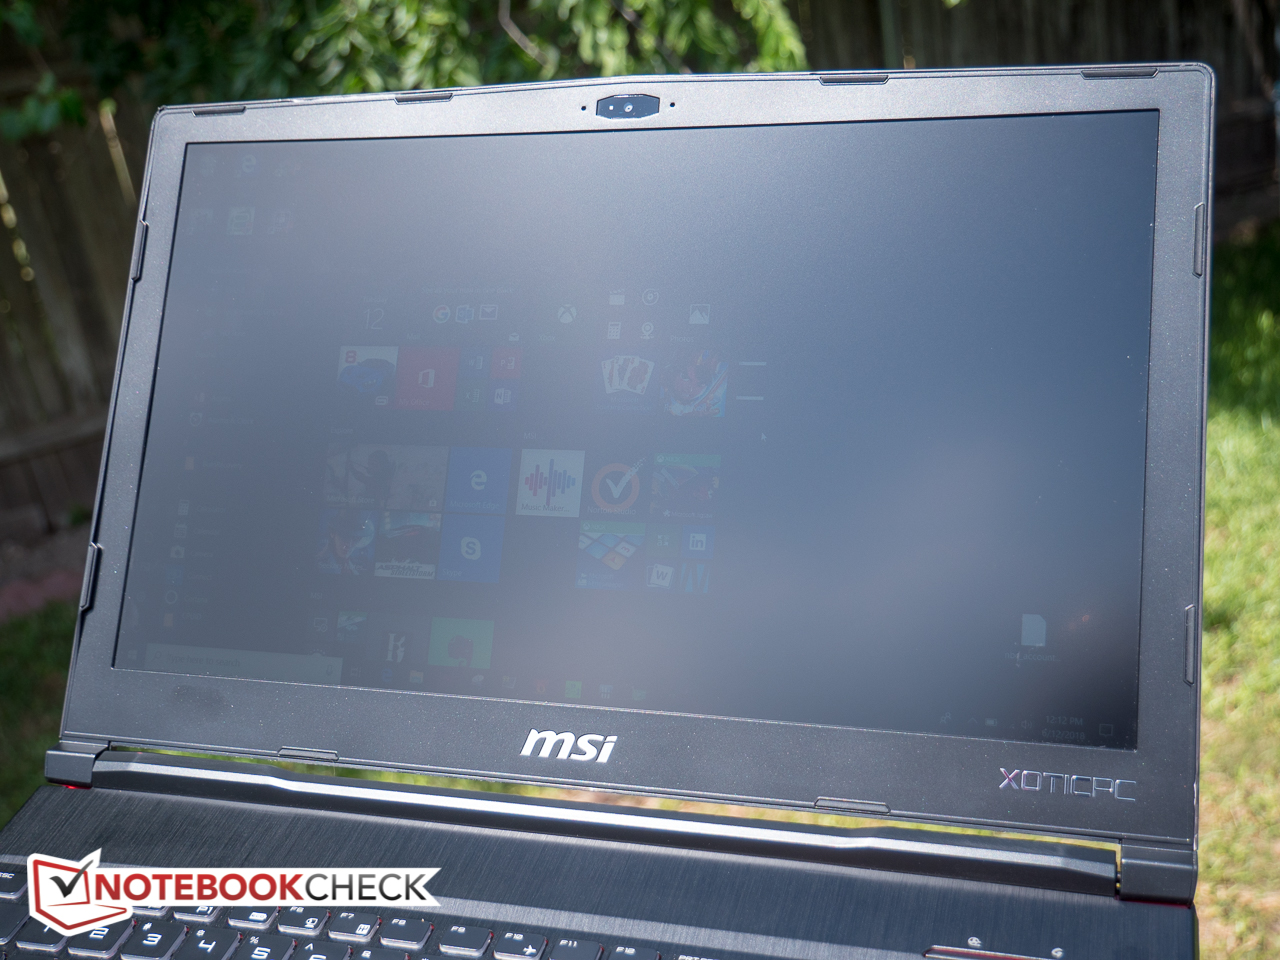
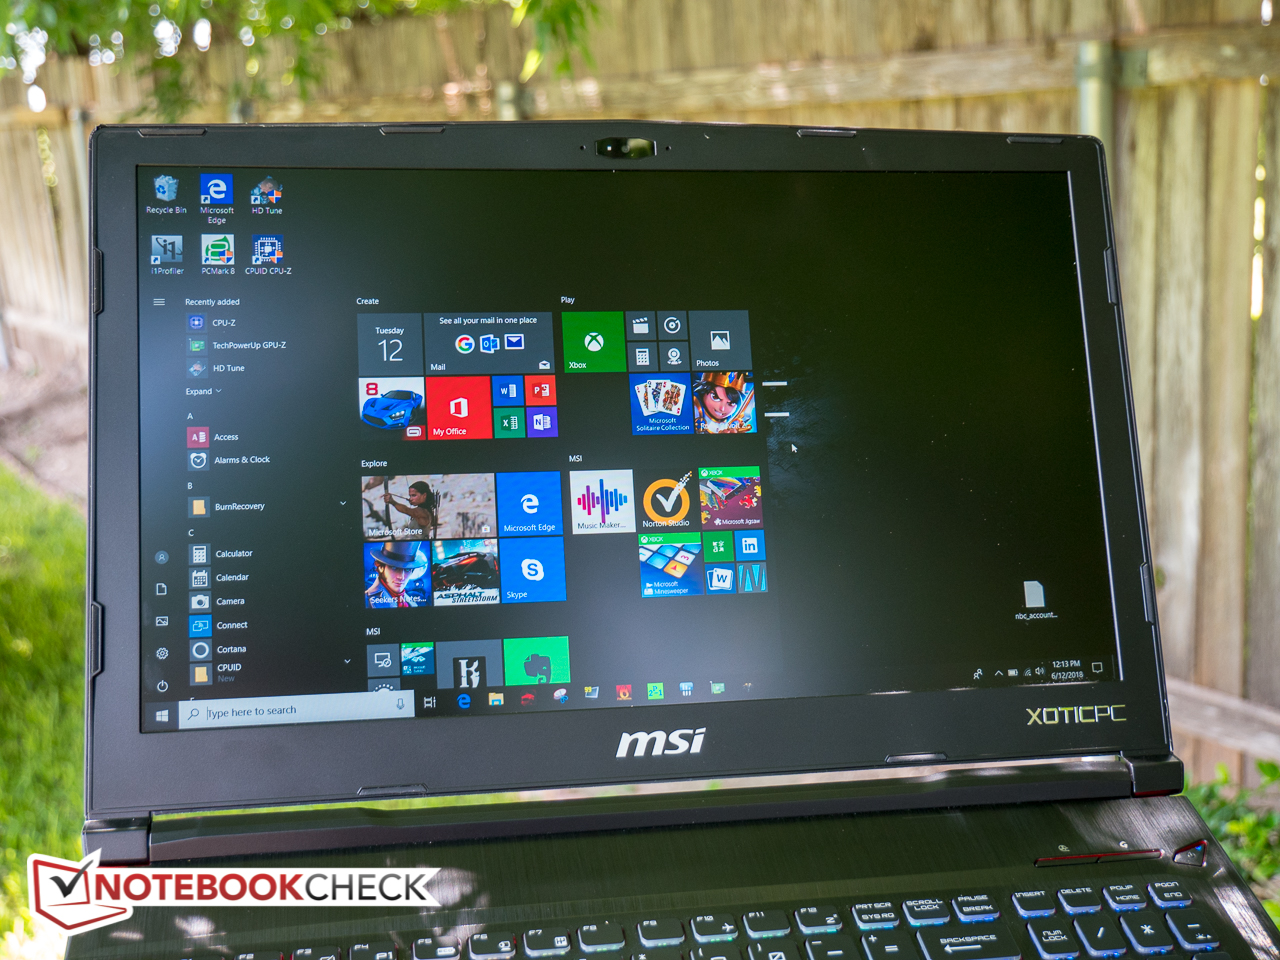
Outdoor usability is quite decent thanks to the high brightness combined with the anti-glare coating, but the screen still needs to be adjusted carefully to minimize reflections particularly in direct sunlight and to ensure a head-on viewing position.
Performance
Thanks to the i7-8550U in combination with an Nvidia GeFroce GTX 1060, primary 128 GB SSD and 16 GB of RAM, the MSI GP63 Leopard is a very capable and well-performing system. Users who buy their MSI notebook through Xotic PC can upgrade various components in the online configurator at the time of purchase. Xotic PC also offers a a lower-end model with FHD IPS display and an Nvida GeForce TX 1050TI for $1200. Both the processor as well as the GPU are fixed for either SKU, but there is a plethora of options especially when it comes to hard drives. An upgrade from the standard 128 GB SATA drive to a 500GB Certified M.2 PCIe SSSD costs $160, just to give just one example.
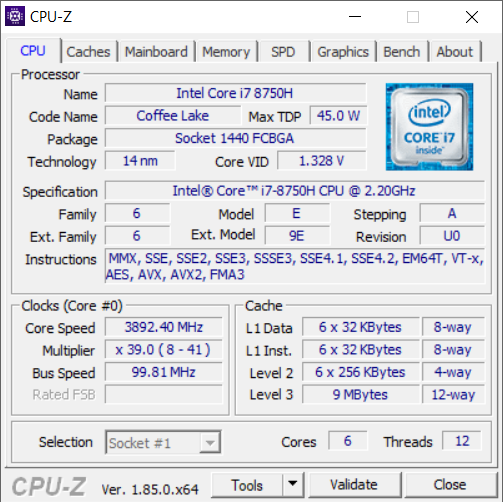


Processor
Processor performance of the 8th gen i7-8750H CPU is generally impressive with a substantial boost over the quad-core predecessor i7-7700HQ especially when it comes to multi-core operation. The Cinebench benchmarks show single-digit improvement in the single-thread scores, but multi-core performance is up by 50 %. The sustained performance is also decent: running CineBench R15 Multi in a loop results in an 8 % initial drop with no further declines throughout the remainder of the test. Note that some systems - particularly the Gigabyte Aero 15X v8 - utilize their Turbo Boost much better and offer up to 20 % better performance than the test notebook. In most usage scenarios - including gaming - the difference in raw performance is more or less negligible.
Please see our dedicated CPU page on the Intel Core i7-8750H for more technical information and benchmark comparisons.
System Performance
The overall system performance according to PCMark 8 is about mid-pack and maybe a tad slower than expected. The likely culprit is likely the slow SATA-based SSD - the PCMark scores generally benefit from faster PCIe NVMe SSDs. The new hexa-core CPU thus doesn't automatically guarantee a higher synthetic benchmark score: as the tables below show, the HP Omen 15-ce002ng with i7- 7700HQ and GeForce GTX 1060 Max-Q is able to perform about as well here as the (at least theoretically) faster GP63 with i7-8750H processor. The PCMark 10 benchmark failed every time we attempted to run it with a score of zero and a message saying that "...the benchmark ended unexpectedly...".
Aside from the issues with PCMark 10 we didn't experience any additional software problems with our test unit during the review period.
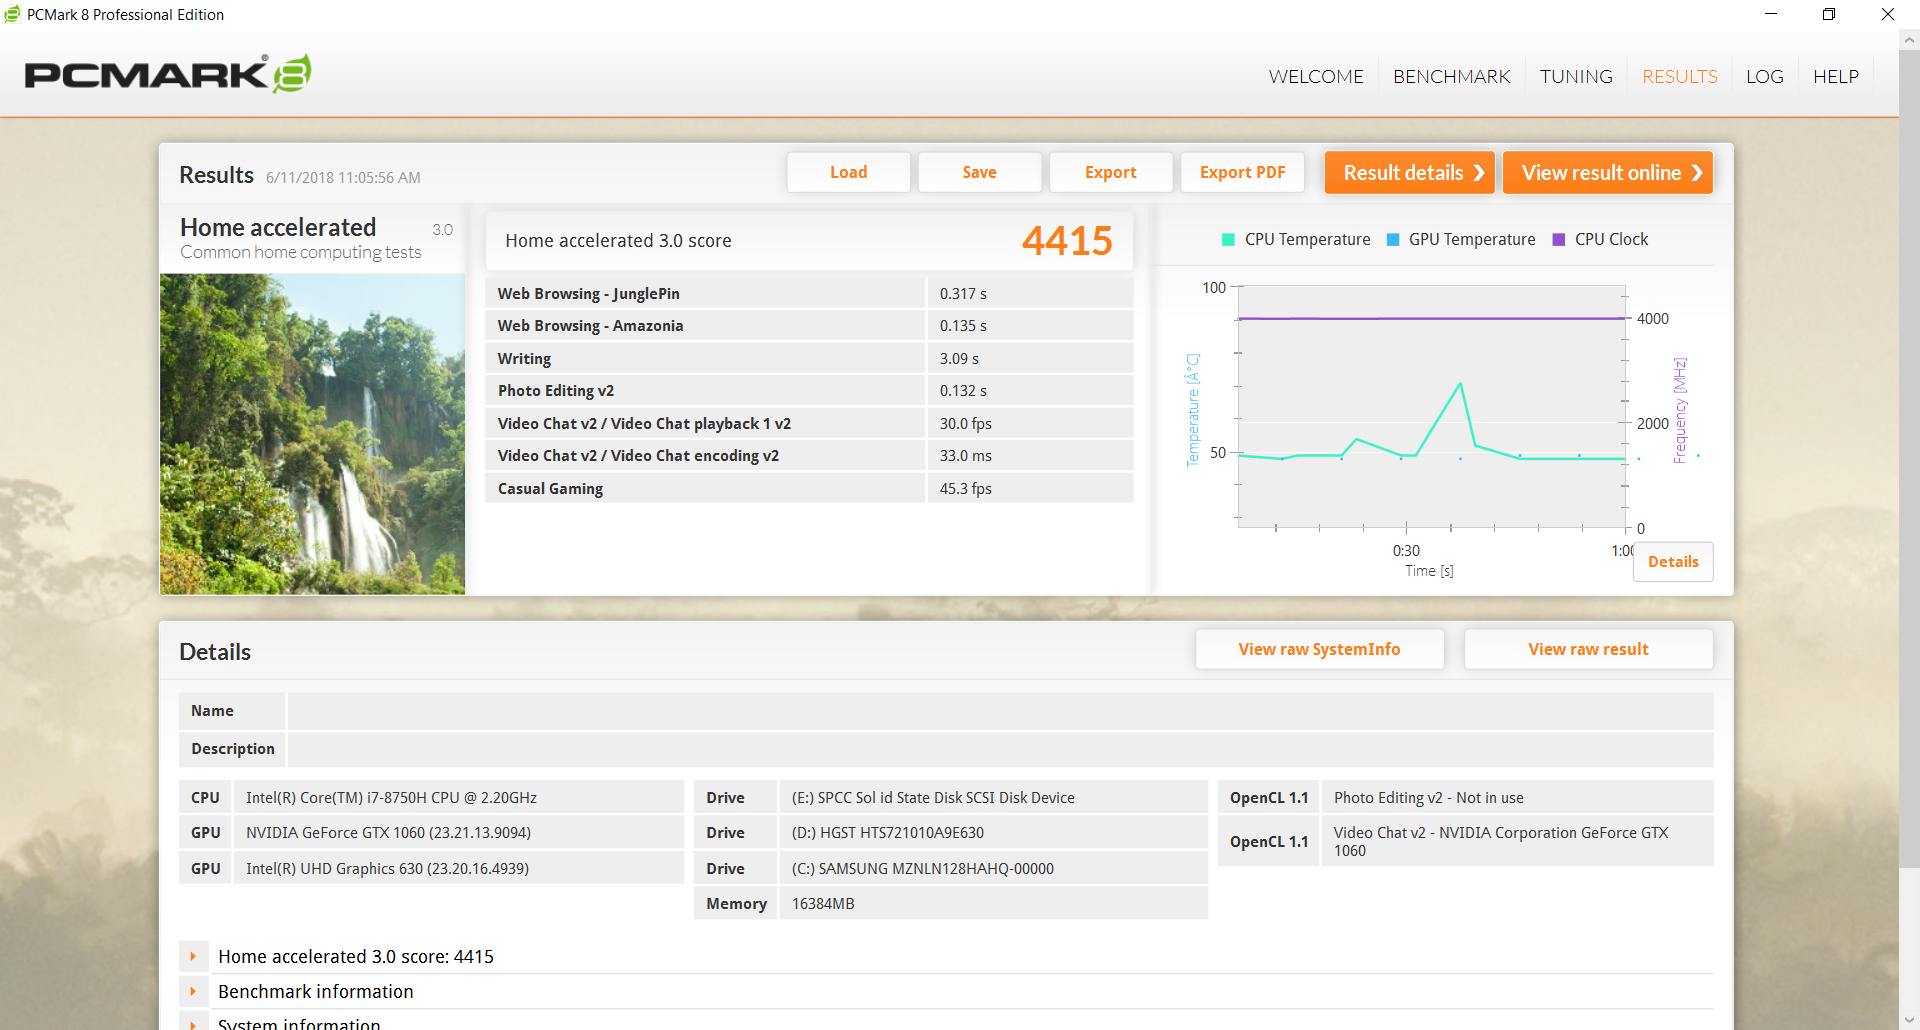
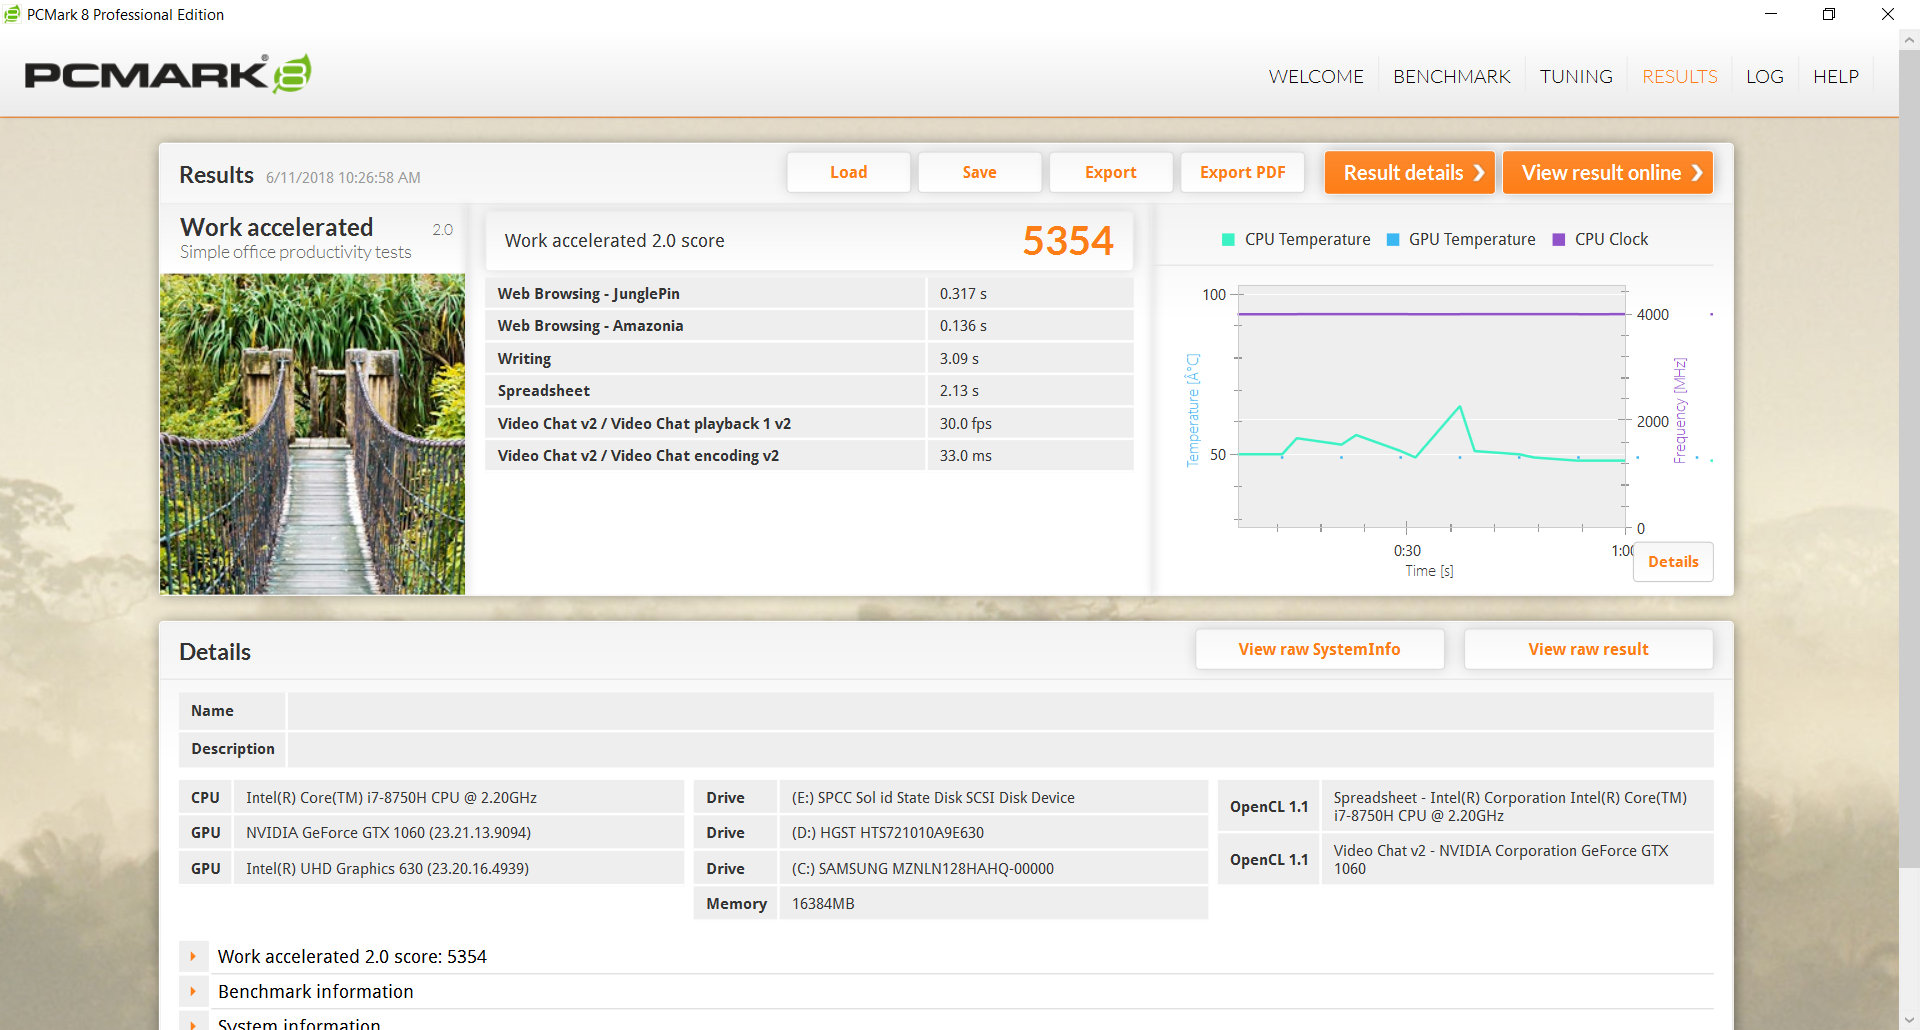
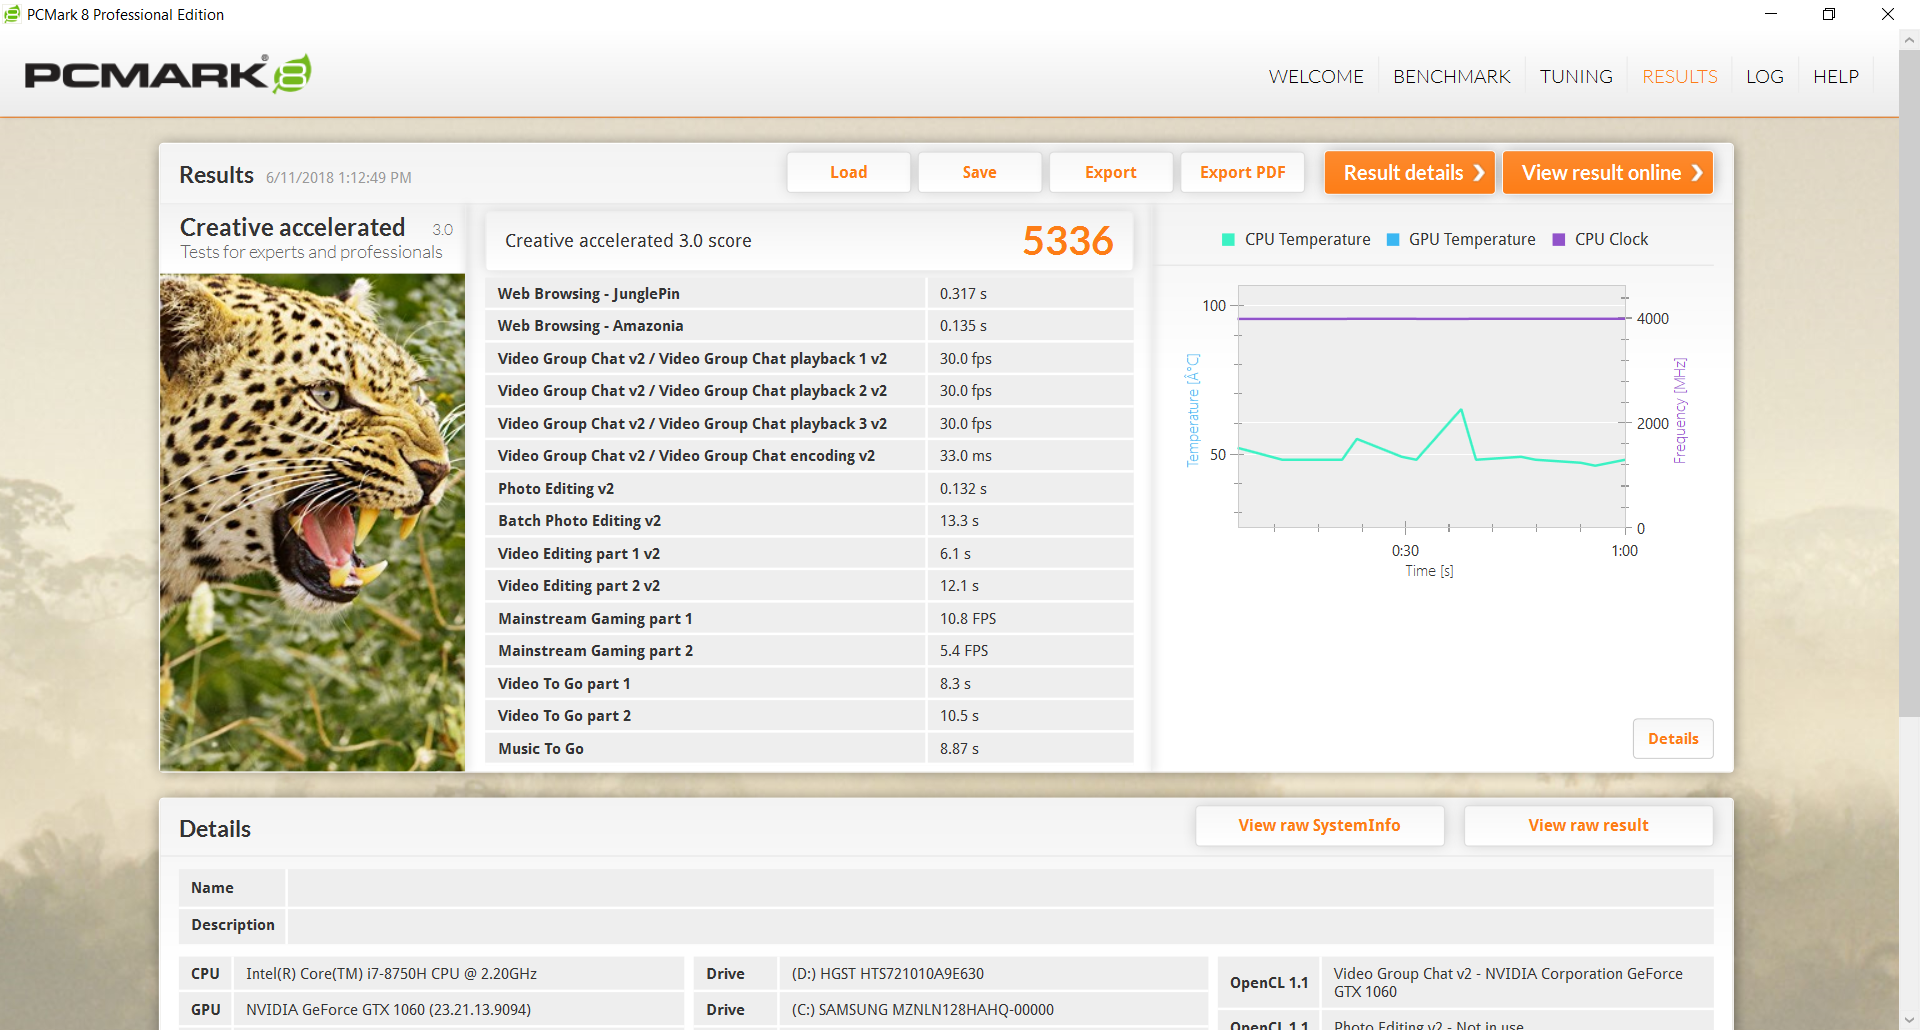
| PCMark 8 Home Score Accelerated v2 | 4415 points | |
| PCMark 8 Creative Score Accelerated v2 | 5336 points | |
| PCMark 8 Work Score Accelerated v2 | 5354 points | |
Help | ||
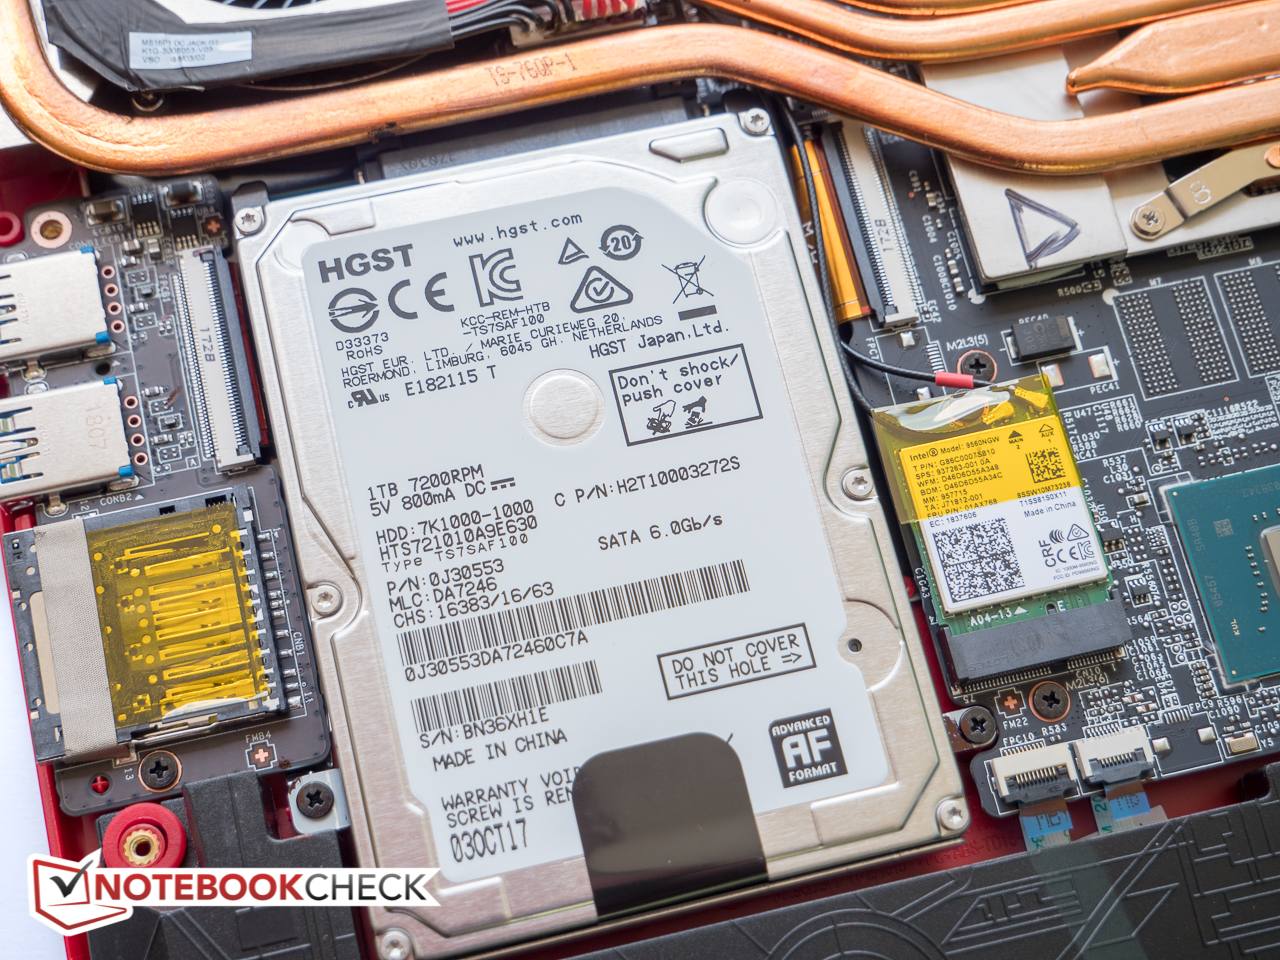
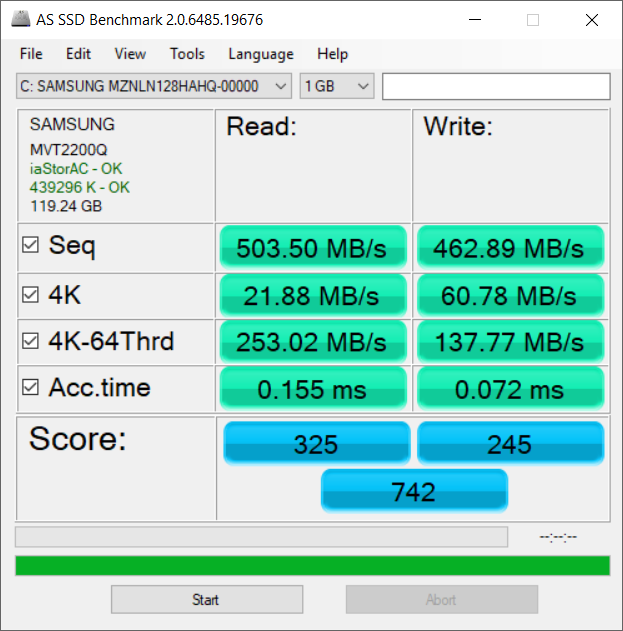
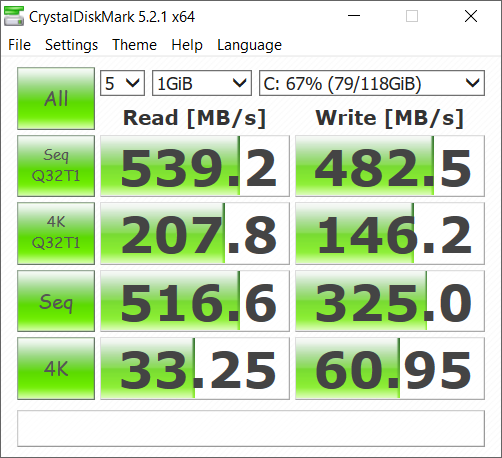
Storage Devices
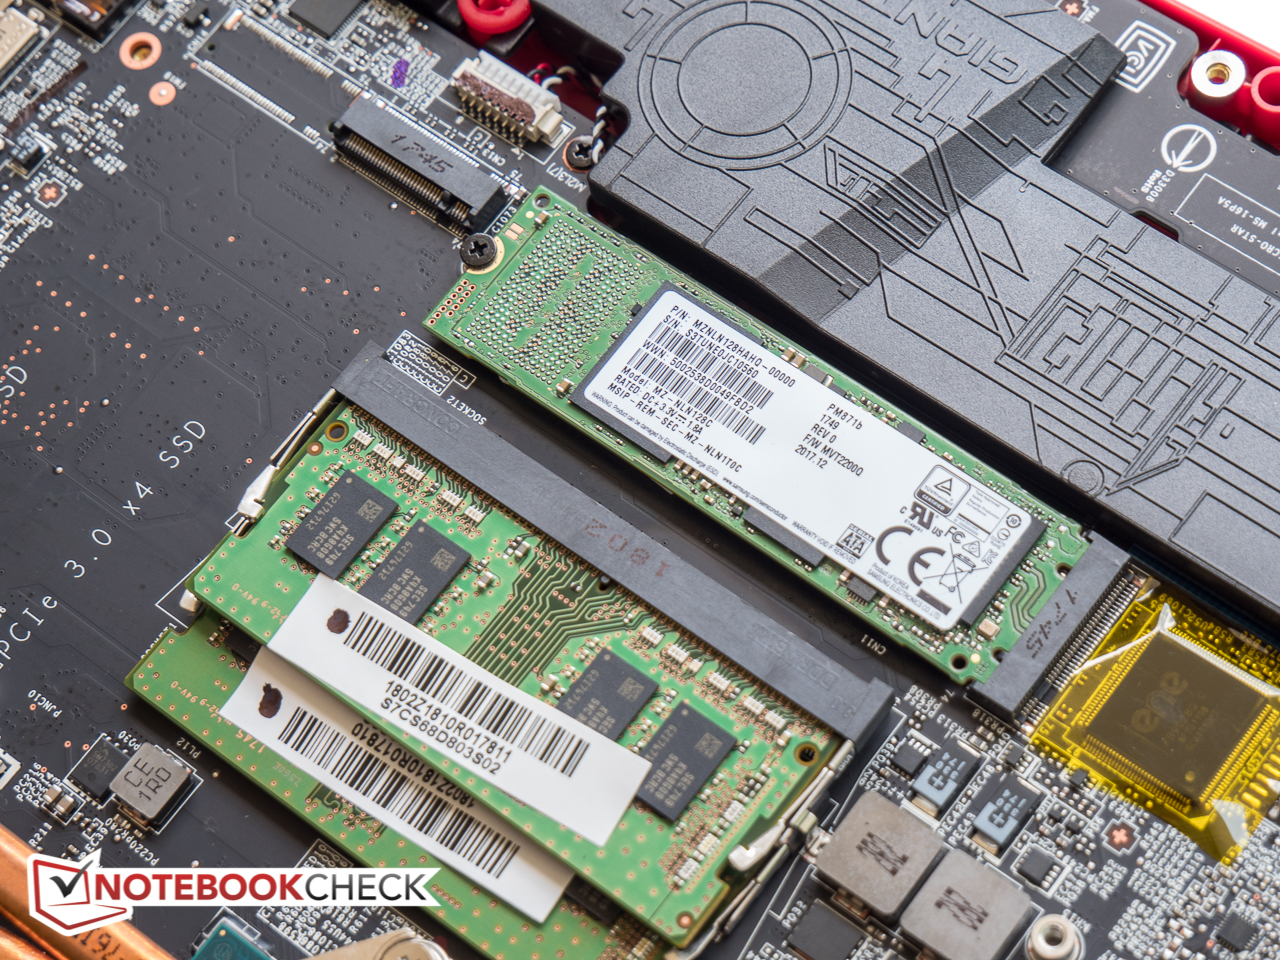
Our review notebook is equipped with a Samsung PM871 M.2 2280 128 GB SATA SSD in combination with a 1 TB 7200 RPM HGST mechanical hard drive for storage. The secondary M.2 slot (also PCIe NVMe) is empty. The throughput is decent for a SATA-based SSD, but compared to competitors with PCIe NVMe drives, the results are less than spectacular. Especially the 4K read rates could be higher: the booting to the desktop is somewhat slow at 28 seconds. The mechanical hard drive offers rather pedestrian performance, but for data storage or games this isn't really an issue. Note that the predecessor GP62 lacked the additional M.2 slot, so the GP63 is definitely a better choice for users demanding maximum storage or those wanting to use RAID arrays for their system drives.
See our table of HDDs and SSDs for more benchmark comparisons.

| MSI GP63 Leopard 8RE-013US Samsung PM871b MZNLN128HAHQ | Gigabyte Aero 15X Samsung SM961 MZVKW512HMJP m.2 PCI-e | Eurocom Q6 Samsung SSD 960 Pro 512 GB m.2 | MSI GE63VR 7RF Raider Toshiba HG6 THNSNJ256G8NY | Dell Inspiron 15 7000 7577 Samsung PM961 MZVLW256HEHP | |
|---|---|---|---|---|---|
| AS SSD | 259% | 282% | 16% | 145% | |
| Copy Game MB/s (MB/s) | 220.7 | 933 323% | 633 187% | 382.5 73% | |
| Copy Program MB/s (MB/s) | 328.1 | 323.8 -1% | 363.4 11% | 274.8 -16% | |
| Copy ISO MB/s (MB/s) | 690 | 1851 168% | 1768 156% | 814 18% | |
| Score Total (Points) | 742 | 3570 381% | 3894 425% | 930 25% | 2405 224% |
| Score Write (Points) | 245 | 1333 444% | 1693 591% | 293 20% | 594 142% |
| Score Read (Points) | 325 | 1522 368% | 1477 354% | 420 29% | 1241 282% |
| Access Time Write * (ms) | 0.072 | 0.033 54% | 0.039 46% | 0.045 37% | 0.037 49% |
| Access Time Read * (ms) | 0.155 | 0.068 56% | 0.049 68% | 0.168 -8% | 0.058 63% |
| 4K-64 Write (MB/s) | 137.8 | 1106 703% | 1403 918% | 170.6 24% | 375.8 173% |
| 4K-64 Read (MB/s) | 253 | 1225 384% | 1195 372% | 350.3 38% | 929 267% |
| 4K Write (MB/s) | 60.8 | 113.8 87% | 96.2 58% | 77.3 27% | 100.2 65% |
| 4K Read (MB/s) | 21.88 | 46.56 113% | 29.62 35% | 19.55 -11% | 46.95 115% |
| Seq Write (MB/s) | 462.9 | 1124 143% | 1943 320% | 447 -3% | 1181 155% |
| Seq Read (MB/s) | 504 | 2508 398% | 2523 401% | 506 0% | 2652 426% |
* ... smaller is better

GPU Performance
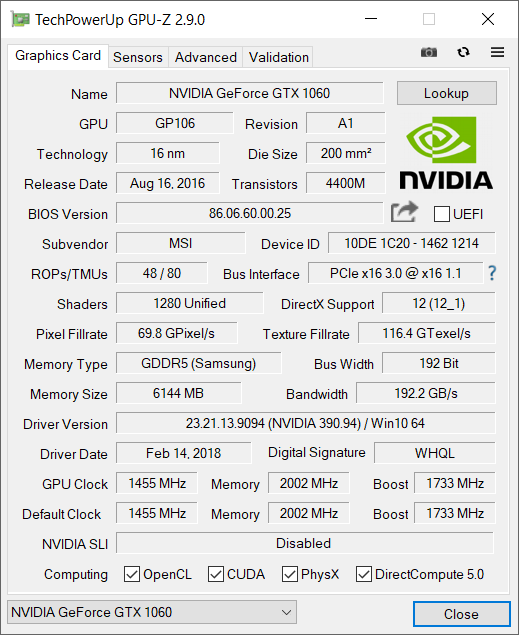
The GP106-based Nvidia GTX1060 features 6 GB of GDDR5 RAM and performs admirably. In fact, according to the 3DMark 11 and 3DMark 13 benchmark tests, the GP63 outperforms many of the other GTX 1060 candidates. With the notebook disconnected from the mains, the performance takes a serious hit: a run of 3DMark 11 with the notebook running on battery shows reduced graphics (-64 %) and physics (-19 %) scores with an overall drop of 8200 points (-58 %).
For additional technical information and benchmark comparisons, please see our dedicated page on the GeForce GTX 1060.
| 3DMark 11 Performance | 14174 points | |
| 3DMark Cloud Gate Standard Score | 32310 points | |
| 3DMark Fire Strike Score | 10722 points | |
| 3DMark Fire Strike Extreme Score | 5536 points | |
Help | ||
Gaming Performance
Gaming performance is excellent for a system with GTX 1060 graphics and the recorded frame rates are up to 10 % higher than average. Notebooks with the GTX 1070 allow for 20 - 30 % higher frame rates depending on the game and the graphics settings, while the older GP62 with GeForce GTX 1050 Ti graphics trails the test unit by up to 50 %.
A quick note on the new processor: although the i7-8750H offers substantial performance gains over the i7-7700HQ, it does so mainly for for multi-threaded productivity titles which can take advantage of the two additional cores. Many modern games will be bottlenecked by the GPU first, so the raw performance gains on the processor side are not necessarily going to translate to a much smoother gaming experience.
| The Witcher 3 | |
| 1366x768 Medium Graphics & Postprocessing | |
| Eurocom Q6 | |
| MSI GP63 Leopard 8RE-013US | |
| Asus GL702ZC-GC104T | |
| HP Omen 15-ce002ng | |
| Lenovo Legion Y720 80VR002XGE | |
| 1920x1080 High Graphics & Postprocessing (Nvidia HairWorks Off) | |
| Eurocom Q6 | |
| Gigabyte Aero 15X v8 | |
| Dell Inspiron 15 7000 7577 | |
| MSI GP63 Leopard 8RE-013US | |
| Asus GL702ZC-GC104T | |
| Lenovo Legion Y720 80VR002XGE | |
| HP Omen 15-ce002ng | |
| 1920x1080 Ultra Graphics & Postprocessing (HBAO+) | |
| MSI GE63VR 7RF Raider | |
| Gigabyte Aero 15X v8 | |
| Eurocom Q6 | |
| MSI GP63 Leopard 8RE-013US | |
| Asus Strix GL703VM-DB74 | |
| Asus GL702ZC-GC104T | |
| Lenovo Legion Y720 80VR002XGE | |
| Dell Inspiron 15 7000 7577 | |
| HP Omen 15-ce002ng | |
| Rise of the Tomb Raider | |
| 1366x768 Medium Preset AF:2x | |
| Eurocom Q6 | |
| MSI GP63 Leopard 8RE-013US | |
| HP Omen 15-ce002ng | |
| Asus GL702ZC-GC104T | |
| MSI GP62 7REX-1045US | |
| 1920x1080 High Preset AA:FX AF:4x | |
| MSI GE63VR 7RF Raider | |
| Eurocom Q6 | |
| MSI GP63 Leopard 8RE-013US | |
| Dell Inspiron 15 7000 7577 | |
| HP Omen 15-ce002ng | |
| Asus GL702ZC-GC104T | |
| MSI GP62 7REX-1045US | |
| 1920x1080 Very High Preset AA:FX AF:16x | |
| MSI GE63VR 7RF Raider | |
| Eurocom Q6 | |
| MSI GP63 Leopard 8RE-013US | |
| Asus Strix GL703VM-DB74 | |
| Dell Inspiron 15 7000 7577 | |
| Asus GL702ZC-GC104T | |
| HP Omen 15-ce002ng | |
| MSI GP62 7REX-1045US | |
| BioShock Infinite | |
| 1366x768 Medium Preset | |
| Eurocom Q6 | |
| MSI GP63 Leopard 8RE-013US | |
| Lenovo Legion Y720 80VR002XGE | |
| MSI GP62 7REX-1045US | |
| 1366x768 High Preset | |
| Eurocom Q6 | |
| MSI GP63 Leopard 8RE-013US | |
| Lenovo Legion Y720 80VR002XGE | |
| MSI GP62 7REX-1045US | |
| 1920x1080 Ultra Preset, DX11 (DDOF) | |
| Eurocom Q6 | |
| MSI GP63 Leopard 8RE-013US | |
| Asus Strix GL703VM-DB74 | |
| Lenovo Legion Y720 80VR002XGE | |
| Dell Inspiron 15 7000 7577 | |
| MSI GP62 7REX-1045US | |
| low | med. | high | ultra | |
|---|---|---|---|---|
| BioShock Infinite (2013) | 272.4 | 233.2 | 225.4 | 115.4 |
| The Witcher 3 (2015) | 197.4 | 138.7 | 68.5 | 42.3 |
| Rise of the Tomb Raider (2016) | 180.3 | 138.2 | 77.3 | 66.6 |
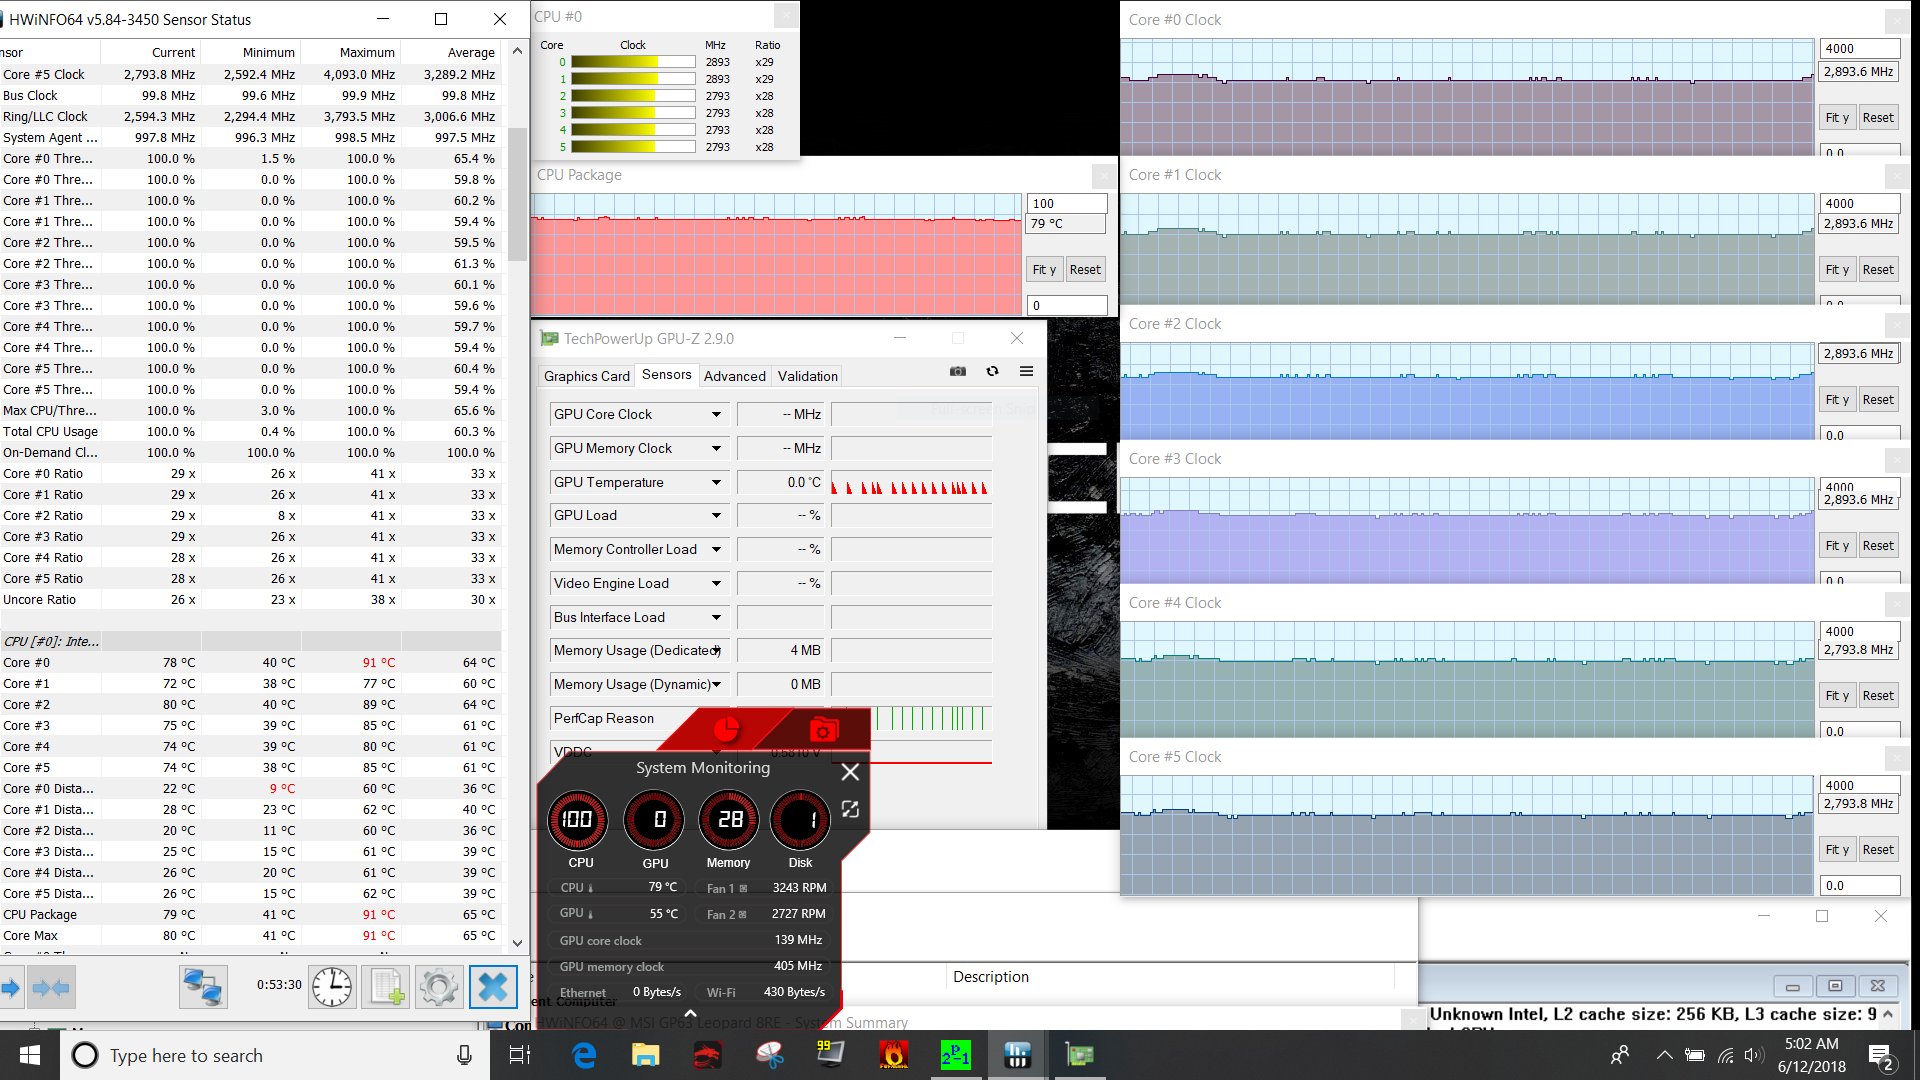
Stress Test
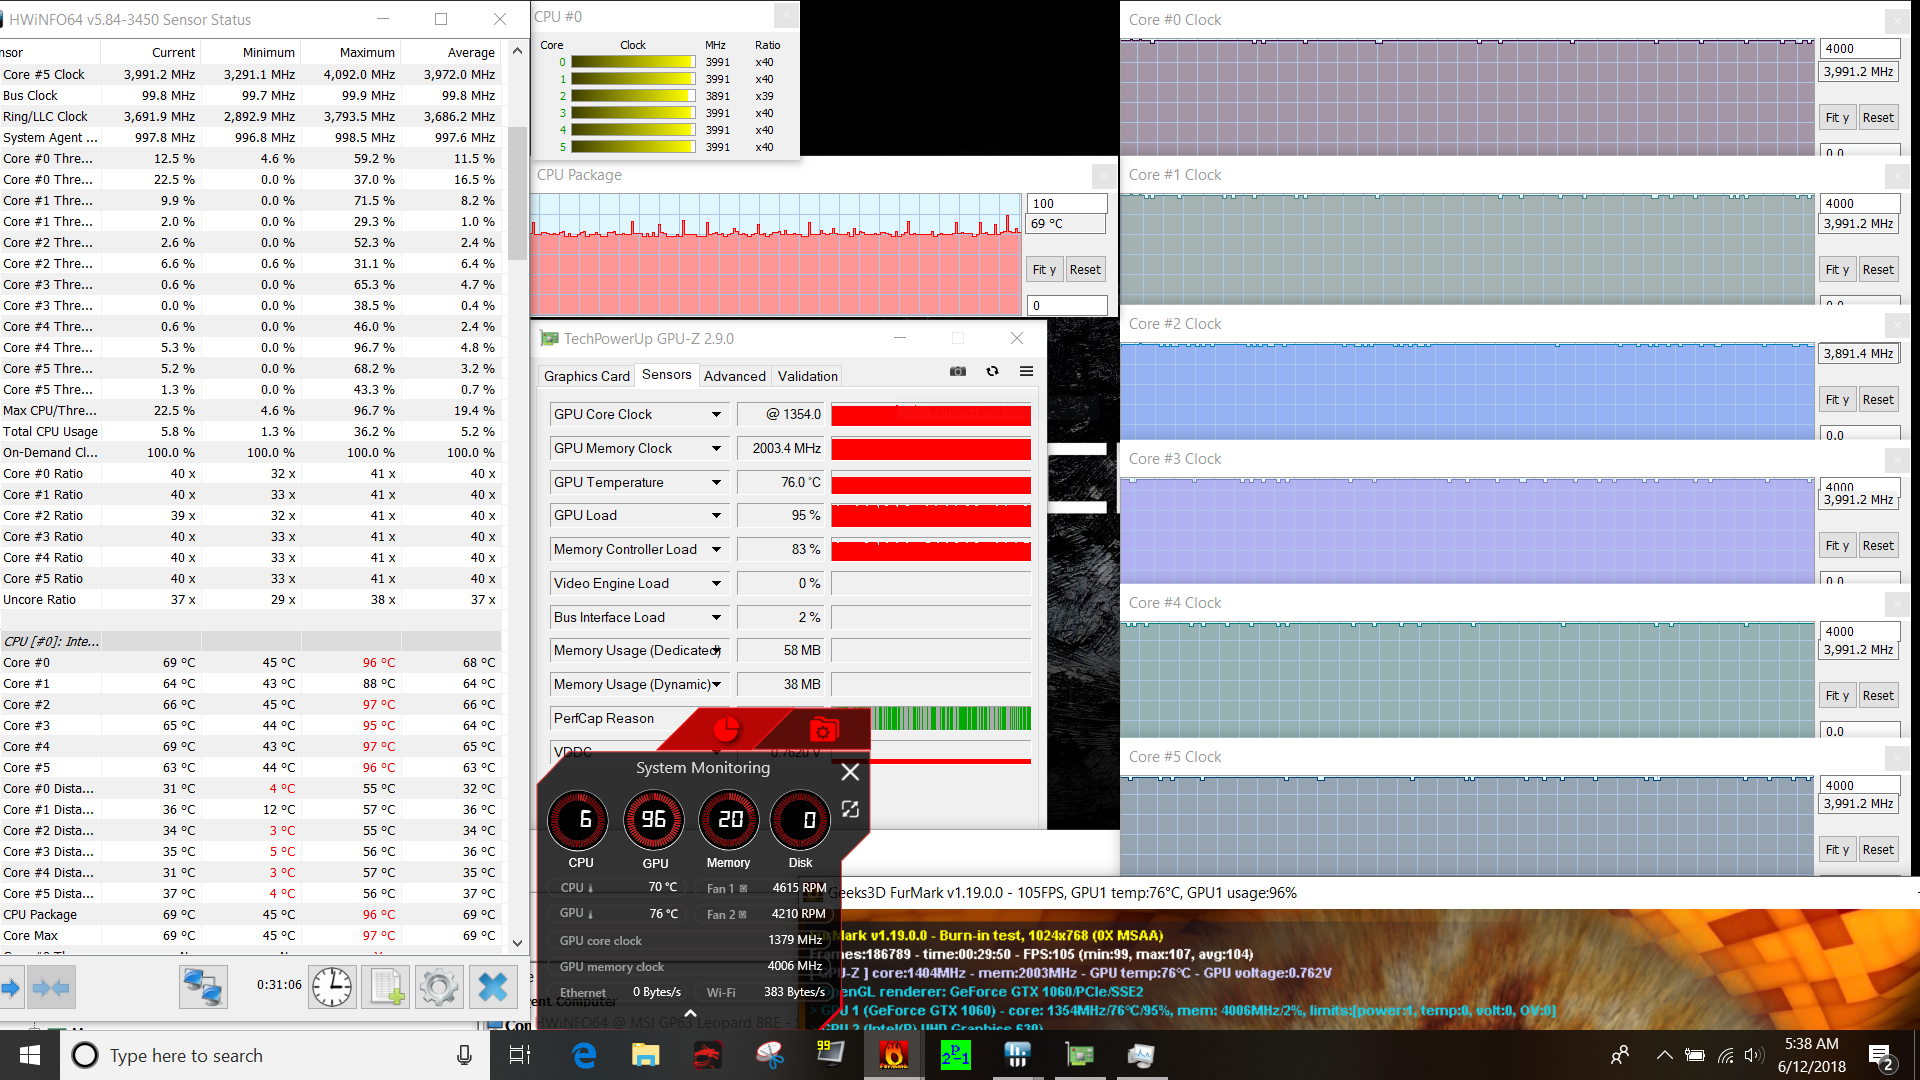
We subject our review notebooks to unrealistically high CPU and GPU loads to identify throttling and potential stability issues. Under Prime95 load, the CPU cores run at between 2.7 - 2.9 GHz at a temperature of 78 - 80 C. The two fans slowly increase in speed and end up at about 3200 RPM for the CPU and 2800 RPM for the GPU, respectively. With Furmark running on its own, the GPU runs at just under 1400 MHz with the temperature eventually reaching 76 C and the fans working much harder at 4600/4200 RPM.
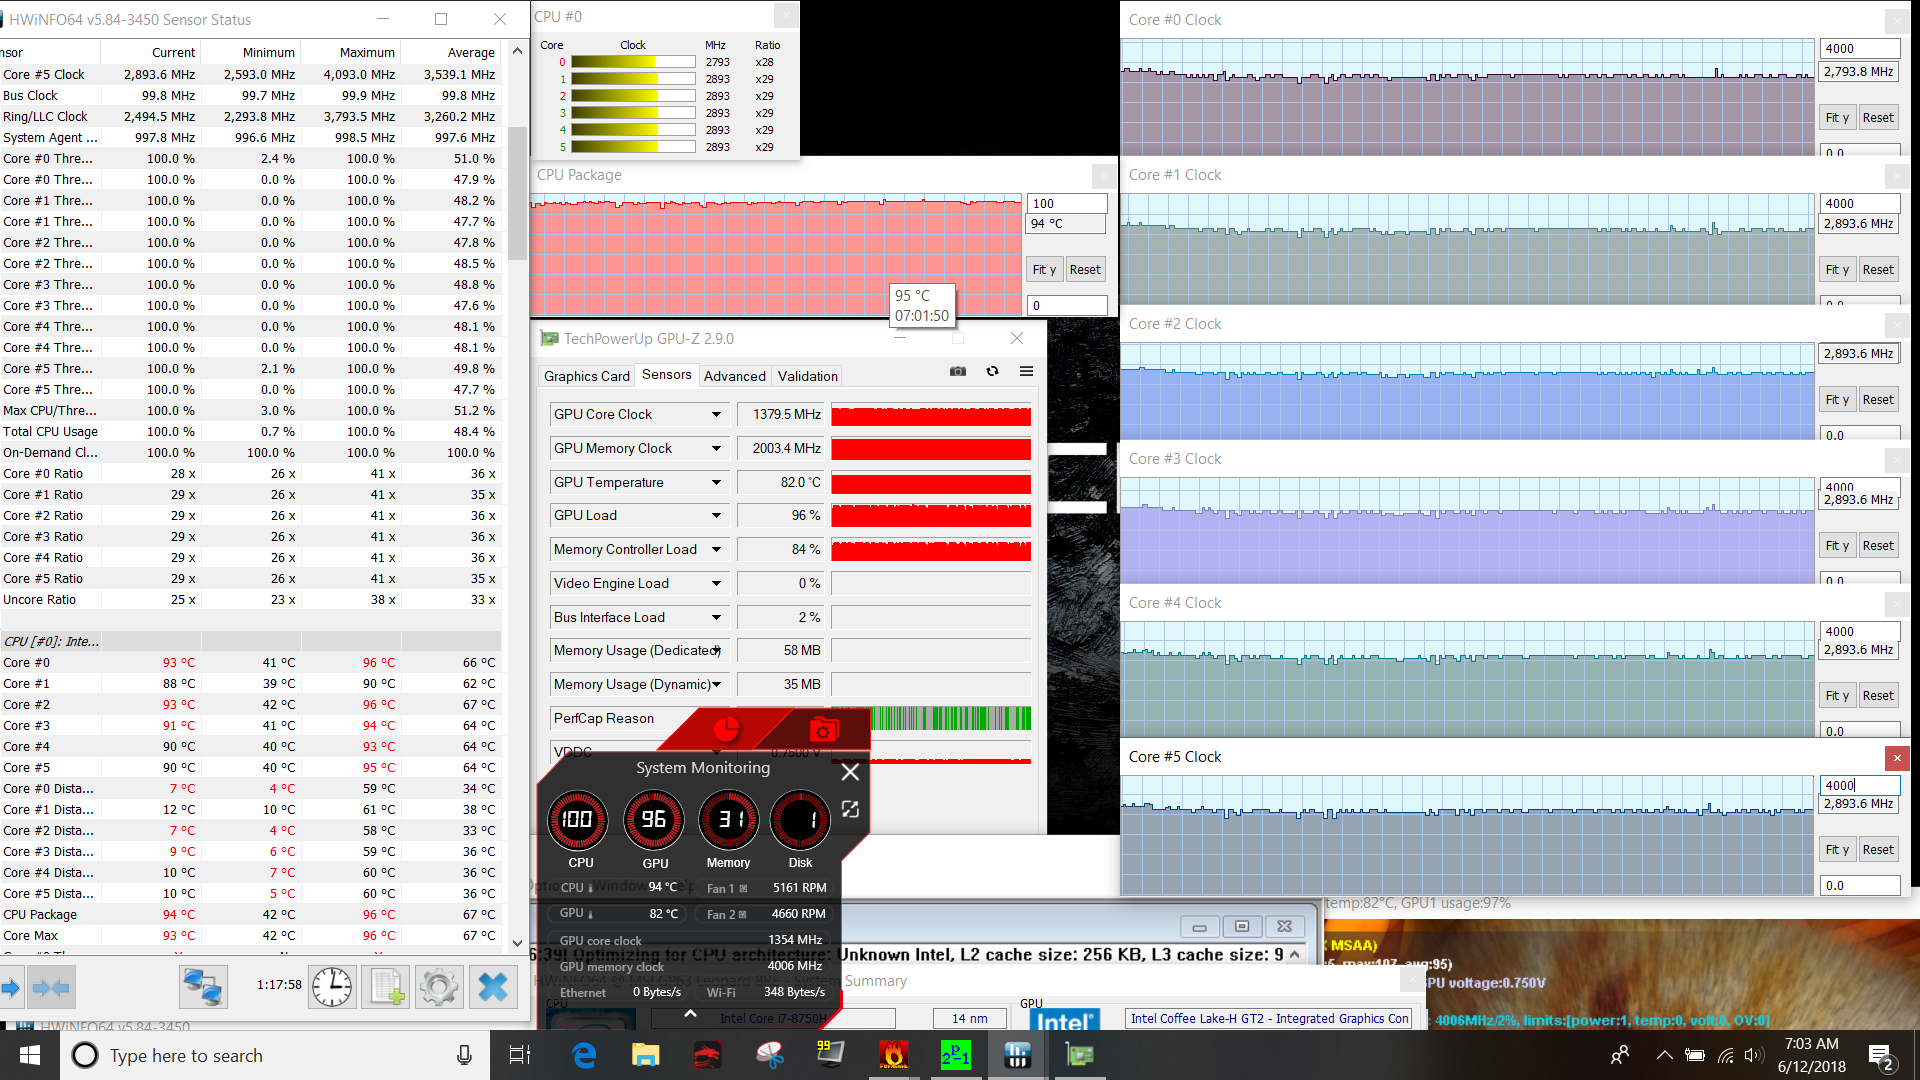
Stressing both the CPU and GPU simultaneously with Prime95 and FurMark results in CPU clock rates of between 2.7 - 2.9 GHz at temperatures of 93 - 95 C, while the GPU remains at just under 1400 MHz at a maximum of 82 C. The fans speeds reach new heights at roughly 5200/4700 RPM.
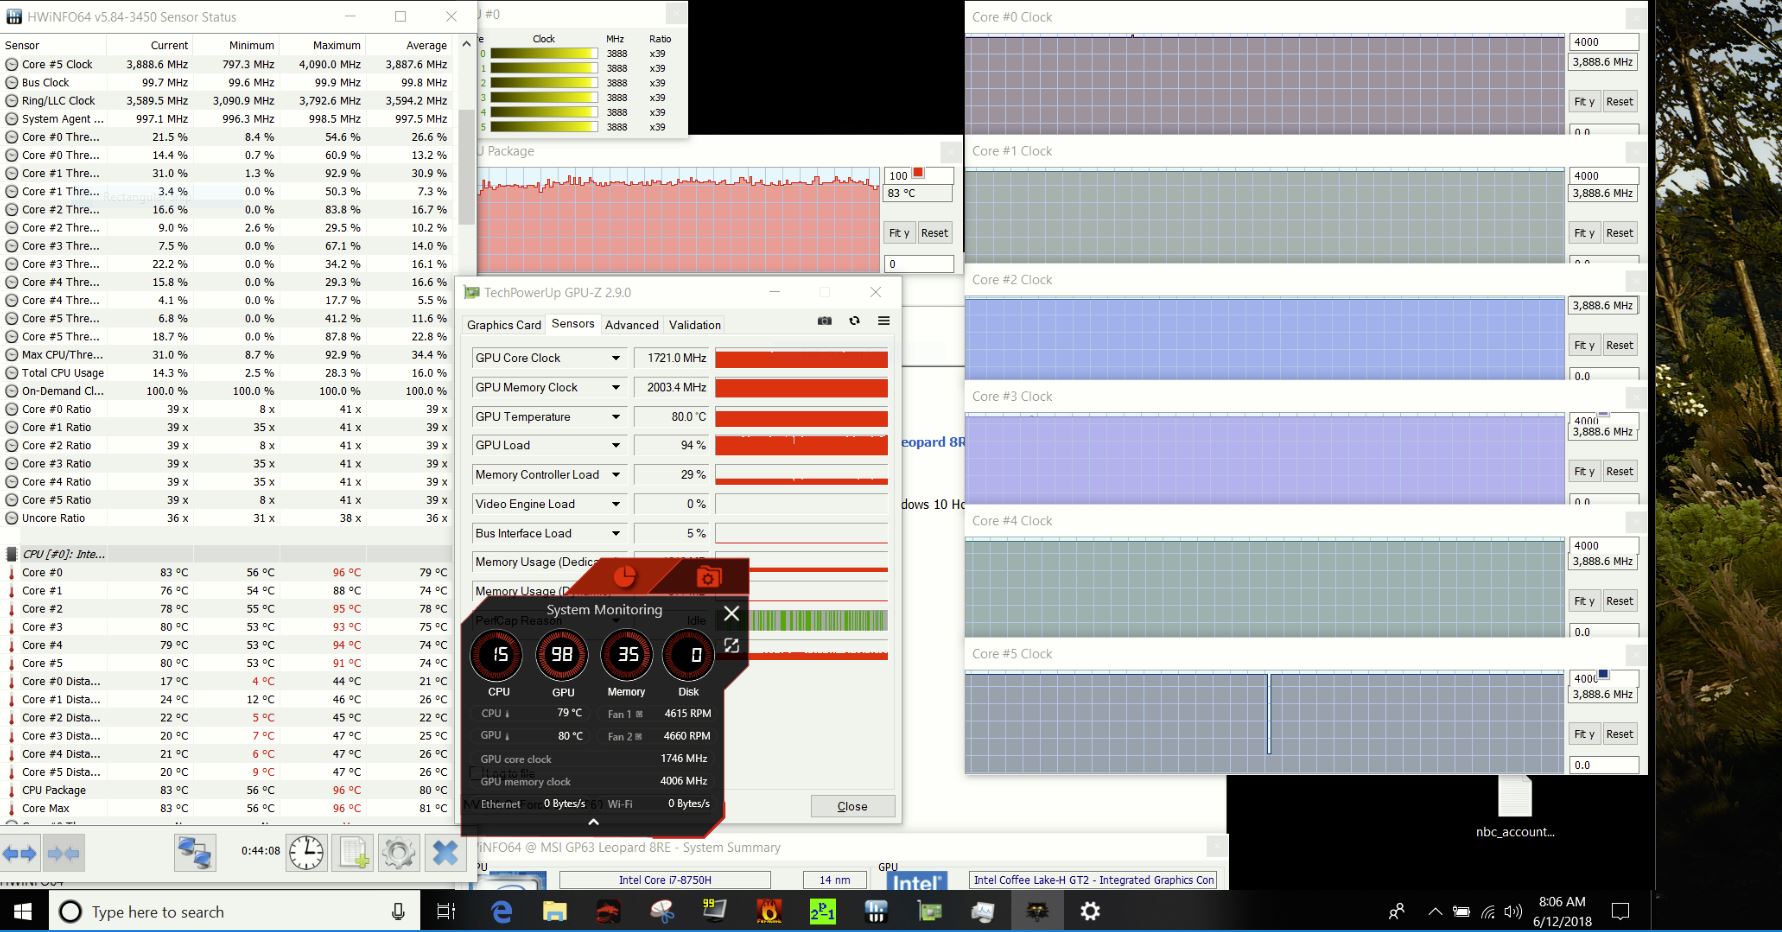
Witcher 3 load much better represents real-world gaming stress. Here, the CPU runs at 3.9 GHz at temperatures of up to 83 C, while the GPU runs at 1700 MHz at 80 C. The fans remain at around 4600 RPM for the duration.
Our main observation here is that MSI employs fairly aggressive thermal management especially during periods of heavy CPU stress, which might help to explain why other notebooks with the same processor score better in the Cinebench tests. MSI's Cooler Boost technology reduces the temperatures of both the CPU and GPU by a about 10 - 12 C with the GPU cycling between 1400 - 1600 MHz. There's no apparent improvement in benchmark performance or frame rates, however, so we used the "auto" setting for the most part to avoid the additional noise the fans generate at maximum RPM.
| CPU Clock (GHz) | GPU Clock (MHz) | Average CPU Temperature (°C) | Average GPU Temperature (°C) | |
| Prime95 Stress | 2.7-2.9 | - | 78-80 | - |
| FurMark Stress | - | 1400 | - | 76 |
| Prime95 + FurMark Stress | 2.7-2.9 | 1400 | 93-95 | 82 |
| Witcher 3 Stress | 3.9 | 83 | 1700 | 80 |
Emissions
System Noise
As we mentioned above, the two fans work pretty hard at times to keep the internal temperatures in check. During idle, the CPU fan will start spinning occasionally for a maximum noise level of 33 dB. Gaming will push both fans into the 4000-5000 RPM range with the noise occasionally topping 50 dB. Maximum load during the stress test resulted in a noise level of almost 57 dB, which is louder than most competitors under similar conditions. Systems like the HP Omen 15 and the Lenovo Y720 are significantly quieter when gaming; the larger 17.3-inch Asus Strix GL703VM is about as loud as the review notebook.
We did not notice any coil whine or electronic noise on our unit even when running hard drive benchmarks.
Noise level
| Idle |
| 32.8 / 32.8 / 33 dB(A) |
| Load |
| 35.8 / 52.3 dB(A) |
 | ||
30 dB silent 40 dB(A) audible 50 dB(A) loud |
||
min: | ||
| MSI GP63 Leopard 8RE-013US GeForce GTX 1060 Mobile, i7-8750H, Samsung PM871b MZNLN128HAHQ | HP Omen 15-ce002ng GeForce GTX 1060 Max-Q, i7-7700HQ, Samsung PM961 MZVLW256HEHP | Lenovo Legion Y720 80VR002XGE GeForce GTX 1060 Mobile, i7-7700HQ, Samsung PM961 MZVLW256HEHP | Acer Aspire VN7-593G-73HP V15 Nitro BE GeForce GTX 1060 Mobile, i7-7700HQ, Seagate Mobile HDD 1TB ST1000LM035 | Asus Strix GL703VM-DB74 GeForce GTX 1060 Mobile, i7-7700HQ, Seagate Mobile HDD 1TB ST1000LX015-1U7172 | |
|---|---|---|---|---|---|
| Noise | -0% | 6% | 3% | 2% | |
| off / environment * (dB) | 28.4 | 30 -6% | 30.3 -7% | 30.4 -7% | 28.4 -0% |
| Idle Minimum * (dB) | 32.8 | 30 9% | 31 5% | 30.9 6% | 30.2 8% |
| Idle Average * (dB) | 32.8 | 33 -1% | 30.9 6% | 30.9 6% | 30.2 8% |
| Idle Maximum * (dB) | 33 | 37 -12% | 31.5 5% | 31.5 5% | 30.2 8% |
| Load Average * (dB) | 35.8 | 41 -15% | 38.7 -8% | 40.7 -14% | 38.4 -7% |
| Witcher 3 ultra * (dB) | 51 | 42 18% | 42 18% | 45.5 11% | 49.7 3% |
| Load Maximum * (dB) | 52.3 | 50 4% | 41.9 20% | 43.9 16% | 54.5 -4% |
* ... smaller is better
Temperature
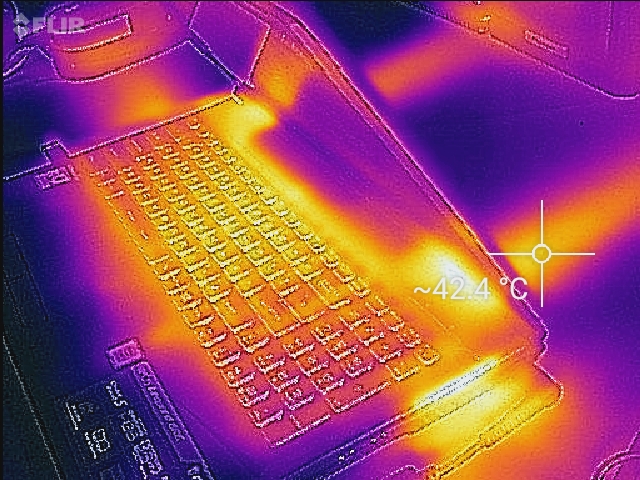
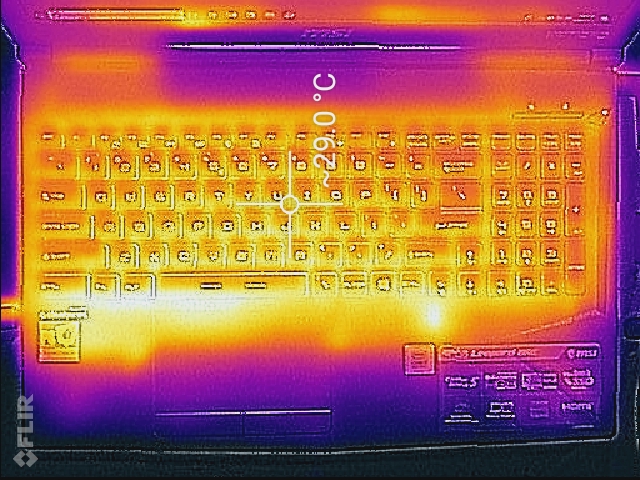
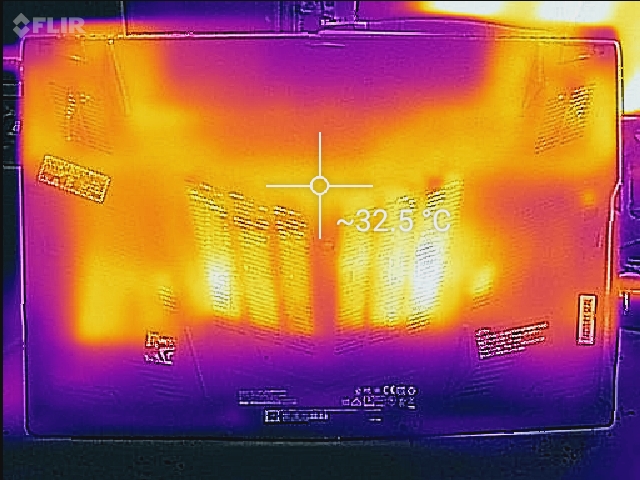
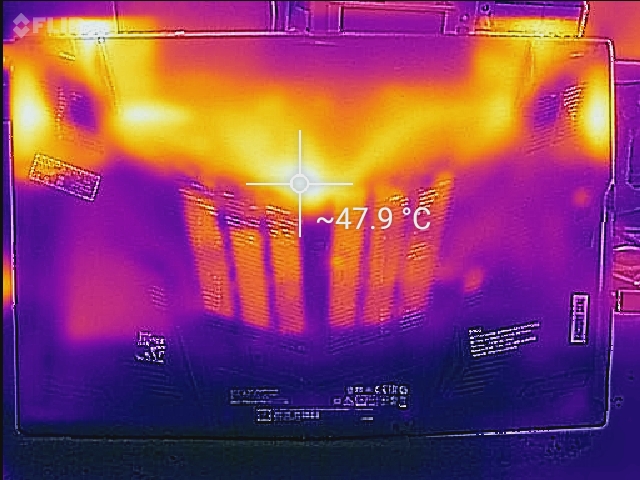
Despite the comparatively aggressive thermal management with well-controlled hardware temperatures, the surface areas do become quite warm. Both our stress test with Prime95 and Furmark and the Witcher 3 test increase the temperature to a maximum of 48 C on the bottom in the middle quadrant. Many competing systems get hotter though: the HP Omen 15 reaches up to 54 C under the same conditions. The WASD key area only gets moderately warm at about 35 C when gaming and the palm rests as well as the touchpad stay cool to the touch even under sustained heavy loads. The new and improved cooling system - MSI now employs seven heat pipes and two additional exhaust vents - keeps the palm rests markedly cooler compared to the predecessor GP62, which could reach 40 C in the touchpad area.
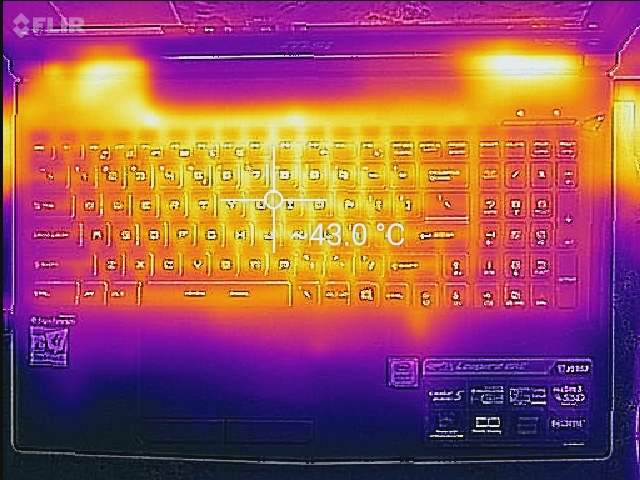
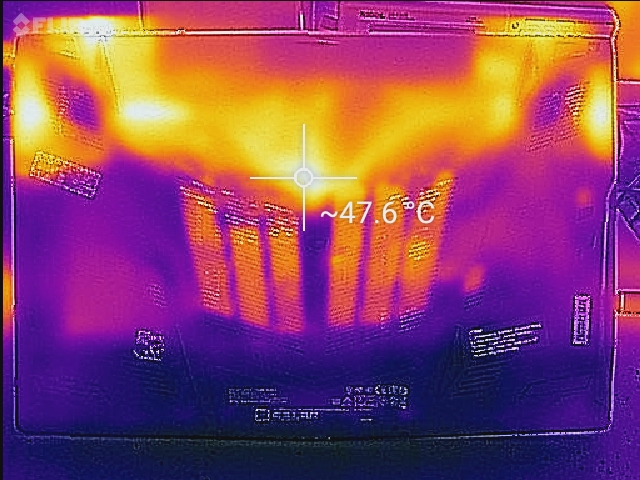
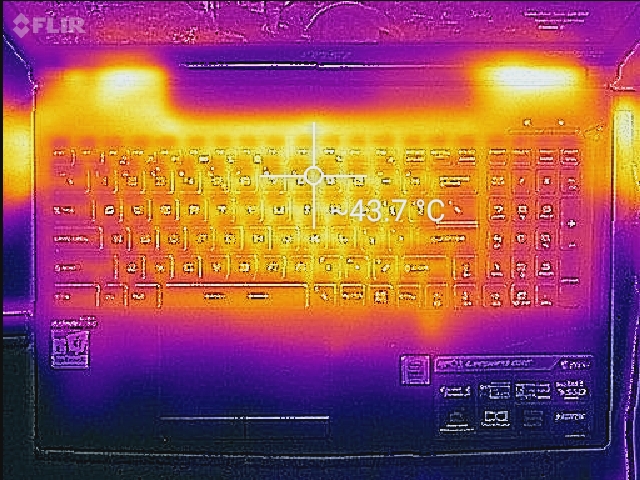
(±) The maximum temperature on the upper side is 42.2 °C / 108 F, compared to the average of 40.4 °C / 105 F, ranging from 21.2 to 68.8 °C for the class Gaming.
(-) The bottom heats up to a maximum of 47.8 °C / 118 F, compared to the average of 43.2 °C / 110 F
(+) In idle usage, the average temperature for the upper side is 25.9 °C / 79 F, compared to the device average of 33.9 °C / 93 F.
(±) Playing The Witcher 3, the average temperature for the upper side is 34.7 °C / 94 F, compared to the device average of 33.9 °C / 93 F.
(+) The palmrests and touchpad are cooler than skin temperature with a maximum of 29.6 °C / 85.3 F and are therefore cool to the touch.
(±) The average temperature of the palmrest area of similar devices was 28.8 °C / 83.8 F (-0.8 °C / -1.5 F).
Speakers
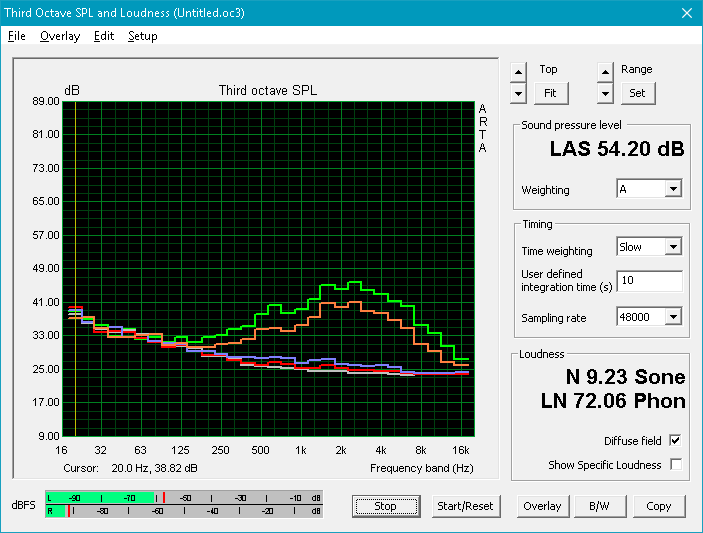
MSI refers to the sound system simply as "giant speakers" and promises "louder sound, more resonance, and higher quality". Our measurements unfortunately can't really confirm the latter claims: the speakers do get quite loud with balanced mids and highs, but the bass output is pretty much non-existent. Despite the included Nahimic software, the speakers remain tinny and unpleasant. We highly recommend headphones or external speakers for a much more satisfying experience.


MSI GP63 Leopard 8RE-013US audio analysis
(±) | speaker loudness is average but good (78.3 dB)
Bass 100 - 315 Hz
(-) | nearly no bass - on average 23.1% lower than median
(±) | linearity of bass is average (10.6% delta to prev. frequency)
Mids 400 - 2000 Hz
(+) | balanced mids - only 3% away from median
(±) | linearity of mids is average (7.1% delta to prev. frequency)
Highs 2 - 16 kHz
(±) | higher highs - on average 5.8% higher than median
(+) | highs are linear (6% delta to prev. frequency)
Overall 100 - 16.000 Hz
(±) | linearity of overall sound is average (21.2% difference to median)
Compared to same class
» 76% of all tested devices in this class were better, 4% similar, 19% worse
» The best had a delta of 6%, average was 18%, worst was 132%
Compared to all devices tested
» 59% of all tested devices were better, 7% similar, 34% worse
» The best had a delta of 4%, average was 23%, worst was 134%
Apple MacBook 12 (Early 2016) 1.1 GHz audio analysis
(+) | speakers can play relatively loud (83.6 dB)
Bass 100 - 315 Hz
(±) | reduced bass - on average 11.3% lower than median
(±) | linearity of bass is average (14.2% delta to prev. frequency)
Mids 400 - 2000 Hz
(+) | balanced mids - only 2.4% away from median
(+) | mids are linear (5.5% delta to prev. frequency)
Highs 2 - 16 kHz
(+) | balanced highs - only 2% away from median
(+) | highs are linear (4.5% delta to prev. frequency)
Overall 100 - 16.000 Hz
(+) | overall sound is linear (10.2% difference to median)
Compared to same class
» 7% of all tested devices in this class were better, 2% similar, 90% worse
» The best had a delta of 5%, average was 18%, worst was 53%
Compared to all devices tested
» 5% of all tested devices were better, 1% similar, 94% worse
» The best had a delta of 4%, average was 23%, worst was 134%
Energy Management
Power Consumption
Idling on desktop will consume 8 to 13.5 W depending on the brightness level, chosen profile, and Optimus setting. The Dell Inspiron 15 with i5-7300HQ and GTX 1060 Max-Q graphics is more frugal here and consumes up to 35 % less. The average and maximum power consumption is up significantly compared to the predecessor and tops other notebooks equipped with either GTX 1060 or GTX 1060 Max-Q GPUs. Gaming can draw up to 160 W, which is probably why MSI chose to go with a more capable 180 W power adapter (previous model: 150 W). Some systems with the GeForce GTX 1070 Max-Q - like the Eurocom Q6 - actually consume less power under load than the test unit.
| Off / Standby | |
| Idle | |
| Load |
|
Key:
min: | |
| MSI GP63 Leopard 8RE-013US i7-8750H, GeForce GTX 1060 Mobile, Samsung PM871b MZNLN128HAHQ, TN LED, 120 Hz, 1920x1080, 15.6" | HP Omen 15-ce002ng i7-7700HQ, GeForce GTX 1060 Max-Q, Samsung PM961 MZVLW256HEHP, IPS, 1920x1080, 15.6" | Lenovo Legion Y720 80VR002XGE i7-7700HQ, GeForce GTX 1060 Mobile, Samsung PM961 MZVLW256HEHP, IPS, 1920x1080, 15.6" | Dell Inspiron 15 7000 7577 i5-7300HQ, GeForce GTX 1060 Max-Q, Samsung PM961 MZVLW256HEHP, IPS, 1920x1080, 15.6" | MSI GP62 7REX-1045US i7-7700HQ, GeForce GTX 1050 Ti Mobile, Toshiba NVMe THNSN5128GP, TN LED, 1920x1080, 15.6" | |
|---|---|---|---|---|---|
| Power Consumption | -46% | 17% | 34% | -14% | |
| Idle Minimum * (Watt) | 7.99 | 18 -125% | 8 -0% | 7.1 11% | 14.6 -83% |
| Idle Average * (Watt) | 12.15 | 23 -89% | 10.9 10% | 7.6 37% | 17.2 -42% |
| Idle Maximum * (Watt) | 13.4 | 30 -124% | 11.8 12% | 8.6 36% | 17.3 -29% |
| Load Average * (Watt) | 103.62 | 85 18% | 70 32% | 59.5 43% | 82.7 20% |
| Witcher 3 ultra * (Watt) | 156.1 | 96 39% | 102 35% | 89 43% | 107 31% |
| Load Maximum * (Watt) | 164.29 | 158 4% | 148 10% | 112.8 31% | 136.7 17% |
* ... smaller is better
Battery Life
Compared to the GP72, the internal battery pack has seen a 25 % bump in capacity to 51 Wh. Real-world browsing results are decent for a gaming notebook with a such a modestly-sized battery and with run times close to 5 hours, users don't always have to be in the vicinity of outlets when traveling. Other laptops feature larger batteries and consequently longer run times. The Dell Inspiron 15 also has a smallish 56 Wh battery, but lasts up to seven hours per charge.
As we mentioned earlier, the performance is massively reduced when running on battery power, so playing games might be a frustrating experience.
| MSI GP63 Leopard 8RE-013US i7-8750H, GeForce GTX 1060 Mobile, 51 Wh | HP Omen 15-ce002ng i7-7700HQ, GeForce GTX 1060 Max-Q, 70 Wh | Lenovo Legion Y720 80VR002XGE i7-7700HQ, GeForce GTX 1060 Mobile, 60 Wh | Acer Aspire VN7-593G-73HP V15 Nitro BE i7-7700HQ, GeForce GTX 1060 Mobile, 69 Wh | MSI GP62 7REX-1045US i7-7700HQ, GeForce GTX 1050 Ti Mobile, 41 Wh | Dell Inspiron 15 7000 7577 i5-7300HQ, GeForce GTX 1060 Max-Q, 56 Wh | |
|---|---|---|---|---|---|---|
| Battery runtime | -10% | 40% | 68% | -35% | 56% | |
| Reader / Idle (h) | 7.5 | 4.3 -43% | 11.8 57% | 8.4 12% | 4.3 -43% | 11 47% |
| WiFi v1.3 (h) | 4.8 | 3.3 -31% | 6.3 31% | 6 25% | 2.9 -40% | 6.9 44% |
| Load (h) | 0.9 | 1.3 44% | 1.2 33% | 2.4 167% | 0.7 -22% | 1.6 78% |
Pros
Cons
Verdict

The MSI GP63 Leopard Xotic PC Edition picks up where the predecessor GP62 left off. The quality of the chassis still isn't all that impressive, but the updated hardware in form of the hexa-core Coffee Lake-H CPU and a slightly higher-end GTX 1060 graphics card guarantees a significant bump in performance and a more enjoyable gaming experience. We also appreciate the additional USB 3.0 port in lieu of the previously integrated DVD+/-RW drive. The tri-zone backlit RGB keyboard is a pleasure to use and the touchpad does its job well. The 120 Hz TN display is bright with still acceptable viewing angles and - at least after a calibration - decent color and grayscale accuracy. The battery capacity has been increased as well, so the machine can serve limited duty as an allrounder notebook as well.
MSI's thermal management remains fairly conservative despite the upgraded and much improved cooling system, which now features seven heat pipes instead of six. While the CPU temperatures generally remain lower across the board than we would have expected, the raw processing power takes a hit as well. We think that a 128 GB primary SSD is the bare minimum these days and given the choice, we would probably upgrade to a larger and faster 256 GB PCIe NVMe SSD. Despite the 120 Hz display, G-Sync is not available.
The MSI GP63 Leopard Xotic PC Edition is a well-mannered gaming laptop with perfectly adequate performance - but it isn't offered at a bargain price.
MSI GP63 Leopard 8RE-013US
- 06/13/2018 v6 (old)
Bernie Pechlaner
Price comparison