Asus Zephyrus GX501VS (i7-7700HQ, GTX 1070 Max-Q) Laptop Review
Asus launched its first Zephyrus GX501VI SKU with GTX 1080 Max-Q graphics early last month for a whopping price of $2800 USD. It was the premier notebook representing the best and most powerful of what Max-Q had to offer and initial results were far from perfect. Our GX501VI test unit suffered from louder fan noise and warmer temperatures than what Nvidia or Asus were claiming. Some of the issues were eventually patched, but the unremarkable experience and especially high asking price left a sour taste.
For our second look at the Zephyrus, we have the newer GX501VS SKU with GTX 1070 Max-Q graphics at more reasonable price of $2300 USD as configured by Xotic PC. This configuration is otherwise nearly identical to our previous GX501VI SKU down to the G-Sync enabled 1080p 120 Hz panel from AU Optronics and the Core i7-7700HQ CPU. Both RAM and SSD capacities have been cut to 16 GB and 256 GB from 24 GB and 512 GB, respectively, on the GX501VI. Nonetheless, we recommend checking out our existing review on the GX501VI for more information on case quality, input devices, and other unique physical features of the system.
The 15.6-inch Zephyrus GX501 series competes directly against other super-thin enthusiast gaming notebooks including the popular MSI GS63VR, Aorus X5, Razer Blade, and Gigabyte P56.
Case
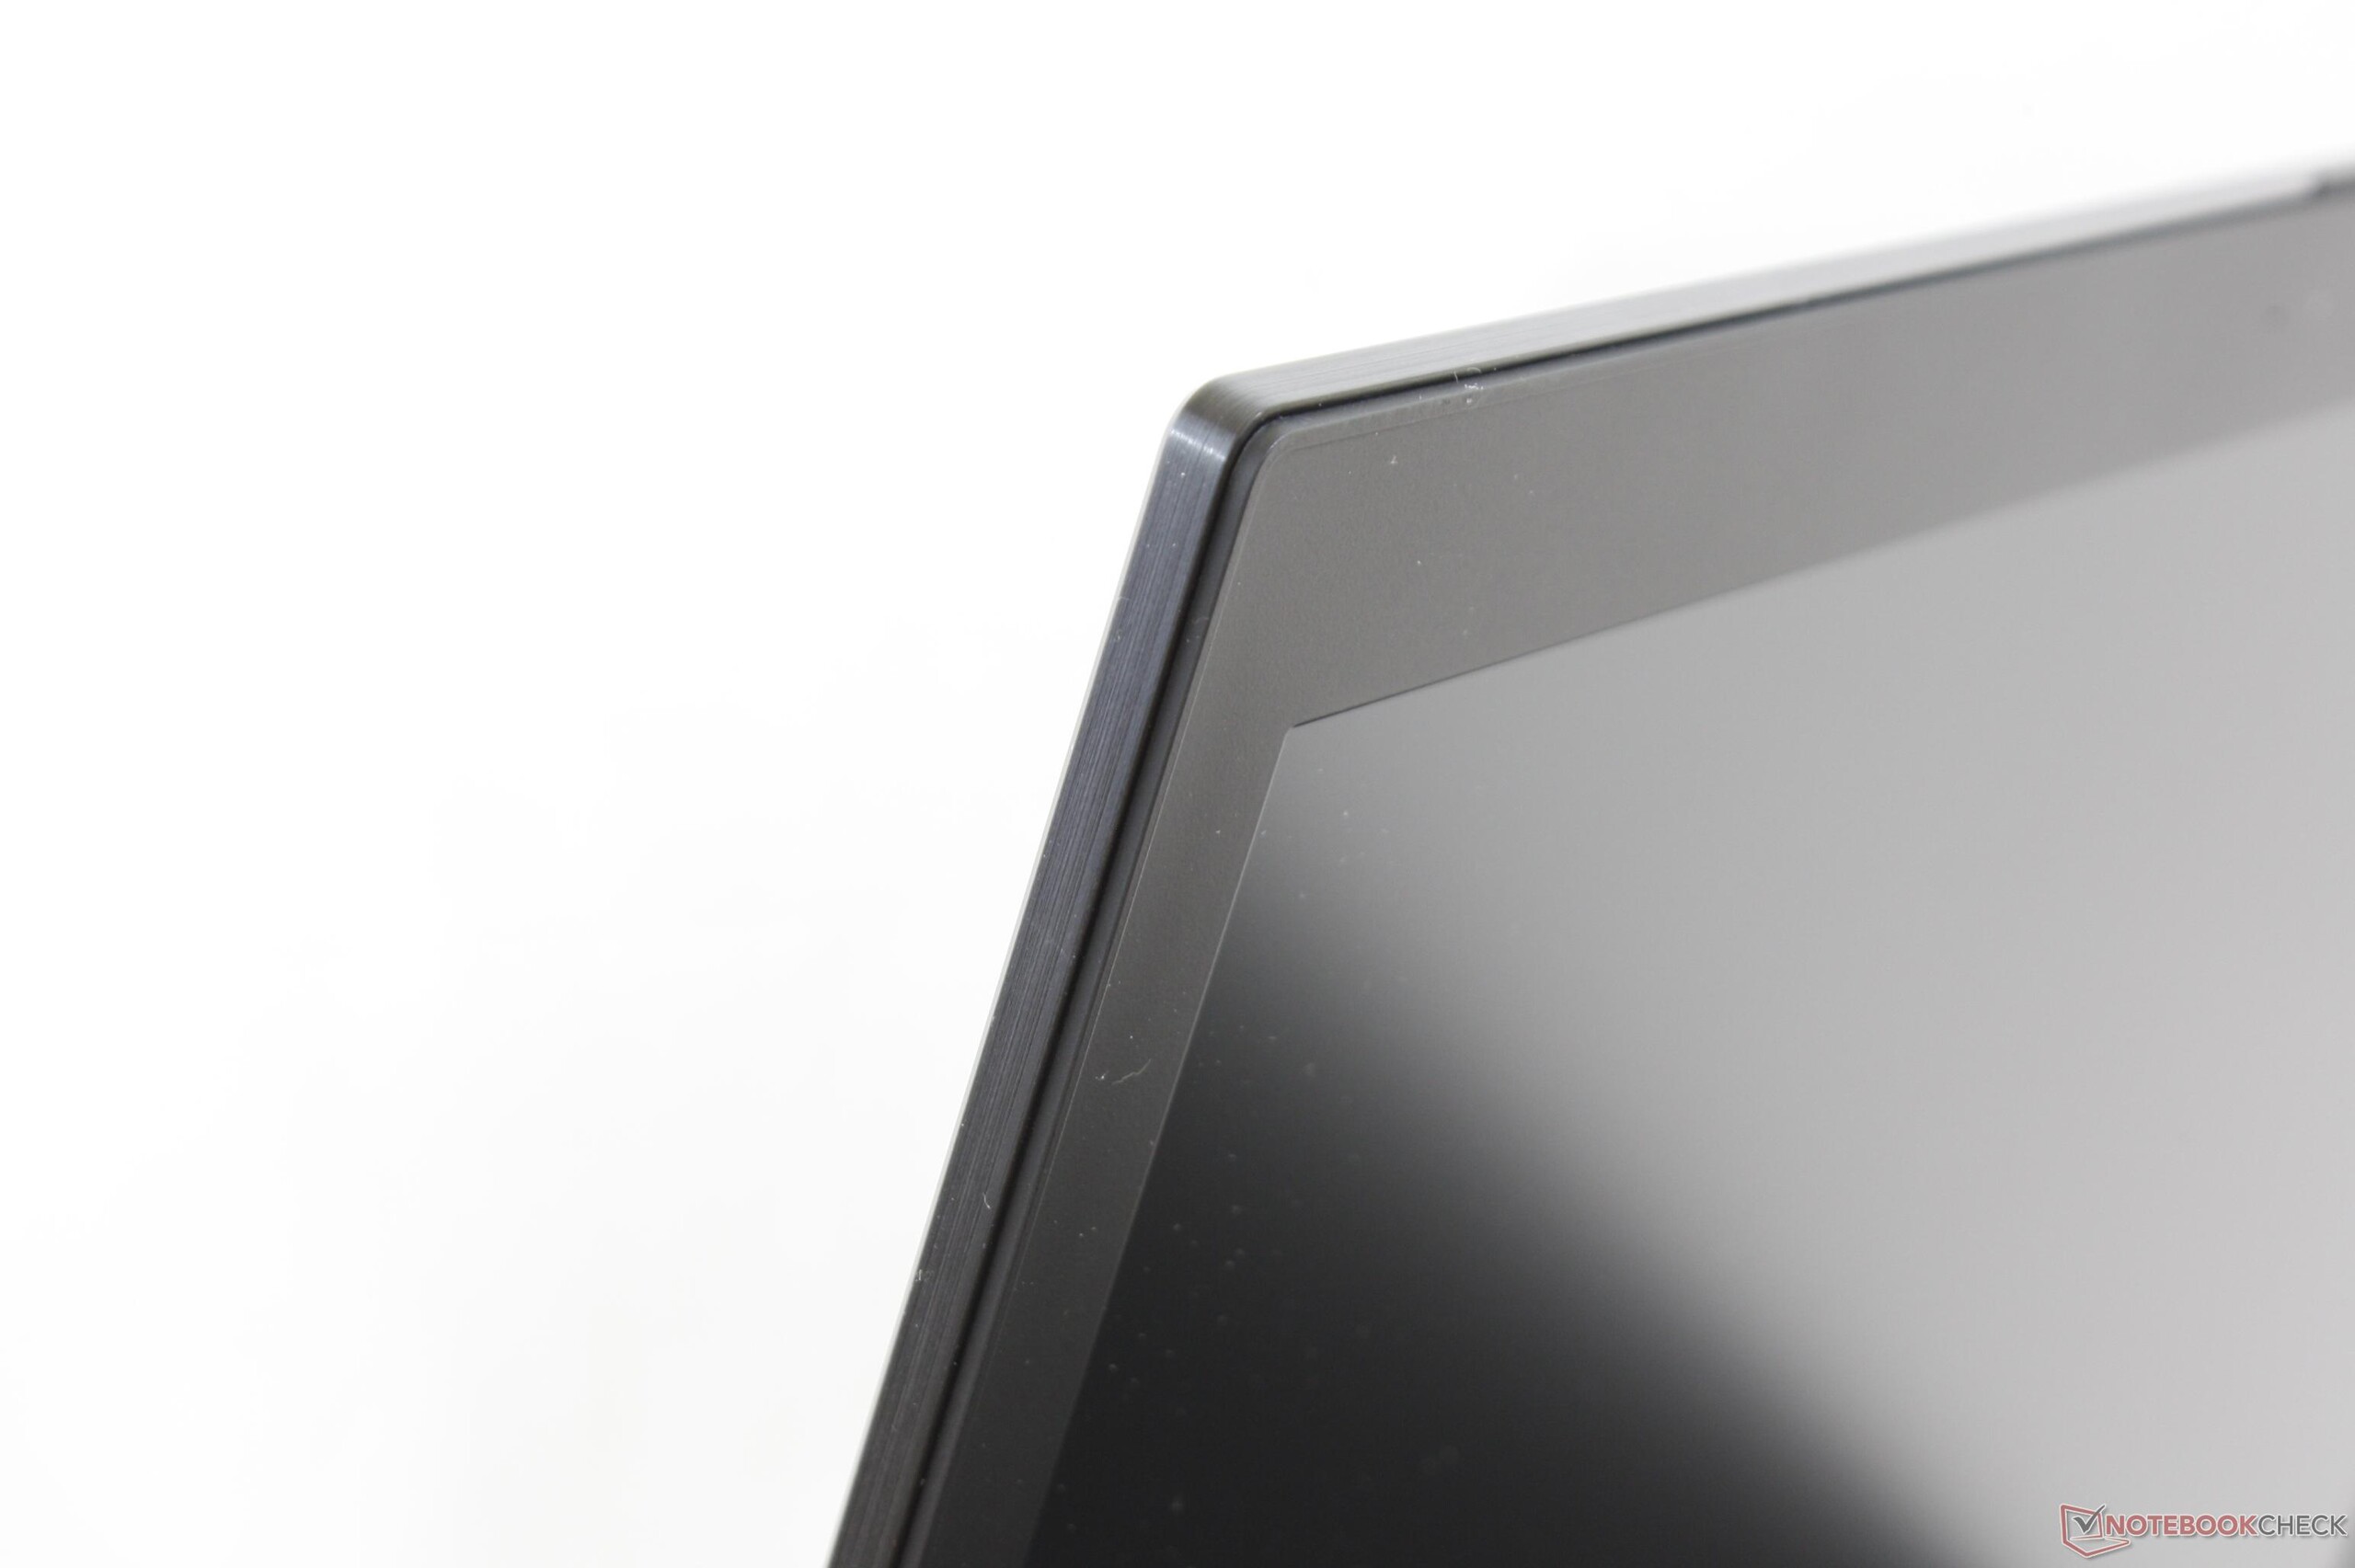
Rigidity of the base is generally very good but with a few caveats. Attempting to twist the base from the front corners will warp the chassis very slightly and applying moderate pressure to the keyboard center will visibly depress the surface. Similarly, the lid is susceptible to side-to-side twisting and slight depressions when applying pressure down the center of its outer surface. There are otherwise no major creaking issues or notable defects on this second SKU of ours. Overall rigidity feels stabler than MSI's GS63VR but still a step below Razer's Blade and Blade Pro series.
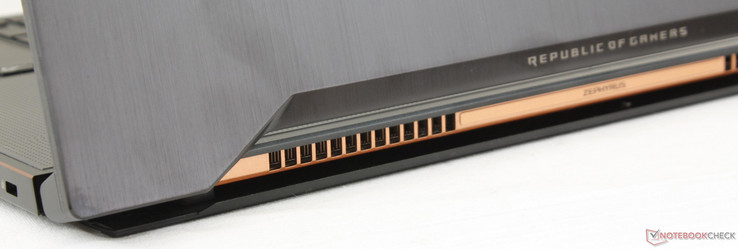
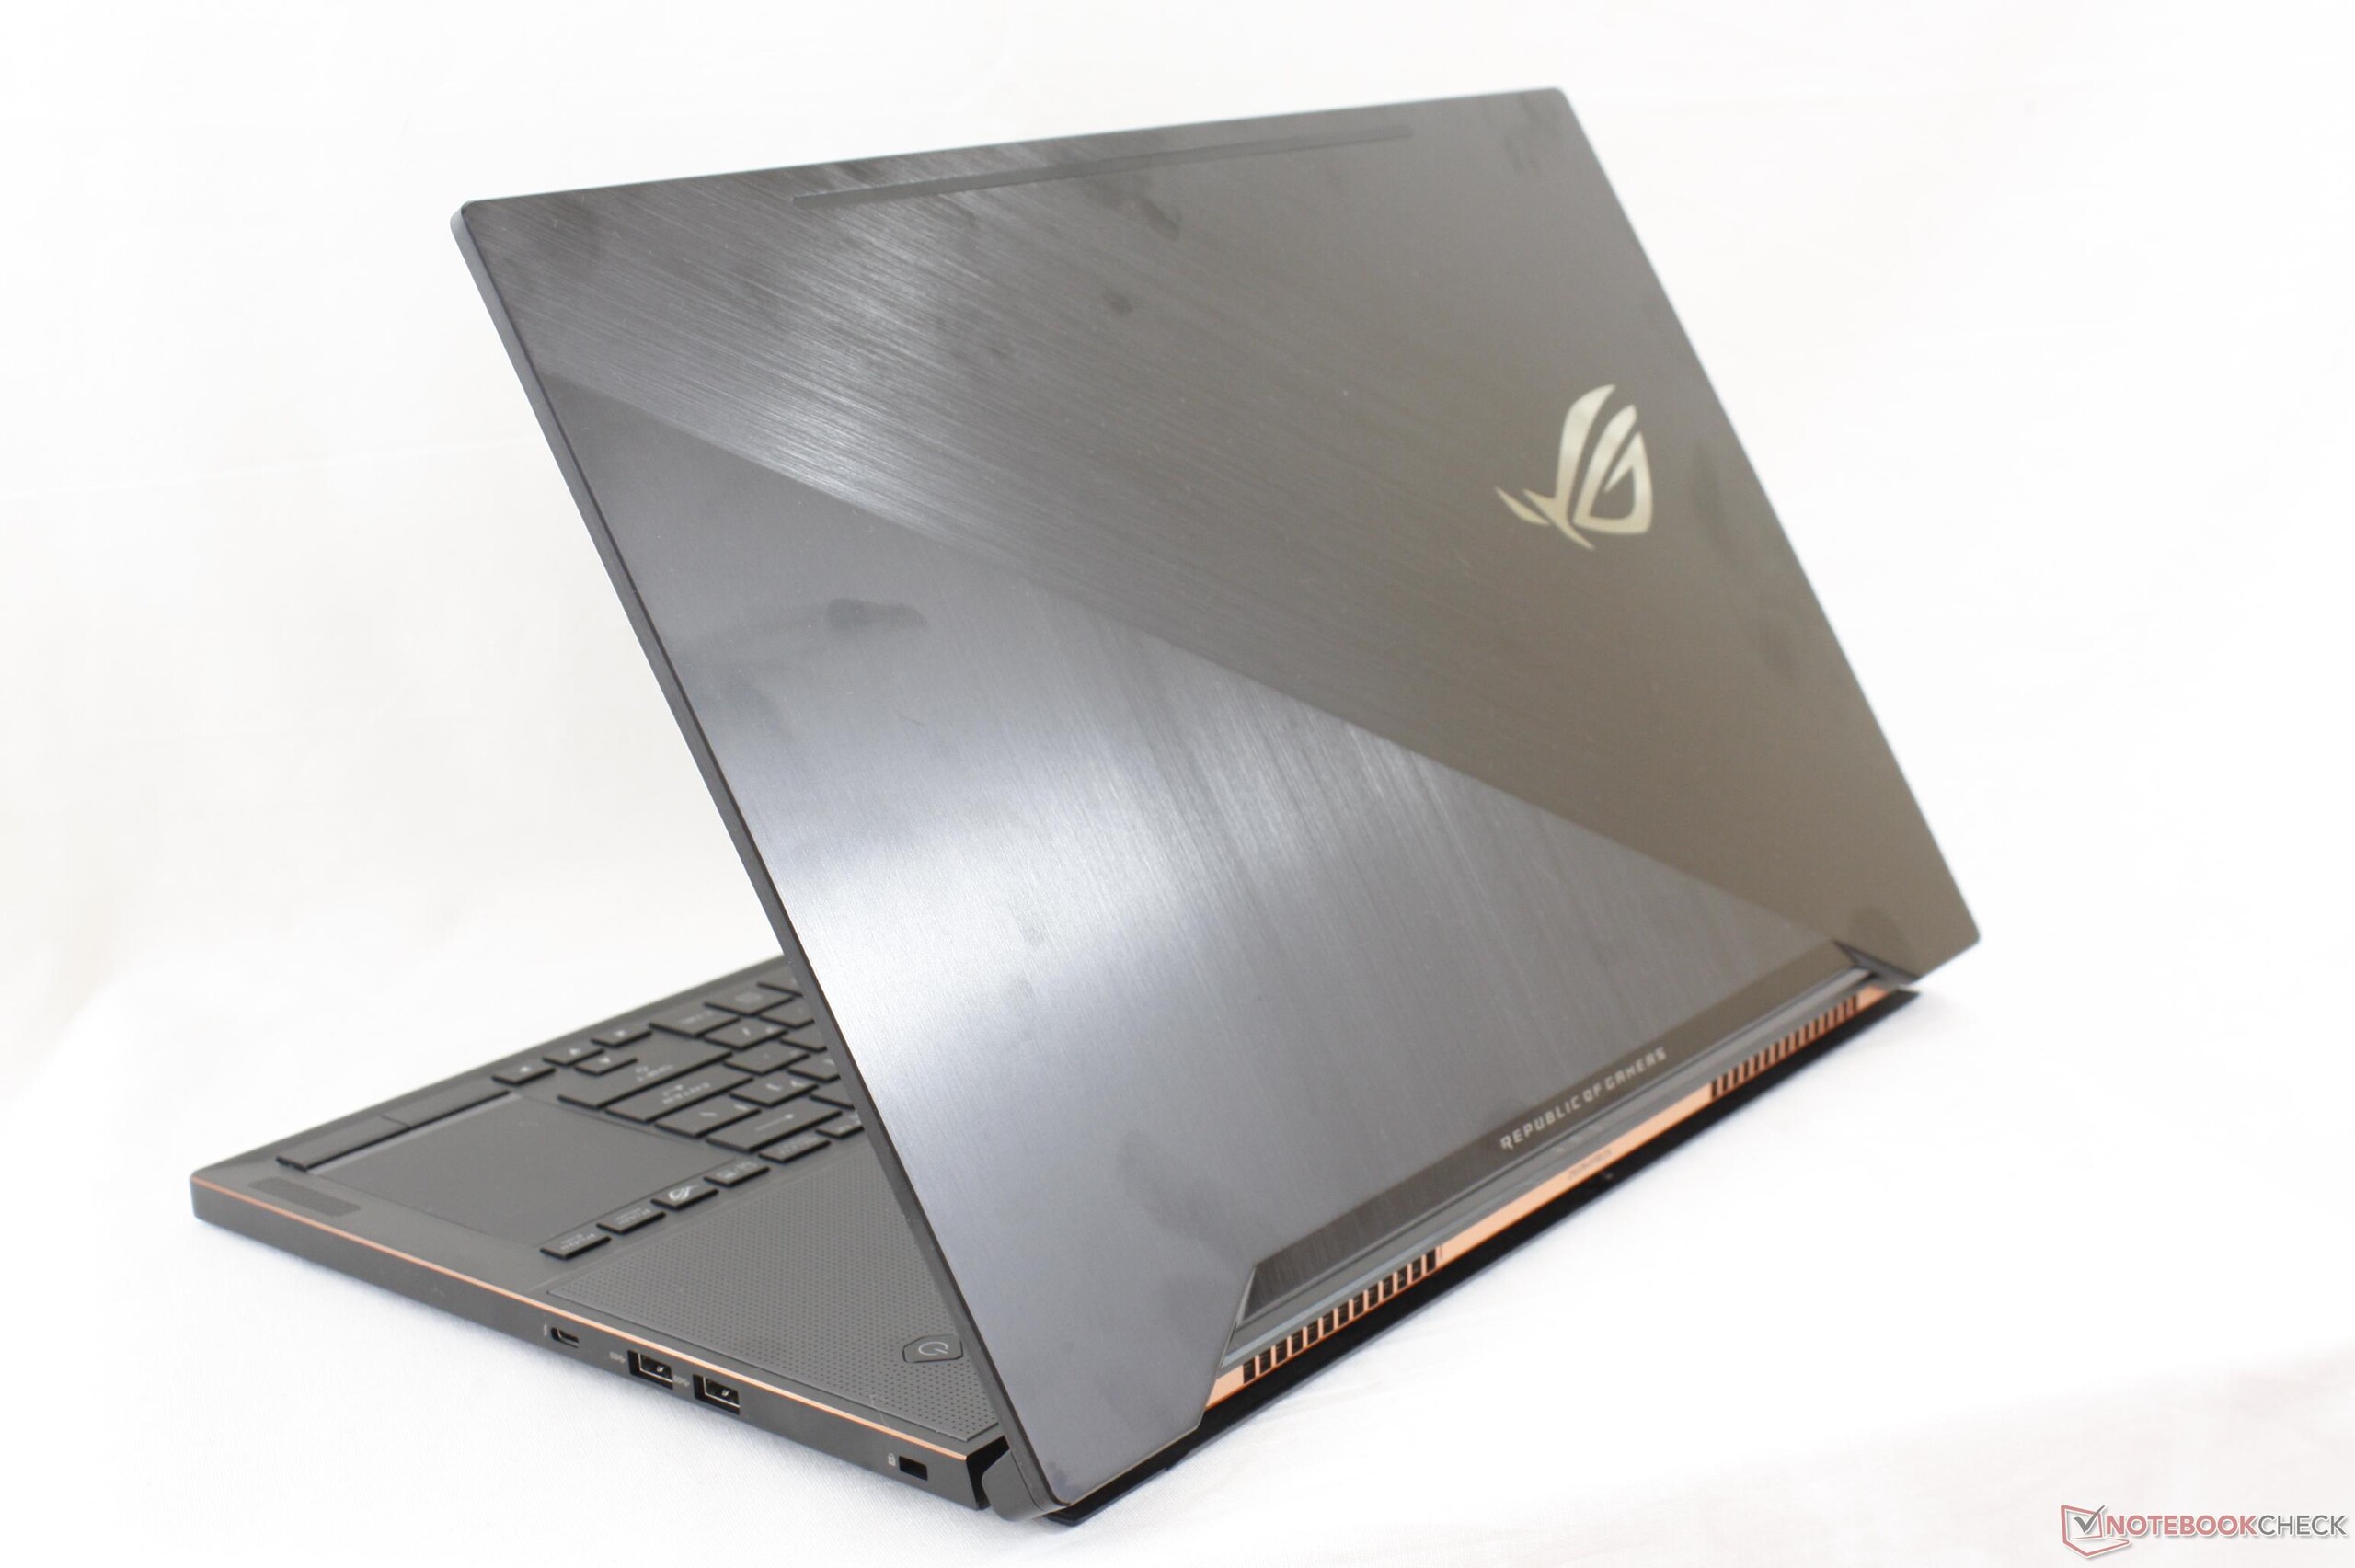
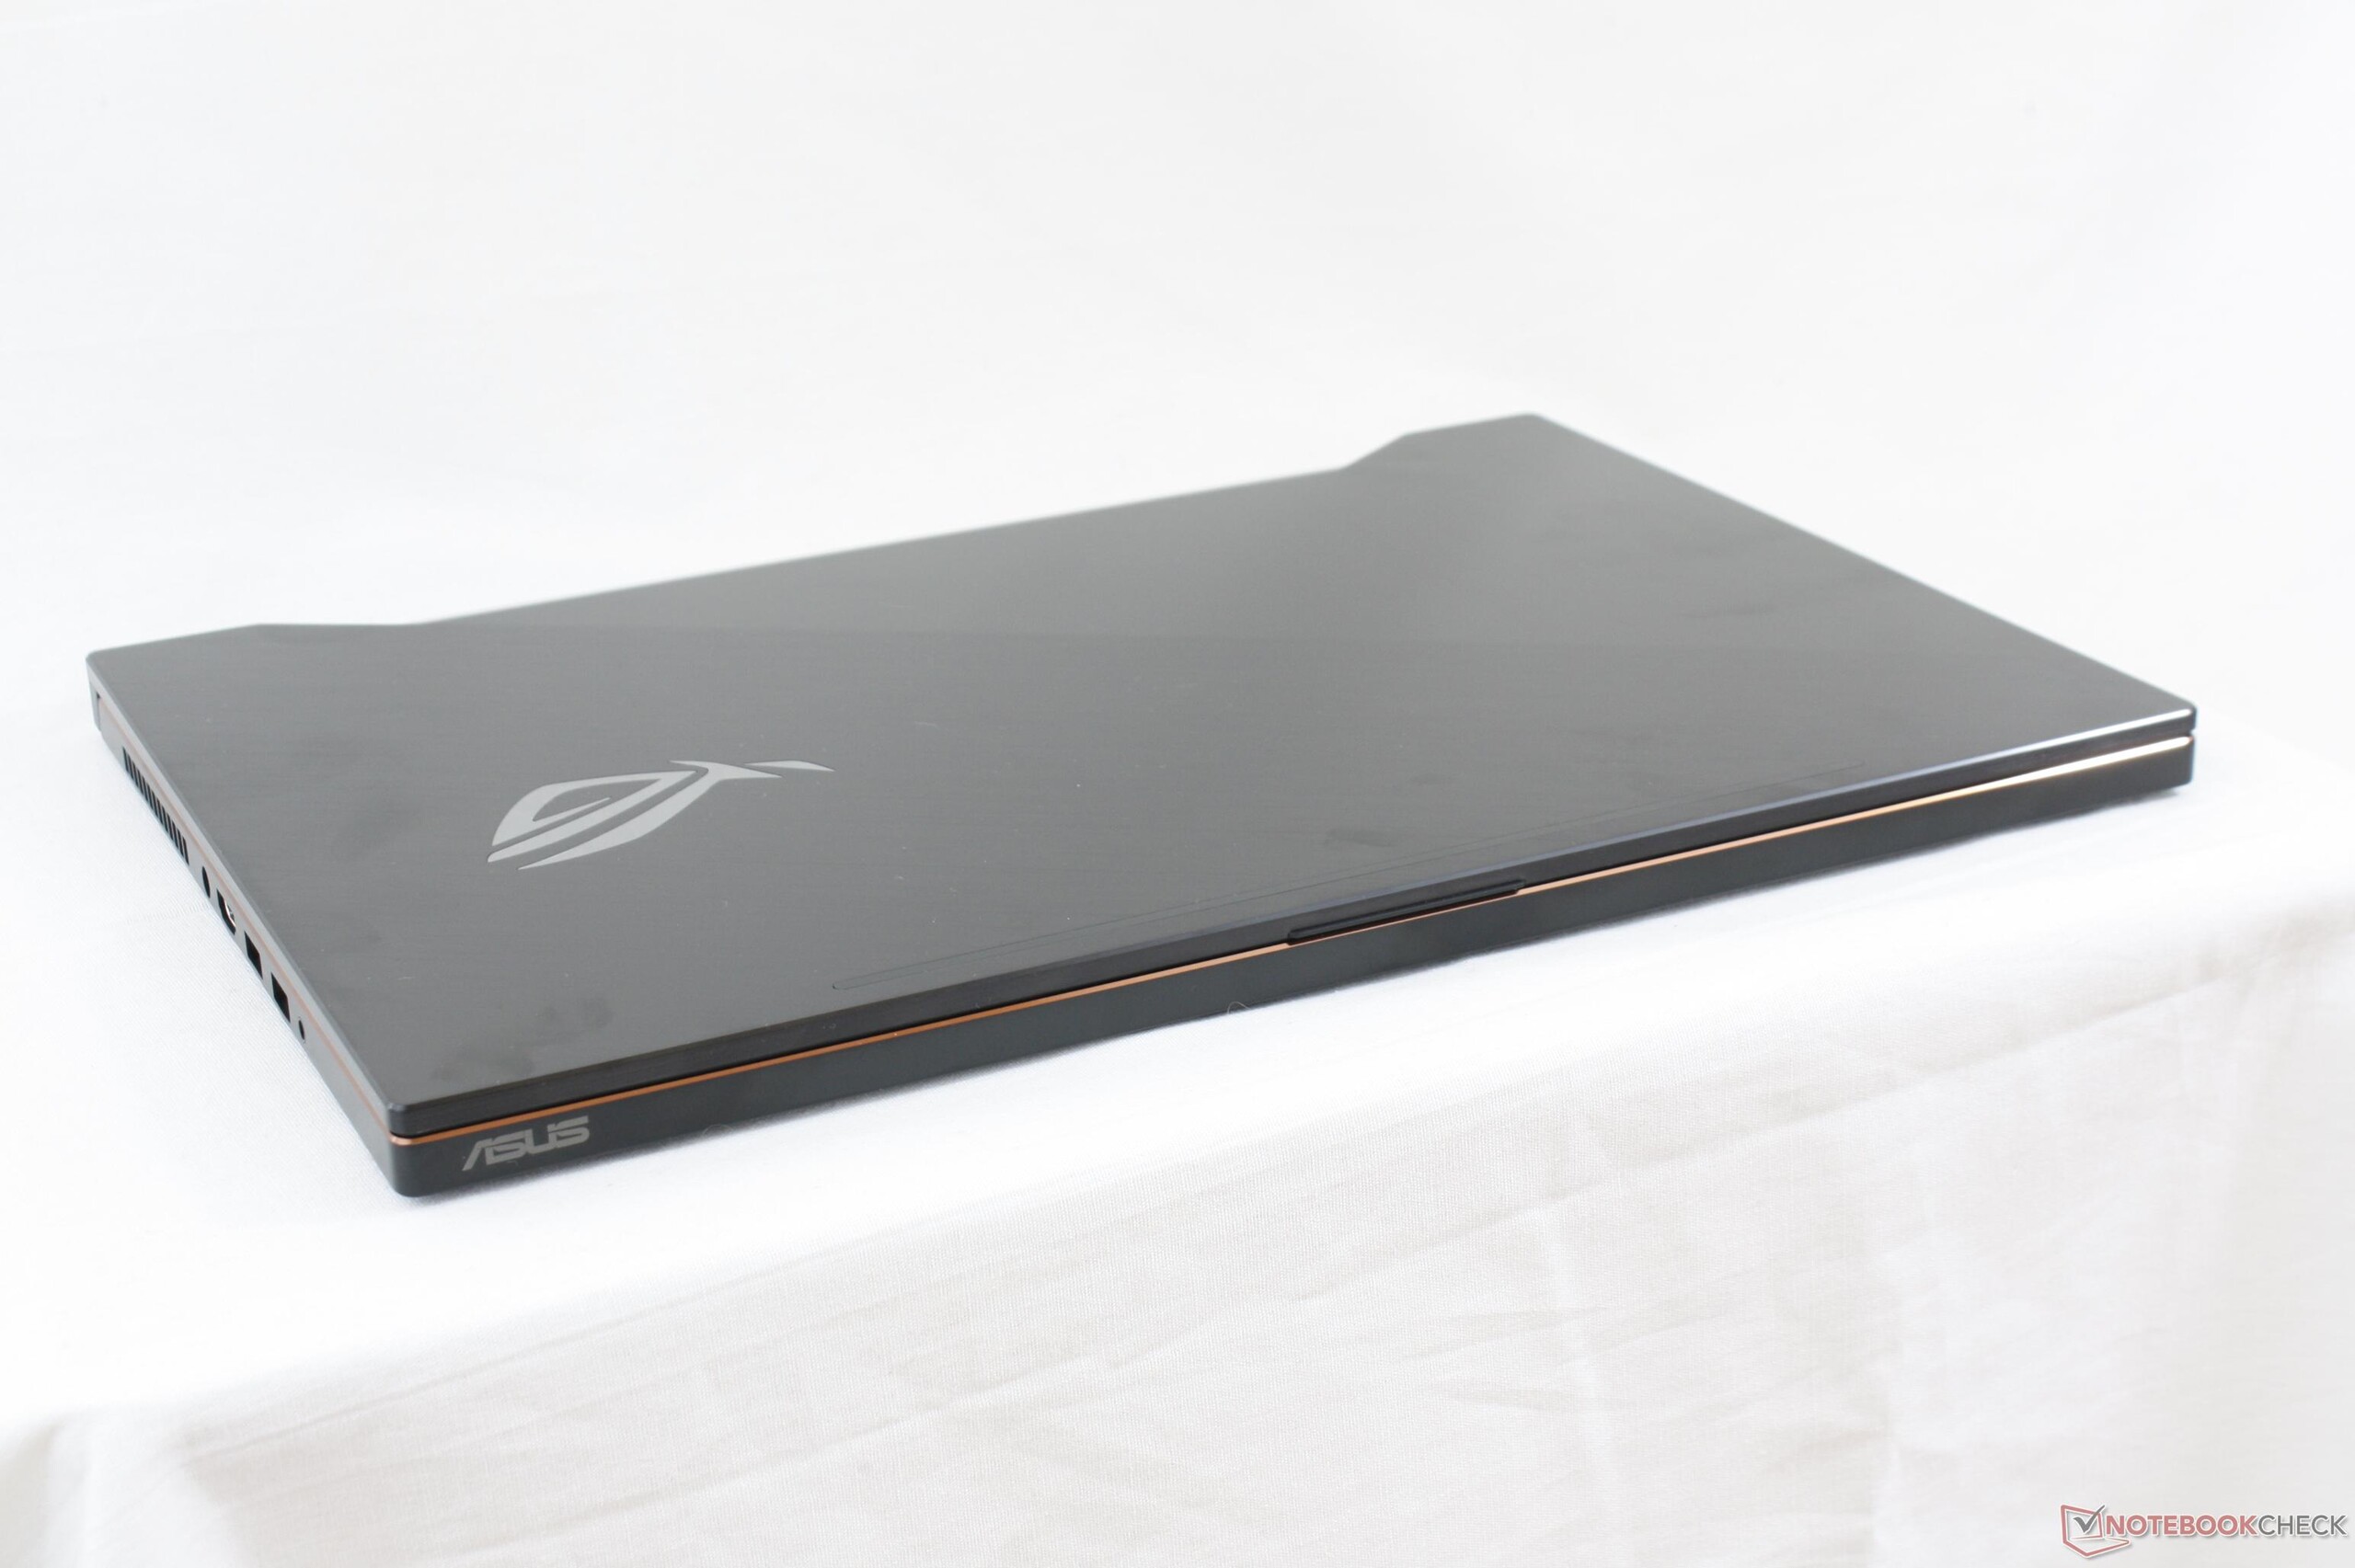
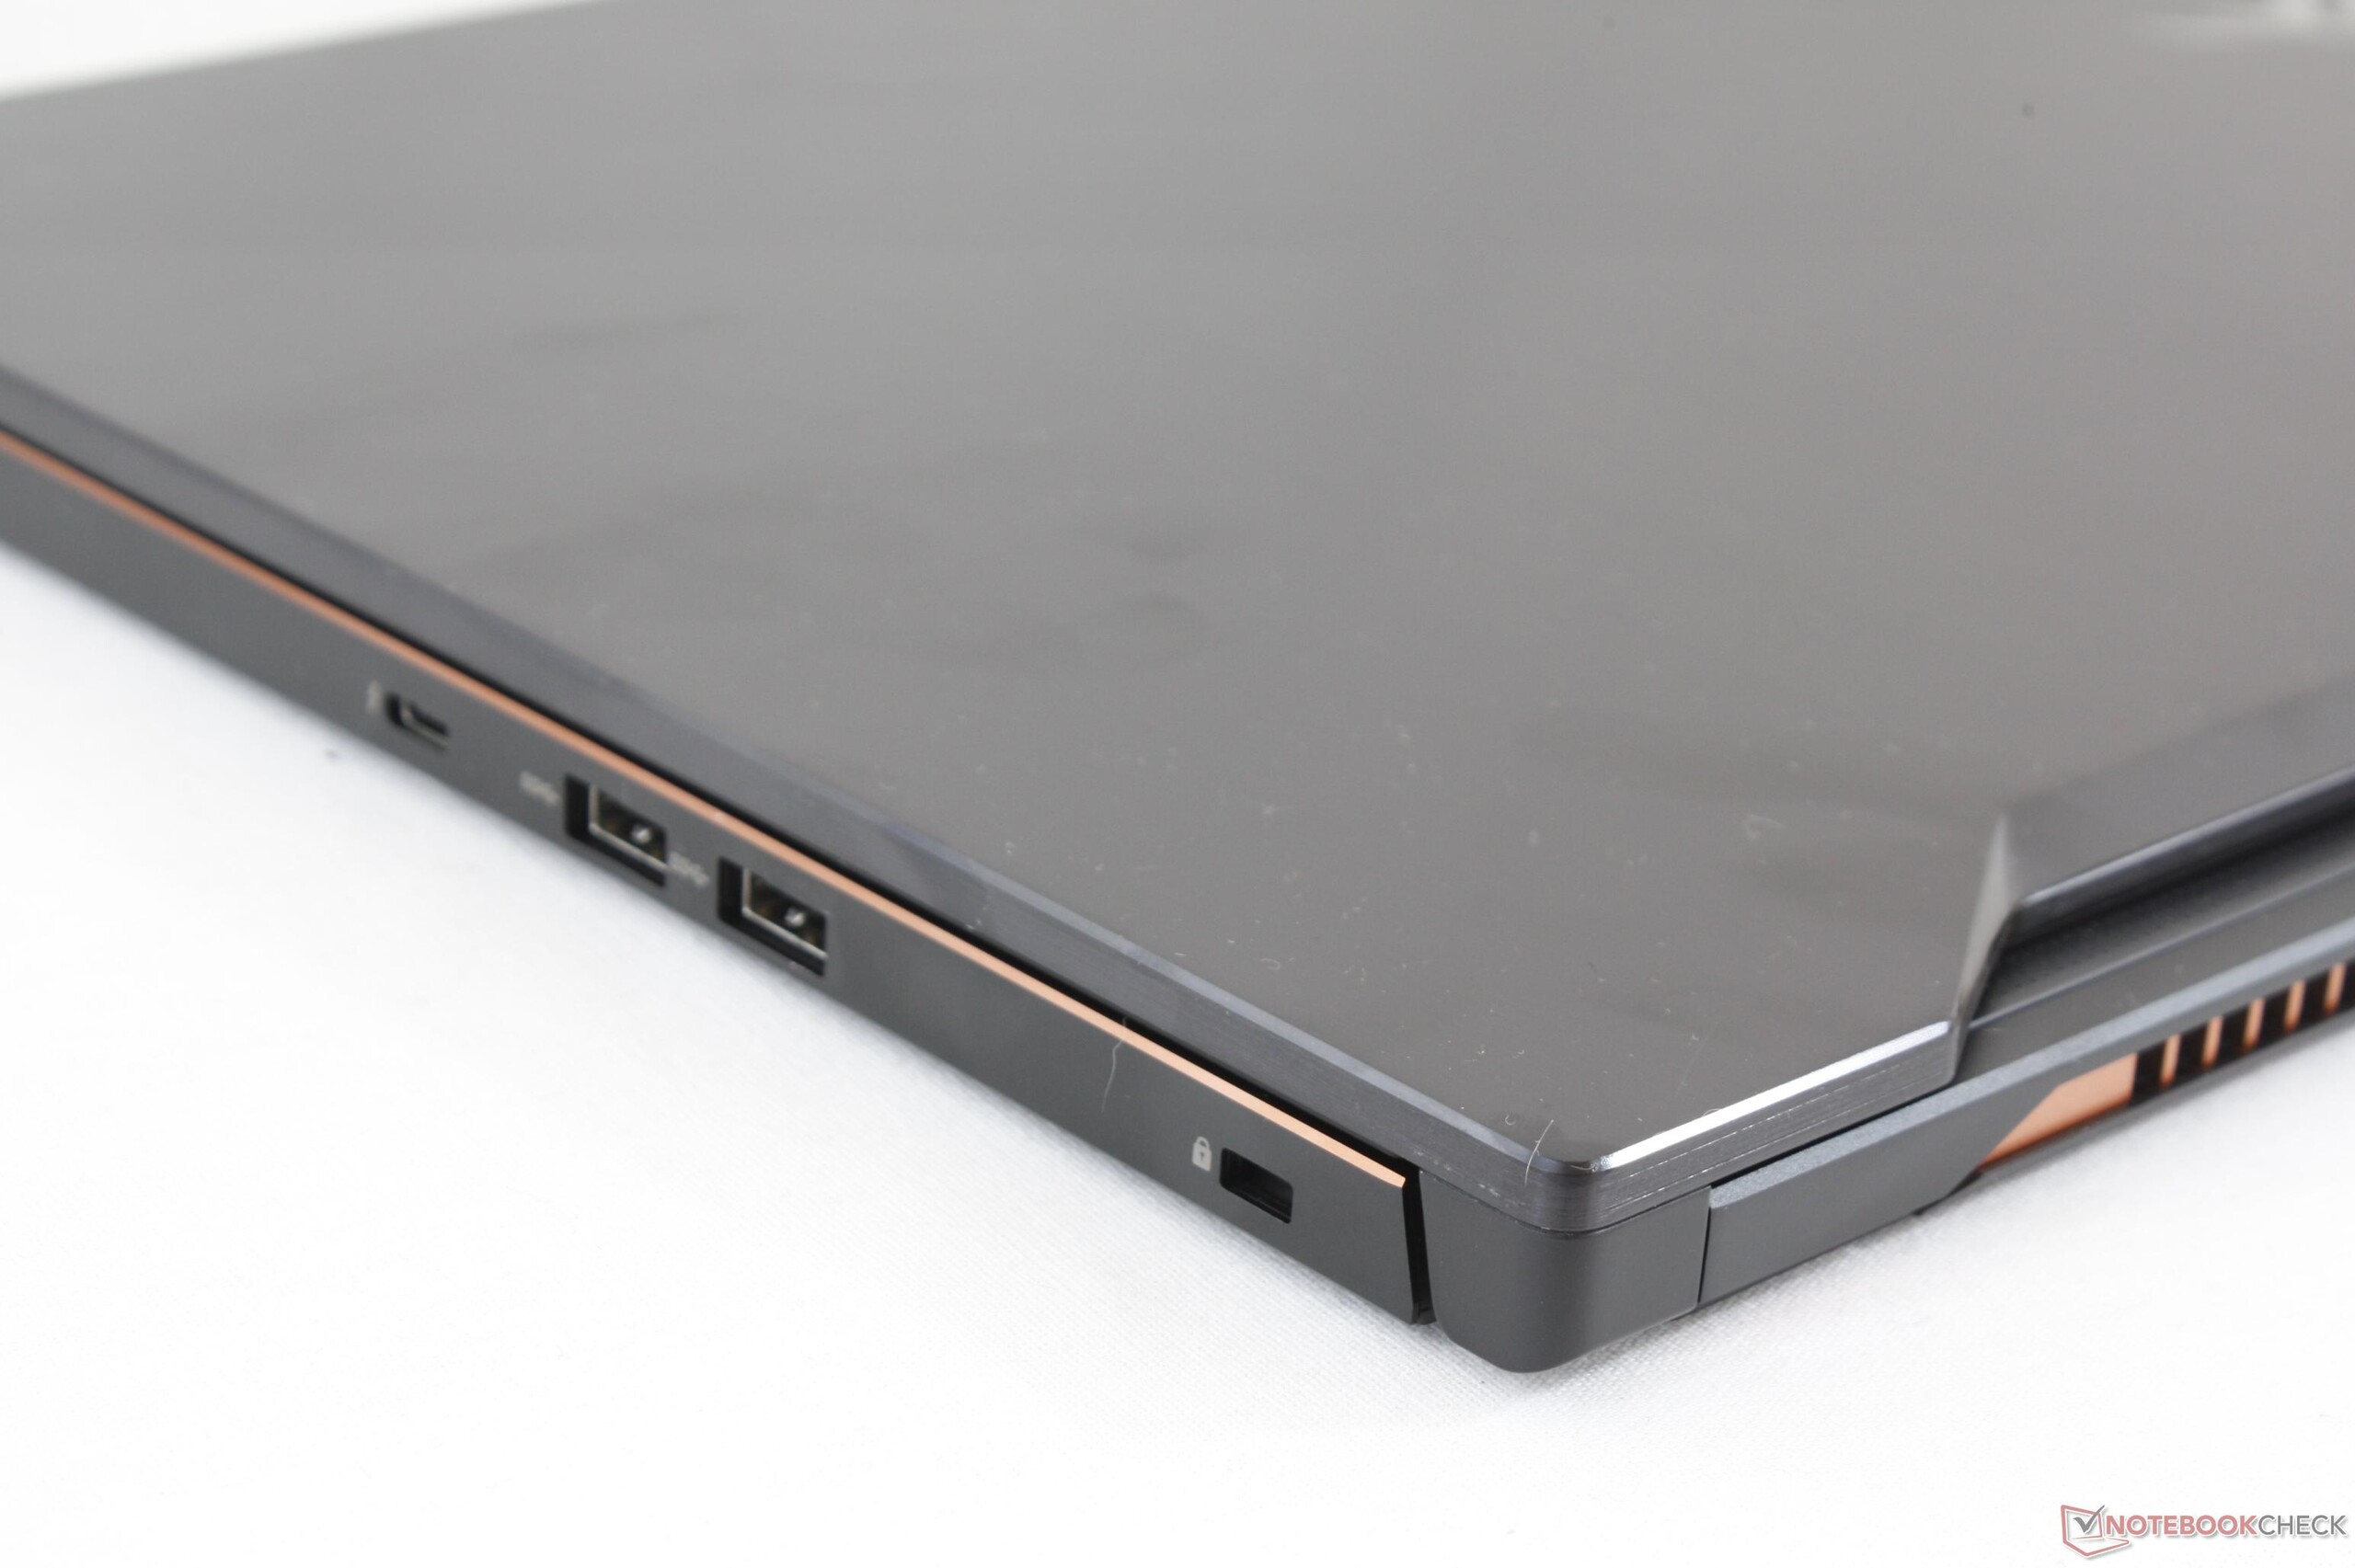
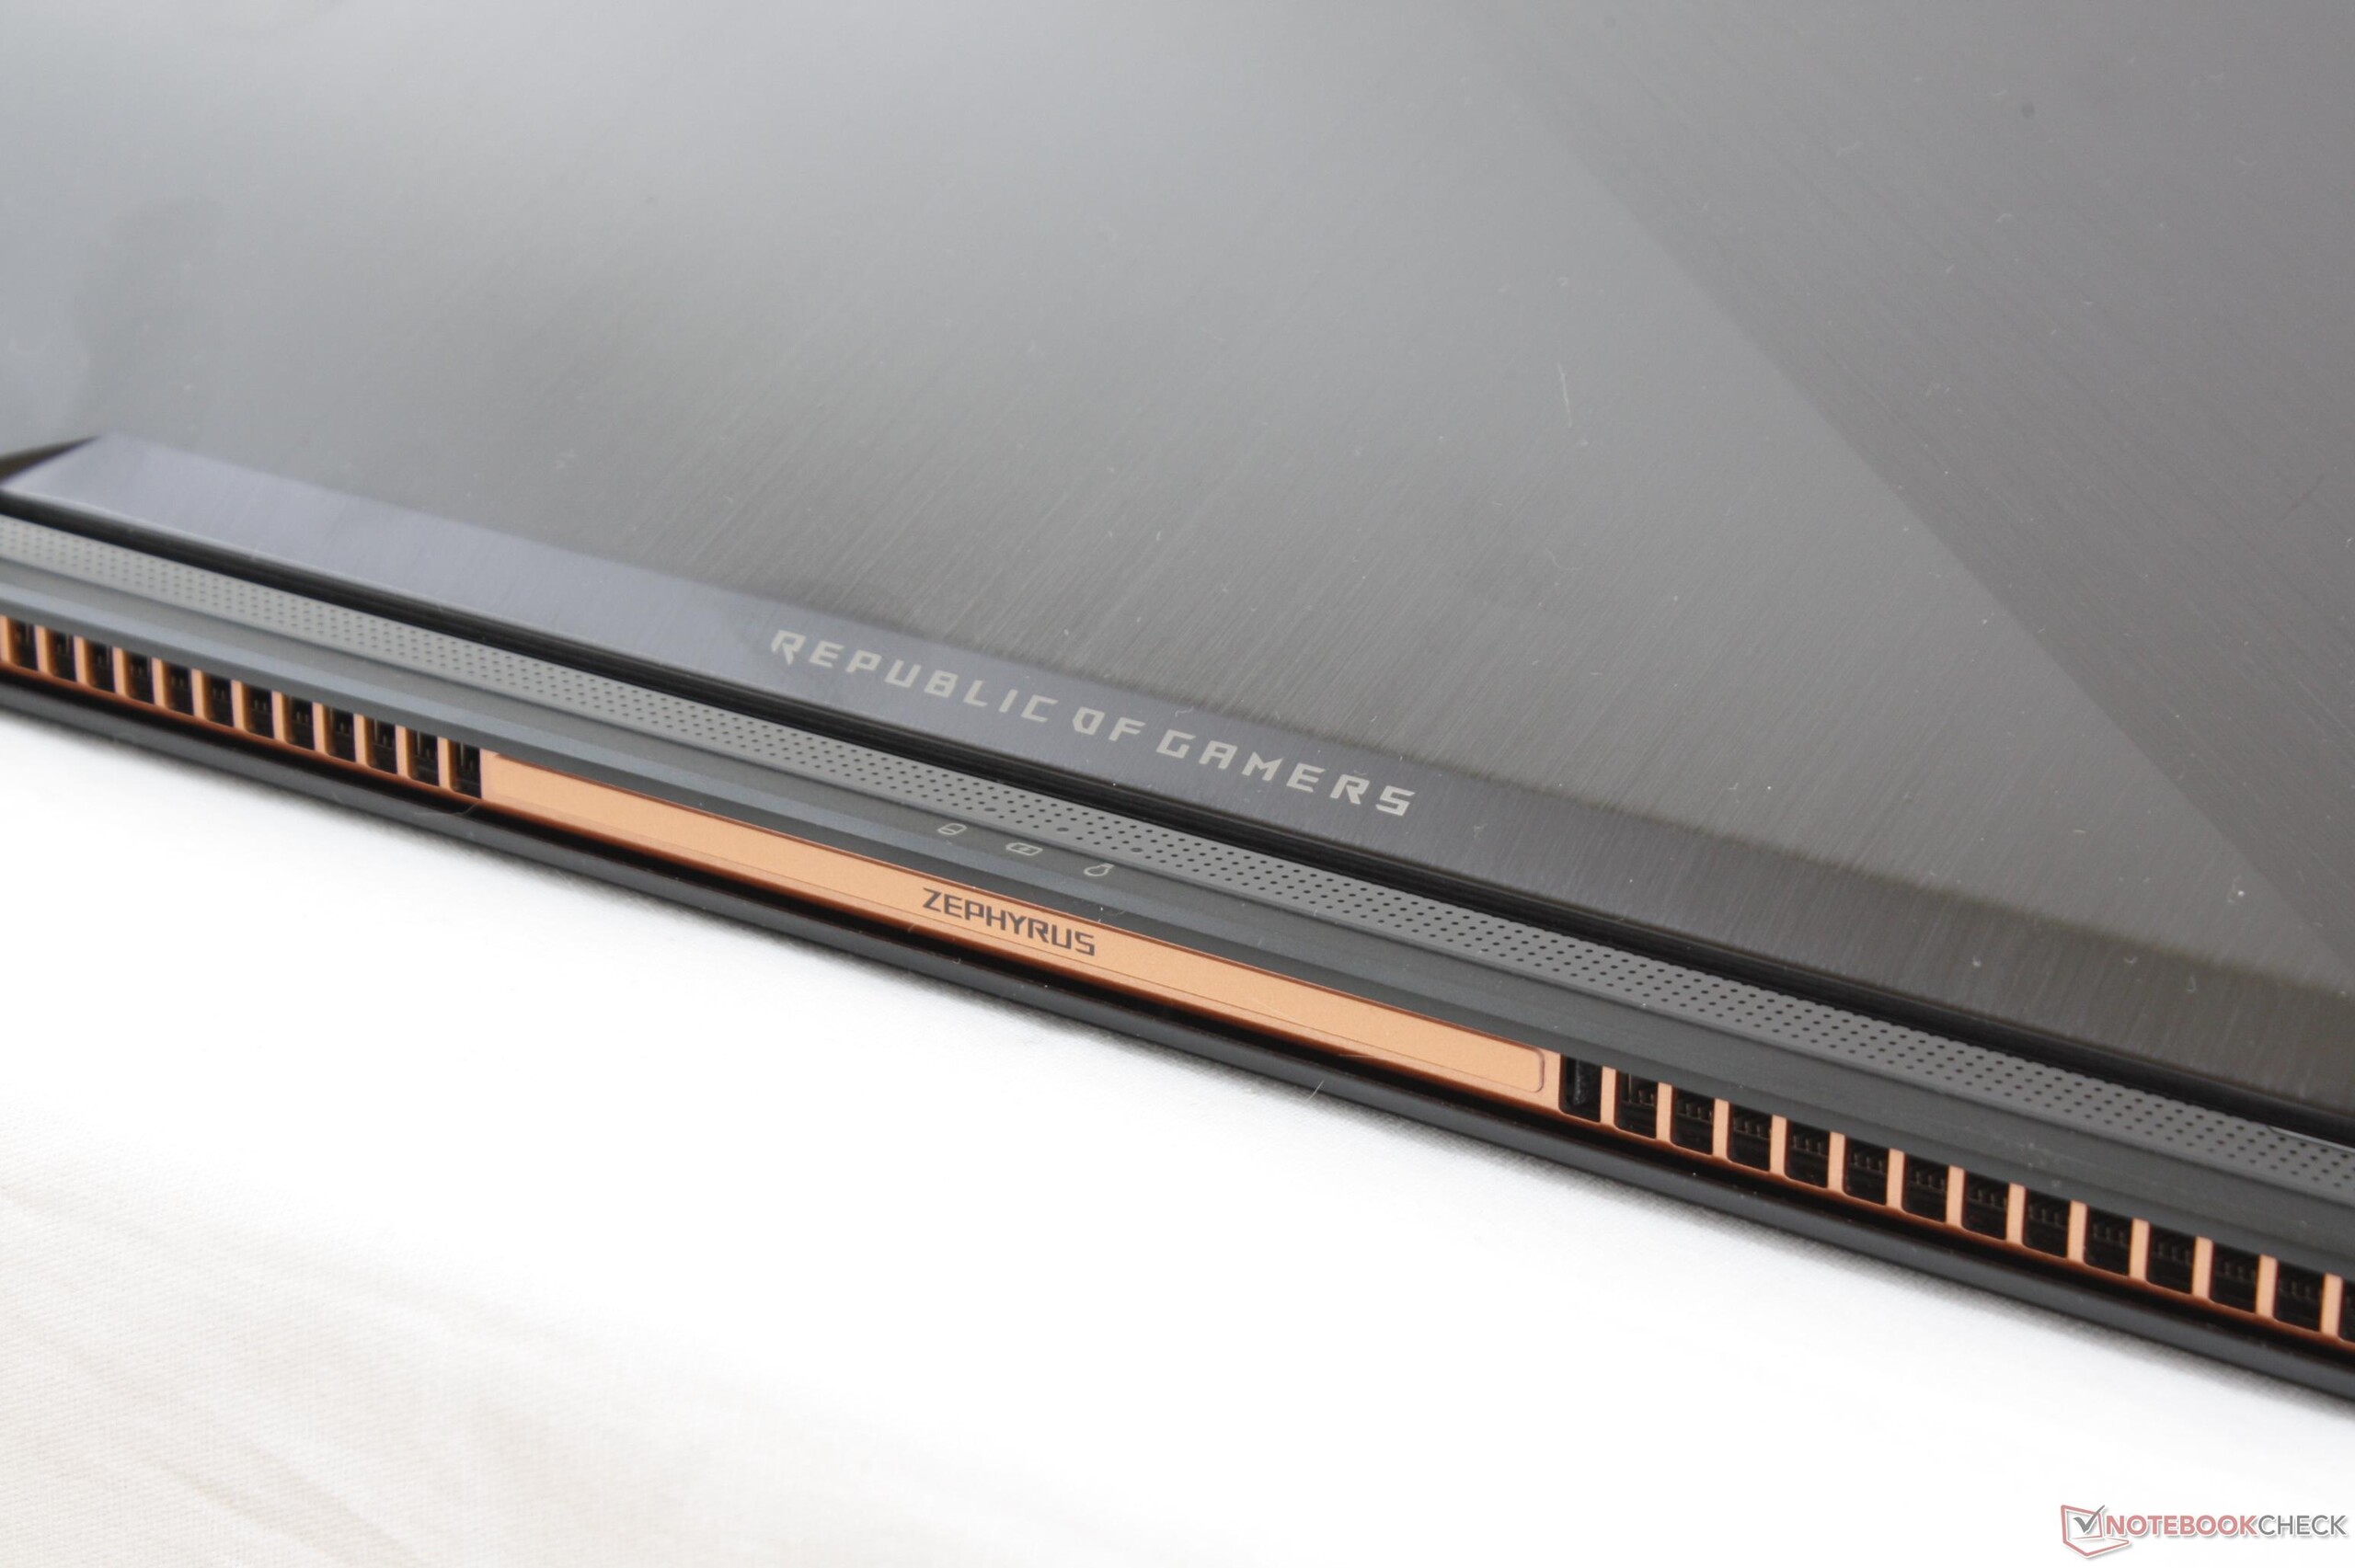
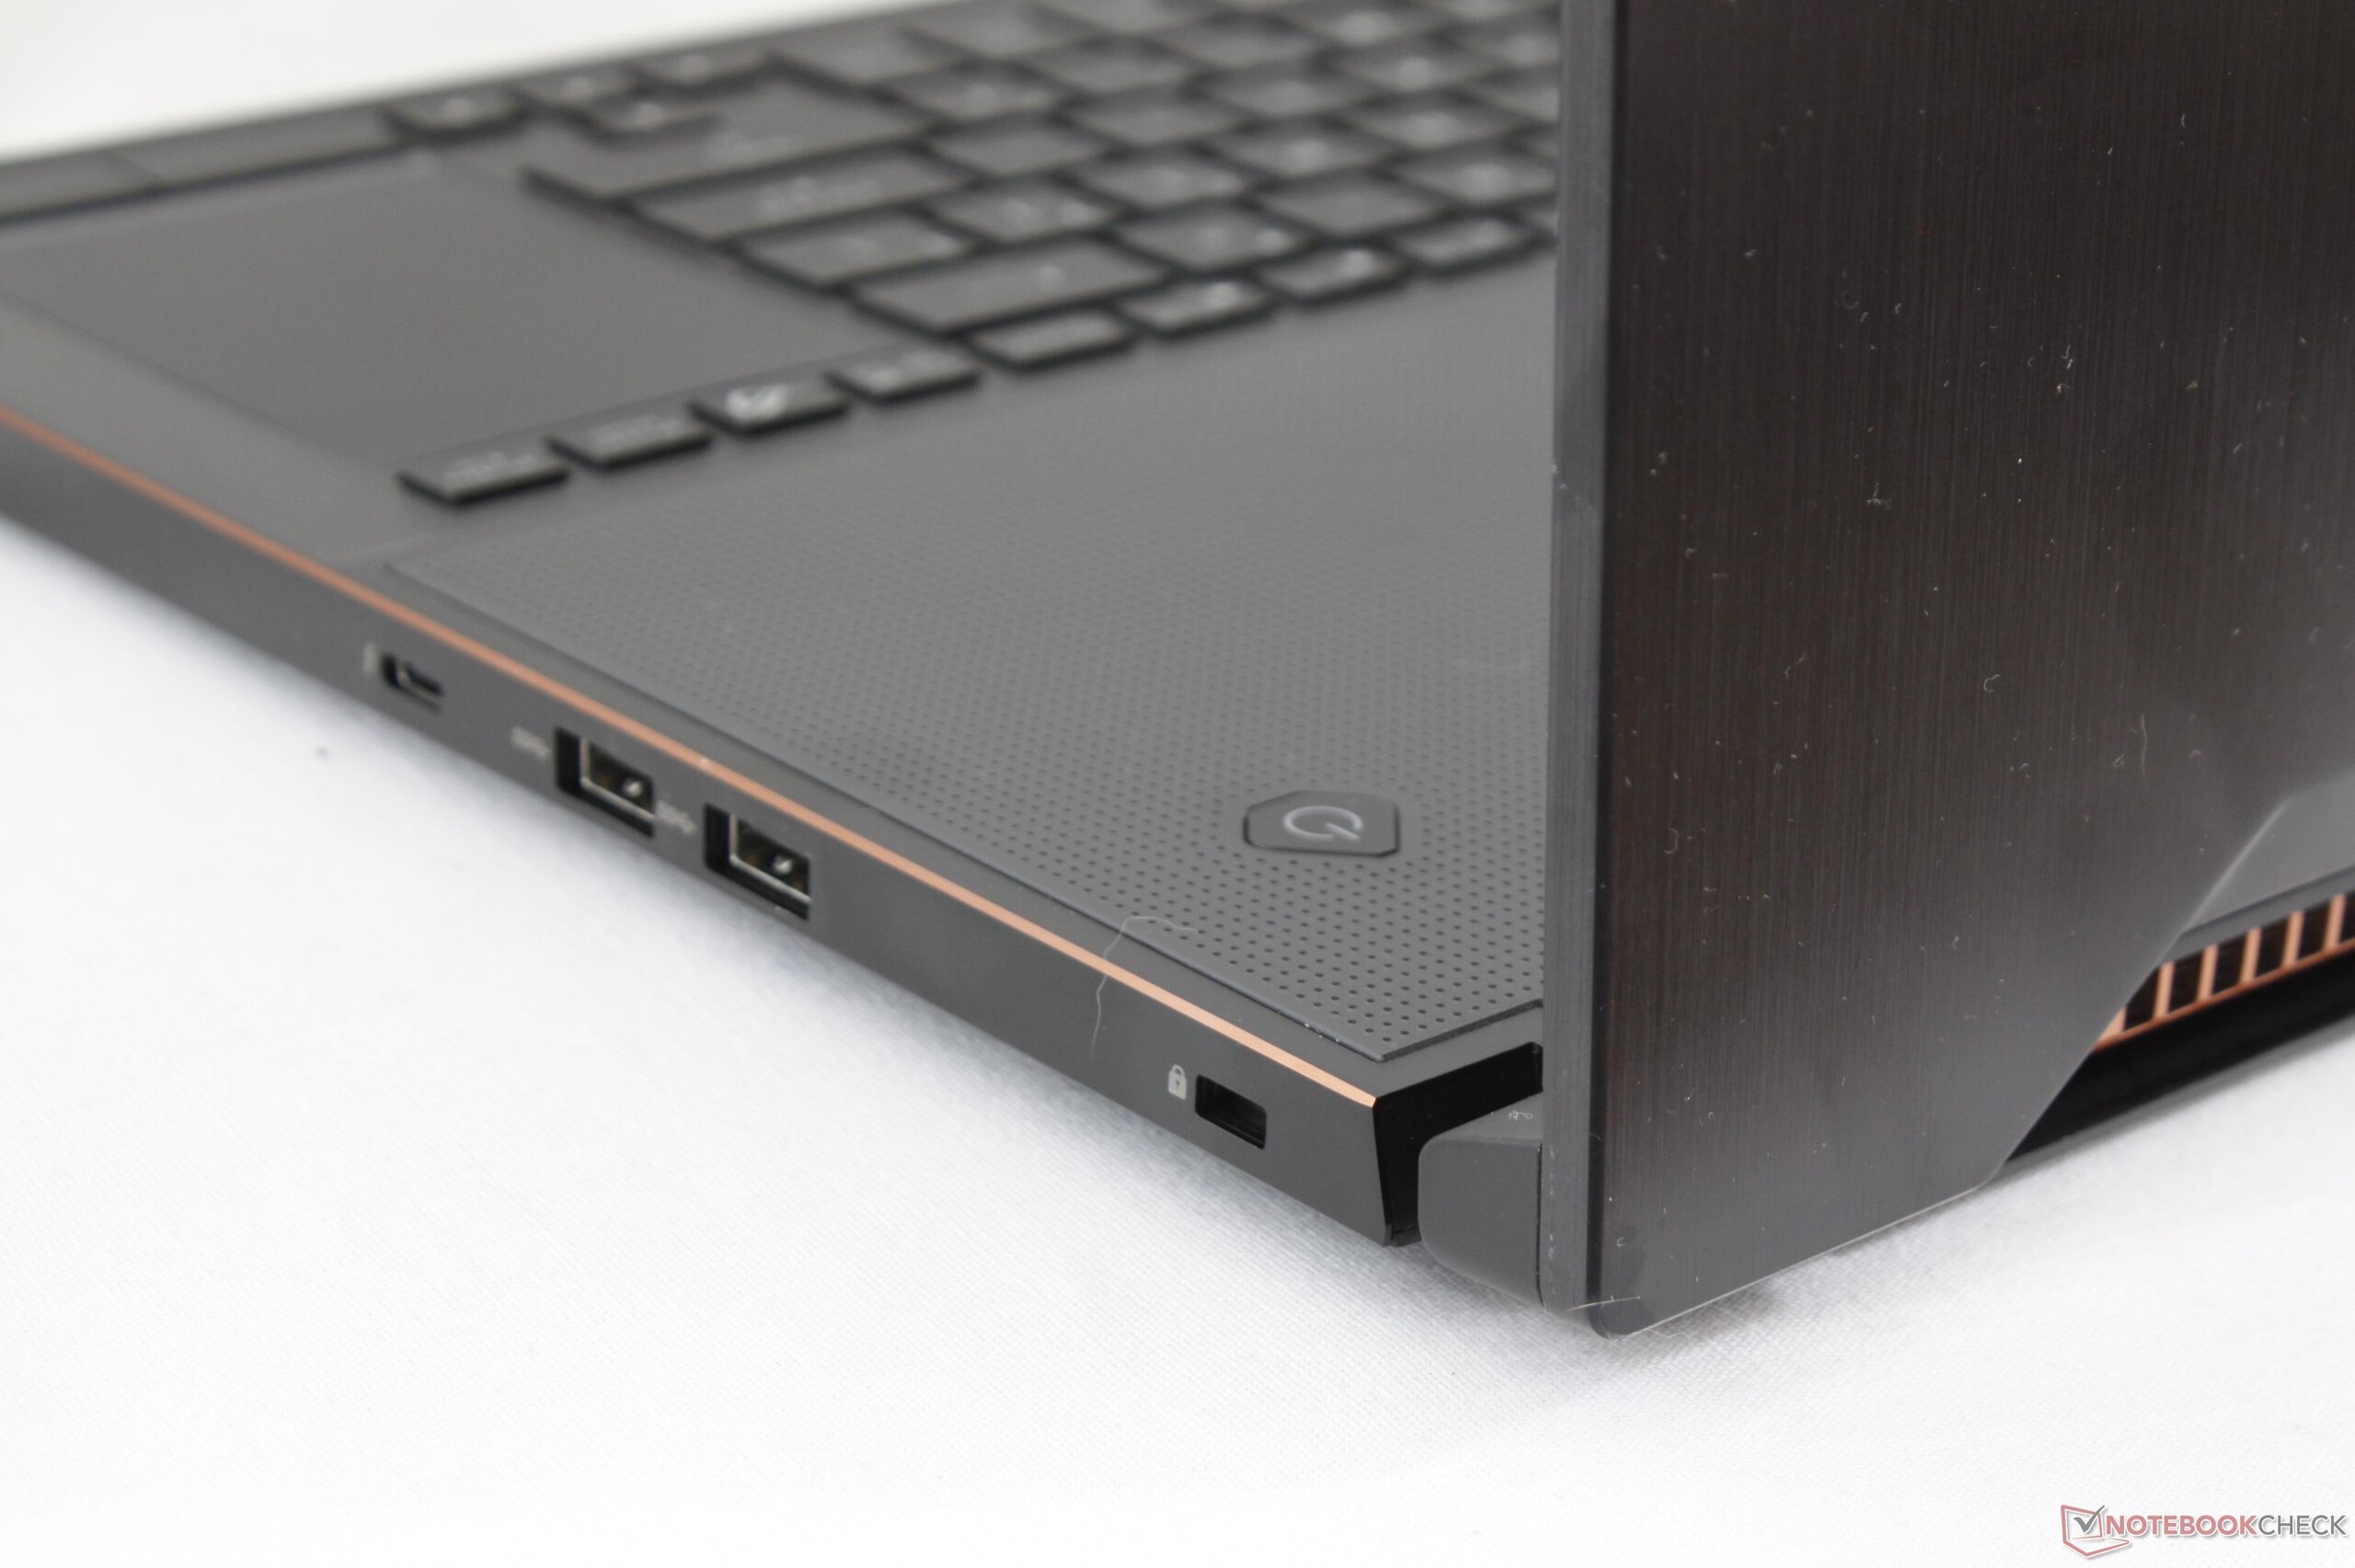
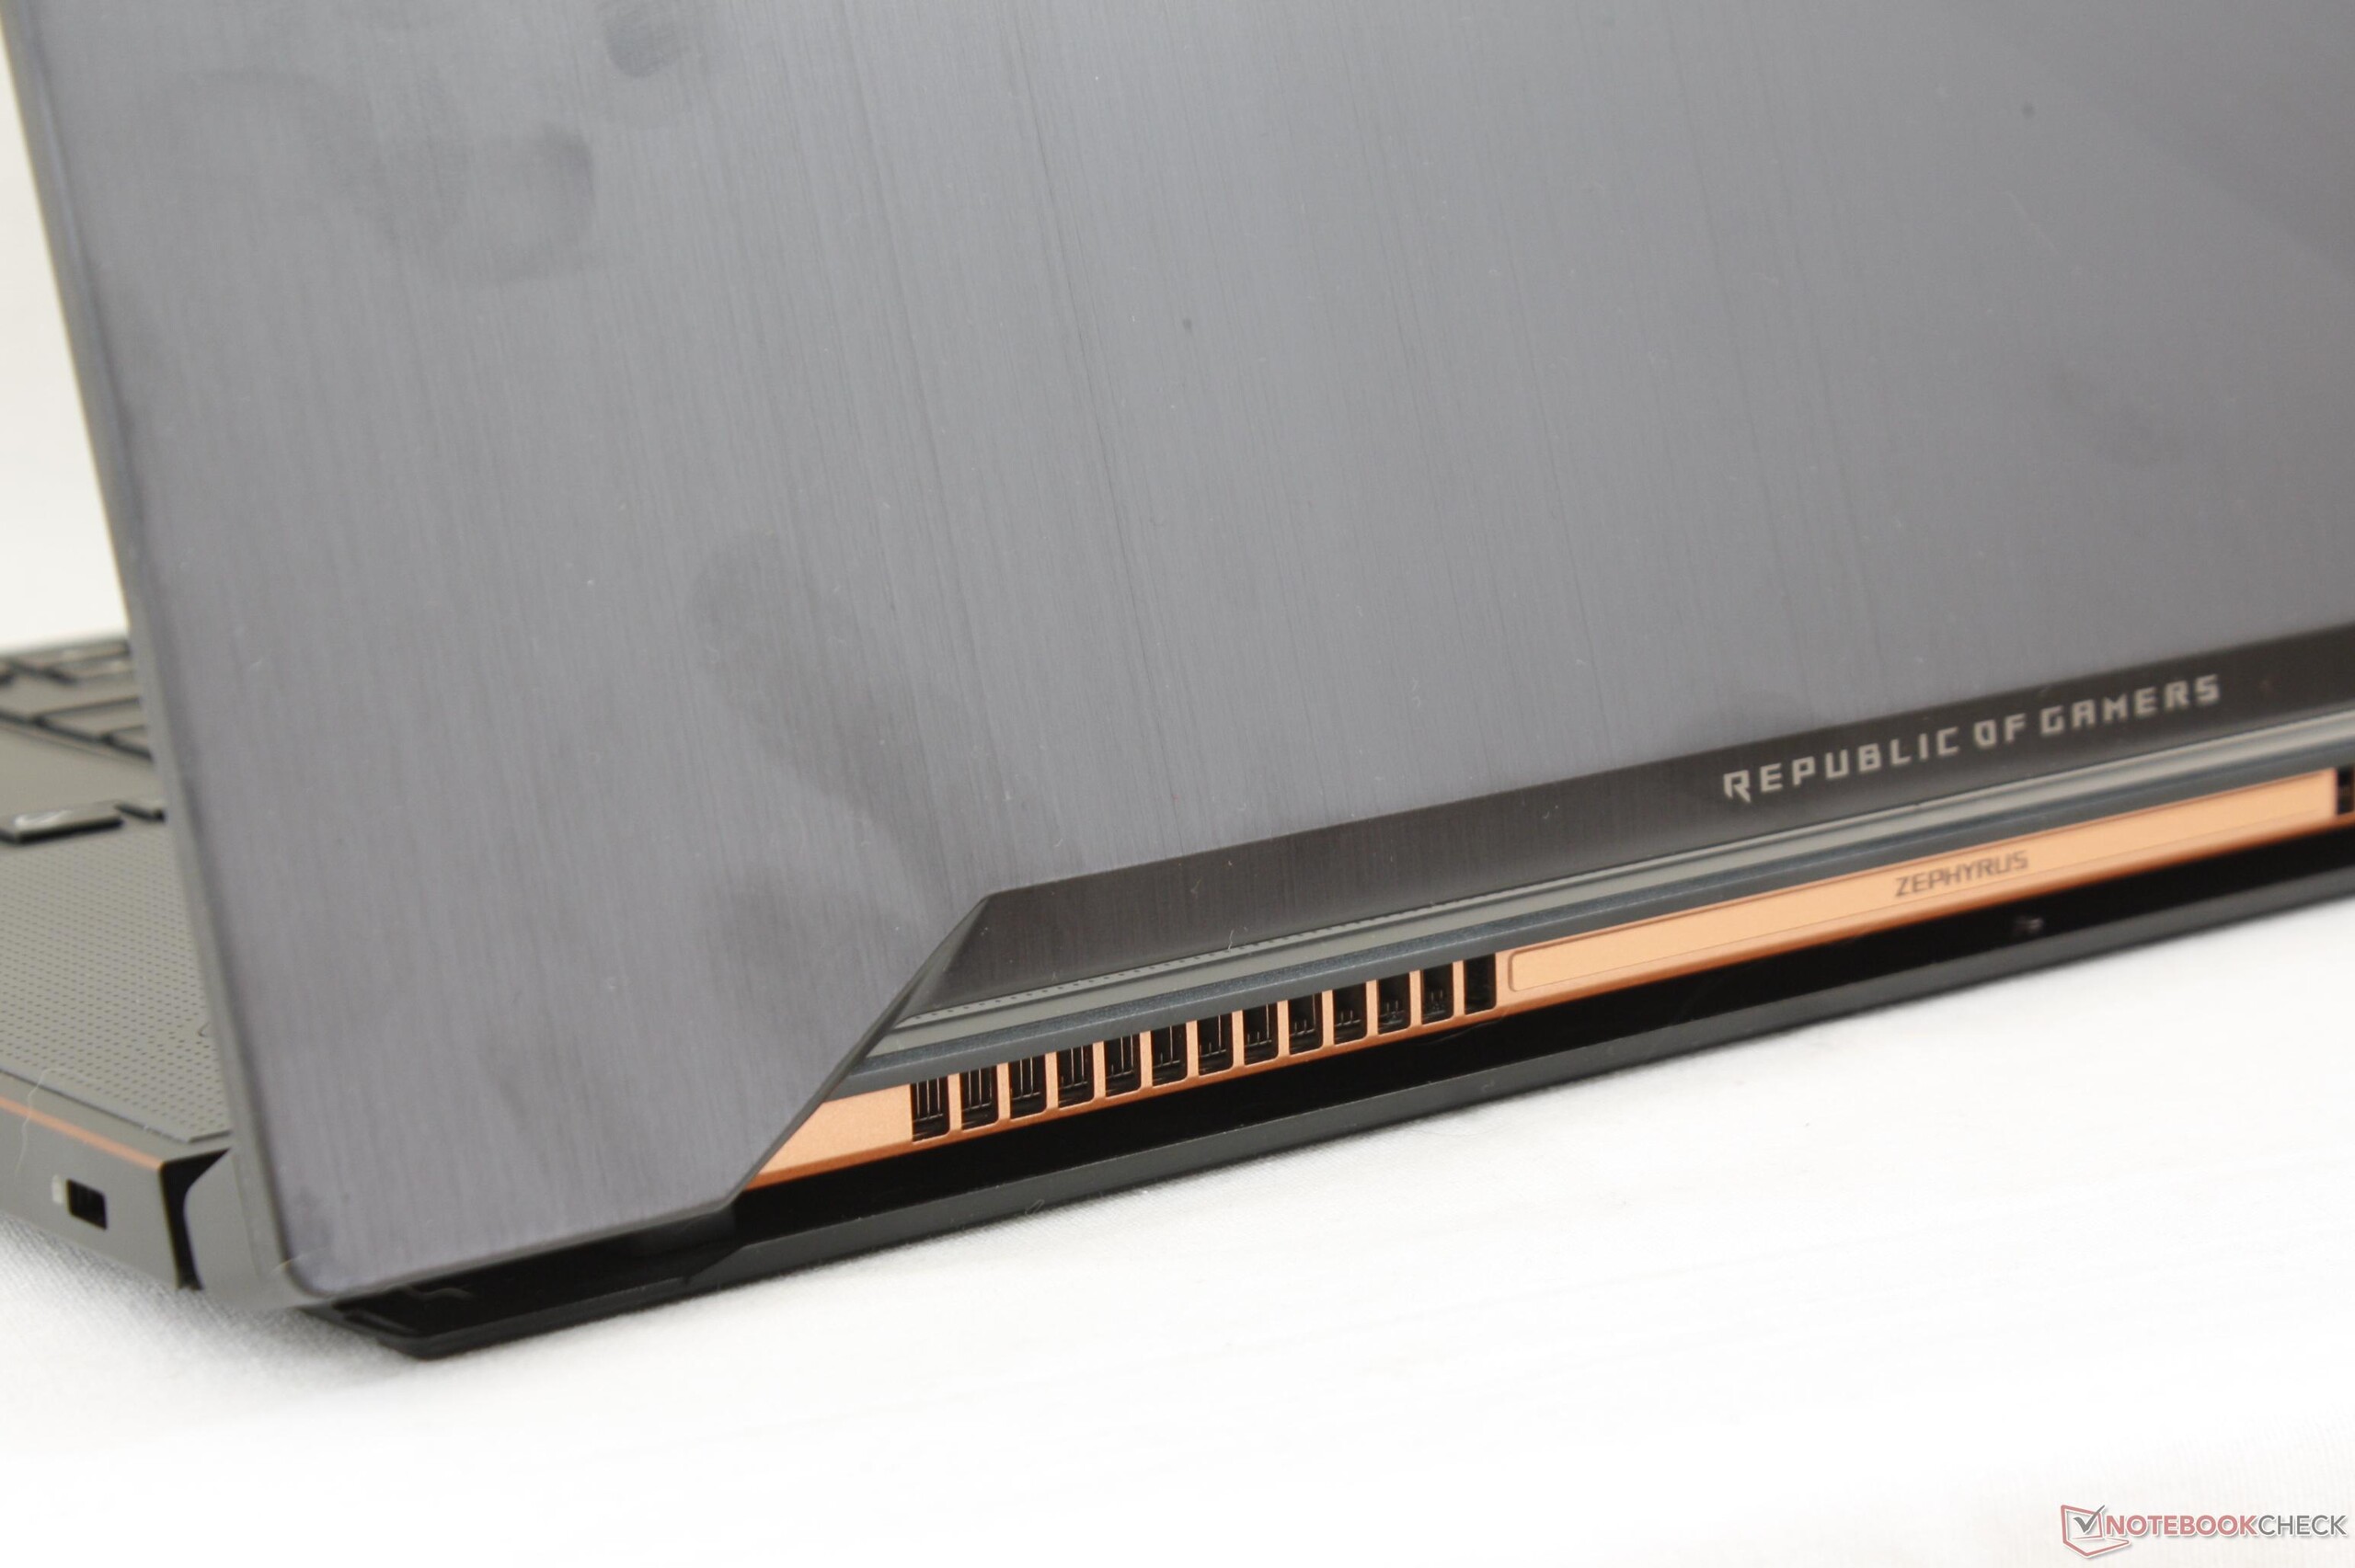
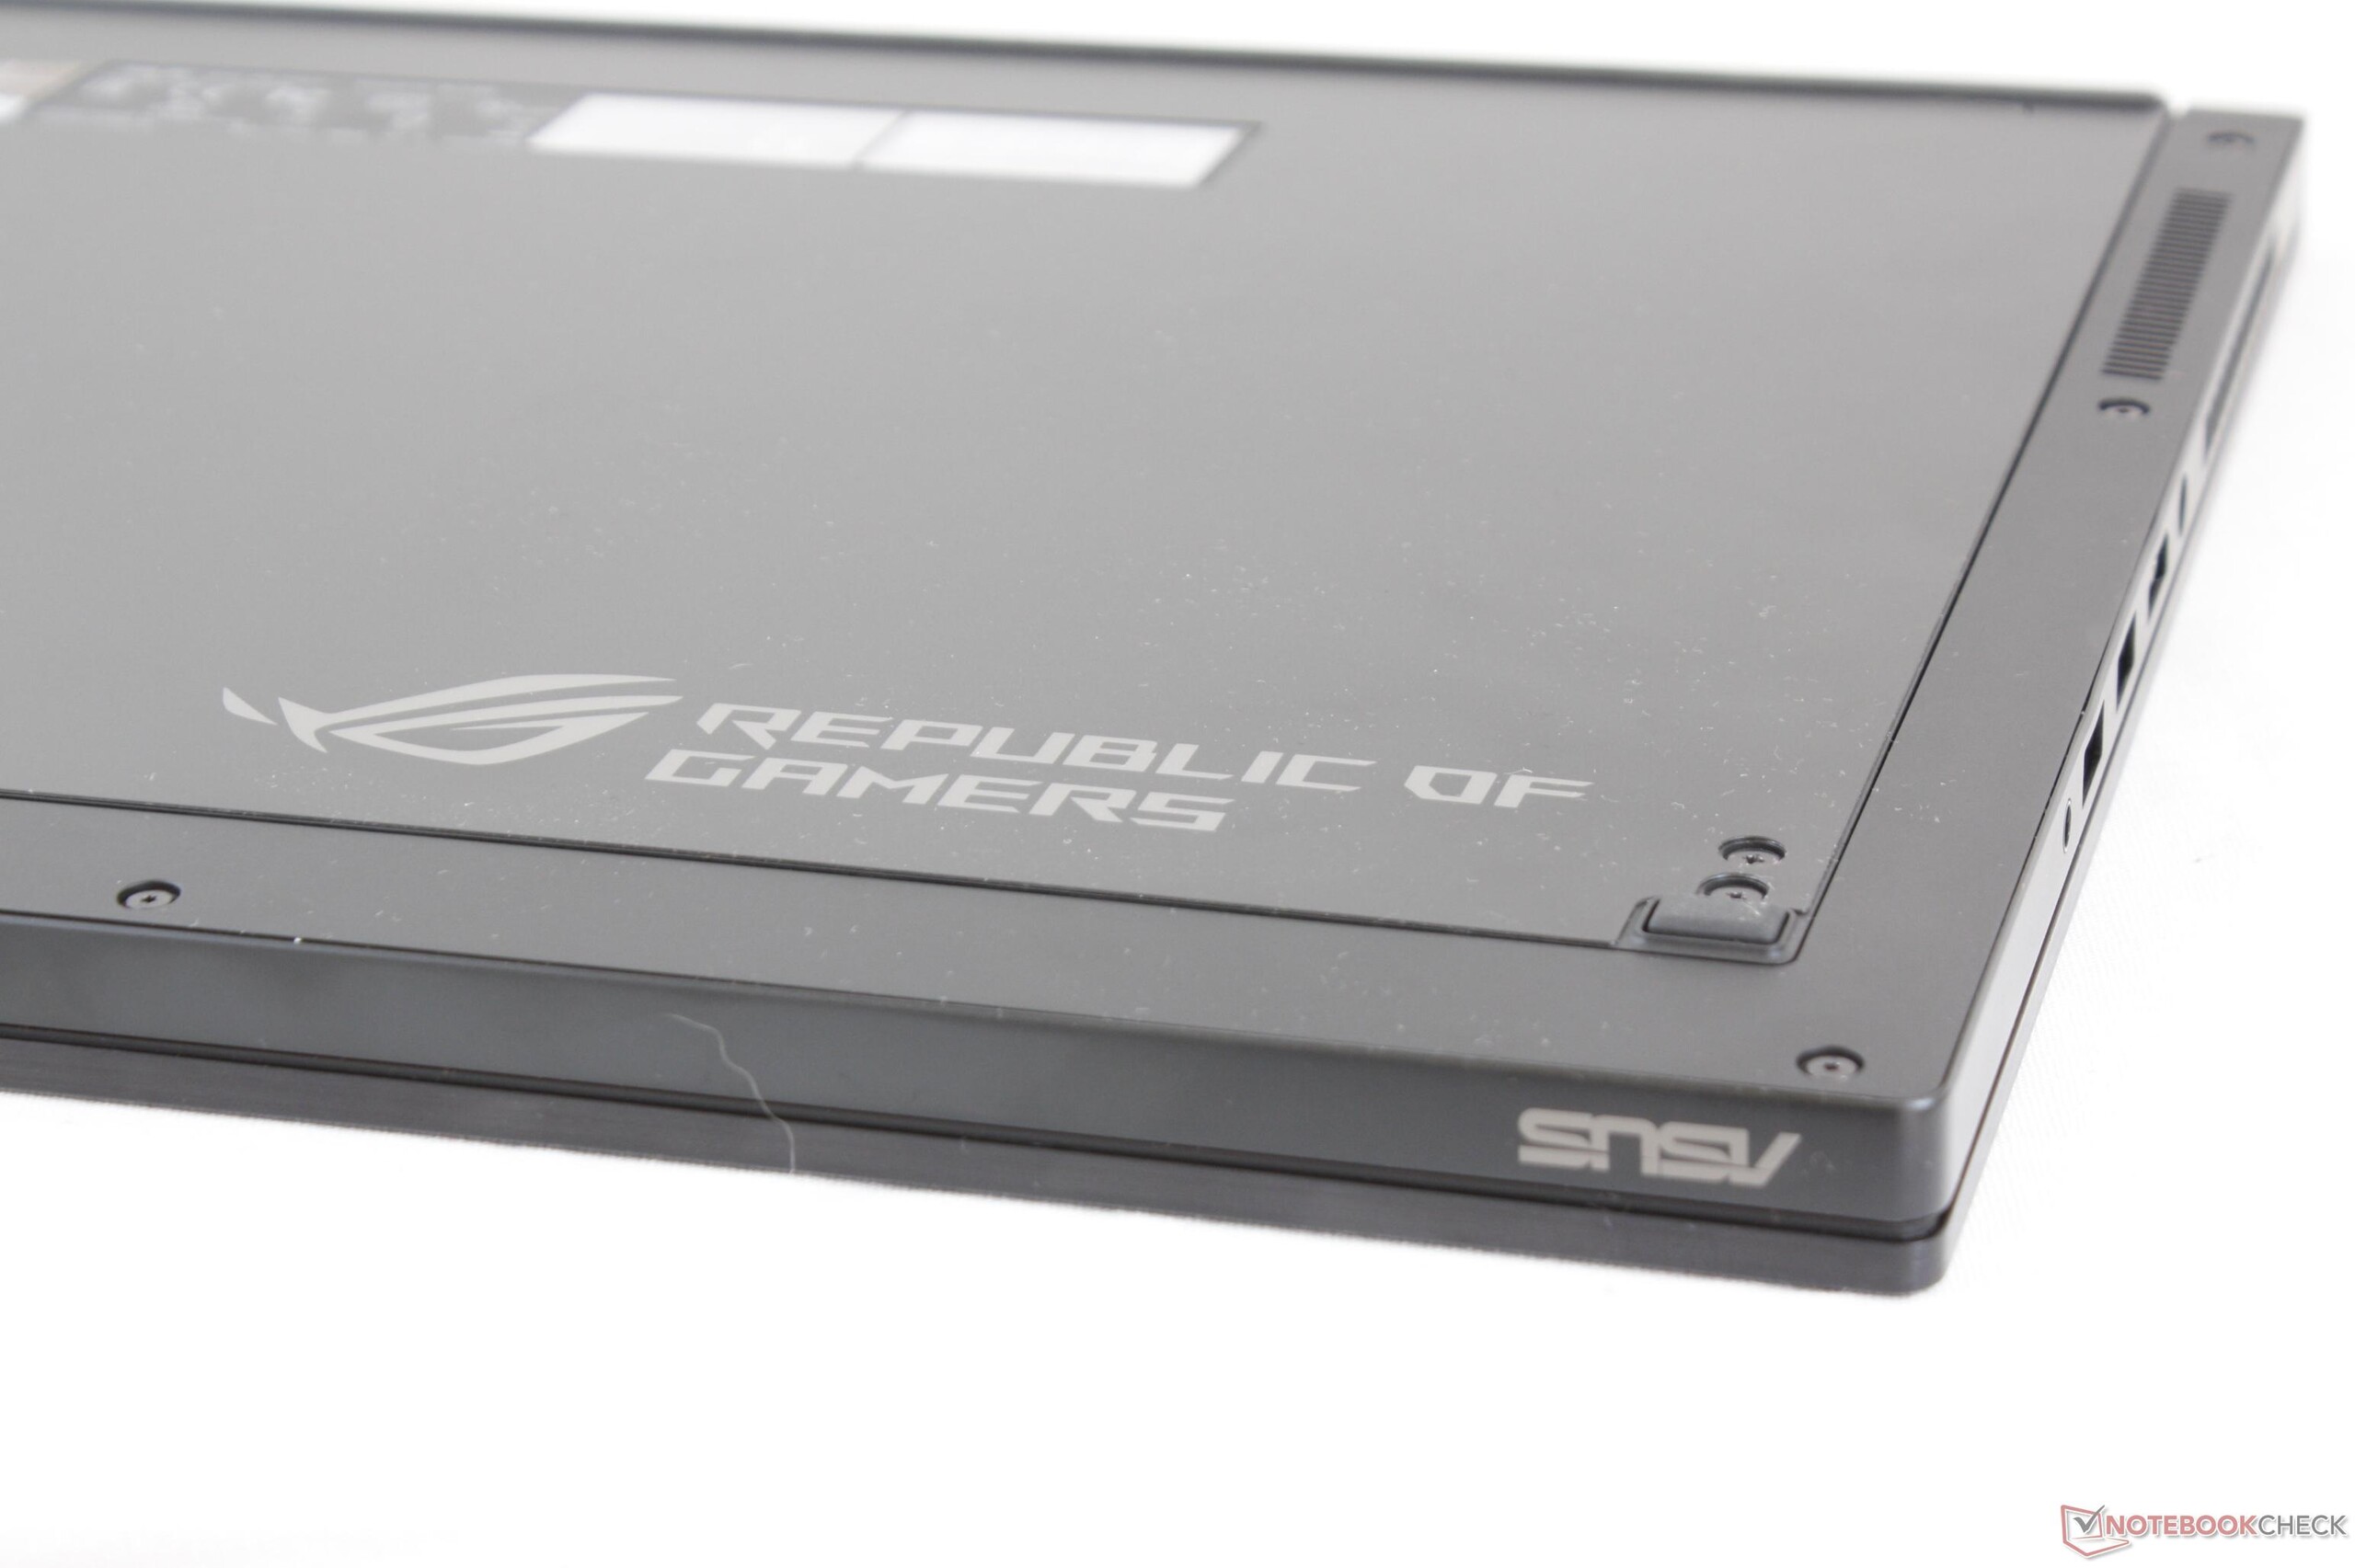
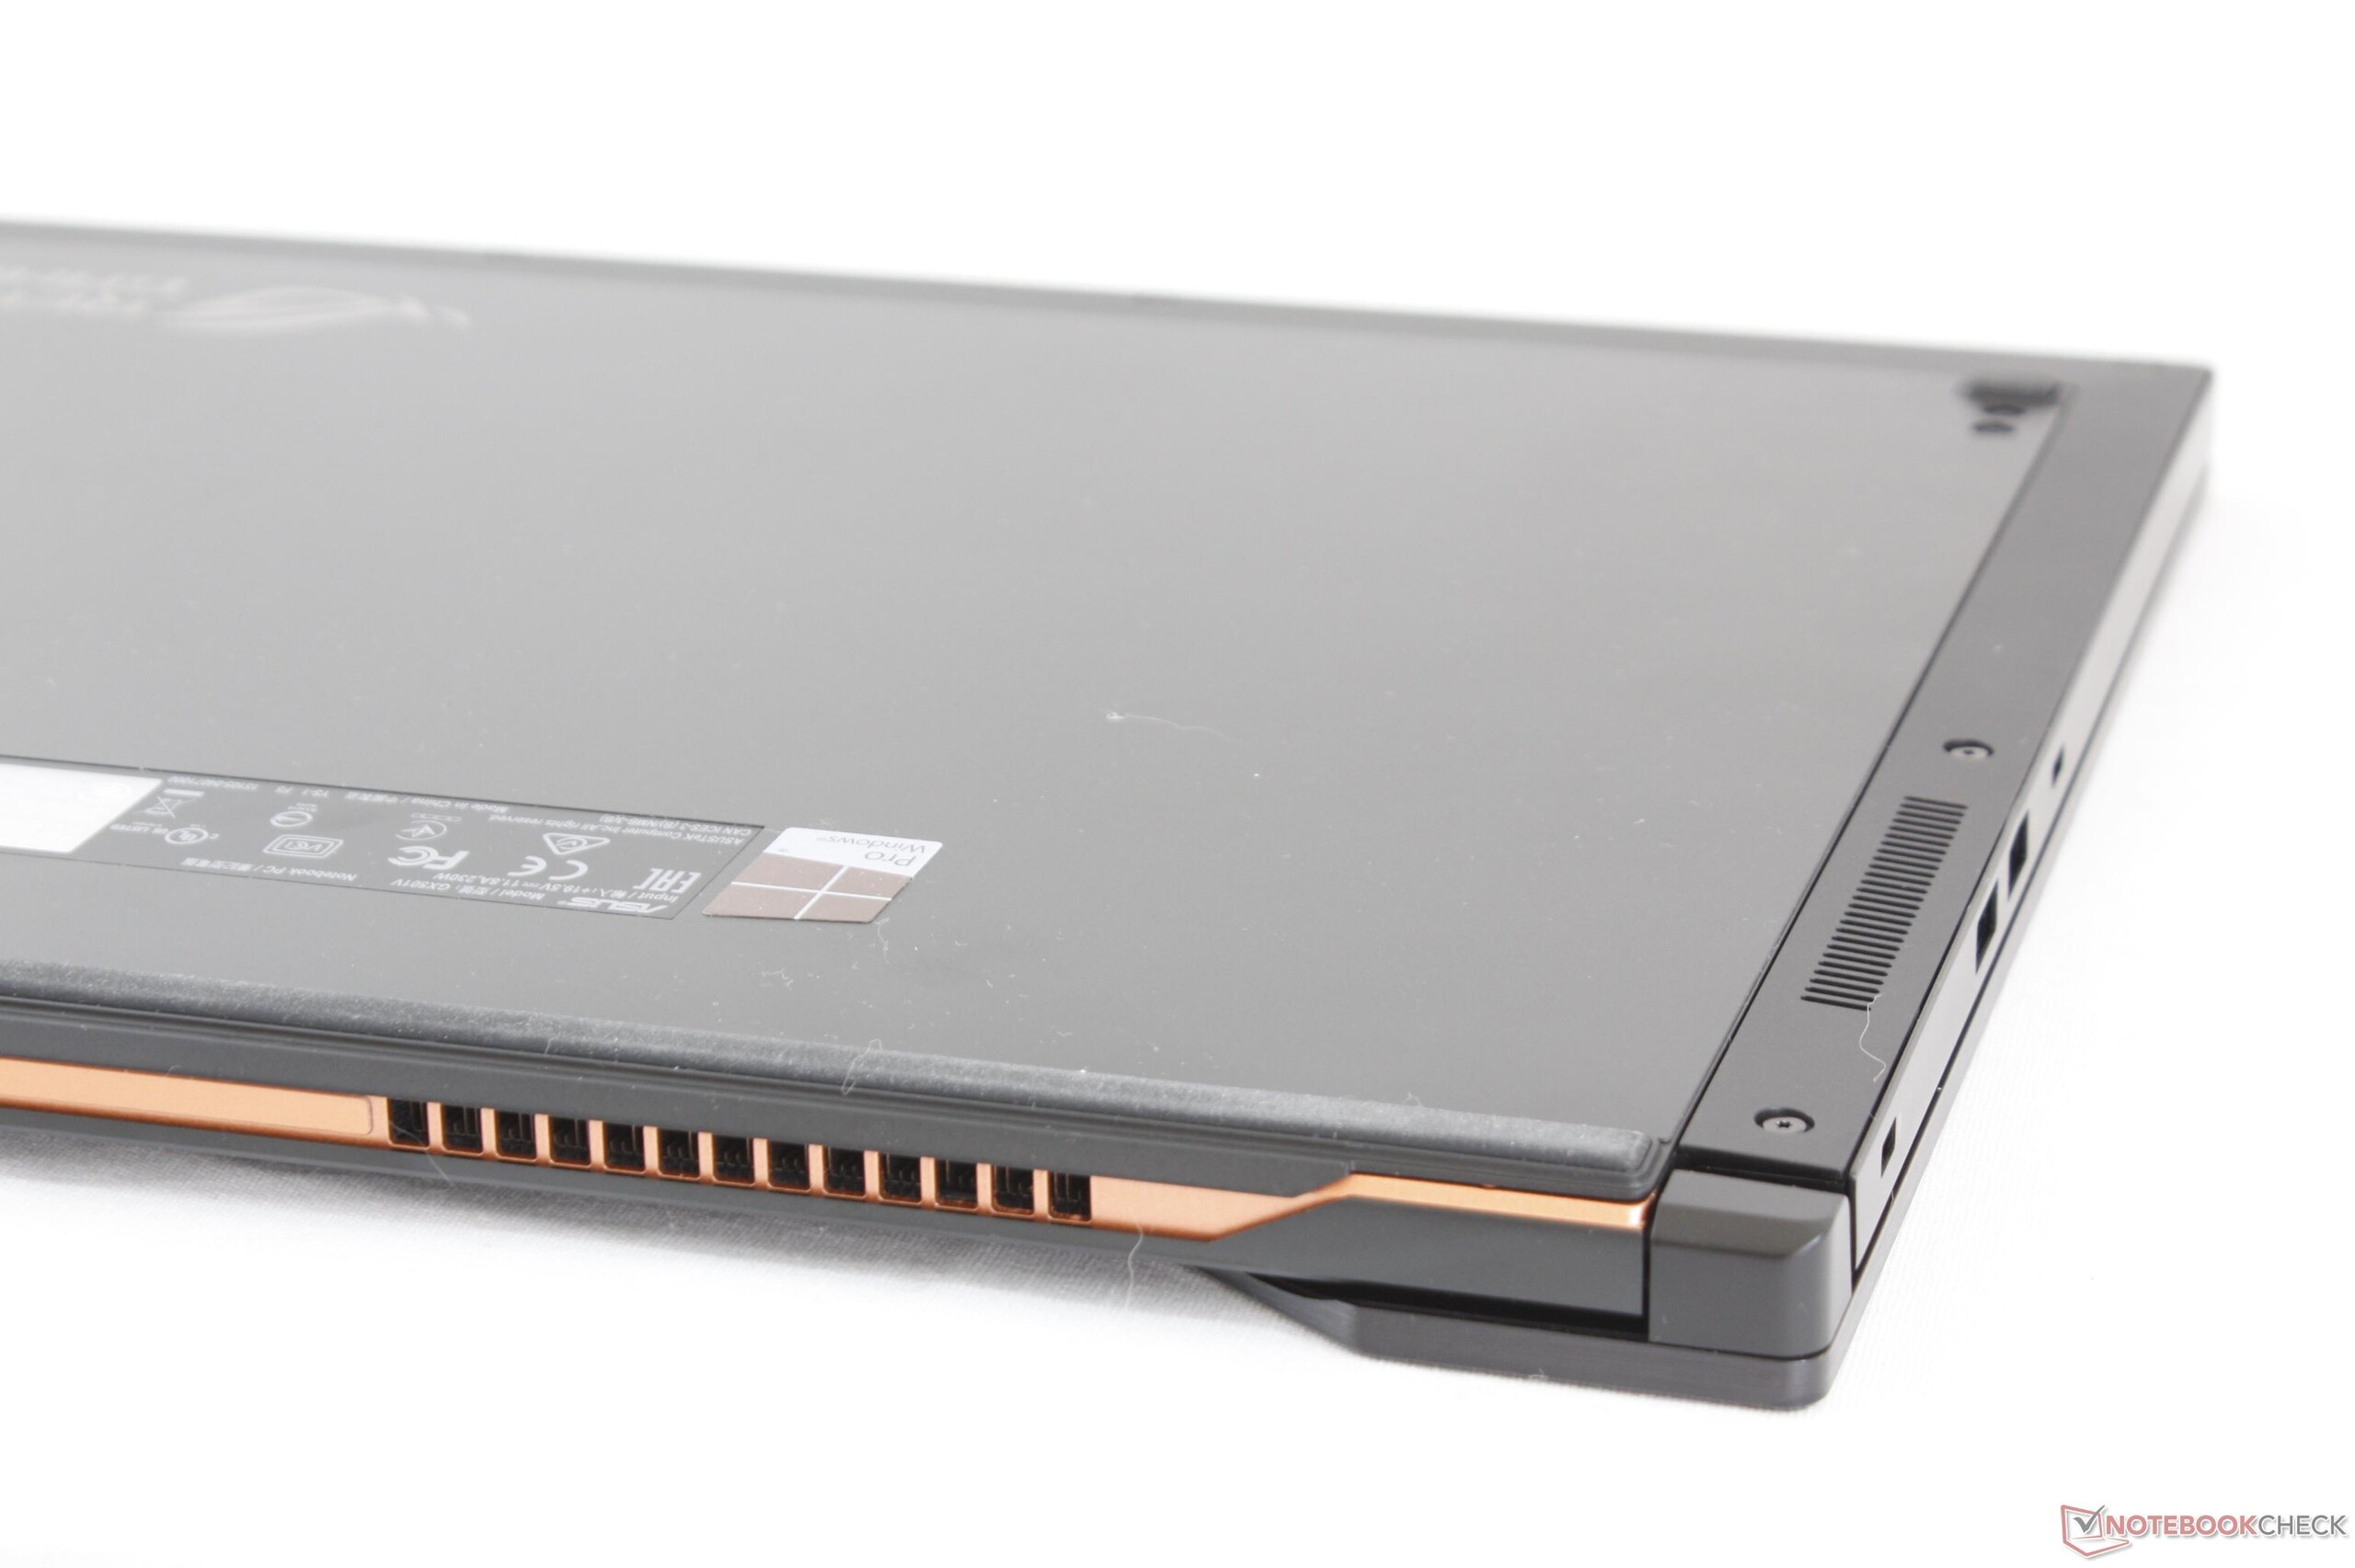
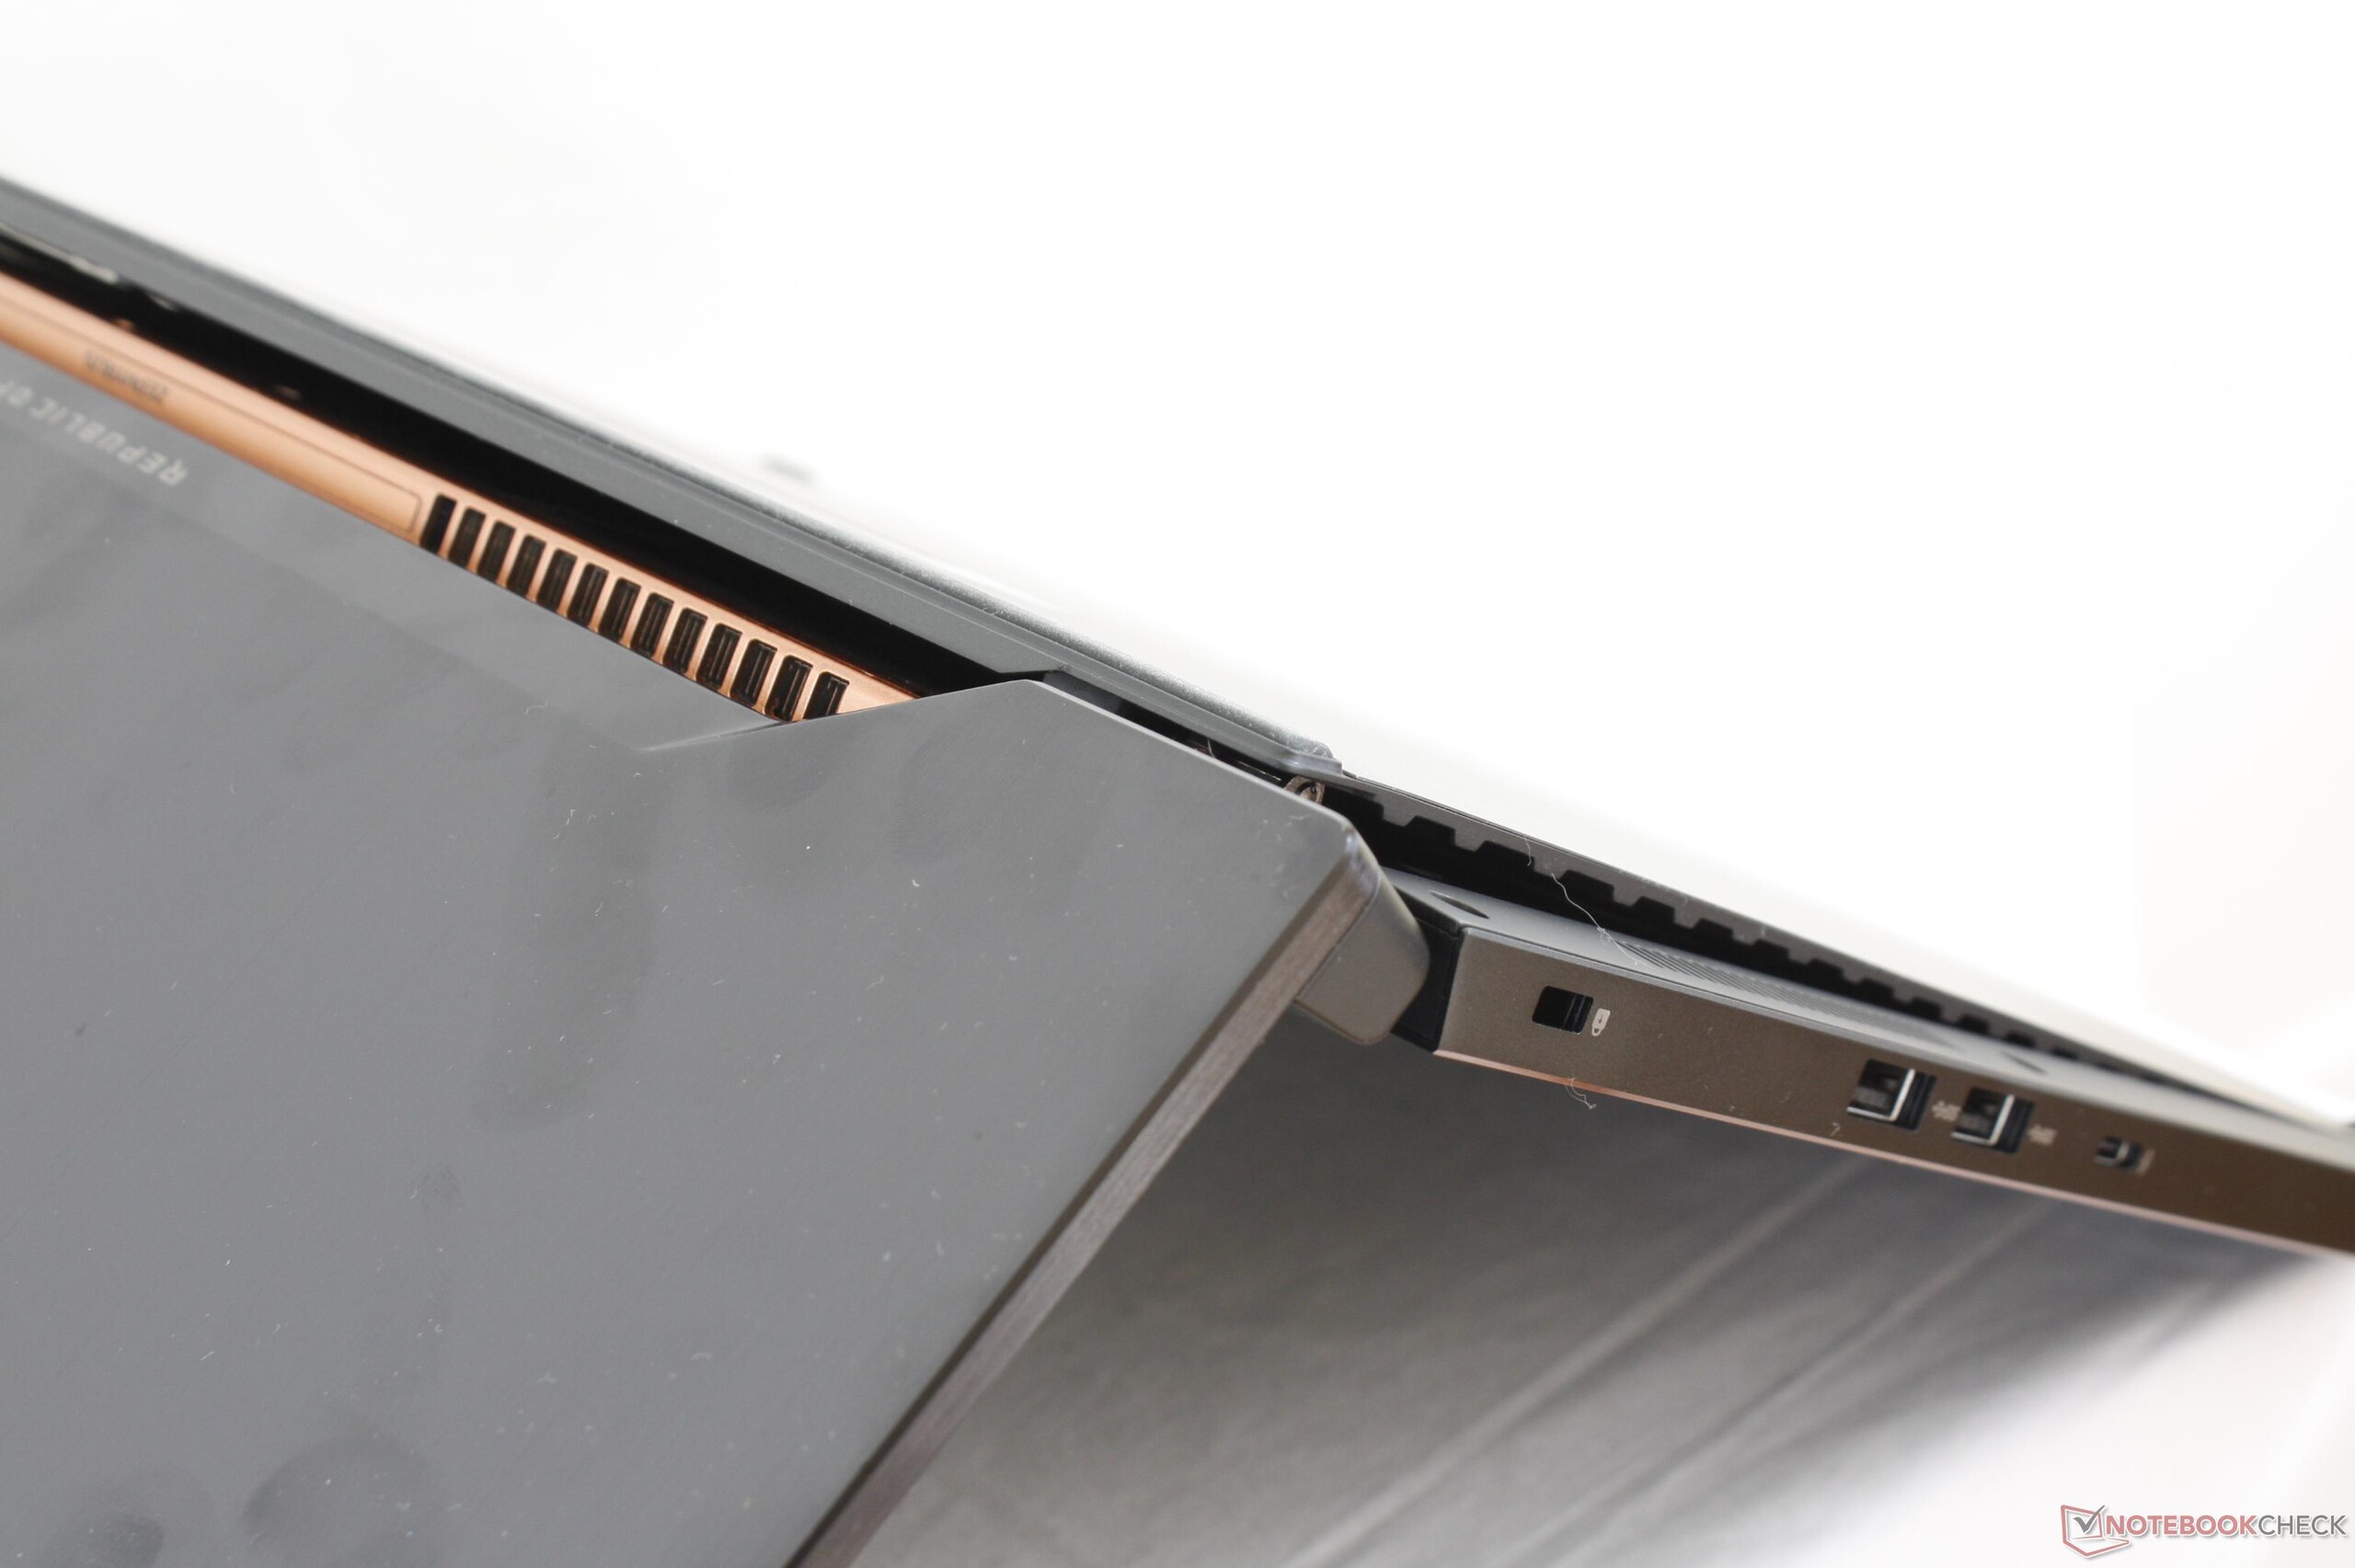
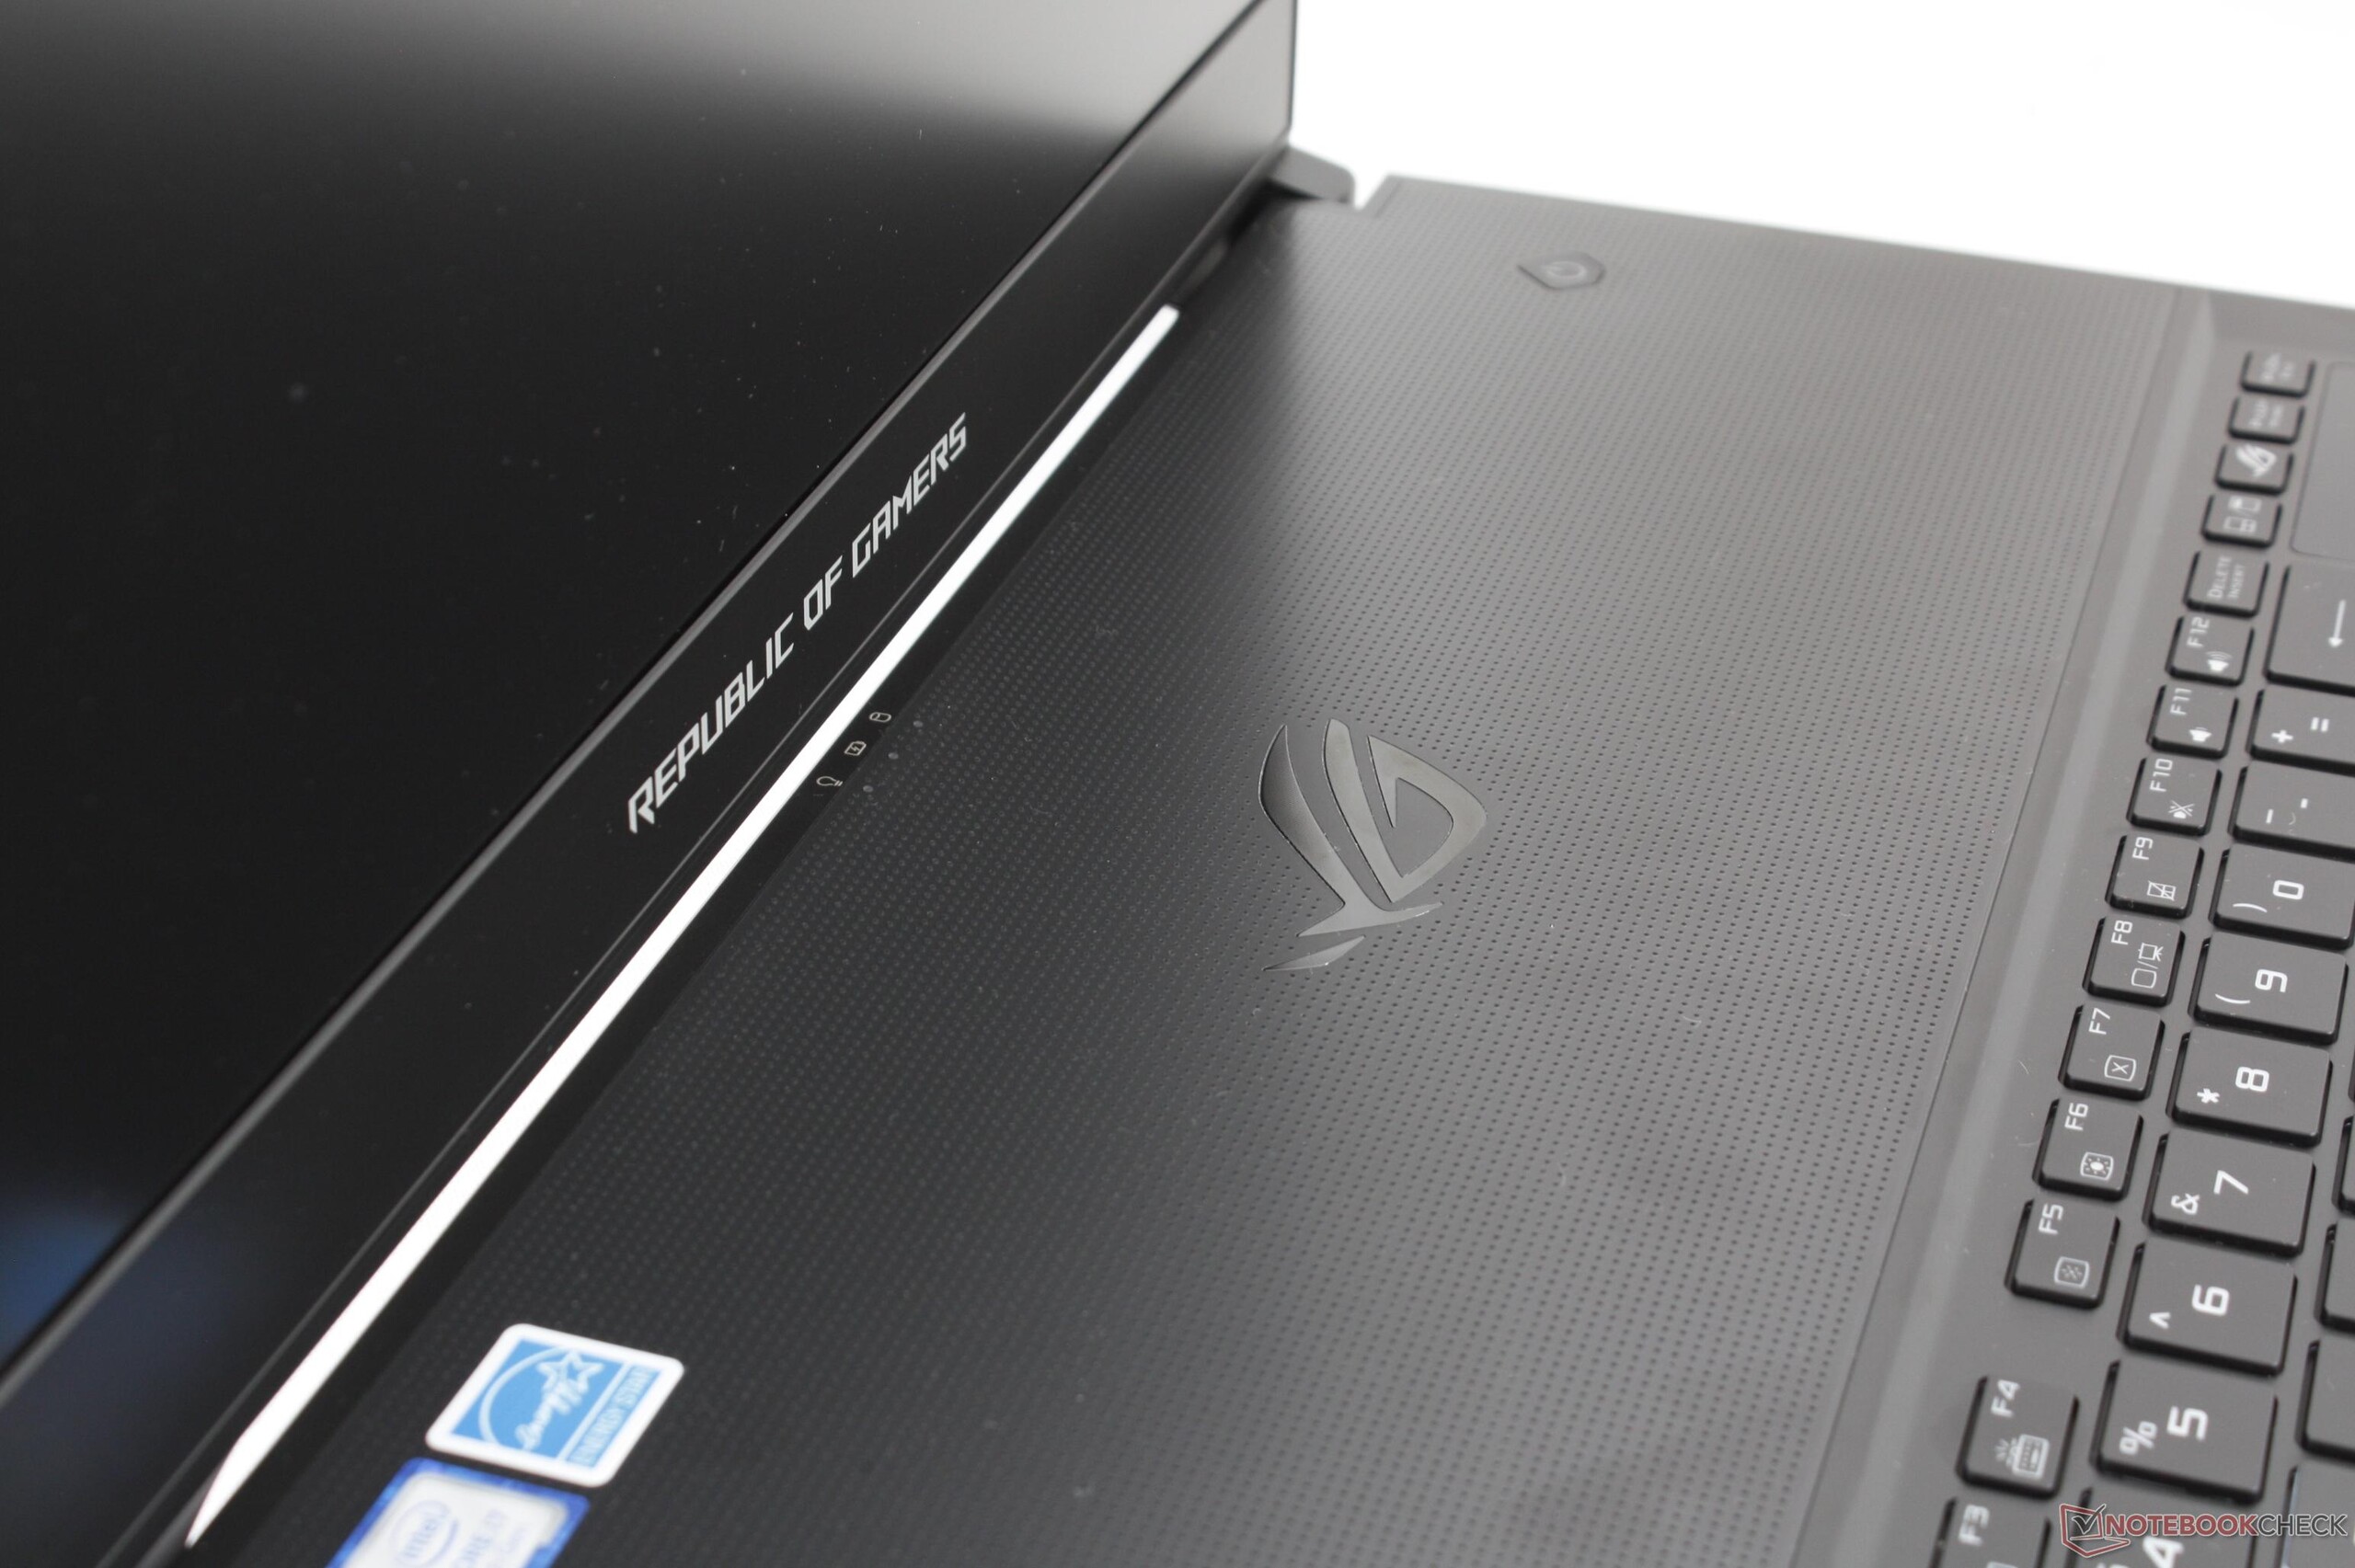
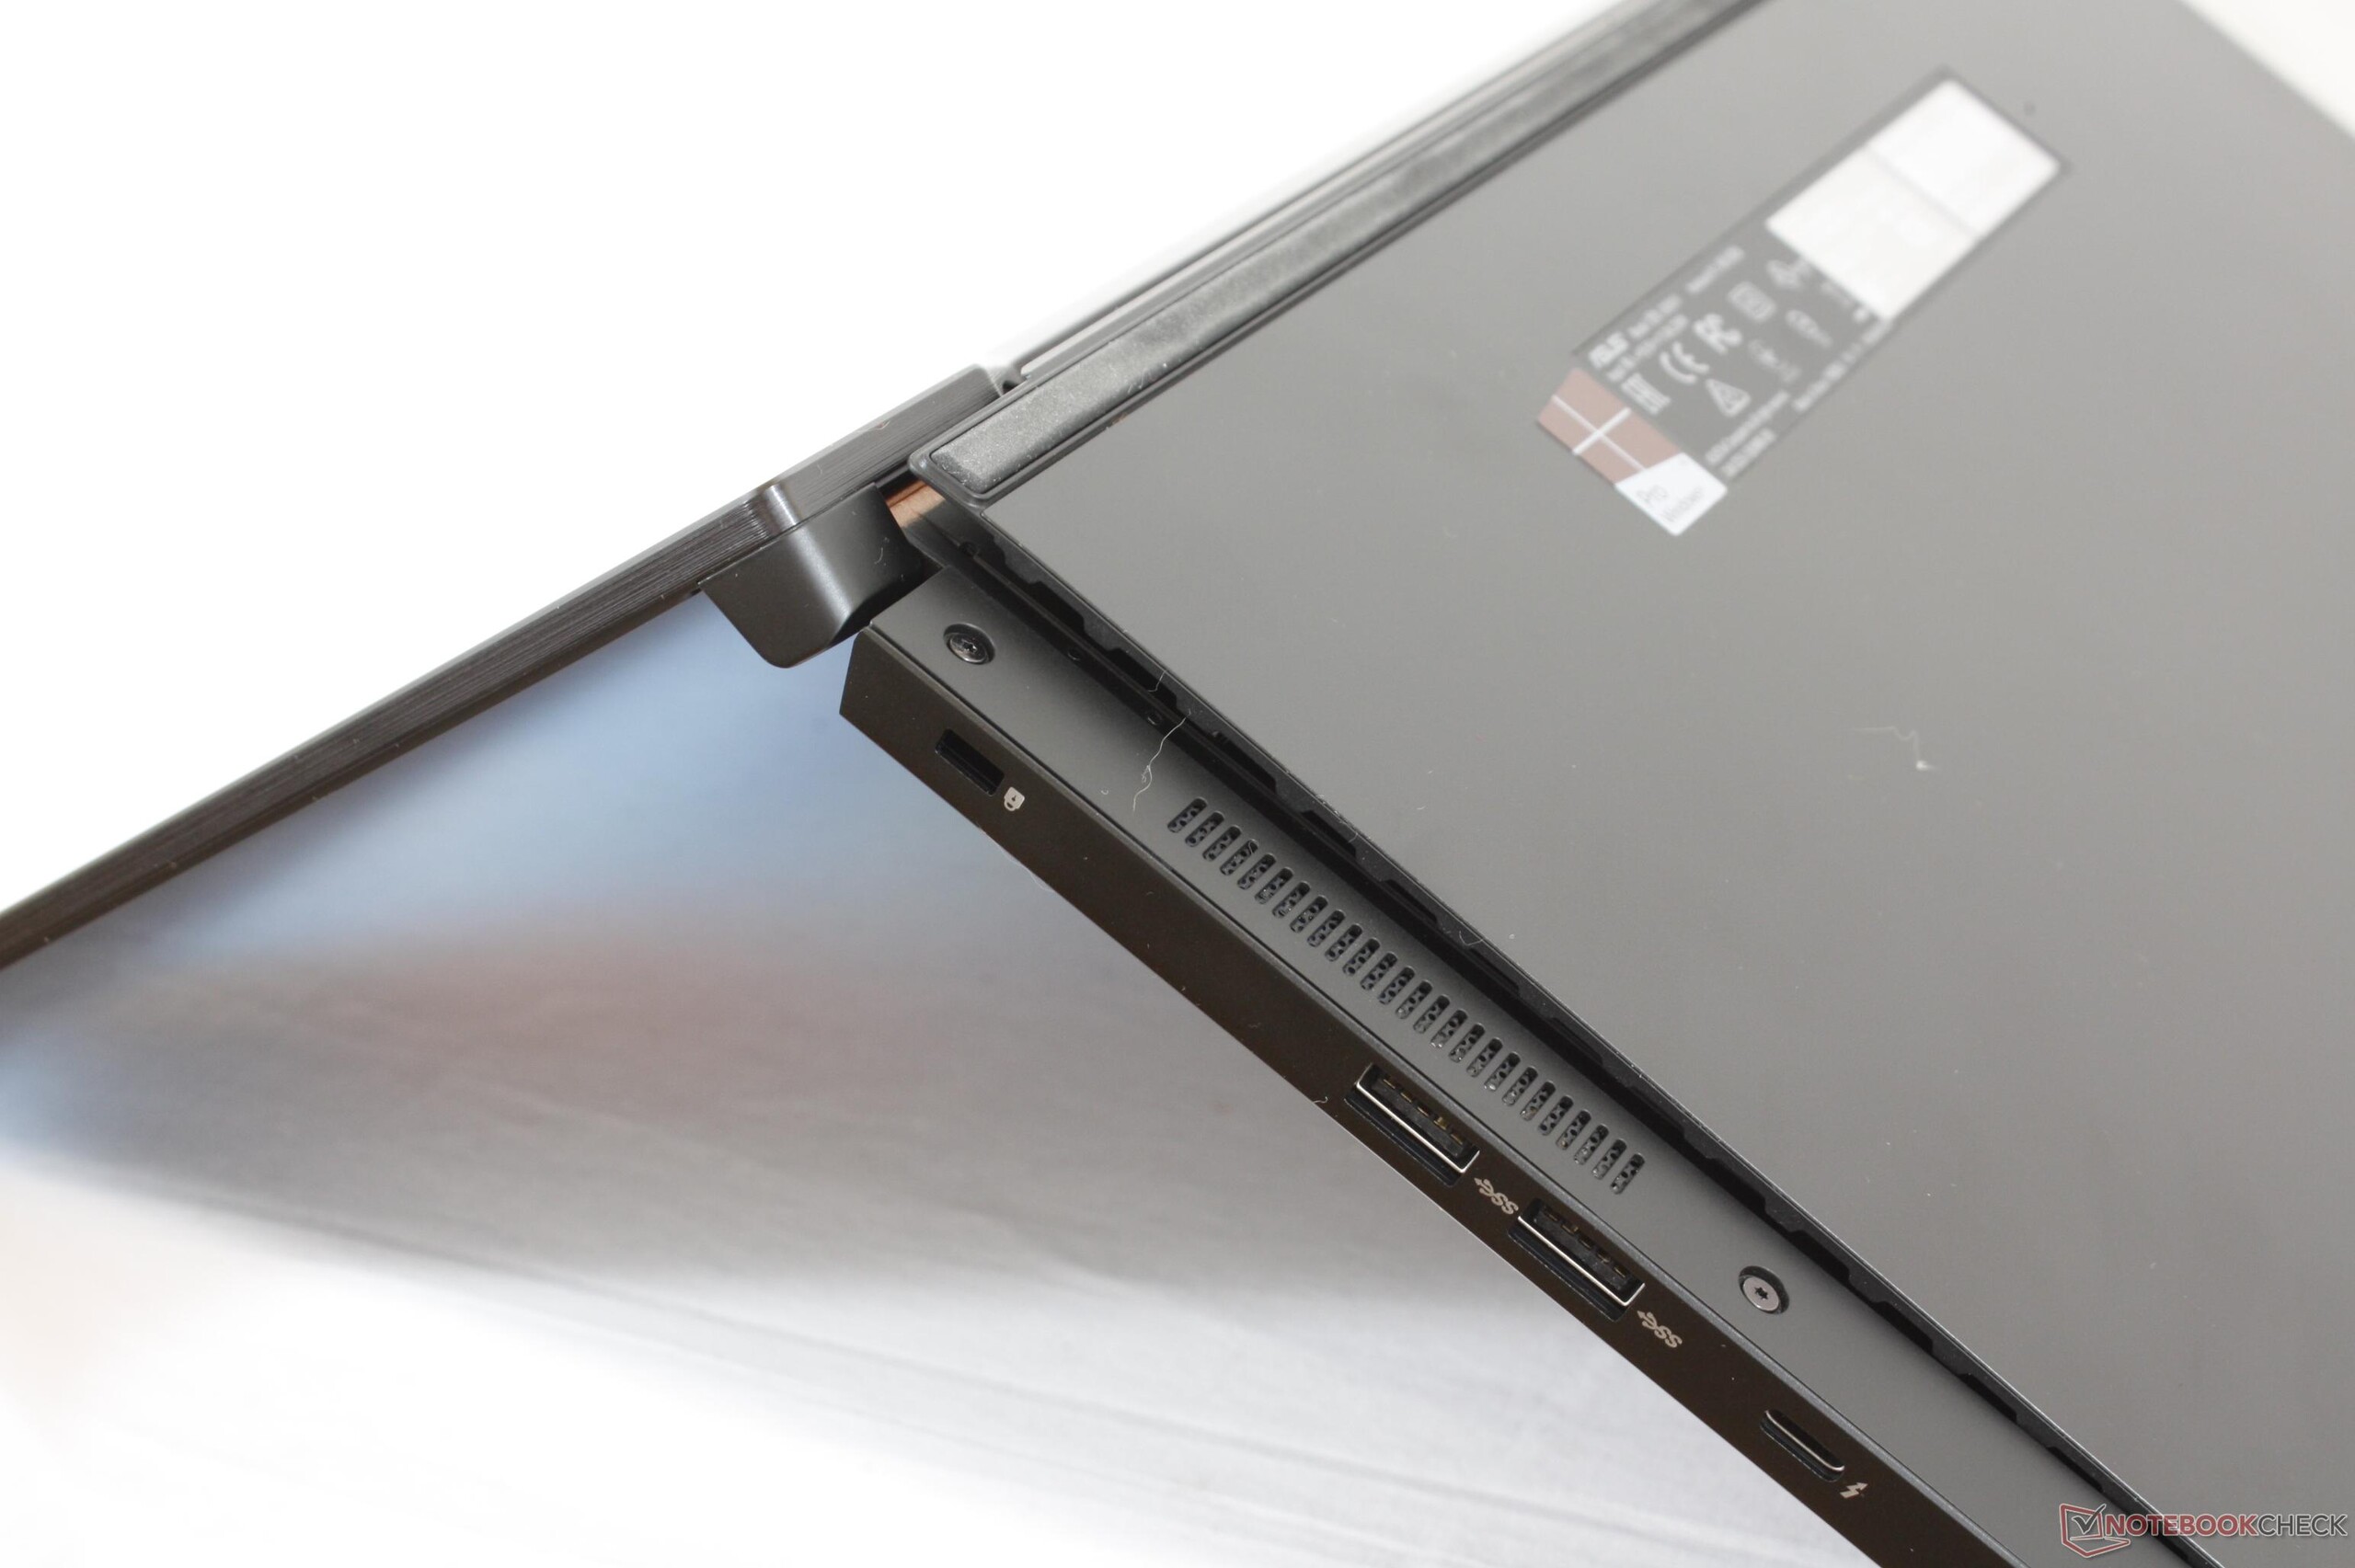
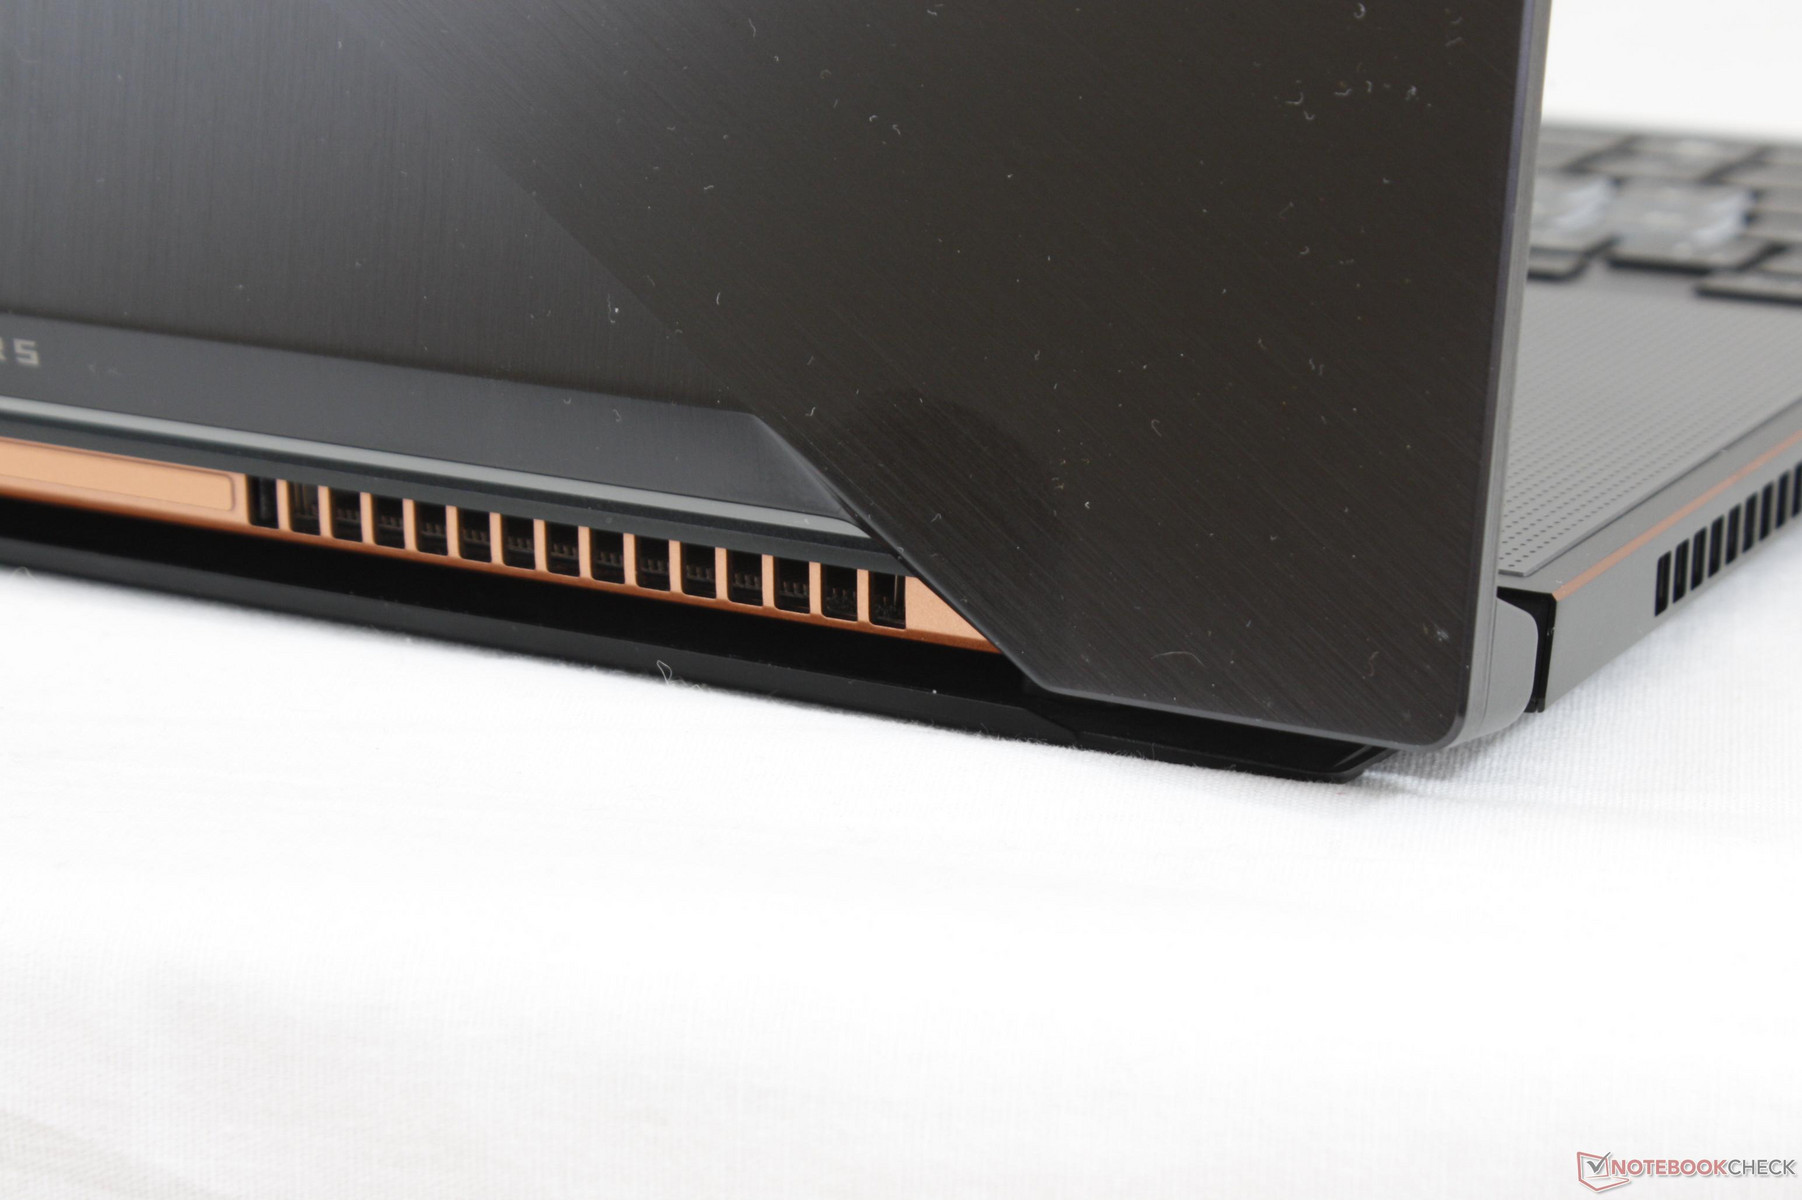
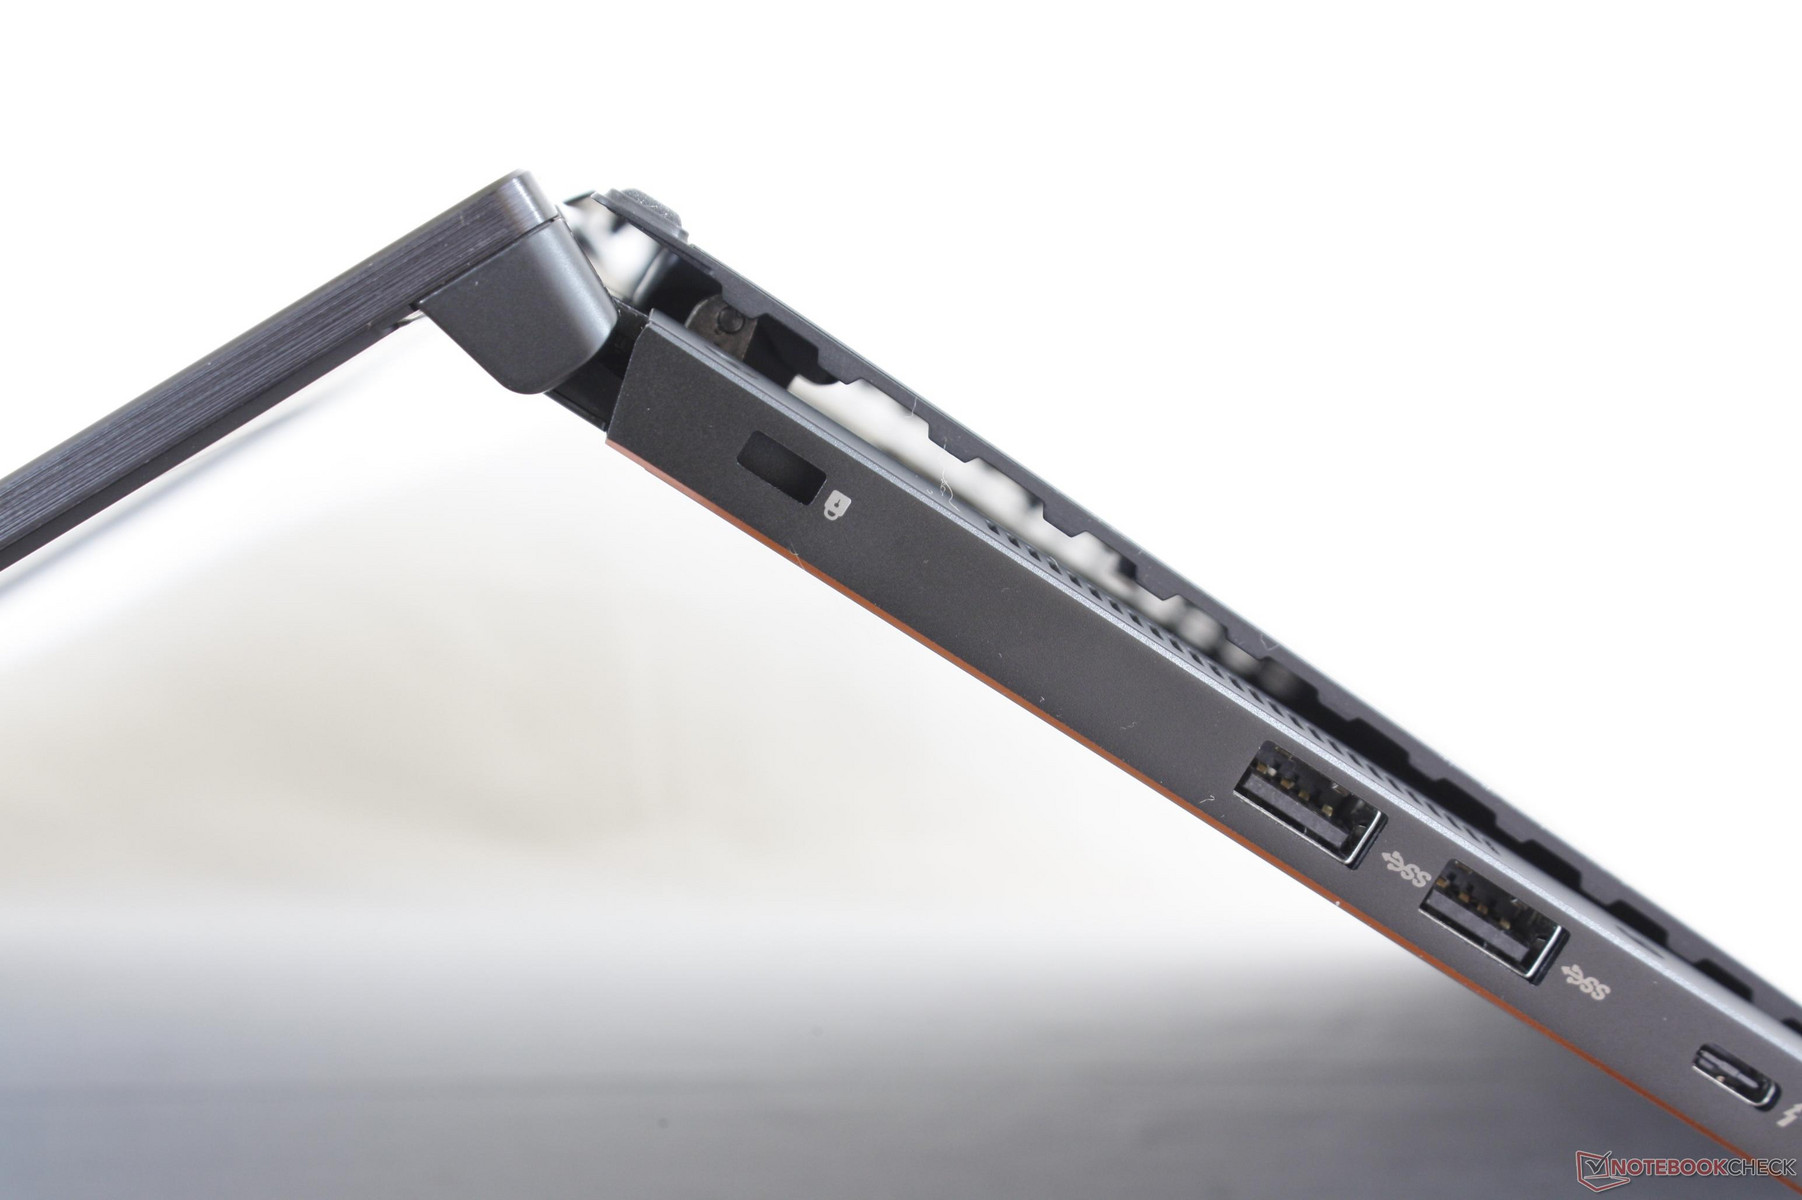
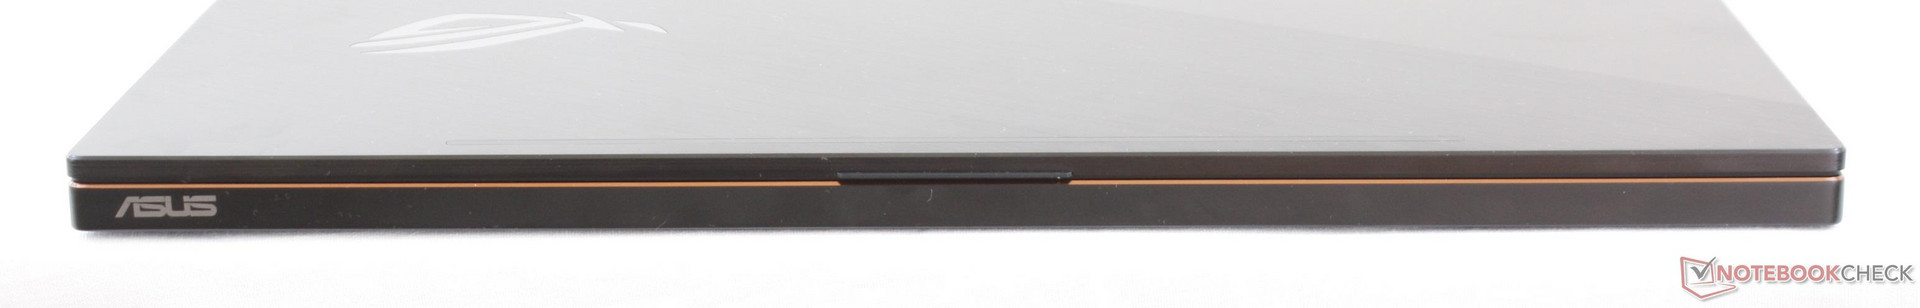
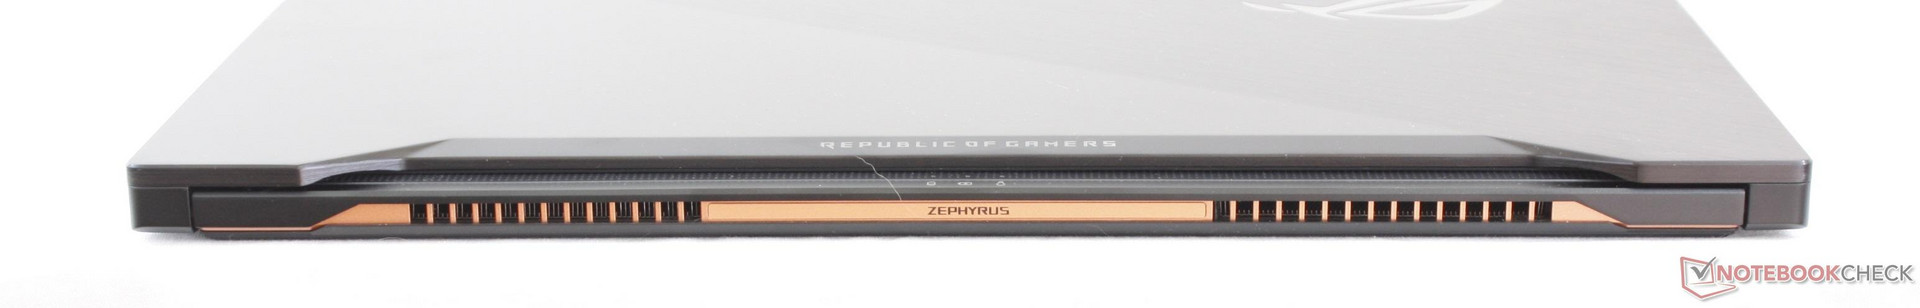
The defining feature of the GX501 is its protruding bottom plate that opens at a slight angle for airflow when lifting the lid. Visually, the unique design allows the bottom surface of the Zephyrus to be almost completely flat with no ventilation grilles or thick rubber footing found on every other gaming notebook. The Zephyrus looks very flat when sitting closed on a desk and there's no denying its visual appeal. In practice, however, the protruding bottom plate warps easily down its center and is not at all rigid. Using the notebook on one's lap or simply carrying it around with one hand while the lid is opened can potentially damage the bottom plate.
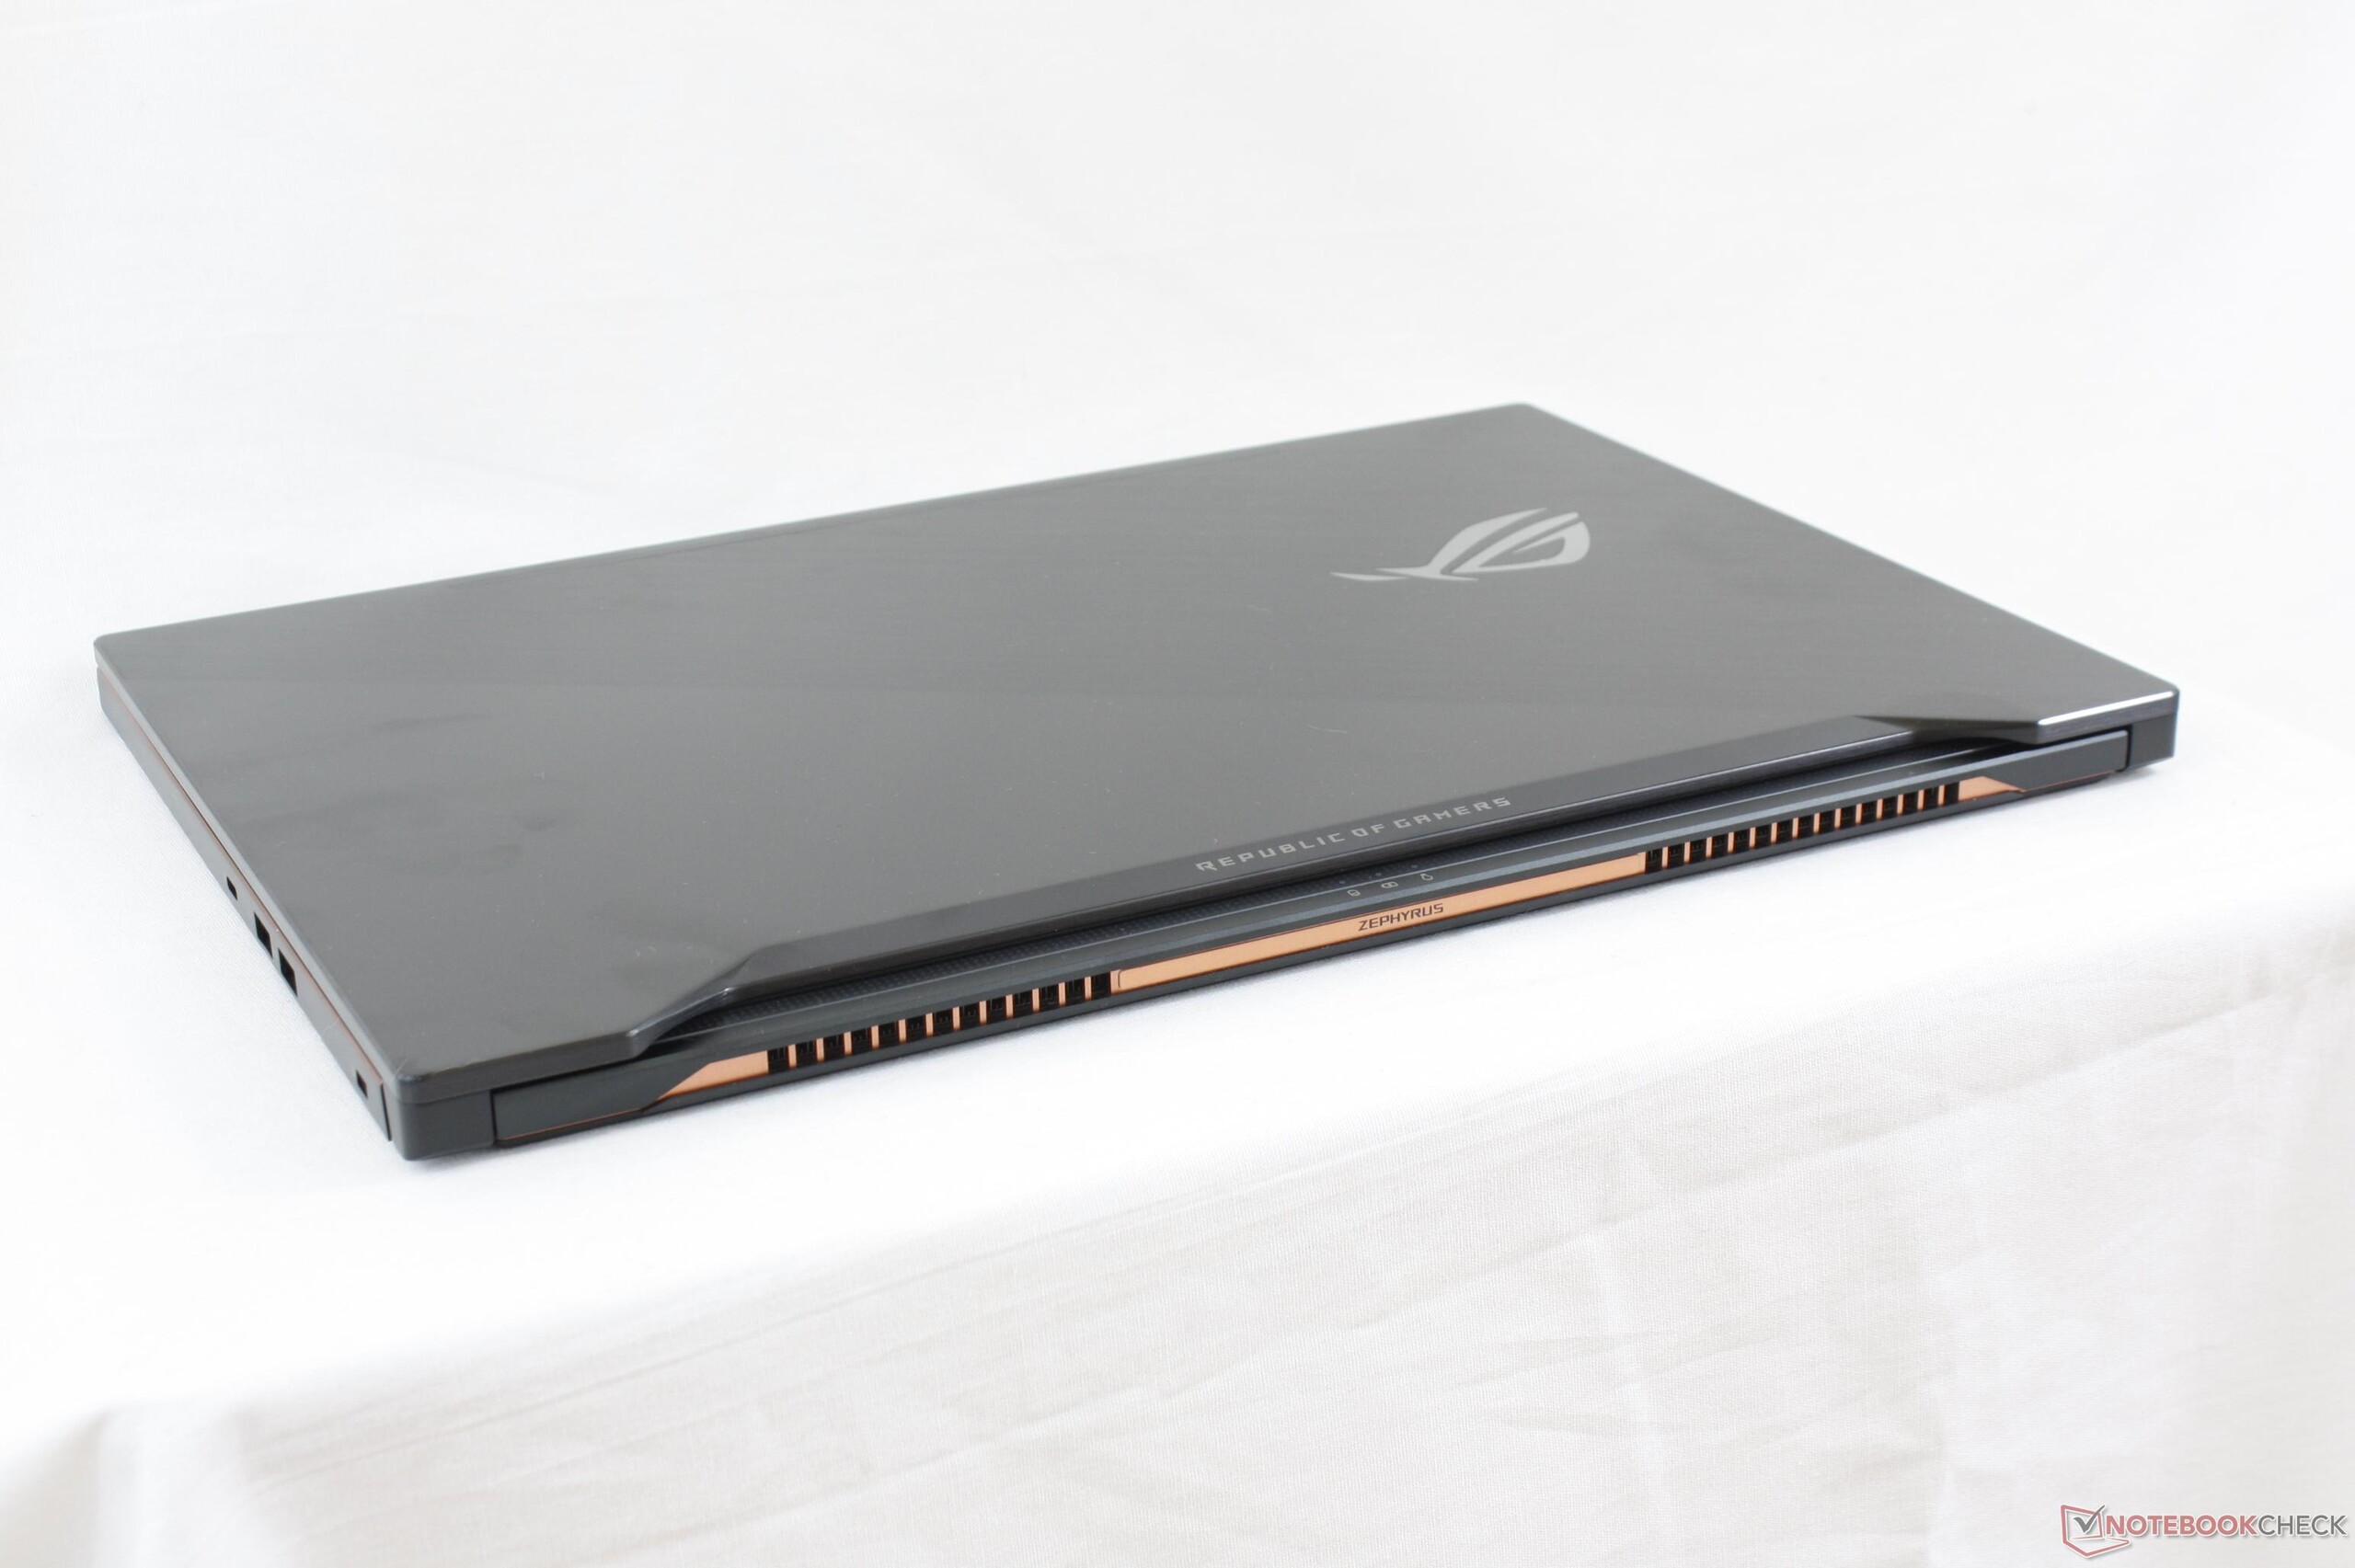
In terms of size and weight, the Zephyrus is very nearly the same as the GS63VR while being a few hundred grams heavier and a fraction of a millimeter thinner. It may not be as portable as the MSI because of the extra heft, but most other competitors in the 15-inch gaming space don't come close if portability is a factor. The power density is still remarkable even on the lesser-equipped GX501VS.
Connectivity
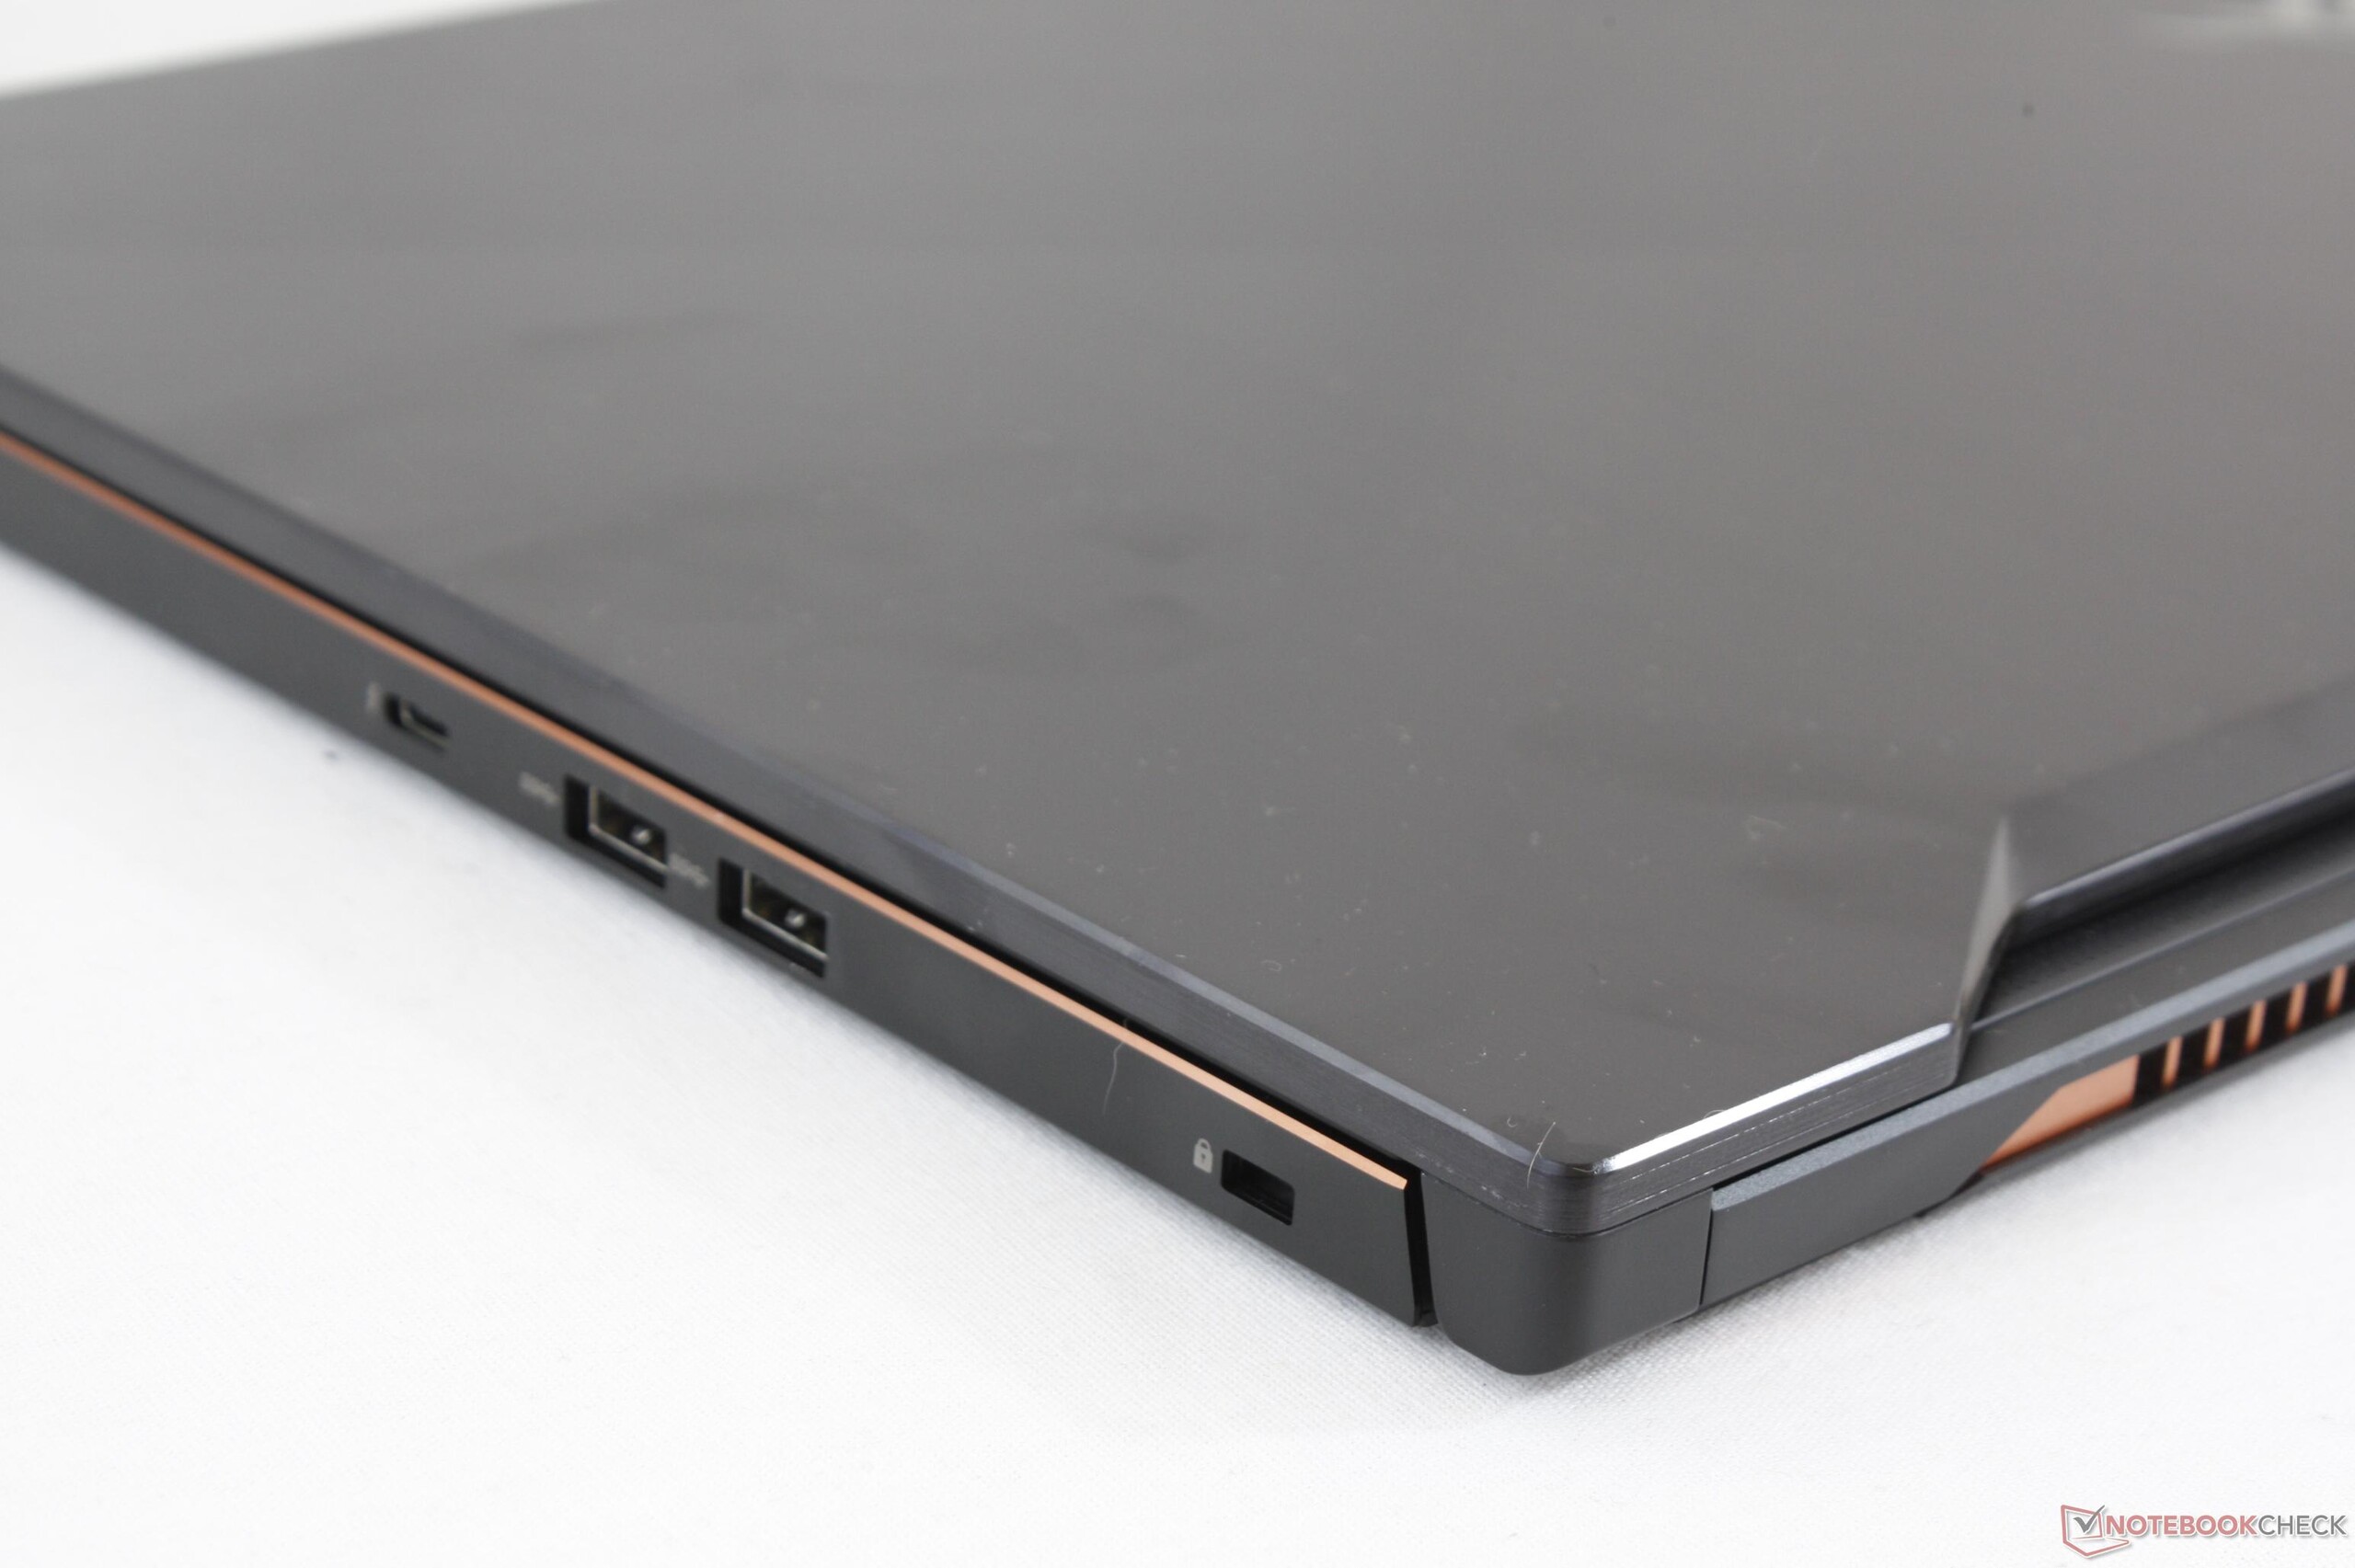
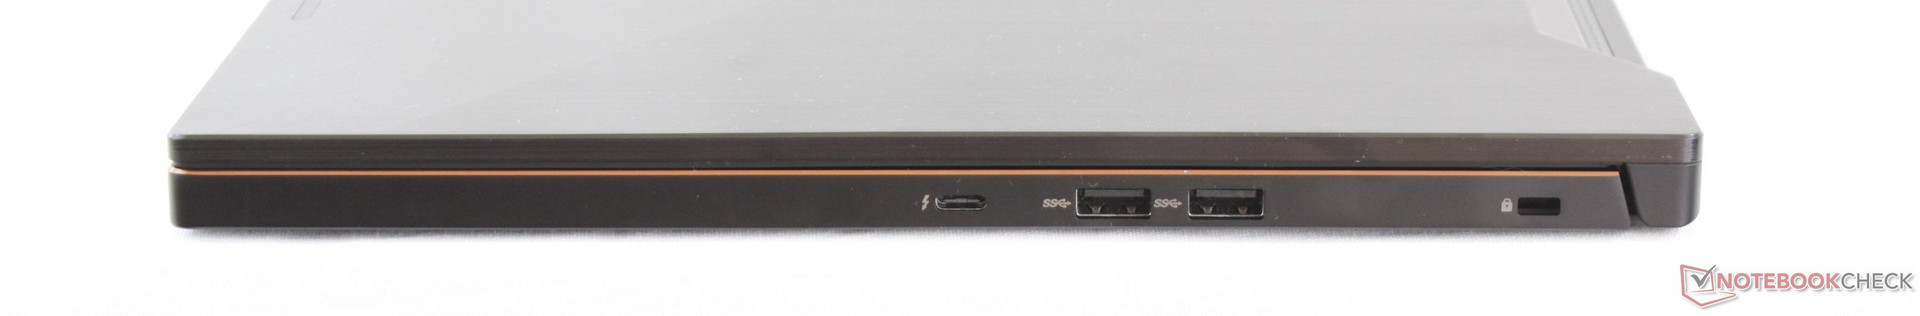
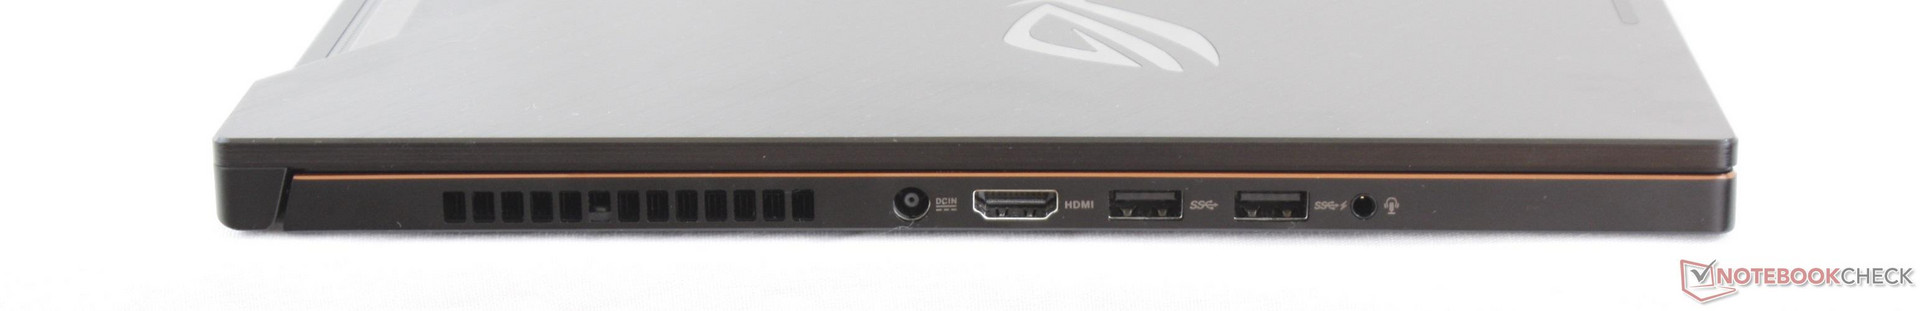
No ports are on the rear due to the unique chassis design. The AC adapter port is quite close to the front edge and could have been positioned more appropriately towards the corner of the notebook where it would be less likely to block adjacent ports. Like Razer, Asus has decided to completely omit an integrated SD reader and Ethernet port.
Software
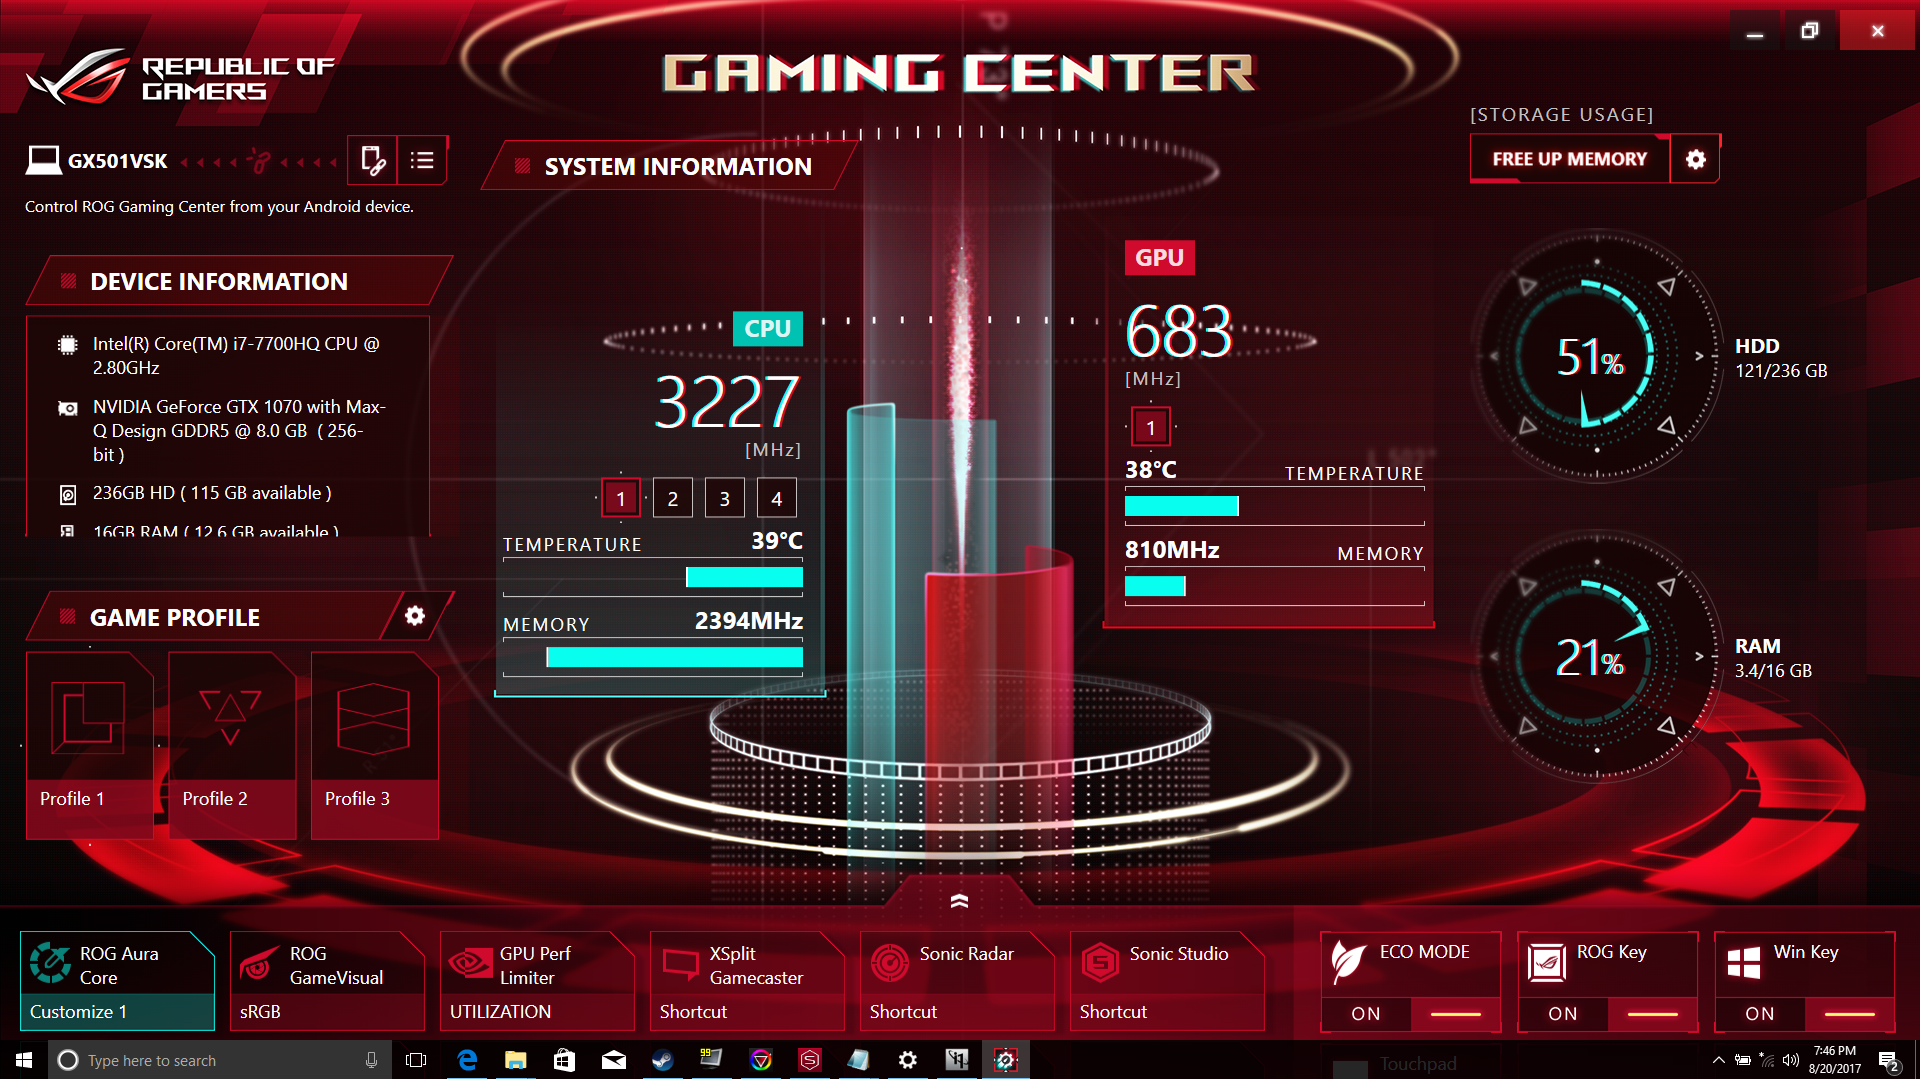
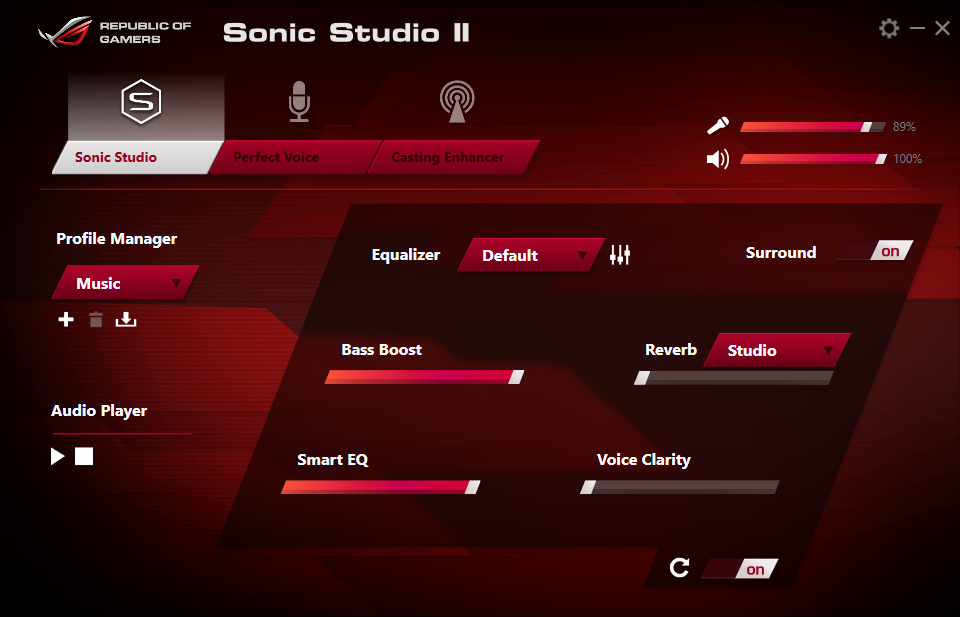
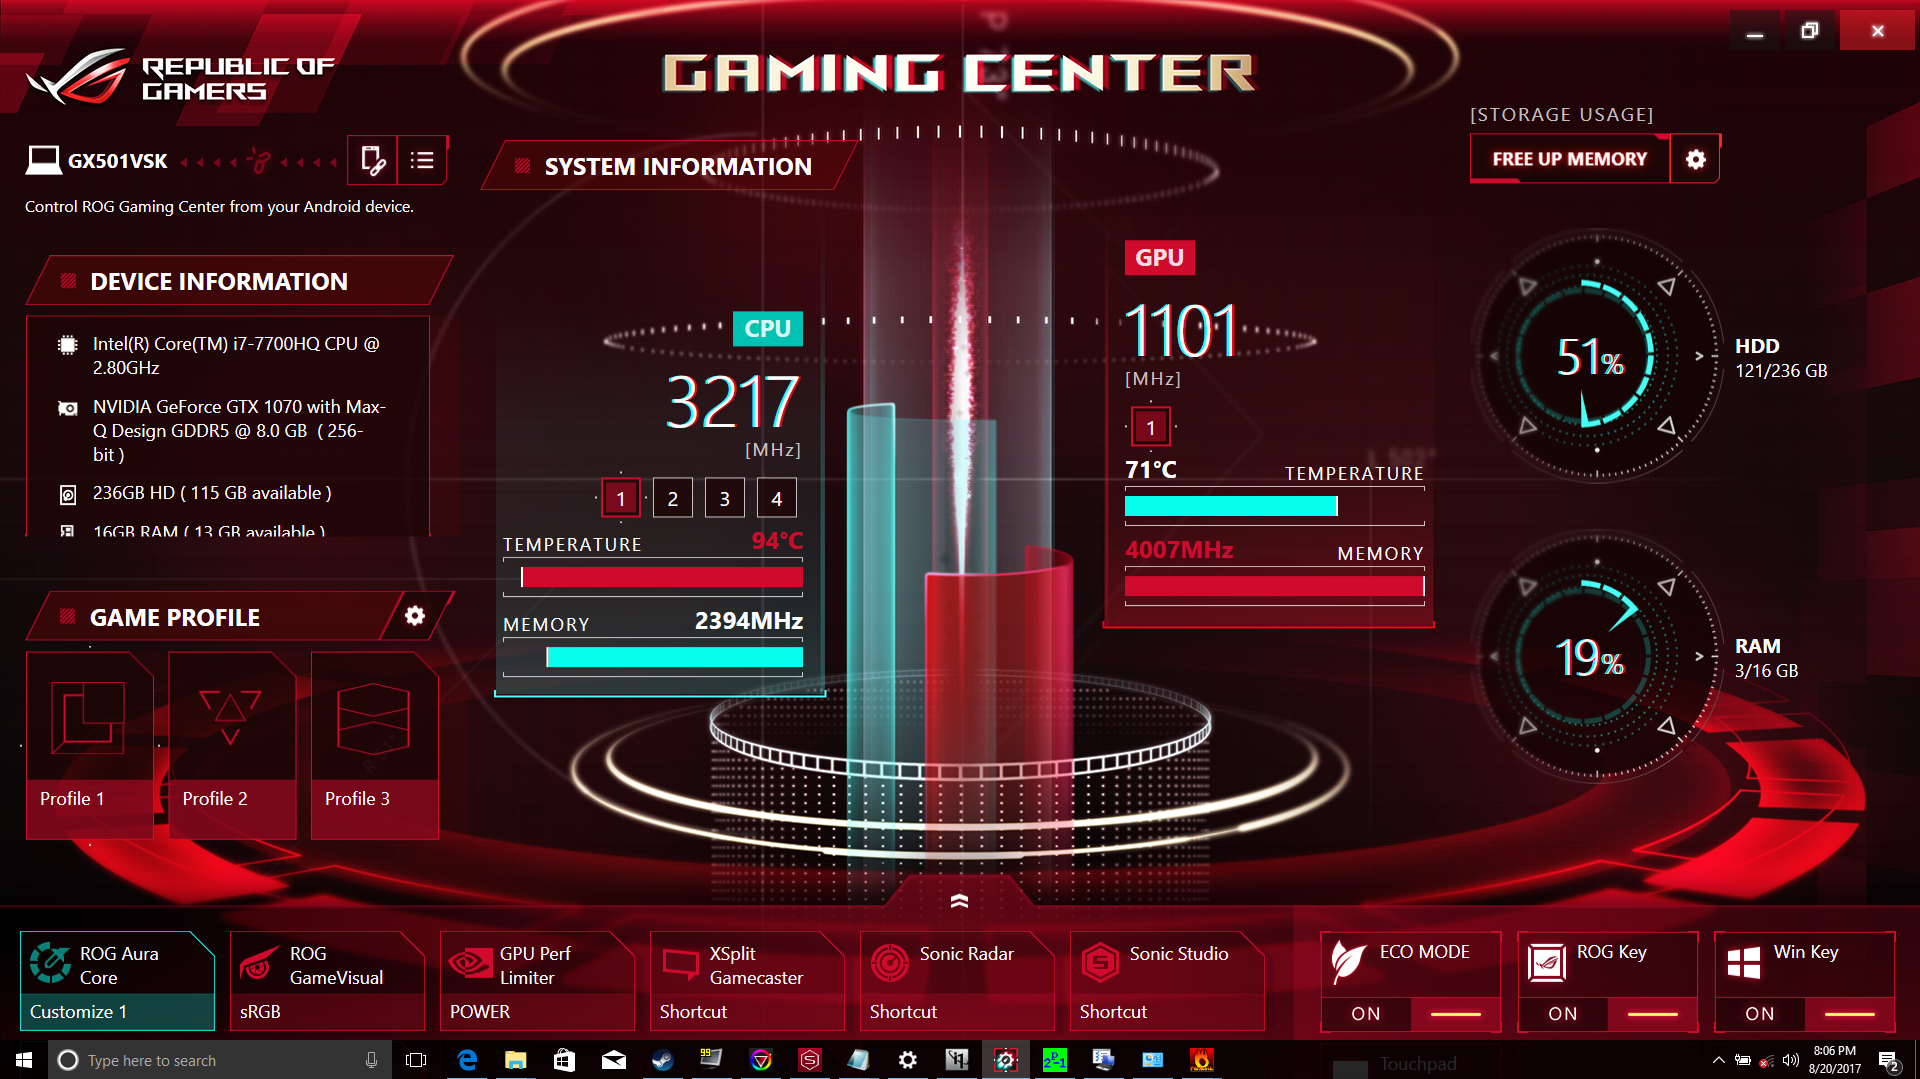
The pre-installed ROG Gaming Center is Asus's system monitor hub for configuring different profiles and launching other software. It's rather basic for an enthusiast-level control center as it provides no FPS or temperature overlays, no fan controls, no built-in recording features, and not even a fan RPM monitor. Similar software from MSI, Alienware, Gigabyte/Aorus, and Clevo/Eurocom feel more fully featured than what is offered here.
Communication
The Intel 8265 comes standard for 802.11ac WLAN and Bluetooth 4.2 connectivity. Other gaming notebooks like the Alienware 15 offer Killer 1535 as an alternative with gamer-centric options for a potentially better wireless experience. Otherwise, we experienced no connectivity issues when paired with our Linksys EA8500 test router.
| Networking | |
| iperf3 transmit AX12 | |
| Asus Zephyrus GX501VS | |
| EVGA SC15 | |
| Gigabyte P56XT | |
| iperf3 receive AX12 | |
| Gigabyte P56XT | |
| EVGA SC15 | |
| Asus Zephyrus GX501VS | |
Accessories
Included extras are a small sheet of ROG stickers and a soft palm rest. The latter in particular is a neat addition since there are no traditional palm rests on the Zephyrus. There is no cleaning cloth normally included on most flagship Ultrabooks and gaming notebooks.
Maintenance
Serviceability has taken a back seat in favor of the unique chassis design. Similar to the GS63VR and Acer Aspire V15 Nitro, the core motherboard components face upwards towards the user instead of downwards. Thus, the keyboard and top panel must be removed in order to gain direct access to the single SODIMM slot, M.2 2280 slot, battery, and cooling solution. Removing the keyboard panel is not a quick task and will require both a T5 hex wrench like on some Razer notebooks and a Philips screwdriver.
The bottom panel can be detached for cleaning purposes only and in case if something becomes lodged underneath.
Warranty
The standard one-year limited manufacturer warranty applies. Retailer Xotic PC offers extension services and free returns within certain time windows.
Please see our Guarantees, Return policies and Warranties FAQ for country-specific information.
Input Devices
Keyboard
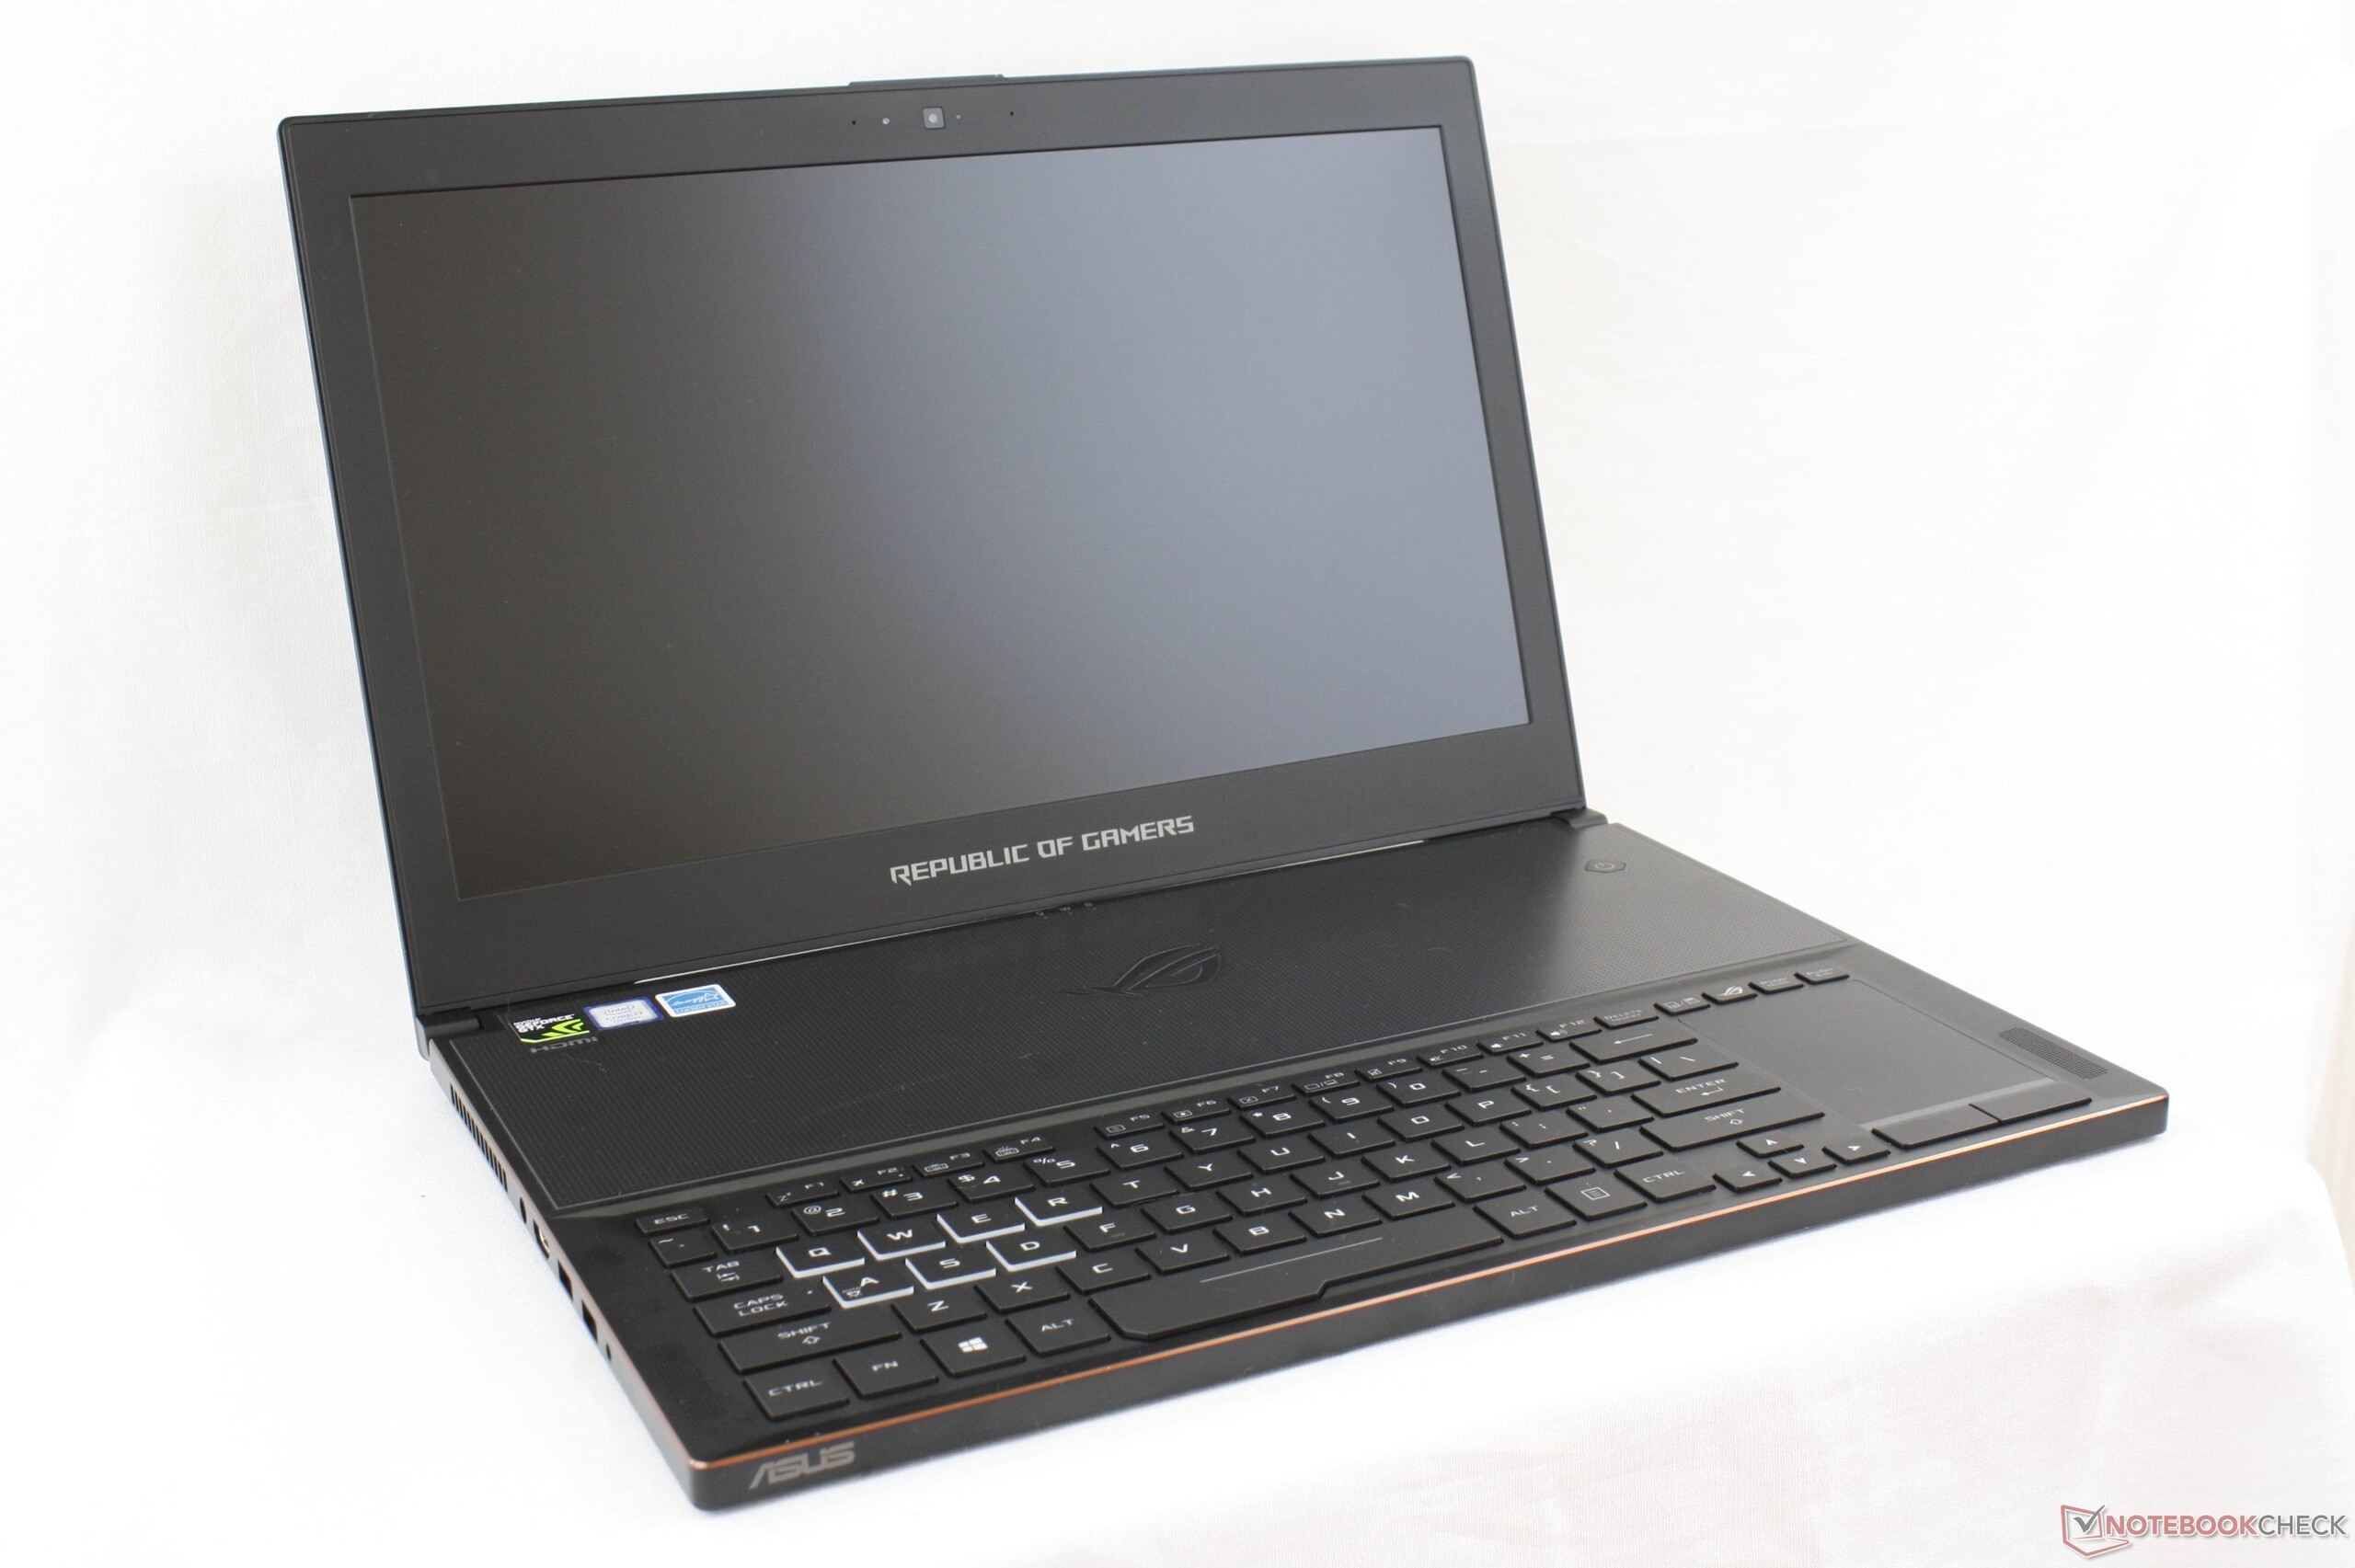
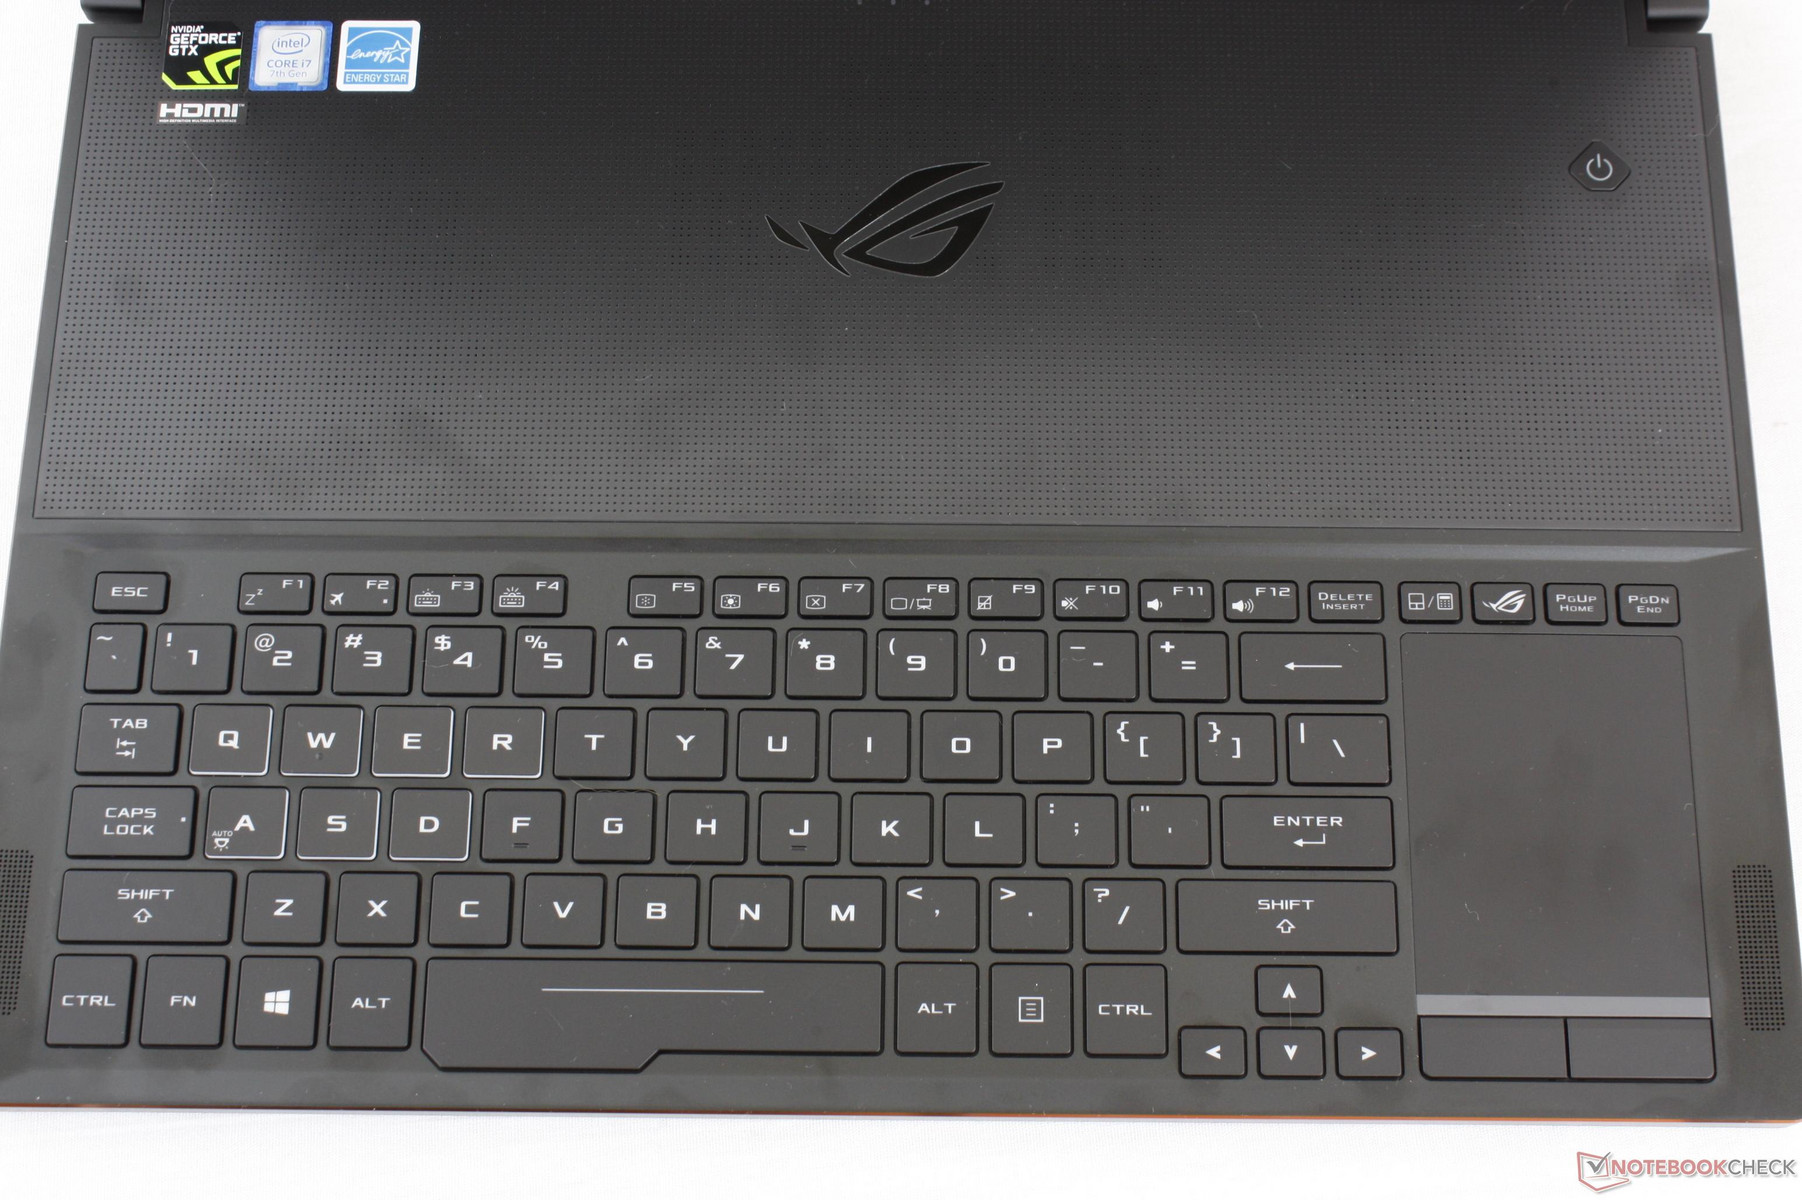
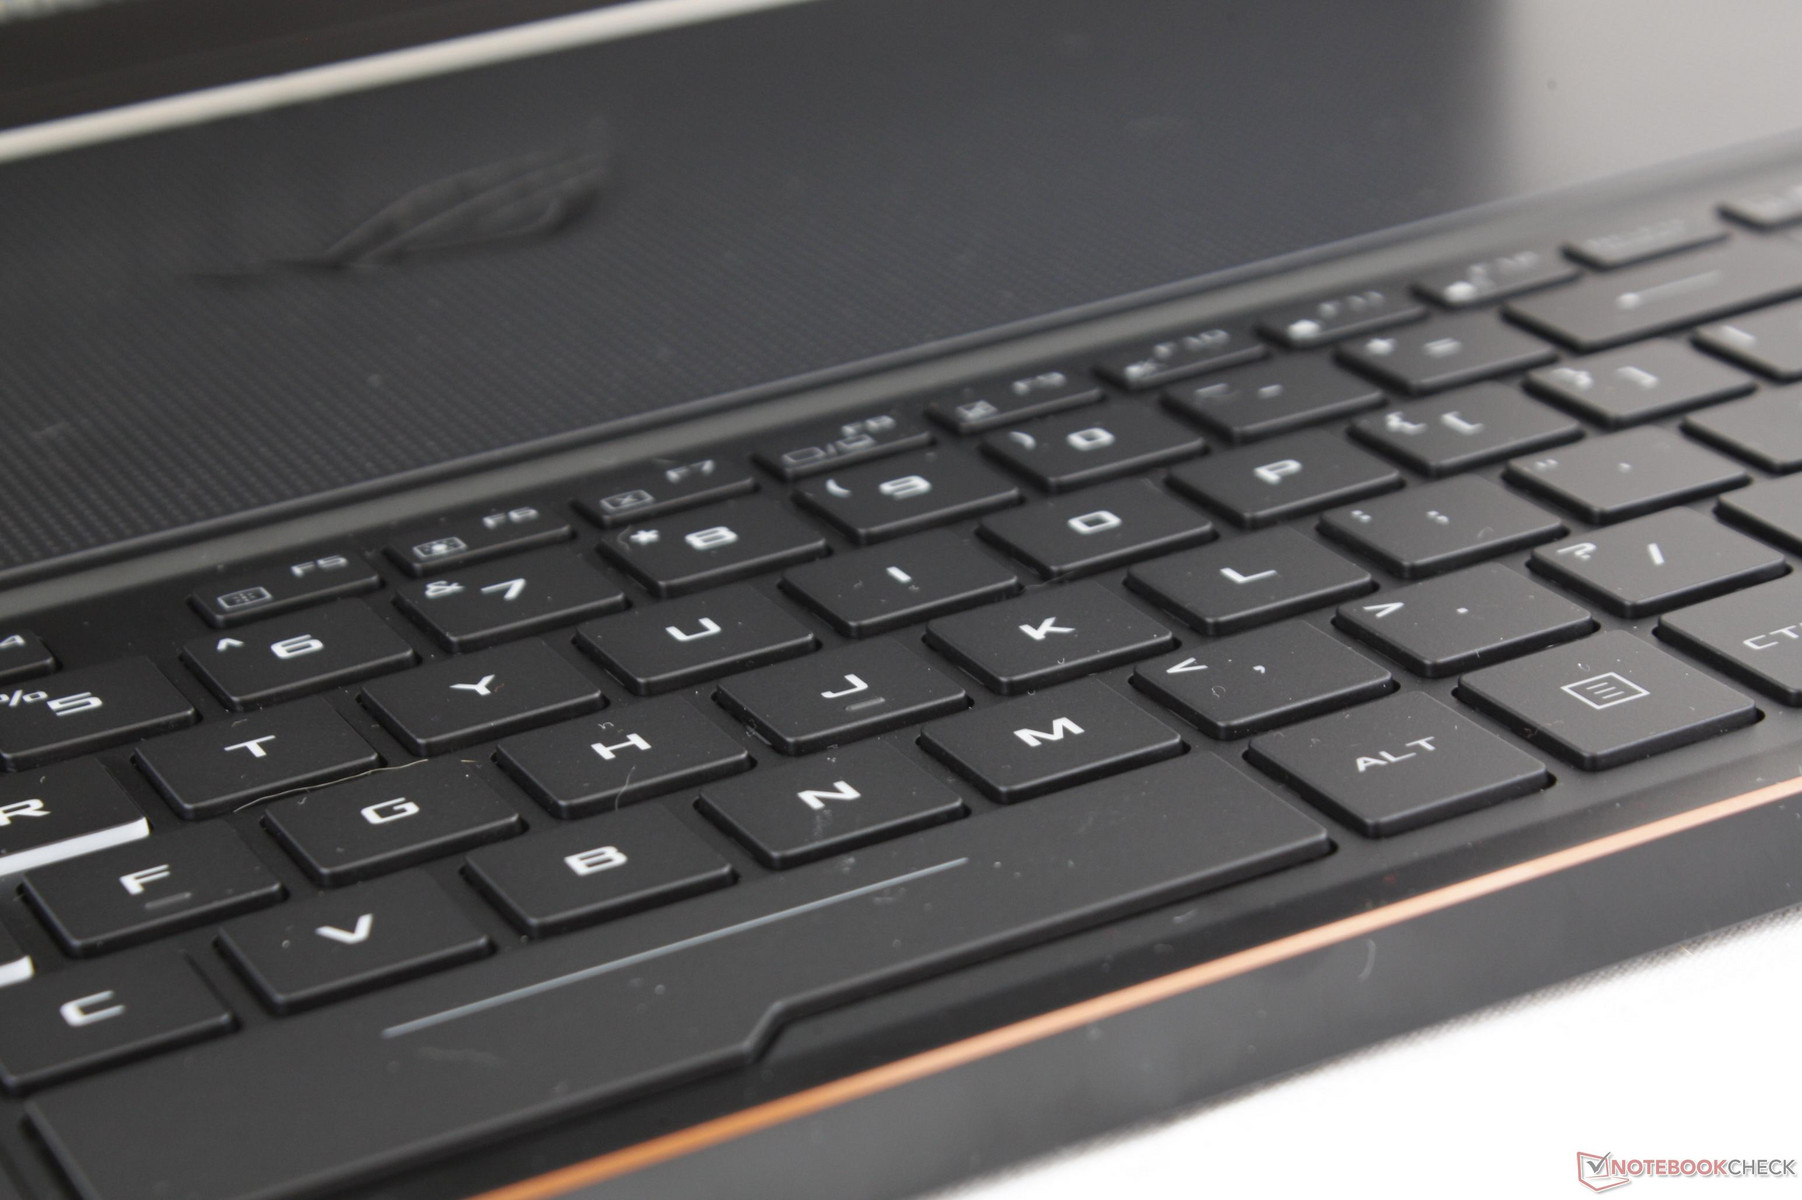
The backlit Chiclet keyboard (~27.8 x 10.2 cm) would have been decent on an Ultrabook, but it is rather disappointing for a gaming notebook. Feedback from the shallow 1.4 mm travel feels far too light compared to the firmer keyboards on larger gaming notebooks like those from the MSI GT series or even Asus' own 17-inch ROG series. The small Arrow keys are horrid for gaming and the Windows key is actually larger than the main QWERTY keys - something that is deplorable for gamers. Clatter is at least relatively quiet due to the soft feedback if noise is a concern.
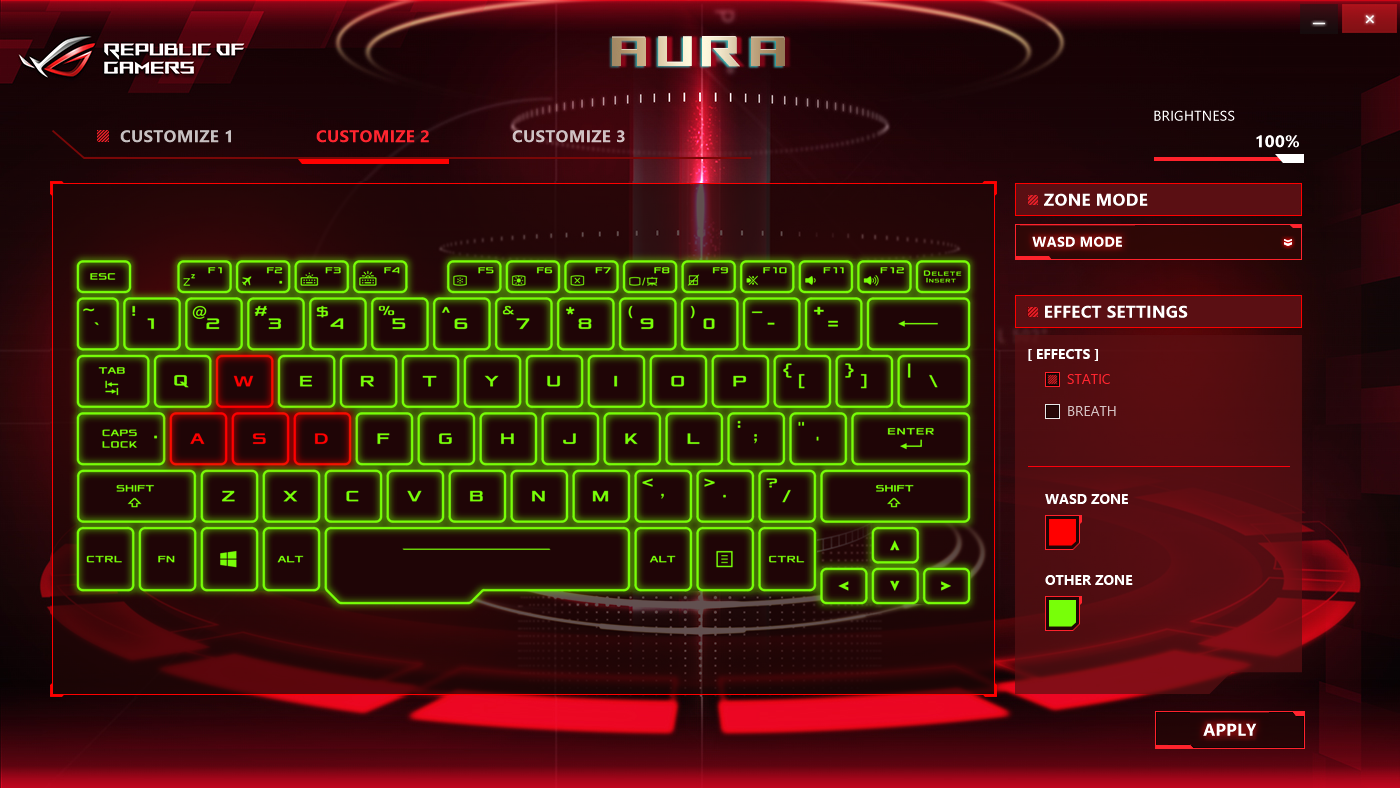
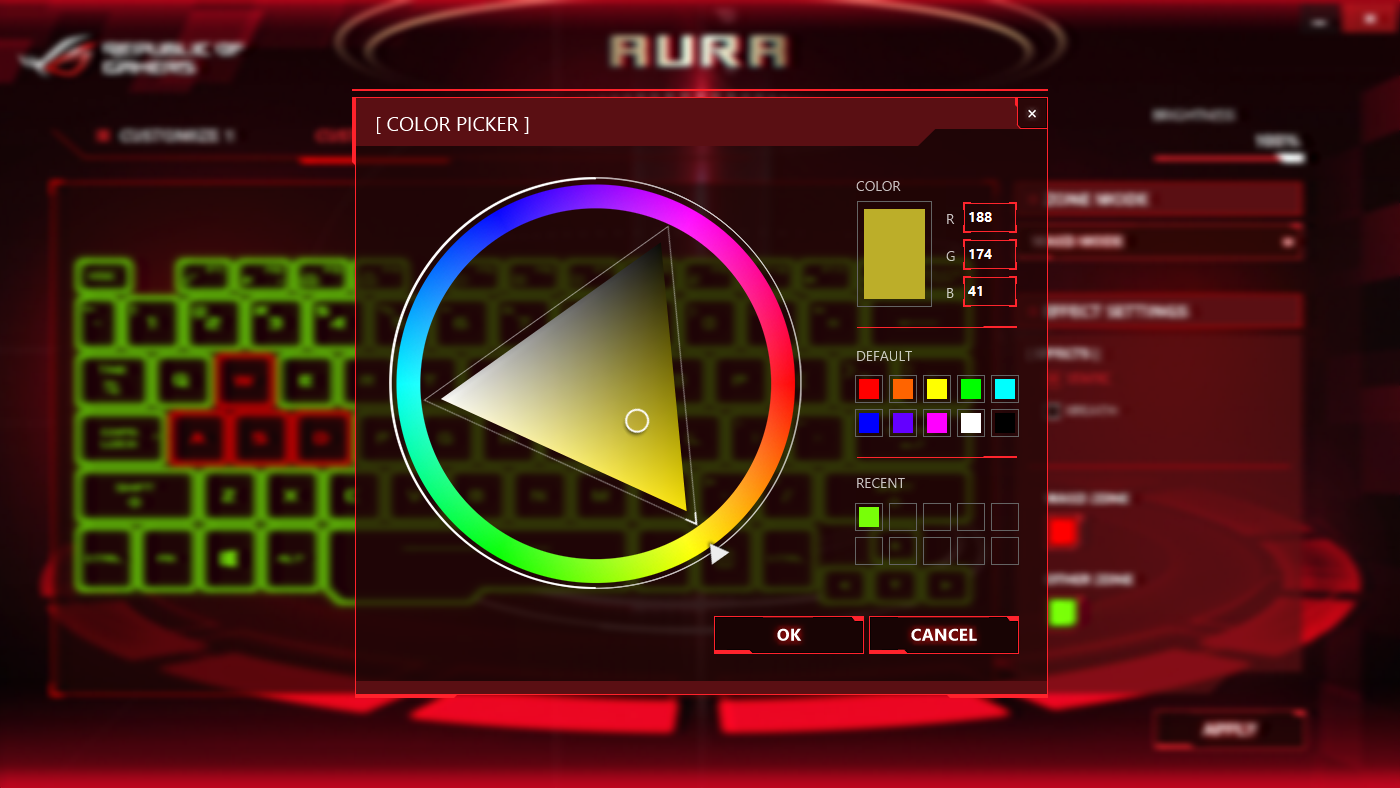
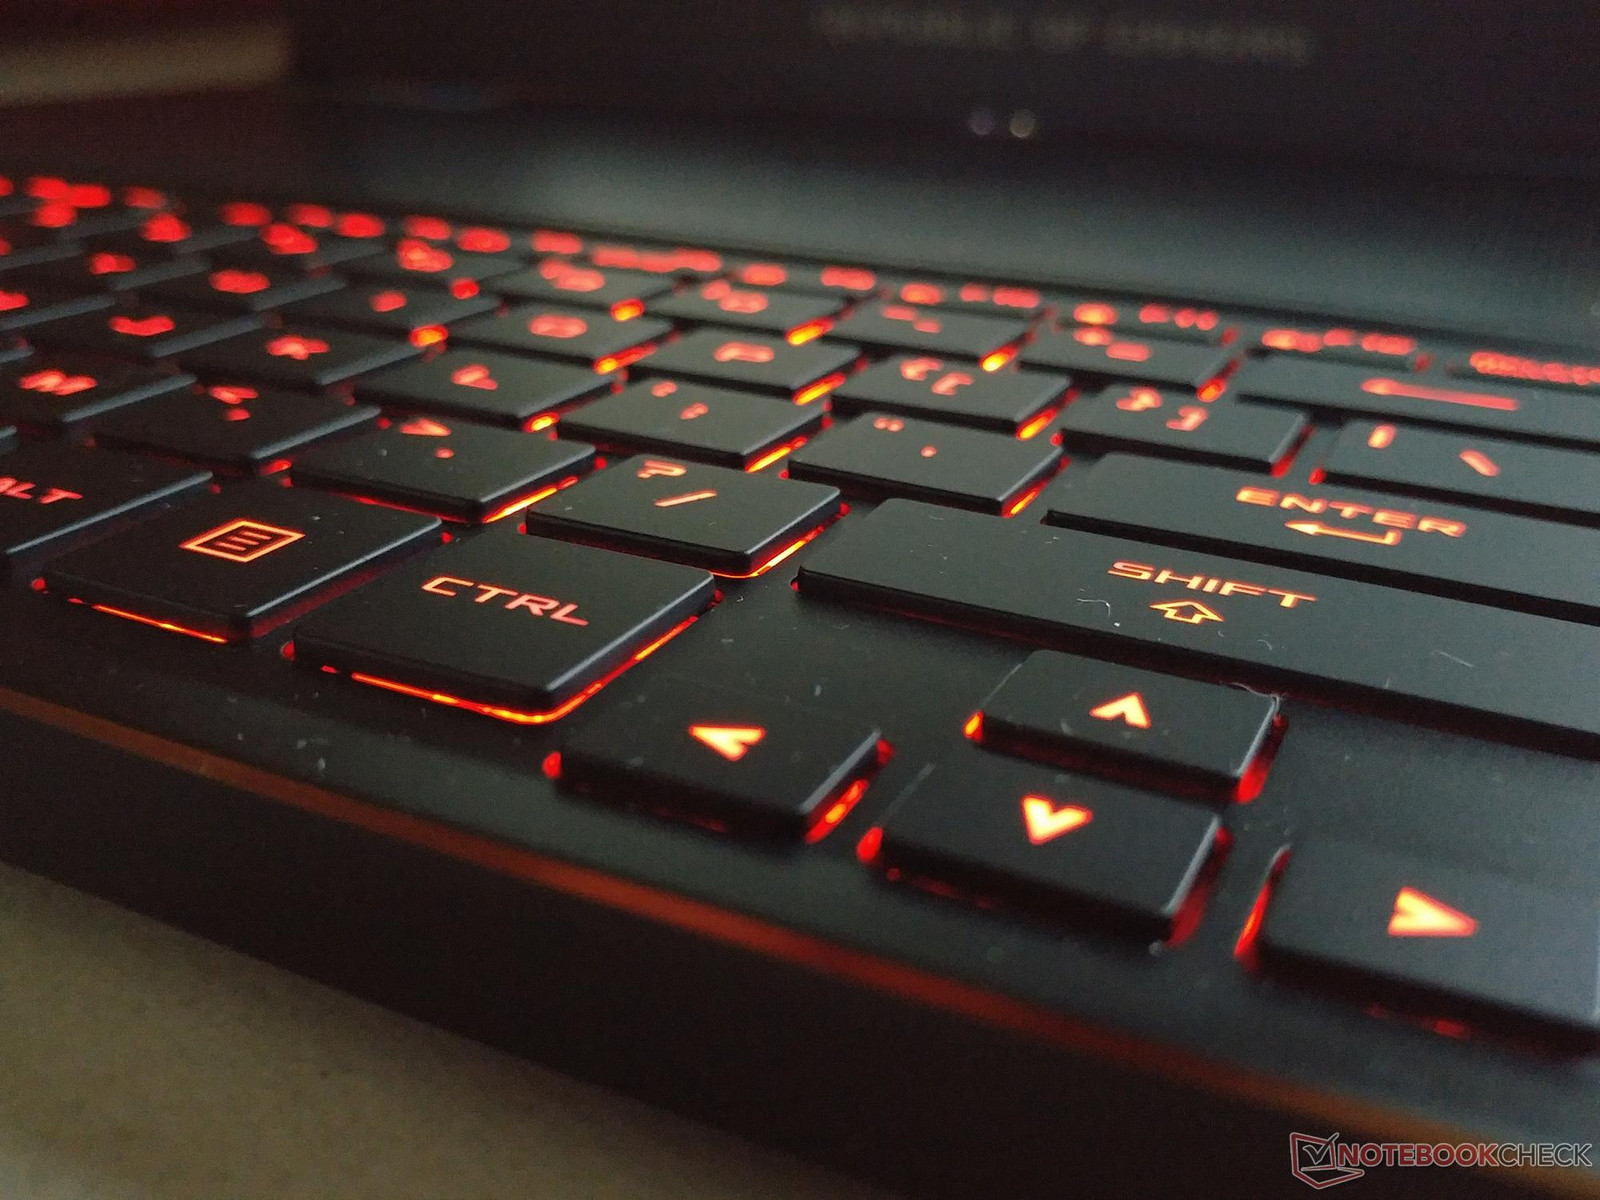
Full RGB lighting is available for all keys sans the touchpad numpad and the four keys directly above it. There are no individually-lit keys (or even a Print Screen key) like on the Aorus or Razer series and so users have only two regions for color customization compared to three on the MSI GS series or seven on the Lenovo Y series.
Touchpad
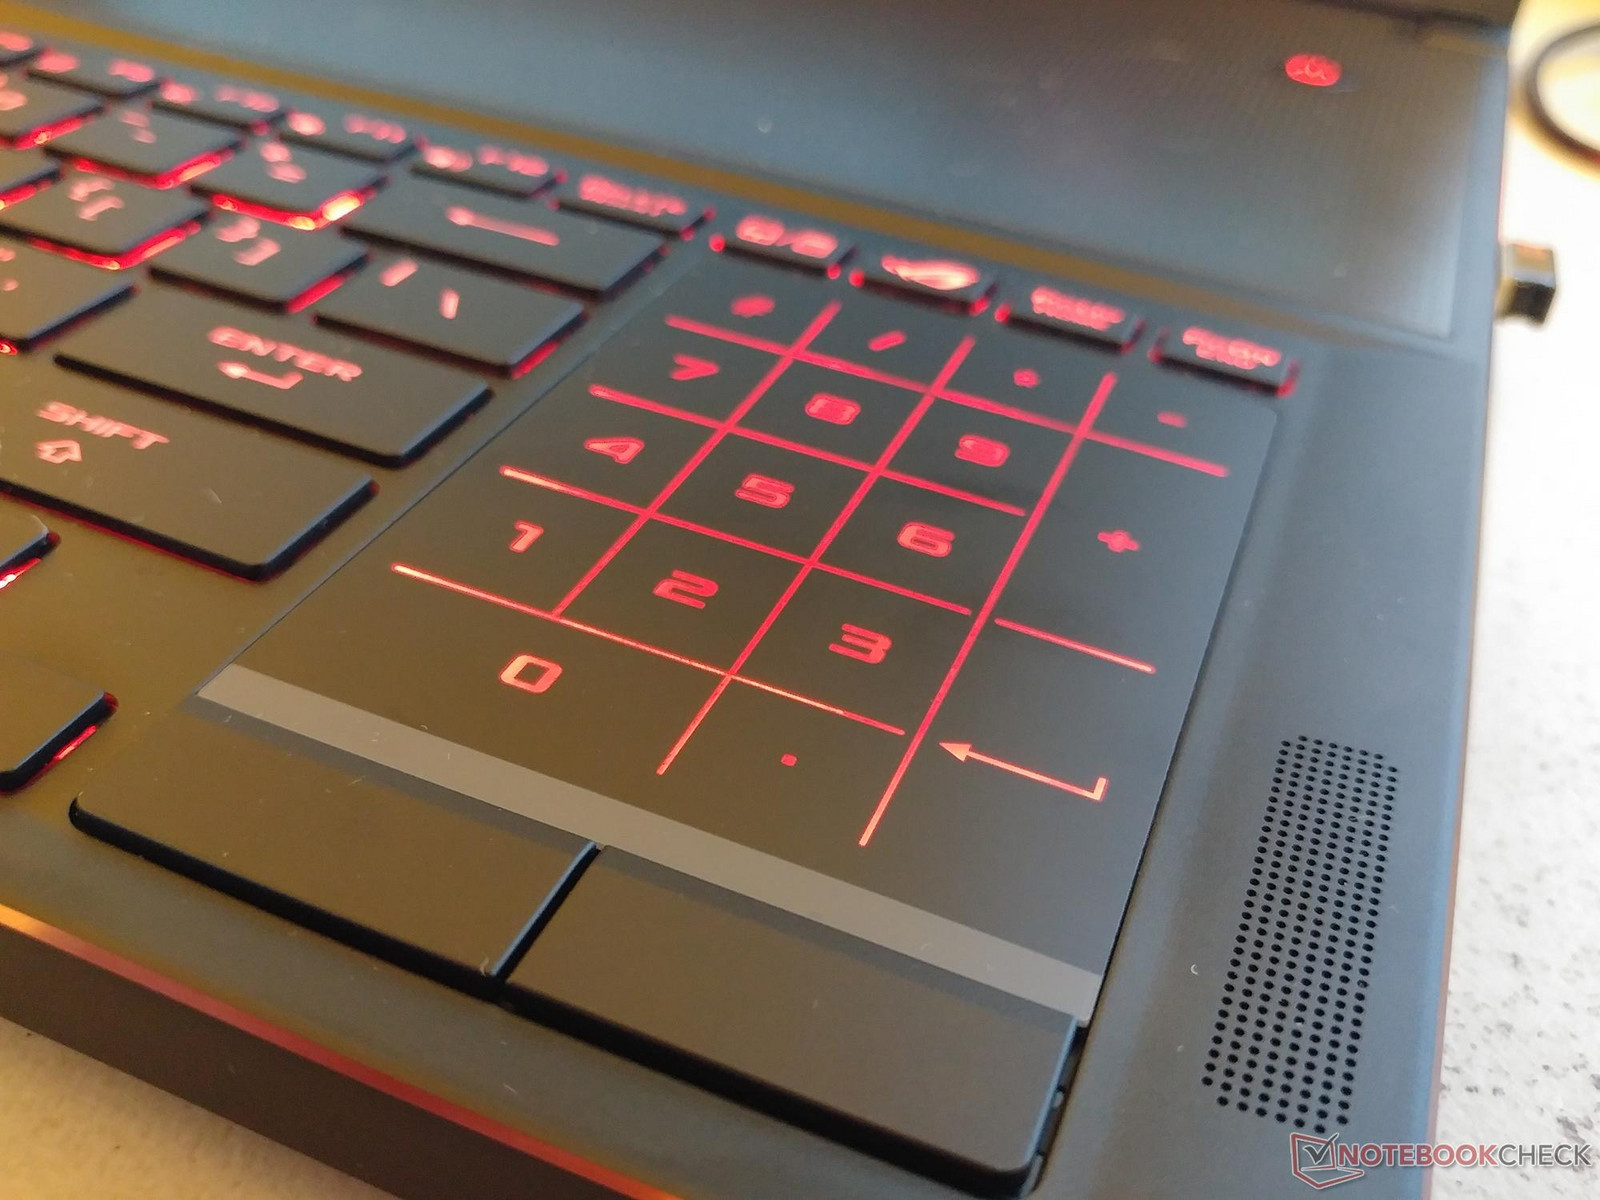
The small trackpad (6.0 x 7.8 cm) works reliably for simple cursor movement and multi-touch scrolling. It's very cramped as one would expect due to its orientation and so an external mouse is always recommended whenever possible. Its smooth matte surface is very susceptible to grease buildup from fingerprints and will visibly warp when applying moderate pressure. The NumPad toggle is neat, but the lack of haptic feedback makes it very poor for data entry purposes.
Lastly, the small dedicated mouse keys are relatively firm and quiet in feedback. Their small size and positioning are again the biggest drawbacks as they are only meant for occasional short-term use if a mouse is unavailable.
Display
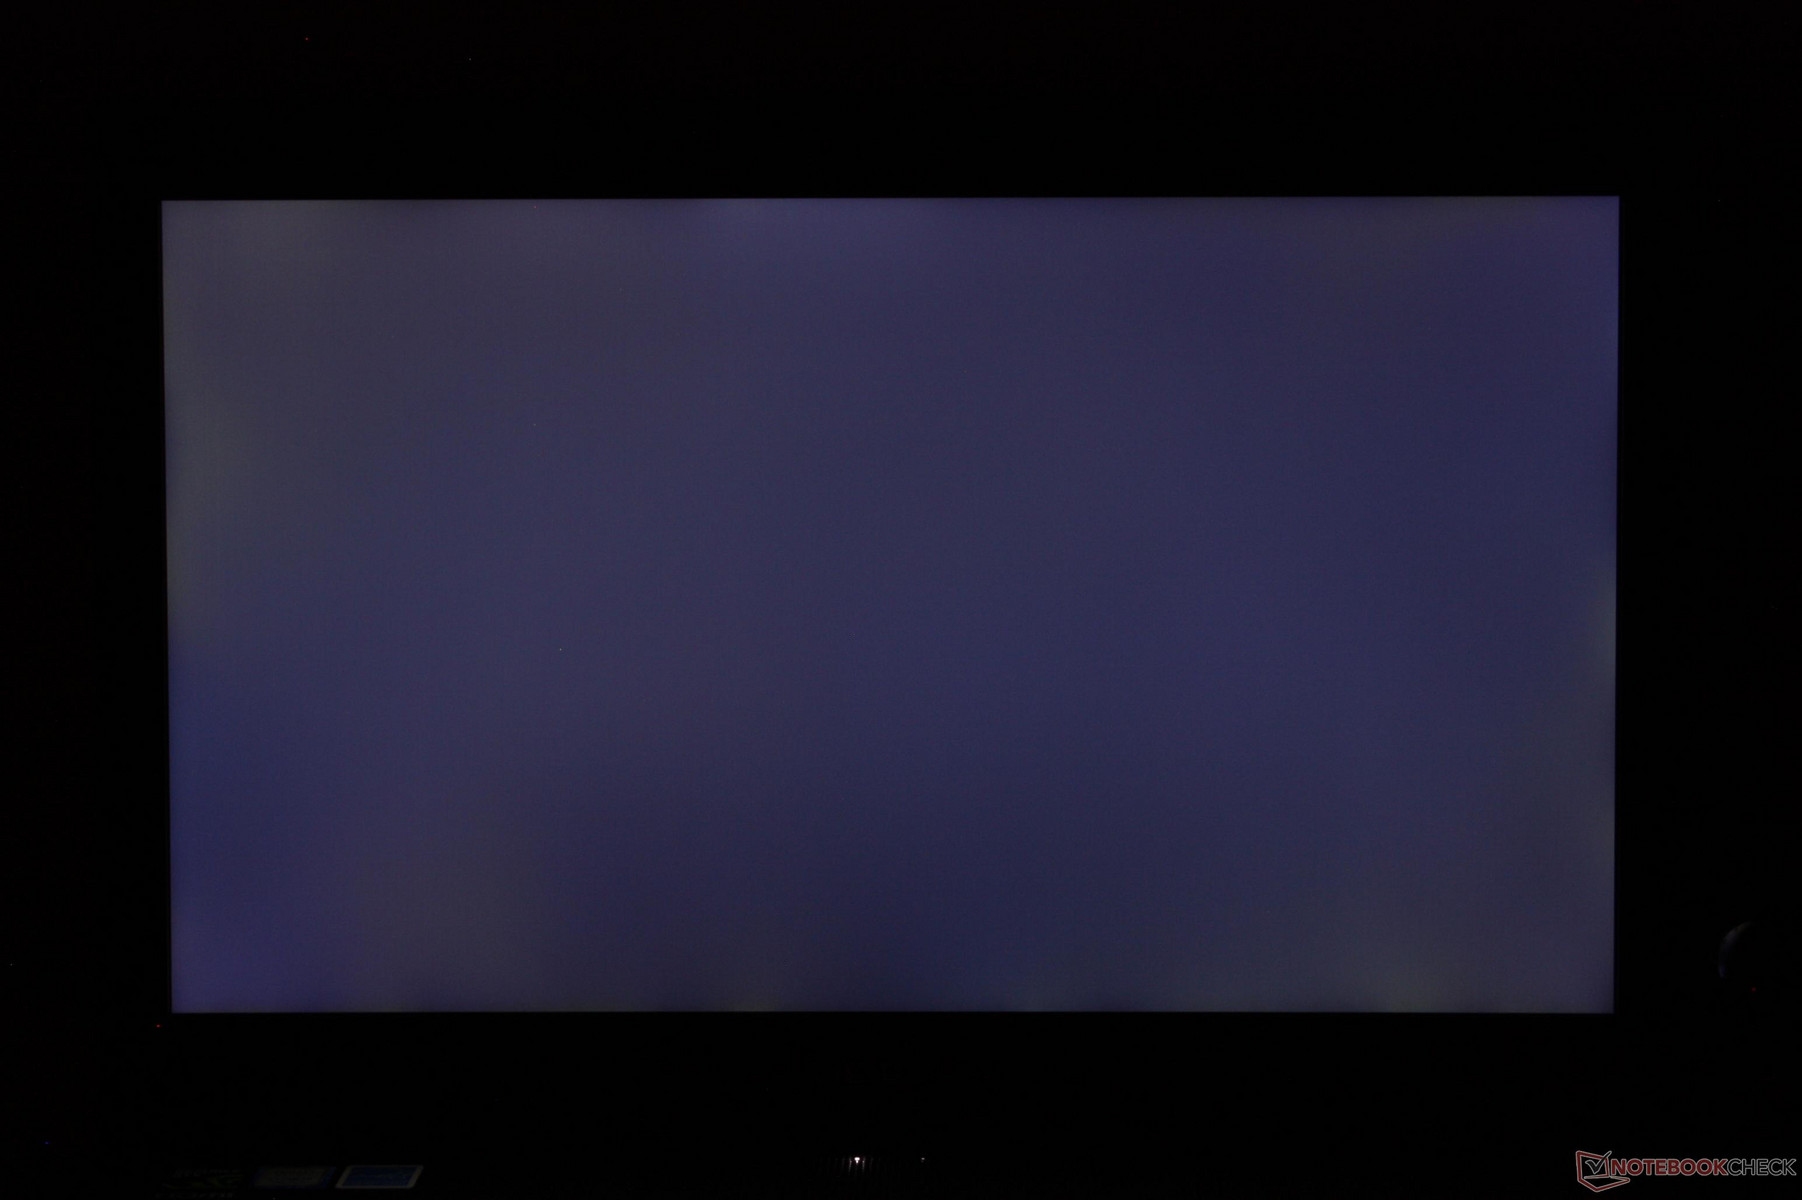
The display remains fixed at a matte 1080p 120 Hz IPS panel. This same AU Optronics B156HAN04.2 panel can also be found on the EVGA SC15 and so both these 15-inch gaming notebooks share similar color coverage properties. Strangely, contrast is lower than that of our original GX501VI despite multiple attempts at remeasuring. This isn't to say that contrast is poor, but this is notable nonetheless.
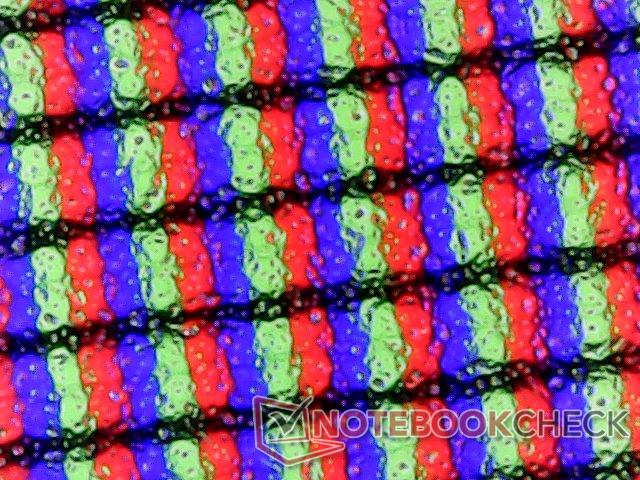
Subjectively, the screen is crisp with only very slight hints of graininess if looking up close. Slight backlight bleeding is present around the edges that becomes just barely noticeable when playing movies with black borders.
| |||||||||||||||||||||||||
Brightness Distribution: 86 %
Center on Battery: 307.1 cd/m²
Contrast: 877:1 (Black: 0.35 cd/m²)
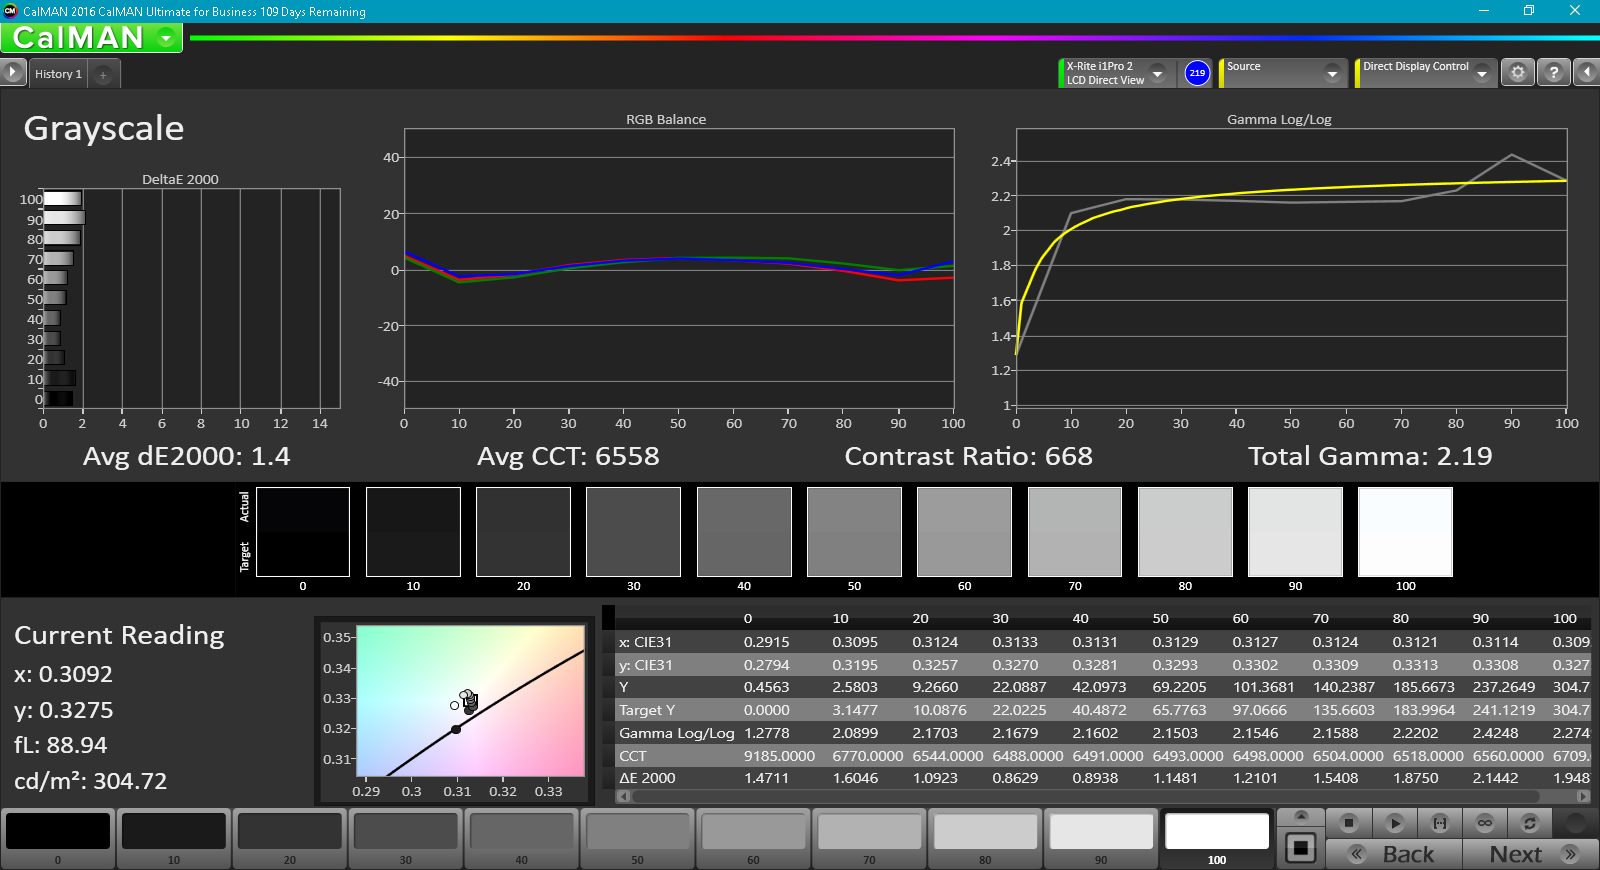
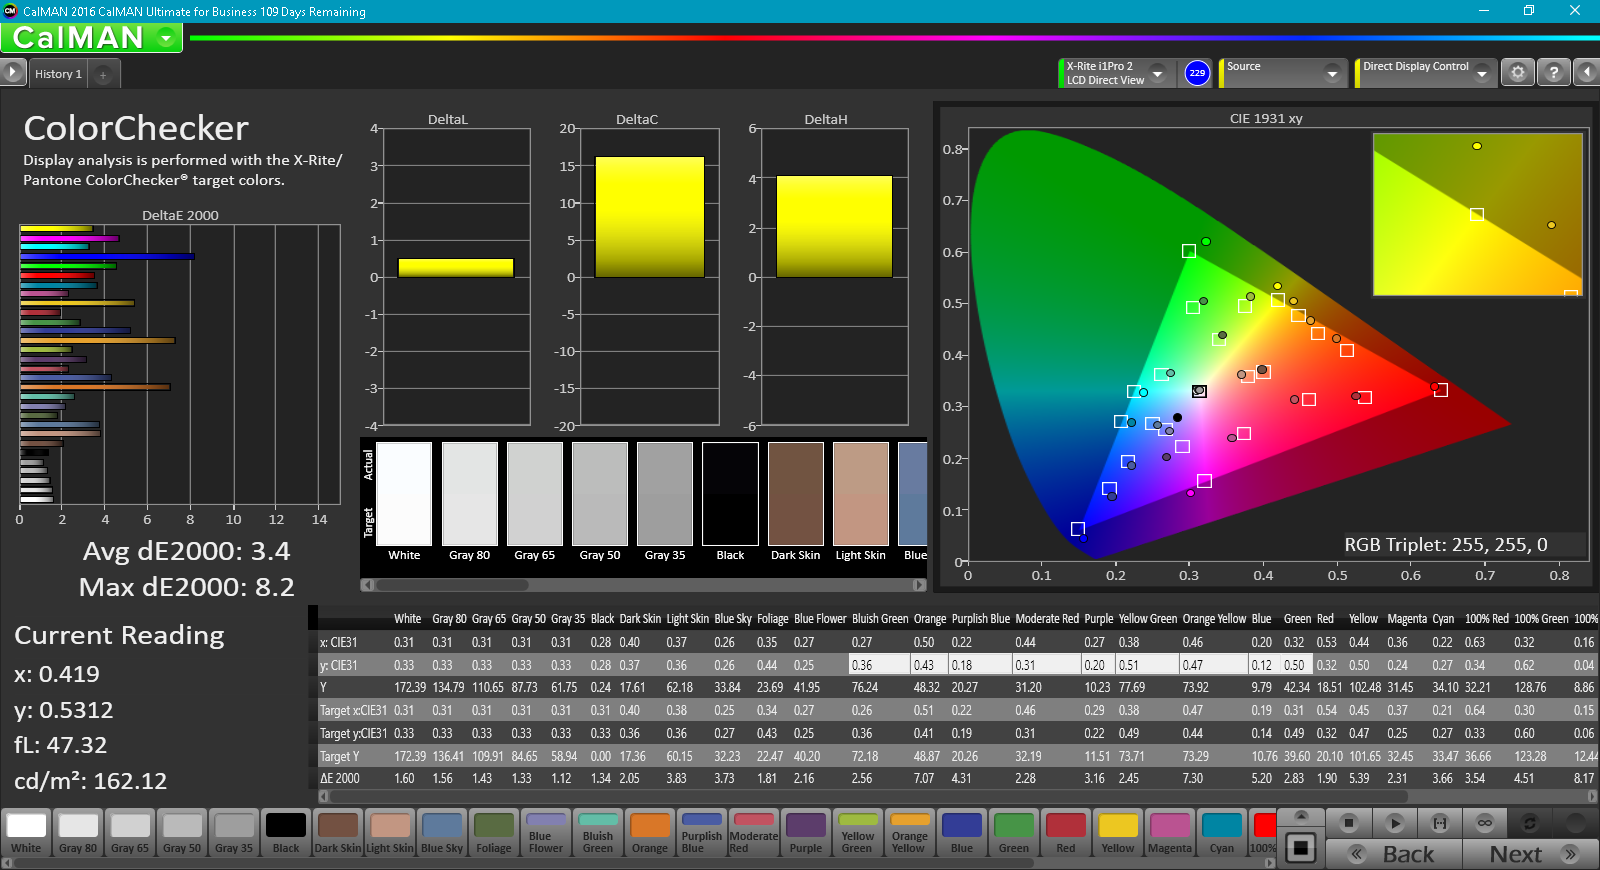
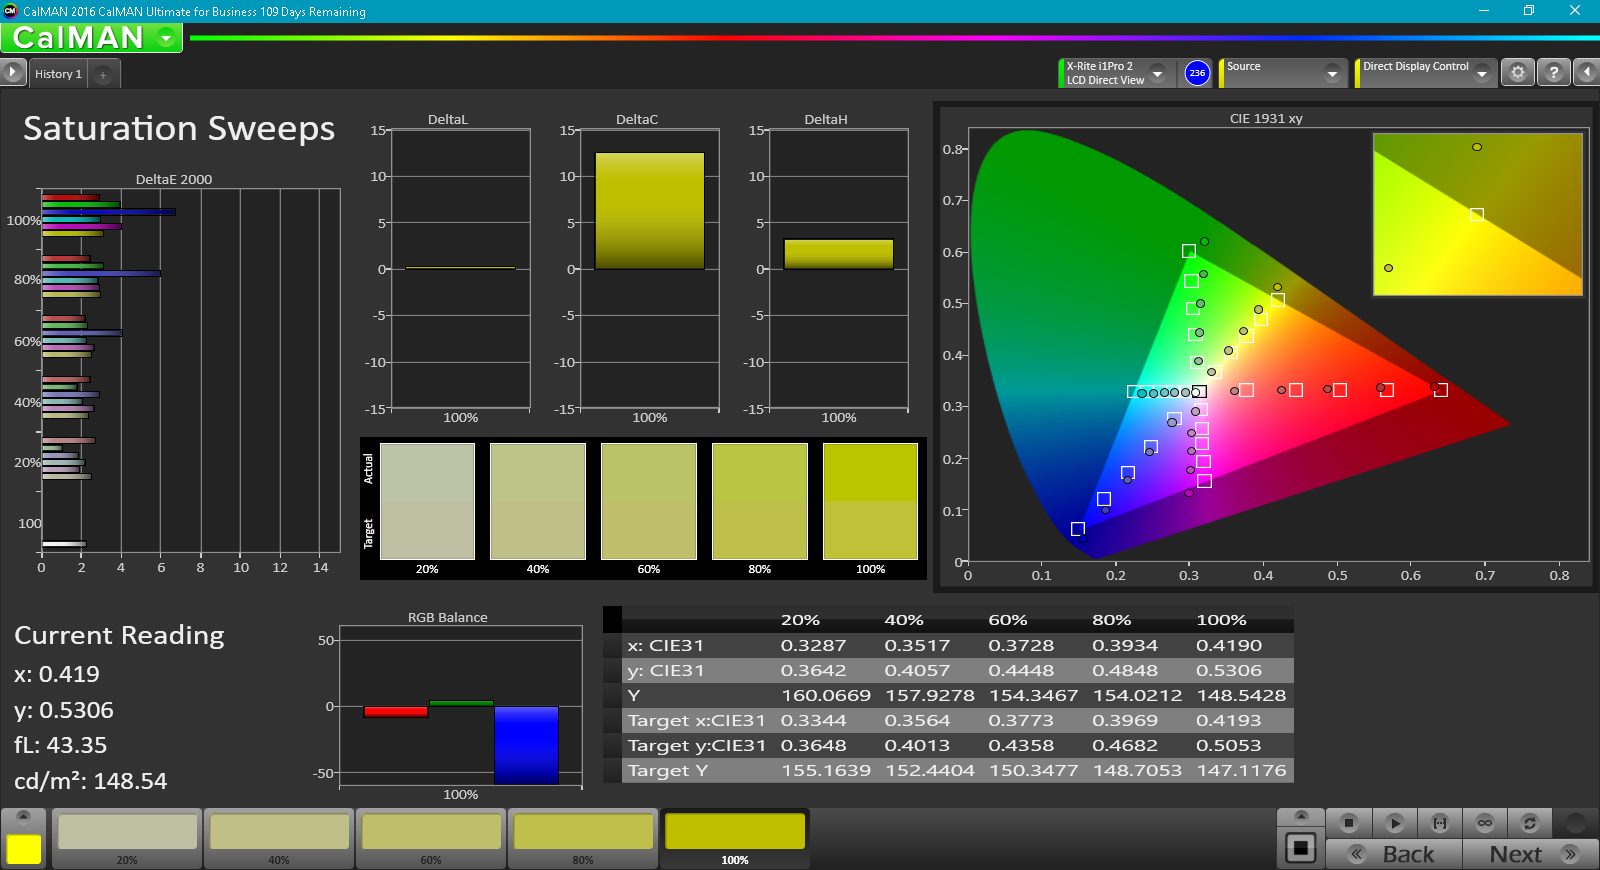
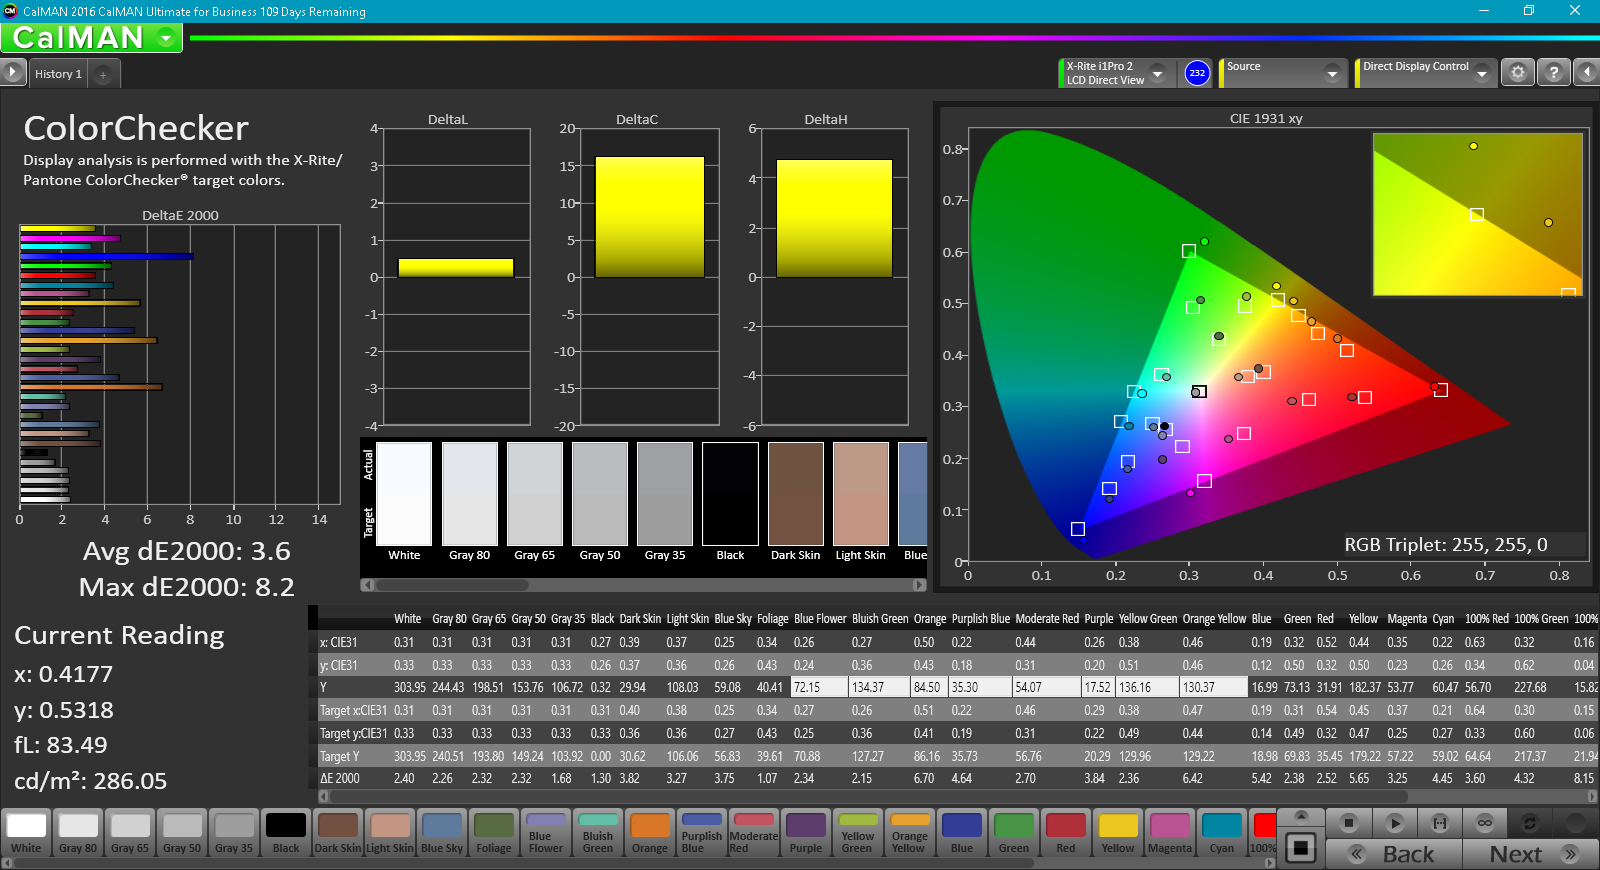
ΔE ColorChecker Calman: 3.4 | ∀{0.5-29.43 Ø4.73}
ΔE Greyscale Calman: 1.4 | ∀{0.09-98 Ø4.97}
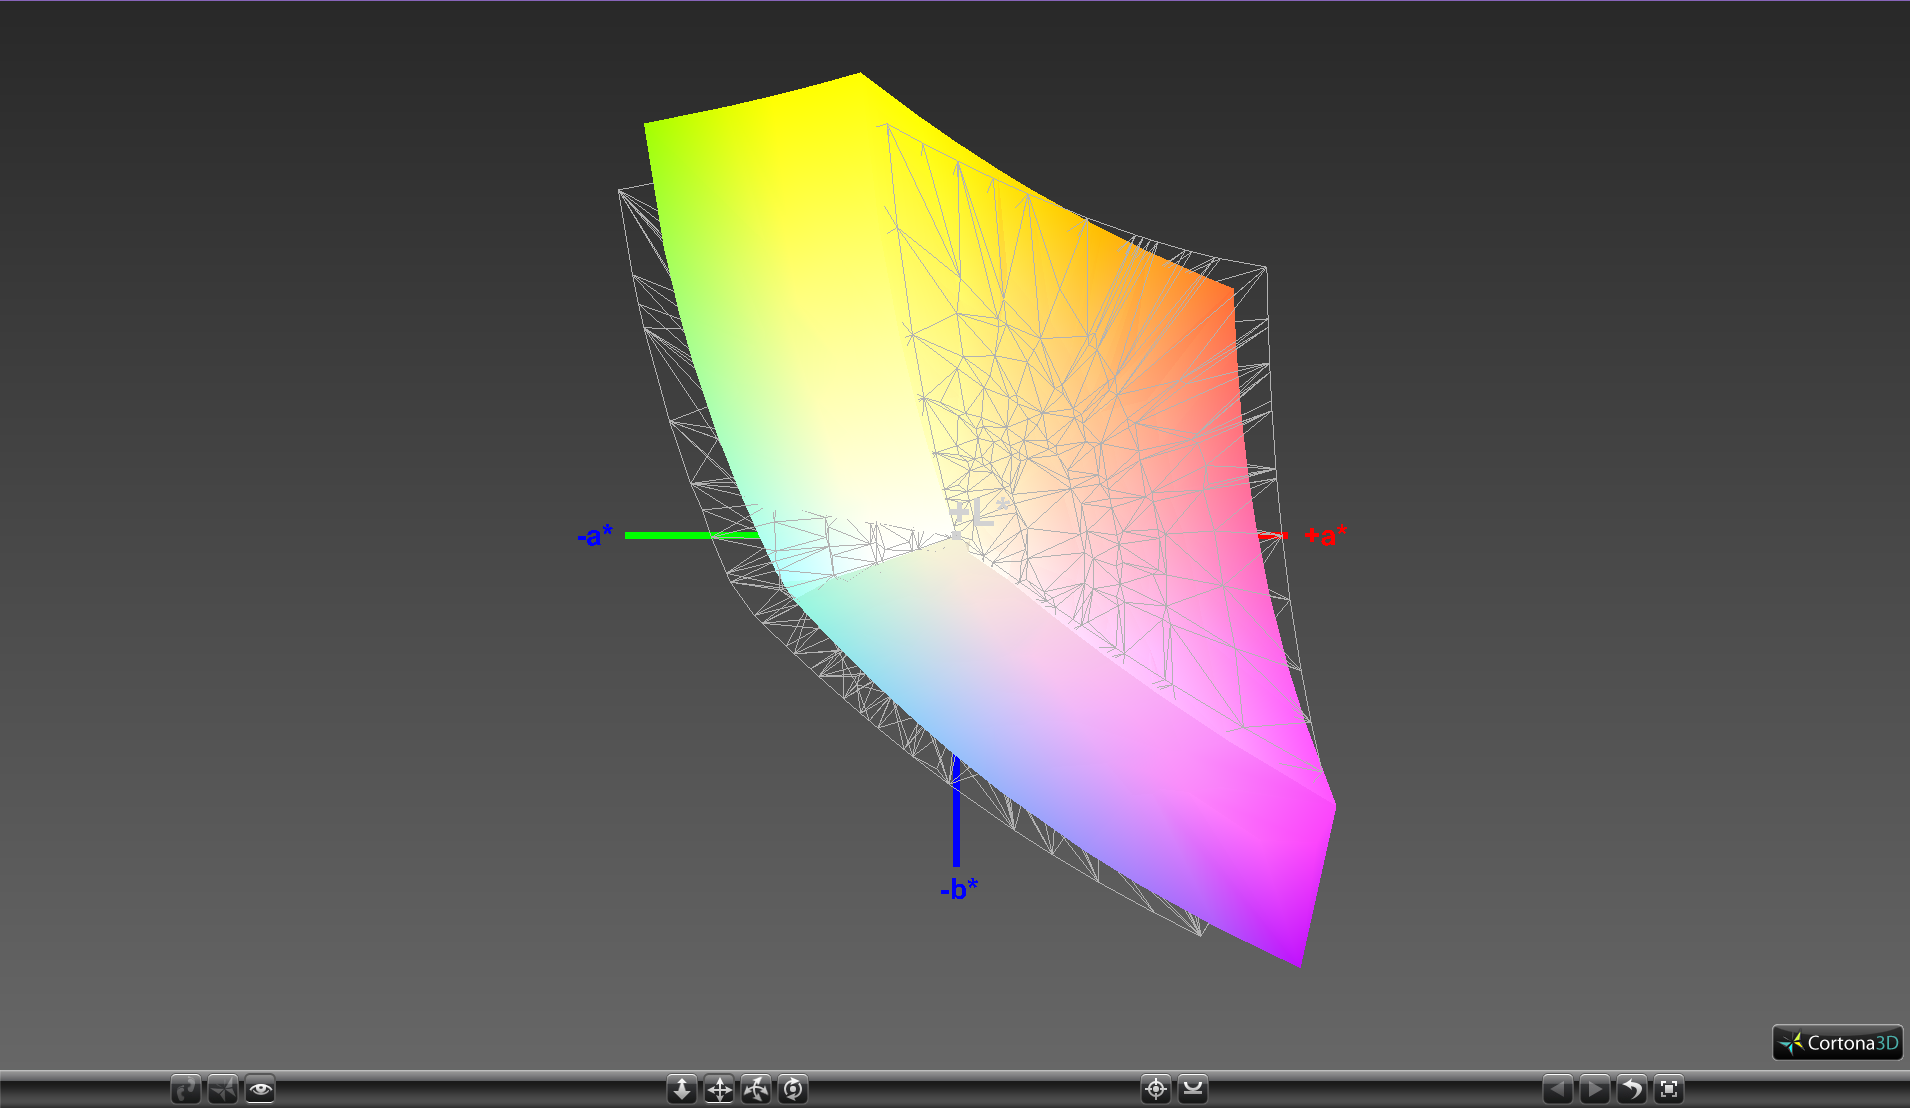
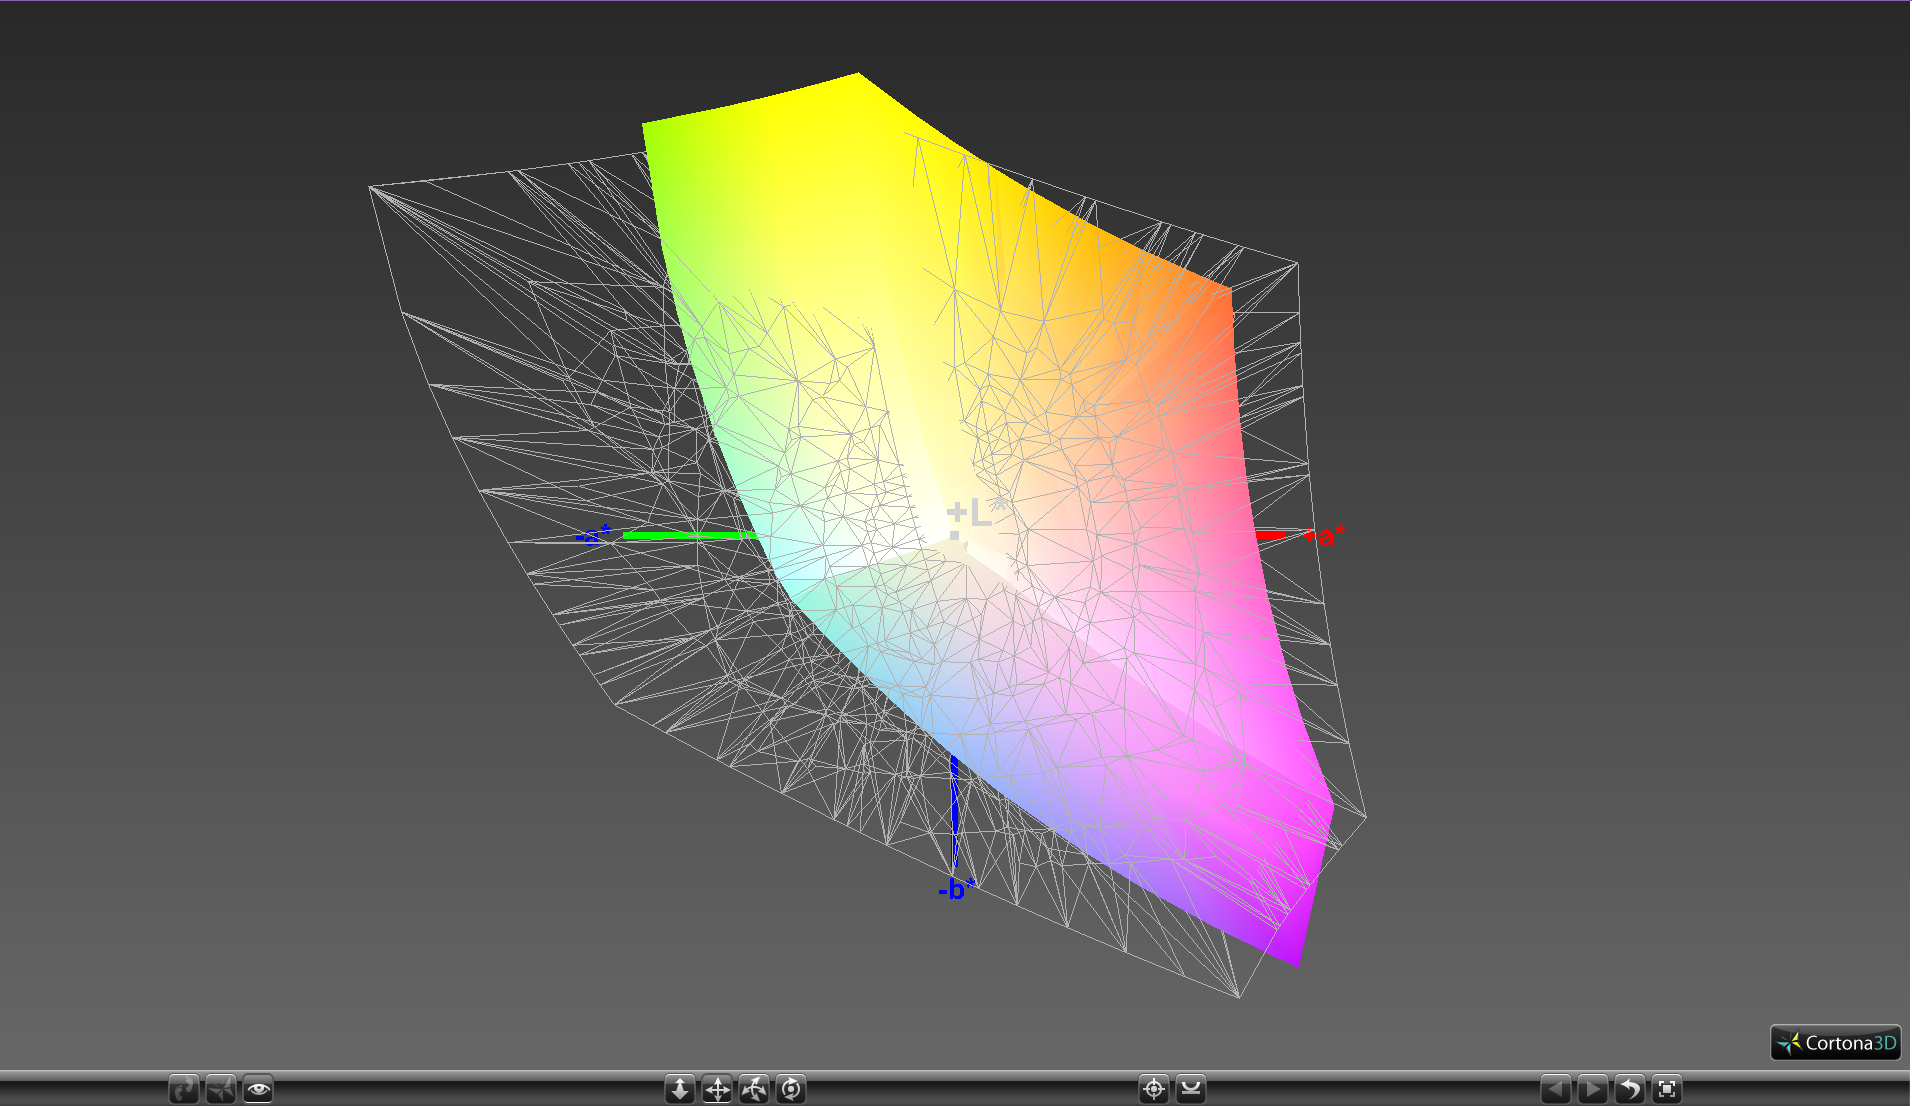
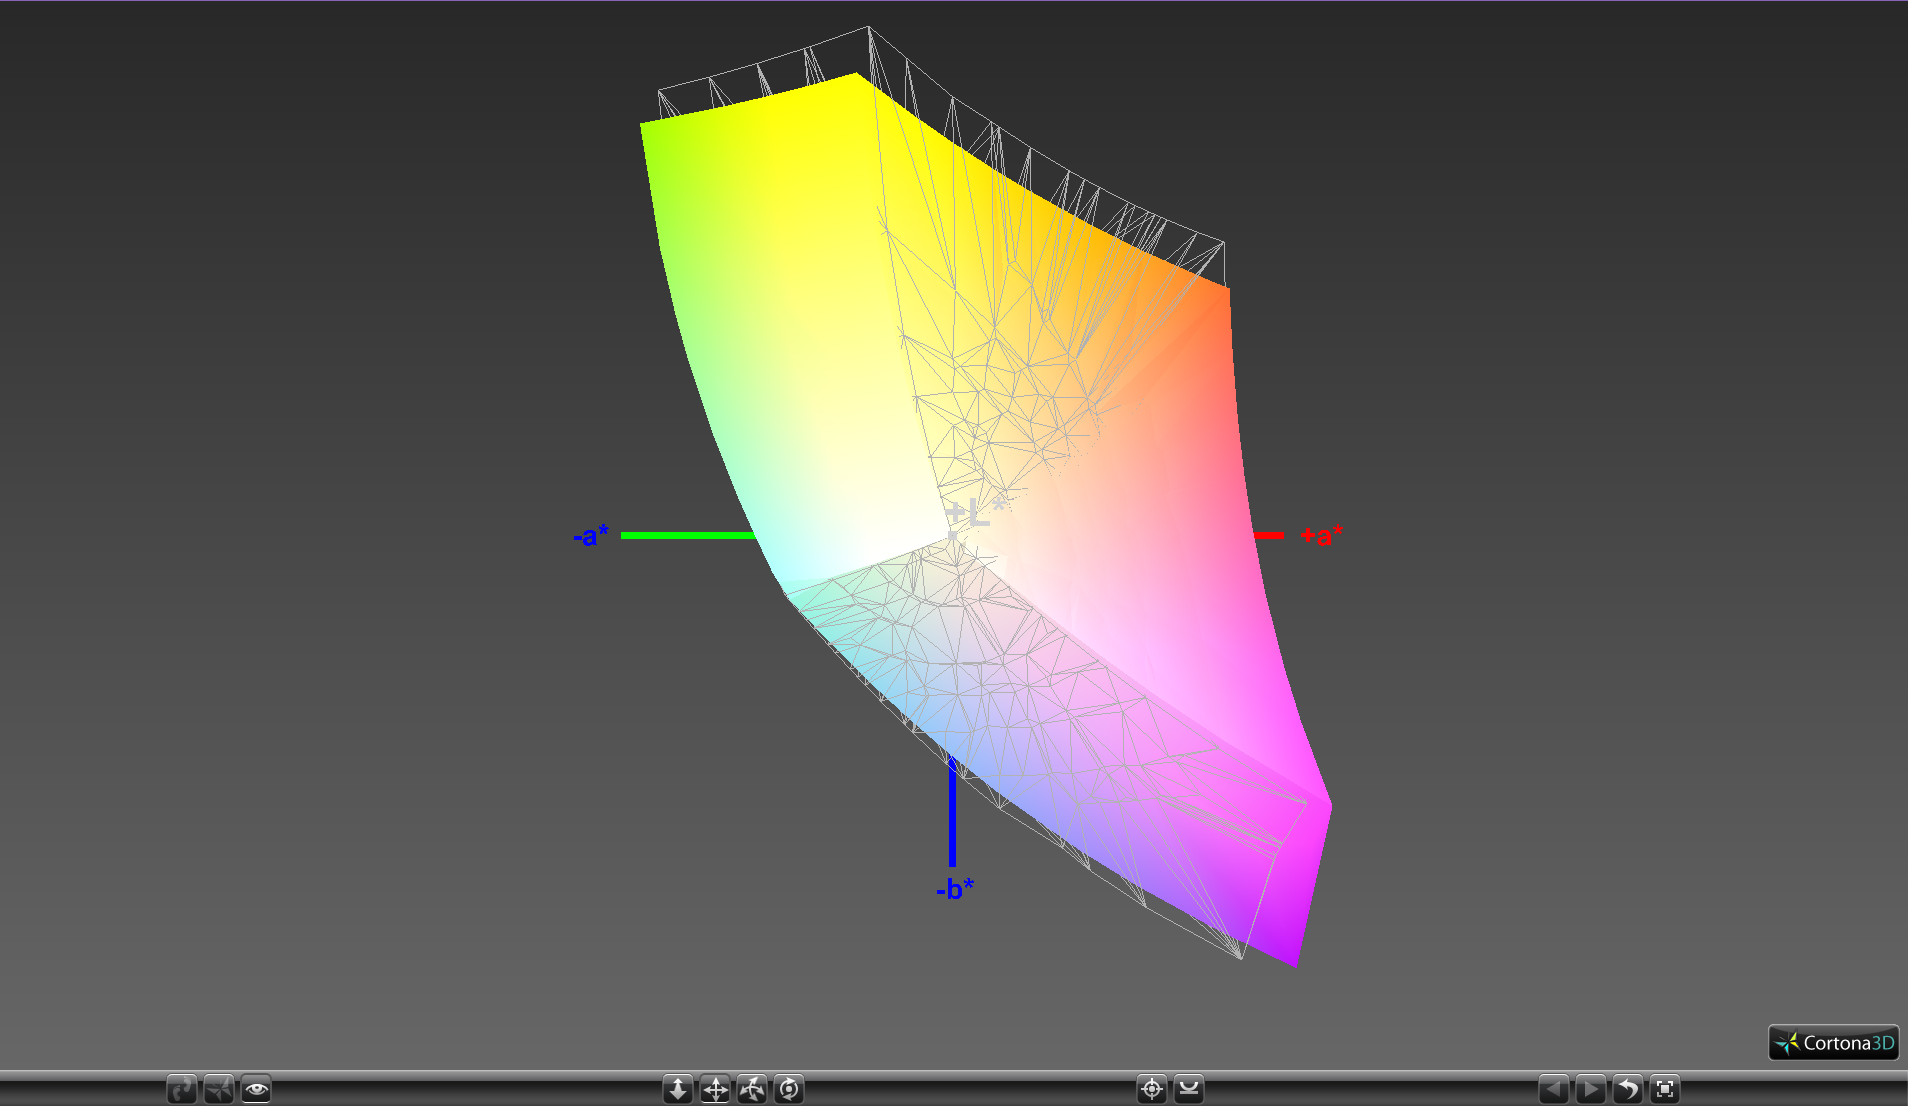
85% sRGB (Argyll 1.6.3 3D)
55.6% AdobeRGB 1998 (Argyll 1.6.3 3D)
62.4% AdobeRGB 1998 (Argyll 3D)
85.6% sRGB (Argyll 3D)
62.1% Display P3 (Argyll 3D)
Gamma: 2.19
CCT: 6558 K
| Asus Zephyrus GX501VS ID: AUO42ED, Name: AU Optronics B156HAN04.2, IPS, 15.6", 1920x1080 | Asus Zephyrus GX501 AUO B156HAN04.2 (AUO42ED), IPS, 15.6", 1920x1080 | Gigabyte P56XT LG Philips LP156WF6 (LGD046F), IPS, 15.6", 1920x1080 | Aorus X5 v6 IPS, 15.6", 2880x1620 | EVGA SC15 ID: AUO42ED, Name: AU Optronics B156HAN04.2, , 15.6", 1920x1080 | |
|---|---|---|---|---|---|
| Display | 6% | 1% | 1% | 2% | |
| Display P3 Coverage (%) | 62.1 | 64.8 4% | 64.8 4% | 62.5 1% | 62.3 0% |
| sRGB Coverage (%) | 85.6 | 91.8 7% | 84.6 -1% | 86.2 1% | 89.6 5% |
| AdobeRGB 1998 Coverage (%) | 62.4 | 65.9 6% | 61.8 -1% | 62.5 0% | 63.6 2% |
| Response Times | -4% | -1% | -8% | -18% | |
| Response Time Grey 50% / Grey 80% * (ms) | 33.2 ? | 40.4 ? -22% | 37.2 ? -12% | 34 ? -2% | 41.6 ? -25% |
| Response Time Black / White * (ms) | 28 ? | 24 ? 14% | 24.8 ? 11% | 32 ? -14% | 30.8 ? -10% |
| PWM Frequency (Hz) | 20000 ? | 198.4 | |||
| Screen | -35% | -44% | -28% | -16% | |
| Brightness middle (cd/m²) | 307.1 | 328 7% | 301 -2% | 280.4 -9% | 281.5 -8% |
| Brightness (cd/m²) | 309 | 305 -1% | 280 -9% | 271 -12% | 253 -18% |
| Brightness Distribution (%) | 86 | 83 -3% | 87 1% | 83 -3% | 73 -15% |
| Black Level * (cd/m²) | 0.35 | 0.25 29% | 0.32 9% | 0.249 29% | 0.27 23% |
| Contrast (:1) | 877 | 1312 50% | 941 7% | 1126 28% | 1043 19% |
| Colorchecker dE 2000 * | 3.4 | 6.02 -77% | 6.21 -83% | 4.94 -45% | 3.9 -15% |
| Colorchecker dE 2000 max. * | 8.2 | 10.14 -24% | 10.78 -31% | 8.13 1% | 7.1 13% |
| Greyscale dE 2000 * | 1.4 | 6.32 -351% | 6.08 -334% | 5.13 -266% | 3.8 -171% |
| Gamma | 2.19 100% | 2.28 96% | 2.31 95% | 2.26 97% | 2.27 97% |
| CCT | 6558 99% | 8194 79% | 7375 88% | 7433 87% | 7322 89% |
| Color Space (Percent of AdobeRGB 1998) (%) | 55.6 | 60 8% | 55 -1% | 55.9 1% | 57.8 4% |
| Color Space (Percent of sRGB) (%) | 85 | 92 8% | 84 -1% | 85.9 1% | 89.3 5% |
| Total Average (Program / Settings) | -11% /
-23% | -15% /
-30% | -12% /
-19% | -11% /
-13% |
* ... smaller is better
Asus advertises full sRGB coverage, but our own independent measurements have proven this false once again. Color space is approximately 85 percent and 56 percent of the AdobeRGB and sRGB standards, respectively, not unlike the LG Philips panel on the Gigabyte P56XT. Interestingly, the gamut is slightly narrower than on our first GX501VI SKU by a few percentage points despite both sharing the same AU Optronics panel. The discrepancy could be due to margins of error during manufacturing and between notebooks. Gamers who want "true" sRGB coverage or more should consider certain high-end TN panels like those found on Clevo systems or the Sharp IGZO panels on the Razer Blade series.
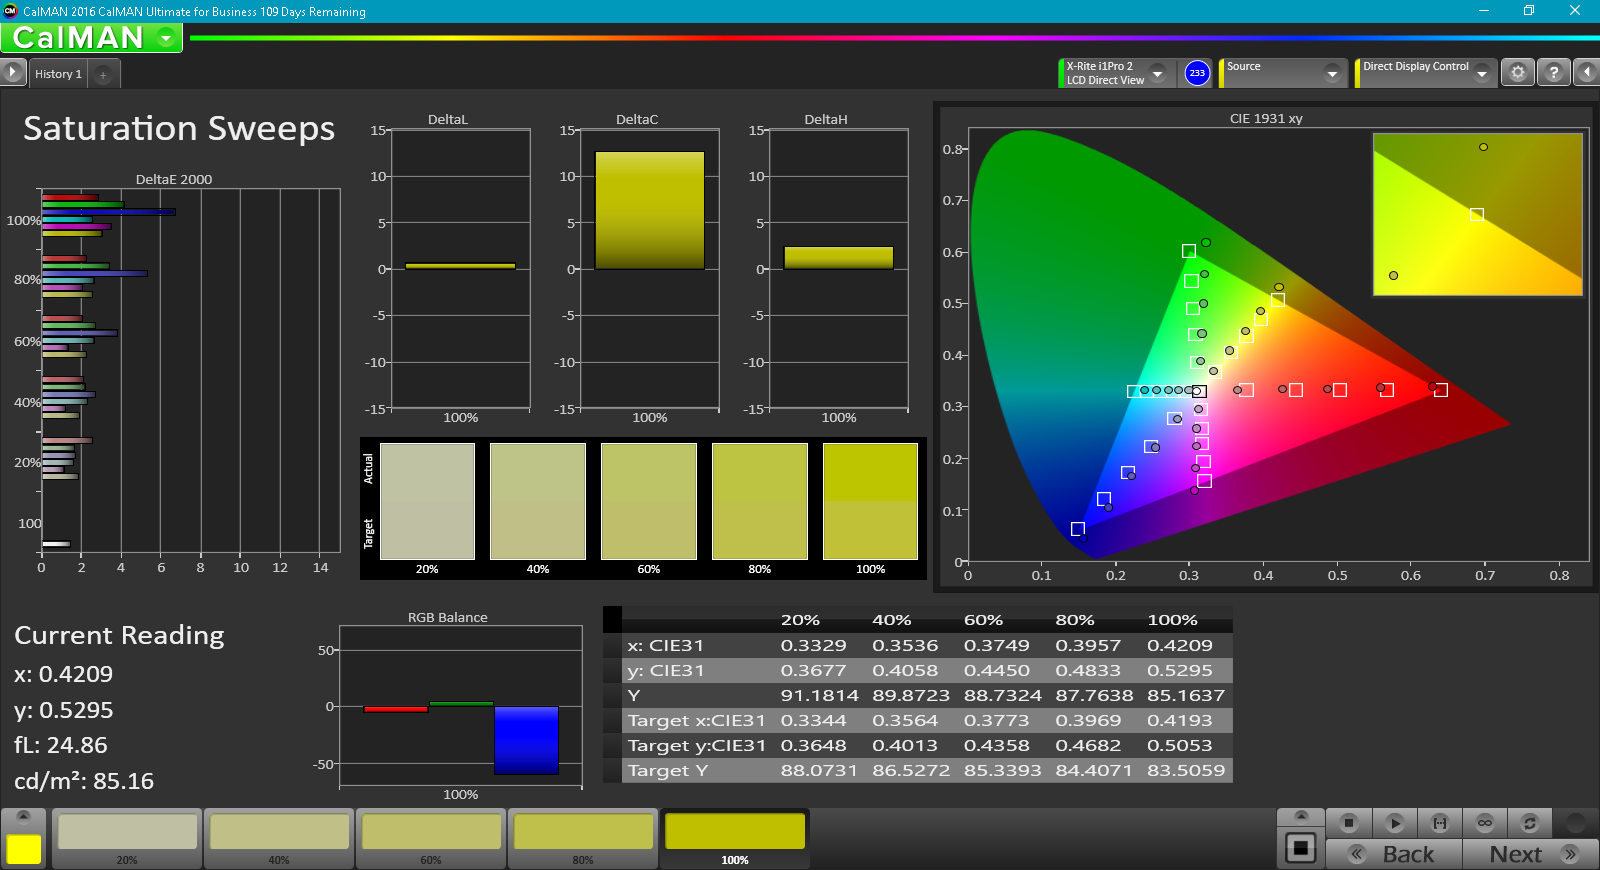
Further display measurements with an X-Rite spectrophotometer reveal accurate grayscale and colors out of the box. Unlike our GX501VI test unit, our GX501VS appears to have been factory calibrated and our own attempts to calibrate the display result in no significant gains. Colors are shown to become more inaccurate the higher the saturation level since sRGB coverage is not perfect.

Display Response Times
| ↔ Response Time Black to White | ||
|---|---|---|
| 28 ms ... rise ↗ and fall ↘ combined | ↗ 15.6 ms rise | 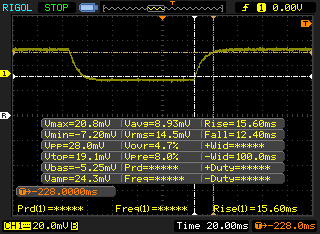 |
| ↘ 12.4 ms fall | ||
| The screen shows relatively slow response rates in our tests and may be too slow for gamers. In comparison, all tested devices range from 0.1 (minimum) to 240 (maximum) ms. » 71 % of all devices are better. This means that the measured response time is worse than the average of all tested devices (19.9 ms). | ||
| ↔ Response Time 50% Grey to 80% Grey | ||
| 33.2 ms ... rise ↗ and fall ↘ combined | ↗ 18.4 ms rise | 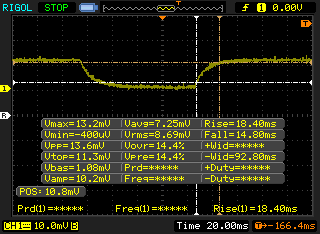 |
| ↘ 14.8 ms fall | ||
| The screen shows slow response rates in our tests and will be unsatisfactory for gamers. In comparison, all tested devices range from 0.165 (minimum) to 636 (maximum) ms. » 46 % of all devices are better. This means that the measured response time is similar to the average of all tested devices (31.1 ms). | ||
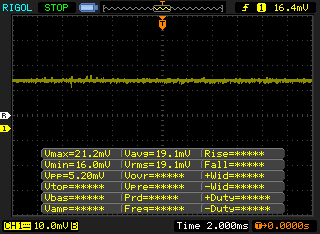
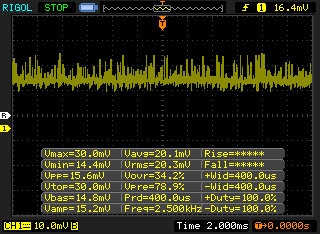
There is no pulse-width modulation in the traditional sense, but there appears to be unusual fluctuations in the LED backlight depending on the brightness level and whether the system is on mains or battery power. If at full brightness and on battery power, the backlight exhibits no flickering and we have the usual flatline. Once connected to mains, however, there is some AC interference from the change in power delivery. This phenomenon occurs between the 50 percent to 100 percent brightness level range when connected to mains and ceases to occur at the lower brightness levels. We don't believe this to have any bearings on real-world use scenarios, but it's a noteworthy observation nonetheless.
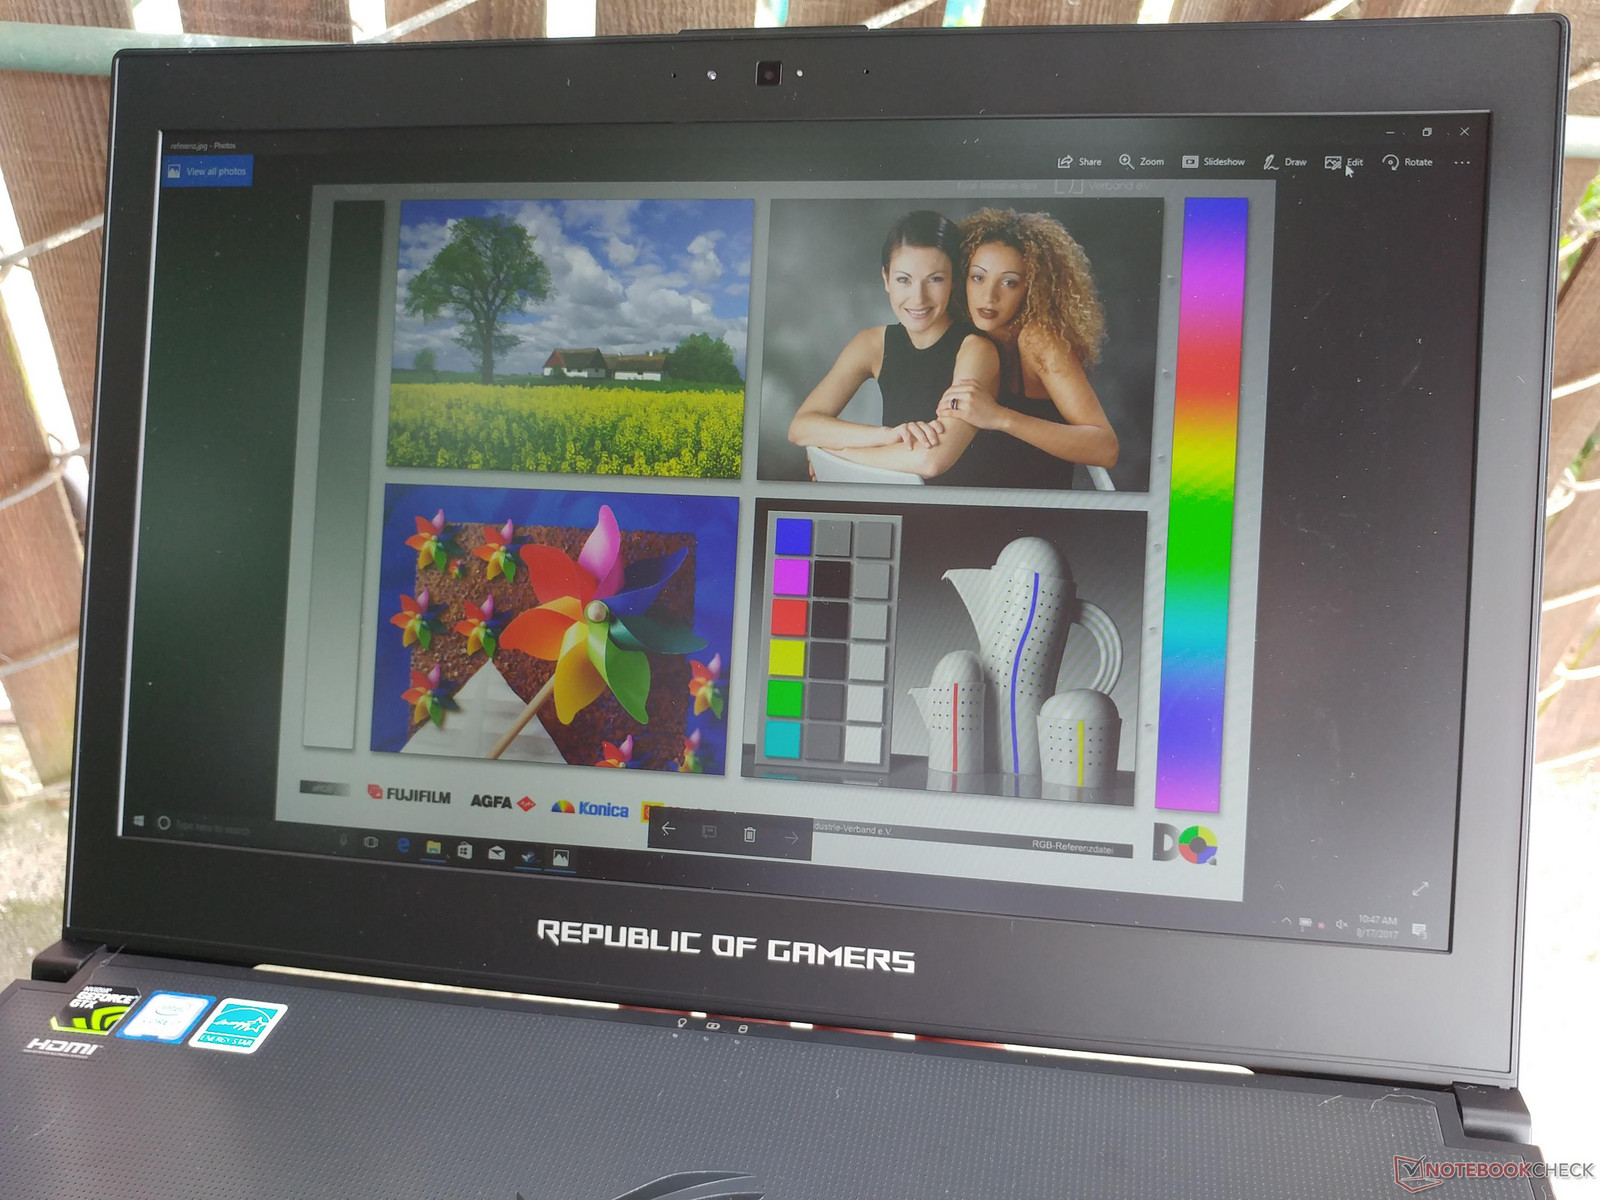
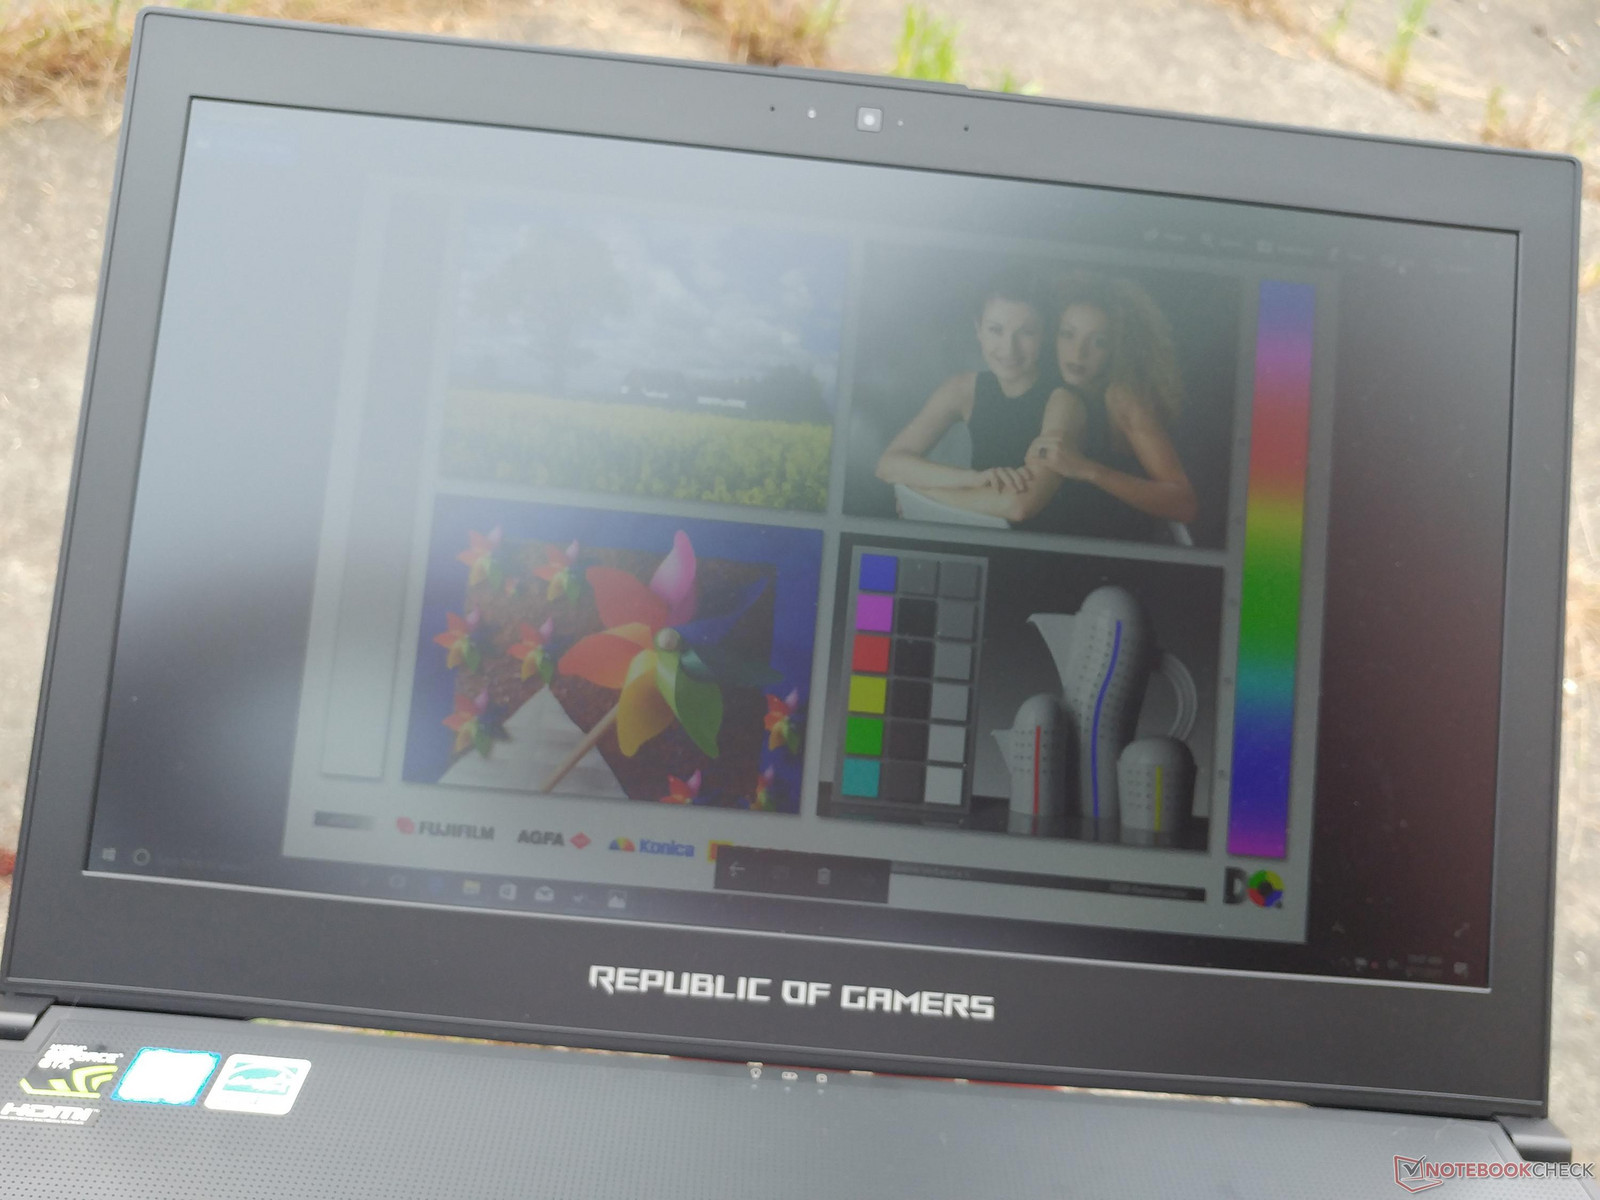
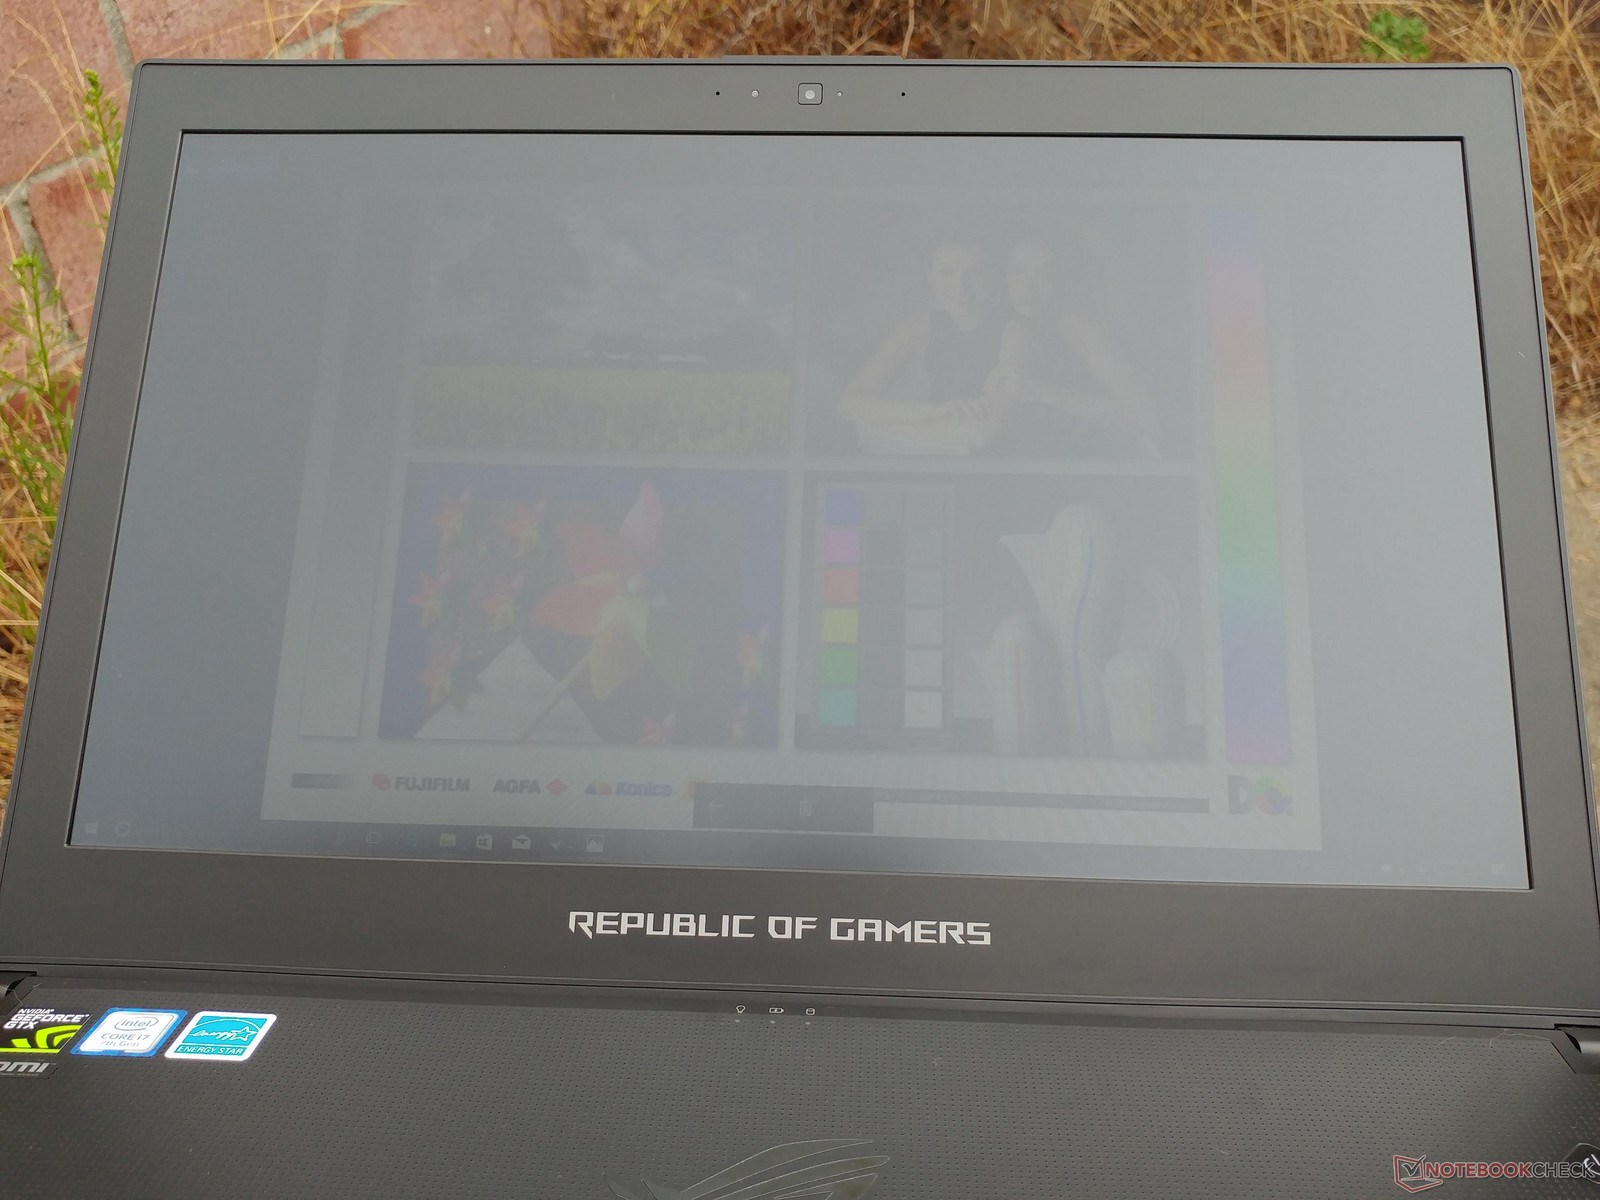
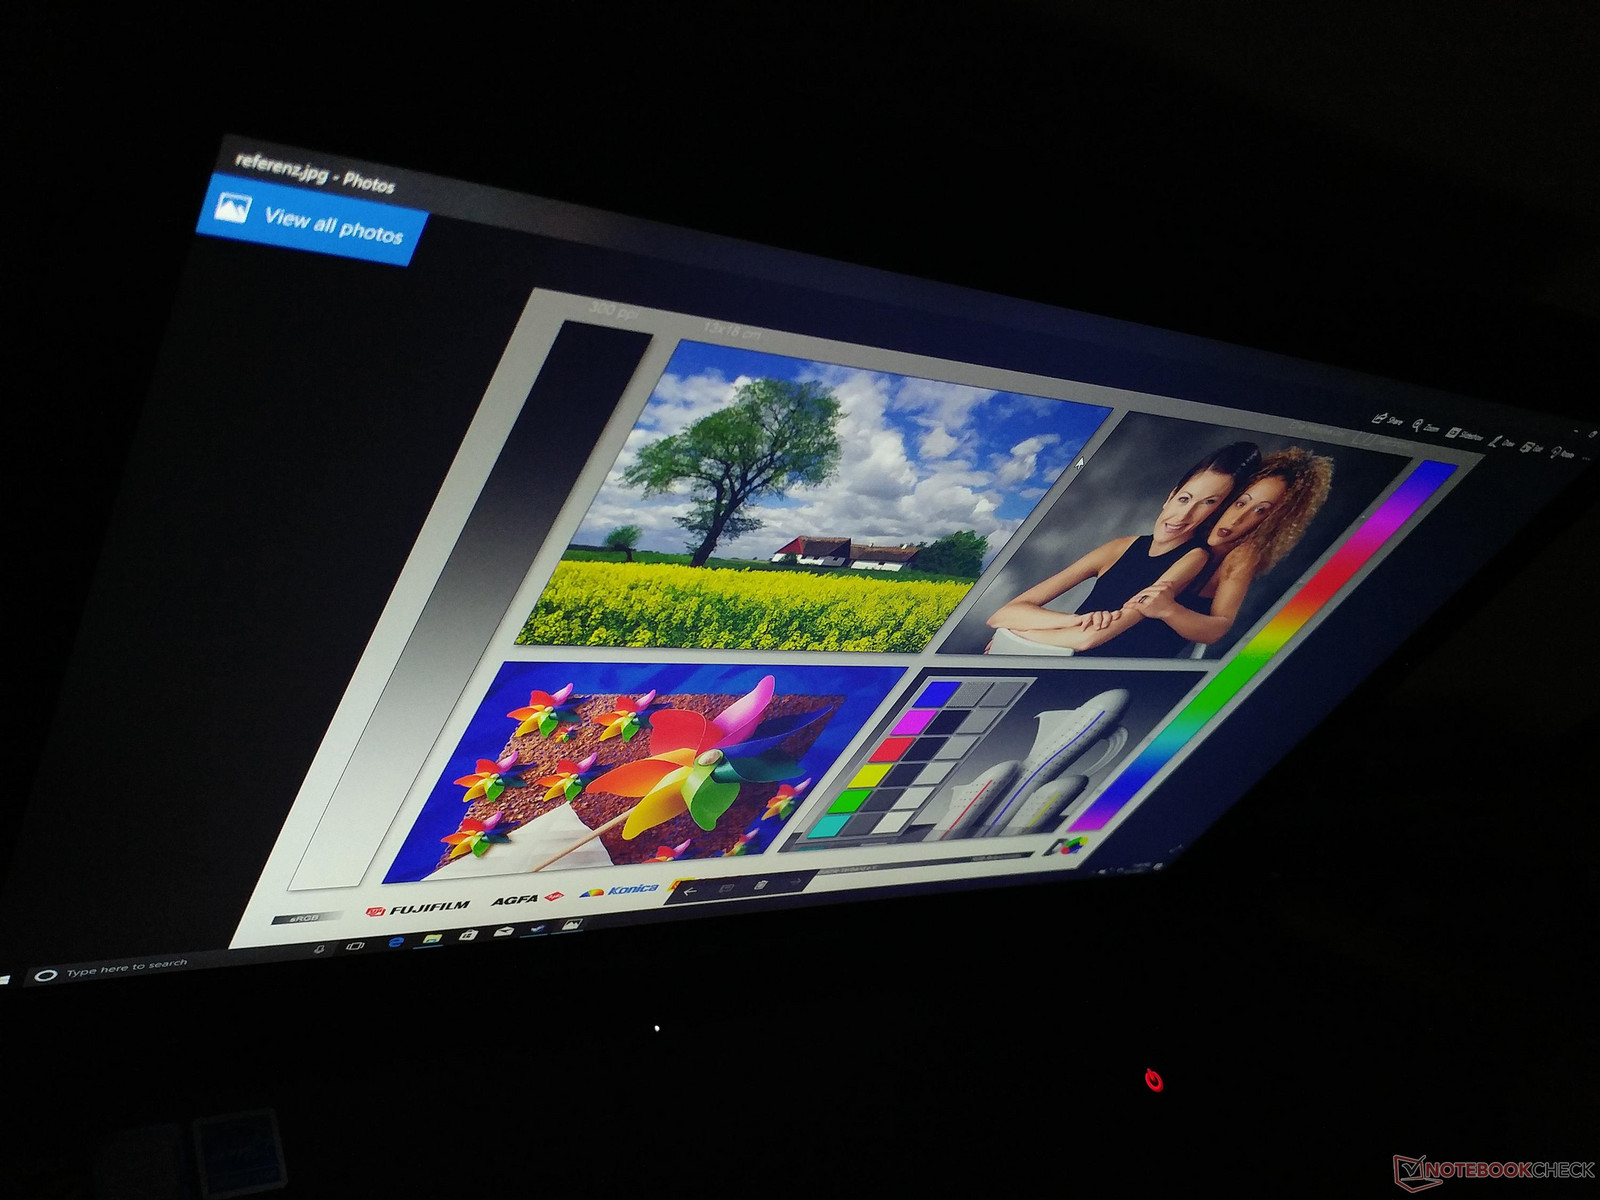
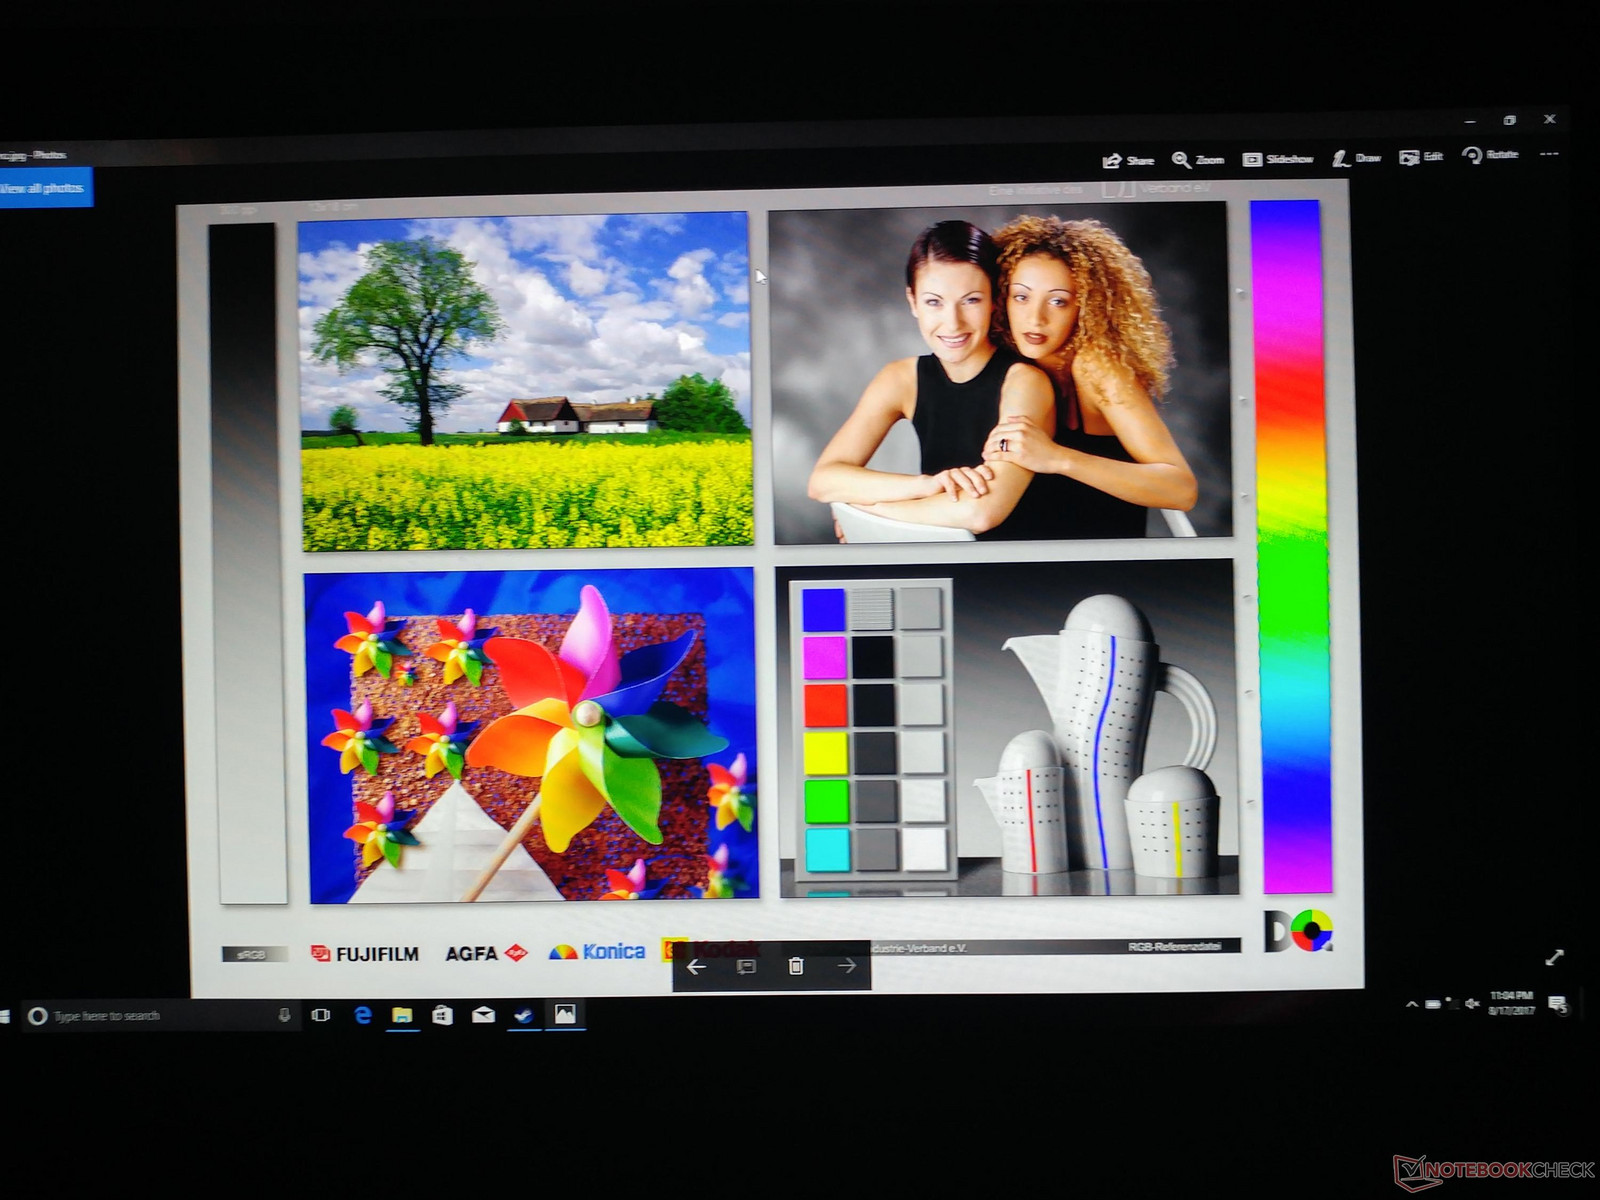
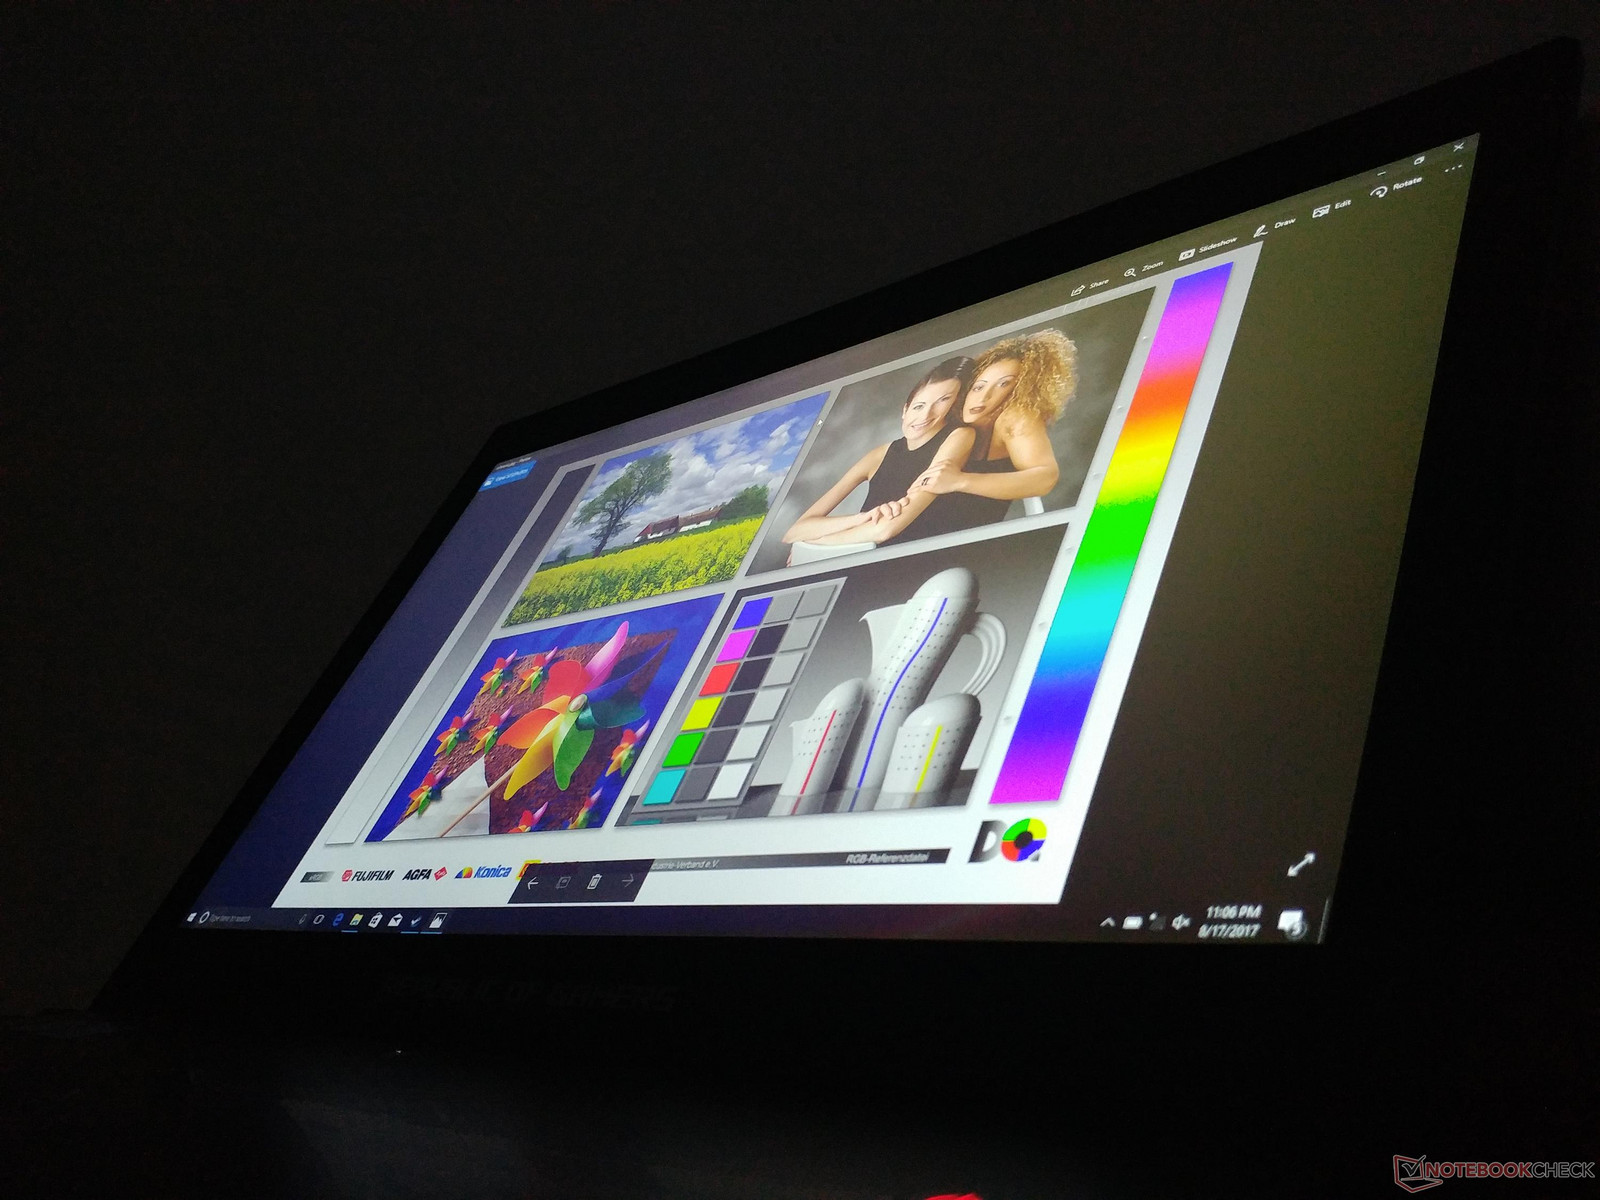
Outdoor visibility is average at best when under shade. Glare isn't a major issue, though the backlight will be easily overwhelmed by sunlight or overcast ambient lighting. Regardless, we don't recommend using the notebook if not on a flat desk because of the aforementioned flexible bottom plate when the display is opened. Viewing angles are otherwise wide with some slight hints of yellowing if viewing from unrealistically extreme angles.
Performance
Internals are identical to the GX501VI save for the more affordable GTX 1070 Max-Q GPU and reduced RAM and SSD sizes. The soldered components and generally inaccessible motherboard mean very limited configurable options. Other thin gaming notebooks like the Razer Blade Pro or Aorus X7 offer the unlocked i7-7820HK, but the performance benefit at stock clock speeds over the i7-7700HQ is far too minimal for us to recommend considering the price premium.
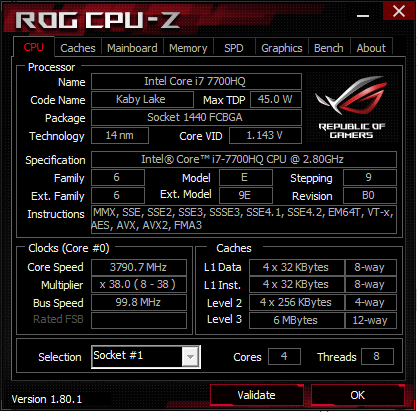
Processor
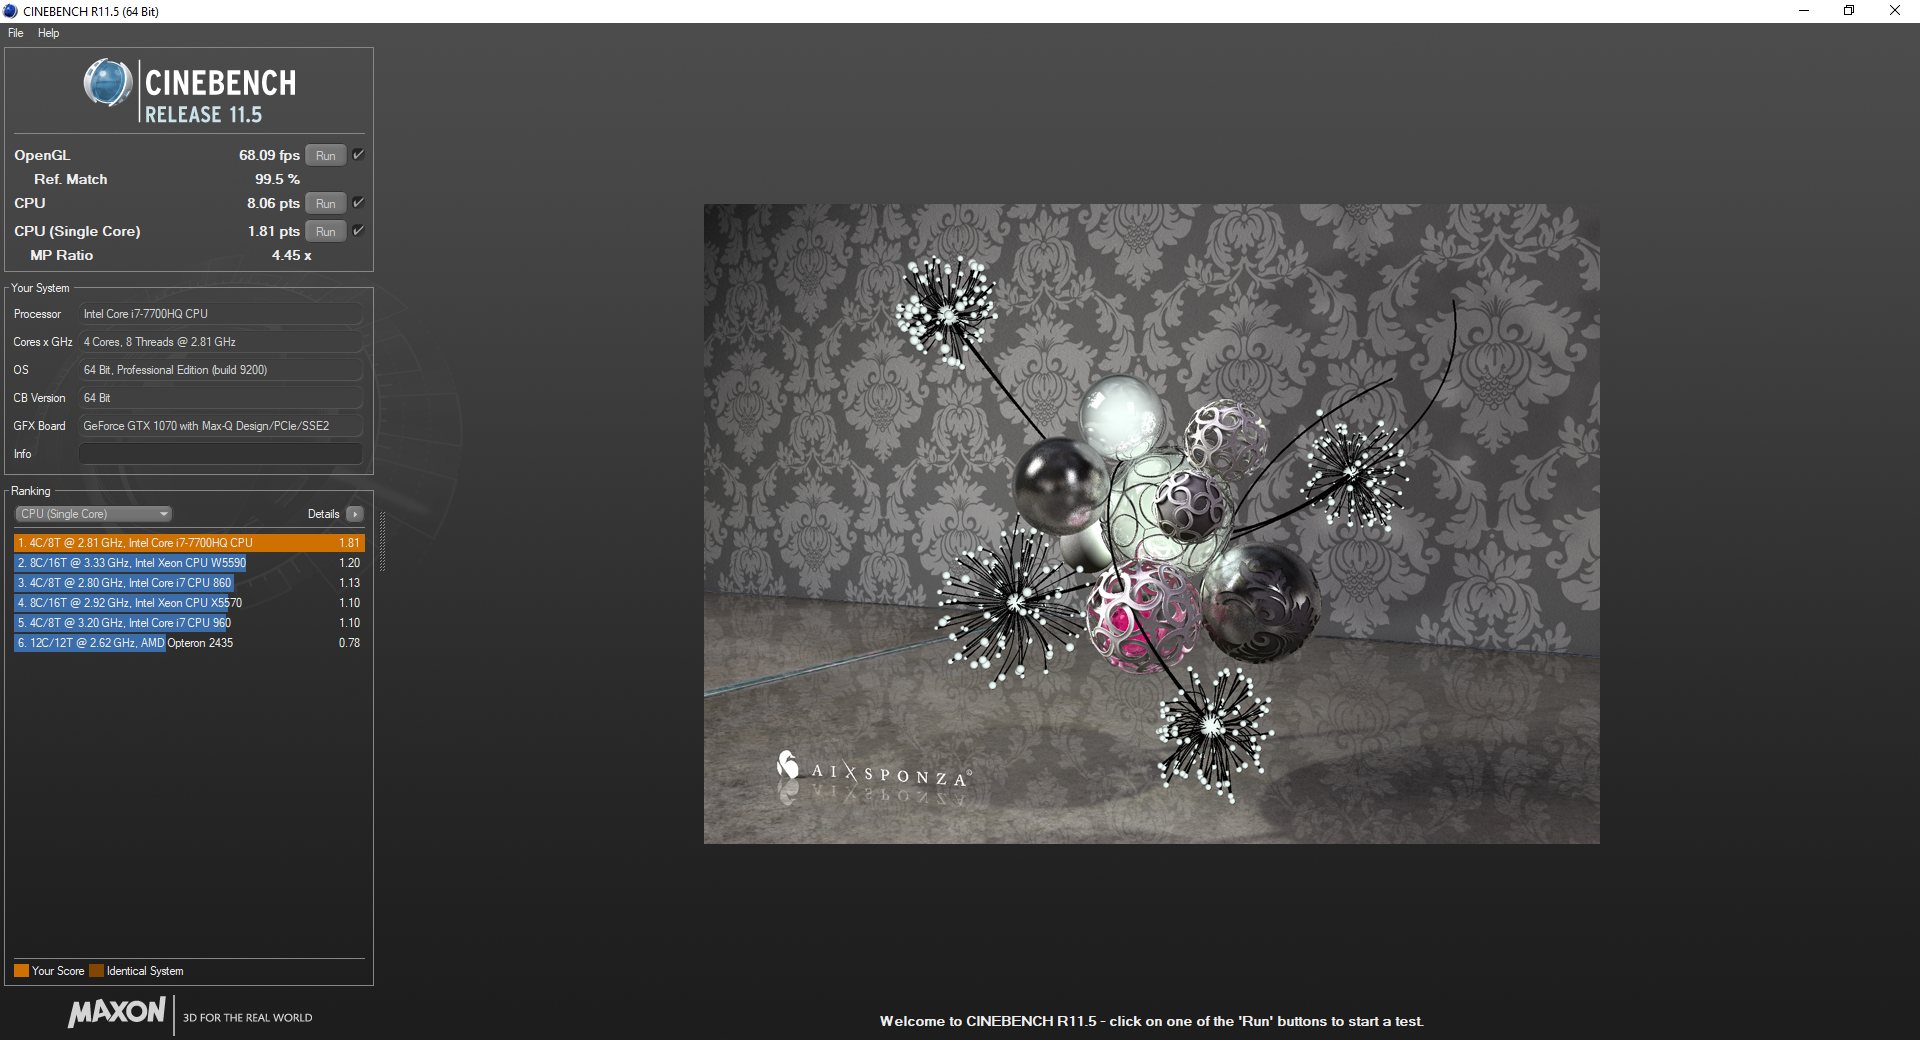
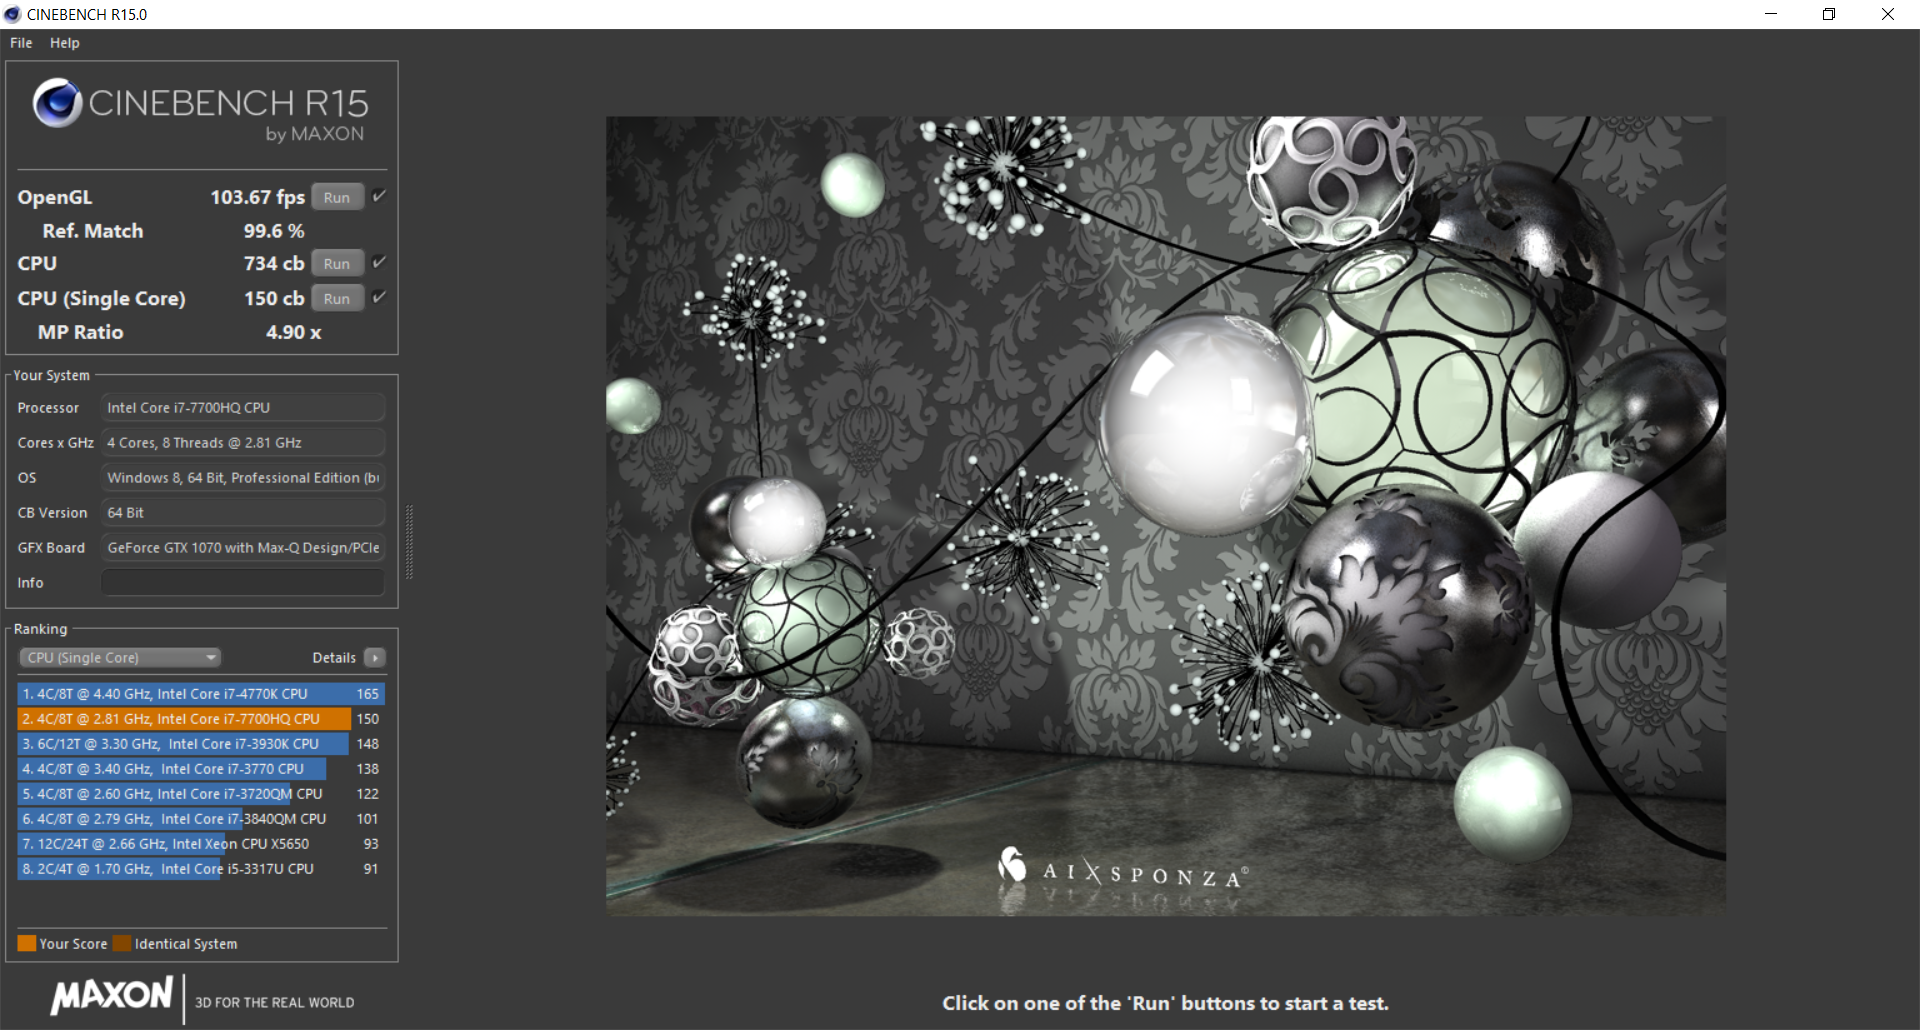
CPU performance is where we expect it to be for an i7-7700HQ. Single- and multi-threaded performances are only marginally faster than the outgoing Skylake i7-6700HQ and Broadwell i7-5700HQ while being about 20 percent slower than the unlocked i7-7700K at factory clock rates. Running CineBench Multi-Thread in a loop results in steady scores throughout the entire run to indicate no significant throttling issues over long periods of CPU stress. This is notable considering the thin design of the Zephyrus and the fact that a number of other thin notebooks like the GS63VR or Sabre 15 may exhibit lower scores in the same loop test.
See our dedicated page on the Core i7-7700HQ for more technical information and benchmark comparisons.
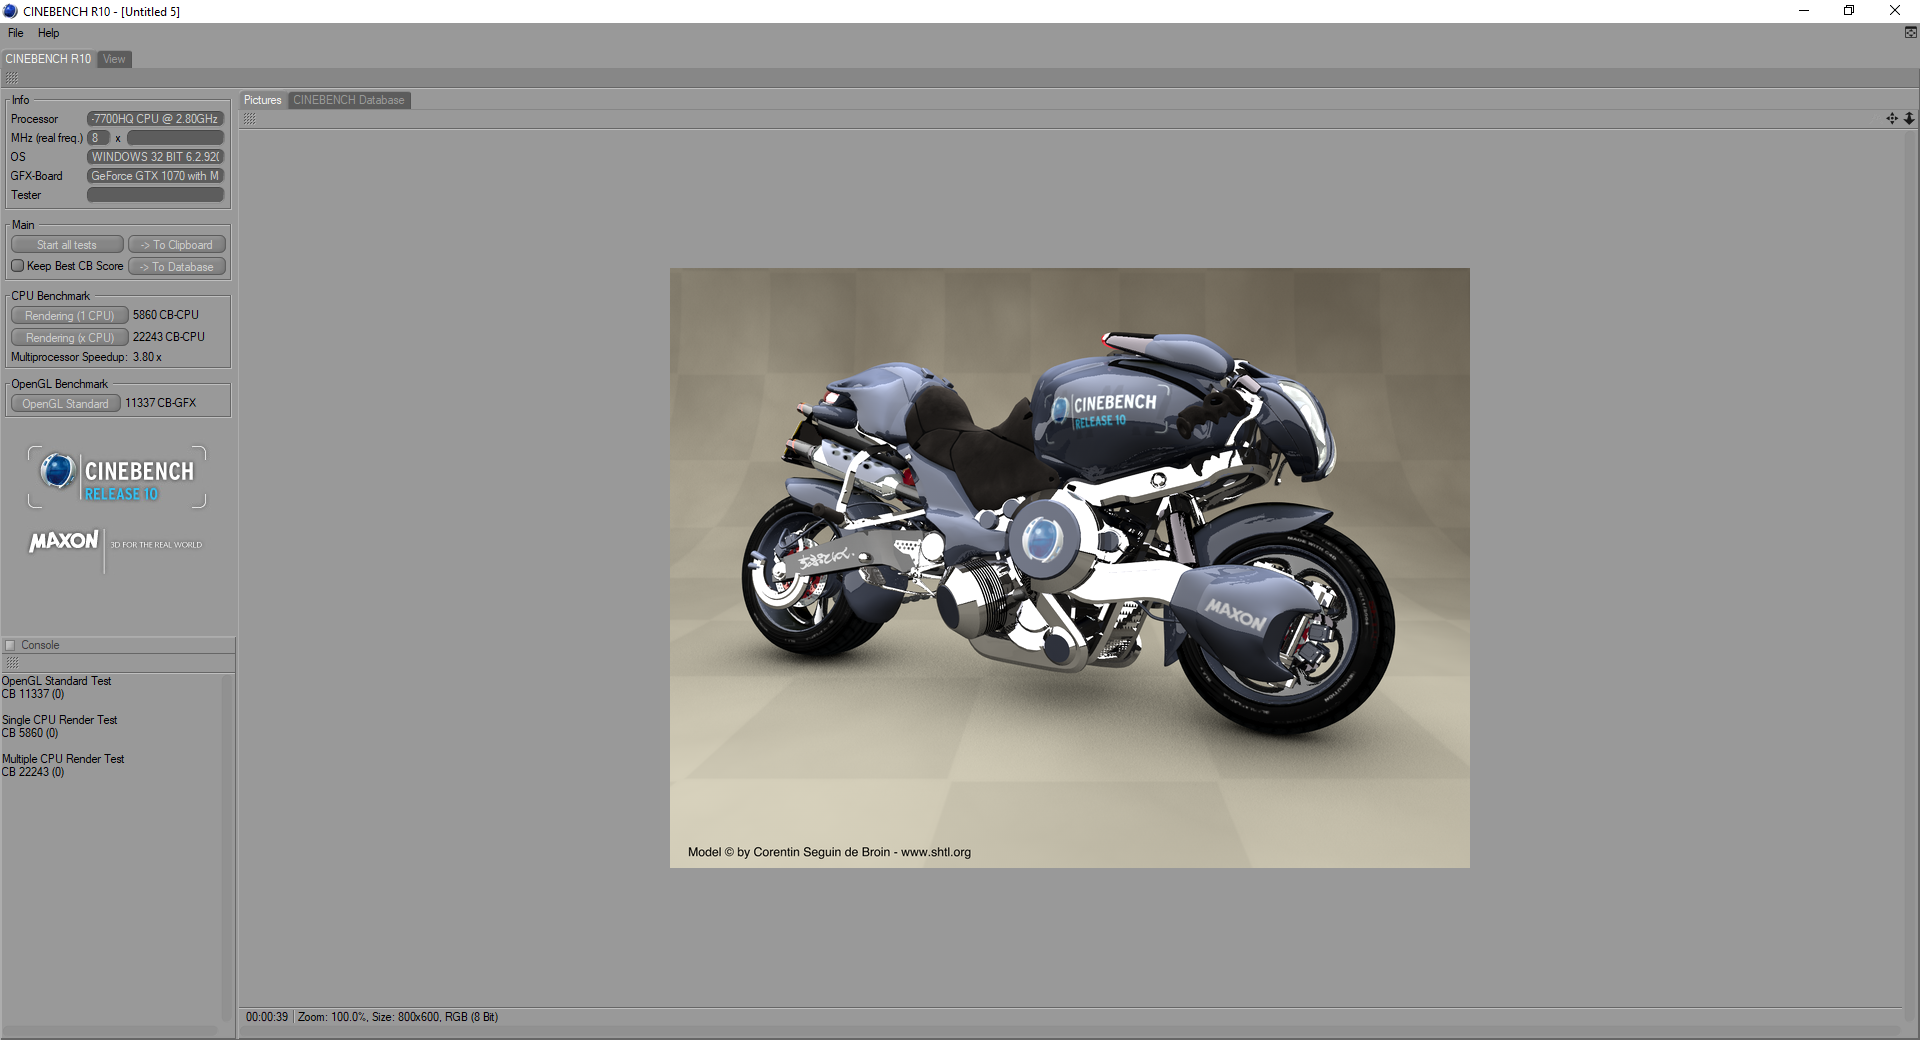
| Cinebench R10 | |
| Rendering Multiple CPUs 32Bit | |
| Eurocom Tornado F5 | |
| Eurocom Sky X7E2 | |
| Eurocom Sky MX5 R3 | |
| Asus Zephyrus GX501 | |
| Asus Zephyrus GX501VS | |
| Asus GL702VM-GC102D | |
| MSI GP62-2QEi781FD | |
| Rendering Single 32Bit | |
| Eurocom Tornado F5 | |
| Eurocom Sky X7E2 | |
| Eurocom Sky MX5 R3 | |
| Asus Zephyrus GX501 | |
| Asus Zephyrus GX501VS | |
| MSI GP62-2QEi781FD | |
| Asus GL702VM-GC102D | |
| wPrime 2.10 - 1024m | |
| Eurocom Sky MX5 R3 | |
| Asus Zephyrus GX501VS | |
| MSI GP62-2QEi781FD | |
| Eurocom Sky X7E2 | |
| Eurocom Tornado F5 | |
* ... smaller is better
System Performance
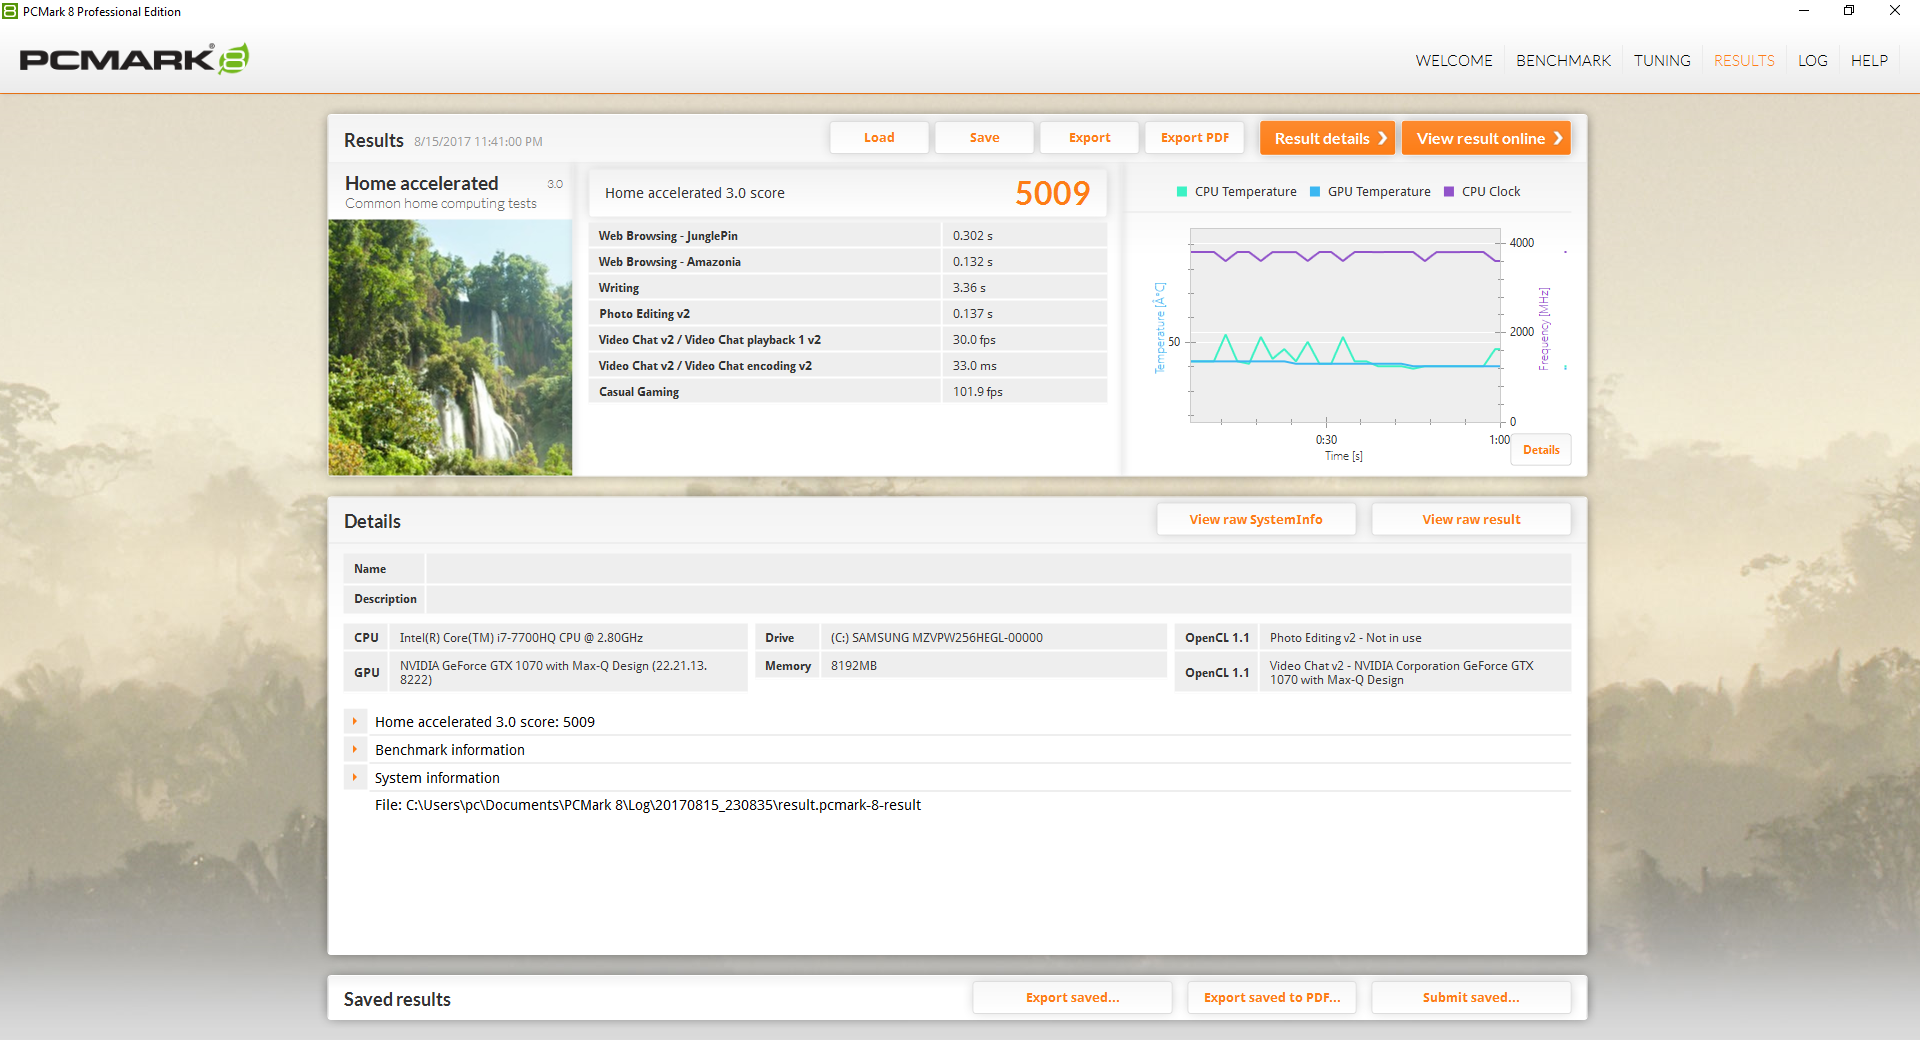
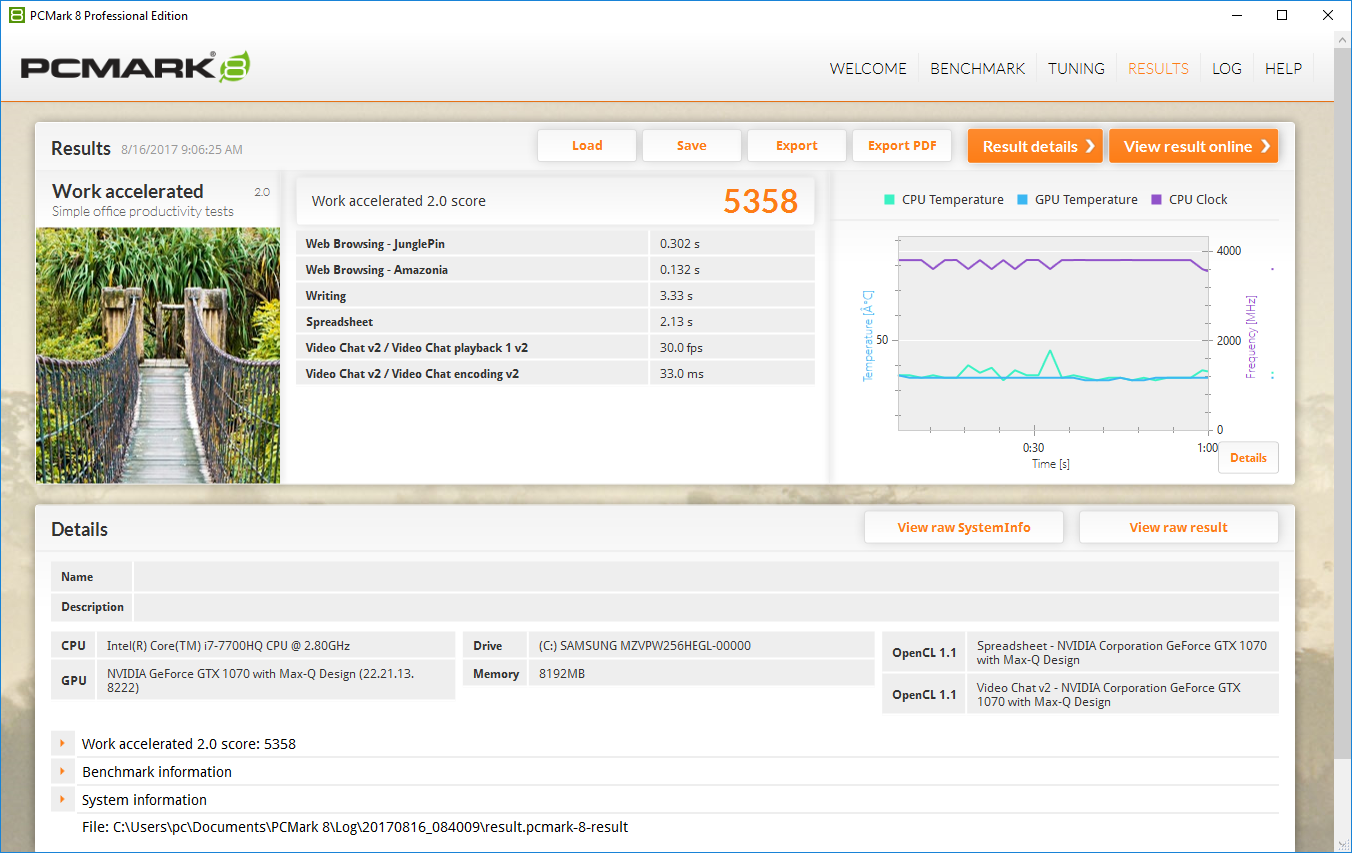
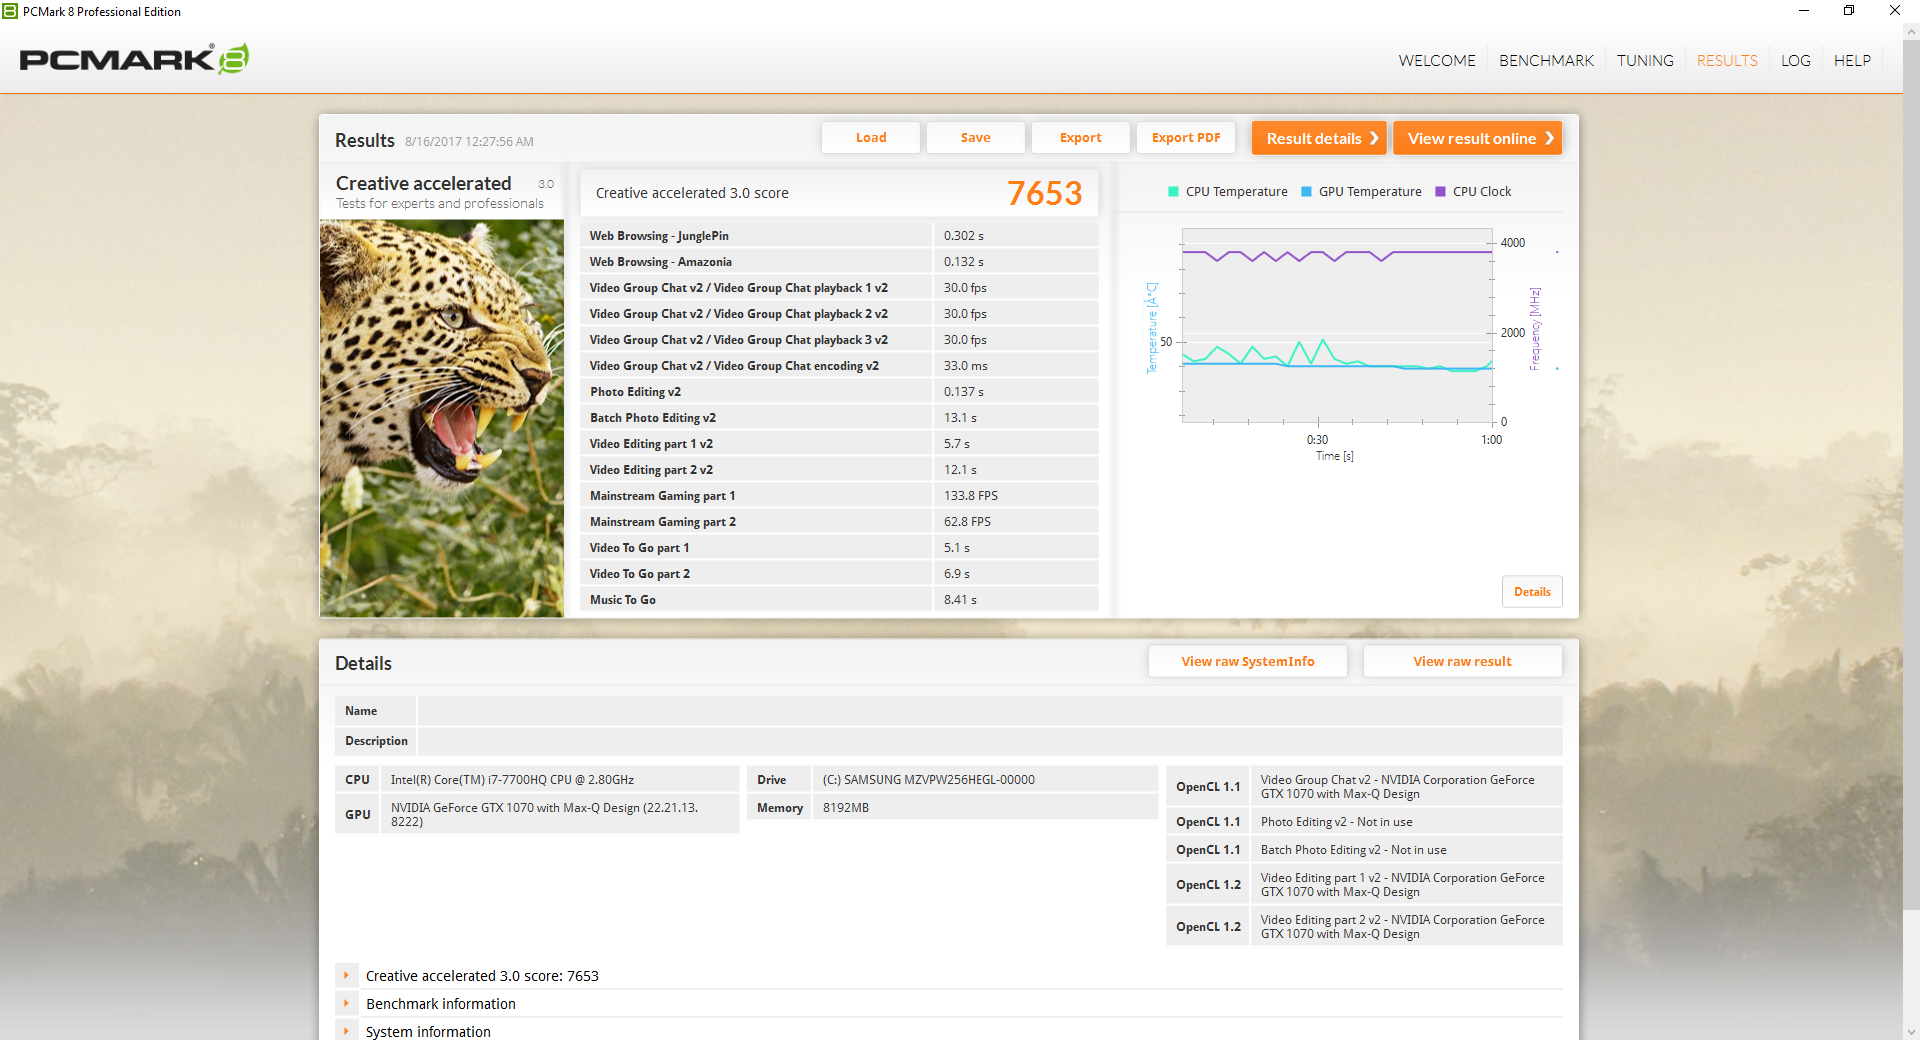
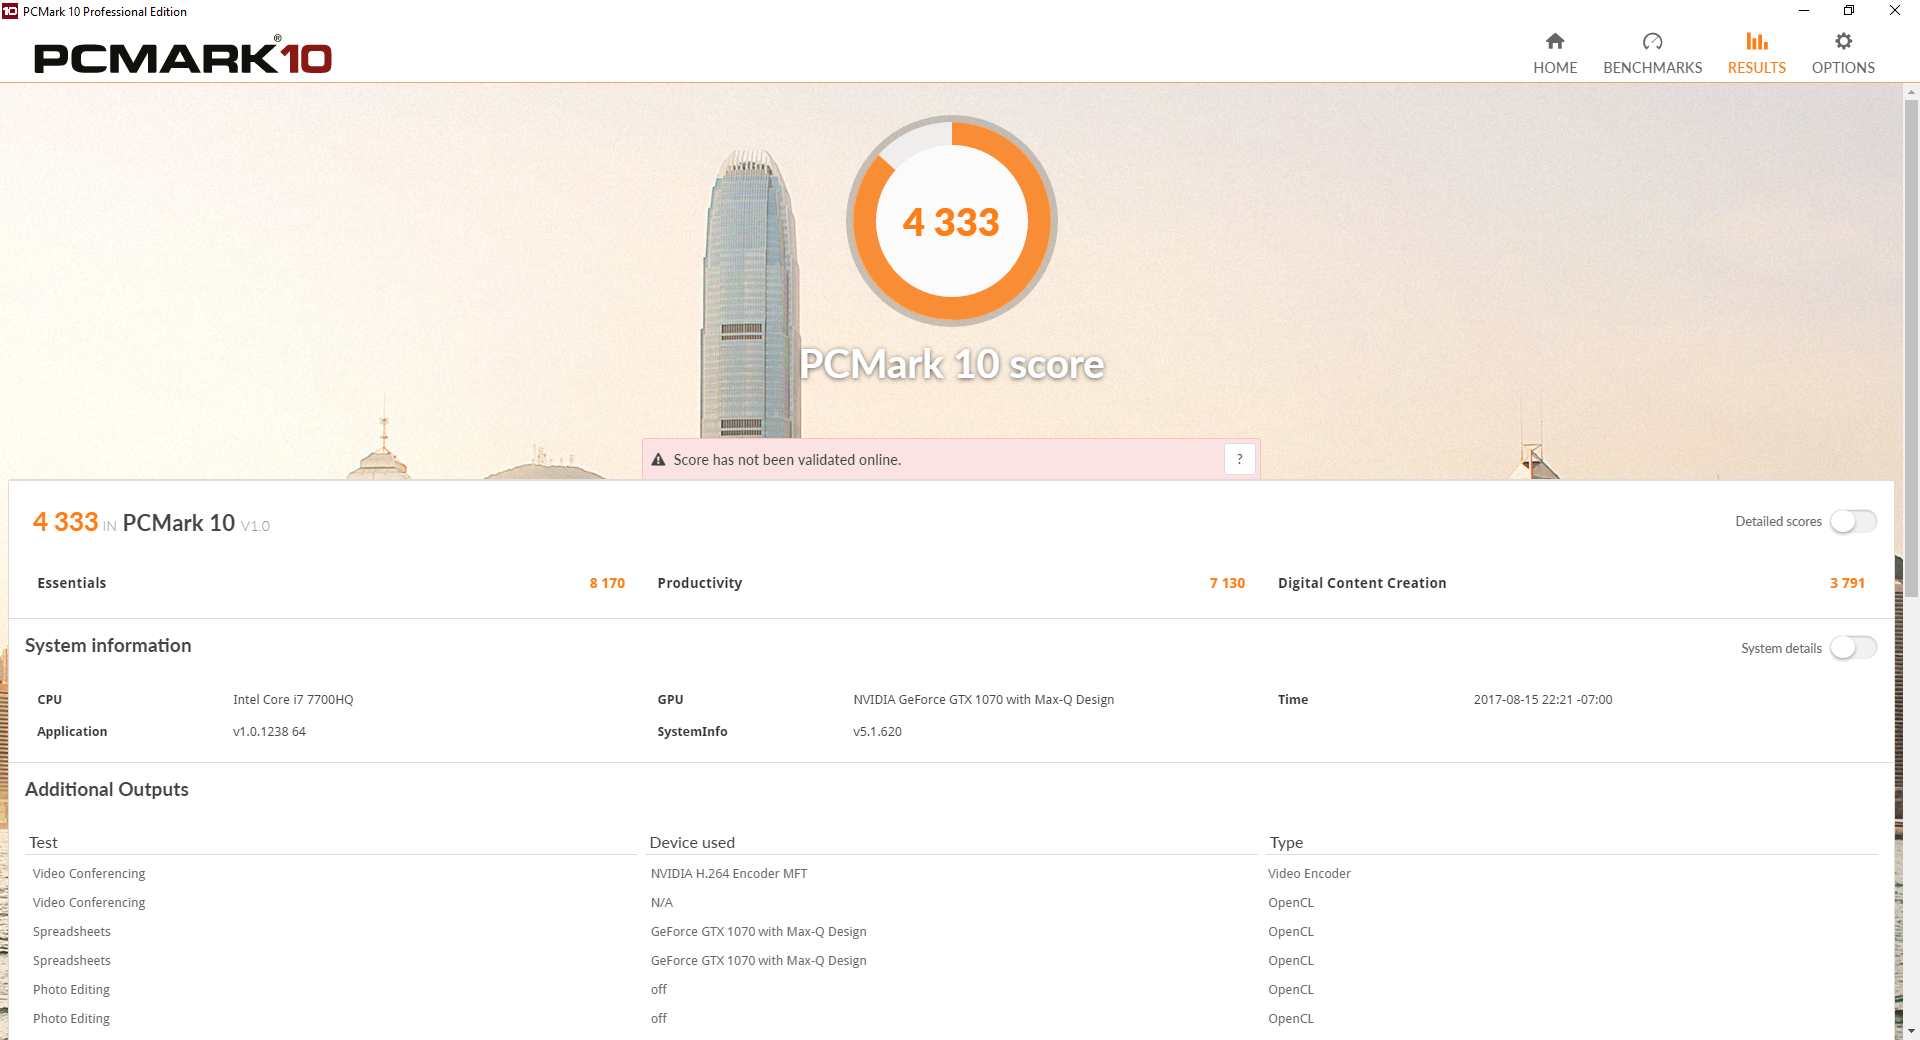
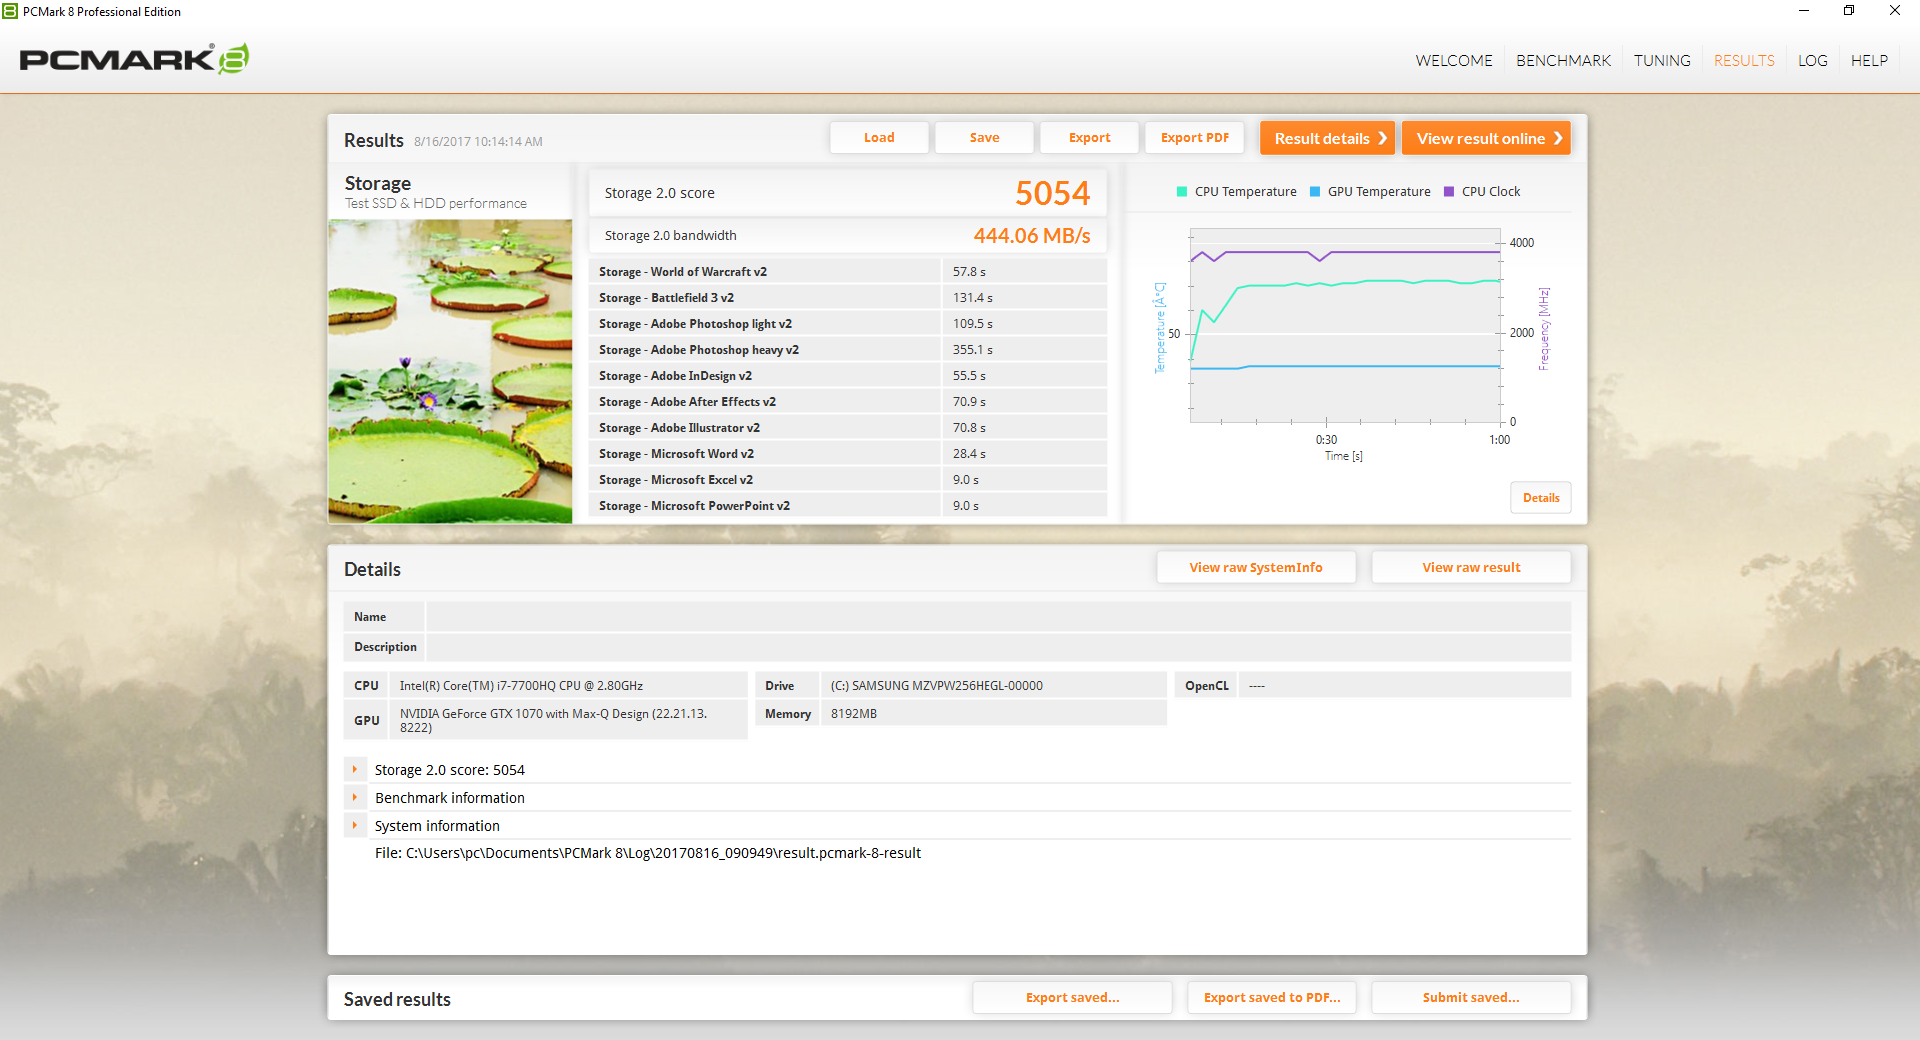
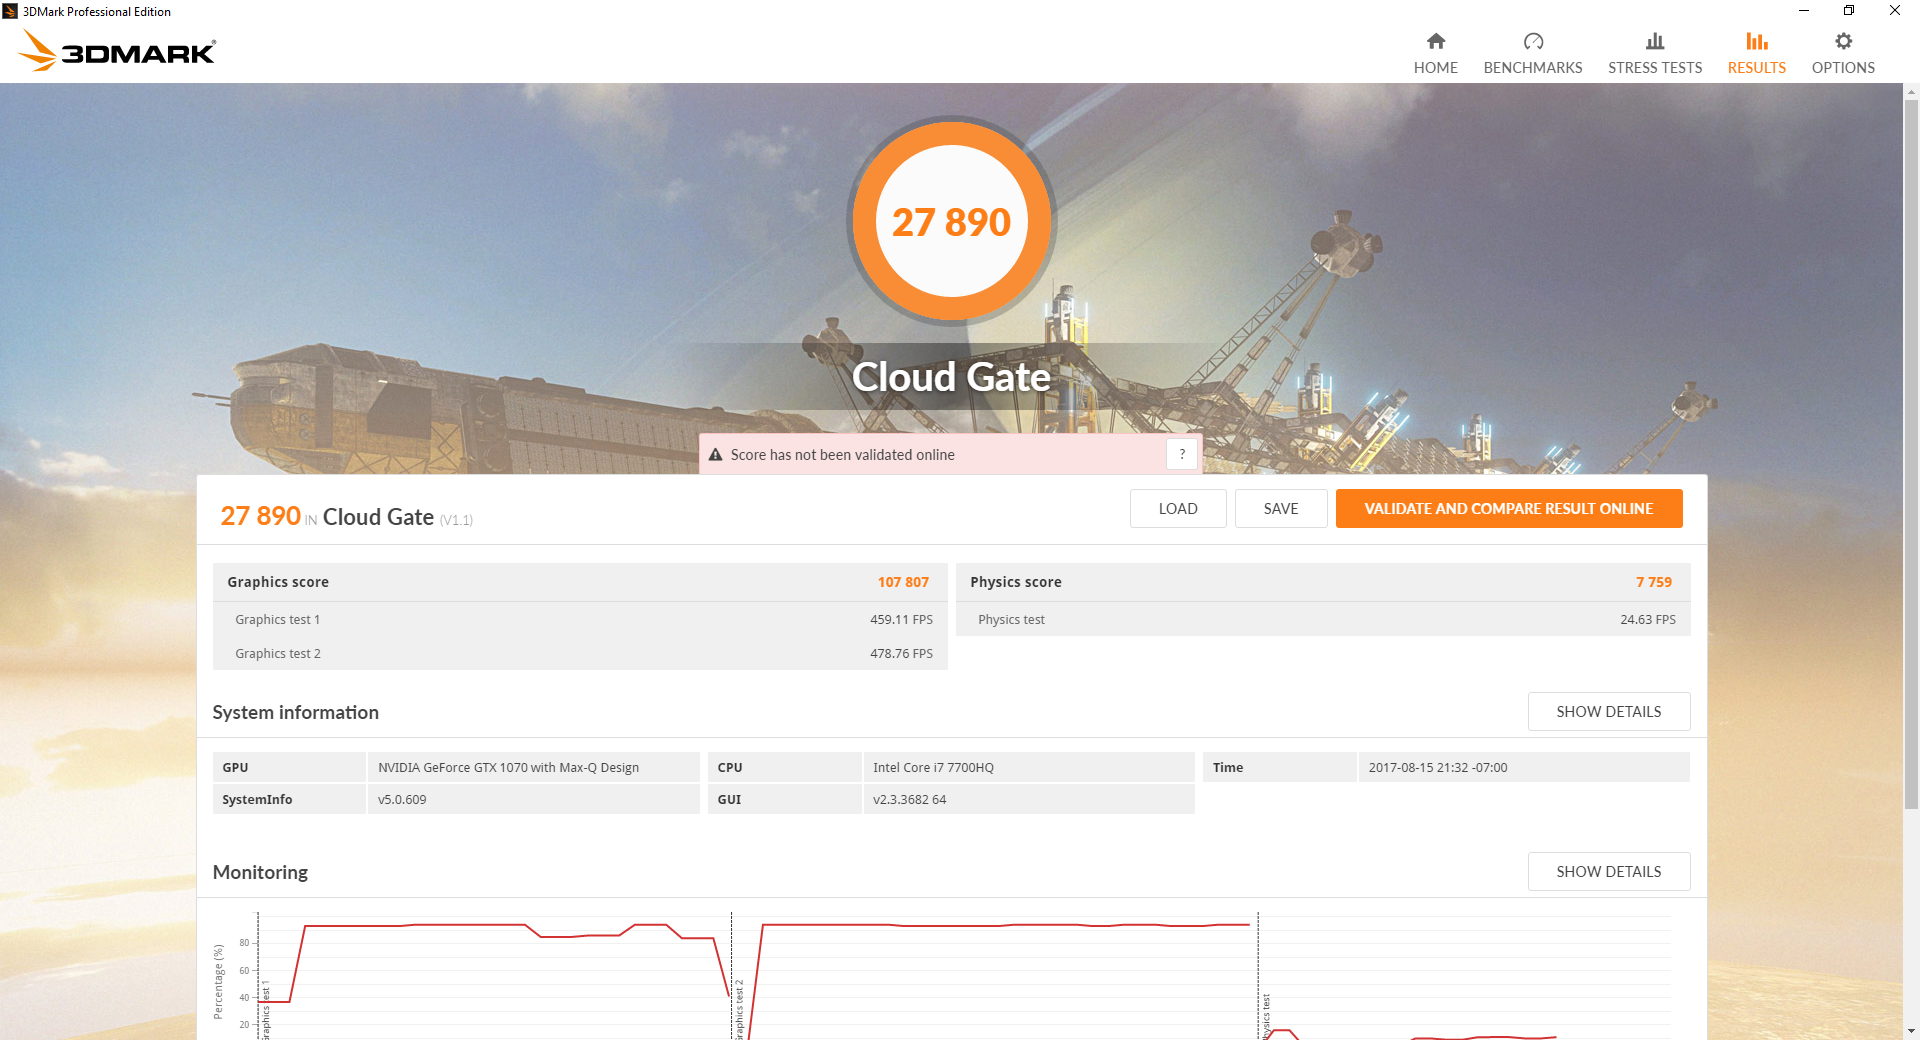
3DMark benchmarks rank the GX501VS very similarly to other gaming notebooks with enthusiast-level GTX Pascal graphics. Subjectively, system responsiveness feels immediate with no software hitches during testing as one would expect from a primary SSD.
| PCMark 8 | |
| Home Score Accelerated v2 | |
| EVGA SC15 | |
| Asus Zephyrus GX501 | |
| Asus Zephyrus GX501VS | |
| Aorus X5 v6 | |
| Work Score Accelerated v2 | |
| EVGA SC15 | |
| Asus Zephyrus GX501VS | |
| Asus Zephyrus GX501 | |
| Aorus X5 v6 | |
| Creative Score Accelerated v2 | |
| Aorus X5 v6 | |
| Asus Zephyrus GX501VS | |
| EVGA SC15 | |
| PCMark 8 Home Score Accelerated v2 | 5009 points | |
| PCMark 8 Creative Score Accelerated v2 | 7653 points | |
| PCMark 8 Work Score Accelerated v2 | 5358 points | |
| PCMark 10 Score | 4333 points | |
Help | ||
Storage Devices
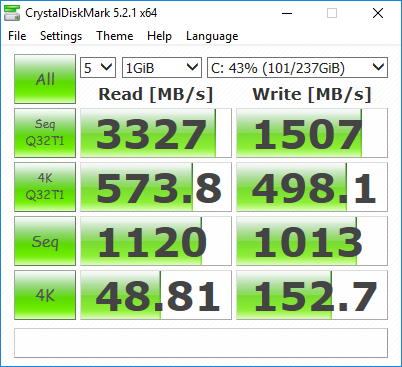
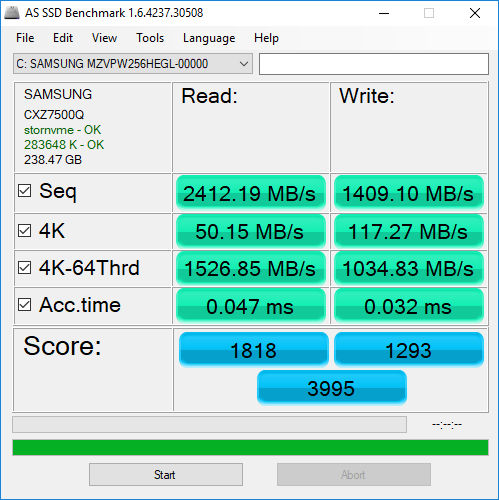
The same Samsung SM961 NVMe SSD from the GX501VI occupies the single M.2 2280 slot but at half the storage capacity. While 256 GB is plenty for an Ultrabook, it can be considered the bare minimum for a gaming machine as a handful of AAA titles will already occupy more than half of the drive. External HDDs will be necessary for those who intend on using the Zephyrus as their primary gaming machine. Otherwise, sequential transfer rates from the SM961 are measurably faster than the older SM951 by about 20 percent.
See our table of SSDs and HDDs for more benchmark comparisons.
| Asus Zephyrus GX501VS Samsung SM961 MZVPW256HEGL | MSI GT62VR 7RE-223 Samsung SSD PM871a MZNLN256HMHQ | Eurocom Tornado F5 Samsung SSD 960 Pro 512 GB m.2 | Aorus X5 v6 Samsung SM951 MZVPV256 m.2 | EVGA SC15 Toshiba NVMe THNSN5256GPU7 | |
|---|---|---|---|---|---|
| AS SSD | -63% | 22% | -76% | -20% | |
| Copy Game MB/s (MB/s) | 719 | 377.8 -47% | 1310 82% | 1073 49% | 977 36% |
| Copy Program MB/s (MB/s) | 383.3 | 199 -48% | 635 66% | 351.5 -8% | 442.3 15% |
| Copy ISO MB/s (MB/s) | 1795 | 354.7 -80% | 1614 -10% | 351.1 -80% | 1071 -40% |
| Score Total (Points) | 3995 | 1019 -74% | 3943 -1% | 1630 -59% | 2474 -38% |
| Score Write (Points) | 1293 | 304 -76% | 1689 31% | 514 -60% | 896 -31% |
| Score Read (Points) | 1818 | 472 -74% | 1512 -17% | 756 -58% | 1081 -41% |
| Access Time Write * (ms) | 0.032 | 0.037 -16% | 0.024 25% | 0.025 22% | 0.035 -9% |
| Access Time Read * (ms) | 0.047 | 0.1 -113% | 0.03 36% | 0.367 -681% | 0.054 -15% |
| 4K-64 Write (MB/s) | 1035 | 171.6 -83% | 1334 29% | 272.5 -74% | 706 -32% |
| 4K-64 Read (MB/s) | 1527 | 383.4 -75% | 1179 -23% | 521 -66% | 822 -46% |
| 4K Write (MB/s) | 117.3 | 104 -11% | 150.5 28% | 131.3 12% | 95.5 -19% |
| 4K Read (MB/s) | 50.2 | 37.2 -26% | 51 2% | 44.6 -11% | 39.13 -22% |
| Seq Write (MB/s) | 1409 | 288.2 -80% | 2046 45% | 1099 -22% | 943 -33% |
| Seq Read (MB/s) | 2412 | 510 -79% | 2819 17% | 1904 -21% | 2203 -9% |
* ... smaller is better

GPU Performance
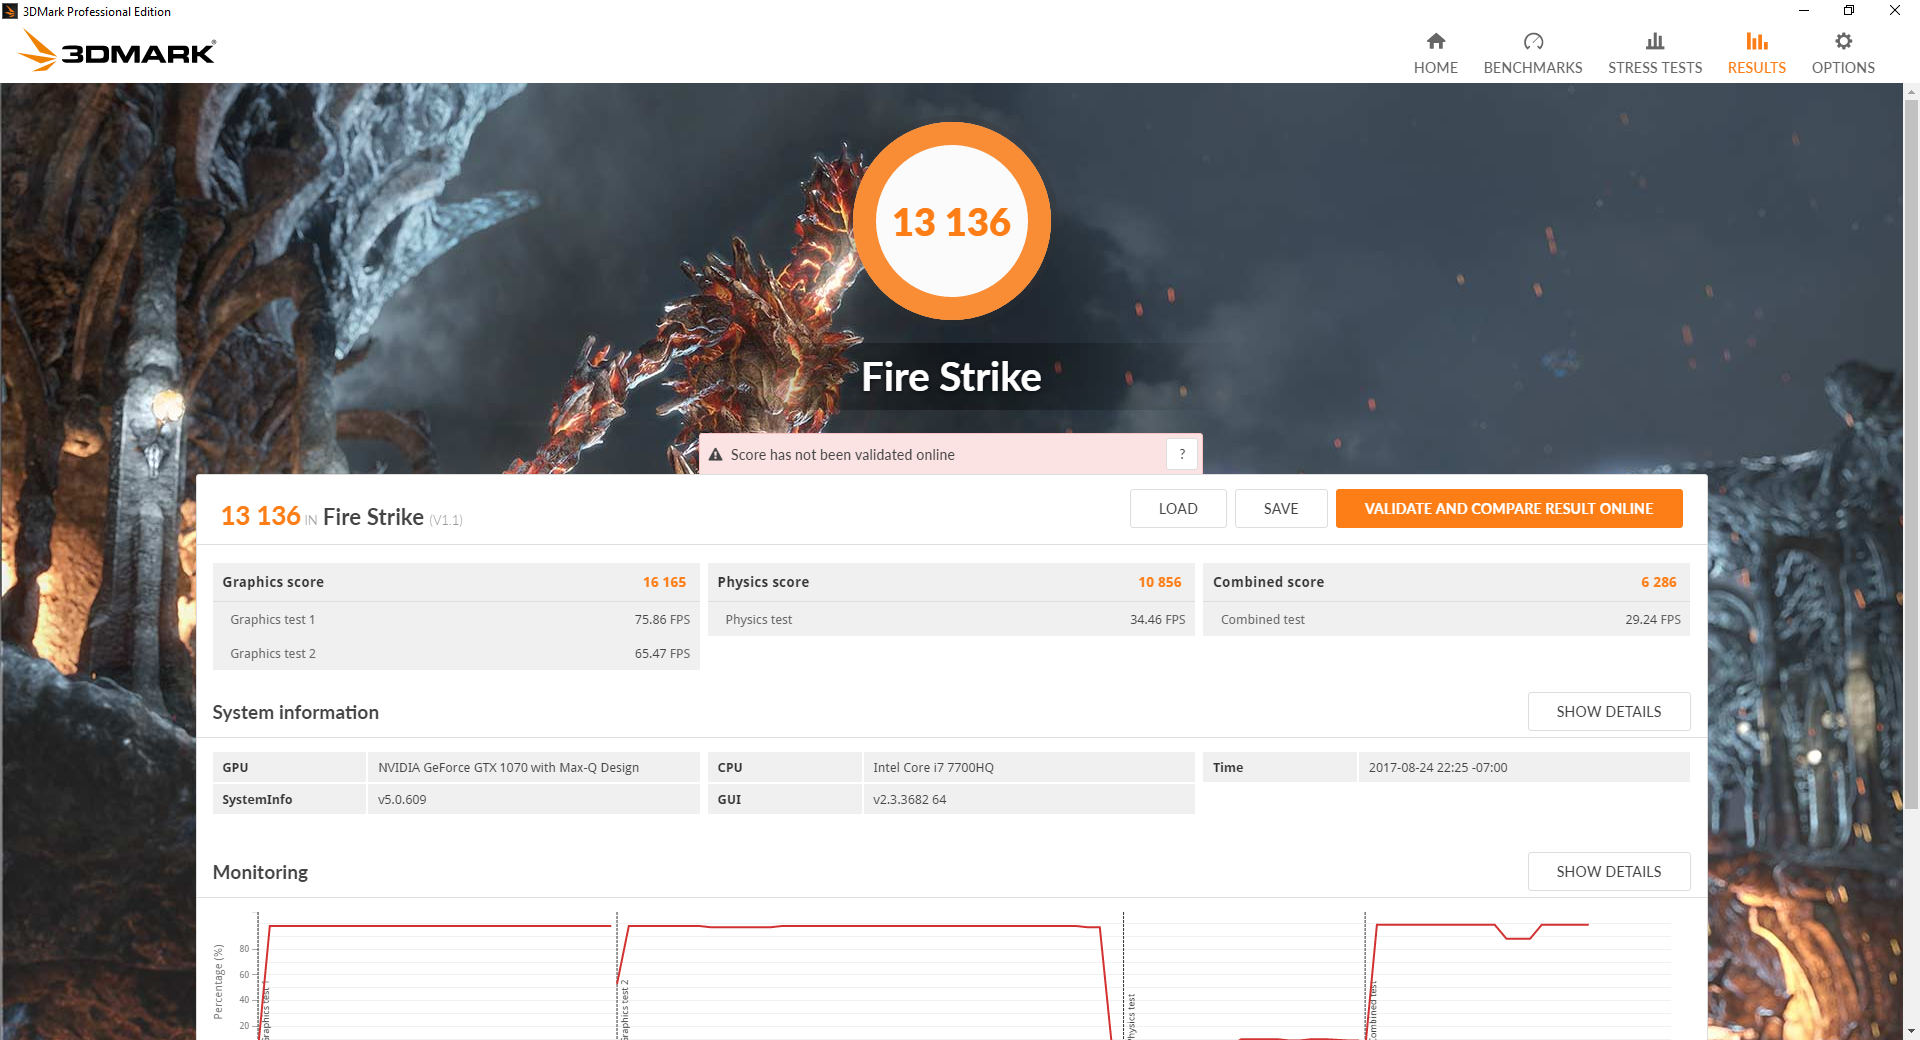
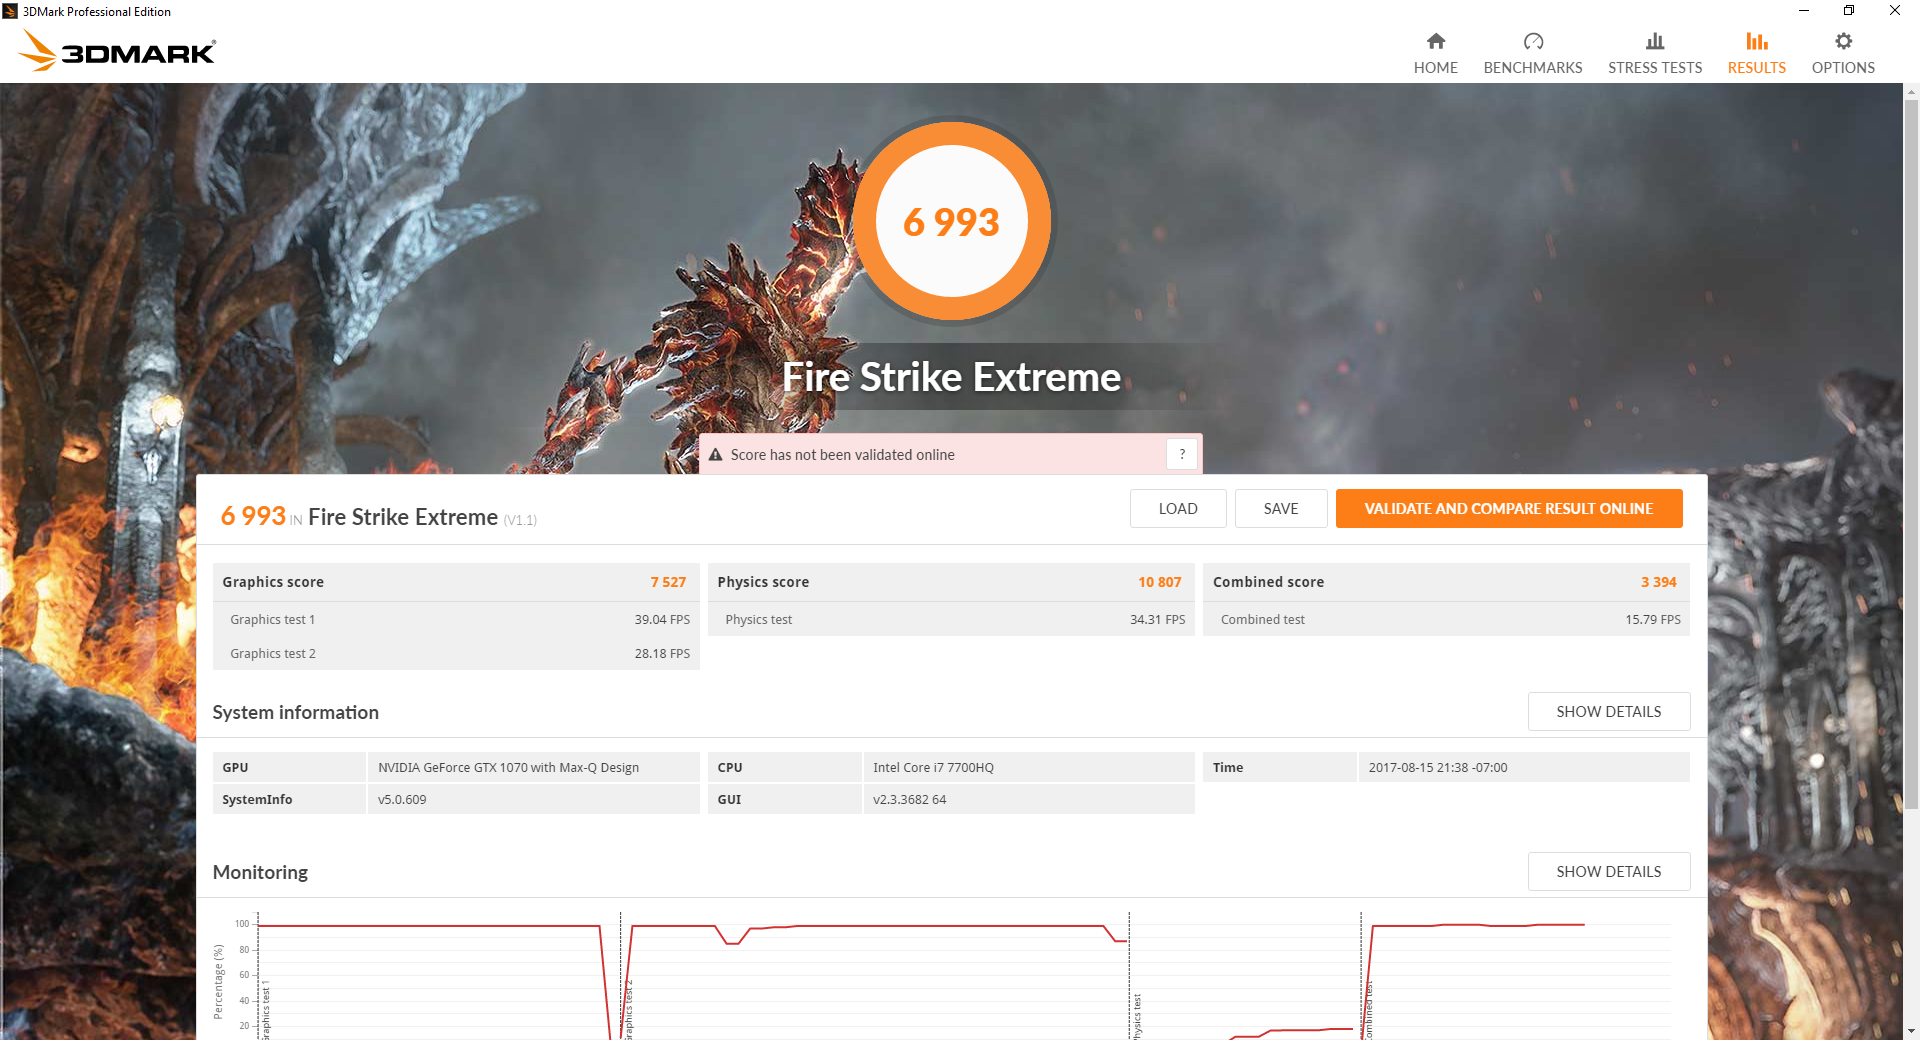
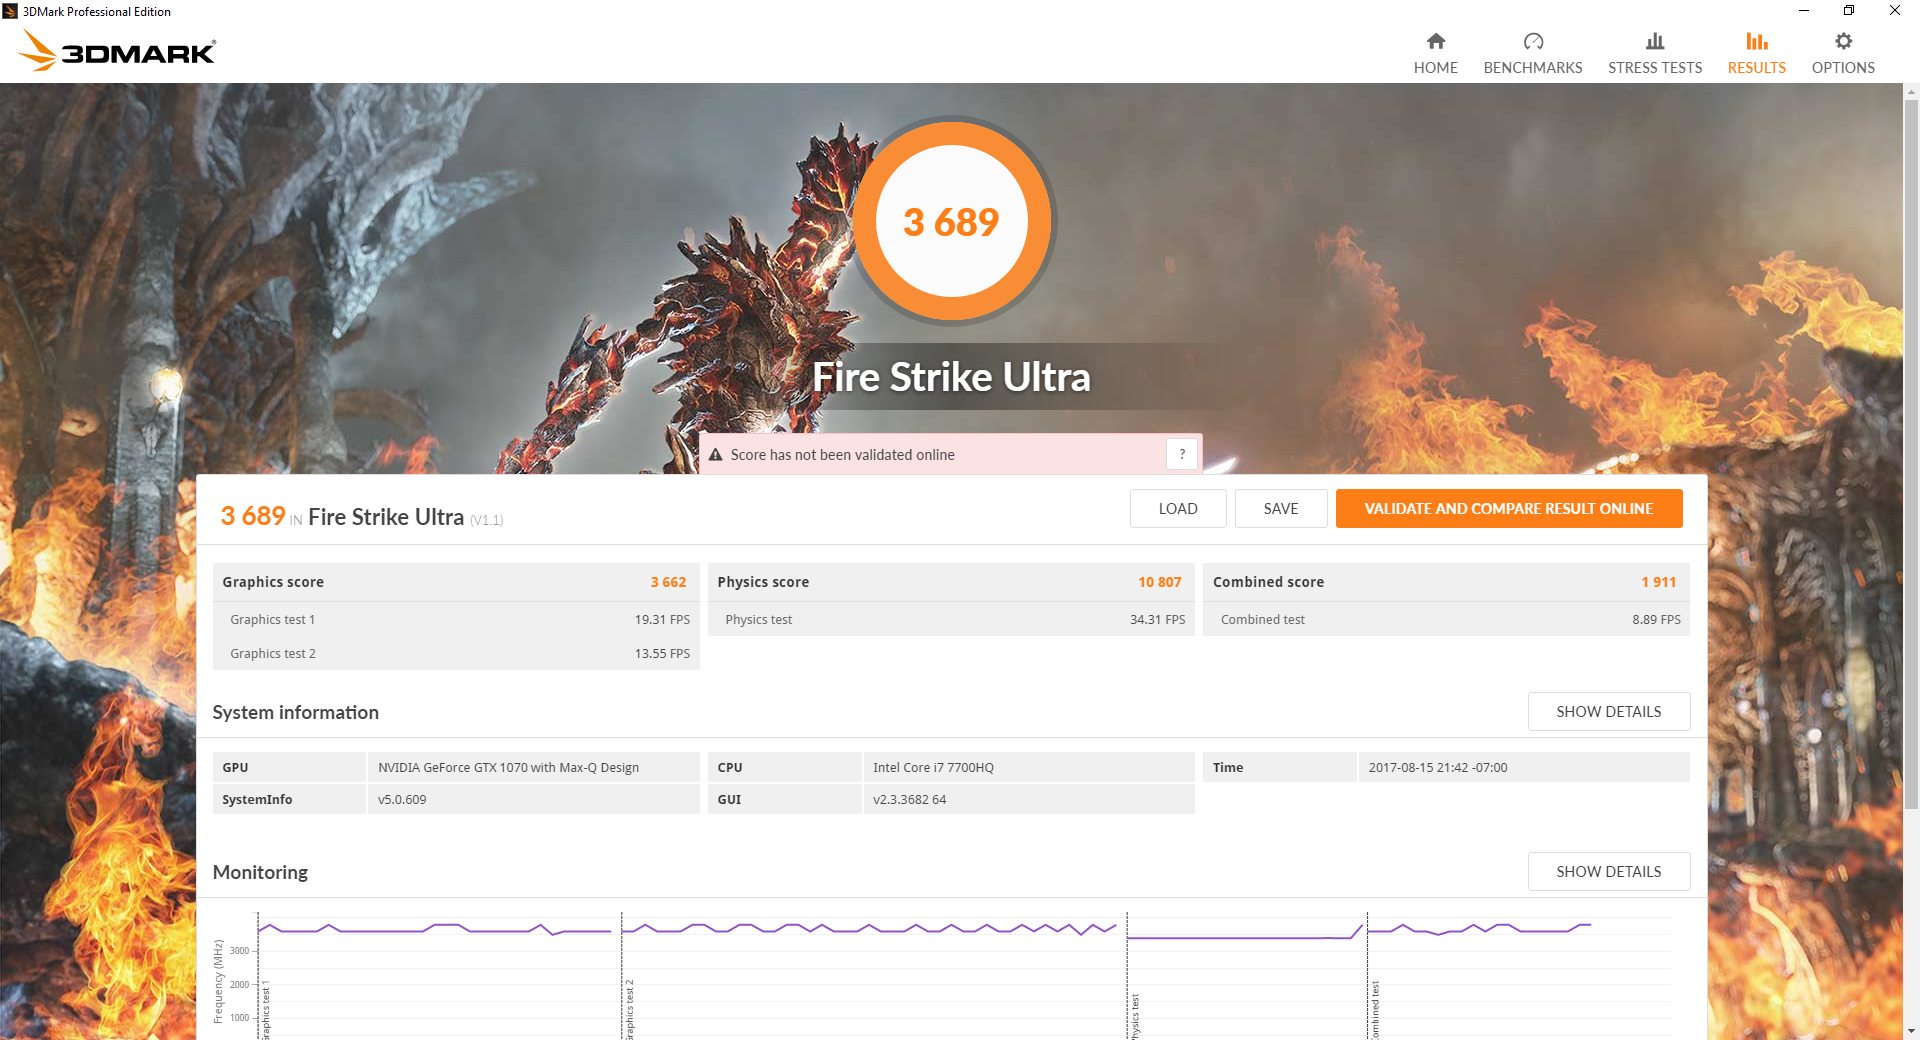
3DMark benchmarks consistently rank our GTX 1070 Max-Q in between the standard GTX 1060 and GTX 1070 for notebooks. Depending on the resolution setting, performance may be closer to the GTX 1060 than to the GTX 1070. Fire Strike Ultra, for example, renders at 4K UHD where the number of CUDA cores begin to matter more than raw GPU clock rates. Performance is therefore higher than the GTX 1060 when running Fire Strike Ultra (+27 percent) than when running the standard Fire Strike at 1080p (+24 percent). Users who intend to game at resolutions higher than 1080p or with supersampling enabled will have more to gain from the GTX 1070 Max-Q than on the GTX 1060. Jumping from the GTX 1070 Max-Q to the GTX 1080 Max-Q is about the same as the jump to the GTX 1070 in terms of raw performance.
See our dedicated preview on the GeForce Max-Q series for more information on the GPU.
(August 24 update: Reran 3DMark 11 and Fire Strike for corrected scores after updating GeForce Experience.)
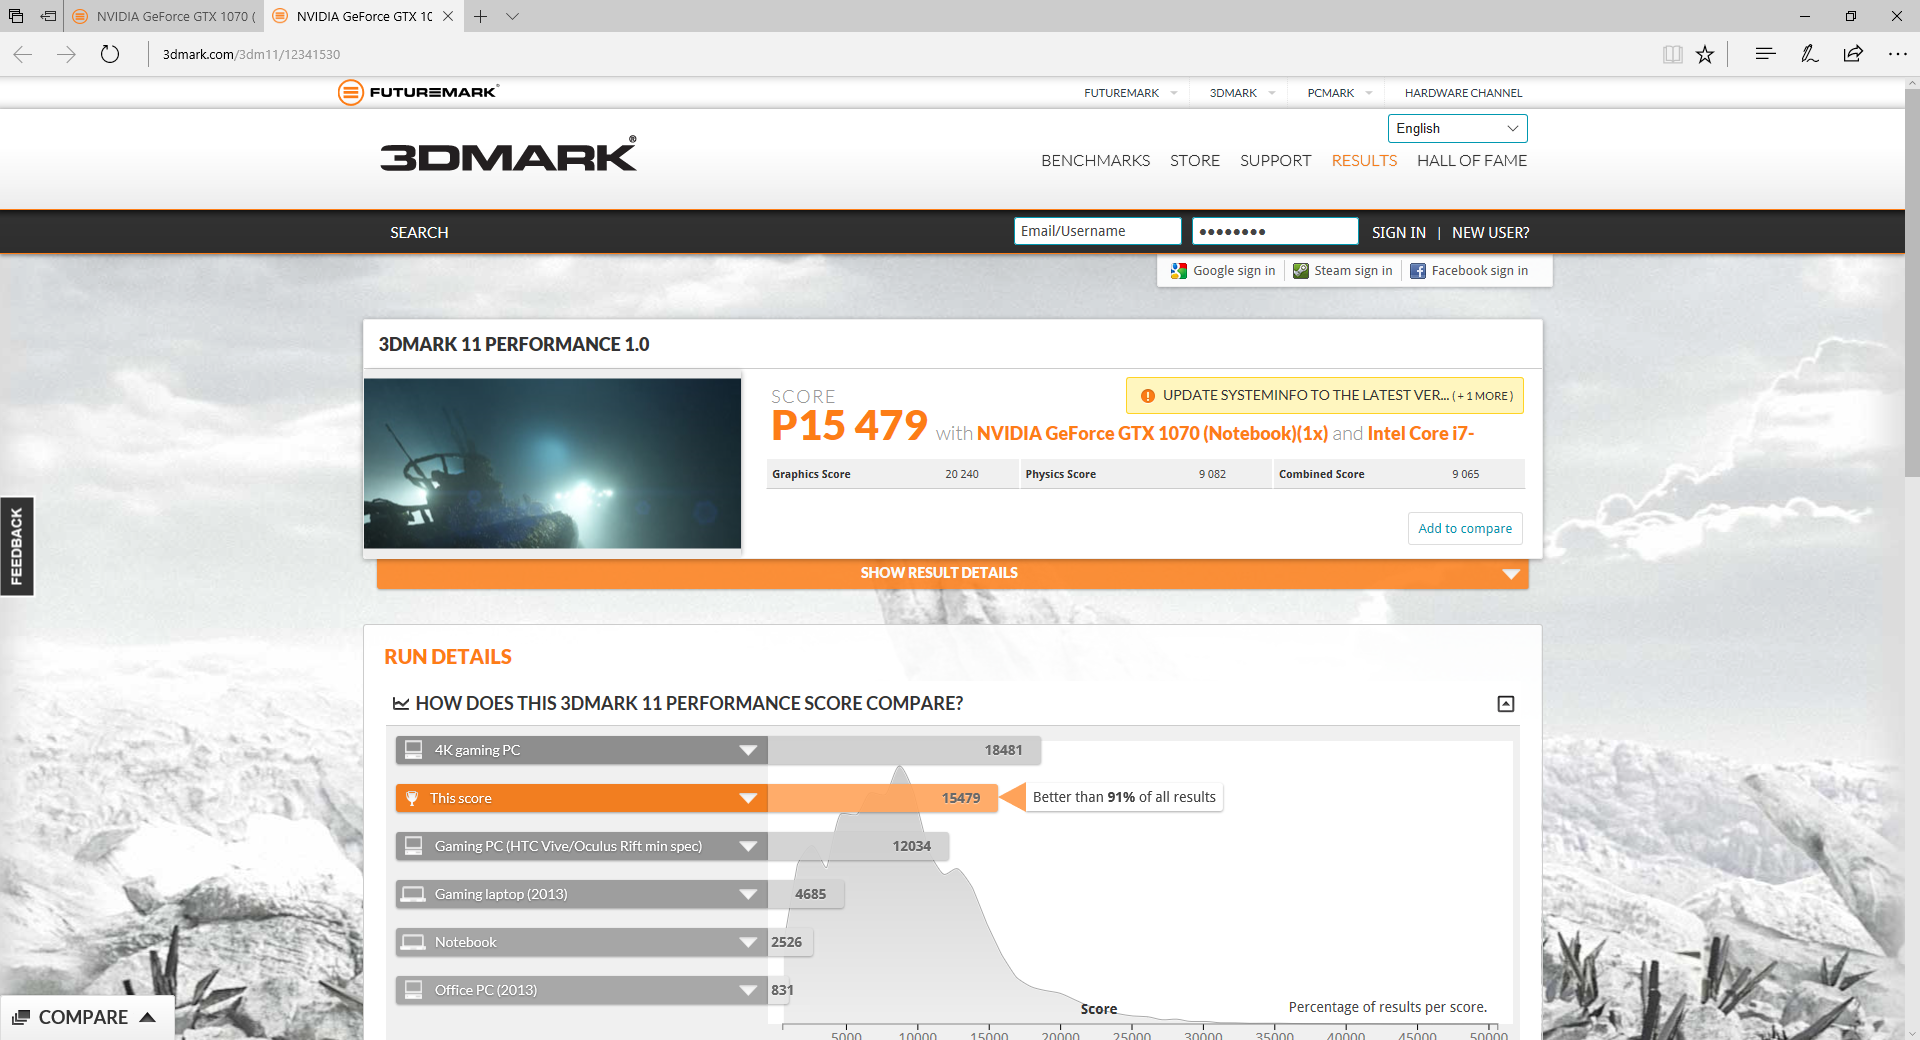
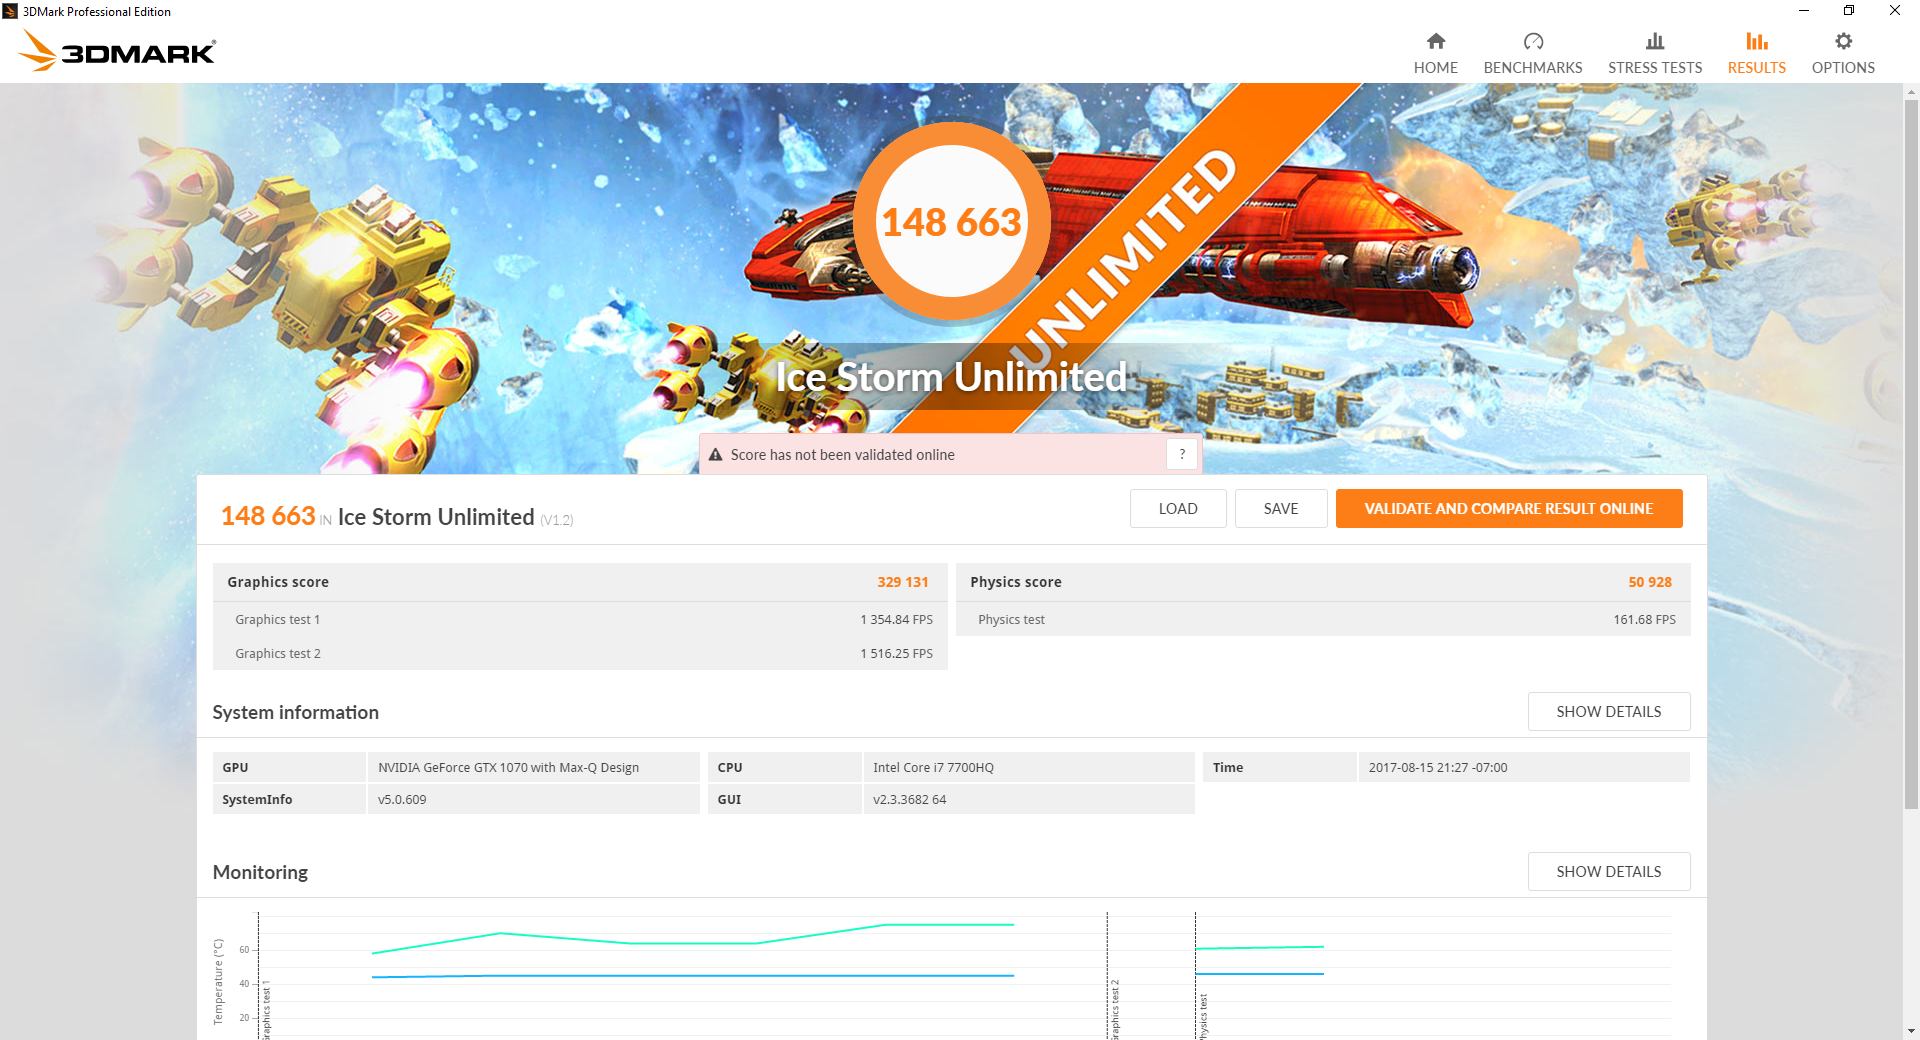
| 3DMark 11 Performance | 15479 points | |
| 3DMark Ice Storm Standard Score | 140612 points | |
| 3DMark Cloud Gate Standard Score | 27890 points | |
| 3DMark Fire Strike Score | 13136 points | |
| 3DMark Fire Strike Extreme Score | 6993 points | |
Help | ||
Gaming Performance
Performance in games does not disappoint. Roughly speaking, the GTX 1070 Max-Q provides a 25 percent and 50 percent performance boost over the GTX 1060 and GTX 1060 Max-Q, respectively, when running Witcher 3 at 1080p. Most titles will run stably at 1080p60 on maximum settings.
See our page on the GTX 1070 Max-Q for more technical information and benchmark comparisons.
| The Witcher 3 - 1920x1080 Ultra Graphics & Postprocessing (HBAO+) | |
| MSI GT75VR 7RF-012 Titan Pro | |
| Asus Zephyrus GX501 | |
| Aorus X7 v7 | |
| Asus Zephyrus GX501VS | |
| MSI GS43VR 7RE-069US | |
| HP Omen 15-ce002ng | |
| HP Omen 17-w206ng | |
| Gigabyte Sabre 15G | |
| low | med. | high | ultra | |
|---|---|---|---|---|
| Guild Wars 2 (2012) | 70 | |||
| BioShock Infinite (2013) | 131.6 | |||
| Metro: Last Light (2013) | 108.4 | |||
| Thief (2014) | 98.8 | |||
| The Witcher 3 (2015) | 96 | 51 | ||
| Batman: Arkham Knight (2015) | 111 | 79 | ||
| Metal Gear Solid V (2015) | 60 | |||
| Fallout 4 (2015) | 95.3 | |||
| Rise of the Tomb Raider (2016) | 85.9 | |||
| Ashes of the Singularity (2016) | 74.2 | 72.8 | ||
| Overwatch (2016) | 81.3 | |||
| Mafia 3 (2016) | 56 | |||
| Prey (2017) | 140.8 | |||
| Dirt 4 (2017) | 82.7 |
Stress Test
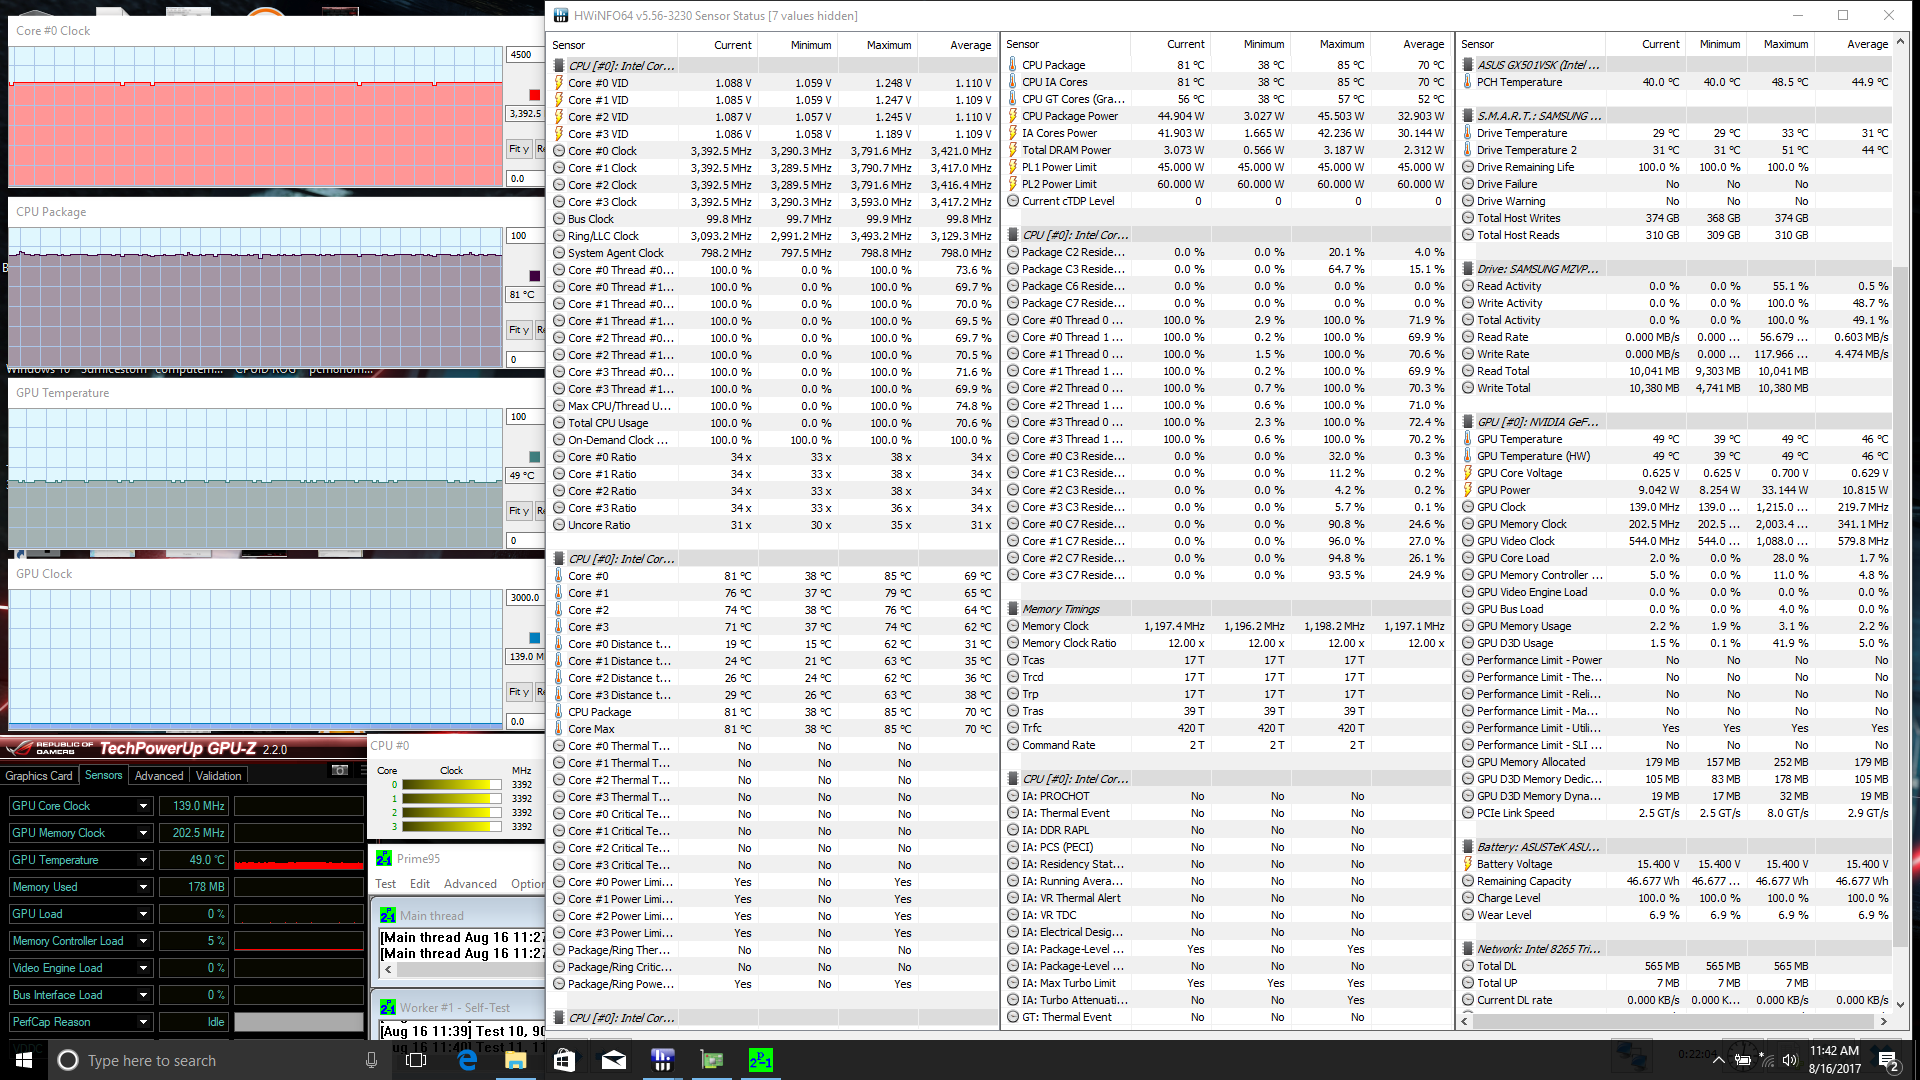
We stress the notebook with synthetic benchmarks to identify for any potential throttling or stability issues. When running Prime95, the CPU can be observed operating at a steady 3.4 GHz or an impressive 600 MHz above its base clock rate without any hints of slowdown. This result is in line with the steady CineBench loop scores above and is quite an impressive feat for such a small notebook.
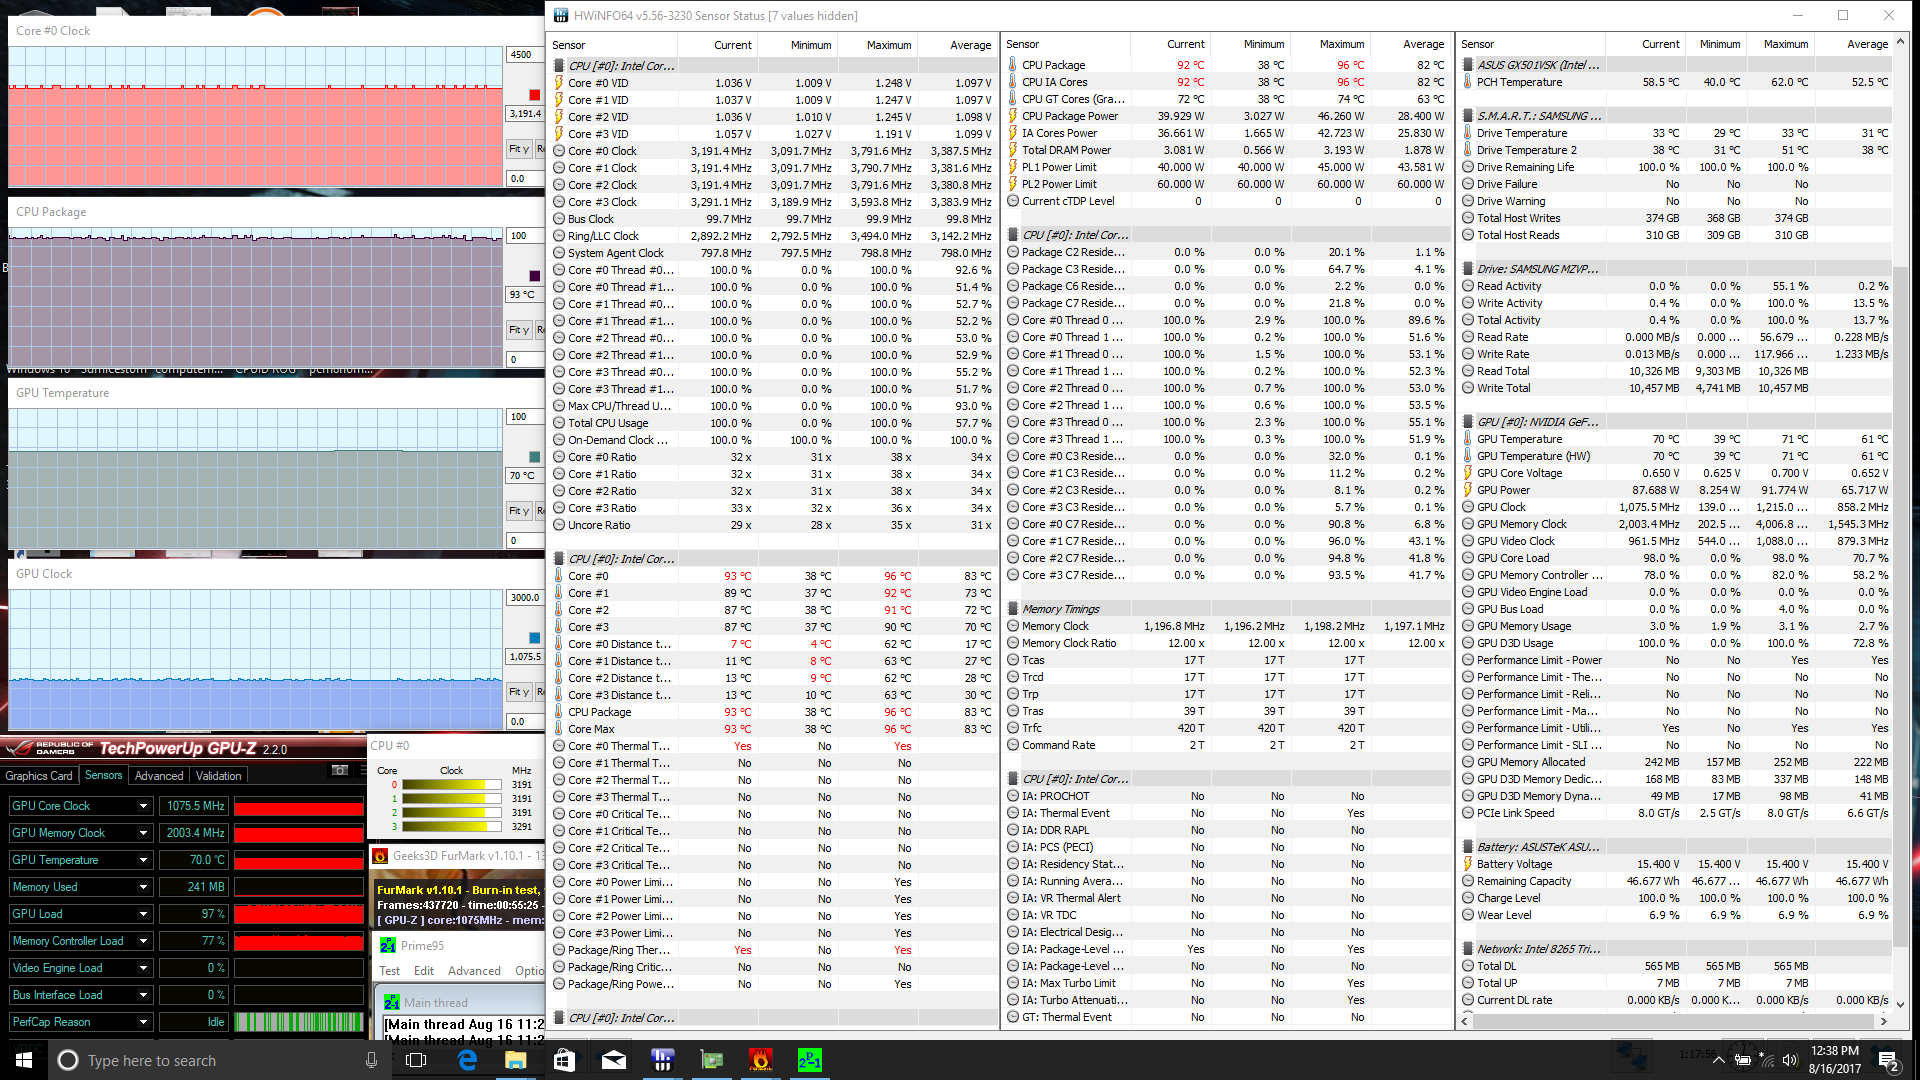
Running both Prime95 and FurMark simultaneously to stress the CPU and GPU will bring CPU clock rate and temperature to a steady 3.2 GHz and 93 C, respectively. In particular, the Nvidia GPU will never operate above its imposed temperature ceiling of 70 C and will throttle the clock rate accordingly.
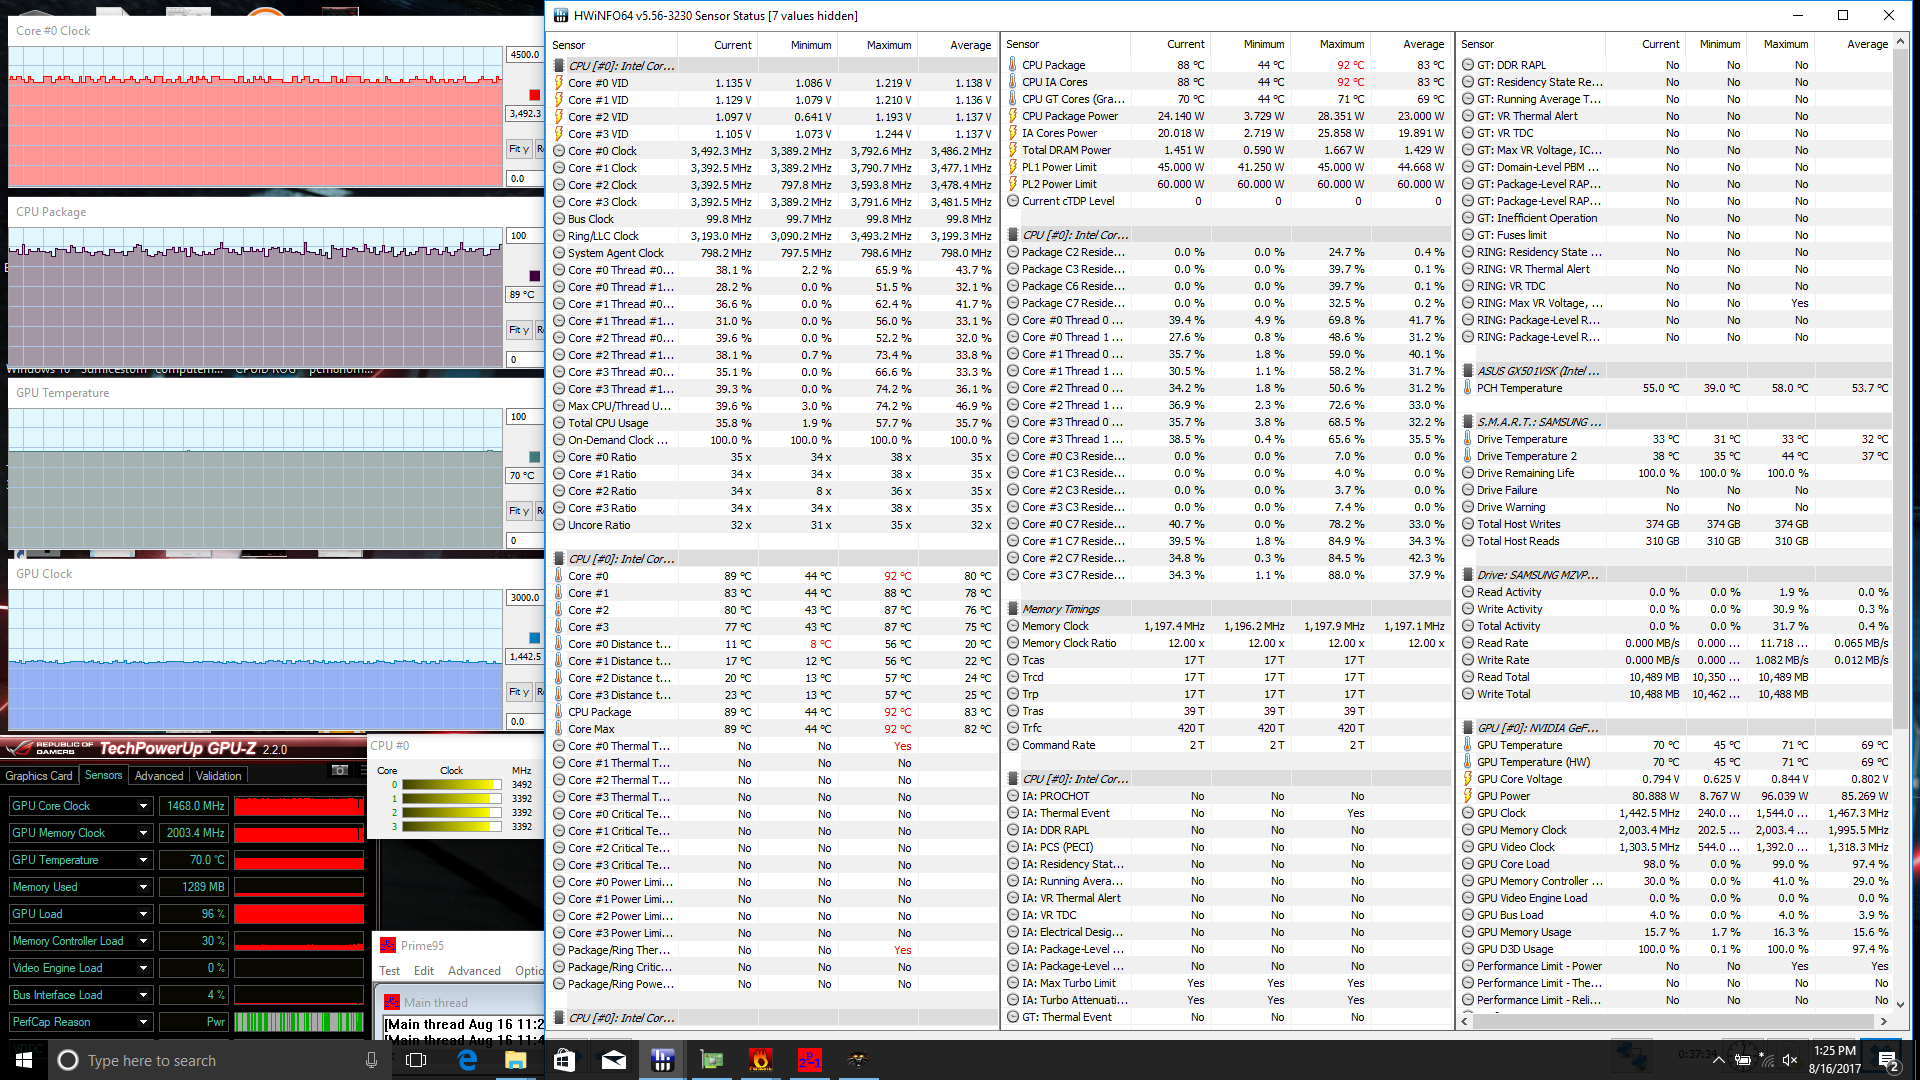
Witcher 3 stress will initially see the GPU running at 1544 MHz until hitting the 71 C mark where it will then throttle down to a steady 1443 MHz in order to maintain a core temperature of 70 C. This is remarkably cool for a thin gaming notebook as the GPUs in the GS63VR (GTX 1060), Aorus X5 v6 (GTX 1070), and Gigabyte P56XT (GTX 1070) can reach well over 80 C or even 90 C when under similar loads. The standard GTX 1070 in the SC15 stabilizes at a similar core temperature of 71 C but with a faster clock rate of ~1607 MHz. Moving up to the GX501VI and its GTX 1080 Max-Q will see the GPU temperature at about 10 C warmer than our GX502VS configuration. CPU temperature, however, will plateau at a very warm 88 C on the GX502VS. Frame rates remain steady at around 51 FPS after about one hour of running the game with very slight single-digit fluctuations due to the in-game day-night cycle.
Running on battery power will throttle GPU performance just slightly even when the "Prefer maximum performance" setting is active. A Fire Strike run on batteries results in Physics and Graphics scores of 10965 and 12842 points, respectively, compared to 10828 and 14053 points when on mains.
| CPU Clock (GHz) | GPU Clock (MHz) | Average CPU Temperature (°C) | Average GPU Temperature (°C) | |
| Prime95 Stress | 3.4 | -- | 81 | -- |
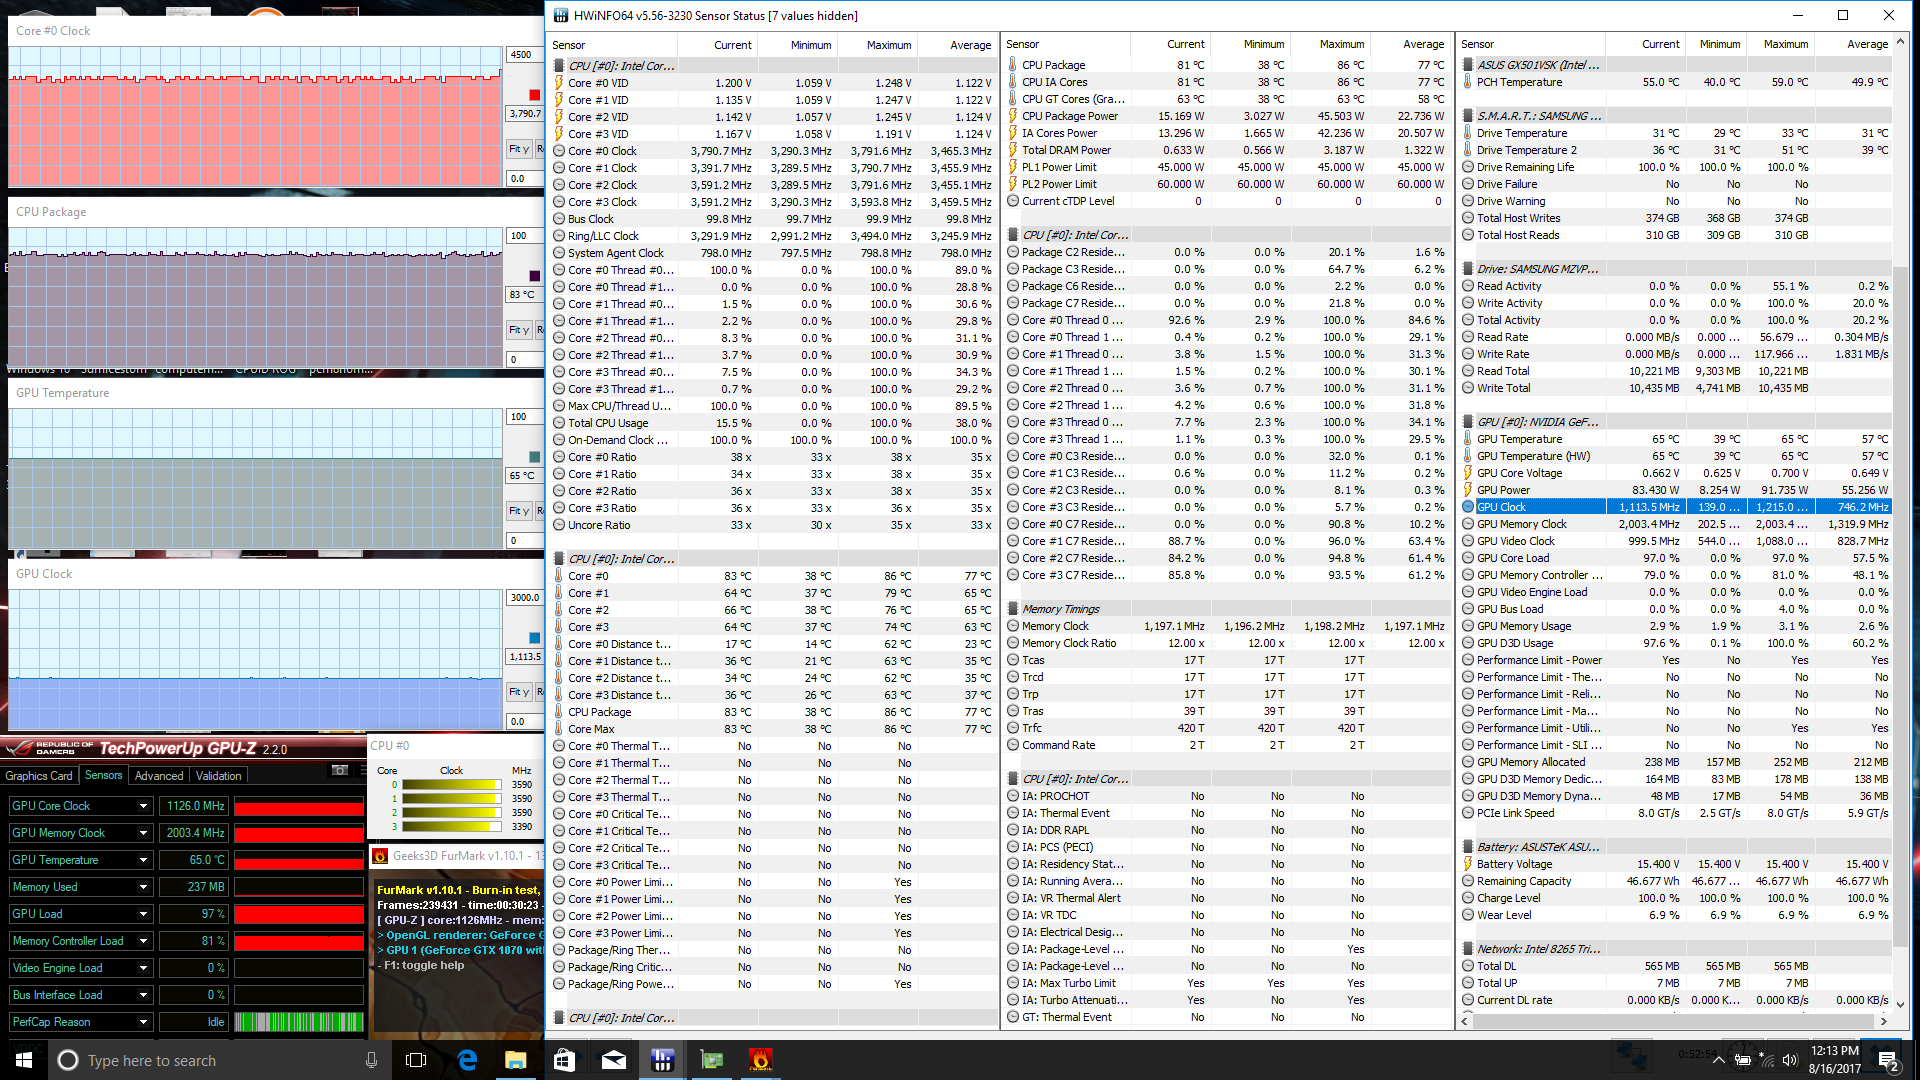
| FurMark Stress | -- | 1114 | -- | 65 |
| Prime95 + FurMark Stress | 3.2 | 1076 | 93 | 70 |
| Witcher 3 Stress | 3.4 - 3.5 | 1443 | 88 | 70 |
Emissions
System Noise
The cooling solution is respectable considering the notebook size as it consists of five heat pipes and twin fans to be somewhat similar to the thicker Aorus X5 series. The fans are idle when sitting on the desktop screen after a cold boot, but they are unfortunately very sensitive to onscreen loads. Common actions like launching a browser application or streaming video will initiate the fans to a low 30.1 dB(A). Heavier multi-tasking loads will boost the fans to the 33 dB(A) range and 3DMark06 will result in a steady 35.2 dB(A). Fan noise isn't necessarily loud during these low-medium loads, but the constantly shifting RPMs make the fans more noticeable than if they were just operating at a steadier and more consistent speed.
Running Witcher 3 will induce a fan noise of just under 42 dB(A) to be almost identical to the GX501VI. While still somewhat loud, this is nonetheless impressive for an ultrathin with GTX 1070-like graphics power. The thin Gigabyte P56XT (GTX 1070) and MSI GS63VR (GTX 1060), for example, are both significantly louder at 48 dB(A) and 46 dB(A), respectively, when under the same Witcher 3 stress test. We're wondering if Asus could have reduced fan noise even more on the GX501VS even if it meant higher GPU temperatures like on the GX501VI, but the already warm CPU would have likely suffered temperatures well north of 90 C.
The fan noise isn't distracting if playing racing games like Dirt 4. Quieter games like MGS V, however, will be more difficult without a headset. This isn't to say that all non Max-Q gaming laptops are louder as the EVGA SC15 (GTX 1060) and MSI GT72 (GTX 1060) will also operate stably in the low 40 dB(A) range at the cost of larger and heavier designs.
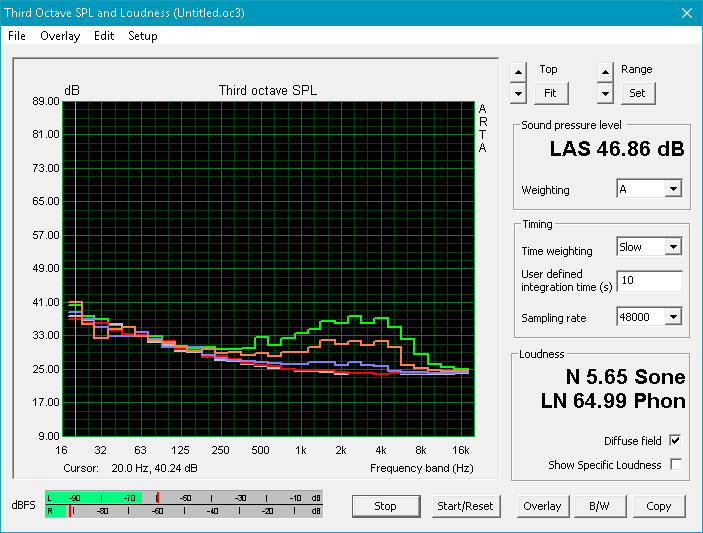
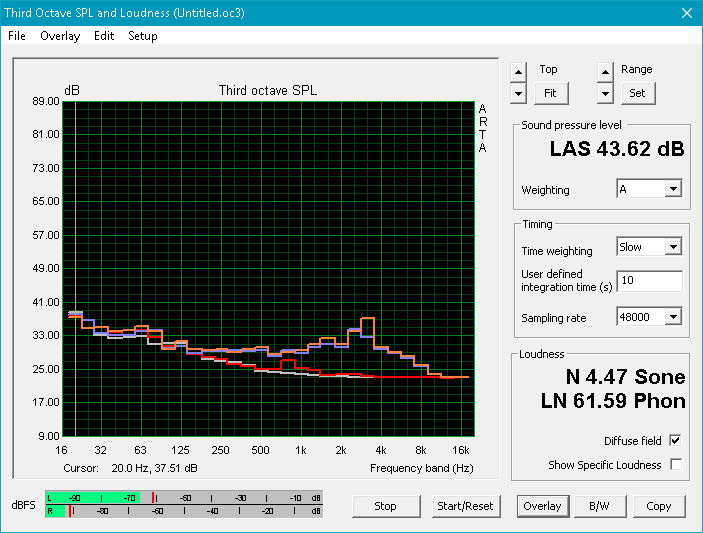
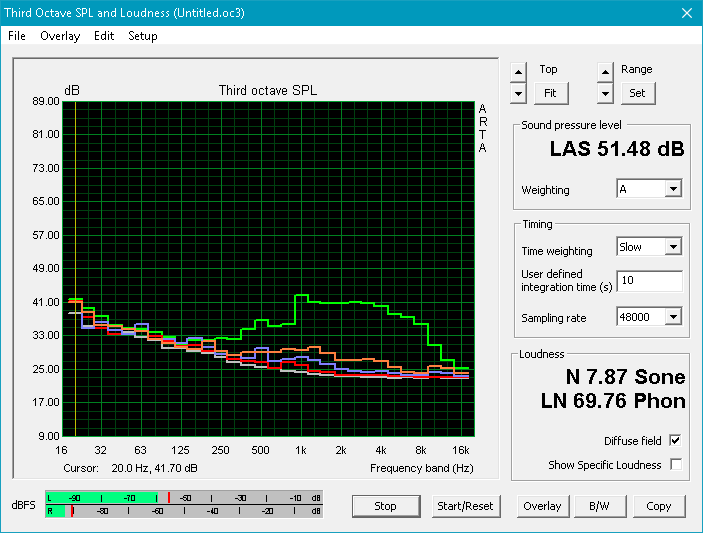
Fan noise frequency is thankfully lower than that of the GS63VR as represented by our microphone measurements below. The broader noise curves compared to the sharper peaks of the MSI mean lower-pitched fan noise during higher processing loads due to the Zephyrus's larger fans.
We're able to notice very slight electronic noise or coil whine on our GX502VS test unit near where the M.2 SSD is situated. It's thankfully minor and essentially unnoticeable in a standard office or gaming environment and shouldn't be a cause for concern.
Noise level
| Idle |
| 28.5 / 28.5 / 30.1 dB(A) |
| Load |
| 35.2 / 48.8 dB(A) |
 | ||
30 dB silent 40 dB(A) audible 50 dB(A) loud |
||
min: | ||
| Asus Zephyrus GX501VS GeForce GTX 1070 Max-Q, i7-7700HQ, Samsung SM961 MZVPW256HEGL | Asus Zephyrus GX501 GeForce GTX 1080 Max-Q, i7-7700HQ, Samsung SSD SM961 1TB M.2 MZVKW1T0HMLH | Gigabyte P56XT GeForce GTX 1070 Mobile, i7-7700HQ, LiteOn CX2-8B256 | MSI GT62VR 7RE-223 GeForce GTX 1070 Mobile, i7-7700HQ, Samsung SSD PM871a MZNLN256HMHQ | EVGA SC15 GeForce GTX 1060 Mobile, i7-7700HQ, Toshiba NVMe THNSN5256GPU7 | MSI GS63VR 7RF-228US GeForce GTX 1060 Mobile, i7-7700HQ, Samsung SM961 MZVKW512HMJP m.2 PCI-e | |
|---|---|---|---|---|---|---|
| Noise | -8% | -15% | -13% | -5% | -9% | |
| off / environment * (dB) | 28.5 | 31 -9% | 30 -5% | 30 -5% | 28 2% | 28.8 -1% |
| Idle Minimum * (dB) | 28.5 | 32 -12% | 34 -19% | 34 -19% | 31.9 -12% | 33.1 -16% |
| Idle Average * (dB) | 28.5 | 33 -16% | 35 -23% | 35 -23% | 32 -12% | 33.1 -16% |
| Idle Maximum * (dB) | 30.1 | 34 -13% | 39 -30% | 36 -20% | 32 -6% | 34 -13% |
| Load Average * (dB) | 35.2 | 39 -11% | 39 -11% | 40 -14% | 36.5 -4% | 37.2 -6% |
| Witcher 3 ultra * (dB) | 41.7 | 42 -1% | 48 -15% | 40.3 3% | 46.1 -11% | |
| Load Maximum * (dB) | 48.8 | 46 6% | 49 -0% | 46 6% | 53.4 -9% | 47.1 3% |
* ... smaller is better
Temperature
Surface temperature development is largely symmetrical and not all that much cooler than the GX501VI despite the GTX 1080 Max-Q running warmer under load. We were able to record a surface temperature of 54 C on the Asus ROG logo when under extreme (Prime95 + FurMark) processing conditions. The keyboard in particular is comparatively cooler and more even than on other thin gaming notebooks like the GS63VR or P56XT due again to the unique design of the Zephyrus. The warm temperatures will not interfere with user comfort if working on a flat desk. However, we don't recommend placing any papers or cups on the flat space above the keyboard as tempting as it may be since since there are ventilation grilles for the fans.
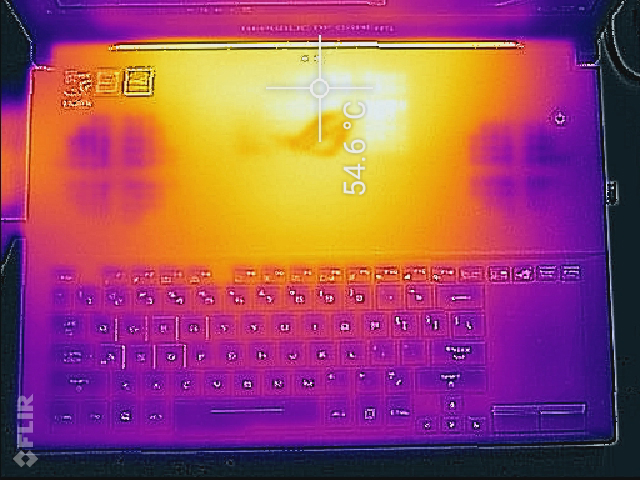
(-) The maximum temperature on the upper side is 54.4 °C / 130 F, compared to the average of 40.4 °C / 105 F, ranging from 21.2 to 68.8 °C for the class Gaming.
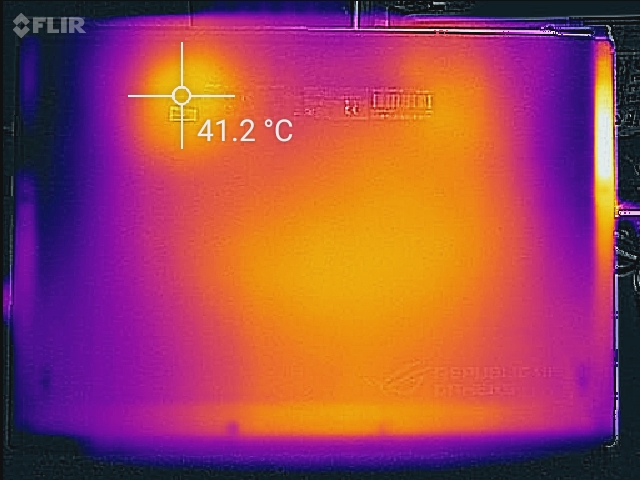
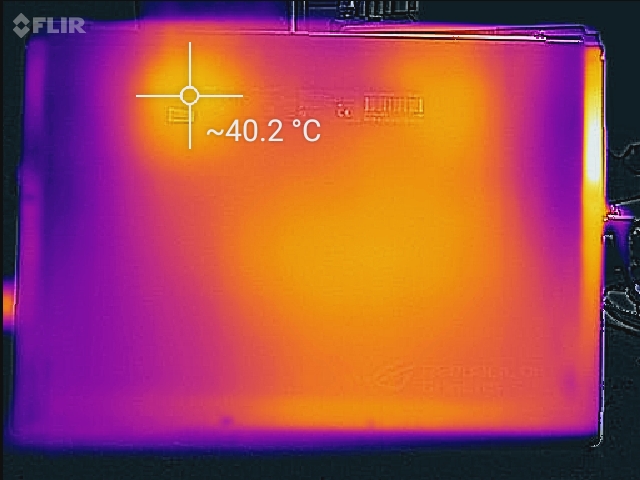
(±) The bottom heats up to a maximum of 41.2 °C / 106 F, compared to the average of 43.2 °C / 110 F
(+) In idle usage, the average temperature for the upper side is 27.2 °C / 81 F, compared to the device average of 33.9 °C / 93 F.
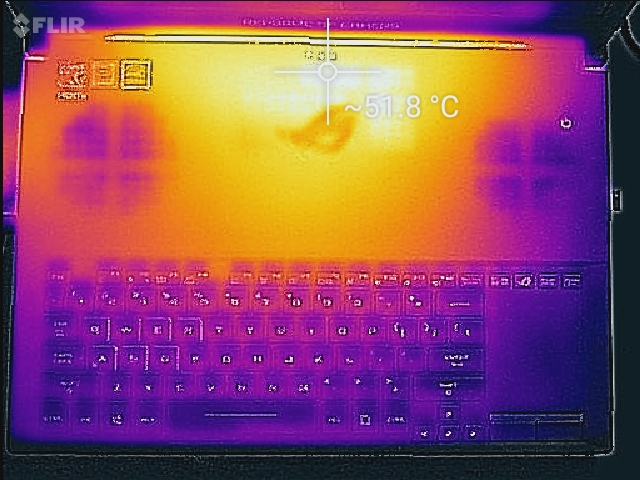
(-) Playing The Witcher 3, the average temperature for the upper side is 41.5 °C / 107 F, compared to the device average of 33.9 °C / 93 F.
(±) The palmrests and touchpad can get very hot to the touch with a maximum of 39 °C / 102.2 F.
(-) The average temperature of the palmrest area of similar devices was 28.8 °C / 83.8 F (-10.2 °C / -18.4 F).
Speakers
The stereo 2 W speakers are decent in quality and not all that different from the GS63VR. Bass is lacking especially when compared to systems with dedicated subwoofers like on the Eurocom X7E2, but maximum volume introduces no static and is sufficiently loud. A higher volume setting will not introduce any static and is sufficiently loud, but it will reverberate the chassis and keyboard since the speakers are so close to the front corners. Unlike the MSI GS/GT series and some Clevo barebones, there is no dedicated Sabre ESS DAC for supporting high impedance headphones or microphones.
The pink graph below was recorded with Bass Boost and Smart EQ set to maximum.
")


Asus Zephyrus GX501VS audio analysis
(-) | not very loud speakers (71.4 dB)
Bass 100 - 315 Hz
(-) | nearly no bass - on average 18.8% lower than median
(±) | linearity of bass is average (11.3% delta to prev. frequency)
Mids 400 - 2000 Hz
(+) | balanced mids - only 1.2% away from median
(+) | mids are linear (6.3% delta to prev. frequency)
Highs 2 - 16 kHz
(±) | higher highs - on average 6.5% higher than median
(+) | highs are linear (6.3% delta to prev. frequency)
Overall 100 - 16.000 Hz
(±) | linearity of overall sound is average (23.4% difference to median)
Compared to same class
» 85% of all tested devices in this class were better, 5% similar, 11% worse
» The best had a delta of 6%, average was 18%, worst was 132%
Compared to all devices tested
» 70% of all tested devices were better, 6% similar, 24% worse
» The best had a delta of 4%, average was 24%, worst was 134%
Apple MacBook 12 (Early 2016) 1.1 GHz audio analysis
(+) | speakers can play relatively loud (83.6 dB)
Bass 100 - 315 Hz
(±) | reduced bass - on average 11.3% lower than median
(±) | linearity of bass is average (14.2% delta to prev. frequency)
Mids 400 - 2000 Hz
(+) | balanced mids - only 2.4% away from median
(+) | mids are linear (5.5% delta to prev. frequency)
Highs 2 - 16 kHz
(+) | balanced highs - only 2% away from median
(+) | highs are linear (4.5% delta to prev. frequency)
Overall 100 - 16.000 Hz
(+) | overall sound is linear (10.2% difference to median)
Compared to same class
» 7% of all tested devices in this class were better, 2% similar, 91% worse
» The best had a delta of 5%, average was 18%, worst was 53%
Compared to all devices tested
» 5% of all tested devices were better, 1% similar, 94% worse
» The best had a delta of 4%, average was 24%, worst was 134%
Frequency Comparison (Checkbox selectable!)
Graph 1: Pink Noise 100% Vol.; Graph 2: Audio off
Energy Management
Power Consumption
As one would expect, the GTX 1070 Max-Q notebook sits between the standard GTX 1060 and GTX 1070 in terms of power demand. Our chart below shows our GX501VS drawing about 20 W less than the more powerful GX501VI but slightly more than the GTX 1060-powered P56XT when running Witcher 3. In other words, we're getting a 14 percent power savings for an 11 percent performance drop in 3DMark Fire Strike when compared to the GX501VI. Savings against a standard GTX 1070 notebook is only slightly better at 18 to 20 percent with a Fire Strike performance deficit of 7 percent. The power consumption and raw graphics performance differences when compared to the GTX 1070 or GTX 1080 Max-Q are not significantly different from one another based on these examples.
Extreme loads with both Prime95 and FurMark running simultaneously will draw about 173 W from a medium-sized (~17 x 8.5 x 3.5 cm) AC adapter rated for 230 W. There is plenty of headroom here since this is the same adapter that must also accommodate the more demanding GTX 1080 Max-Q GX501VI SKU.
| Off / Standby | |
| Idle | |
| Load |
|
Key:
min: | |
| Asus Zephyrus GX501VS i7-7700HQ, GeForce GTX 1070 Max-Q, Samsung SM961 MZVPW256HEGL, IPS, 1920x1080, 15.6" | Gigabyte P56XT i7-7700HQ, GeForce GTX 1070 Mobile, LiteOn CX2-8B256, IPS, 1920x1080, 15.6" | EVGA SC15 i7-7700HQ, GeForce GTX 1060 Mobile, Toshiba NVMe THNSN5256GPU7, , 1920x1080, 15.6" | Asus Zephyrus GX501 i7-7700HQ, GeForce GTX 1080 Max-Q, Samsung SSD SM961 1TB M.2 MZVKW1T0HMLH, IPS, 1920x1080, 15.6" | MSI GT75VR 7RF-012 Titan Pro i7-7820HK, GeForce GTX 1080 Mobile, 2x Samsung SM961 MZVPW256HEGL NVMe (RAID 0), TN LED, 1920x1080, 17.3" | |
|---|---|---|---|---|---|
| Power Consumption | -1% | -13% | -14% | -88% | |
| Idle Minimum * (Watt) | 19.1 | 13 32% | 25.8 -35% | 18 6% | 34 -78% |
| Idle Average * (Watt) | 20.8 | 17 18% | 26.6 -28% | 23 -11% | 41 -97% |
| Idle Maximum * (Watt) | 21.8 | 22 -1% | 26.7 -22% | 31 -42% | 50 -129% |
| Load Average * (Watt) | 73.7 | 85 -15% | 80.3 -9% | 79 -7% | 106 -44% |
| Witcher 3 ultra * (Watt) | 130.2 | 154 -18% | 121.2 7% | 148 -14% | 257 -97% |
| Load Maximum * (Watt) | 173.1 | 208 -20% | 159.3 8% | 196 -13% | 320 -85% |
* ... smaller is better
Battery Life
Max-Q is no substitution for Optimus if long runtimes are priority. Battery life is only a few minutes longer than on the Zephyrus GX501VI at just under 2.5 hours when under similar WLAN loads. Competing 15.6-inch gaming notebooks tend to last longer due in part to the smaller battery capacity of the Zephyrus. The GS63VR, for example, carries a 65 Wh battery compared to 50 Wh on our Asus.
Charging from near empty to full capacity is rather quick at just under 1.5 hours.
| Asus Zephyrus GX501VS i7-7700HQ, GeForce GTX 1070 Max-Q, 50 Wh | MSI GT62VR 7RE-223 i7-7700HQ, GeForce GTX 1070 Mobile, 75 Wh | Gigabyte P56XT i7-7700HQ, GeForce GTX 1070 Mobile, 91.2 Wh | Aorus X5 v6 6820HK, GeForce GTX 1070 Mobile, 94.24 Wh | EVGA SC15 i7-7700HQ, GeForce GTX 1060 Mobile, 62 Wh | Asus Zephyrus GX501 i7-7700HQ, GeForce GTX 1080 Max-Q, 50 Wh | |
|---|---|---|---|---|---|---|
| Battery runtime | 77% | 152% | 48% | 28% | -14% | |
| Reader / Idle (h) | 3.8 | 6.3 66% | 9.5 150% | 4.2 11% | 3.7 -3% | 3.1 -18% |
| WiFi v1.3 (h) | 2.5 | 4.1 64% | 6.4 156% | 3 20% | 2.8 12% | 2.2 -12% |
| Load (h) | 0.8 | 1.6 100% | 2 150% | 1.7 113% | 1.4 75% | 0.7 -13% |
Pros
Cons
Verdict

The GX501VS is currently retailing for $500 cheaper than the $2800 GX501VI. Gamers who can cope with the ~15 percent performance drop from the GTX 1080 Max-Q to the GTX 1070 Max-Q will find a more compelling lower barrier to entry on this latest Zephyrus configuration. This is especially true if 120 FPS or 4K UHD gaming are not appealing as the GTX 1070 Max-Q is currently more than enough for 1080p60 on most tested titles. When compared to its closest non Max-Q competitors, the GX501 is impressively faster and quieter.
Beyond the performance discrepancies between the two Max-Q SKUs, our analyses on the GX501VI still apply to the GX501VS. Fan noise is about the same despite the slower GTX 1070 Max-Q running 10 C cooler when under gaming loads. CPU performance is steady at the cost of high core temperatures and the keyboard is still pretty subpar for gaming purposes.
The unique hinge feature continues to be a mixed bag. It allows for a very flat and attractive chassis, but this is definitely not the notebook to use on the lap or on the train without a flat desk. Even then, the up-close keyboard positioning disfavors tight spaces like on airplane flights. These disadvantages are at odds with the otherwise thin and portable design.
Asus's more affordable GX501VS packs a serious amount of power while running quieter than other superthin gaming notebooks currently in the market. Users who want the Zephyrus for its size, decent fan noise, and 1080p graphics potential will find a lot to like. Otherwise, larger and more traditional 15-inch gaming notebooks with standard GTX 1070 graphics will still give more for the money.
Asus Zephyrus GX501VS
- 08/25/2017 v6 (old)
Allen Ngo
Price comparison
