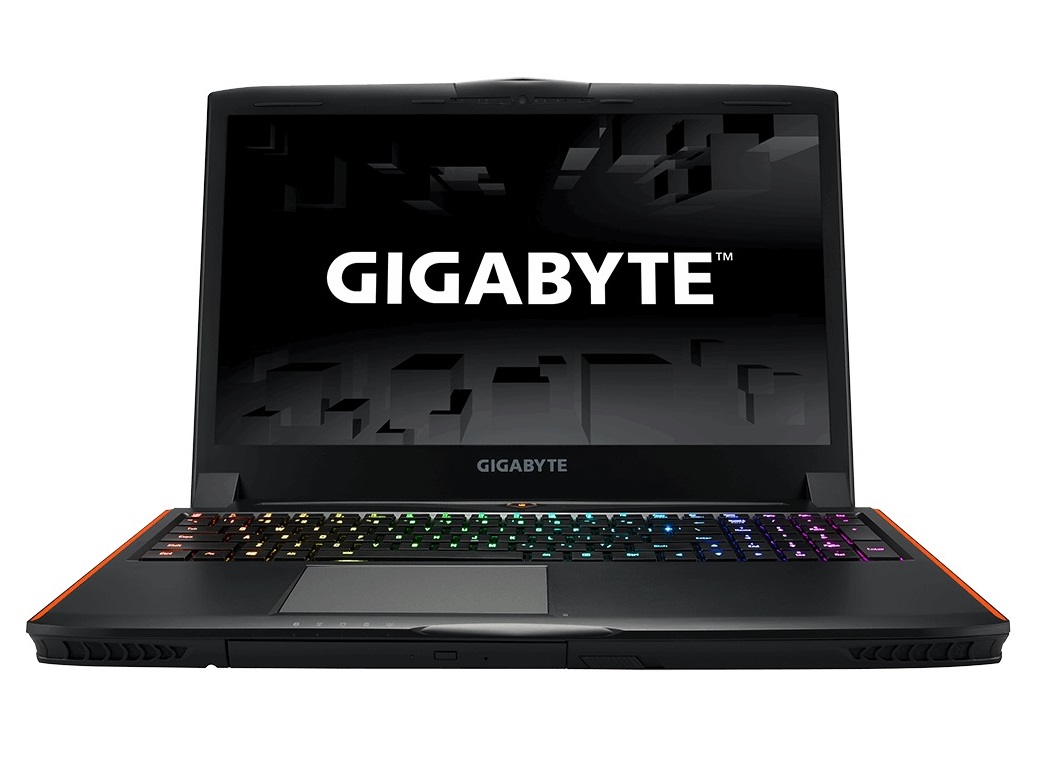
Gigabyte P56XT (7700HQ, GTX 1070, Full HD) Laptop

For the original German review, click here.
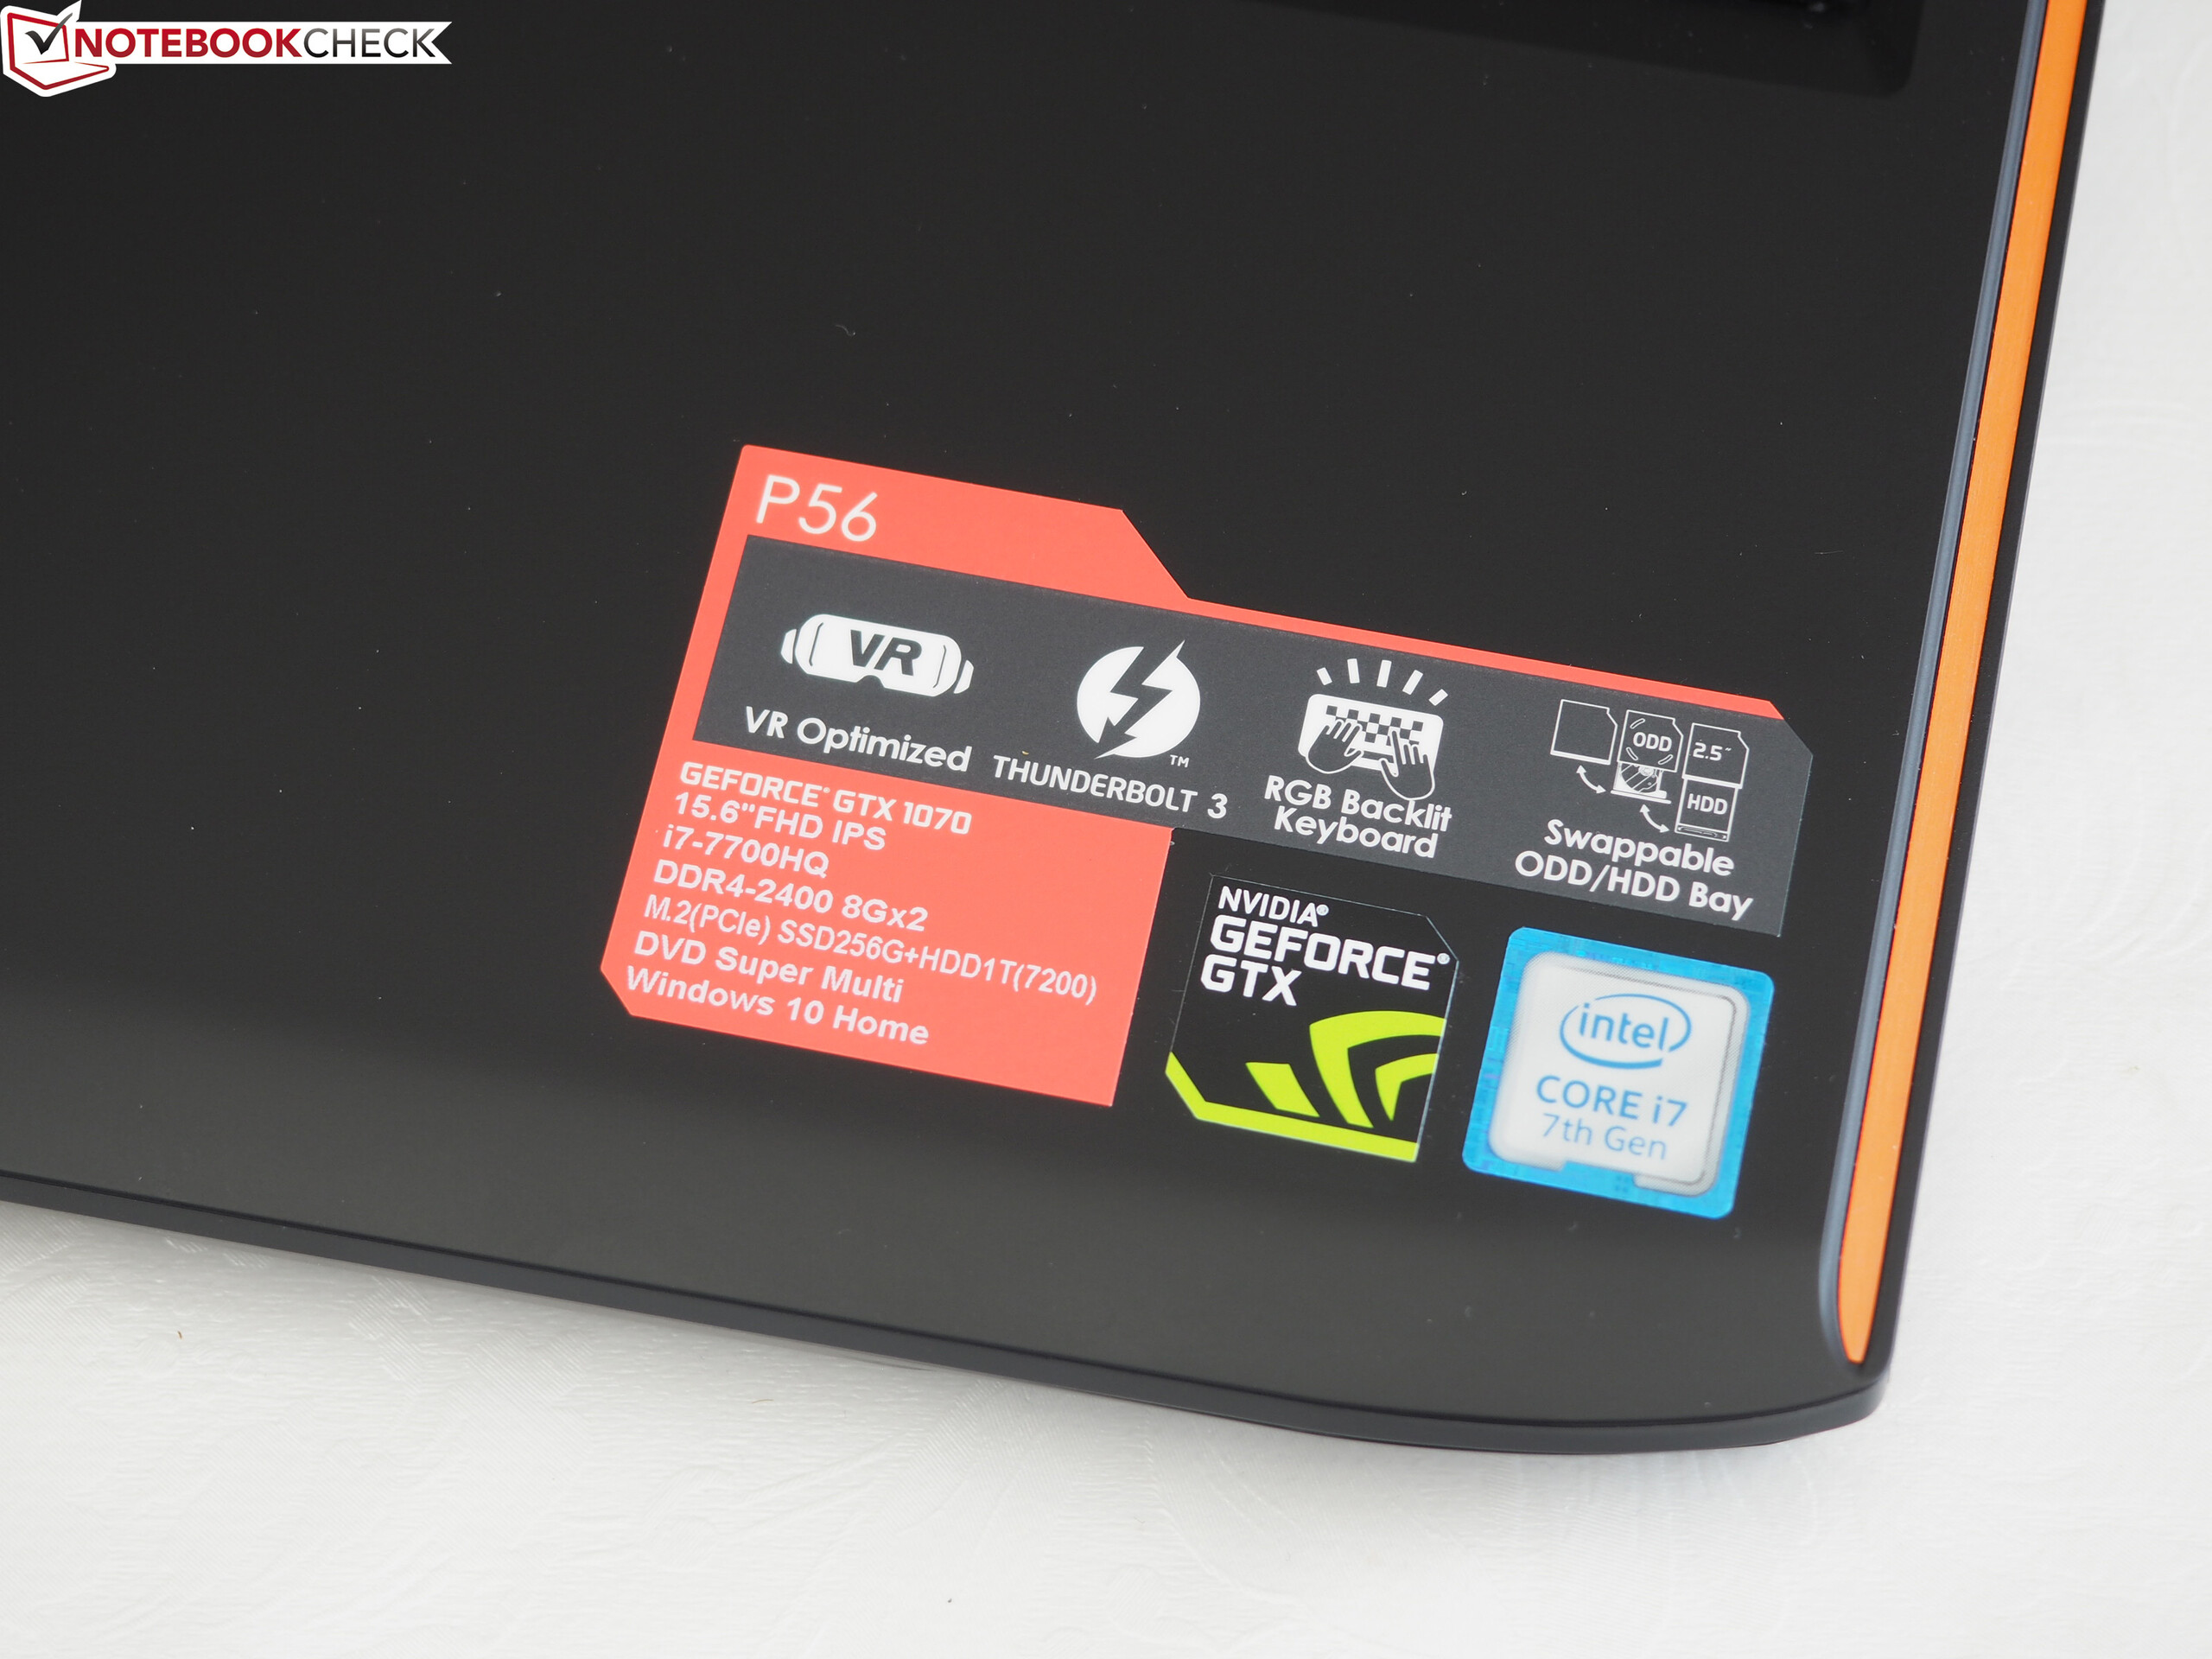
While Gigabyte considers the Aero 15 (rated at 87%) to be an all-round device, the P56XT is clearly aimed at the gaming sector. Consequently, it has powerful components. Nvidia's GeForce GTX 1070 can really get the integrated Full HD display (UHD optional) going.
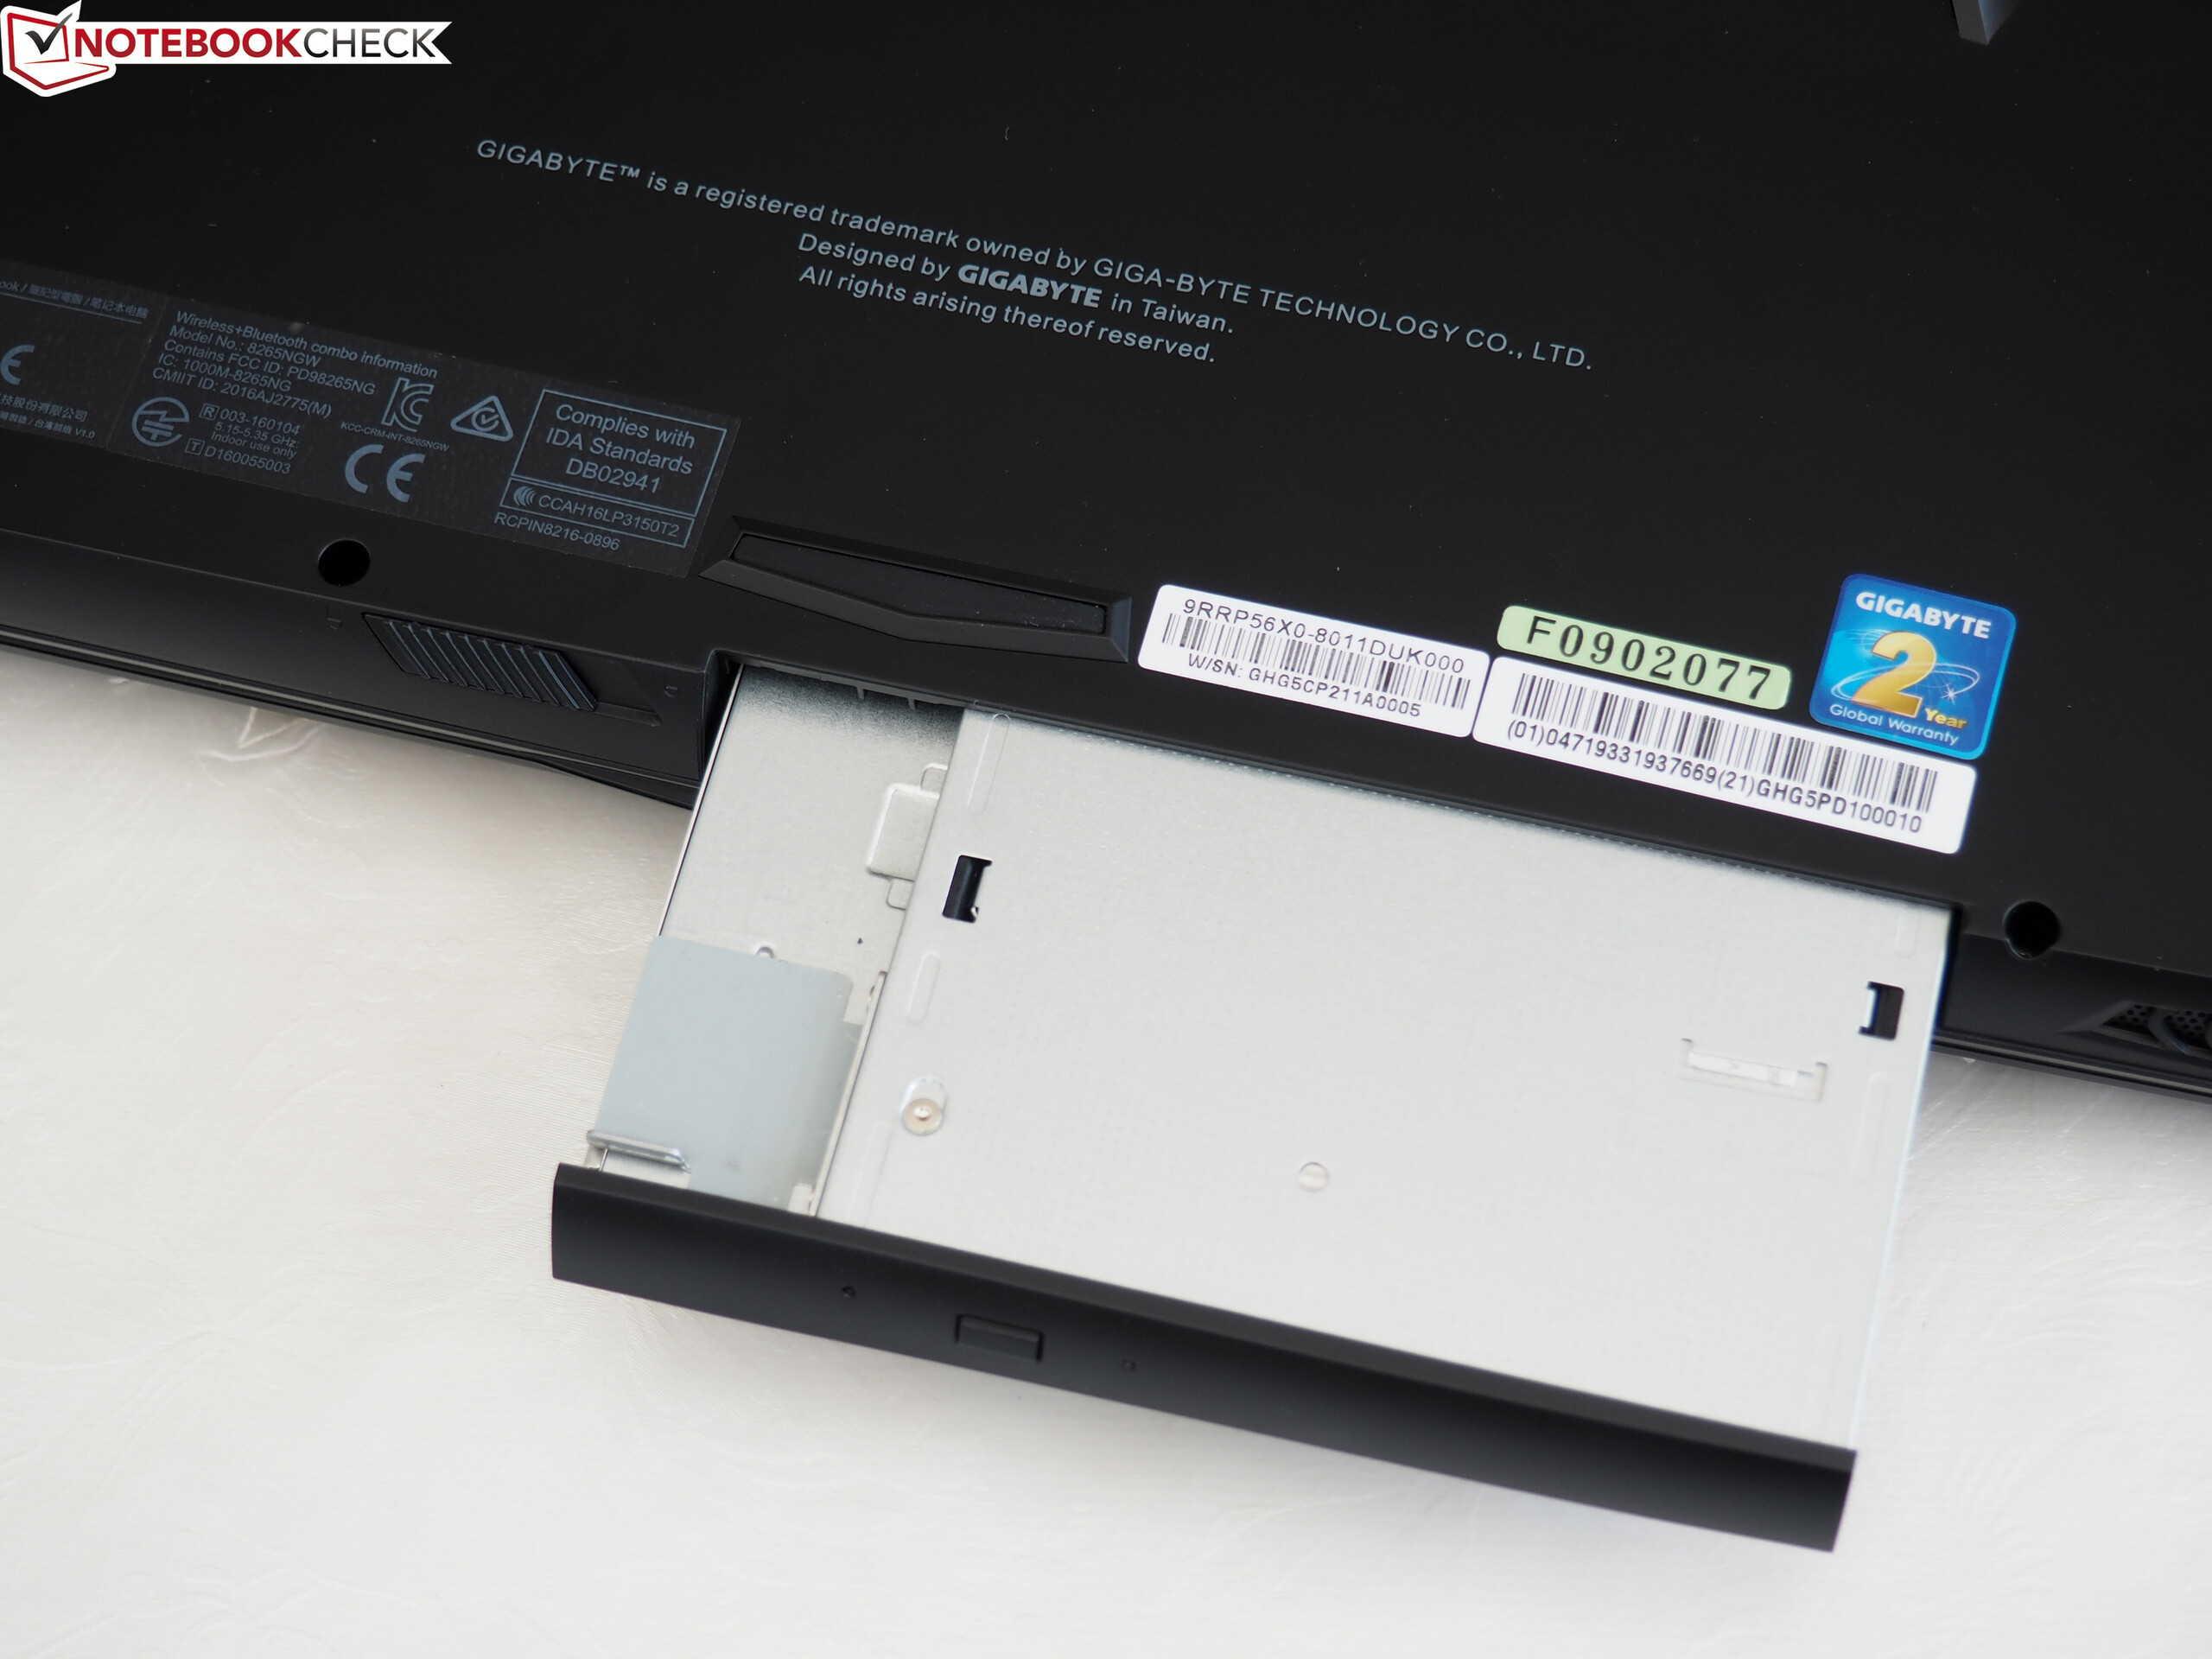
The device is also equipped with a suitable quad-core processor from Intel's Kaby Lake series (i7-7700HQ) and 16 GB of DDR4 RAM. Games and programs can be saved either on the 256-GB M.2 SSD or the 1-TB 2.5-inch HDD. Its unique selling point is definitely the Hot Swap bay, positioned at the front of the device. This can be used for an optical drive (the test unit has a DVD burner) or an additional hard drive.
The P56XT is not yet widespread and difficult to find on price search engines. You can expect to pay about 2000 Euros (~$2400) for the 15-inch device.
Our comparison devices come from both our (mobile) Gaming Top 10 and our multimedia list. They include some slimmer GTX-1060 notebooks such as the MSI GS63VR 7RF, the Acer Aspire V15 Nitro or the Gigabyte Aero 15; and similarly thick or even thicker GTX-1070 laptops such as the Schenker XMG P507 and the Acer Predator 15. These are the devices that will accompany us during this review.
Update 07/27/17: Gigabyte sent us a second test model since we had encountered some problems with our first device. In short: There is fortunately no major GPU throttling anymore. We repeated all 3D measurements in the sections System Noise and Temperature and changed the results or tables, respectively. The overall rating is increased from 78 to 83%.
Case
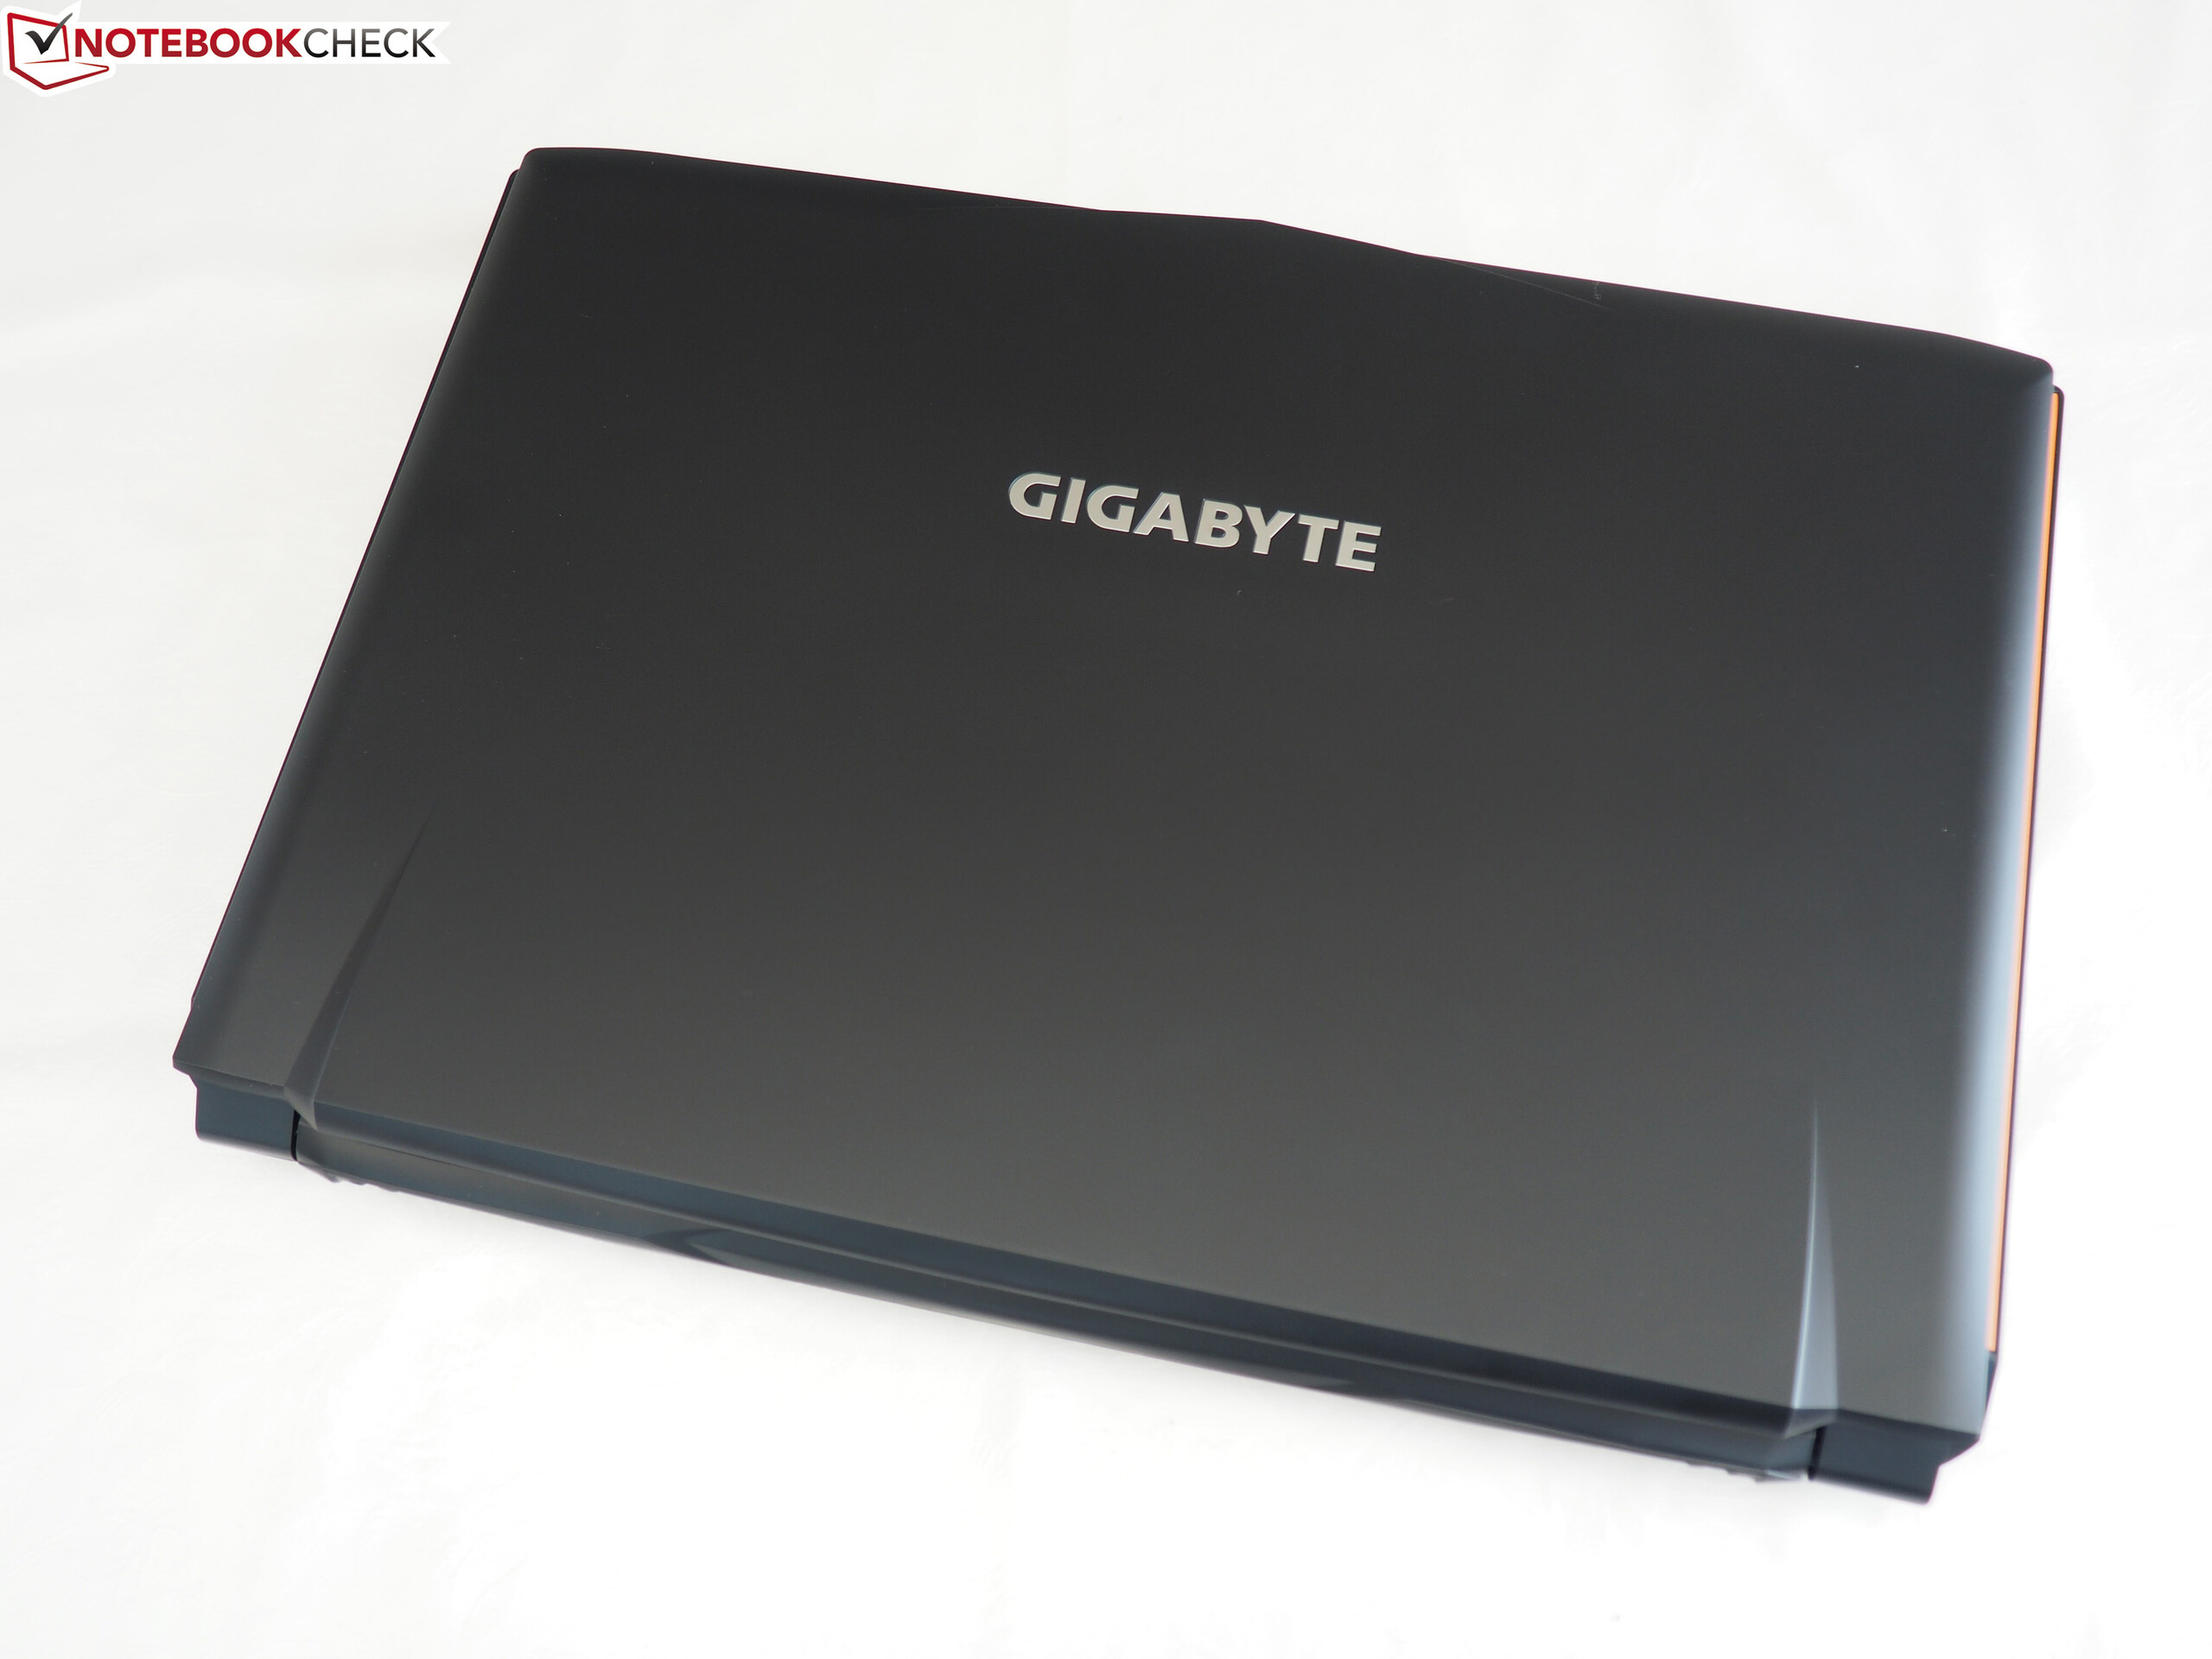
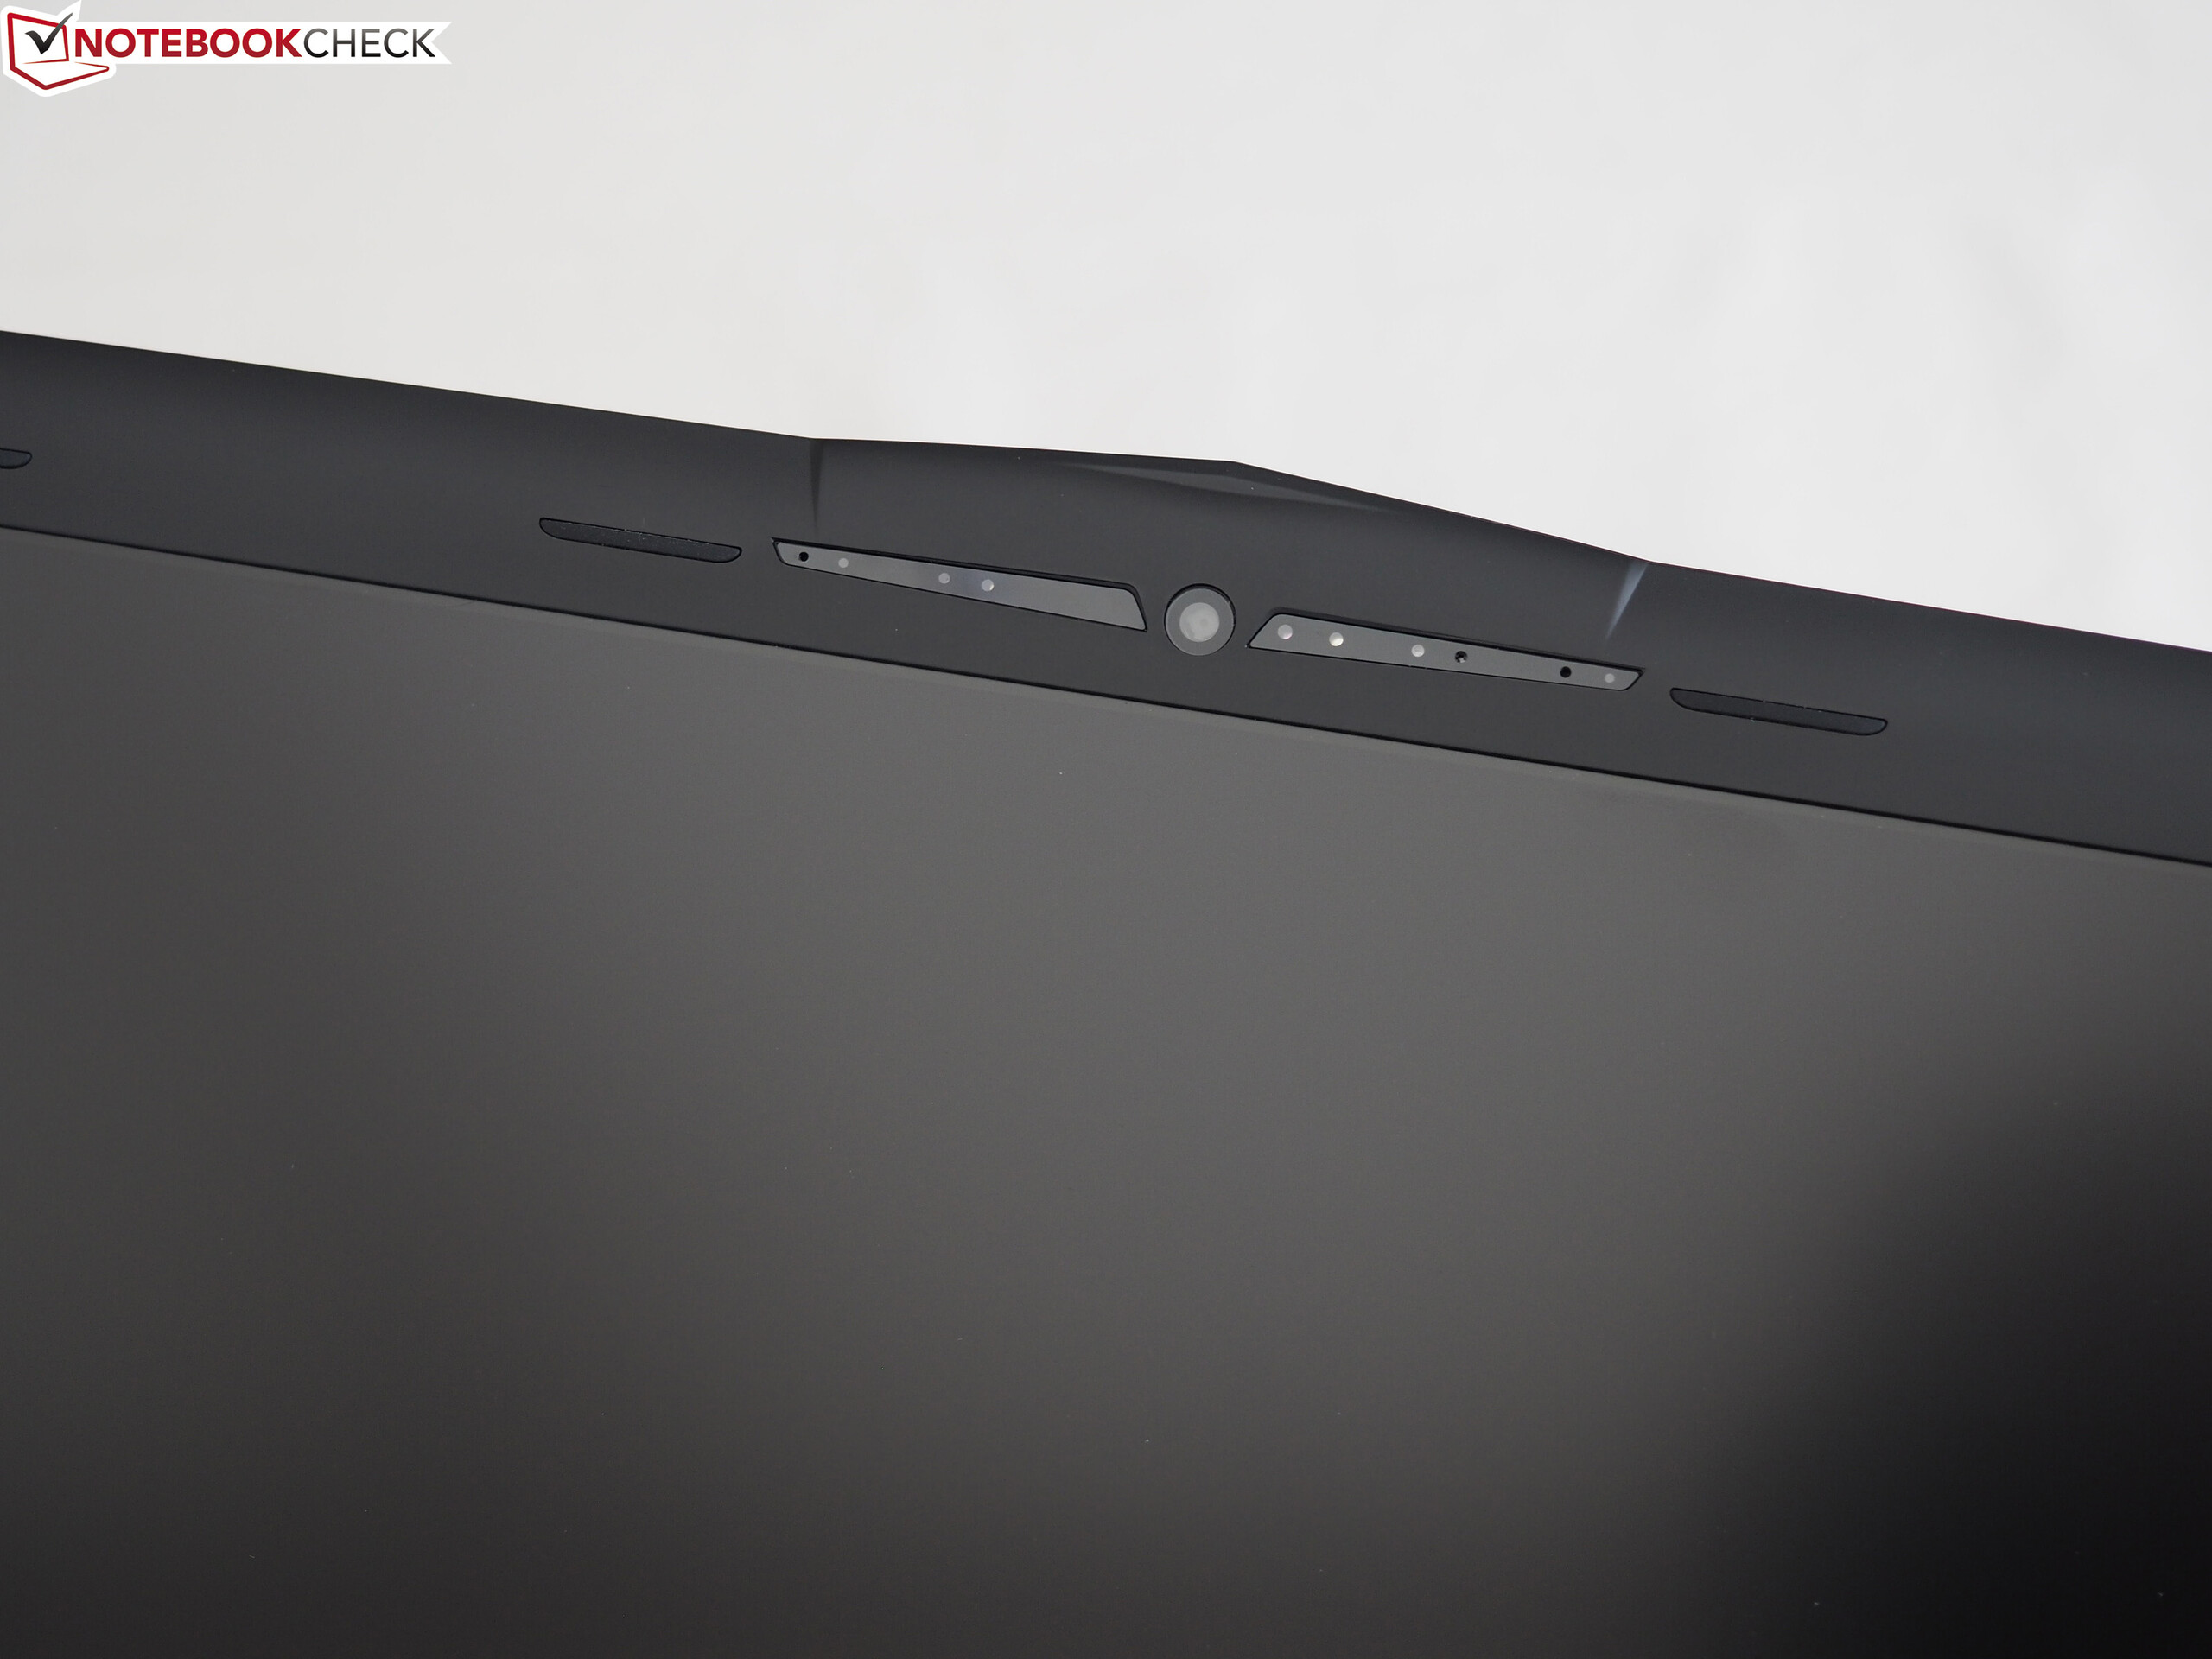
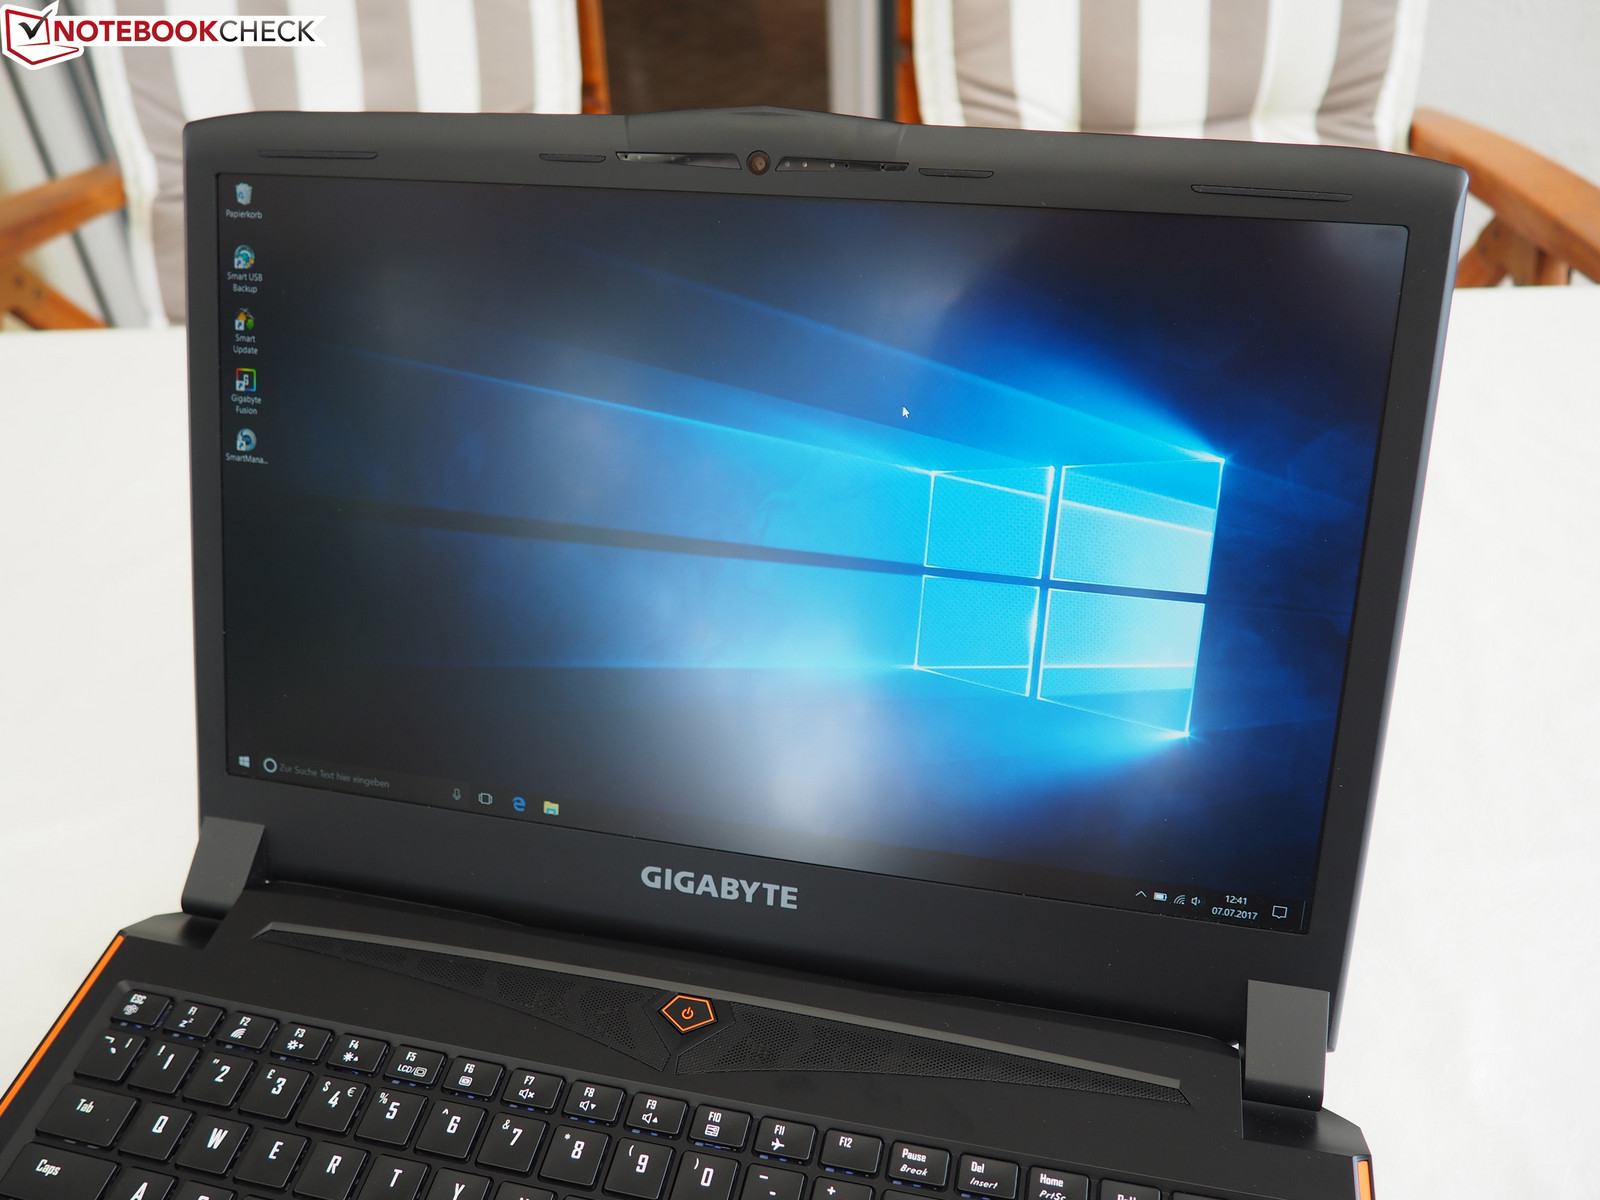
The P56XT's quality is based on the usual gaming standard. The case has dark plastic surfaces that look and feel good. However, the case does rattle a little. The workmanship is good, although there would still be a little room for improvement where the materials are not flush (lid and display frame, for example).
The base unit is very stable. Even under strong pressure we did not manage to warp the case. The display cover was less resistant to warping and made noises when bending it with two hands - as is often the case with display covers. There is nothing to criticize about the hinges that keep the screen mostly in place with just a few wobbles when the road gets bumpy.
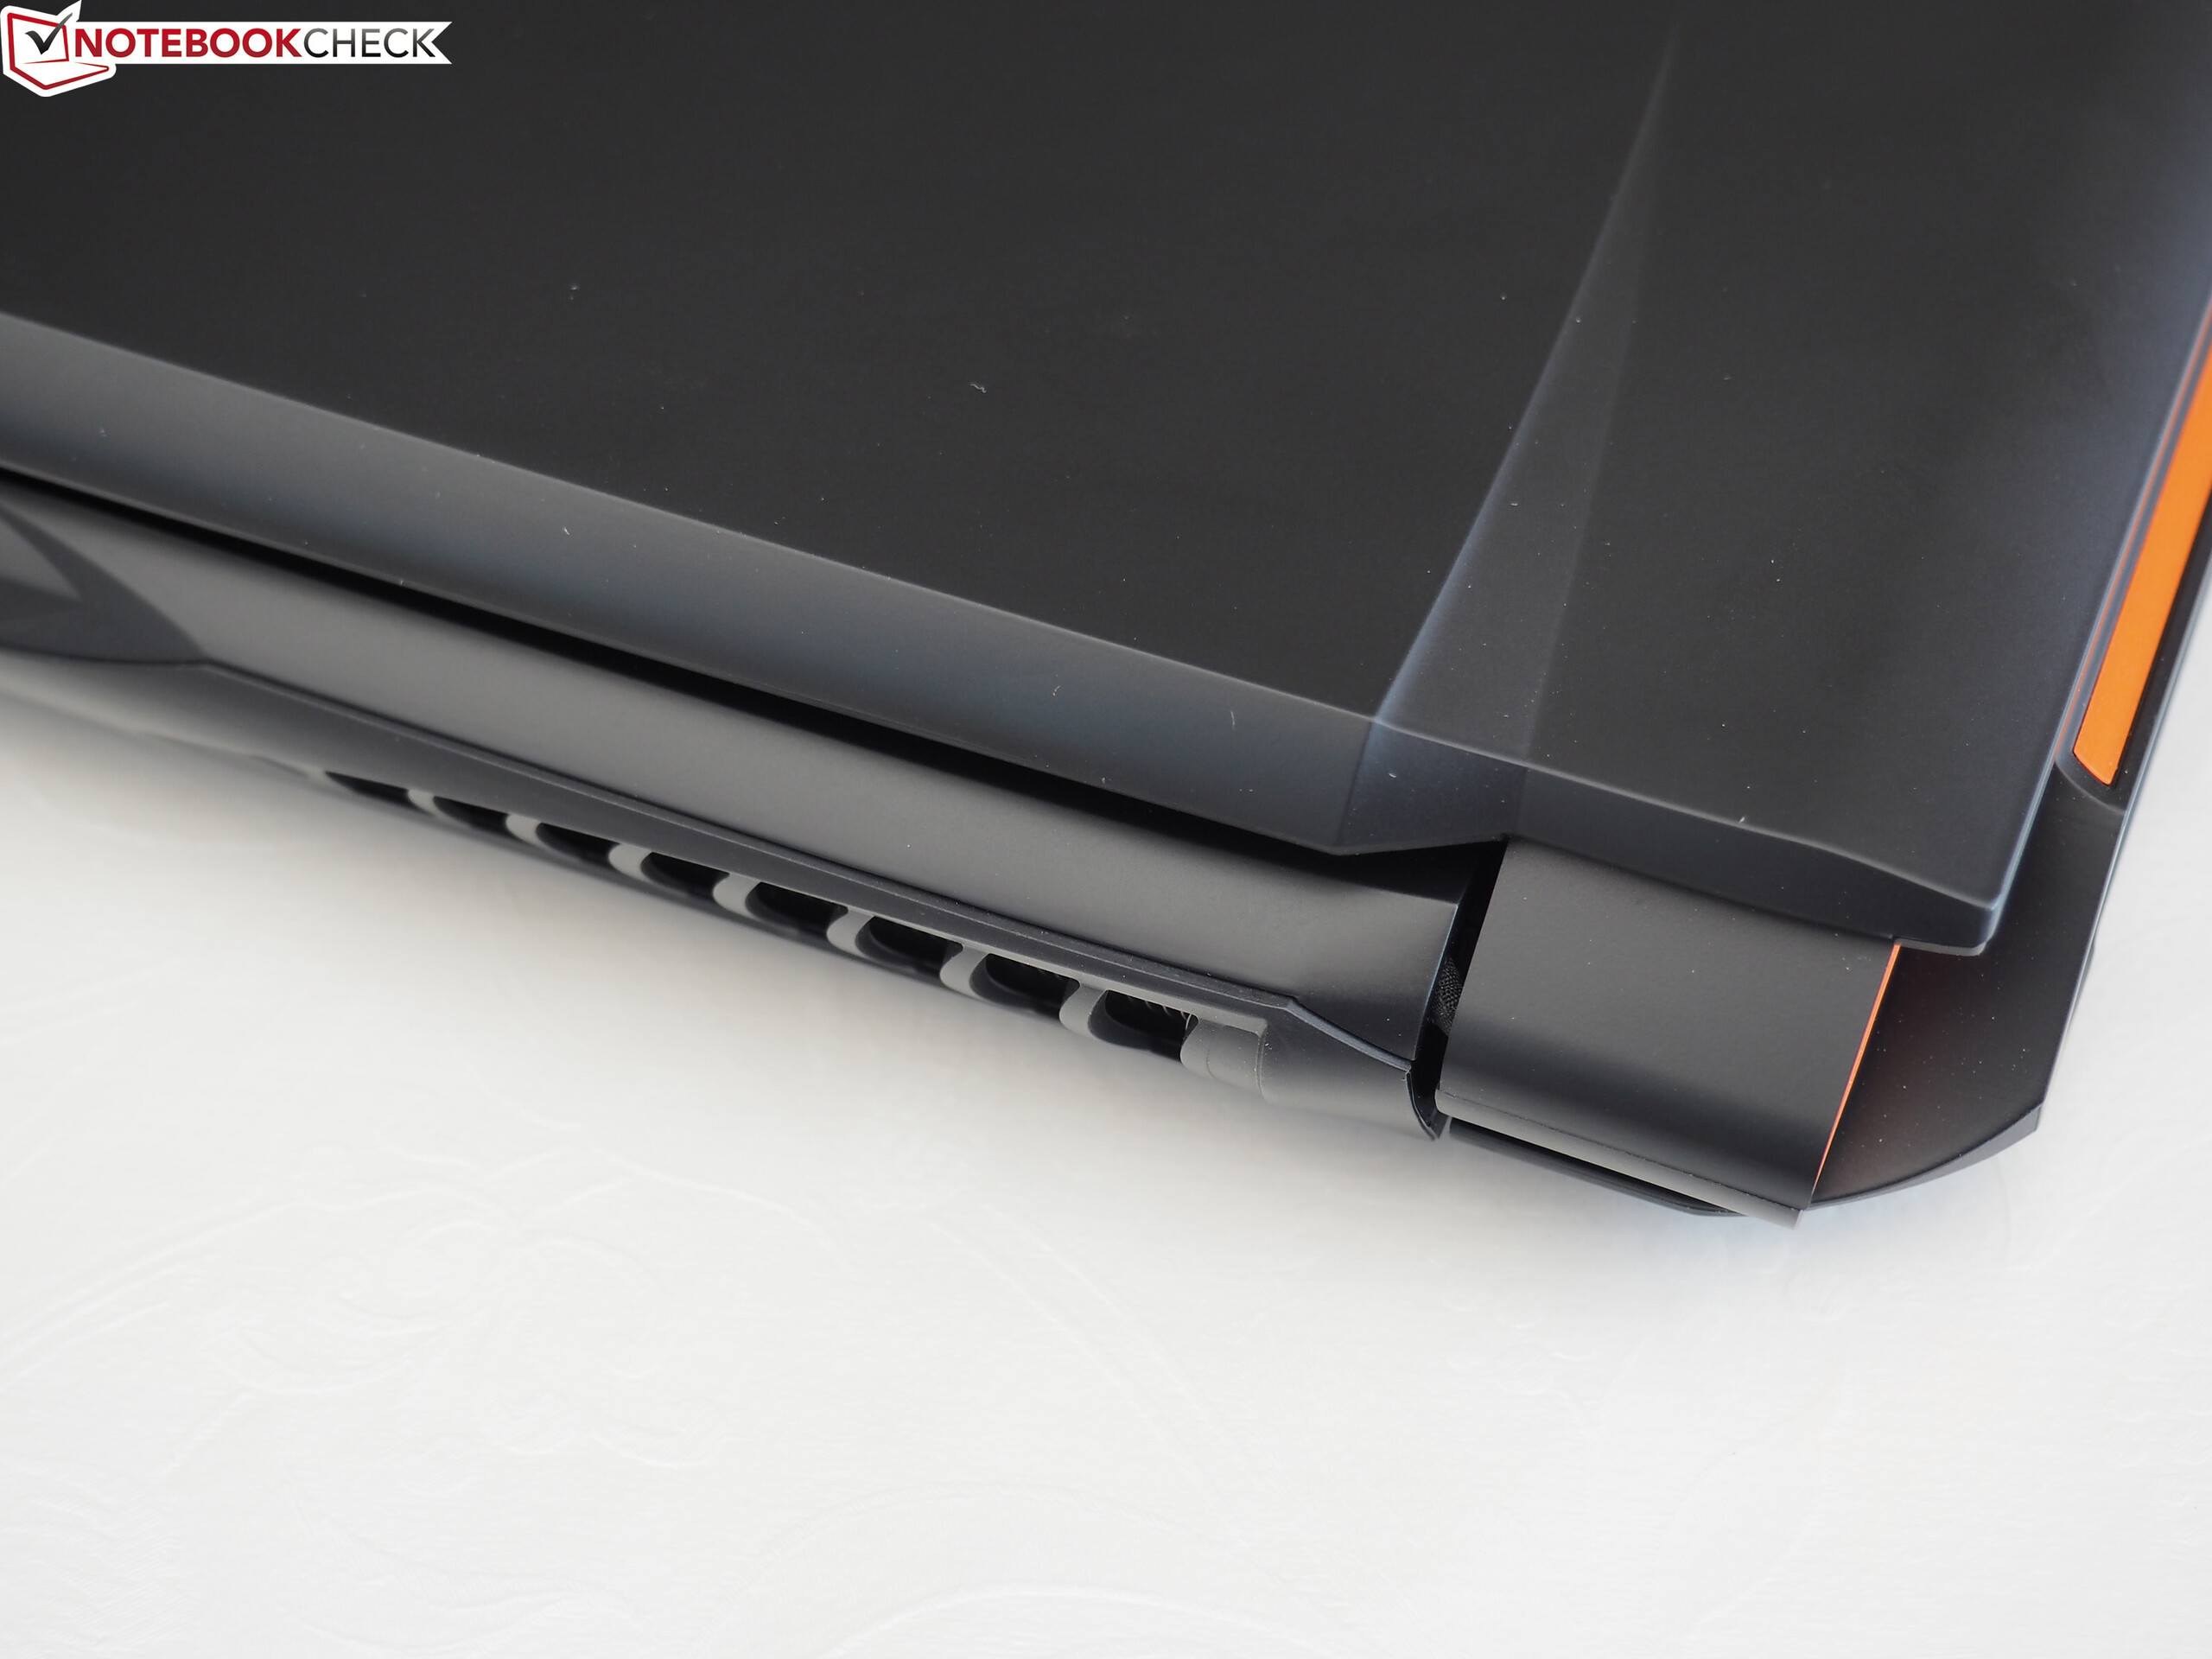

With a height of 3.0 cm (~1.2 in), the P56XT is neither thick nor slim. It seems as if Gigabyte had thrown the two gaming models P55 (3.4 cm/~1.3 in) and P35 (2.1 cm/~0.8 in) into a pot and melted them into something new that combines the best of both devices (strong GPU and compact build). As you can see from our size comparison, the P56XT's dimensions are quite similar to the Clevo Barebone P651HS-G that we tested as a Schenker XMG P507.
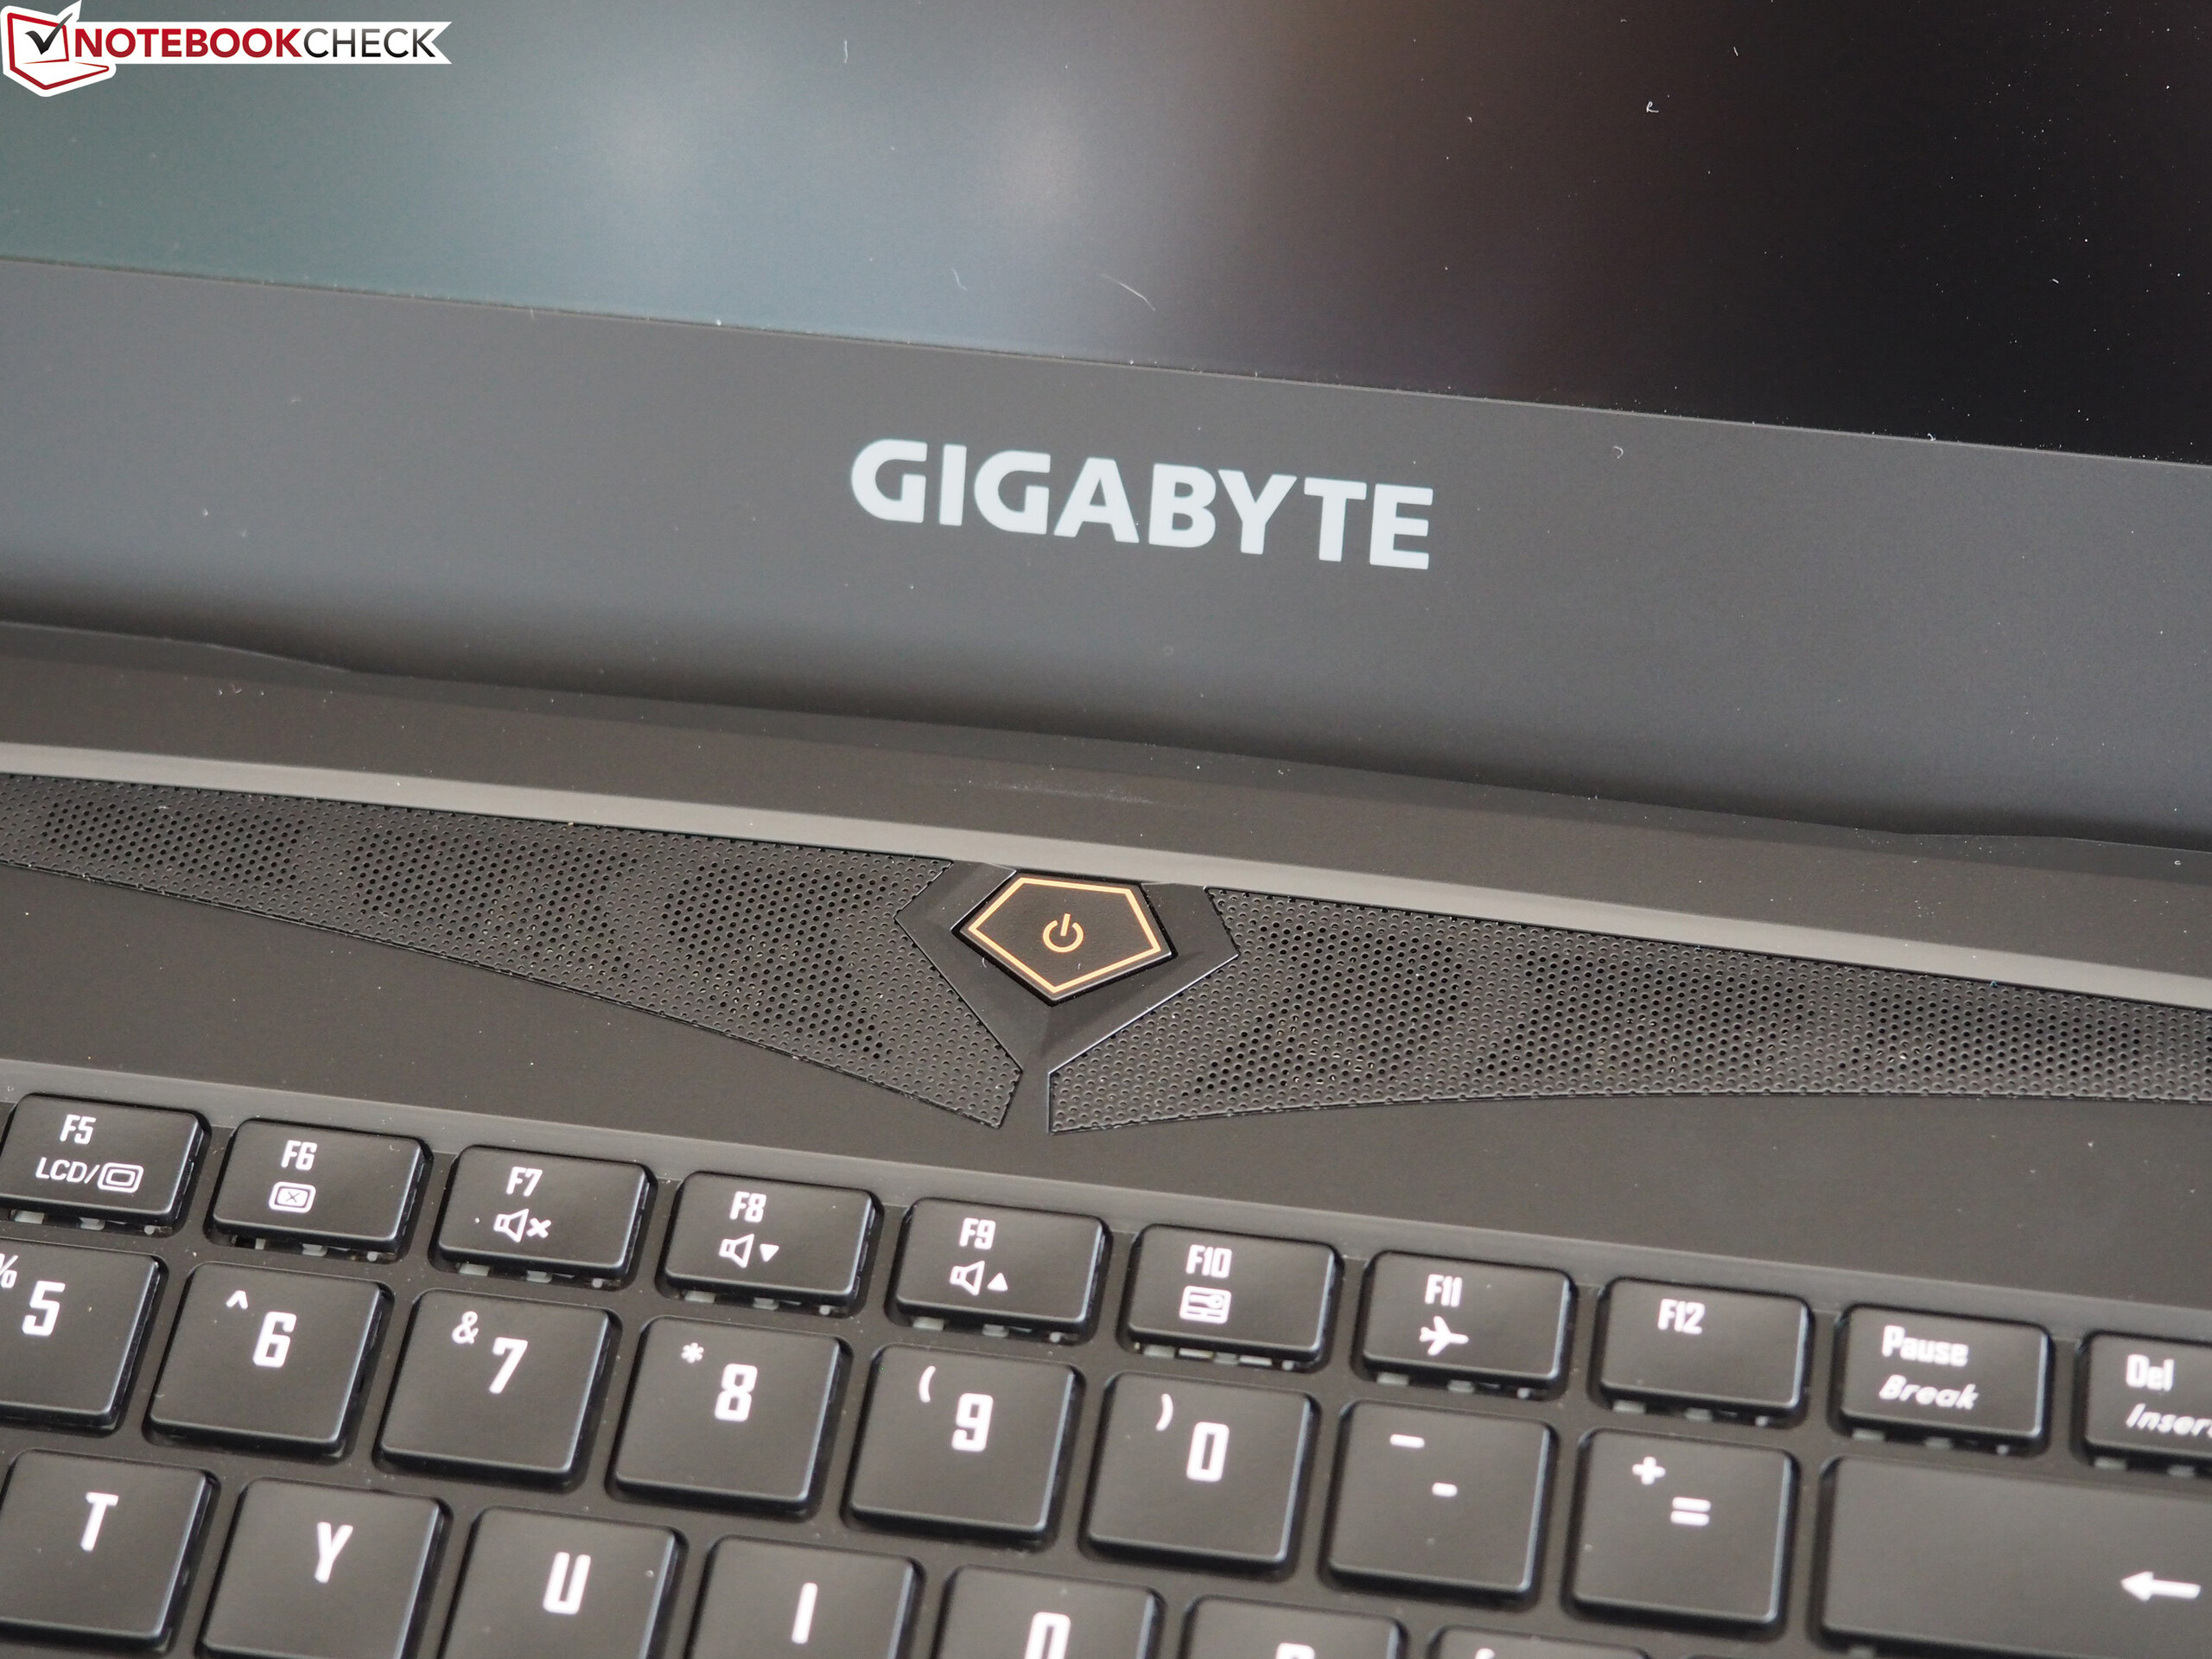
The device also has an average weight of 2.67 kg (~5.8 lbs). Overall, we would say that the P56XT is easily portable. The case has a distinctive design with accentuated orange lines on both sides (that are not covered by the display cover) as well as orange hinges.
Connectivity
Ports
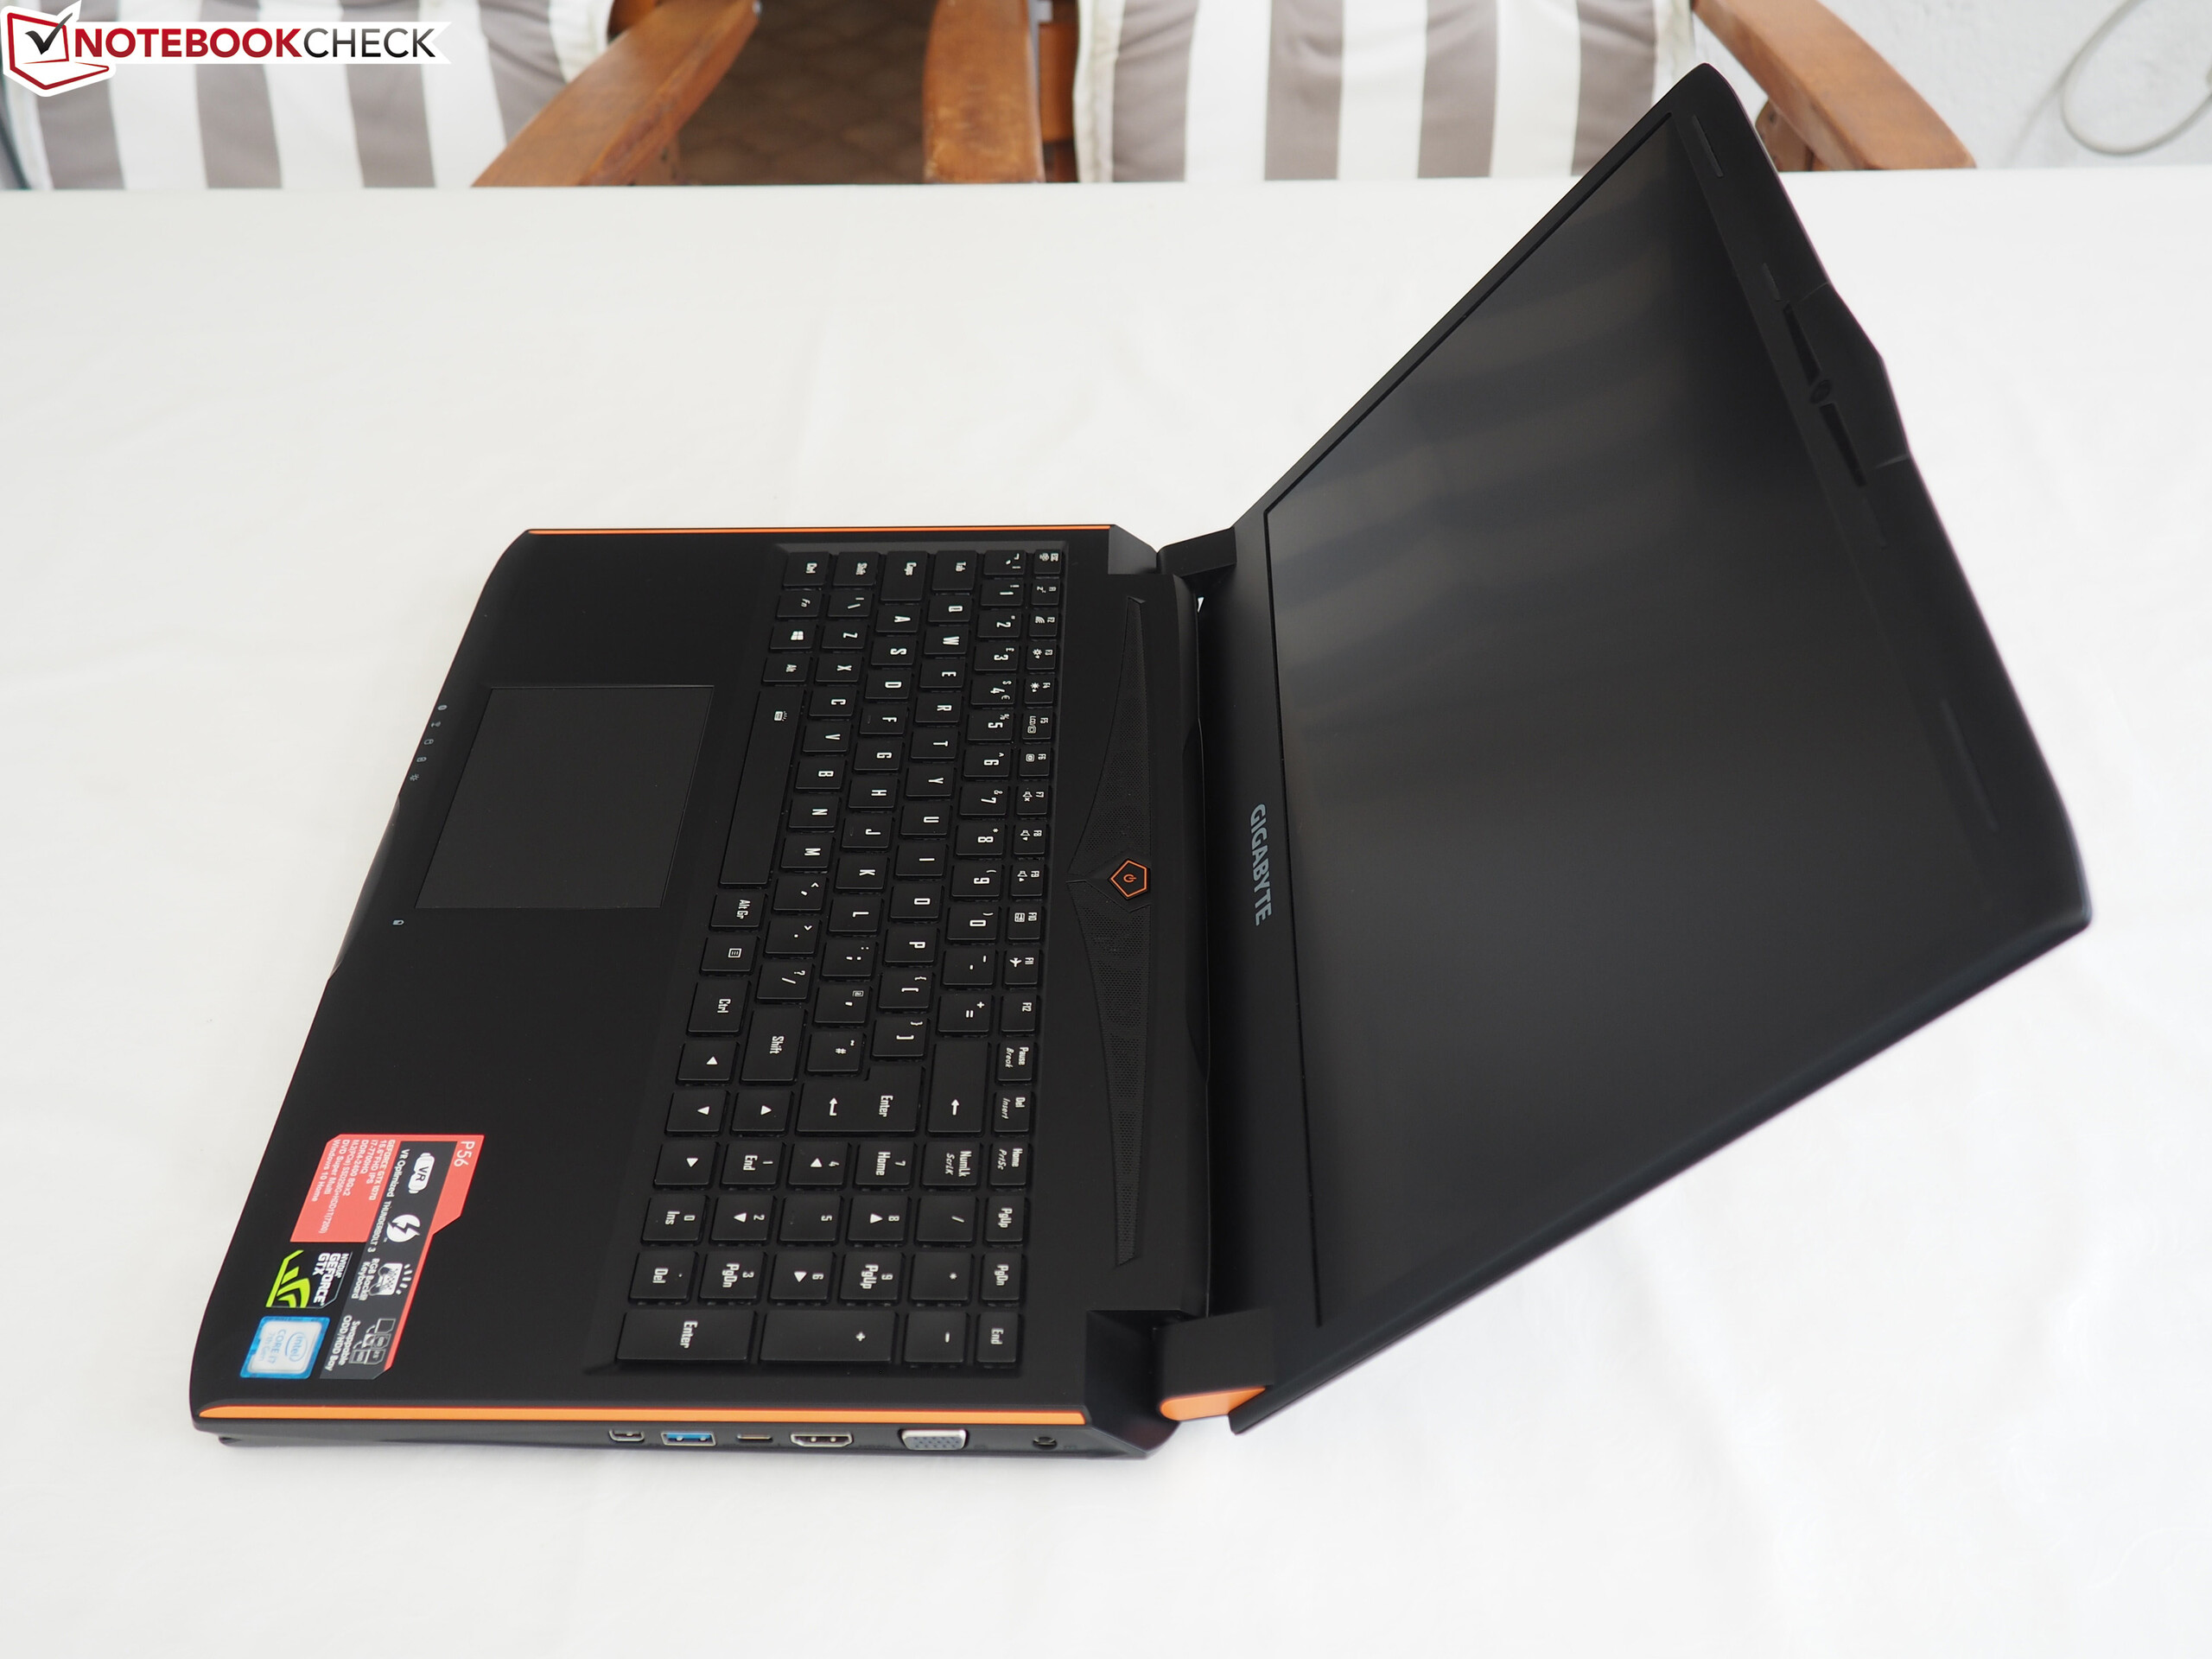
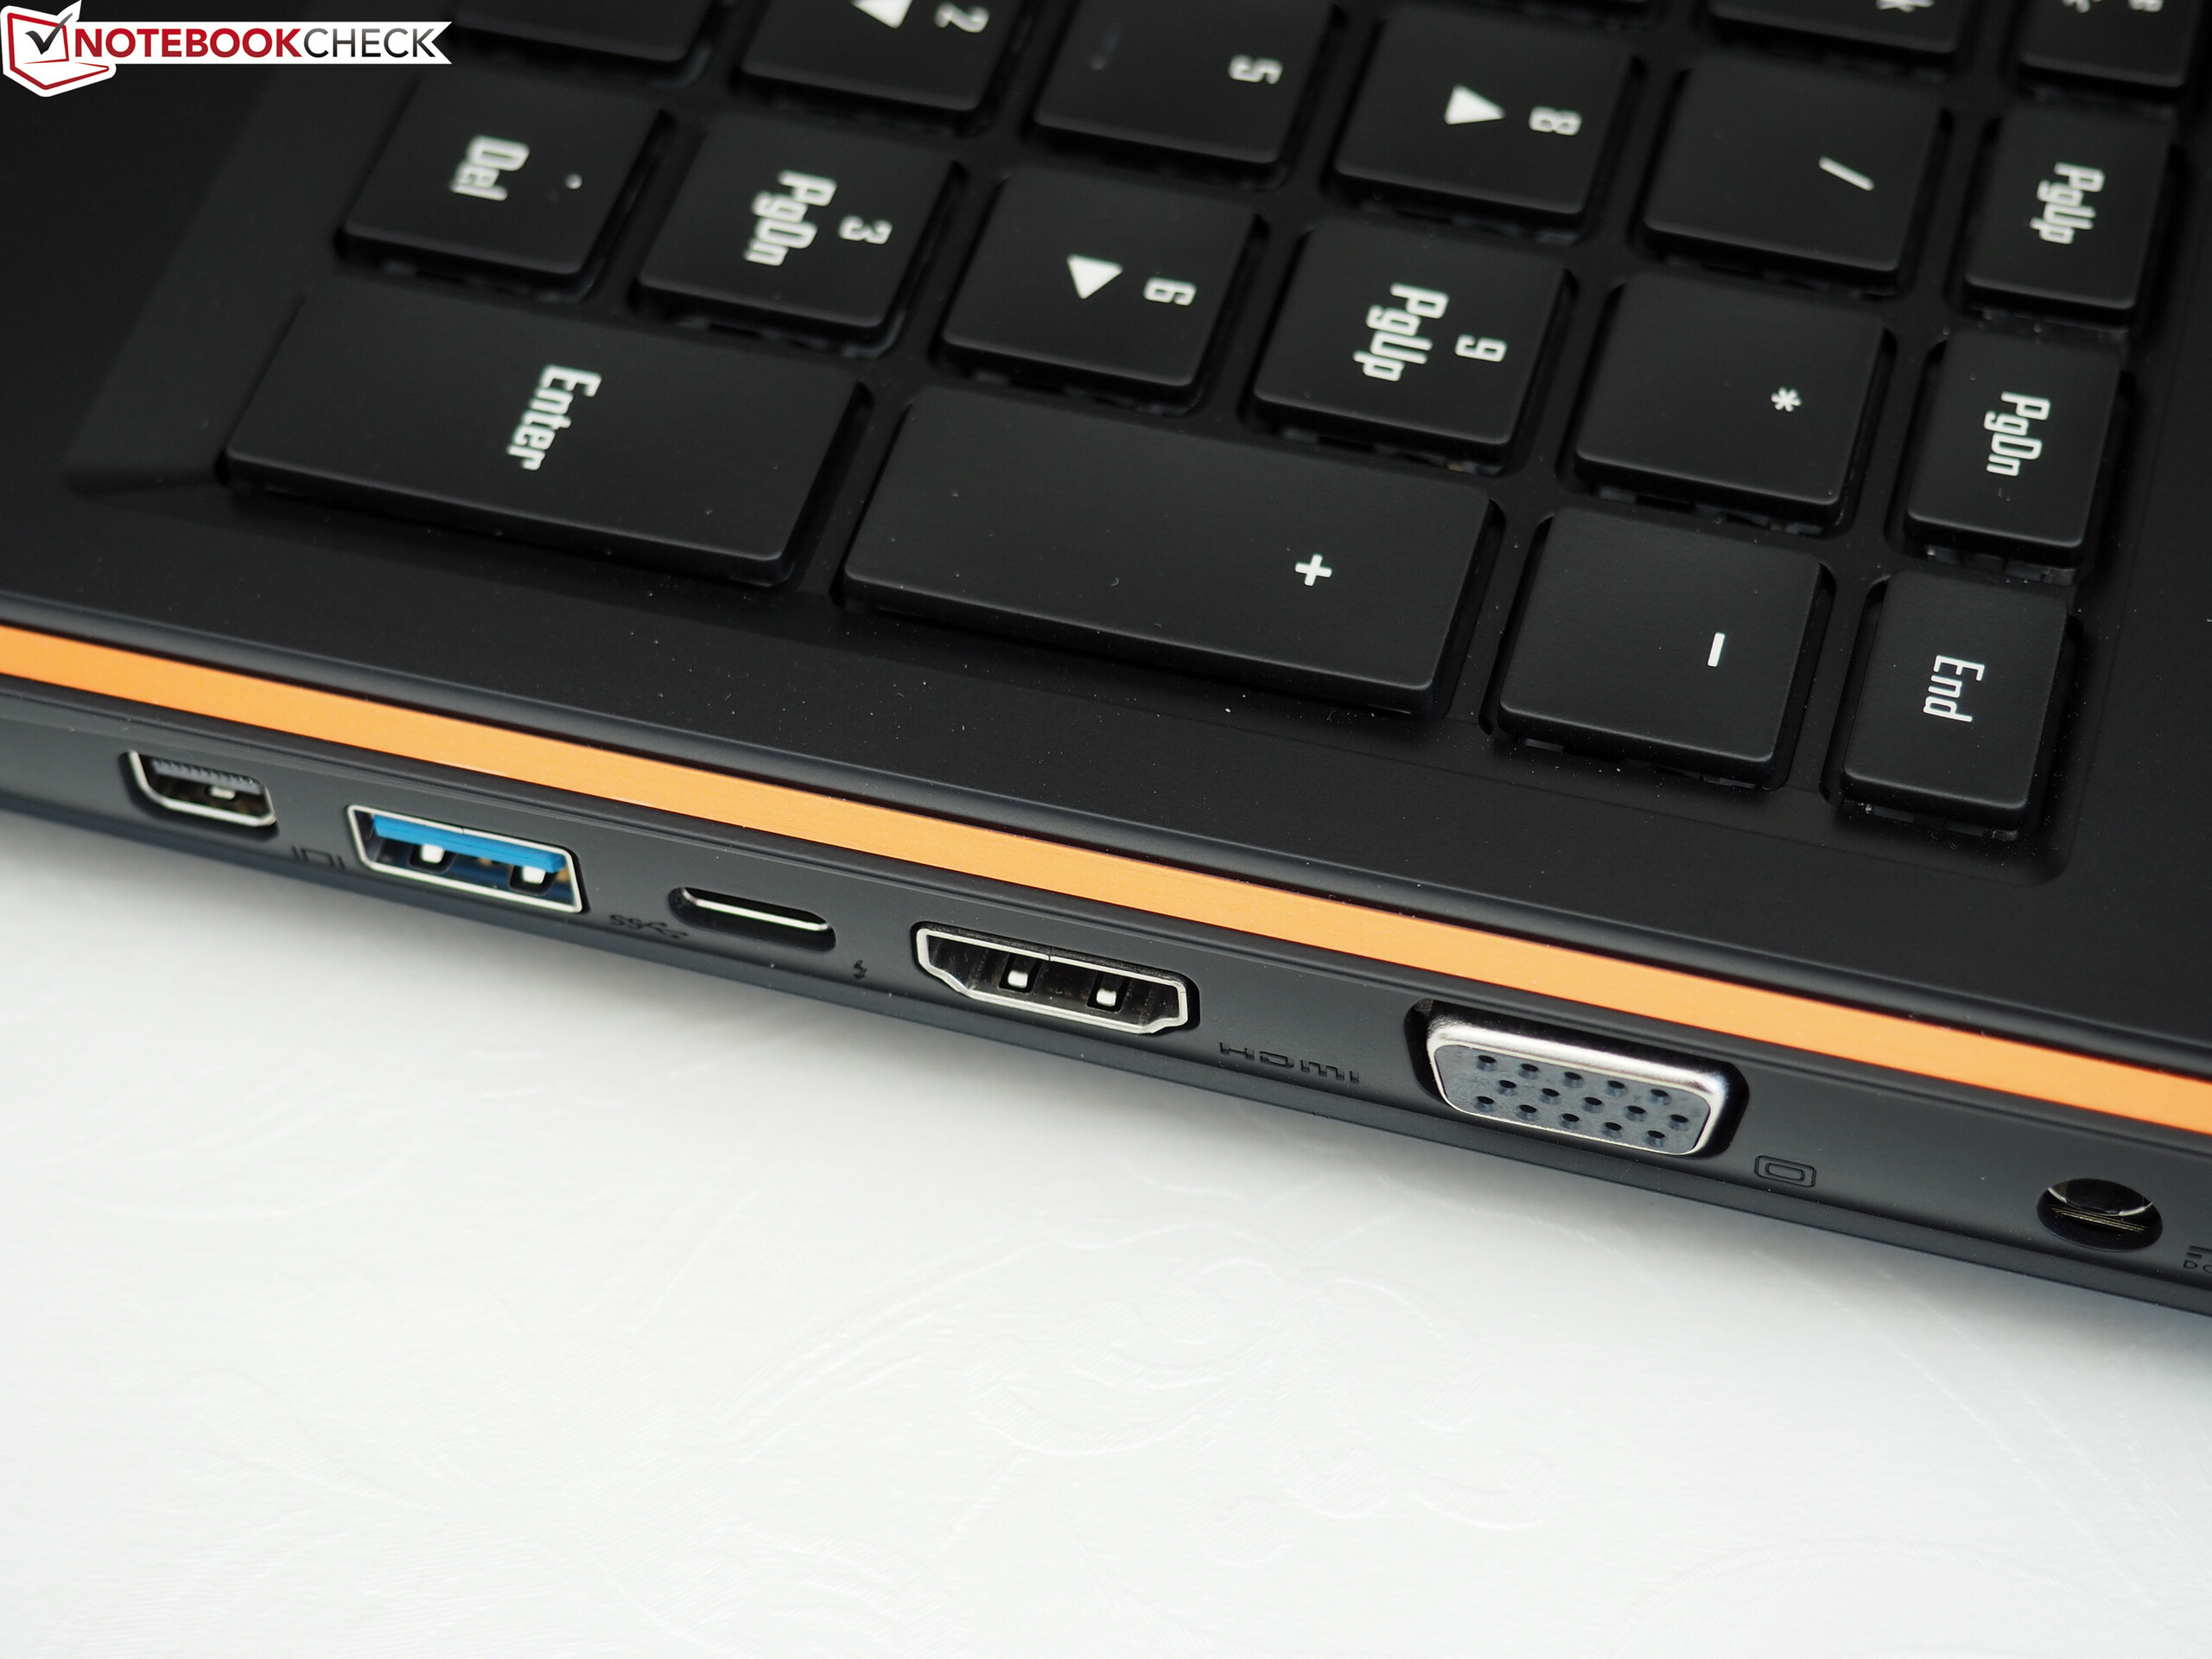
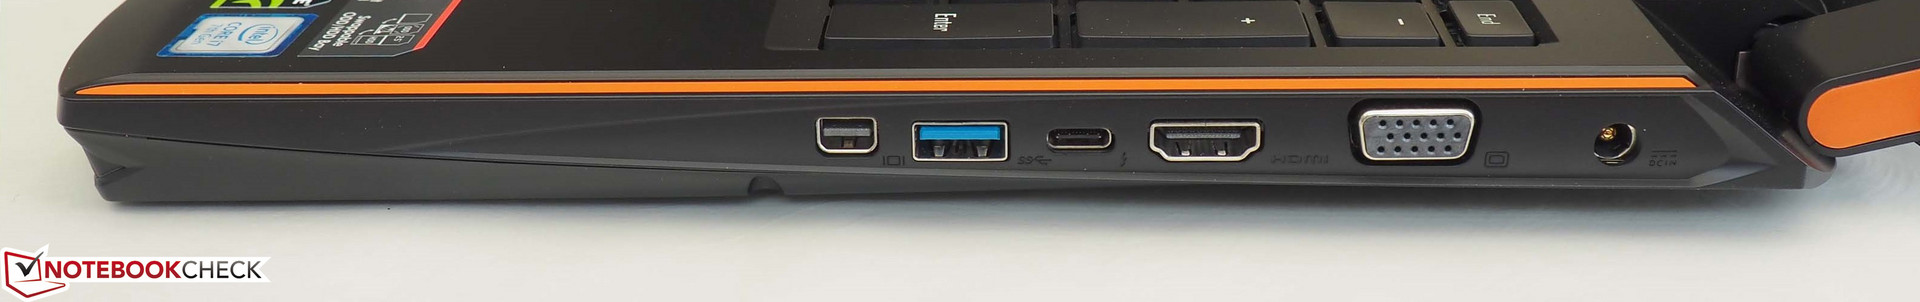
Our device's connectivity is what you would expect for this price. While most Gigabyte notebooks in the past had to manage without Thunderbolt 3, the P56XT now offers a Thunderbolt 3 Type-C that also supports USB 3.1 Gen2 and DisplayPort. You can easily connect external screens via the HDMI 2.0 port, the Mini DisplayPort 1.2 or the VGA output.
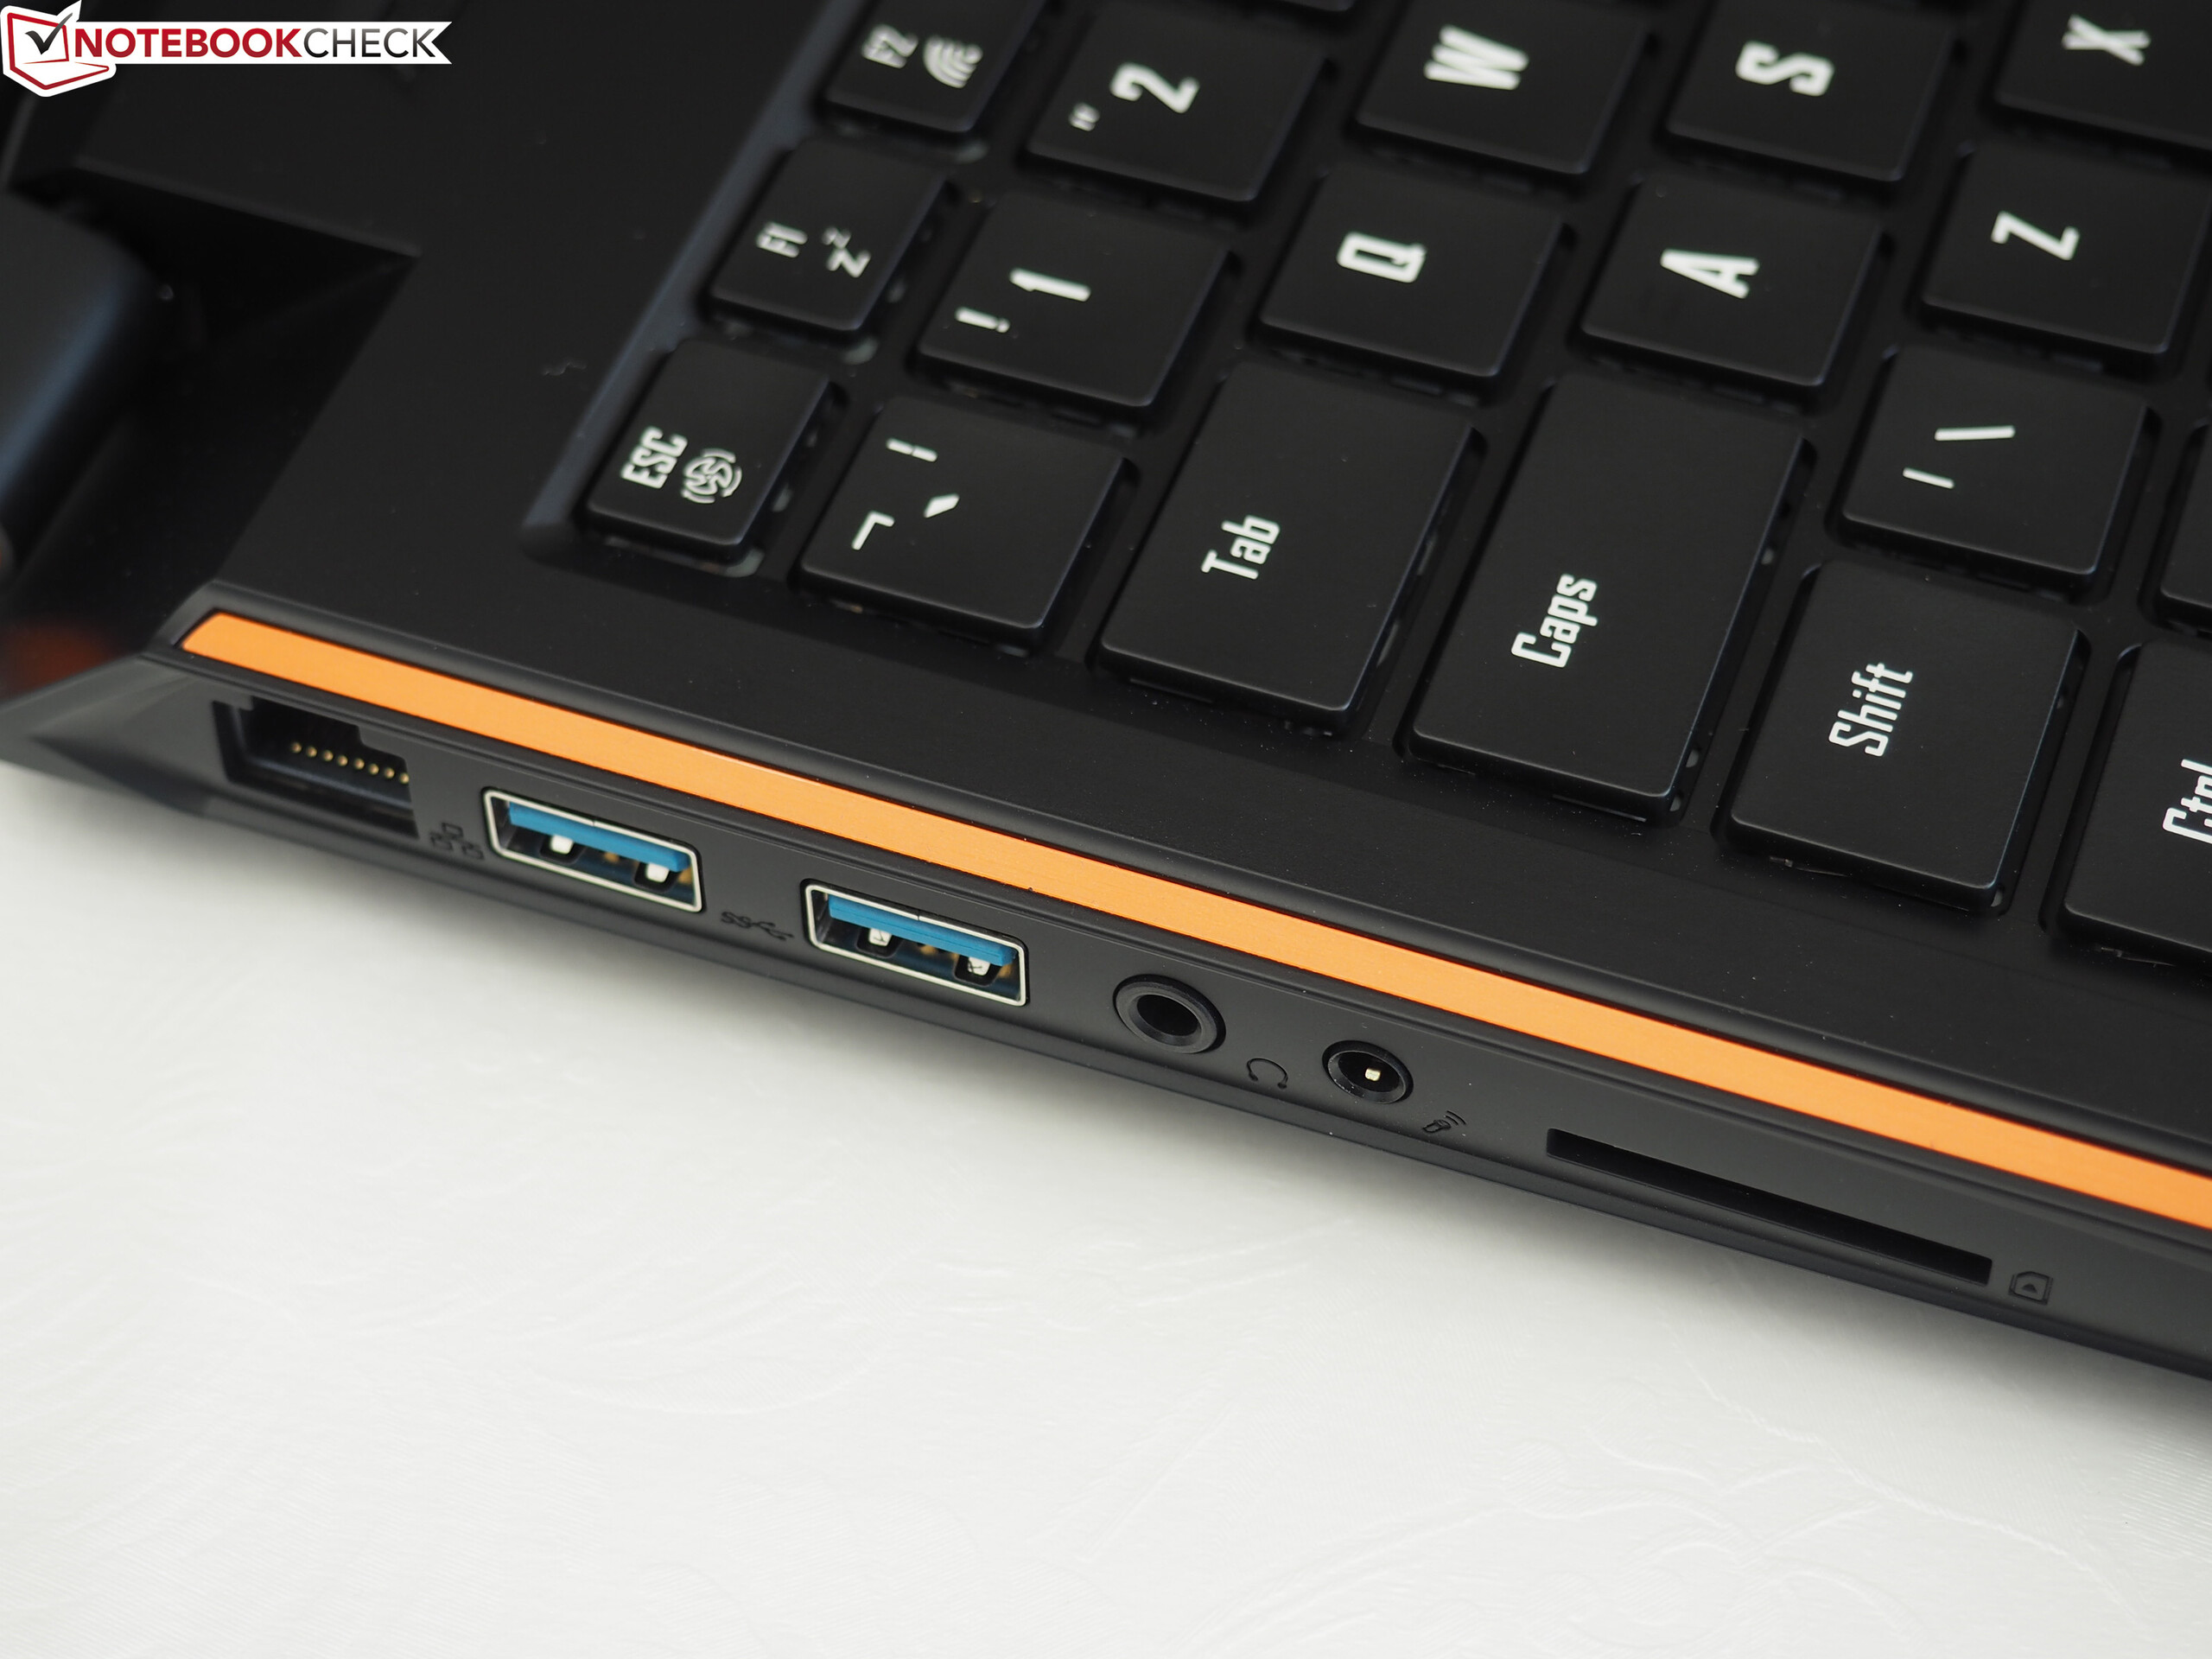
A USB-A 3.0 port and power supply are positioned on the right side. We would have preferred this to be on the left to avoid being in the way of the mouse (for right-handed people). The left side is fitted with a card reader, two audio jacks (headphones and microphone), two USB-A 3.0 ports and an RJ45 LAN port.
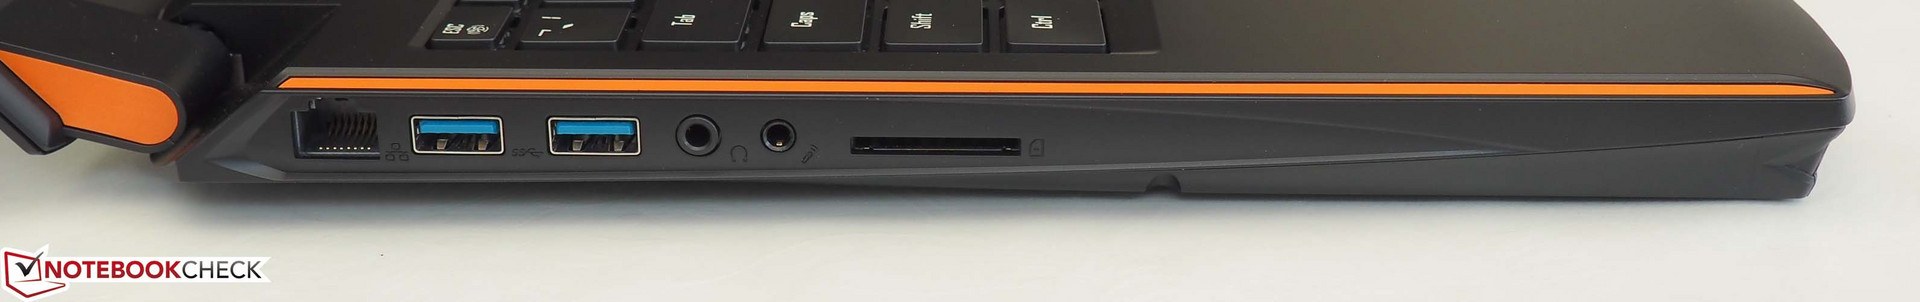
SD card reader
The card reader's performance is rather average. It manages 89 MB/s in sequential reading and 76 MB/s when transferring photos - which are normal values that could have just as well come from the Acer Predator 15, Schenker XMG P507 or the Aero 15. Only the MSI GS63VF and the Acer Aspire V15 Nitro fall behind with 21 to 27 MB/s. Note: half of the SD card stands out of the port. USB sticks also have quite a bit of leeway.
| SD Card Reader | |
| average JPG Copy Test (av. of 3 runs) | |
| Acer Predator 15 G9-593-751X (Toshiba Exceria Pro SDXC 64 GB UHS-II) | |
| Schenker XMG P507 PRO (Toshiba Exceria Pro SDXC 64 GB UHS-II) | |
| Gigabyte Aero 15 (Toshiba Exceria Pro SDXC 64 GB UHS-II) | |
| Gigabyte P56XT (Toshiba Exceria Pro SDXC 64 GB UHS-II) | |
| MSI GS63VR 7RF-228US (Toshiba Exceria Pro SDXC 64 GB UHS-II) | |
| Acer Aspire VN7-593G-73HP V15 Nitro BE | |
| maximum AS SSD Seq Read Test (1GB) | |
| Gigabyte Aero 15 (Toshiba Exceria Pro SDXC 64 GB UHS-II) | |
| Acer Predator 15 G9-593-751X (Toshiba Exceria Pro SDXC 64 GB UHS-II) | |
| Gigabyte P56XT (Toshiba Exceria Pro SDXC 64 GB UHS-II) | |
| Schenker XMG P507 PRO (Toshiba Exceria Pro SDXC 64 GB UHS-II) | |
| Acer Aspire VN7-593G-73HP V15 Nitro BE | |
| MSI GS63VR 7RF-228US (Toshiba Exceria Pro SDXC 64 GB UHS-II) | |
Communication
The Wi-Fi performance gave us an average to good impression. In terms of reception, the Intel Dual Band Wireless AC 8265 chip is on par with the Killer Wireless n/a/ac 1435 that is used in many gaming notebooks. It cannot keep up with its competition when sending data, however. Other 15-inch devices are one and a half to two times faster.
But there still should not be any restrictions in everyday use. We managed to connect the P56XT to the router and the internet even through several walls.
Accessories
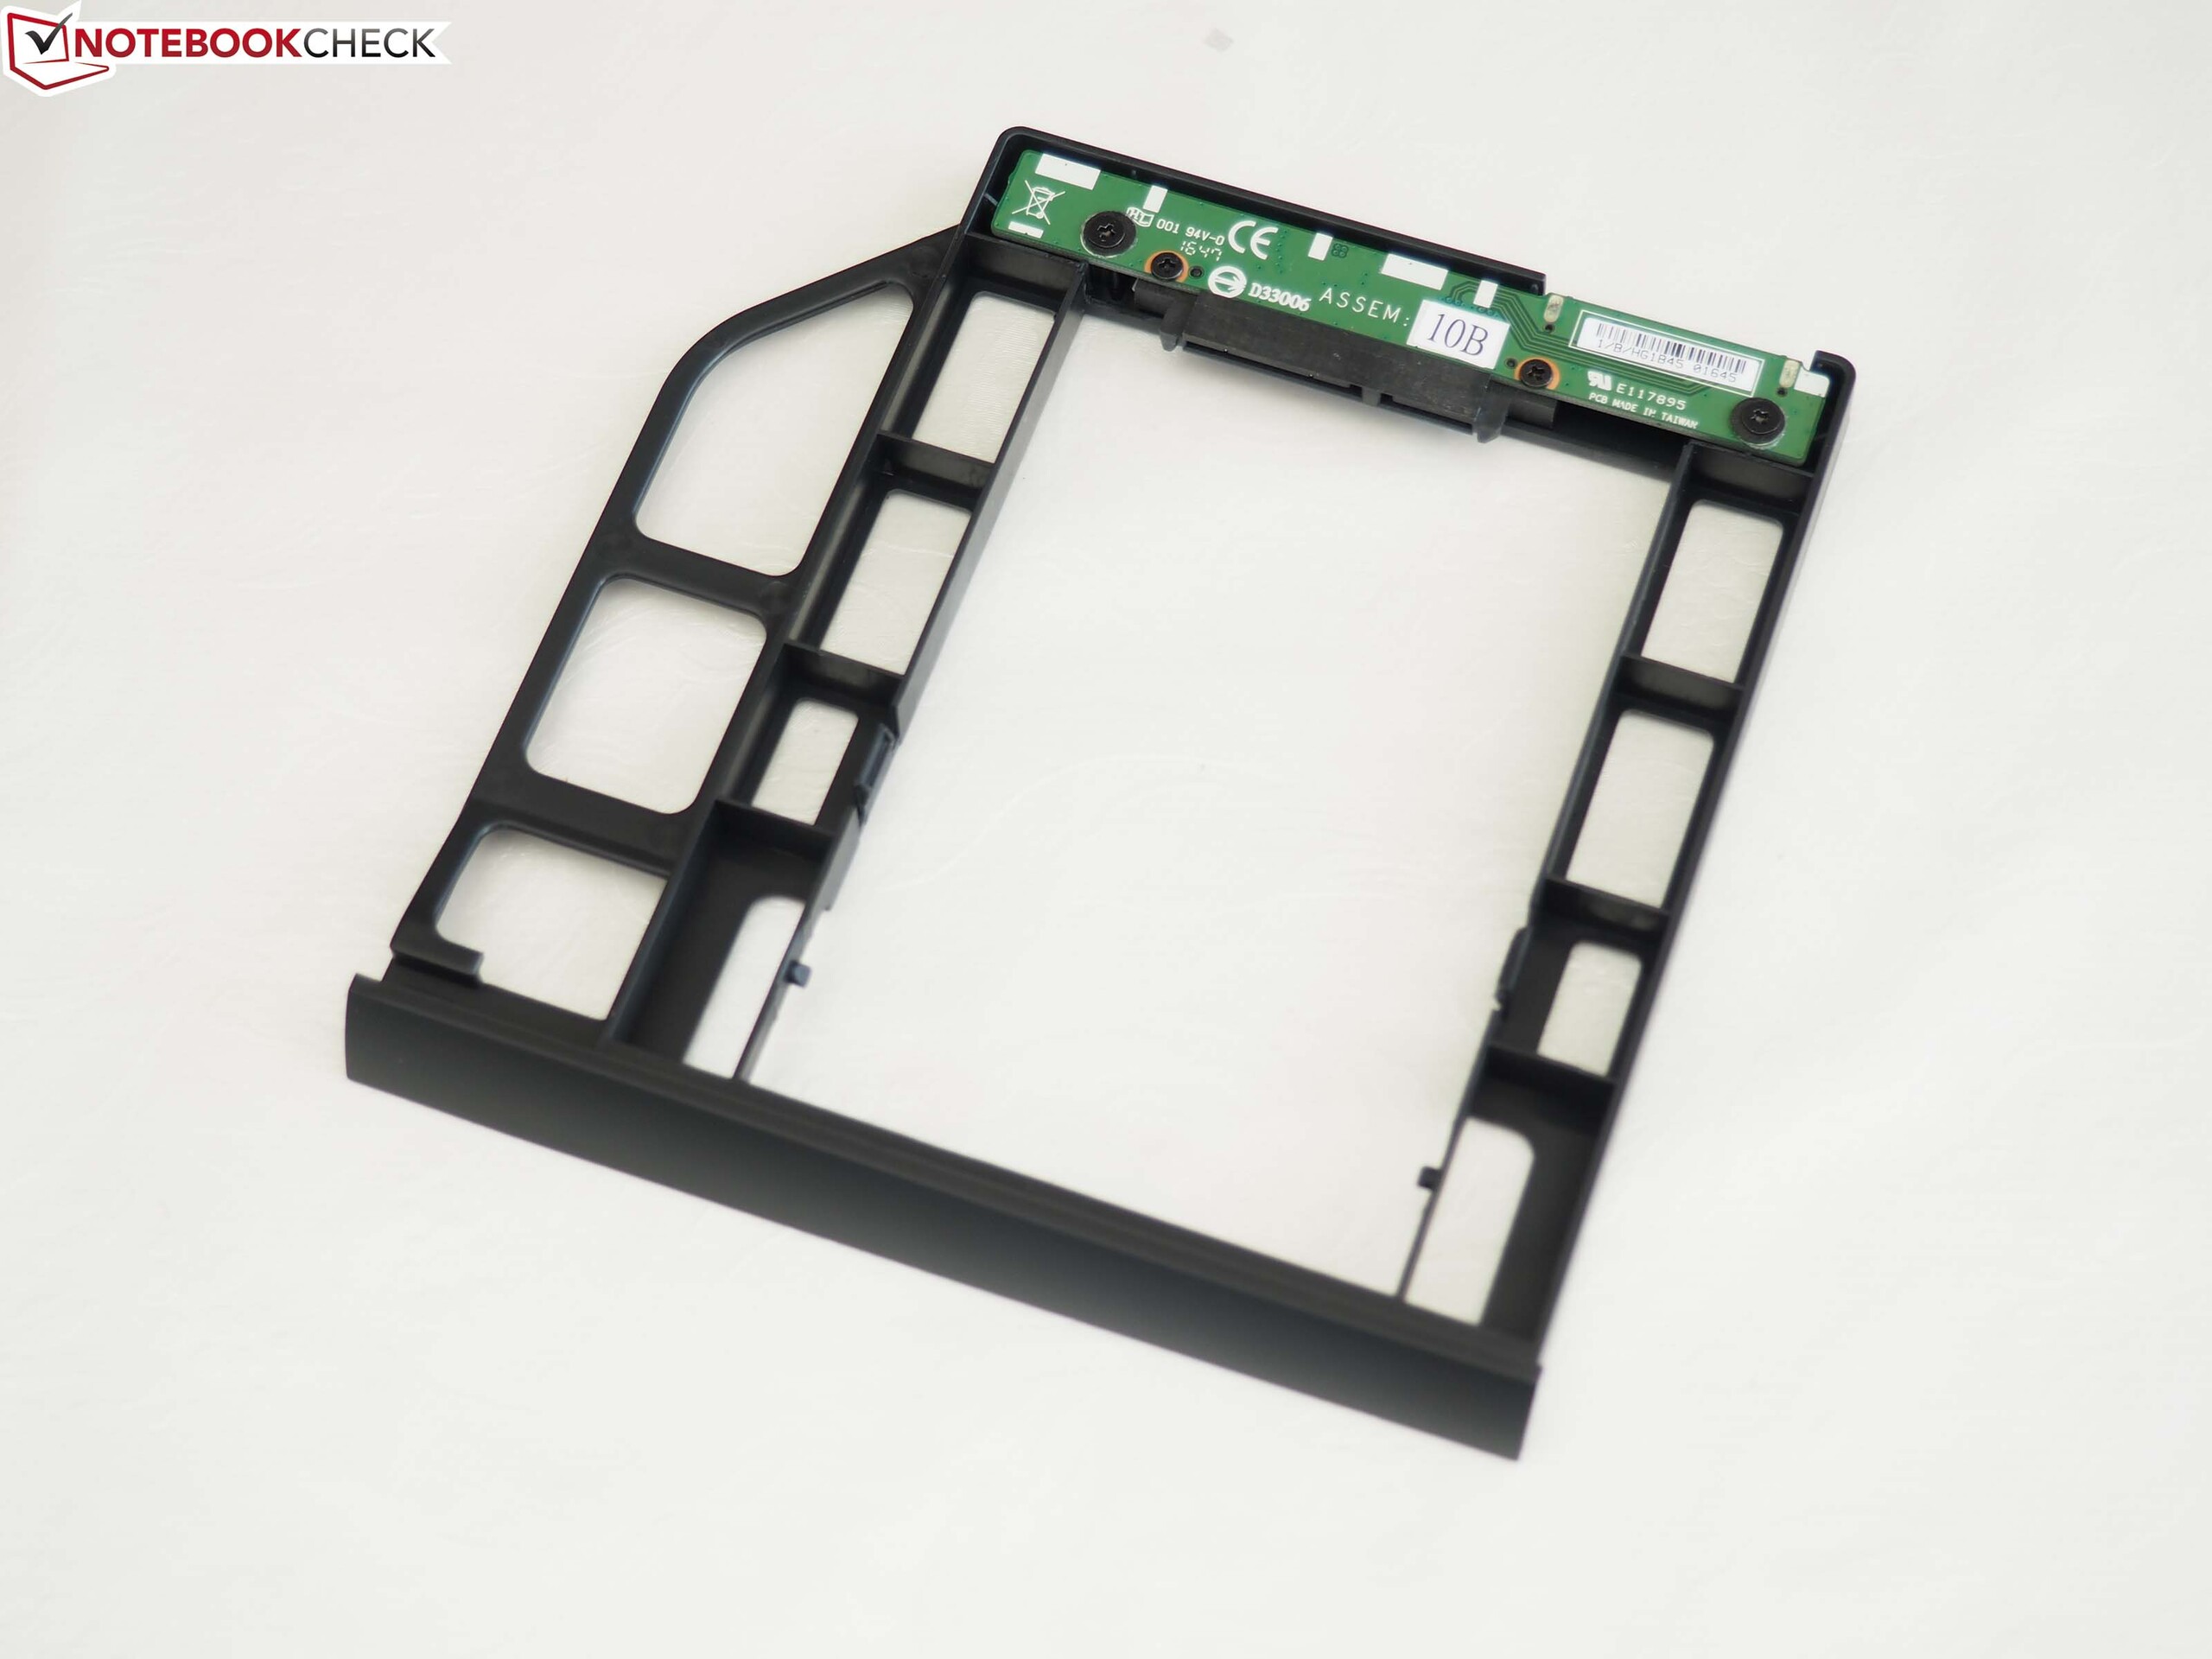
The device comes with some reading material: a user's manual and warranty information. It also includes a driver DVD and power supply (200 watts, 17 x 9.5 x 2.5 cm/6.7 x 3.7 x 0.9 in). The most interesting accessory is the Hot Swap bay, which - as already mentioned above - can be inserted instead of the optical drive and can hold a 2.5-inch hard drive with which internal storage can be expanded.
Warranty
The warranty for the P56XT lasts 24 months. Please see our Guarantees, Return policies and Warranties FAQ for country-specific information.
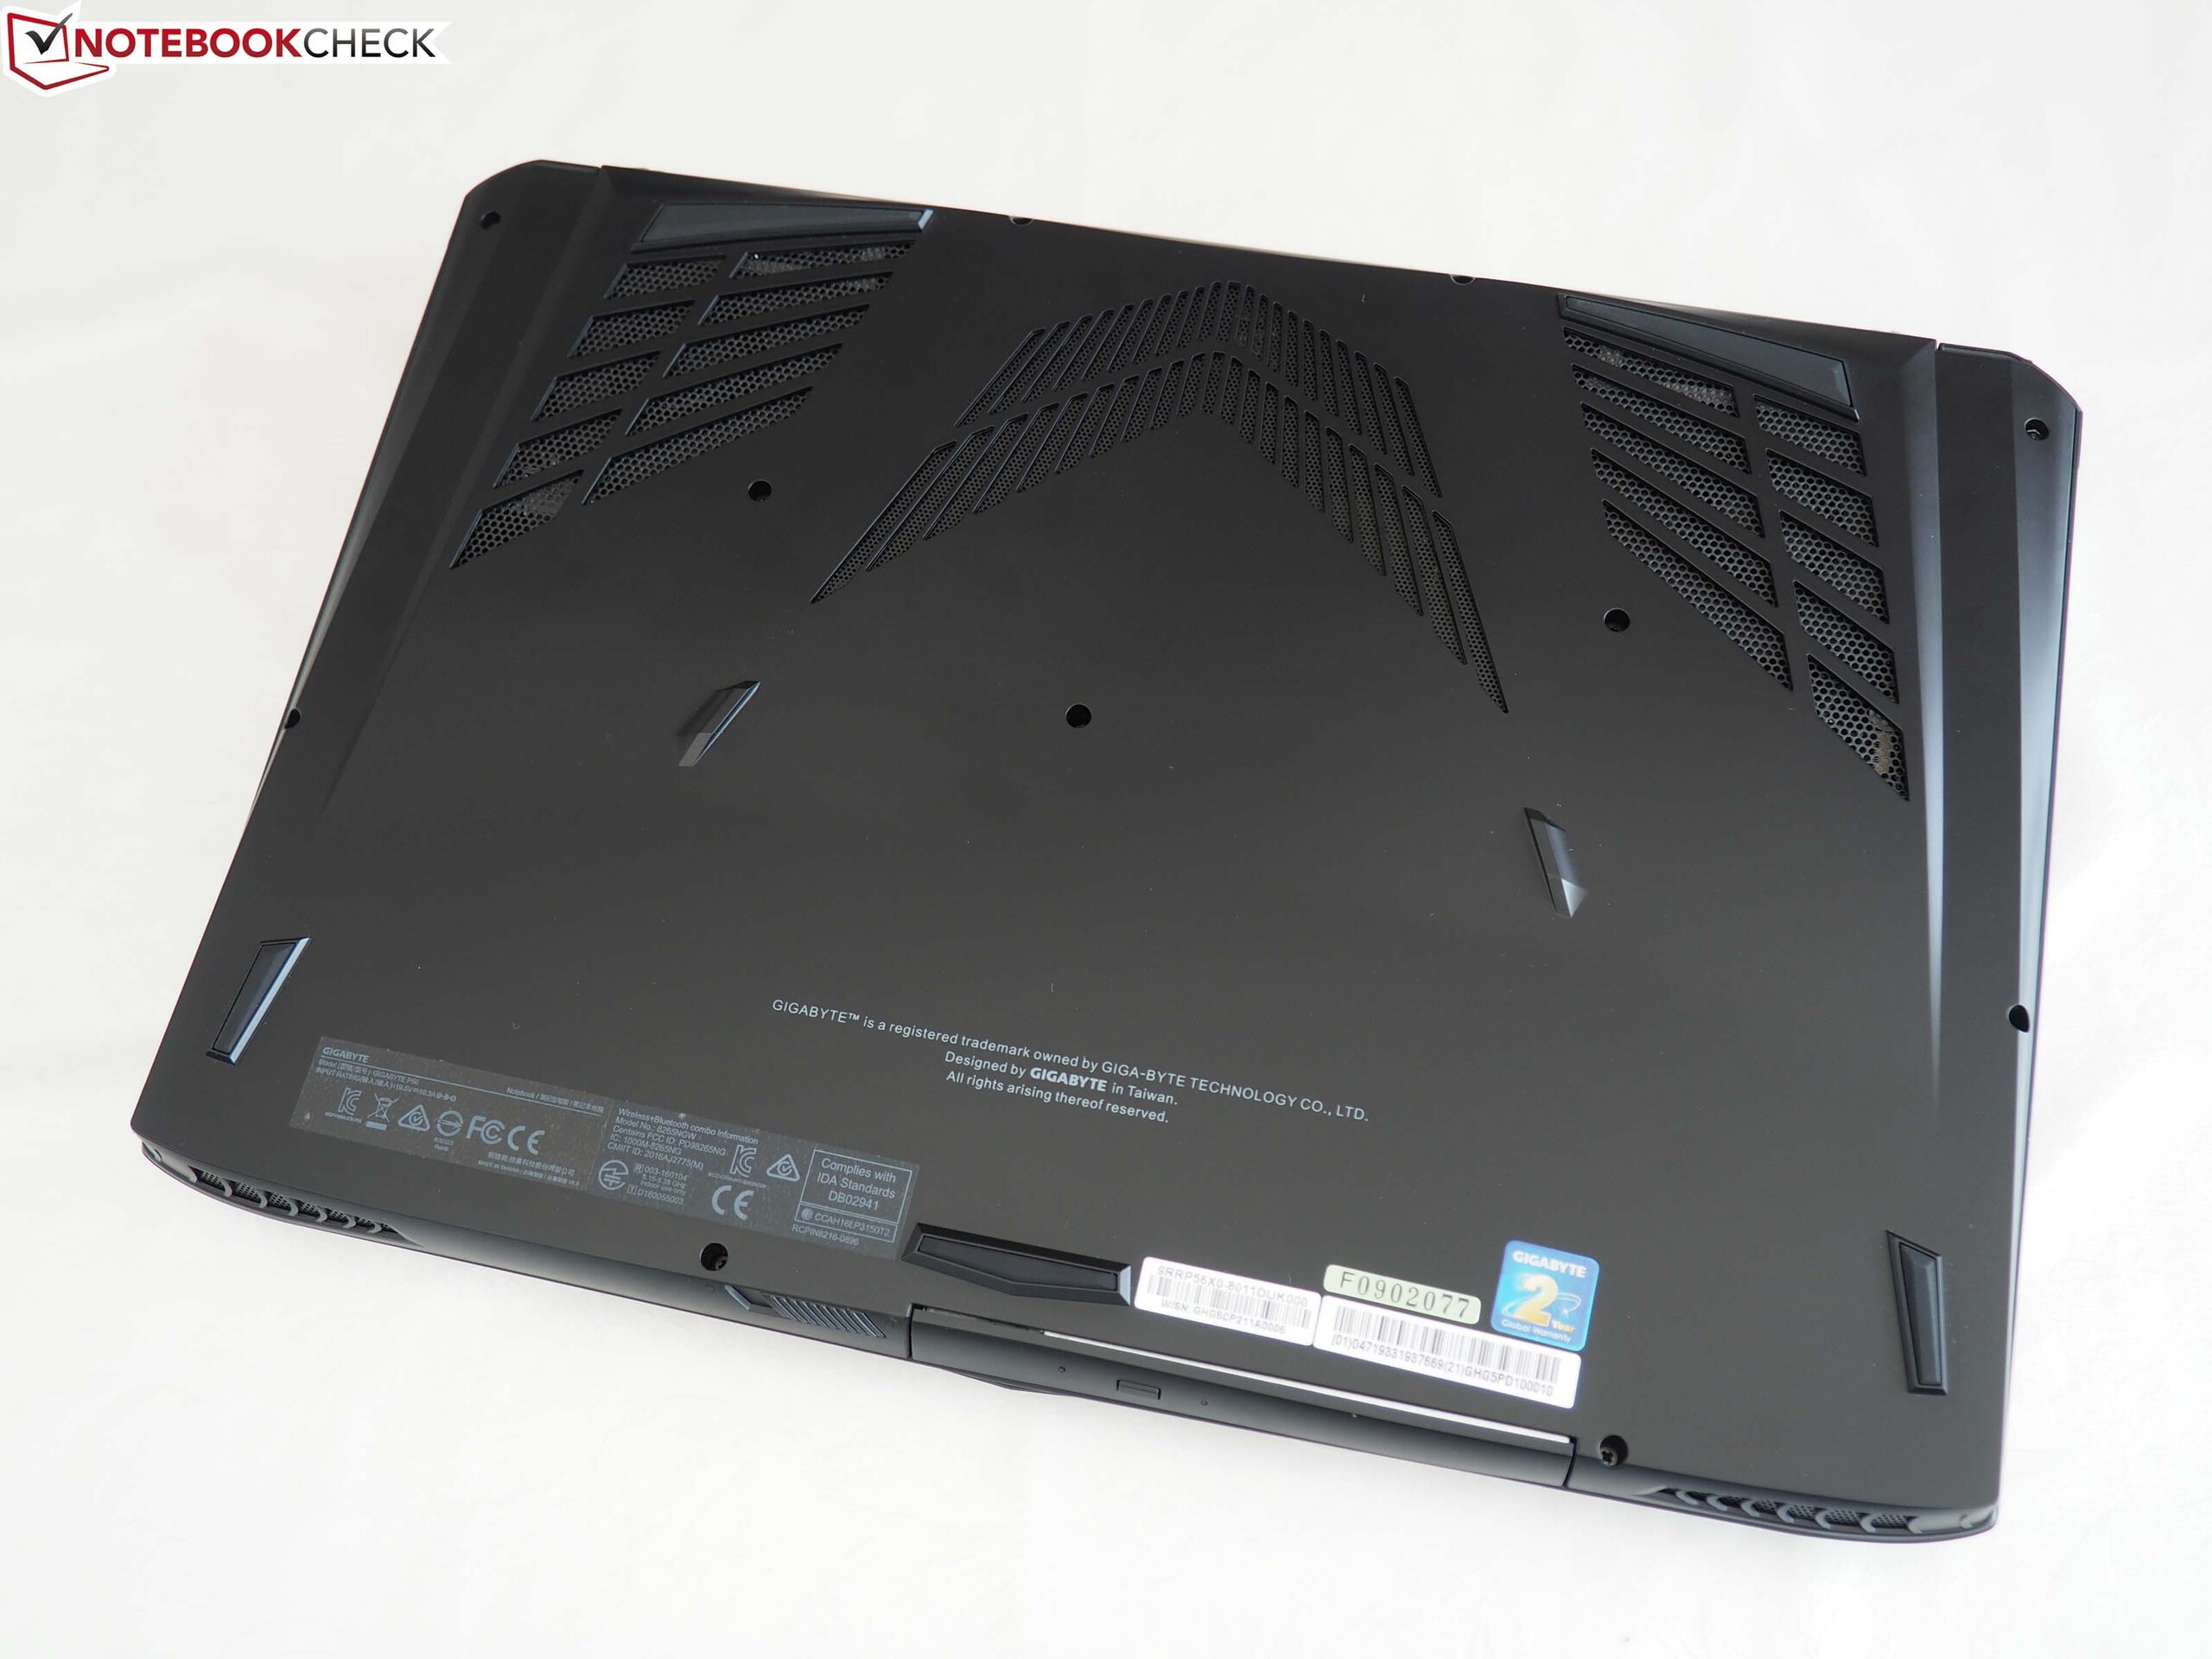
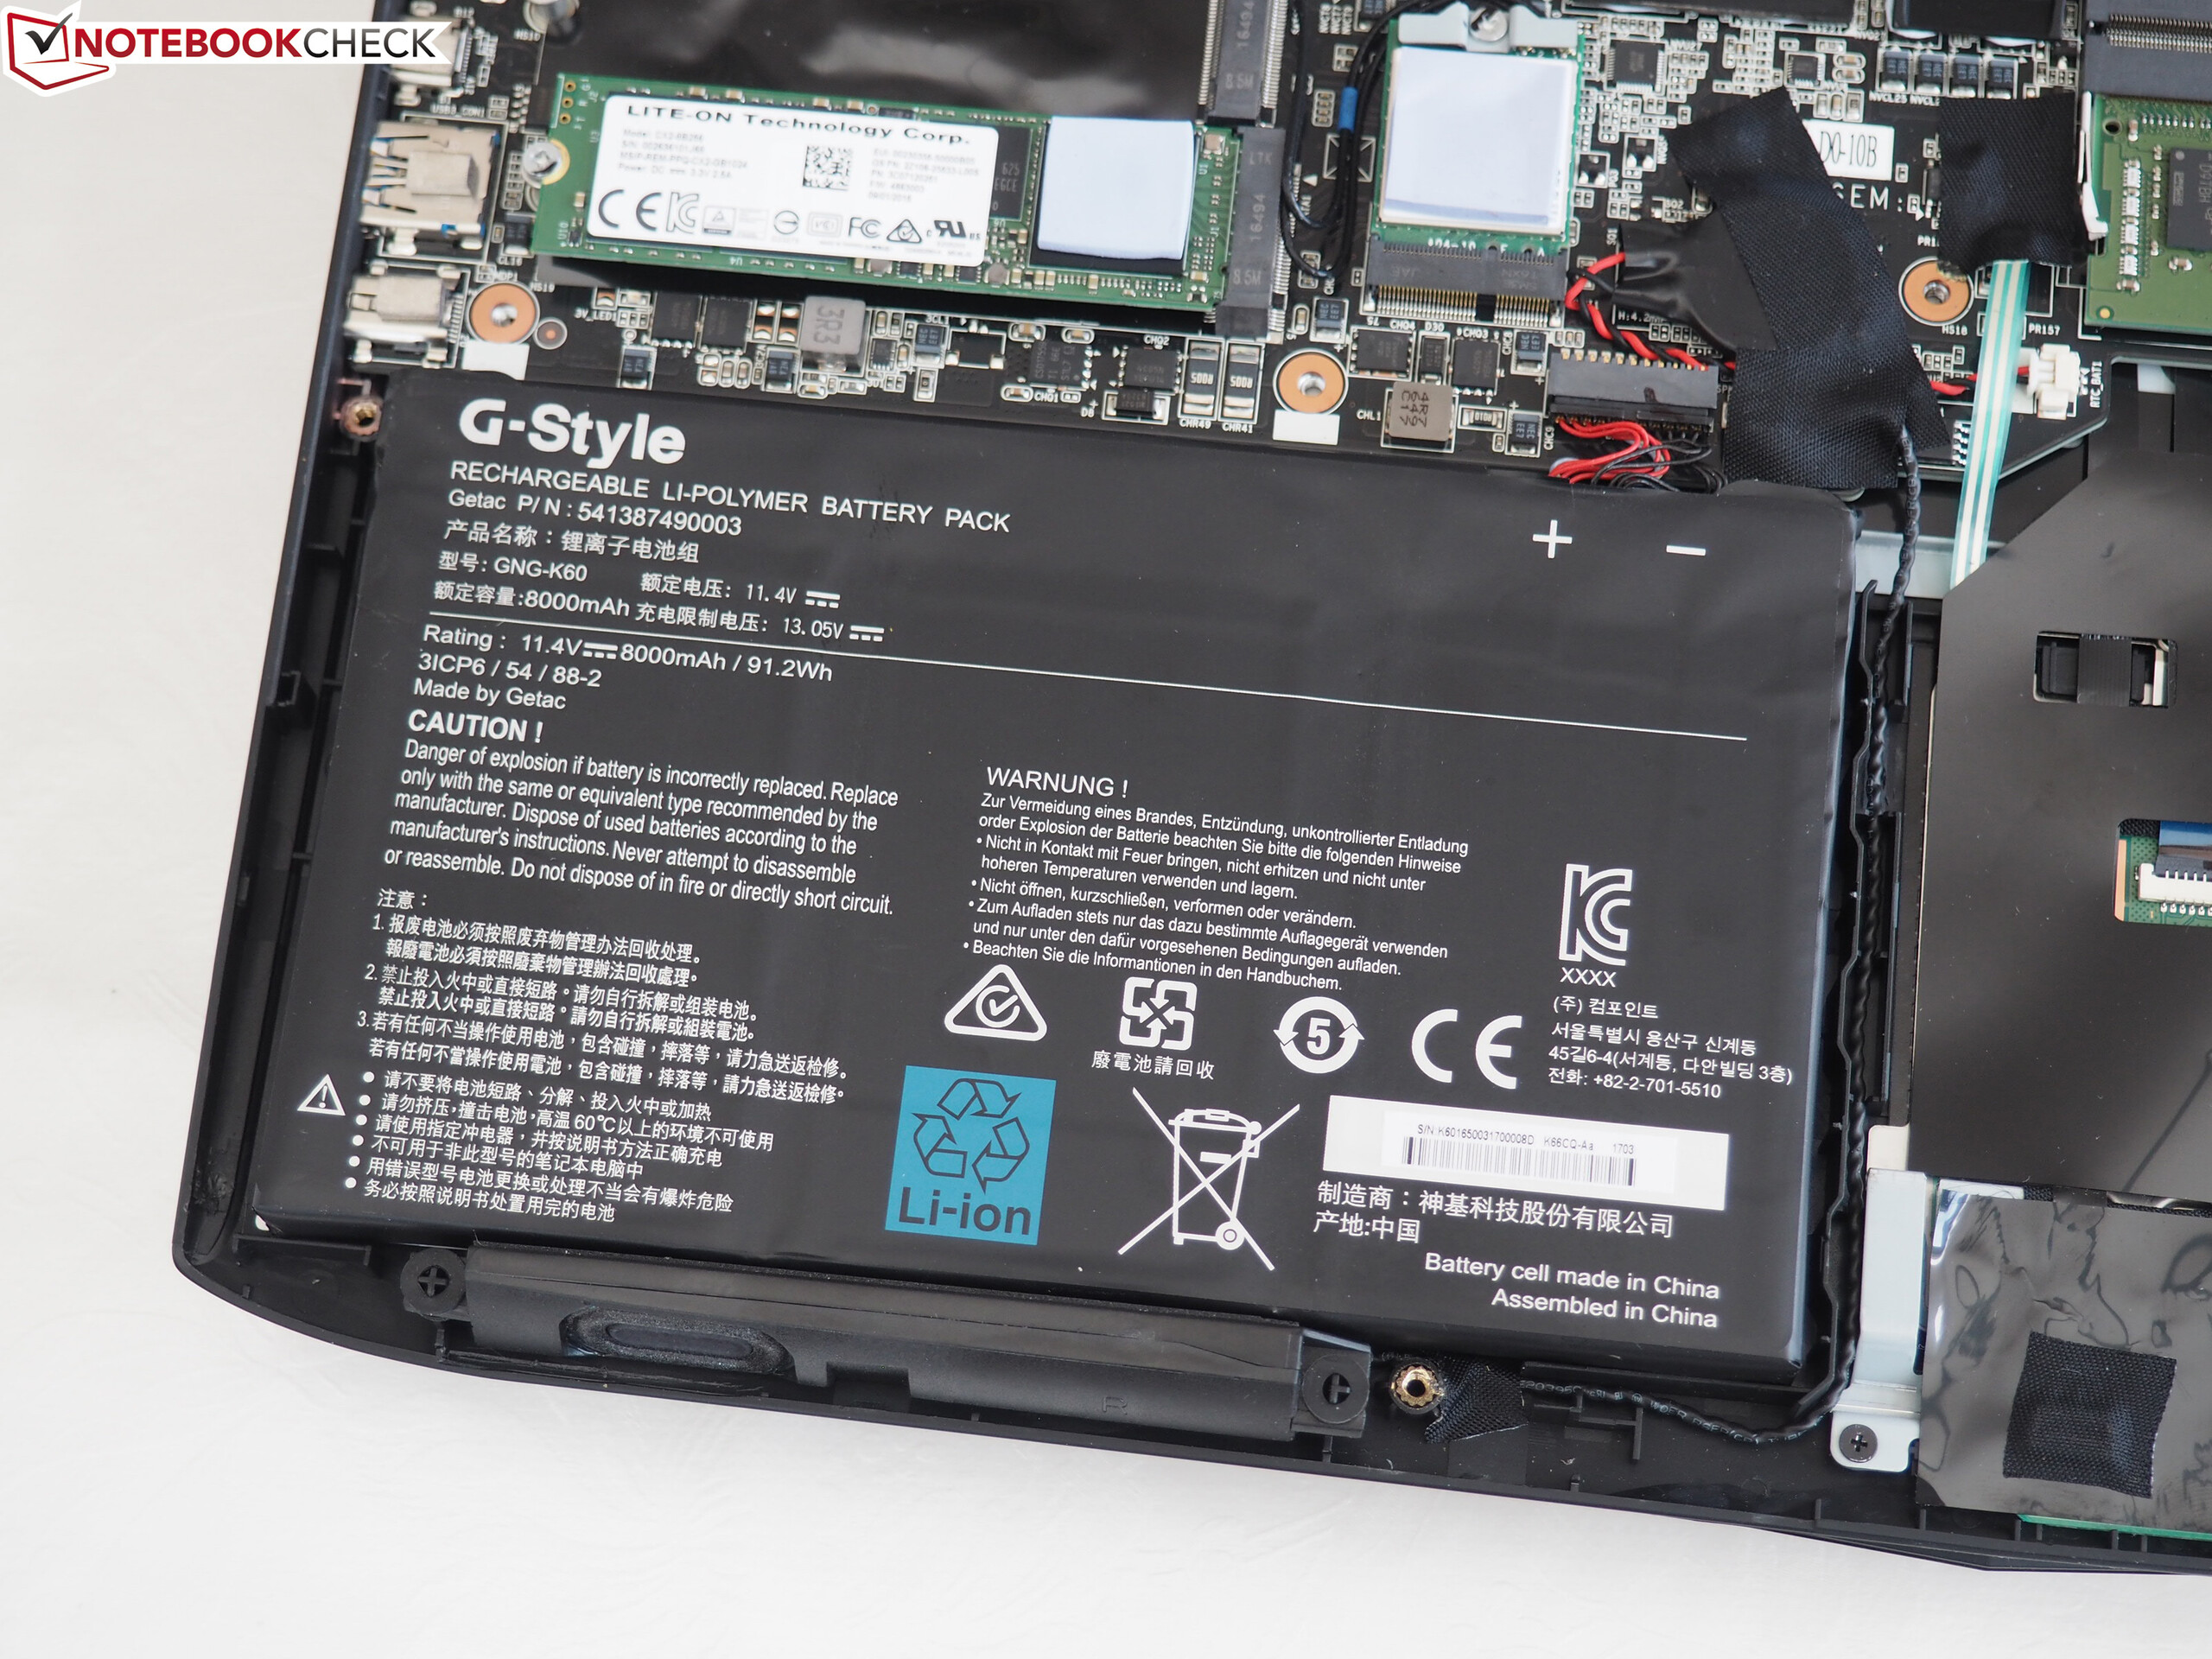
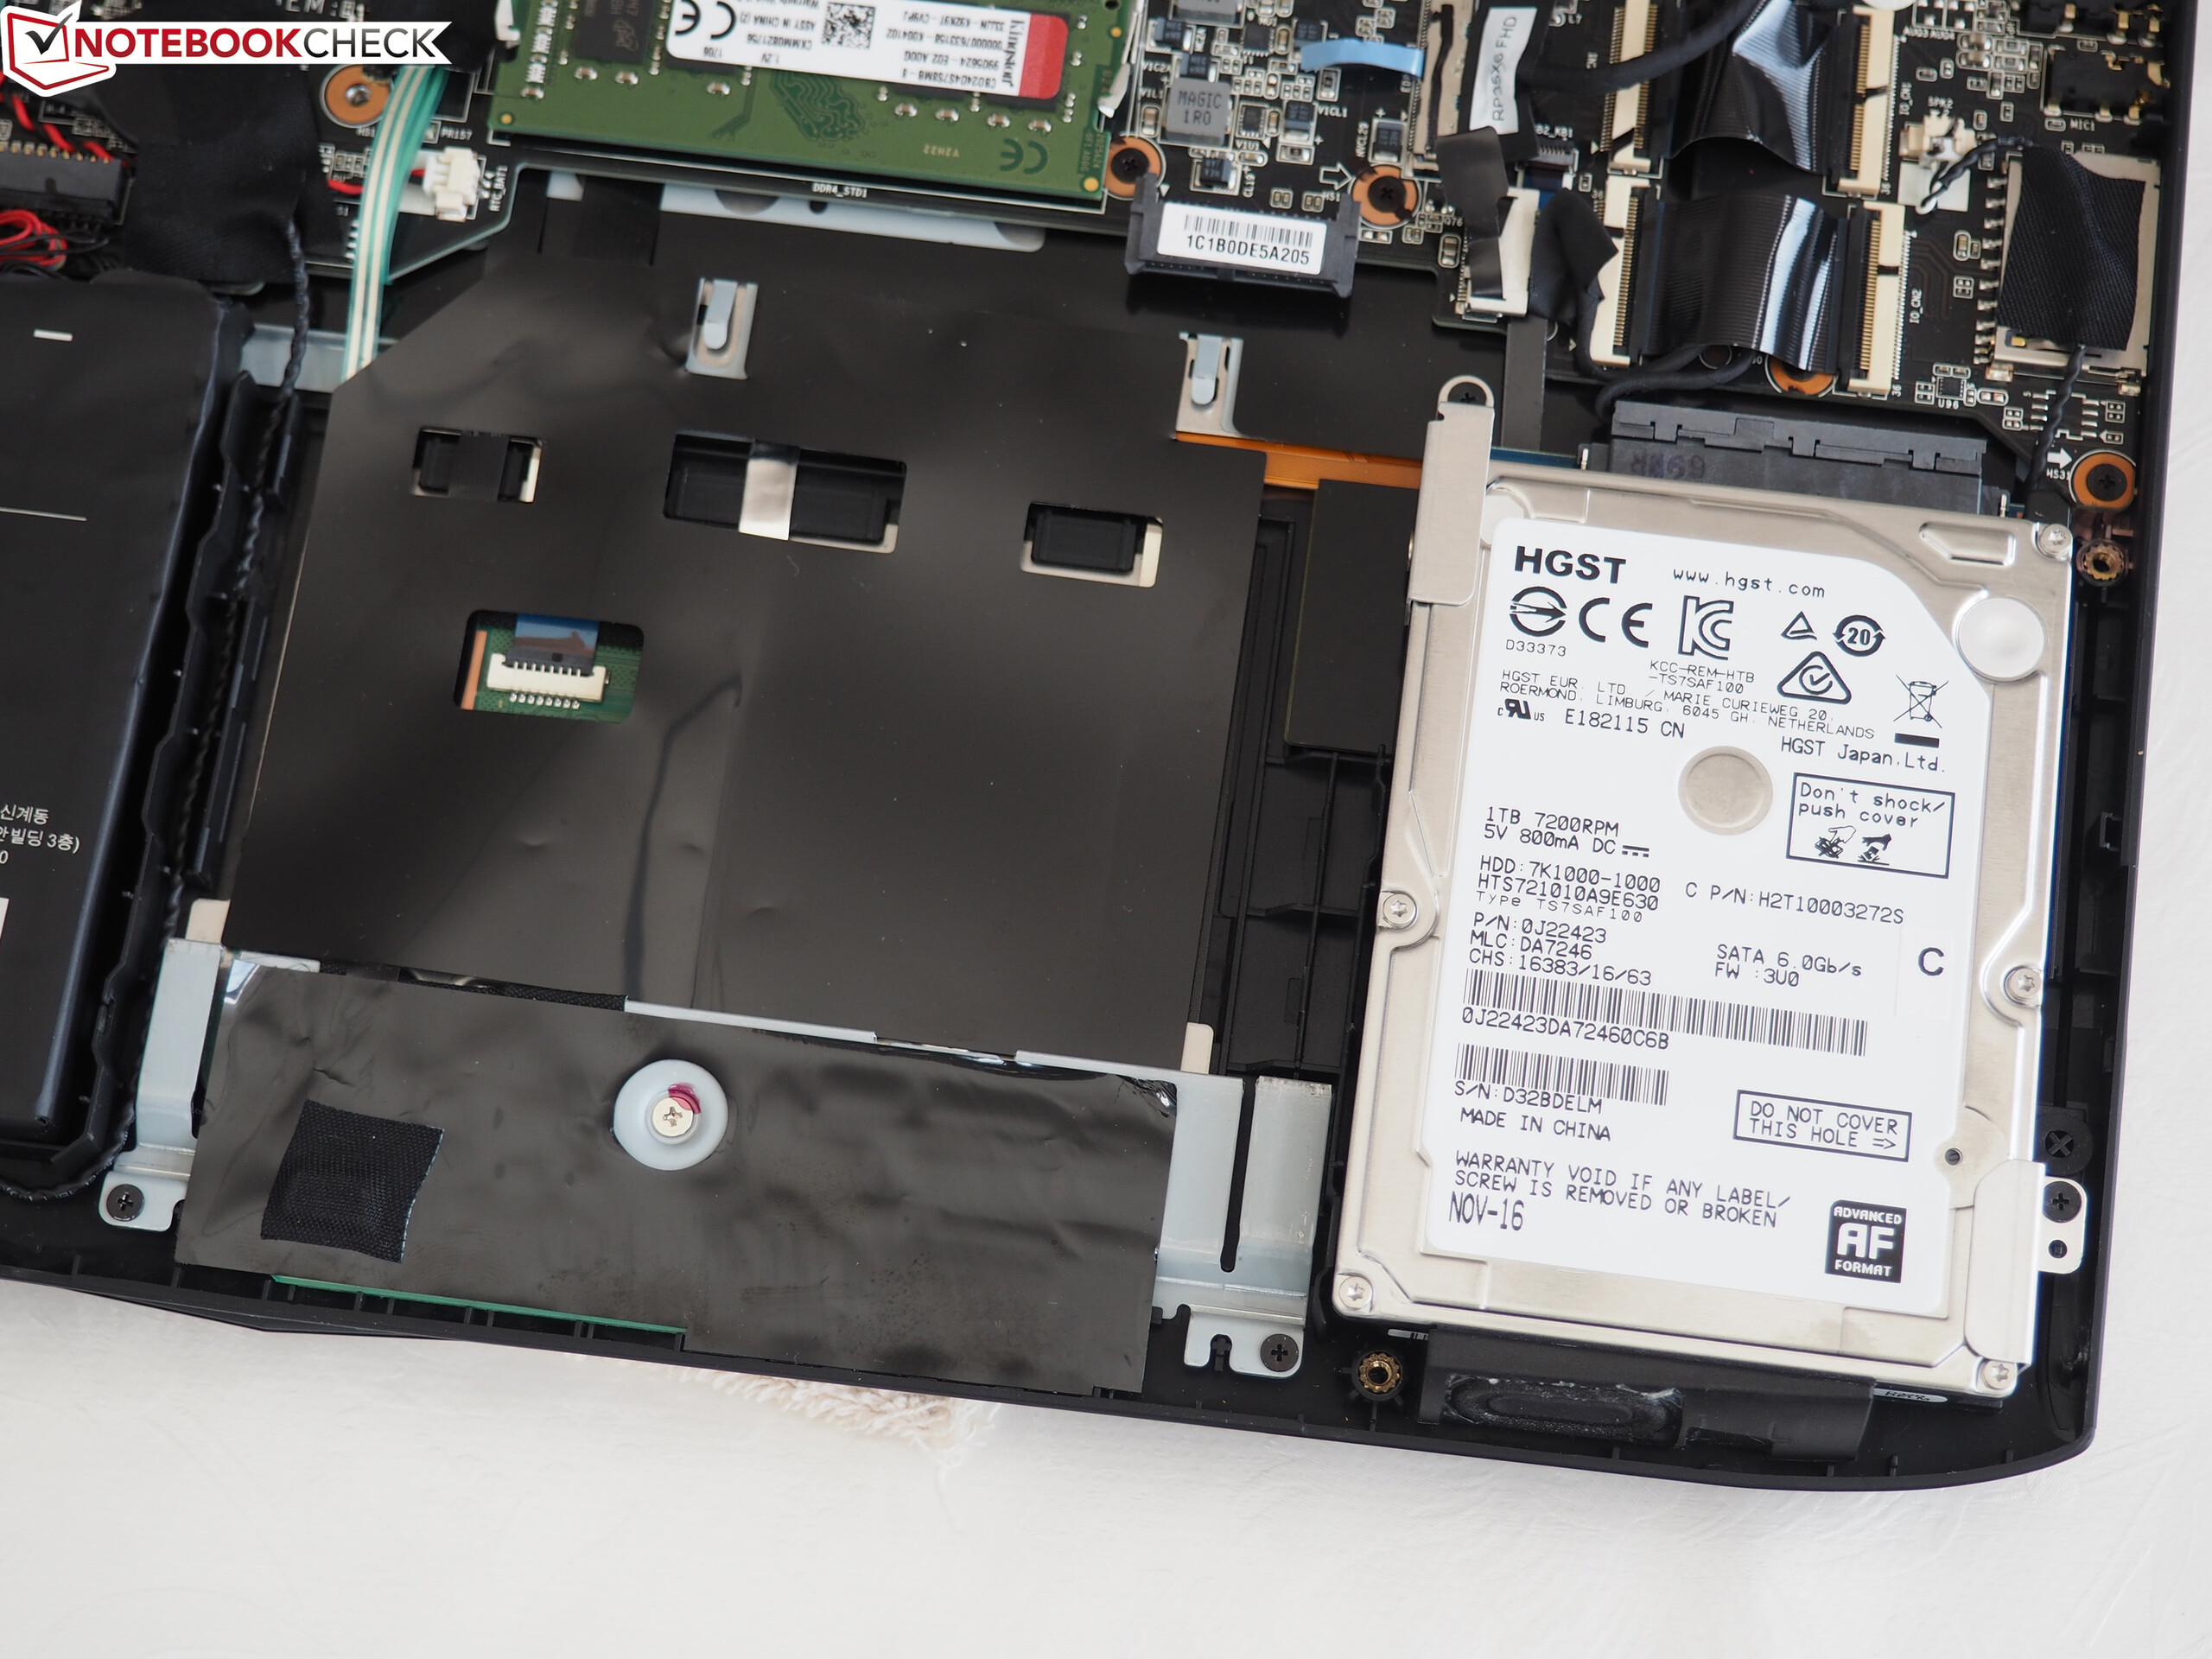
Maintenance
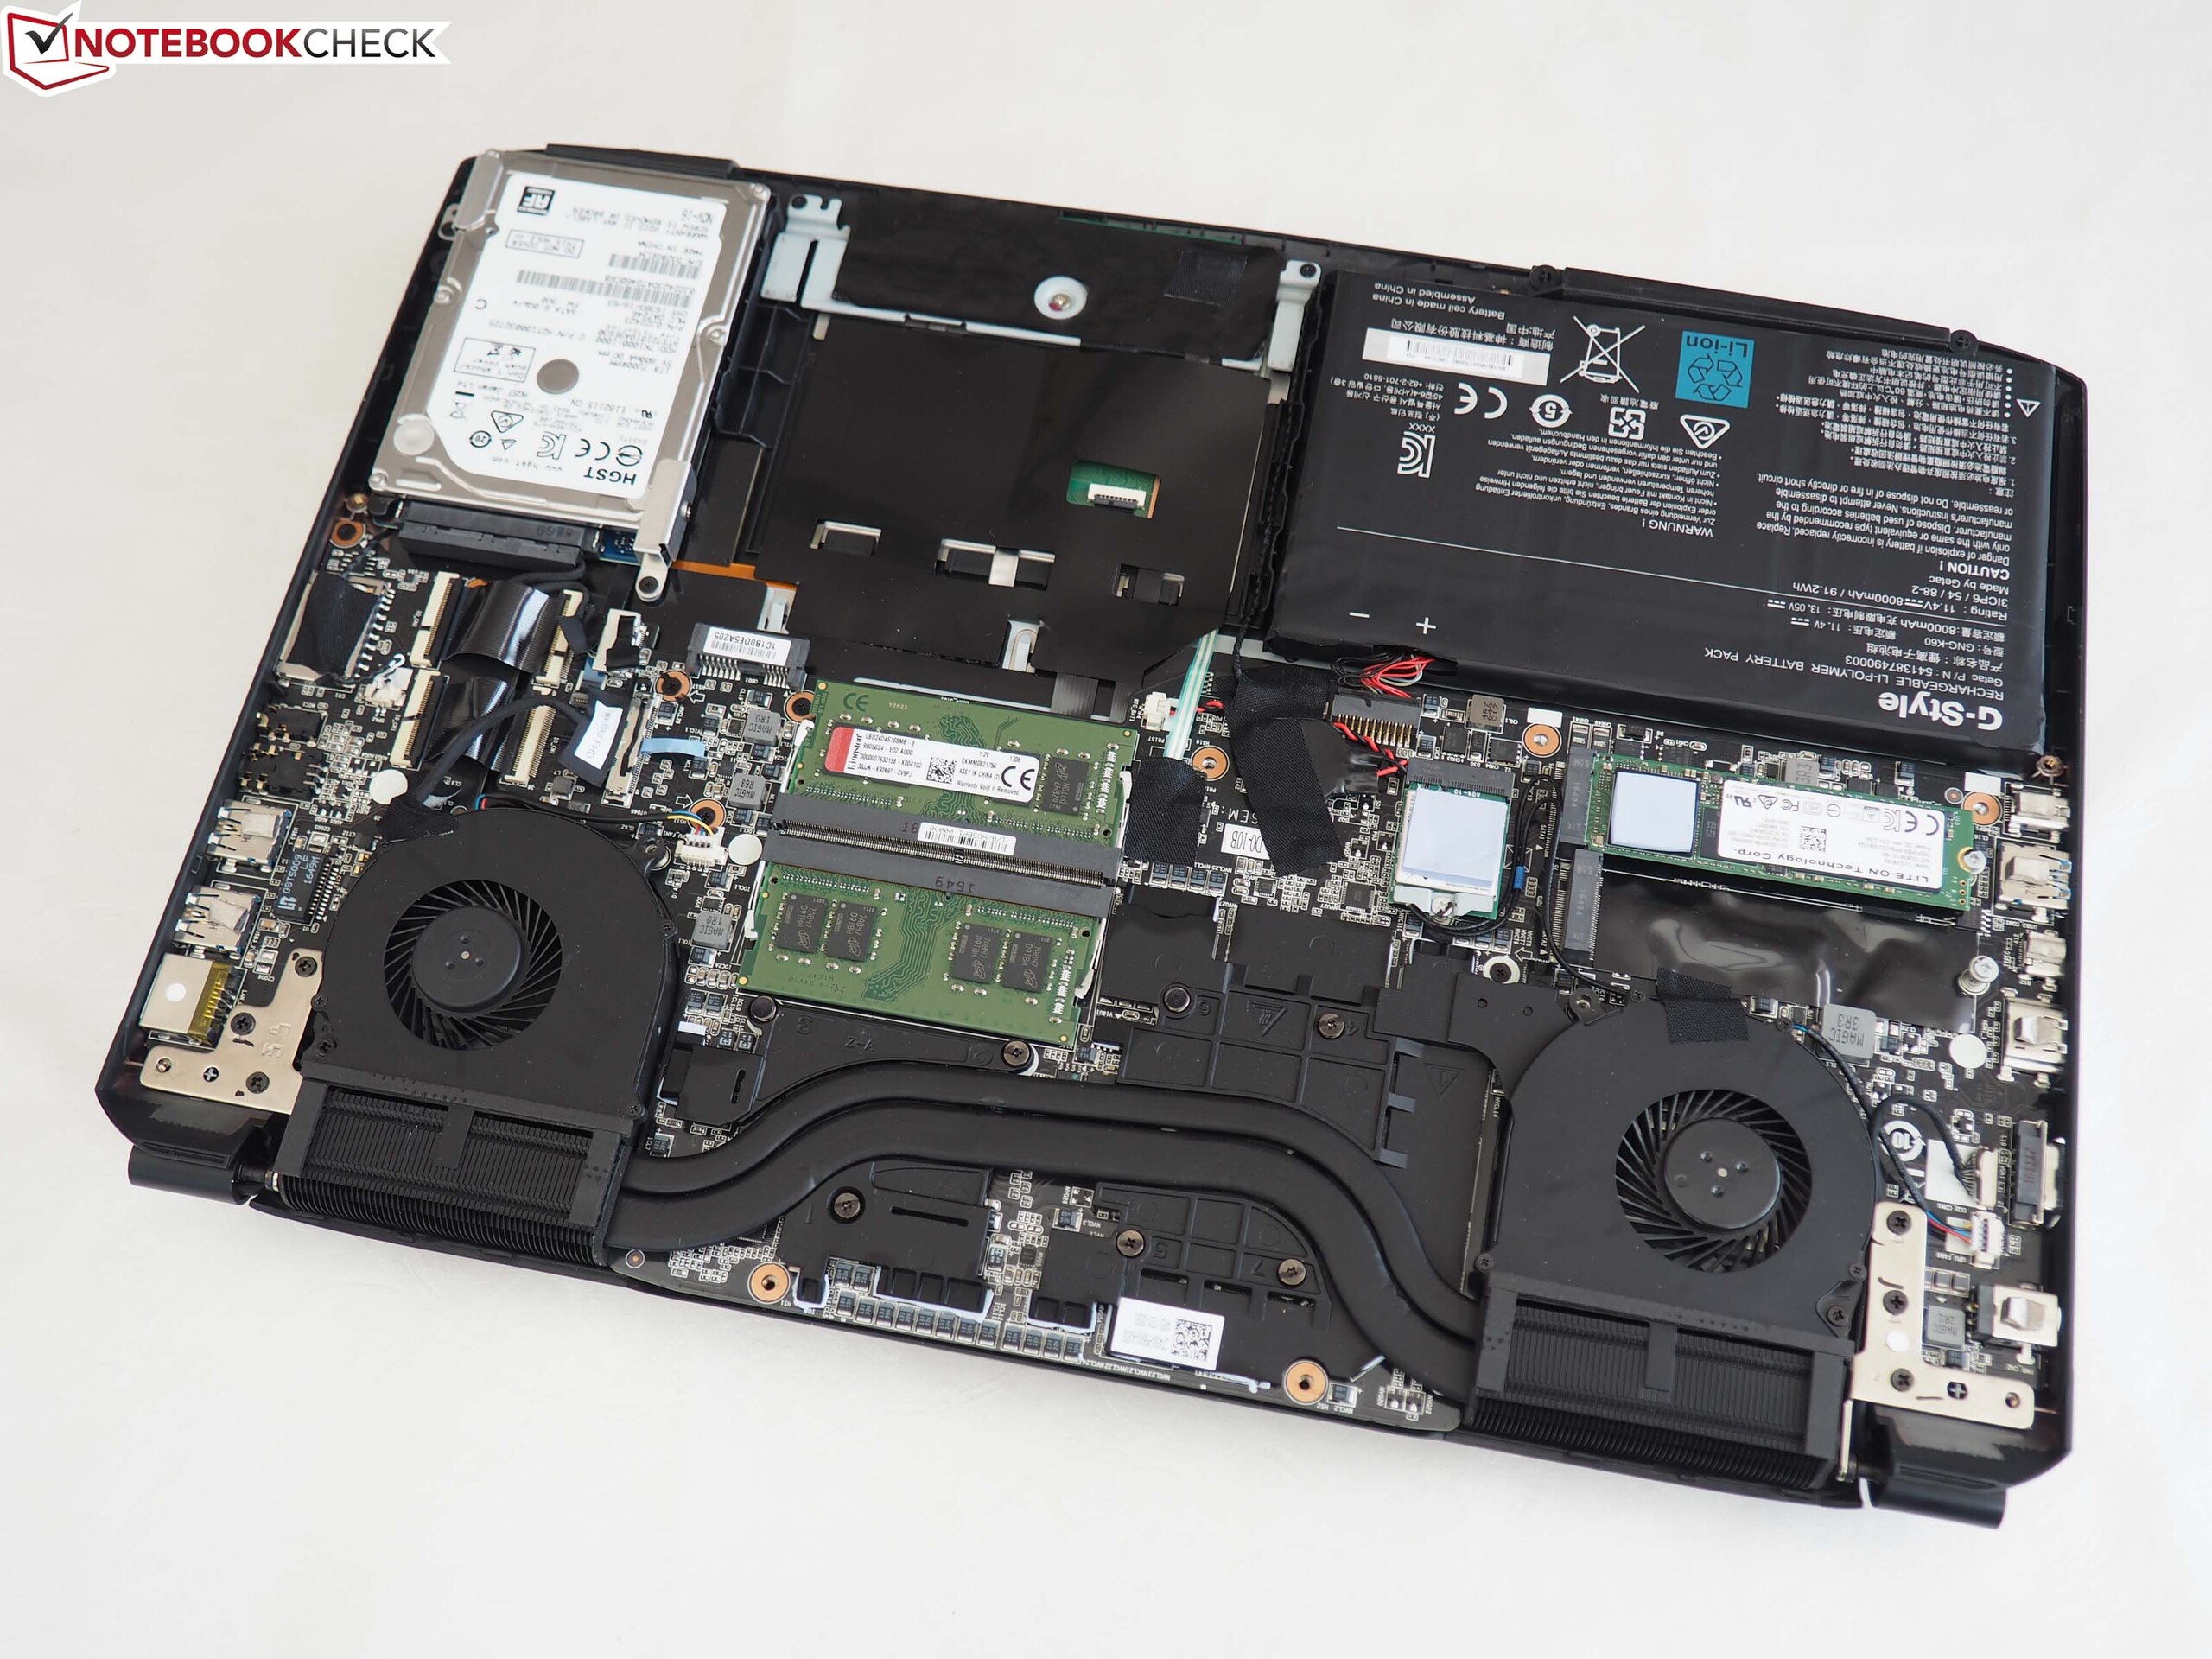
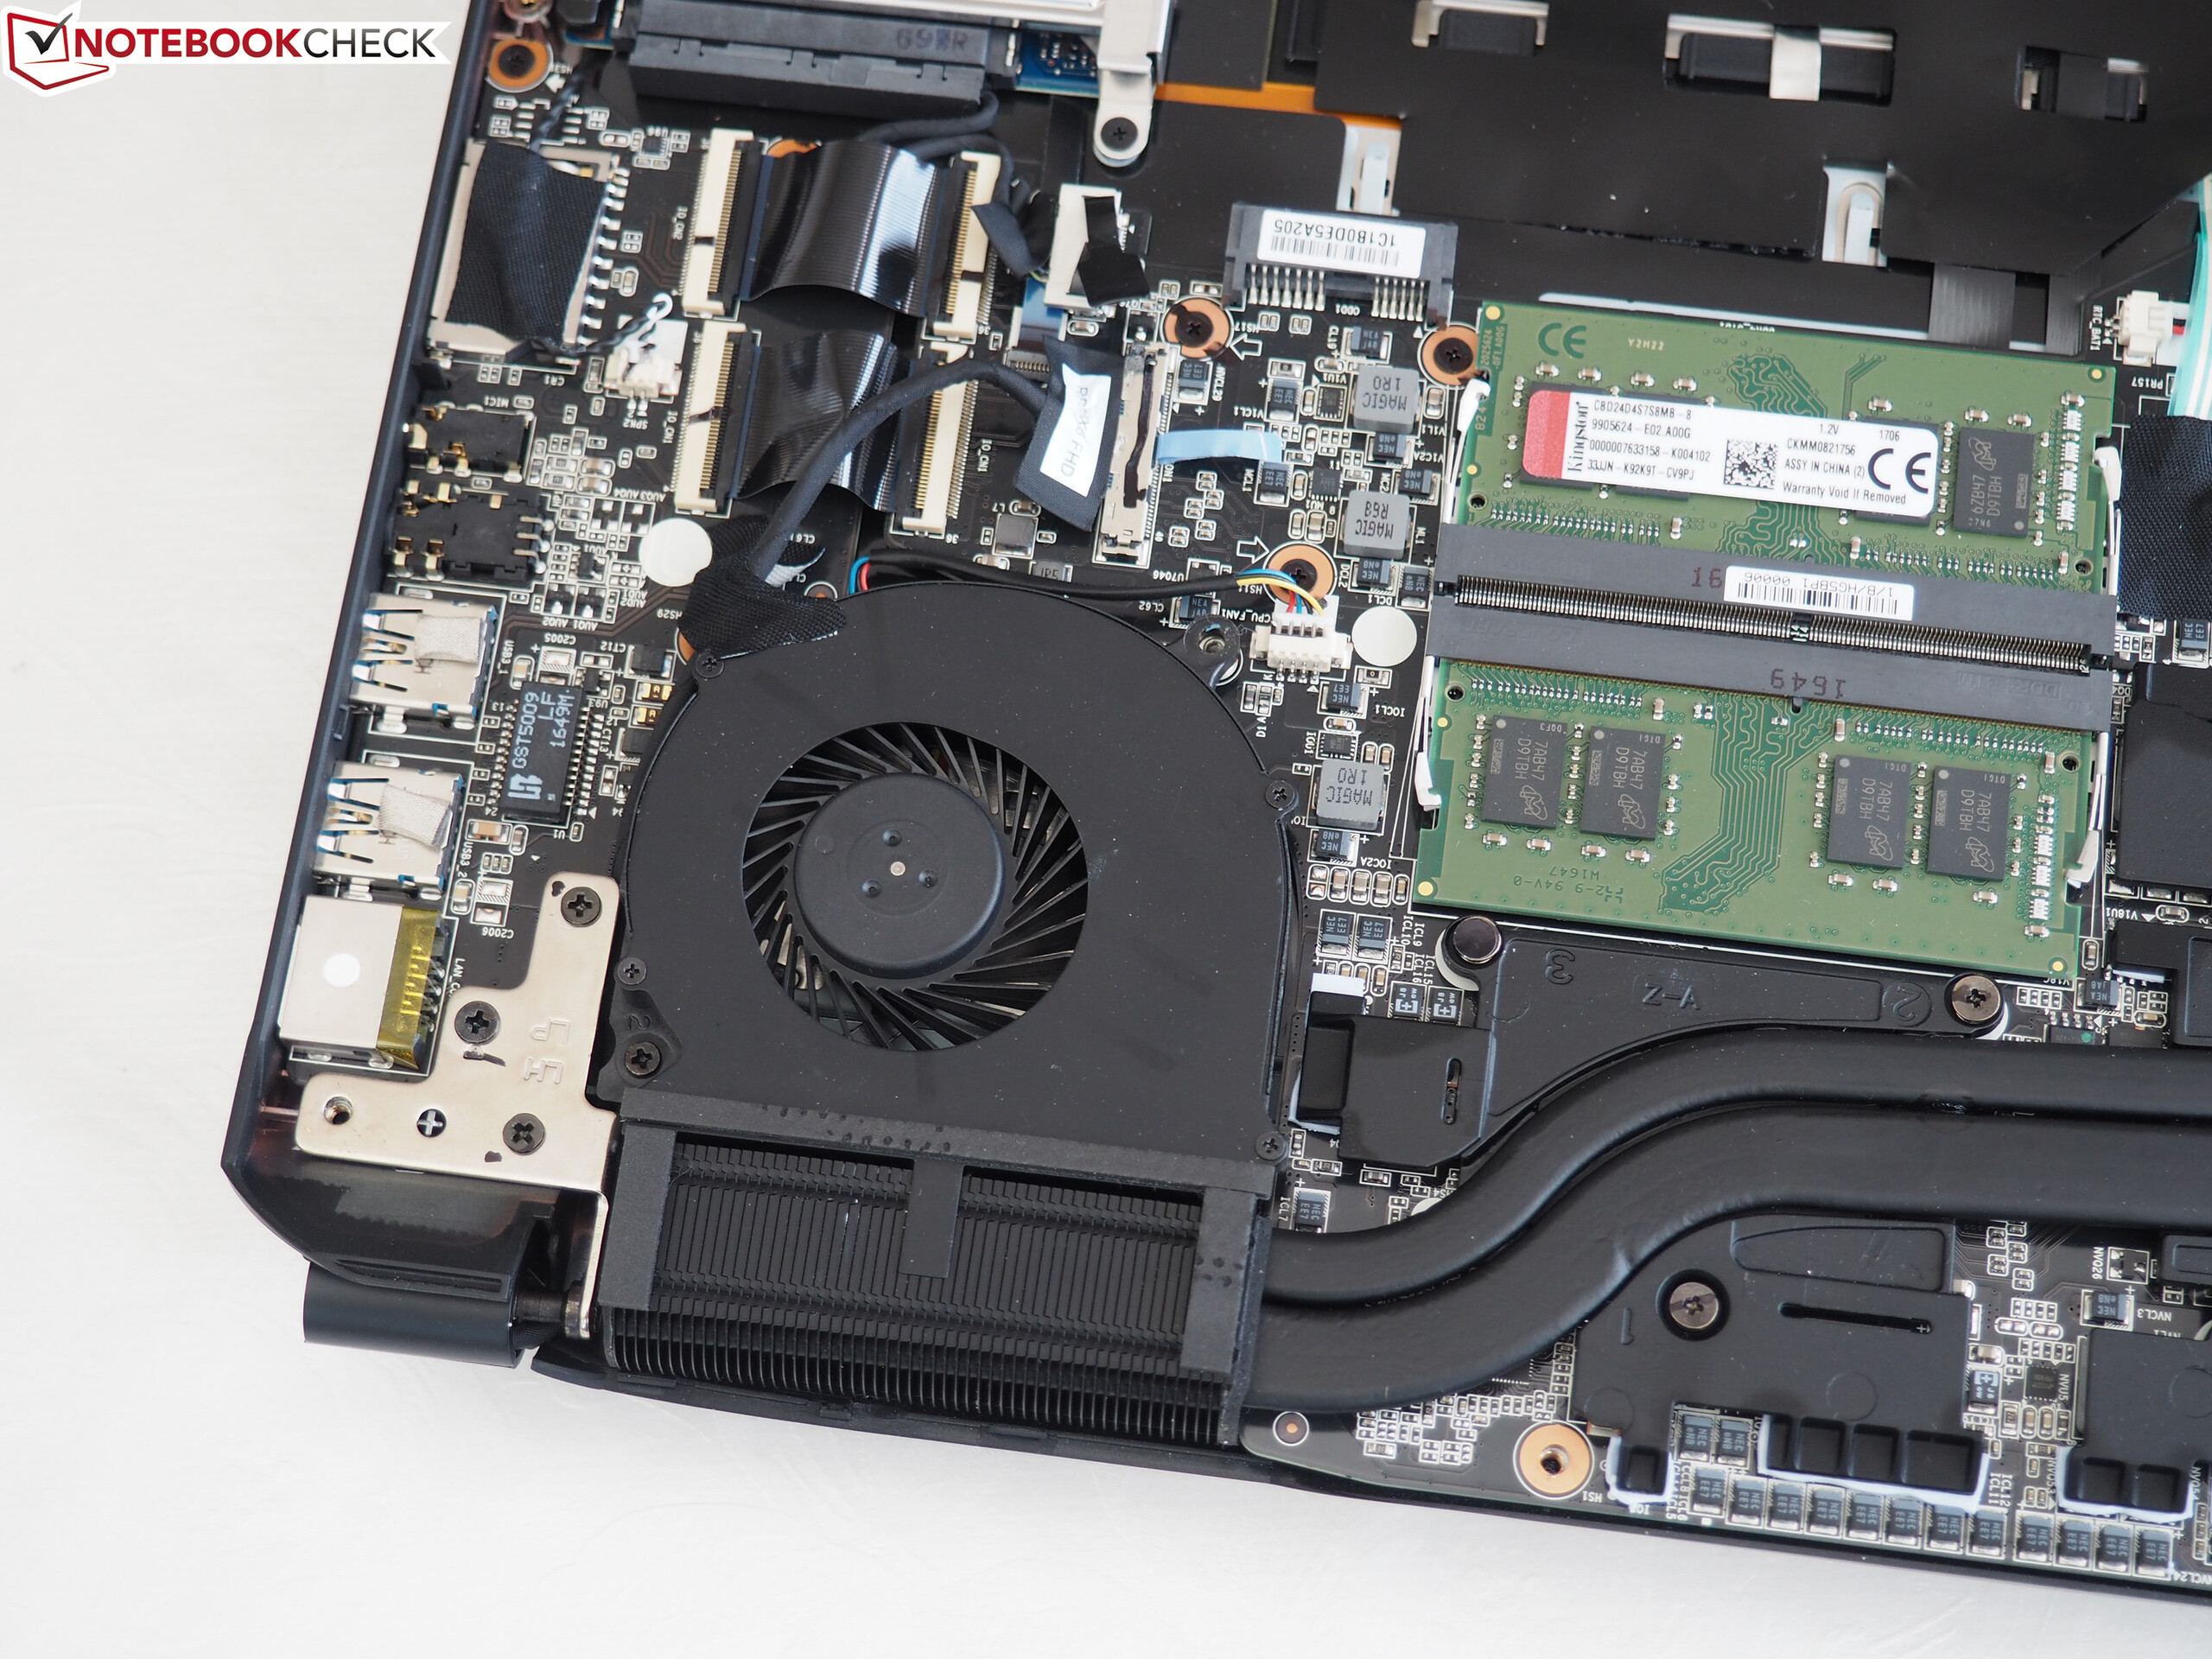
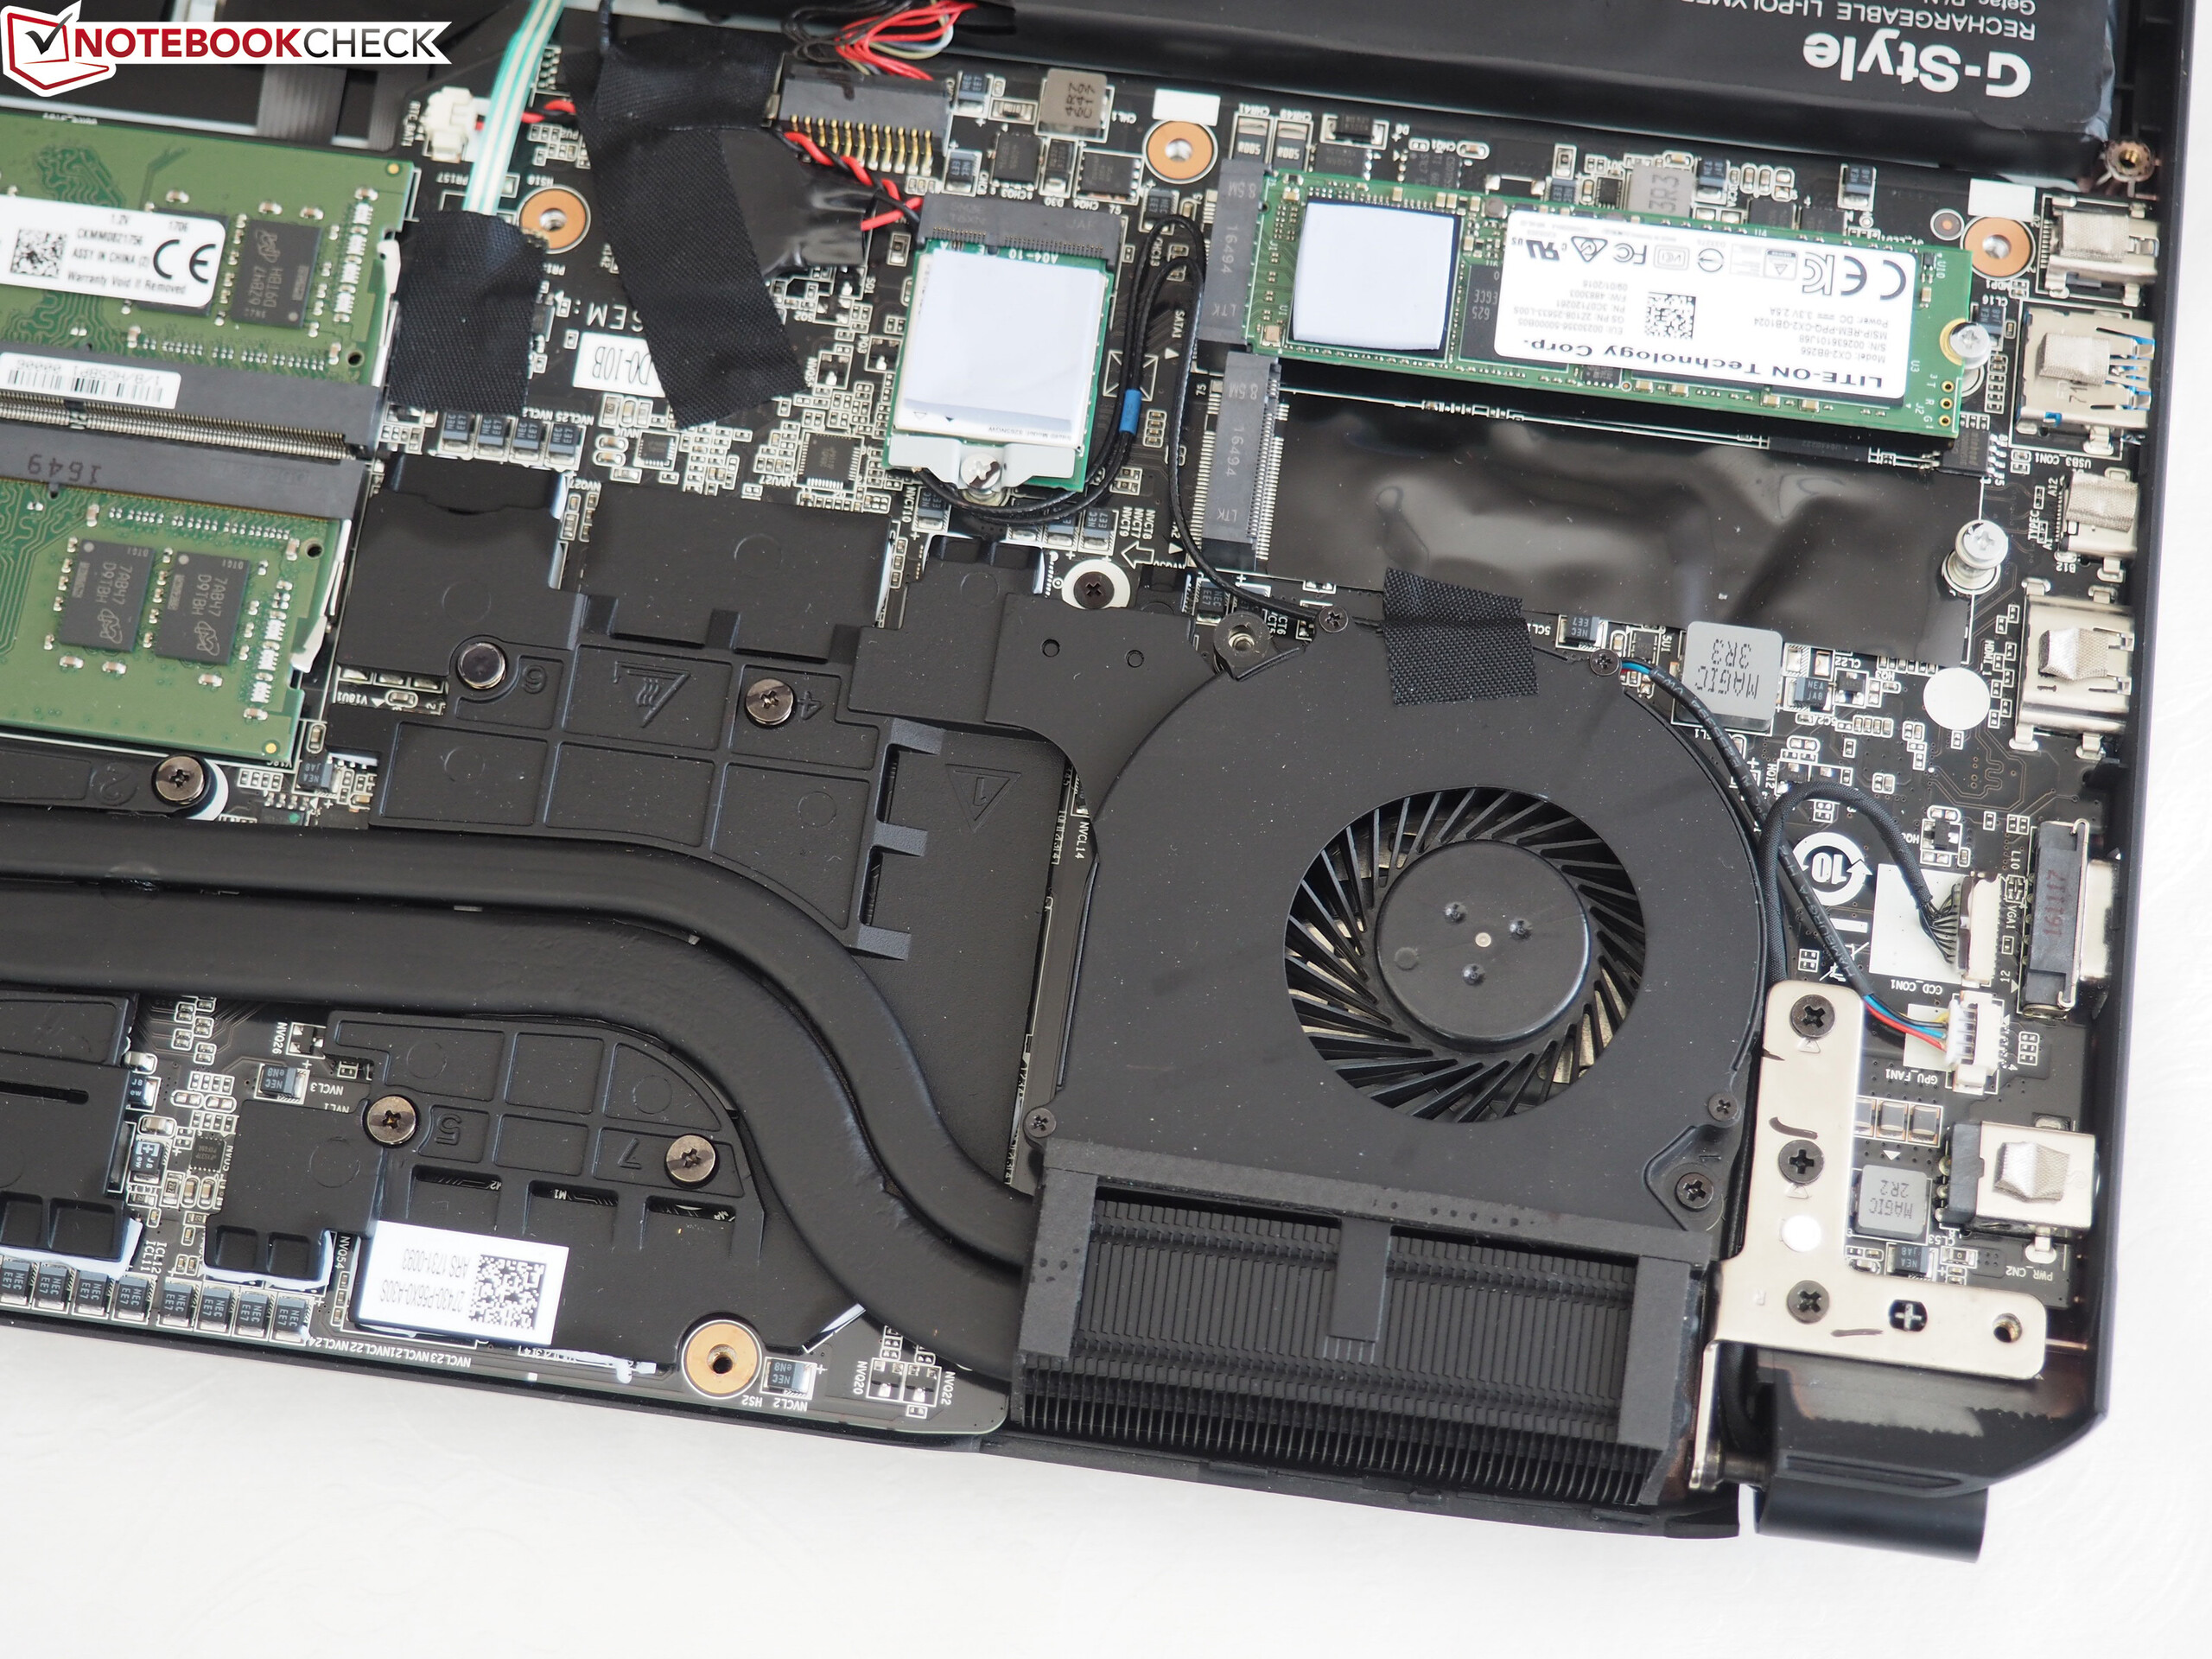
The fact that the manufacturer has decided to do without a maintenance hatch is not a big problem as the entire cover of the base unit can be removed with a simple double-slot screwdriver (11 screws). Beneath the cover you will find two DDR4 slots, the WLAN module, the battery and drive bays (1x 2.5 inch + 2x M.2 Type 2280 with PCIe support.) One of these slots was free in our test unit.
The cooling system is made up of two fans and two heat pipes, which seems rather sparse in view of the device's graphics performance and its strong heat and system noise development. Although other high-end notebooks also offer two cooling fans at the most, they often have a lot more heat pipes and/or separate cooling systems for CPU and GPU. By the way, the Core i7-7700HQ and the GeForce GTX 1070 are both soldered onto the motherboard.
Software
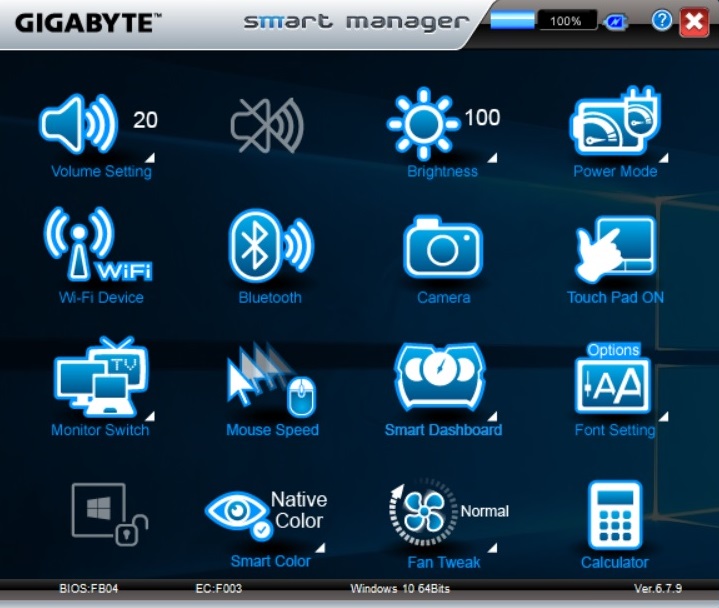
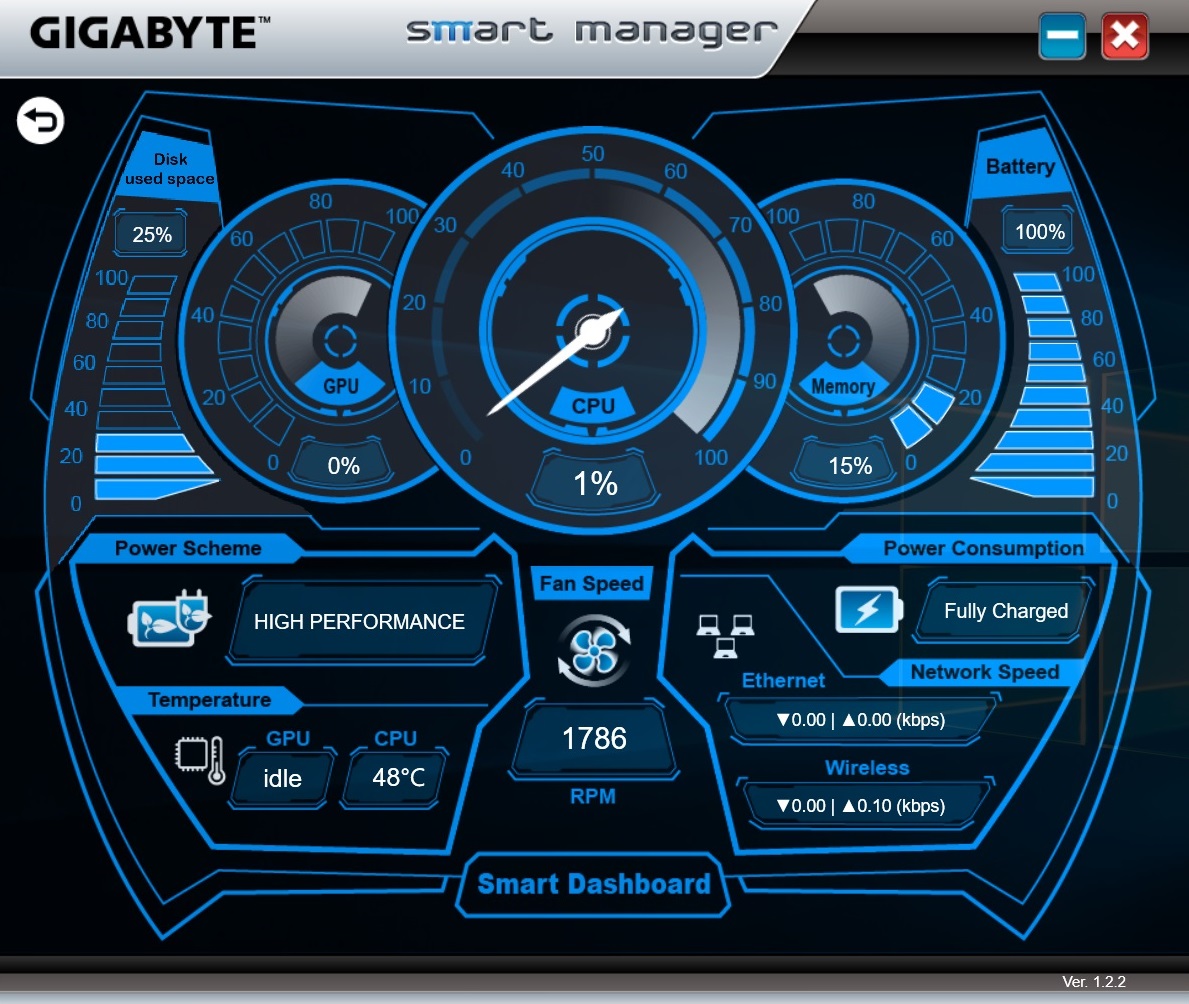
Gigabyte has installed some interesting tools. The most important one is the so-called Smart Manager, which combines various functions and special modes to control image display (Smart Color) and the cooling system (Fan Tweak)
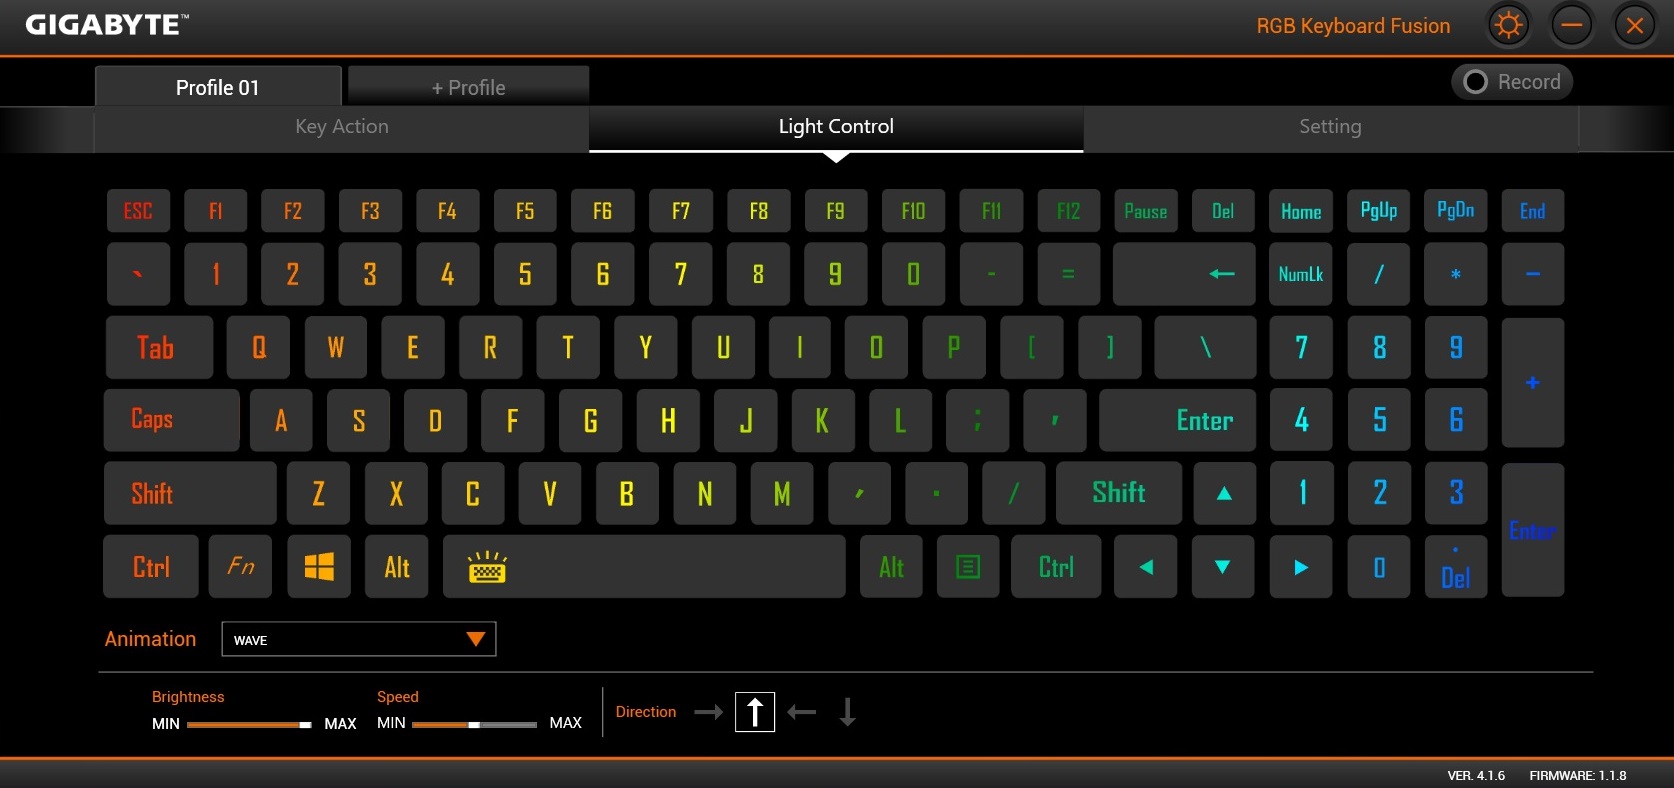
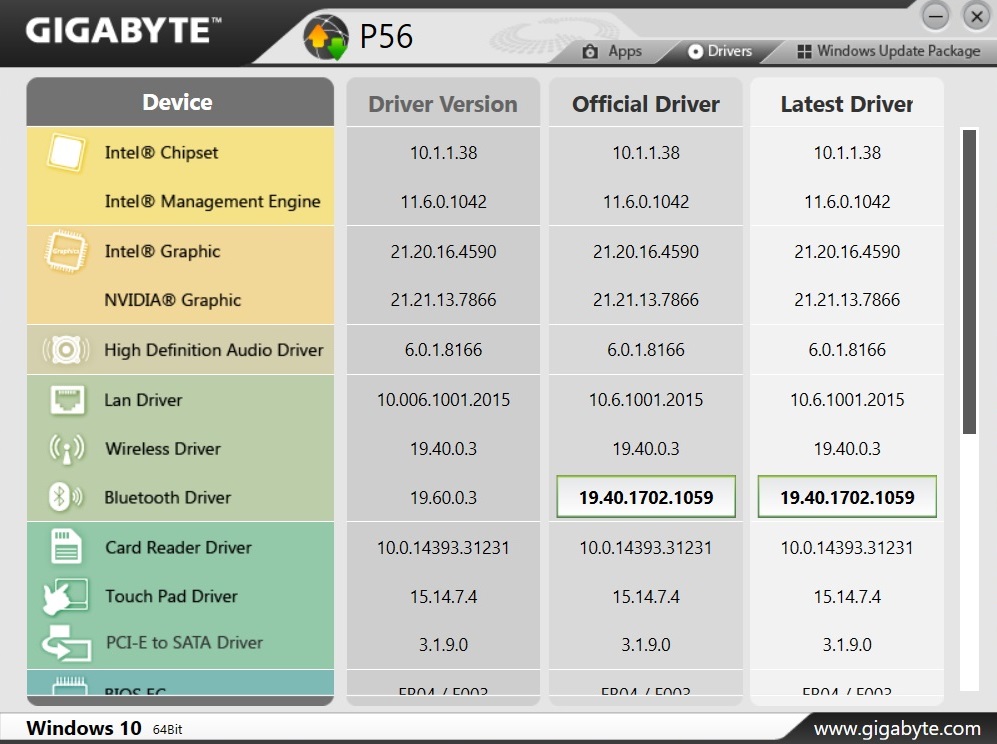
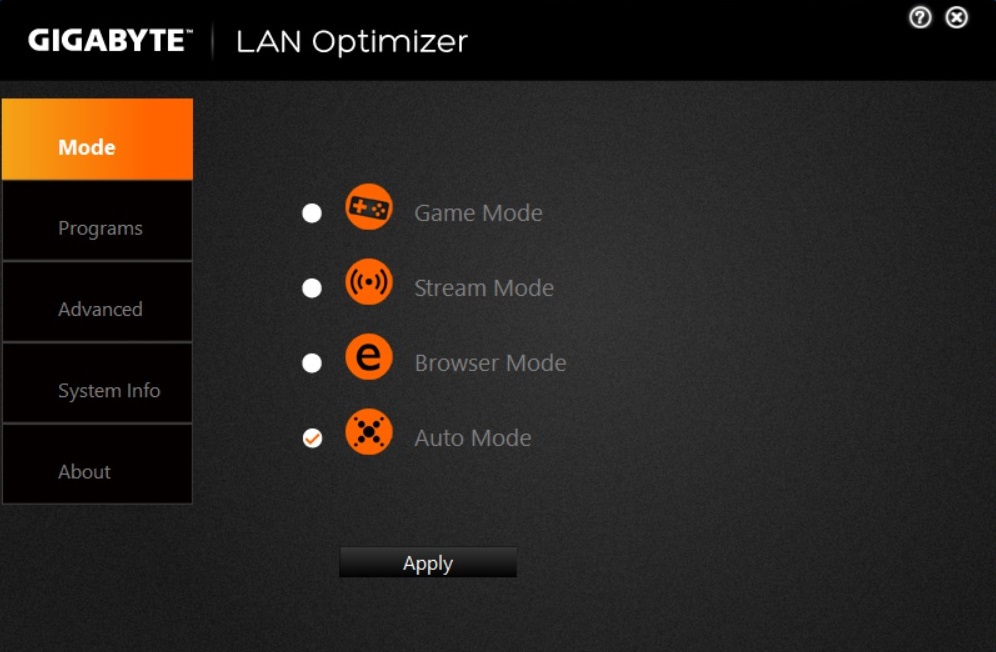
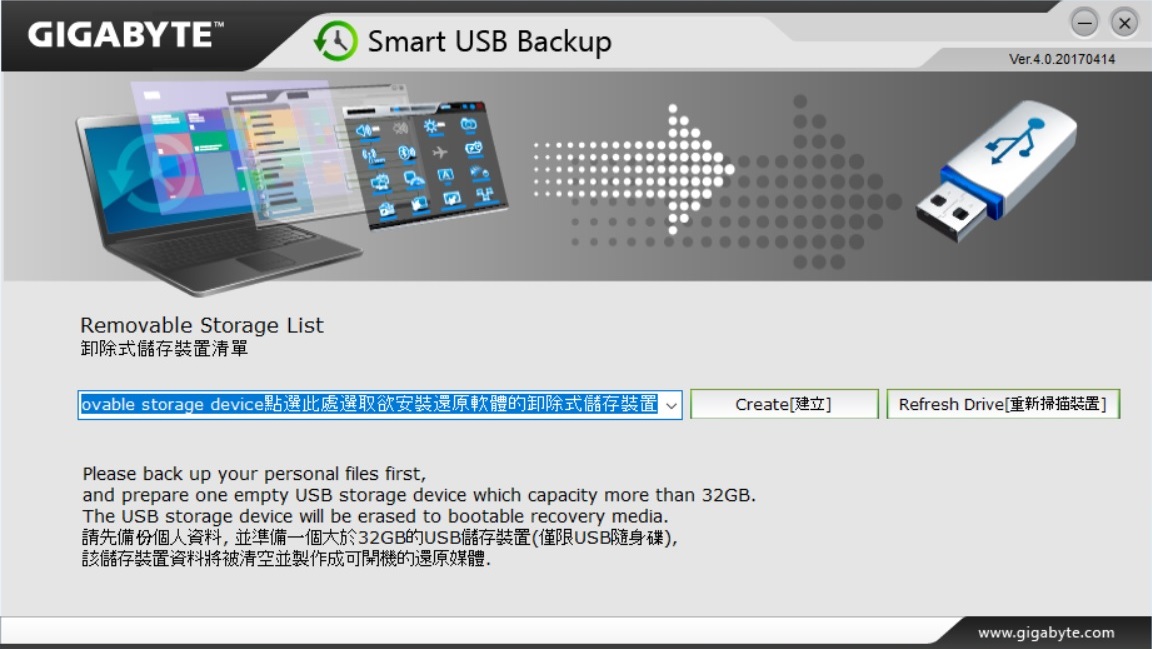
Our tests were all done in "Native Color" mode and with the cooling set to "normal". The programs for monitoring the system (Smart Dashboard) and configuring keyboard backlighting (Fusion) are a nice addition. The package is completed with an update software, LAN optimizing and a backup tool.
Input Devices
Keyboard
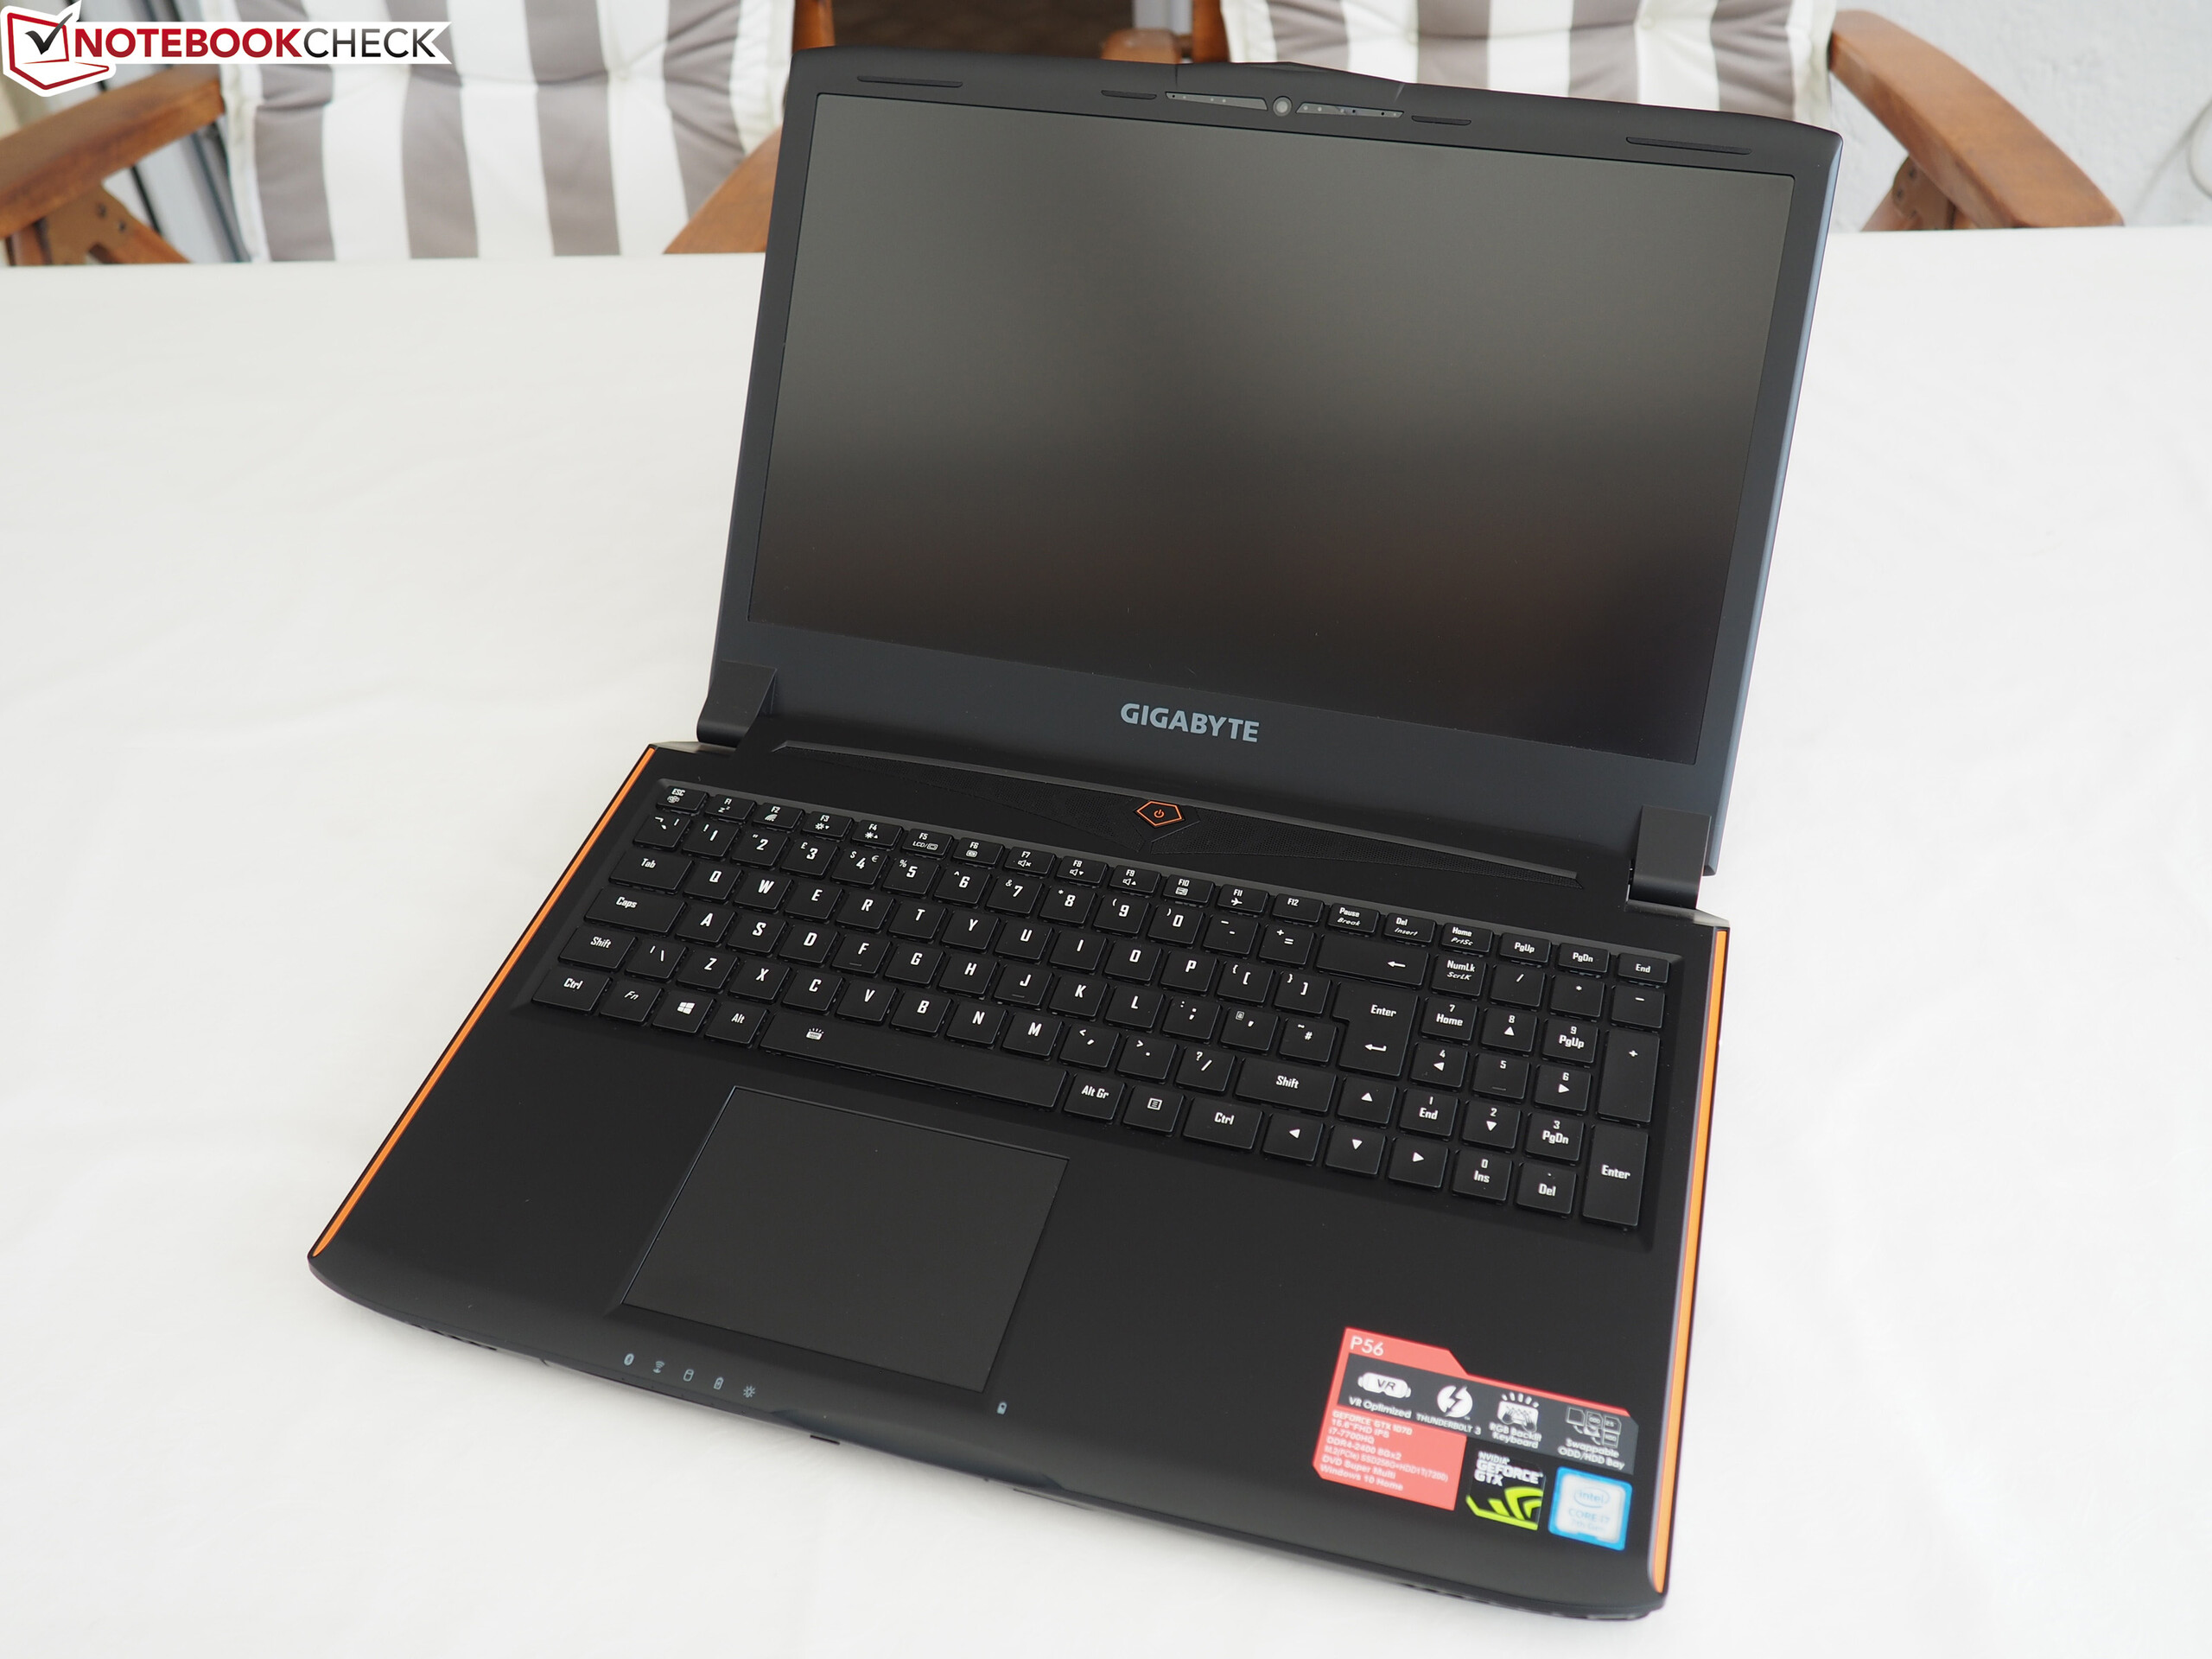
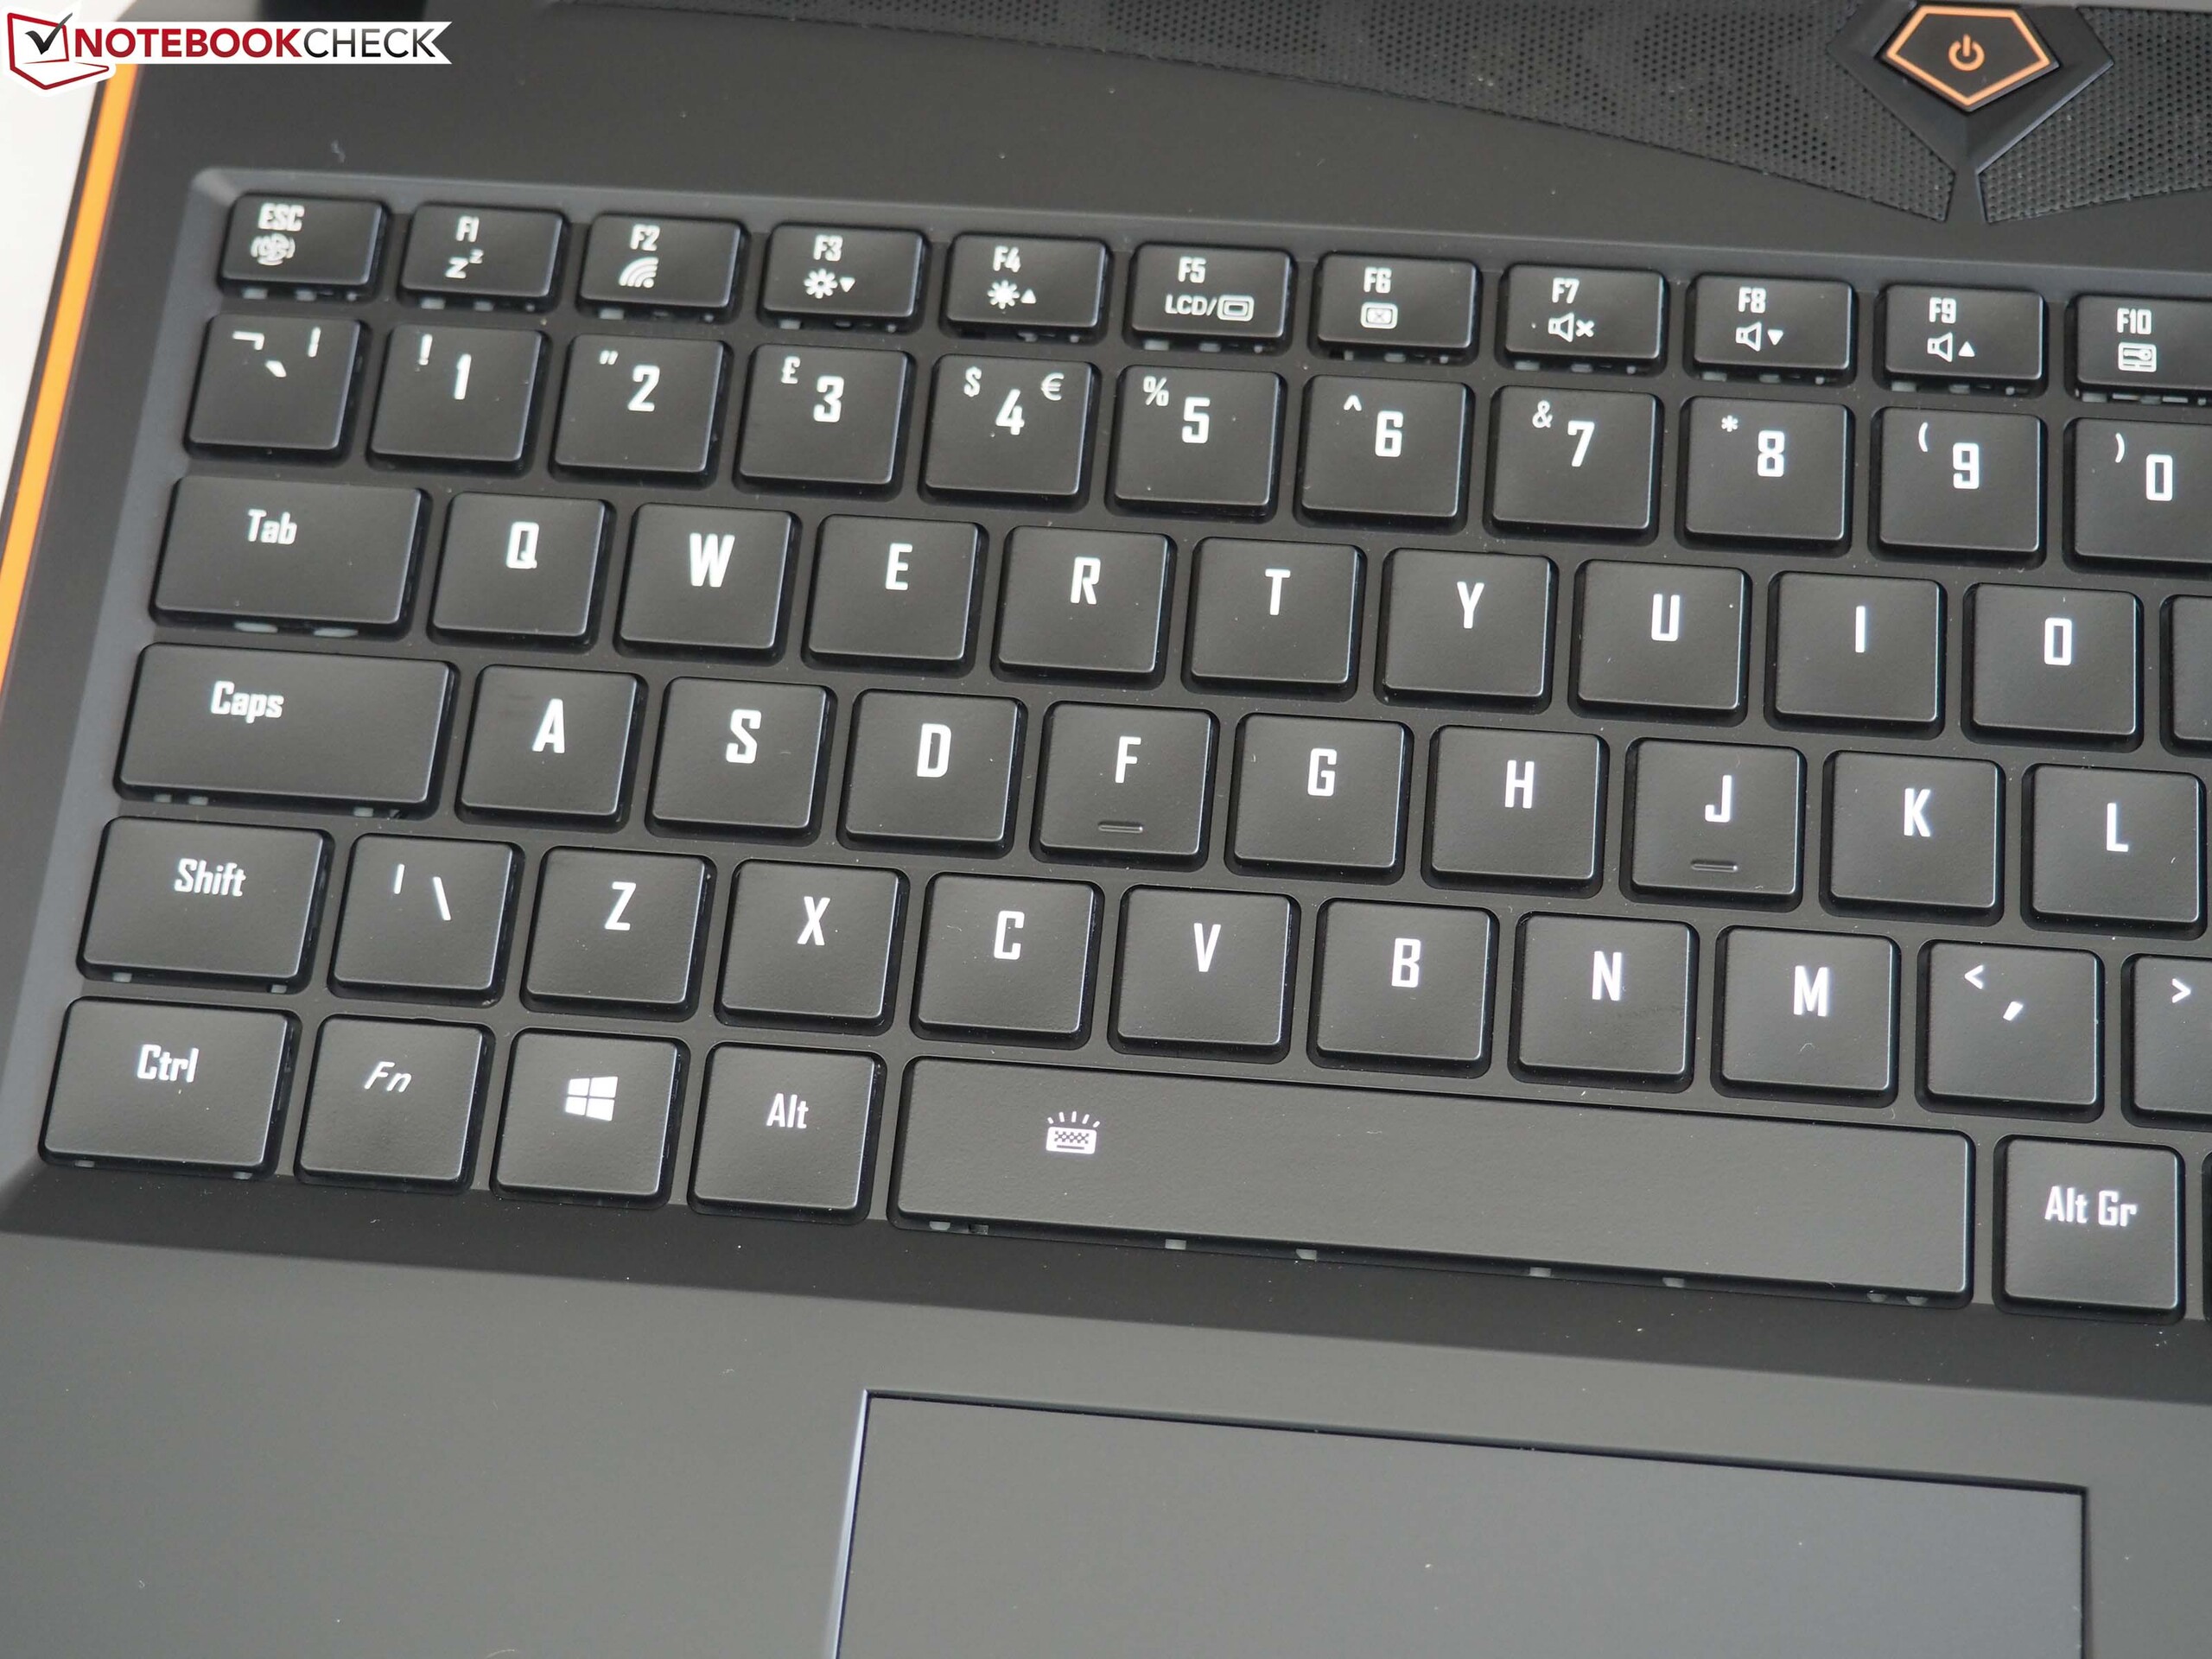
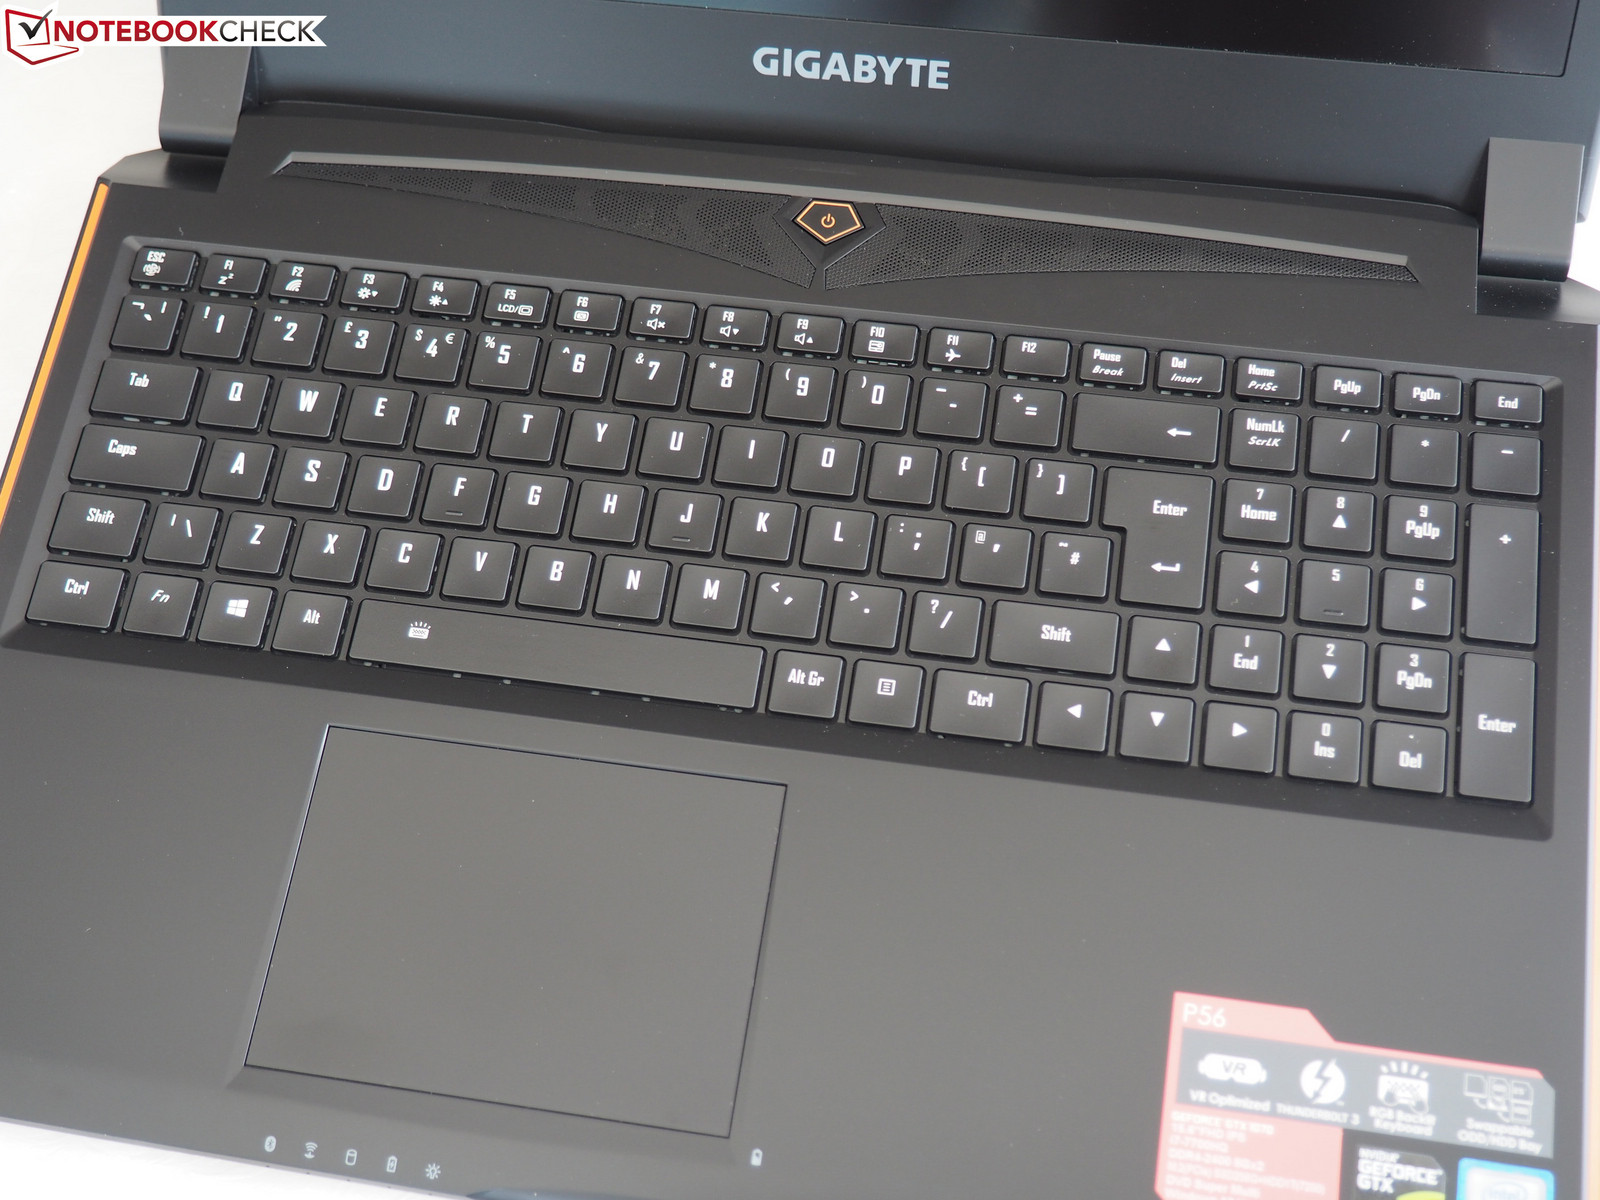
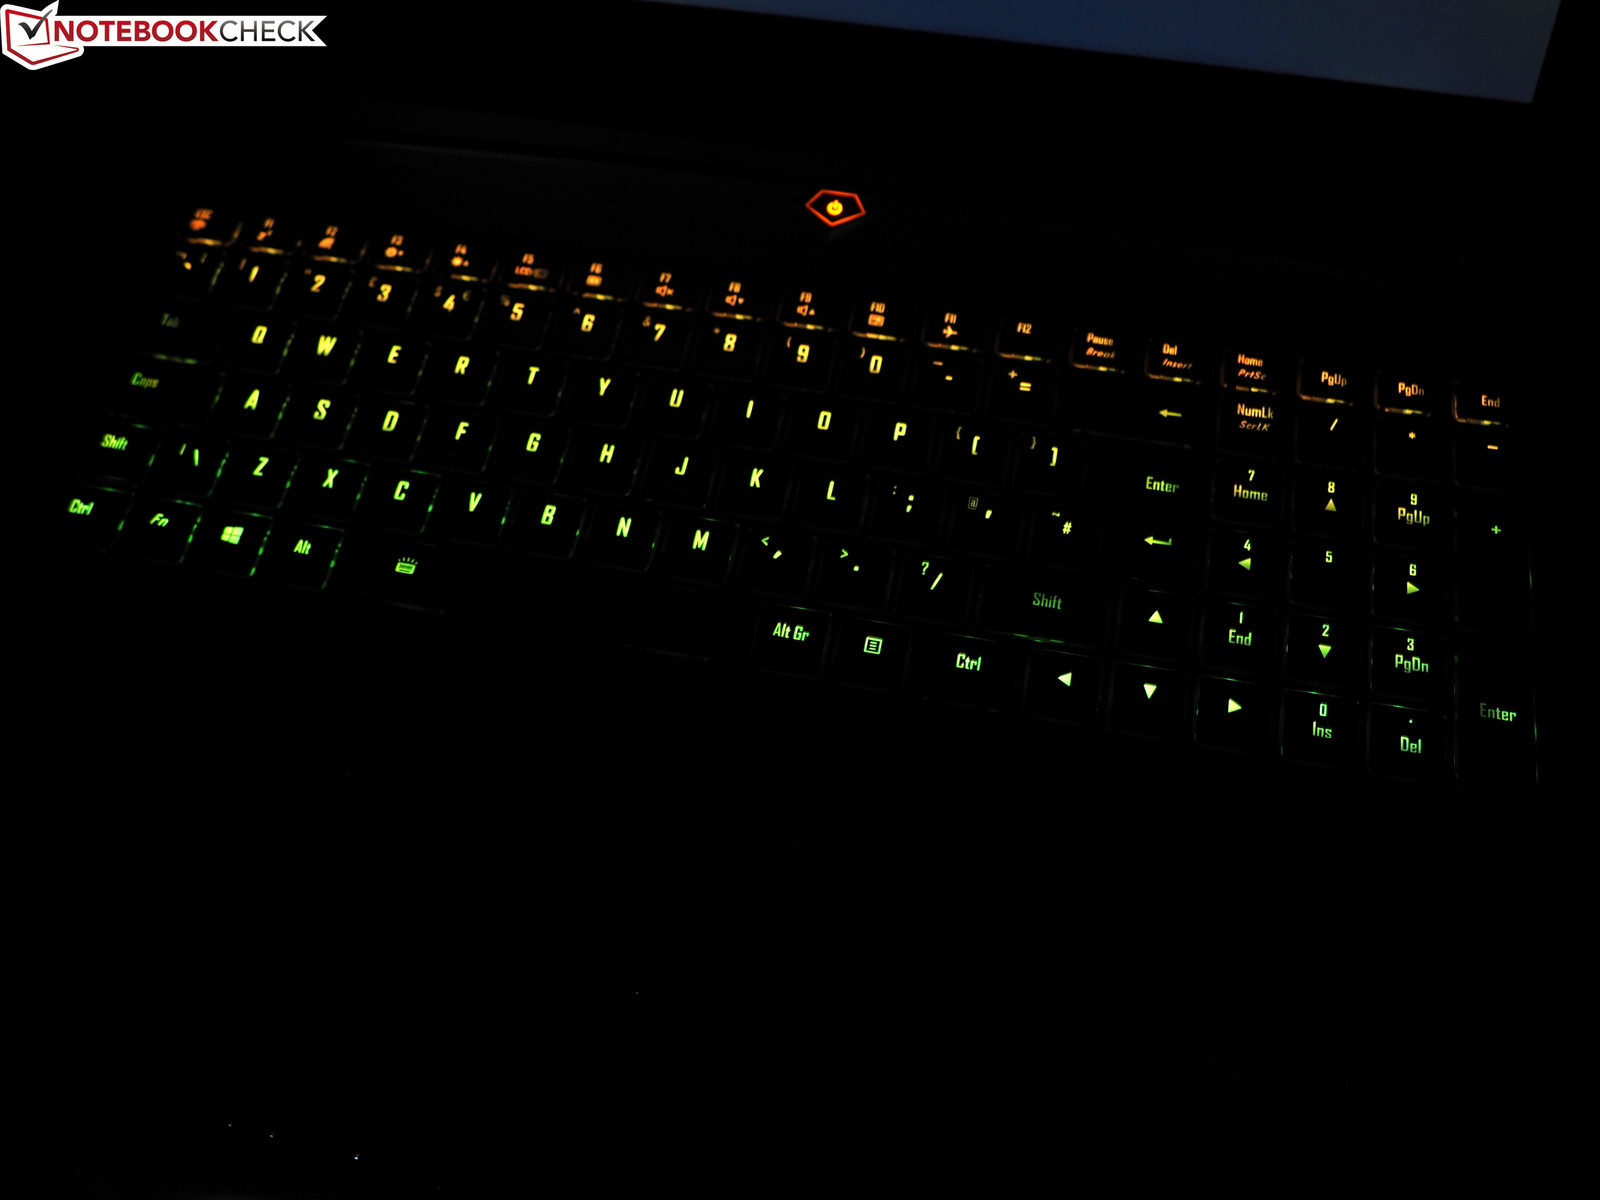
The chiclet keyboard is definitely one of the strong points of the P56XT. Thanks to RGB backlighting, the keyboard can be customized perfectly (there are several animations and various brightness and speed levels). It also enables you to use the keyboard in complete darkness. Although the pressure point could be a little more defined, we still enjoyed the comfortably firm and precise typing experience.
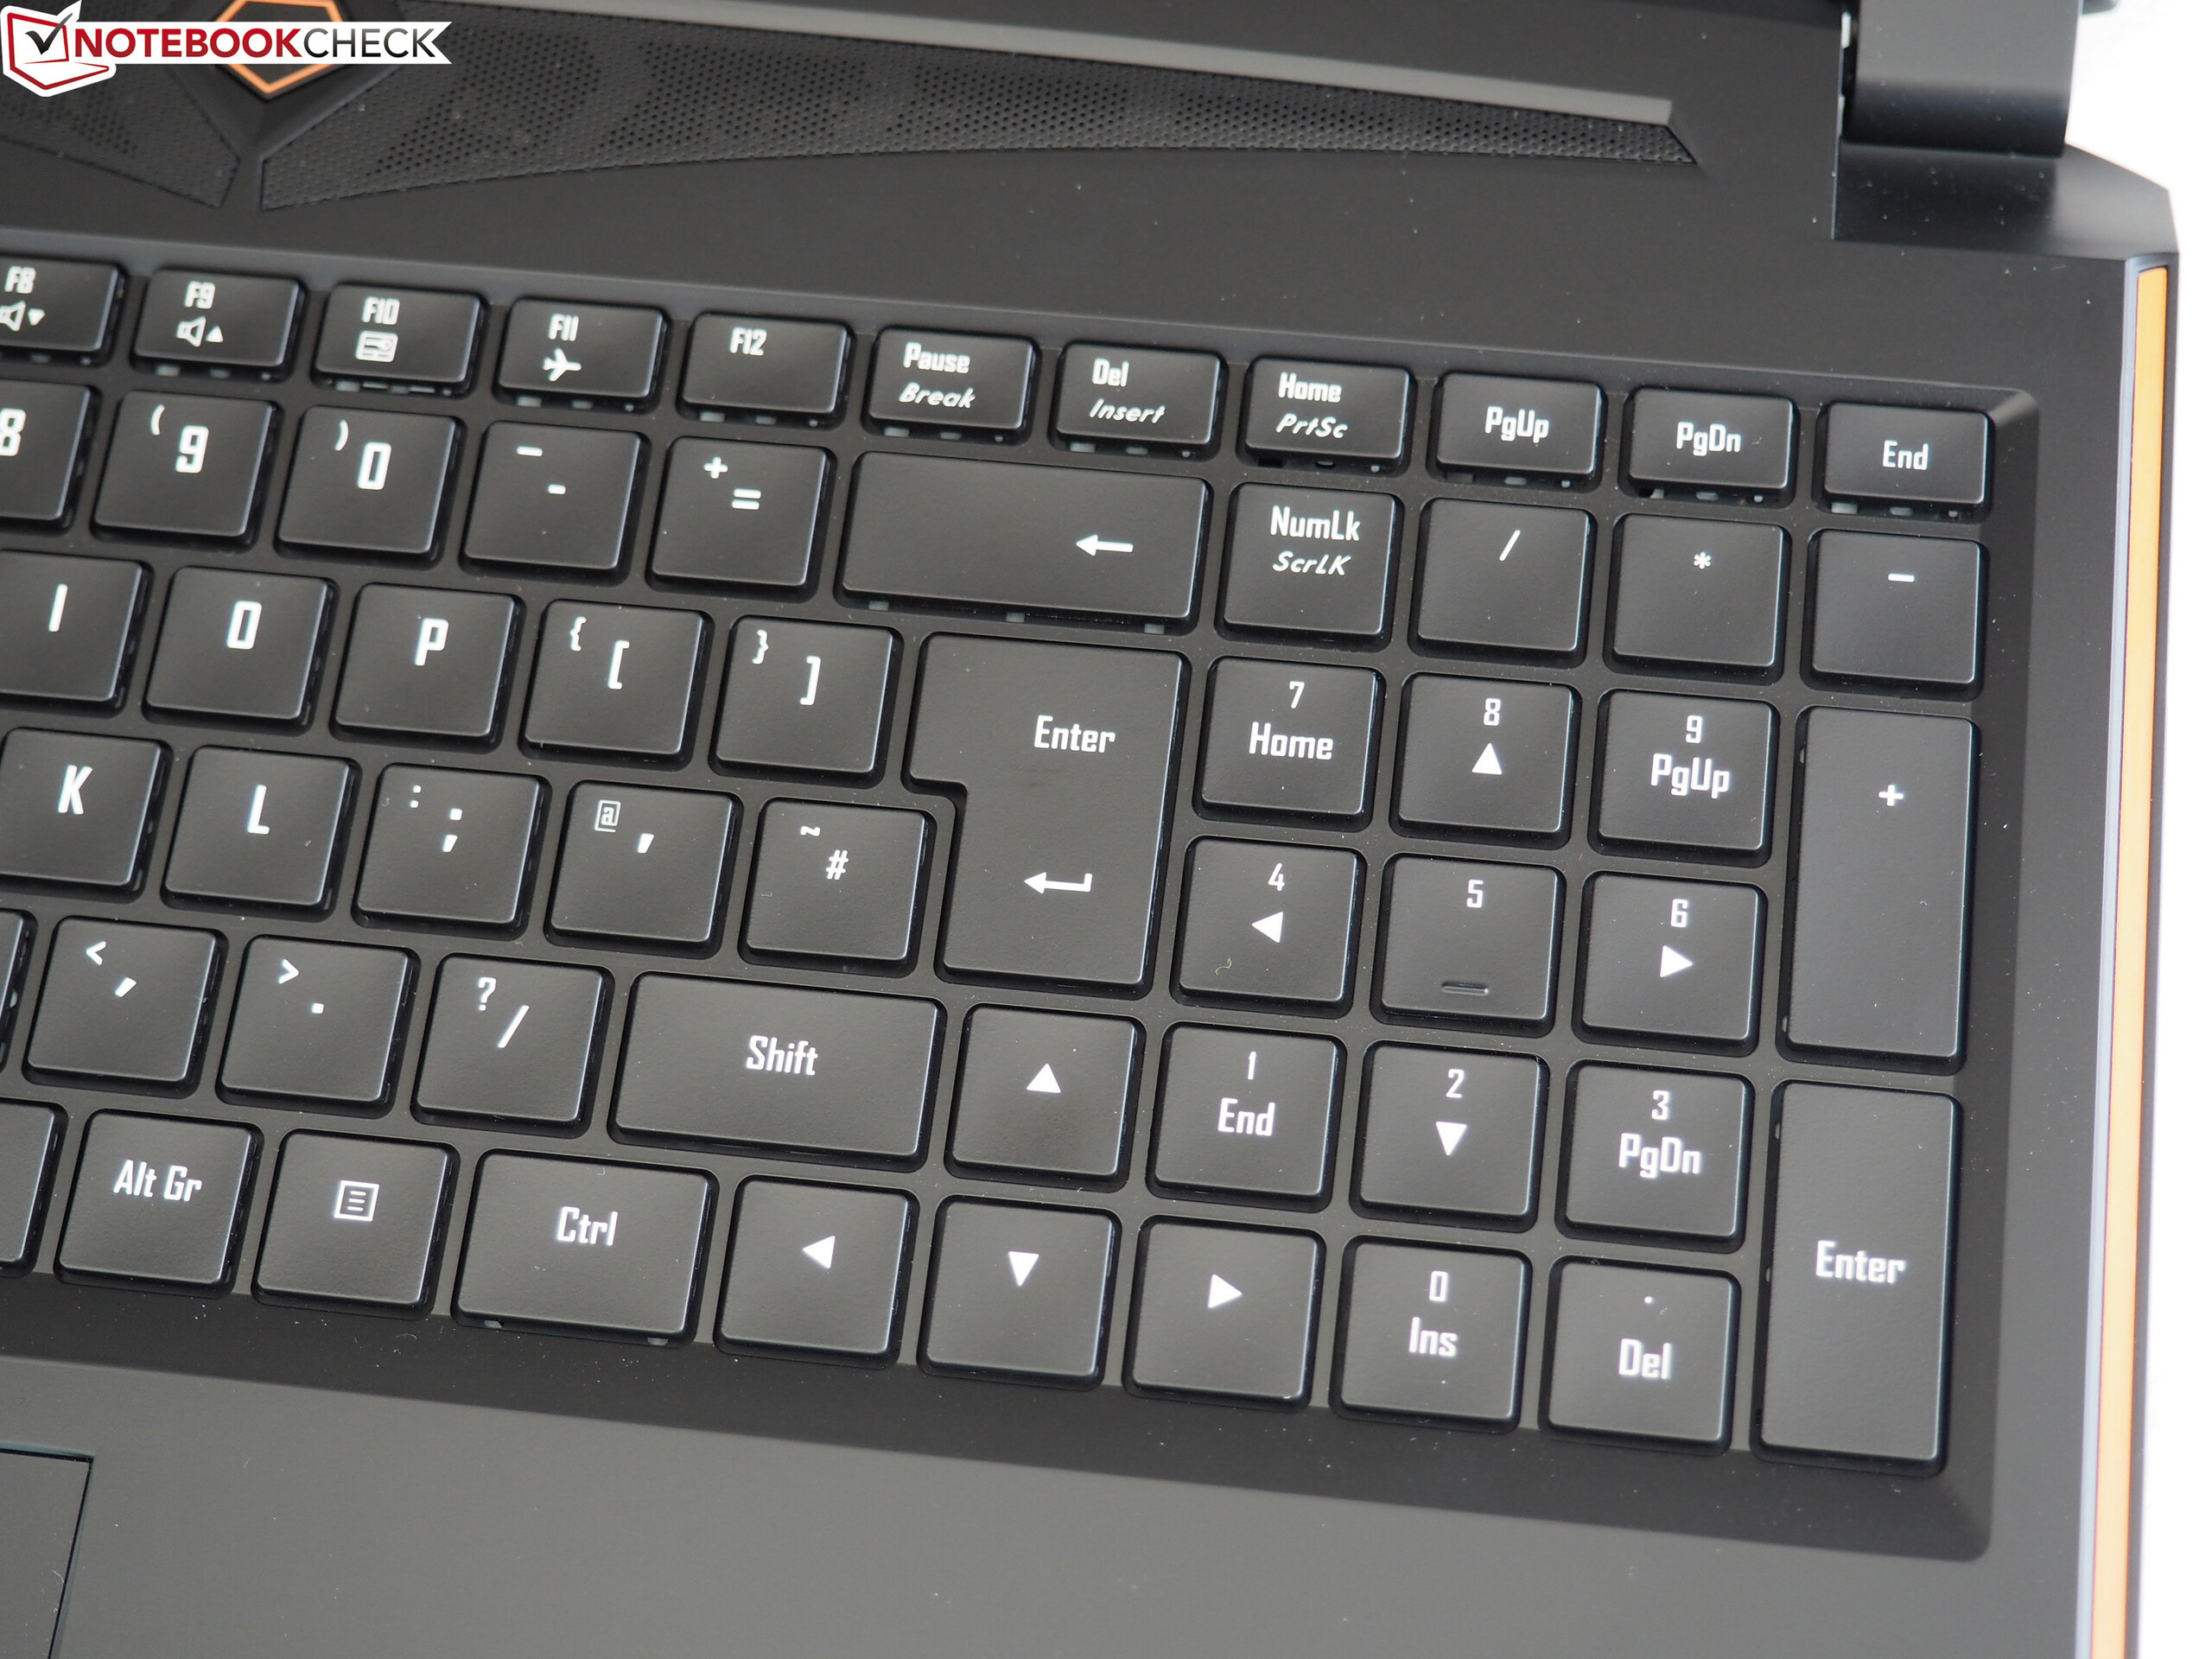
As you can see from the photo below, the P56XT has well-dimensioned arrow keys and a dedicated numeric keypad. It is no surprise that you can provoke certain functions (volume, etc.) with the help of Fn combinations. Gigabyte has also done a good job in terms of dimensioning the keys: the slightly rounded and detached keys are about 15 x 15 mm (0.6 x 0.6 in) large. The sound made by typing is of average loudness.
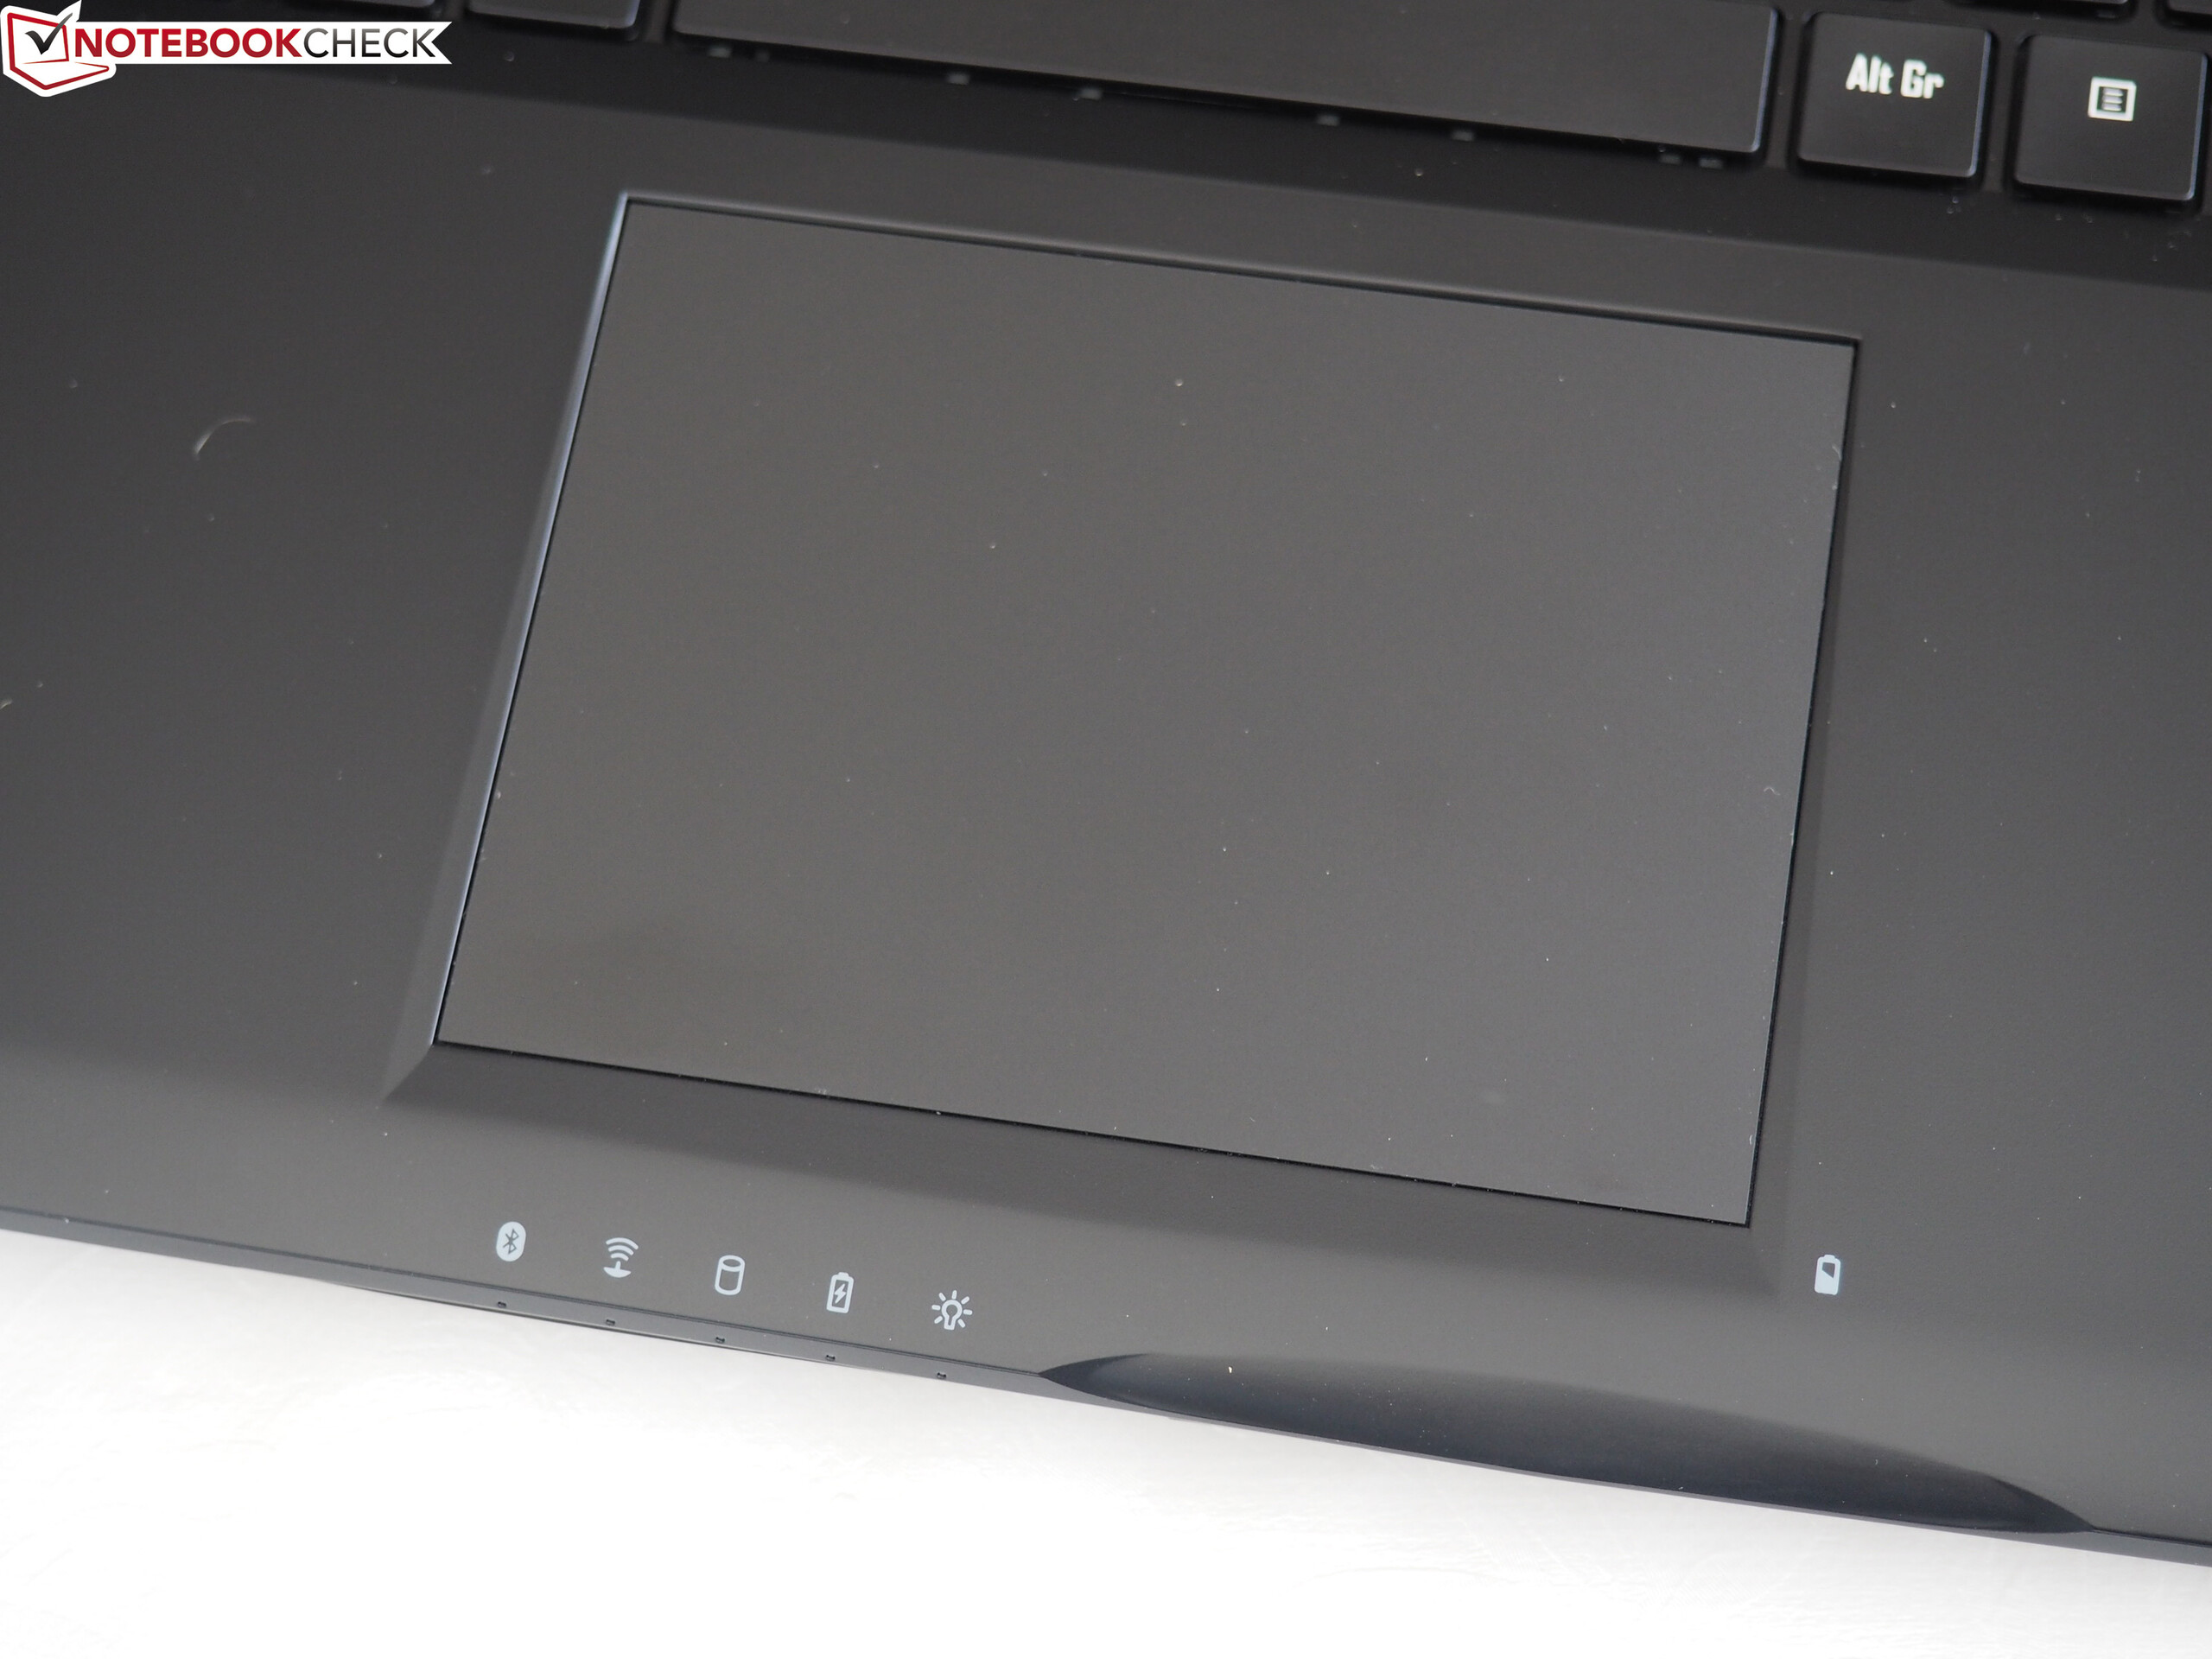
Touchpad
The ClickPad (10.5 x 7.8 cm/4.1 x 3 in) is rather large for a 15-inch device and comes without dedicated keys. As Gigabyte has decided to go with a smooth finish, fingers glide nicely. The ClickPad reacts precisely and gesture control with multiple fingers (zooming, scrolling, rotating) works well too.
Unfortunately, click recognition is not always reliable. The device does not register right clicks properly, requiring us to sometimes click twice or even three times. The same can be said for the keyboard's Escape key, which is why we are taking 1% off the overall rating. The latter is also connected to some software bugs that might not occur in the standard production. In our case, the system would not shut down properly, which obliged us to force a reboot. Furthermore, the P56XT had some problems with a few tools (HWiNFO, Core Temp and HWMonitor kept crashing or simply would not start).
Update 07/27/17: The aforementioned problems unfortunately occurred with the second test model as well, so the 1% deduction still applies.
Display
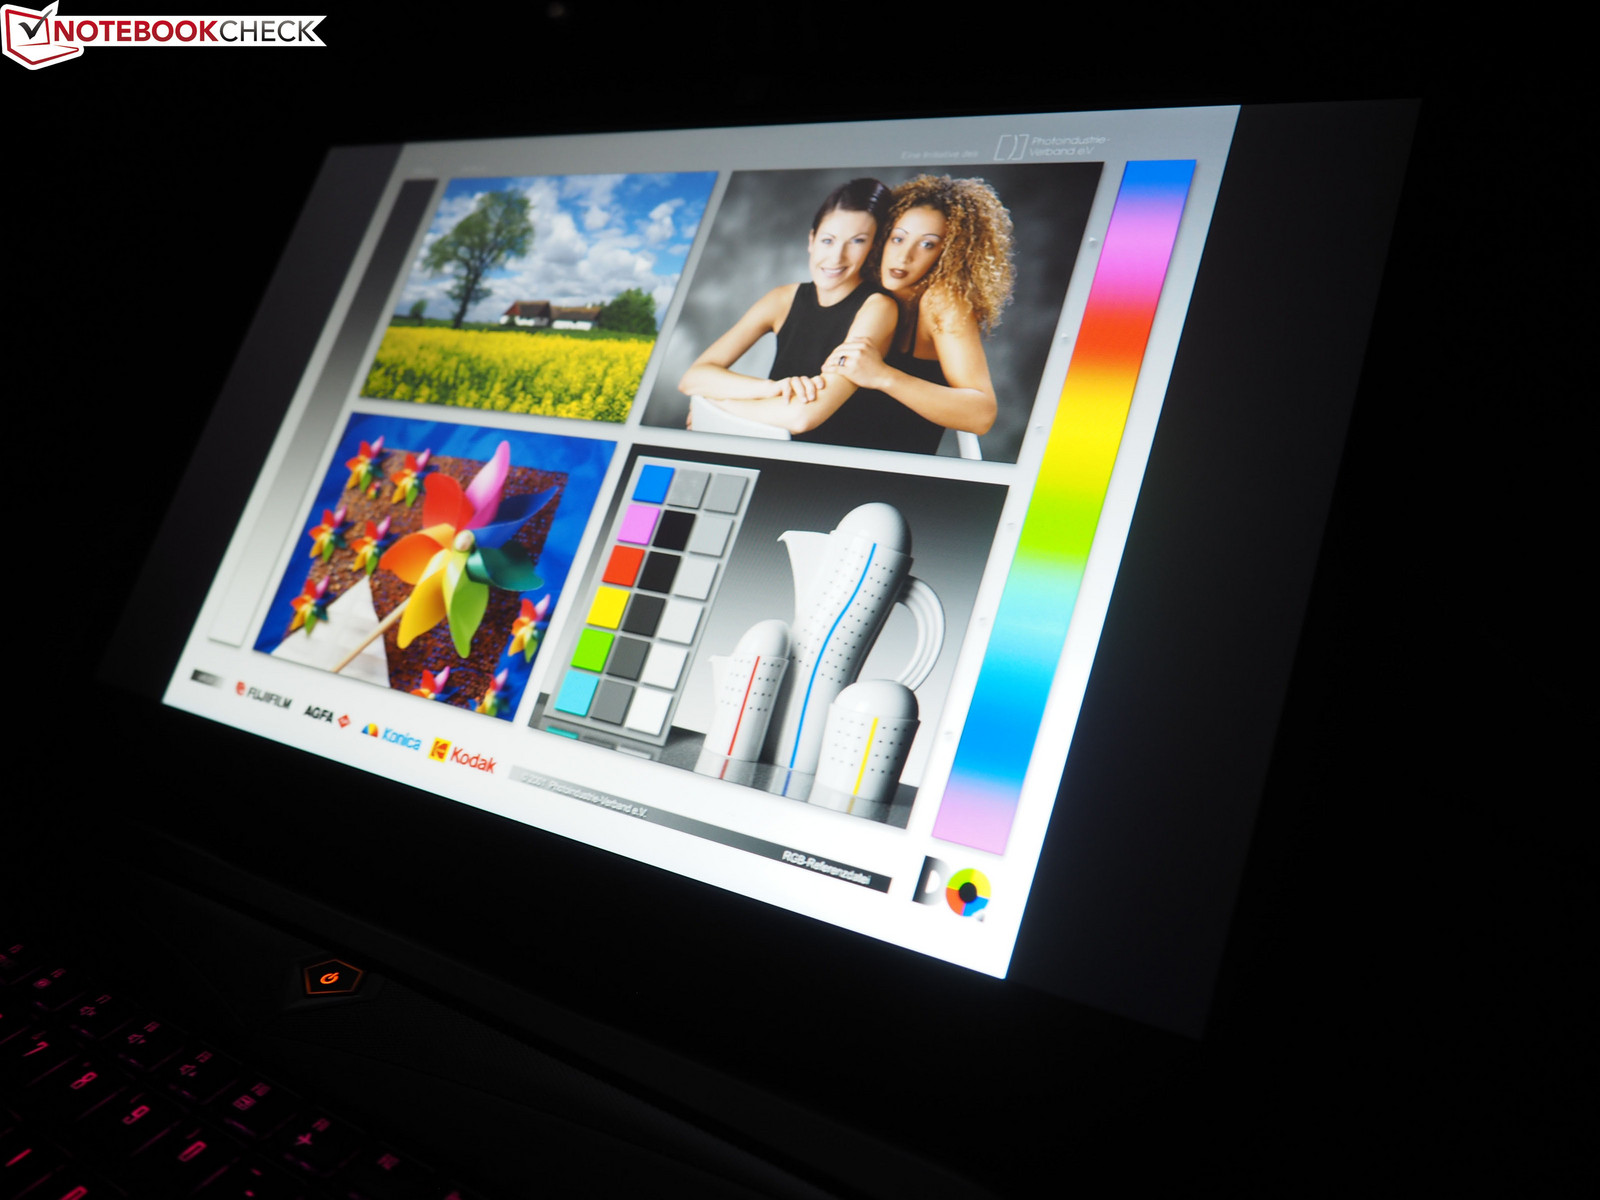
Our test unit is equipped with the Full HD panel LG Philips LP156WF6, which we are already familiar with from many gaming notebooks. Not long ago, we tested it in the XMG A517, for example, where it gave us the usual good impression. The P56XT is no exception. Although brightness is a little too low for outdoors (280 cd/m²), the IPS display won us over.
| |||||||||||||||||||||||||
Brightness Distribution: 87 %
Center on Battery: 301 cd/m²
Contrast: 941:1 (Black: 0.32 cd/m²)
ΔE ColorChecker Calman: 6.21 | ∀{0.5-29.43 Ø4.73}
ΔE Greyscale Calman: 6.08 | ∀{0.09-98 Ø4.97}
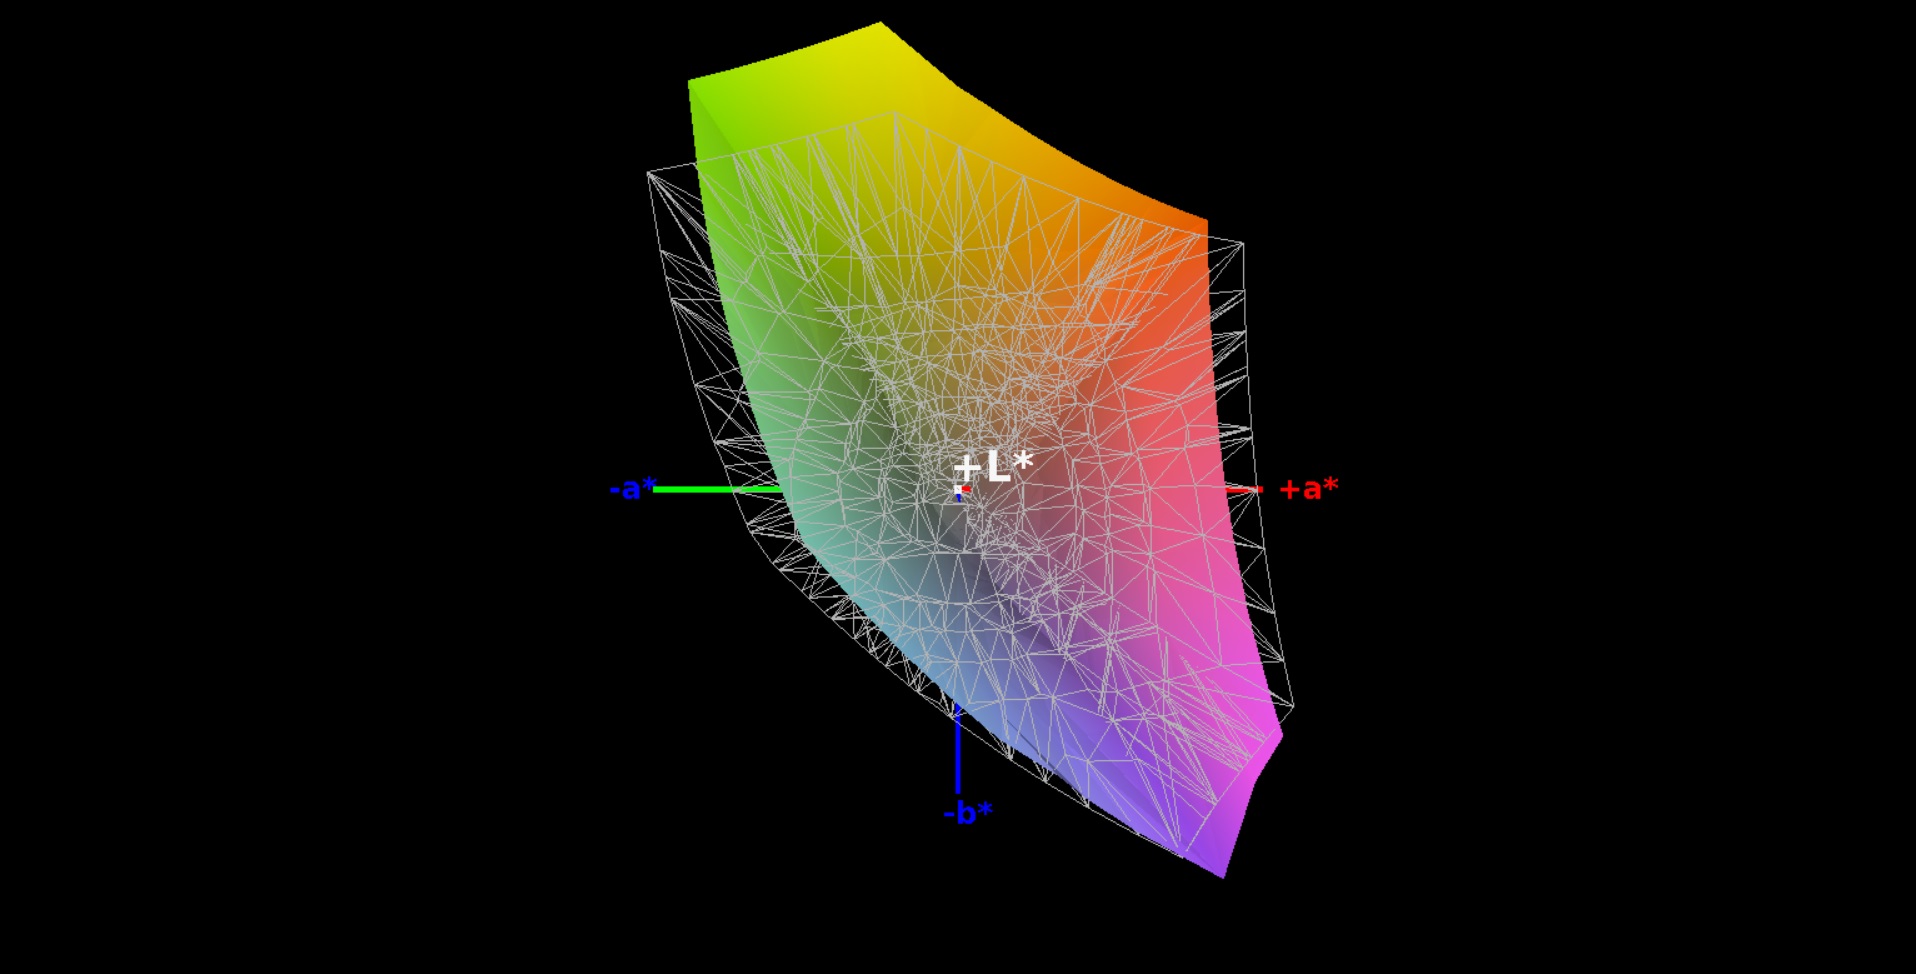
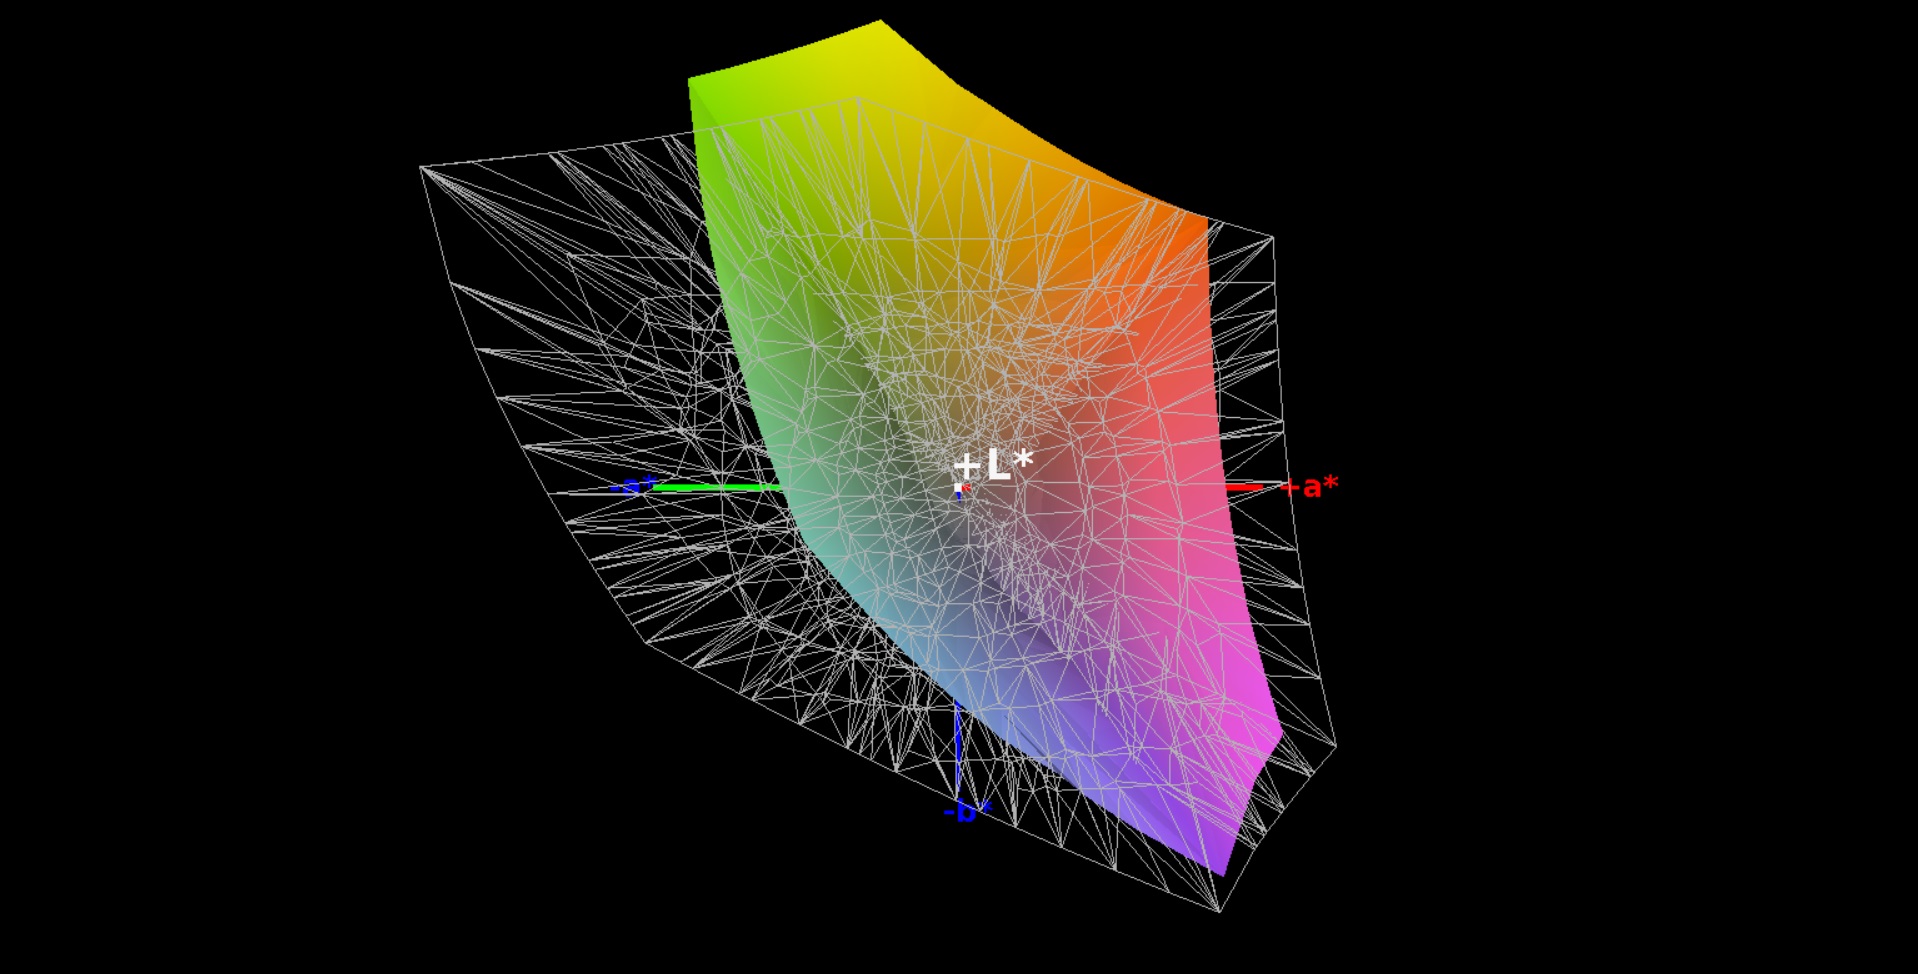
84% sRGB (Argyll 1.6.3 3D)
55% AdobeRGB 1998 (Argyll 1.6.3 3D)
61.8% AdobeRGB 1998 (Argyll 3D)
84.6% sRGB (Argyll 3D)
64.8% Display P3 (Argyll 3D)
Gamma: 2.31
CCT: 7375 K
| Gigabyte P56XT LG Philips LP156WF6 (LGD046F), 1920x1080 | Acer Predator 15 G9-593-751X LG Philips LP156WF6-SPP1 (LGD04D5), 1920x1080 | Schenker XMG P507 PRO AUO B156HTN05.2 (AUO52ED), 1920x1080 | MSI GS63VR 7RF-228US 3840x2160 | Acer Aspire VN7-593G-73HP V15 Nitro BE LG Display LP156WF6-SPP1, 1920x1080 | Gigabyte Aero 15 N156HCA-EA1 (CMN15D7), 1920x1080 | |
|---|---|---|---|---|---|---|
| Display | 1% | 4% | -20% | 1% | 6% | |
| Display P3 Coverage (%) | 64.8 | 65.4 1% | 66.4 2% | 48.21 -26% | 65.8 2% | 65.2 1% |
| sRGB Coverage (%) | 84.6 | 85.5 1% | 88.9 5% | 72.6 -14% | 85.1 1% | 92.5 9% |
| AdobeRGB 1998 Coverage (%) | 61.8 | 62.5 1% | 65.1 5% | 49.81 -19% | 62.2 1% | 66.5 8% |
| Response Times | -2% | 44% | 15% | -24% | -22% | |
| Response Time Grey 50% / Grey 80% * (ms) | 37.2 ? | 36 ? 3% | 24 ? 35% | 28 ? 25% | 41 ? -10% | 42.8 ? -15% |
| Response Time Black / White * (ms) | 24.8 ? | 26.4 ? -6% | 12 ? 52% | 23.6 ? 5% | 34 ? -37% | 32 ? -29% |
| PWM Frequency (Hz) | 20000 ? | 20830 ? | 1351 ? | 26000 ? | ||
| Screen | 6% | -19% | -23% | 9% | 6% | |
| Brightness middle (cd/m²) | 301 | 295 -2% | 357 19% | 274.2 -9% | 322 7% | 320 6% |
| Brightness (cd/m²) | 280 | 274 -2% | 365 30% | 263 -6% | 297 6% | 316 13% |
| Brightness Distribution (%) | 87 | 88 1% | 85 -2% | 92 6% | 86 -1% | 90 3% |
| Black Level * (cd/m²) | 0.32 | 0.32 -0% | 0.5 -56% | 0.44 -38% | 0.31 3% | 0.36 -13% |
| Contrast (:1) | 941 | 922 -2% | 714 -24% | 623 -34% | 1039 10% | 889 -6% |
| Colorchecker dE 2000 * | 6.21 | 4.59 26% | 9.93 -60% | 8 -29% | 4.73 24% | 4.62 26% |
| Colorchecker dE 2000 max. * | 10.78 | 11 -2% | 14.87 -38% | 14.6 -35% | 12.37 -15% | 9.75 10% |
| Greyscale dE 2000 * | 6.08 | 4.03 34% | 10.32 -70% | 9.1 -50% | 2.99 51% | 6 1% |
| Gamma | 2.31 95% | 2.3 96% | 2.11 104% | 2.24 98% | 2.32 95% | 2.46 89% |
| CCT | 7375 88% | 7229 90% | 10096 64% | 5020 129% | 6905 94% | 6761 96% |
| Color Space (Percent of AdobeRGB 1998) (%) | 55 | 56 2% | 58 5% | 45.7 -17% | 56 2% | 60 9% |
| Color Space (Percent of sRGB) (%) | 84 | 85 1% | 89 6% | 72.1 -14% | 85 1% | 92 10% |
| Total Average (Program / Settings) | 2% /
4% | 10% /
-6% | -9% /
-17% | -5% /
3% | -3% /
2% |
* ... smaller is better
0.32 cd/m² black value and a contrast of 940:1 should satisfy most buyers. Although the brightness distribution at 87% is not ideal in theory, our test unit displayed images evenly and without screen bleeding. Color space coverage is at 84% of the sRGB and 55% of the AdobeRGB color space, which is a good value for gaming and multimedia devices.
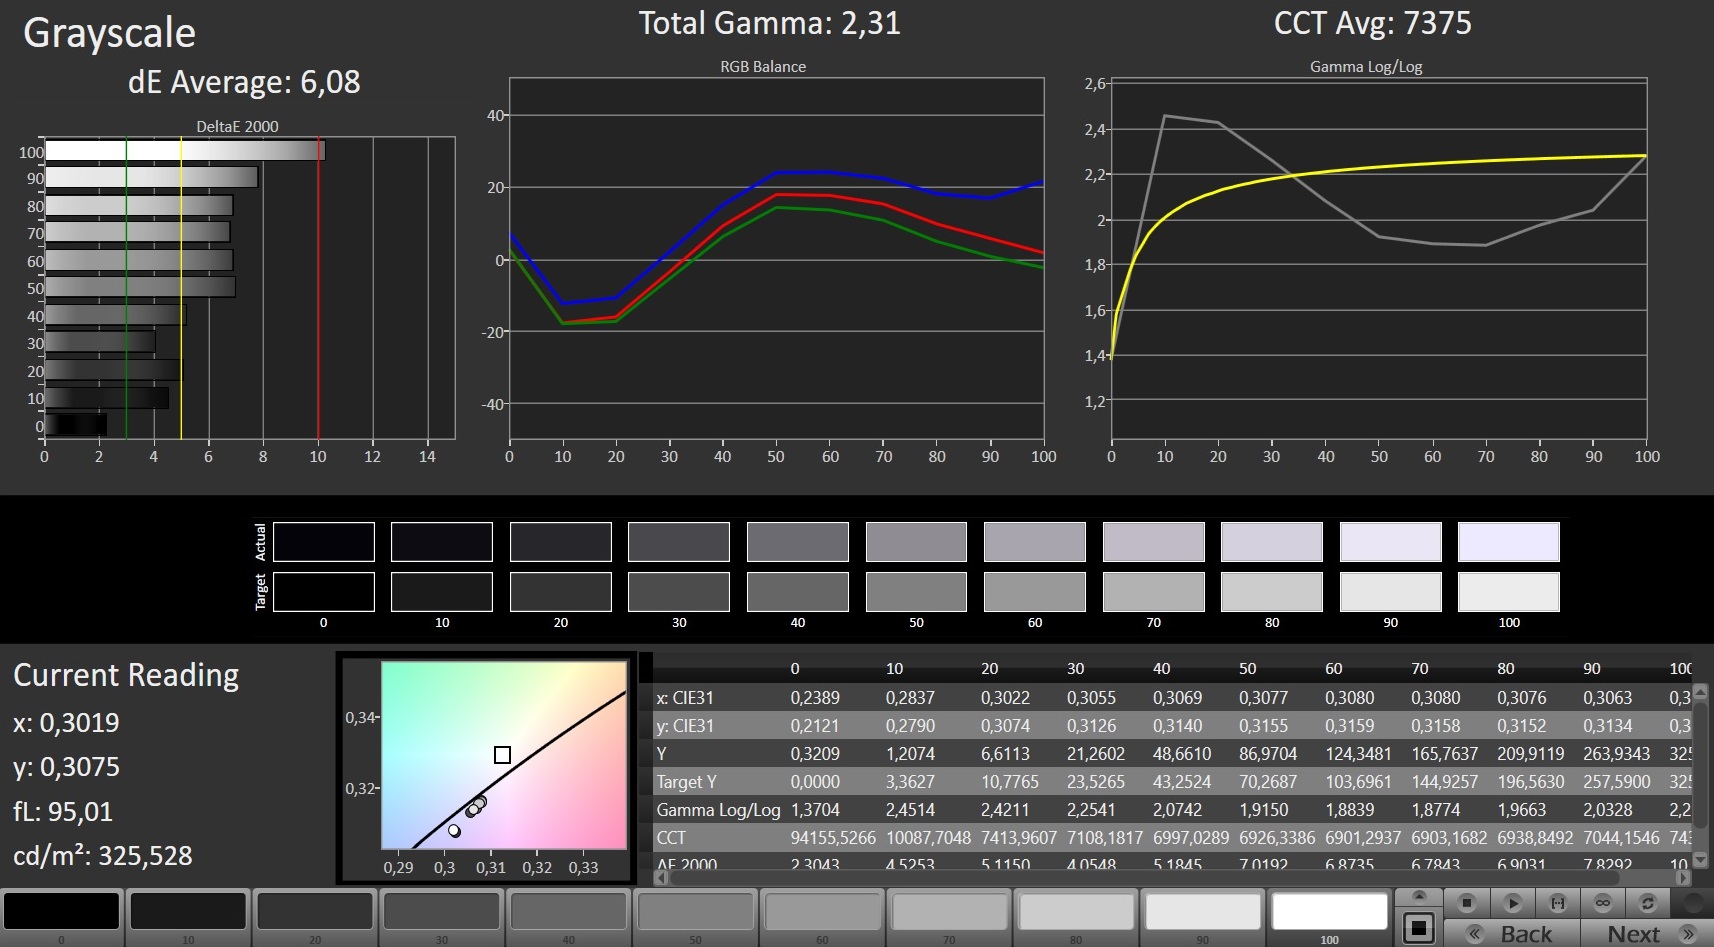
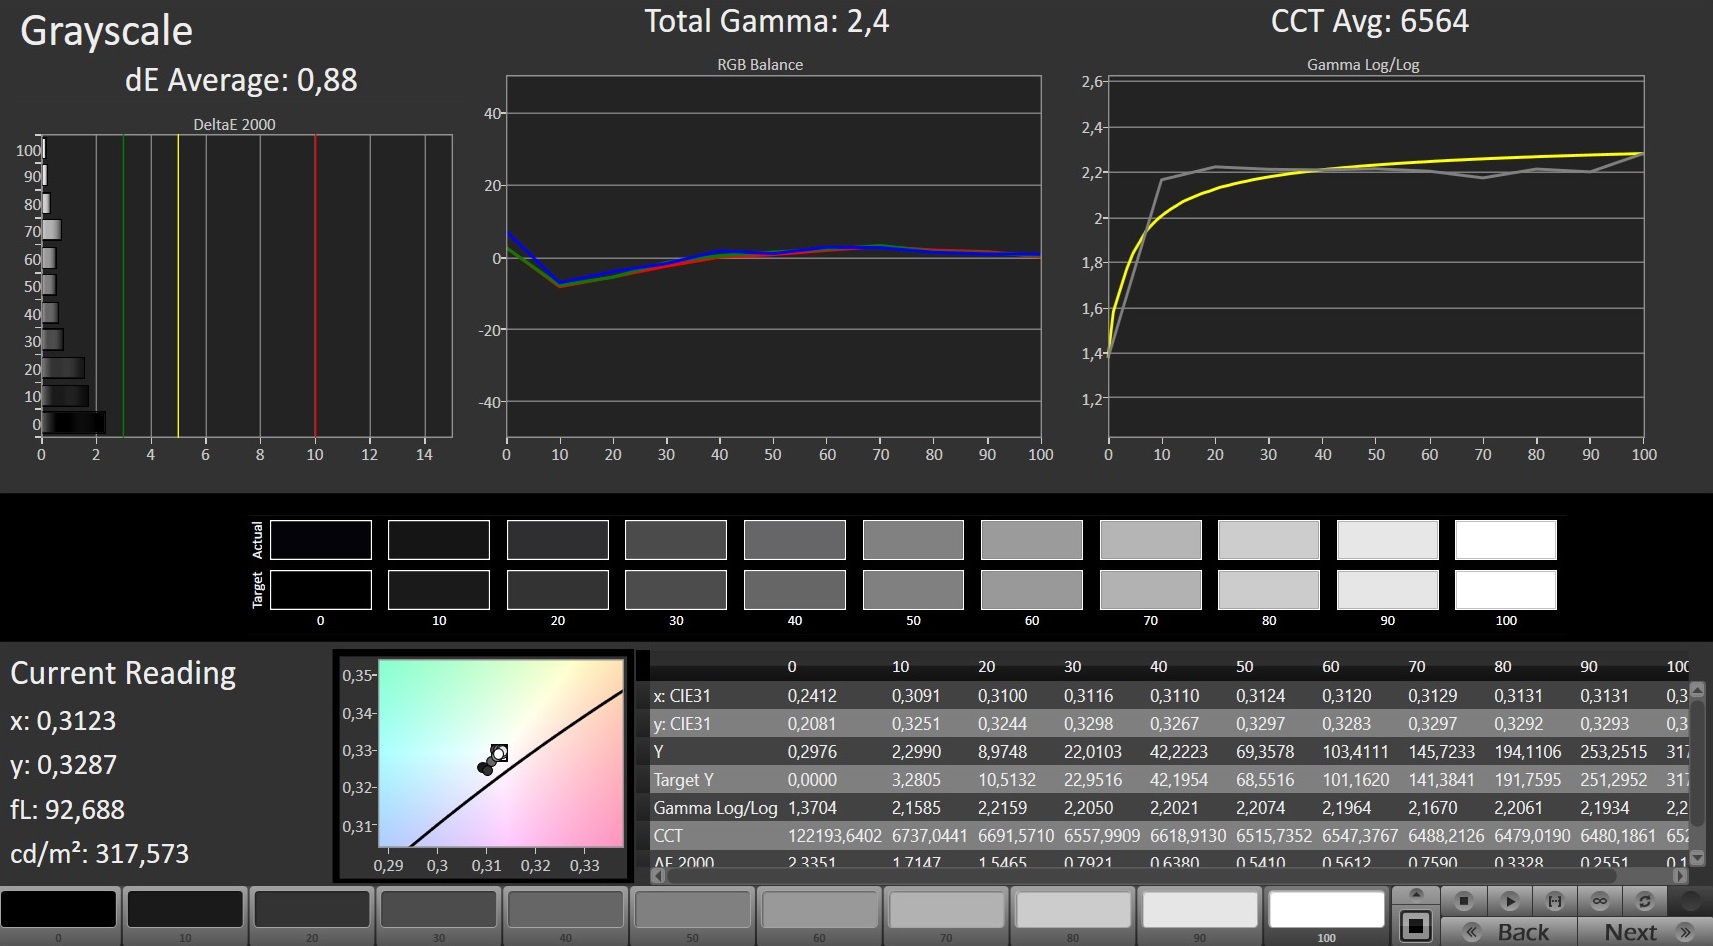
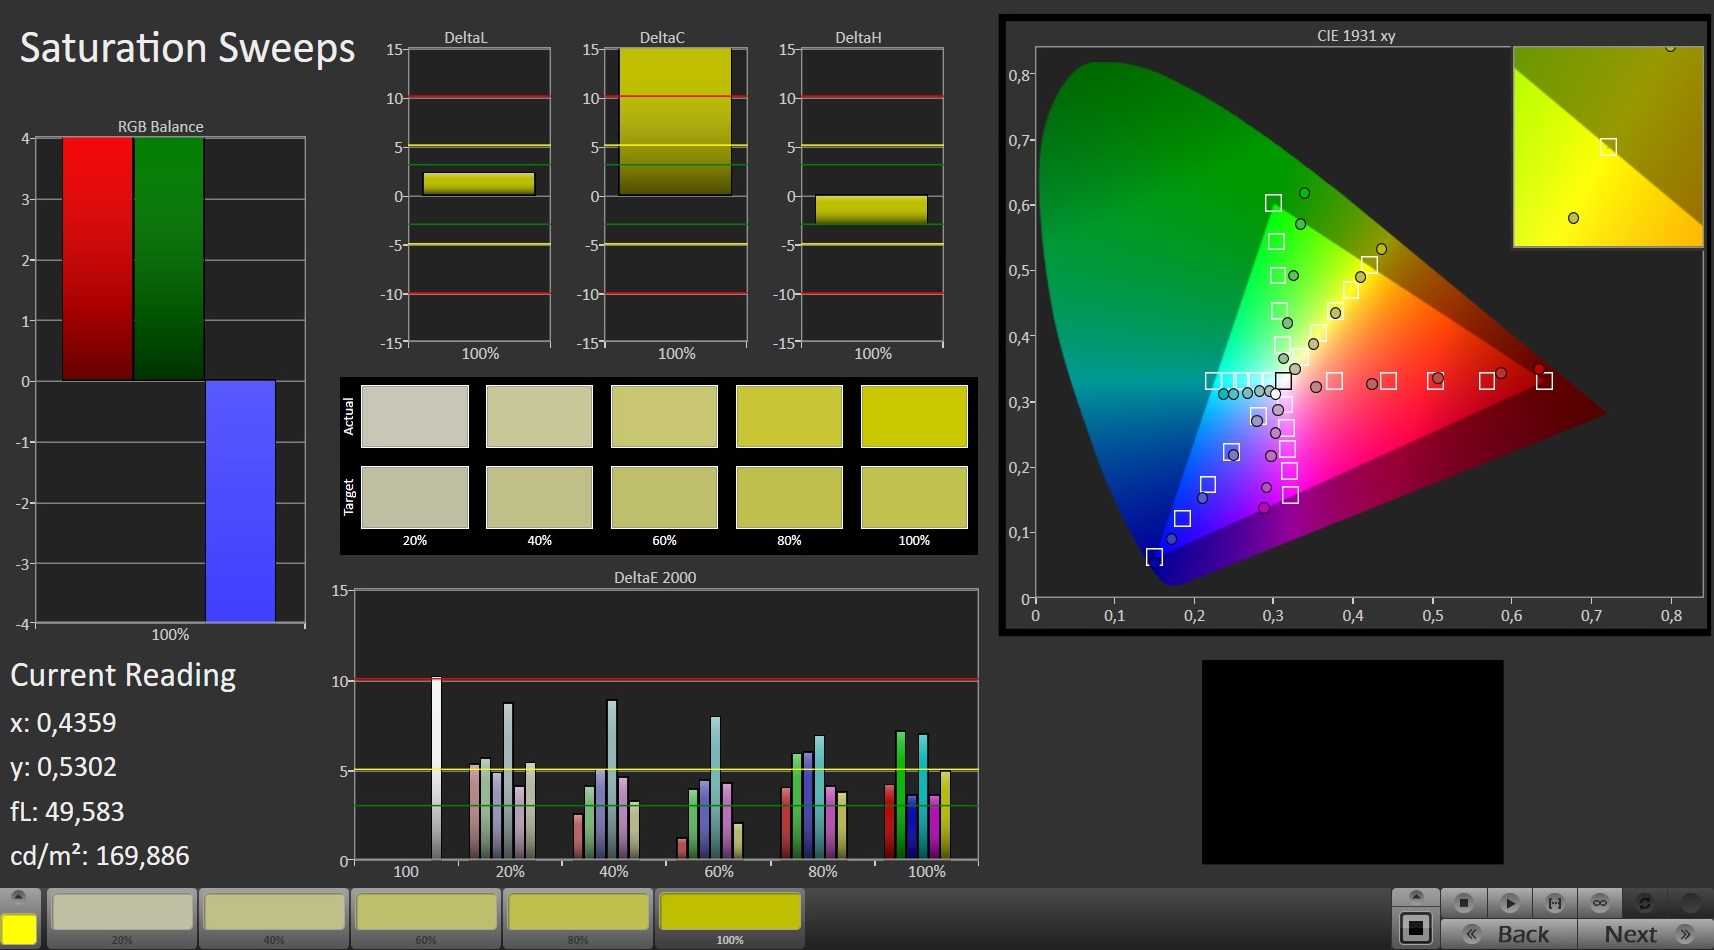
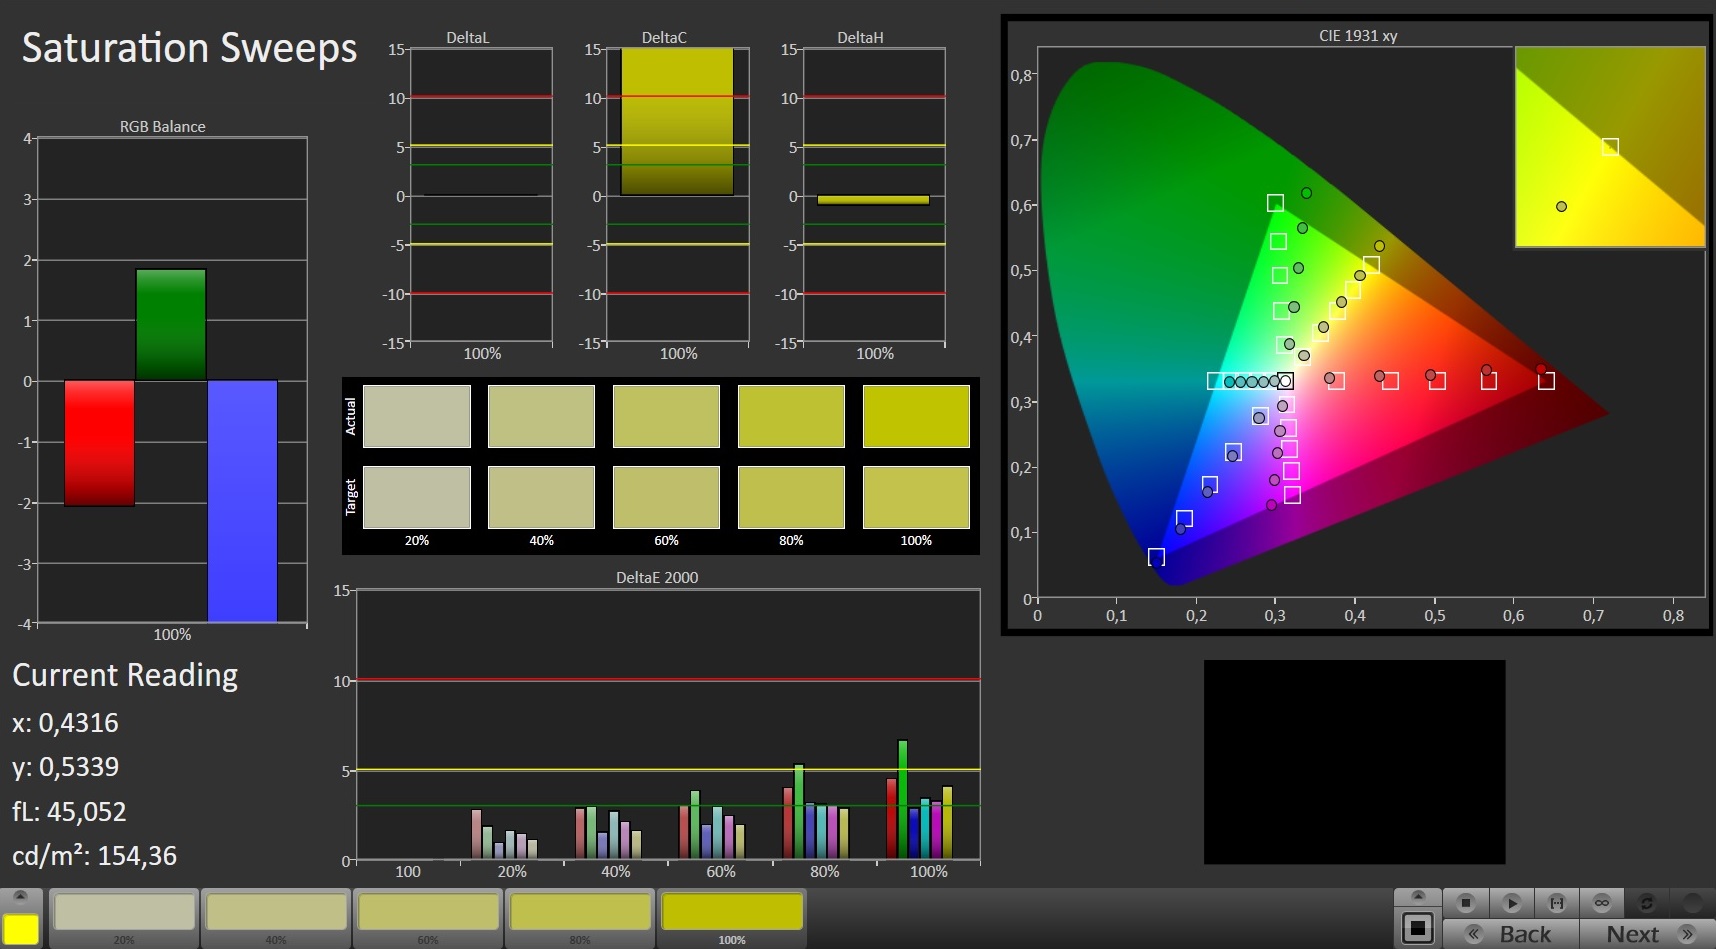
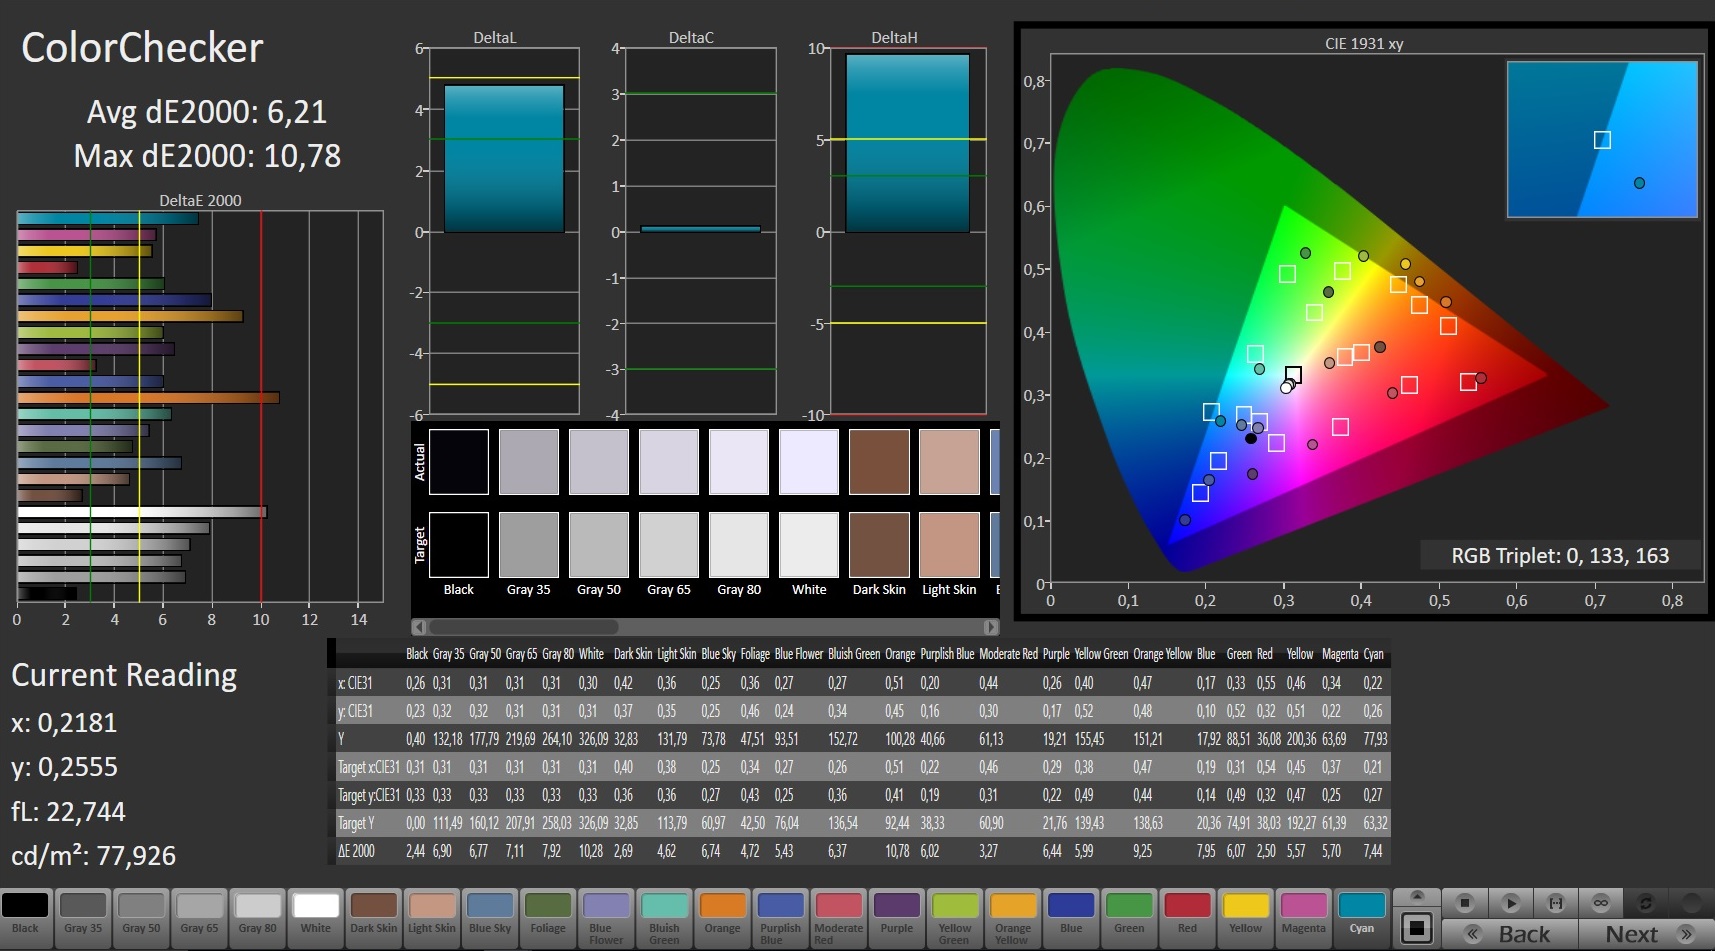
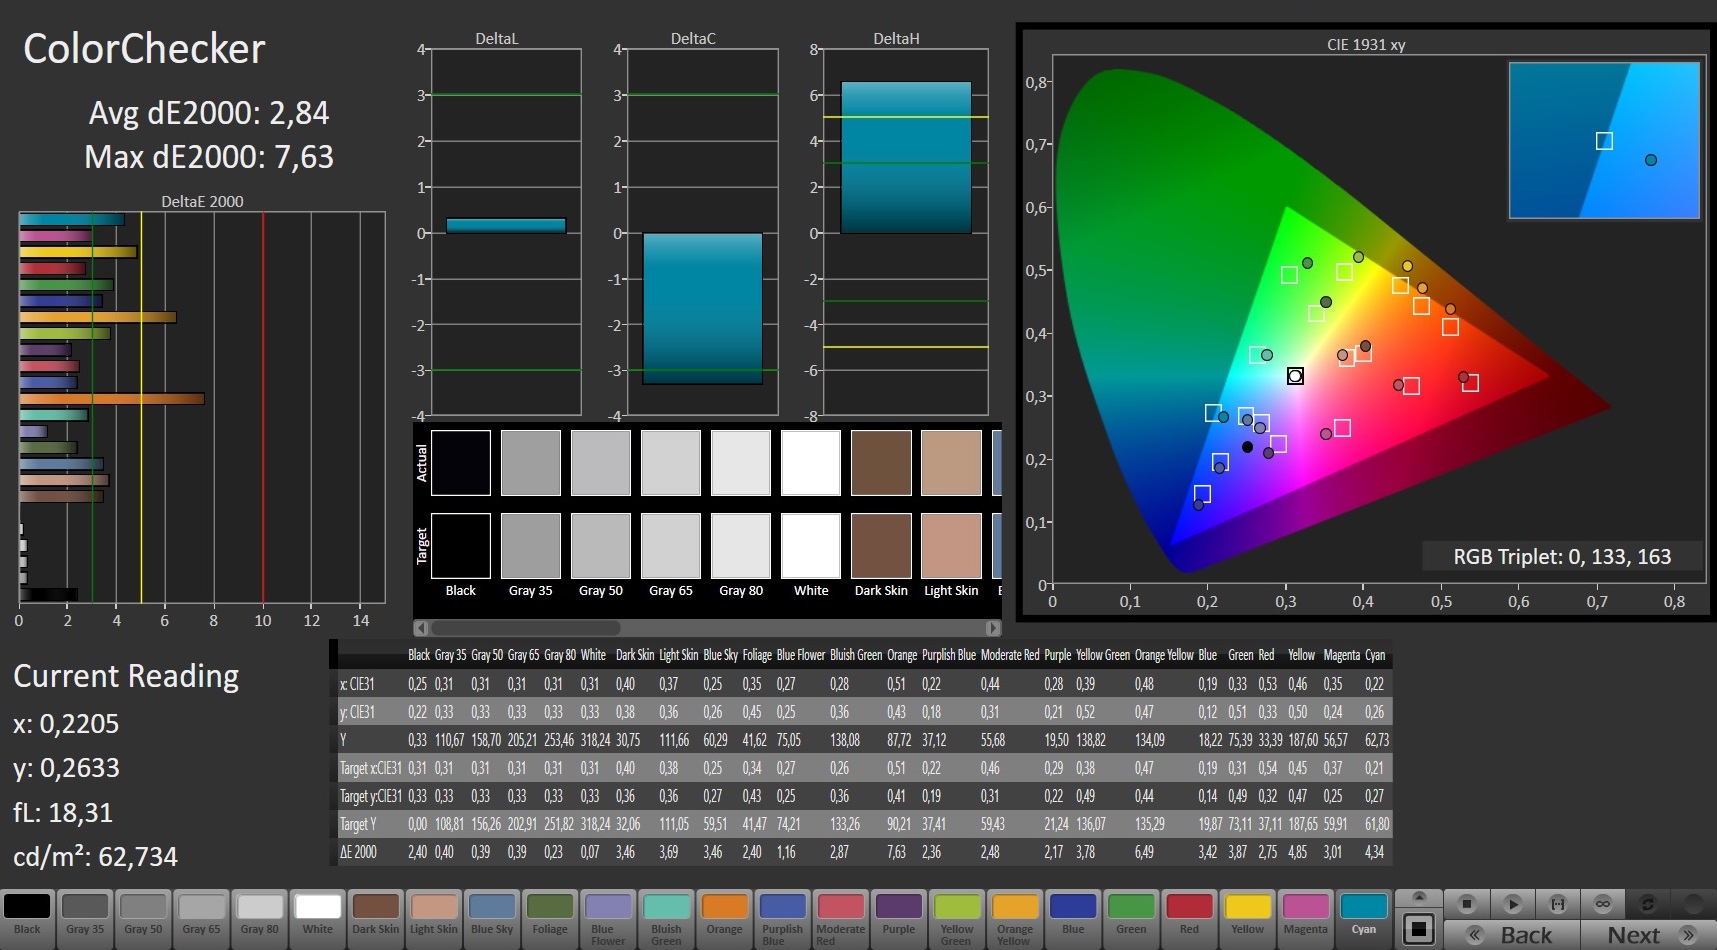
You cannot expect wonders in terms of color accuracy. We measured the DeltaE 2000 deviation at about 6, with the ideal value being below 3. We managed to reach this value after a professional calibration (our ICC profile is available for download above).
Reaction time is at the typical IPS level: 24.8 ms (back to white) and 37.2 ms (gray to gray). There is flickering up to a brightness level of 95%, but this should not be a problem even for sensitive users due to its high frequency (20 KHz).
Display Response Times
| ↔ Response Time Black to White | ||
|---|---|---|
| 24.8 ms ... rise ↗ and fall ↘ combined | ↗ 14 ms rise | 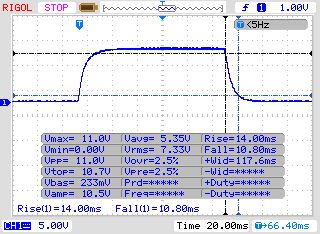 |
| ↘ 10.8 ms fall | ||
| The screen shows good response rates in our tests, but may be too slow for competitive gamers. In comparison, all tested devices range from 0.1 (minimum) to 240 (maximum) ms. » 58 % of all devices are better. This means that the measured response time is worse than the average of all tested devices (19.9 ms). | ||
| ↔ Response Time 50% Grey to 80% Grey | ||
| 37.2 ms ... rise ↗ and fall ↘ combined | ↗ 18.4 ms rise | 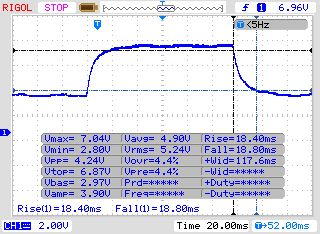 |
| ↘ 18.8 ms fall | ||
| The screen shows slow response rates in our tests and will be unsatisfactory for gamers. In comparison, all tested devices range from 0.165 (minimum) to 636 (maximum) ms. » 54 % of all devices are better. This means that the measured response time is worse than the average of all tested devices (31.1 ms). | ||
Screen Flickering / PWM (Pulse-Width Modulation)
| Screen flickering / PWM detected | 20000 Hz | ≤ 95 % brightness setting | 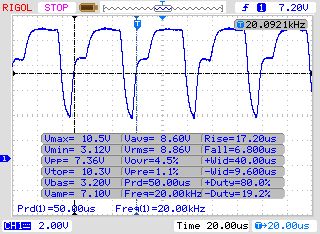 |
The display backlight flickers at 20000 Hz (worst case, e.g., utilizing PWM) Flickering detected at a brightness setting of 95 % and below. There should be no flickering or PWM above this brightness setting. The frequency of 20000 Hz is quite high, so most users sensitive to PWM should not notice any flickering. In comparison: 52 % of all tested devices do not use PWM to dim the display. If PWM was detected, an average of 7798 (minimum: 5 - maximum: 343500) Hz was measured. | |||
Performance
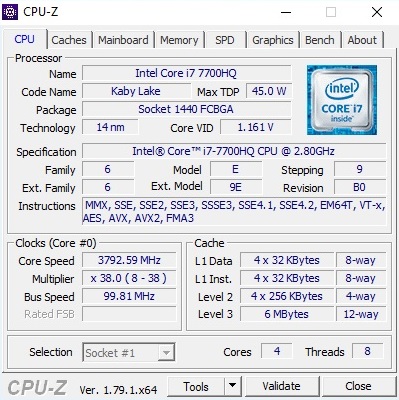
Processor
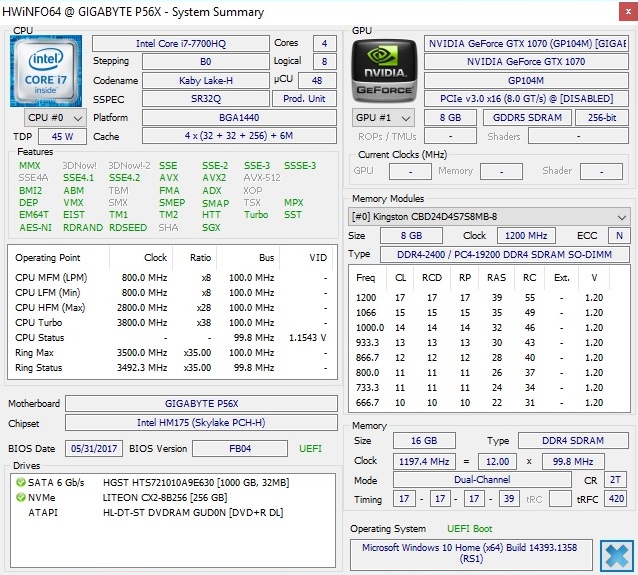
The P56XT is equipped with Intel’s favorite quad-core CPU of the Kaby Lake generation. The Core i7-7700HQ is a 14-nm model that manages 2.8 to 3.8 GHz under load.
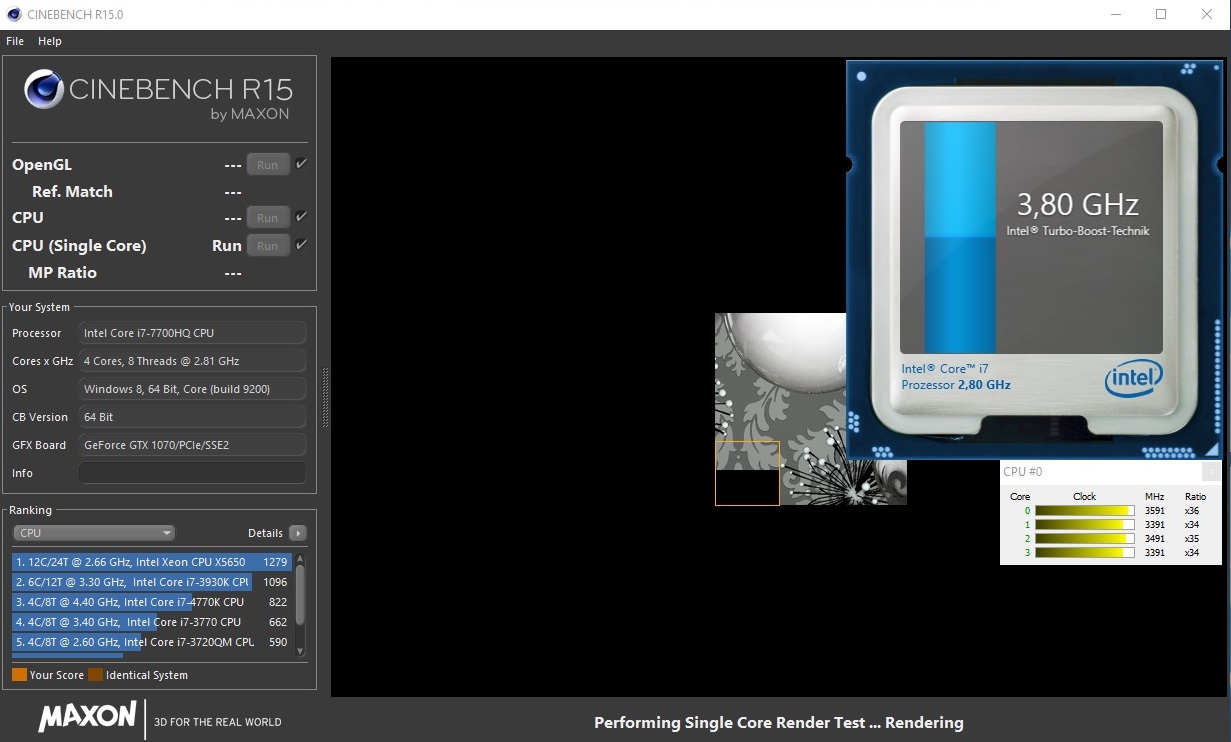
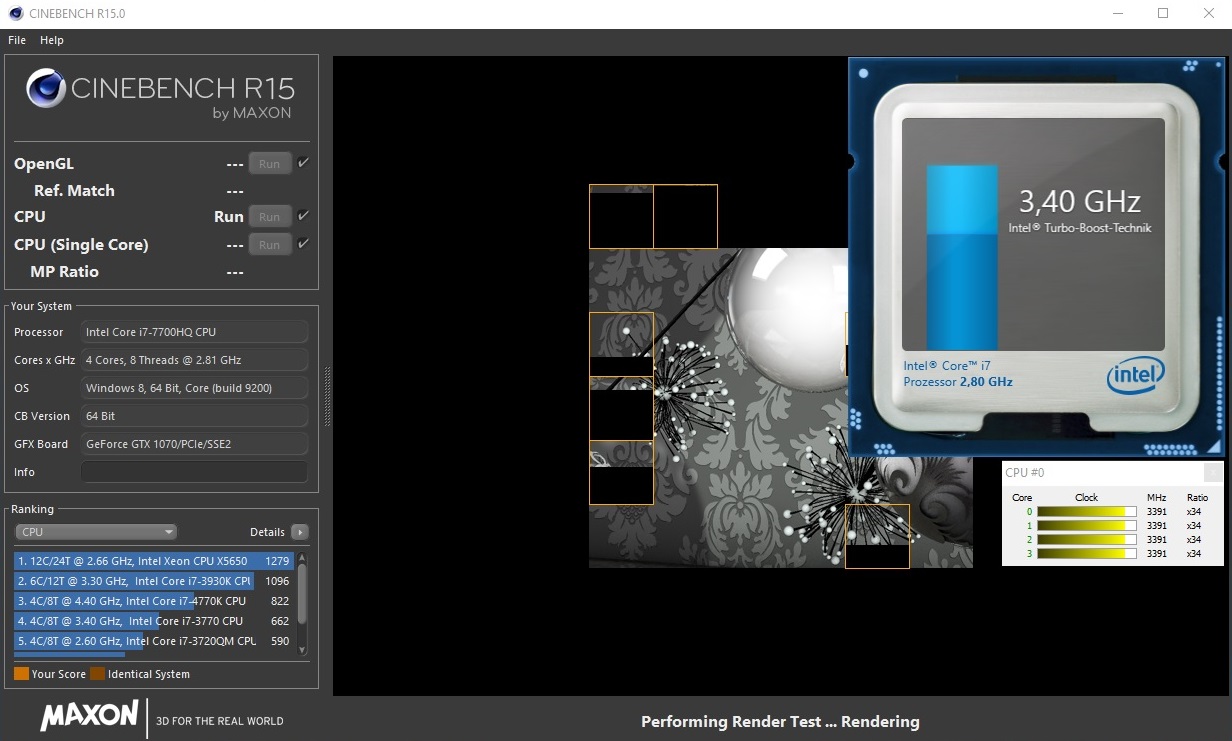
The Turbo Boost feature reaches its full potential in the P56XT. A maximum of 3.8 GHz under single-core load and exactly 3.4 GHz under multi-core load are the exact same numbers as Intel cites. Our test device easily kept up these good results over prolonged periods of time. Even after 50 rounds of our Cinebench loop, the Core i7-7700HQ kept up the same good performance.
The CPU benchmarks confirm the positive impression that we have received so far. Both in the Cinebench R15 and the Cinebench R11.5, the P56XT performs just as fast as its i7-7700HQ-based competition.
System Performance
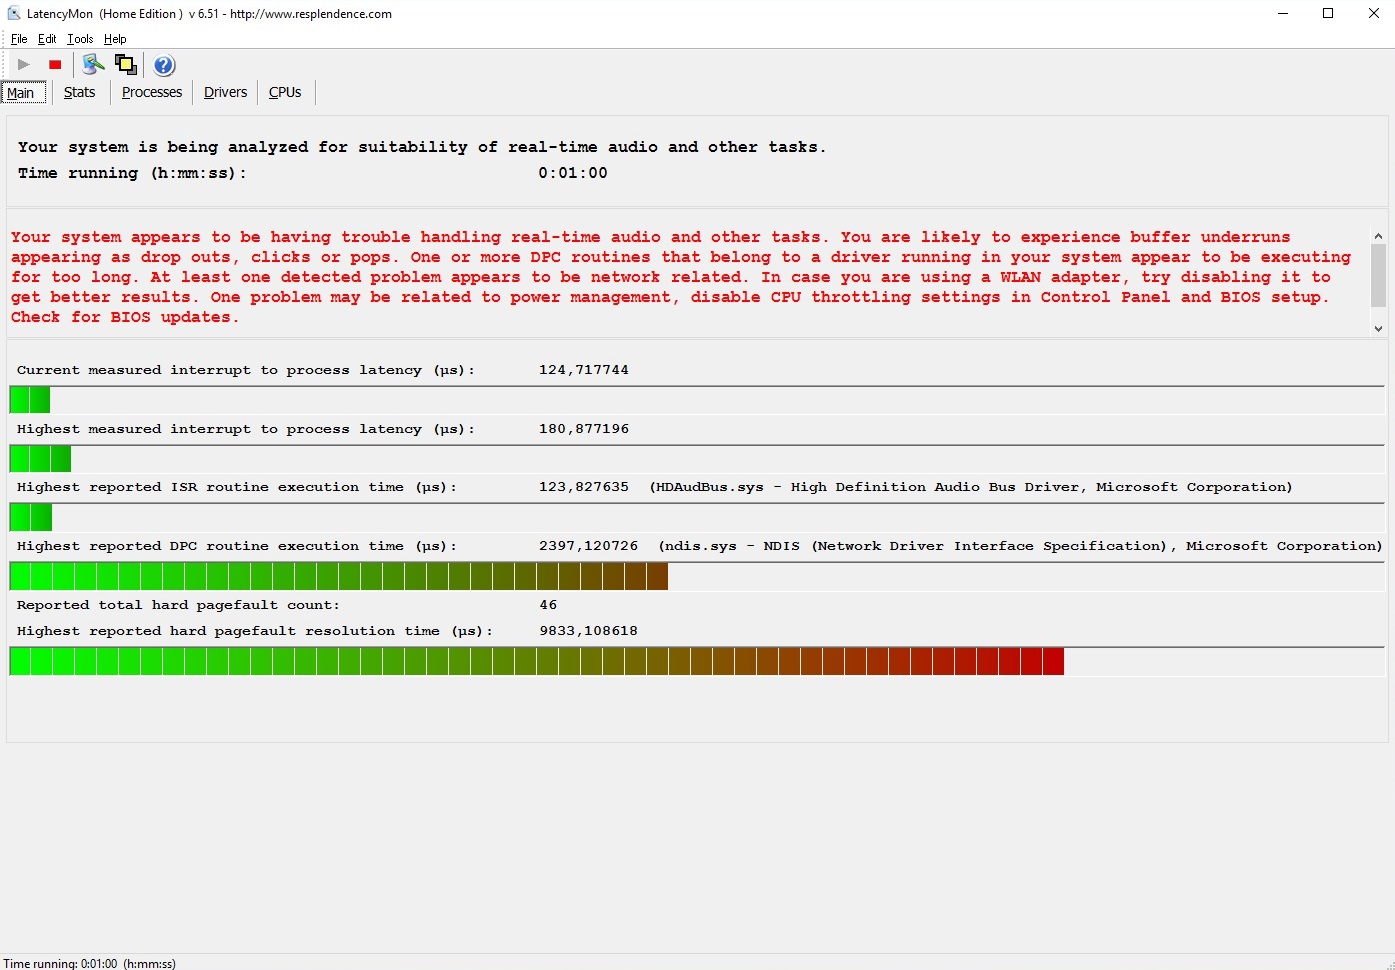
The 15-inch device has good cards for system performance. The PCMark 8 suites show no surprises and the P56XT’s performance slots in well among the comparison devices. In practice, system speed was not always optimal. Windows 10 tended to crash or play up when starting programs, which is possibly due to the badly programmed drivers (see latency screenshots further above). This is a problem that we have occasionally noticed in other notebooks as well. These problems happen within a fraction of a second during which the operating system will not react to anything.
Update 07/27/17: We also experienced the mentioned stutters on the second test model.
| PCMark 8 | |
| Home Score Accelerated v2 | |
| Acer Predator 15 G9-593-751X | |
| Schenker XMG P507 PRO | |
| Gigabyte Aero 15 | |
| Gigabyte P56XT | |
| MSI GS63VR 7RF-228US | |
| Work Score Accelerated v2 | |
| Acer Predator 15 G9-593-751X | |
| Gigabyte Aero 15 | |
| MSI GS63VR 7RF-228US | |
| Gigabyte P56XT | |
| Schenker XMG P507 PRO | |
| PCMark 10 - Score | |
| Gigabyte P56XT | |
| PCMark 8 Home Score Accelerated v2 | 4239 points | |
| PCMark 8 Work Score Accelerated v2 | 5261 points | |
| PCMark 10 Score | 5021 points | |
Help | ||
Storage Devices
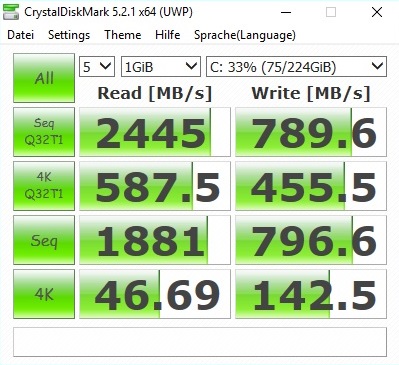
In order to justify the high price, Gigabyte has equipped our test configuration with an M.2 SSD based on NVMe, which is way ahead of cheaper SATA III SSDs in terms of sequential speeds. The 256-GB model from LiteOn does not belong to the PCIe elite, however. The Samsung competitors 960 EVO (Schenker XMG A517) and SM961 (Asus ROG Zephyrus) reach higher scores on average, regardless of their capacity.
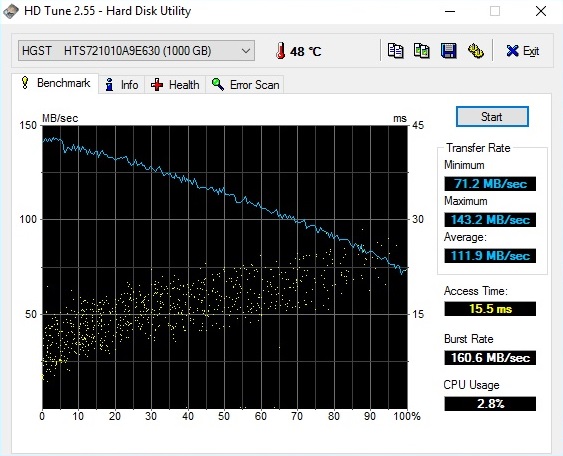
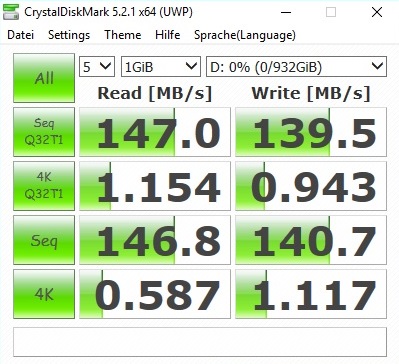
Should storage space become tight at some point, games and other data can be saved to the secondary hard drive. The 1-TB drive HGST Travelstar 7K1000 (7200 RPM) is present in many gaming notebooks. This is not surprising, as it offers very good value for your money. If you use the free M.2 slot and change the optical drive for a 2.5-inch drive with the Hot Swap function, you can use up to four storage devices in the P56XT.
| Gigabyte P56XT LiteOn CX2-8B256 | Asus Zephyrus GX501 Samsung SSD SM961 1TB M.2 MZVKW1T0HMLH | Schenker XMG A517 Samsung SSD 960 Evo 500GB m.2 NVMe | |
|---|---|---|---|
| CrystalDiskMark 5.2 / 6 | 19% | 43% | |
| Read Seq Q32T1 (MB/s) | 2445 | 3445 41% | 3389 39% |
| Write Seq Q32T1 (MB/s) | 790 | 1848 134% | 1706 116% |
| Read 4K Q32T1 (MB/s) | 588 | 547 -7% | 627 7% |
| Write 4K Q32T1 (MB/s) | 455.5 | 463 2% | 591 30% |
| Read Seq (MB/s) | 1881 | 954 -49% | 1856 -1% |
| Write Seq (MB/s) | 797 | 1049 32% | 1652 107% |
| Read 4K (MB/s) | 46.69 | 45 -4% | 49 5% |
| Write 4K (MB/s) | 142.5 | 149 5% | 196 38% |

Graphics
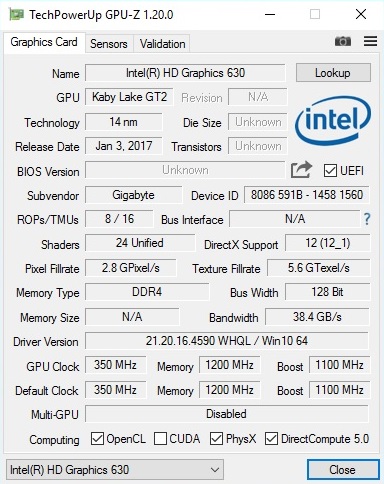
There are two chips available for GPU calculations. Thanks to Nvidia’s Optimus technology, the P56XT can smoothly switch from the integrated HD Graphics 630 to the GeForce GTX 1070, which saves a lot of power when doing simple tasks such as Office, watching videos or surfing the web. On the downside, there is no G-Sync (nor 120-Hz display), which would round-off the content display nicely.
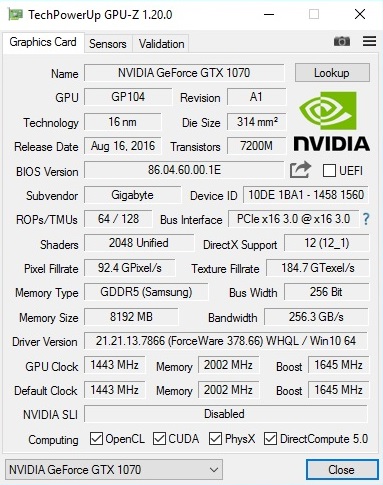
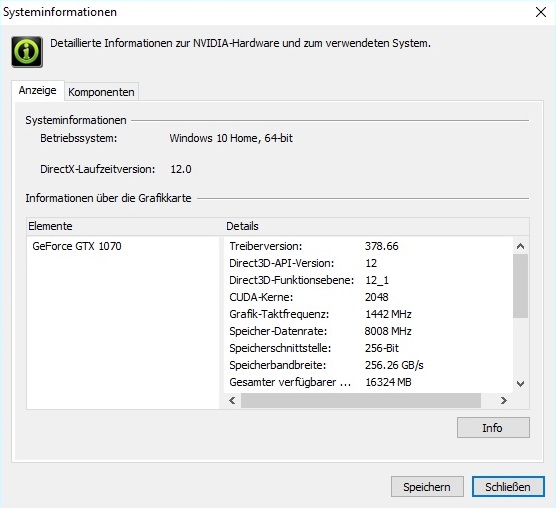
After the GeForce GTX 1080 and GTX 1080 Max-Q, the GeForce GTX 1070 is Nvidia’s third-strongest Pascal GPU for notebooks. The DirectX-12 model offers 2048 shaders and 8 GB of GDDR5 VRAM that is attached via a 193-bit-wide interface and effectively runs at 8000 MHz. Nvidia cites a Turbo clock rate of 1443 to 1645 MHz, although more is possible in perfect conditions (a maximum of 1835 in the GPU-Z render test).
| 3DMark - 1920x1080 Fire Strike Graphics | |
| Acer Predator 15 G9-593-751X | |
| Schenker XMG P507 PRO | |
| Gigabyte P56XT | |
| Acer Aspire VN7-593G-73HP V15 Nitro BE | |
| MSI GS63VR 7RF-228US | |
| Gigabyte Aero 15 | |
| 3DMark 11 - 1280x720 Performance GPU | |
| Acer Predator 15 G9-593-751X | |
| Schenker XMG P507 PRO | |
| Gigabyte P56XT | |
| Acer Aspire VN7-593G-73HP V15 Nitro BE | |
| MSI GS63VR 7RF-228US | |
| Gigabyte Aero 15 | |
| Unigine Heaven 4.0 - Extreme Preset DX11 | |
| Schenker XMG P507 PRO | |
| Gigabyte P56XT | |
| Gigabyte Aero 15 | |
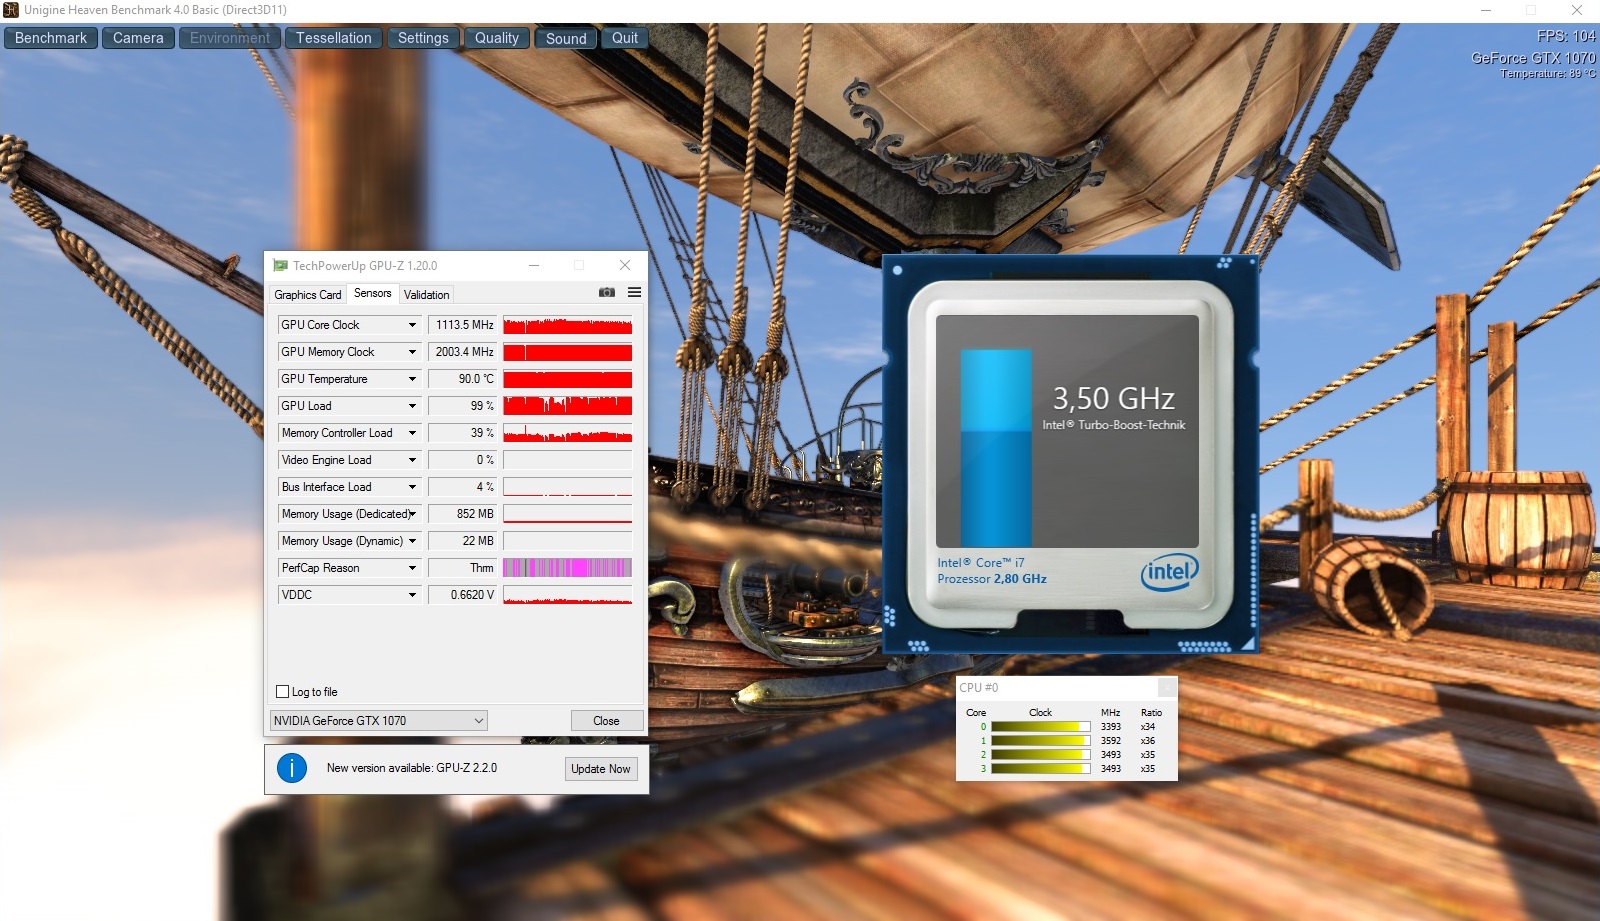
Our first impression was that the P56XT seemed to be making good use of its graphics power. The Acer Predator 15 and Schenker XMG P507 do perform a little faster during the 3DMark tests, but a certain level of fluctuations is normal. We became suspicious when competing devices with the GTX 1070 performed better by 10% during the Unigine Heaven 4.0 benchmark.
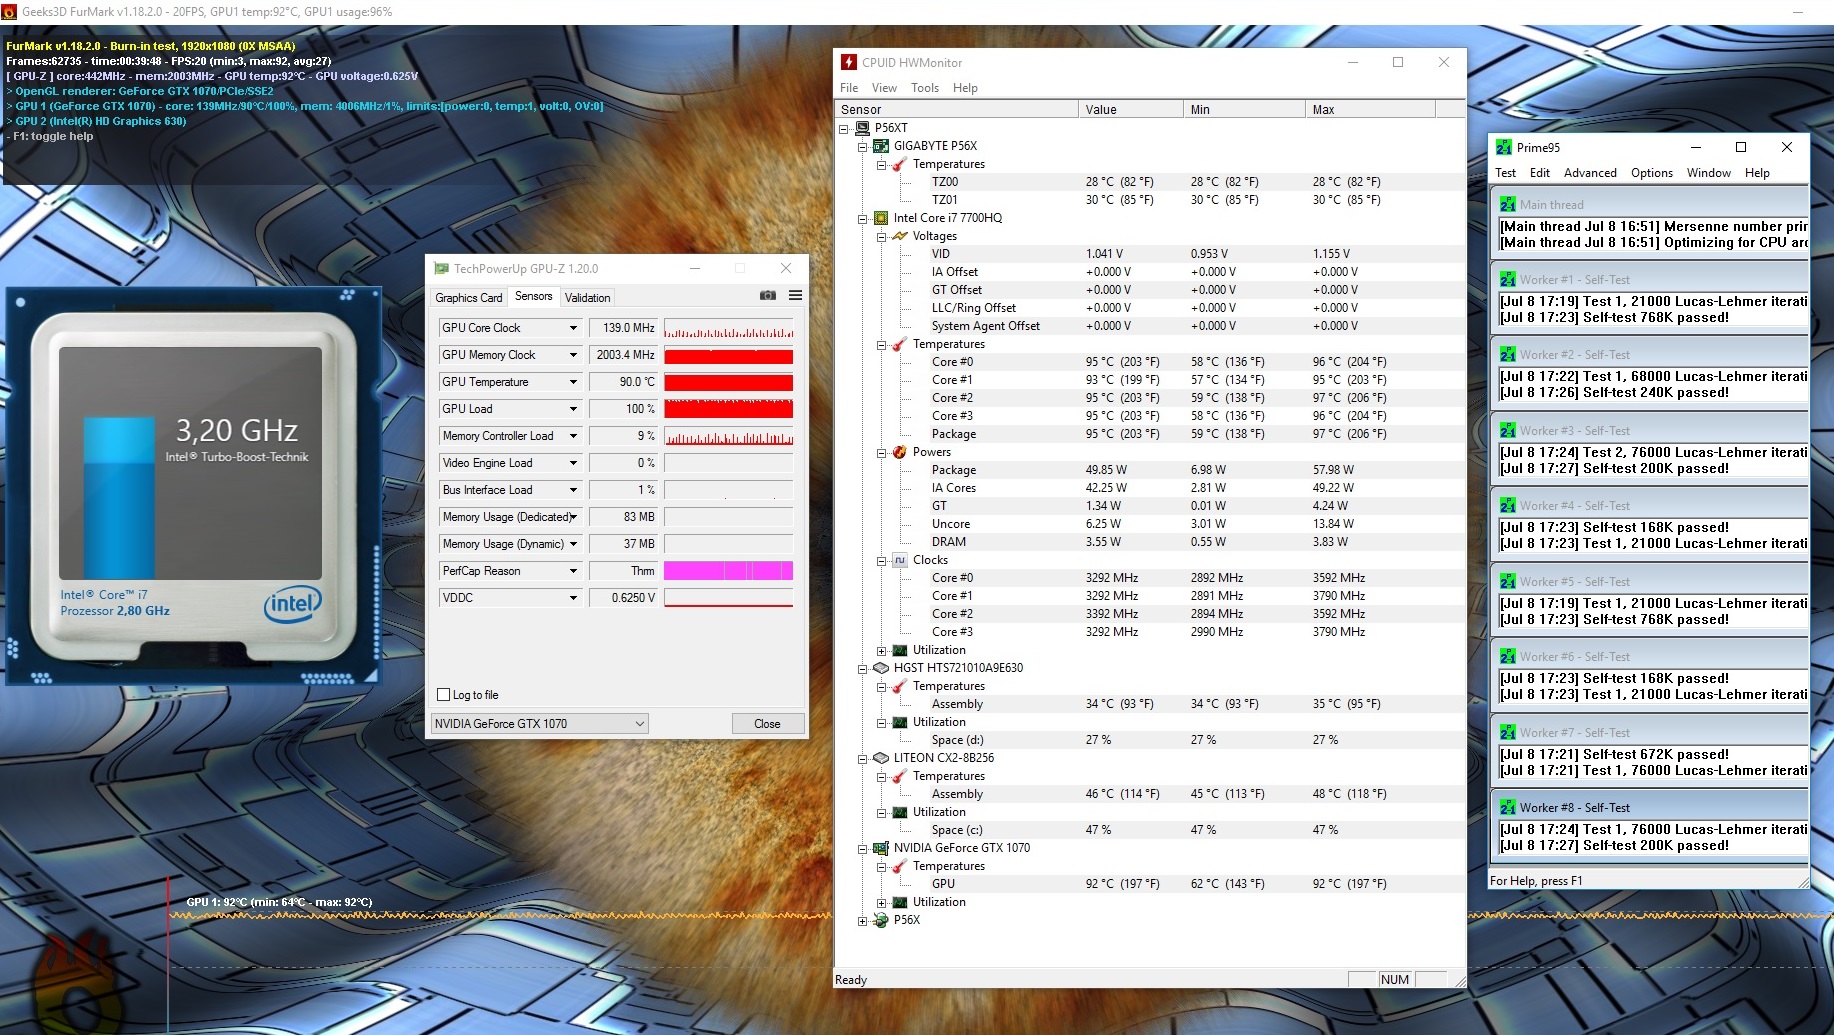
As it turned out when we checked the clock rates, throttling was increasing in the core of the GeForce GTX 1070. Although throttling occurs regularly during unrealistic stress tests such as FurMark and Prime95, during normal 3D use (including benchmarks and games), clock rates should not sink below base clock rates.
| 3DMark 11 Performance | 15625 points | |
| 3DMark Ice Storm Standard Score | 109939 points | |
| 3DMark Cloud Gate Standard Score | 26099 points | |
| 3DMark Fire Strike Score | 13179 points | |
Help | ||
This drop in performance is particularly noticeable in our “The Witcher 3” test, which runs for 60 minutes with 1920x1080 pixels and maximum details. During the test, the frame rate dropped from about 57 fps to an average of 45 fps very quickly. That corresponds to a loss of 20%. We therefore feel compelled to subtract 20% off the game performance. The main reason for throttling in our test unit was the GPU temperature that reached 90°C (~194 °F) in a flash. Although we could not find any deficiencies during our intensive check of the cooling system (there is enough thermal paste), our test unit, which is a sample for the press, must have some defect.
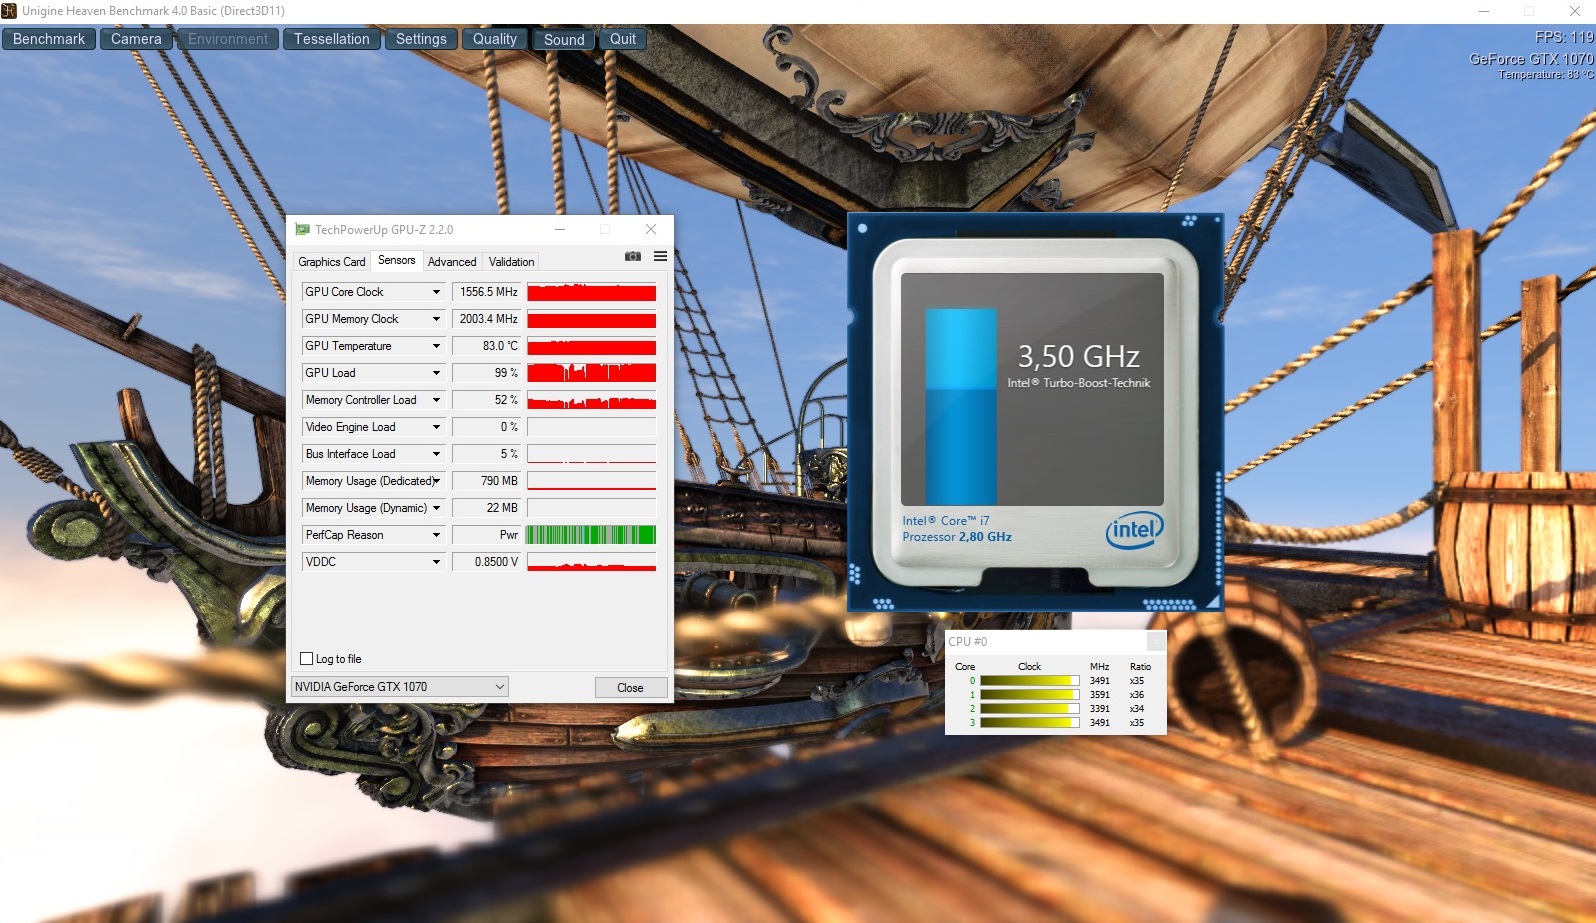
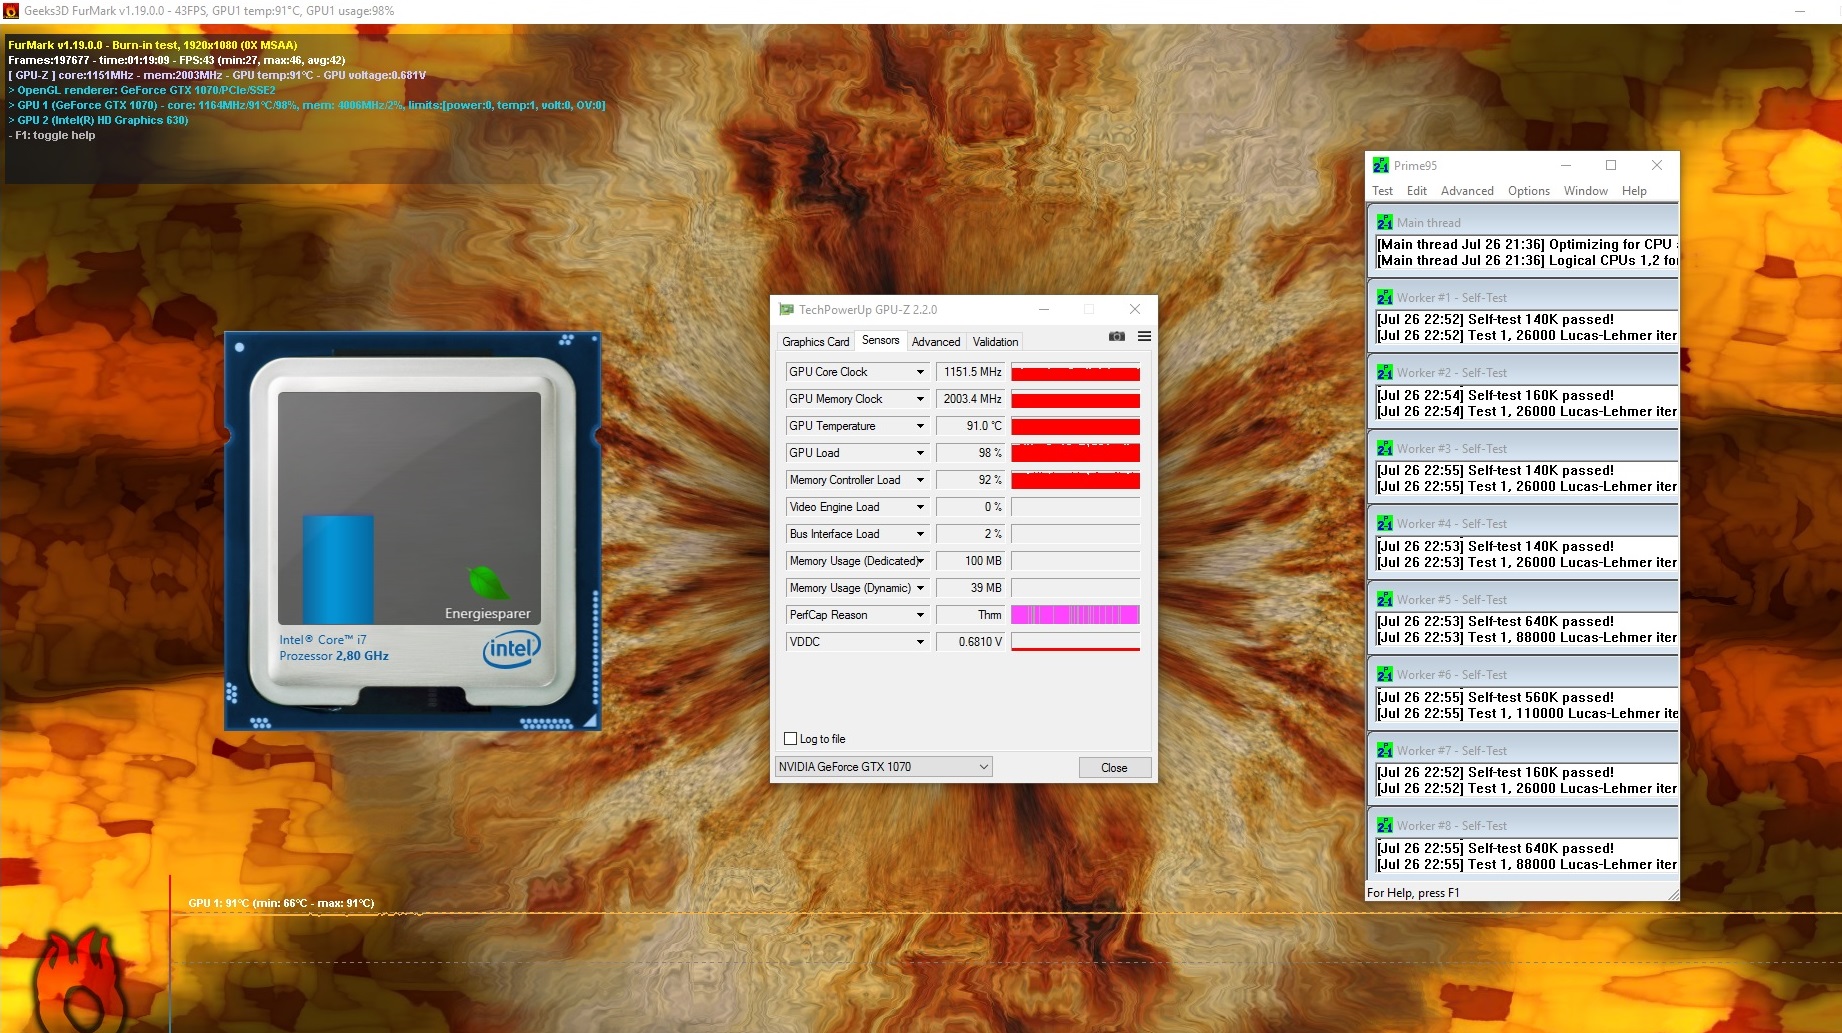
Update 07/27/17: The replacement device does not suffer from GPU throttling in regular 3D applications anymore. The GeForce GTX 1070 leveled off at around 1550 MHz under load and a temperature of 83 °C (Unigine Heaven 4.0 benchmark; now 105.8 instead of 97.8 fps) and 87 °C (The Witcher 3, the following diagram is from the second model), respectively.
Gaming Performance
Despite the throttling mentioned above that also makes its mark on the gaming benchmarks, the P56XT’s speed is still closer to the other GTX 1070 notebooks rather than the cheaper GTX 1060 devices. As long as everything is done properly, all modern games can be played in native resolution with full details. This includes role-playing games such as “Mass Effect Andromeda”, racing games such as “Dirt 4”, action-adventures like “Assassins’' Creed Syndicate”, strategy games such as “Warhammer Dawn of War 3” or Ego-Shooters or multiplayer games (“Star Wars Battlefront”, “Rainbow Six Siege”, “Rocket League”…).
Update 07/27/17: We added the benchmark results for the new survival hit PUBG, but we did not repeat the other gaming tests with the replacement device. The frame rates should be slightly higher compared to the first test sample thanks to the lack of GPU throttling.
| low | med. | high | ultra | |
|---|---|---|---|---|
| The Witcher 3 (2015) | 90.8 | 50.2 | ||
| Star Wars Battlefront (2015) | 120 | 109 | ||
| Assassin's Creed Syndicate (2015) | 81.6 | 39.7 | ||
| Rainbow Six Siege (2015) | 162 | 141 | ||
| Mass Effect Andromeda (2017) | 70.1 | 60.4 | ||
| Warhammer 40.000: Dawn of War III (2017) | 81.6 | 78.4 | ||
| Rocket League (2017) | 200 | |||
| Dirt 4 (2017) | 129 | 76.6 | ||
| Playerunknown's Battlegrounds (PUBG) (2017) | 75.2 | 70 |
Emissions
System Noise
The combination of a relatively flat build and a strong high-end GPU necessarily also means more system noise. Under load, the P56XT reaches 47 dB(A) (3DMark 06) to 53 dB(A) (stress test), and sounds similar to the Schenker XMG P507 that reaches 46 to 52 dB(A). The GTX-1070 competitor, Acer Predator 15, which is 1 cm (~0.4 in) thicker, mostly remains noticeably quieter with 41 to 50 dB(A). The same is the case for all comparison devices with the GTX 1060.
While idling, the P56XT could be quieter as well. The two cooling fans never turn off completely (even when the Smart Manager is set to "Quiet"), but continue running at a constant audible level of 34 to 35 dB(A). Apart from when the system is booting, the cooling fans never turn on for no reason, as is the case in the XMG P507. However, the P56XT does have some annoying characteristics. Depending on its load, the cooling fans tend to hum (while idling) or throb (under load).
Update 07/27/17: The fan characteristics of the second test model were not perfect, either, but the overall impression is better this time. The notebook was much quieter in 3D application at 39-49 dB(A).
Noise level
| Idle |
| 34 / 35 / 39 dB(A) |
| DVD |
| 42 / dB(A) |
| Load |
| 39 / 49 dB(A) |
 | ||
30 dB silent 40 dB(A) audible 50 dB(A) loud |
||
min: | ||
| Gigabyte P56XT i7-7700HQ, GeForce GTX 1070 Mobile | Acer Predator 15 G9-593-751X i7-7700HQ, GeForce GTX 1070 Mobile | Schenker XMG P507 PRO i7-7700HQ, GeForce GTX 1070 Mobile | MSI GS63VR 7RF-228US i7-7700HQ, GeForce GTX 1060 Mobile | Acer Aspire VN7-593G-73HP V15 Nitro BE i7-7700HQ, GeForce GTX 1060 Mobile | Gigabyte Aero 15 i7-7700HQ, GeForce GTX 1060 Mobile | |
|---|---|---|---|---|---|---|
| Noise | -0% | -6% | 5% | 7% | 4% | |
| off / environment * (dB) | 30 | 32 -7% | 31 -3% | 28.8 4% | 30.4 -1% | 31 -3% |
| Idle Minimum * (dB) | 34 | 34 -0% | 33 3% | 33.1 3% | 30.9 9% | 32 6% |
| Idle Average * (dB) | 35 | 36 -3% | 34 3% | 33.1 5% | 30.9 12% | 33 6% |
| Idle Maximum * (dB) | 39 | 38 3% | 44 -13% | 34 13% | 31.5 19% | 34 13% |
| Load Average * (dB) | 39 | 41 -5% | 46 -18% | 37.2 5% | 40.7 -4% | 39 -0% |
| Witcher 3 ultra * (dB) | 48 | 42 12% | 46.1 4% | 45.5 5% | 43 10% | |
| Load Maximum * (dB) | 49 | 50 -2% | 52 -6% | 47.1 4% | 43.9 10% | 50 -2% |
* ... smaller is better
Temperature
Adding to the rather loud system noise, is the high heat development. The case remains nicely cool at about 29 °C (~ 84.2 °F) while idling (only the left side of the wrist rest heats up a little due to the unlucky position of the 2.5-inch HDD), but it heats up dramatically during 3D mode.
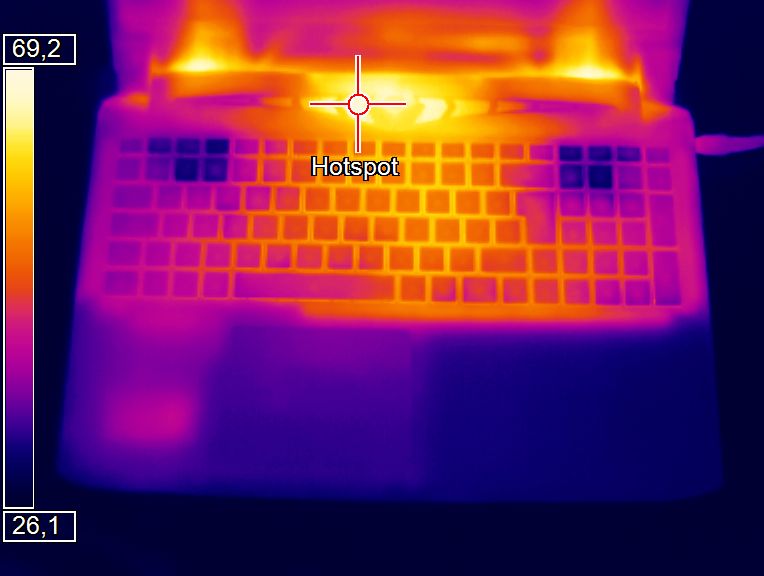
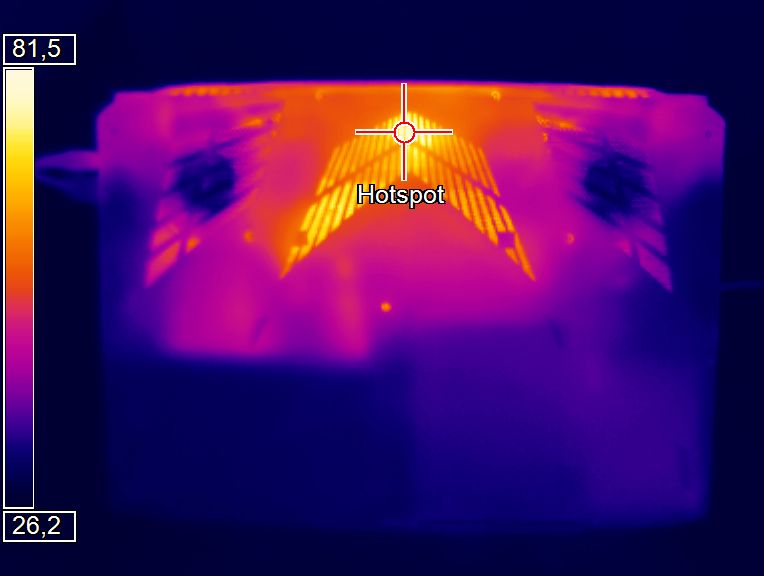
A maximum of 63 °C (~145 °F) in “The Witcher 3” and a max. 68 °C (~154 °F) in the stress test mean that it is not a good idea to use the P56XT for gaming on your lap. The top of the base unit also heats up to 54 and 60 °C respectively (~129 and 140 °F). Its competition does a better job during prolonged sessions.
Update 07/27/17: While the second test model is quieter, the chassis temperatures are even a couple of degrees higher, so the distance to the competition grows and the rating in this section is lower.
(-) The maximum temperature on the upper side is 65 °C / 149 F, compared to the average of 40.4 °C / 105 F, ranging from 21.2 to 68.8 °C for the class Gaming.
(-) The bottom heats up to a maximum of 71 °C / 160 F, compared to the average of 43.2 °C / 110 F
(+) In idle usage, the average temperature for the upper side is 29.4 °C / 85 F, compared to the device average of 33.9 °C / 93 F.
(-) Playing The Witcher 3, the average temperature for the upper side is 45.7 °C / 114 F, compared to the device average of 33.9 °C / 93 F.
(+) The palmrests and touchpad are reaching skin temperature as a maximum (35 °C / 95 F) and are therefore not hot.
(-) The average temperature of the palmrest area of similar devices was 28.8 °C / 83.8 F (-6.2 °C / -11.2 F).
| Gigabyte P56XT i7-7700HQ, GeForce GTX 1070 Mobile | Acer Predator 15 G9-593-751X i7-7700HQ, GeForce GTX 1070 Mobile | Schenker XMG P507 PRO i7-7700HQ, GeForce GTX 1070 Mobile | MSI GS63VR 7RF-228US i7-7700HQ, GeForce GTX 1060 Mobile | Acer Aspire VN7-593G-73HP V15 Nitro BE i7-7700HQ, GeForce GTX 1060 Mobile | Gigabyte Aero 15 i7-7700HQ, GeForce GTX 1060 Mobile | |
|---|---|---|---|---|---|---|
| Heat | 28% | 9% | 10% | 16% | 19% | |
| Maximum Upper Side * (°C) | 65 | 42.3 35% | 49.2 24% | 51.9 20% | 56 14% | |
| Maximum Bottom * (°C) | 71 | 40.9 42% | 62 13% | 54.6 23% | 61 14% | |
| Idle Upper Side * (°C) | 35 | 28.4 19% | 32.4 7% | 28.4 19% | 29.1 17% | 25 29% |
| Idle Bottom * (°C) | 30 | 25.2 16% | 33 -10% | 29.6 1% | 29.3 2% | 24 20% |
* ... smaller is better
Speakers
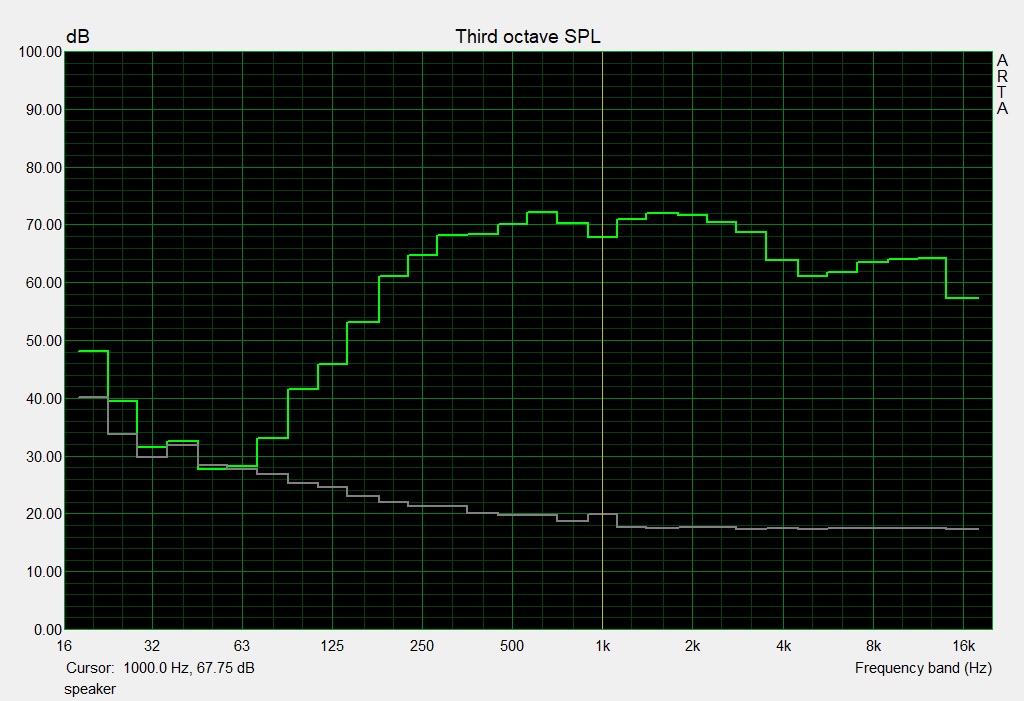
The sound quality is normal. The 2.0 system is positioned at the front of the notebook and has no blatant errors, as you will see from our audio analysis. This is also due to the pre-installed software Dolby Home Theater that offers several profiles, sound improvements and an equalizer. The maximum volume of 81 dB(A) is enough for the P56XT to fill small to medium-sized rooms. Most comparison devices had similar capacities.
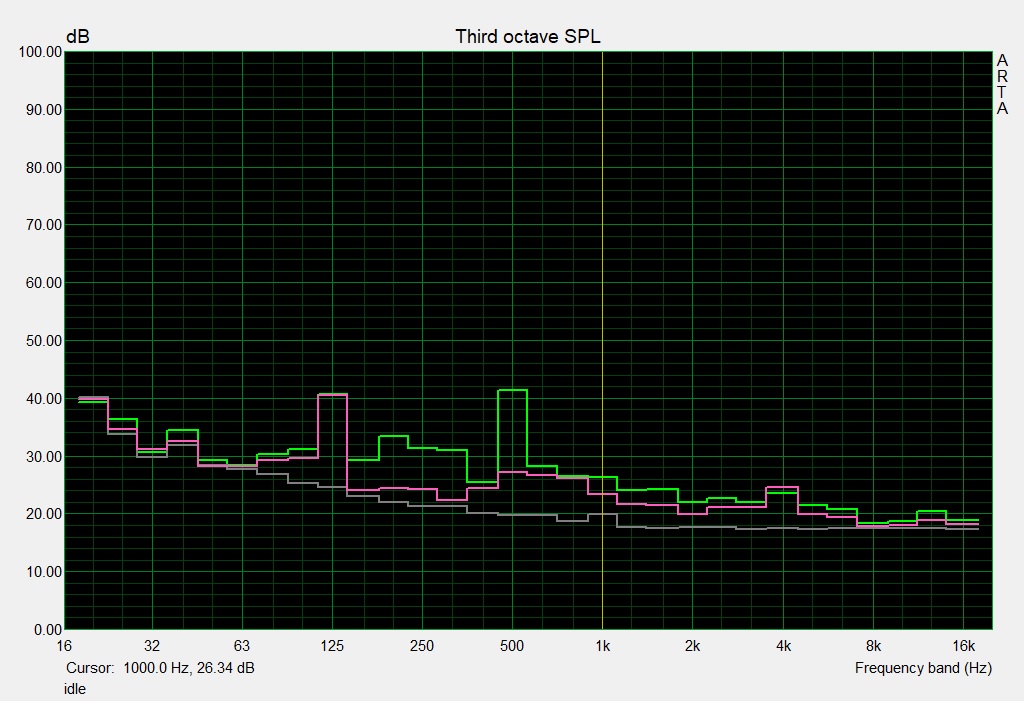
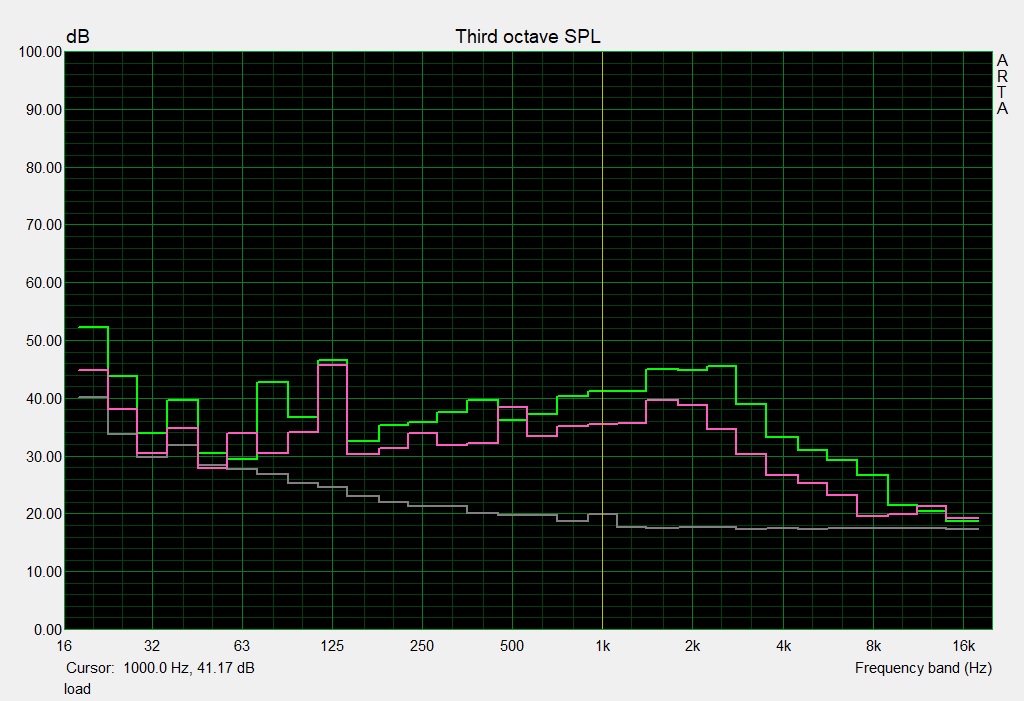
Gigabyte P56XT audio analysis
(±) | speaker loudness is average but good (81 dB)
Bass 100 - 315 Hz
(±) | reduced bass - on average 10.1% lower than median
(±) | linearity of bass is average (12.5% delta to prev. frequency)
Mids 400 - 2000 Hz
(±) | higher mids - on average 5.7% higher than median
(+) | mids are linear (3.4% delta to prev. frequency)
Highs 2 - 16 kHz
(+) | balanced highs - only 2.7% away from median
(+) | highs are linear (4.1% delta to prev. frequency)
Overall 100 - 16.000 Hz
(+) | overall sound is linear (13.8% difference to median)
Compared to same class
» 21% of all tested devices in this class were better, 7% similar, 72% worse
» The best had a delta of 6%, average was 18%, worst was 132%
Compared to all devices tested
» 15% of all tested devices were better, 4% similar, 81% worse
» The best had a delta of 4%, average was 24%, worst was 134%
Schenker XMG P507 PRO audio analysis
(±) | speaker loudness is average but good (75 dB)
Bass 100 - 315 Hz
(-) | nearly no bass - on average 20.2% lower than median
(±) | linearity of bass is average (7.6% delta to prev. frequency)
Mids 400 - 2000 Hz
(+) | balanced mids - only 2.2% away from median
(+) | mids are linear (5.9% delta to prev. frequency)
Highs 2 - 16 kHz
(+) | balanced highs - only 2.2% away from median
(+) | highs are linear (4.4% delta to prev. frequency)
Overall 100 - 16.000 Hz
(±) | linearity of overall sound is average (19.8% difference to median)
Compared to same class
» 69% of all tested devices in this class were better, 6% similar, 24% worse
» The best had a delta of 6%, average was 18%, worst was 132%
Compared to all devices tested
» 50% of all tested devices were better, 7% similar, 43% worse
» The best had a delta of 4%, average was 24%, worst was 134%
Frequency diagram in comparison (checkboxes above can be turned on/off)
Energy Management
Power Consumption
Power consumption while idling is rather low due to graphics switching. It needs 13 to 22 watts, which is lower than the already energy-efficient Schenker XMG P507 (14 to 24 watts). Under load, power consumption values remain acceptable. 85 watts during the first scene of the 3DMark 06 and up to 208 watts during the stress test are typical for a GTX 1070 notebook, although we would have given the P56XT a 230-watt power supply, just to be on the safe side (200 watts seems a little tight).
| Off / Standby | |
| Idle | |
| Load |
|
Key:
min: | |
| Gigabyte P56XT i7-7700HQ, GeForce GTX 1070 Mobile | Acer Predator 15 G9-593-751X i7-7700HQ, GeForce GTX 1070 Mobile | Schenker XMG P507 PRO i7-7700HQ, GeForce GTX 1070 Mobile | MSI GS63VR 7RF-228US i7-7700HQ, GeForce GTX 1060 Mobile | Acer Aspire VN7-593G-73HP V15 Nitro BE i7-7700HQ, GeForce GTX 1060 Mobile | Gigabyte Aero 15 i7-7700HQ, GeForce GTX 1060 Mobile | |
|---|---|---|---|---|---|---|
| Power Consumption | -21% | -4% | 3% | 26% | 14% | |
| Idle Minimum * (Watt) | 13 | 18 -38% | 14 -8% | 14.5 -12% | 7.2 45% | 12 8% |
| Idle Average * (Watt) | 17 | 23 -35% | 18 -6% | 17.3 -2% | 10.5 38% | 15 12% |
| Idle Maximum * (Watt) | 22 | 30 -36% | 24 -9% | 17.4 21% | 16 27% | 20 9% |
| Load Average * (Watt) | 85 | 89 -5% | 87 -2% | 93 -9% | 82 4% | 82 4% |
| Witcher 3 ultra * (Watt) | 154 | 168 -9% | 128.8 16% | 124 19% | 111 28% | |
| Load Maximum * (Watt) | 208 | 213 -2% | 201 3% | 155 25% | 161 23% |
* ... smaller is better
Battery Runtime
The biggest highlight of this entire review is the device's long battery runtime. While 2 hours during 3D mode (at full brightness) are average, the P56XT hums its way past most of its competitors during real-life testing with medium brightness. It can manage about 6.5 hours of surfing the web via Wi-Fi and 6 hours of playing HD films. This is long for a gaming laptop. We managed to get a maximum of 9.5 hours out of the 15-inch device, which is a great result.
These top-notch results are not coming out of nowhere. Gigabyte has given the device a strong battery with 91 Wh. This is admirable considering three storage device bays and the Hot Swap bay, which all take up a lot of space.
| Gigabyte P56XT i7-7700HQ, GeForce GTX 1070 Mobile, 91.2 Wh | Acer Predator 15 G9-593-751X i7-7700HQ, GeForce GTX 1070 Mobile, 90 Wh | Schenker XMG P507 PRO i7-7700HQ, GeForce GTX 1070 Mobile, 60 Wh | MSI GS63VR 7RF-228US i7-7700HQ, GeForce GTX 1060 Mobile, 65 Wh | Acer Aspire VN7-593G-73HP V15 Nitro BE i7-7700HQ, GeForce GTX 1060 Mobile, 69 Wh | Gigabyte Aero 15 i7-7700HQ, GeForce GTX 1060 Mobile, 94.24 Wh | |
|---|---|---|---|---|---|---|
| Battery runtime | -12% | -45% | -36% | 1% | 10% | |
| Reader / Idle (h) | 9.5 | 8.4 -12% | 6.4 -33% | 8.4 -12% | 10.6 12% | |
| H.264 (h) | 6.2 | 4.9 -21% | 3.6 -42% | 7.7 24% | ||
| WiFi v1.3 (h) | 6.4 | 5.5 -14% | 3.3 -48% | 3.9 -39% | 6 -6% | 7 9% |
| Load (h) | 2 | 2 0% | 1.3 -35% | 2.4 20% | 1.9 -5% |
Verdict
Pros
Cons
The Gigabyte P56XT is a good high.end notebook, despite the high temperature and noise development while gaming. It does not really stand out in any category except for the above-average battery runtime, but is a solid performer in general.
The plastic chassis has decent build quality with decent up to good input devices (keyboard with RGB support). You also get clever tools, fast NVMe-SSD storage and an IPS panel with wide viewing angles. Connectivity enthusiasts will be pleased with the Thunderbolt 3 port.
Thanks to the Hot Swap concept (optical drive or 2.5-inch hard drive), the mixture of P35 and P55 stands out from the masses.
Gigabyte P56XT
- 07/27/2017 v6 (old)
Florian Glaser
Price comparison
