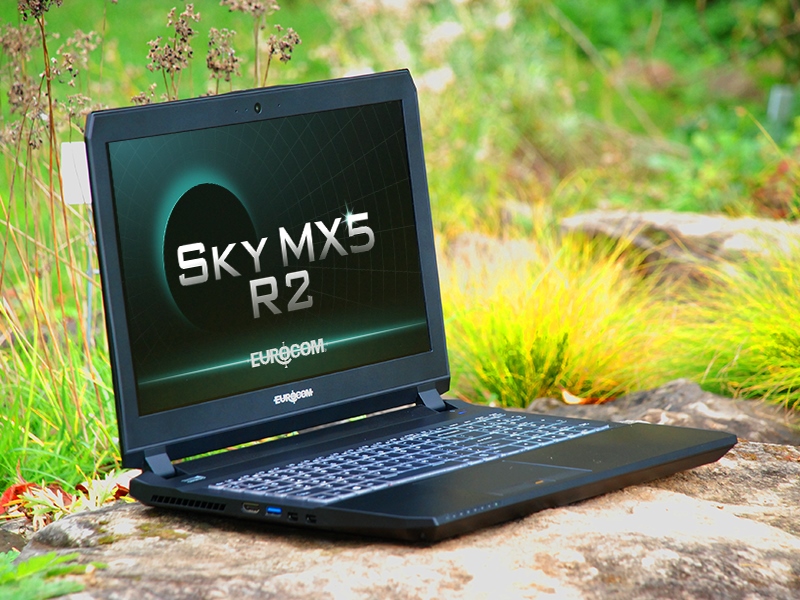
Eurocom Sky MX5 R3 (i7-7820HK, FHD, Clevo P650HS-G) Laptop Review
Eurocom is a popular builder and reseller of Clevo barebones for both North American and European customers. Similar to the XMG series from Schenker Technologies, these enthusiast systems are some of the fastest gaming notebooks money can buy including the Tornado F5 Killer Edition and Sky X7E2 that come equipped with desktop CPUs. This latest Sky MX5 R3 utilizes more down-to-Earth mobile components like the HQ and HK class of Intel CPUs and a GTX 1070 GPU. Changes are largely internal from the outgoing Skylake-based Sky MX5 R2 and so users can expect the same chassis design from the previous generation.
The MX5 R3 is significantly smaller than the Tornado series or the MSI GT series since its processors are soldered for a more compact design. This makes the MX5 R3 a more solid competitor to medium-sized enthusiast gaming systems like the EVGA SC15 or Asus ROG GL502VS. We recommend checking out our existing Eurocom pages below for a more complete view of what the reseller has to offer.
Case
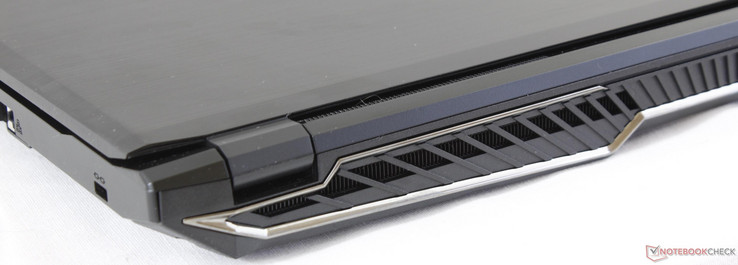
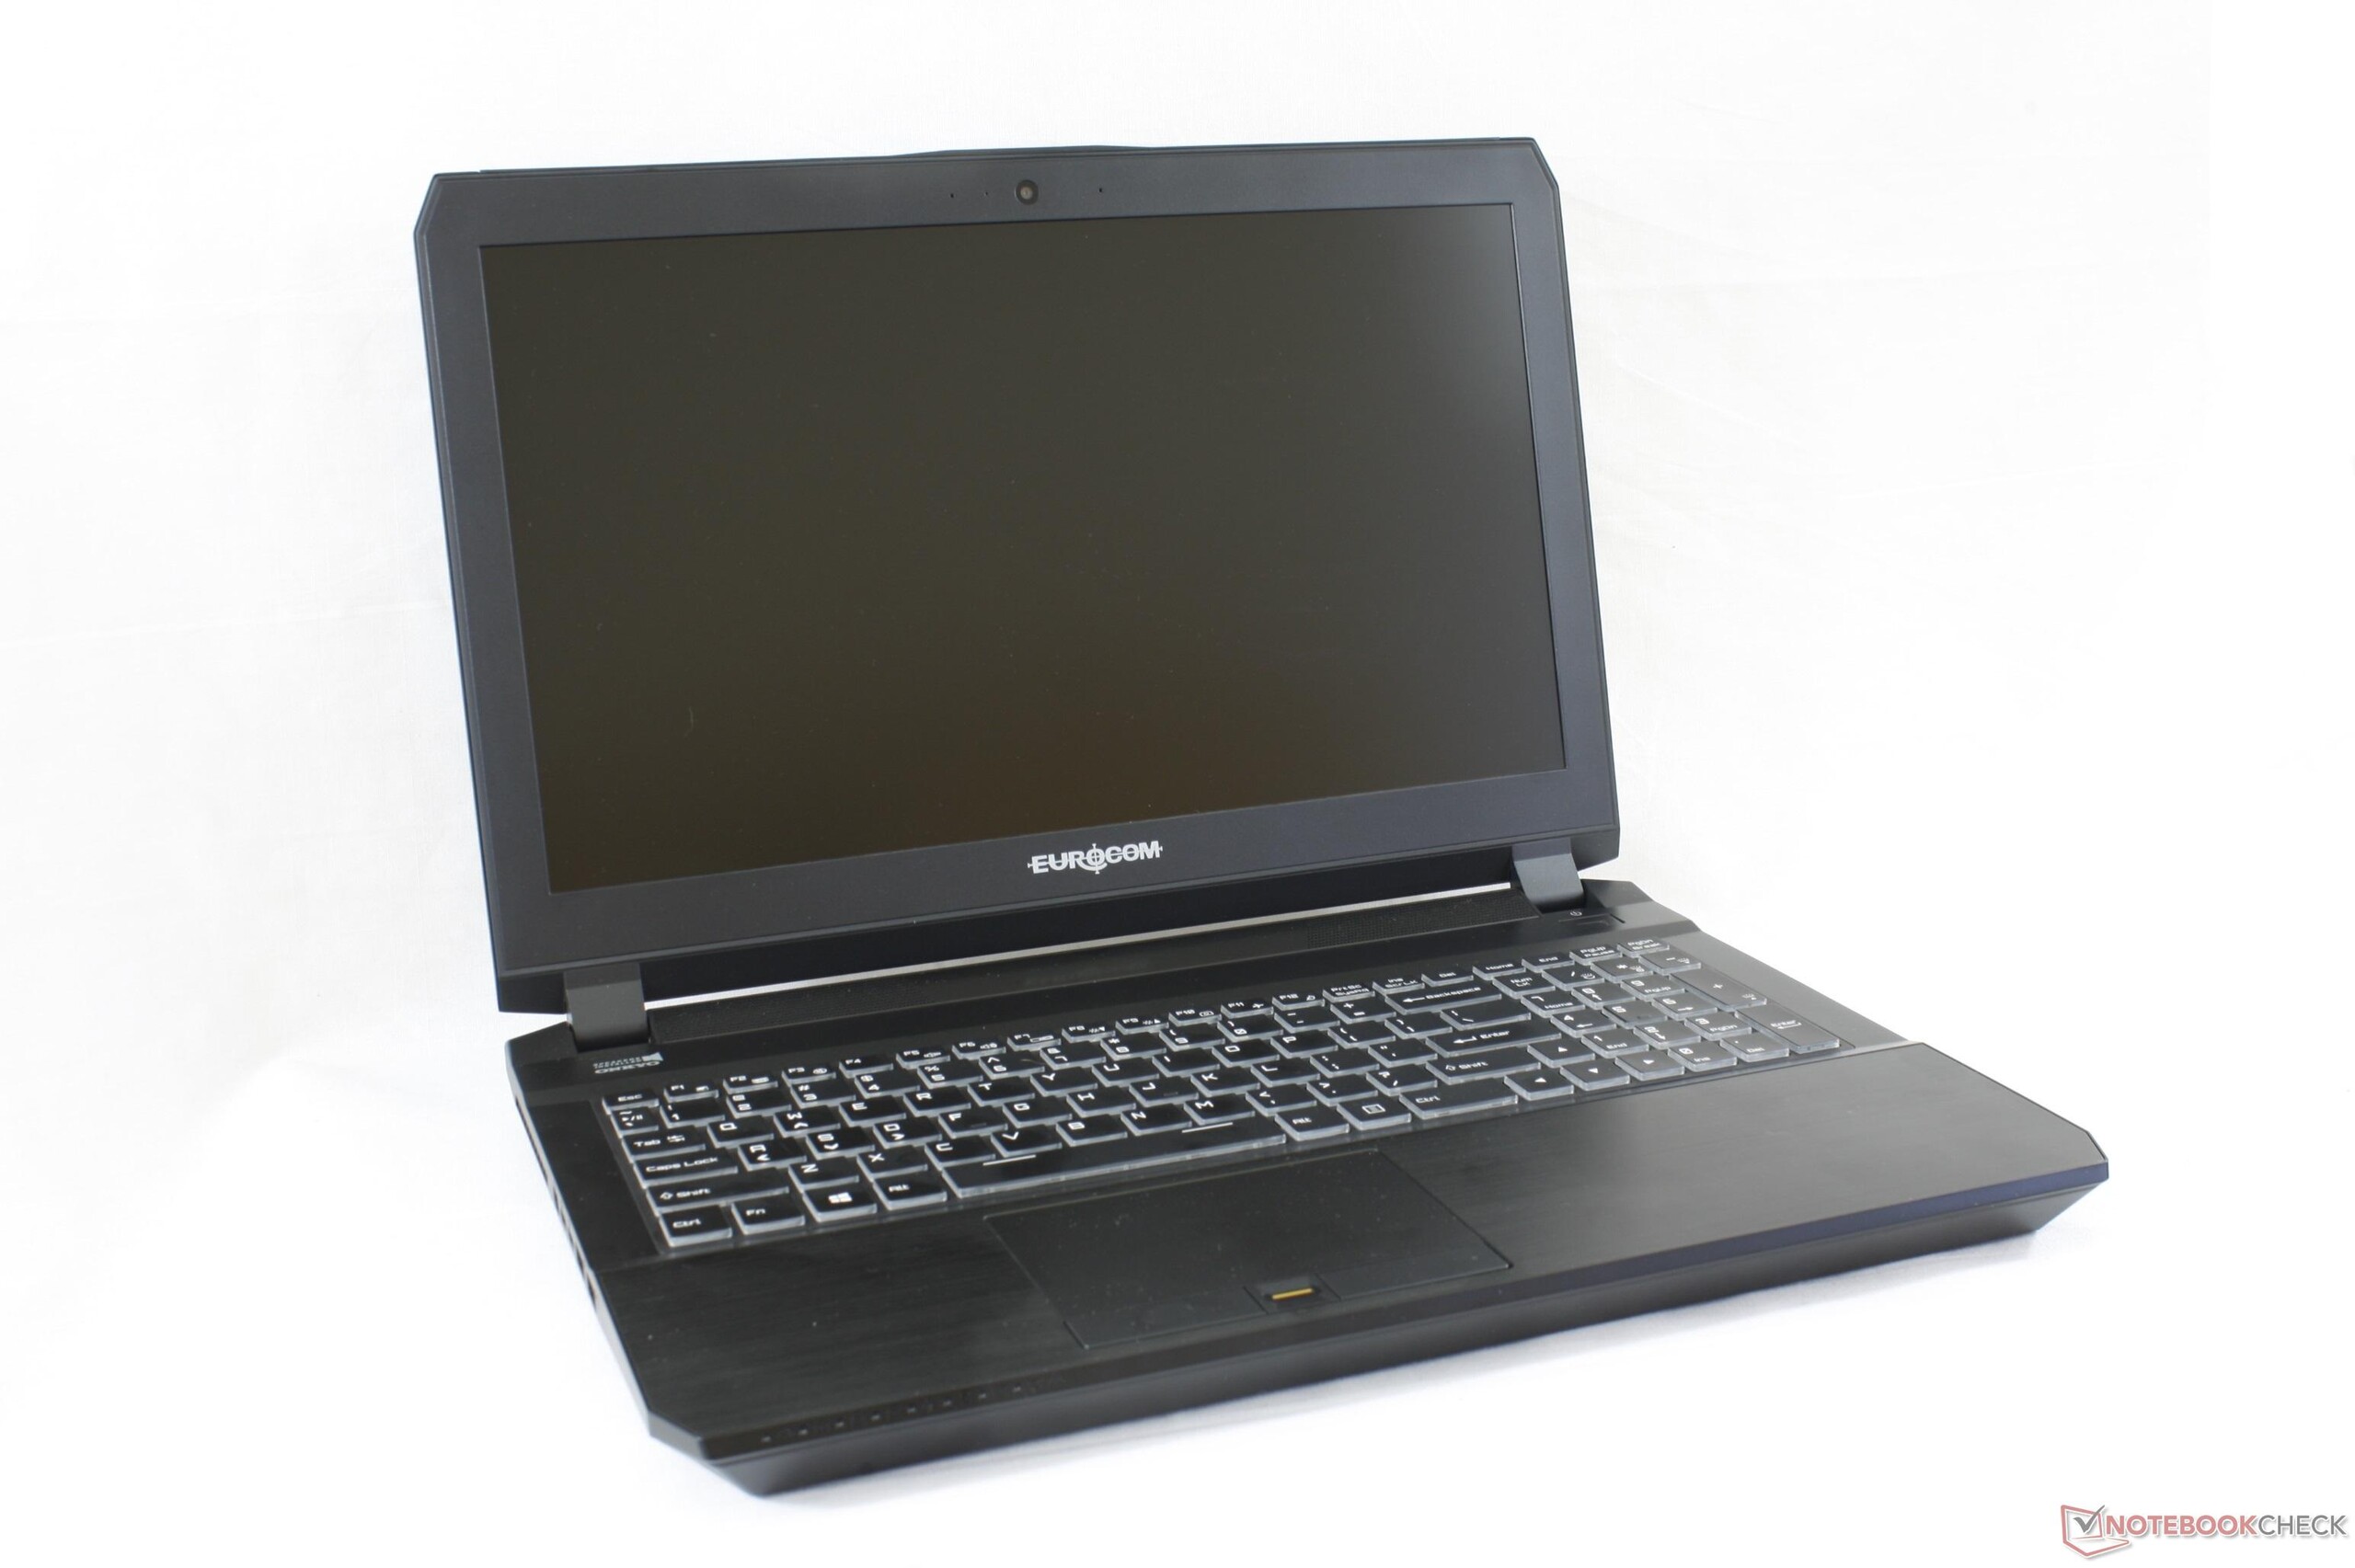
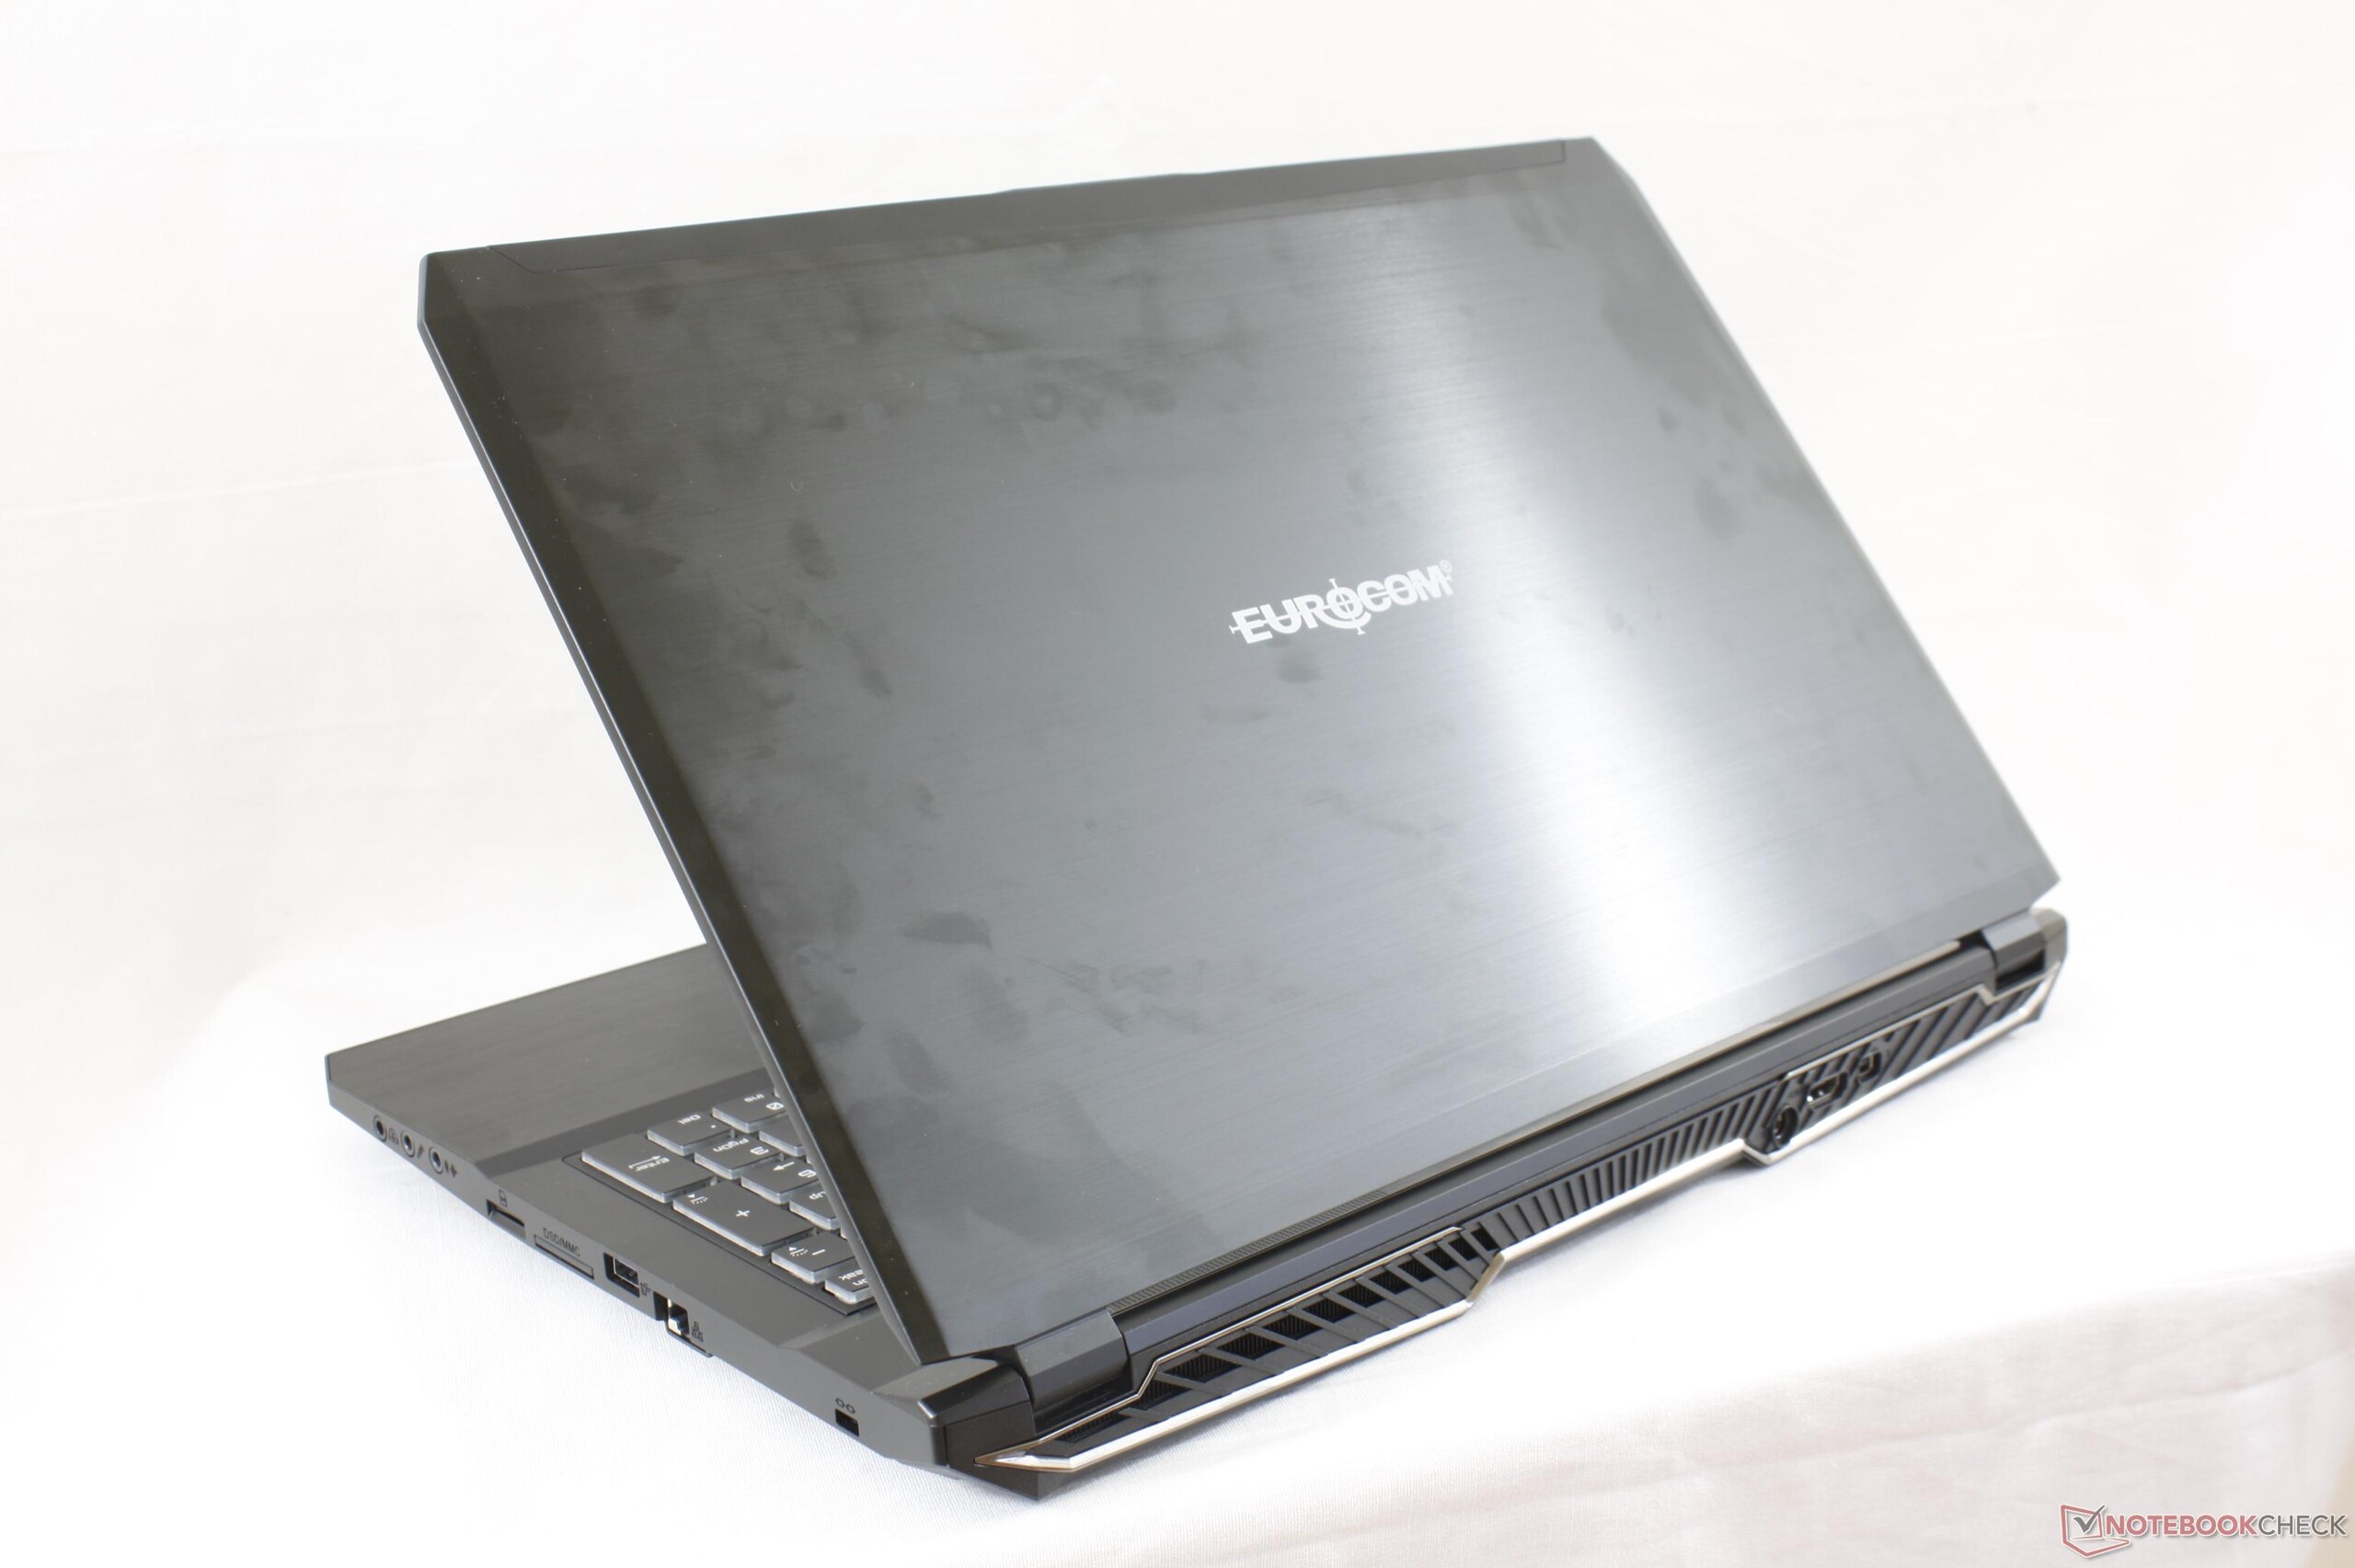
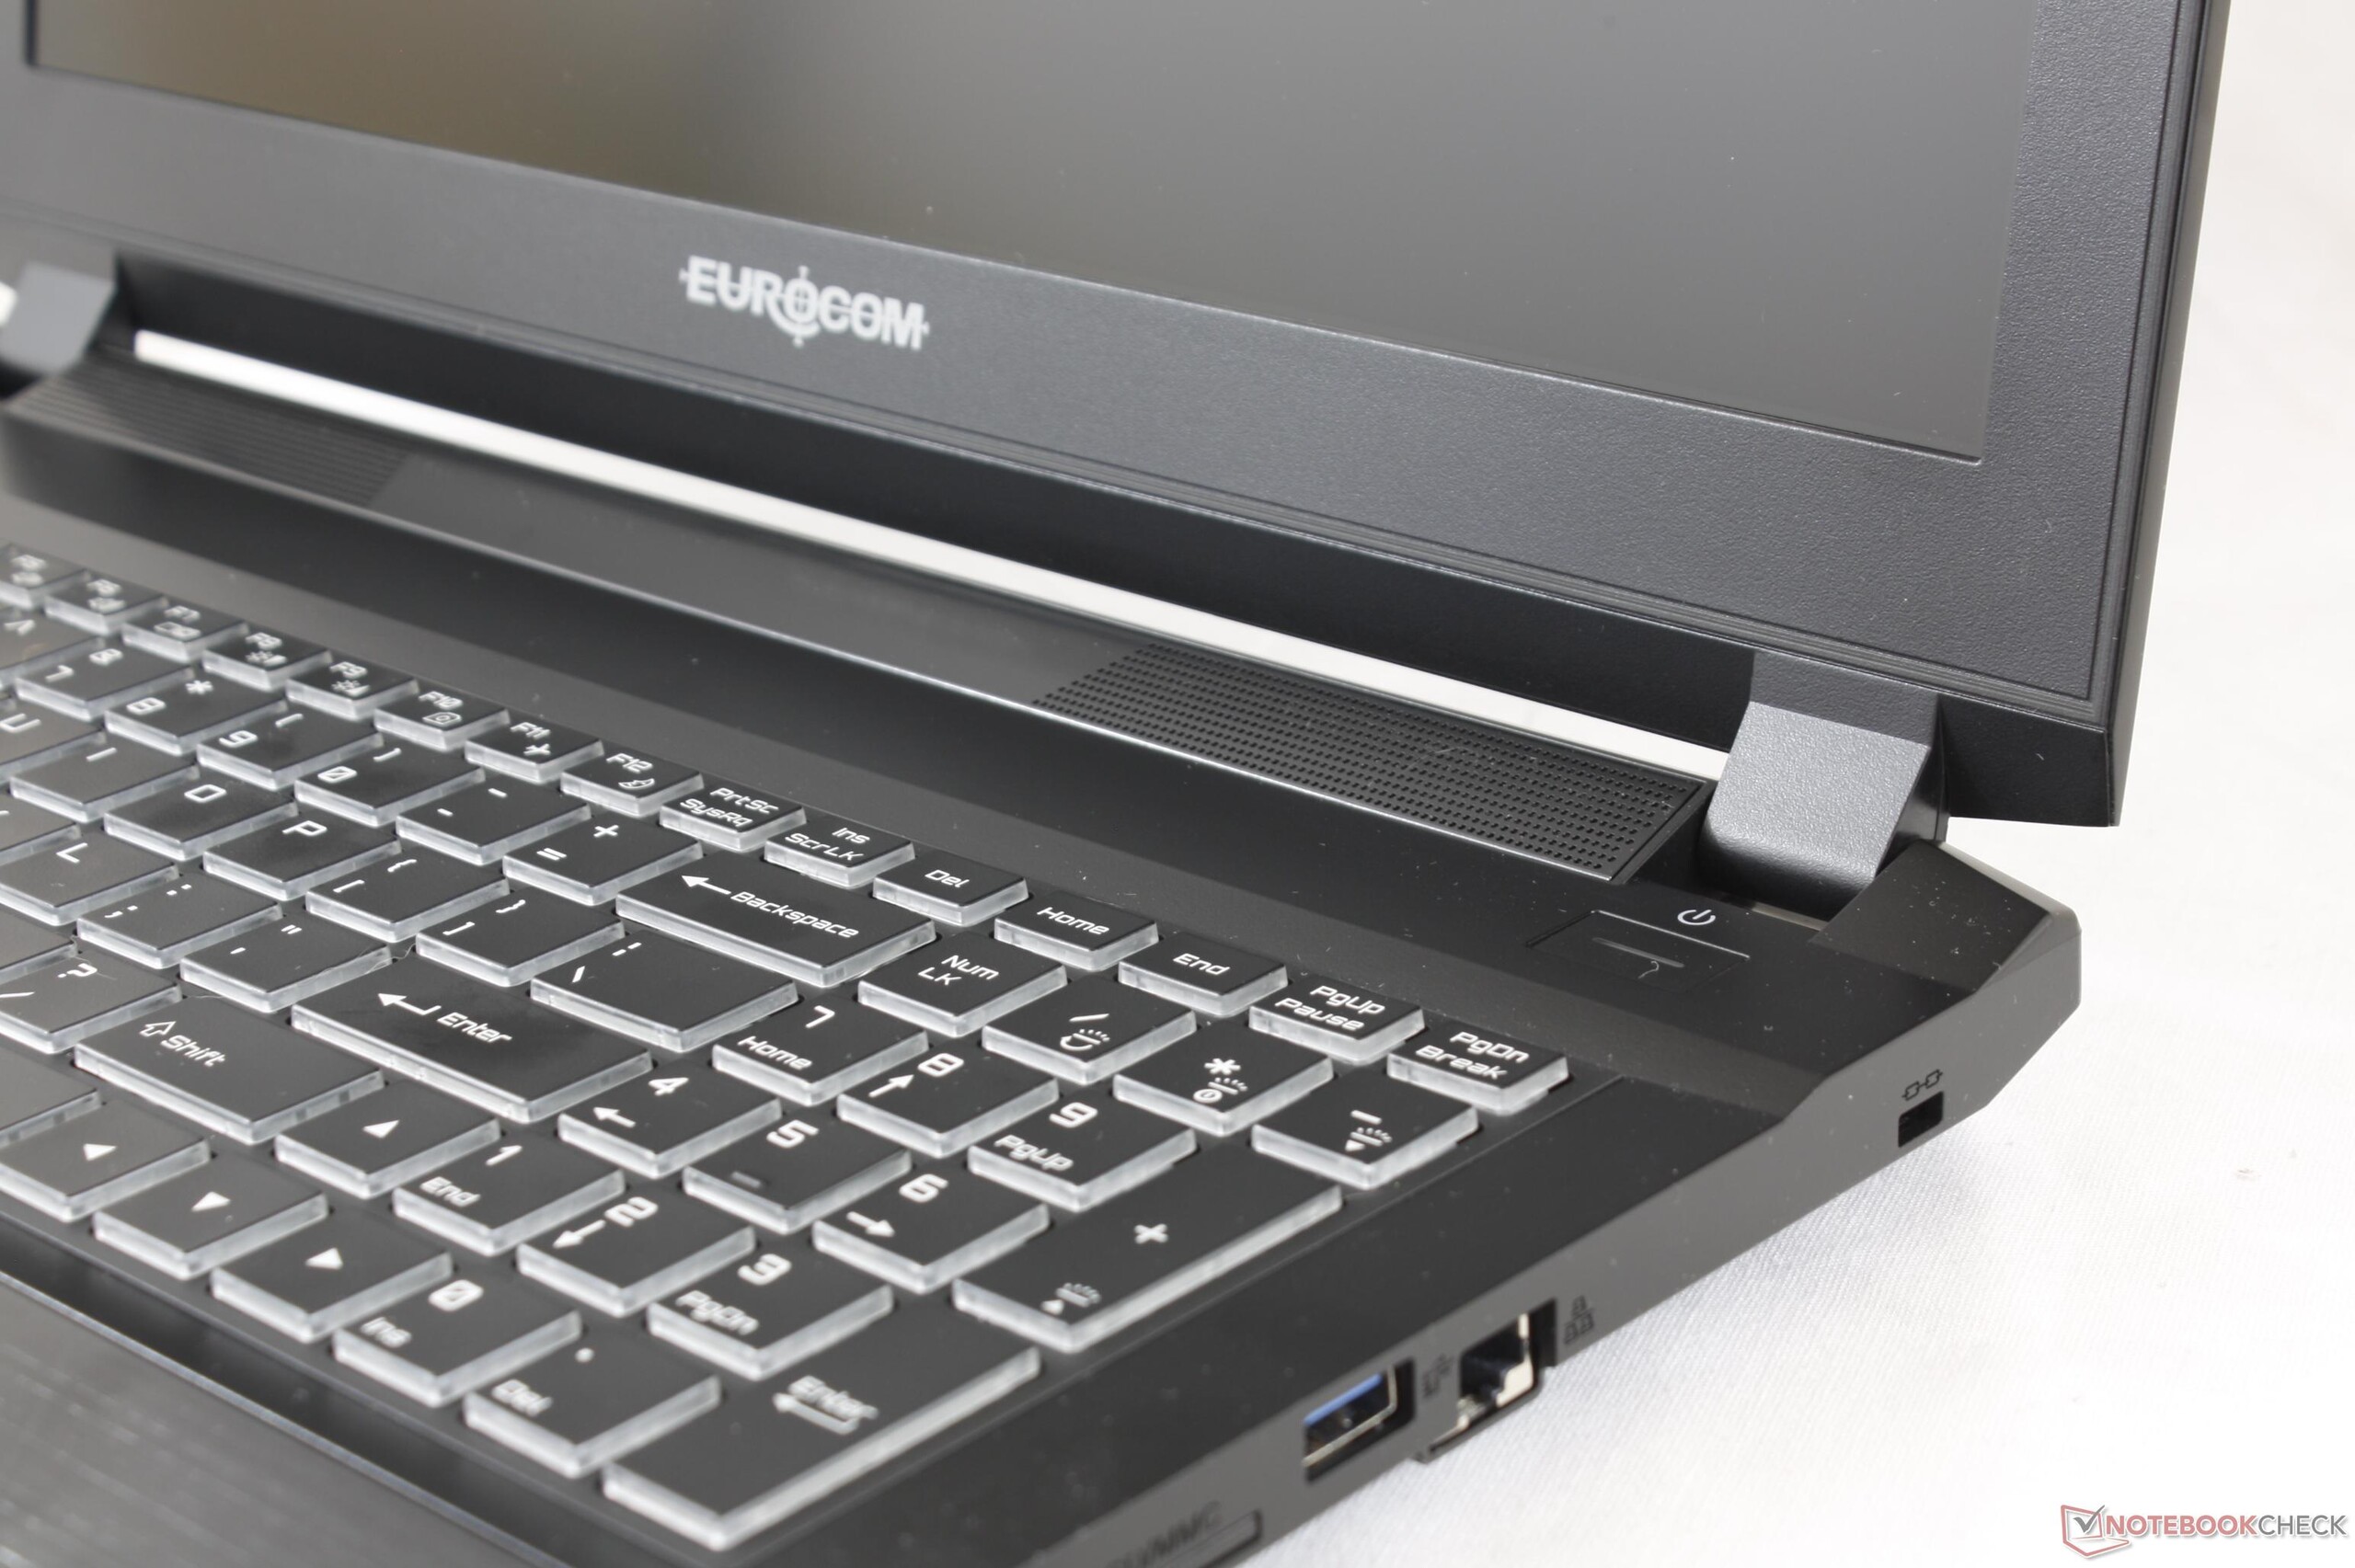
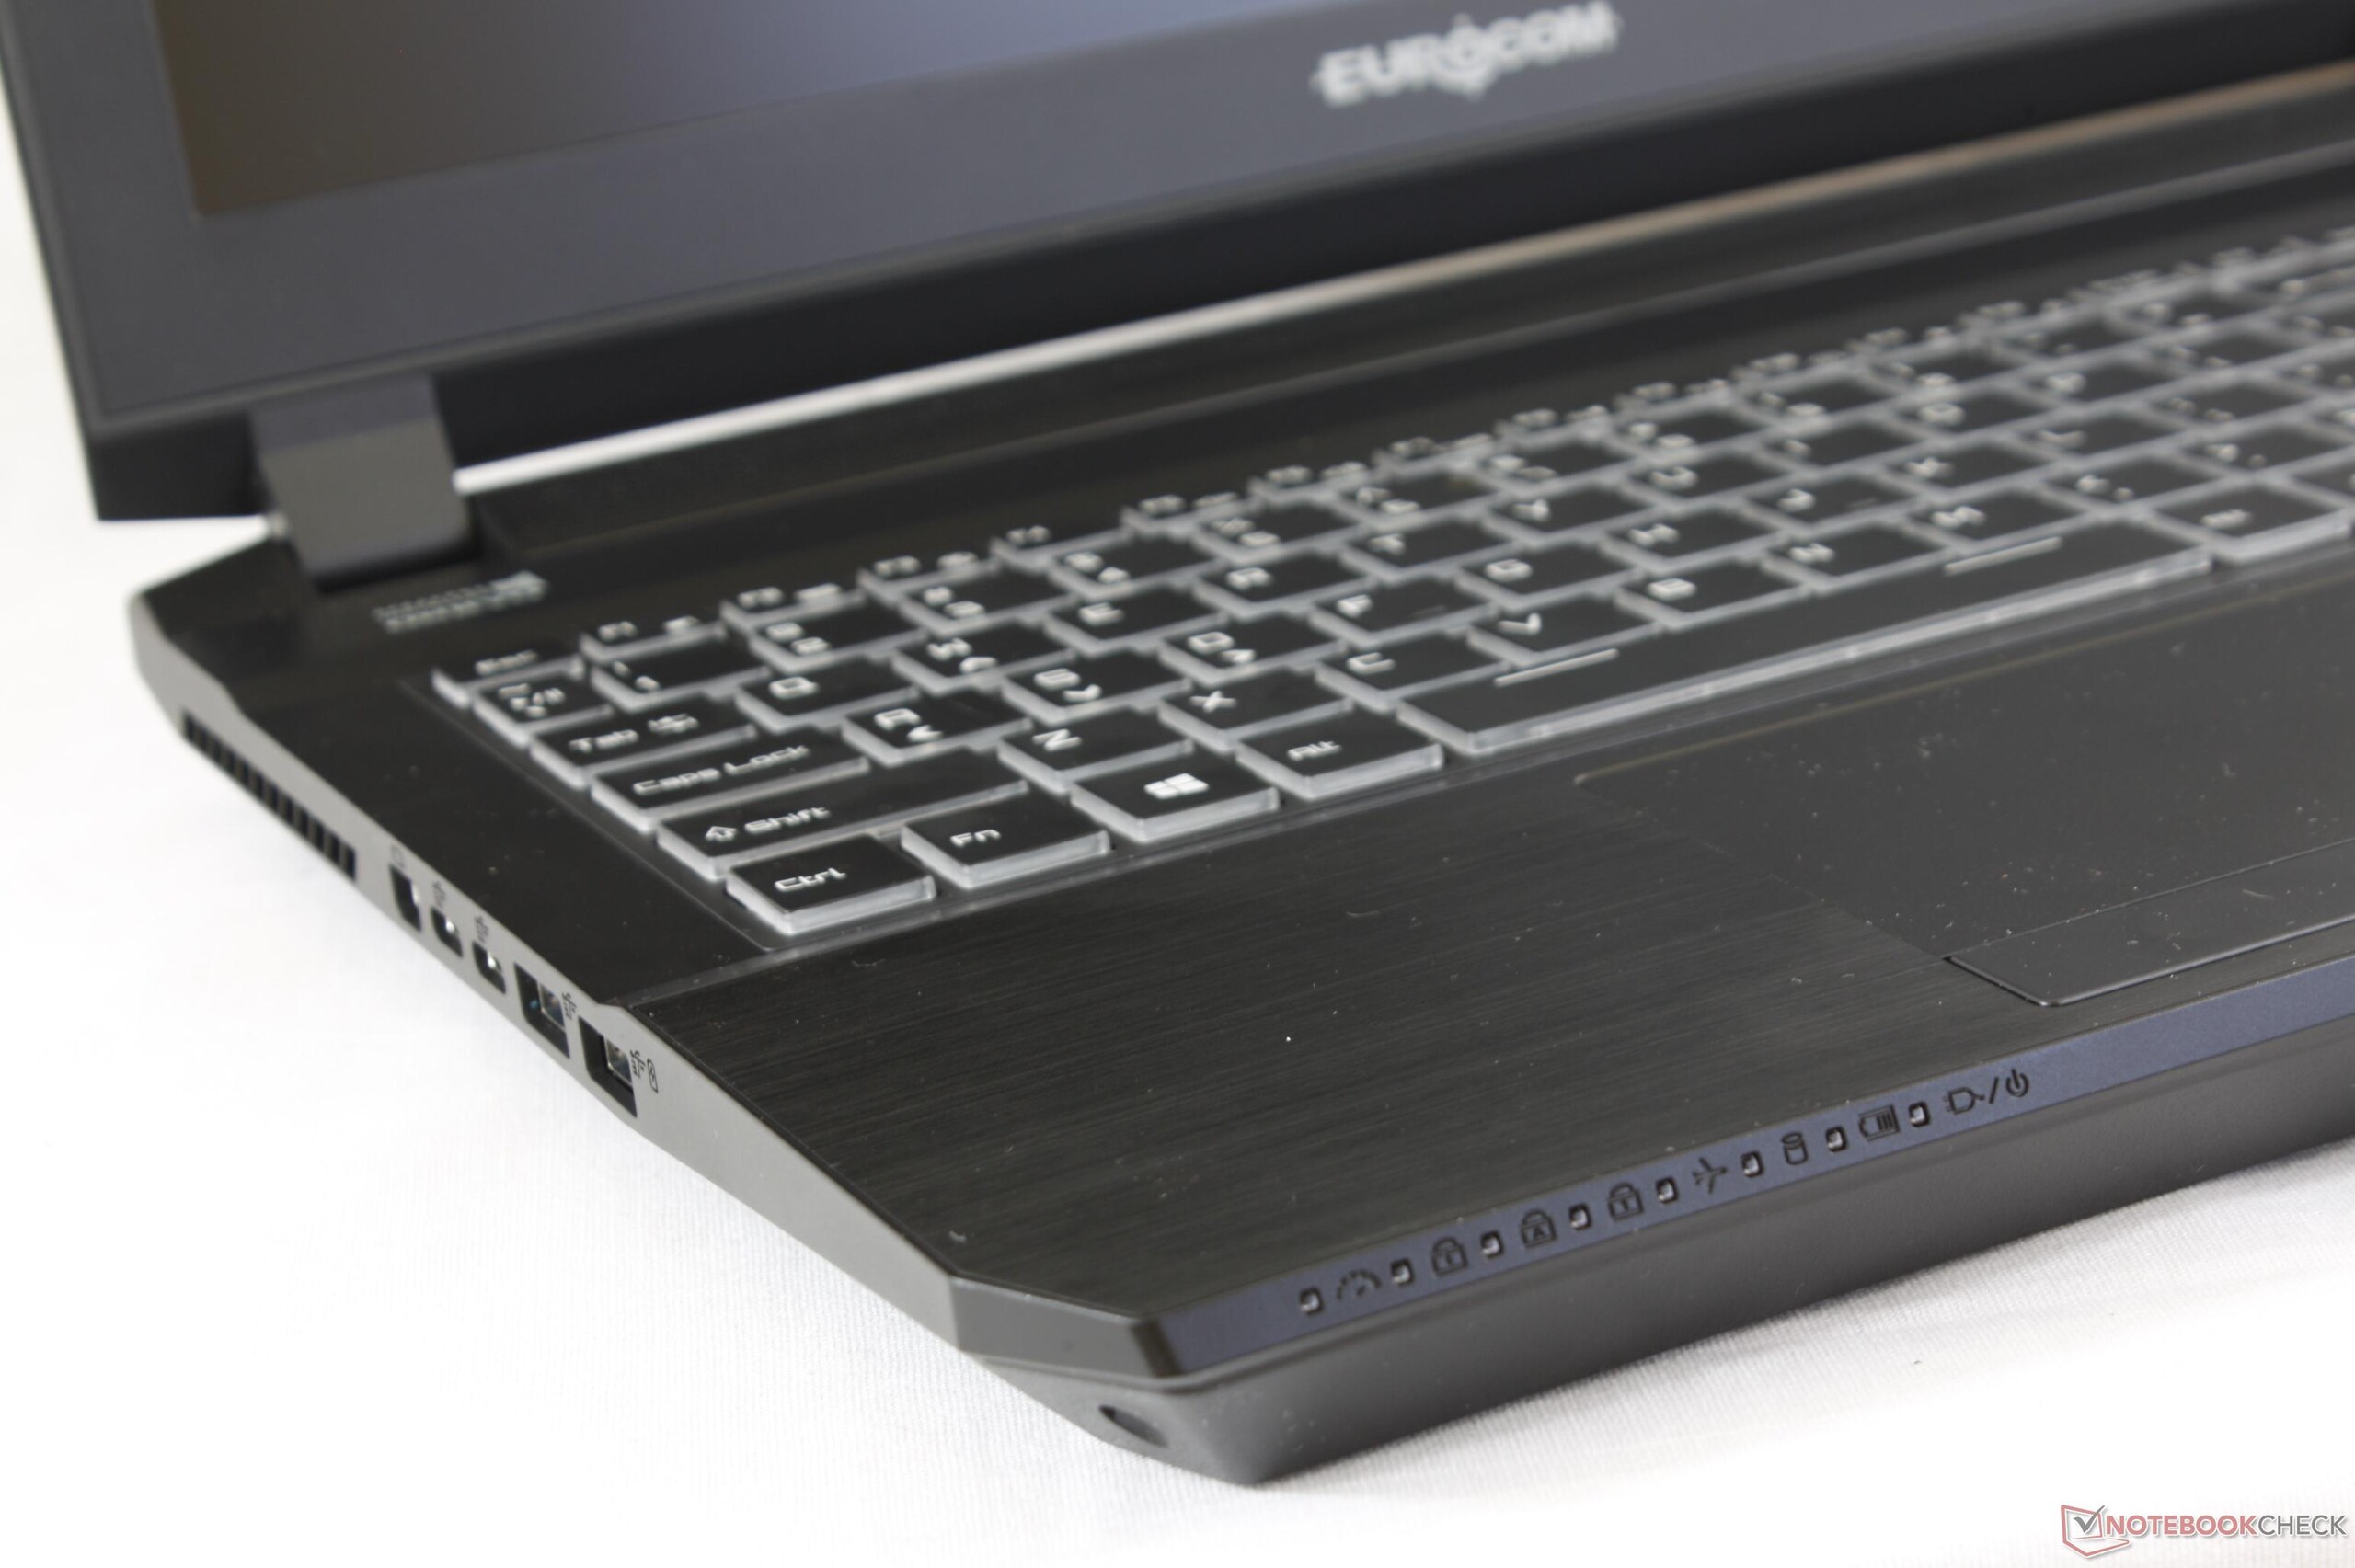
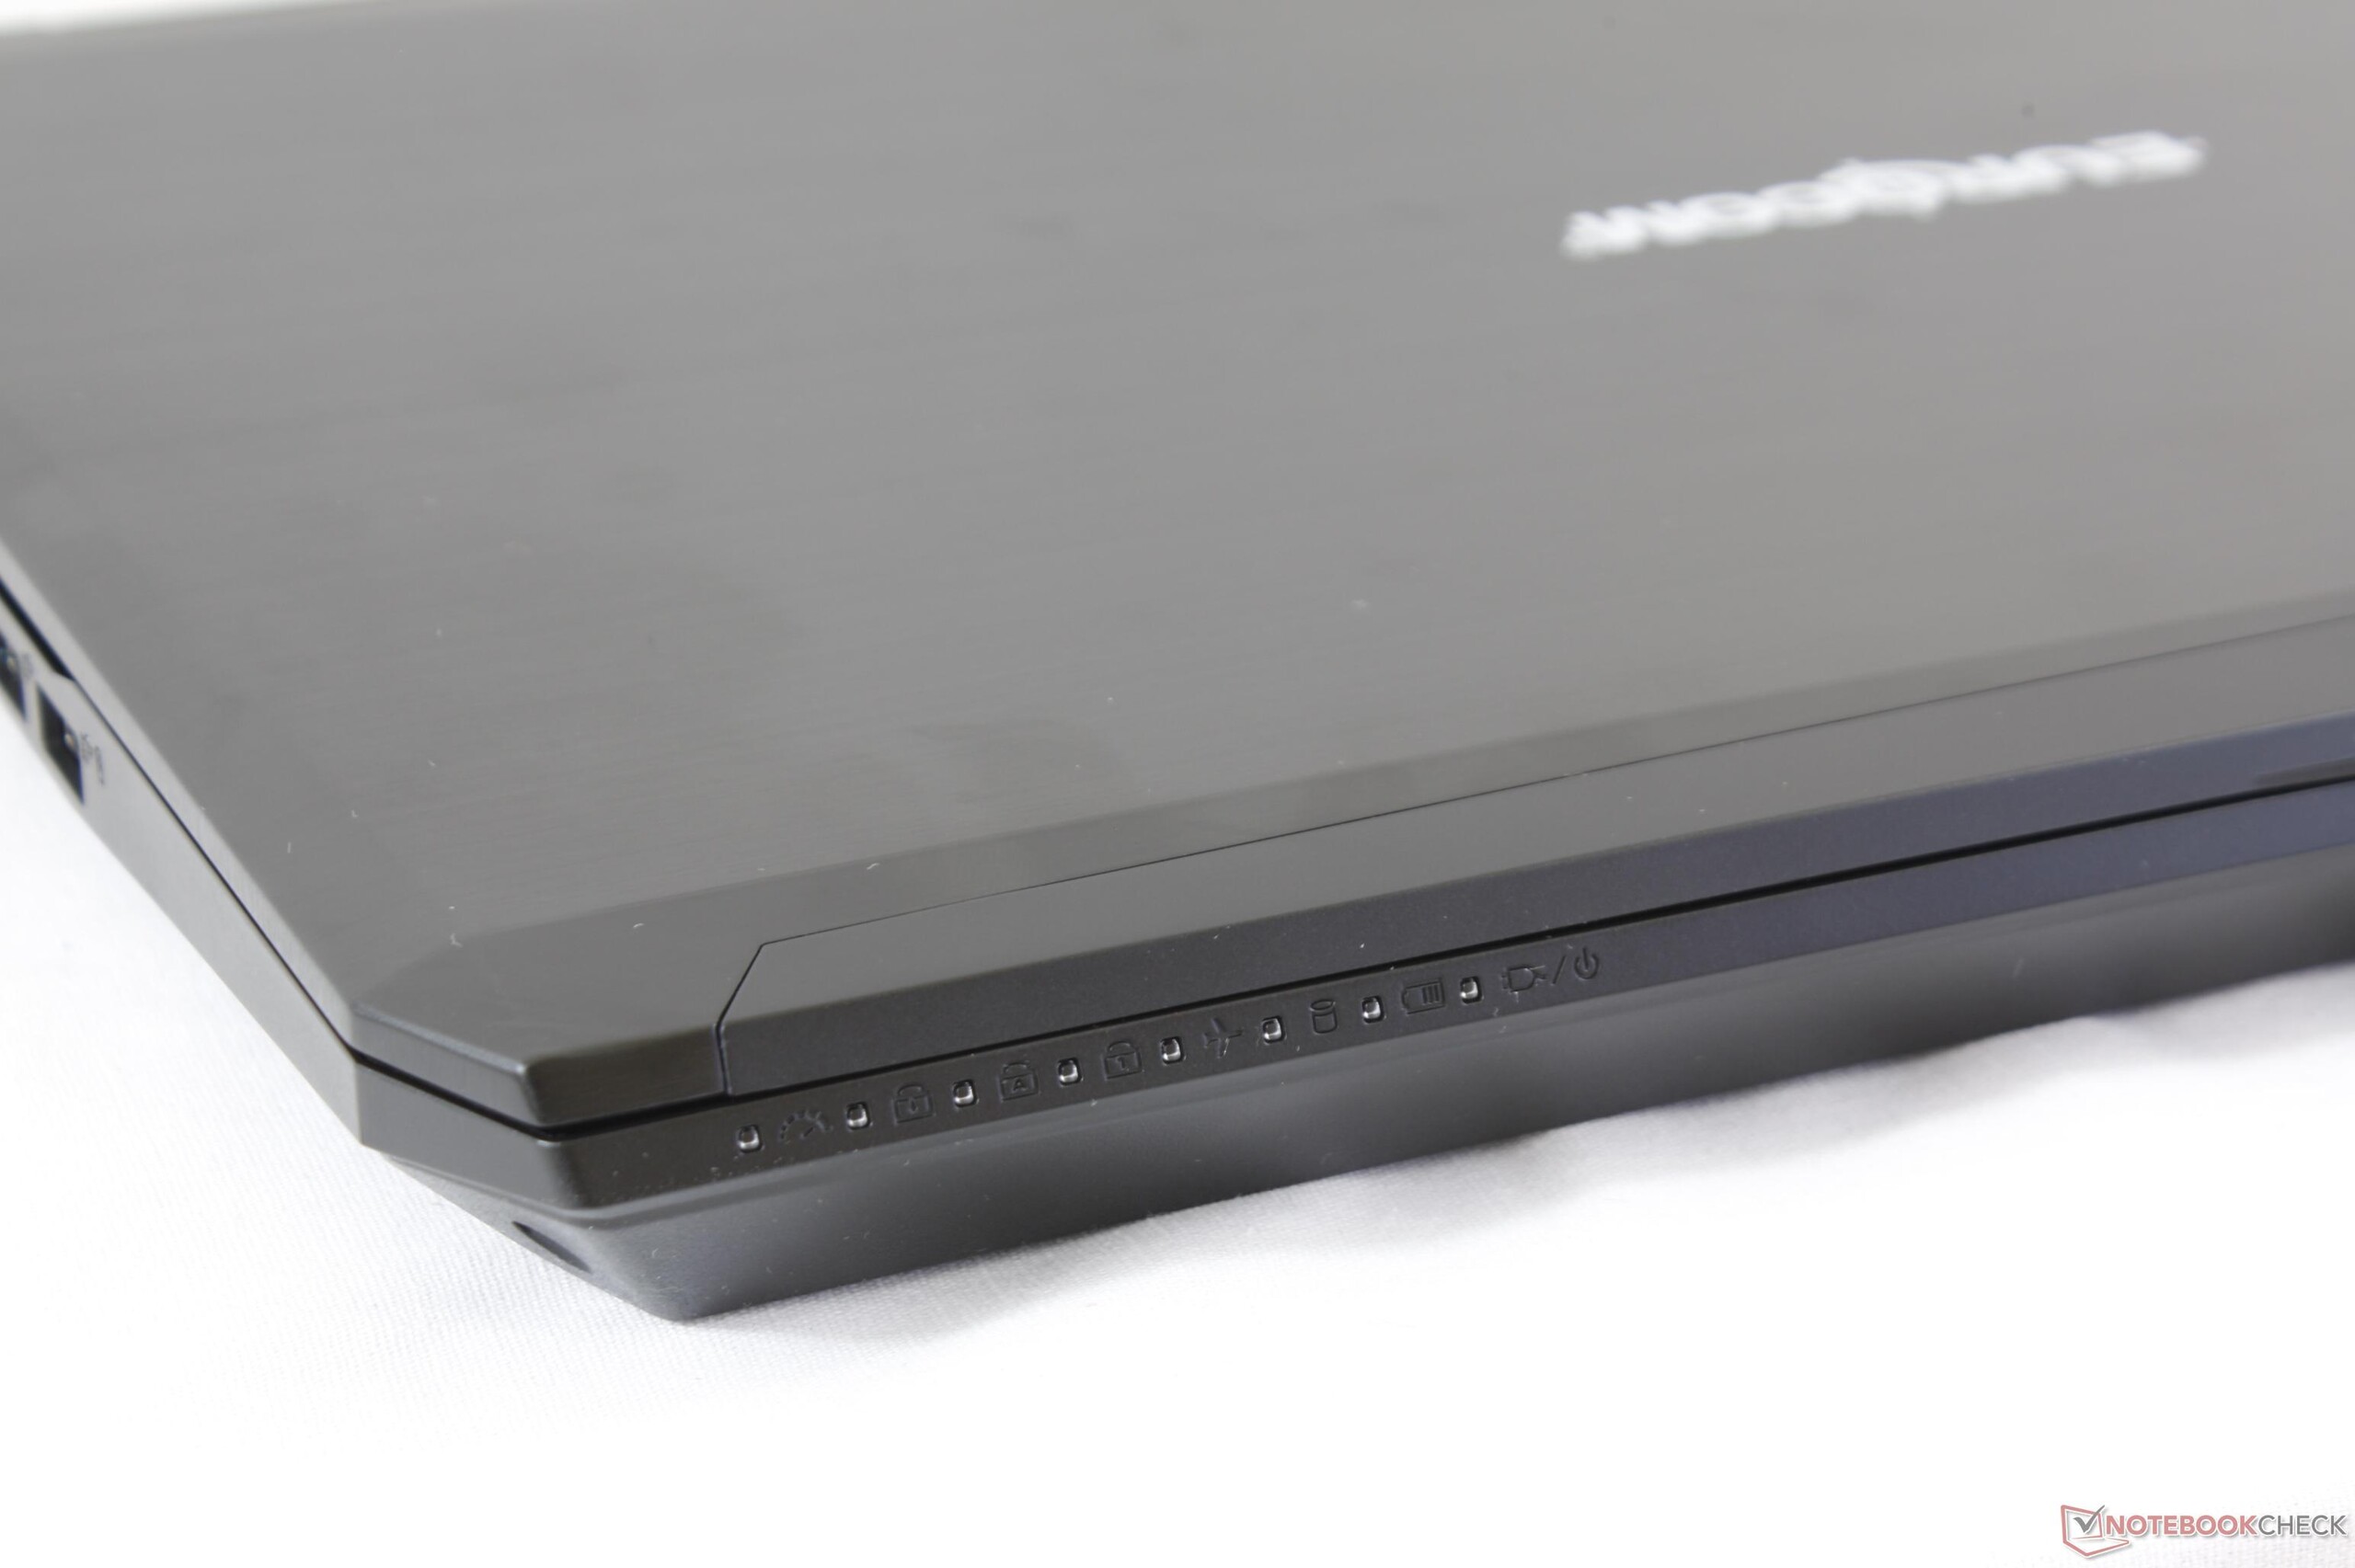
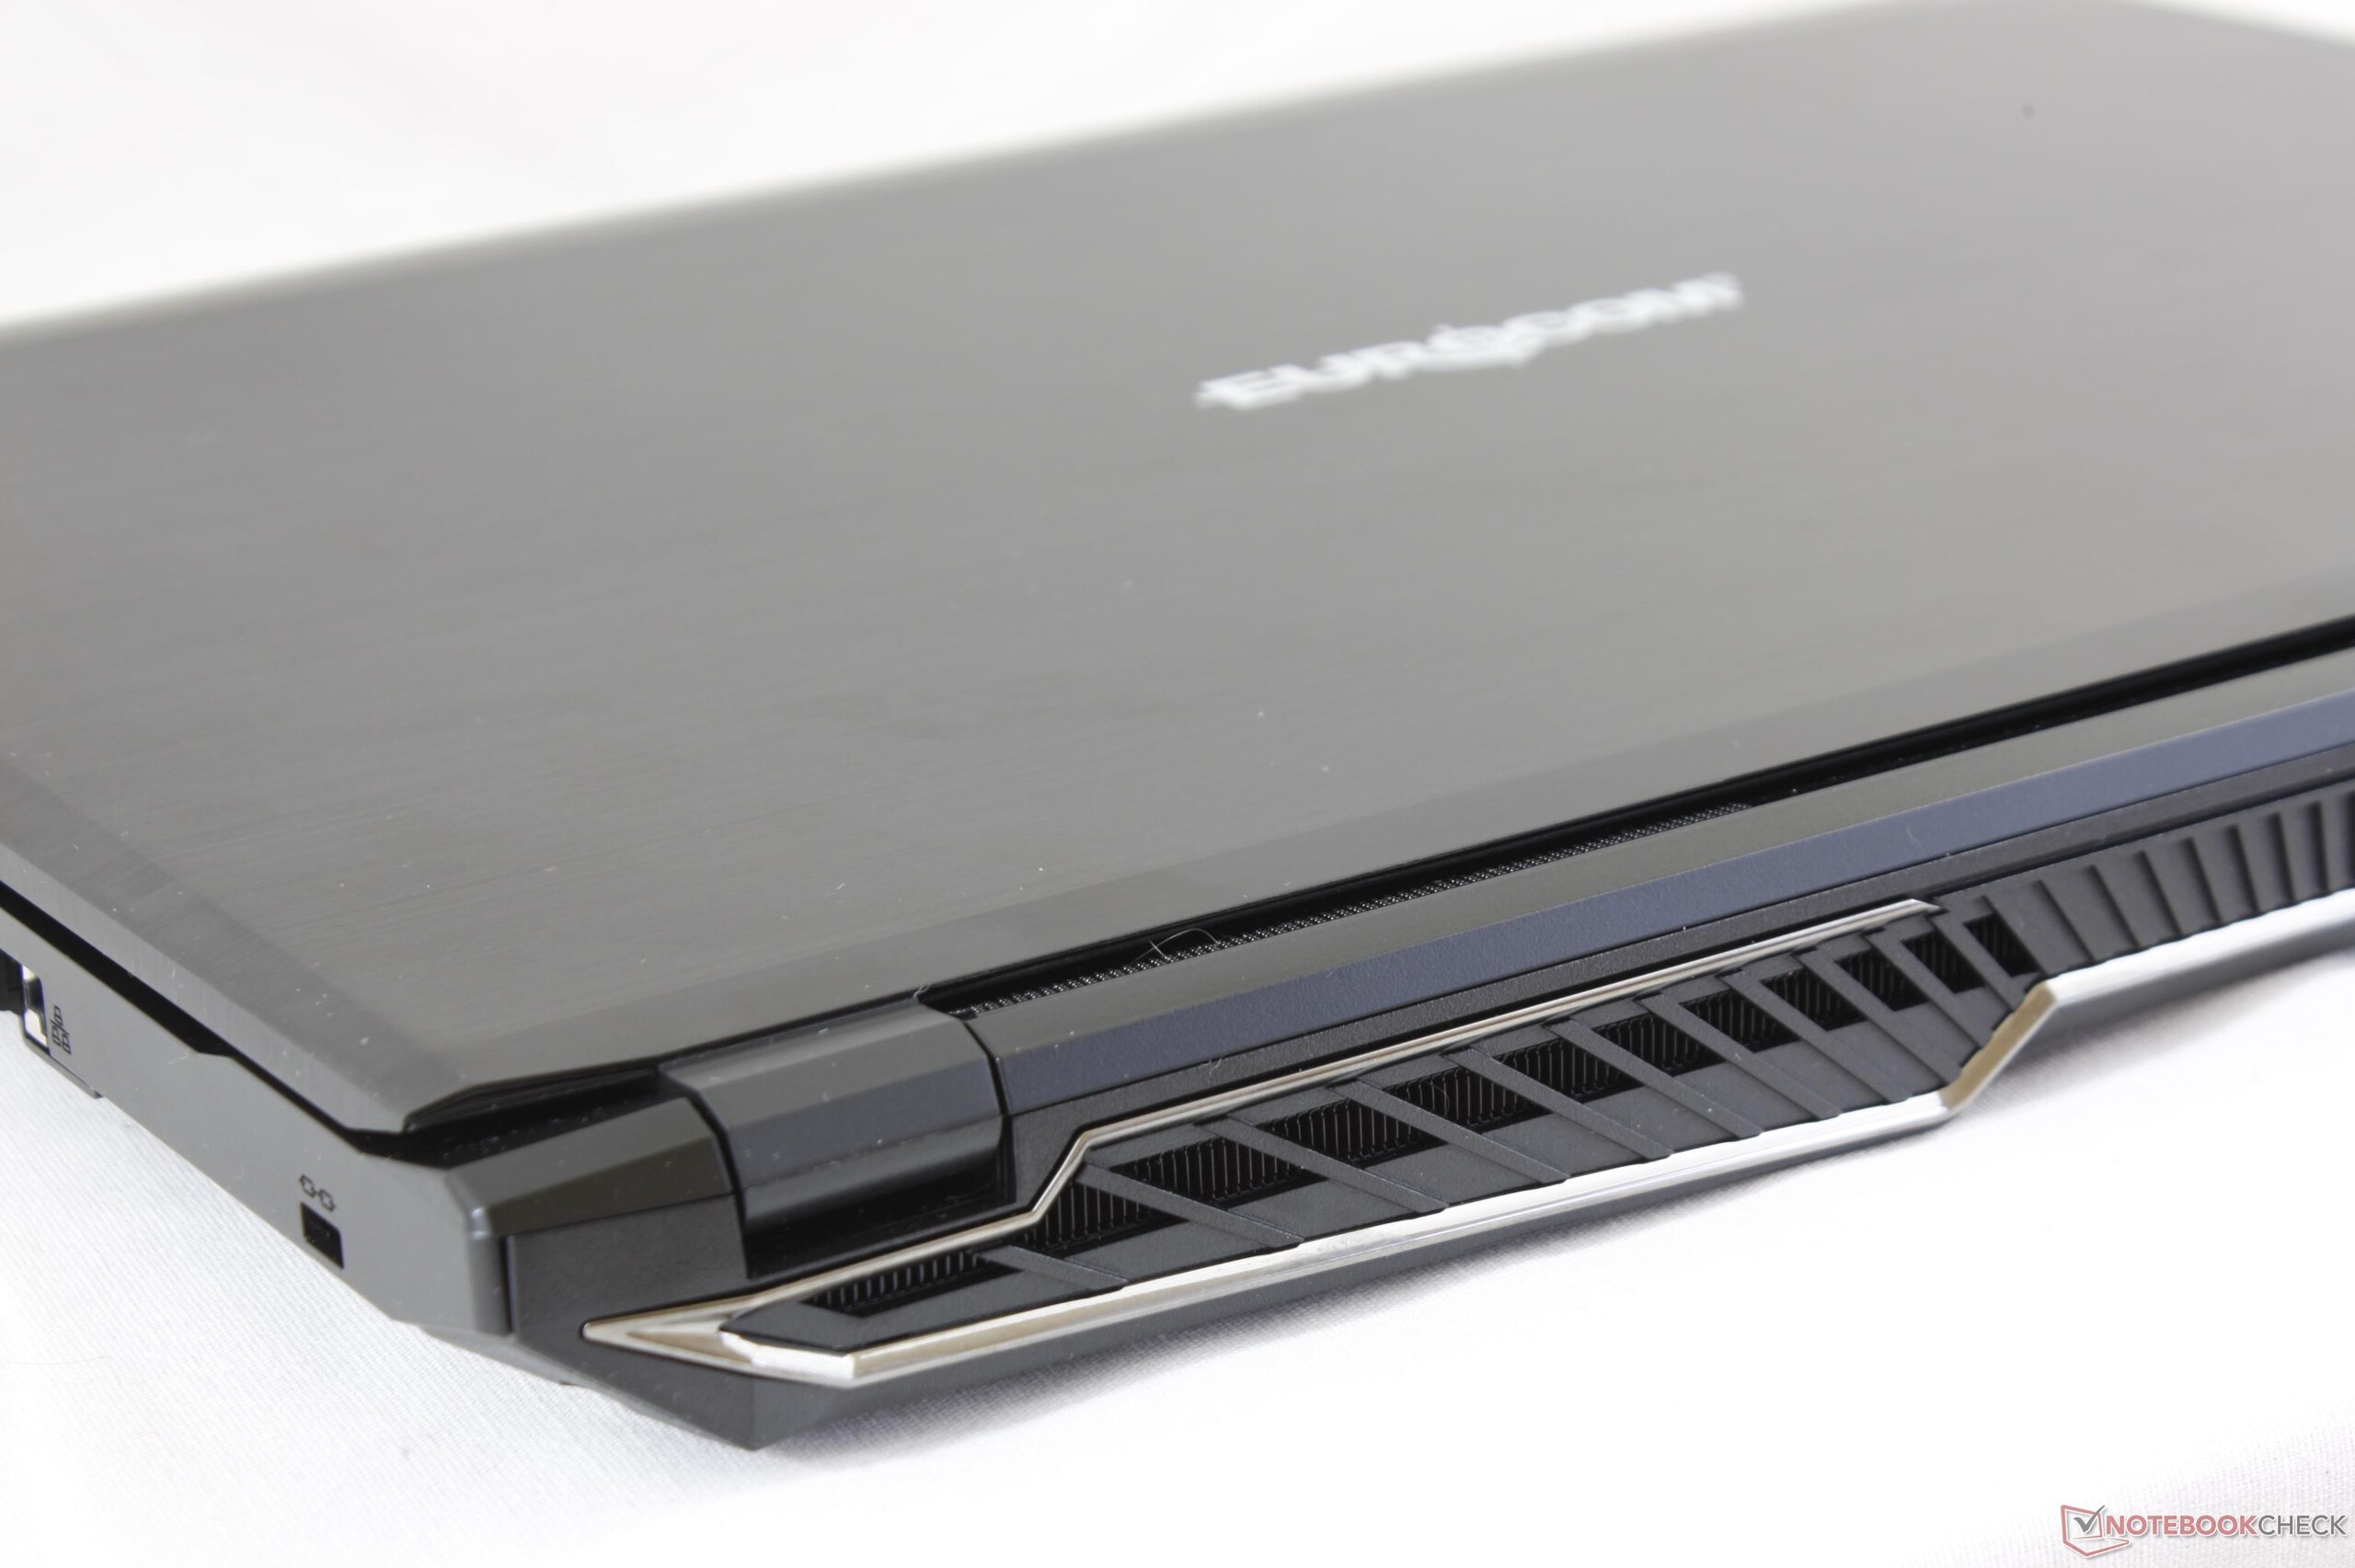
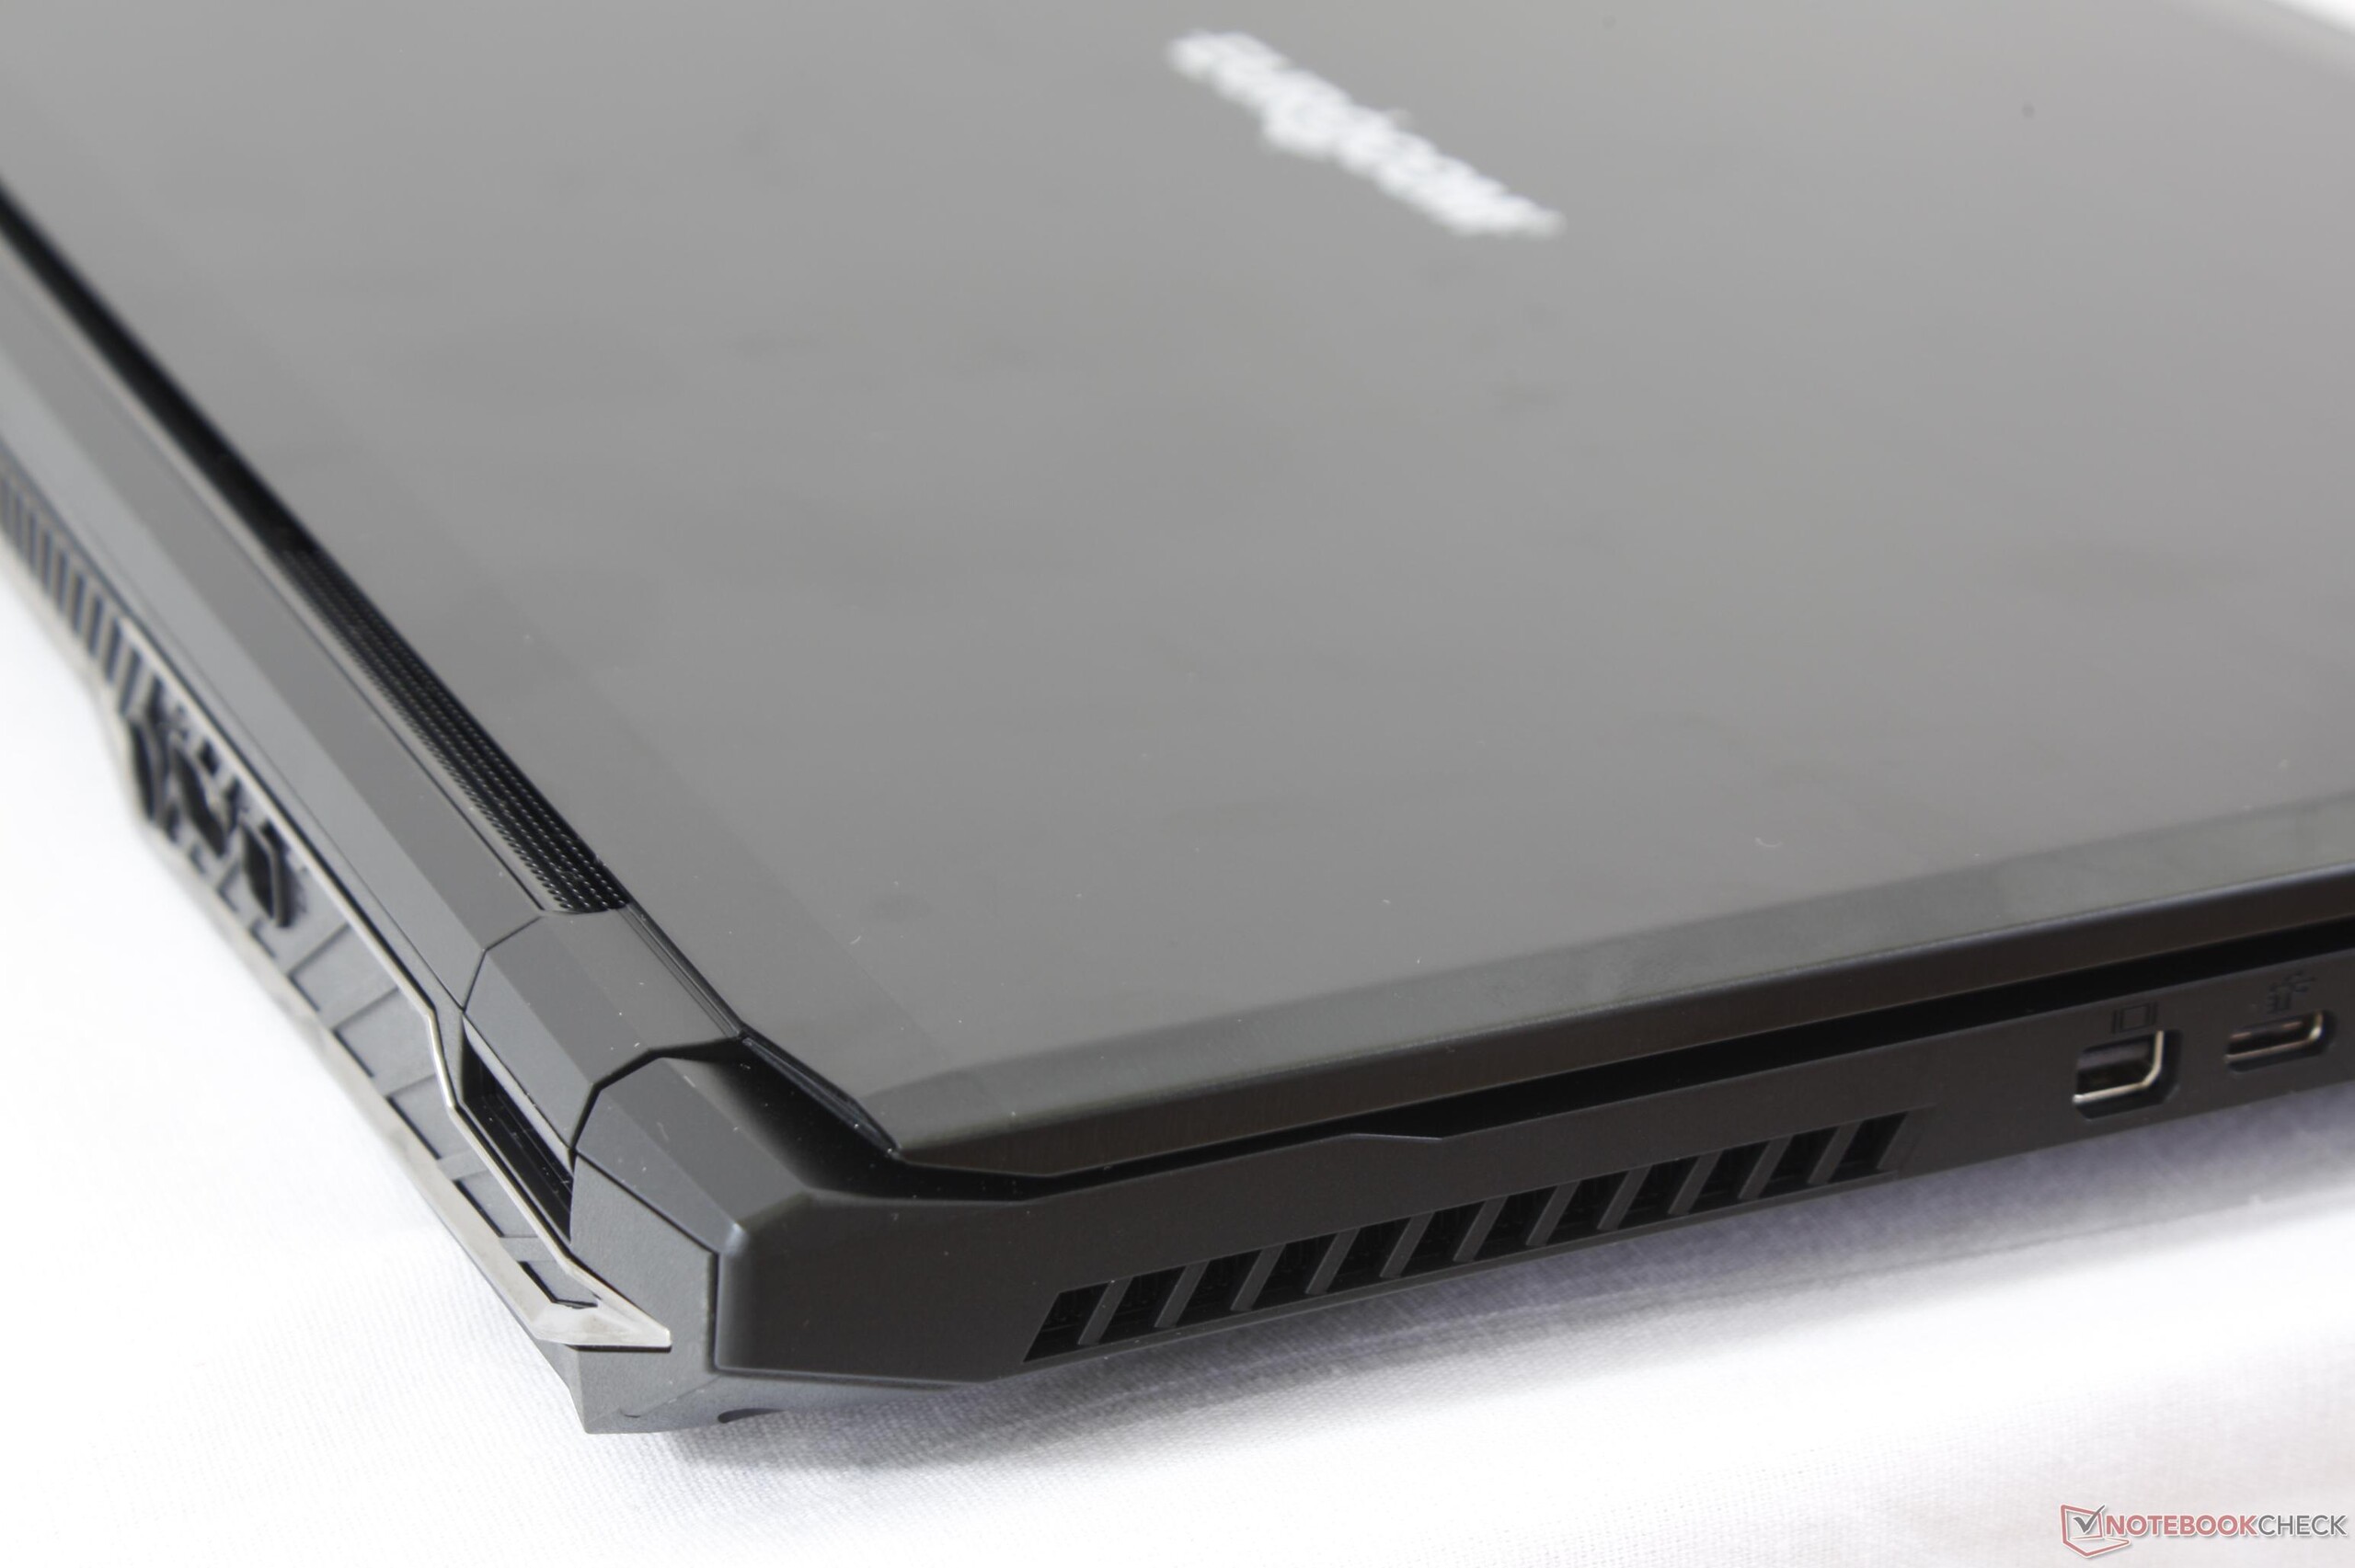
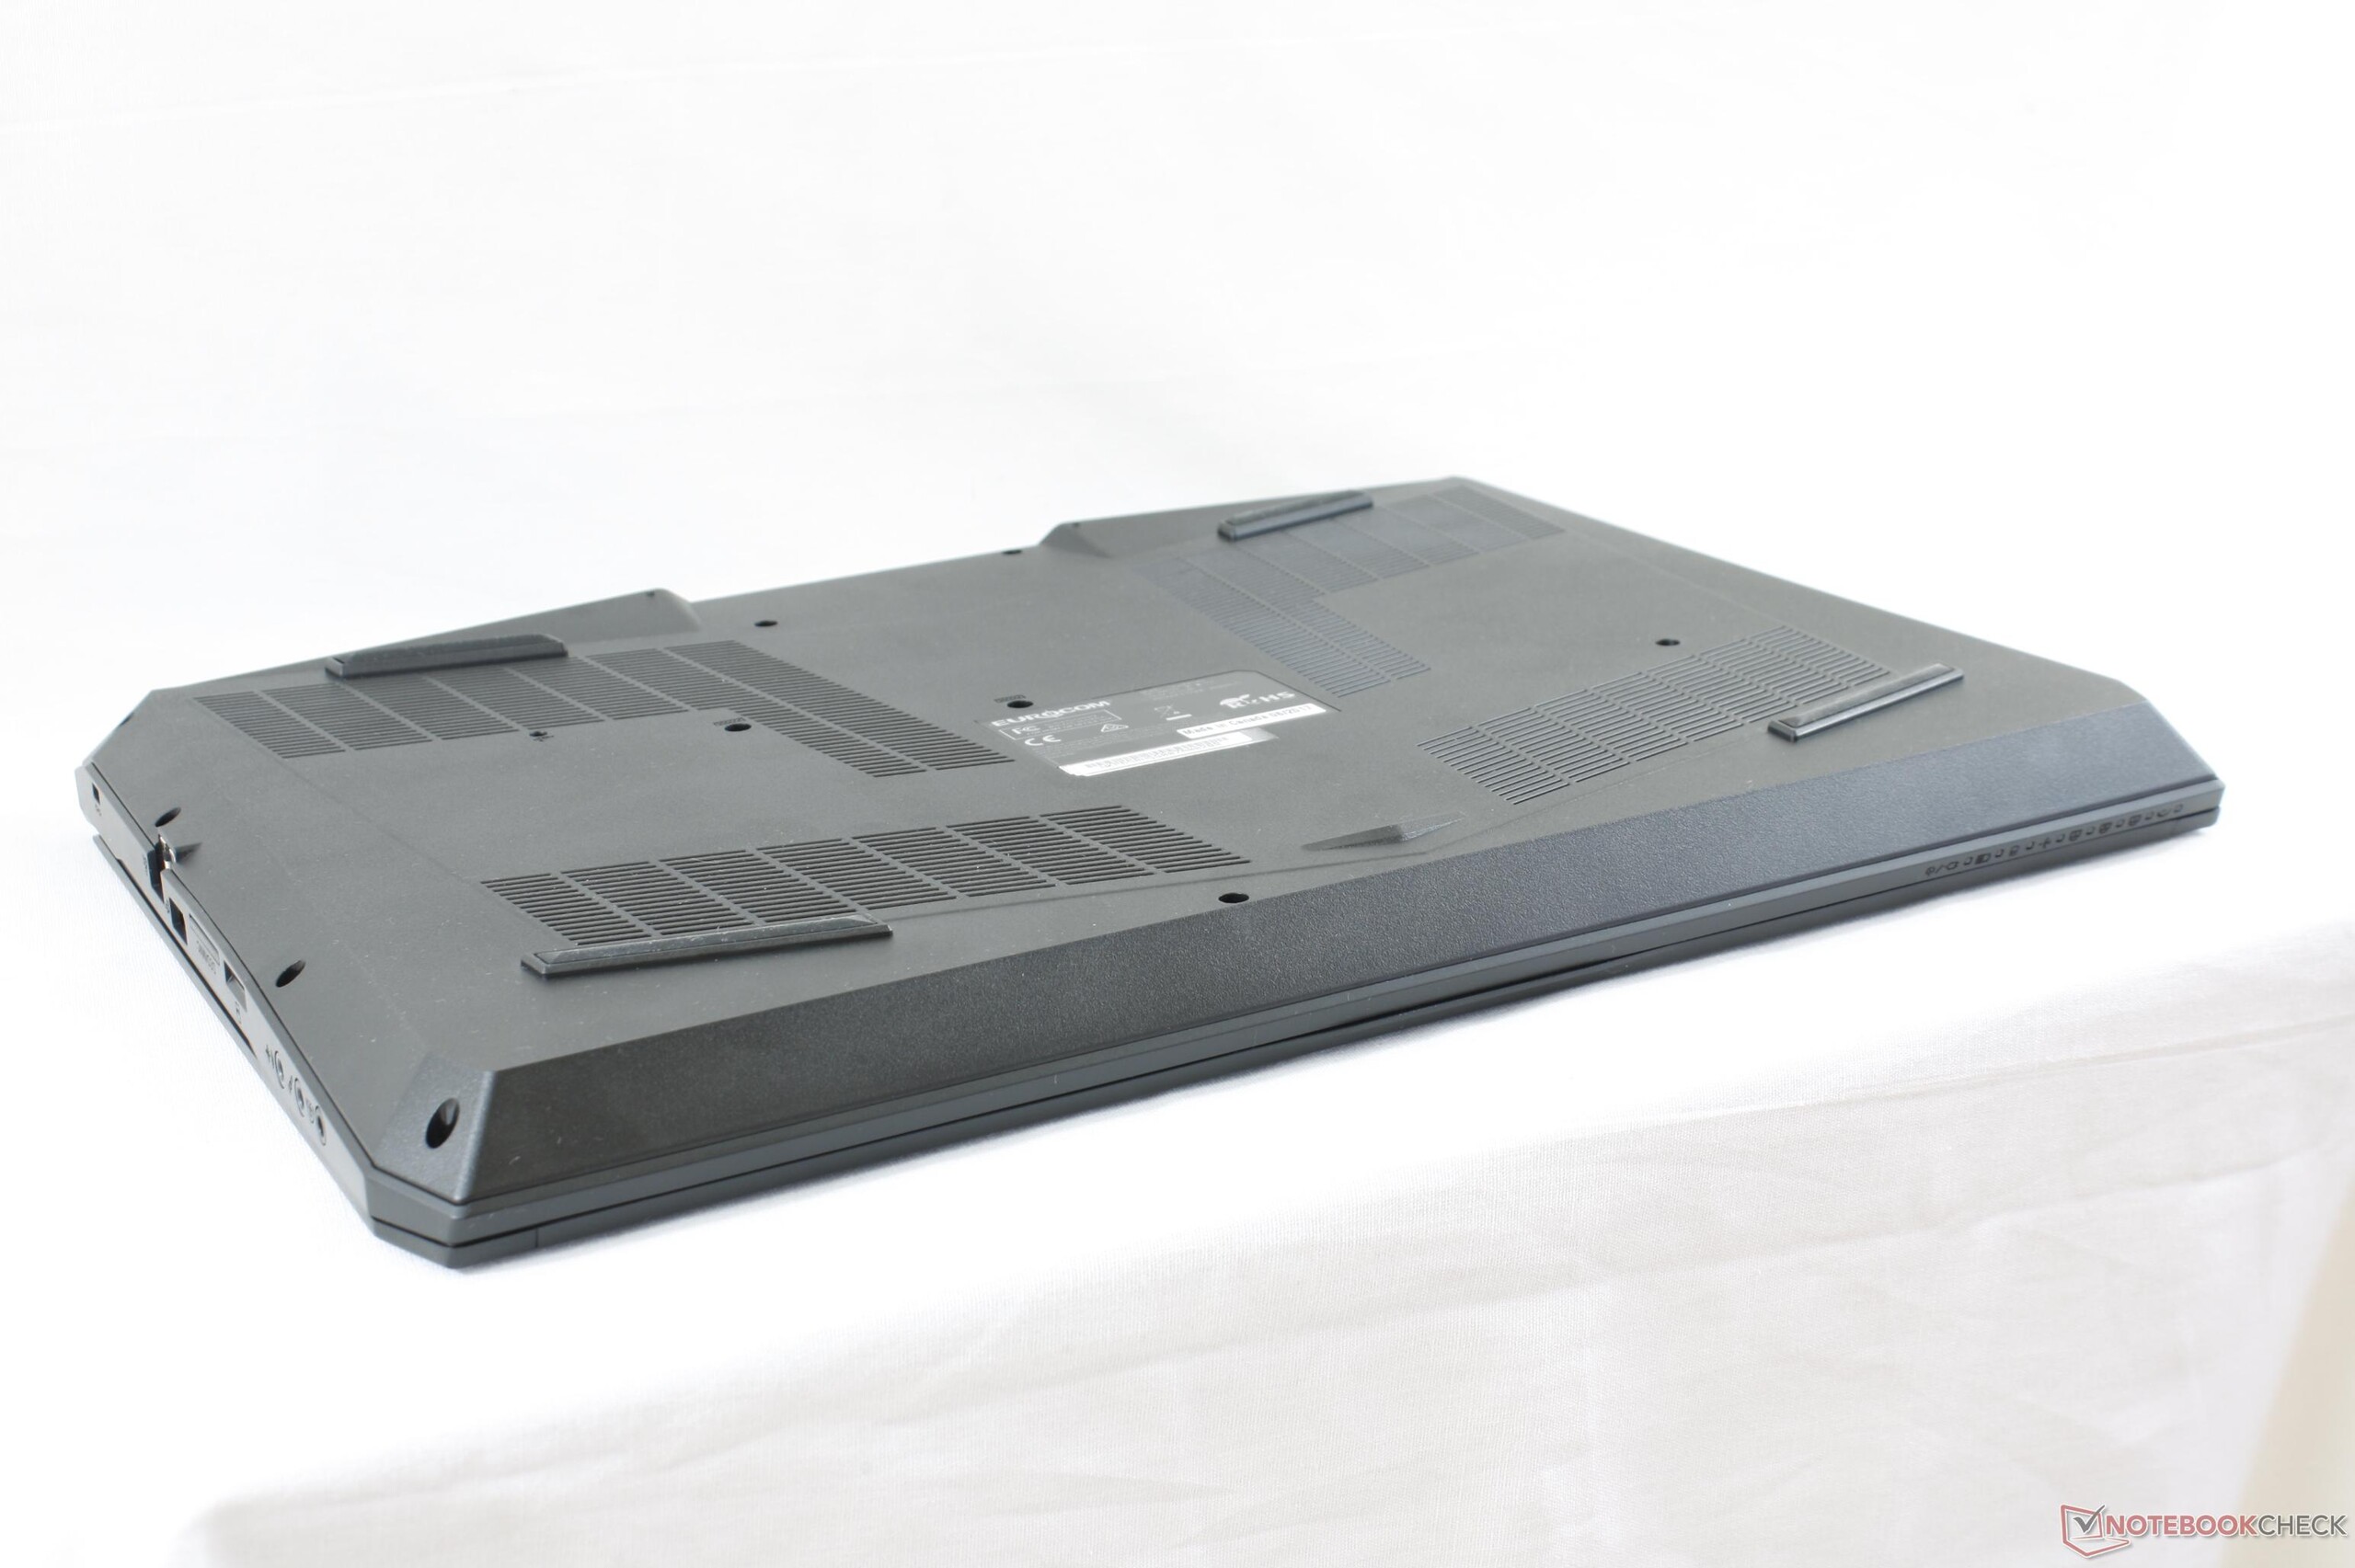
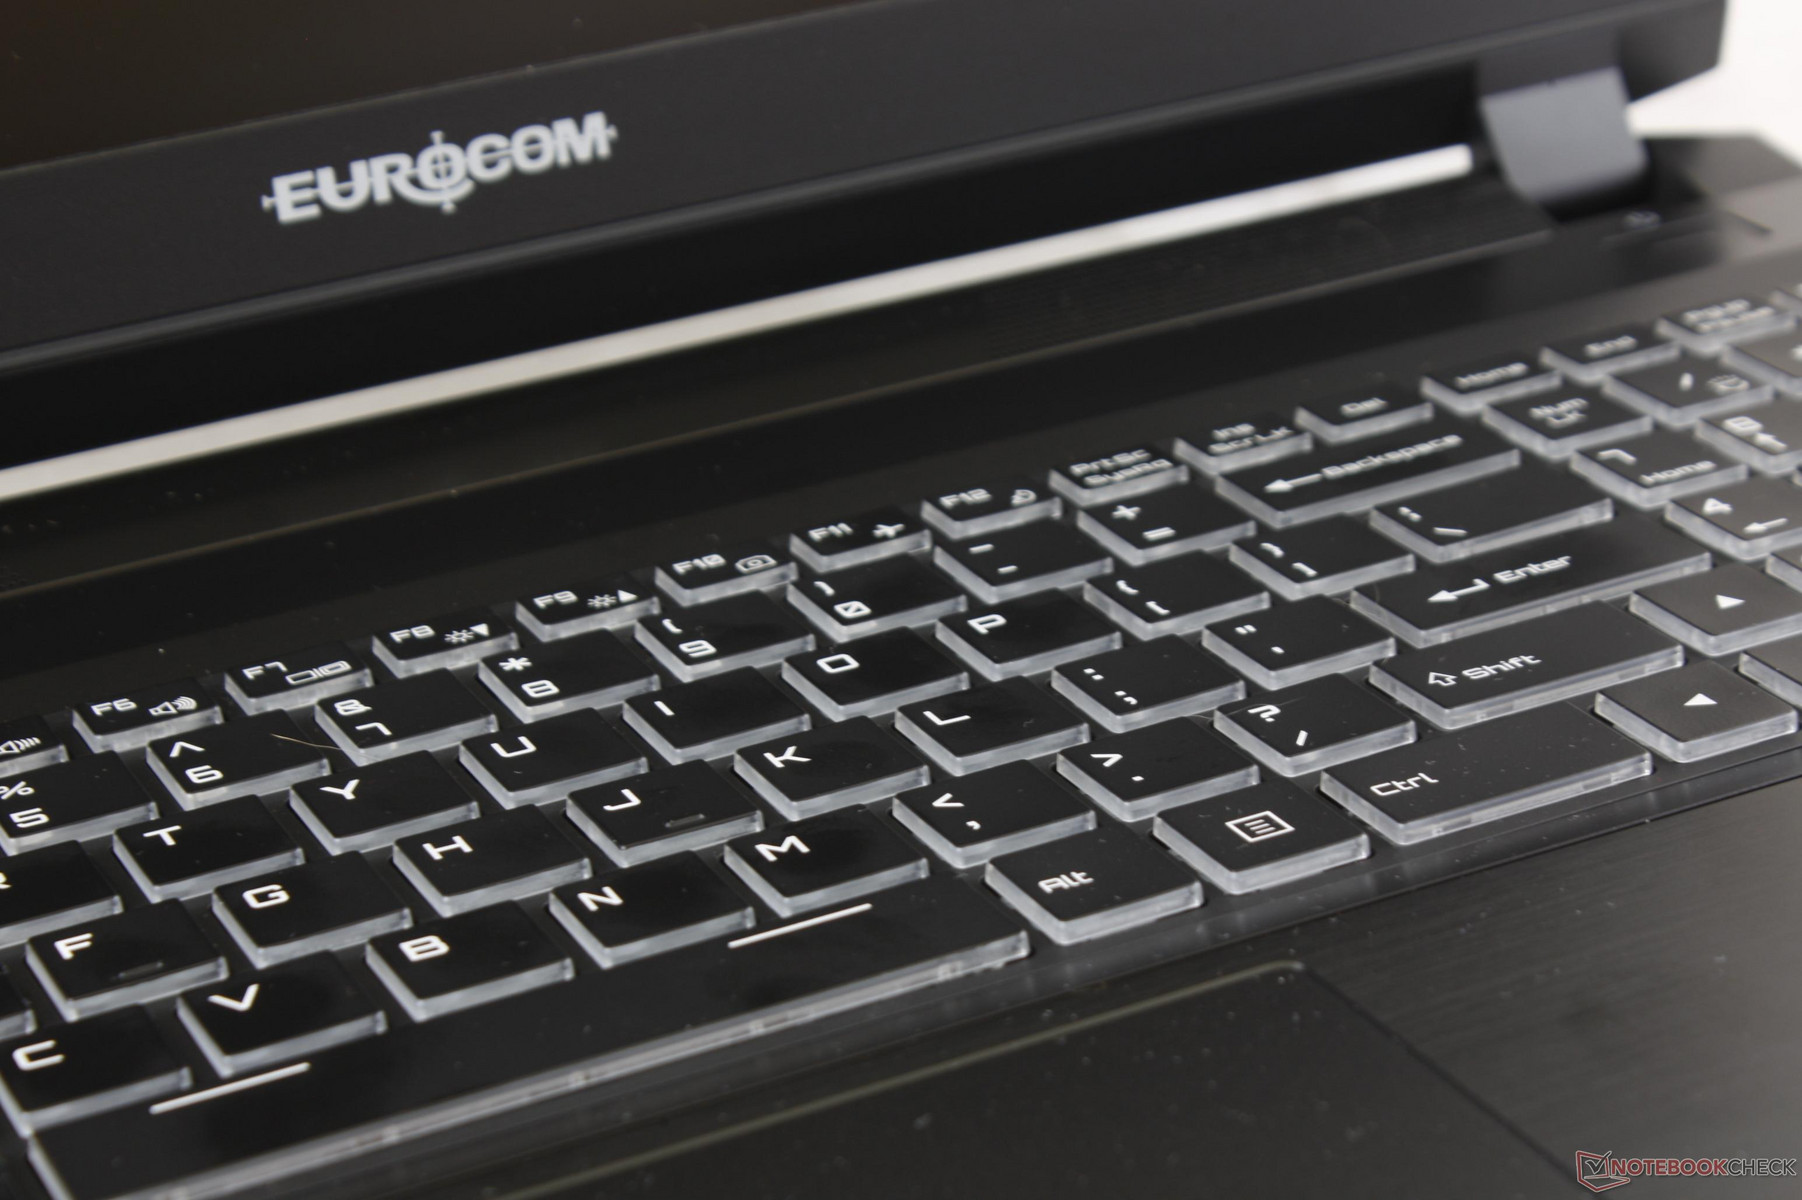
Clevo designs are typically characterized by the jet black color scheme, ABS plastic, sharp and boxy edges and corners, flat top, and a generally understated appearance compared to the gaudy Asus ROG or Alienware designs. The Sky MX5 R3 doesn't stray too far away from this philosophy with only a few added embellishments such as the brushed aluminum palm rests and chrome-lined ventilation grilles along the rear.
Case rigidity is excellent for the base with just minimal warping when applying pressure on the keyboard or palm rests or when attempting to twist the sides of the unit. There is some slight creaking when applying moderate force, but it's nowhere near significant enough to be of any concern during day-to-day use. Instead, it's the lid that could use the most improvement as it's more susceptible to warping and twisting than the displays of the Alienware 15 or XPS 15. More specifically, the edge of the lid in between the two small hinges is quite flexible in contrast to the unyielding base. The hinges themselves are otherwise firm with minimal teetering up to the maximum angle of 140 degrees.
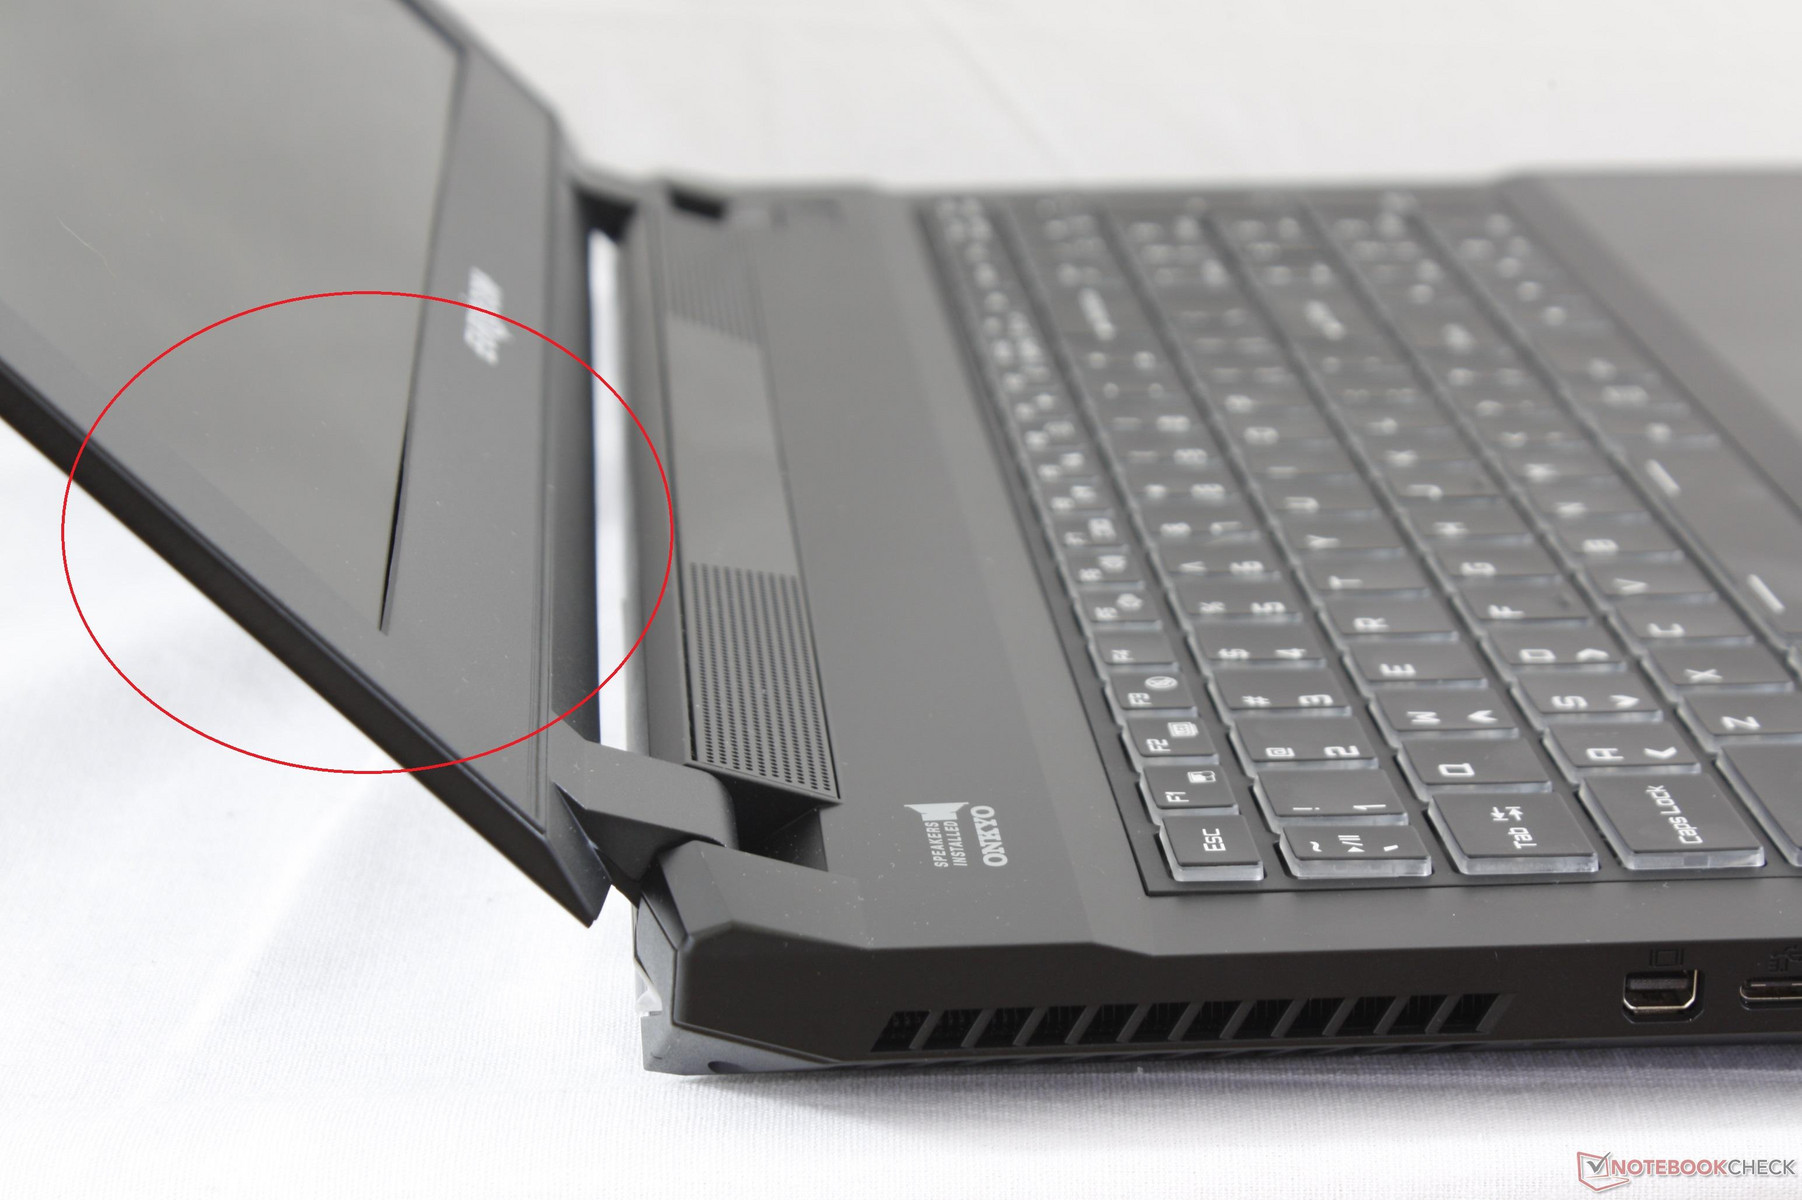
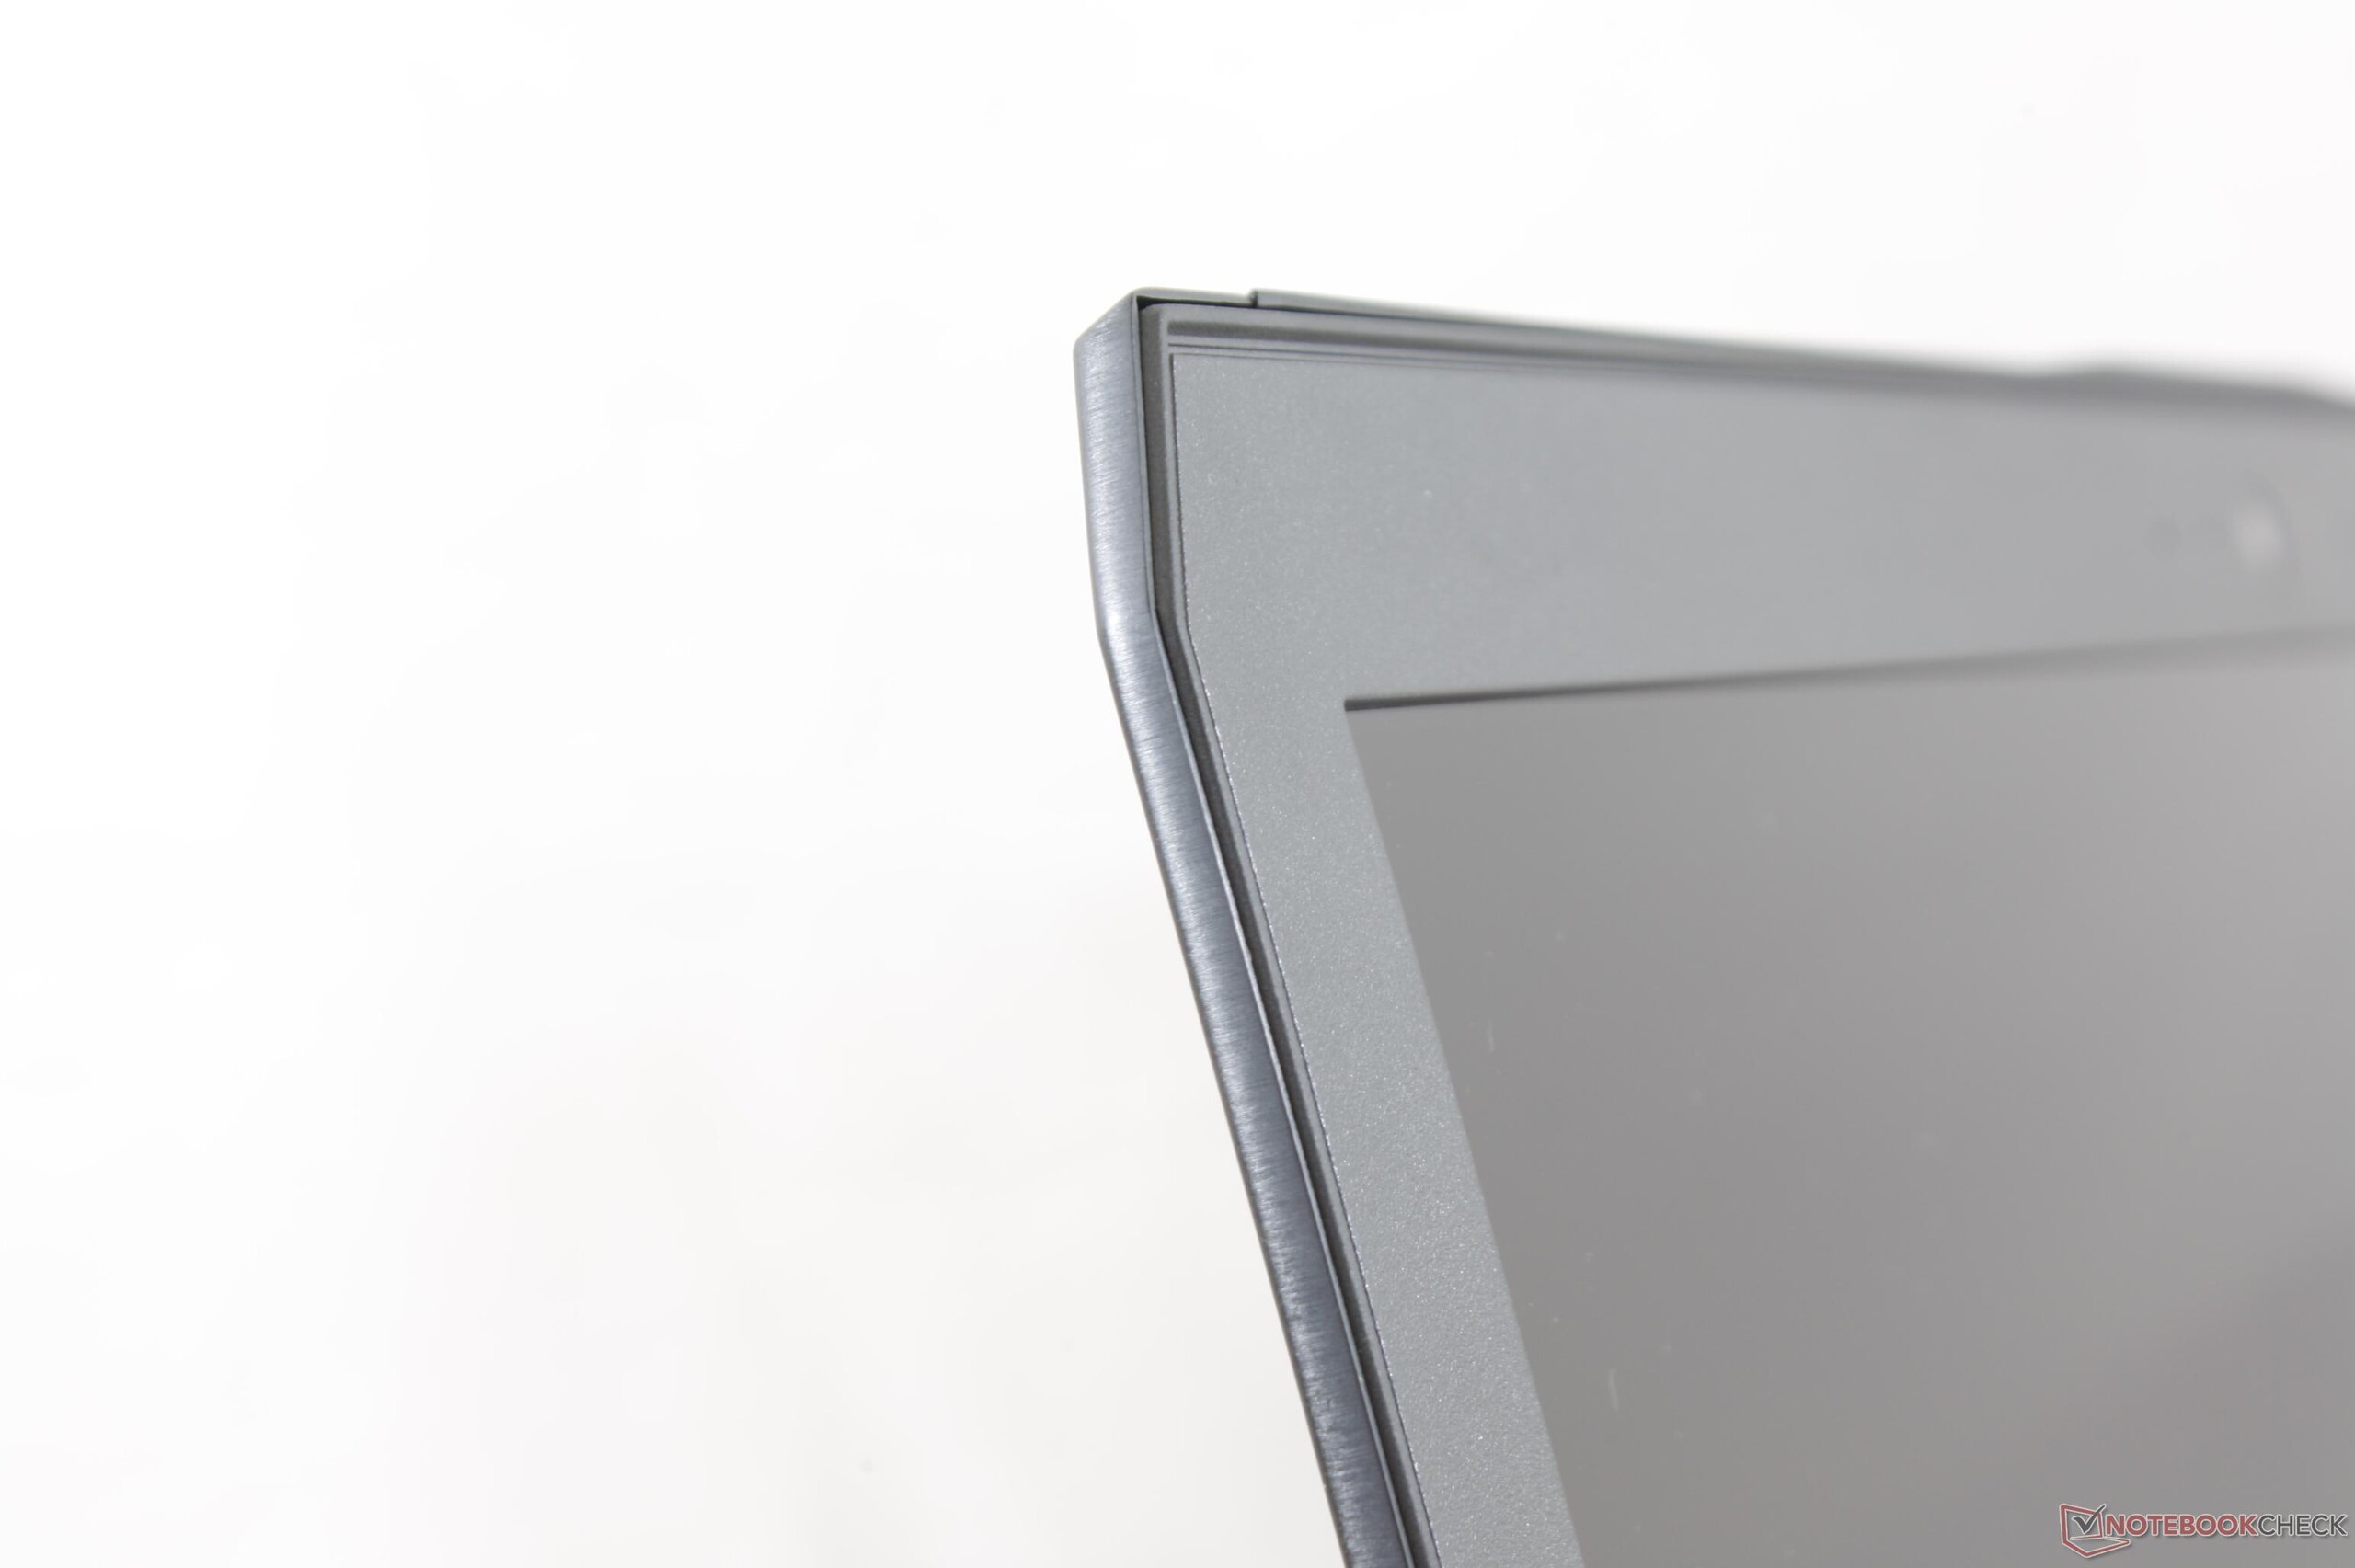
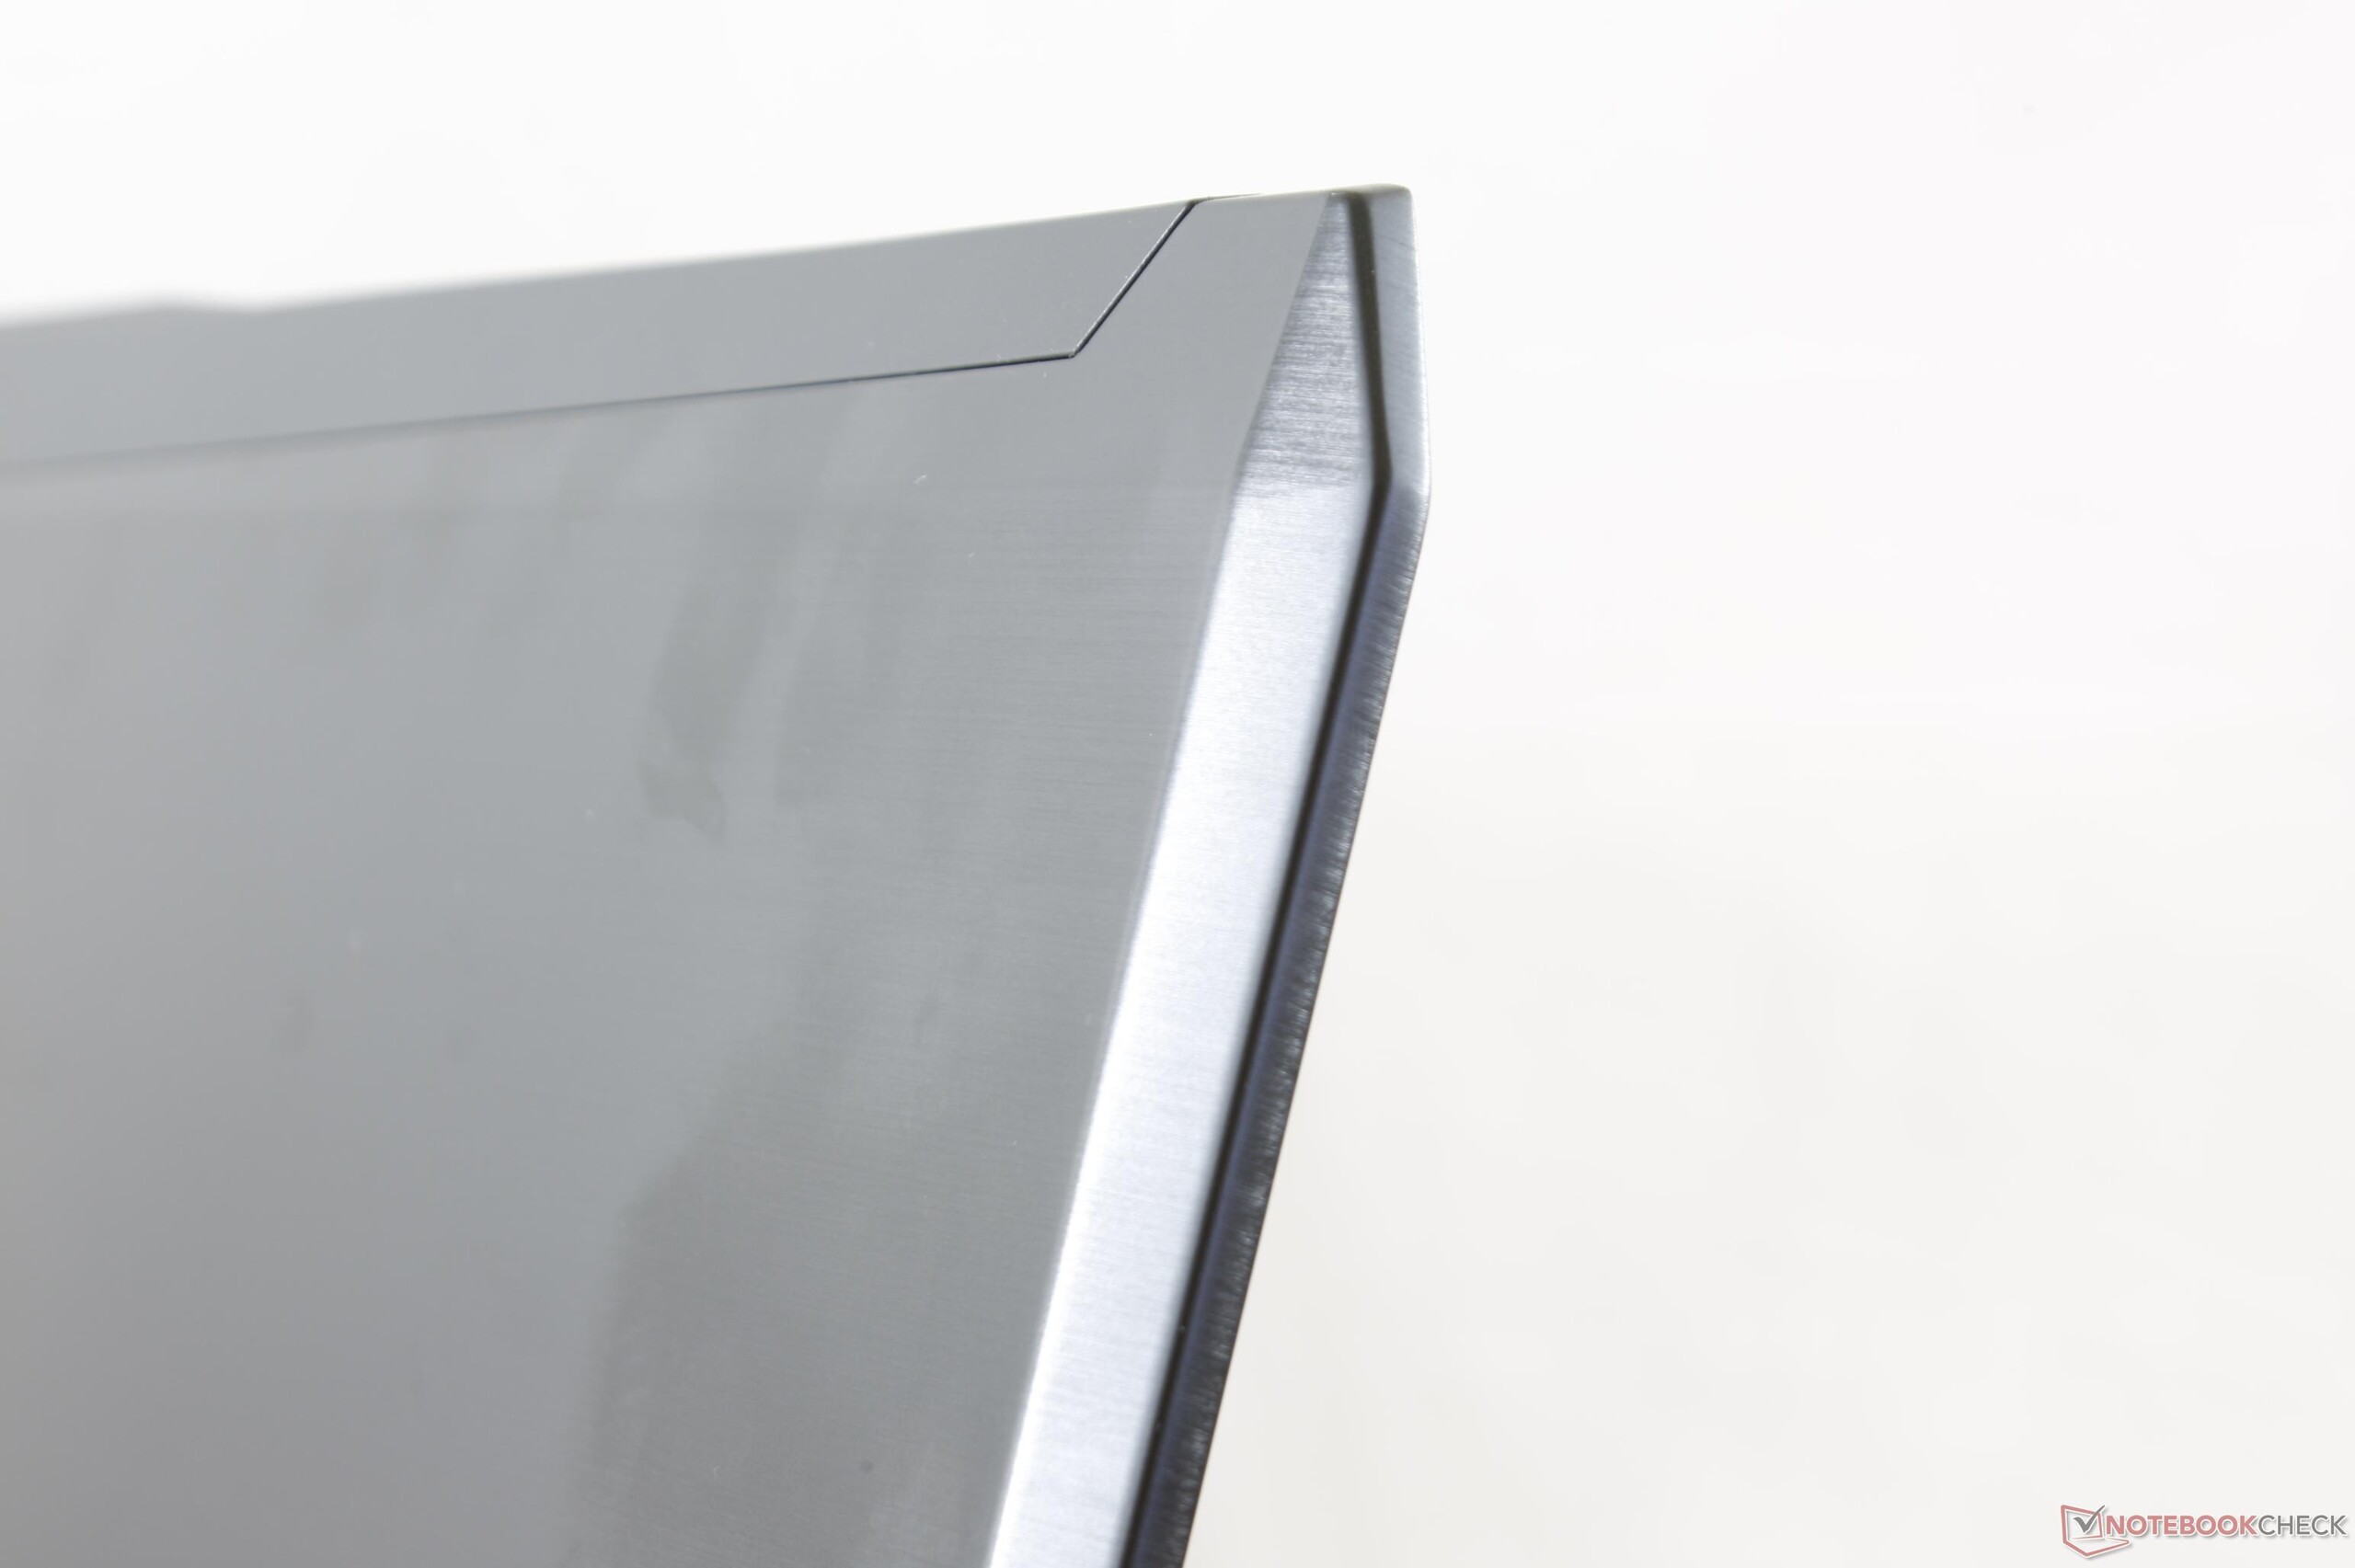
Construction quality is excellent with no unintended gaps or jutting corners between the different parts of the chassis. While not uncommon to hear for unibody designs, this is a noteworthy achievement for the Sky MX5 R3 as its chassis is made of up smaller parts and is more modular as a result. Unfortunately, the system is not perfect as we can observe gaps between the edges of the screen and the inner bezel where the surface should be flat. MSI systems will occasionally exhibit this same flaw as well.
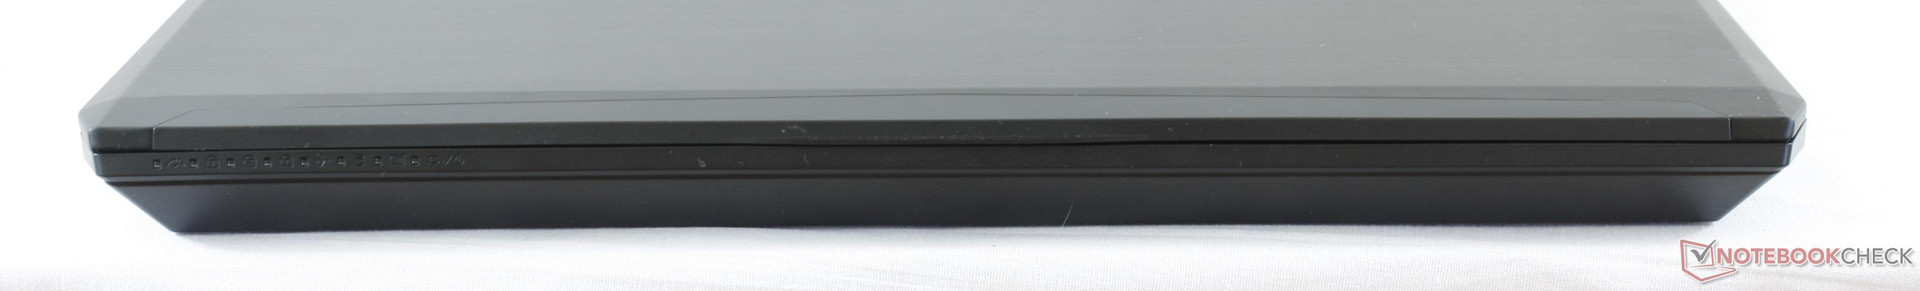
The Sky MX5 R3 is over 10 mm thinner and 200 g lighter than the more capable Eurocom Tornado F5. Perhaps more notably, the system weighs about the same as the GT62VR that comes in significantly thicker than our Eurocom in review. Thid is a very dense system that sits comfortably between thicker alternatives like the Predator 15 and super-thin solutions like the GS63VR or Gigabyte P55W. Redesigns with narrower bezels could potentially be in the works to better compete against the increasingly popular Dell XPS 15 and Gigabyte Aero 15.
Connectivity
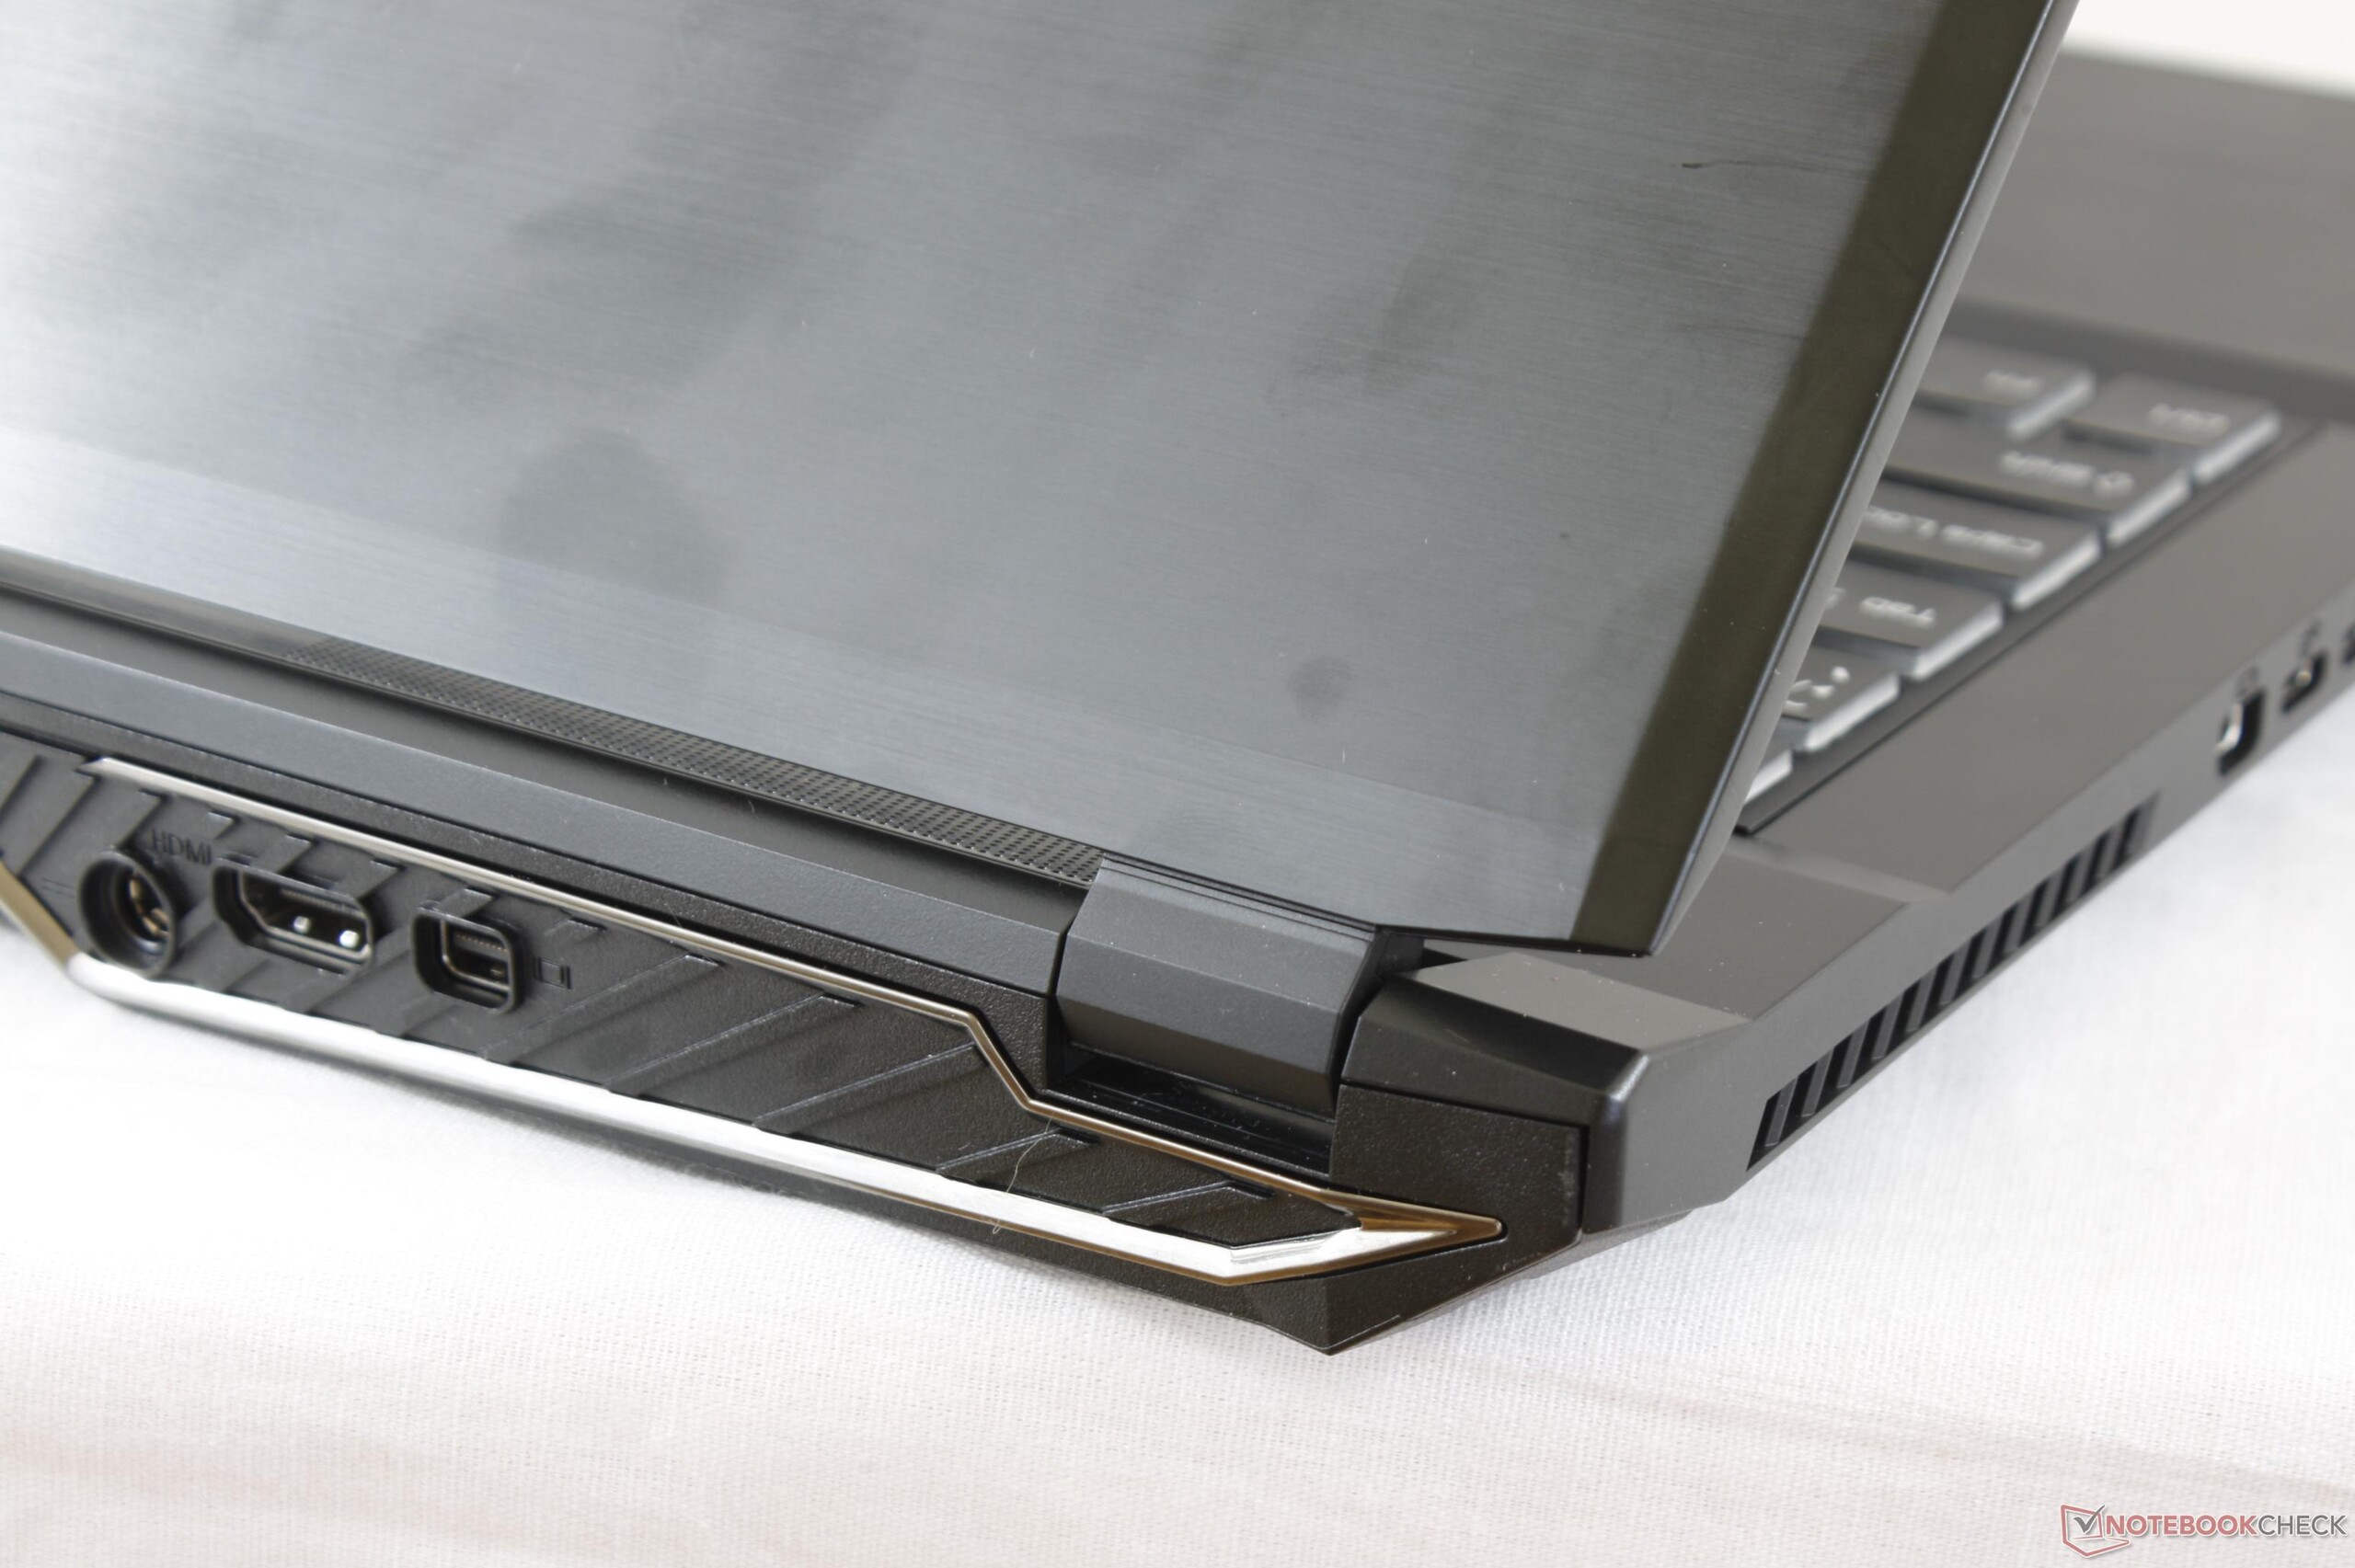
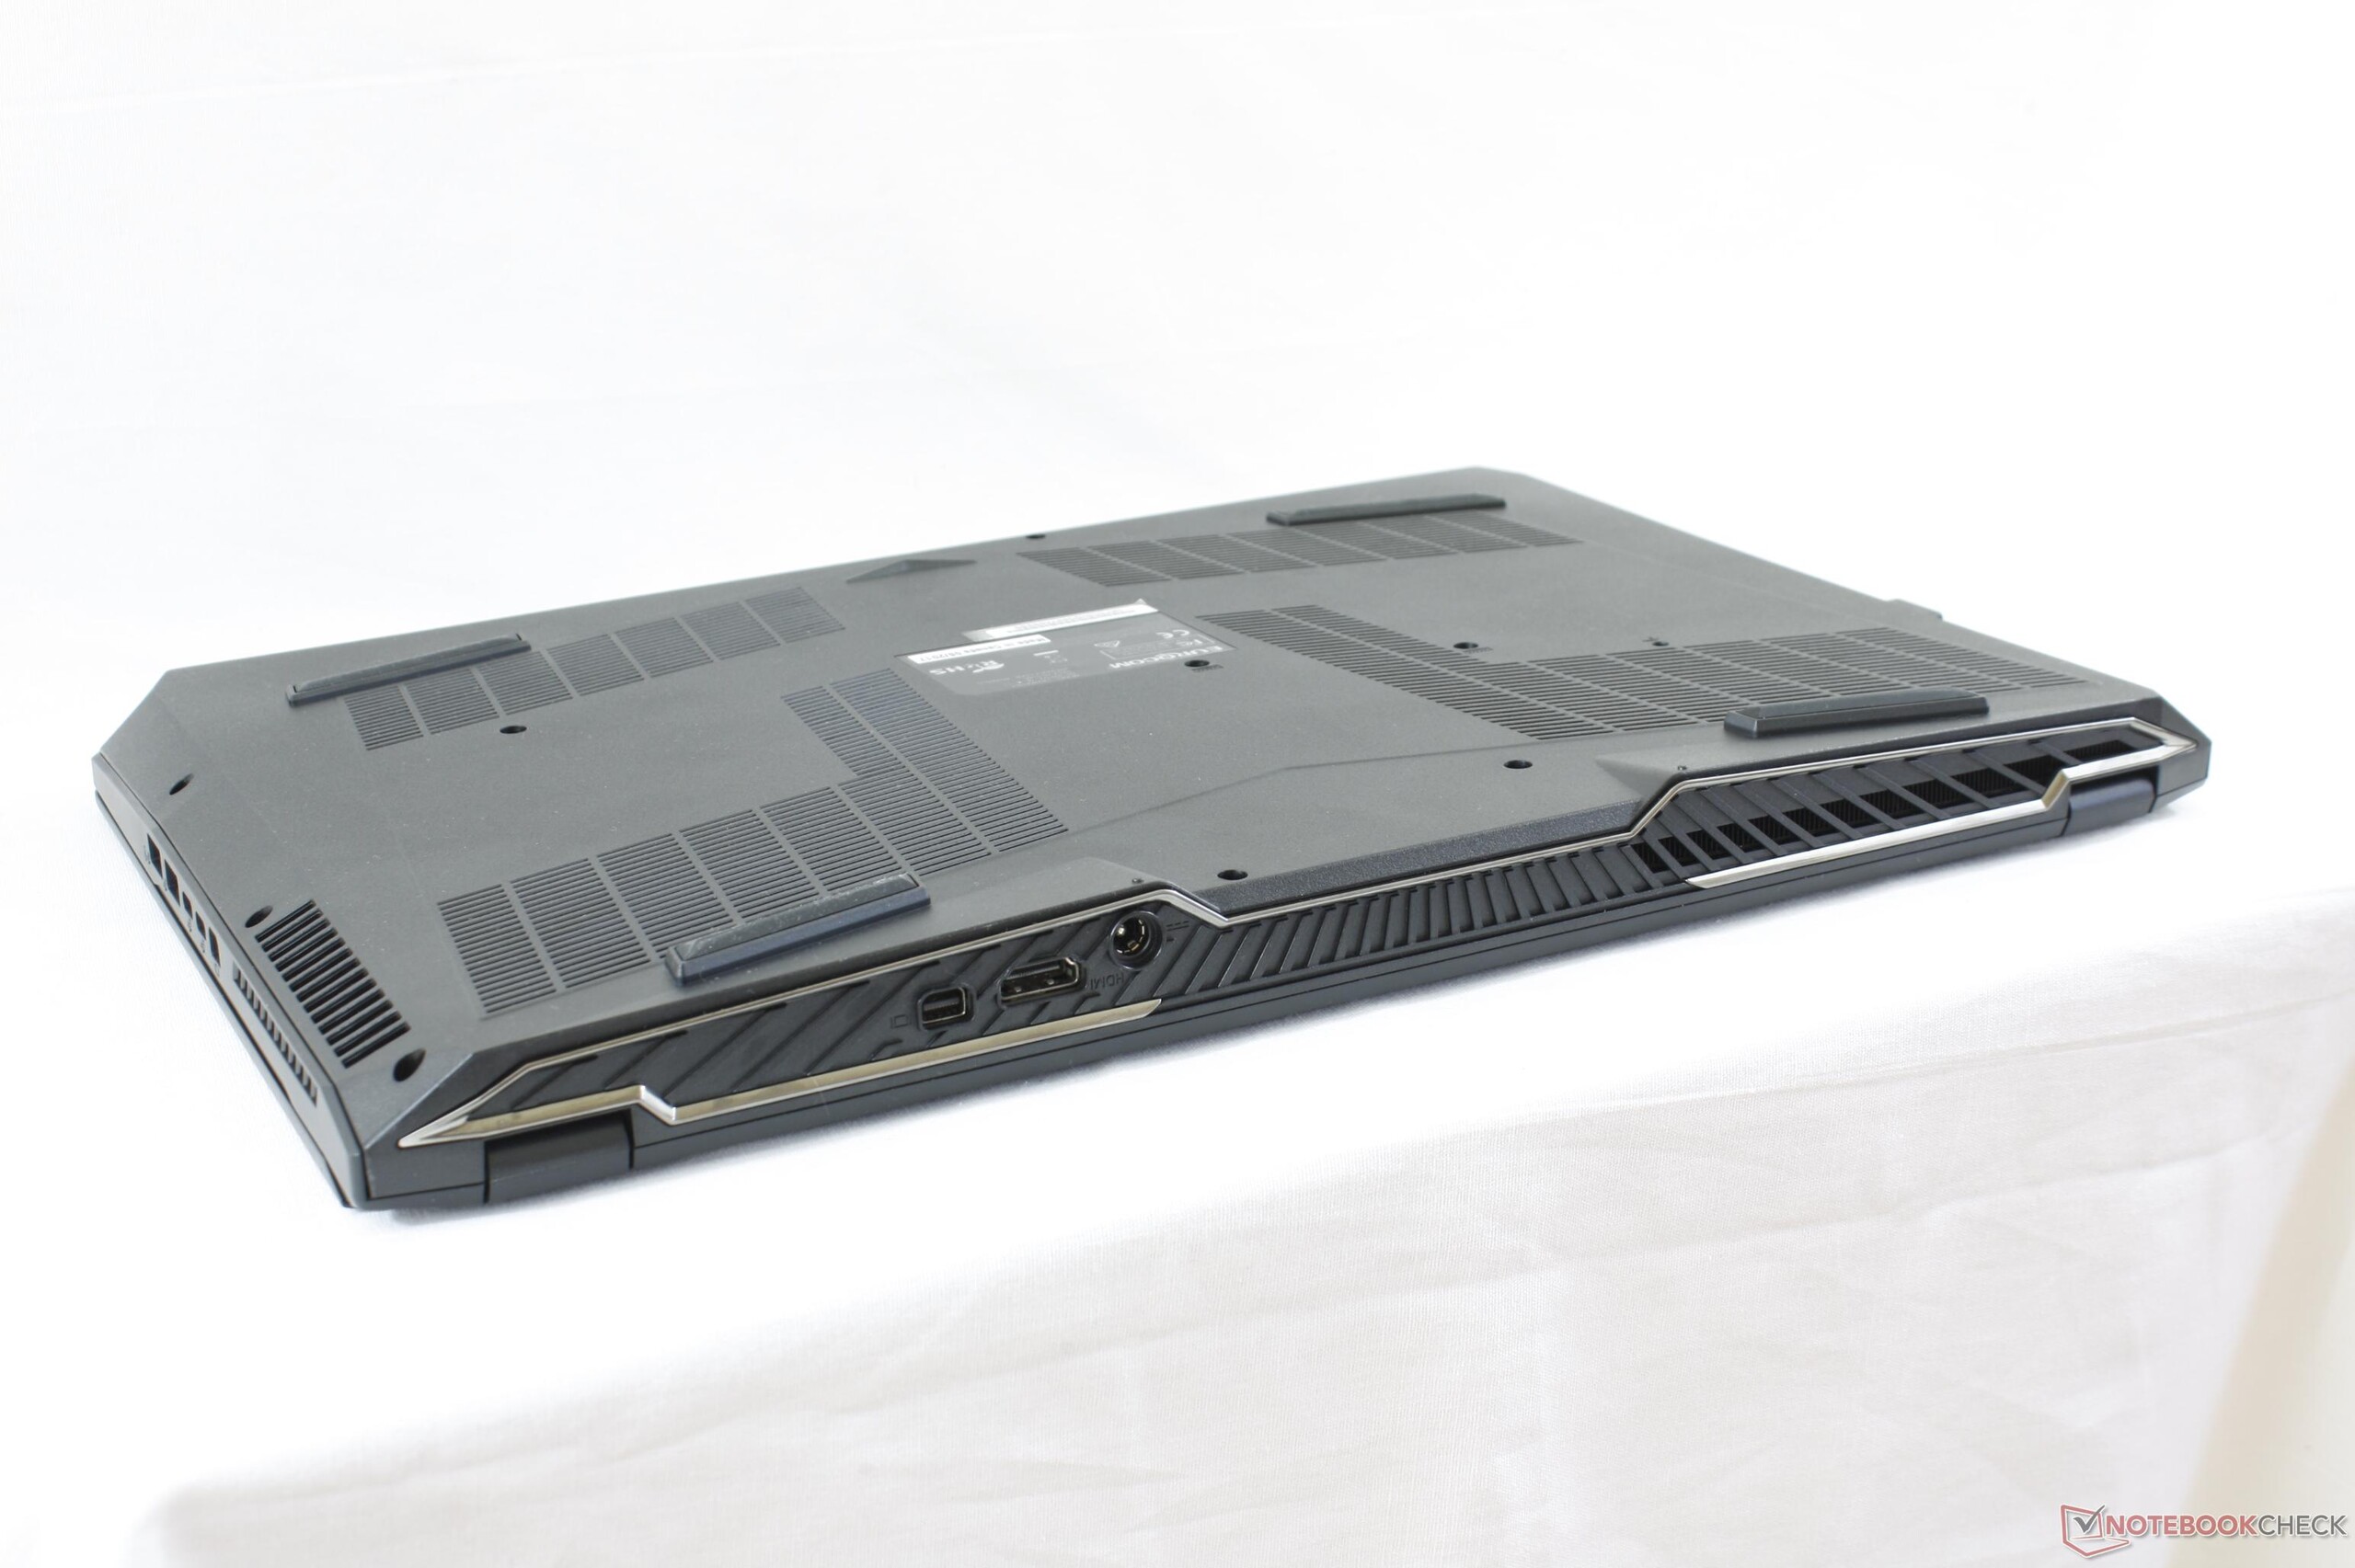
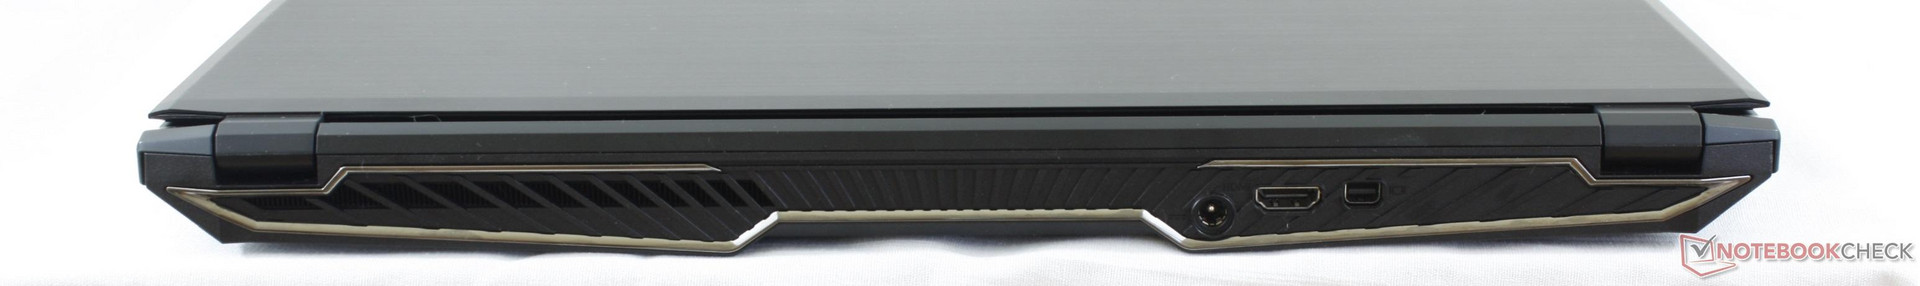
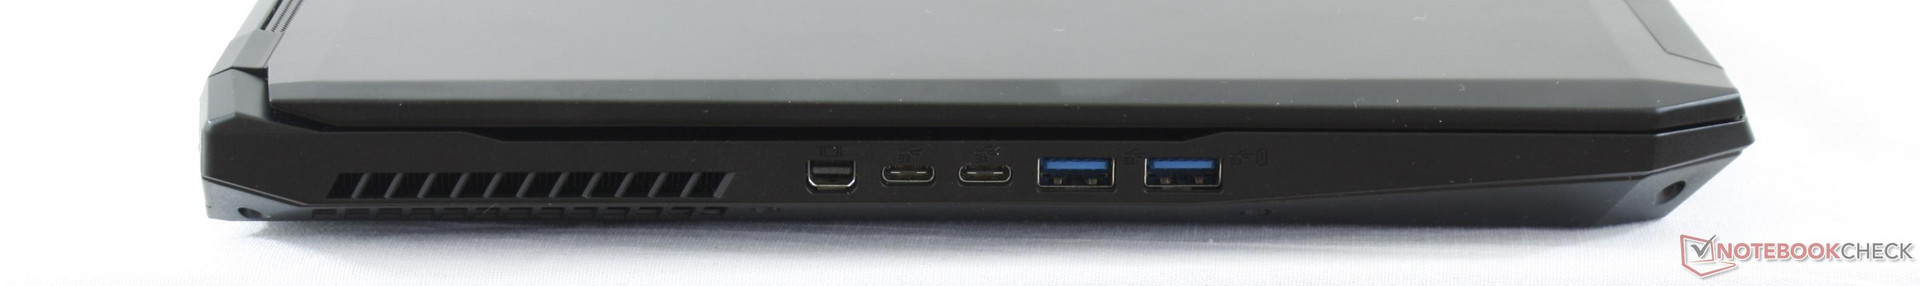
A varied selection of ports is available including multiple USB Type-C ports, multiple video-out ports, multiple audio ports, and multiple USB Type-A ports. The mini-SIM slot is particularly interesting since it is quite rare on notebooks let alone a dedicated gaming system. The dual USB Type-C Gen. 2 ports are unfortunately not compatible with Thunderbolt 3. All ports are easy to reach, but the audio ports are too close to the front edge and can take up valuable desk space for right-handed mouse users. The Alienware 15, for example, has its audio ports further back where cables are less likely to be a nuisance.
HDMI 2.0 comes standard for outputting at 4K60 whereas some gaming notebooks like the MSI GT73VR are still shipping with HDMI 1.4.
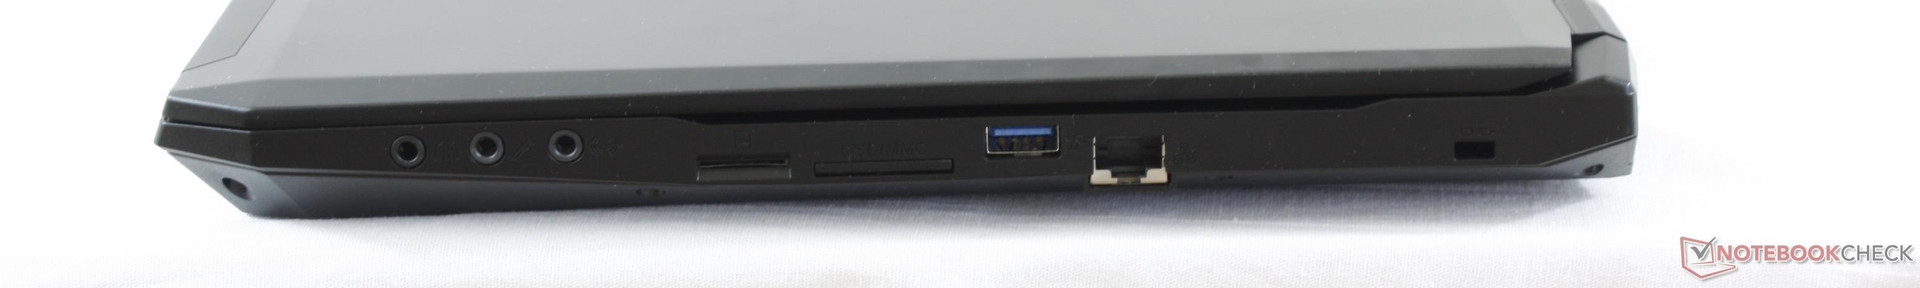
SD Card Reader
The spring-loaded integrated card reader is nowhere near as fast as the one on the larger Sky X7E2. The average transfer rate sits at just under 90 MB/s with our Toshbia Exceria UHS-II test card and moving 1 GB of files from the card to desktop takes about 13 seconds. The card reader on the MSI GT62VR can accomplish this same file transfer in just half the time.
Fully inserted SD cards do not sit flush against the edge and will protrude by about 1 to 2 mm.
| SD Card Reader | |
| average JPG Copy Test (av. of 3 runs) | |
| Eurocom Sky X7E2 | |
| MSI GT62VR 7RE-223 | |
| Eurocom Sky MX5 R3 | |
| Gigabyte Aero 15 | |
| maximum AS SSD Seq Read Test (1GB) | |
| Eurocom Sky X7E2 | |
| MSI GT62VR 7RE-223 | |
| Eurocom Sky MX5 R3 | |
| Gigabyte Aero 15 | |
Communication
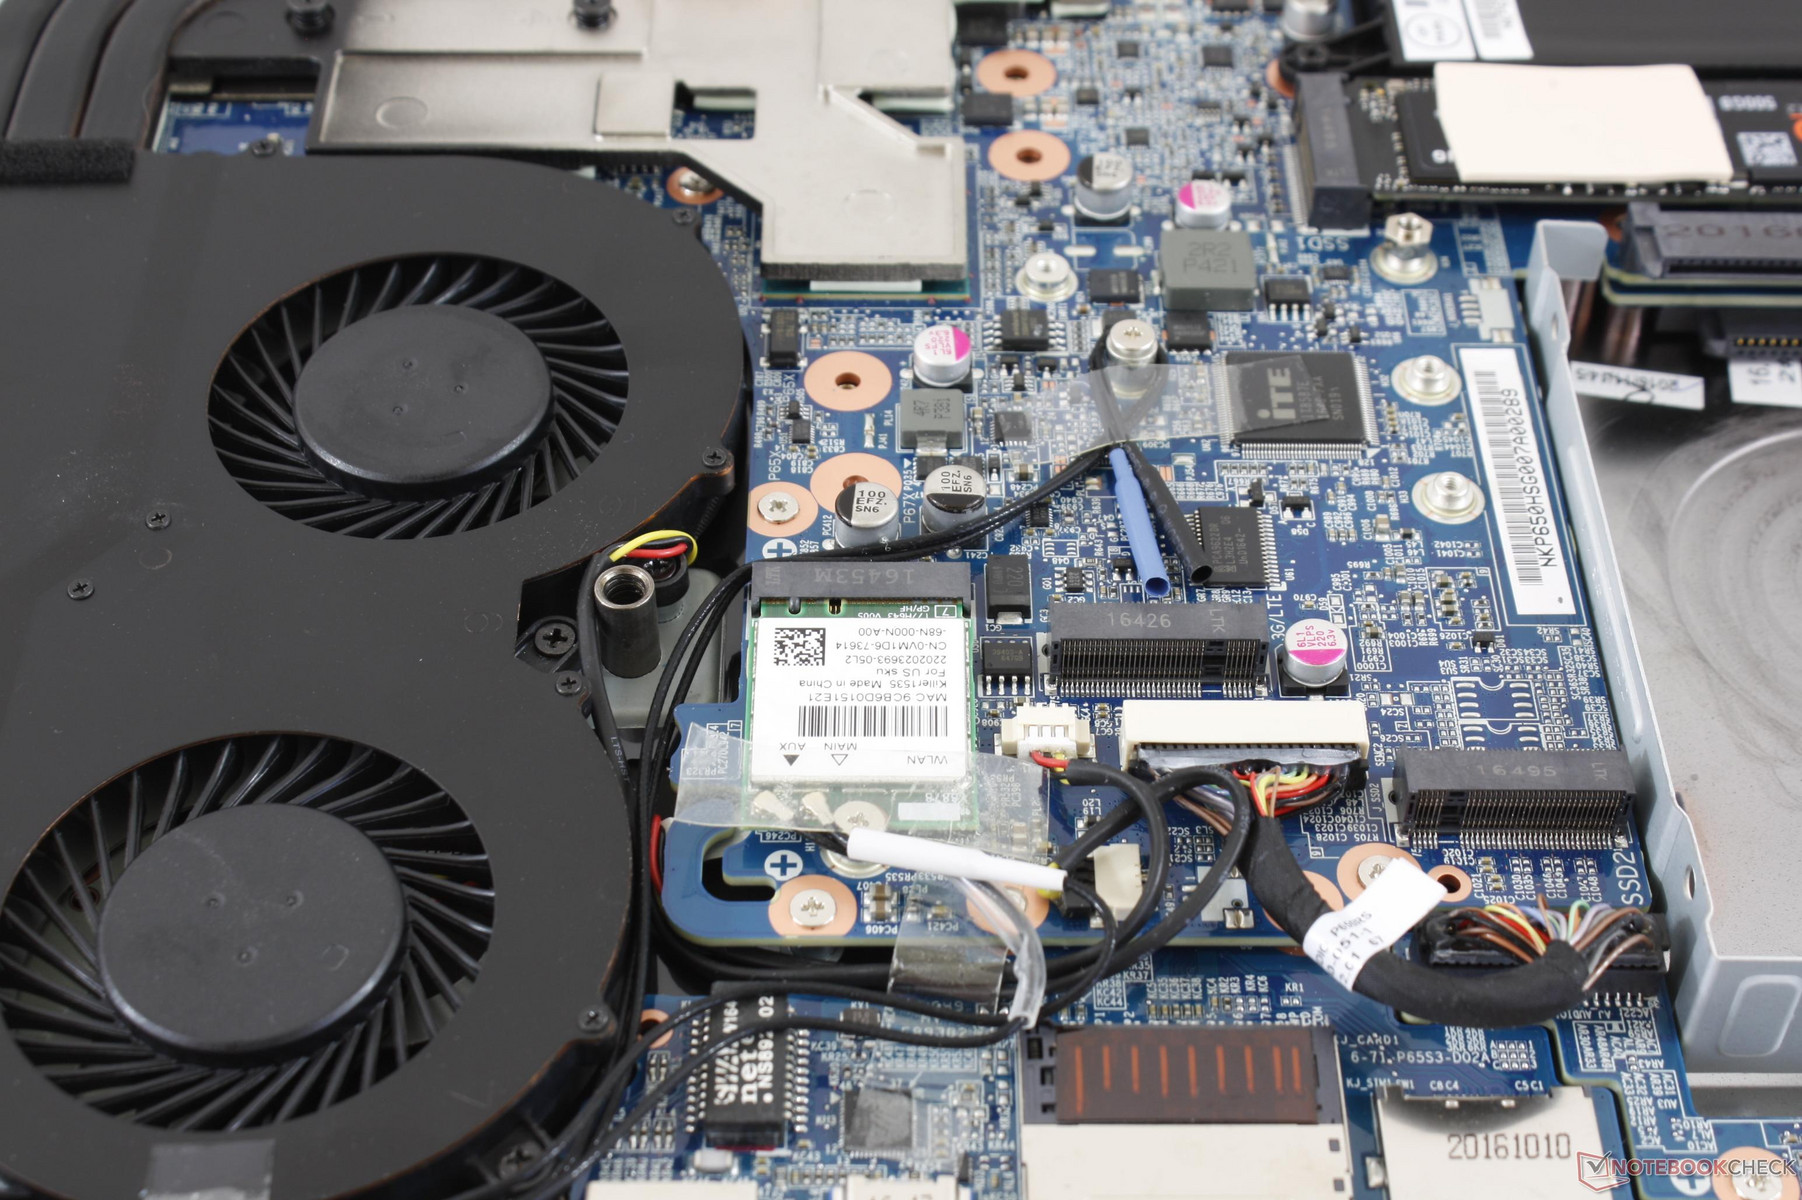
Configurable M.2 2230 WLAN options include the Killer 1535, Intel 8260/8265/7260/7265, and Realtek RTL8723BE with 802.11n/ac and Bluetooth 4.0/4.1/4.2 depending on the selection. Our test unit uses the Killer solution and we are able to record a real-world average transfer rate of 675 Mbps against its theoretical maximum of 867 Mbps. We experienced no connectivity issues during our time with the unit. See our dedicated review on the Killer 1535 for more details on its gamer-centric features and software.
Unique to the Sky MX5 series is its WWAN support via an M.2 2242 slot. The system is "LTE ready" in that the antennae are pre-installed on every configuration. It will be up to the end-user to install Gobi or other broadband cards suitable to the local wireless carrier.
| Networking | |
| iperf3 transmit AX12 | |
| Eurocom Sky MX5 R3 | |
| Gigabyte Aero 15 | |
| Lenovo Legion Y520-15IKBN-80WK001KUS | |
| iperf3 receive AX12 | |
| Gigabyte Aero 15 | |
| Eurocom Sky MX5 R3 | |
| Lenovo Legion Y520-15IKBN-80WK001KUS | |
Software
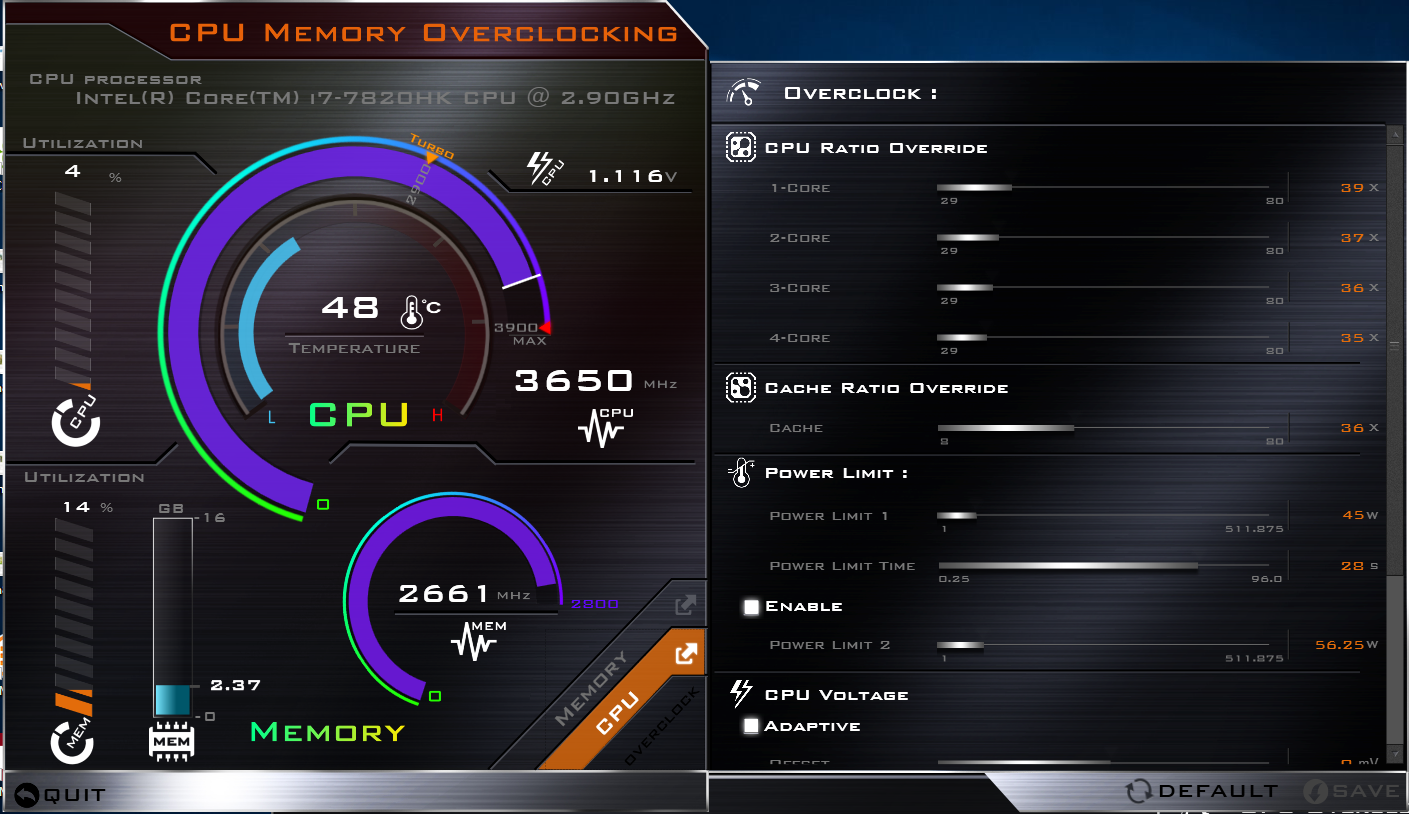
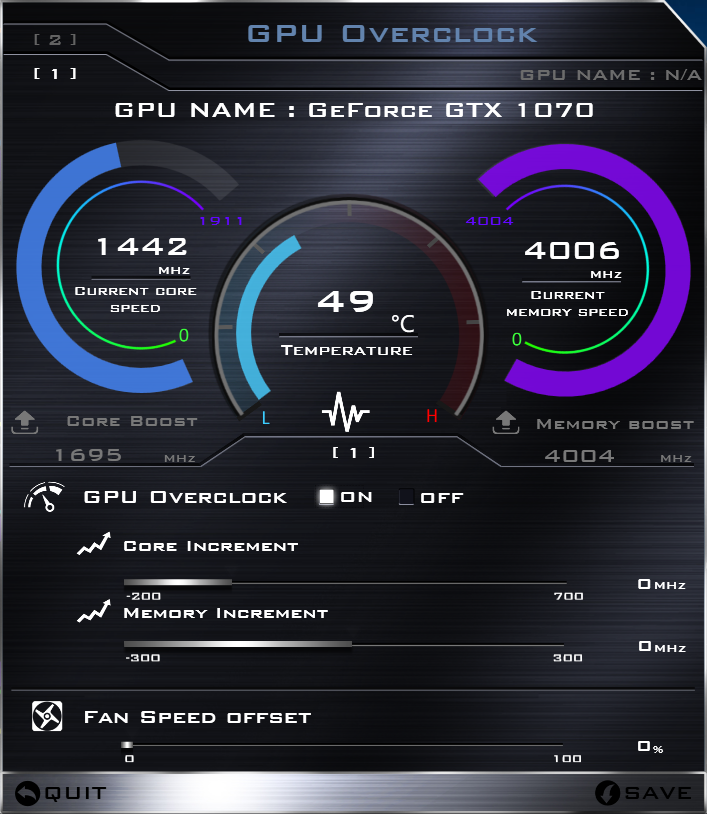
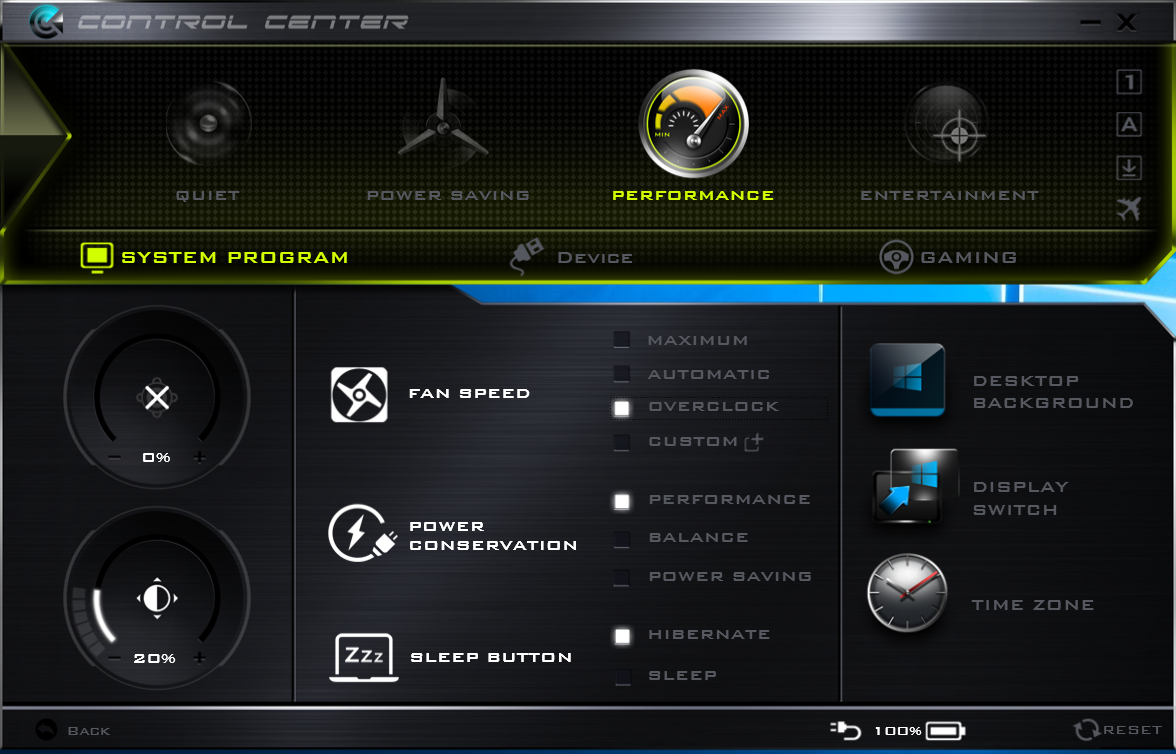
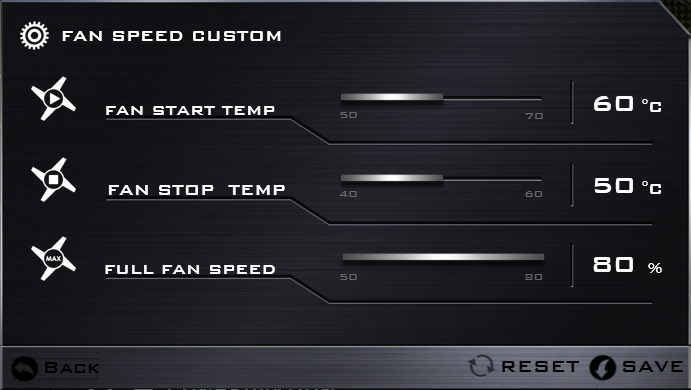
FlexiKey, Control Center, and CPU/GPU/RAM overclocking utilities are all pre-loaded for keyboard lighting and macro control, fan speed control, and system performance control, respectively. We find the UI easy to use especially in regards to the overclocking utility when compared to the overly clustered Aorus solution. The Control Center, however, conflicts with the Windows Power Profile settings and so it is possible to have the Control Center at "Performance" while the Windows Power Profile is at "Power Saver". It's a small but annoying detail that we hope will be addressed in a future update. A performance overlay showing core temperatures and clock rates when gaming in fullscreen would have been very helpful for gaming enthusiasts.
Users can still overclock the CPU the traditional way through BIOS, but Clevo offers no fancy BIOS UI that is becoming more common on gaming systems.
Accessories
Eurocom has always been quite generous with included extras. The retail box ships with a disassembly guide, Quick Start guide, small screen wipe, USB stick with drivers (instead of DVDs), and two pieces of thermal padding for internal drives. End-user servicing is obviously encouraged based on what is included at no extra cost.
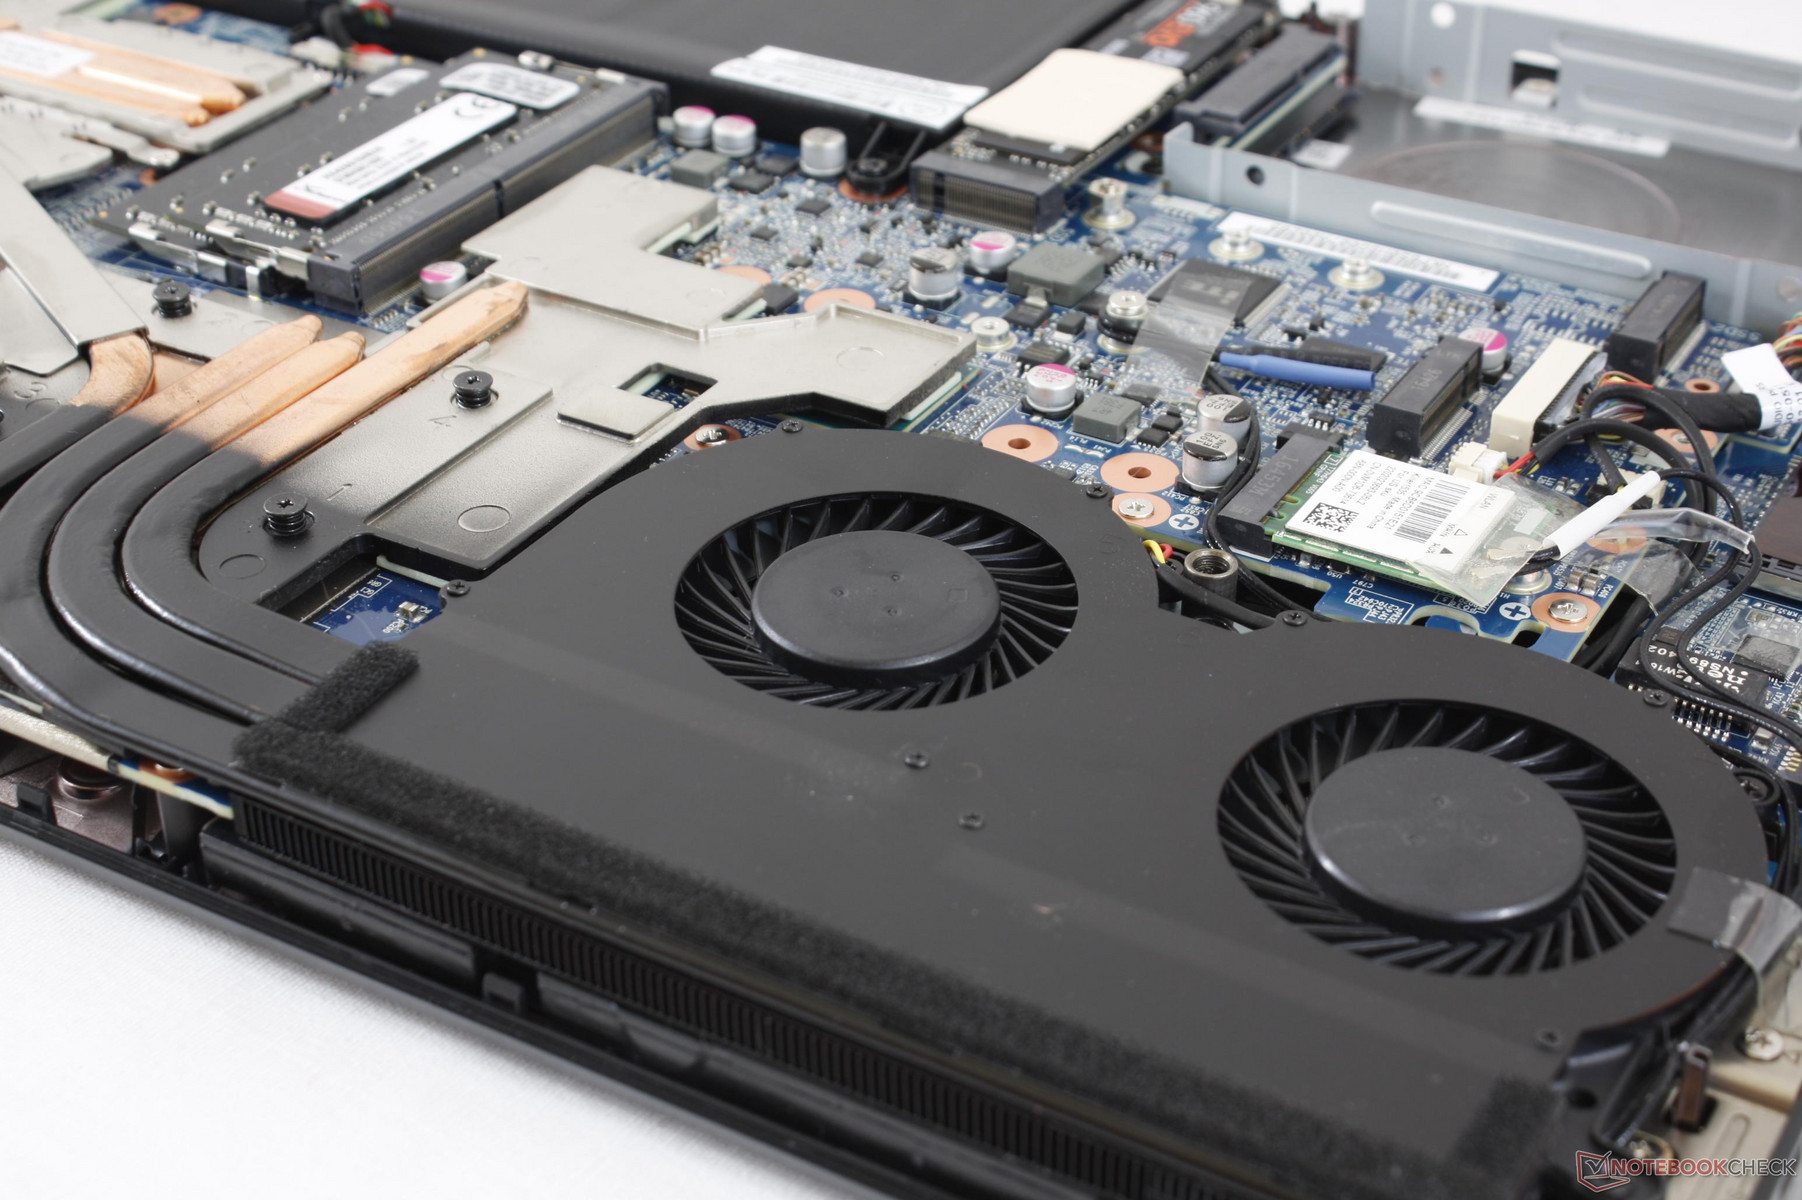
Maintenance
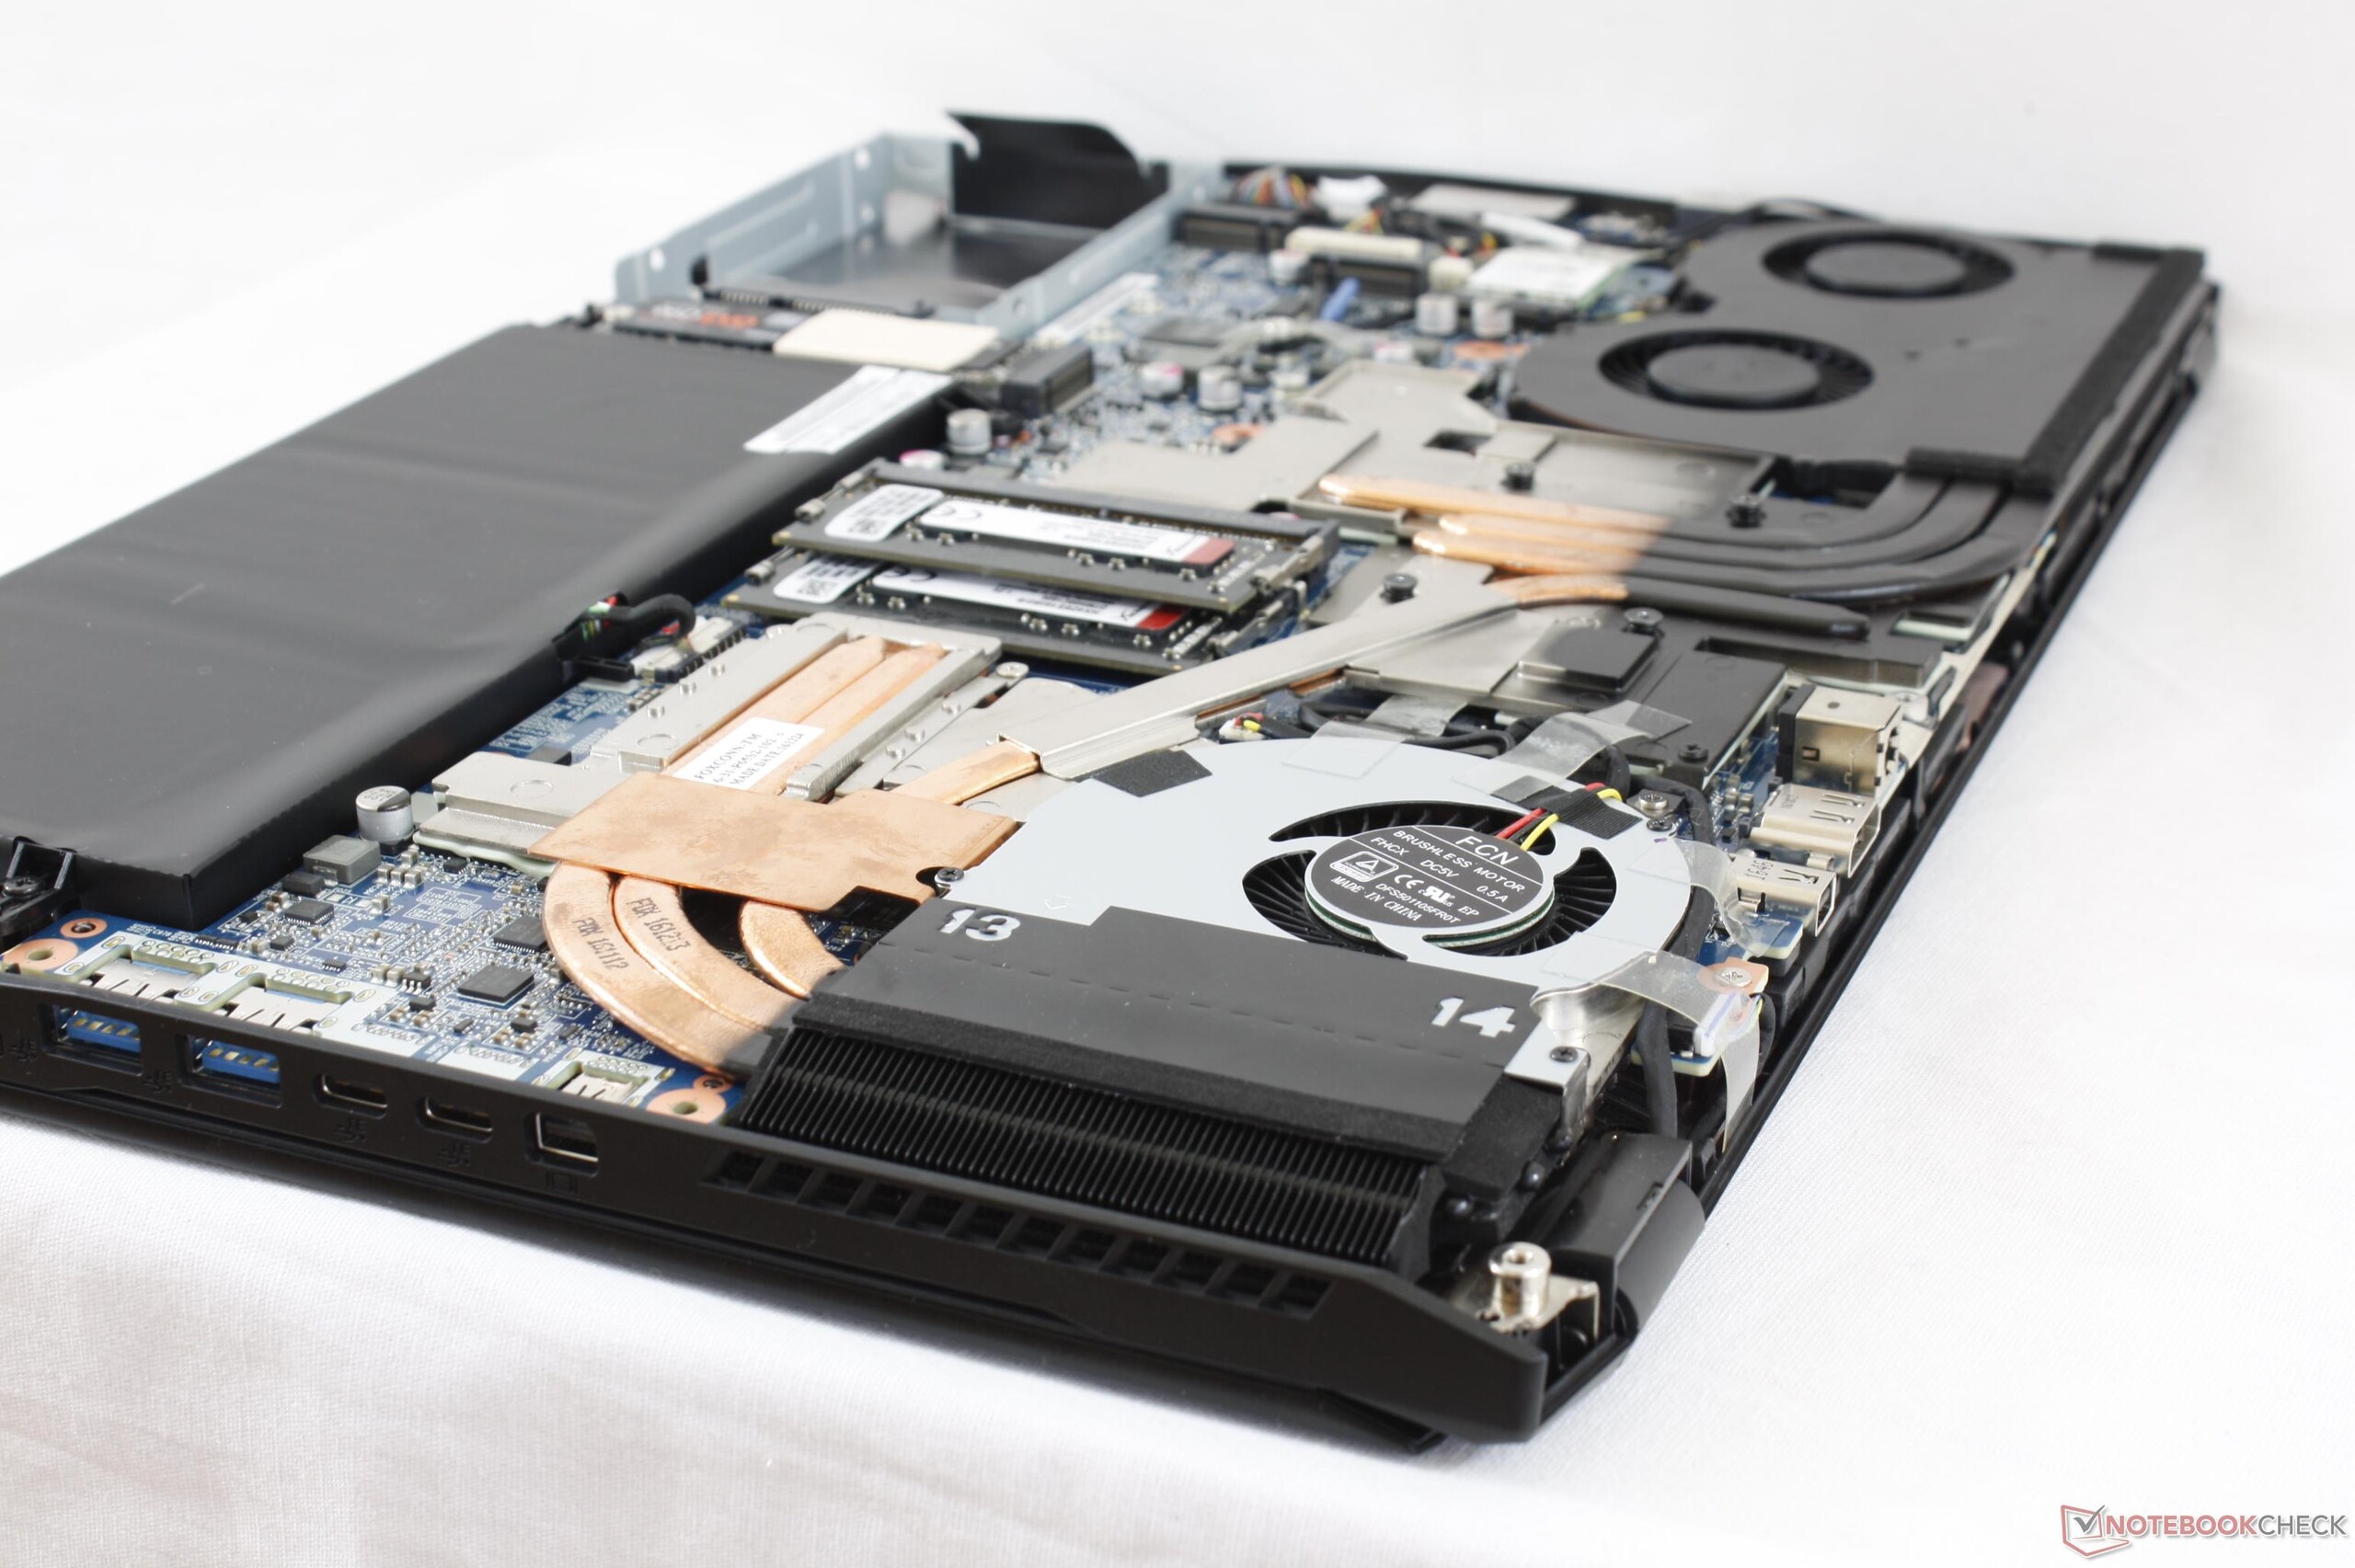
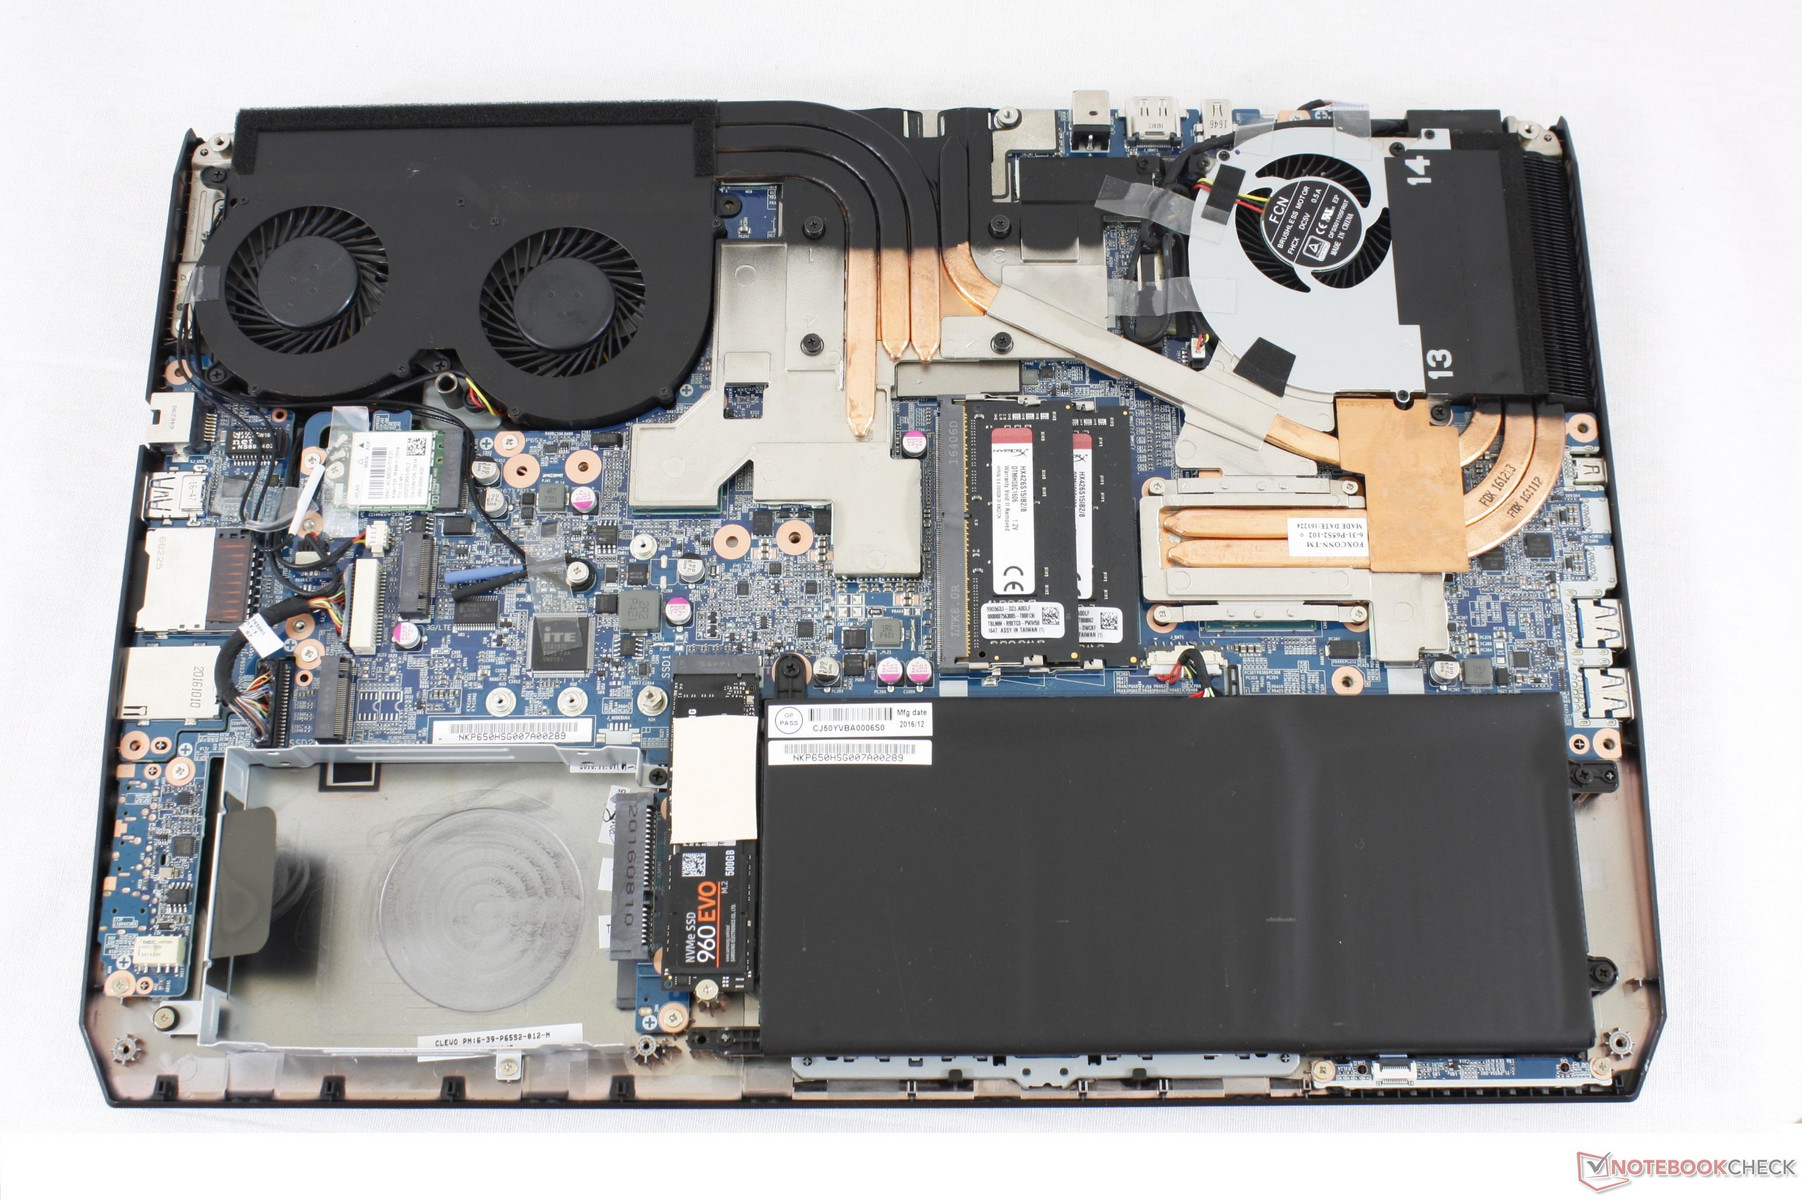
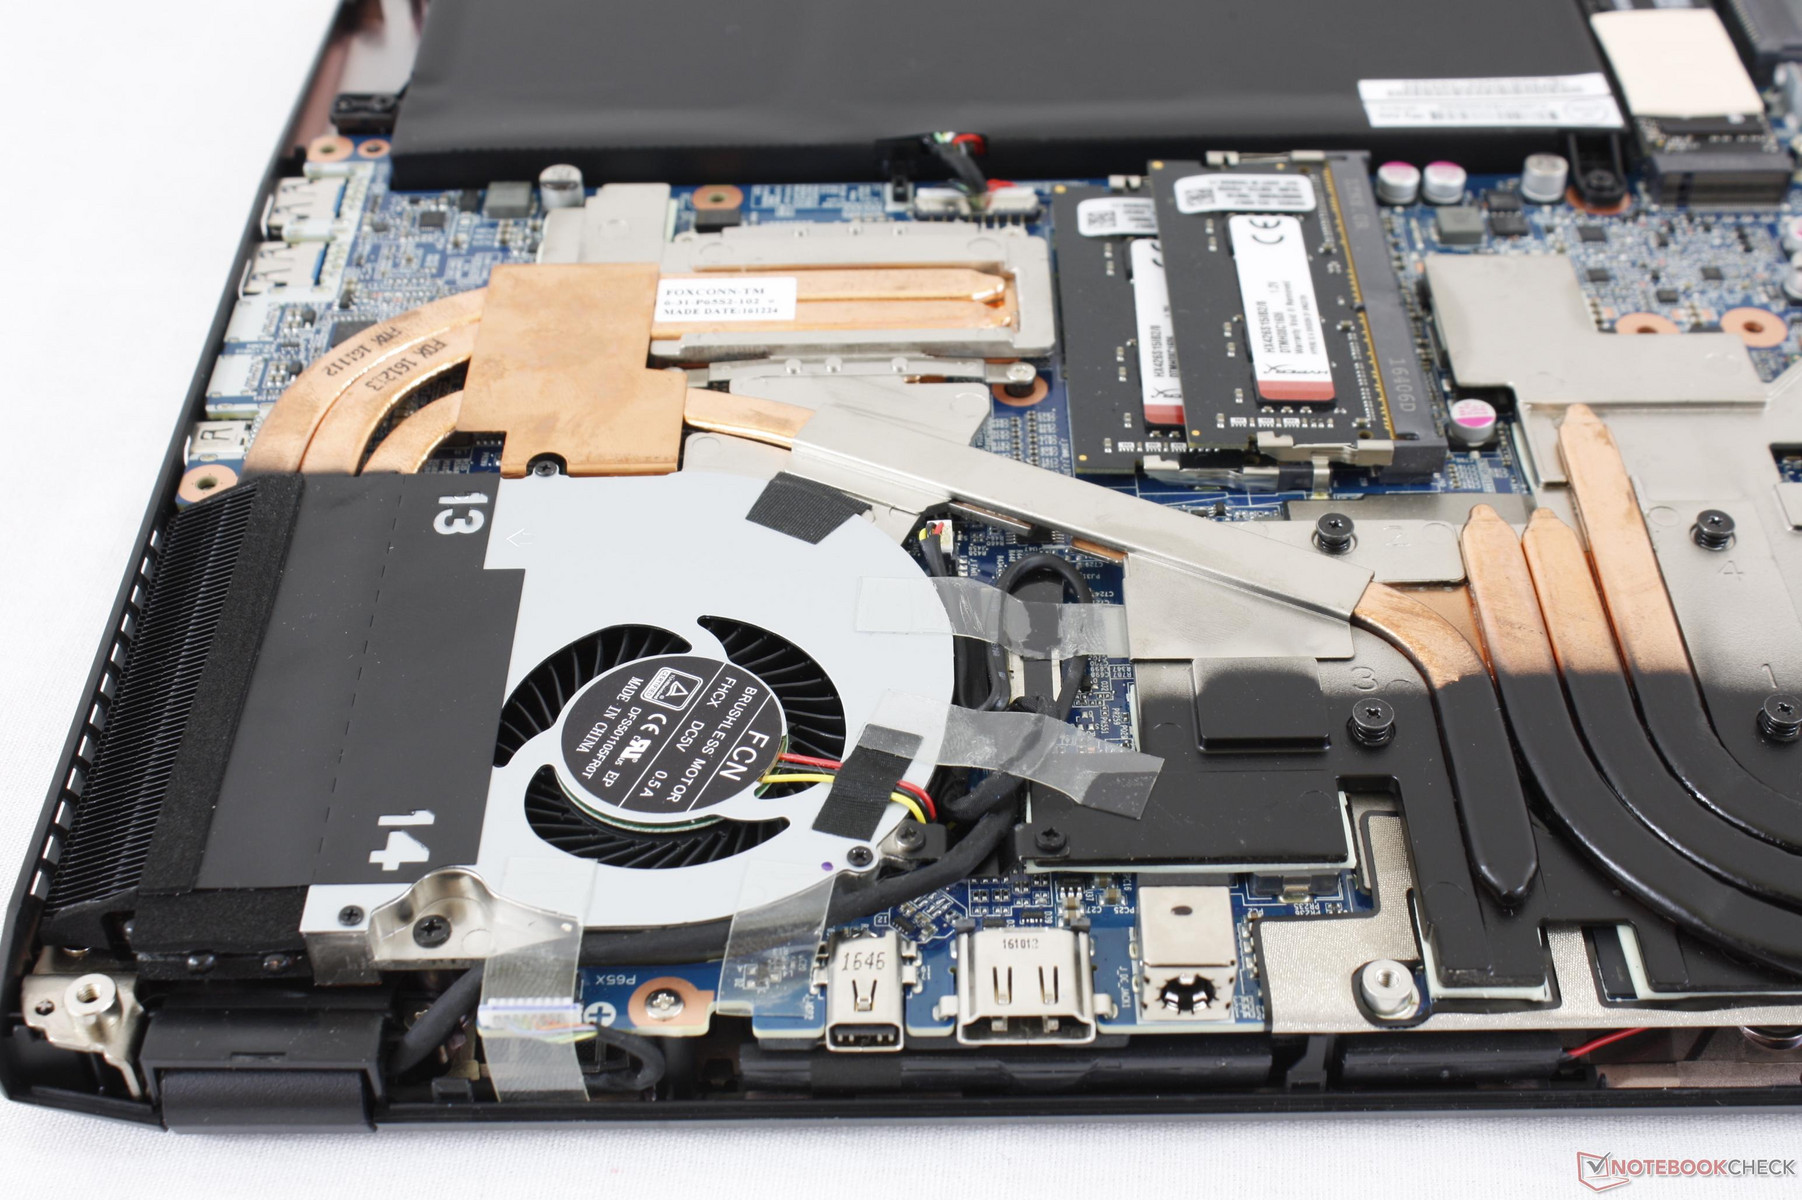
Easy serviceability has always been a hallmark of the Clevo chassis. The bottom panel is secured by 13 screws and a Philips screwdriver is all that is needed for it to pop right off. Users have direct access to most major components including the cooling system, all storage bays, two SODIMM slots, internal battery, and both WLAN and WAN M.2 slots. Additional disassembly is required to access the other two SODIMM slots on the other side of the motherboard.
Warranty
The standard one-year limited warranty applies with options to extend up to three years. Some competitors like Gigabyte and Aorus offer two-year limited warranty as a baseline and we're hoping to see this become the norm from more manufacturers. Please see our Guarantees, Return policies and Warranties FAQ for country-specific information.
Input Devices
Keyboard
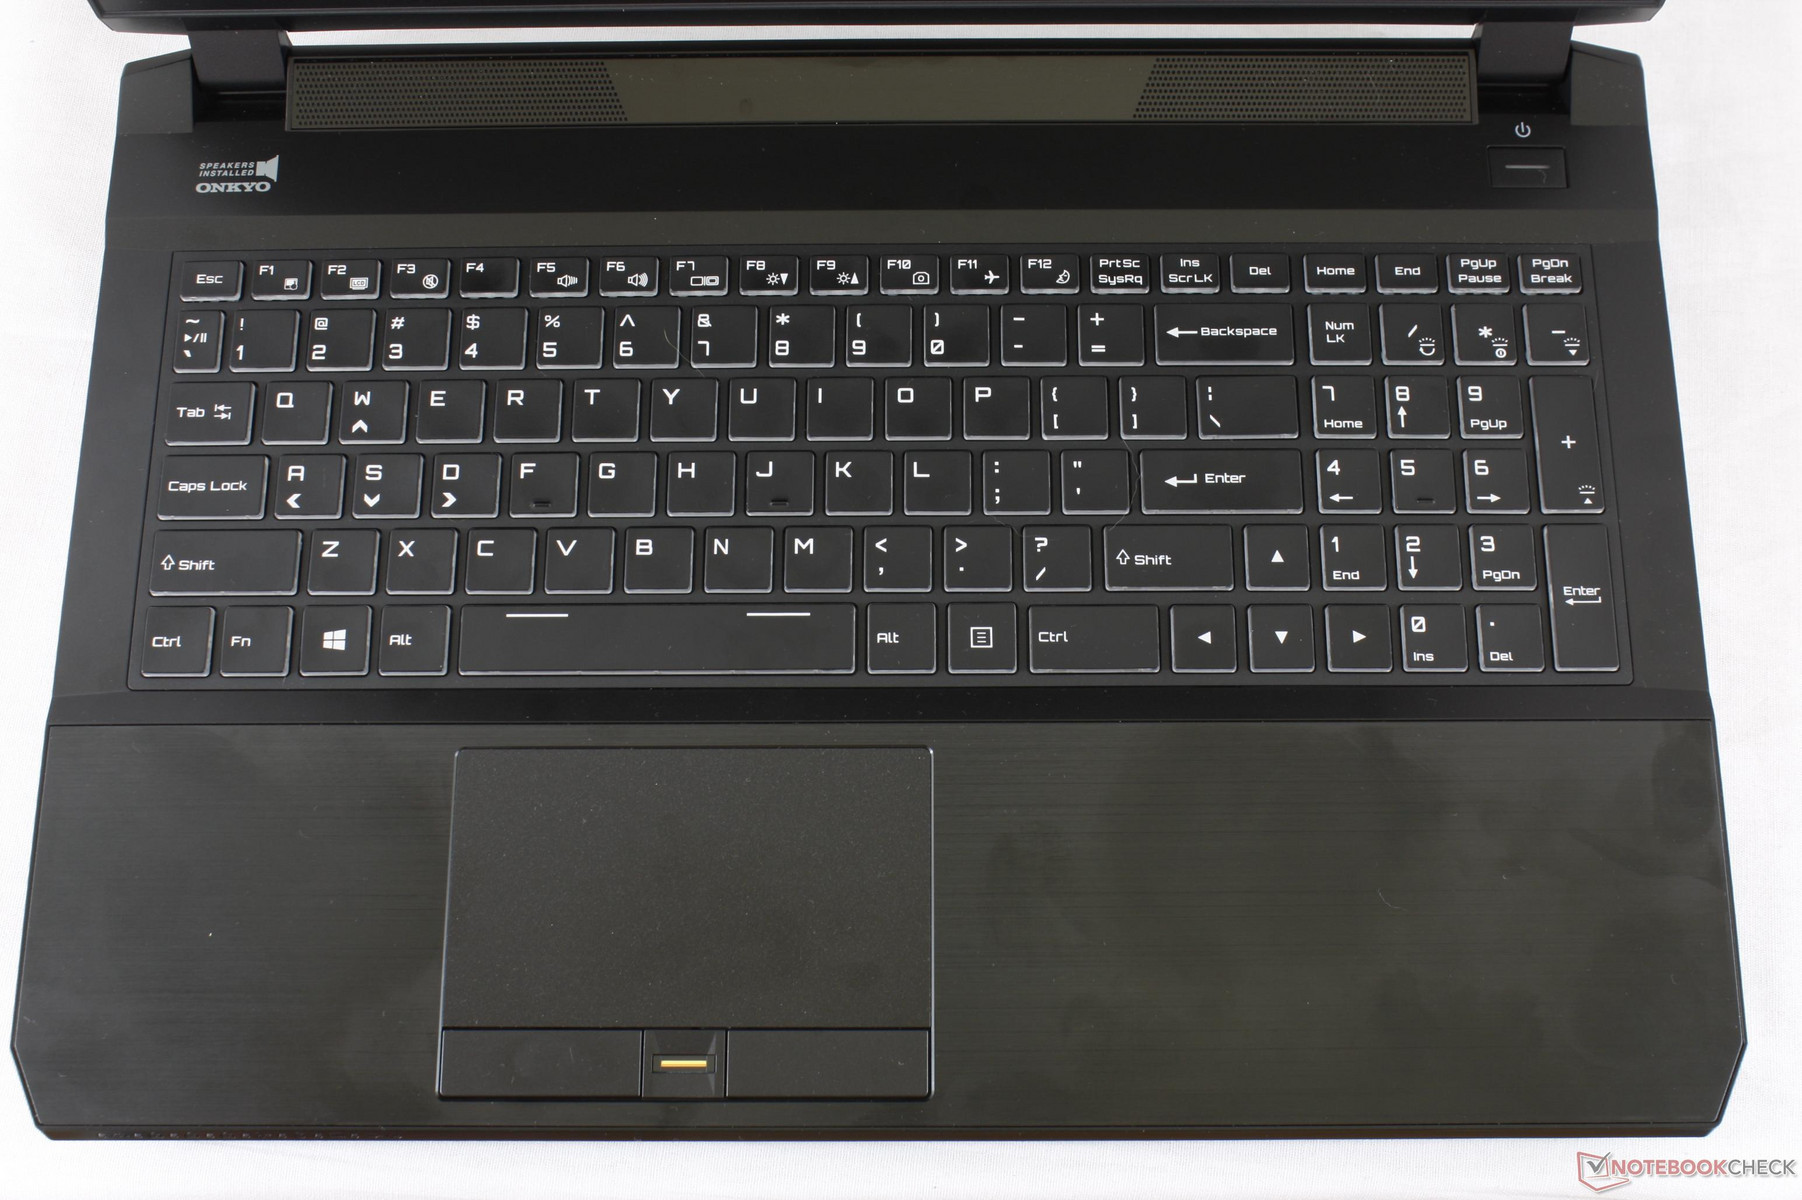
The full-size keyboard (34.5 x 10.5 cm) is softer in feedback than initially expected and exhibits low clatter as a result. It's not necessarily poor especially if users prefer a quieter typing experience, but individual keys feel spongier than on the XPS 15 and could have been firmer.
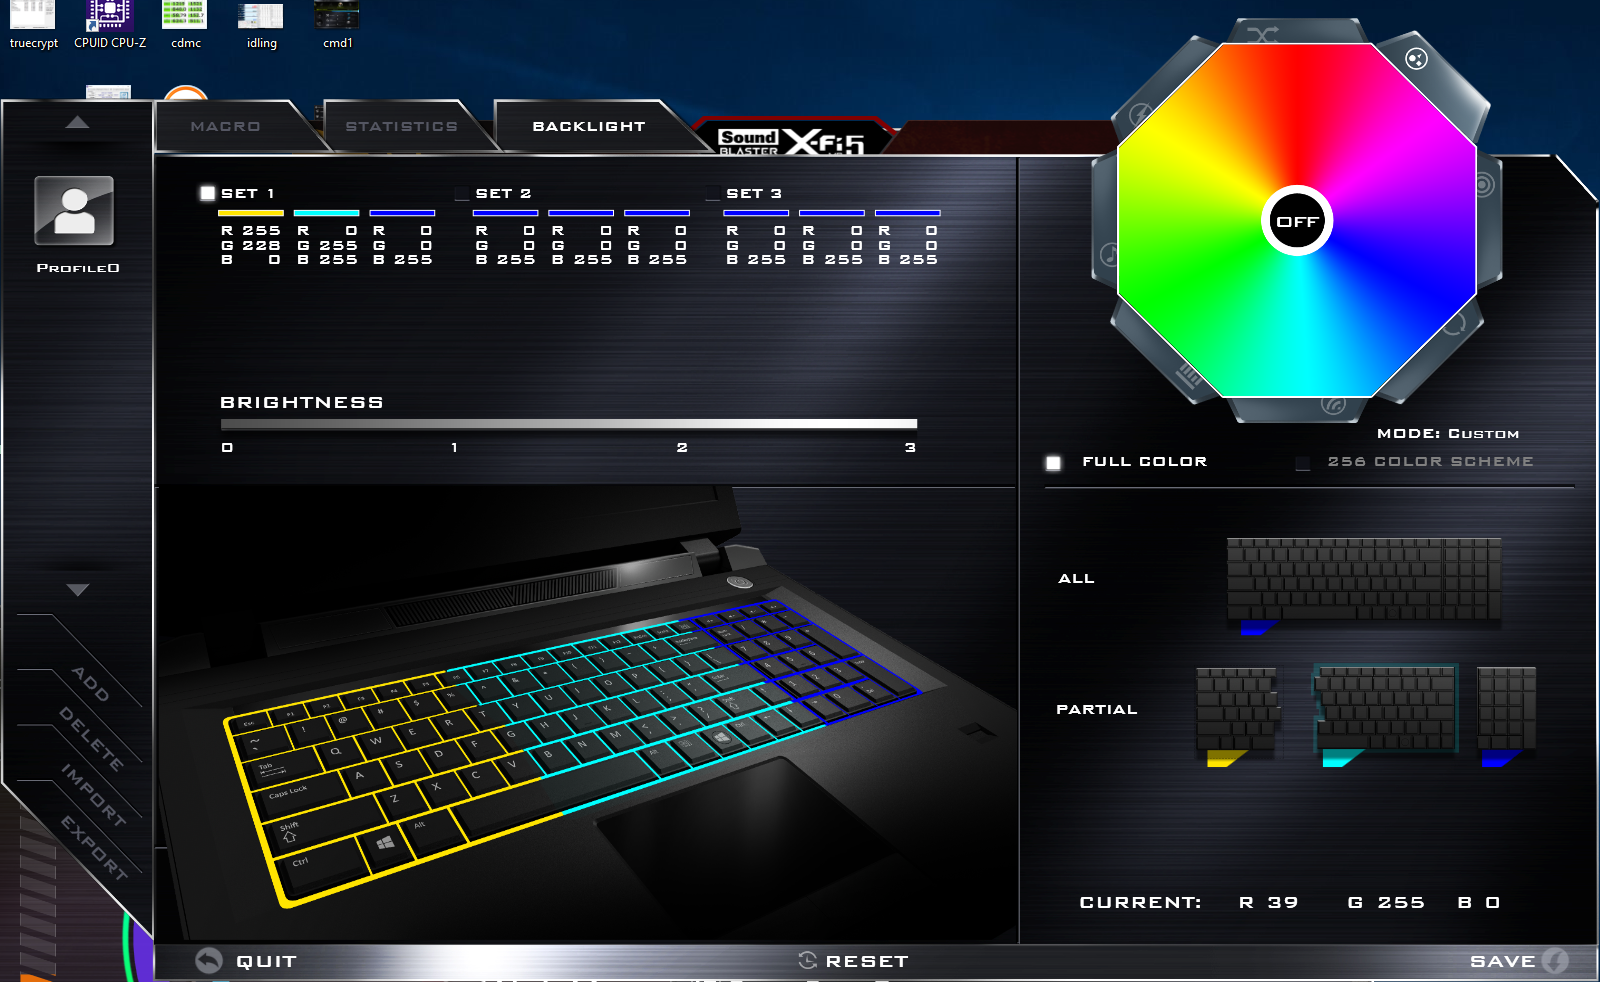
Full RGB backlighting is available and is split into three separate zones. We hope to see individually-lit RGB keys from more Clevo barebone systems as this is becoming common amongst enthusiast gaming notebooks.
Touchpad
The adequately-sized (11.0 x 6.5 cm) trackpad is larger than on the Alienware 15 R3 and has a smooth glide with a firm surface that barely yields to applied pressure. Its onscreen cursor is responsive with no jittering and can recognize up to four-finger gestures. We especially appreciate that the trackpad has defined edges and corners unlike on the completely flushed trackpad of the GT72 series. Overall, the trackpad works as one would expect with no notable issues. Some lighting options around the perimeter would have been a neat aesthetic addition.
The dedicated mouse keys are deeper in travel than on most gaming notebooks with softer and quieter feedback when pressed. The plastic keys feel slightly spongy as a result, but we still prefer this over systems with integrated clickpads.
Display
Display options are usually diverse on Eurocom systems and the Sky MX5 R3 is no exception. Users have the option between matte 1080p 60 Hz IPS, matte 1080p 120 Hz TN, matte 4K UHD 60 Hz IPS, glossy 4K UHD 60 Hz IPS, and semi-glossy 4K UHD 60 Hz IPS with varying levels of color coverage, response times, contrast ratios, and backlight brightness. Combinations such as matte 1080p 120 Hz IPS or matte 4K UHD 120 Hz IPS are still out of reach for gaming notebooks since such panels are not yet available in mass quantities for manufacturers to implement as of early 2017.
Our test model comes equipped with the matte 1080p 120 Hz TN option that we believe is the better panel for a gaming notebook considering the i7-7820HK CPU and GTX 1070 GPU. While IPS and 4K may have clearer images and wider viewing angles than our TN SKU, they often suffer from more ghosting and lower frame rates, respectively. Our measurements and analyses below reflect only the matte 1080p 120 Hz TN configuration.
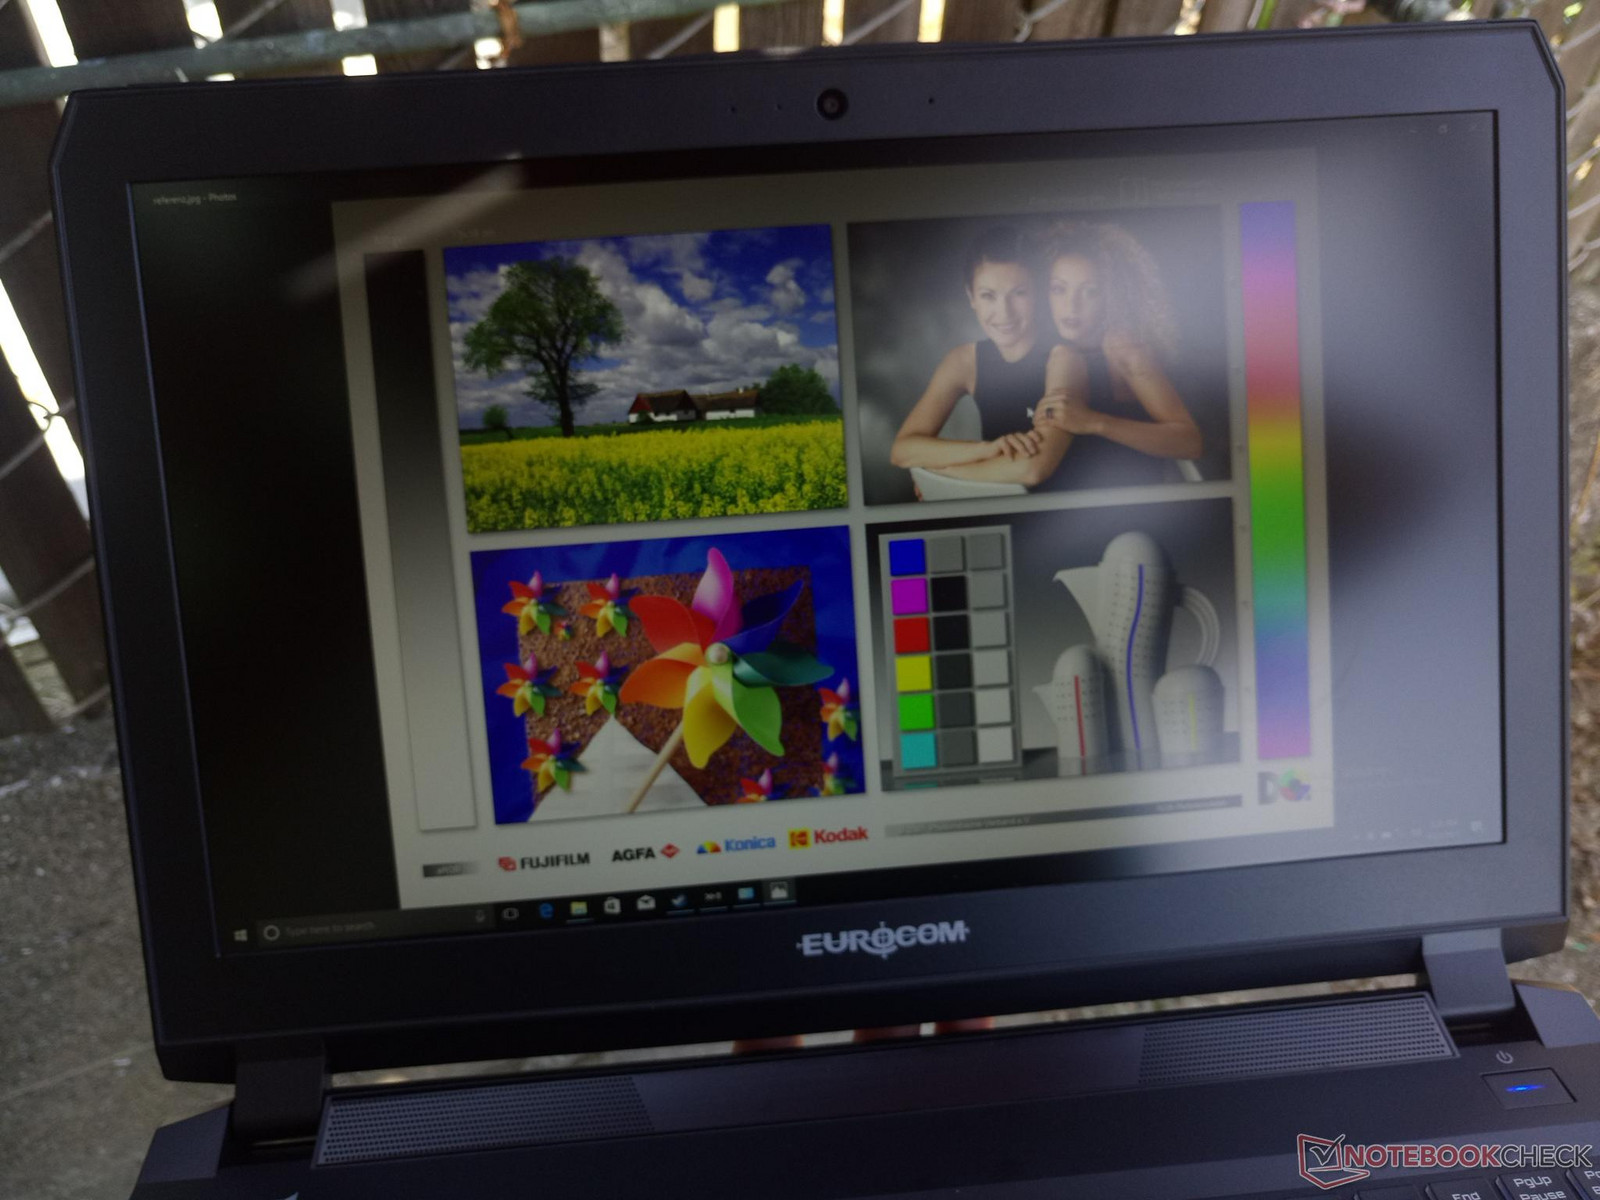
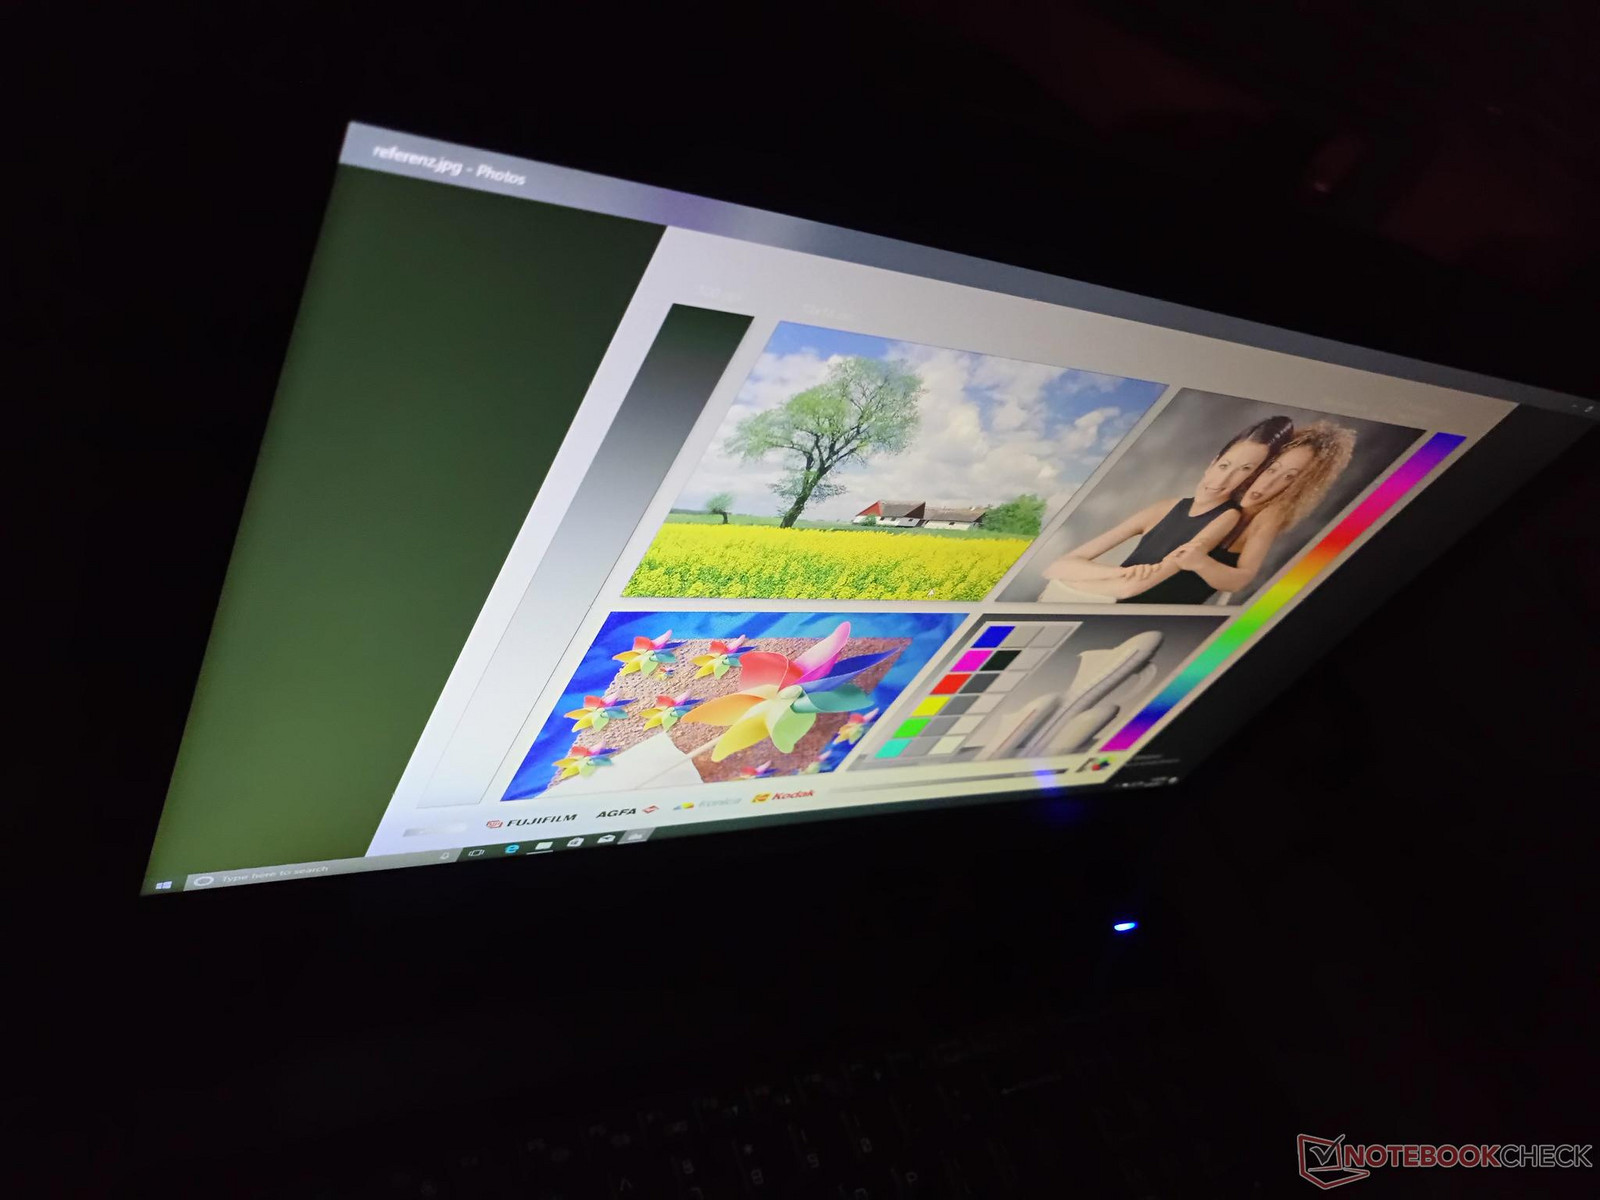
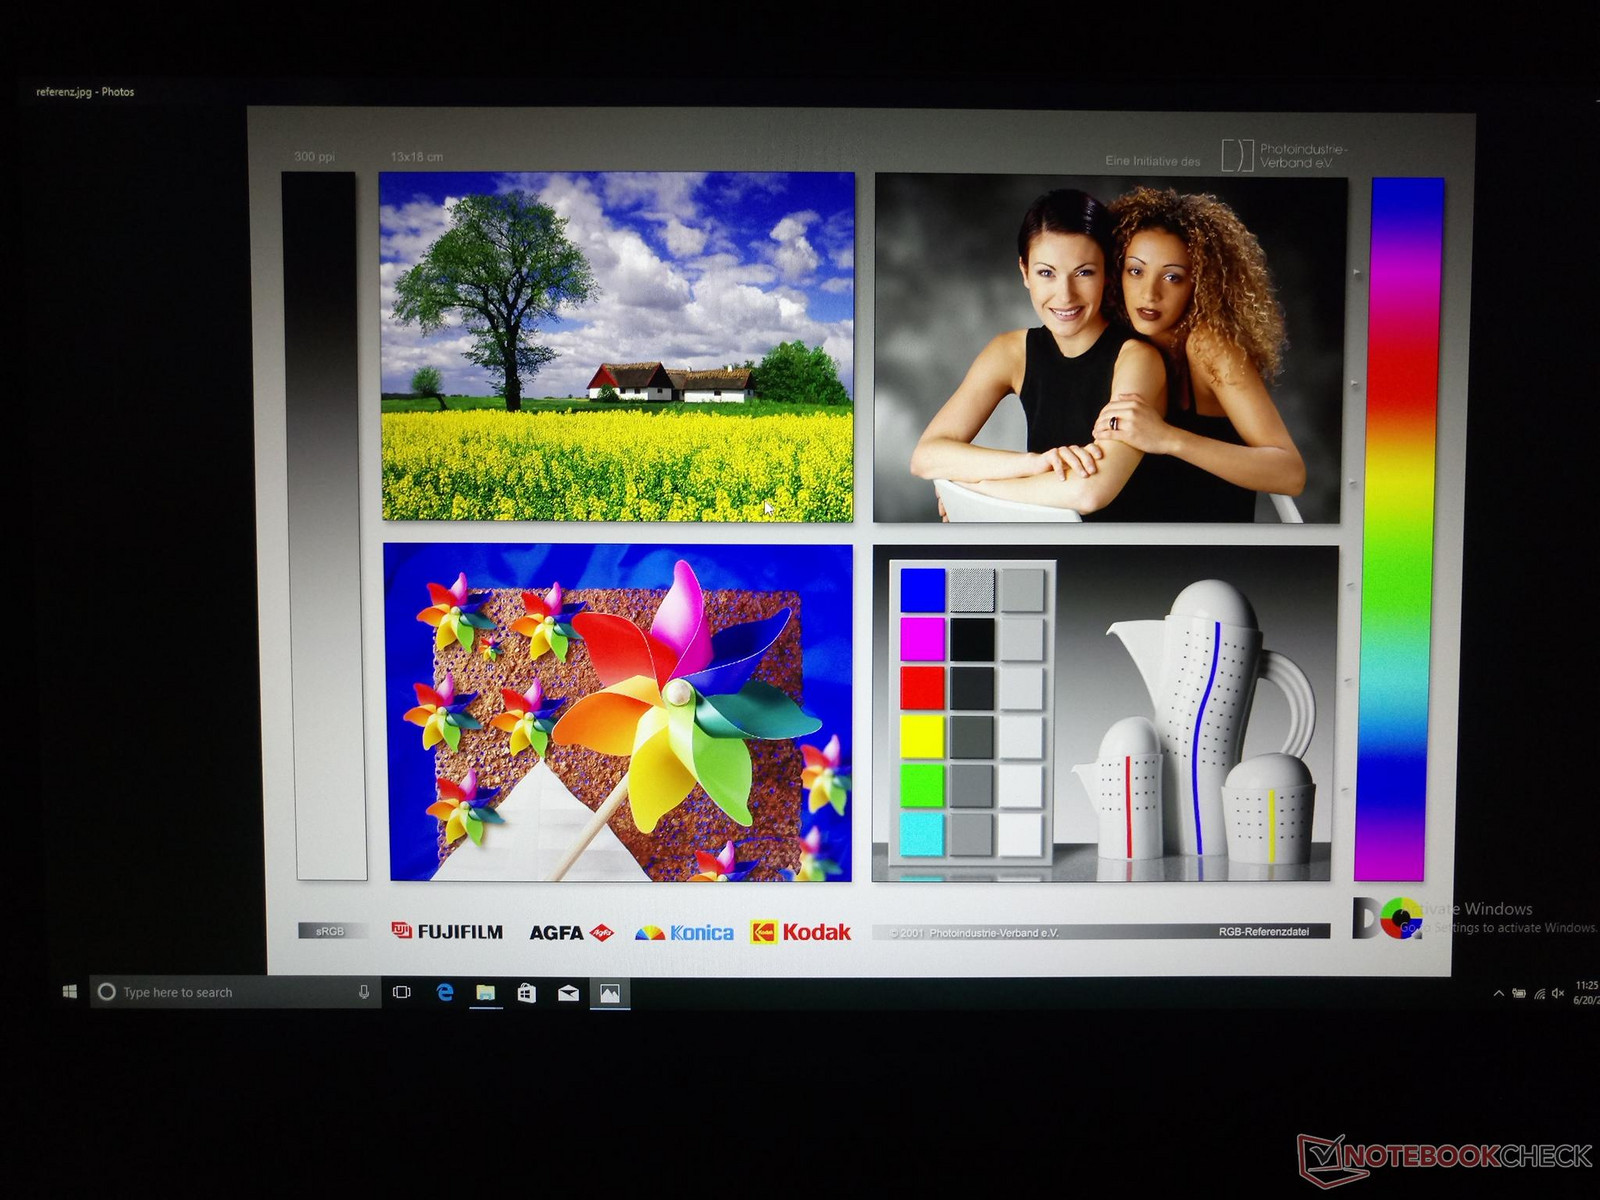
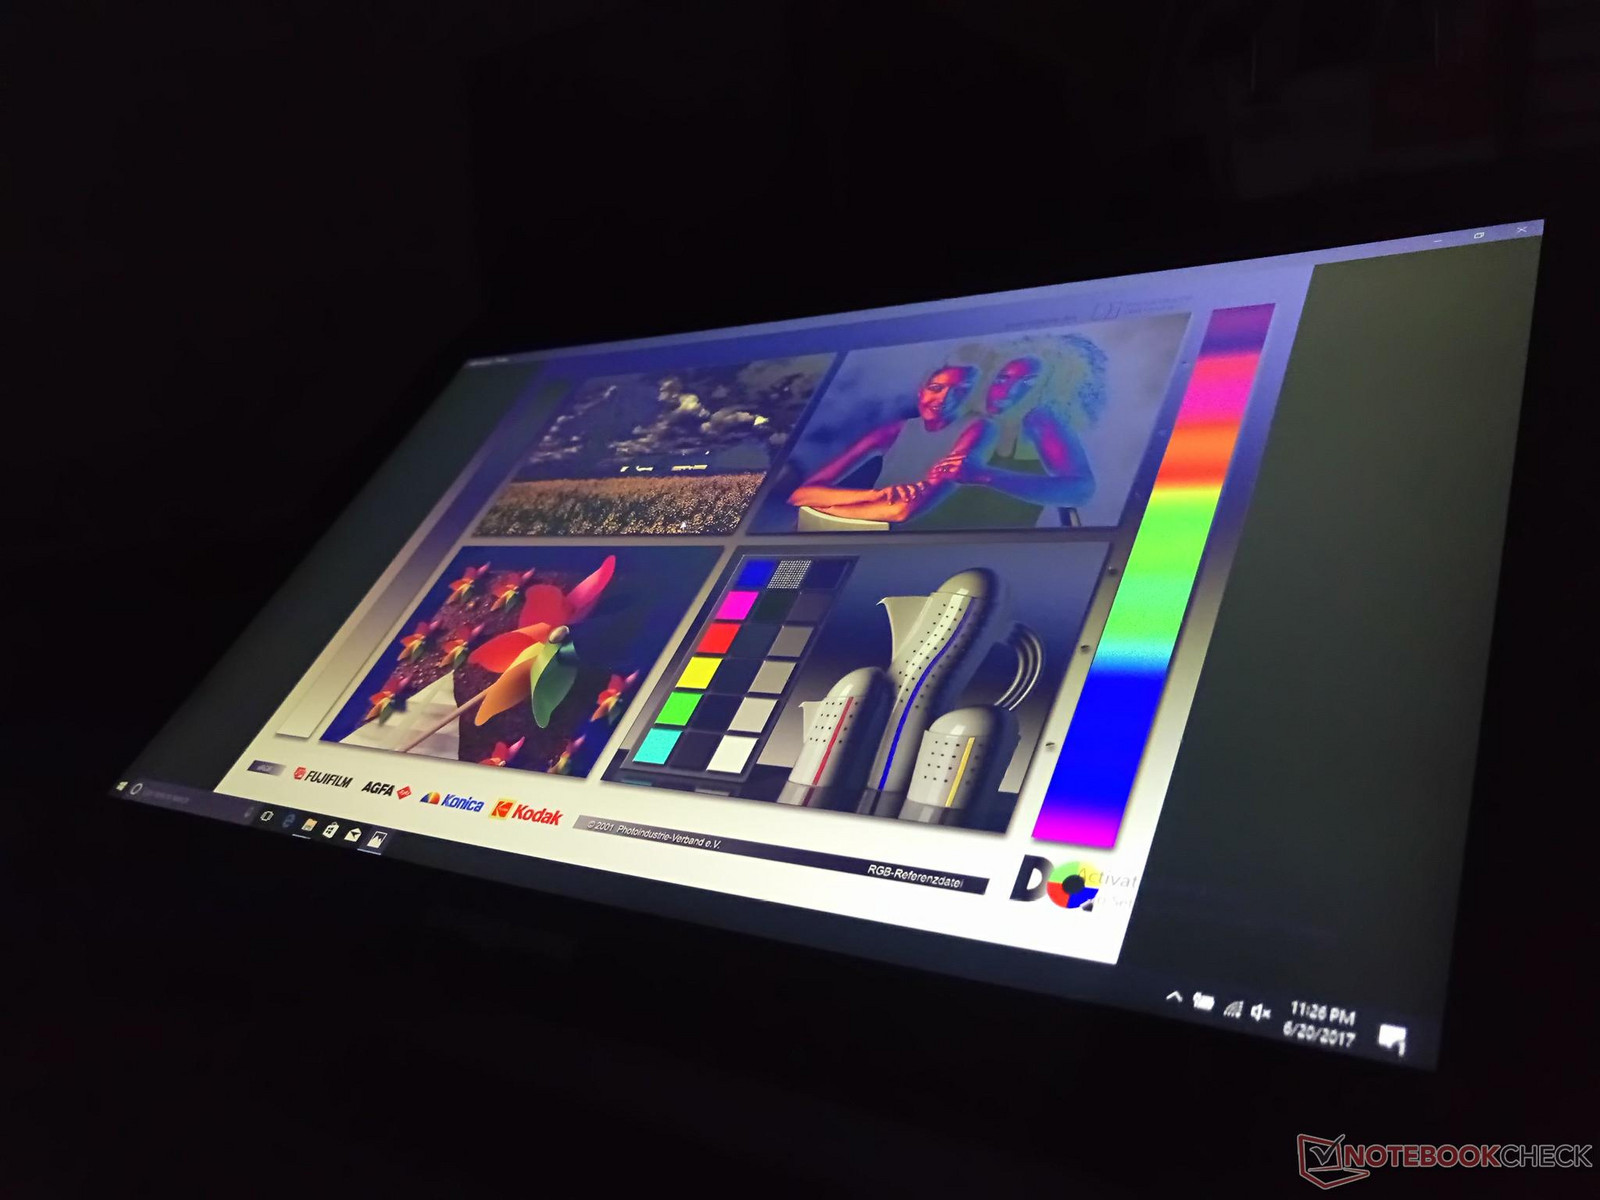
The highlights of the display are its very fast black-white and gray-gray response times and high refresh rate for a silky smooth gaming experience akin to a dedicated gaming monitor. The backlight is surprisingly bright as well and is one of the brighter panels we've tested on a gaming machine. The low contrast ratio of under 500:1 is the main disadvantage compared to the other display options and so darker scenes in movies and games will appear muddier with less fidelity.
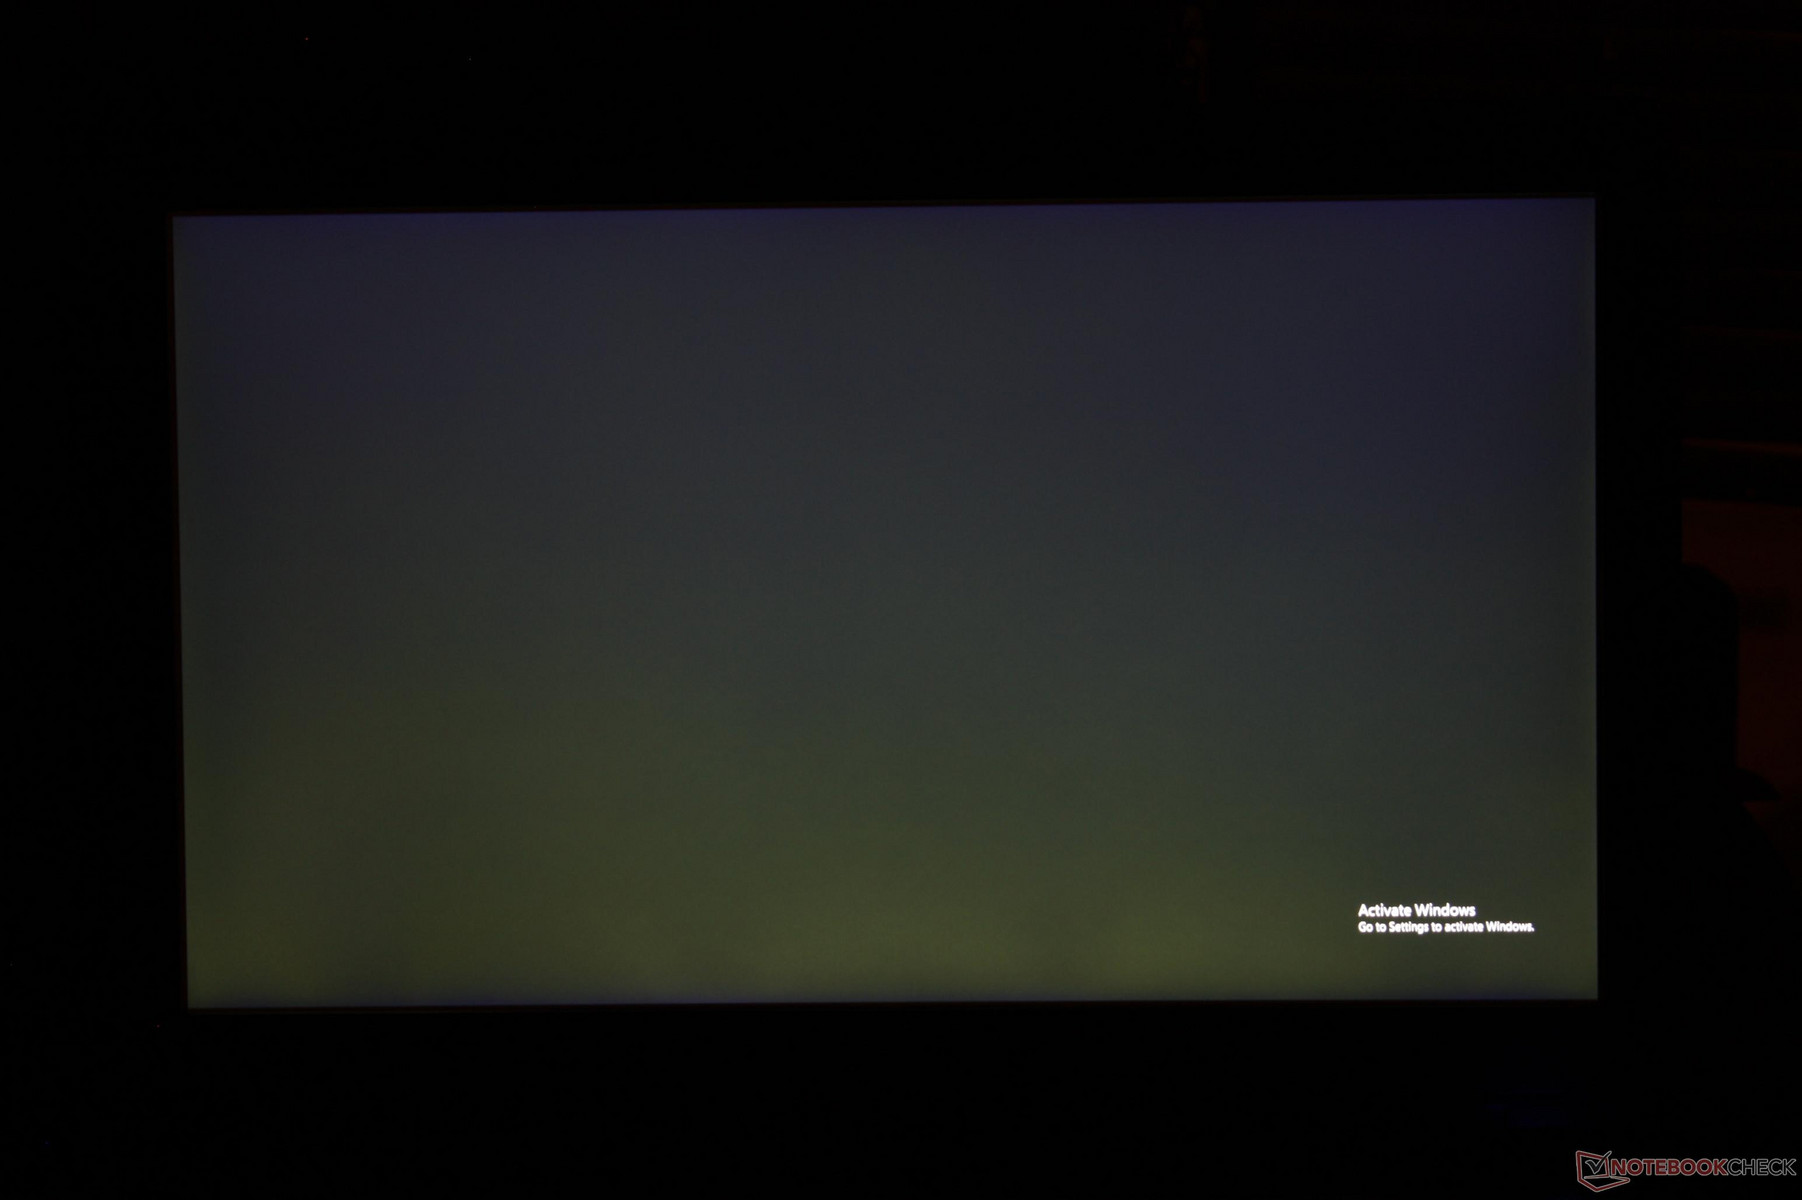
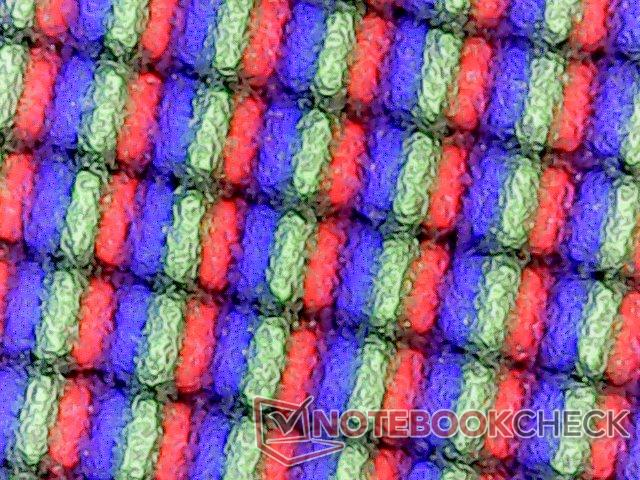
Uneven backlight bleeding is not an issue, but expect contrast and colors to degrade if viewing too far off from the sides. We can observe only a tiny bit of graininess on the screen if viewing up close and on maximum brightness. It's less noticeable here than on most other matte panels and is not significant enough to be distracting when gaming or browsing. Note that AU Optronics provides panels similar to the AUO52ED on some other 15-inch gaming notebooks including the Alienware 15 R3 and Schenker XMG U507.
| |||||||||||||||||||||||||
Brightness Distribution: 94 %
Center on Battery: 416.2 cd/m²
Contrast: 484:1 (Black: 0.86 cd/m²)
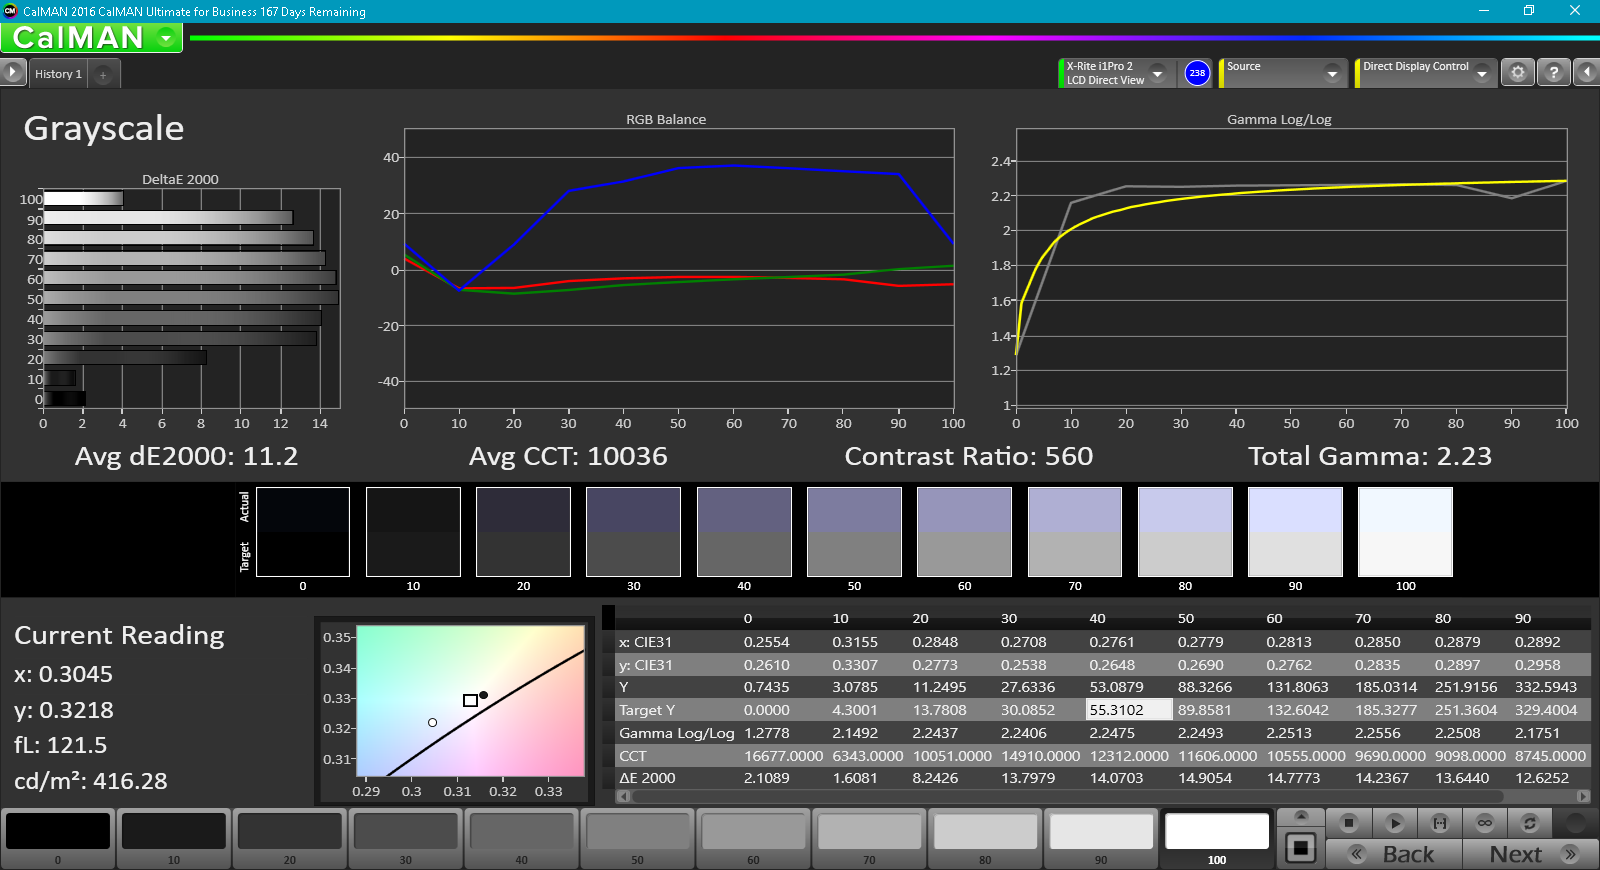
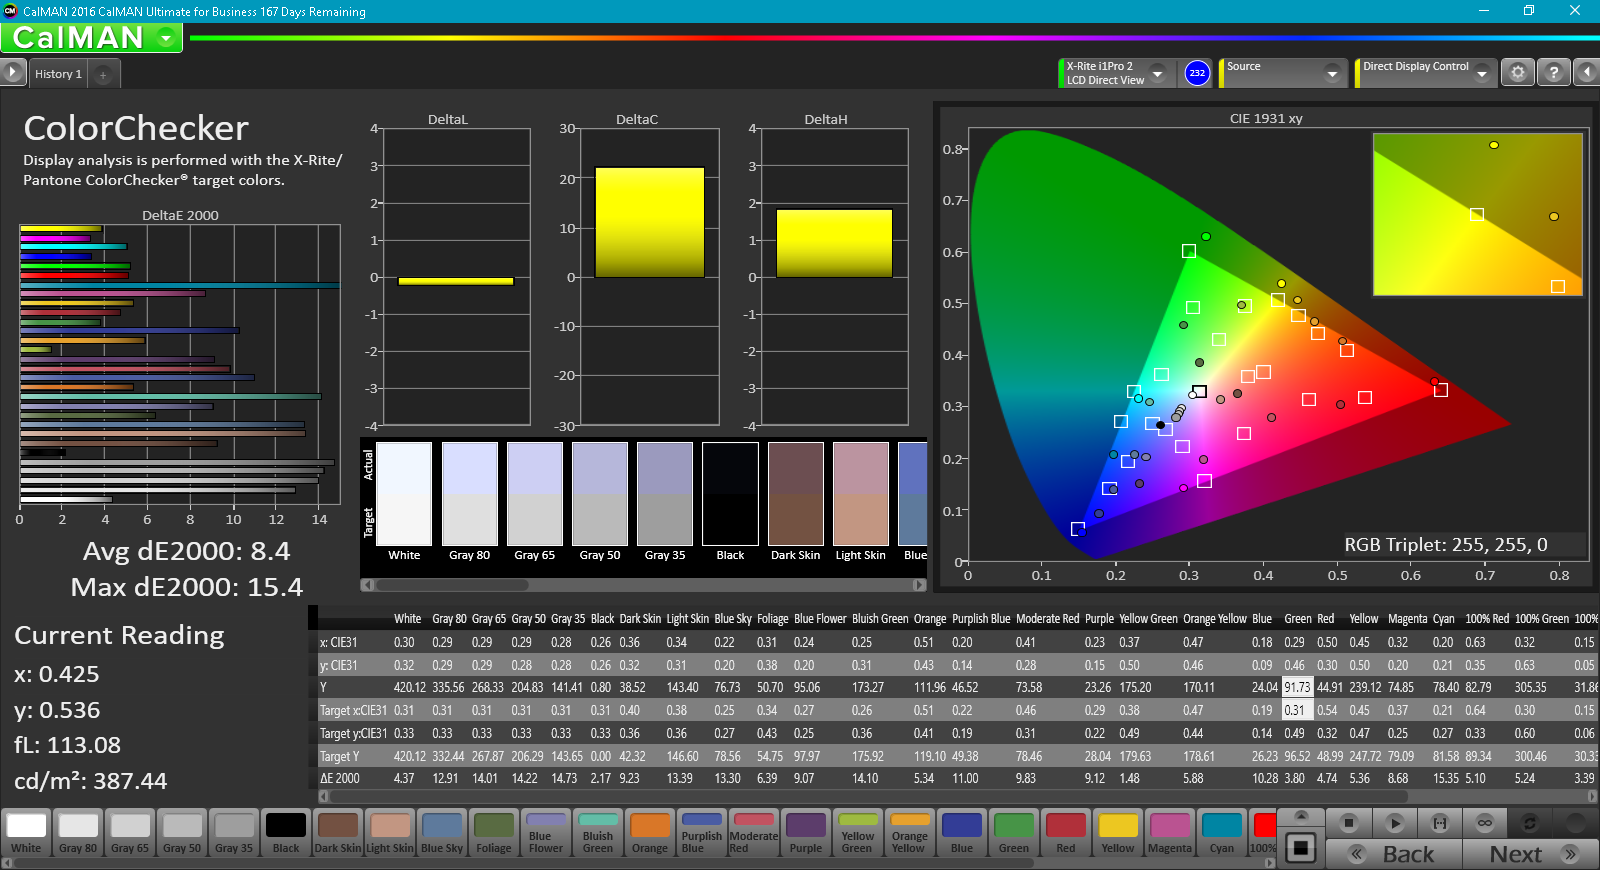
ΔE ColorChecker Calman: 8.4 | ∀{0.5-29.43 Ø4.71}
ΔE Greyscale Calman: 11.2 | ∀{0.09-98 Ø4.96}
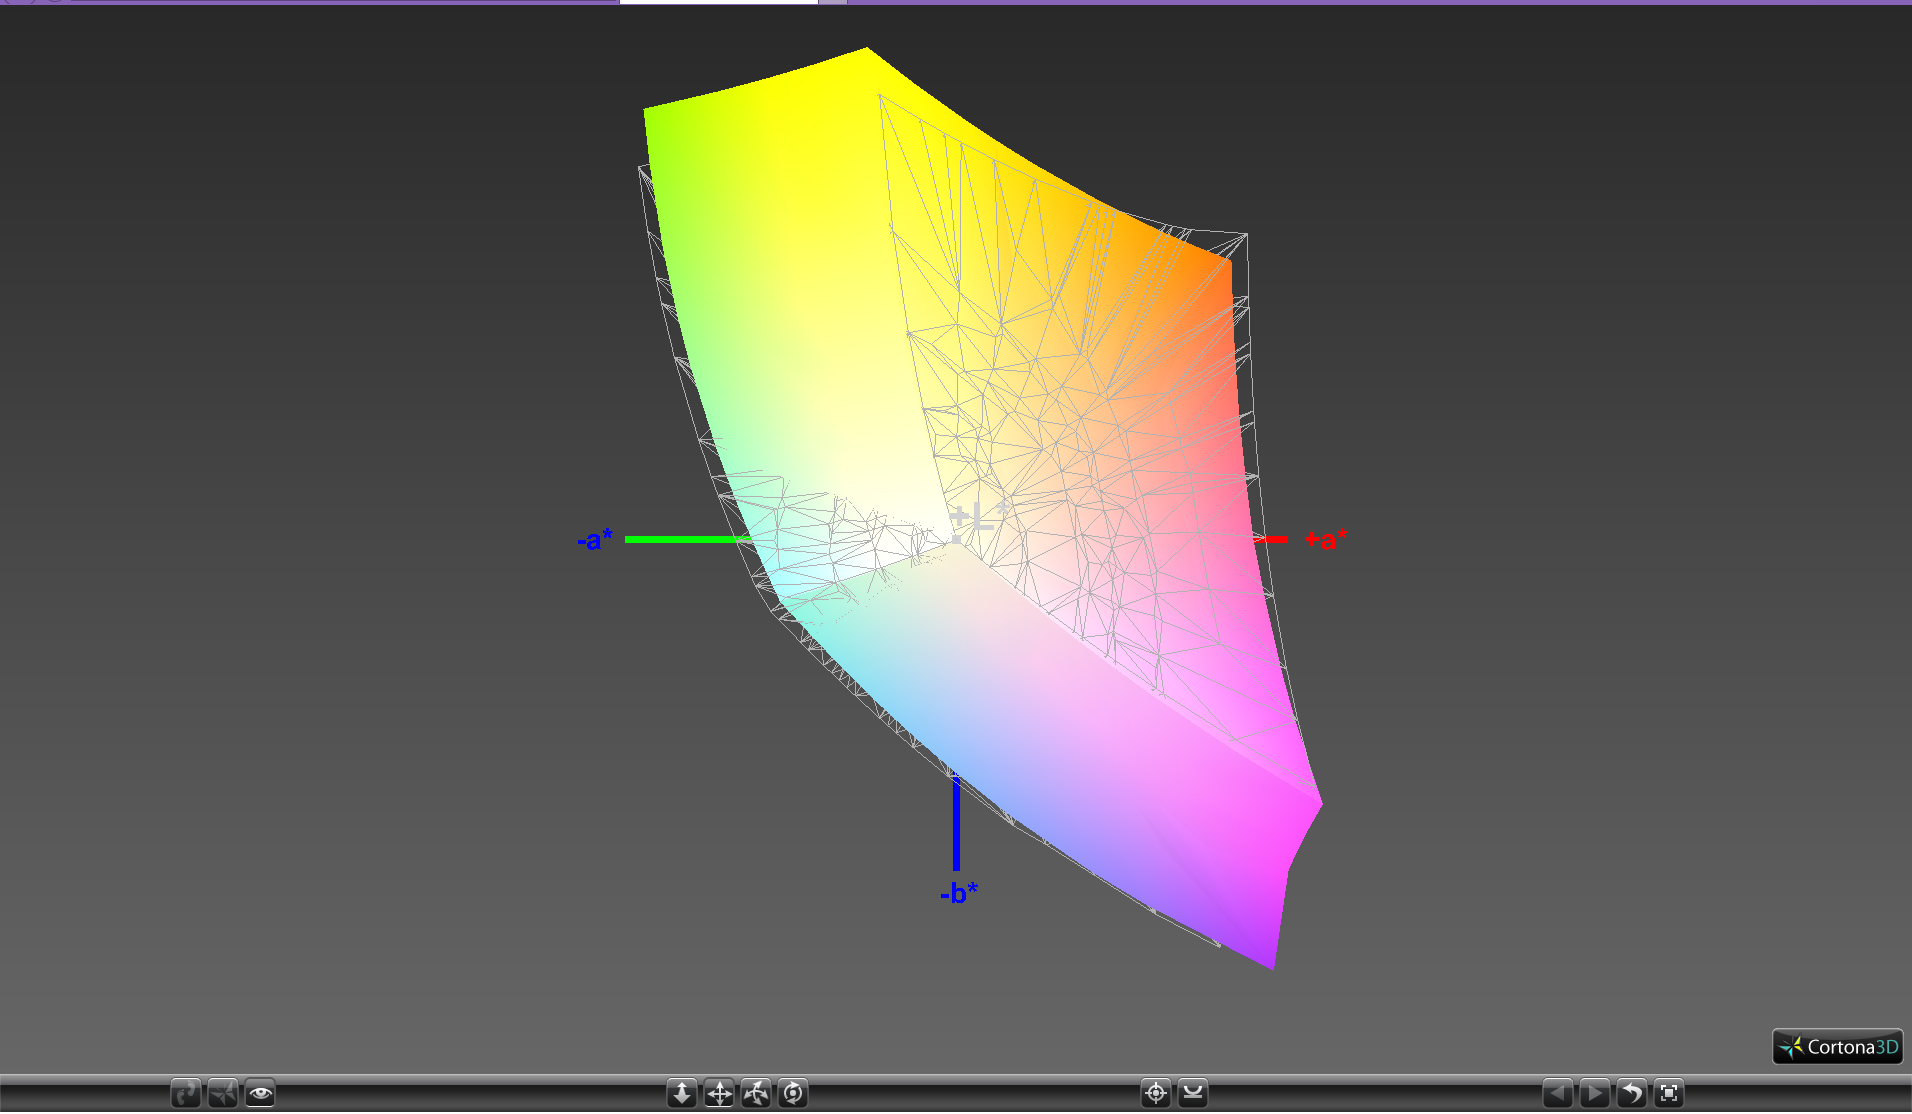
87.3% sRGB (Argyll 1.6.3 3D)
57.2% AdobeRGB 1998 (Argyll 1.6.3 3D)
64.2% AdobeRGB 1998 (Argyll 3D)
87.8% sRGB (Argyll 3D)
65.9% Display P3 (Argyll 3D)
Gamma: 2.23
CCT: 10036 K
| Eurocom Sky MX5 R3 ID: AUO52ED, Name: AU Optronics B156HTN05.2, , 15.6", 1920x1080 | Acer Predator 15 G9-593-751X LG Philips LP156WF6-SPP1 (LGD04D5), IPS, 15.6", 1920x1080 | Lenovo Legion Y520-15IKBN-80WK001KUS LP156WF6-SPK3, IPS, 15.6", 1920x1080 | Gigabyte Aero 15 N156HCA-EA1 (CMN15D7), IPS, 15.6", 1920x1080 | Alienware 15 R3 HPJGK_B156HTN (AUO51ED), TN, 15.6", 1920x1080 | MSI GT62VR 7RE-223 LG Philips LP156WF6 (LGD046F), IPS, 15.6", 1920x1080 | |
|---|---|---|---|---|---|---|
| Display | -2% | 3% | 2% | -4% | ||
| Display P3 Coverage (%) | 65.9 | 65.4 -1% | 65.2 -1% | 66 0% | 63.9 -3% | |
| sRGB Coverage (%) | 87.8 | 85.5 -3% | 92.5 5% | 90.5 3% | 83.1 -5% | |
| AdobeRGB 1998 Coverage (%) | 64.2 | 62.5 -3% | 66.5 4% | 66.2 3% | 60.8 -5% | |
| Response Times | -137% | -246% | -185% | -28% | -131% | |
| Response Time Grey 50% / Grey 80% * (ms) | 20.8 ? | 36 ? -73% | 58.8 ? -183% | 42.8 ? -106% | 25 ? -20% | 37 ? -78% |
| Response Time Black / White * (ms) | 8.8 ? | 26.4 ? -200% | 36 ? -309% | 32 ? -264% | 12 ? -36% | 25 ? -184% |
| PWM Frequency (Hz) | 20830 ? | 21550 ? | 26000 ? | |||
| Screen | 22% | -6% | 23% | 13% | 25% | |
| Brightness middle (cd/m²) | 416.2 | 295 -29% | 239 -43% | 320 -23% | 386 -7% | 310 -26% |
| Brightness (cd/m²) | 409 | 274 -33% | 244 -40% | 316 -23% | 382 -7% | 311 -24% |
| Brightness Distribution (%) | 94 | 88 -6% | 88 -6% | 90 -4% | 93 -1% | 85 -10% |
| Black Level * (cd/m²) | 0.86 | 0.32 63% | 0.35 59% | 0.36 58% | 0.39 55% | 0.3 65% |
| Contrast (:1) | 484 | 922 90% | 683 41% | 889 84% | 990 105% | 1033 113% |
| Colorchecker dE 2000 * | 8.4 | 4.59 45% | 7.3 13% | 4.62 45% | 10.2 -21% | 4.82 43% |
| Colorchecker dE 2000 max. * | 15.4 | 11 29% | 24.7 -60% | 9.75 37% | 15.81 -3% | 10.14 34% |
| Greyscale dE 2000 * | 11.2 | 4.03 64% | 4.9 56% | 6 46% | 11.28 -1% | 3.94 65% |
| Gamma | 2.23 99% | 2.3 96% | 2.19 100% | 2.46 89% | 2.23 99% | 2.45 90% |
| CCT | 10036 65% | 7229 90% | 7332 89% | 6761 96% | 11383 57% | 6877 95% |
| Color Space (Percent of AdobeRGB 1998) (%) | 57.2 | 56 -2% | 35 -39% | 60 5% | 59 3% | 54 -6% |
| Color Space (Percent of sRGB) (%) | 87.3 | 85 -3% | 55 -37% | 92 5% | 90 3% | 83 -5% |
| Total Average (Program / Settings) | -39% /
-4% | -126% /
-46% | -53% /
-9% | -4% /
5% | -37% /
-2% |
* ... smaller is better
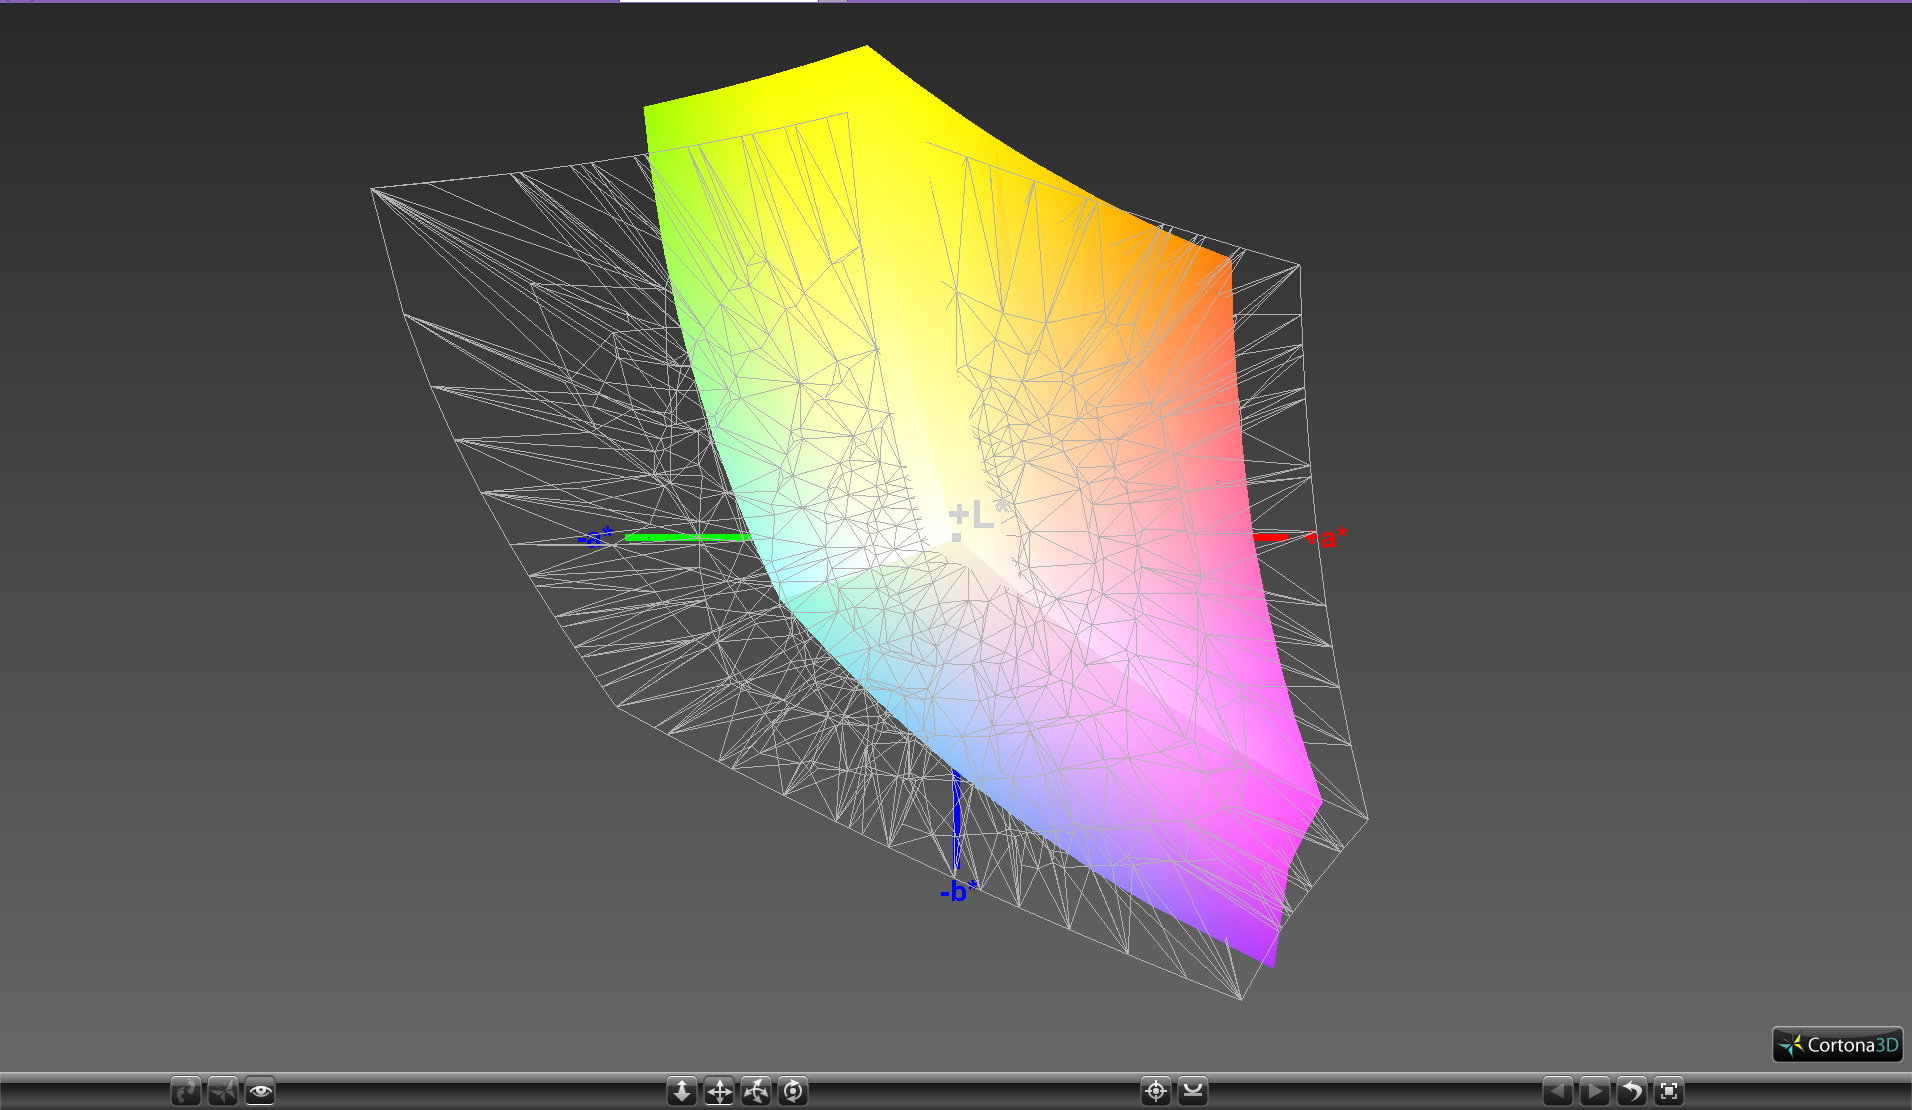
Color coverage is approximately 87 percent and 57 percent of the sRGB and AdobeRGB standards, respectively. This is very similar to the LG Philips panel on the Predator 15 and is indicative of a high-end TN panel. While relatively unimportant for gaming, certain manufacturers like Gigabyte and Razer offer wider color gamuts for deeper and potentially more accurate colors.

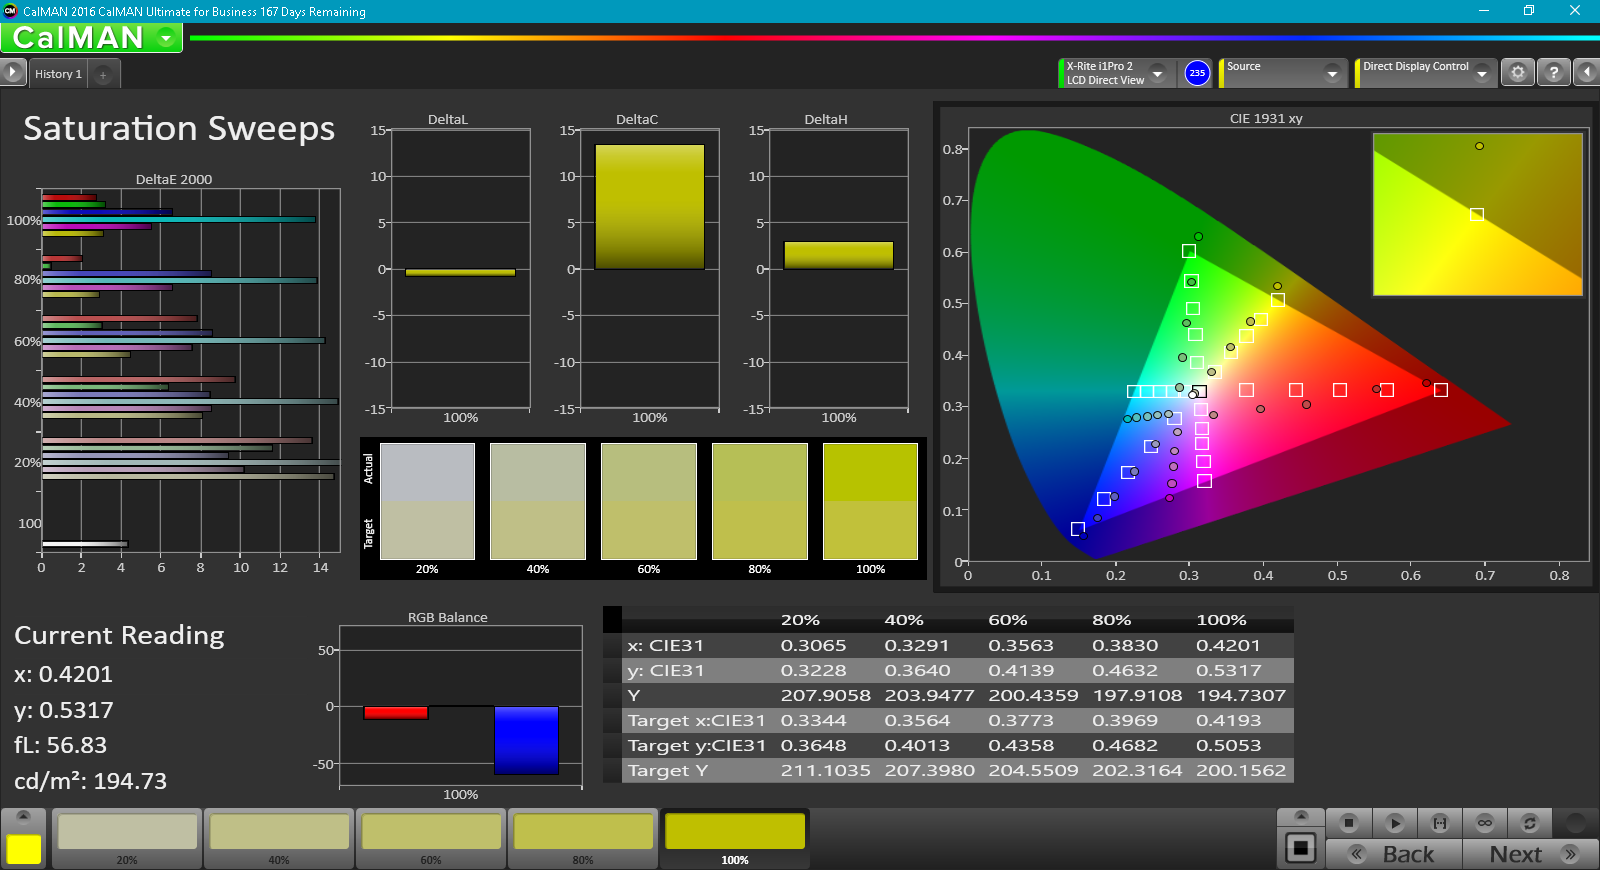
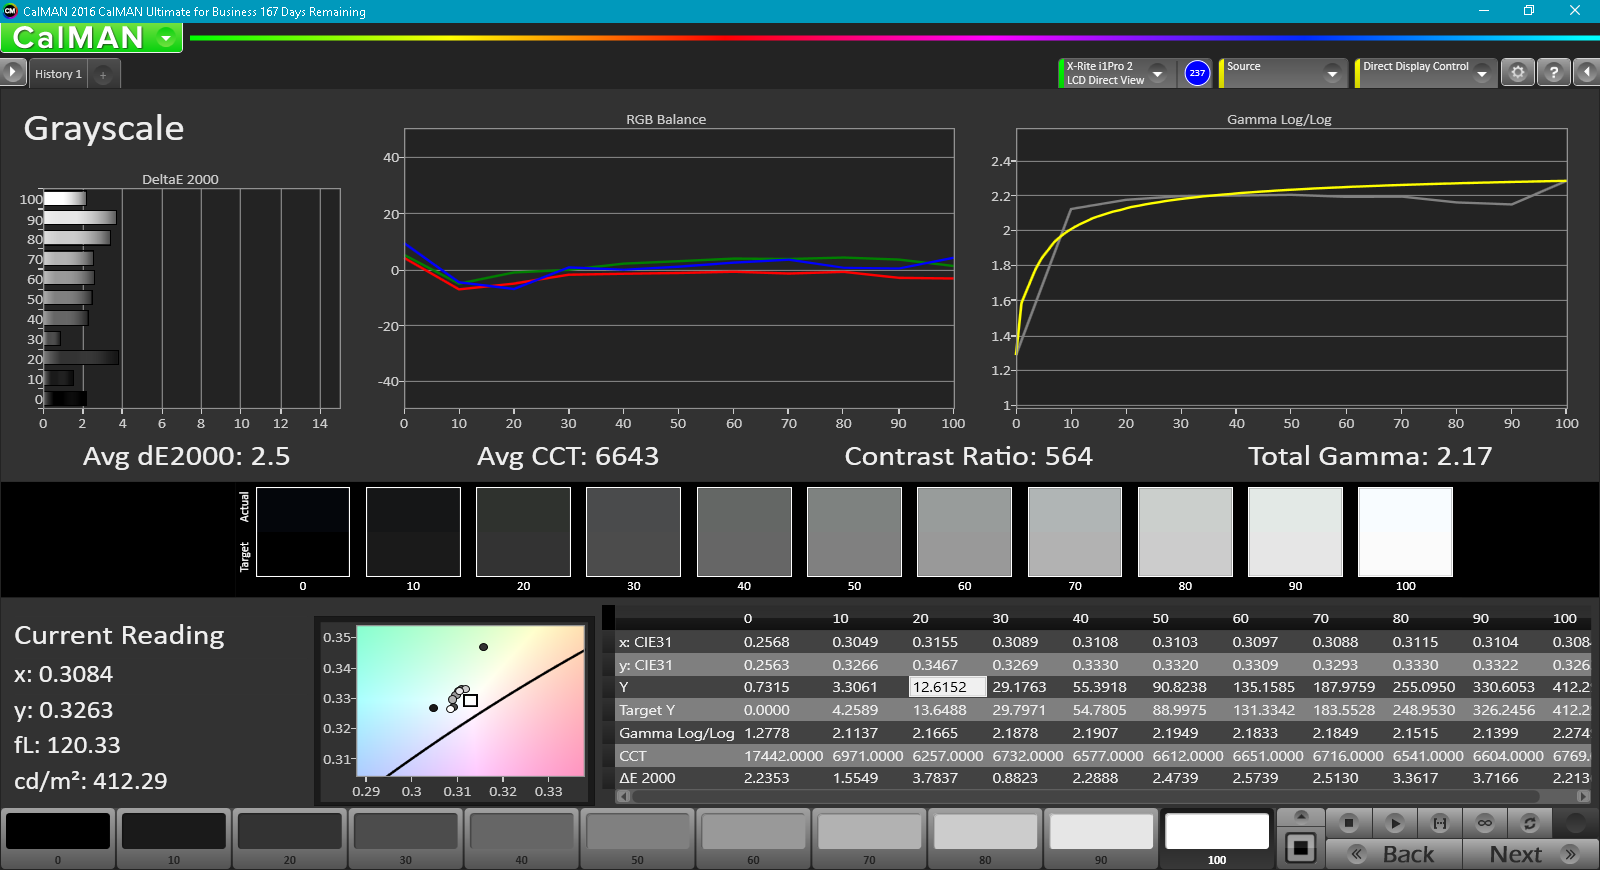
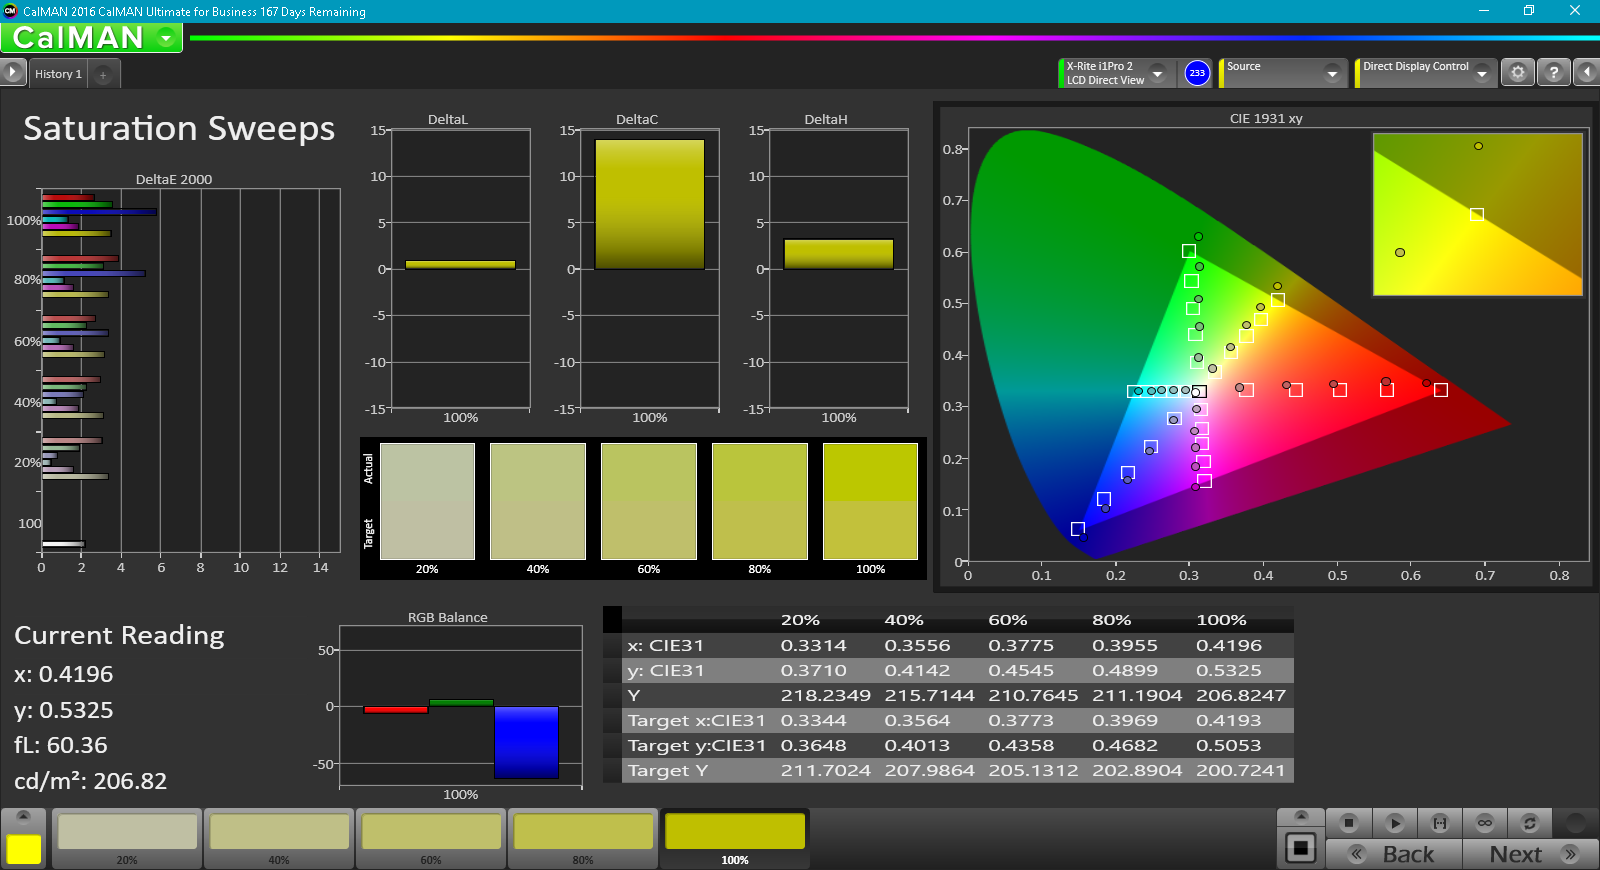
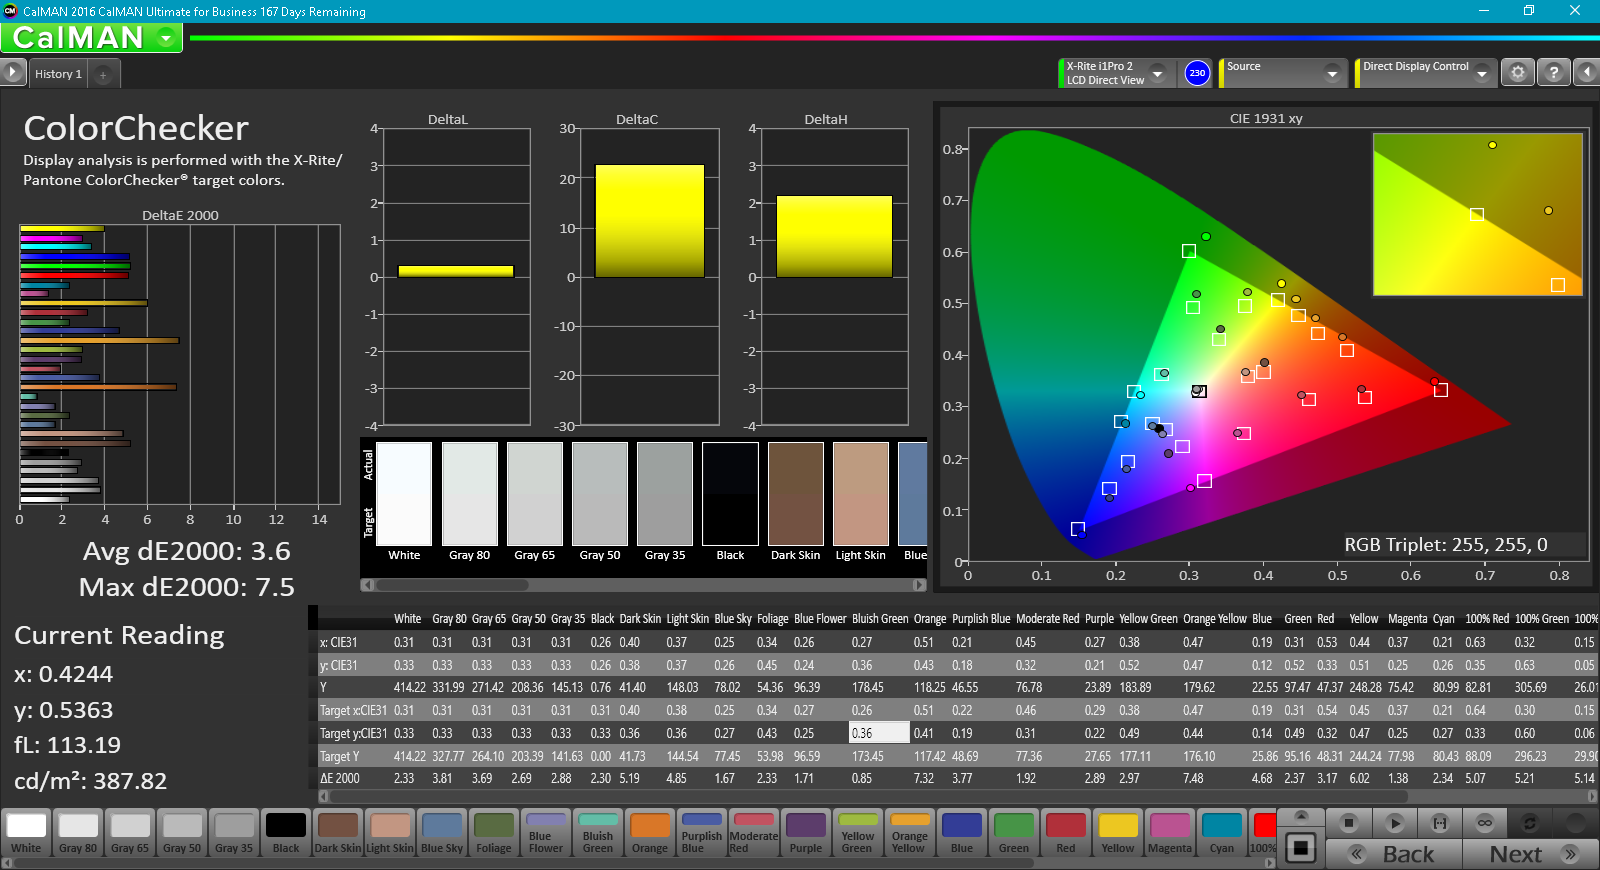
Further measurements with an X-Rite spectrophotometer reveal very inaccurate grayscale and colors prior to any calibration efforts. Color temperature is much too cool against the sRGB standard and all colors are negatively impacted. The display improves dramatically after calibration with a low DeltaE average as shown by our CalMan measurements below. Blue and orange colors are represented slightly less accurately than others.
Display Response Times
| ↔ Response Time Black to White | ||
|---|---|---|
| 8.8 ms ... rise ↗ and fall ↘ combined | ↗ 6.8 ms rise | 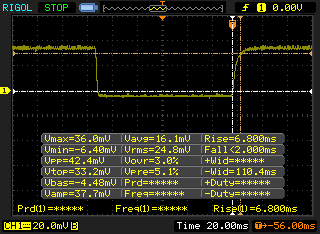 |
| ↘ 2 ms fall | ||
| The screen shows fast response rates in our tests and should be suited for gaming. In comparison, all tested devices range from 0.1 (minimum) to 240 (maximum) ms. » 25 % of all devices are better. This means that the measured response time is better than the average of all tested devices (19.8 ms). | ||
| ↔ Response Time 50% Grey to 80% Grey | ||
| 20.8 ms ... rise ↗ and fall ↘ combined | ↗ 11.6 ms rise | 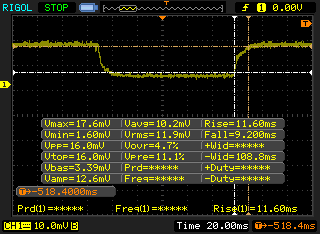 |
| ↘ 9.2 ms fall | ||
| The screen shows good response rates in our tests, but may be too slow for competitive gamers. In comparison, all tested devices range from 0.165 (minimum) to 636 (maximum) ms. » 33 % of all devices are better. This means that the measured response time is better than the average of all tested devices (31 ms). | ||
Screen Flickering / PWM (Pulse-Width Modulation)
| Screen flickering / PWM not detected | 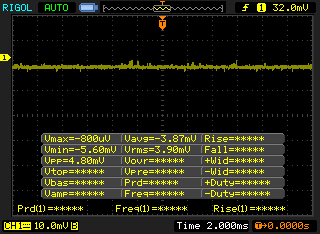 | ||
In comparison: 52 % of all tested devices do not use PWM to dim the display. If PWM was detected, an average of 7757 (minimum: 5 - maximum: 343500) Hz was measured. | |||
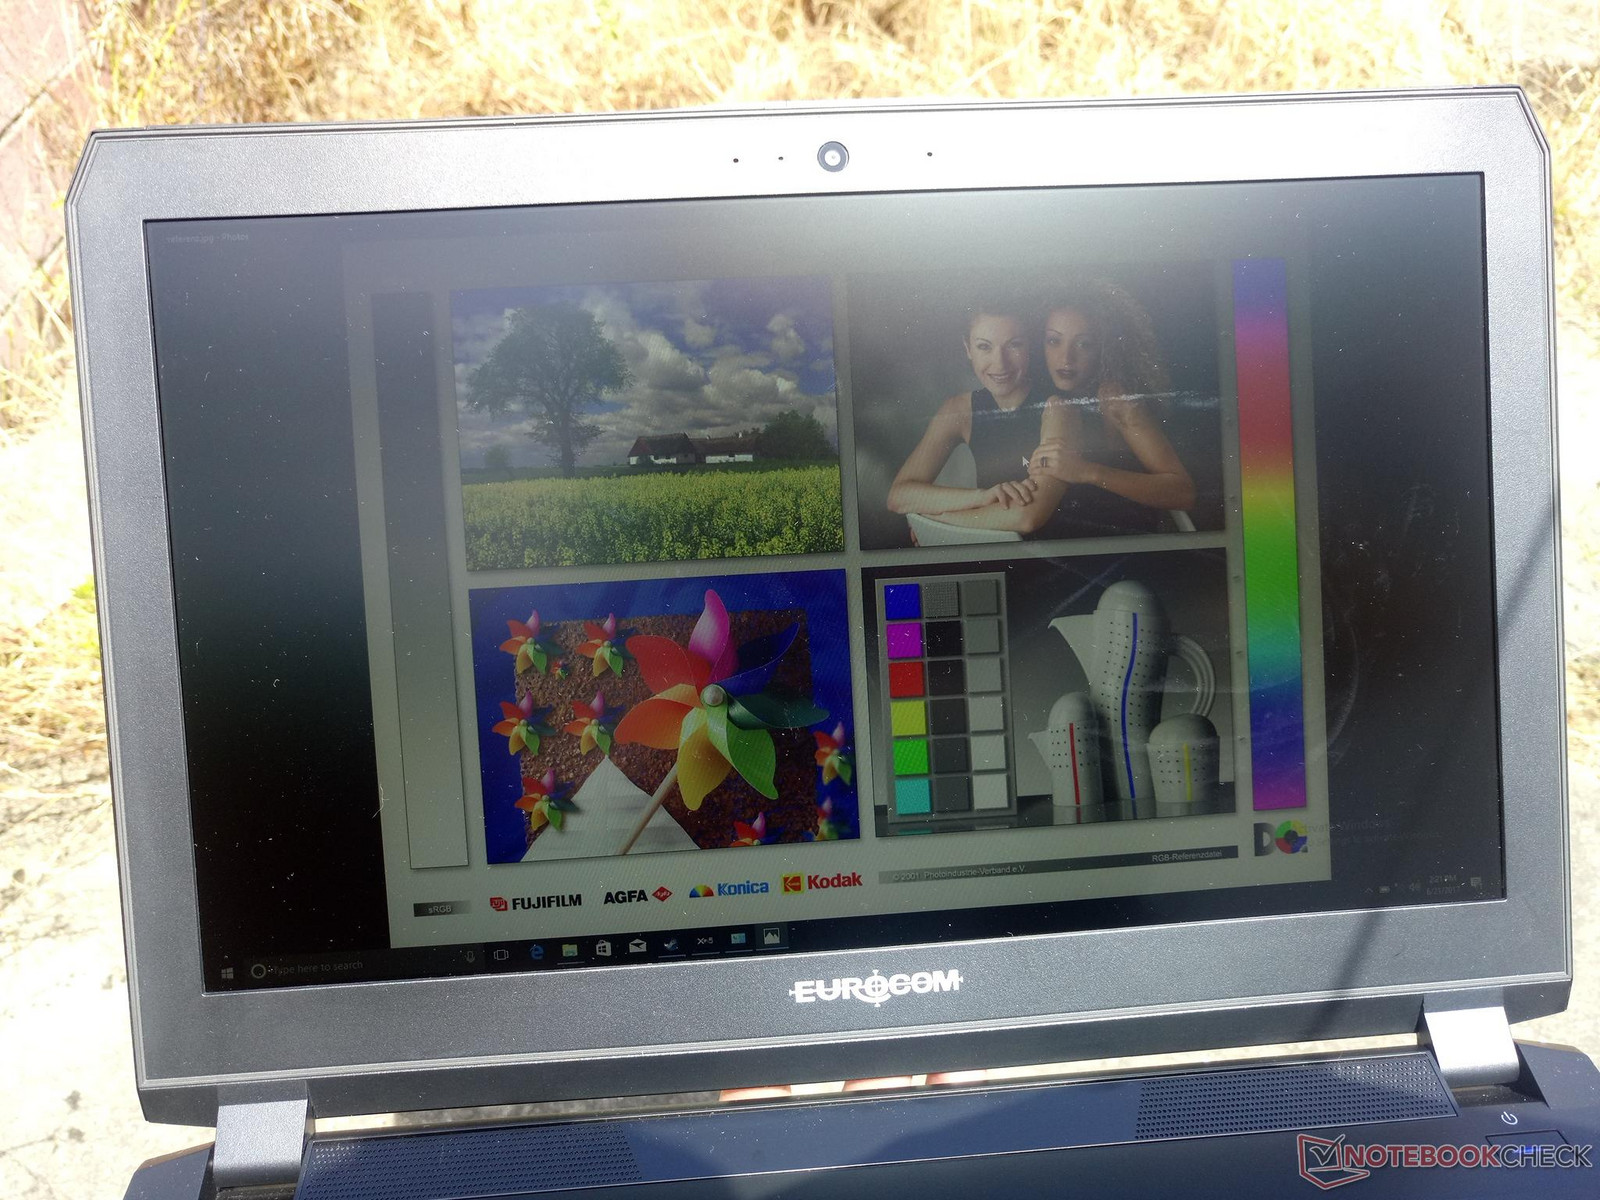
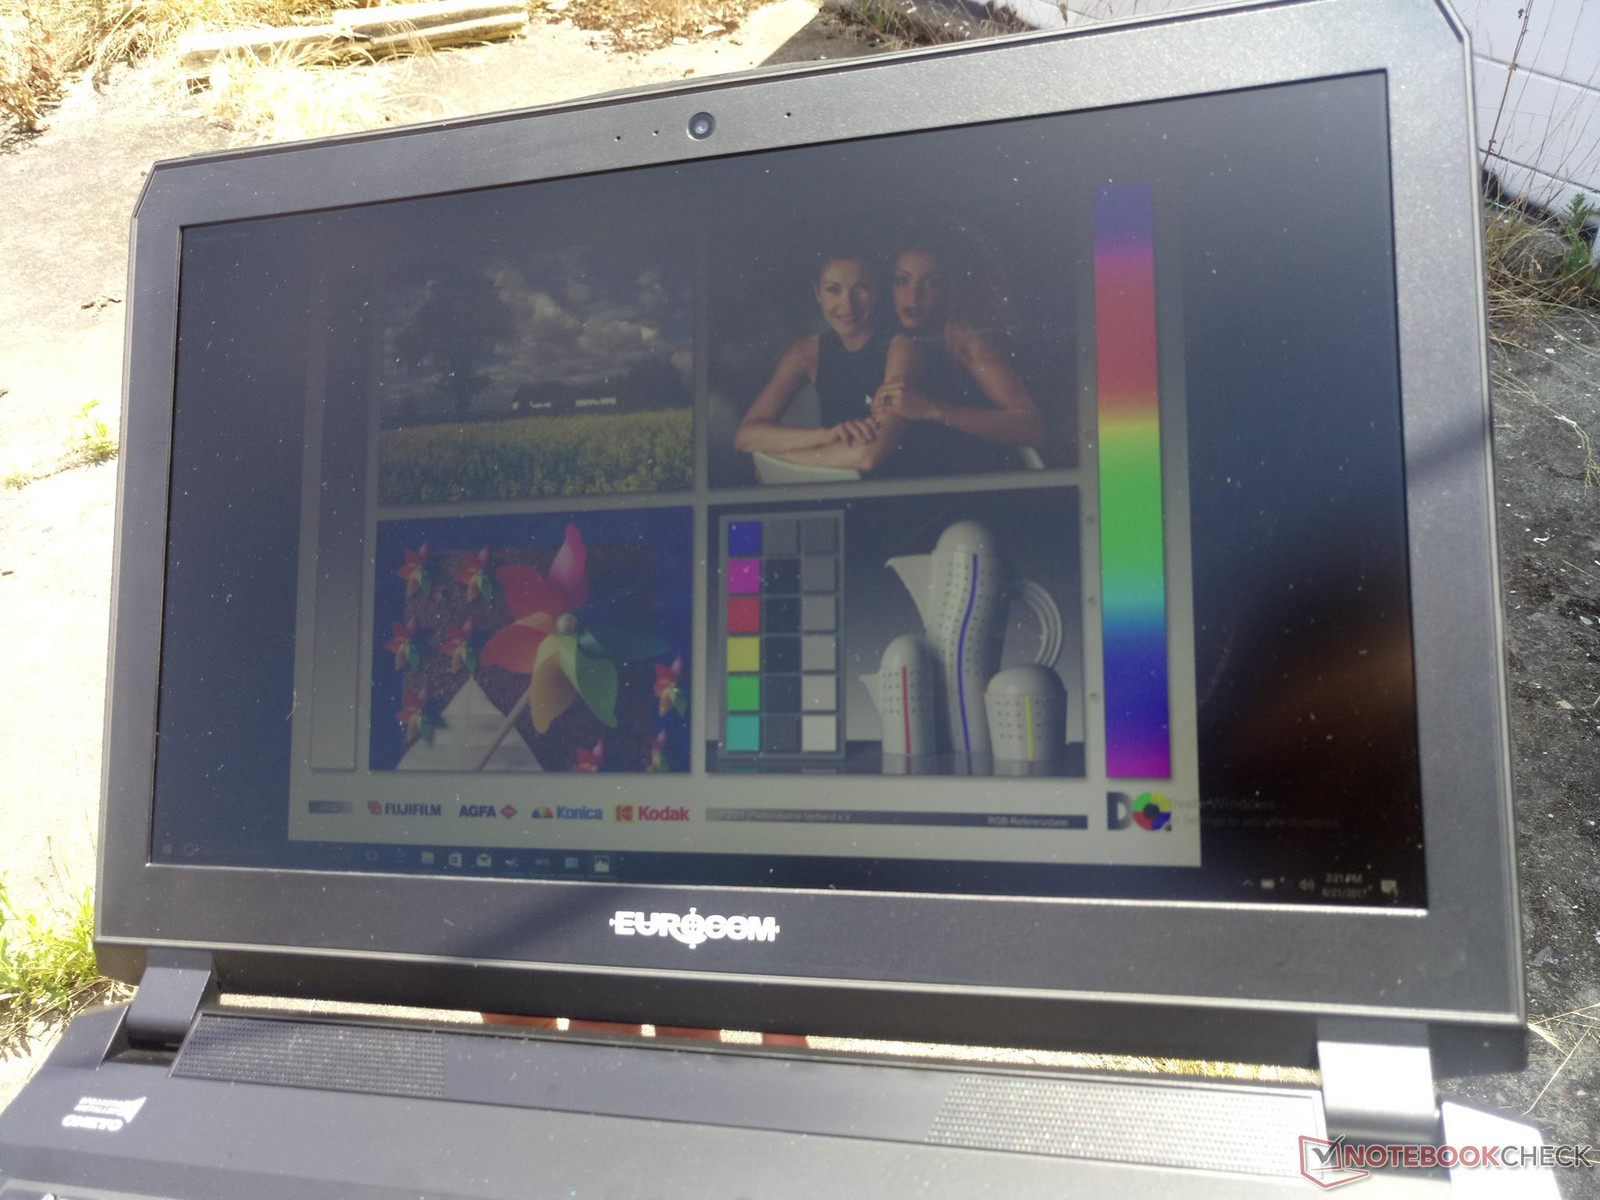
Outdoor visibility is acceptable when under shade due to the matte panel and brighter-than-expected backlight. The narrow TN viewing angles and 140-degree hinges are not as impactful to the experience since glare is not a huge issue. This all changes if using the notebook under direct sunlight as colors and glare become more washed out and apparent, respectively, even when the display is to maximum brightness. Still, we can't imagine anyone using the Sky MX5 R3 under sunlight for too long as it was not built to be an outdoors machine.
Performance
While the larger Eurocom Sky X7E2 model may have multiple CPU and GPU options, the Sky MX5 R3 is more streamlined since it lacks both the LGA 1151 and MXM 3.0 sockets. Only two processors are available (i7-7700HQ and i7-7820HK) with the fixed GTX 1070 GPU and so users are mostly limited to the various display, RAM, and storage selections.
Users can configure with or without G-Sync support. Optimus will be disabled if G-Sync is enabled since both cannot be active simultaneously.
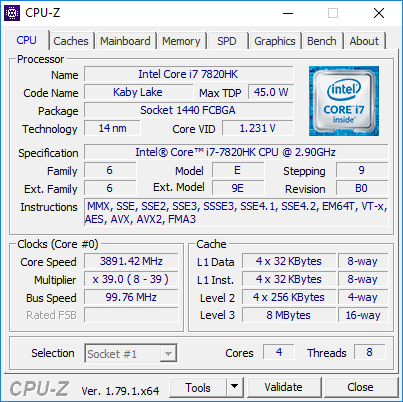
Processor
CPU performance is underwhelming as scores for the i7-7820HK in the Eurocom are lower than other systems sporting the same processor even after repeat runs. For example, the similarly equipped Alienware 17 R4 handily outperforms our SKy MX5 R3 SKU by about 10 percent in both single-thread and multi-thread CineBench workloads. The reason for the below average scores is the processor's inability to maintain very high Turbo Boost speeds as detailed in our Stress Test section below. Running CineBench Multi-Thread in a loop will result in steadily falling scores for the first couple of runs before plateauing in the 740 range. In comparison, the Alienware 17 R4 CPU is able to maintain maximum speeds under similar testing conditions.
Overall performance is subsequently not unlike the much cheaper i7-7700HQ and so users who have no intention of overclocking the i7-7820HK will be better off saving themselves a couple hundred Dollars. Meanwhile, enthusiasts who want even more performance can consider the Sky X7E2 and its desktop i7-7700K for a 20 percent increase in raw CPU power.
See our dedicated CPU page on the Core i7-7820HK for more technical information and benchmarks.
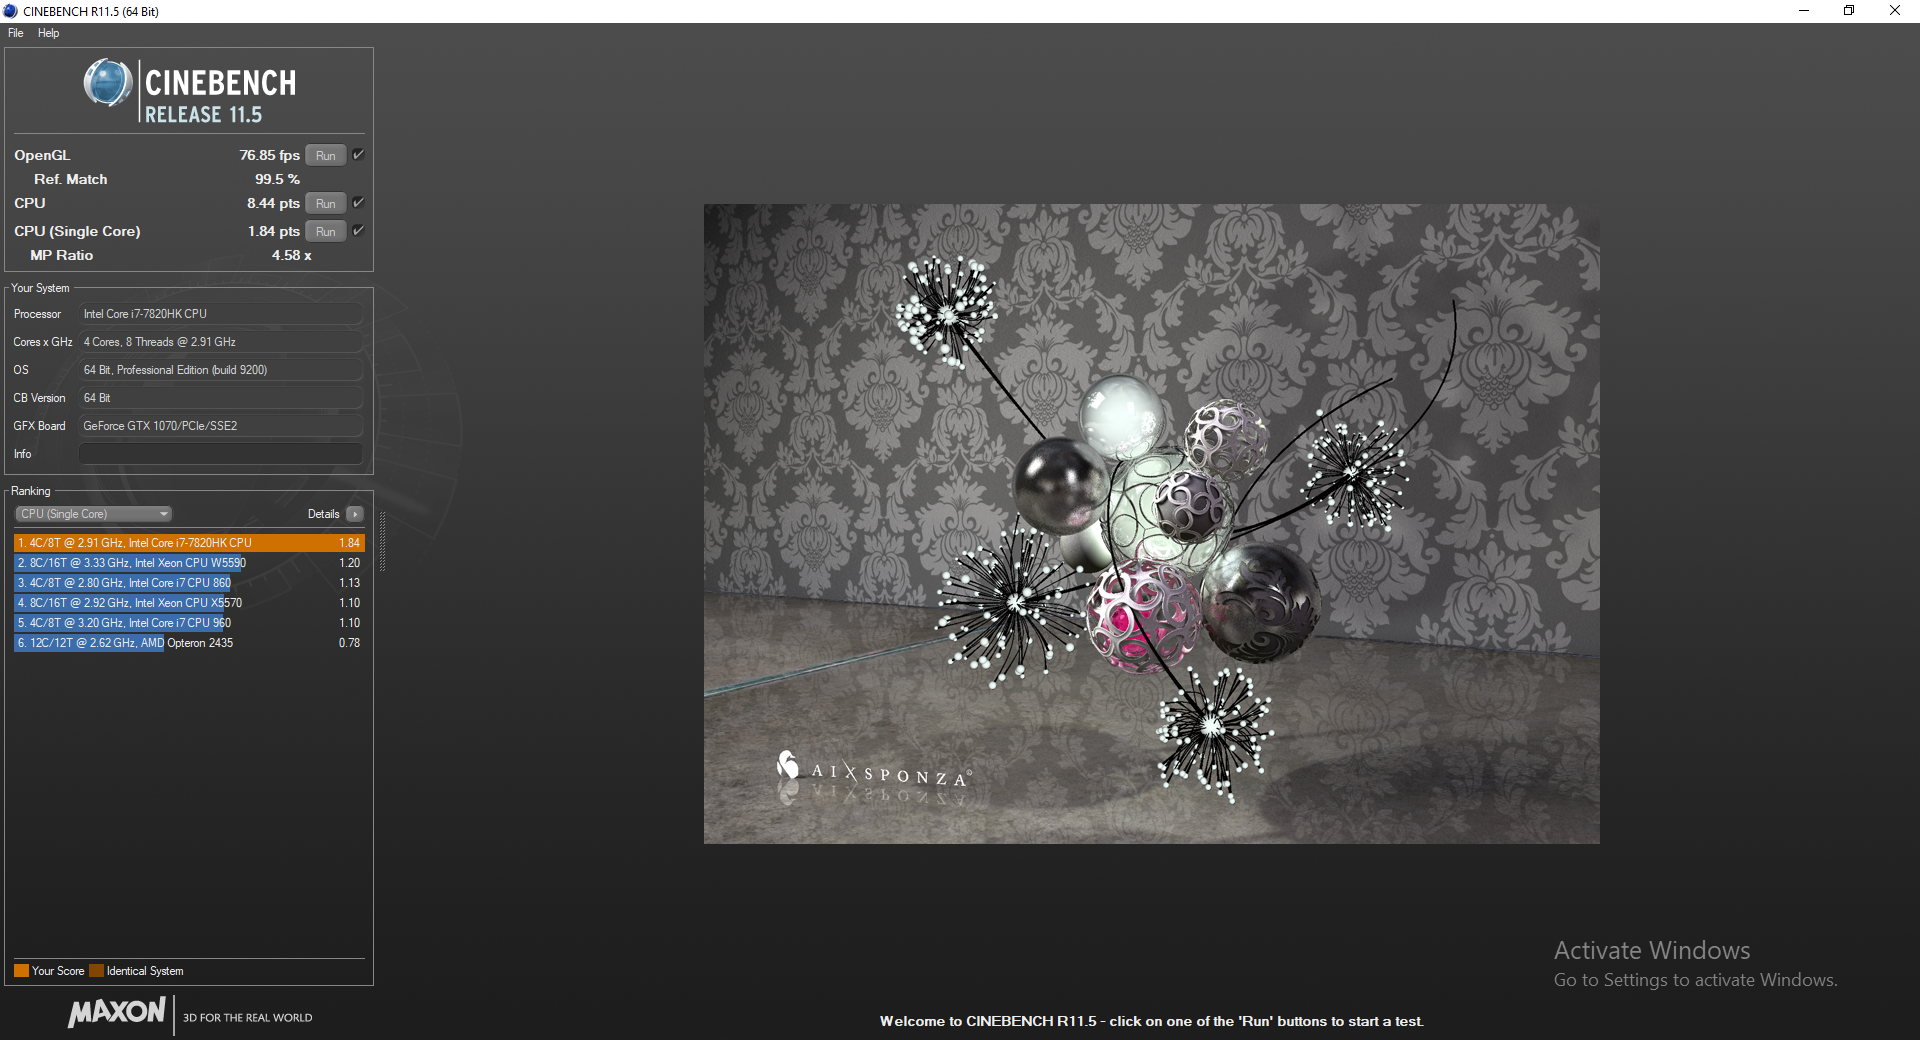
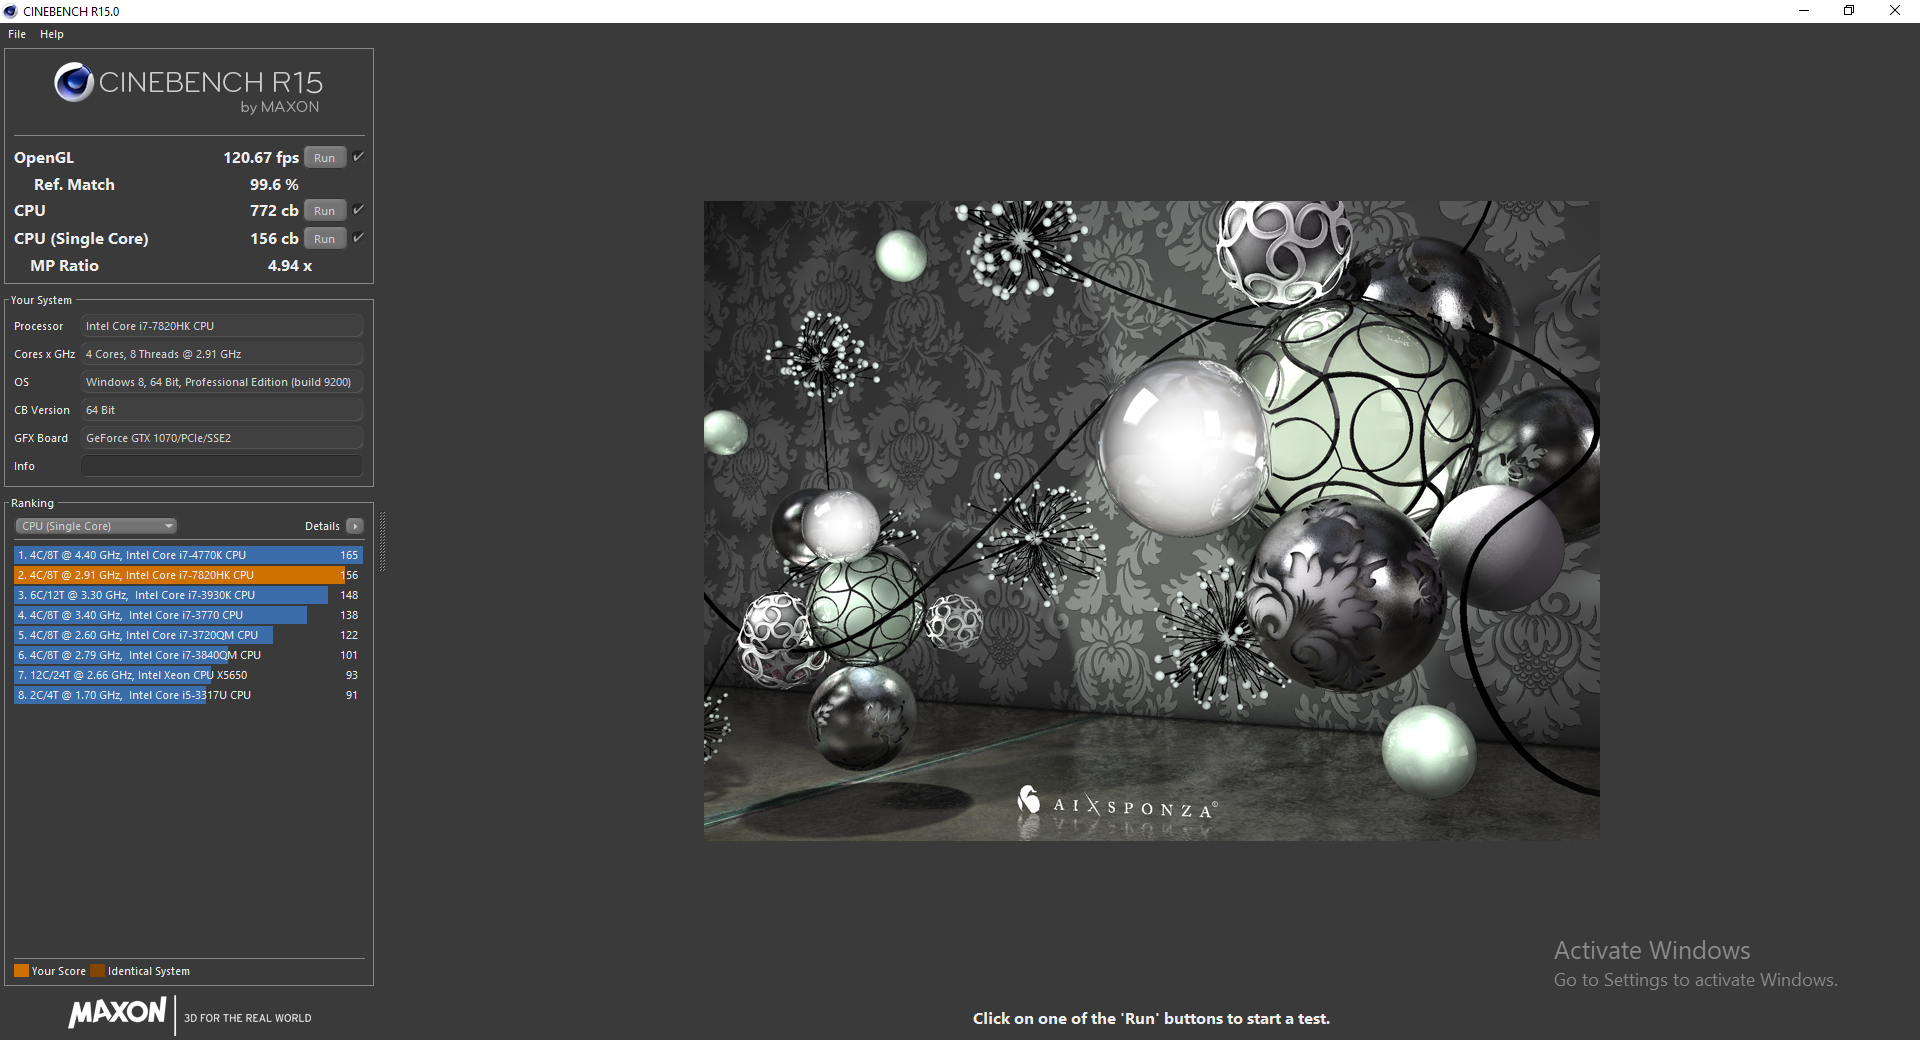
| Cinebench R11.5 | |
| CPU Single 64Bit | |
| Schenker XMG U507 2017 | |
| MSI GT83VR-6RE32SR451 | |
| Eurocom Sky MX5 R3 | |
| Eurocom Sky X7E2 | |
| Alienware 17 R4 | |
| MSI GE62 2QC-468XPL | |
| Lenovo IdeaPad Y50 | |
| CPU Multi 64Bit | |
| Schenker XMG U507 2017 | |
| Alienware 17 R4 | |
| MSI GT83VR-6RE32SR451 | |
| Eurocom Sky X7E2 | |
| Eurocom Sky MX5 R3 | |
| MSI GE62 2QC-468XPL | |
| Lenovo IdeaPad Y50 | |
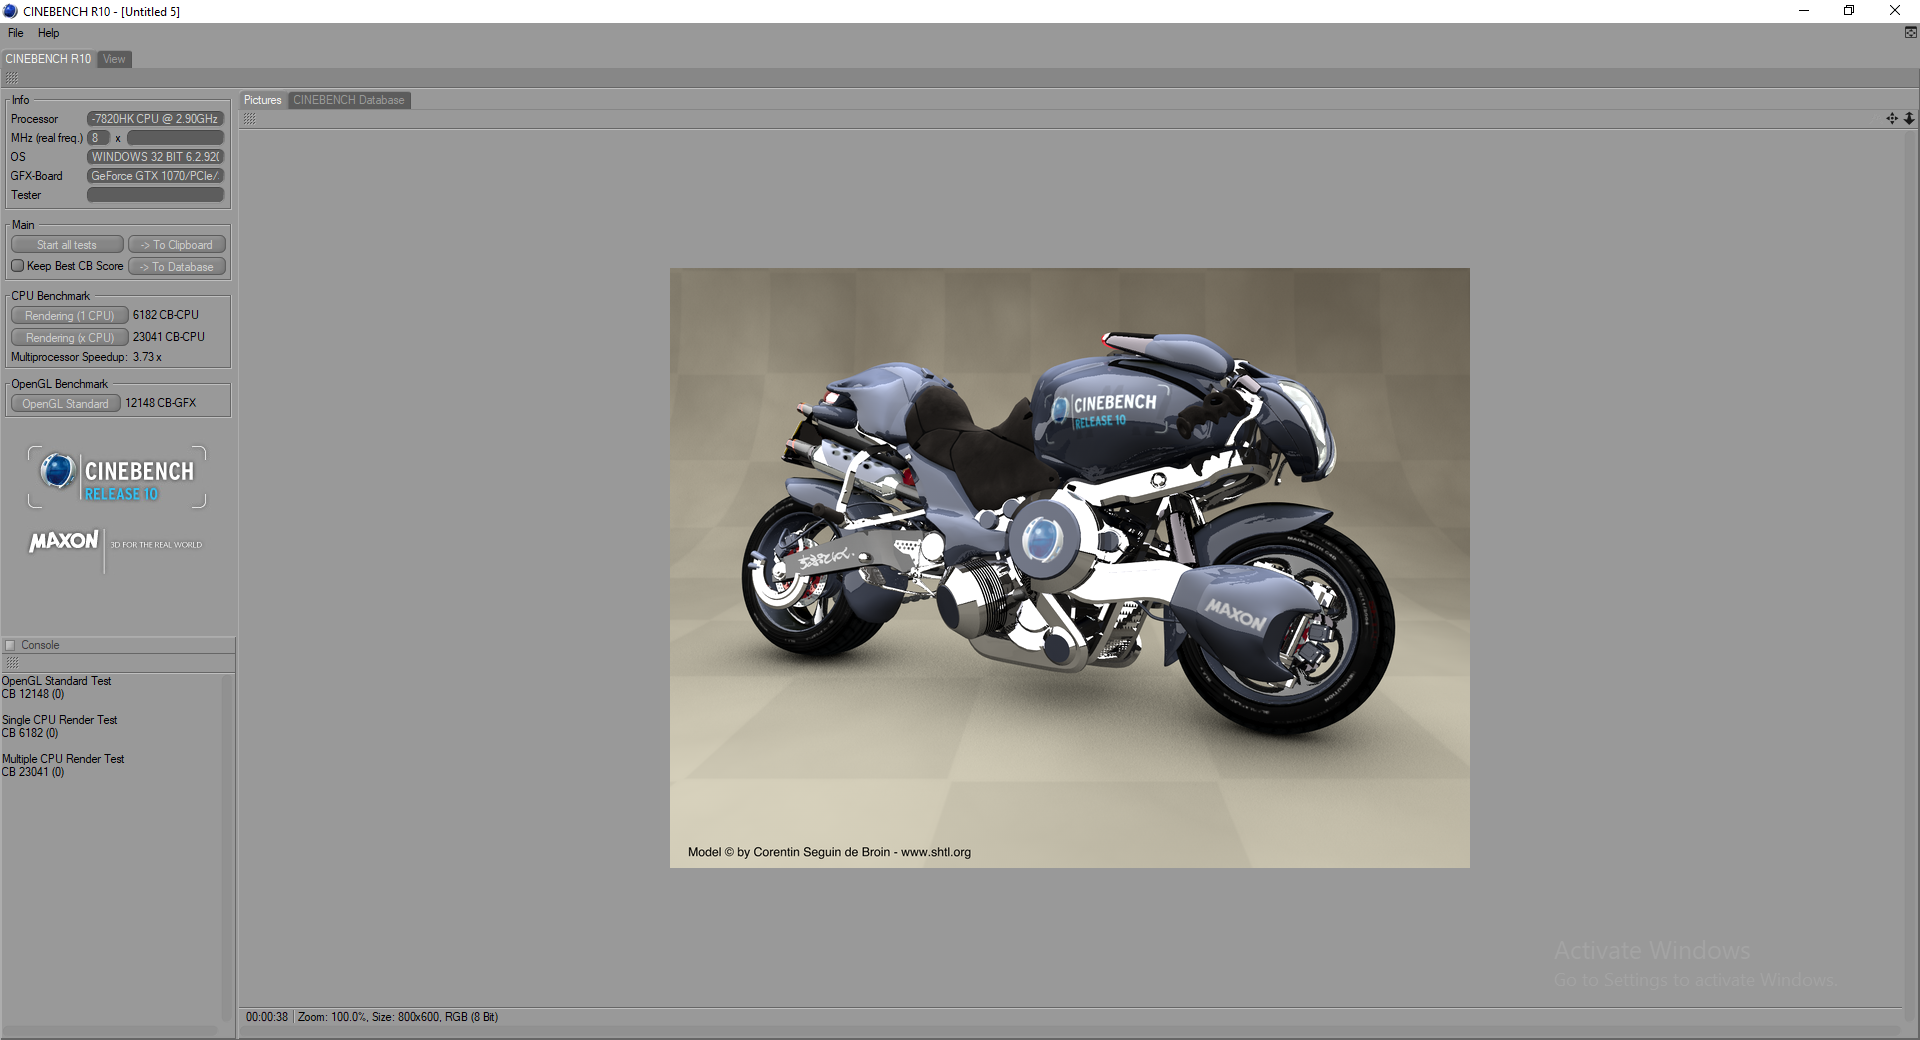
| Cinebench R10 | |
| Rendering Multiple CPUs 32Bit | |
| Alienware 17 R4 | |
| Eurocom Sky X7E2 | |
| Eurocom Sky MX5 R3 | |
| MSI GE62 2QC-468XPL | |
| Lenovo IdeaPad Y50 | |
| Rendering Single 32Bit | |
| Alienware 17 R4 | |
| Eurocom Sky X7E2 | |
| Eurocom Sky MX5 R3 | |
| MSI GE62 2QC-468XPL | |
| Lenovo IdeaPad Y50 | |
| wPrime 2.10 - 1024m | |
| Lenovo IdeaPad Y50 | |
| Apple MacBook Pro 15 2017 (2.8 GHz, 555) | |
| Eurocom Sky MX5 R3 | |
| MSI GE62 2QC-468XPL | |
| Eurocom Sky X7E2 | |
| Alienware 17 R4 | |
* ... smaller is better
System Performance
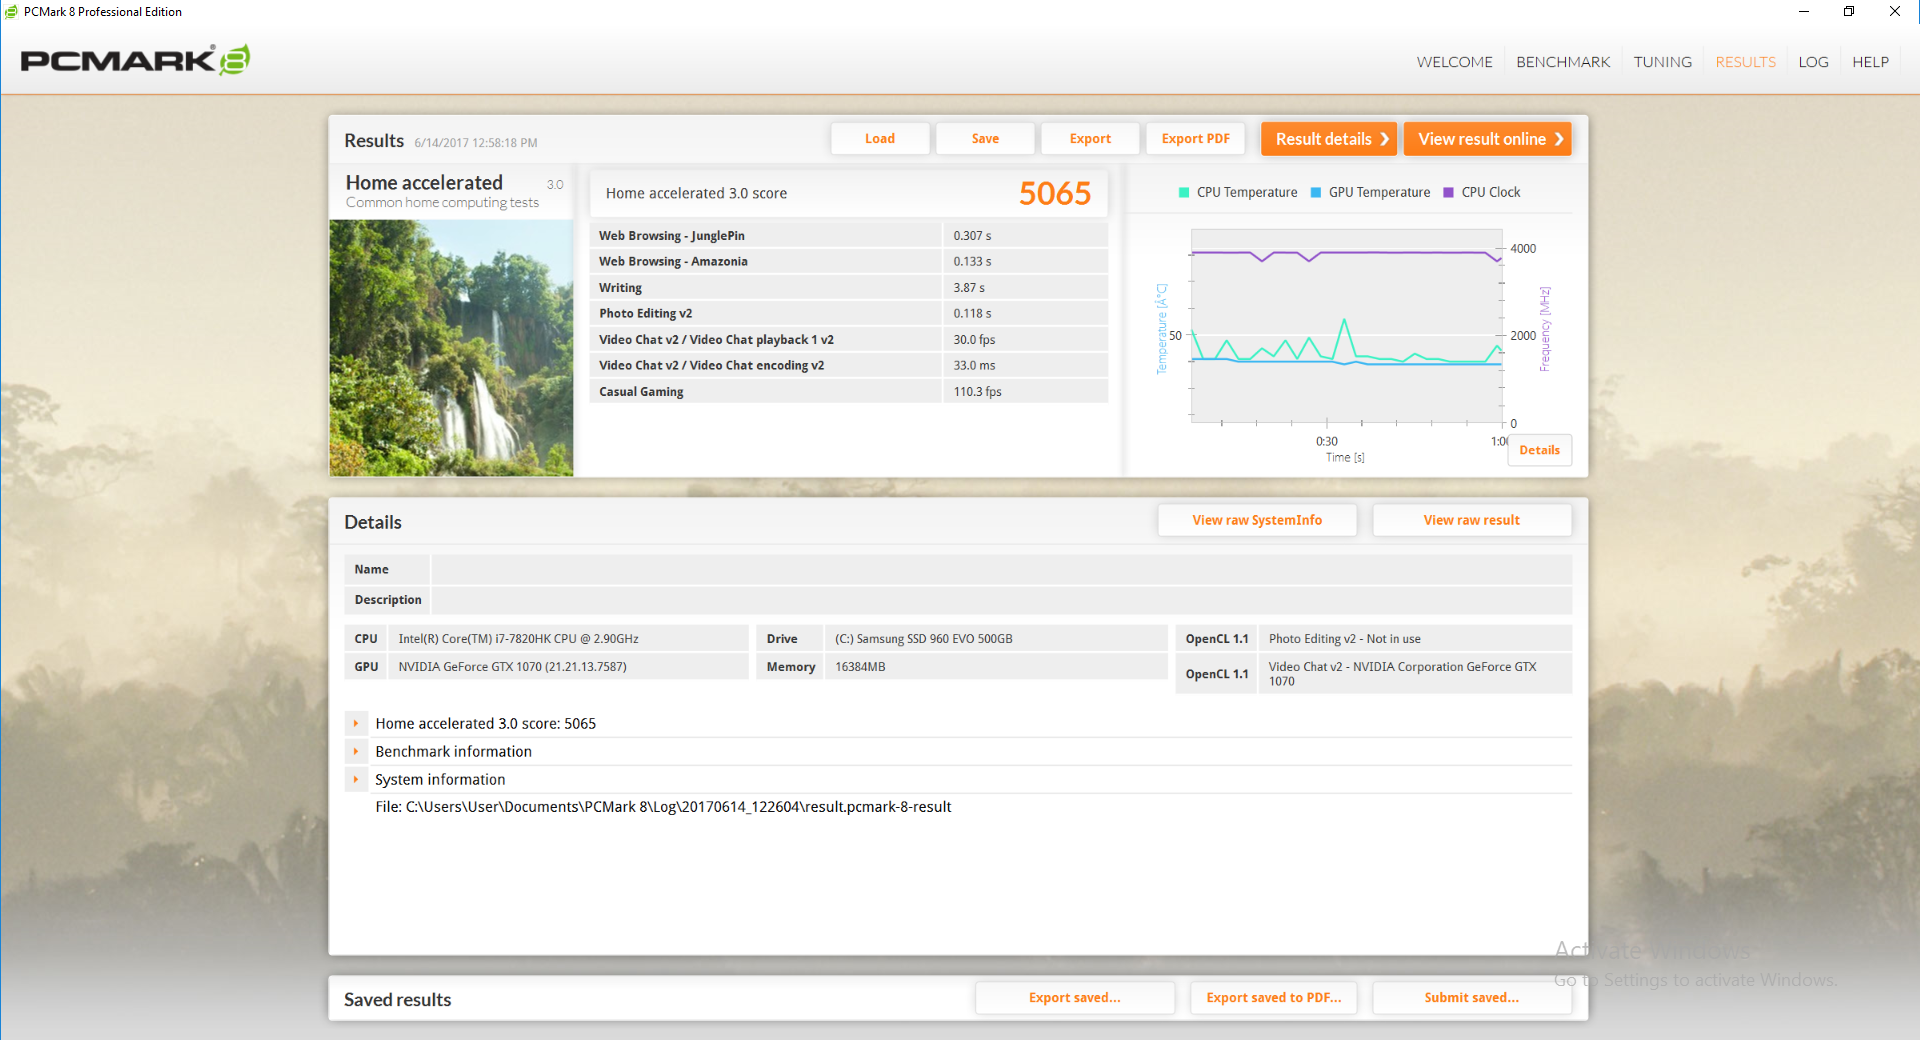
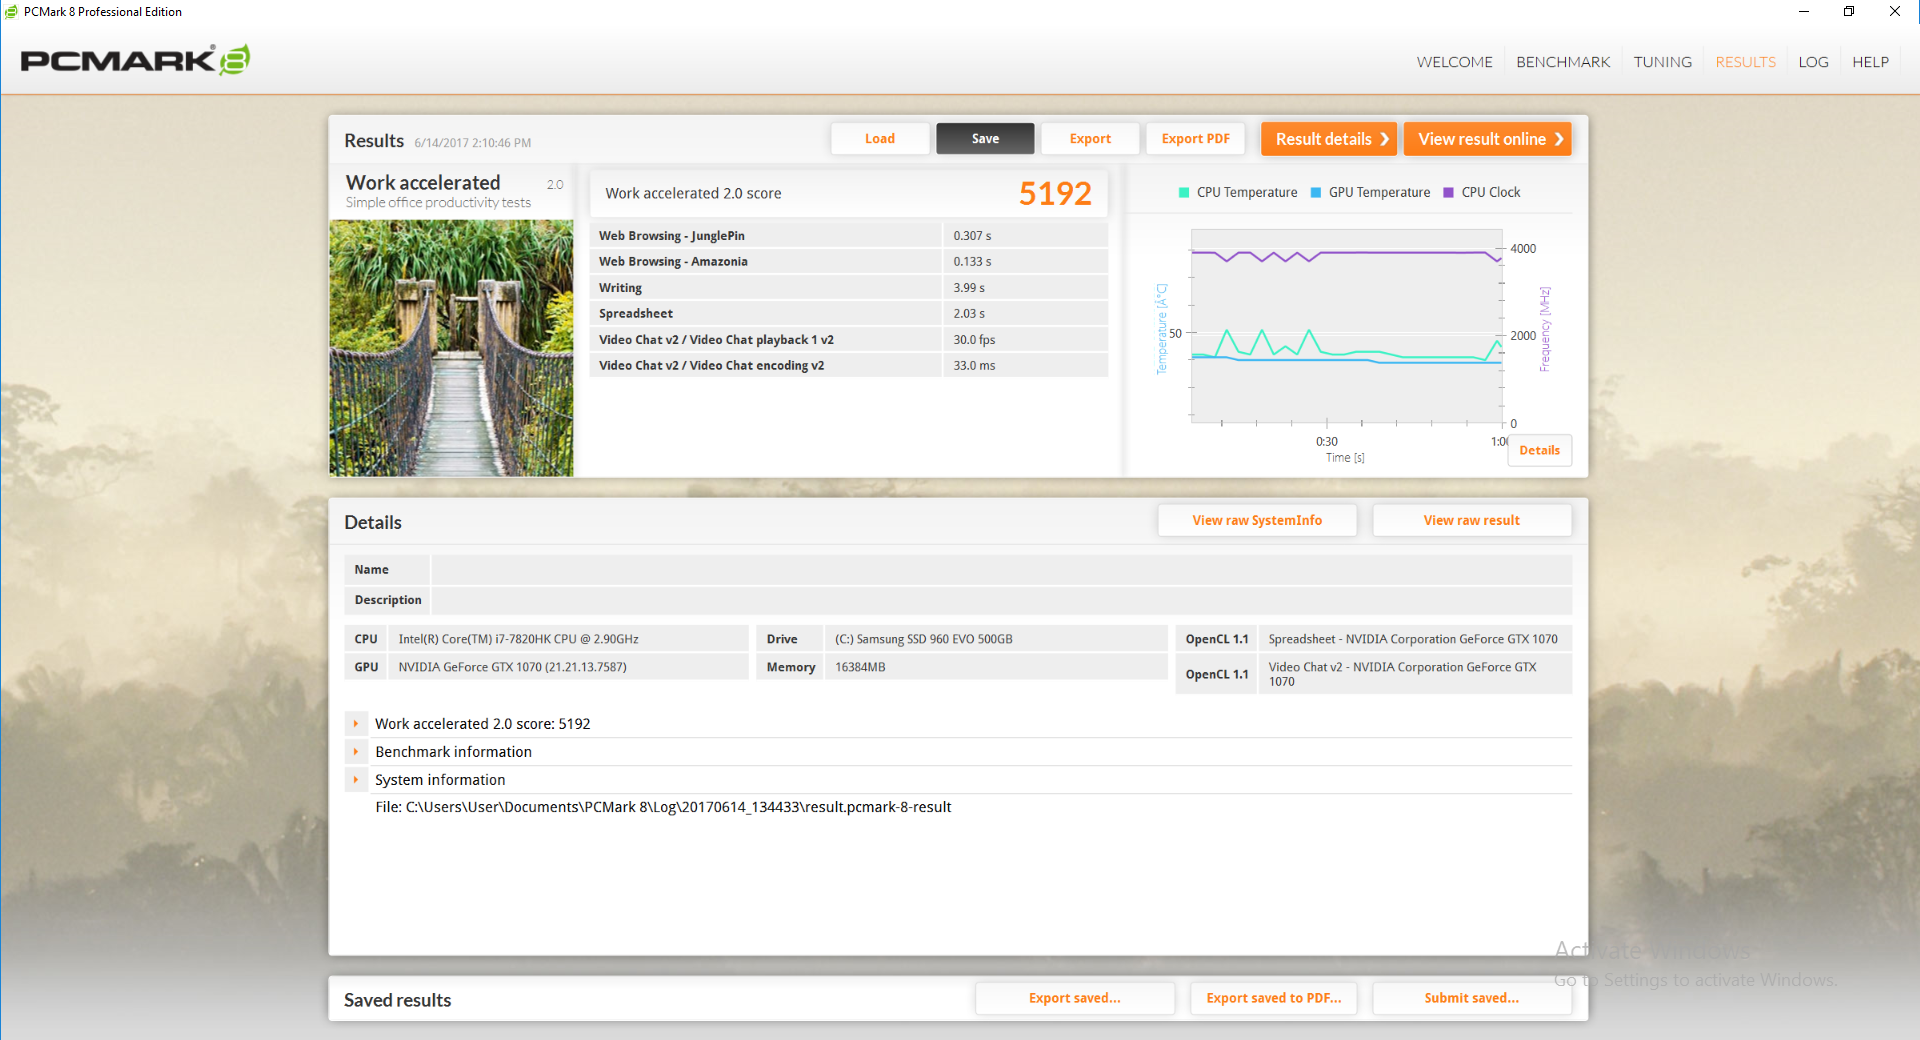
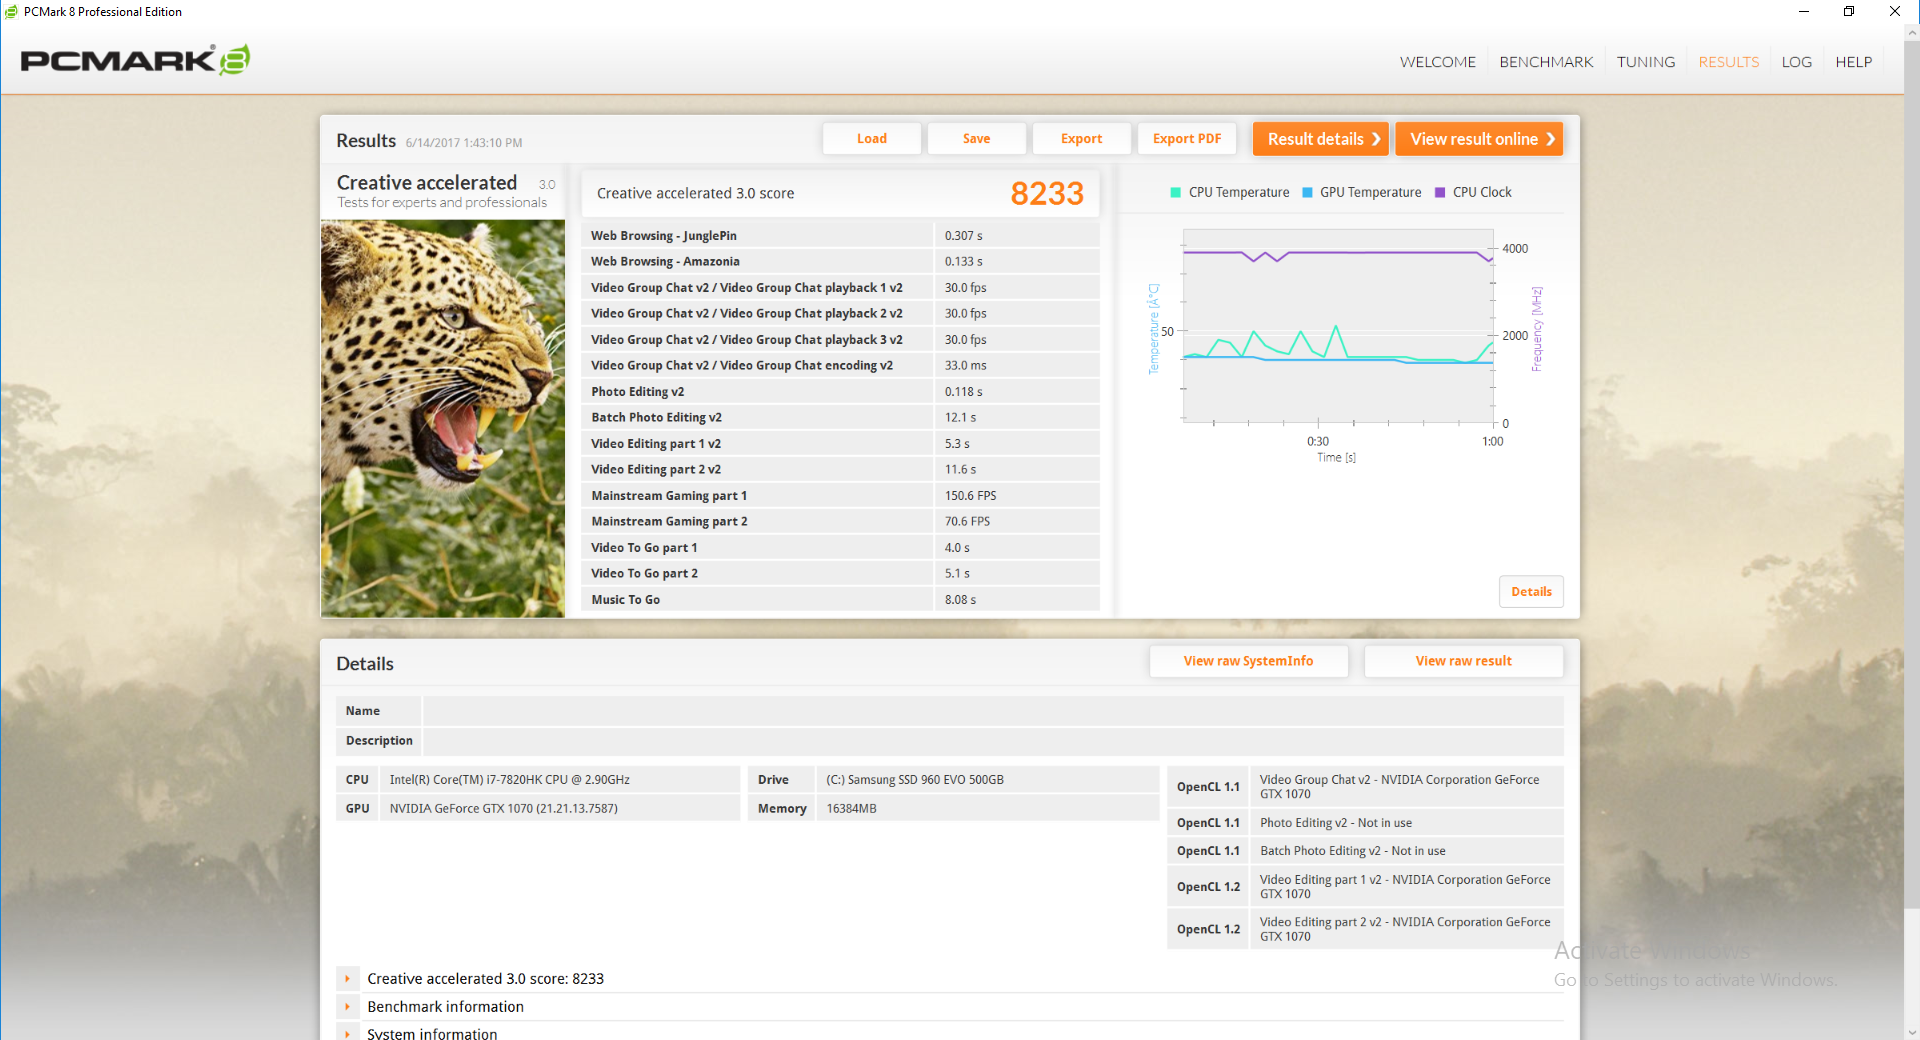
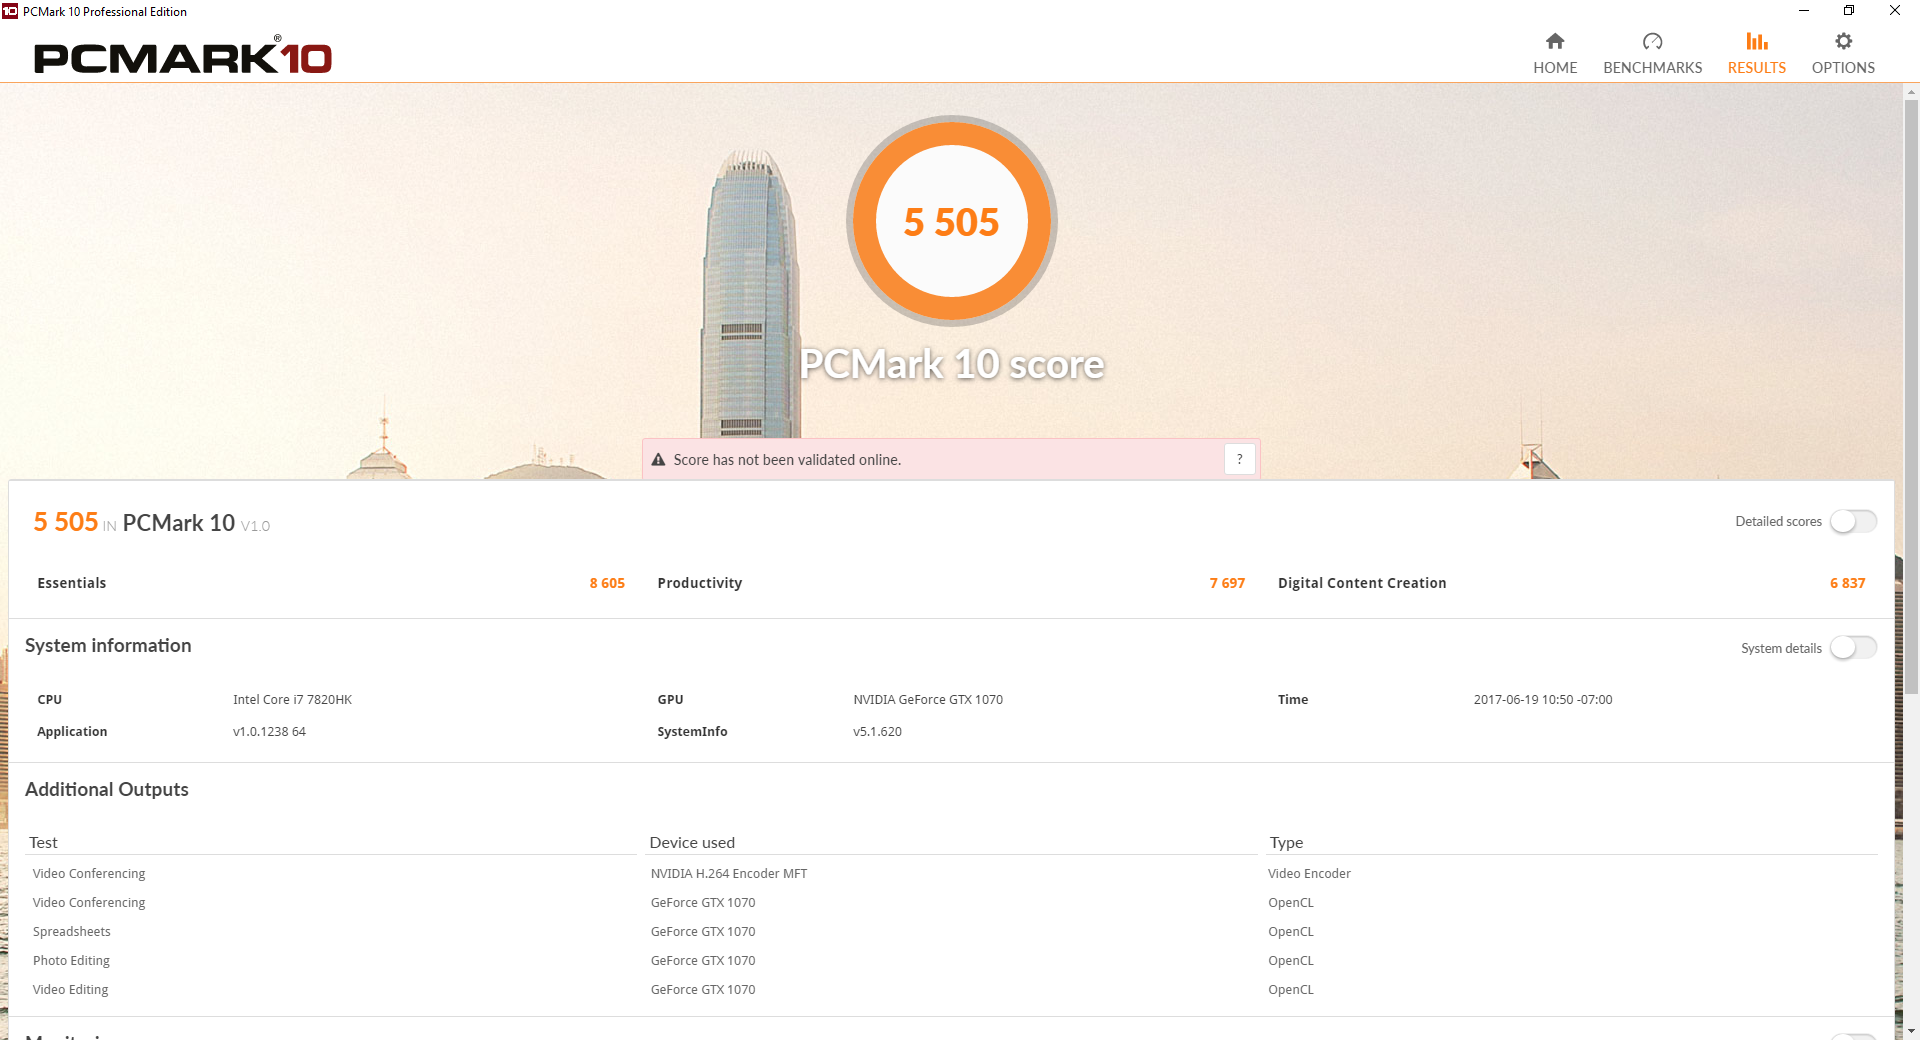
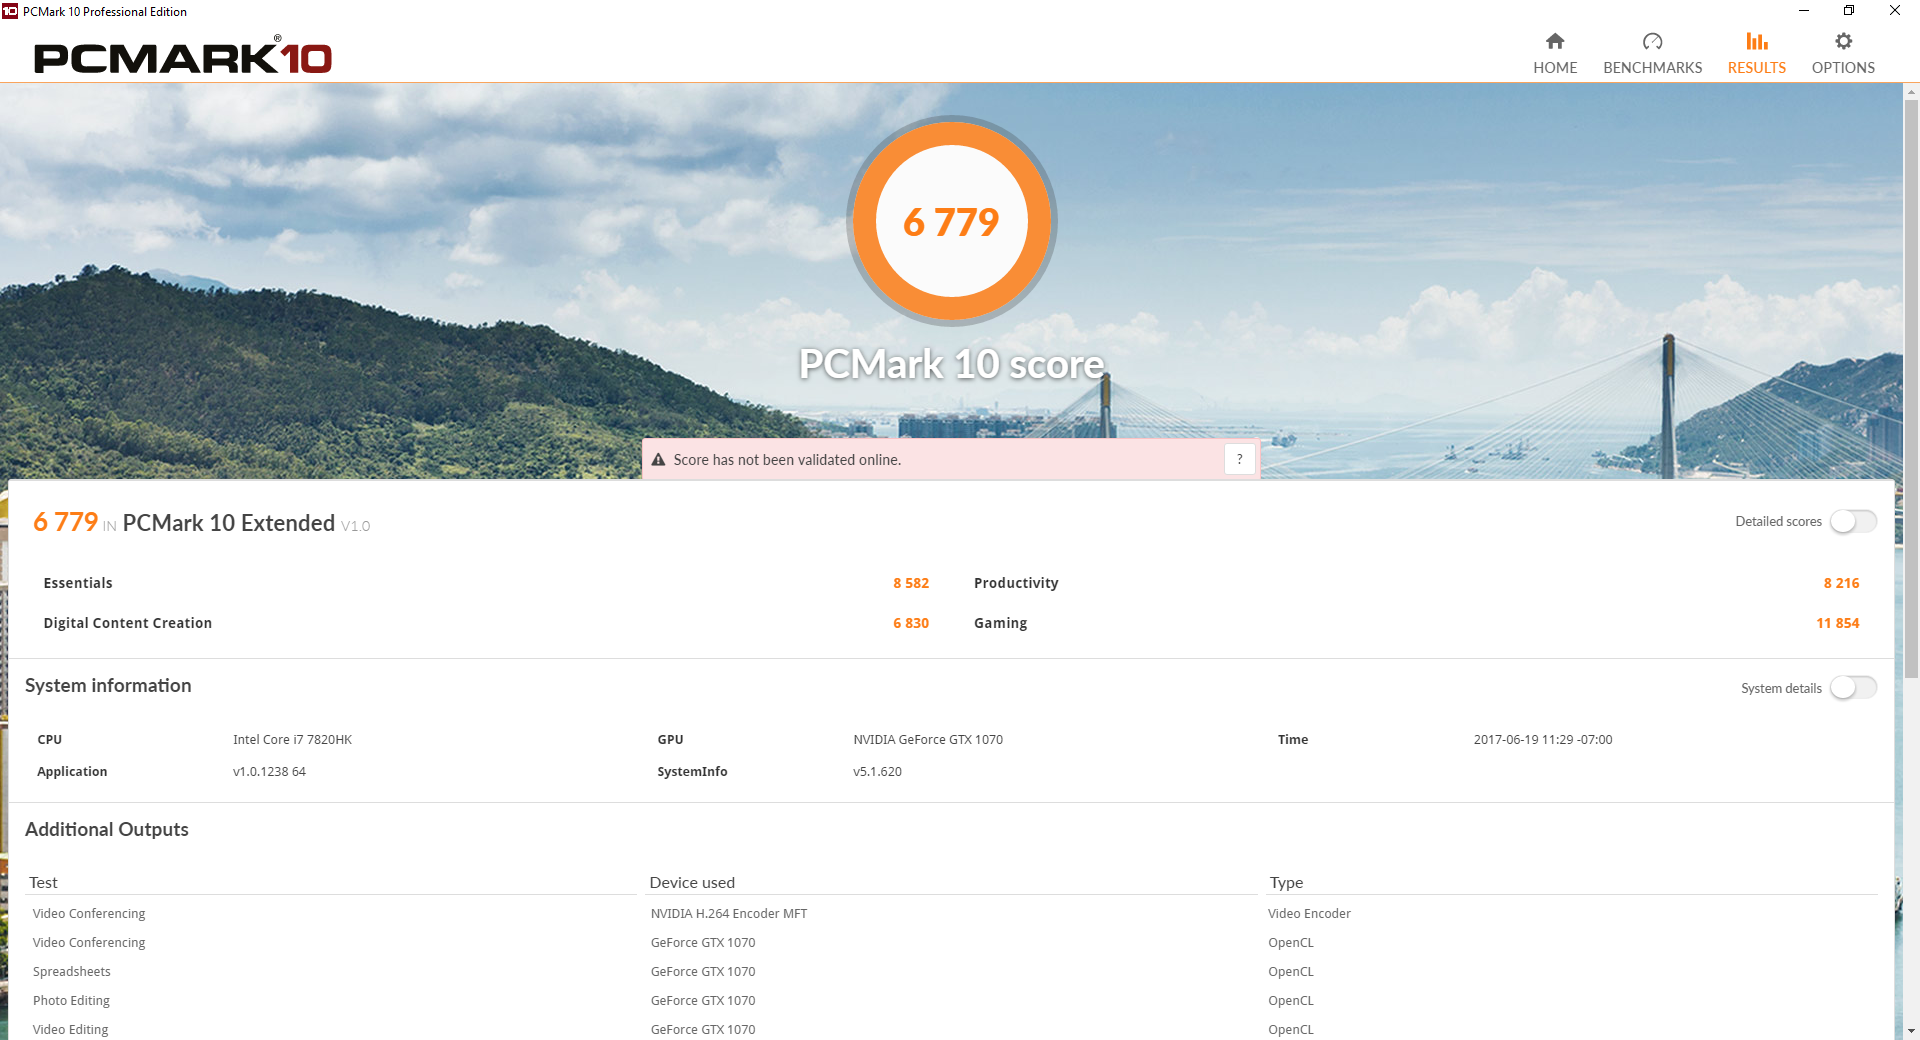
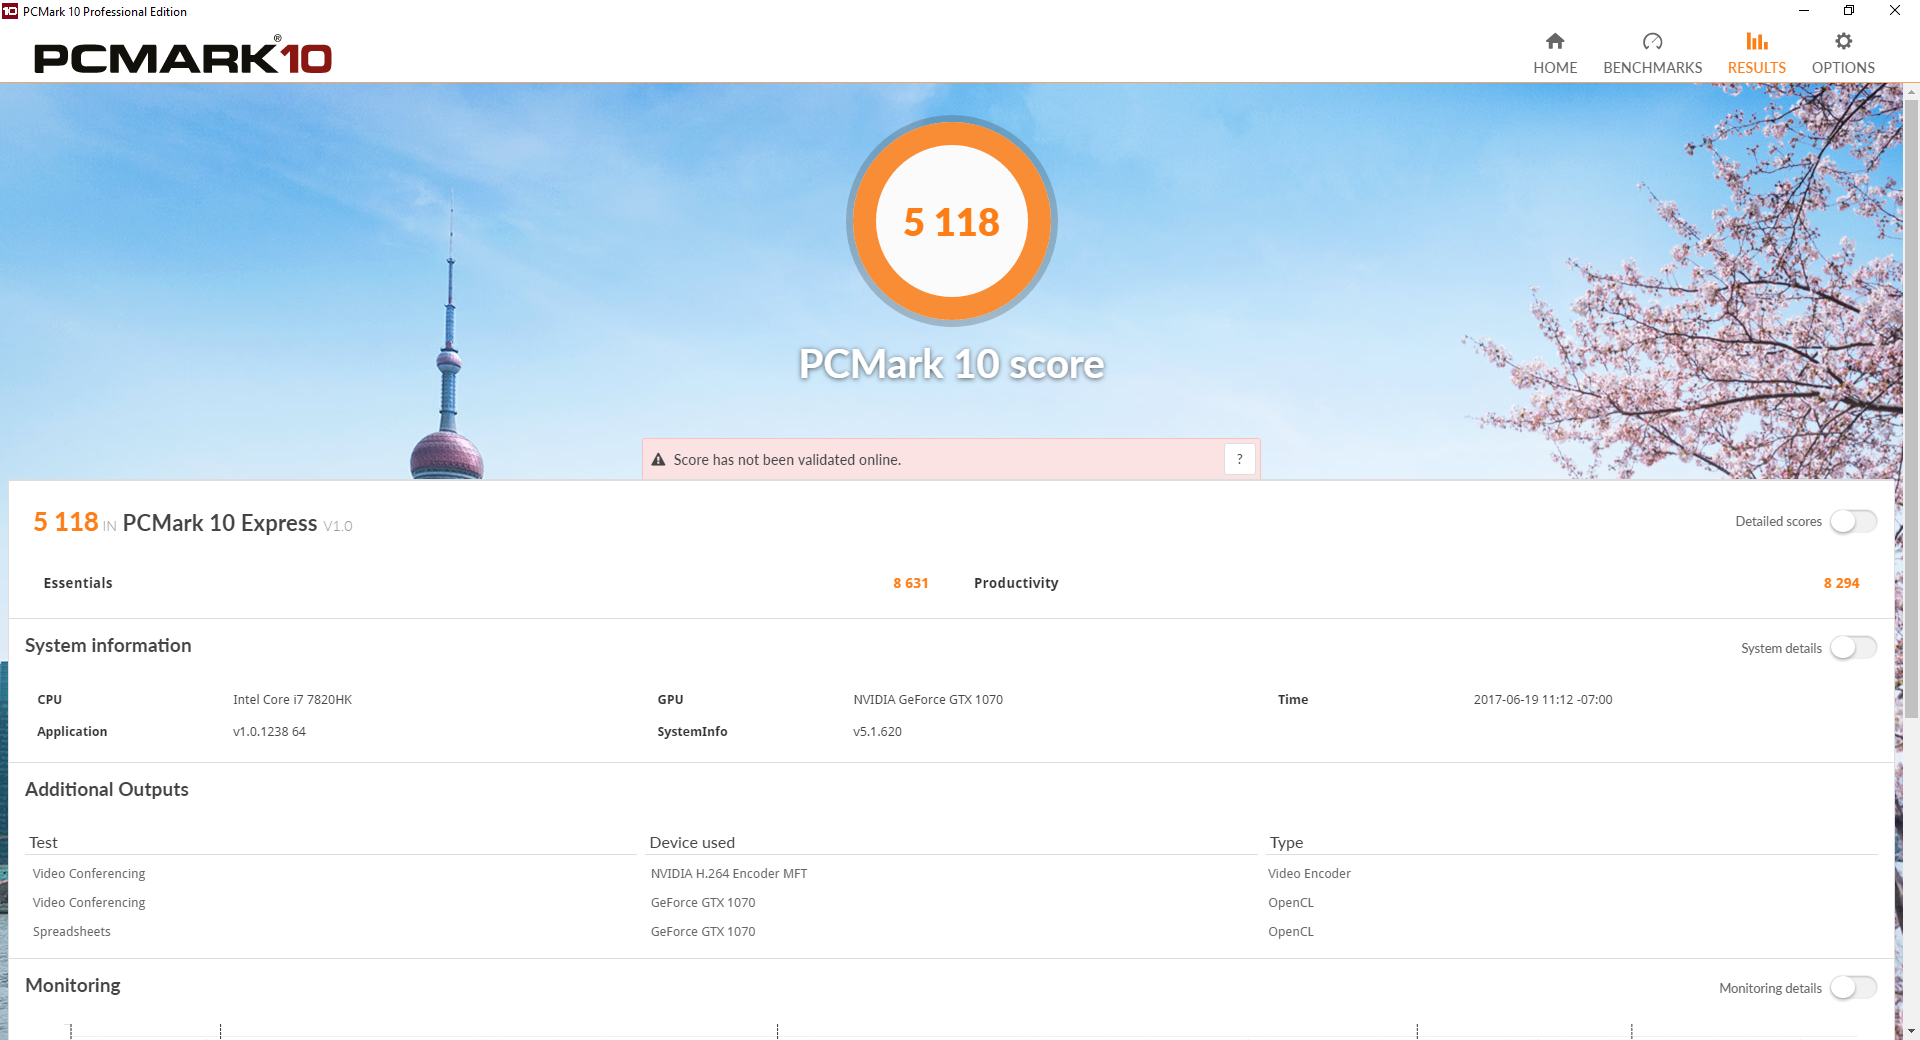
PCMark 8 scores are essentially identical to the Acer Predator 15. We've also provided PCMark 10 scores below without any comparisons as the benchmark is only a few weeks old. Our Eurocom test unit ran without any notable software or hardware glitches when gaming or web browsing.
| PCMark 8 | |
| Home Score Accelerated v2 | |
| Acer Predator 15 G9-593-751X | |
| Eurocom Sky MX5 R3 | |
| Gigabyte Aero 15 | |
| Work Score Accelerated v2 | |
| Acer Predator 15 G9-593-751X | |
| Gigabyte Aero 15 | |
| Eurocom Sky MX5 R3 | |
| Creative Score Accelerated v2 | |
| Eurocom Sky MX5 R3 | |
| Acer Predator 15 G9-593-751X | |
| PCMark 8 Home Score Accelerated v2 | 5065 points | |
| PCMark 8 Creative Score Accelerated v2 | 8233 points | |
| PCMark 8 Work Score Accelerated v2 | 5192 points | |
Help | ||
Storage Devices
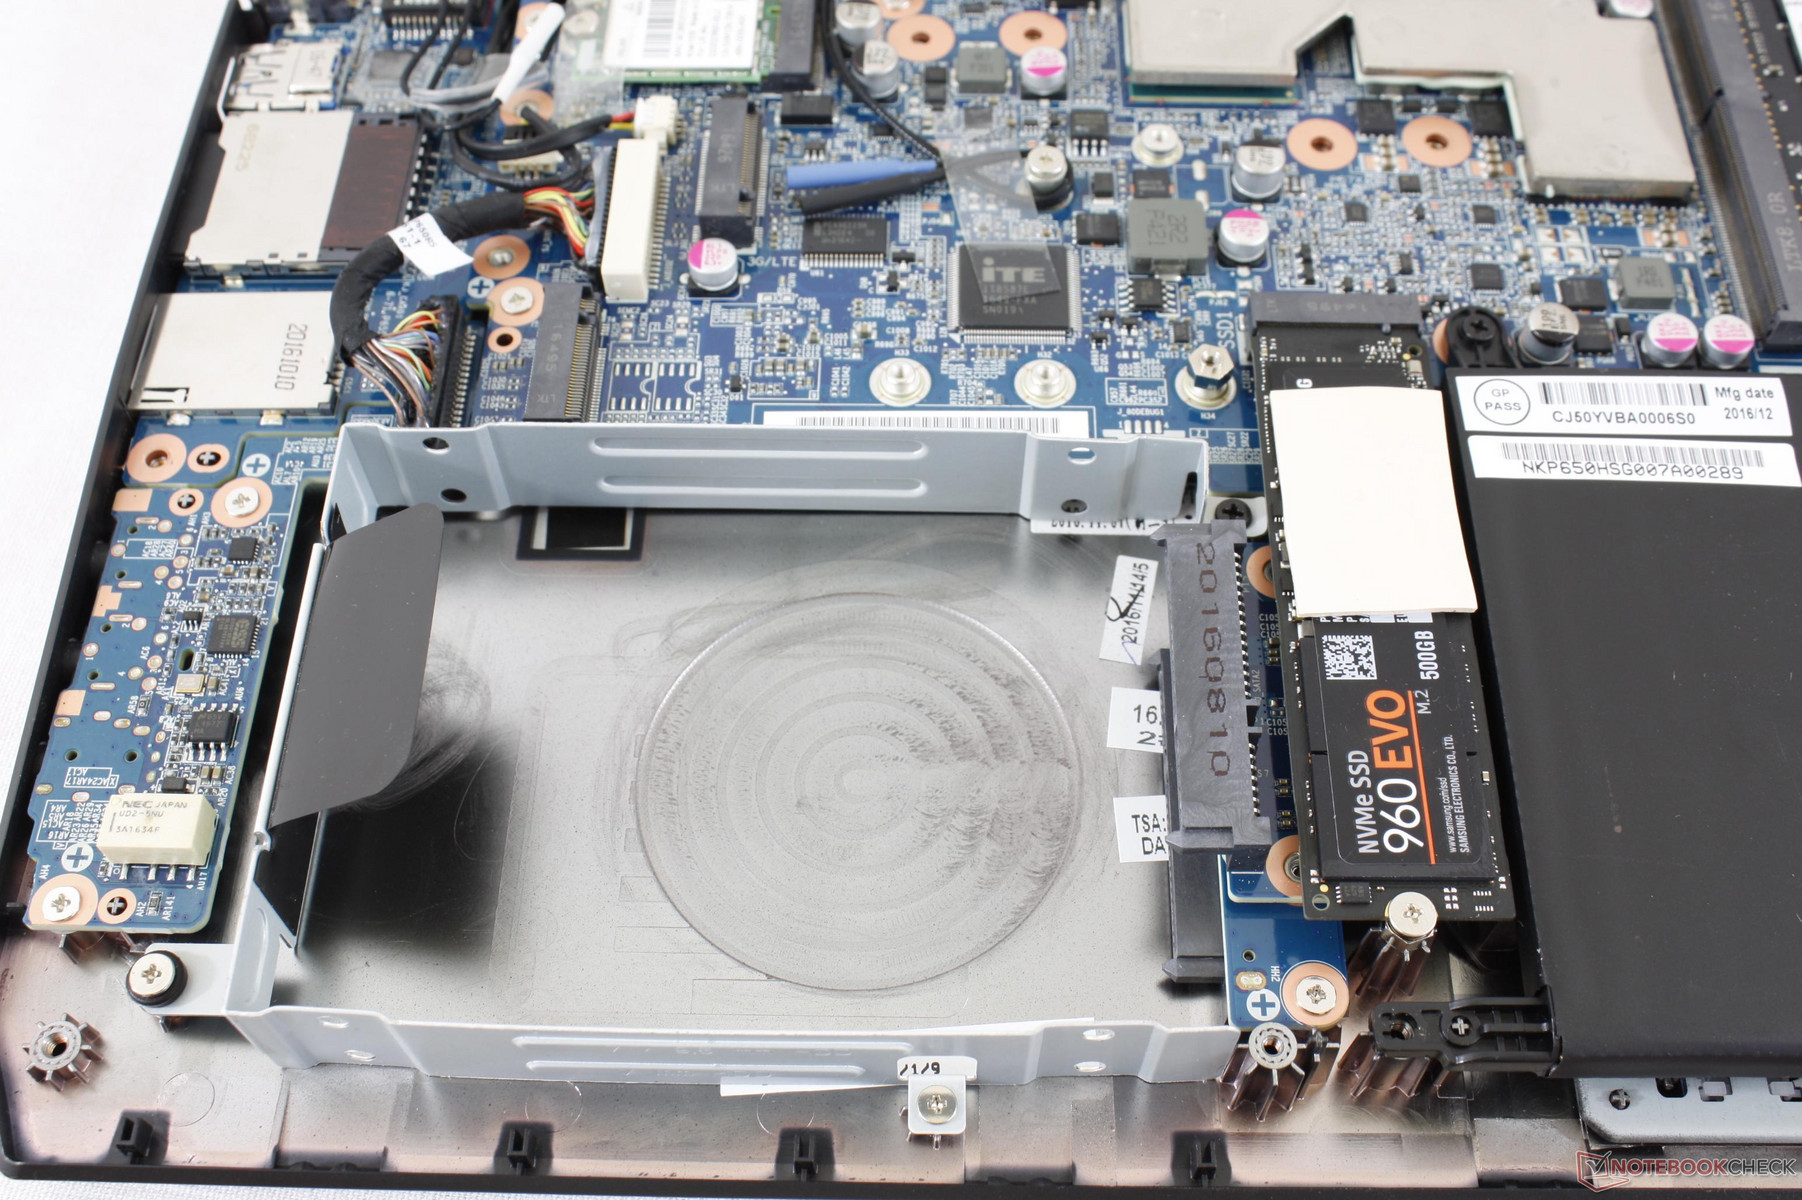
Clevo systems tend to have plenty of internal storage options and the Sky MX5 R3 continues this tradition with its four bays (2x M.2 2280 + 2x 2.5-inch SATA III). NVMe and RAID 0/1 are both supported, but this particular Intel chipset will not support RAID between multiple NVMe SSDs. Eurocom offers a very wide range of SSDs and HDDs from a 500 GB Seagate HDD to a 4 TB Samsung 850 EVO SSD. The first 2.5-inch bay can accept both 7 mm and 9.5 mm drives while it is recommended to use 7 mm drives for the second bay.
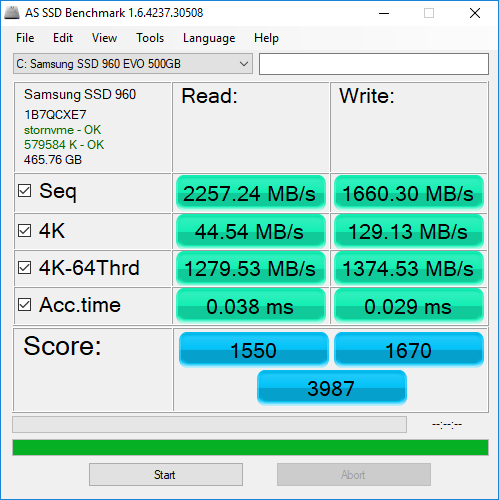
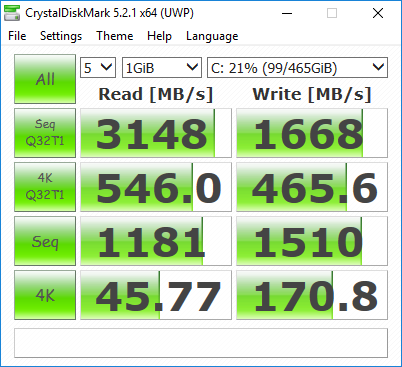
Our test configuration is equipped with a primary 500 GB Samsung 960 M.2 NVMe SSD that excels in sequential write rates when compared to the Samsung SM951 and PM961 NVMe SSDs. Slower drives including the Micron M600 or Samsung 950 Pro are also available at lower prices. See our growing table of SSDs and HDDs for more benchmark comparisons.
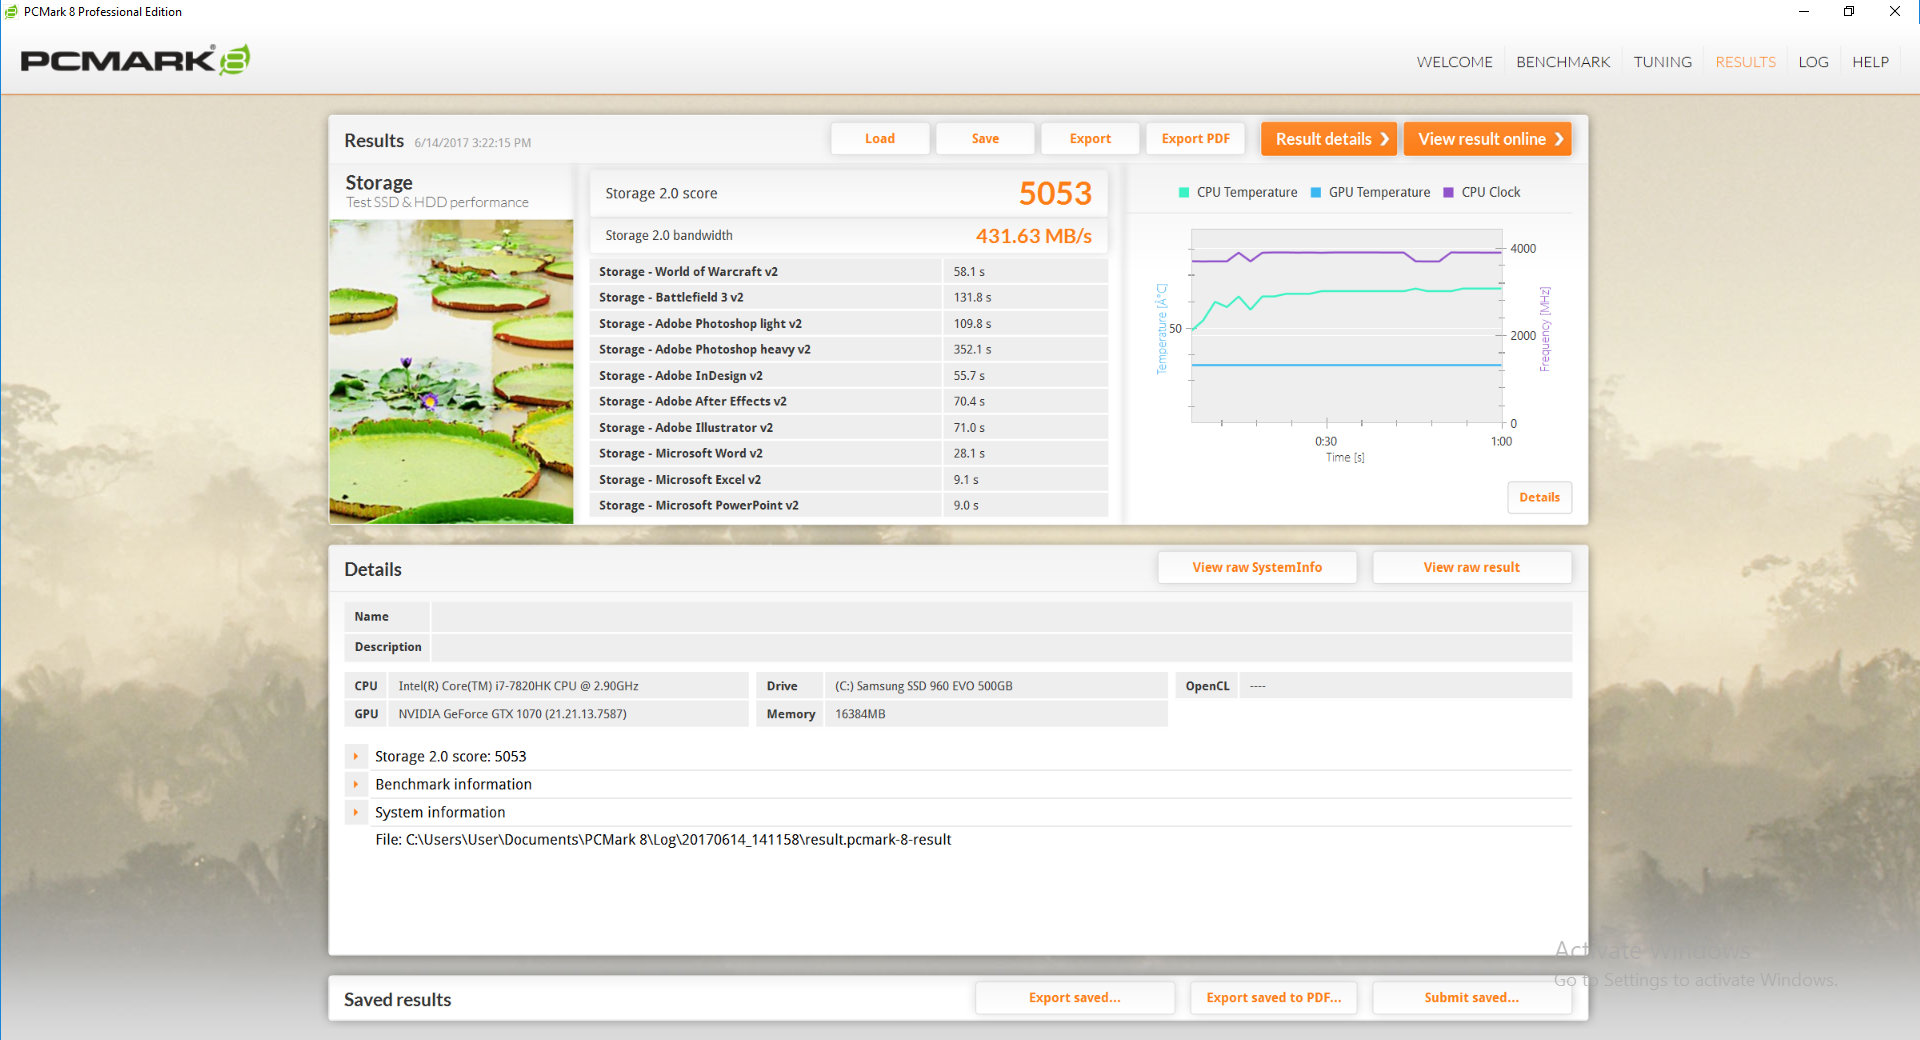
| Eurocom Sky MX5 R3 Samsung SSD 960 Evo 500GB m.2 NVMe | Acer Predator 15 G9-593-751X Samsung SM951 MZVPV256HDGL m.2 PCI-e | Lenovo Legion Y520-15IKBN-80WK001KUS Samsung PM961 MZVLW256HEHP | MSI GT62VR 7RE-223 Samsung SSD PM871a MZNLN256HMHQ | Aorus X5 v6 Samsung SM951 MZVPV256 m.2 | |
|---|---|---|---|---|---|
| AS SSD | -22% | -14% | -69% | -94% | |
| Copy Game MB/s (MB/s) | 1191 | 1091 -8% | 1115 -6% | 377.8 -68% | 1073 -10% |
| Copy Program MB/s (MB/s) | 441.8 | 488.6 11% | 502 14% | 199 -55% | 351.5 -20% |
| Copy ISO MB/s (MB/s) | 1375 | 1575 15% | 1912 39% | 354.7 -74% | 351.1 -74% |
| Score Total (Points) | 3987 | 2574 -35% | 2617 -34% | 1019 -74% | 1630 -59% |
| Score Write (Points) | 1670 | 570 -66% | 807 -52% | 304 -82% | 514 -69% |
| Score Read (Points) | 1550 | 1350 -13% | 1232 -21% | 472 -70% | 756 -51% |
| Access Time Write * (ms) | 0.029 | 0.032 -10% | 0.027 7% | 0.037 -28% | 0.025 14% |
| Access Time Read * (ms) | 0.038 | 0.059 -55% | 0.065 -71% | 0.1 -163% | 0.367 -866% |
| 4K-64 Write (MB/s) | 1375 | 346 -75% | 529 -62% | 171.6 -88% | 272.5 -80% |
| 4K-64 Read (MB/s) | 1280 | 1109 -13% | 919 -28% | 383.4 -70% | 521 -59% |
| 4K Write (MB/s) | 129.1 | 117.3 -9% | 139.4 8% | 104 -19% | 131.3 2% |
| 4K Read (MB/s) | 44.54 | 46.35 4% | 48.57 9% | 37.2 -16% | 44.6 0% |
| Seq Write (MB/s) | 1660 | 1067 -36% | 1392 -16% | 288.2 -83% | 1099 -34% |
| Seq Read (MB/s) | 2257 | 1941 -14% | 2649 17% | 510 -77% | 1904 -16% |
* ... smaller is better

GPU Performance
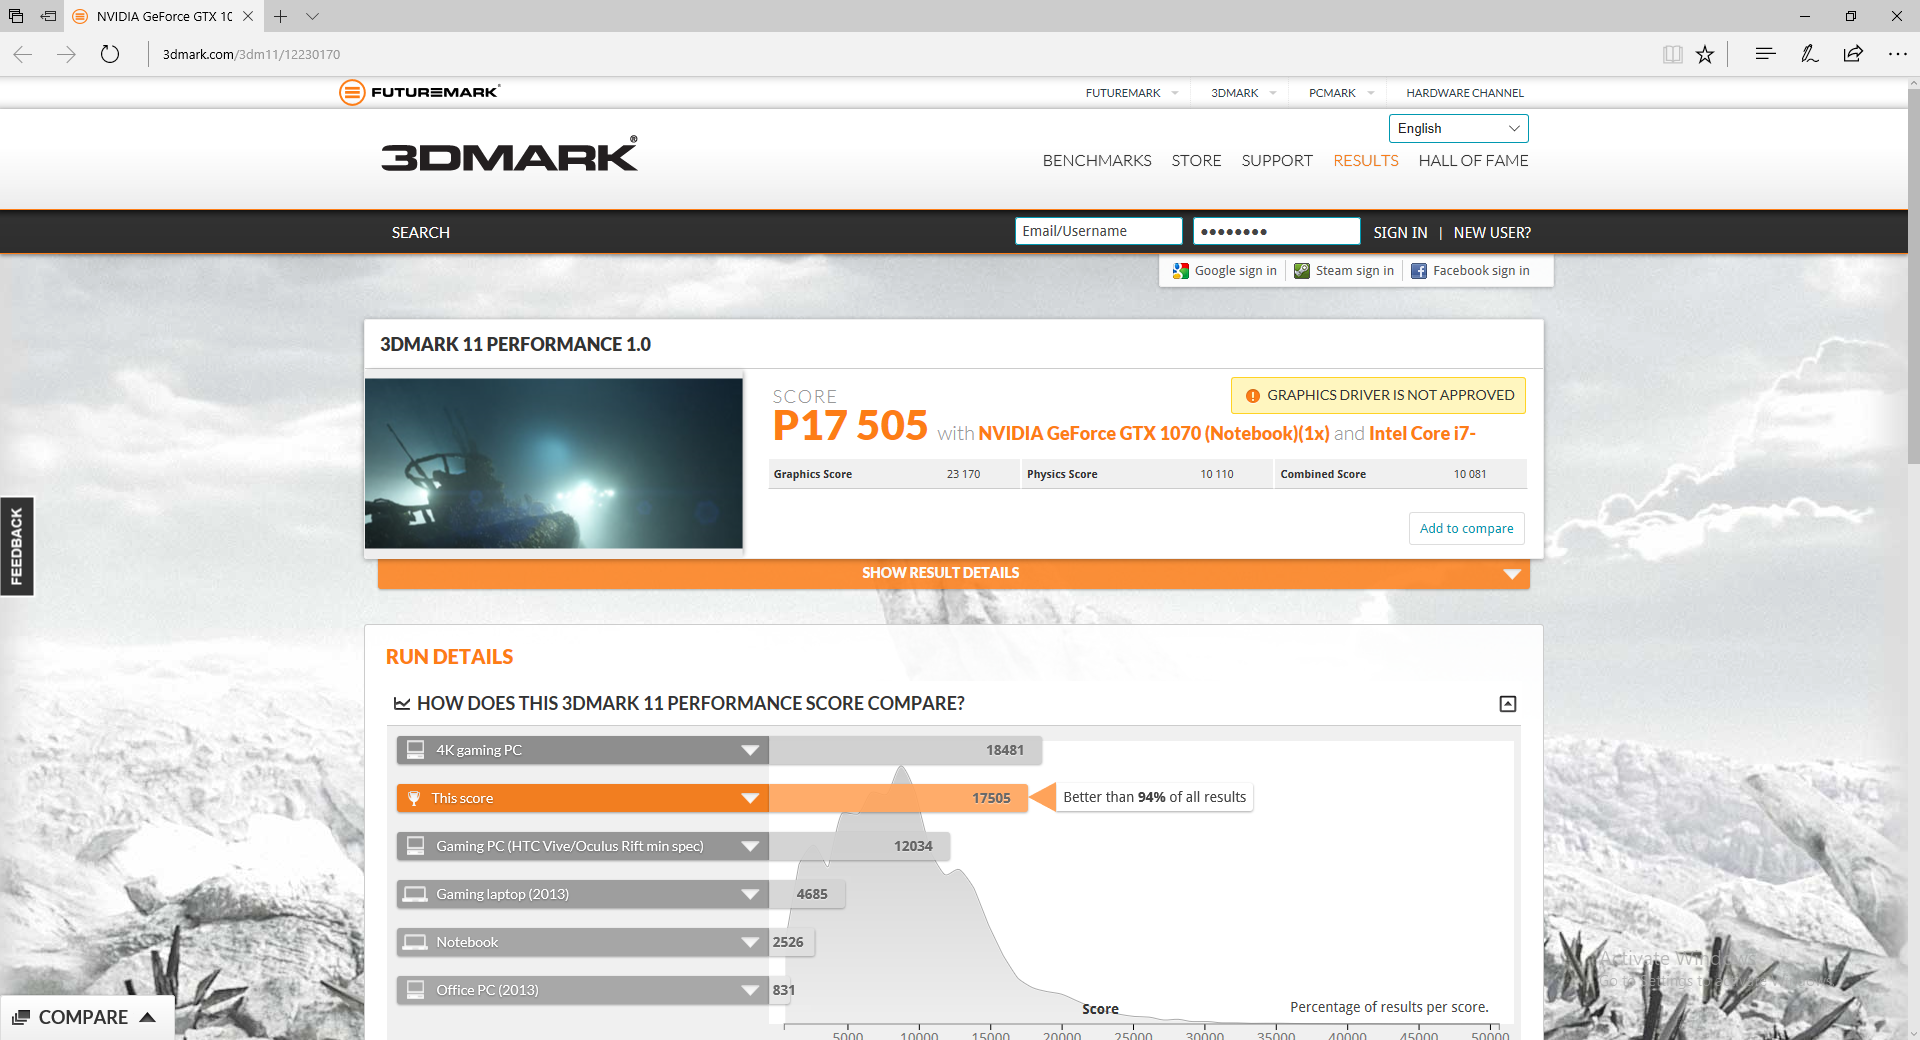
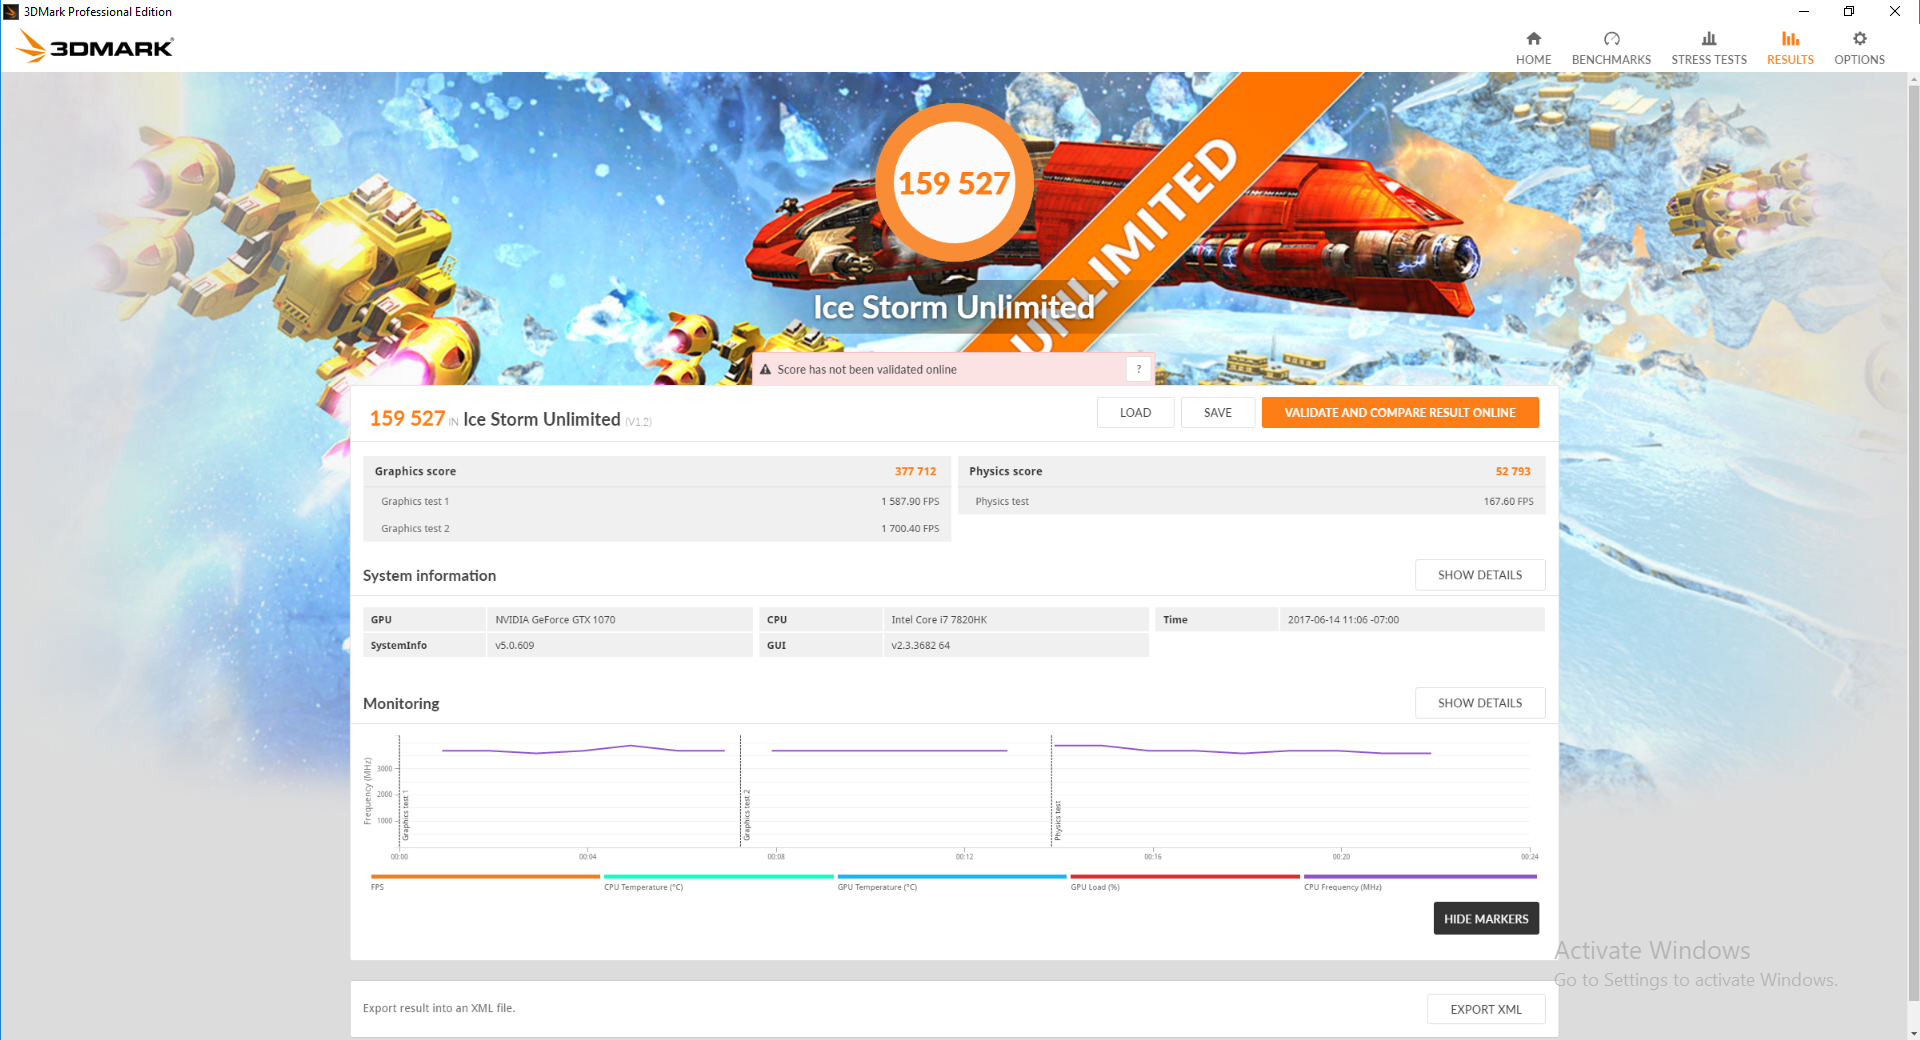
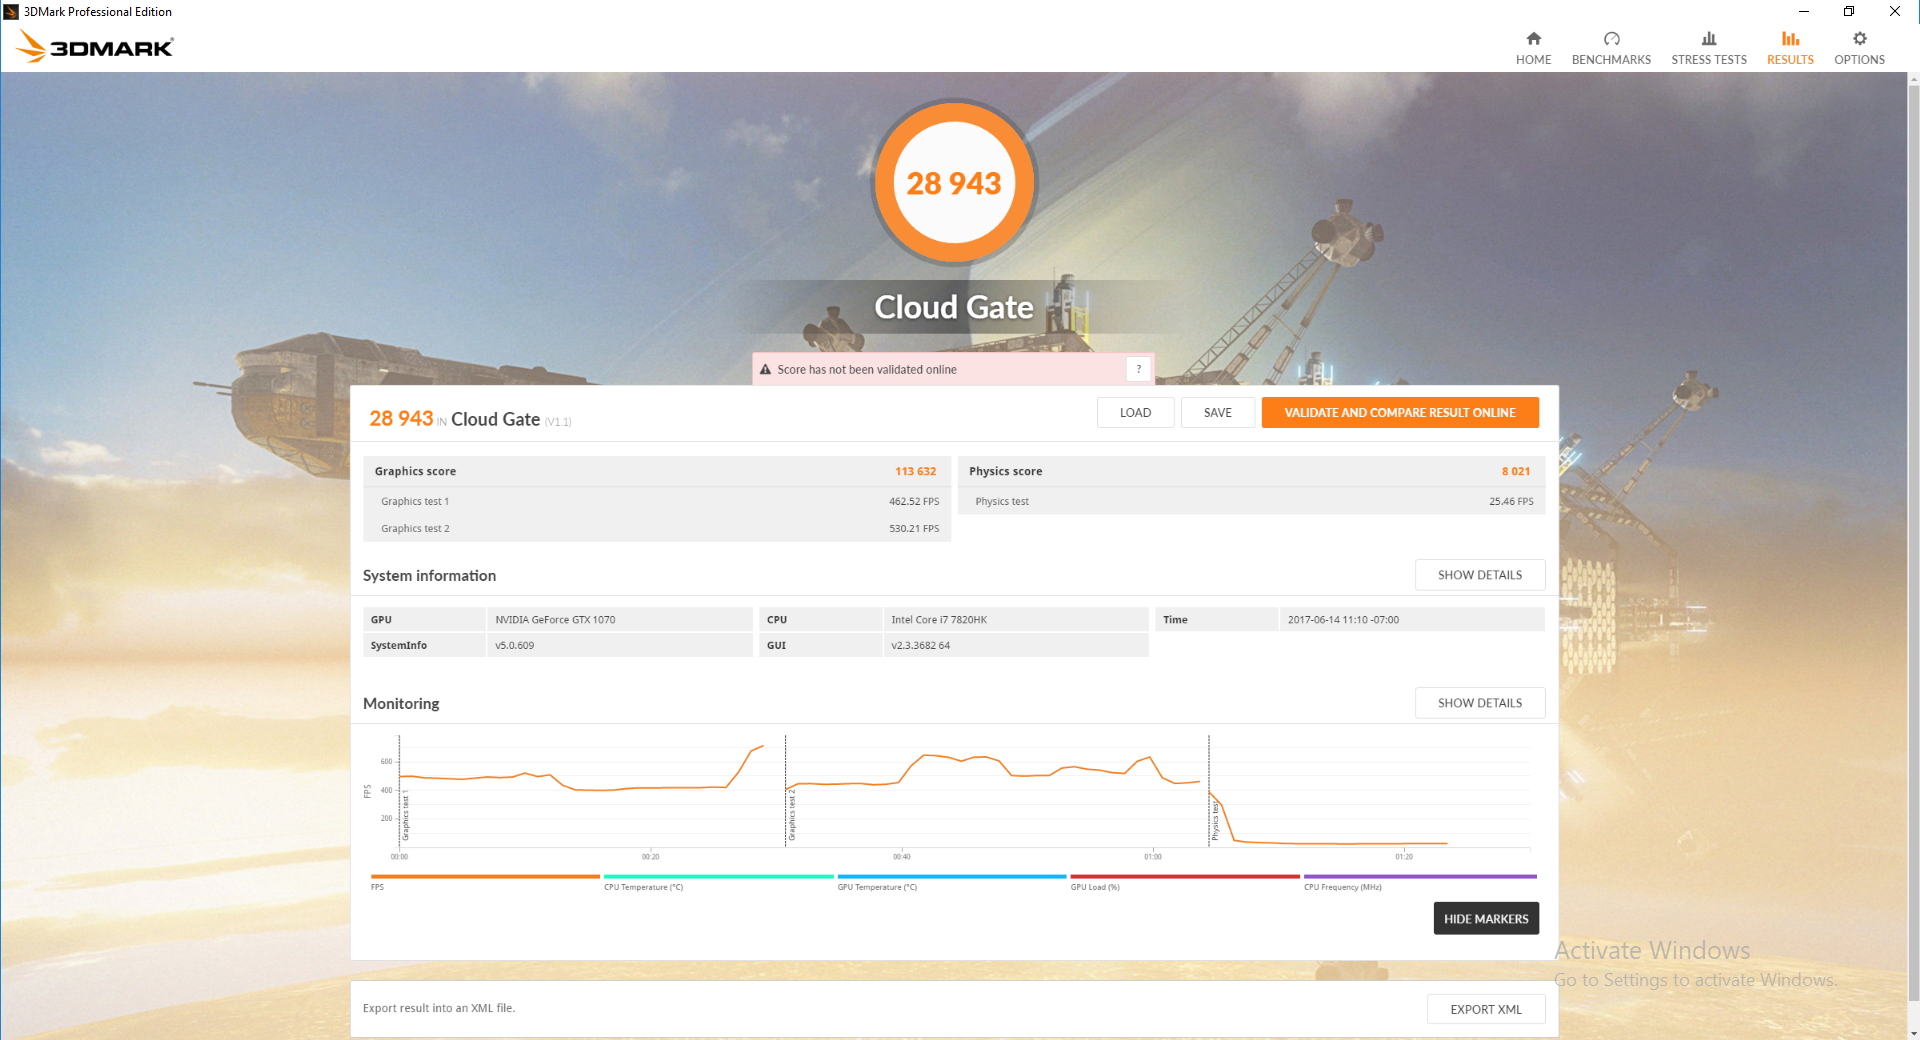
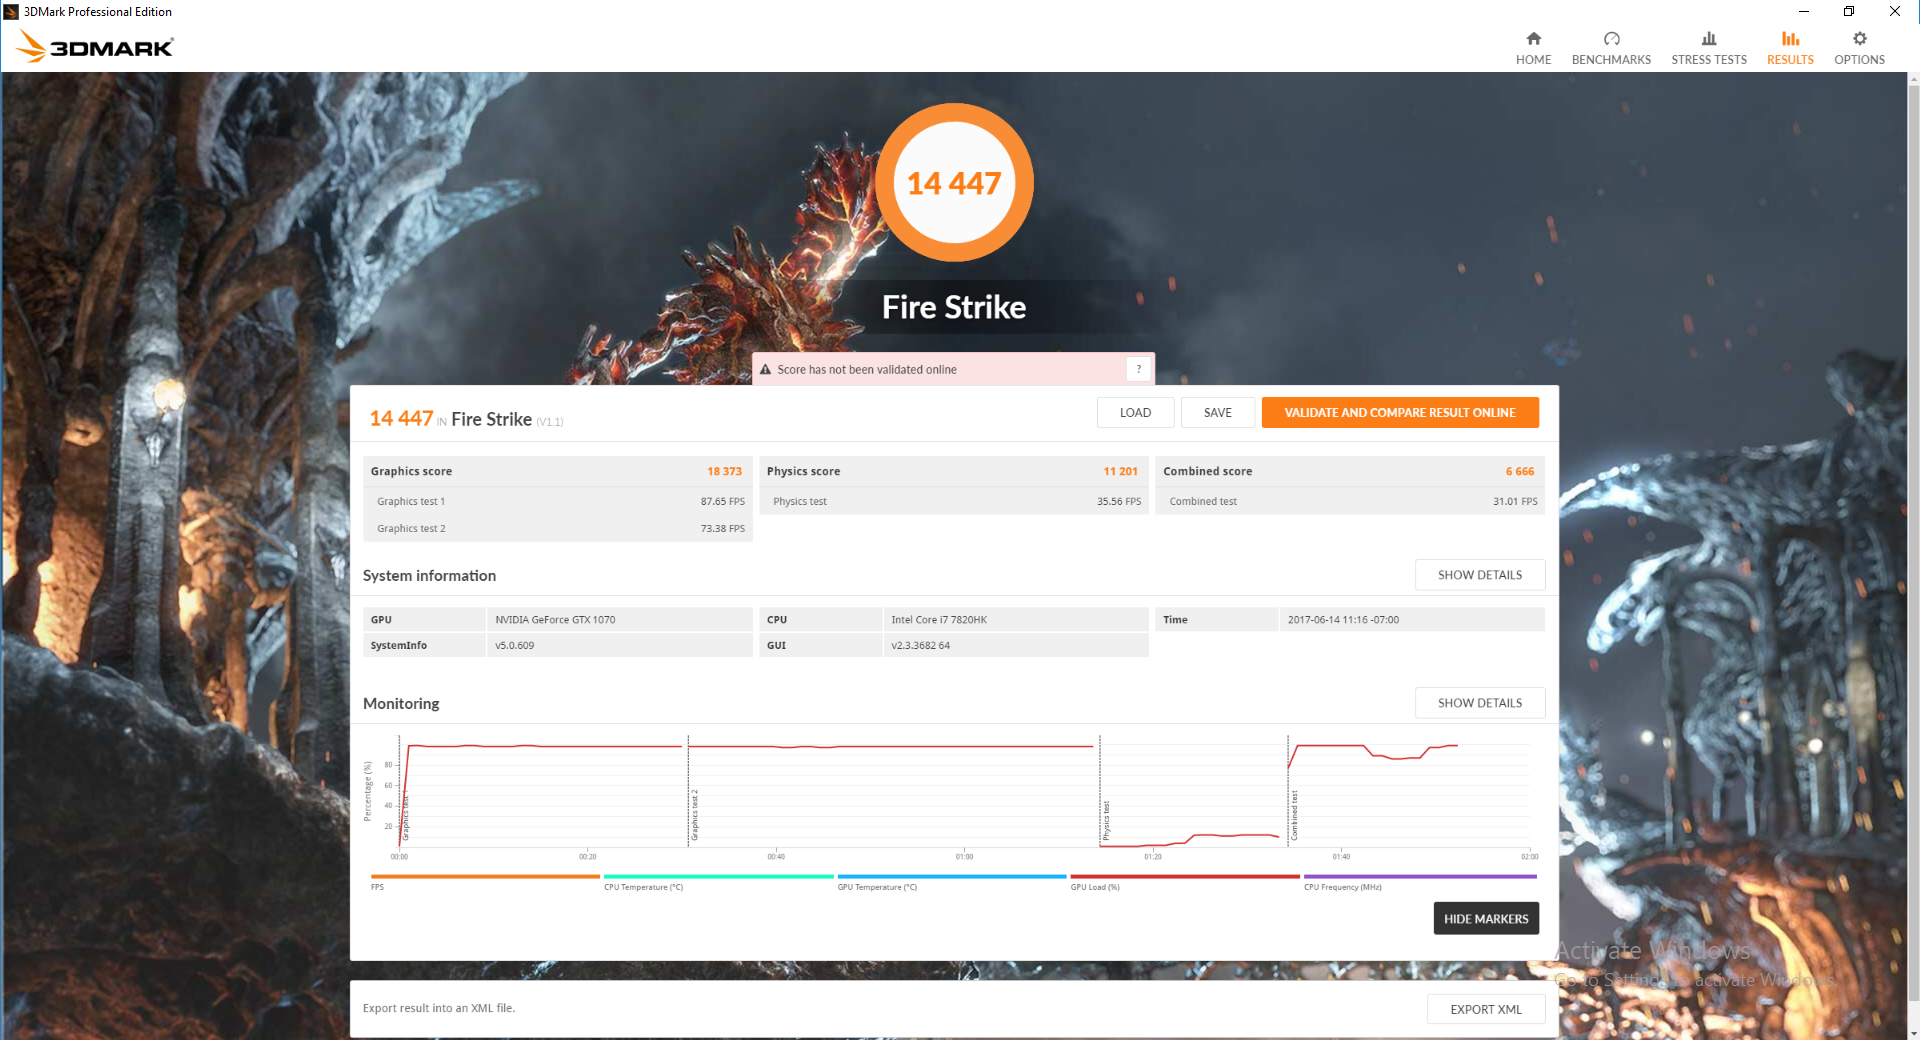
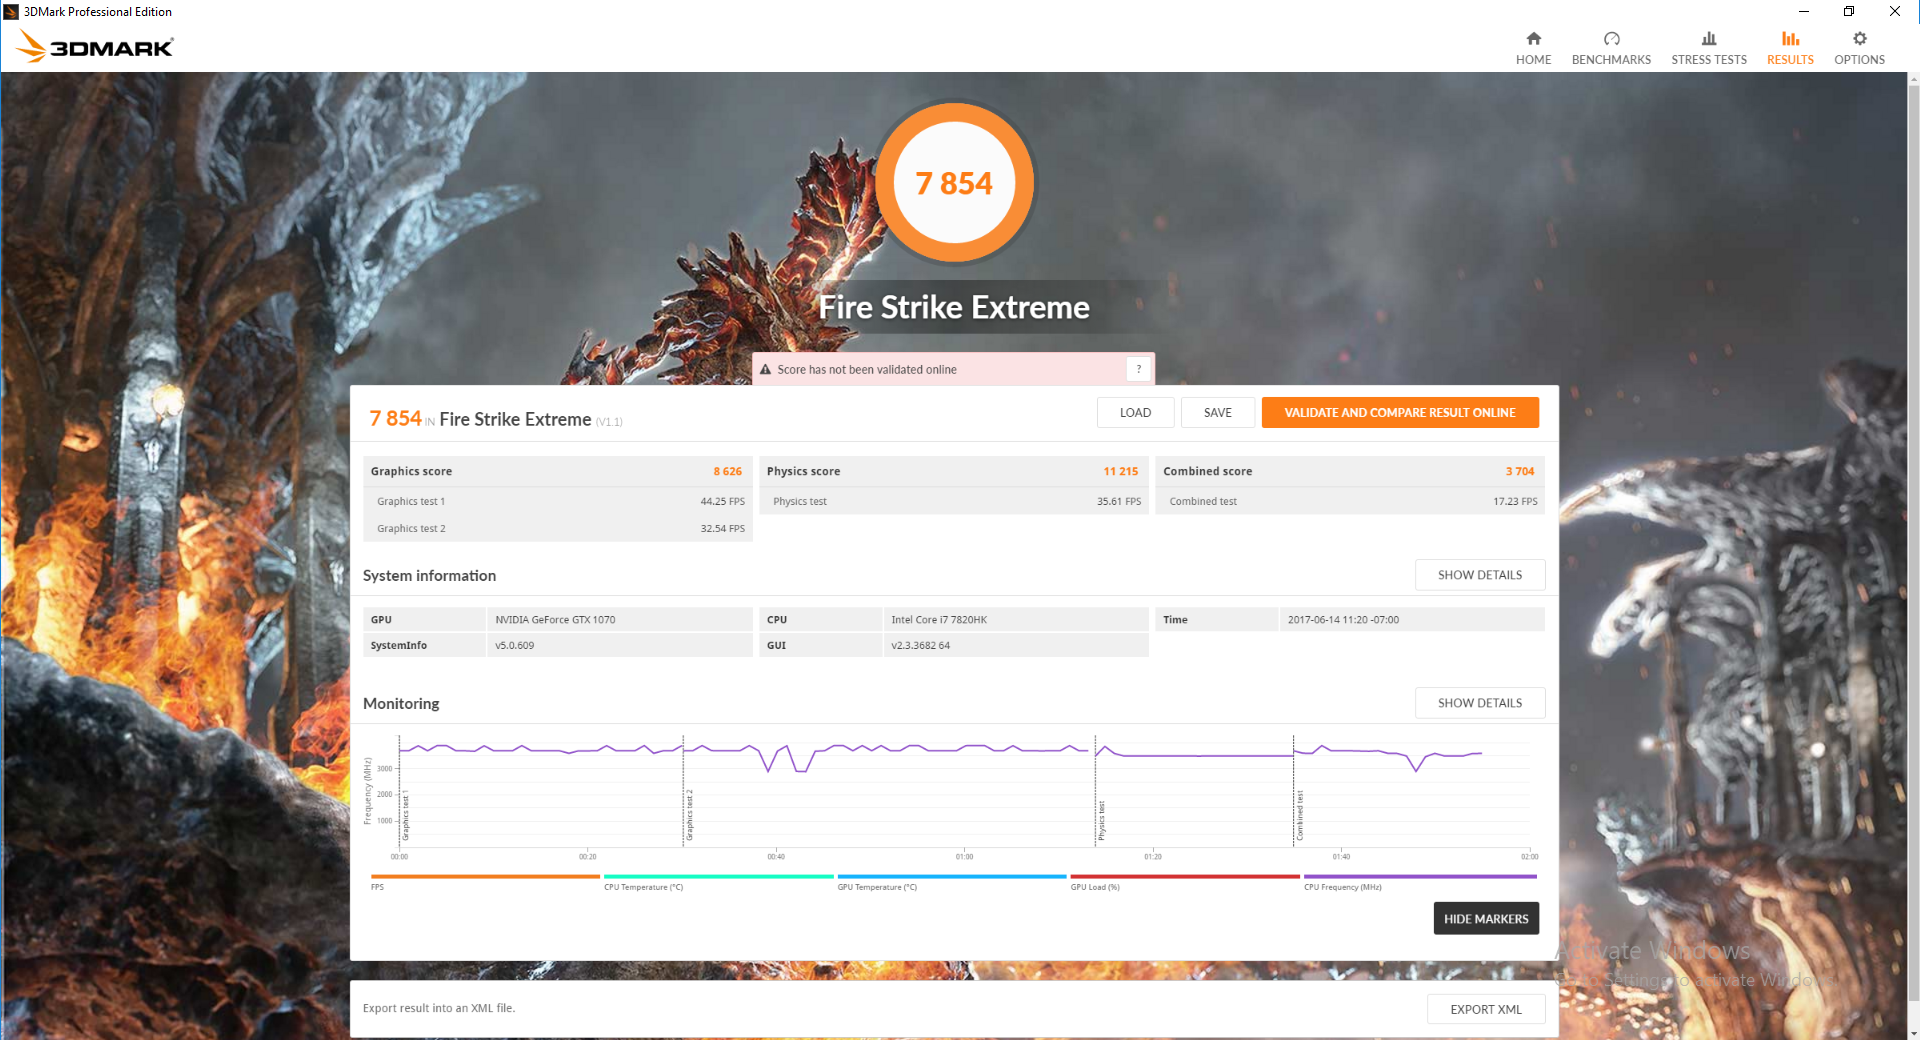
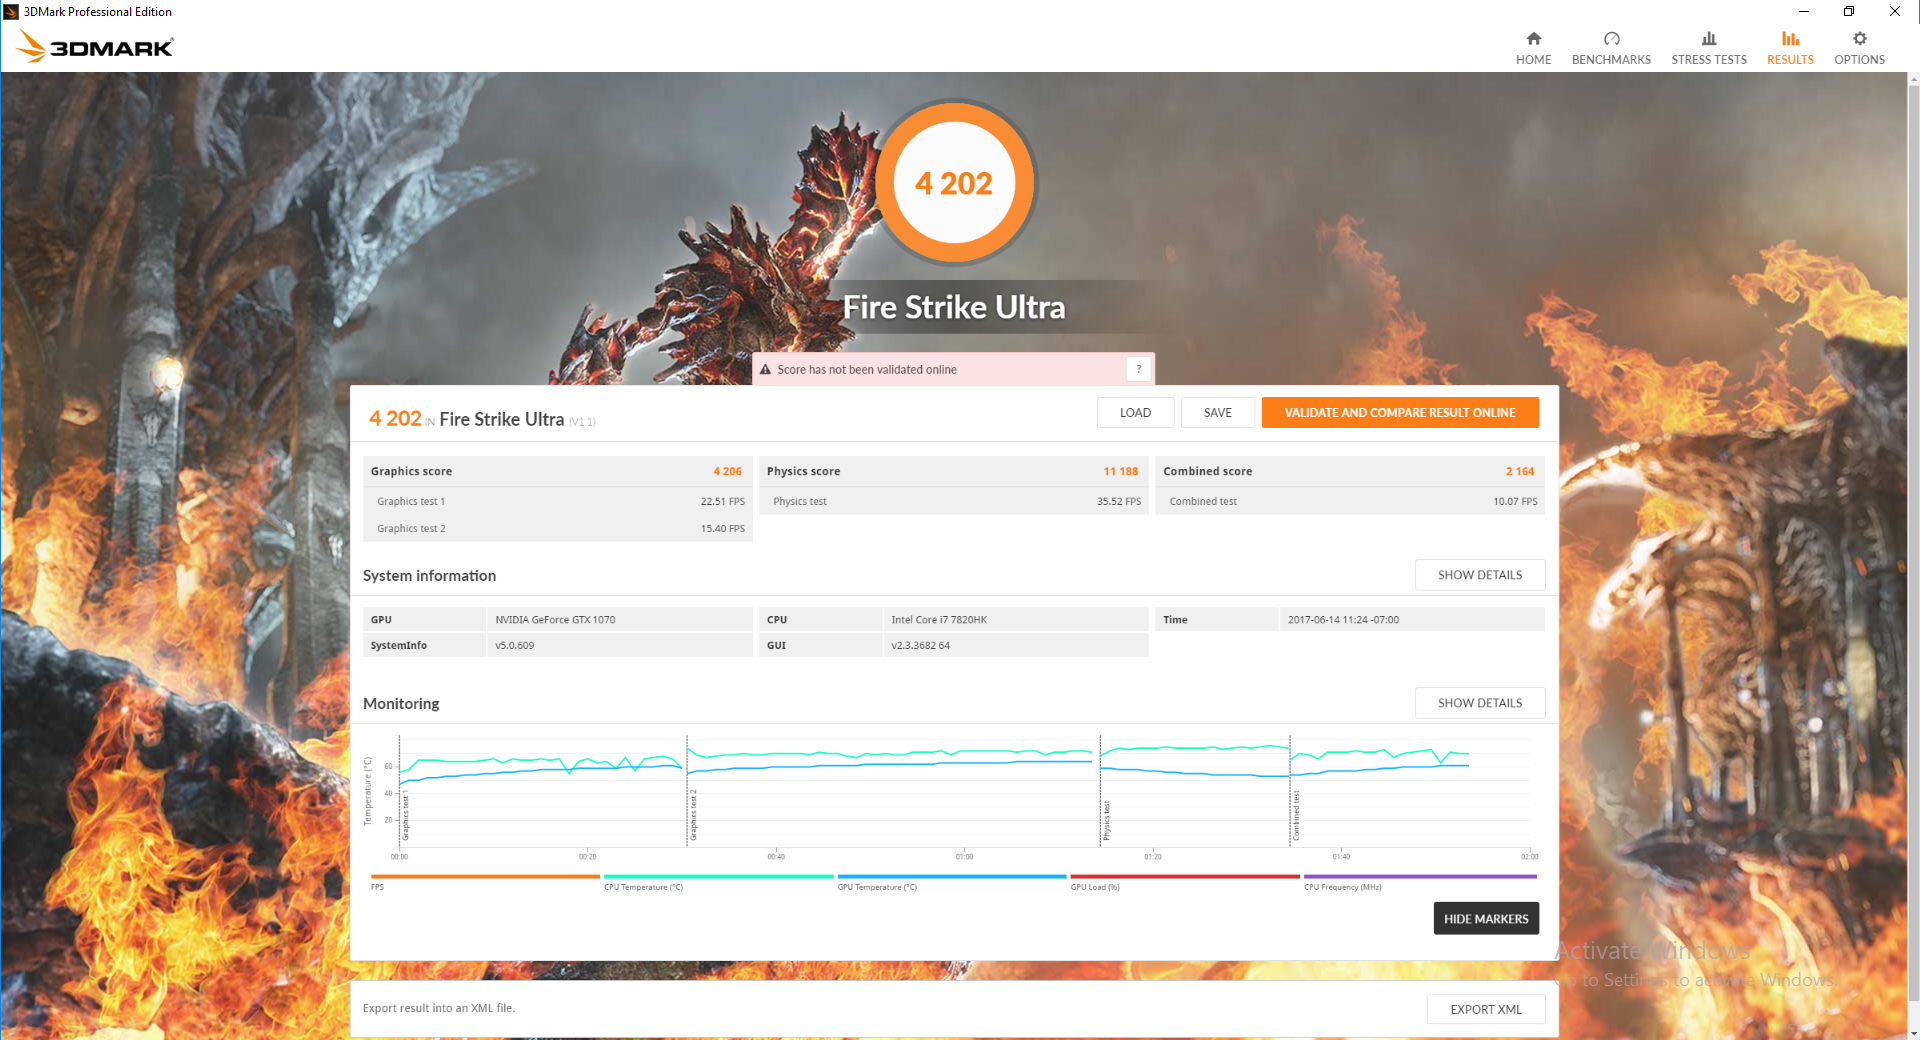
3DMark benchmarks show the mobile GTX 1070 performing nearly the same as our reference GTX 1070 desktop build. Thus, we can confirm no hidden under-clocking or power impediment that manufacturers like Razer may employ in order to fit GPUs onto thinner designs. Users moving up from the Maxwell GTX 980 can expect a raw performance boost of 40 percent while going one step higher to the GTX 1080 will bring a 20 percent performance boost over the GTX 1070.
See our dedicated review on the GTX 1070 for more technical details and comparisons.
| 3DMark | |
| 1920x1080 Fire Strike Graphics | |
| Nvidia GeForce GTX 1080 Ti Founders Edition | |
| Alienware 17 R4 | |
| Eurocom Sky MX5 R3 | |
| Asus G752VS-BA338T | |
| Nvidia GeForce GTX 1070 Founders Edition | |
| Asus G701VO-CS74K | |
| Aorus x3 Plus v7 | |
| Fire Strike Extreme Graphics | |
| Alienware 17 R4 | |
| Asus G752VS-BA338T | |
| Eurocom Sky MX5 R3 | |
| Asus G701VO-CS74K | |
| Aorus x3 Plus v7 | |
| 3840x2160 Fire Strike Ultra Graphics | |
| Nvidia GeForce GTX 1080 Ti Founders Edition | |
| Alienware 17 R4 | |
| Asus G752VS-BA338T | |
| Eurocom Sky MX5 R3 | |
| Nvidia GeForce GTX 1070 Founders Edition | |
| Asus G701VO-CS74K | |
| 3DMark 11 Performance | 17505 points | |
| 3DMark Ice Storm Standard Score | 156072 points | |
| 3DMark Cloud Gate Standard Score | 28943 points | |
| 3DMark Fire Strike Score | 14447 points | |
| 3DMark Fire Strike Extreme Score | 7854 points | |
Help | ||
Gaming Performance
The GTX 1070 performs where we expect it to be alongside other systems equipped with the same Nvidia GPU. Frame rates remain well above 100 FPS on maximum 1080p settings for the majority of titles and this pairs up excellently with the 120 Hz/5 ms FHD display. Ghosting is significantly less of an issue and response times are much faster as well especially when compared to older Aorus notebooks where ghosting can be abhorrent.
Gamers who prefer visual fidelity over response times and frame rates may want to configure the system with the 4K UHD 60 Hz option. See our dedicated GTX 1070 page for more gaming benchmarks.
| Rise of the Tomb Raider - 1920x1080 Very High Preset AA:FX AF:16x | |
| Nvidia GeForce GTX 1080 Ti Founders Edition | |
| Alienware 17 R4 | |
| Eurocom Sky MX5 R3 | |
| Eurocom Tornado F5 | |
| Nvidia GeForce GTX 1070 Founders Edition | |
| Zotac ZBOX Magnus EN980-U | |
| Aorus x3 Plus v7 | |
| BioShock Infinite - 1920x1080 Ultra Preset, DX11 (DDOF) | |
| Nvidia GeForce GTX 1080 Ti Founders Edition | |
| Alienware 17 R4 | |
| Nvidia GeForce GTX 1070 Founders Edition | |
| Eurocom Tornado F5 | |
| Eurocom Sky MX5 R3 | |
| Zotac ZBOX Magnus EN980-U | |
| Aorus x3 Plus v7 | |
| Metro: Last Light - 1920x1080 Very High (DX11) AF:16x | |
| Nvidia GeForce GTX 1080 Ti Founders Edition | |
| Alienware 17 R4 | |
| Nvidia GeForce GTX 1070 Founders Edition | |
| Eurocom Tornado F5 | |
| Eurocom Sky MX5 R3 | |
| Zotac ZBOX Magnus EN980-U | |
| Aorus x3 Plus v7 | |
| Batman: Arkham Knight - 1920x1080 High / On AA:SM AF:16x | |
| Alienware 17 R4 | |
| Eurocom Tornado F5 | |
| Eurocom Sky MX5 R3 | |
| Zotac ZBOX Magnus EN980-U | |
| Fallout 4 - 1920x1080 Ultra Preset AA:T AF:16x | |
| Nvidia GeForce GTX 1080 Ti Founders Edition | |
| Alienware 17 R4 | |
| Nvidia GeForce GTX 1070 Founders Edition | |
| Eurocom Tornado F5 | |
| Eurocom Sky MX5 R3 | |
| Zotac ZBOX Magnus EN980-U | |
| Aorus x3 Plus v7 | |
| Ashes of the Singularity - 1920x1080 high | |
| Nvidia GeForce GTX 1080 Ti Founders Edition | |
| Eurocom Tornado F5 | |
| Nvidia GeForce GTX 1070 Founders Edition | |
| Eurocom Sky MX5 R3 | |
| Alienware 17 R4 | |
| Aorus x3 Plus v7 | |
| Overwatch - 1920x1080 Epic (Render Scale 100 %) AA:SM AF:16x | |
| Nvidia GeForce GTX 1080 Ti Founders Edition | |
| Alienware 17 R4 | |
| Nvidia GeForce GTX 1070 Founders Edition | |
| Eurocom Sky MX5 R3 | |
| Eurocom Tornado F5 | |
| Zotac ZBOX Magnus EN980-U | |
| Mafia 3 - 1920x1080 High Preset | |
| Nvidia GeForce GTX 1080 Ti Founders Edition | |
| Alienware 17 R4 | |
| Eurocom Tornado F5 | |
| Eurocom Sky MX5 R3 | |
| Aorus x3 Plus v7 | |
| Prey - 1920x1080 Very High Preset AA:2TX SM AF:16x | |
| Nvidia GeForce GTX 1080 Ti Founders Edition | |
| Eurocom Sky MX5 R3 | |
| low | med. | high | ultra | |
|---|---|---|---|---|
| BioShock Infinite (2013) | 141 | |||
| Metro: Last Light (2013) | 115 | |||
| The Witcher 3 (2015) | 66.3 | |||
| Batman: Arkham Knight (2015) | 85 | |||
| Metal Gear Solid V (2015) | 60 | |||
| Fallout 4 (2015) | 103.3 | |||
| Rise of the Tomb Raider (2016) | 100.5 | |||
| Ashes of the Singularity (2016) | 76.4 | |||
| Doom (2016) | 126.7 | |||
| Overwatch (2016) | 160.6 | |||
| Mafia 3 (2016) | 65.7 | |||
| Prey (2017) | 138.5 |
Stress Test
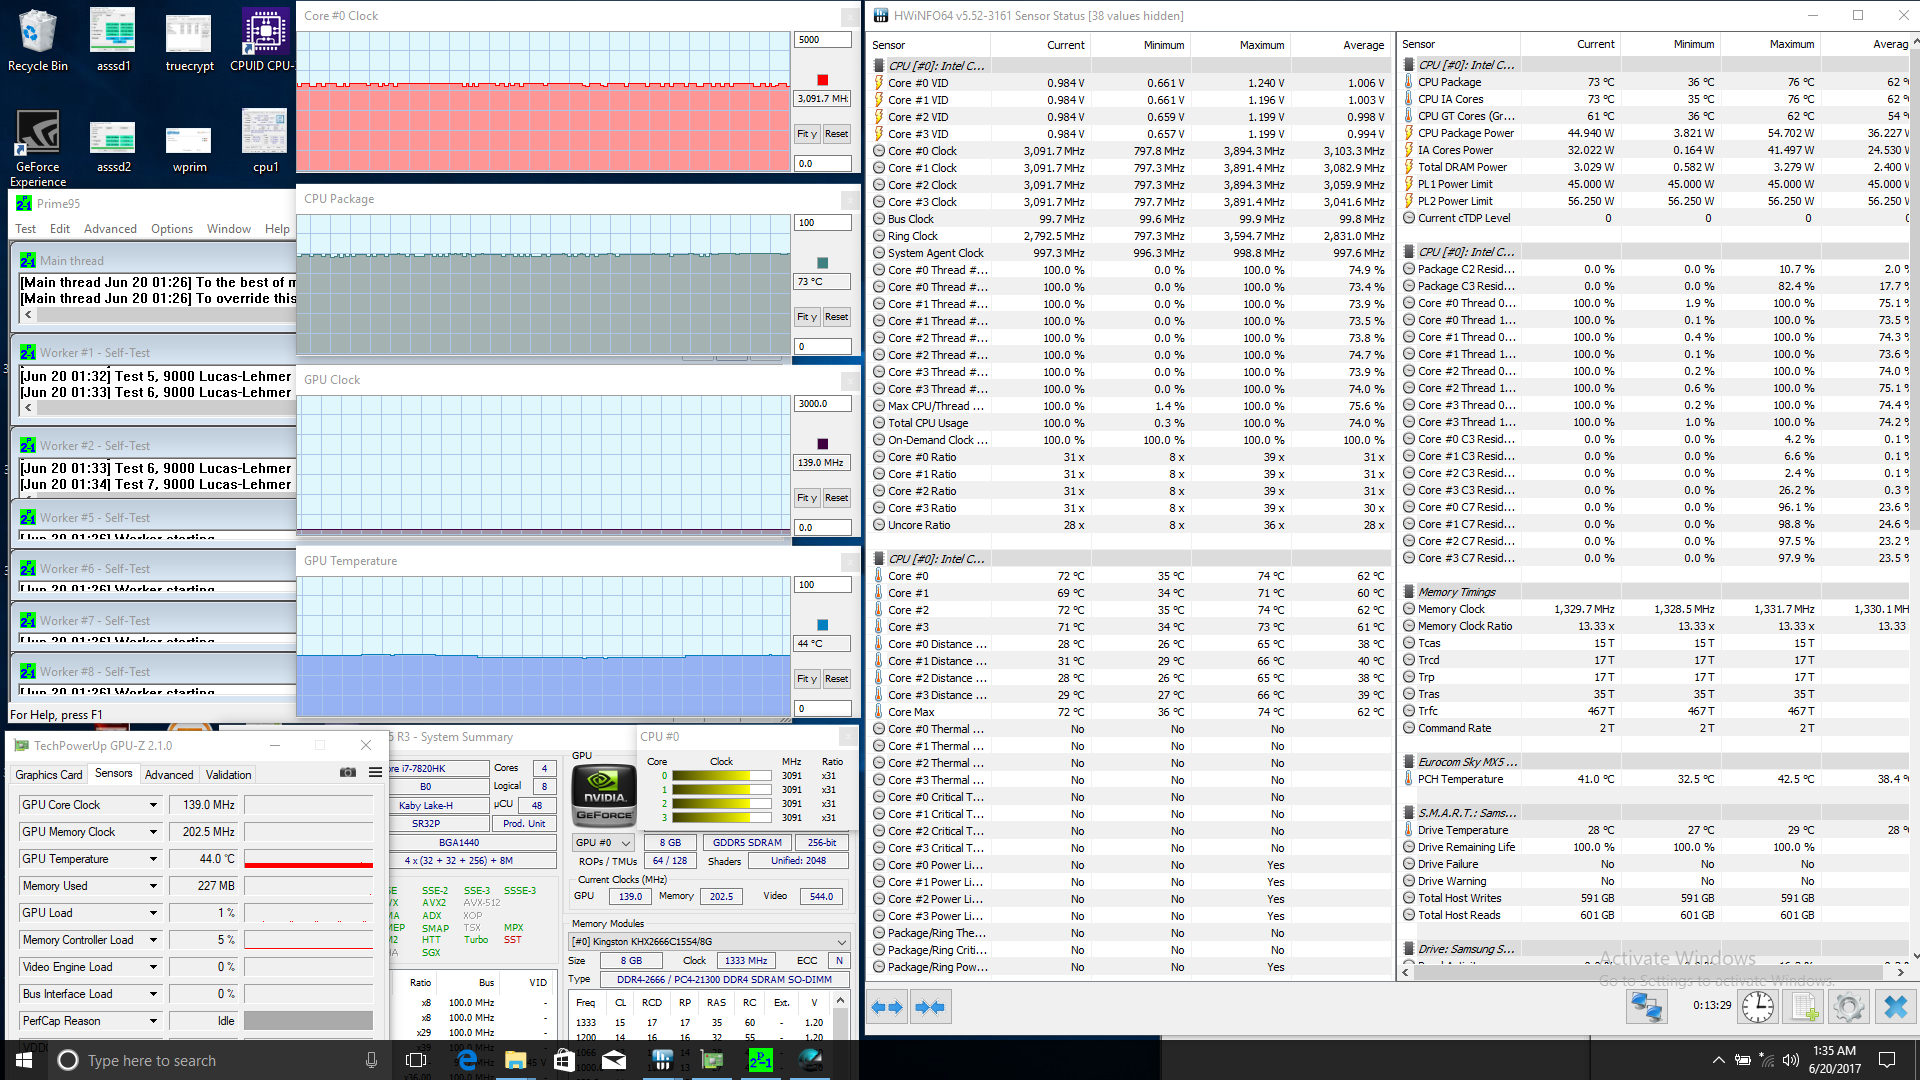
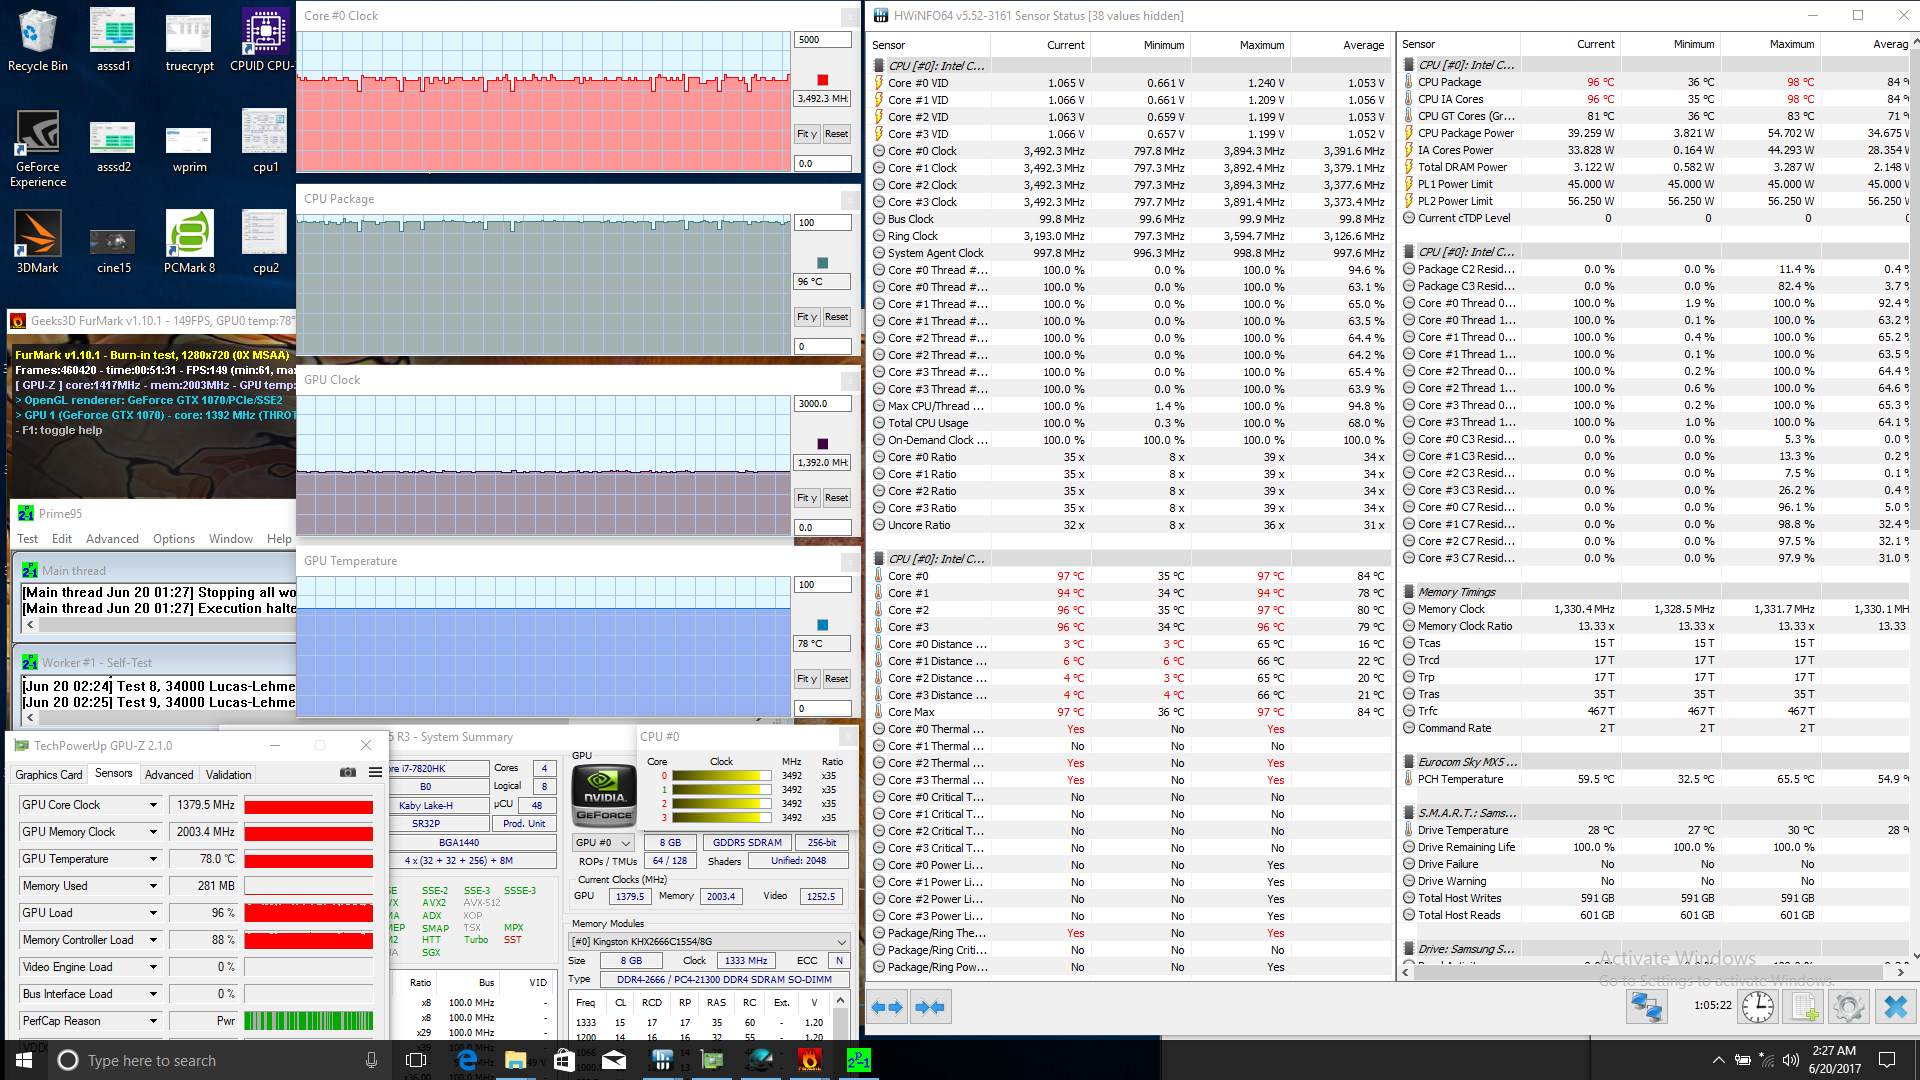
We stress the notebook in High Performance mode in order to identify for any potential throttling or stability issues. When under Prime95 load to stress the processor, clock rates will sustain a maximum of 3.5 GHz only for the first minute or so before falling to a steady 3.1 GHz. This observation is in line with our steadily decreasing CineBench loop scores from above and is very disappointing to see in a gaming notebook. The i7-7820HK CPU itself is rated for a base clock rate of 2.9 GHz and a multi-thread Turbo Boost of up to 3.5 GHz, so a steady clock rate of only 200 MHz above the base is definitely not impressive. Processor temperature remains relatively low for a gaming notebook in the 73 C range.
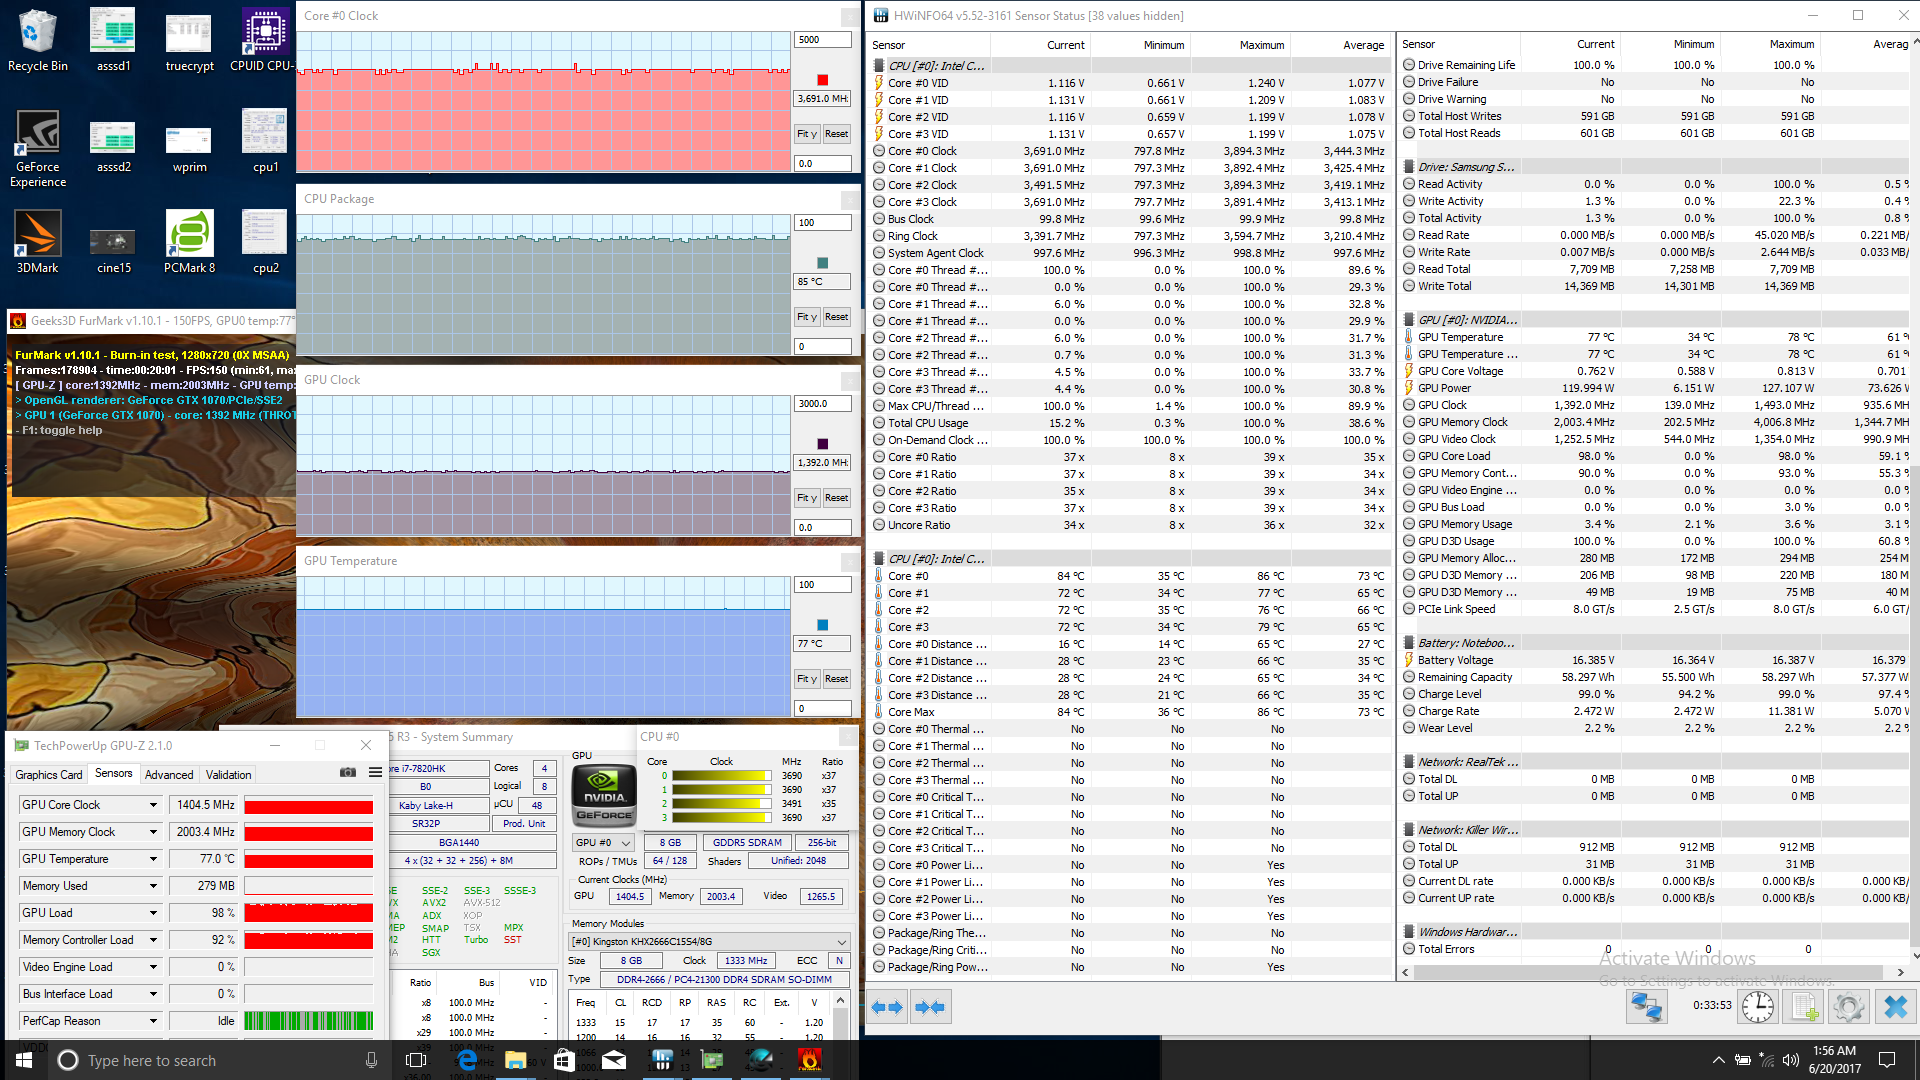
Running FurMark to stress the GTX 1070 will bring GPU temperature to a steady 77 C. Perhaps more interestingly, running both Prime95 and FurMark will inexplicably lift the CPU clock rate to its maximum 3.5 GHz. Perhaps the notebook automatically switches to a "Turbo Mode" once heavy GPU activity is detected as we were able to repeat this phenomenon with the same results. Note, however, that CPU temperature will scale up to 96 C to be dangerously close to the ~100 C safe operating limit of the Kaby Lake processor. Thus, users who choose to overclock the CPU may not have much headroom given the record temperatures.
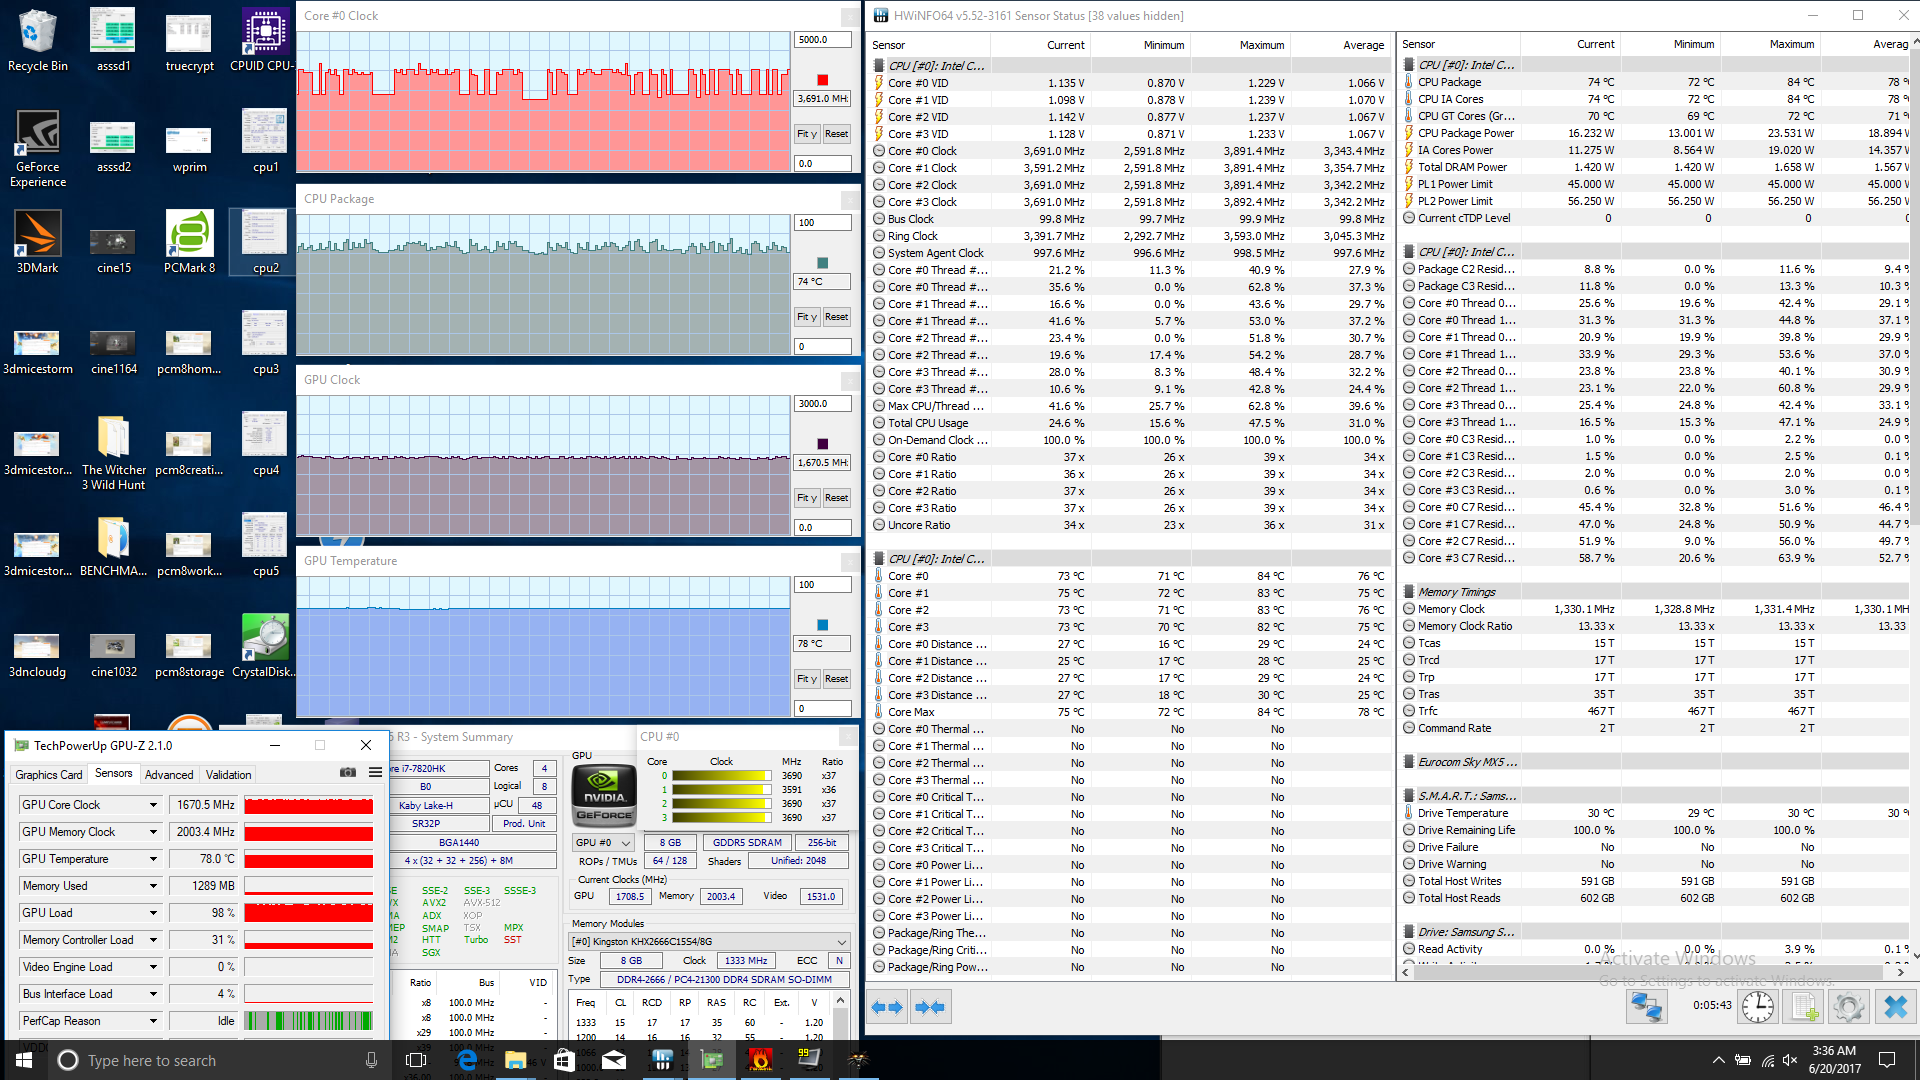
Witcher 3 is more representative of gaming loads and core temperatures can be observed stabilizing in the mid-to-high 70 C range. The CPU will only boost when needed while the GPU maintains a clock rate of 1670 MHz compared to its base of 1480 MHz.
Running on batteries will severely limit both CPU and GPU performances. A 3DMark Fire Strike test on battery power returns Physics and Graphics scores of 5407 and 11567 points, respectively, compared to 11201 and 18373 points when on mains.
| The Witcher 3 | |||
| Resolution | Settings | Value | |
| 1920x1080 | Ultra Graphics & Postprocessing (HBAO+) | 66.3 fps | |
| CPU Clock (GHz) | GPU Clock (MHz) | Average CPU Temperature (°C) | Average GPU Temperature (°C) | |
| Prime95 Stress | 3.1 | -- | 73 | 44 |
| FurMark Stress | -- | 1392 | 85 | 77 |
| Prime95 + FurMark Stress | 3.5 | 1392 | 96 | 78 |
| Witcher 3 Stress | 2.6 - 3.7 | 1670 | 74 | 78 |
Emissions
System Noise
The cooling solution consists of triple 50 mm fans and six heat pipes between them. As usual, the GPU and its surrounding GDDR5 VRAM modules take up the bulk of the cooling.
Fan noise is a mixed bag due largely to the fact that the fans are very sensitive to onscreen loads. If idling on desktop on Power Saver, the fans are barely audible over ambient noise. Light loads like browsing or video playback will ramp fans up to 35 dB(A) regardless of the power profile. The fans become even more sensitive if on the High Performance profile and so we highly recommend setting Windows to Power Saver and the GPU to "Optimal power" if word processing, checking email, or streaming movies. Otherwise, the pulsing fans will be bothersome during day-to-day use and the fans themselves will take longer than usual to fall back down to quieter RPMs.
Gaming loads as represented by 3DMark06 and Witcher 3 show a steady fan noise of 47 dB(A) to be significantly louder than many competing notebooks like the Predator 15 and GT62VR. While the low 40 dB(A) range is somewhat more tolerable, the higher 40 dB(A) range can be very distracting especially when playing quieter titles. Headphones are definitely recommended for a better gaming experience.
The less expensive i7-7700HQ configuration is not overclockable and has a chance to run cooler and quieter than our i7-7820HK SKU.
A very small hint of electronic noise can be heard if placing an ear directly next to the keyboard. Otherwise, it is essentially unnoticeable during regular use.
Noise level
| Idle |
| 28.5 / 29.2 / 35.5 dB(A) |
| Load |
| 47 / 51 dB(A) |
 | ||
30 dB silent 40 dB(A) audible 50 dB(A) loud |
||
min: | ||
| Eurocom Sky MX5 R3 GeForce GTX 1070 Mobile, i7-7820HK, Samsung SSD 960 Evo 500GB m.2 NVMe | Acer Predator 15 G9-593-751X GeForce GTX 1070 Mobile, i7-7700HQ, Samsung SM951 MZVPV256HDGL m.2 PCI-e | Lenovo Legion Y520-15IKBN-80WK001KUS GeForce GTX 1050 Ti Mobile, i7-7700HQ, Samsung PM961 MZVLW256HEHP | Gigabyte Aero 15 GeForce GTX 1060 Mobile, i7-7700HQ, Lite-On CX2-8B512-Q11 | Alienware 15 R3 GeForce GTX 1070 Mobile, i7-7700HQ | MSI GT62VR 7RE-223 GeForce GTX 1070 Mobile, i7-7700HQ, Samsung SSD PM871a MZNLN256HMHQ | |
|---|---|---|---|---|---|---|
| Noise | -8% | 6% | -2% | -8% | -4% | |
| off / environment * (dB) | 28 | 32 -14% | 27.7 1% | 31 -11% | 30 -7% | 30 -7% |
| Idle Minimum * (dB) | 28.5 | 34 -19% | 30.5 -7% | 32 -12% | 31 -9% | 34 -19% |
| Idle Average * (dB) | 29.2 | 36 -23% | 30.5 -4% | 33 -13% | 32 -10% | 35 -20% |
| Idle Maximum * (dB) | 35.5 | 38 -7% | 30.6 14% | 34 4% | 42 -18% | 36 -1% |
| Load Average * (dB) | 47 | 41 13% | 40 15% | 39 17% | 49 -4% | 40 15% |
| Load Maximum * (dB) | 51 | 50 2% | 42.6 16% | 50 2% | 50 2% | 46 10% |
| Witcher 3 ultra * (dB) | 42 | 40 | 43 |
* ... smaller is better
Temperature
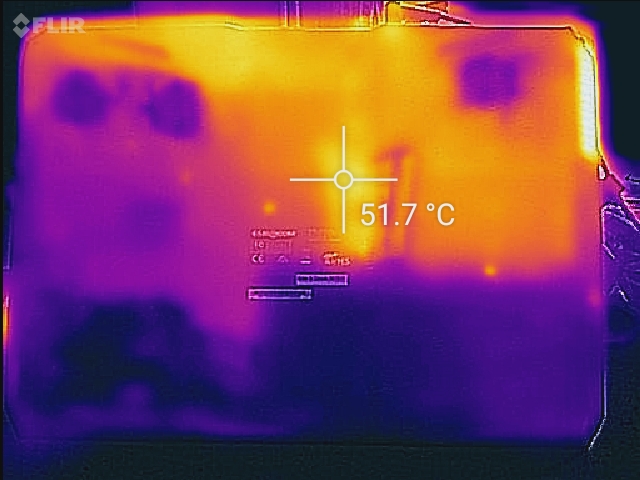
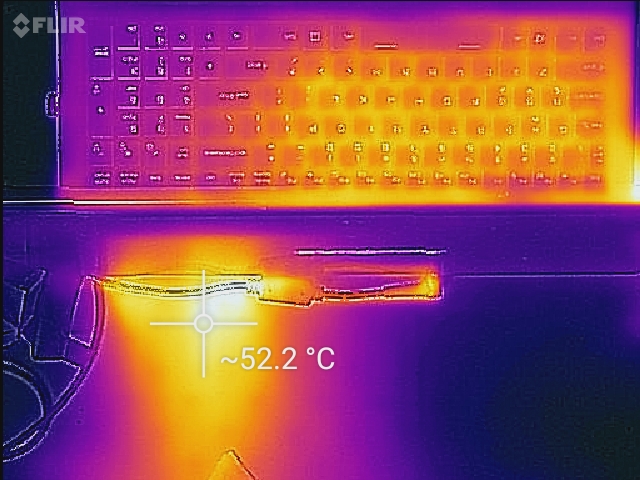
Surface temperatures when idling are noticeably warmer around the keyboard keys than the frontal palm rests and trackpad by about a few degrees C. If running very high loads, the palm rests remain cool while the rear quadrants above the top of row keyboard keys can reach 50 C. Users are less likely to touch these hot spots and we don't find the hot surfaces to be of any concern when gaming. Due to the placement of the CPU directly underneath the WASD keys, however, the left side of the keyboard will be significantly warmer then the NumPad and this is generally unfavorable when playing games. Excess heat exhausts through two sets of ventilation grilles on the left and rear edges of the notebook. Temperature development on the Eurocom is not as symmetrical as on the Alienware 15 or MSI GT62VR, but it is at least cooler on average than the super-thin and less powerful MSI GS63VR.
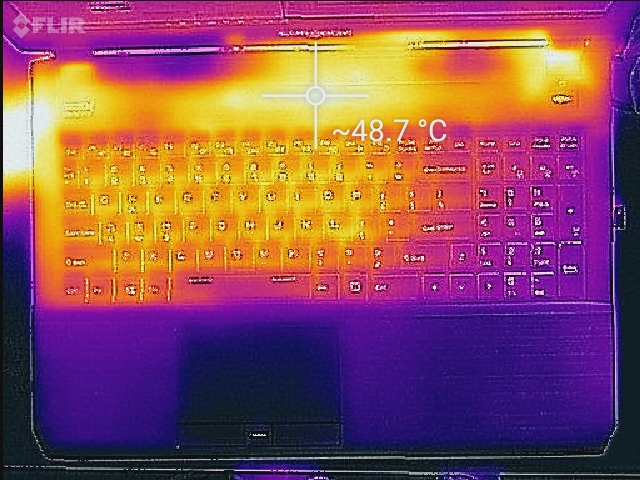
(-) The maximum temperature on the upper side is 50 °C / 122 F, compared to the average of 40.4 °C / 105 F, ranging from 21.2 to 68.8 °C for the class Gaming.
(-) The bottom heats up to a maximum of 52.2 °C / 126 F, compared to the average of 43.2 °C / 110 F
(+) In idle usage, the average temperature for the upper side is 30 °C / 86 F, compared to the device average of 33.9 °C / 93 F.
(±) Playing The Witcher 3, the average temperature for the upper side is 36.7 °C / 98 F, compared to the device average of 33.9 °C / 93 F.
(+) The palmrests and touchpad are cooler than skin temperature with a maximum of 28.2 °C / 82.8 F and are therefore cool to the touch.
(±) The average temperature of the palmrest area of similar devices was 28.8 °C / 83.8 F (+0.6 °C / 1 F).
Speakers
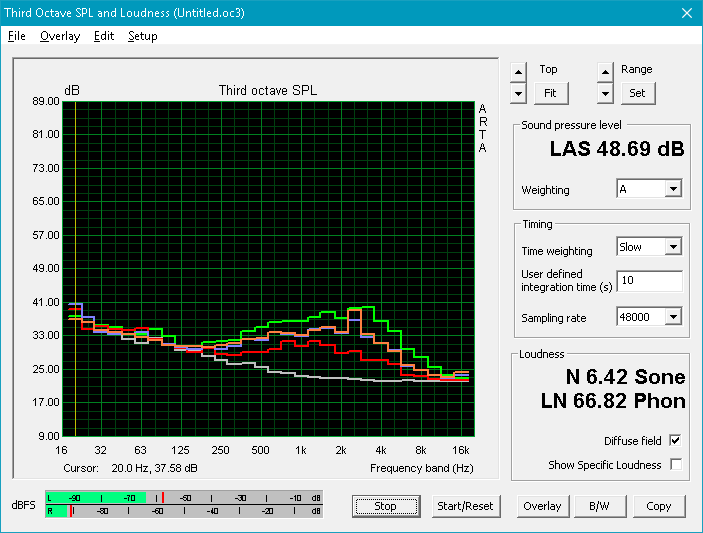
The 2 W stereo speakers are disappointing in both sound quality and maximum volume. Bass is underrepresented as shown by our microphone measurements below likely due to the lack of a dedicated subwoofer. The SKy X7E2, for example, exhibits a wider and more stable pink noise graph than the less balanced MX5 R3. Fortunately, higher volume settings will not introduce any static or reverberate the palm rests since the speakers are located towards the rear of the notebook instead of the front edge.
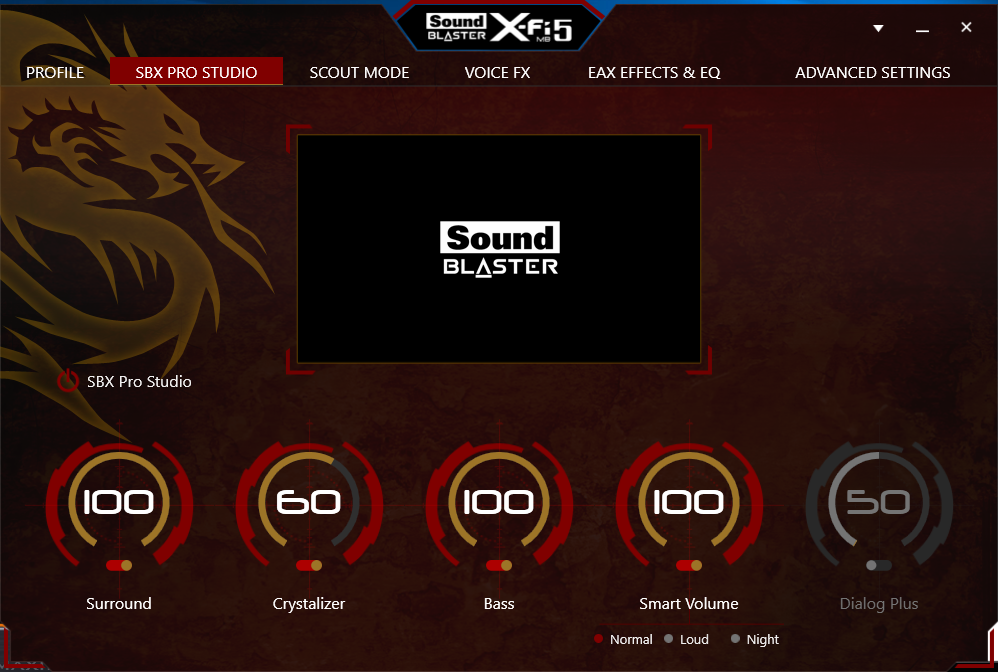
The same ESS Sabre HiFi DAC as found on the MSI GS and GT series is also here on the Eurocom to support professional-grade headphones. Mainstream users will likely not take notice, but streamers and audiophiles will appreciate the wider impedance range and higher SNR.
")


Eurocom Sky MX5 R3 audio analysis
(-) | not very loud speakers (55.7 dB)
Bass 100 - 315 Hz
(±) | reduced bass - on average 11.4% lower than median
(±) | linearity of bass is average (11.8% delta to prev. frequency)
Mids 400 - 2000 Hz
(+) | balanced mids - only 3.7% away from median
(±) | linearity of mids is average (10.8% delta to prev. frequency)
Highs 2 - 16 kHz
(+) | balanced highs - only 2% away from median
(±) | linearity of highs is average (7% delta to prev. frequency)
Overall 100 - 16.000 Hz
(±) | linearity of overall sound is average (28.3% difference to median)
Compared to same class
» 94% of all tested devices in this class were better, 1% similar, 4% worse
» The best had a delta of 6%, average was 18%, worst was 132%
Compared to all devices tested
» 86% of all tested devices were better, 3% similar, 12% worse
» The best had a delta of 4%, average was 23%, worst was 134%
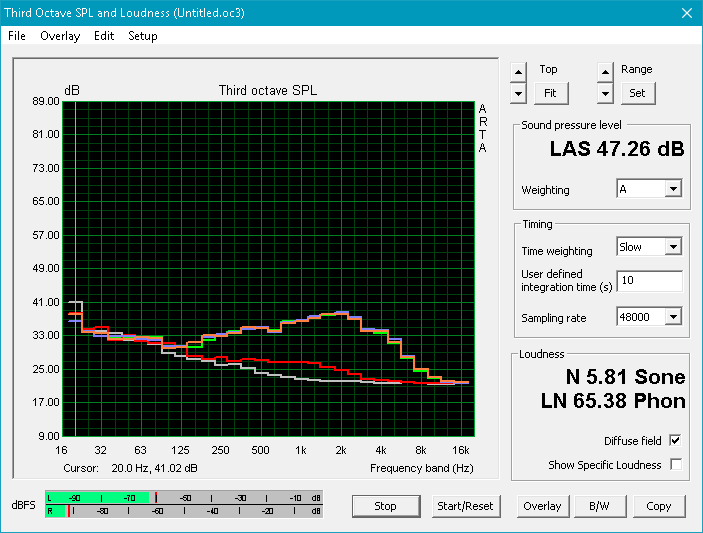
Apple MacBook 12 (Early 2016) 1.1 GHz audio analysis
(+) | speakers can play relatively loud (83.6 dB)
Bass 100 - 315 Hz
(±) | reduced bass - on average 11.3% lower than median
(±) | linearity of bass is average (14.2% delta to prev. frequency)
Mids 400 - 2000 Hz
(+) | balanced mids - only 2.4% away from median
(+) | mids are linear (5.5% delta to prev. frequency)
Highs 2 - 16 kHz
(+) | balanced highs - only 2% away from median
(+) | highs are linear (4.5% delta to prev. frequency)
Overall 100 - 16.000 Hz
(+) | overall sound is linear (10.2% difference to median)
Compared to same class
» 7% of all tested devices in this class were better, 2% similar, 90% worse
» The best had a delta of 5%, average was 18%, worst was 53%
Compared to all devices tested
» 5% of all tested devices were better, 1% similar, 94% worse
» The best had a delta of 4%, average was 23%, worst was 134%
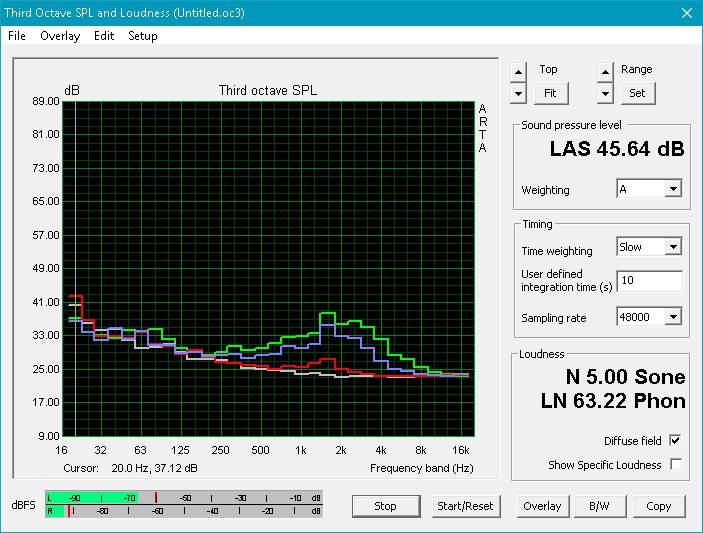
Frequency Comparison (Checkbox selectable!)
Graph 1: Pink Noise 100% Vol.; Graph 2: Audio off
Energy Management
Power Consumption
The Eurocom is slightly more demanding than competing 15.6-inch gaming notebooks with GTX 1070 GPUs due in part to its HK-class CPU. Running 3DMark06 will draw about 97 W while Witcher 3 will demand as much as 177 W. Maximum load with both Prime95 and FurMark will draw 214 W from a medium-sized AC adapter rated for up to 230 W. Though sufficient as is, we would have preferred a more capable PSU in the 250 W range or higher for the extra headroom.
| Off / Standby | |
| Idle | |
| Load |
|
Key:
min: | |
| Eurocom Sky MX5 R3 i7-7820HK, GeForce GTX 1070 Mobile, Samsung SSD 960 Evo 500GB m.2 NVMe, , 1920x1080, 15.6" | Acer Predator 15 G9-593-751X i7-7700HQ, GeForce GTX 1070 Mobile, Samsung SM951 MZVPV256HDGL m.2 PCI-e, IPS, 1920x1080, 15.6" | Lenovo Legion Y520-15IKBN-80WK001KUS i7-7700HQ, GeForce GTX 1050 Ti Mobile, Samsung PM961 MZVLW256HEHP, IPS, 1920x1080, 15.6" | Gigabyte Aero 15 i7-7700HQ, GeForce GTX 1060 Mobile, Lite-On CX2-8B512-Q11, IPS, 1920x1080, 15.6" | Alienware 15 R3 i7-7700HQ, GeForce GTX 1070 Mobile, , TN, 1920x1080, 15.6" | MSI GT62VR 7RE-223 i7-7700HQ, GeForce GTX 1070 Mobile, Samsung SSD PM871a MZNLN256HMHQ, IPS, 1920x1080, 15.6" | |
|---|---|---|---|---|---|---|
| Power Consumption | 3% | 49% | 31% | 6% | 4% | |
| Idle Minimum * (Watt) | 22 | 18 18% | 8.5 61% | 12 45% | 19 14% | 20 9% |
| Idle Average * (Watt) | 24.5 | 23 6% | 9.1 63% | 15 39% | 23 6% | 24 2% |
| Idle Maximum * (Watt) | 25.2 | 30 -19% | 9.7 62% | 20 21% | 29 -15% | 29 -15% |
| Load Average * (Watt) | 97.2 | 89 8% | 79.9 18% | 82 16% | 85 13% | 82 16% |
| Witcher 3 ultra * (Watt) | 177.5 | 168 5% | 97.7 45% | 111 37% | ||
| Load Maximum * (Watt) | 213.8 | 213 -0% | 121.5 43% | 161 25% | 192 10% | 193 10% |
* ... smaller is better
Battery Life
Unsurprisingly, runtimes are very short at just under 3 hours of real-world WLAN use. Long battery life is never an expectation from powerful gaming systems like what we have here, but it doesn't excuse the fact that competing gaming systems can still last for much longer when under similar loads by an hour or more. Part of this is due to the smaller 60 Wh battery of the Sky MX5 R3 when compared to the 90 Wh or higher capacities of the Predator 15, Aero 15, and Alienware 15 R3.
Charging from near empty to full capacity will take less than 1.5 hours compared to 2 hours on most other notebooks.
| Eurocom Sky MX5 R3 i7-7820HK, GeForce GTX 1070 Mobile, Wh | Acer Predator 15 G9-593-751X i7-7700HQ, GeForce GTX 1070 Mobile, 90 Wh | Lenovo Legion Y520-15IKBN-80WK001KUS i7-7700HQ, GeForce GTX 1050 Ti Mobile, 45 Wh | Gigabyte Aero 15 i7-7700HQ, GeForce GTX 1060 Mobile, 94.24 Wh | Alienware 15 R3 i7-7700HQ, GeForce GTX 1070 Mobile, 99 Wh | MSI GT62VR 7RE-223 i7-7700HQ, GeForce GTX 1070 Mobile, 75 Wh | |
|---|---|---|---|---|---|---|
| Battery runtime | 83% | 44% | 120% | 45% | 38% | |
| Reader / Idle (h) | 3.4 | 8.4 147% | 8.5 150% | 10.6 212% | 6.4 88% | 6.3 85% |
| WiFi v1.3 (h) | 2.9 | 5.5 90% | 4 38% | 7 141% | 4.4 52% | 4.1 41% |
| Load (h) | 1.8 | 2 11% | 0.8 -56% | 1.9 6% | 1.7 -6% | 1.6 -11% |
Pros
Cons
Verdict
The Sky MX5 R3 has almost everything a core mobile gamer will need including easy serviceability, a healthy number of display options and ports, and an excellent balance of components that complement each other well. The GTX 1070 pairs perfectly with both the 1080p 120 Hz or 4K UHD 60 Hz screens while the i7-7820HK or i7-7700HQ CPU will be more than enough for most titles. Users will find the notebook especially alluring if its 4G/WWAN capabilities will be utilized and if GPU upgrades are not to be considered.
Key drawbacks include the absence of Thunderbolt 3, average contrast ratio, and a loud fan noise even for a gaming notebook. The middling performance of the i7-7820HK at stock speeds and its alarmingly high CPU temperature when running at maximum Turbo Boost are asterisks on an otherwise versatile system. It's in this vital area where the MSI GT62VR can still be the better buy for its quieter fan noise. Still, the Eurocom outperforms the MSI on other aspects including its brighter backlight, lower average surface temperatures, thinner build, and wider port selection.
Build quality is better than on the Asus GL702VS while having a wider variety of configurable options than the MSI GT62VR. Fan noise is disappointing and we recommend configuring with the lower-end i7-7700HQ as gains from the pricier i7-7820HK are essentially imperceptible.
Eurocom Sky MX5 R3
- 06/23/2017 v6 (old)
Allen Ngo
Price comparison
