MSI GV62 8RE (i5-8300H, GTX 1060, FHD) Laptop Review

MSI has a machine for almost any consumer. Ranging from the mighty GT75 Titan to the budget-oriented PL62, the company is no stranger to consumer choice. Enter the GV62 8RE. The GV62 line is positioned as entry-level gaming laptops equipped with mid-tier specs, and our review device today fully reflects this. Priced at USD $1050, the GV62 8RE sports a quad-core Intel Core i5-8300H with Hyperthreading and an Nvidia GeForce GTX 1060, a combination we typically see in gaming notebooks at slightly higher price points.
However, to keep costs down, MSI had to cut some corners. For one, the same plastic shell seen in last year's GV62 7RE is used. MSI also opted for the 3 GB variant of the GTX 1060 in lieu of the more common 6 GB model. We will see what other sacrifices had to be made in the name of affordability and if they were worth the price in this review.
Based on its price and internals, the GV62 competes directly with other budget gaming devices, including Acer's Helios 300, Dell's new G5 and older Inspiron 15 7577, and Lenovo's Legion Y520. We will also compare MSI's GF62, which shares several things in common with the GV62 (including the case). Let's cinch up our wallets and dive in.
Case
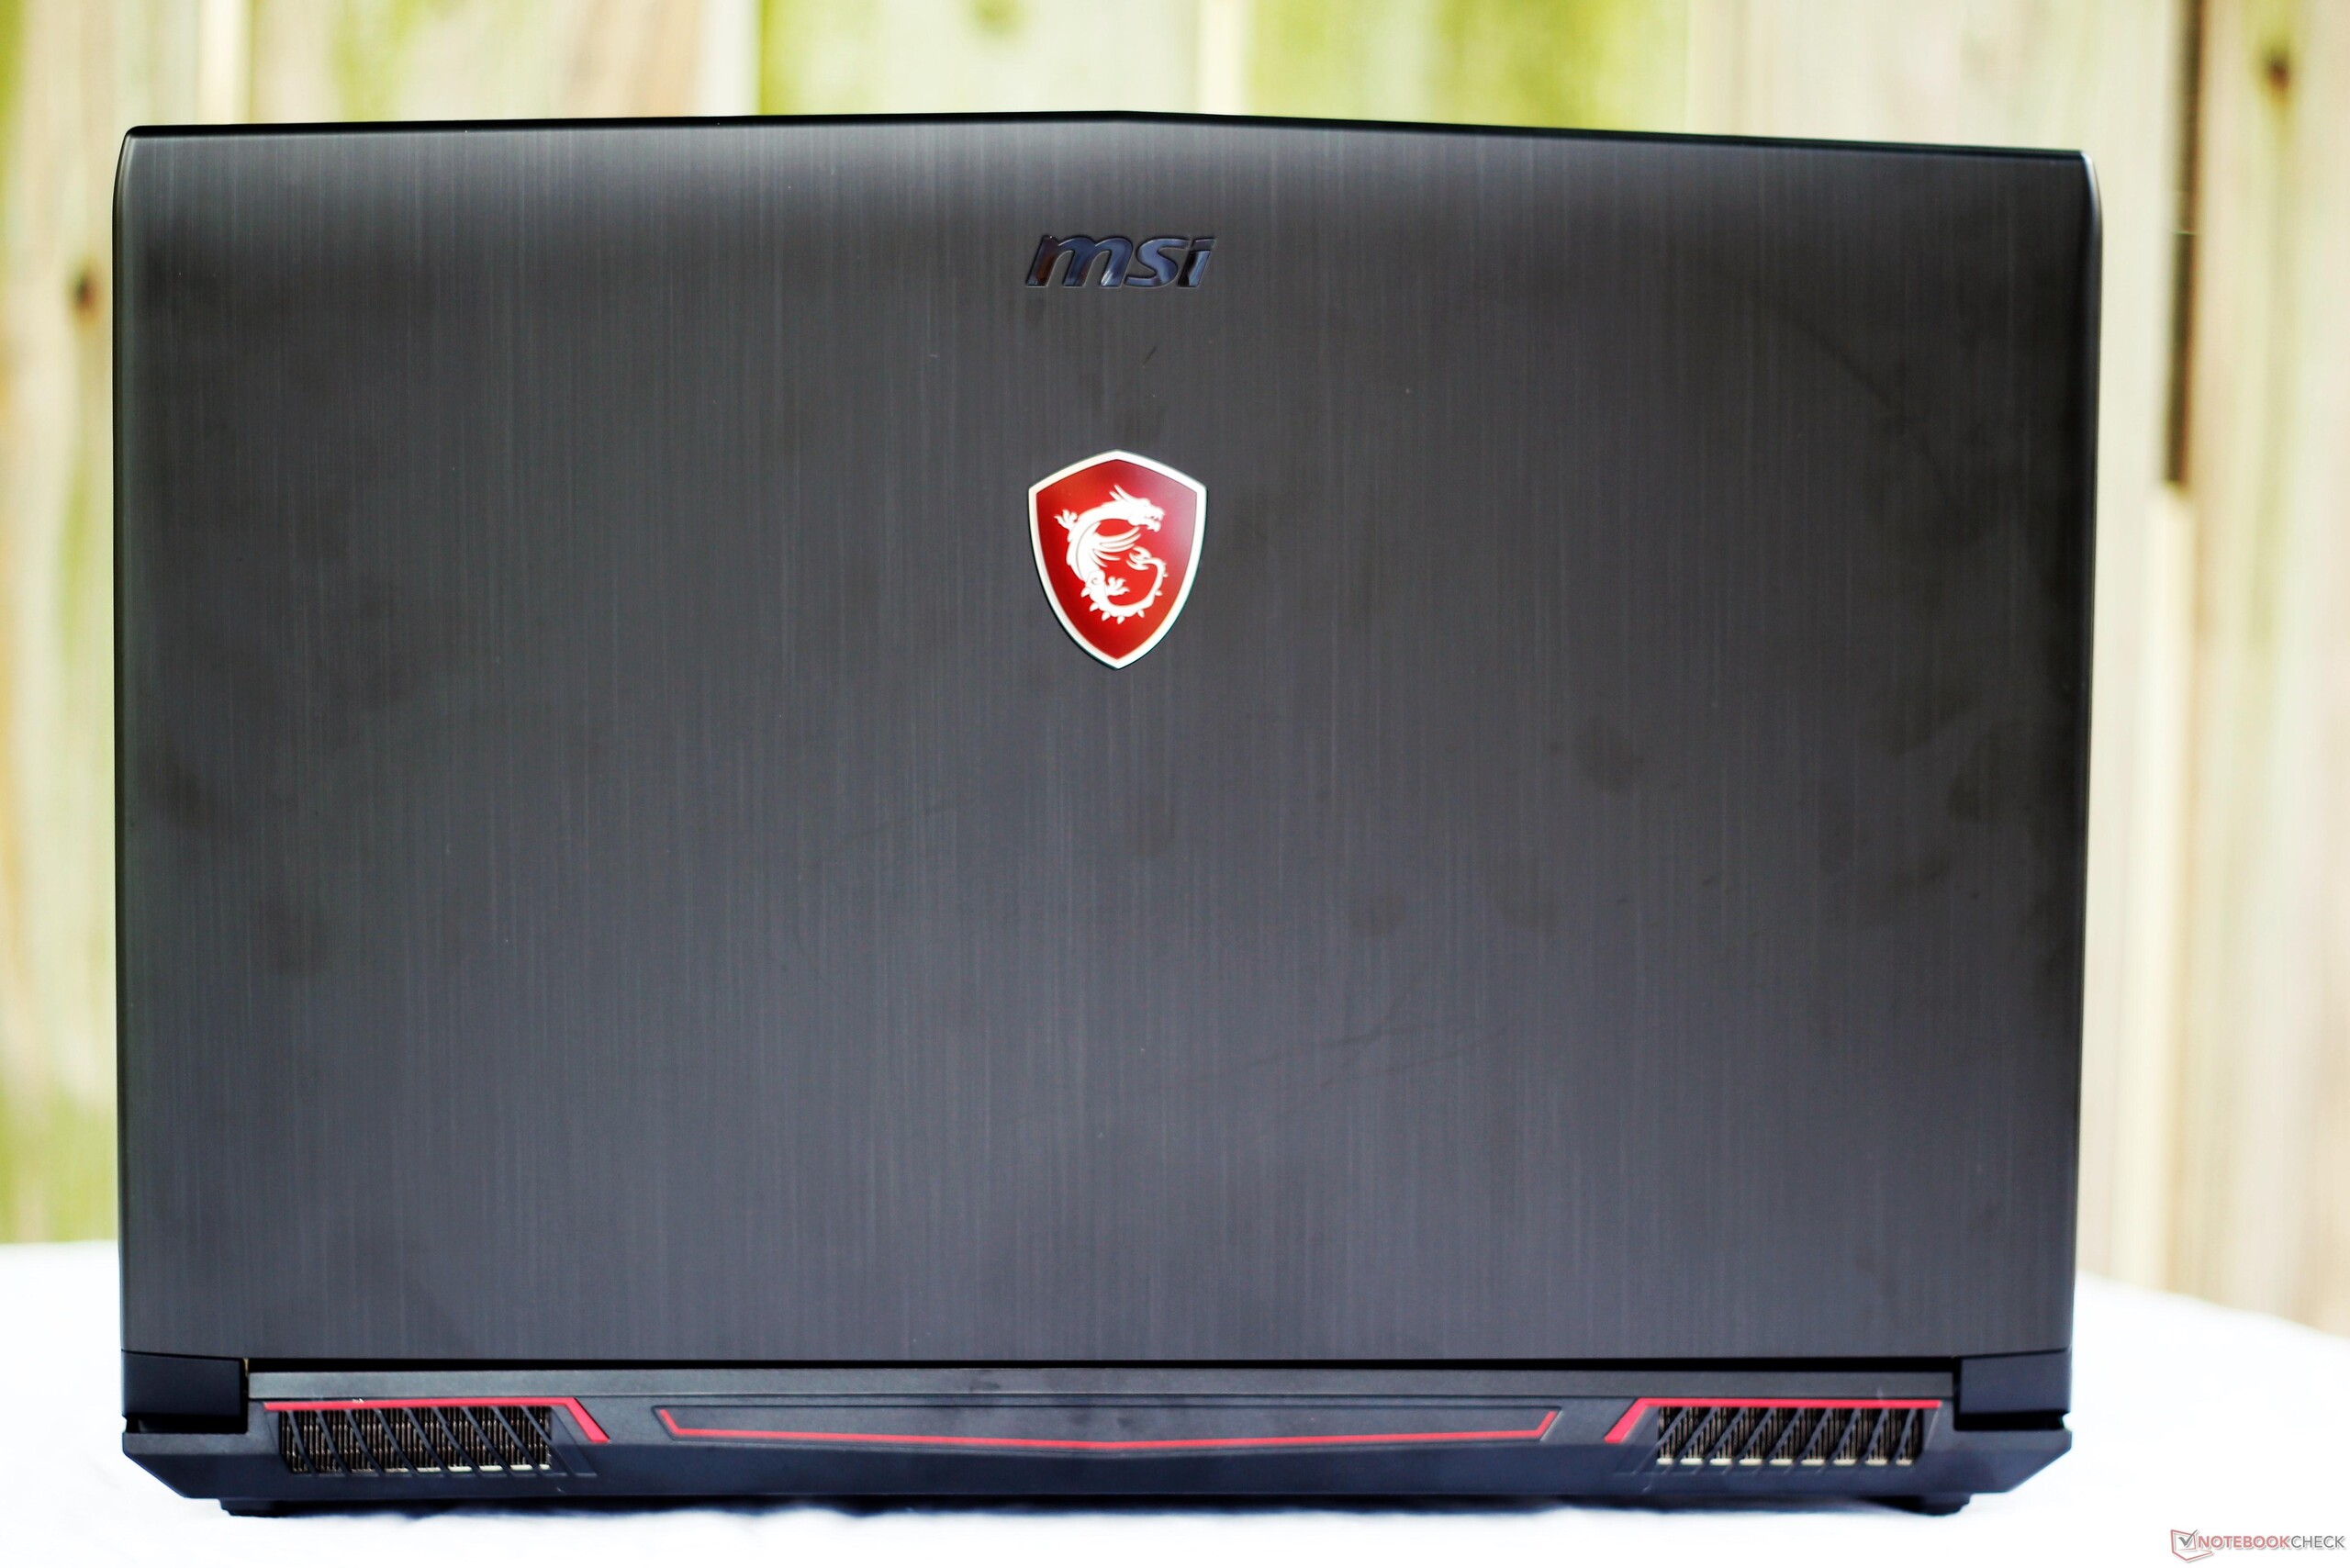
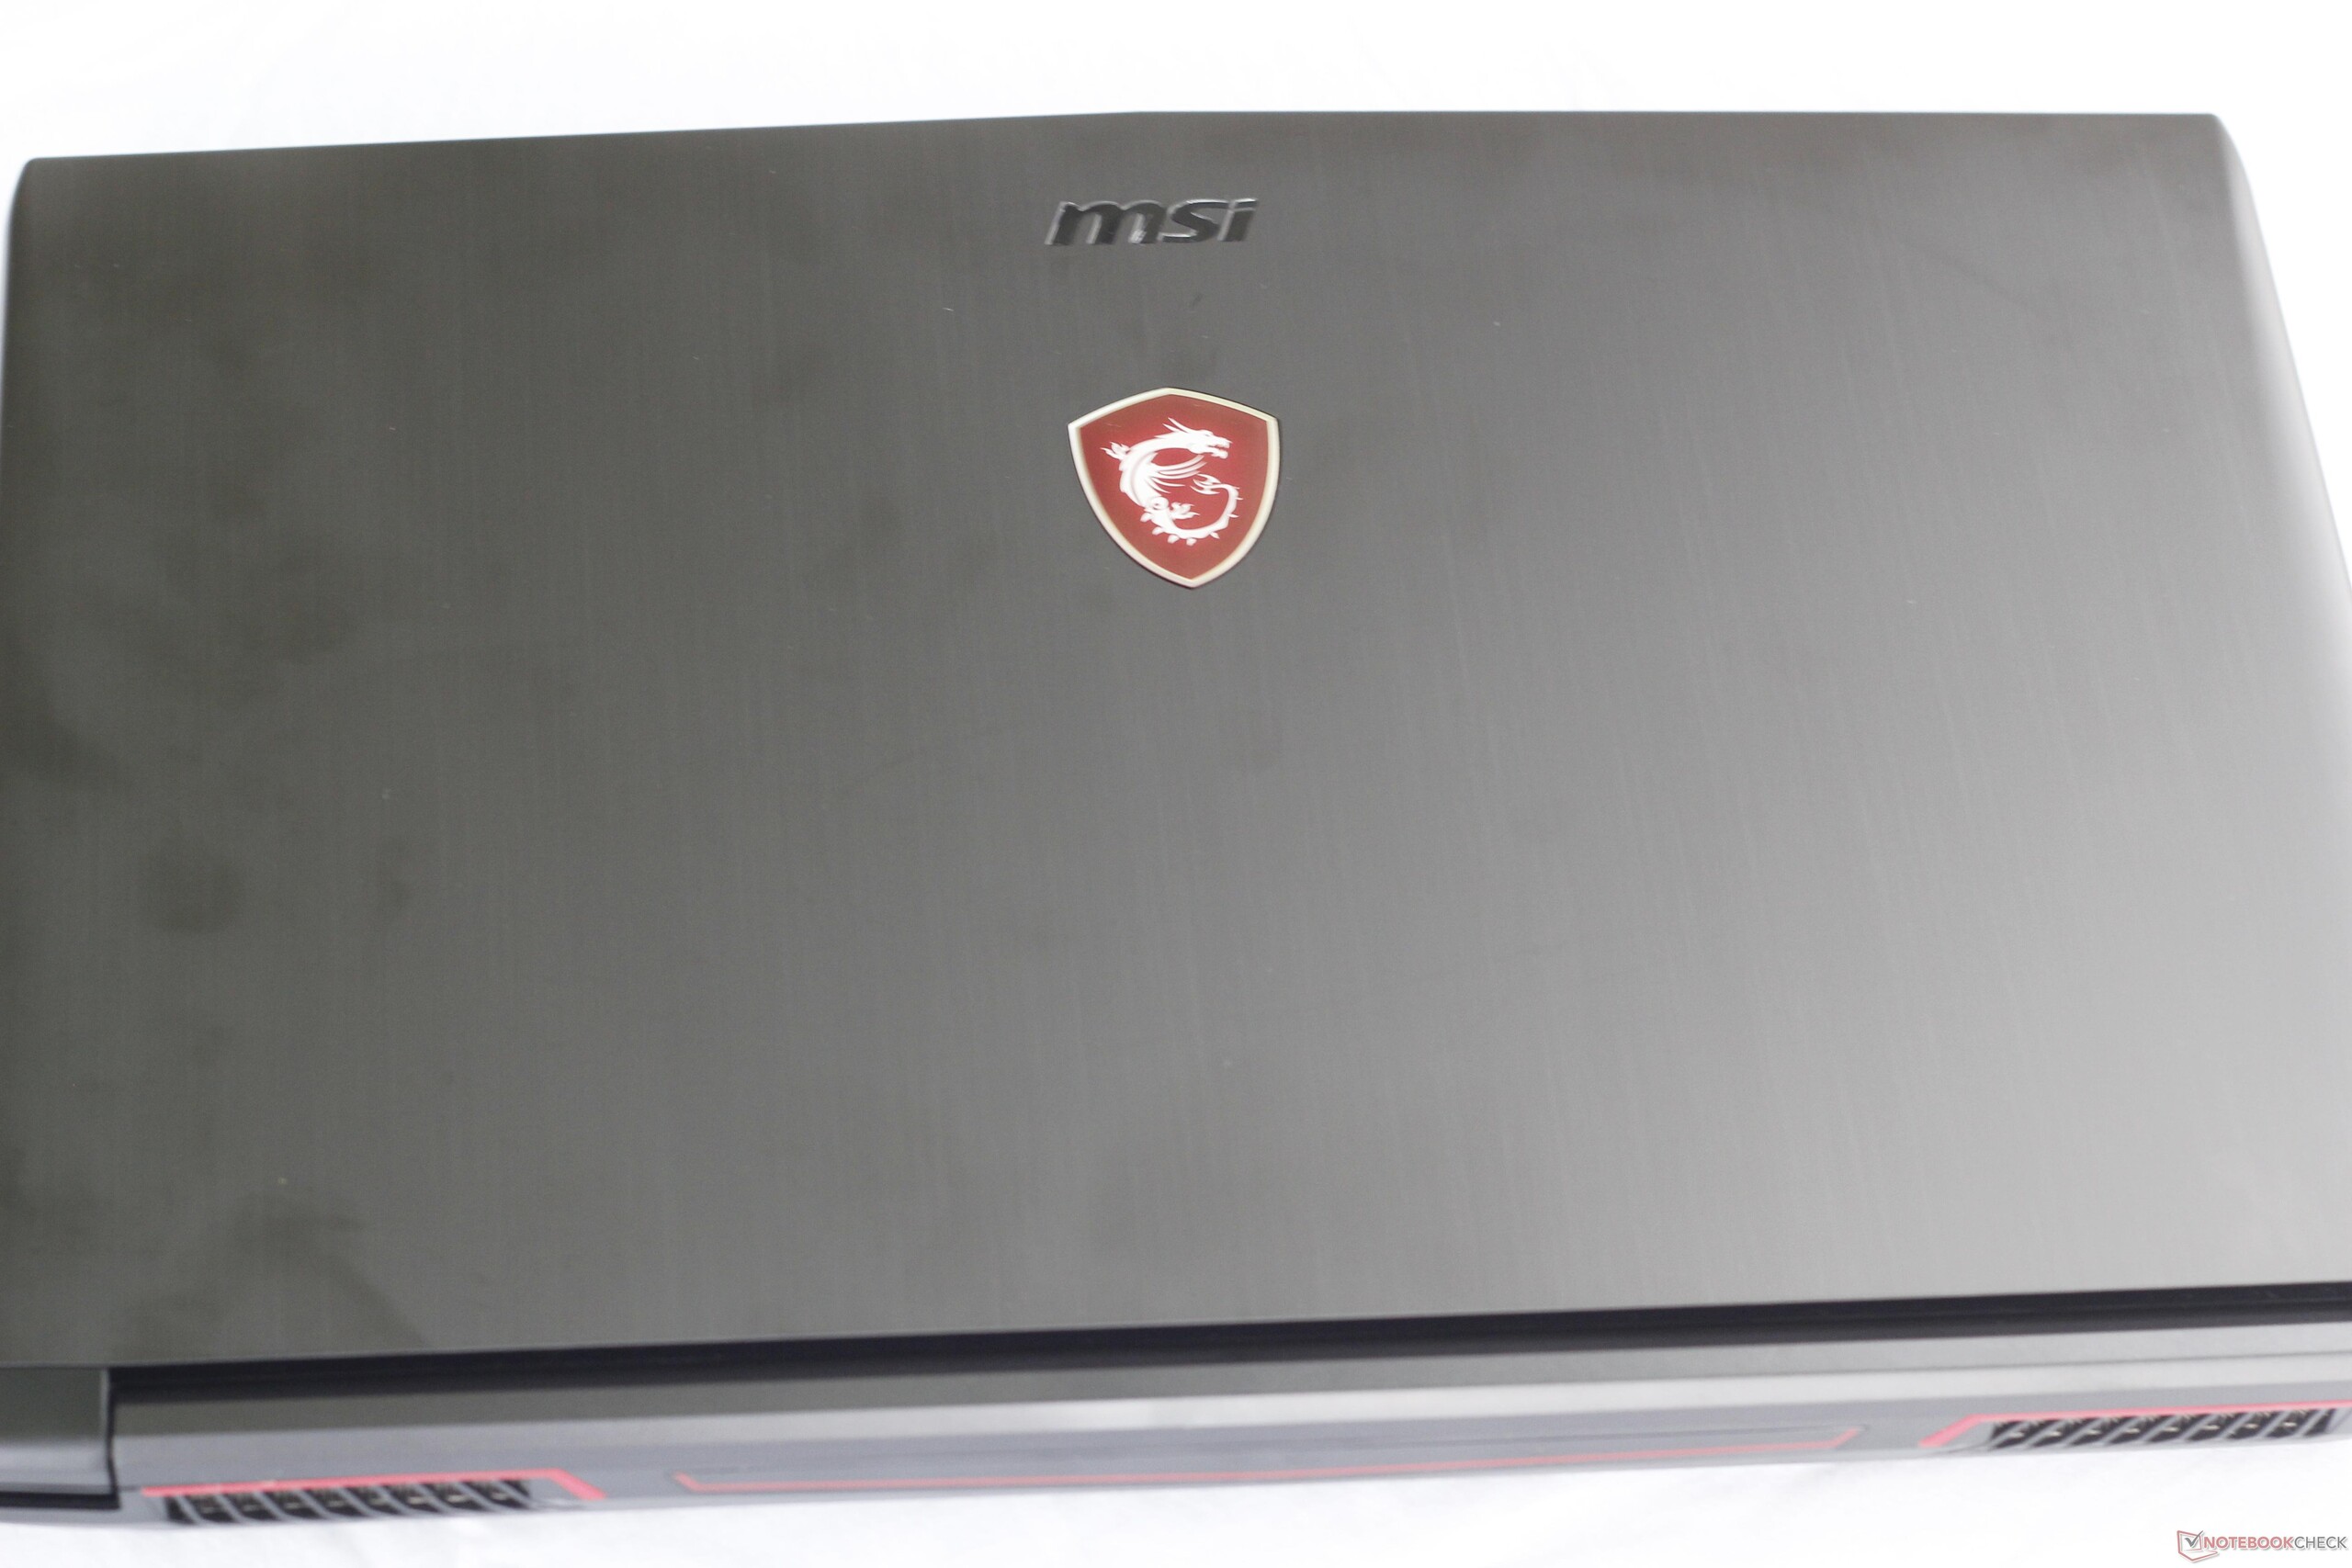
The case is perhaps the biggest cost-saving measure of the device. The chassis is almost a photocopy of other entry-level gaming notebooks from MSI. Looking at the GF62VR as a reference, the same pain points are present, sans the brushed aluminum lid. Plastic is the name of the game here, and with the cheaper material come several downsides. Fingerprints and smudges show readily and mar the faux-brushed finish. They can be wiped away with some effort. The keyboard deck is firm and barely deforms under direct pressure. The same goes for the bottom panel. The lid is not rigid enough for our tastes and can be twisted by applying pressure at the sides and heavily warped (making contact with the keyboard deck) by pressing the center down. The hinge mechanism is also stiff and requires two hands to open. The lid opens to a maximum of about 135°.
The creaks and groans might be the worst facet of the case. When pressed along the seams, the chassis will click and pop as if the pieces are not fully secured. This is especially prevalent along the bottom panel, almost as though the plastic clips that hold it on aren't fully secured. The hinges in our unit also don't seem set properly. When the lid is opened, the bottom edge of the display bezel clicks against the back of the keyboard deck unpleasantly. This problem may be unique to our review unit, though.
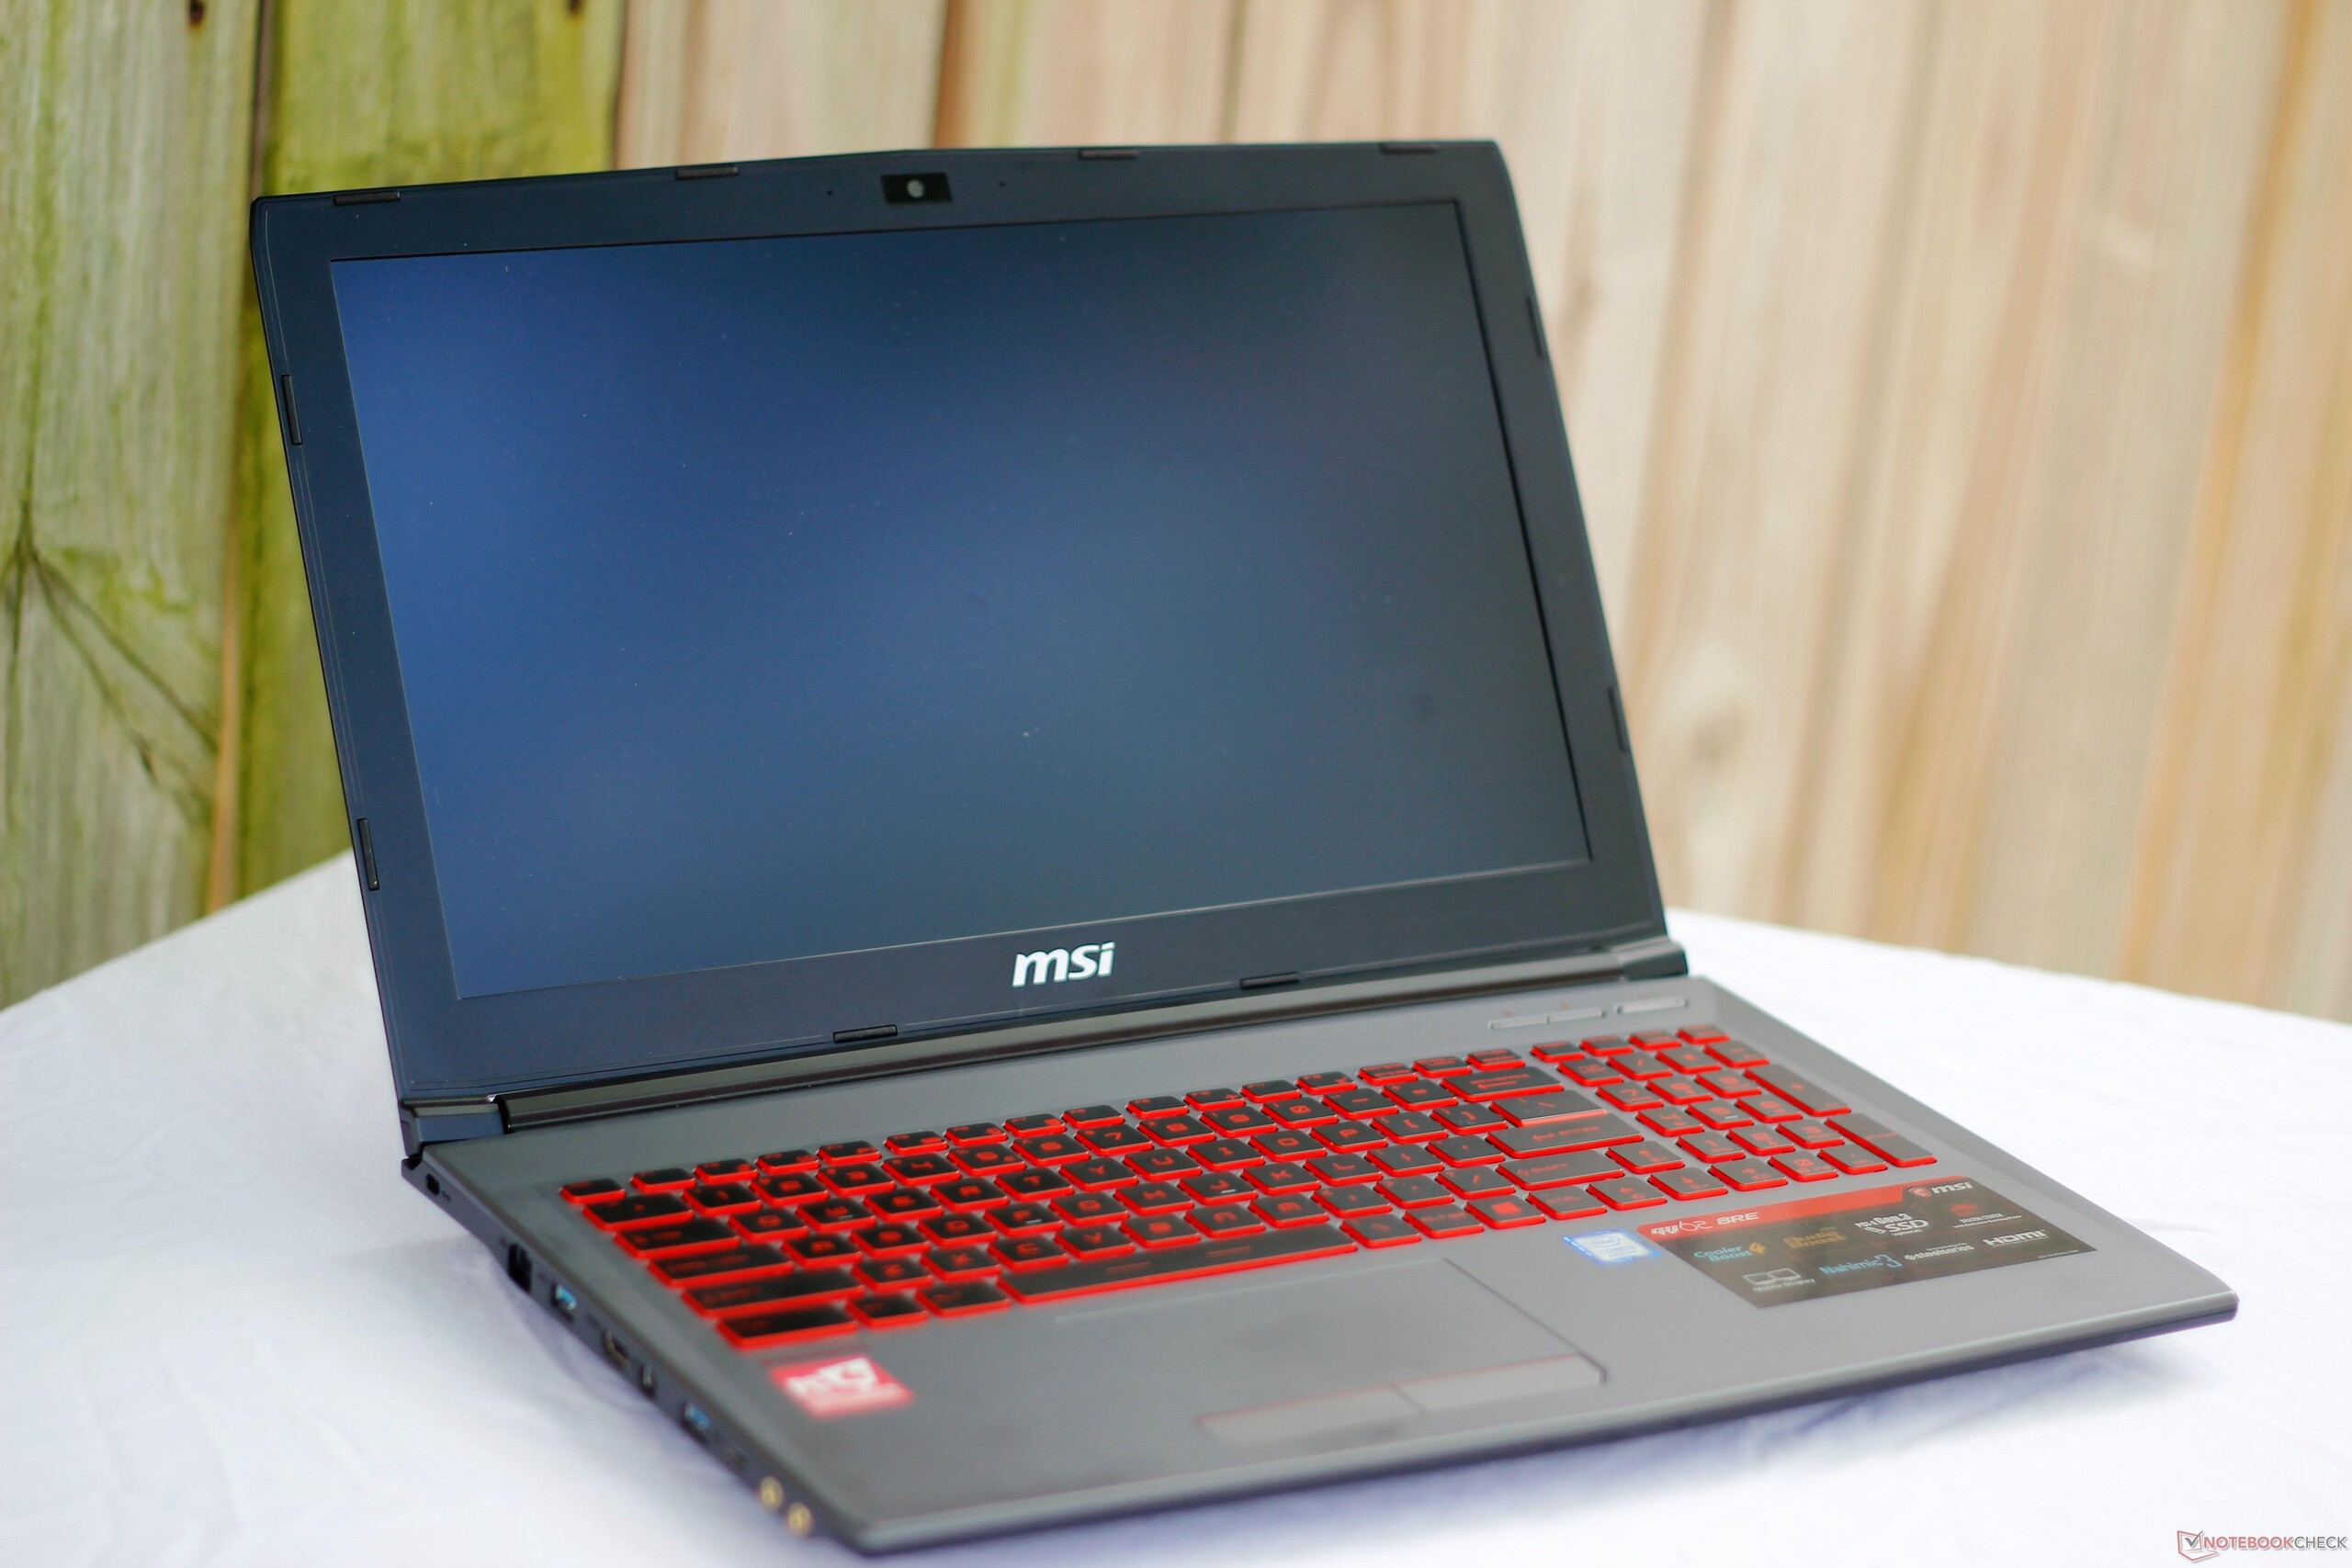
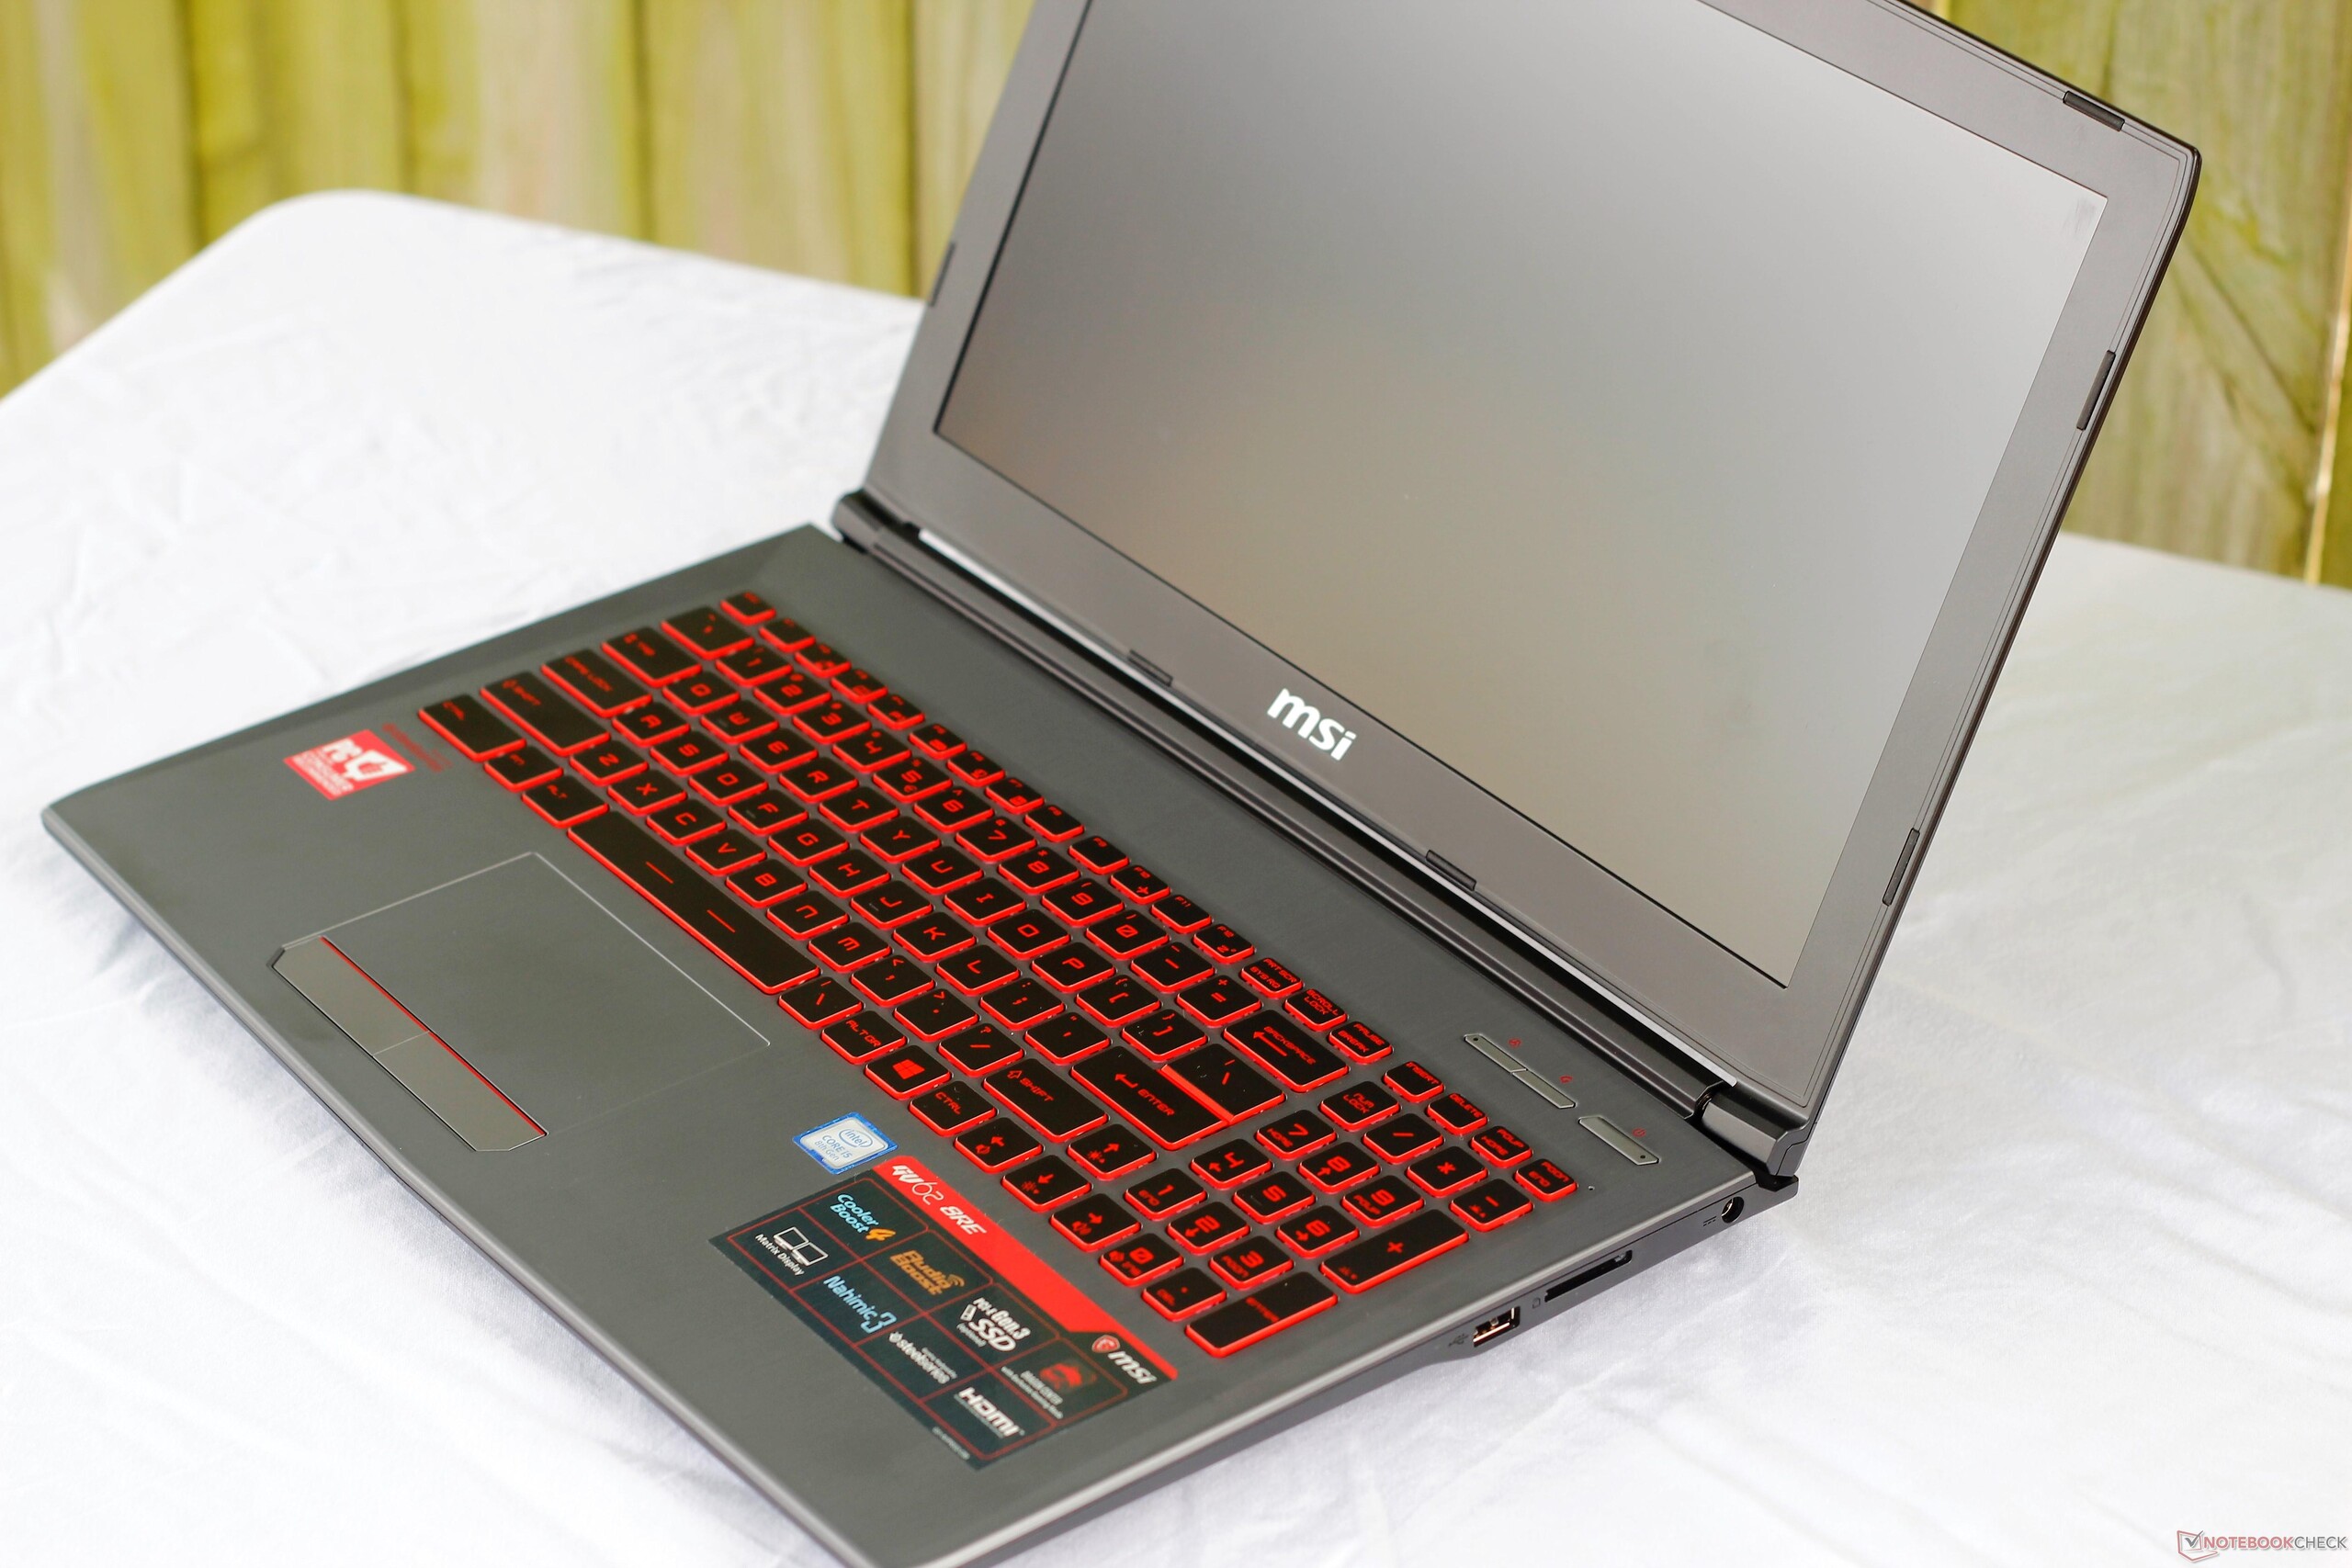

All that plastic does have one benefit: weight. At 2.2 kg, the GV62 is relatively light for a budget gaming laptop. The overall footprint is about the same as Dell's G5. The machine is a bit thick at 29 mm, but it should fit into a backpack without much fuss and is light enough to haul around campus or coffee shops without inducing back strain.
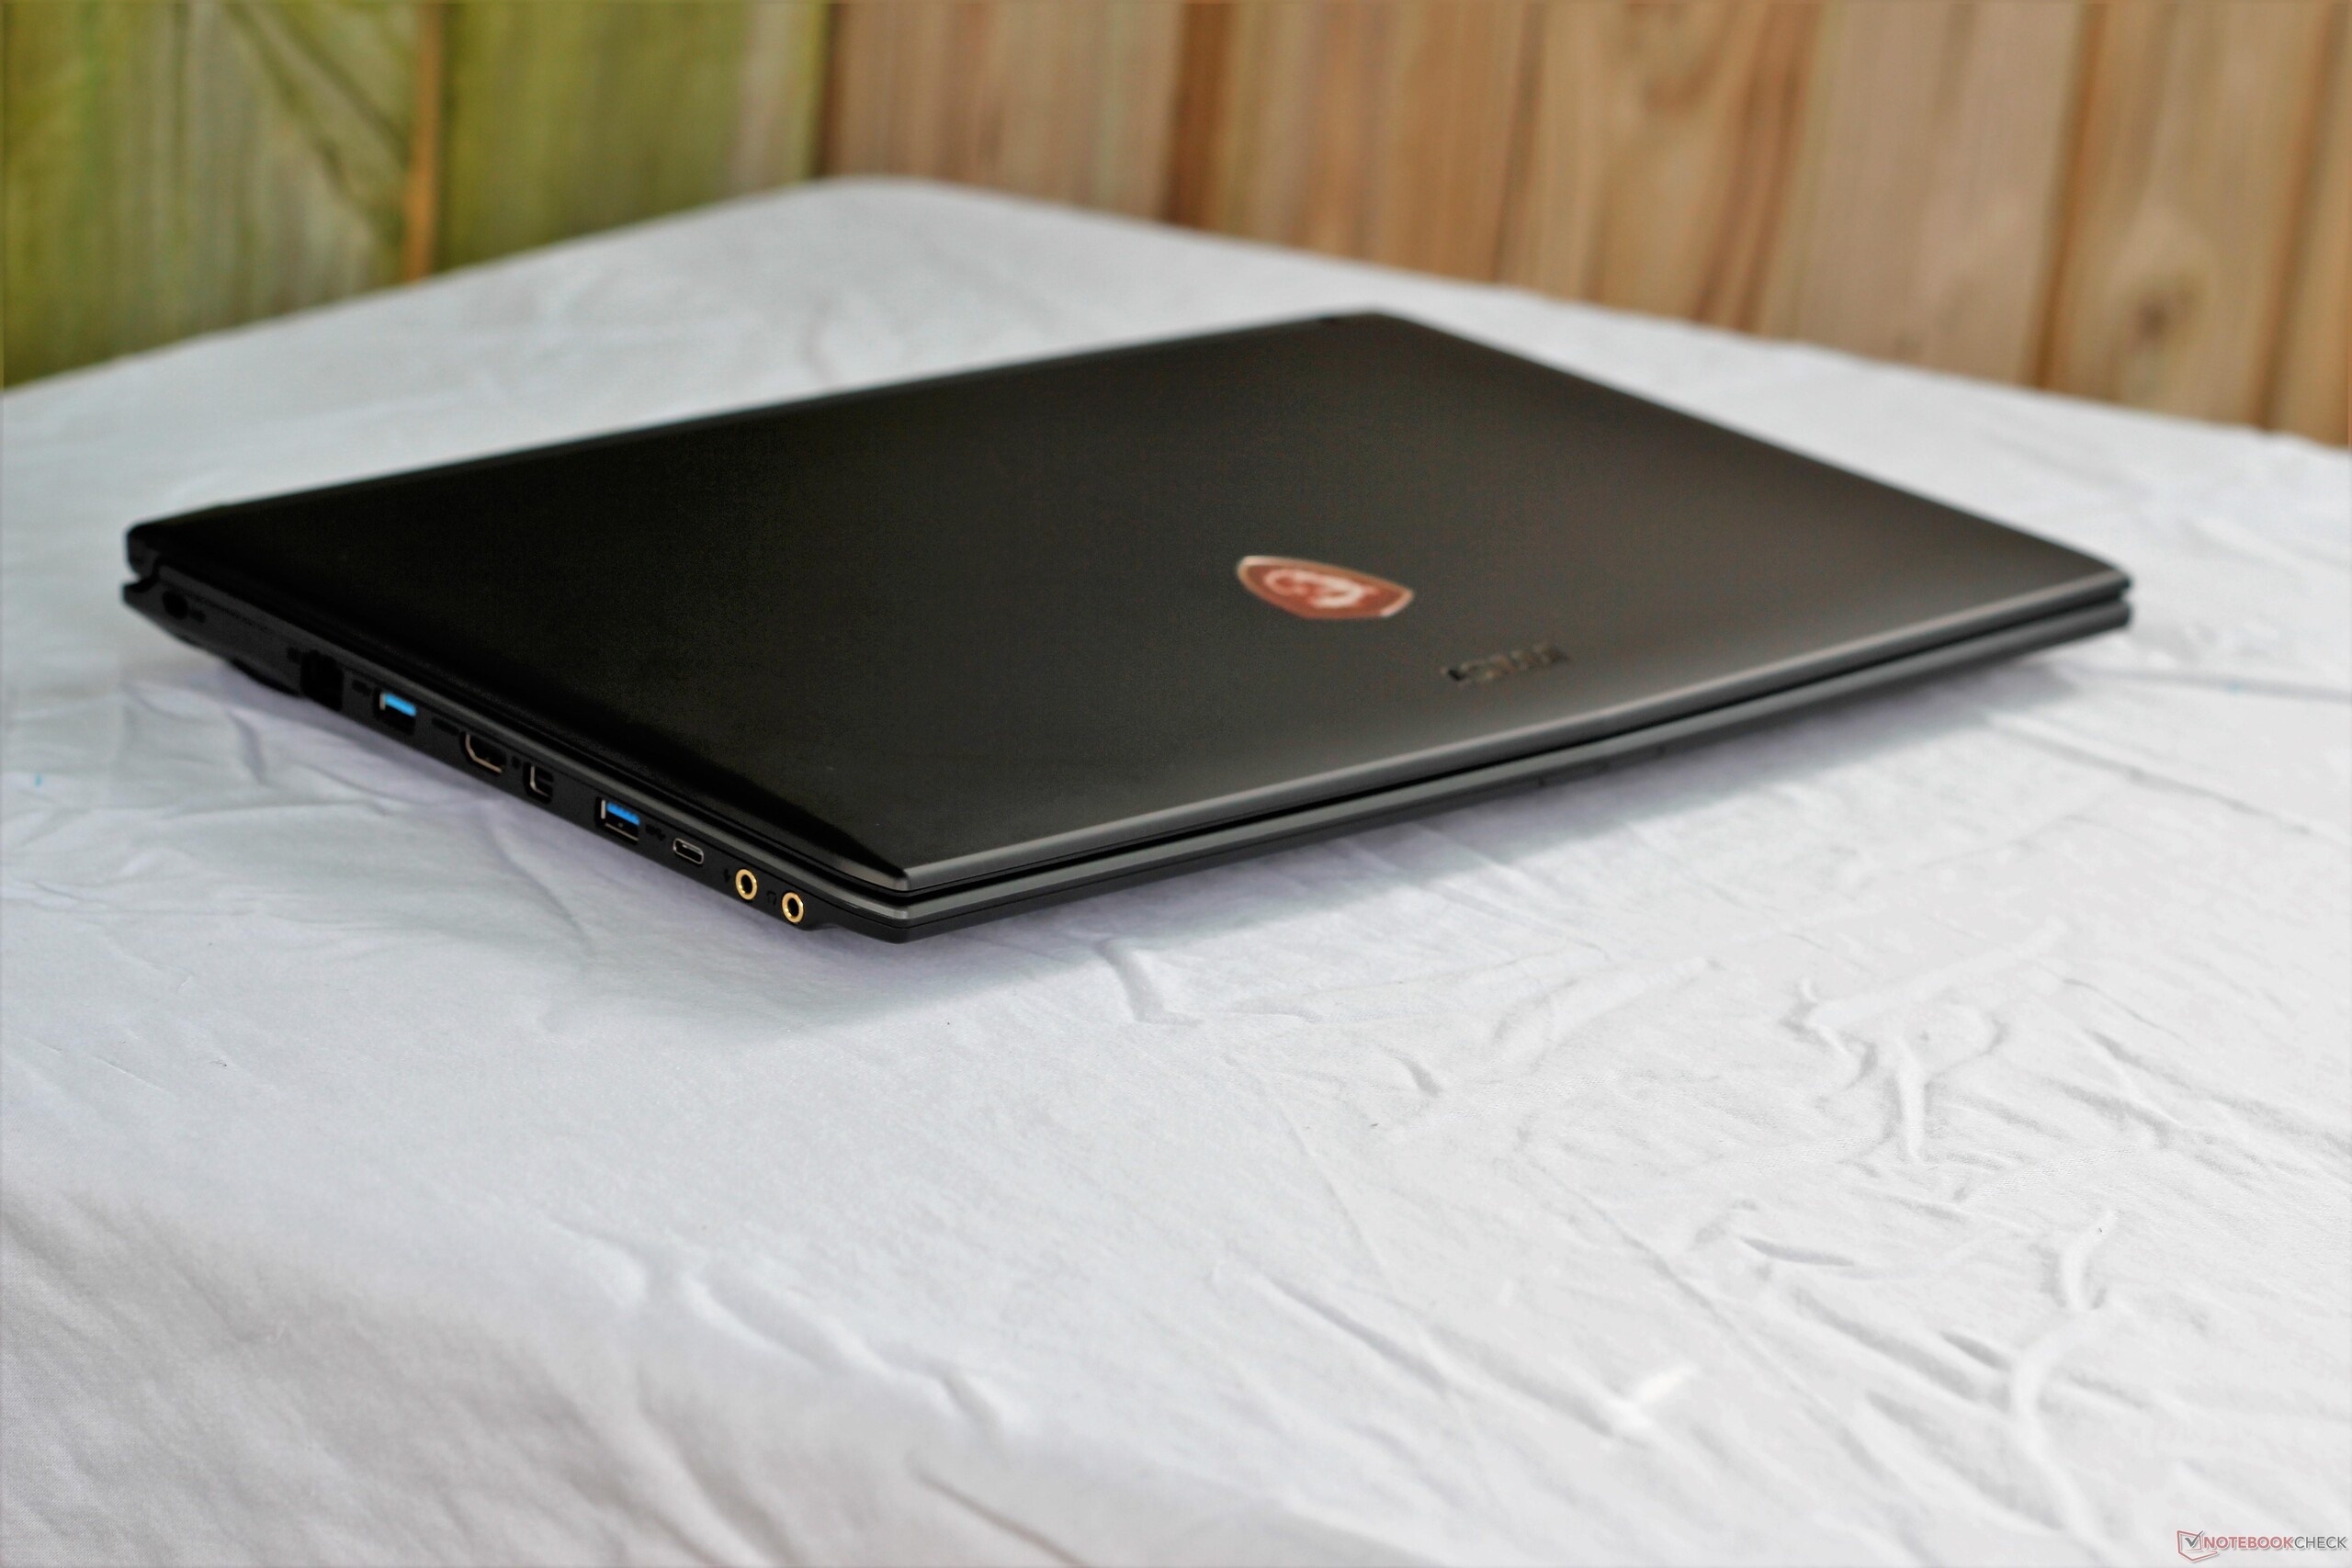
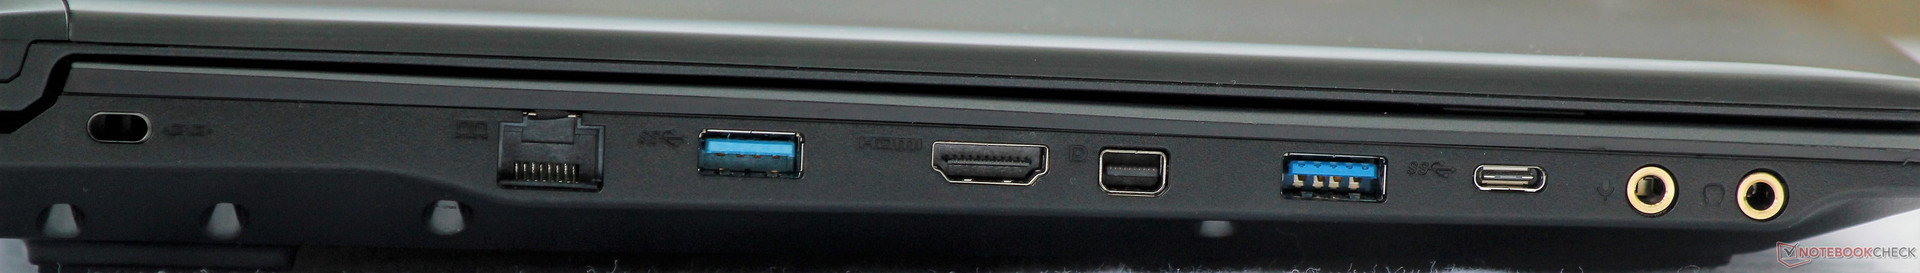
Connectivity
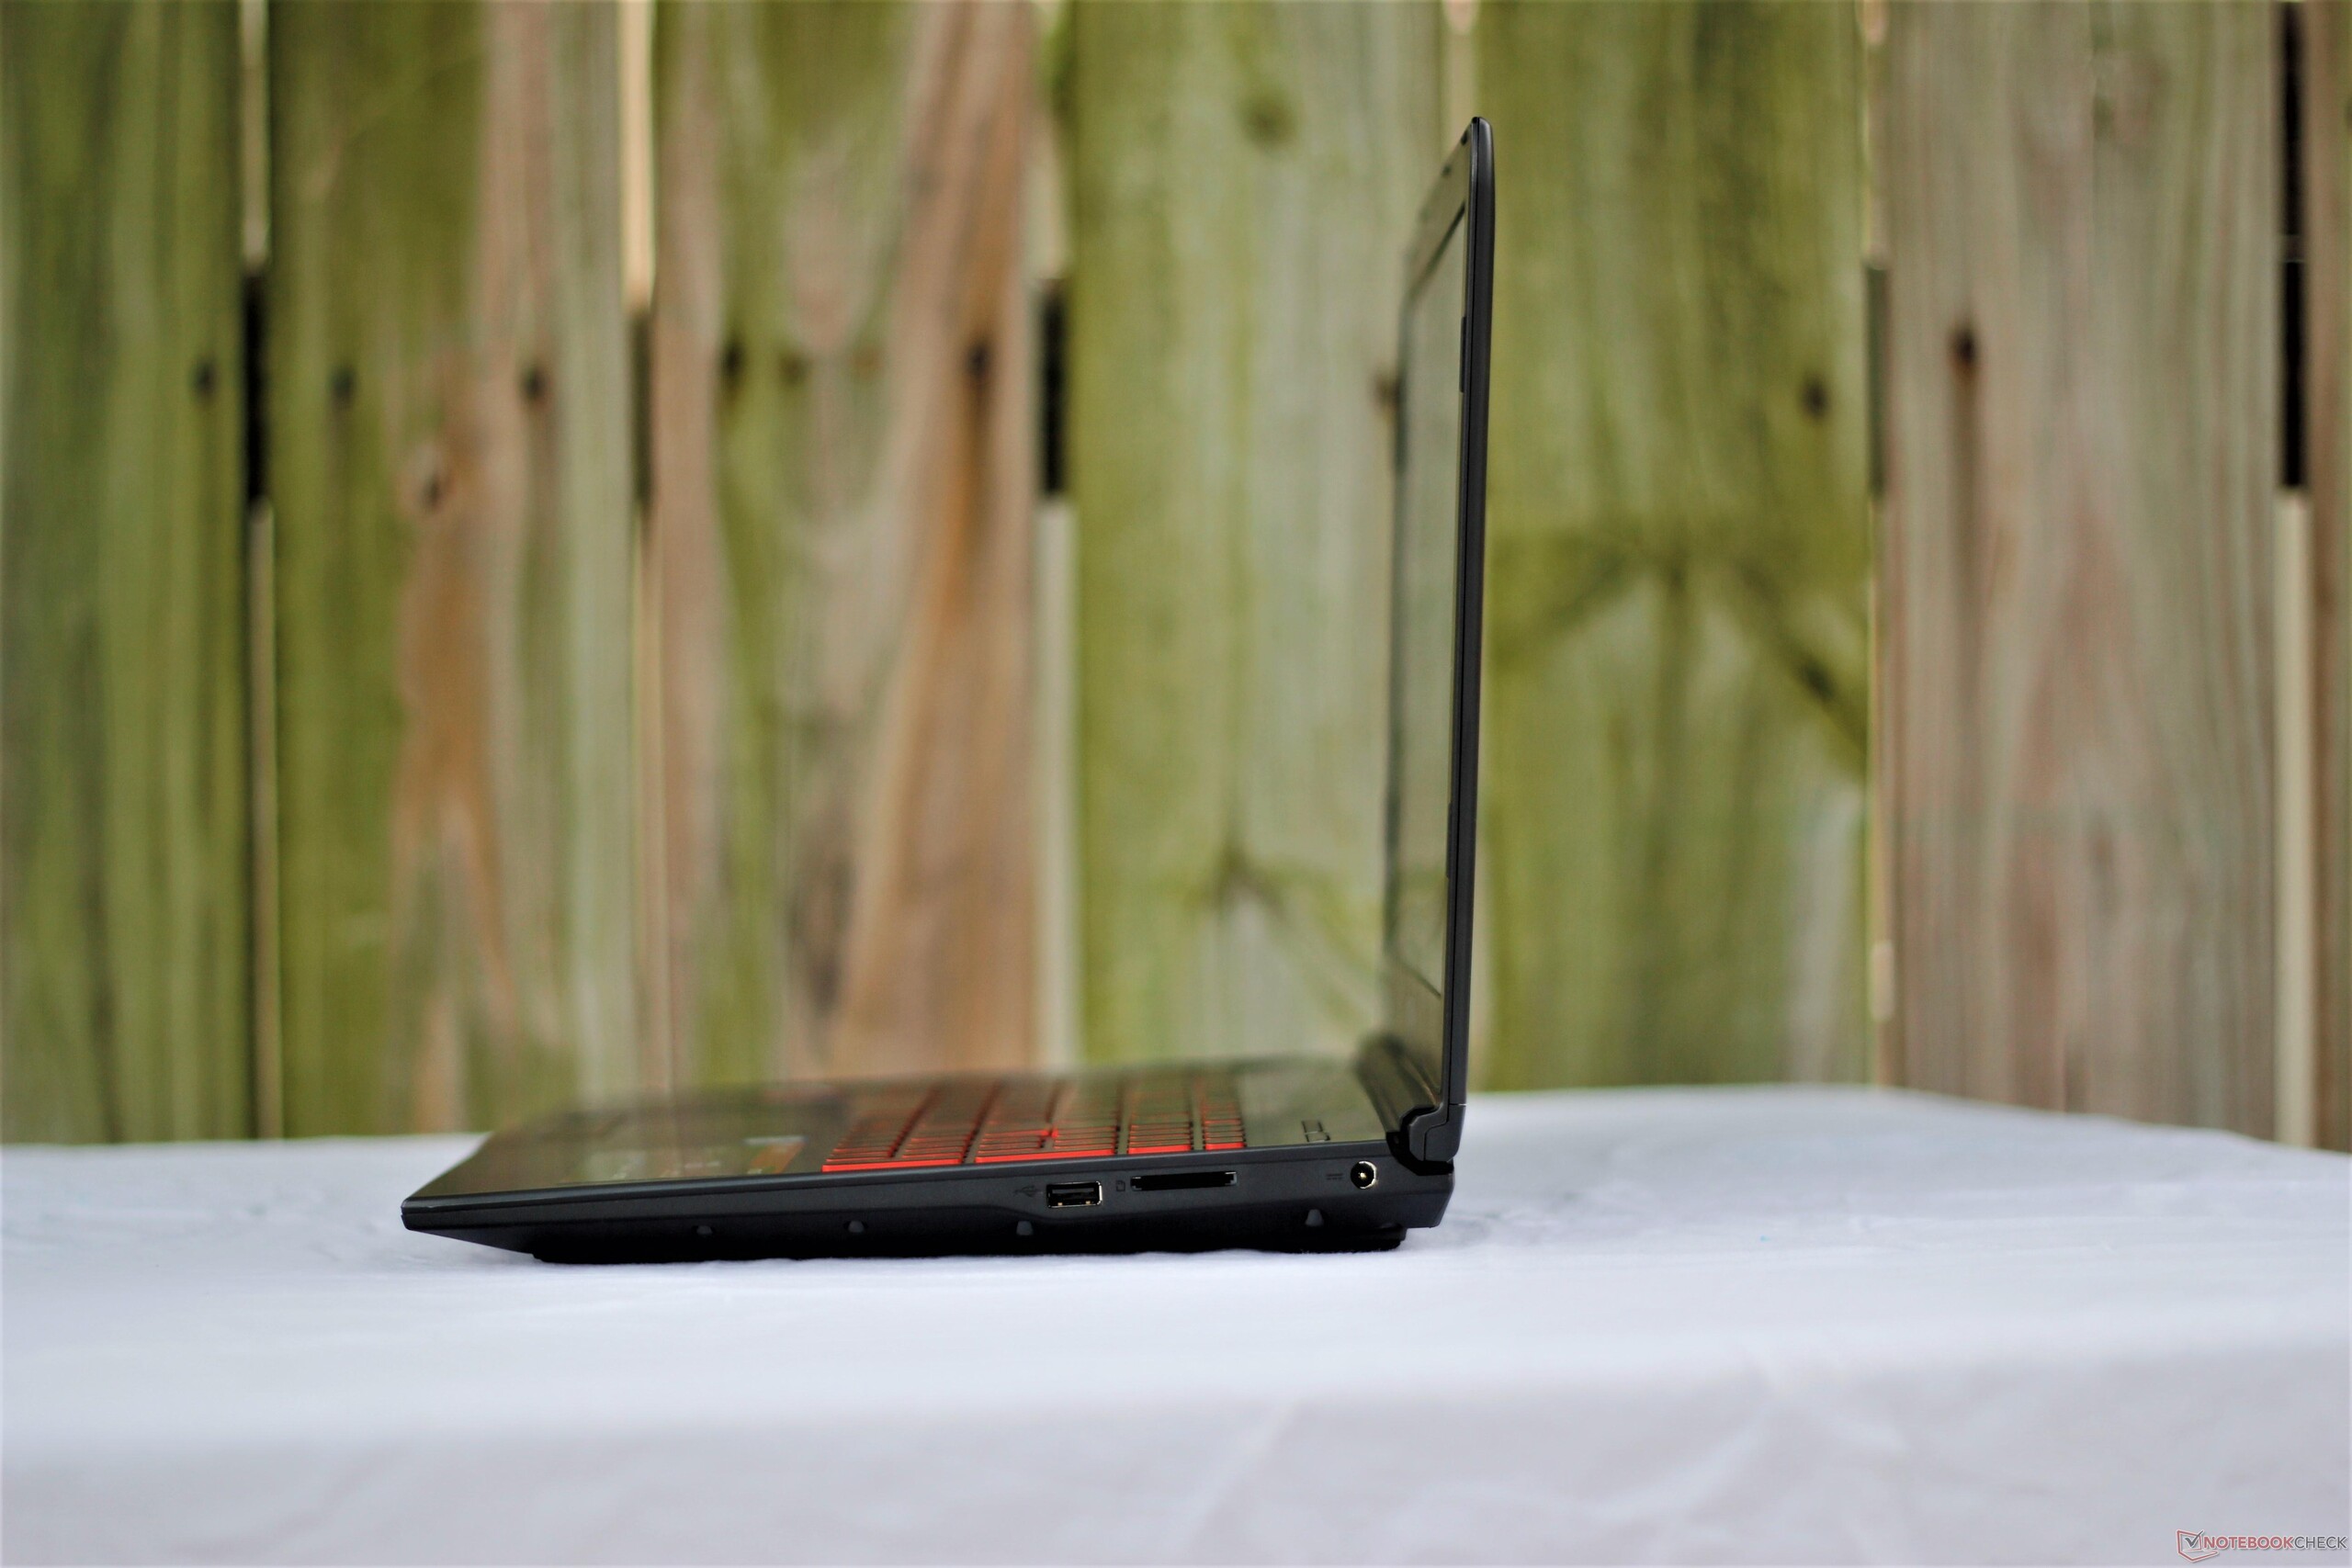
Port selection is similar to other budget gaming machines. All the basics are here, including two display outputs that support a minimum of 4K at 60 Hz. The dedicated microphone and audio out jacks are appreciated, as is the Ethernet jack, a connection that is becoming increasingly rare these days. The lack of Thunderbolt 3 is notable, but its absence is to be expected at this price.
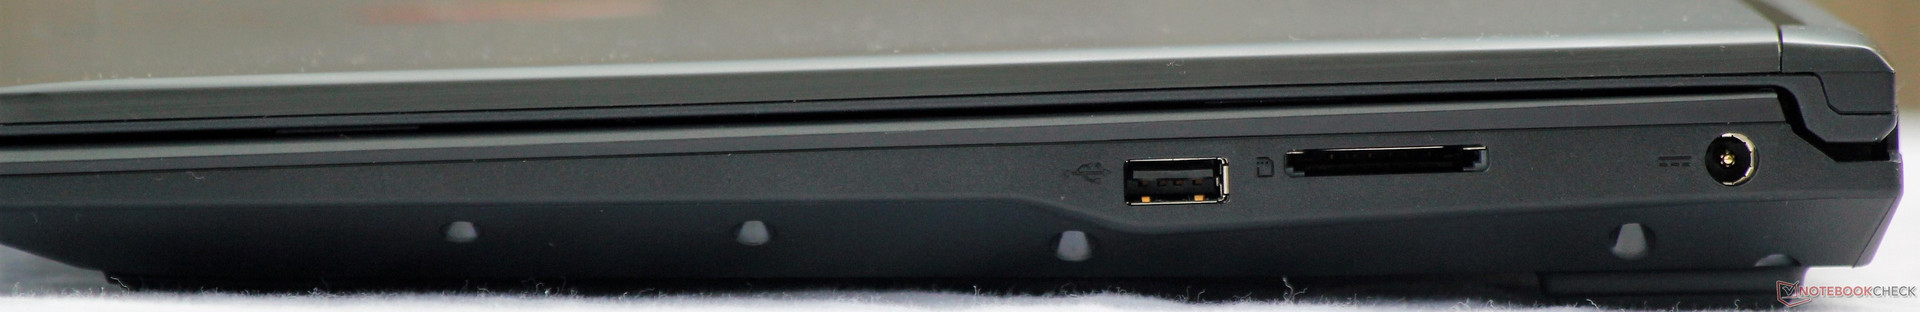
SD Card Reader
The performance of the SD card reader is abysmal. MSI still includes slow card readers in its budget gaming machines, which has long been a point of frustration. That said, other gaming notebooks at this price bracket also use slow card readers. Users that rely on SD cards should look elsewhere; with read speeds of about 30 MB/s, file transfers will be aggravatingly slow. There are much better options, even at this end of the market (e.g., Acer's Predator Helios 300).
| SD Card Reader | |
| average JPG Copy Test (av. of 3 runs) | |
| Average of class Gaming (20.9 - 210, n=55, last 2 years) | |
| Acer Predator Helios 300 PH317-52-51M6 (Toshiba Exceria Pro SDXC 64 GB UHS-II) | |
| Dell Inspiron 15 7000 7577 4K (Toshiba Exceria Pro SDXC 64 GB UHS-II) | |
| MSI GV62 8RE-016US (Toshiba Exceria Pro SDXC 64 GB UHS-II) | |
| MSI GF62VR 7RF-877 (Toshiba Exceria Pro SDXC 64 GB UHS-II) | |
| Dell G5 15 5587 (Toshiba Exceria Pro SDXC 64 GB UHS-II) | |
| maximum AS SSD Seq Read Test (1GB) | |
| Average of class Gaming (25.5 - 261, n=52, last 2 years) | |
| Acer Predator Helios 300 PH317-52-51M6 (Toshiba Exceria Pro SDXC 64 GB UHS-II) | |
| Dell G5 15 5587 (Toshiba Exceria Pro SDXC 64 GB UHS-II) | |
| MSI GV62 8RE-016US (Toshiba Exceria Pro SDXC 64 GB UHS-II) | |
| Dell Inspiron 15 7000 7577 4K (Toshiba Exceria Pro SDXC 64 GB UHS-II) | |
| MSI GF62VR 7RF-877 (Toshiba Exceria Pro SDXC 64 GB UHS-II) | |
Communication
In a similar vein to the SD card reader, wireless performance is disappointing. The Intel 9462 wireless card supports 802.11ac WiFi but doesn't match expectations. While wireless speeds are adequate, larger downloads like games may take time. The main reason for the comparitive slugishness is the Intel 9462, which is a 1x1 wireless card. Most other gaming laptops use the Intel 8265, a 2x2 card that offers twice the speeds. As such, gamers with faster internet connections (50 MBps and up) may opt for a hardwire connection via the gigabit Ethernet port. While slow, WiFi reliability is good; during our review period, we did not experience drops in signal strength or speed.
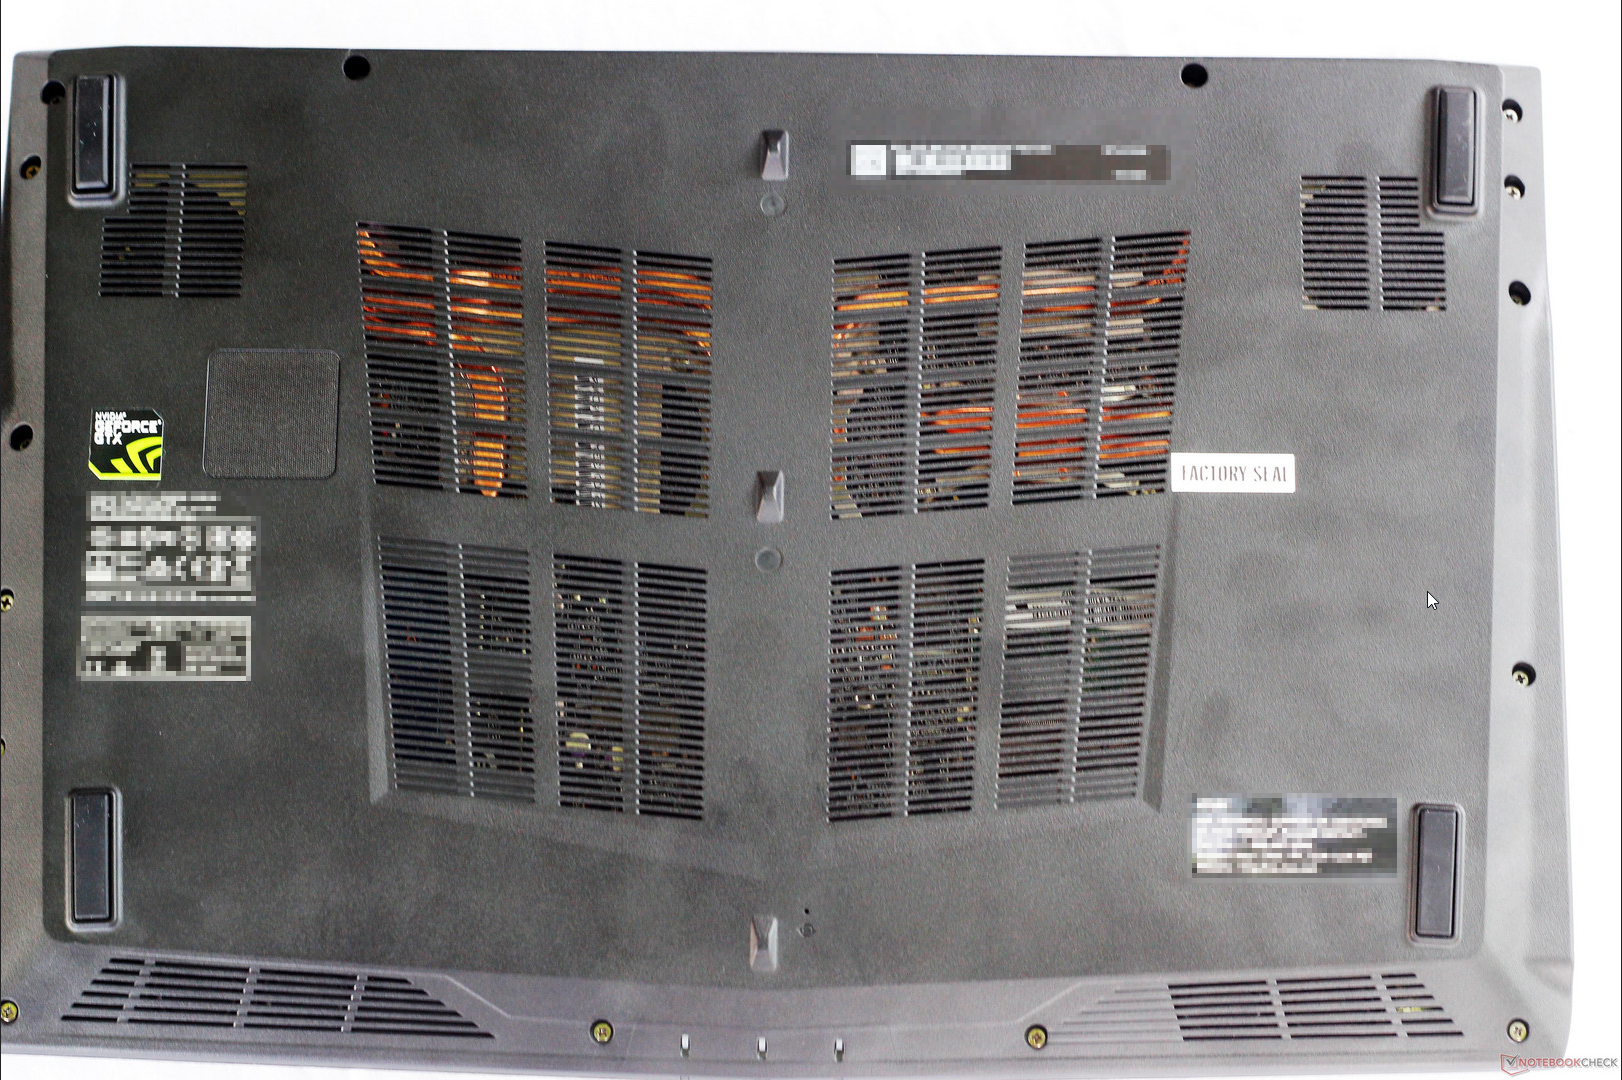
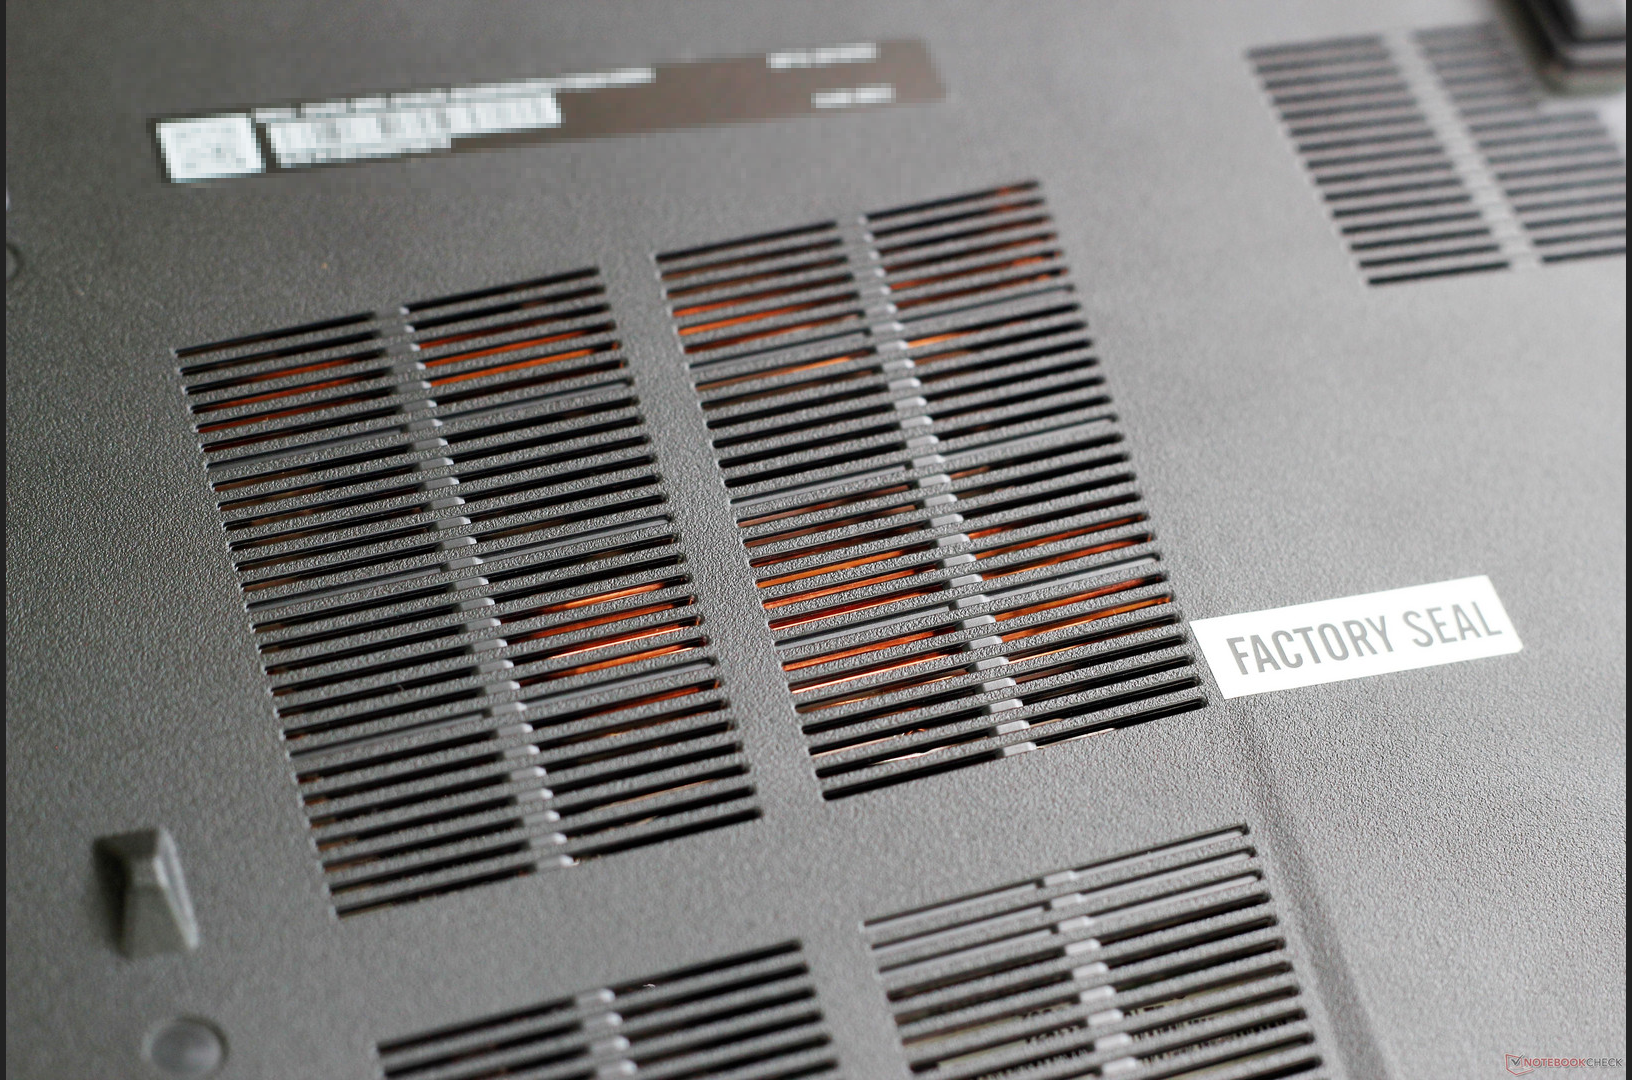
Maintenance & Warranty
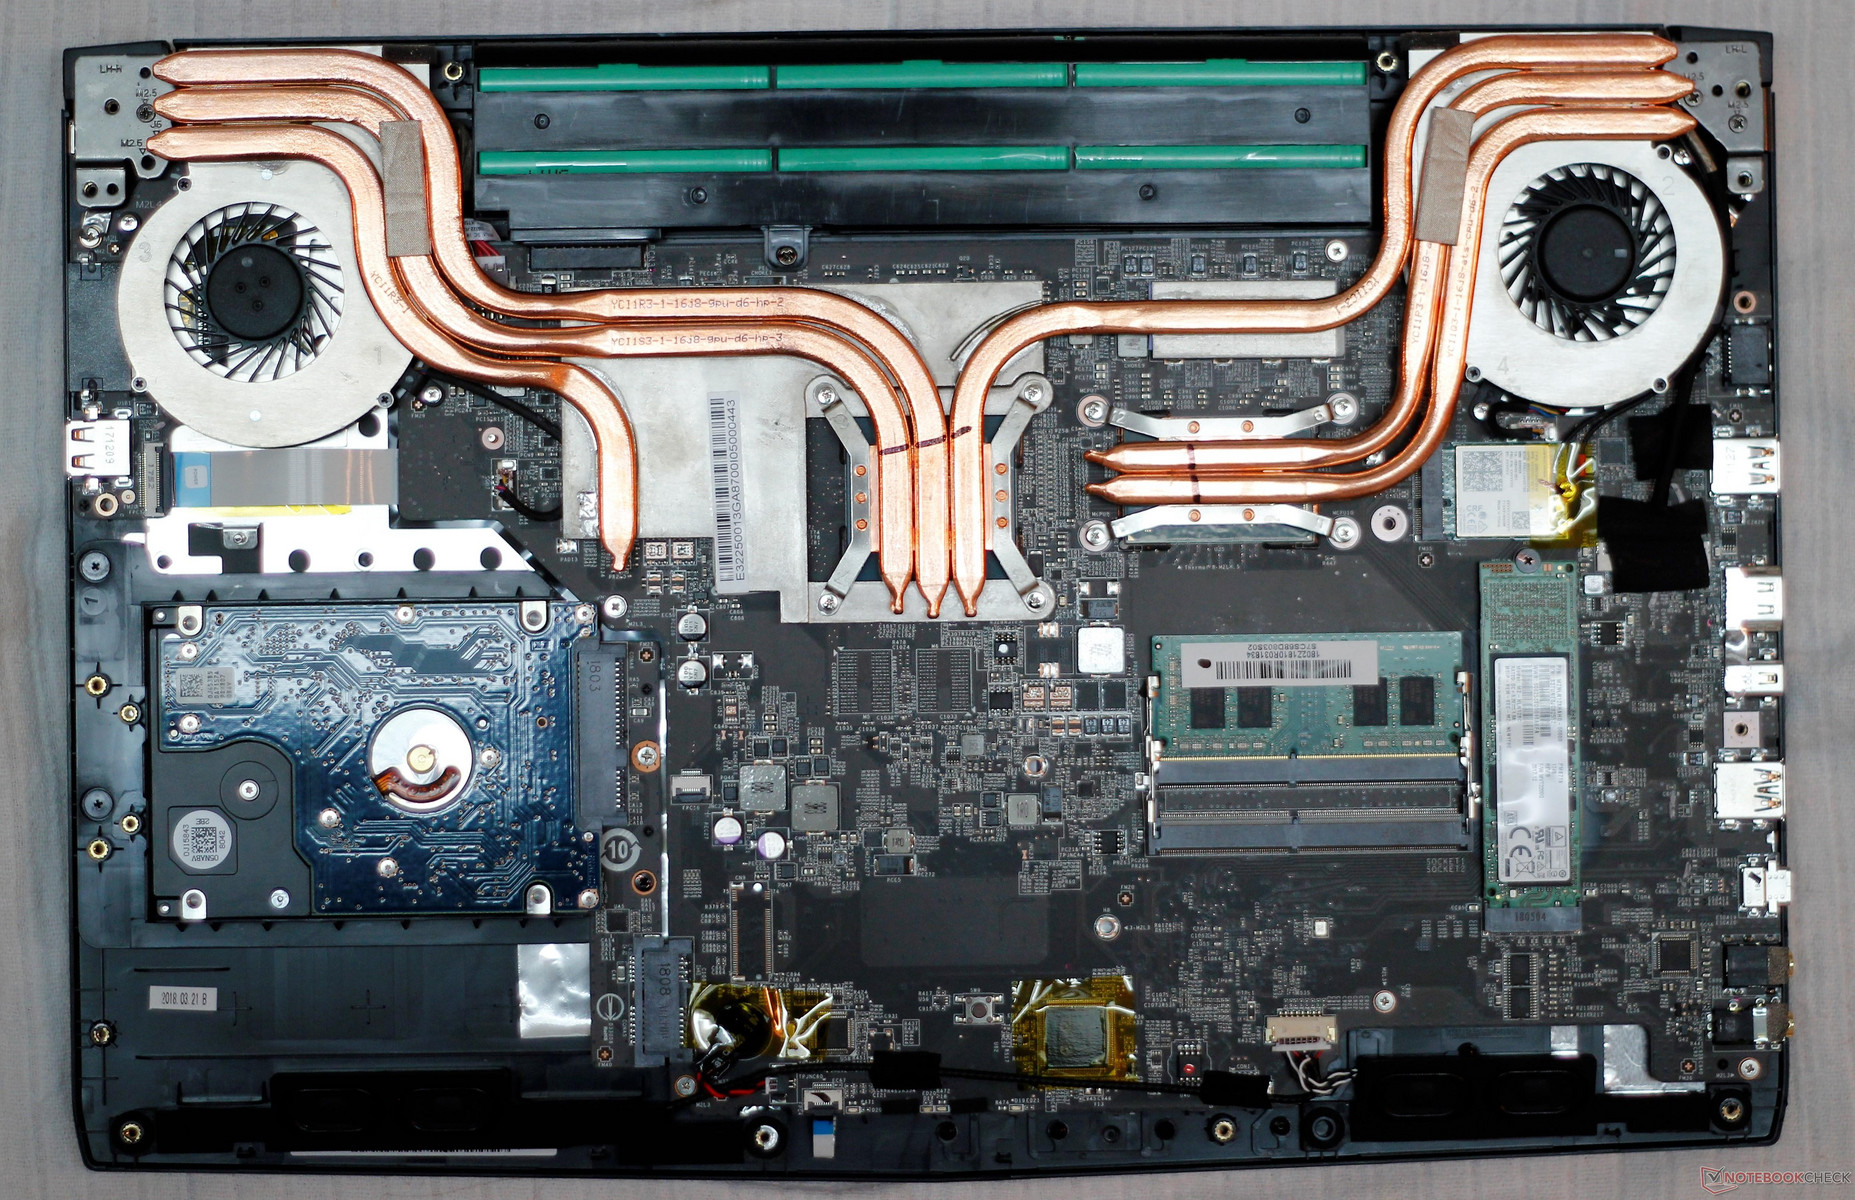
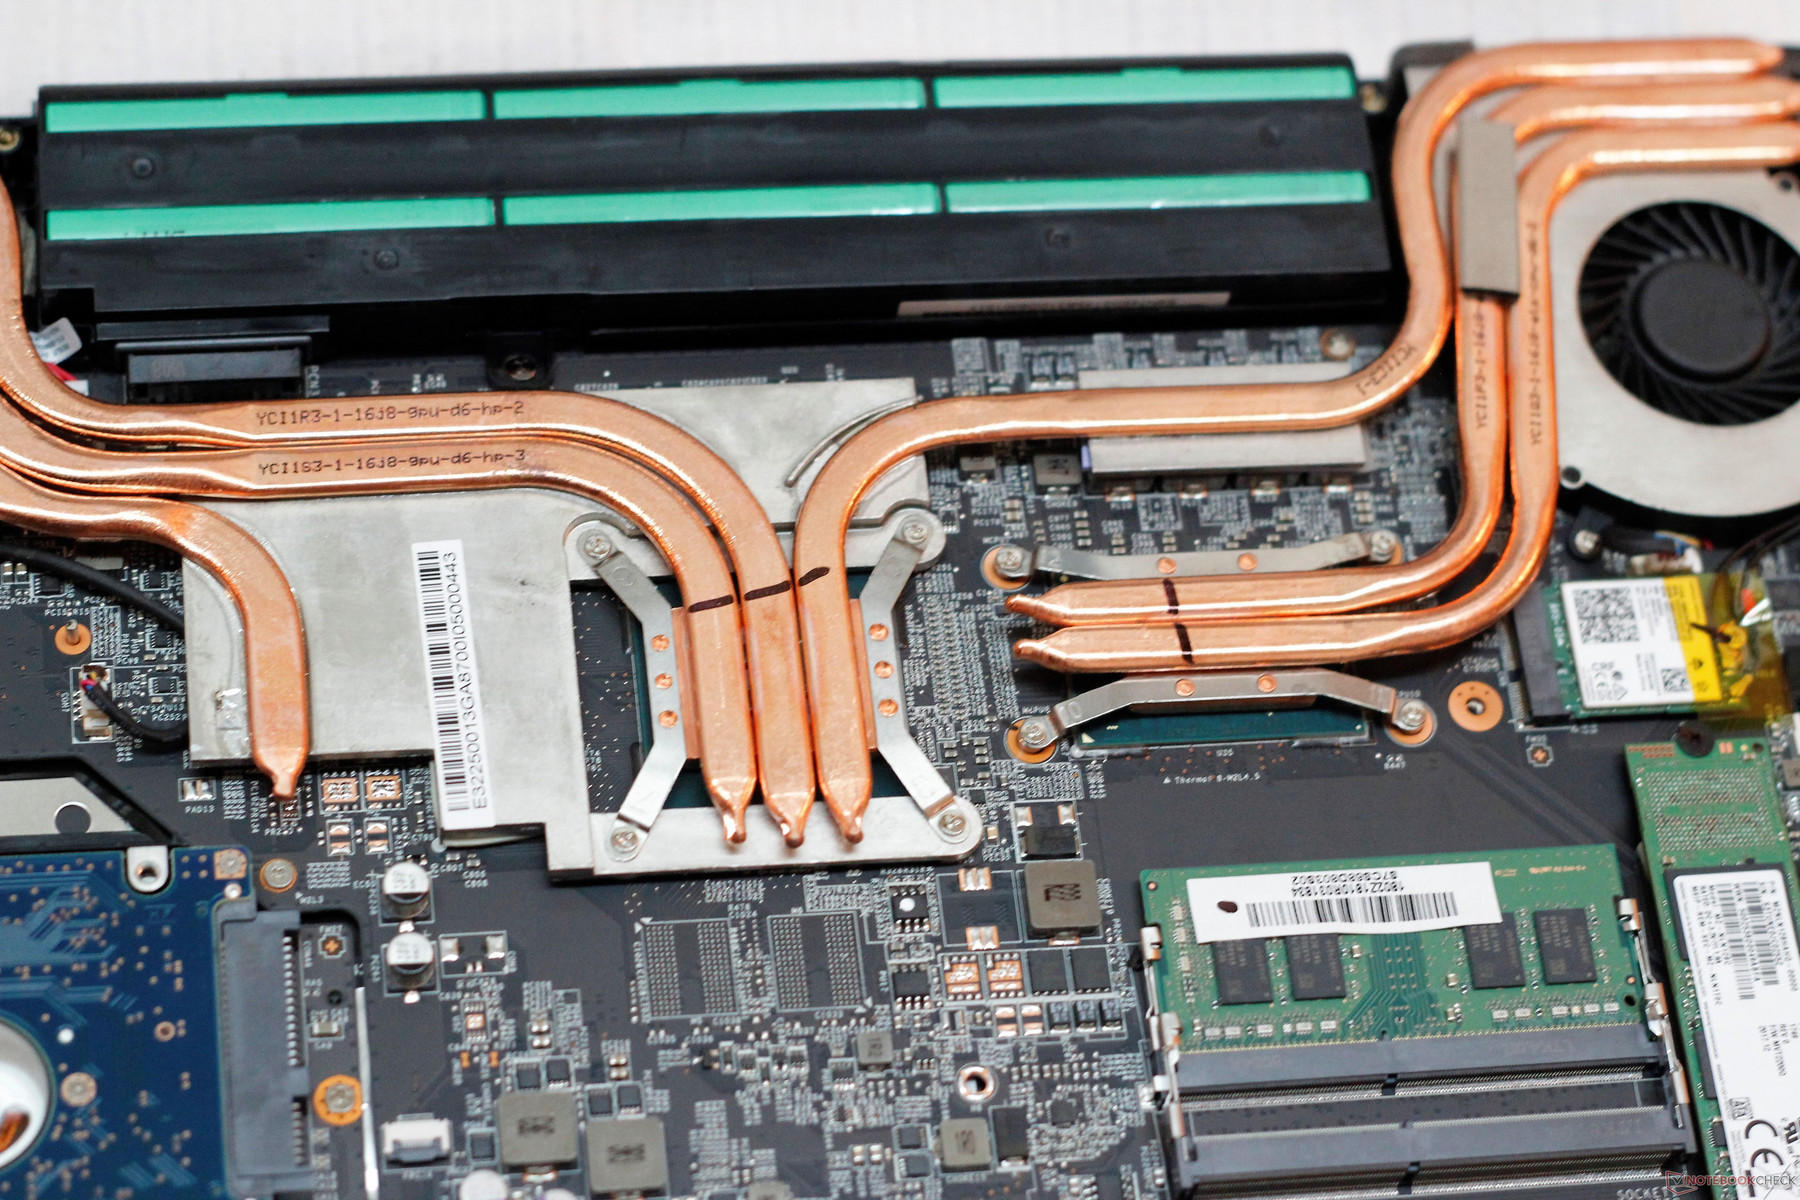
Maintenance options are excellent, but the process can be frustrating. There are 16 screws that need to be removed, including one hidden under a "factory seal" sticker. MSI has a spotty record of voiding warranties should this sticker be pierced; sometimes this will void a warranty, other times it will not. Determined DIYers will appreciate the fact that all screws are the same size. Once the screws are removed, there are several plastic clips that must be disengaged. While these are easily handled, the bottom panel fits tightly over the ports along the sides, especially the mini-DisplayPort and HDMI output. Some maneuvering is necessary to get the bottom panel off these ports without cracking the thin plastic, but it can be done with a bit of patience.
Once inside, users will have access to almost every component. The RAM, wireless card, PCIe drive, HDD, and cooling system are all easily accessible for upgrades and cleaning. The CPU and GPU are easy to get to for repasting, but they are soldered on (as is the industry standard now) and thus cannot be upgraded.
MSI offers a basic 12-month limited warranty.
Input Devices
Keyboard
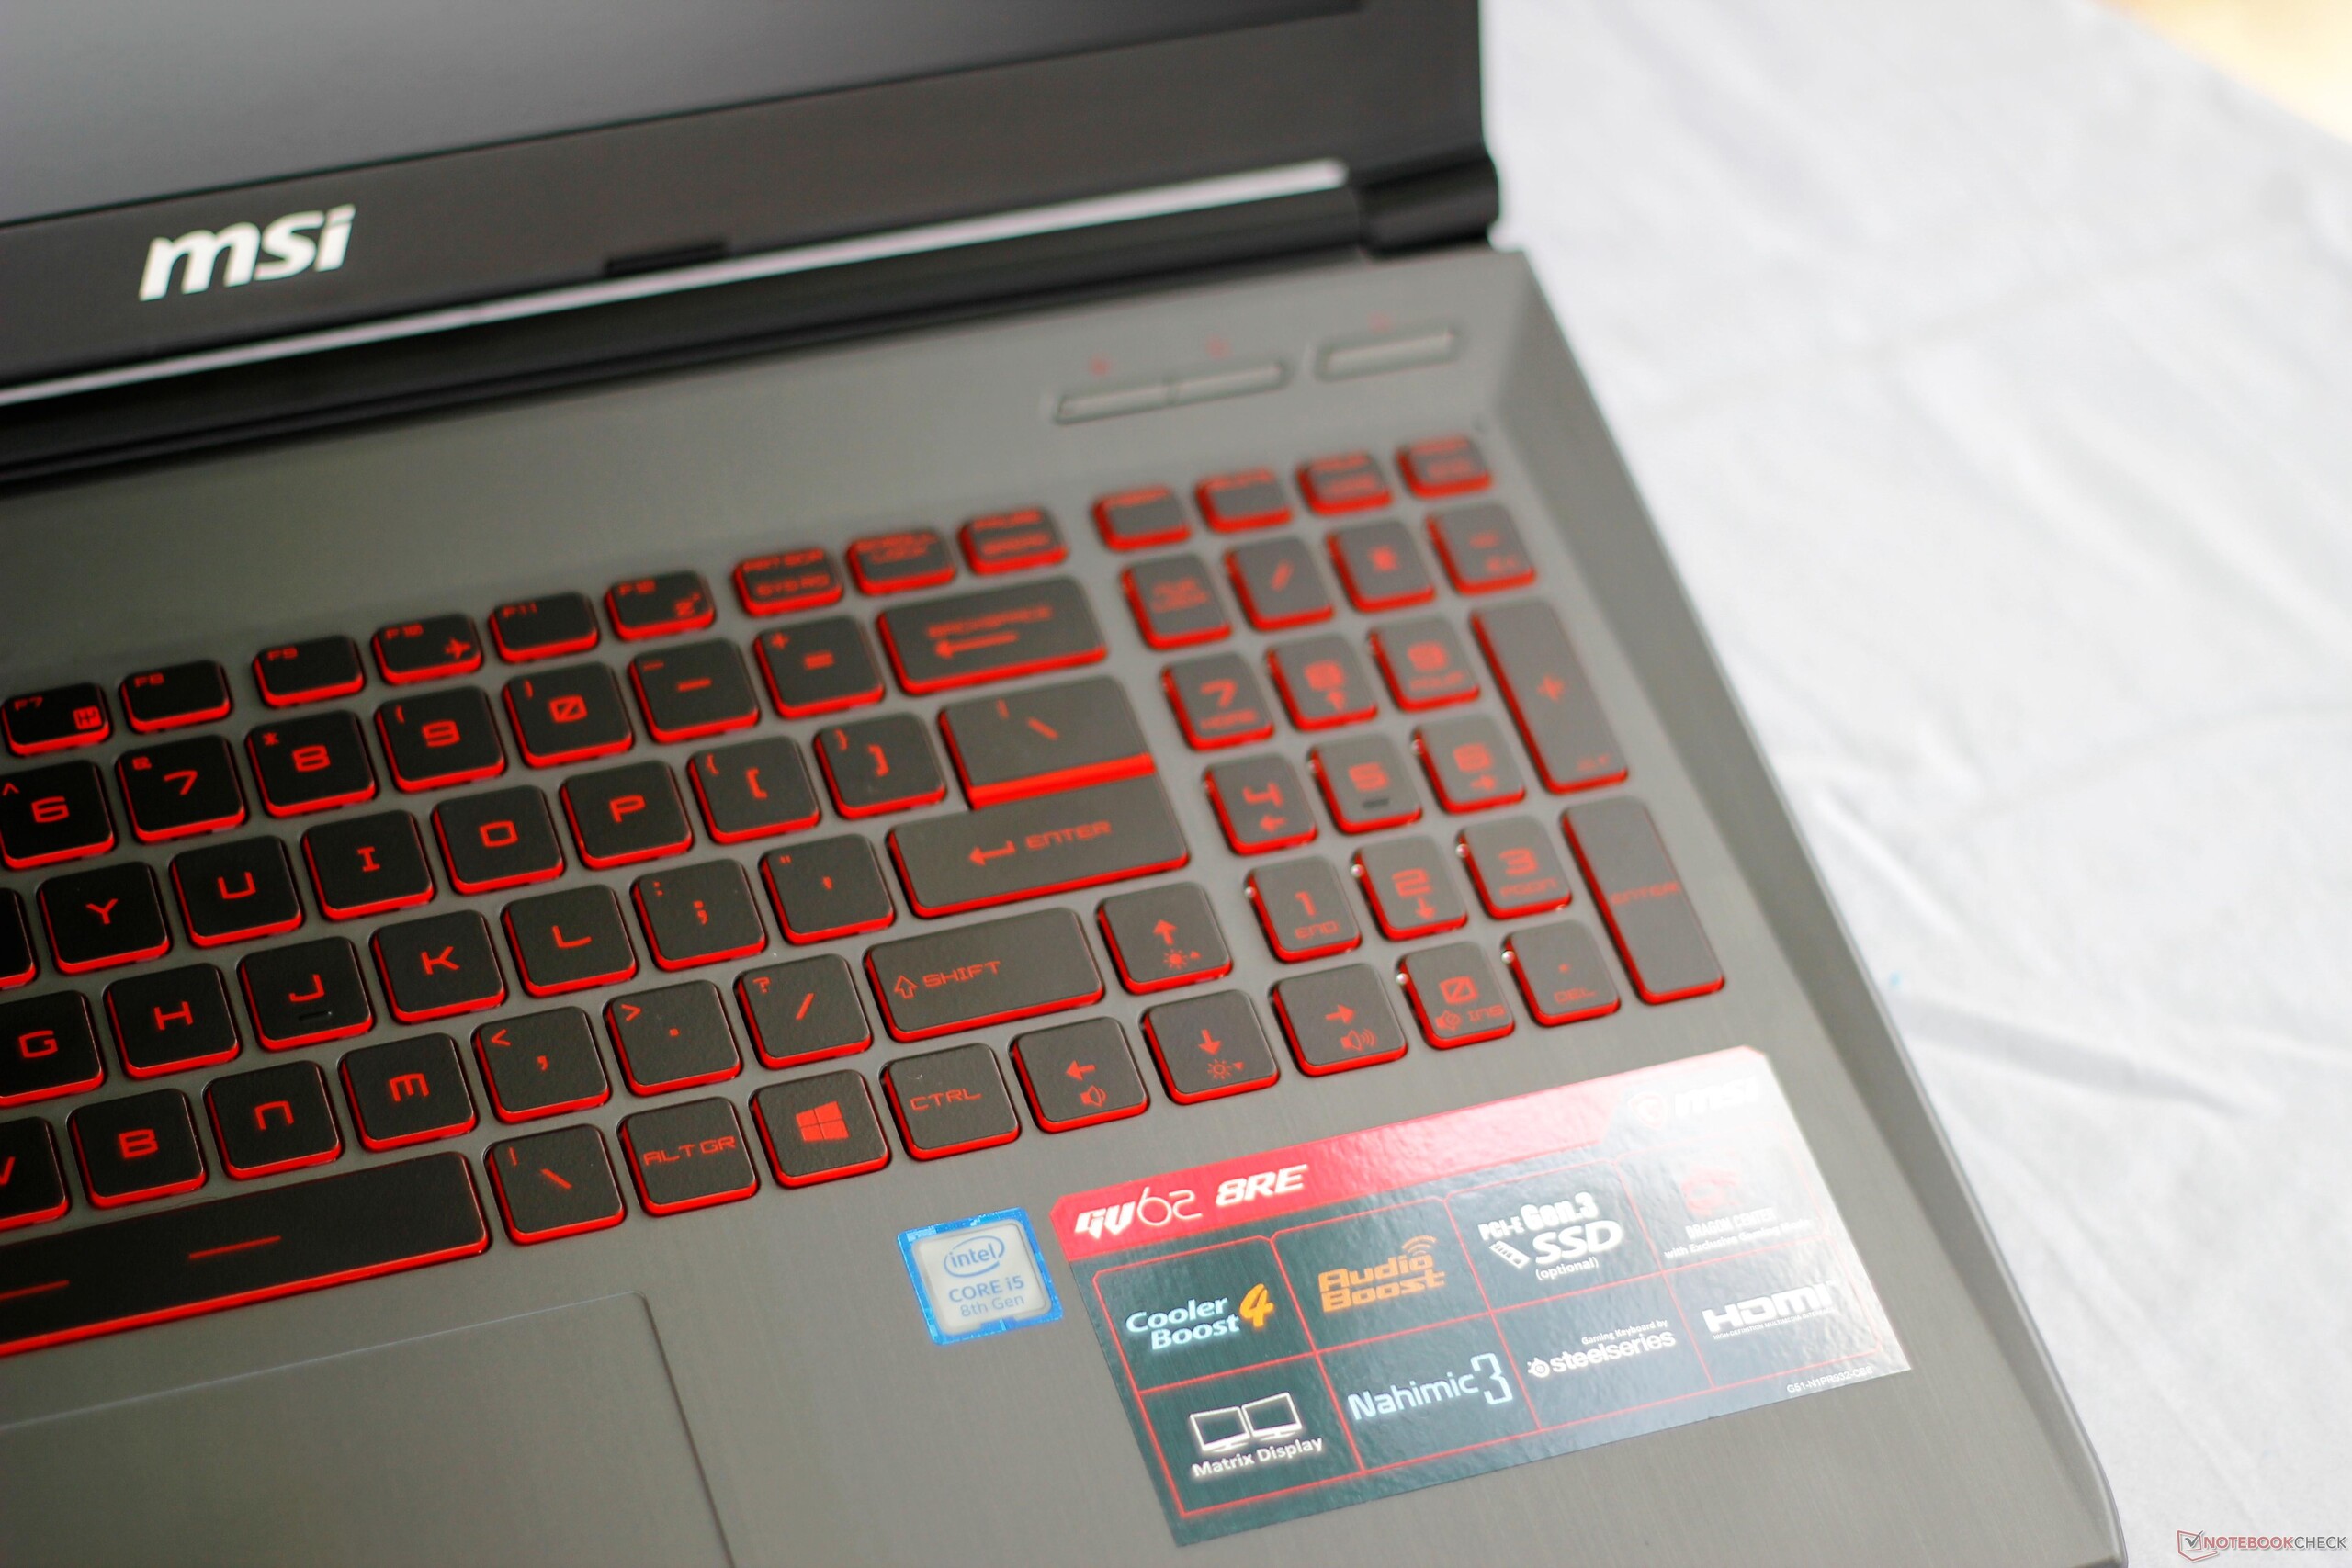
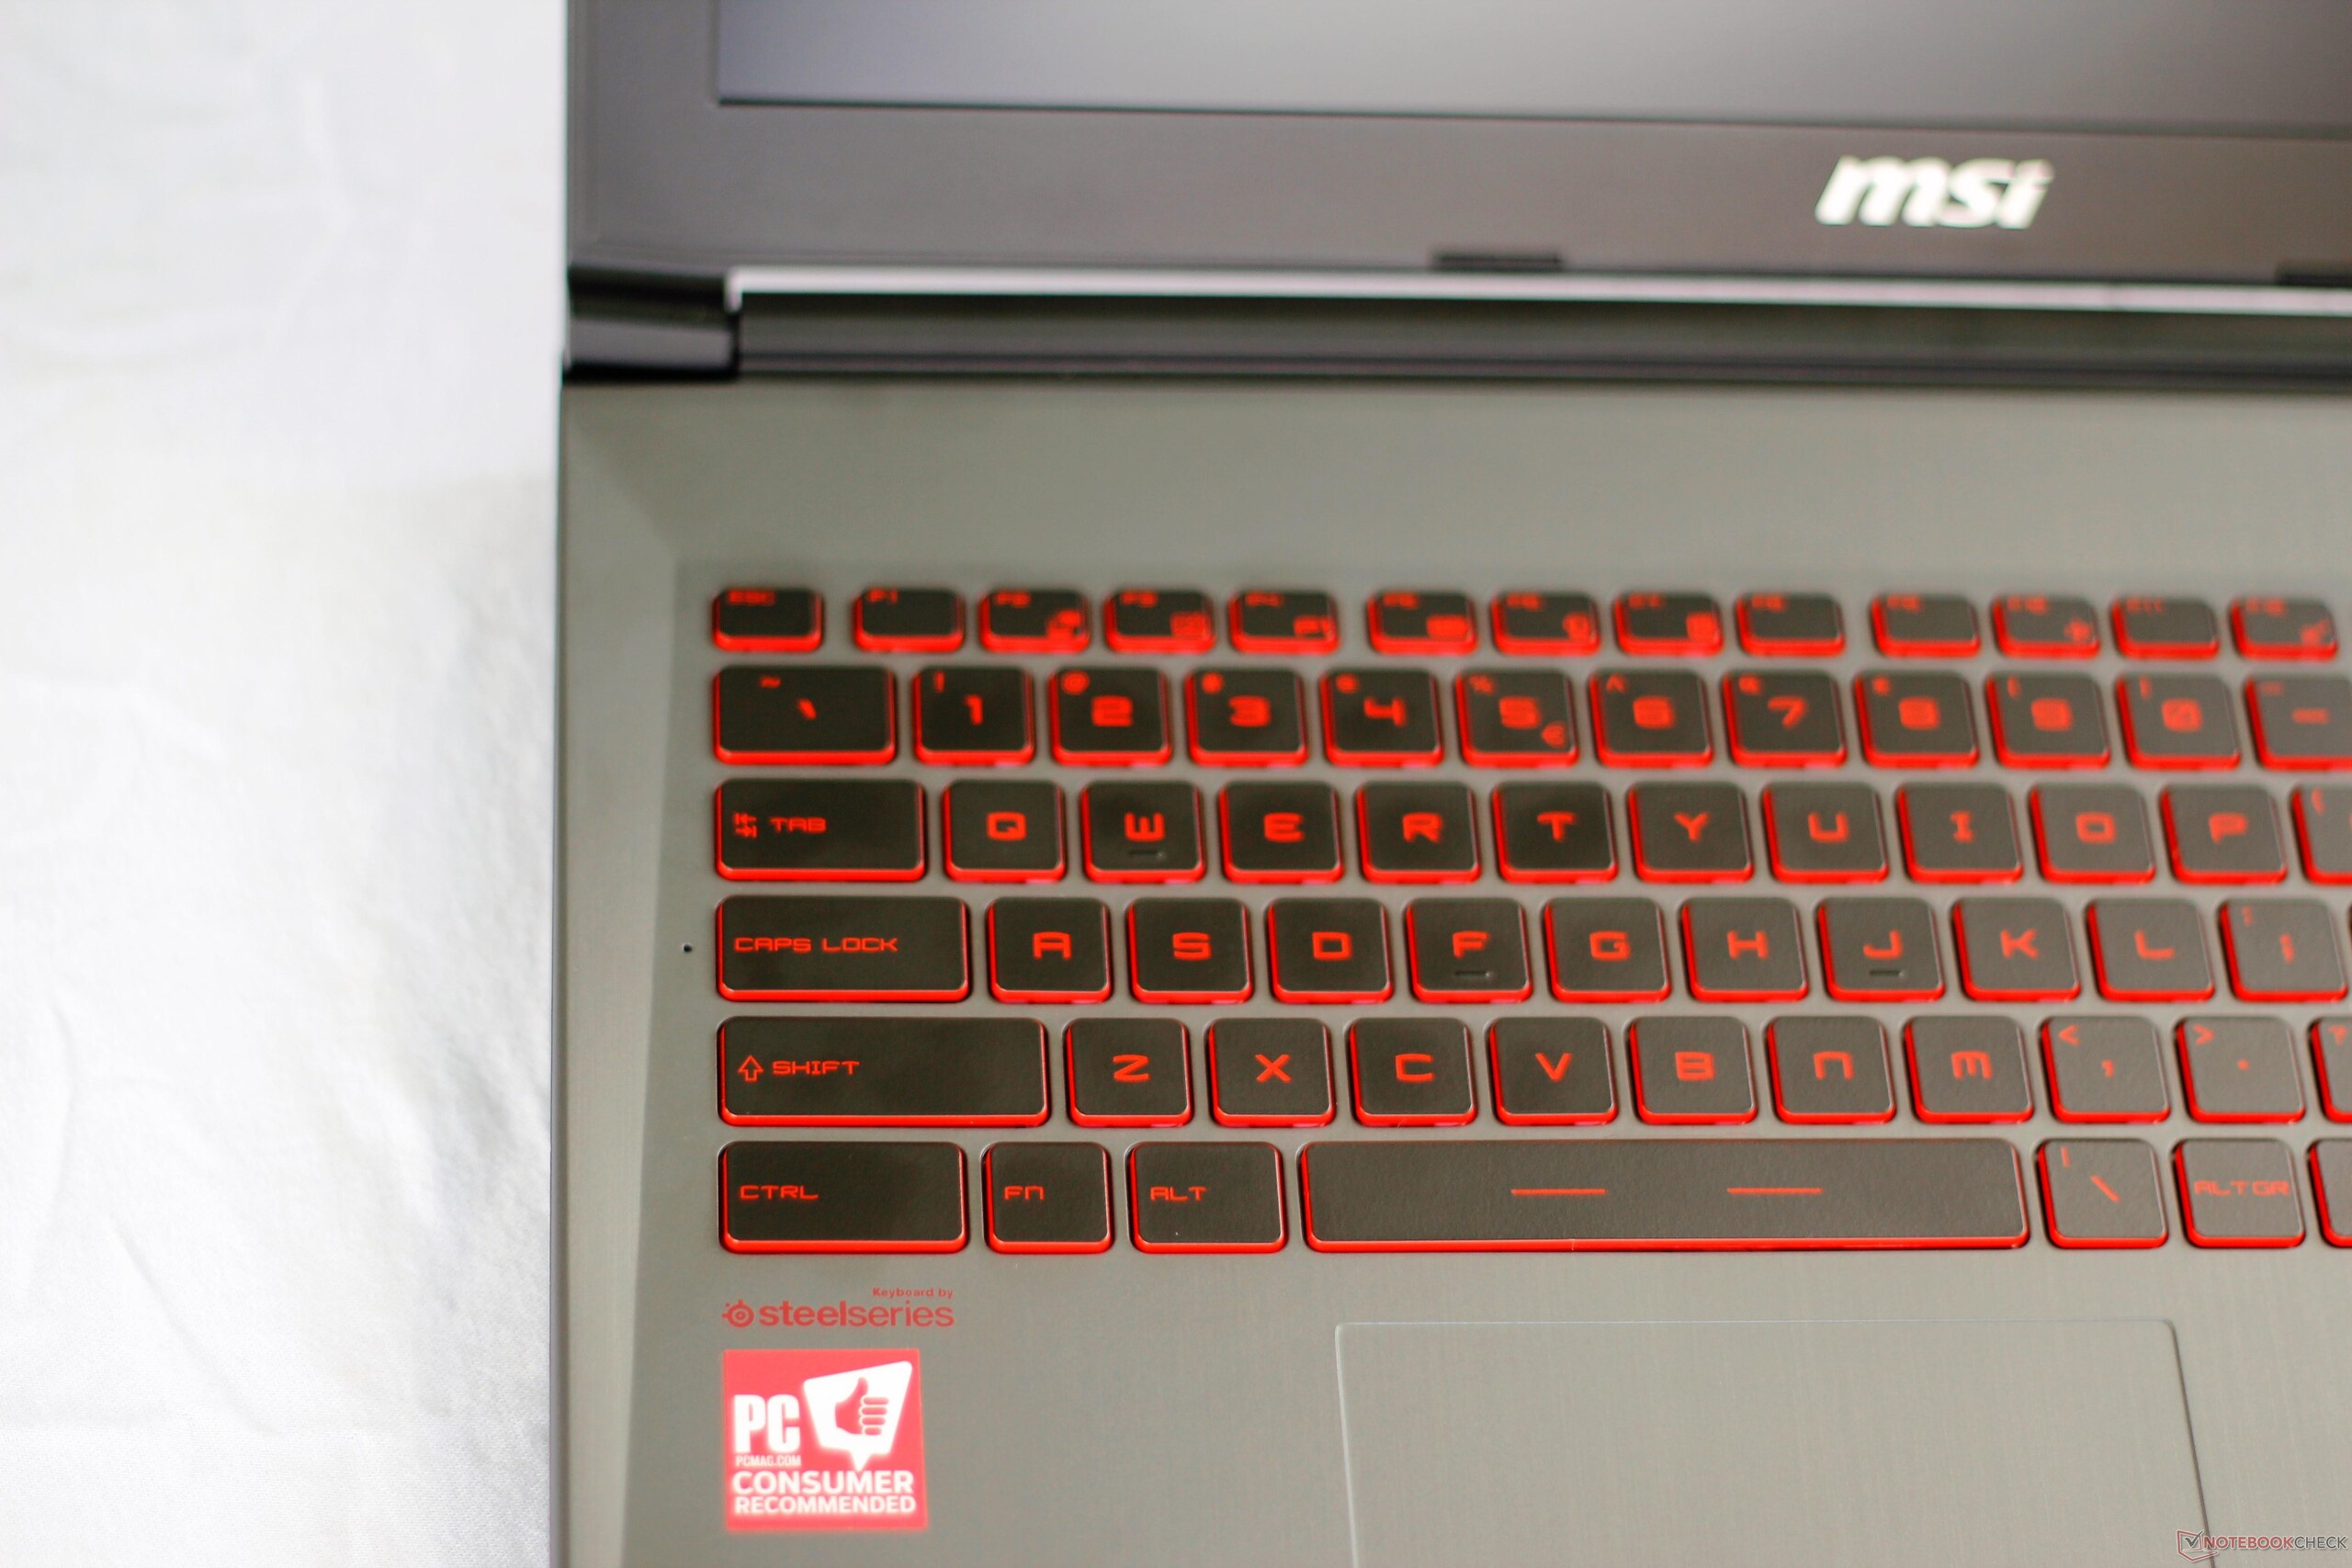
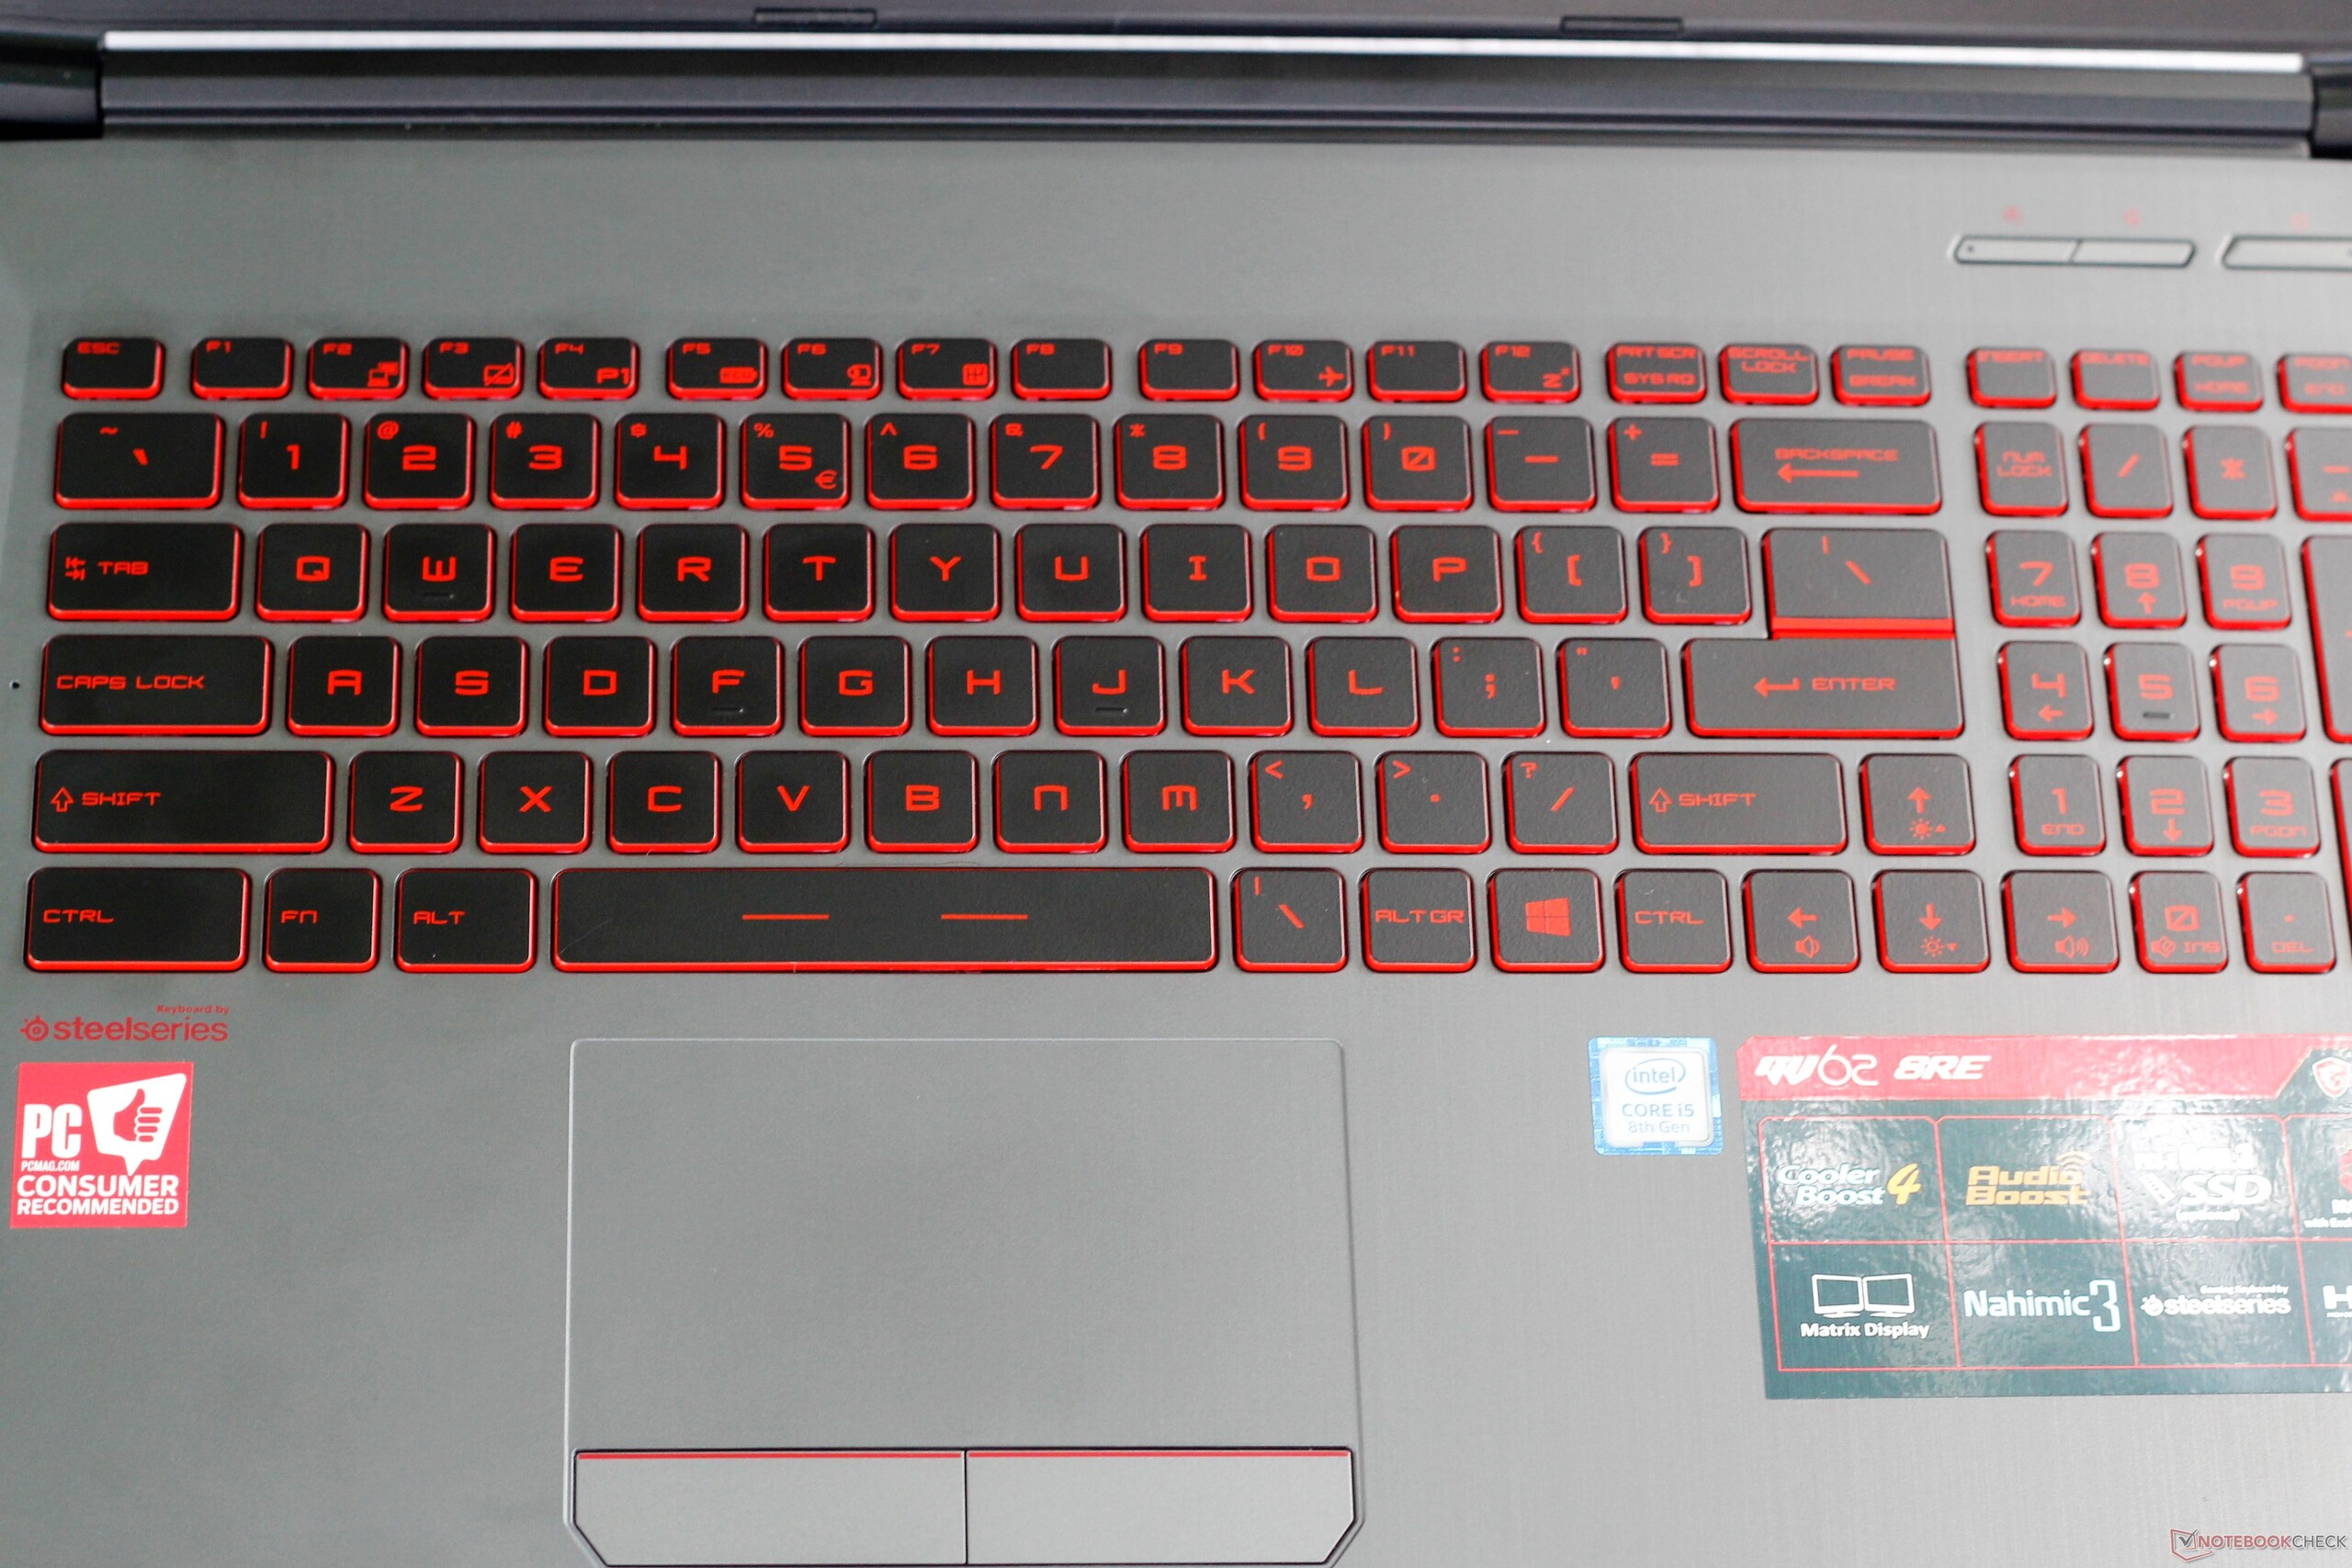
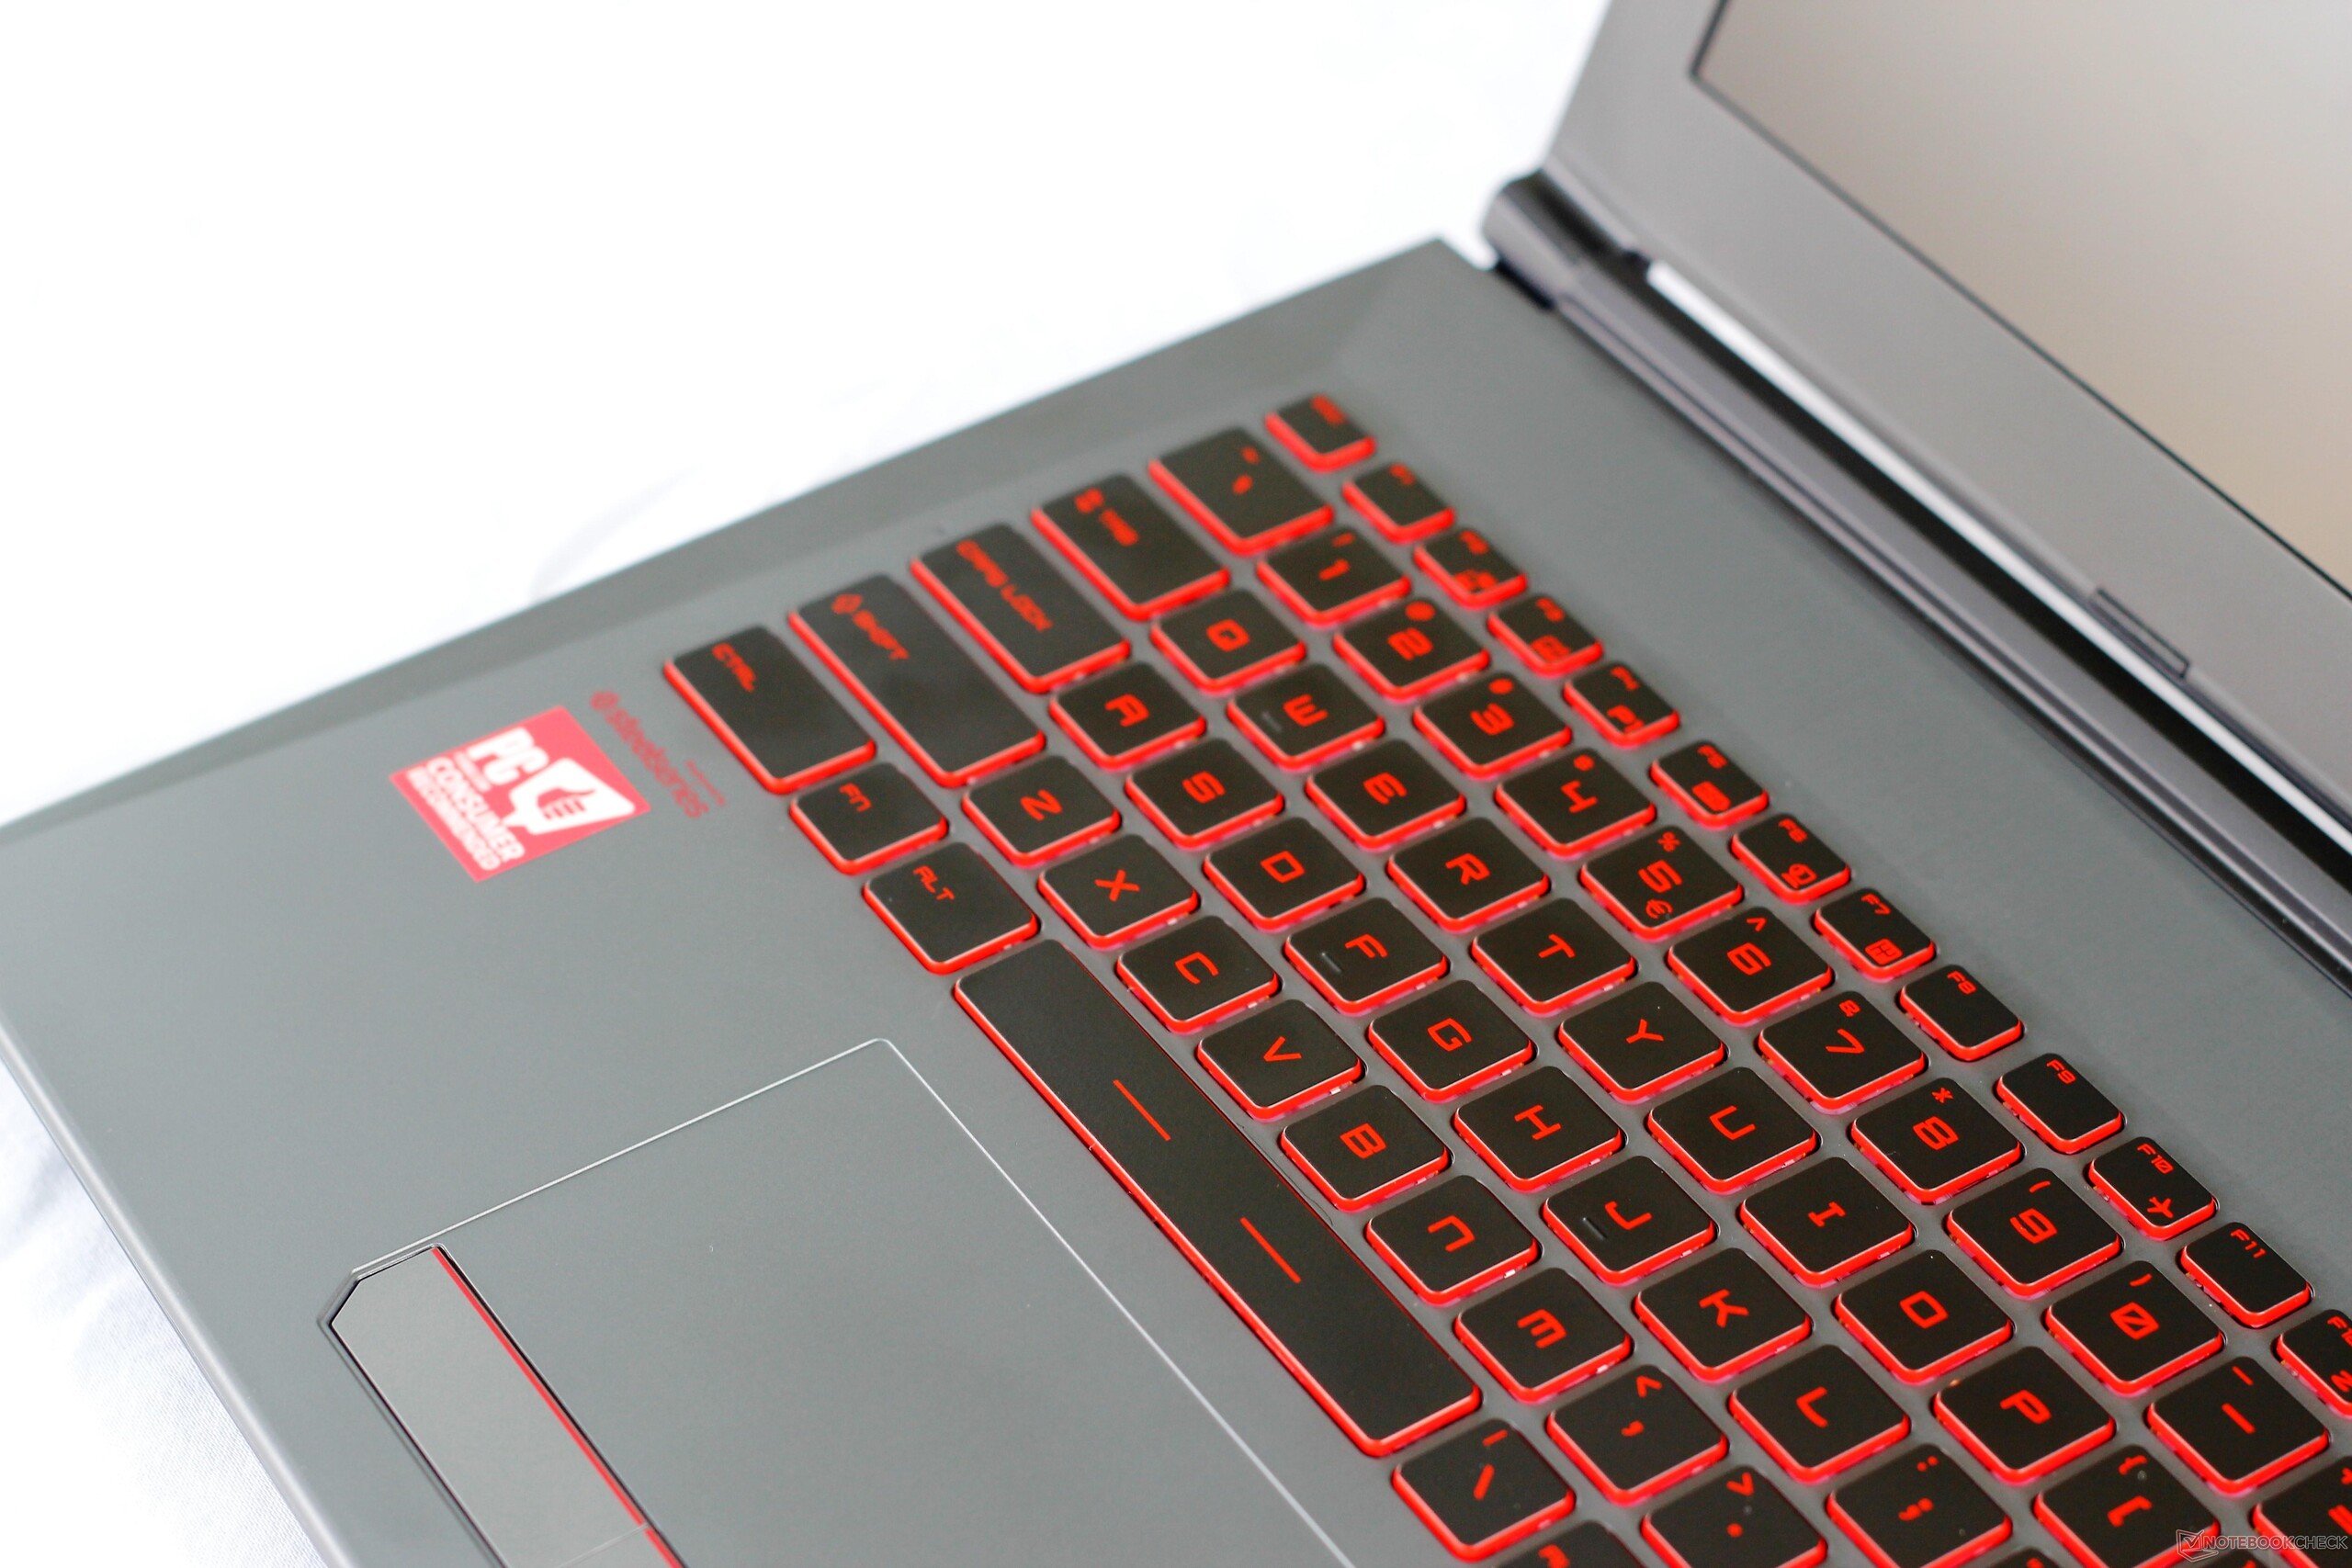
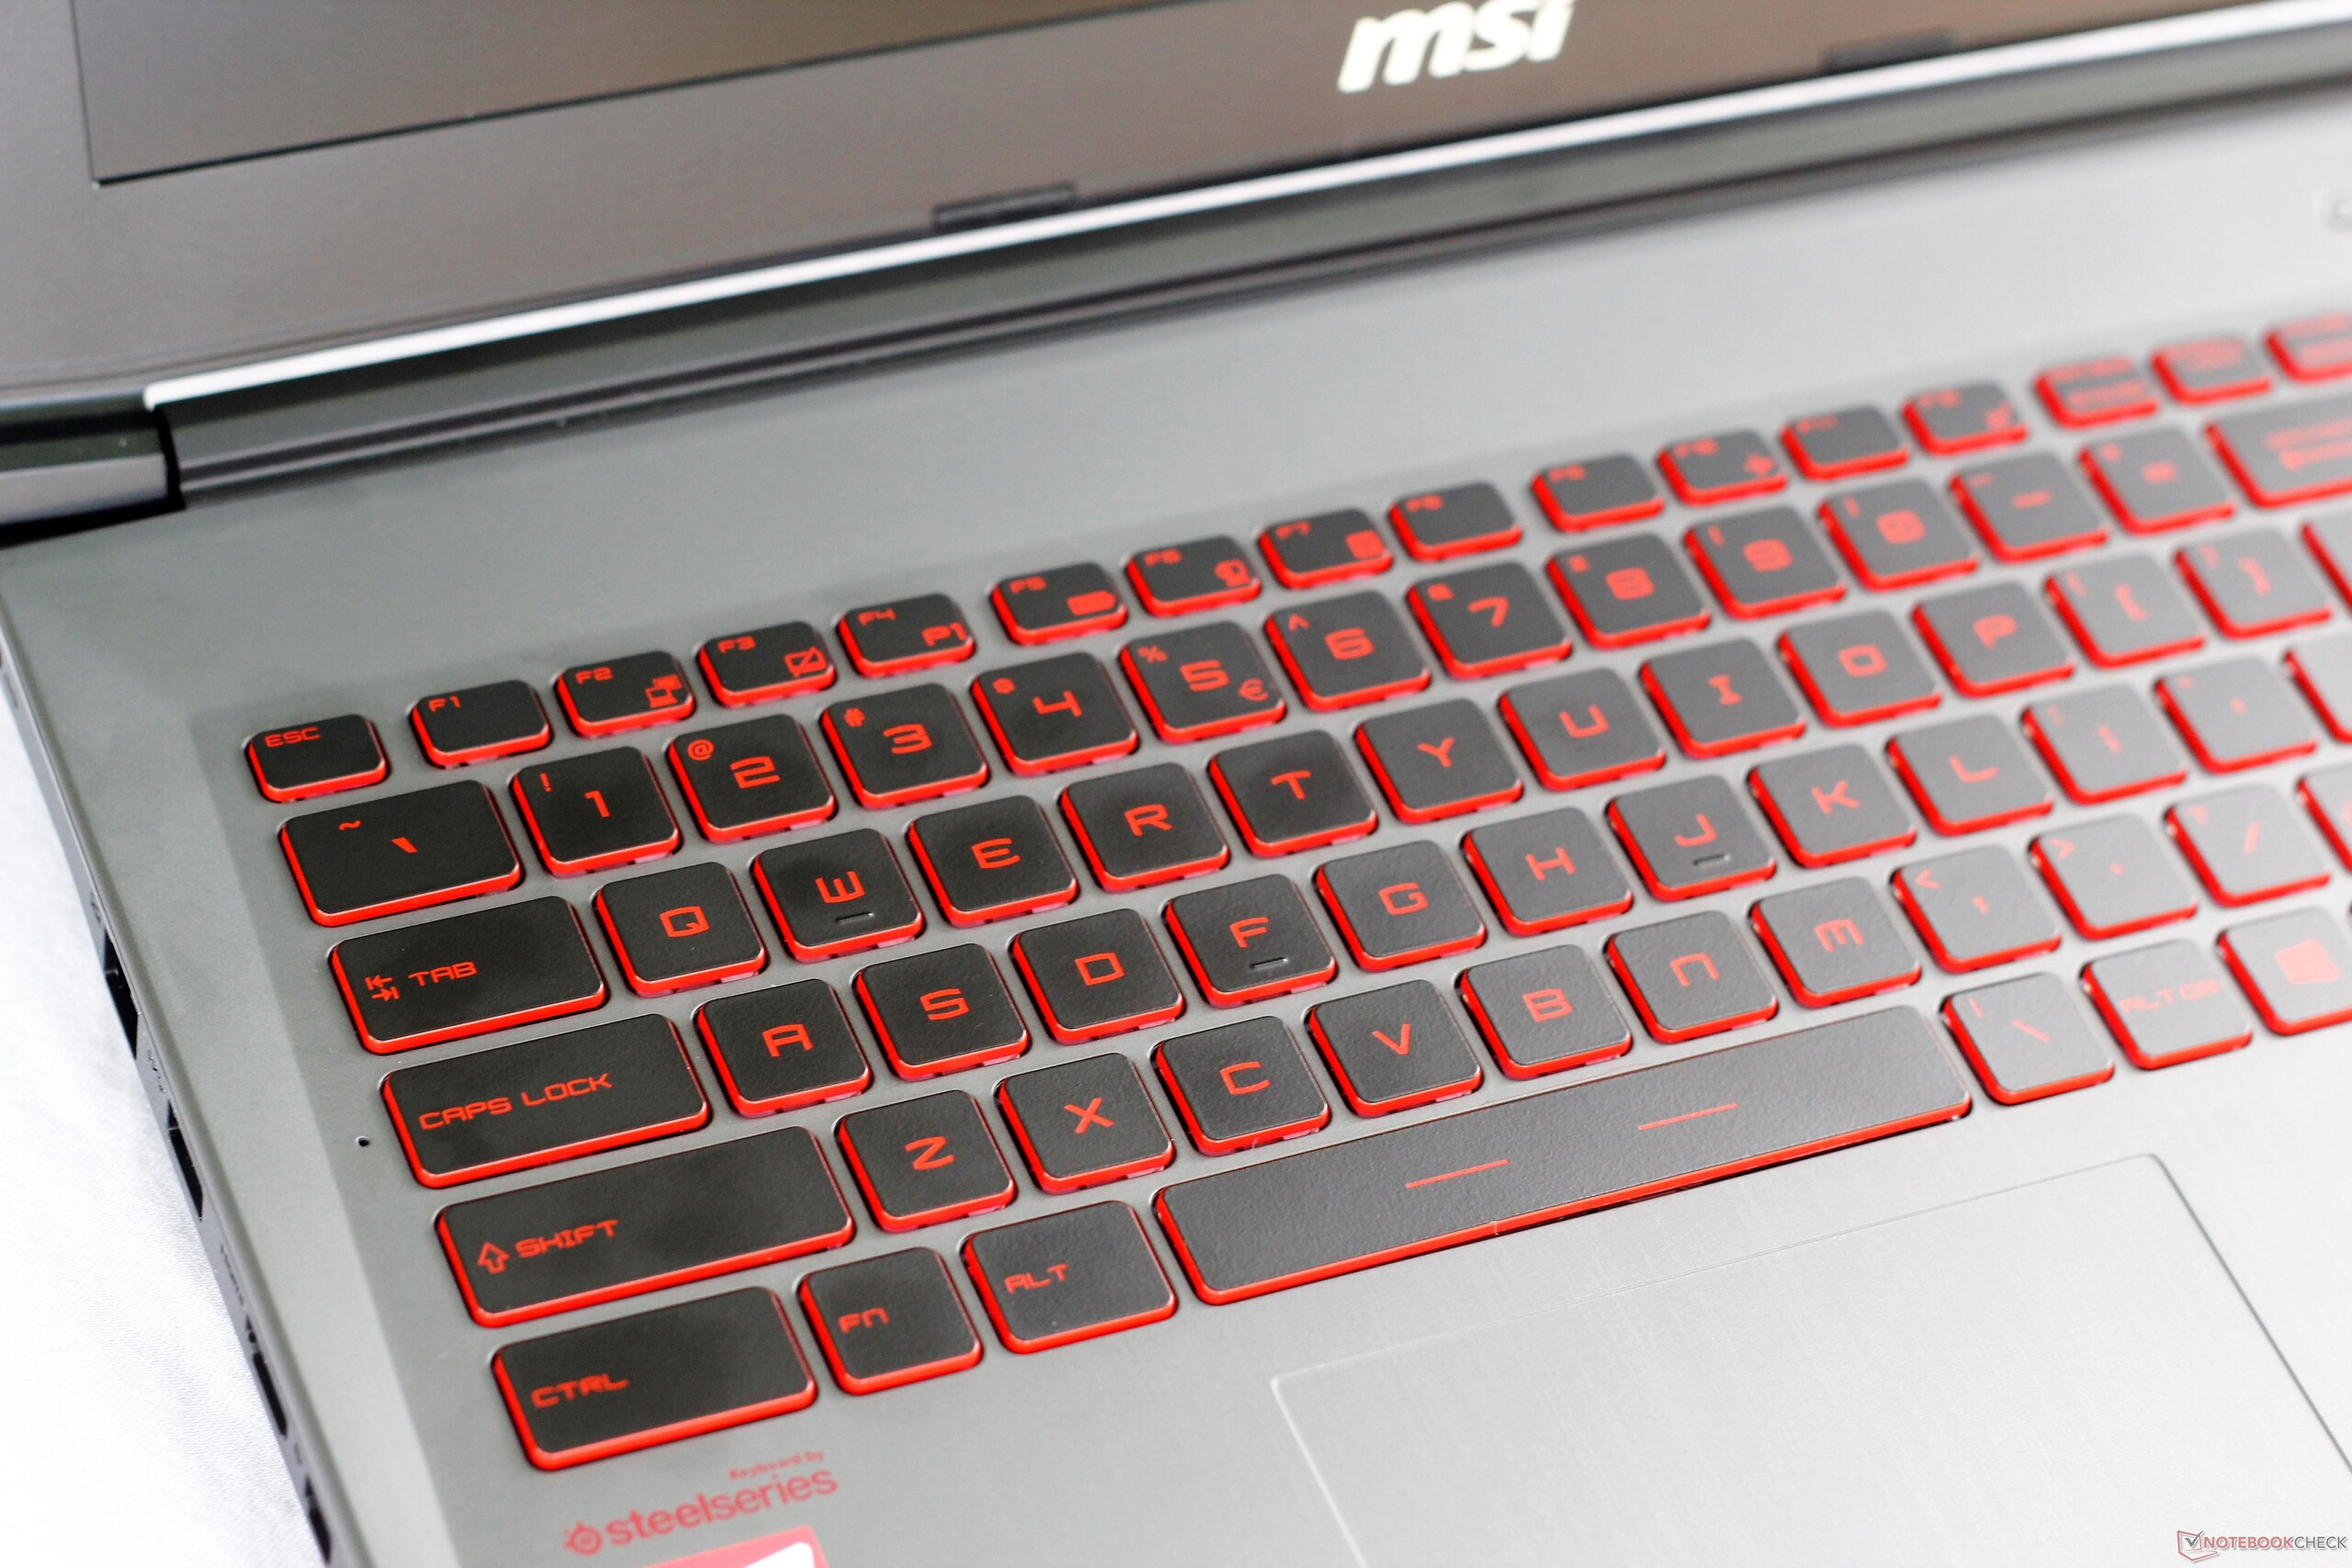
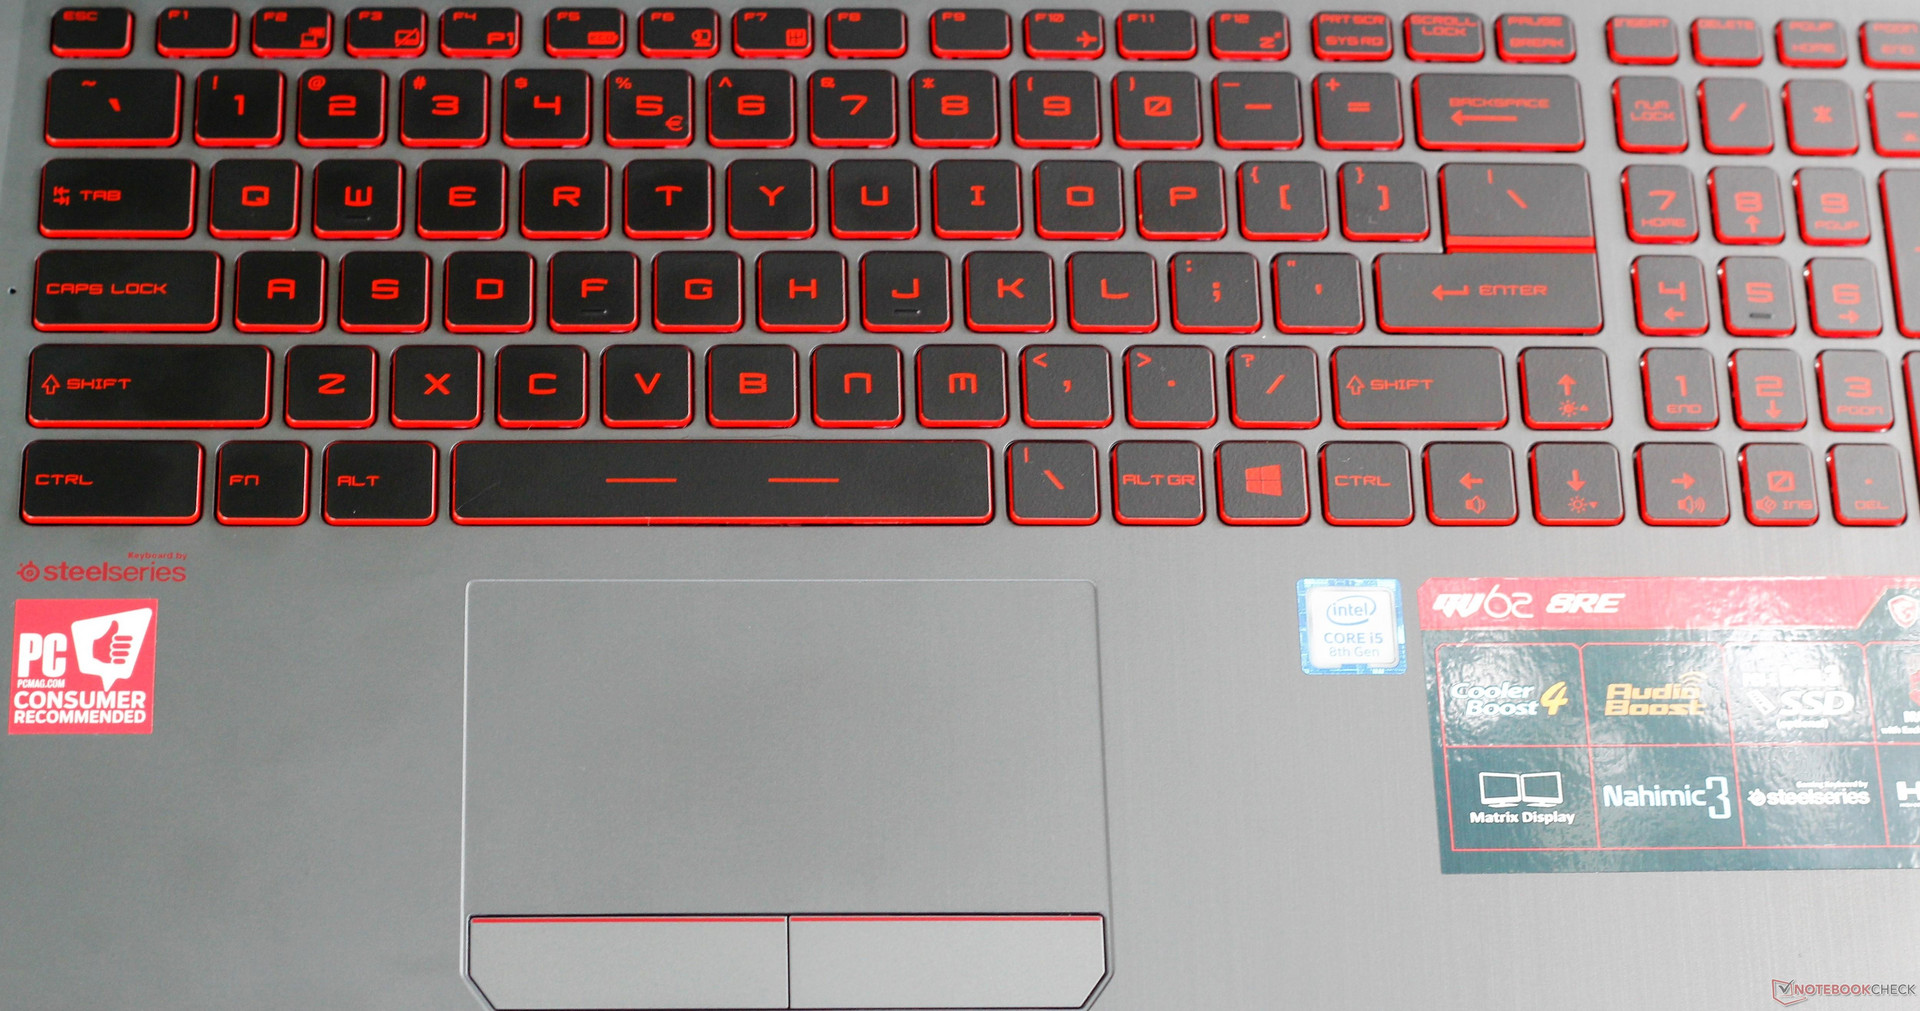
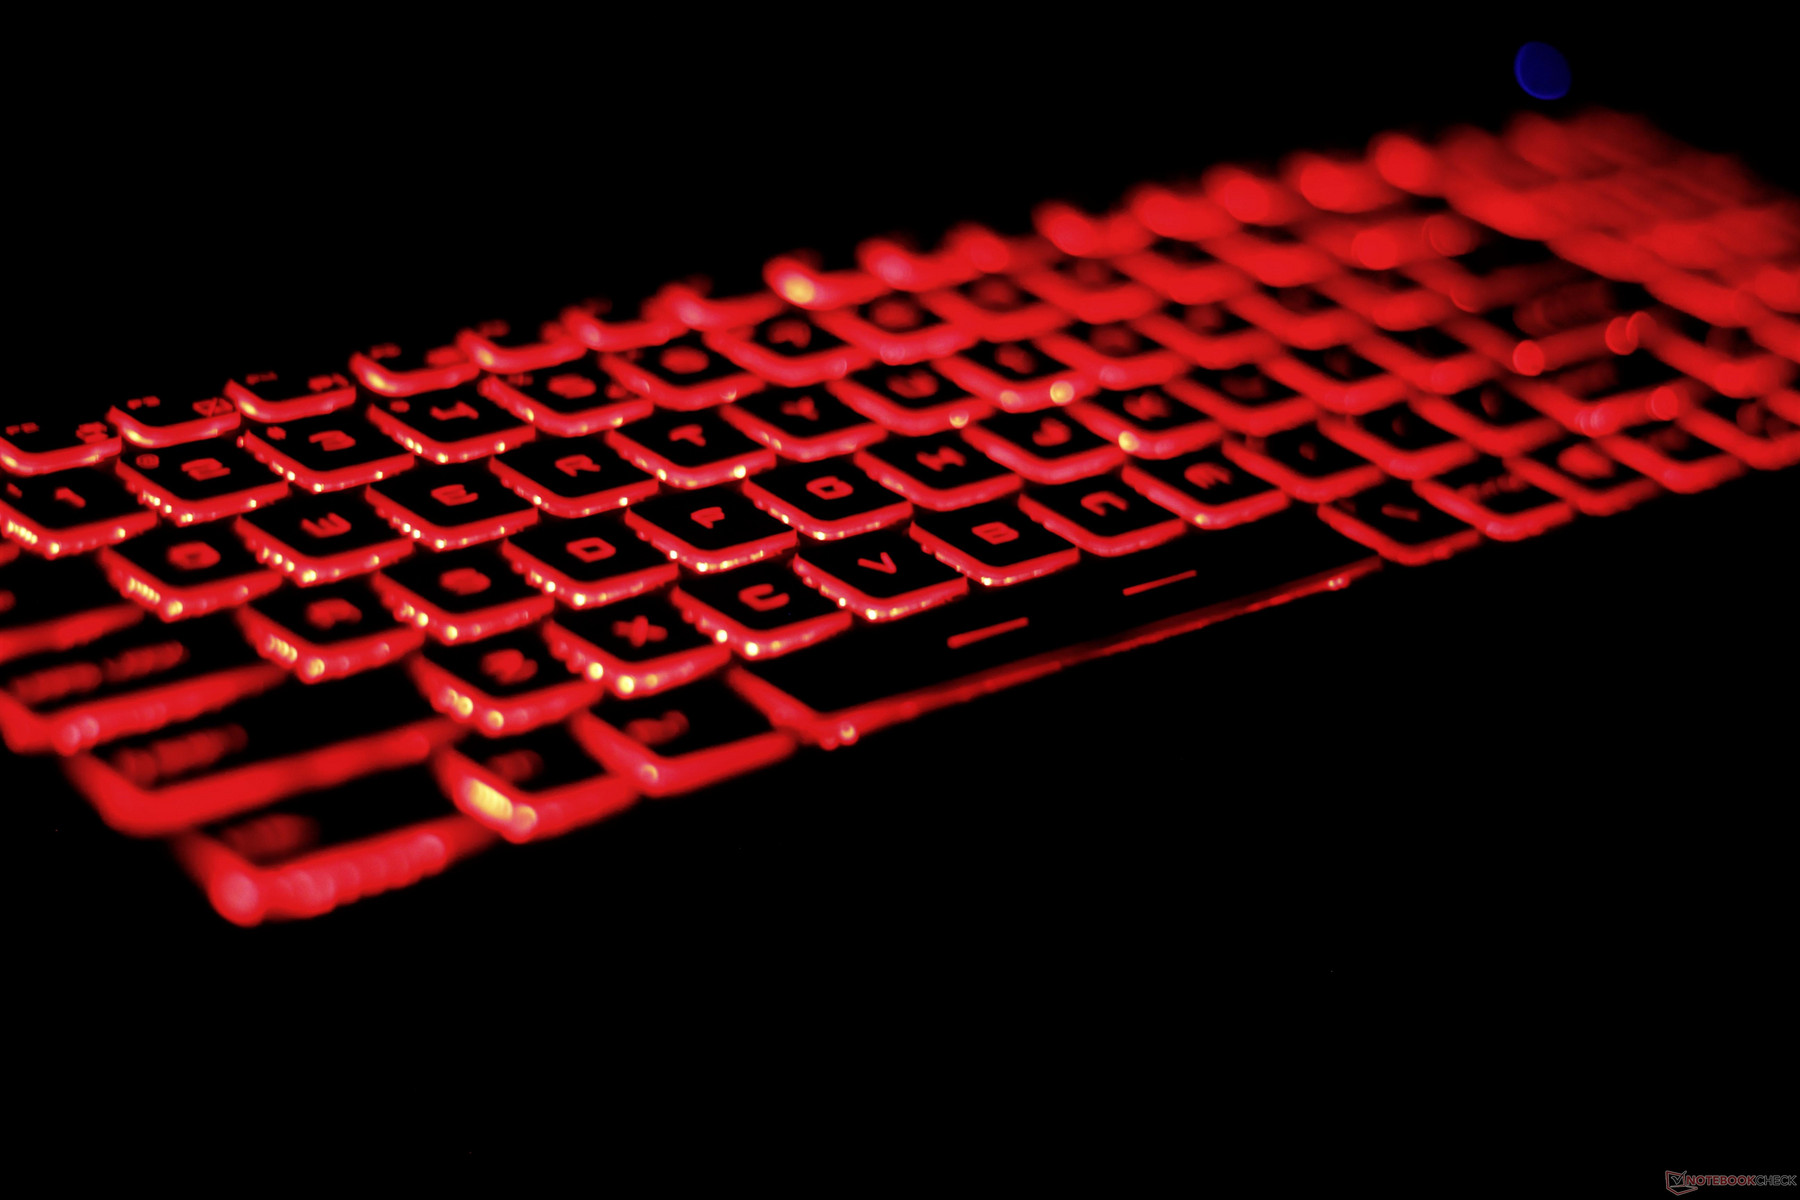
As with most MSI machines, the SteelSeries keyboard is excellent. Feedback is crisp and firm, and the keys offer a generous amount of travel with a pillowy drop. The keyboard is similar to that of the GF62 with the same minimal noise and great feel. All said, MSI's keyboards are some of the best on gaming laptops, and that continues even in their budget lines. The only drawback to the keyboard is the lack of RGB lighting and the divisive aesthetic comprised of red paint along the sides of the keys. The backlight gets fairly bright but is limited to a red color.
Touchpad
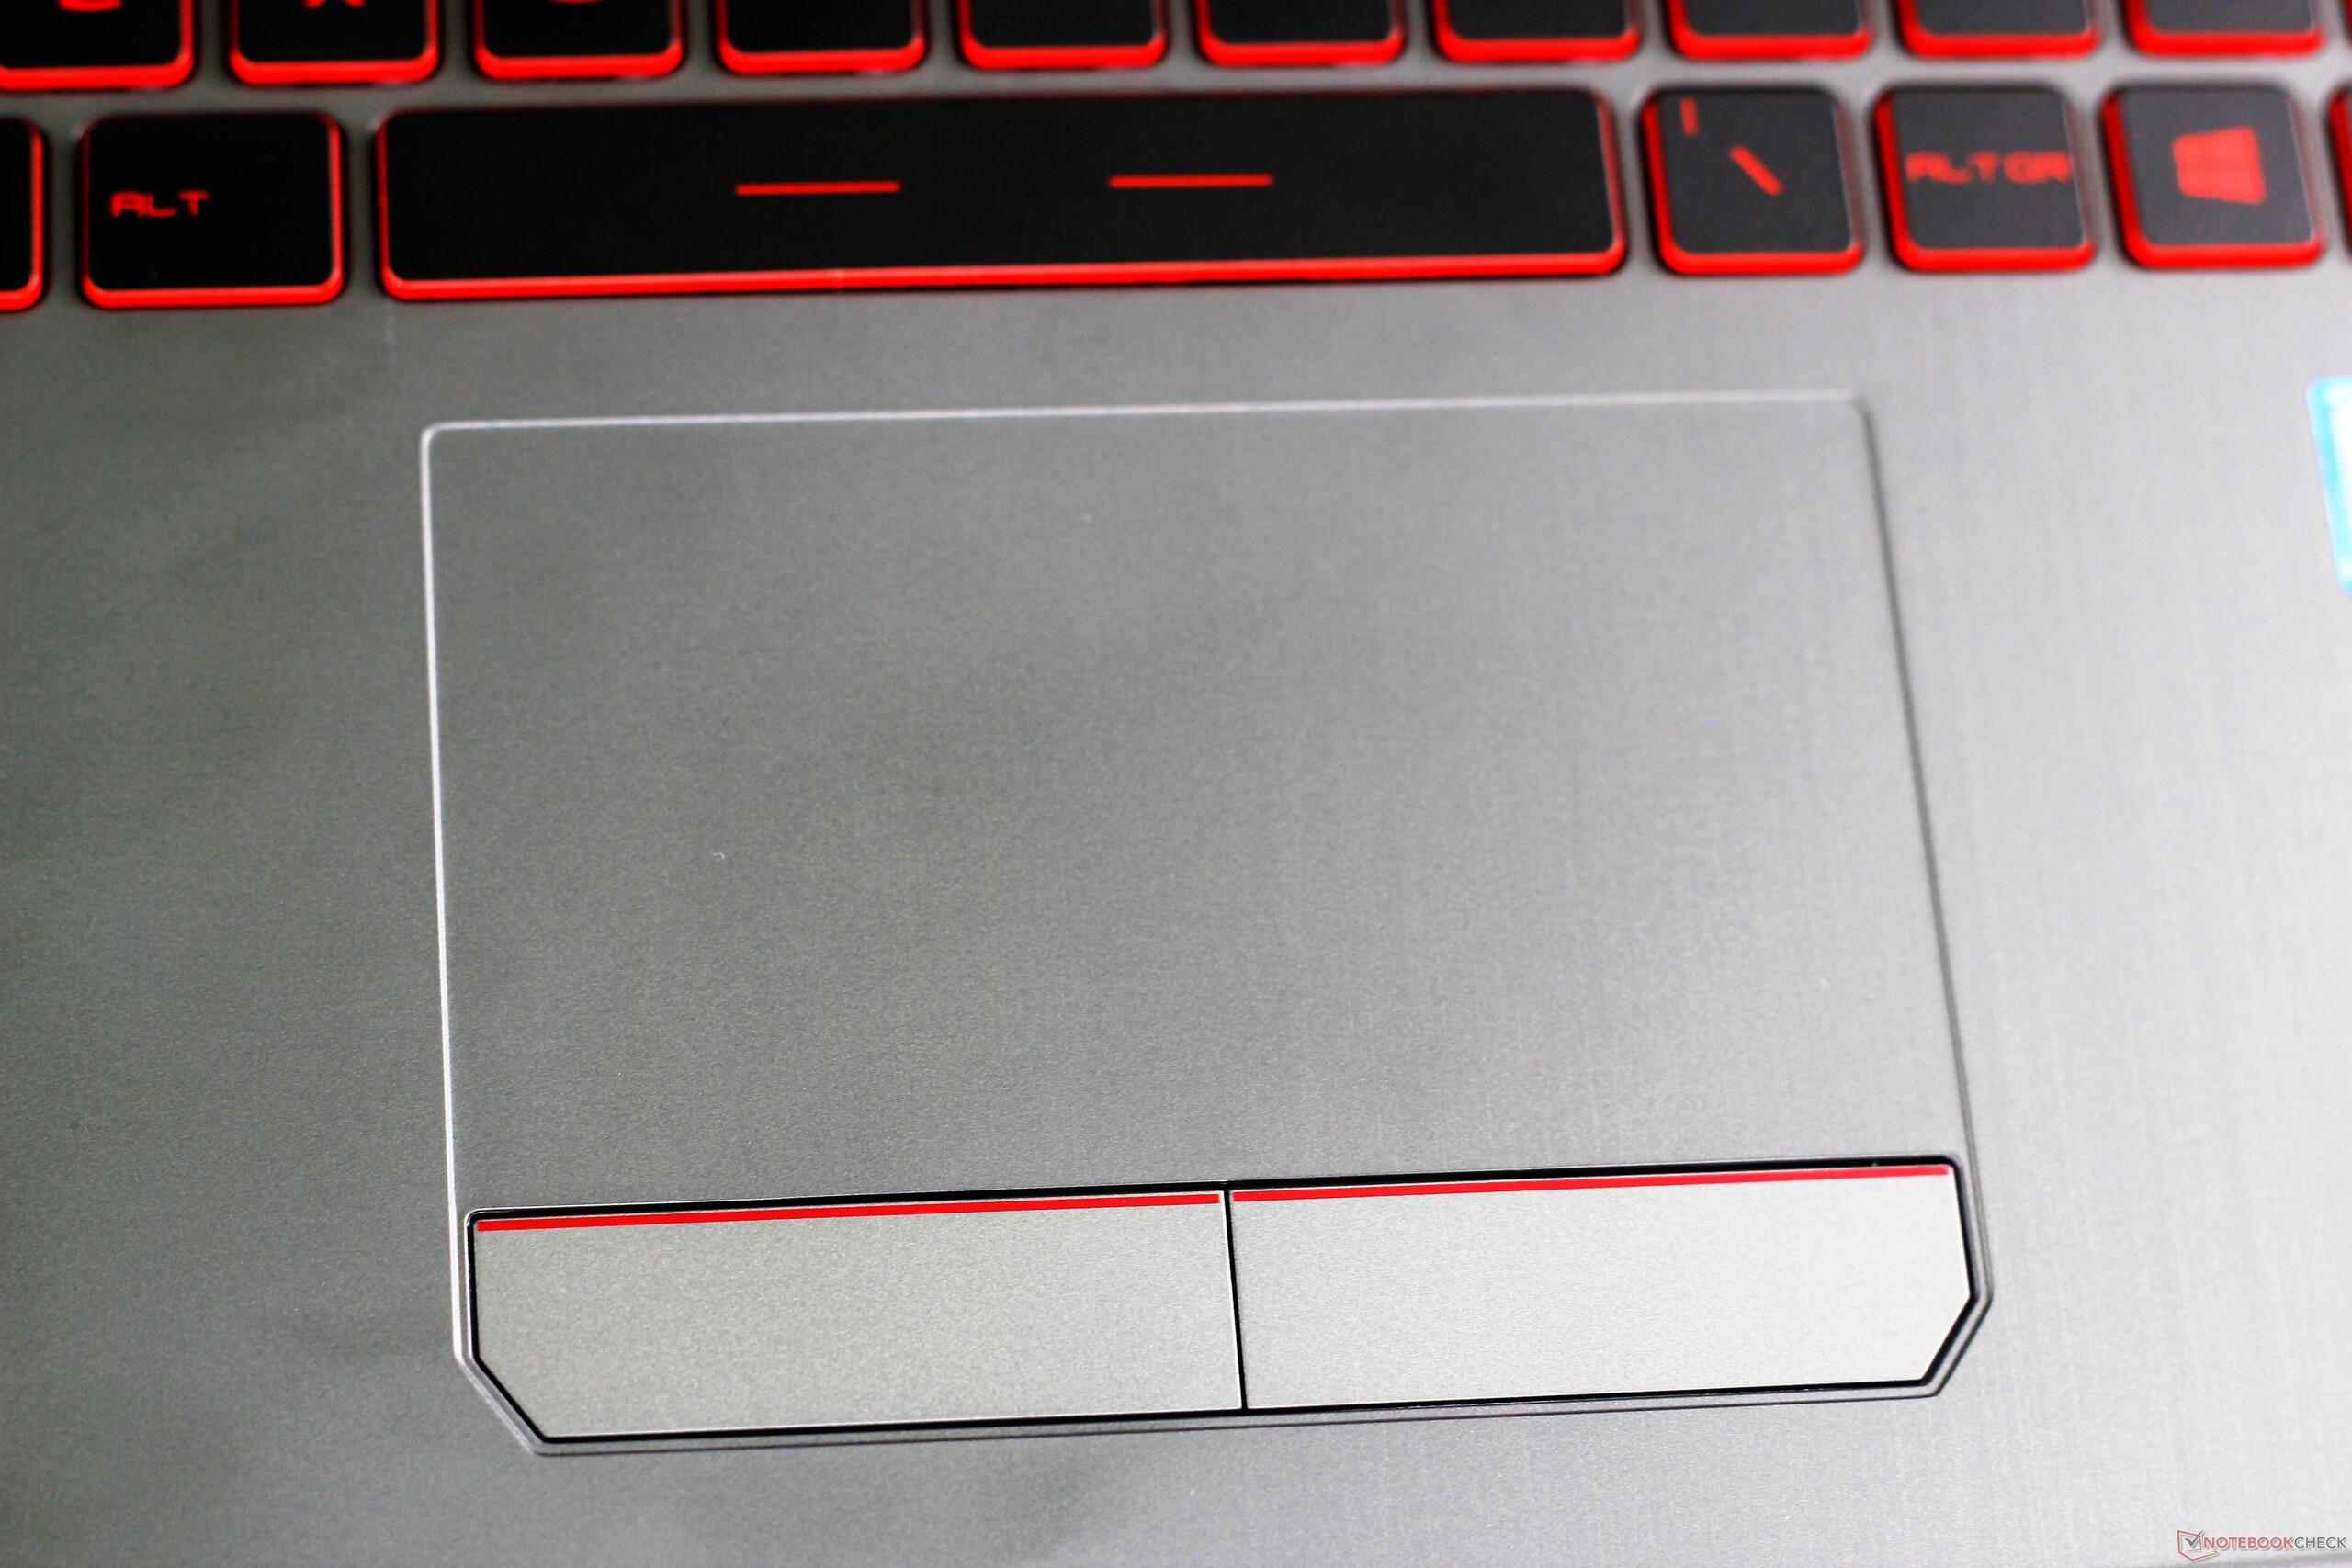
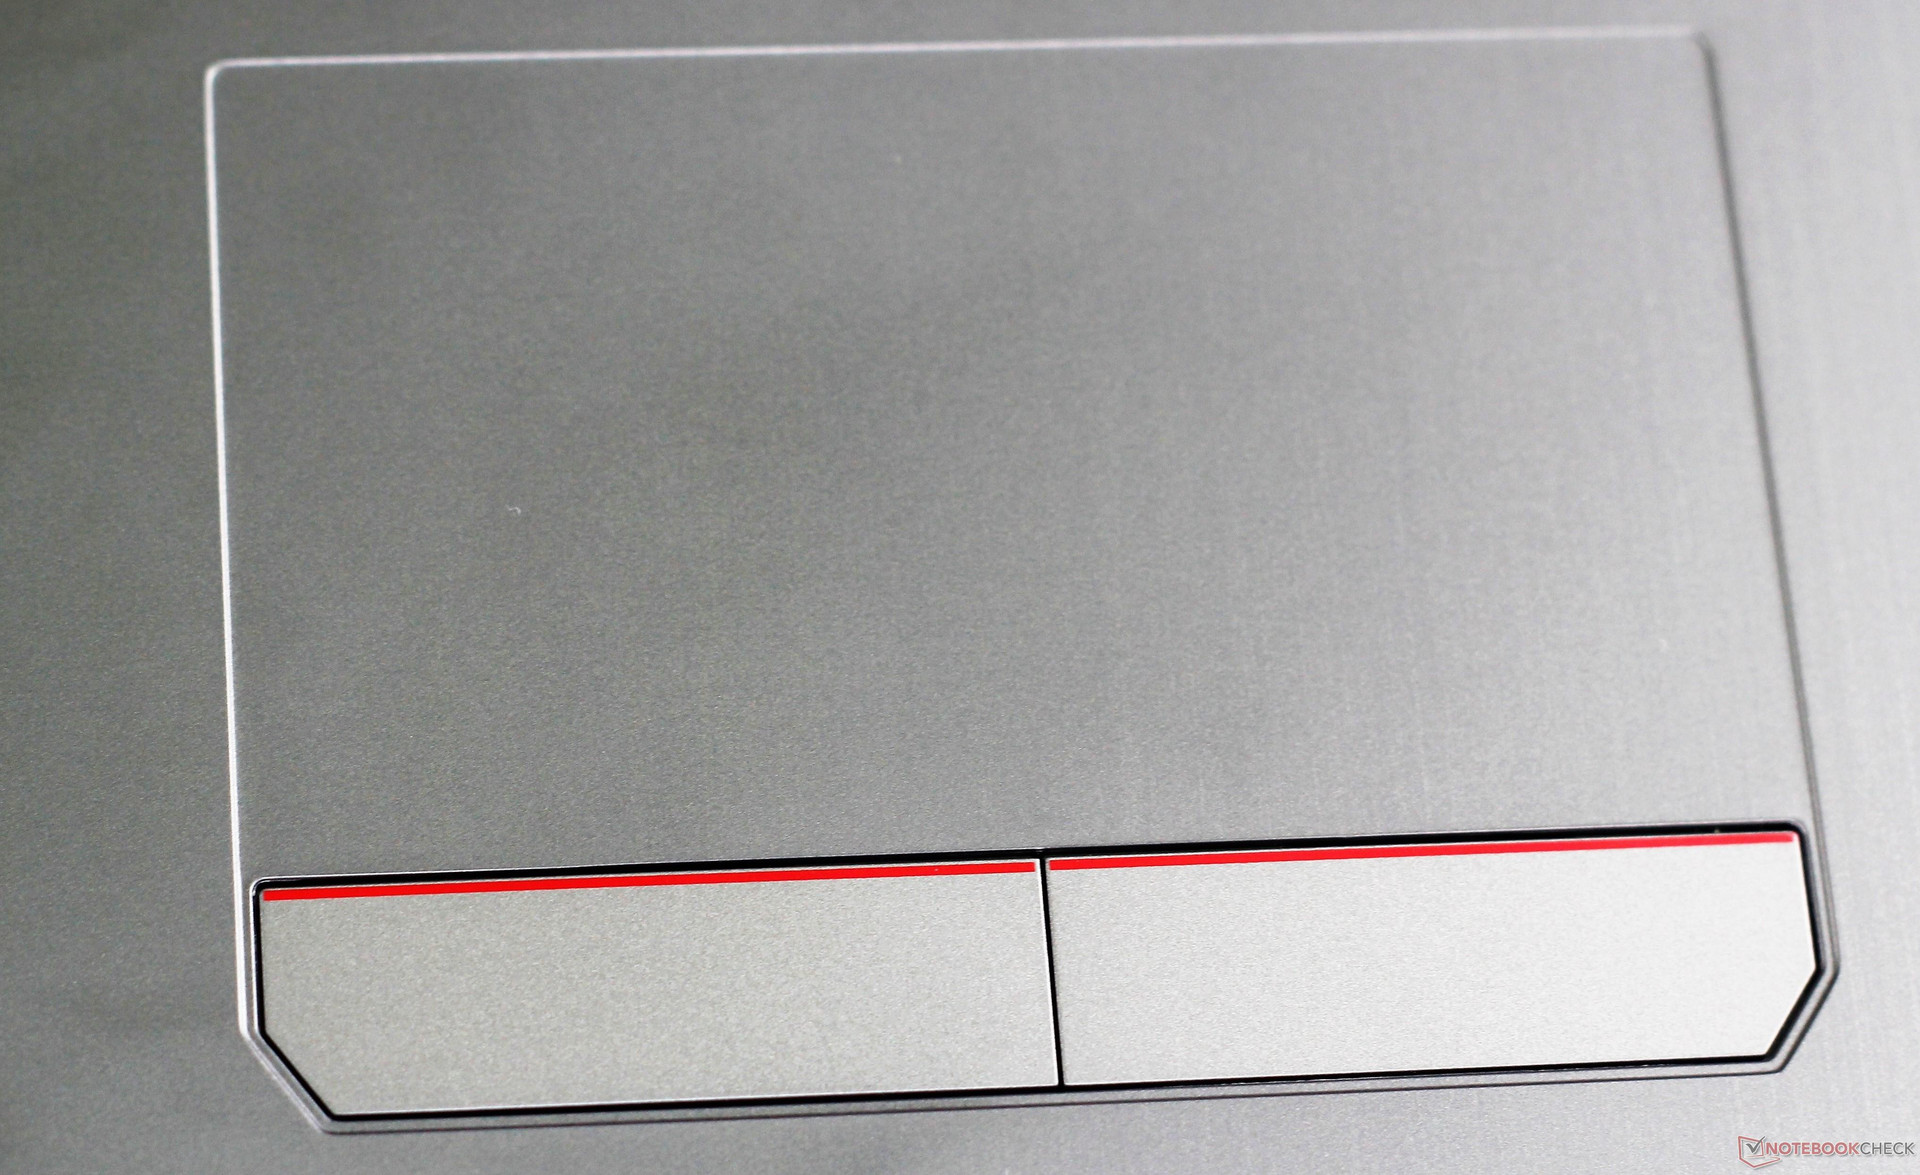
Whereas the keyboard is surprisingly great considering the price, the touchpad is less so. At 10.8 cm by 6 cm, it may be too small for some. The surface is the same smooth plastic used on the rest of the keyboard deck and feels decent underhand. The pad itself is firm under pressure, but the case around it can be warped. Tracking is responsive, and we did not experience any cursor skipping during our use time. The separate buttons along the bottom have the same stiff, hollow click as the GF62. While adequate, the buttons feel thin and cheaply made. In sum, the touchpad feels more like an afterthought than a focal point of the machine; it is present and works, but not much more can be said.
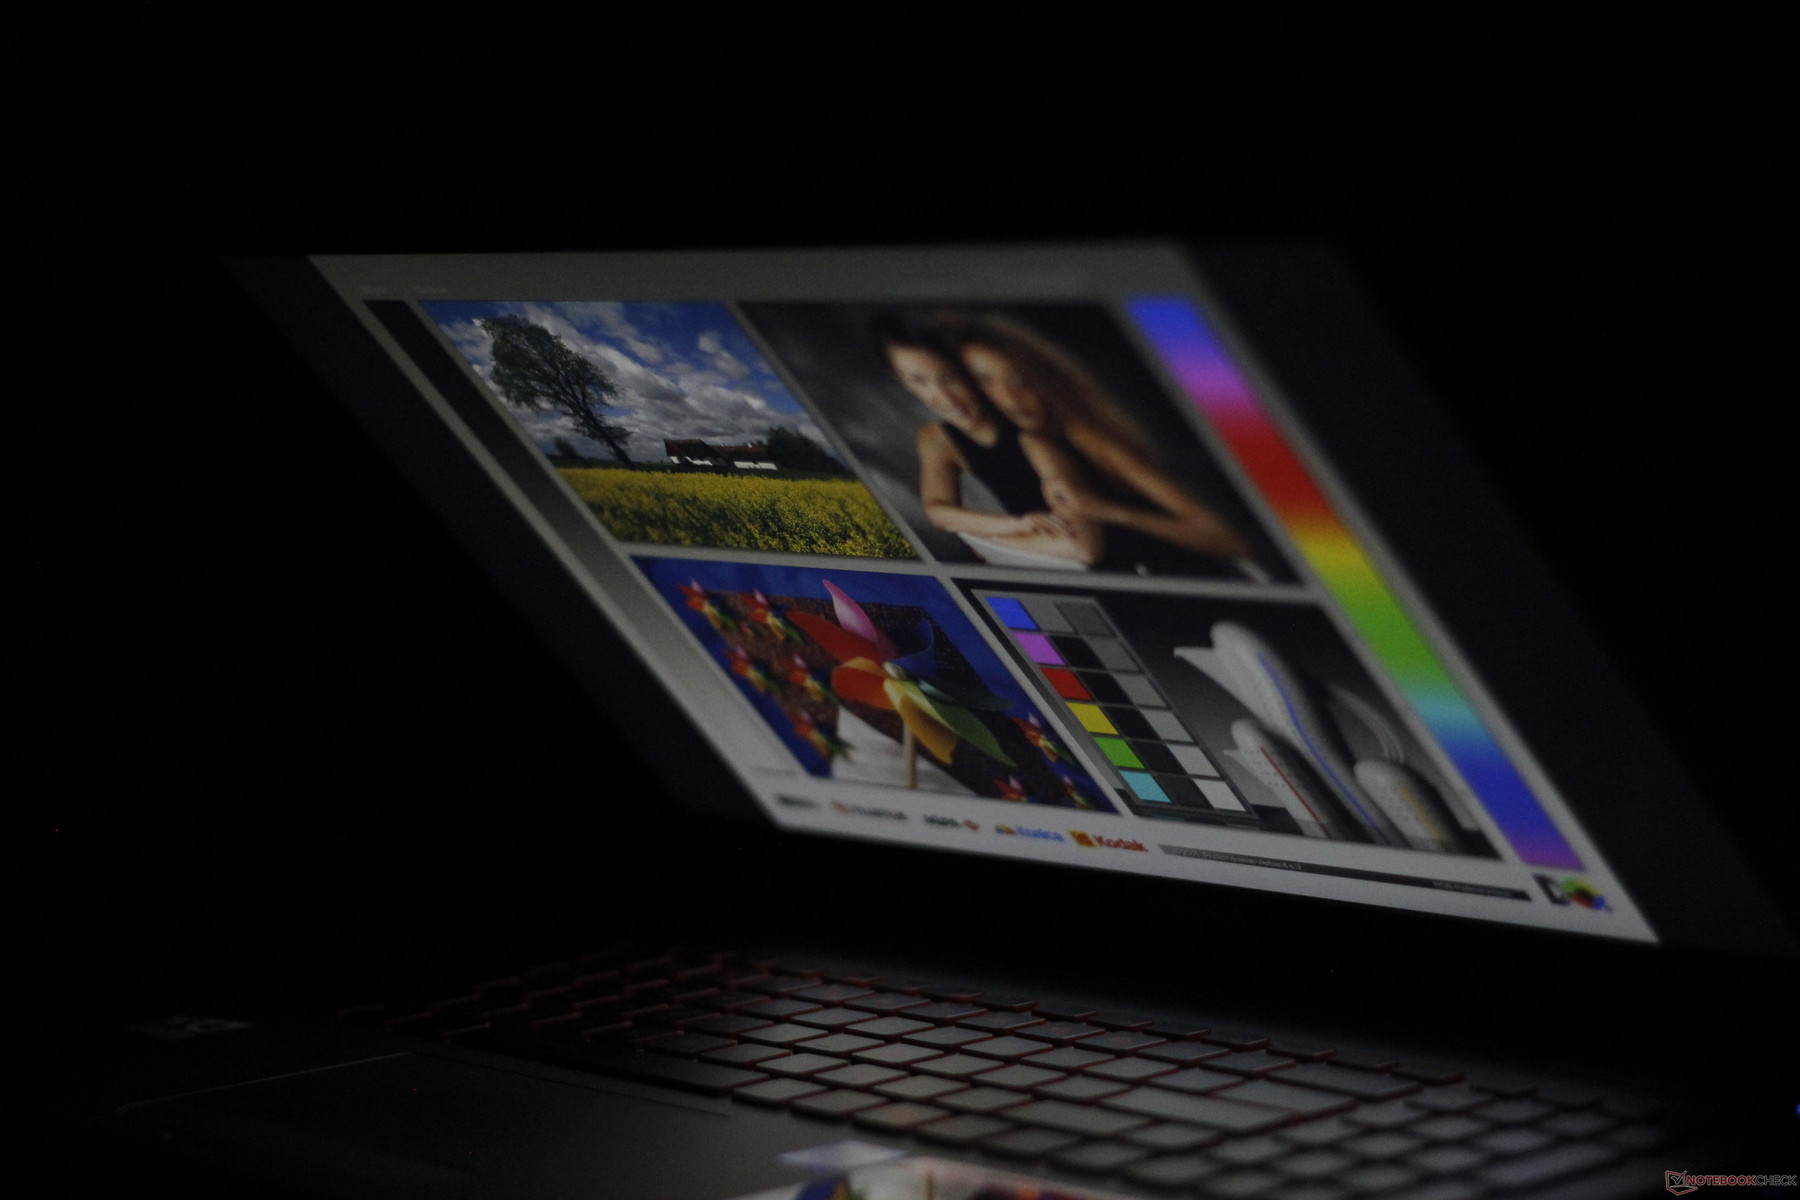
Display
The semi-matte IPS display is another corner cut by MSI. While the FHD resolution is welcome, overall screen brightness is low and the backlight is uneven. This uneven distribution isn't noticeable at higher brightness levels. Overall brightness is adequate at about 250 nits, but the screen will appear dim under bright lights and is nigh unusable in direct sunlight. Response times are adequate for an IPS display. On the plus side, PWM is non-existent. MSI also offers a SKU of the GV62 with a 120 Hz refresh rate.
| |||||||||||||||||||||||||
Brightness Distribution: 82 %
Center on Battery: 268.7 cd/m²
Contrast: 640:1 (Black: 0.42 cd/m²)
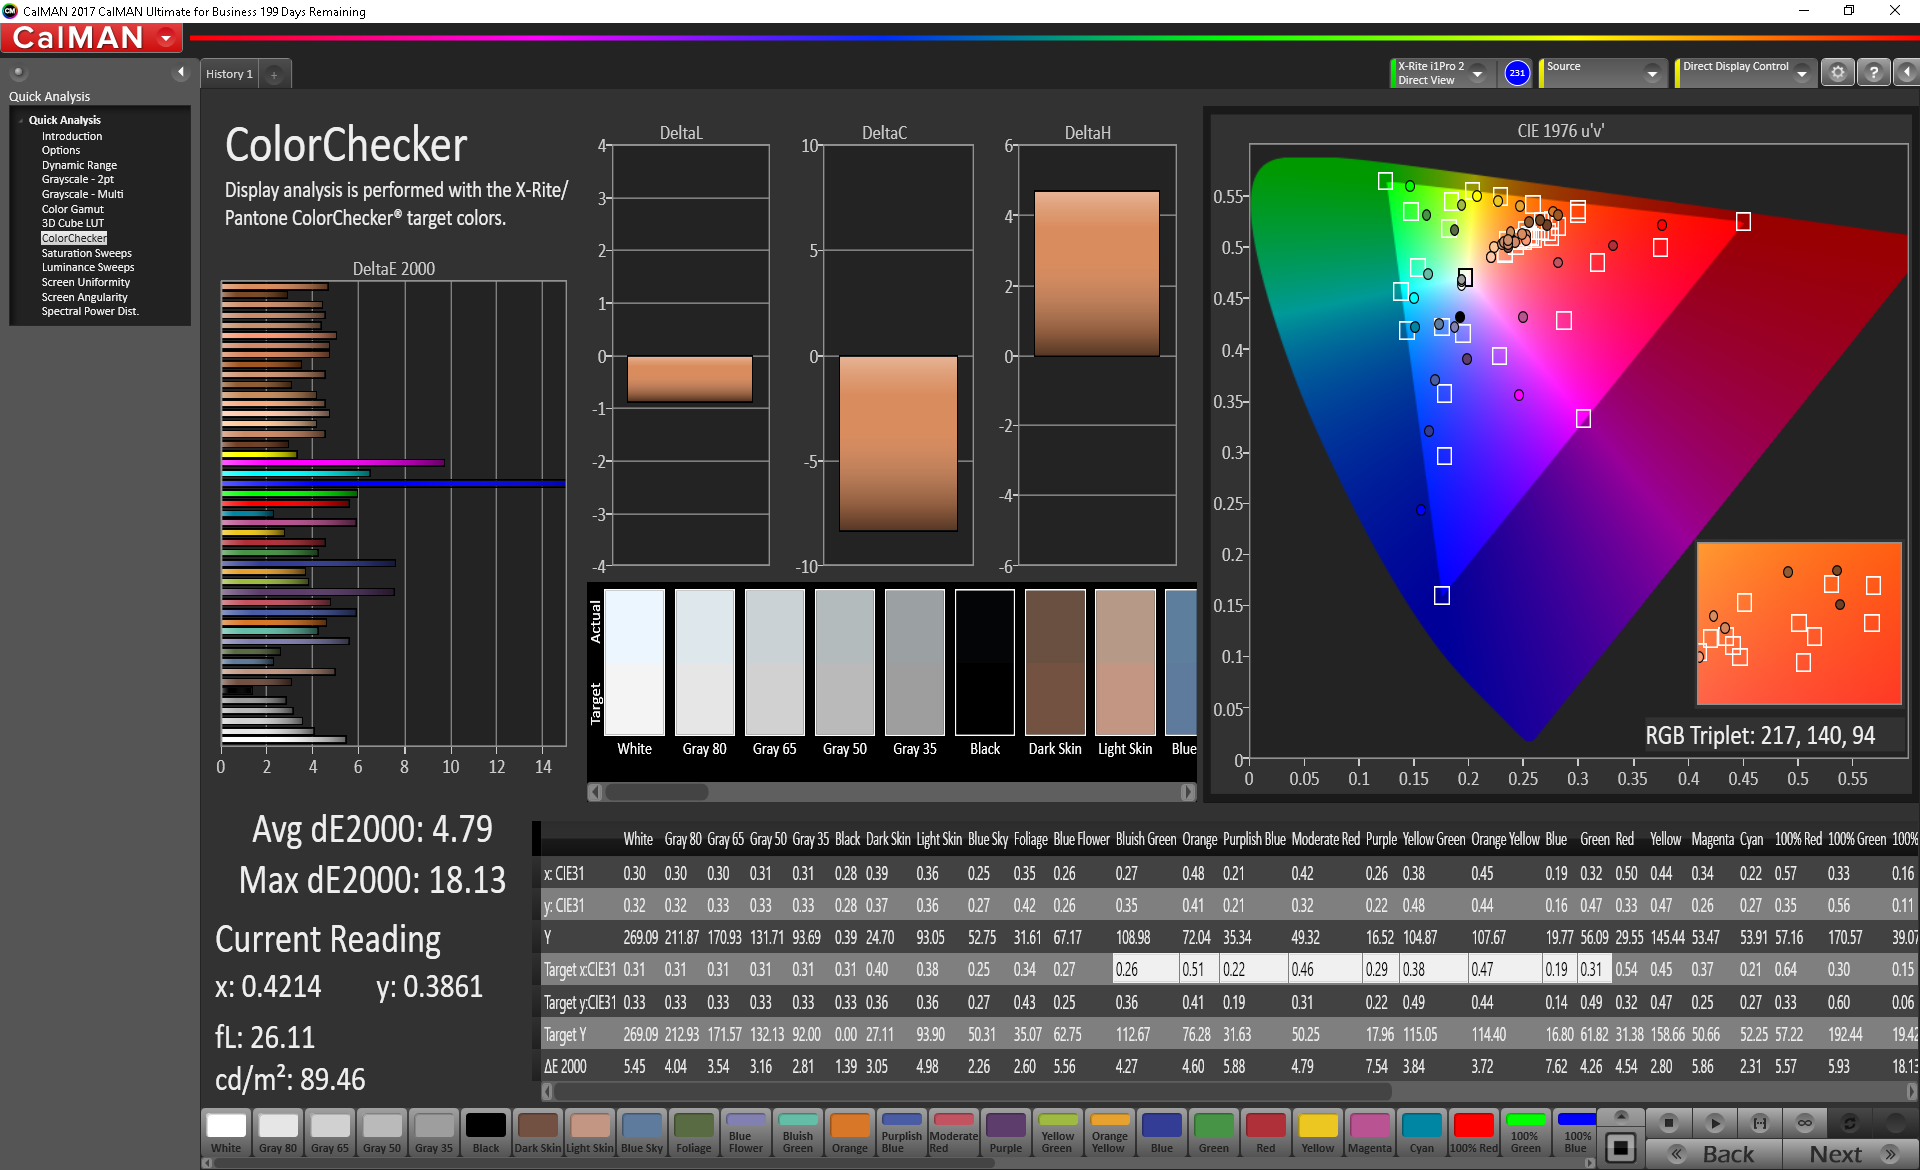
ΔE ColorChecker Calman: 4.79 | ∀{0.5-29.43 Ø4.73}
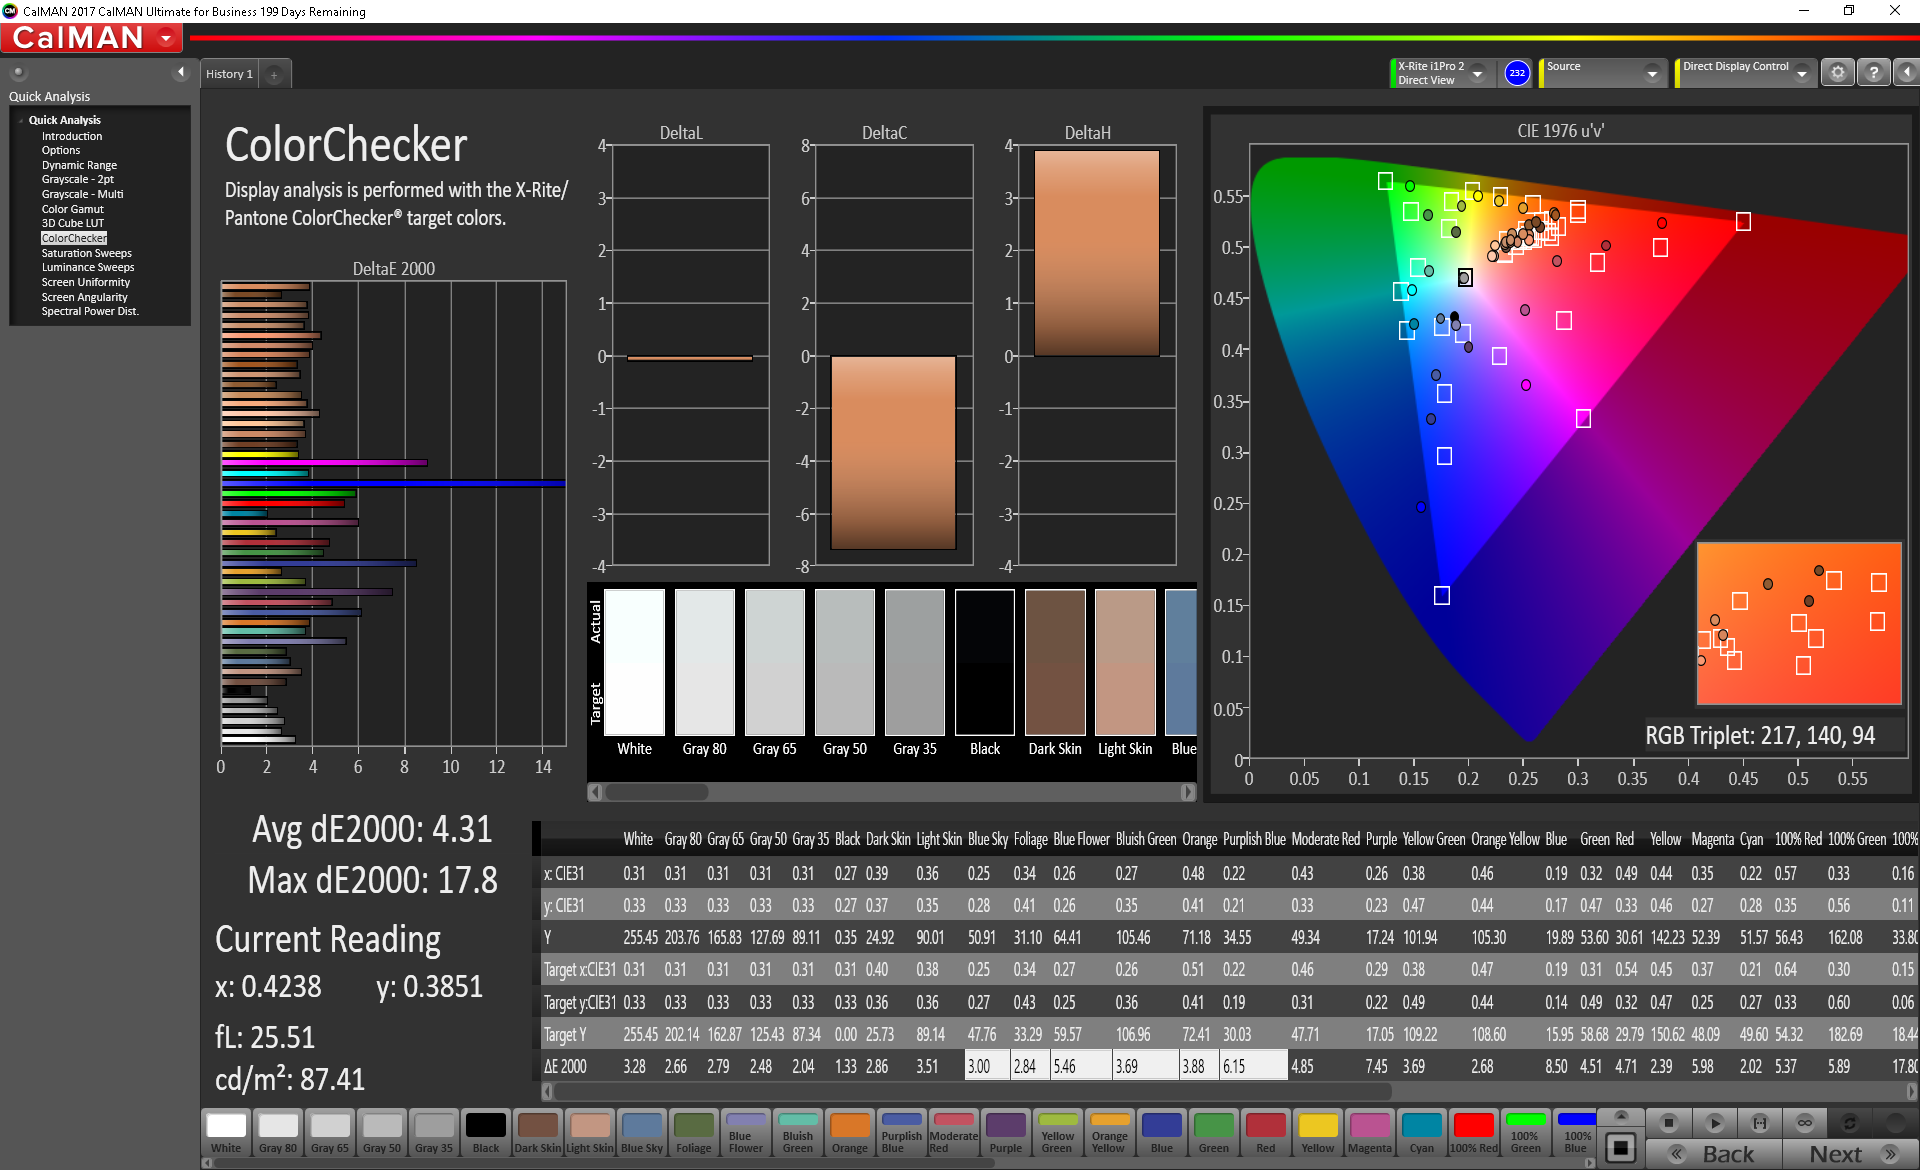
calibrated: 4.31
ΔE Greyscale Calman: 3.1 | ∀{0.09-98 Ø4.97}
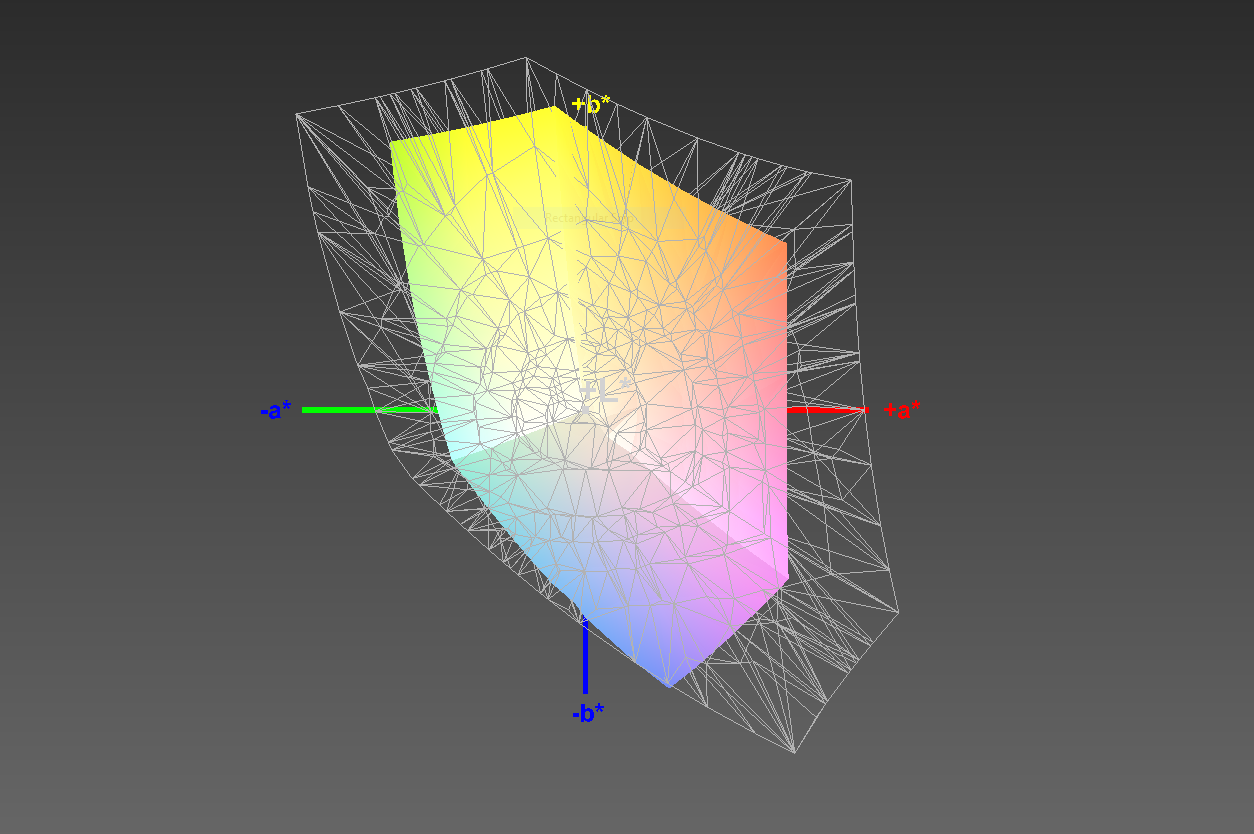
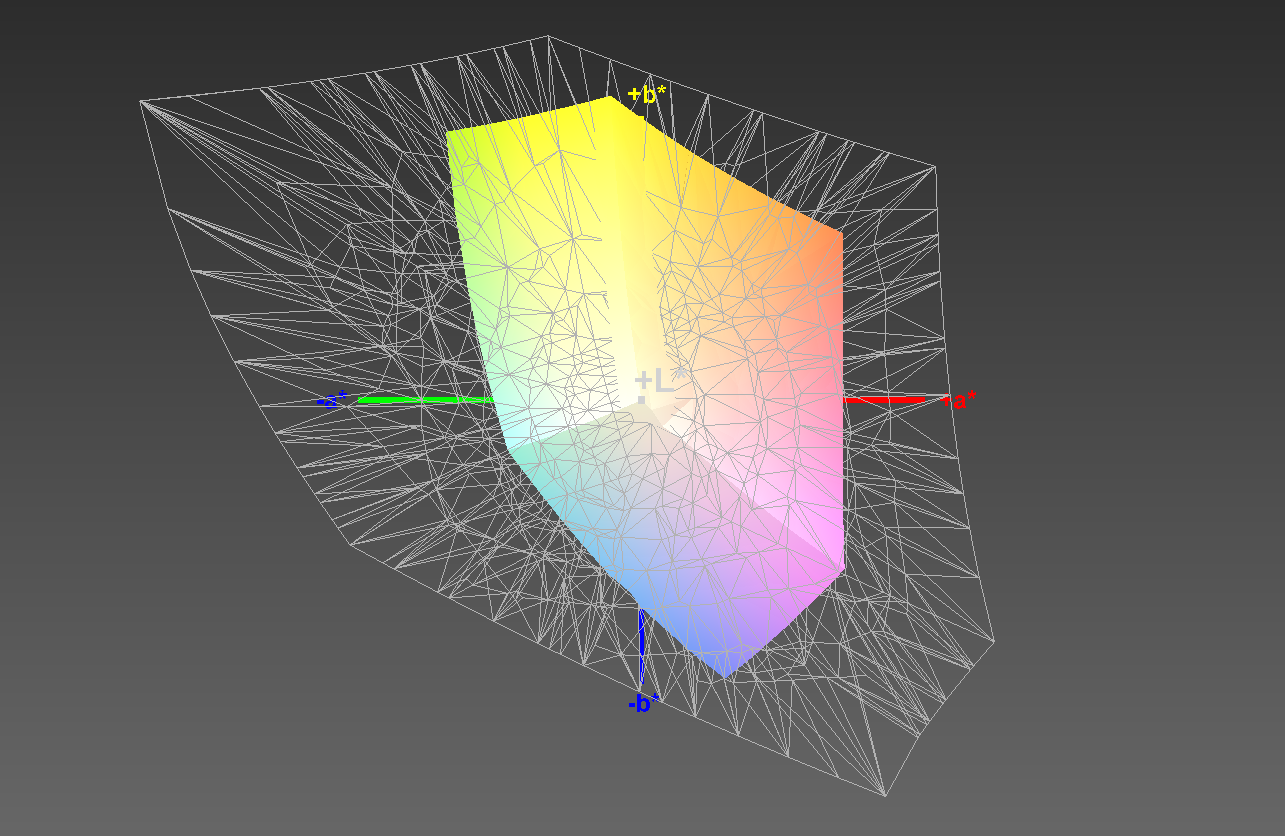
59% sRGB (Argyll 1.6.3 3D)
38% AdobeRGB 1998 (Argyll 1.6.3 3D)
40.91% AdobeRGB 1998 (Argyll 3D)
59.5% sRGB (Argyll 3D)
39.58% Display P3 (Argyll 3D)
Gamma: 2.28
CCT: 7049 K
| MSI GV62 8RE-016US LG Philips LGD0590, IPS, 15.6", 1920x1080 | Dell Inspiron 15 7000 7577 4K Name: AU Optronics B156ZAN, IPS, 15.6", 3840x2160 | MSI GF62VR 7RF-877 Chi Mei N156HGA-EAL, TN LED, 15.6", 1920x1080 | Lenovo Legion Y520-15IKBN 80WK0042GE LG Philips LP156WF6-SPK3, IPS, 15.6", 1920x1080 | Acer Predator Helios 300 PH317-52-51M6 LG Philips LP173WF4-SPF5 (LGD056D), IPS, 17.3", 1920x1080 | Dell G5 15 5587 LGD053F, 156WF6, IPS, 15.6", 1920x1080 | |
|---|---|---|---|---|---|---|
| Display | 69% | 96% | -1% | 56% | -4% | |
| Display P3 Coverage (%) | 39.58 | 68.4 73% | 85.6 116% | 39.01 -1% | 67.1 70% | 38.13 -4% |
| sRGB Coverage (%) | 59.5 | 97.1 63% | 99.9 68% | 58.4 -2% | 86.1 45% | 56.8 -5% |
| AdobeRGB 1998 Coverage (%) | 40.91 | 69.6 70% | 83.9 105% | 40.34 -1% | 63 54% | 39.47 -4% |
| Response Times | -11% | -25% | -18% | 1% | 2% | |
| Response Time Grey 50% / Grey 80% * (ms) | 33.2 ? | 35.2 ? -6% | 49.6 ? -49% | 39 ? -17% | 36 ? -8% | 33 ? 1% |
| Response Time Black / White * (ms) | 24.4 ? | 28.4 ? -16% | 24.4 ? -0% | 29 ? -19% | 22 ? 10% | 24 ? 2% |
| PWM Frequency (Hz) | 25510 ? | 21000 ? | 122000 ? | |||
| Screen | 24% | -36% | -3% | 15% | -8% | |
| Brightness middle (cd/m²) | 268.7 | 322.9 20% | 223.9 -17% | 283 5% | 365 36% | 229 -15% |
| Brightness (cd/m²) | 246 | 309 26% | 208 -15% | 281 14% | 341 39% | 224 -9% |
| Brightness Distribution (%) | 82 | 90 10% | 88 7% | 91 11% | 89 9% | 87 6% |
| Black Level * (cd/m²) | 0.42 | 0.36 14% | 0.56 -33% | 0.39 7% | 0.32 24% | 0.28 33% |
| Contrast (:1) | 640 | 897 40% | 400 -37% | 726 13% | 1141 78% | 818 28% |
| Colorchecker dE 2000 * | 4.79 | 3.99 17% | 9.7 -103% | 6.1 -27% | 6.51 -36% | 6.1 -27% |
| Colorchecker dE 2000 max. * | 18.13 | 8.97 51% | 19.7 -9% | 11.08 39% | 12.32 32% | 12.2 33% |
| Colorchecker dE 2000 calibrated * | 4.31 | 2.9 33% | 6.12 -42% | |||
| Greyscale dE 2000 * | 3.1 | 5.3 -71% | 12.9 -316% | 5.69 -84% | 7.65 -147% | 5.68 -83% |
| Gamma | 2.28 96% | 2.041 108% | 2.18 101% | 2.44 90% | 2.64 83% | 2.4 92% |
| CCT | 7049 92% | 6941 94% | 15225 43% | 6702 97% | 8066 81% | 6989 93% |
| Color Space (Percent of AdobeRGB 1998) (%) | 38 | 62.9 66% | 75 97% | 37 -3% | 56 47% | 36 -5% |
| Color Space (Percent of sRGB) (%) | 59 | 96.8 64% | 100 69% | 58 -2% | 86 46% | 57 -3% |
| Total Average (Program / Settings) | 27% /
28% | 12% /
-8% | -7% /
-4% | 24% /
21% | -3% /
-6% |
* ... smaller is better
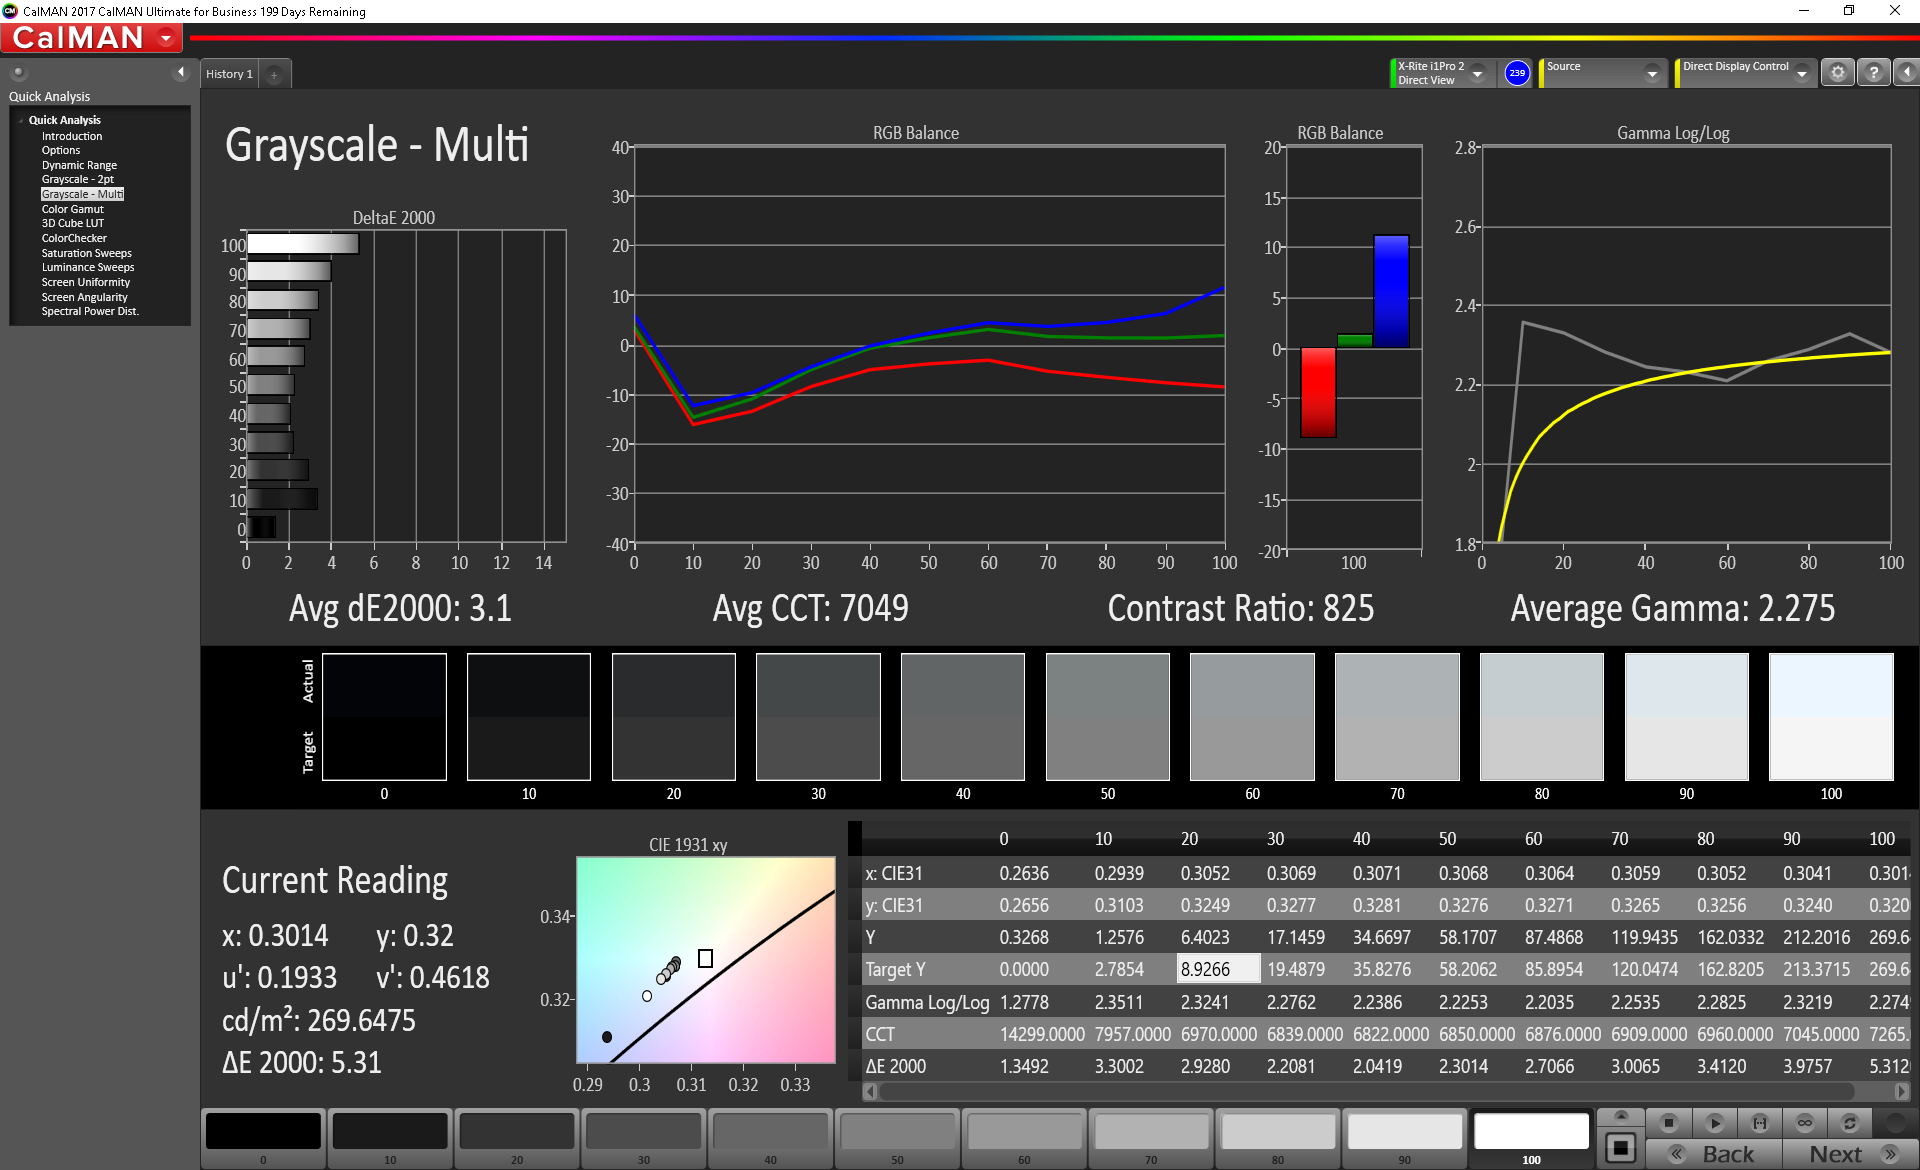
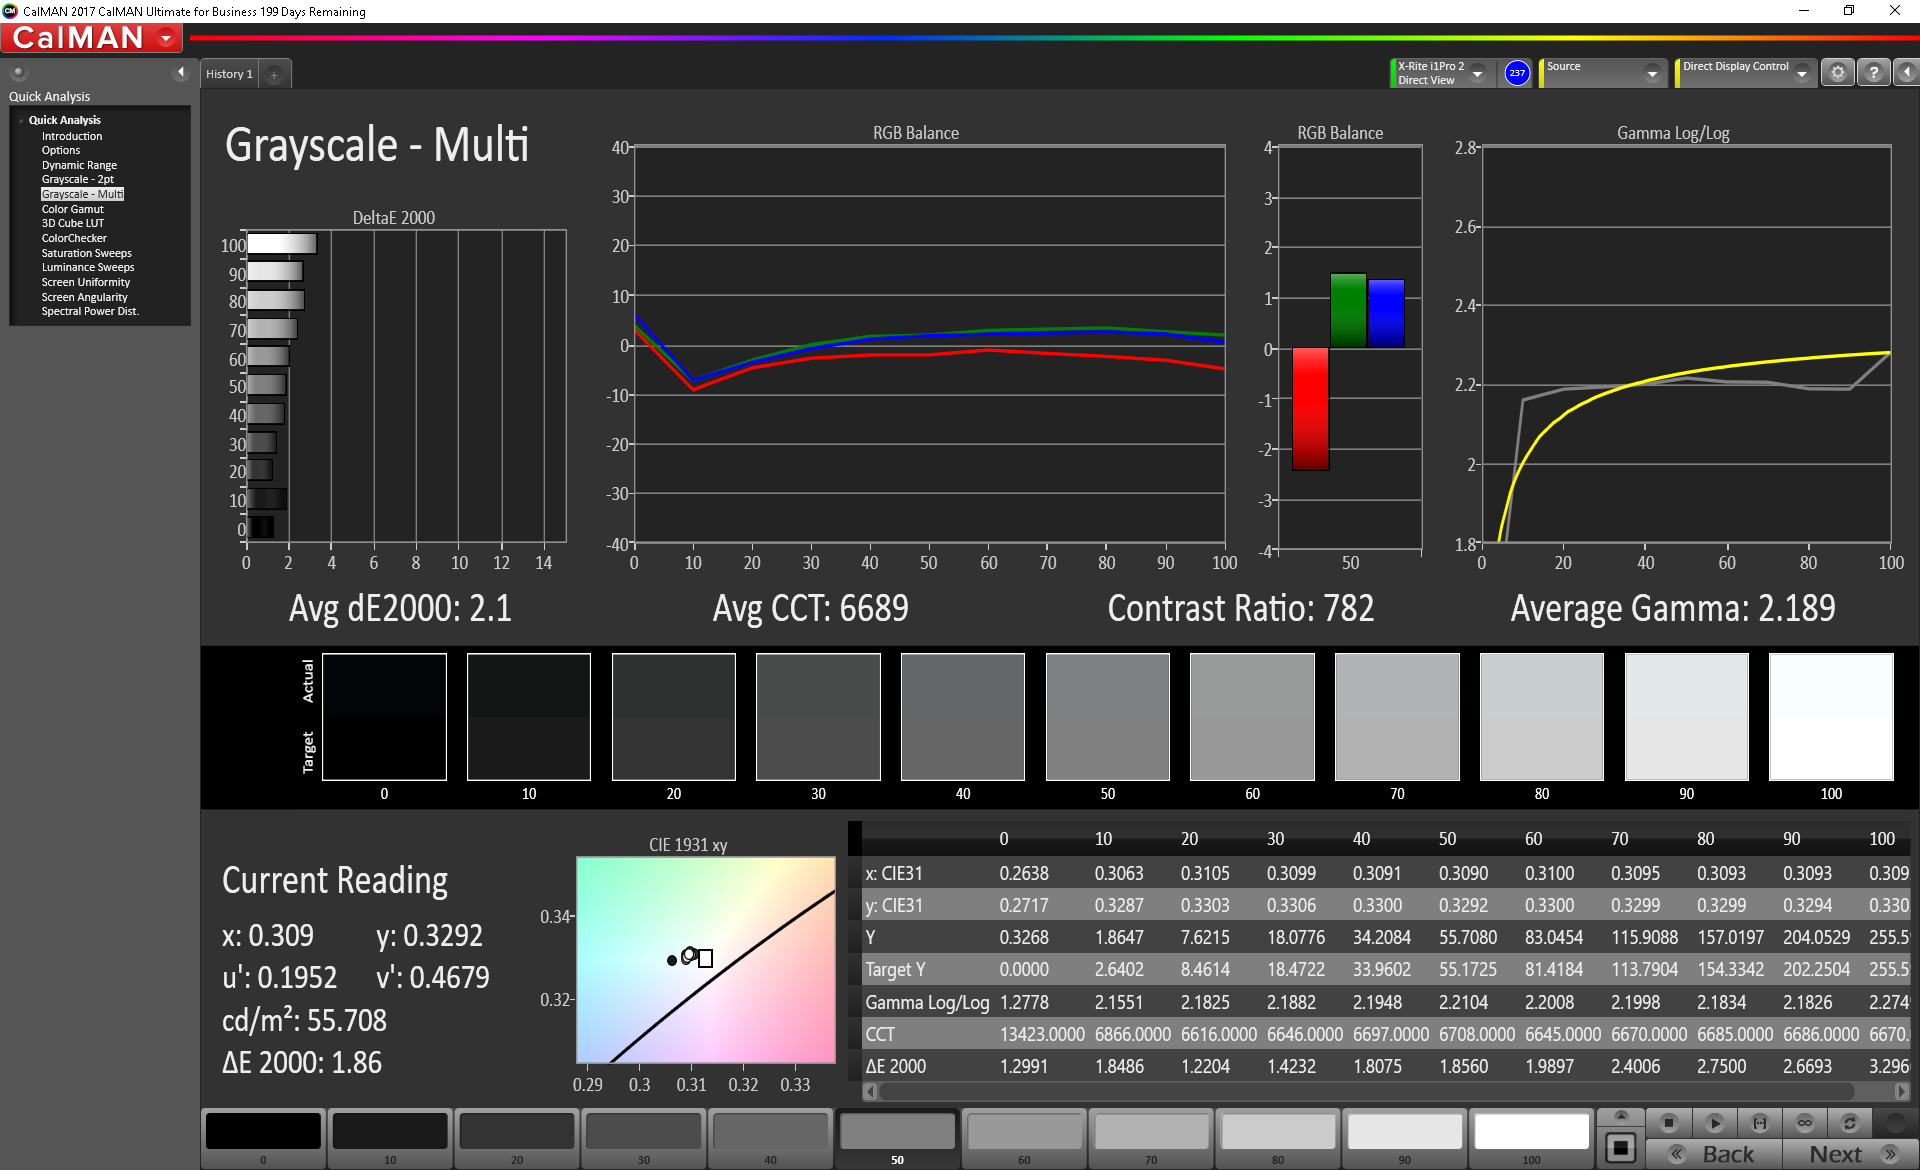
Color accuracy is fairly good out of the box (DeltaE2000 score of 4.79), but there is a wide range in color accuracy; blues are much more inaccurate than other colors. Color coverage is also severely lacking. The LG panel covers a mere 59% of the sRGB gamut. While this is to be expected of a budget gaming device, there are entry-level laptops that offer much better color reproduction. Acer's Predator Helios 300, for instance, covers 86% of the sRGB gamut and has a tighter variance in its DeltaE scores for colors. That said, the purpose of the MSI GV62 is to offer a cheaper gaming laptop. In that regard, colors are acceptable and won't be distracting during gameplay.
Display Response Times
| ↔ Response Time Black to White | ||
|---|---|---|
| 24.4 ms ... rise ↗ and fall ↘ combined | ↗ 13.6 ms rise | 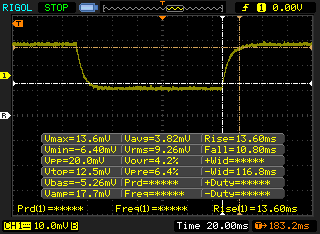 |
| ↘ 10.8 ms fall | ||
| The screen shows good response rates in our tests, but may be too slow for competitive gamers. In comparison, all tested devices range from 0.1 (minimum) to 240 (maximum) ms. » 57 % of all devices are better. This means that the measured response time is worse than the average of all tested devices (19.9 ms). | ||
| ↔ Response Time 50% Grey to 80% Grey | ||
| 33.2 ms ... rise ↗ and fall ↘ combined | ↗ 16.4 ms rise | 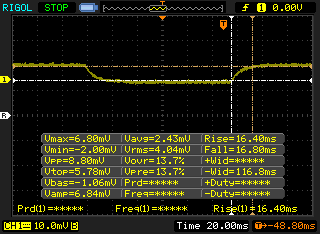 |
| ↘ 16.8 ms fall | ||
| The screen shows slow response rates in our tests and will be unsatisfactory for gamers. In comparison, all tested devices range from 0.165 (minimum) to 636 (maximum) ms. » 46 % of all devices are better. This means that the measured response time is similar to the average of all tested devices (31.1 ms). | ||
Screen Flickering / PWM (Pulse-Width Modulation)
| Screen flickering / PWM not detected | 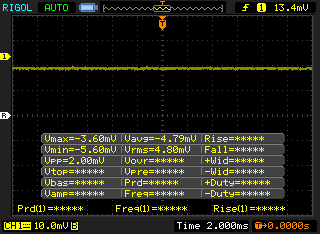 | ||
In comparison: 52 % of all tested devices do not use PWM to dim the display. If PWM was detected, an average of 7798 (minimum: 5 - maximum: 343500) Hz was measured. | |||
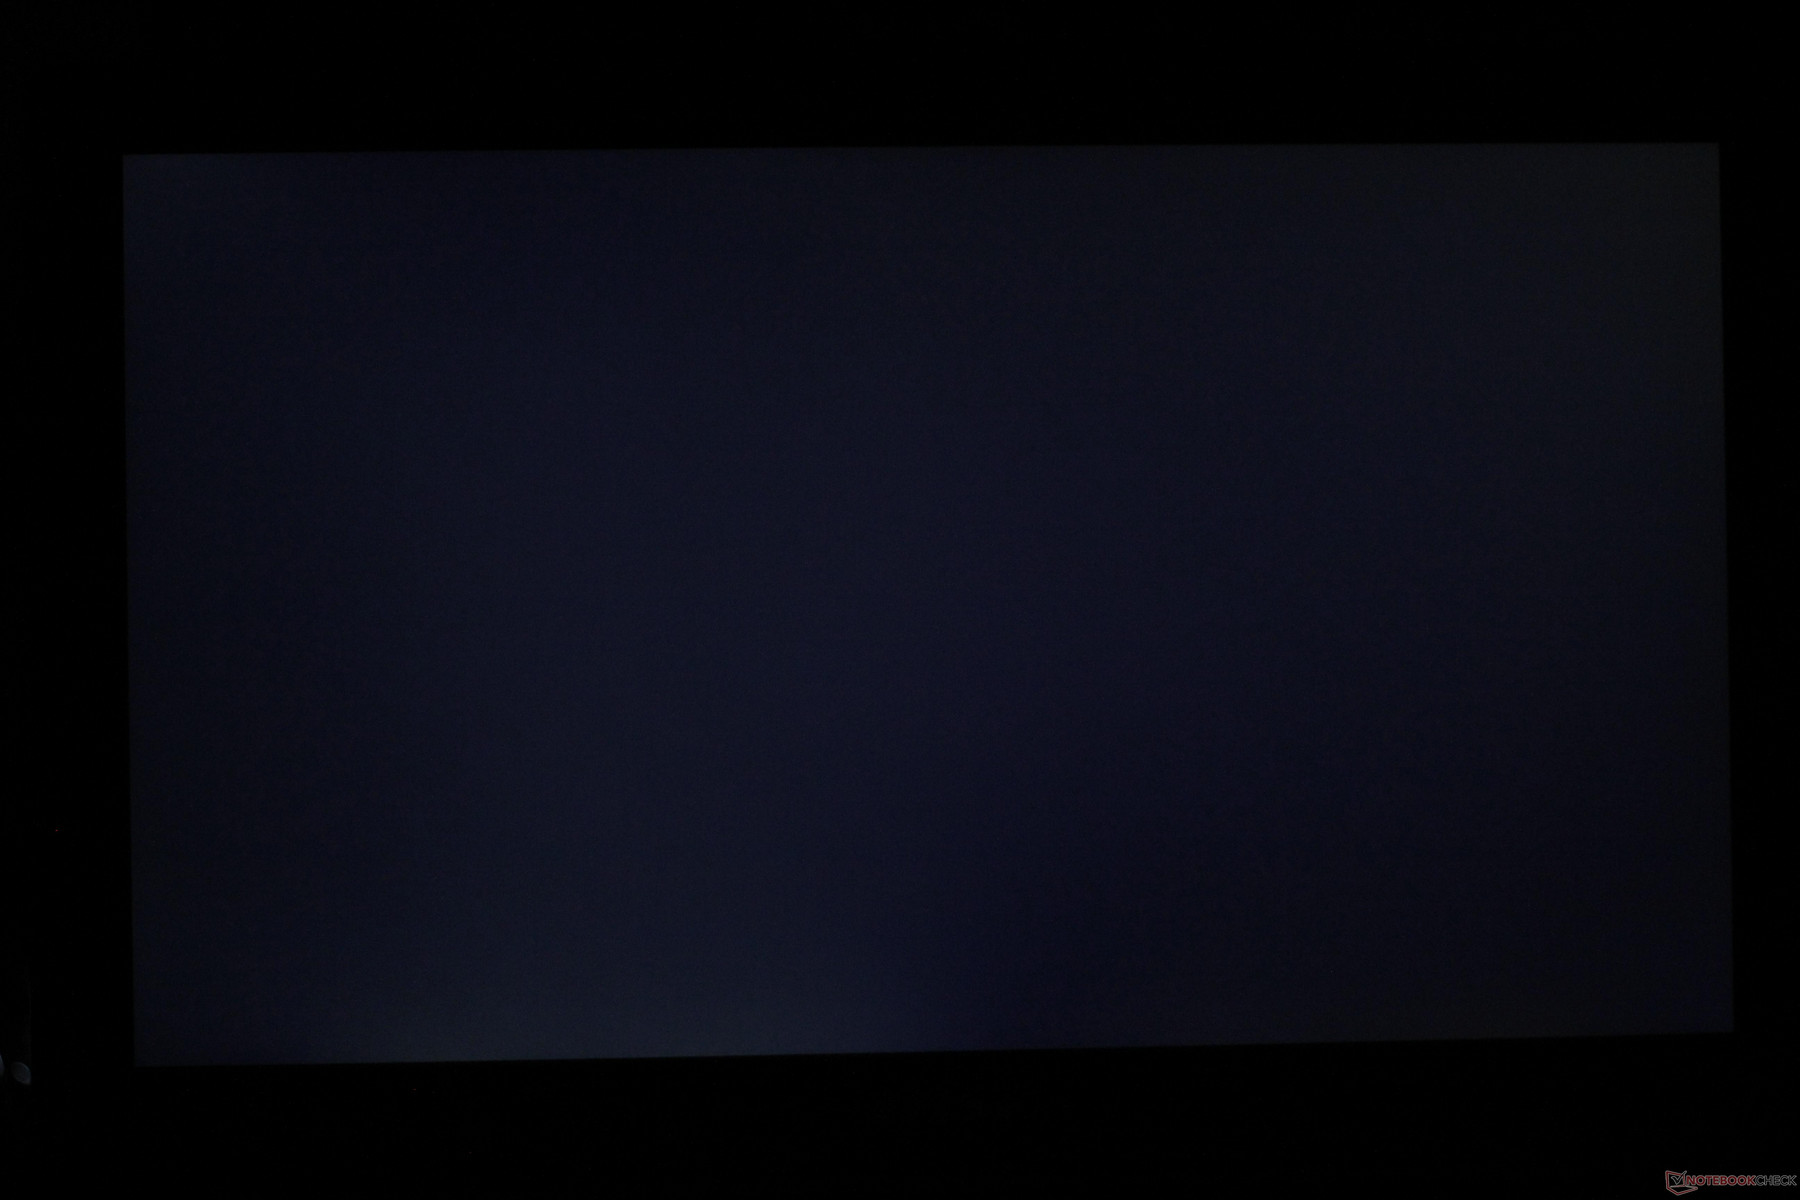
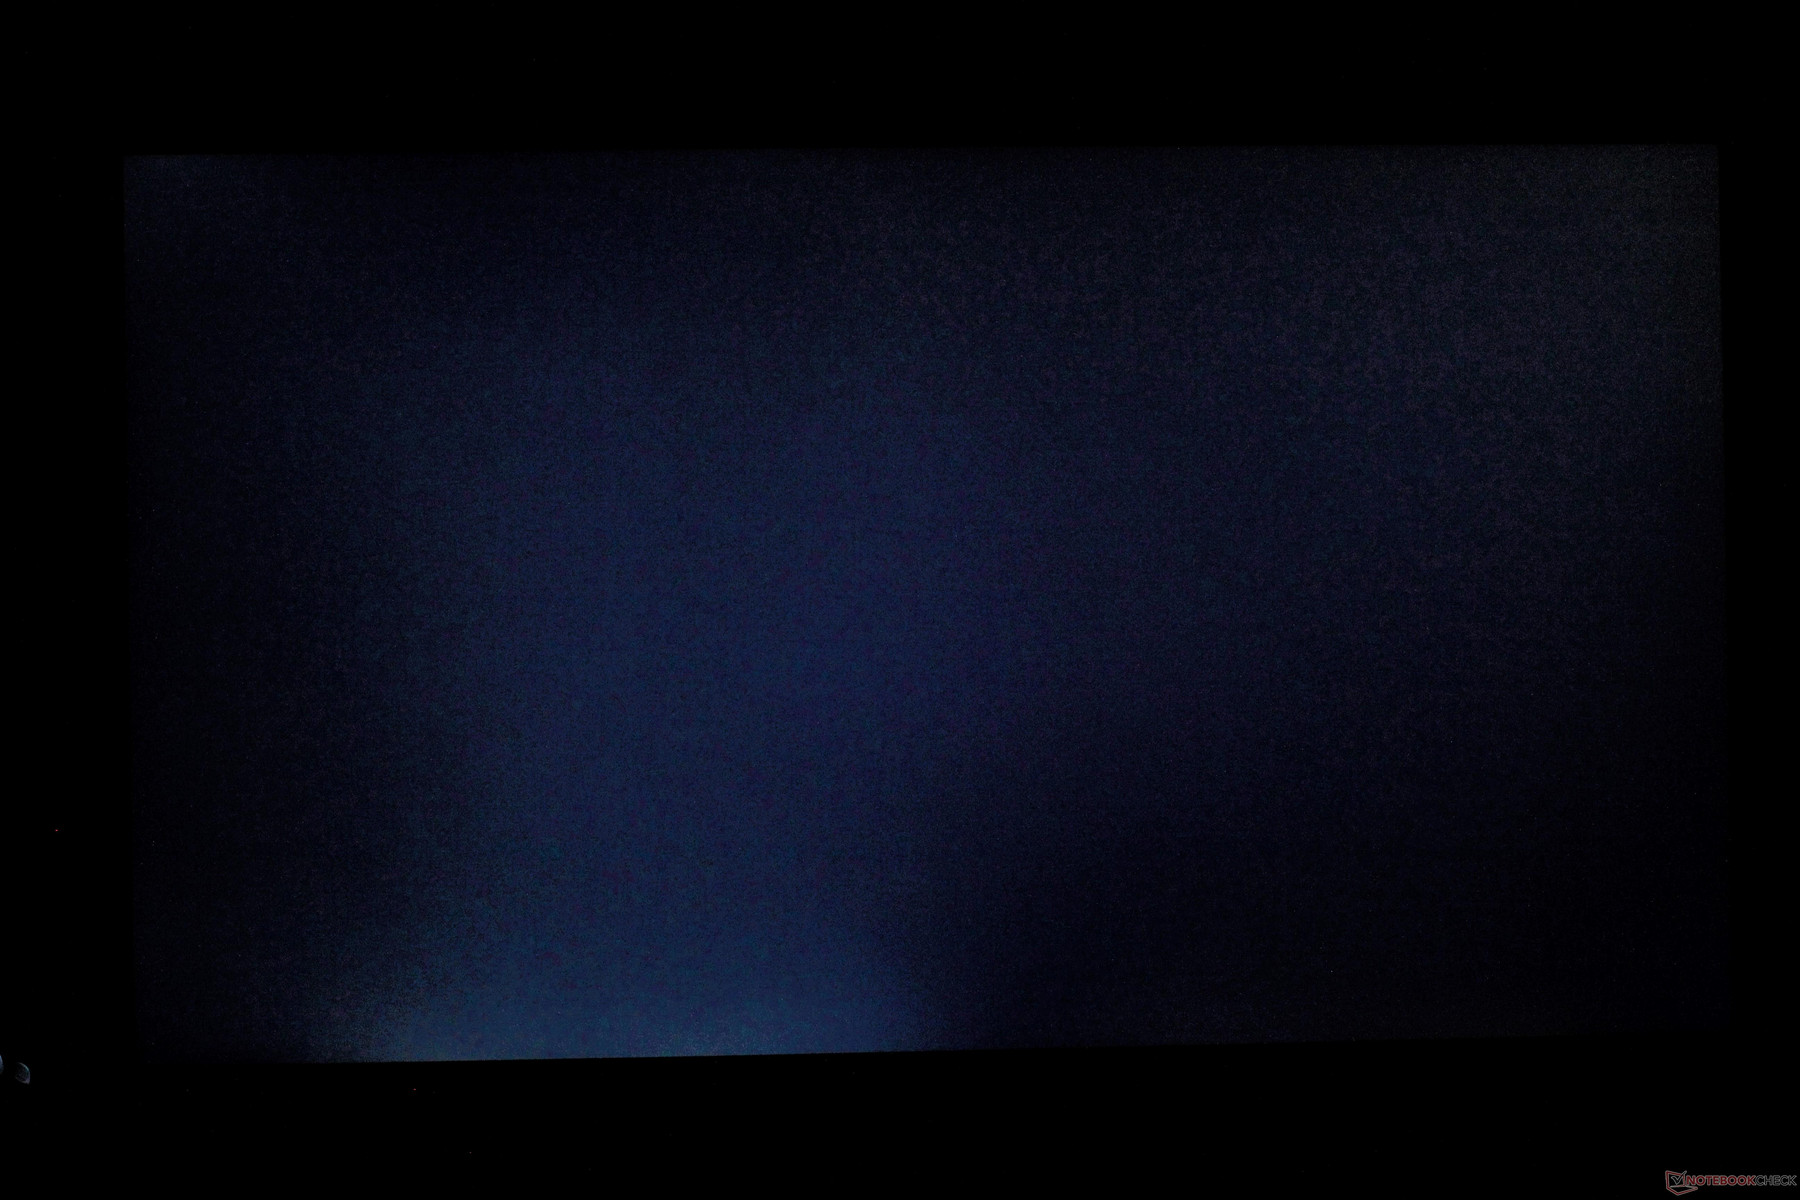
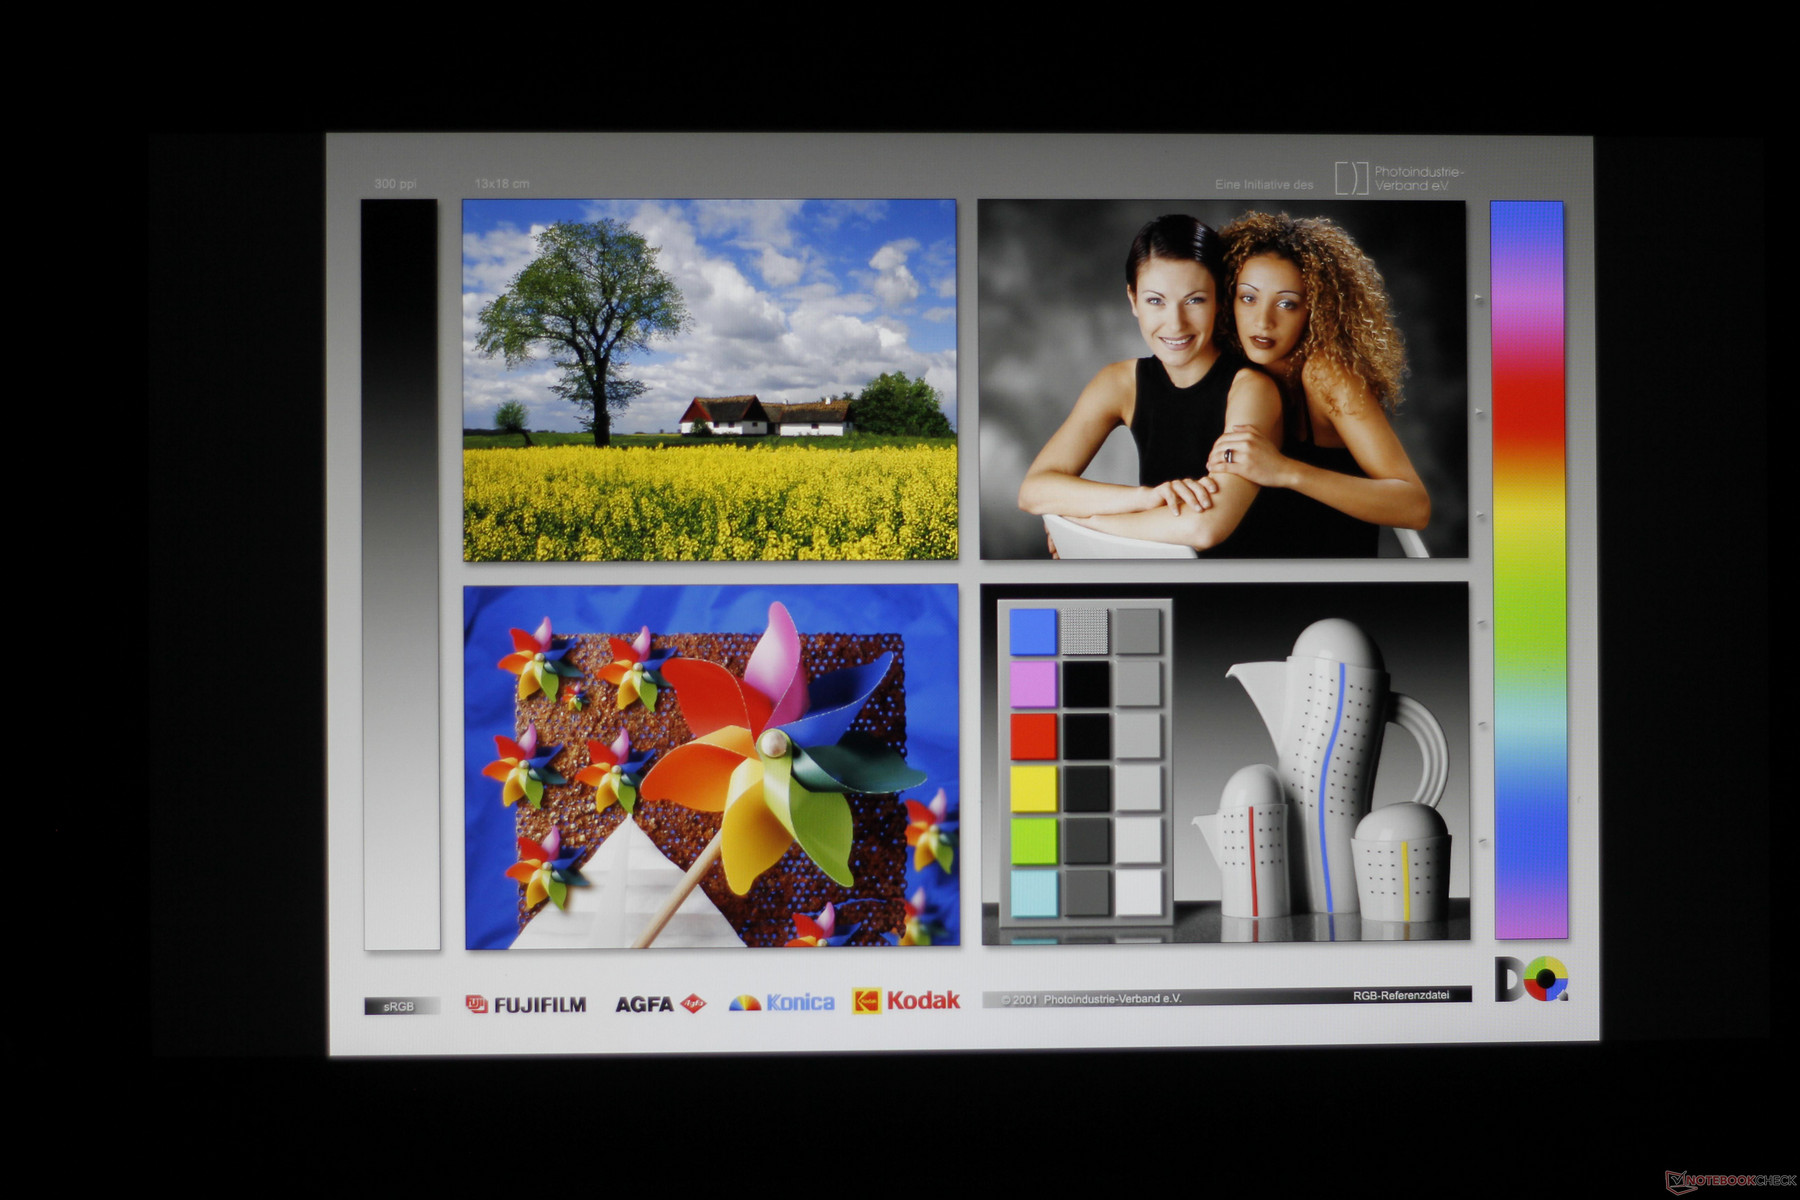
A high point of the display experience is the absence of noticeable backlight bleed (above). Even in a dark room, there is virtually no backlight bleed at any brightness level. Viewing angles are also fairly good. While the screen dims when viewed from 45° off-center, there is no color shift.

Performance
Based on the specs alone, the GV62 is decidedly "middle class." While not as powerful as the Core i7-8750H, the Intel Core i5-8300H gets the job done and should be more than adequate for most users' needs. The CPU is also well-suited to gaming at Full HD. The main downside is heat management on the components; as we will see in stress testing, the internals get warm and heavy loads may cause throttling if sustained for a long time.

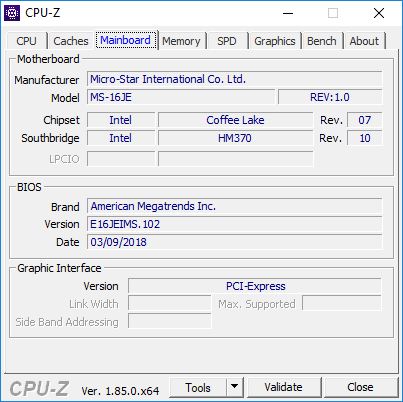

Processor
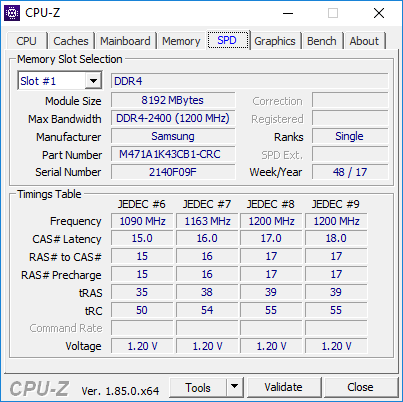
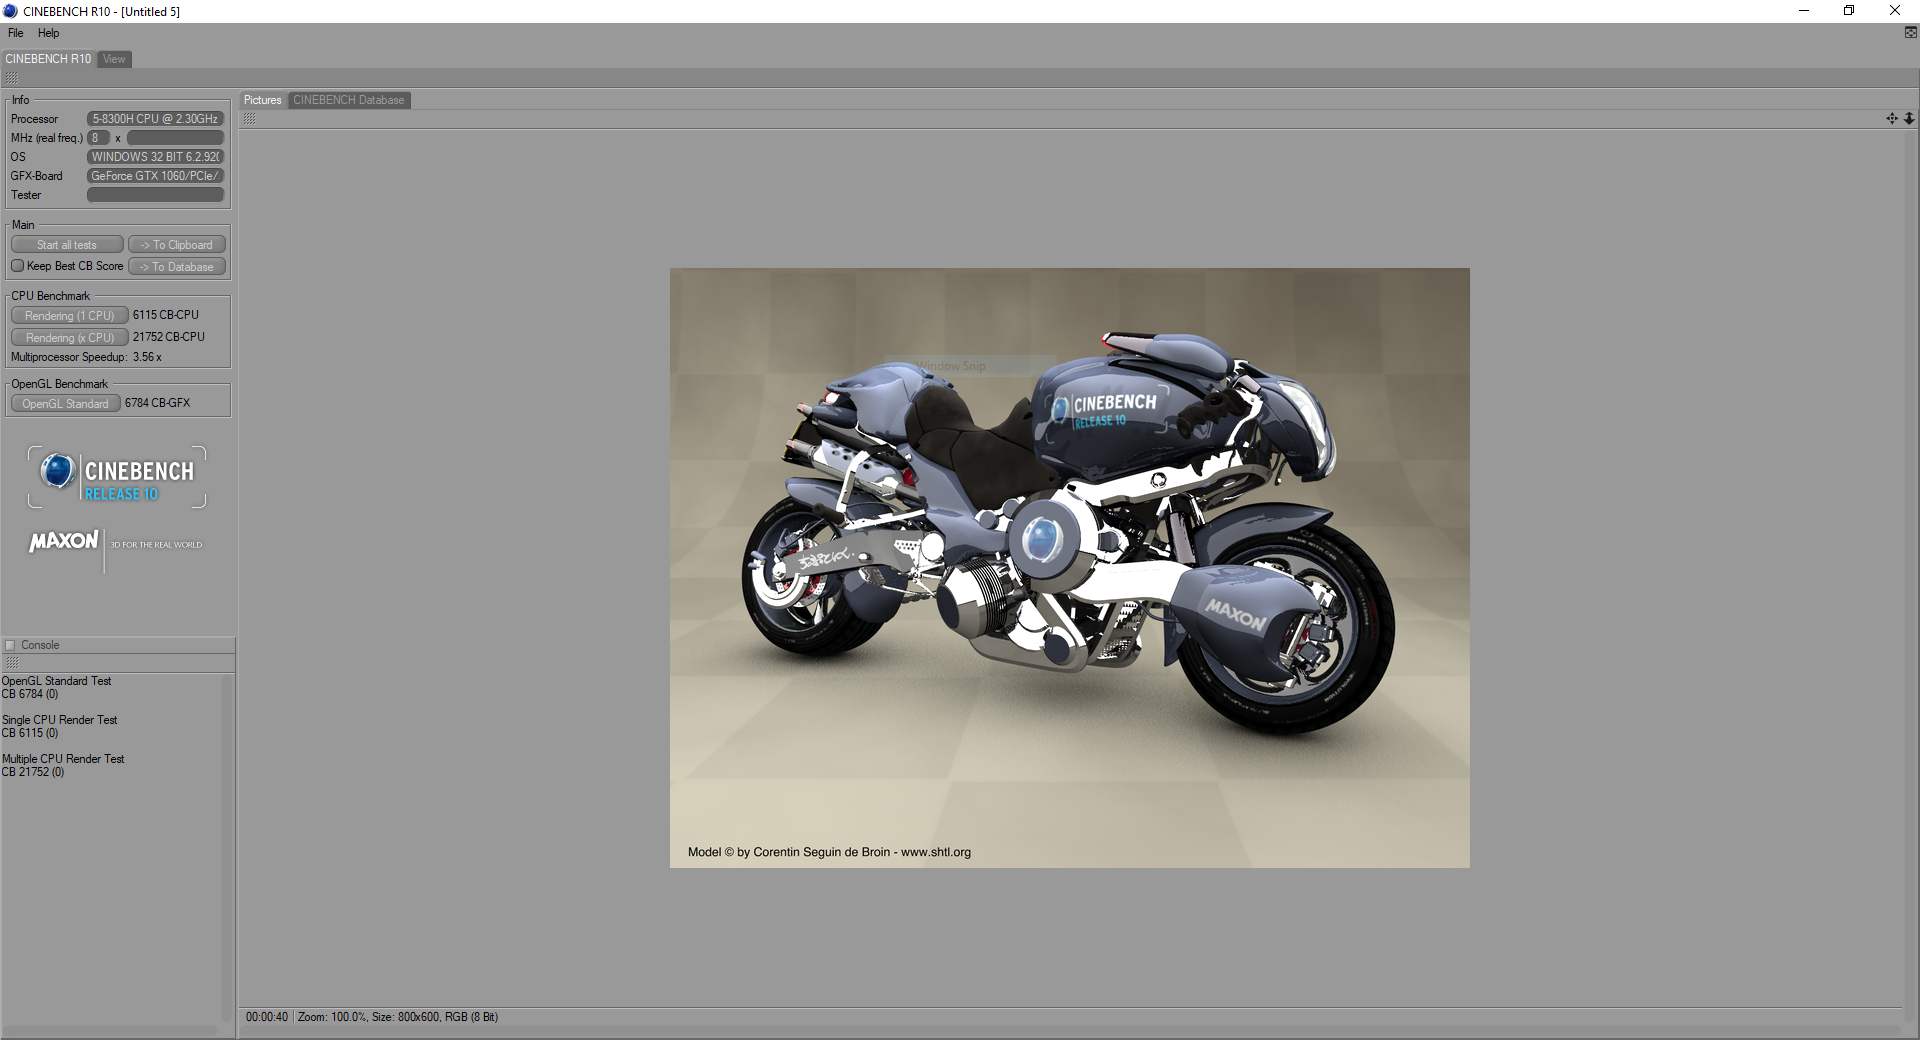
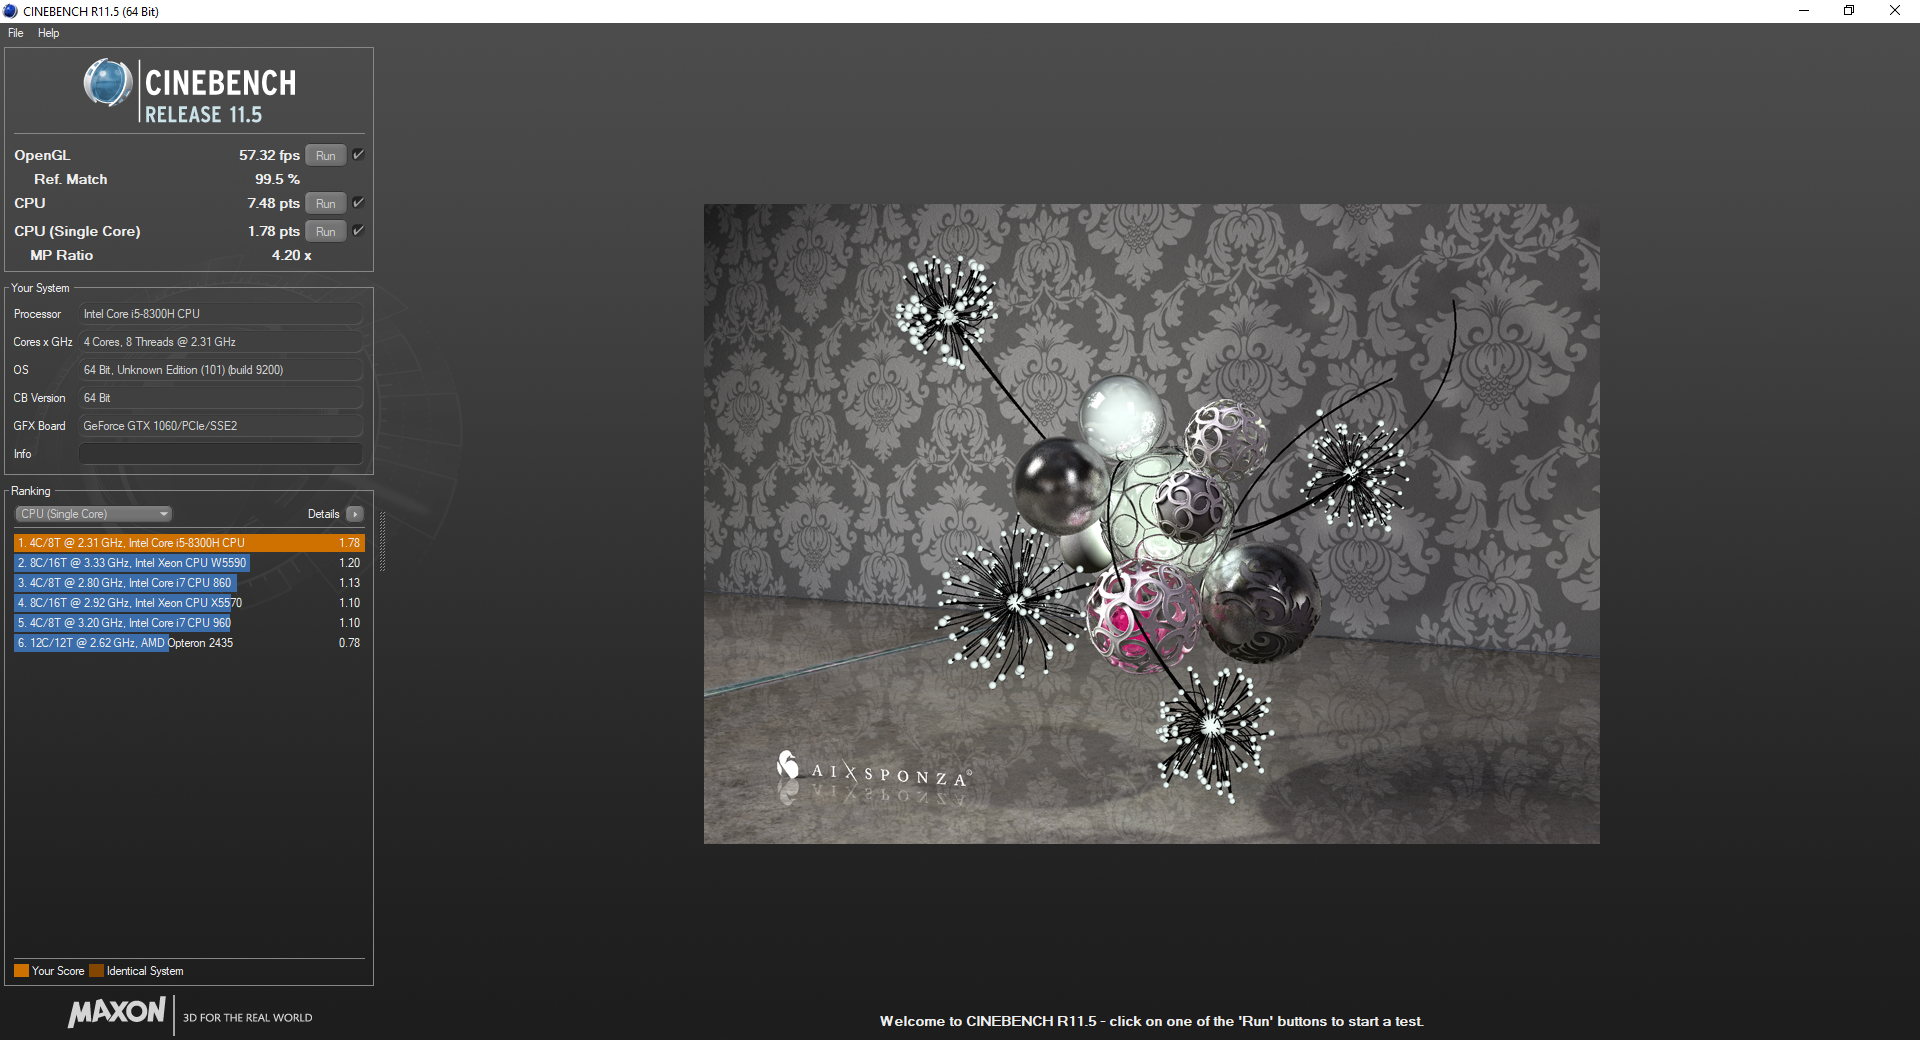
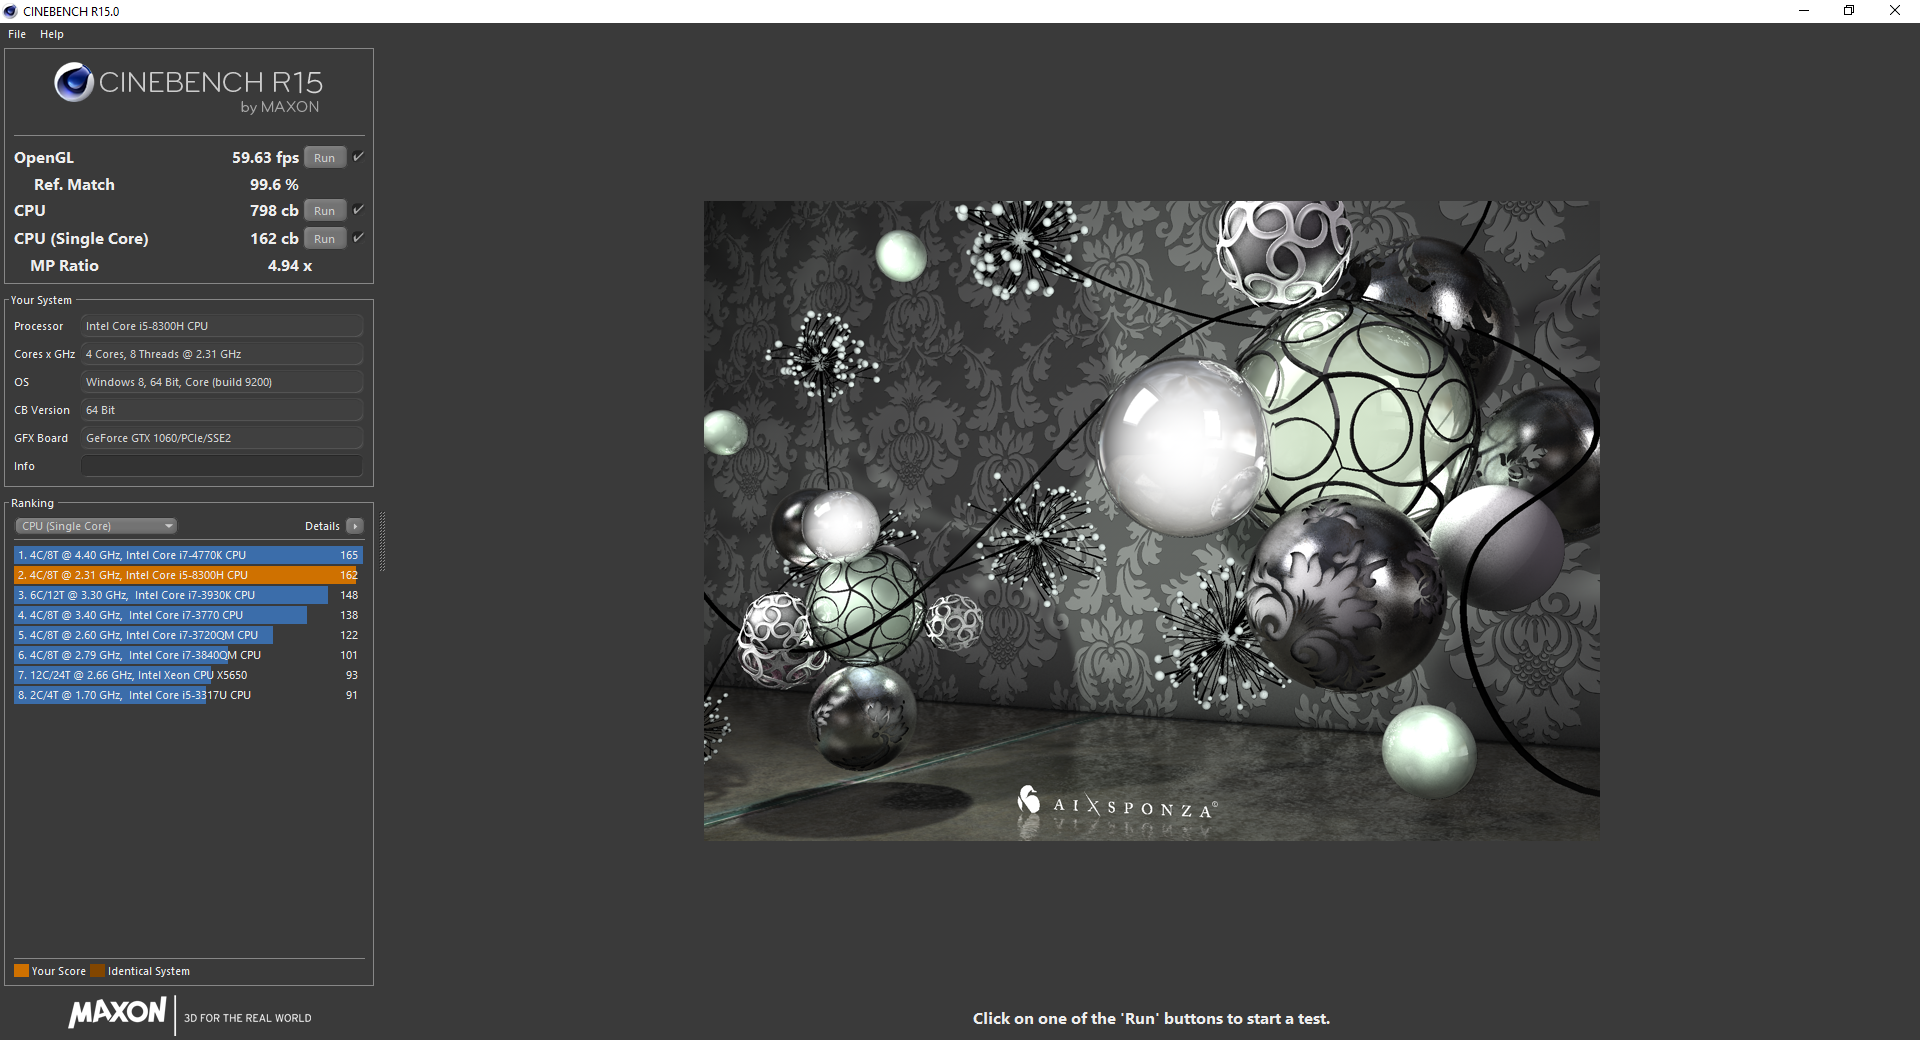
Intel's Coffee Lake CPUs are the refresh the chip maker has needed for the past few years. Instead of the incremental improvements brought by Haswell, Broadwell, and Kaby Lake, Coffee Lake is a major overhaul that increased the core count on most CPUs and brought Hyperthreading to others. Case in point: the quad-core Core i5-8300H now boasts Hyperthreading, increasing multi-threaded performance by about 50% over the i5-7300HQ. Using Cinebench R15 as a standard, the 8300H scores about 10% better than even last generation's i7-7700HQ in multi-core workloads. The processor remains steady over length workloads as well, as seen in our Cinebench R15 loop test. On battery, there is no discernible hit to CPU performance.
The i5-8300H is Coffee Lake's mid-tier 45 W CPU and thus falls about 20% behind the current flagship Core i7-8750H. That said, the i5-8300H should be more than adequate for gaming. Content creators should also find the CPU suitable for most rendering and creative work. AMD's Ryzen 5 1600 and Ryzen 7 1700 offer much better performance, but they come at the cost of increased power draw as they are full desktop CPUs.
For more information on the Intel Core i5-8300H, please see our dedicated CPU page here.
* ... smaller is better
System Performance
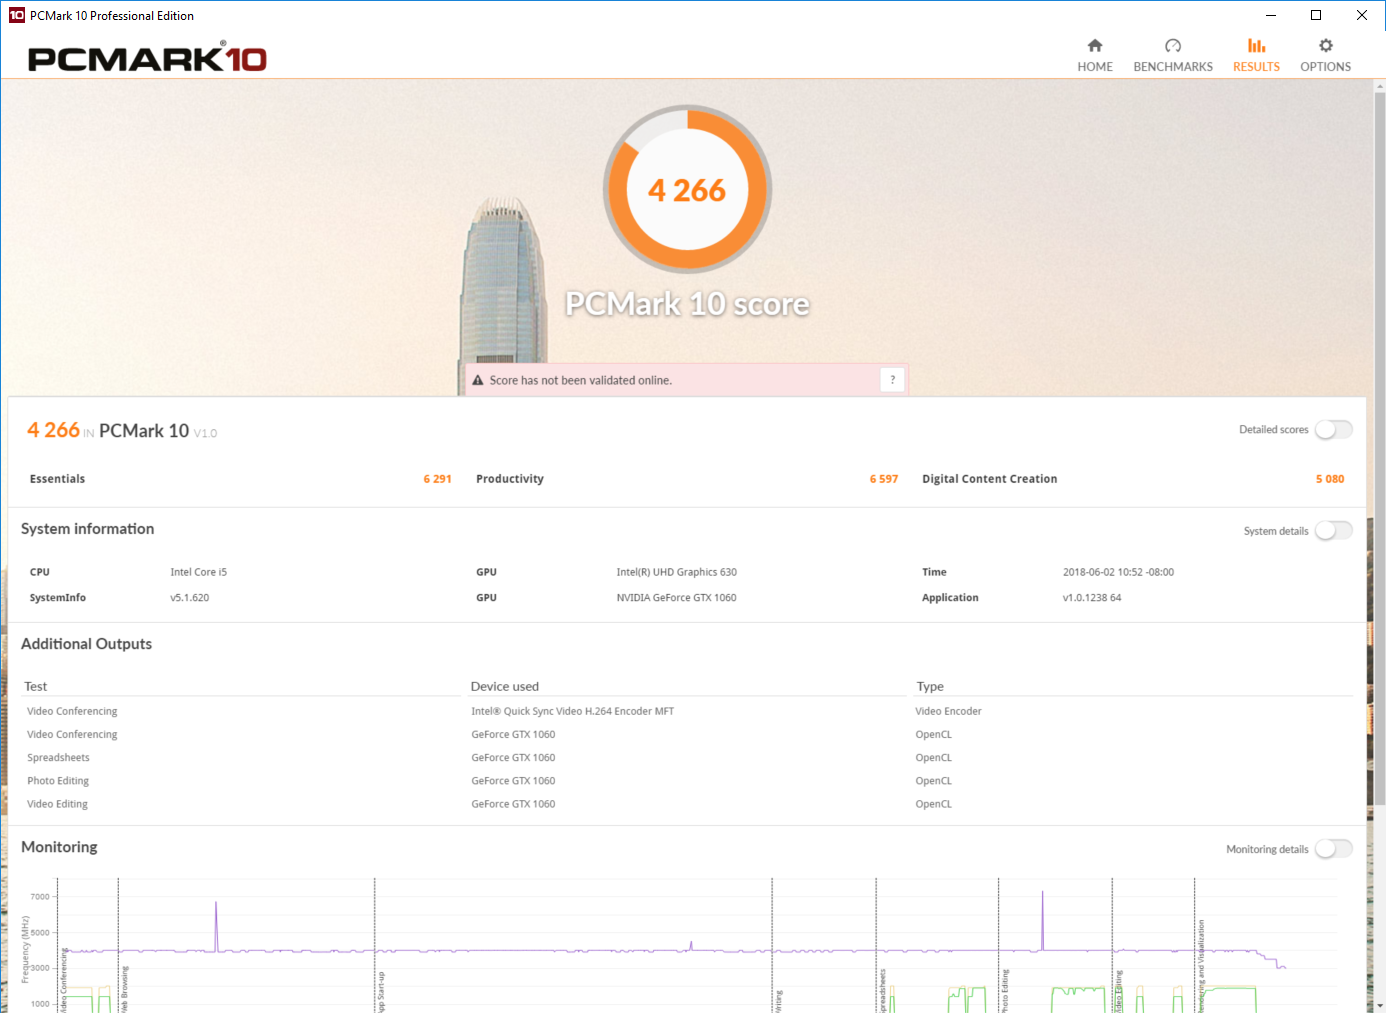
System performance is a strange beast. While the GV62 looks responsive on paper (i.e., in PCMark 8 and PCMark 10), real-world use does not reflect these scores. Some tasks are responsive and quick, such as opening programs and launching games. Other tasks that are simple seem to trip up the machine. For example, opening the Windows Explorer takes about 3 seconds, which can completely kill a workflow.
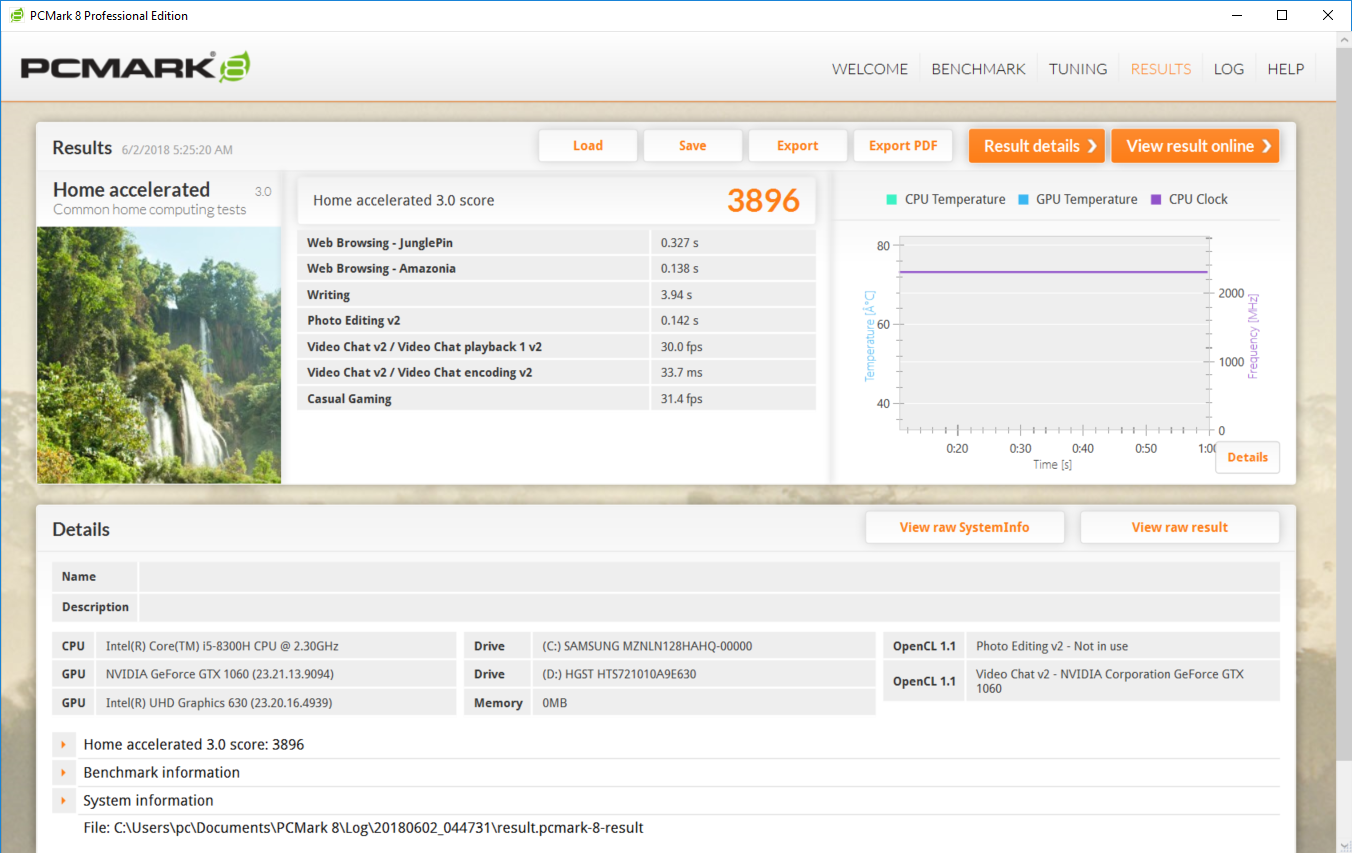

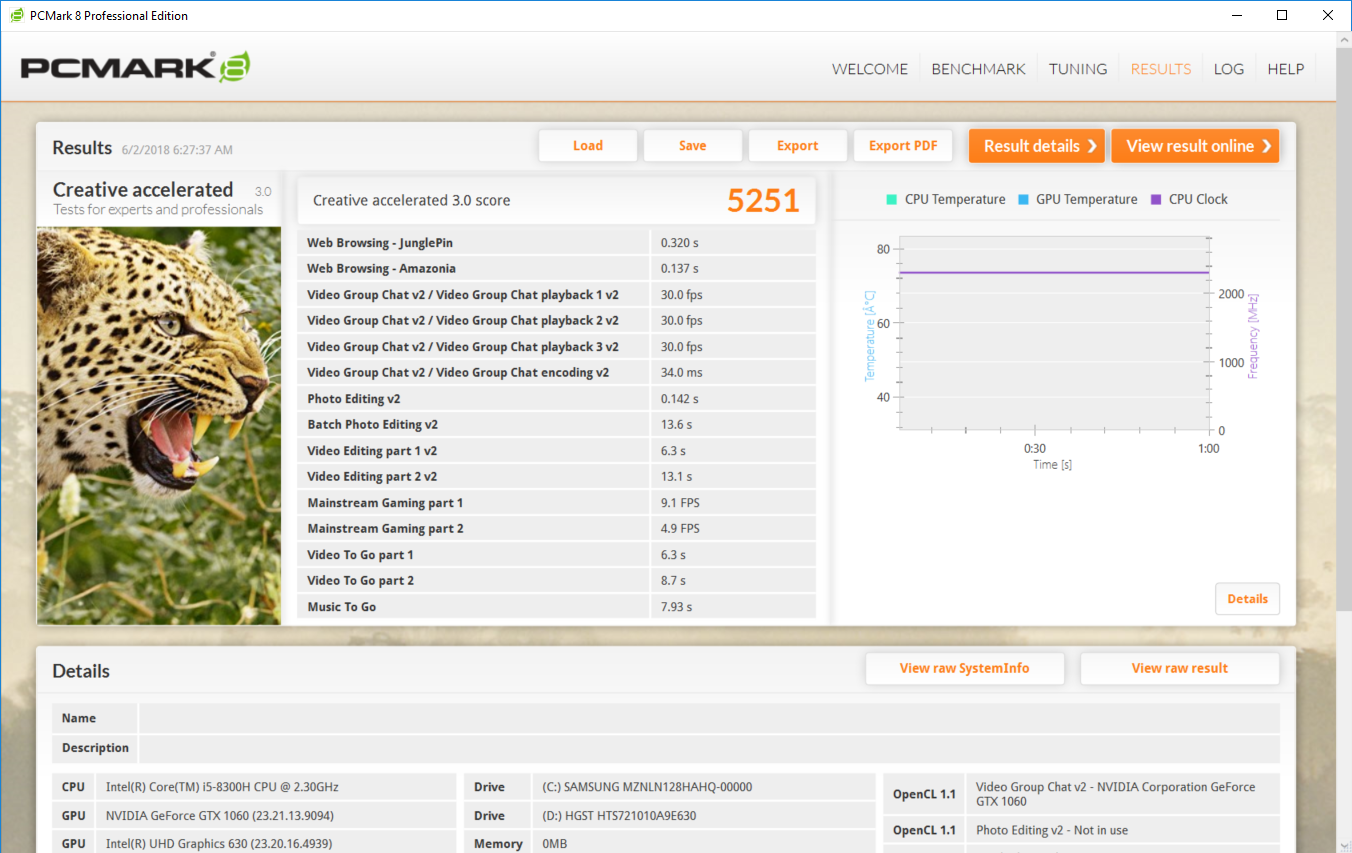
| PCMark 8 Home Score Accelerated v2 | 3896 points | |
| PCMark 8 Creative Score Accelerated v2 | 5251 points | |
| PCMark 8 Work Score Accelerated v2 | 5098 points | |
| PCMark 10 Score | 4266 points | |
Help | ||
Storage Devices
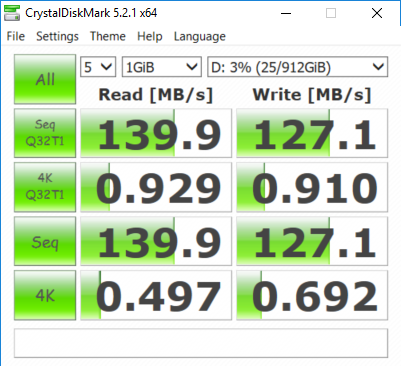
MSI advertises the GV62 with a PCIe NVMe drive, but this is not that model. The SSD in our unit uses the m.2 form factor, but the installed drive uses operates at slow SATA speeds. As such, drive performance is disappointing. These speeds are not out of the normal for this price bracket, but users may want to install an NVMe drive for shorter load times and quicker app launching. The installed HDD is a 5400 RPM drive; speeds are consequently slow but within expectation. Both drives are readily accessible by removing the bottom panel and should be straightforward to upgrade.
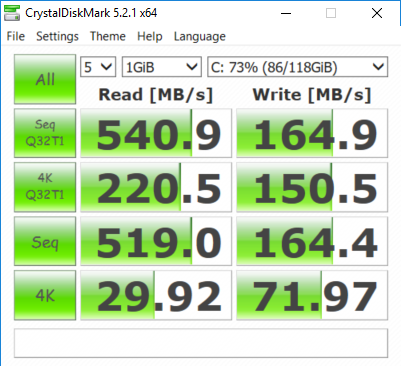
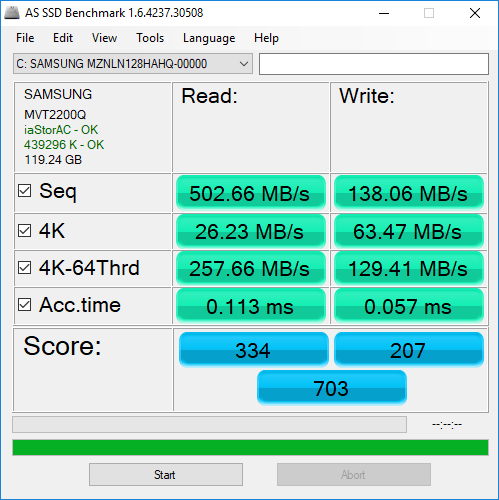

| MSI GV62 8RE-016US Samsung PM871b MZNLN128HAHQ | MSI GF62VR 7RF-877 Intel SSD 600p SSDPEKKW256G7 | Dell Inspiron 15 7000 7577 4K SK hynix SC311 M.2 | Lenovo Legion Y520-15IKBN 80WK0042GE Samsung PM961 NVMe MZVLW128HEGR | Acer Predator Helios 300 PH317-52-51M6 Hynix HFS128G39TND | Dell G5 15 5587 SK hynix SC311 M.2 | Average Samsung PM871b MZNLN128HAHQ | |
|---|---|---|---|---|---|---|---|
| AS SSD | 160% | 20% | 133% | -30% | -2% | 34% | |
| Copy Game MB/s (MB/s) | 122.6 | 471.7 285% | 185.4 51% | 197.3 61% | 130.9 7% | 160.6 ? 31% | |
| Copy Program MB/s (MB/s) | 69.2 | 286.5 314% | 142.2 105% | 127.3 84% | 95.7 38% | 134.7 ? 95% | |
| Copy ISO MB/s (MB/s) | 170.5 | 1069 527% | 363.6 113% | 497.6 192% | 146.6 -14% | 299 ? 75% | |
| Score Total (Points) | 703 | 1324 88% | 578 -18% | 1434 104% | 811 15% | 557 -21% | 774 ? 10% |
| Score Write (Points) | 207 | 693 235% | 227 10% | 368 78% | 196 -5% | 199 -4% | 262 ? 27% |
| Score Read (Points) | 334 | 448 34% | 234 -30% | 746 123% | 414 24% | 240 -28% | 335 ? 0% |
| Access Time Write * (ms) | 0.057 | 0.03 47% | 0.058 -2% | 0.032 44% | 0.259 -354% | 0.066 -16% | 0.05417 ? 5% |
| Access Time Read * (ms) | 0.113 | 0.09 20% | 0.126 -12% | 0.07 38% | 0.128 -13% | 0.1102 ? 2% | |
| 4K-64 Write (MB/s) | 129.4 | 551 326% | 127.2 -2% | 158.6 23% | 120.1 -7% | 112.4 -13% | 149.2 ? 15% |
| 4K-64 Read (MB/s) | 257.7 | 280.1 9% | 156.6 -39% | 463.2 80% | 336.6 31% | 164.1 -36% | 256 ? -1% |
| 4K Write (MB/s) | 63.5 | 118.3 86% | 74 17% | 127.9 101% | 62.7 -1% | 62.2 -2% | 73.1 ? 15% |
| 4K Read (MB/s) | 26.23 | 31.27 19% | 26.24 0% | 46.98 79% | 26.5 1% | 24.44 -7% | 29.1 ? 11% |
| Seq Write (MB/s) | 138.1 | 234.9 70% | 259.9 88% | 814 489% | 128.2 -7% | 243.7 76% | 398 ? 188% |
| Seq Read (MB/s) | 503 | 1371 173% | 508 1% | 2362 370% | 513 2% | 511 2% | 496 ? -1% |
* ... smaller is better

GPU Performance
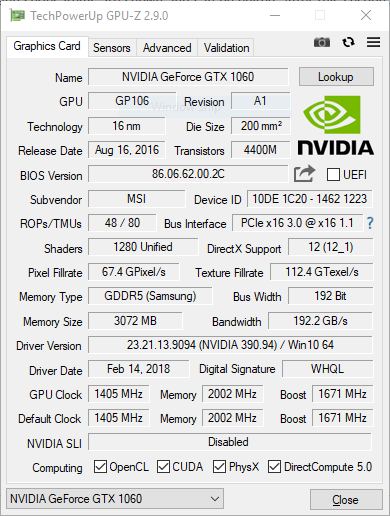
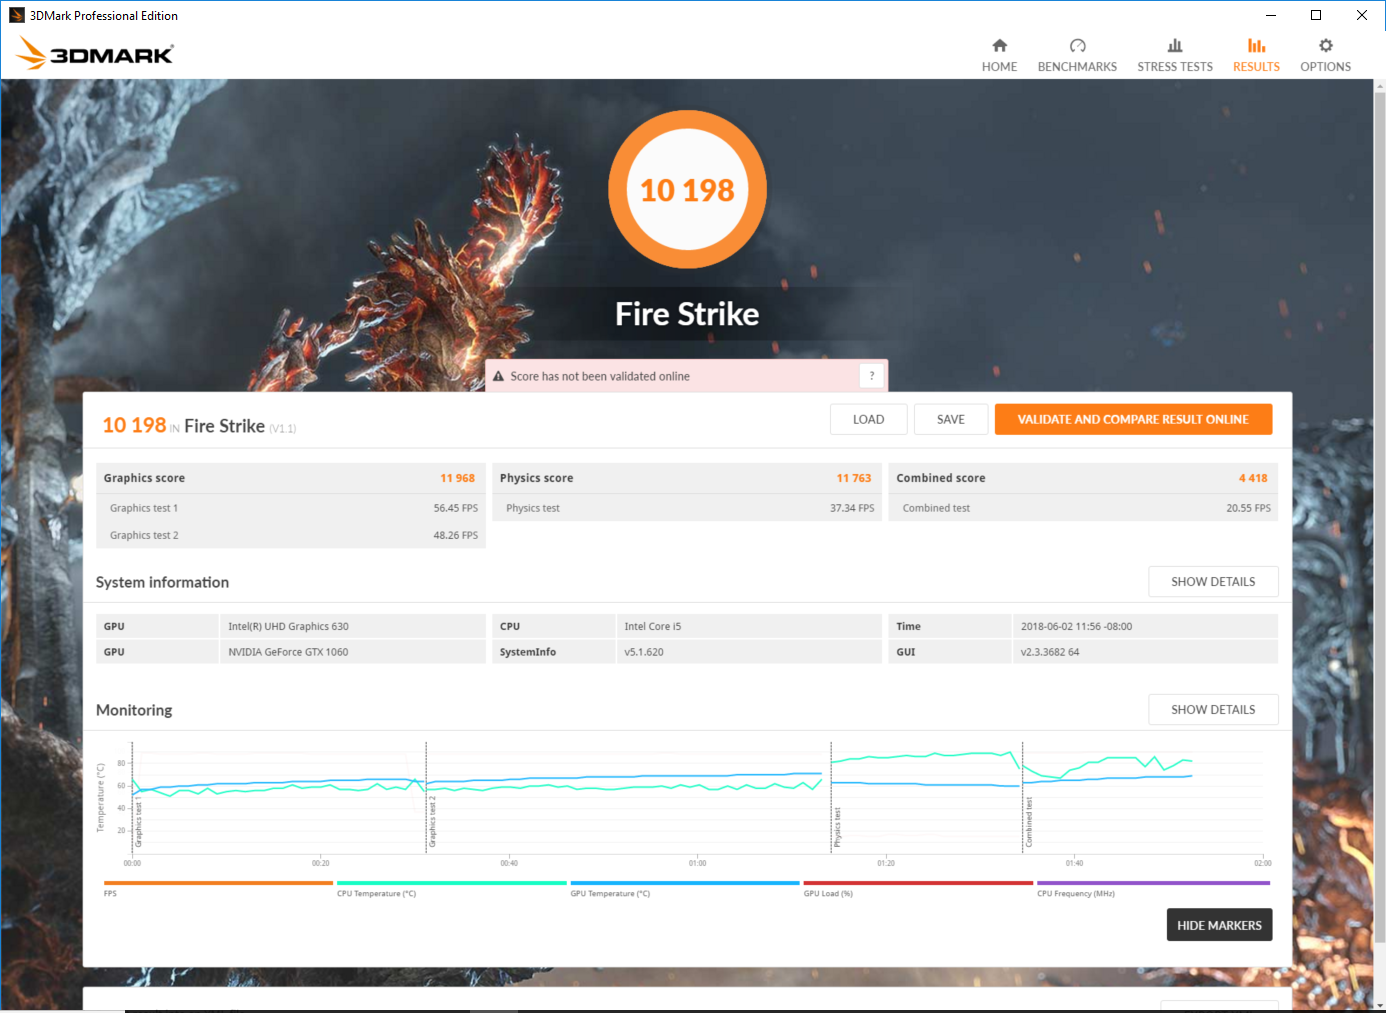
The GV62 uses Nvidia's GeForce GTX 1060 for its graphics solution, one of the most popular cards found in gaming laptops. However, most gaming notebooks opt for the higher variant with 6 GB of VRAM. The GV62, conversely, uses the 3 GB version. How does this choice affect graphical and gaming performance?
The short answer: not much. The GV62 handles Fire Strike a bit above the average GTX 1060-equipped laptop. While the VRAM is cut in half, the rest of the cards is largely the same, and performance should not see much variance as a result. Even with the cut in VRAM, the GTX 1060 is quite welcome considering that most gaming laptops at this price opt for Nvidia's GTX 1050 Ti or GTX 1050, which came offer about 67% and 50% the performance of the GTX 1060, respectively. The GV62 hits 90% of its measured performance when on battery.
For more information on the GeForce GTX 1060, please see our dedicated GPU page here.
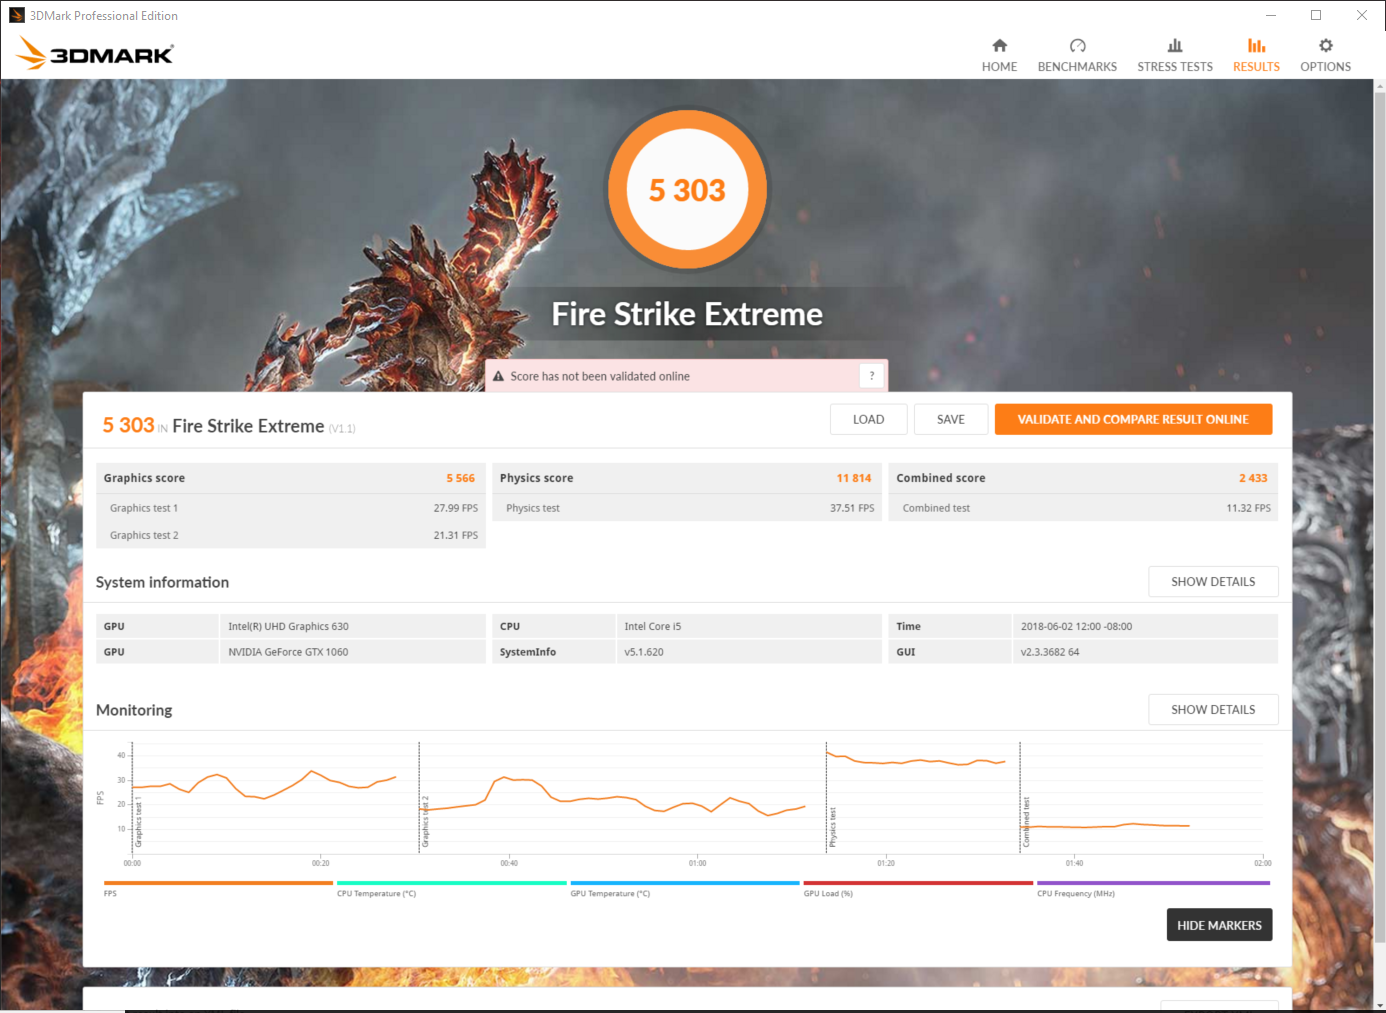
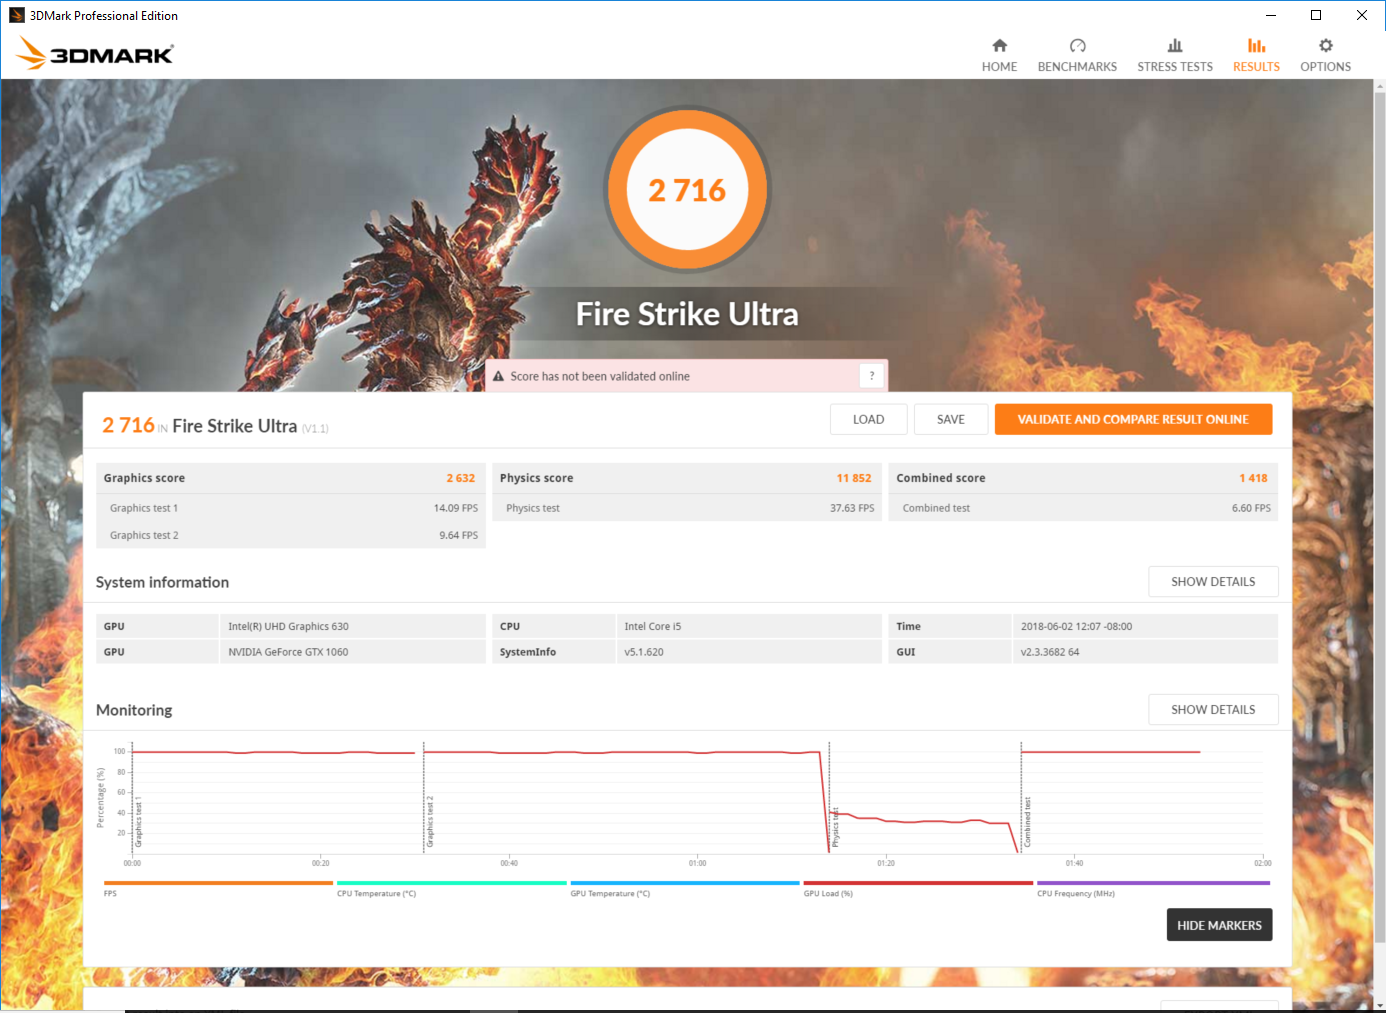
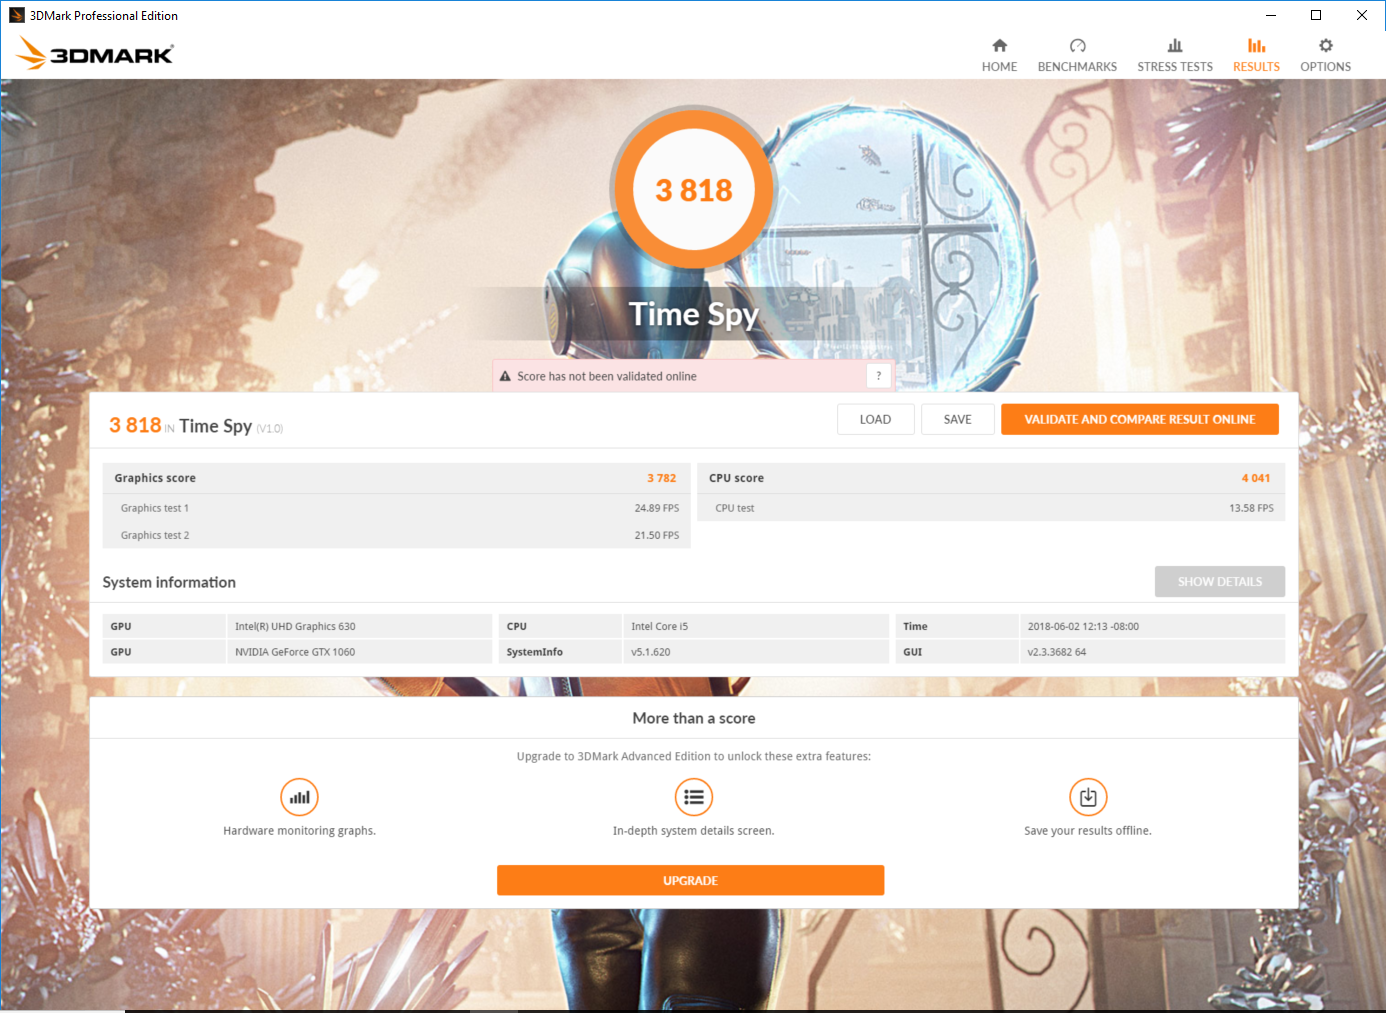
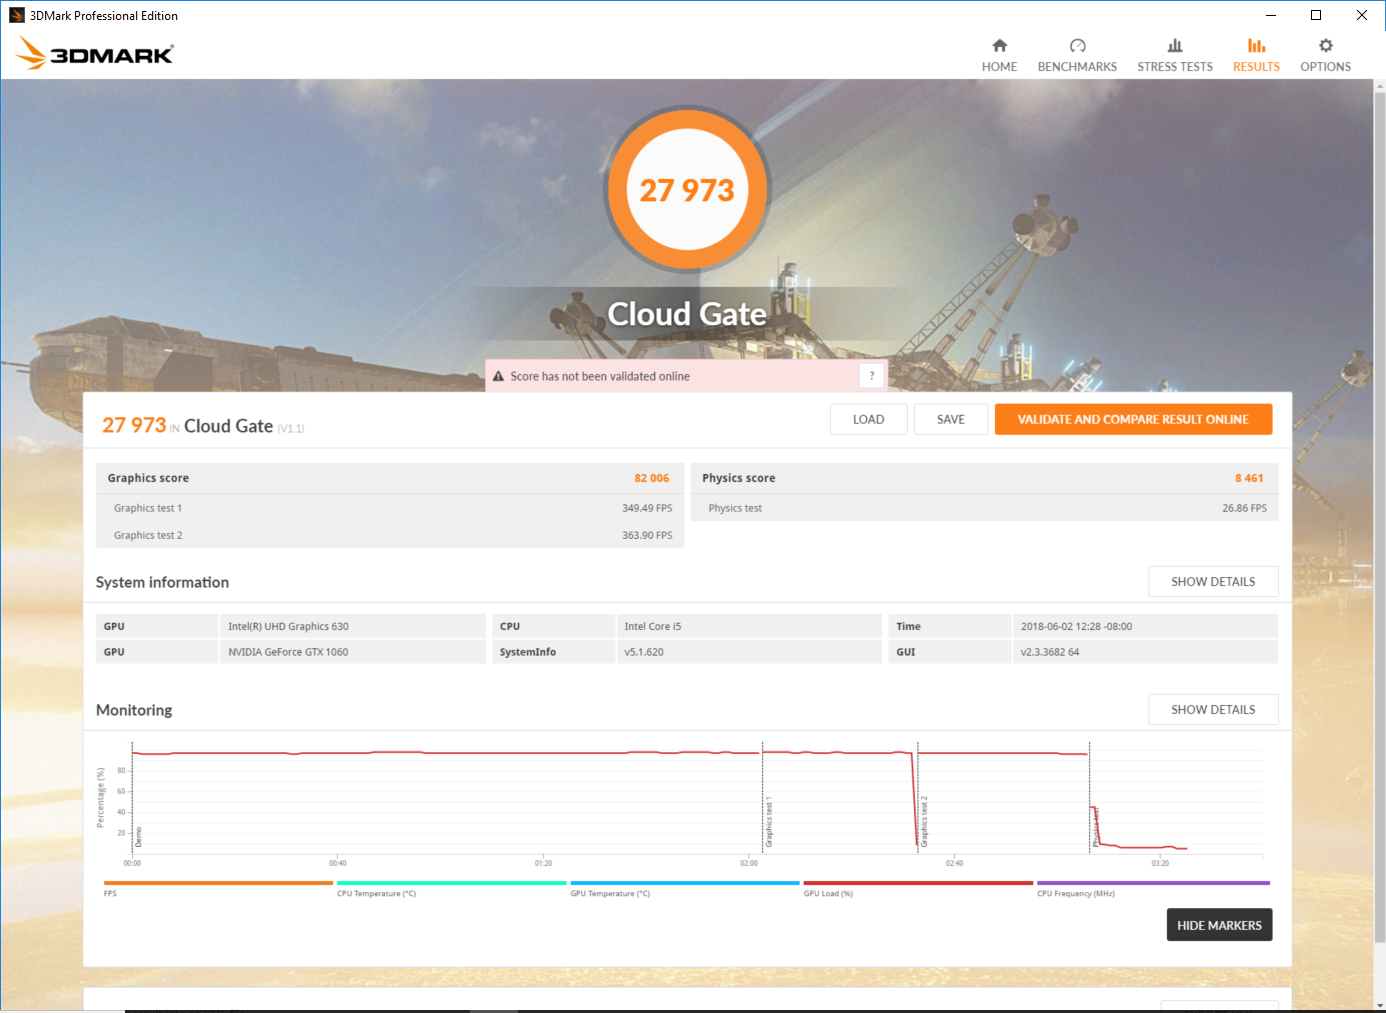
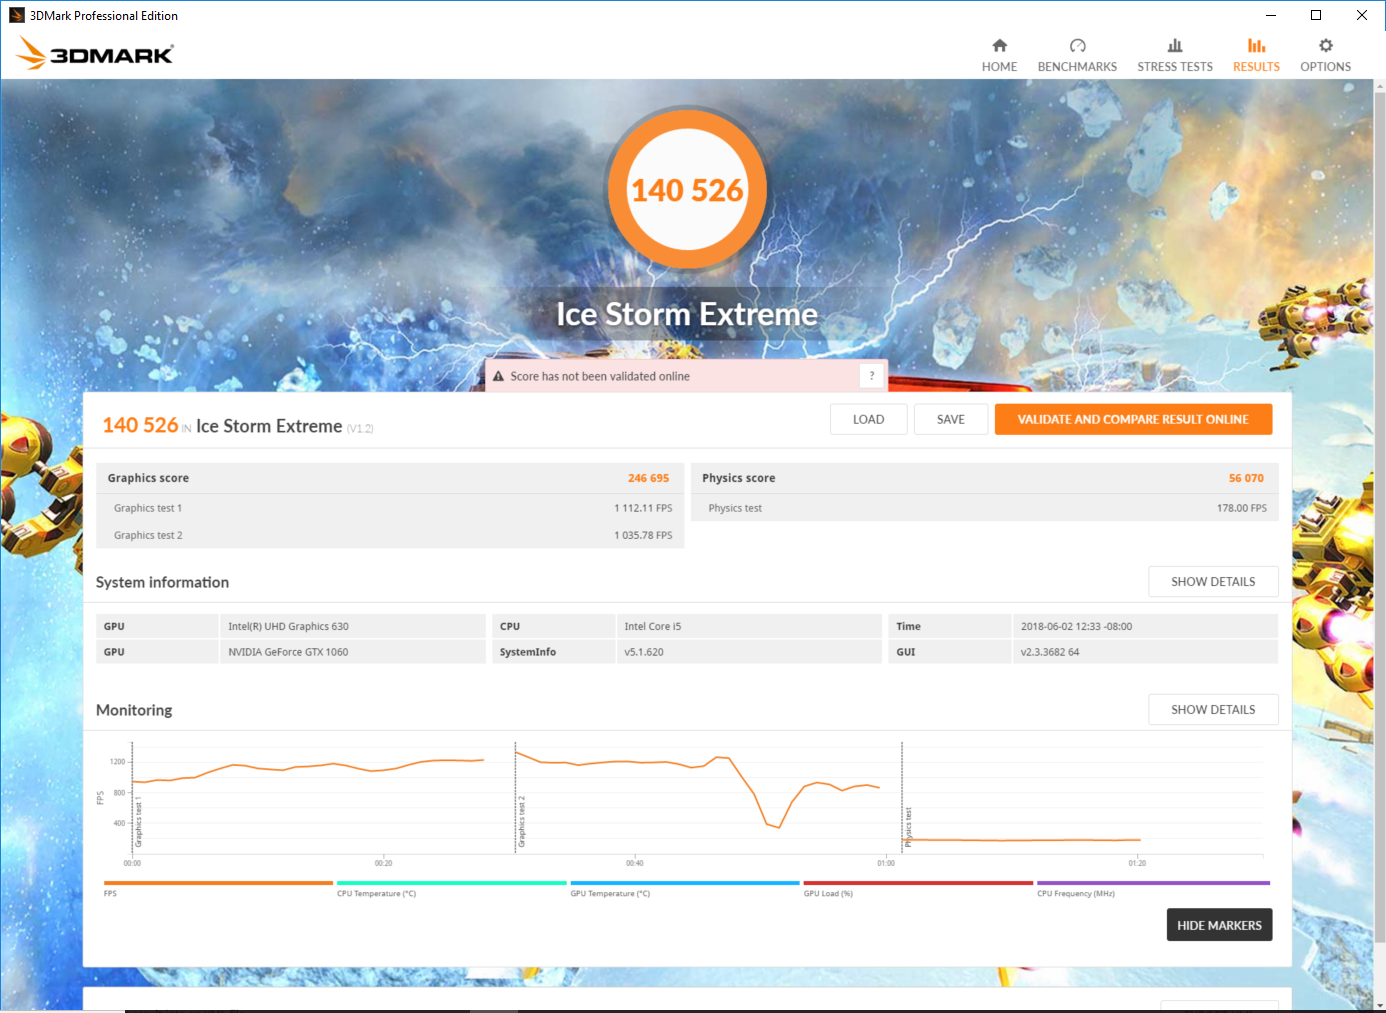
| 3DMark 11 Performance | 12532 points | |
| 3DMark Cloud Gate Standard Score | 27973 points | |
| 3DMark Fire Strike Score | 10198 points | |
Help | ||
Gaming Performance
As mentioned, gaming performance is in line with other GTX 1060 gaming laptops. That is, most titles will be perfectly playable at High or Ultra settings at Full HD. However, the limited VRAM (3 GB) will restrict some nicer settings (e.g., hair and fiber simulation, volumetric smoke). Also, Full HD is the highest resolution comfortably available. 1440p and 4K require more memory than this GTX 1060 card has available and are thus out of reach for most titles.
| BioShock Infinite | |
| 1920x1080 Ultra Preset, DX11 (DDOF) (sort by value) | |
| MSI GV62 8RE-016US | |
| Dell Inspiron 15 7000 7577 4K | |
| MSI GF62VR 7RF-877 | |
| Lenovo Legion Y520-15IKBN 80WK0042GE | |
| Dell G5 15 5587 | |
| Average NVIDIA GeForce GTX 1060 Mobile (82 - 159, n=48) | |
| 1366x768 High Preset (sort by value) | |
| MSI GV62 8RE-016US | |
| Lenovo Legion Y520-15IKBN 80WK0042GE | |
| Dell G5 15 5587 | |
| Average NVIDIA GeForce GTX 1060 Mobile (128 - 234, n=29) | |
| The Witcher 3 | |
| 1920x1080 Ultra Graphics & Postprocessing (HBAO+) (sort by value) | |
| MSI GV62 8RE-016US | |
| Dell Inspiron 15 7000 7577 4K | |
| MSI GF62VR 7RF-877 | |
| Lenovo Legion Y520-15IKBN 80WK0042GE | |
| Acer Predator Helios 300 PH317-52-51M6 | |
| Dell G5 15 5587 | |
| Average NVIDIA GeForce GTX 1060 Mobile (24 - 42.3, n=60) | |
| Average of class Gaming (95 - 240, n=8, last 2 years) | |
| 1920x1080 High Graphics & Postprocessing (Nvidia HairWorks Off) (sort by value) | |
| MSI GV62 8RE-016US | |
| Dell Inspiron 15 7000 7577 4K | |
| MSI GF62VR 7RF-877 | |
| Lenovo Legion Y520-15IKBN 80WK0042GE | |
| Acer Predator Helios 300 PH317-52-51M6 | |
| Dell G5 15 5587 | |
| Average NVIDIA GeForce GTX 1060 Mobile (52.6 - 80.6, n=49) | |
| Average of class Gaming (181 - 341, n=3, last 2 years) | |
| Rise of the Tomb Raider | |
| 1920x1080 Very High Preset AA:FX AF:16x (sort by value) | |
| MSI GV62 8RE-016US | |
| Dell Inspiron 15 7000 7577 4K | |
| MSI GF62VR 7RF-877 | |
| Dell G5 15 5587 | |
| Average NVIDIA GeForce GTX 1060 Mobile (51 - 68.8, n=37) | |
| 1920x1080 High Preset AA:FX AF:4x (sort by value) | |
| MSI GV62 8RE-016US | |
| MSI GF62VR 7RF-877 | |
| Dell G5 15 5587 | |
| Average NVIDIA GeForce GTX 1060 Mobile (65.3 - 82, n=24) | |
| 1366x768 Medium Preset AF:2x (sort by value) | |
| MSI GV62 8RE-016US | |
| Dell G5 15 5587 | |
| Average NVIDIA GeForce GTX 1060 Mobile (82.2 - 140, n=14) | |
| Middle-earth: Shadow of War | |
| 1920x1080 Ultra Preset AA:T (sort by value) | |
| MSI GV62 8RE-016US | |
| Dell Inspiron 15 7000 7577 4K | |
| Average NVIDIA GeForce GTX 1060 Mobile (52 - 54, n=5) | |
| 1920x1080 High Preset AA:T (sort by value) | |
| MSI GV62 8RE-016US | |
| Dell Inspiron 15 7000 7577 4K | |
| Average NVIDIA GeForce GTX 1060 Mobile (58 - 74, n=4) | |
| 1920x1080 Medium Preset AA:T (sort by value) | |
| MSI GV62 8RE-016US | |
| Dell Inspiron 15 7000 7577 4K | |
| Average NVIDIA GeForce GTX 1060 Mobile (79 - 97, n=2) | |
| low | med. | high | ultra | |
|---|---|---|---|---|
| BioShock Infinite (2013) | 234 | 205 | 187 | 112 |
| The Witcher 3 (2015) | 163 | 121 | 67 | 42 |
| Rise of the Tomb Raider (2016) | 162 | 125 | 73 | 59 |
| Middle-earth: Shadow of War (2017) | 110 | 79 | 58 | 52 |
Stress Test
Under stress, the GV62 is able to keep performance up at the expense of high internal temperatures. Running Prime95 to fully load the CPU, clock speeds hover around 3.5 GHz, close to the CPU's rated boost clock of 3.9 GHz. Temperatures are reasonable at 80° C across the die. Stressing the GPU with FurMark shows good results, as the CPU and GPU are able to boost with almost no consequence. While CPU temps are somewhat erratic (flitting between 60-80° C), the GPU is rock solid at 76° C. It should be noted that one of the CPU cores hit 94° C during the test before pulling back to about 80° C.
Under loads that heavily tax both the CPU and GPU, the system does not fare as well. Running Prime95 and FurMark concurrently reveal a weak point in the CPU's thermal management. During this test, the CPU stays around 95° C, which is fairly warm. The GPU handles heat better and stays at a reasonable 84° C. However, it should be noted that synthetic loads like these are unlikely to occur. Rather, stressing the machine with an hour-long session of The Witcher 3 gives a better real-world picture. During our playtime, the GPU is able to boost freely between 1650 and 1700 MHz, and the CPU boosts as needed. CPU temperatures are still hectic and never quite stabilize, moving between the low 70° C range and upwards of 95° C. The higher temperatures aren't held for long periods of time. We did observe some frame drops and skips during our playtime.

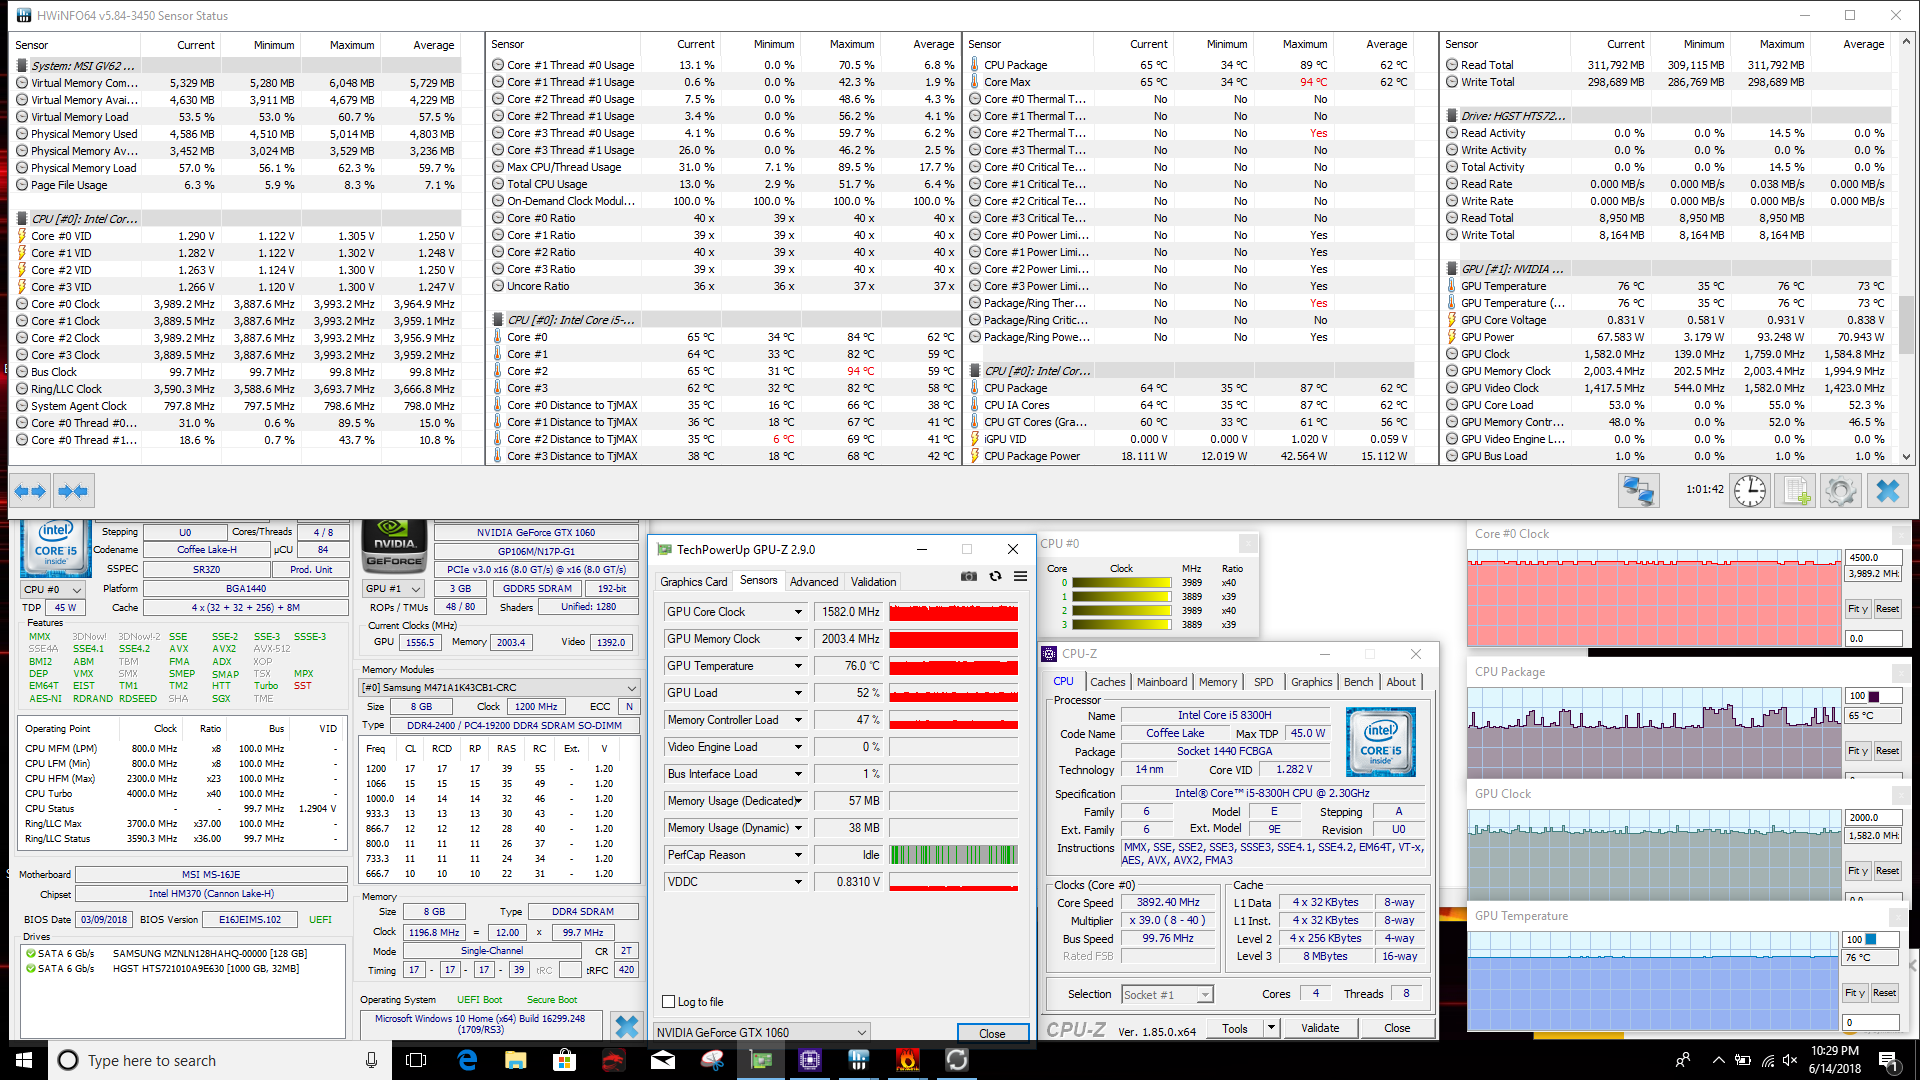
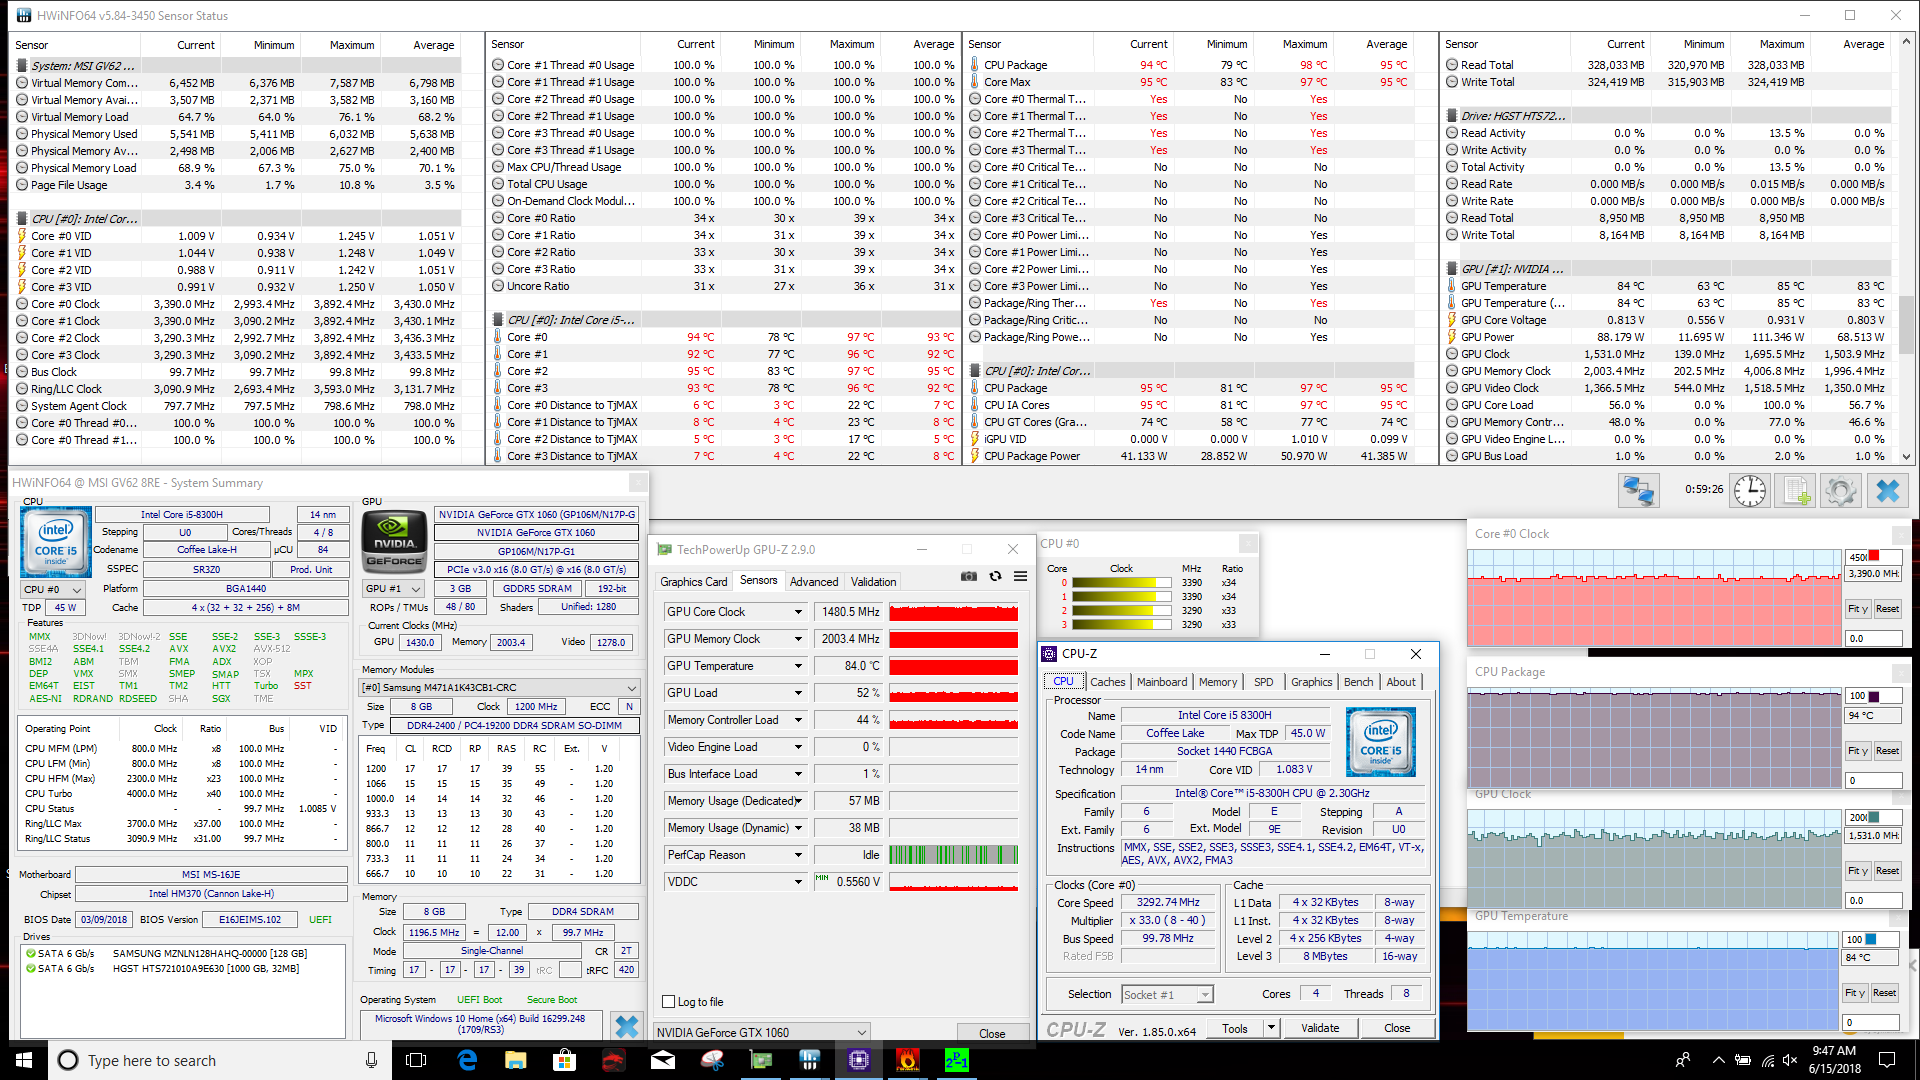
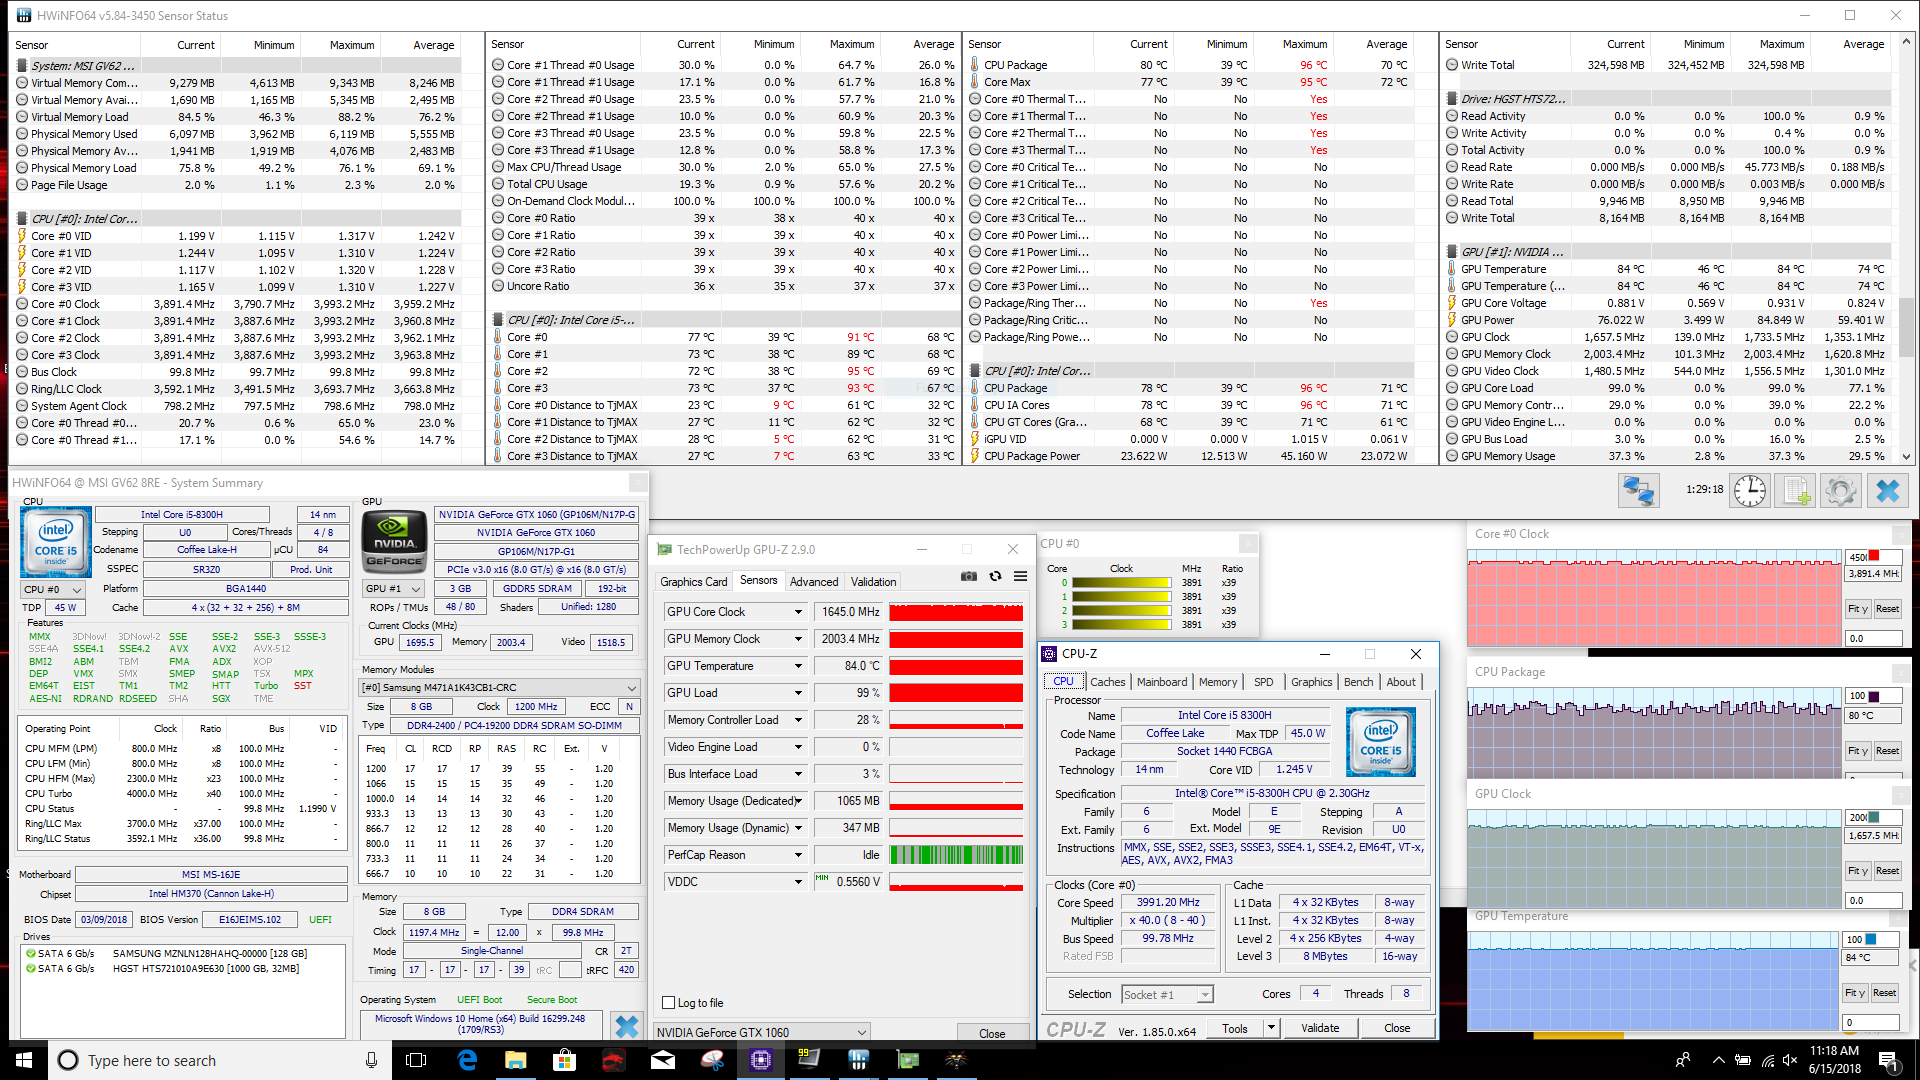
| CPU Clock (GHz) | GPU Clock (MHz) | Average CPU Temperature (°C) | Average GPU Temperature (°C) | |
| Prime95 Stress | 3.5 | - | 80 | - |
| FurMark Stress | 4.0 | 1585 | 65 | 76 |
| Prime95 + FurMark Stress | 3.4 | 1531 | 95 | 84 |
| Witcher 3 Stress | 4.0 | 1658 | 80 | 84 |
Emissions
System Noise
Fan noise is, for the most part, unobtrusive. Under most workloads (web browsing, video streaming), fan noise stays between 40 and 45 db(A). While audible, the even pitch of the fans keeps noise from grating on the ears. There is noticeable coil whine that can be heard about 3 feet from the keyboard, and the hard drive can be heard when accessed from this same distance.
Under heavy load or with the Cooler Boost mode engaged, fan noise can eclipse 52 dB(A). Again, the fans are not high pitched like those used in other devices (e.g., Asus' GL553VD). Fan noise can get loud, but it isn't terribly distracting or annoying and more akin to a loud whir than a piercing whine.
Noise level
| Idle |
| 33.5 / 33.5 / 33.7 dB(A) |
| Load |
| 41 / 52.3 dB(A) |
 | ||
30 dB silent 40 dB(A) audible 50 dB(A) loud |
||
min: | ||
| MSI GV62 8RE-016US GeForce GTX 1060 Mobile, i5-8300H, Samsung PM871b MZNLN128HAHQ | MSI GF62VR 7RF-877 GeForce GTX 1060 Mobile, i7-7700HQ, Intel SSD 600p SSDPEKKW256G7 | Dell Inspiron 15 7000 7577 4K GeForce GTX 1060 Max-Q, i7-7700HQ, SK hynix SC311 M.2 | Lenovo Legion Y520-15IKBN 80WK0042GE GeForce GTX 1050 Ti Mobile, i5-7300HQ, Samsung PM961 NVMe MZVLW128HEGR | Acer Predator Helios 300 PH317-52-51M6 GeForce GTX 1050 Ti Mobile, i5-8300H, Hynix HFS128G39TND | Dell G5 15 5587 GeForce GTX 1060 Max-Q, i5-8300H, SK hynix SC311 M.2 | |
|---|---|---|---|---|---|---|
| Noise | 1% | 11% | 10% | 4% | 8% | |
| off / environment * (dB) | 28.2 | 28.1 -0% | 28.5 -1% | 30.6 -9% | 29 -3% | 30.3 -7% |
| Idle Minimum * (dB) | 33.5 | 33.5 -0% | 28.8 14% | 31.9 5% | 29 13% | 31.1 7% |
| Idle Average * (dB) | 33.5 | 33.5 -0% | 29.2 13% | 31.9 5% | 31 7% | 31.1 7% |
| Idle Maximum * (dB) | 33.7 | 33.5 1% | 29.2 13% | 31.9 5% | 33 2% | 34.2 -1% |
| Load Average * (dB) | 41 | 41.3 -1% | 34.6 16% | 34.6 16% | 45 -10% | 34.9 15% |
| Witcher 3 ultra * (dB) | 52.3 | 48.5 7% | 44.1 16% | 39.3 25% | 45 14% | 42.7 18% |
| Load Maximum * (dB) | 52.3 | 53.5 -2% | 49.3 6% | 41.7 20% | 51 2% | 44 16% |
* ... smaller is better
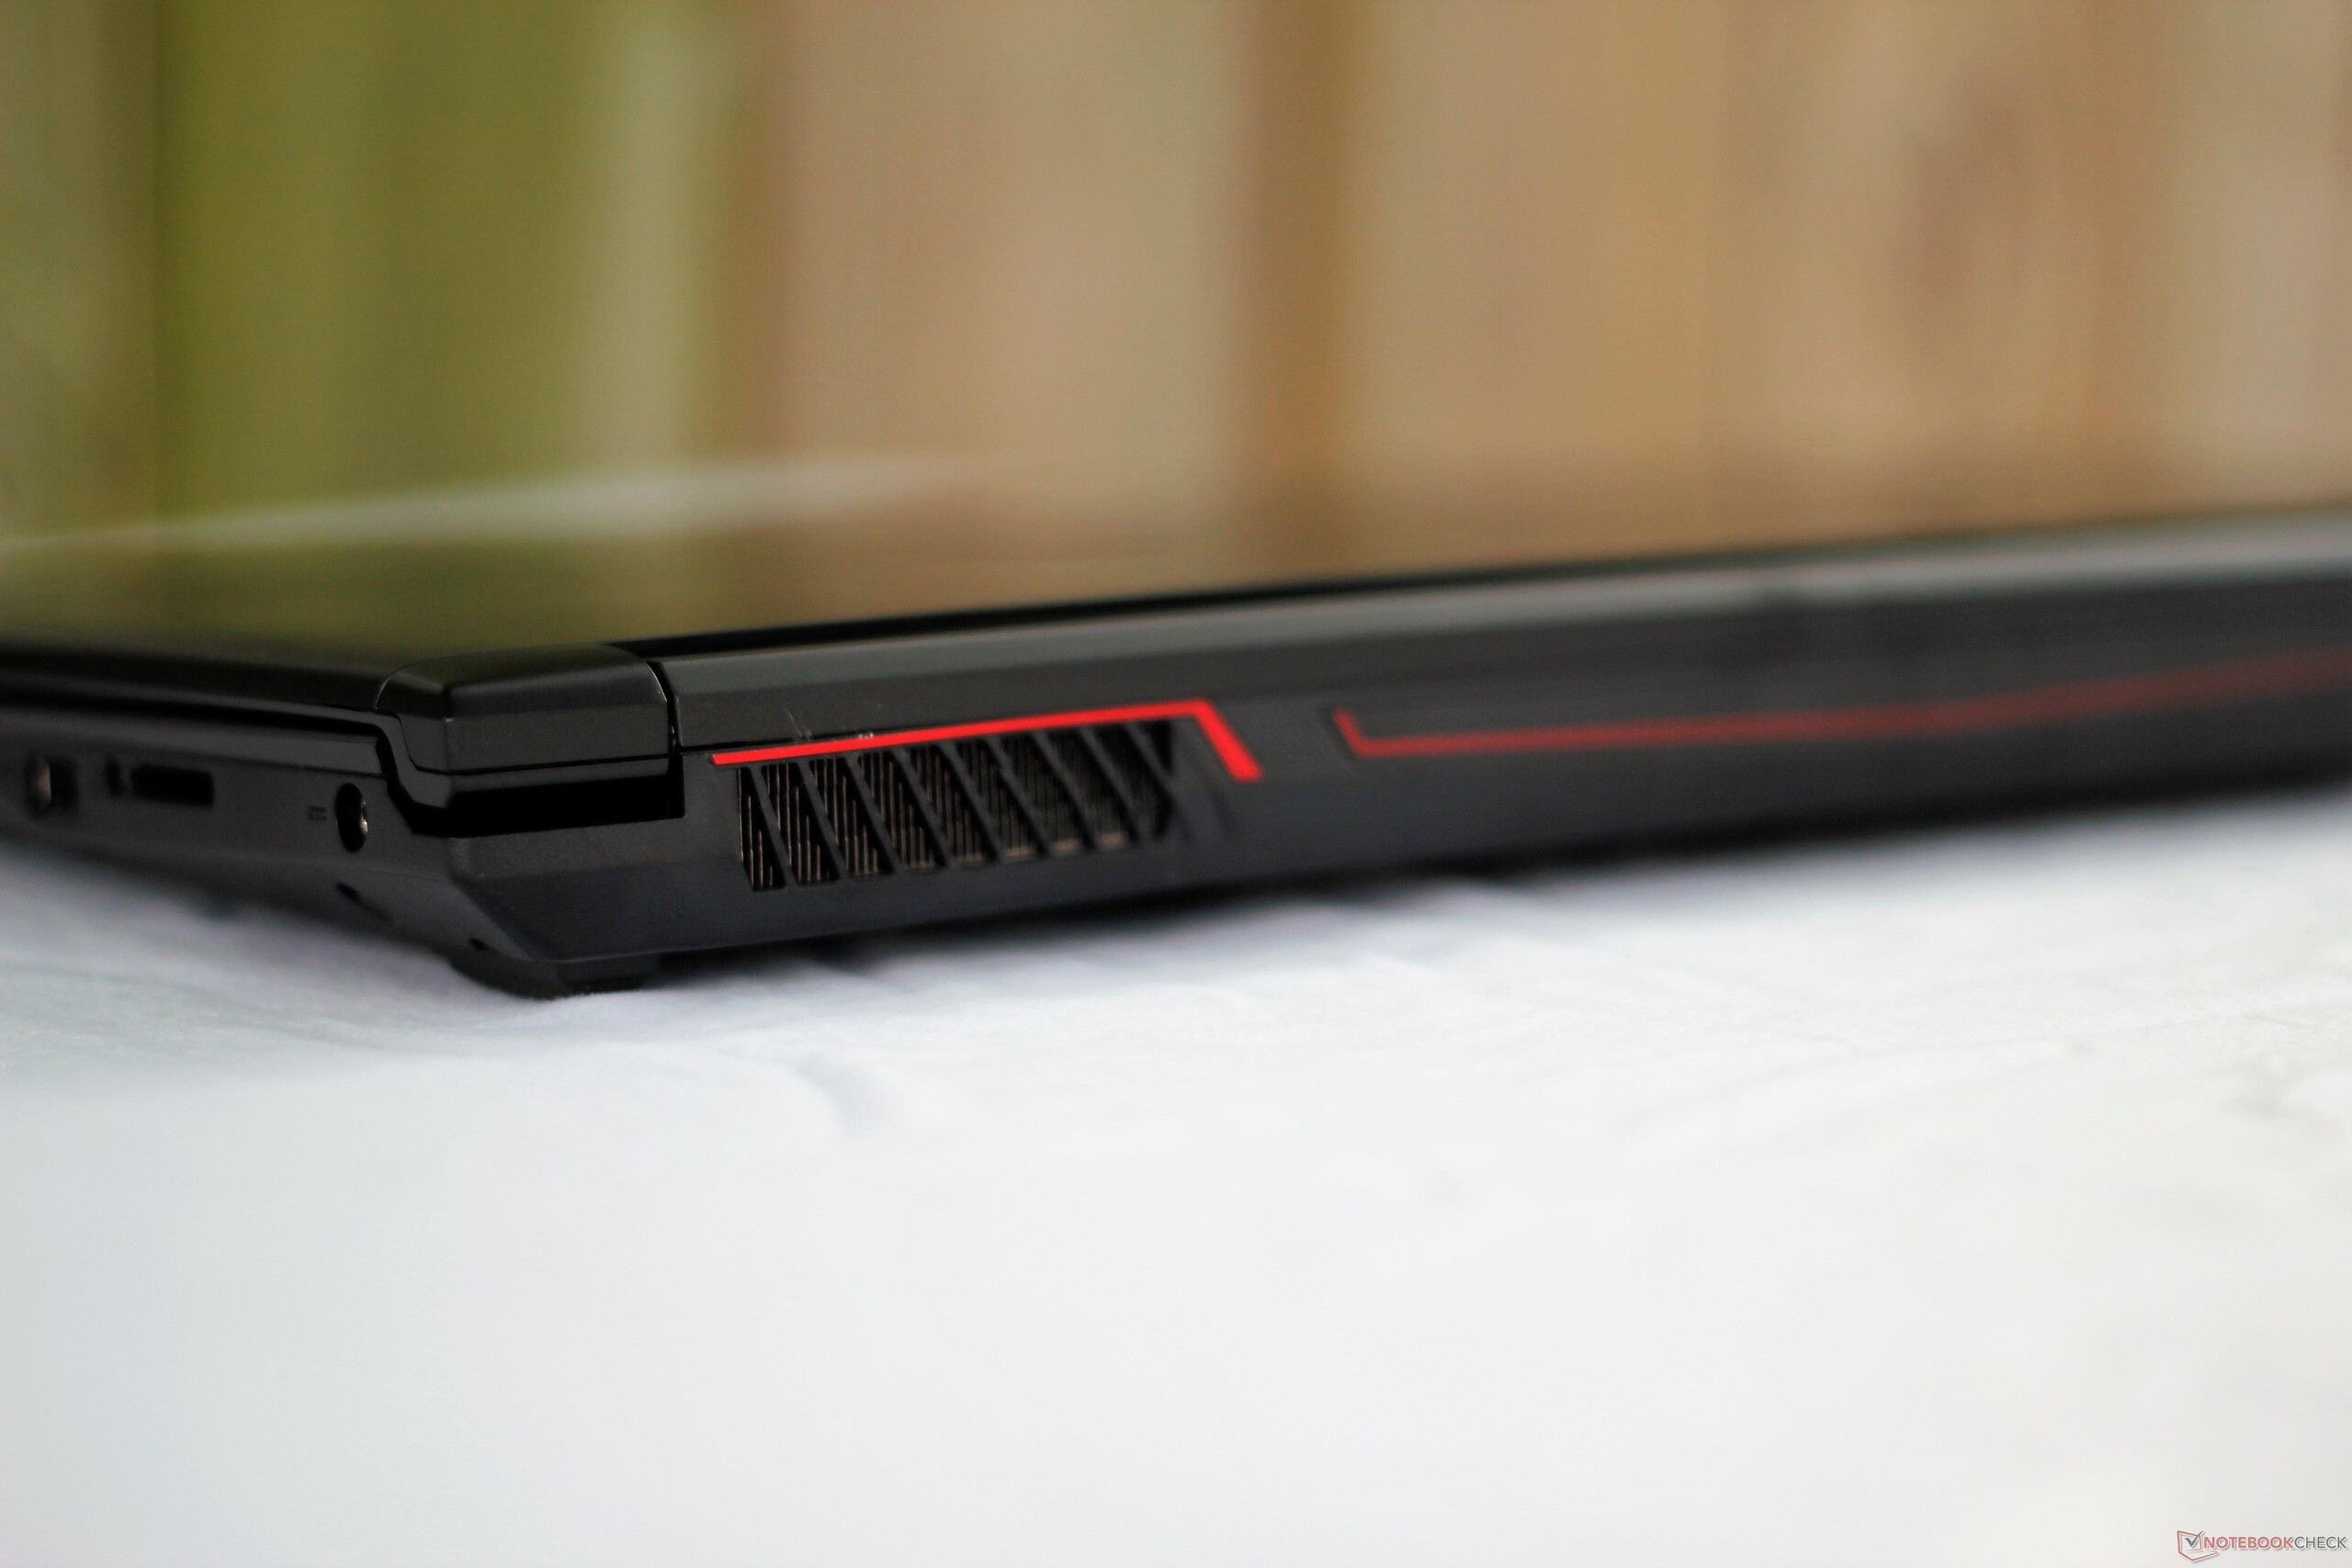
Temperature
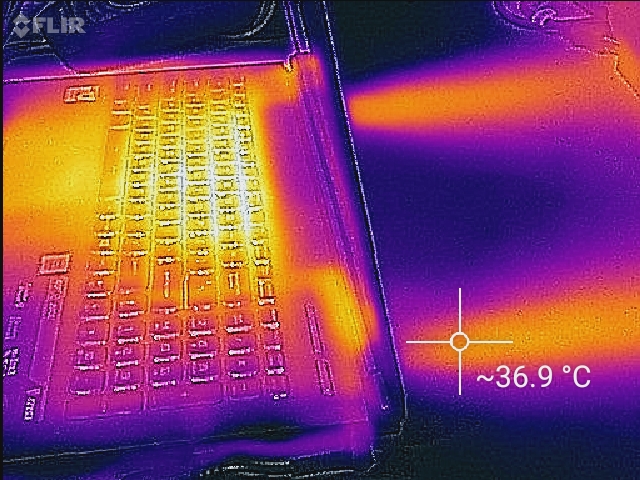
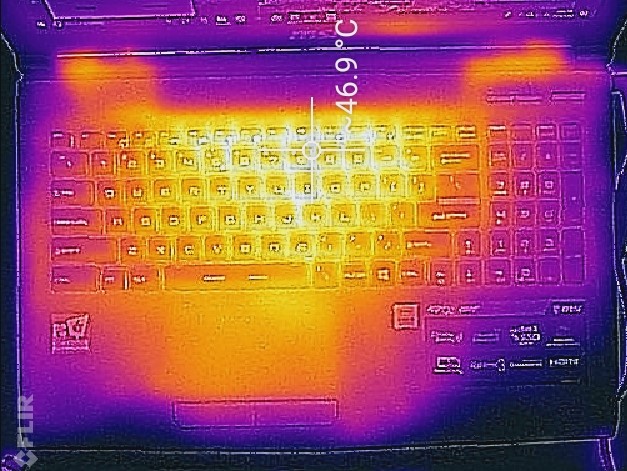
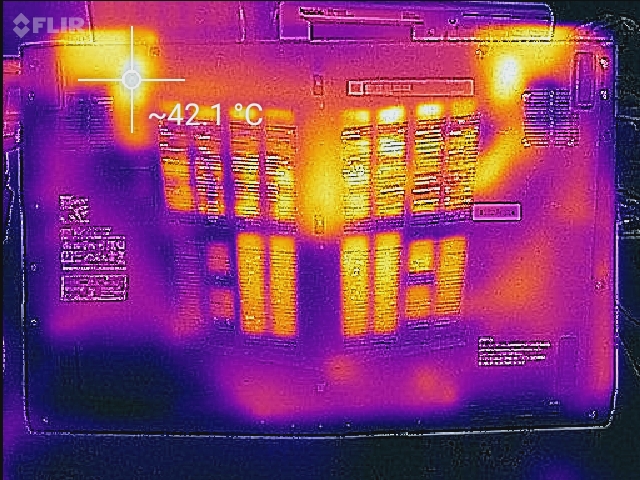
External temperatures are handled well. Under full load, the two fans do a good job of exhausting most heat out of the rear corners of the chassis. For this reason, gaming on a flat surface is recommended. The keyboard gets warm in the center (around the U, I, and O keys), reaching about 47° C at the hottest point. The WASD keys stay comparatively cool at 35° C and shouldn't cause any sweaty palms.
(-) The maximum temperature on the upper side is 47 °C / 117 F, compared to the average of 40.4 °C / 105 F, ranging from 21.2 to 68.8 °C for the class Gaming.
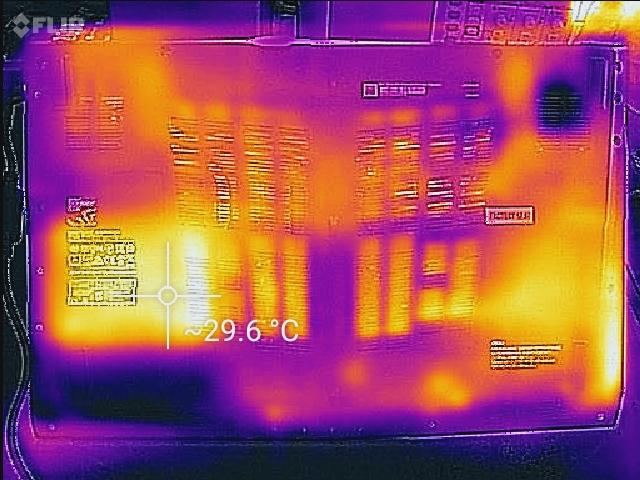
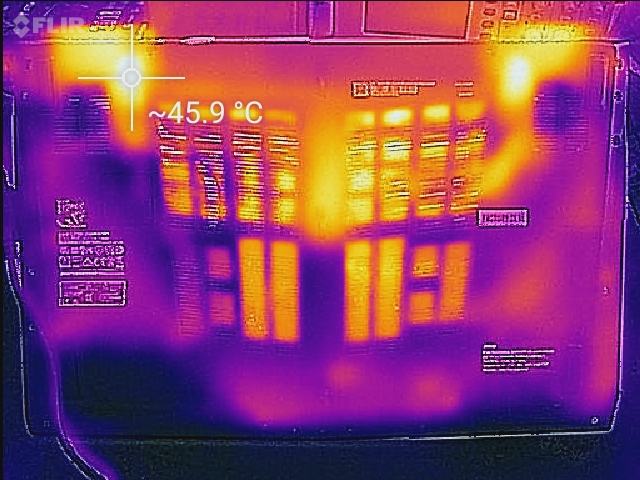
(-) The bottom heats up to a maximum of 45.6 °C / 114 F, compared to the average of 43.2 °C / 110 F
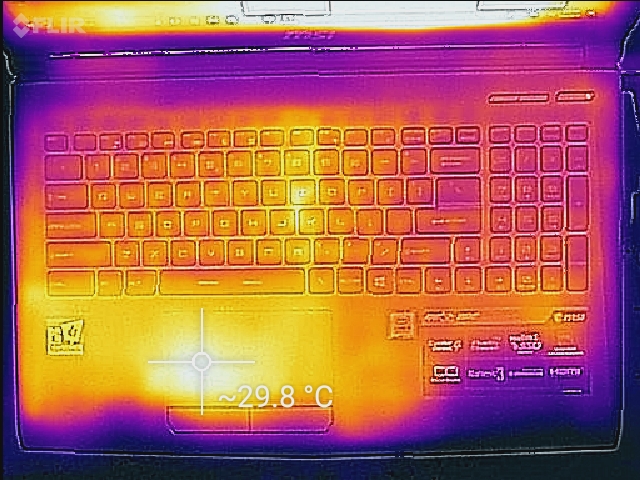
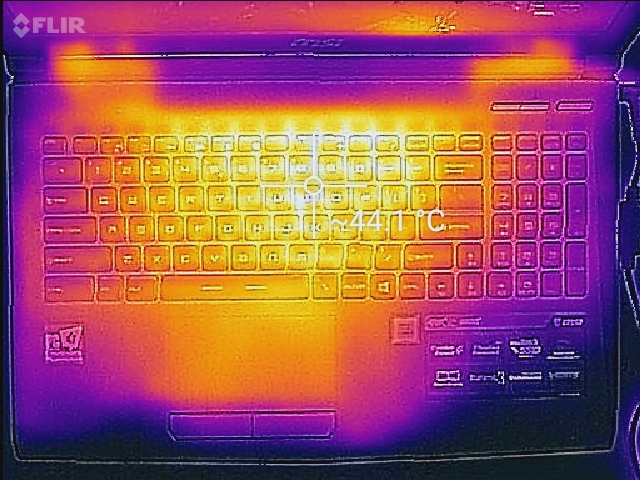
(+) In idle usage, the average temperature for the upper side is 27.2 °C / 81 F, compared to the device average of 33.9 °C / 93 F.
(±) Playing The Witcher 3, the average temperature for the upper side is 36.3 °C / 97 F, compared to the device average of 33.9 °C / 93 F.
(±) The palmrests and touchpad can get very hot to the touch with a maximum of 38.4 °C / 101.1 F.
(-) The average temperature of the palmrest area of similar devices was 28.8 °C / 83.8 F (-9.6 °C / -17.3 F).
Speakers

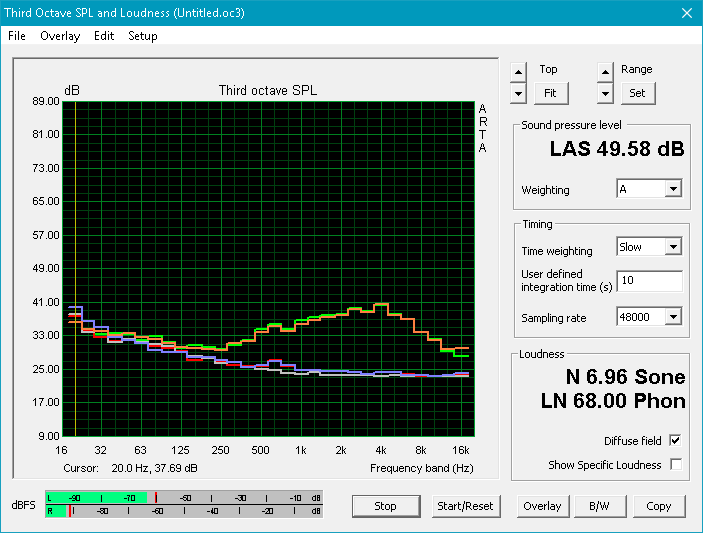
The four 2 Watt speakers get quite loud, peaking at about 80 dB. However, the lack of bass is a major sore point. There is a vent for a subwoofer, but such a speaker is sadly absent from the internals of the device. That's a shame, as a sub would greatly help the overall sound profile. Higher-end models from MSI that use the same chassis include a subwoofer. Lower frequencies aside, mids and highs are reasonably well-balanced and clear, though there is a bit of chassis rattle when the volume is turned up. As is usual for MSI gaming laptops, there is a dedicated headphone/SPDIF jack, but this model doesn't seem to support HiFi headphones, so an external DAC may be needed for better sound quality.
MSI GV62 8RE-016US audio analysis
(±) | speaker loudness is average but good (81.1 dB)
Bass 100 - 315 Hz
(-) | nearly no bass - on average 28.2% lower than median
(±) | linearity of bass is average (11% delta to prev. frequency)
Mids 400 - 2000 Hz
(±) | higher mids - on average 6.4% higher than median
(±) | linearity of mids is average (8.9% delta to prev. frequency)
Highs 2 - 16 kHz
(±) | higher highs - on average 5.6% higher than median
(±) | linearity of highs is average (7.6% delta to prev. frequency)
Overall 100 - 16.000 Hz
(±) | linearity of overall sound is average (27.3% difference to median)
Compared to same class
» 93% of all tested devices in this class were better, 1% similar, 6% worse
» The best had a delta of 6%, average was 18%, worst was 132%
Compared to all devices tested
» 83% of all tested devices were better, 4% similar, 13% worse
» The best had a delta of 4%, average was 24%, worst was 134%
Dell G5 15 5587 audio analysis
(-) | not very loud speakers (68.5 dB)
Bass 100 - 315 Hz
(±) | reduced bass - on average 12.5% lower than median
(+) | bass is linear (5.9% delta to prev. frequency)
Mids 400 - 2000 Hz
(+) | balanced mids - only 4.6% away from median
(+) | mids are linear (5.1% delta to prev. frequency)
Highs 2 - 16 kHz
(+) | balanced highs - only 1.1% away from median
(+) | highs are linear (3.6% delta to prev. frequency)
Overall 100 - 16.000 Hz
(+) | overall sound is linear (14.9% difference to median)
Compared to same class
» 30% of all tested devices in this class were better, 7% similar, 63% worse
» The best had a delta of 6%, average was 18%, worst was 132%
Compared to all devices tested
» 20% of all tested devices were better, 4% similar, 76% worse
» The best had a delta of 4%, average was 24%, worst was 134%
Energy Management
Power Consumption
Power draw is in line with expectations. When idle, the system pulls about 10-15 Watts. The GV62 will draw about 130-150 Watts under gaming loads, which is about average considering the specifications. Dell's Inspiron 15 and G5 15, both of which use a GTX 1060 Max-Q GPU, need considerably less power while gaming, each pulling about 100-110 Watts. Power-conscious users may want to opt for these laptops; the 20-30% reduction in power use may be worth the 10% lower gaming performance. The power adapter supplies up to 180 Watts.
| Off / Standby | |
| Idle | |
| Load |
|
Key:
min: | |
| MSI GV62 8RE-016US i5-8300H, GeForce GTX 1060 Mobile, Samsung PM871b MZNLN128HAHQ, IPS, 1920x1080, 15.6" | MSI GF62VR 7RF-877 i7-7700HQ, GeForce GTX 1060 Mobile, Intel SSD 600p SSDPEKKW256G7, TN LED, 1920x1080, 15.6" | Dell Inspiron 15 7000 7577 4K i7-7700HQ, GeForce GTX 1060 Max-Q, SK hynix SC311 M.2, IPS, 3840x2160, 15.6" | Lenovo Legion Y520-15IKBN 80WK0042GE i5-7300HQ, GeForce GTX 1050 Ti Mobile, Samsung PM961 NVMe MZVLW128HEGR, IPS, 1920x1080, 15.6" | Acer Predator Helios 300 PH317-52-51M6 i5-8300H, GeForce GTX 1050 Ti Mobile, Hynix HFS128G39TND, IPS, 1920x1080, 17.3" | Dell G5 15 5587 i5-8300H, GeForce GTX 1060 Max-Q, SK hynix SC311 M.2, IPS, 1920x1080, 15.6" | |
|---|---|---|---|---|---|---|
| Power Consumption | -12% | 31% | 40% | 25% | 30% | |
| Idle Minimum * (Watt) | 9.38 | 16.2 -73% | 5.5 41% | 5.2 45% | 6 36% | 4.9 48% |
| Idle Average * (Watt) | 15.95 | 18.2 -14% | 10.5 34% | 8.3 48% | 9 44% | 8.5 47% |
| Idle Maximum * (Watt) | 18.46 | 18.9 -2% | 10.9 41% | 10.1 45% | 13 30% | 9.1 51% |
| Load Average * (Watt) | 95.68 | 82.7 14% | 72 25% | 62.7 34% | 95 1% | 90.7 5% |
| Witcher 3 ultra * (Watt) | 135.6 | 125.7 7% | 97.4 28% | 94 31% | 102 25% | 110 19% |
| Load Maximum * (Watt) | 156.98 | 162.3 -3% | 130.4 17% | 100 36% | 134 15% | 144 8% |
* ... smaller is better
Battery Life
Battery life is poor. In our WiFi v1.3 battery test, the GV62 lasted a meager 3.5 hours, due in part to its small 41 Wh battery. While budget gaming laptops aren't renowned for their longevity, the offerings from Dell, Lenovo, and Acer each lasted 2-2.5 hours longer during the same test. Users will need to bring the power adapter (16.5 cm x 7.8 cm x 2.4 cm) along when working and playing away from home.
| MSI GV62 8RE-016US i5-8300H, GeForce GTX 1060 Mobile, 41 Wh | MSI GF62VR 7RF-877 i7-7700HQ, GeForce GTX 1060 Mobile, 41 Wh | Dell Inspiron 15 7000 7577 4K i7-7700HQ, GeForce GTX 1060 Max-Q, 56 Wh | Lenovo Legion Y520-15IKBN 80WK0042GE i5-7300HQ, GeForce GTX 1050 Ti Mobile, 45 Wh | Acer Predator Helios 300 PH317-52-51M6 i5-8300H, GeForce GTX 1050 Ti Mobile, 48 Wh | Dell G5 15 5587 i5-8300H, GeForce GTX 1060 Max-Q, 56 Wh | |
|---|---|---|---|---|---|---|
| Battery runtime | -31% | 86% | 83% | 112% | 141% | |
| Reader / Idle (h) | 5.3 | 2.8 -47% | 10 89% | 10.6 100% | 11.8 123% | 11.8 123% |
| WiFi v1.3 (h) | 3.5 | 1.9 -46% | 5.4 54% | 5.2 49% | 5.9 69% | 6.5 86% |
| Load (h) | 0.7 | 0.7 0% | 1.5 114% | 1.4 100% | 1.7 143% | 2.2 214% |
Pros
Cons
Verdict
MSI is known for offering multiple choices to match almost any need, but at this point, they may be over-saturating their own marketplace. Case in point: today's review model. The GV62 has little to offer that can't already be found in its other lines. The GV62 is a near-carbon copy of the GF62VR, the GE62VR, the GL62VR, and the GP62VR, all of which are currently offered by MSI through various online retailers. The cases are the same, the keyboards are the same, the cooling solutions are the same, the port selections are the same, and so on. The major differences lie in the specifications. Even then, all of these lines offer similar (if not the exact same) configurations.
MSI's other laptops aside, the GV62 is a fairly competent entry-level gaming laptop. For USD $1050, it ticks a lot of boxes, especially when it comes to performance. The Core i5-8300H is a great match for the GTX 1060, a GPU not often found in laptops under $1200. Compared to other entry-level gaming notebooks priced around $1000, the GV62 offers better bang-for-the-buck performance in games and multi-threaded workloads. However, this improved performance comes at the cost of case design, screen quality, and battery life.
The GV62 is perhaps a redundant device, but it's still a good choice for gamers on a tight budget. MSI has a good answer to the current budget gaming kings, the Acer Predator Helios 300 and Dell Inspiron 15 7577, and any of these laptops are a good choice for the price. Budget gaming laptops have never been better.
MSI GV62 8RE-016US
- 06/21/2018 v6 (old)
Sam Medley
Price comparison
