Dell XPS 15 9575 (i7-8705G, Vega M GL, 4K UHD) Convertible Review
We reviewed our first XPS 15 9575 SKU just a few weeks ago and its performance surprised us. Not only are the Core i5-8305G CPU and Radeon RX Vega M GL GPU comparable to the Core i7-7700HQ and GTX 1050, respectively, the thinner XPS 15 9575 even manages to run cooler and quieter than the thicker XPS 15 9560 that it derives from.
For our second look at the XPS 15 9575, we want to see what benefits the Core i7-8705G SKU can bring to the table over the i5-8305G SKU. Both processors are equipped with the same Vega M GL GPU, but Dell is locking both the 4K UHD touchscreen and 16 GB RAM options for the Core i7 configuration only. As a result, our test unit today retails for over $2200 USD compared to just $1500 USD for our original Core i5 XPS 15 9575 unit. Does the extra performance justify the price differential?
We recommend checking out our original review on the Core i5 XPS 15 9575 SKU for more information on the chassis and its features. The XPS 15 9575 is Dell's premier 15-inch XPS convertible and the first with MagLev keyboard keys, GORE insulation, and Kaby Lake-G all in a laptop.
| SD Card Reader | |
| average JPG Copy Test (av. of 3 runs) | |
| Eurocom Sky X9C (Toshiba Exceria Pro SDXC 64 GB UHS-II) | |
| Dell XPS 15 9575 i7-8705G (Toshiba Exceria Pro M501 UHS-II) | |
| Dell XPS 15 9560 (i7-7700HQ, UHD) (Toshiba Exceria Pro SDXC 64 GB UHS-II) | |
| Gigabyte Aero 14-K8 (Toshiba Exceria Pro SDXC 64 GB UHS-II) | |
| maximum AS SSD Seq Read Test (1GB) | |
| Dell XPS 15 9560 (i7-7700HQ, UHD) (Toshiba Exceria Pro SDXC 64 GB UHS-II) | |
| Eurocom Sky X9C (Toshiba Exceria Pro SDXC 64 GB UHS-II) | |
| Dell XPS 15 9575 i7-8705G (Toshiba Exceria Pro M501 UHS-II) | |
| Gigabyte Aero 14-K8 (Toshiba Exceria Pro SDXC 64 GB UHS-II) | |
Accessories
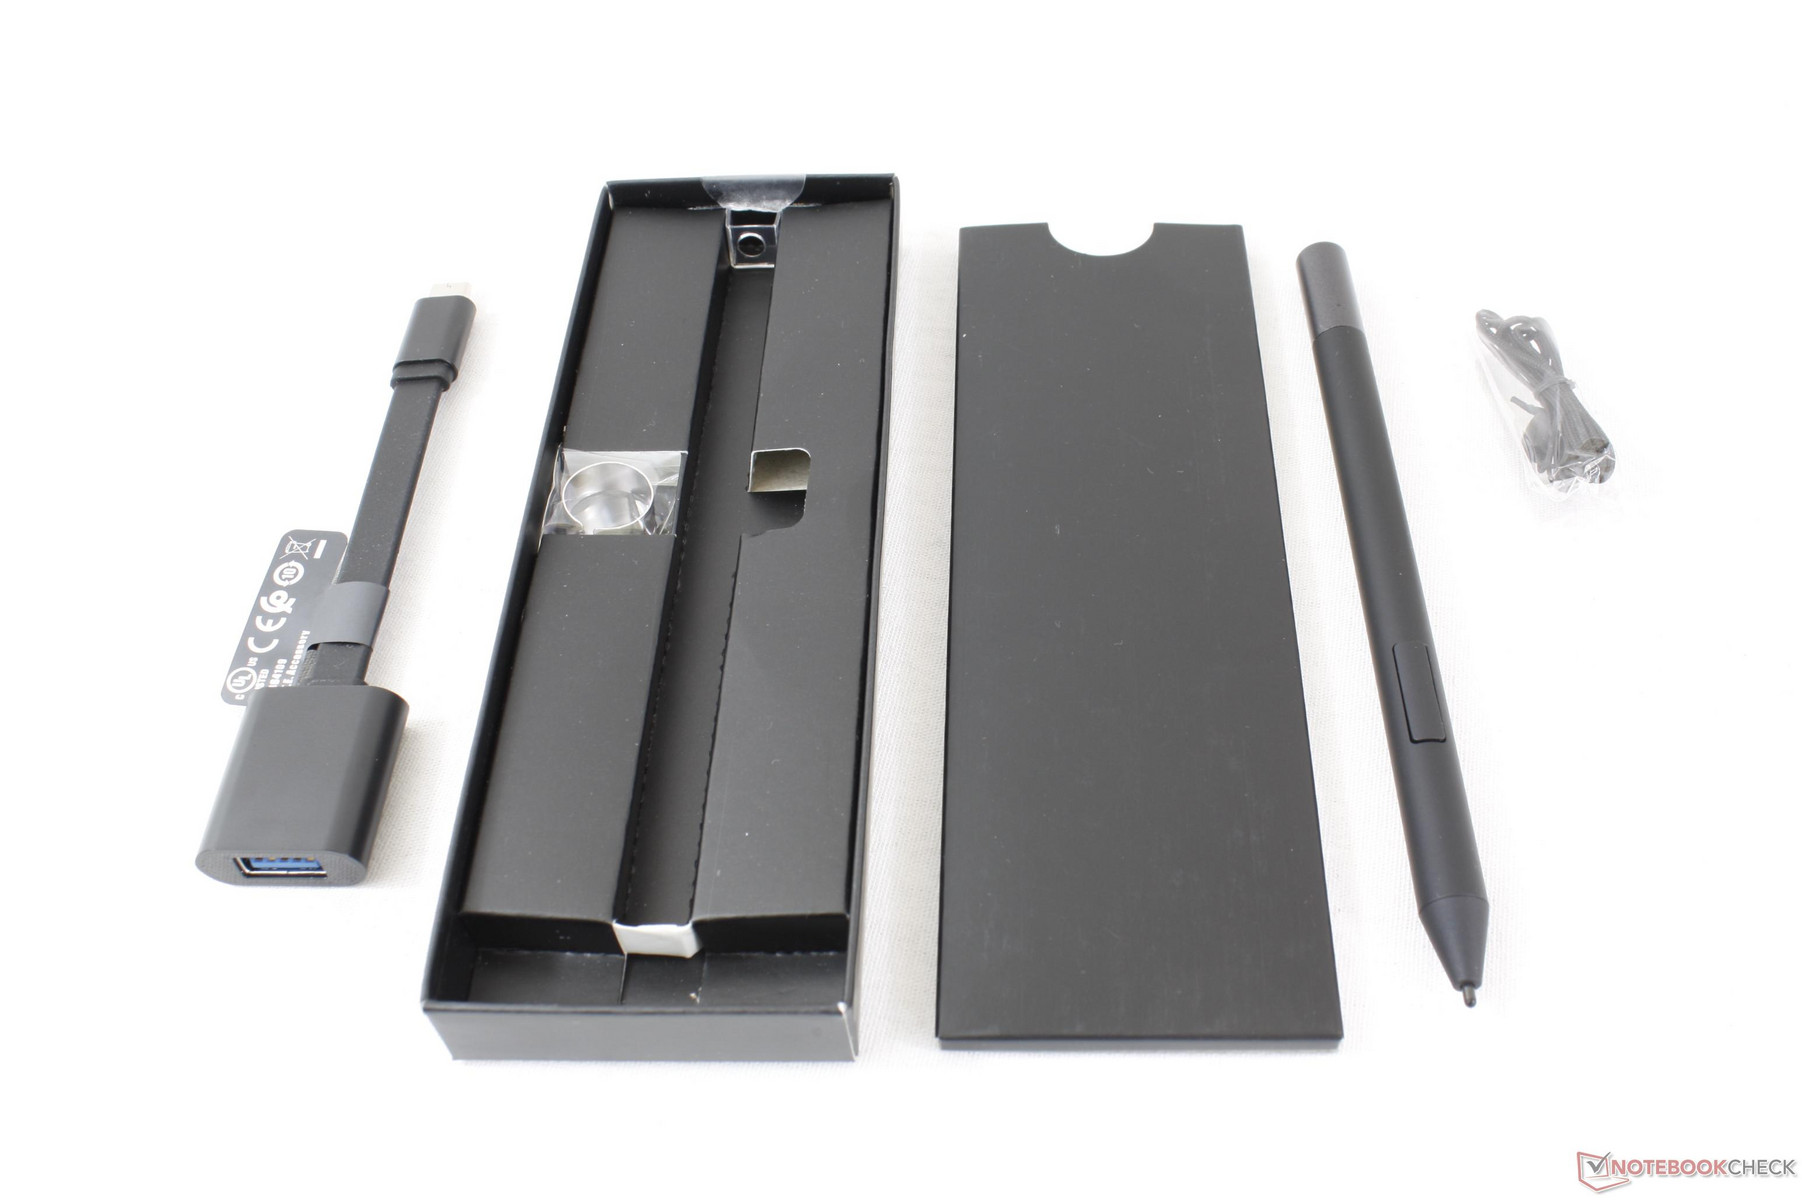
Our last unit was not representative of the retail unit users would receive. Fortunately, our Core i7 SKU comes with all the expected extras in the box including a USB Type-C to Type-A adapter, an active stylus pen, warranty card, and a Quick Start guide. A detailed disassembly guide can be found on Dell's official support site here.
Warranty
The standard one-year limited warranty applies with options of up to 4 years of Premium Plus coverage. Please see our Guarantees, Return policies and Warranties FAQ for country-specific information.
Input Devices
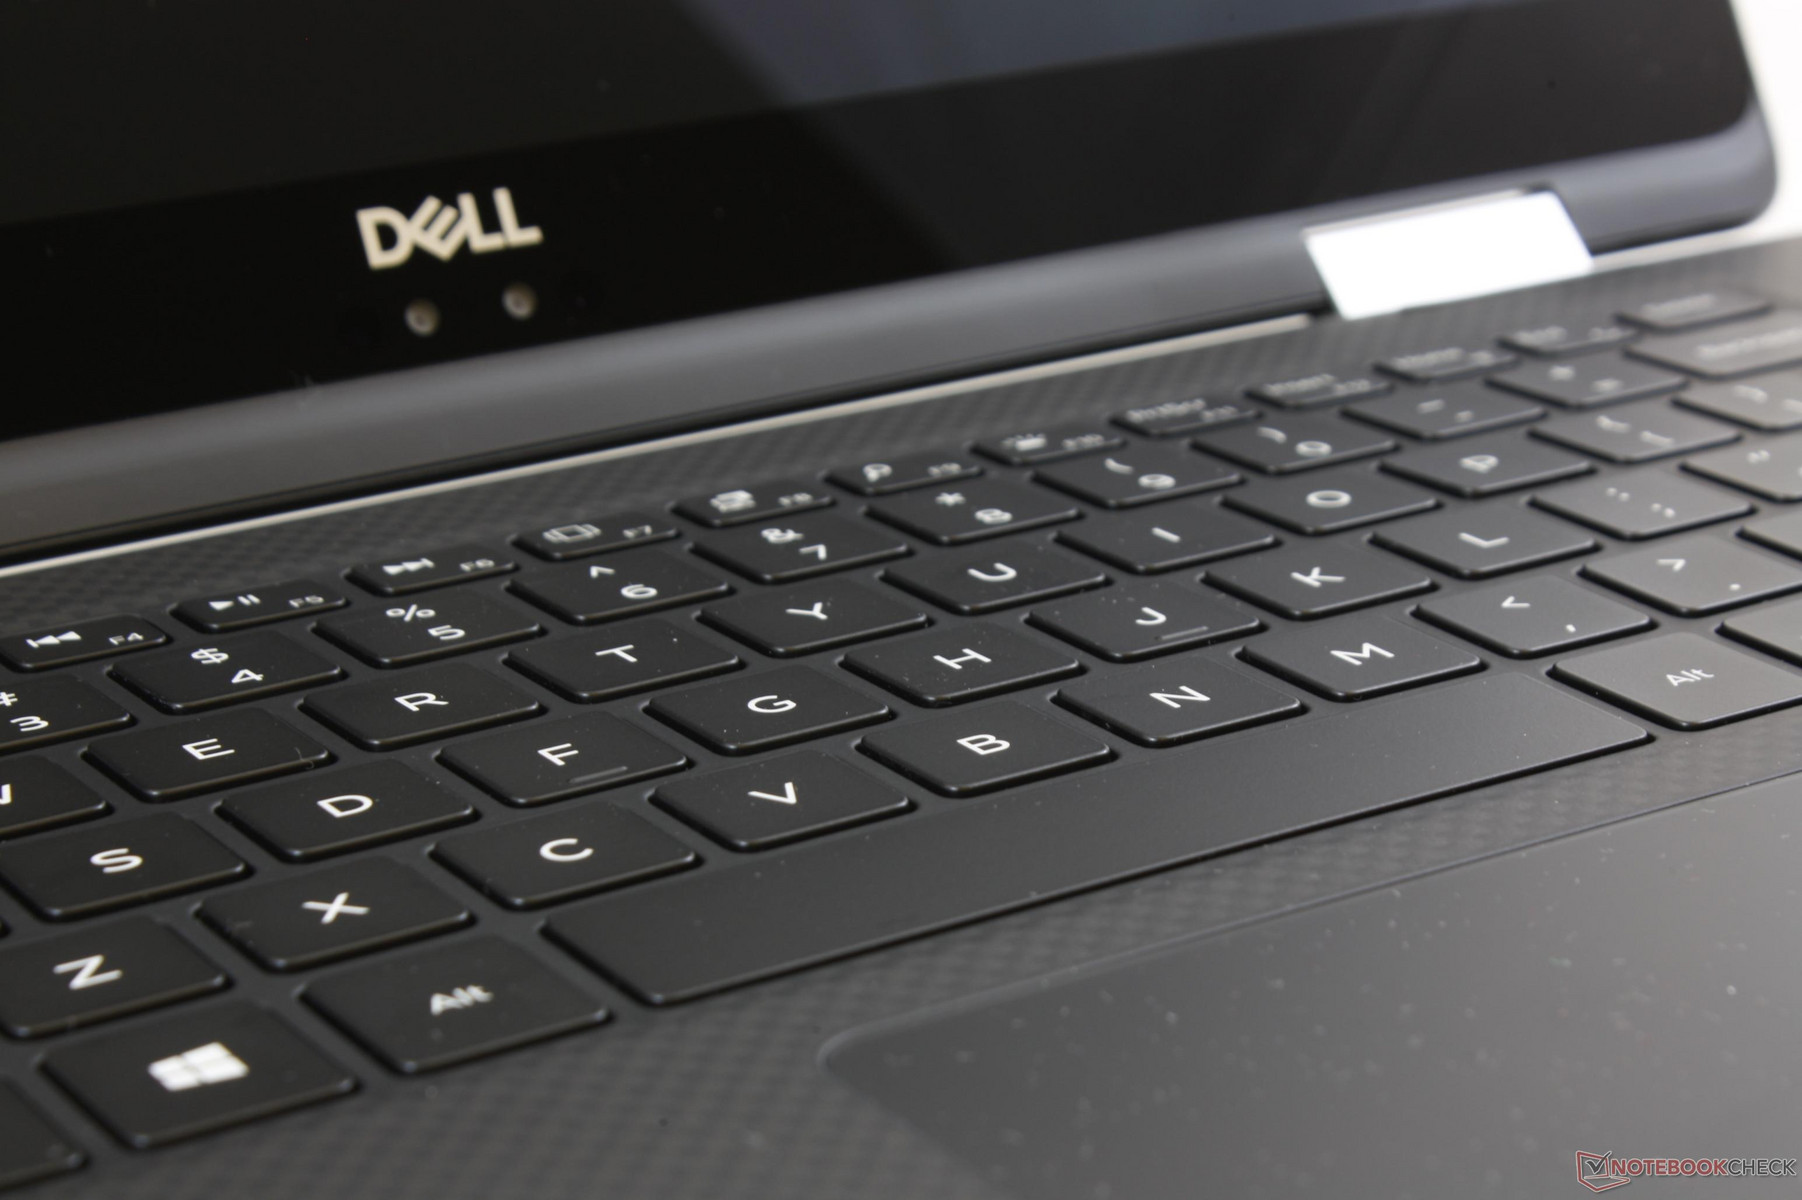
Keyboard & Touchpad
As mentioned before, the MagLev keyboard will take some time to become accustomed to because it feels very different from the usual membrane-based keyboards found on most Windows laptops. Travel is extremely shallow (0.7 mm) to give an experience more akin to a MacBook that users will either love or hate. We can, however, appreciate the fact that feedback is uniform and very consistent between each main key. We wish the Function keys and Arrow keys could have been larger as the super-short travel pairs poorly with their small sizes.
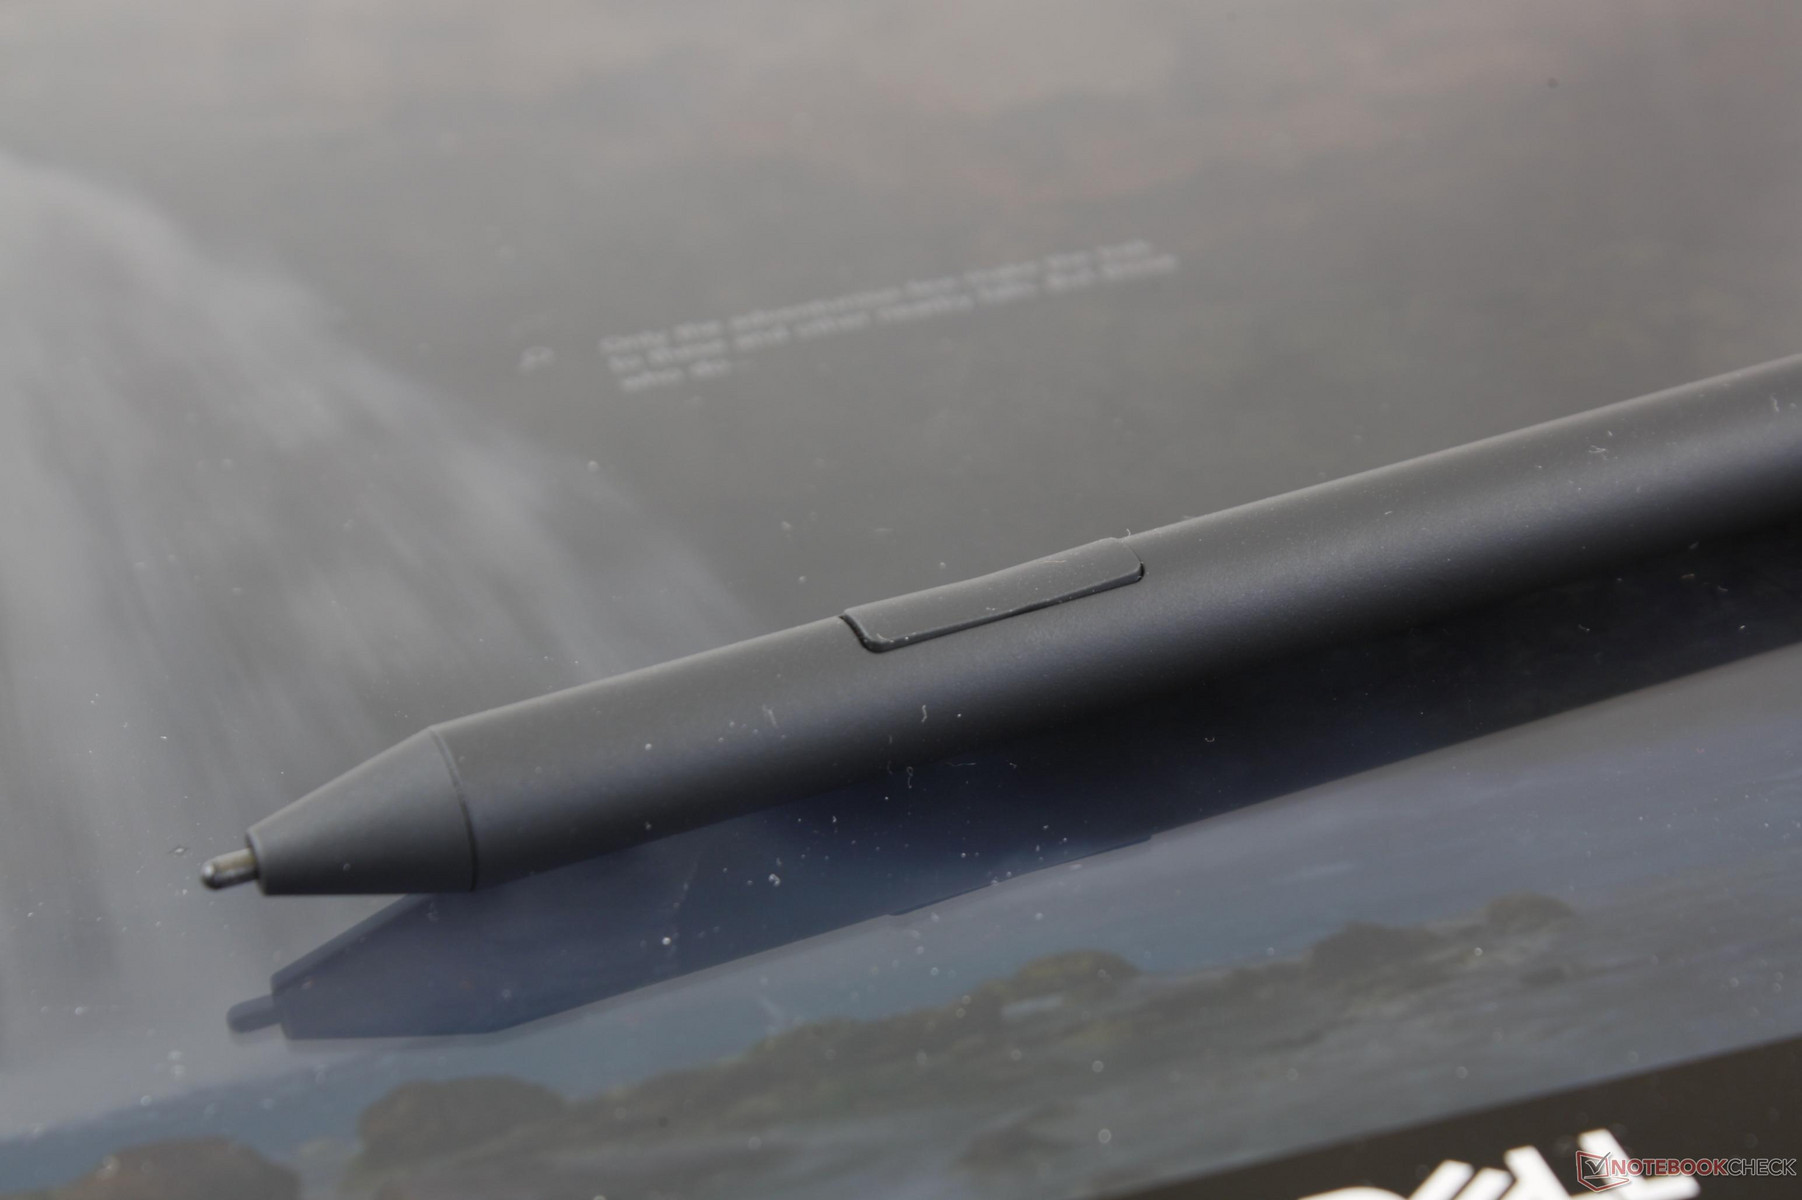
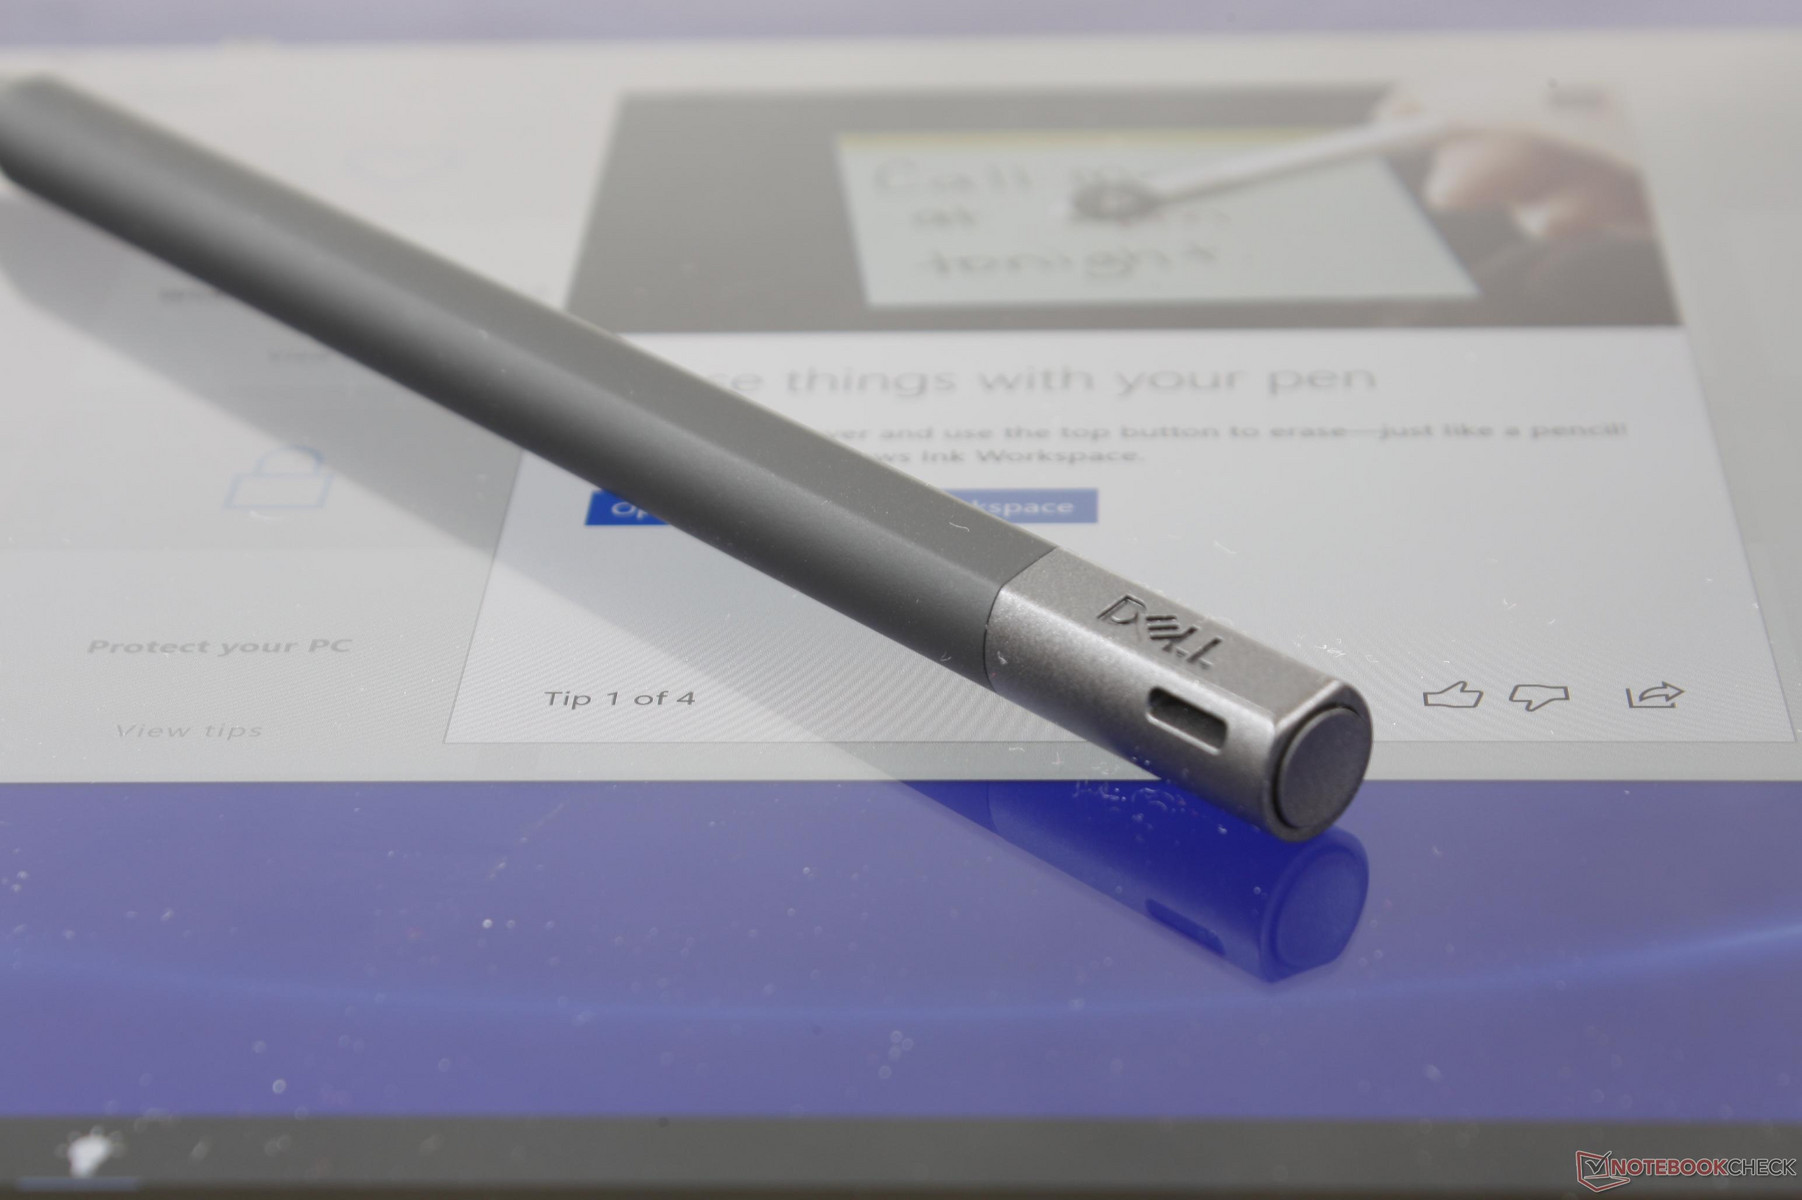
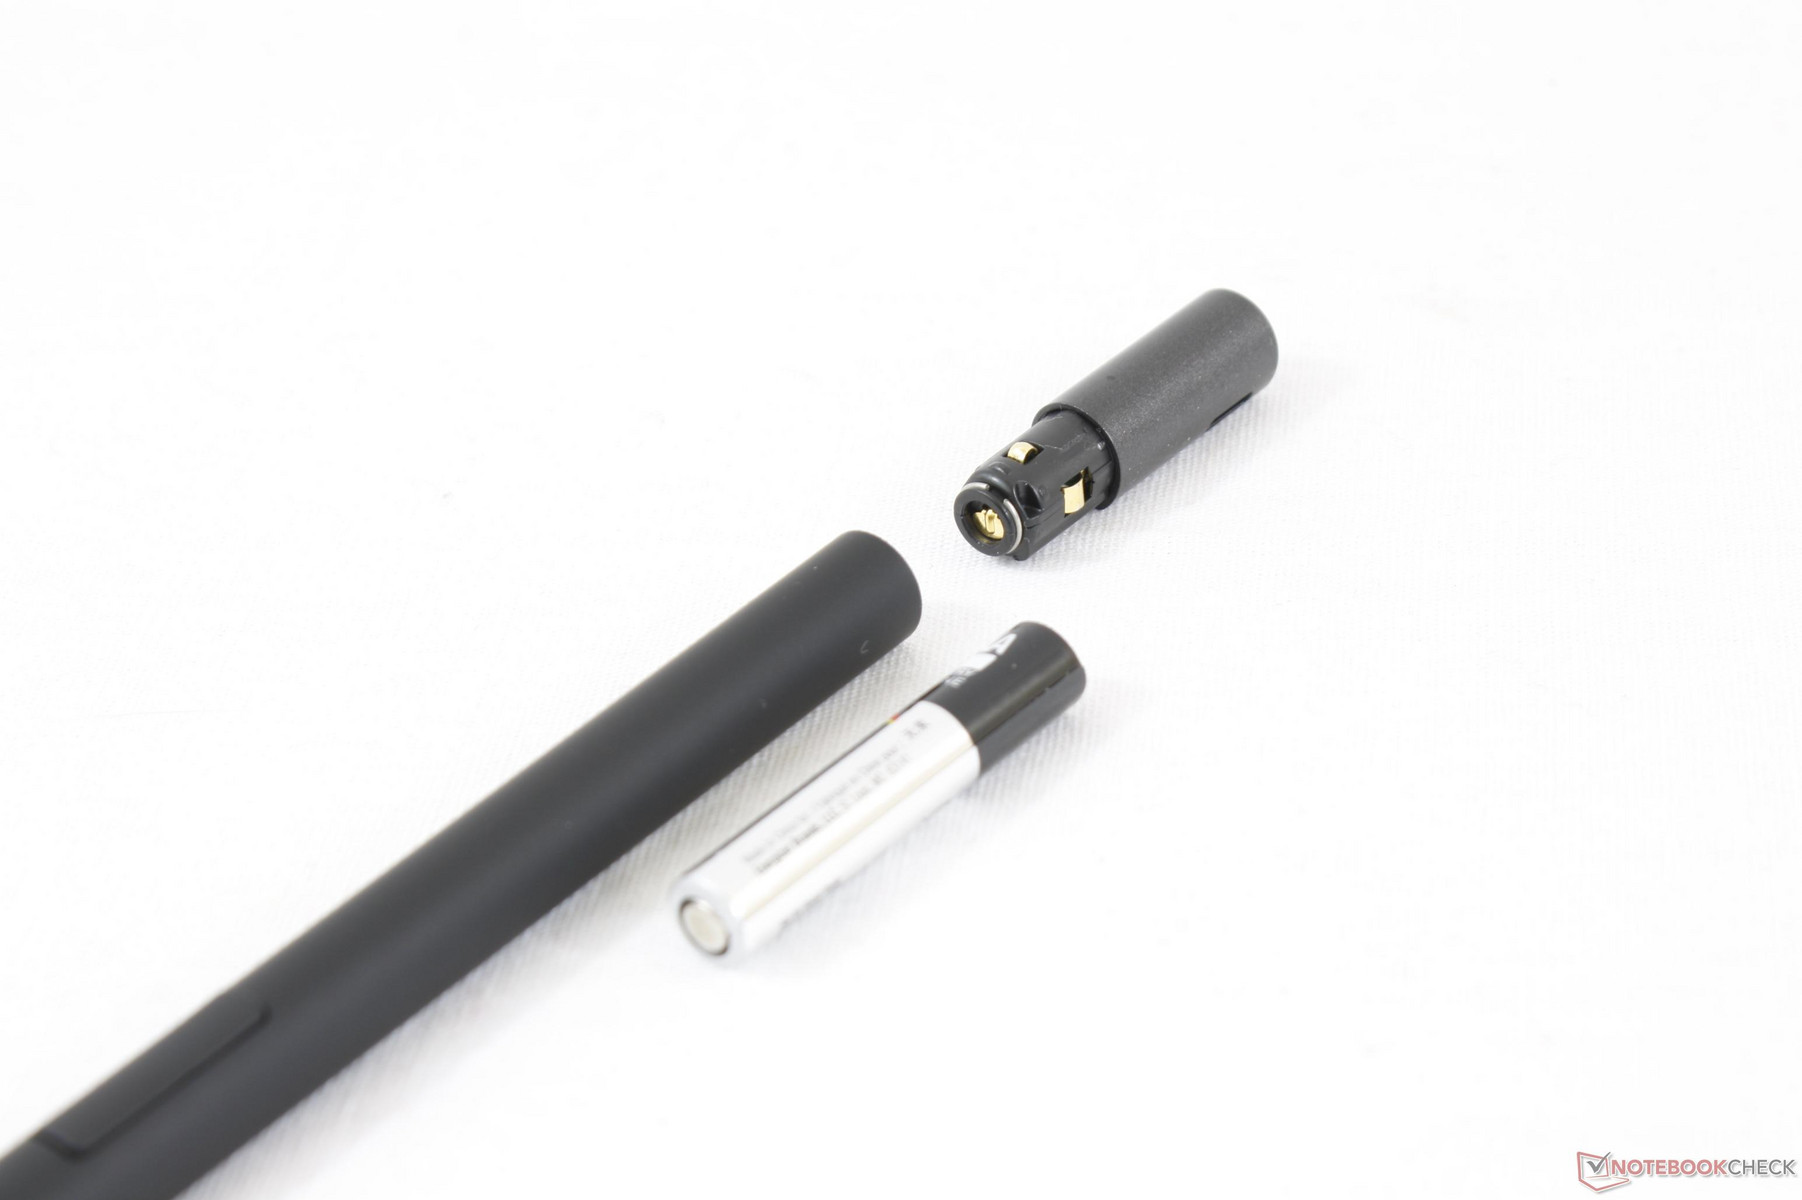
The included WACOM Premium Active Pen (PN579X) is 15 cm in length with 4096 levels of pressure sensitivity and a 240 Hz report rate as defined by the AES 2.0 standard. The top button and two side buttons are used to launch applications and pair with the system. Unfortunately, the side buttons have weak feedback when pressed compared to the Microsoft Surface Pen and they could have benefited from a firmer feel. Unlike on the older Dell Active Stylus Pen, the newer Premium Active Pen has no pen hook near the top for clamping onto clothing or paperwork. Instead, the stylus relies on a magnet to stick onto objects and along the edge of the XPS system.
There appears to be no replacement pen tips at the time of writing.
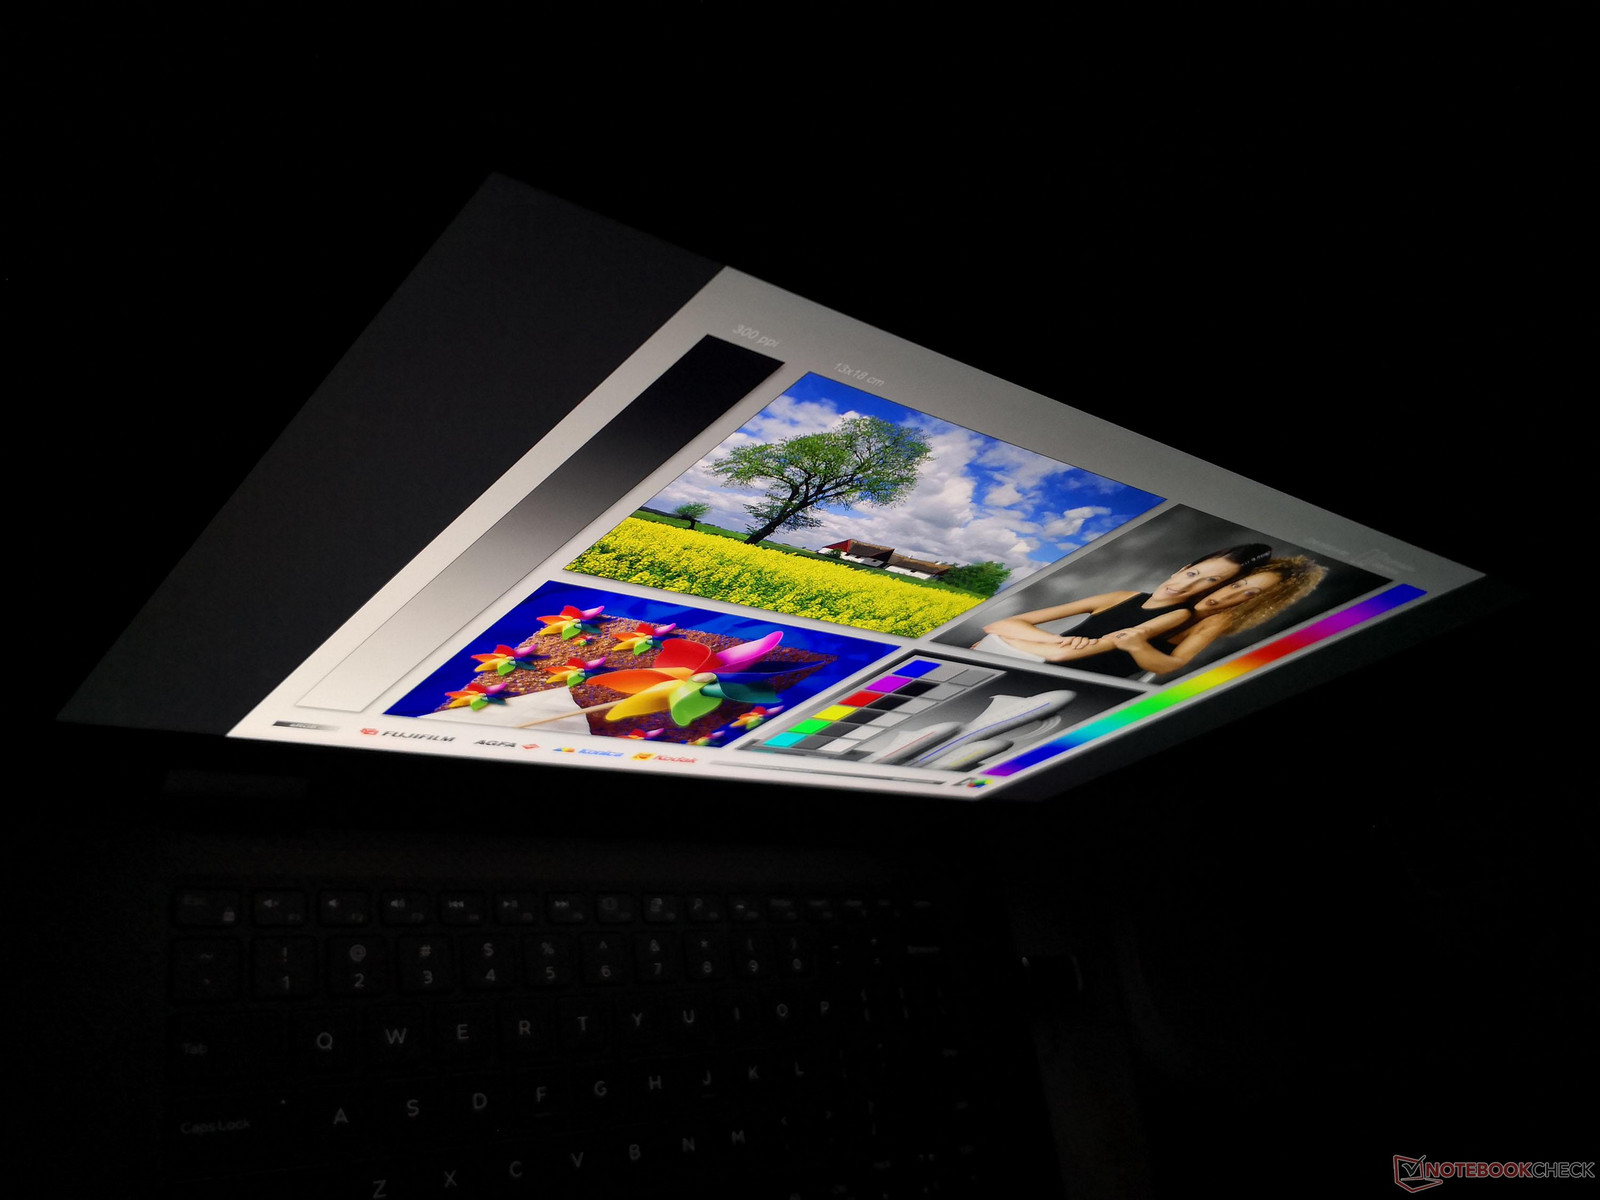
Display
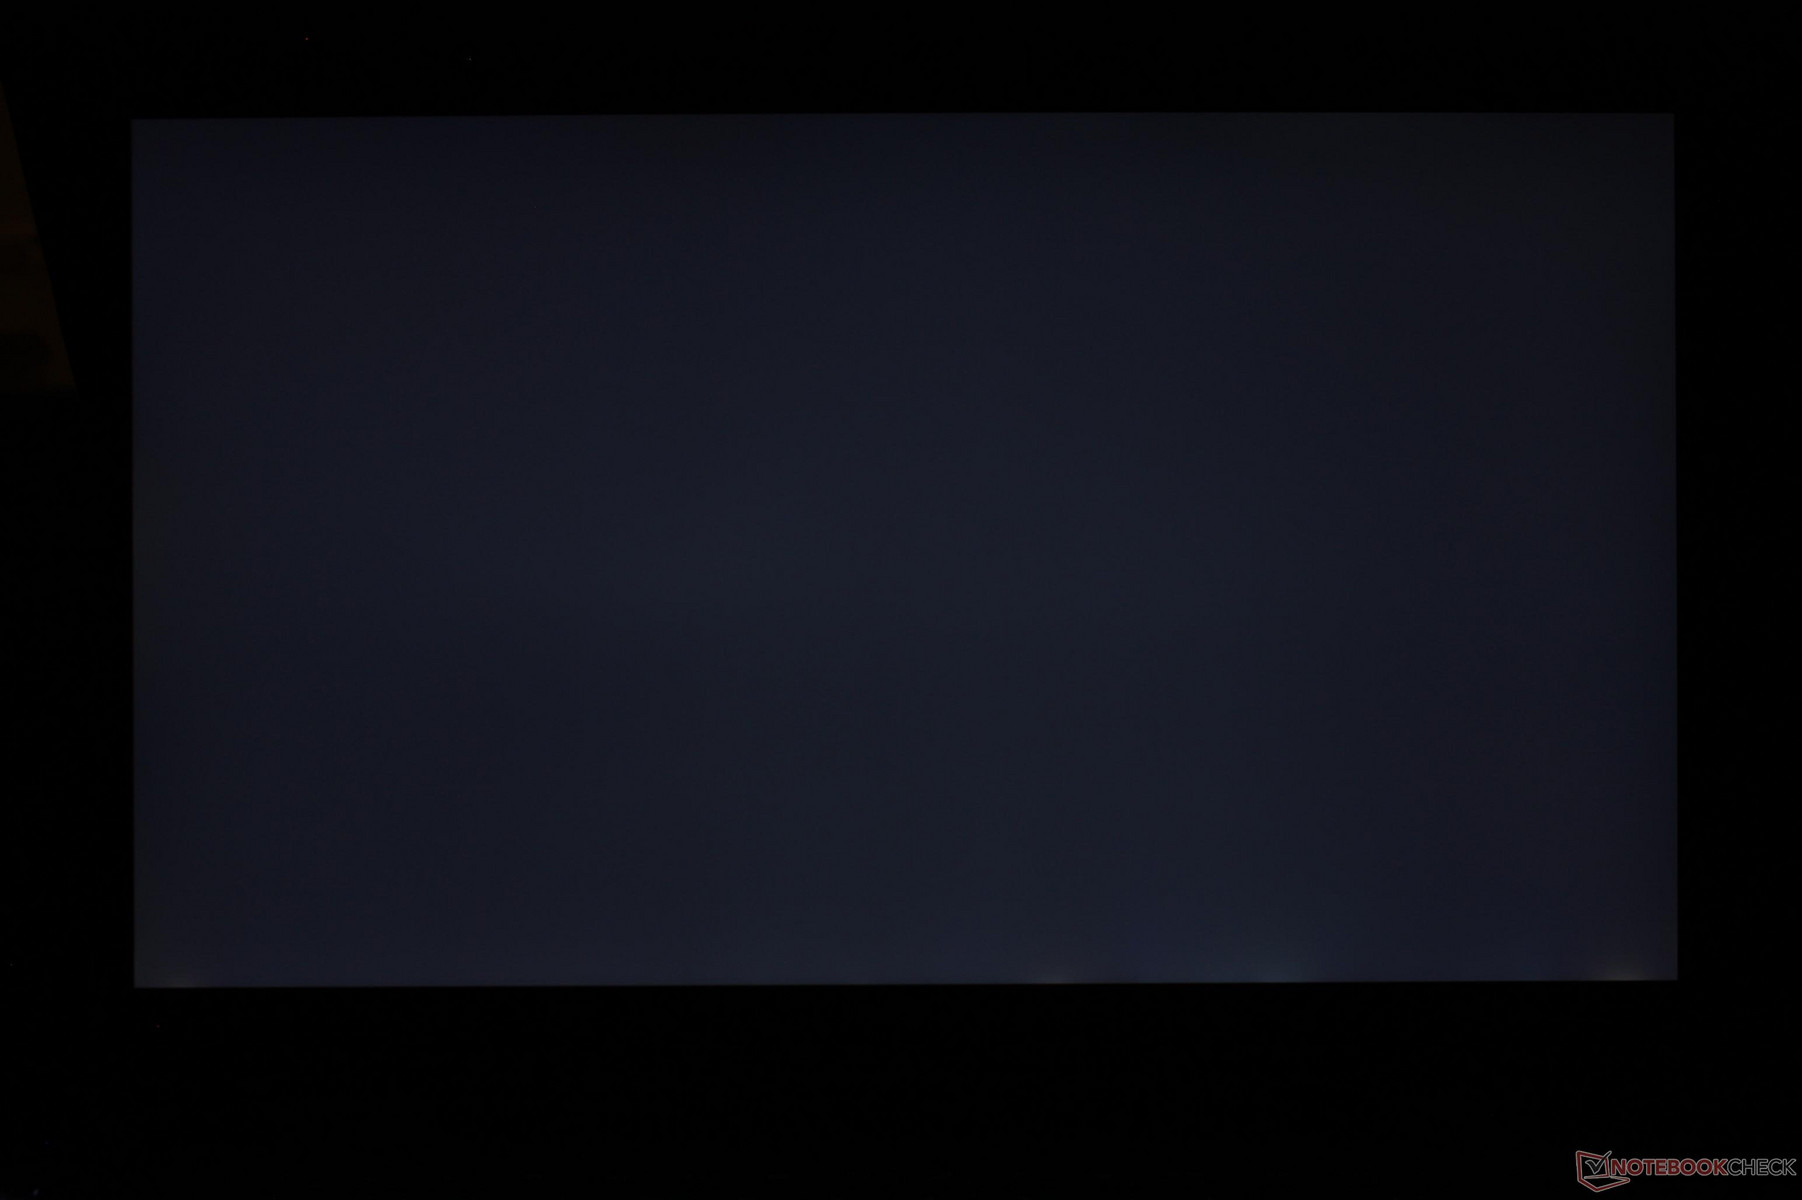
Much like the XPS 15 9560, the XPS 15 9575 includes FHD and 4K UHD options with panels provided by Sharp. Workstation laptops like the Precision 5510 and Lenovo ThinkPad P50 carry very similar 4K UHD panels as our XPS 15 9575 since they all share the same LQ156D1 identification. Subjectively, texts and images are crisp and free of grains just like on the XPS 15 9560. When compared to the FHD SKU of the XPS 15 9575, the 4K panel here is brighter on the center but with poorer backlight uniformity. In other words, the 4K UHD screen is dimmer around the edges and corners compared to the FHD SKU. Black-White response times are still moderately slow especially when compared to the 5 ms and 7 ms panels found on newer gaming notebooks.
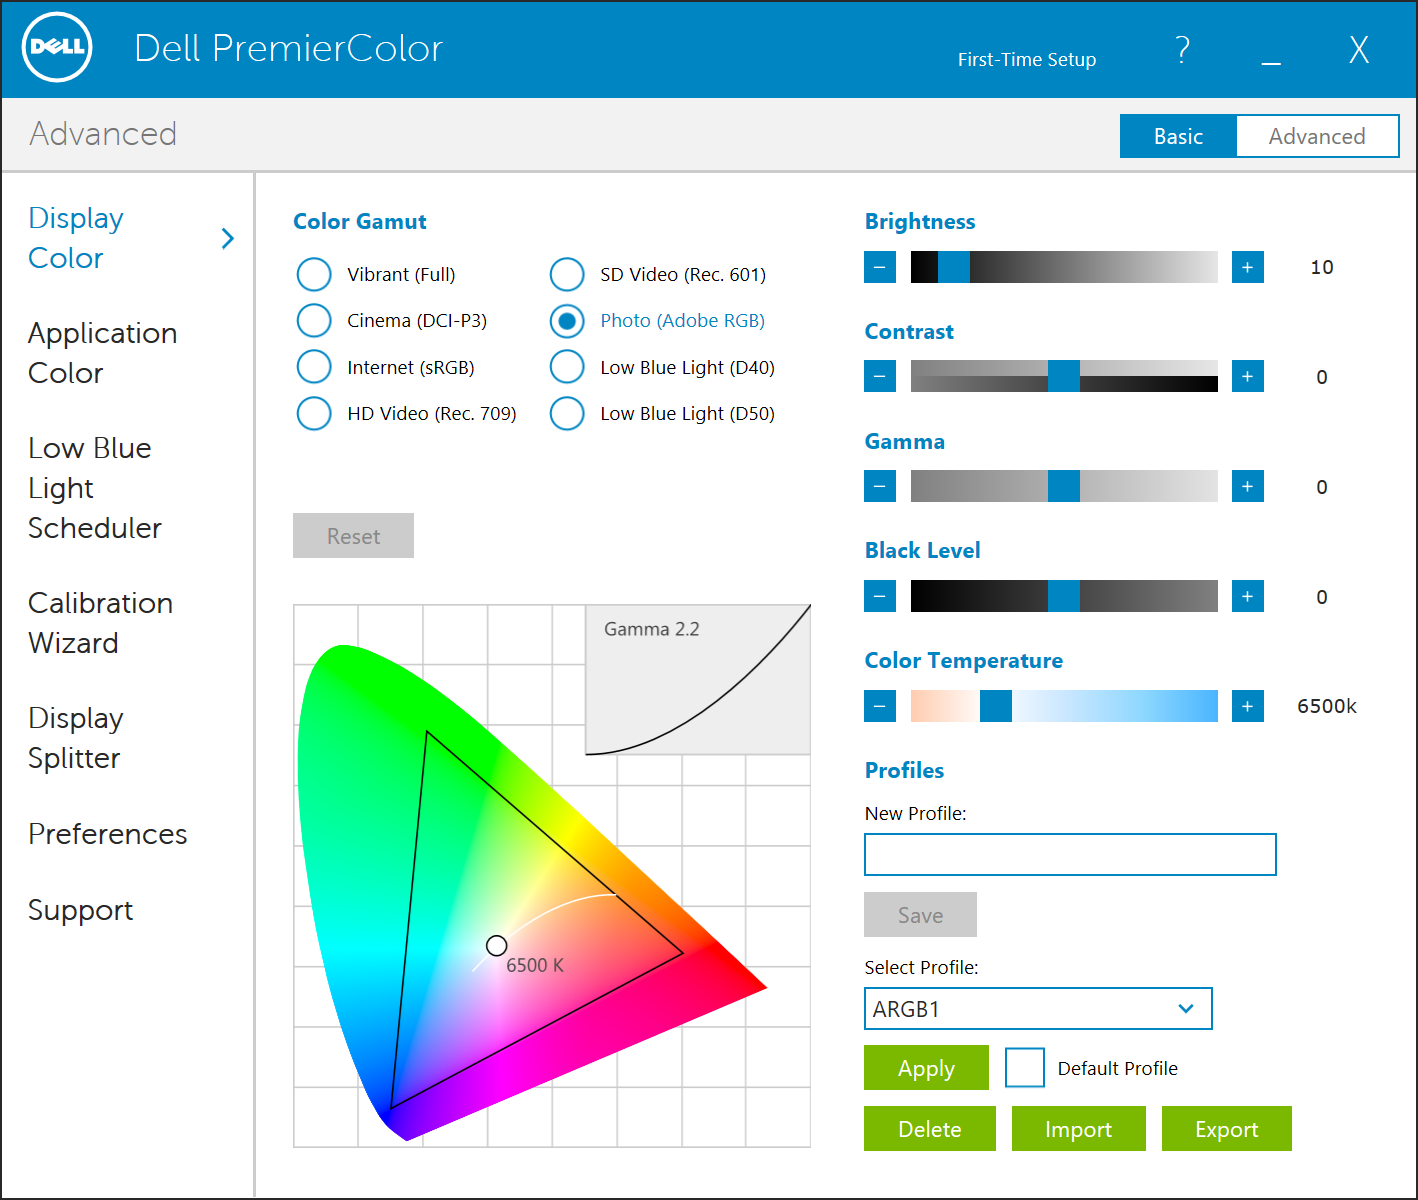
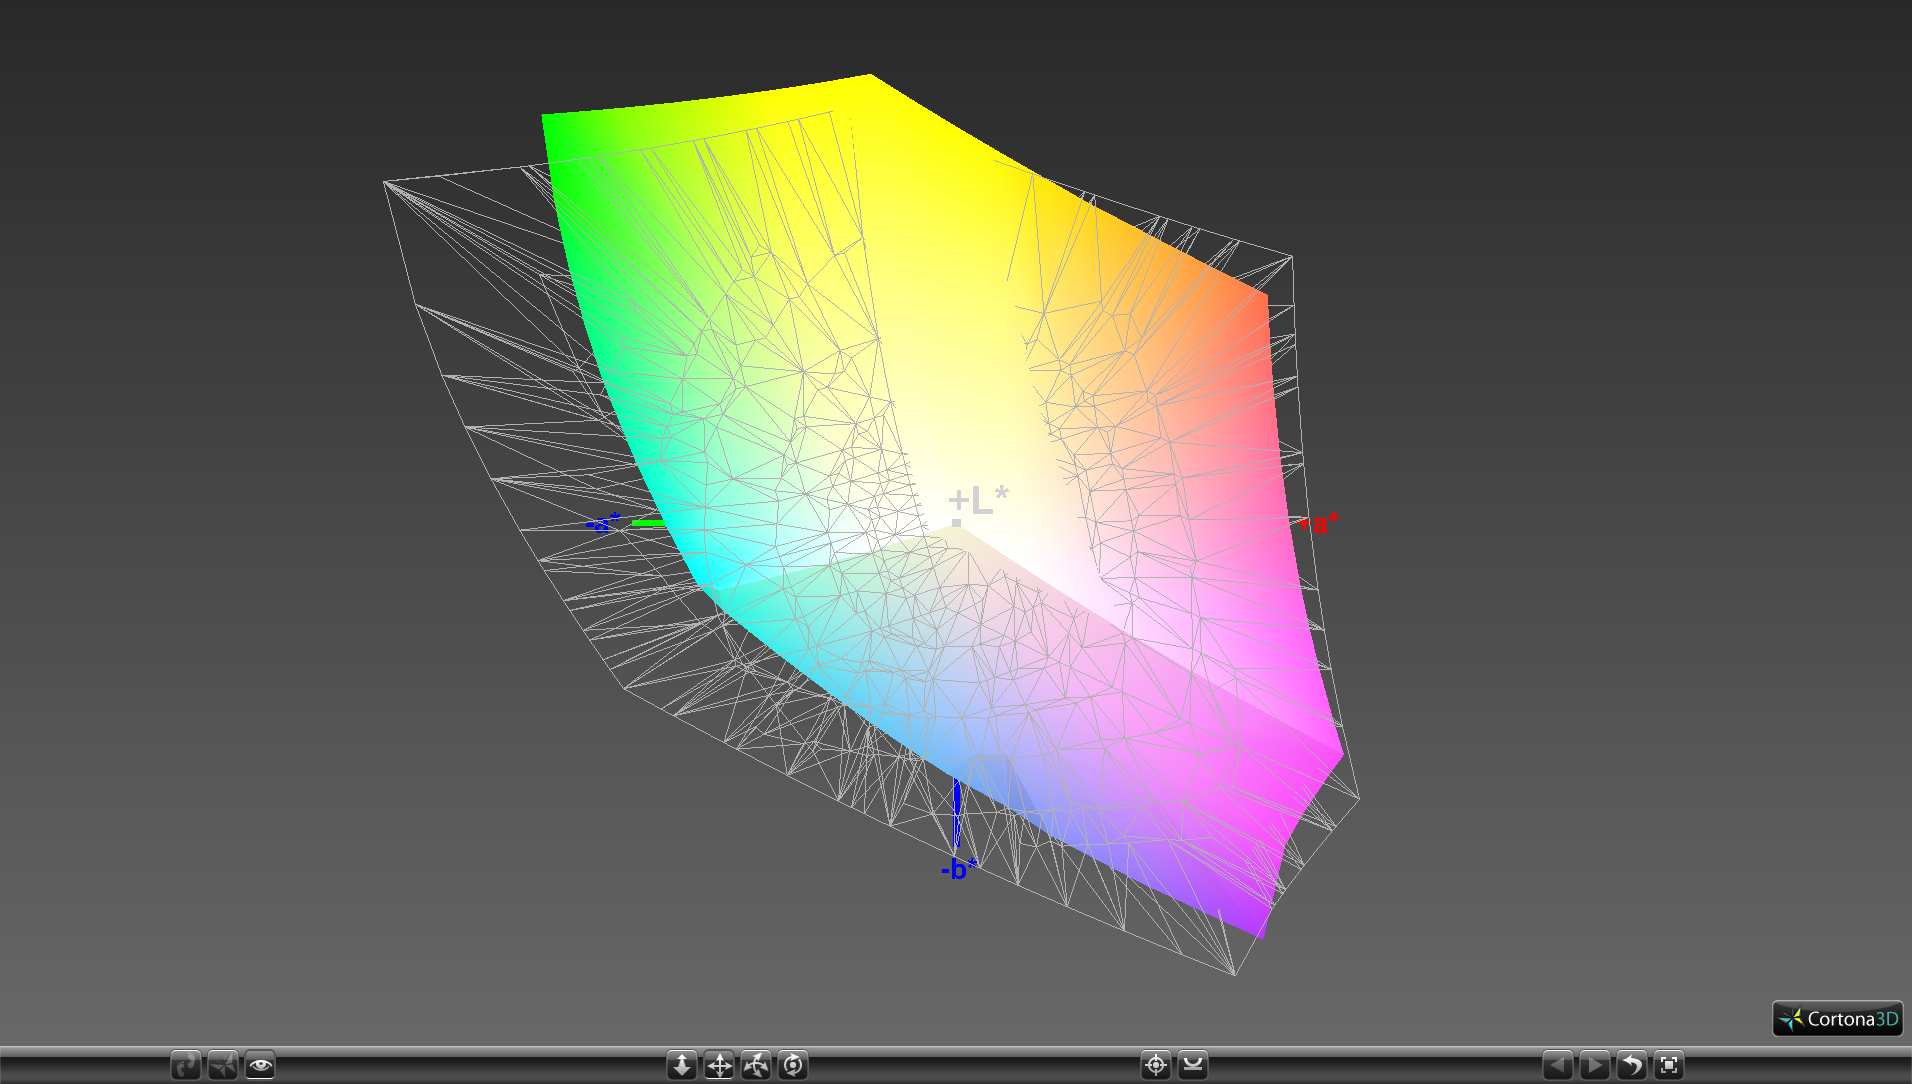
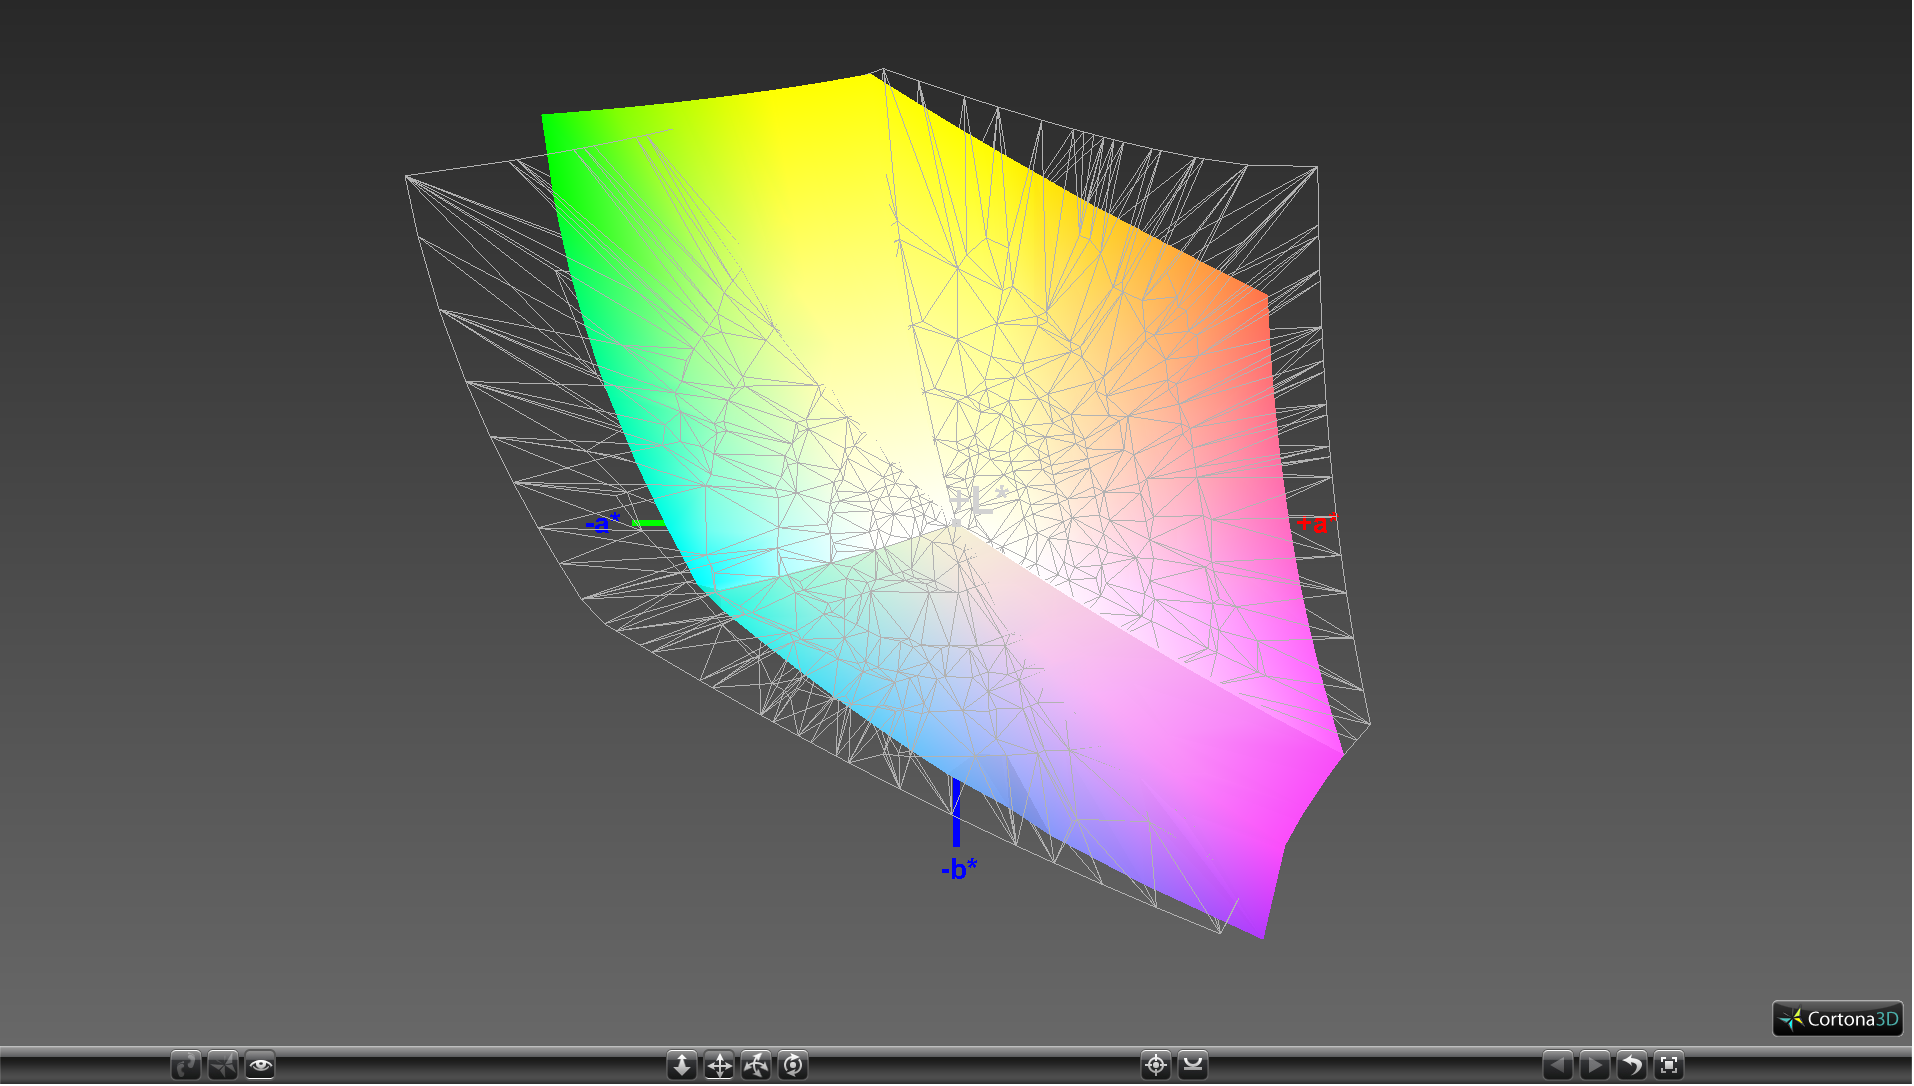
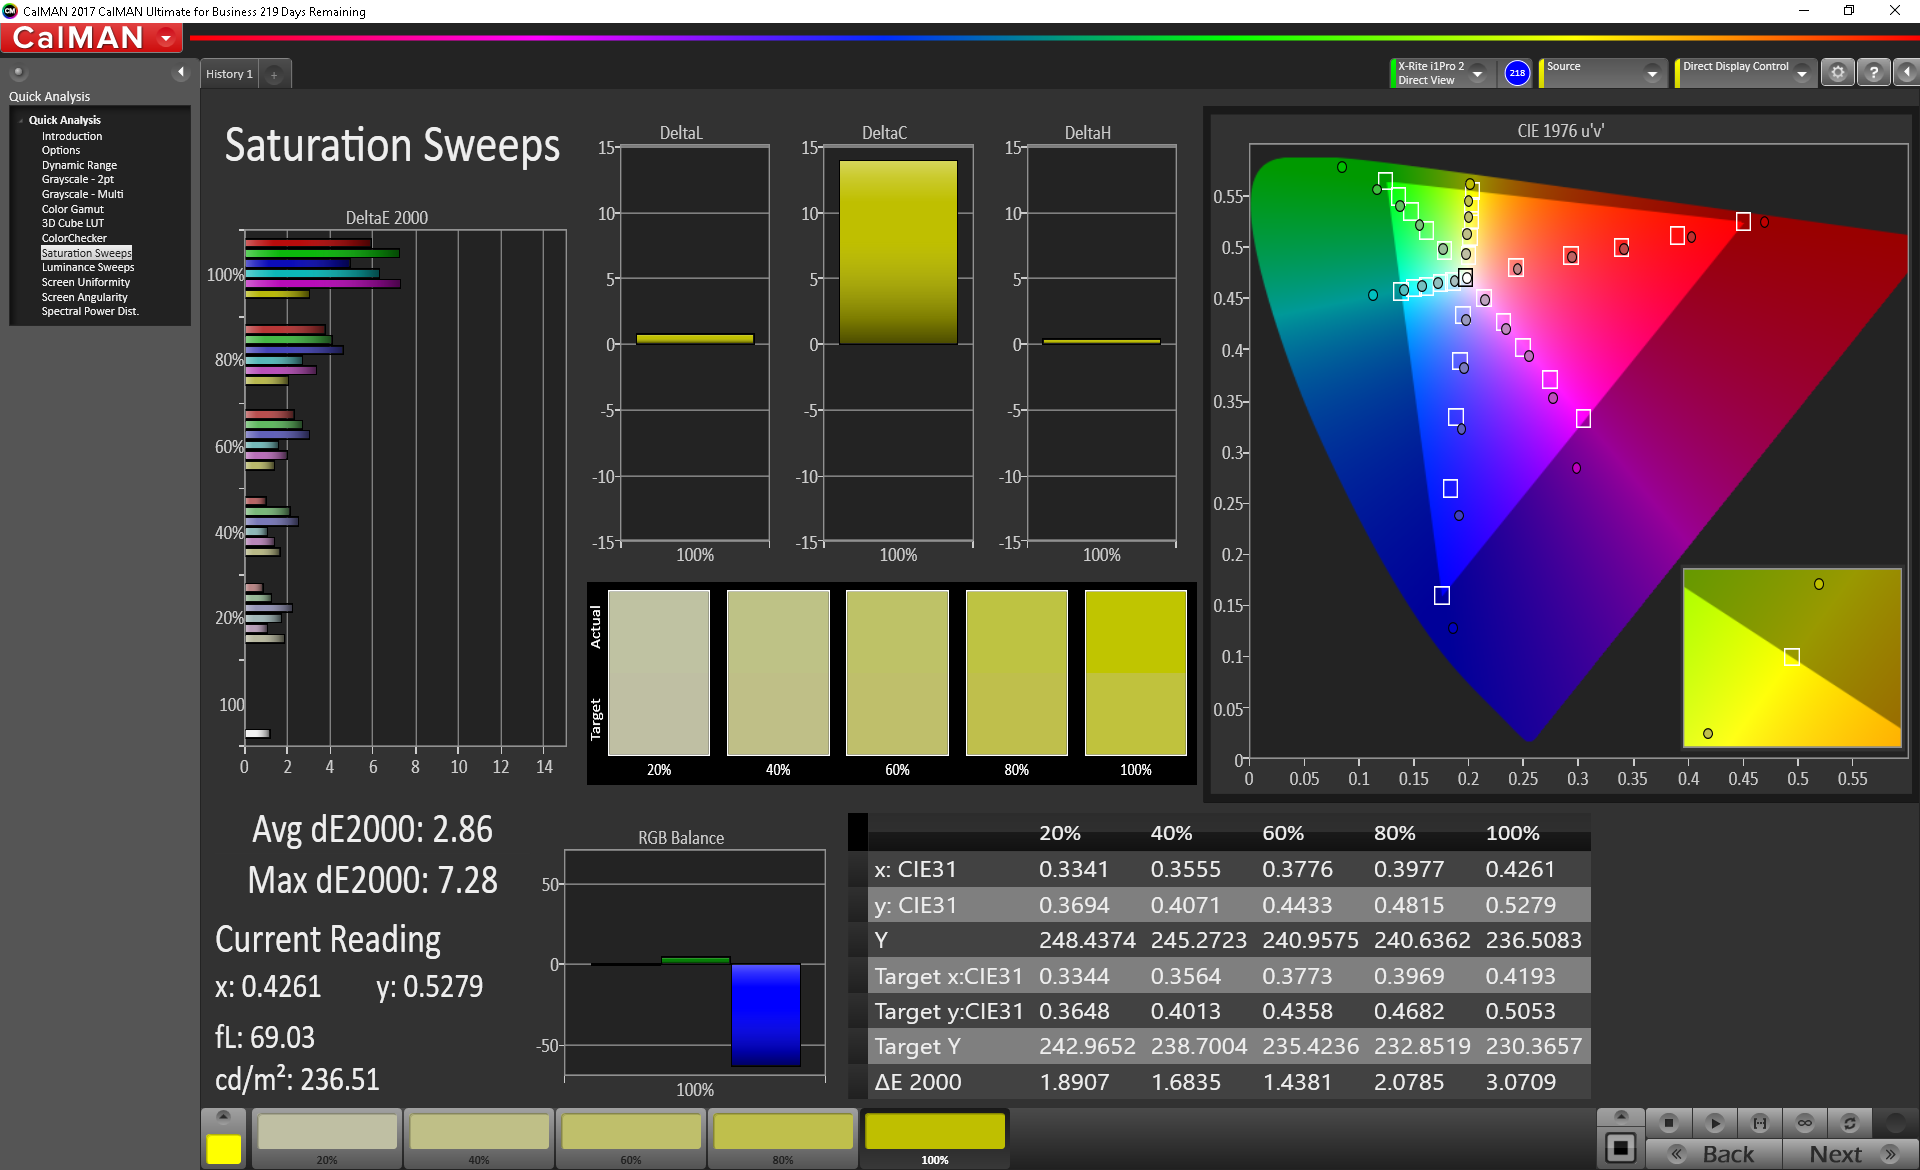
One major oddity we must mention is its smaller-than-expected gamut. The 4K UHD Sharp panels on the XPS 15 9560, ThinkPad P50, and Precision 5510 can each cover >85 percent of the AdobeRGB standard and essentially 100 percent of sRGB. On the 4K UHD XPS 15 9575, however, gamut covers only 72 percent of AdobeRGB. While color coverage is still wider than on the FHD SKU, this is nowhere near the full AdobeRGB coverage that Dell is advertising even after accounting for any calculation errors. We made sure to set the PremierColor software to AdobeRGB but color coverage results remain the same.
In contrast to Dell, Gigabyte standardizes and calibrates every Aero 15 display at factory under the X-Rite Pantone color certification. Colors and grayscale for the Aero 15 series are significantly more accurate as a result since they are equipped with color profiles individually tailored to each unit. Our reviews and CalMAN results on the original Aero 15 and the latest Aero 15X V8 show that the Gigabyte systems can indeed reproduce sRGB more accurately than our Dell convertible.

| |||||||||||||||||||||||||
Brightness Distribution: 81 %
Center on Battery: 488 cd/m²
Contrast: 1627:1 (Black: 0.3 cd/m²)
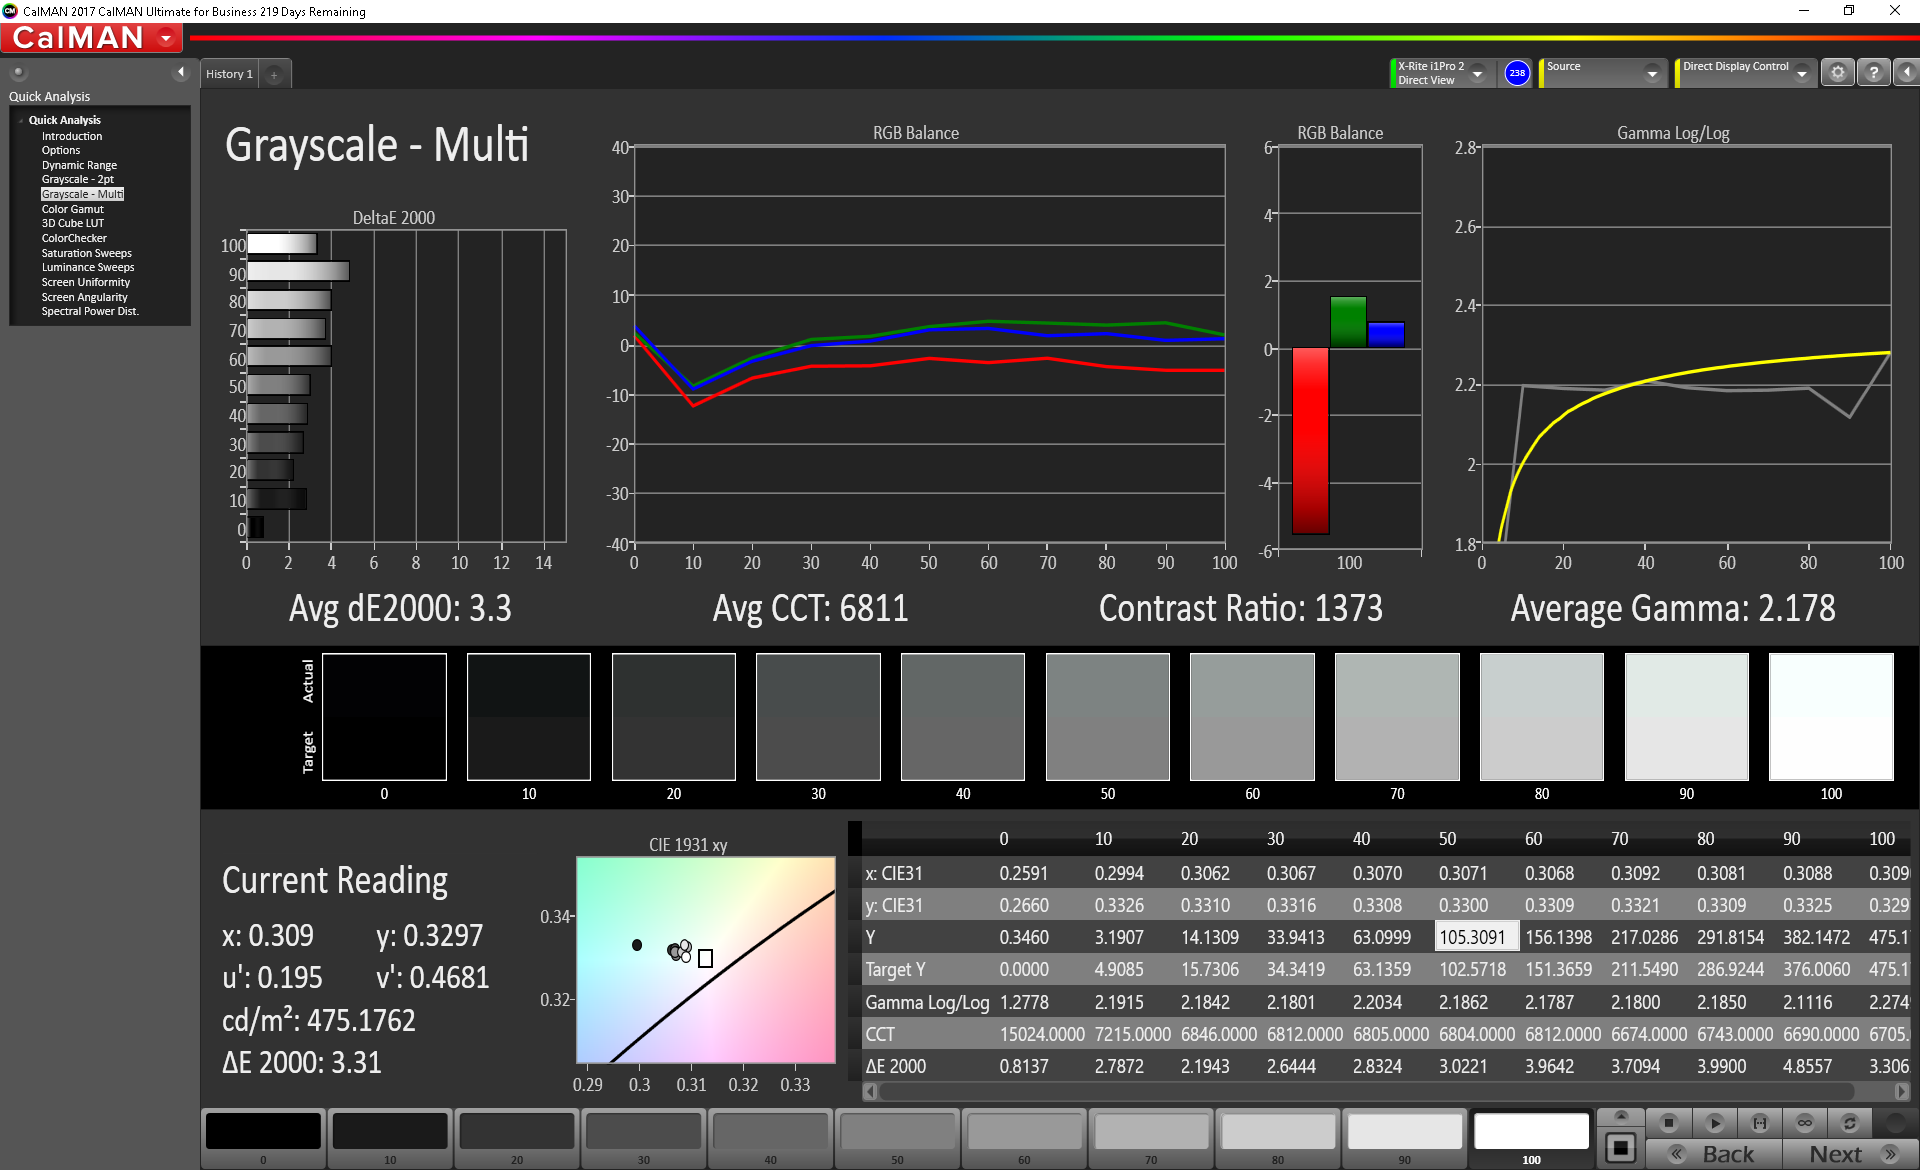
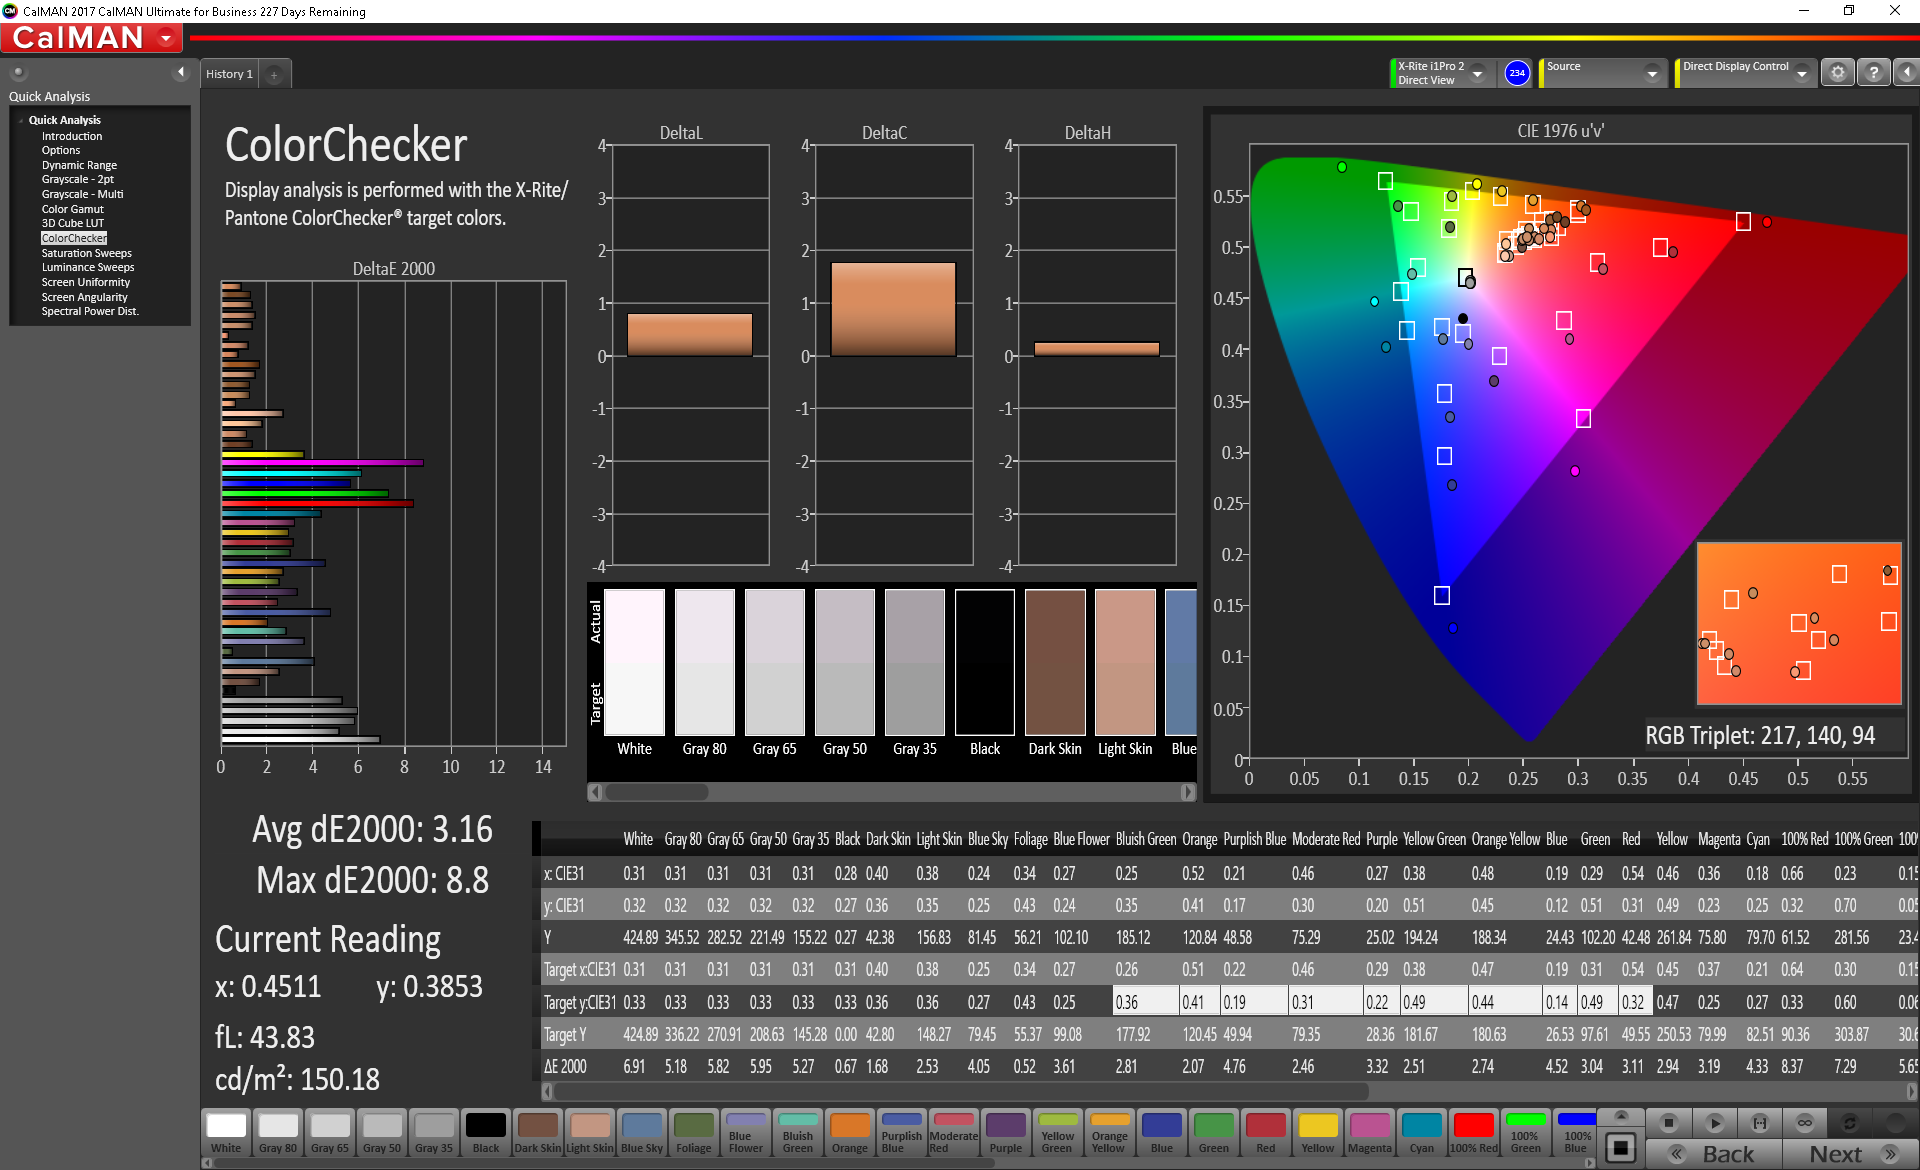
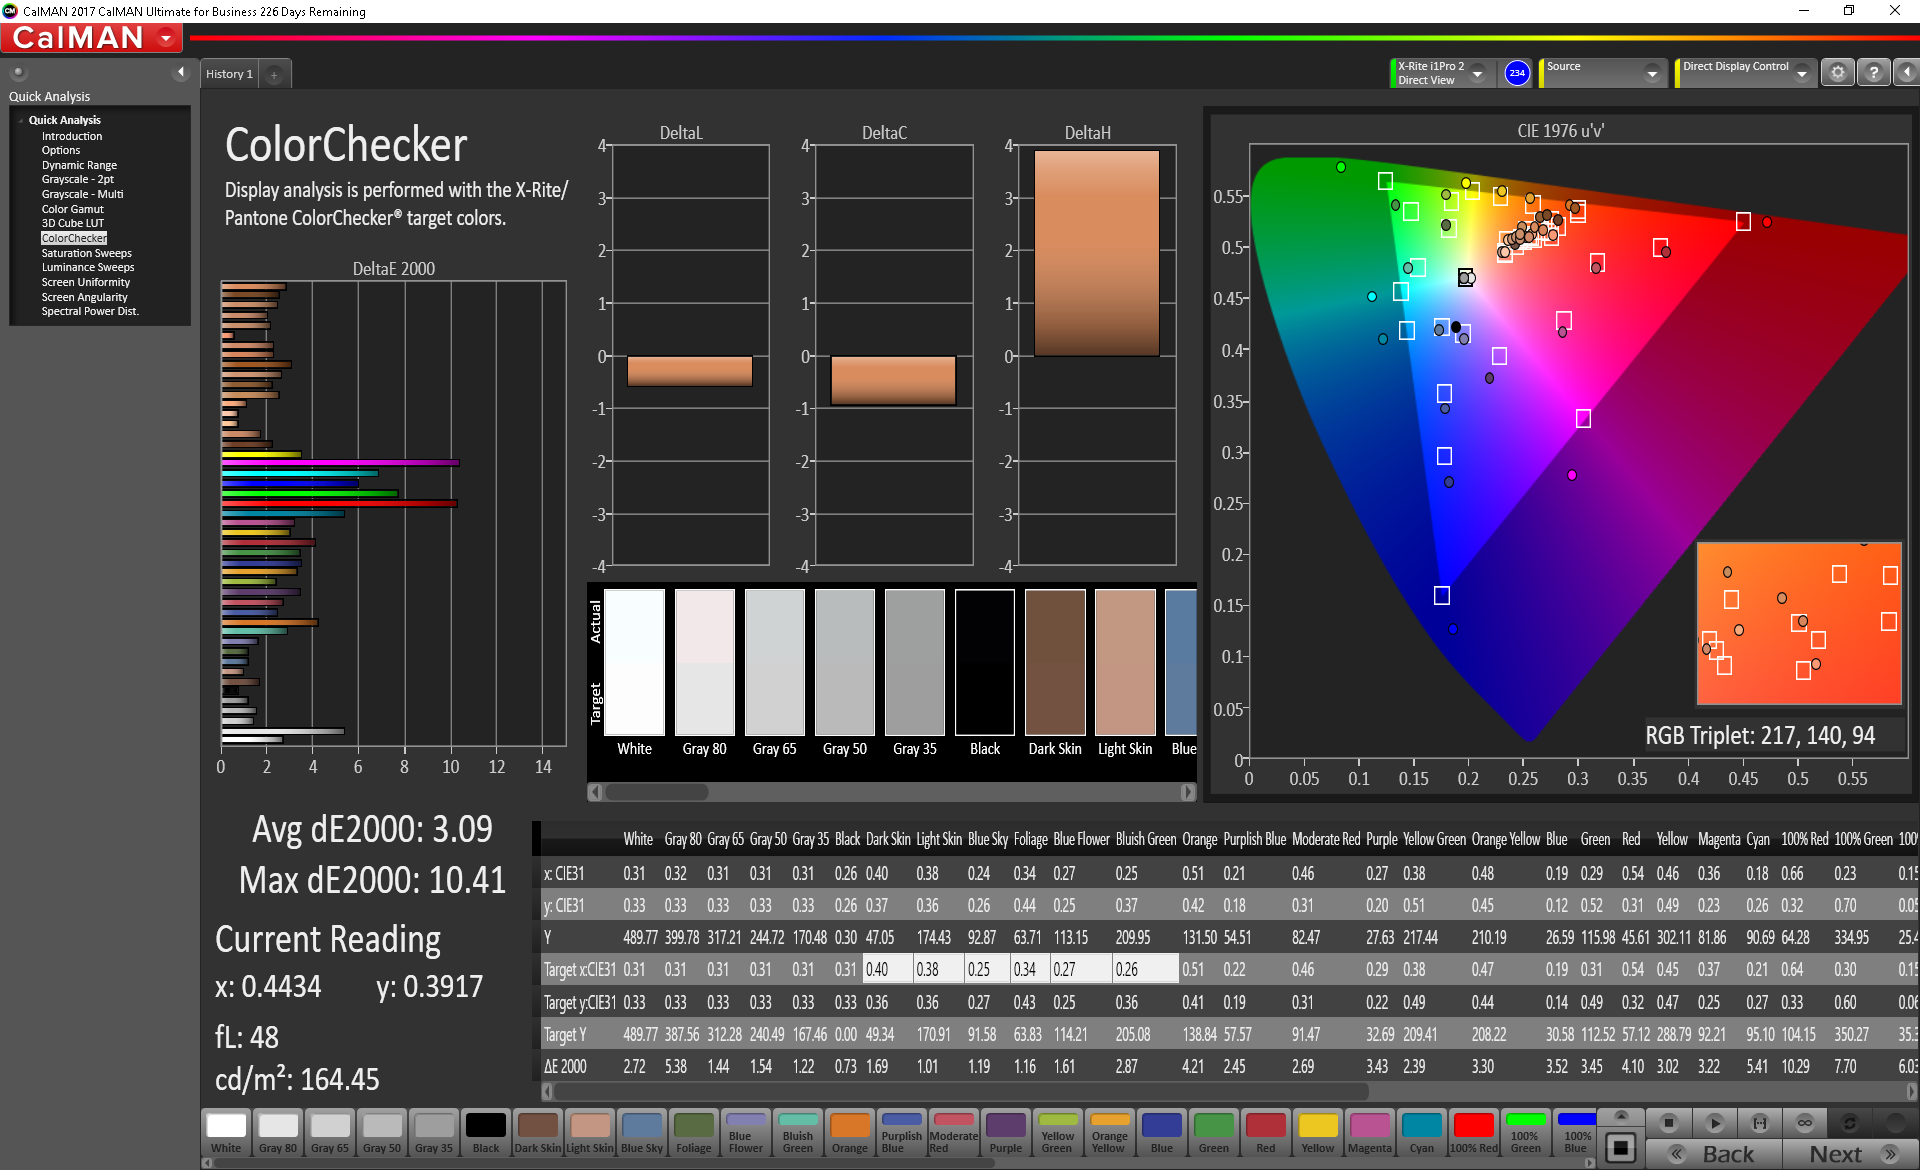
ΔE ColorChecker Calman: 3.16 | ∀{0.5-29.43 Ø4.73}
ΔE Greyscale Calman: 3.3 | ∀{0.09-98 Ø4.97}
97.9% sRGB (Argyll 1.6.3 3D)
71.7% AdobeRGB 1998 (Argyll 1.6.3 3D)
79.2% AdobeRGB 1998 (Argyll 3D)
97.9% sRGB (Argyll 3D)
78.7% Display P3 (Argyll 3D)
Gamma: 2.178
CCT: 6811 K
| Dell XPS 15 9575 i7-8705G Sharp SHP148D, IPS, 15.6", 3840x2160 | Dell XPS 15 9575 i5-8305G Sharp SHP148E, IPS, 15.6", 1920x1080 | Dell XPS 15 9560 (i7-7700HQ, UHD) IGZO IPS, 15.6", 3840x2160 | HP Spectre x360 15t-bl100 BOE06C3, IPS, 15.6", 3840x2160 | Dell Precision 5510 SHP143E, 7PHPT_LQ156D1, IGZO LED, 15.6", 3840x2160 | Lenovo ThinkPad P50 LQ156D1JW05, IPS, 15.6", 3840x2160 | |
|---|---|---|---|---|---|---|
| Display | -15% | 14% | -15% | 13% | 11% | |
| Display P3 Coverage (%) | 78.7 | 63.3 -20% | 89.7 14% | 66.6 -15% | 88.4 12% | 85.8 9% |
| sRGB Coverage (%) | 97.9 | 92.5 -6% | 100 2% | 86.9 -11% | 100 2% | 98.6 1% |
| AdobeRGB 1998 Coverage (%) | 79.2 | 63.9 -19% | 100 26% | 63.5 -20% | 99.5 26% | 98.2 24% |
| Response Times | -8% | -16% | 15% | -8% | 28% | |
| Response Time Grey 50% / Grey 80% * (ms) | 48.4 ? | 53.6 ? -11% | 57.2 ? -18% | 41.2 ? 15% | 56.4 ? -17% | 39.2 ? 19% |
| Response Time Black / White * (ms) | 34.8 ? | 36.4 ? -5% | 39.2 ? -13% | 29.6 ? 15% | 34 ? 2% | 22 ? 37% |
| PWM Frequency (Hz) | 1000 ? | 1000 ? | 962 | 1000 | 217 | |
| Screen | -14% | -19% | -21% | -16% | -29% | |
| Brightness middle (cd/m²) | 488 | 418.5 -14% | 370.1 -24% | 338.7 -31% | 391 -20% | 250 -49% |
| Brightness (cd/m²) | 440 | 391 -11% | 356 -19% | 325 -26% | 361 -18% | 250 -43% |
| Brightness Distribution (%) | 81 | 87 7% | 87 7% | 91 12% | 87 7% | 86 6% |
| Black Level * (cd/m²) | 0.3 | 0.35 -17% | 0.37 -23% | 0.28 7% | 0.4 -33% | 0.31 -3% |
| Contrast (:1) | 1627 | 1196 -26% | 1000 -39% | 1210 -26% | 978 -40% | 806 -50% |
| Colorchecker dE 2000 * | 3.16 | 3.5 -11% | 5.3 -68% | 4.9 -55% | 4.85 -53% | 4.5 -42% |
| Colorchecker dE 2000 max. * | 8.8 | 7.57 14% | 9.9 -13% | 8.7 1% | 9.3 -6% | |
| Greyscale dE 2000 * | 3.3 | 5.3 -61% | 4.6 -39% | 5.5 -67% | 4.01 -22% | 7.2 -118% |
| Gamma | 2.178 101% | 2.2 100% | 2.31 95% | 2.08 106% | 2.18 101% | 2.31 95% |
| CCT | 6811 95% | 7500 87% | 6284 103% | 7498 87% | 7340 89% | 6399 102% |
| Color Space (Percent of AdobeRGB 1998) (%) | 71.7 | 57.9 -19% | 88.3 23% | 63.5 -11% | 96 34% | 85 19% |
| Color Space (Percent of sRGB) (%) | 97.9 | 92.1 -6% | 100 2% | 86.92 -11% | 100 2% | 98.6 1% |
| Colorchecker dE 2000 calibrated * | 2.51 | |||||
| Total Average (Program / Settings) | -12% /
-14% | -7% /
-12% | -7% /
-15% | -4% /
-8% | 3% /
-13% |
* ... smaller is better
AdobeRGB color space is smaller than on the 4K UHD panel for the XPS 15 9560 (72 percent vs. 88 percent). Despite double-checking our findings, Dell's only response is that the 4K UHD panel for the XPS 15 9575 promises 100 percent AdobeRGB coverage. Graphics artists may want to look elsewhere because of the questionable color coverage of the XPS 15 convertible.

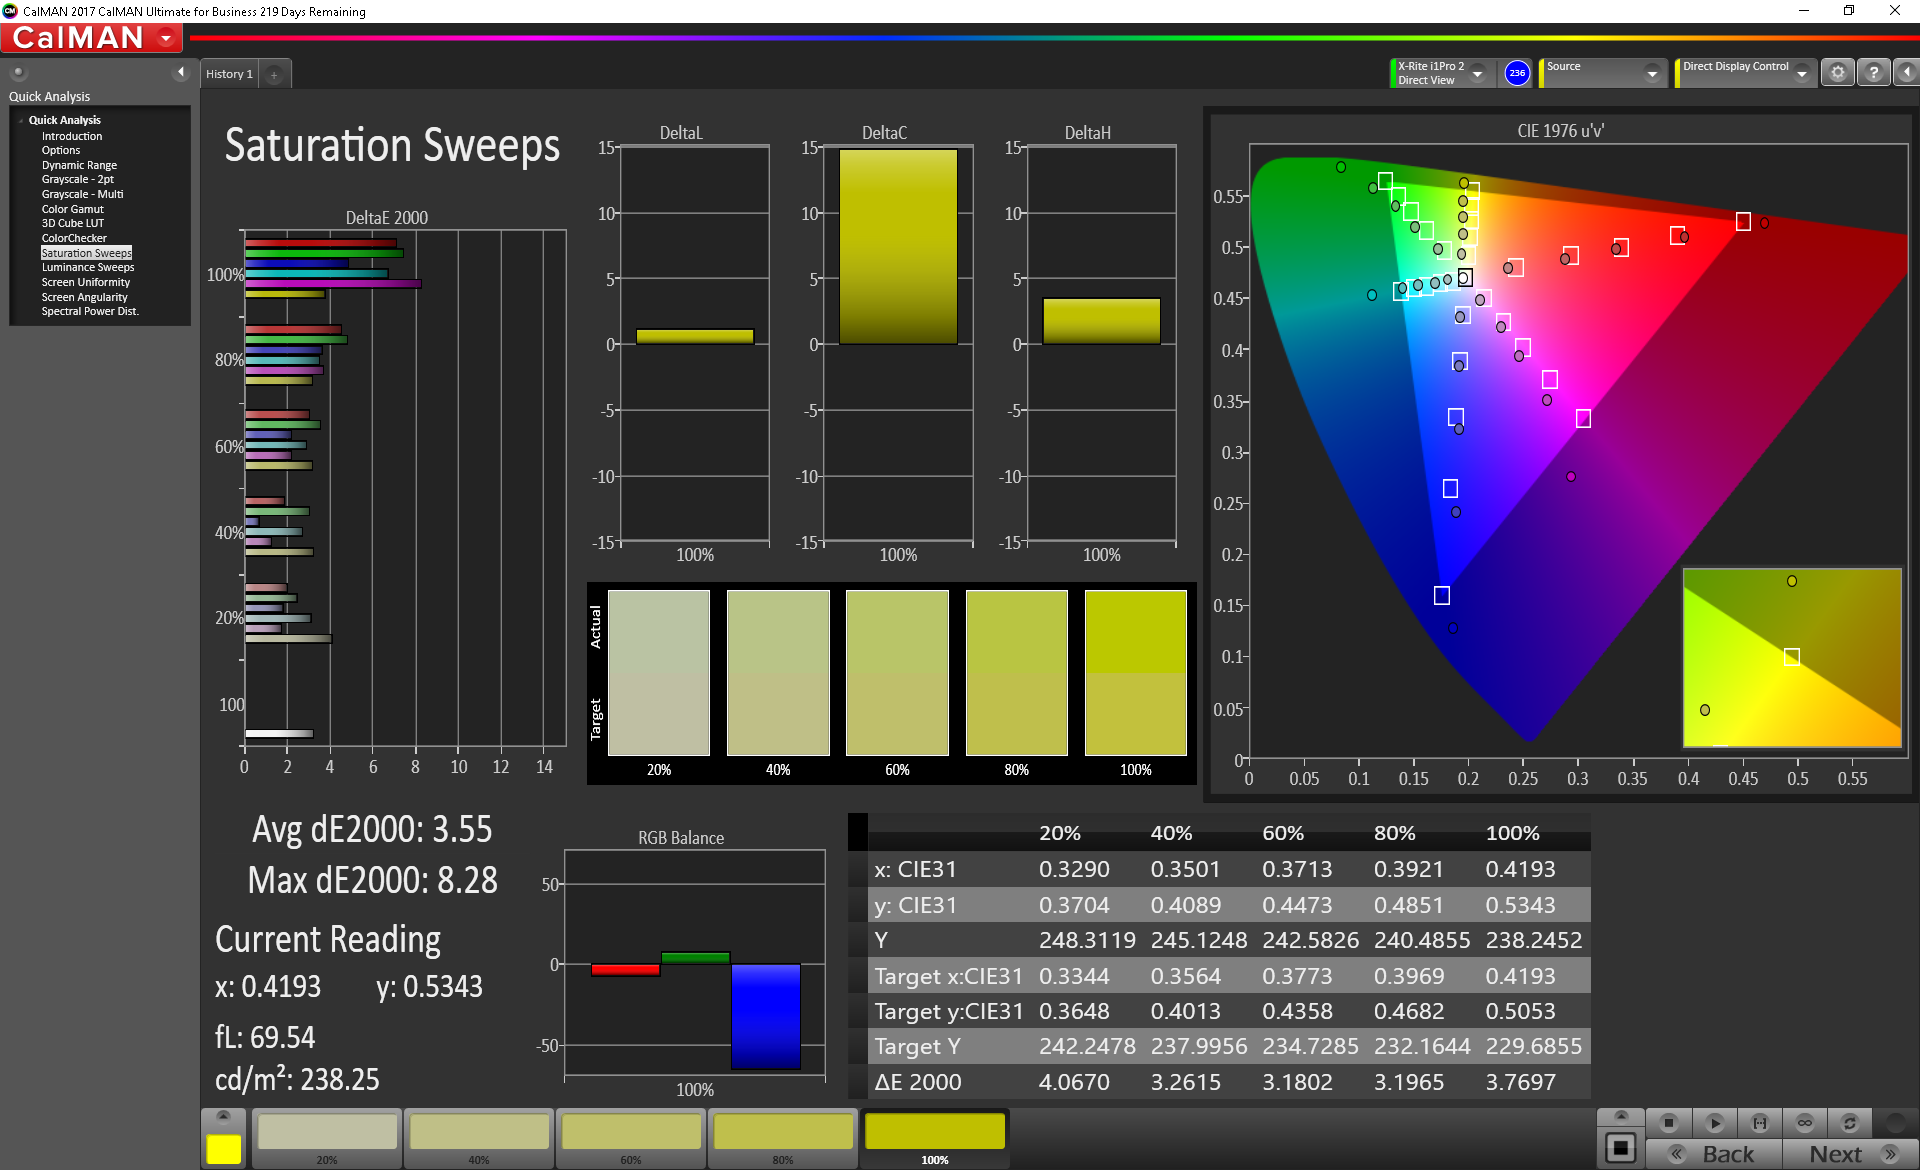
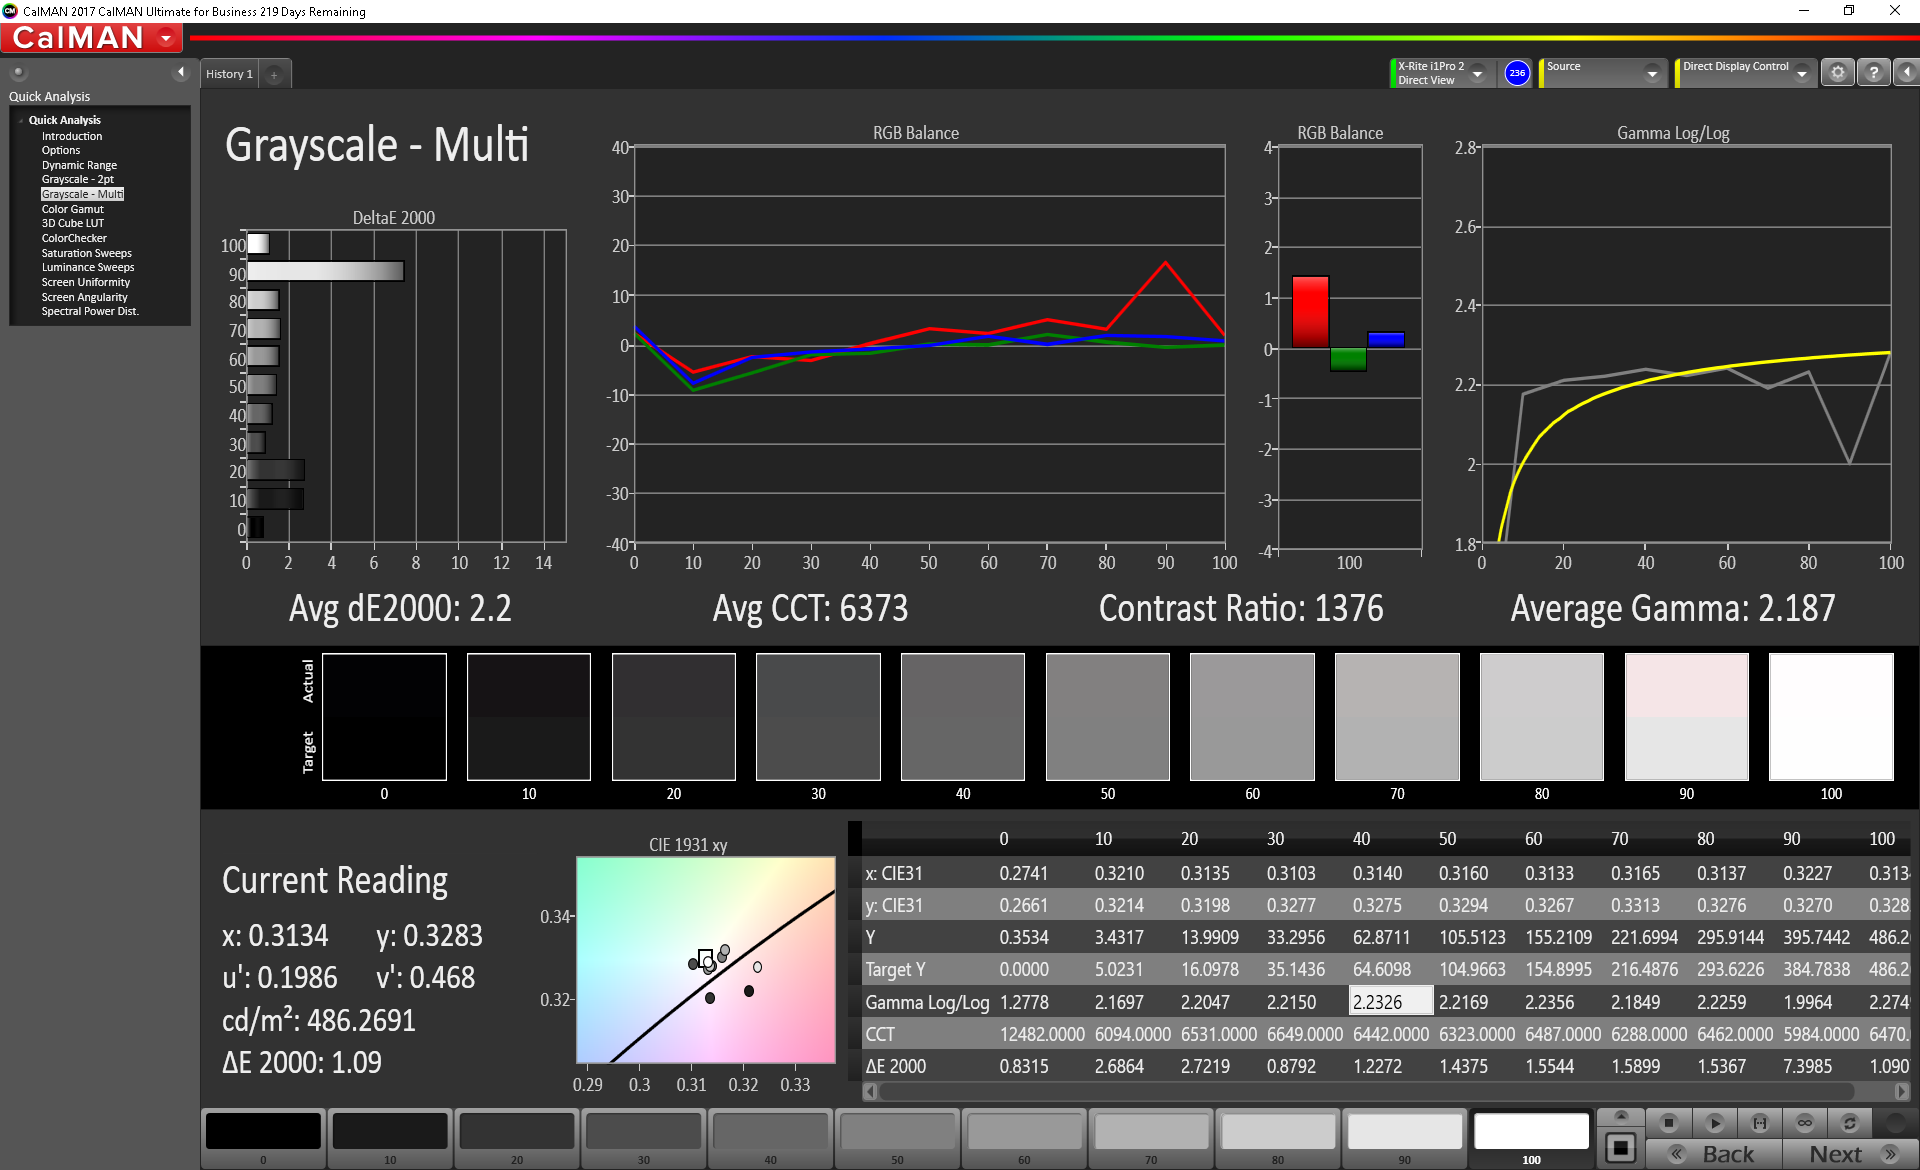
The strange color behavior only continues with our X-Rite spectrophotometer analyses. Colors become notably more inaccurate the higher the saturation level despite having full sRGB coverage. Our automatic calibration attempts strangely do not improve upon this whereas our same procedure on other notebooks typically result in more accurate displays. In fact, setting the panel to sRGB mode through PremierColor creates a very imbalanced grayscale at the 90 percent saturation level as shown by our CalMAN results below. We're not sure why this is occurring on the 4K UHD panel and not the FHD panel, but more tuning will be necessary between PremierColor settings and Windows color profiles.
Display Response Times
| ↔ Response Time Black to White | ||
|---|---|---|
| 34.8 ms ... rise ↗ and fall ↘ combined | ↗ 19.2 ms rise | 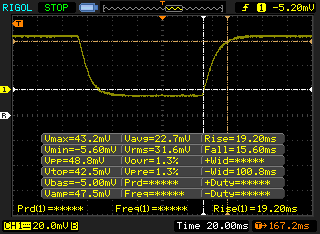 |
| ↘ 15.6 ms fall | ||
| The screen shows slow response rates in our tests and will be unsatisfactory for gamers. In comparison, all tested devices range from 0.1 (minimum) to 240 (maximum) ms. » 92 % of all devices are better. This means that the measured response time is worse than the average of all tested devices (19.9 ms). | ||
| ↔ Response Time 50% Grey to 80% Grey | ||
| 48.4 ms ... rise ↗ and fall ↘ combined | ↗ 23.2 ms rise | 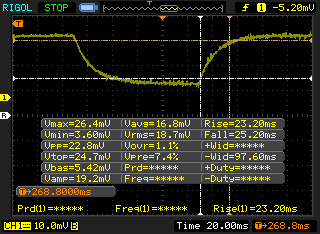 |
| ↘ 25.2 ms fall | ||
| The screen shows slow response rates in our tests and will be unsatisfactory for gamers. In comparison, all tested devices range from 0.165 (minimum) to 636 (maximum) ms. » 84 % of all devices are better. This means that the measured response time is worse than the average of all tested devices (31.1 ms). | ||
Screen Flickering / PWM (Pulse-Width Modulation)
| Screen flickering / PWM detected | 1000 Hz | ≤ 25 % brightness setting | 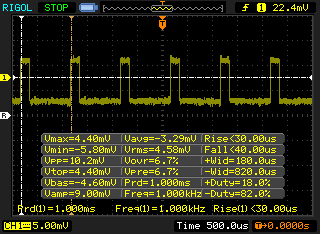 |
The display backlight flickers at 1000 Hz (worst case, e.g., utilizing PWM) Flickering detected at a brightness setting of 25 % and below. There should be no flickering or PWM above this brightness setting. The frequency of 1000 Hz is quite high, so most users sensitive to PWM should not notice any flickering. In comparison: 52 % of all tested devices do not use PWM to dim the display. If PWM was detected, an average of 7798 (minimum: 5 - maximum: 343500) Hz was measured. | |||
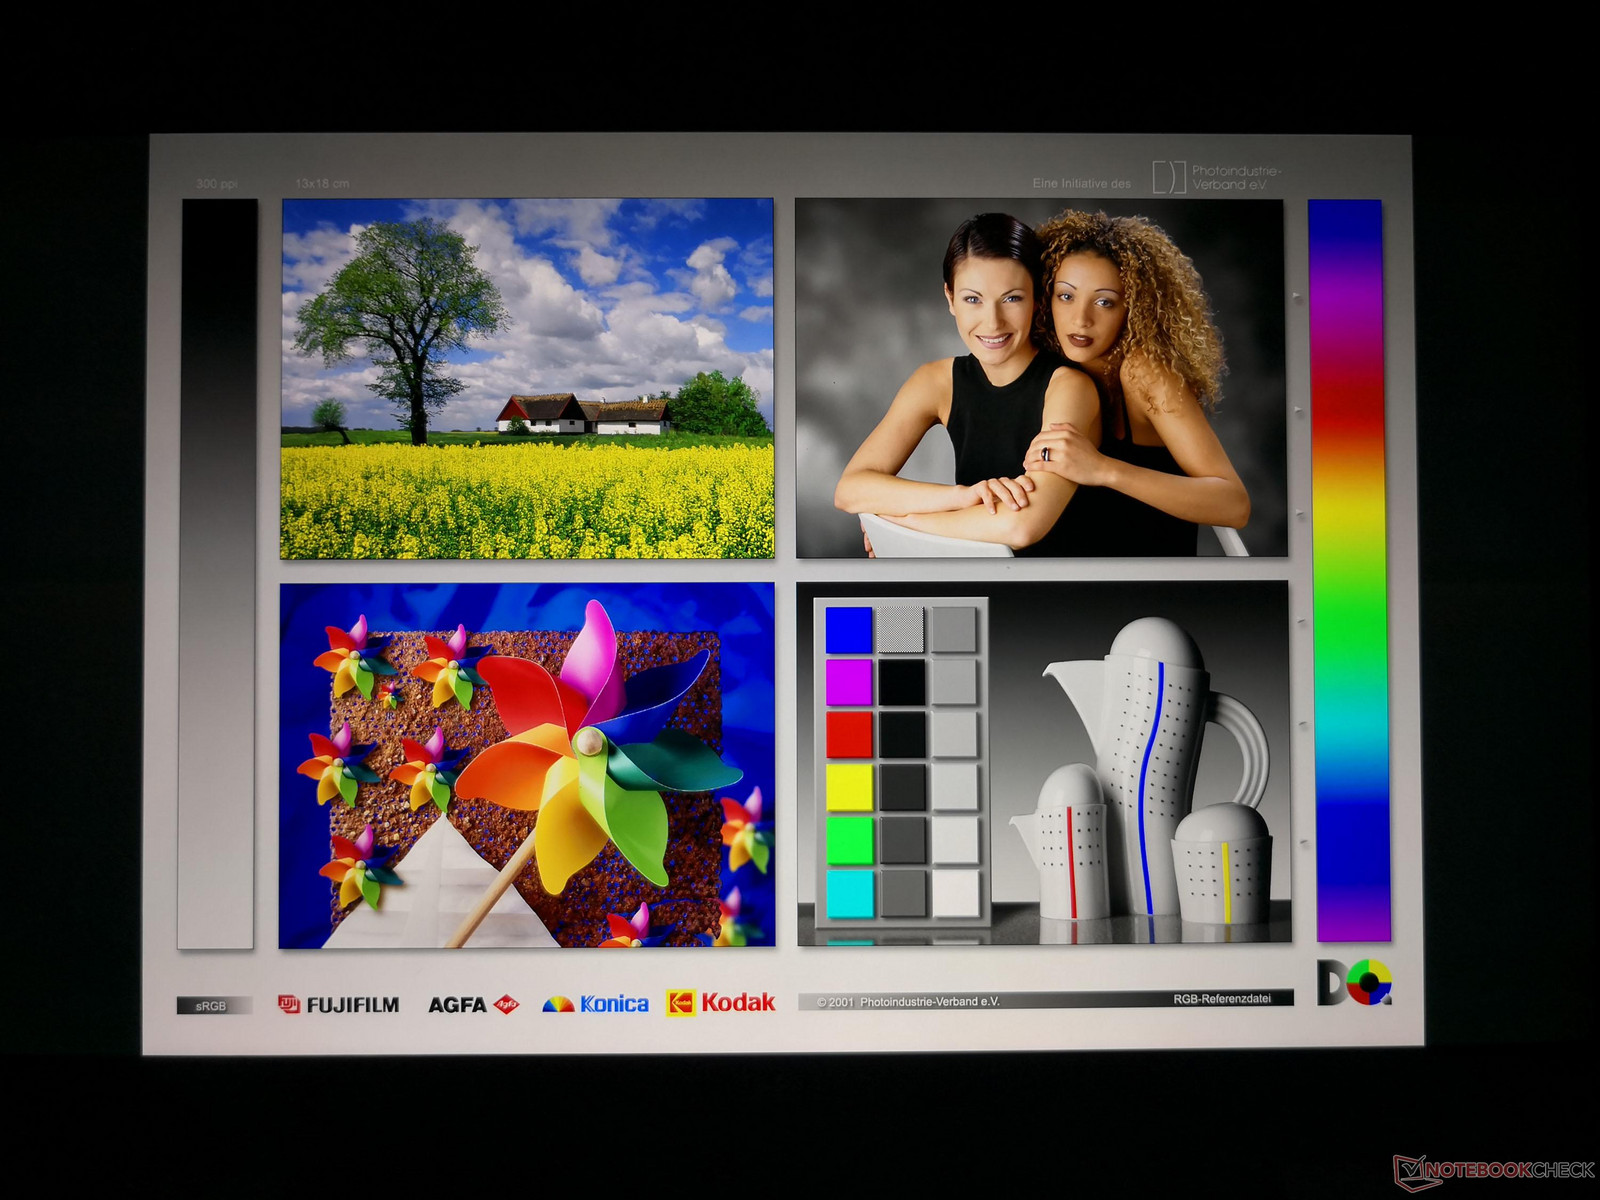
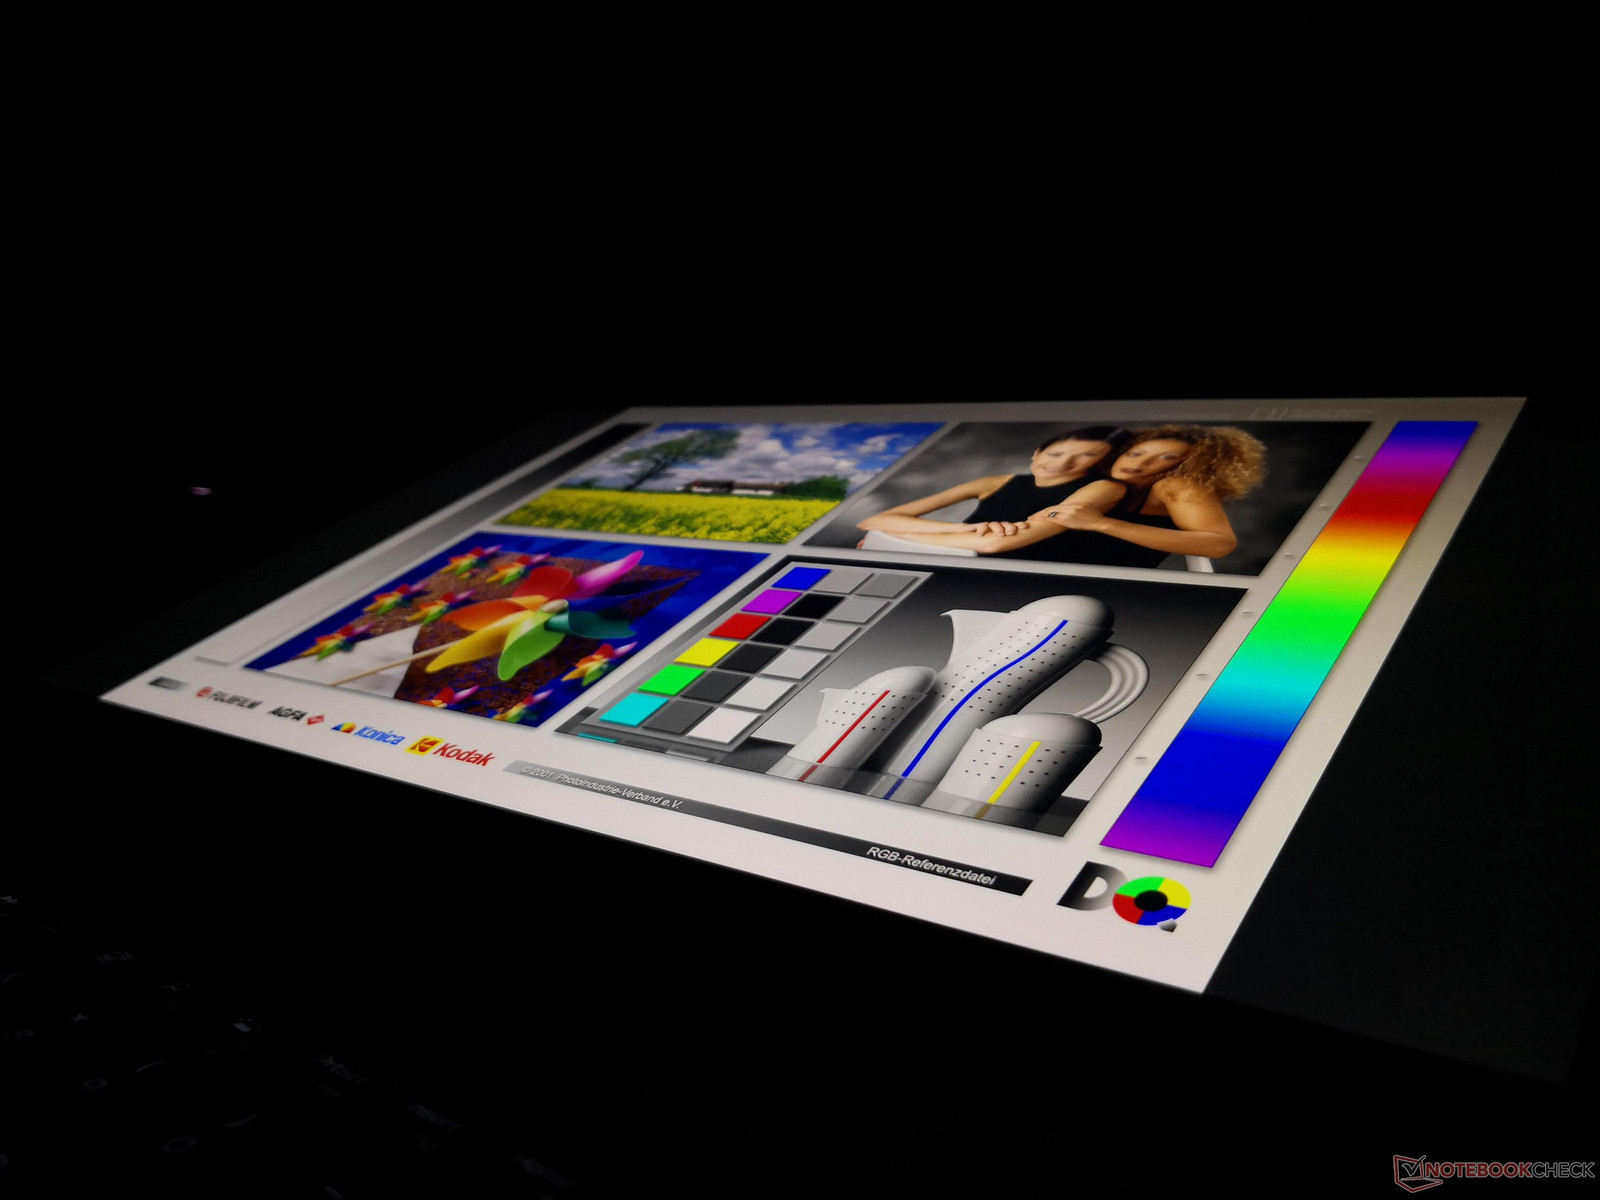
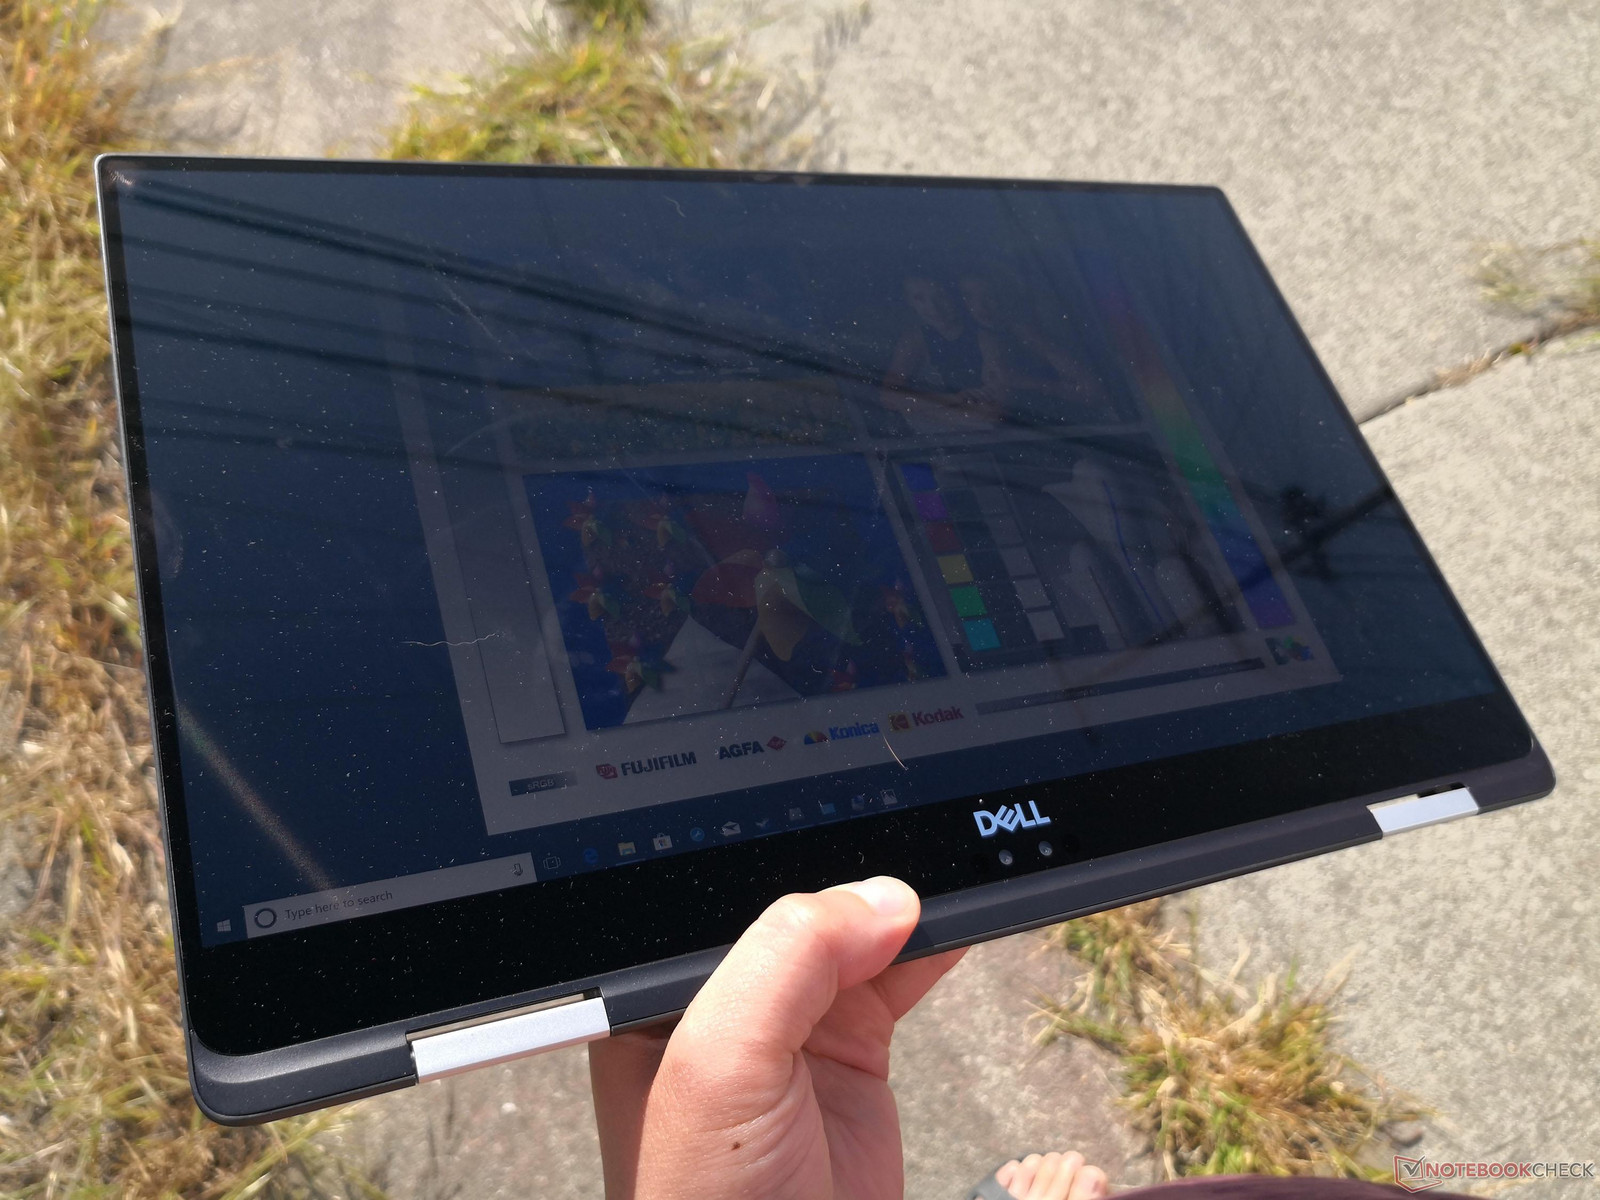
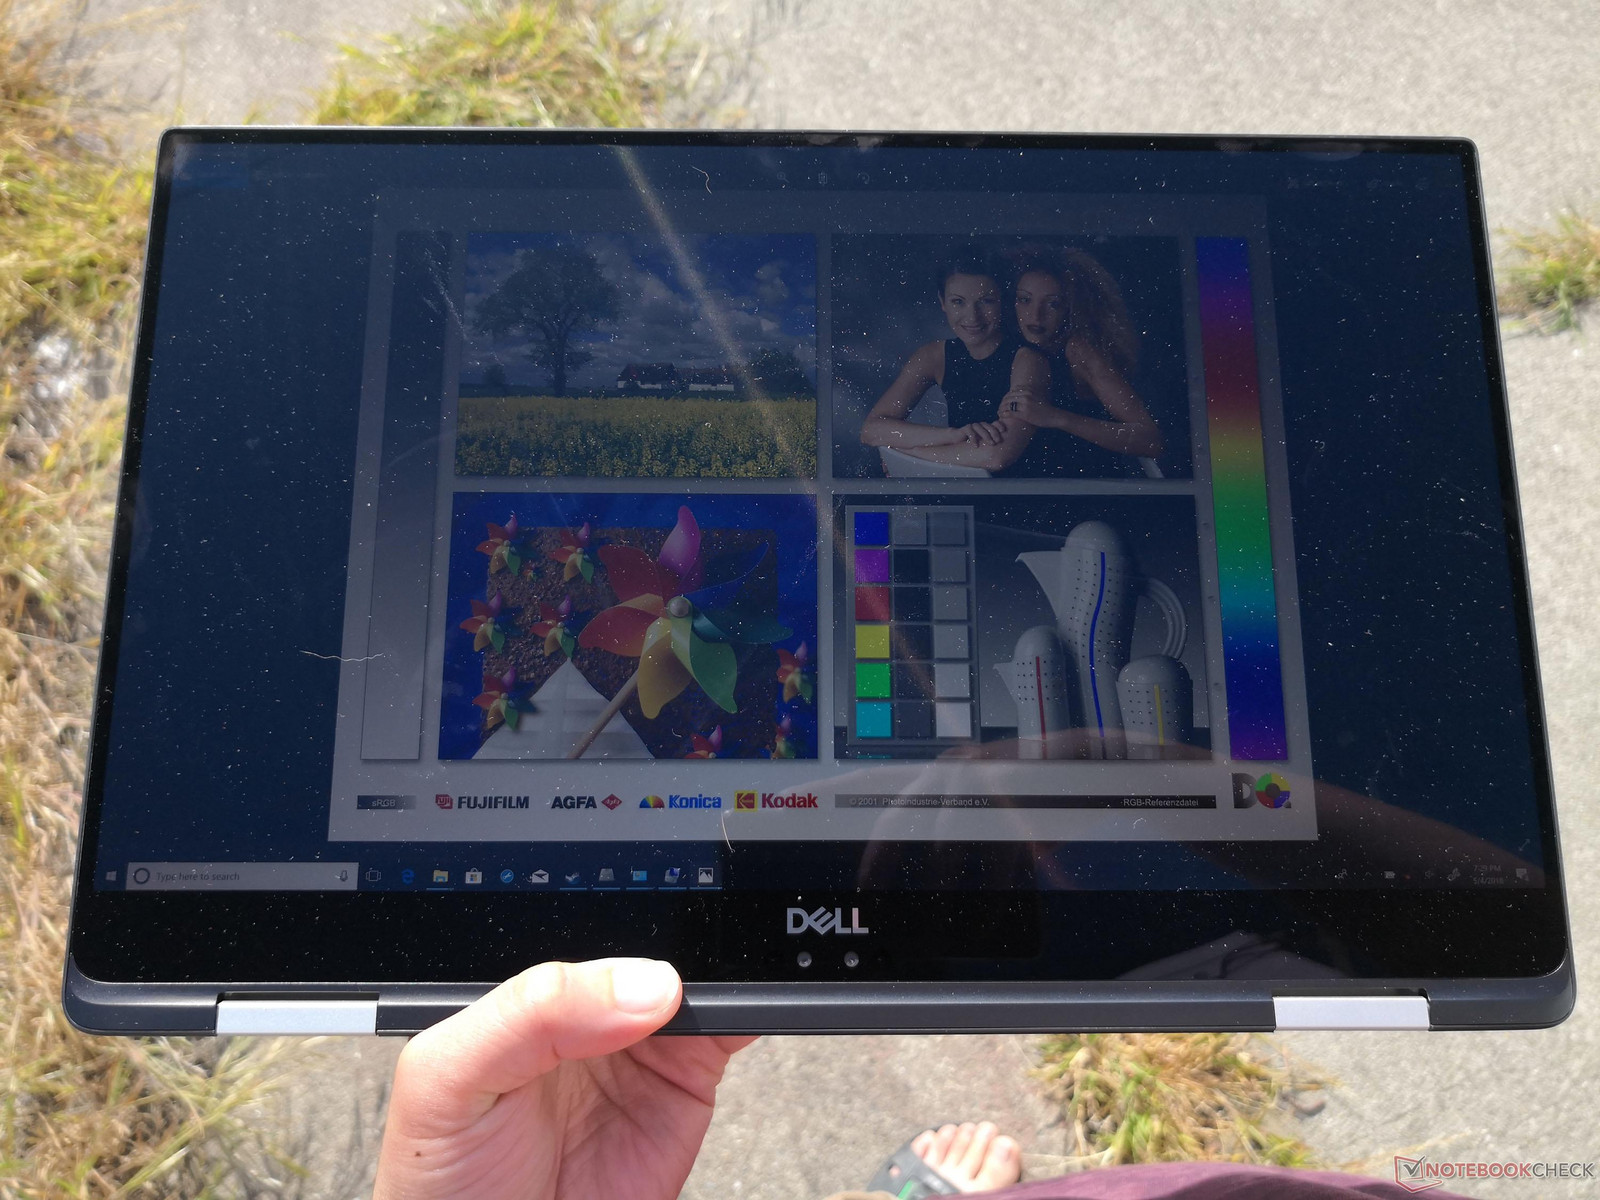
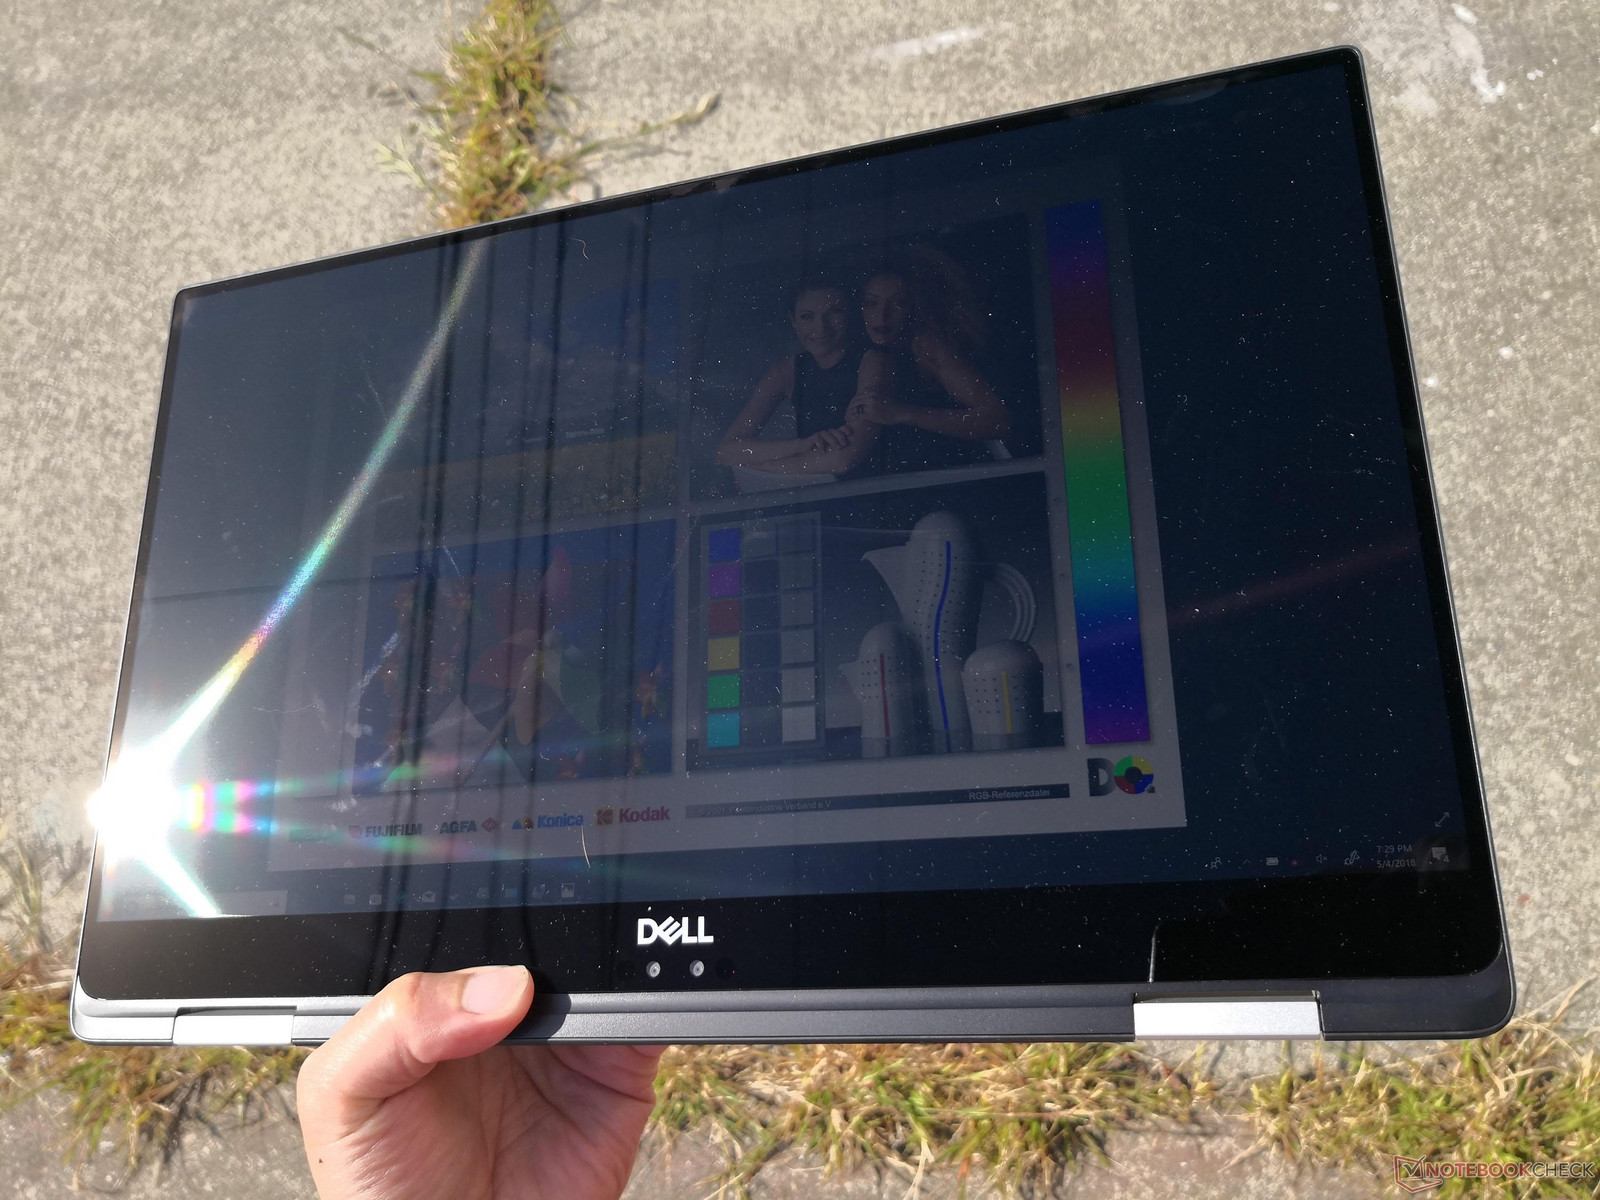
Outdoor visibility is good when under shade and merely average when under direct sunlight. The wide viewing angles and 360-degree hinges help in reducing as much glare as possible, but glare is still inevitable on the super-glossy panel. Certain 15-inch notebooks like the Samsung NP900X5N or even the MacBook Pro 15 are equipped with brighter backlighting for a superior experience than the Dell when outdoors.
Performance
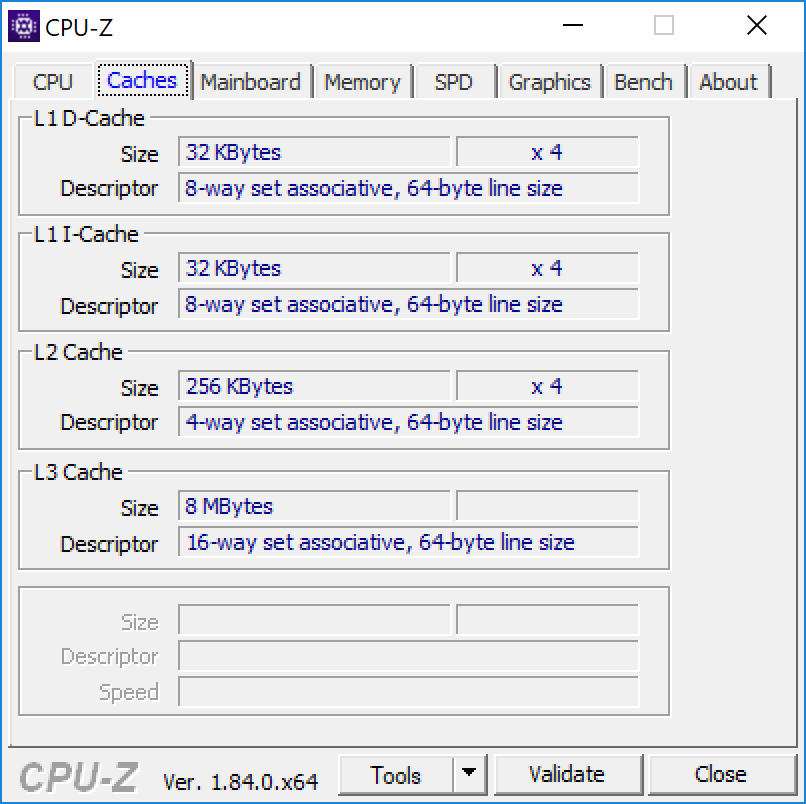
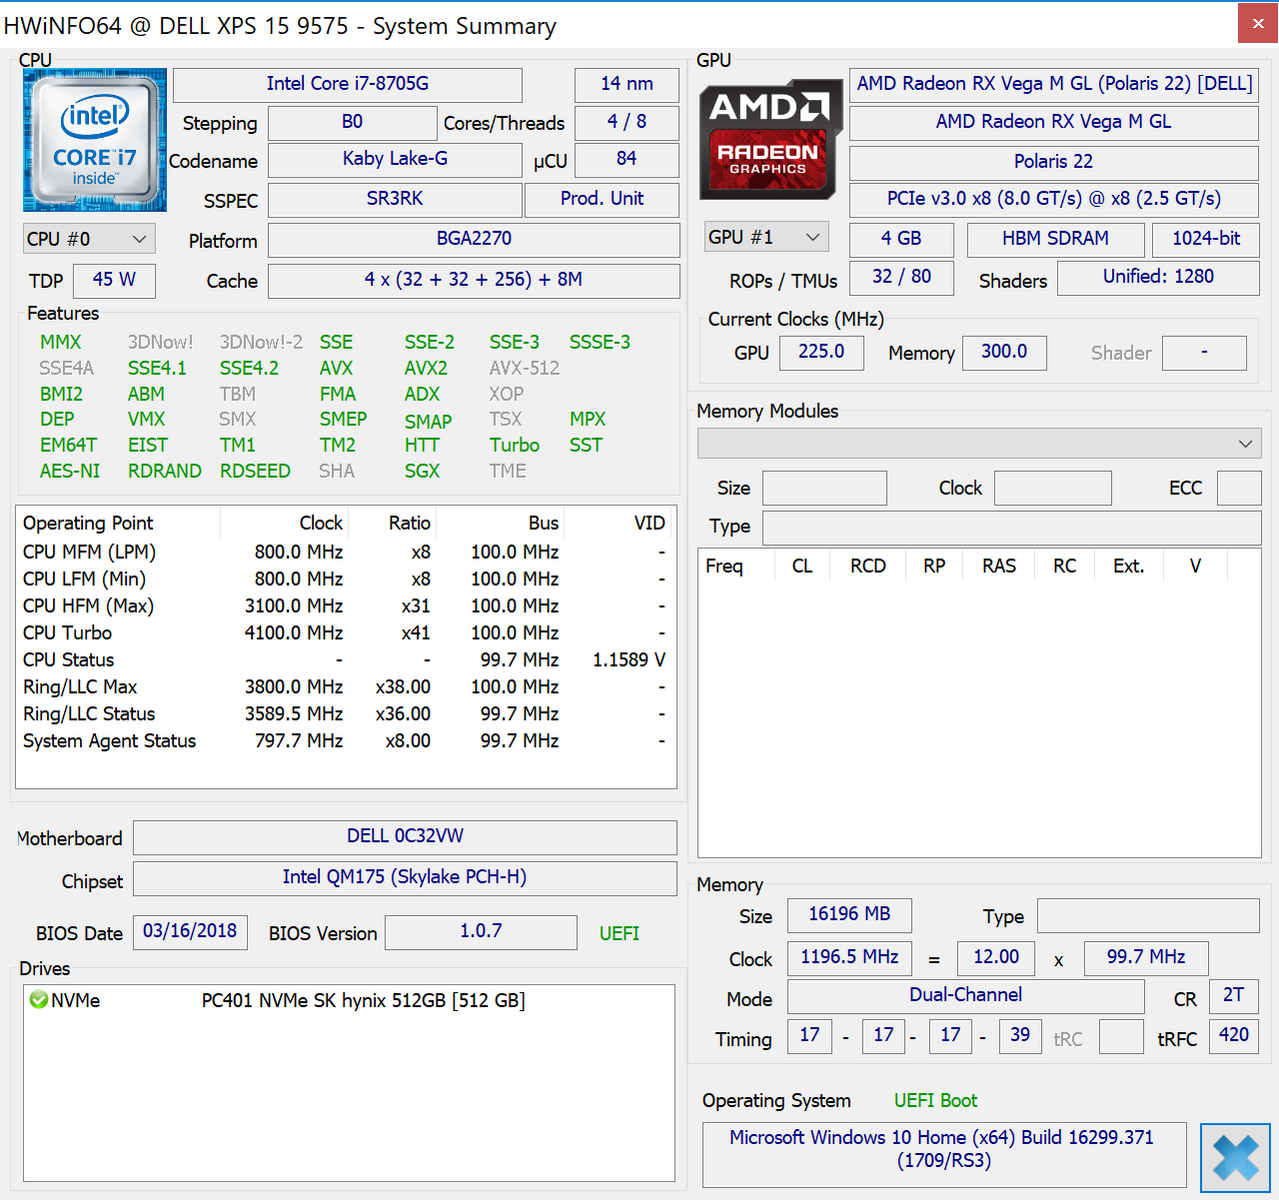
There are only two CPU options for the current XPS 9575: The quad-core i5-8305G and quad-core i7-8705G. Unlike the quad-core i5-7300HQ in the XPS 15 9560, the i5-8305G sports Hyper-Threading which is key to explaining why the i5-8305G can perform so closely to the i7-8705G as our benchmarks below will show. In fact, the only major difference between the 3.1 GHz i7-8705G and 2.8 GHz i5-8305G is that the former is 300 MHz faster and with a larger L3 cache size. Otherwise, both 65 W CPUs utilize the same HD Graphics 630 and Radeon RX Vega M GL GPUs at identically rated clock rates.
It's somewhat disappointing to see no 100 W Core i7-8809G options as this particular processor brings notable gains in both CPU and GPU power over the 65 W CPU options in the current XPS 15 convertible lineup. The cooling solution of the notebook was not likely designed to handle the more demanding i7-8809G.
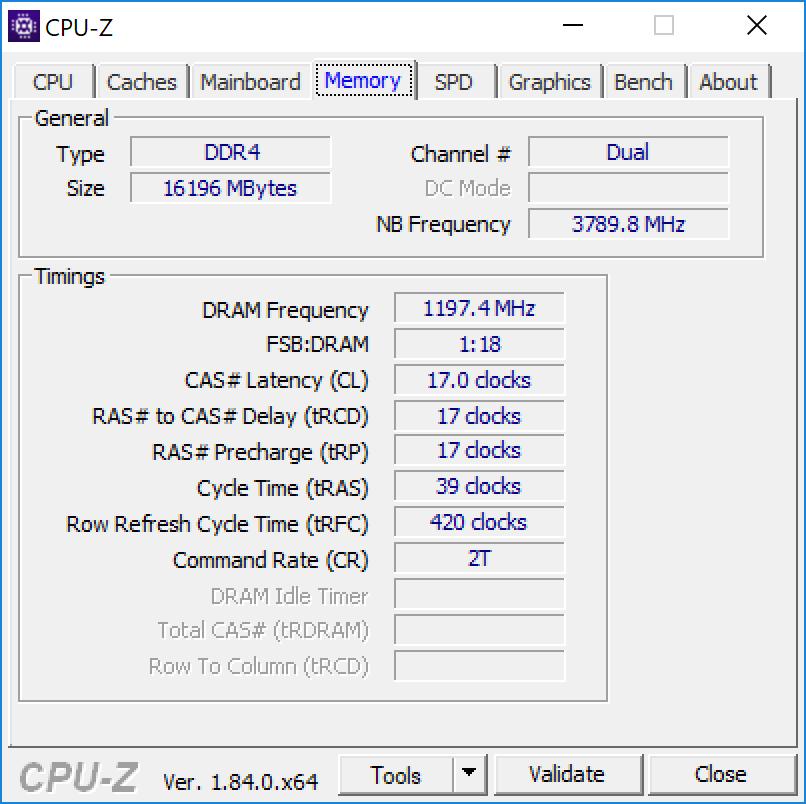
Once again, it's important to note that RAM is soldered and not user upgradeable unlike on the XPS 15 9550/9560/9570 series.
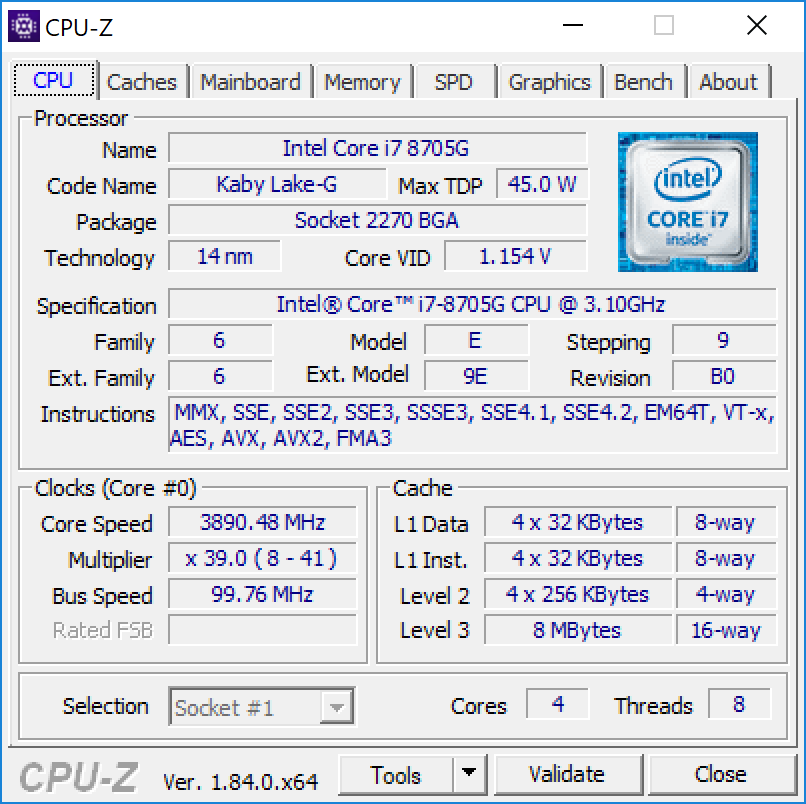
Processor
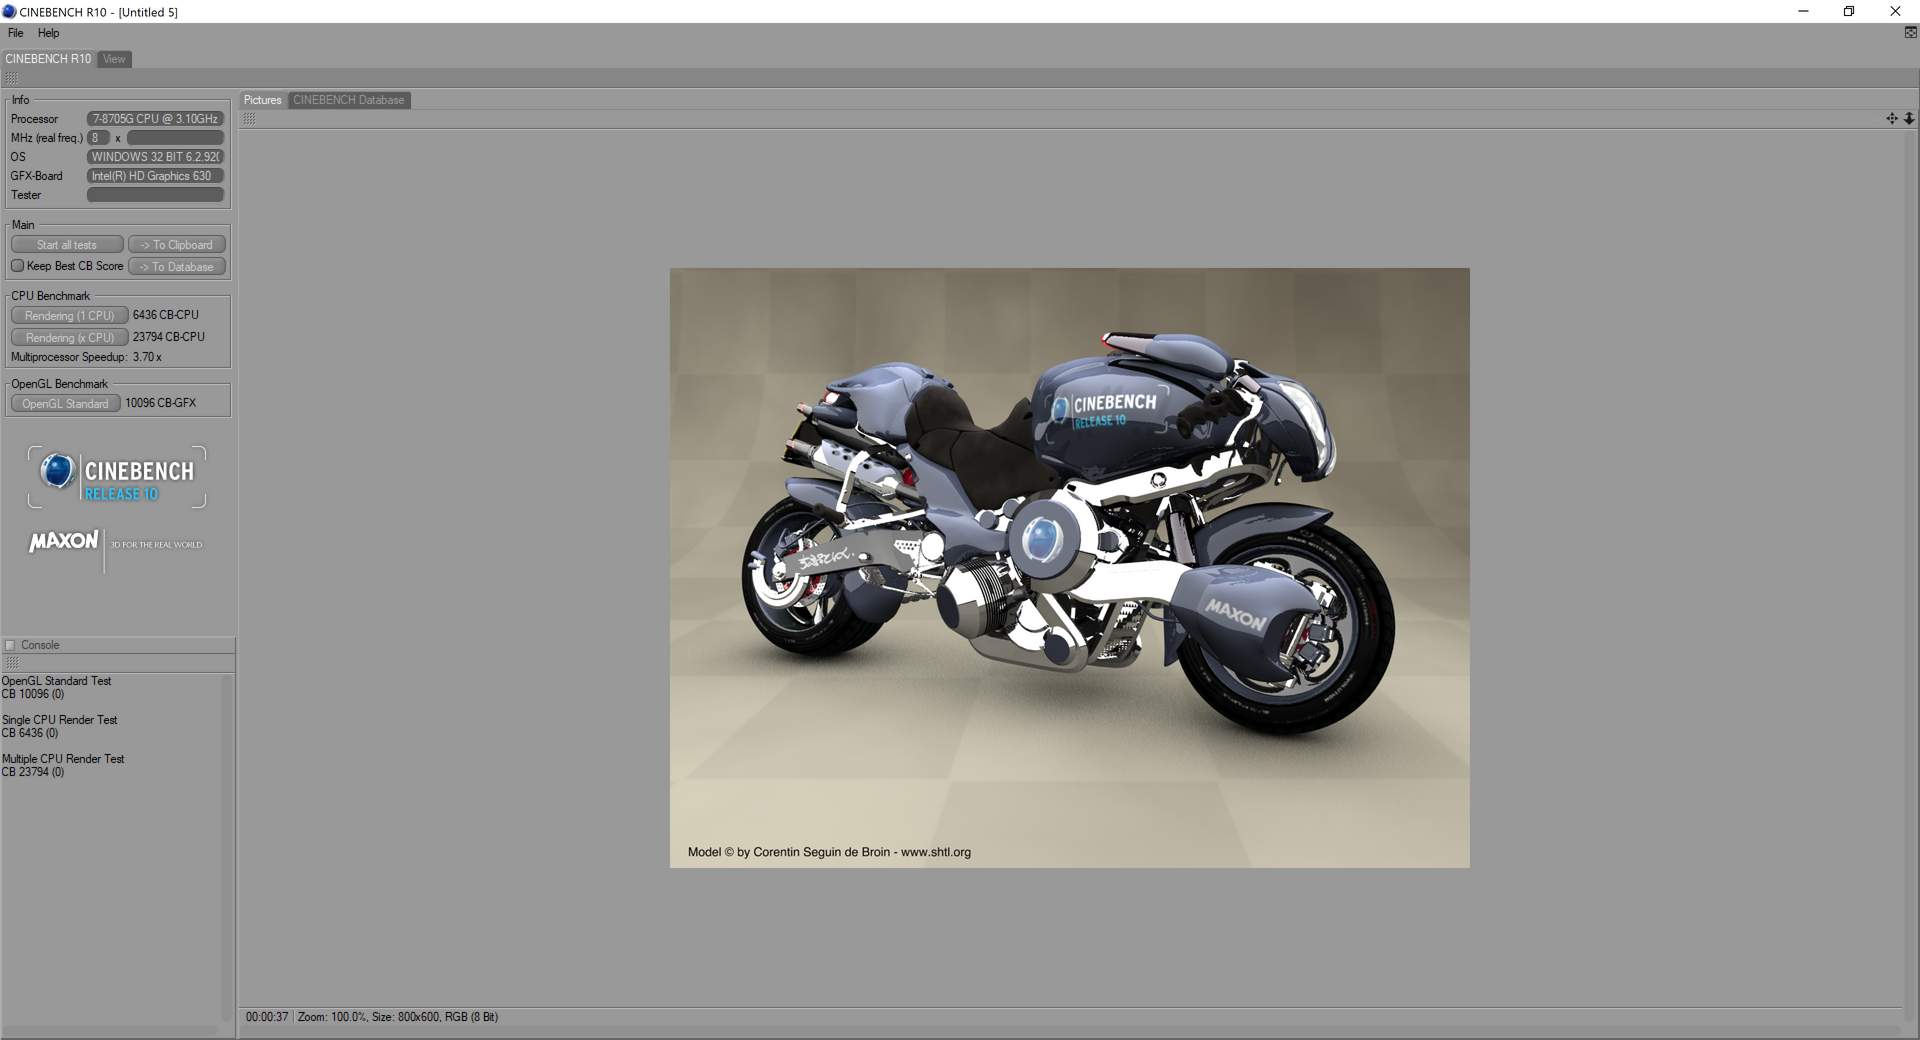
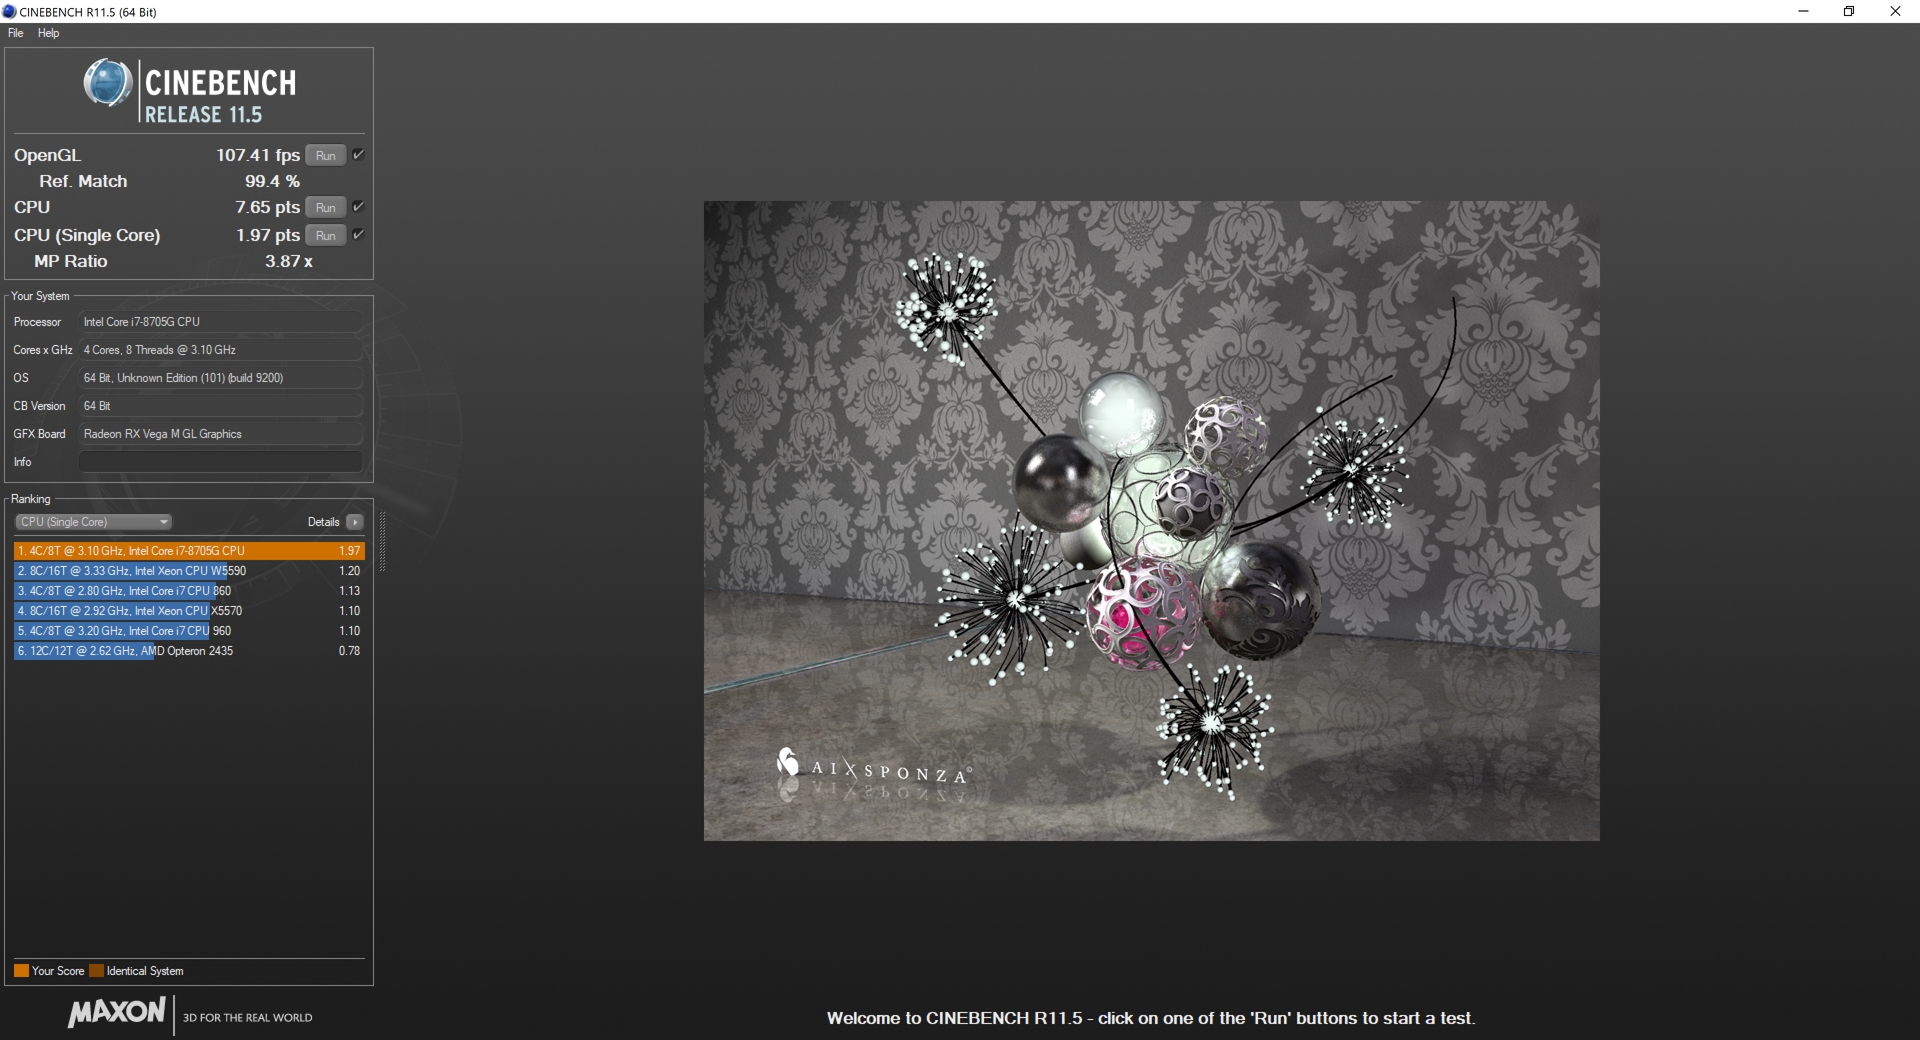
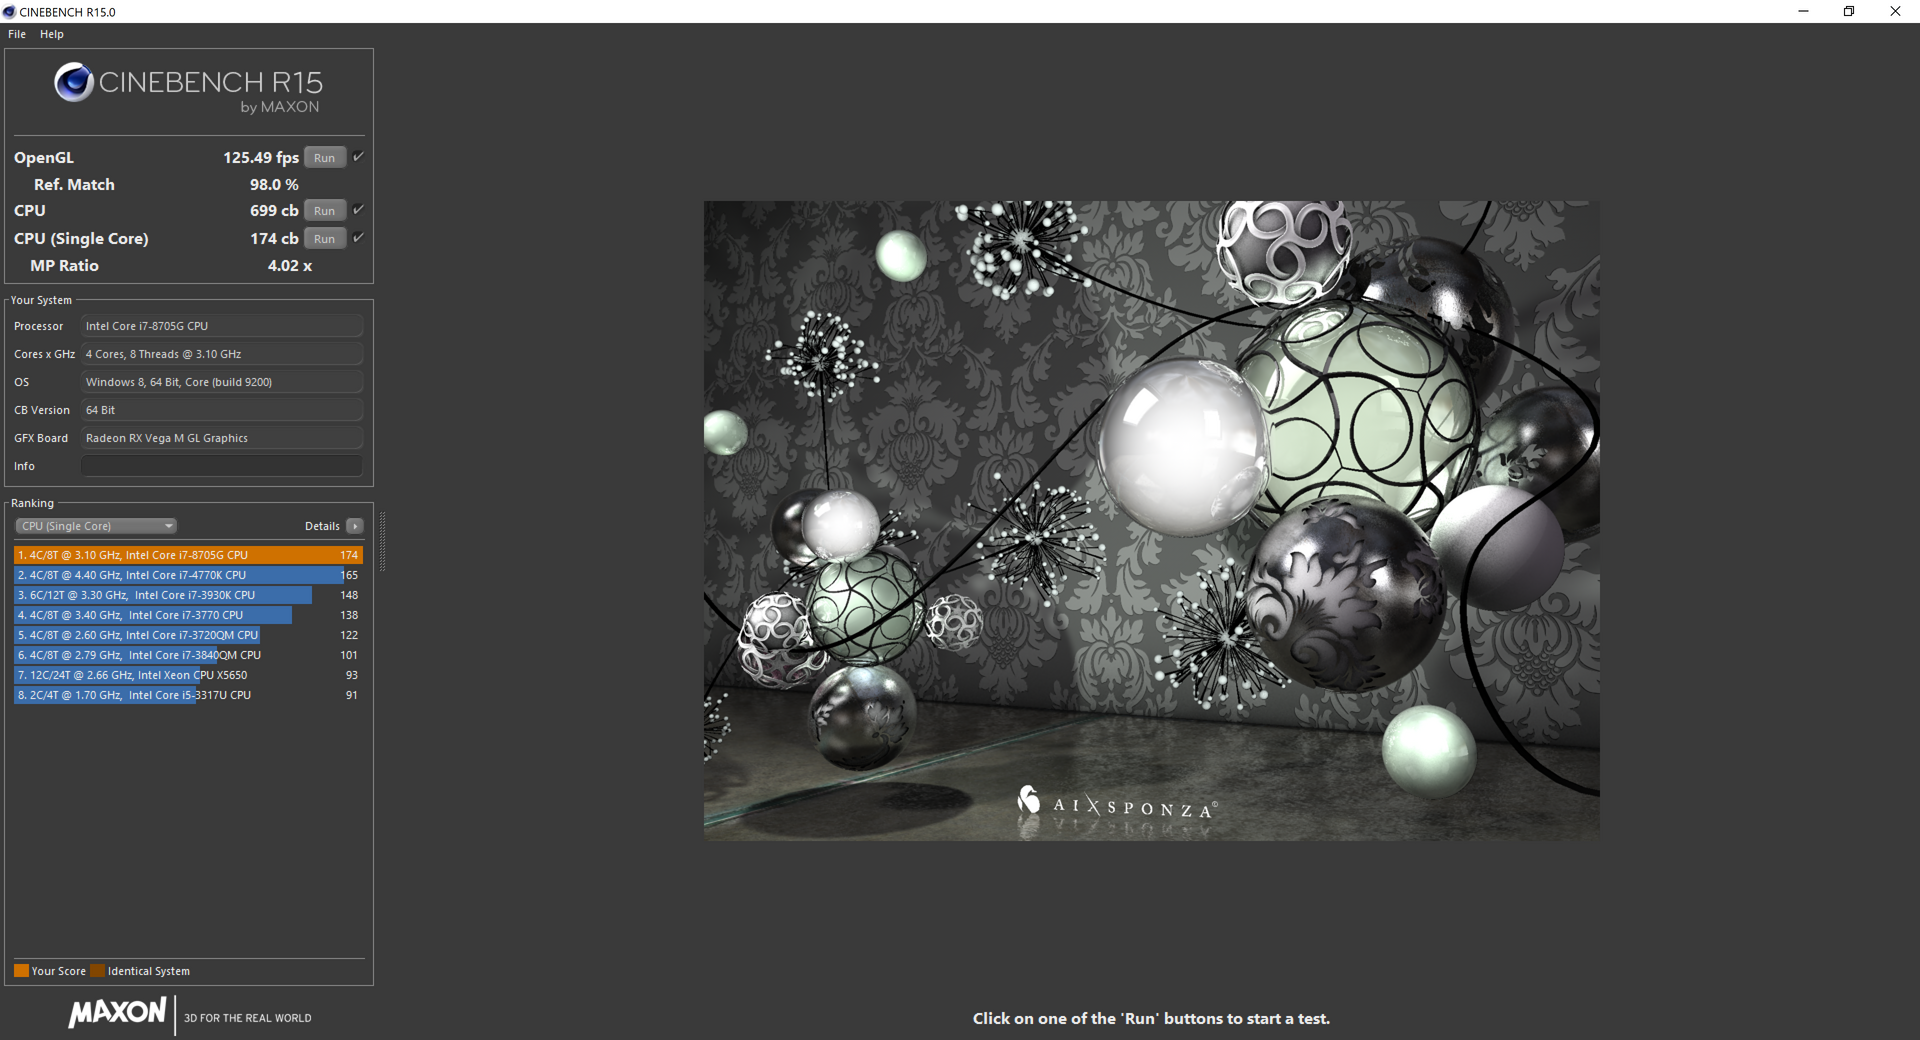
The Core i7-8705G is within a few percentage points from the Core i5-8305G in both single- and multi-threaded workloads according to CineBench. The delta is so insignificant compared to the price difference between the Kaby Lake-G Core i5 and Core i7 SKUs that most users will not even notice the minuscule benefits of the Core i7 CPU. With that said, its performance is still comparable to the Core i7-7700HQ CPU as found on the XPS 15 9560 and most Kaby Lake gaming notebooks of 2017. The Core i7-8750H currently shipping on the latest XPS 15 9570 is about 50 percent faster than our XPS convertible in multi-threaded workloads while the i7-8809G can be almost 25 percent faster.
Running CineBench R15 Multi-Thread in a loop results in an initial high score of 749 points before stabilizing in the 680 range to represent a performance drop of about 9 percent. In comparison, the i5-8305G SKU is able to achieve an initial high score of 710 points before stabilizing at about 670 to represent a drop of almost 6 percent. Though these dips are relatively minor, neither of these processors can maintain maximum Turbo Boost for more than just 30 seconds or so at best.
See our dedicated page on the Core i7-8705G CPU for more technical information and benchmarks.
* ... smaller is better
System Performance
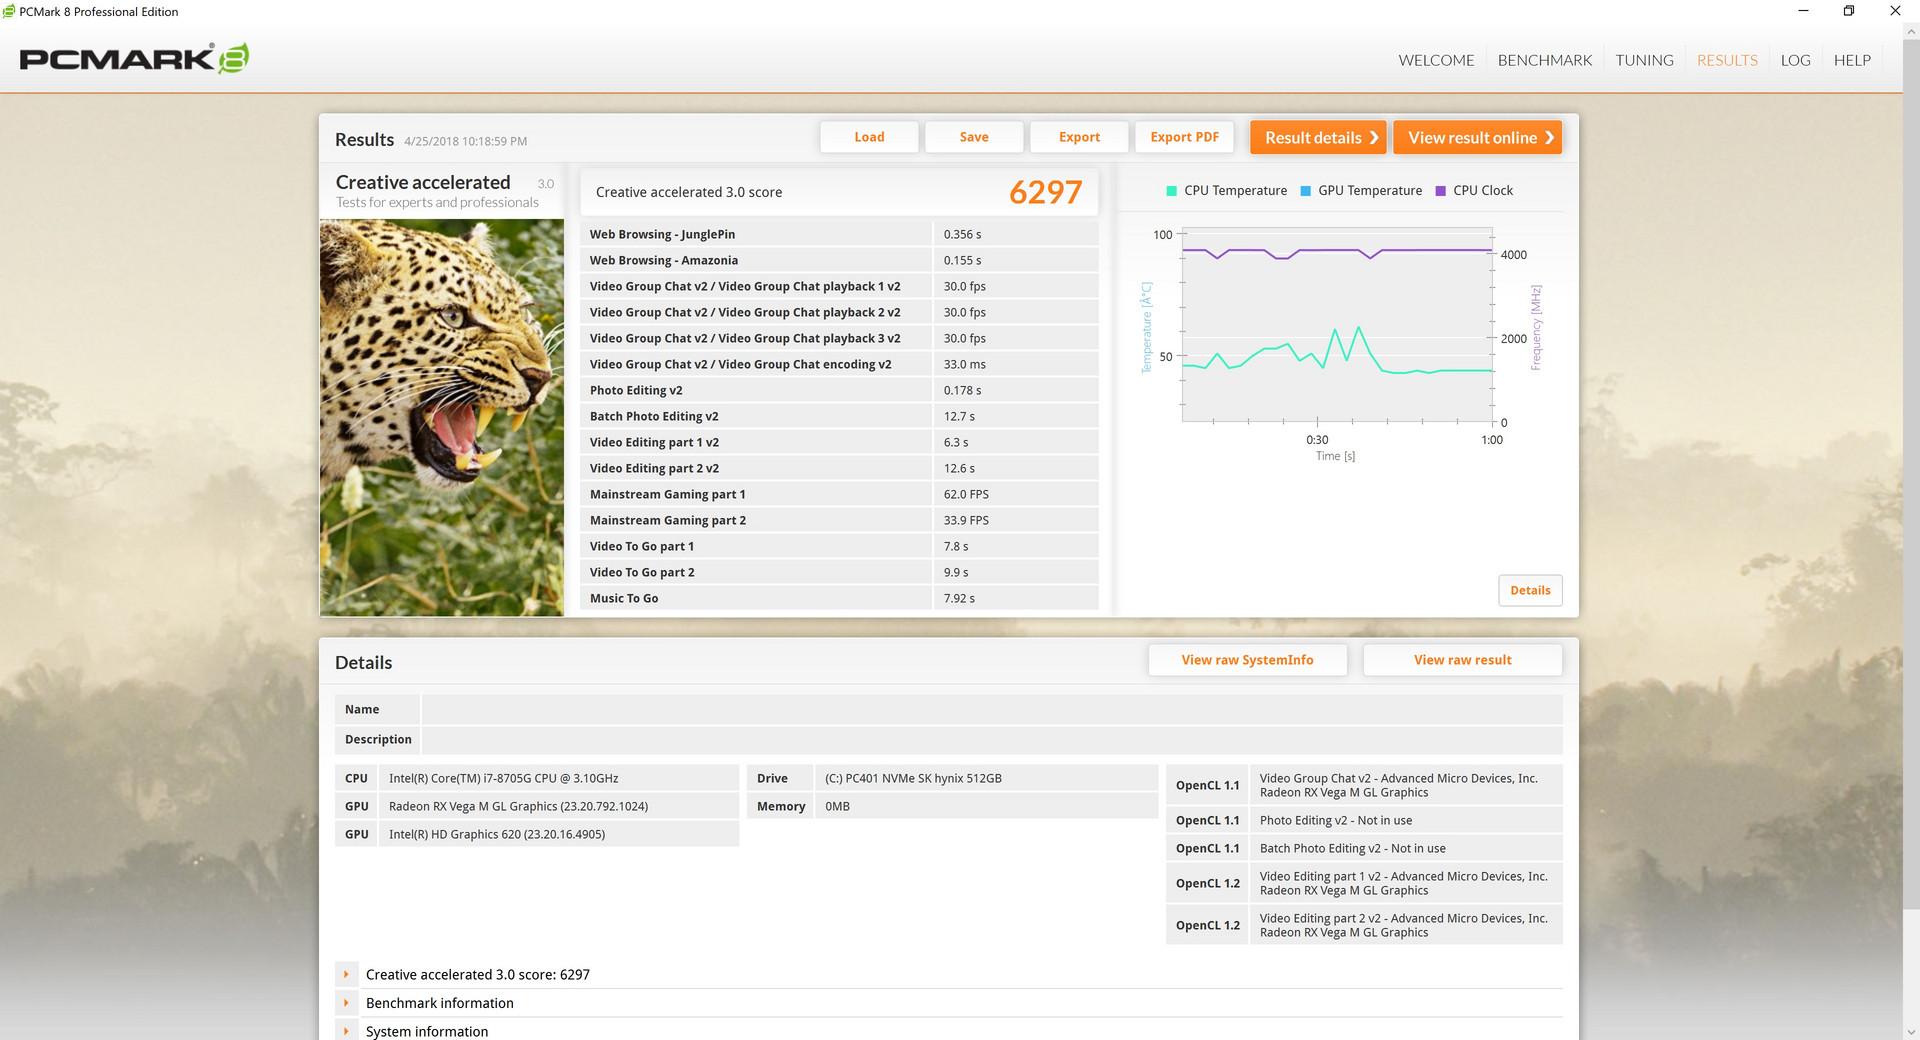
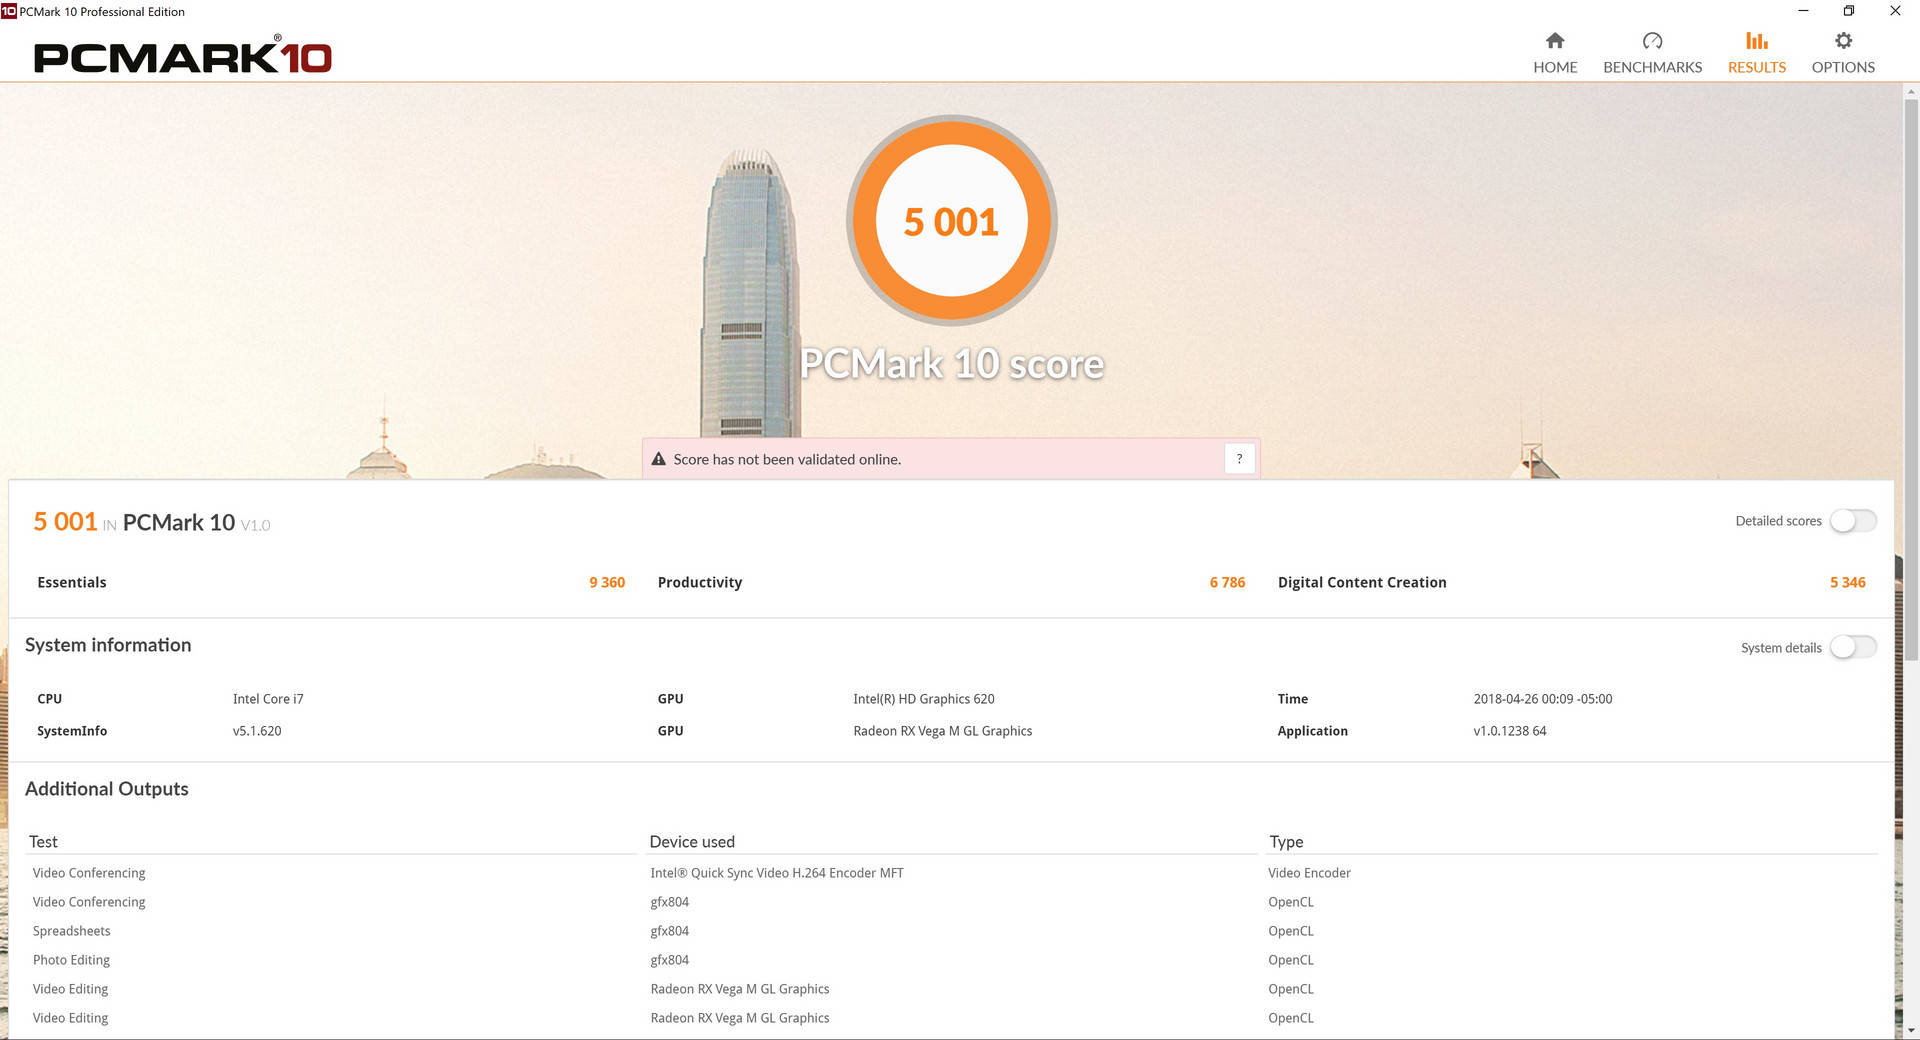
PCMark benchmarks have been scoring all our Kaby Lake-G systems quite highly. Both of our XPS 15 9575 configurations are within single-digit percentages from powerful systems like the Asus Zenbook Pro UX550 and even the latest Gigabyte Aero 15X v8.
We experienced no major hardware or software issues during our time with the unit aside from the color issues above.
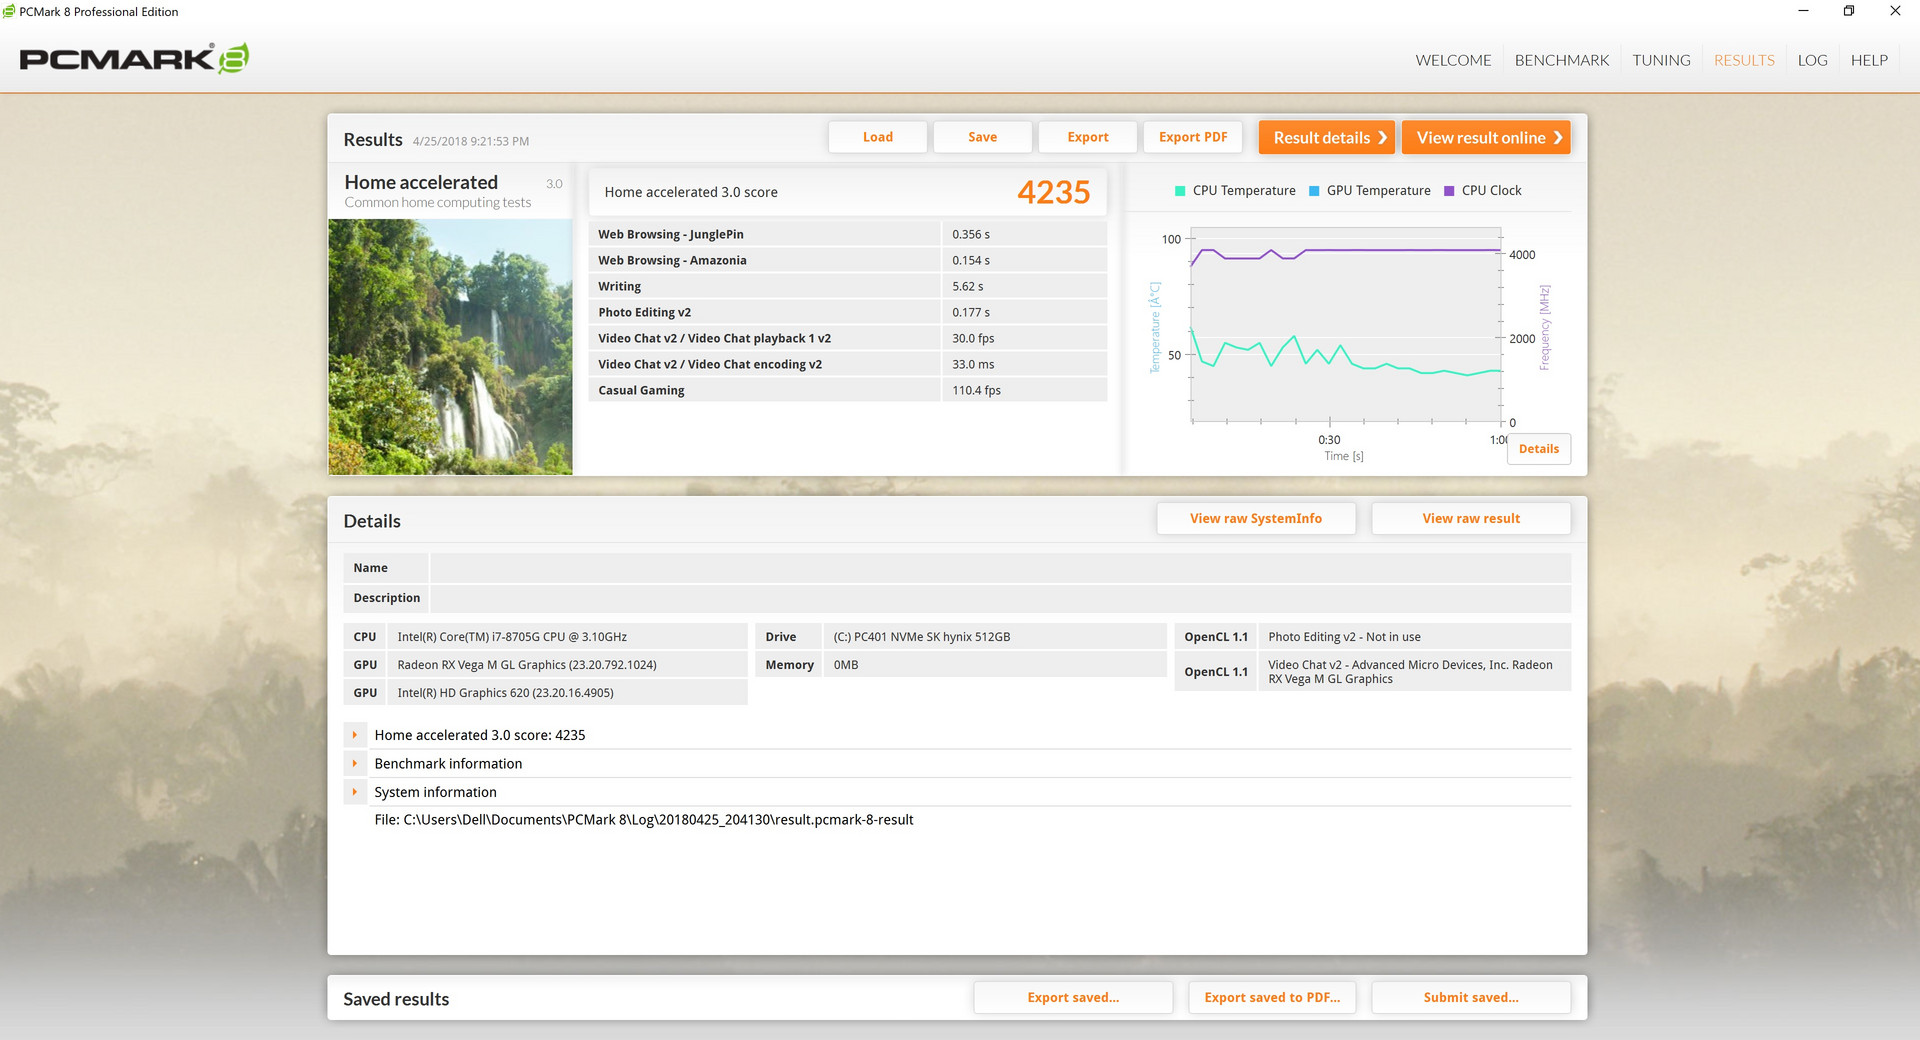
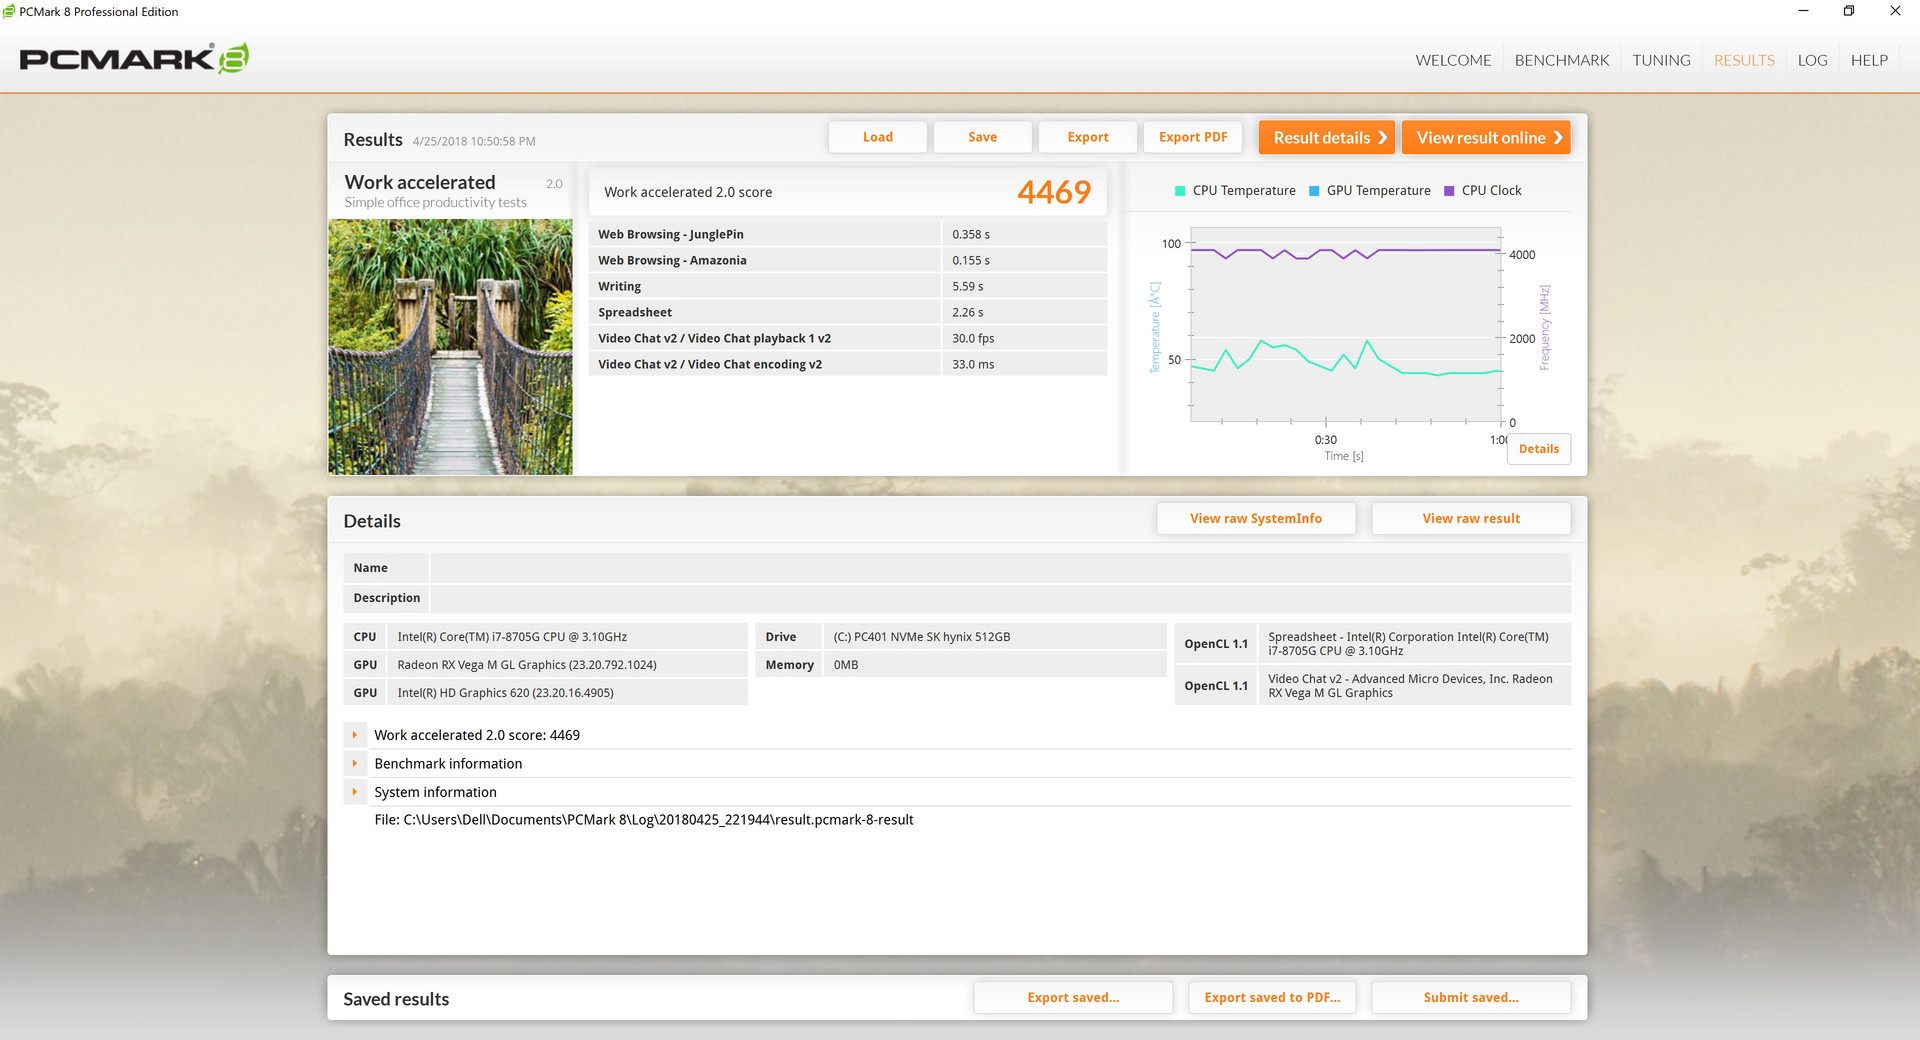
| PCMark 8 Home Score Accelerated v2 | 4235 points | |
| PCMark 8 Creative Score Accelerated v2 | 6297 points | |
| PCMark 8 Work Score Accelerated v2 | 4469 points | |
| PCMark 10 Score | 5001 points | |
Help | ||
Storage Devices
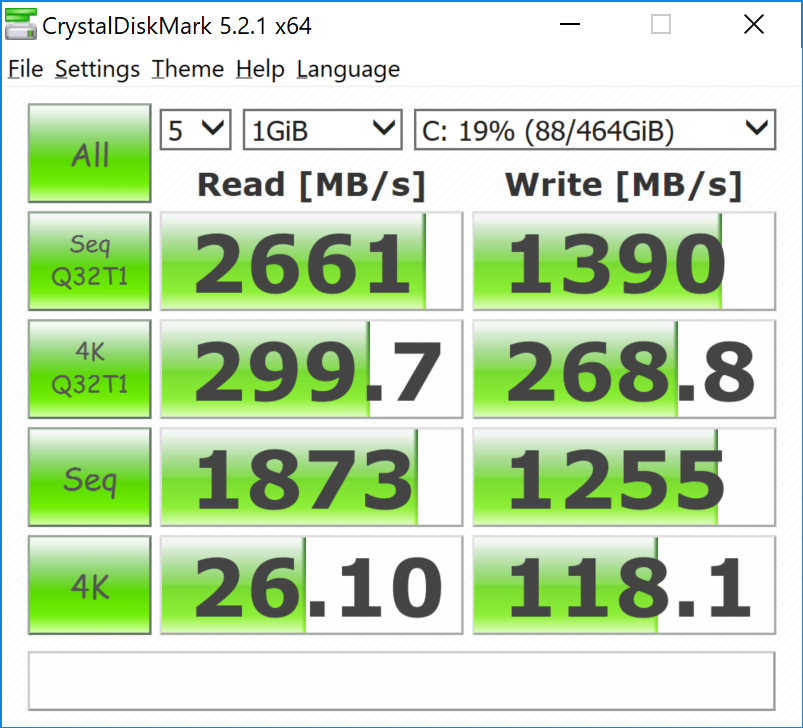
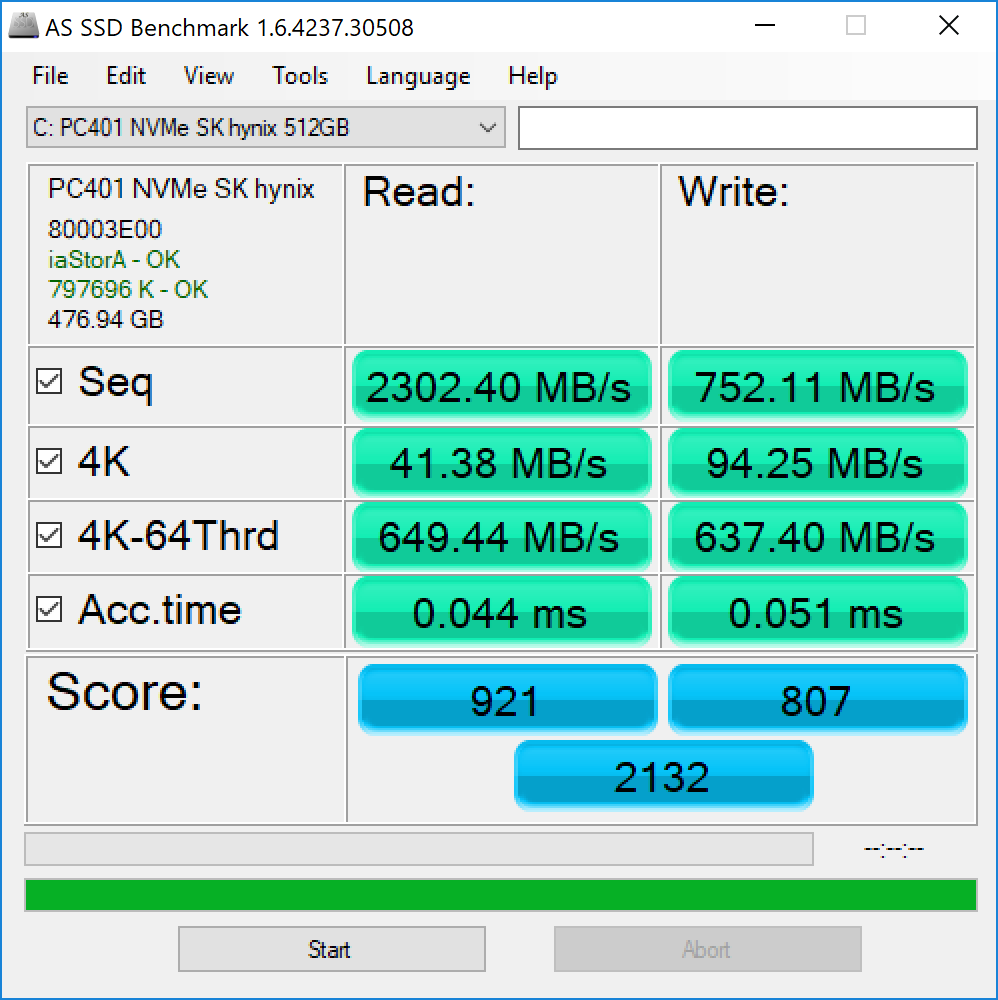
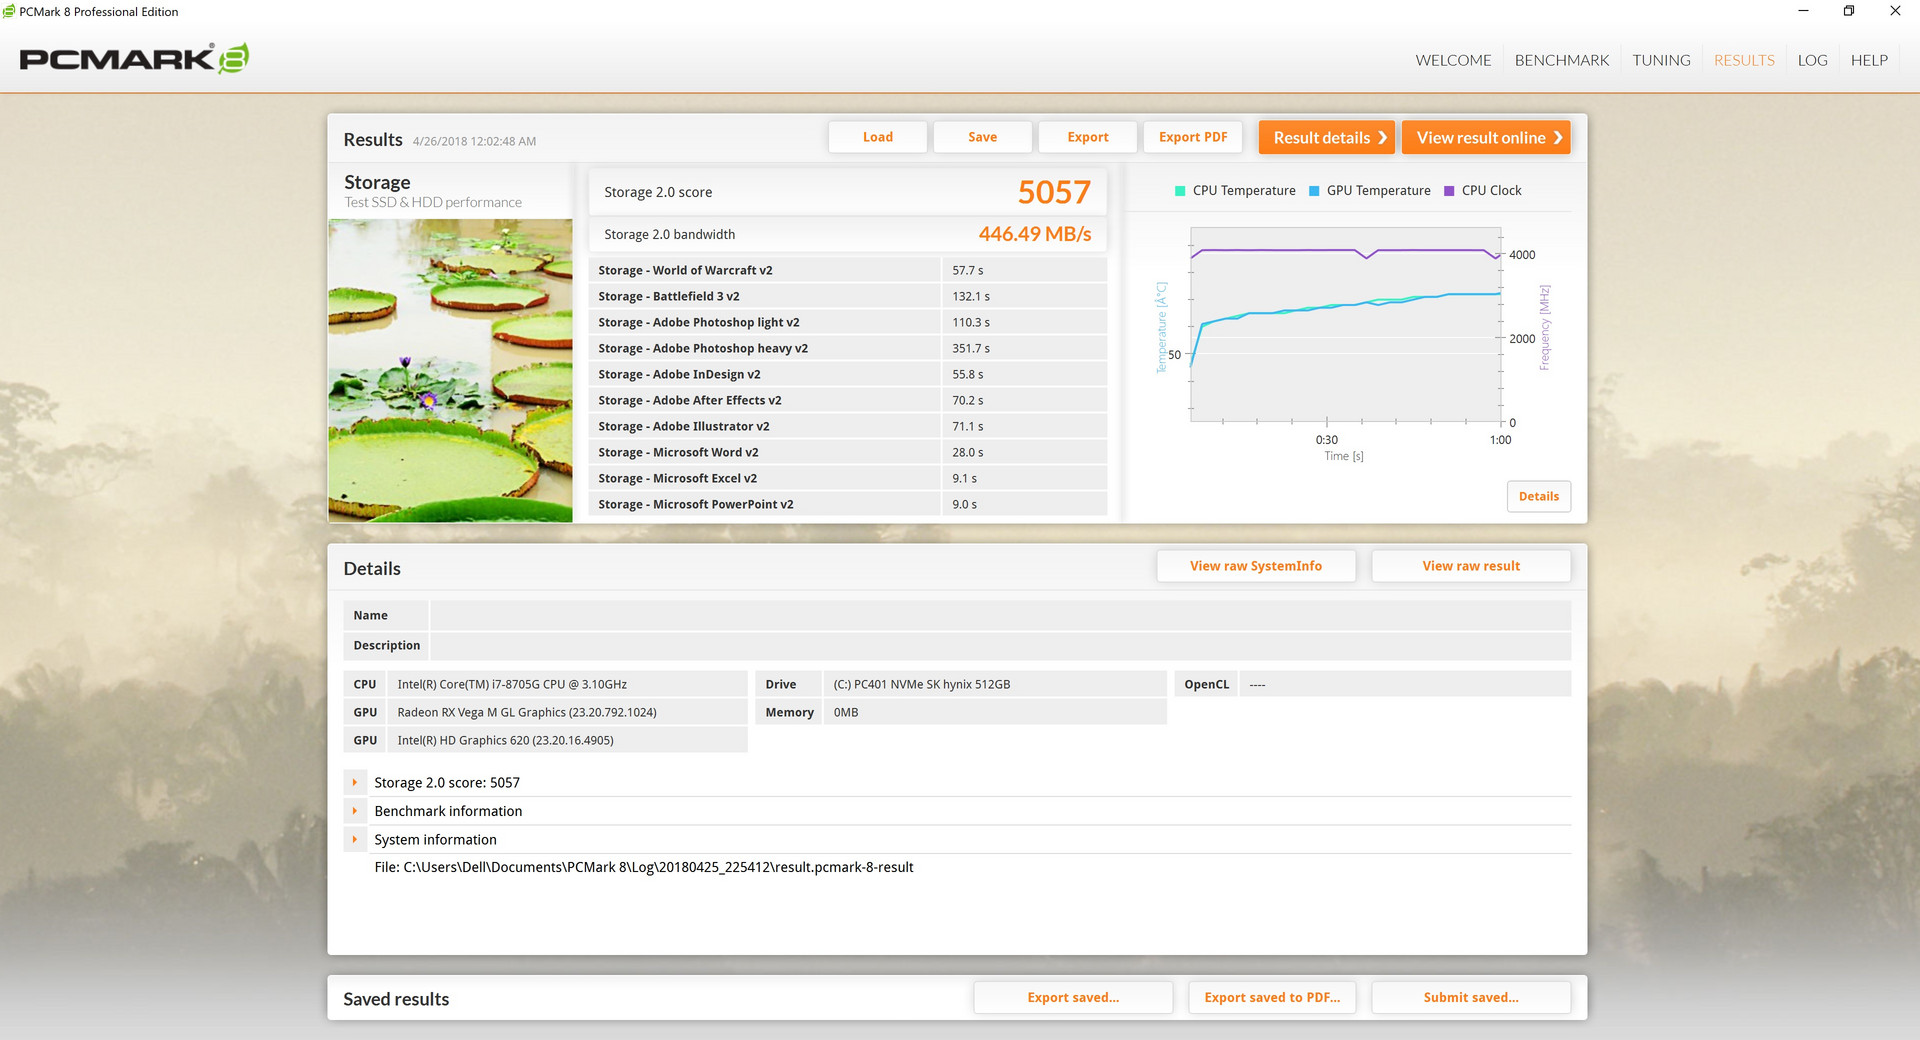
Our test unit has been specially configured by Dell with a 512 GB SK Hynix PC401 NVMe SSD whereas all current SKUs are limited to 128 GB to 256 GB SSD. Thus, our results here may not represent what users will get when they purchase the XPS 15 9575.
The SK Hynix SSD in our unit returns an excellent sequential read rate of 2302 MB/s and an average write rate of 752 MB/s. In comparison, the popular Samsung PM961 NVMe is able to achieve write rates twice as fast (1475 vs. 752 MB/s) while the Toshiba XG5 SSD in the retail XPS 15 9575 unit can be twice as slow (334 vs. 752 MB/s). We hope to see the SK Hynix SSD in future SKUs of the XPS 15 9575 since it will be an upgrade over the Toshiba in more ways than just storage capacity.
See our table of SSDs and HDDs for more benchmark comparisons. It's worth noting that this very same SK Hynix PC401 SSD can also be found on the Latitude 7390 2-in-1.
| Dell XPS 15 9575 i7-8705G SK hynix PC401 NVMe 500 GB | Dell XPS 15 9575 i5-8305G Toshiba XG5 KXG50ZNV256G | Asus ZenBook Flip 15 UX561UD Micron 1100 MTFDDAV256TBN | Asus Zenbook Pro UX550VE-DB71T Samsung PM961 NVMe MZVLW512HMJP | Asus G501VW-FY081T Samsung CM871 MZNLF128HCHP | |
|---|---|---|---|---|---|
| AS SSD | -58% | -59% | 31% | -122% | |
| Copy Game MB/s (MB/s) | 944 | 250.5 -73% | 282.3 -70% | 477.1 -49% | 141.5 -85% |
| Copy Program MB/s (MB/s) | 487.9 | 174.9 -64% | 196.8 -60% | 294.6 -40% | 99.9 -80% |
| Copy ISO MB/s (MB/s) | 1523 | 392.7 -74% | 291 -81% | 1269 -17% | 163 -89% |
| Score Total (Points) | 2132 | 1113 -48% | 844 -60% | 3721 75% | 269 -87% |
| Score Write (Points) | 807 | 307 -62% | 371 -54% | 1421 76% | 63 -92% |
| Score Read (Points) | 921 | 595 -35% | 310 -66% | 1541 67% | 152 -83% |
| Access Time Write * (ms) | 0.051 | 0.056 -10% | 0.056 -10% | 0.034 33% | 0.225 -341% |
| Access Time Read * (ms) | 0.044 | 0.146 -232% | 0.097 -120% | 0.054 -23% | 0.207 -370% |
| 4K-64 Write (MB/s) | 637 | 181.2 -72% | 248.5 -61% | 1160 82% | 19.4 -97% |
| 4K-64 Read (MB/s) | 649 | 337.1 -48% | 235.5 -64% | 1269 96% | 87.6 -87% |
| 4K Write (MB/s) | 94.3 | 92.7 -2% | 84.8 -10% | 112.8 20% | 30.66 -67% |
| 4K Read (MB/s) | 41.38 | 24.78 -40% | 25.79 -38% | 51 23% | 13.87 -66% |
| Seq Write (MB/s) | 752 | 334.3 -56% | 379.3 -50% | 1475 96% | 126.9 -83% |
| Seq Read (MB/s) | 2302 | 2335 1% | 488 -79% | 2208 -4% | 504 -78% |
* ... smaller is better

GPU Performance
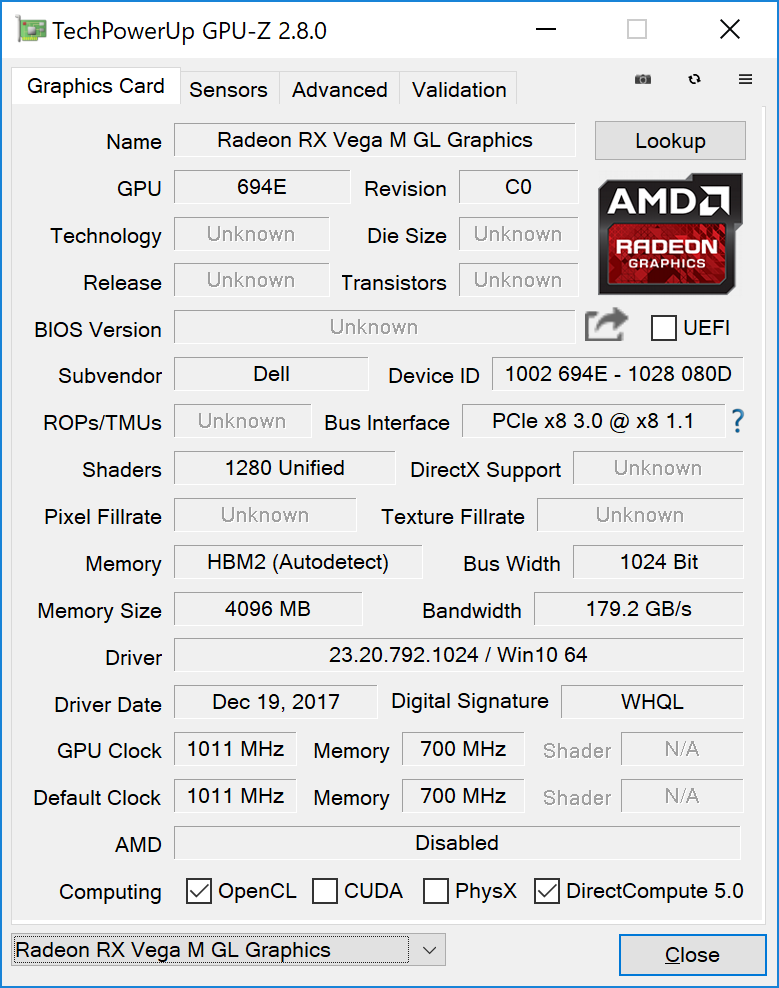
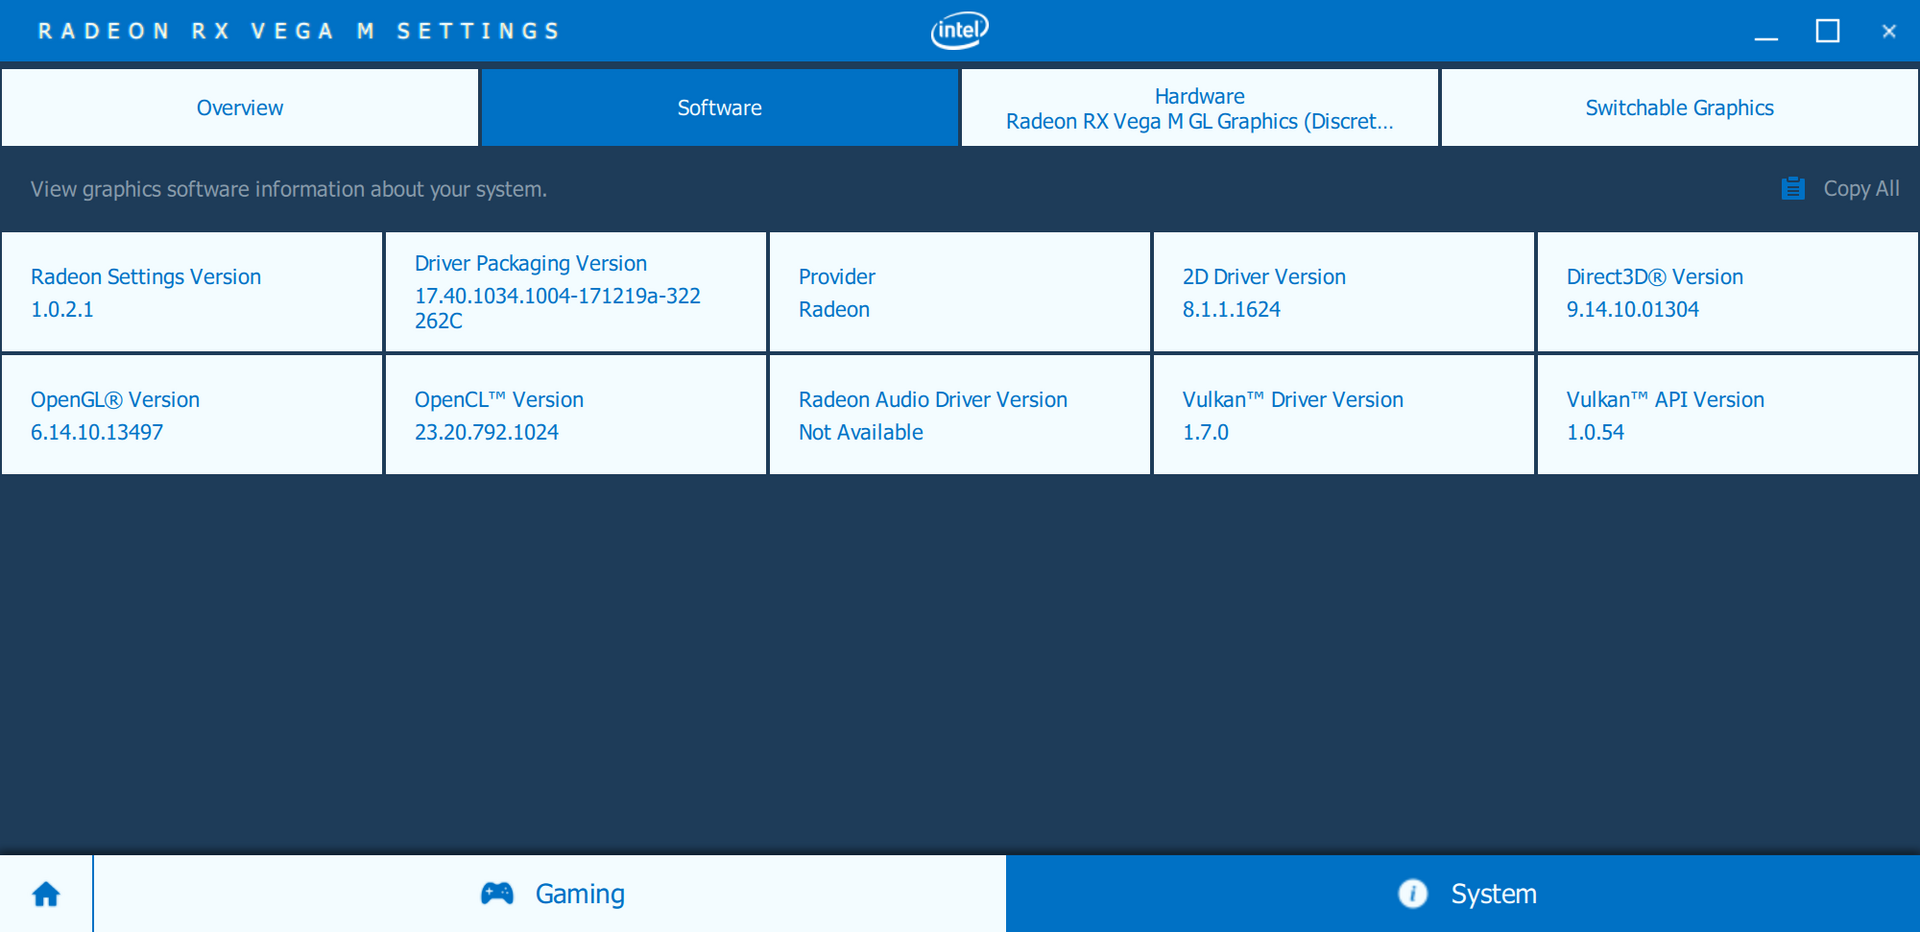
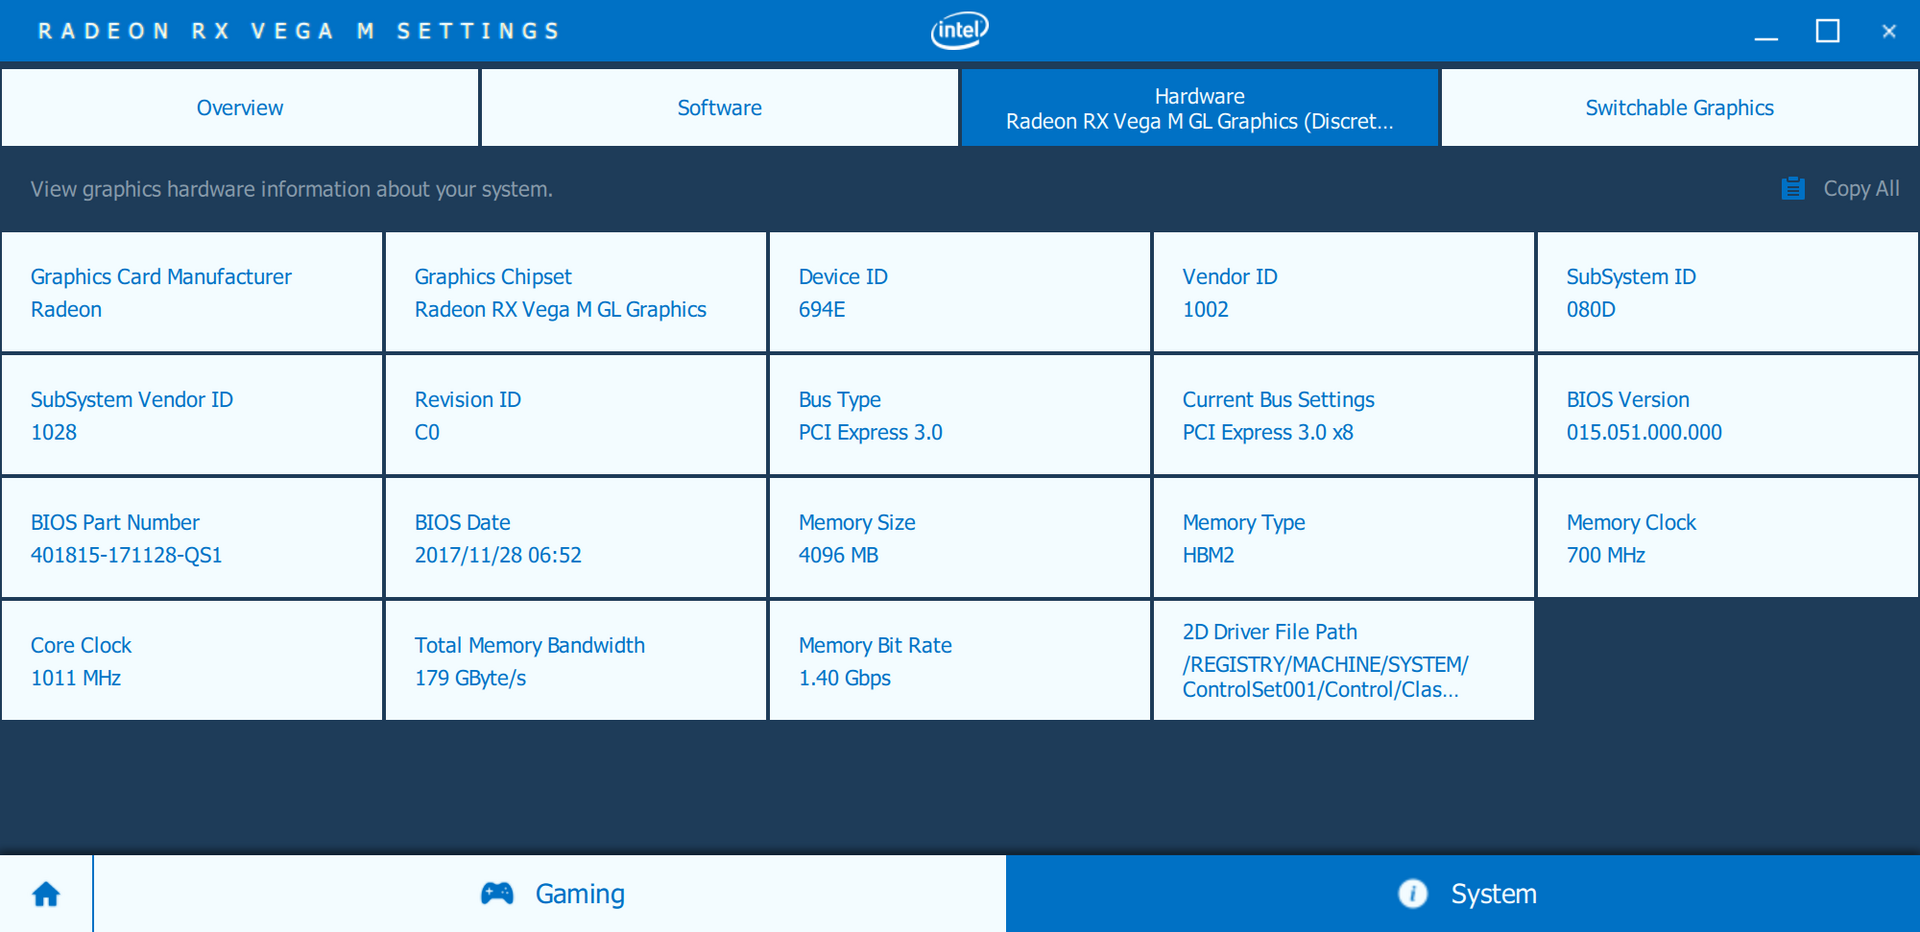
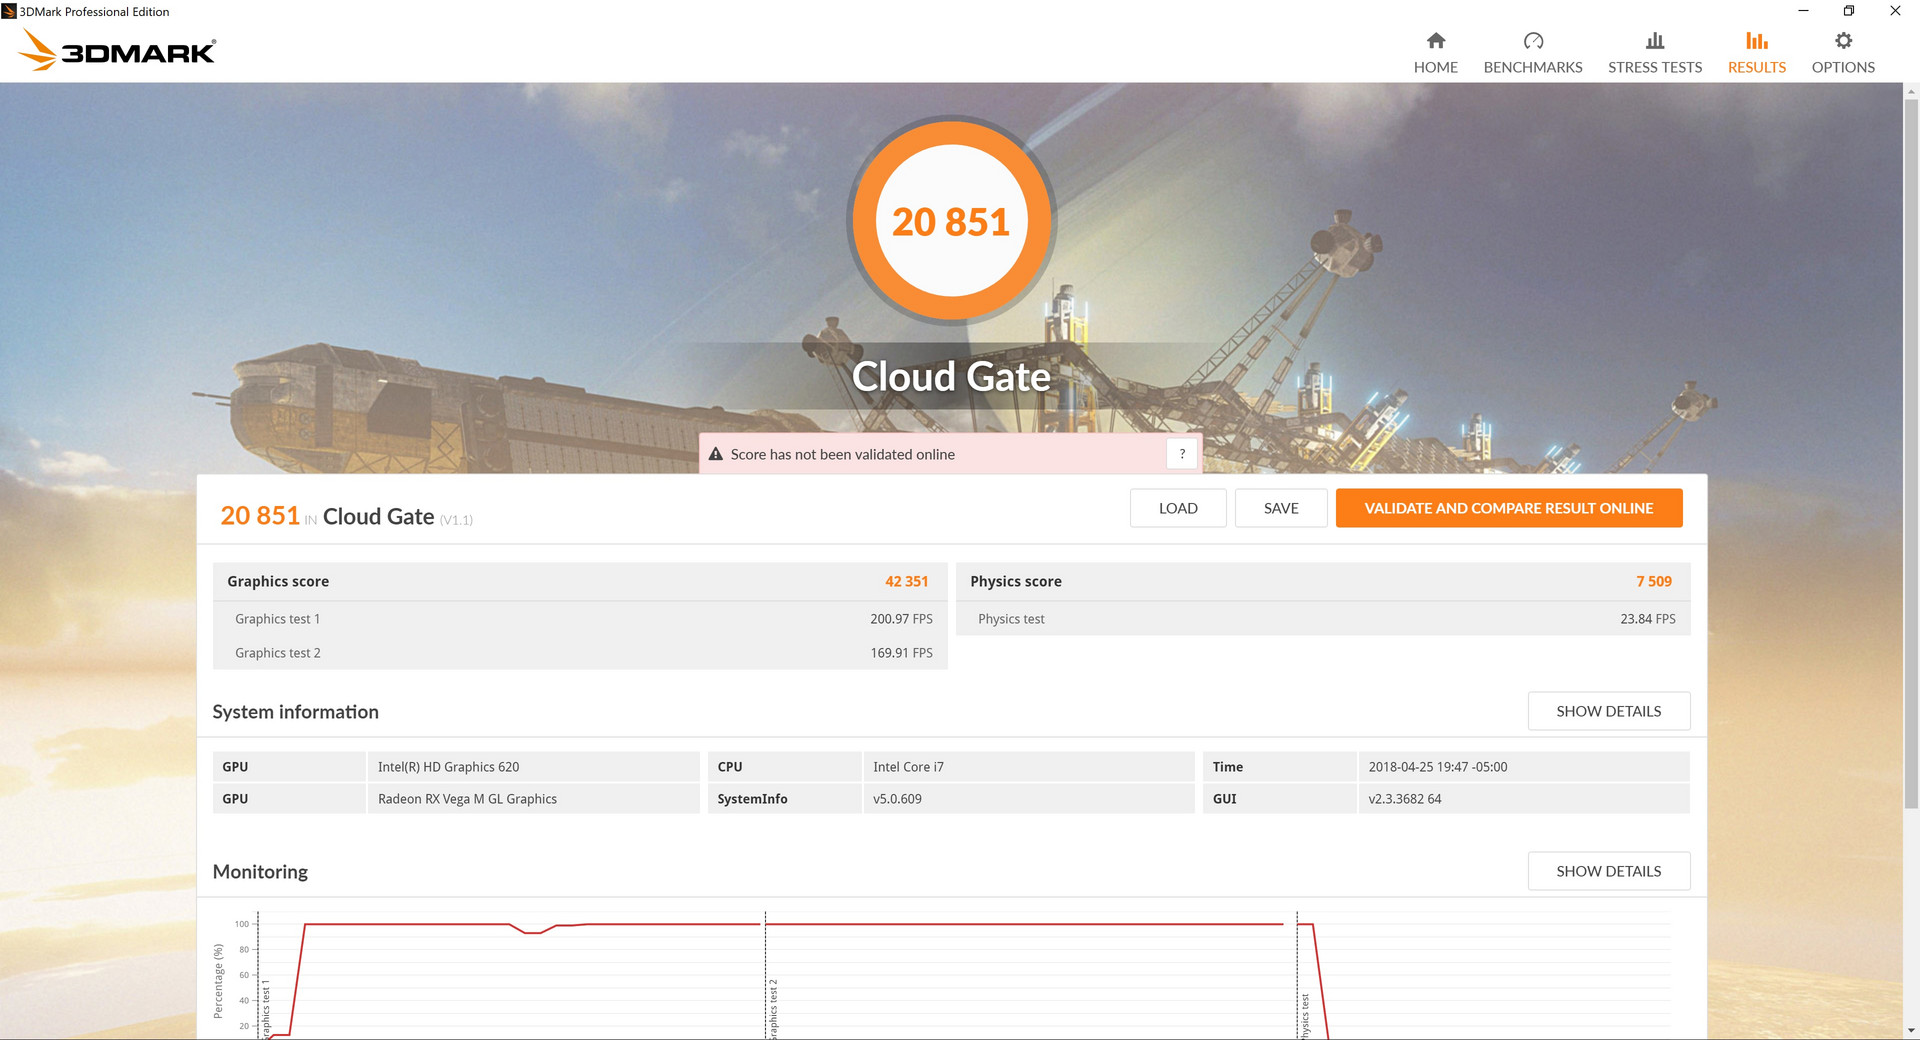
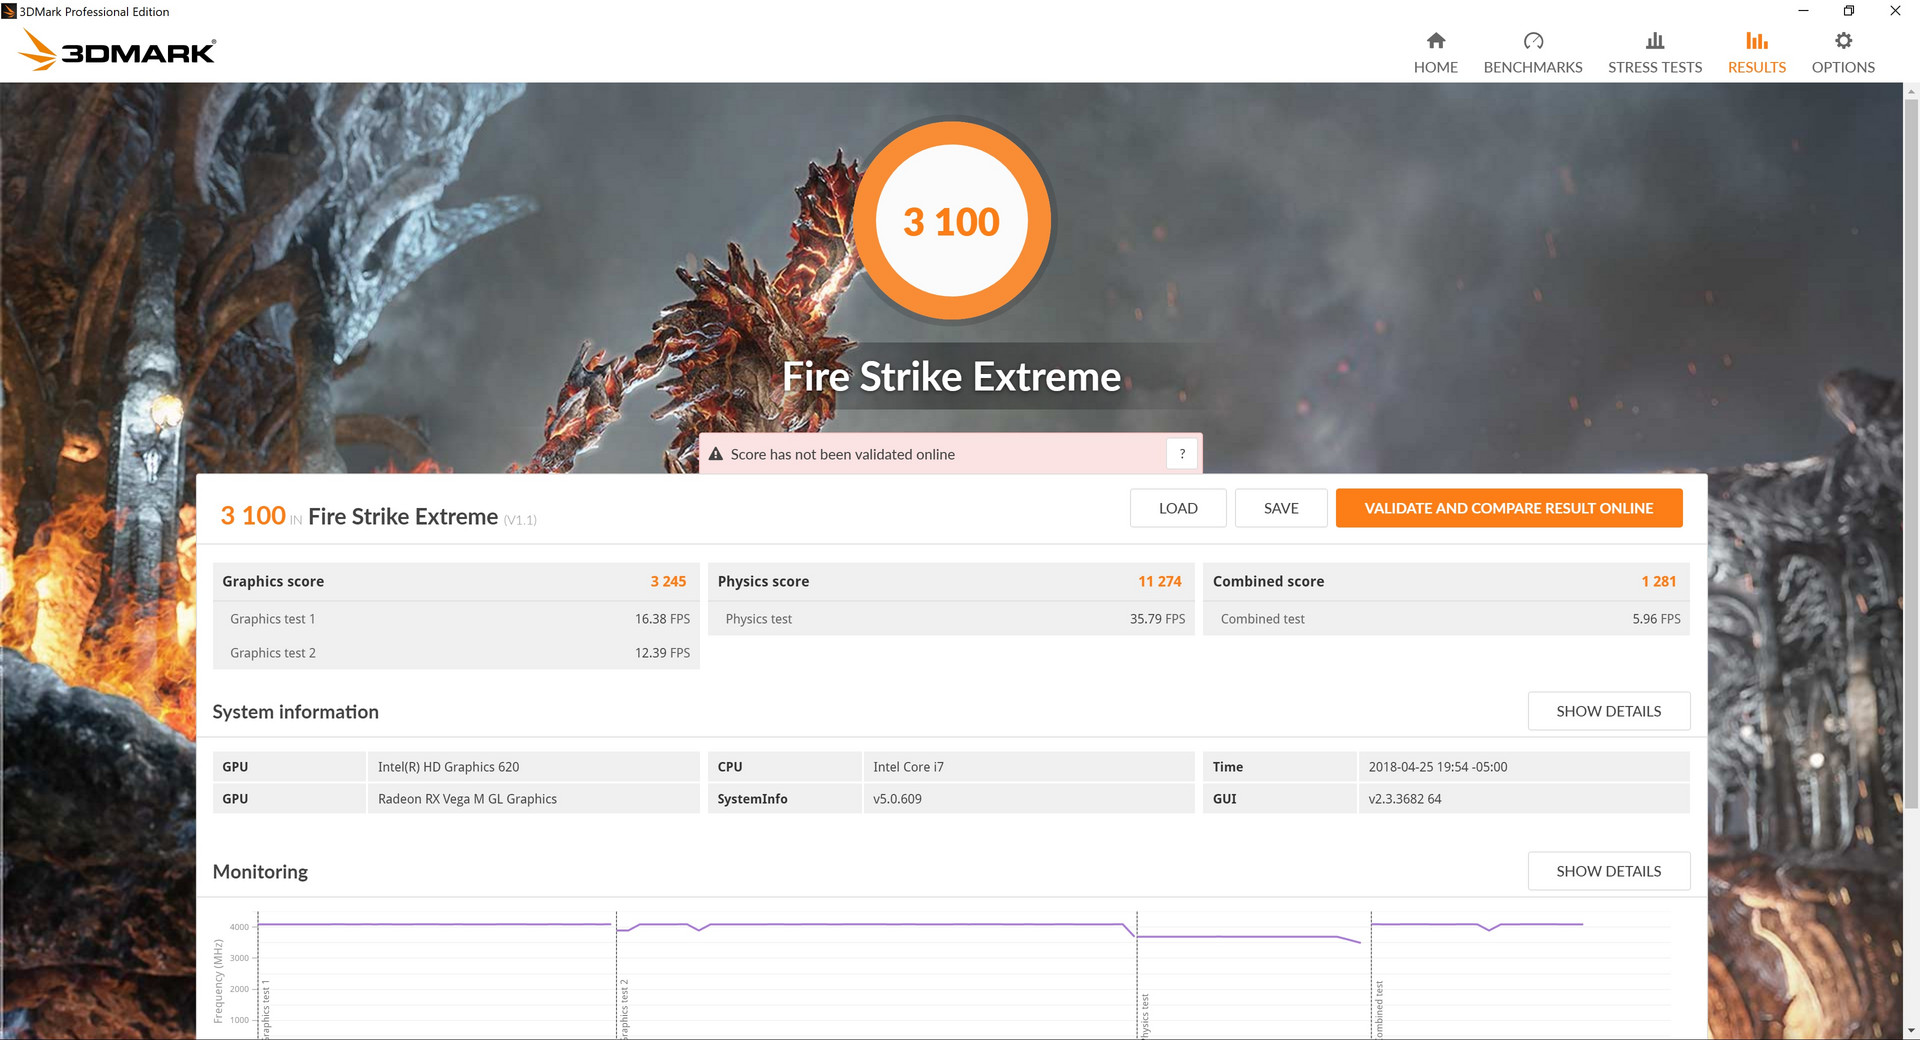
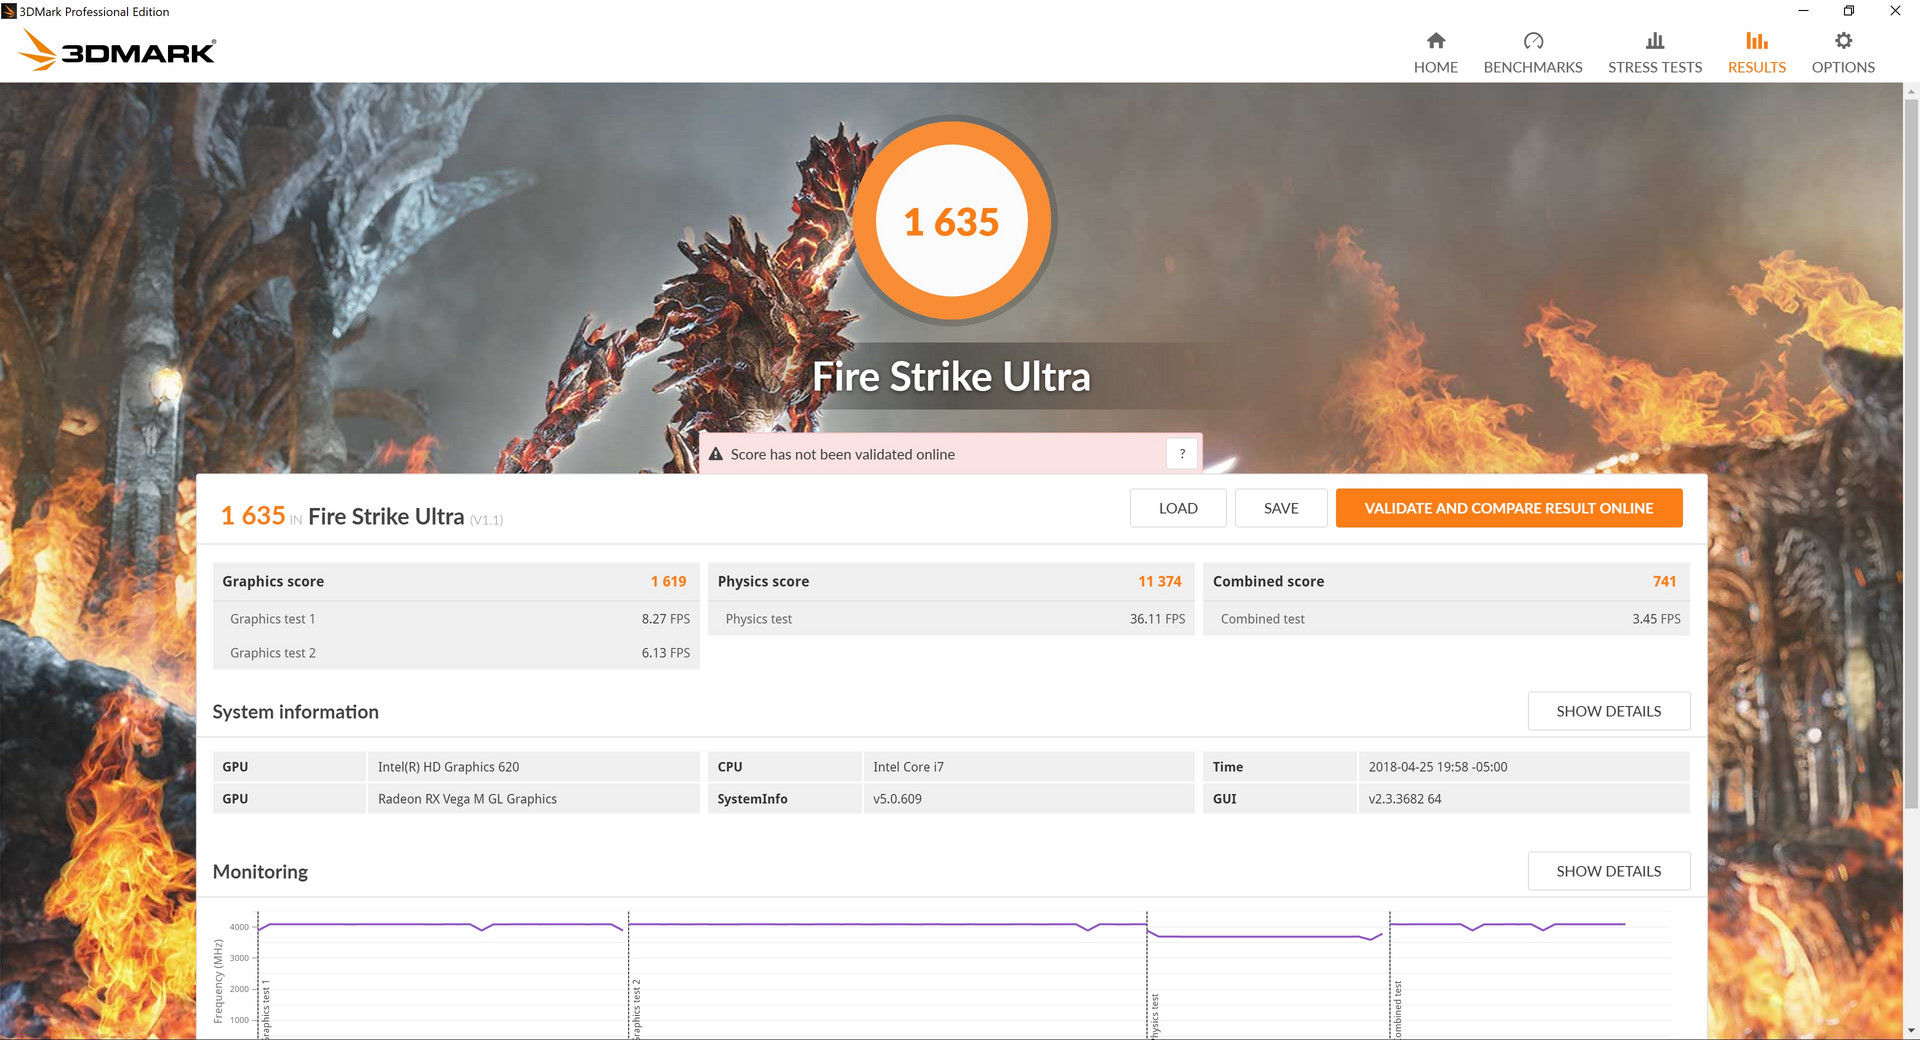
In Intel systems, the same integrated HD Graphics 620 GPU can be found on a wide range of U-class CPUs from the Core i3-7100U to the Core i7-7600U. Actual GPU performance, however, is still very similar between these systems. The same can be said for the AMD Radeon RX Vega M GL GPU in the Core i5-8305G and Core i7-8705G. 3DMark results show that both of the Dell SKUs are nearly identical in raw graphics performance to the point where any benefits in gaming should be unnoticeable. As our Stress Test section will show, the Vega M GL GPU runs at the same 1011 MHz clock rate between the two i5 and i7 CPUs.
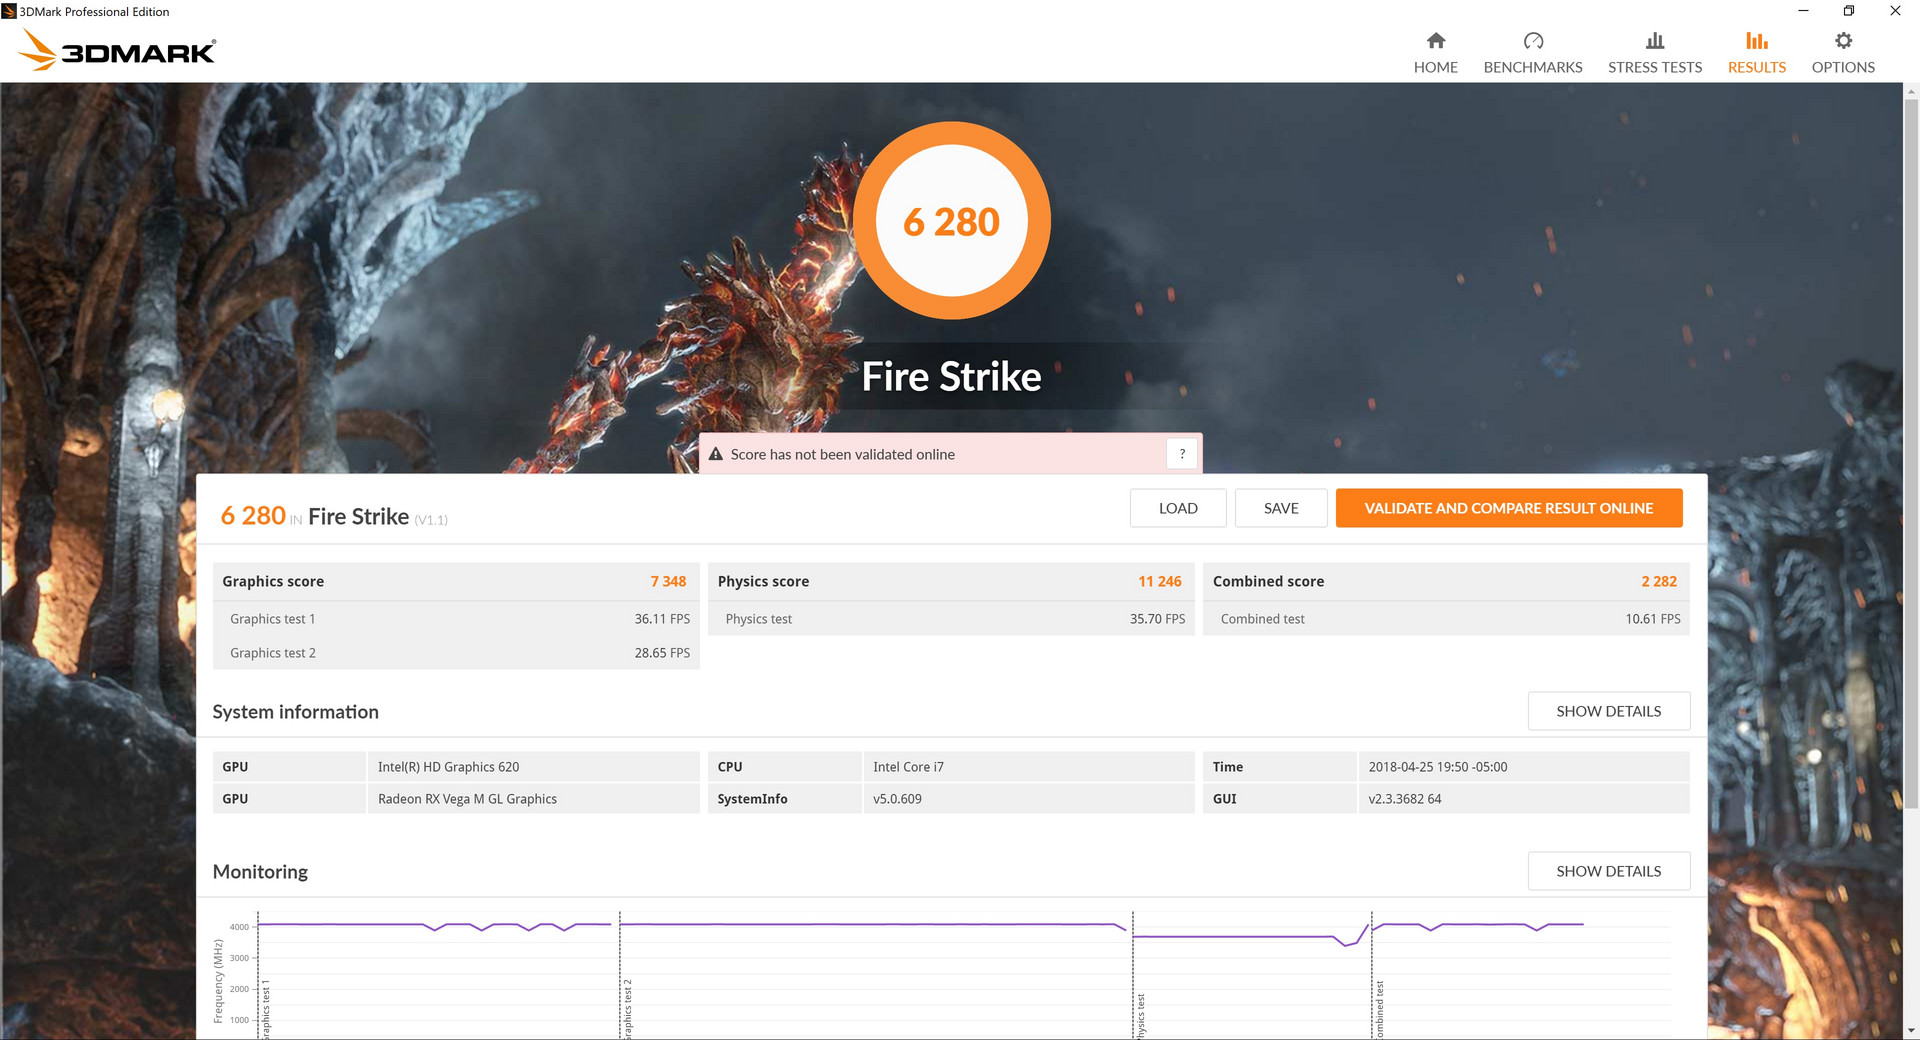
Raw graphics power is between the GTX 1050 and GTX 1050 Ti and comparable to the GTX 965M. Thus, gamers can expect similar performance levels to the XPS 15 9560. Some titles, however, may run much slower on the AMD GPU due to poorer optimization. See our dedicated page on the Radeon RX Vega M GL here for more technical information and benchmarks.
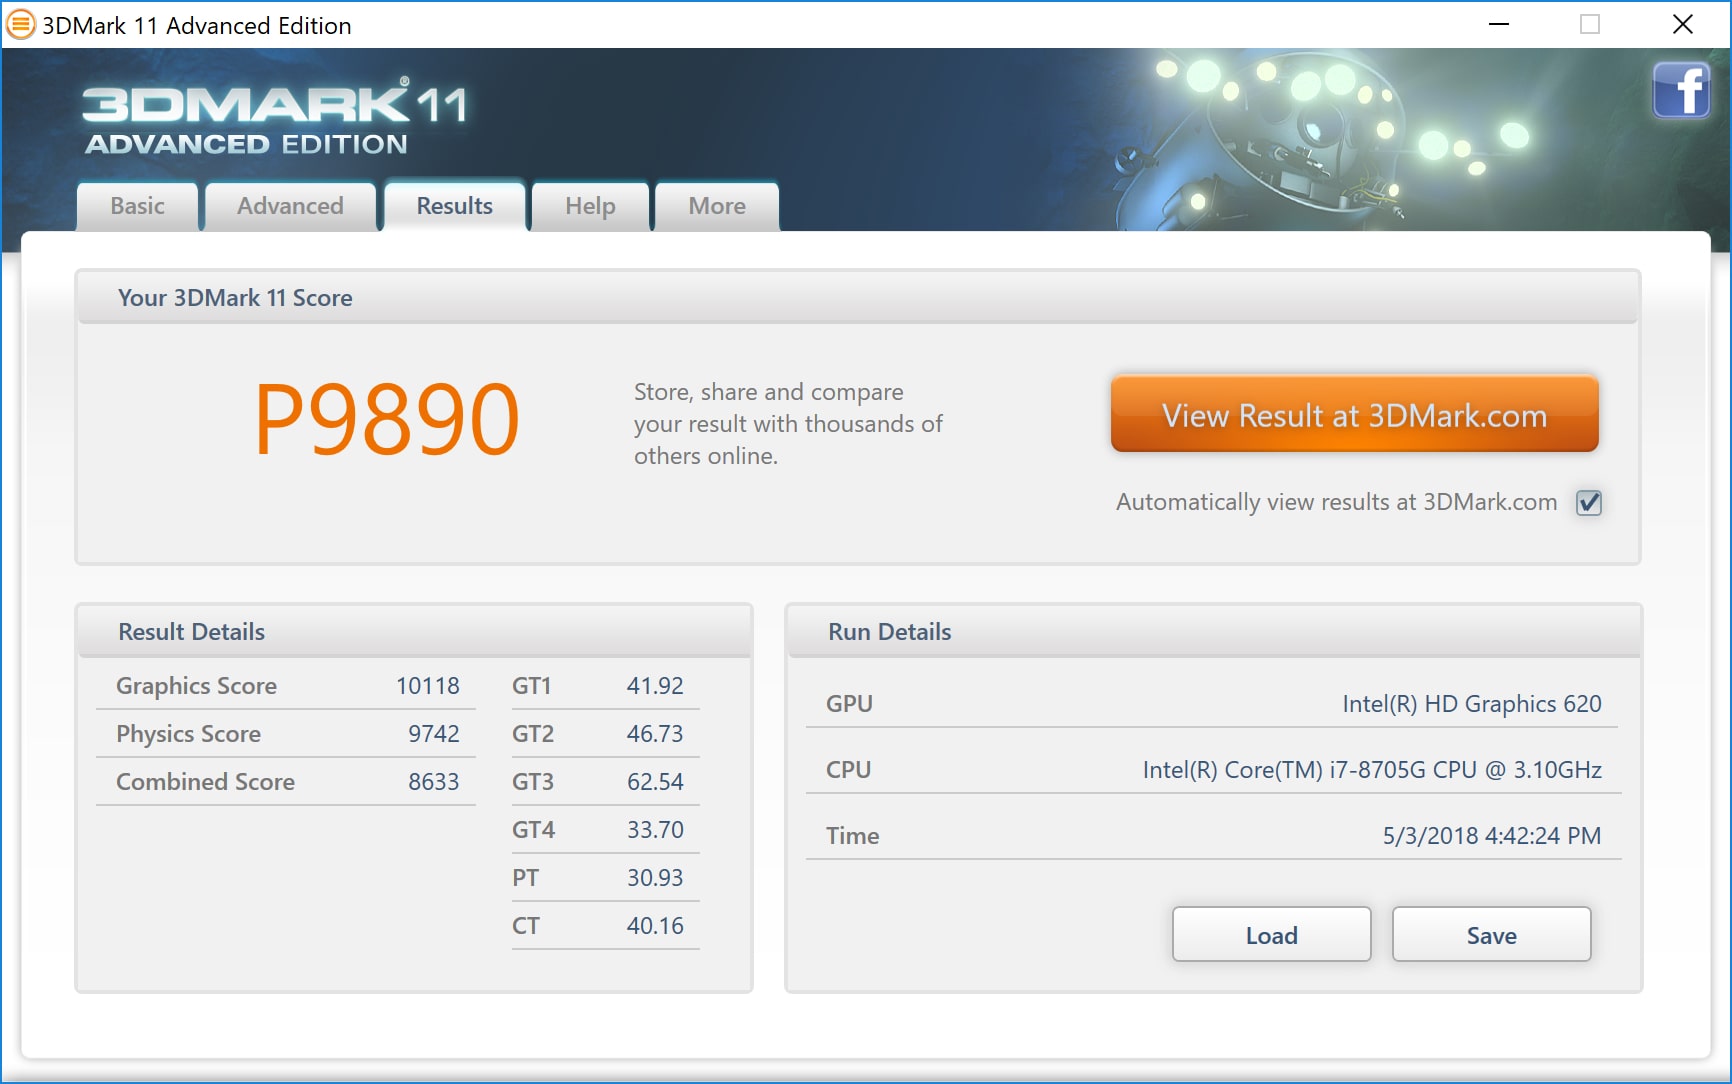

| 3DMark 11 Performance | 9890 points | |
| 3DMark Ice Storm Standard Score | 67107 points | |
| 3DMark Cloud Gate Standard Score | 20851 points | |
| 3DMark Fire Strike Score | 6280 points | |
| 3DMark Fire Strike Extreme Score | 3100 points | |
| 3DMark Time Spy Score | 2225 points | |
Help | ||
| low | med. | high | ultra | 4K | |
|---|---|---|---|---|---|
| BioShock Infinite (2013) | 224.5 | 181.4 | 161 | 52.5 | |
| Batman: Arkham Knight (2015) | 108 | 95 | 54 | 16 | |
| Rise of the Tomb Raider (2016) | 133.1 | 81.2 | 42.4 | 32.8 | 14.3 |
| Ashes of the Singularity (2016) | 54.9 | 37 | 32.7 |
Stress Test
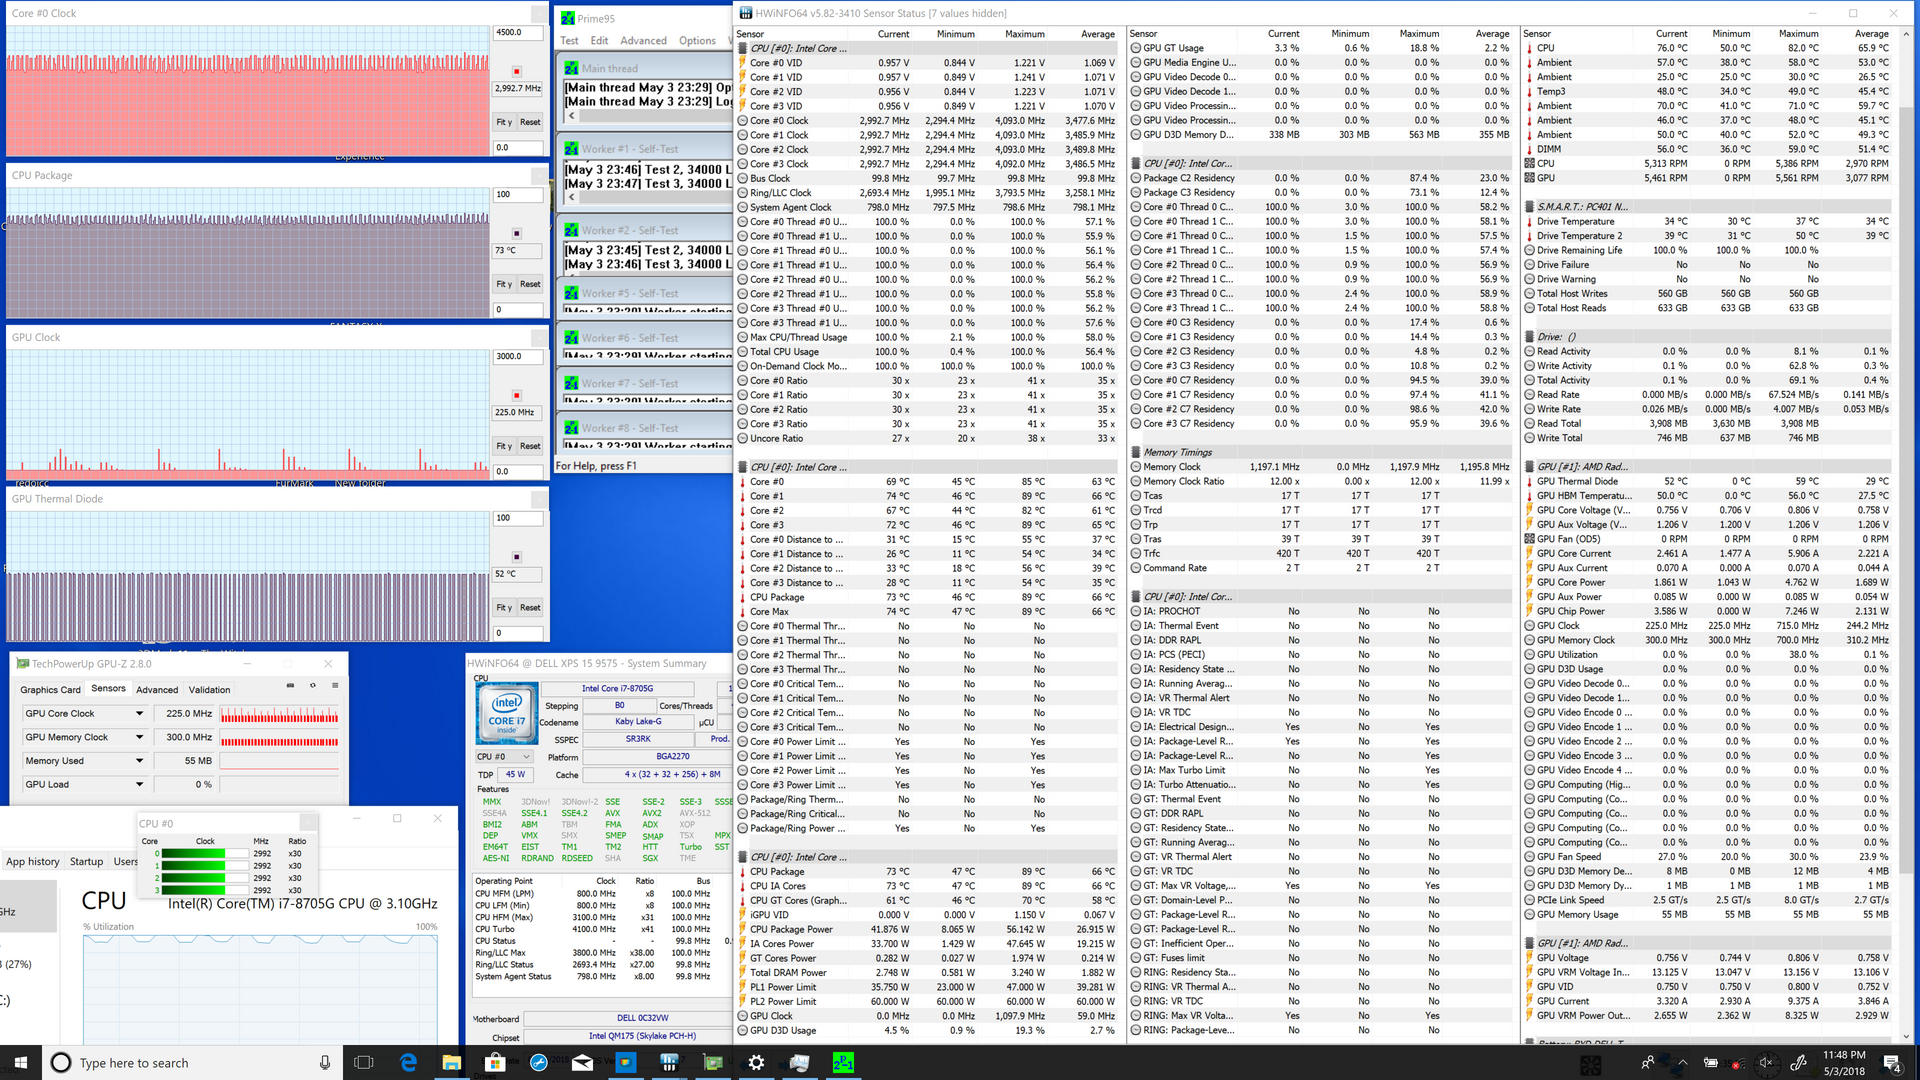
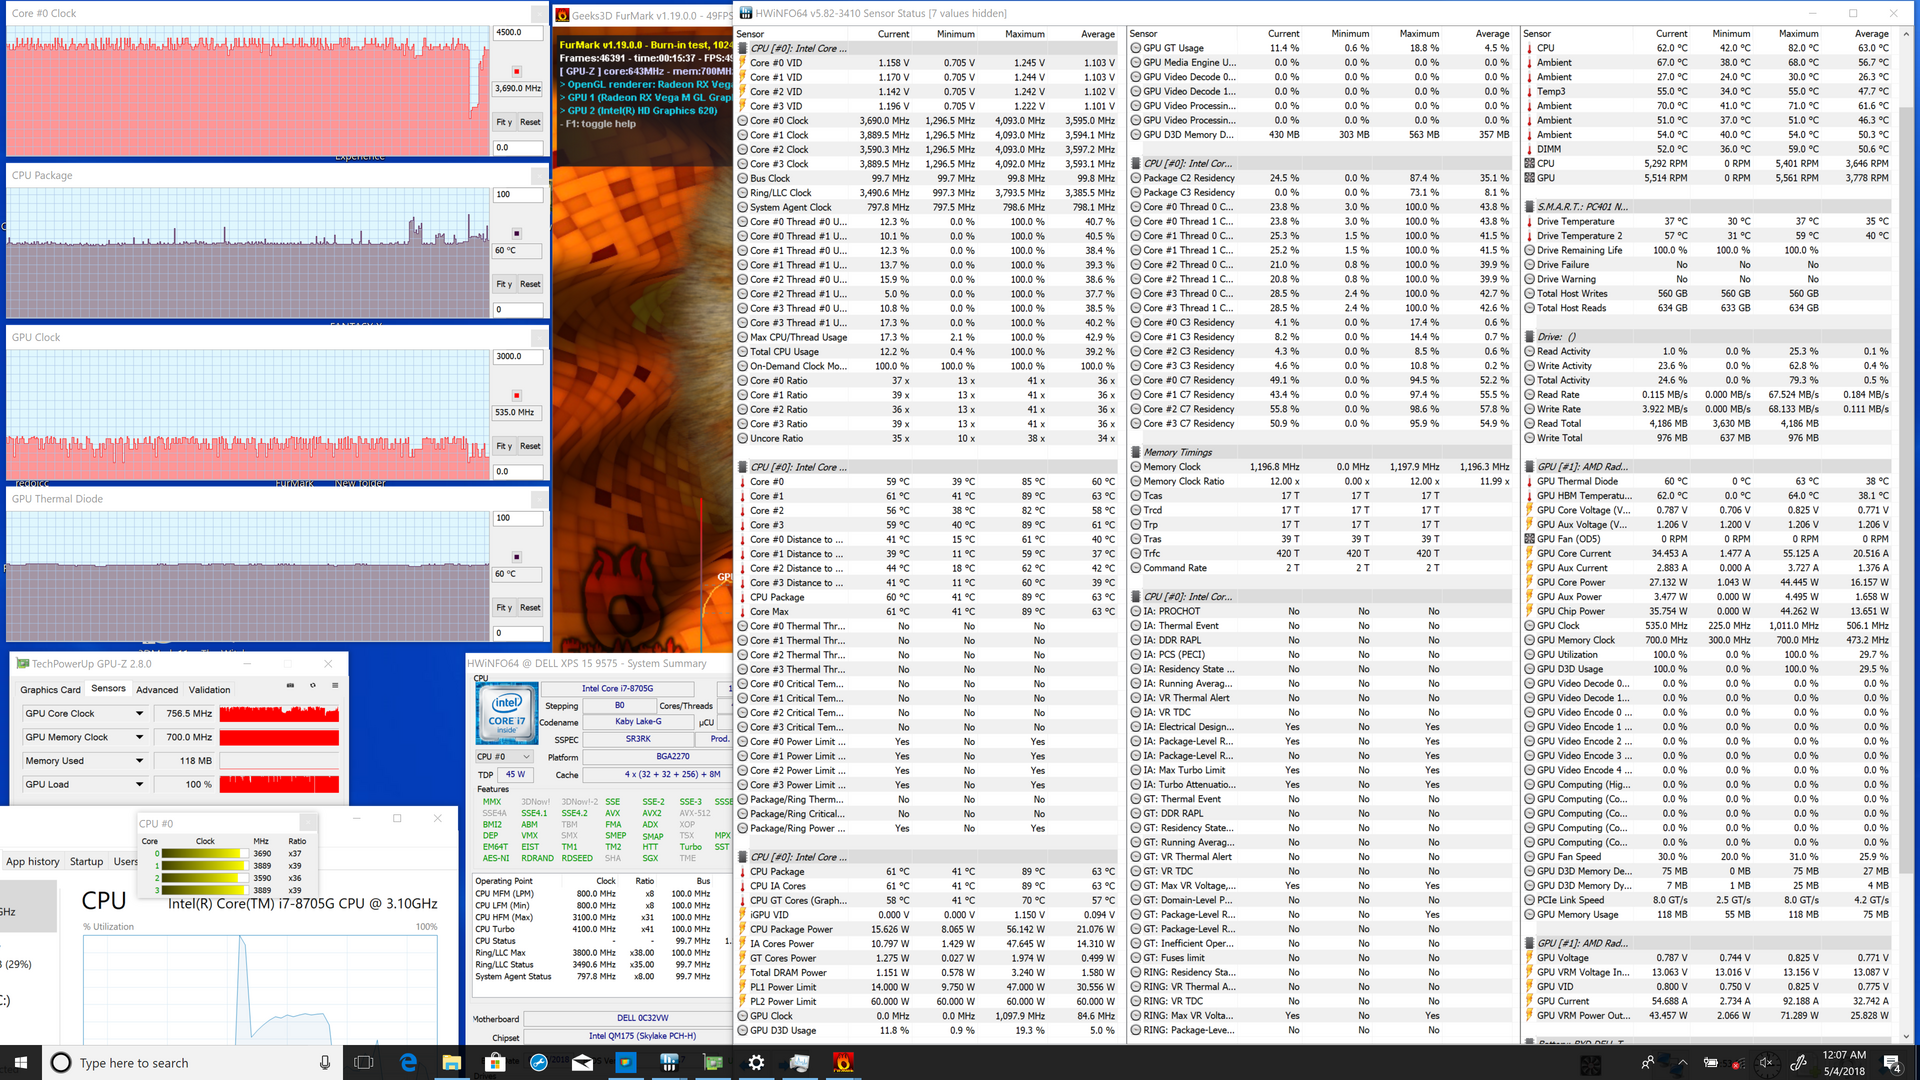
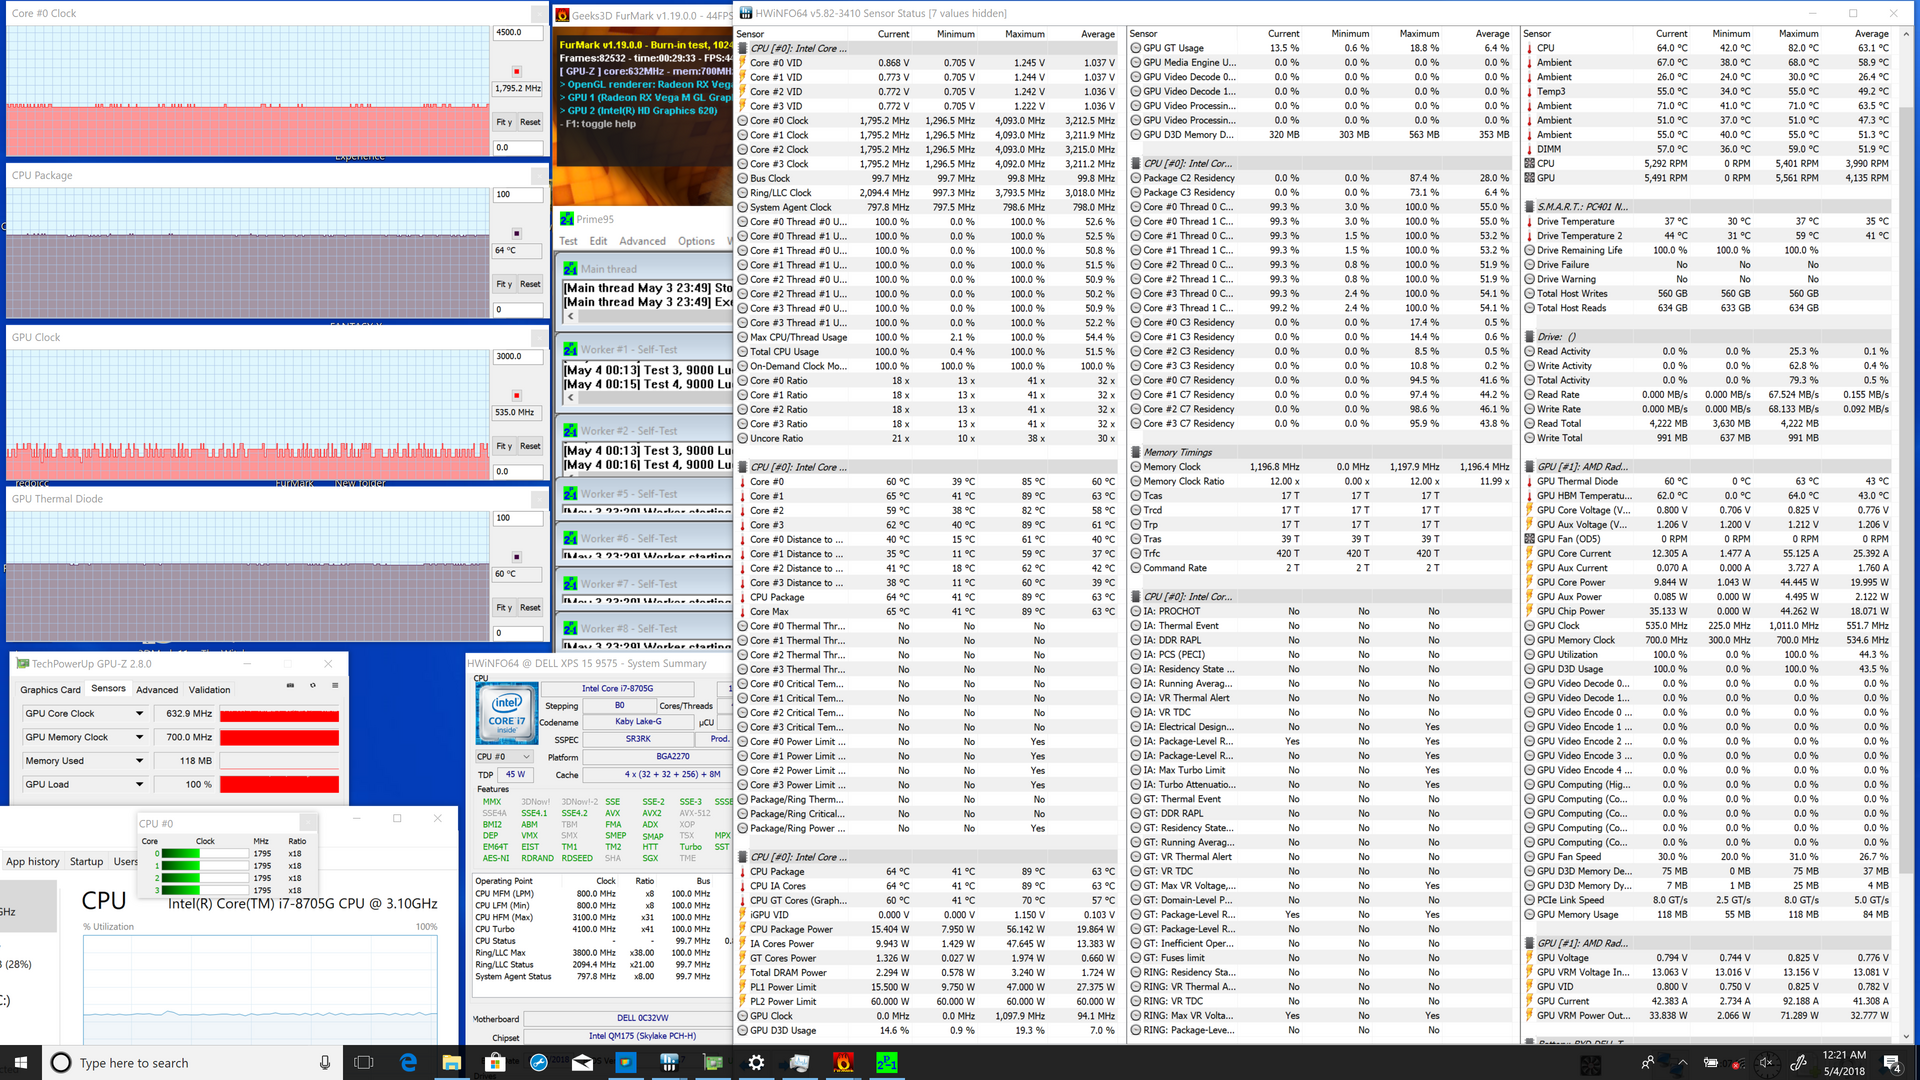
We stress the laptop to identify for any potential throttling or stability issues. When running Prime95 to stress the CPU, clock speeds can be observed running at 3.7 GHz for the first 20 seconds or so before dropping and stabilizing in the 3.1 to 3.5 GHz range. The higher initial clock speeds mirror our CineBench loop test from above where the high initial score of 746 points can only be attainable on a cold run. When compared to the XPS 15 9575 Core i5-8305G SKU, the Core i7-8705G runs warmer and at higher clock rates when at 100 percent capacity. Running Prime95 and FurMark simultaneously to stress the system will throttle both the CPU and GPU in order to maintain a stable core temperature of 64 C.
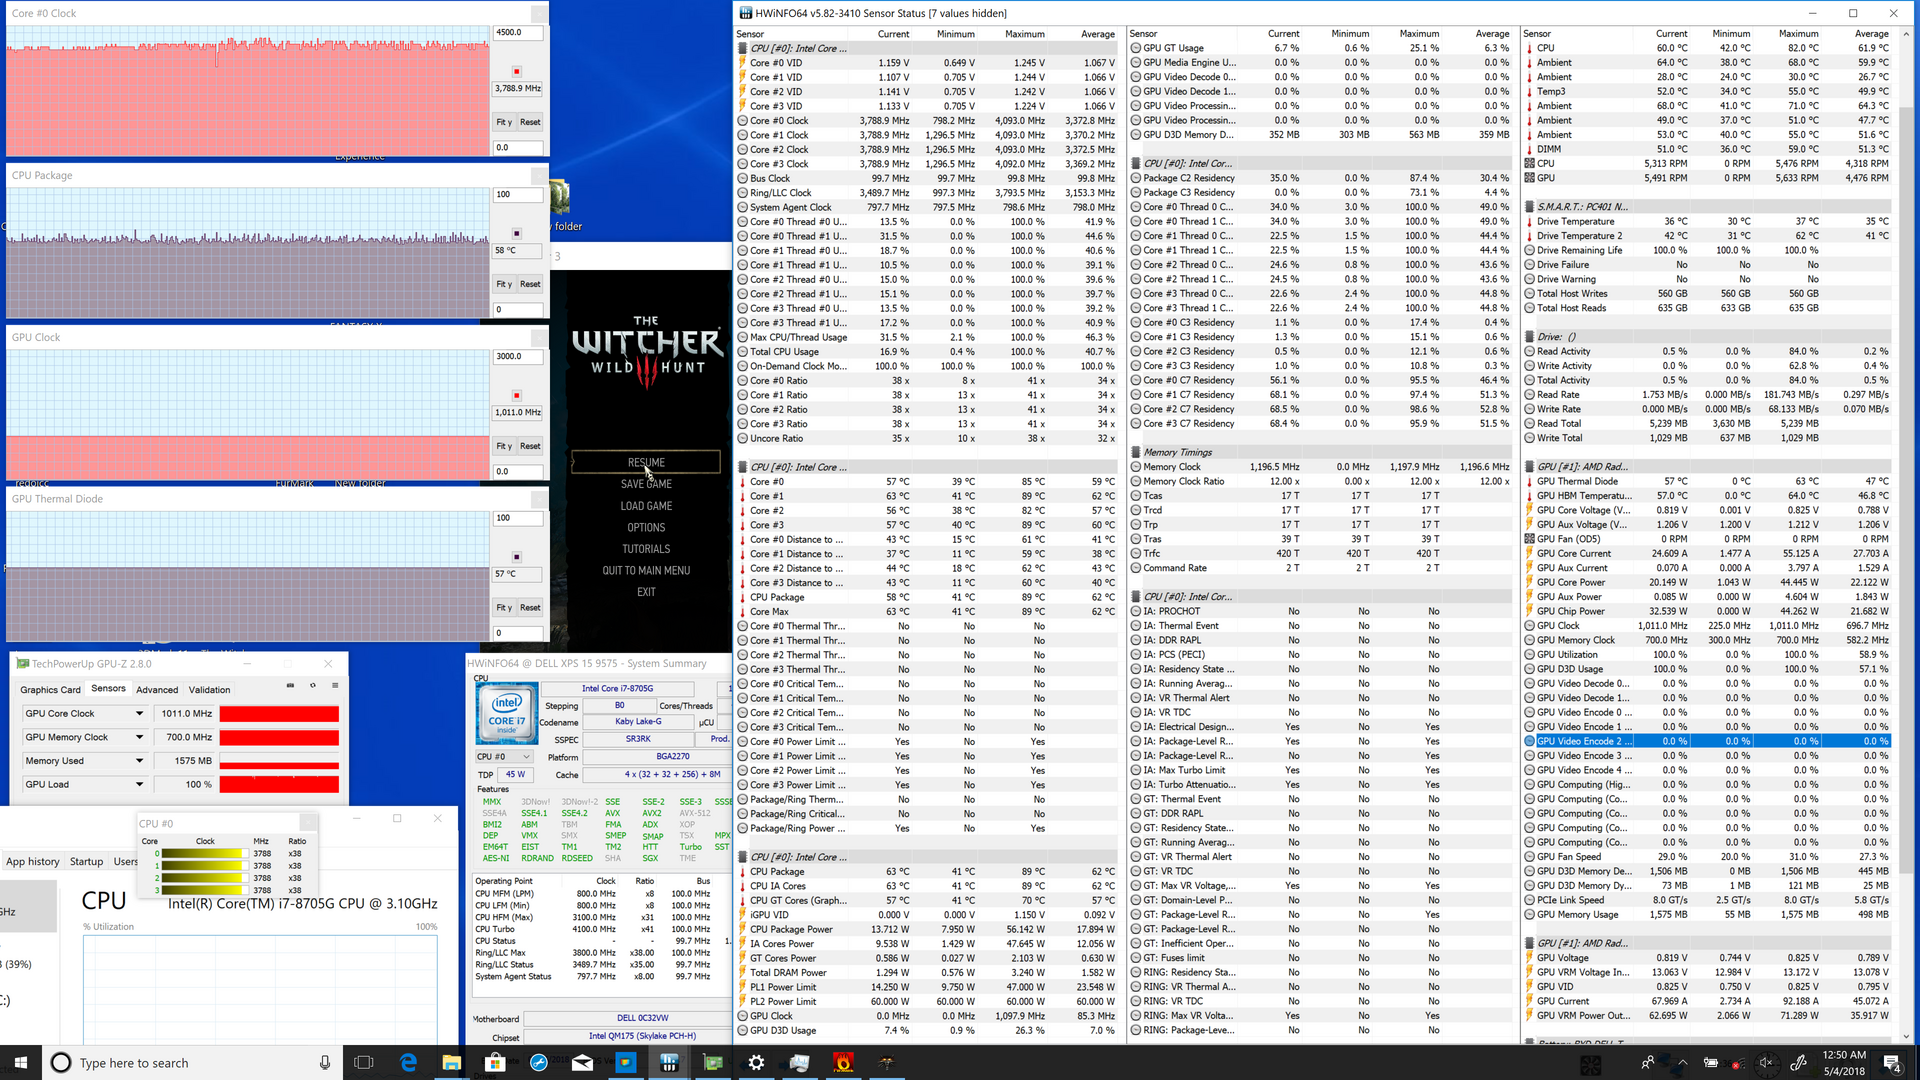
Running Witcher 3 is more representative of the types of loads gamers will experience. The CPU and GPU can be observed operating at stable 3.8 GHz and 1011 MHz clock rates, respectively, compared to 3.4 GHz and 1011 MHz on the i5-8305G in the less expensive XPS 15 9575 SKU. Core temperature is slightly cooler as well likely due in part to differences in ambient temperature. Despite the oddity, core temperatures are still significantly cooler than the GTX 1050 GPU in the ZenBook Flip 15 and just a few degrees warmer than the GTX 1050 in the thicker 17.3-inch Asus ROG Strix GL703VD.
Running on battery power will throttle GPU performance while CPU performance does not change. A 3DMark 11 run on batteries returns Physics and Graphics scores of 9762 and 5660 points, respectively, compared to 9742 and 10118 points when on mains.
| CPU Clock (GHz) | GPU Clock (MHz) | Average CPU Temperature (°C) | |
| Prime95 Stress | 3.1 - 3.5 | -- | 75 - 83 |
| FurMark Stress | -- | 535 - 1011 | 60 |
| Prime95 + FurMark Stress | 1.8 | 535 - 830 | 64 |
| Witcher 3 Stress | 3.8 | 1011 | 65 |
Emissions
System Noise
Fan behavior is identical to the slower i5-8305G SKU. We can notice no coil whine or electronic noise on our unit. The fans are still loud when gaming but nowhere near as loud as on the XPS 15 9560.
Noise level
| Idle |
| 28.2 / 28.2 / 28.2 dB(A) |
| Load |
| 29 / 47.4 dB(A) |
 | ||
30 dB silent 40 dB(A) audible 50 dB(A) loud |
||
min: | ||
| Dell XPS 15 9575 i7-8705G Vega M GL / 870, i7-8705G, SK hynix PC401 NVMe 500 GB | Lenovo Yoga 720-15IKB-80X7 GeForce GTX 1050 Mobile, i7-7700HQ, Samsung PM961 MZVLW256HEHP | Asus ZenBook Flip 15 UX561UD GeForce GTX 1050 Mobile, i5-8550U, Micron 1100 MTFDDAV256TBN | Asus Zenbook Pro UX550VE-DB71T GeForce GTX 1050 Ti Mobile, i7-7700HQ, Samsung PM961 NVMe MZVLW512HMJP | Alienware 13 R3 (i5-7300HQ, GTX 1050 Ti) GeForce GTX 1050 Ti Mobile, i5-7300HQ, Samsung PM961 MZVLW256HEHP | |
|---|---|---|---|---|---|
| Noise | -5% | -8% | -11% | -3% | |
| off / environment * (dB) | 28.2 | 28.2 -0% | 30.4 -8% | 28.3 -0% | 29.7 -5% |
| Idle Minimum * (dB) | 28.2 | 28.2 -0% | 31.3 -11% | 30.4 -8% | 29.7 -5% |
| Idle Average * (dB) | 28.2 | 28.2 -0% | 31.3 -11% | 31 -10% | 29.7 -5% |
| Idle Maximum * (dB) | 28.2 | 28.2 -0% | 31.3 -11% | 31.2 -11% | 29.7 -5% |
| Load Average * (dB) | 29 | 39 -34% | 36.4 -26% | 43.3 -49% | 32.7 -13% |
| Witcher 3 ultra * (dB) | 44.7 | 46.2 -3% | 36.4 19% | ||
| Load Maximum * (dB) | 47.4 | 46.3 2% | 37.1 22% | 46.2 3% | 50 -5% |
* ... smaller is better
Temperature
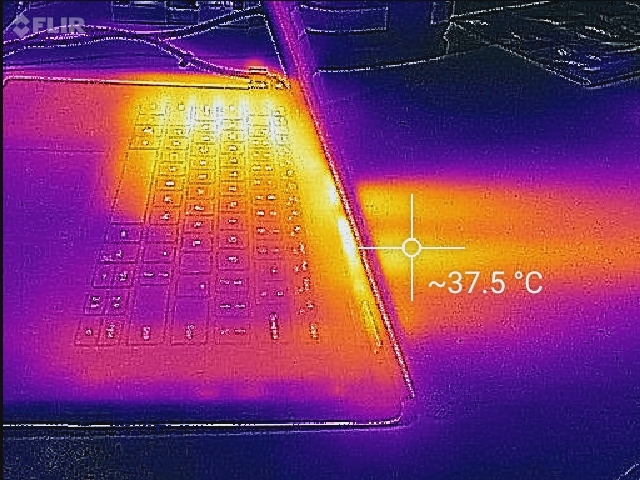
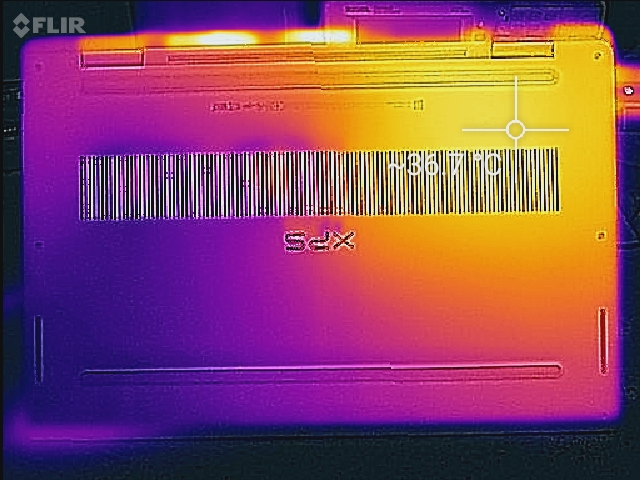
Once again, the new GORE insulators really work to keep surface temperatures at more comfortable levels. The bottom panel maintains a temperature cooler than 40 C at its warmest spot when gaming compared to 43 C and 50 C on the thicker XPS 15 9560 and Yoga 720-15IKB convertibles, respectively.
Unfortunately, the XPS 9575 series no longer has the symmetrical temperature gradient as experienced on the XPS 15 9560 because of the redesigned motherboard. The positioning of the Kaby Lake-G processor means that the left side of the notebook will always be warmer than the right and this delta will only increase when under higher loads. For example, the important WASD keys can be as warm as 45 C when gaming compared to just 35 C on the XPS 15. Even though the XPS 15 9575 is slightly more powerful than its XPS 15 sibling, gamers may not appreciate the warmer keys.
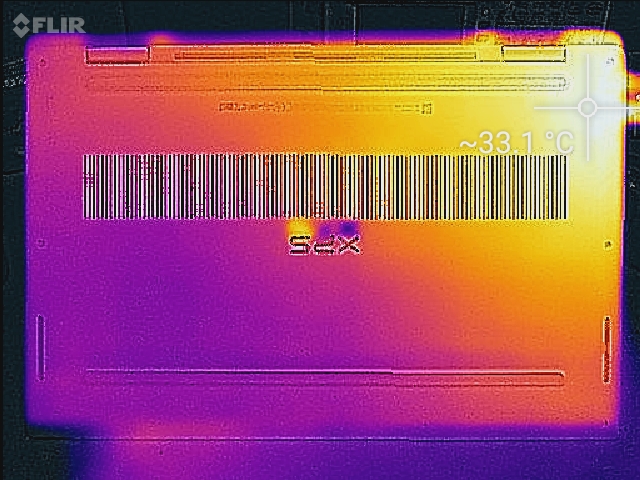
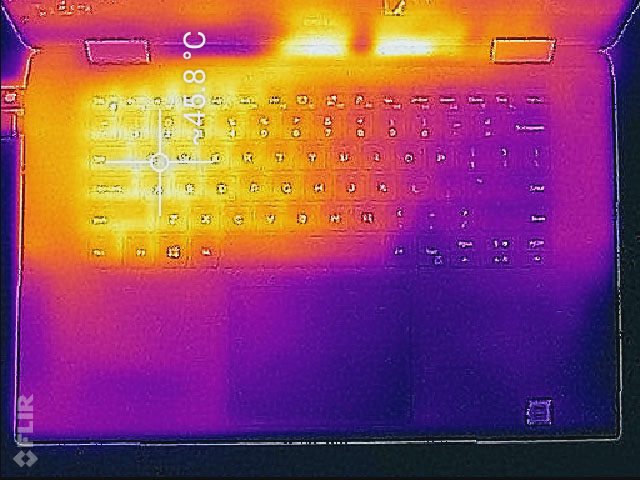
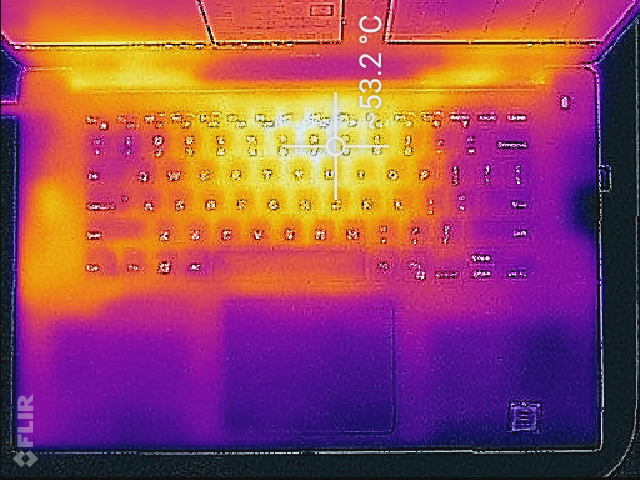
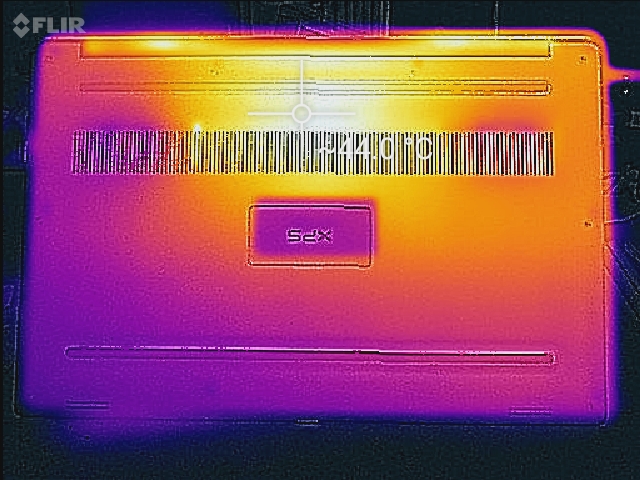
(±) The maximum temperature on the upper side is 45 °C / 113 F, compared to the average of 36.8 °C / 98 F, ranging from 21 to 71 °C for the class Multimedia.
(+) The bottom heats up to a maximum of 36.6 °C / 98 F, compared to the average of 39.1 °C / 102 F
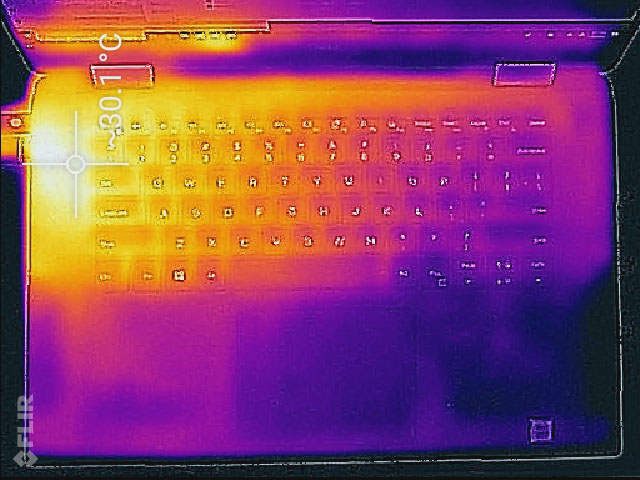
(+) In idle usage, the average temperature for the upper side is 24.8 °C / 77 F, compared to the device average of 31.3 °C / 88 F.
(±) Playing The Witcher 3, the average temperature for the upper side is 33.5 °C / 92 F, compared to the device average of 31.3 °C / 88 F.
(+) The palmrests and touchpad are cooler than skin temperature with a maximum of 28 °C / 82.4 F and are therefore cool to the touch.
(±) The average temperature of the palmrest area of similar devices was 28.7 °C / 83.7 F (+0.7 °C / 1.3 F).
Energy Management
Power Consumption
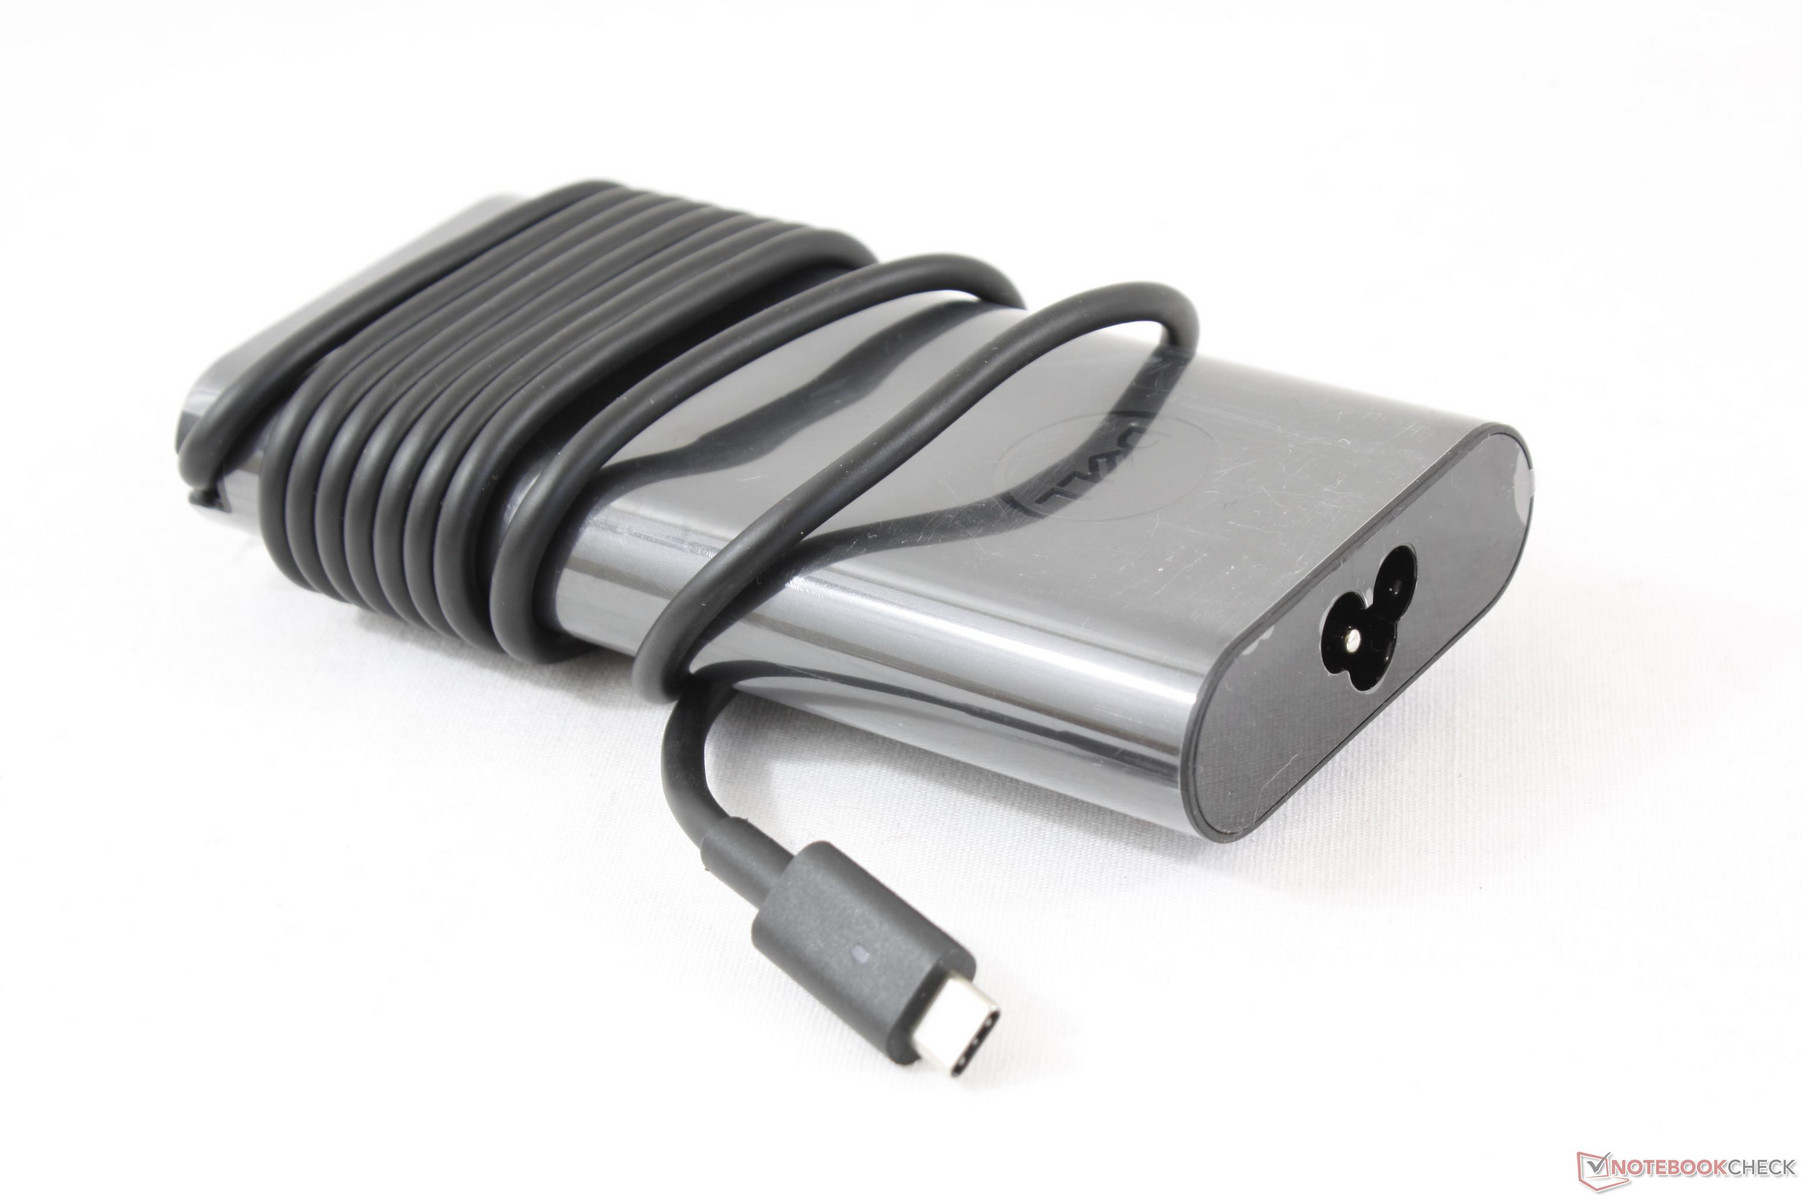
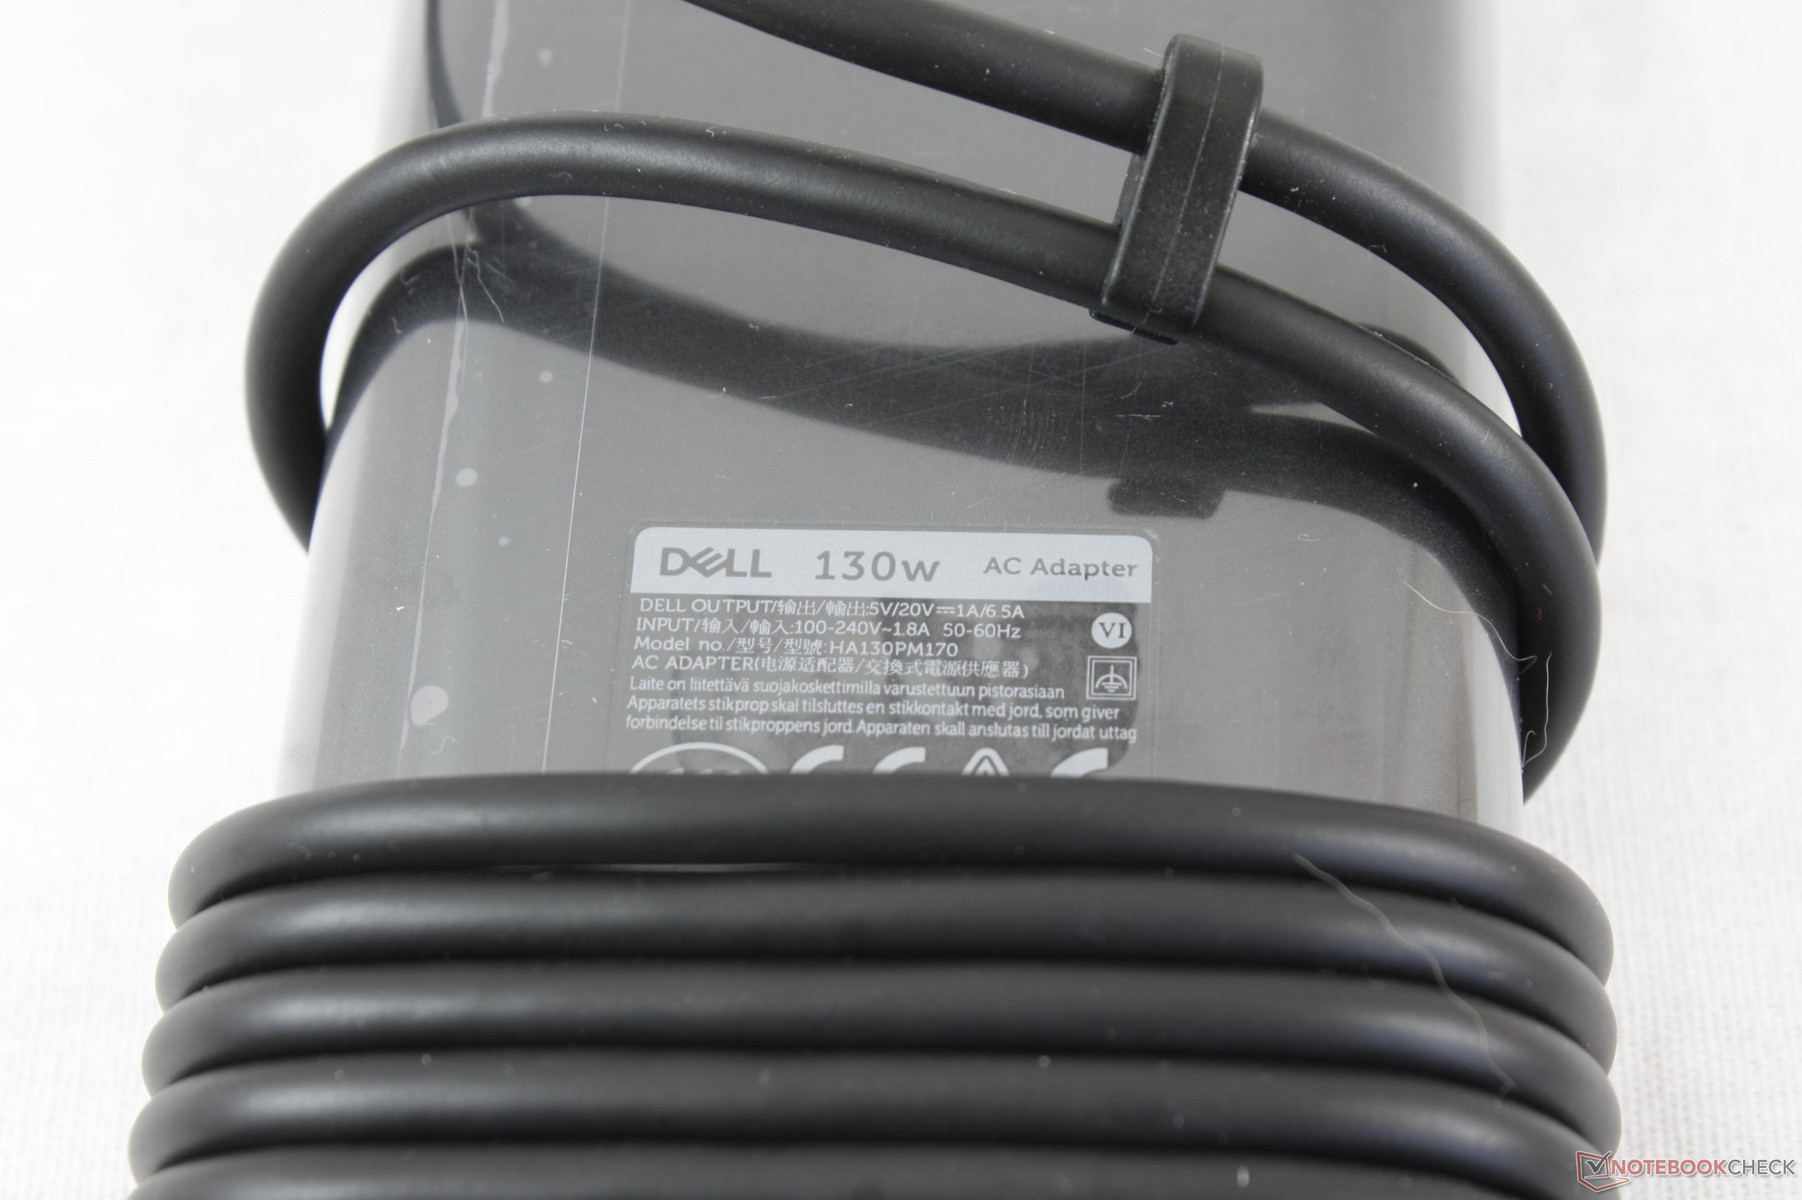
Our first XPS 15 9575 review unit shipped with a faulty AC adapter and we were unable to provide our usual power consumption measurements as a result. Fortunately, our second XPS unit includes an operable AC adapter. It's worth noting that the adapter is rated for 130 W even though the industry specification for USB Type-C charging is limited to 100 W.
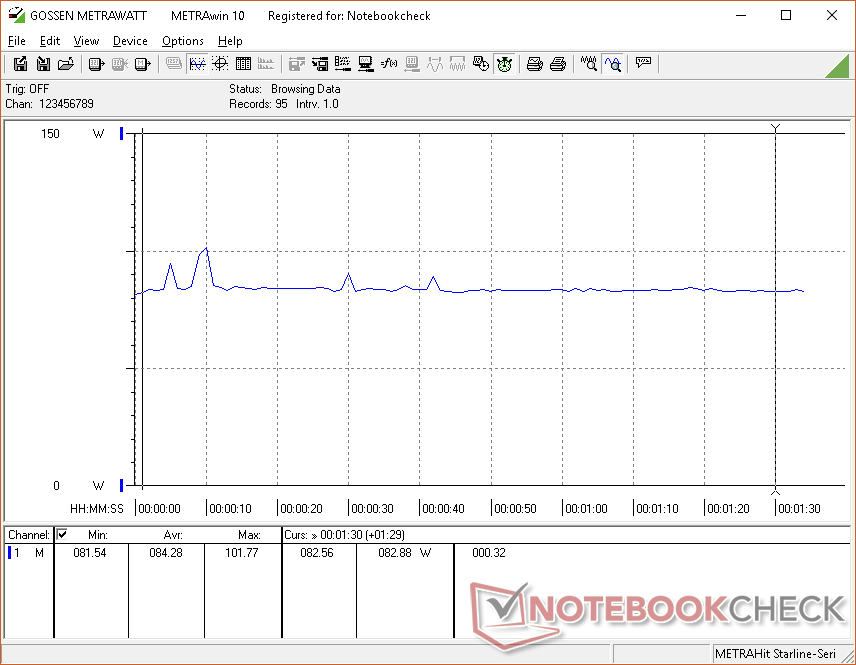
Idling on desktop will draw between 6 W and 14 W depending on the screen brightness and Power Profile settings. The results are very similar to the Asus ZenBook Flip 15 while also being significantly more power efficient than the XPS 15 9560 across the board. Gaming loads will demand about 85 W compared to 105 W on the XPS 15 9560 (w/ GTX 1050) even though raw GPU power is 20 percent faster on the XPS 15 9575. In short, the XPS convertible is both faster and more efficient than what the XPS 15 9560 series can offer. Notebooks with the GTX 1050 Ti may consume more power when gaming, but the overall differences in performance-per-Watt between these systems are more marginal than we were expecting.
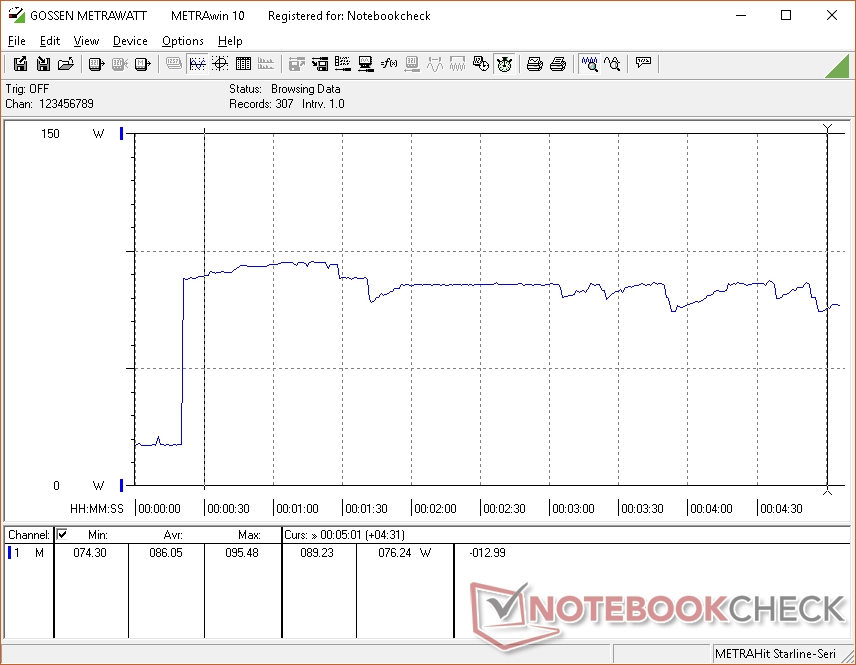
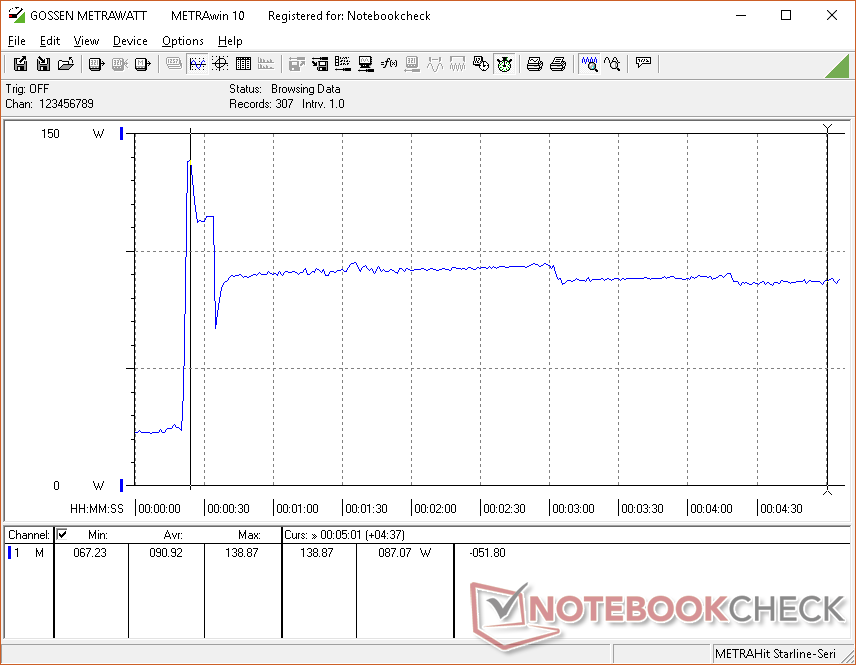
What about the 130 W power delivery? Dell says it designed the USB Type-C connector in the XPS 15 2-in-1 to be uncapped for up to 130 W. To test this, we stressed the notebook to 100 percent activity with Prime95 and FurMark running simultaneously. Our graph below shows that power consumption spikes to almost 140 W in the first couple of seconds before quickly dropping to stabilize at around 88 W. Thus, while the system can indeed draw over 100 W, it is unsustainable. This thankfully has no impact on the actual performance of the system as 100 W appears to be more than sufficient in practice. The extra 30 W from the adapter is likely overhead to ensure stability.

| Off / Standby | |
| Idle | |
| Load |
|
Key:
min: | |
| Dell XPS 15 9575 i7-8705G i7-8705G, Vega M GL / 870, SK hynix PC401 NVMe 500 GB, IPS, 3840x2160, 15.6" | Dell XPS 15 9560 (i7-7700HQ, UHD) i7-7700HQ, GeForce GTX 1050 Mobile, Lite-On CX2-8B512-Q11, IGZO IPS, 3840x2160, 15.6" | Lenovo Yoga 720-15IKB-80X7 i7-7700HQ, GeForce GTX 1050 Mobile, Samsung PM961 MZVLW256HEHP, IPS, 1920x1080, 15.6" | Asus ZenBook Flip 15 UX561UD i5-8550U, GeForce GTX 1050 Mobile, Micron 1100 MTFDDAV256TBN, IPS, 3840x2160, 15.6" | Asus Zenbook Pro UX550VE-DB71T i7-7700HQ, GeForce GTX 1050 Ti Mobile, Samsung PM961 NVMe MZVLW512HMJP, IPS, 1920x1080, 15.6" | |
|---|---|---|---|---|---|
| Power Consumption | -37% | -2% | -3% | 8% | |
| Idle Minimum * (Watt) | 6.2 | 11.9 -92% | 8.3 -34% | 5.4 13% | 6.3 -2% |
| Idle Average * (Watt) | 12.9 | 17.1 -33% | 10.2 21% | 10.8 16% | 7.9 39% |
| Idle Maximum * (Watt) | 13.6 | 17.3 -27% | 10.4 24% | 13.9 -2% | 8.1 40% |
| Load Average * (Watt) | 76.1 | 94.7 -24% | 67.5 11% | 94 -24% | 84.9 -12% |
| Witcher 3 ultra * (Watt) | 84.3 | 104.8 -24% | 96.5 -14% | 96.3 -14% | |
| Load Maximum * (Watt) | 99.4 | 122 -23% | 117.2 -18% | 116.6 -17% | 102.4 -3% |
* ... smaller is better
Battery Life
Users can expect around 7 hours of real-world WLAN use before needing to recharge. Competing notebooks with the i7-7700HQ and GTX 1050 return similar all-day results. Unlike the XPS 15 9560, there is only one battery option across all current XPS 9575 SKUs.
Charging from near empty to full capacity will take about 2 to 2.5 hours with the included AC adapter. It's a bit slower than expected since 1.5 to 2 hours is more typical of Ultrabooks and multimedia notebooks.
| Dell XPS 15 9575 i7-8705G i7-8705G, Vega M GL / 870, 75 Wh | Dell XPS 15 9575 i5-8305G i5-8305G, Vega M GL / 870, 75 Wh | Lenovo Yoga 720-15IKB-80X7 i7-7700HQ, GeForce GTX 1050 Mobile, 72 Wh | Asus ZenBook Flip 15 UX561UD i5-8550U, GeForce GTX 1050 Mobile, 52 Wh | Asus Zenbook Pro UX550VE-DB71T i7-7700HQ, GeForce GTX 1050 Ti Mobile, 73 Wh | Asus Strix GL502VT-DS74 6700HQ, GeForce GTX 970M, 64 Wh | |
|---|---|---|---|---|---|---|
| Battery runtime | 17% | 40% | -5% | 30% | -16% | |
| Reader / Idle (h) | 11.2 | 11.1 -1% | 17.8 59% | 9.3 -17% | 17.1 53% | 9.7 -13% |
| WiFi v1.3 (h) | 7 | 9.4 34% | 8.1 16% | 5.2 -26% | 8.9 27% | 5.9 -16% |
| Load (h) | 1.1 | 1.3 18% | 1.6 45% | 1.4 27% | 1.2 9% | 0.9 -18% |
Pros
Cons
Verdict
Current SKUs of the XPS 15 9560 include the Core i5-7300HQ and Core i7-7700HQ similar to how the current selection of XPS 15 9575 SKUs include the Core i5-8305G and Core i7-8705G. Whereas the jump from an i5-7300HQ to i7-7700HQ can bring a 40 percent boost in performance, the jump from an i5-8305G to i7-8705G is just 5 to 10 percent. When you factor in the massive cost difference between the i5 and i7 SKUs of the XPS 15 9575 ($1300 USD vs. $2200 USD), it becomes clear that users shouldn't purchase the Core i7 configuration if performance-per-Dollar is priority.
Instead, Dell is justifying the wide price delta with the higher RAM and higher resolution panel that only come with the Core i7 SKU as of this writing. Heavy multi-taskers, touchscreen stylus users, and video editors will find more value from the 16 GB RAM and 4K UHD option than most home users. Nonetheless, it's a bit disappointing that current Core i5 SKUs are limited to just 8 GB of RAM.
Aside from the above differences, our existing comments of the Core i5 XPS 15 9575 still apply here. Kaby Lake-G is proving itself to be an excellent alternative to the ubiquitous Core i7-7700HQ and GTX 1050 or 1050 Ti commonly found on competing notebooks. The Dell convertible is even more power efficient and cooler than the mentioned systems and quieter than the XPS 15 9560. So long as users are aware of its laundry list of drawbacks (see right), competing 15-inch convertibles don't come close to what the XPS 15 9575 can offer with the notable exception of the upcoming 2018 HP Spectre x360 15.
You don't need to spend $2200 USD on the Core i7-8705G option when the Core i5-8705G is only slightly slower for almost $1000 USD less. Even the cheapest configuration of the XPS 15 9575 is nearly as fast as the priciest XPS 15 9575 or XPS 9560. We hope to see more RAM and display options for future Core i5 SKUs to make the series even more appealing.
Dell XPS 15 9575 i7-8705G
- 05/08/2018 v6 (old)
Allen Ngo
Price comparison
