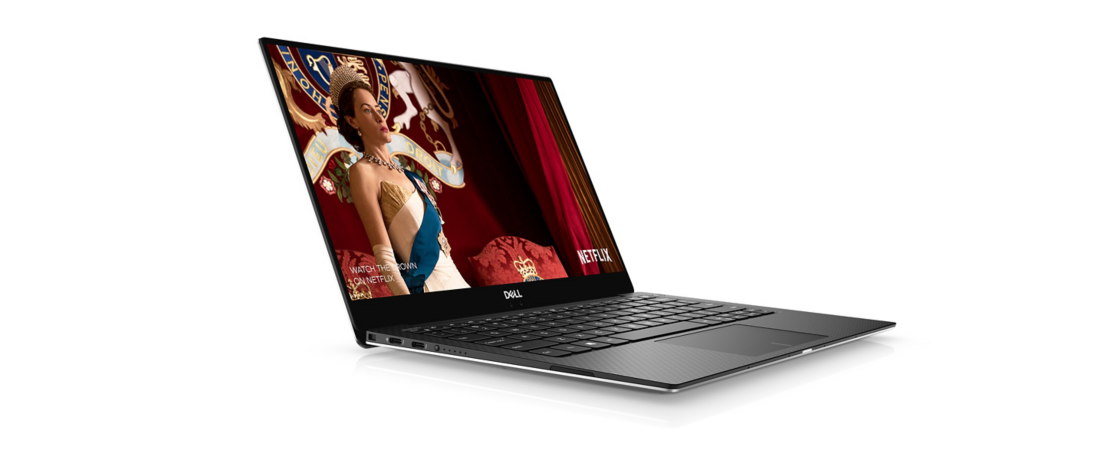
Dell XPS 13 9370 (i7-8550U, 4K UHD) Laptop Review
Just a couple of months ago we took a look at the newest iteration of the highly-regarded Dell XPS 13, which spearheaded the now so popular "narrow-bezel" design. The XPS 13 9370 with i5-8250U processor and 4K UHD panel in essence continues where the 9360-series predecessors left off and thus still makes for a very compelling choice. For our review this time we'll take a look at a top-of-the-line XPS 13 with quad-core i7, 16 GB of RAM and a larger SSD. At the time of writing, Dell offers the XPS 13 9370 with 8th-generation Intel Core i5-8250U Processor or i7-8550U Processor, 4 - 16 GB of RAM and SSDs from 128 GB to 256 GB. Display choices for the i5 model are limited to the 1080p non-touch display, while the i7 version can also be equipped with the 4K UHD touchscreen panel.
Prices range from $1000 for the i5-equipped XPS 13 with 4 GB of RAM and 128 GB SSD to $1850 for the i7 model with 4K display, 16 GB of RAM and 256 GB SSD. Curiously enough, our review notebook - with i7 CPU, 16 GB of RAM, 512 GB of RAM - is not one of the available SKUs in Dell's online store, although we were able to find it elsewhere for about $2000.
Since our review notebook just differs in the hardware, we'll primarily focus our attention at the performance differences and try to answer the question if an upgrade to the faster CPU is worth the price. We recommend looking at our existing review page for the Dell XPS 13 9370 with i5-8250U for further details as far as the chassis, connectivity, input devices, and other features are concerned. Note that Dell also still sells the previous-generation XPS 13 9360, so we've included links to some of our older reviews as well.
- Dell XPS 13 9370 (i5-8250U, 4K UHD)
- Dell XPS 13 9370 (i5-8250U, FHD)
- Dell XPS 13 9360 (i5-8250U, QHD+)
- Dell XPS 13 9360 (i7-7560U, FHD)
- Dell XPS 13 9360 (i7-8550U, QHD+)
- Dell XPS 13 9360 (i5-7200U, FHD)
- Dell XPS 13 9360 (i7-7500U, QHD+)
Competitors in this segment are aplenty and include stalwarts like the HP Spectre 13, the Lenovo ThinkPad X1 Carbon 2018, or the Razer Blade Stealth. It's interesting that many of the other competing notebooks - like the Asus ZenBook 13, Lenovo IdeaPad 320S or Xiaomi Mi Notebook Air 13.3 - now feature dedicated GPUs in form of the GeForce MX150 instead of just integrated graphics.
Please note: during the latter part of our review we encountered a few blue screens followed by a fatal system crash when the system failed to wake up from sleep mode. We were forced to completely restore our XPS 13 at this point. Since we hadn't yet completed all benchmarks, our evaluation consists of a mix of the results from before and after the crash.
May 11, 2018 update: XPS 13 9370 owners have been reporting keyboard skipping issues when typing. Of the three 9370 SKUs we've tested, one system exhibited this problem. While Dell has yet to release the promised hotfix, the (hopefully) temporary issue was not taken into account in our scoring.
SD Card Reader
Curiously enough, the MicroSD card reader (we use a Toshiba Exceria Pro UHS-II test card for our measurements) is about 30 MB/s slower during the jpeg copy test than the same card reader in the i5 model. Still, overall speeds are very good and easily surpass those of many competitors like the Lenovo IdeaPad 320S-13IKB or the Asus ZenBook 13 UX331UN, which are limited to USB 3.0 speeds.
| SD Card Reader | |
| average JPG Copy Test (av. of 3 runs) | |
| Lenovo ThinkPad X1 Carbon 2018-20KGS03900 (Toshiba Exceria Pro M501) | |
| Dell XPS 13 9370 i5 UHD (Toshiba Exceria Pro M501 64 GB UHS-II) | |
| Dell XPS 13 9370 i7 UHD (Toshiba Exceria Pro UHS-II) | |
| Lenovo IdeaPad 320S-13IKB (Toshiba Exceria Pro M501) | |
| Average of class Subnotebook (23.7 - 188, n=9, last 2 years) | |
| Asus ZenBook 13 UX331UN (Toshiba Exceria Pro M501 microSDXC 64GB) | |
| maximum AS SSD Seq Read Test (1GB) | |
| Lenovo ThinkPad X1 Carbon 2018-20KGS03900 (Toshiba Exceria Pro M501) | |
| Dell XPS 13 9370 i5 UHD (Toshiba Exceria Pro M501 64 GB UHS-II) | |
| Dell XPS 13 9370 i7 UHD (Toshiba Exceria Pro UHS-II) | |
| Average of class Subnotebook (24.9 - 195, n=8, last 2 years) | |
| Lenovo IdeaPad 320S-13IKB (Toshiba Exceria Pro M501) | |
| Asus ZenBook 13 UX331UN (Toshiba Exceria Pro M501 microSDXC 64GB) | |
Communication
Transmit and receive rates 1 m away from our Linksys EA8500 test router are comparable to those of the i5-equipped sibling. The Killer 1435 wireless module functions flawlessly and we did not experience any issues like random disconnects or similar problems during the review period.
Security
The power-button integrated fingerprint reader is easy to configure and provides near-instantaneous logins via Windows Hello even if the fingers are slightly moist.
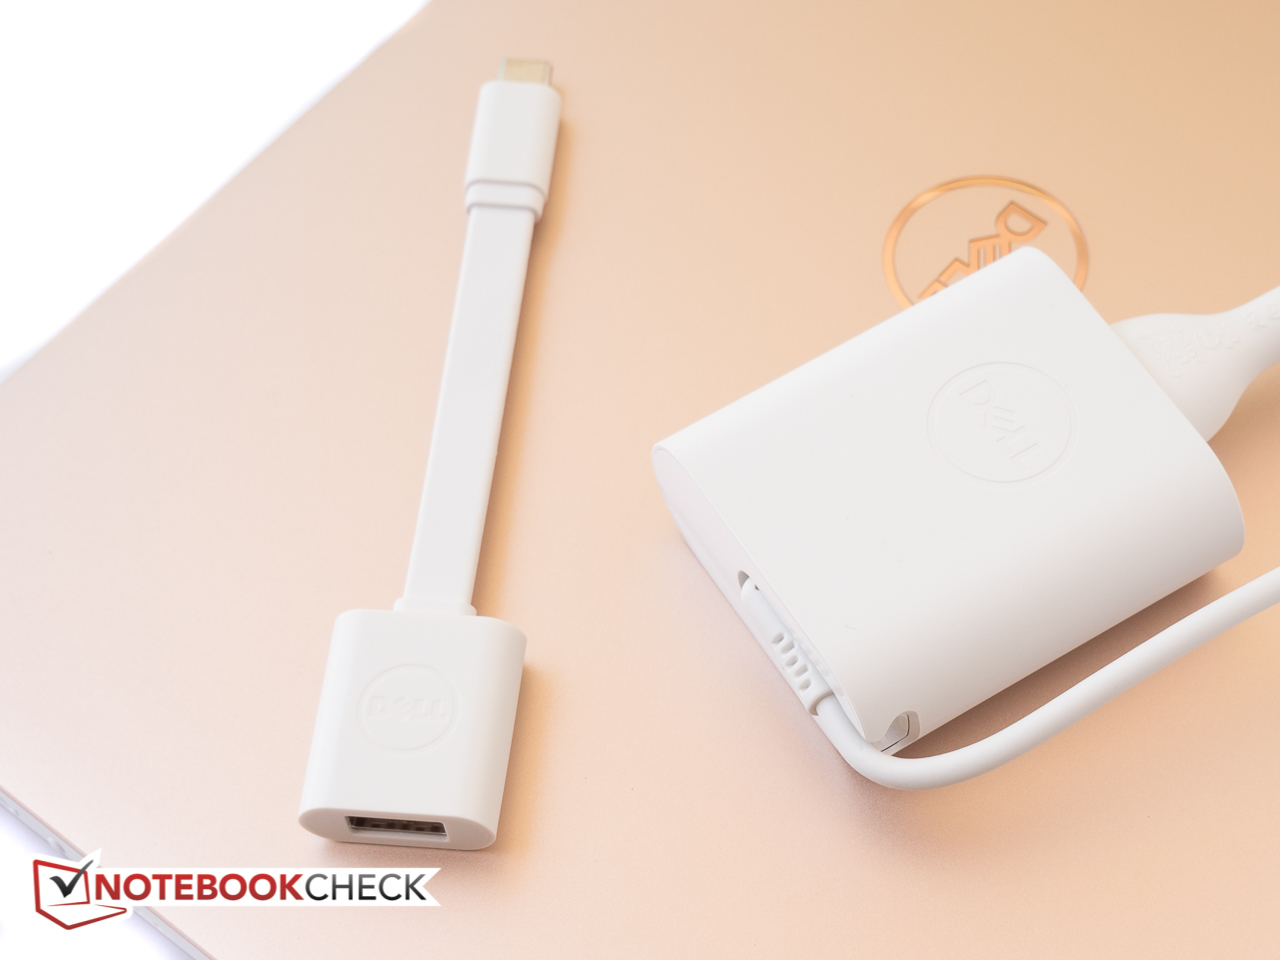
Accessories
Dell only includes a quick start guide and a USB USB Type-C to Type-A dongle in the sleek white box. A protective sleeve for the notebook is unfortunately not included, but Dell offers one for $50. Other, not necessarily dedicated accessories include the Dell Business Thunderbolt Dock (TB16) with 240 W Adapter for $270, the Dell Universal Dock (D6000) for $150, or the USB-C to HDMI/VGA/Ethernet/USB 3.0 adapter (DA200) for $60.
Warranty
In the US, Dell provides a standard 1 year mail-in service against manufacturing defects. 4 Years of Premium Support can be purchased for $250; 4 Years of Premium Support Plus service - which includes accidental damage protection as well - cost a hefty $490.
Please see our Guarantees, Return Policies and Warranties FAQ for country-specific information.
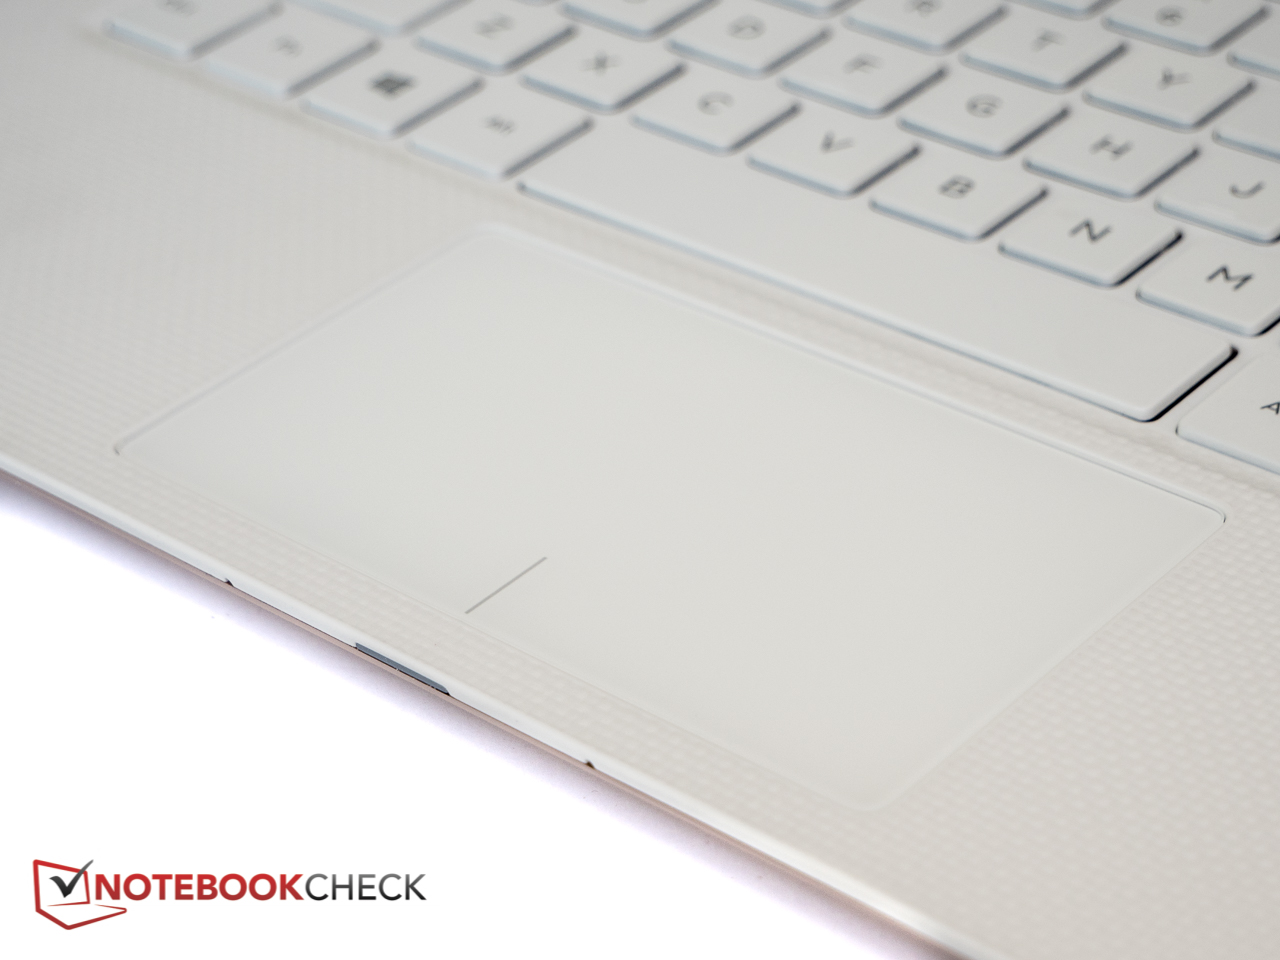
Input Devices
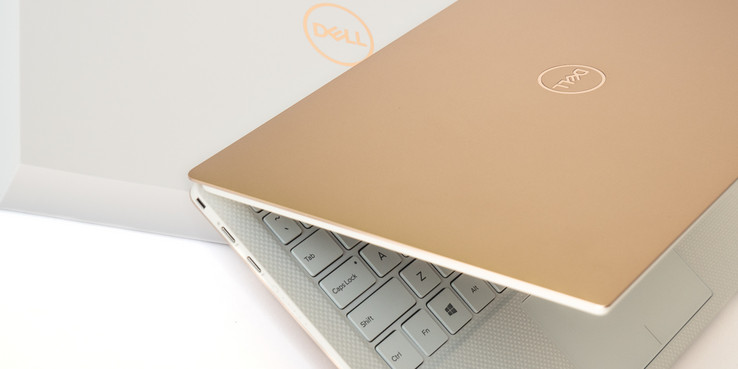
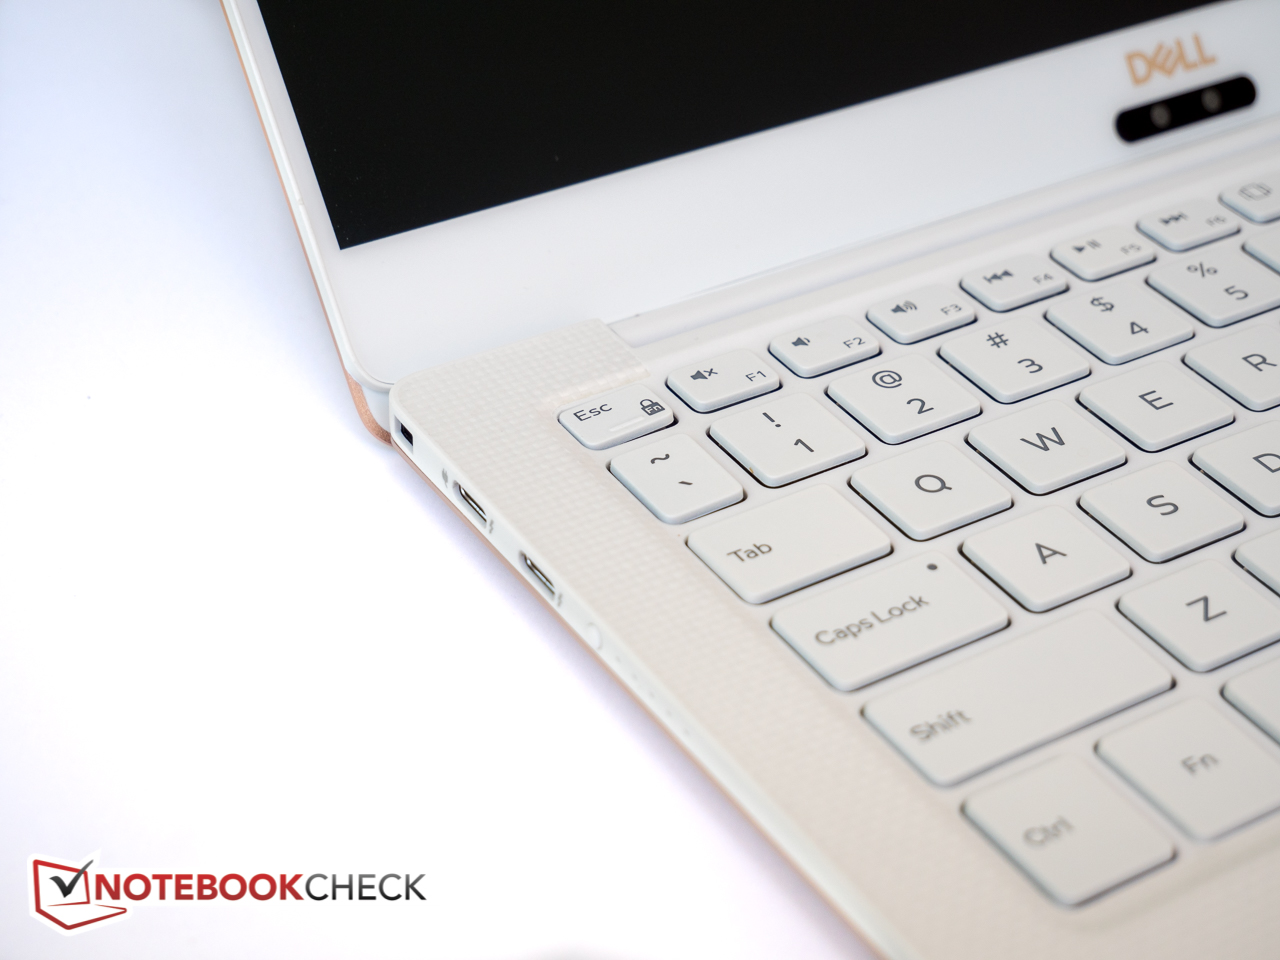
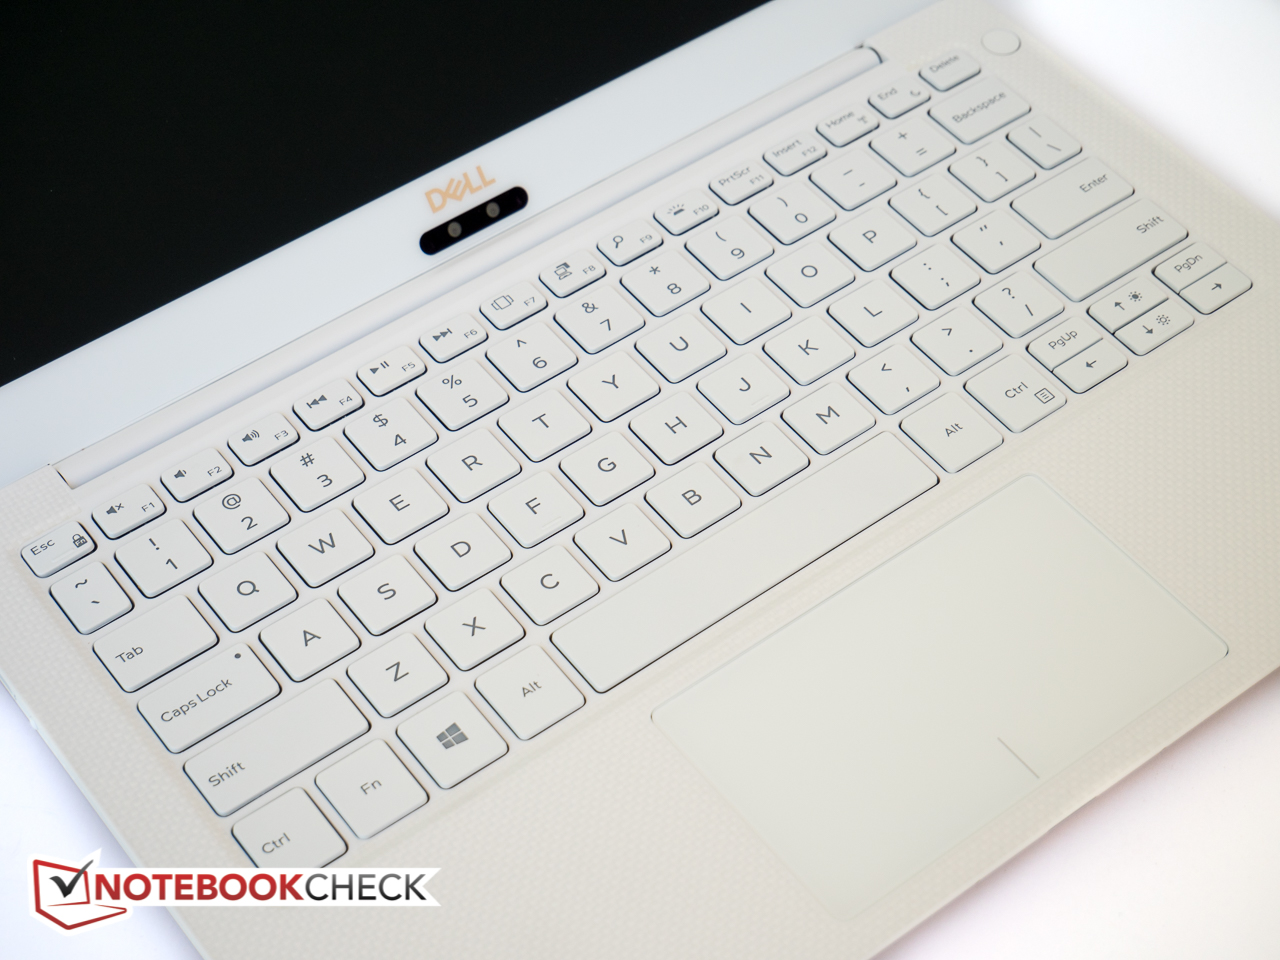
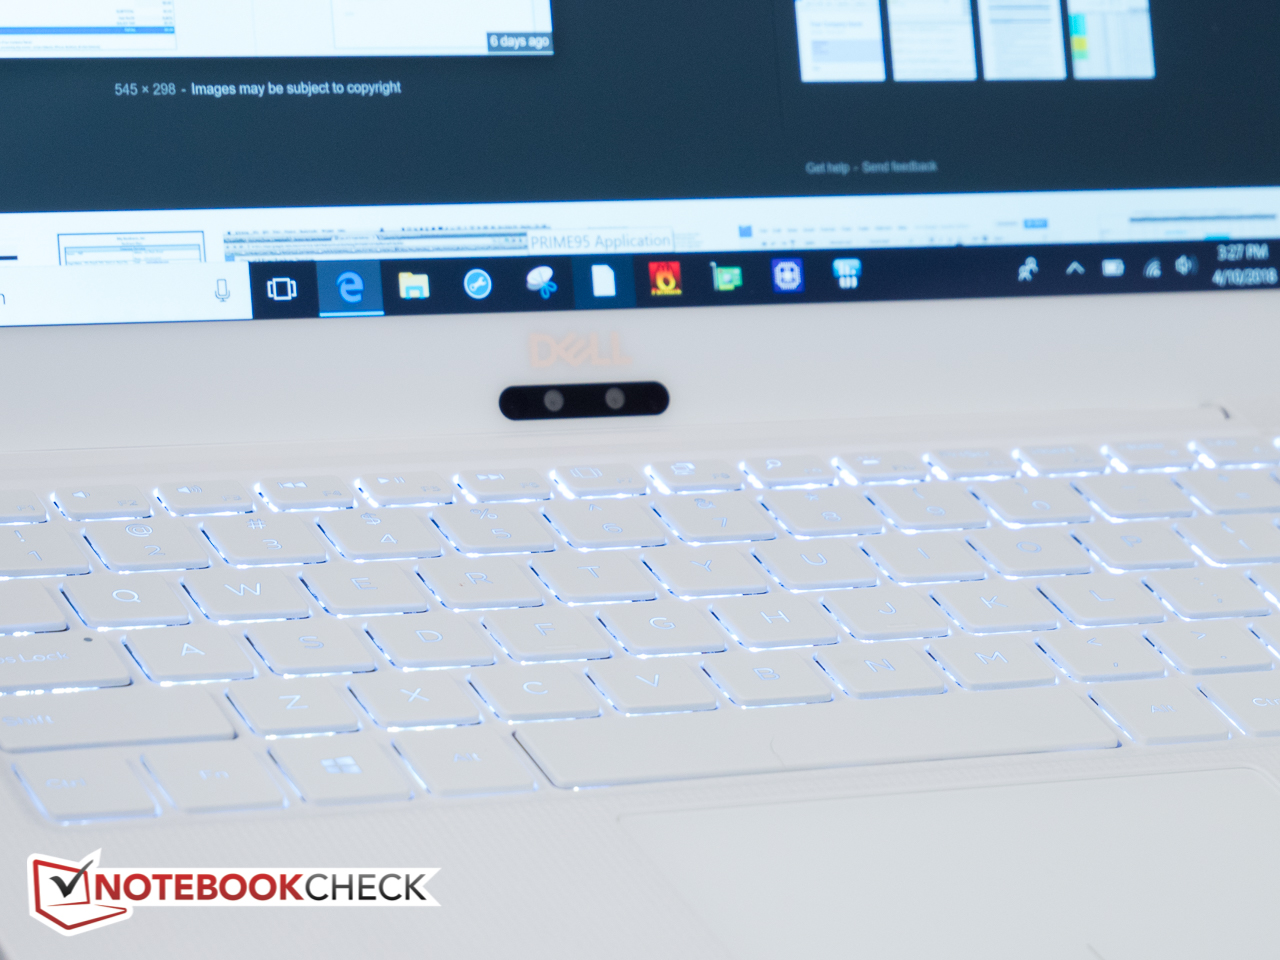
Please check our previous review for more details on the layout and functionality of the keyboard and the touchpad. One item of note: the Escape key in the function row of our review unit is slanted significantly - so much so, that the left edge of the key sits flush with the deck, while the right edge sits at normal height. While functionality isn't impeded and this flaw likely just affects our review sample, it's still a hard pill to swallow on a notebook costing this much. In difficult lighting conditions, the backlit keys are also much easier to identify on the gray model compared to the white edition. In completely dark environments, both versions are easy to work with, however.

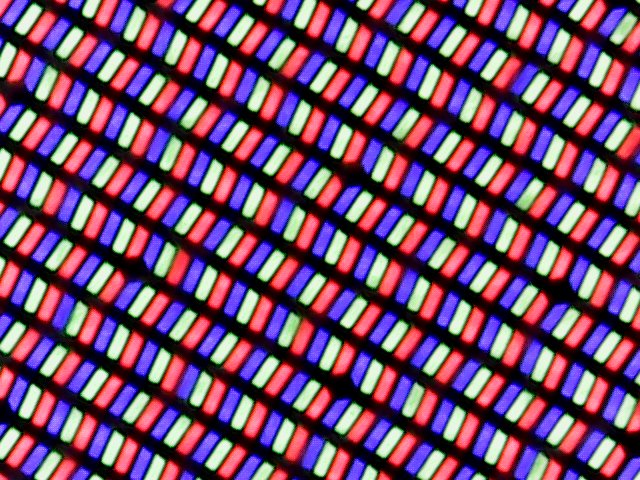
Display
The Dell XPS 13 9370 with i7-8550U uses the very same 4K UHD display panel (Sharp SHP148B LQ133D1) as the model with i5 CPU. Note that the i5 model is also available with FHD display at the time of writing, whereas the i7 version is not. At about 470 nits average, the brightness measurements of our XPS 13 are very close to those of the i5 sibling; the fairly minor differences can be attributed to panel variation and measurement inaccuracy. The Dell panel is quite impressive here, although the Lenovo ThinkPad X1 Carbon 2018 is visibly brighter still.
As before, we encountered Pulse-Width Modulation at brightness levels of 20 percent and lower, although the frequency is high enough (3760 Hz) to not affect most users.

| |||||||||||||||||||||||||
Brightness Distribution: 86 %
Center on Battery: 478.5 cd/m²
Contrast: 1113:1 (Black: 0.43 cd/m²)
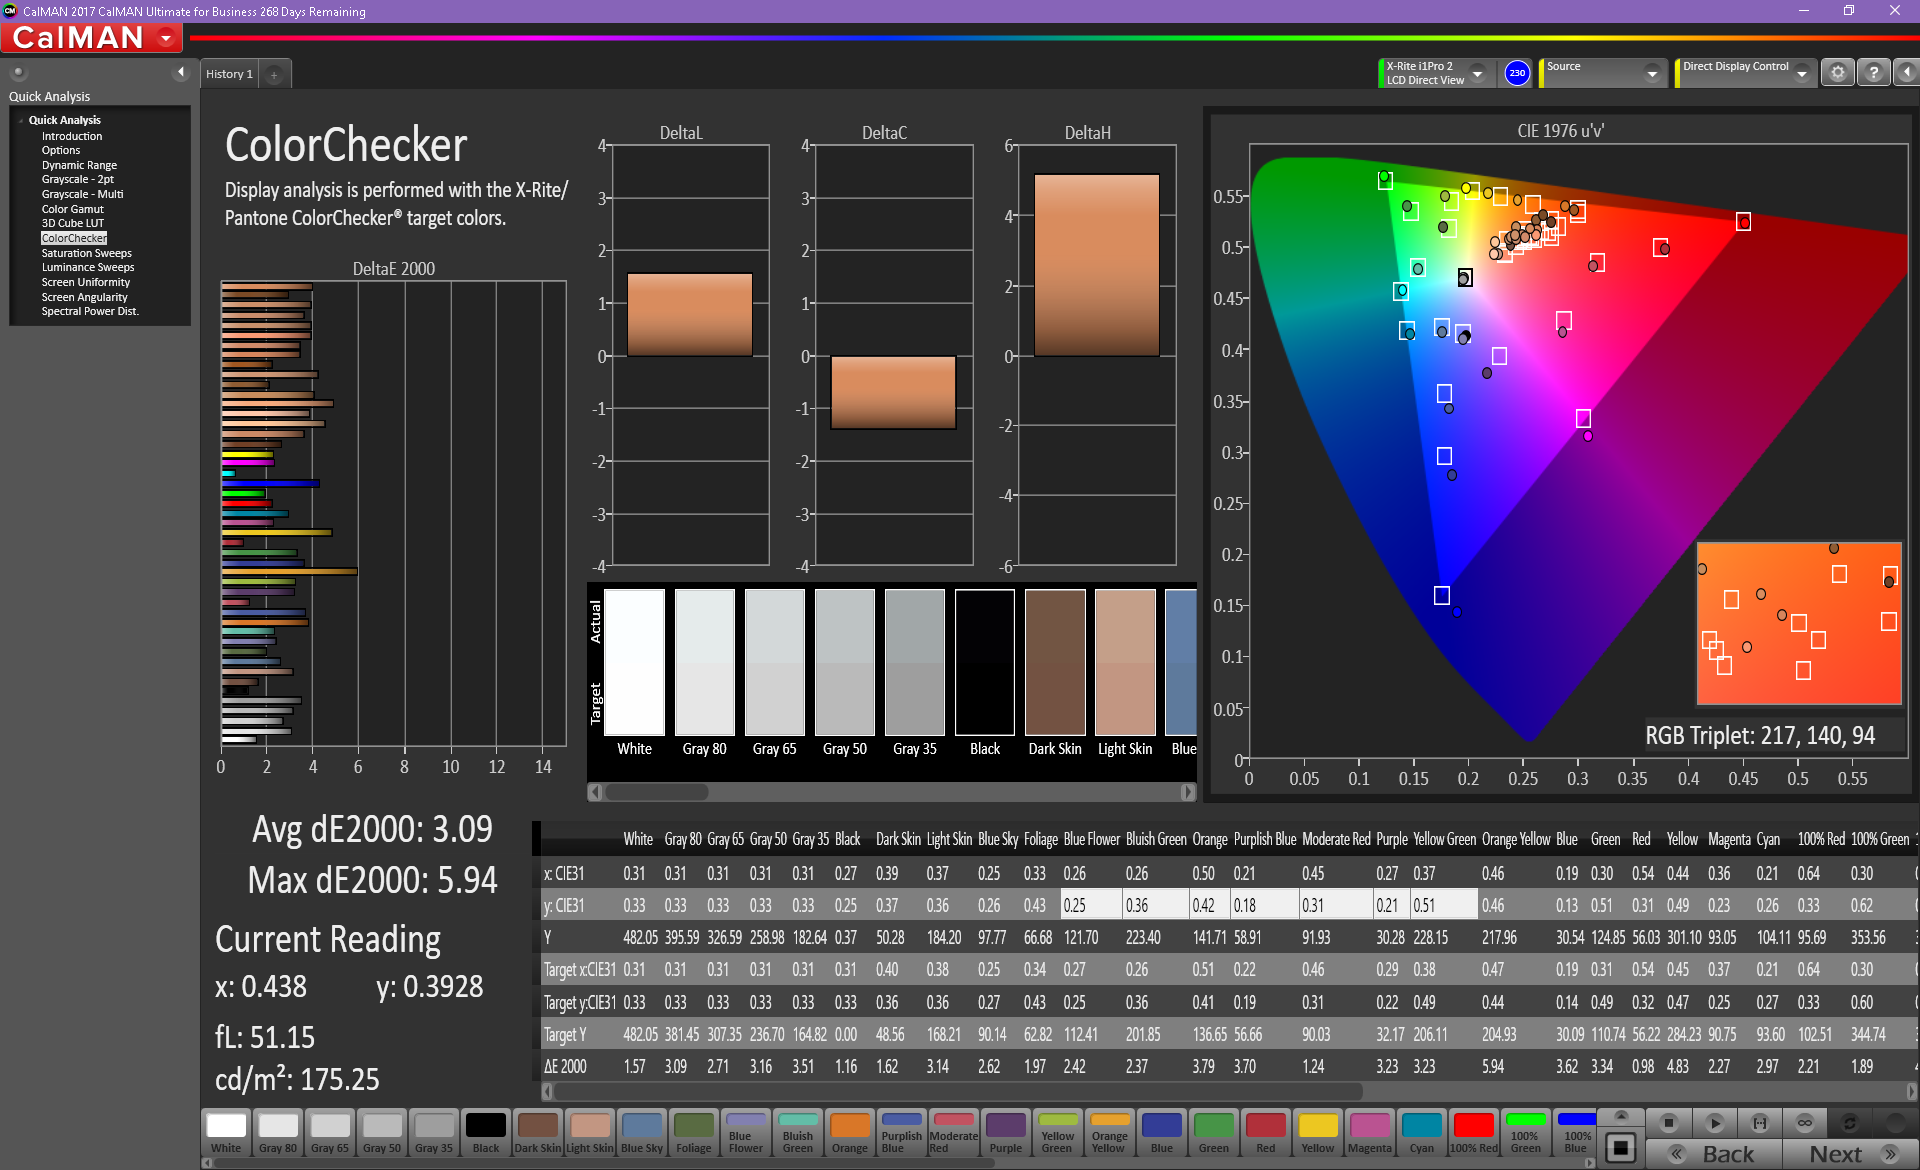
ΔE ColorChecker Calman: 3.09 | ∀{0.5-29.43 Ø4.72}
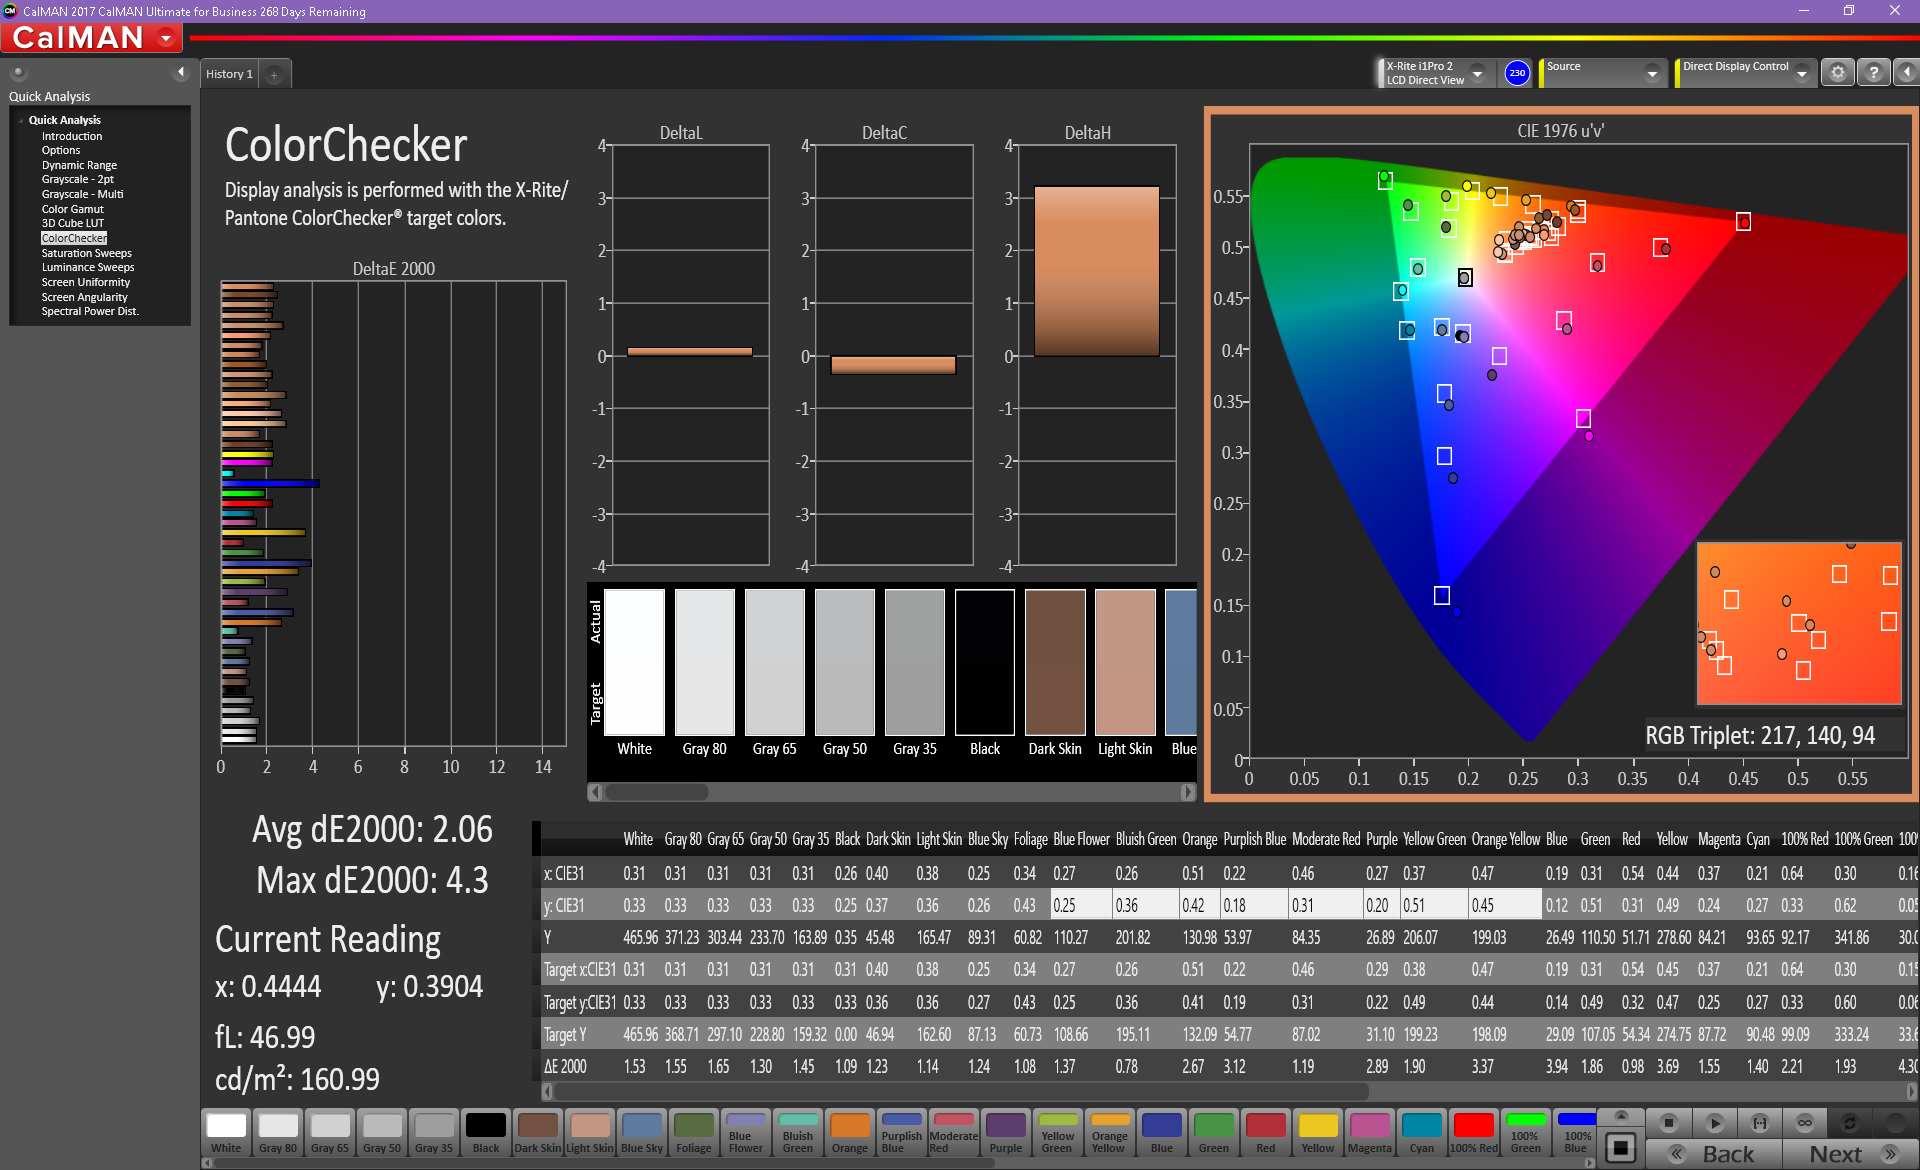
calibrated: 2.06
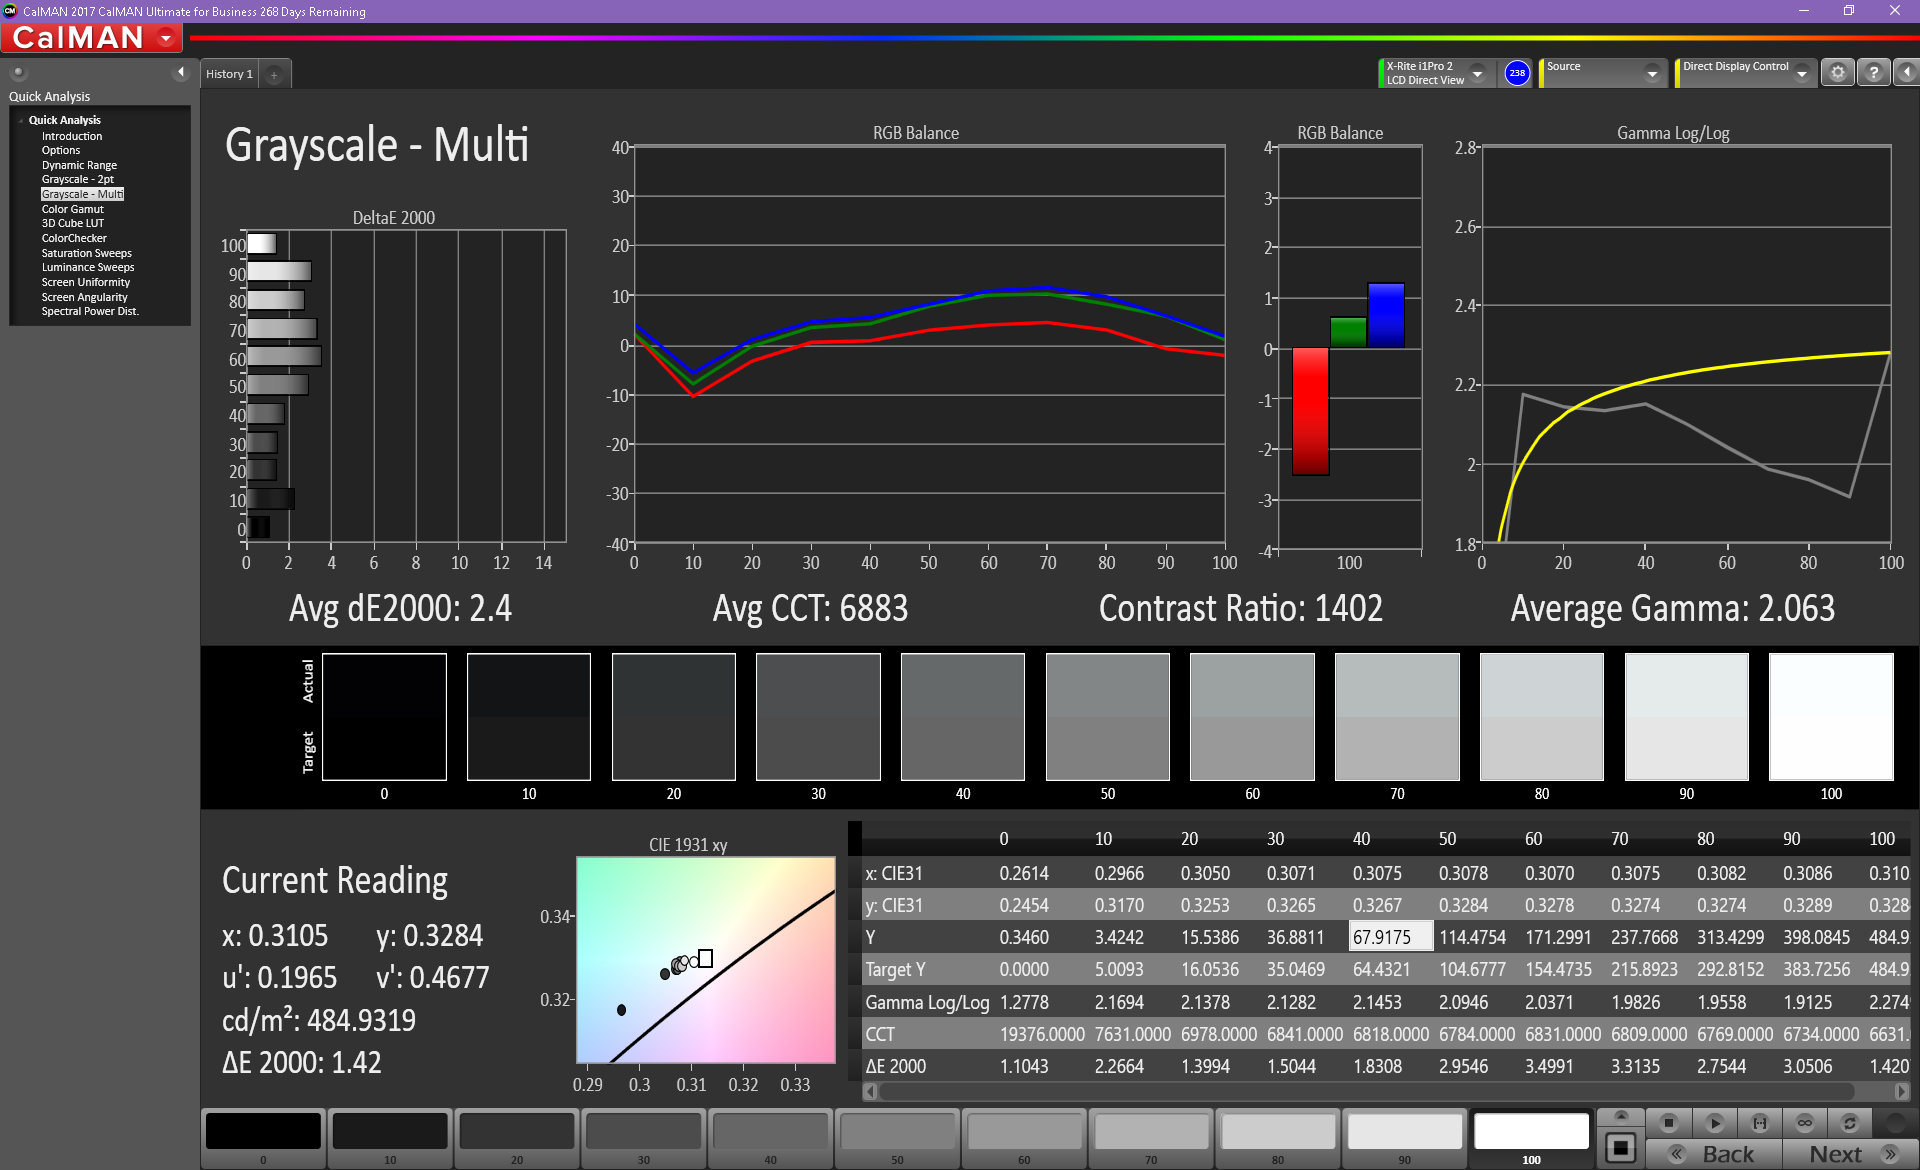
ΔE Greyscale Calman: 2.4 | ∀{0.09-98 Ø4.97}
98.36% sRGB (Argyll 1.6.3 3D)
69.47% AdobeRGB 1998 (Argyll 1.6.3 3D)
69.5% AdobeRGB 1998 (Argyll 3D)
98.4% sRGB (Argyll 3D)
68.9% Display P3 (Argyll 3D)
Gamma: 2.063
CCT: 6883 K
| Dell XPS 13 9370 i7 UHD ID: Sharp SHP148B, Name: LQ133D1, Dell P/N: 8XDHY, IPS, 13.3", 3840x2160 | Dell XPS 13 9370 i5 UHD ID: Sharp SHP148B, Name: LQ133D1, Dell P/N: 8XDHY, IPS, 13.3", 3840x2160 | Asus ZenBook 13 UX331UN AU Optronics B133HAN04.9, IPS, 13.3", 1920x1080 | Lenovo IdeaPad 320S-13IKB InfoVision M133NWF4R0, IPS LED, 13.3", 1920x1080 | Lenovo ThinkPad X1 Carbon 2018-20KGS03900 B140QAN02.0, IPS, 14", 2560x1440 | Samsung Notebook 9 NP900X3N-K01US ID: BOE06E1, Name: NV133FHB-N31, IPS, 13.3", 1920x1080 | |
|---|---|---|---|---|---|---|
| Display | 0% | -10% | -2% | 24% | -9% | |
| Display P3 Coverage (%) | 68.9 | 68.9 0% | 63.3 -8% | 66.3 -4% | 87.7 27% | 63.4 -8% |
| sRGB Coverage (%) | 98.4 | 98.4 0% | 86.7 -12% | 97.4 -1% | 100 2% | 88.6 -10% |
| AdobeRGB 1998 Coverage (%) | 69.5 | 69.5 0% | 63.4 -9% | 68.1 -2% | 99.9 44% | 64 -8% |
| Response Times | 4% | 41% | 23% | 19% | 32% | |
| Response Time Grey 50% / Grey 80% * (ms) | 69.6 ? | 67.2 ? 3% | 44 ? 37% | 56.8 ? 18% | 59.2 ? 15% | 41.6 ? 40% |
| Response Time Black / White * (ms) | 44 ? | 41.6 ? 5% | 24 ? 45% | 31.6 ? 28% | 34.4 ? 22% | 34 ? 23% |
| PWM Frequency (Hz) | 3759 ? | 2500 ? | 198.4 ? | 210.1 ? | ||
| Screen | -8% | -13% | 5% | 20% | -10% | |
| Brightness middle (cd/m²) | 478.5 | 496.4 4% | 329 -31% | 330 -31% | 578 21% | 510.7 7% |
| Brightness (cd/m²) | 466 | 469 1% | 306 -34% | 304 -35% | 533 14% | 481 3% |
| Brightness Distribution (%) | 86 | 84 -2% | 86 0% | 88 2% | 84 -2% | 90 5% |
| Black Level * (cd/m²) | 0.43 | 0.5 -16% | 0.3 30% | 0.25 42% | 0.38 12% | 0.66 -53% |
| Contrast (:1) | 1113 | 993 -11% | 1097 -1% | 1320 19% | 1521 37% | 774 -30% |
| Colorchecker dE 2000 * | 3.09 | 2.9 6% | 4.07 -32% | 1.8 42% | 1.9 39% | 2.4 22% |
| Colorchecker dE 2000 max. * | 5.94 | 5.26 11% | 7.05 -19% | 4.3 28% | 3.8 36% | 7.3 -23% |
| Colorchecker dE 2000 calibrated * | 2.06 | 0.8 61% | ||||
| Greyscale dE 2000 * | 2.4 | 3.9 -63% | 2.76 -15% | 2.5 -4% | 3 -25% | 2.4 -0% |
| Gamma | 2.063 107% | 2.066 106% | 2.56 86% | 2.11 104% | 2.14 103% | 2.23 99% |
| CCT | 6883 94% | 7169 91% | 6915 94% | 6588 99% | 6377 102% | 6747 96% |
| Color Space (Percent of AdobeRGB 1998) (%) | 69.47 | 63.9 -8% | 56 -19% | 61.8 -11% | 88.8 28% | 57 -18% |
| Color Space (Percent of sRGB) (%) | 98.36 | 98.2 0% | 86 -13% | 97.3 -1% | 100 2% | 88.1 -10% |
| Total Average (Program / Settings) | -1% /
-5% | 6% /
-5% | 9% /
6% | 21% /
21% | 4% /
-4% |
* ... smaller is better
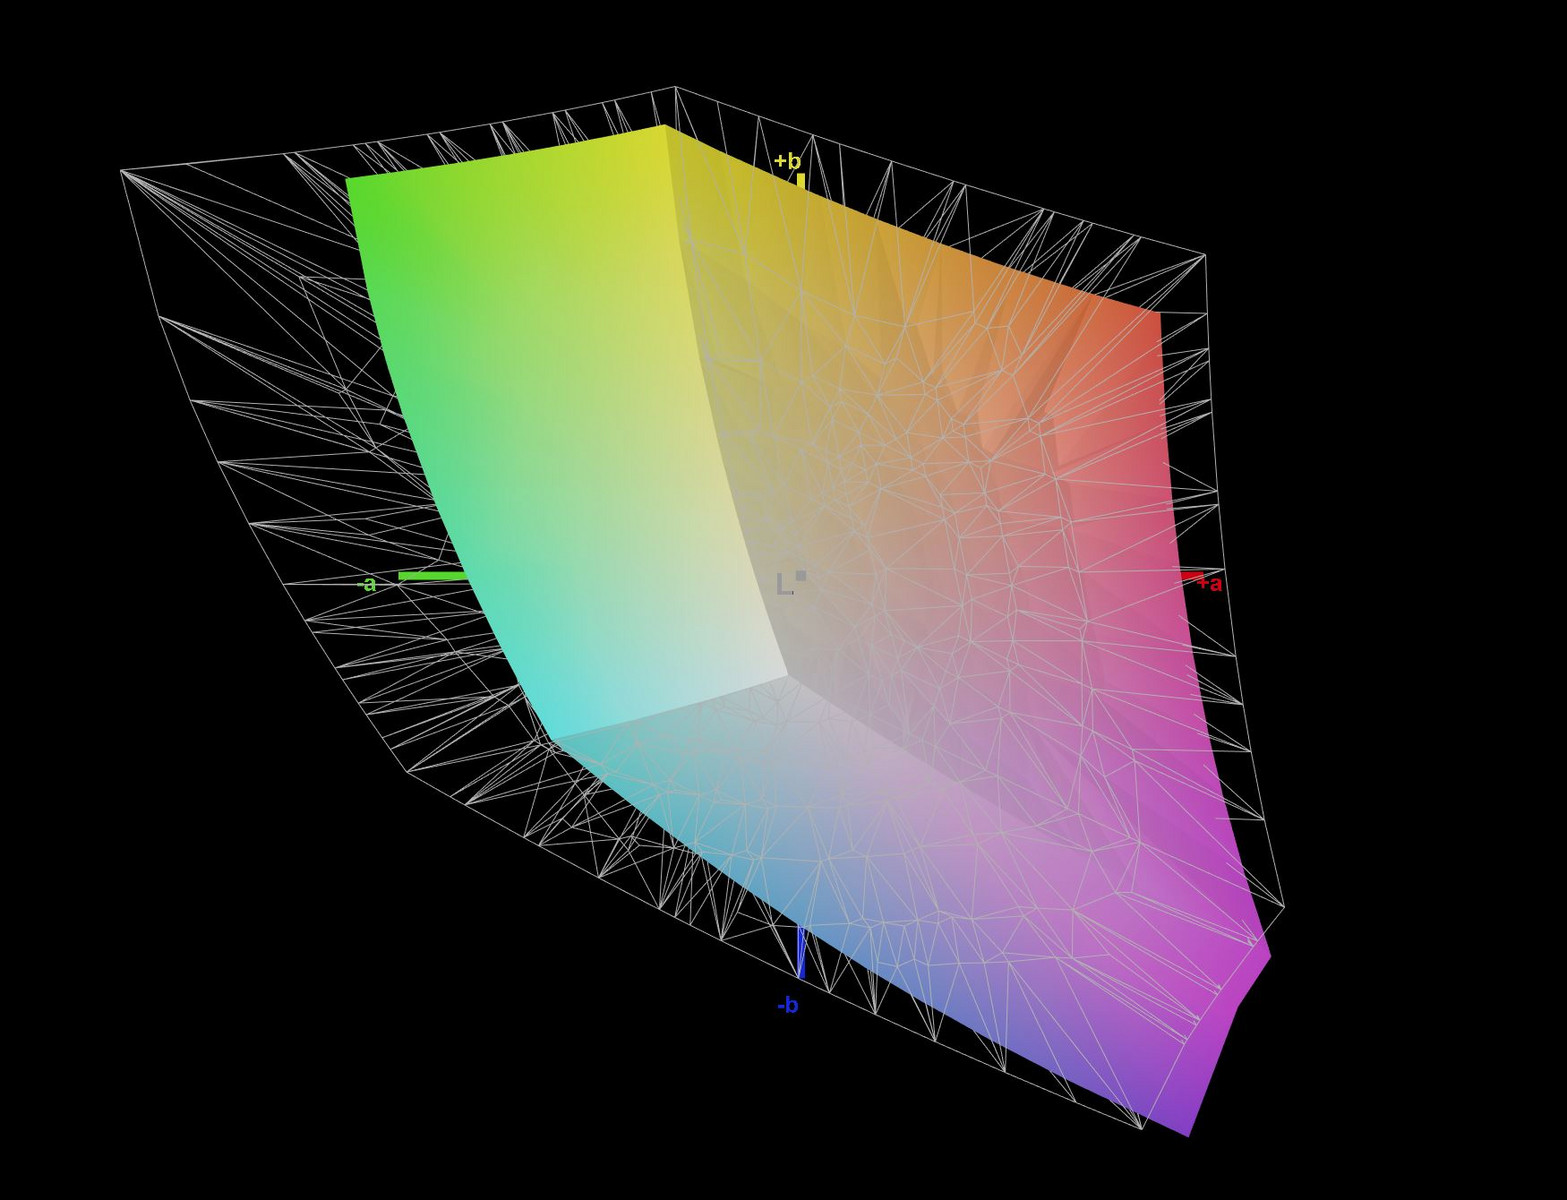
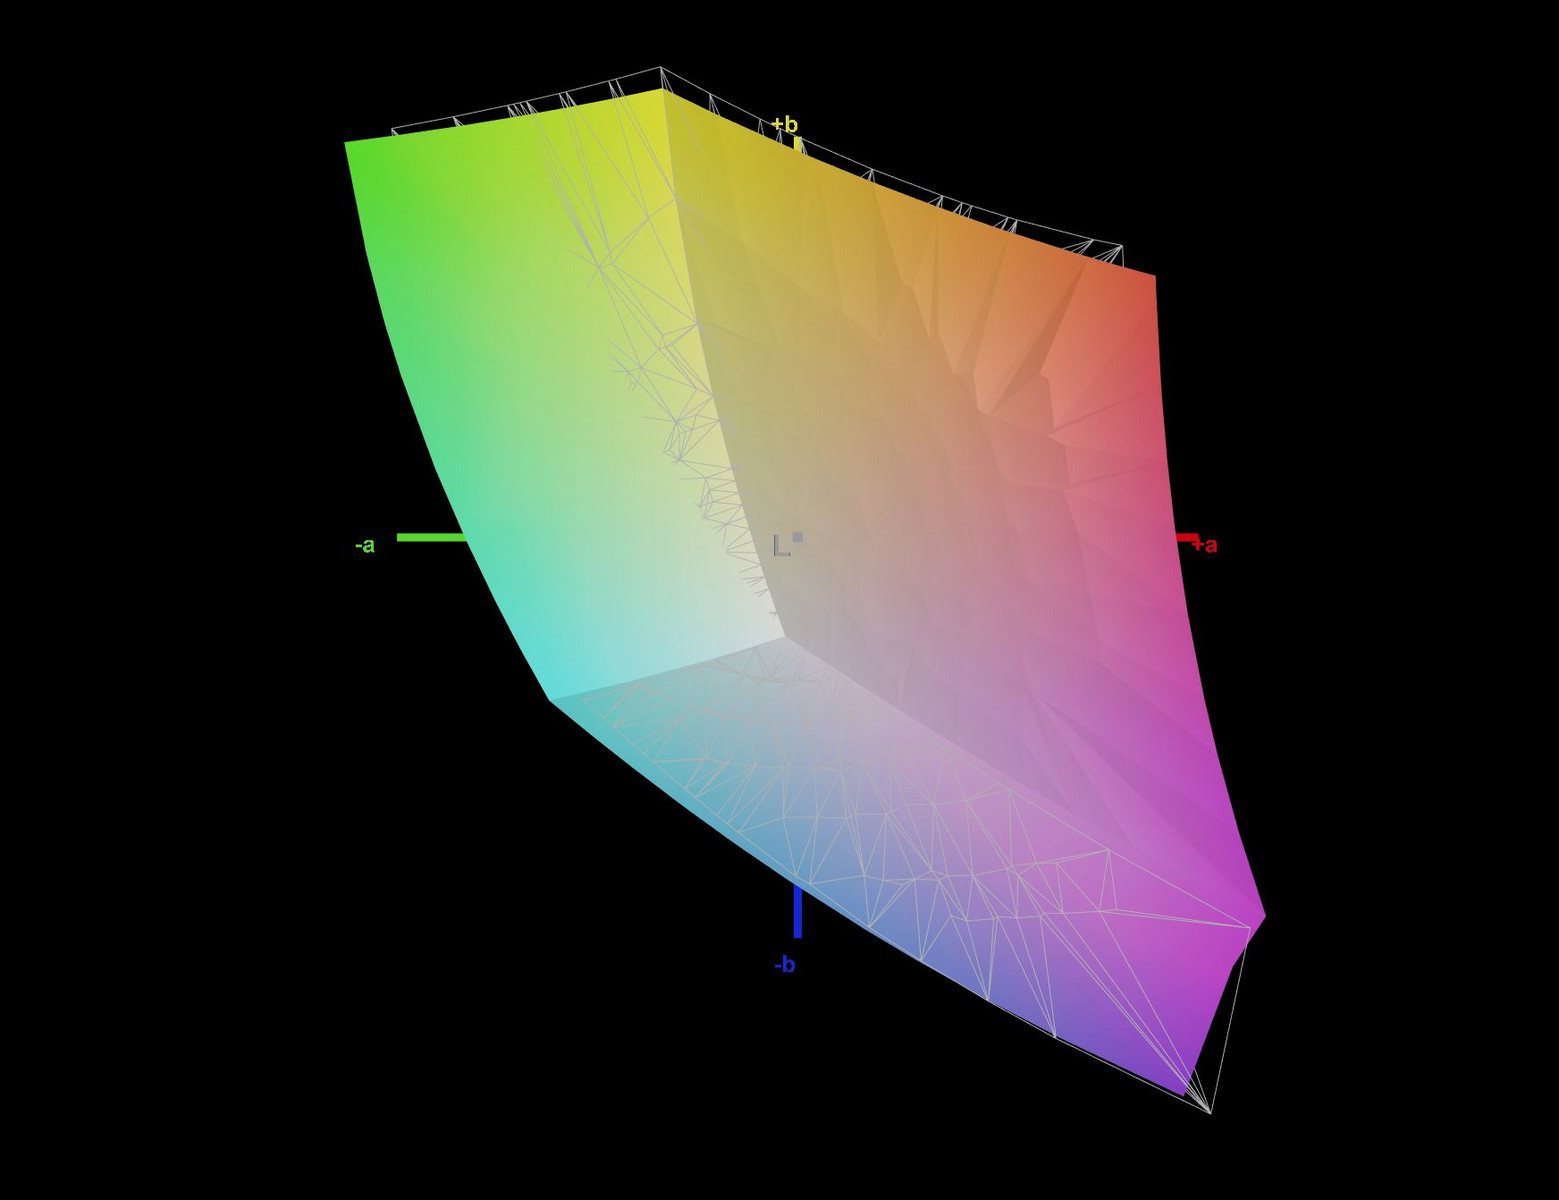
Color space rendering of the i7-equipped version is once again very good with 98 and 69 percent of the sRGB and AdobeRGB standards, respectively. Competitors like the Asus ZenBook 13 UX331UN or the Samsung Notebook 9 NP900X3N-K01US reproduce less than 90 percent of the smaller sRGB color space, while the 14-inch Lenovo ThinkPad X1 Carbon 2018 with WQHD HDR display offers complete coverage.
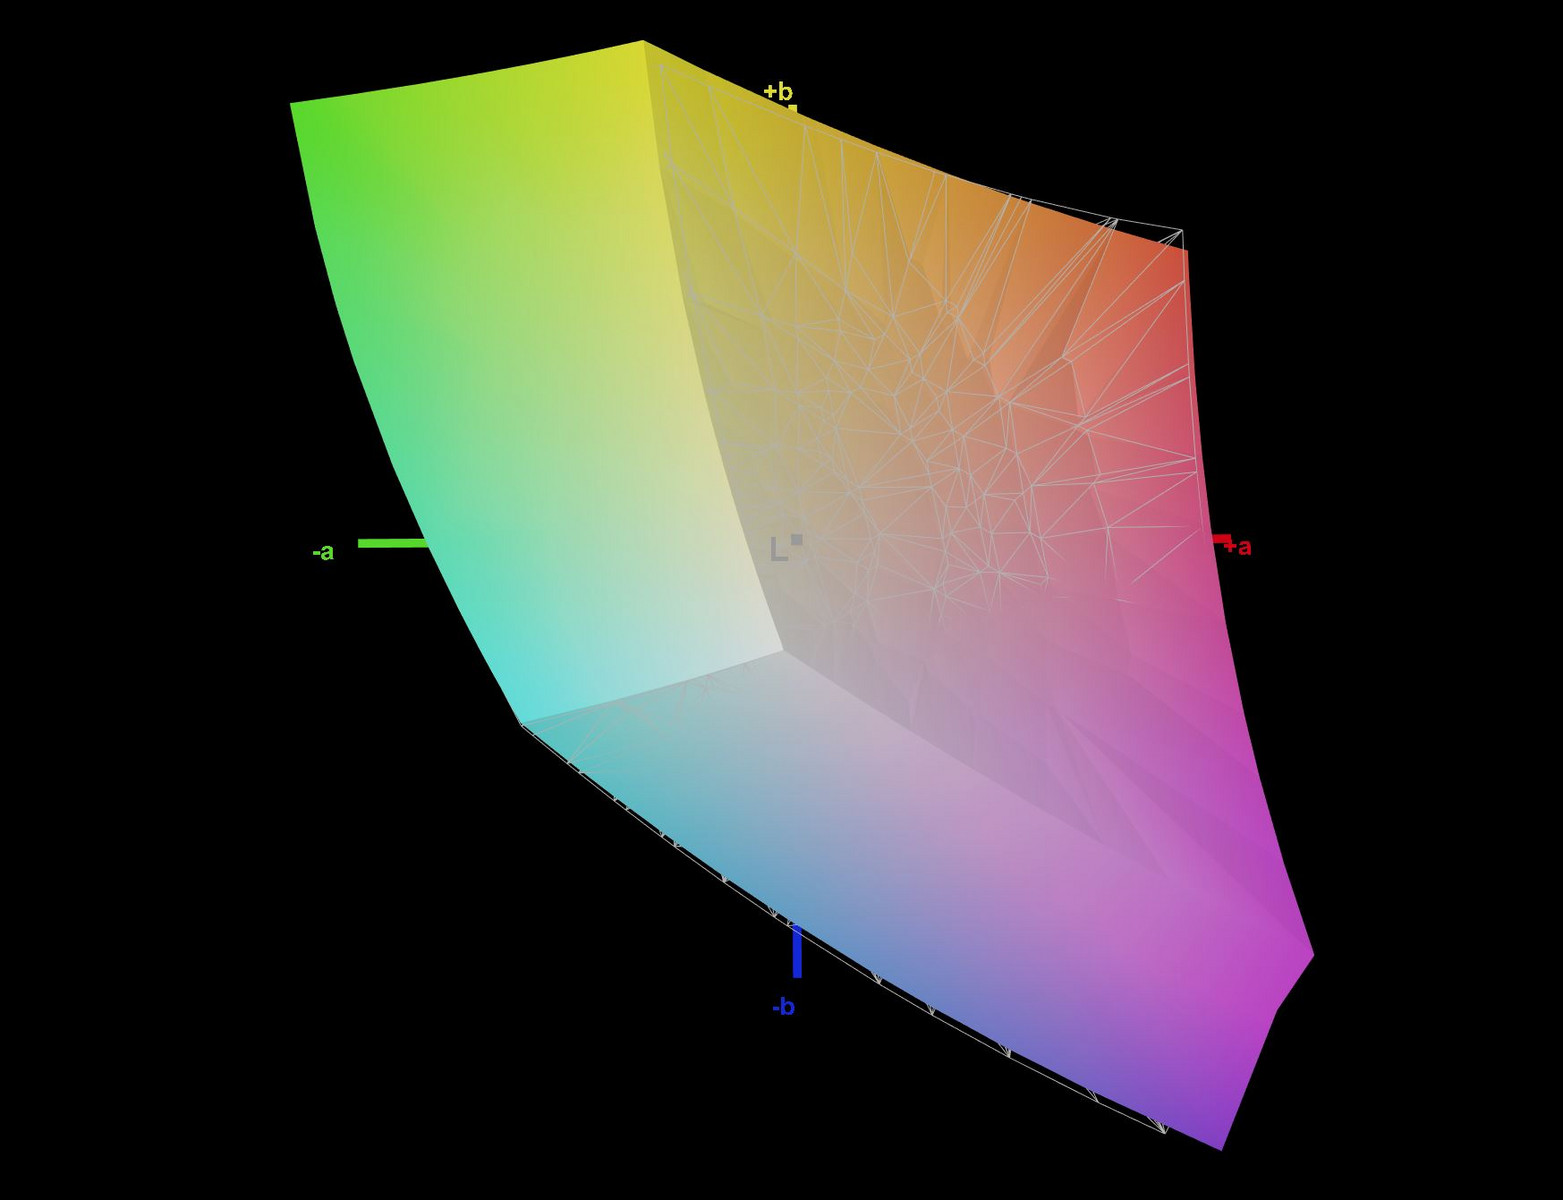
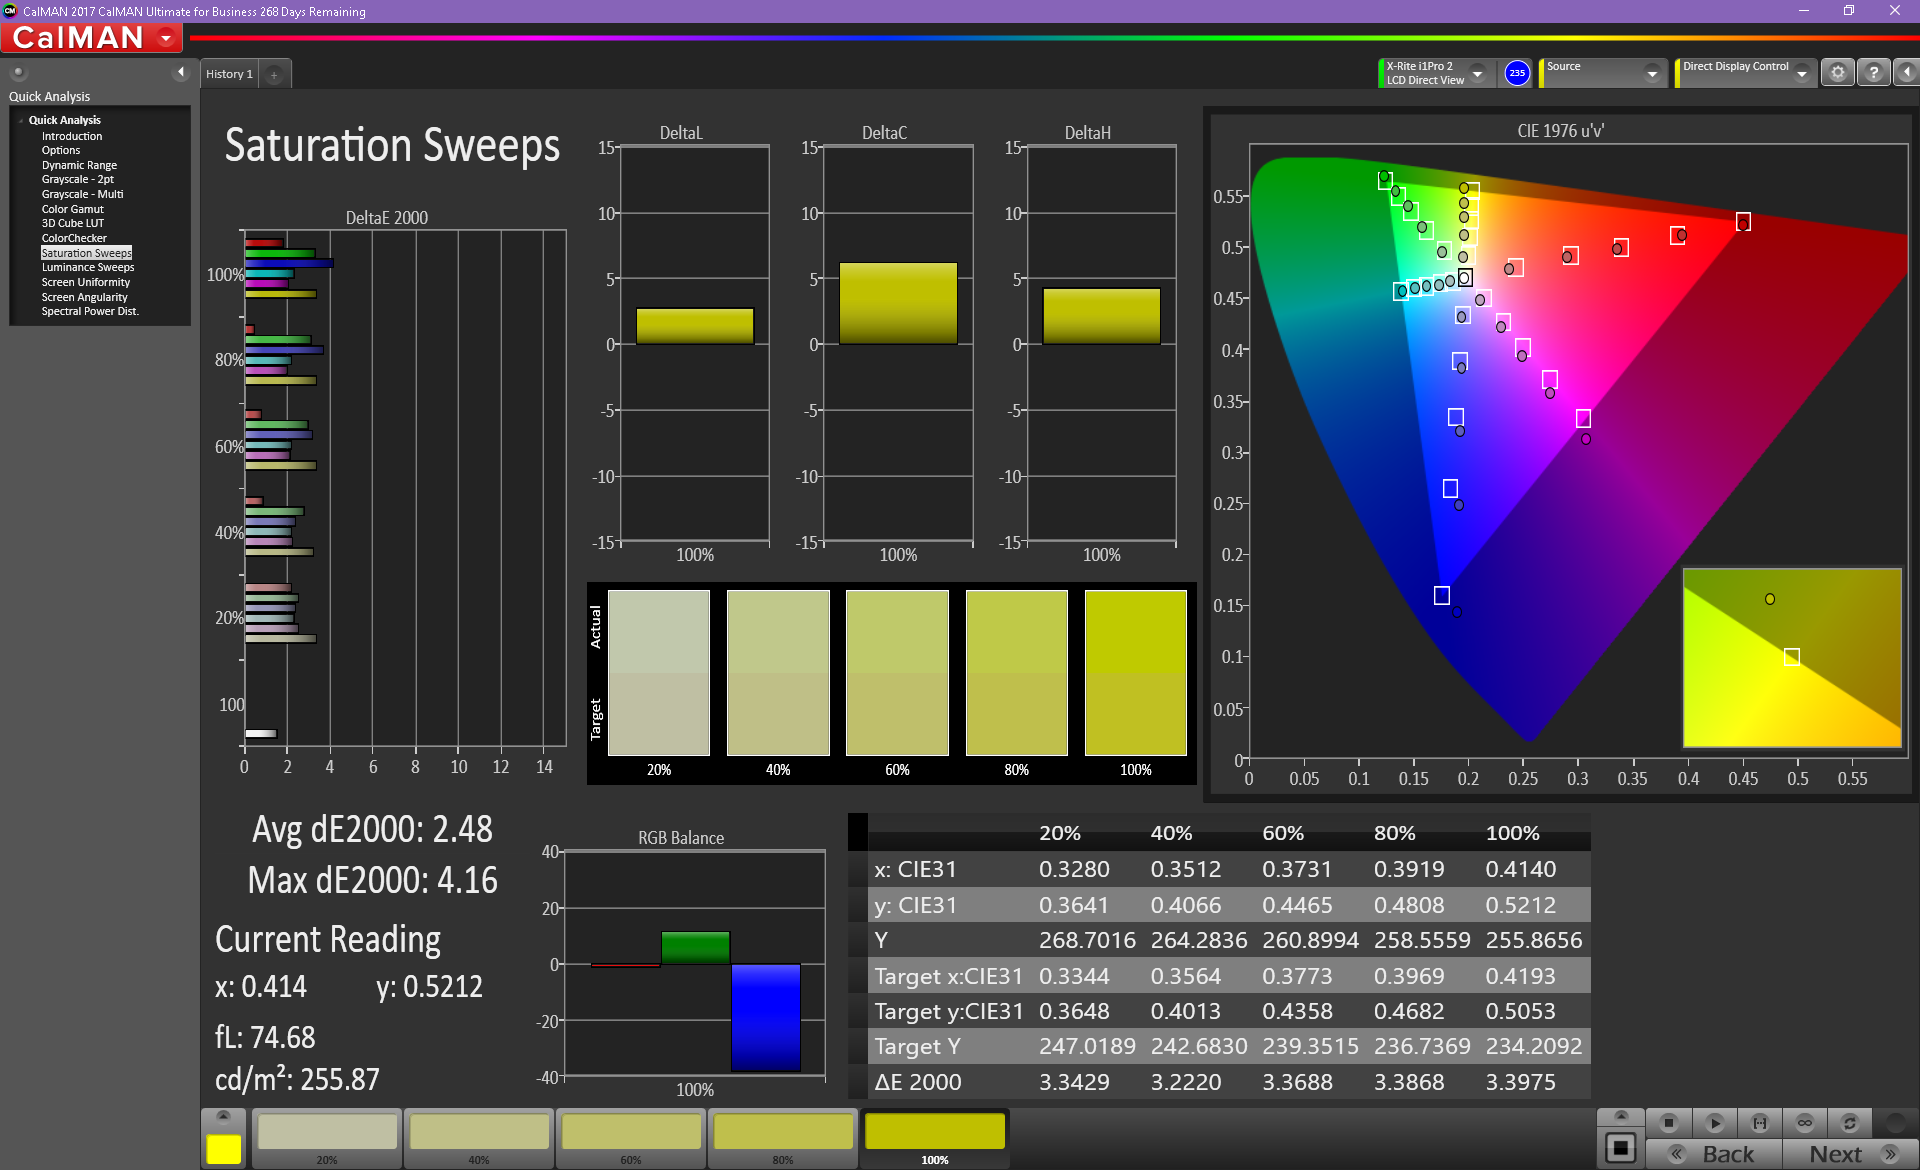
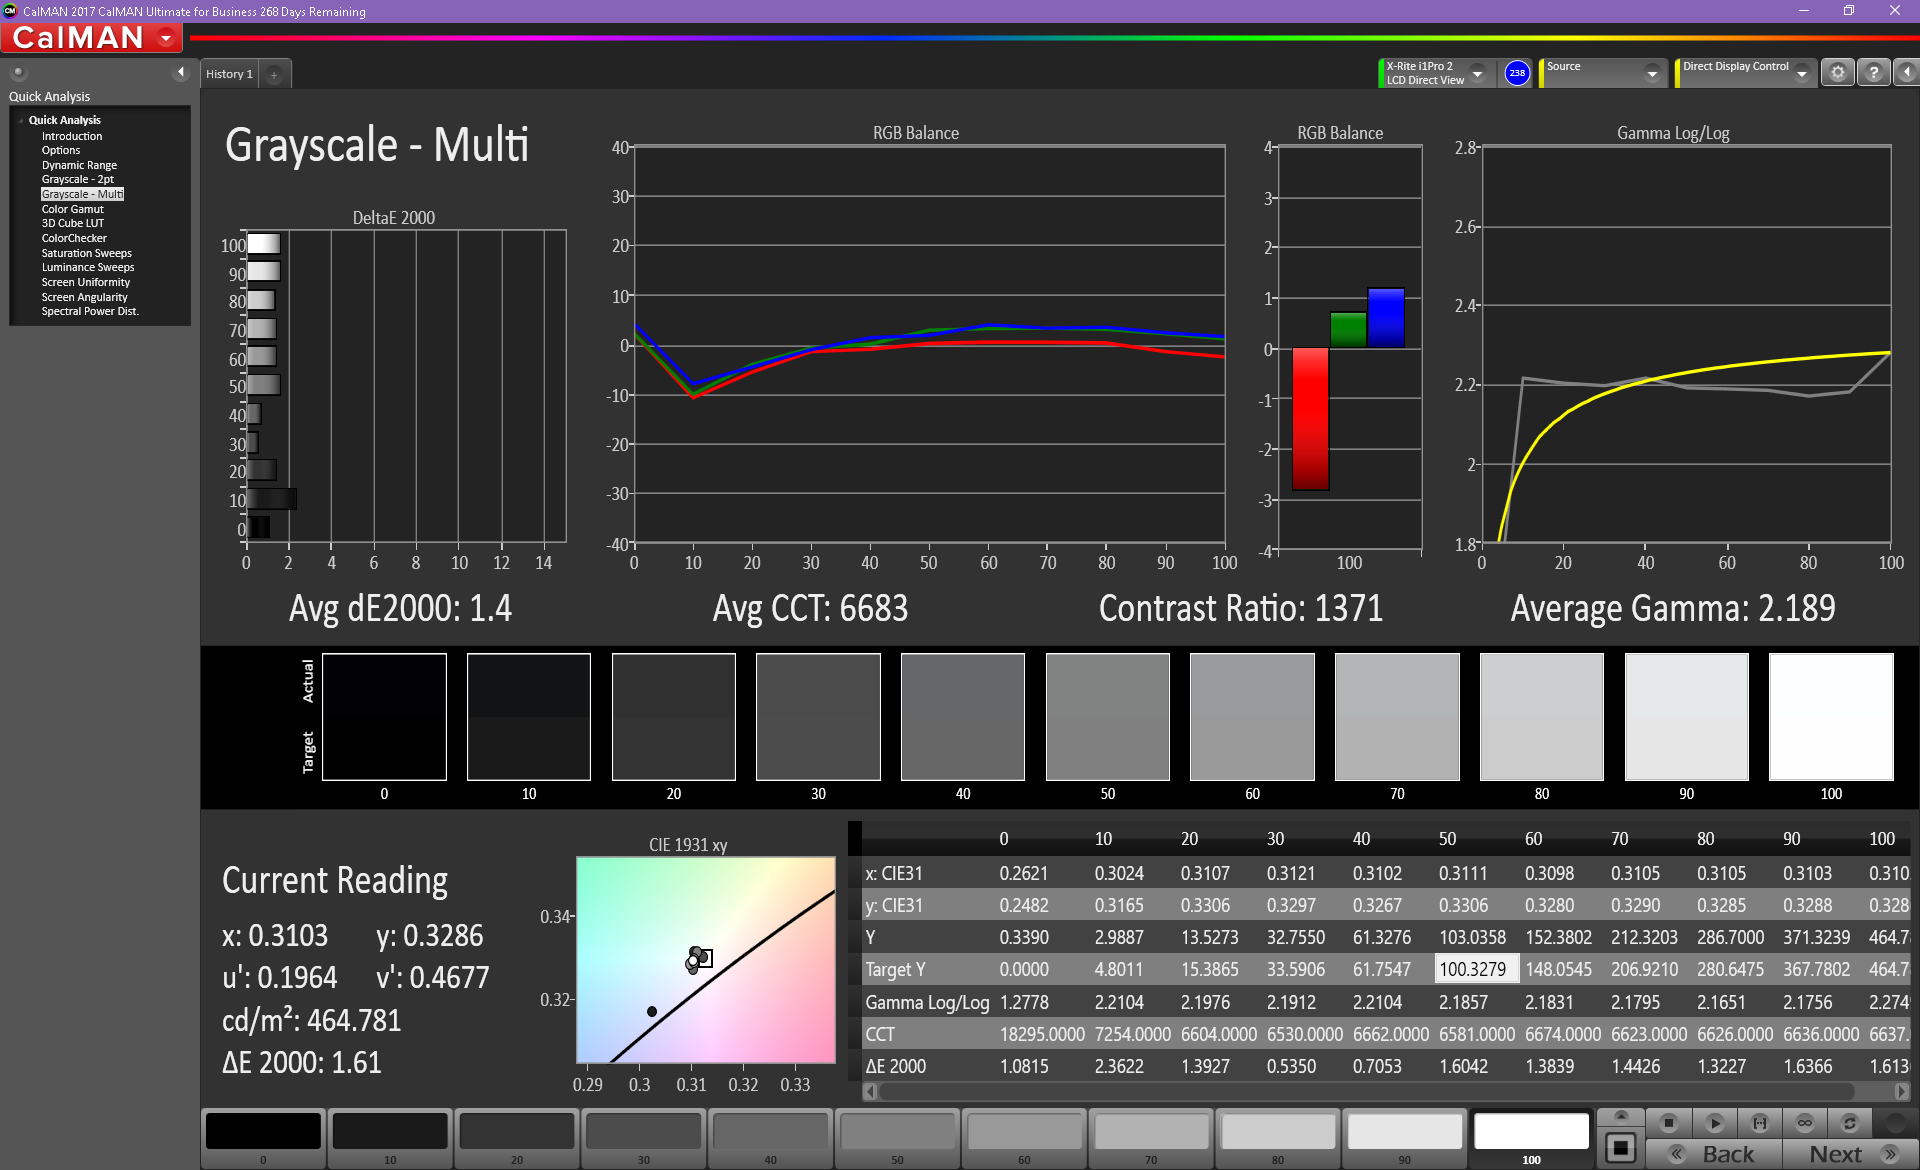
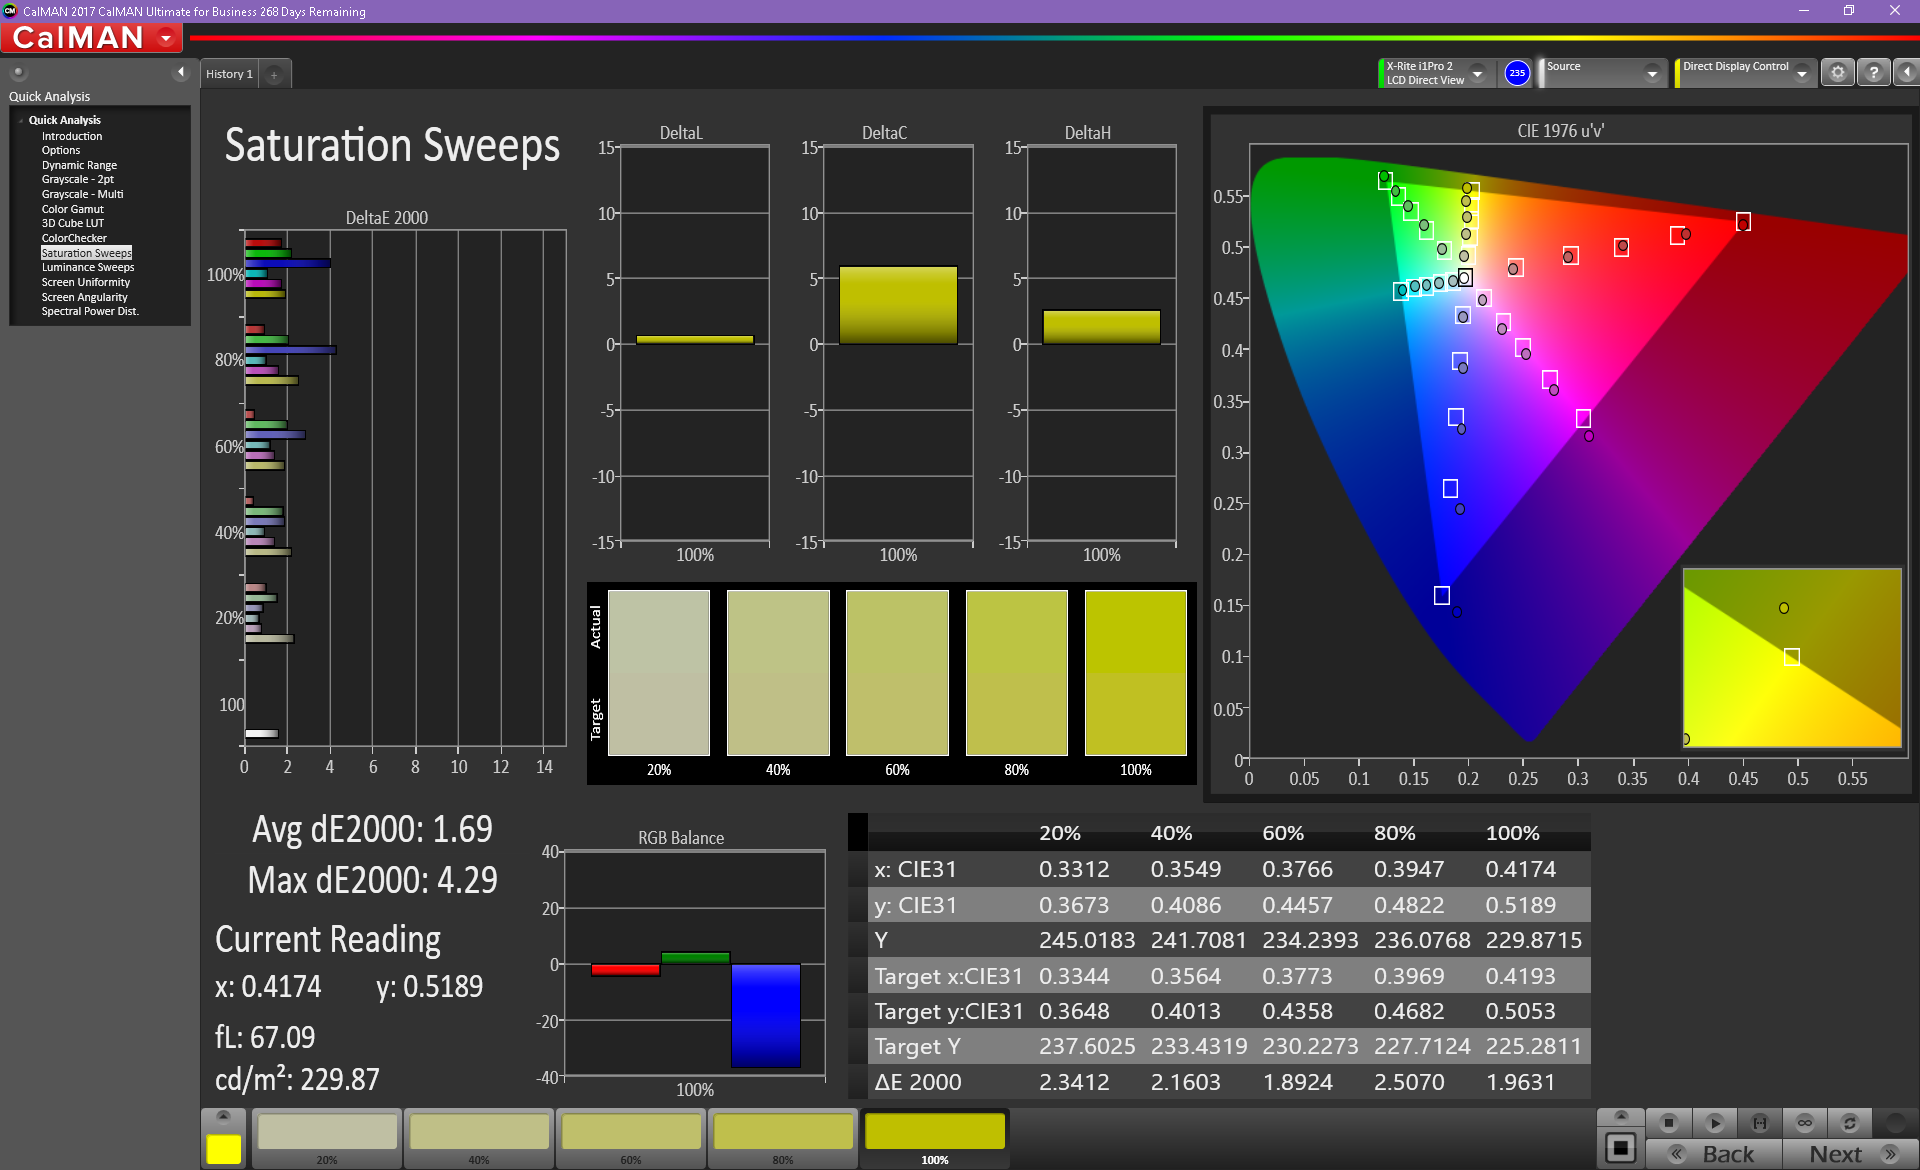
According to our measurements with the X-Rite spectrophotometer and analysis with the CalMAN software, grayscale and color are decent out of the box with average DeltaE values of 2.4 and 3, respectively, although the gamma is slightly too high. A quick calibration brings the color temperature and the gamma more in line with the sRGB standards; at higher saturation levels, the DeltaE-deviation remains a little high for the color blue (DeltaE just over 4). That said, the XPS 13 definitely benefits from a calibration, after which the notebook is certainly usable for semi-professional photo and video editing thanks to the good color space coverage and reasonably accurate colors.
Display Response Times
| ↔ Response Time Black to White | ||
|---|---|---|
| 44 ms ... rise ↗ and fall ↘ combined | ↗ 24.4 ms rise | 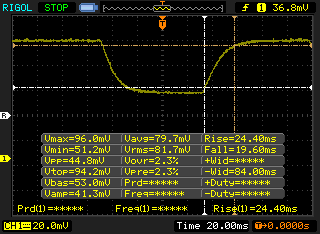 |
| ↘ 19.6 ms fall | ||
| The screen shows slow response rates in our tests and will be unsatisfactory for gamers. In comparison, all tested devices range from 0.1 (minimum) to 240 (maximum) ms. » 98 % of all devices are better. This means that the measured response time is worse than the average of all tested devices (19.8 ms). | ||
| ↔ Response Time 50% Grey to 80% Grey | ||
| 69.6 ms ... rise ↗ and fall ↘ combined | ↗ 32.4 ms rise | 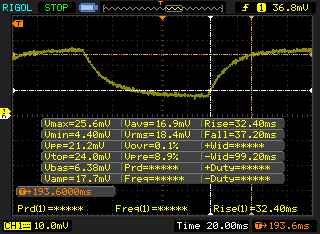 |
| ↘ 37.2 ms fall | ||
| The screen shows slow response rates in our tests and will be unsatisfactory for gamers. In comparison, all tested devices range from 0.165 (minimum) to 636 (maximum) ms. » 99 % of all devices are better. This means that the measured response time is worse than the average of all tested devices (31 ms). | ||
Screen Flickering / PWM (Pulse-Width Modulation)
| Screen flickering / PWM detected | 3759 Hz | ≤ 20 % brightness setting | 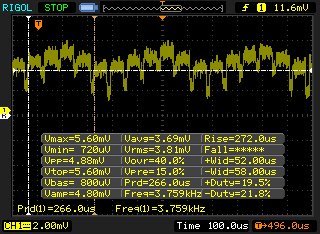 |
The display backlight flickers at 3759 Hz (worst case, e.g., utilizing PWM) Flickering detected at a brightness setting of 20 % and below. There should be no flickering or PWM above this brightness setting. The frequency of 3759 Hz is quite high, so most users sensitive to PWM should not notice any flickering. In comparison: 52 % of all tested devices do not use PWM to dim the display. If PWM was detected, an average of 7769 (minimum: 5 - maximum: 343500) Hz was measured. | |||
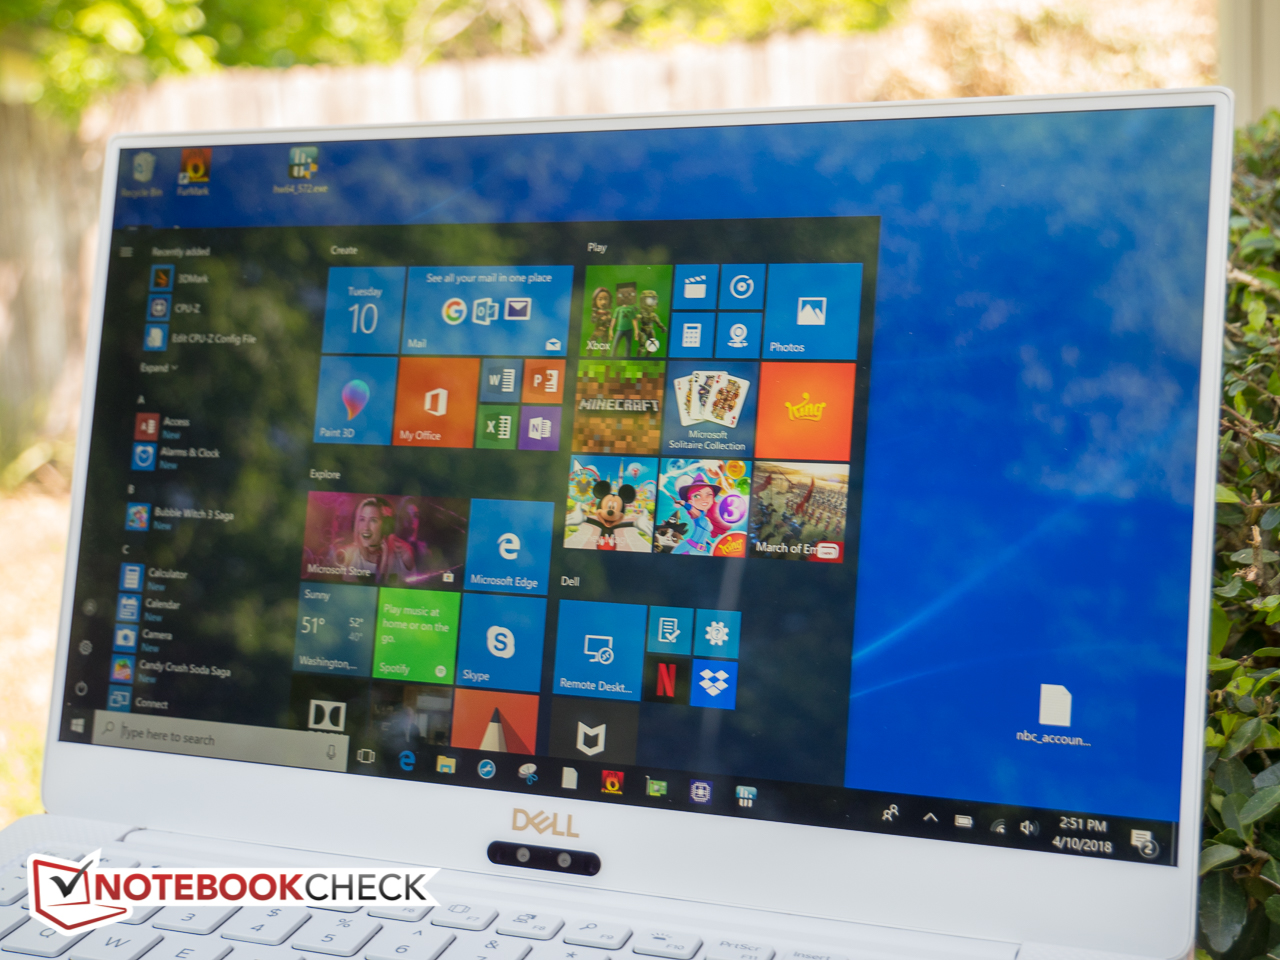
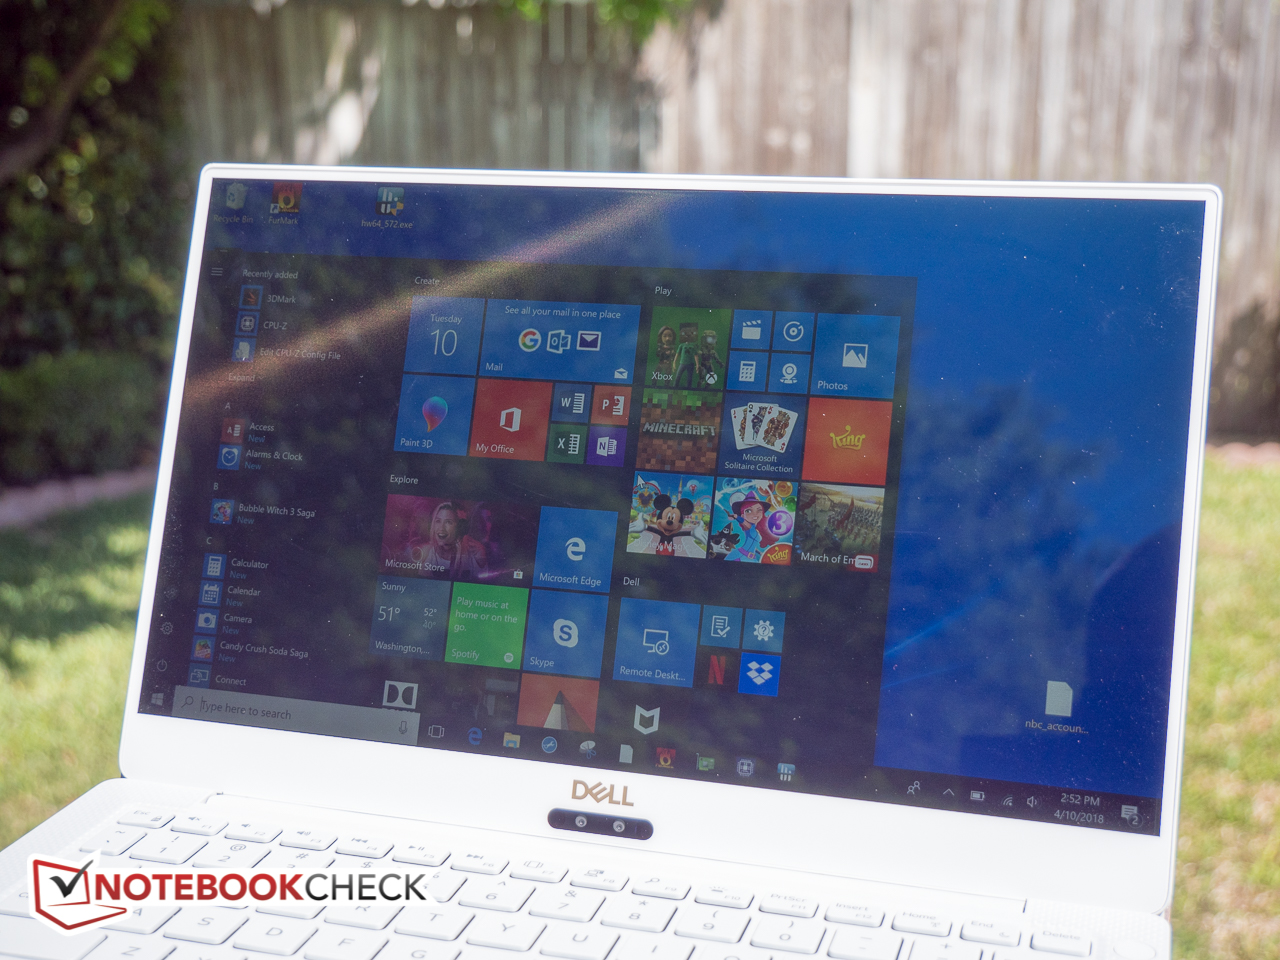
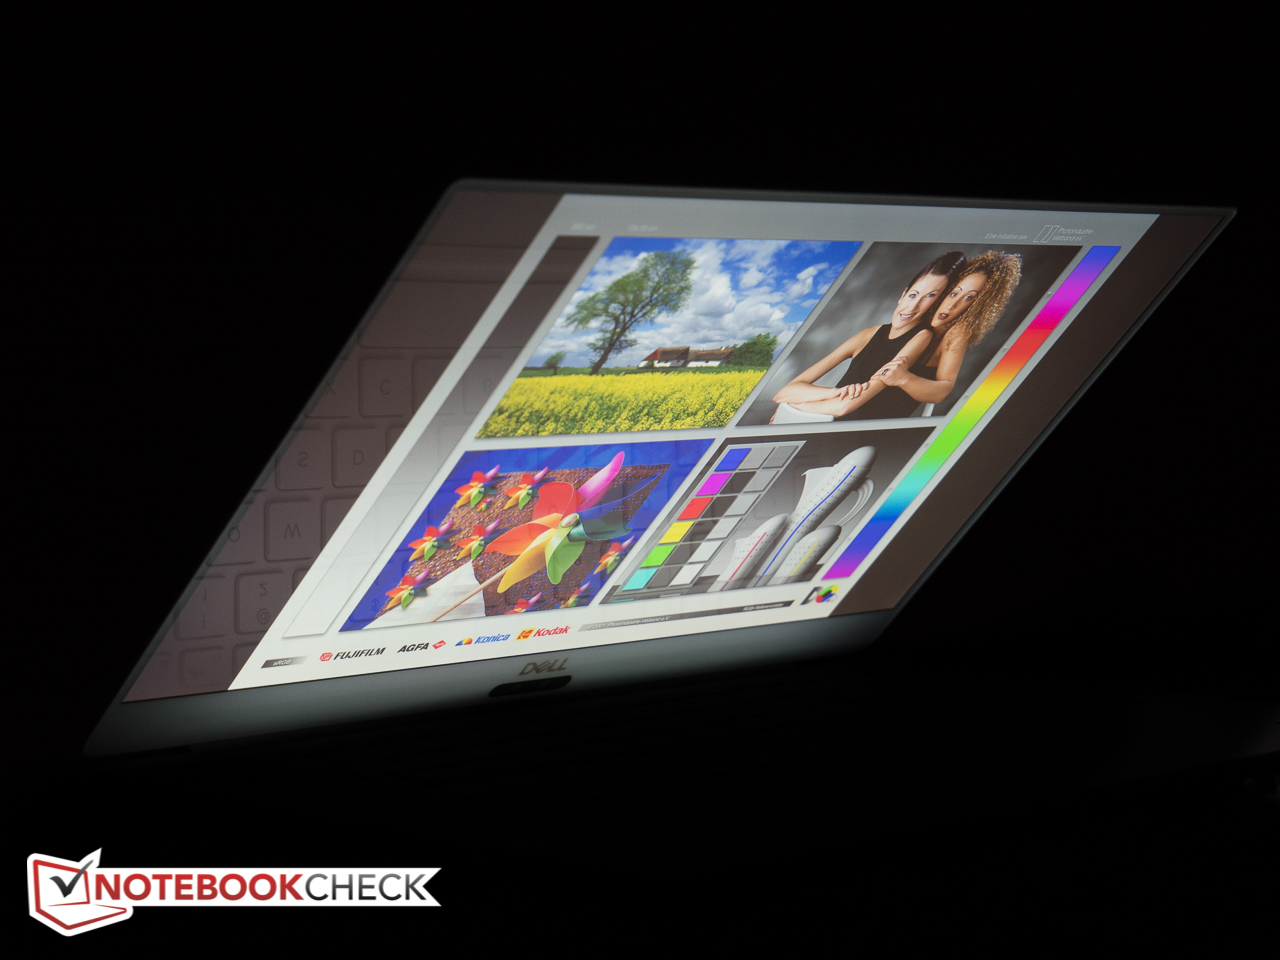
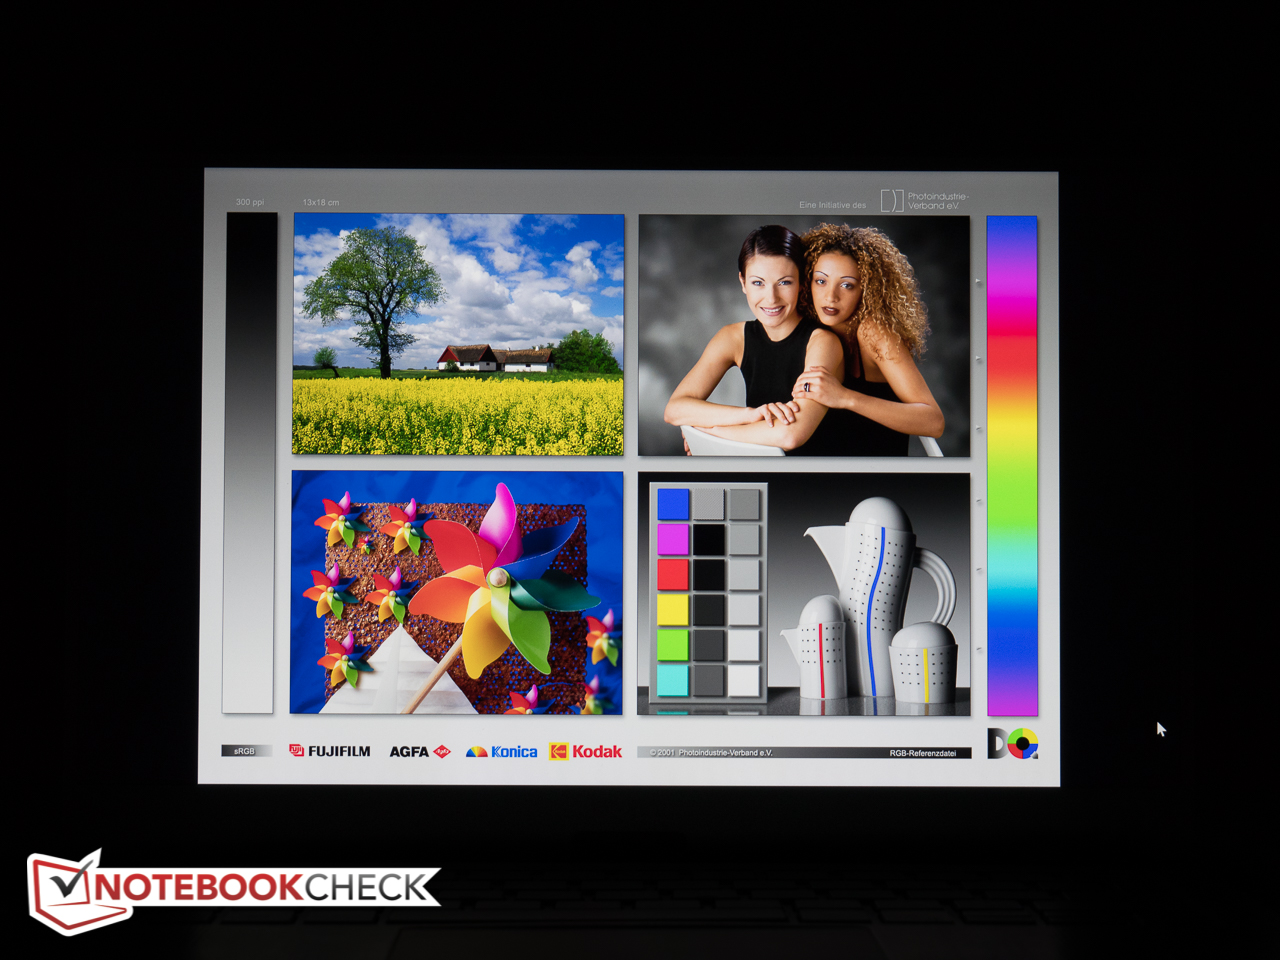
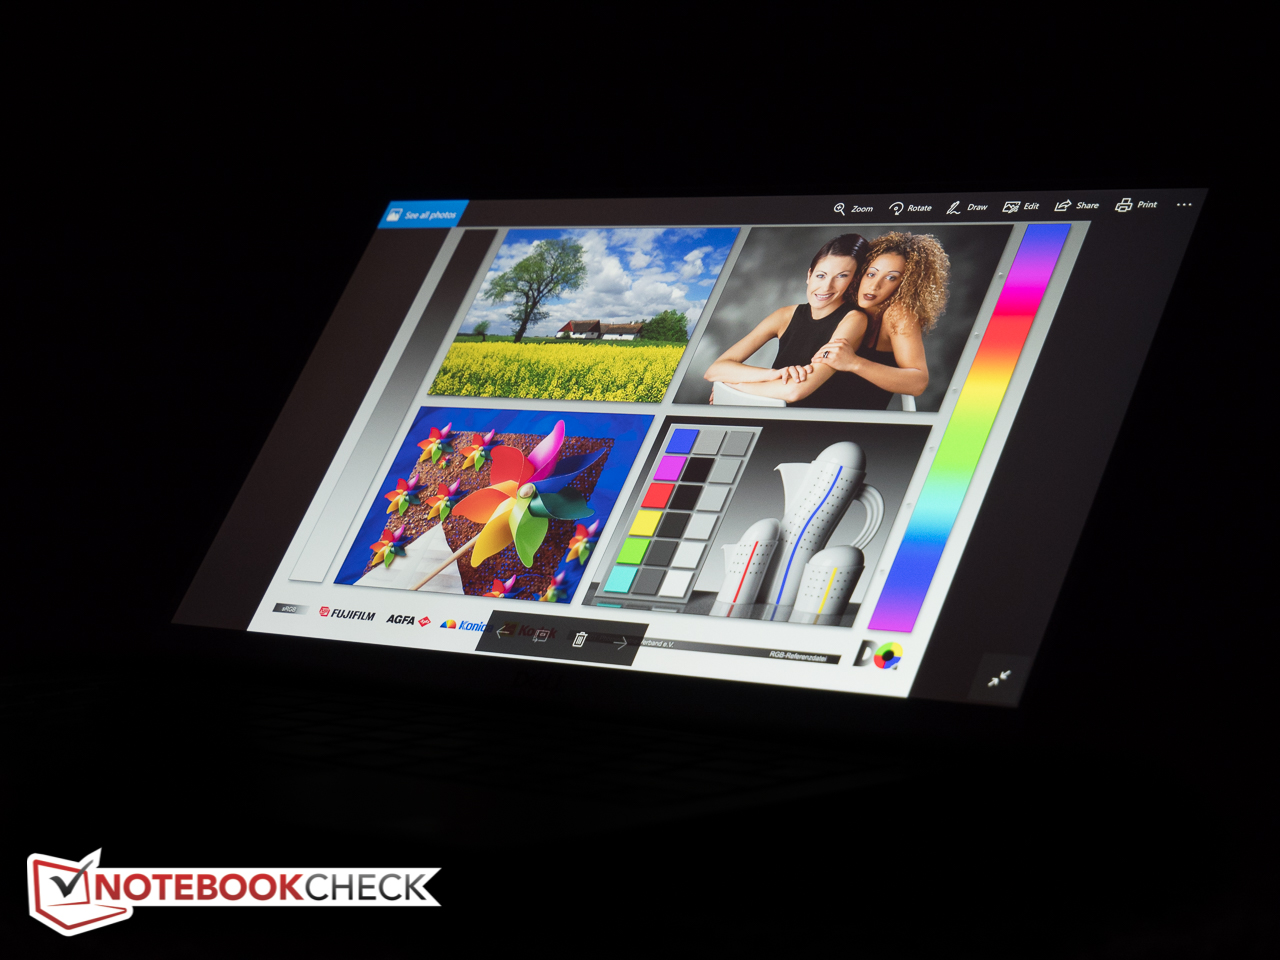
With an average brightness of about 470 nits, the XPS 13 9370 is comparatively well-suited for outdoor use despite the touchscreen glass panel. Reflections are acceptable in the shade and occasionally under overcast skies as long as the panel is adjusted properly, but direct sunlight remains an issue for any glare-type panel and readability is severely impacted in such conditions. The panel is based on IPS technology, so the viewing angle stability is very good with minor darkening but no significant color changes at shallow angles.
Performance
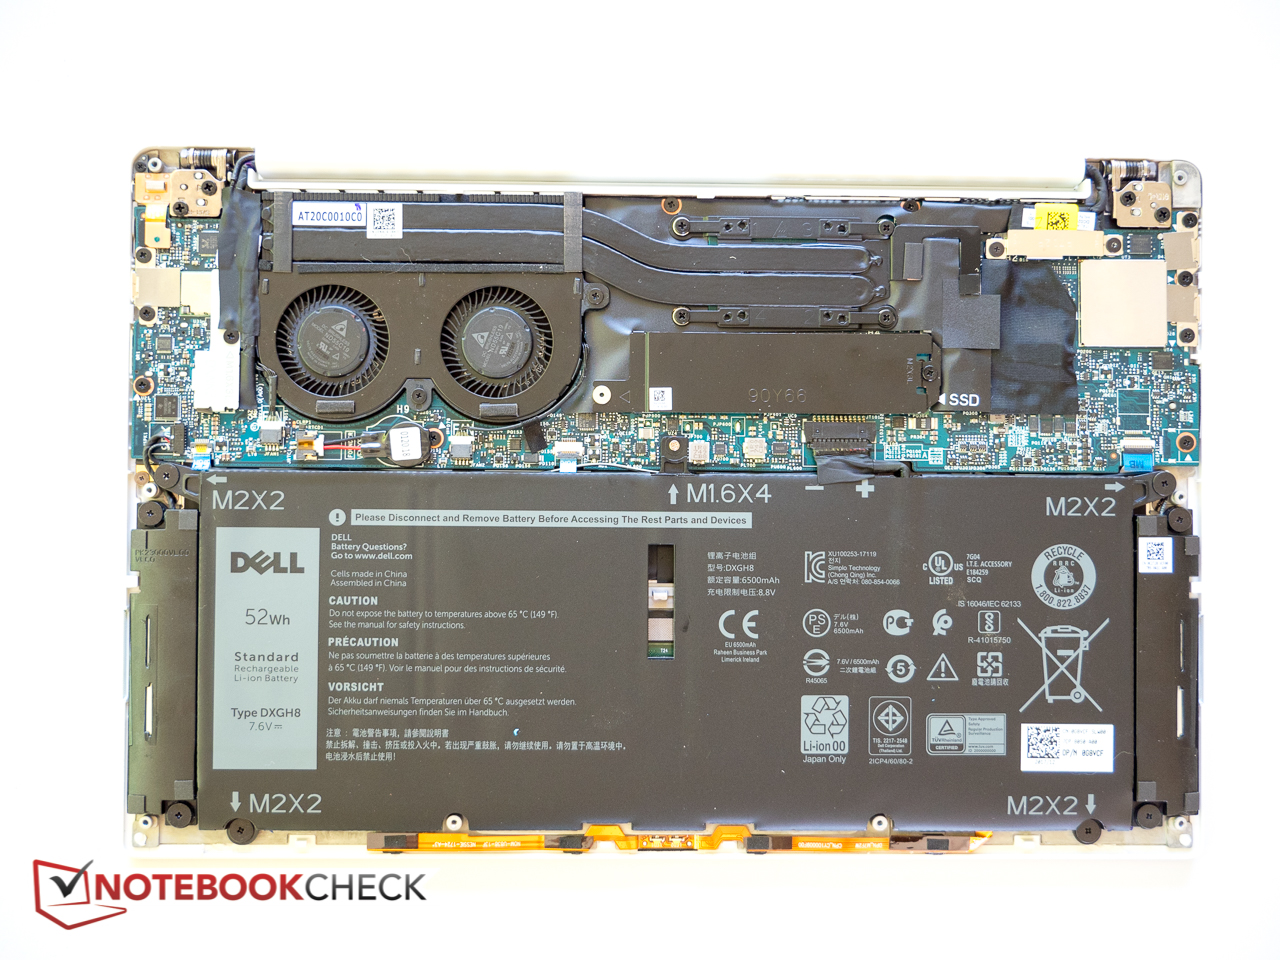
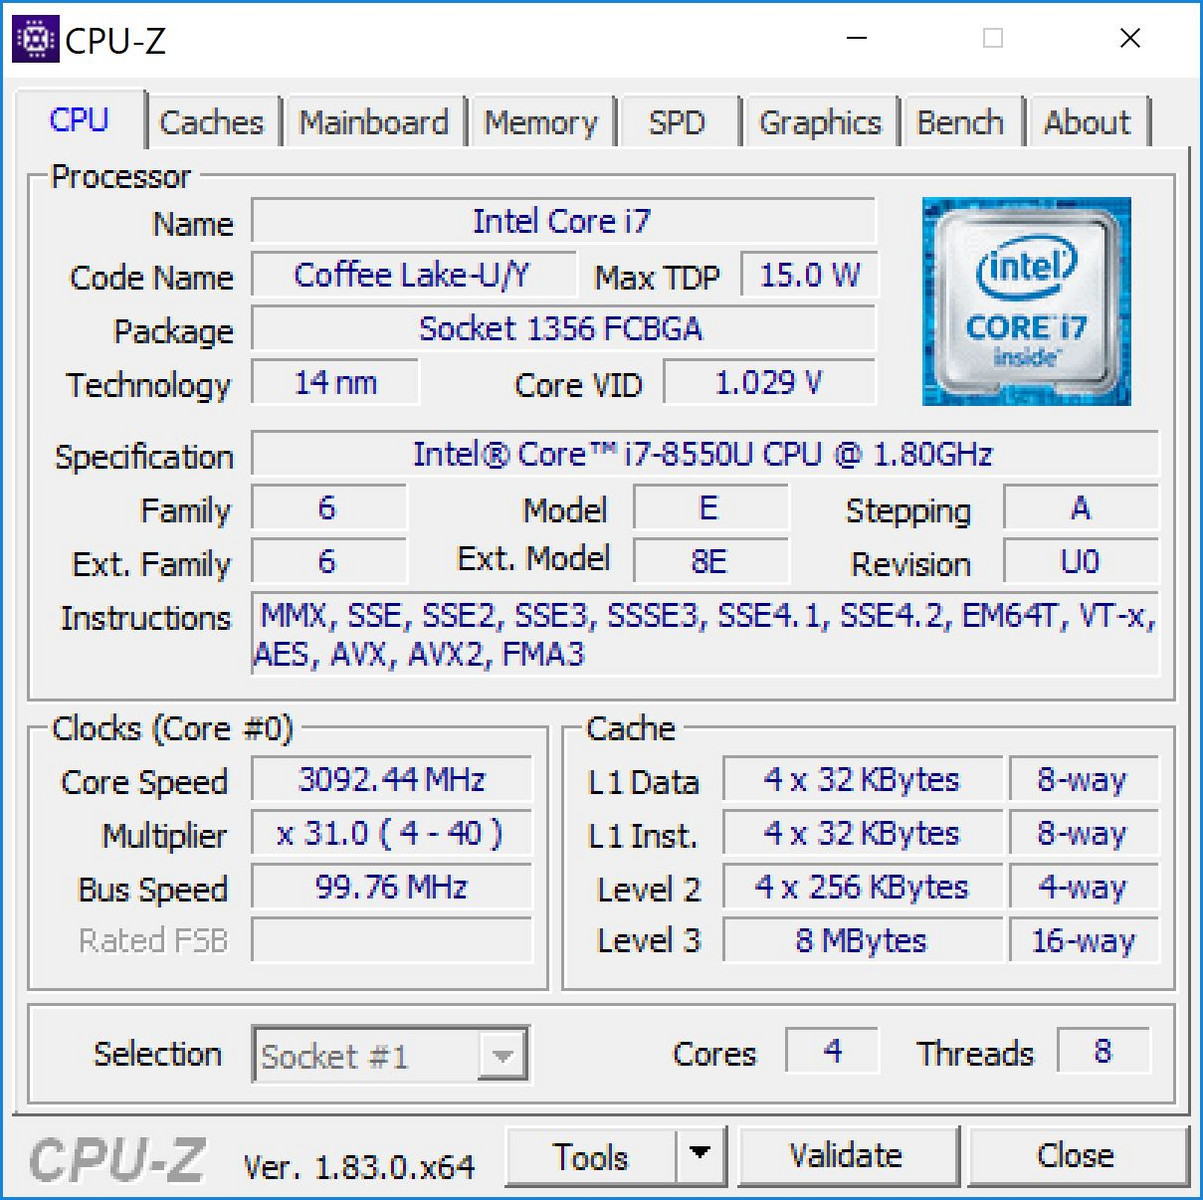
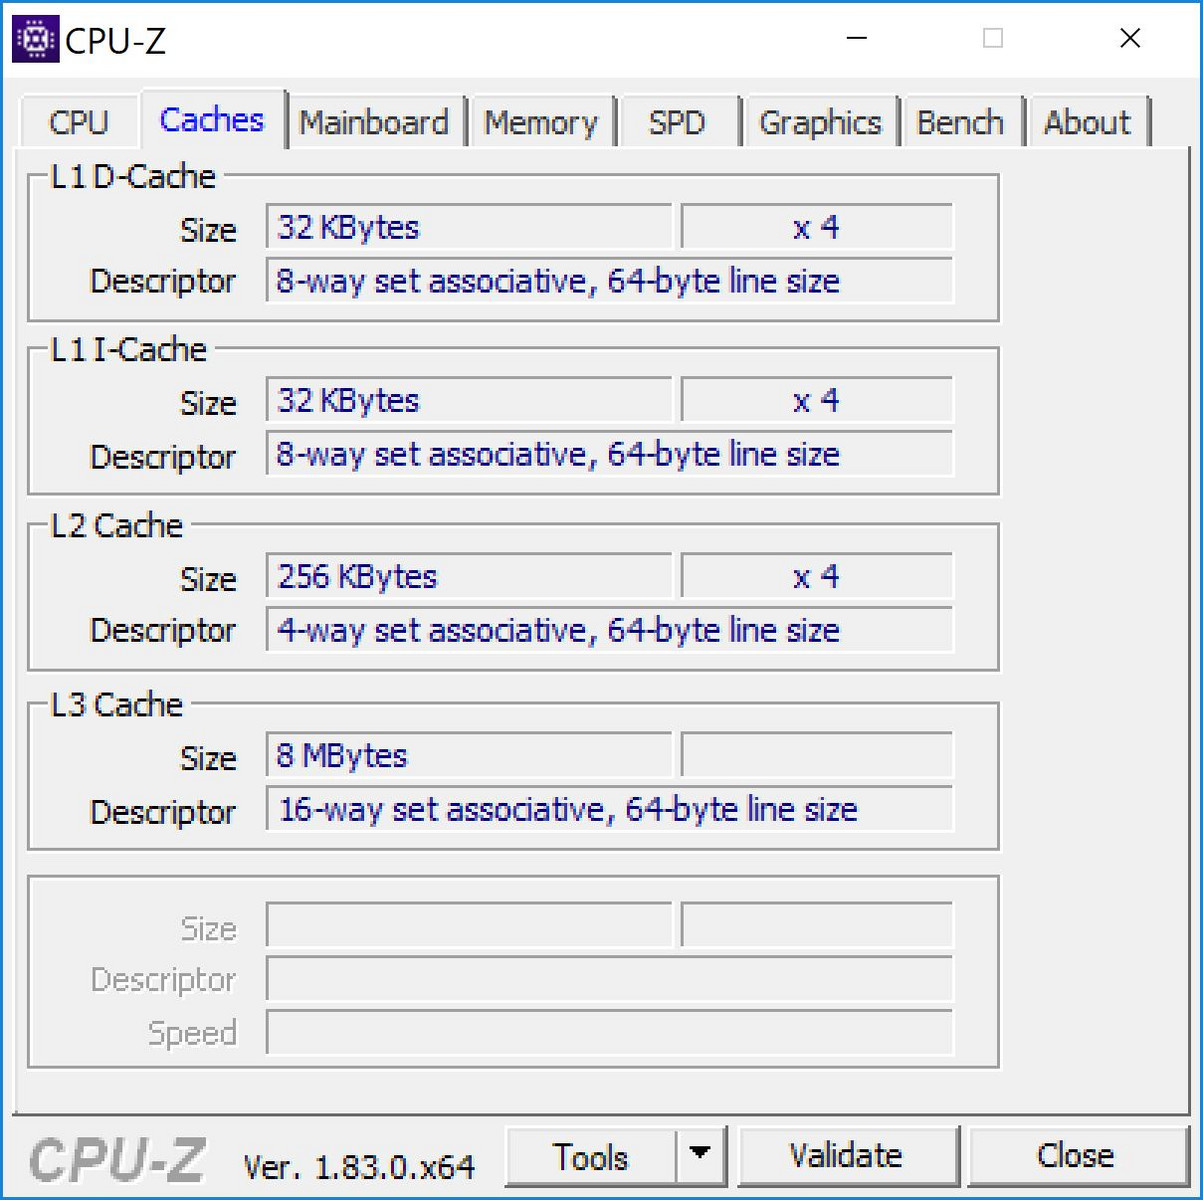
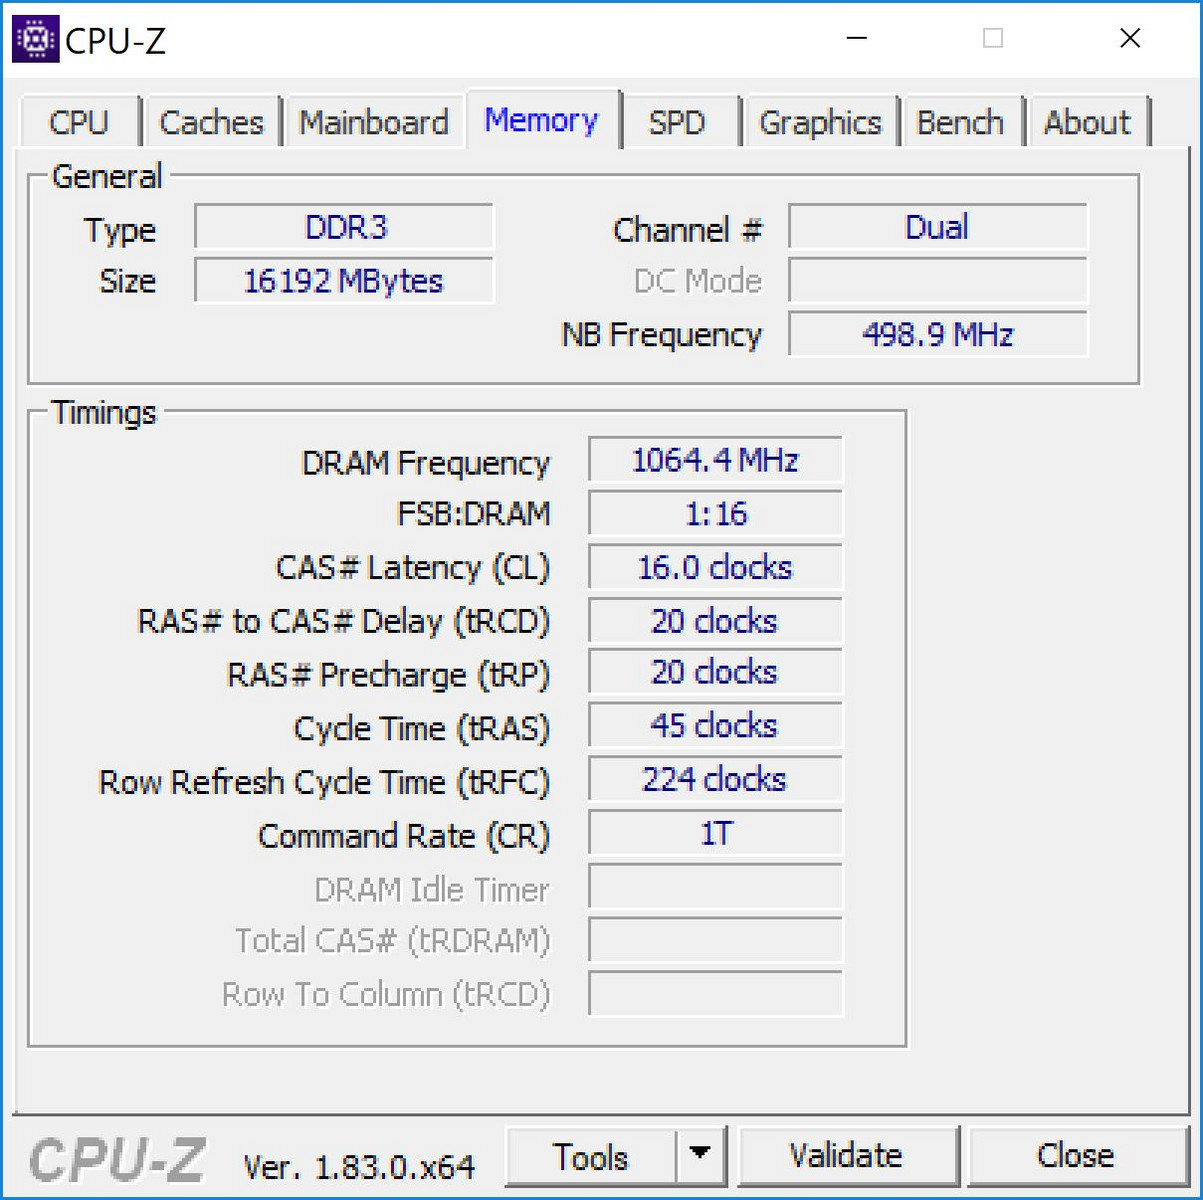
Unlike the Dell XPS 13 9370 with Core i5-8250 processor, our review notebook is equipped with the Core i7-8550U just like the predecessor XPS 13 9360 from 2017. Our model with 512 GB SSD can't be purchased from Dell directly at this time, as the high-end configuration in Dell's online store tops out at 256 GB. According to the spec sheet, Dell actually plans to offer drives up to 1 TB in size. As mentioned before, the lowest configuration is equipped with only 4 GB of LPDDR3 RAM, while the more beefy configurations can contain up to 16 GB of dual-channel RAM. Note that the RAM is soldered on and cannot be upgraded by the user. Dedicated GPUs are not offered and all versions of the notebook thus rely on the integrated Intel UHD Graphics 620 for graphics processing.
Processor
The 8th-generation Kaby Lake R quad-core Intel Core i7-8550U performs well enough for the most part, but doesn't necessarily best the i5-8250U by a significant margin: in our case, the XPS 13 with the "lesser" CPU returned a near-identical CineBench R15 Multi-score (636 vs. 639 points). We should mention here that the high performance power profile is not an option even after enabling alternate profiles in the registry, so we ran all of our tests and benchmarks using the standard balanced profile. Other system with the same i5 CPU don't fare quite as well, although the performance difference between the i5 and i7 processors generally doesn't exceed 20 percent. Systems with predecessor dual-core CPUs like the Razer Blade Stealth QHD with i7-7500U processor seem hopelessly outdated, as they are up to 50 % slower when all cores are working in parallel. Sustained performance is good: after an initial drop of about 8 percent, the subsequent scores stabilize around the 600 point mark. As shown by the comparison graphs below, the quad-core i7 in the XPS 13 9370 maintains higher scores (by 20 to 30 points) across the board than the same CPU in the predecessor XPS 13 9360.
Also interesting is the fact that while the scores of the XPS 13 9370 with i5-8250U fluctuate much more widely during the CineBench R15 loop test, the i7 model with its smoother graph certainly isn't leaps and bounds ahead as one might hope or expect.
For more information about the Intel Core i7-8550U and additional benchmarks, please visit our dedicated processor page.
XPS 13 9370 i7-8550U
XPS 13 9360 i7-8550U
XPS 13 9370 i5-8250U
* ... smaller is better
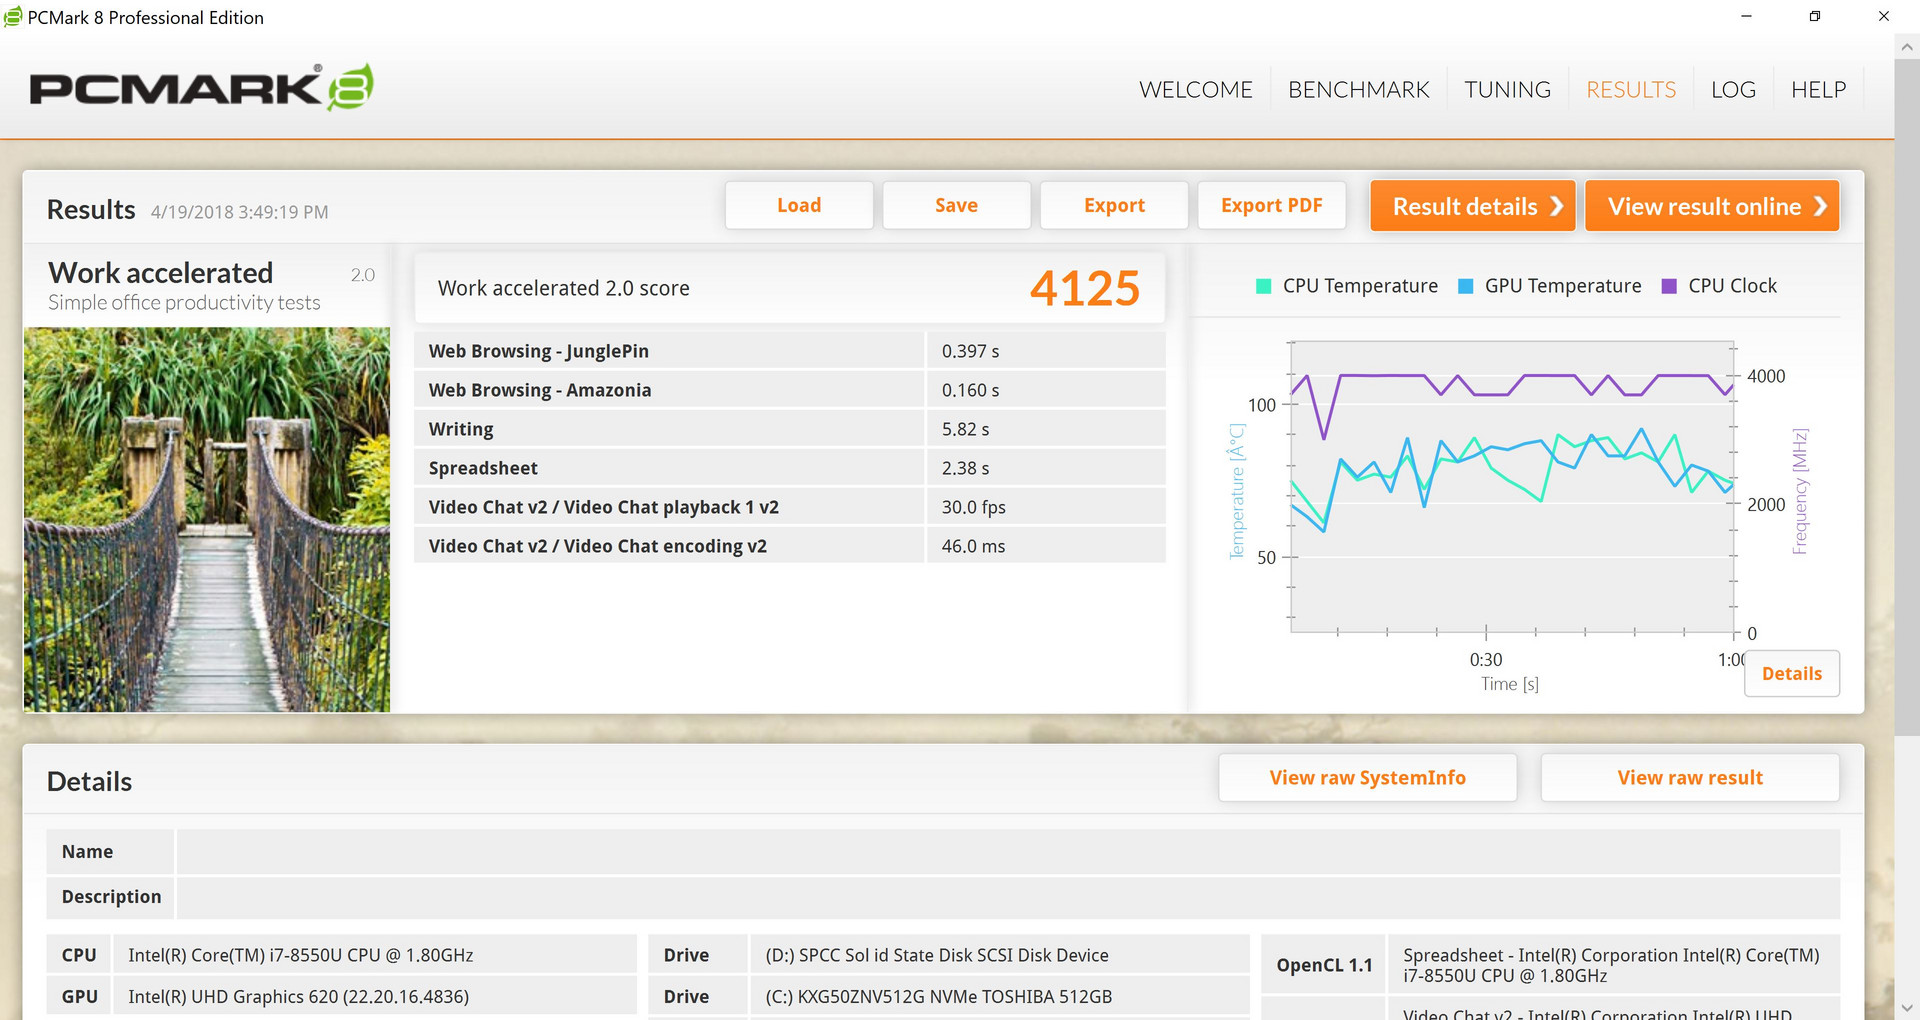
System Performance
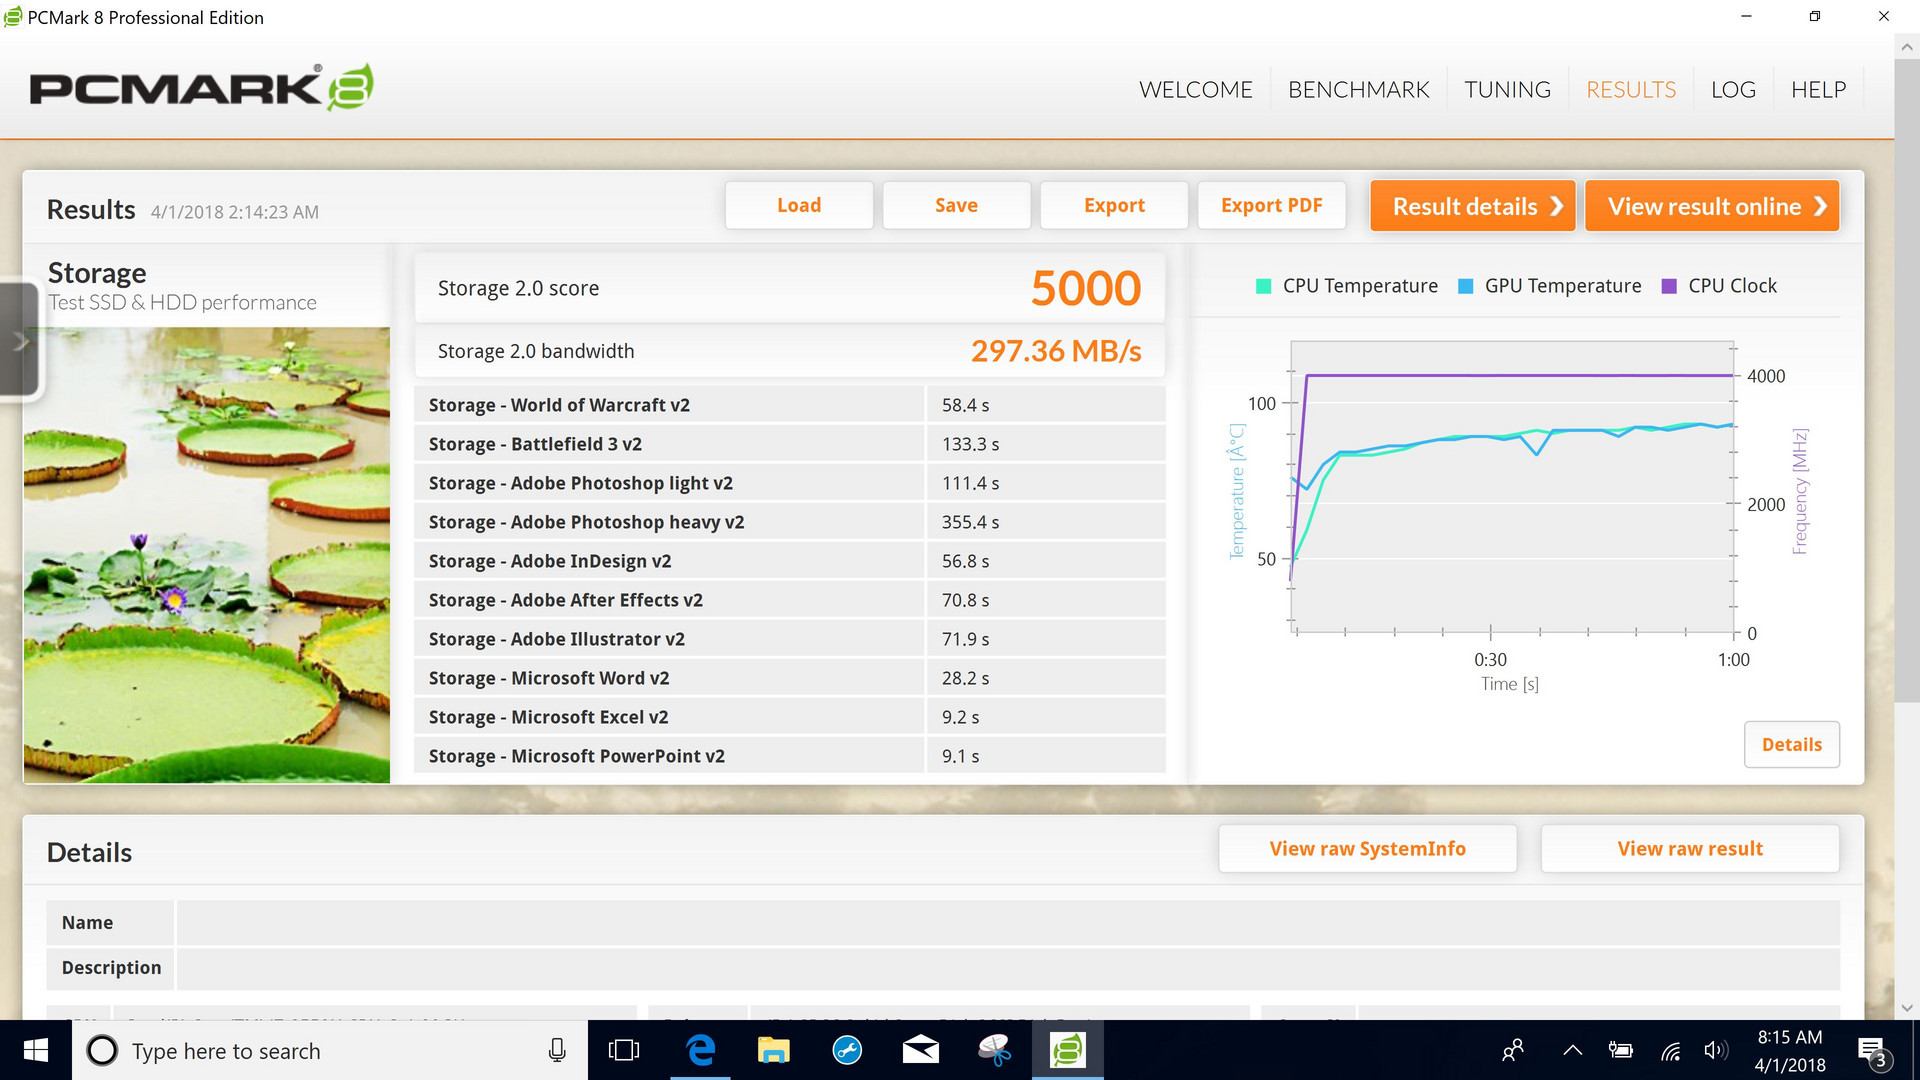
The system performance according to the PCMark benchmark tests is not class leading and in 3 out of 4 tests the XPS with Core i7-8550U actually trails the sibling with i5-8250U CPU. Granted, the difference amounts to just a few percentage points and is thus not significant during normal use, but users purchasing the supposedly higher-end i7 variant might be disappointed that there isn't better separation between the two. The stress test (see farther down below) might provide some insight as to why the i7-model can't outperform its i5 sibling.
We experienced frequent wake-from-sleep issues with a completely powered-off display panel on resume. In every case, the keyboard backlight comes on when pressing a key or when the touching the clickpad, but the screen remains dark. Driver updates did nothing to remedy the situation.
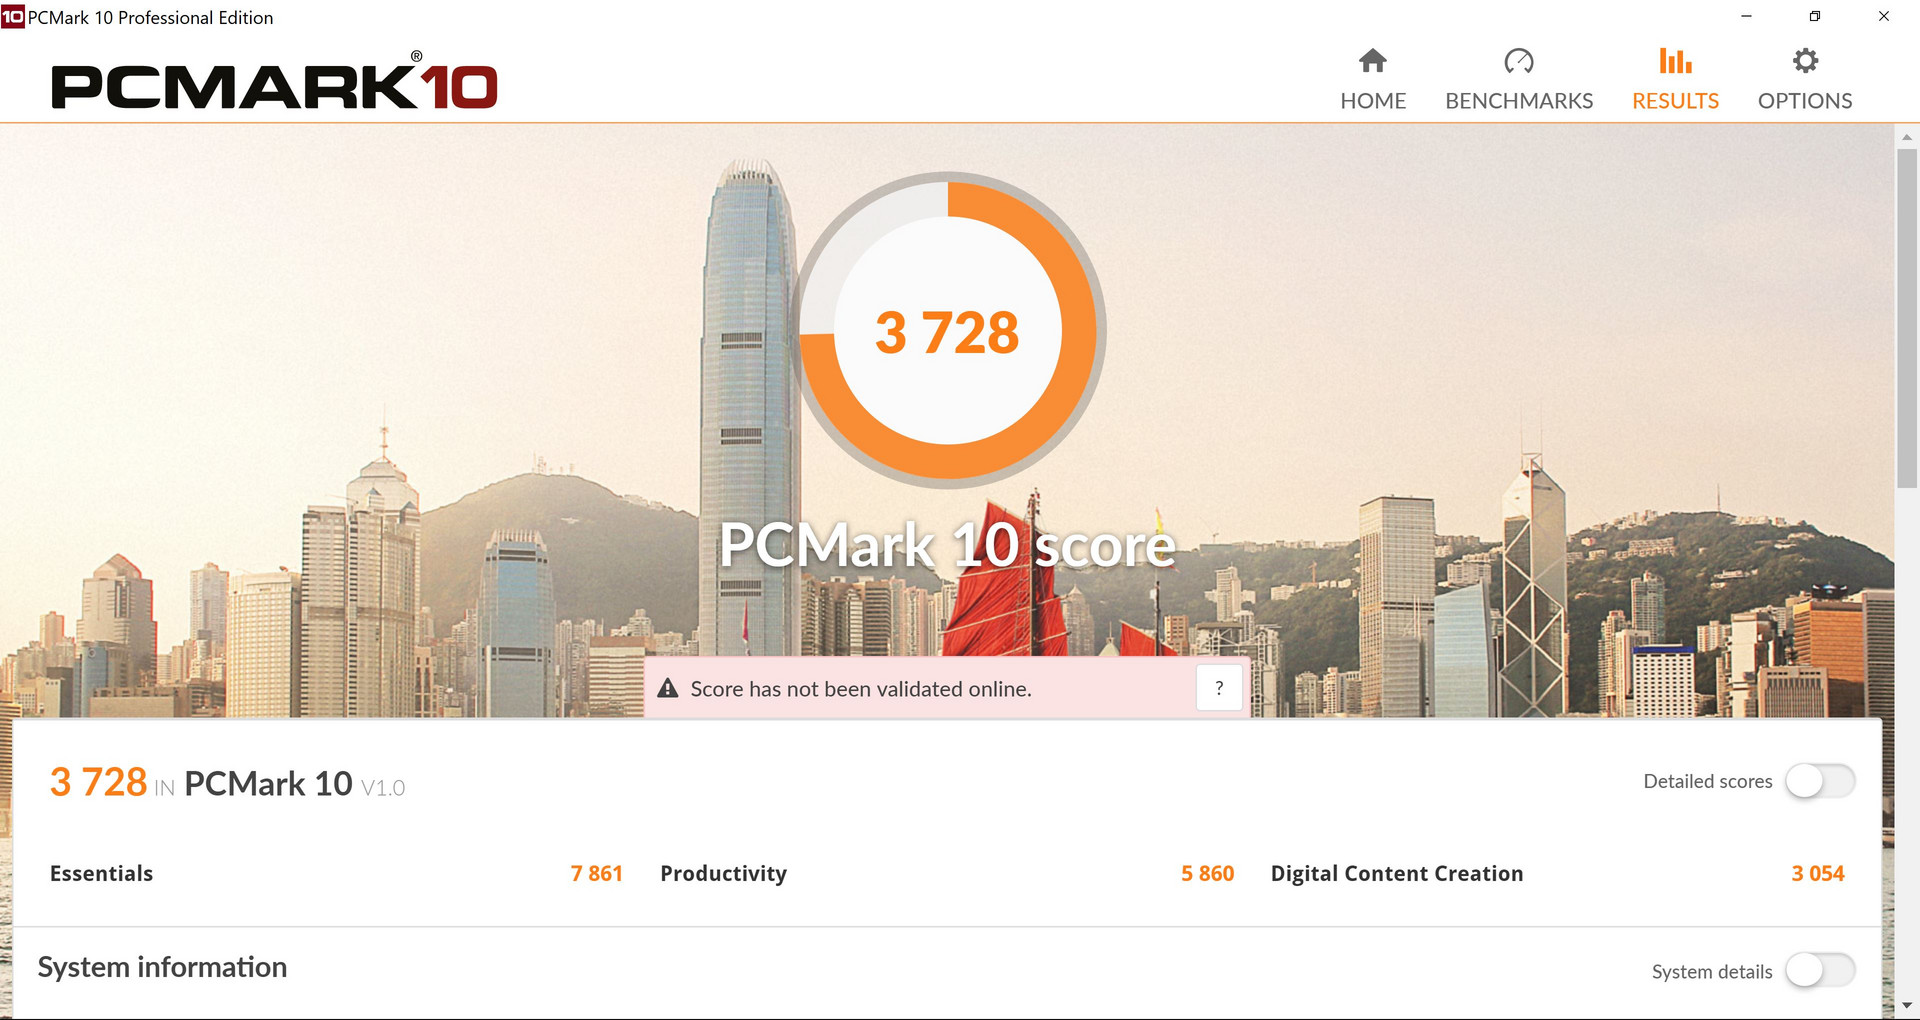
Please note that the PCMark 10 score improved slightly by about 5 percent after the restore. The higher score is reflected below.
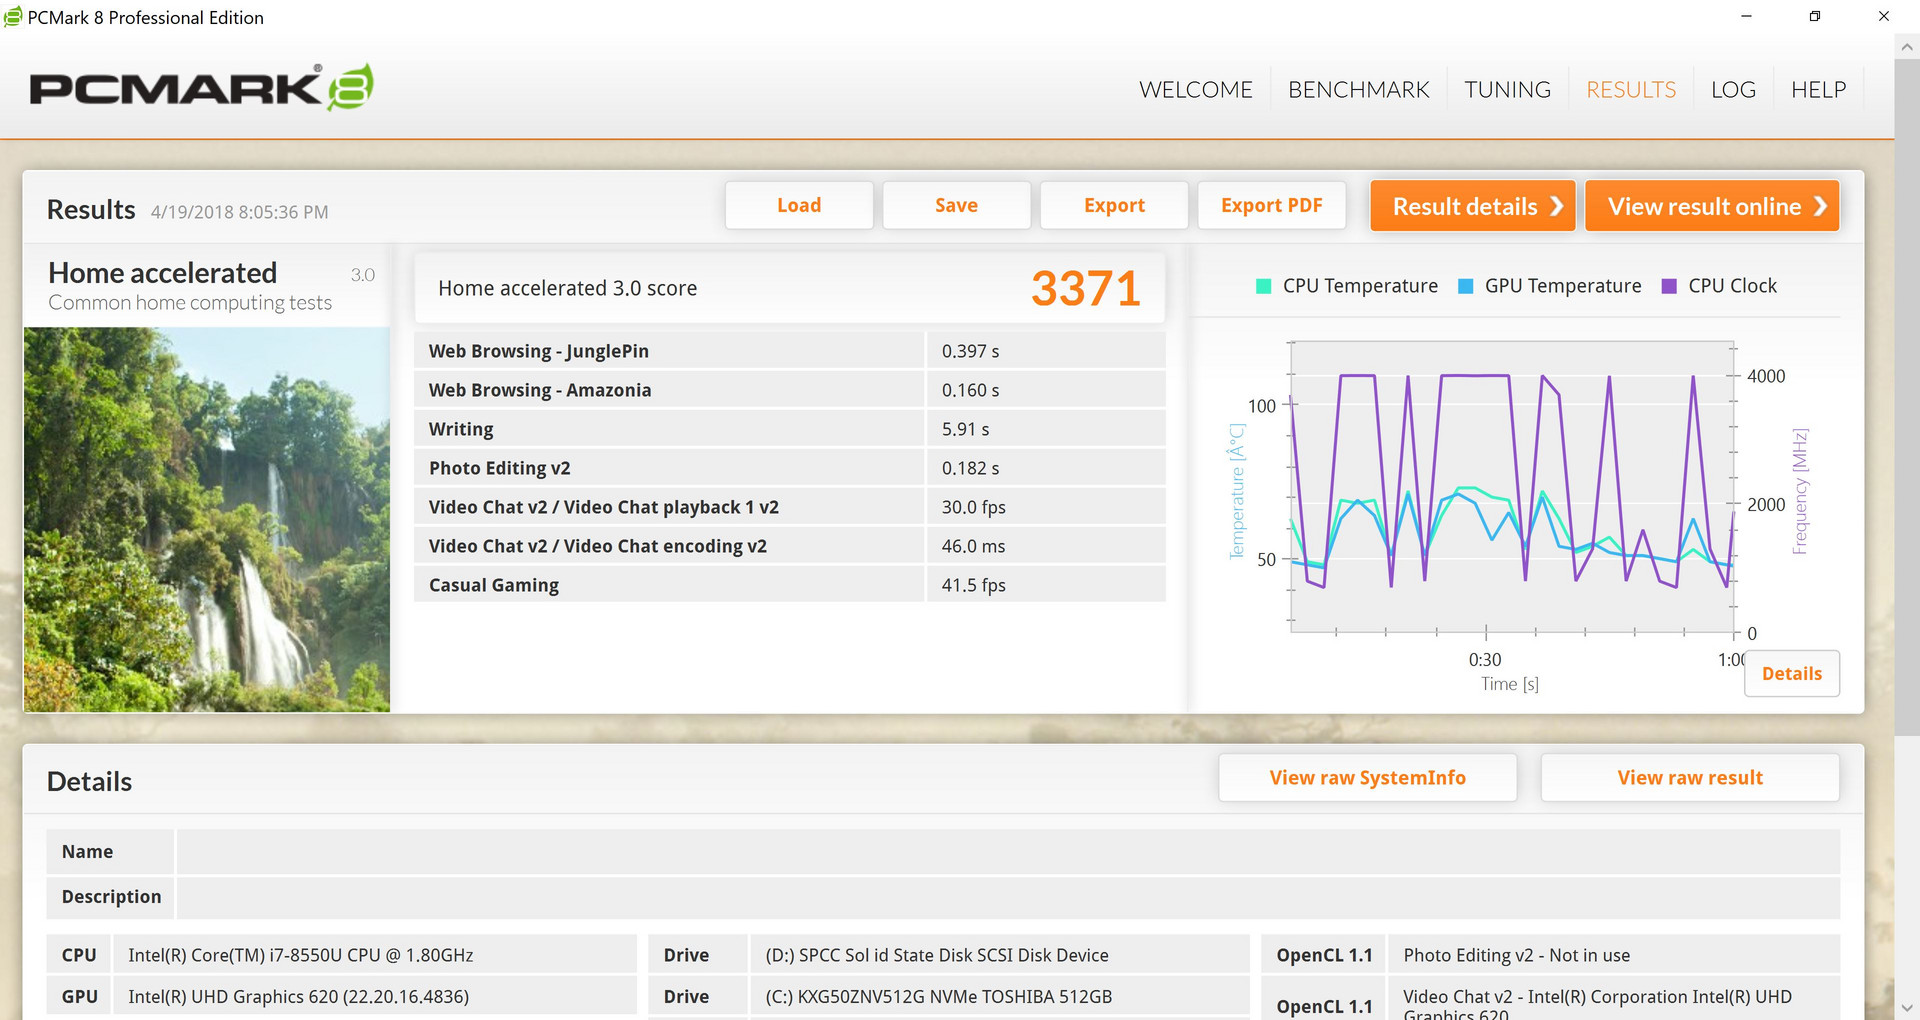

| PCMark 8 Home Score Accelerated v2 | 3371 points | |
| PCMark 8 Creative Score Accelerated v2 | 4865 points | |
| PCMark 8 Work Score Accelerated v2 | 4125 points | |
| PCMark 10 Score | 3728 points | |
Help | ||
Storage Devices
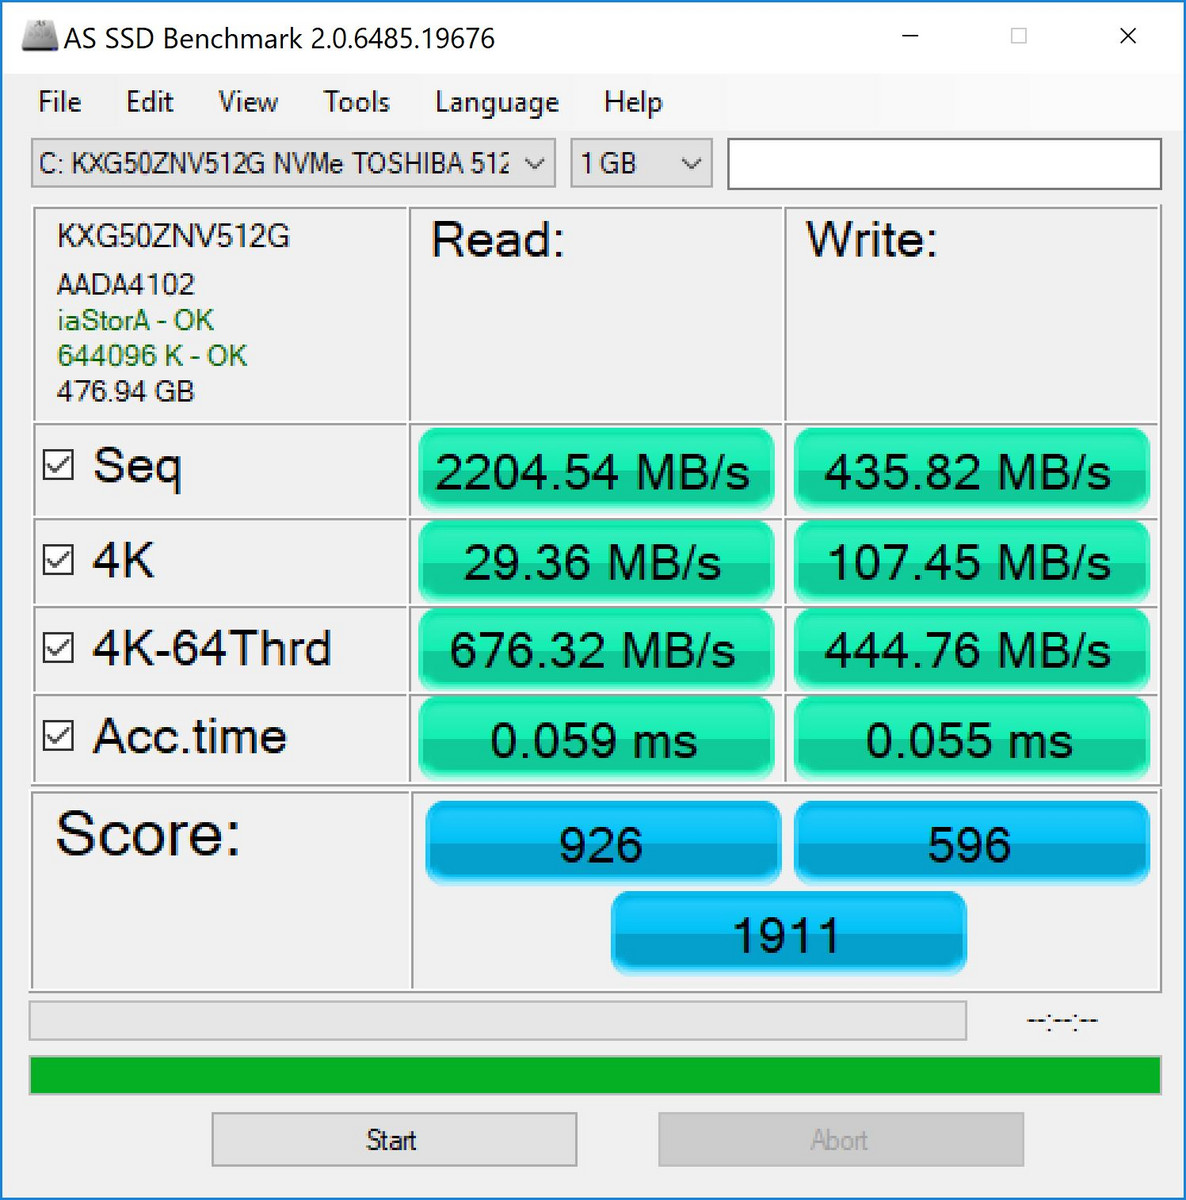
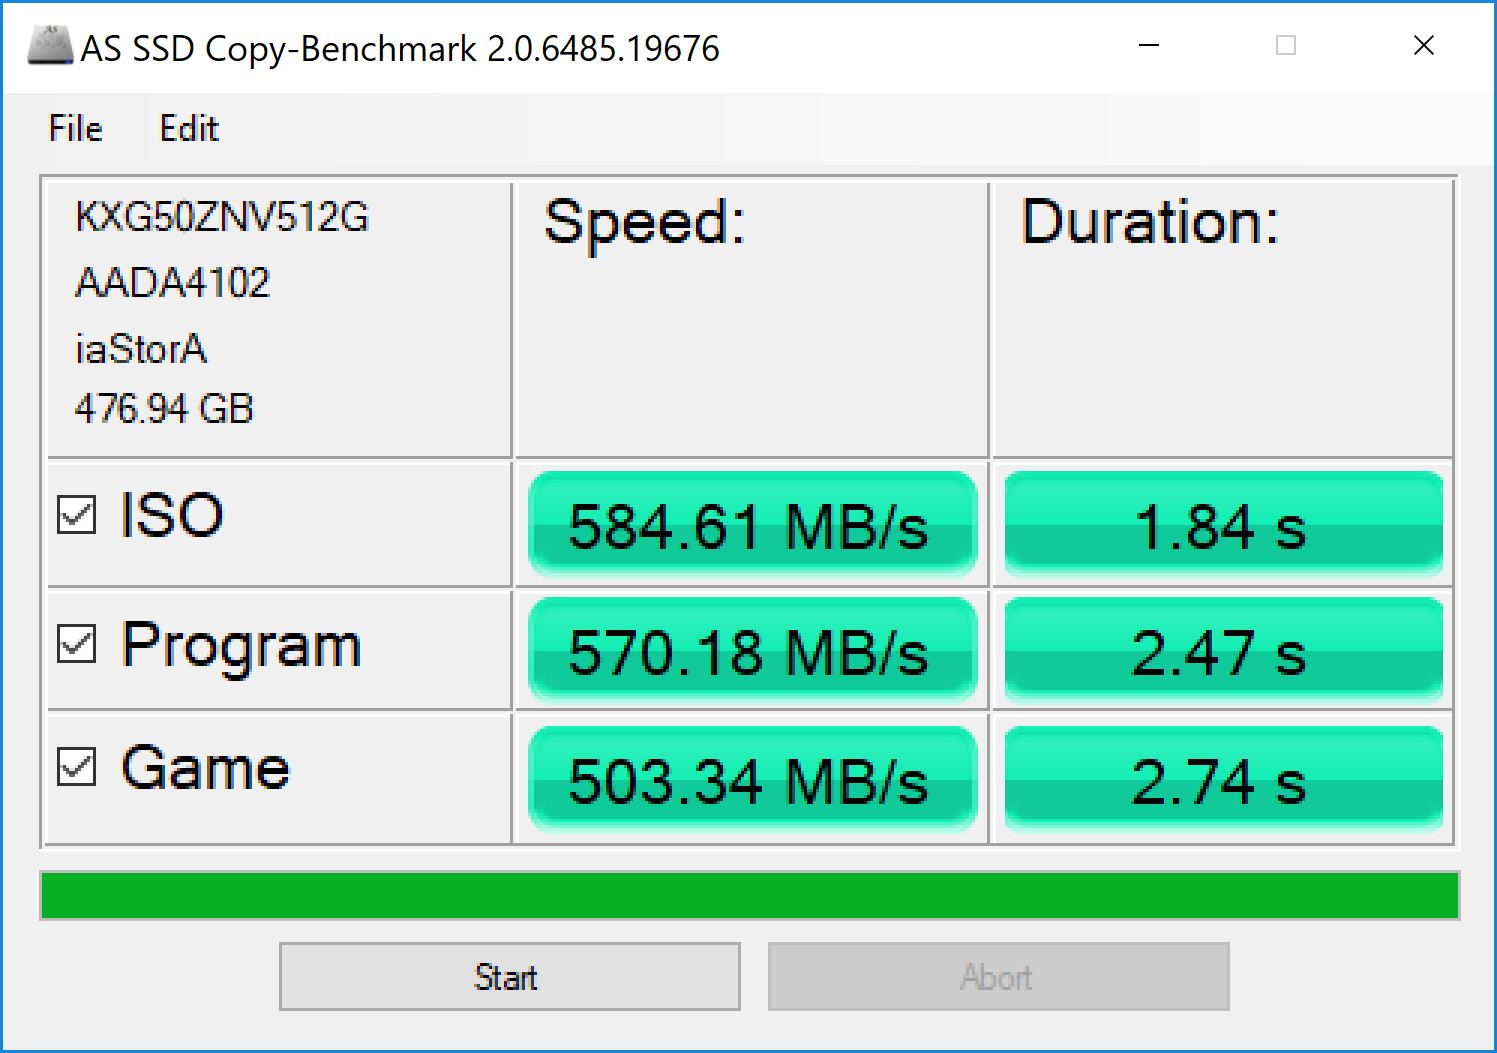
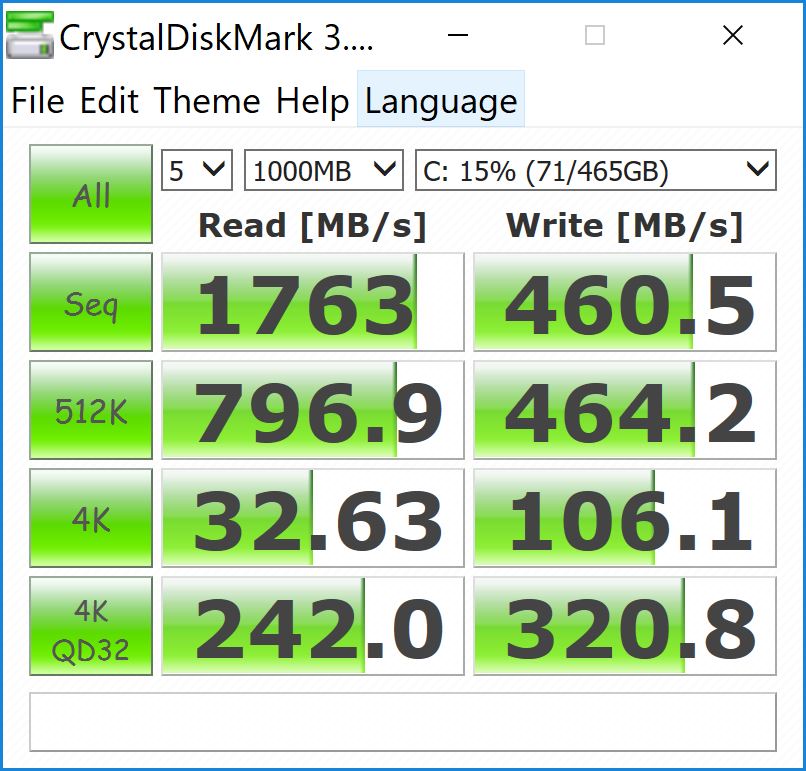
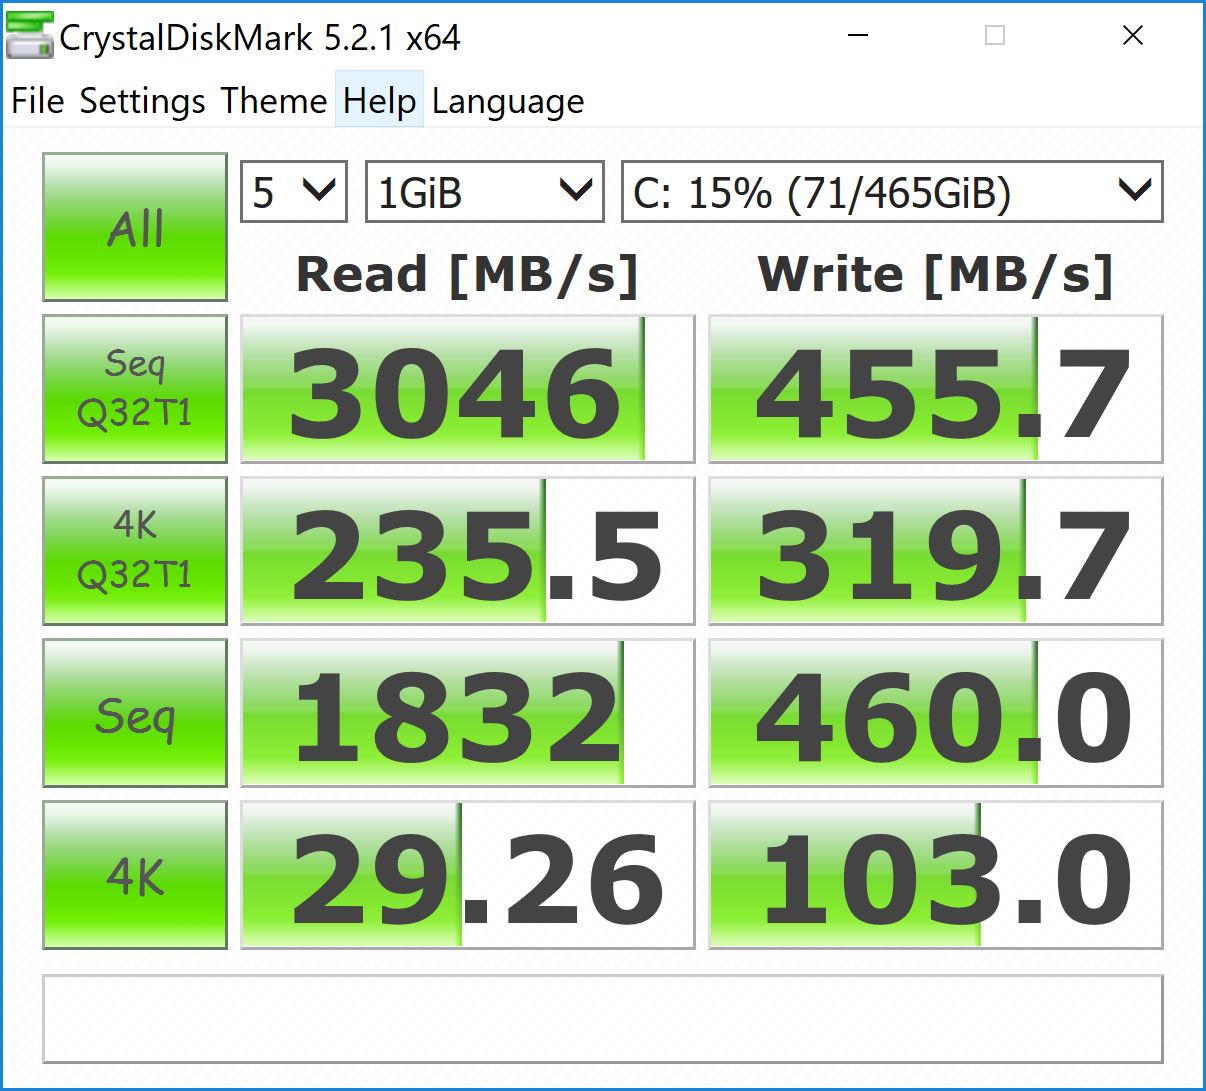
With write speeds of below 500 MB/s according to the various hard drive benchmarks, the 512 GB Toshiba XG5 KXG50ZNV512G doesn't quite live up to expectations - at least when considering that this is a PCIe NVMe drive. The 256 GB variant of the XG5 in the i5 XPS 13 performed inconstantly, but the overall write performance was faster. The Lenovo ThinkPad X1 Carbon features a 512 GB Samsung PM981 SSD with about 1800 MB/s sequential write speeds.
See our table of SSDs and HDDs for more benchmark comparisons.
| Dell XPS 13 9370 i7 UHD Toshiba XG5 KXG50ZNV512G | Dell XPS 13 9370 i5 UHD Toshiba XG5 KXG50ZNV256G | Asus ZenBook 13 UX331UN SK Hynix HFS256G39TND-N210A | Lenovo ThinkPad X1 Carbon 2018-20KGS03900 Samsung SSD PM981 MZVLB512HAJQ | HP Spectre 13-af033ng Samsung PM961 NVMe MZVLW512HMJP | |
|---|---|---|---|---|---|
| AS SSD | 16% | -71% | 88% | -310% | |
| Copy Game MB/s (MB/s) | 503 | 291.4 -42% | 154.1 -69% | 1107 120% | 381.2 -24% |
| Copy Program MB/s (MB/s) | 570 | 207 -64% | 129.7 -77% | 460.2 -19% | 337.8 -41% |
| Copy ISO MB/s (MB/s) | 585 | 357.4 -39% | 192.4 -67% | 1247 113% | 695 19% |
| Score Total (Points) | 1911 | 2437 28% | 991 -48% | 3529 85% | 1879 -2% |
| Score Write (Points) | 596 | 1135 90% | 323 -46% | 1801 202% | 105 -82% |
| Score Read (Points) | 926 | 894 -3% | 445 -52% | 1168 26% | 1201 30% |
| Access Time Write * (ms) | 0.055 | 0.038 31% | 0.23 -318% | 0.027 51% | 2.294 -4071% |
| Access Time Read * (ms) | 0.059 | 0.063 -7% | 0.09 -53% | 0.029 51% | 0.073 -24% |
| 4K-64 Write (MB/s) | 444.8 | 937 111% | 233.1 -48% | 1529 244% | 69.7 -84% |
| 4K-64 Read (MB/s) | 678 | 657 -3% | 368.4 -46% | 876 29% | 1020 50% |
| 4K Write (MB/s) | 107.4 | 107.2 0% | 68.9 -36% | 134.3 25% | 1.07 -99% |
| 4K Read (MB/s) | 29.36 | 33.81 15% | 27.98 -5% | 52.4 78% | 45.86 56% |
| Seq Write (MB/s) | 435.8 | 907 108% | 213.7 -51% | 1376 216% | 337.5 -23% |
| Seq Read (MB/s) | 2205 | 2037 -8% | 483.7 -78% | 2396 9% | 1351 -39% |
* ... smaller is better

GPU Performance
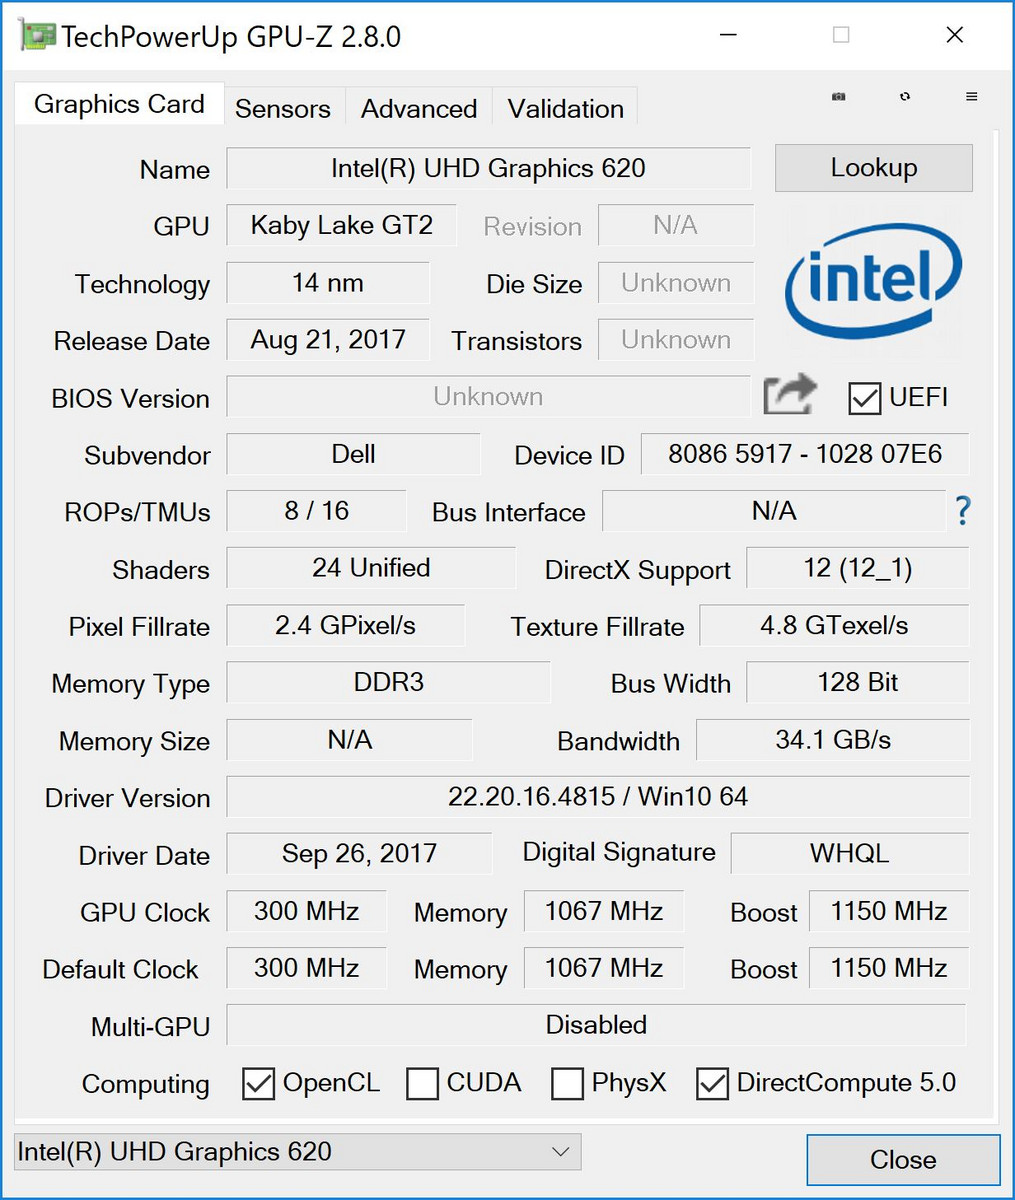
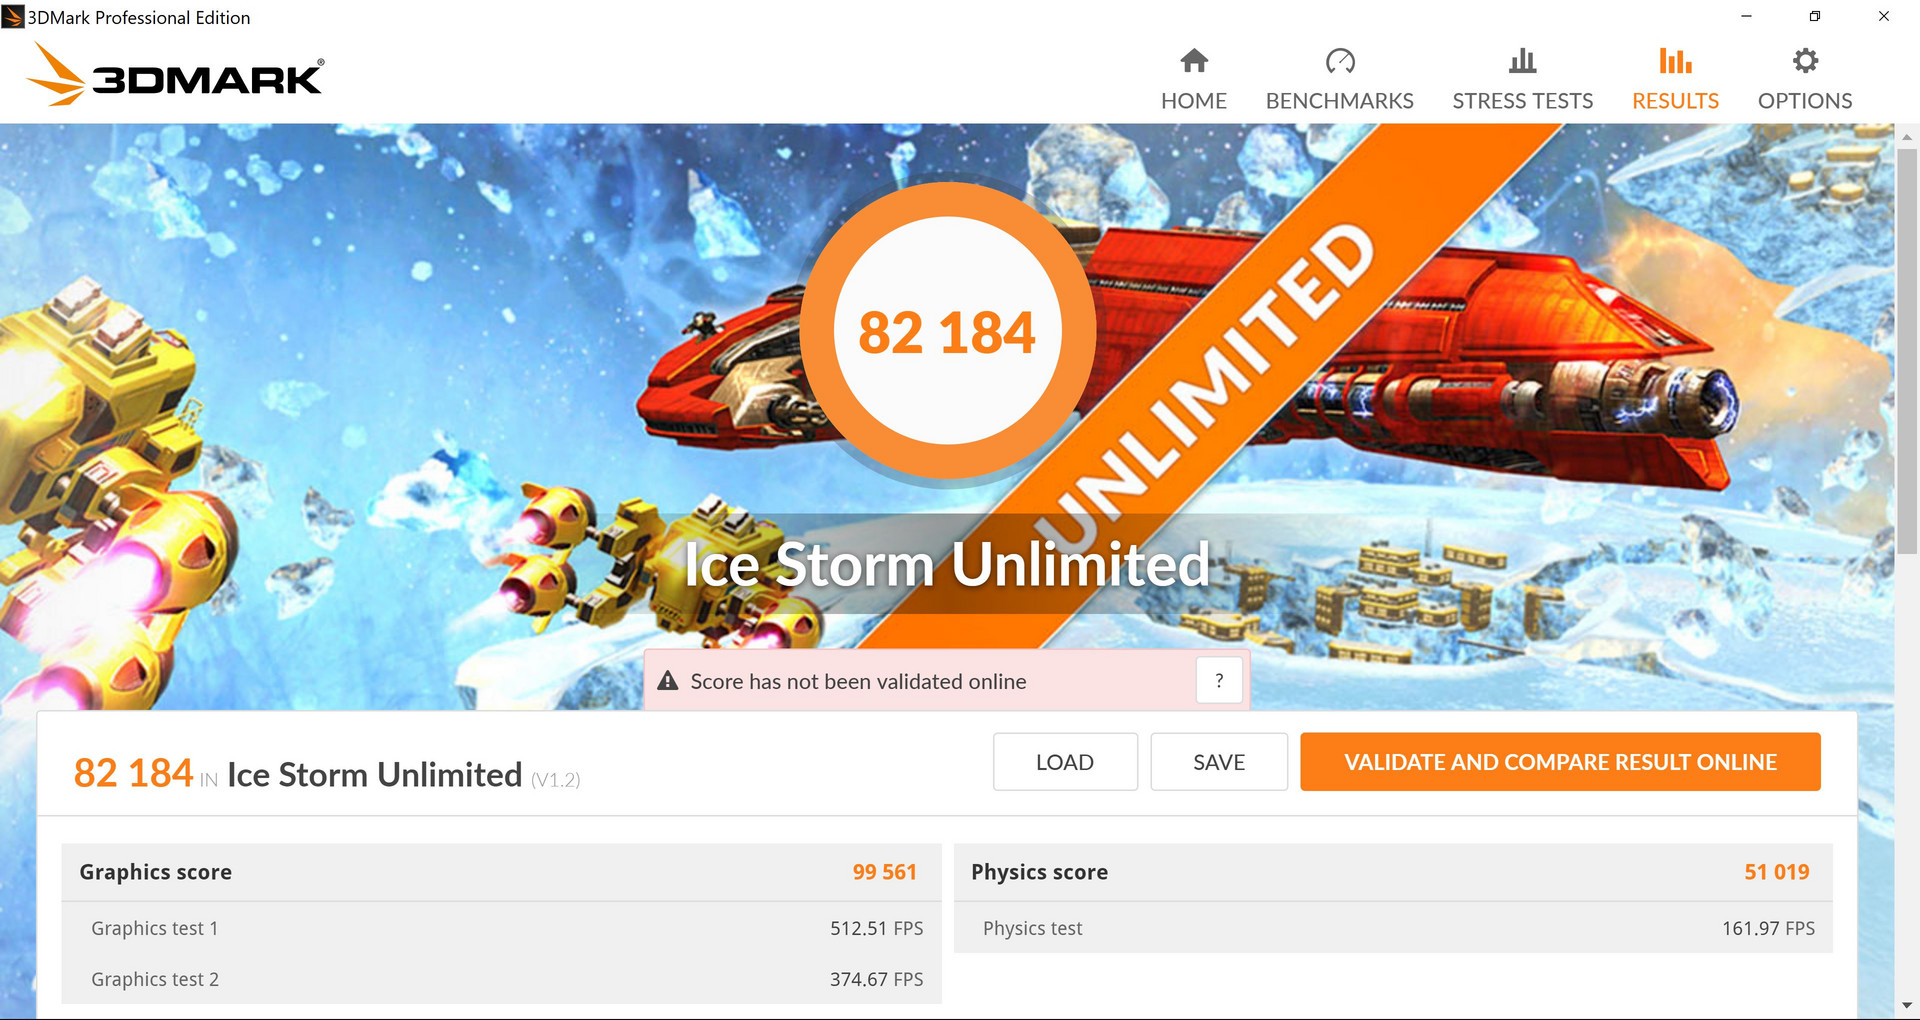
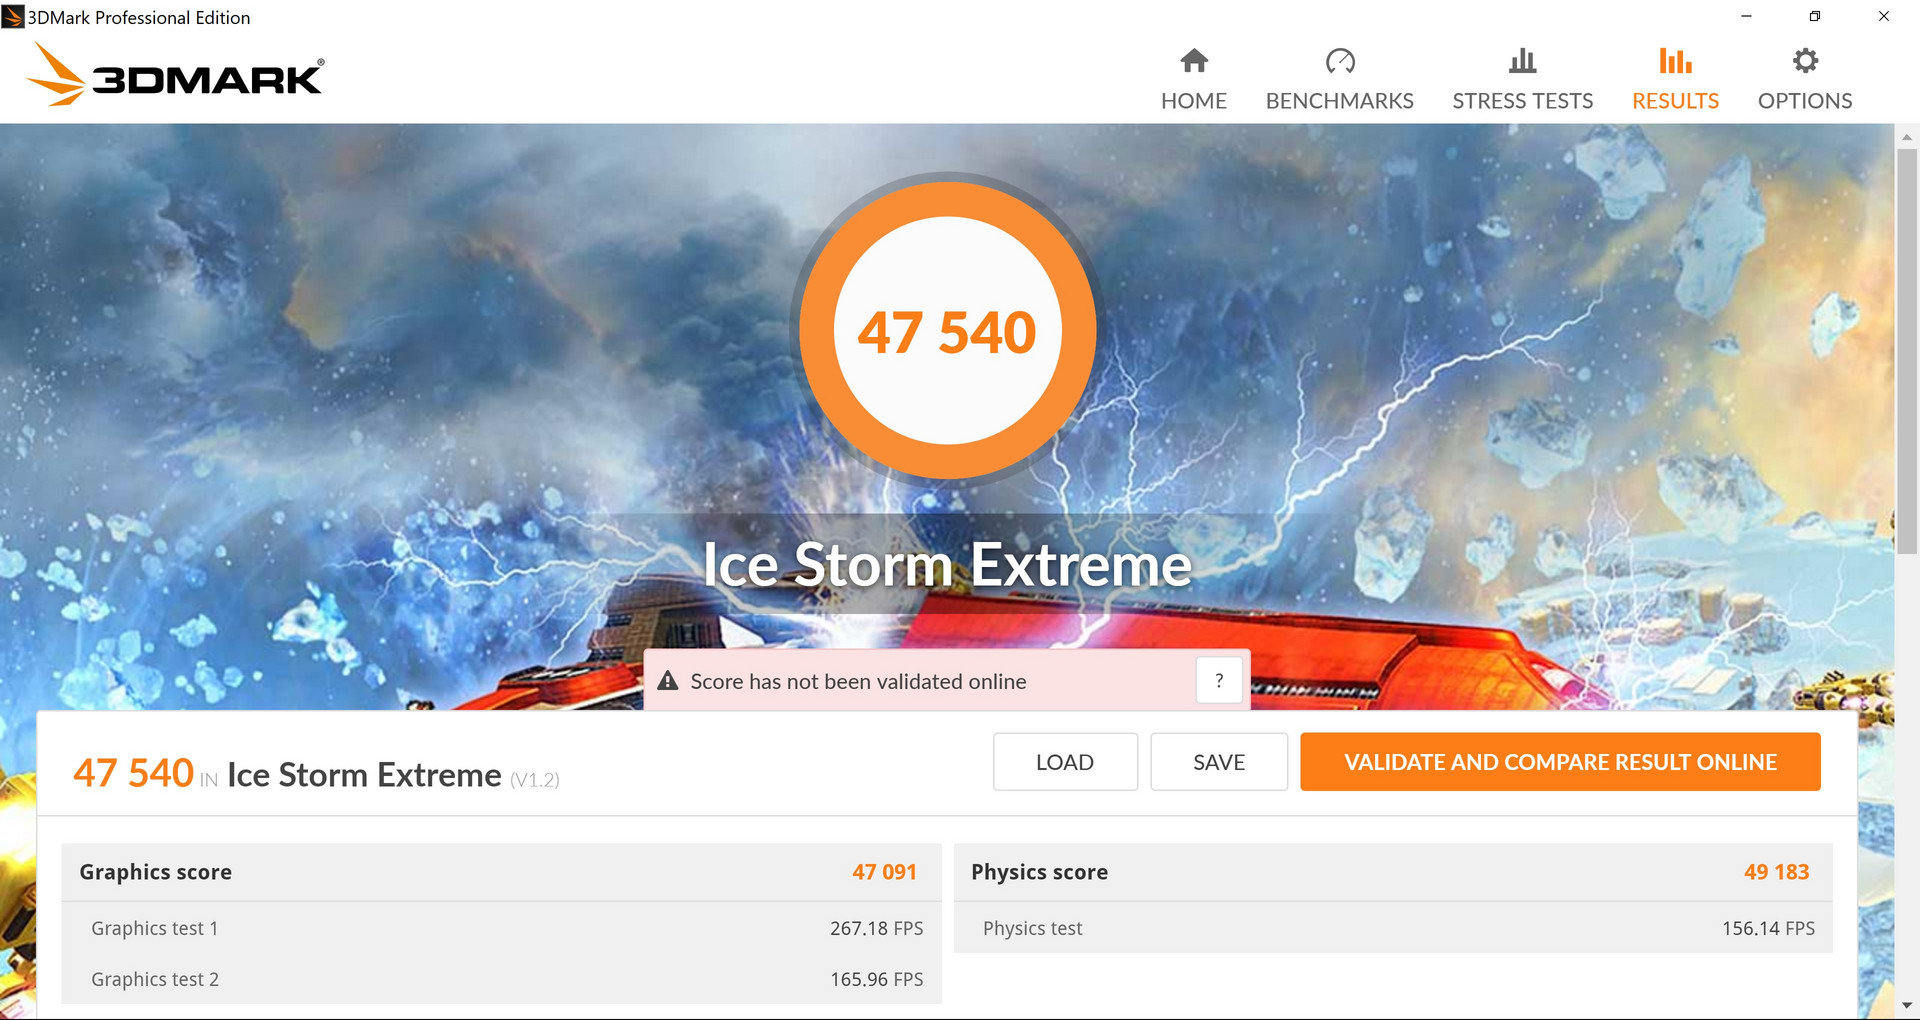
While some competitors rely on dedicated graphics - namely Nvidia's entry-level Pascal-based offering GeForce MX150 - the Dell XPS 13 can only be purchased with the integrated Intel UHD Graphics 620 and thus trails the Nvidia-competition by a significant margin when performing graphic-intensive tasks. Everyday workloads like browsing or video streaming pose no problem, but 3D applications push the integrated graphics card quite quickly to its limits. Depending on the benchmark, systems with the Nvidia MX150 are up to more than twice as fast.
For more technical information and additional benchmark comparisons please check our dedicated Intel UHD Graphics 620 GPU page.
Note that the overall 3DMark 11 score improved after the restore as well by roughly 5 percent (2117 vs. 2009 points) largely because of a better Physics Score (6359 vs 4927 points). It is the higher score which is reflected below.
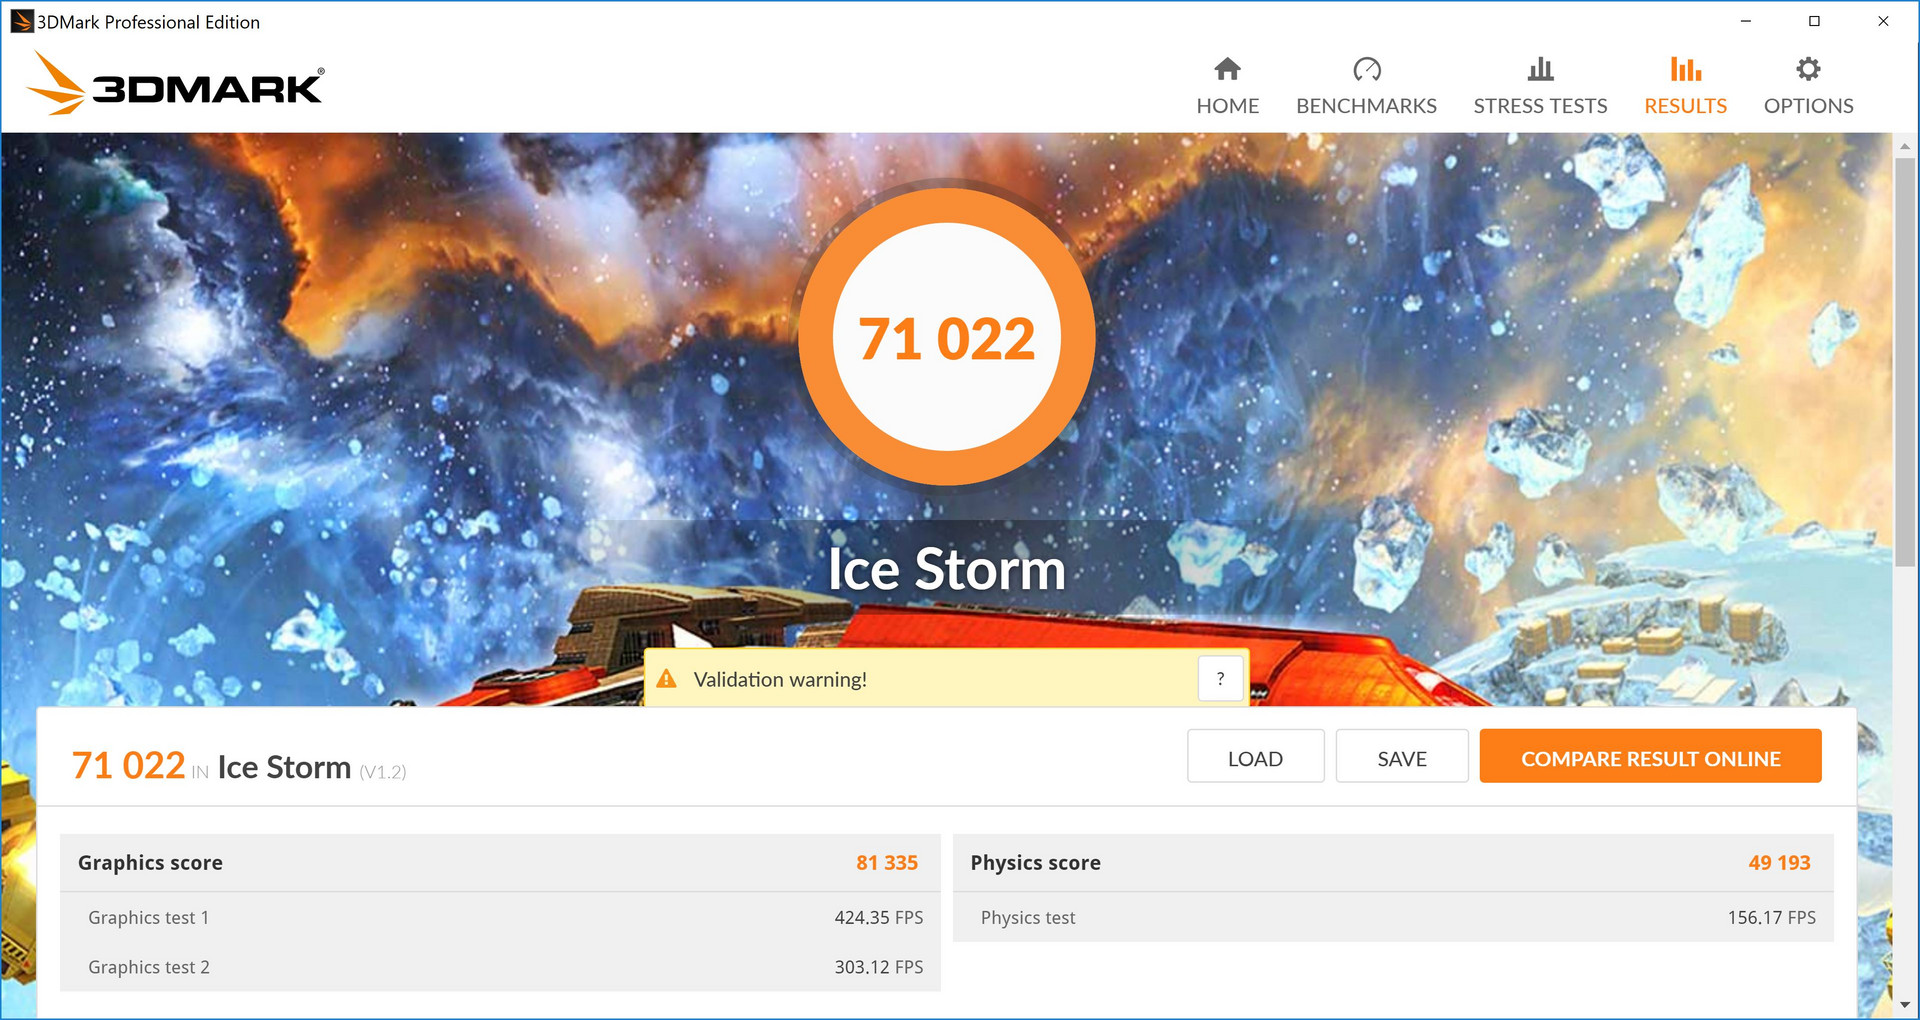
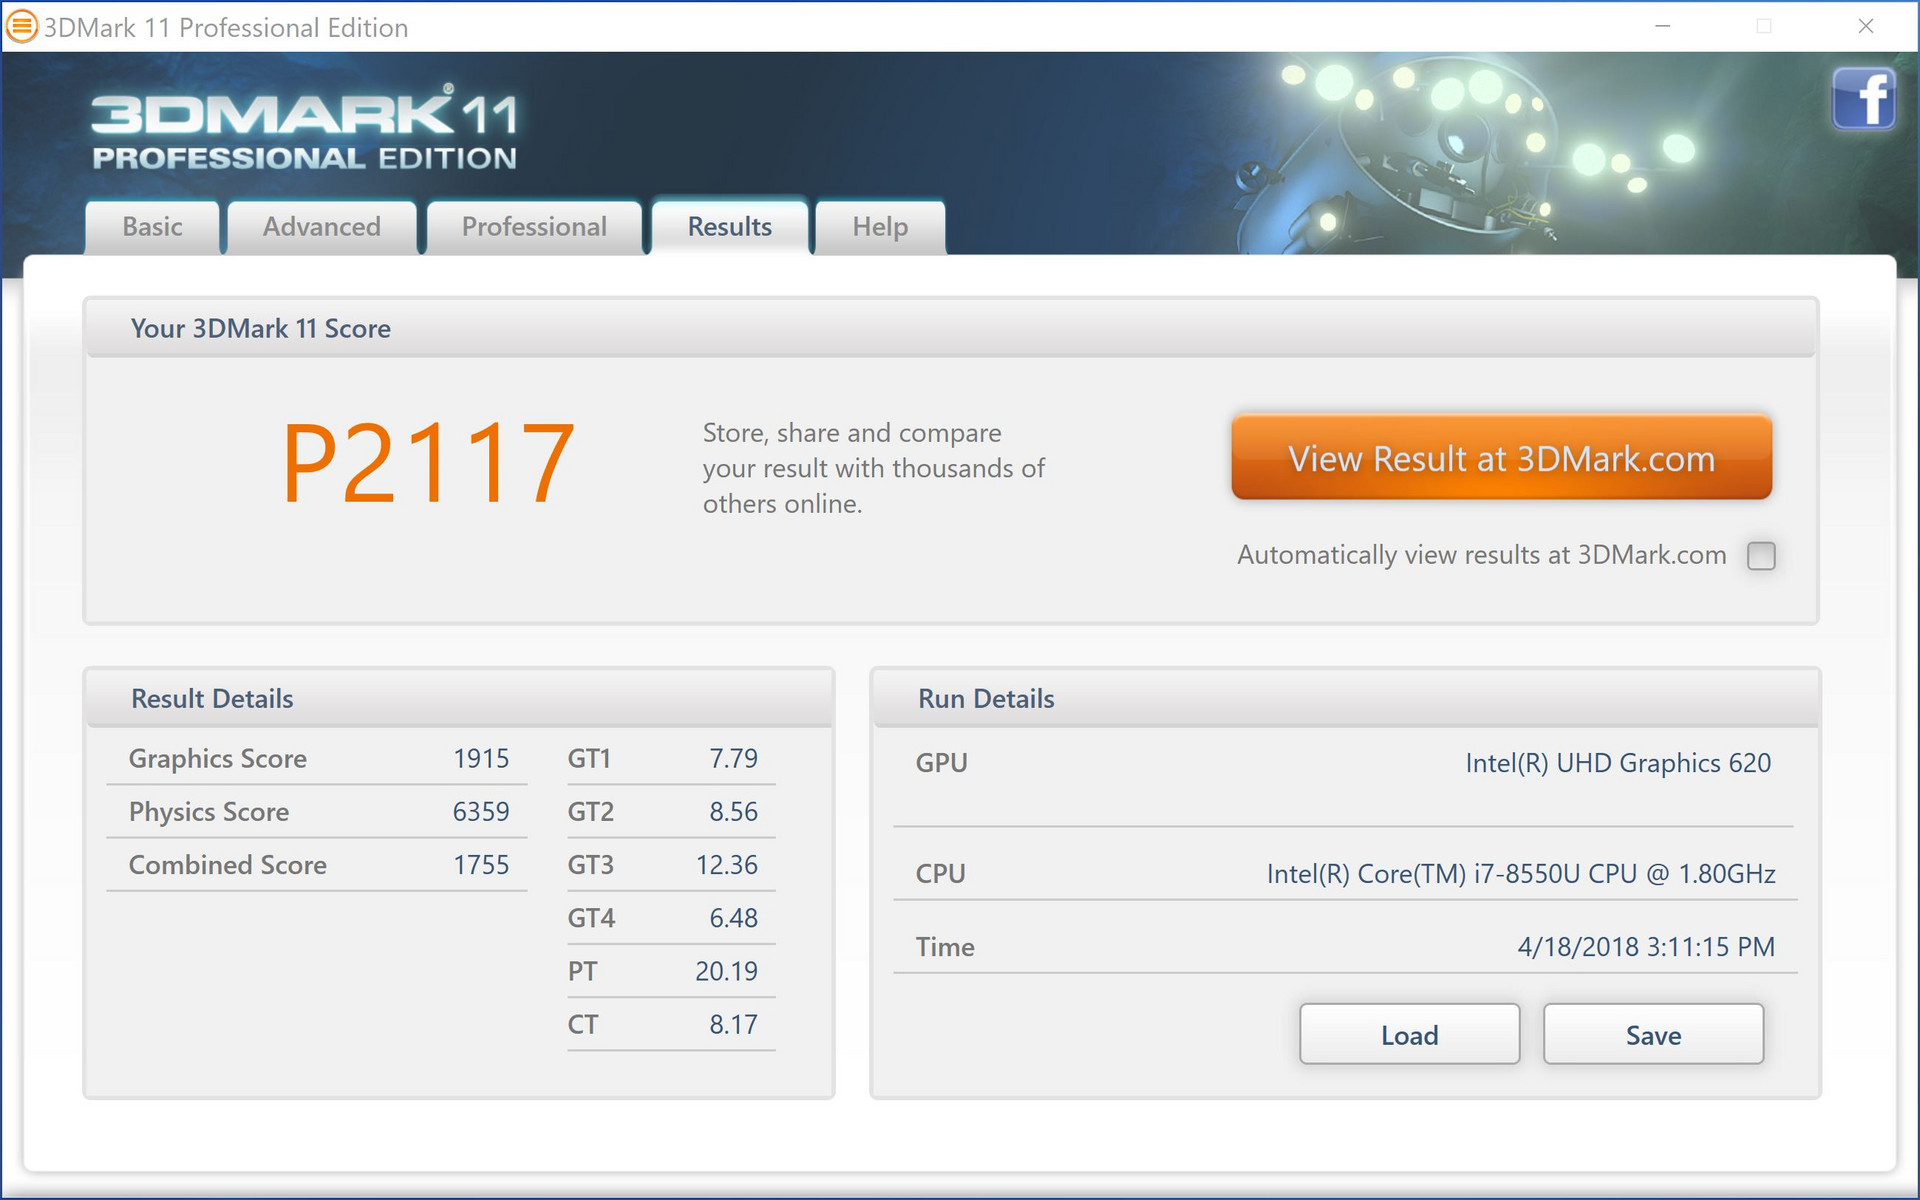
| 3DMark 11 Performance | 2117 points | |
| 3DMark Ice Storm Standard Score | 71022 points | |
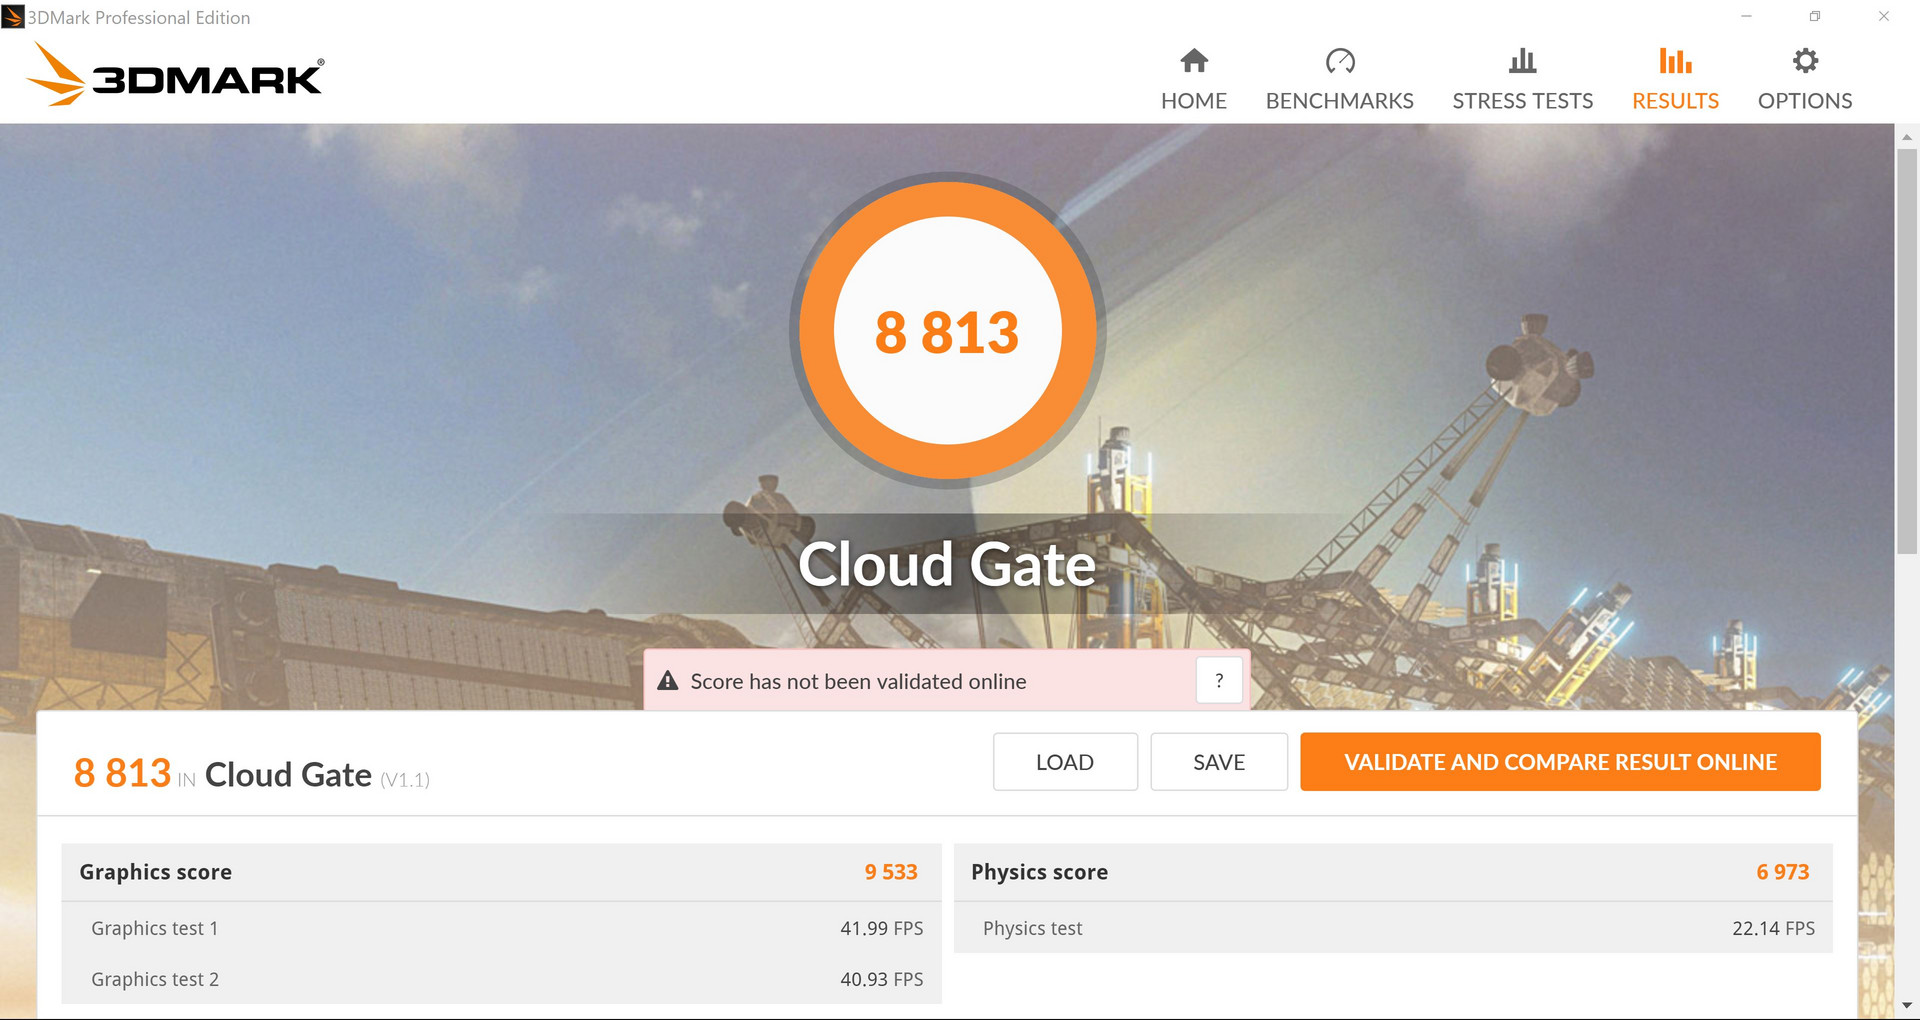
| 3DMark Cloud Gate Standard Score | 8813 points | |
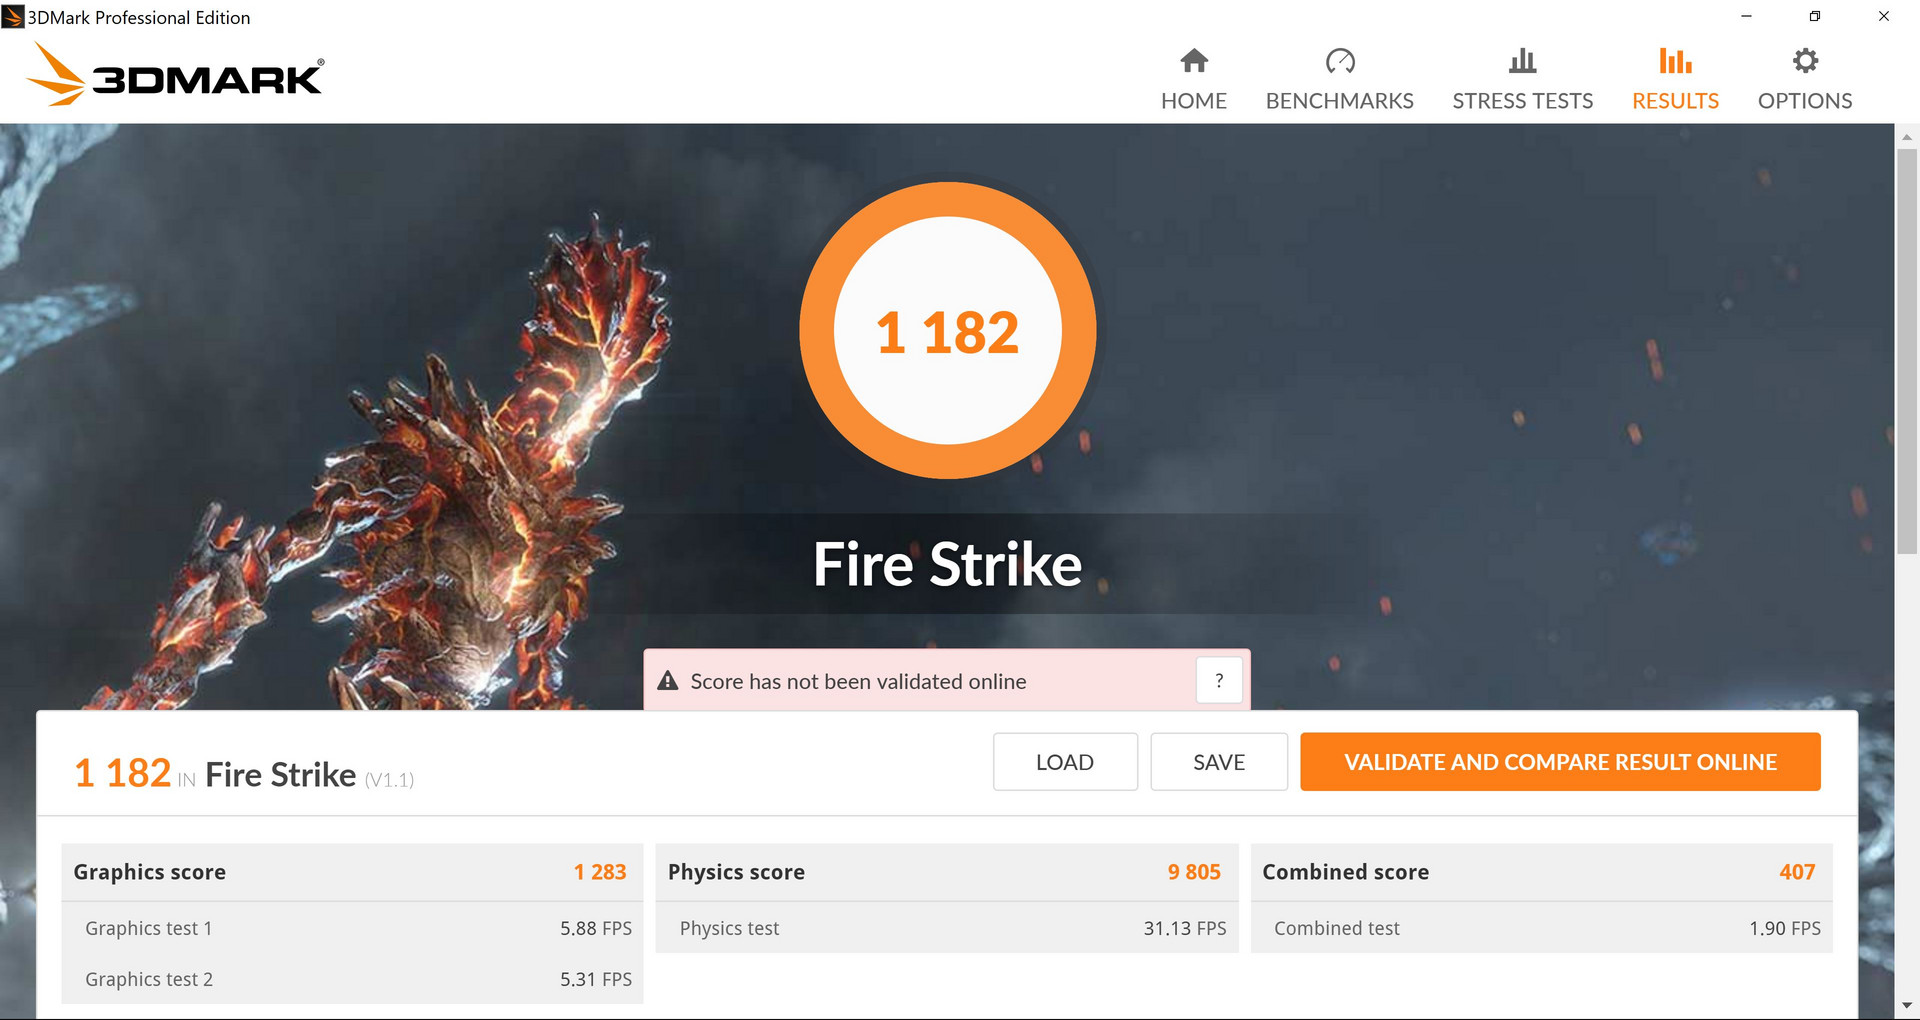
| 3DMark Fire Strike Score | 1182 points | |
Help | ||
| low | med. | high | ultra | |
|---|---|---|---|---|
| BioShock Infinite (2013) | 71.2 | 34.6 | 30.2 | 10 |
| Rise of the Tomb Raider (2016) | 22 | 12.2 |
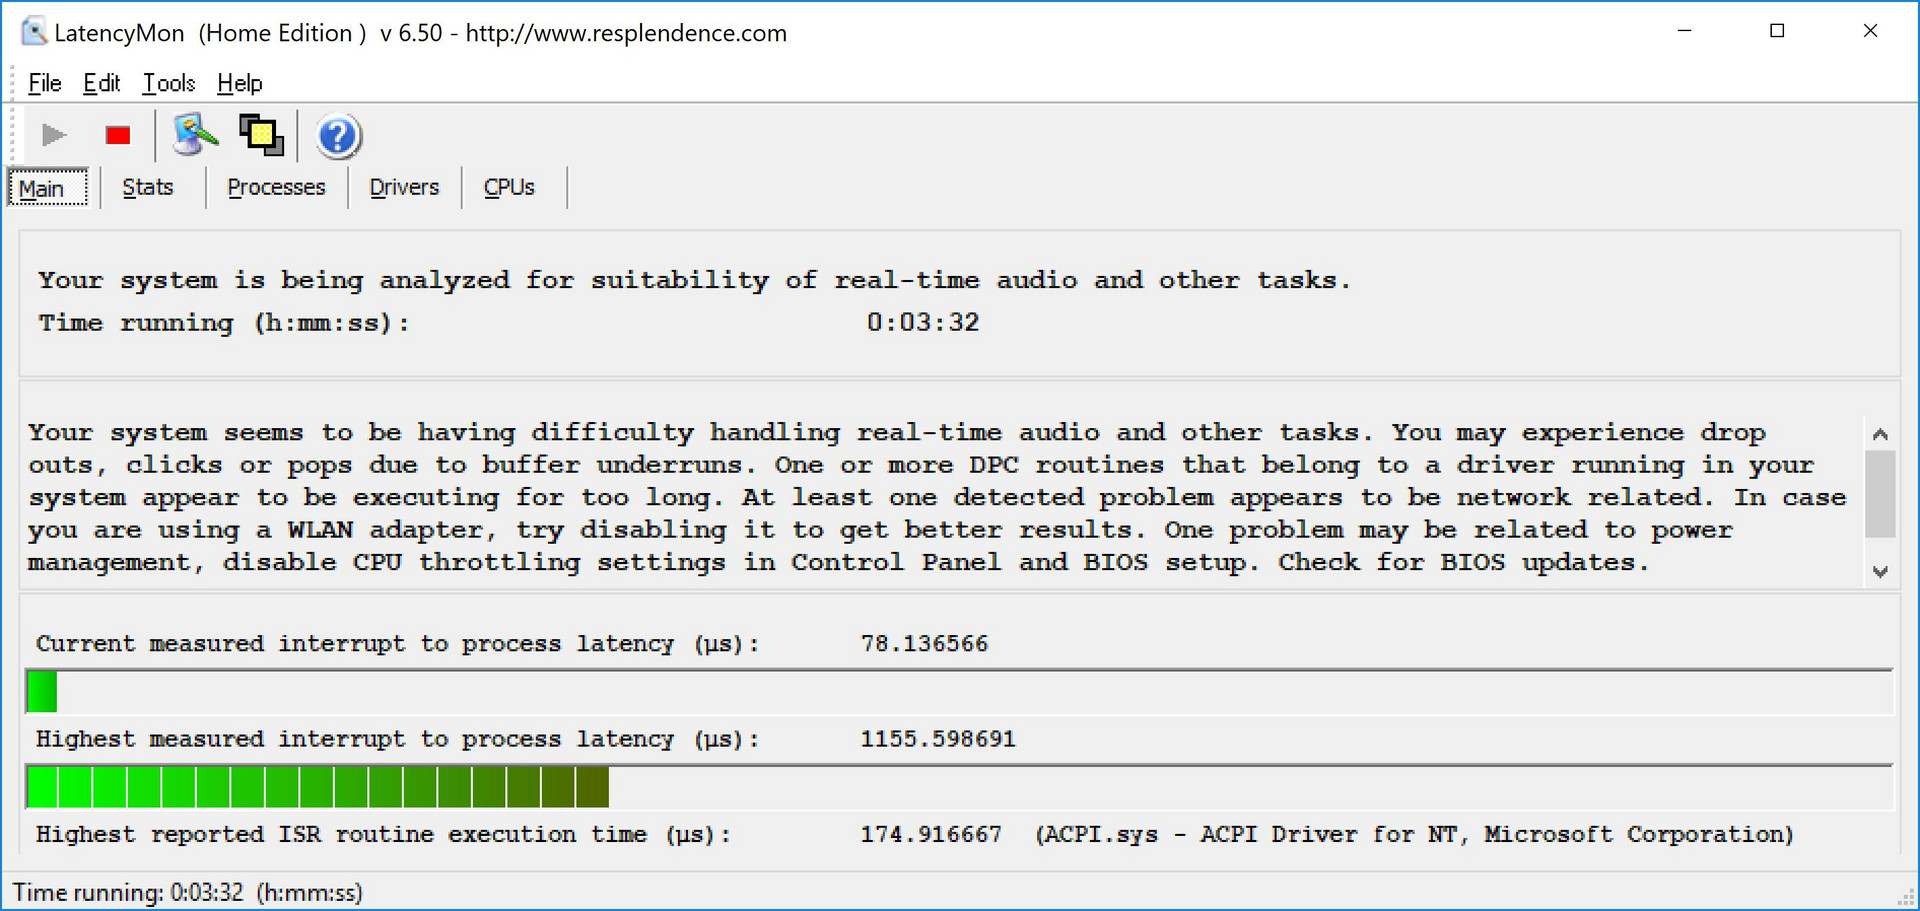
Stress Test
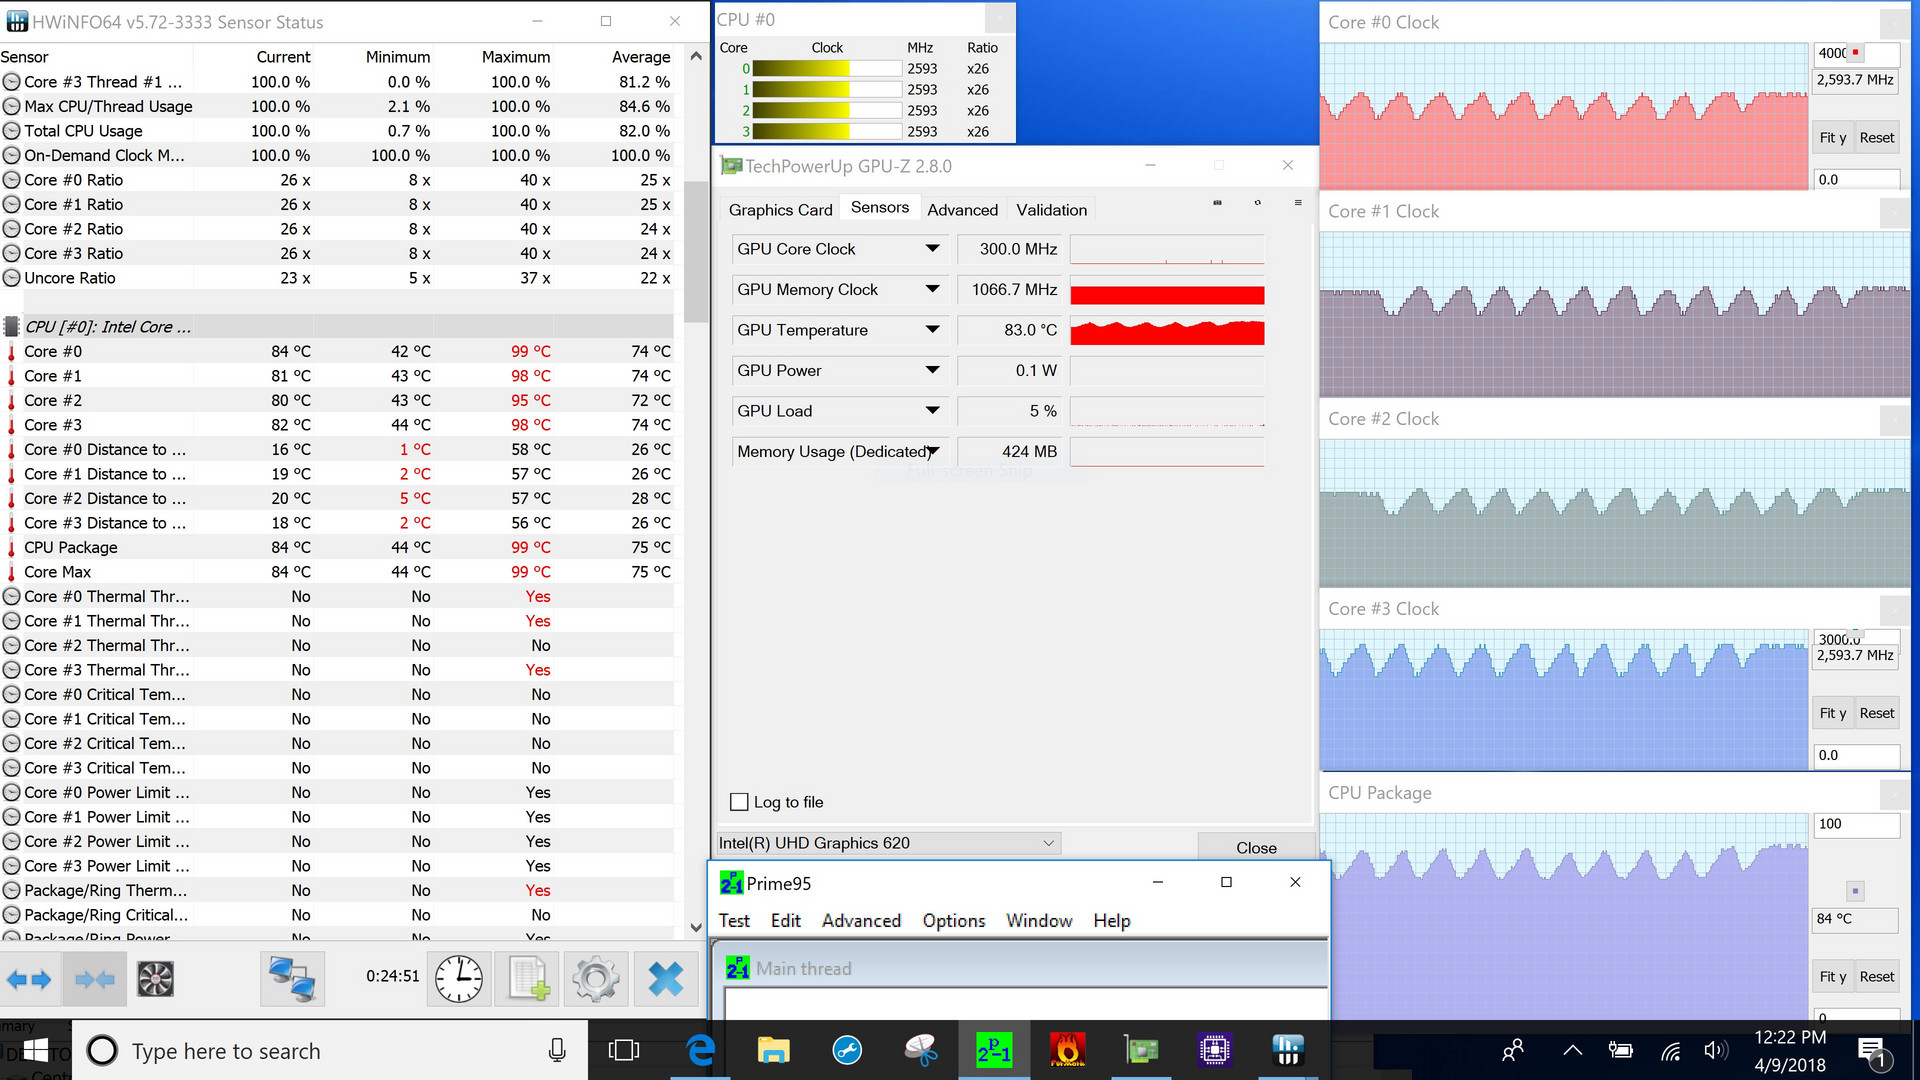
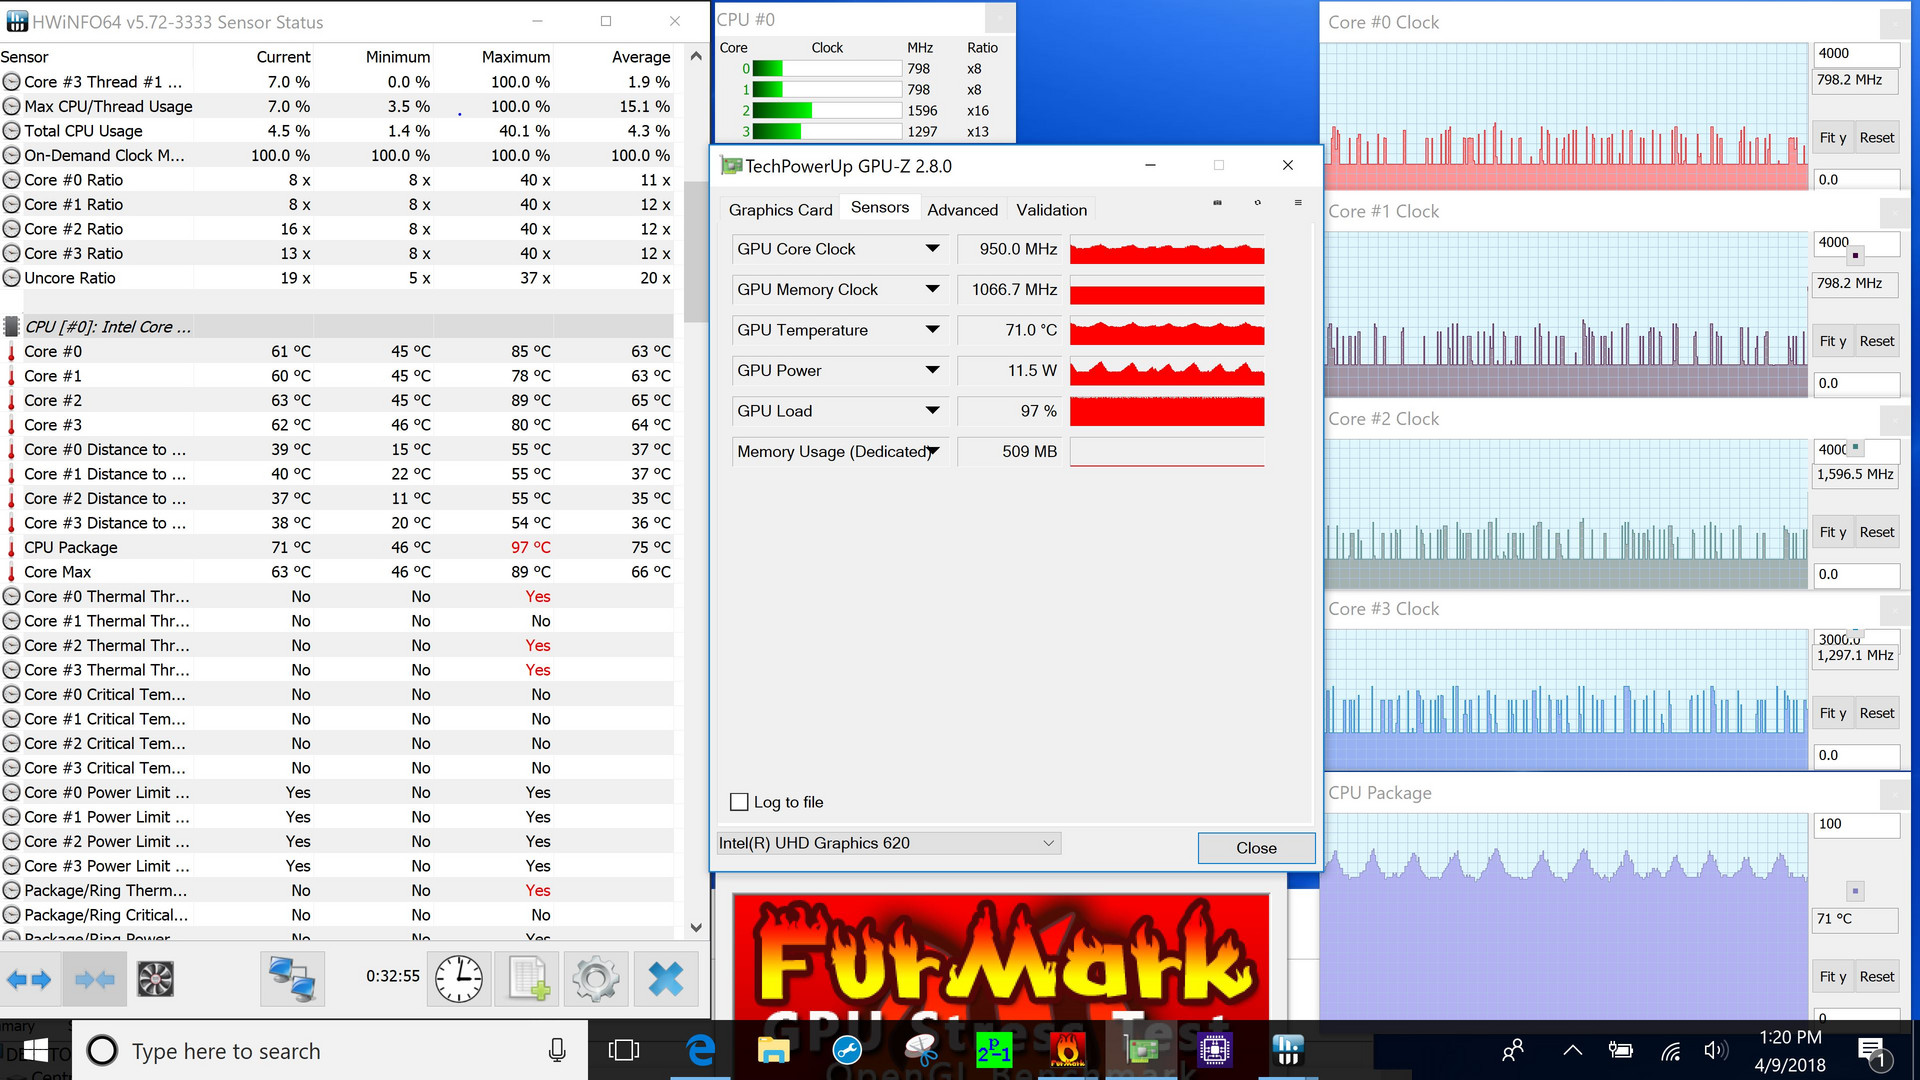
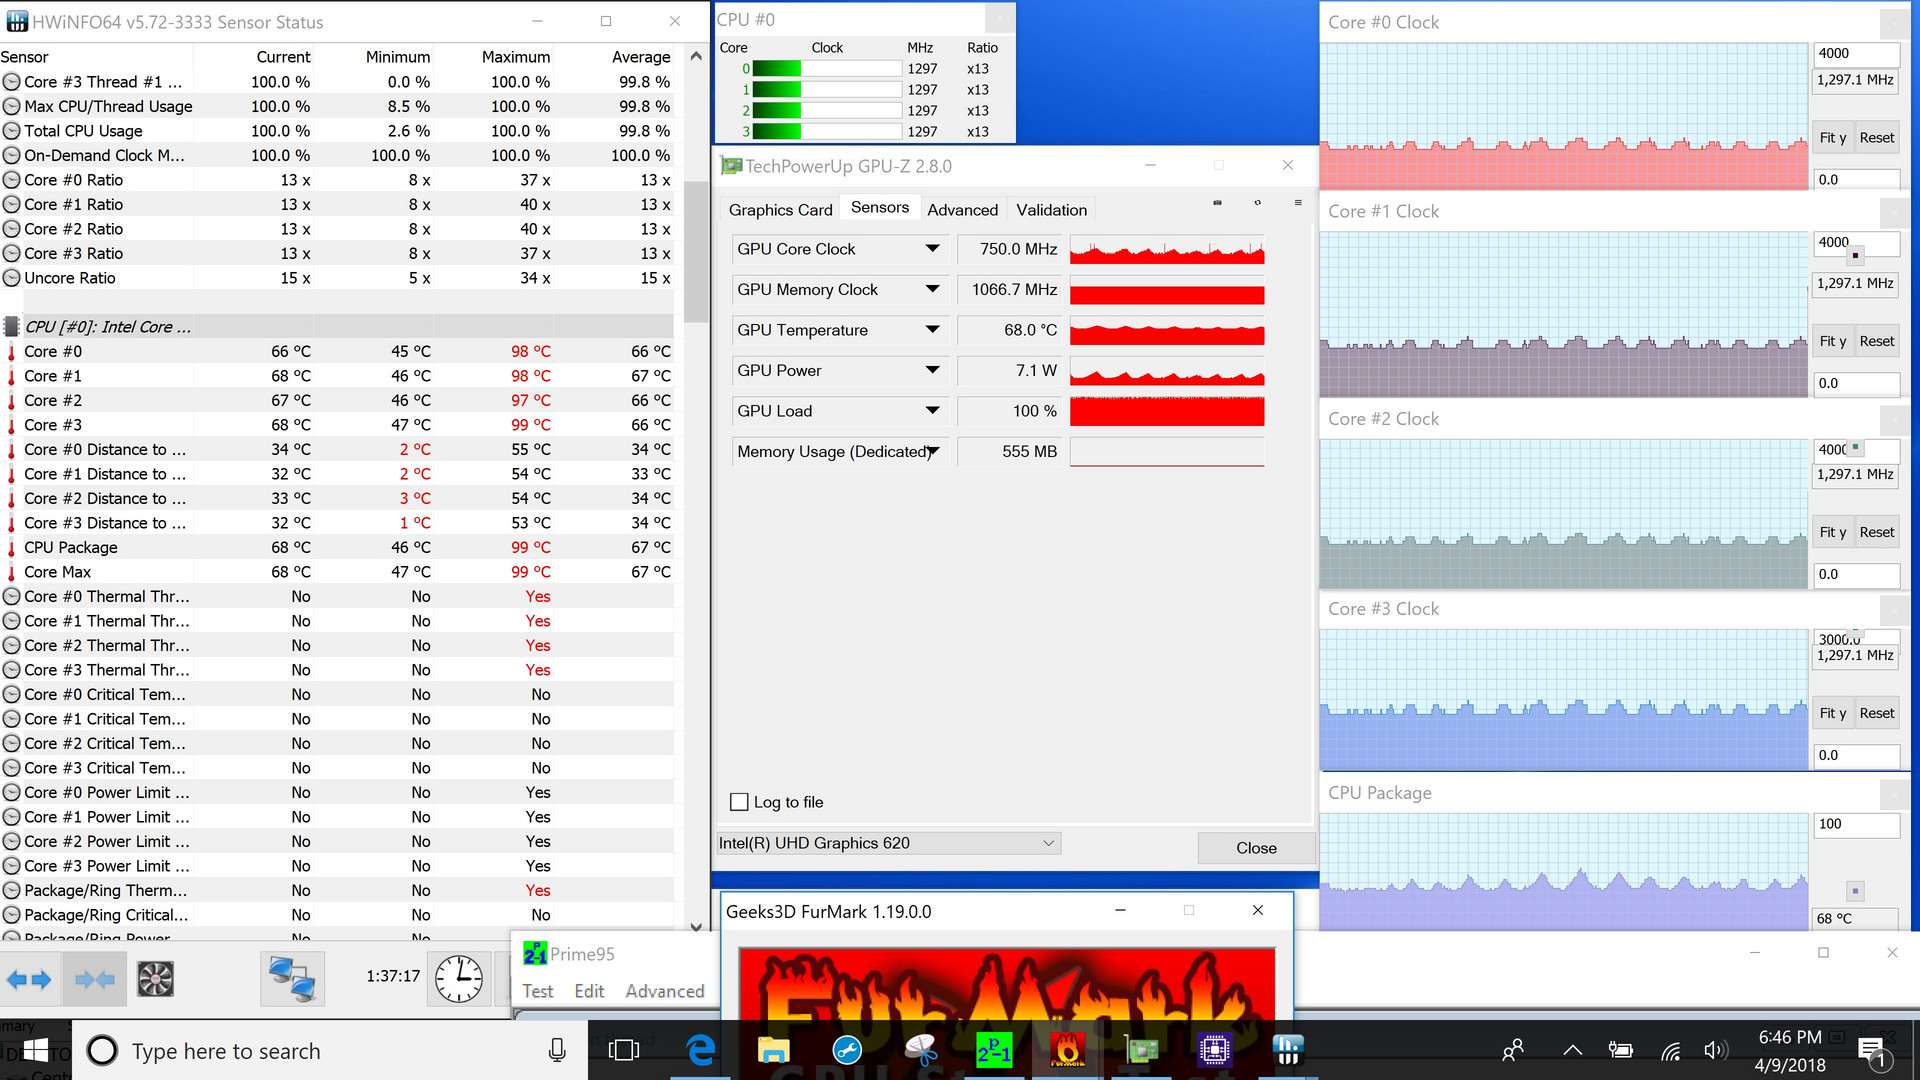
As always, we subject the review notebook to unrealistically high loads with synthetic benchmarks to identify throttling and potential stability issues. When running Prime95, the CPU cores immediately drop to 2.5 - 2.6 GHz, since the temperature increases to 98 - 99 C within seconds. After about half an hour, the fans run at a steady speed while the CPU fluctuates between 2.0 - 2.7 GHz at temperatures ranging from 77 to 86 C. Note that the sibling with i5 processor reaches the same speeds and consequently offers very similar performance as well.
Under Furmark load, the integrated GPU starts out at 1150 MHz at 50 C, but the temperature rises quickly and the frequency subsequently drops to between 900 - 1100 MHz at 70 - 86 C. Running both Prime95 and FurMark in parallel will throttle the CPU clock rate to between 1.2 - to 1.4 GHz; the GPU runs at 700 - 900 MHz with the temperatures in the 65 - 72 C range.
The results above show that the XPS 13 7360 with i5 processor actually maintains about the same clock speeds at different load levels, which again helps to explain the minimal differences in performance between the two processor versions.
According to 3DMark 11, the performance declines just about 1 percent on average with the notebook running on battery power.
| CPU Clock (GHz) | GPU Clock (MHz) | Average CPU Temperature (°C) | |
| Prime95 Stress | 2.0-2.7 | - | 77-86 |
| FurMark Stress | - | 900-1100 | 70-86 |
| Prime95 + FurMark Stress | 1.2-1.4 | 700-900 | 65-72 |
Emissions
System Noise
The dual fans remain completely silent when performing minor task like word processing or web browsing. At higher sustained loads, the fans reach up to 42 dB; moderate loads result in a noise floor of about 32 dB. In other words: the XPS 13 with Core i7-8550U is exactly as loud as its sibling with i5-8250U CPU. We appreciate Dell's effort here, as the XPS 13 is free from the pulsating fan behavior which can get annoying really quick and plagues many competitors.
As of late, many Dell systems have been affected by noticeable coil whine - and our XPS 13 is unfortunately no exception. The high-pitched electronic noise is easily audible from 2 feet away especially when running SSD benchmarks.
Noise level
| Idle |
| 28 / 28 / 28 dB(A) |
| Load |
| 32.5 / 42.2 dB(A) |
 | ||
30 dB silent 40 dB(A) audible 50 dB(A) loud |
||
min: | ||
| Dell XPS 13 9370 i7 UHD UHD Graphics 620, i5-8550U, Toshiba XG5 KXG50ZNV512G | Dell XPS 13 9370 i5 UHD UHD Graphics 620, i5-8250U, Toshiba XG5 KXG50ZNV256G | Asus ZenBook 13 UX331UN GeForce MX150, i5-8550U, SK Hynix HFS256G39TND-N210A | Lenovo IdeaPad 320S-13IKB GeForce MX150, i5-8250U, Samsung PM961 NVMe MZVLW512HMJP | Lenovo ThinkPad X1 Carbon 2018-20KGS03900 UHD Graphics 620, i5-8550U, Samsung SSD PM981 MZVLB512HAJQ | Samsung Notebook 9 NP900X3N-K01US HD Graphics 620, i5-7200U, Samsung CM871a MZNTY256HDHP | HP Spectre 13-af033ng UHD Graphics 620, i5-8550U, Samsung PM961 NVMe MZVLW512HMJP | |
|---|---|---|---|---|---|---|---|
| Noise | -2% | -8% | -3% | -3% | 2% | -1% | |
| off / environment * (dB) | 28 | 29 -4% | 30.13 -8% | 29.4 -5% | 28.9 -3% | 28.4 -1% | 30.13 -8% |
| Idle Minimum * (dB) | 28 | 29 -4% | 30.13 -8% | 30 -7% | 28.9 -3% | 28.4 -1% | 30.13 -8% |
| Idle Average * (dB) | 28 | 29 -4% | 30.3 -8% | 30 -7% | 28.9 -3% | 28.4 -1% | 30.13 -8% |
| Idle Maximum * (dB) | 28 | 29 -4% | 30.3 -8% | 30 -7% | 32.5 -16% | 28.4 -1% | 30.13 -8% |
| Load Average * (dB) | 32.5 | 32 2% | 39.2 -21% | 32.2 1% | 35.1 -8% | 33.2 -2% | 31.5 3% |
| Load Maximum * (dB) | 42.2 | 40.1 5% | 41 3% | 38.8 8% | 35.1 17% | 35.2 17% | 33.5 21% |
| Witcher 3 ultra * (dB) | 35.2 |
* ... smaller is better
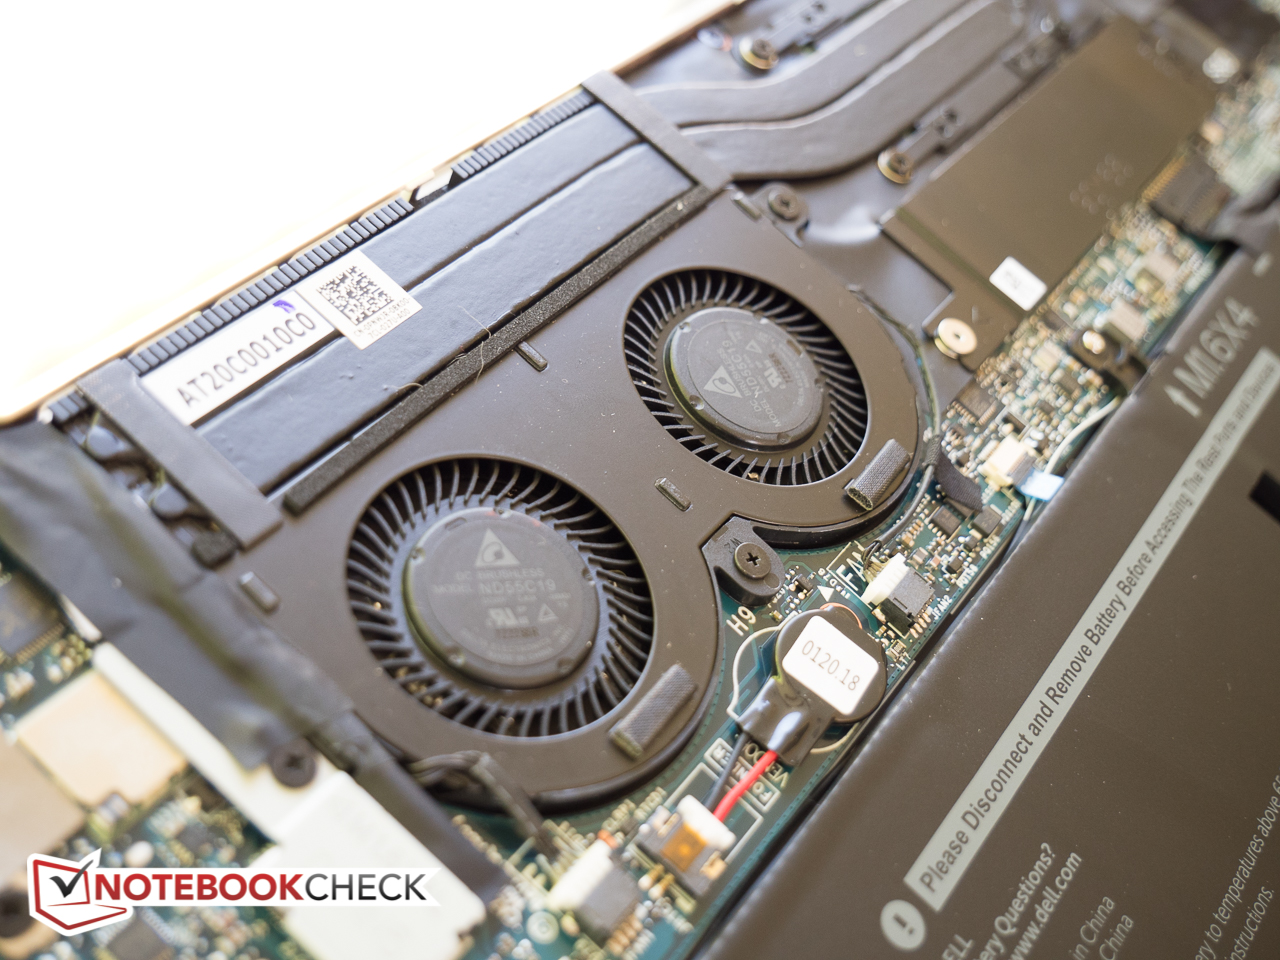
Temperature
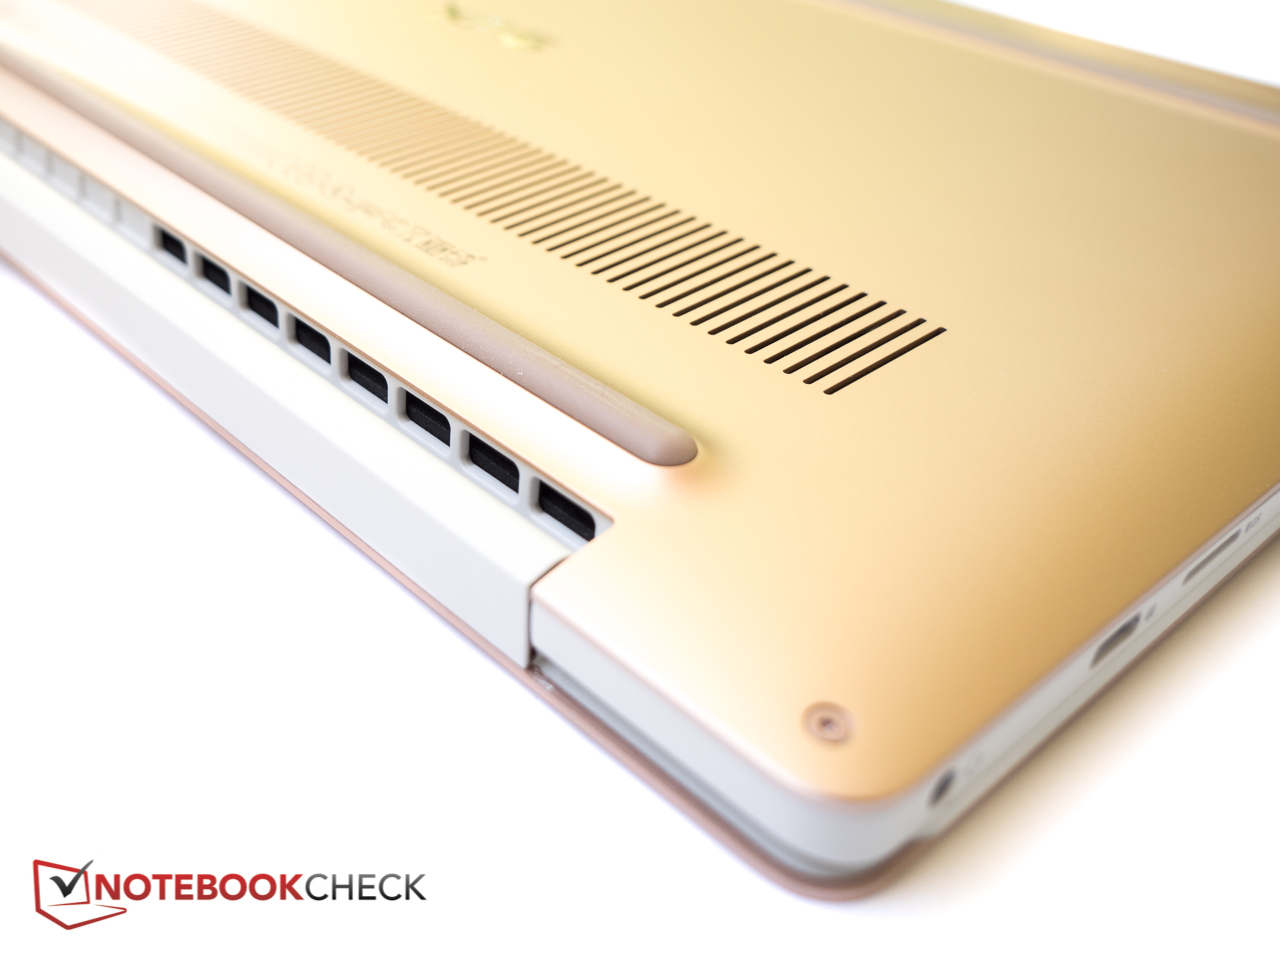
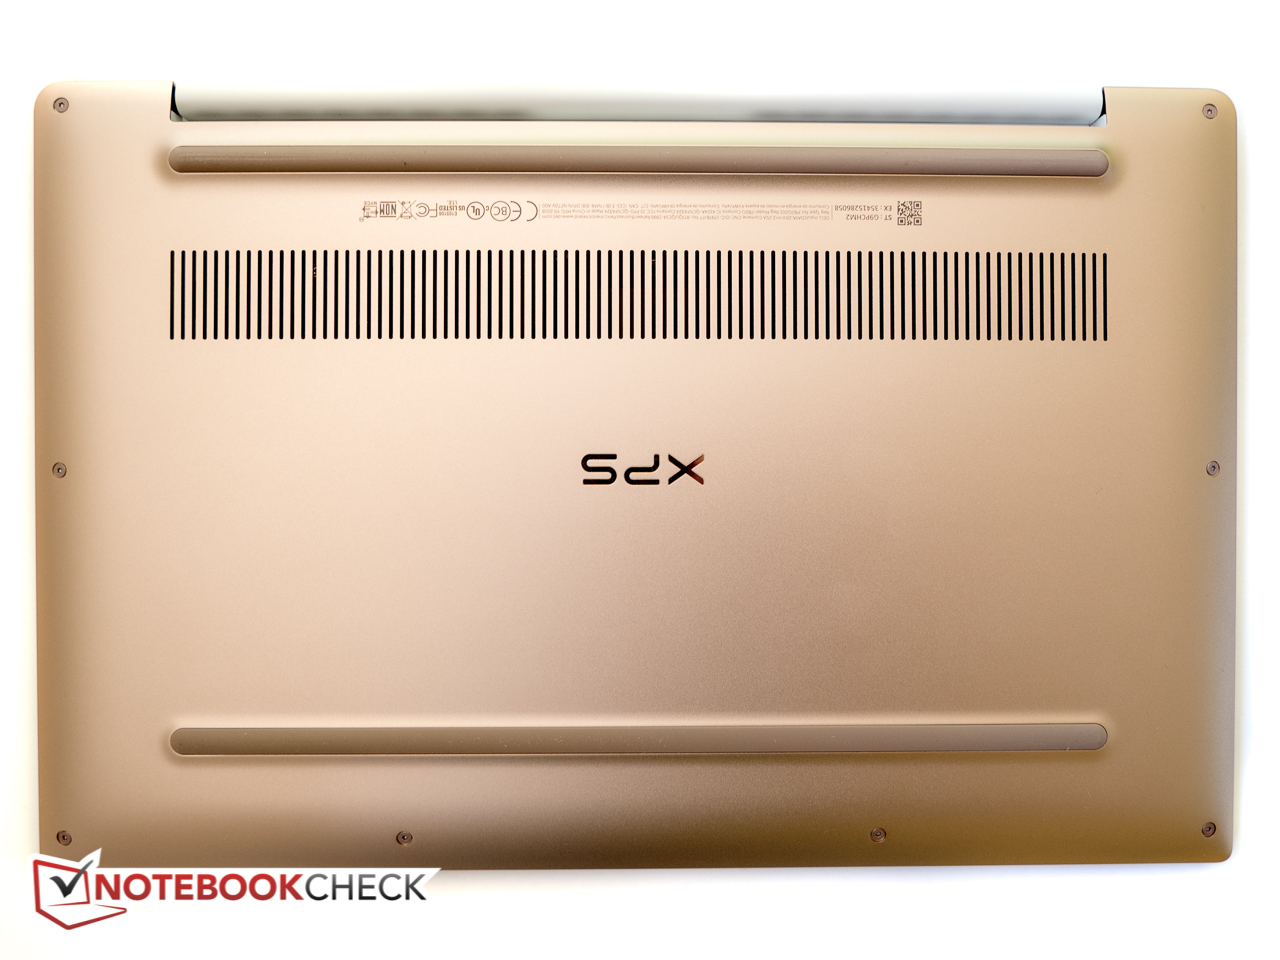
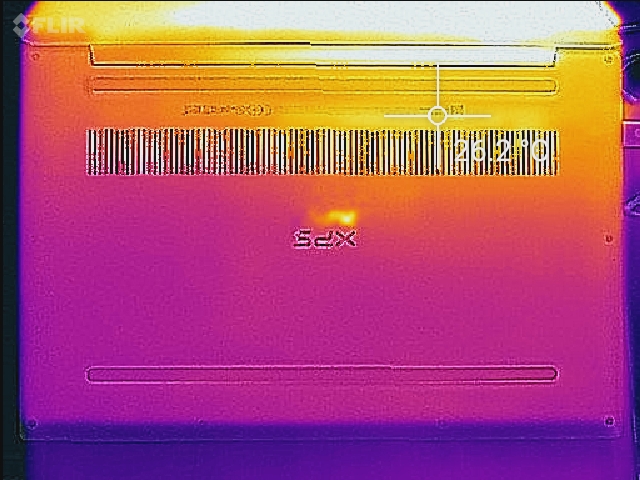
The XPS 13 is an extremely compact and consequently quite dense notebook, so it does get pretty warm despite the dual 30 mm fans Dell was able to incorporate into the chassis. While the palm rests stay quite cool - the left side does get a few degrees warmer than the right side - the middle of the keyboard can reach 45 C when the XPS 13 is subjected to heave loads (stress test - Prime95 and FurMark in parallel). The left bottom rear corner reaches 47 C, which means that the notebook isn't suitable for lap duty under extreme stress. The Spectre's hot spot of 45 C is more centered on the bottom towards the rear, so it's less noticeable. The Lenovo ThinkPad X1 Carbon 2018 gets hotter still and reaches up to 53 C. We should mention though that these high temperatures are unlikely occur during normal use and can be ignored for the most part when considering the merits of an Ultrabook.
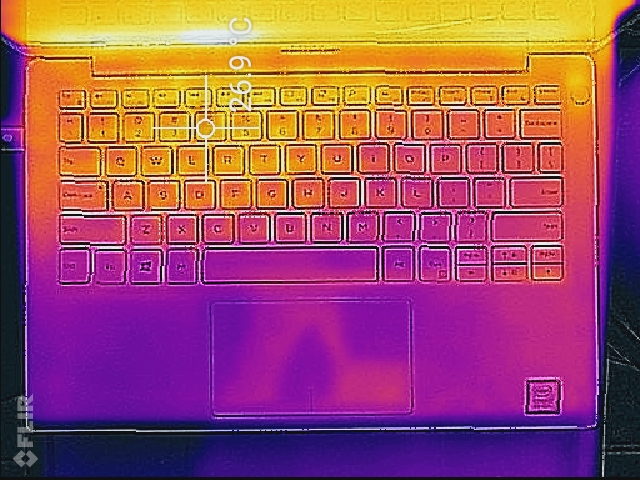
(-) The maximum temperature on the upper side is 45.2 °C / 113 F, compared to the average of 35.9 °C / 97 F, ranging from 21.4 to 59 °C for the class Subnotebook.
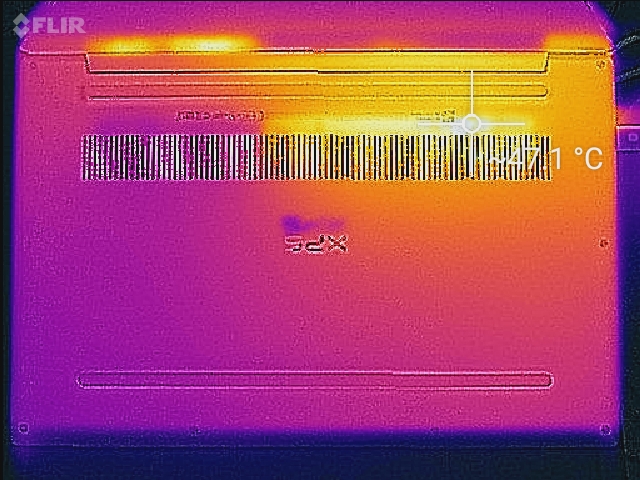
(-) The bottom heats up to a maximum of 47.4 °C / 117 F, compared to the average of 39.2 °C / 103 F
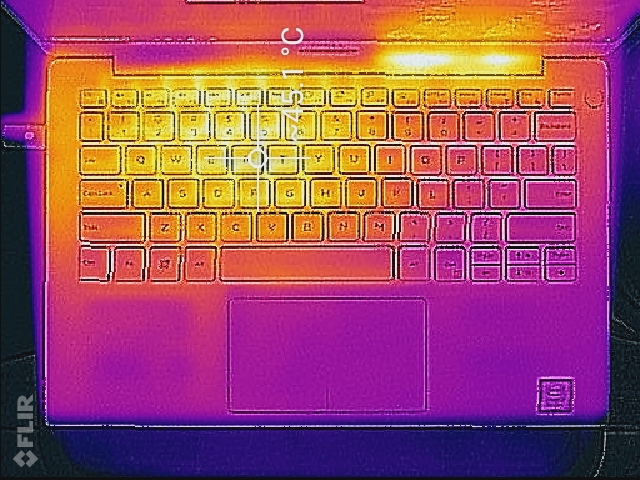
(+) In idle usage, the average temperature for the upper side is 25.4 °C / 78 F, compared to the device average of 30.8 °C / 87 F.
(+) The palmrests and touchpad are cooler than skin temperature with a maximum of 28 °C / 82.4 F and are therefore cool to the touch.
(±) The average temperature of the palmrest area of similar devices was 28.2 °C / 82.8 F (+0.2 °C / 0.4 F).
Speakers
The integrated stereo speakers on the left and right edges are just loud enough for a medium-sized room without distorting too much, although the chassis reverberates quite noticeably at maximum volume settings. Without the included Waves MaxxAudio Pro software, the sound is decidedly lackluster with non-existent bass, but tweaking the settings via the included equalizer helps out a little in that department. Still, for watching movies and especially when listening to music we recommend a pair of high-quality headphones.


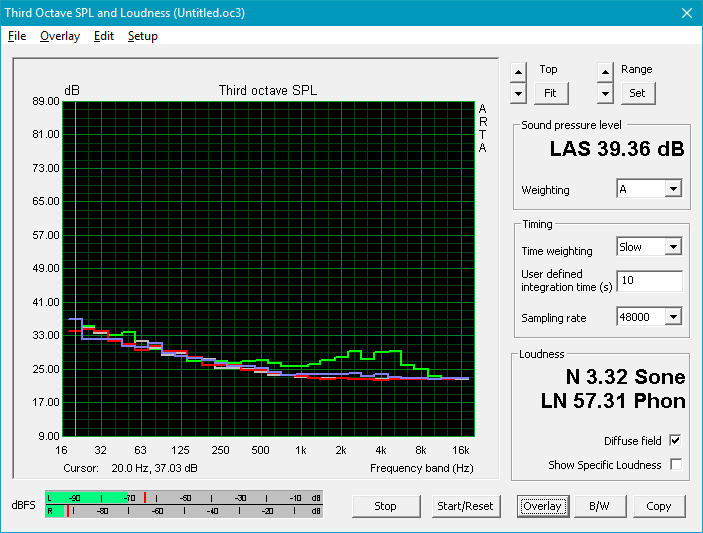
Dell XPS 13 9370 i7 UHD audio analysis
(±) | speaker loudness is average but good (72.6 dB)
Bass 100 - 315 Hz
(-) | nearly no bass - on average 15.3% lower than median
(±) | linearity of bass is average (11.5% delta to prev. frequency)
Mids 400 - 2000 Hz
(+) | balanced mids - only 4.5% away from median
(+) | mids are linear (4.9% delta to prev. frequency)
Highs 2 - 16 kHz
(+) | balanced highs - only 2.6% away from median
(±) | linearity of highs is average (7.1% delta to prev. frequency)
Overall 100 - 16.000 Hz
(±) | linearity of overall sound is average (18.9% difference to median)
Compared to same class
» 57% of all tested devices in this class were better, 6% similar, 36% worse
» The best had a delta of 5%, average was 18%, worst was 53%
Compared to all devices tested
» 44% of all tested devices were better, 8% similar, 48% worse
» The best had a delta of 4%, average was 24%, worst was 134%
Apple MacBook 12 (Early 2016) 1.1 GHz audio analysis
(+) | speakers can play relatively loud (83.6 dB)
Bass 100 - 315 Hz
(±) | reduced bass - on average 11.3% lower than median
(±) | linearity of bass is average (14.2% delta to prev. frequency)
Mids 400 - 2000 Hz
(+) | balanced mids - only 2.4% away from median
(+) | mids are linear (5.5% delta to prev. frequency)
Highs 2 - 16 kHz
(+) | balanced highs - only 2% away from median
(+) | highs are linear (4.5% delta to prev. frequency)
Overall 100 - 16.000 Hz
(+) | overall sound is linear (10.2% difference to median)
Compared to same class
» 7% of all tested devices in this class were better, 2% similar, 91% worse
» The best had a delta of 5%, average was 18%, worst was 53%
Compared to all devices tested
» 5% of all tested devices were better, 1% similar, 94% worse
» The best had a delta of 4%, average was 24%, worst was 134%
Energy Management
Power Consumption
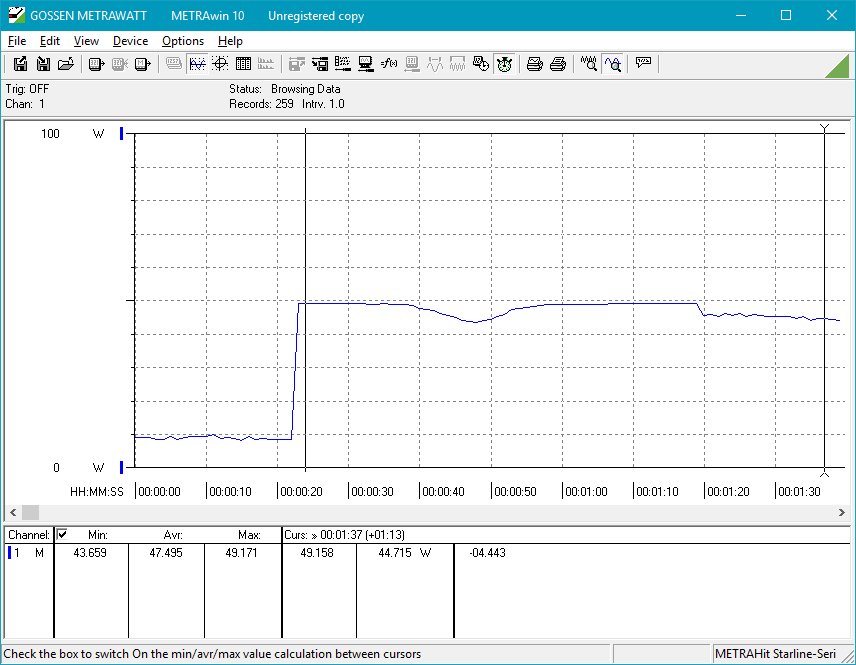
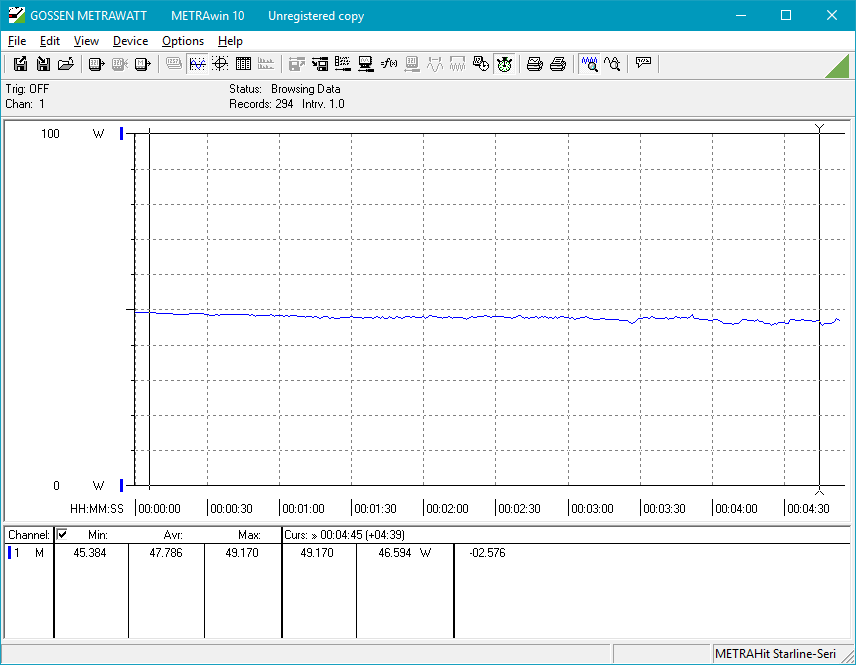
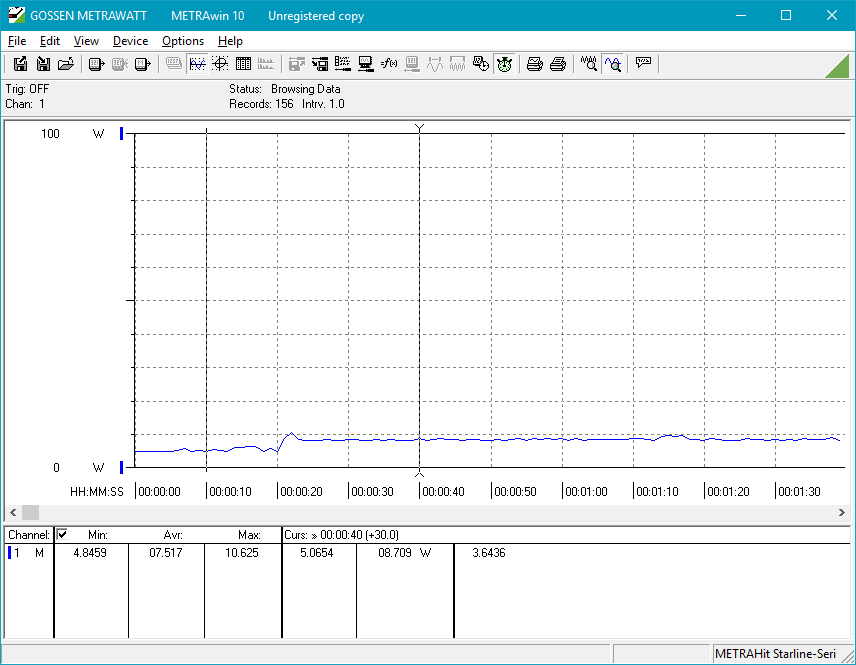
Power consumption when idling ranges from 5 W to 8 W and matches the draw of the XPS 13 with i5 CPU almost exactly, although the minimum power consumptions is slightly higher. At medium load levels (3DMark06), the review notebook once again requires as much as its lower-powered sibling. During the stress test with Prime95 and FurMark we recorded a maximum power consumption of about 49 W - the model with i5 draws 1 W more. The power adapter is rated for only 45 W and will be pushed past the comfort zone at high loads.
| Off / Standby | |
| Idle | |
| Load |
|
Key:
min: | |
| Dell XPS 13 9370 i7 UHD i5-8550U, UHD Graphics 620, Toshiba XG5 KXG50ZNV512G, IPS, 3840x2160, 13.3" | Dell XPS 13 9370 i5 UHD i5-8250U, UHD Graphics 620, Toshiba XG5 KXG50ZNV256G, IPS, 3840x2160, 13.3" | Asus ZenBook 13 UX331UN i5-8550U, GeForce MX150, SK Hynix HFS256G39TND-N210A, IPS, 1920x1080, 13.3" | Lenovo IdeaPad 320S-13IKB i5-8250U, GeForce MX150, Samsung PM961 NVMe MZVLW512HMJP, IPS LED, 1920x1080, 13.3" | Lenovo ThinkPad X1 Carbon 2018-20KGS03900 i5-8550U, UHD Graphics 620, Samsung SSD PM981 MZVLB512HAJQ, IPS, 2560x1440, 14" | Xiaomi Mi Notebook Air 13.3 2018 i5-8250U, GeForce MX150, Samsung PM961 MZVLW256HEHP, IPS, 1920x1080, 13.3" | HP Spectre 13-af033ng i5-8550U, UHD Graphics 620, Samsung PM961 NVMe MZVLW512HMJP, IPS, 1920x1080, 13.3" | |
|---|---|---|---|---|---|---|---|
| Power Consumption | 5% | 26% | 10% | -6% | 9% | 24% | |
| Idle Minimum * (Watt) | 5 | 4.3 14% | 2.2 56% | 3.4 32% | 3.8 24% | 3.9 22% | 2.8 44% |
| Idle Average * (Watt) | 8.3 | 8 4% | 5 40% | 6.1 27% | 8.9 -7% | 7 16% | 6.2 25% |
| Idle Maximum * (Watt) | 8.8 | 8.1 8% | 8 9% | 7.7 12% | 11.9 -35% | 7.5 15% | 9.4 -7% |
| Load Average * (Watt) | 46.4 | 46.6 -0% | 33 29% | 44.2 5% | 47.5 -2% | 44.4 4% | 32.2 31% |
| Load Maximum * (Watt) | 48.6 | 49.8 -2% | 49.4 -2% | 60.3 -24% | 52.5 -8% | 55.1 -13% | 36.6 25% |
| Witcher 3 ultra * (Watt) | 37.6 | 32.8 |
* ... smaller is better
Battery Life
Although the power consumption of the two notebooks is near-identical, the i7 model lasted a good hour longer than its i5-equipped sibling during our WLAN test (brightness of 150 nits, balanced profile setting, 30-second refresh loop using the Edge browser). Variances in WLAN and background activity/downloads could be responsible for the differences. The predecessor Dell XPS 13 9360 with the same i7 CPU lasted almost 10 hours thanks to its larger 60 Wh battery and lower power minimums.
| Dell XPS 13 9370 i7 UHD i5-8550U, UHD Graphics 620, 52 Wh | Dell XPS 13 9370 i5 UHD i5-8250U, UHD Graphics 620, 52 Wh | Asus ZenBook 13 UX331UN i5-8550U, GeForce MX150, 50 Wh | Lenovo IdeaPad 320S-13IKB i5-8250U, GeForce MX150, 36 Wh | Lenovo ThinkPad X1 Carbon 2018-20KGS03900 i5-8550U, UHD Graphics 620, 57 Wh | Samsung Notebook 9 NP900X3N-K01US i5-7200U, HD Graphics 620, 30 Wh | HP Spectre 13-af033ng i5-8550U, UHD Graphics 620, 43 Wh | Xiaomi Mi Notebook Air 13.3 2018 i5-8250U, GeForce MX150, 39 Wh | |
|---|---|---|---|---|---|---|---|---|
| Battery runtime | -2% | 22% | -23% | 24% | -33% | -15% | -18% | |
| Reader / Idle (h) | 13.7 | 14.5 6% | 20.7 51% | 12.3 -10% | 22.1 61% | 11.6 -15% | 13 -5% | |
| WiFi v1.3 (h) | 7.8 | 6.8 -13% | 9 15% | 5.7 -27% | 8.7 12% | 4.7 -40% | 5.9 -24% | 6.1 -22% |
| Load (h) | 1.8 | 1.8 0% | 1.8 0% | 1.2 -33% | 1.8 0% | 1 -44% | 1.7 -6% | 1.3 -28% |
| Witcher 3 ultra (h) | 1.4 |
Pros
Cons
Verdict
So, is the the XPS 13 9370 with i7 processor a better choice than its less expensive sibling with i5 CPU? At this point in time, the answer can only be a resounding "no". Aside from the battery life - which surprisingly beats that of the i5 UHD model - the performance of our particular XPS 13 review unit is somewhat disappointing. That is not to say that the i7-8550U necessarily performs much worse in this particular implementation than in other notebooks, but the fact remains that the i7-based XPS 13 9370 can't really distance itself from our previous review model with i5 CPU, which costs hundreds less. It is possible that we ended up with a defective unit - the blue screens and the fatal system crash certainly make this a plausible explanation. Should we get the chance to review a replacement model at a later time, we will update this review accordingly.
That said, the XPS 13 9370 is certainly a pleasing every-day companion with a great display - slow response times notwithstanding - and good ergonomics all around. Especially the fan control is executed to perfection, as the surface temperatures under normal use and low to medium loads remain pleasant and the system noise is a lot more steady and less obtrusive than we've come to expect from a thin-and-light.
The XPS 13 9370 with i7-8550U is only a compelling choice if a larger SSD and the maximum amount of RAM are a top concern. An i5 model with 16 GB of RAM and 512 GB SSD would get our vote every time, but at this point in time Dell doesn't offer this particular configuration.
Dell XPS 13 9370 i7 UHD
- 04/20/2018 v6 (old)
Bernie Pechlaner
Price comparison