Intel Hades Canyon NUC8i7HVK (i7-8809G, Radeon RX Vega M GH) Mini PC Review
Similar to how the original Asus Zephyrus was the premier Nvidia Max-Q notebook, the latest Intel NUC has become the poster child for Intel's Kaby Lake-G series. Hades Canyon is the direct successor to the 2016 Skull Canyon NUC and it is set to be the first - and so far only - consumer product with the unlocked 8th gen Core i7-8809G CPU, discrete Radeon RX Vega M GH GPU, and HBM2 graphics memory all in a single 100 W TDP package. It's a lot of firsts for such a small mini PC and so Intel is putting a lot of faith in its performance to prove that the surprising partnership with AMD is more than just smoke and mirrors.
Our review unit today is the higher-end NUC8i7HVK SKU while a lower-end NUC8i7HNK SKU with the slower i7-8705G CPU and Radeon RX Vega M GL GPU is also available. Intel has been marketing the i7-8809G as a direct alternative to the all-popular GTX 1060 and GTX 1060 Max-Q and so the list of competing devices can be populated with mainstream gaming notebooks and GTX-based mini PCs alike. The MSI GS series, Zotac ZBox series, Gigabyte Sabre series, and the Razer Blade series can all be considered competitors in terms of raw performance and gaming potential.
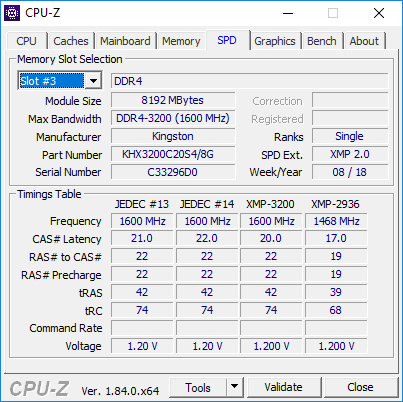
The entry-level and high-end barebone SKUs retail for $800 USD and $1000 USD, respectively, not unlike most gaming mini PCs and SFF solutions. Our particular unit is equipped with 16 GB of DDR4 RAM and a primary Intel Optane 800p SSD for testing purposes.
Case - A thicker Skull Canyon
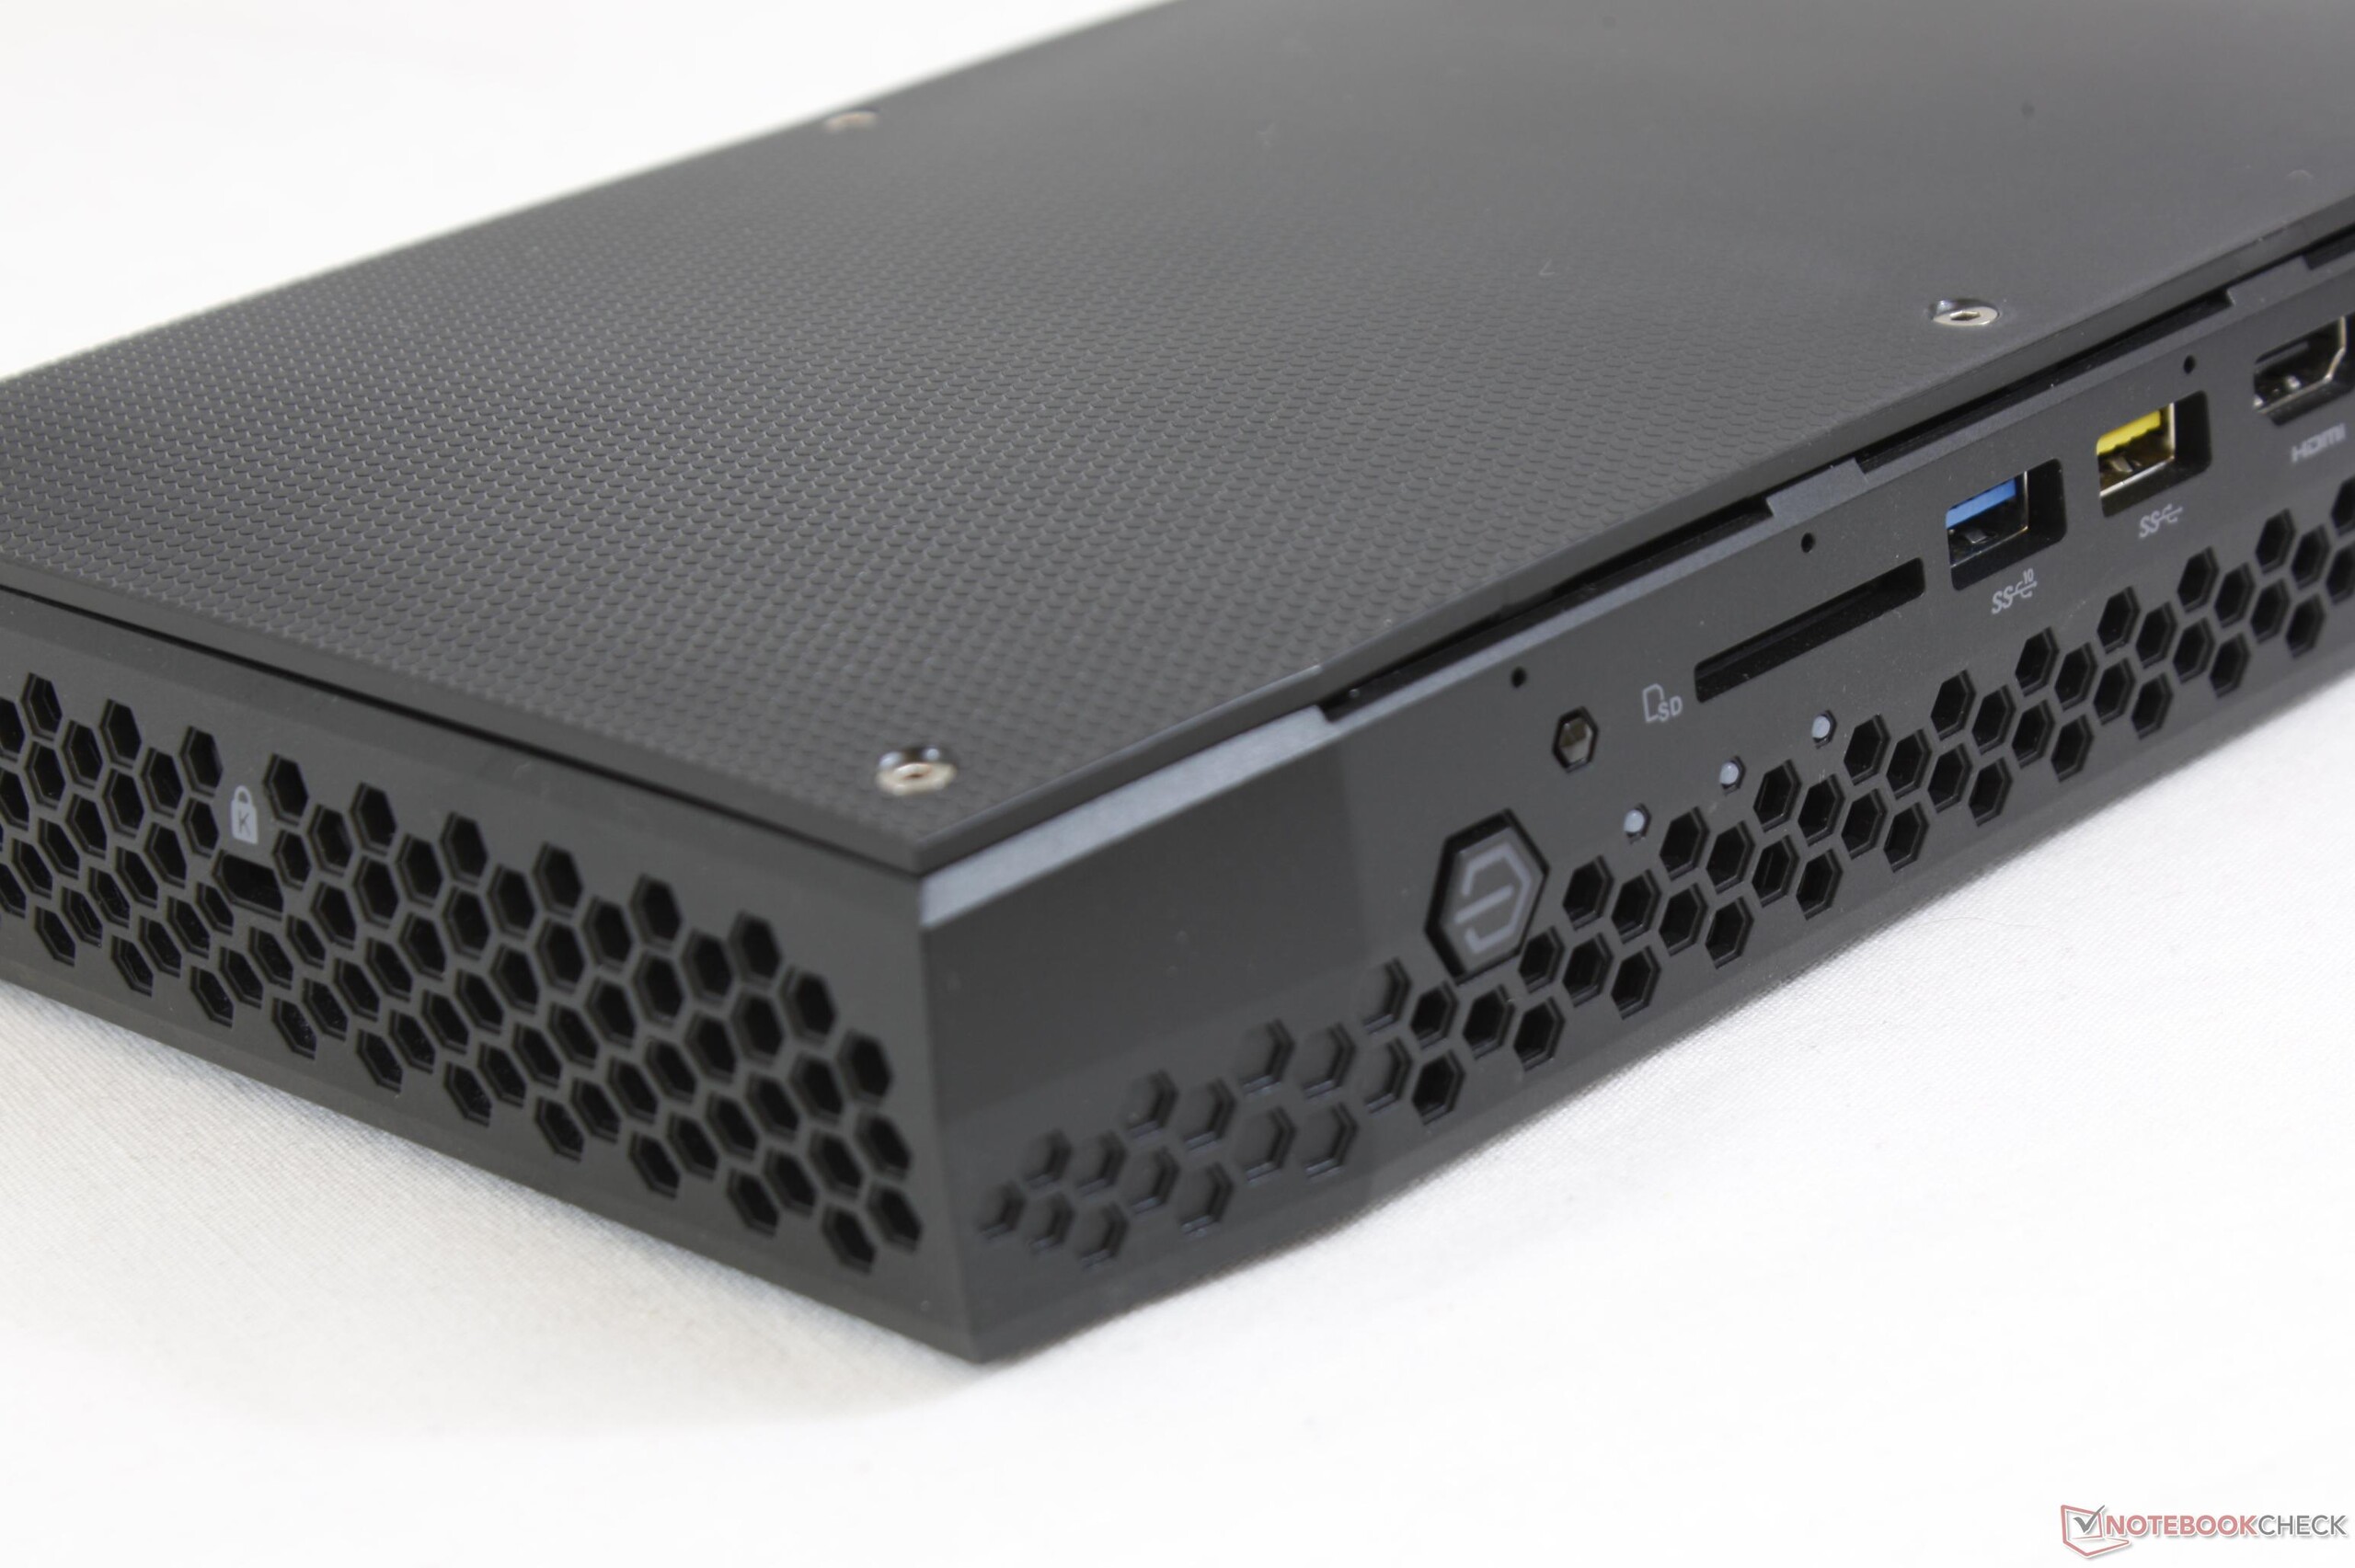
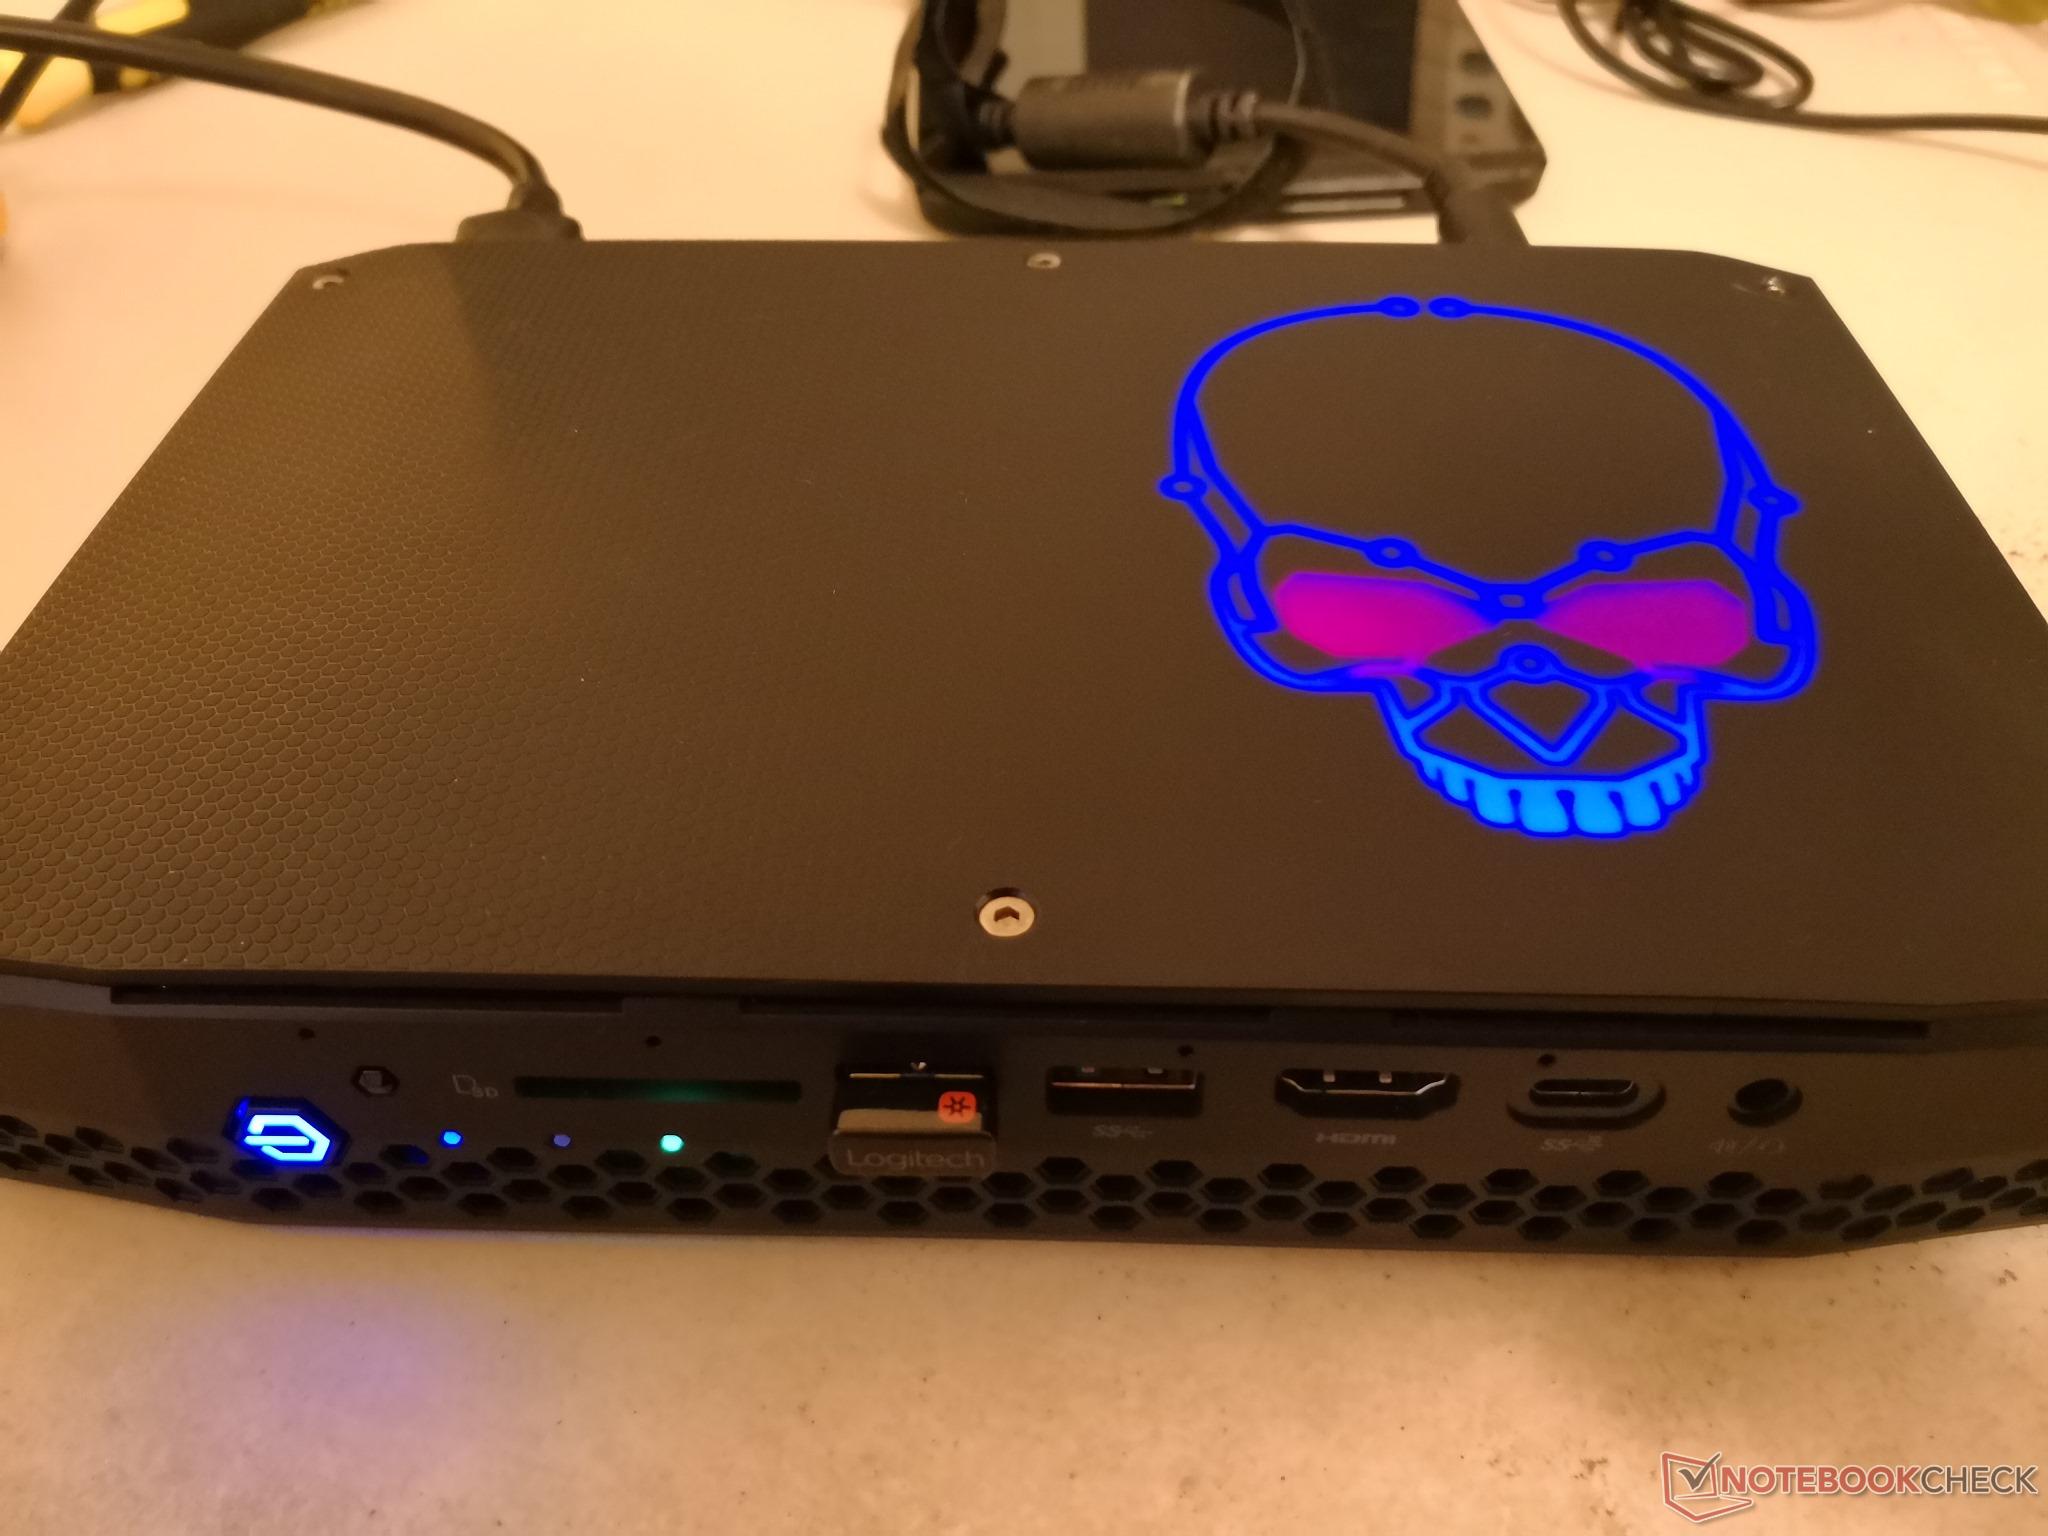
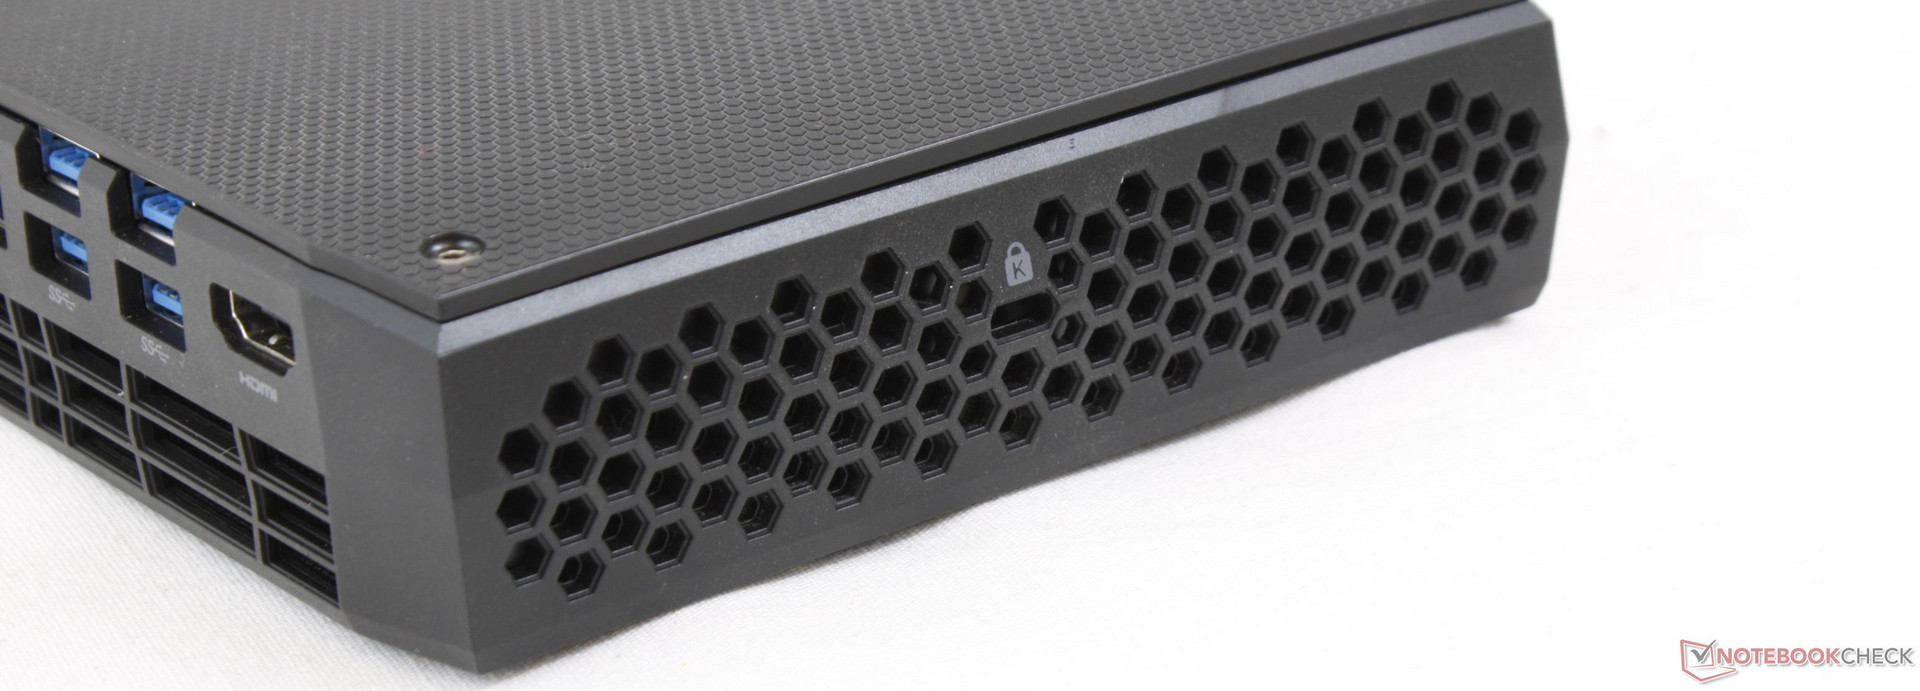
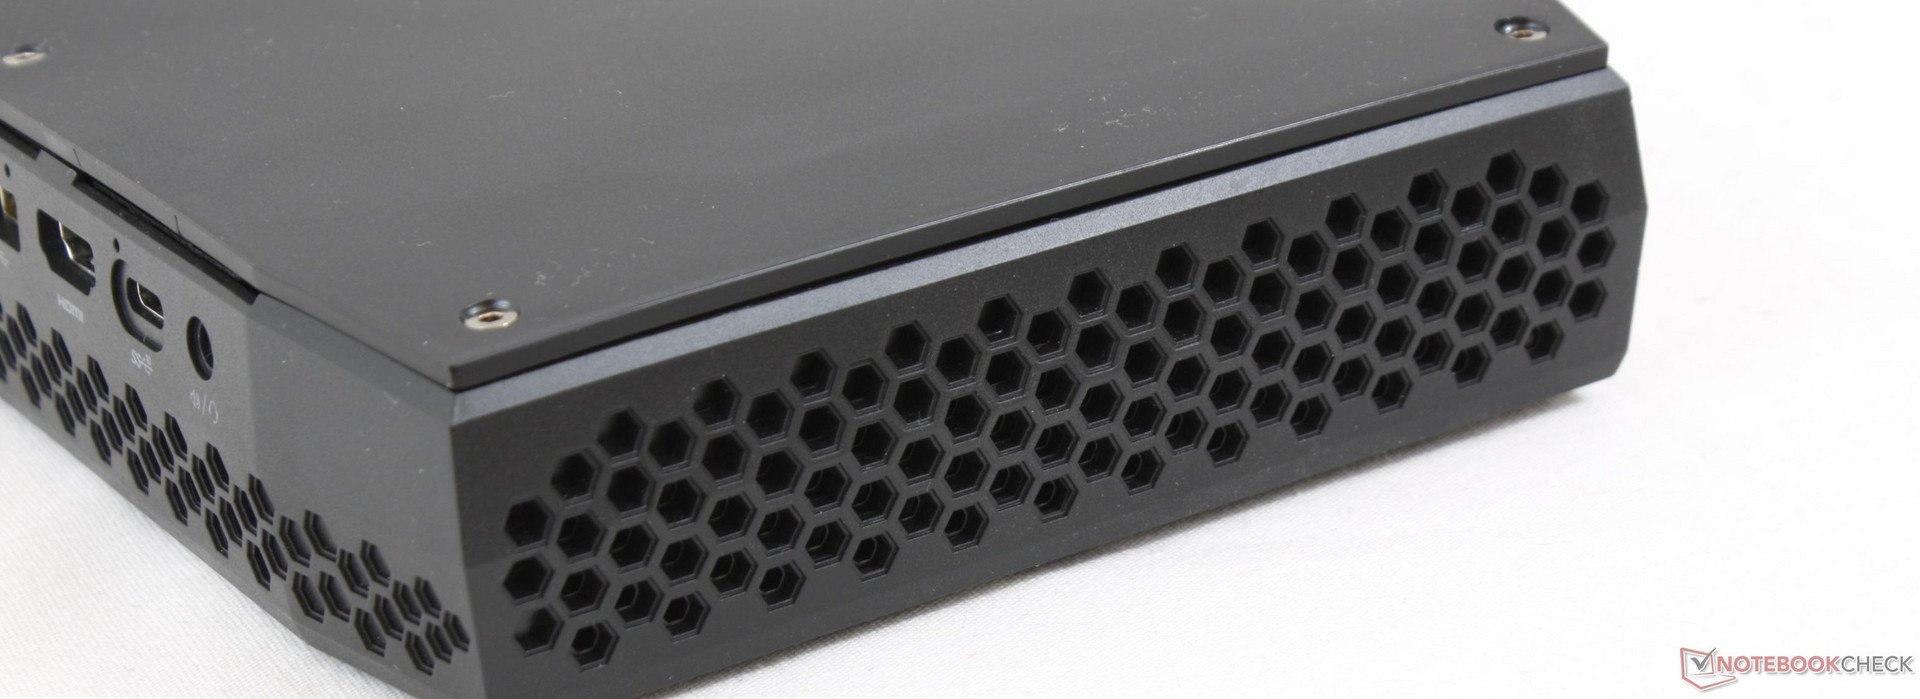
The chassis design takes on the familiar appearance of the last generation NUC down to its shape, plastic material, and honeycomb grilles. It's a subtle and unostentatious look that should work well in both professional and home environments.
Quality is firm on all sides with slight but unconcerning creaking when attempting to twist or press on the unit. Surfaces feel thicker and more rigid than on a Zotac Magnus EN1060 series equivalent due in part to having less hollow space inside and an internal metal plate for reinforcement.
In terms of size and weight, the Hades Canyon NUC is thicker (27.9 vs. 39 mm), larger (.69 L vs. 1.2 L), and over twice as heavy (0.63 kg vs. 1.3 kg) as the previous generation model. The increase in girth and density can be partly attributed to the significantly larger cooling solution that a 100 W TDP package demands. It's all relative, however, as the unit is still lighter and smaller than competing mini PCs with GeForce GPUs like the ZBox Magnus EN51050. Owners of a MacBook Pro 13 already have an idea of how dense the Intel NUC is as both weigh almost the same.
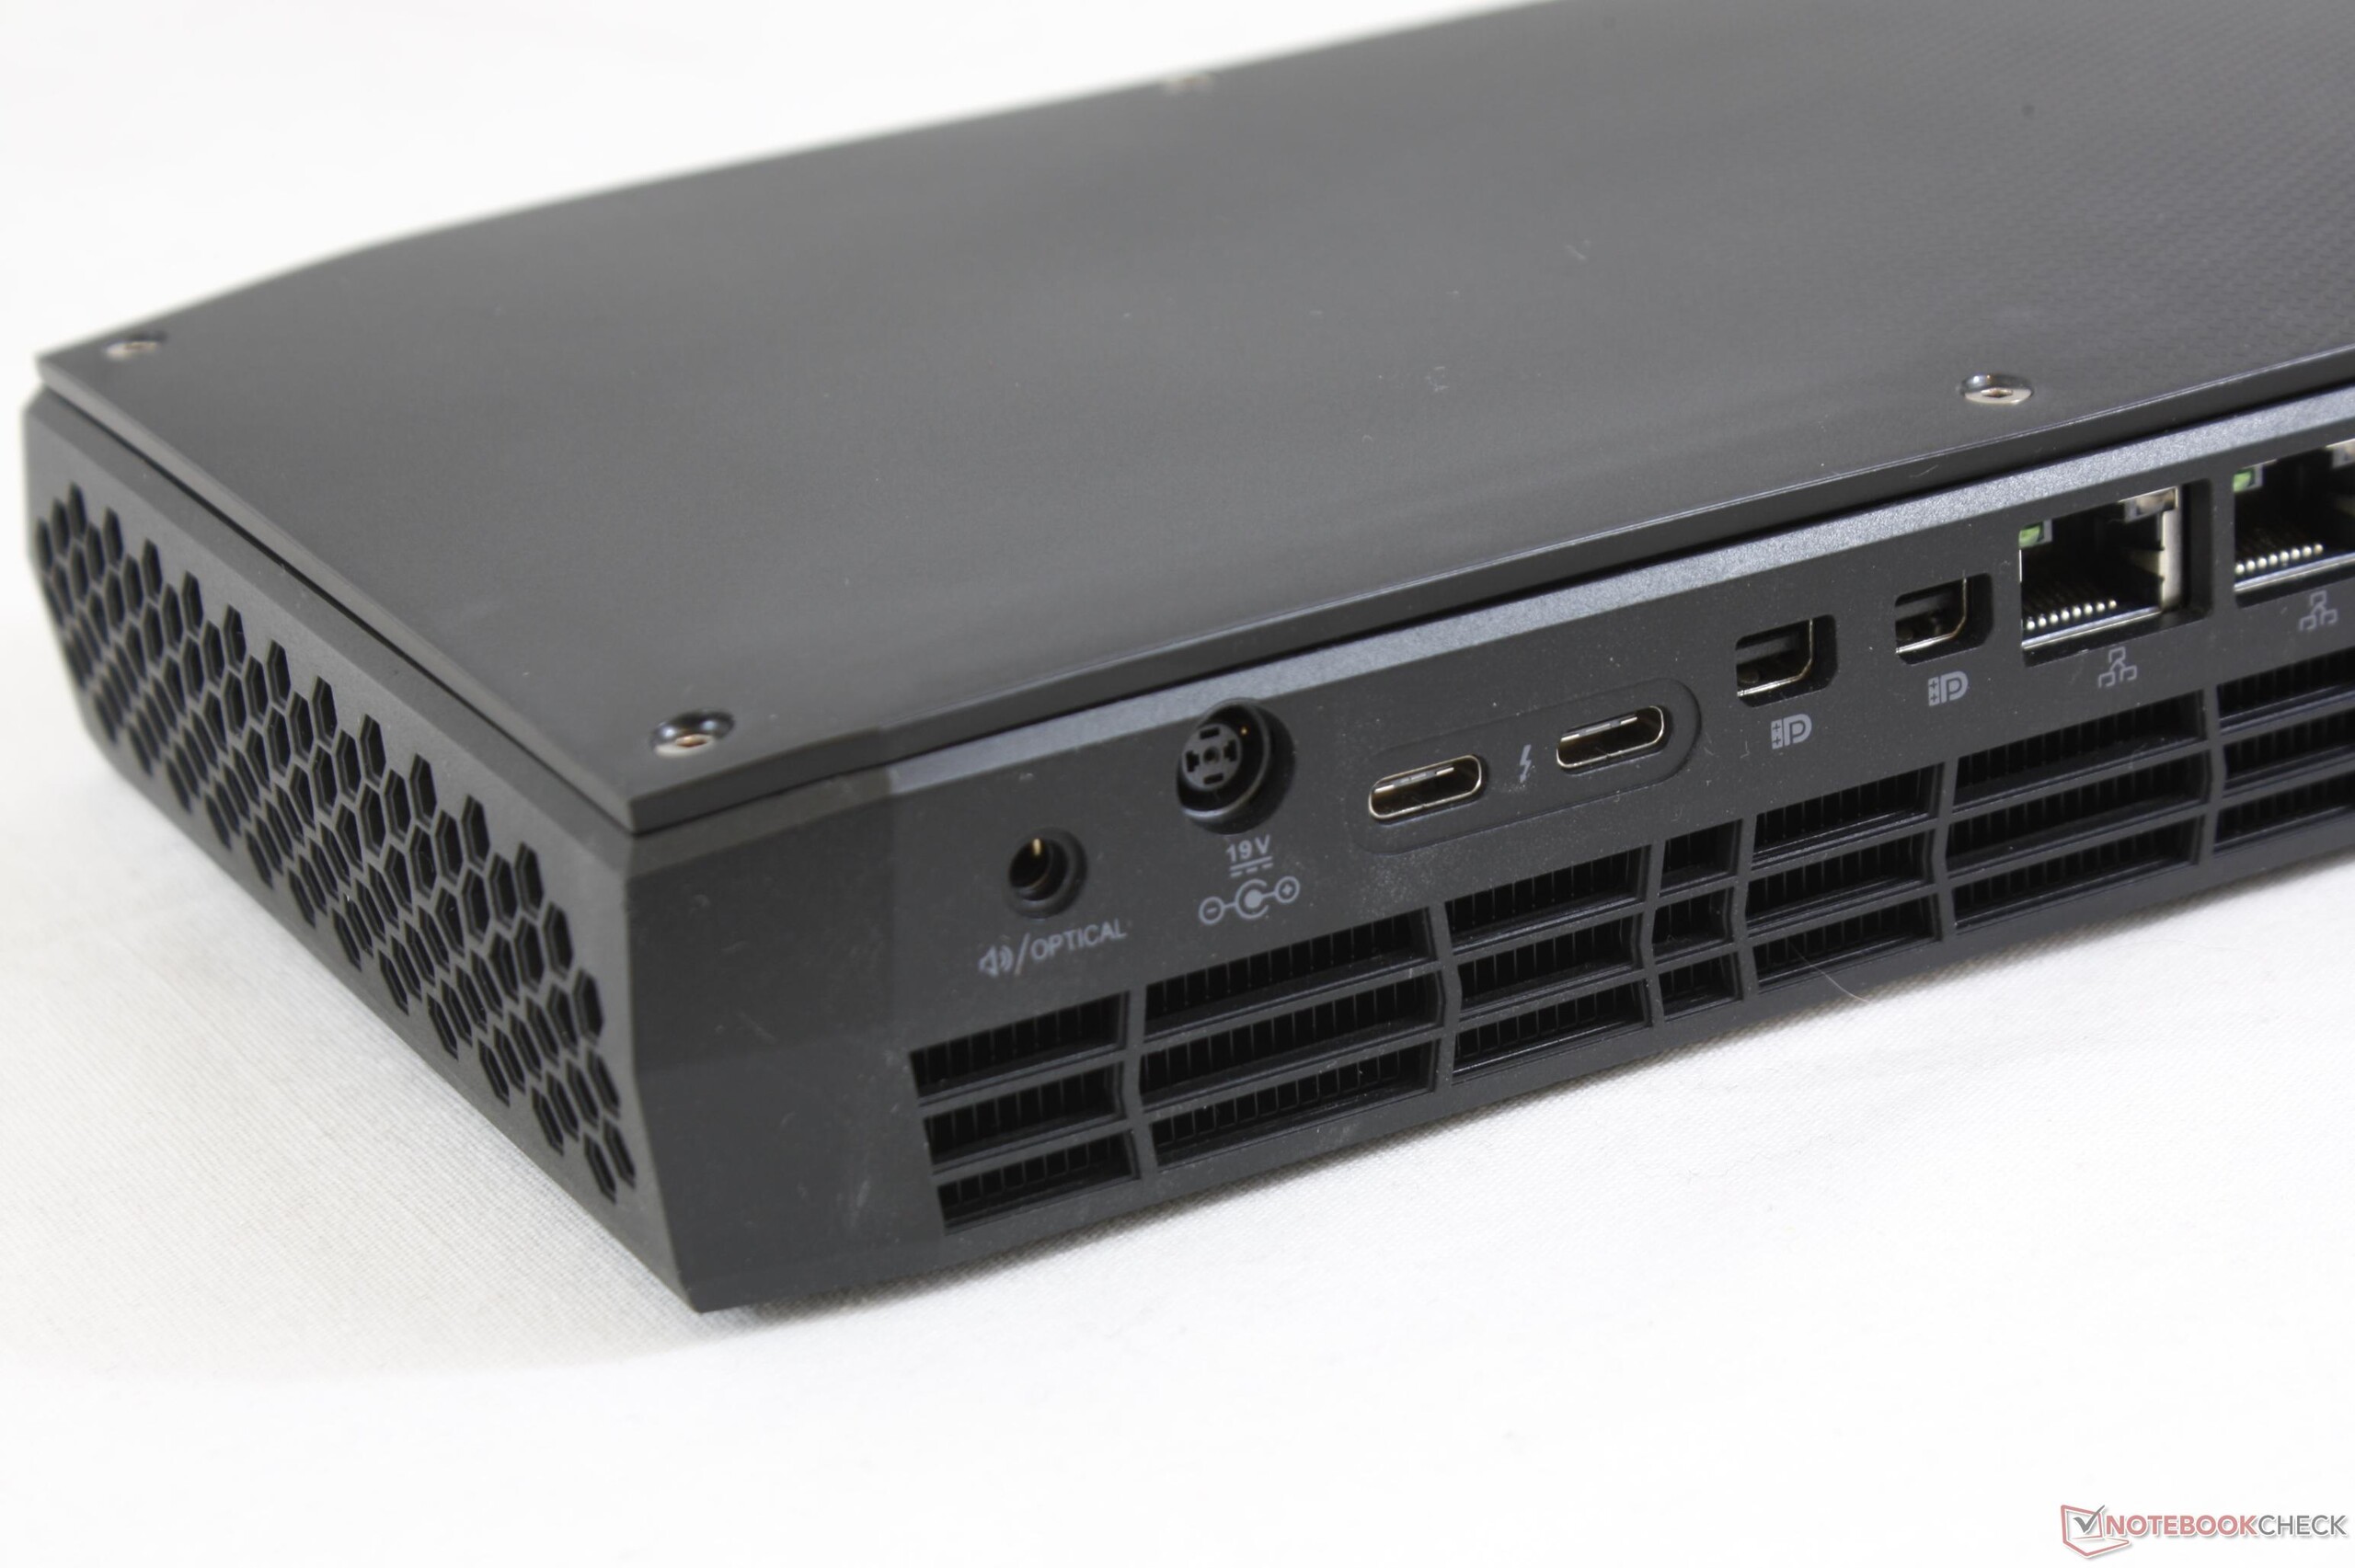
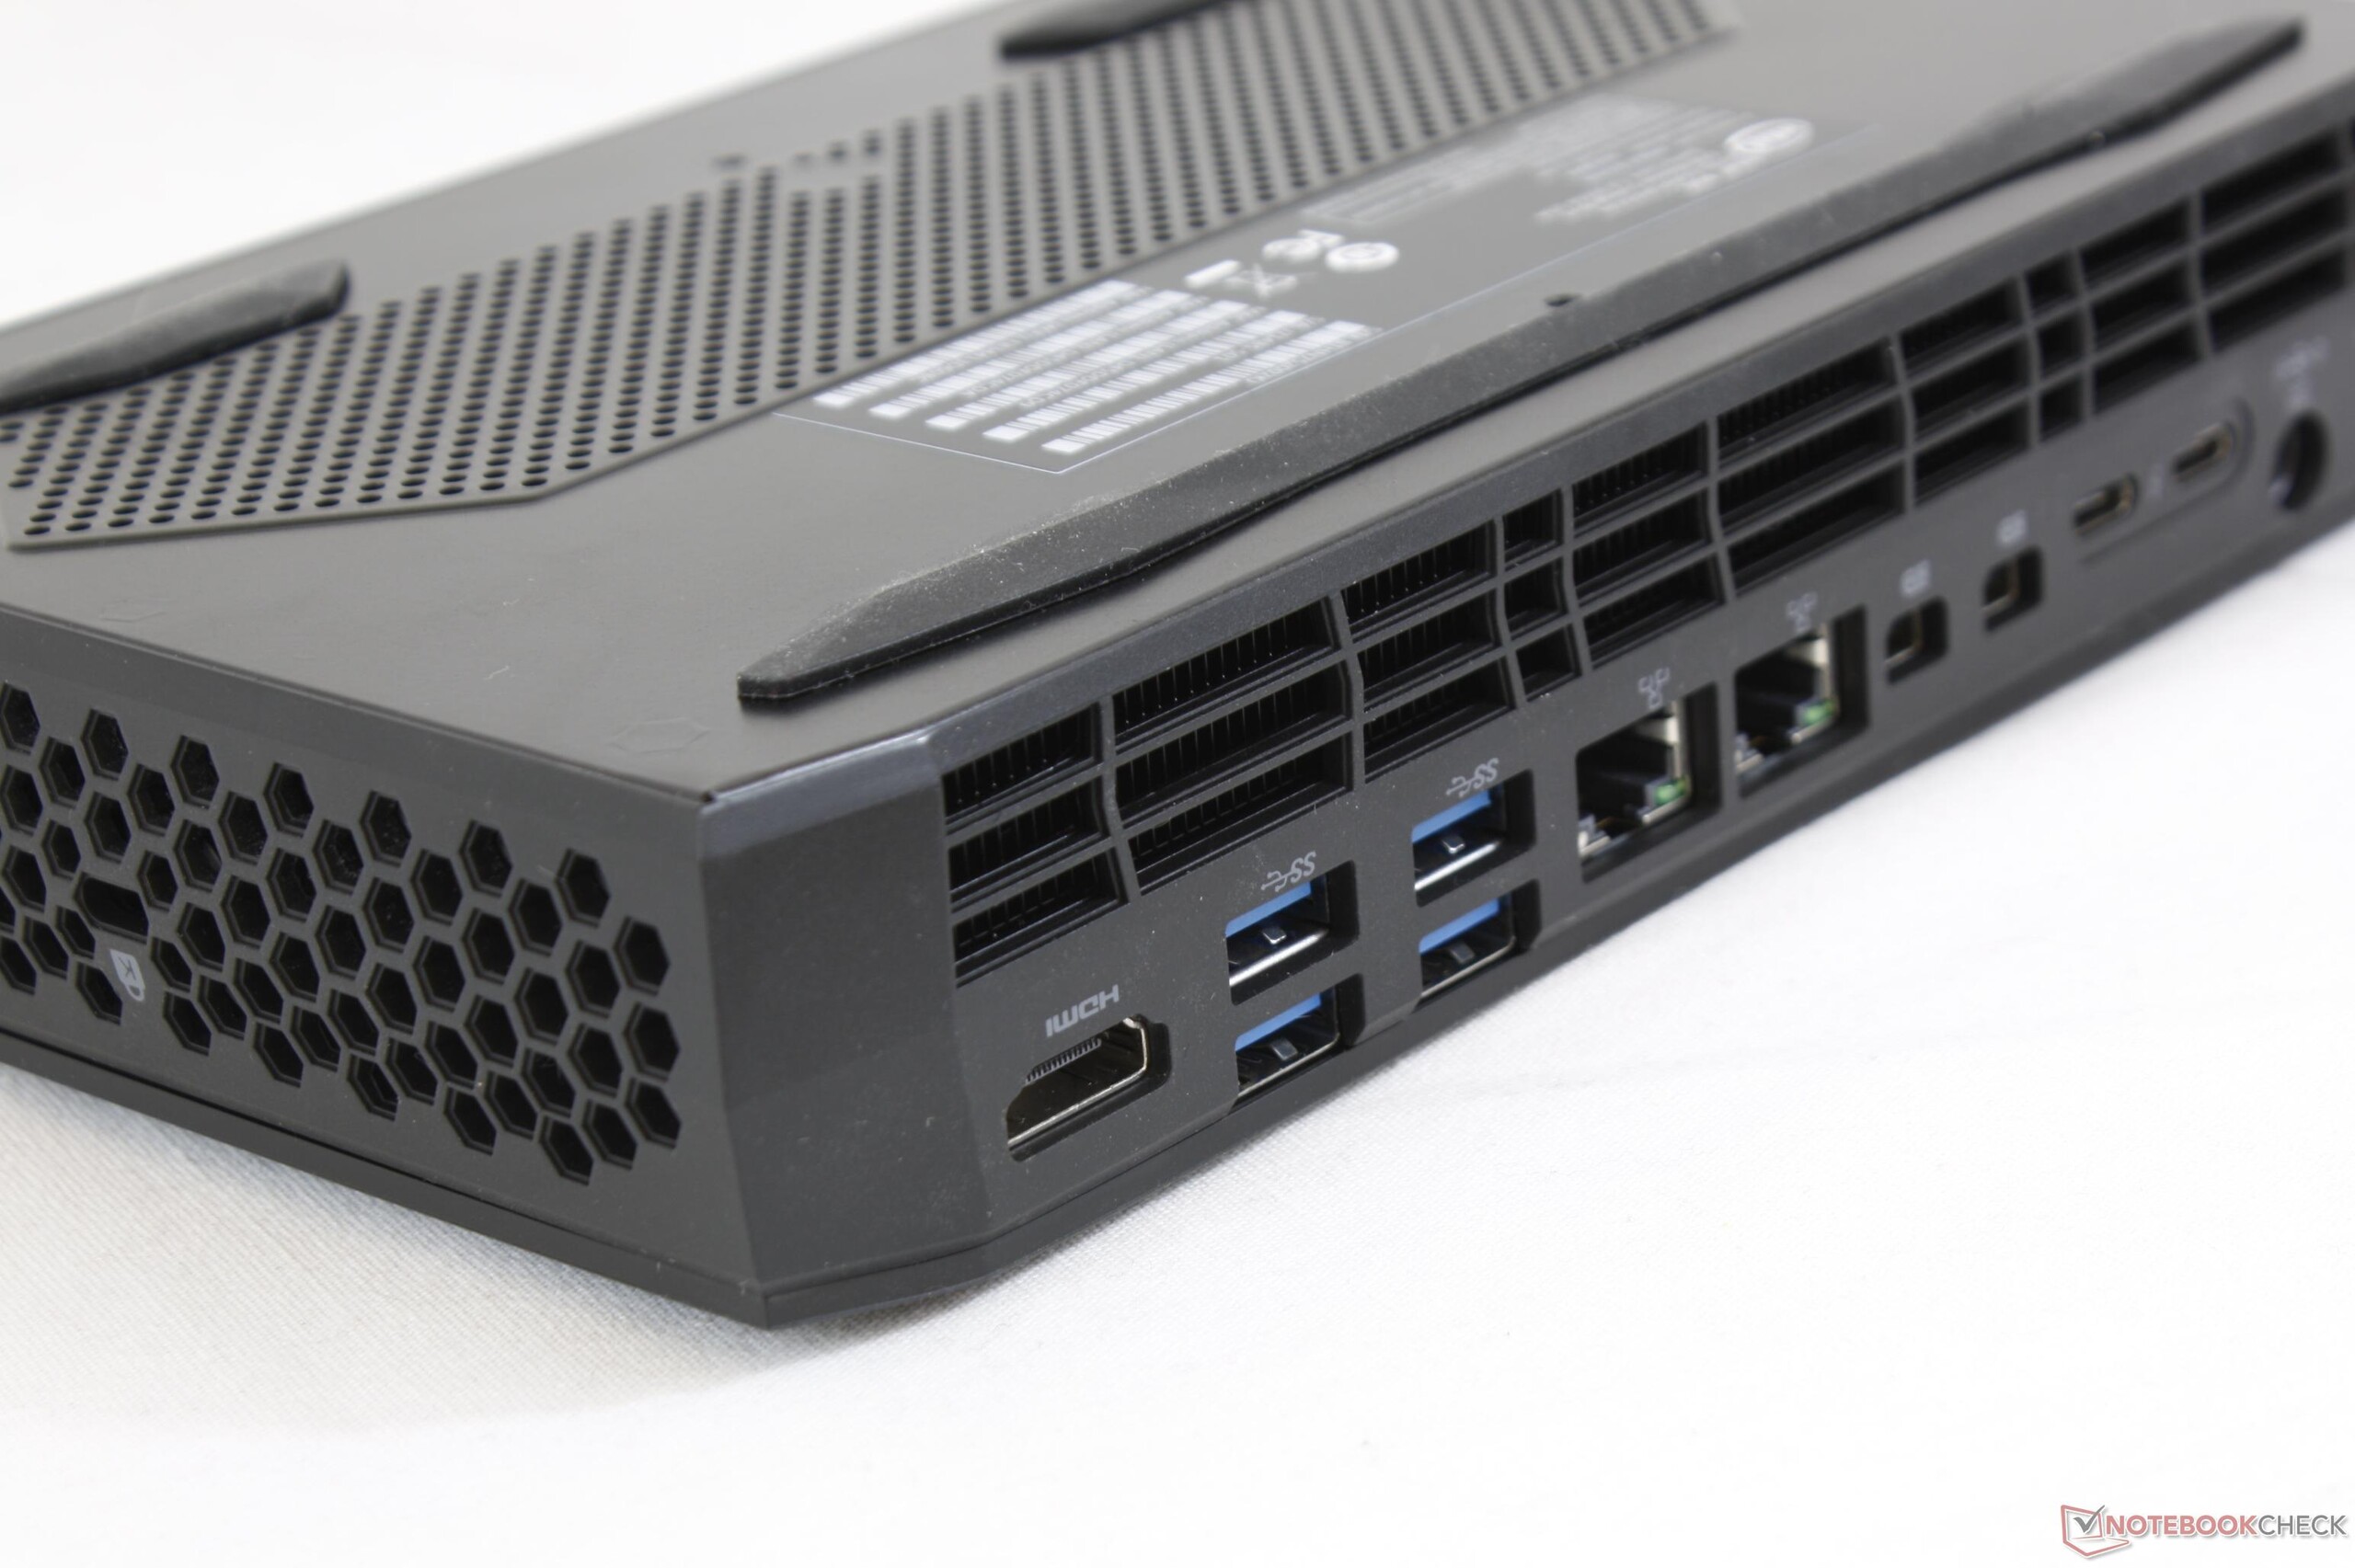
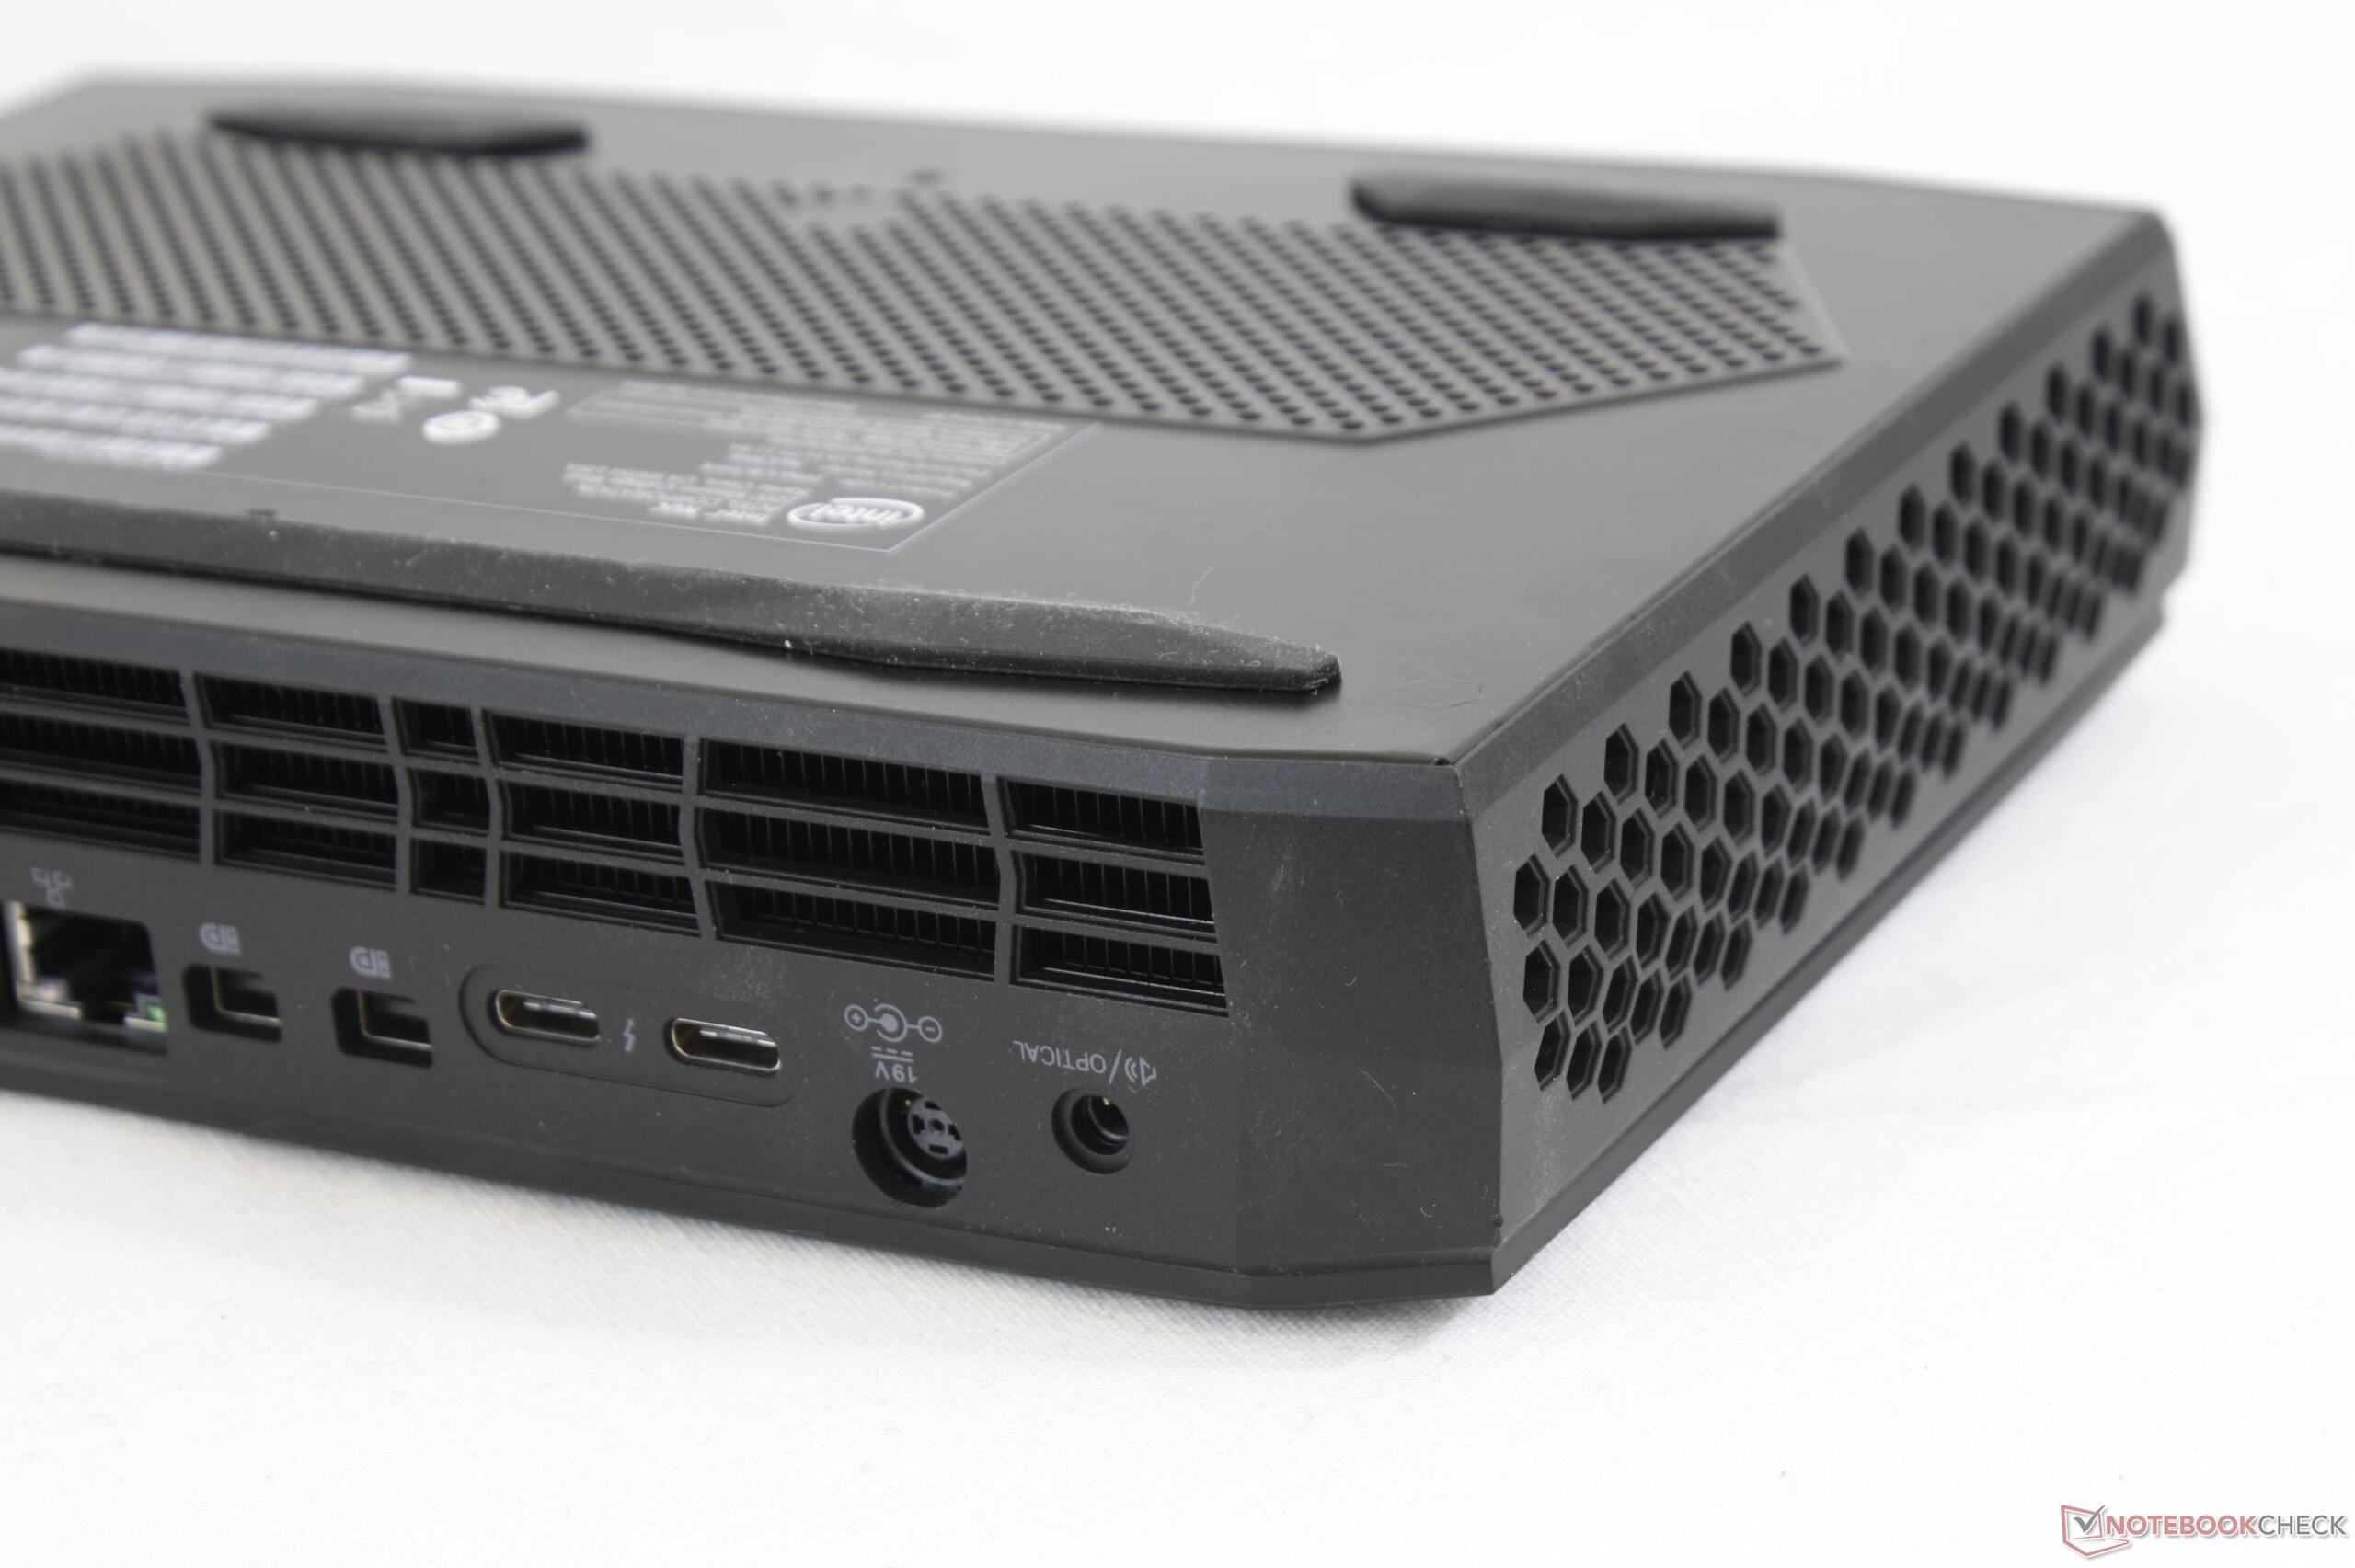
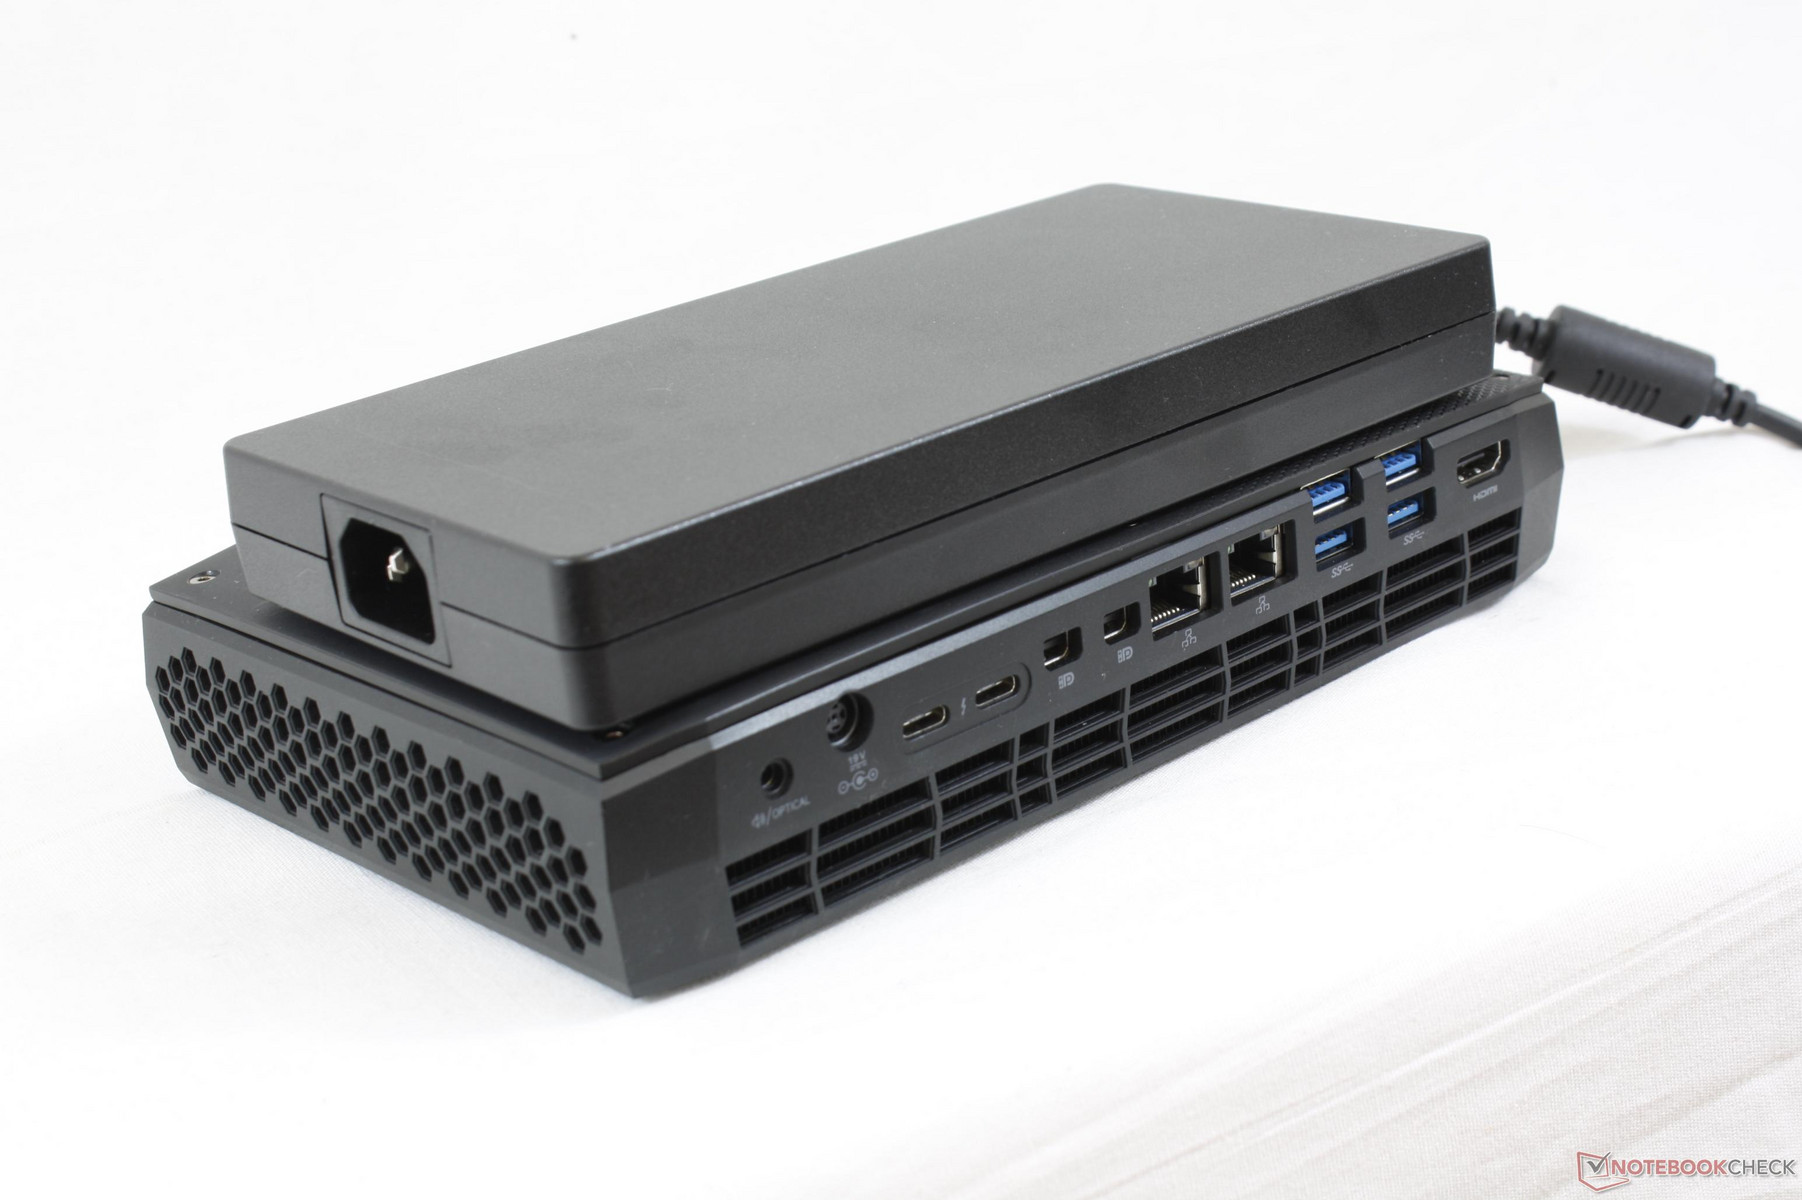
Connectivity - Ports galore
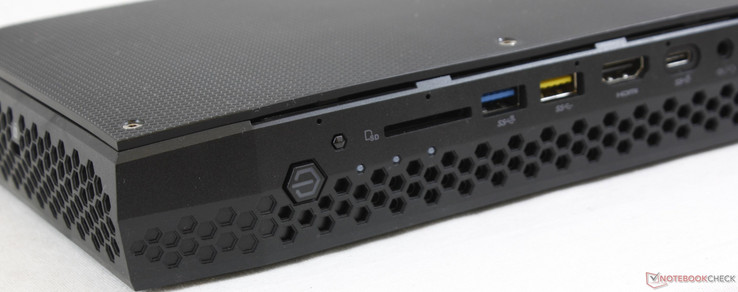
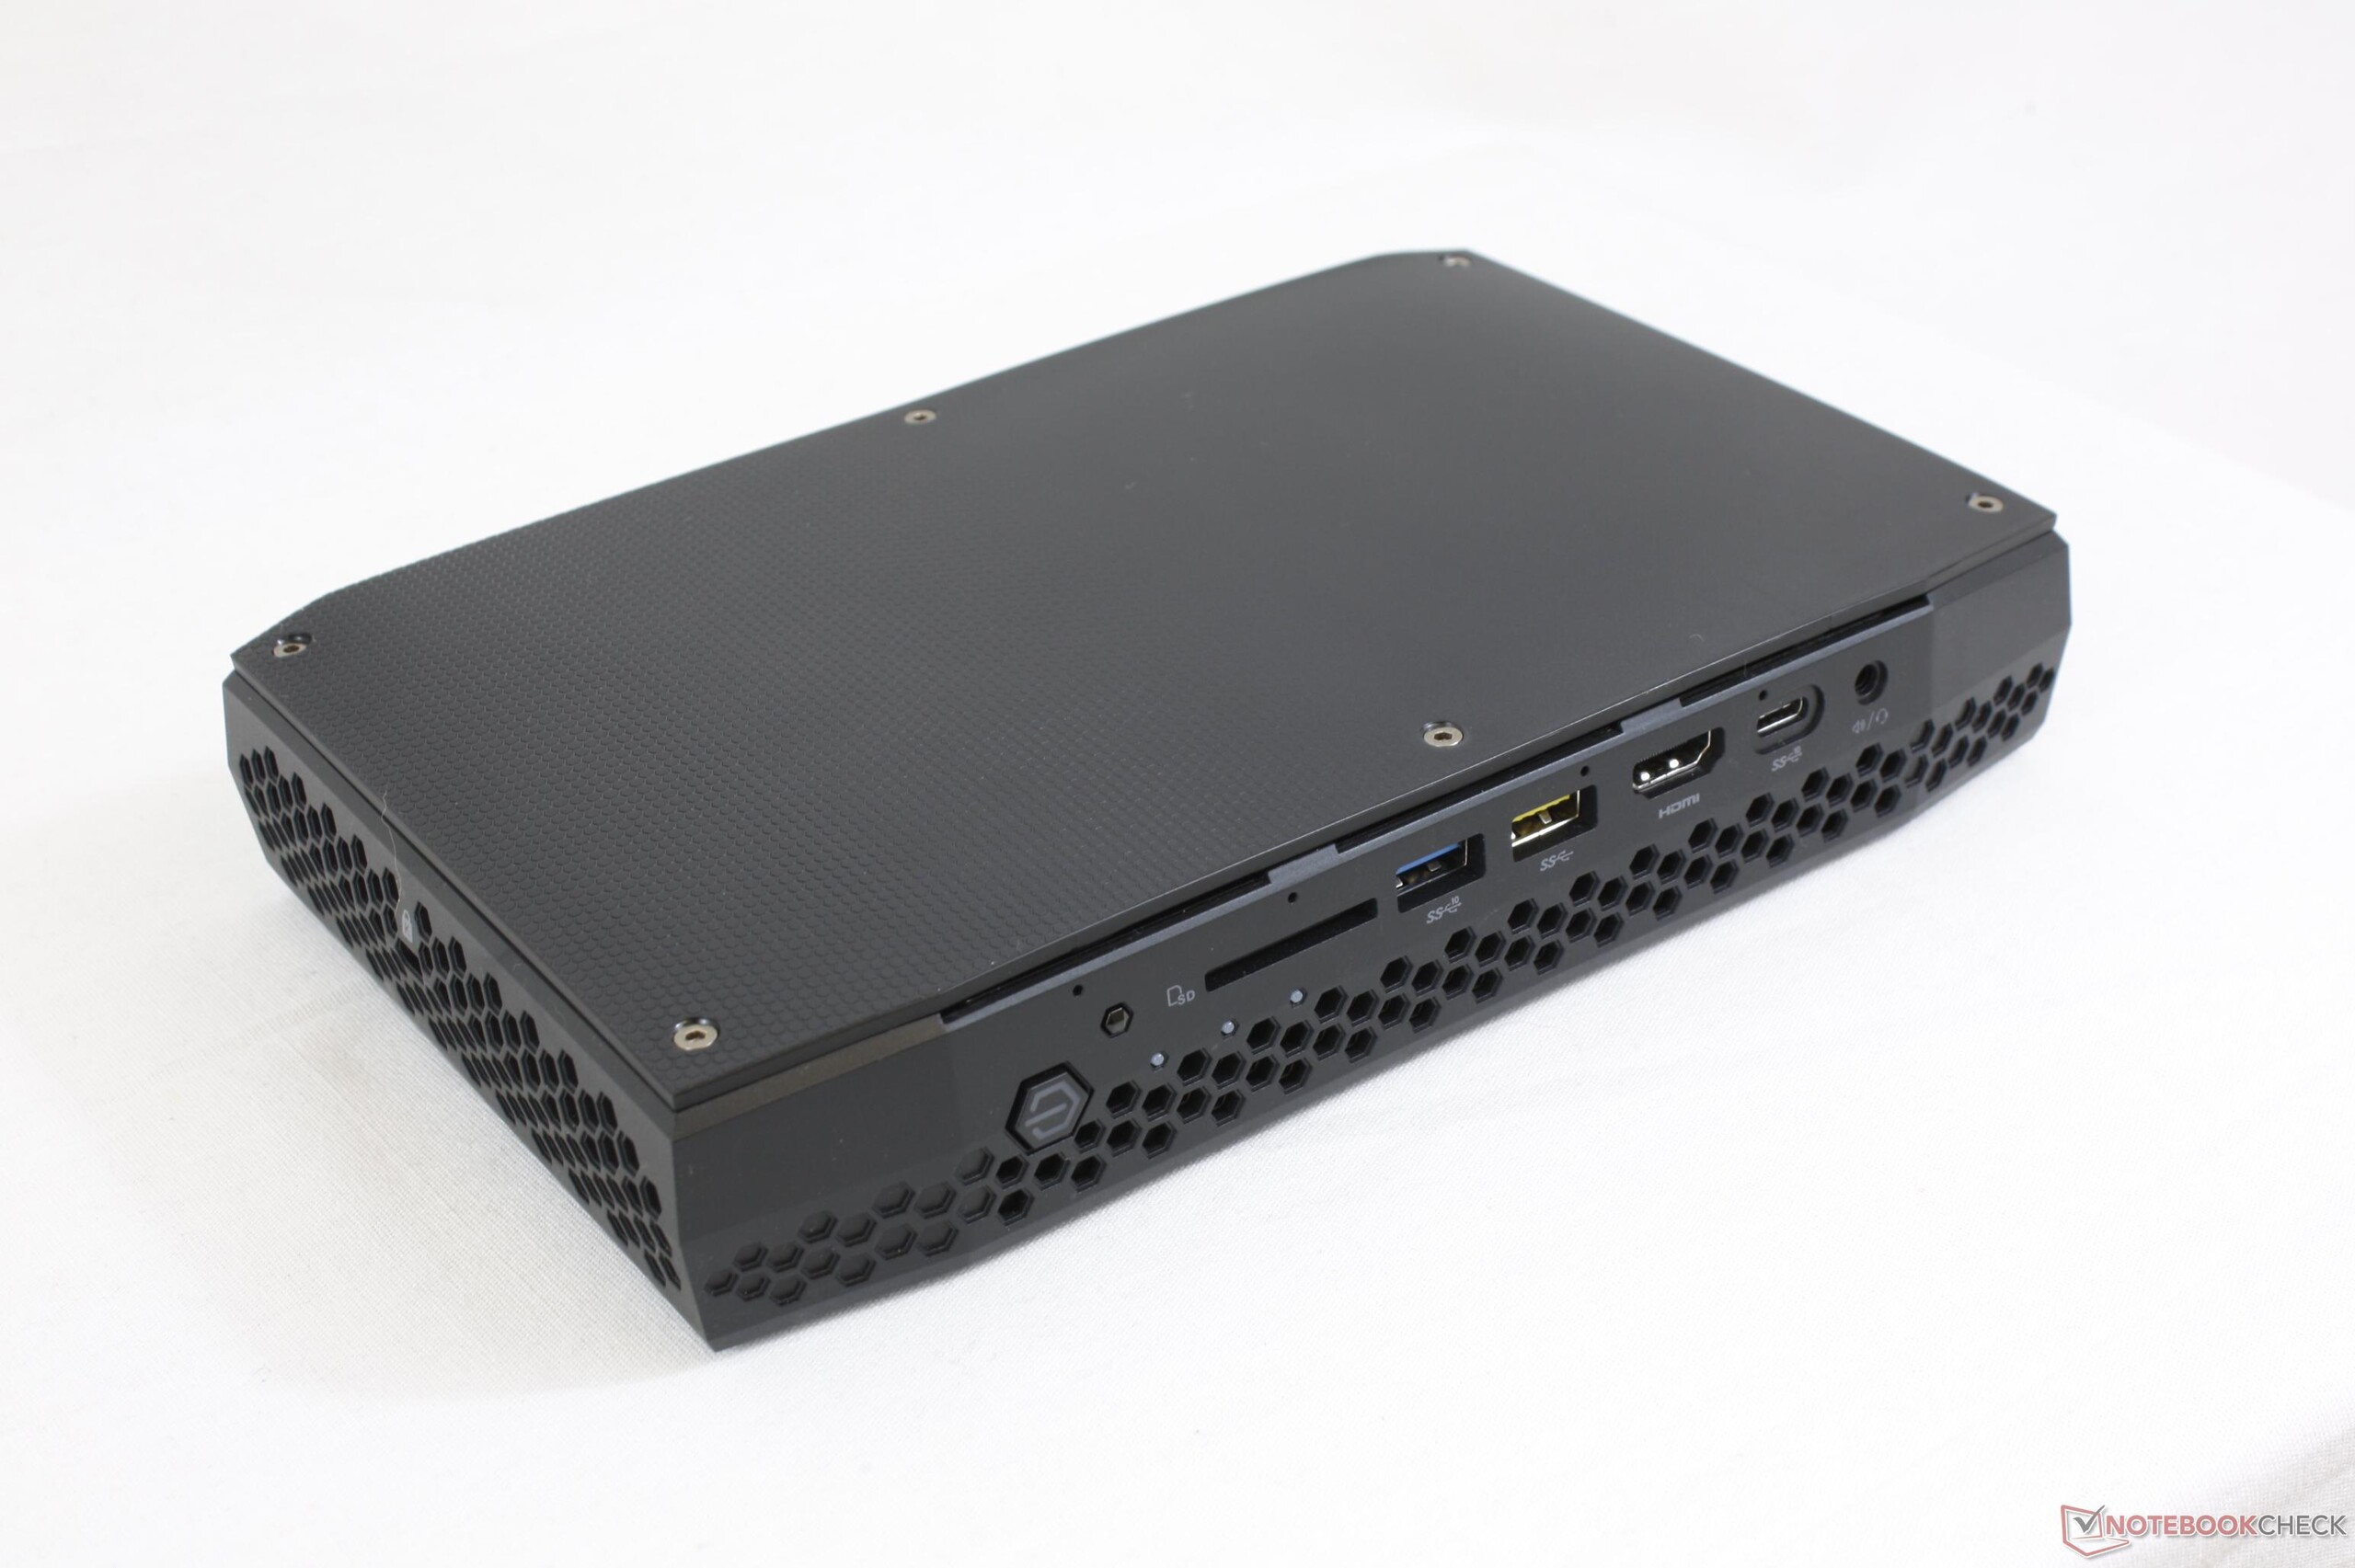
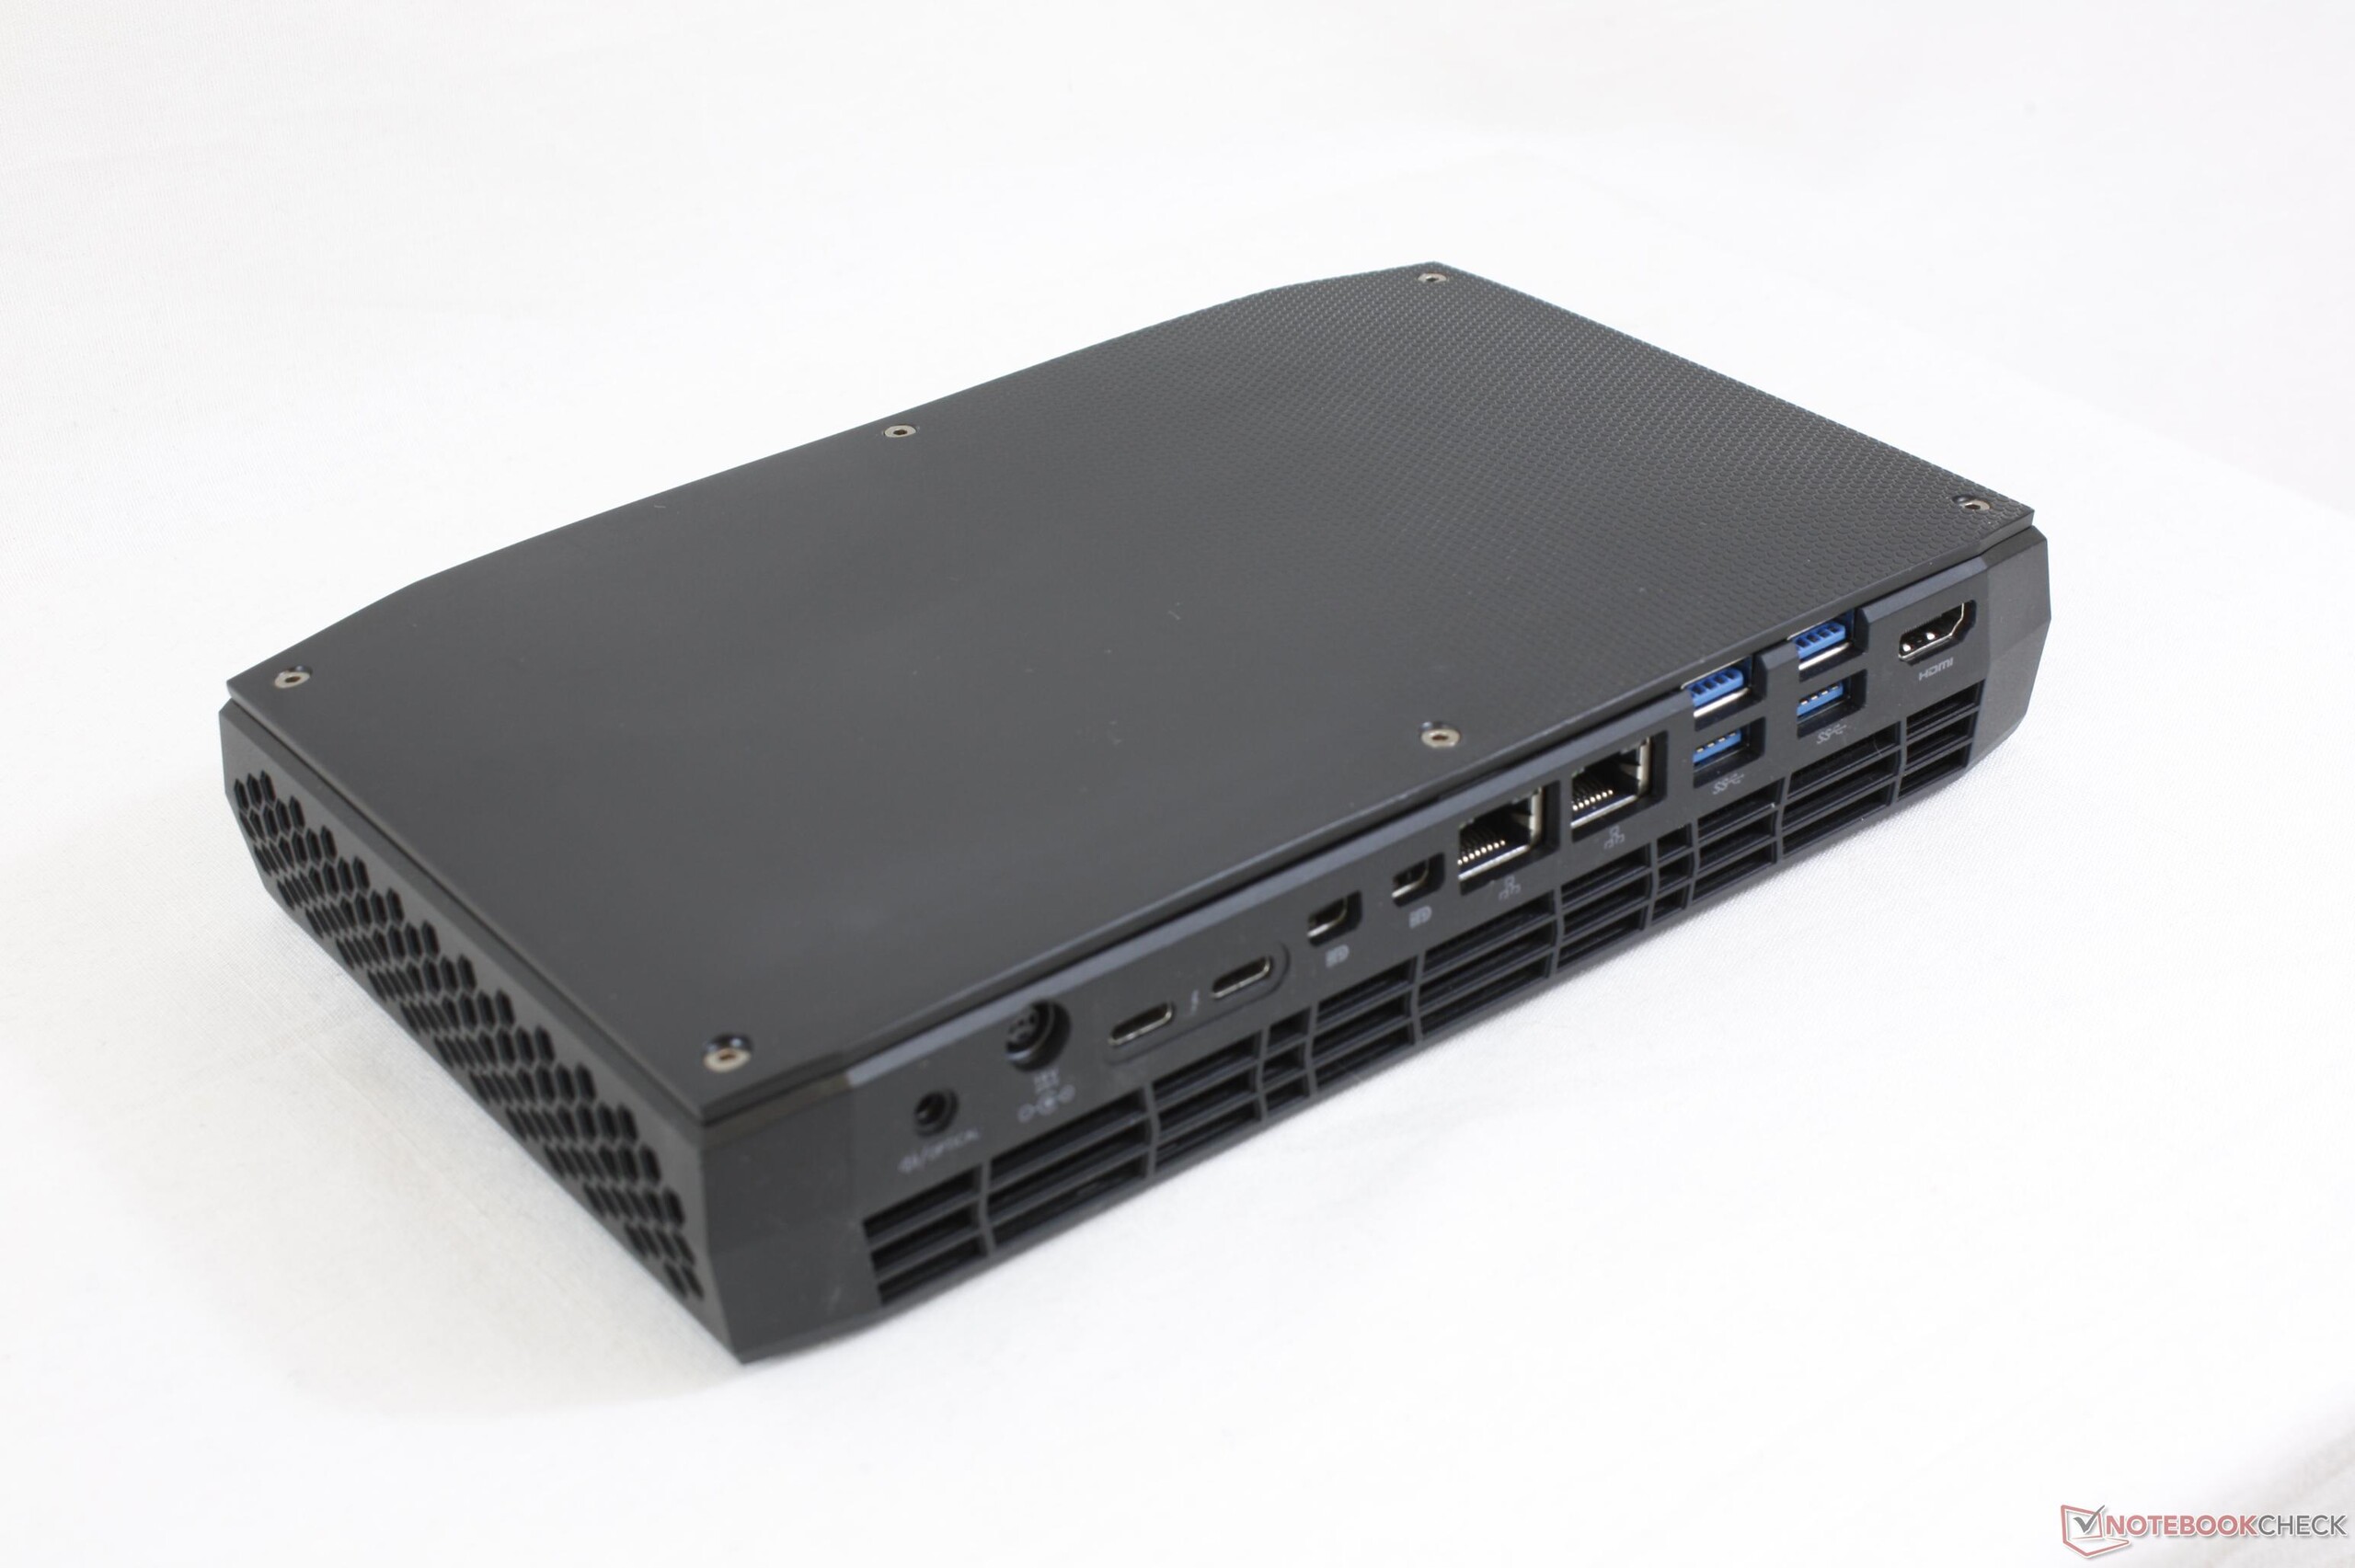
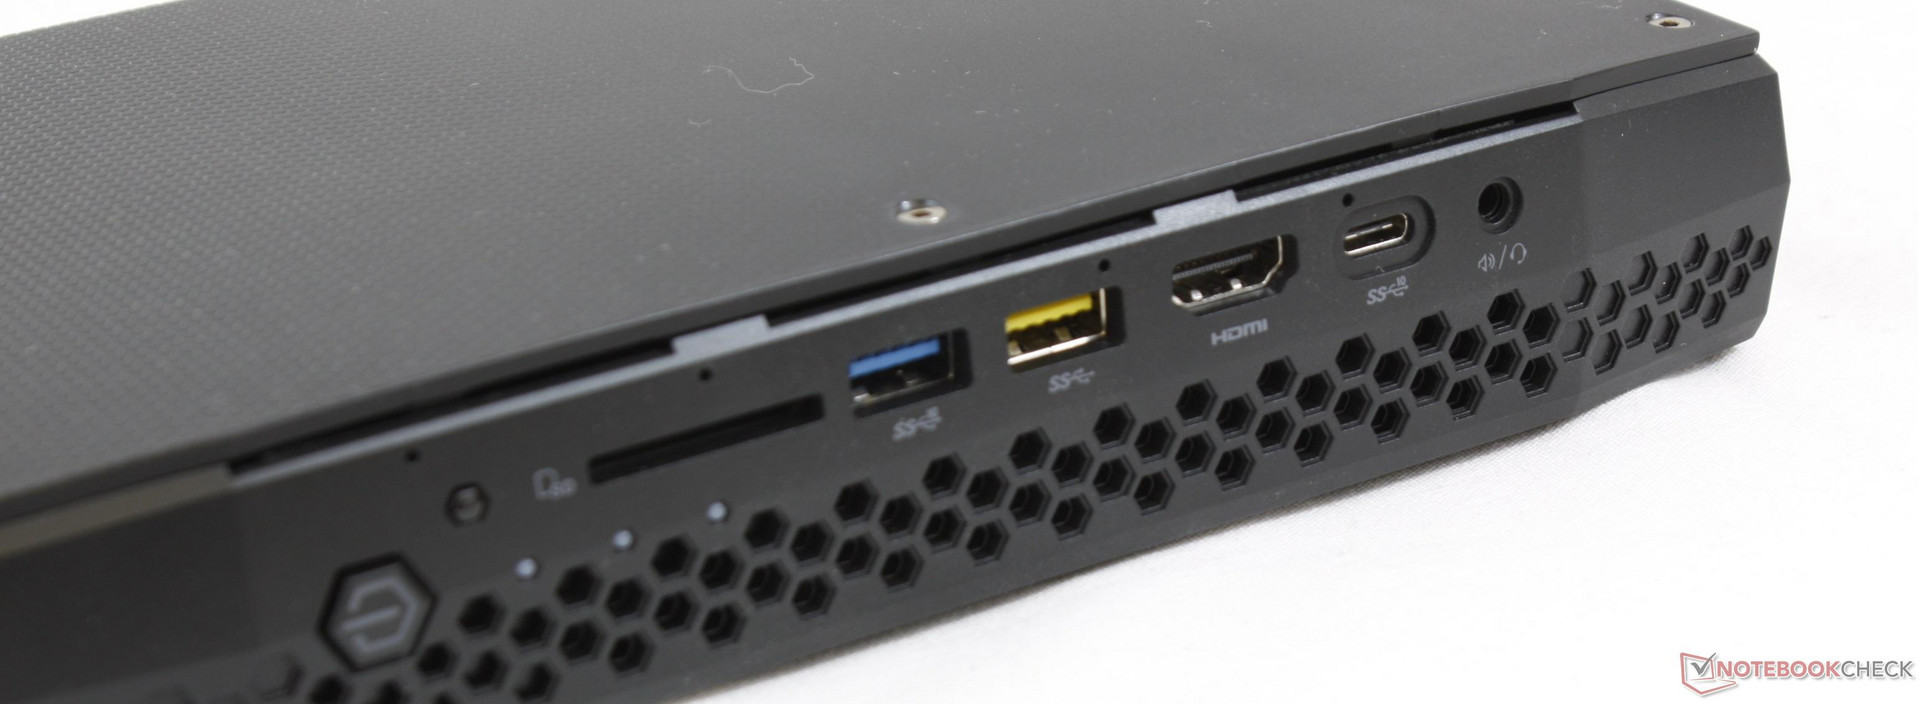
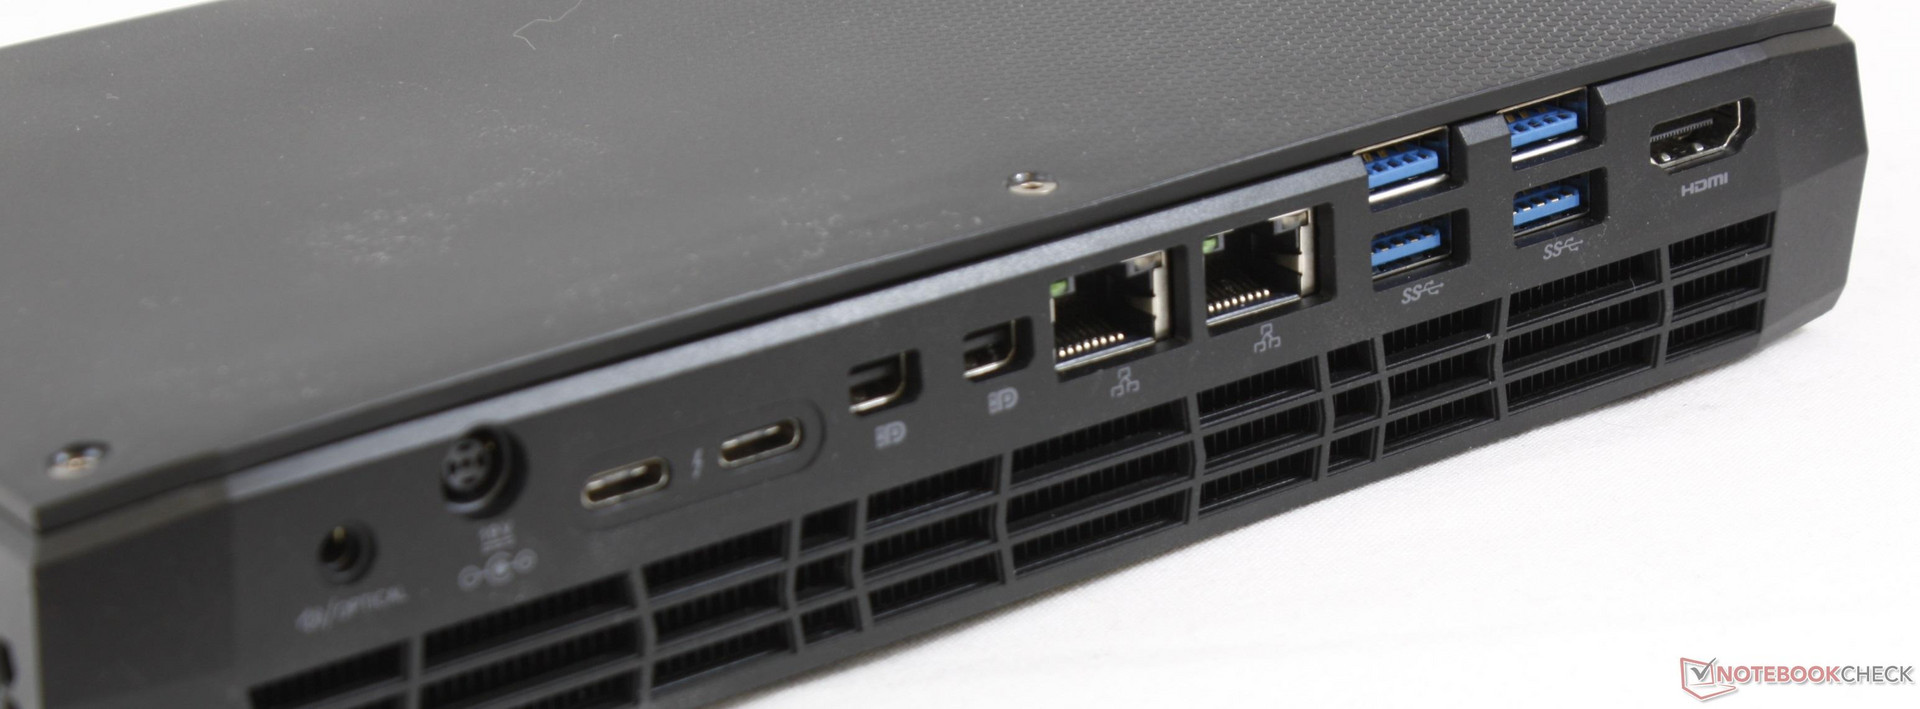
Intel didn't let the larger size go to waste as there is an abundant number of available ports. There are at least two of almost every port including Thunderbolt 3, Gigabit RJ-45, mini-DisplayPort, HDMI, and USB to be more than what larger SFF PCs offer like the MSI Trident 3 or Asus GR8 II. Port spacing is uniform if not a bit tight along the rear. The Vega M GPU can output up to 6 independent 4K displays simultaneously on the higher-end SKU only. We would like to see a HDMI-in port in the future to further establish the NUC as a home multimedia system.
A minor but noteworthy annoyance is that the USB ports on the rear of the unit are upside-down while the front USB ports are right-side up. It's certainly not a deal breaker, but it's headache inducing nonetheless.
SD Card Reader
Transfer rates from the SD reader are average at about 88 MB/s. Moving 1 GB worth of photos from our Toshiba UHS-II test card takes just under 13 seconds compared to under 6 seconds on some high-end gaming notebooks like the GS73VR. While not as fast as we had hoped, the NUC card reader is at least faster than the card readers of Zotac ZBox systems.
The card reader is not spring-loaded and a fully inserted SD card will still protrude by about half its length.
| SD Card Reader | |
| average JPG Copy Test (av. of 3 runs) | |
| MSI GS73VR 7RG (Toshiba Exceria Pro SDXC 64 GB UHS-II) | |
| Dell XPS 13 i5-8250U (Toshiba Exceria Pro SDXC 64 GB UHS-II) | |
| Intel Hades Canyon NUC8i7HVK (Toshiba Exceria Pro SDXC 64 GB UHS-II) | |
| Zotac ZBOX Magnus EN51050 (Toshiba Exceria Pro SDXC 64 GB UHS-II) | |
| maximum AS SSD Seq Read Test (1GB) | |
| MSI GS73VR 7RG (Toshiba Exceria Pro SDXC 64 GB UHS-II) | |
| Dell XPS 13 i5-8250U (Toshiba Exceria Pro SDXC 64 GB UHS-II) | |
| Intel Hades Canyon NUC8i7HVK (Toshiba Exceria Pro SDXC 64 GB UHS-II) | |
| Zotac ZBOX Magnus EN51050 (Toshiba Exceria Pro SDXC 64 GB UHS-II) | |
Software
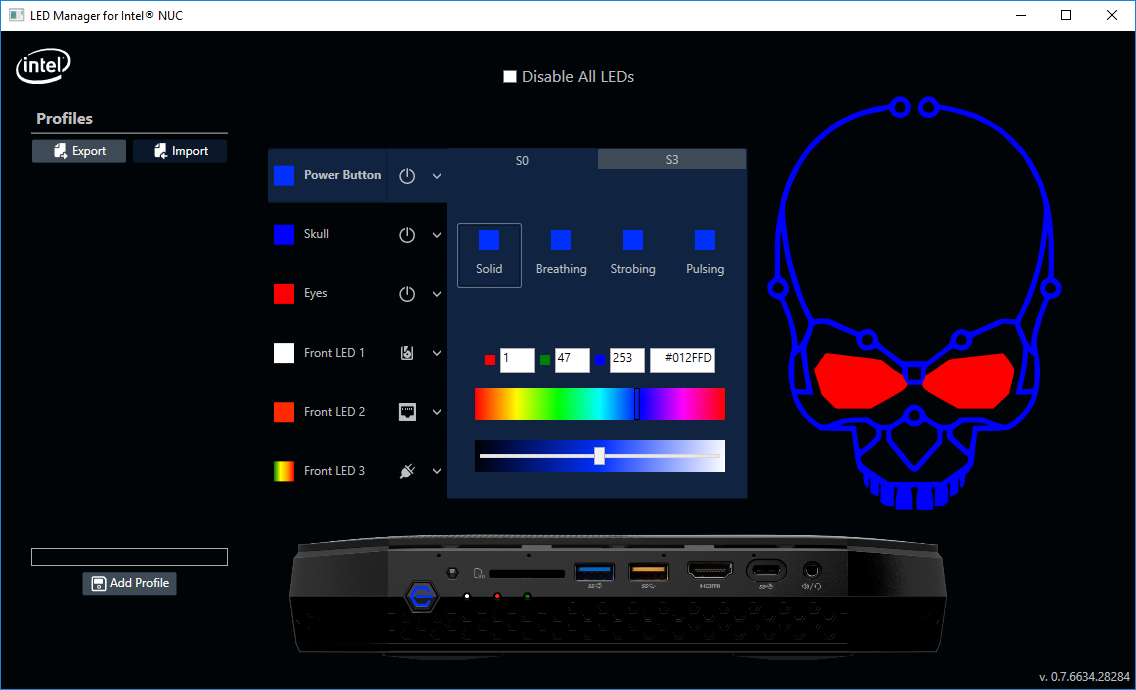
For visual customization, the easy-to-use LED Manager allows 16.7 million colors for the outer plate skull, three front LEDs, and the power button. The handy 'Disable All LEDs' option turns off all colors to make the NUC more appropriate for professional or work settings.
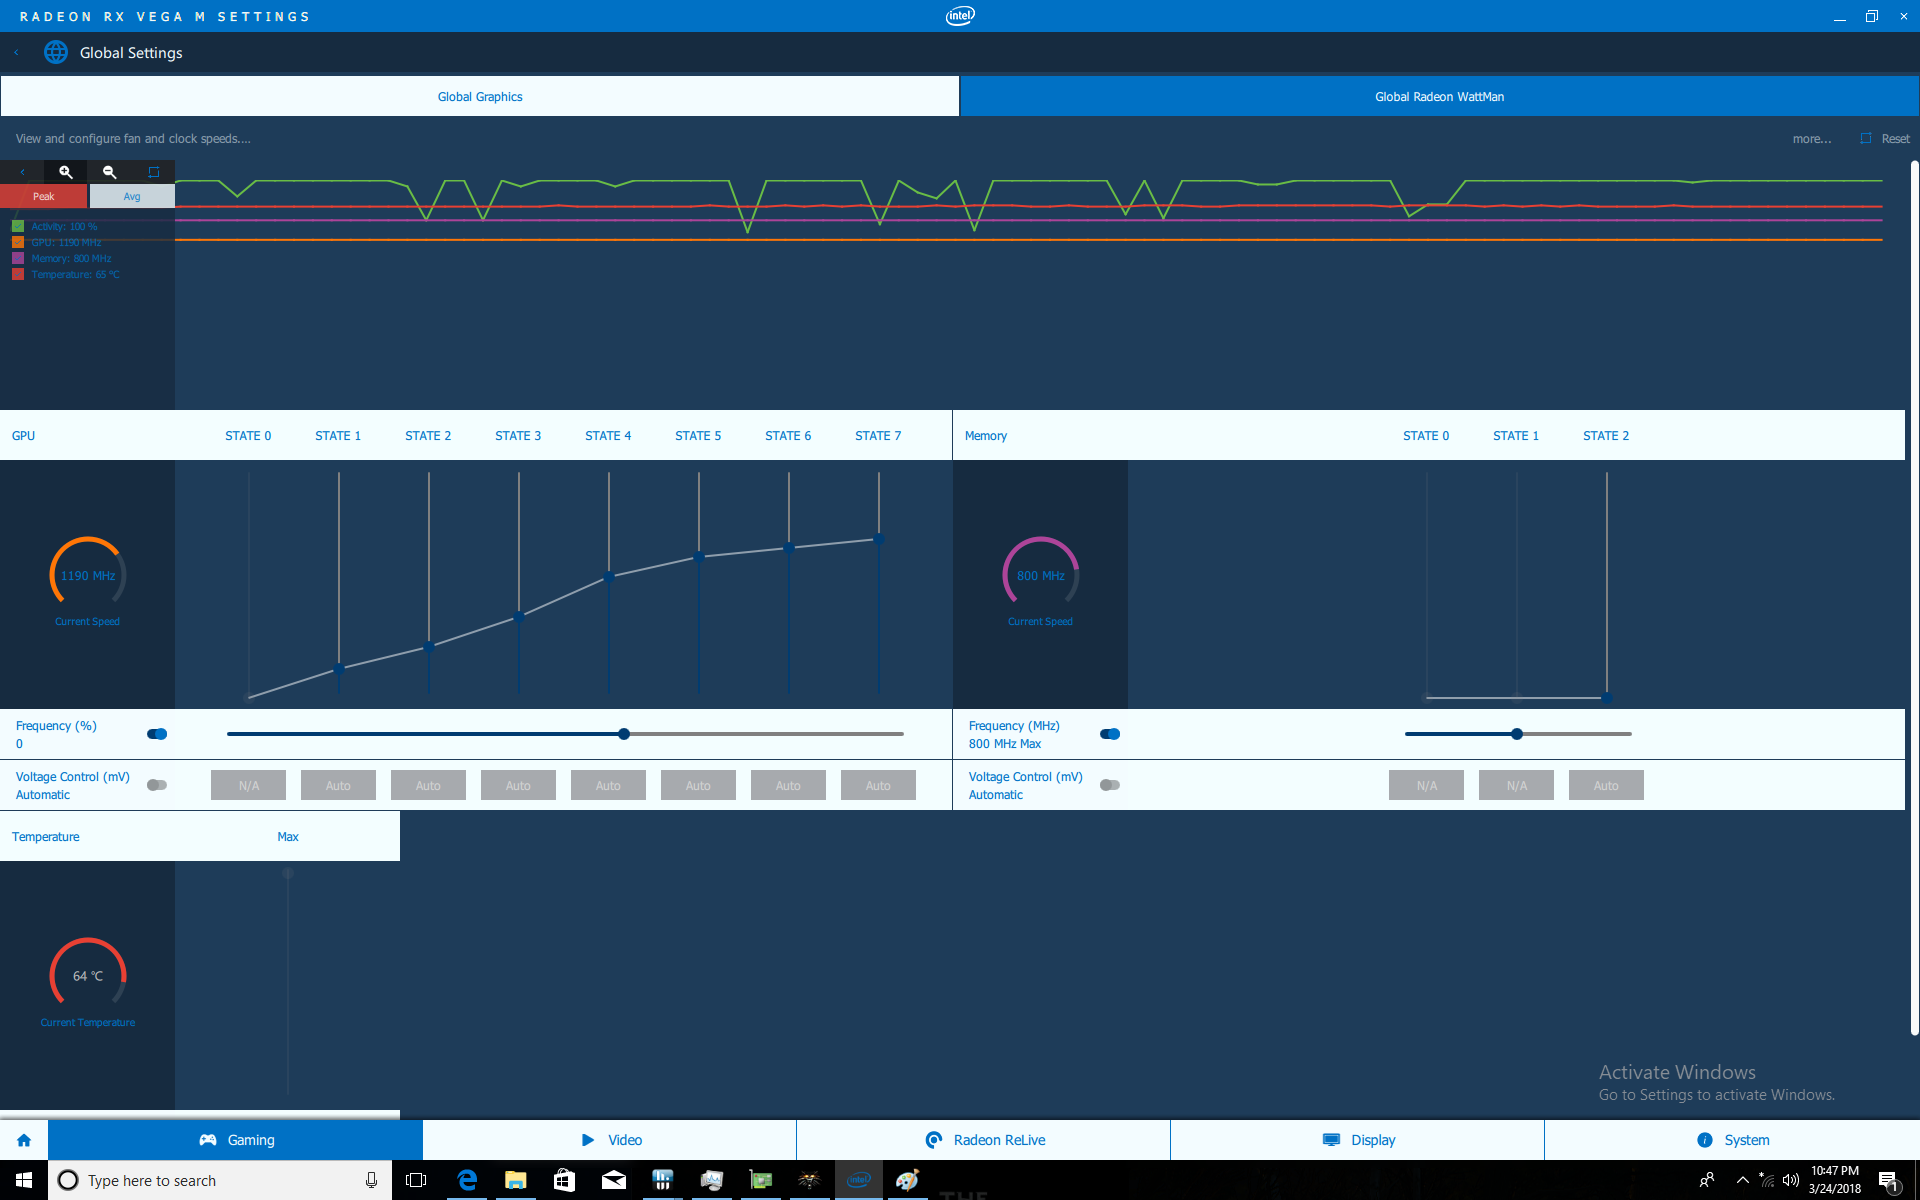
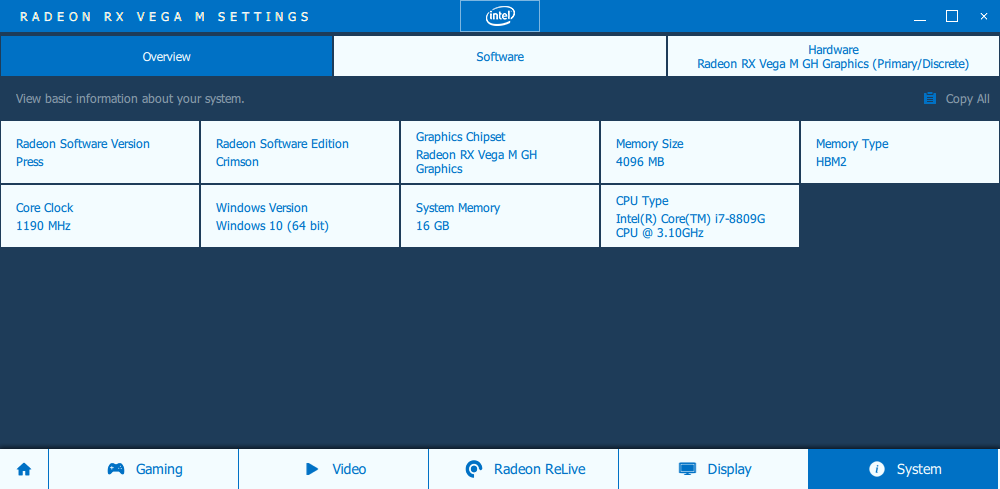
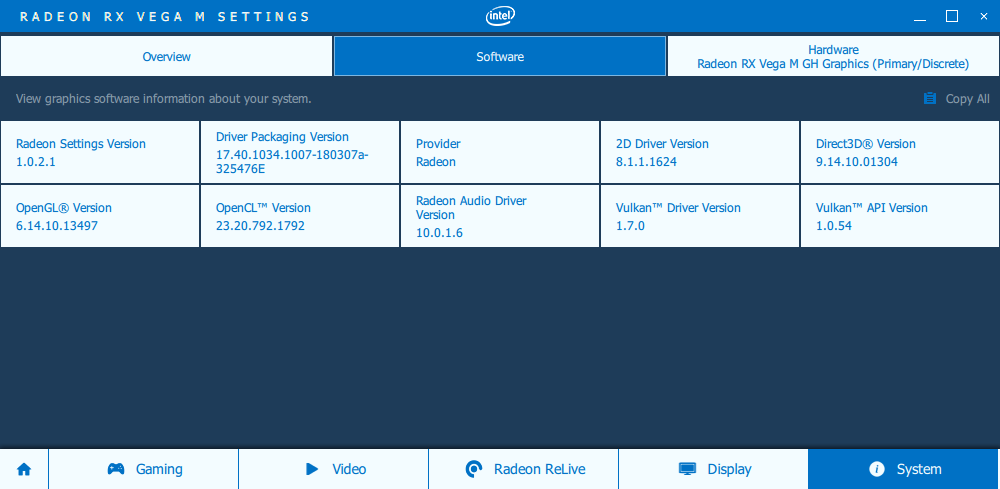
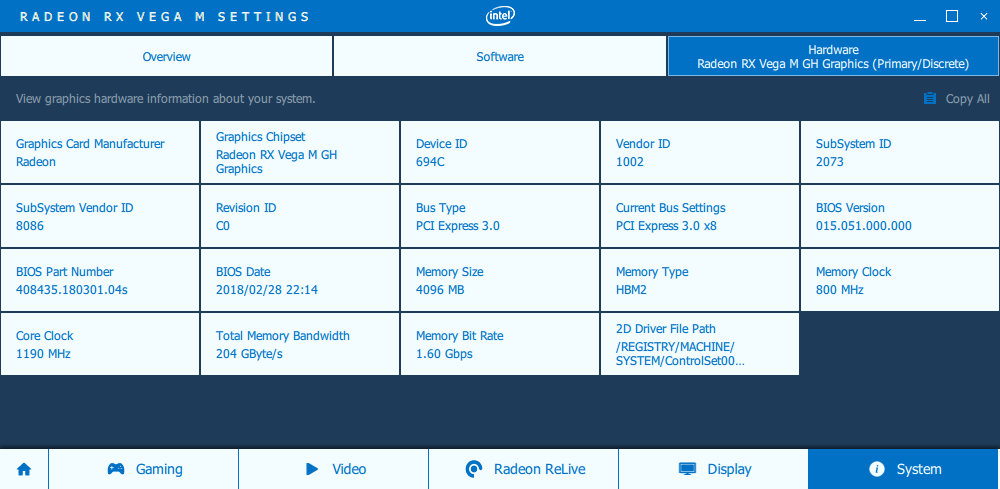
The Radeon RX Vega M settings software is nearly identical to the AMD Radeon Settings menu found on newer Radeon GPUs but with a fresh coat of blue paint. Users can access Radeon-specific features like ReLive, WattMan, Chill, FreeSync, and core hardware info through the settings menu. Many of these features are hidden through branching menus which can be annoying to users unfamiliar with the menu setup. Perhaps a "Search" feature could make navigation easier.
Communication
The included 2x2 Intel 8265 WLAN module is capable of theoretical transfer rates of up to 867 Mbps with support for Bluetooth 4.2. Our real-world test standing one meter away from our Linksys EA8500 test router returns an average transfer rate of 591 Mbps. The NUC lacks the large antennae that most Zotac gaming mini PCs carry and so its range will likely drop off more quickly from room to room. Competing systems with the Killer 1535 or 1435 have more gaming-centric features and software than what Intel has provided here.
We can note no unexpected drops or connectivity issues during our time with the test unit.
| Networking | |
| iperf3 transmit AX12 | |
| Dell XPS 13 9370 i5 UHD | |
| Intel Hades Canyon NUC8i7HVK | |
| Dell Latitude 5290 2-in-1 | |
| Zotac ZBOX Magnus EN51050 | |
| iperf3 receive AX12 | |
| Dell Latitude 5290 2-in-1 | |
| Dell XPS 13 9370 i5 UHD | |
| Intel Hades Canyon NUC8i7HVK | |
| Zotac ZBOX Magnus EN51050 | |
Accessories
Included extras are a Quick Start guide, Hex wrench, mounting screws, and a 75 mm/100 mm VESA plate. The bottom plate of the NUC must be removed with a Philips screwdriver in order to properly mount the VESA plate. Unlike on the Skull Canyon NUC, Hades Canyon does not come with an extra top plate for users to swap.
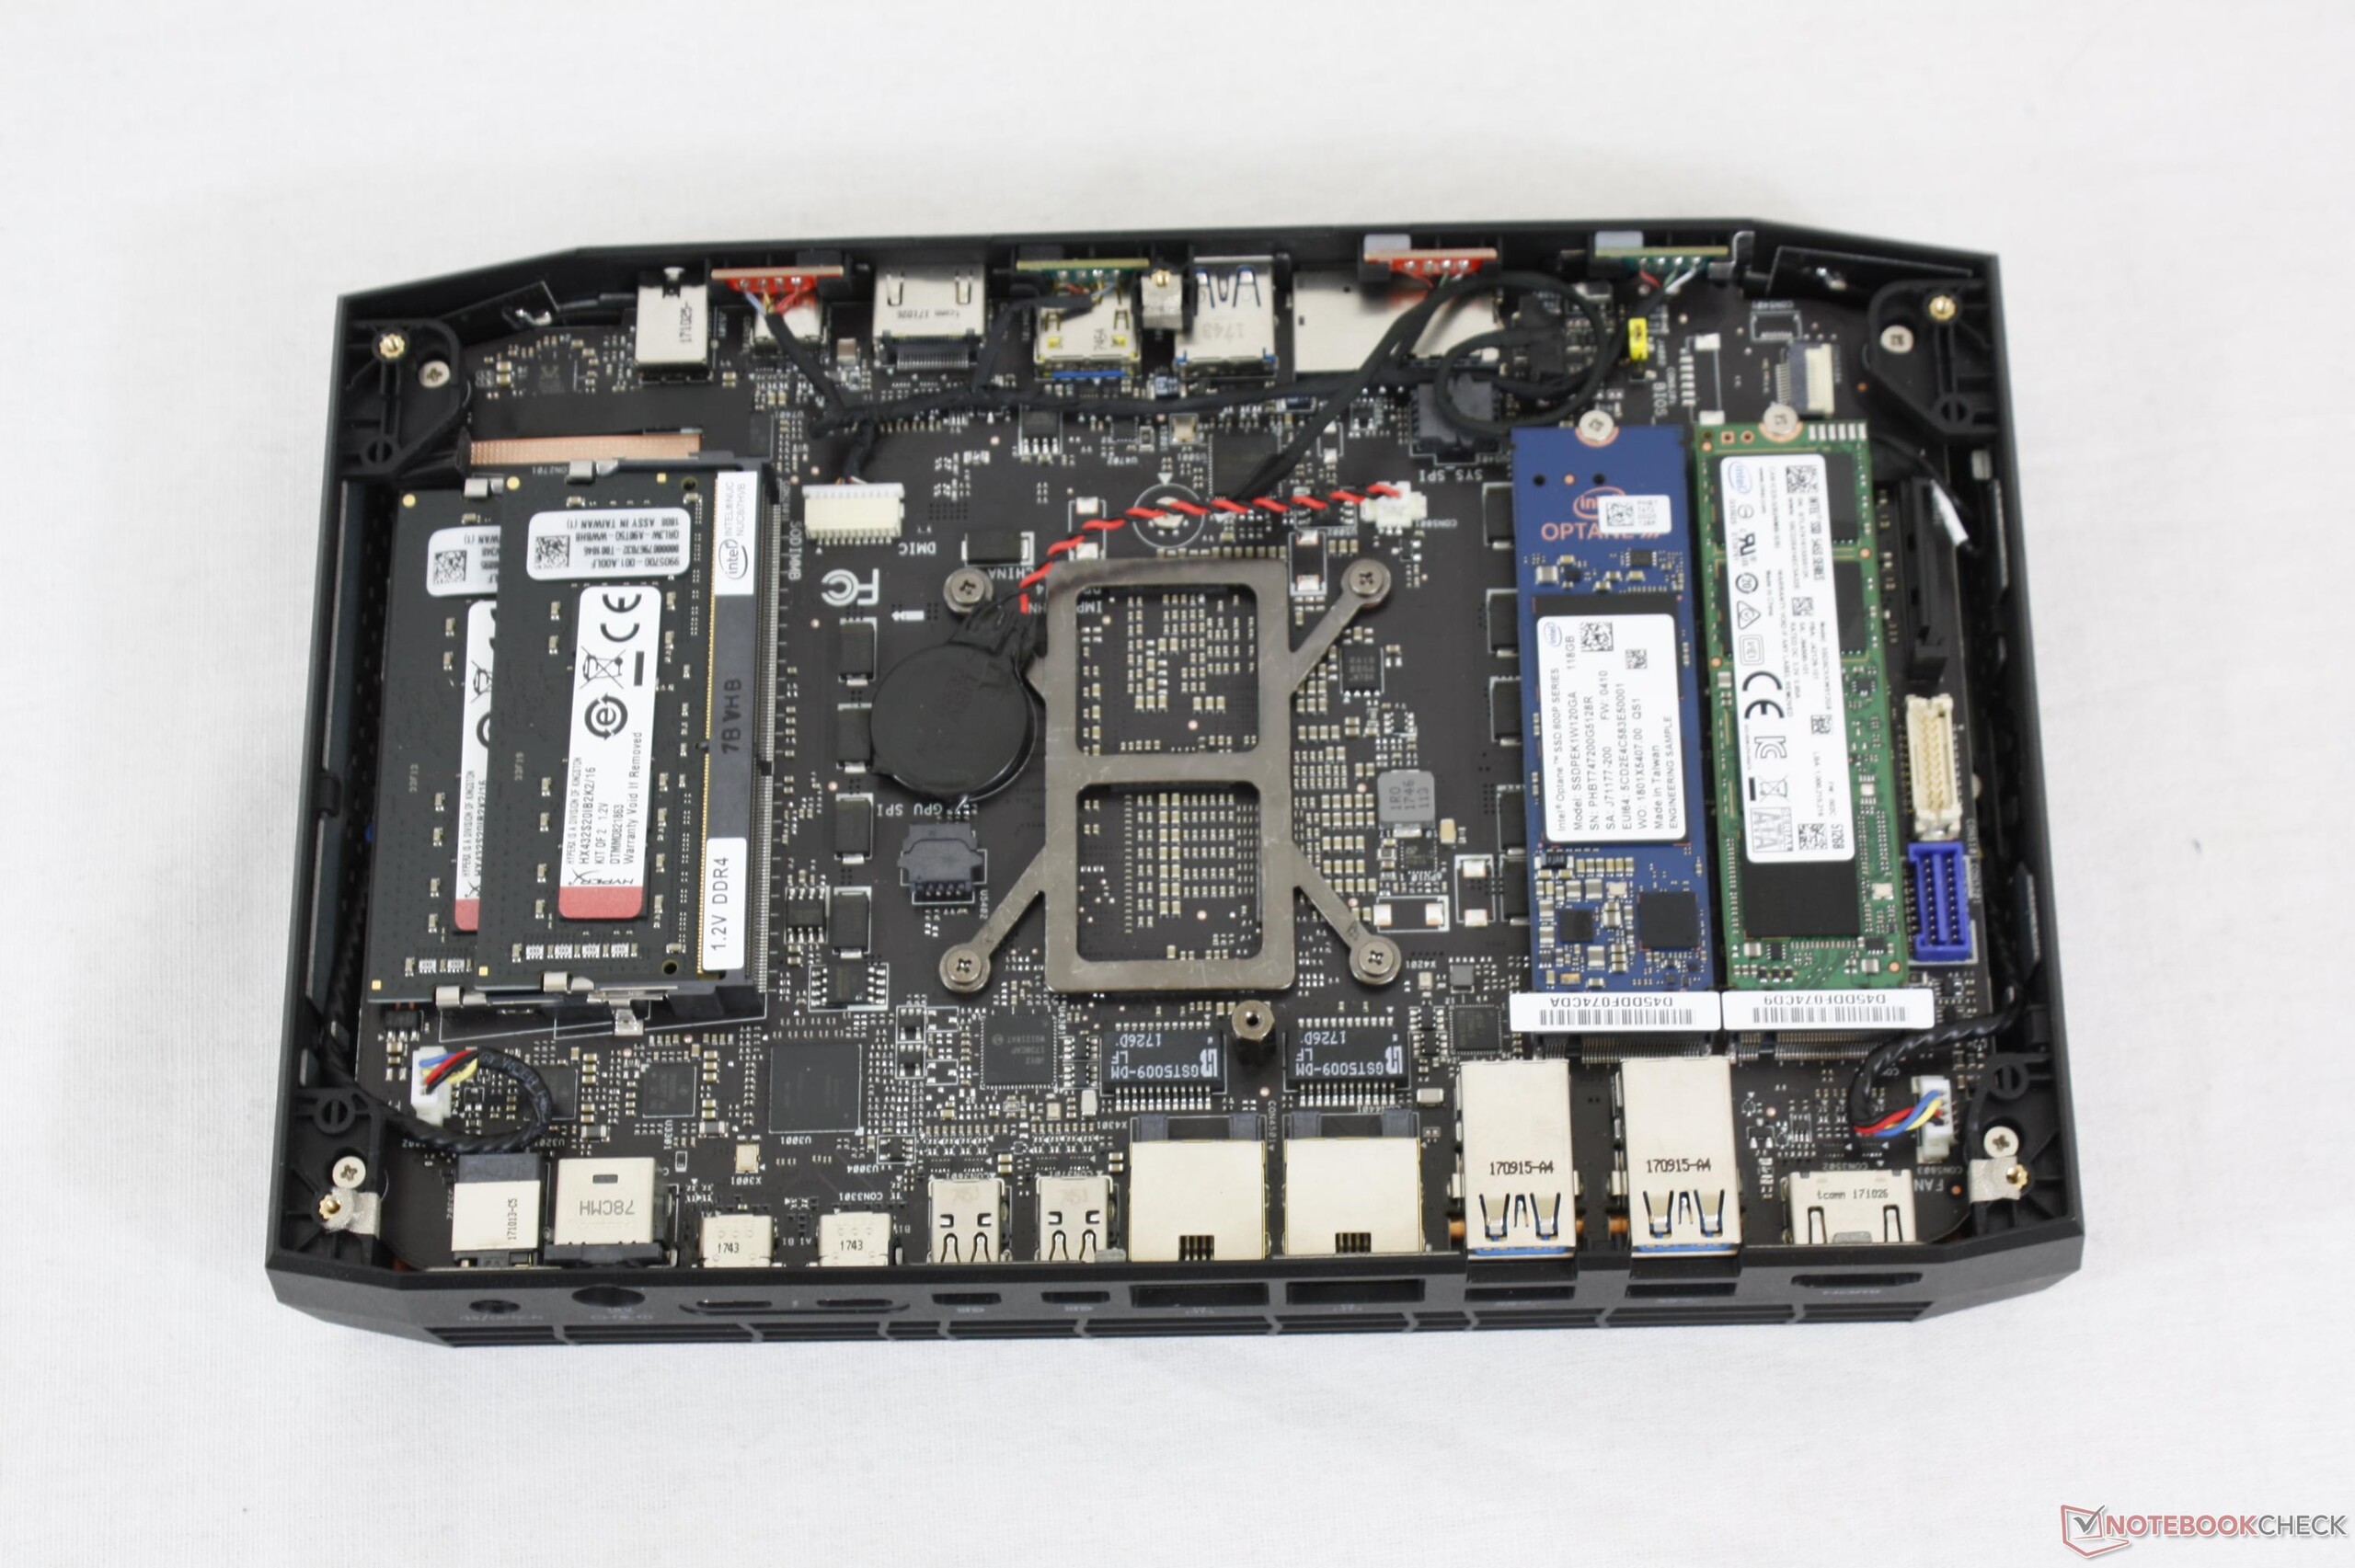
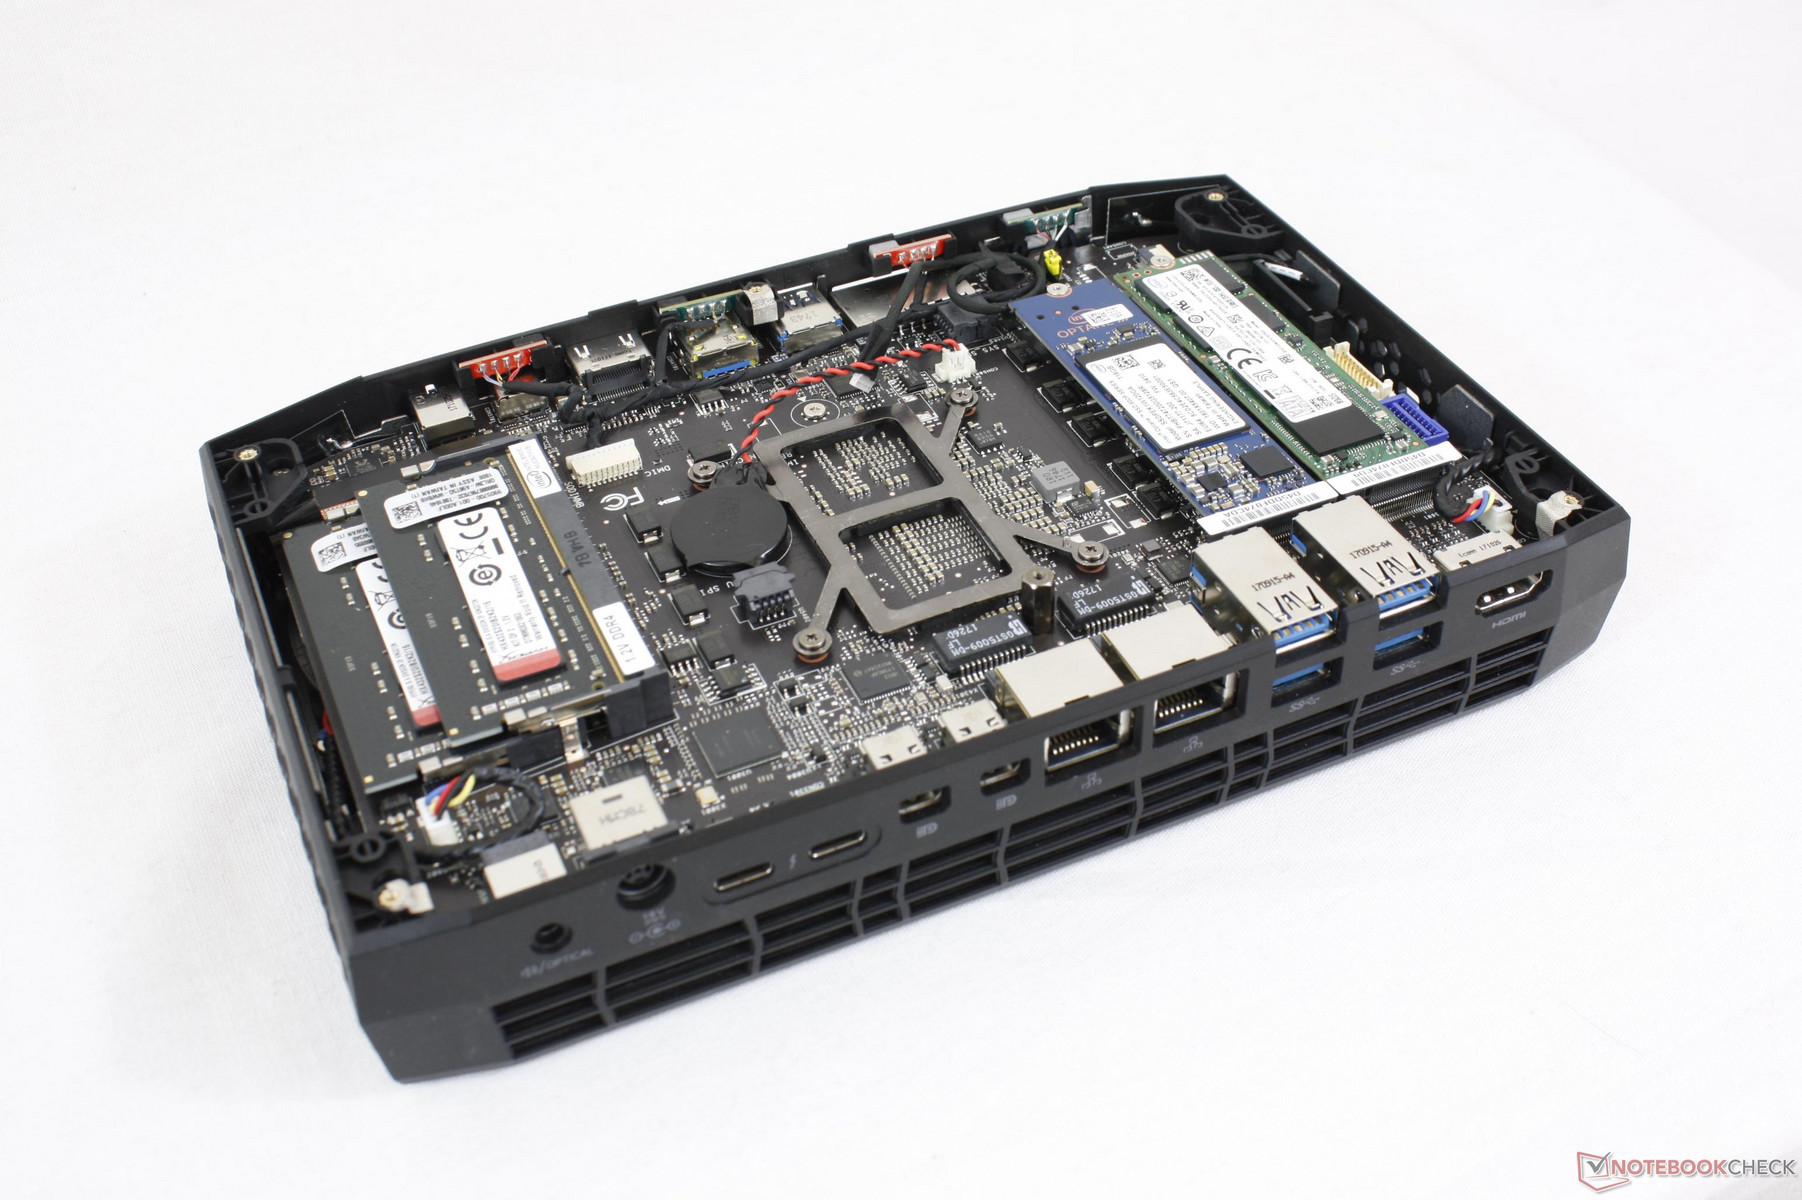
Maintenance
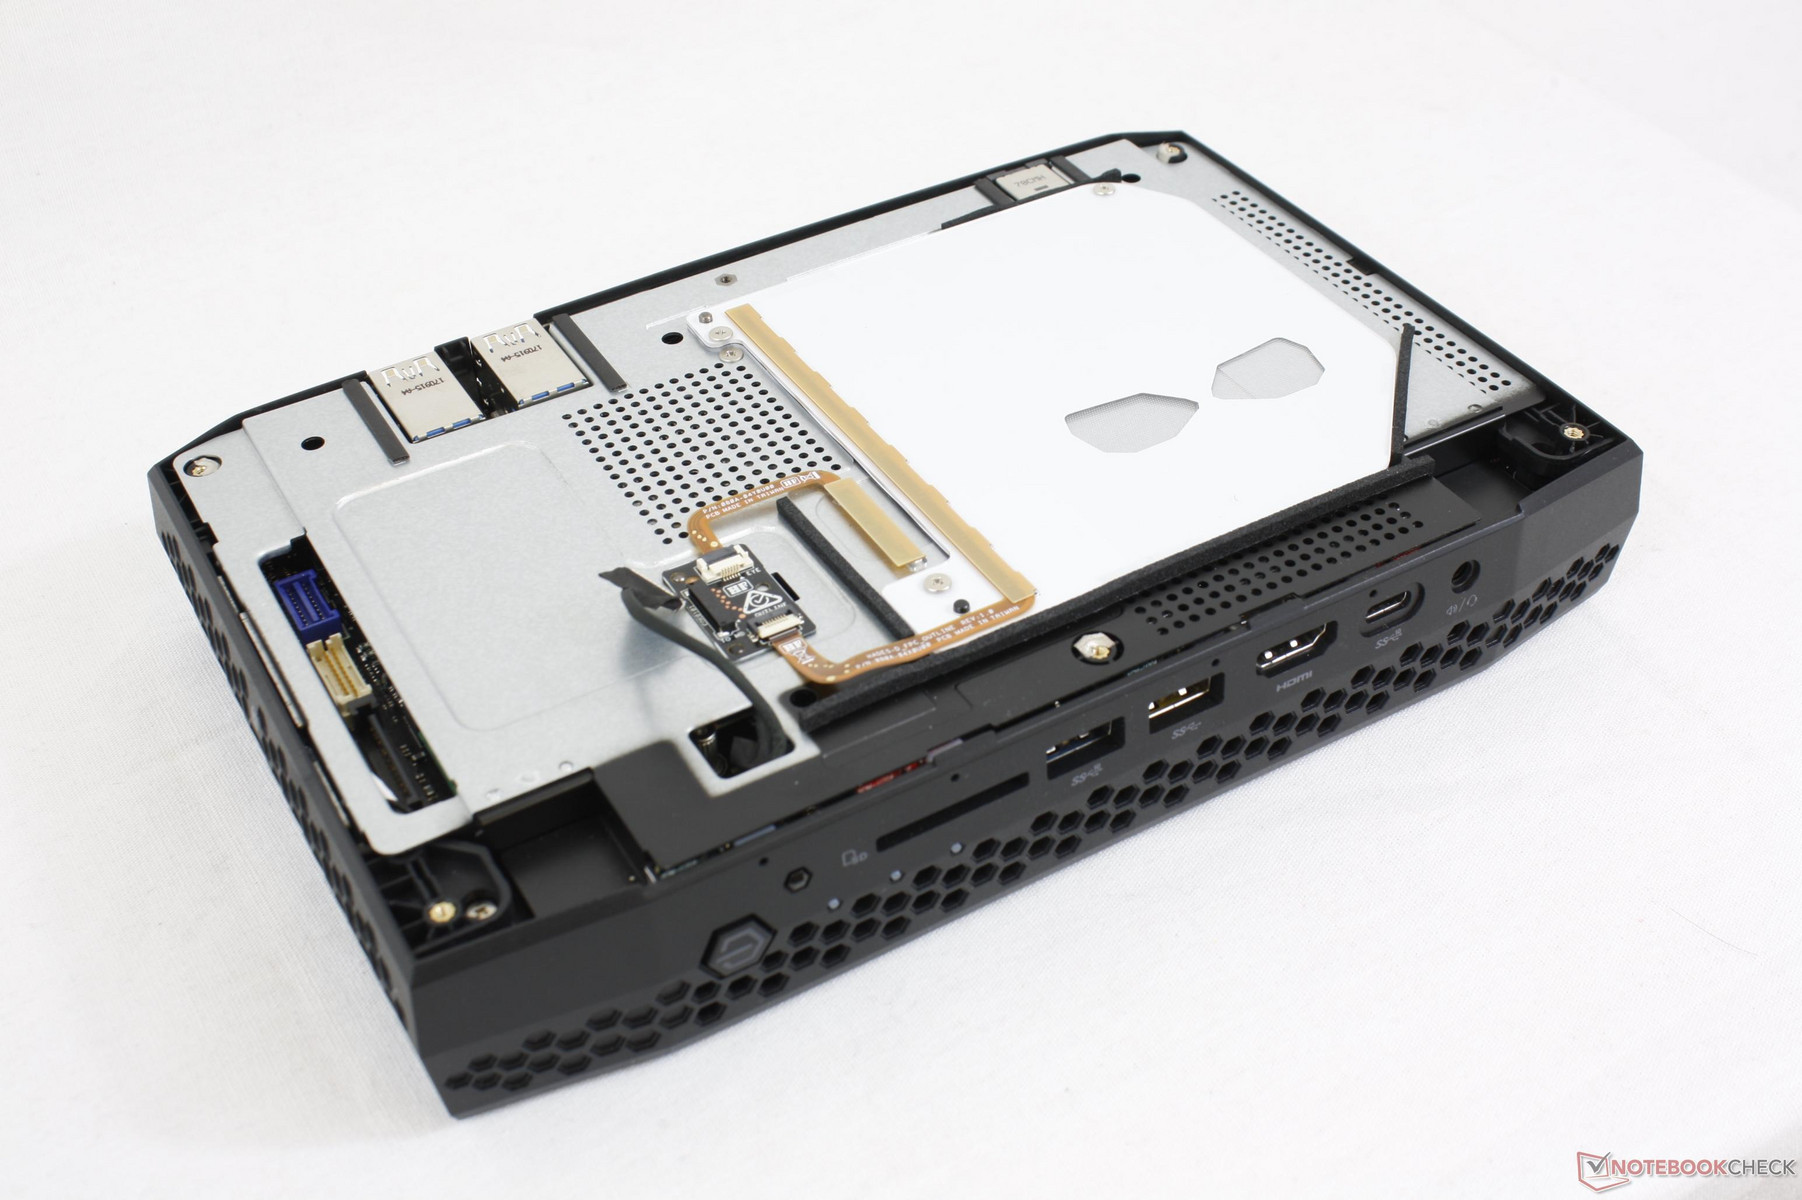
The top panel is removable once again and it will require a relatively large T8 Hex wrench whereas notebooks like the XPS 13 or Razer Blade utilize smaller T5 Hex screws. Popping the panel reveals the LED skull and the protective metal plate. A single Philips screw must be removed before lifting the plate that the included manual fails to mention.
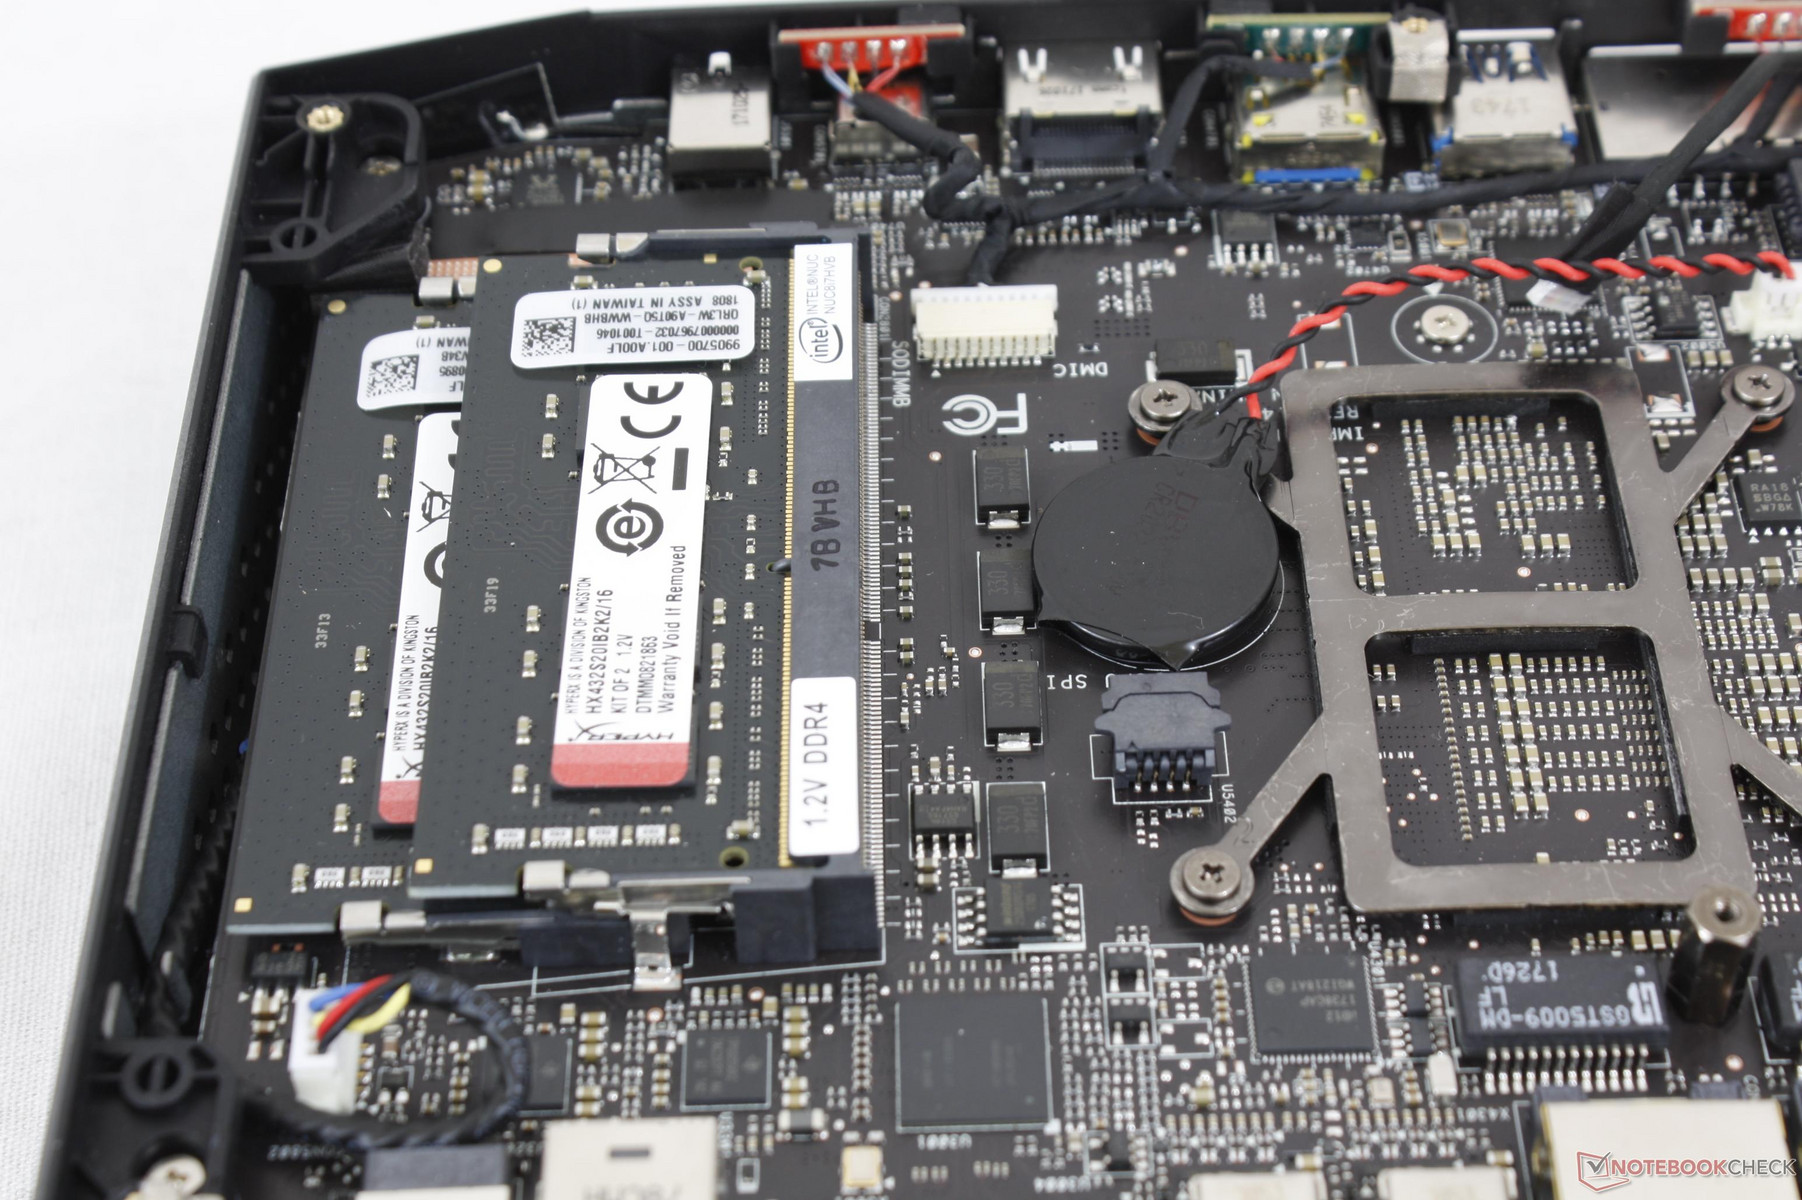
Once inside, users have direct access to 2x DDR4 SODIMM slots, 2x M.2 2280 storage bays, and the BIOS battery. Additional disassembly is required to reach the processor on the other side of the motherboard.
Warranty
Intel NUCs are covered by a limited three-year warranty worldwide or two years longer than most electronics in North America. Please see our Guarantees, Return Policies and Warranties FAQ for country-specific information.
Performance - HBM2 for the first time in a consumer device
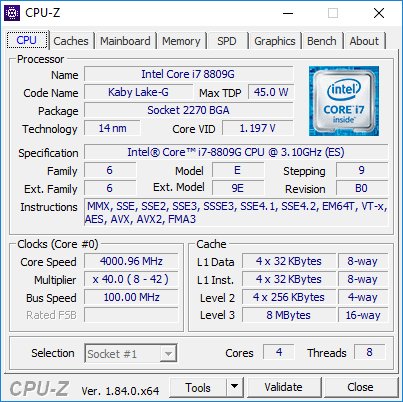
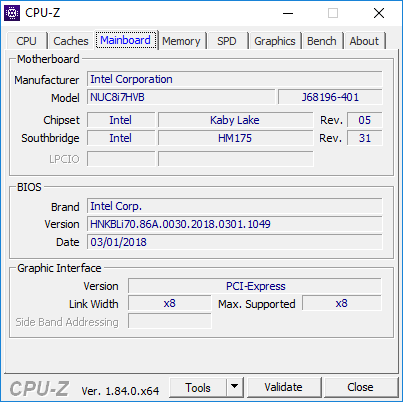
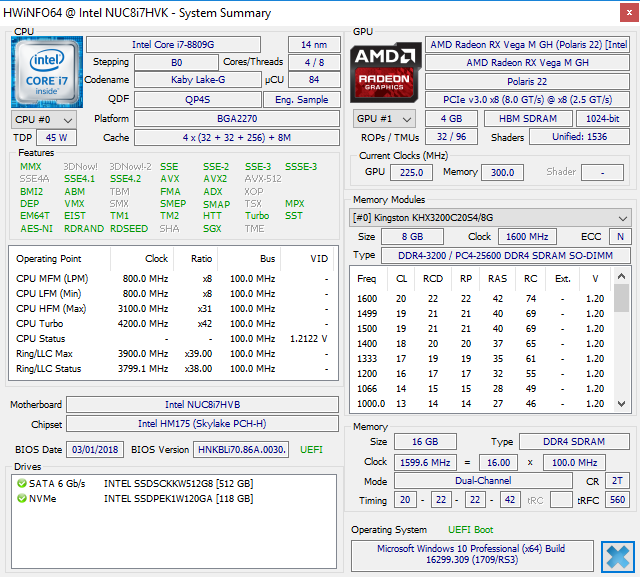
At its most basic and rudimentary level, the 100 W TDP Core i7-8809G can be thought of as a quad-core HQ-series CPU connected to a custom discrete AMD Vega GPU via an 8x PCIe 3.0 bus. Intel says that the physical distance between the CPU and GPU is deliberately wide to avoid a very hot point heat source and to aid in cooling should both processors be stressed simultaneously. Although Intel markets it as an 8th gen CPU, the processor portion has more in common with a 45 W 7th gen i7-7820HK than a mobile 8th gen Coffee Lake-H CPU since it only carries four physical cores instead of six. To address this, Intel has implemented "Dynamic Tuning" where the CPU can take advantage of the larger TDP budget when the GPU is otherwise not stressed and vice versa. Intel promises an 18 percent higher performance-per-Watt with its tighter power management controls.
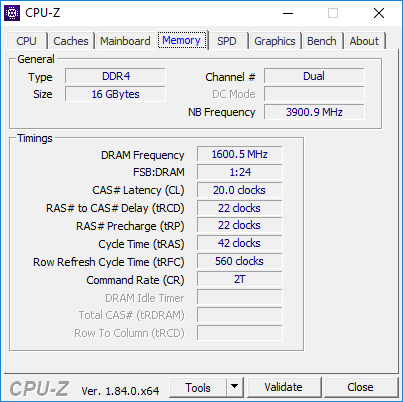
As if the Intel CPU and AMD GPU pairing wasn't crazy enough, the NUC also utilizes 4 GB of HBM2 (High-Bandwidth Memory 2) for video RAM in place of the common DDR4 or GDDR5. While HBM2 is likely costlier per GB, it occupies less real-estate than both alternatives while being more energy efficient. Intel was headstrong in producing a chipset with the CPU, GPU, and VRAM all in one package for mini PCs and laptops.
Note that the lower-end i7-8705G SKU is not unlocked and is not advertised as VR compatible in contrast to the higher-end SKU. The Dell XPS 15 2-in-1 and HP Spectre x360 15 will carry the i7-8705G with no i7-8809G options.
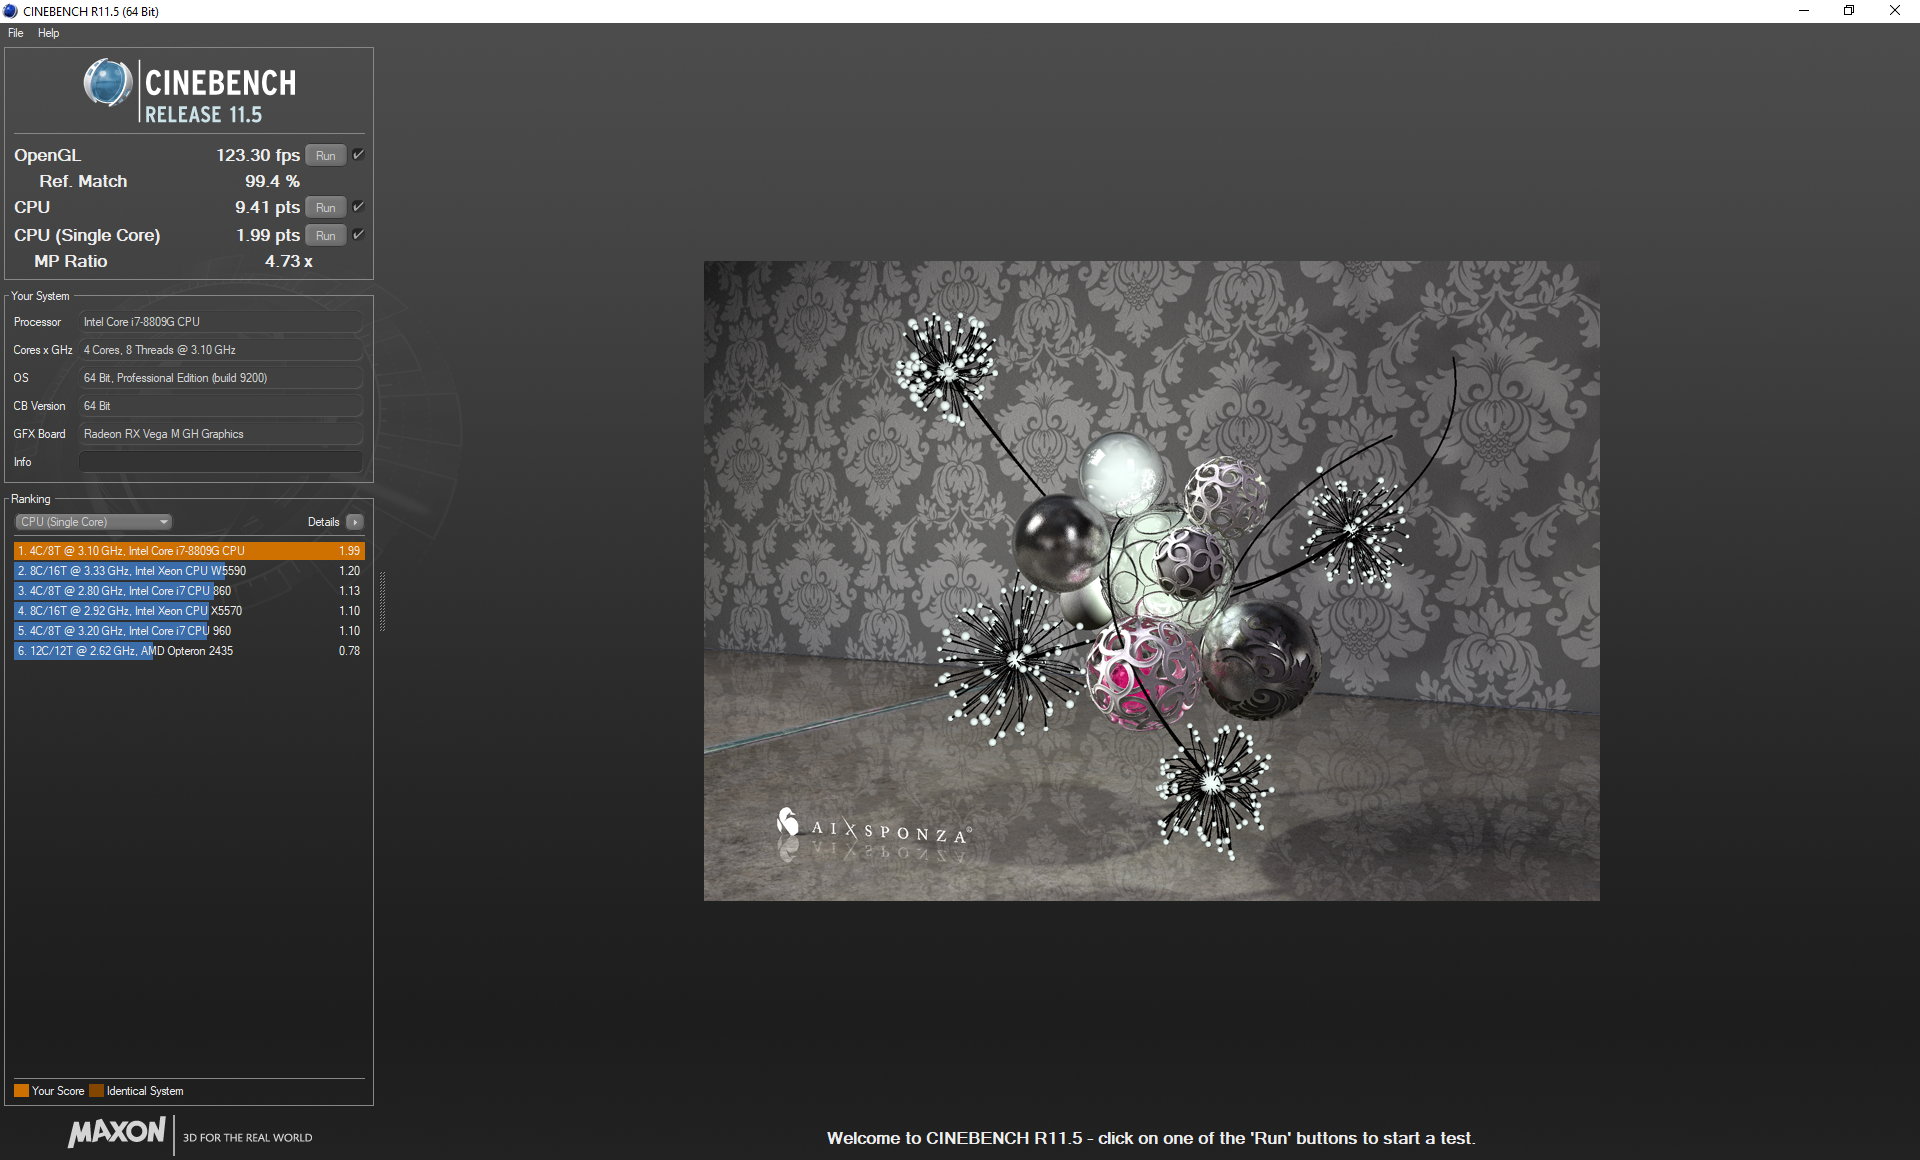
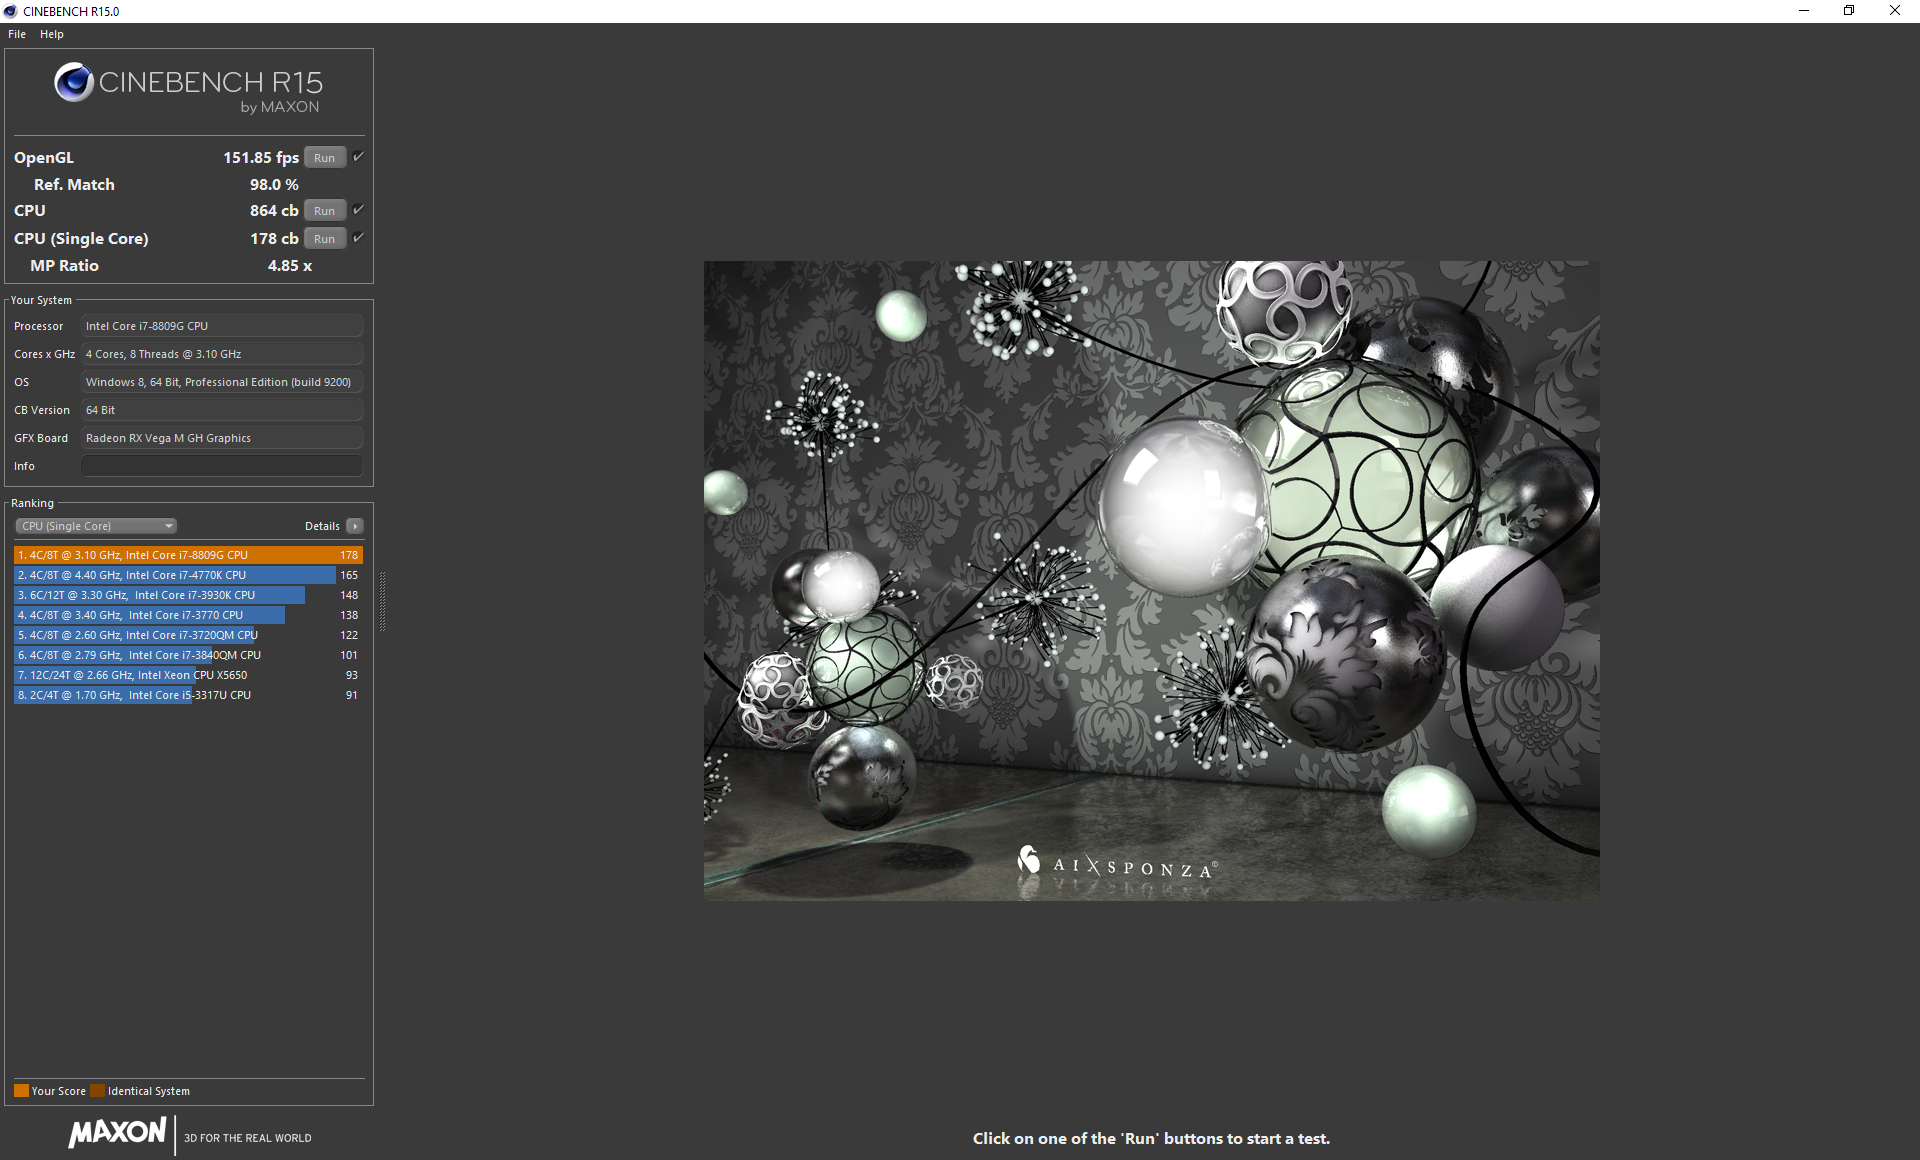
Processor - Within reach of the Core i7-7700K
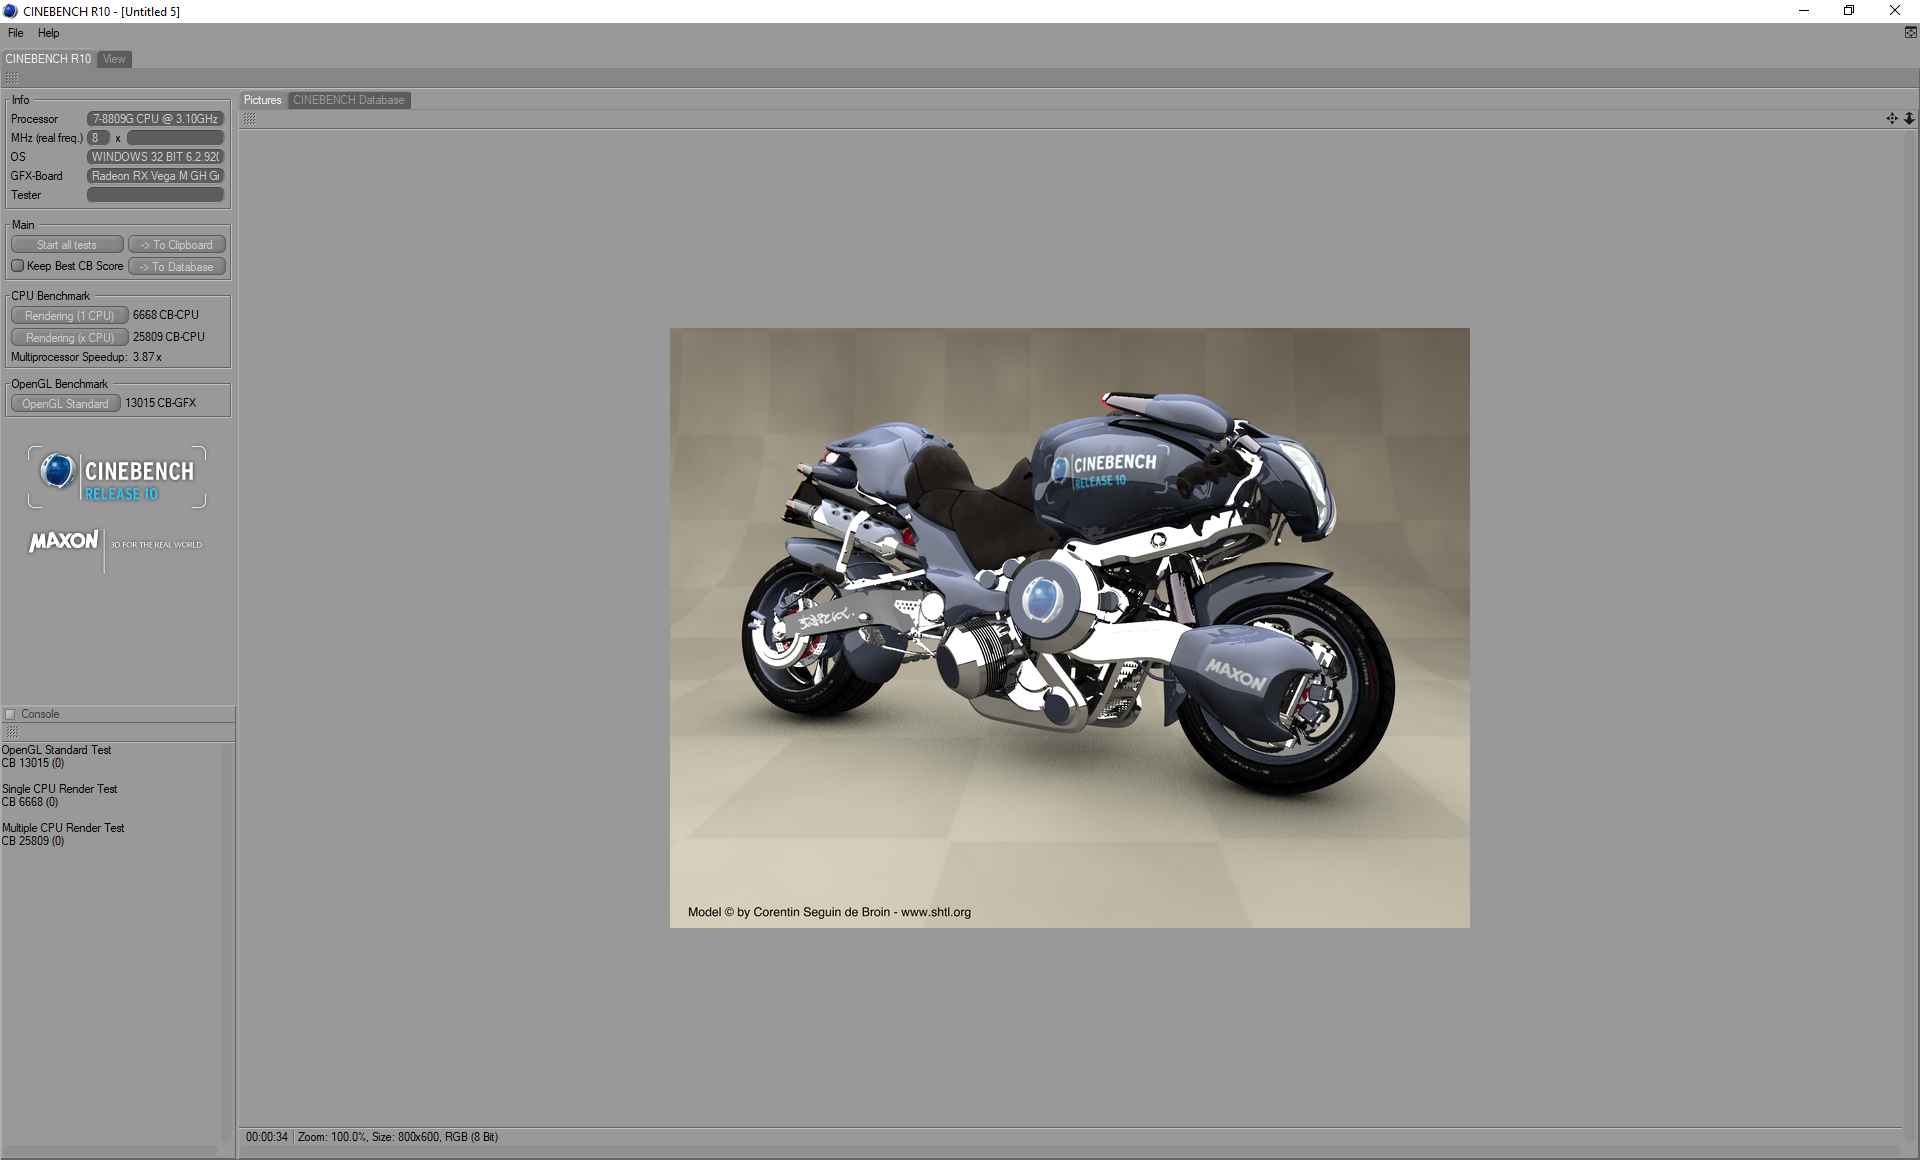
CPU performance is insanely fast even before considering the small form factor. CineBench benchmarks rank the i7-8809G 22 percent faster than the i7-6770HQ found in the Skull Canyon NUC and it's even faster than flagship laptops equipped with unlocked i7-7820HK CPUs like the HP Omen X 17. It rivals a Core i7-7700K at stock speeds while being about 25 percent slower than the hexa-core Ryzen 5 1600.
The raw scores are made even more impressive by the NUC's ability to maintain high CPU clock rates. As detailed in our Stress Test section, processor clock rates are very steady no matter the workload for consistent performance results. Running CineBench R15 Multi-Thread in a loop results in stable scores throughout the entire duration of the test whereas this same test on a MSI GS63VR 7RF results in a performance drop of about 10 percent just after the first loop.
More technical information and benchmark results on the Core i7-8809G can be found on our CPU page here.
| wPrime 2.10 - 1024m | |
| Asus ROG Strix GL702ZC-GC204T | |
| Asus Strix GL703VM-DB74 | |
| Intel Skull Canyon NUC6i7KYK | |
| HP Omen X 17-ap0xx | |
| Intel Hades Canyon NUC8i7HVK | |
| Eurocom Tornado F5 | |
* ... smaller is better
System Performance
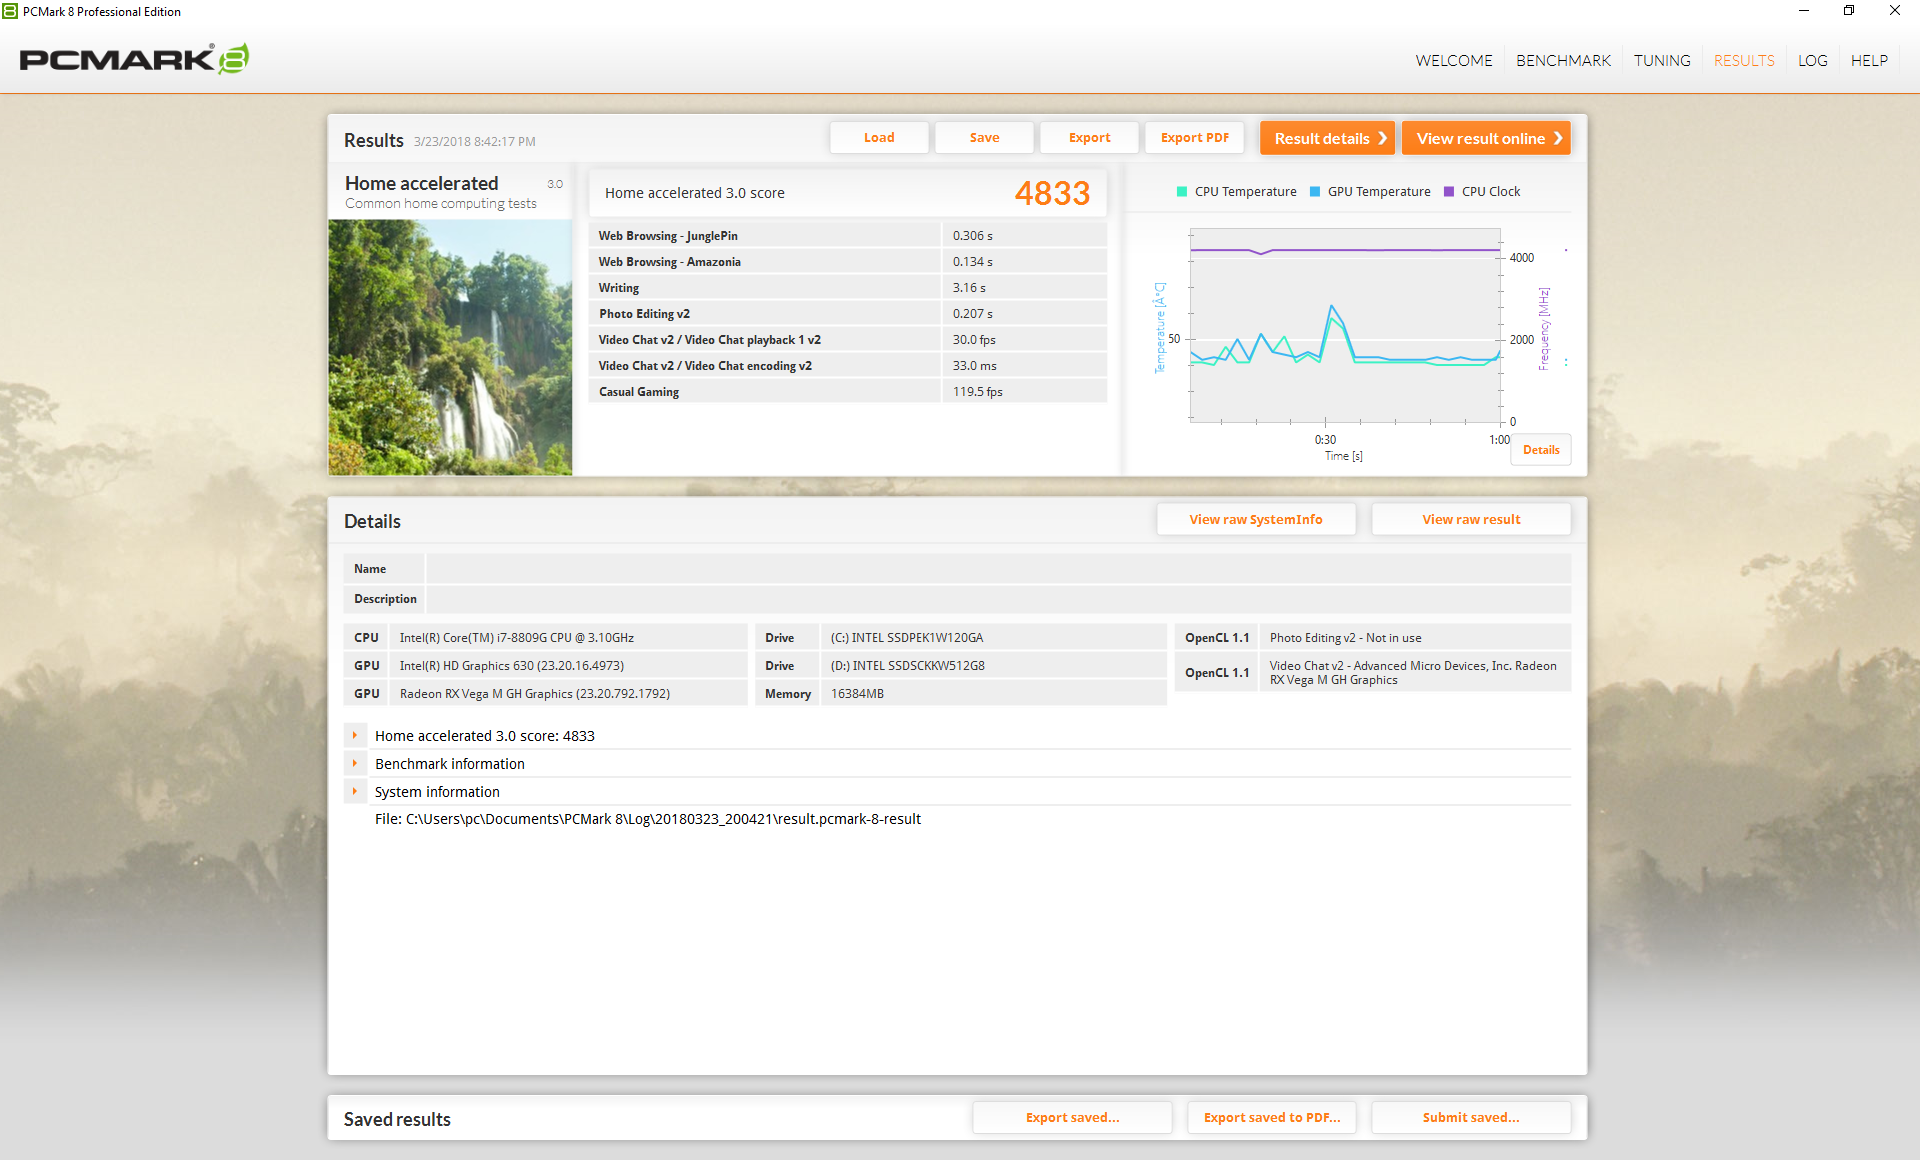
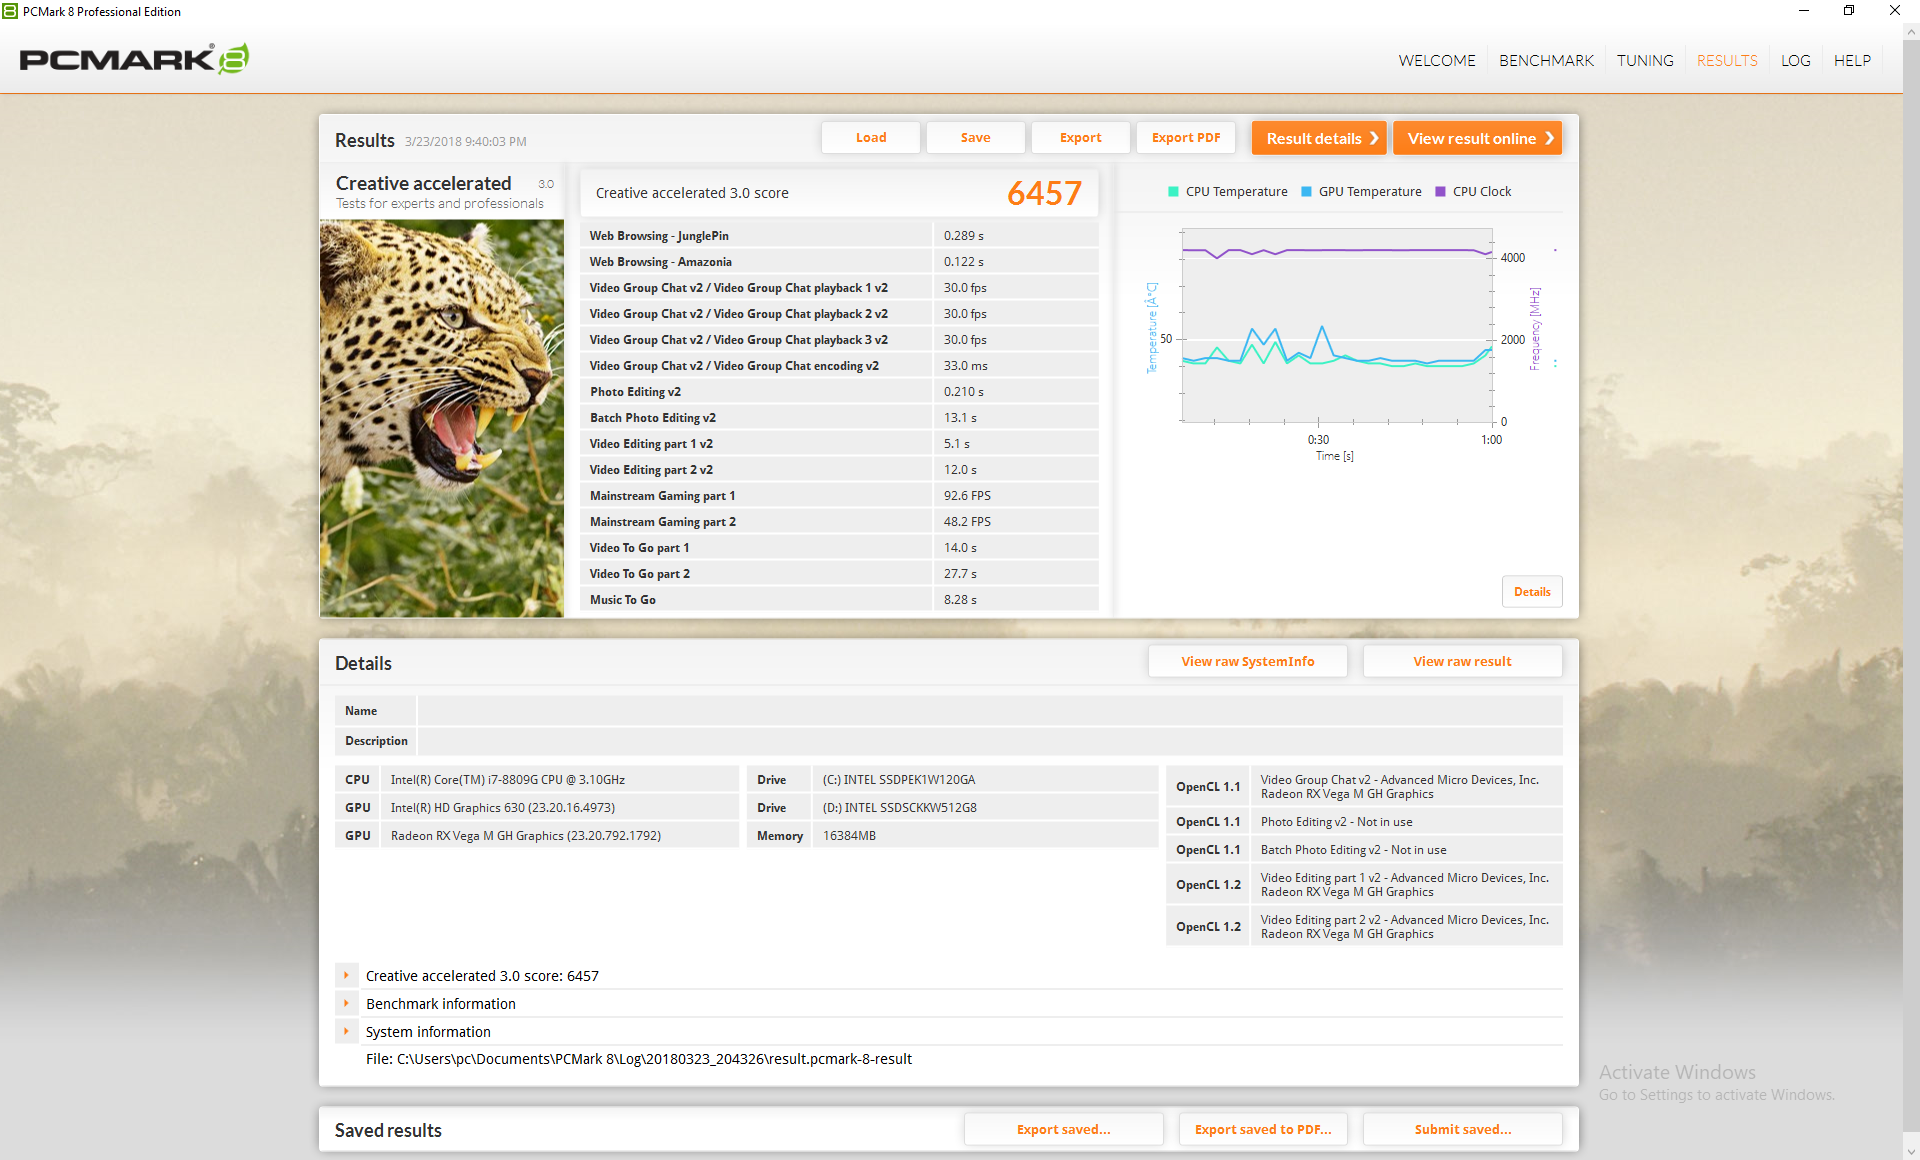
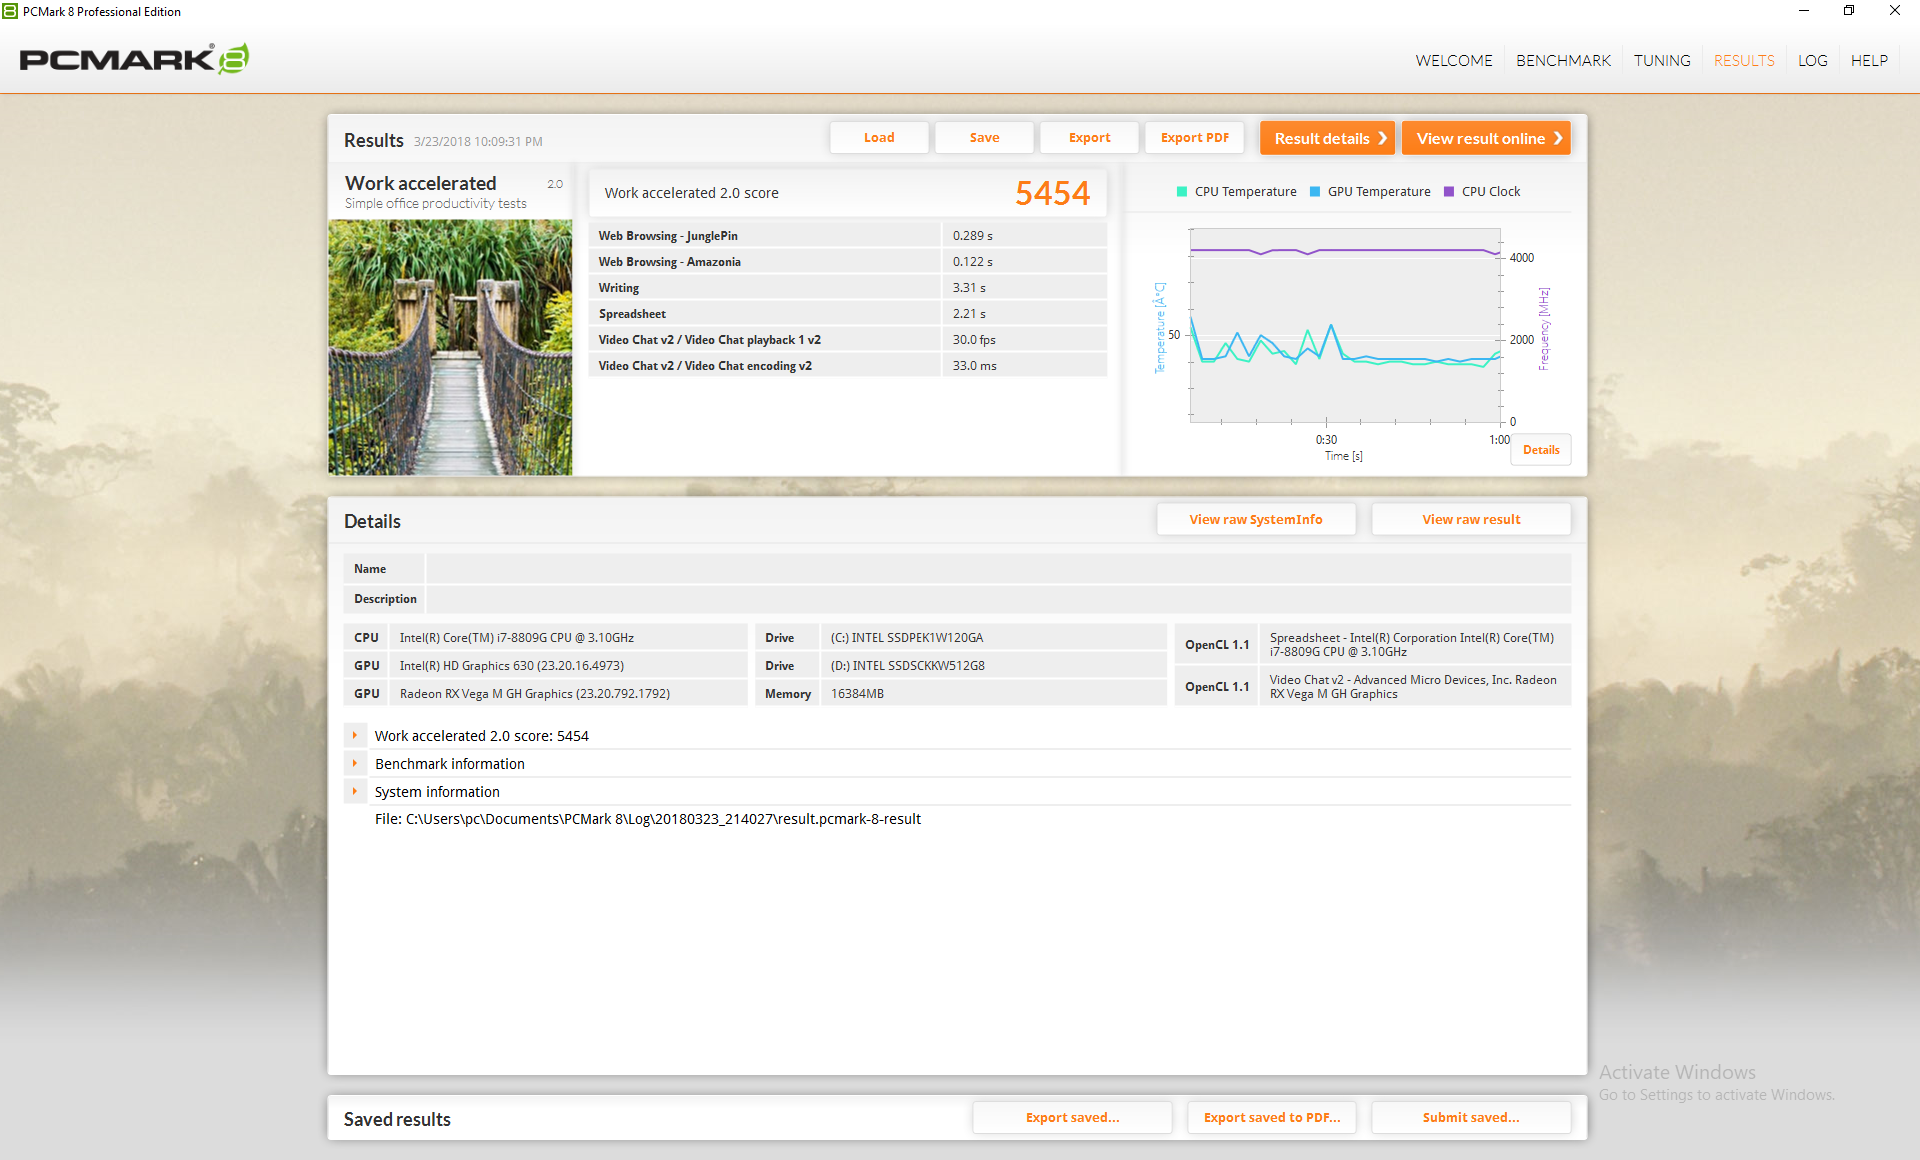
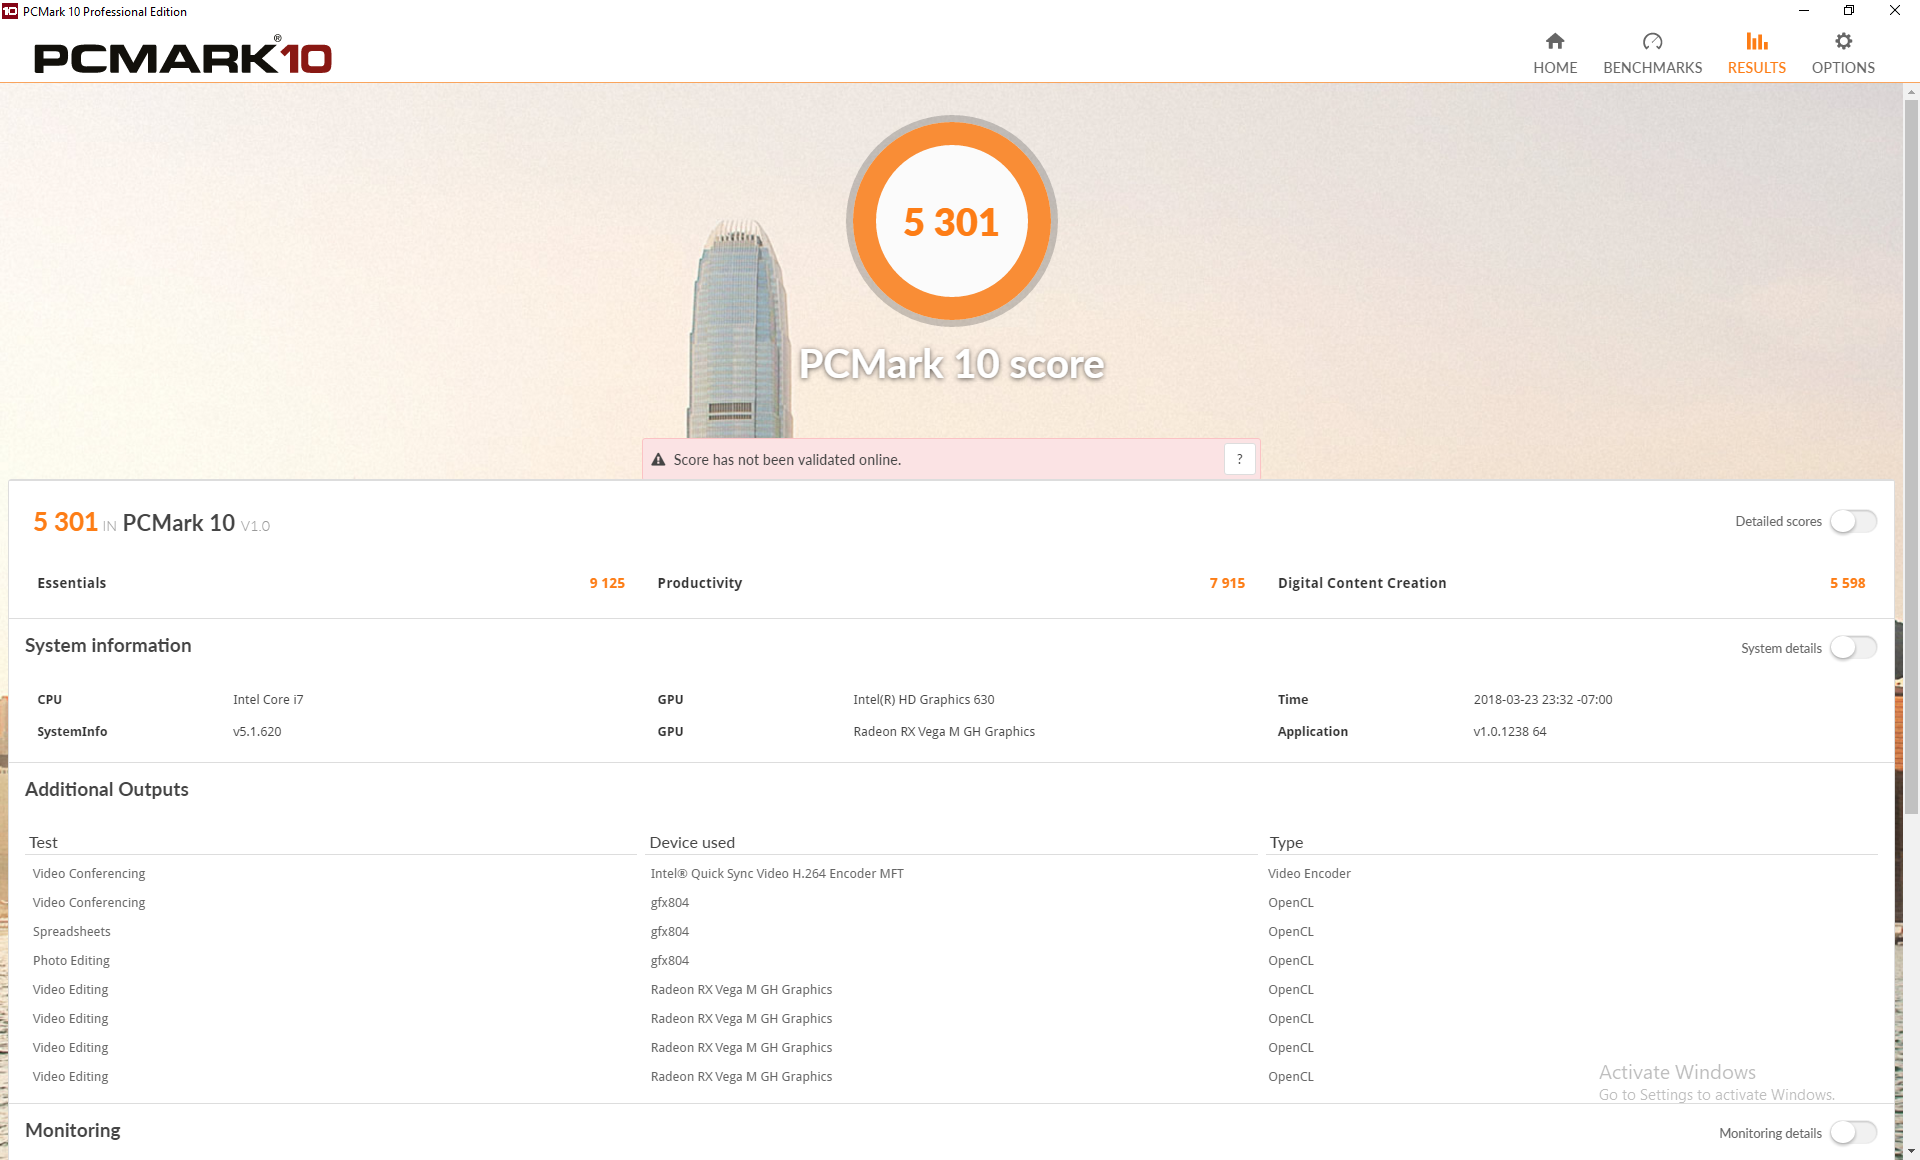
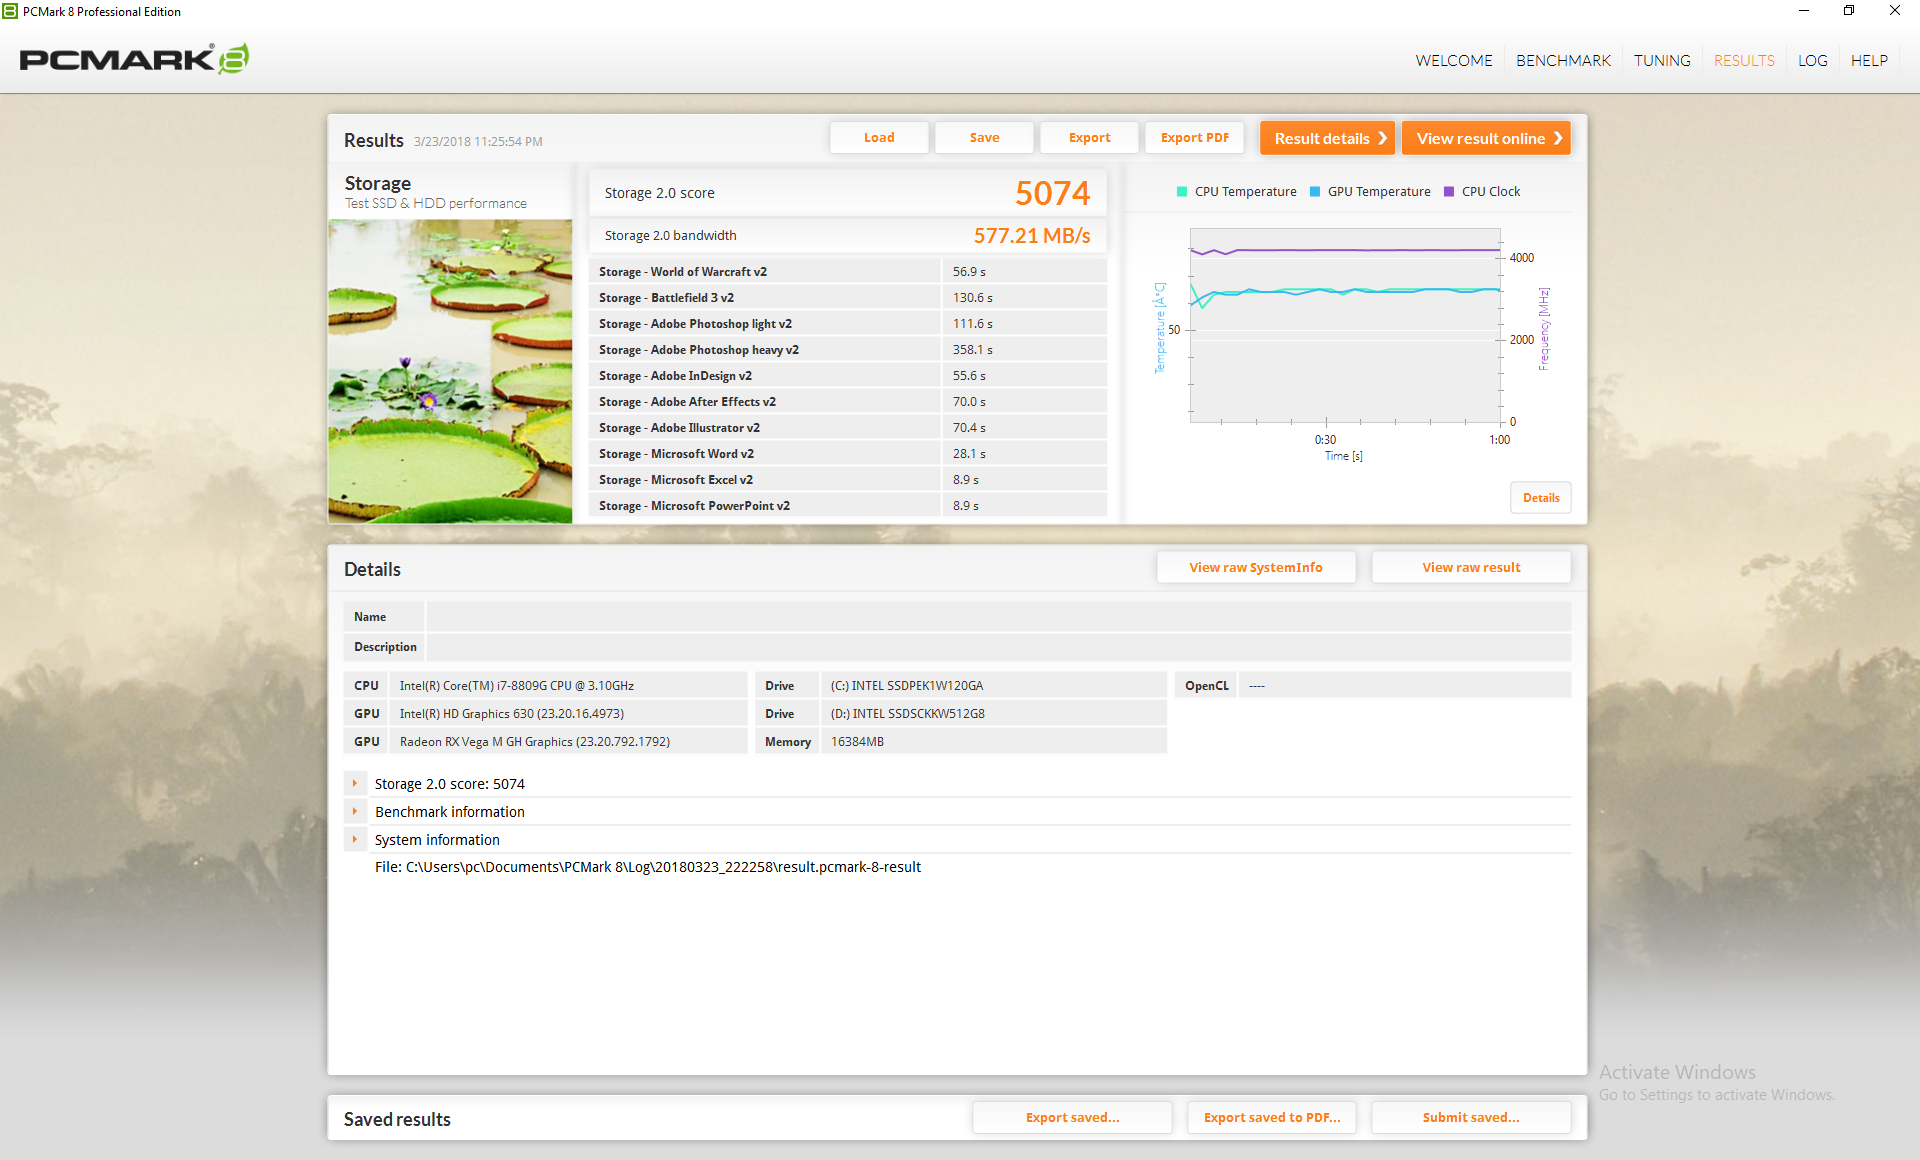
PCMark results are some of the highest in our database with final scores rivaling that of some GTX 1080 laptops including the massive HP Omen X 17 and Acer Predator Triton 700. The Intel NUC is indubitably slower than these systems in raw graphical power and so its exotic HBM2, Optane SSD, and Kaby Lake-G intricacies are likely factors since none are found together in any other notebook. Nonetheless, users will be getting a very fast and responsive PC experience with the Intel NUC. We experienced no software or hardware hiccups during our time with the unit.
| PCMark 10 - Score | |
| Intel Hades Canyon NUC8i7HVK | |
| Schenker XMG Pro 17 | |
| Microsoft Surface Book 2 15 | |
| Zotac ZBOX Magnus EN51050 | |
| Dell XPS 13 9370 i5 UHD | |
| Acer Swift 3 SF315-41-R4W1 | |
| PCMark 8 Home Score Accelerated v2 | 4833 points | |
| PCMark 8 Creative Score Accelerated v2 | 6457 points | |
| PCMark 8 Work Score Accelerated v2 | 5454 points | |
| PCMark 10 Score | 5301 points | |
Help | ||
Storage Devices - Accessible dual M.2 SSDs
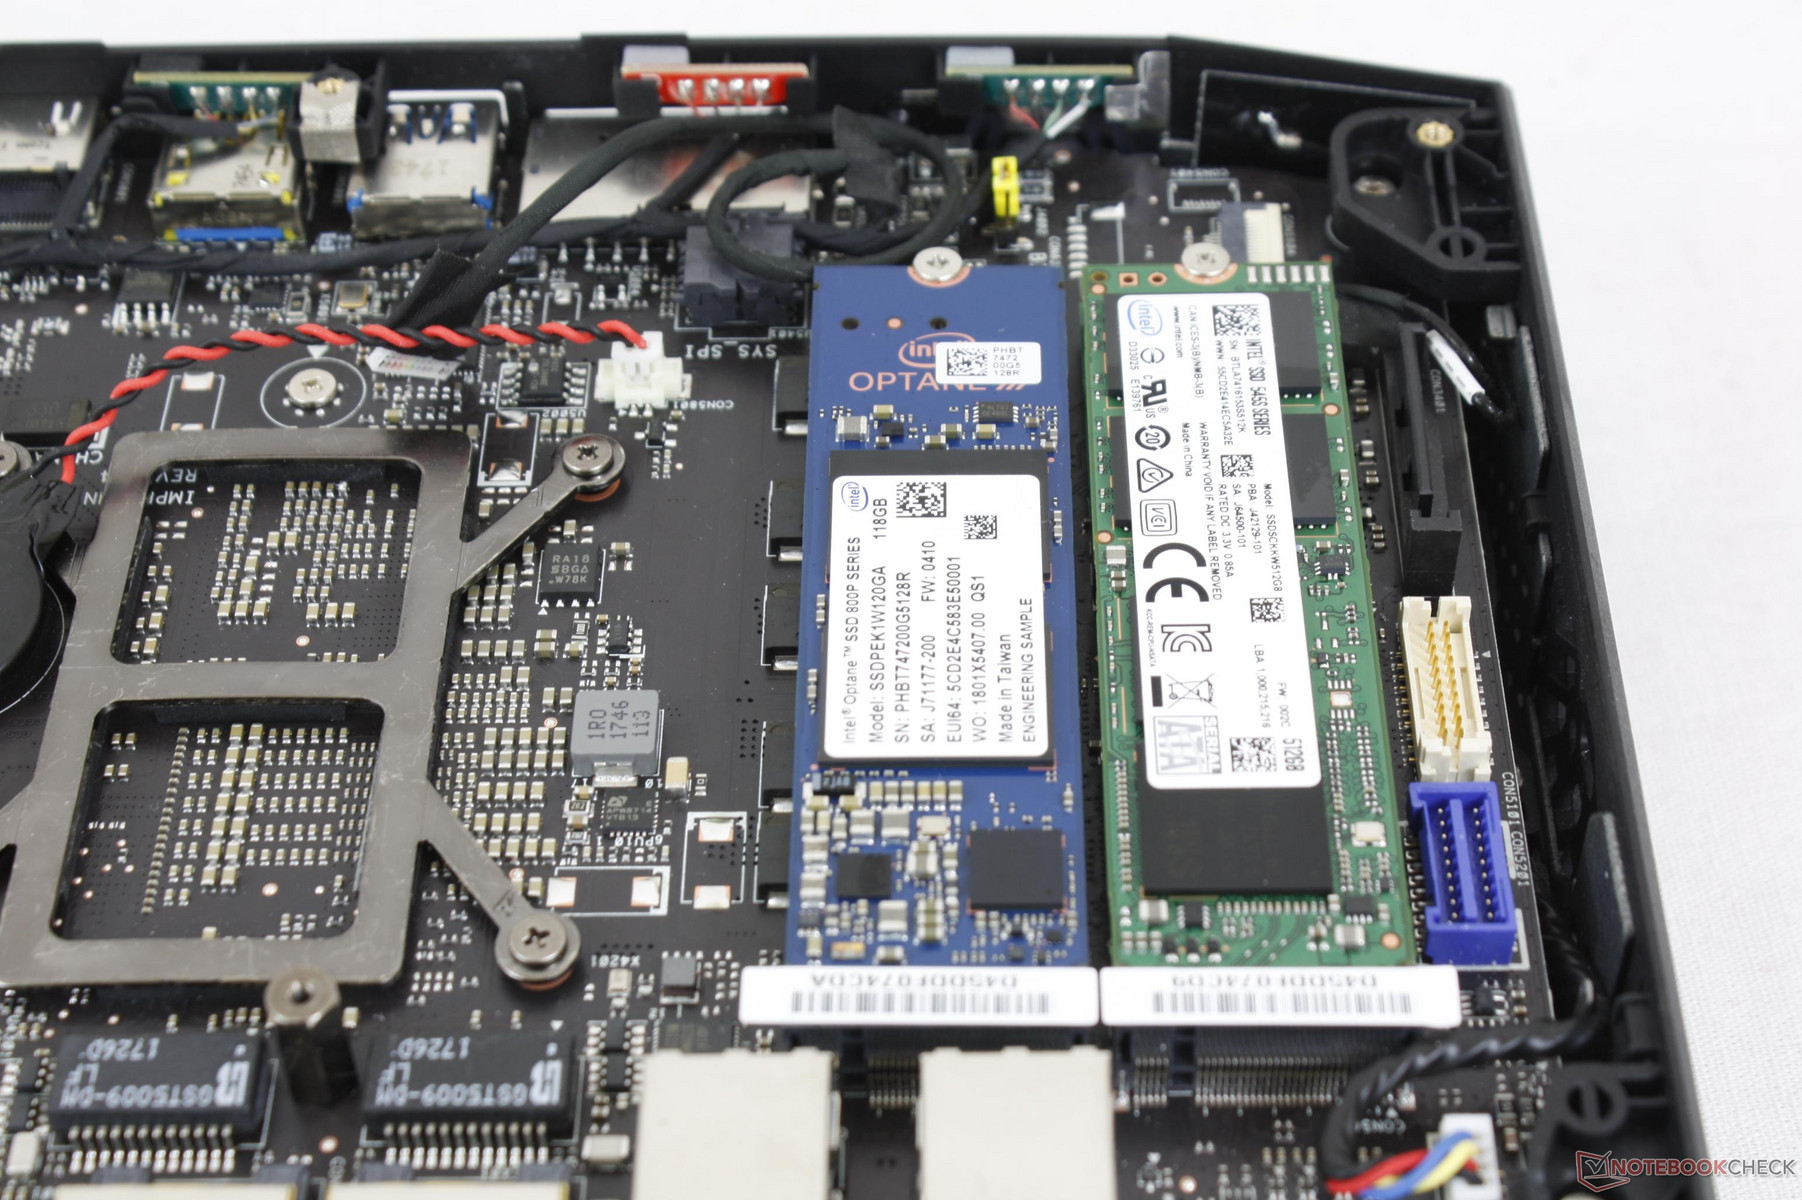
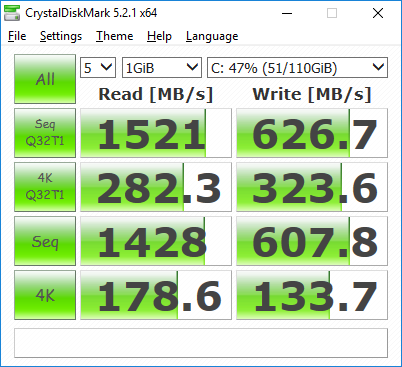
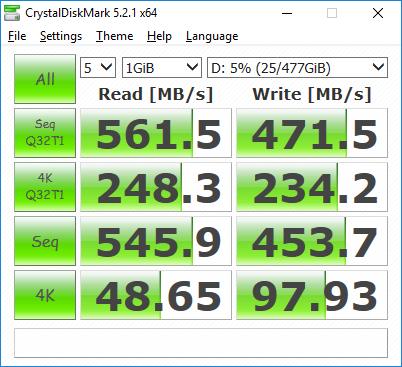
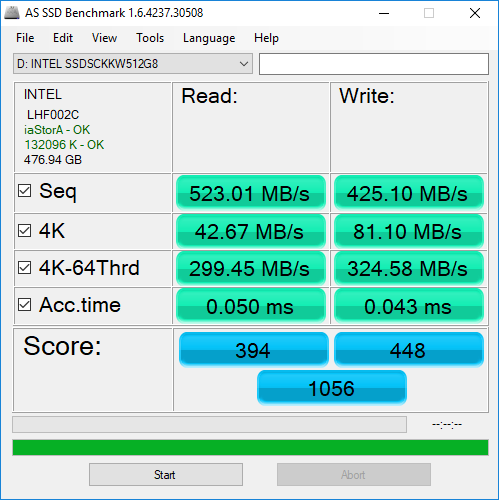
Like the Skull Canyon NUC, Hades Canyon includes two internal M.2 2280 slots compatible with NVMe SSDs and RAID 0/1 features. Our particular test model is equipped with the newly launched 120 GB Intel Optane 800P SSD as the primary drive and a standard 512 GB Intel 545s SSD limited to SATA III speeds for the secondary.
Performance from the primary SSD is mixed. Sequential read and write rates are limited to PCIe x2 and the SSD itself is rated for only 1450 MB/s read and 640 MB/s write while a "traditional" PCIe x4 NVMe SSD can be two to three times faster. Optane's primary feature is improved low queue depth performance, but it comes at the cost of storage capacity. This seems to be at odds with the target gaming audience as gamers are more likely to prefer faster sequential transfer rates and higher capacities for games rather than faster transfer rates of very small files. We recommend going for a standard SATA III or NVMe SSD and waiting until Optane comes down in price and up in capacity.
See our table of SSDs and HDDs for more benchmark comparisons.

| Intel Hades Canyon NUC8i7HVK Intel Optane 120 GB SSDPEK1W120GA | Intel Skull Canyon NUC6i7KYK Samsung SSD 850 EVO m.2 120GB | Dell XPS 13 i5-8250U Toshiba XG5 KXG50ZNV256G | Razer Blade (2017) UHD Samsung PM961 NVMe MZVLW512HMJP | MSI GS63VR 7RG-005 Samsung SM961 MZVPW256HEGL | |
|---|---|---|---|---|---|
| AS SSD | -67% | -721% | -1265% | 27% | |
| Copy Game MB/s (MB/s) | 768 | 295.8 -61% | 892 16% | ||
| Copy Program MB/s (MB/s) | 342.4 | 213.1 -38% | 317.5 -7% | ||
| Copy ISO MB/s (MB/s) | 1125 | 358 -68% | 1698 51% | ||
| Score Total (Points) | 3023 | 919 -70% | 815 -73% | 1557 -48% | 3848 27% |
| Score Write (Points) | 714 | 268 -62% | 71 -90% | 80 -89% | 1185 66% |
| Score Read (Points) | 1524 | 424 -72% | 531 -65% | 1034 -32% | 1795 18% |
| Access Time Write * (ms) | 0.033 | 0.047 -42% | 2.148 -6409% | 4.467 -13436% | 0.03 9% |
| Access Time Read * (ms) | 0.025 | 0.075 -200% | 0.244 -876% | 0.036 -44% | 0.039 -56% |
| 4K-64 Write (MB/s) | 556 | 145.2 -74% | 52.3 -91% | 42.59 -92% | 932 68% |
| 4K-64 Read (MB/s) | 1258 | 337.4 -73% | 385.7 -69% | 755 -40% | 1506 20% |
| 4K Write (MB/s) | 103.5 | 76.9 -26% | 1.94 -98% | 1.03 -99% | 124.7 20% |
| 4K Read (MB/s) | 127.9 | 35.55 -72% | 11.93 -91% | 47.31 -63% | 51 -60% |
| Seq Write (MB/s) | 553 | 460.4 -17% | 166 -70% | 359.9 -35% | 1281 132% |
| Seq Read (MB/s) | 1379 | 508 -63% | 1338 -3% | 2318 68% | 2382 73% |
* ... smaller is better

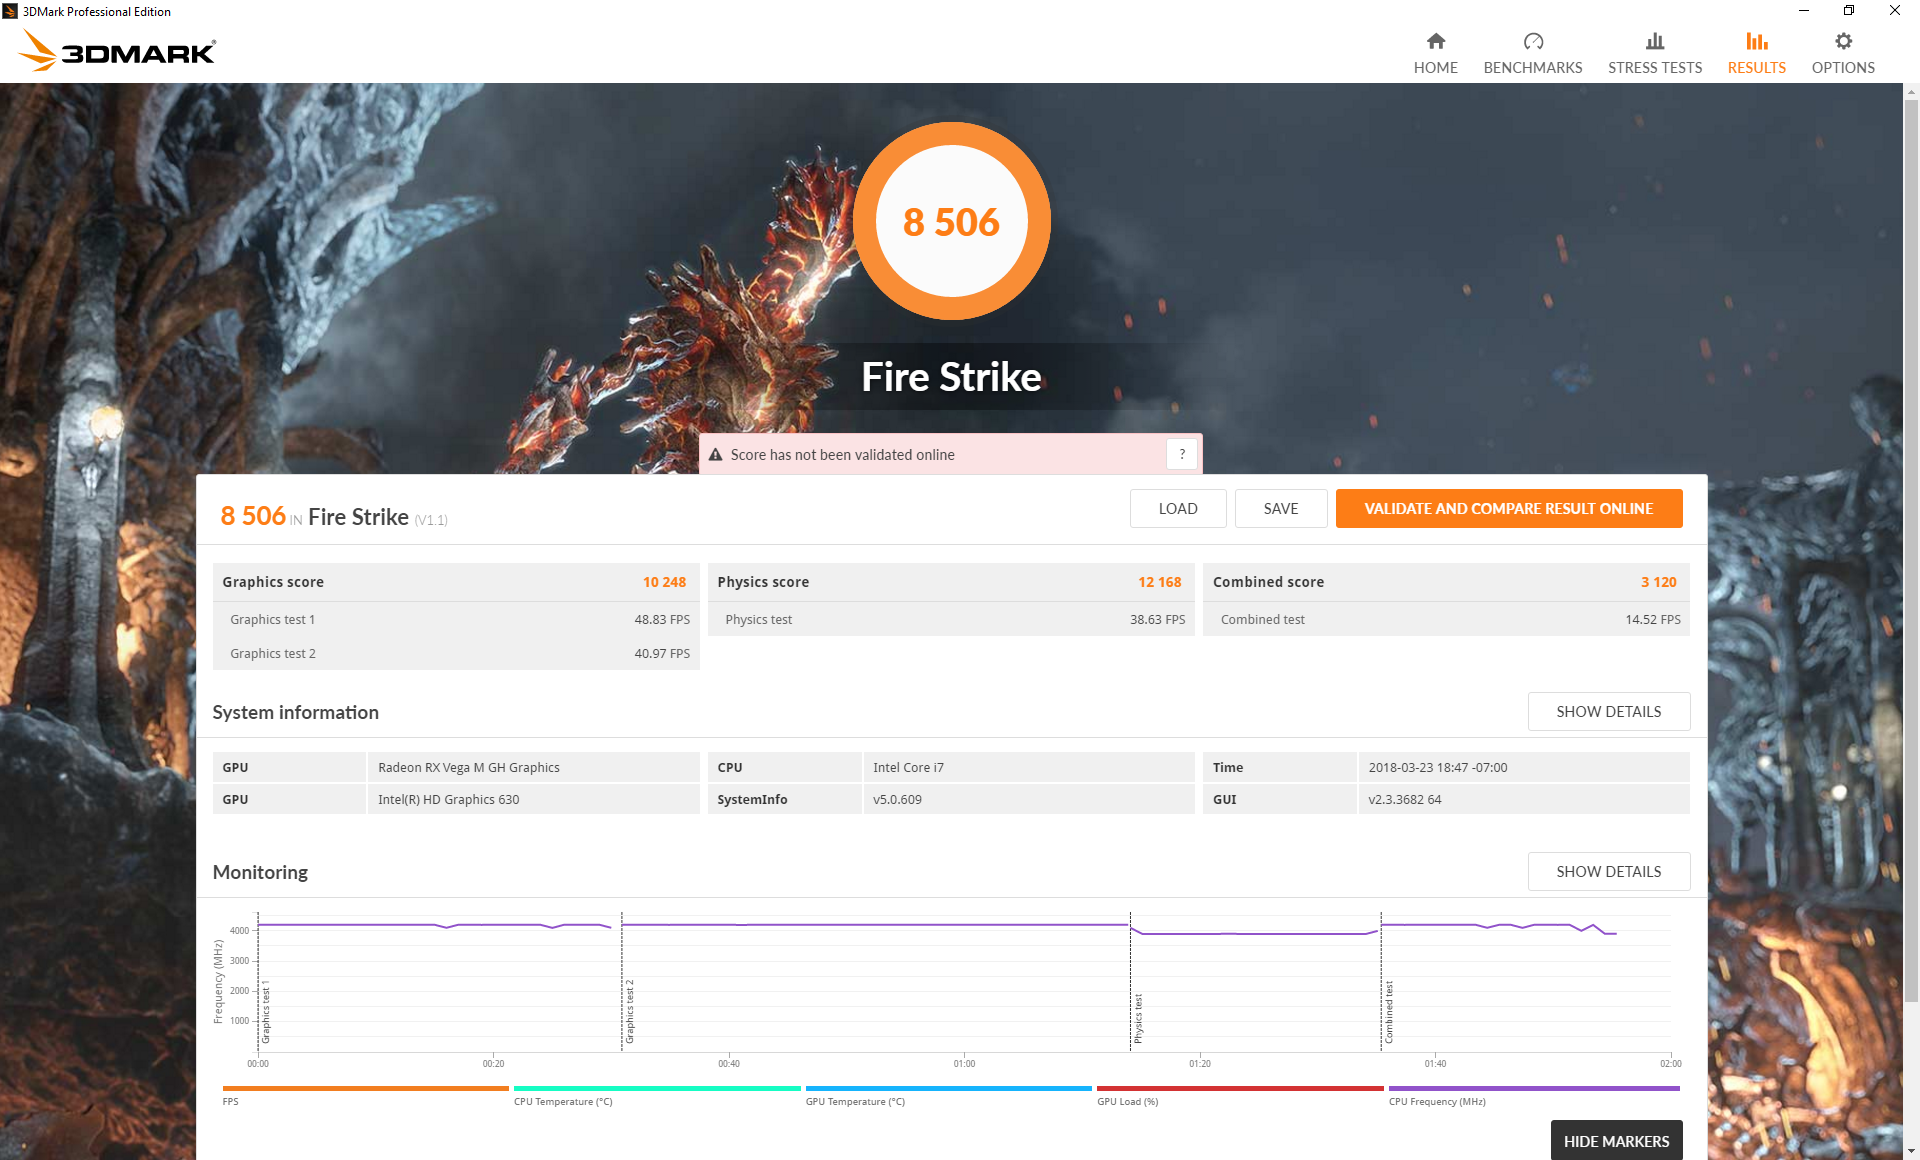
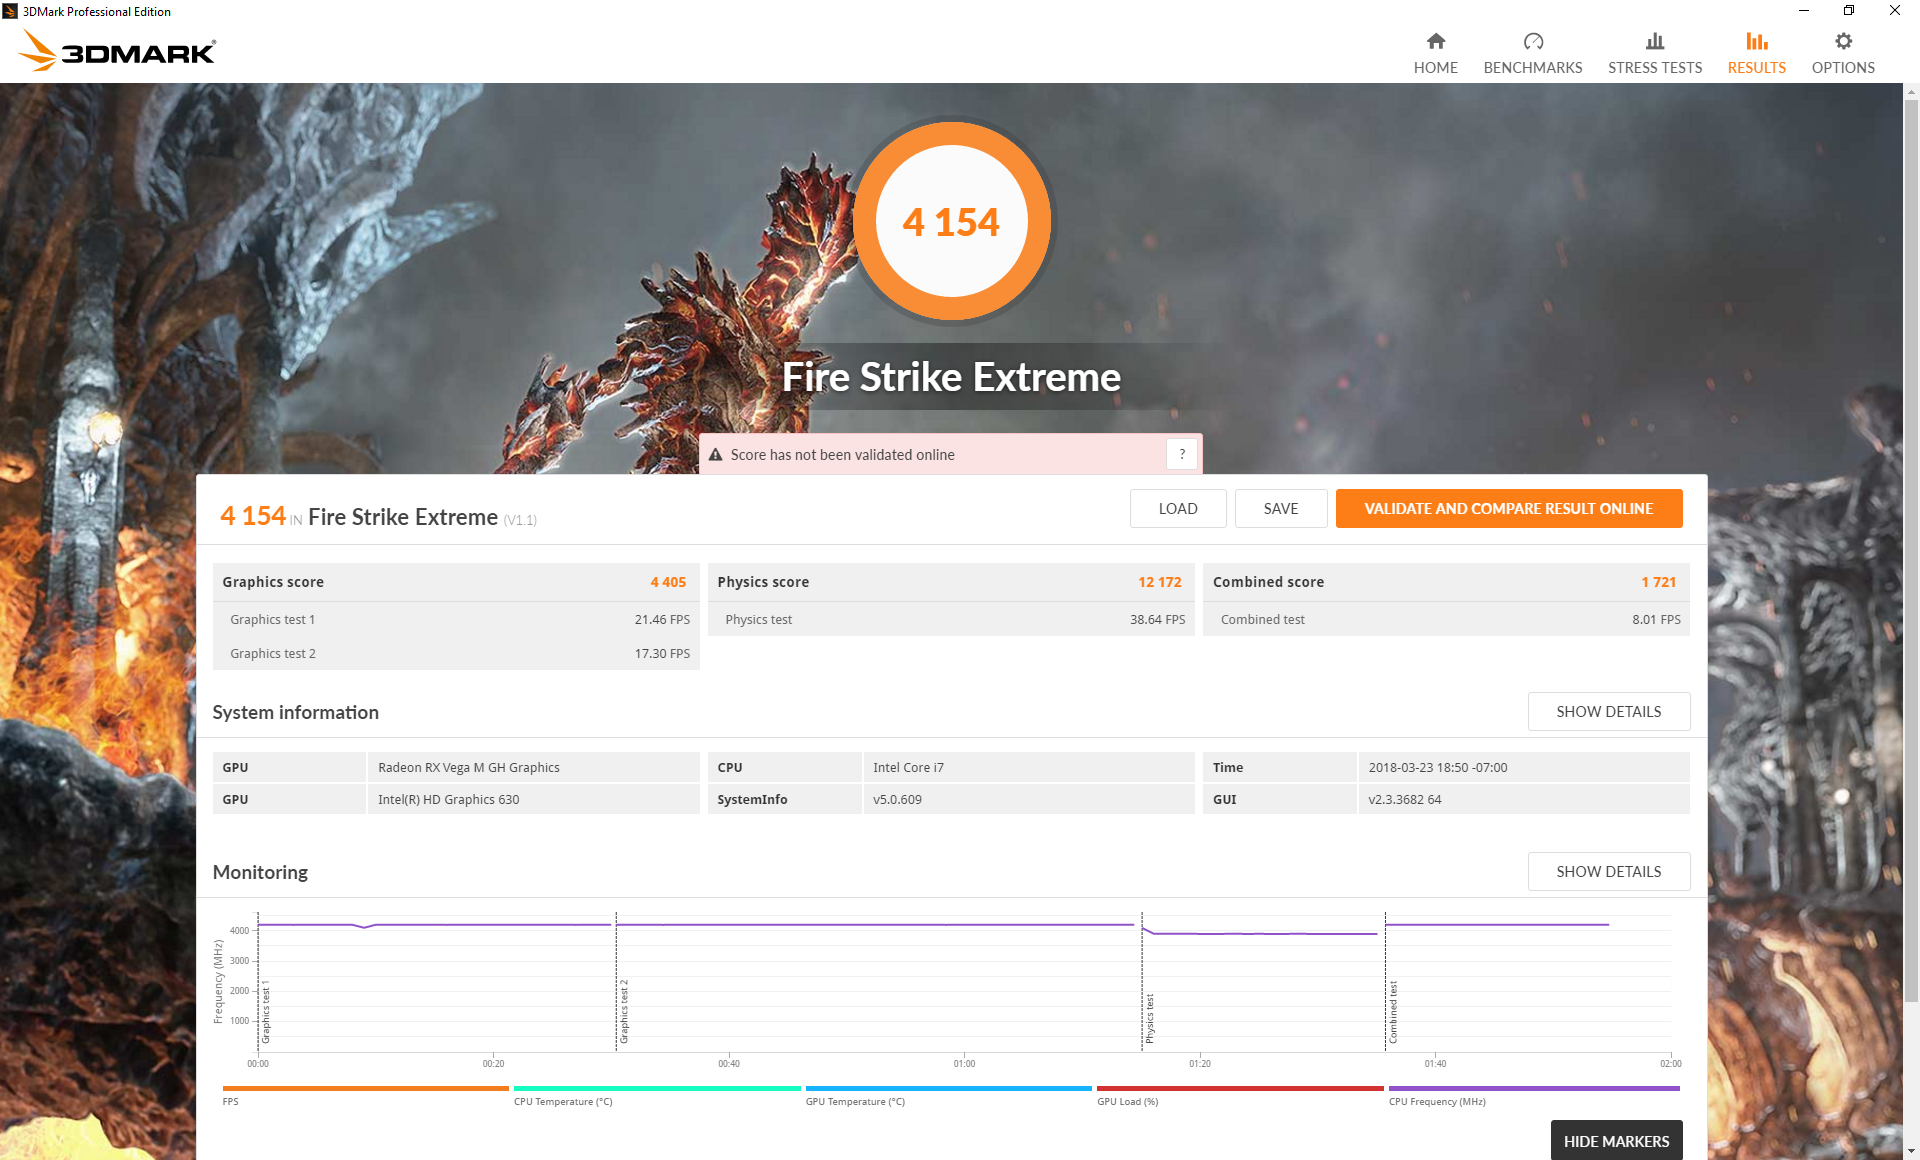
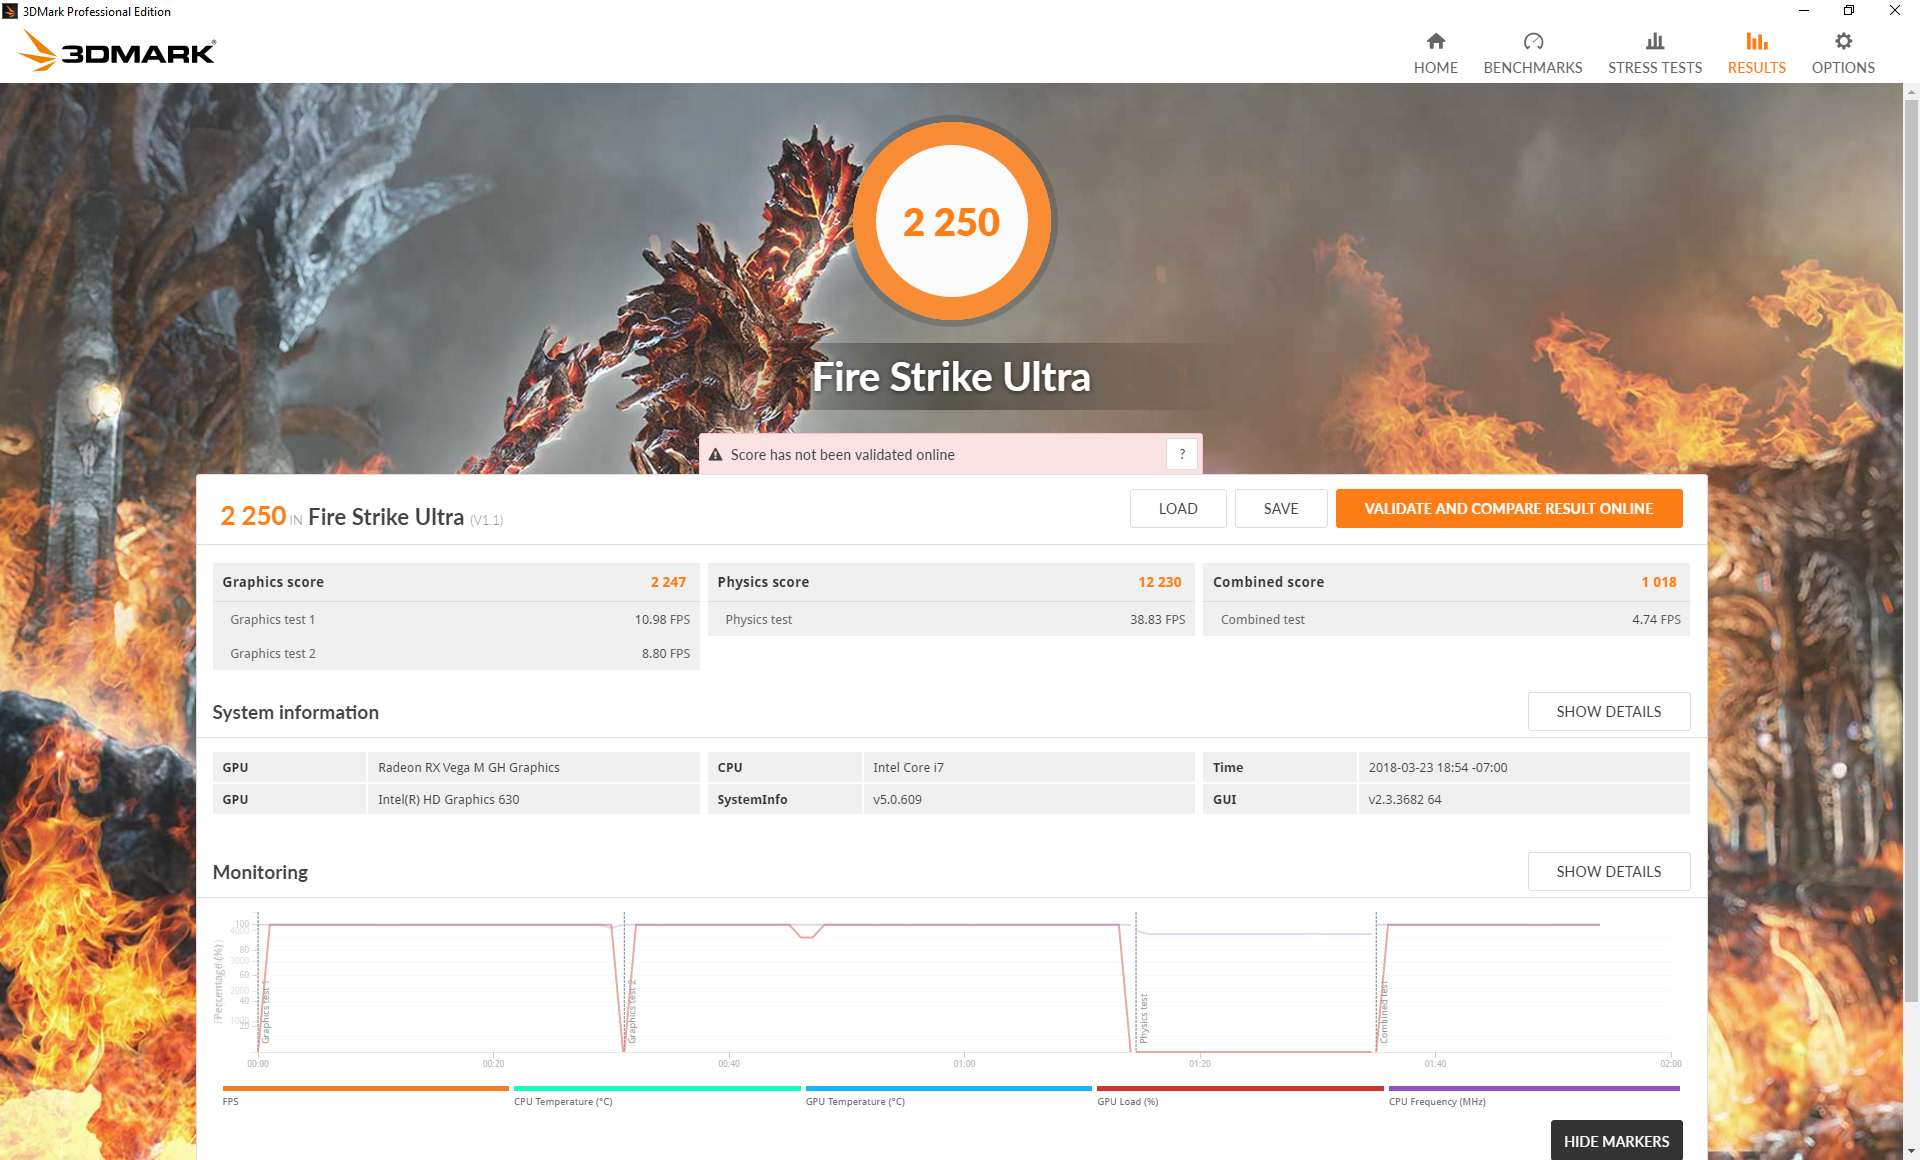
GPU Performance - On par with the GTX 1060 as advertised
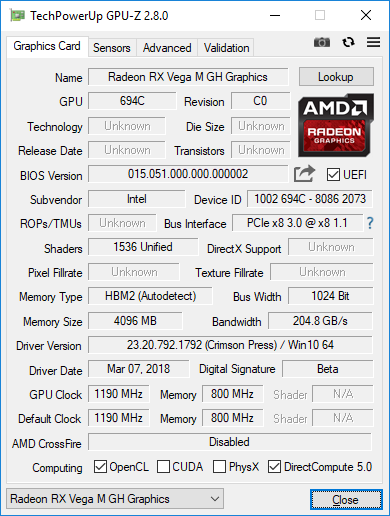
Whether or not the unprecedented partnership between the two biggest semiconductor rivals was worth the investment comes down to graphics performance. From a purely synthetic benchmark standpoint, the Radeon RX Vega M GH sits comfortably between the GTX 1060 Max-Q and GTX 1060 for laptops just as Intel advertised during the Hades Canyon reveal. By extension, this means that users are getting the raw graphics performance of a GTX 980M all in a single Core i7-8809G package. This becomes more impressive when considering that the GTX 980M was the fastest mobile GPU solution for large gaming notebooks like the Alienware 17 or MSI GT70 just two to three years ago and it makes Intel's own Iris solution look antiquated in comparison.
Readers with GTX 1060 gaming PCs - and there are quite a few of you out there - still have the upper-hand by about 15 to 20 percent over the RX Vega M GH according to 3DMark benchmarks. The Intel-AMD GPU straddles the line between mainstream and enthusiast without resorting to physically larger discrete graphics solutions.
More technical information and benchmarks on the Radeon RX Vega M GH can be found on our GPU page here.
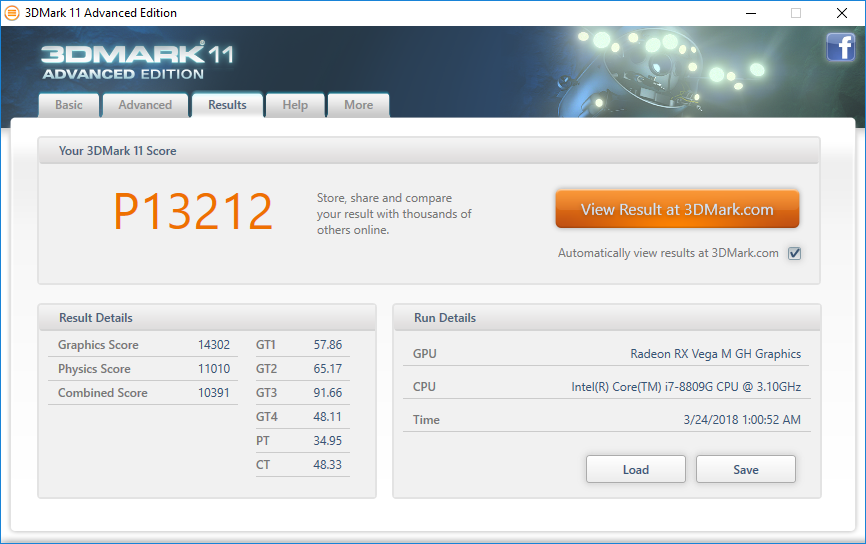
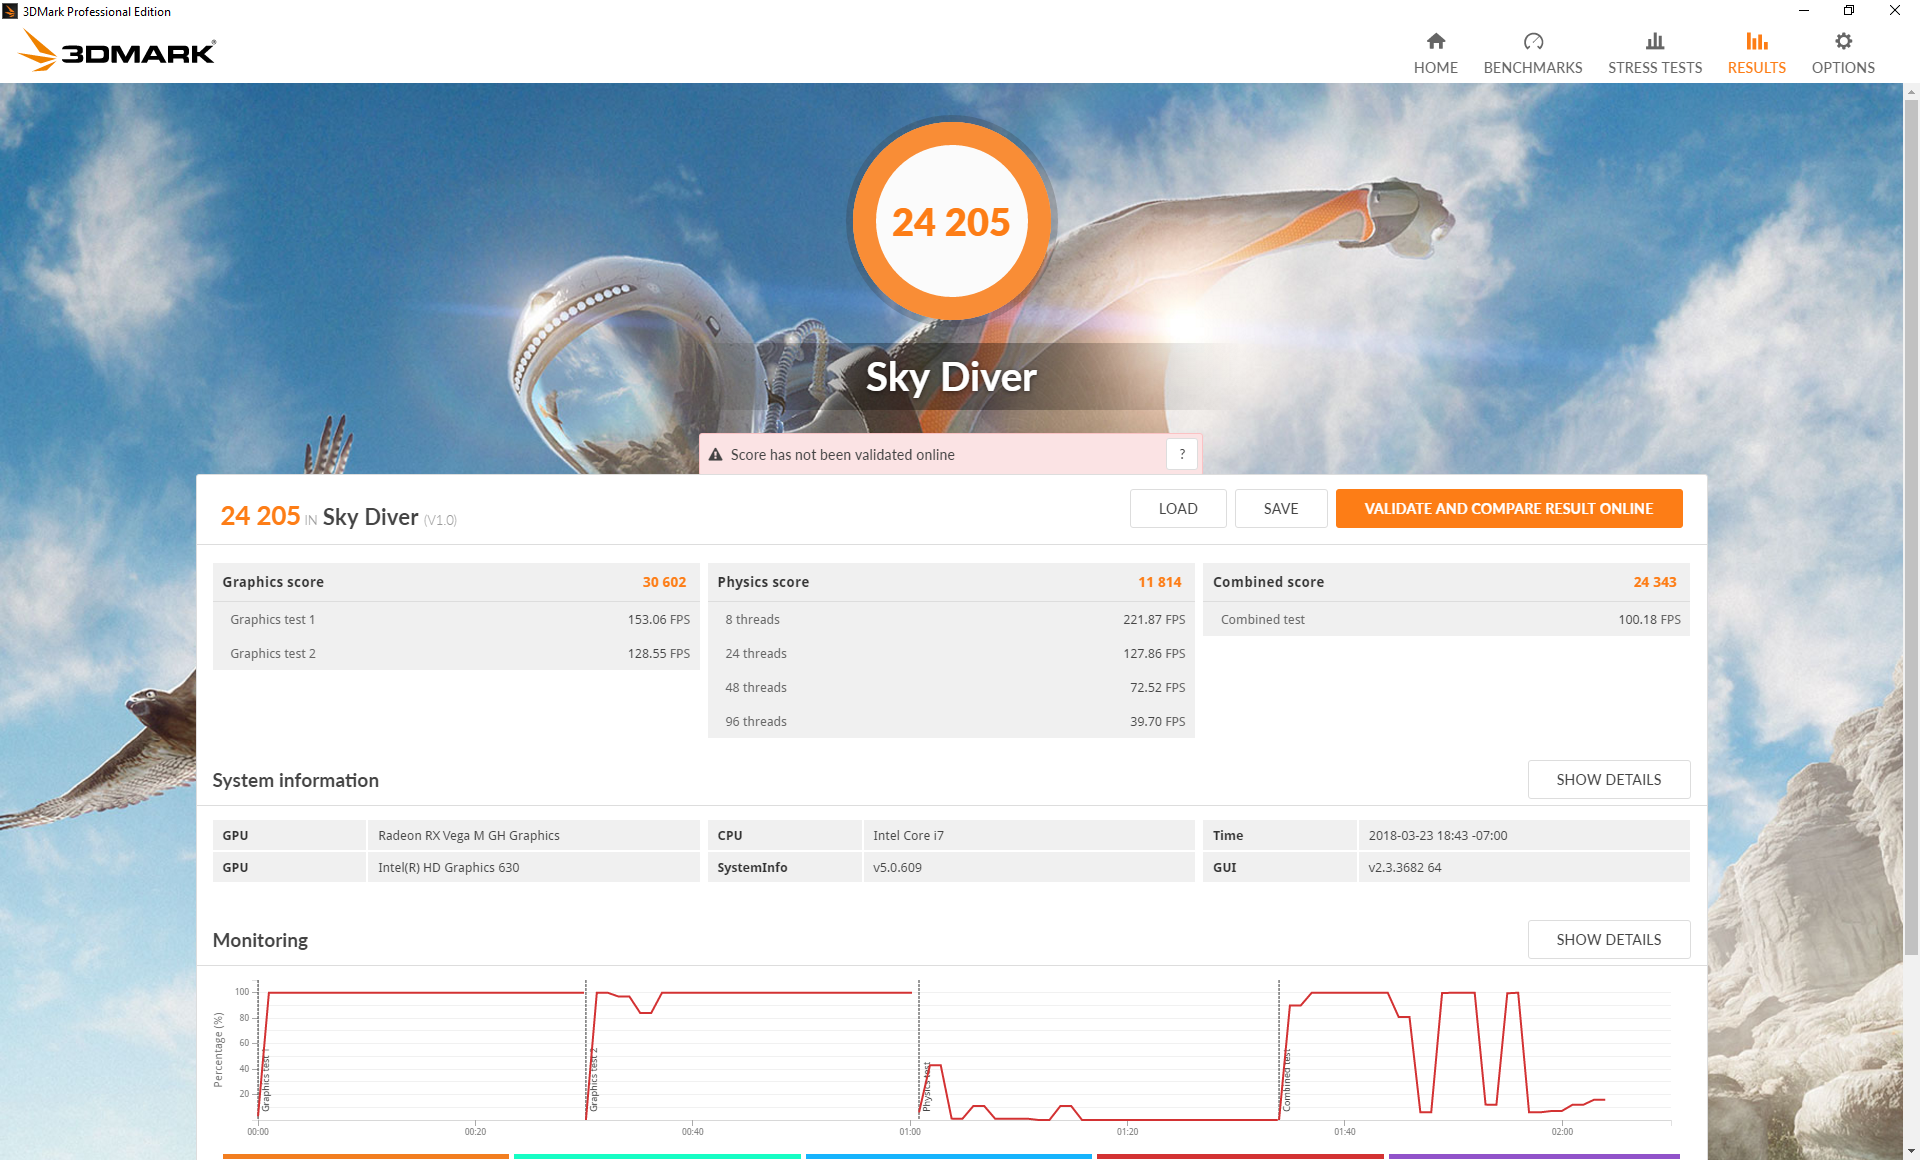

| 3DMark 06 Standard Score | 33046 points | |
| 3DMark 11 Performance | 13212 points | |
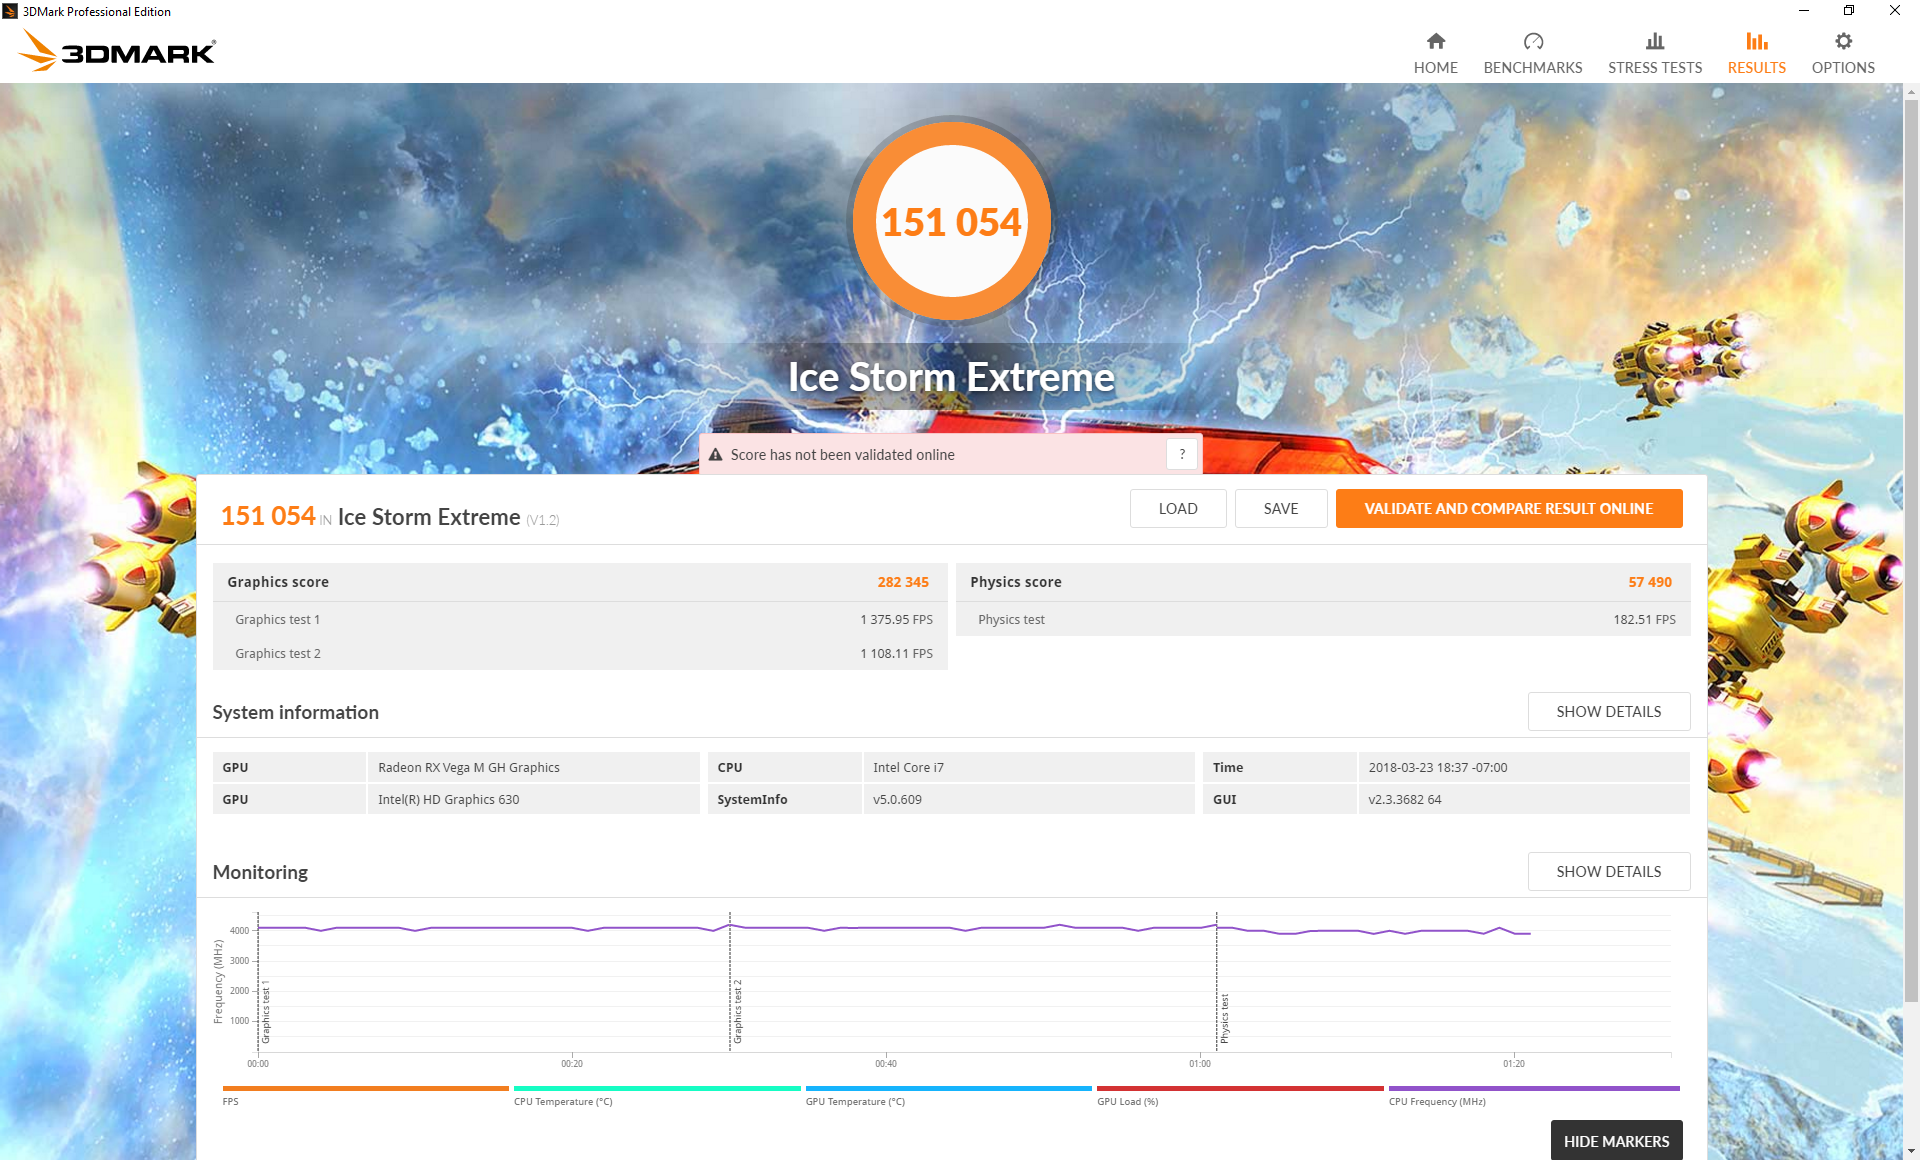
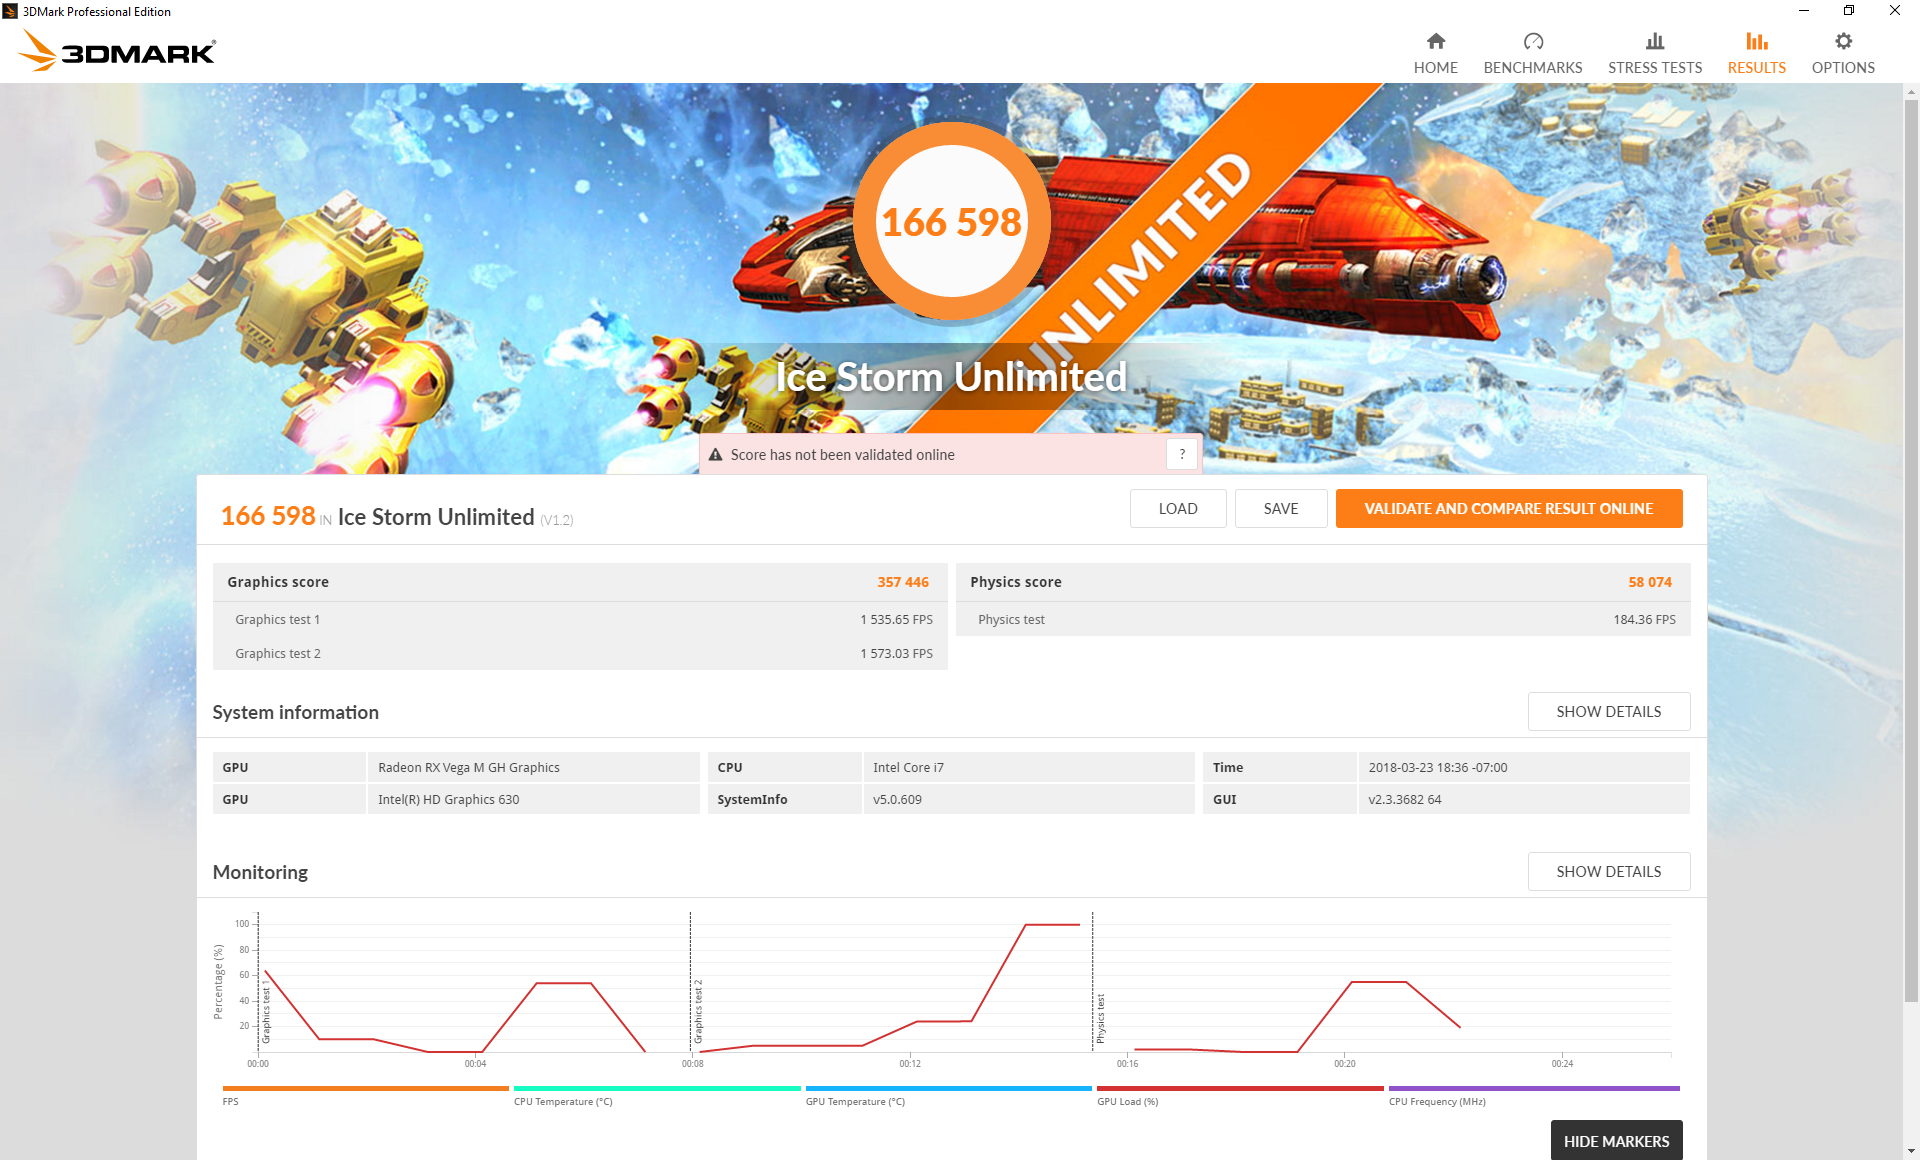
| 3DMark Ice Storm Standard Score | 156453 points | |
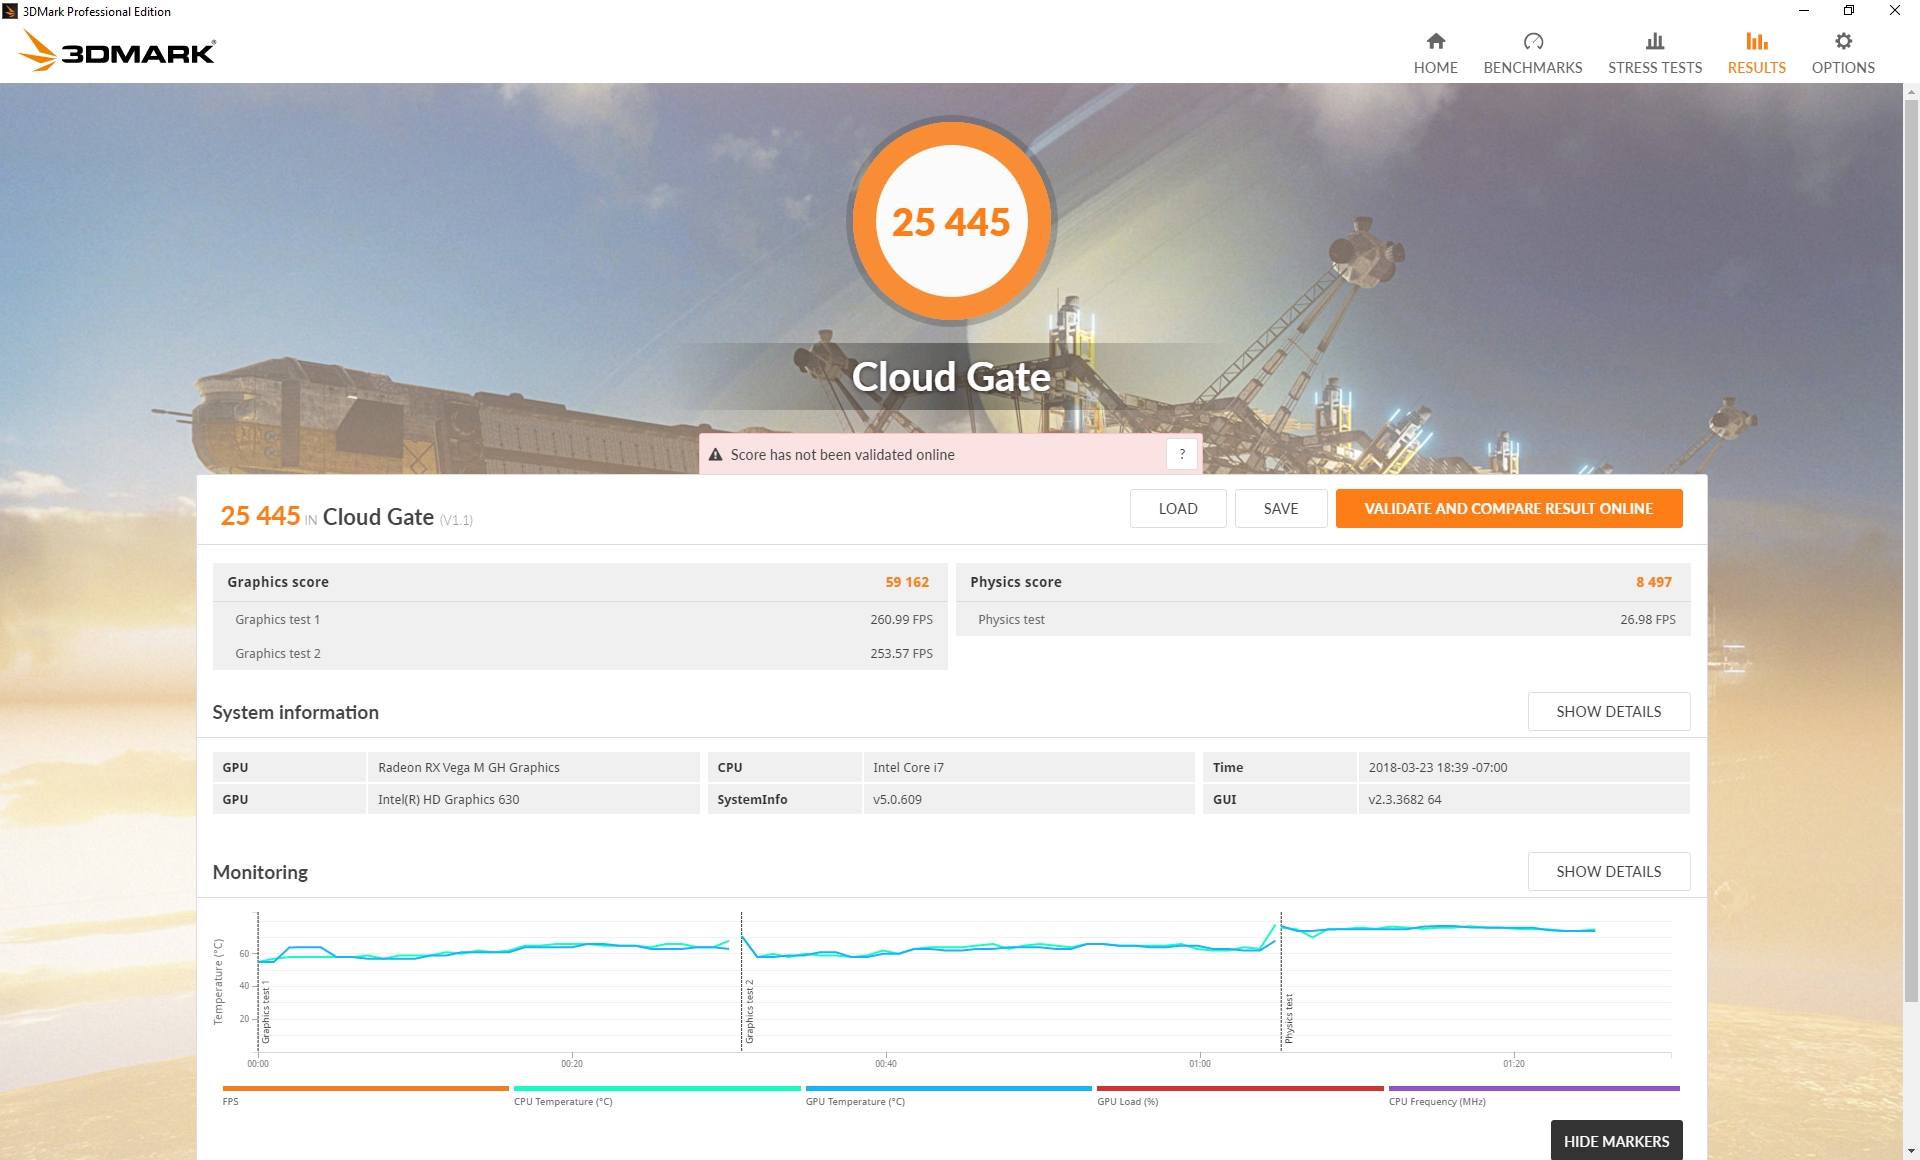
| 3DMark Cloud Gate Standard Score | 25445 points | |
| 3DMark Fire Strike Score | 8506 points | |
| 3DMark Fire Strike Extreme Score | 4154 points | |
| 3DMark Time Spy Score | 3096 points | |
Help | ||
Gaming Performance - More like a GTX 1050 Ti
Raw power means little if it doesn't translate well to gaming. Our experience with AMD Fusion-based laptops and mobile Ryzen 5 Vega GPUs in the past have been less than stellar because of driver and software issues. Thus, we're quite surprised to find that all tested games launched successfully and without any issues like one would expect from any gaming laptop. Intel's claim of "day zero" compatibility with current titles is looking very promising so far.
Actual gaming performance sits slightly below the GTX 1060 Max-Q even though 3DMark benchmarks rank the Vega GPU slightly higher. Rise of the Tomb Raider and Bioshock Infinite may run about 10 percent and 20 percent slower, respectively, than on a GTX 1060 Max-Q laptop set to maximum 1080p settings. Attaining the locked 1080p60 experience that many mainstream gamers are aiming for will require dialing down more graphical embellishments than a full-fledged GTX 1060 system. Gamers sporting the GTX 1050 Ti will have a very good idea of the real-world gaming capabilities of the Hades Canyon NUC.
FreeSync is supported and even recommended since frame rates tend to run between 40 and 60 FPS where the adaptive sync technology works best.
We will continue to test and record more game titles in the coming week.
| BioShock Infinite - 1920x1080 Ultra Preset, DX11 (DDOF) | |
| MSI GS63VR 7RG-005 | |
| MSI GF62VR 7RF-877 | |
| Dell Inspiron 15 7000 7577 4K | |
| EVGA SC17 | |
| Intel Hades Canyon NUC8i7HVK | |
| Gigabyte Aero 14-K7 | |
| Asus GL503VD-DB74 | |
| Asus Zenbook UX430UN | |
| Rise of the Tomb Raider - 1920x1080 Very High Preset AA:FX AF:16x | |
| MSI GF62VR 7RF-877 | |
| EVGA SC17 | |
| Dell Inspiron 15 7000 7577 4K | |
| Intel Hades Canyon NUC8i7HVK | |
| Asus GL503VD-DB74 | |
| Asus Zenbook UX430UN | |
| low | med. | high | ultra | QHD | 4K | |
|---|---|---|---|---|---|---|
| BioShock Infinite (2013) | 302.7 | 239.3 | 209.2 | 81.4 | ||
| Metro: Last Light (2013) | 159.2 | 156.5 | 113.1 | 55.9 | ||
| Thief (2014) | 120.7 | 109.8 | 107.1 | 62.6 | ||
| GTA V (2015) | 165 | 158 | 81.2 | 39.4 | ||
| The Witcher 3 (2015) | 165.5 | 105.1 | 59.7 | 34.3 | ||
| Batman: Arkham Knight (2015) | 146 | 135 | 74 | |||
| Metal Gear Solid V (2015) | 60 | 60 | 60 | 59 | ||
| Dota 2 Reborn (2015) | 127 | 119 | 108 | 94.6 | ||
| Fallout 4 (2015) | 179.1 | 63.4 | 50.8 | |||
| Rise of the Tomb Raider (2016) | 161.8 | 102.4 | 53.9 | 40.8 | ||
| Ashes of the Singularity (2016) | 80.2 | 50.8 | 45.1 | |||
| Overwatch (2016) | 197.3 | 148.3 | 71 | |||
| Deus Ex Mankind Divided (2016) | 48.3 | 23.4 | ||||
| Mafia 3 (2016) | 63 | 39.4 | 36 | |||
| Prey (2017) | 143 | 118.9 | 96.5 | 81.5 | ||
| Rocket League (2017) | 141 | 49.1 | ||||
| Dirt 4 (2017) | 202.1 | 137.9 | 81.2 | 46.9 | ||
| F1 2017 (2017) | 215 | 105 | 86 | 53 | ||
| Middle-earth: Shadow of War (2017) | 150 | 69 | 48 | 36 | ||
| Destiny 2 (2017) | 106.1 | 81.2 | 78.8 | 65.9 | ||
| Assassin´s Creed Origins (2017) | 64 | 45 | 42 | 34 | ||
| Final Fantasy XV Benchmark (2018) | 81.8 | 41.2 | 20.4 | |||
| X-Plane 11.11 (2018) | 61.8 | 52.8 | 45.5 | |||
| World of Tanks enCore (2018) | 386.1 | 186.1 | 63.3 | 41.8 | 21.4 | |
| Far Cry 5 (2018) | 51 | 47 | ||||
| The Crew 2 (2018) | 51 | |||||
| F1 2018 (2018) | 139 | 83 | 70 | 46.1 | ||
| Strange Brigade (2018) | 210 | 85.3 | 68 | 56.6 | ||
| Shadow of the Tomb Raider (2018) | 109 | 47 | 43 | 36 | ||
| Forza Horizon 4 (2018) | 0 game wont start (benchmark wont start) | |||||
| Assassin´s Creed Odyssey (2018) | 44 | 35 | 21 | |||
| Call of Duty Black Ops 4 (2018) | 66 | 38.7 | 17.8 | |||
| Hitman 2 (2018) | 53 | 52.8 | 46.2 | 41.3 | 14.4 | |
| Fallout 76 (2018) | 50.4 | |||||
| Battlefield V (2018) | 161 | 81 | 66 | 59.8 | 43.3 | 20.9 |
| Farming Simulator 19 (2018) | 142.9 | 101.6 | 88.6 | 57.1 | 21.3 | |
| Darksiders III (2018) | 134.7 | 59.7 | 49.7 | 42.3 | 14.3 | |
| Just Cause 4 (2018) | 76.2 | 51.6 | 41.9 | 40.3 | 14 | |
| Far Cry New Dawn (2019) | 71 | 55 | 51 | 47 | 22 | |
| Metro Exodus (2019) | 85.1 | 43.11 | 28.43 | 24.01 | 10.94 | |
| Anthem (2019) | 23.81 | 19.78 | 10 | |||
| Dirt Rally 2.0 (2019) | 164.7 | 78.2 | 64.7 | 35.95 | ||
| The Division 2 (2019) | 57 | 52 | 44 | 35 | 10 | |
| Rage 2 (2019) | 100.2 | 46.8 | 39.7 | 38.6 | ||
| Total War: Three Kingdoms (2019) | 149 | 49.4 | 29.8 | 19.8 | 12.7 | 5.4 |
| League of Legends (2019) | 174.9 | 160.4 | 158.8 | 156.8 | 156.2 | 156 |
| F1 2019 (2019) | 133 | 87 | 74 | 50.1 | 37.8 | 21.5 |
| Control (2019) | 102 | 34 | 24 | 15 | ||
| Borderlands 3 (2019) | 80.8 | 50 | 31.5 | 21.9 | 16.8 | 6.6 |
| FIFA 20 (2019) | 148.2 | 145.1 | 139.3 | 137.3 | 127.4 | 74.3 |
| Ghost Recon Breakpoint (2019) | 44 | 36 | 32 | 21 | 13 | |
| Need for Speed Heat (2019) | 70.9 | 55 | 48 | 41 | 29 | |
| Star Wars Jedi Fallen Order (2019) | 39 | 33 | 27.9 | |||
| Hunt Showdown (2020) | 133 | 53.3 | 41.3 | 24.5 | 11 | |
| Gears Tactics (2020) | 134.9 | 84.4 | 49 | 37.7 | 23.5 | 12.1 |
| F1 2020 (2020) | 204 | 105 | 81.5 | 56.1 | 40.8 | 20.8 |
| Forza Horizon 5 (2021) | 85 | 47 | 35 | 14 | 13 | |
| Cyberpunk 2077 1.6 (2022) | 39 | 30 | 23 | 23 | 4 |
Stress Test - Acceptable temperatures when gaming
We stress the mini PC to identify for any throttling or hardware issues. When subjected Prime95 to stress the CPU, the processor can be observed stabilizing at 3.9 GHz or 800 MHz above its base clock rate and never reaching any faster from the very start of the test. This behavior has more in common with Intel's HQ-series of CPUs whereas U-series CPUs tend to hit very high Turbo Boost clock rates for very short periods before stabilizing at slower speeds. Its stable core temperature of 85 C is subsequently warmer than on most Ultrabooks but still cooler than the i7-6770HQ in the Skull Canyon where temperatures can reach >95 C when under similar Prime95 conditions. In this case, the thicker chassis design is at least partly responsible for the improved cooling potential over the last generation NUC.
Running both Prime95 and FurMark simultaneously to stress the processor package will result in a steady core temperature of 99 C. Whether or not such a high temperature can be considered "stable" will depend on who you ask, but this is technically stable to Intel engineers as they've confirmed TjMax to be 100 C for the i7-8809G. In our minds, however, plateauing at 99 C is unacceptable for most enthusiasts as even the fastest ultra-thin laptops like the MSI GS or Razer Blade series tend to stabilize at cooler core temperatures when under similar conditions. Interestingly, the GPU clock never drops below its rated dynamic maximum of 1190 MHz no matter how stressful the load while the CPU can drop to as low as 3.5 GHz to indicate a preference for stabler GPU performance at the cost of CPU performance.
Running Witcher 3 is more representative of loads most gamers will experience. The CPU stabilizes at a respectable mid-to-high 60 C range to be cooler than many gaming notebooks including the Aorus X7 or Asus ROG G752VS where >80 C can be the norm.
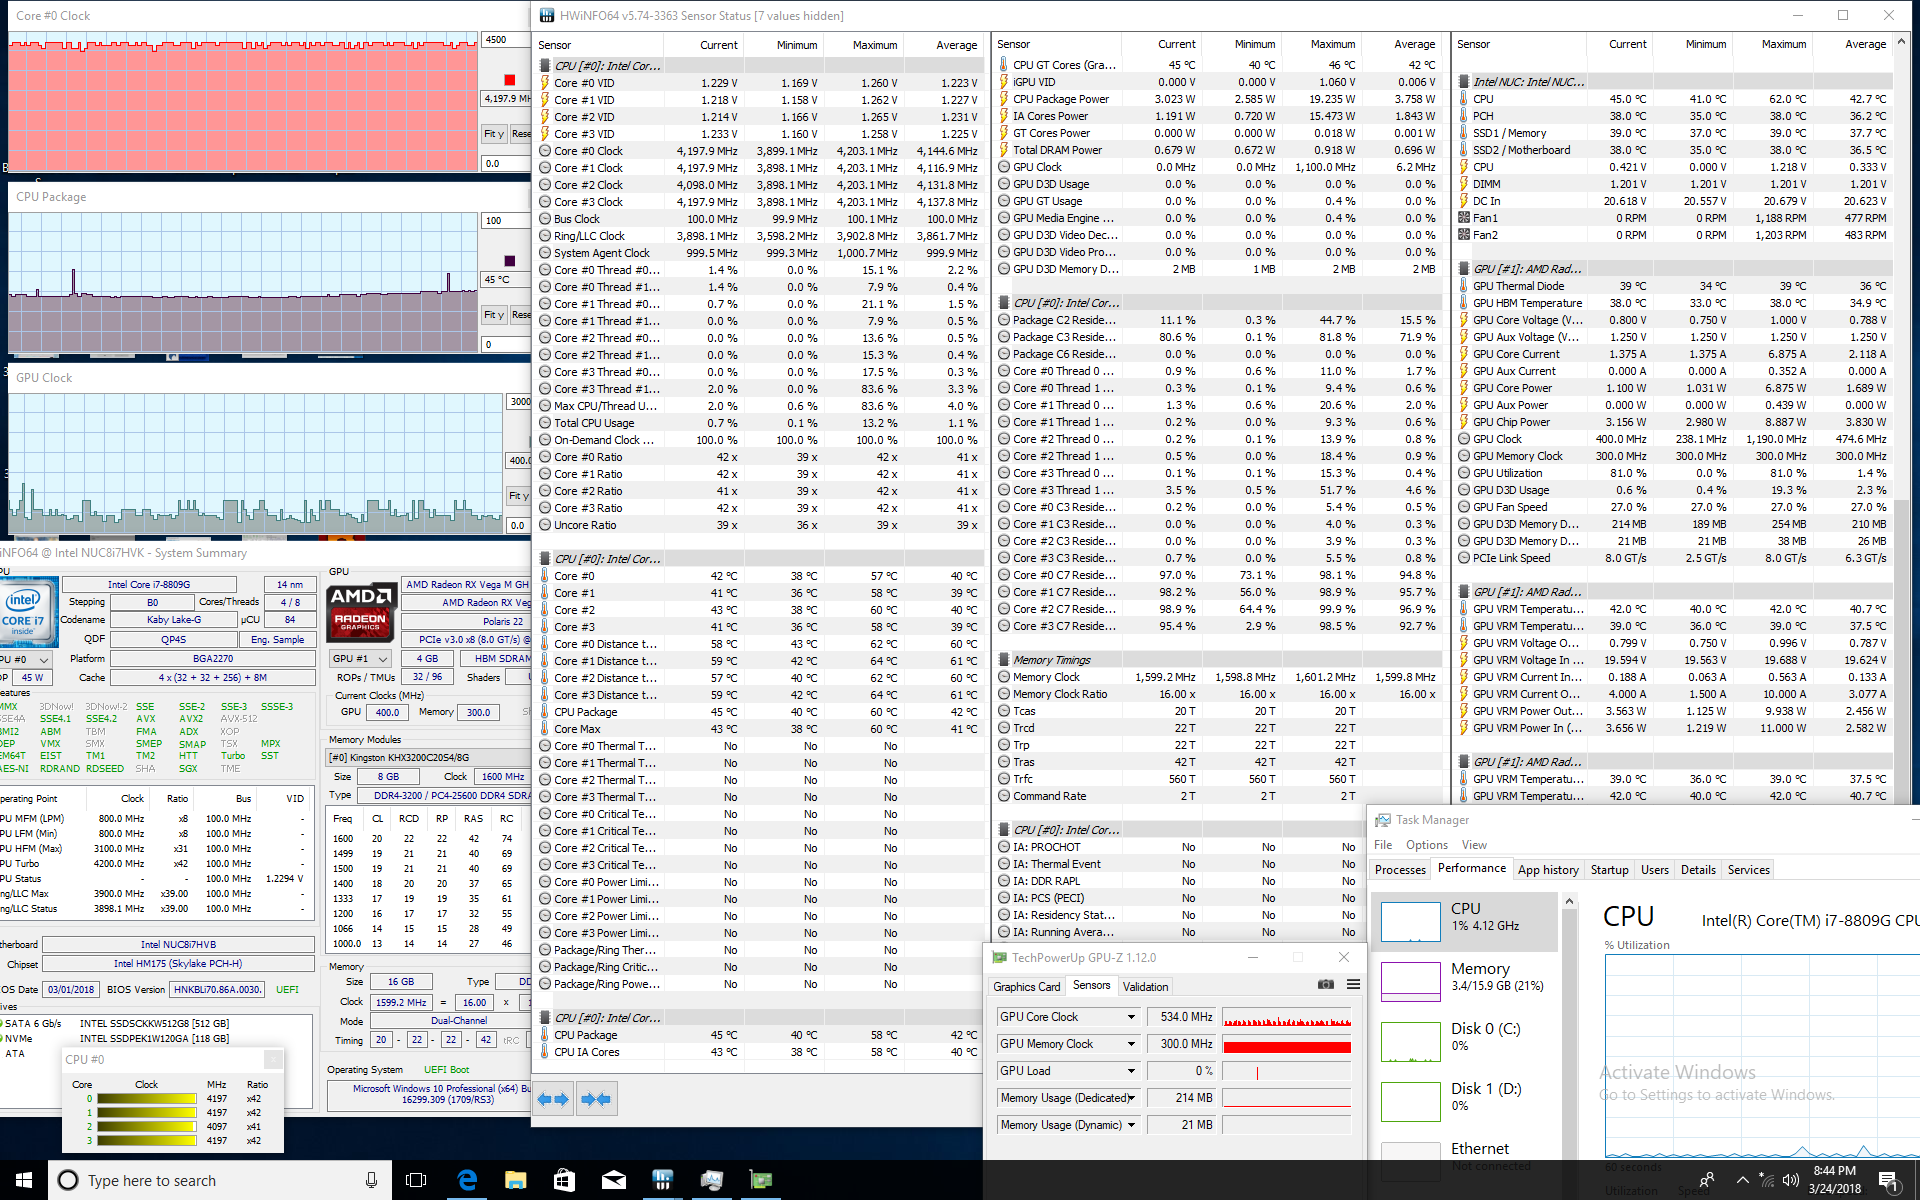
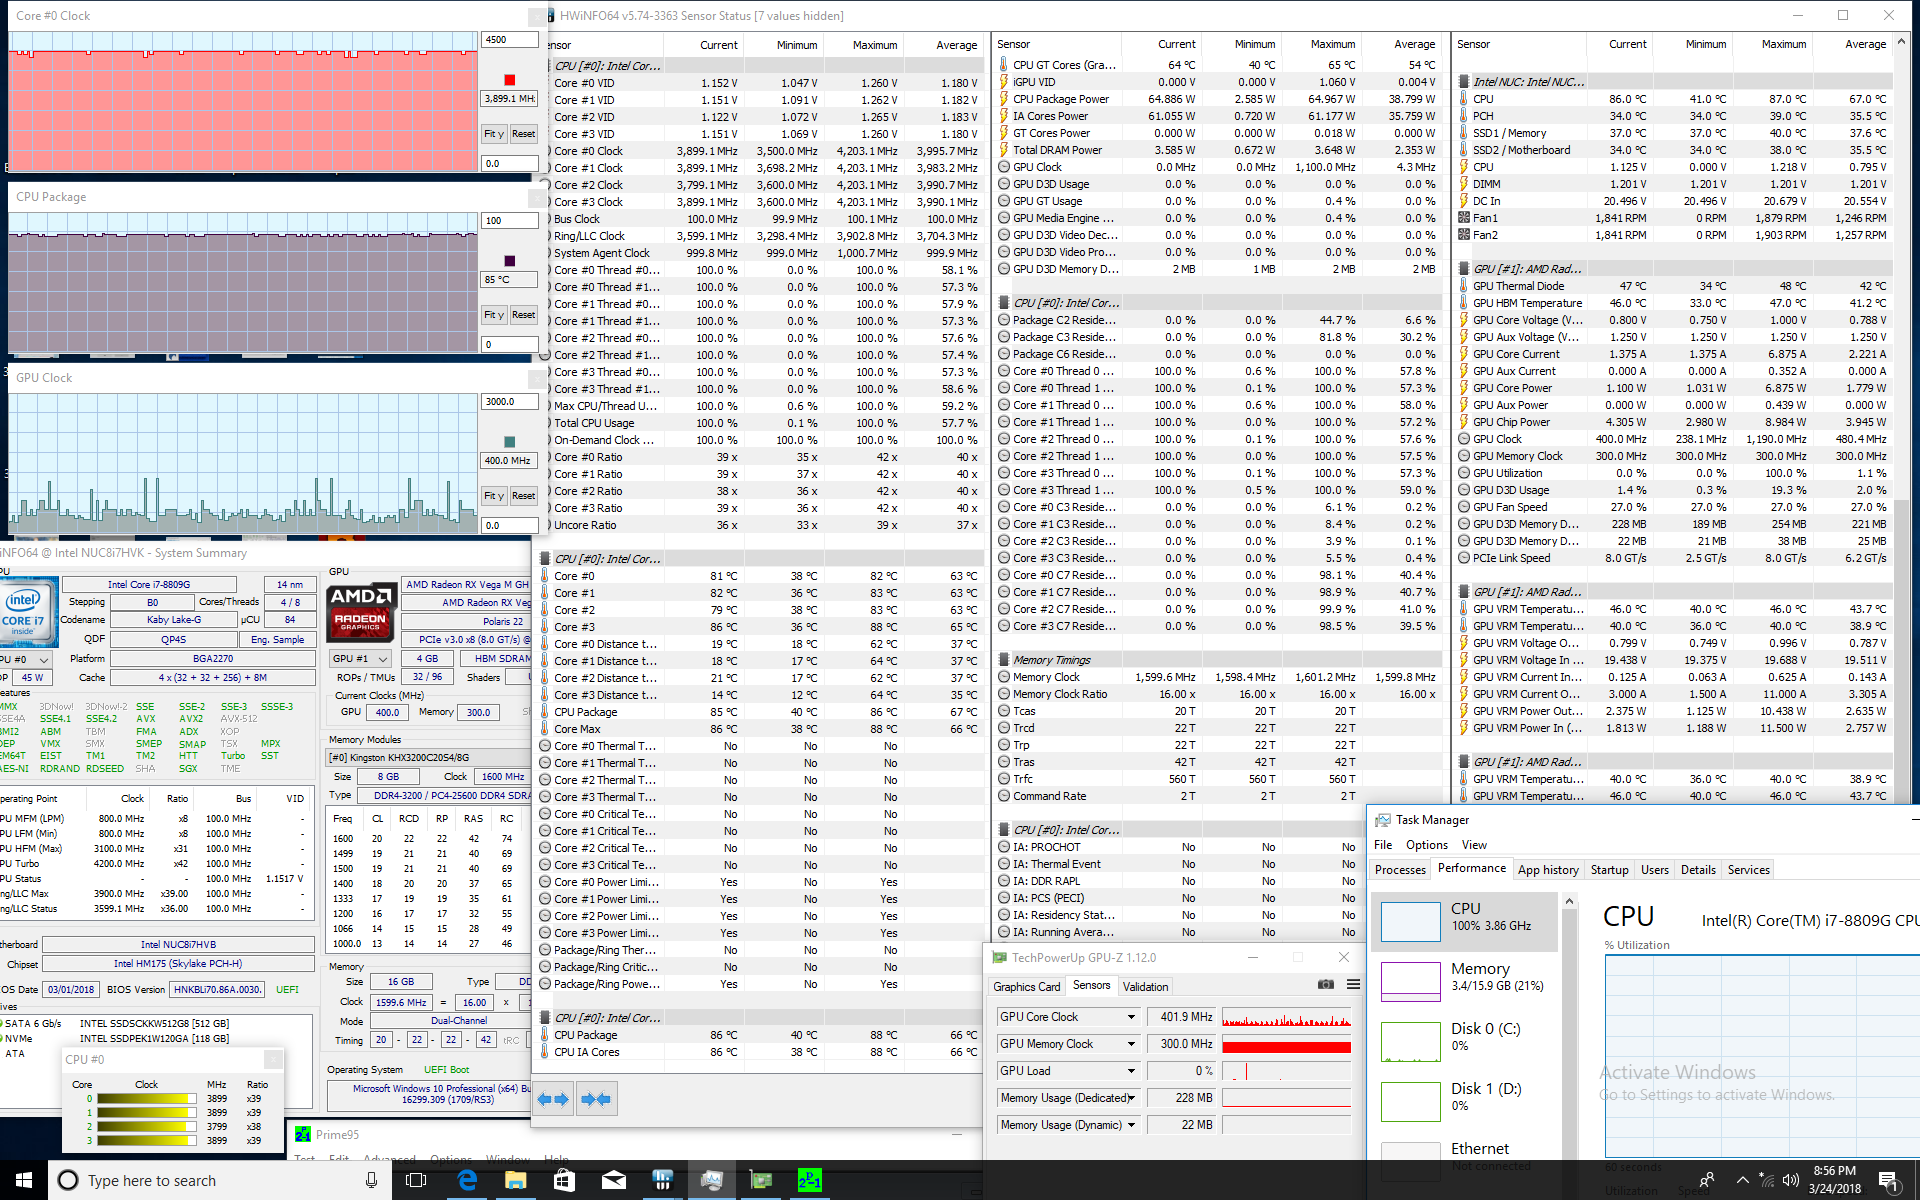
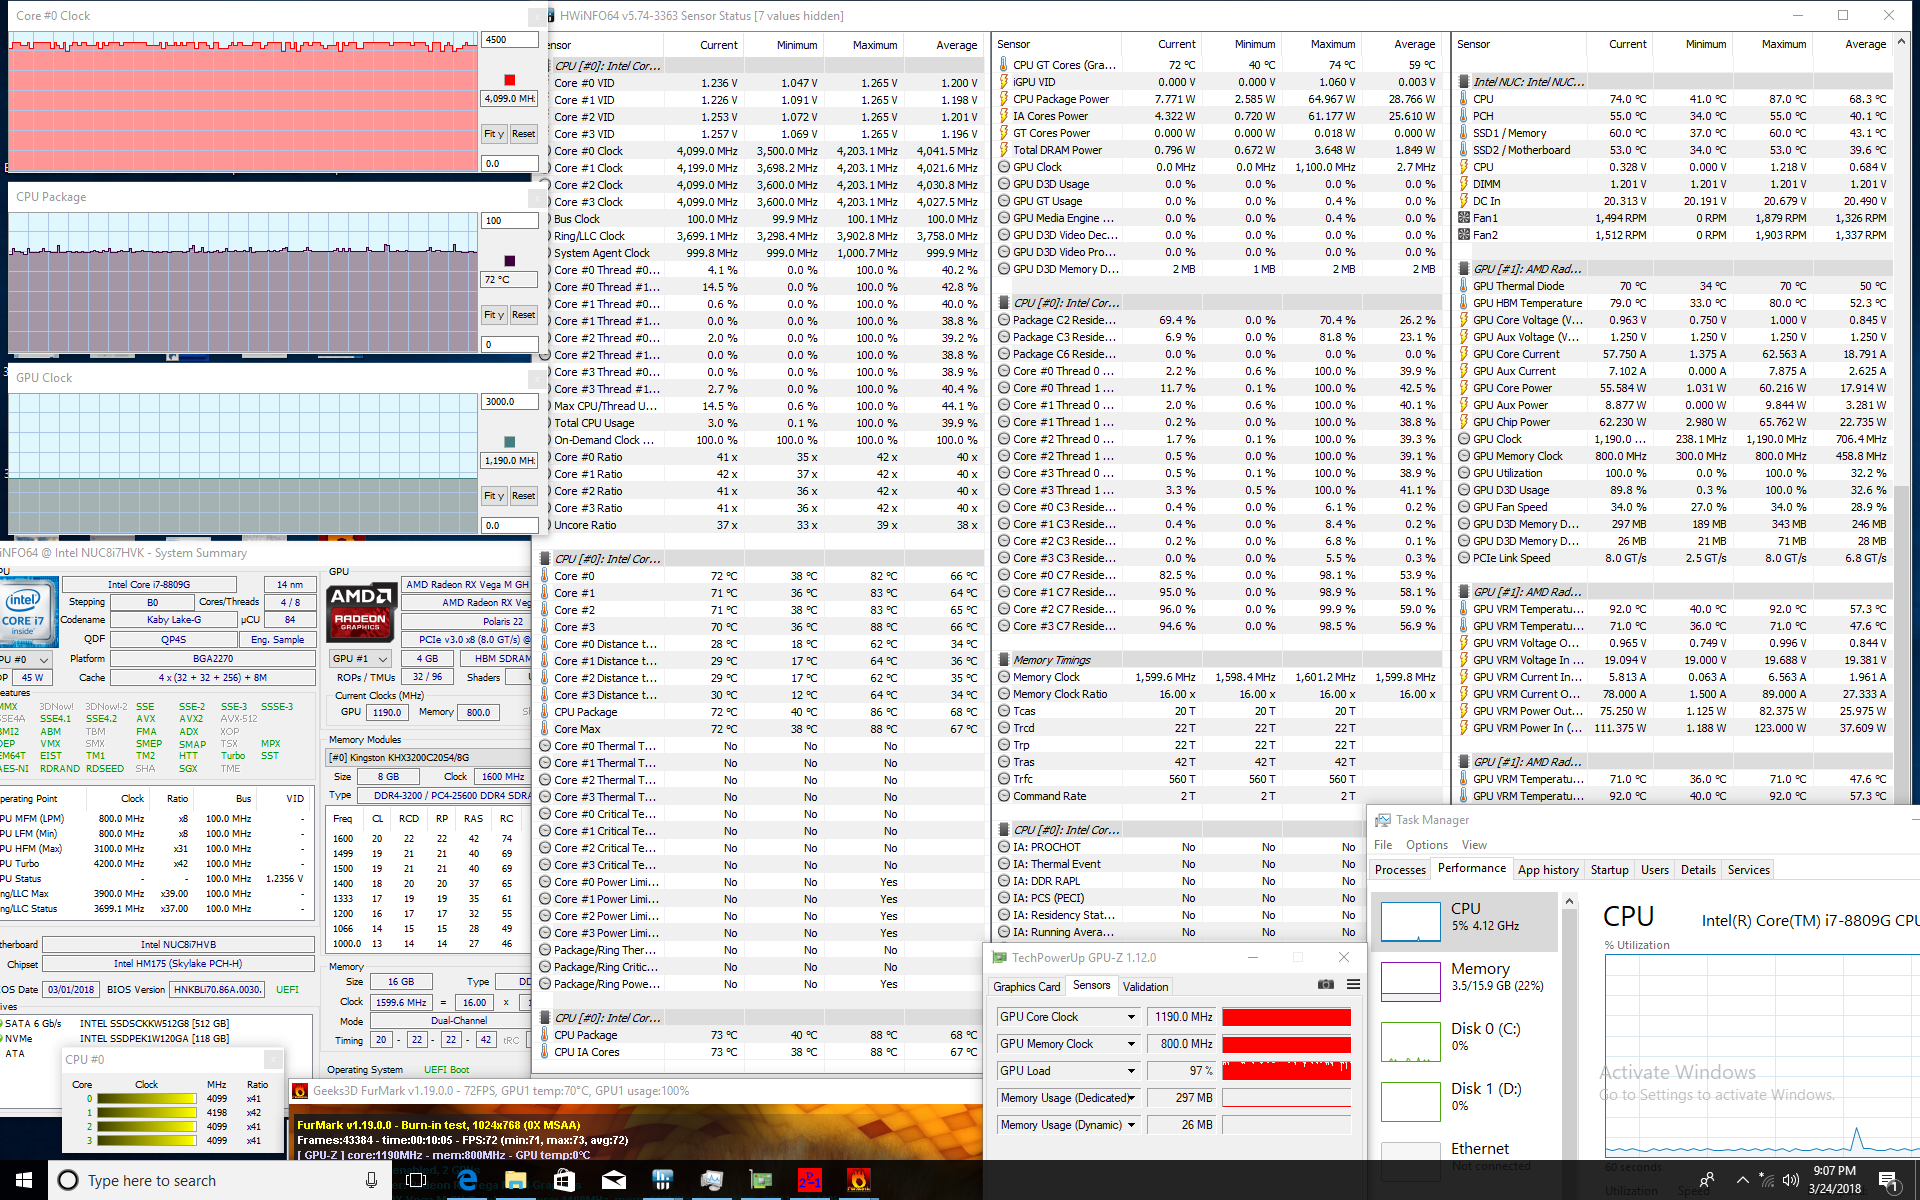
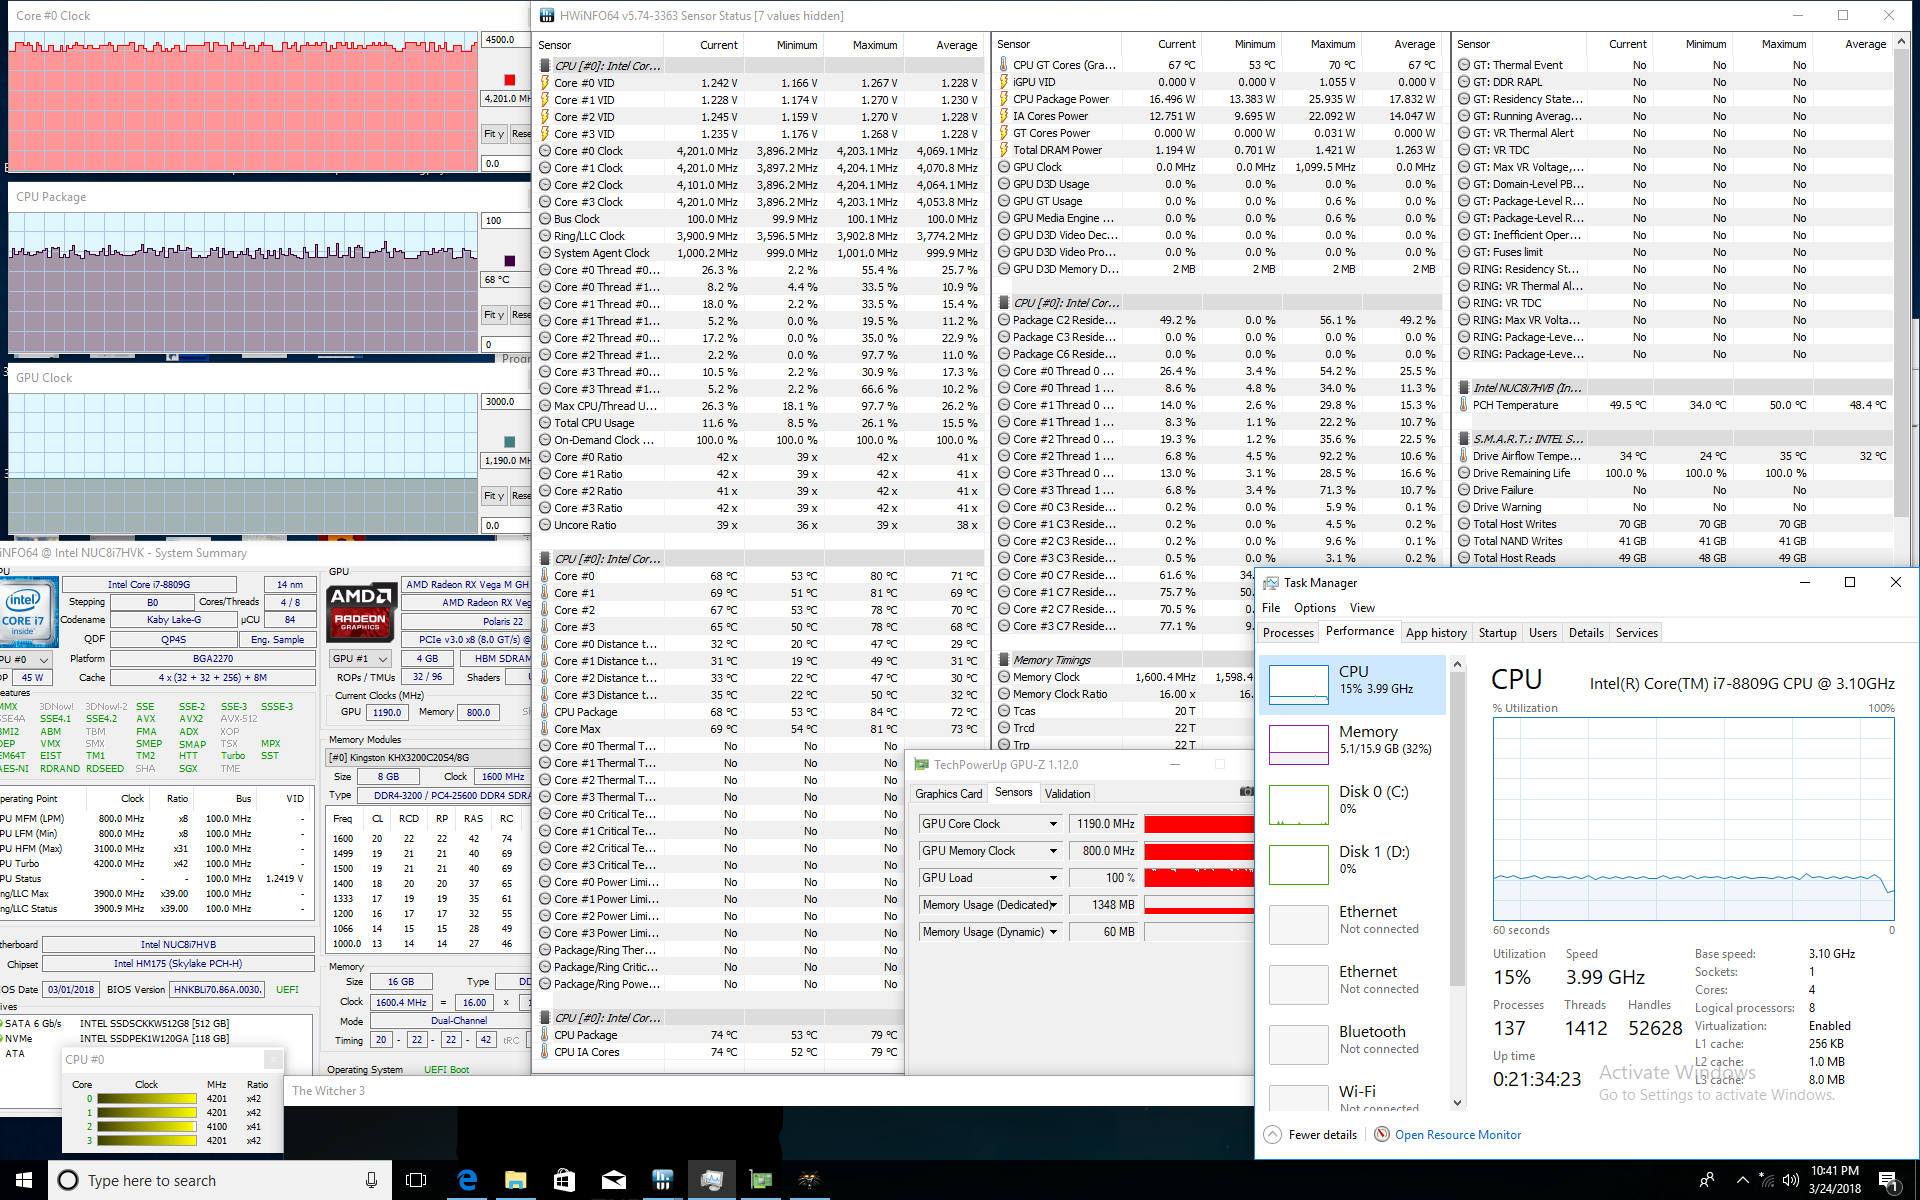
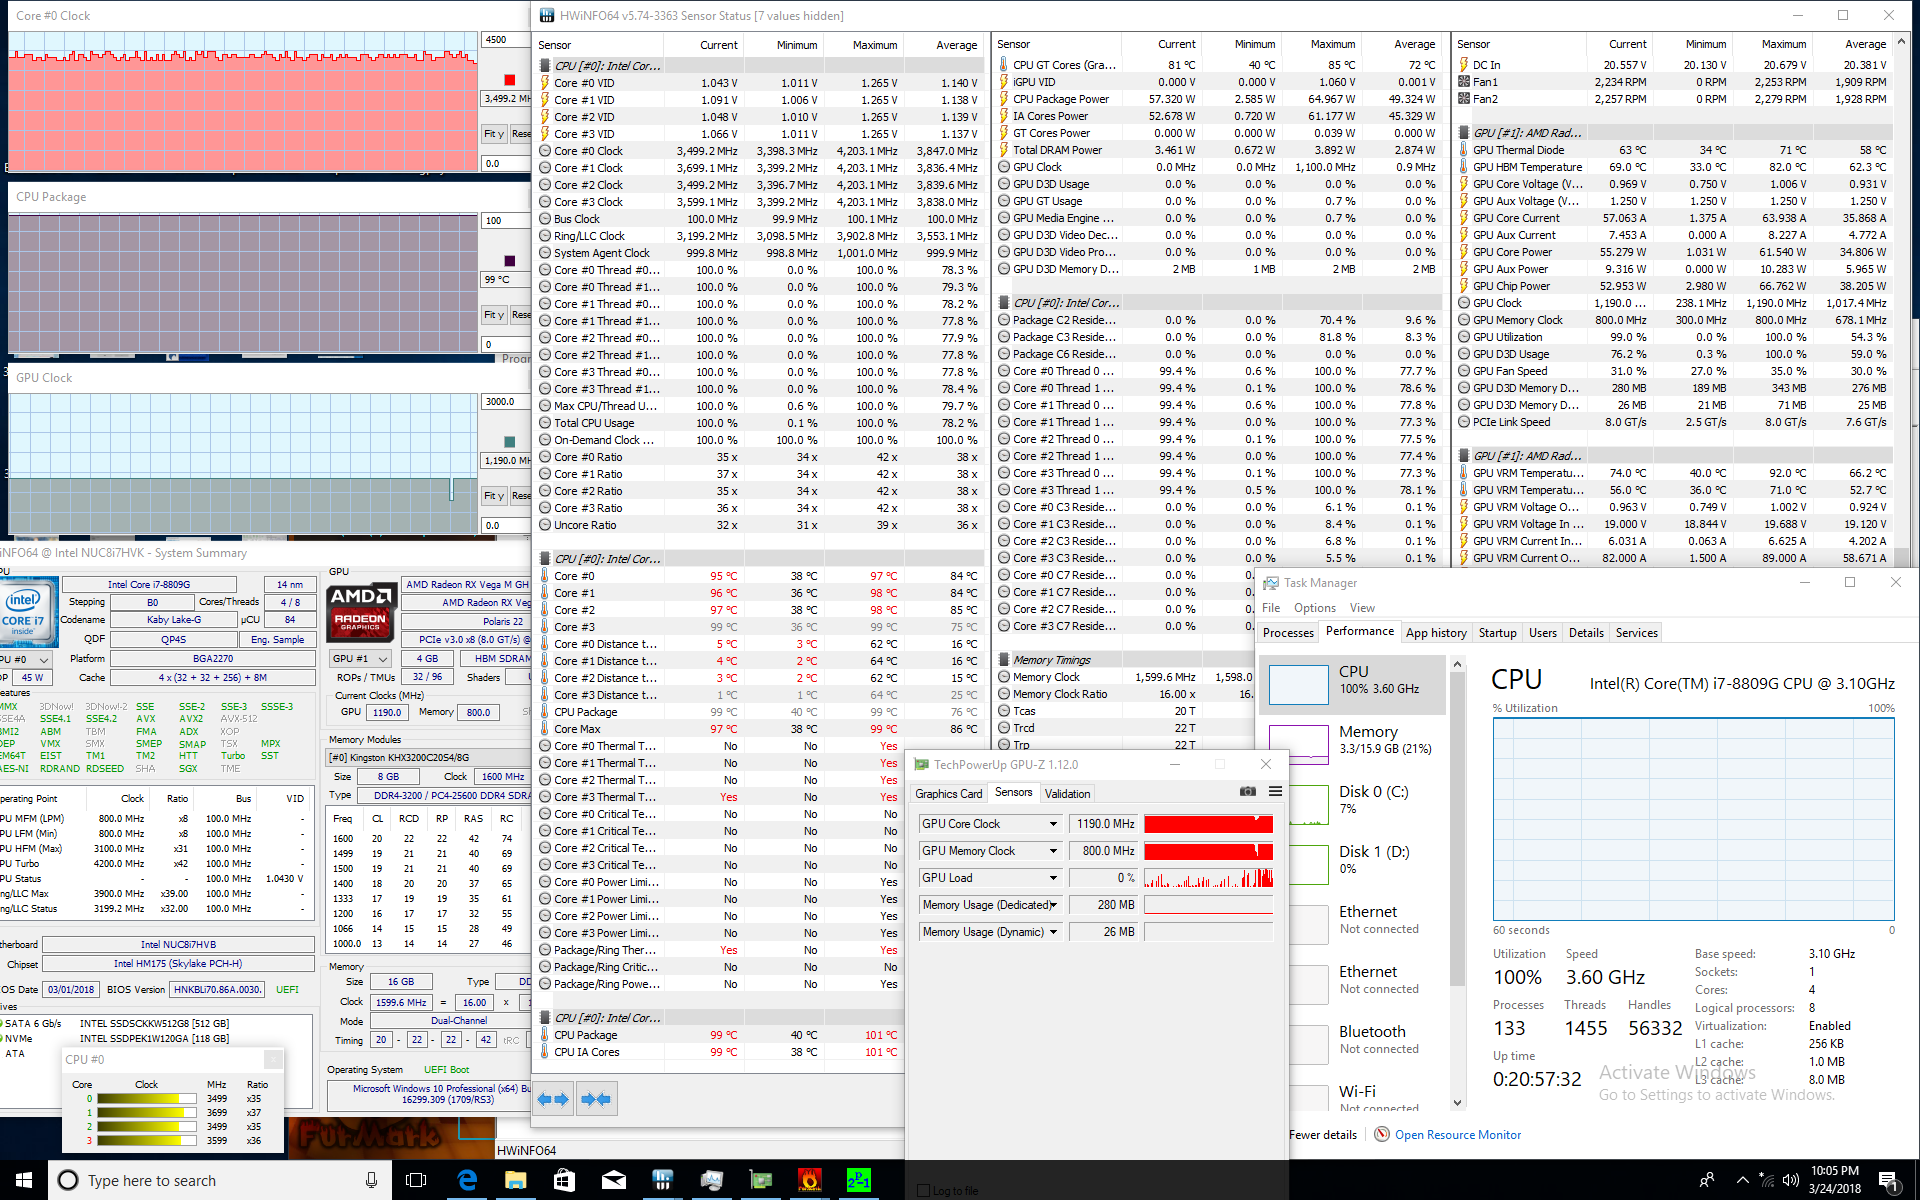
| CPU Clock (GHz) | GPU Clock (MHz) | Average CPU Temperature (°C) | |
| Prime95 Stress | 3.8 - 3.9 | -- | 85 |
| FurMark Stress | -- | 1190 | 72 |
| Prime95 + FurMark Stress | 3.5 - 3.8 | 1190 | 99 |
| Witcher 3 Stress | 3.9 - 4.2 | 1190 | 65 - 70 |
Emissions - Now a bit quieter
System Noise
How do you cool a 100 W TDP processor in a chassis that's a fraction of the size of a PC? Instead of traditional heat pipes, the NUC utilizes vapor chamber cooling alongside dual system fans similar in concept to the Asus ROG G752VY. The main drawback is its increased cost and weight over heat pipes in return for superior cooling per unit area or volume. As such, the size increase from the smaller Skull Canyon NUC can be attributed to the denser and larger cooling solution.
End results show that the move to vapor chamber may be well worth it. System noise is both generally quieter and lower-pitched than the previous model and most ultrathin gaming notebooks when idling or gaming partly due to having larger fans. The fans are always active but barely noticeable during low loads like browsing or streaming.
Fan behavior is still not perfect and could have been better when running higher loads. When gaming, for example, the fans tend to pulsate between 36 dB(A) and 42 dB(A) every minute or so. A steady fan noise somewhere in the middle would have been more preferable to be less disruptive.
Maximum load will bump fan noise up to almost 50 dB(A), but such high levels are not representative of day-to-day or gaming loads. Overclockers may experience these very fast RPMs since core temperature is already about 70 C when gaming or >85 C when under extreme stress on stock settings.
Electronic noise or coil whine is present on our unit. It is thankfully very soft and unnoticeable unless if placing an ear directly on the unit.
Noise level
| Idle |
| 29 / 29 / 29 dB(A) |
| Load |
| 36 / 49.4 dB(A) |
 | ||
30 dB silent 40 dB(A) audible 50 dB(A) loud |
||
min: | ||
| Intel Hades Canyon NUC8i7HVK Vega M GH, i7-8809G, Intel Optane 120 GB SSDPEK1W120GA | Intel Skull Canyon NUC6i7KYK Iris Pro Graphics 580, 6770HQ, Samsung SSD 850 EVO m.2 120GB | Zotac ZBOX Magnus EN51050 GeForce GTX 1050 Mobile, i5-7500T, Samsung SSD 960 Pro 512 GB m.2 | Razer Blade (2017) UHD GeForce GTX 1060 Mobile, i7-7700HQ, Samsung PM961 NVMe MZVLW512HMJP | Dell XPS 13 9370 i5 UHD UHD Graphics 620, i5-8250U, Toshiba XG5 KXG50ZNV256G | MSI GS63VR 7RG-005 GeForce GTX 1070 Max-Q, i7-7700HQ, Samsung SM961 MZVPW256HEGL | |
|---|---|---|---|---|---|---|
| Noise | -7% | -13% | -8% | 5% | -9% | |
| off / environment * (dB) | 28.7 | 29.5 -3% | 30.7 -7% | 30.3 -6% | 29 -1% | 30 -5% |
| Idle Minimum * (dB) | 29 | 31.6 -9% | 37.6 -30% | 30.3 -4% | 29 -0% | 31 -7% |
| Idle Average * (dB) | 29 | 32.2 -11% | 37.6 -30% | 30.3 -4% | 29 -0% | 34 -17% |
| Idle Maximum * (dB) | 29 | 32.3 -11% | 37.7 -30% | 30.3 -4% | 29 -0% | 35 -21% |
| Load Average * (dB) | 36 | 43 -19% | 39.3 -9% | 42.2 -17% | 32 11% | 42 -17% |
| Witcher 3 ultra * (dB) | 42 | 40.6 3% | 44 -5% | |||
| Load Maximum * (dB) | 49.4 | 43.2 13% | 44 11% | 55.7 -13% | 40.1 19% | 46 7% |
* ... smaller is better
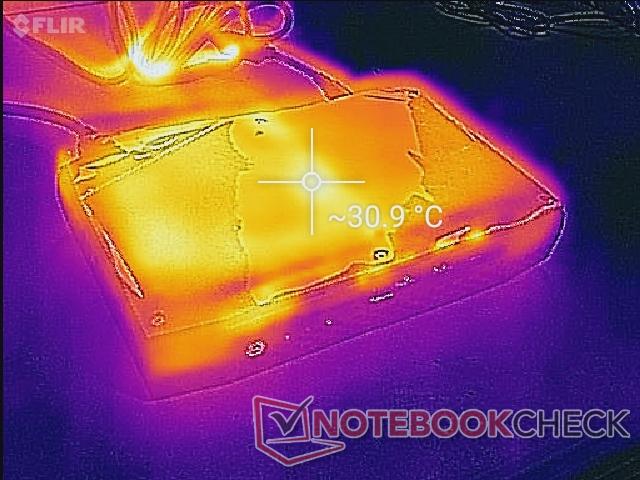
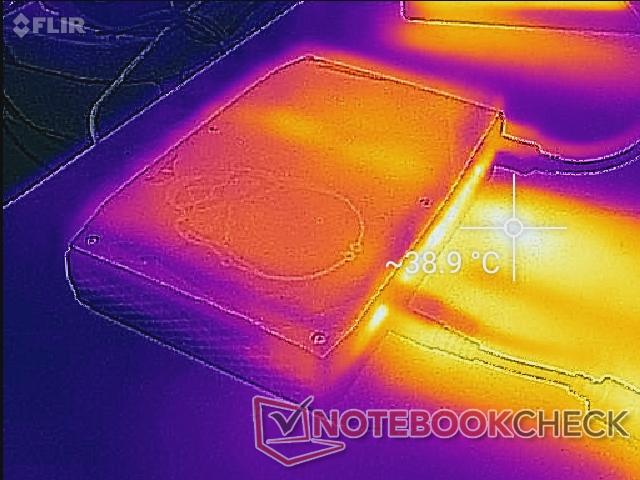
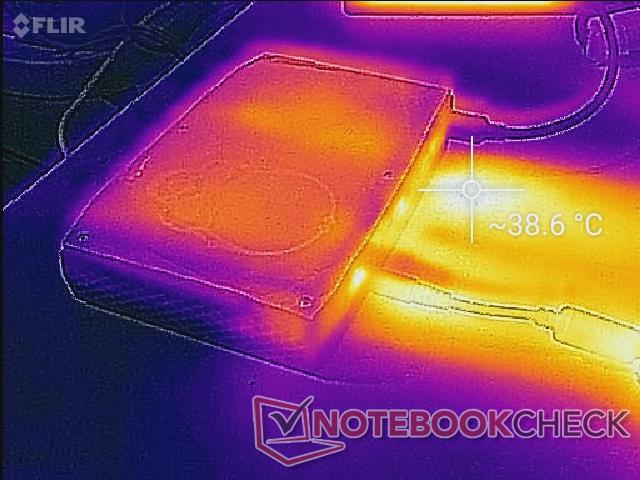
Temperature - Don't block those ventilation grilles
Surface temperatures are cooler on the Hades Canyon NUC when compared to the Skull Canyon NUC despite having a more demanding processor. Whereas the last generation model can become as warm as 42 C when under very high processing loads, this latest model barely changes in temperature and remains at about 30 C no matter the load.
So, where does all the heat go? The chassis includes a plethora of ventilation grilles on 5 of its 6 sides. Exhaust exits only from the rear of the unit and anything caught in its path will become very warm as suggested by our heat maps below. Needless to say, it is especially important to not block any of the ventilation grilles or orient the system sideways on a table.


Energy Management - More demanding than a GTX 1060 laptop
Power Consumption
Idling on desktop demands about 16 W to be very similar to the slower Skull Canyon NUC. From a notebook perspective, the new NUC sits between an Ultrabook and a full-fledged gaming notebook in terms of power consumption when idling or during very low loads.
Results get more interesting when subjecting the system to higher loads. When running 3DMark 06, the NUC will draw 83 W or slightly more than the GTX 1060-powered Razer Blade or Asus FX503VM under similar conditions. This delta grows even larger when running Witcher 3 as we can record a consumption of 135 W versus just 107 W on the Asus FX503VM. The performance of the Vega RX M GH is very nearly on par with the GTX 1060 for laptops and so it's disappointing to see a lower performance-per-Watt out of the i7-8809G when gaming. Fortunately, the performance-per-Watt is significantly greater if comparing against Nvidia's last generation Maxwell series or Intel's own Iris series. As an example, Hades Canyon consumes 33 percent more power than Skull Canyon when running 3DMark06 while providing a graphics boost of about 450 percent according to 3DMark.
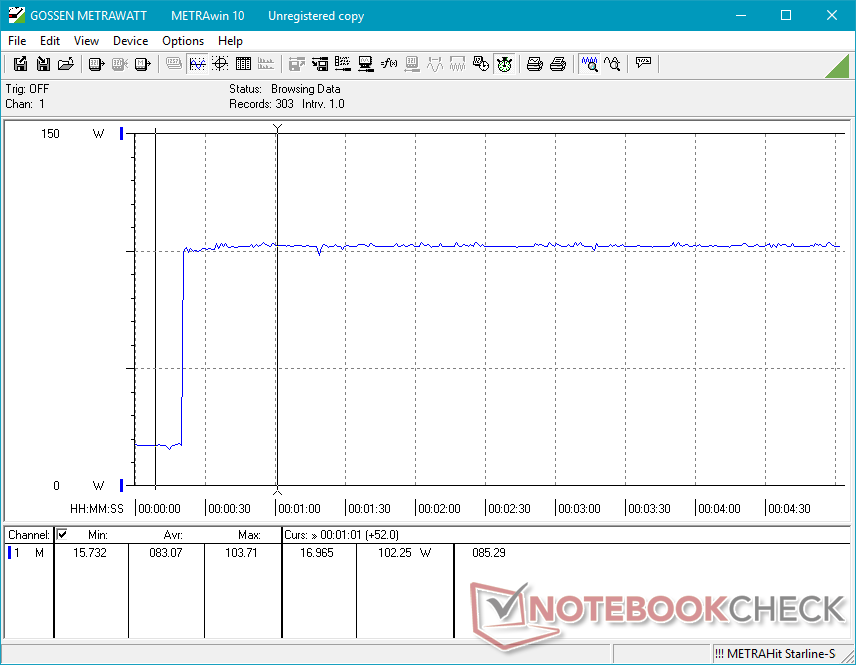
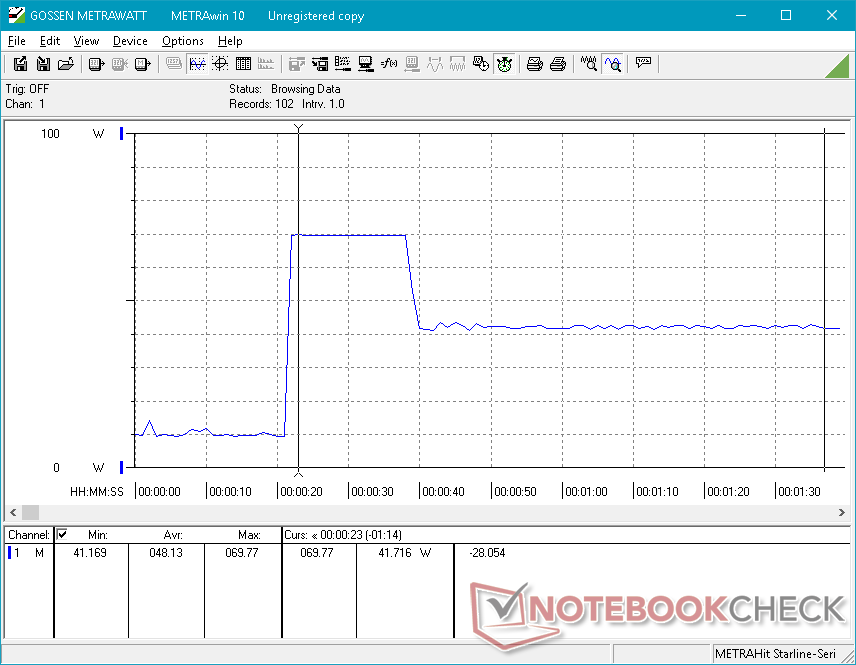
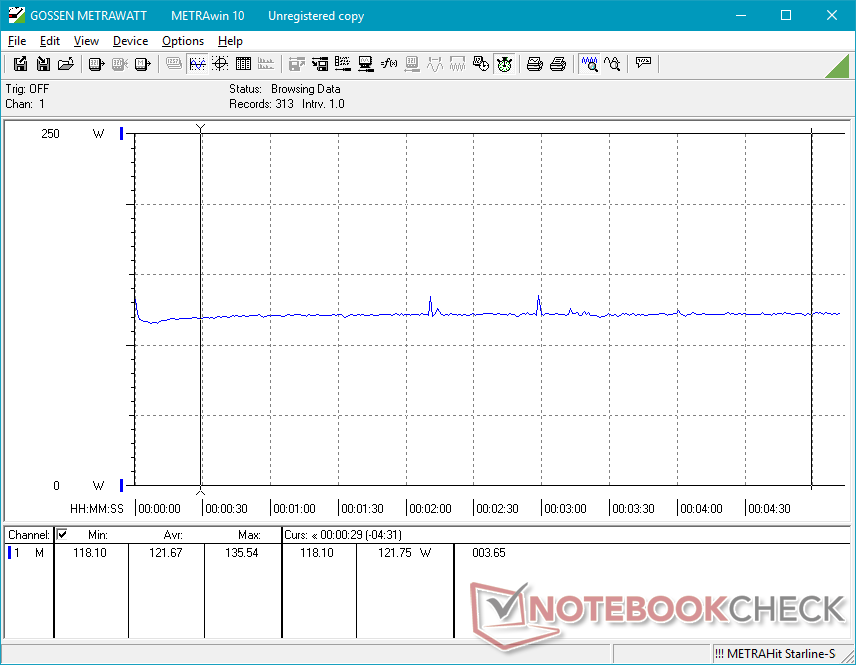
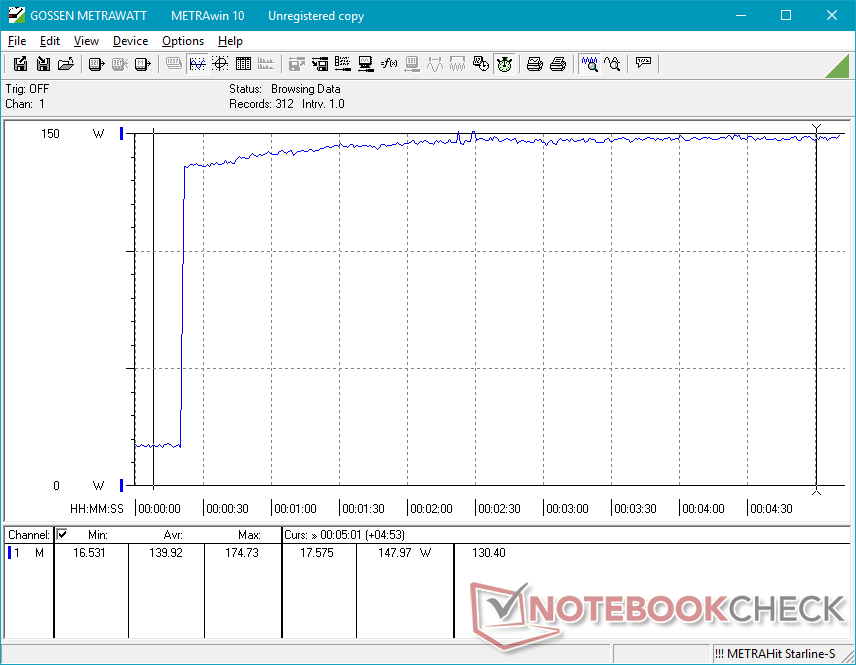
Power consumption when running Prime95 is in line with our steady CineBench loop results from above. Consumption jumps from 16 W at idle to 103 W almost instantaneously and it never drops from there to imply steady performance and Turbo Boost. In comparison, a U-class CPU may experience higher power draw during the first few seconds of running Prime95 before dropping to lower levels as shown by the comparison below.
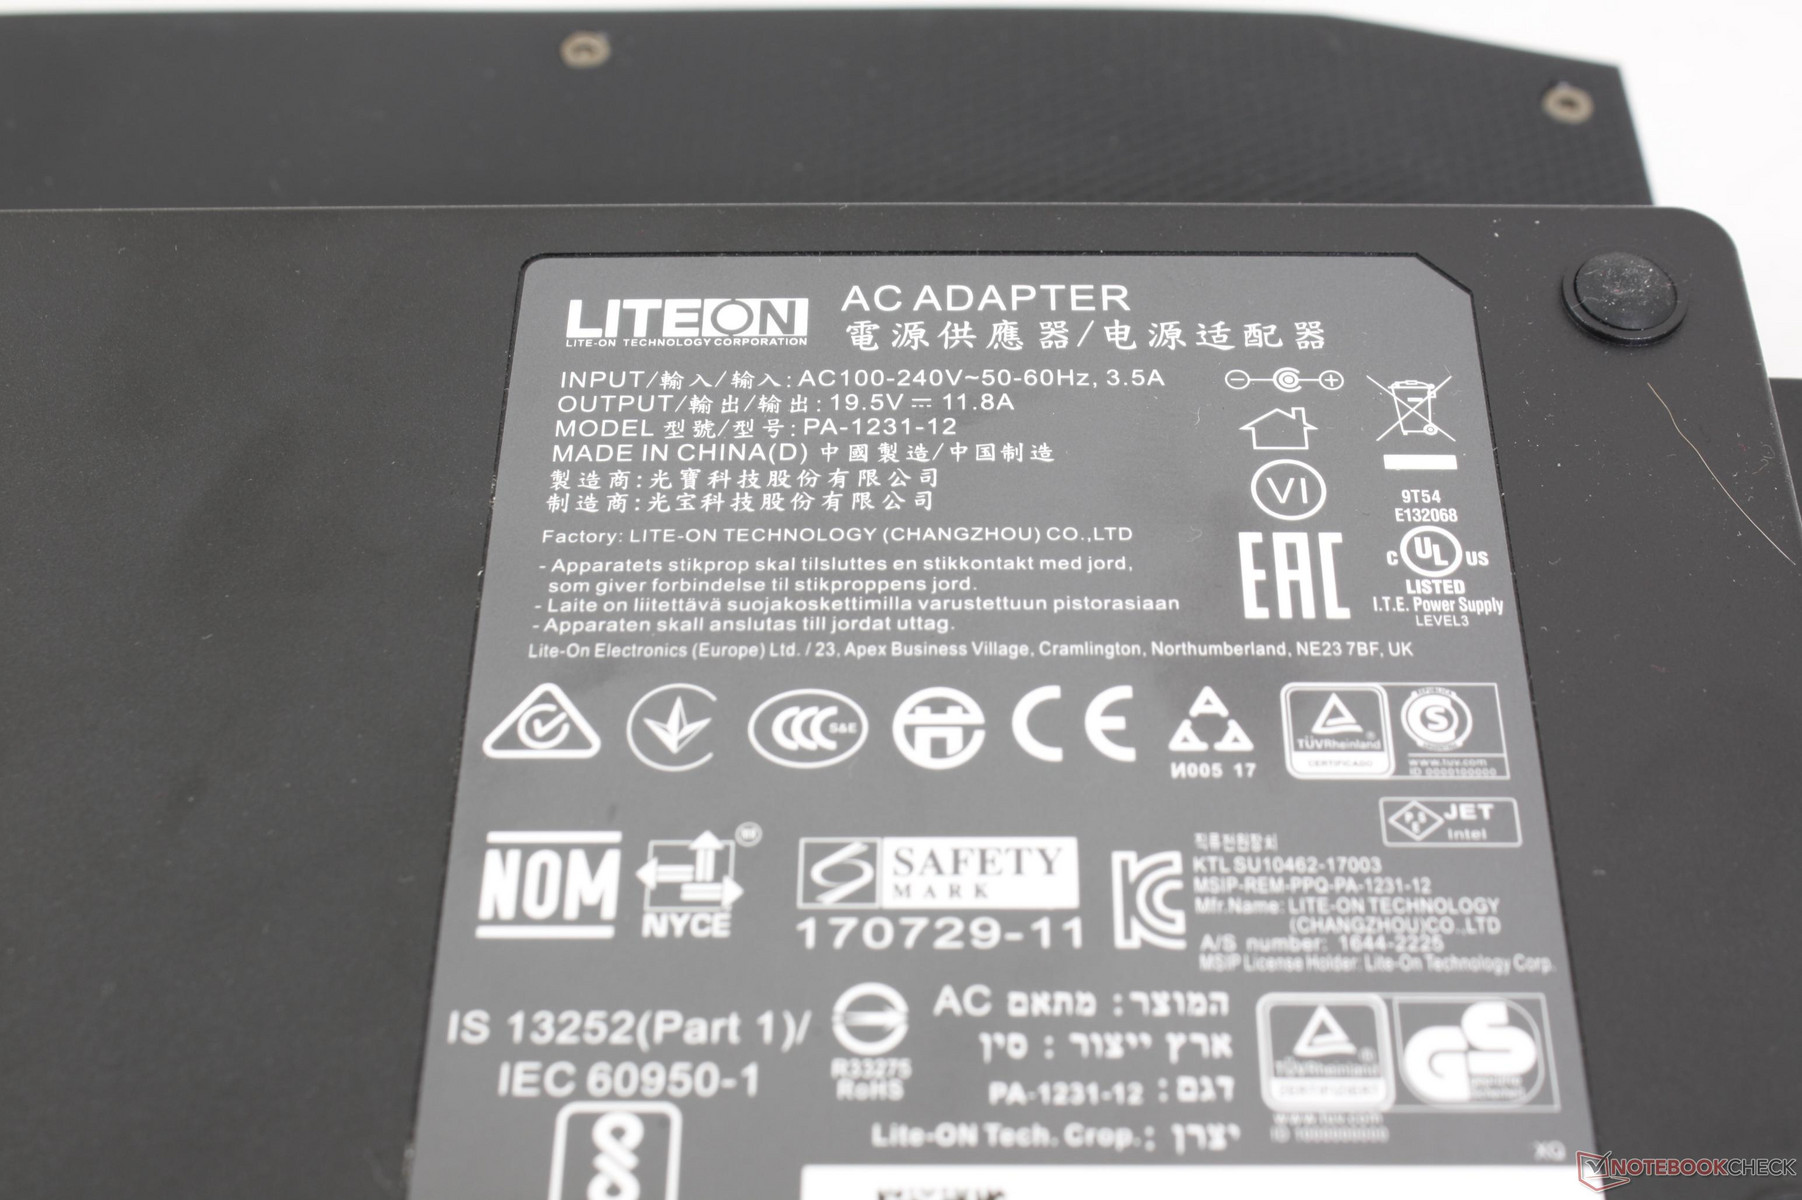
We are able to record an average power draw of 174 W over 90 seconds when running both Prime95 and FurMark simultaneously. Note that power consumption will fluctuate heavily from 150 W to 225 W when under 100 percent load conditions as shown below. The external power adapter is rated for 230 W and so a slightly more capable PSU would have been appreciated for the greater overhead.

| Off / Standby | |
| Idle | |
| Load |
|
Key:
min: | |
| Intel Hades Canyon NUC8i7HVK i7-8809G, Vega M GH, Intel Optane 120 GB SSDPEK1W120GA, , x, | Zotac ZBOX Magnus EN51050 i5-7500T, GeForce GTX 1050 Mobile, Samsung SSD 960 Pro 512 GB m.2, , x, | Razer Blade (2017) UHD i7-7700HQ, GeForce GTX 1060 Mobile, Samsung PM961 NVMe MZVLW512HMJP, IPS, 3840x2160, 14" | Intel Skull Canyon NUC6i7KYK 6770HQ, Iris Pro Graphics 580, Samsung SSD 850 EVO m.2 120GB, , x, 0" | Asus Strix GL502VY-DS71 6700HQ, GeForce GTX 980M, SanDisk SD8SN8U1T001122, IPS, 1920x1080, 15.6" | Asus FX503VM-EH73 i7-7700HQ, GeForce GTX 1060 Mobile, SanDisk SD8SN8U128G1002, IPS, 1920x1080, 15.6" | |
|---|---|---|---|---|---|---|
| Power Consumption | -12% | 15% | 22% | -33% | 10% | |
| Idle Minimum * (Watt) | 15.5 | 21.1 -36% | 8.1 48% | 14.8 5% | 20.6 -33% | 12.8 17% |
| Idle Average * (Watt) | 16.2 | 22.1 -36% | 14.3 12% | 15.7 3% | 22.1 -36% | 15.4 5% |
| Idle Maximum * (Watt) | 16.5 | 26.6 -61% | 16.3 1% | 15.8 4% | 22.5 -36% | 15.9 4% |
| Load Average * (Watt) | 83.4 | 77.5 7% | 74 11% | 62.7 25% | 130.6 -57% | 78 6% |
| Witcher 3 ultra * (Watt) | 121.7 | 92.4 24% | 107.3 12% | |||
| Load Maximum * (Watt) | 173.5 | 121.7 30% | 164 5% | 48.5 72% | 177.2 -2% | 143.4 17% |
* ... smaller is better
Pros
Cons
Verdict
From the outside, the Hades Canyon NUC looks like a drab and marginal update to the 2016 Skull Canyon NUC. Performance-wise, however, this couldn't be further from the truth. Intel has addressed everything we didn't like about Skull Canyon from the inside for a superior experience all around. Fan noise is noticeably quieter, core temperatures are cooler, and gaming performance is leagues beyond what the Iris series is currently capable of to the point of rivaling a GTX 1050 Ti or GTX 1060 gaming notebook. Not only is Kaby Lake-G more functional than any mobile AMD Fusion APU before it, but it hits the ground running by delivering on its promises on the very first try.
Perhaps the biggest fault we can identify is the poorer performance-per-Watt of the Core i7-8809G compared to a GTX 1060 equivalent. The NUC demands more power than a 15.6-inch gaming laptop equipped with a 7th gen HQ-class CPU and GTX 1060 or GTX 1060 Max-Q GPU even after accounting for the display and keyboard components that the NUC lacks. This revelation mirrors the current state of desktop Vega 56/64 GPUs as they have also been found to have inferior performance-per-Watt than their popular Pascal alternatives. In other words, all that processing power in such a small form factor comes at the price of higher-than-expected power consumption.
Speaking of price, the $1000 MSRP could dissuade potential buyers. The NUC does not include RAM, storage, or OS and so users must invest even more for a fully functional system. In contrast, a gaming laptop with GTX 1050 Ti or GTX 1060 graphics can be had for $1000 to $1200 USD complete with RAM, storage, OS, display, and more. Users who want the Intel NUC will be paying a premium for its diminutive size and new-fangled processor.
Its other disadvantages are relatively minor in our point of view. Core temperatures could still be a lot cooler as users who really stress the CPU and/or GPU may see temperatures as high as 85 C to 99 C before any overclocking. The average card reader performance, upside-down USB ports, slow pulsing fans when gaming, and large AC adapter round up our list of smaller inconveniences.
It's not the fastest mini PC as any GTX 1060-powered equivalent can give the NUC a run for its money. It is, however, an excellent performance standard for the new Kaby Lake-G platform that we hope future mini PCs and laptops can emulate. We can't wait for prices to come down to be more cost-competitive against mainstream Pascal.
Price comparison
