MSI GT70 (GTX 970M) Notebook Review
For the original German review, see here.
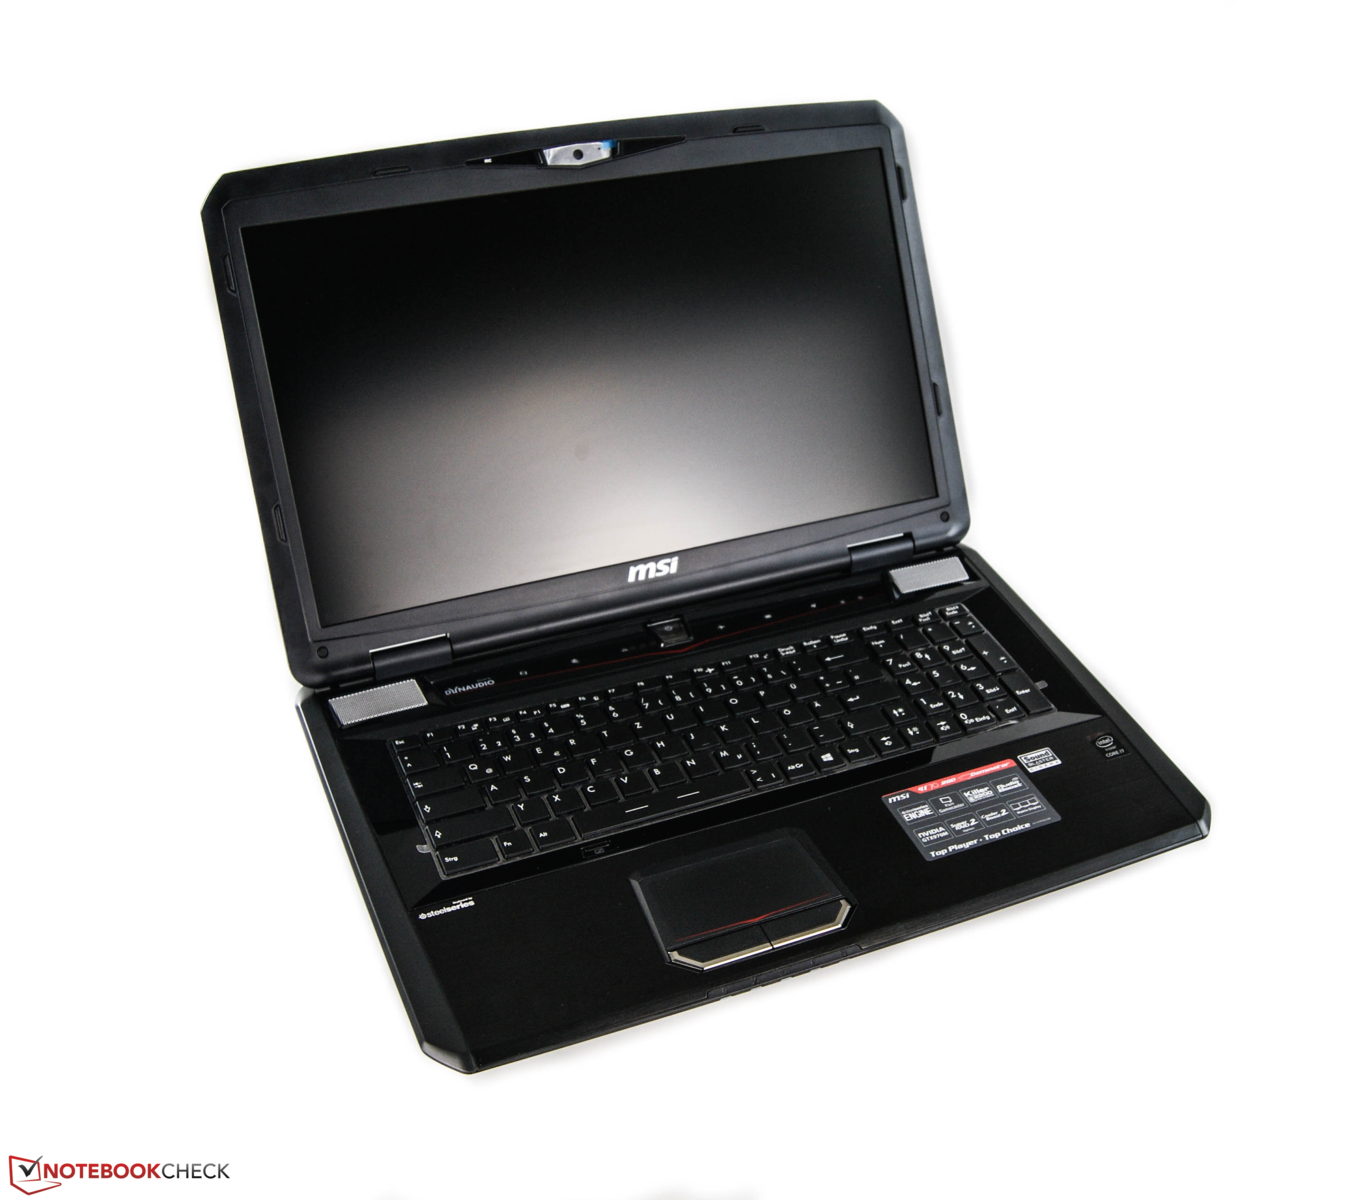
The title "Dominator" of MSI's GT70 lineup already suggests what will be found under the hood of the 17.3-inch laptop. The manufacturer convinced with its well-developed total package in the last test. A look at the technical specs reveals that a monster slumbers in the laptop, true to the dragon logo. Compared with the previously tested MSI GT70, this involves a leap from an Nvidia GTX 880M to an Nvidia GTX 970M, and 16 GB rather than 12 GB of working memory. Furthermore, a RAID system based on two 128 GB SSDs is installed. A 7200 rpm, 1 TB HDD provides enough storage capacity. The manufacturer uses the same Full HD screen as before. Potential buyers of the former lineup will be pleased about a considerably lower price. Our configuration of MSI's machine costs 1600 Euros (~$1780), which is a whole 300 Euros (~$333) less than the previously tested GT70.
We will focus on the fundamental modifications in this report and would refer to the review of the GT70-2PE for more details. Furthermore, we will use the new GT72 and other models from our Top 10 chart as comparison laptops in our benchmarks.
Display
As mentioned, the screen's model and manufacturer is identical with the old MSI GT70. The TN screen from Chi Mei has a resolution of 1920x1080 pixels and achieves an average brightness of 312 cd/m². Thus, the brightness is sufficient and equivalent with comparable devices. The brightness remains stable when the bulky gaming laptop runs on battery power. We did not notice intense screen bleeding, either. Unfortunately, MSI does not have any screen alternatives. Other manufacturers, such as XMG or Alienware, optionally have higher resolution versions and/or use higher-quality IPS screen. We only ascertained an average screen brightness of approximately 260 cd/m² in the pricier GT 72 by MSI.
| |||||||||||||||||||||||||
Brightness Distribution: 80 %
Center on Battery: 325 cd/m²
Contrast: 903:1 (Black: 0.36 cd/m²)
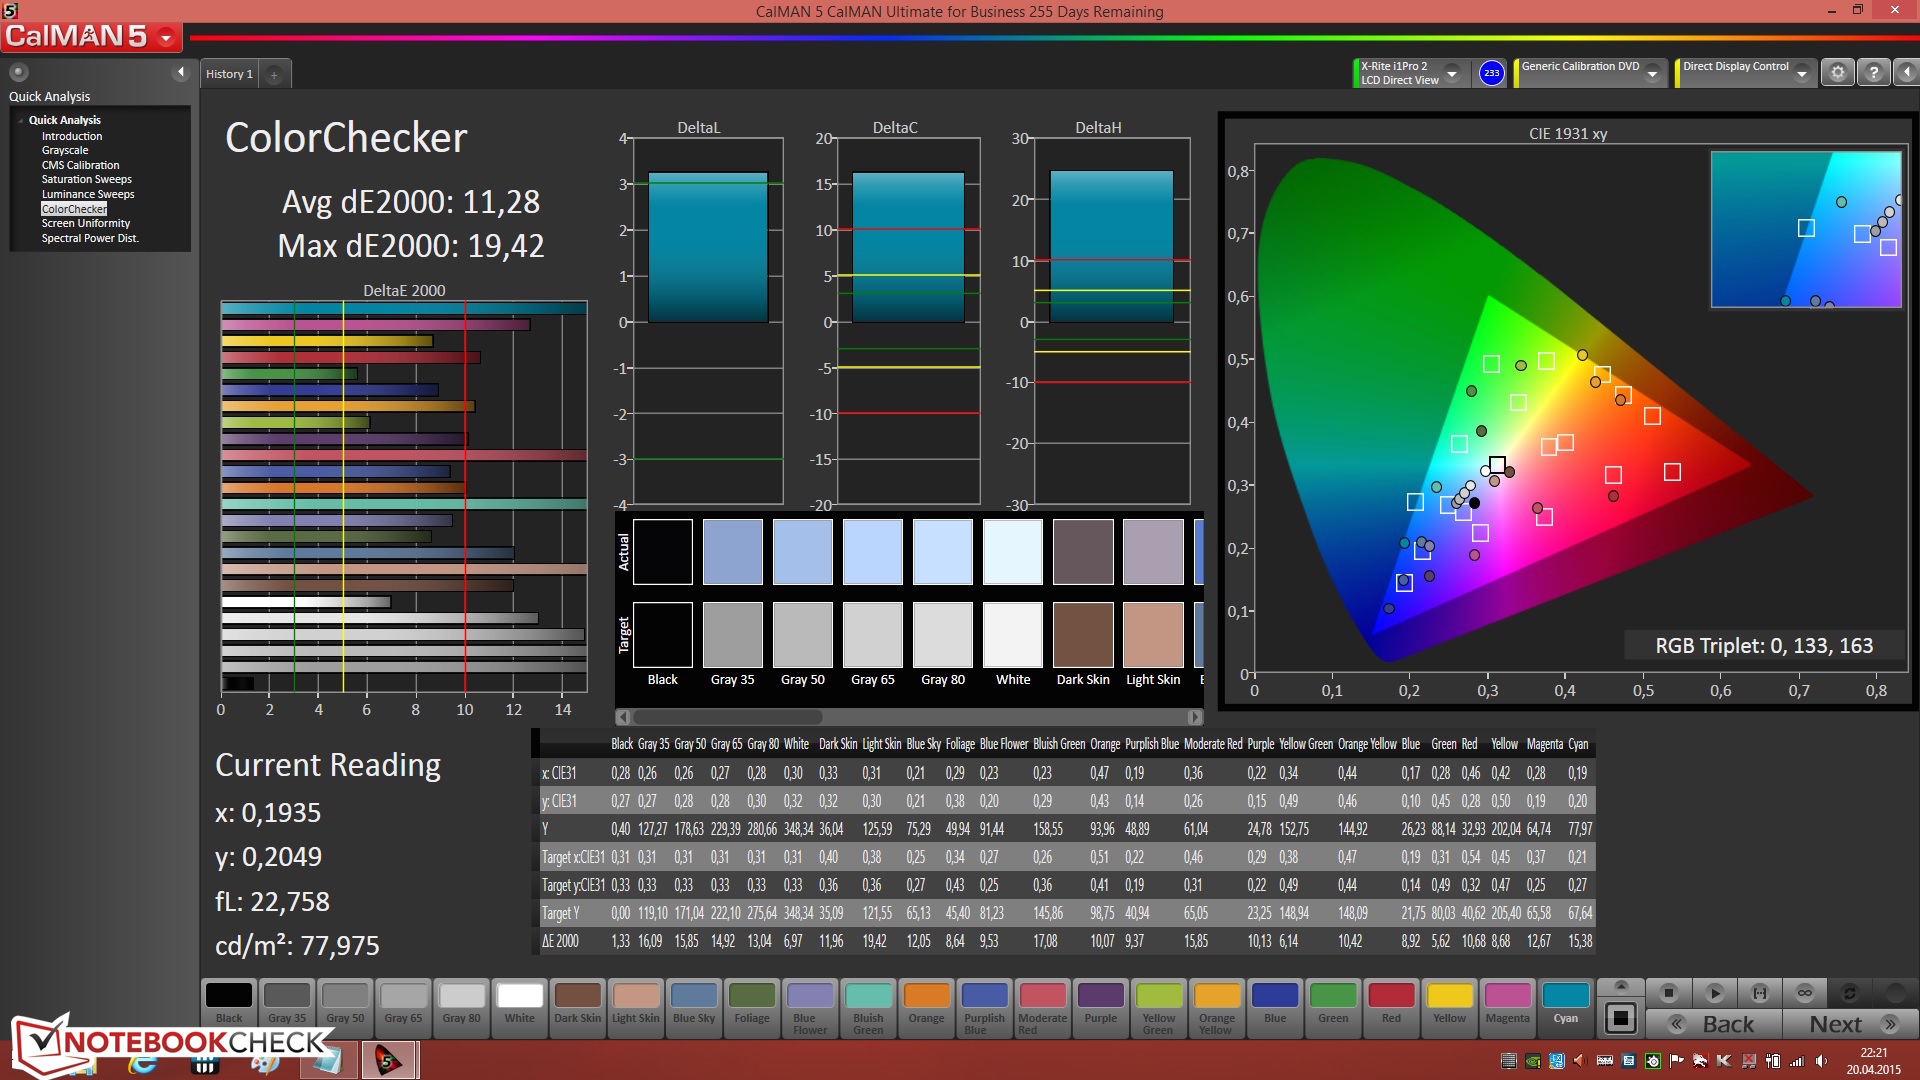
ΔE ColorChecker Calman: 11.28 | ∀{0.5-29.43 Ø4.72}
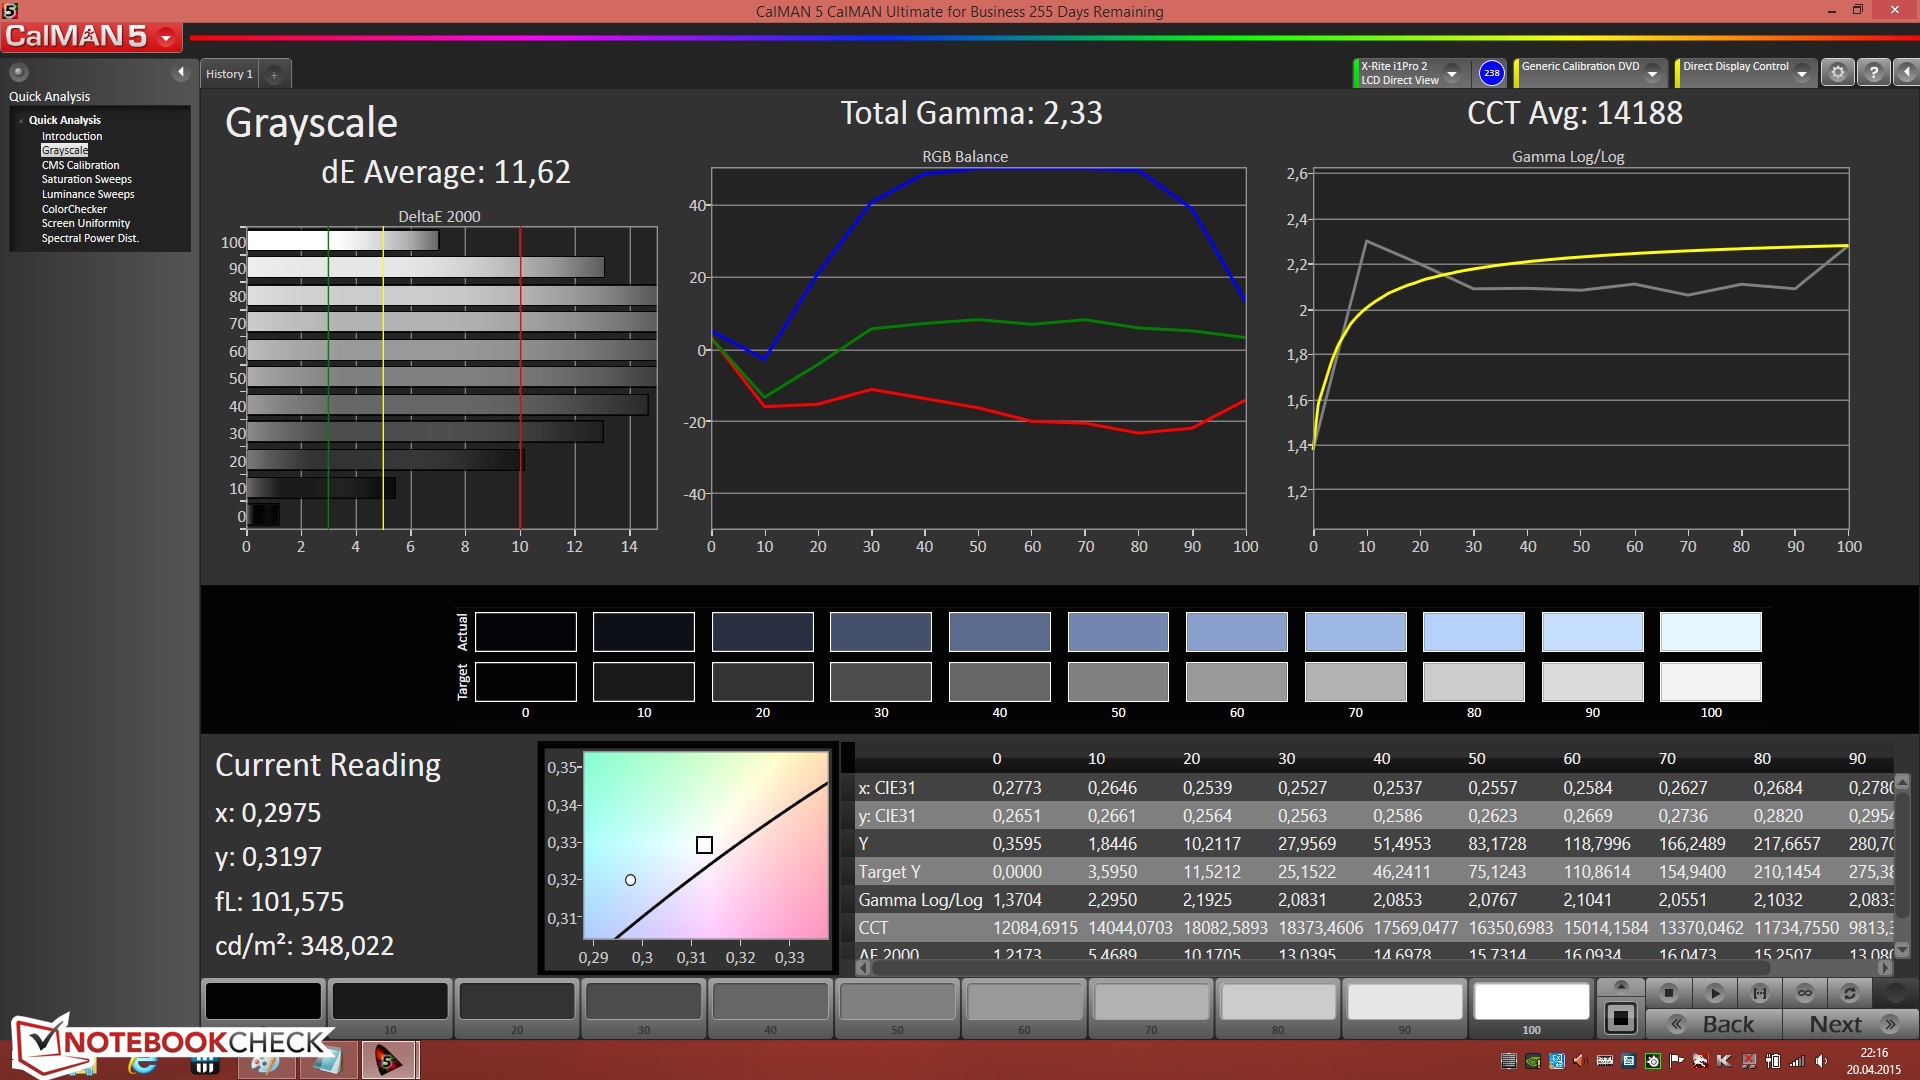
ΔE Greyscale Calman: 11.62 | ∀{0.09-98 Ø4.97}
61% AdobeRGB 1998 (Argyll 1.6.3 3D)
67.2% AdobeRGB 1998 (Argyll 3D)
93.7% sRGB (Argyll 3D)
65.4% Display P3 (Argyll 3D)
Gamma: 2.33
CCT: 14188 K
| MSI GT70-2QD16SR21 Chi Mei N173HGE-L11 (CM01720) | MSI GT72-2QE32SR311BW CMN N173HGE-E11 (CMN1735) | MSI GT70 2PE-890US Chi Mei N173HGE-L11 | Alienware 17 R2 LG Philips LGD0459 / 173WF4 (Dell P/N: CV69H) | Schenker XMG U705 LG Philips LP173WF4-SPD1 (LGD046C) | |
|---|---|---|---|---|---|
| Display | -9% | -9% | -5% | -6% | |
| Display P3 Coverage (%) | 65.4 | 60.3 -8% | 60.2 -8% | 66.6 2% | 66.3 1% |
| sRGB Coverage (%) | 93.7 | 84 -10% | 84.6 -10% | 84.3 -10% | 83.4 -11% |
| AdobeRGB 1998 Coverage (%) | 67.2 | 61.4 -9% | 61.3 -9% | 61.6 -8% | 61 -9% |
| Screen | -3% | 1% | 20% | 20% | |
| Brightness middle (cd/m²) | 325 | 273 -16% | 324 0% | 331 2% | 333 2% |
| Brightness (cd/m²) | 312 | 259 -17% | 302 -3% | 307 -2% | 317 2% |
| Brightness Distribution (%) | 80 | 85 6% | 83 4% | 84 5% | 86 8% |
| Black Level * (cd/m²) | 0.36 | 0.3 17% | 0.35 3% | 0.3 17% | 0.3 17% |
| Contrast (:1) | 903 | 910 1% | 926 3% | 1103 22% | 1110 23% |
| Colorchecker dE 2000 * | 11.28 | 11.63 -3% | 10.55 6% | 4.88 57% | 5.24 54% |
| Greyscale dE 2000 * | 11.62 | 11.9 -2% | 11.01 5% | 3.63 69% | 4.33 63% |
| Gamma | 2.33 94% | 2.56 86% | 2.62 84% | 2.17 101% | 2.14 103% |
| CCT | 14188 46% | 15491 42% | 14184 46% | 6325 103% | 6437 101% |
| Color Space (Percent of AdobeRGB 1998) (%) | 61 | 54 -11% | 54 -11% | 55 -10% | 55 -10% |
| Color Space (Percent of sRGB) (%) | 84.2 | 83.3 | |||
| Total Average (Program / Settings) | -6% /
-5% | -4% /
-2% | 8% /
13% | 7% /
13% |
* ... smaller is better
The screen achieves a contrast of almost 900:1 and a black level of 0.36 cd/m². That is enough for a sufficiently deep black. However, it looks better in, for example, Schenker's XMG U705 that achieves even better results with a contrast of 1110:1 and black level of 0.3 cd/m².
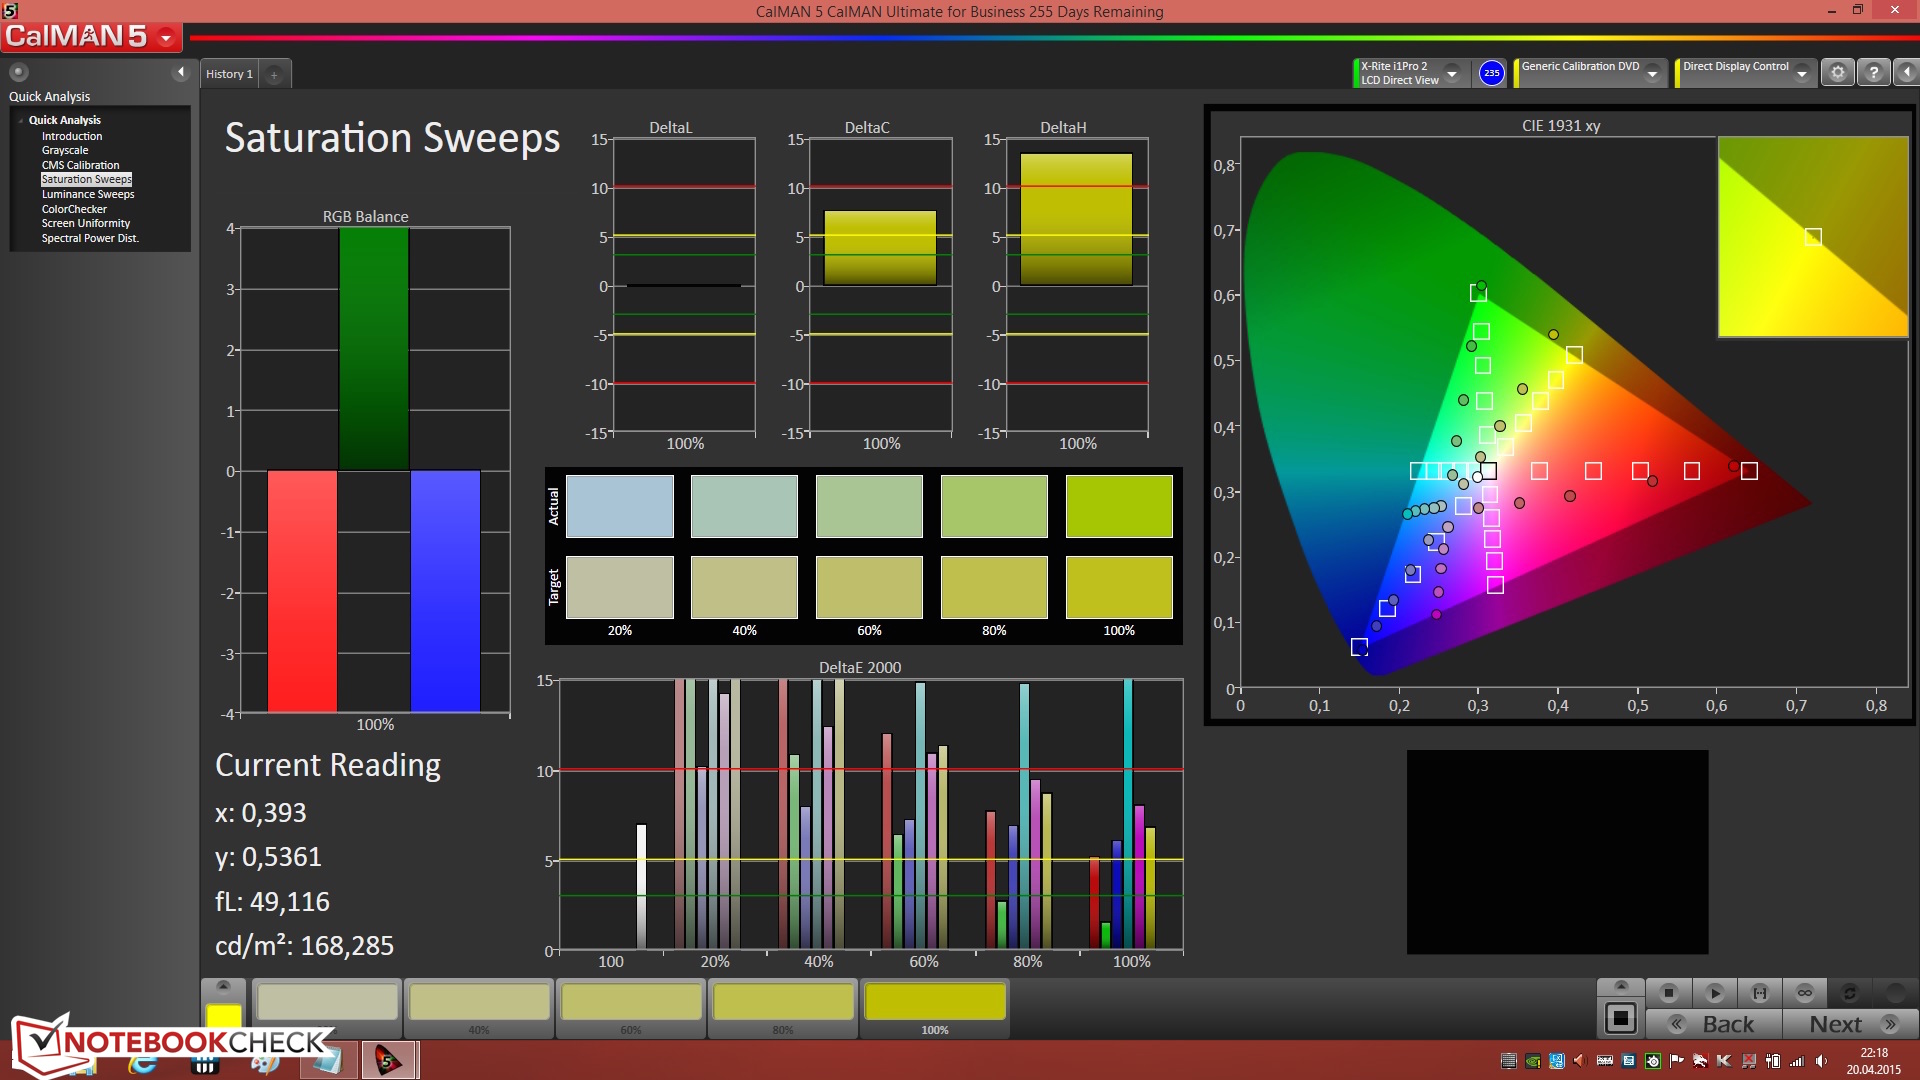
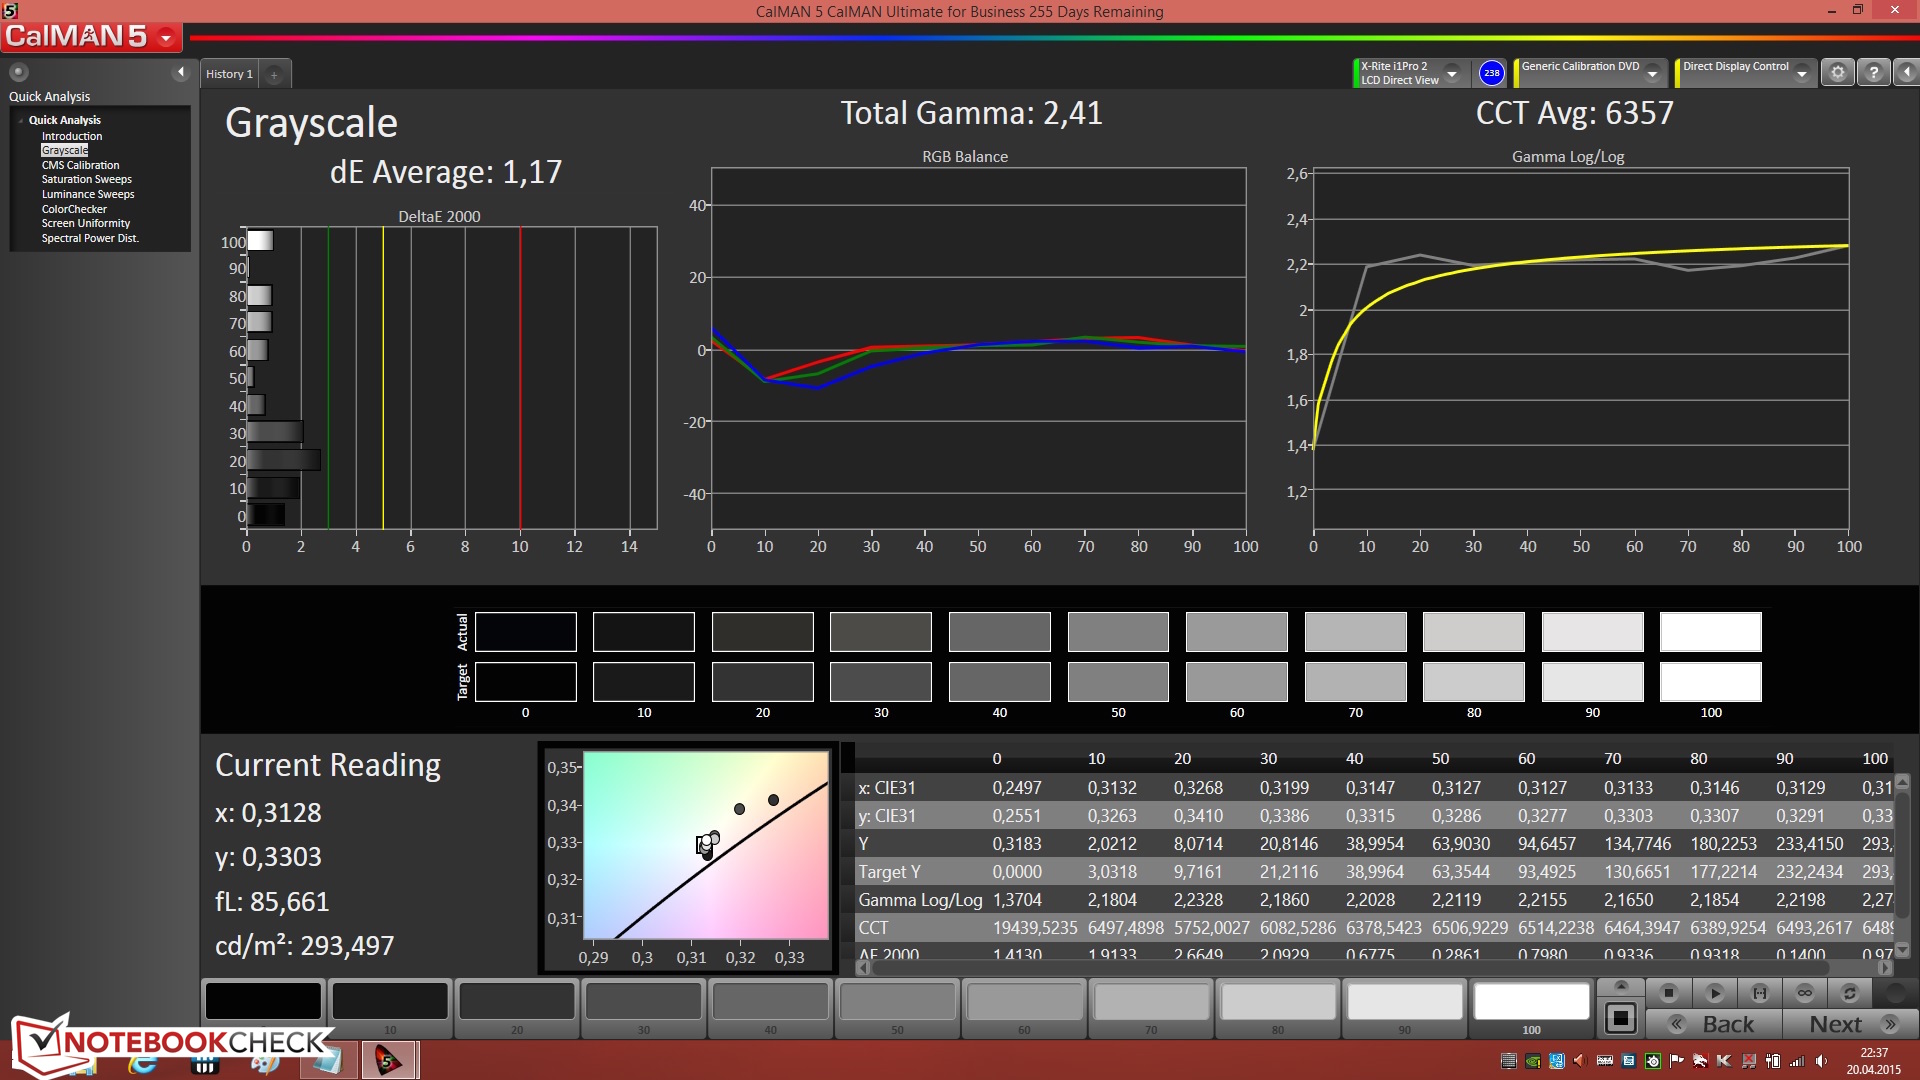
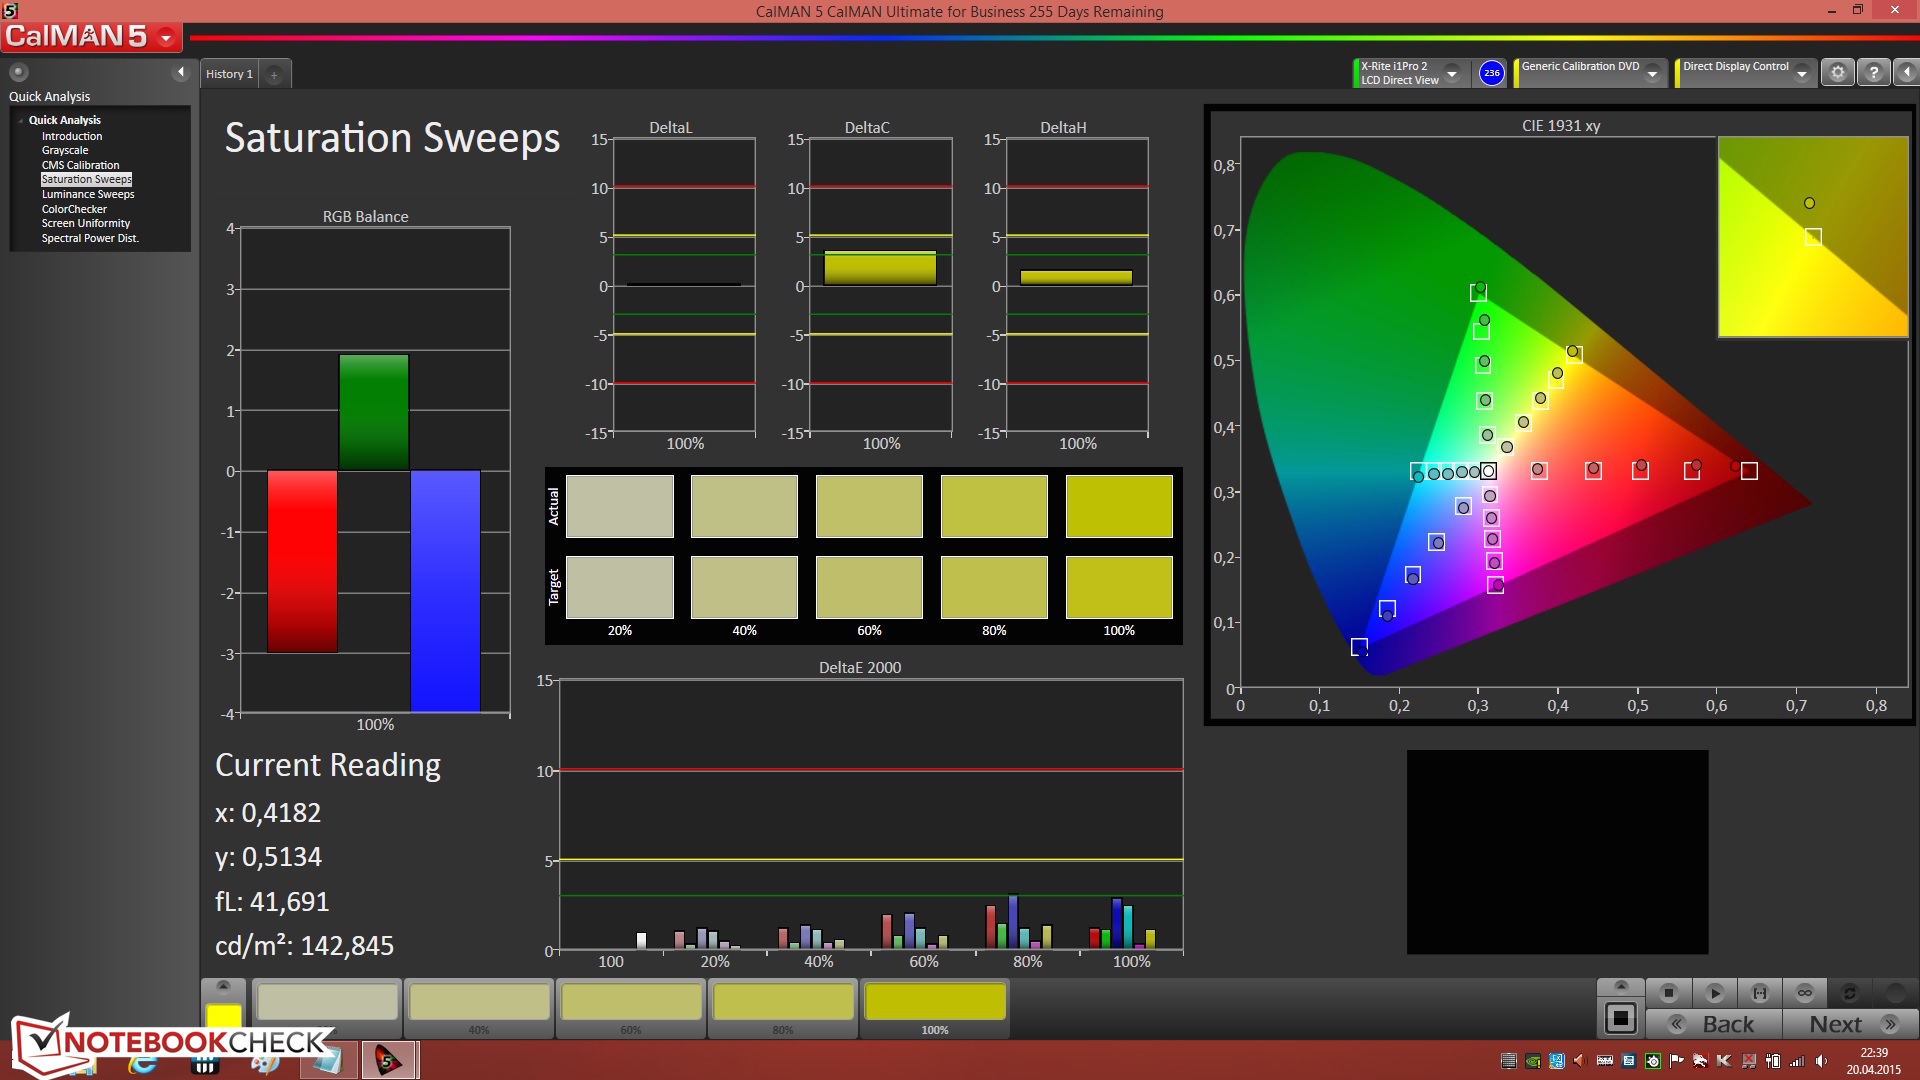
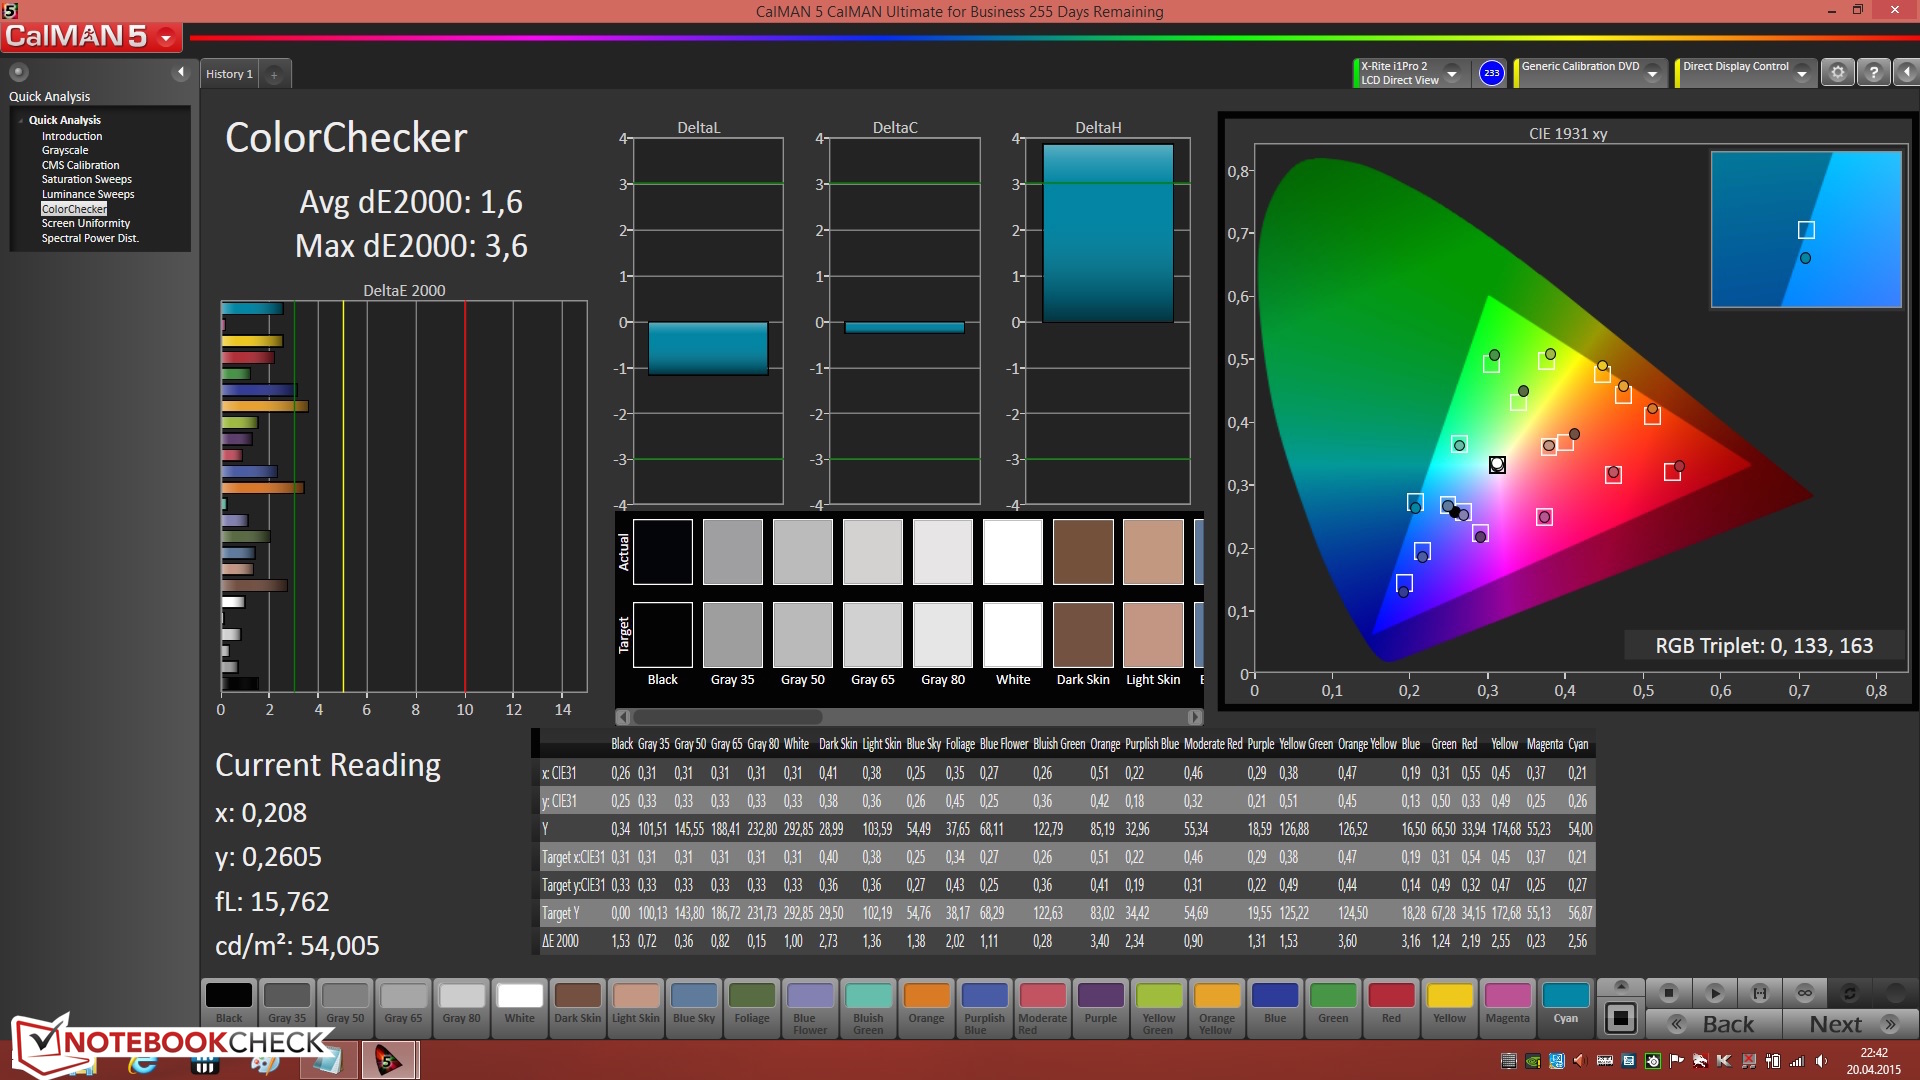
Unfortunately, a heavy bluish cast has to be accepted in a pre-calibrated state. CalMAN software confirms that with a DeltaE shift of 11.62 in the grayscale analysis. The color accuracy is not better with virtually identical deviations and underlines the weak TN screen. However, almost all differences are reduced post-calibration. They even drop to a solid dE rate of 1.17 in the grayscale levels and 1.6 in the colors.
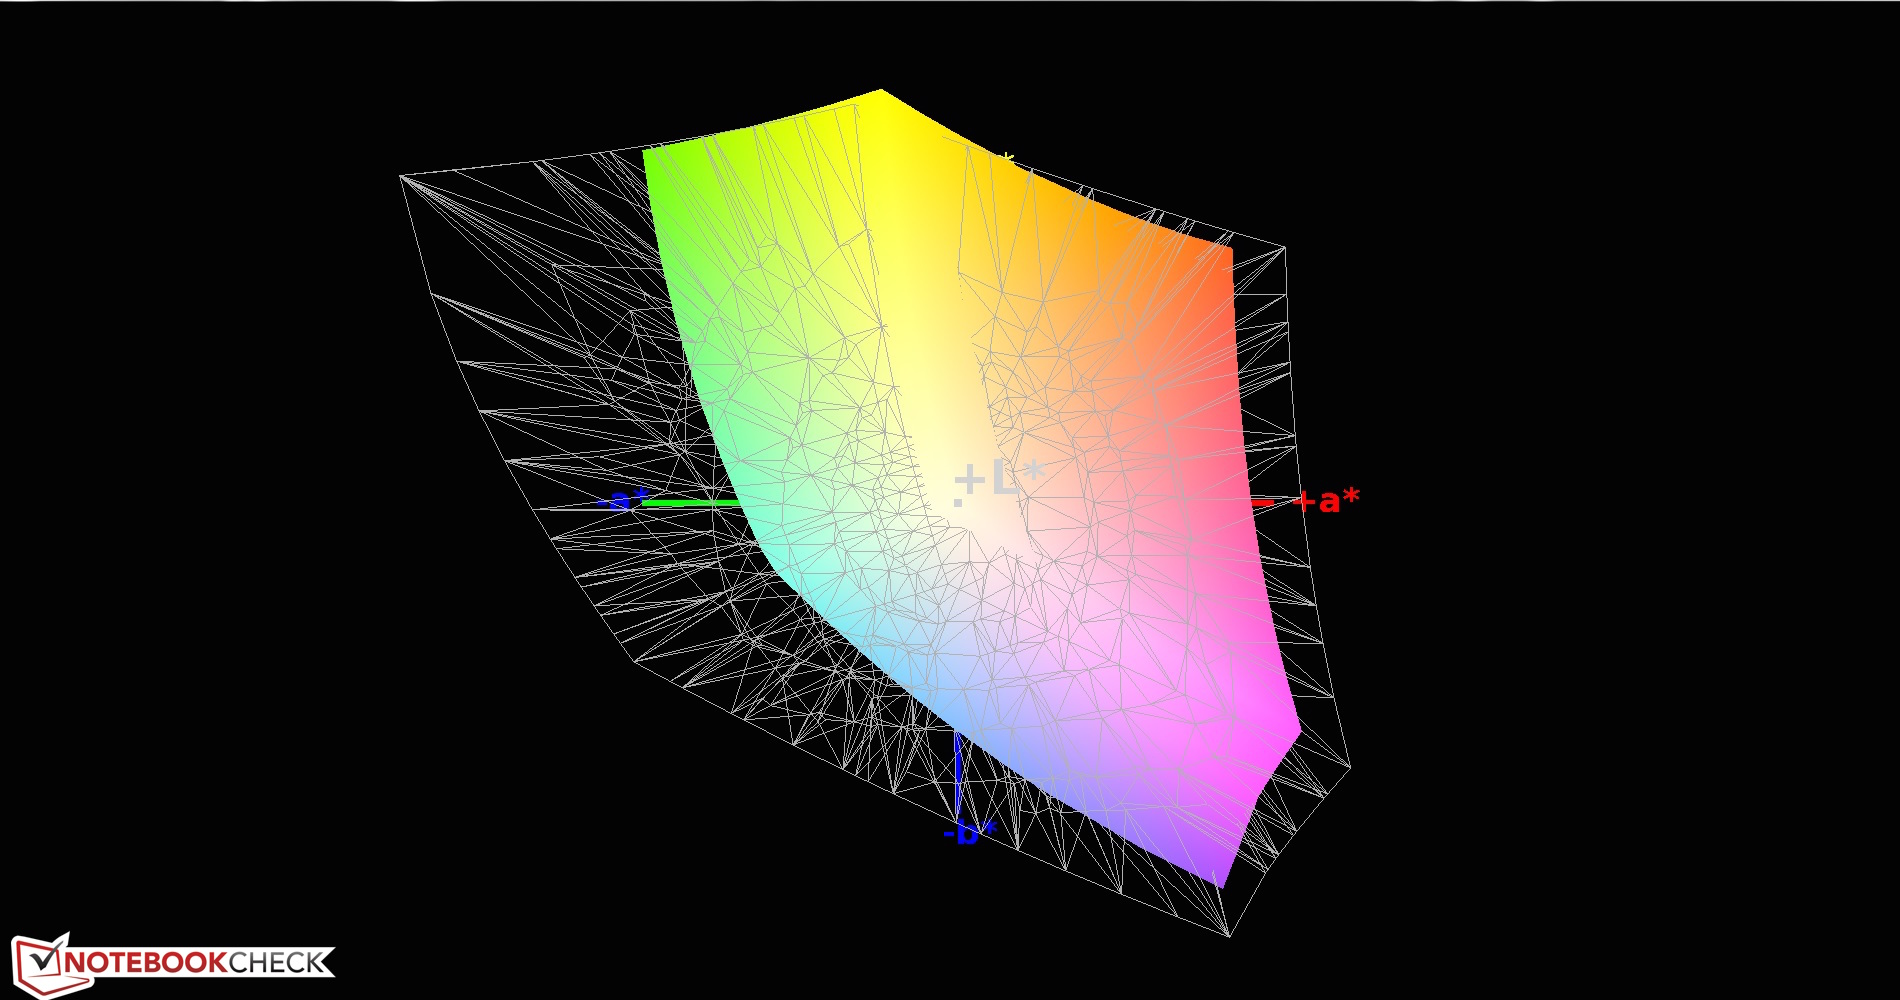
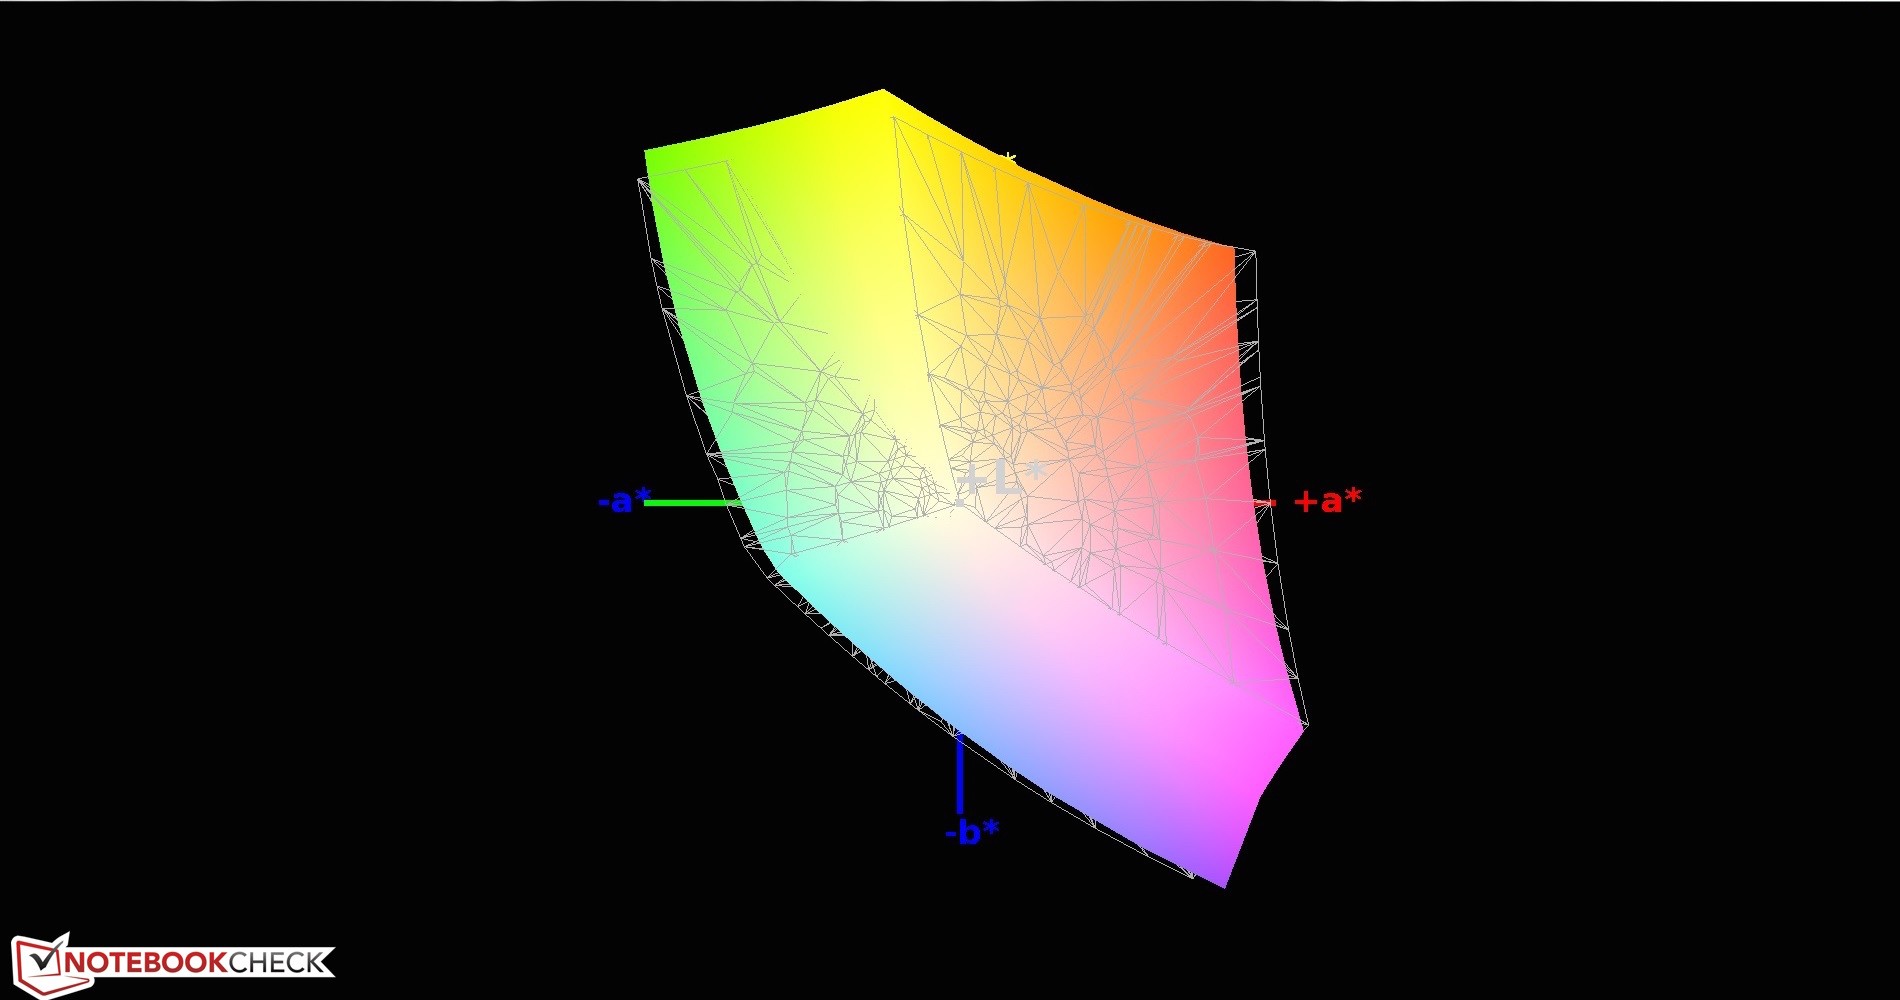
The color-space coverage needs special mention. The high rate of our review sample is rare. The sRGB color space is covered by 98% and AdobeRGB by 64%.
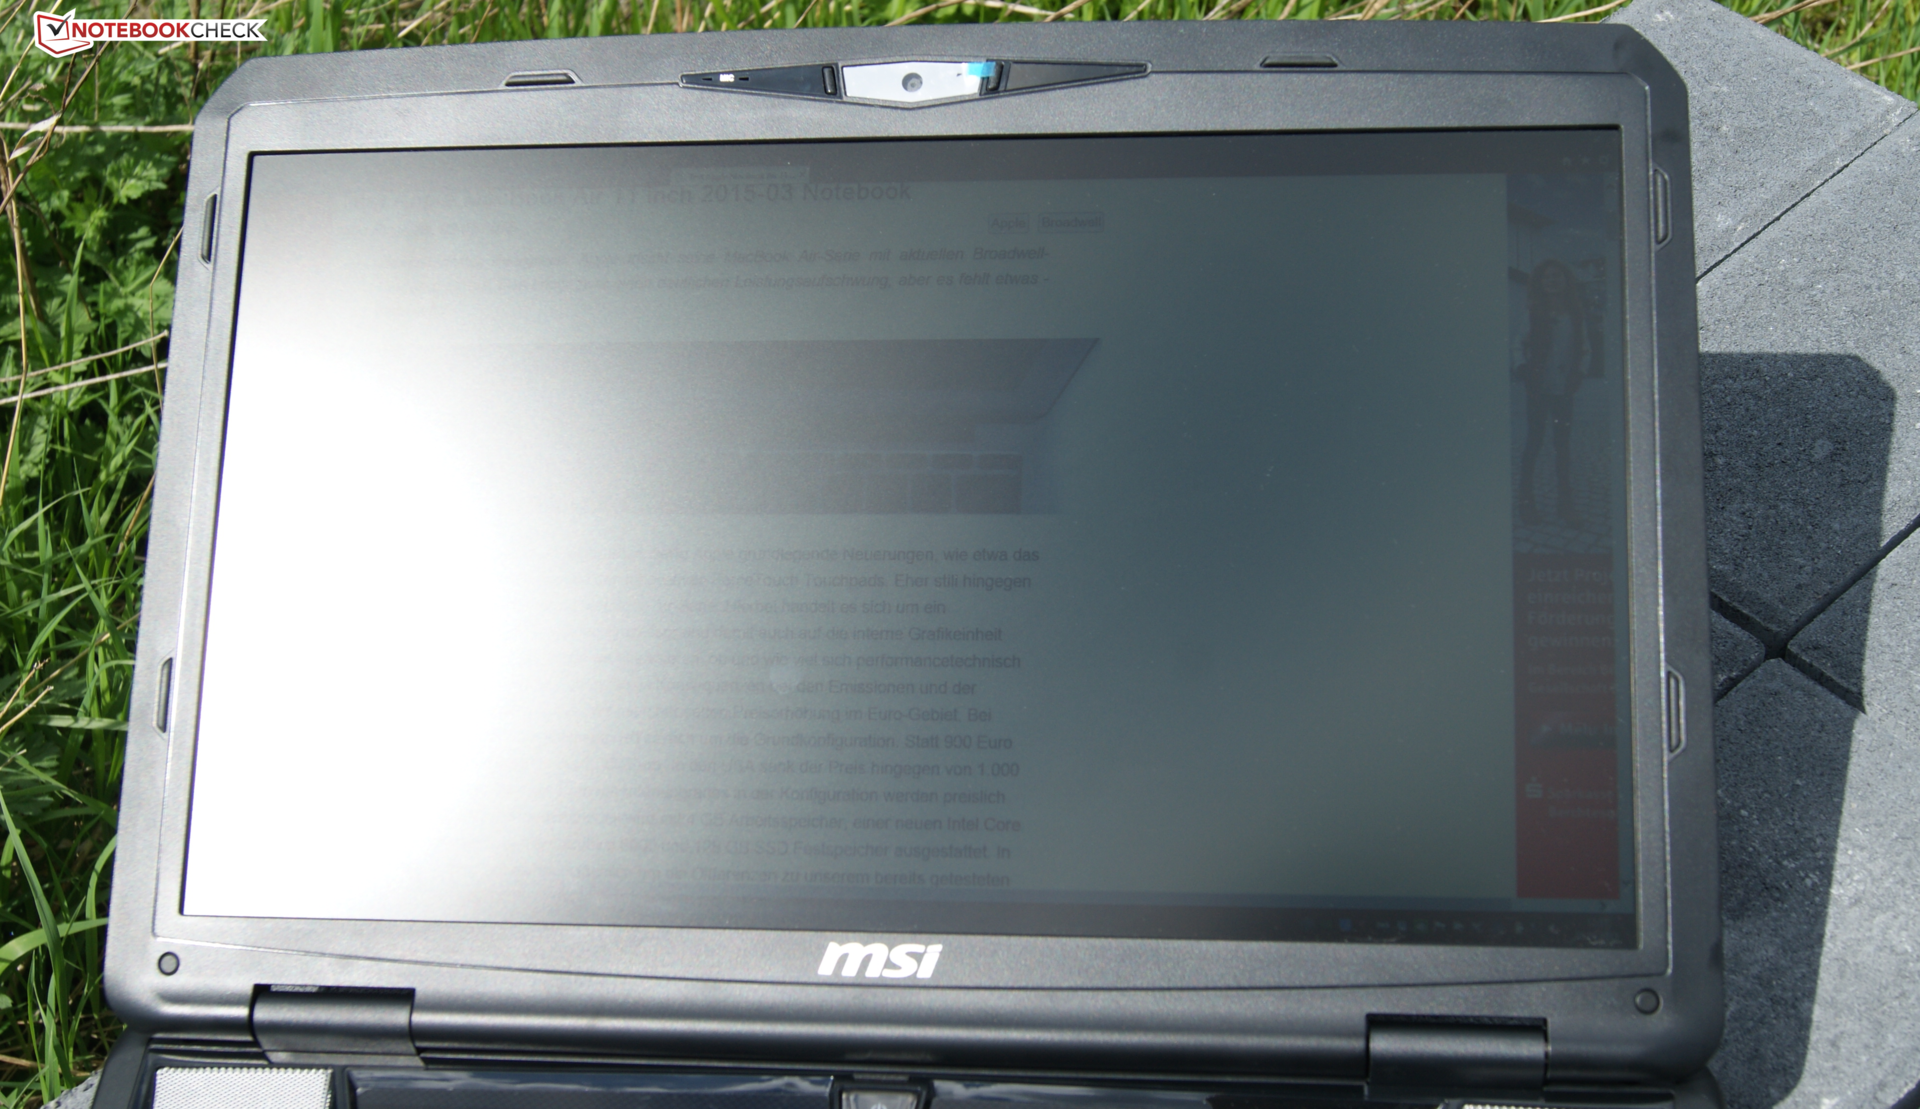
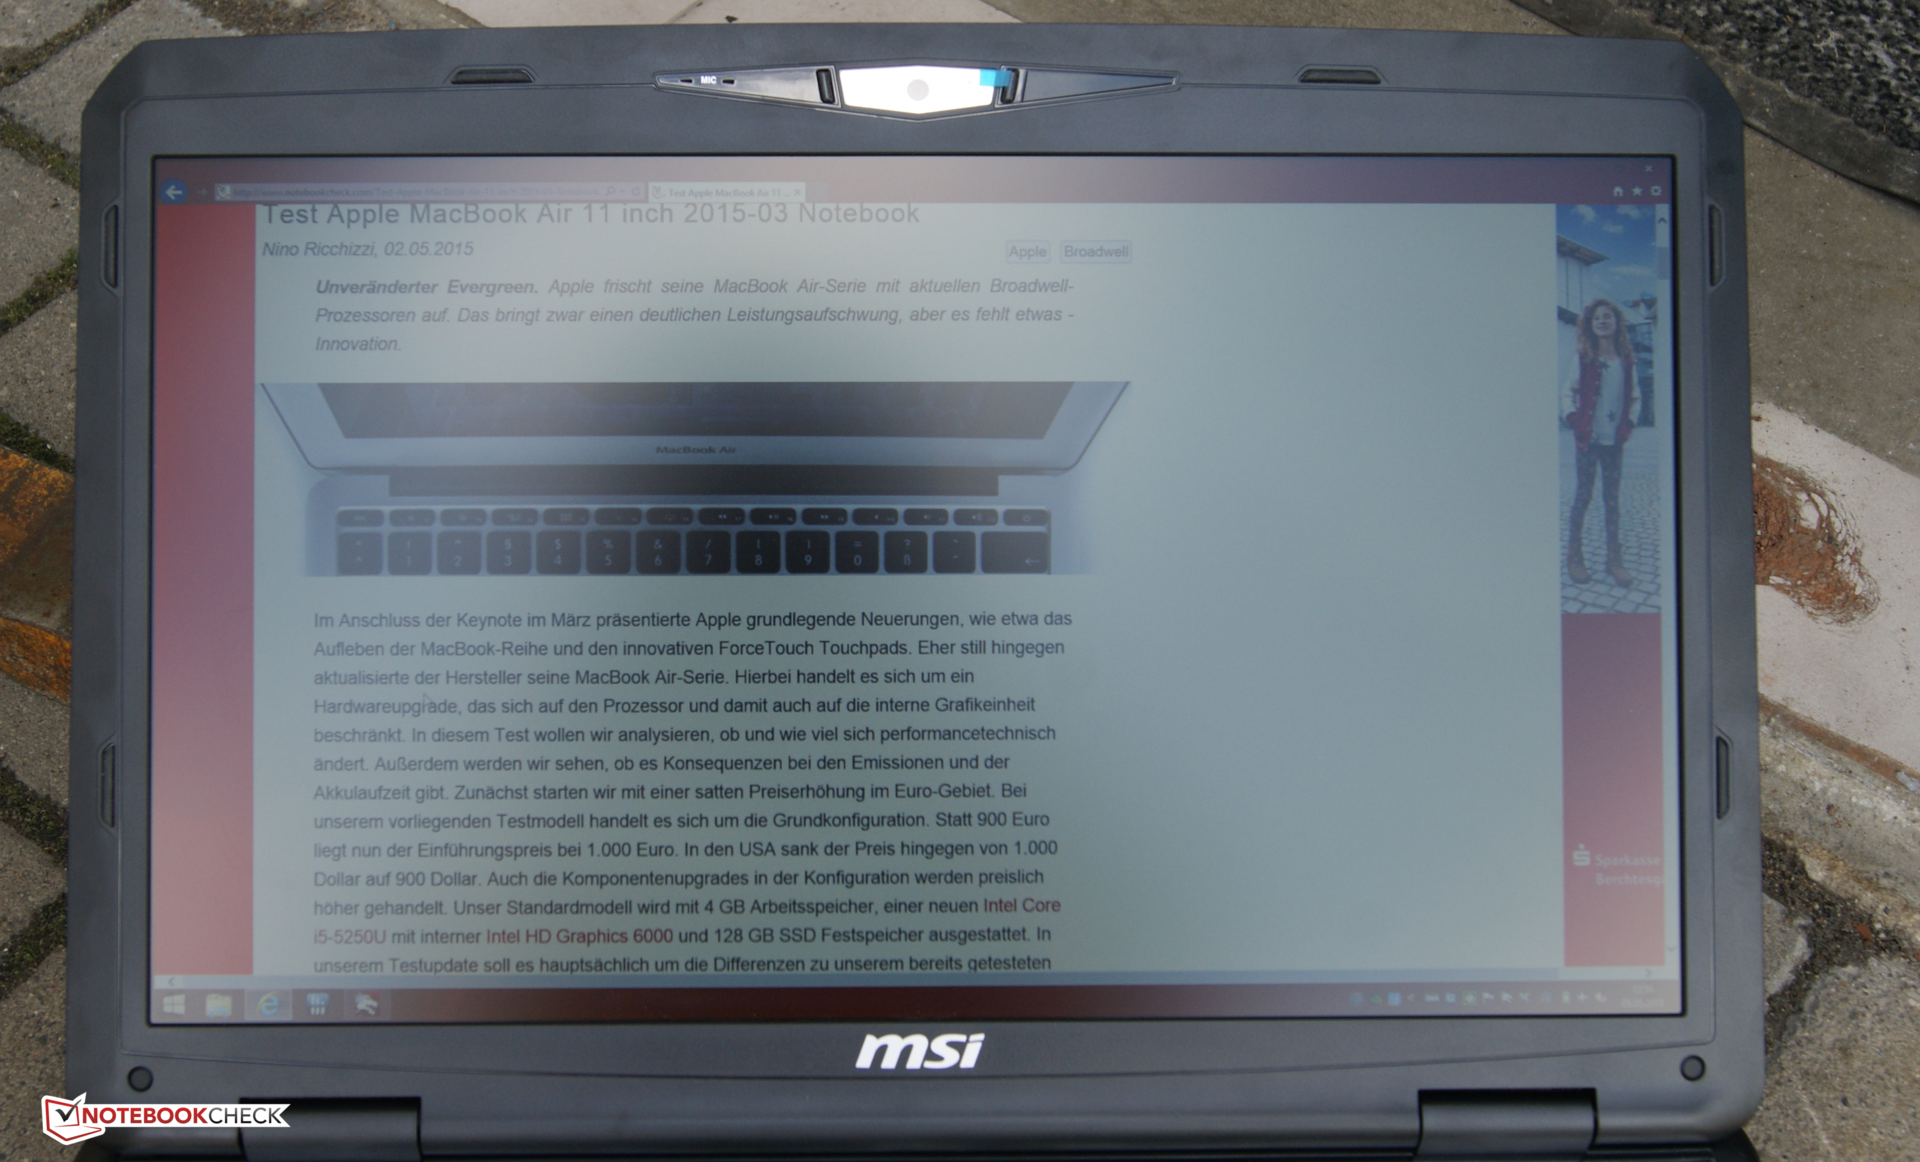
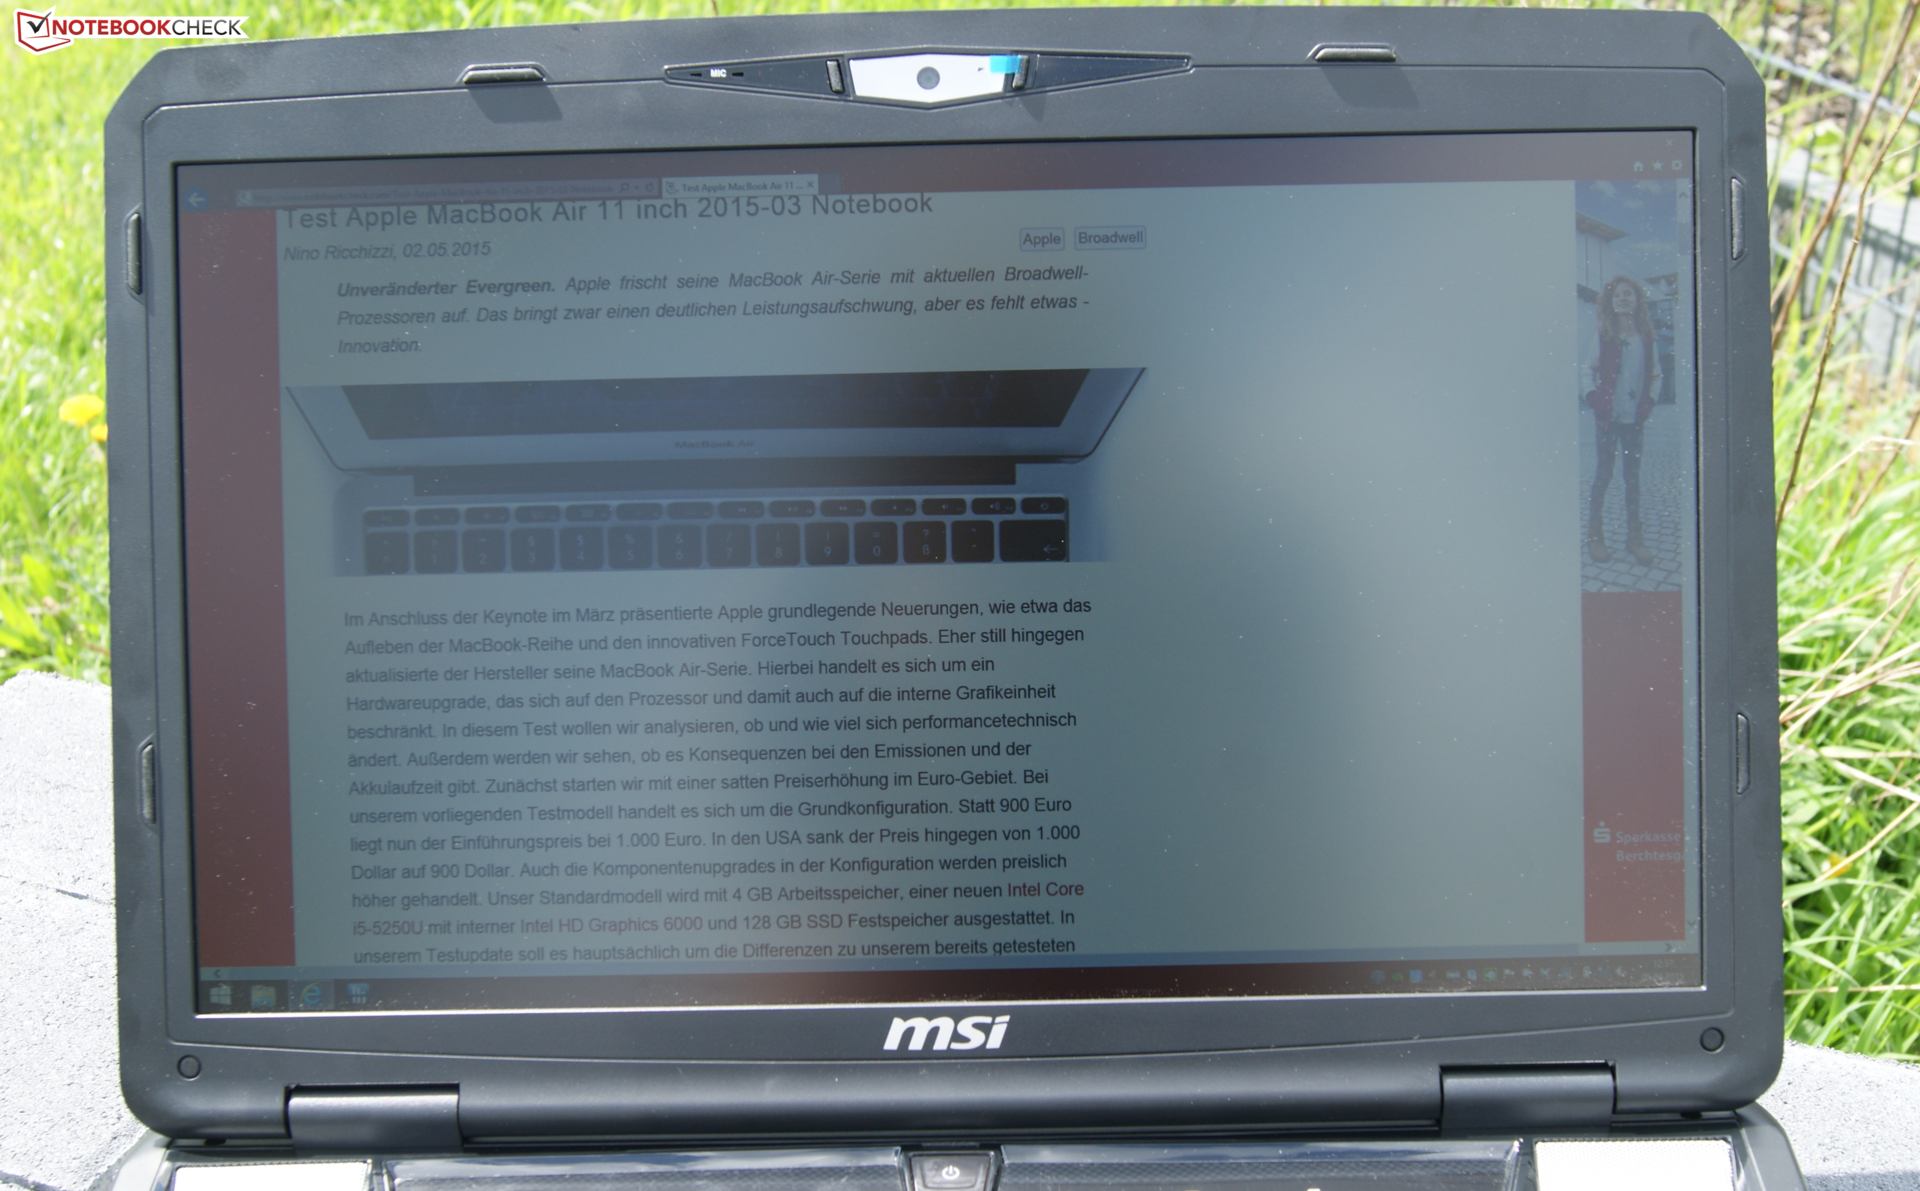
Outdoor use is technically quite possible just from the screen. The brightness in conjunction with the matte surface predestines the device for outdoor use. However, the size and weight of the 3.9 kg and 17.3-inch device might be a problem.
The screen's build actually point to a low viewing-angle stability. Other comparison devices prove that a rather low-cost TN product is not a must. The screen in the review sample distorts colors and brightness only when tilted extremely. Otherwise the screen surprises with relatively good viewing-angle stability. We praised the TN screen in our former test. The opening angle of the GT70 is wide enough to put the device in almost every thinkable position.

Performance
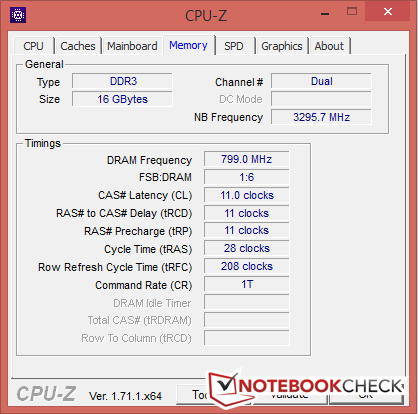
Our review sample exclusively sports high-performance equipment. One of Nvidia's strongest graphics card, a fast quad-core processor, 16 GB of working memory, and a RAID 0 array ensure swift response times in both office use and gaming scenarios. The manufacturer does not provide many configuration options; in return there are multiple other laptops in the GT lineup. An example is our tested MSI GT72 that features an even stronger Nvidia GTX 980M. The top model of this line up (GT80), for example, has an SLI interface and a bigger screen.
Processor
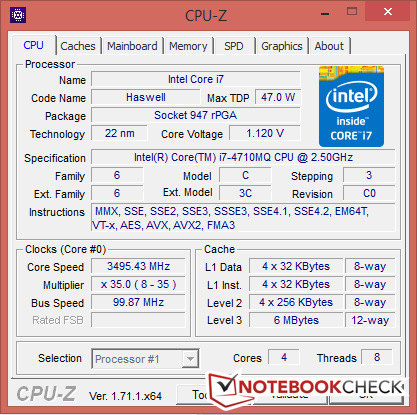
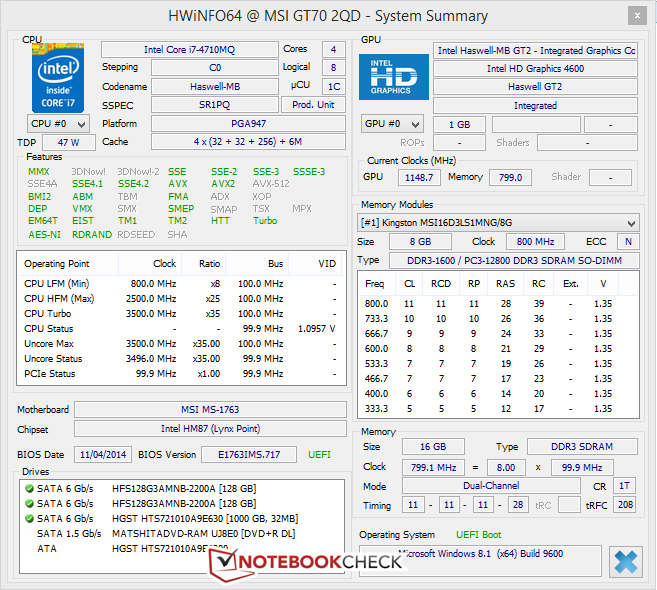
MSI installs a fast quad-core processor with a clock rate of 2.5 GHz. Speeds of up to 3.5 GHz are possible via Turbo. Intel's Core i7-4710MQ comes from the Haswell generation and tops the Core i7-4800MQ in the last review sample in our ranking. According to the spec sheet, it has a maximum power dissipation of 47 W (TDP). The most important difference to the HQ version in the GT72 is that the MQ version is not socketed and does not support VT-d.
We used Cinebench R15 for comparing the single rivals. The multi-core test achieved the expected score of 649 points. Our differently configured GT70 is a bit better with 680 points. Owing to its desktop processor, Schenker's passes the benchmarks with flying colors and outperforms its contenders. However, Alienware's 17 R2 also surpasses our review sample by 20 points thanks to its Intel i7-4970HQ.
The Turbo speed of 3.3 - 3.5 GHz was always available in the CPU tests. There were no losses when working in battery mode, either.
More details and comparisons regarding the installed CPU can be found in our benchmark chart.
System Performance
A quad-core processor, plenty of storage capacity and a RAID system ensure an uncompromisingly smooth workflow. This subjective impression is also reflected in the PCMark scores. With almost 6000 points, PCMark achieves a better score than Asus' G750JZ-T4023H (5746 points) or Medion's Erazer X7831-MD98776 (5597 points). However, Alienware's 17 R2 achieves a considerably higher score of 6622 points. Overall, MSI's review sample is on the expected level and reaps in almost 2500 more points than MSI's GT70 with a GeForce GTX 880M and only an HDD storage device.
| PCMark 7 Score | 5984 points | |
| PCMark 8 Home Score Accelerated v2 | 3892 points | |
| PCMark 8 Creative Score Accelerated v2 | 4755 points | |
| PCMark 8 Work Score Accelerated v2 | 4971 points | |
Help | ||
Storage Devices
A total of three storage devices are in the review sample. The two 128 GB SSDs operate in a RAID system. An option MSI calls Super RAID 2 is also available. The difference here is that three rather than two SSD storages operate in RAID 0. The RAID array in our configuration achieves read rates of up to 8812 MB/s and maximum write rates of 628 MB/s according to CrystalDiskMark. This advantage decreases compared with models without a RAID system in the crucial 4K rates, though. For example, Alienware's 17 R2 accomplishes up to 8 MB/s better 4K read rates. The additionally integrated magnetic hard drive from HGST (Travelstar 7K1000) spins at 7200 rpm and has a capacity of 1 TB.
| MSI GT70-2QD16SR21 Hynix HFS128G3AMNB | MSI GT72-2QE32SR311BW 4x Kingston RBU-SNS8100S3256GD1 (RAID 0) | MSI GT70 2PE-890US HGST Travelstar 7K1000 HTS721010A9E630 | Alienware 17 R2 Lite-On IT L8T-256L9G | Schenker XMG U705 Samsung SM951 MZHPV256HDGL m.2 PCI-e | |
|---|---|---|---|---|---|
| CrystalDiskMark 3.0 | 35% | -94% | -24% | 50% | |
| Read Seq (MB/s) | 882 | 1346 53% | 123.6 -86% | 485.9 -45% | 1420 61% |
| Write Seq (MB/s) | 628 | 1105 76% | 117.4 -81% | 414 -34% | 1266 102% |
| Read 512 (MB/s) | 519 | 826 59% | 35.32 -93% | 367.9 -29% | 997 92% |
| Write 512 (MB/s) | 631 | 1044 65% | 48.08 -92% | 391.4 -38% | 1046 66% |
| Read 4k (MB/s) | 24.1 | 29.3 22% | 0.4 -98% | 31.76 32% | 45.24 88% |
| Write 4k (MB/s) | 80.4 | 79.8 -1% | 0.842 -99% | 66.4 -17% | 121.1 51% |
| Read 4k QD32 (MB/s) | 457.4 | 519 13% | 0.748 -100% | 360.7 -21% | 363.6 -21% |
| Write 4k QD32 (MB/s) | 526 | 502 -5% | 0.855 -100% | 328.2 -38% | 338.1 -36% |

Graphics Card
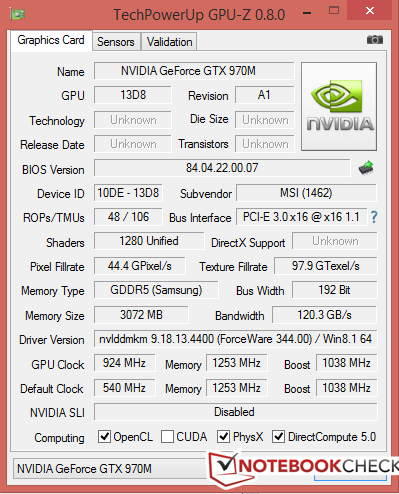
MSI has upgraded the graphics card to a GeForce GTX 970M. In previous tests, it delivered 15% more power than Nvidia's former GeForce GTX 880M top model. The manufacturer treats the installed graphics unit to 3 GB of working memory. We ascertained a core clock of 924 MHZ and a memory rate of 1250 MHz with the GPUz tool. The chip is based on the Maxwell architecture. It is the second-fastest GPU from 2014 and allows enjoying games in high to maximum settings. We use 3DMark 11 to find out whether it fulfills our expectations. The achieved 9028 points are in the lower midfield of laptops with an identical GeForce GTX 970M. The average is 9300 points. Alienware's 15 with the same graphics unit achieves 400 points less than our review sample. Schenker's XMG U705 reaps in 700 points more owing to its desktop CPU and the twice as big video memory of 6 GB. The considerably stronger GeForce GTX 980M accomplishes approximately 2000 points more than our MSI GT70.
More comparisons and details regarding the installed graphics card can be found in our benchmark chart. In a final step we compared the performance in battery mode. The 3DMark 11 score dropped to 6258 points so that clear losses will have to be reckoned with in battery mode.
| 3DMark - 1920x1080 Fire Strike Score (sort by value) | |
| MSI GT70-2QD16SR21 | |
| MSI GT72-2QE32SR311BW | |
| MSI GT70 2PE-890US | |
| Alienware 17 R2 | |
| Schenker XMG U705 | |
| 3DMark 11 - 1280x720 Performance (sort by value) | |
| MSI GT70-2QD16SR21 | |
| MSI GT72-2QE32SR311BW | |
| MSI GT70 2PE-890US | |
| Alienware 17 R2 | |
| Schenker XMG U705 | |
| 3DMark 11 Performance | 9082 points | |
| 3DMark Ice Storm Standard Score | 90360 points | |
| 3DMark Cloud Gate Standard Score | 20330 points | |
| 3DMark Fire Strike Score | 6389 points | |
Help | ||
Gaming Performance
Only the ultimately achieved frames per second are significant for true gaming fun. We looked at some games from this year and the last and ascertained almost consistently smooth settings on a high quality level. Even Rockstar's new smash hit GTA V can be played in high settings without problems. Users who want more should take a competitor product with a GeForce GTX 980M. That might make the last graphics leap in GTA V possible. The GTX 980M achieves approximately 30% more fps than the Nvidia GeForce GTX 970M used here in Watchdogs. However, the GTX 970M is still one of the fastest available laptop graphics cards and also proves that without exception in our benchmarks.
| GRID: Autosport | |
| 1920x1080 High Preset (sort by value) | |
| MSI GT70-2QD16SR21 | |
| MSI GT72-2QE32SR311BW | |
| Alienware 17 R2 | |
| Schenker XMG U705 | |
| 1920x1080 Ultra Preset AA:4x MS (sort by value) | |
| MSI GT70-2QD16SR21 | |
| MSI GT72-2QE32SR311BW | |
| Alienware 17 R2 | |
| Schenker XMG U705 | |
| Watch Dogs | |
| 1920x1080 High Overall Quality, High Textures AA:2x MS (sort by value) | |
| MSI GT70-2QD16SR21 | |
| MSI GT72-2QE32SR311BW | |
| Schenker XMG U705 | |
| 1920x1080 Ultra Overall Quality, Ultra Textures AA:4x MS (sort by value) | |
| MSI GT70-2QD16SR21 | |
| MSI GT72-2QE32SR311BW | |
| Schenker XMG U705 | |
| low | med. | high | ultra | |
|---|---|---|---|---|
| Crysis 3 (2013) | 120 | 107.5 | 83.4 | 32.8 |
| Watch Dogs (2014) | 92.4 | 79.9 | 48.5 | 35.1 |
| GRID: Autosport (2014) | 229 | 134.4 | 121.6 | 84.5 |
| Middle-earth: Shadow of Mordor (2014) | 148.7 | 122.8 | 66 | 50.6 |
| Alien: Isolation (2014) | 217.4 | 192.2 | 107.2 | 74.5 |
| GTA V (2015) | 139.4 | 126.3 | 58.4 | 26 |
Emissions
System Noise
The review sample is equipped with high-performance components which produce a lot of waste heat that has to be discharged. Unfortunately, MSI has not managed to find a way to disable the fans at least in idle mode. Although the laptop's casing has a large volume, the fans are always audible. Alienware, for example, uses a better strategy that makes the fans almost inaudible in idle mode. Our review sample ran at full speed in full load. Noise levels of up to 53 dB(A) will have to be accepted. At least the laptop decreases the speed quickly after full load. The fans spin very dynamically with an average ranging from 35 to 42 dB(A). The fans' noise is generally very subdued and is not infiltrated by buzzing or other noises. Like in other GT models, the manufacturer installs a "Cooler Boost" that pushes the fans to their maximum speed.
| MSI GT70-2QD16SR21 GeForce GTX 970M, 4710MQ | MSI GT72-2QE32SR311BW GeForce GTX 980M, 4710HQ | MSI GT70 2PE-890US GeForce GTX 880M, 4800MQ | Alienware 17 R2 GeForce GTX 980M, 4980HQ | Schenker XMG U705 GeForce GTX 970M, 4790 | |
|---|---|---|---|---|---|
| Noise | 0% | -6% | 2% | 4% | |
| Idle Minimum * (dB) | 33.8 | 34 -1% | 34.2 -1% | 29.4 13% | 29.2 14% |
| Idle Average * (dB) | 35.2 | 34.5 2% | 34.4 2% | 30.8 12% | 32.6 7% |
| Idle Maximum * (dB) | 35.6 | 34.7 3% | 34.8 2% | 35 2% | 33.2 7% |
| Load Average * (dB) | 36.6 | 40.3 -10% | 46.8 -28% | 43.4 -19% | 44.2 -21% |
| Load Maximum * (dB) | 53 | 49.4 7% | 56 -6% | 51.6 3% | 45.4 14% |
* ... smaller is better
Noise level
| Idle |
| 33.8 / 35.2 / 35.6 dB(A) |
| HDD |
| 35.6 dB(A) |
| DVD |
| 37.8 / dB(A) |
| Load |
| 36.6 / 53 dB(A) |
 | ||
30 dB silent 40 dB(A) audible 50 dB(A) loud |
||
min: | ||
Temperature
The review sample does not have any chance to heat up in idle mode owing to the large design and permanently spinning fans. Only load operation demands more from MSI's laptop. The temperature hot spot of approximately 50 °C is found on the underside. Schenker's XMG U705 can get 5 °C warmer. Overall, MSI's device is on a common level for the laptop category. Our other GT70 achieved maximum temperatures of 45 °C due to the weaker GeForce GTX 880M. MSI's GT72 heats up 2 °C more, which is again owed to the stronger GeForce GTX 980M.
Particular caution should be taken with the power supply that can reach 62 °C. It should never be placed under blankets or pillows.
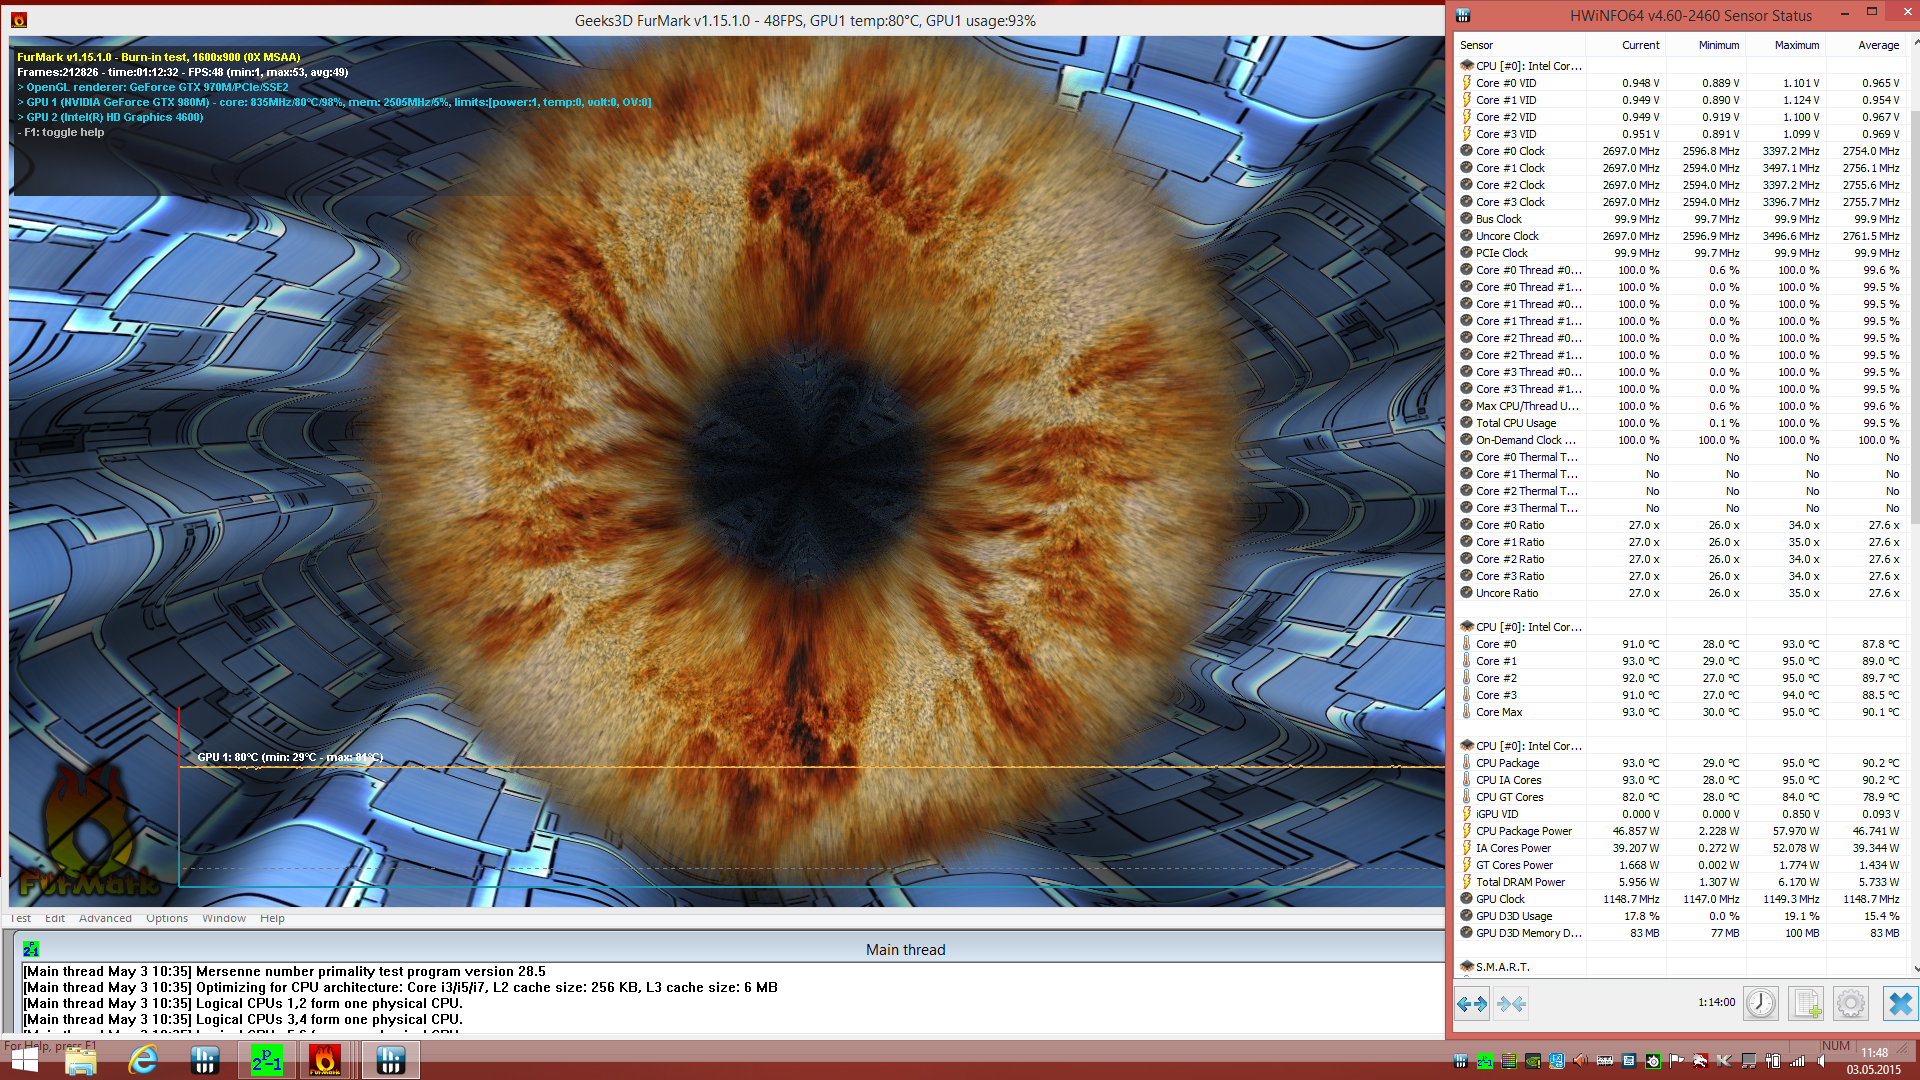
We performed our stress test to find out whether or not it is possible to prevent thermal throttling in performance-devouring applications in view of the laptop's extreme height. The stress test is based on the tools Prime95 and Furmark. Although we exposed our present MSI GT70 to these extreme conditions for over an hour, it always calculated over its base clock. The device settled to 2700 MHz after the stress test. Alienware's 17, for example, shows that this exemplary behavior is not always the case with occasional throttling. 3DMark 11 achieved an identical score as in a cold start after our test.
| MSI GT70-2QD16SR21 GeForce GTX 970M, 4710MQ | MSI GT72-2QE32SR311BW GeForce GTX 980M, 4710HQ | MSI GT70 2PE-890US GeForce GTX 880M, 4800MQ | Alienware 17 R2 GeForce GTX 980M, 4980HQ | Schenker XMG U705 GeForce GTX 970M, 4790 | |
|---|---|---|---|---|---|
| Heat | -10% | -10% | -22% | -41% | |
| Maximum Upper Side * (°C) | 46.8 | 40.1 14% | 43.5 7% | 50.8 -9% | 46.6 -0% |
| Maximum Bottom * (°C) | 50.2 | 52.1 -4% | 45.4 10% | 48.7 3% | 55 -10% |
| Idle Upper Side * (°C) | 22.9 | 28 -22% | 26.5 -16% | 30.9 -35% | 38.8 -69% |
| Idle Bottom * (°C) | 21.8 | 27.5 -26% | 30.3 -39% | 31.7 -45% | 40 -83% |
* ... smaller is better
(-) The maximum temperature on the upper side is 46.8 °C / 116 F, compared to the average of 40.4 °C / 105 F, ranging from 21.2 to 68.8 °C for the class Gaming.
(-) The bottom heats up to a maximum of 50.2 °C / 122 F, compared to the average of 43.2 °C / 110 F
(+) In idle usage, the average temperature for the upper side is 21.3 °C / 70 F, compared to the device average of 33.9 °C / 93 F.
(+) The palmrests and touchpad are cooler than skin temperature with a maximum of 23.8 °C / 74.8 F and are therefore cool to the touch.
(+) The average temperature of the palmrest area of similar devices was 28.8 °C / 83.8 F (+5 °C / 9 F).
Energy Management
Power Consumption
The power consumption is never particularly low. For example, Alienware's 17 minimum consumption is only approximately 9 watts despite stronger hardware. Our review sample treats itself to at least 14.2 watts. MSI's GT72 consumes considerably more with 23.9 watts. That will have a great impact on the maximum possible battery runtime. MSI's GT70 requires between 92 and 106 watts in average load operation. At first glance, the 180-watt power supply still has enough reserves. The maximum power consumption of 186.1 watts is also sill acceptable (measured at the socket). We did not ascertain battery depletion in this stress situation, which is often the case. Comparable gaming machines with a GeForce GTX 980M easily surpass 200 watts. Solely Alienware's 17 is not quite as guzzling with 165 watts.
| MSI GT70-2QD16SR21 GeForce GTX 970M, 4710MQ | MSI GT72-2QE32SR311BW GeForce GTX 980M, 4710HQ | MSI GT70 2PE-890US GeForce GTX 880M, 4800MQ | Alienware 17 R2 GeForce GTX 980M, 4980HQ | Schenker XMG U705 GeForce GTX 970M, 4790 | |
|---|---|---|---|---|---|
| Power Consumption | -29% | 0% | 9% | -72% | |
| Idle Minimum * (Watt) | 14.2 | 23.9 -68% | 11 23% | 8.9 37% | 38.3 -170% |
| Idle Average * (Watt) | 21.5 | 29 -35% | 18.3 15% | 16 26% | 38.8 -80% |
| Idle Maximum * (Watt) | 26.2 | 33.6 -28% | 28.4 -8% | 26.6 -2% | 44.4 -69% |
| Load Average * (Watt) | 97.4 | 97.2 -0% | 127.5 -31% | 124 -27% | 119.3 -22% |
| Load Maximum * (Watt) | 186.1 | 210.1 -13% | 182 2% | 165.8 11% | 221.4 -19% |
* ... smaller is better
| Off / Standby | |
| Idle | |
| Load |
|
Key:
min: | |
Battery Runtime
As we discovered, losses in graphics power will have to be reckoned with in battery mode. The big 17.3-inch laptop will therefore sooner be disconnected from the outlet for multimedia purposes, such as video playback. The manufacturer installs a 9-cell battery with a capacity of 87 Wh for this case.
We first ascertained the maximum possible runtime using minimum brightness and enabling the Windows energy-saving plan while simulating reading text. MSI's laptop switched to standby after roughly 7 hours. Our stronger MSI GT72 was depleted almost 20 minutes sooner. Schenker's XMG U705 gave up after a bit over two hours. Alienware's 17, for example, achieved a considerably longer runtime of 12 hours.
A real-life scenario is all the more interesting, though. We simulate website browsing with a screen brightness of approx. 150 cd/m² for this. Our review sample managed almost 4.5 hours. MSI's GT72, for example, only lasted three hours. The leader is still Alienware's 17 with 5 hours and 45 minutes.
We use Battery Eater's tool to simulate load operation. The Classic test of this program is initiated under maximum brightness and Windows high-performance mode. Barely any gaming laptop lasts for over 1.5 hours, and MSI's GT70 also only managed 1 hour and 14 minutes.
| MSI GT70-2QD16SR21 GeForce GTX 970M, 4710MQ | MSI GT72-2QE32SR311BW GeForce GTX 980M, 4710HQ | MSI GT70 2PE-890US GeForce GTX 880M, 4800MQ | Alienware 17 R2 GeForce GTX 980M, 4980HQ | Schenker XMG U705 GeForce GTX 970M, 4790 | |
|---|---|---|---|---|---|
| Battery runtime | 10% | -4% | 58% | -21% | |
| Reader / Idle (h) | 7 | 6.6 -6% | 6.5 -7% | 12.2 74% | 2.3 -67% |
| Load (h) | 1.2 | 1.5 25% | 1.2 0% | 1.7 42% | 1.5 25% |
Pros
Cons
Verdict
MSI adds a decent portion of gaming power and system performance to its GT70 lineup. The higher-performance Nvidia GeForce GTX 970M plays a significant role in this just like the SSD storage that operates in RAID 0. The fact that the price has dropped to approximately 1600 Euros (~$1780) is particularly compelling. The review sample operates uncompromisingly fast and convinces with a ruthless gaming experience. Apart from the performance, we also discovered old weaknesses, though. For example, MSI installs a TN screen. Other contenders, such as Alienware's 17 or Schenker's, have switched to IPS technology in the meantime.
The GT lineup is comprised of true gaming monsters that are, however, more harmless in some areas than expected.
Buyers who want a better screen, a thinner build or lower noise development should take a closer look at our contenders. A glance in the Top 10 Gaming Notebooks chart is particularly recommendable.
MSI GT70-2QD16SR21
- 05/11/2015 v4 (old)
Nino Ricchizzi
Price comparison
