Notebookcheck Logo

Alien: Isolation Benchmarked

On the hunt for horror. Creative Assembly, known mostly for their time-consuming epic strategy games (the Total War series), dares to take on one of the greatest film classics ever. Alien: Isolation is intended to transport the player into the atmosphere of the original movie. Your role? The hunted. Which GPU is fast enough to "outrun" Alien?
Alien: Isolation Logo

For the original German article, see here.

Graphics

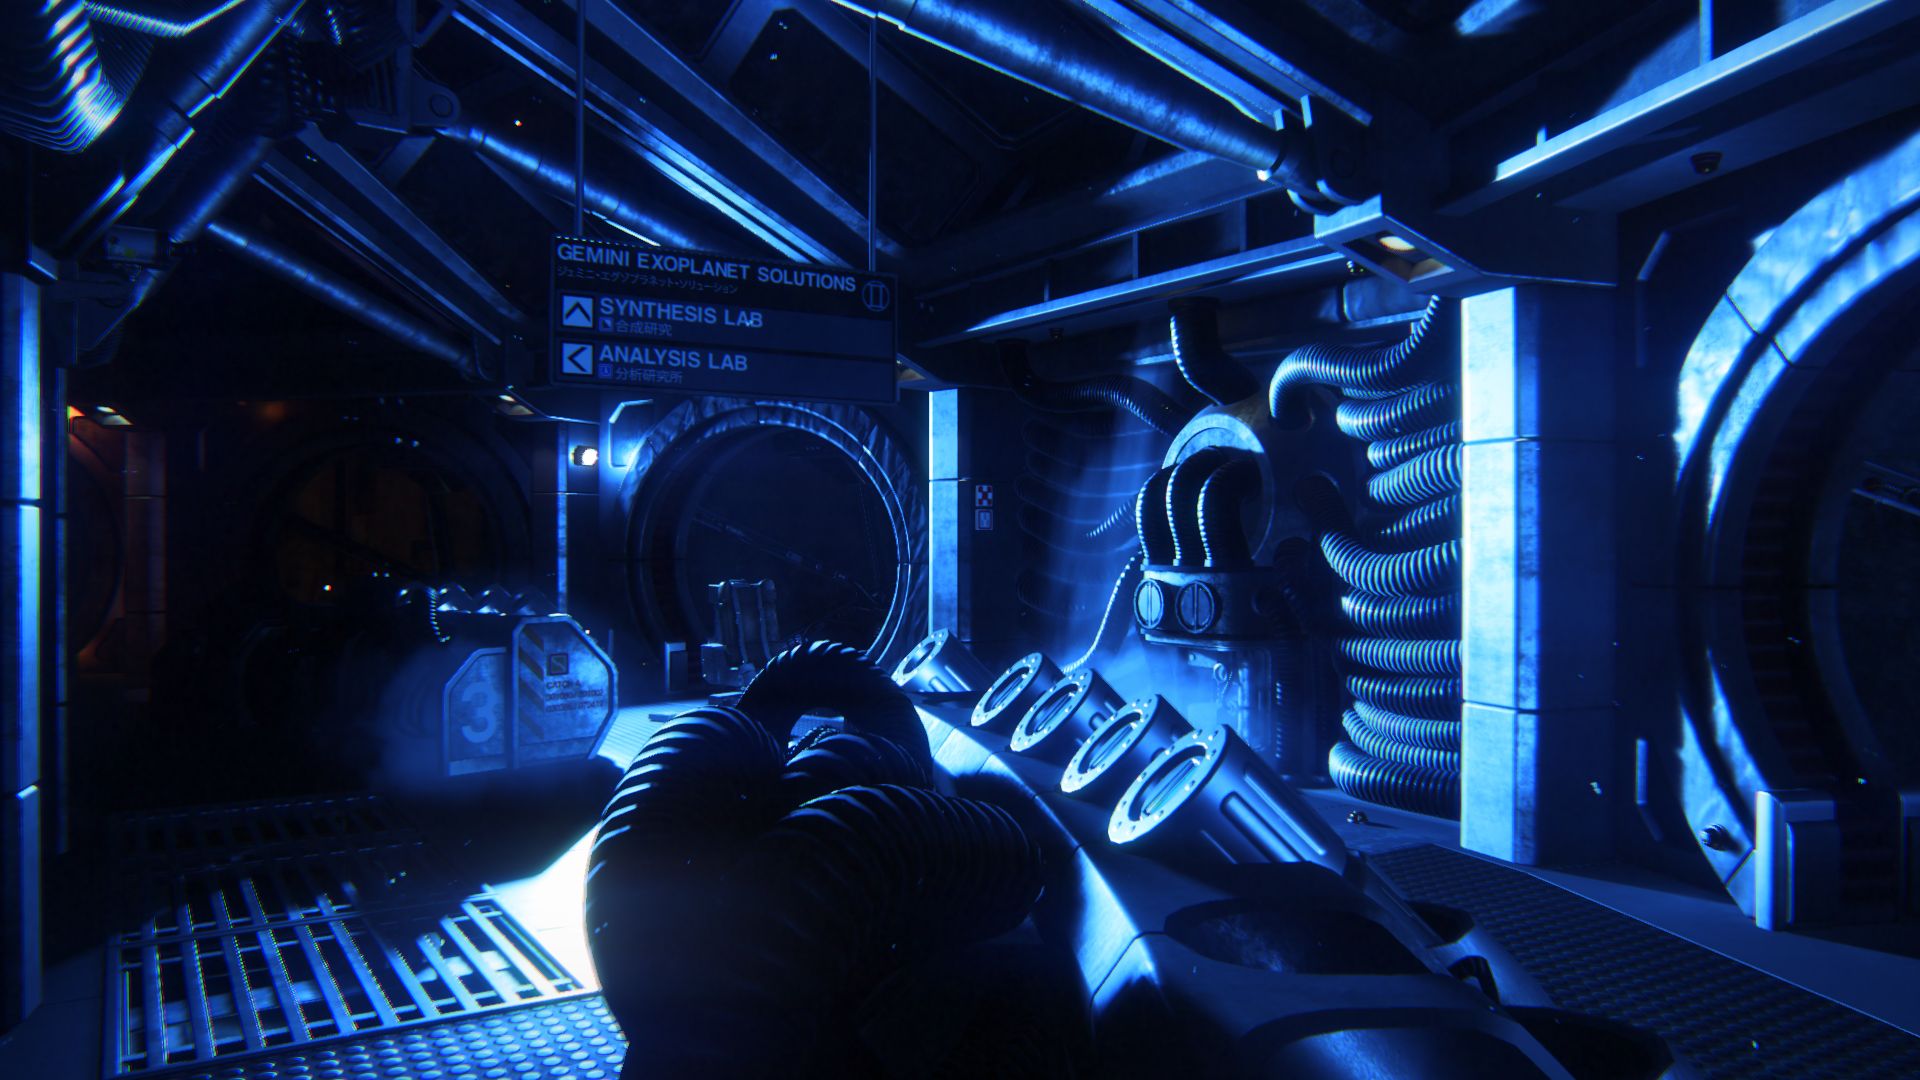
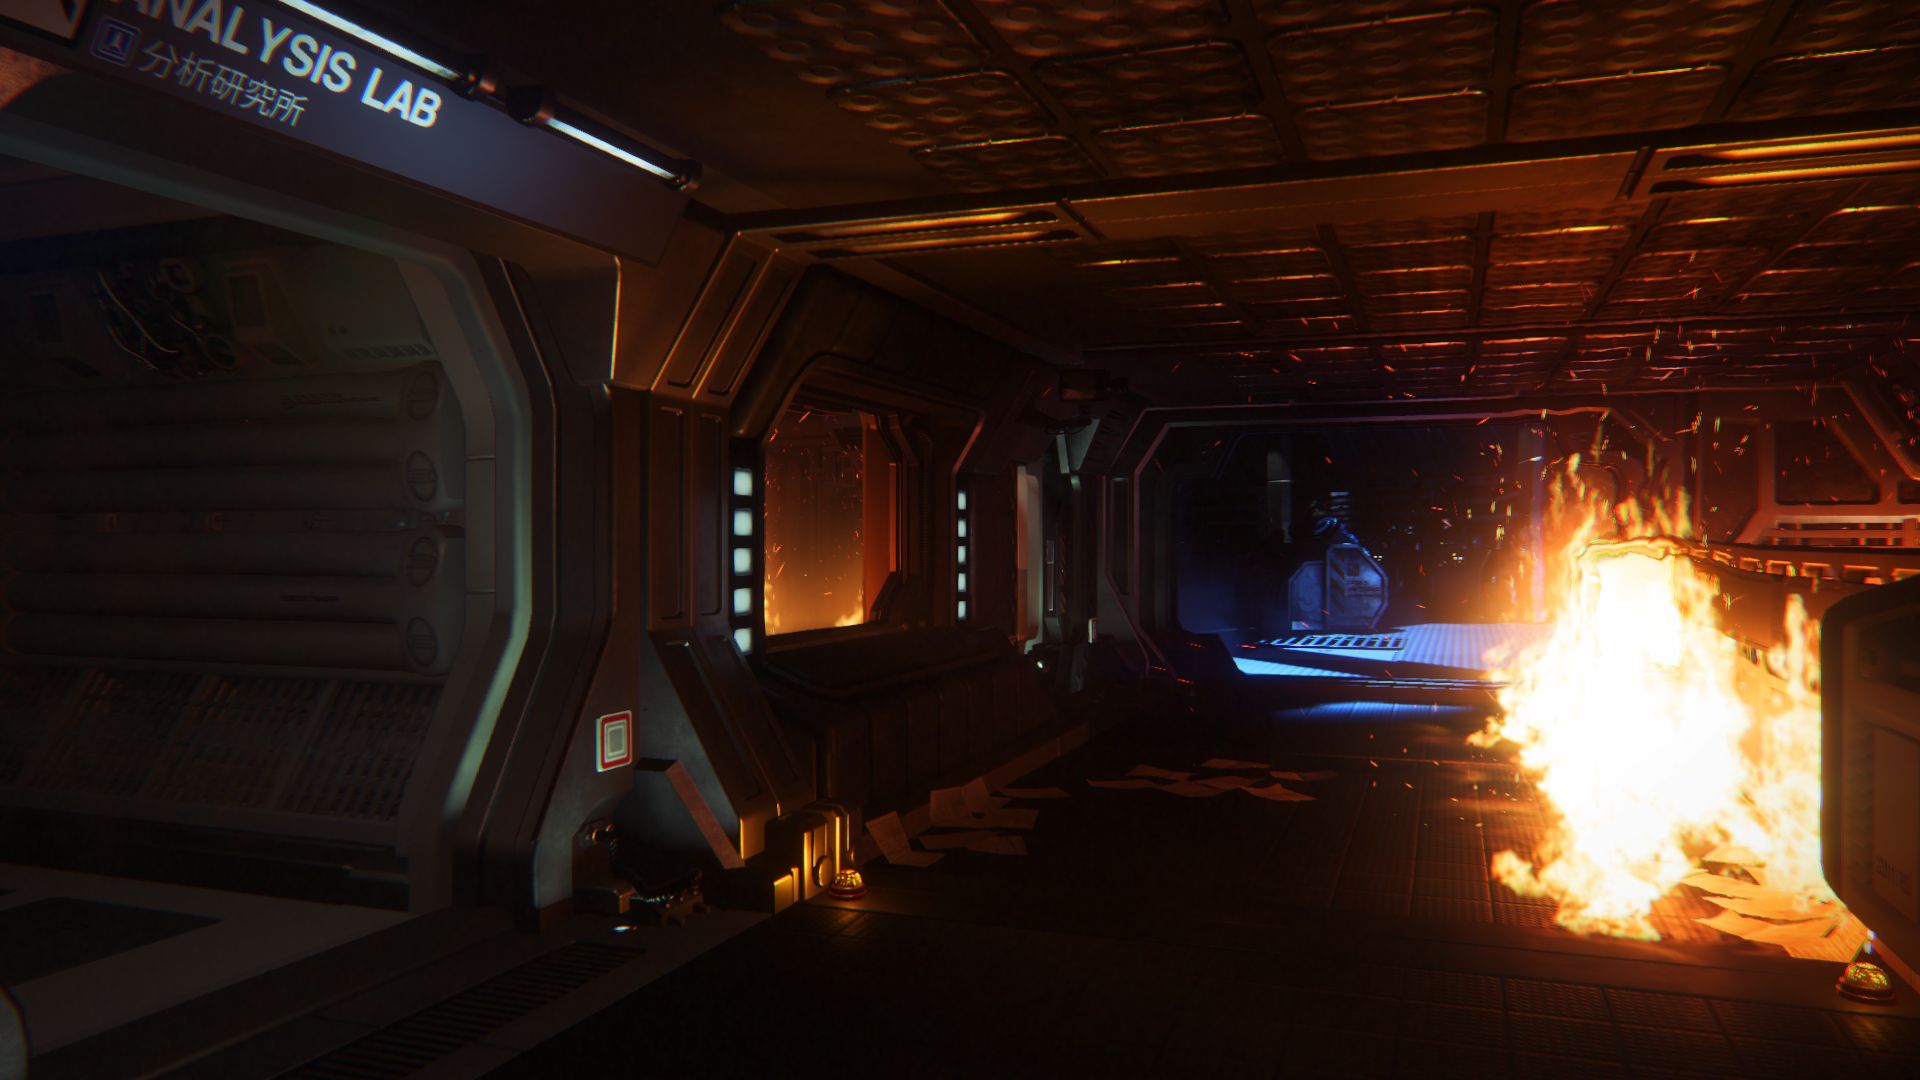
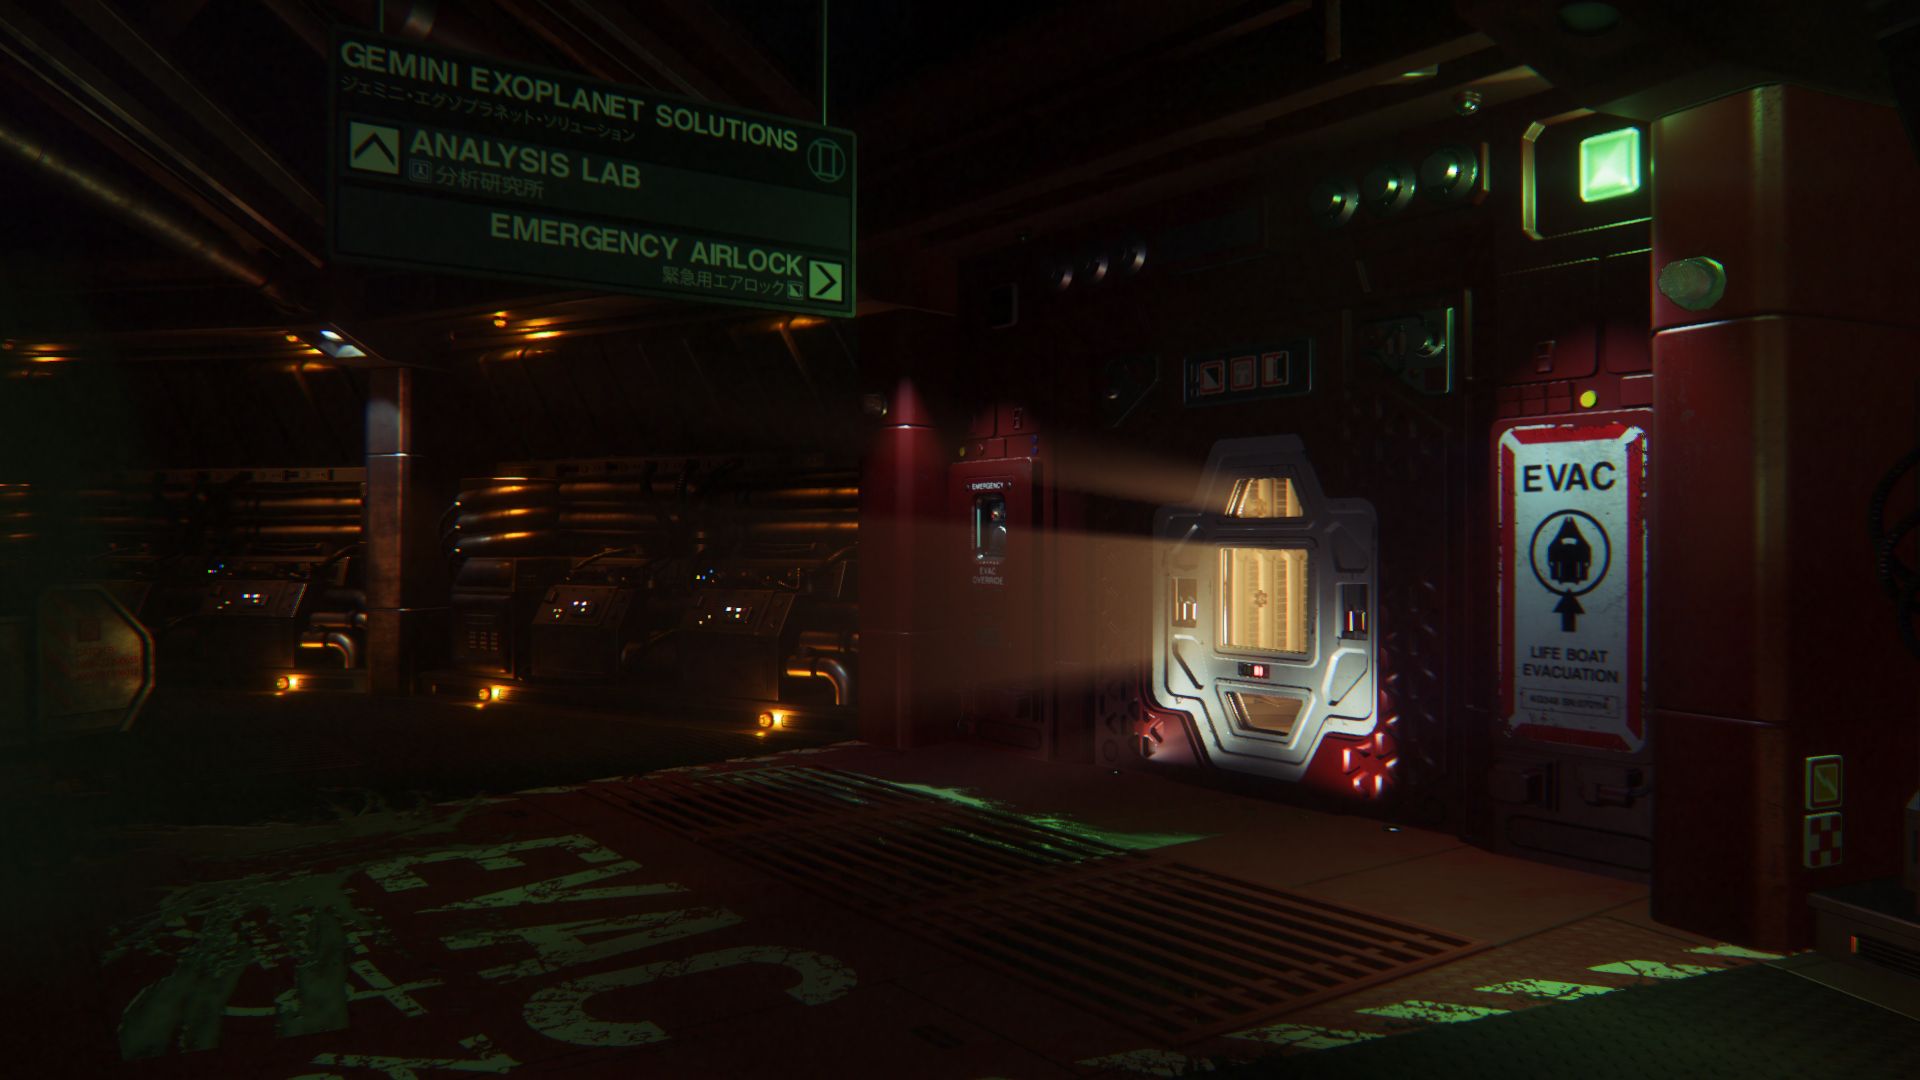
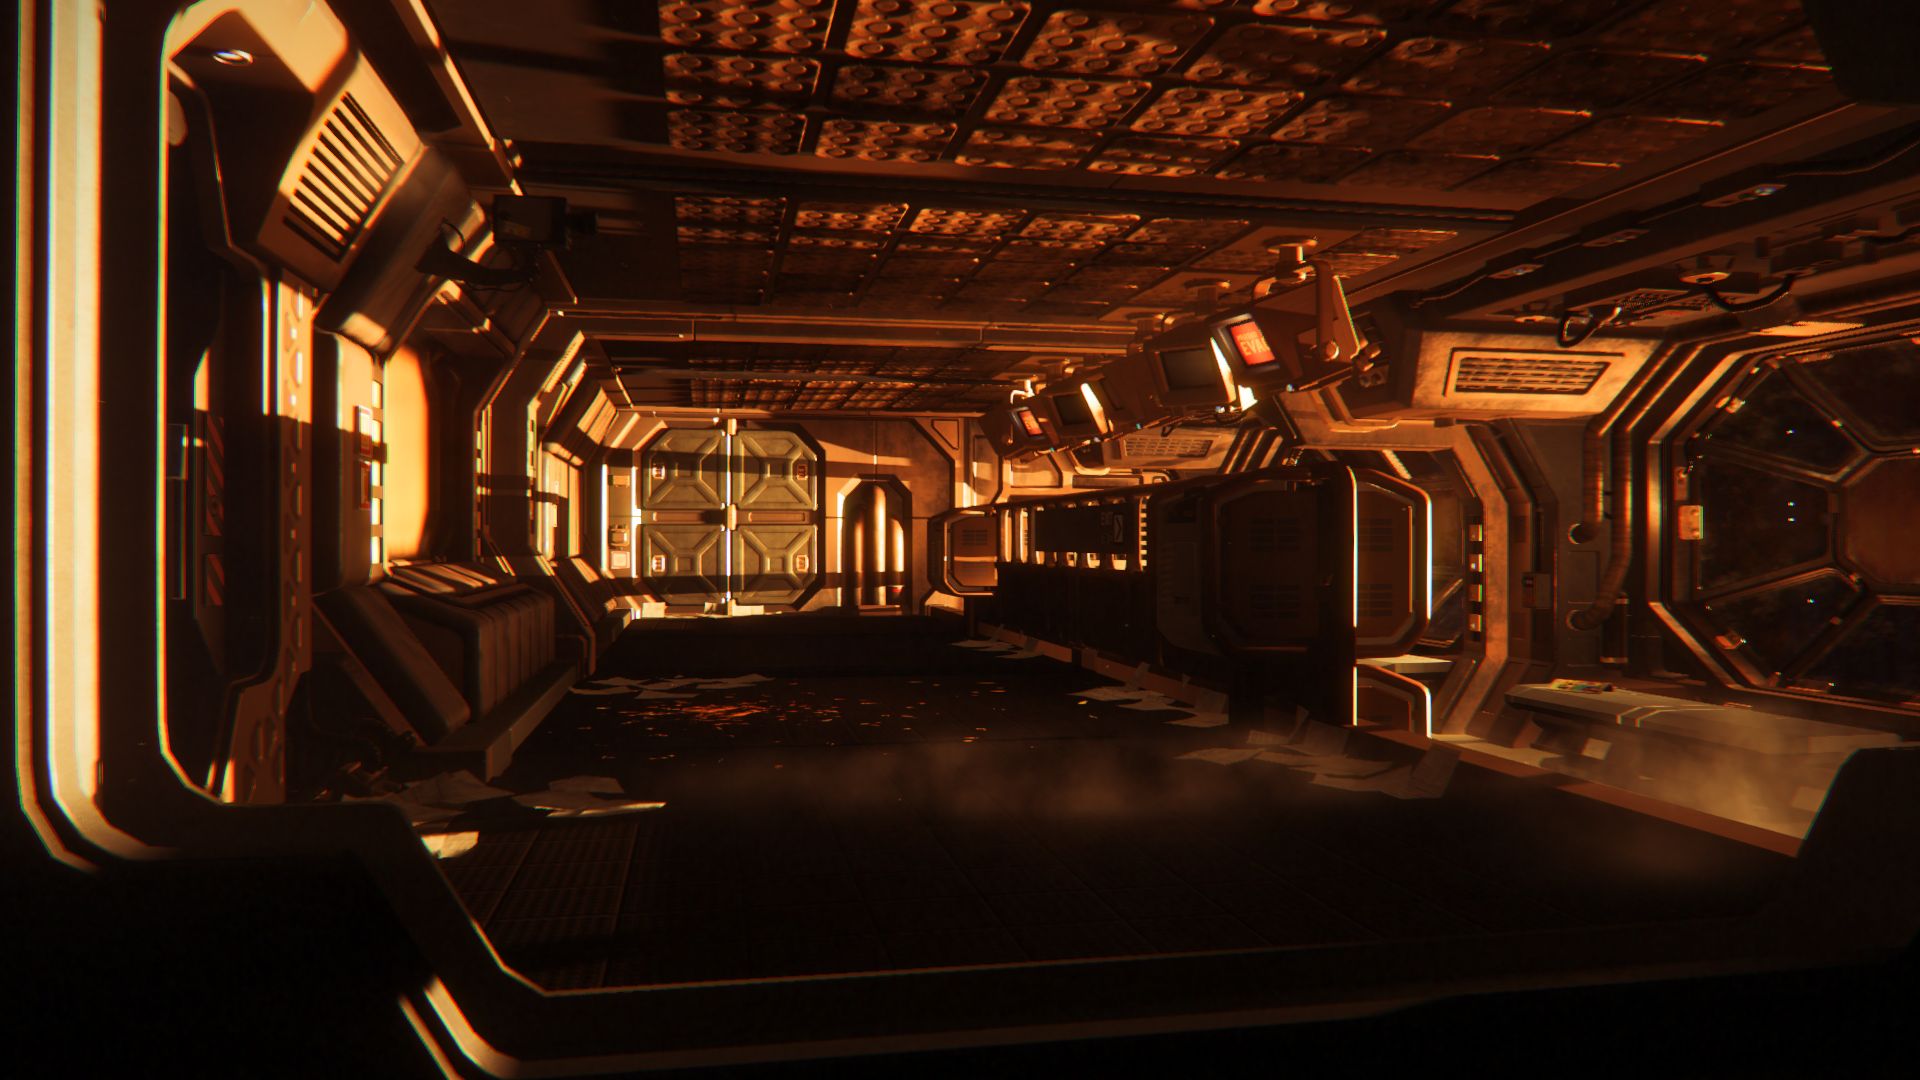
The engine, specially programmed for the game, is not in every respect on the level we would desire of a game released in 2014, but the graphics still make a very good impression. In terms of positive aspects, the play of light and shadows is certainly worthy of mention. When the player, represented by the female main character, creeps down the dark, narrow passageways in the Sevastopol space station, the claustrophobic atmosphere is immediately palpable. Often the contrast between bright and dark environments is interrupted by colorful lights and/or walls, which makes for a great color dynamic.

In general, the makers of Alien: Isolation are very faithful to the original. When we say that, we mean more than just the story - we mean the film's unique style. Any search for modern computers or other technological gadgets we carry with us today would be fruitless. The fact that the atmosphere is reminiscent of 2001: A Space Odyssey is deserving of praise.

Alien: Isolation
Alien: Isolation
Alien: Isolation

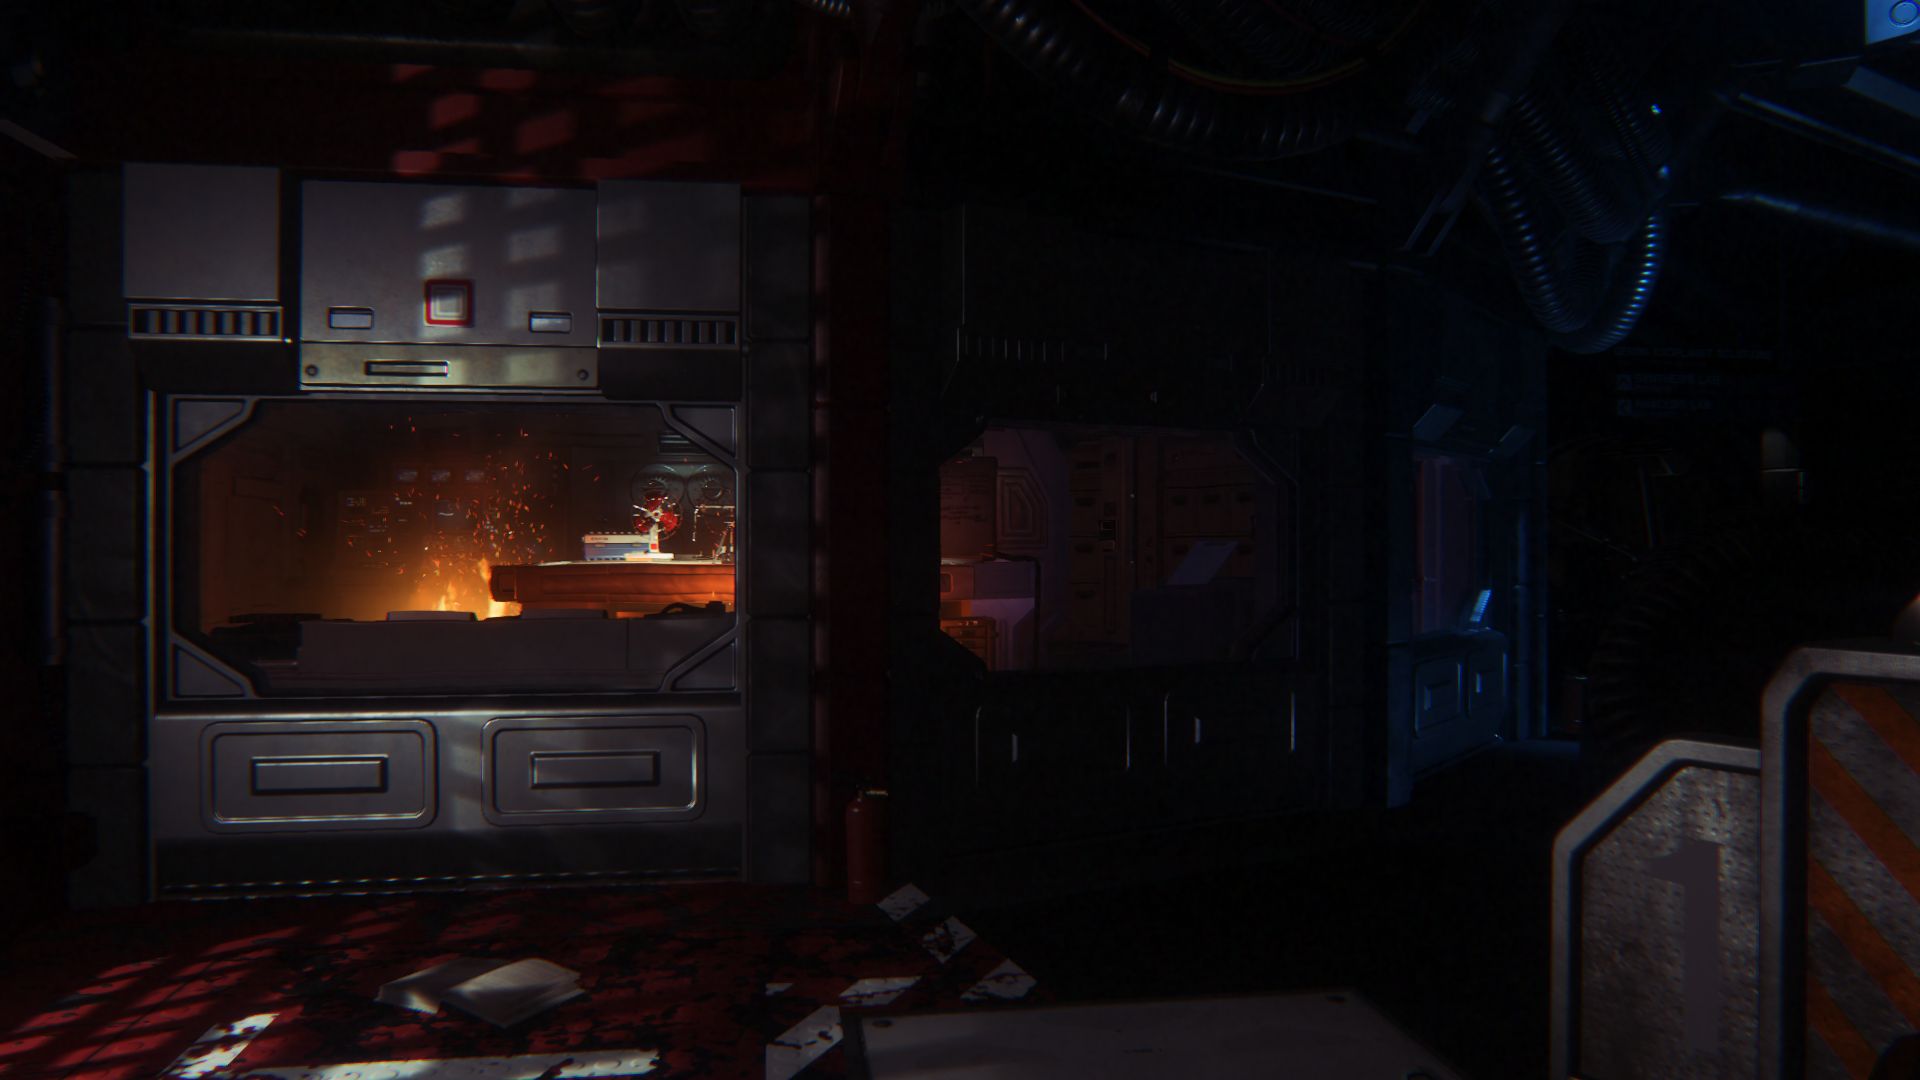
But back to the graphics. While the game environments are often less than fantastic, the main characters are very believable (especially the faces). Along with the polygon count, the texture sharpness is also well-done here. Only when it comes to animation do we see room for improvement.

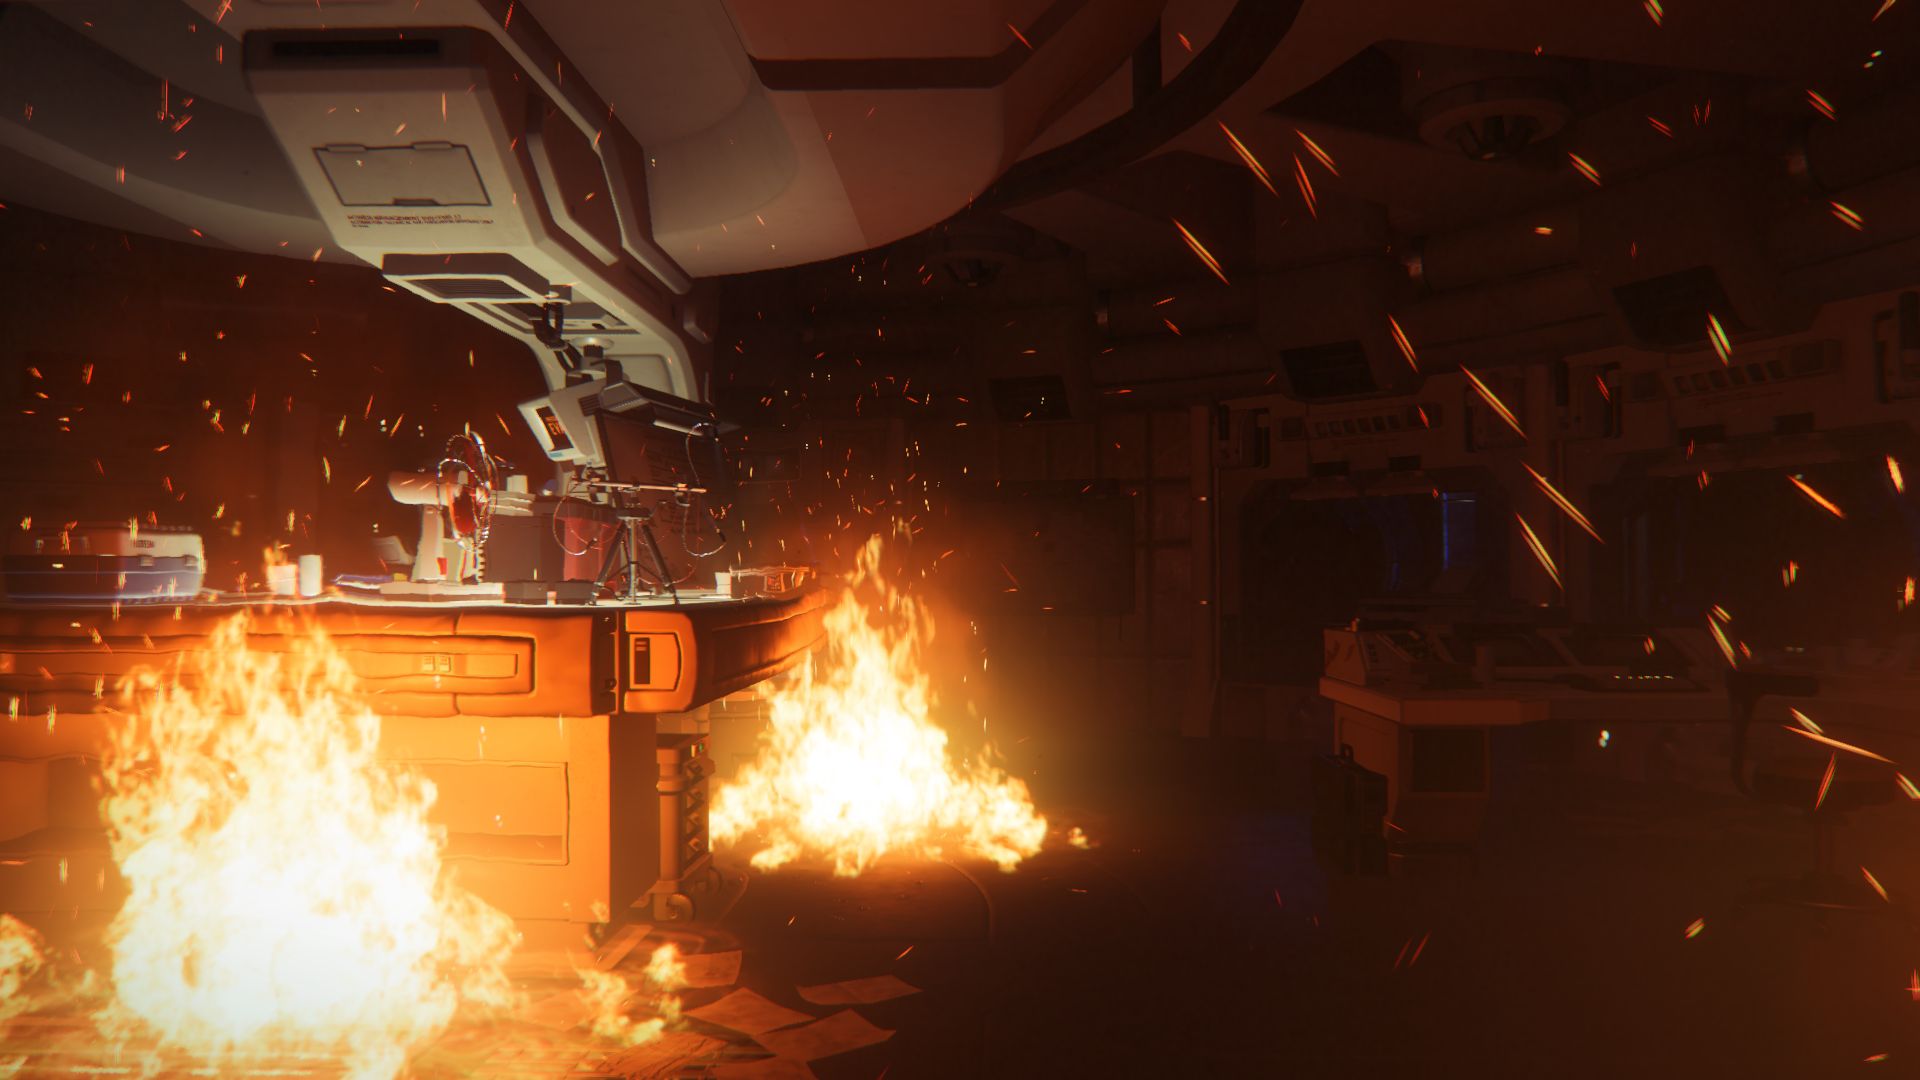
The second highlight - as previously mentioned - is the lighting. The particle, smoke and fire effects make the game even more pleasing to the eye. The developer's choice to nix high-quality anti-aliasing, however, we count as a flaw. The FXAA and SMAA modes only smooth the edges subtly. With MSAA or the like, the image would look calmer.

Alien: Isolation
Alien: Isolation
Alien: Isolation

The graphics menu immediately makes a good impression. True, scrolling through with a mouse and keyboard is a bit tricky, but the title offers almost 20 options, ranging from A as in "Adjust Gamma" to V as in "Vsync".

Of course, Creative Assembly also built in a few modern features, including ambient occlusion in the forms of SSAO and HDAO, for example. While some options can only be turned "on" and "off", the detail level, the shadow quality and the particles can be adjusted across 4-5 notches.

Low Settings
Low Settings
Medium Settings
Medium Settings
High Settings
High Settings
Ultra Settings
Ultra Settings

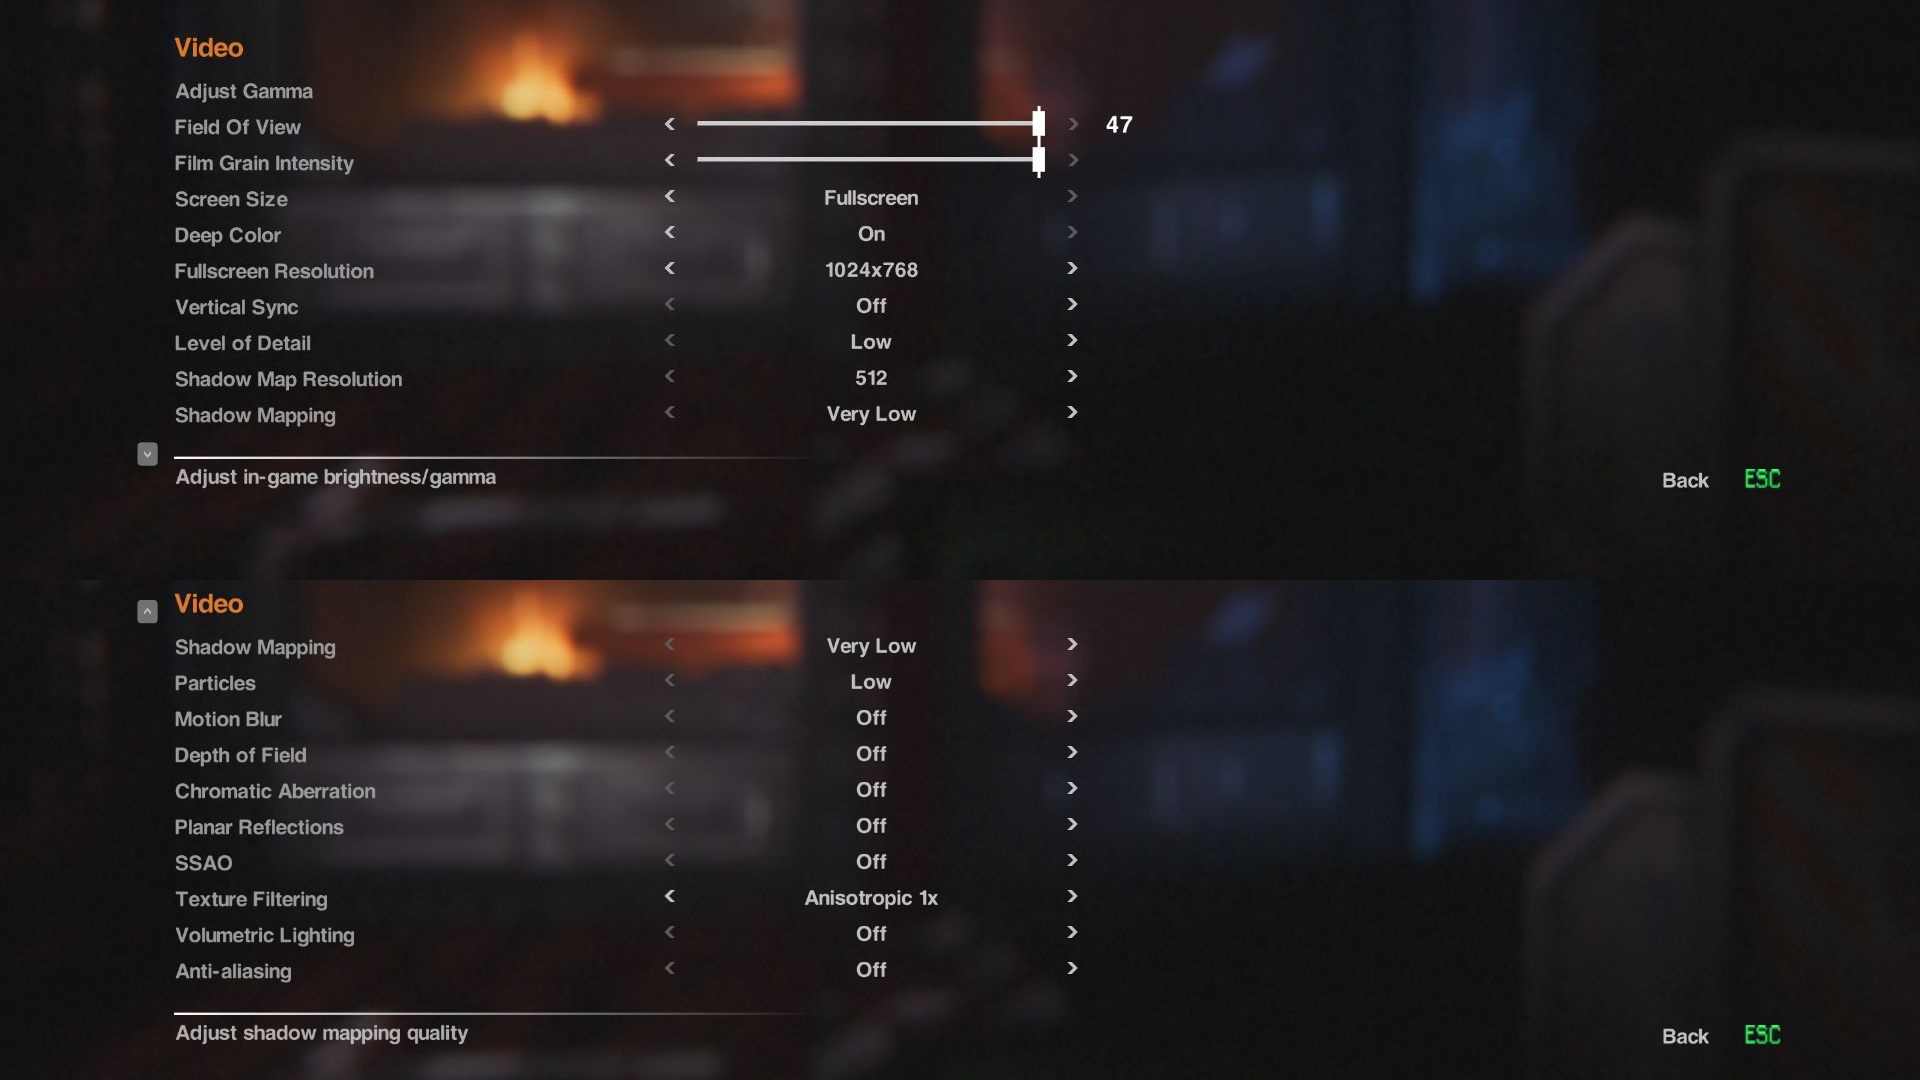
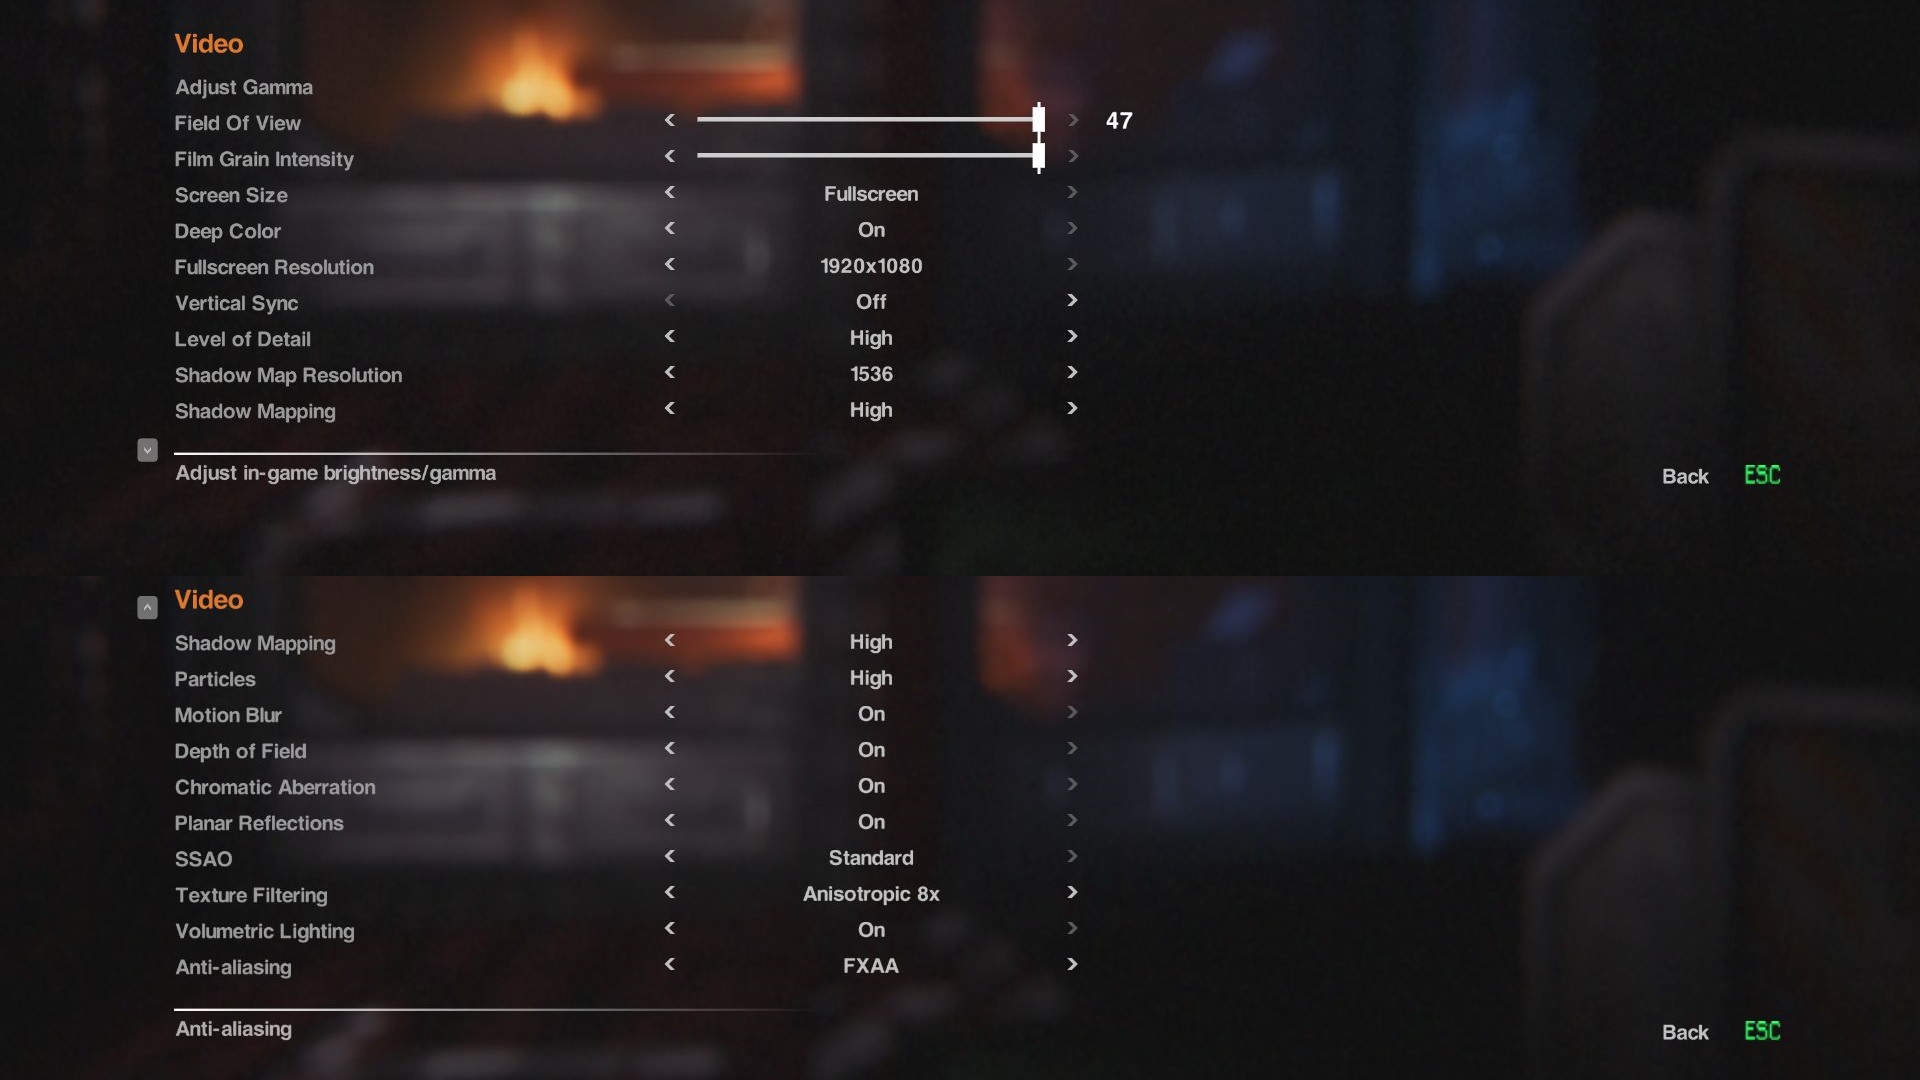
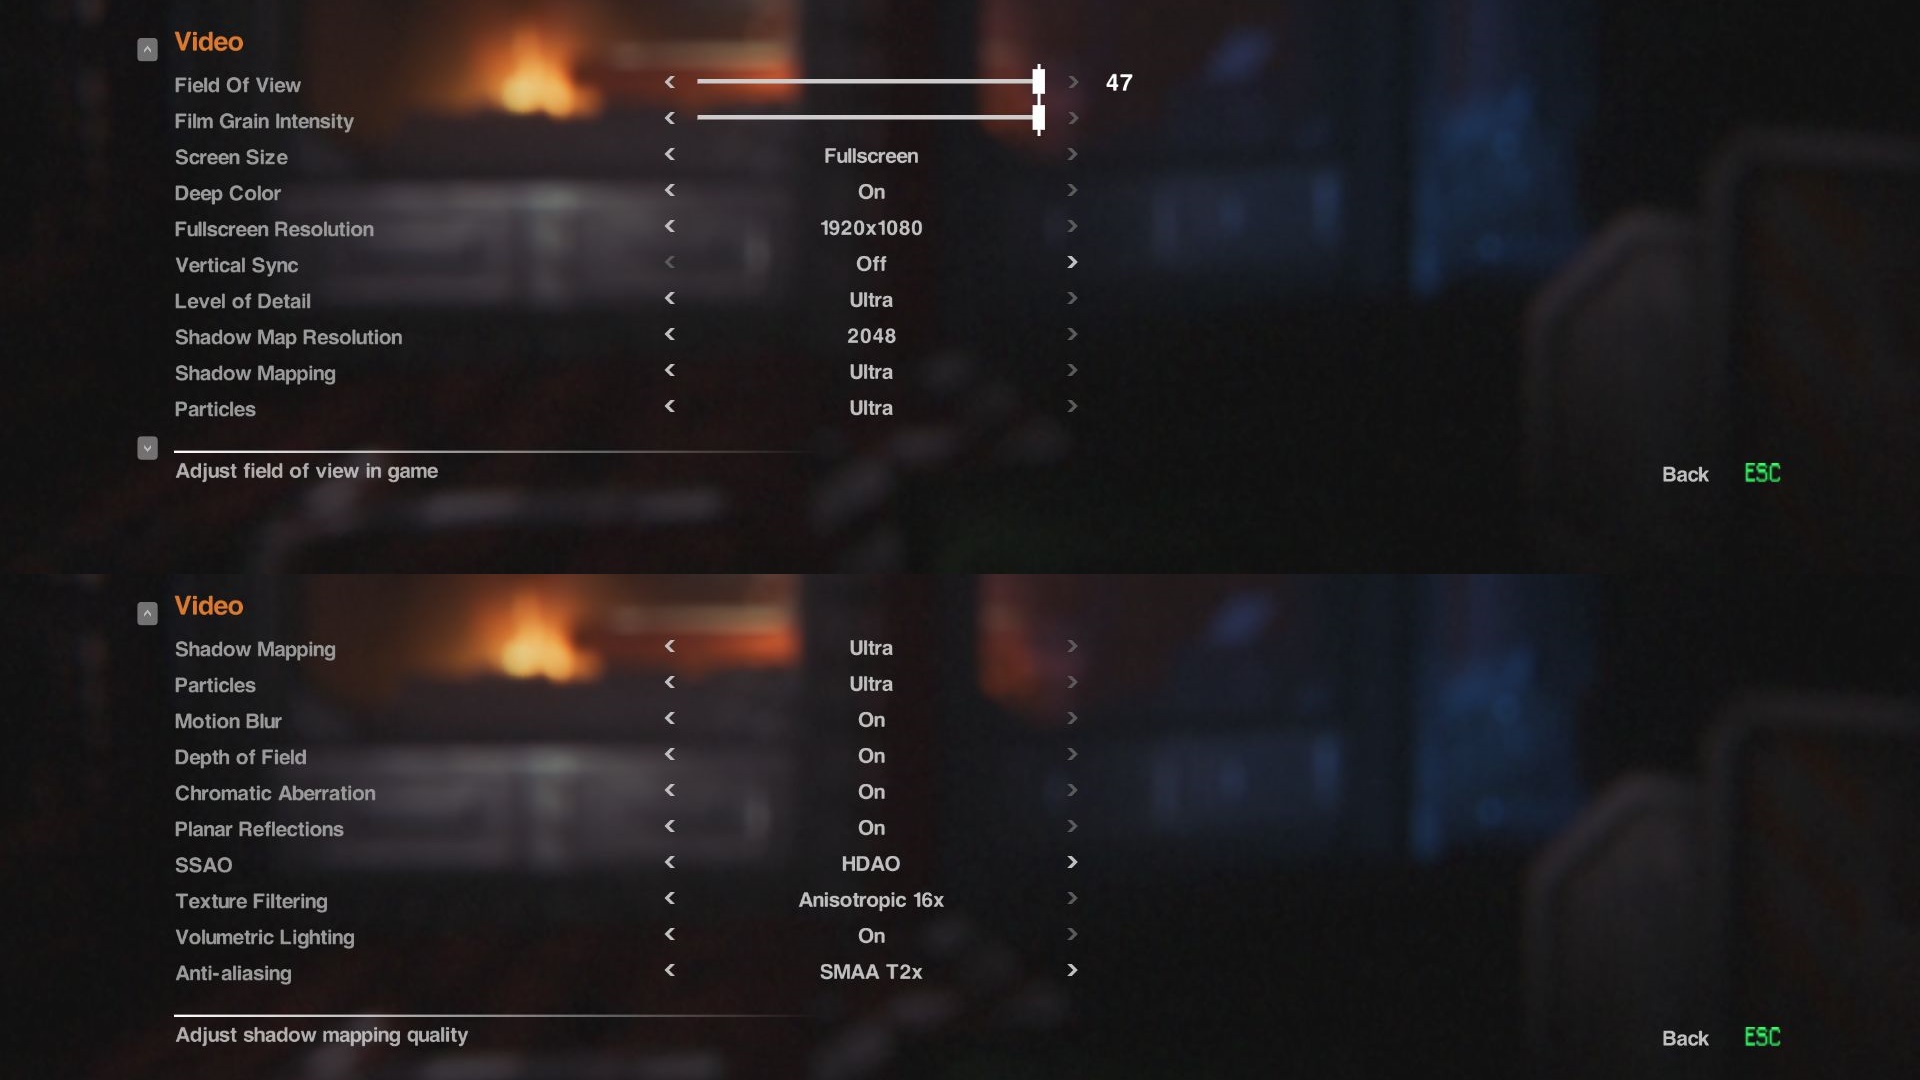
Except when it comes to shadows, however, changes to these settings are hardly noticeable in practice. This means Isolation never looks bad, but it never looks fantastic either. Those who like the "old-school" look can even modify the intensity of the grain filter. A field of view switcher and anisotropic texture filtering (1-16x) are also part of the repertoire. We are especially pleased that all changes can be adopted without a restart.

Unlock the benchmark
Review the results
Review the results

Benchmark

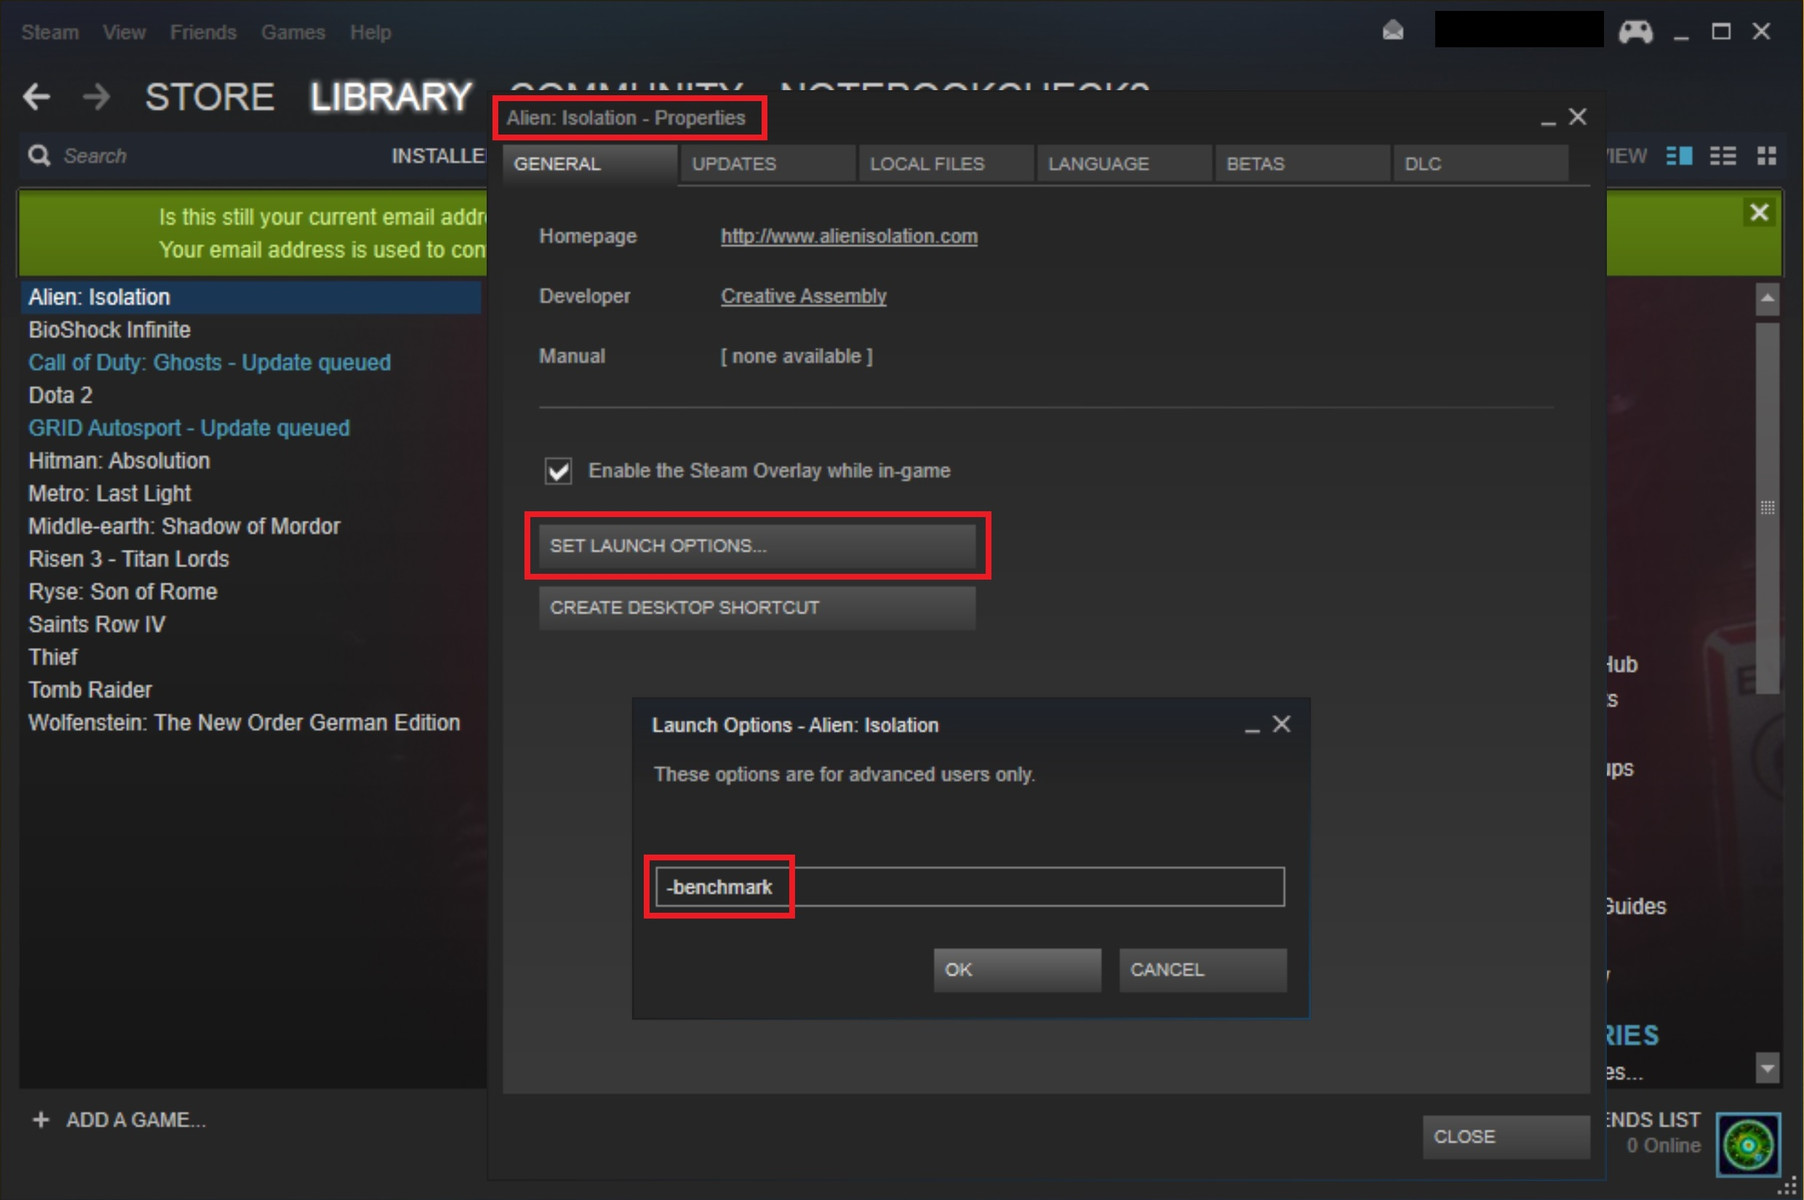
Alien: Isolation has a hidden benchmark function (did someone say Batman: Arkham Origins?) that can be activated by hand. Step 1: In Steam, right click to open the game's "Properties" menu. Step 2: Click on "Set Launch Options" and add the word -benchmark to the command line. Step 3: Confirm by clicking OK and start the game. A sequence lasting just under two minutes should follow.

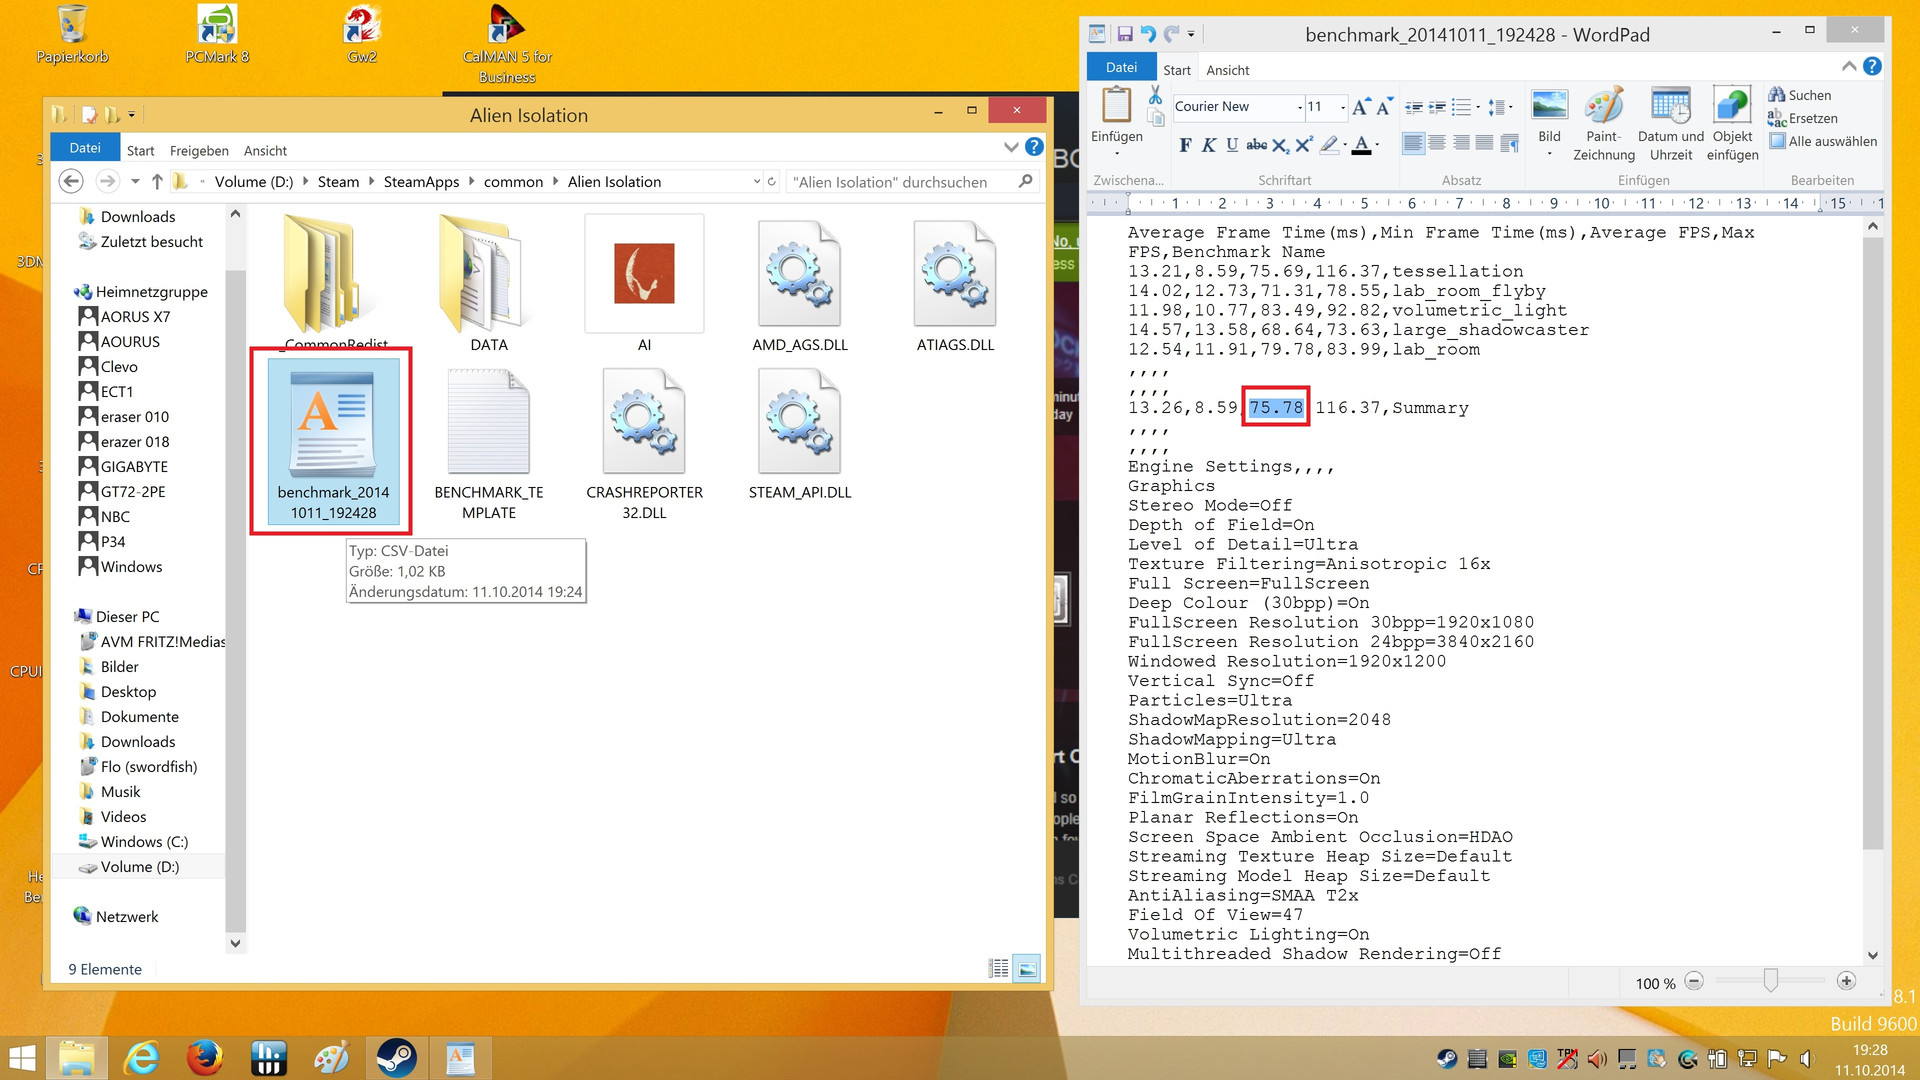
Unfortunately, the results do not show automatically after the sequence is complete. In order to access them, the user has to rummage through the game folder (Steam\SteamApps\common\Alien Isolation) and open the newly created benchmark_xyz.csv file. The average frame rate is the third entry listed under "Summary" (highlighted in the above image).

Despite the game's rather leisurely tempo, we suggest at least 40 fps. Otherwise, the ego-shooter does not run 100% fluidly. The question remains: Why is the benchmark not directly accessible from the options menu? Did the developers create it for their own tests, or did they only implement it shortly before the release? Who knows...

Results

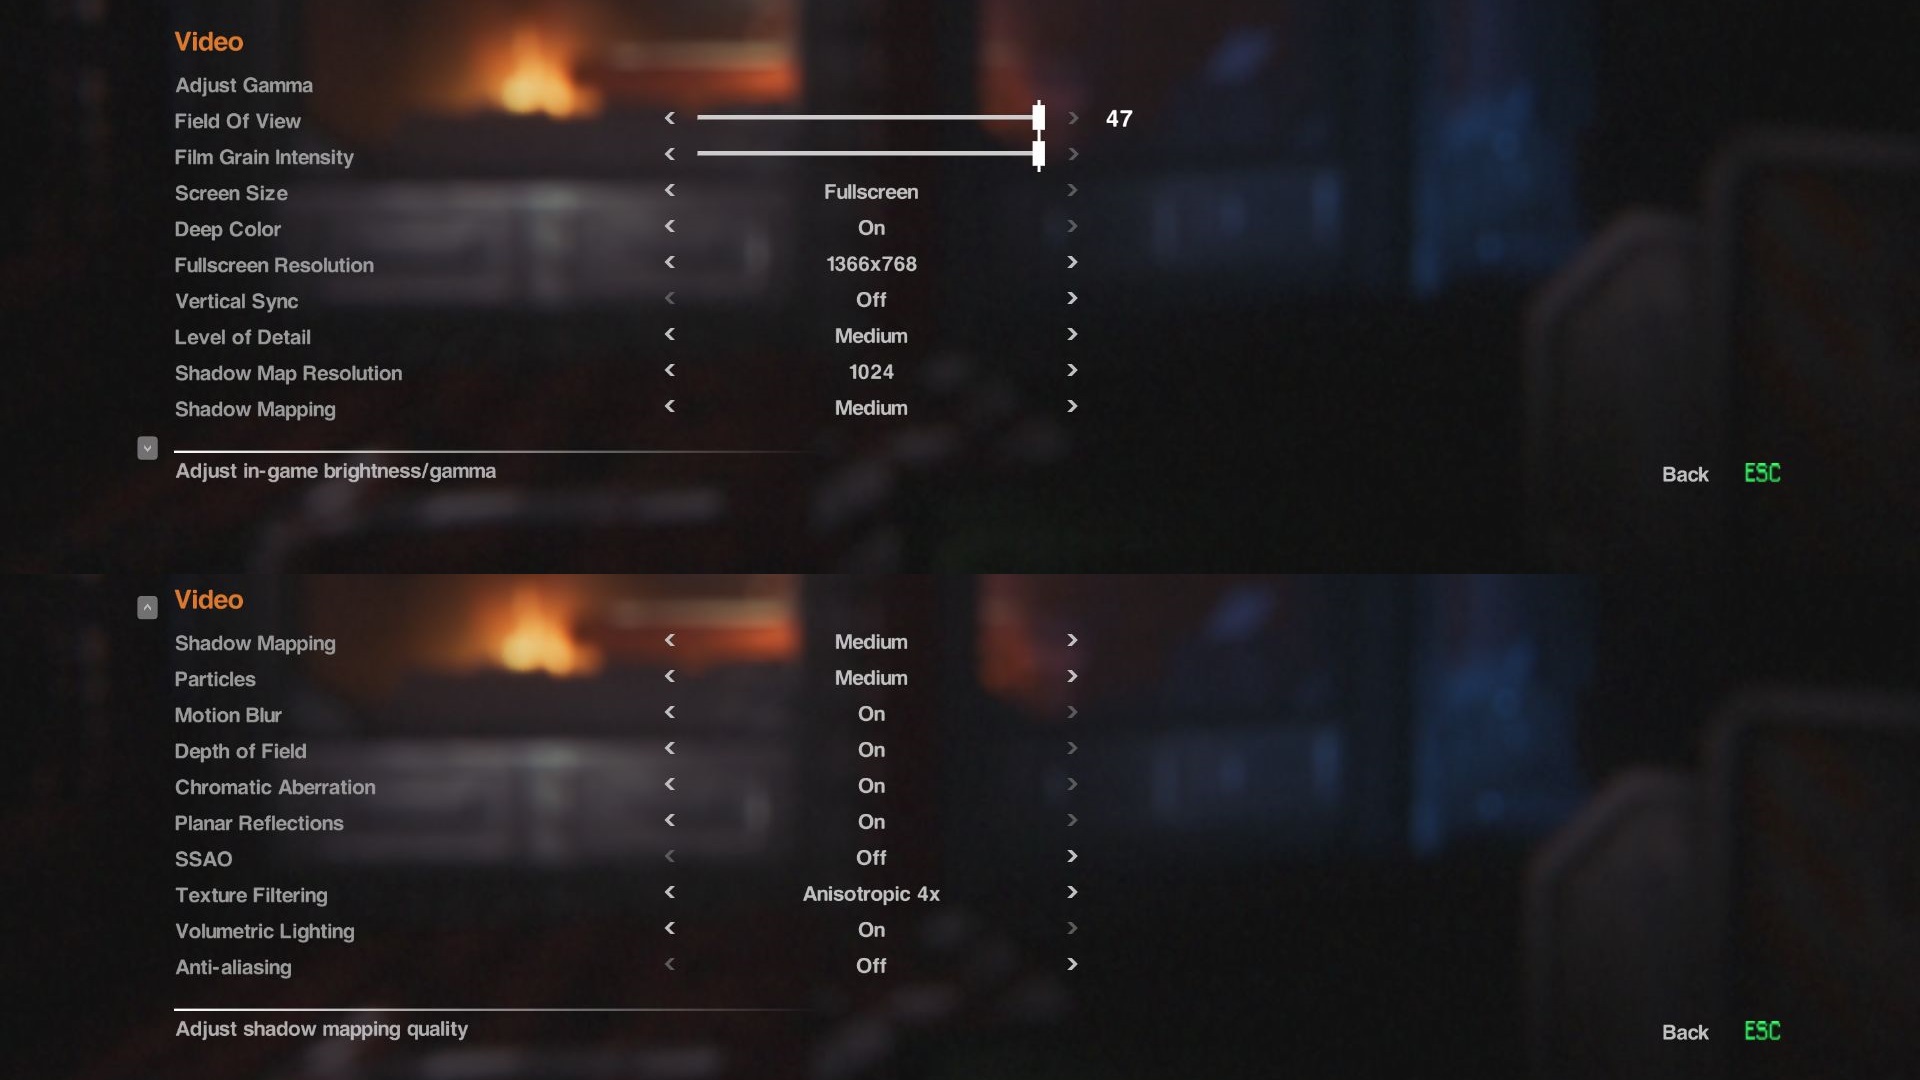
Looking over the performance results for both AMD and Nvidia cards graphics cards, there is no clear winner. The GPU experts' chips are more or less on par with each other. Thanks to the game's moderate hardware demands, an entry-level model suffices for low details and 1024x768 pixels. Both the HD Graphics 4600 and the Radeon HD 7660G managed more than 35 fps is our test. Medium settings, and 1366x768 pixels (all options except SSAO and anti-aliasing activated), on the other hand, require a midrange card. The GeForce GT 750M, for instance, averaged 51 fps.

For high details and 1920x1080 pixels, a little more graphics power is required. Only a GeForce GTX 850MGTX 765M or above can run this mix stutter-free. To enjoy the "Ultra" level, nothing beneath a high-end model - starting at a GeForce GTX 860M or GTX 770M - will fit the bill. In contrast to other titles, the processor hardly plays a role here. All aspects considered, Alien: Isolation's graphics are well-optimized for the PC. Thumbs up!

Alien: Isolation
    1920x1080 Ultra, On, Shadow Map 2048, HDAO AA:2x SM AF:16x     1920x1080 High, On, Shadow Map 1536, Standard SSAO AA:FX AF:8x     1366x768 Medium, On (AA & SSAO Off), Shadow Map 1024 AF:4x     1024x768 (Very) Low, Off, Shadow Map 512 AF:1x
GeForce GTX 780 Ti, 3770K
Desktop-PC
116.3 (0min) fps ∼50%
166.6 (0min) fps ∼56%
234.4 (0min) fps ∼76%
250.3 (0min) fps ∼69%
Radeon R9 290X, 2600K, Samsung SSD 840 Pro 256GB MZ7PD256HAFV-0Z000
Sapphire Tri-X R9 290X Desktop
108 (0min) fps ∼46%
131 (0min) fps ∼44%
160 (0min) fps ∼52%
179 (0min) fps ∼49%
Radeon R9 280X, 3770K
Desktop-PC
85.6 (0min) fps ∼37%
111.6 (0min) fps ∼37%
167 (0min) fps ∼54%
197.7 (0min) fps ∼54%
GeForce GTX 880M, 4700MQ
Schenker W504
68.9 (0min) fps ∼29%
101.2 (0min) fps ∼34%
178 (0min) fps ∼57%
207.3 (0min) fps ∼57%
GeForce GTX 760, 3770K
Desktop-PC
67.7 (0min) fps ∼29%
97.5 (0min) fps ∼33%
176.8 (0min) fps ∼57%
242.7 (0min) fps ∼67%
GeForce GTX 780M, 4700MQ
Schenker W503
64.5 (0min) fps ∼28%
95.4 (0min) fps ∼32%
167.9 (0min) fps ∼54%
193.2 (0min) fps ∼53%
Radeon R9 M290X, 4700MQ
Schenker W504
57.1 (0min) fps ∼24%
73.4 (0min) fps ∼25%
120.5 (0min) fps ∼39%
140.4 (0min) fps ∼38%
GeForce GTX 870M, 4700MQ
Schenker W504
55.9 (0min) fps ∼24%
77.9 (0min) fps ∼26%
145.7 (0min) fps ∼47%
205.9 (0min) fps ∼56%
GeForce GTX 750 Ti, 3770K
Desktop-PC
46.2 (0min) fps ∼20%
65 (0min) fps ∼22%
129 (0min) fps ∼42%
196.3 (0min) fps ∼54%
GeForce GTX 770M, 4700MQ
Schenker W503
42.8 (0min) fps ∼18%
62.4 (0min) fps ∼21%
116.8 (0min) fps ∼38%
167.3 (0min) fps ∼46%
GeForce GTX 860M, 4700MQ
Schenker W504
39.8 (0min) fps ∼17%
53.8 (0min) fps ∼18%
101.2 (0min) fps ∼33%
150.6 (0min) fps ∼41%
GeForce GTX 850M, 4340M
Schenker M504
33.7 (0min) fps ∼14%
47 (0min) fps ∼16%
93.8 (0min) fps ∼30%
141.4 (0min) fps ∼39%
GeForce GTX 765M, 4700MQ
Schenker W503
32.1 (0min) fps ∼14%
43.1 (0min) fps ∼14%
81.6 (0min) fps ∼26%
126.4 (0min) fps ∼35%
GeForce GT 750M, 4702MQ
Schenker M503
19.3 (0min) fps ∼8%
26.6 (0min) fps ∼9%
51.2 (0min) fps ∼17%
76.9 (0min) fps ∼21%
Radeon R7 512 Cores (Kaveri Desktop), A10-7850K, Samsung SSD 470 Series MZ-5PA256/EU
A10-7850K Asus A88-XM-PLUS
16.8 (0min) fps ∼7%
21.7 (0min) fps ∼7%
40 (0min) fps ∼13%
58 (0min) fps ∼16%
Iris Pro Graphics 5200, 4750HQ, Intel SSD 525 Series SSDMCEAC180B3
SCHENKER S413
16.4 (0min) fps ∼7%
24.6 (0min) fps ∼8%
47 (0min) fps ∼15%
69 (0min) fps ∼19%
GeForce GT 640M, 2637M, Lite-On LMT-256M3M
Acer Aspire M3-581TG
15.5 (0min) fps ∼7%
22.4 (0min) fps ∼8%
43.2 (0min) fps ∼14%
65 (0min) fps ∼18%
GeForce GT 740M, 4200M
HP Envy 15-j011sg
12 (0min) fps ∼5%
16.4 (0min) fps ∼6%
33 (0min) fps ∼11%
49.2 (0min) fps ∼13%
GeForce GT 720M, 4200M, WDC Scorpio Blue WD10JPVX-22JC3T0
MSI CX61-i572M
9.2 (0min) fps ∼4%
13.1 (0min) fps ∼4%
25.6 (0min) fps ∼8%
38.4 (0min) fps ∼11%
GeForce GT 630M, 3720QM, Seagate Momentus 7200.5 ST9750420AS
Asus N56VM
9.8 (0min) fps ∼4%
13.8 (0min) fps ∼5%
26.3 (0min) fps ∼8%
HD Graphics 4600, 4700MQ
Schenker W503
8.8 (0min) fps ∼4%
13.4 (0min) fps ∼4%
26 (0min) fps ∼8%
42 (0min) fps ∼12%
Radeon HD 8650G, A10-5750M, Samsung SSD 470 Series MZ-5PA256/EU
Pumori Test Platform (A10-5750M)
11.2 (0min) fps ∼5%
14.2 (0min) fps ∼5%
24.6 (0min) fps ∼8%
37.1 (0min) fps ∼10%
HD Graphics 4000, 3720QM
Asus N56VM
18.2 (0min) fps ∼6%
28.6 (0min) fps ∼8%

Four of our test devices are courtesy of Schenker Technologies (mysn.de):

  • W504 (Core i7-4700MQ, 8 GB DDR3, GeForce GTX 860M, GTX 870M, GTX 880M, Radeon R9 M290X)
  • W503 (Core i7-4700MQ, 8 GB DDR3, GeForce GTX 765M, GTX 770M, GTX 780M)
  • M504 (Core i5-4340M, 8 GB DDR3, GeForce GTX 850M)
  • M503 (Core i7-4702MQ, 8 GB DDR3, GeForce GT 750M)

Windows 7 64-bit is installed on each other these notebooks. A further thank you goes to Micron for the 480 GB Crucial M500.

Another test device is courtesy of Nvidia:

  • HP Envy 15-j011sg (Core i5-4200M, 12 GB DDR3, GeForce GT 740M)

GPU drivers used: Nvidia 344.11, AMD 14.9, Intel 10.18.10.3907

Additionally, there are benchmarks from other notebooks, potentially with different drivers.

Overview

Show Restrictions
PosModel< PrevNext >Alien: Isolation
 Alien: Isolation (2014)
low
1024x768
(Very) Low, Off, Shadow Map 512
1xAF
med.
1366x768
Medium, On (AA & SSAO Off), Shadow Map 1024
4xAF
high
1920x1080
High, On, Shadow Map 1536, Standard SSAO
8xAF FXAA
ultra
1920x1080
Ultra, On, Shadow Map 2048, HDAO
16xAF 2x SMAA
NVIDIA GeForce GTX 1080 (Desktop)
298
221
NVIDIA GeForce GTX 1080 Mobile
270
229
NVIDIA GeForce GTX 1070 (Desktop)
190.5n2
NVIDIA GeForce GTX 1070 Mobile
148
147n2
139
AMD Radeon R9 Fury
171
137
AMD Radeon R9 Nano
141
NVIDIA GeForce GTX 980
245.3
229.8
135n3
114.2n3
NVIDIA GeForce GTX 980 (Laptop)
272.55n2
252.8n2
188.65n2
135.55n2
NVIDIA GeForce GTX 1060 (Desktop)
331
310
195
133
AMD Radeon RX 480 (Desktop)
151
122
NVIDIA GeForce GTX 1060 Mobile
163
115
NVIDIA GeForce GTX 780 Ti
250.3
234.4
166.6
116.3
NVIDIA GeForce GTX 970
291.6
272.1
160.5
112.9
AMD Radeon R9 290X
217n2
185.5n2
138.5n2
111.5n2
NVIDIA GeForce GTX 980M
240.1n4
218.5n4
127.25n4
95.3n4
AMD Radeon R9 280X
197.7
167
111.6
85.6
NVIDIA GeForce GTX 960
275
217
113.3
80.9
NVIDIA GeForce GTX 1050 Ti Mobile
238.3
215.4
122.4
80.9
NVIDIA GeForce GTX 1050 Ti (Desktop)
84
PosModel< PrevNext >Alien: Isolation
low med. high ultra
NVIDIA GeForce GTX 970M
222n5
199n5
107.55n6
75.1n6
AMD Radeon R9 M295X
131.85n2
89.3
70.1n2
58.7n2
NVIDIA GeForce GTX 1050 (Desktop)
75.2
AMD Radeon R7 370
201.9
142.3
78.1
59.3
NVIDIA GeForce GTX 880M
207.3
178
101.2
68.9
NVIDIA GeForce GTX 950
264.4
182.3
92.1
66
NVIDIA GeForce GTX 760
242.7
176.8
97.5
67.7
NVIDIA GeForce GTX 780M
193.2
167.9
95.4
64.5
AMD Radeon RX 460 (Desktop)
60.9
NVIDIA GeForce GTX 965M
194.6n3
149.7n3
77.1n3
58.25n4
NVIDIA GeForce GTX 870M
205.9
145.7
77.9
55.9
AMD Radeon R9 M290X
140.4
120.5
73.4
57.1
AMD Radeon R9 M390
56
NVIDIA GeForce GTX 960M
155.3n3
116.5n4
62n5
46.5n7
NVIDIA GeForce GTX 750 Ti
196.3
129
65
46.2
NVIDIA GeForce MX150
40.4
NVIDIA GeForce GTX 770M
167.3
116.8
62.4
42.8
NVIDIA GeForce GTX 860M
127.85n2
97.55n2
54.55n2
40.1n2
NVIDIA GeForce GTX 950M
116.4n2
87n3
44.8n3
32n3
NVIDIA GeForce GTX 850M
123.5n2
87.7n2
45.25n2
31.9n2
PosModel< PrevNext >Alien: Isolation
low med. high ultra
AMD Radeon R9 M280X
37.3
25.8
19.2
NVIDIA GeForce 945M
130.2
85.9
43.7
30.2
NVIDIA GeForce GTX 765M
126.4
81.6
43.1
32.1
AMD Radeon RX Vega 10
76.1
54.6
29.8
23.1
AMD Radeon R9 M370X
100.3
59.7
35.6
28
NVIDIA GeForce 845M
68.5
33.8
27.4
AMD Radeon R9 M265X
80.7
53.7
22.1
17.6
NVIDIA GeForce GT 750M
76.9
51.2
26.6
19.3
NVIDIA GeForce 940MX
65.6
42.8
AMD Radeon RX Vega 8 (Ryzen 2000/3000)
71.9
49.5
28.7
22.3
NVIDIA GeForce 940M
63.85n2
44.65n2
22.7n2
17.4
AMD Radeon R9 M375
53.4
38.7
21.6
NVIDIA GeForce 840M
64.95n2
43.1n2
21.35n2
16.25n2
AMD Radeon R7 512 Cores (Kaveri Desktop)
58
40
21.7
16.8
Intel Iris Pro Graphics 5200
69
47
24.6
16.4
AMD Radeon R7 384 Cores (Kaveri Desktop)
56
37
19.6
15.5
NVIDIA GeForce GT 740M
49.2
33
16.4
12
NVIDIA GeForce 930M
63.5n3
41.8n3
21.2n3
15.7
NVIDIA GeForce 830M
60.3
41.3
20.7
14.8
NVIDIA GeForce 920MX
58.9
38.8
19.9
PosModel< PrevNext >Alien: Isolation
low med. high ultra
AMD Radeon R7 M260X
55.8
37
20.2
15.7
AMD Radeon R7 M270
45.2
31
17
13.9
AMD Radeon R7 M265
33.6
28.3
17.6
13.8
AMD Radeon R7 (Bristol Ridge)
32
20
NVIDIA GeForce GT 640M
65
43.2
22.4
15.5
AMD Radeon R7 (Kaveri)
41.12n2
27.9n2
17.25n2
14.7
AMD Radeon R7 M460
50.1
37.6
18
14.7
AMD Radeon R7 M360
38.7
27.3
15.2
12.7
NVIDIA GeForce 920M
45.5n2
29.3n2
14.7n2
9.15n2
AMD Radeon R7 M260
25.7n3
18.5n3
11.08n2
7.5
AMD Radeon R7 M340
42.3
31.3
16.9
13.8
AMD Radeon RX Vega 6 (Ryzen 2000/3000)
26.7
19.7
10.6
Intel HD Graphics 530
48.8n2
31.1n2
15.25n2
10.6
AMD Radeon R5 (Bristol Ridge)
42.9
22.9
11.7
11.5
Intel UHD Graphics 620
51.5
35.6
17
15.6
AMD Radeon R6 (Carrizo)
35.6
21.9
Intel HD Graphics 5600
45.3
28.3
14.4
10.5
AMD Radeon HD 8670M
30.9
21.3
AMD Radeon HD 8650G
37.1
24.6
14.2
11.2
NVIDIA GeForce GT 630M
26.3
13.8
9.8
PosModel< PrevNext >Alien: Isolation
low med. high ultra
AMD Radeon R5 M335
31.6
22.1
12.1
8.3
AMD Radeon R5 M330
26.2
15.1
9.5
AMD Radeon R5 M255
27.5
21.5
13.5
NVIDIA GeForce 820M
41.15n2
27.35n2
14.4
Intel HD Graphics 520
39.25n2
24.1n2
Intel Iris Graphics 6100
36.15n2
26.55n2
15.65n2
11.3
NVIDIA GeForce GT 720M
38.4
25.6
13.1
9.2
AMD Radeon R5 M240
32.05n2
22.15n2
12.1
AMD Radeon R5 M230
27.4
18.6
9.8
AMD Radeon R5 (Stoney Ridge)
27
17
Intel HD Graphics 6000
34
26.41
Intel Iris Graphics 5100
27.1n2
20.55n2
11.65n2
Intel HD Graphics 4600
35.85n2
22.75n2
11.65n2
7.8n2
Intel HD Graphics 5500
31.42n4
21.76n4
11.2n3
8.3n3
Intel HD Graphics 615
26.3
19
9.7
AMD Radeon R5 (Kaveri)
21.3
14.2
AMD Radeon HD 7660G
36
24.7
13.5
11
Intel HD Graphics 5000
28.9
20.9
11.4
Intel HD Graphics 610
30.6
18.3
Intel HD Graphics 4400
29.3n3
18.5n3
10.4n2
PosModel< PrevNext >Alien: Isolation
low med. high ultra
Intel UHD Graphics 605
17.5
13.1
Intel HD Graphics 505
18.3
14.1
Intel HD Graphics 5300
20.1n3
13.9n3
7.6n3
4.63
Intel HD Graphics 4000
28.6
18.2
AMD Radeon R5 (Beema/Carrizo-L)
20n2
12.75n2
AMD Radeon R4 (Beema)
21.9
14.5
AMD Radeon R3 (Mullins/Beema)
19.9
12.3
AMD Radeon R2 (Stoney Ridge)
17.8
10.3
Intel HD Graphics 4200
12.9
9
5.1
AMD Radeon HD 8350G
24.9
15.2
AMD Radeon HD 8330
16.7
10.3
Intel HD Graphics 405 (Braswell)
18.9
13.6
Intel HD Graphics (Braswell)
13.7
8.8
Intel HD Graphics 400 (Braswell)
11.7n2
7
Intel HD Graphics (Haswell)
21.6
12.9
Intel HD Graphics (Bay Trail)
9.1
5.1
(-) * Smaller values are better. / n123 Number of benchmarks for this median value / * Approximate position


Legend
5Stutters – This game is very likely to stutter and have poor frame rates. Based on all known benchmarks using the specified graphical settings, average frame rates are expected to fall below 25fps
May Stutter – This graphics card has not been explicitly tested on this game. Based on interpolated information from surrounding graphics cards of similar performance levels, stutters and poor frame rates are expected.
30Fluent – Based on all known benchmarks using the specified graphical settings, this game should run at or above 25fps
40Fluent – Based on all known benchmarks using the specified graphical settings, this game should run at or above 35fps
60Fluent – Based on all known benchmarks using the specified graphical settings, this game should run at or above 58fps
May Run Fluently – This graphics card has not been explicitly tested on this game. Based on interpolated information from surrounding graphics cards of similar performance levels, fluent frame rates are expected.
?Uncertain – This graphics card experienced unexpected performance issues during testing for this game. A slower card may be able to achieve better and more consistent frame rates than this particular GPU running the same benchmark scene.
Uncertain – This graphics card has not been explicitly tested on this game and no reliable interpolation can be made based on the performances of surrounding cards of the same class or family.
The value in the fields displays the average frame rate of all values in the database. Move your cursor over the value to see individual results.
static version load dynamic
Loading Comments
Comment on this article
Please share our article, every link counts!
Florian Glaser, 2014-10-21 (Update: 2021-05-18)