Intel Iris Graphics 6100 The Intel Iris Graphics 6100 (GT3) is an integrated Broadwell graphics card revealed in Q1 2015. It can be found in several low-voltage SoCs (28 W TDP) such as the Core i5-5257U or i7-5557U . While Core i5 and Core i7 chips feature 48 EUs, the Core i3 version offers just 47 EUs. Depending on the specific CPU, the maximum GPU frequency varies between 1000 and 1100 MHz.
Architecture and Features
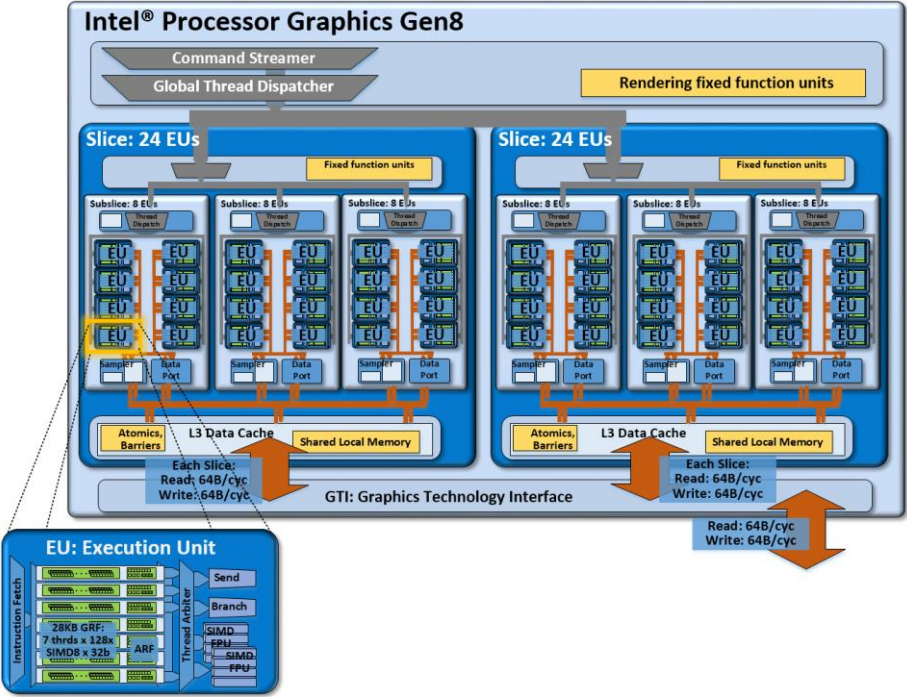
Broadwell features a GPU based on the Intel Gen8 architecture, which has been optimized in various aspects compared to the previous Gen7.5 (Haswell). Inter alia, the shader arrays called "subslice" have been reorganized and now offer 8 Execution Units (EUs) each. Three subslices form a "slice" for a total of 24 EUs. Combined with other improvements such as larger L1 caches and an optimized frontend, the integrated GPU has become faster and more efficient than its predecessor.
The Iris Graphics 6100 represents the top-end version of the Broadwell GPU family and consists of two slices with 48 EUs. Beyond that, there is also a low-end (GT1, 12 EUs), a mid-range (GT2, 24 EUs) and a high-end variant (GT3e, 48 EUs + eDRAM).
All Broadwell GPUs support OpenCL 2.0 and DirectX 12 (FL 11_1) . The video engine can now decode H.265 using both fixed function hardware as well as available GPU shaders. Up to three displays can be connected via DP 1.2/eDP 1.3 (max. 3840 x 2160 @ 60 Hz) or HDMI 1.4a (max. 3840 x 2160 @ 24 Hz). HDMI 2.0, however, is not supported.
Performance
Depending on the specific CPU, the maximum GPU frequency varies between 1000 and 1100 MHz. Even though the Iris Graphics 6100 is technically identical to the HD Graphics 6000 , the higher TDP (28 W instead of 15 W) leads to a better utilization of the Turbo Boost and therefore a superior performance. Overall, the Iris 6100 is about as fast as a dedicated GeForce 820M and outperforms the former Iris Graphics 5100 by 20 - 25 percent.
Older and less demanding games such as Diablo III, Counter-Strike: GO oder Dota 2 can be played fluently in 1366 x 768 pixels and high settings. More demanding titles, however, may require lower settings or won't run at a decent framerate at all.
Power Consumption
Utilizing a new 14 nm process, the Broadwell LV chips are specified at 28 W TDP and therefore suited for medium-sized ultrabooks. The TDP is flexible and can be further reduced (23 W), which has a significant impact on performance.
Iris Series Codename Broadwell GT3 Architecture Gen. 8 Broadwell iGPU Integrated Graphics Pipelines 48 - unified Core Speed 300 - 1100 (Boost) MHz Memory Bus Width 64/128 Bit Shared Memory yes API DirectX 12 (FL 11_1), OpenGL 4.3 Power Consumption 28 Watt Transistor Count 1.9 Billion Man. Technology 14 nm Features QuickSync Date of Announcement 05.01.2015
Benchmarks Performance Rating - 3DMark 11 + Fire Strike + Time Spy
3DMark - 3DMark Fire Strike Standard Score
min: 811 avg: 880 median: 864.5 (1%) max: 981 Points
3DMark - 3DMark Fire Strike Standard Graphics
min: 857 avg: 917 median: 874 (1%) max: 1020 Points
3DMark - 3DMark Ice Storm Graphics
min: 60636 avg: 64246 median: 61997 (7%) max: 70106 Points
3DMark - 3DMark Time Spy Score
3DMark - 3DMark Time Spy Graphics
3DMark - 3DMark Ice Storm Unlimited Graphics
3DMark - 3DMark Ice Storm Extreme Graphics
min: 43469 avg: 46800 median: 46800 (5%) max: 50131 Points
3DMark - 3DMark Cloud Gate Score
min: 5746 avg: 6119 median: 6141 (6%) max: 6637 Points
3DMark - 3DMark Cloud Gate Graphics
min: 7175 avg: 7743 median: 7798 (2%) max: 8199 Points
3DMark 11 - 3DM11 Performance Score
min: 1581 avg: 1763 median: 1768 (2%) max: 1884 Points
3DMark 11 - 3DM11 Performance GPU
min: 1471 avg: 1656 median: 1694.5 (1%) max: 1765 Points
3DMark Vantage + 3DMark Vantage - 3DM Vant. Perf. total
3DM Vant. Perf. GPU no PhysX + 3DMark Vantage - 3DM Vant. Perf. GPU no PhysX
3DMark 06 3DMark 06 - Standard 1280x1024 + 3DMark 06
min: 7929 avg: 8675 median: 8764 (11%) max: 9332 Points
Unigine Heaven 3.0 - Unigine Heaven 3.0 OpenGL
SPECviewperf 12 + SPECviewperf 12 - specvp12 sw-03
specvp12 snx-02 + SPECviewperf 12 - specvp12 snx-02
specvp12 showcase-01 + SPECviewperf 12 - specvp12 showcase-01
specvp12 mediacal-01 + SPECviewperf 12 - specvp12 mediacal-01
specvp12 maya-04 + SPECviewperf 12 - specvp12 maya-04
specvp12 energy-01 + SPECviewperf 12 - specvp12 energy-01
specvp12 creo-01 + SPECviewperf 12 - specvp12 creo-01
specvp12 catia-04 + SPECviewperf 12 - specvp12 catia-04
Cinebench R10 Cinebench R10 Shading (32bit) + Cinebench R10 - Cinebench R10 Shading (32bit)
min: 7690 avg: 7993 median: 7832.5 (6%) max: 8615 points
Cinebench R11.5 Cinebench R11.5 OpenGL 64 Bit + Cinebench R11.5 - Cinebench R11.5 OpenGL 64 Bit
min: 20.23 avg: 24.9 median: 24.9 (3%) max: 28.68 fps
Cinebench R15 + Cinebench R15 - Cinebench R15 OpenGL 64 Bit
min: 29.16 avg: 34.9 median: 36.4 (2%) max: 37.51 fps
Cinebench R15 OpenGL Ref. Match 64 Bit + Cinebench R15 - Cinebench R15 OpenGL Ref. Match 64 Bit
GFXBench 3.0 - GFXBench 3.0 Manhattan Offscreen
GFXBench (DX / GLBenchmark) 2.7 + GFXBench (DX / GLBenchmark) 2.7 - GFXBench T-Rex HD Offscreen C24Z16
LuxMark v2.0 64Bit - LuxMark v2.0 Room GPU
LuxMark v2.0 64Bit - LuxMark v2.0 Sala GPU
ComputeMark v2.1 - ComputeMark v2.1 Result
Power Consumption - Furmark Stress Test Power Consumption - external Monitor *
Power Consumption - The Witcher 3 Power Consumption - external Monitor *
Clock Speed - GPU Clock Witcher 3 ultra
Clock Speed - GPU Clock Speed Furmark
- Range of benchmark values
- Average benchmark values
* Smaller numbers mean a higher performance
Game Benchmarks The following benchmarks stem from our benchmarks of review laptops. The performance depends on the used graphics memory, clock rate, processor, system settings, drivers, and operating systems. So the results don't have to be representative for all laptops with this GPU. For detailed information on the benchmark results, click on the fps number.
13.5 (!) [X] Intel NUC5i7RYH Intel Core i7-5557U 3.1GHz
Iris Graphics 6100
min:
11 fps, max:
16 fps
fps
+ Compare
- Hide Comparison
» The benchmarks indicate that the game is not playable in the tested settings.
» The benchmarks indicate that the game is not playable in the tested settings.
» The benchmarks indicate that the game is not playable in the tested settings.
» With all tested laptops playable in detail settings high.
» With all tested laptops playable in detail settings low.
» With all tested laptops playable in detail settings low.
» The benchmarks indicate that the game is not playable in the tested settings.
» With all tested laptops playable in detail settings med..
» The benchmarks indicate that the game is not playable in the tested settings.
» The benchmarks indicate that the game is not playable in the tested settings.
» The benchmarks indicate that the game is not playable in the tested settings.
» The benchmarks indicate that the game is not playable in the tested settings.
» The benchmarks indicate that the game is not playable in the tested settings.
» The benchmarks indicate that the game is not playable in the tested settings.
» The benchmarks indicate that the game is not playable in the tested settings.
» The benchmarks indicate that the game is not playable in the tested settings.
20.7 (!) [X] Intel NUC5i7RYH Intel Core i7-5557U 3.1GHz
Iris Graphics 6100
min:
17 fps, max:
26 fps
fps
+ Compare
- Hide Comparison
9.8 (!) [X] Intel NUC5i7RYH Intel Core i7-5557U 3.1GHz
Iris Graphics 6100
min:
8 fps, max:
13 fps
fps
+ Compare
- Hide Comparison
» The benchmarks indicate that the game is not playable in the tested settings.
» The benchmarks indicate that the game is not playable in the tested settings.
» The benchmarks indicate that the game is not playable in the tested settings.
37.1 37.2 [X] Medion Akoya E6418-MD99620 Intel Core i5-5257U 2.7GHz
Iris Graphics 6100
42.7 (!) [X] Intel NUC5i7RYH Intel Core i7-5557U 3.1GHz
Iris Graphics 6100
min:
38 fps, max:
48 fps
~ 39 fps
+ Compare
- Hide Comparison
19.1 [X] Medion Akoya E6418-MD99620 Intel Core i5-5257U 2.7GHz
Iris Graphics 6100
22.8 [X] Intel NUC5i7RYH Intel Core i7-5557U 3.1GHz
Iris Graphics 6100
min:
19 fps, max:
25 fps
~ 21 fps
+ Compare
- Hide Comparison
» With all tested laptops playable in detail settings high.
45.1 [X] Medion Akoya E6418-MD99620 Intel Core i5-5257U 2.7GHz
Iris Graphics 6100
54 [X] Intel NUC5i7RYH Intel Core i7-5557U 3.1GHz
Iris Graphics 6100
min:
35 fps, max:
64 fps
~ 50 fps
+ Compare
- Hide Comparison
31.9 [X] Medion Akoya E6418-MD99620 Intel Core i5-5257U 2.7GHz
Iris Graphics 6100
37.4 [X] Intel NUC5i7RYH 0.5.0.0
Intel Core i7-5557U 3.1GHz
Iris Graphics 6100
min:
25 fps, max:
51 fps
~ 35 fps
+ Compare
- Hide Comparison
20.5 [X] Medion Akoya E6418-MD99620 Intel Core i5-5257U 2.7GHz
Iris Graphics 6100
22.2 [X] Intel NUC5i7RYH 0.5.0.0
Intel Core i7-5557U 3.1GHz
Iris Graphics 6100
min:
13 fps, max:
30 fps
~ 21 fps
+ Compare
- Hide Comparison
16 [X] Medion Akoya E6418-MD99620 Intel Core i5-5257U 2.7GHz
Iris Graphics 6100
16.9 [X] Intel NUC5i7RYH 0.5.0.0
Intel Core i7-5557U 3.1GHz
Iris Graphics 6100
min:
10 fps, max:
24 fps
~ 16 fps
+ Compare
- Hide Comparison
» With all tested laptops playable in detail settings low.
32.2 [X] Medion Akoya E6418-MD99620 Intel Core i5-5257U 2.7GHz
Iris Graphics 6100
38.9 [X] Intel NUC5i7RYH Intel Core i7-5557U 3.1GHz
Iris Graphics 6100
min:
33 fps, max:
41 fps
~ 36 fps
+ Compare
- Hide Comparison
24.4 [X] Medion Akoya E6418-MD99620 Intel Core i5-5257U 2.7GHz
Iris Graphics 6100
26.3 [X] Intel NUC5i7RYH Intel Core i7-5557U 3.1GHz
Iris Graphics 6100
min:
23 fps, max:
28 fps
~ 25 fps
+ Compare
- Hide Comparison
9.5 [X] Medion Akoya E6418-MD99620 Intel Core i5-5257U 2.7GHz
Iris Graphics 6100
10.3 [X] Intel NUC5i7RYH Intel Core i7-5557U 3.1GHz
Iris Graphics 6100
min:
9 fps, max:
11 fps
~ 10 fps
+ Compare
- Hide Comparison
» With most tested laptops playable in detail settings low.
19.1 [X] Medion Akoya E6418-MD99620 Intel Core i5-5257U 2.7GHz
Iris Graphics 6100
21.6 [X] Intel NUC5i7RYH Intel Core i7-5557U 3.1GHz
Iris Graphics 6100
min:
18 fps, max:
24 fps
~ 20 fps
+ Compare
- Hide Comparison
» The benchmarks indicate that the game is not playable in the tested settings.
» With all tested laptops playable in detail settings med..
15 [X] Medion Akoya E6417-MD99248 Intel Core i3-5157U 2.5GHz
Iris Graphics 6100
16 [X] Intel NUC5i7RYH Intel Core i7-5557U 3.1GHz
Iris Graphics 6100
min:
12 fps, max:
22 fps
~ 16 fps
+ Compare
- Hide Comparison
» The benchmarks indicate that the game is not playable in the tested settings.
15.3 [X] Medion Akoya E6417-MD99248 Intel Core i3-5157U 2.5GHz
Iris Graphics 6100
16.3 [X] Intel NUC5i7RYH Intel Core i7-5557U 3.1GHz
Iris Graphics 6100
min:
12 fps, max:
22 fps
~ 16 fps
+ Compare
- Hide Comparison
10.1 [X] Medion Akoya E6417-MD99248 Intel Core i3-5157U 2.5GHz
Iris Graphics 6100
10.4 [X] Intel NUC5i7RYH Intel Core i7-5557U 3.1GHz
Iris Graphics 6100
min:
8 fps, max:
15 fps
~ 10 fps
+ Compare
- Hide Comparison
» The benchmarks indicate that the game is not playable in the tested settings.
83.4 [X] Medion Akoya E6417-MD99248 Intel Core i3-5157U 2.5GHz
Iris Graphics 6100
83.7 [X] Medion Akoya E6418-MD99620 Intel Core i5-5257U 2.7GHz
Iris Graphics 6100
103 [X] Intel NUC5i7RYH Intel Core i7-5557U 3.1GHz
Iris Graphics 6100
min:
89 fps, max:
139 fps
~ 90 fps
+ Compare
- Hide Comparison
24.3 [X] Medion Akoya E6417-MD99248 Intel Core i3-5157U 2.5GHz
Iris Graphics 6100
25.8 [X] Medion Akoya E6418-MD99620 Intel Core i5-5257U 2.7GHz
Iris Graphics 6100
28.6 [X] Intel NUC5i7RYH Intel Core i7-5557U 3.1GHz
Iris Graphics 6100
min:
23 fps, max:
39 fps
~ 26 fps
+ Compare
- Hide Comparison
13.4 [X] Medion Akoya E6418-MD99620 Intel Core i5-5257U 2.7GHz
Iris Graphics 6100
13.8 [X] Medion Akoya E6417-MD99248 Intel Core i3-5157U 2.5GHz
Iris Graphics 6100
14.2 [X] Intel NUC5i7RYH Intel Core i7-5557U 3.1GHz
Iris Graphics 6100
min:
12.5 fps, max:
18 fps
~ 14 fps
+ Compare
- Hide Comparison
» With all tested laptops playable in detail settings low.
» The benchmarks indicate that the game is not playable in the tested settings.
39.3 [X] Medion Akoya E6418-MD99620 Intel Core i5-5257U 2.7GHz
Iris Graphics 6100
45.7 [X] Intel NUC5i7RYH Intel Core i7-5557U 3.1GHz
Iris Graphics 6100
min:
36 fps, max:
54 fps
~ 43 fps
+ Compare
- Hide Comparison
25.1 [X] Medion Akoya E6418-MD99620 Intel Core i5-5257U 2.7GHz
Iris Graphics 6100
27.9 [X] Intel NUC5i7RYH Intel Core i7-5557U 3.1GHz
Iris Graphics 6100
min:
22 fps, max:
31 fps
~ 27 fps
+ Compare
- Hide Comparison
8.9 [X] Medion Akoya E6418-MD99620 Intel Core i5-5257U 2.7GHz
Iris Graphics 6100
9.9 [X] Intel NUC5i7RYH Intel Core i7-5557U 3.1GHz
Iris Graphics 6100
min:
8 fps, max:
12 fps
~ 9 fps
+ Compare
- Hide Comparison
» With all tested laptops playable in detail settings low.
» The benchmarks indicate that the game is not playable in the tested settings.
» The benchmarks indicate that the game is not playable in the tested settings.
» The benchmarks indicate that the game is not playable in the tested settings.
» With most tested laptops playable in detail settings low.
» With all tested laptops playable in detail settings low.
» With all tested laptops playable in detail settings med..
» The benchmarks indicate that the game is not playable in the tested settings.
» The benchmarks indicate that the game is not playable in the tested settings.
» With all tested laptops playable in detail settings low.
» The benchmarks indicate that the game is not playable in the tested settings.
» With all tested laptops playable in detail settings high.
» With all tested laptops playable in detail settings med..
» The benchmarks indicate that the game is not playable in the tested settings.
» With all tested laptops playable in detail settings low.
» The benchmarks indicate that the game is not playable in the tested settings.
» With all tested laptops playable in detail settings low.
» With all tested laptops playable in detail settings med..
» The benchmarks indicate that the game is not playable in the tested settings.
» The benchmarks indicate that the game is not playable in the tested settings.
» With most tested laptops playable in detail settings low.
» With all tested laptops playable in detail settings low.
» The benchmarks indicate that the game is not playable in the tested settings.
» With all tested laptops playable in detail settings high.
» With all tested laptops playable in detail settings high.
» With all tested laptops playable in detail settings med..
» With all tested laptops playable in detail settings low.
For more games that might be playable and a list of all games and graphics cards visit our Gaming List
v1.35
log 15. 04:38:06
#0 ran 0s before starting gpusingle class +0s ... 0s
#1 no ids found in url (should be separated by "_") +0s ... 0s
#2 not redirecting to Ajax server +0s ... 0s
#3 did not recreate cache, as it is less than 5 days old! Created at Mon, 13 Jul 2026 05:31:40 +0200 +0.002s ... 0.002s
#4 composed specs +0.048s ... 0.051s
#5 did output specs +0s ... 0.051s
#6 start showIntegratedCPUs +0s ... 0.051s
#7 getting avg benchmarks for device 5945 +0.092s ... 0.142s
#8 got single benchmarks 5945 +0.016s ... 0.158s
#9 got avg benchmarks for devices +0s ... 0.158s
#10 min, max, avg, median took s +3.793s ... 3.951s
#11 before gaming benchmark output +0s ... 3.951s
#12 Got 308 rows for game benchmarks. +0.011s ... 3.962s
#13 composed SQL query for gamebenchmarks +0s ... 3.962s
#14 got data and put it in $dataArray +0.035s ... 3.997s
#15 benchmarks composed for output. +0.727s ... 4.724s
#16 return log +0.598s ... 5.322s