Notebook reviews with NVIDIA GeForce GTX 1650 Max-Q graphics card
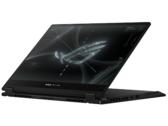
Asus ROG Flow X13 in review: Gaming convertible with an AMD Ryzen 9 5980H and an optional RTX 3080
The Asus Flow X13 is an ultra-compact 13-inch convertible with a high-resolution display. With the optional display dock, equipped with an Nvidia Geforce RTX 3080 GPU, the Flow X13, together with the AMD Ryzen 9 5980H CPU integrated into the laptop, would theoretically even make desktop computers look old. Due to the lack of availability, we will only review the Flow X13 without the eGPU for now.
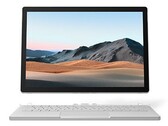
AMD Ryzen 9 5980HS, NVIDIA GeForce GTX 1650 Max-Q, 13.4", 1.4 kgSurface Book 3 13.5 review: Microsoft convertible is slowly getting old
With the latest edition of the Surface Book 3, Microsoft updates its multi-talented device to Intel's Ice Lake generation. We get an overall picture of the i7 variant with Nvidia GeForce GTX 1650 and clarify what performance users can expect from it in our review.
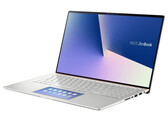
Intel Core i7-1065G7, NVIDIA GeForce GTX 1650 Max-Q, 13.5", 1.6 kgAsus ZenBook 15 UX534FTC in Review: Matte, powerful king of battery life
Asus has equipped the slim laptop with a four-core processor and a dedicated graphics card. The features are excellent otherwise as well: matte IPS screen, NVMe SSD, 16 GB of RAM (in dual-channel mode), backlit keyboard. On top of that, the outstanding battery life rounds off the overall package well.
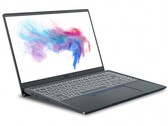
Intel Core i7-10510U, NVIDIA GeForce GTX 1650 Max-Q, 15.6", 1.6 kgMSI Prestige 14 A10SC-009 laptop review: Comet Lake for content creators
The MSI Prestige 14 is a small powerhouse with a design and equipment that are convincing. We also like the keyboard with its normal-sized arrow keys very much. Our detailed review clarifies how the 14-inch laptop performs for creatives.
Intel Core i7-10710U, NVIDIA GeForce GTX 1650 Max-Q, 14", 1.3 kgLenovo IdeaPad S740-15IRH Laptop Review: Best and Priciest IdeaPad Yet
Although the IdeaPad name is commonly associated with inexpensive entry-level to mid-range offerings, the IdeaPad S740 is easily the most luxurious and powerful in its family. The big catch is that it'll cost you almost as much as the more well-known Dell XPS 15 or HP Spectre x360 15.
Intel Core i7-9750H, NVIDIA GeForce GTX 1650 Max-Q, 15.6", 1.9 kgMSI GF63 Thin 9SC: Intel Core i5-9300H, 15.60", 1.8 kg
Review » MSI GF63 Thin 9SC Laptop Review: Lightweight gamer for just under $1000
Lenovo Yoga C940-15IRH: Intel Core i7-9750H, 15.60", 2 kg
Review » Lenovo Yoga C940-15IRH Convertible Review: The XPS 15 2-in-1 Dell Should Have Made
Razer Blade Stealth 13, Core i7-1065G7: Intel Core i7-1065G7, 13.30", 1.5 kg
Review » Razer Blade Stealth (GTX 1650 Max-Q) Review: 4K screen, battery life & CPU performance disappoint
MSI Prestige 15 A10SC: Intel Core i7-10710U, 15.60", 1.7 kg
Review » MSI Prestige 15 A10SC Laptop Review: One of the Best Dell XPS 15 Alternatives
Lenovo IdeaPad S540-15IWL 81SW0015GE: Intel Core i7-8565U, 15.60", 1.9 kg
Review » Lenovo IdeaPad S540-15IWL Review: A great all-rounder with only one real weakness
Asus ZenBook 15 UX534FT-DB77: Intel Core i7-8565U, 15.60", 1.7 kg
Review » Asus ZenBook 15 UX534F Laptop Review: Look Like an Ultrabook, Play Like a Gamer
MSI Prestige 14 i7-10710U: Intel Core i7-10710U, 14.00", 1.3 kg
Review » MSI Prestige 14 Hands-On Laptop Review: Faster than ever and still great for content creators
MSI PS63 Modern 8SC: Intel Core i7-8565U, 15.60", 1.7 kg
Review » A true all-rounder: MSI PS63 Modern 8SC Laptop in Review
Asus VivoBook Pro 15 K3500PH: Intel Core i7-11370H, 15.60", 1.7 kg
External Review » Asus VivoBook Pro 15 K3500PH
MSI GV15 Thin 11SC-633: Intel Core i5-11400H, 15.60", 1.9 kg
External Review » MSI GV15 Thin 11SC-633
Acer Swift X SFX14-41G-R6BZ: AMD Ryzen 5 5500U, 14.00", 1.5 kg
External Review » Acer Swift X SFX14-41G-R6BZ
Acer Swift X SFX14-41G-R9Q5: AMD Ryzen 5 5500U, 14.00", 1.5 kg
External Review » Acer Swift X SFX14-41G-R9Q5
Asus ROG Flow X13 GV301QH-K6069T: AMD Ryzen 7 5800HS, 13.40", 1.3 kg
External Review » Asus ROG Flow X13 GV301QH-K6069T
Asus ZenBook Pro 15 UX535LH-BN150T : Intel Core i7-10870H, 15.60", 1.8 kg
External Review » Asus ZenBook Pro 15 UX535LH-BN150T
Asus ZenBook Pro 15 UX535LH-BN024T: Intel Core i5-10300H, 15.60", 1.8 kg
External Review » Asus ZenBook Pro 15 UX535LH-BN024T
Lenovo ThinkBook 15p IMH-20V30007GE: Intel Core i5-10300H, 15.60", 1.9 kg
External Review » Lenovo ThinkBook 15p IMH-20V30007GE
Asus ZenBook Flip 15 UX564PH-EZ007R: Intel Core i7-11370H, 15.60", 1.9 kg
External Review » Asus ZenBook Flip 15 UX564PH-EZ007R
MSI GF63 Thin 10SC-206: Intel Core i5-10300H, 15.60", 1.9 kg
External Review » MSI GF63 Thin 10SC-206
Asus ROG Flow X13 GV301QH-K6034T-BE: AMD Ryzen 7 5800HS, 13.40", 1.3 kg
External Review » Asus ROG Flow X13 GV301QH-K6034T-BE
MSI Prestige 15 A11SCX-019XES: Intel Core i7-1185G7, 15.60", 1.7 kg
External Review » MSI Prestige 15 A11SCX-019XES
MSI Prestige 15 A10SC-014: Intel Core i7-10710U, 15.60", 1.7 kg
External Review » MSI Prestige 15 A10SC-014
Asus ROG Flow X13 GV301QH: AMD Ryzen 9 5980HS, 13.40", 1.4 kg
External Review » Asus ROG Flow X13 GV301QH
Lenovo ThinkPad X1 Extreme-20QV000WGE: Intel Core i7-9750H, 15.60", 1.7 kg
External Review » Lenovo ThinkPad X1 Extreme-20QV000WGE
Microsoft Surface Book 3 13.5: Intel Core i7-1065G7, 13.50", 1.6 kg
External Review » Microsoft Surface Book 3 13.5
MSI Prestige 14 A10SC-009: Intel Core i7-10710U, 14.00", 1.3 kg
External Review » MSI Prestige 14 A10SC-009
Lenovo ThinkPad X1 Extreme G2-20QV000KUS: Intel Core i7-9850H, 15.60", 1.8 kg
External Review » Lenovo ThinkPad X1 Extreme G2-20QV000KUS
Razer Blade Stealth i7-1065G7, GTX 1650 Max-Q: Intel Core i7-1065G7, 13.30", 1.5 kg
External Review » Razer Blade Stealth i7-1065G7, GTX 1650 Max-Q
Lenovo ThinkPad X1 Extreme G2-20QV00CEGE: Intel Core i9-9880H, 15.60", 1.8 kg
External Review » Lenovo ThinkPad X1 Extreme G2-20QV00CEGE
Lenovo ThinkPad X1 Extreme G2-20QV00CMGE: Intel Core i7-9750H, 15.60", 1.7 kg
External Review » Lenovo ThinkPad X1 Extreme G2-20QV00CMGE
Lenovo Yoga C940-15IRH: Intel Core i7-9750H, 15.60", 2 kg
External Review » Lenovo Yoga C940-15IRH
MSI Prestige 15 A10SC-029NL: Intel Core i7-10710U, 15.60", 1.6 kg
External Review » MSI Prestige 15 A10SC-029NL
MSI Prestige 15 A10SC-044XES: Intel Core i7-10710U, 15.60", 1.7 kg
External Review » MSI Prestige 15 A10SC-044XES
MSI Prestige 14 A10SC-004NL: Intel Core i7-10710U, 14.00", 1.3 kg
External Review » MSI Prestige 14 A10SC-004NL
MSI Prestige 15 A10SC-060XES: Intel Core i7-10710U, 15.60", 1.7 kg
External Review » MSI Prestige 15 A10SC-060XES
Lenovo ThinkPad X1 Extreme G2-20QV000UGE: Intel Core i5-9300H, 15.60", 1.7 kg
External Review » Lenovo ThinkPad X1 Extreme G2-20QV000UGE
Asus ZenBook 15 UX534FT-DB77: Intel Core i7-8565U, 15.60", 1.7 kg
External Review » Asus ZenBook 15 UX534FT-DB77
Asus ZenBook 15 UX534FTC-A8078R: Intel Core i7-10510U, 15.60", 1.7 kg
External Review » Asus ZenBook 15 UX534FTC-A8078R
MSI Prestige 15 A10SC: Intel Core i7-10710U, 15.60", 1.7 kg
External Review » MSI Prestige 15 A10SC
Asus ZenBook 15 UX534FT-A8145T: Intel Core i7-8565U, 15.60", 1.7 kg
External Review » Asus ZenBook 15 UX534FT-A8145T
MSI Prestige 15 A10SC-011: Intel Core i7-10710U, 15.60", 1.6 kg
External Review » MSI Prestige 15 A10SC-011
Lenovo ThinkPad X1 Extreme G2-20QV000WGE: Intel Core i7-9750H, 15.60", 1.7 kg
External Review » Lenovo ThinkPad X1 Extreme G2-20QV000WGE
MSI GF63 9SC-662: Intel Core i5-9300H, 15.60", 1.9 kg
External Review » MSI GF63 9SC-662
MSI Prestige 14 i7-10710U: Intel Core i7-10710U, 14.00", 1.3 kg
External Review » MSI Prestige 14 i7-10710U
Lenovo Ideapad S540-15IWL 81SW001SMH: Intel Core i5-8265U, 15.60", 1.8 kg
External Review » Lenovo Ideapad S540-15IWL 81SW001SMH
MSI GF75 Thin 9SC-039XES: Intel Core i7-9750H, 15.60", 2.2 kg
External Review » MSI GF75 Thin 9SC-039XES
Asus ZenBook 15 UX534FT, i7-8565U: Intel Core i7-8565U, 15.60", 1.7 kg
External Review » Asus ZenBook 15 UX534FT, i7-8565U
MSI PS63 8SC-003NL: Intel Core i7-8565U, 15.60", 1.6 kg
External Review » MSI PS63 8SC-003NL
Microsoft Surface Book 3 13.5: Intel Core i7-1065G7, 13.50", 1.6 kg
» Microsoft Surface Book 3 13.5: Is it worth switching from the previous model?
Asus ZenBook 15 UX534FTC-A8190T: Intel Core i7-10510U, 15.60", 1.6 kg
» A matte screen suits the Zenbook - Asus Zenbook 15 UX534FTC in review
MSI Prestige 14 A10SC-009: Intel Core i7-10710U, 14.00", 1.3 kg
» MSI Prestige 14: Compactly-packed performance