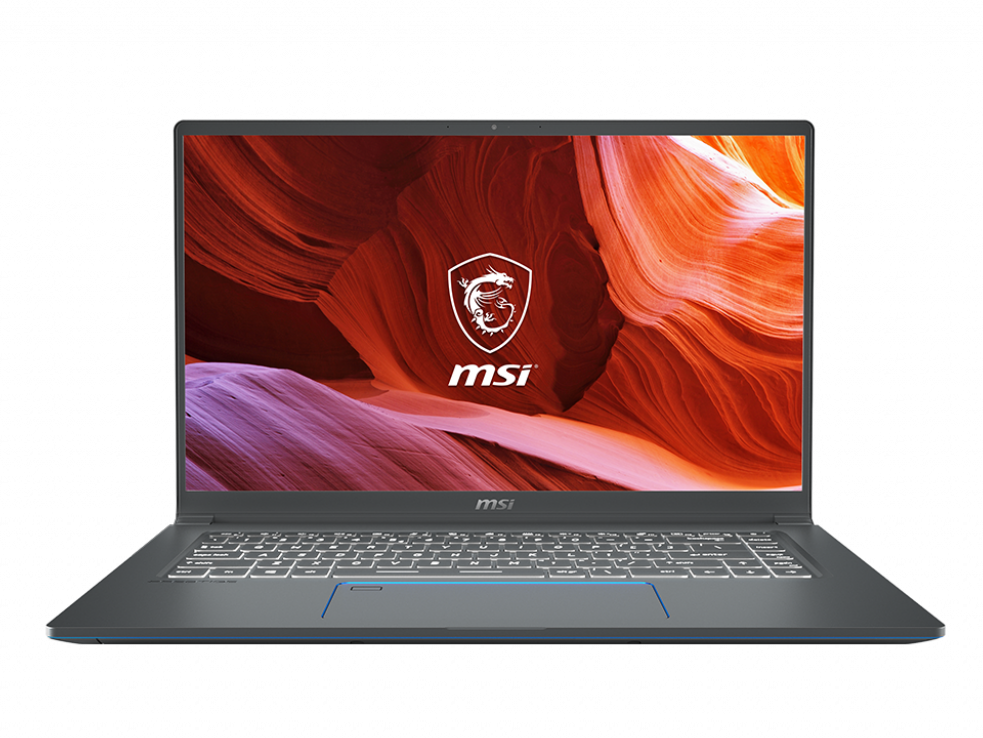
MSI Prestige 15 A10SC Laptop Review: One of the Best Dell XPS 15 Alternatives

What would happen if the Dell XPS 15 shipped with an Intel U-series CPU instead of an Intel H-series? The MSI Prestige 15 can be best described as a lighter and more power-efficient XPS 15 alternative while offering faster graphics options than most other Ultrabooks via its GeForce GTX 1650 Max-Q GPU. Unlike the professional MSI W workstation series or the more well-known MSI gaming G Series, the high-end MSI Prestige series targets traditional office users who want higher graphics power in a lighter form factor.
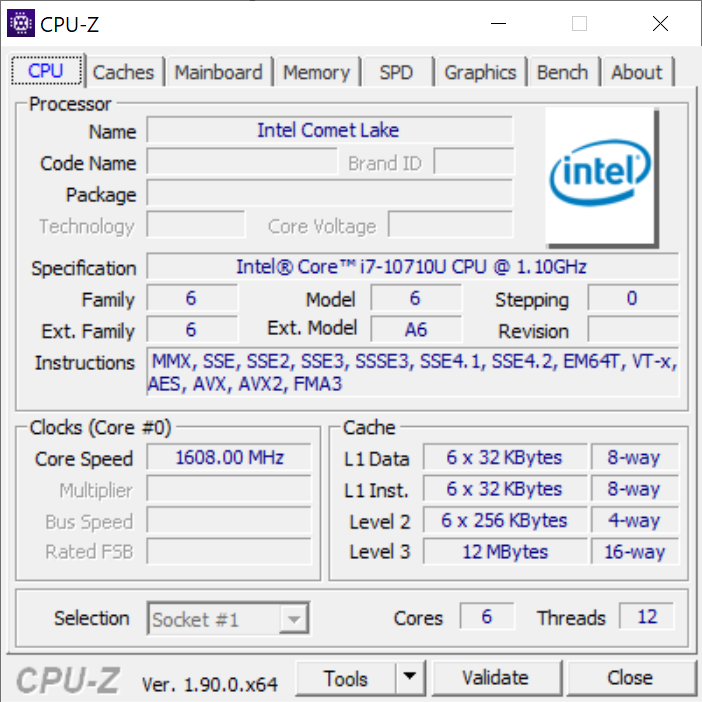
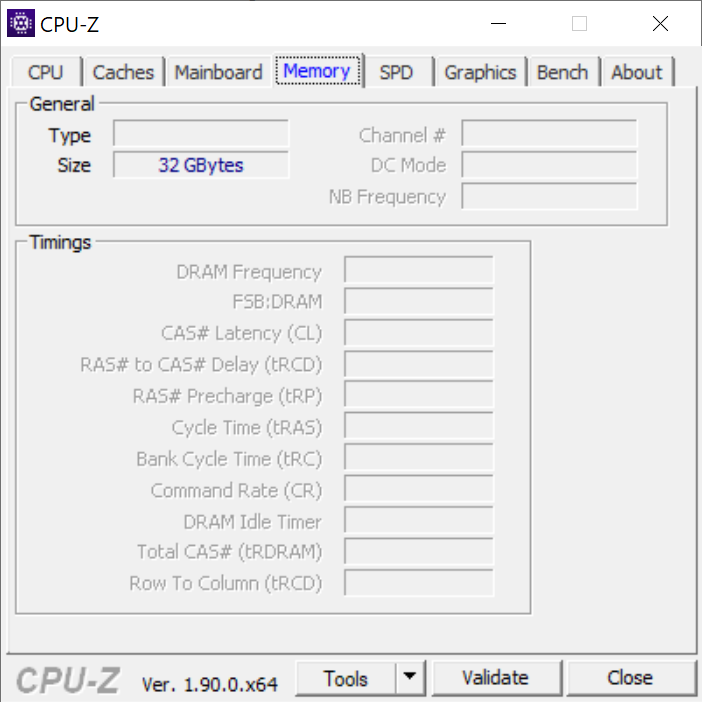
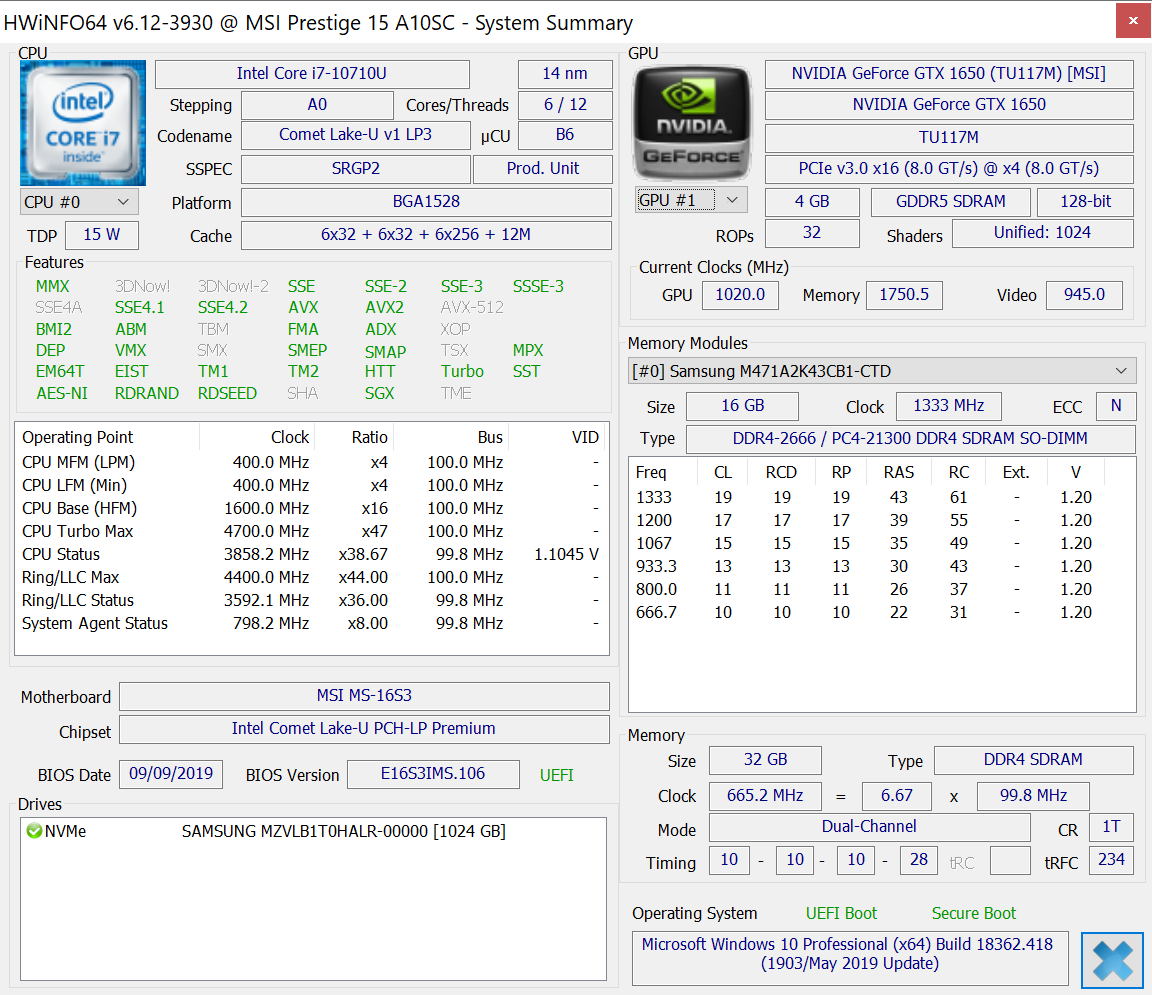
The Prestige 15 system we have today is the top-end SKU equipped with Intel's brand new hexa-core Comet Lake-U Core i7-10710U CPU, the uncommon GeForce GTX 1650 Max-Q GPU, 4K UHD IPS display, 32 GB of DDR4 RAM, and a 1 TB SSD for a retail price of $1800 USD. A lesser SKU with half the storage space, half the RAM, and an FHD display can also be found for $1400. Note that the smaller 14-inch Prestige 14 comes with the same CPU and GPU options as the Prestige 15 despite their size differences.
Direct competitors to the Prestige 15 include most high-end 15-inch multimedia laptops like the Asus ZenBook 15 UX534, Dell XPS 15, Lenovo IdeaPad S740, Apple MacBook Pro 15, and the Microsoft Surface Book or Surface Laptop series.
More MSI reviews:
Rating | Date | Model | Weight | Height | Size | Resolution | Price |
|---|---|---|---|---|---|---|---|
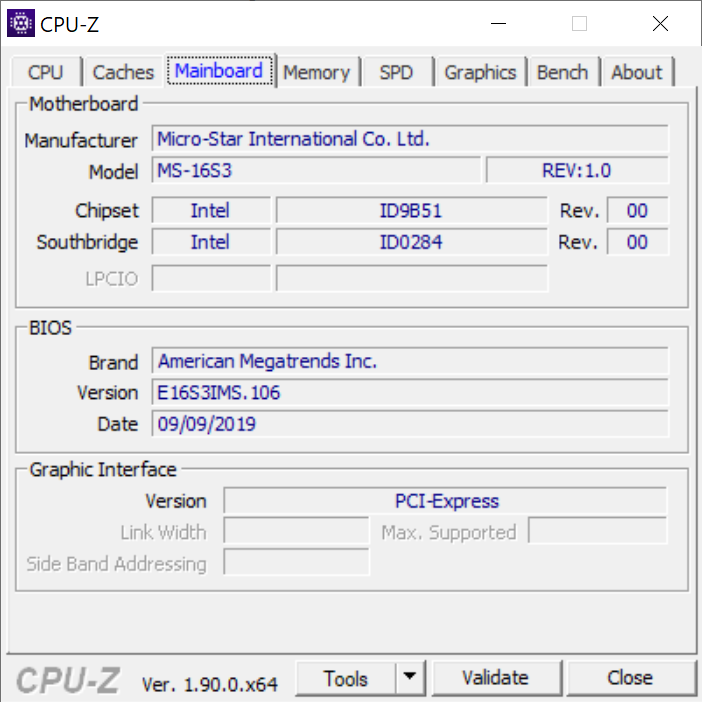
| 85.2 % v7 (old) | 11 / 2019 | MSI Prestige 15 A10SC i7-10710U, GeForce GTX 1650 Max-Q | 1.7 kg | 16 mm | 15.60" | 3840x2160 | |
| 82.9 % v7 (old) | 10 / 2019 | Microsoft Surface Laptop 3 15 Ryzen 5 3580U R5 3580U, Vega 9 | 1.5 kg | 14.7 mm | 15.00" | 2496x1664 | |
| 86.6 % v7 (old) | 07 / 2019 | Lenovo ThinkPad T590-20N4002VGE i7-8565U, GeForce MX250 | 1.9 kg | 19.95 mm | 15.60" | 1920x1080 | |
| 83.1 % v7 (old) | 09 / 2019 | Asus ZenBook 15 UX534FT-DB77 i7-8565U, GeForce GTX 1650 Max-Q | 1.7 kg | 18.9 mm | 15.60" | 1920x1080 | |
| 86.3 % v7 (old) | 09 / 2019 | Dell XPS 15 7590 i5 iGPU FHD i5-9300H, UHD Graphics 630 | 1.9 kg | 17 mm | 15.60" | 1920x1080 |
Case - More Streamlined than a Gaming G Series
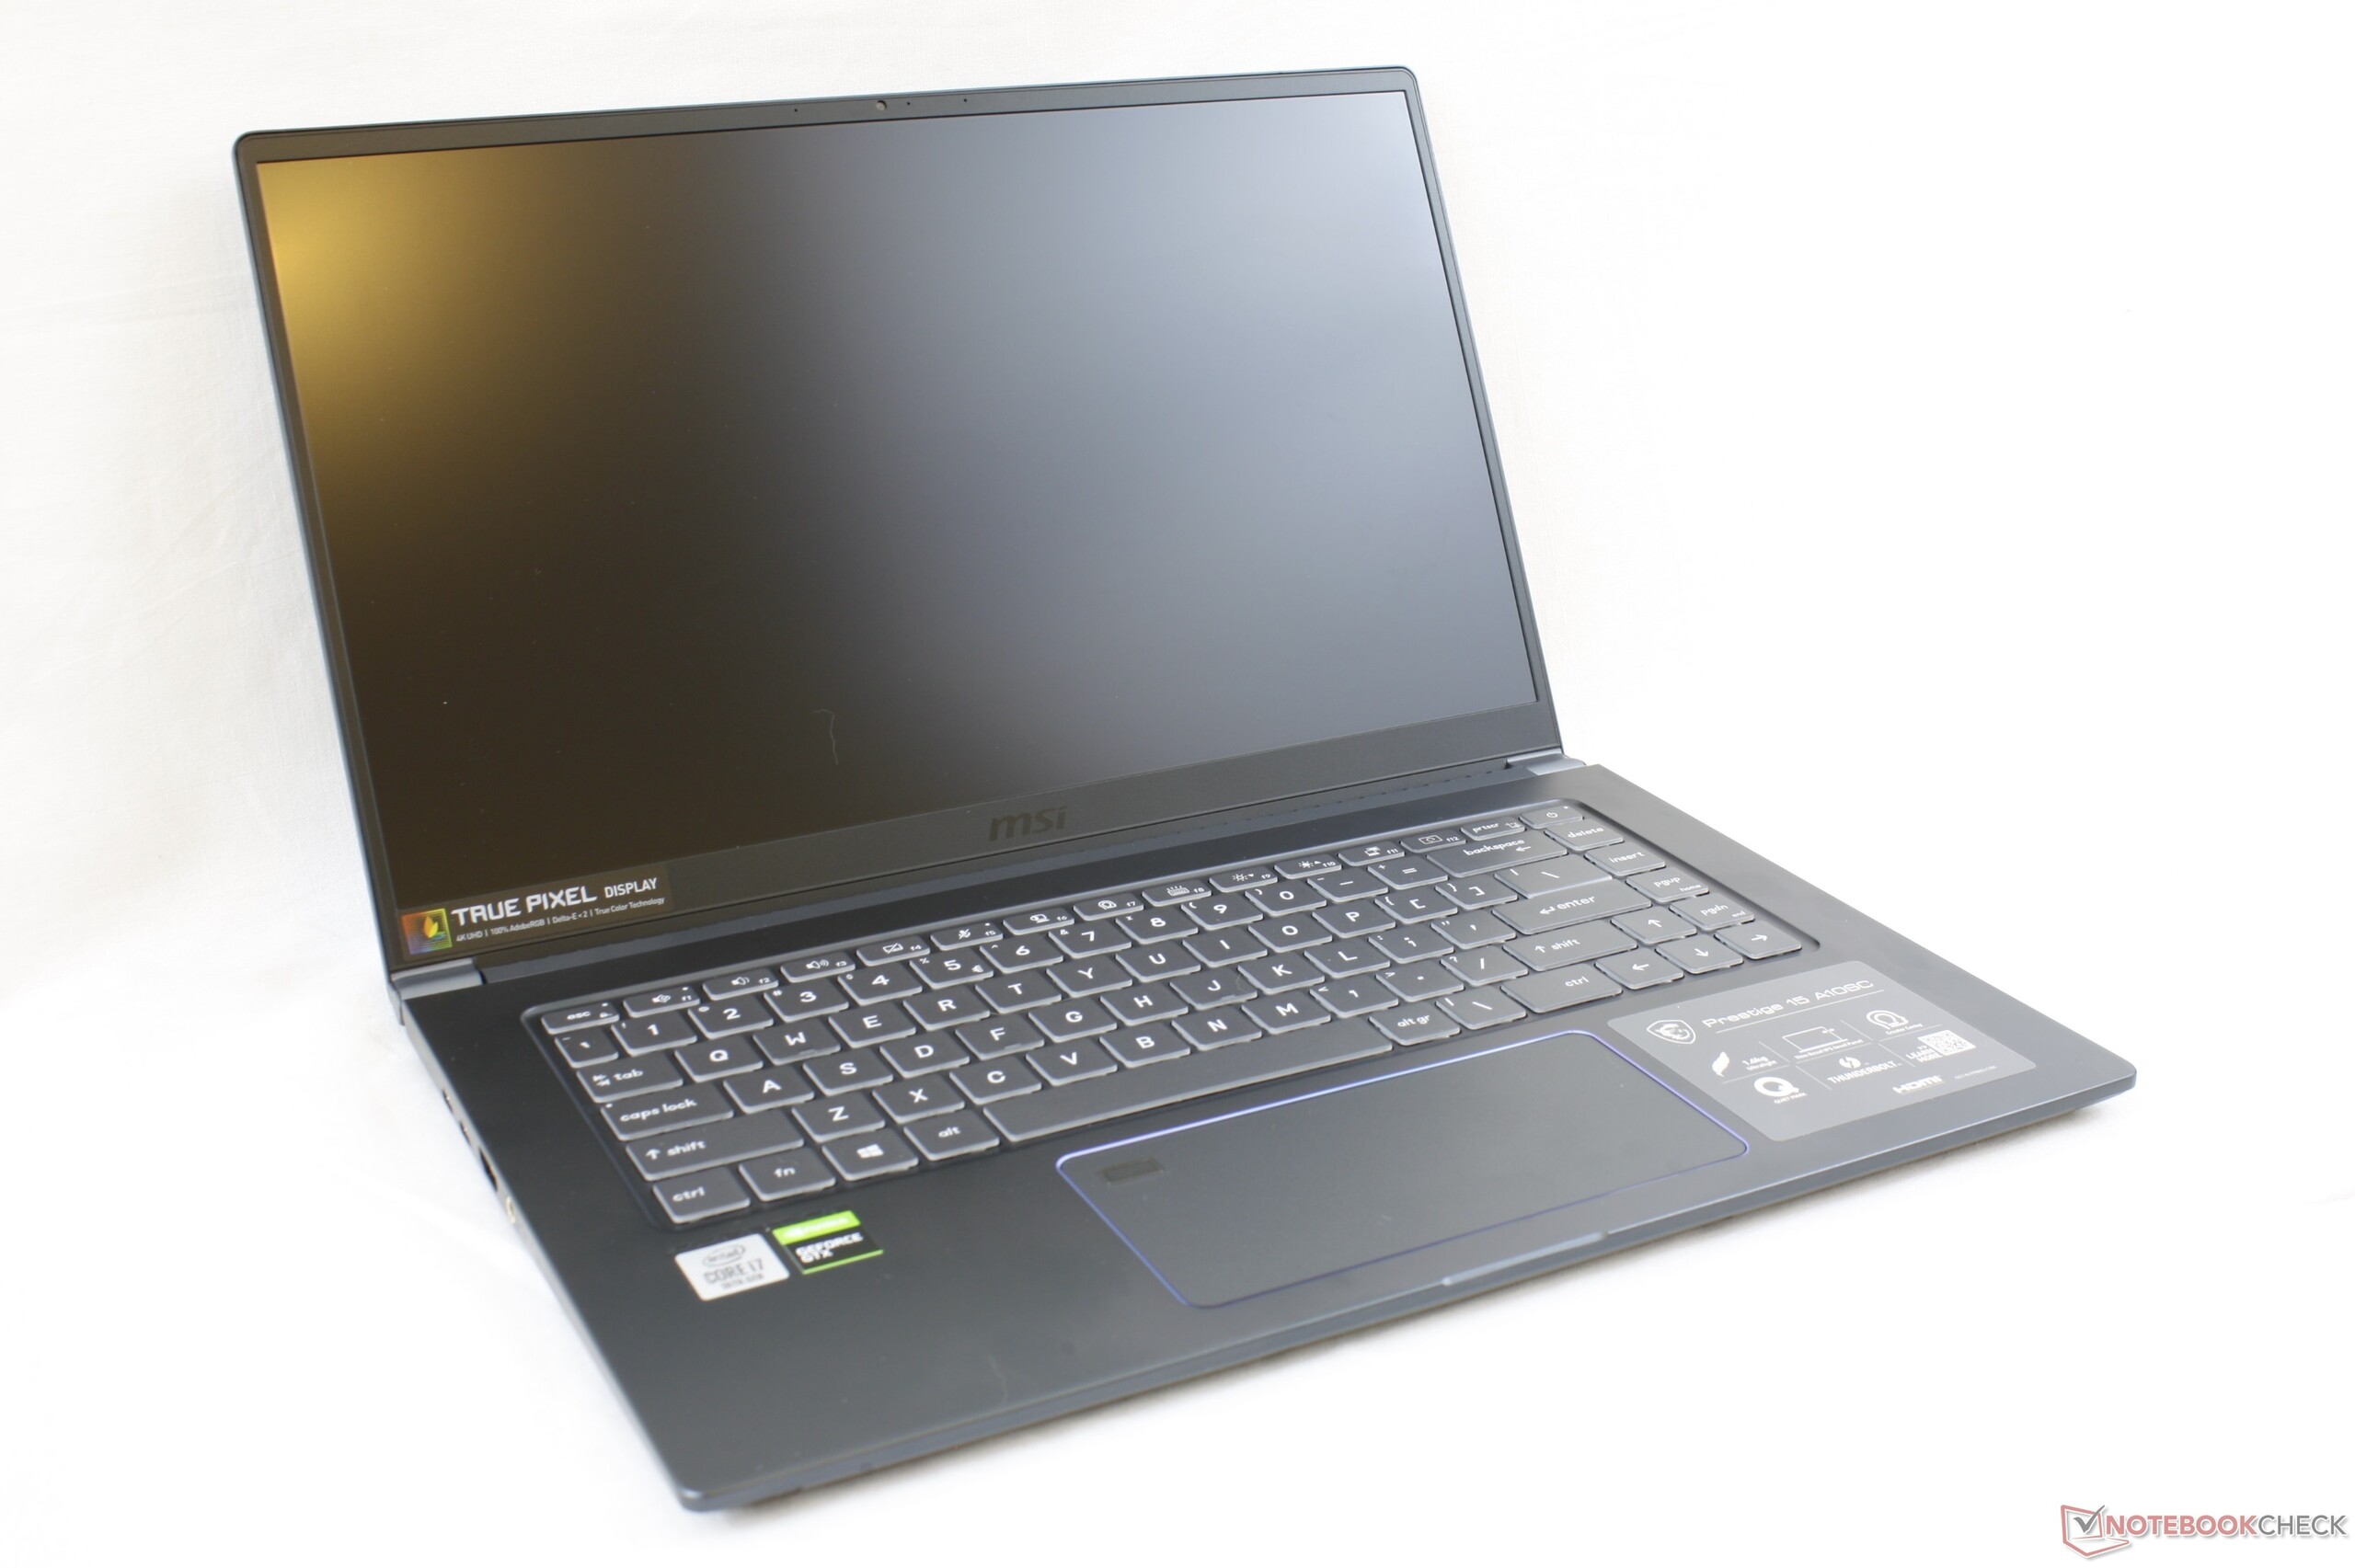
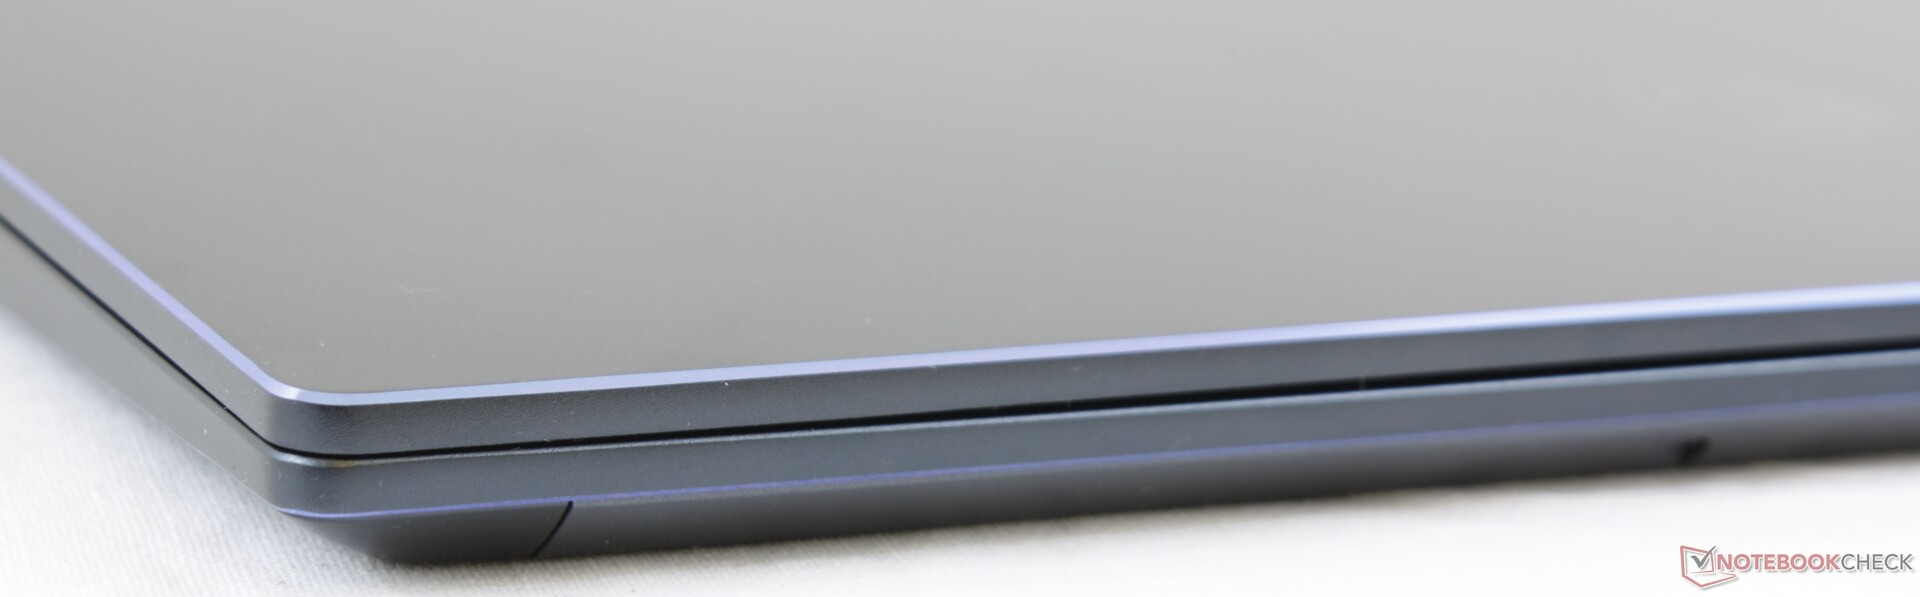
Unlike the MSI P65 Creator which is essentially an MSI GS65 in a coat of white paint, the Prestige 15 is an original chassis design that caters more towards office users and professionals. It exchanges the gaudy and gamer-y features of the GS65 for a more straight-forward and agreeable look complete with smooth matte aluminum surfaces and chrome-cut edges and corners.
While the sleek and sexy visuals are arguably on par with the HP Spectre x360 15, Asus ZenBook 15, or Dell XPS 15, the rigidity of the chassis is a few steps down. Surfaces feel thinner and not as firm as on any of the aforementioned alternatives. Attempting to twist the base or lid from their edges, for example, results in more noticeable warping. The small hinges also have us a bit concerned about their longevity when compared to the stiffer hinges of the HP or Dell equivalent.
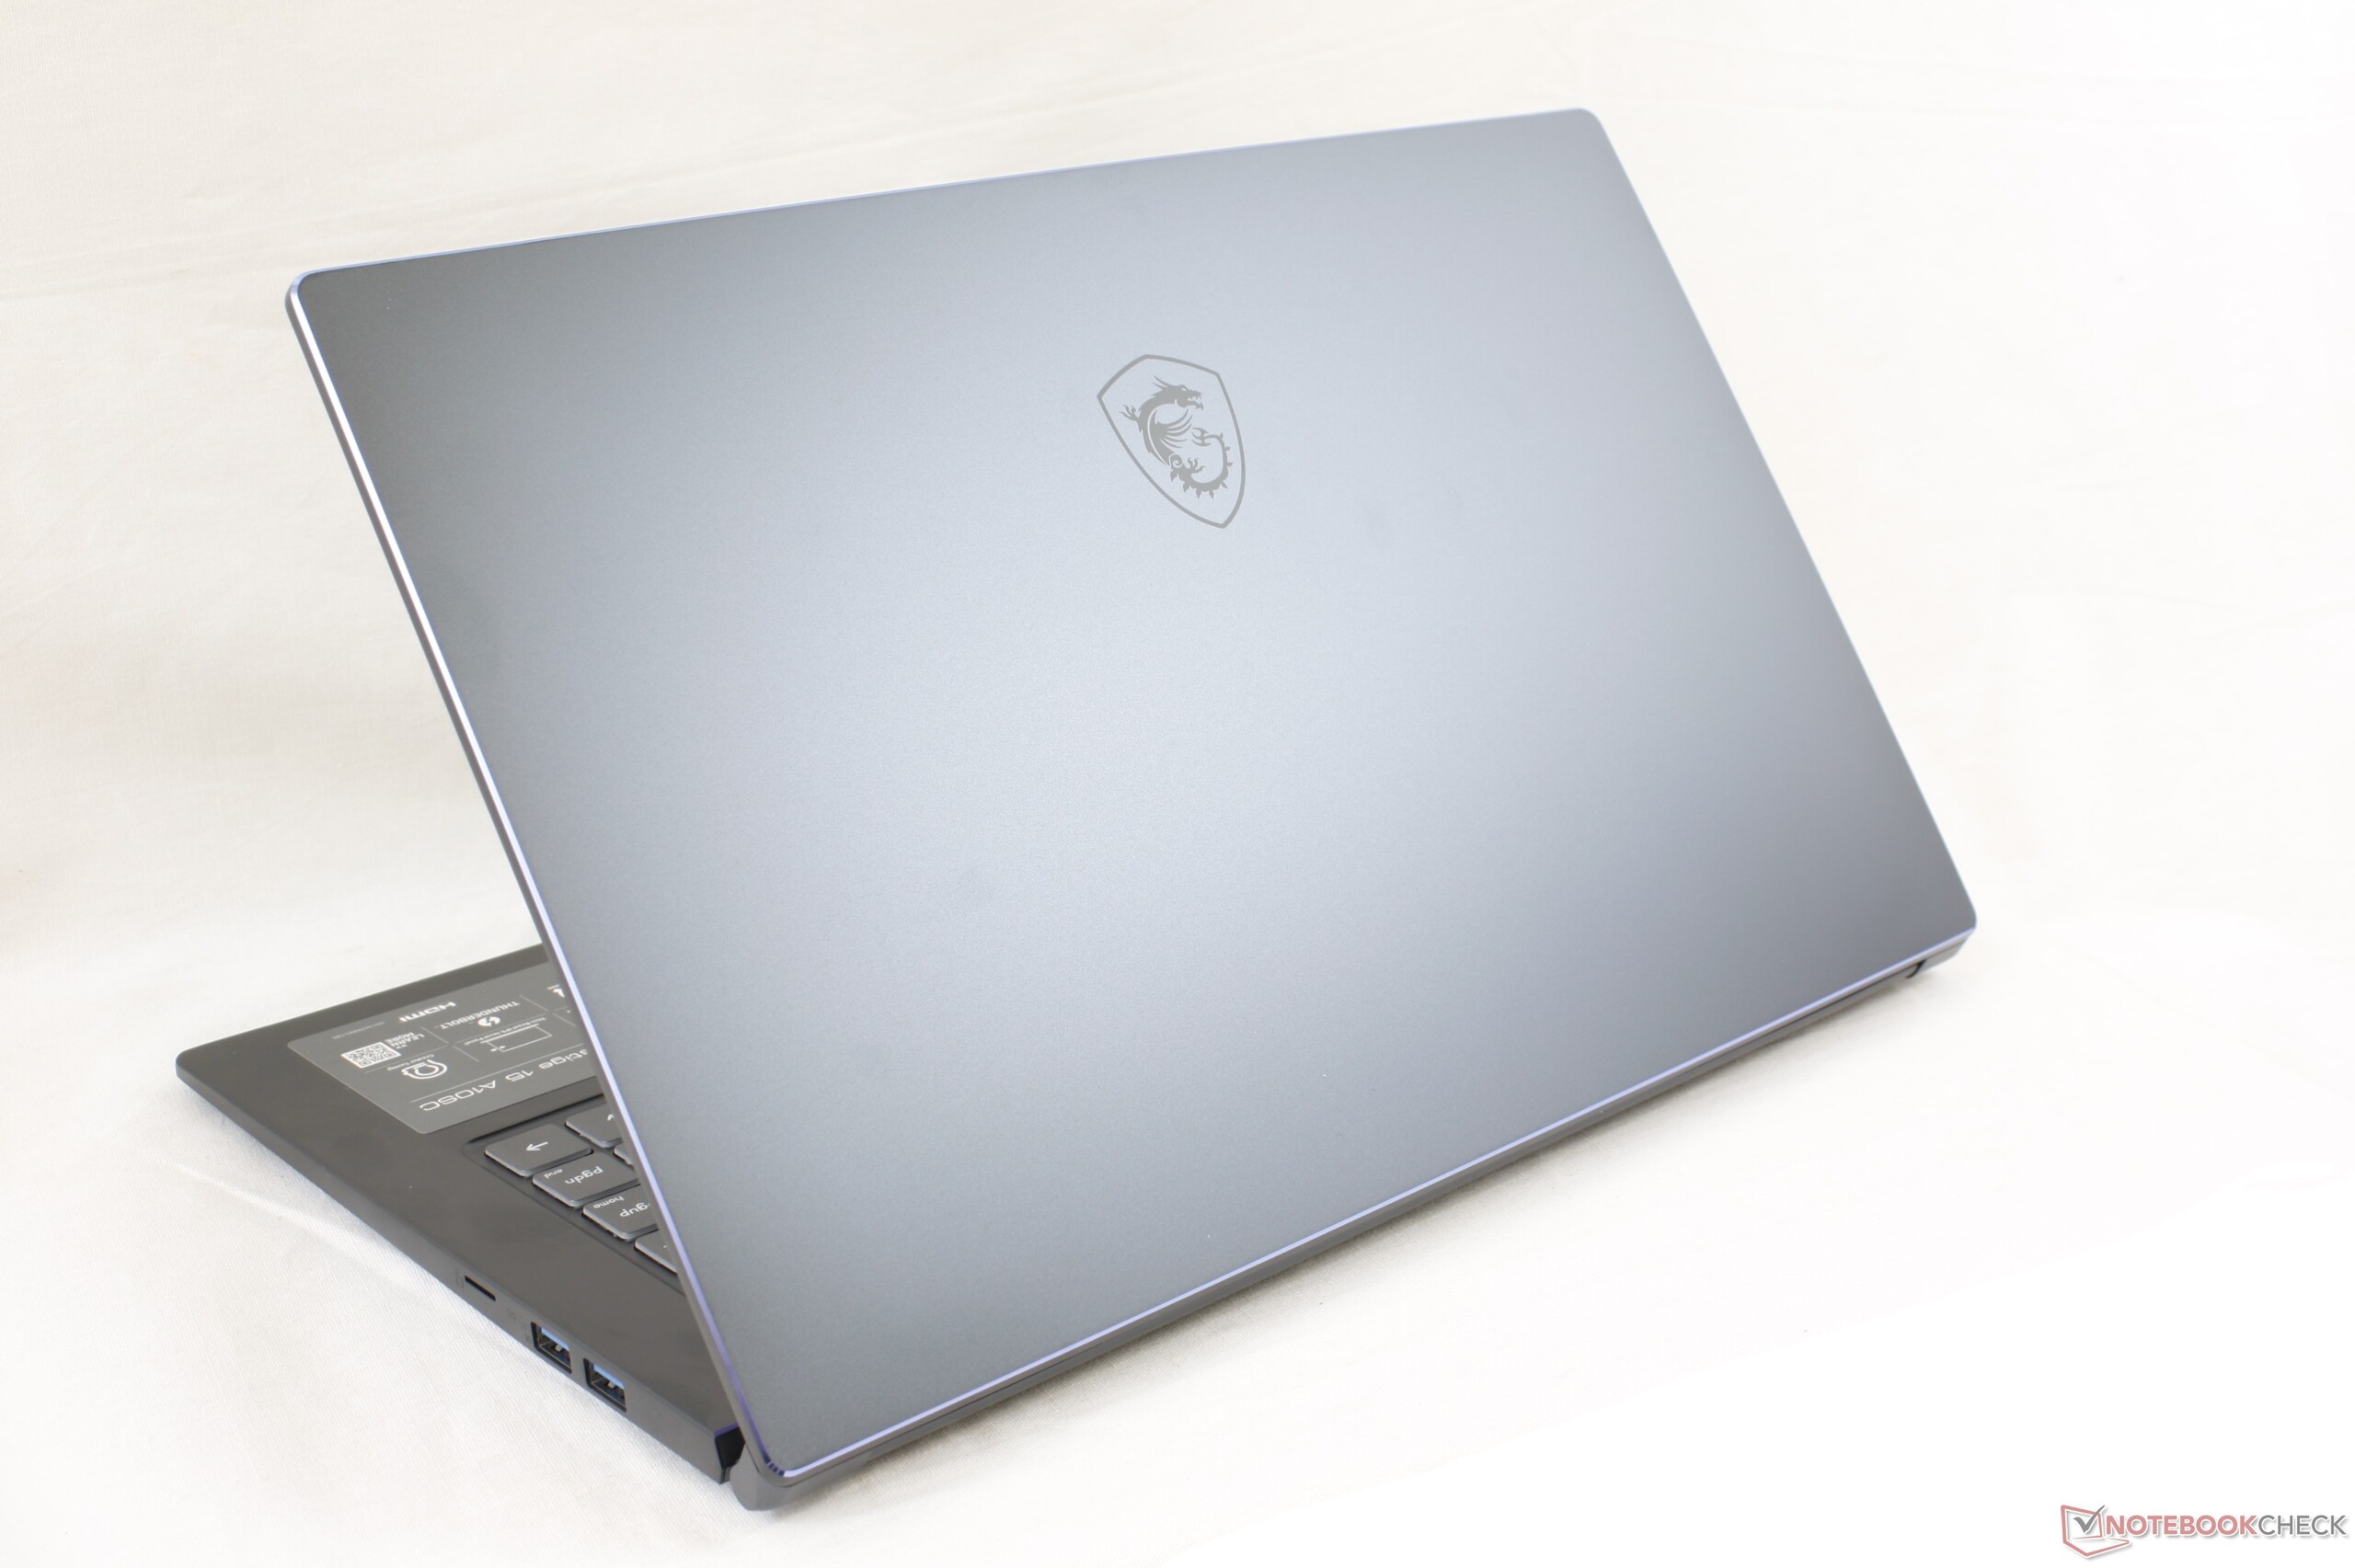
The MSI system is about 100 g to 200 g lighter than most other 15-inch multimedia laptops including the popular XPS 15, MacBook Pro 15, ZenBook 15, and the HP Spectre x360 15. The most noticeable drawback to the lighter weight is the more flexible chassis mentioned earlier; the Prestige 15 is more prone to warping and flexing than its competitors.
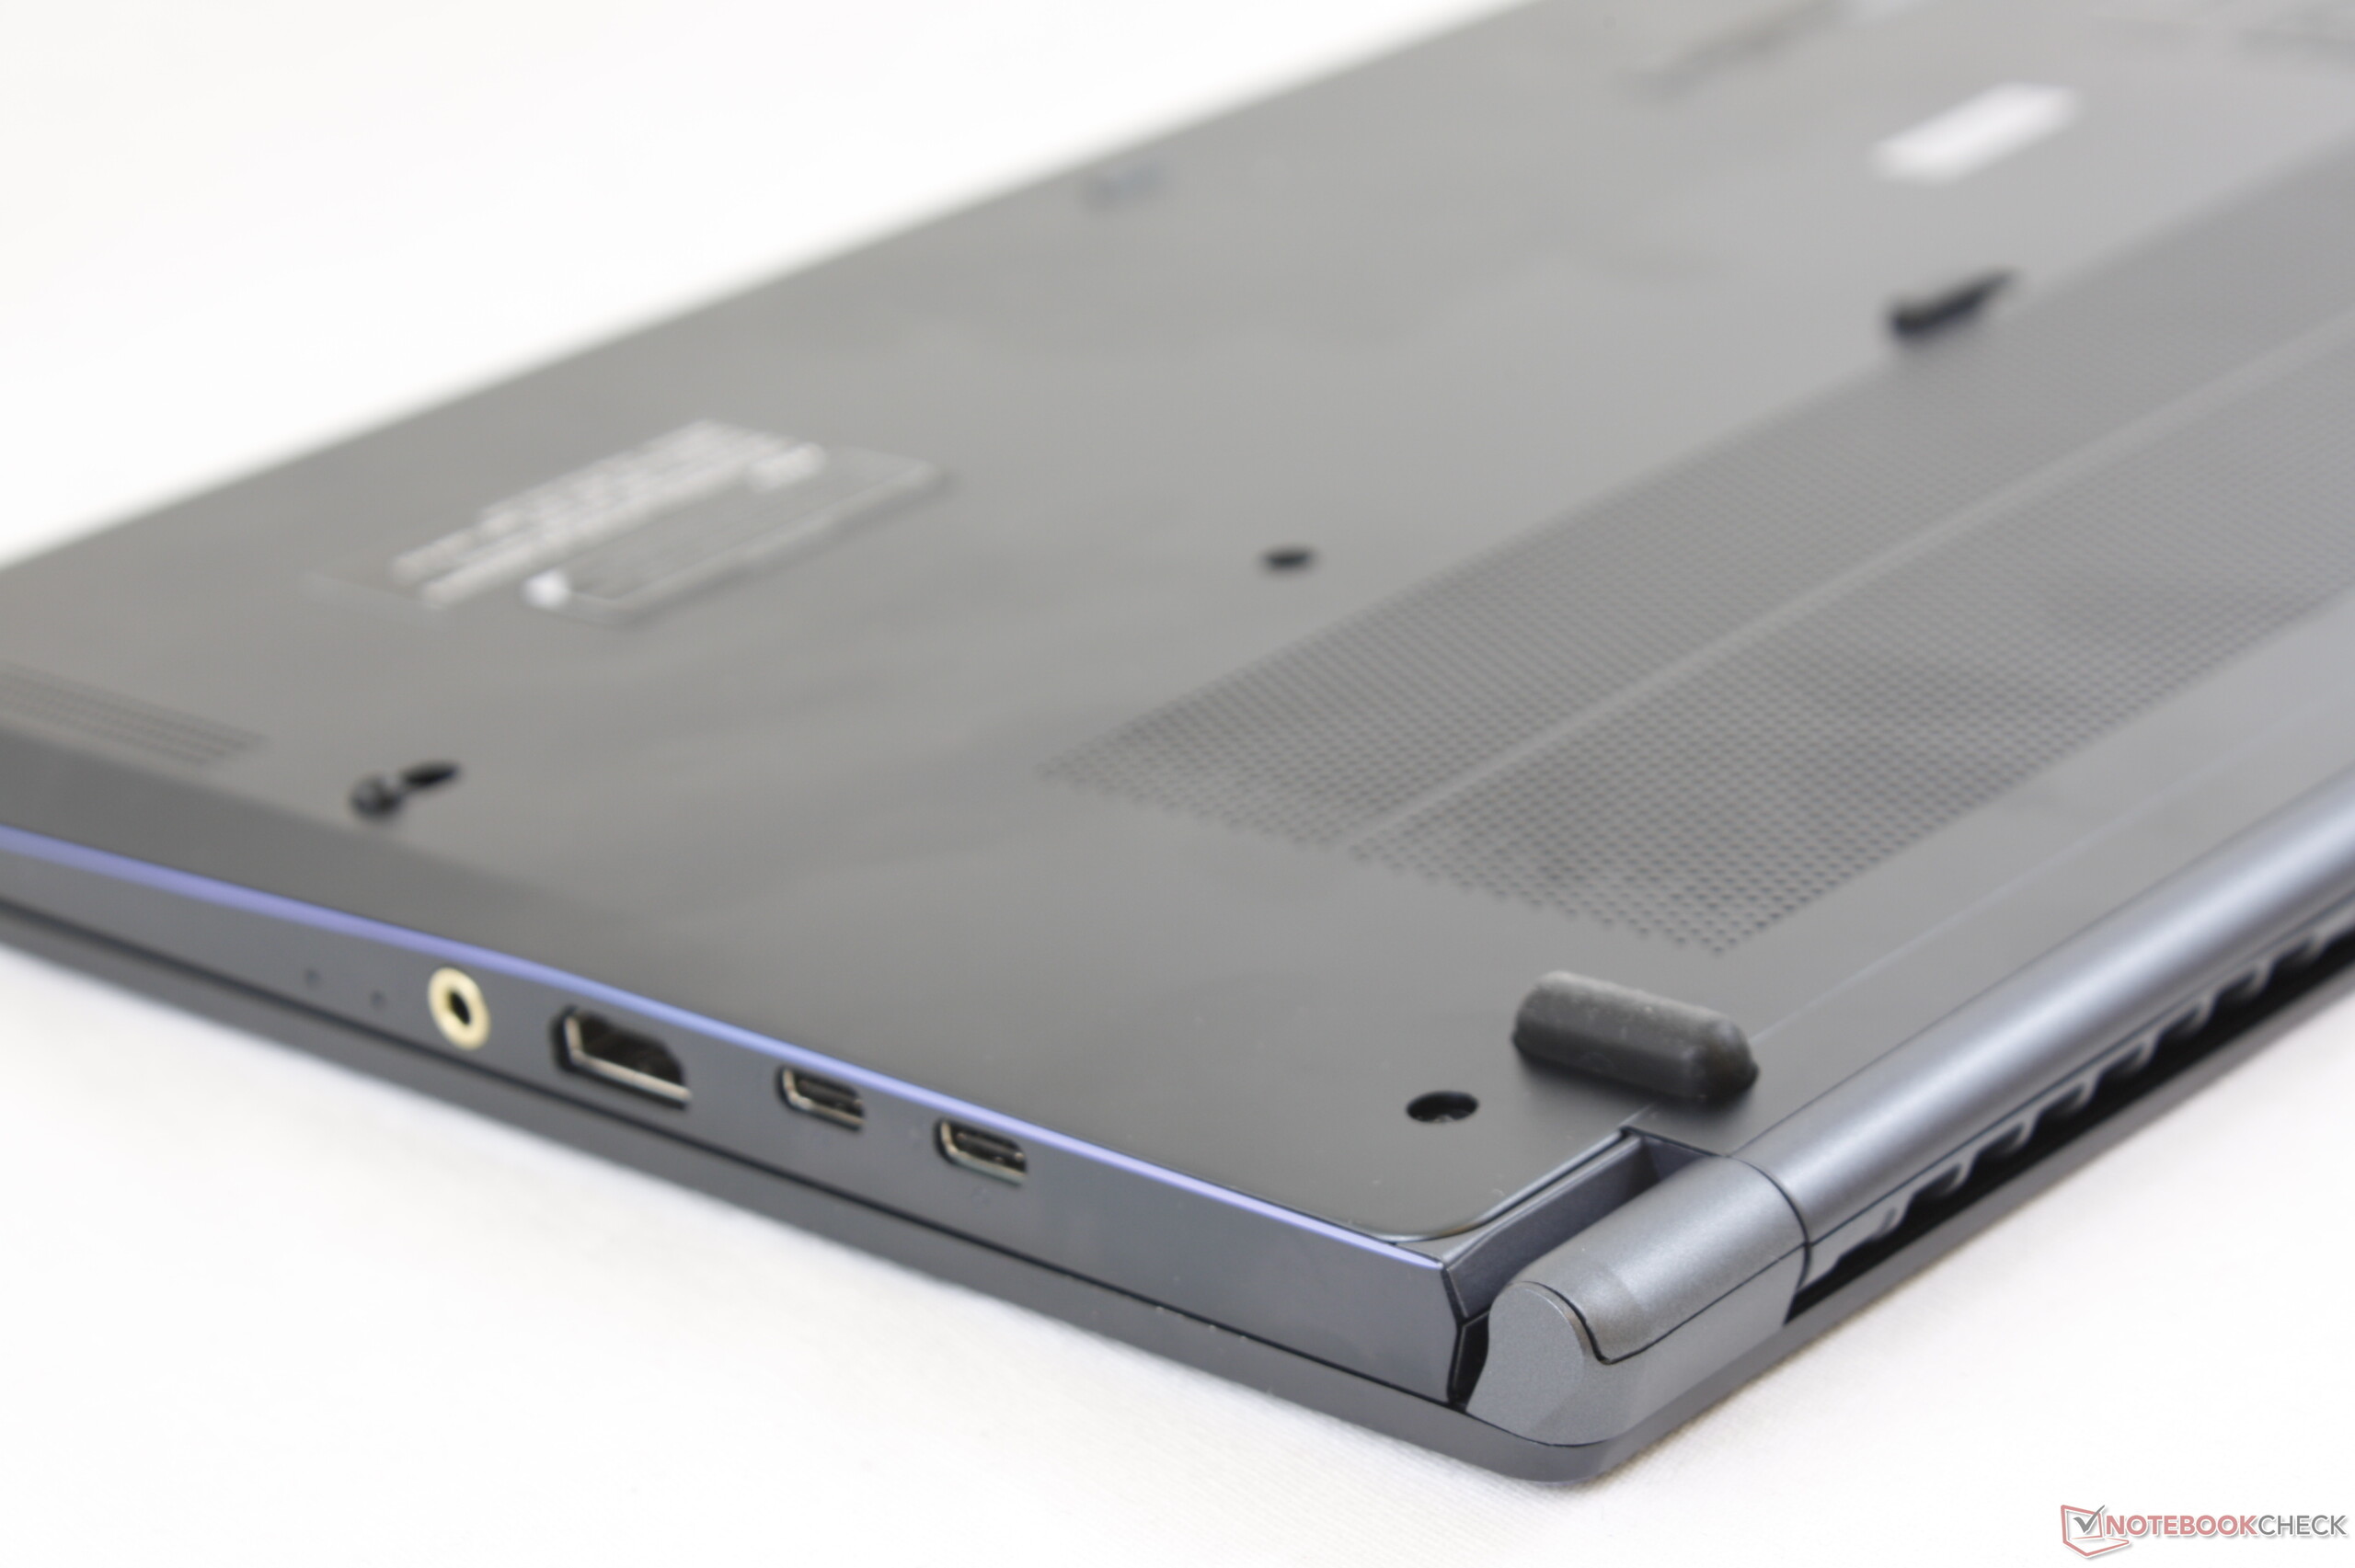
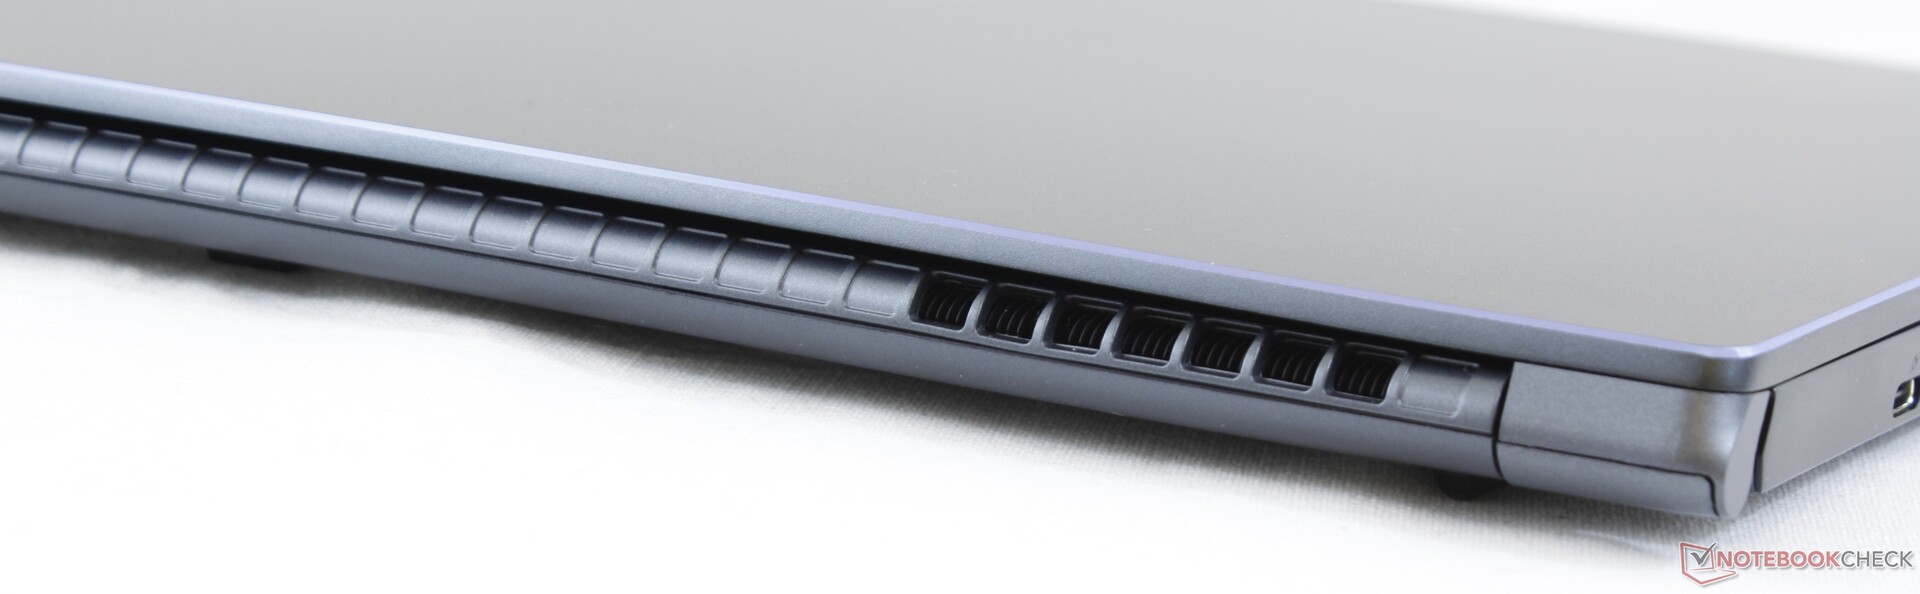
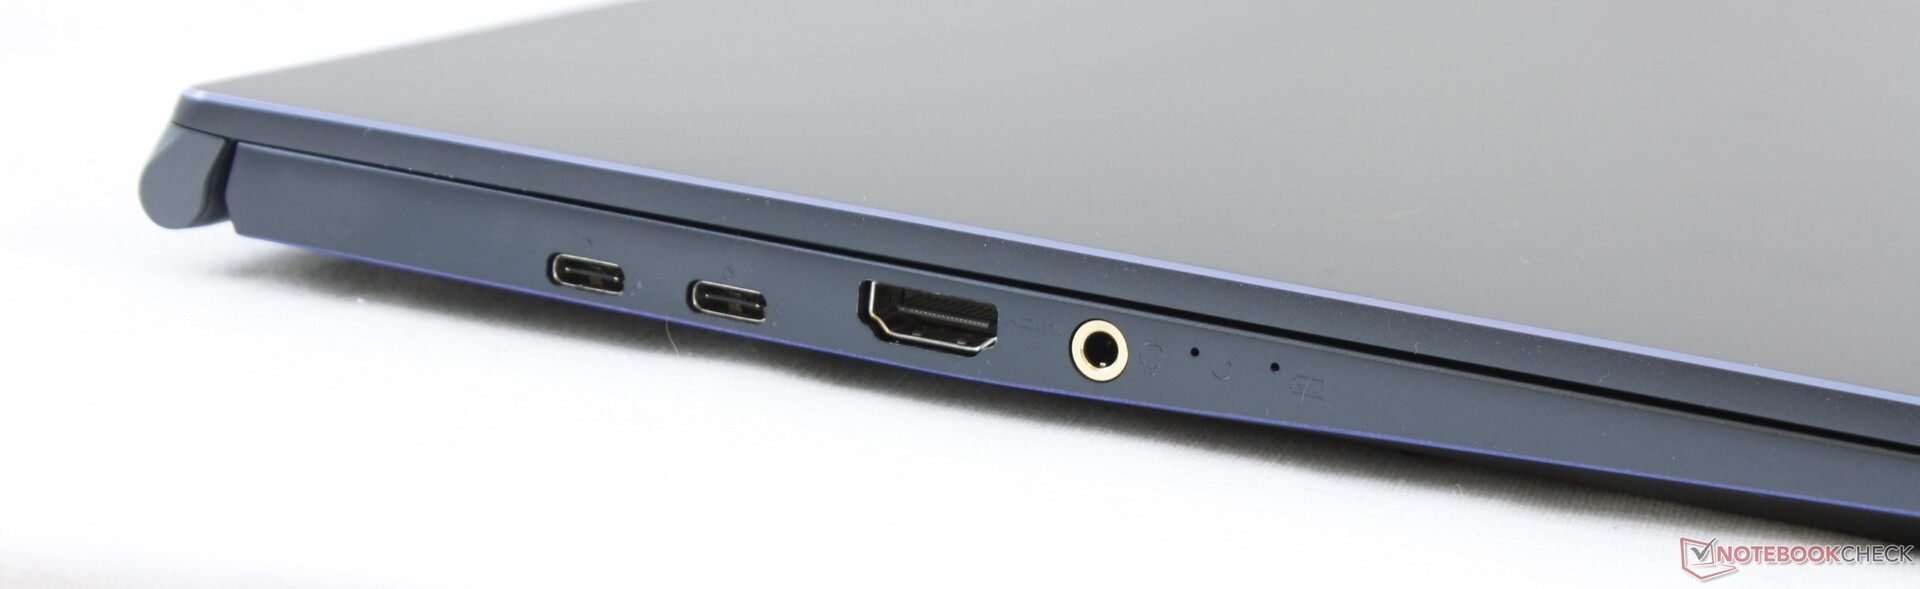
Connectivity - Port Positioning Could be Better
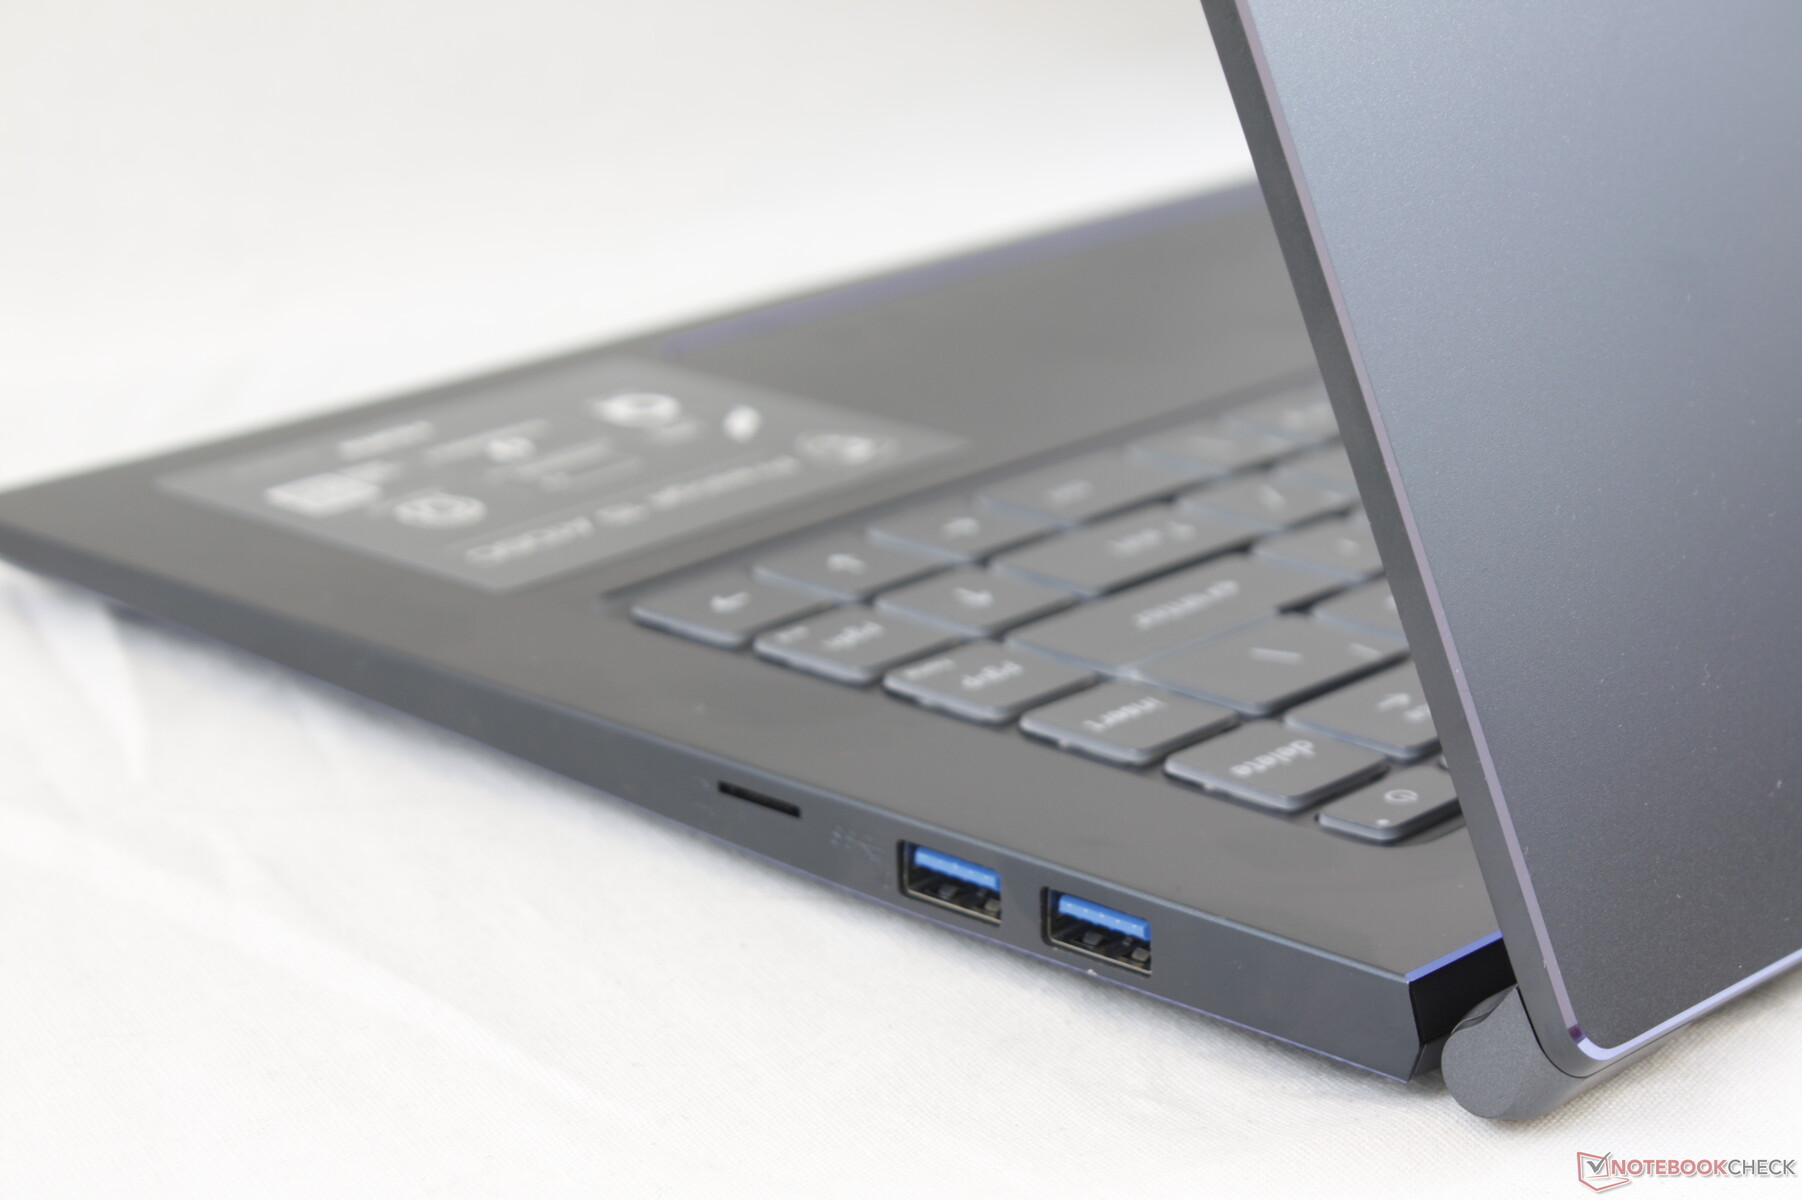
All ports on the Prestige 14 can be found here on the Prestige 15 but with the addition of an HDMI port. It's a bit disappointing to find no Kensington lock while port positioning could have been better as there are no USB Type-A ports along the left edge.
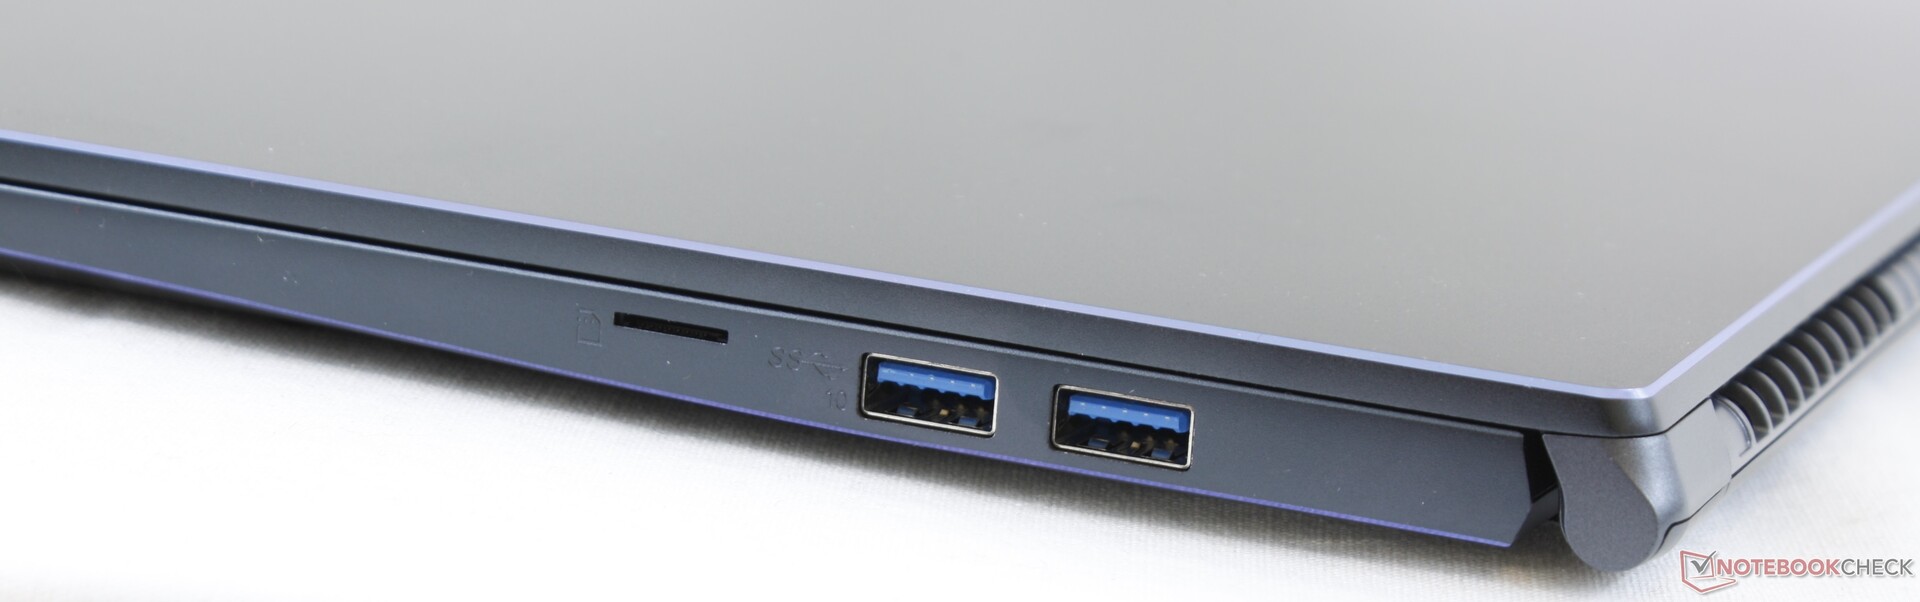
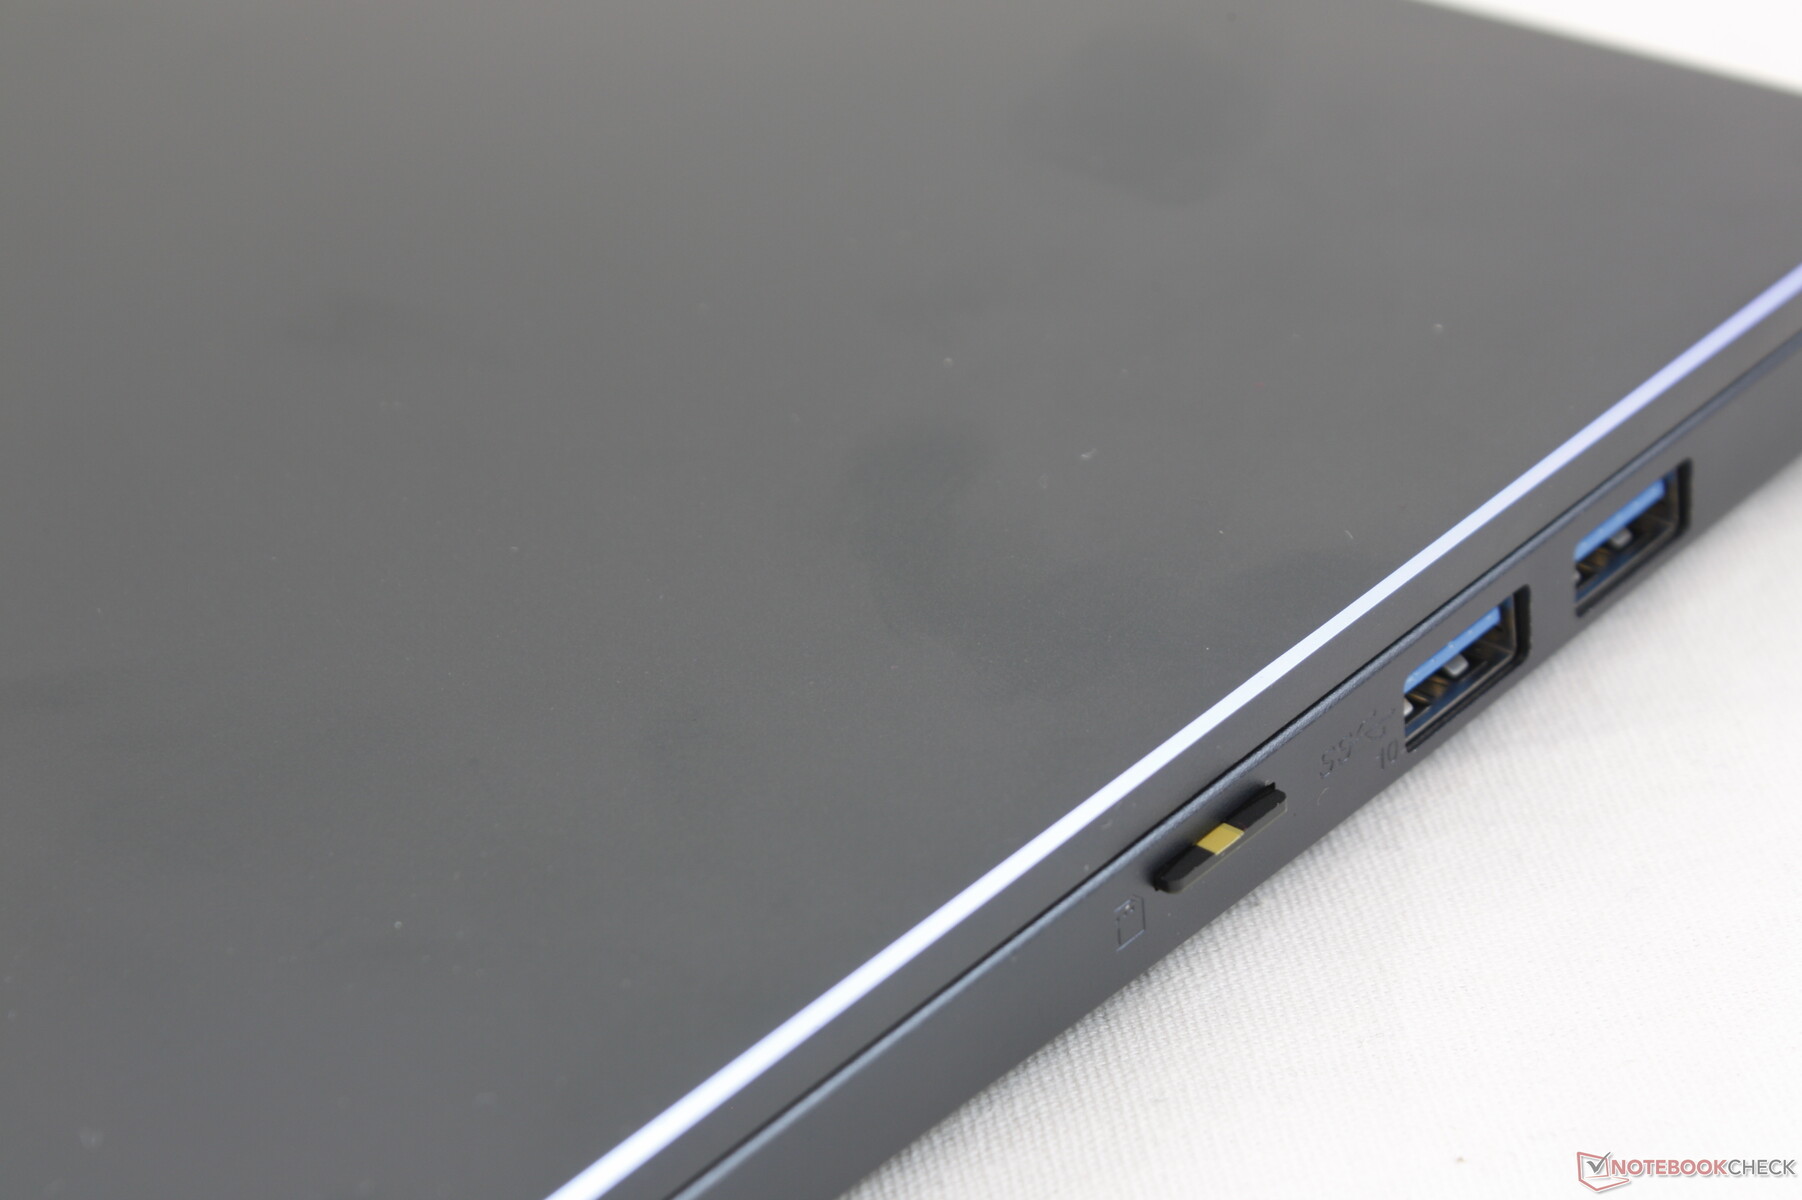
SD Card Reader
Users will have to make do with a spring-loaded MicroSD reader instead of the full-size SD readers as found on the MSI GS series. Transfer rates are still fast at almost 200 MB/s with our UHS-II test card.
| SD Card Reader | |
| average JPG Copy Test (av. of 3 runs) | |
| Dell Latitude 5500 (Toshiba Exceria Pro M501 64 GB UHS-II) | |
| Dell Precision 5530 Xeon E-2176M (Toshiba Exceria Pro SDXC 64 GB UHS-II) | |
| MSI Prestige 15 A10SC (Toshiba Exceria Pro M501 UHS-II) | |
| Lenovo ThinkPad T590-20N4002VGE (Toshiba Exceria Pro M501 UHS-II) | |
| maximum AS SSD Seq Read Test (1GB) | |
| Dell Latitude 5500 (Toshiba Exceria Pro M501 64 GB UHS-II) | |
| MSI Prestige 15 A10SC (Toshiba Exceria Pro M501 UHS-II) | |
| Dell Precision 5530 Xeon E-2176M (Toshiba Exceria Pro SDXC 64 GB UHS-II) | |
| Lenovo ThinkPad T590-20N4002VGE (Toshiba Exceria Pro M501 UHS-II) | |
Communication
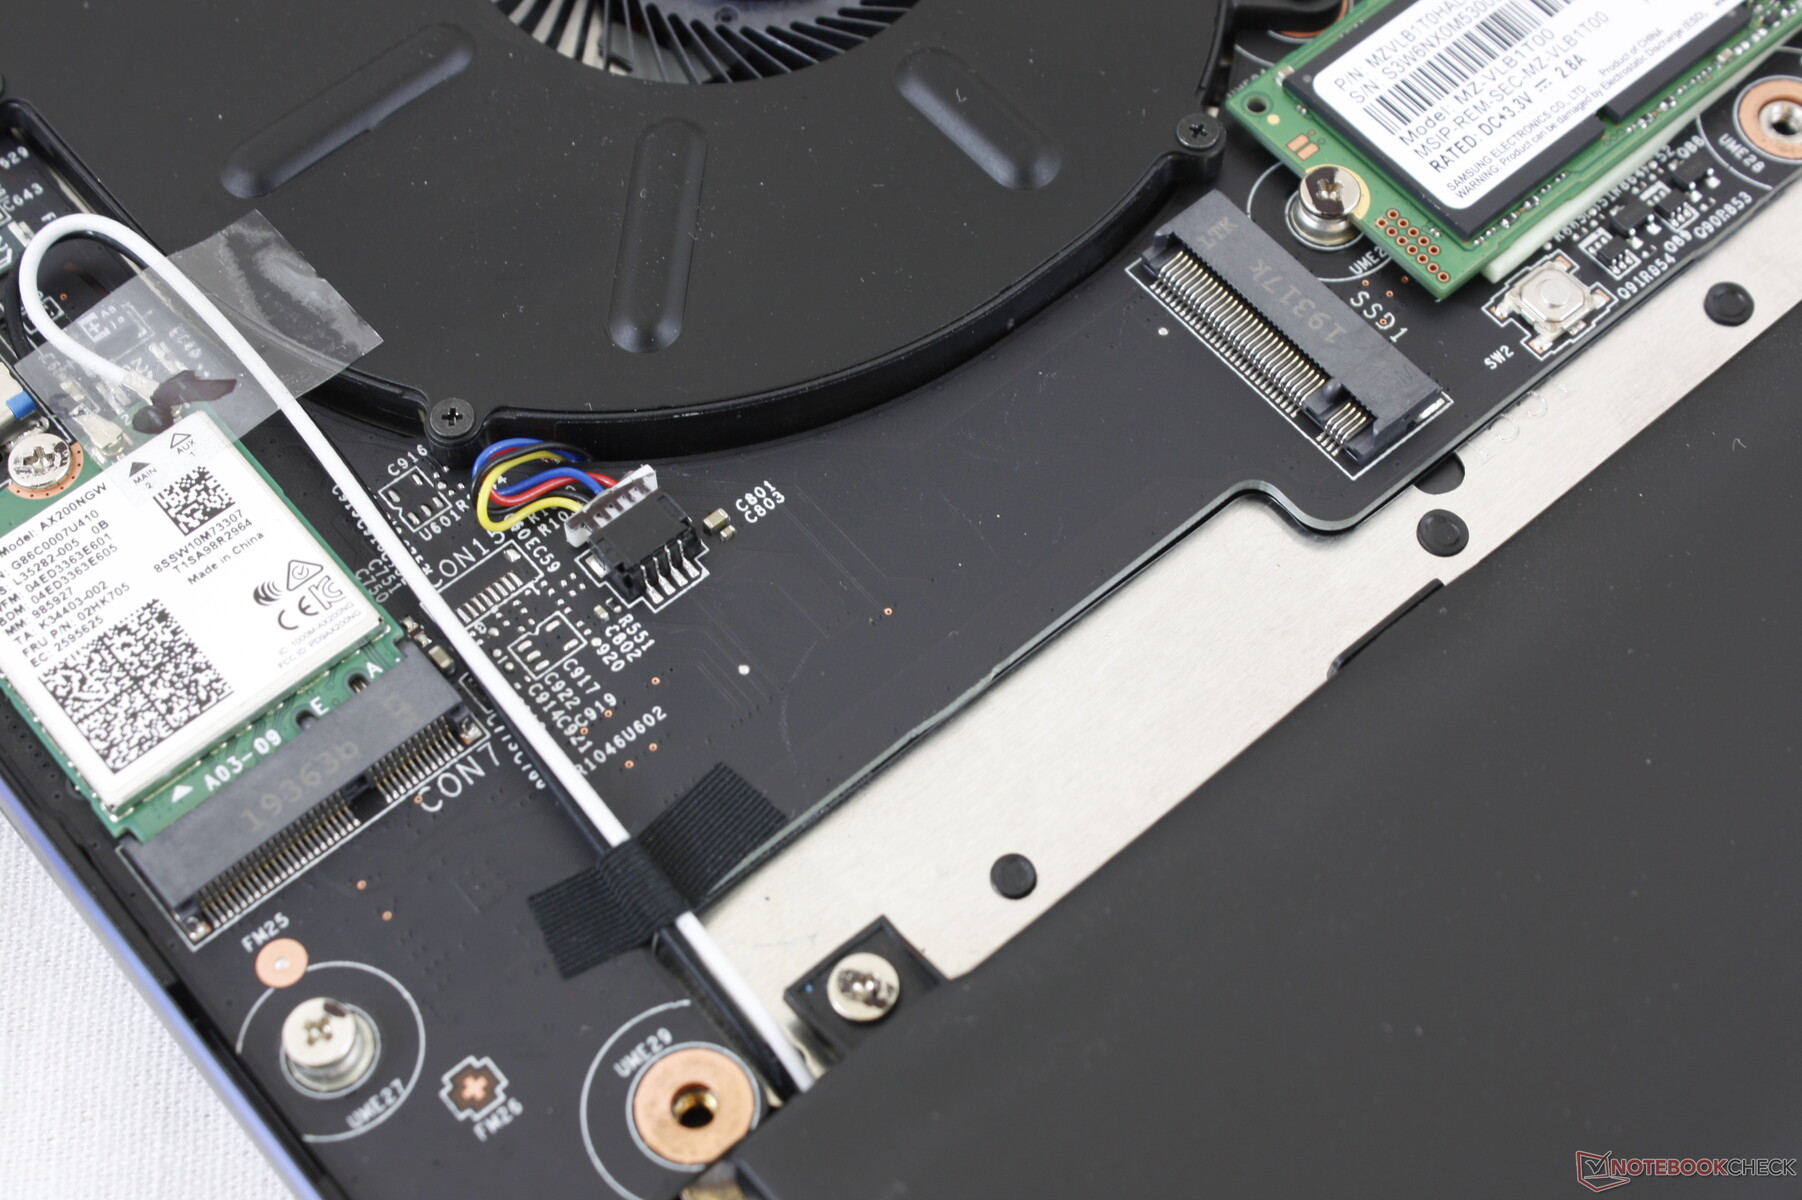
The Intel AX200 comes standard for Wi-Fi 6 and Bluetooth 5 connectivity. We didn't experience any wireless issues during our time with the unit.
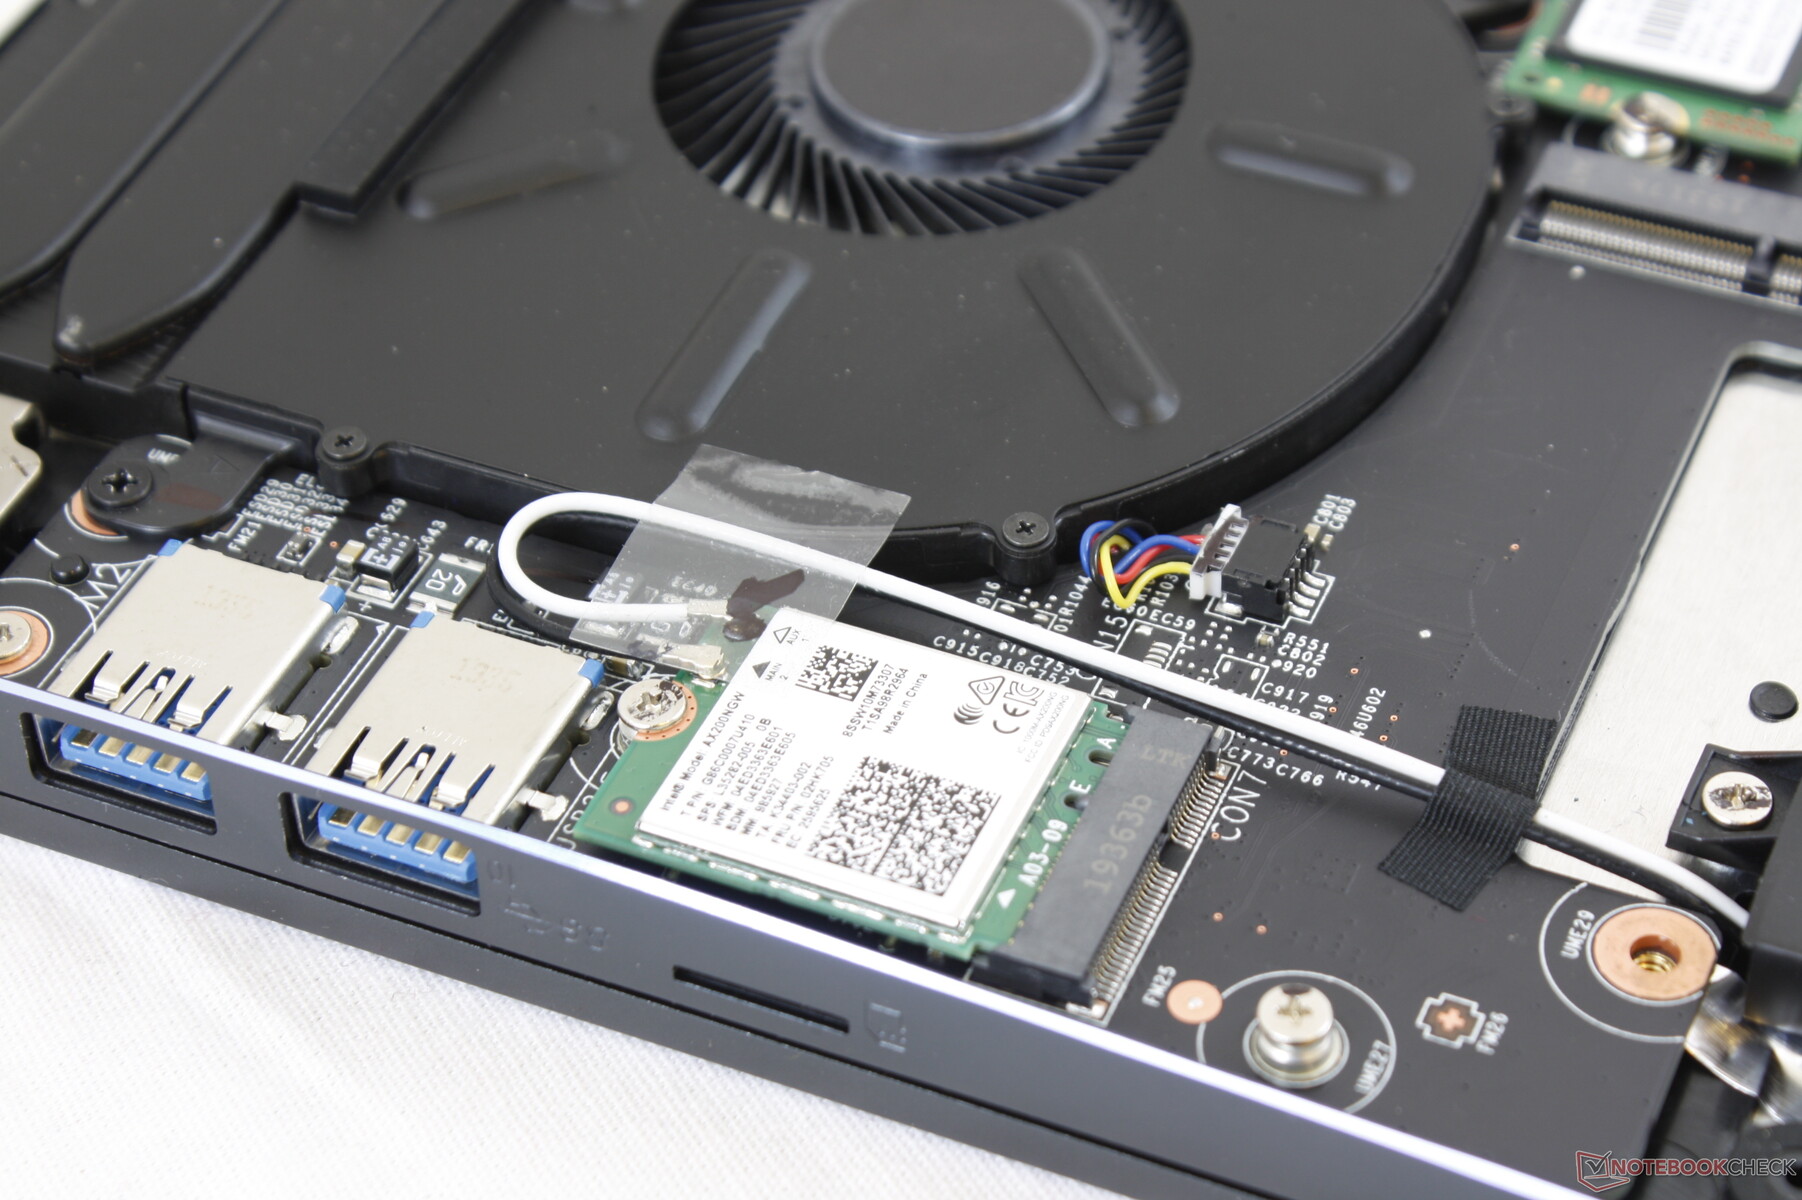
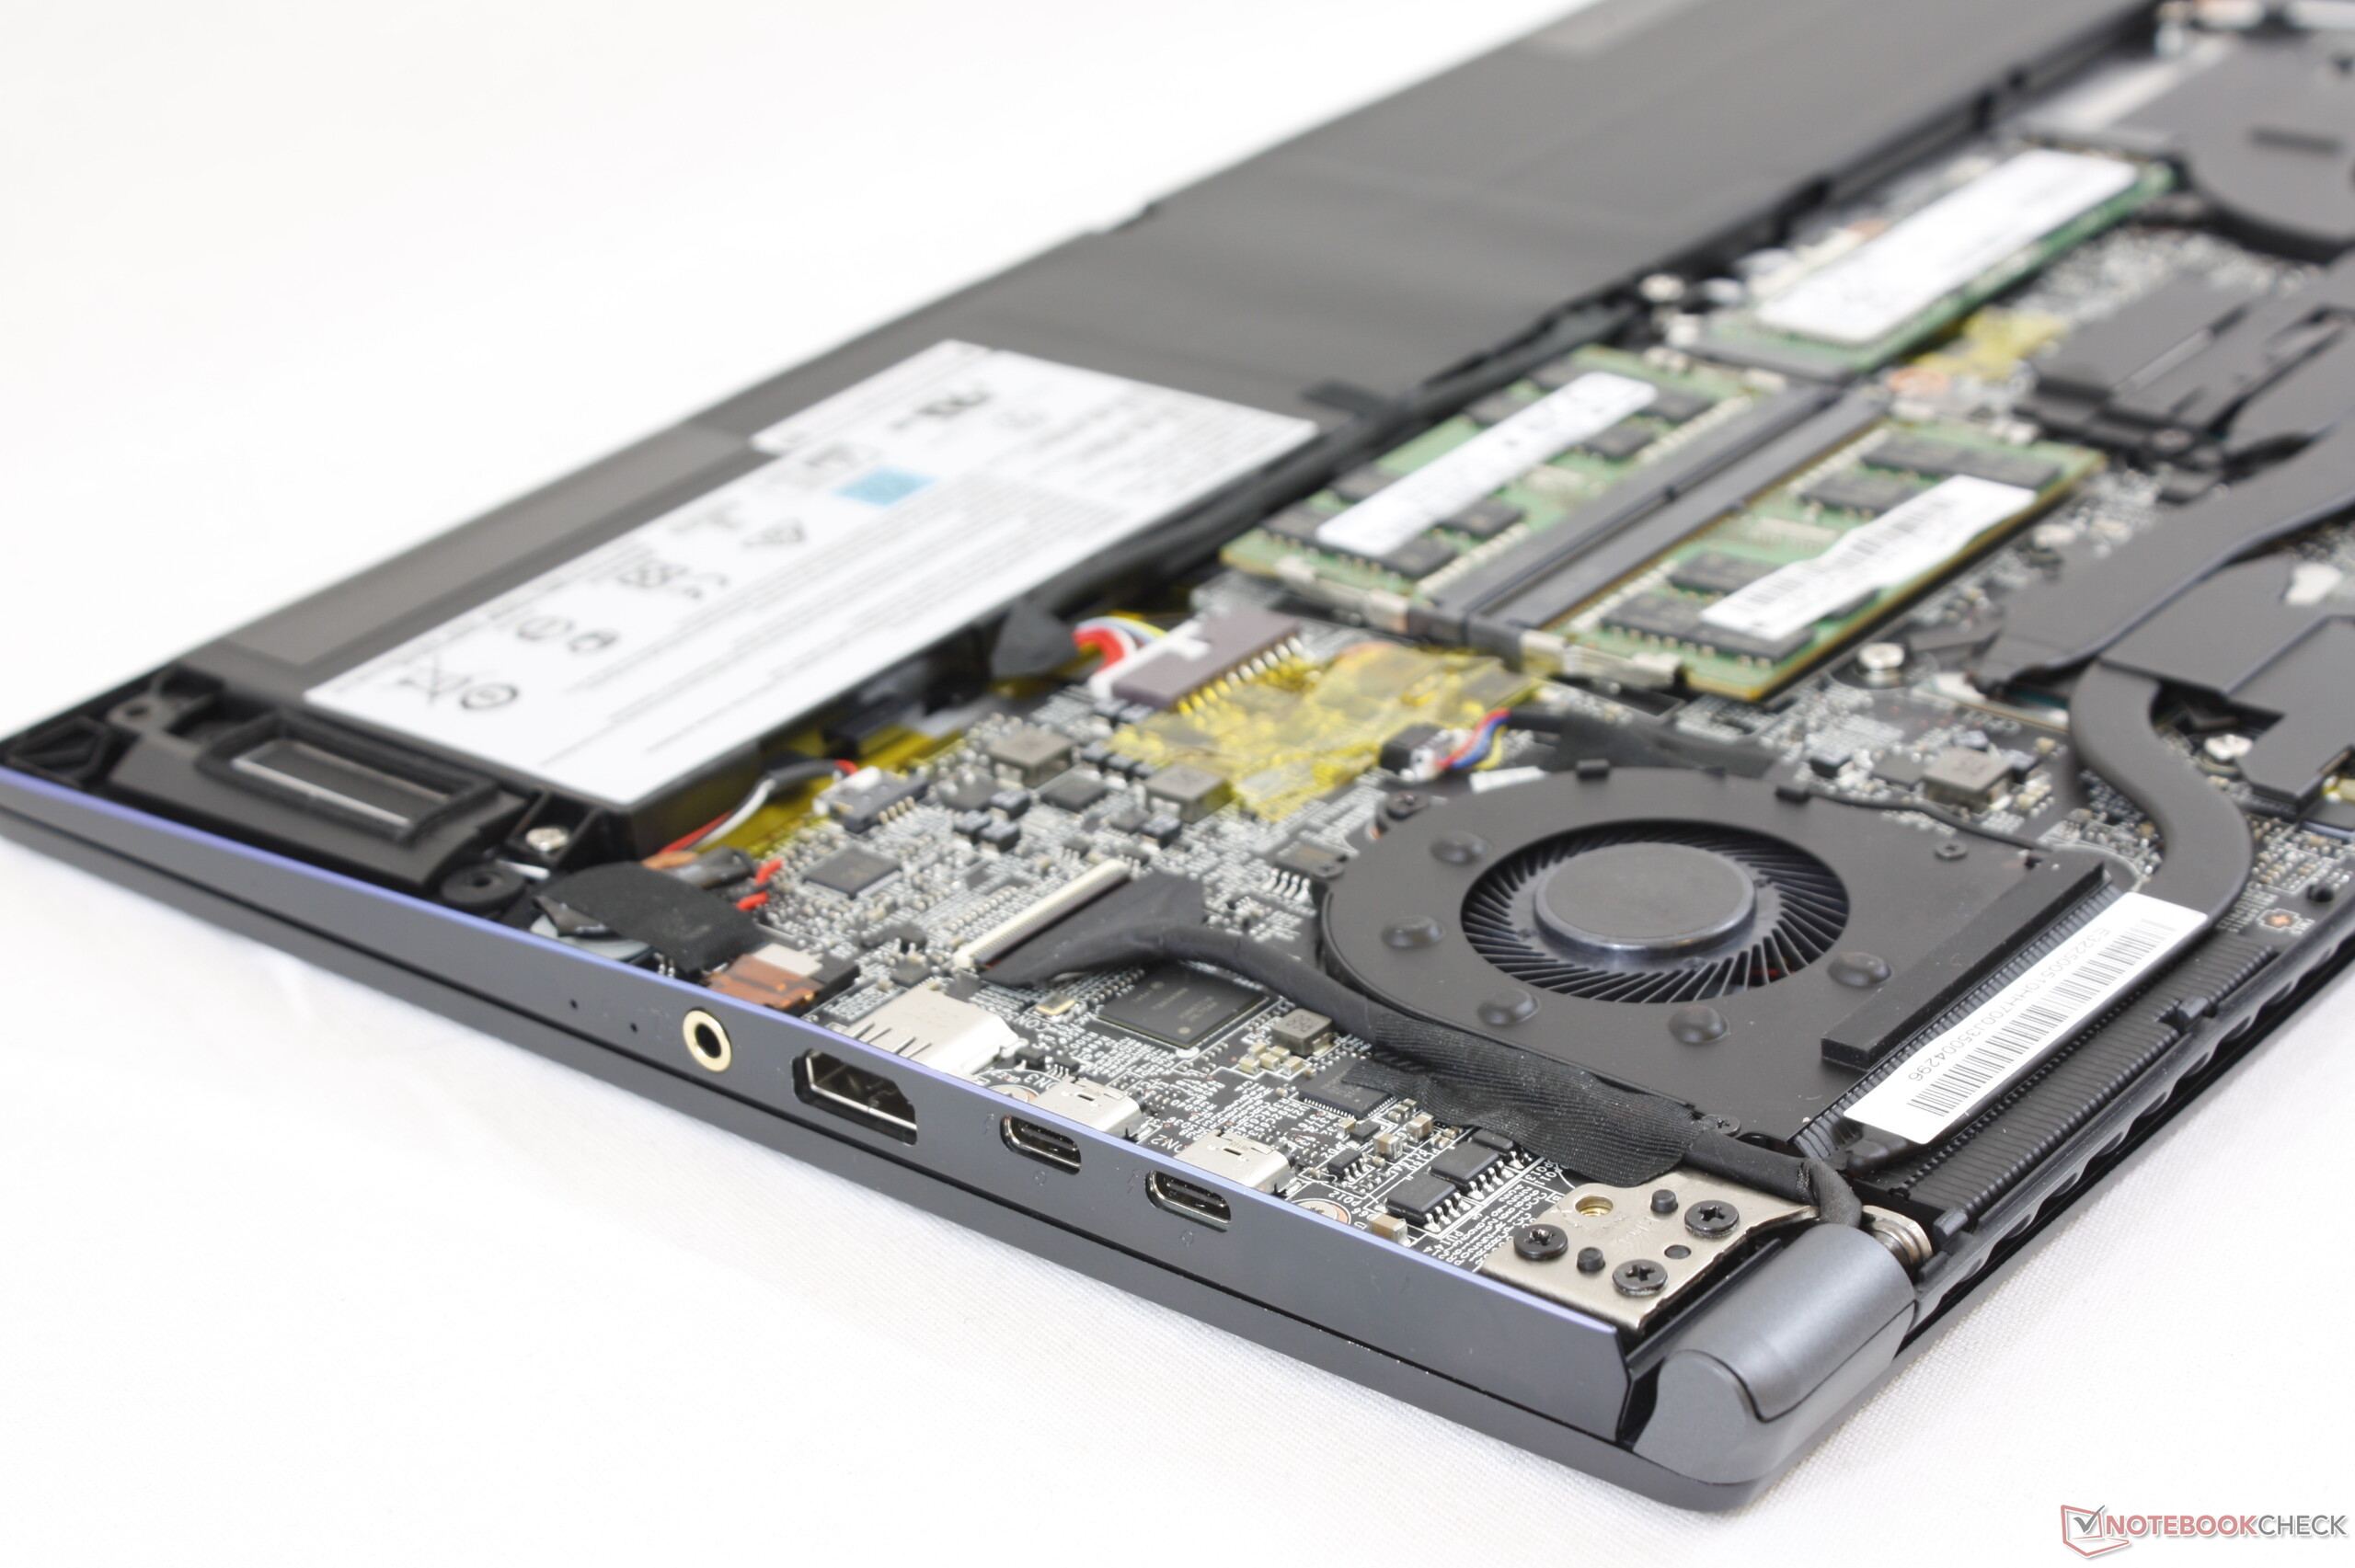
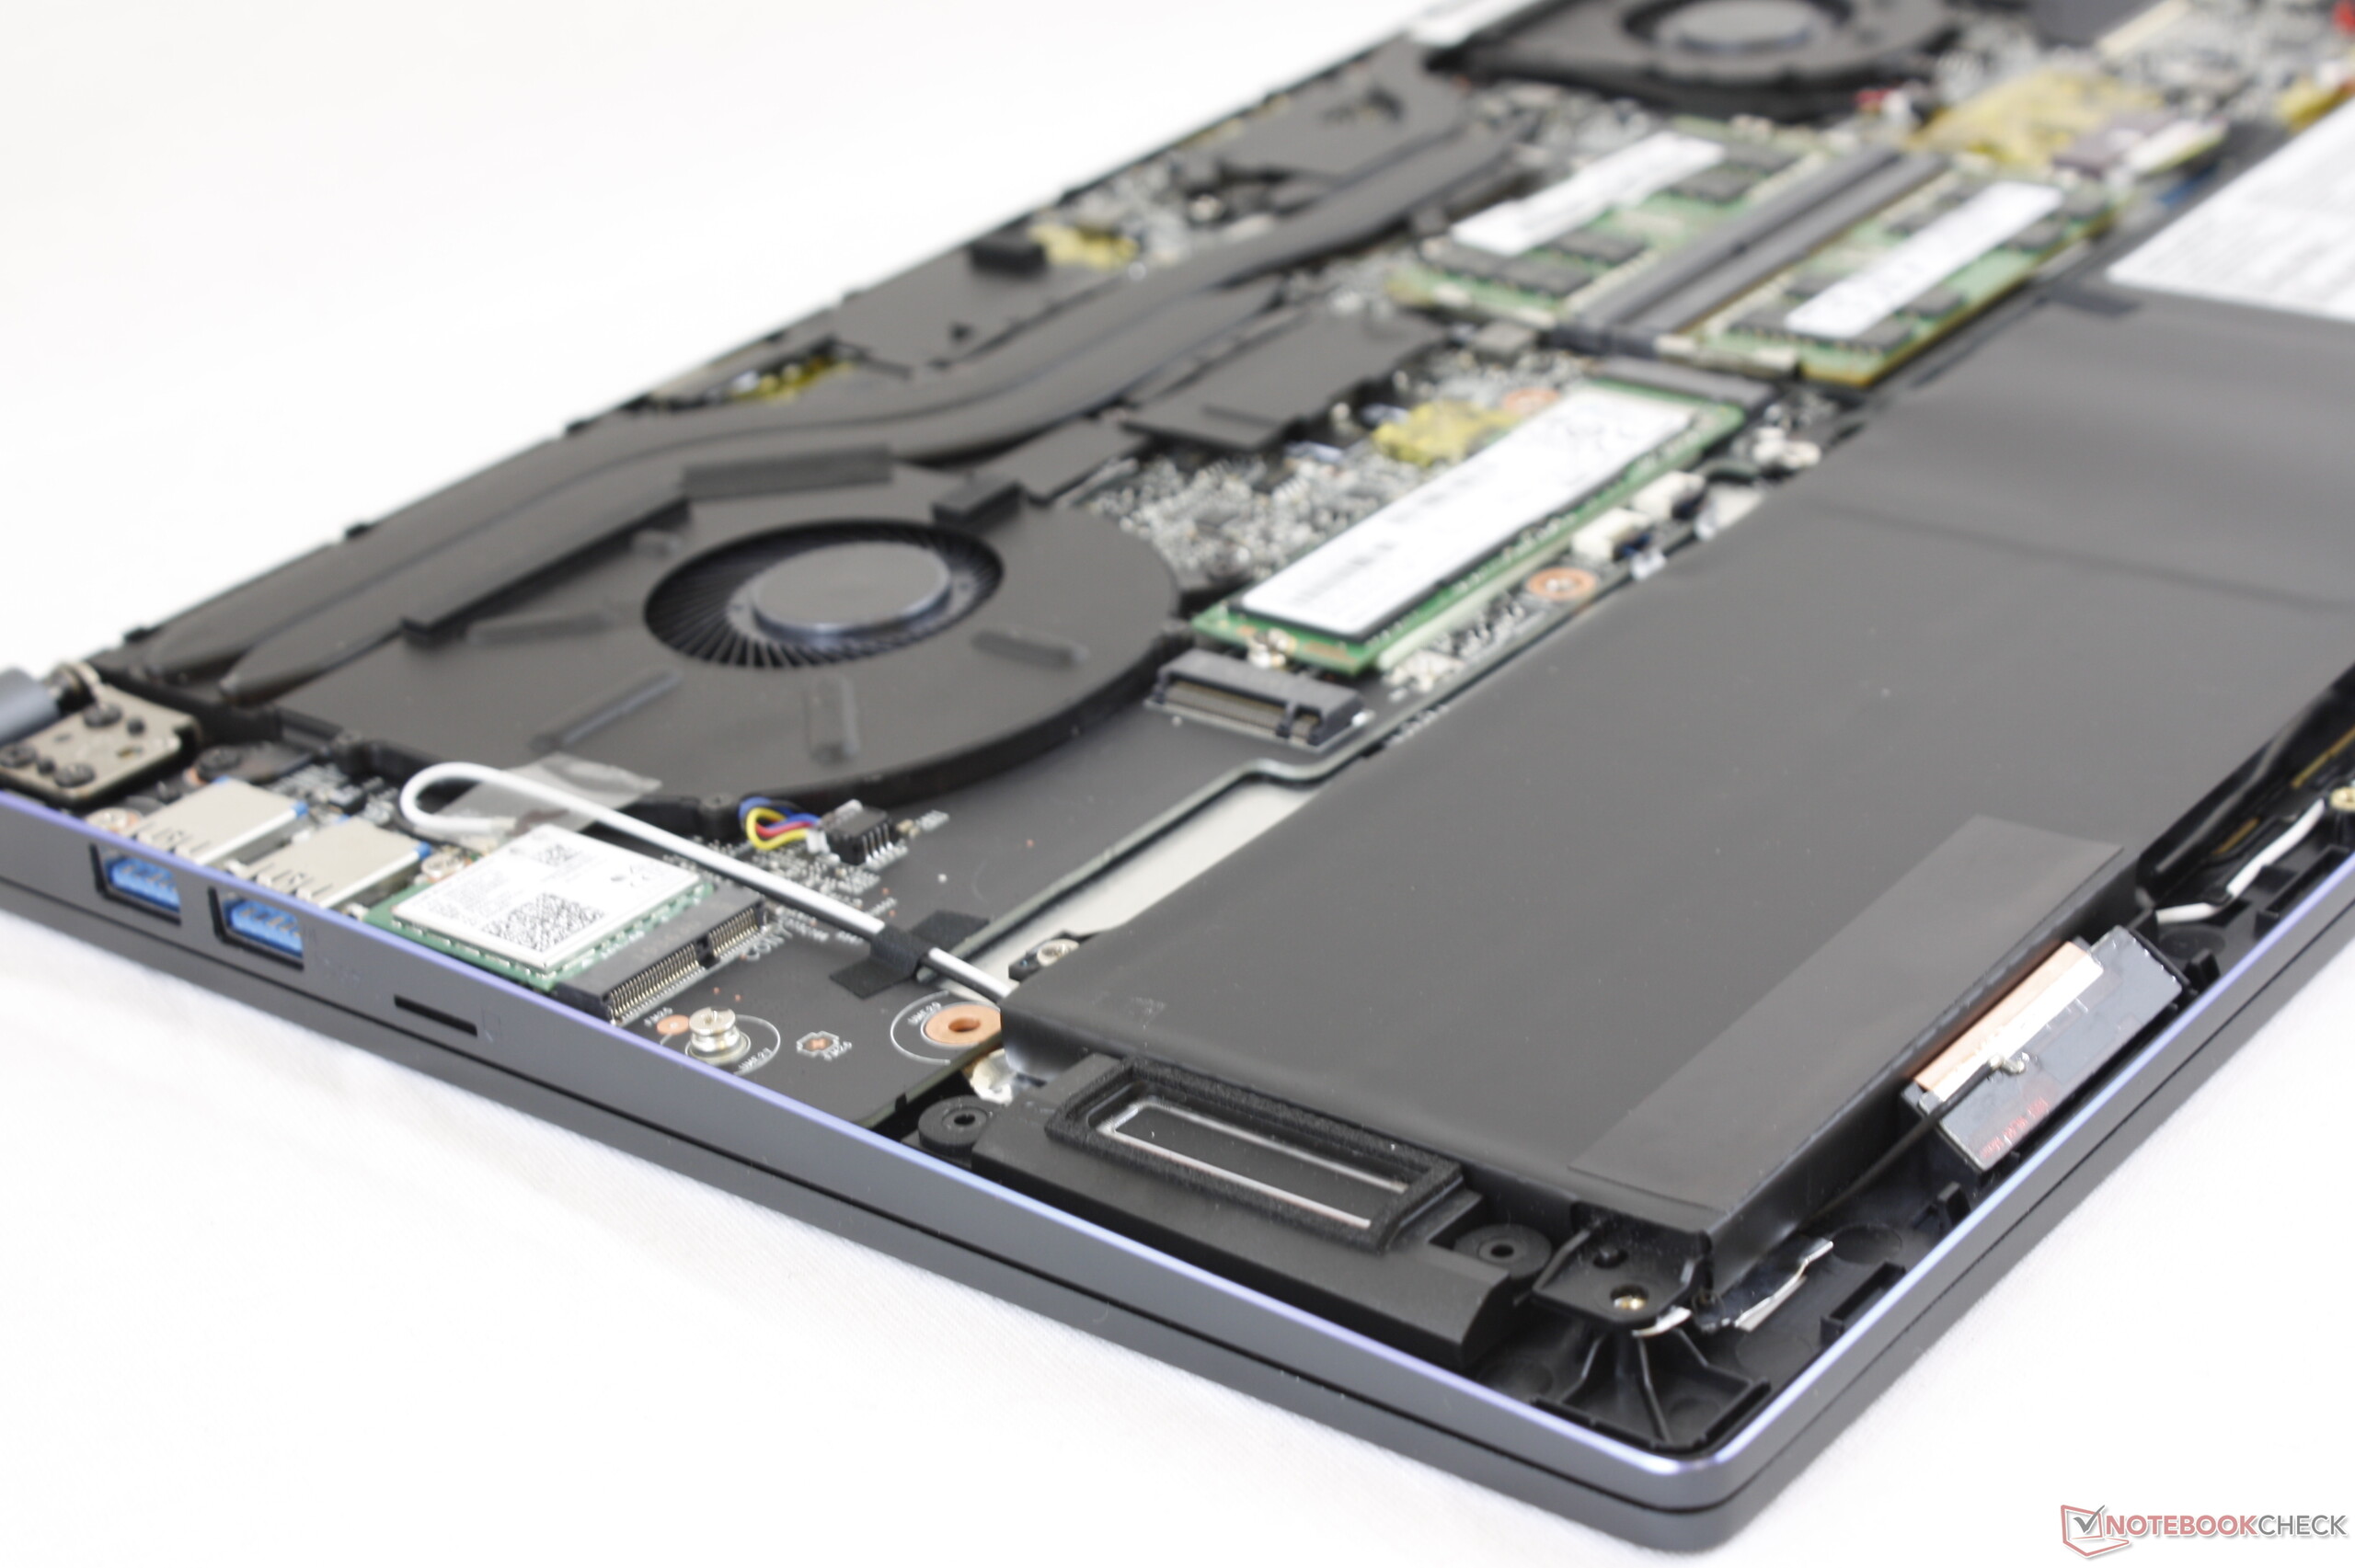
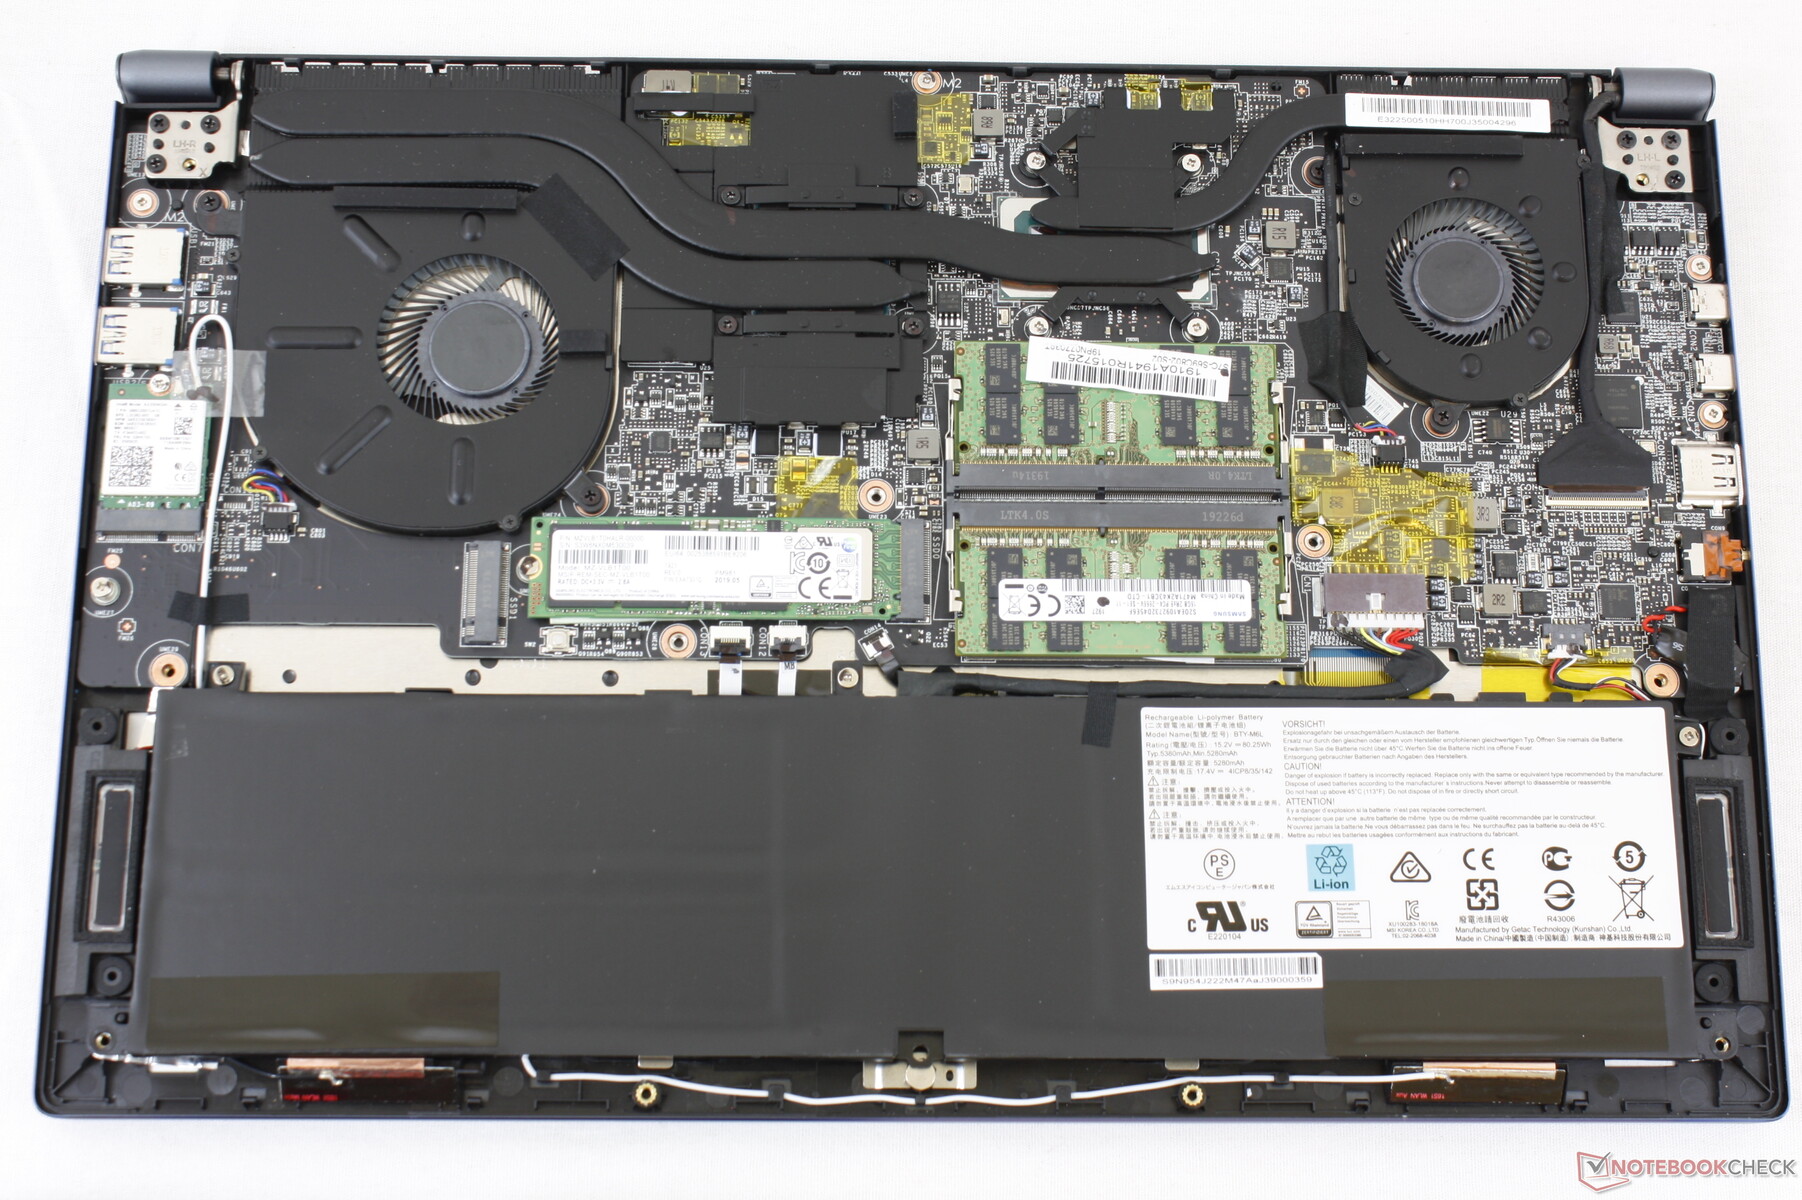
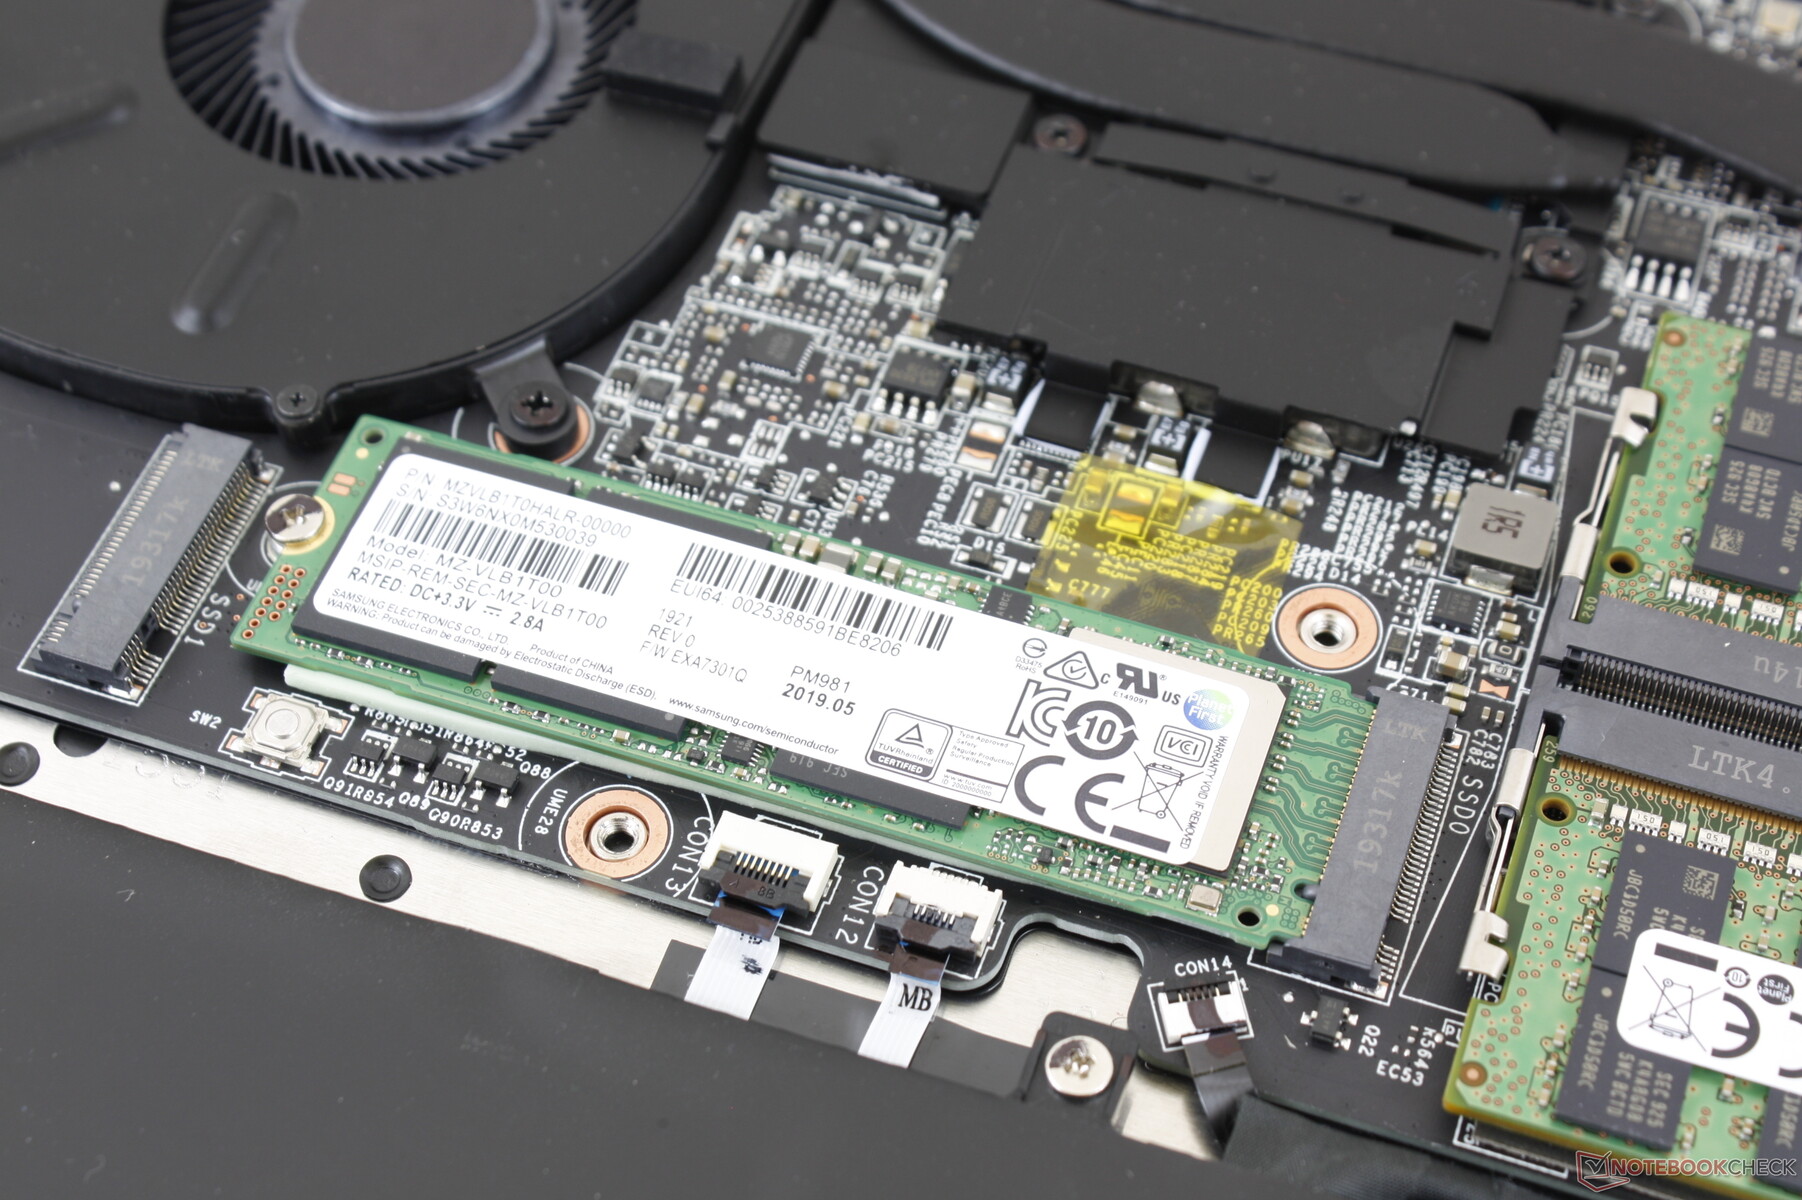
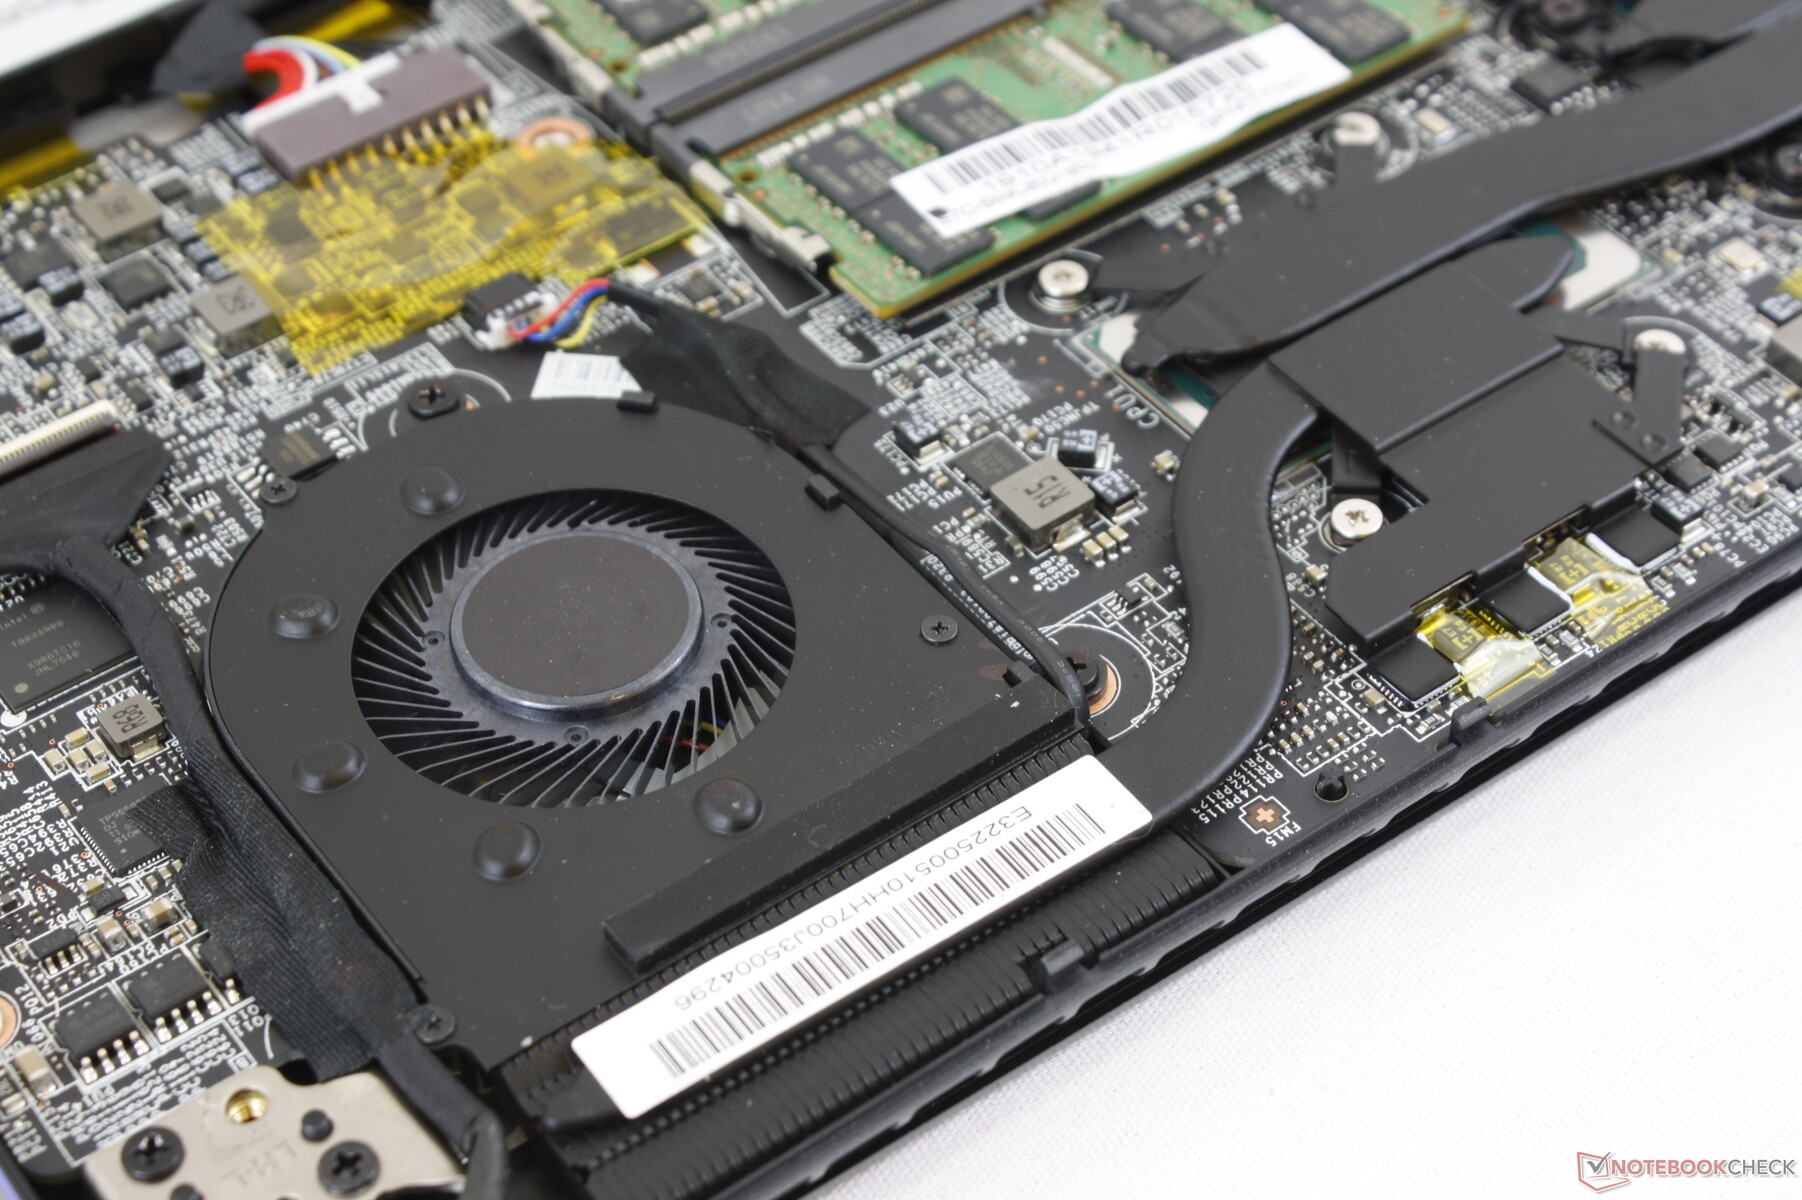
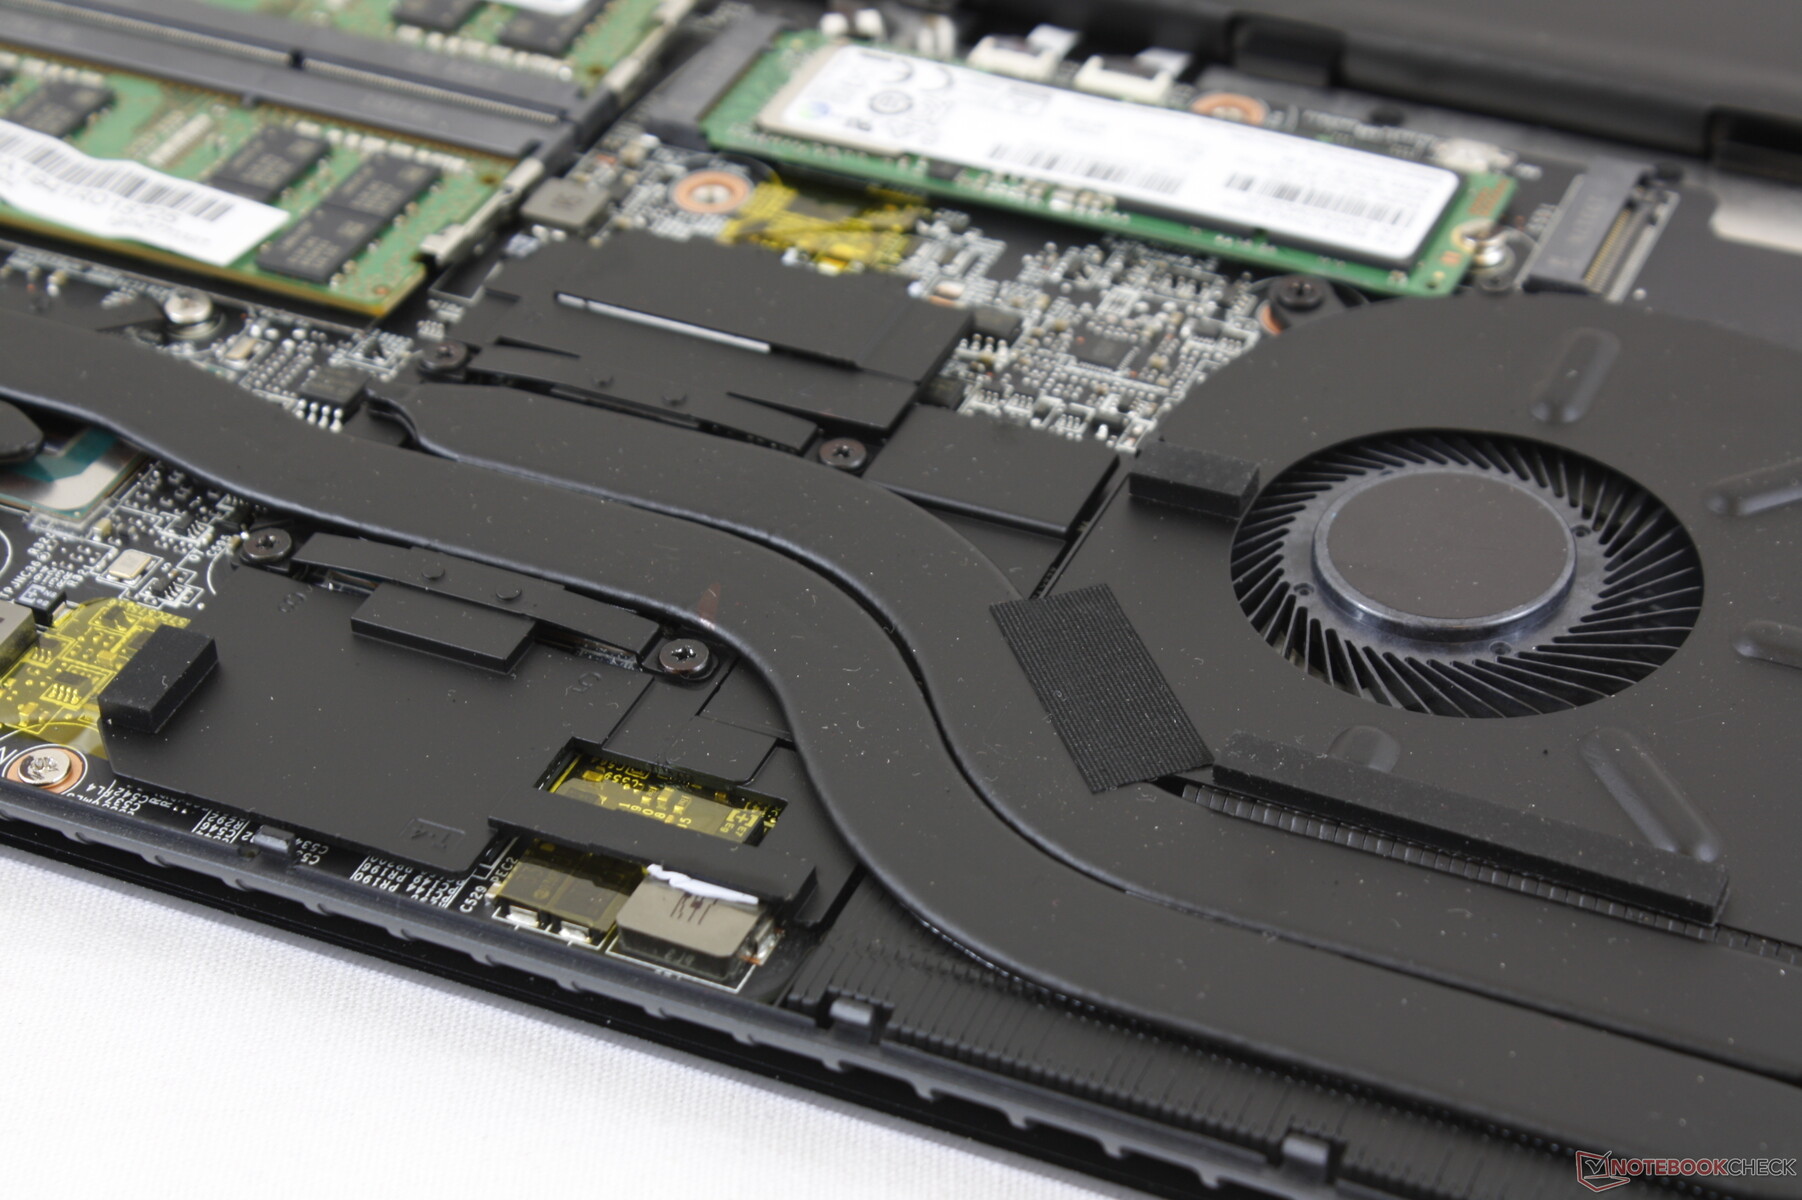
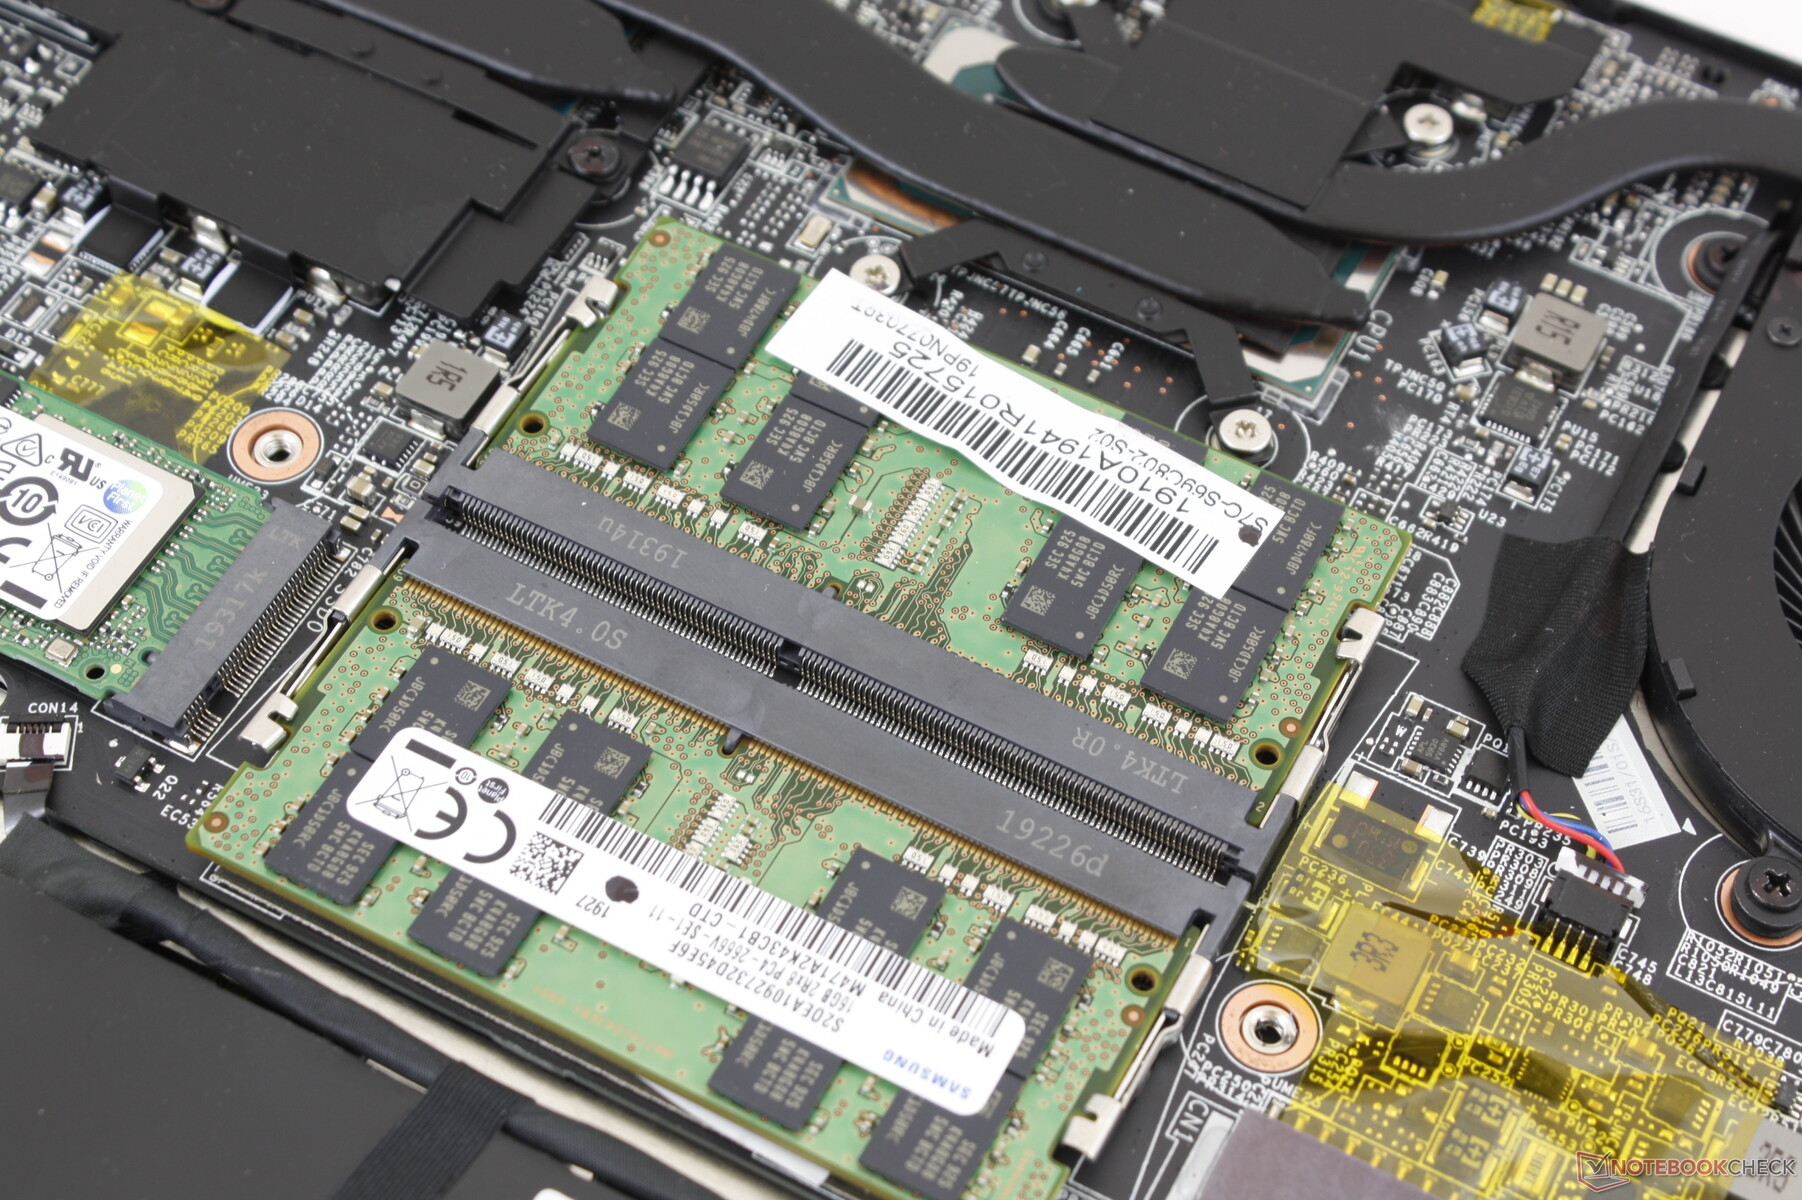
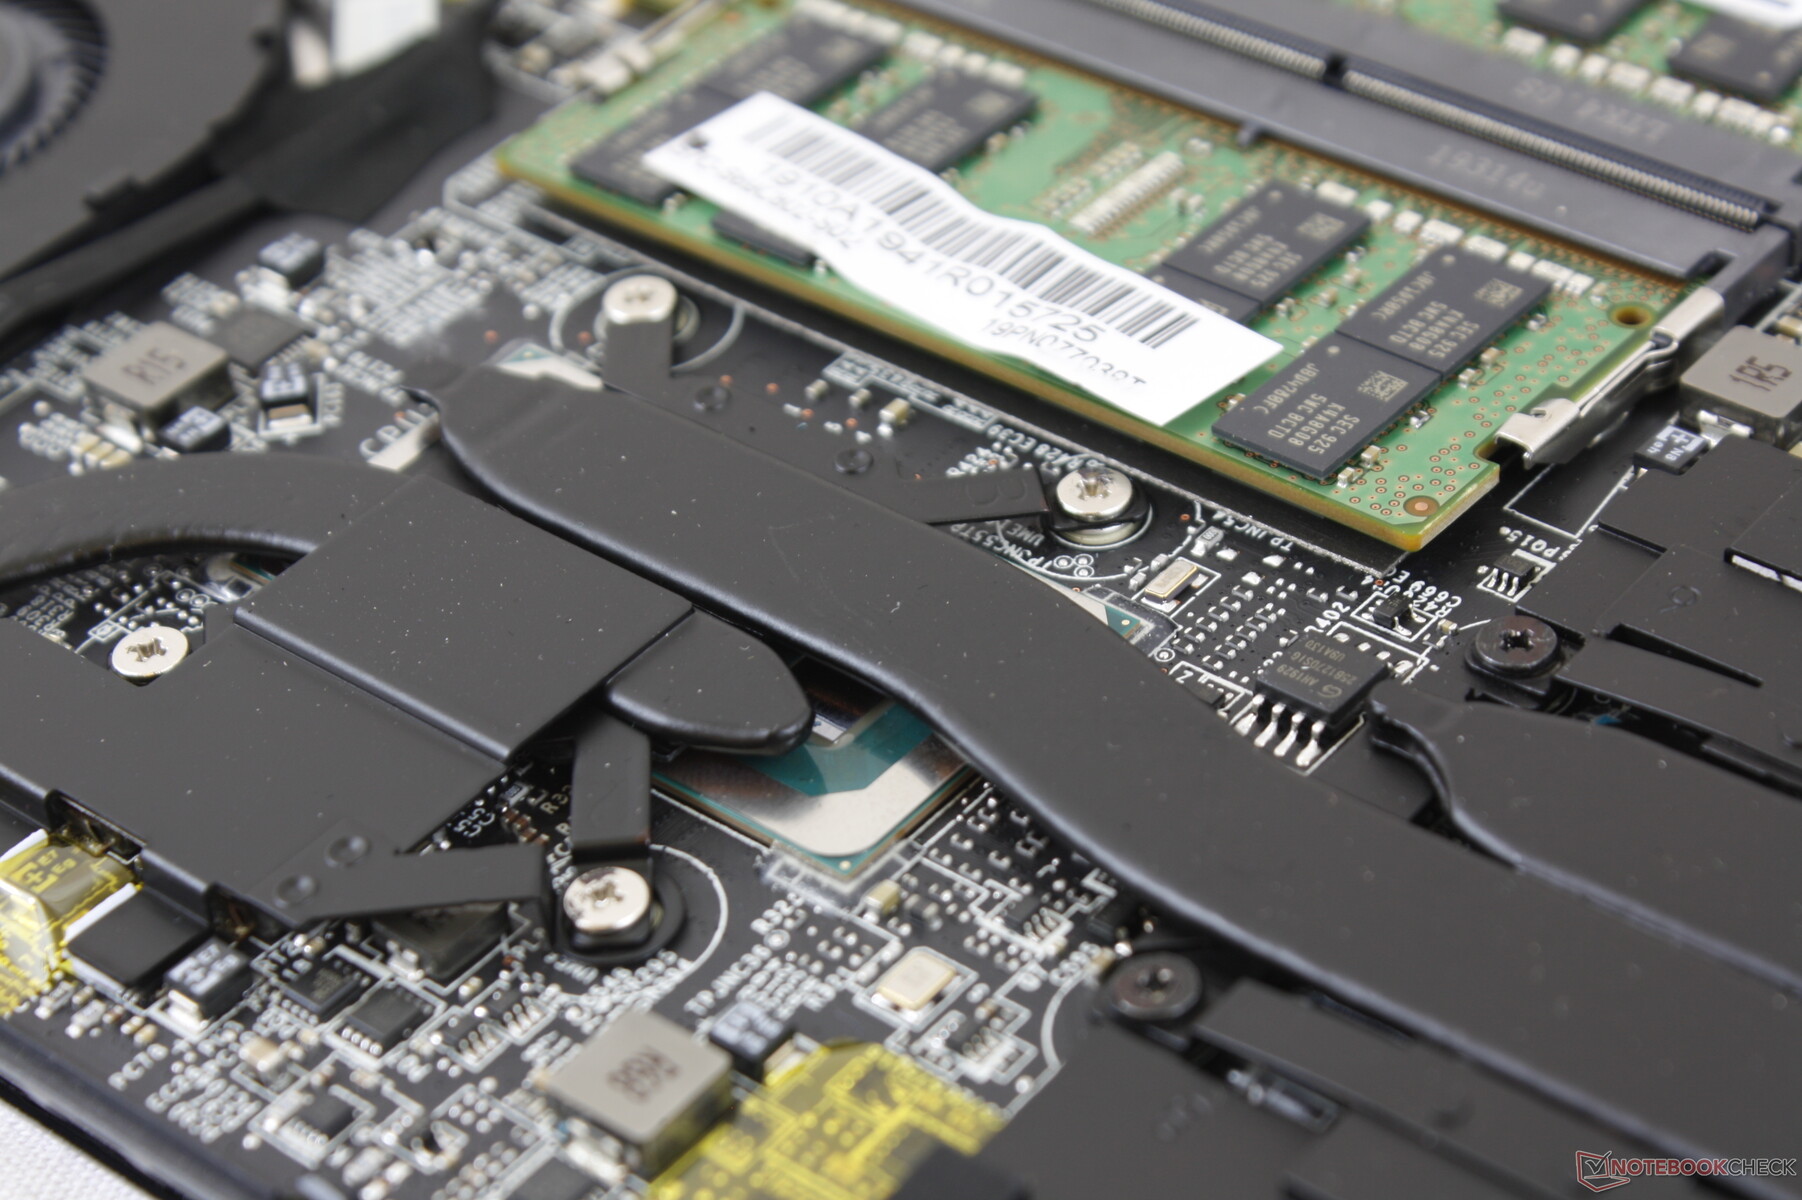
Maintenance - Still Requires Tearing a Factory Seal Sticker
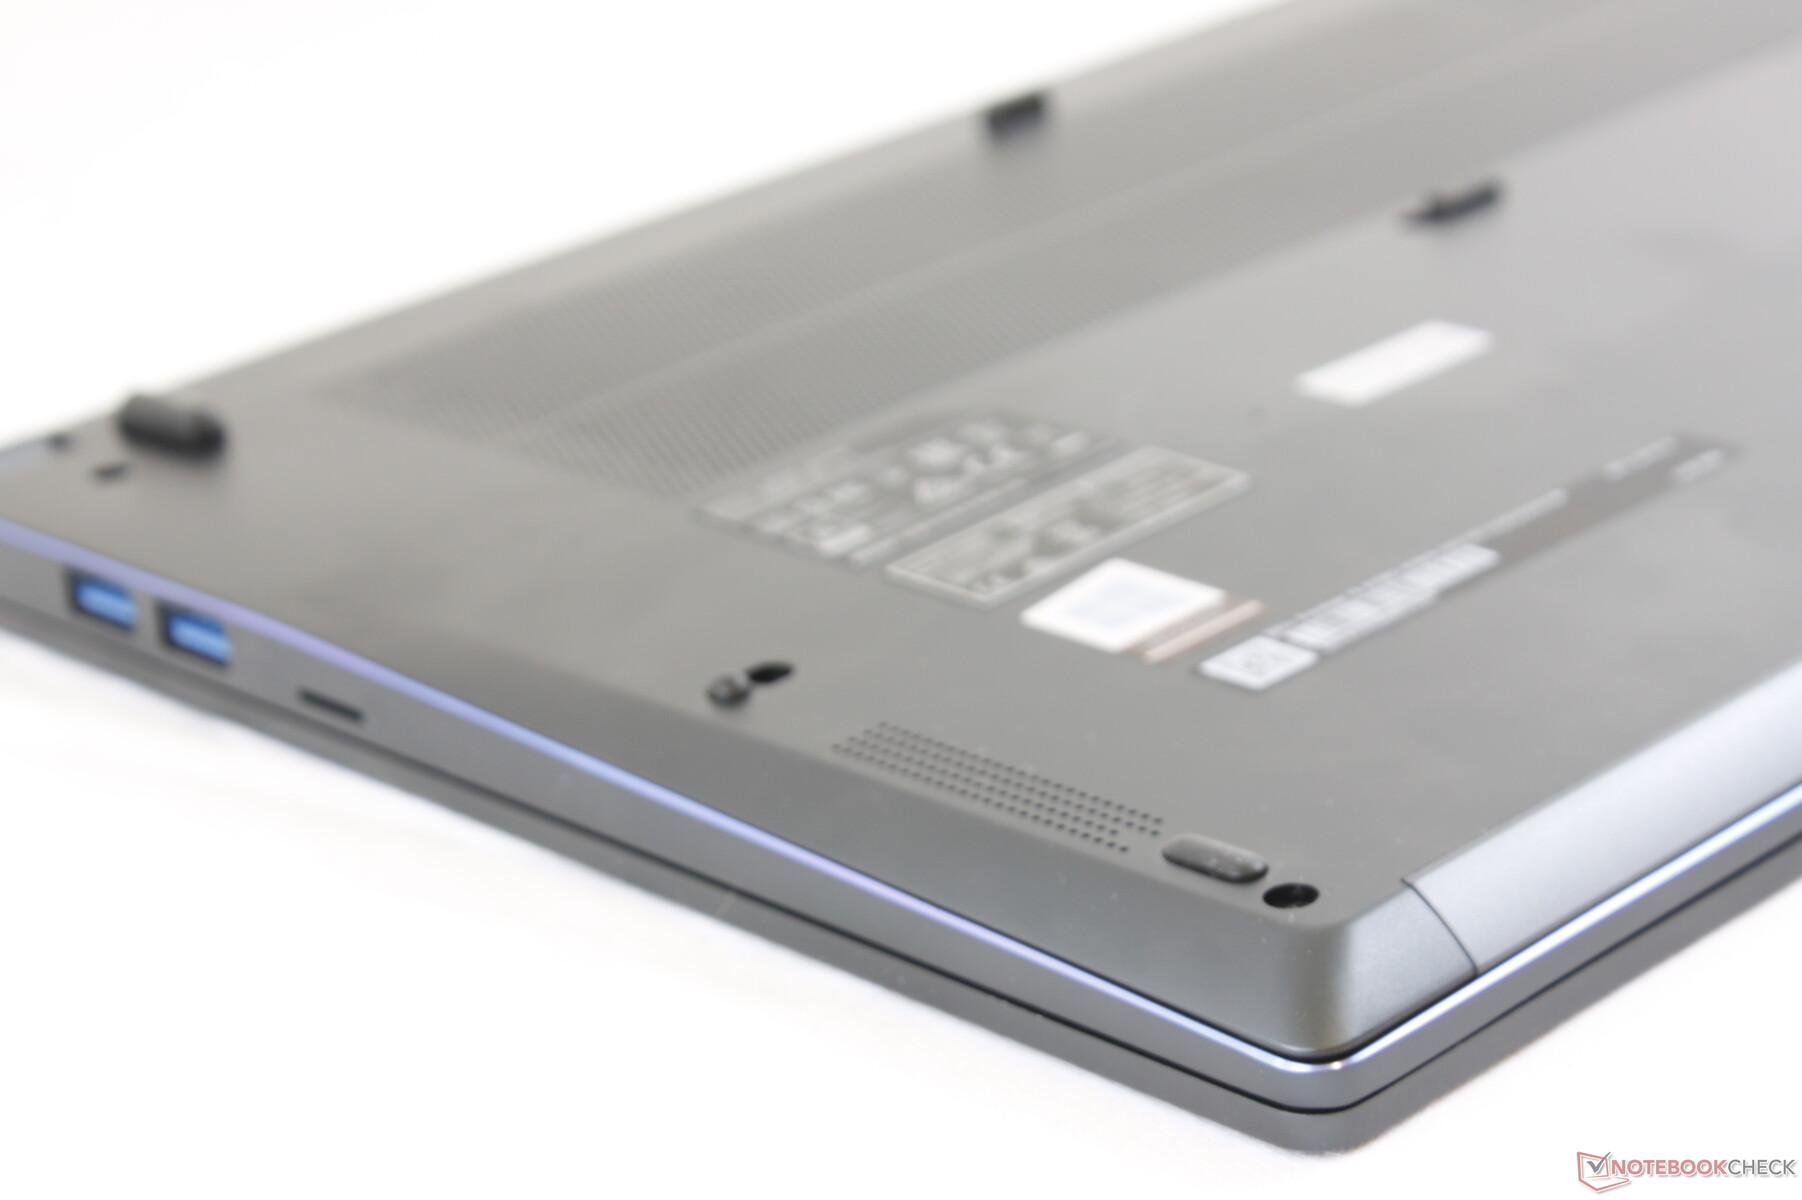
The bottom panel is secured by 11 Philips screws with one hidden underneath a "Factory Seal" sticker. Servicing is relatively easy as owners will get direct access to both RAM slots, both storage bays, the WLAN module, and the internal battery.
Accessories and Warranty
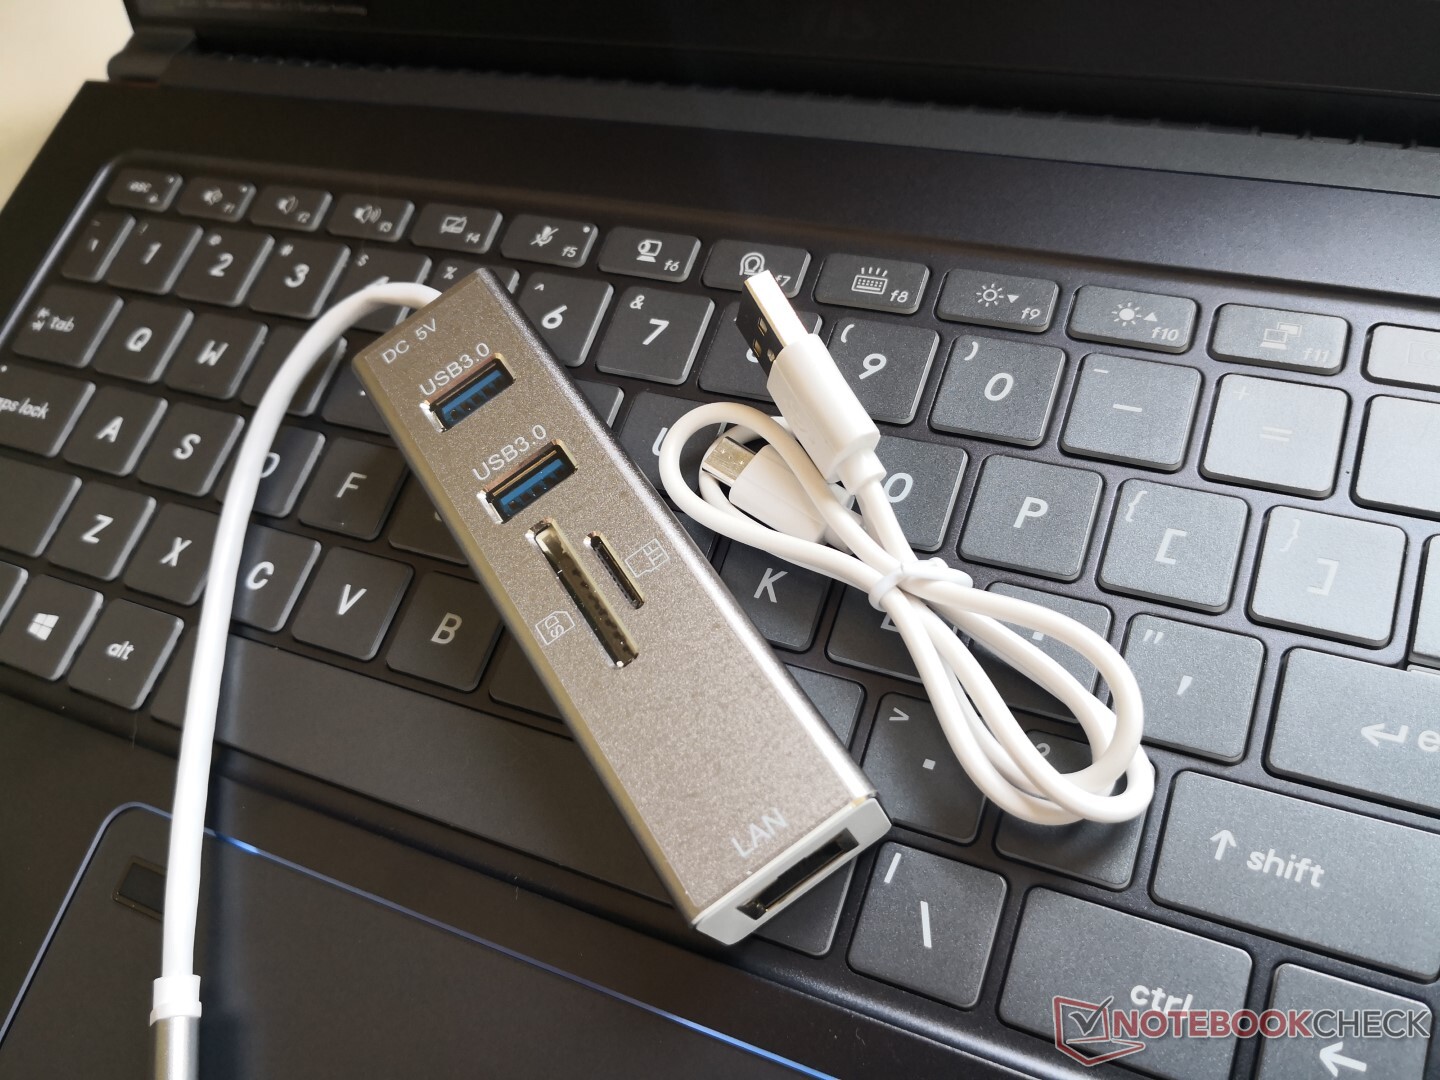
Included extras are a faux leather sleeve and a USB Type-C dock with 2x USB Type-A ports, full-size SD reader, MicroSD reader, RJ-45 port, and a Micro-USB power port. It's definitely cool to see these accessories in the retail box as most other OEMs never include anything outside of the usual AC adapter.
The standard one-year limited warranty applies.
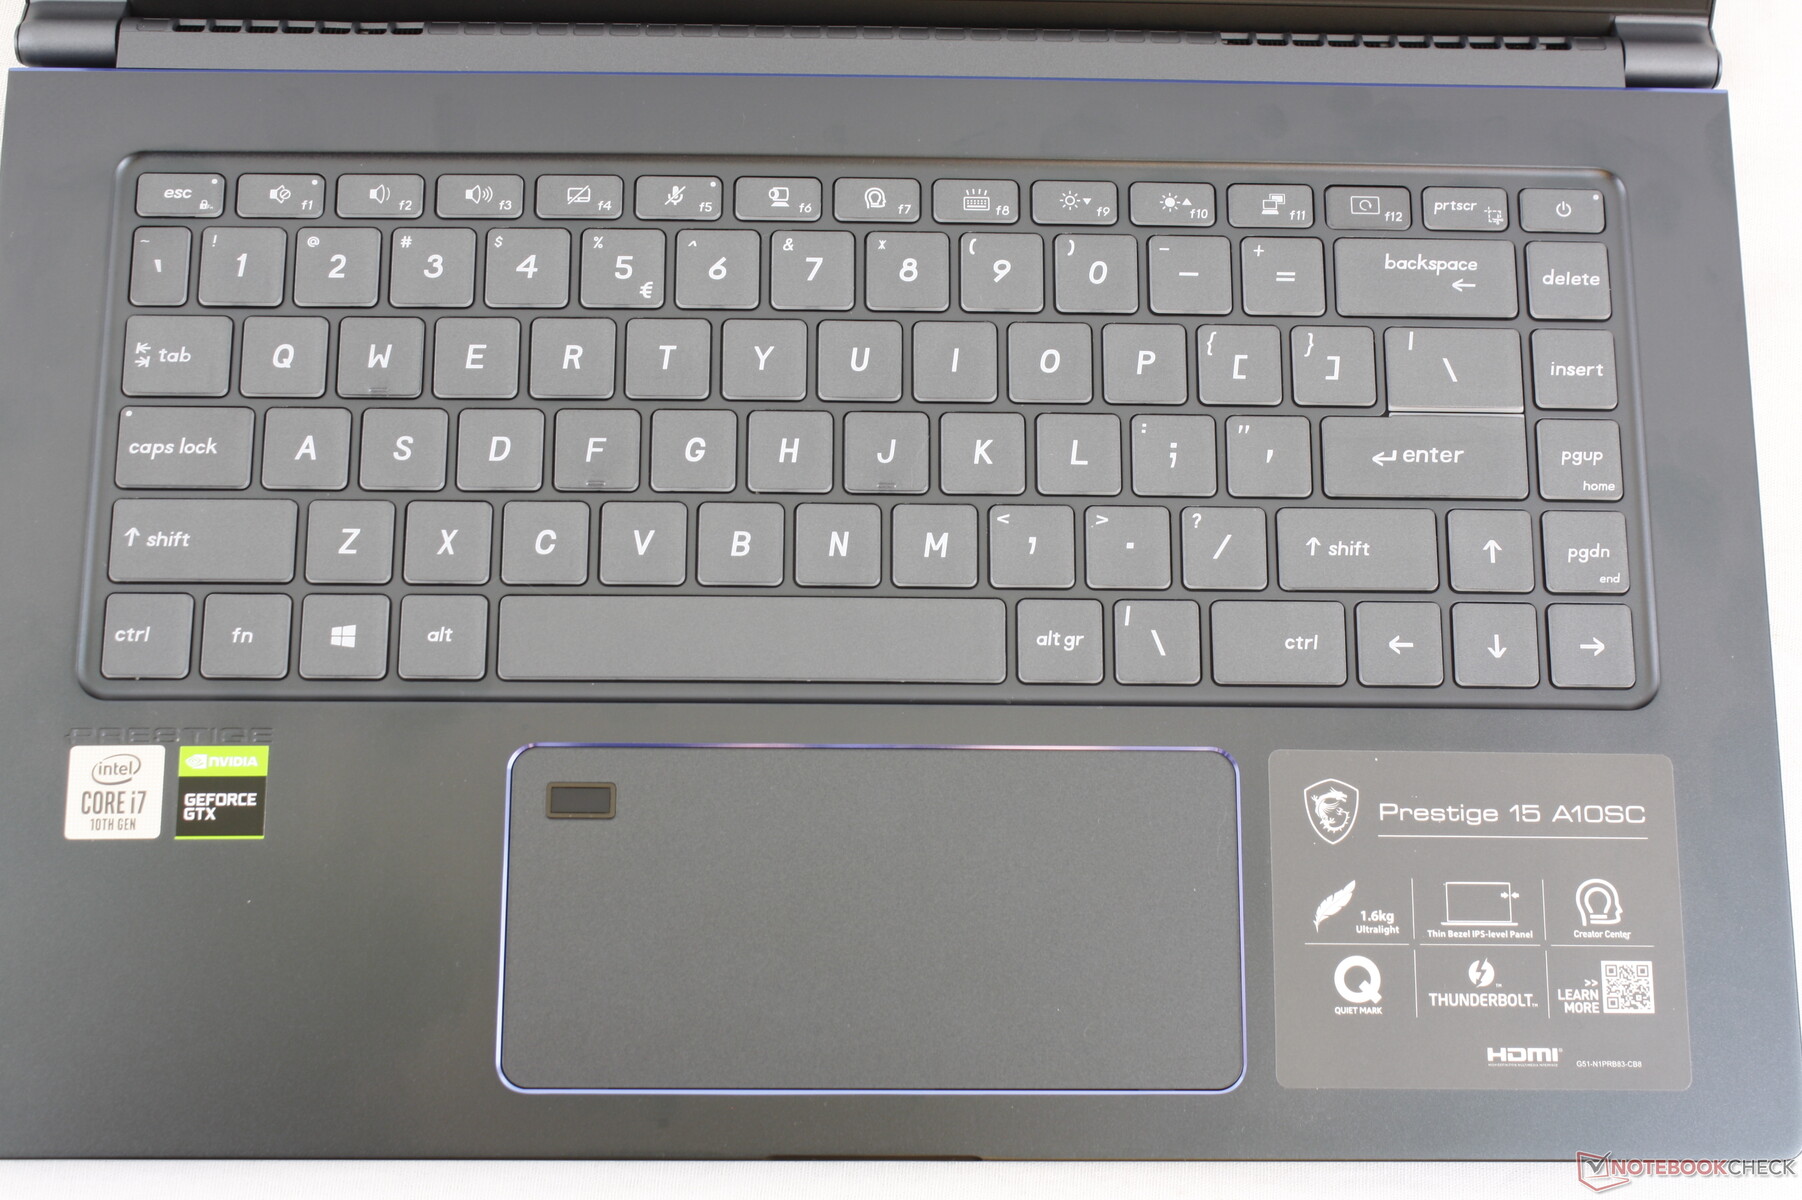
Input Devices - Shallow and Spongy
Keyboard
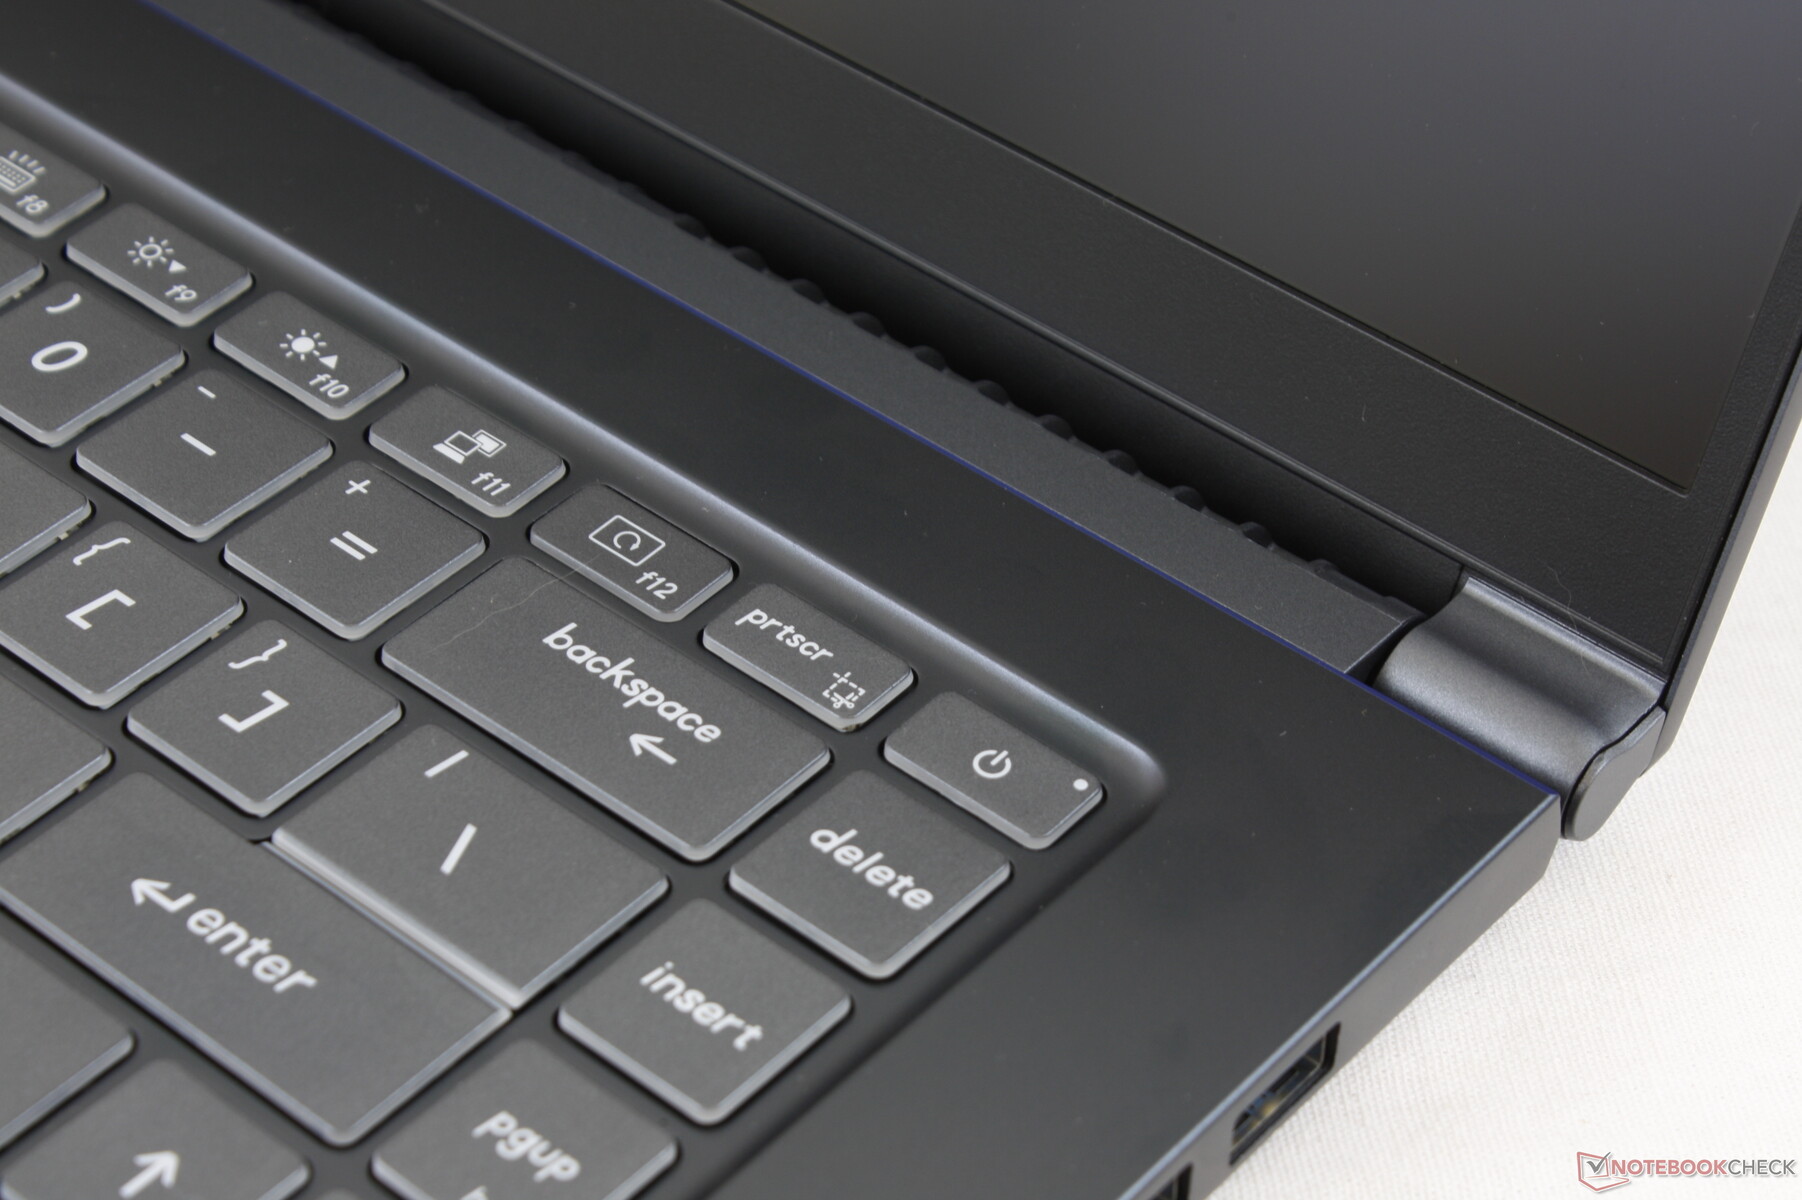
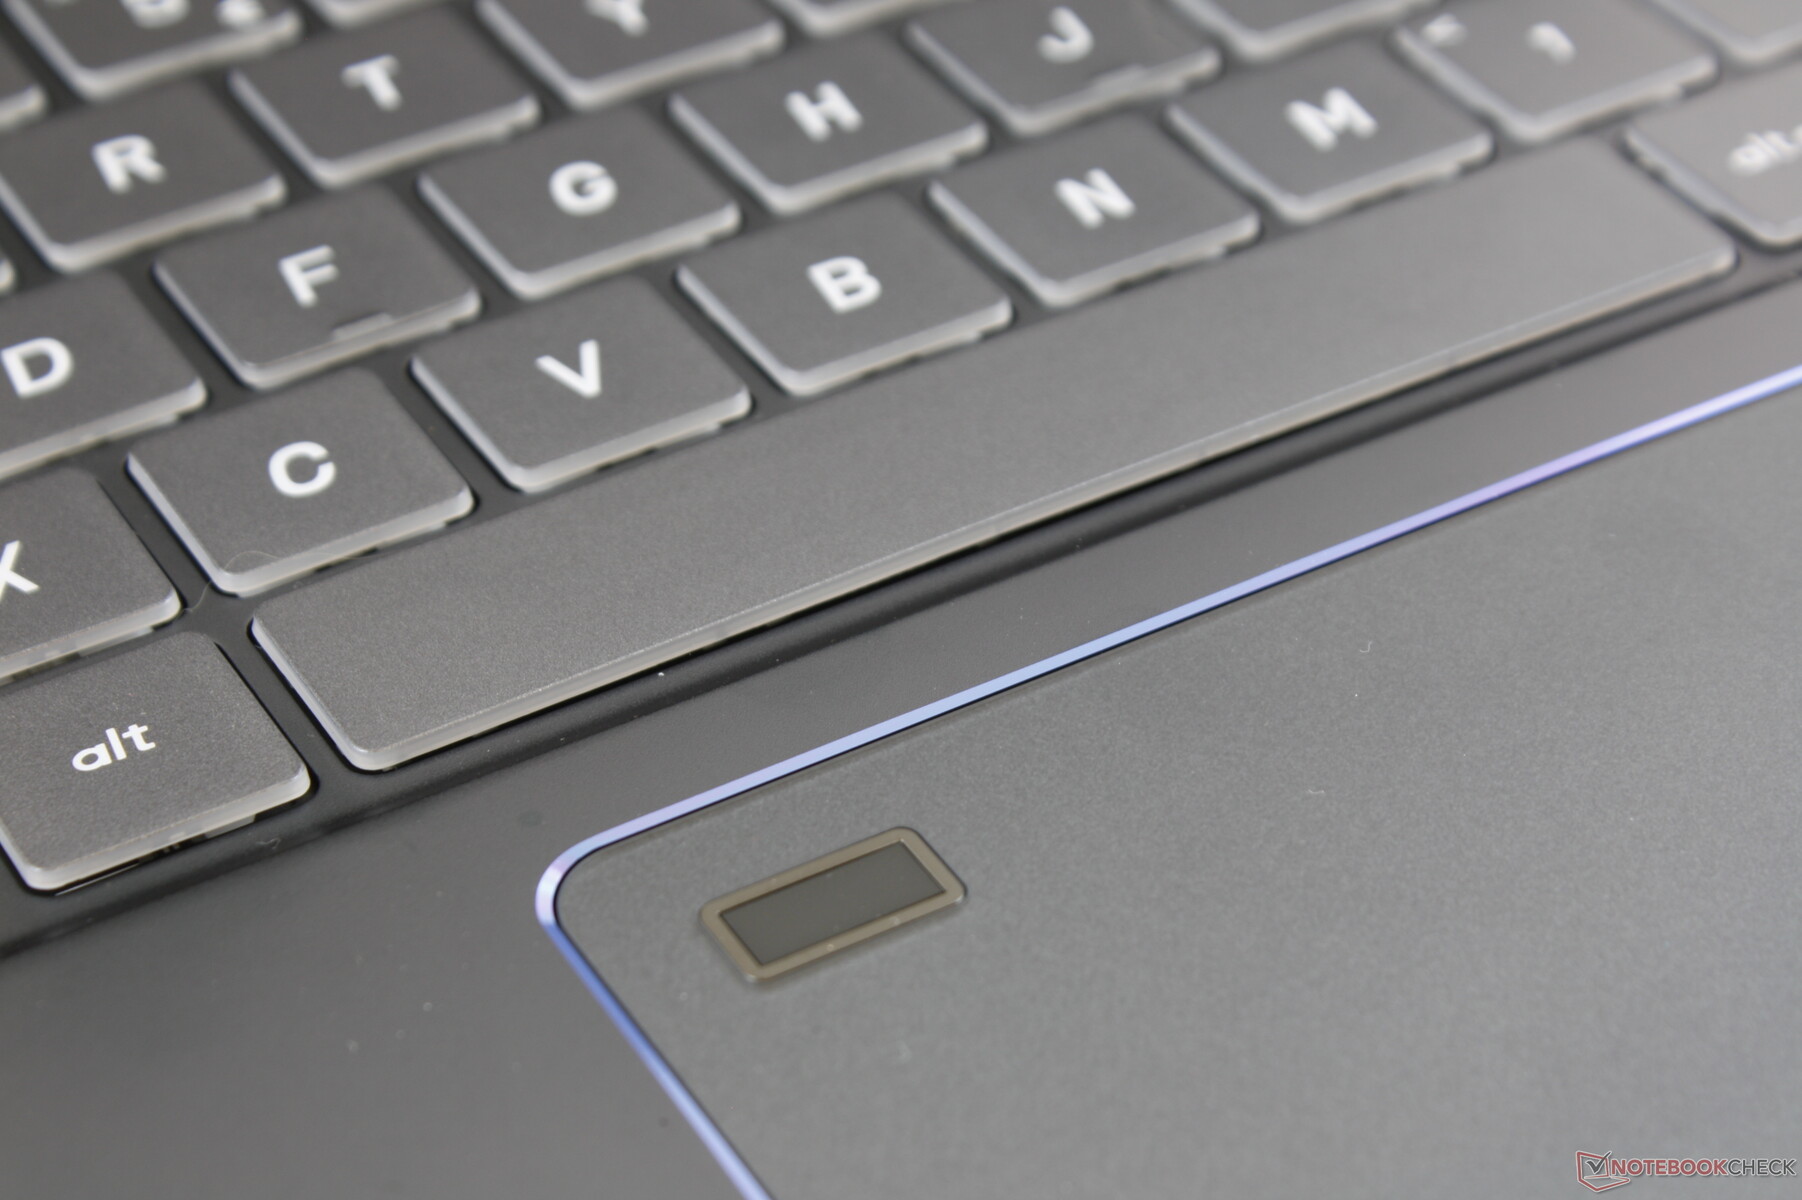
Key size and layout are similar to the GS65 with a few visual differences. The font on the Prestige 15 keys is slightly different while the Power button is now on the corner not unlike on some Asus VivoBook laptops. Though we appreciate that the keyboard feels roomy to type on, key feedback is lighter than we would like. The keys on the XPS 15 or Spectre x360 15 feel crisper and more satisfying than on the MSI. Users accustomed to the generally shallow and light keys of most Ultrabooks should feel right at home with the keyboard on the Prestige 15.
Touchpad
The clickpad (14 x 6.5 cm) is the same as it appears on the GS65 9SG. Its wide surface area makes it more comfortable for multi-touch inputs than most other laptops. Because it's so wide, however, expect some accidental inputs every once in a while since palm rejection is not perfect. The integrated mouse keys are soft in feedback, shallow in travel, and relatively quiet. Dedicated mouse keys would have provided both better accuracy and feedback.


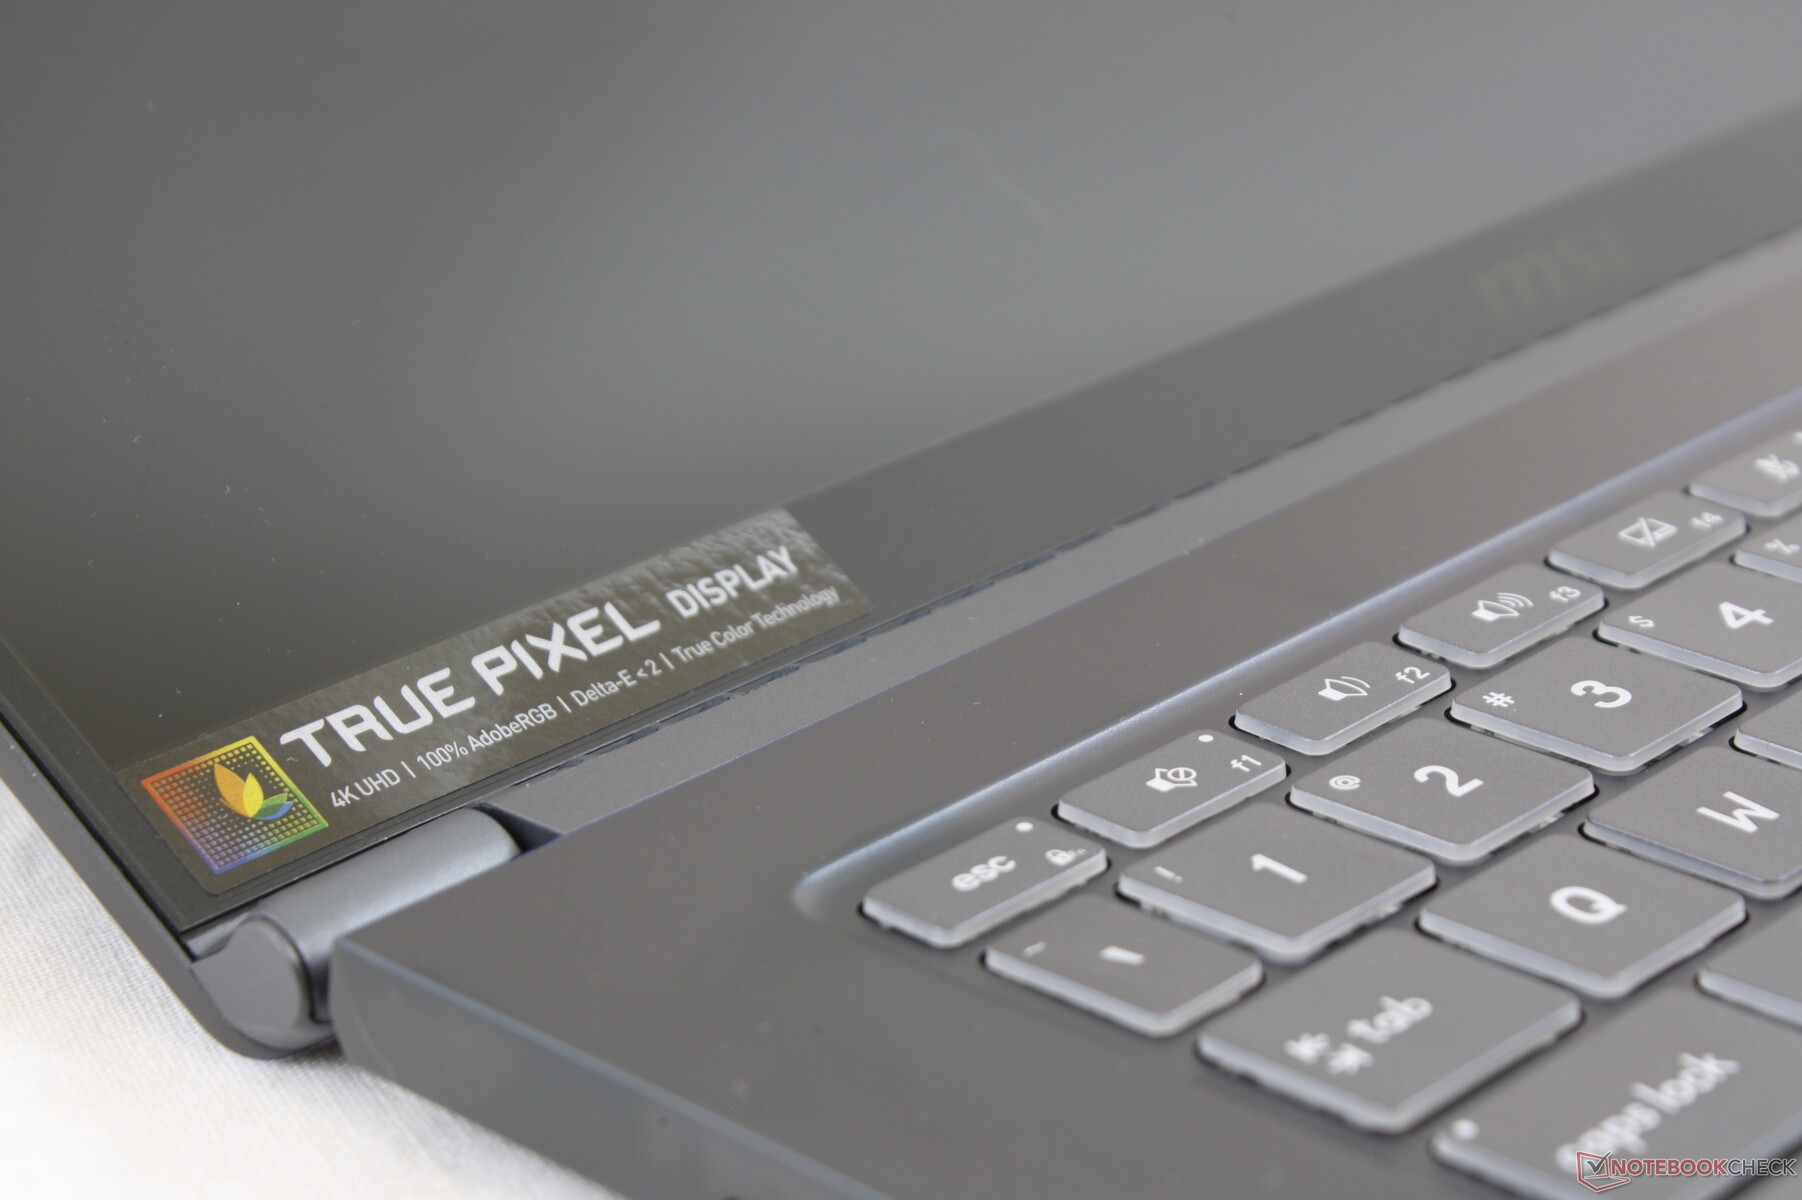
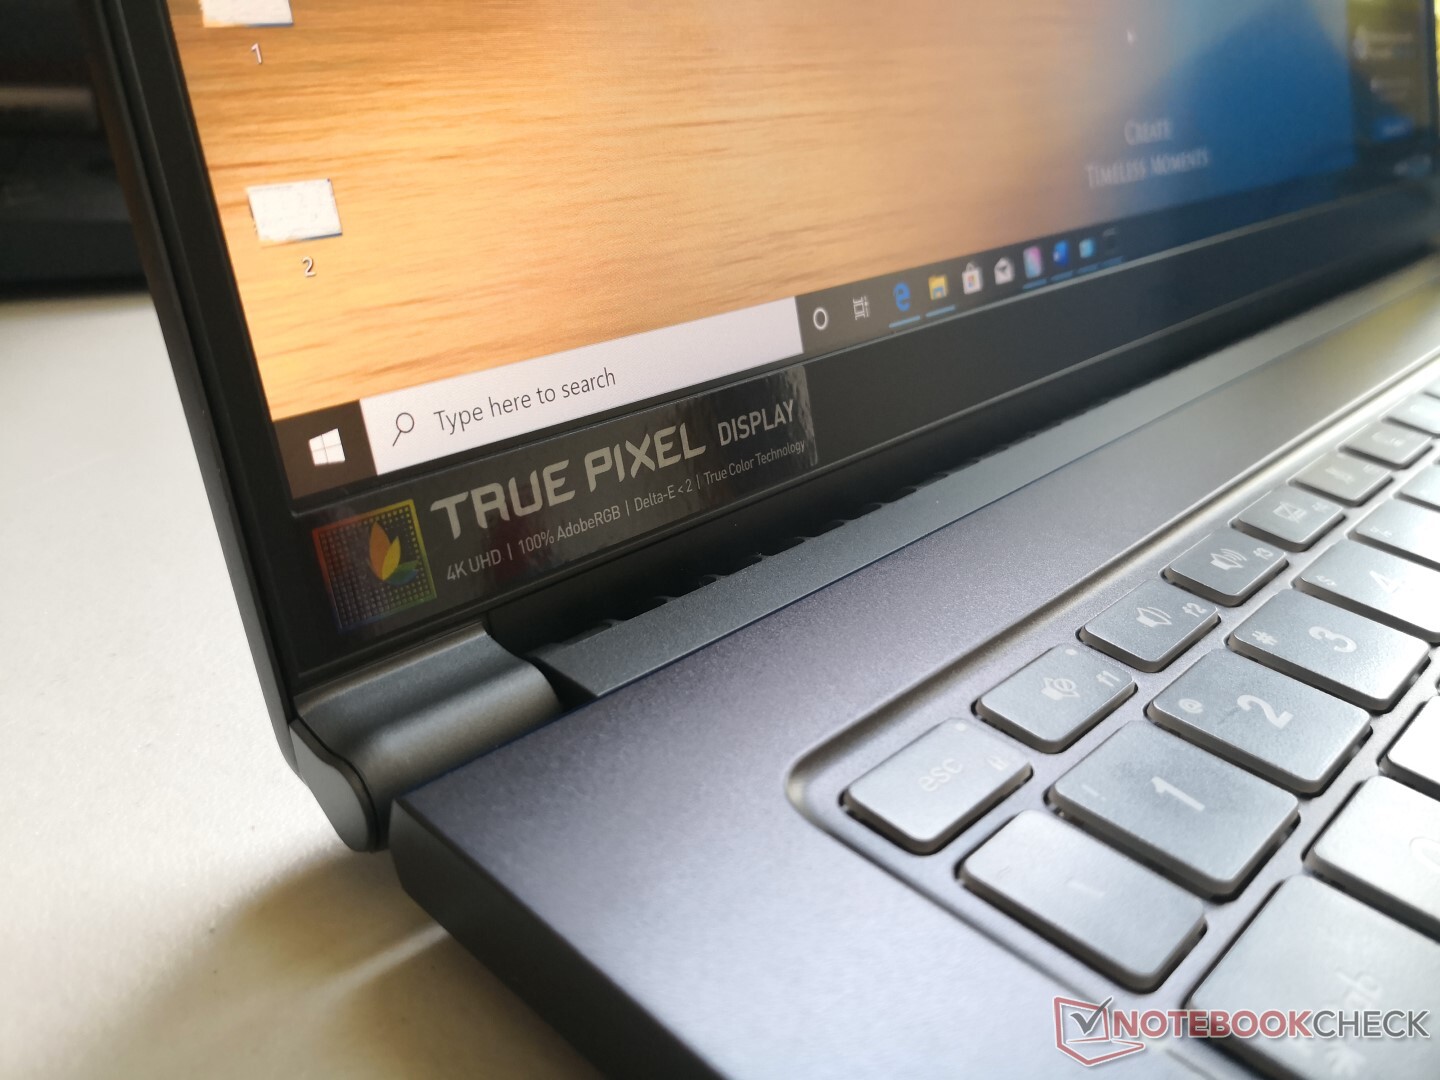
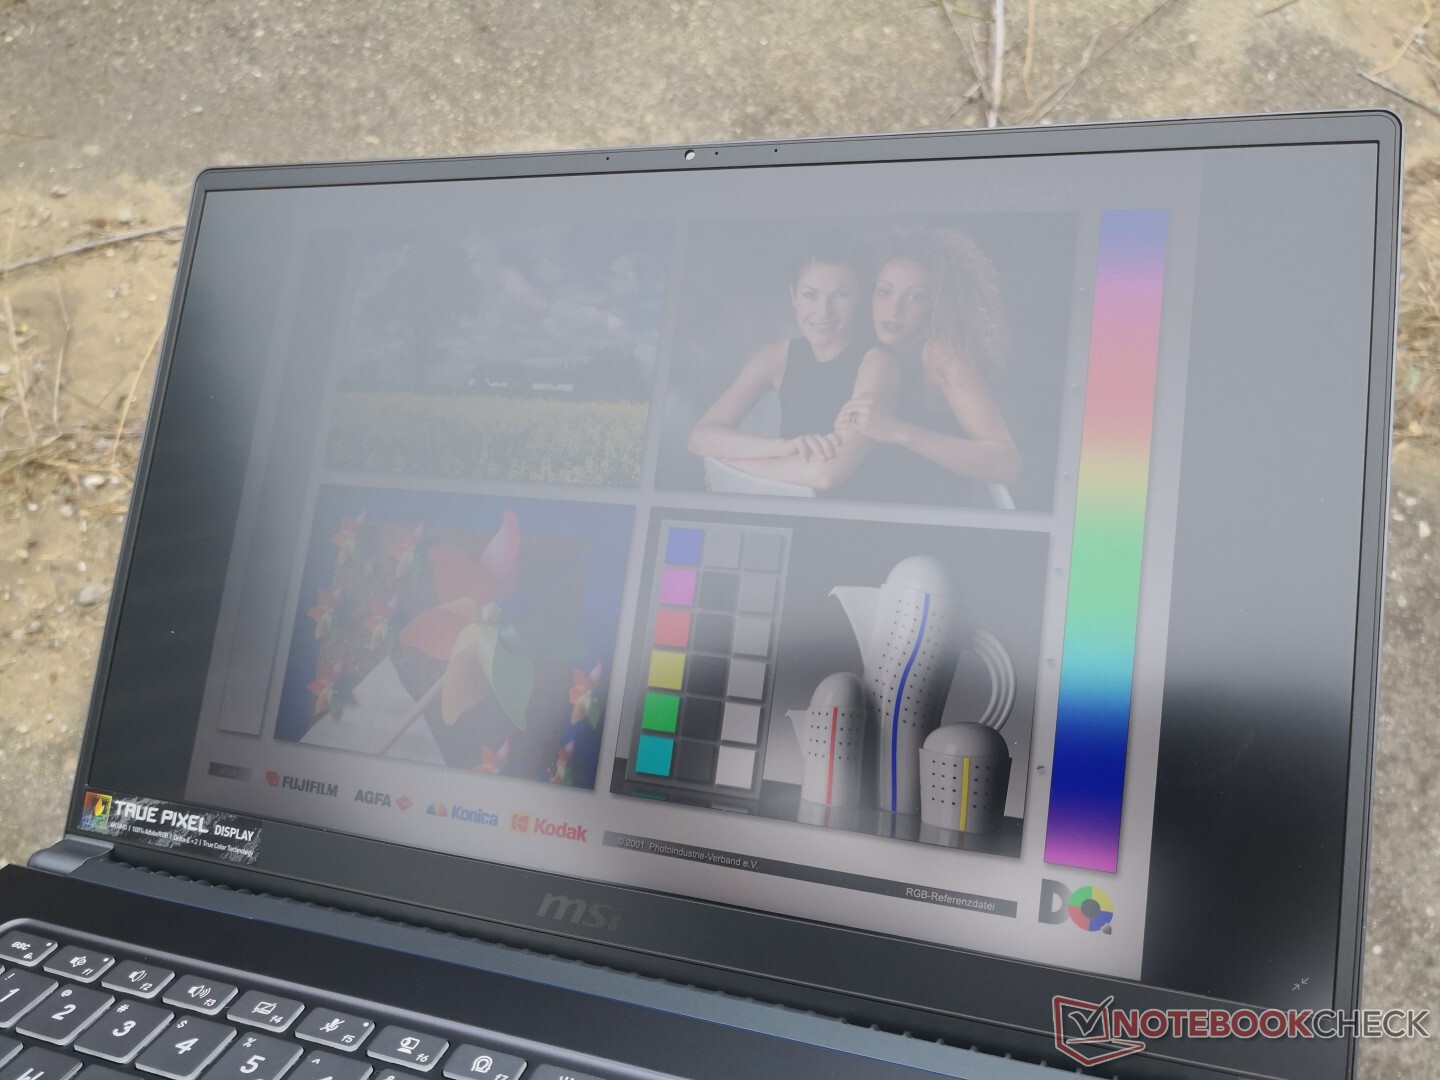
Display - Well-calibrated from the get-go
MSI offers FHD and 4K UHD options for its Prestige 15. Our specific test unit comes equipped with a 4K UHD Sharp LQ156D1JW42 IPS panel that can be found on no other laptop in our database. The more general Sharp LQ156D1, however, can be found on the Lenovo ThinkPad P50 and Dell XPS 15 9570 which exhibit similar contrast ratio and color space characteristics as our MSI unit.
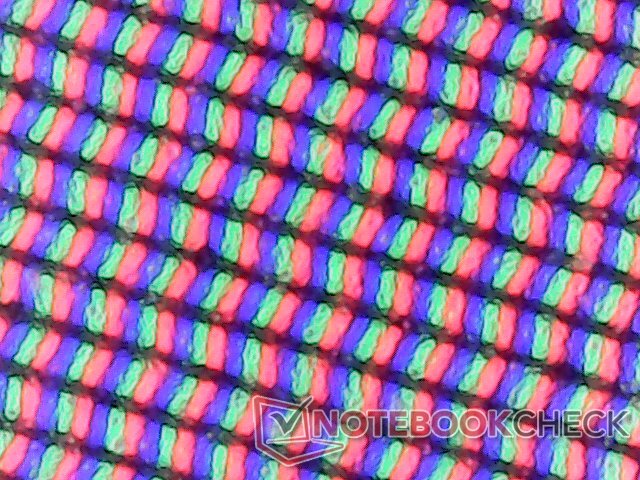
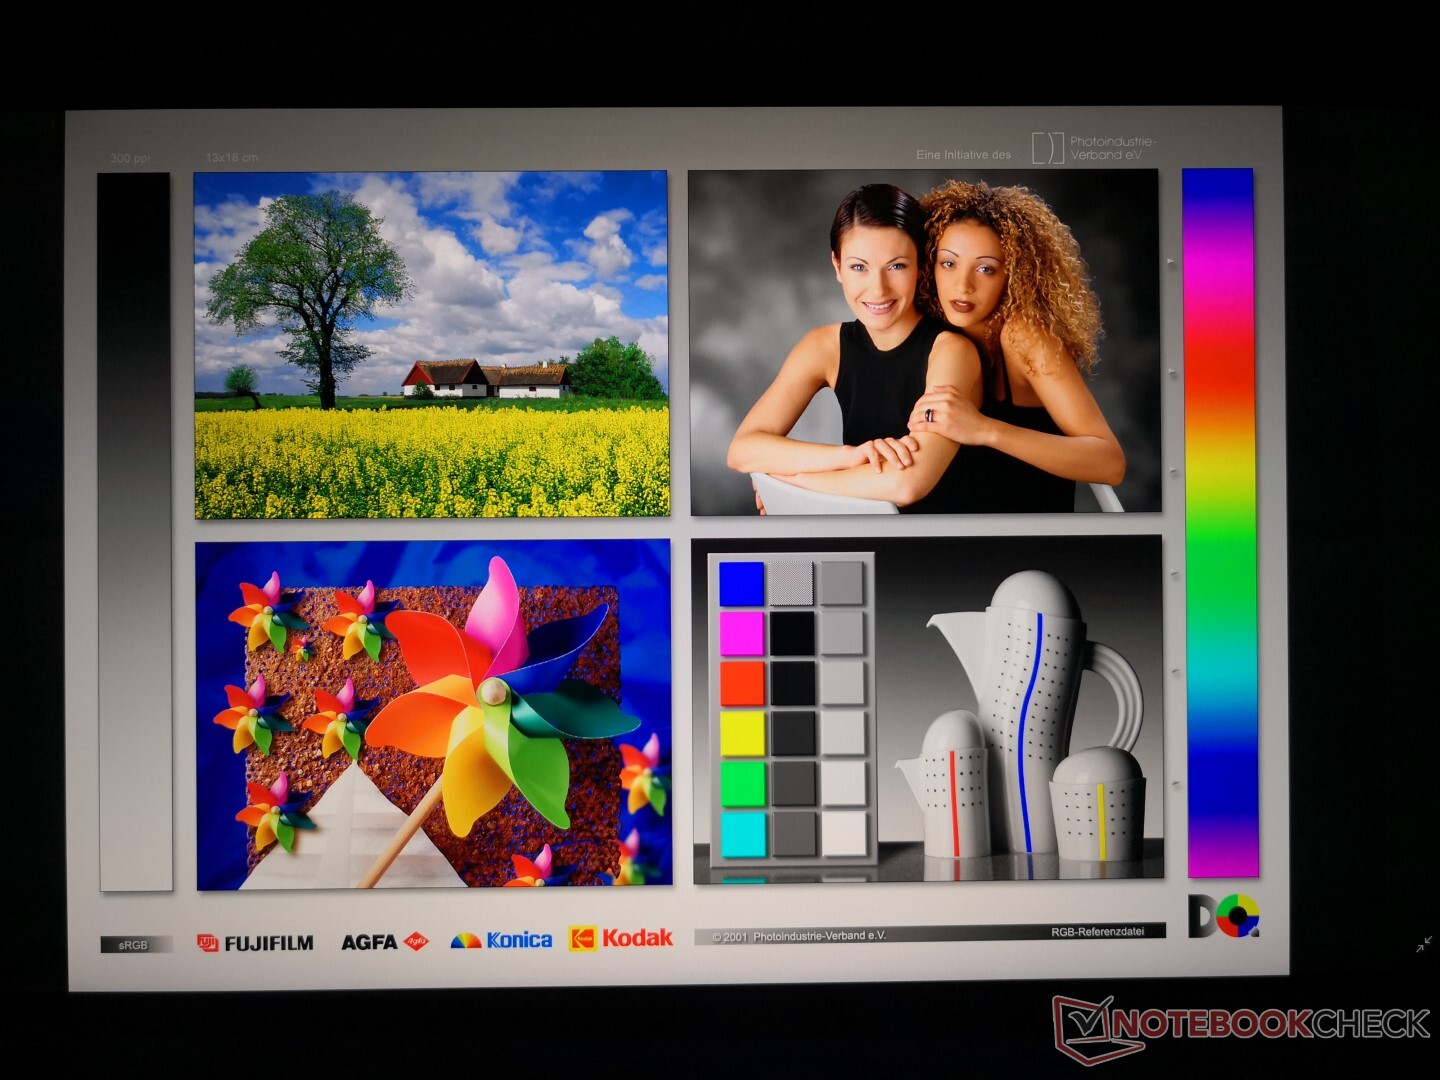
Display quality is excellent with colors that pop and only a minor level of graininess despite the matte overlay. Its backlight in particular is on par with the backlight on the XPS 15 which is brighter than on most other Ultrabooks. The biggest drawback of the display is its slow black-white and gray-gray response times for more noticeable ghosting.

| |||||||||||||||||||||||||
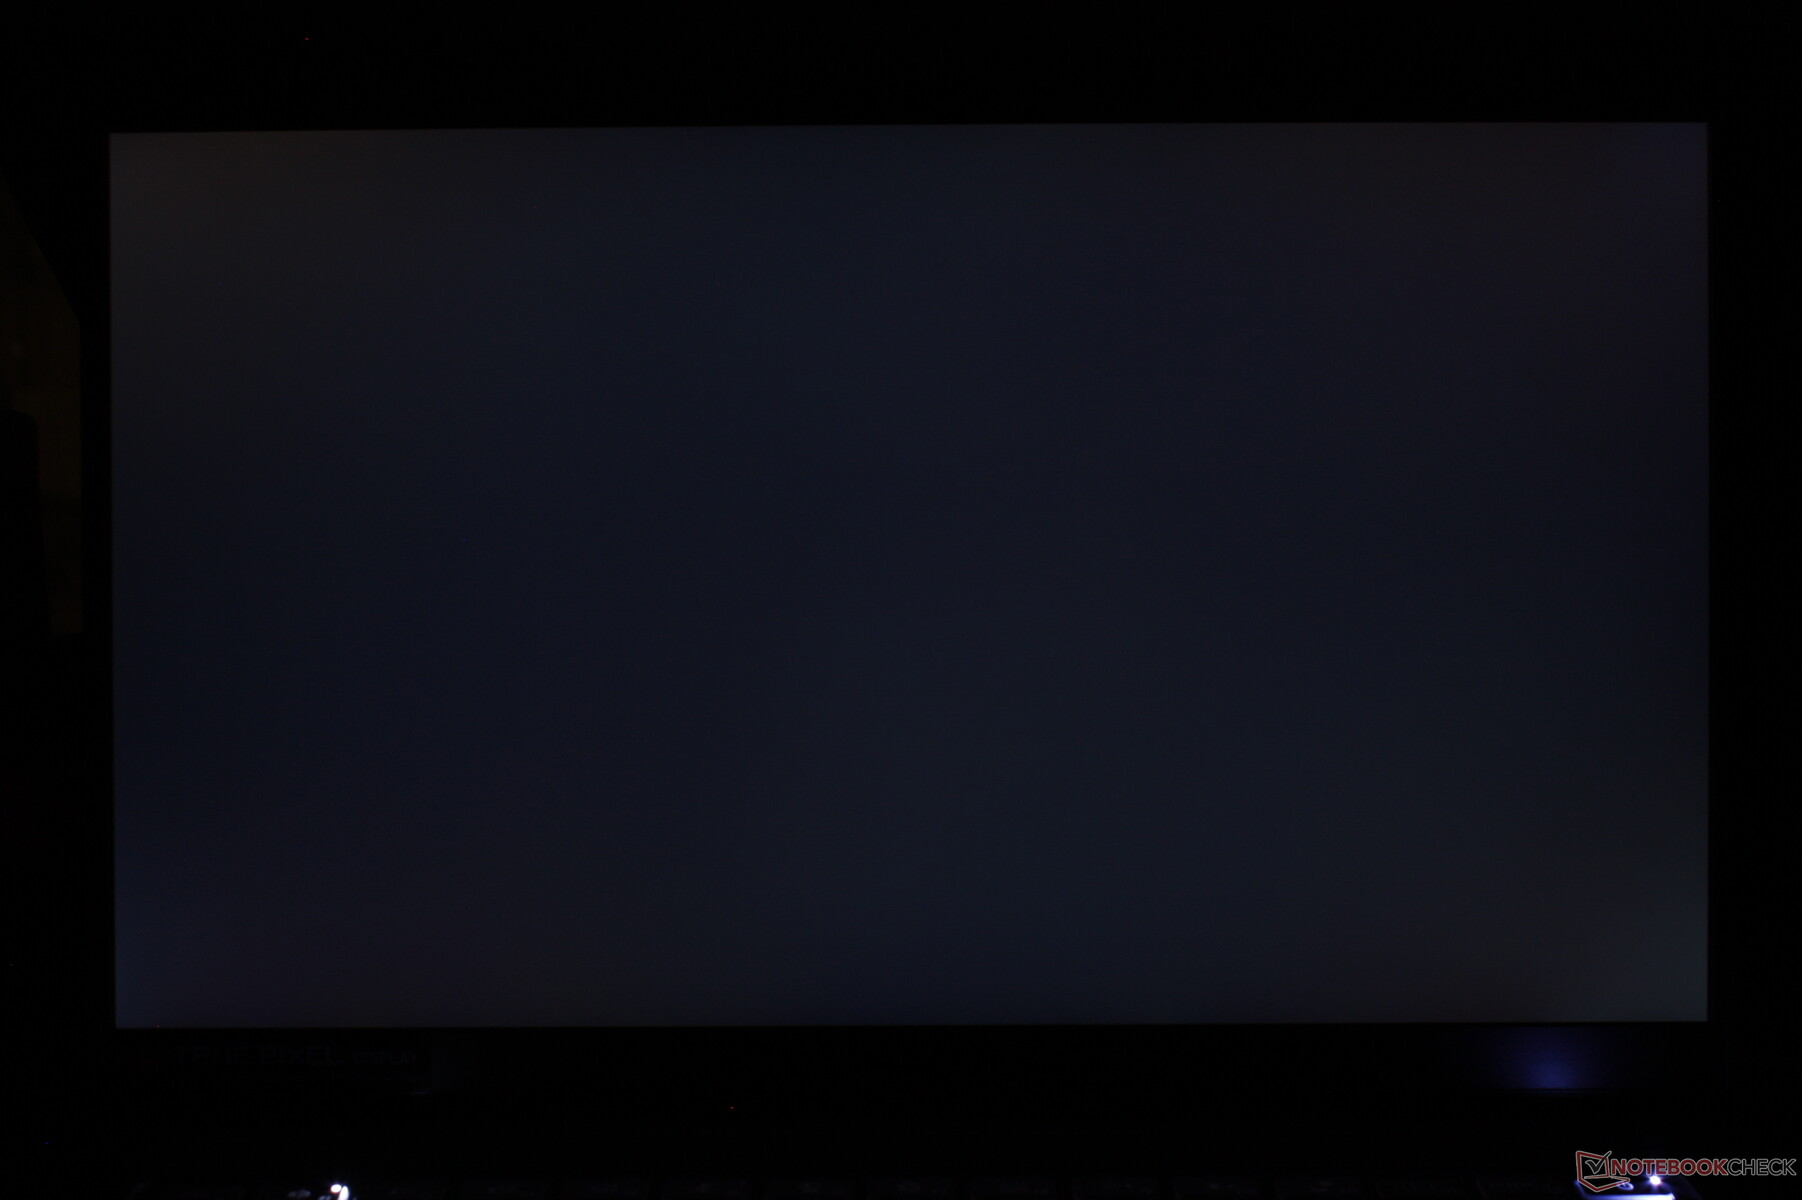
Brightness Distribution: 92 %
Center on Battery: 464.5 cd/m²
Contrast: 929:1 (Black: 0.5 cd/m²)
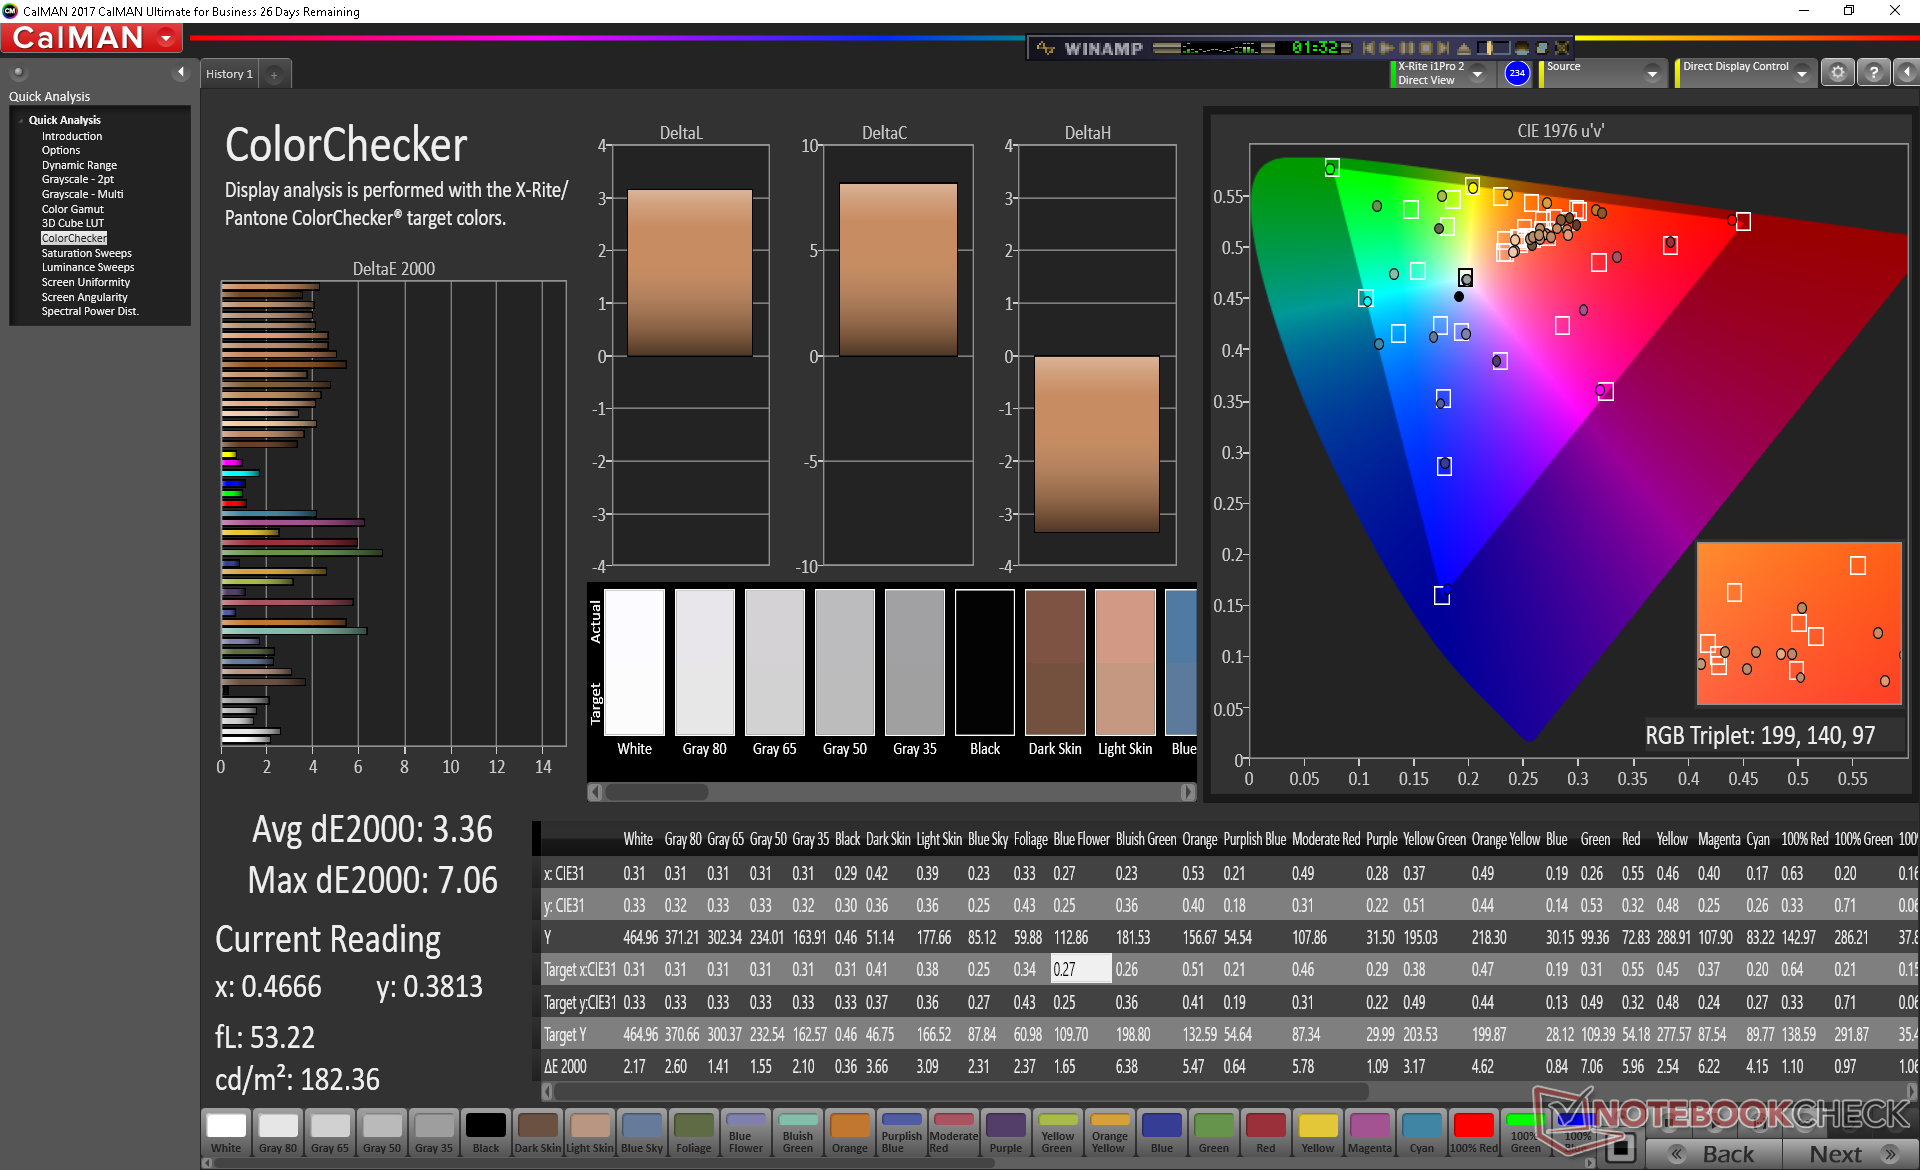
ΔE ColorChecker Calman: 3.36 | ∀{0.5-29.43 Ø4.75}
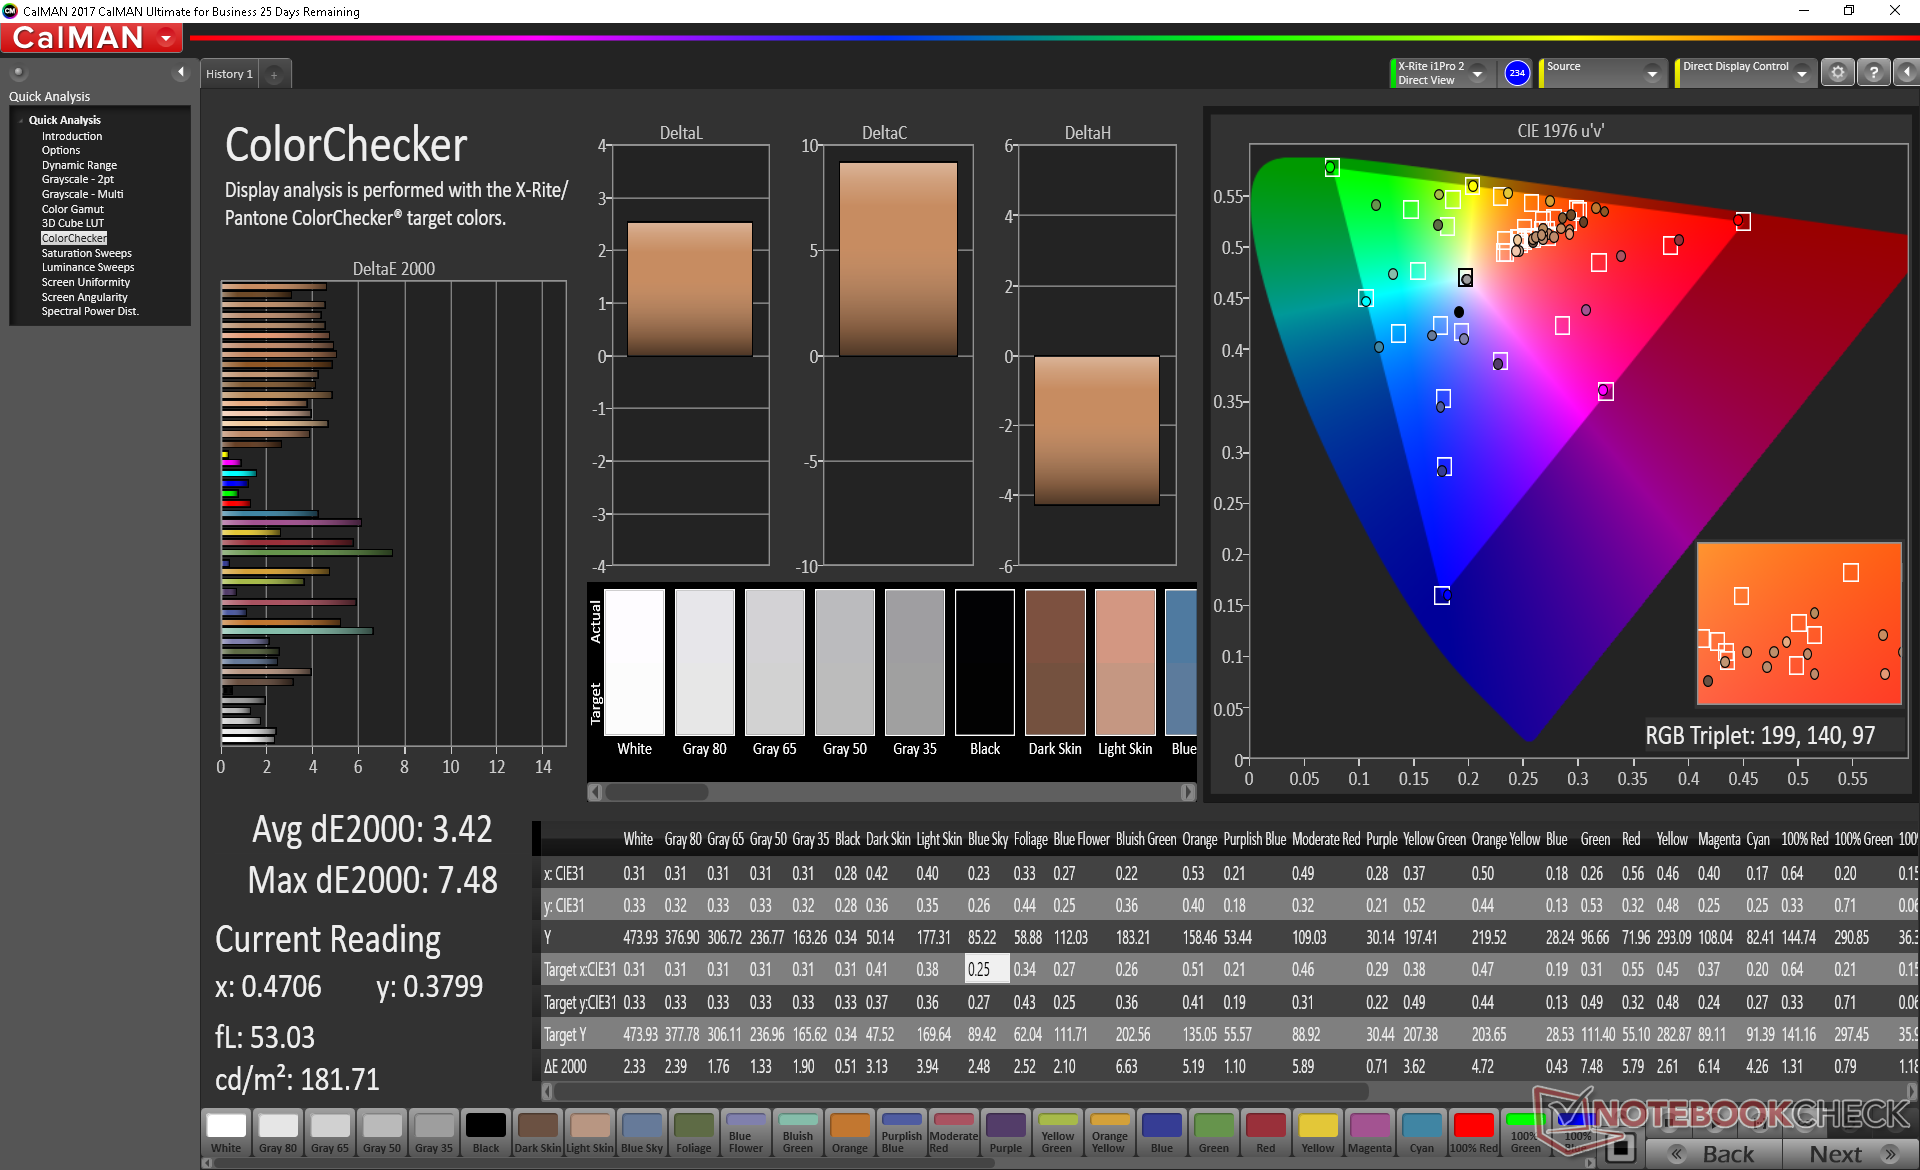
calibrated: 3.42
ΔE Greyscale Calman: 1.3 | ∀{0.09-98 Ø5}
98.3% sRGB (Argyll 1.6.3 3D)
84.8% AdobeRGB 1998 (Argyll 1.6.3 3D)
96.2% AdobeRGB 1998 (Argyll 3D)
98.3% sRGB (Argyll 3D)
82% Display P3 (Argyll 3D)
Gamma: 2.14
CCT: 6596 K
| MSI Prestige 15 A10SC Sharp LQ156D1JW42, IPS, 15.6", 3840x2160 | Microsoft Surface Laptop 3 15 Ryzen 5 3580U Sharp LQ150P1JX51, IPS, 15", 2496x1664 | MSI P65 Creator 9SF-657 AU Optronics AUO41EB, IPS, 15.6", 3840x2160 | Dell Precision 5530 Xeon E-2176M Sharp SHP148D / LQ156D1, IGZO, 15.6", 3840x2160 | Dell Latitude 5500 LGD05FF 156WFD, IPS, 15.6", 1920x1080 | Lenovo ThinkPad T590-20N4002VGE LP156WFC-SPD1, aSi IPS LED, 15.6", 1920x1080 | |
|---|---|---|---|---|---|---|
| Display | -17% | 2% | -9% | -52% | -51% | |
| Display P3 Coverage (%) | 82 | 66.9 -18% | 84.4 3% | 76.5 -7% | 38.07 -54% | 38.79 -53% |
| sRGB Coverage (%) | 98.3 | 99.3 1% | 100 2% | 98.4 0% | 57.3 -42% | 58.3 -41% |
| AdobeRGB 1998 Coverage (%) | 96.2 | 63.7 -34% | 98.5 2% | 76.4 -21% | 39.33 -59% | 40.11 -58% |
| Response Times | 16% | 20% | 19% | 34% | 36% | |
| Response Time Grey 50% / Grey 80% * (ms) | 60 ? | 47.2 ? 21% | 51 ? 15% | 48 ? 20% | 37.6 ? 37% | 37.2 ? 38% |
| Response Time Black / White * (ms) | 41.2 ? | 36.8 ? 11% | 31 ? 25% | 33.6 ? 18% | 28.4 ? 31% | 27.2 ? 34% |
| PWM Frequency (Hz) | 26040 ? | 21370 ? | 1000 | |||
| Screen | 4% | -31% | -16% | -39% | -43% | |
| Brightness middle (cd/m²) | 464.5 | 416.9 -10% | 445 -4% | 451.7 -3% | 234 -50% | 276 -41% |
| Brightness (cd/m²) | 451 | 389 -14% | 462 2% | 440 -2% | 229 -49% | 262 -42% |
| Brightness Distribution (%) | 92 | 86 -7% | 83 -10% | 90 -2% | 93 1% | 88 -4% |
| Black Level * (cd/m²) | 0.5 | 0.4 20% | 0.5 -0% | 0.4 20% | 0.23 54% | 0.23 54% |
| Contrast (:1) | 929 | 1042 12% | 890 -4% | 1129 22% | 1017 9% | 1200 29% |
| Colorchecker dE 2000 * | 3.36 | 2.75 18% | 4.75 -41% | 3.11 7% | 5.2 -55% | 5.6 -67% |
| Colorchecker dE 2000 max. * | 7.06 | 6.64 6% | 7.79 -10% | 8.62 -22% | 14.7 -108% | 16.4 -132% |
| Colorchecker dE 2000 calibrated * | 3.42 | 0.71 79% | 3.07 10% | 4.6 -35% | 4.7 -37% | |
| Greyscale dE 2000 * | 1.3 | 1.8 -38% | 4.49 -245% | 3.7 -185% | 2.5 -92% | 3 -131% |
| Gamma | 2.14 103% | 2.09 105% | 2.49 88% | 2.11 104% | 2.44 90% | 2.18 101% |
| CCT | 6596 99% | 6646 98% | 7374 88% | 6492 100% | 6649 98% | 7075 92% |
| Color Space (Percent of AdobeRGB 1998) (%) | 84.8 | 63.4 -25% | 87 3% | 69 -19% | 36.2 -57% | 36.9 -56% |
| Color Space (Percent of sRGB) (%) | 98.3 | 99.4 1% | 100 2% | 98 0% | 57 -42% | 58.1 -41% |
| Total Average (Program / Settings) | 1% /
1% | -3% /
-17% | -2% /
-10% | -19% /
-32% | -19% /
-34% |
* ... smaller is better
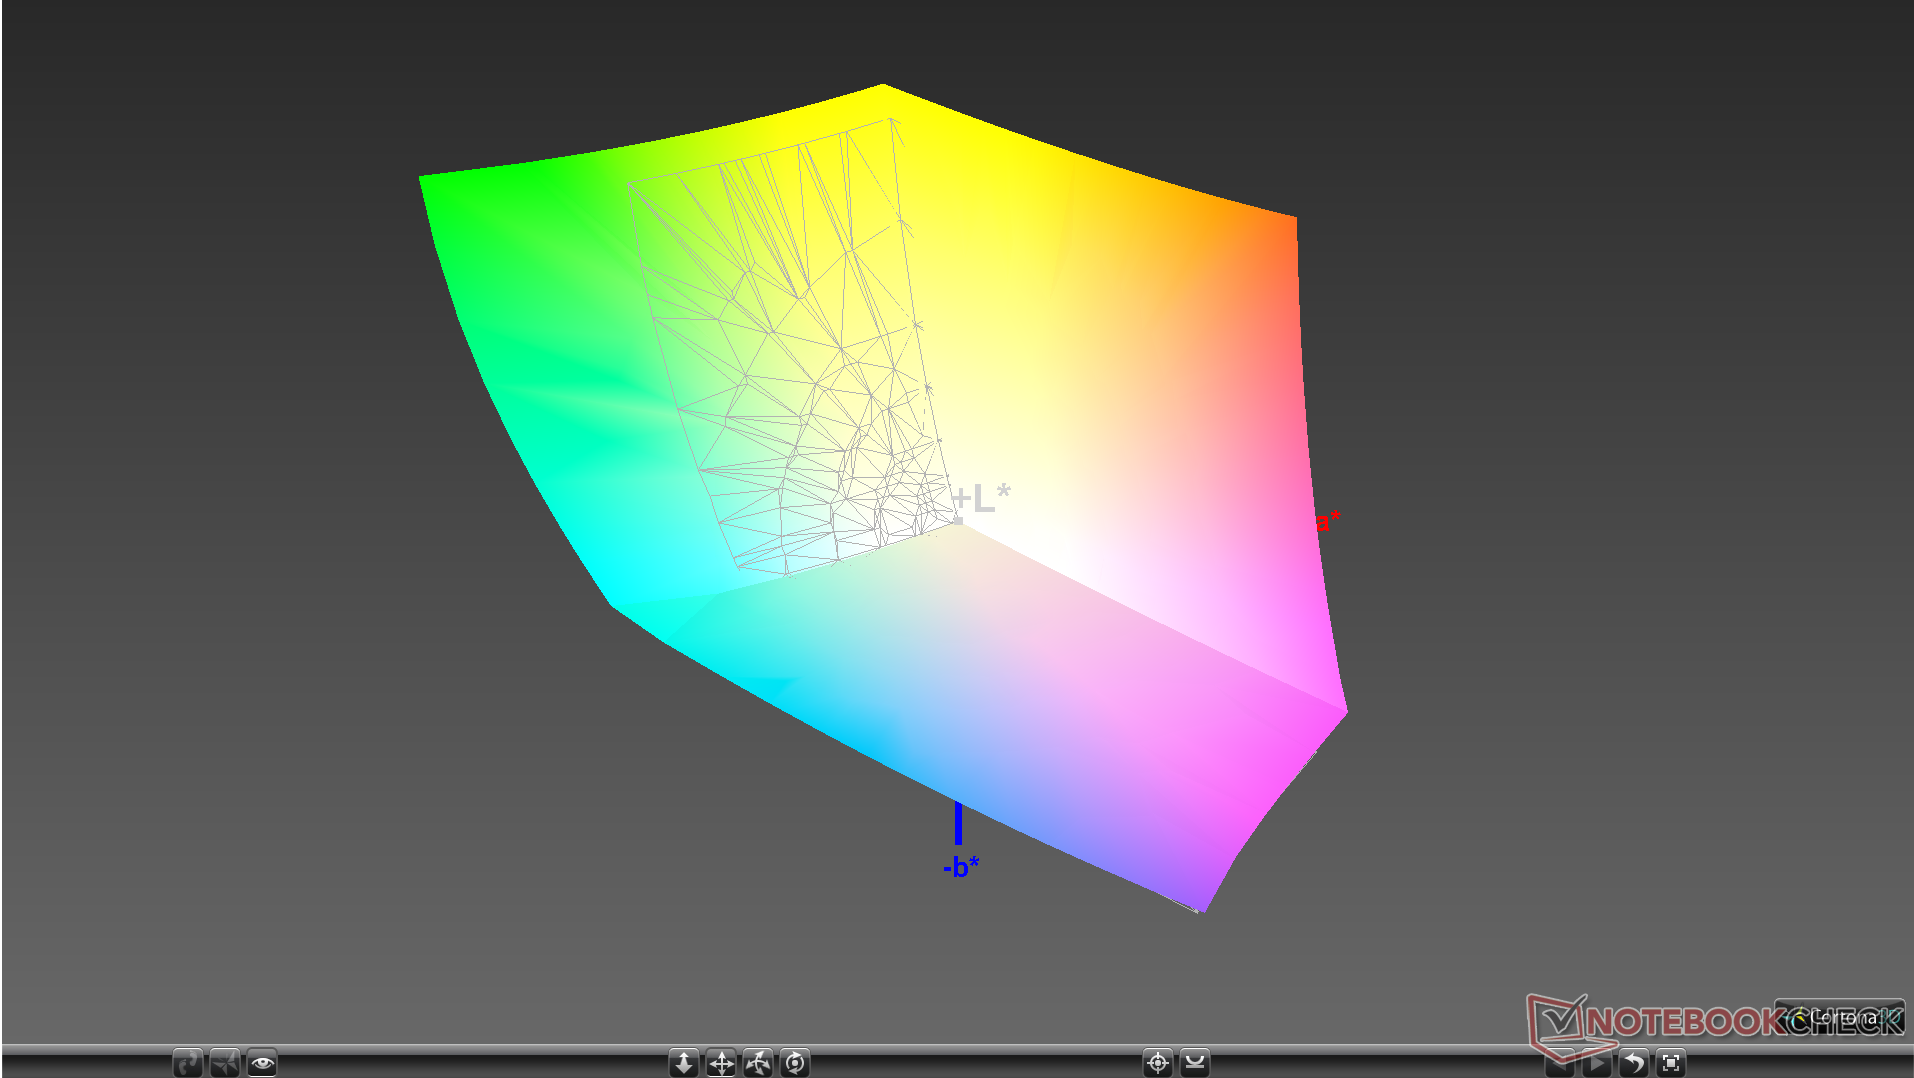
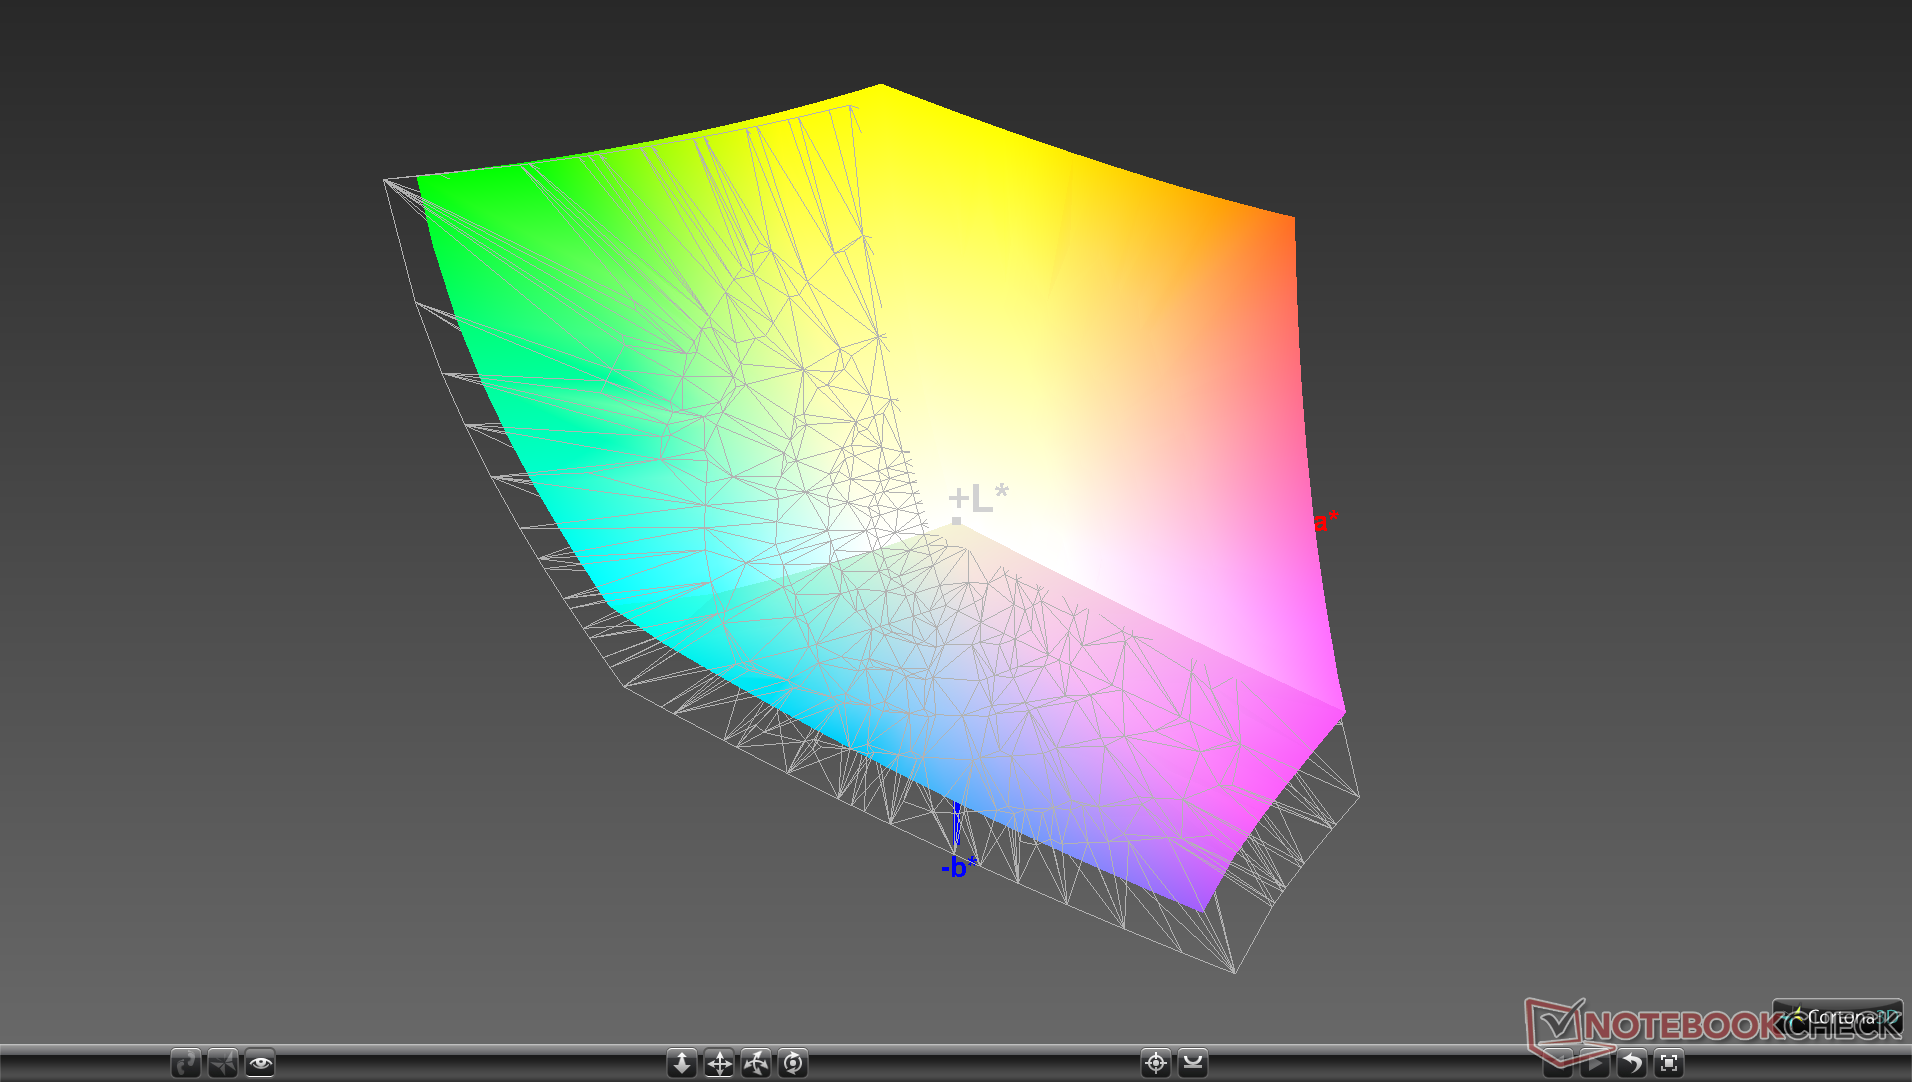
Color space is nearly identical to the P65 Creator and wider than on most sub-4K laptops including the Microsoft Surface Laptop 3 15. MSI claims full AdobeRGB coverage which we can confirm with our own independent measurements.
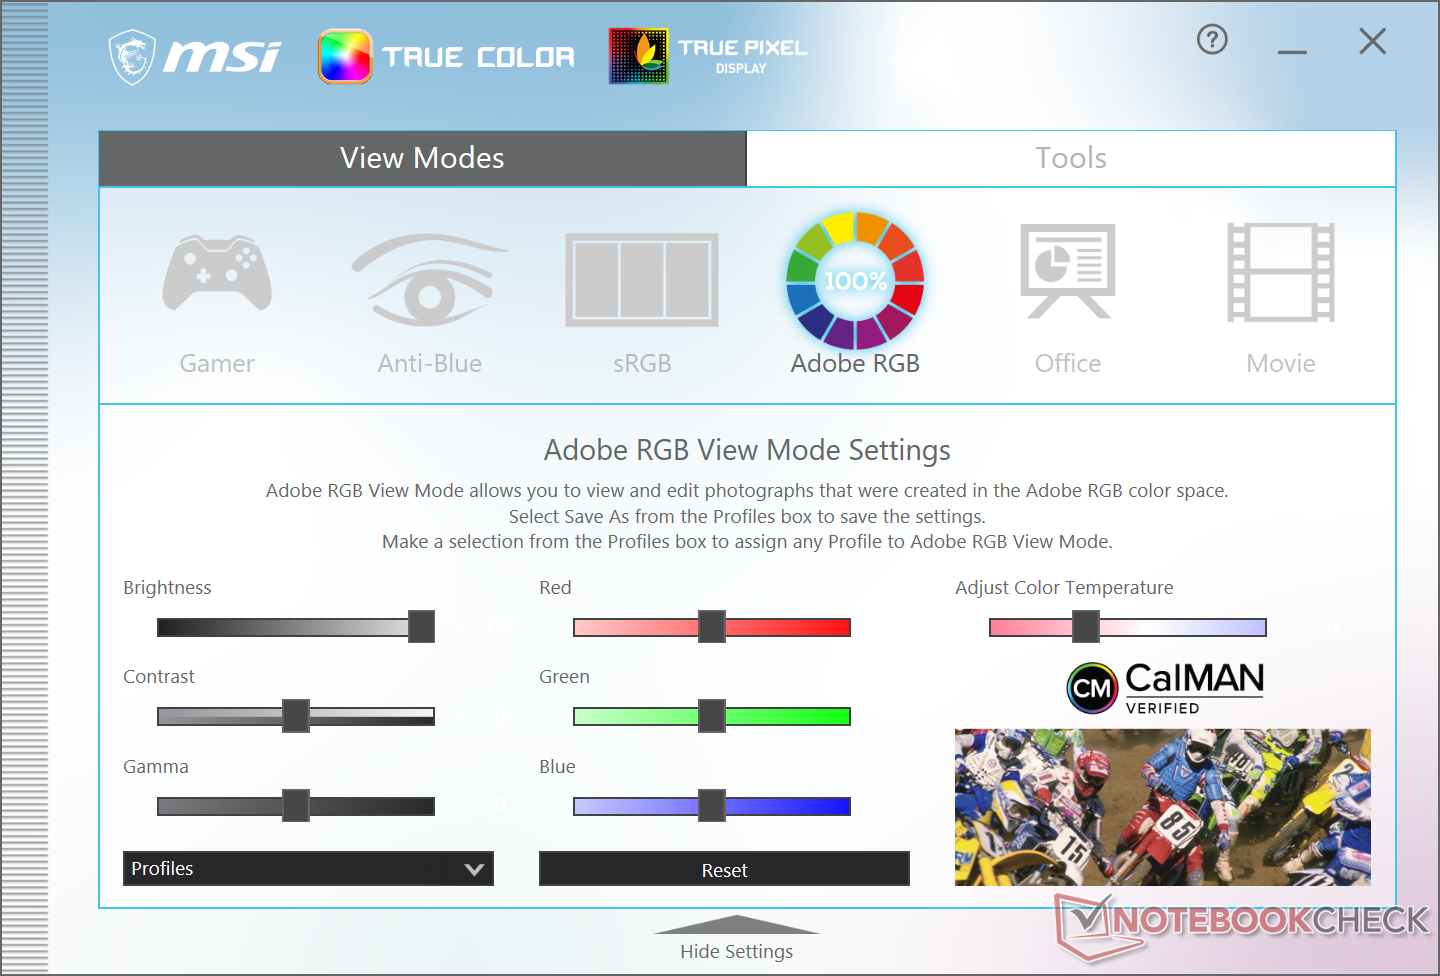
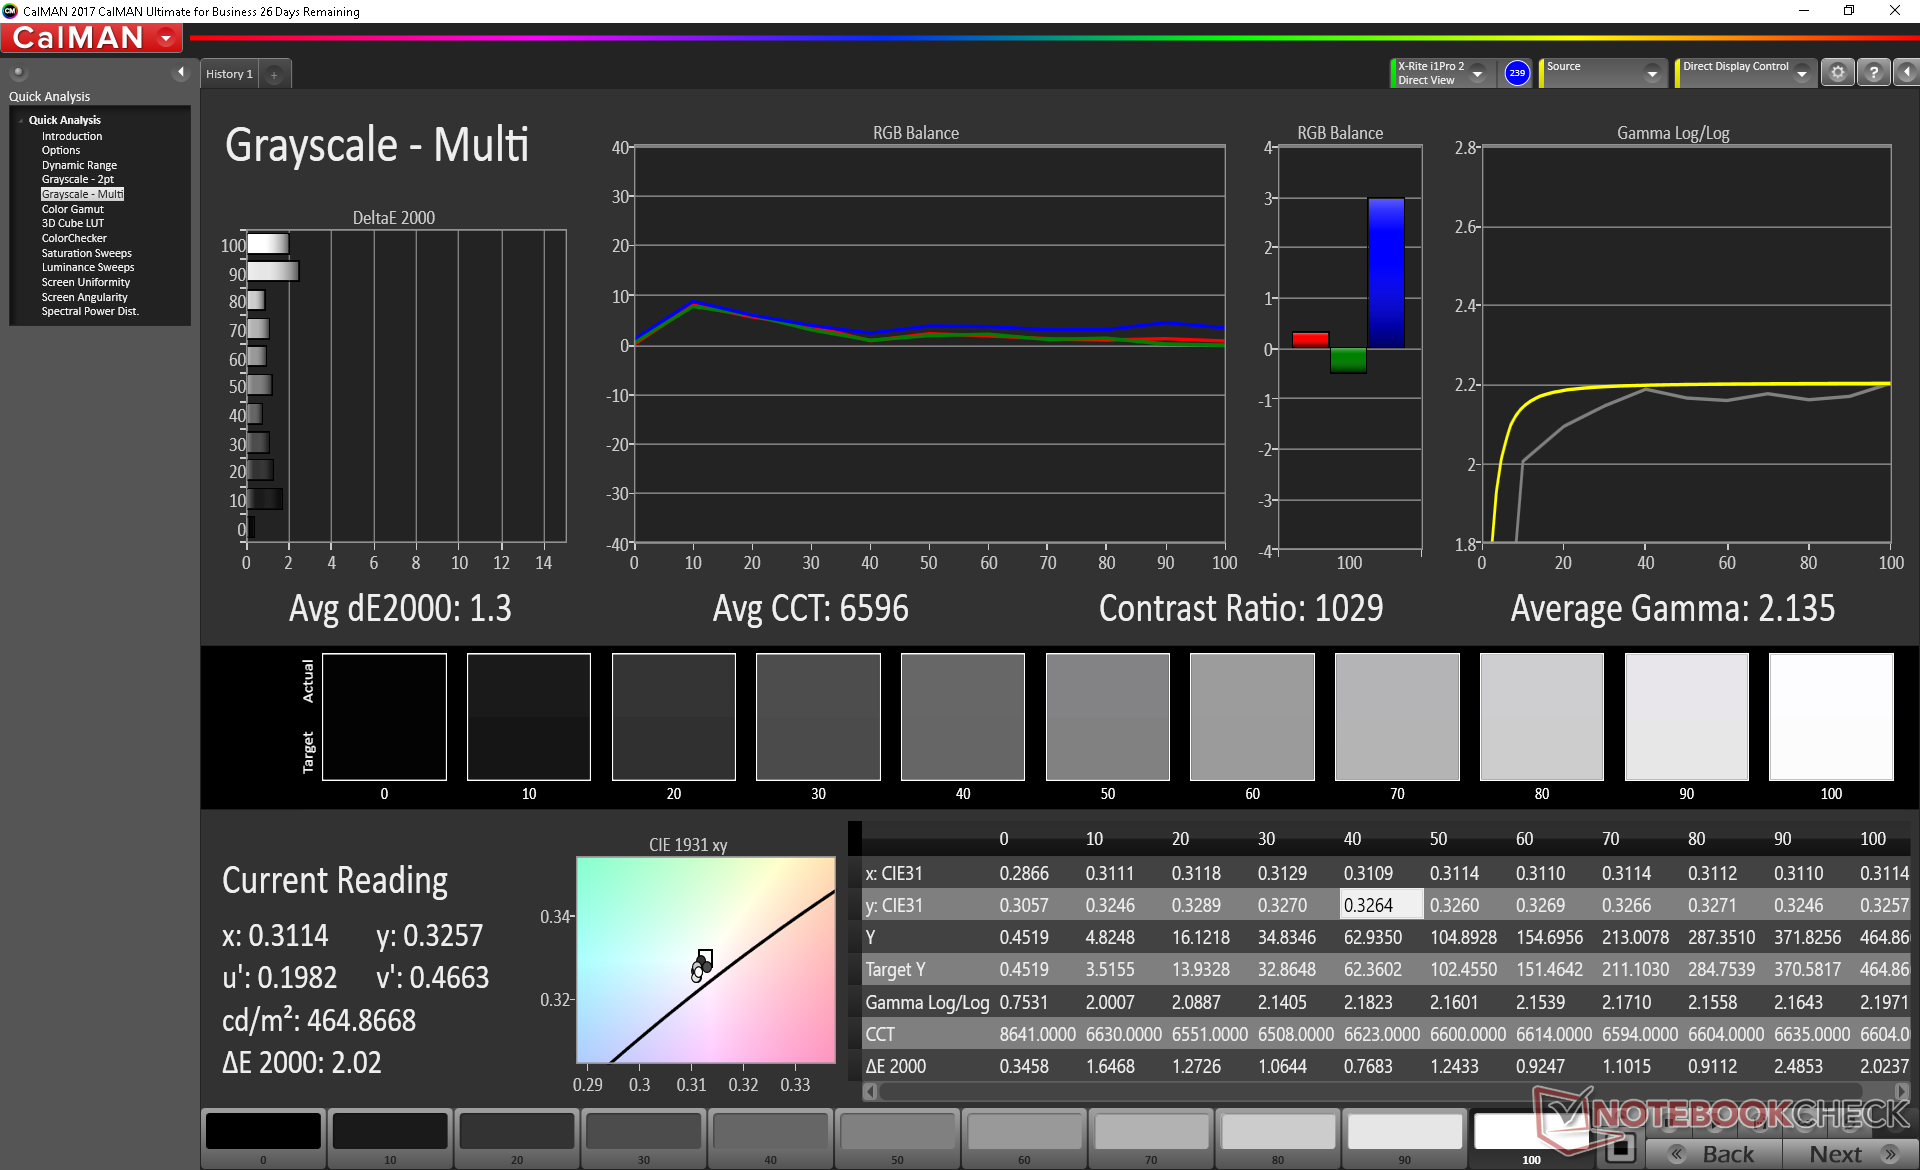
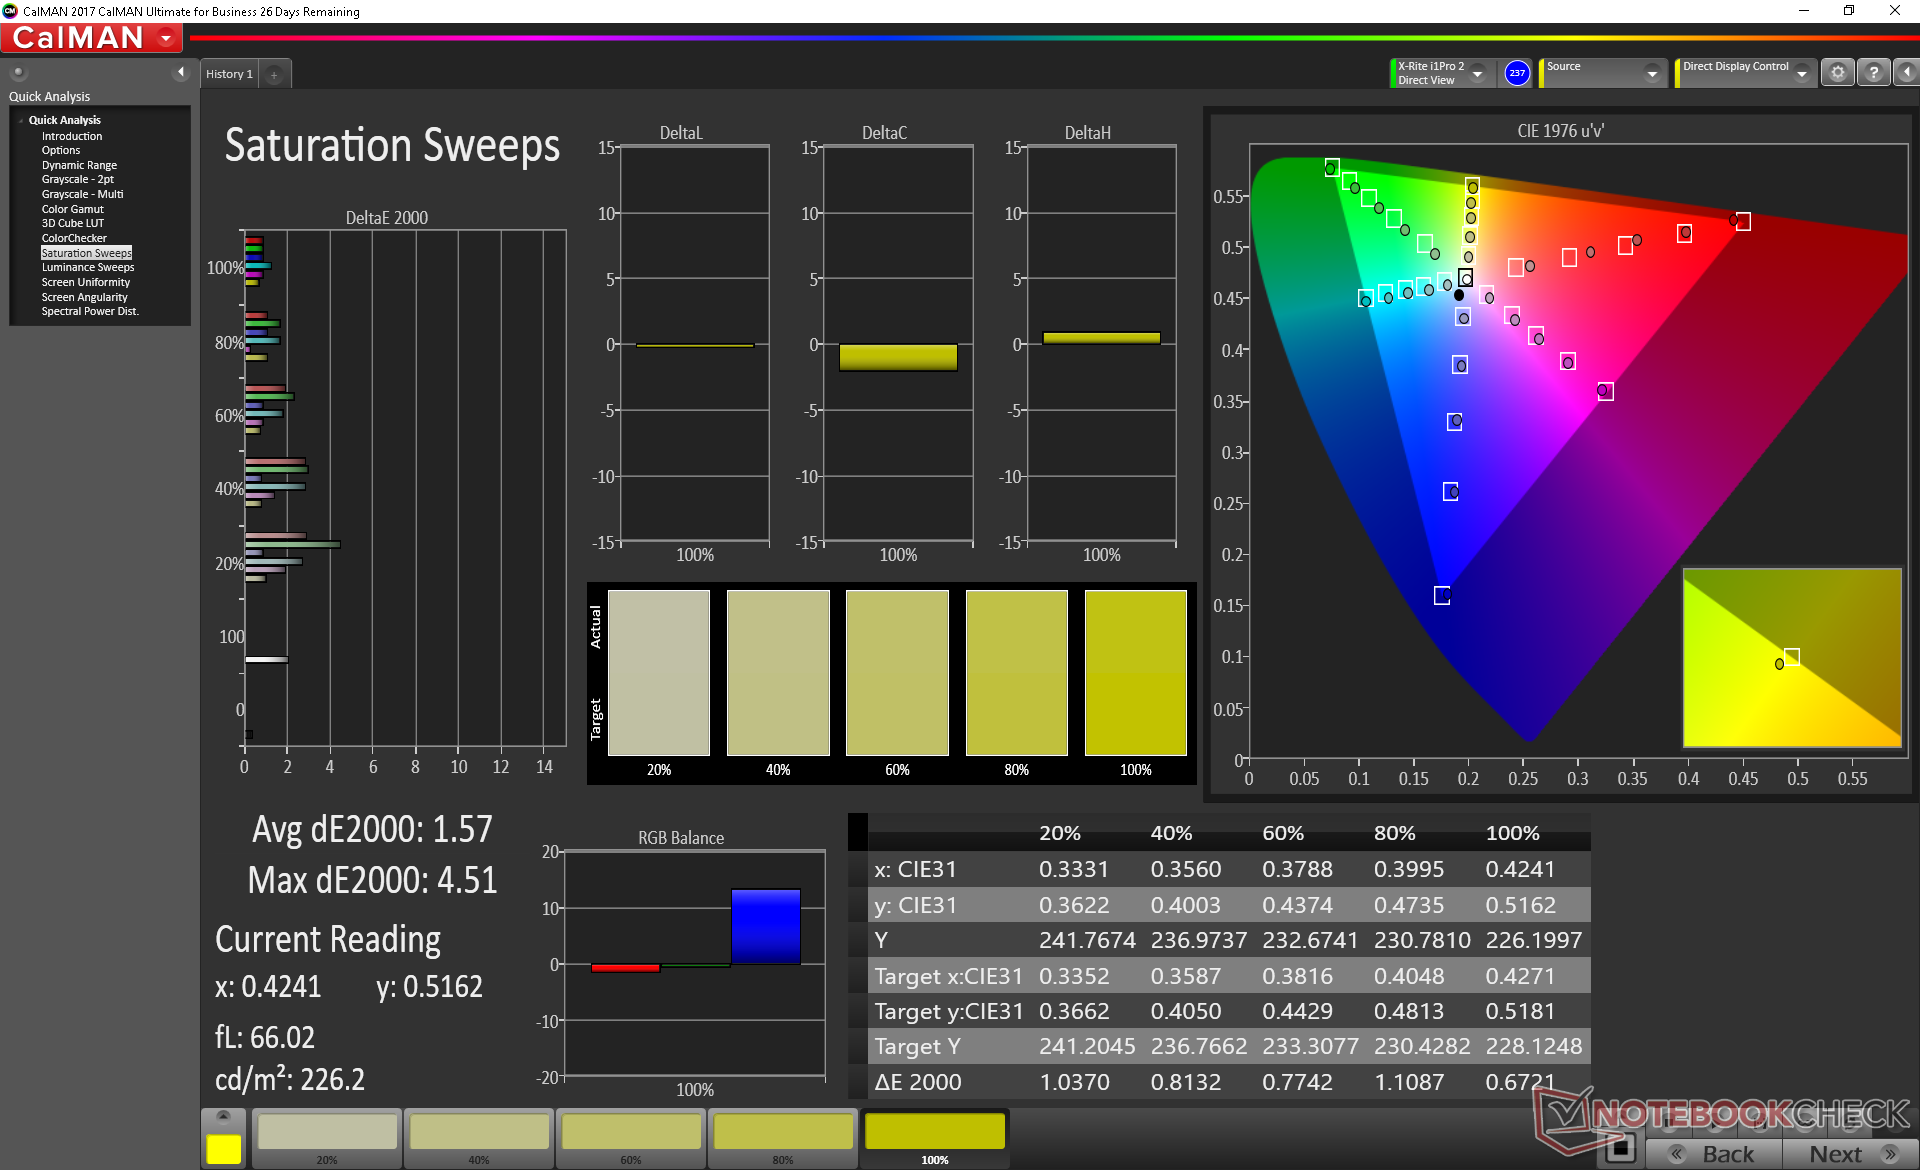
MSI advertises a DeltaE value of under 2 — a bold claim when most laptop displays struggle to be accurate out of the box. Thankfully, our own measurements can indeed confirm grayscale and color saturation deltaE values of just 1.3 and 1.57, respectively. An end-user calibration will not be necessary even though colors could still be slightly more accurate when at lower saturation levels.


Display Response Times
| ↔ Response Time Black to White | ||
|---|---|---|
| 41.2 ms ... rise ↗ and fall ↘ combined | ↗ 22.8 ms rise | 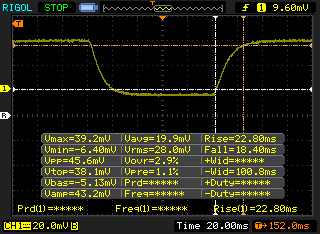 |
| ↘ 18.4 ms fall | ||
| The screen shows slow response rates in our tests and will be unsatisfactory for gamers. In comparison, all tested devices range from 0.1 (minimum) to 240 (maximum) ms. » 98 % of all devices are better. This means that the measured response time is worse than the average of all tested devices (20.1 ms). | ||
| ↔ Response Time 50% Grey to 80% Grey | ||
| 60 ms ... rise ↗ and fall ↘ combined | ↗ 29.2 ms rise | 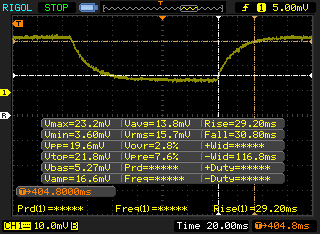 |
| ↘ 30.8 ms fall | ||
| The screen shows slow response rates in our tests and will be unsatisfactory for gamers. In comparison, all tested devices range from 0.165 (minimum) to 636 (maximum) ms. » 96 % of all devices are better. This means that the measured response time is worse than the average of all tested devices (31.4 ms). | ||
Screen Flickering / PWM (Pulse-Width Modulation)
| Screen flickering / PWM detected | 26040 Hz | ≤ 24 % brightness setting | 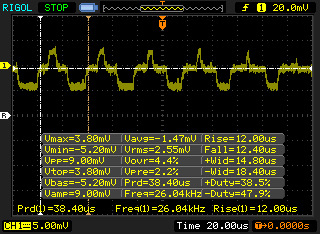 |
The display backlight flickers at 26040 Hz (worst case, e.g., utilizing PWM) Flickering detected at a brightness setting of 24 % and below. There should be no flickering or PWM above this brightness setting. The frequency of 26040 Hz is quite high, so most users sensitive to PWM should not notice any flickering. In comparison: 53 % of all tested devices do not use PWM to dim the display. If PWM was detected, an average of 7996 (minimum: 5 - maximum: 343500) Hz was measured. | |||
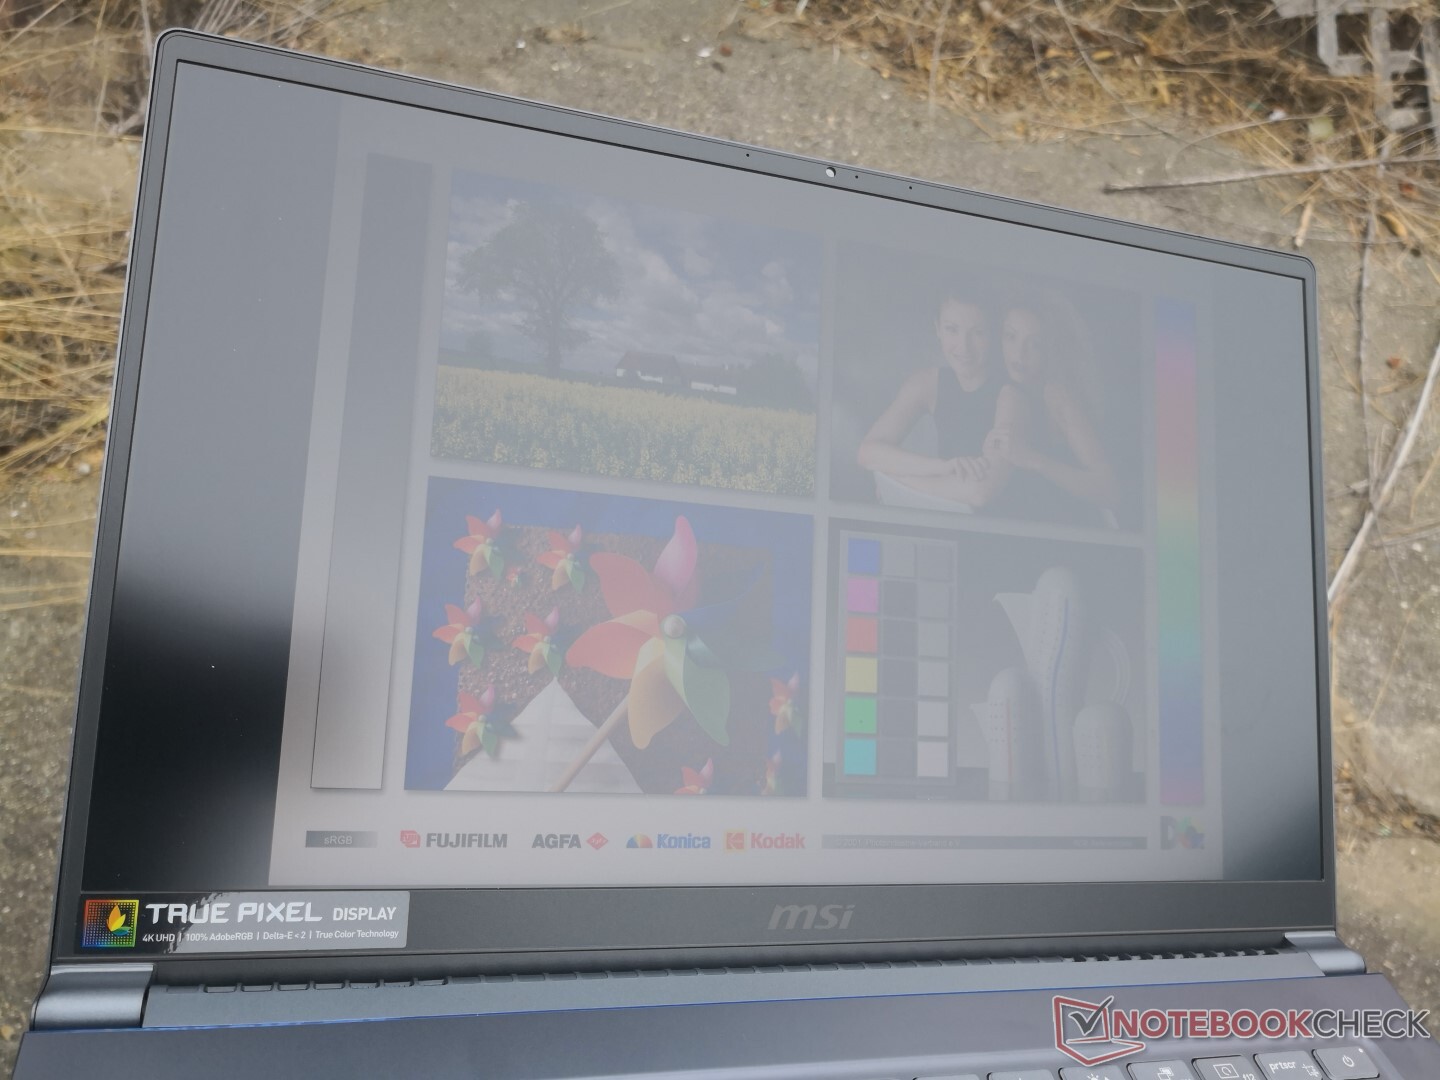
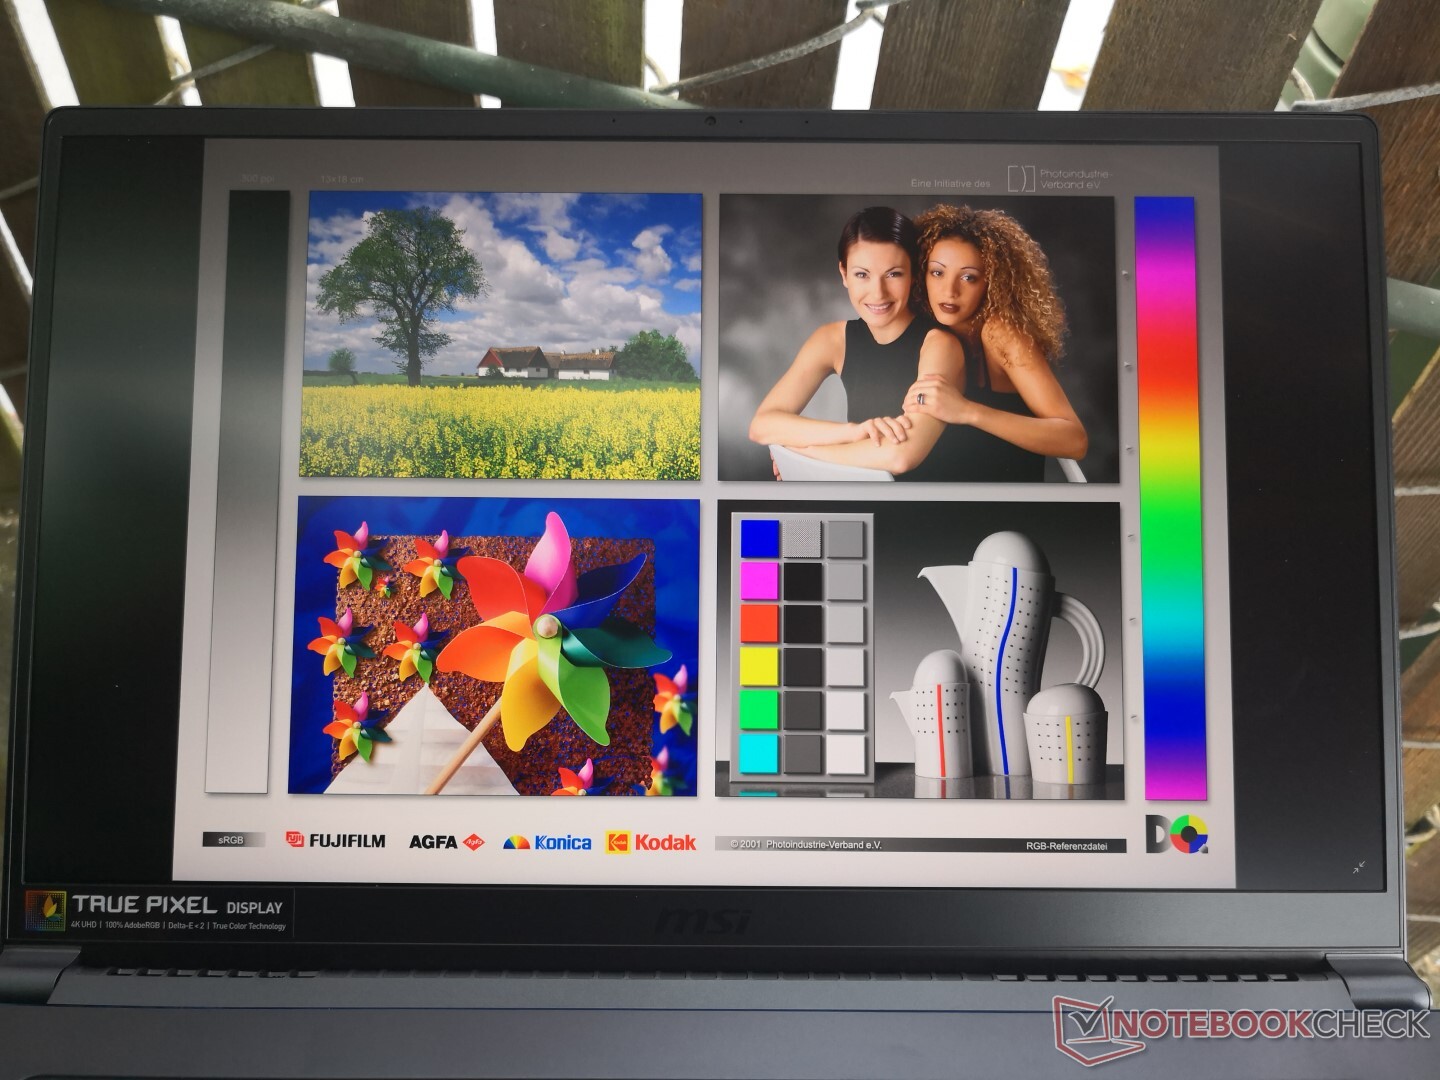
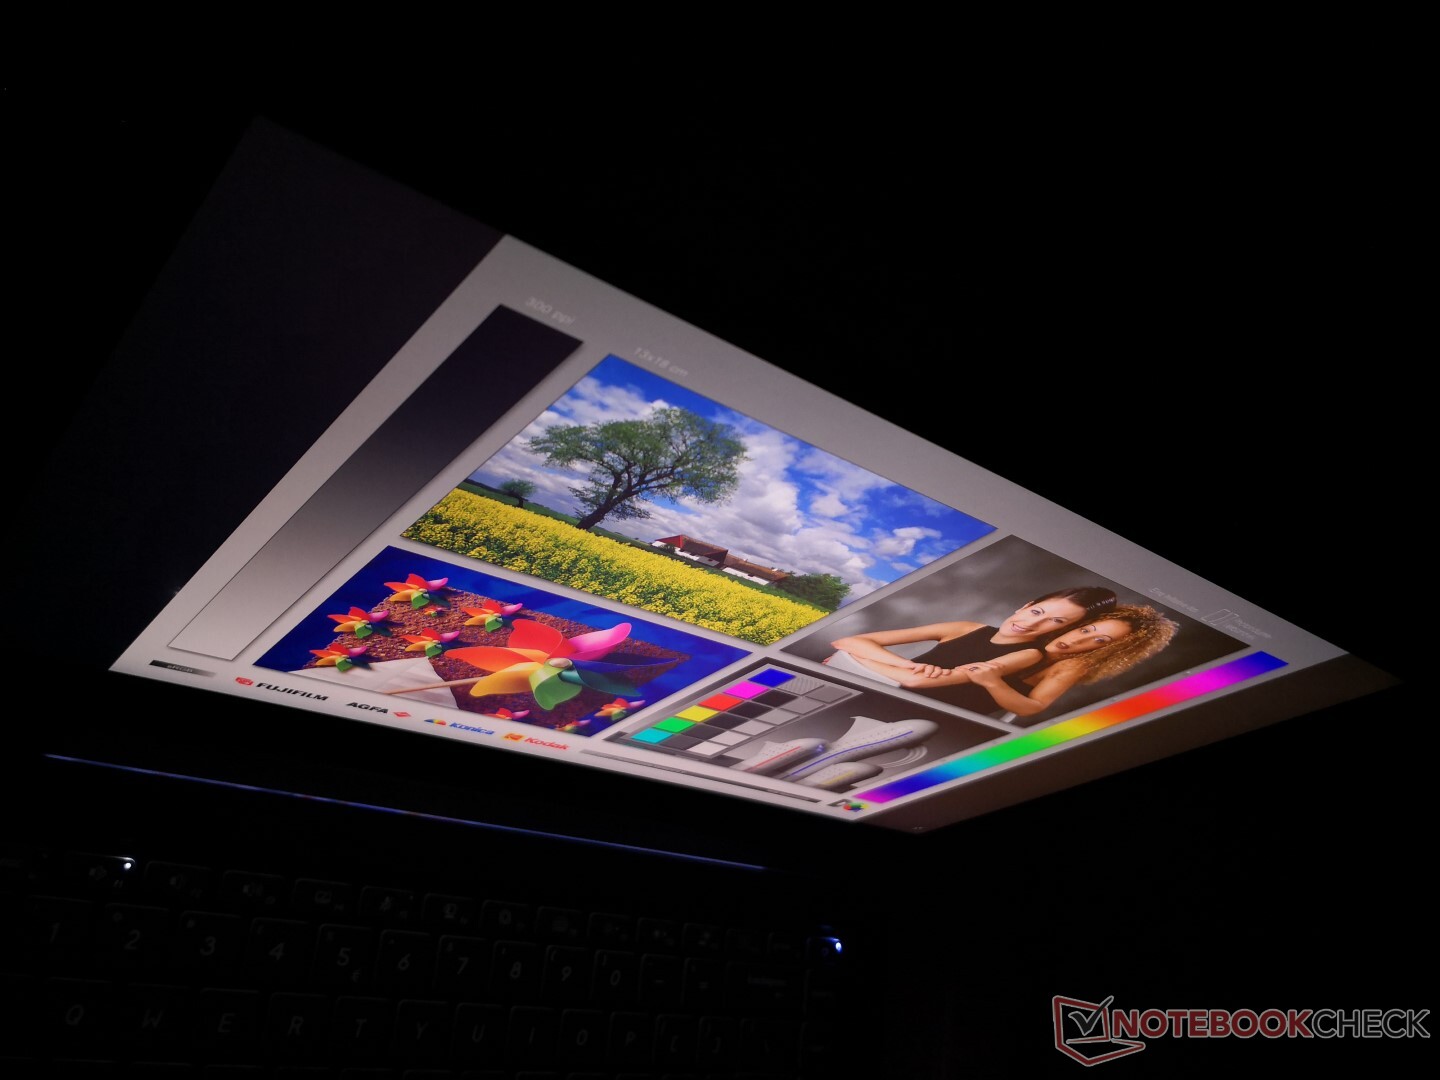
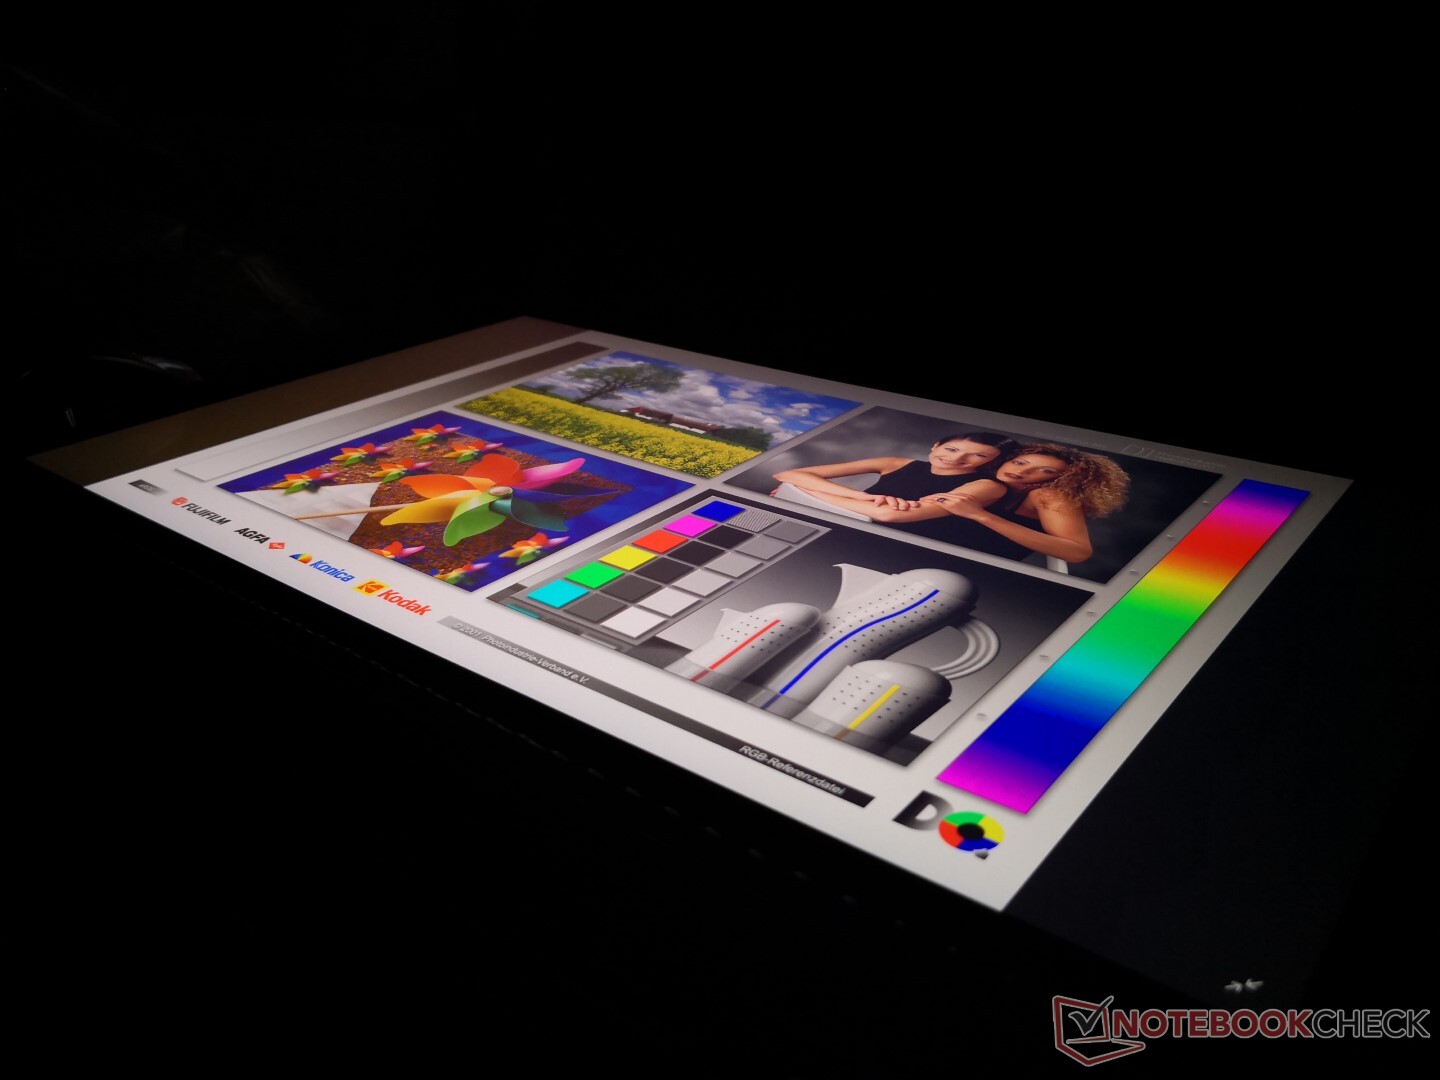
Outdoor visibility is as good as on the P65 Creator since brightness is almost the same between them. The display is much brighter than the display on the ThinkPad T590 and most cheaper Ultrabooks. Viewing angles are wide as one would expect from an IPS panel.
Performance - MSI's first ULV Hexa-core Laptop
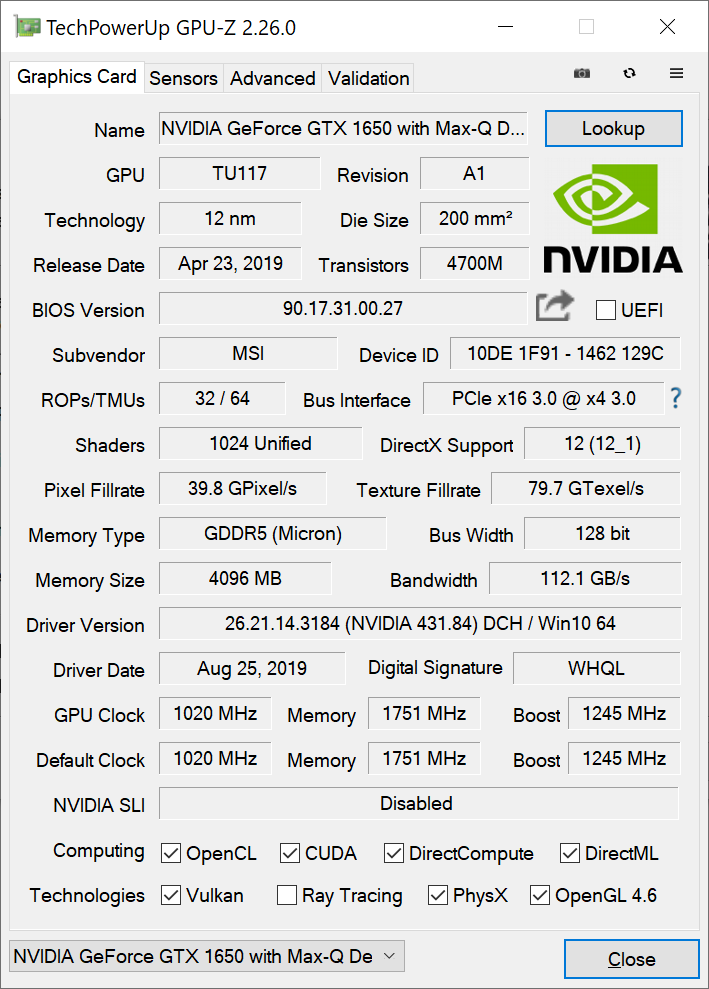
Despite being relatively thin and carrying an Intel U series CPU, the Prestige 15 is still targeting high-performance users with its hexa-core Core i7-10710U CPU and discrete GeForce GTX 1650 Max-Q graphics to replace the last generation quad-core Core i7-8565U and GeForce GTX 1050, respectively. There are no Core i3/i5 or integrated GPU options for now.
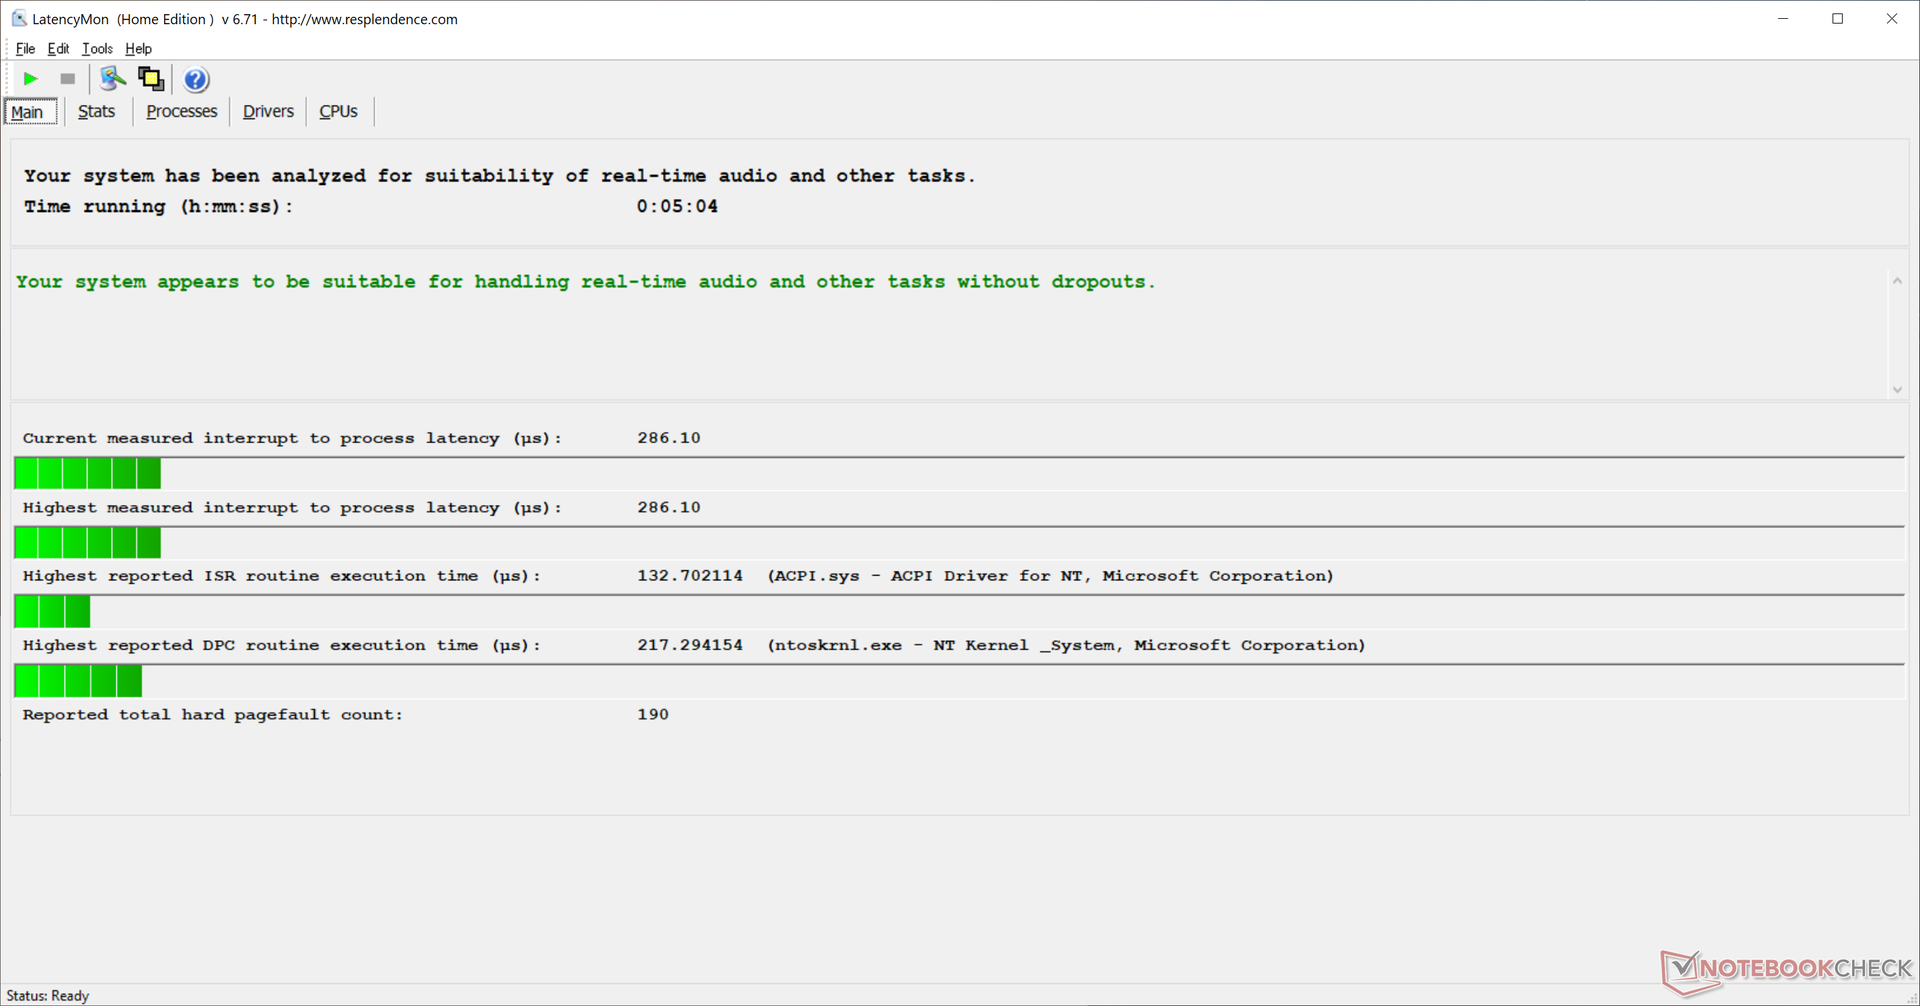
Nvidia Optimus comes standard for automatic graphics switching to the UHD Graphics 620. LatencyMon shows no DPC latency issues even when wireless is enabled unlike on the XPS 15.
Processor
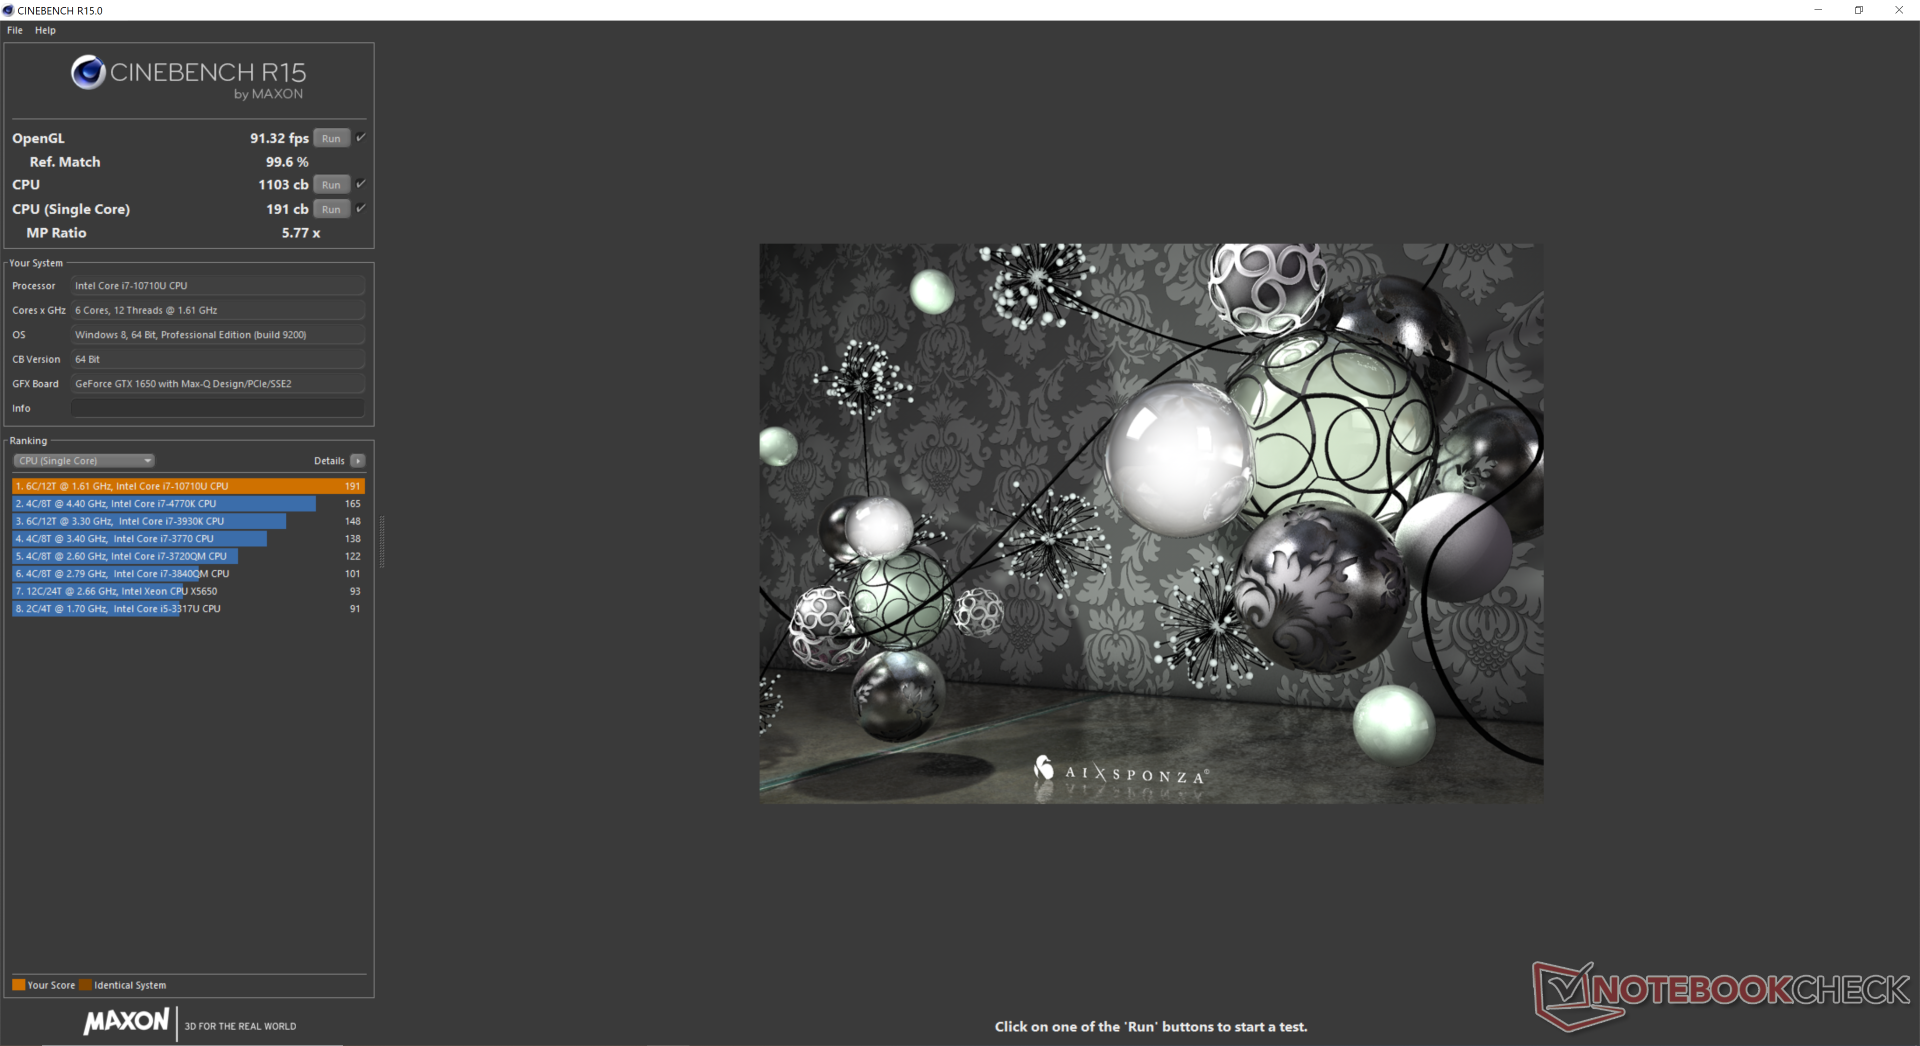
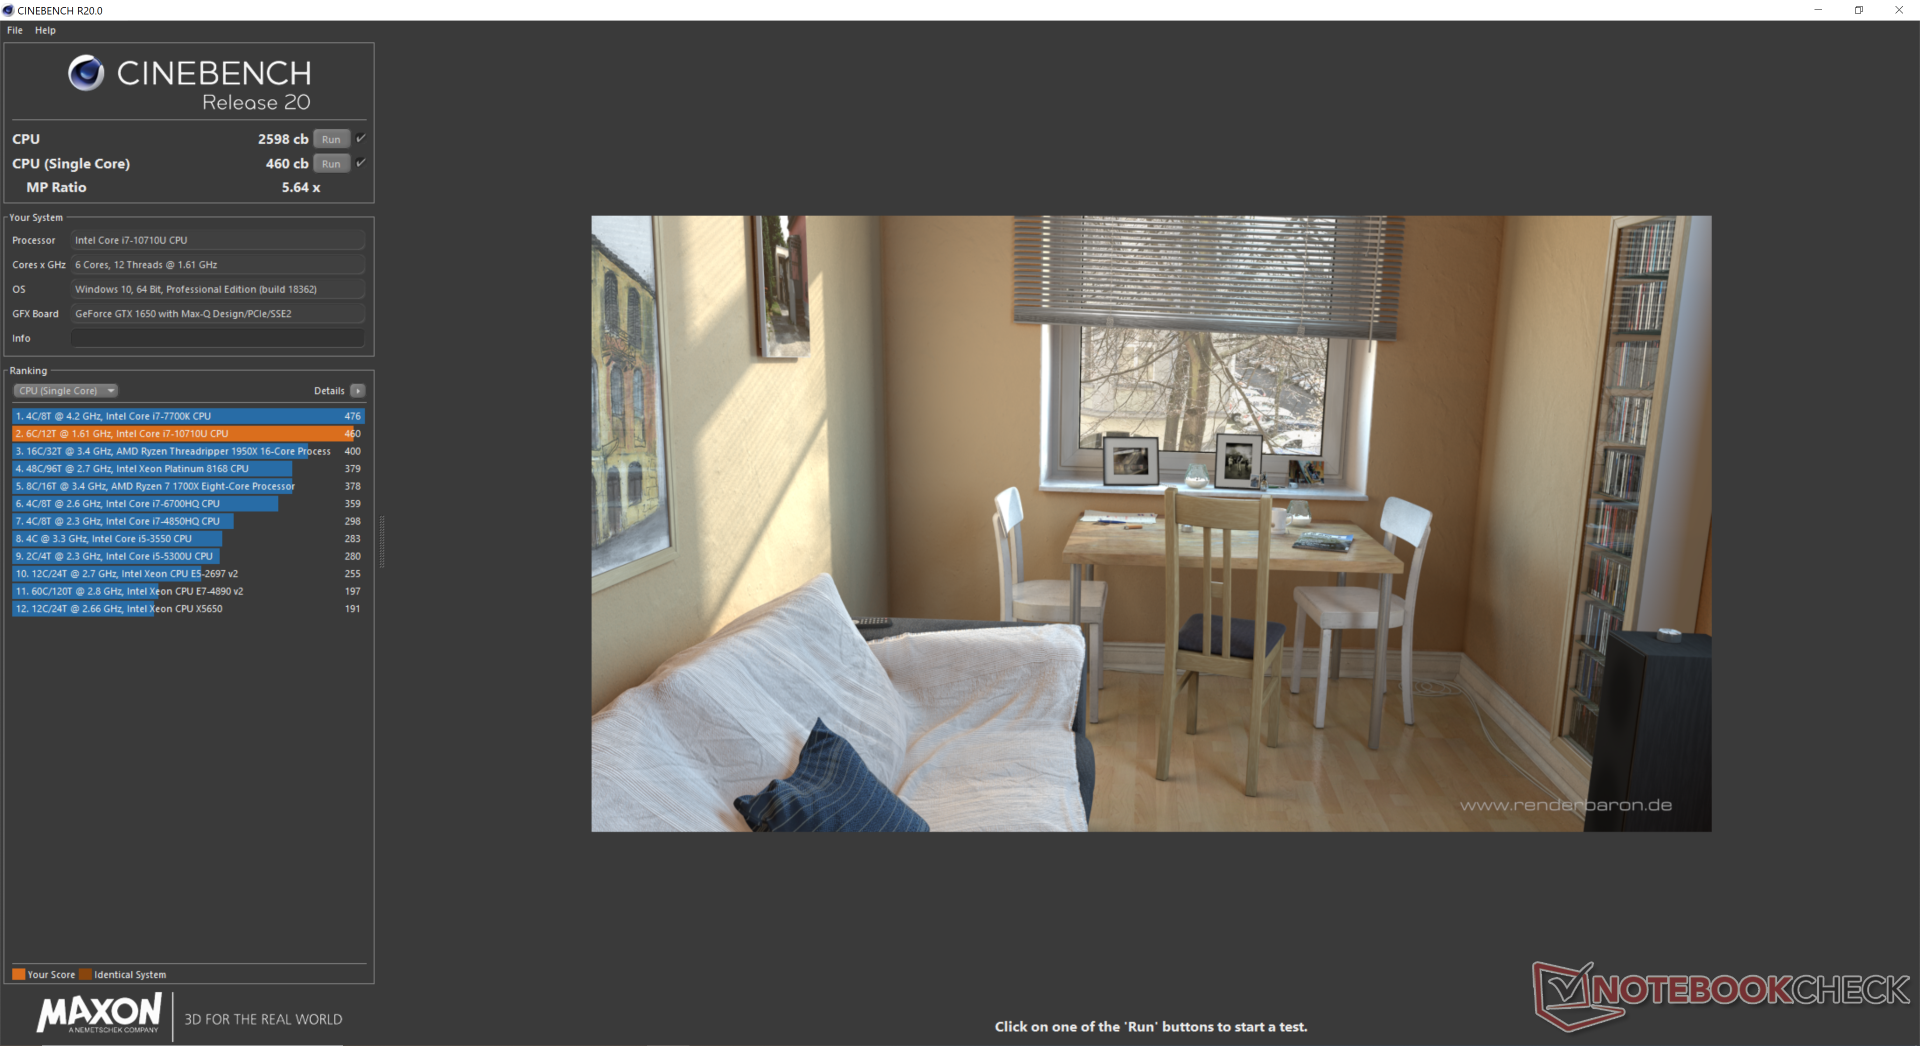
CineBench results are impressive as raw multi-thread scores are neck-to-neck with both the quad-core Core i7-8750H and Core i7-9750H. Performance sustainability is also excellent as shown by our CineBench R15 Multi-Thread loop test below especially when compared to what we observed on the Dell XPS 13 7390 with the same hexa-core CPU. Users can expect about 30 to 35 percent faster performance than the Core i7-1065G7, Core i5-8300H, and Core i5-9300H or about 60 percent faster performance than the Core i7-8565U.
Nonetheless, the excellent CineBench scores may be misleading. Our Prime95 Stress Test will show that clock rates may bounce and throttle wildly when the CPU is subjected to uninterrupted 100 percent utilization.
See our dedicated page on the Core i7-10710U for more technical information and benchmark comparisons.
| wPrime 2.10 - 1024m | |
| Dell XPS 13 7390 2-in-1 Core i7 | |
| Average Intel Core i7-10710U (171.1 - 177.4, n=2) | |
| MSI GE75 9SG | |
* ... smaller is better
System Performance
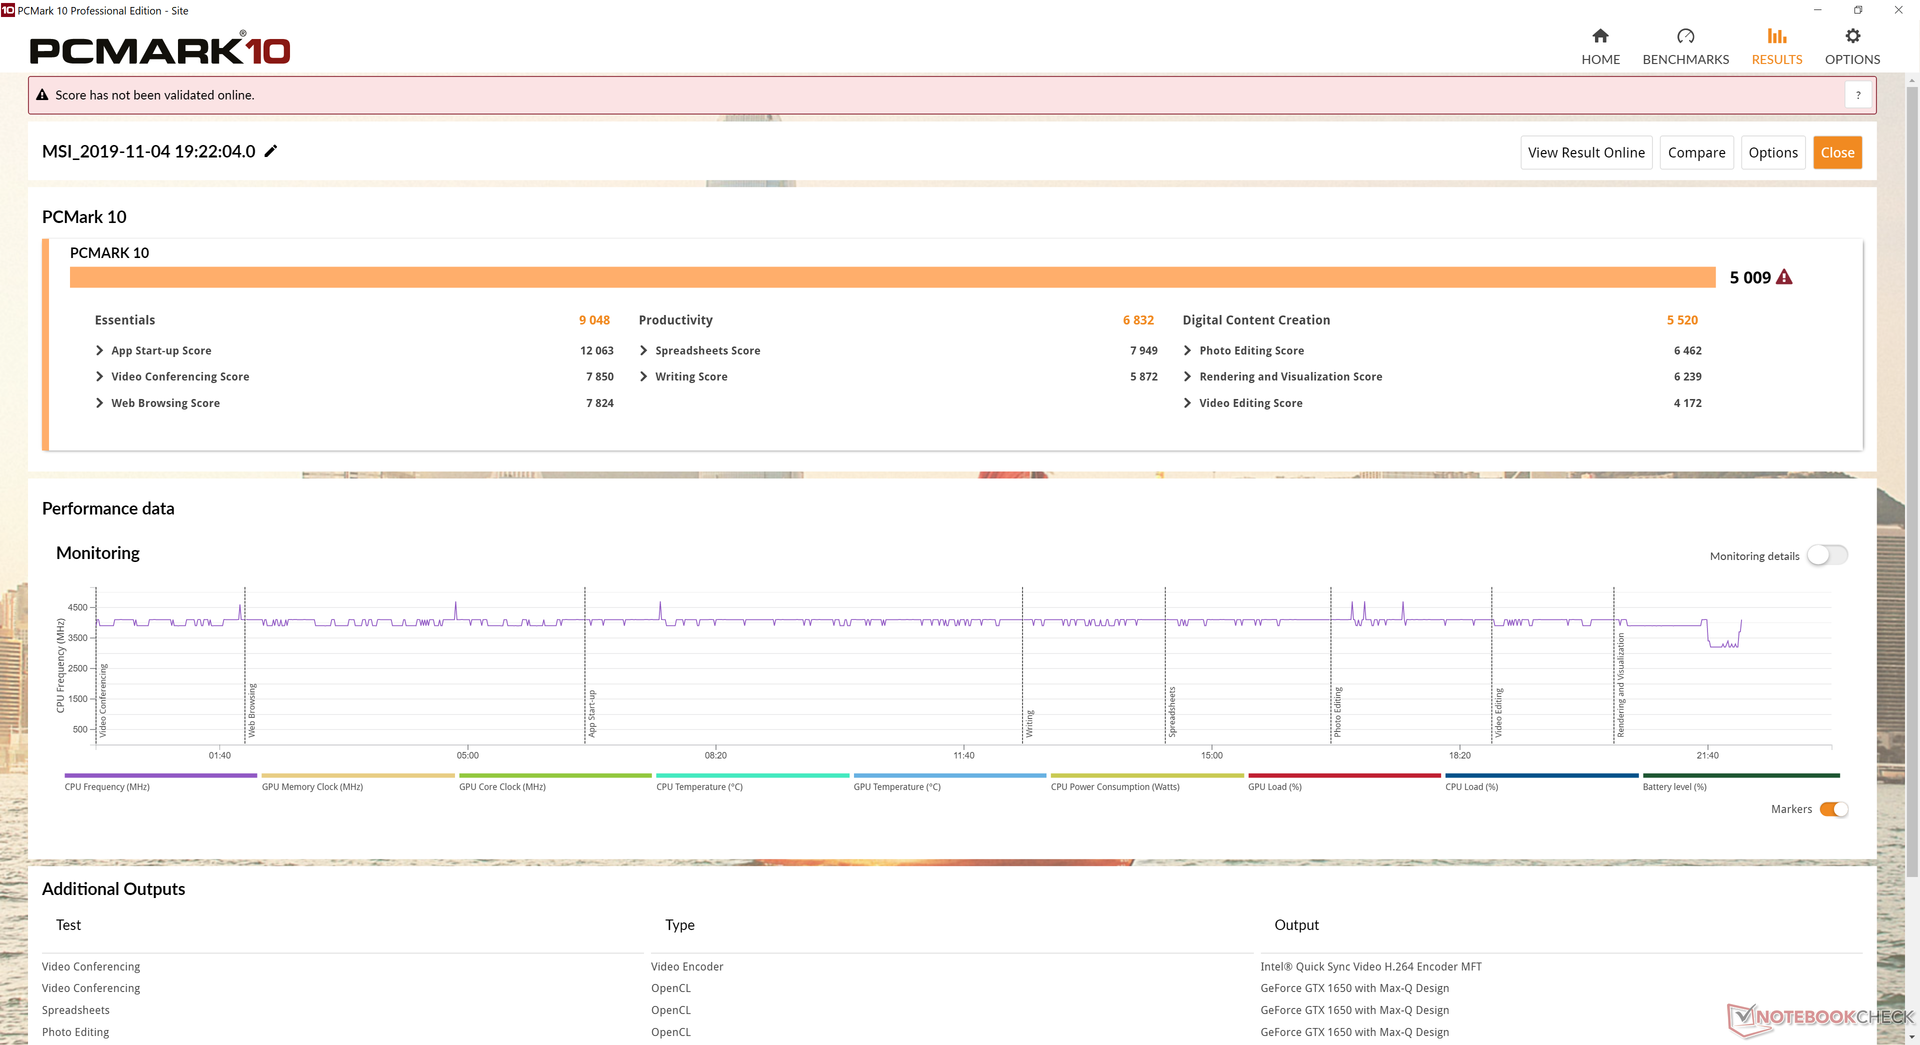
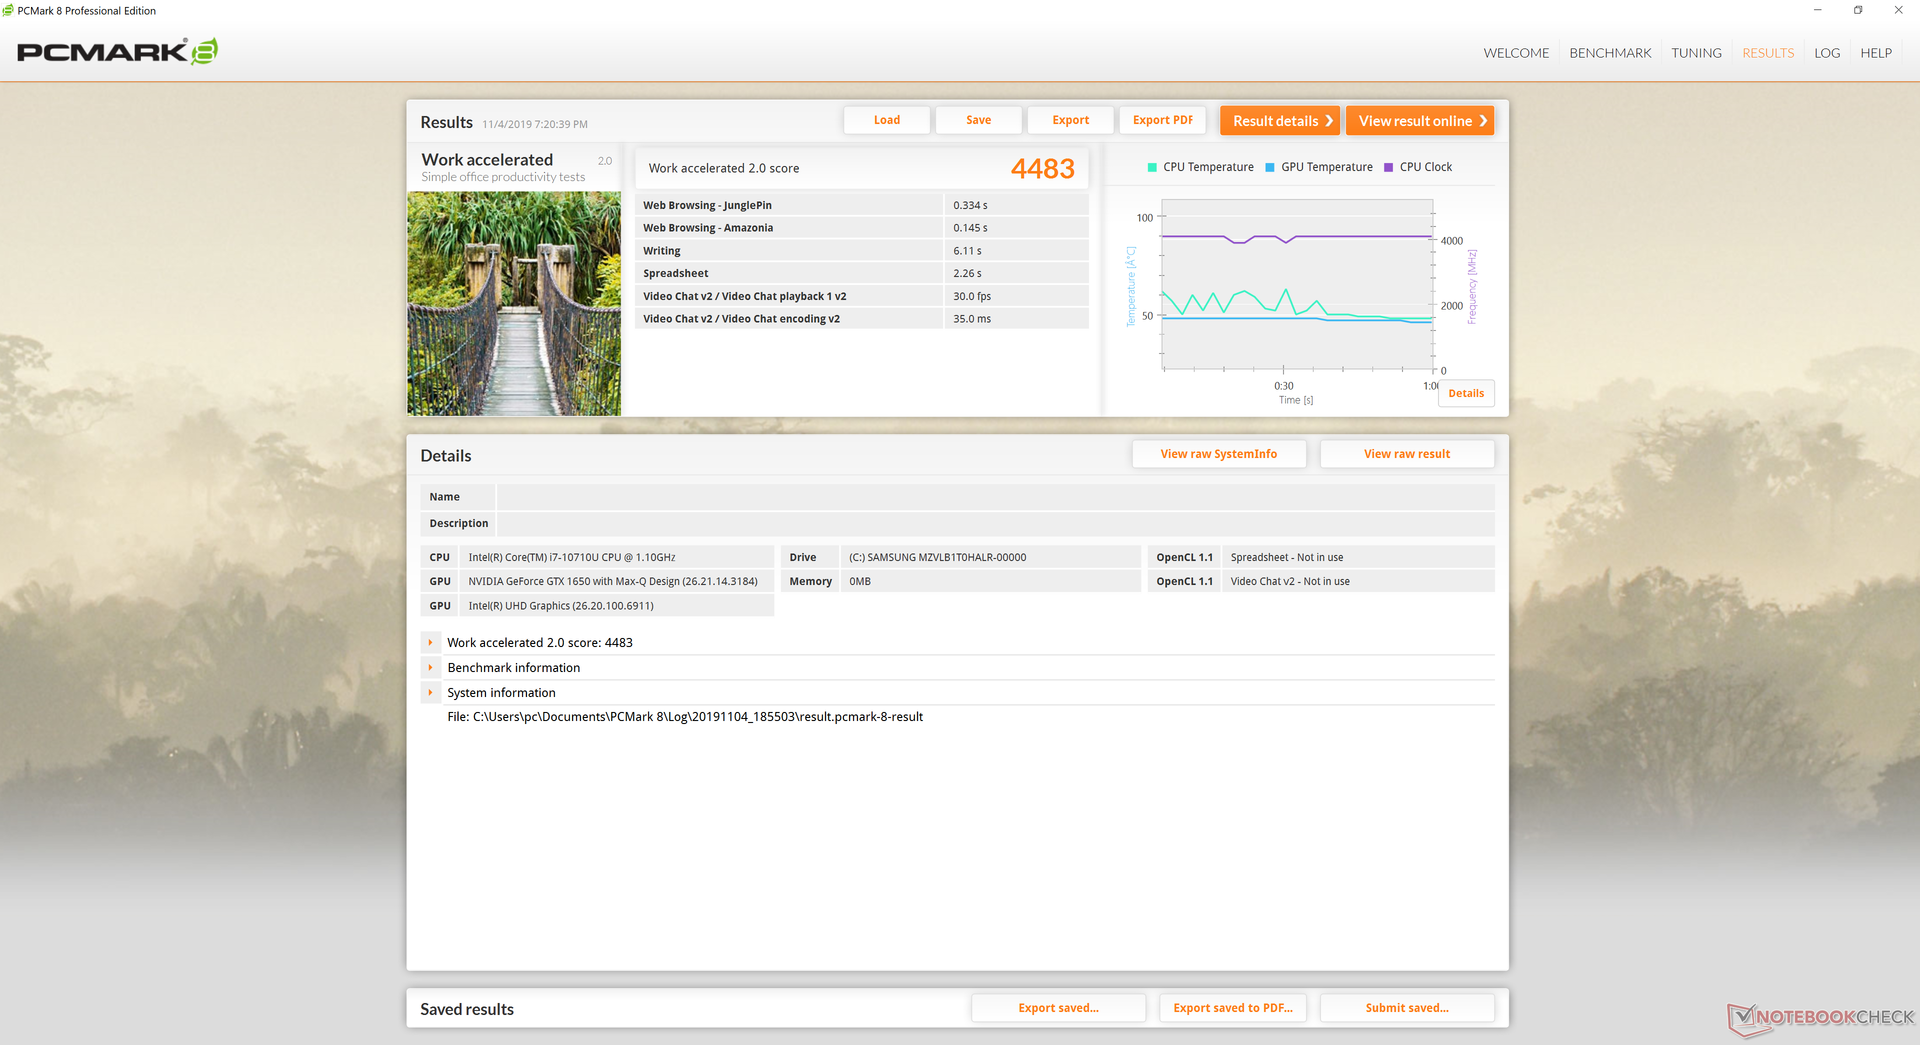
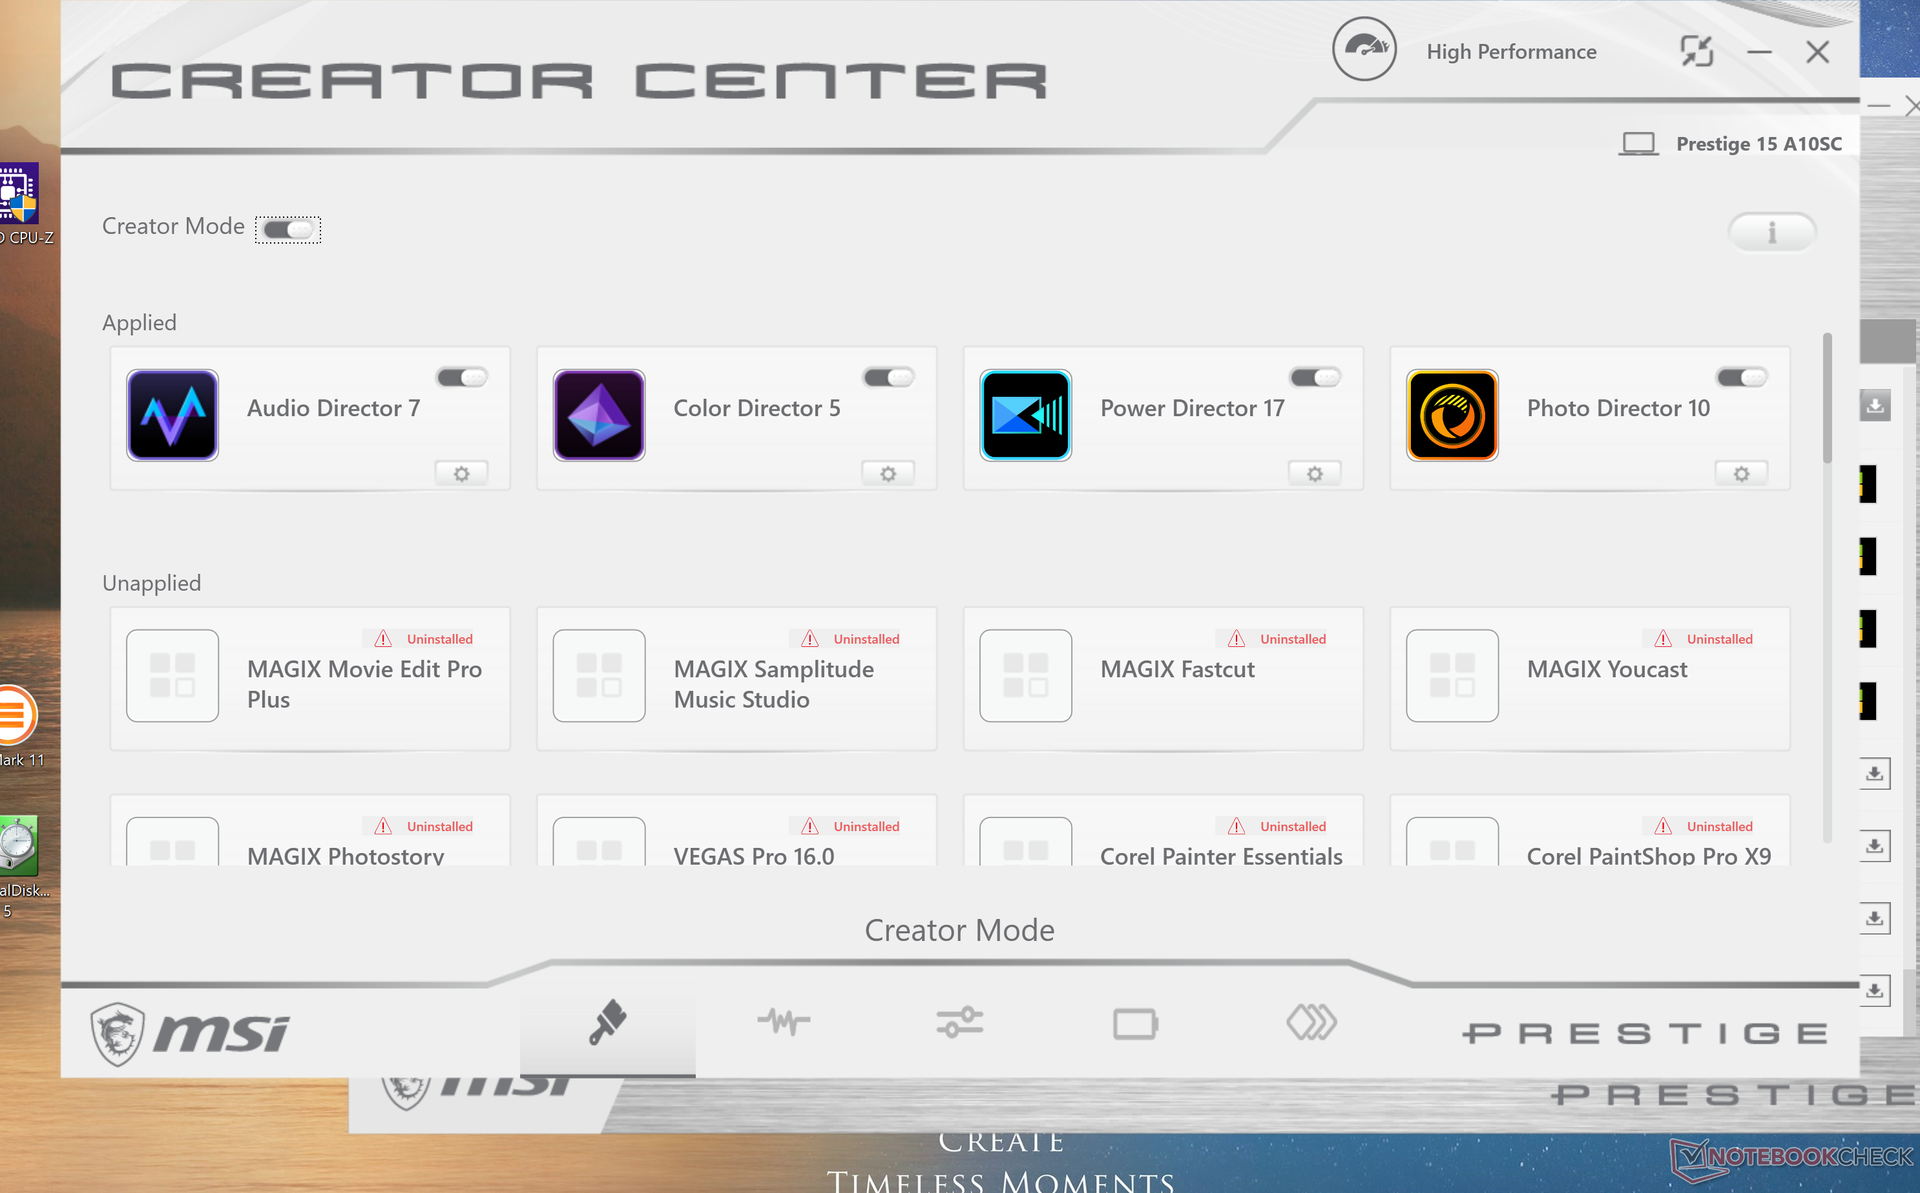
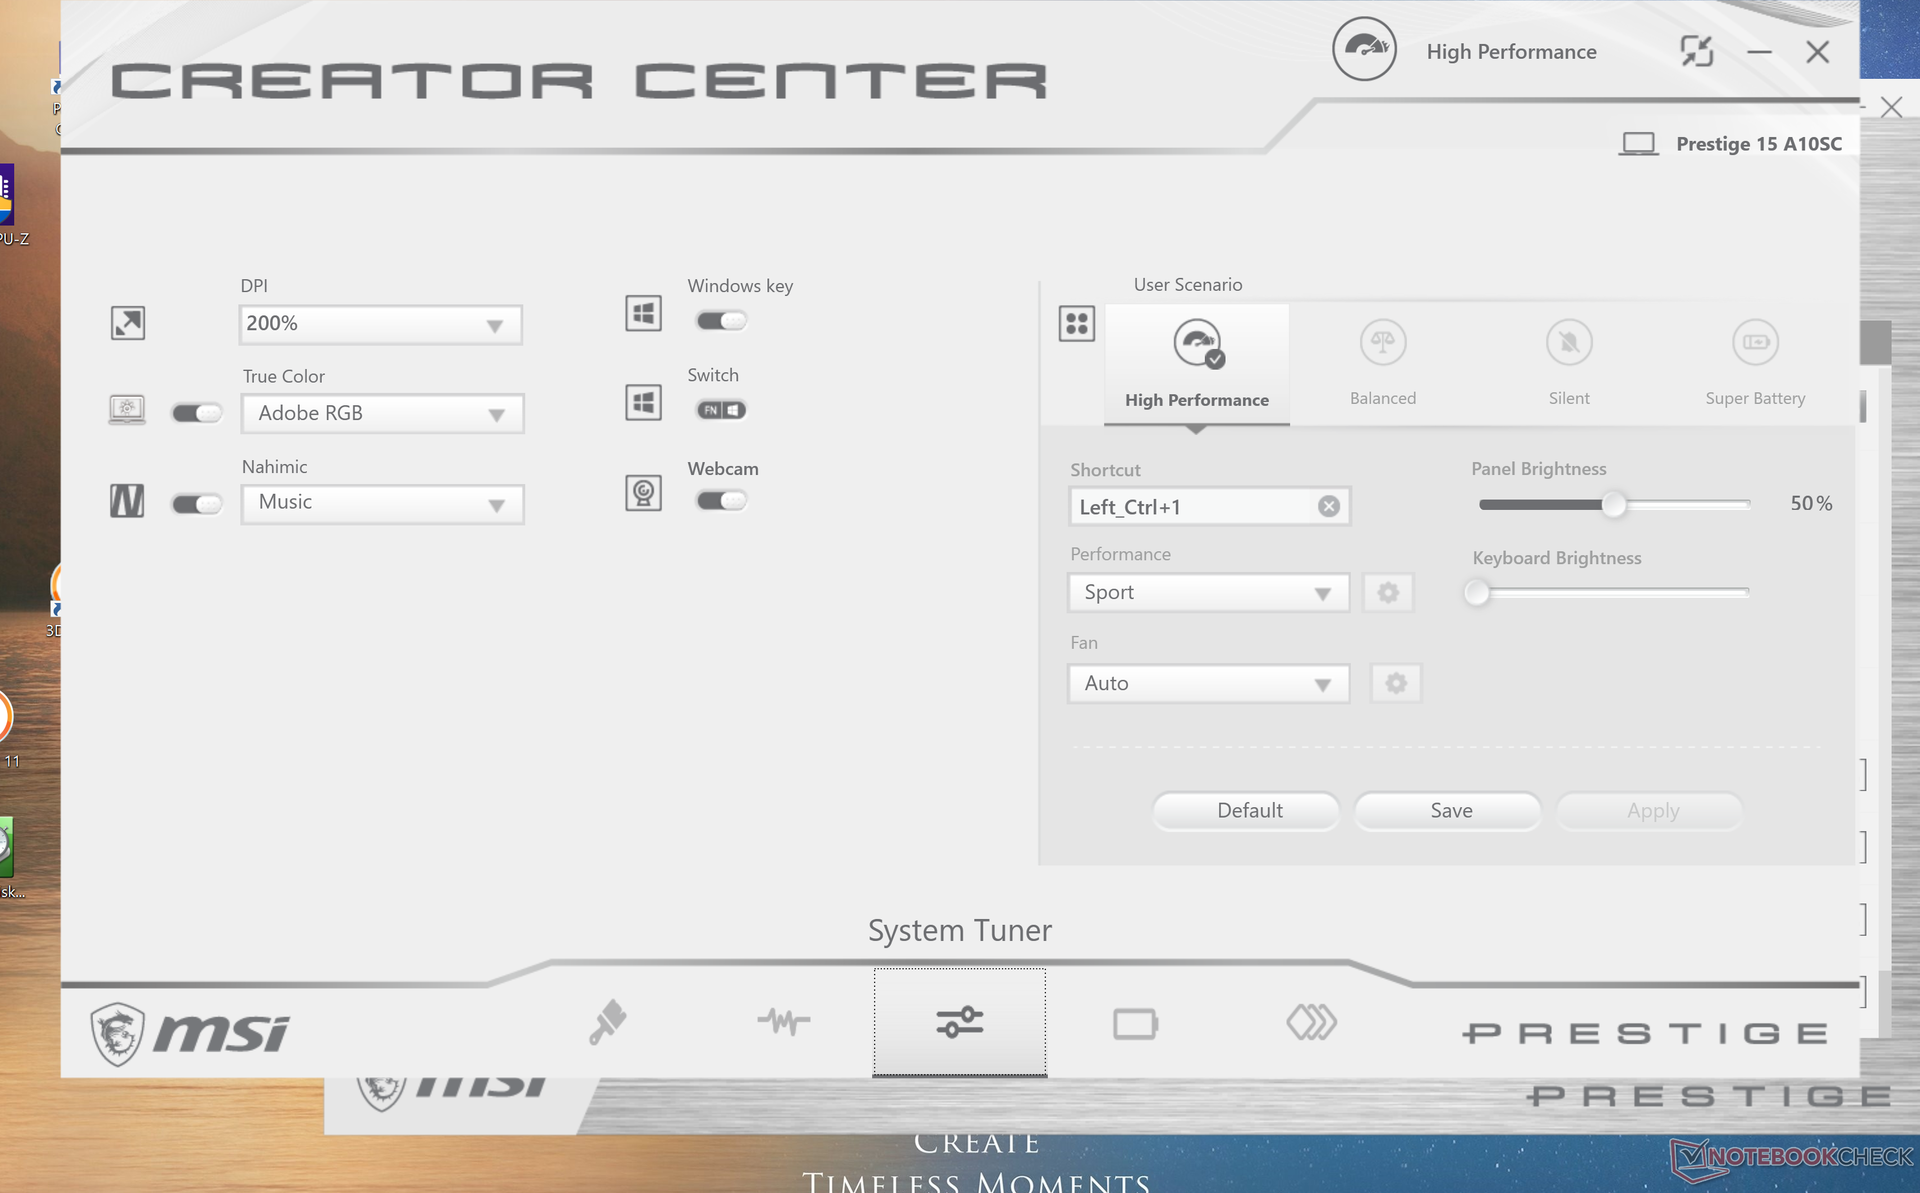
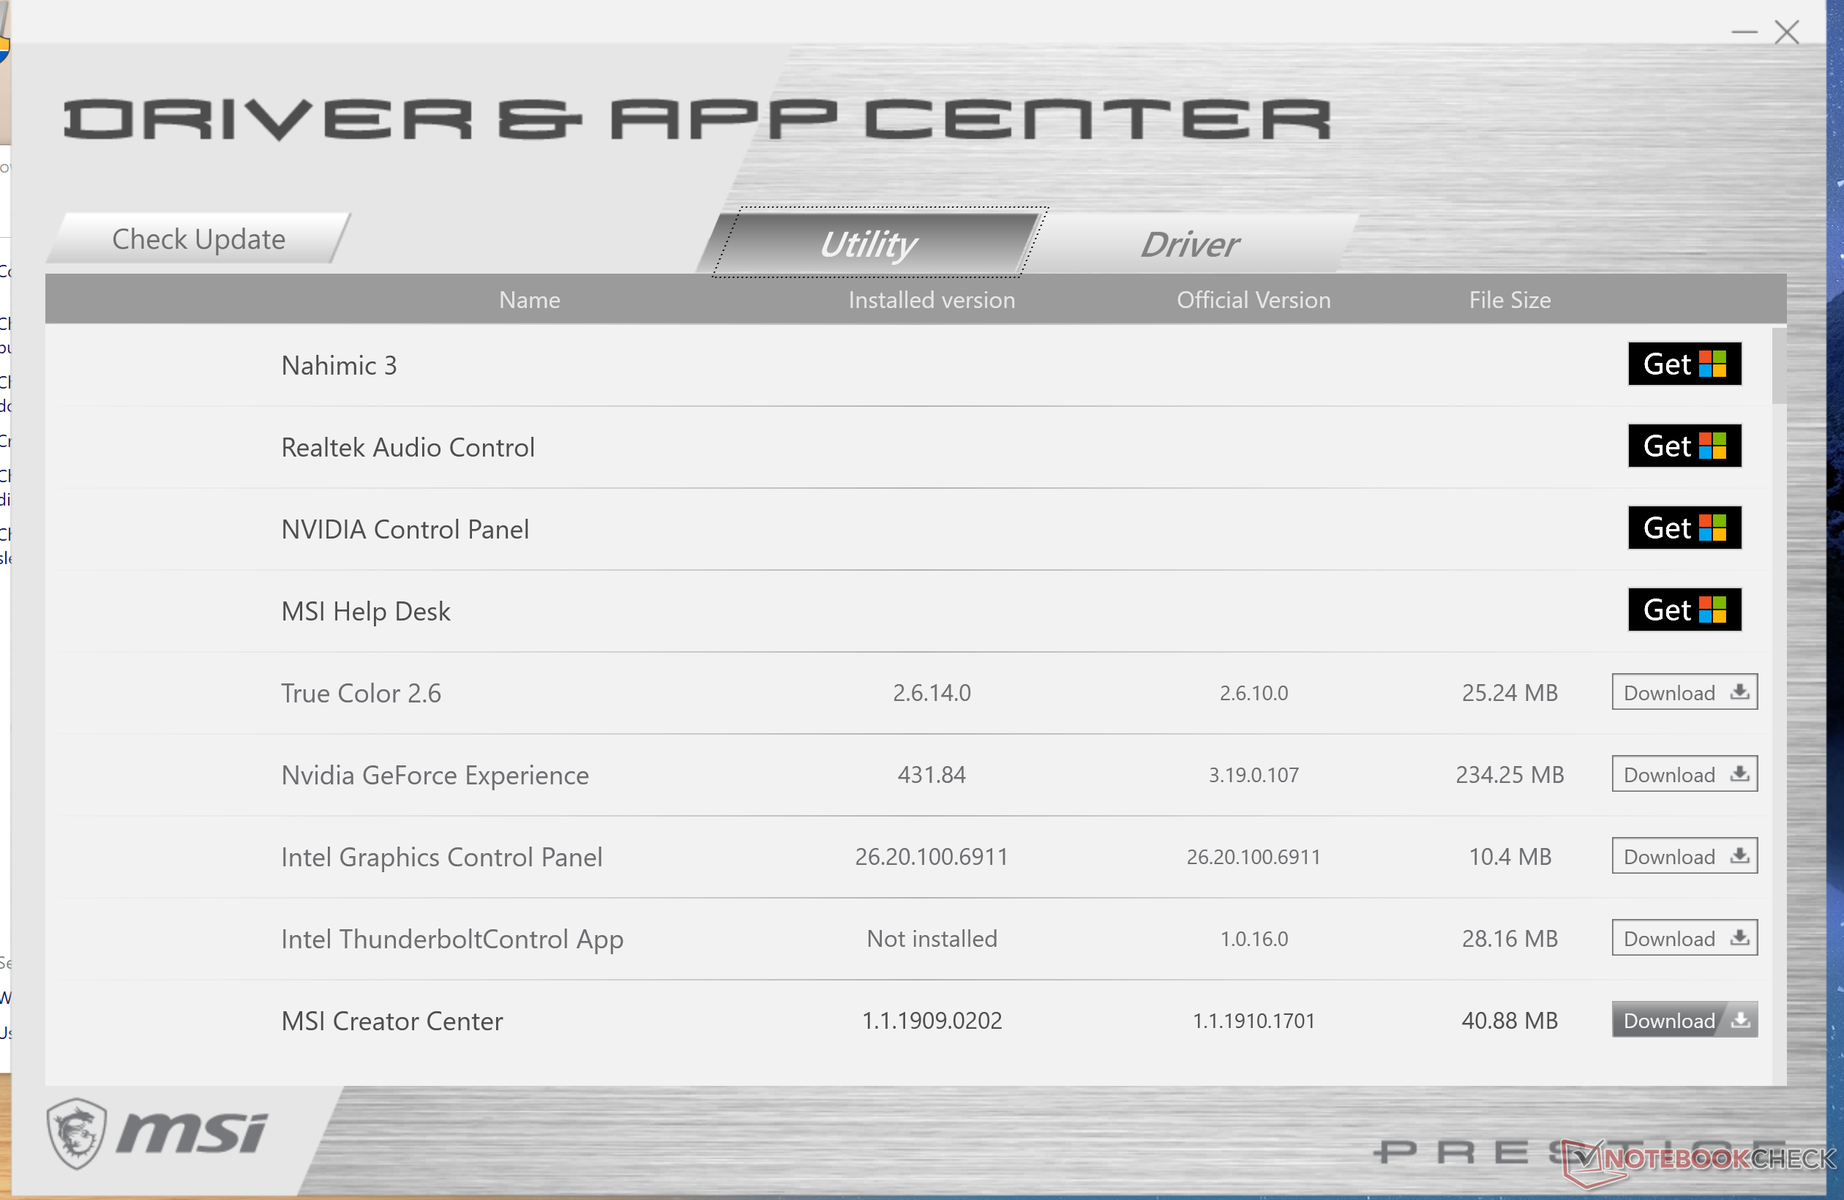
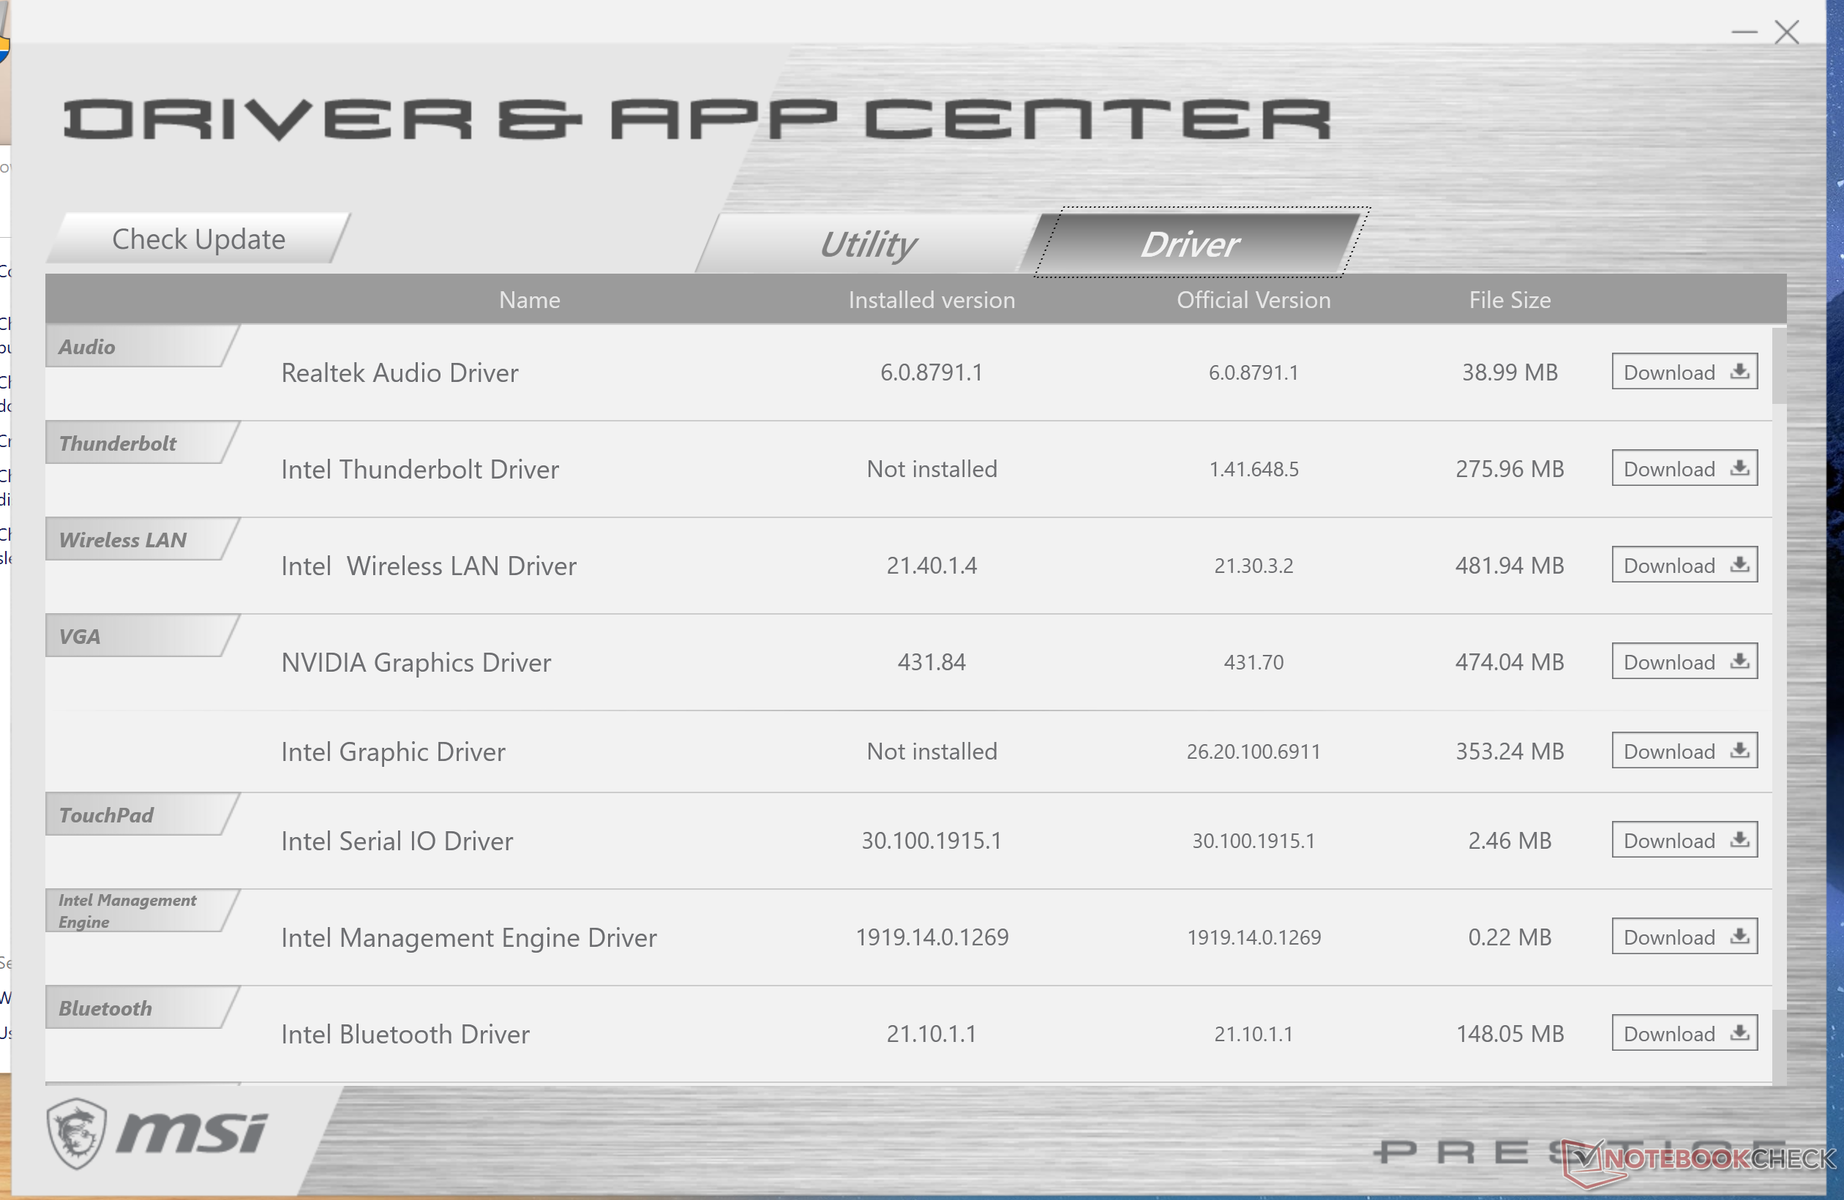
PCMark results are excellent and higher than your typical quad-core ULV business laptop including the Lenovo ThinkPad T590 or Microsoft's latest Surface Laptop 3 15. We experienced no software or hardware issues during our time with the test unit. However, we recommend that owners become familiar with the pre-loaded MSI applications like Creator Center, True Color, and the Driver and App Center where core features and settings unique to the Prestige 15 can all be found.
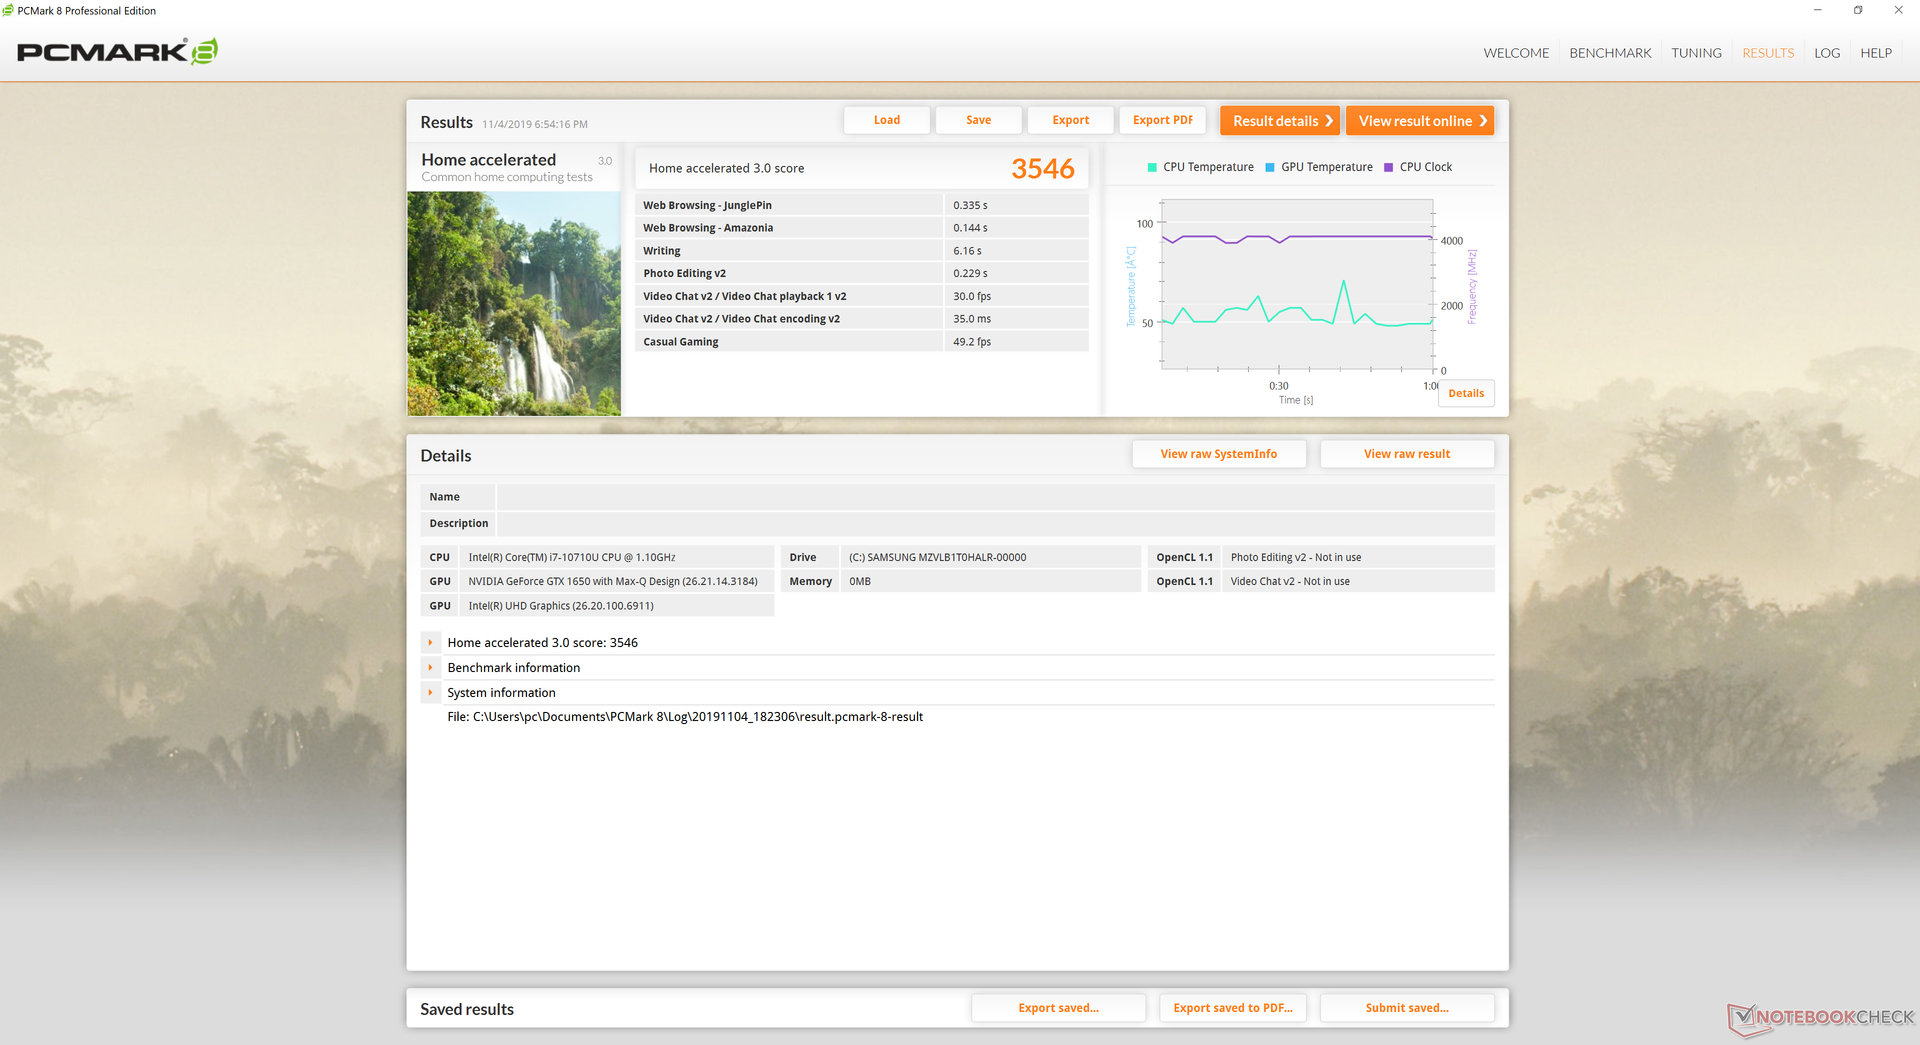

| PCMark 8 Home Score Accelerated v2 | 3546 points | |
| PCMark 8 Work Score Accelerated v2 | 4483 points | |
| PCMark 10 Score | 5009 points | |
Help | ||
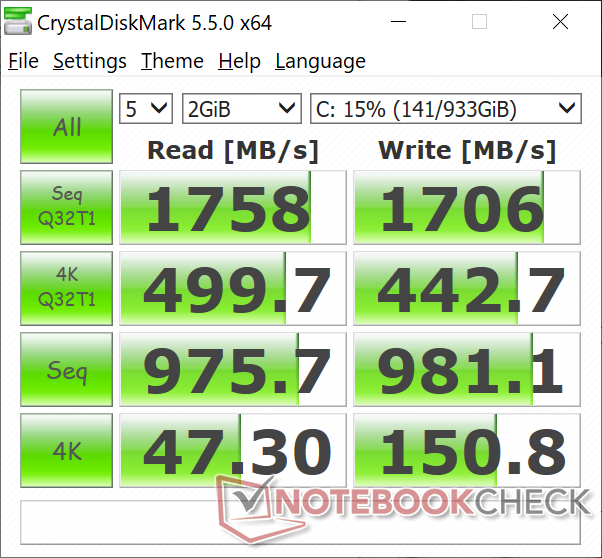
Storage Devices - Dual M.2 Options
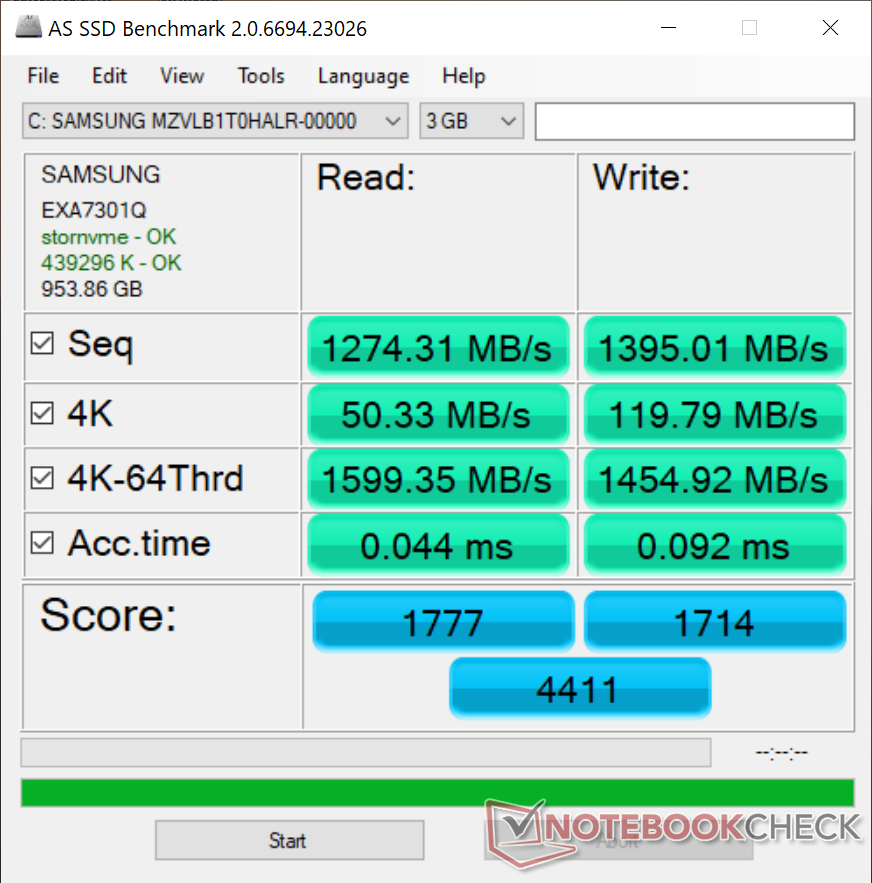
Two internal M.2 2280 slots are available. While our particular unit comes with a 1 TB Samsung SSD PM981, it's likely that resellers will include SSDs from other manufacturers. Sequential read and write speeds hover around 1300 MB/s eac according to AS SSD to be slower than the 512 GB Toshiba XG6.
See our table of SSDs and HDDs for more benchmark comparisons.
| MSI Prestige 15 A10SC Samsung SSD PM981 MZVLB1T0HALR | Microsoft Surface Laptop 3 15 Ryzen 5 3580U SK hynix BC501 HFM256GDGTNG | Lenovo ThinkPad T590-20N4002VGE Toshiba XG6 KXG60ZNV512G | Dell Latitude 5500 Toshiba XG6 KXG60ZNV1T02 | HP EliteBook 755 G5 3UN79EA Toshiba XG5 KXG50ZNV512G | Dell Precision 5530 Xeon E-2176M SK hynix PC400 512 GB | MSI P65 Creator 9SF-657 2x Samsung SSD PM981 MZVLB512HAJQ (RAID 0) | |
|---|---|---|---|---|---|---|---|
| AS SSD | -52% | 13% | 2% | -149% | -18% | 20% | |
| Seq Read (MB/s) | 1274 | 1122 -12% | 2551 100% | 1287 1% | 1810 42% | 2169 70% | 2860 124% |
| Seq Write (MB/s) | 1395 | 514 -63% | 2376 70% | 1280 -8% | 261.4 -81% | 1022 -27% | 2604 87% |
| 4K Read (MB/s) | 50.3 | 34.98 -30% | 52.7 5% | 49.57 -1% | 24.38 -52% | 38.43 -24% | 45.15 -10% |
| 4K Write (MB/s) | 119.8 | 96.8 -19% | 153 28% | 158 32% | 5.77 -95% | 92.8 -23% | 100.2 -16% |
| 4K-64 Read (MB/s) | 1599 | 492 -69% | 1406 -12% | 1043 -35% | 528 -67% | 970 -39% | 1428 -11% |
| 4K-64 Write (MB/s) | 1455 | 339.9 -77% | 1439 -1% | 1415 -3% | 90.7 -94% | 926 -36% | 1401 -4% |
| Access Time Read * (ms) | 0.044 | 0.056 -27% | 0.067 -52% | 0.039 11% | 0.2 -355% | 0.073 -66% | 0.049 -11% |
| Access Time Write * (ms) | 0.092 | 0.11 -20% | 0.027 71% | 0.027 71% | 0.748 -713% | 0.053 42% | 0.037 60% |
| Score Read (Points) | 1777 | 639 -64% | 1714 -4% | 1221 -31% | 733 -59% | 1226 -31% | 1759 -1% |
| Score Write (Points) | 1714 | 488 -72% | 1829 7% | 1701 -1% | 123 -93% | 1121 -35% | 1762 3% |
| Score Total (Points) | 4411 | 1434 -67% | 4418 0% | 3558 -19% | 1157 -74% | 2922 -34% | 4411 0% |
| Copy ISO MB/s (MB/s) | 2830 | 828 -71% | 2625 -7% | ||||
| Copy Program MB/s (MB/s) | 609 | 200.5 -67% | 495.9 -19% | ||||
| Copy Game MB/s (MB/s) | 1424 | 387.4 -73% | 1384 -3% |
* ... smaller is better

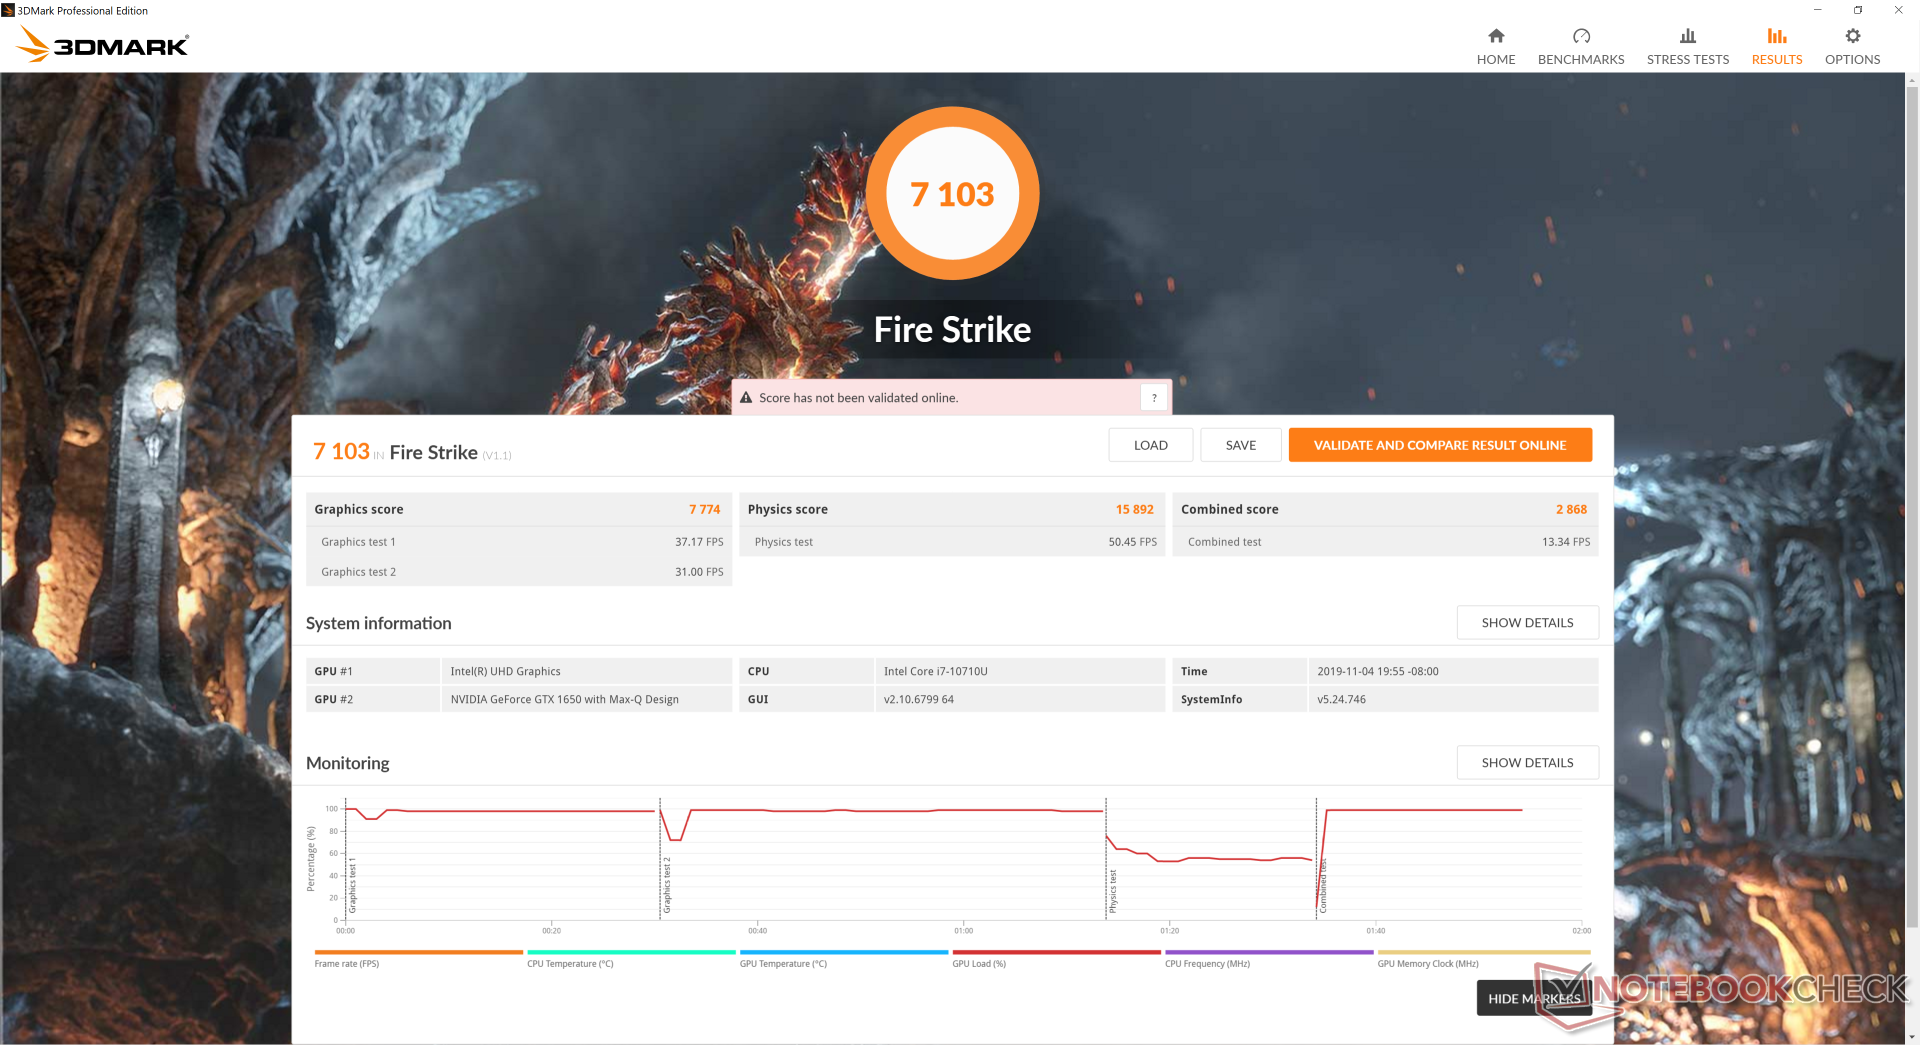
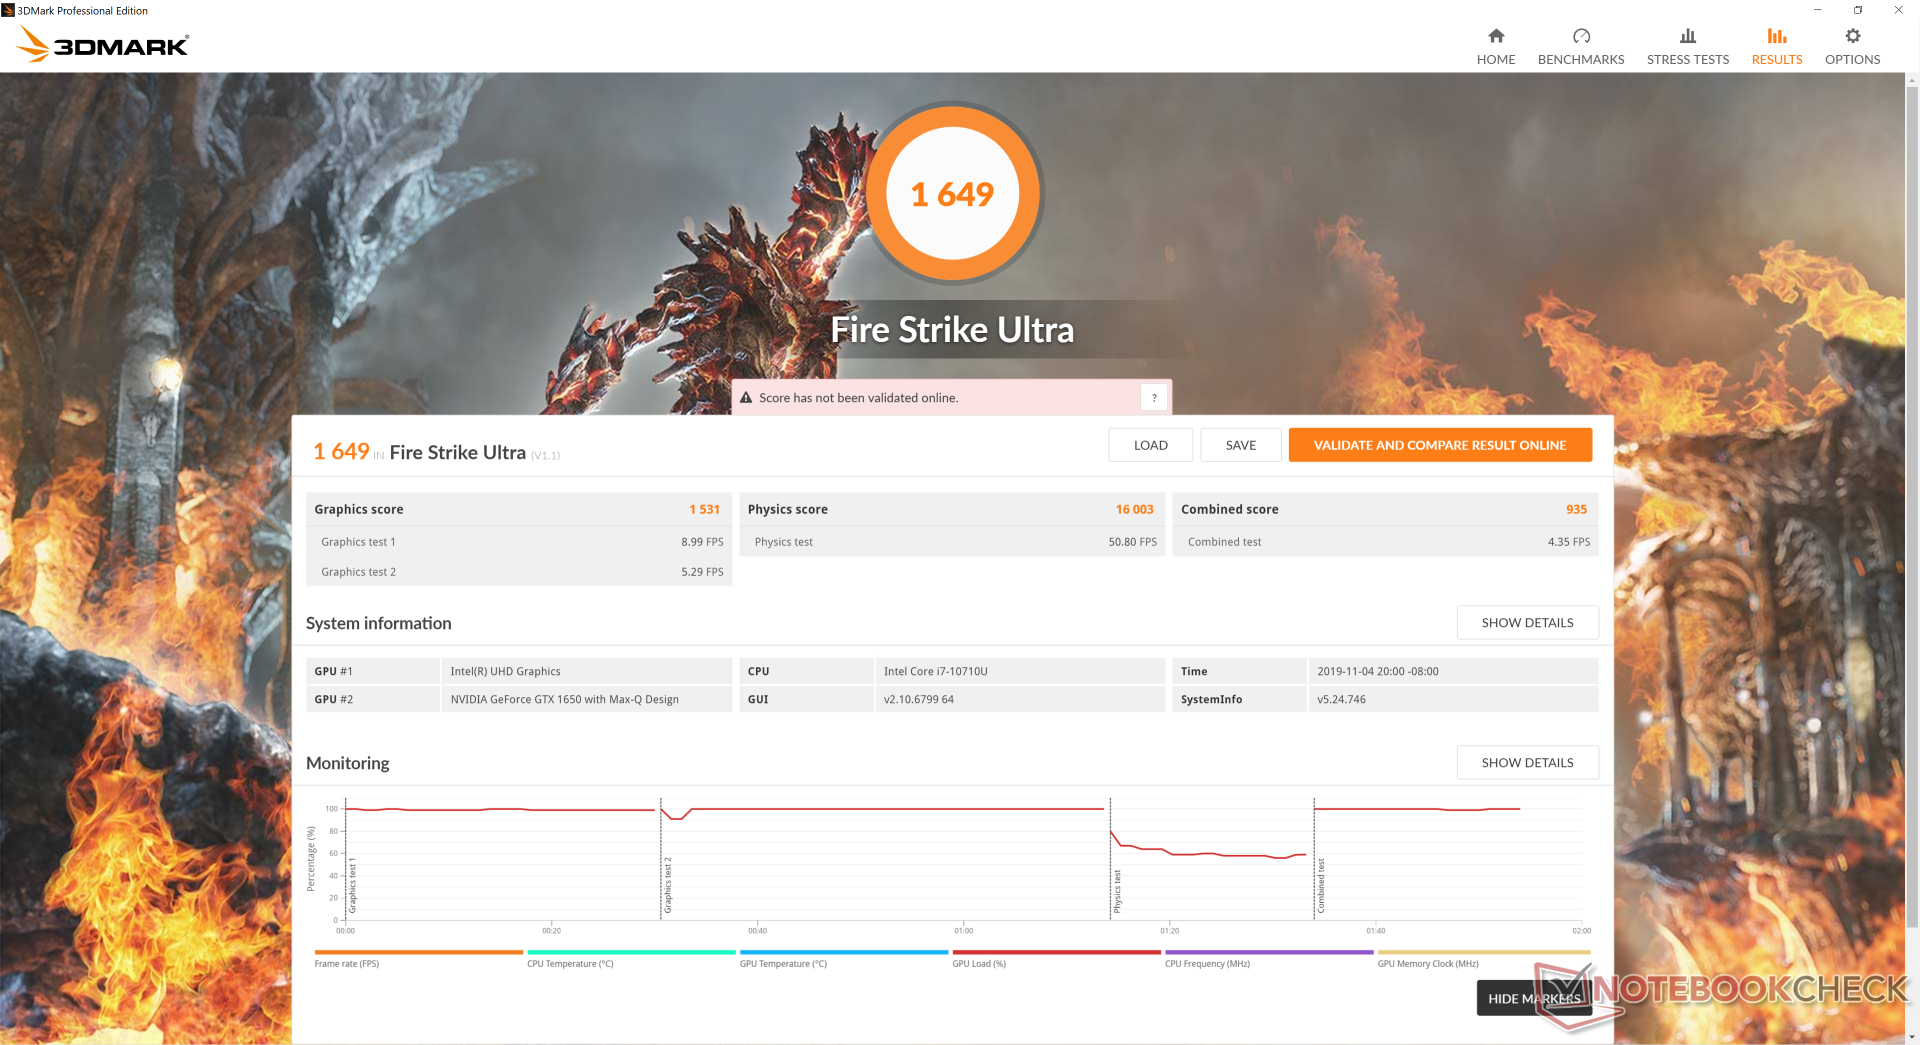
GPU Performance - Gaming Ready
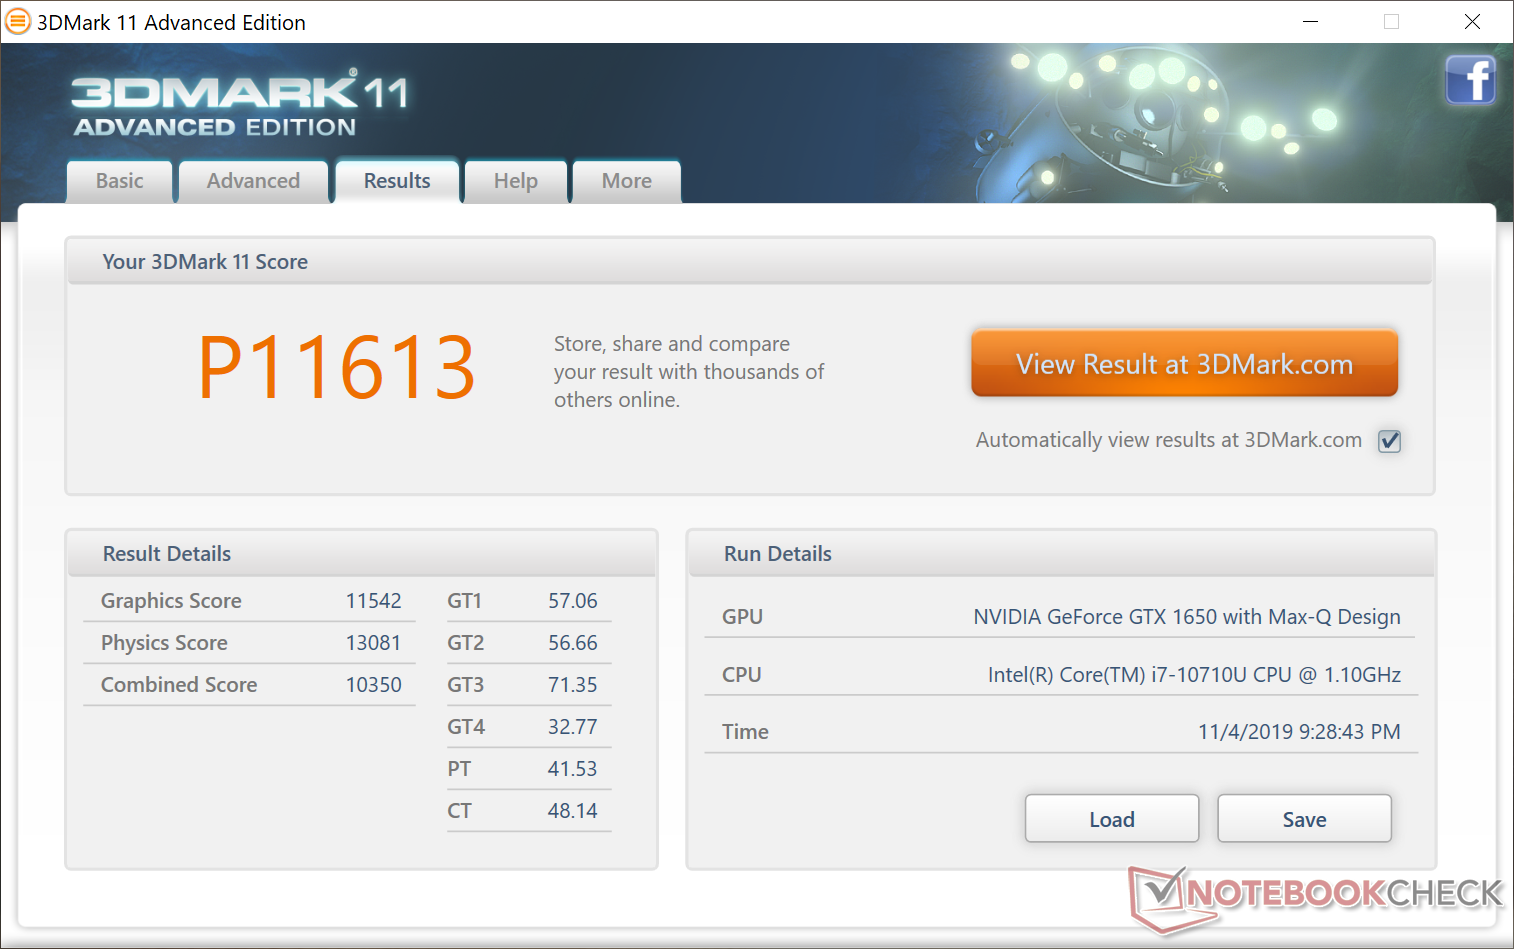
While the GeForce 1650 Max-Q is an uncommon GPU, we would love to see it on more laptops. 3DMark benchmarks place it just 15 percent behind the "proper" desktop GTX 1650 or about 15 to 50 percent faster than the GeForce GTX 1050 Ti. Nvidia Turing is optimized for DX12 titles meaning that you'll see more of a performance boost over the older GTX 1050 Ti when running newer DX12 games. Note that this is the same GPU that ships with the recent Razer Blade Stealth.
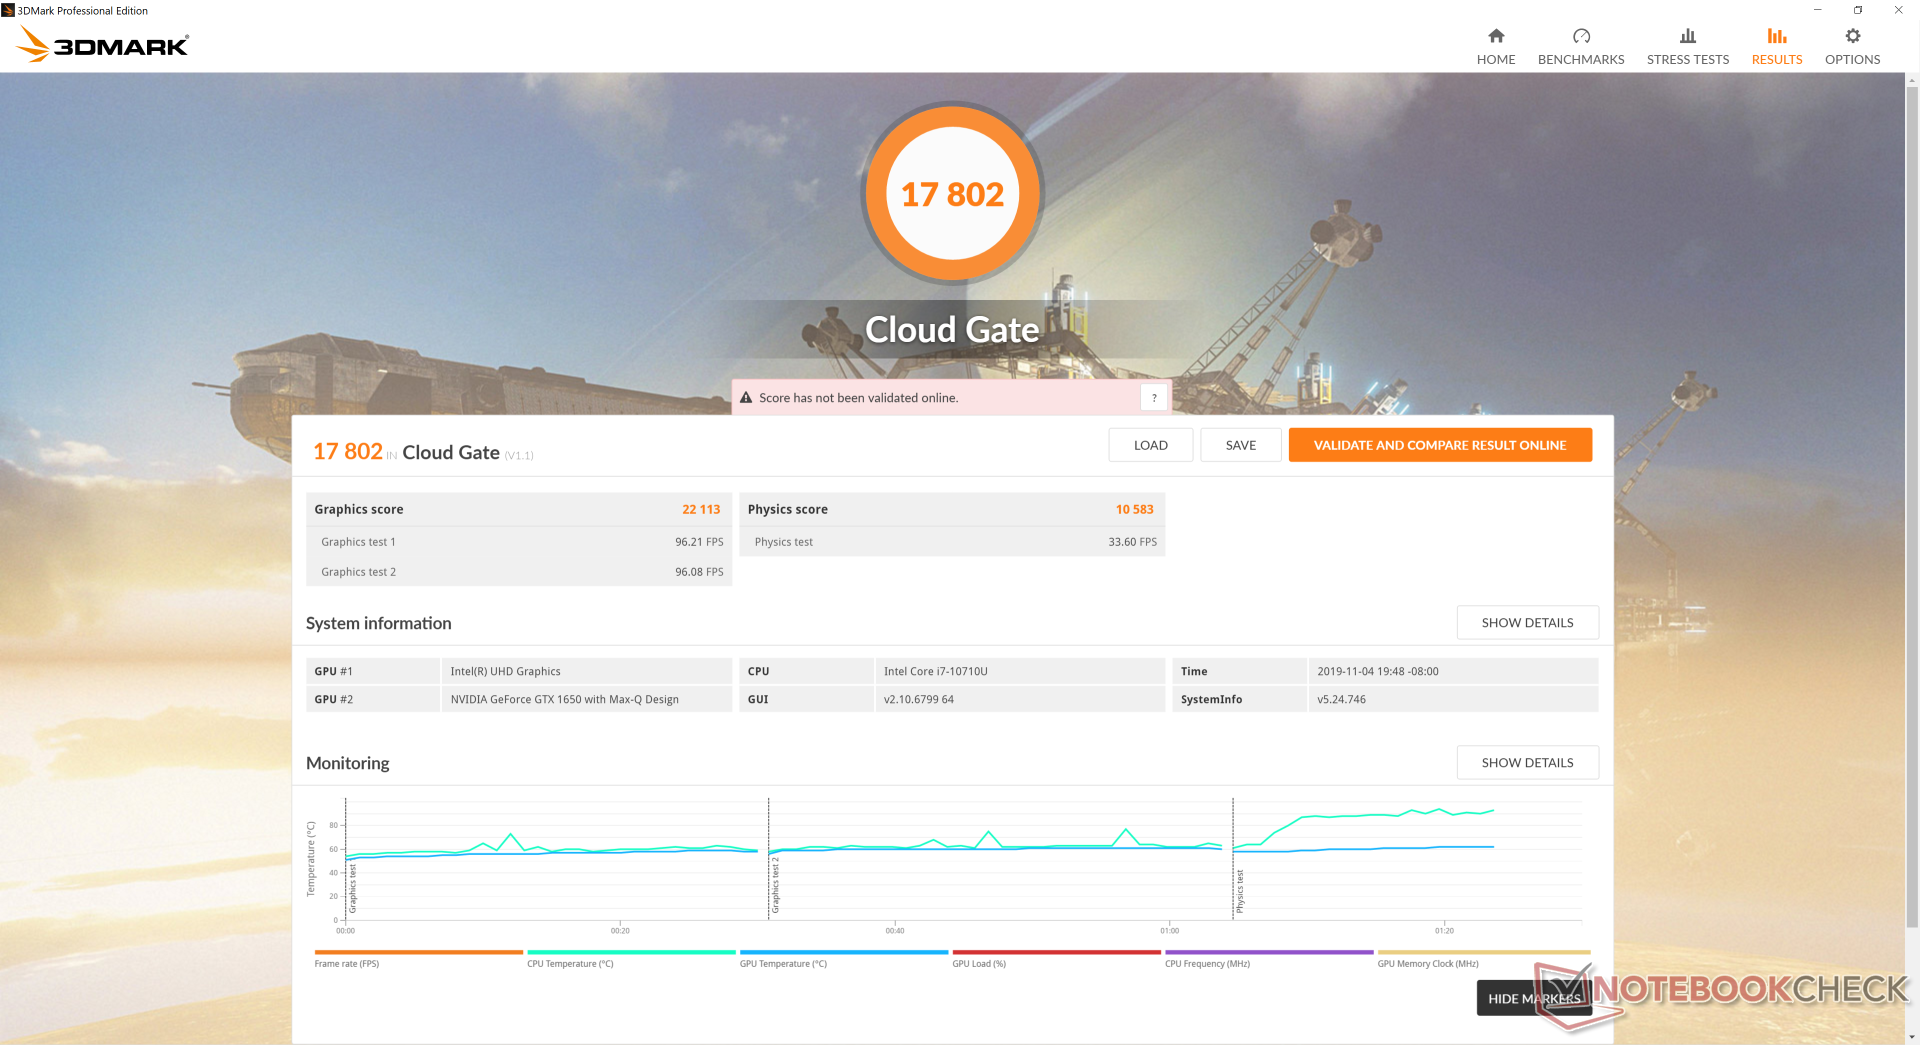
Cloud Gate scores are low likely due to the ULV CPU. Most other laptops with GeForce GTX or Max-Q graphics tend to ship with Intel H-class CPUs instead.
| 3DMark | |
| 1280x720 Cloud Gate Standard Graphics | |
| Lenovo Legion Y740-17IRH | |
| Razer Blade 15 GTX 1660 Ti | |
| Asus FX503VM-EH73 | |
| MSI GT72S-6QEG16SR421BW | |
| Acer Nitro 5 AN515-54-78TL | |
| Gainward GeForce GTX 1650 4 GB | |
| HP Pavilion Gaming 15-cx0003ng | |
| Average NVIDIA GeForce GTX 1650 Max-Q (21759 - 53981, n=12) | |
| Lenovo Yoga 730-15IKB | |
| MSI Prestige 15 A10SC | |
| 1920x1080 Fire Strike Graphics | |
| Lenovo Legion Y740-17IRH | |
| Razer Blade 15 GTX 1660 Ti | |
| Asus FX503VM-EH73 | |
| MSI GT72S-6QEG16SR421BW | |
| Acer Nitro 5 AN515-54-78TL | |
| Gainward GeForce GTX 1650 4 GB | |
| Average NVIDIA GeForce GTX 1650 Max-Q (6985 - 8618, n=12) | |
| MSI Prestige 15 A10SC | |
| HP Pavilion Gaming 15-cx0003ng | |
| Lenovo Yoga 730-15IKB | |
| 2560x1440 Time Spy Graphics | |
| Lenovo Legion Y740-17IRH | |
| Razer Blade 15 GTX 1660 Ti | |
| Asus FX503VM-EH73 | |
| Gainward GeForce GTX 1650 4 GB | |
| Acer Nitro 5 AN515-54-78TL | |
| MSI Prestige 15 A10SC | |
| Average NVIDIA GeForce GTX 1650 Max-Q (2836 - 3238, n=10) | |
| MSI GT72S-6QEG16SR421BW | |
| HP Pavilion Gaming 15-cx0003ng | |
| Lenovo Yoga 730-15IKB | |
| 3DMark 11 | |
| 1280x720 Performance GPU | |
| Lenovo Legion Y740-17IRH | |
| Razer Blade 15 GTX 1660 Ti | |
| Asus FX503VM-EH73 | |
| Gainward GeForce GTX 1650 4 GB | |
| MSI GT72S-6QEG16SR421BW | |
| MSI Prestige 15 A10SC | |
| Average NVIDIA GeForce GTX 1650 Max-Q (10248 - 12259, n=14) | |
| HP Pavilion Gaming 15-cx0003ng | |
| Lenovo Yoga 730-15IKB | |
| 1280x720 Performance Combined | |
| Lenovo Legion Y740-17IRH | |
| Gainward GeForce GTX 1650 4 GB | |
| Razer Blade 15 GTX 1660 Ti | |
| MSI Prestige 15 A10SC | |
| MSI GT72S-6QEG16SR421BW | |
| Average NVIDIA GeForce GTX 1650 Max-Q (6409 - 10846, n=13) | |
| HP Pavilion Gaming 15-cx0003ng | |
| Asus FX503VM-EH73 | |
| Lenovo Yoga 730-15IKB | |
| 3DMark 11 Performance | 11613 points | |
| 3DMark Cloud Gate Standard Score | 17802 points | |
| 3DMark Fire Strike Score | 7103 points | |
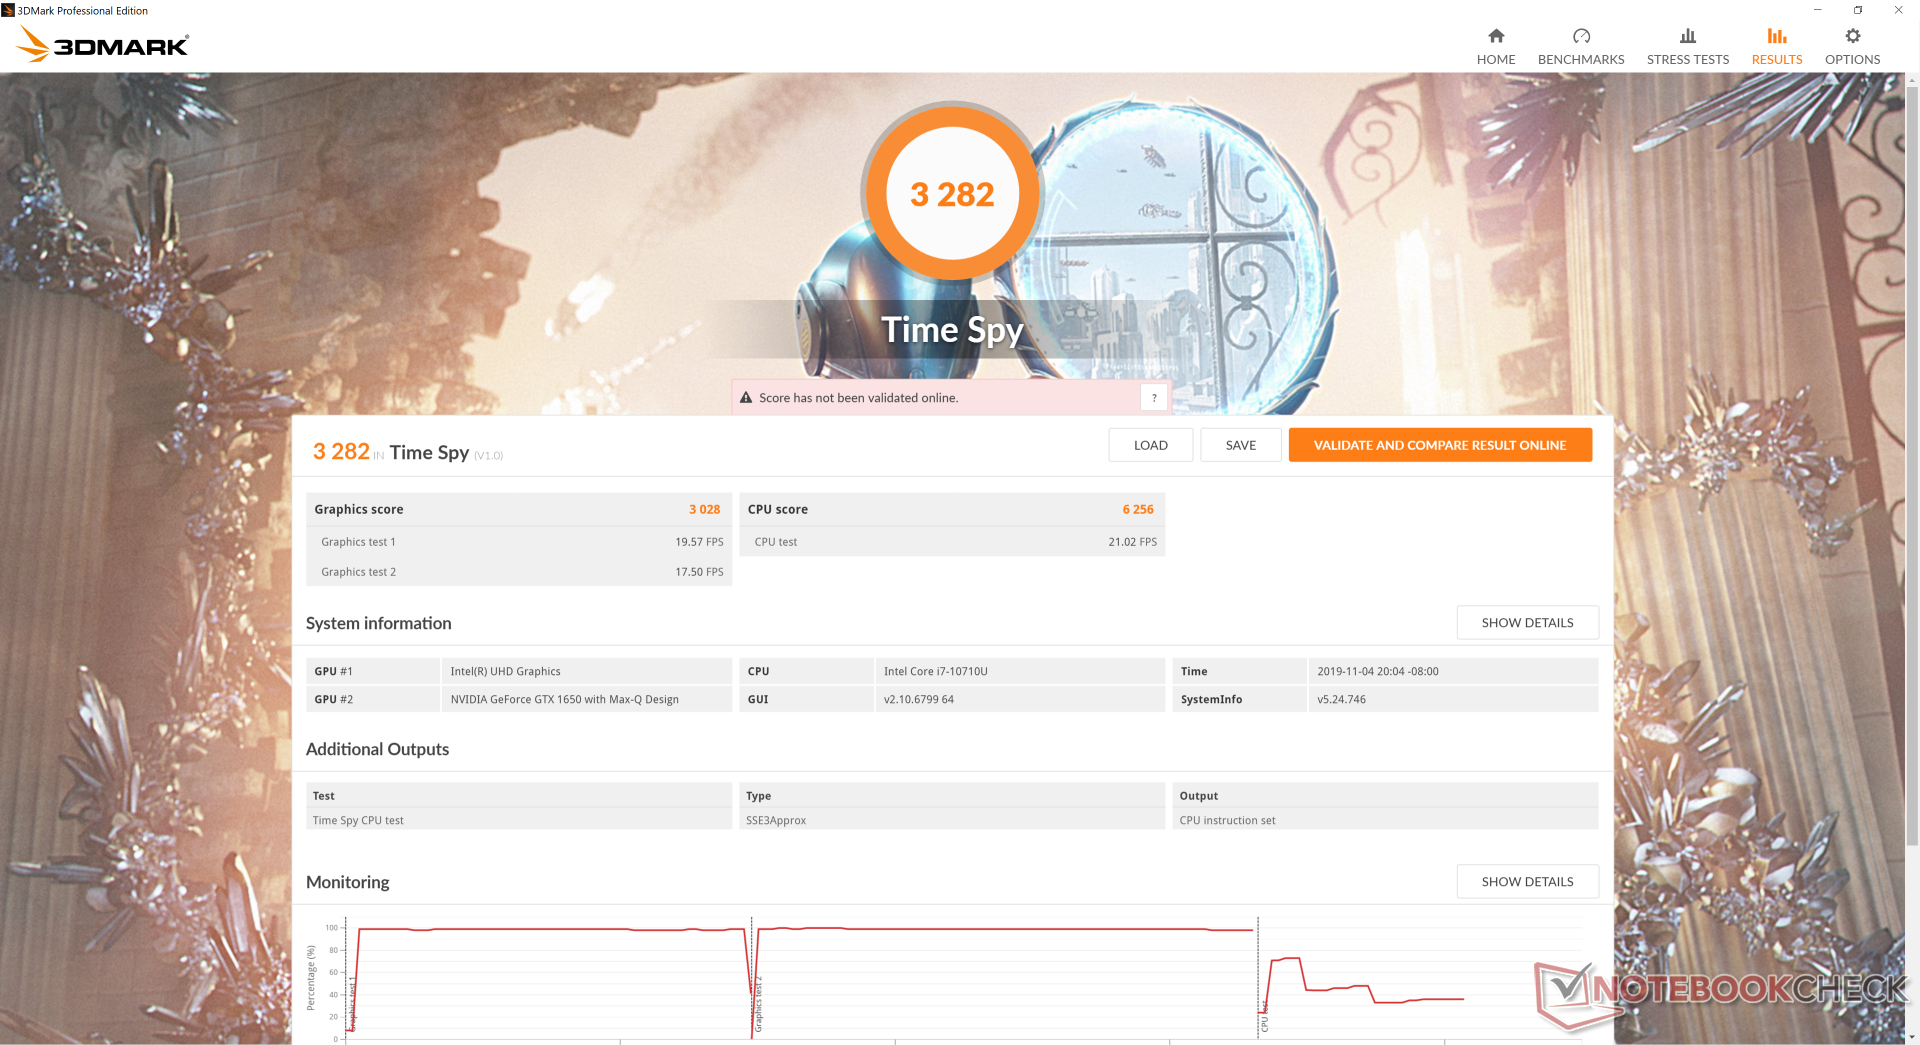
| 3DMark Time Spy Score | 3282 points | |
Help | ||
Gaming Performance
The latest titles can run at native 1080p and 30+ FPS with most settings on High to Ultra — not bad for a laptop with an ULV CPU and a Max-Q GPU. Reaching a stable 60 FPS can still be tough outside of undemanding titles like Rocket League, Overwatch, LoL, or Fortnite.
See our dedicated page on the GeForce GTX 1650 Max-Q for more gaming benchmark comparisons.
| Shadow of the Tomb Raider | |
| 1280x720 Lowest Preset | |
| MSI GE75 9SG | |
| Gainward GeForce GTX 1650 4 GB | |
| Razer Blade Pro 17 4K UHD 120 Hz | |
| Lenovo Legion Y740-17IRH | |
| Alienware m15 P79F | |
| Average NVIDIA GeForce GTX 1650 Max-Q (92 - 151, n=5) | |
| Razer Blade 15 GTX 1660 Ti | |
| MSI Prestige 15 A10SC | |
| Dell G3 3590 | |
| Asus GL753VD | |
| Asus TUF FX705GE-EW096T | |
| Dell Inspiron 15 5000 5585 | |
| Microsoft Surface Laptop 3 15 Ryzen 5 3580U | |
| Dell XPS 13 7390 2-in-1 Core i7 | |
| 1920x1080 Highest Preset AA:T | |
| MSI GE75 9SG | |
| Razer Blade Pro 17 4K UHD 120 Hz | |
| Alienware m15 P79F | |
| Lenovo Legion Y740-17IRH | |
| Razer Blade 15 GTX 1660 Ti | |
| Gainward GeForce GTX 1650 4 GB | |
| Average NVIDIA GeForce GTX 1650 Max-Q (33 - 45, n=6) | |
| MSI Prestige 15 A10SC | |
| Asus TUF FX705GE-EW096T | |
| Asus GL753VD | |
| low | med. | high | ultra | |
|---|---|---|---|---|
| BioShock Infinite (2013) | 296.3 | 215.1 | 188.4 | 77 |
| The Witcher 3 (2015) | 155.4 | 94.1 | 54.8 | 30.8 |
| Rocket League (2017) | 196 | 128.2 | 88 | |
| Shadow of the Tomb Raider (2018) | 113 | 51 | 42 | 35 |
Emissions
System Noise - Audible, but Quiet
The cooling solution consists of two asymmetric fans (~40 mm + ~50 mm) and three heat pipes. The fans are never truly idle even when set to Silent mode, but the noise is barely noticeable when under most ambient conditions anyway. We're able to record a noise of just 30.2 dB(A) against a background of 29.3 dB(A) when idling or desktop or browsing the web.
Fan noise remains surprisingly quiet when under heavier browsing or streaming loads. Running 3DMark 06, for example, results in a fan noise of just 31.5 dB(A) compared to 40.9 dB(A) on the more powerful MSI P65. Expect a steady noise level of about 37 dB(A) when gaming to be quieter than most dedicated gaming laptops. At worst, we're able to record a noise level of 47 dB(A) when running both Prime95 and FurMark simultaneously.
We can notice no electronic noise or coil whine from our test unit.
| MSI Prestige 15 A10SC GeForce GTX 1650 Max-Q, i7-10710U, Samsung SSD PM981 MZVLB1T0HALR | Microsoft Surface Laptop 3 15 Ryzen 5 3580U Vega 9, R5 3580U, SK hynix BC501 HFM256GDGTNG | MSI P65 Creator 9SF-657 GeForce RTX 2070 Max-Q, i9-9880H, 2x Samsung SSD PM981 MZVLB512HAJQ (RAID 0) | Lenovo ThinkPad T590-20N4002VGE GeForce MX250, i7-8565U, Toshiba XG6 KXG60ZNV512G | Dell Latitude 5500 UHD Graphics 620, i7-8665U, Toshiba XG6 KXG60ZNV1T02 | HP EliteBook 755 G5 3UN79EA Vega 10, R7 2700U, Toshiba XG5 KXG50ZNV512G | Dell Precision 5530 Xeon E-2176M Quadro P2000, E-2176M, SK hynix PC400 512 GB | |
|---|---|---|---|---|---|---|---|
| Noise | 6% | -9% | 4% | 9% | 0% | -7% | |
| off / environment * (dB) | 29.3 | 28 4% | 30.2 -3% | 29.4 -0% | 28.8 2% | 30.5 -4% | 28.4 3% |
| Idle Minimum * (dB) | 30.1 | 28 7% | 32.8 -9% | 29.3 3% | 28.8 4% | 30.5 -1% | 28.4 6% |
| Idle Average * (dB) | 30.2 | 28 7% | 32.8 -9% | 29.3 3% | 28.8 5% | 30.5 -1% | 28.4 6% |
| Idle Maximum * (dB) | 30.2 | 28 7% | 33.6 -11% | 31.8 -5% | 28.8 5% | 30.5 -1% | 28.4 6% |
| Load Average * (dB) | 31.5 | 29.2 7% | 40.9 -30% | 33.5 -6% | 30.3 4% | 37.5 -19% | 46.5 -48% |
| Witcher 3 ultra * (dB) | 37 | 39 -5% | 33.5 9% | 46.5 -26% | |||
| Load Maximum * (dB) | 47 | 41.4 12% | 42.7 9% | 35.8 24% | 32.6 31% | 35 26% | 46.5 1% |
* ... smaller is better
Noise level
| Idle |
| 30.1 / 30.2 / 30.2 dB(A) |
| Load |
| 31.5 / 47 dB(A) |
 | ||
30 dB silent 40 dB(A) audible 50 dB(A) loud |
||
min: | ||
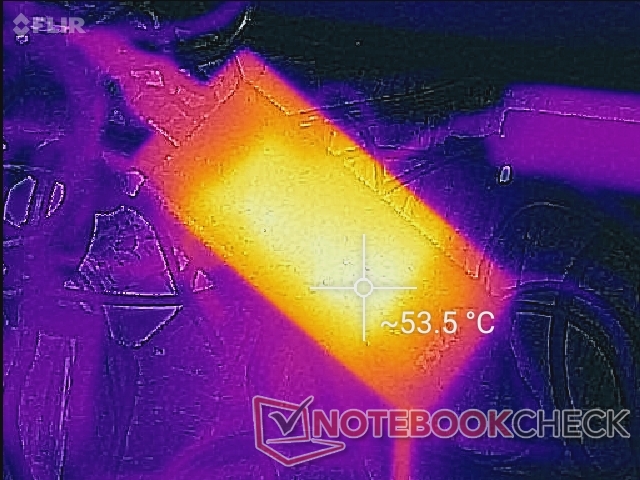
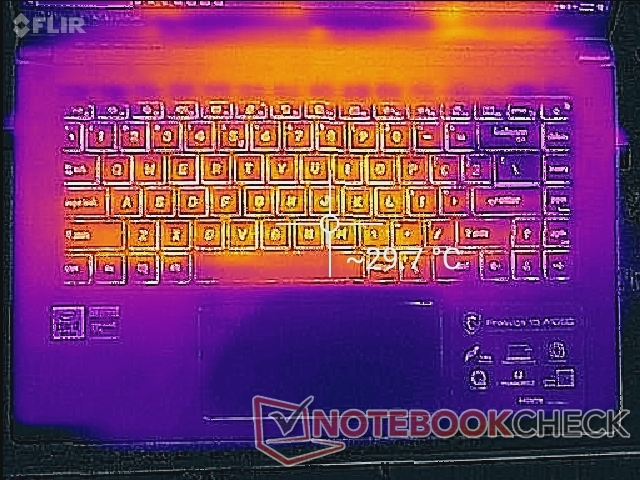
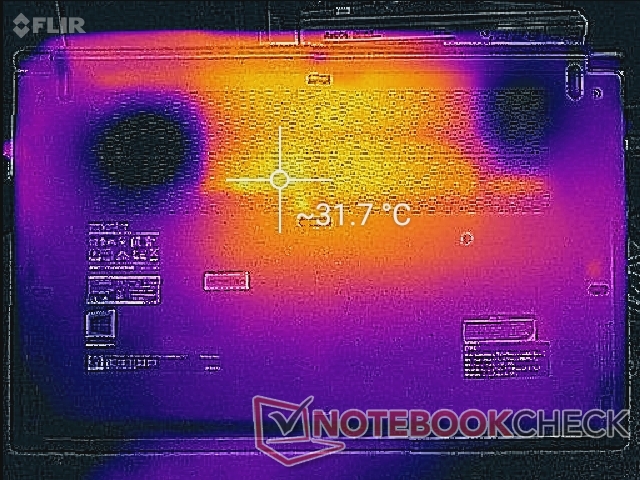
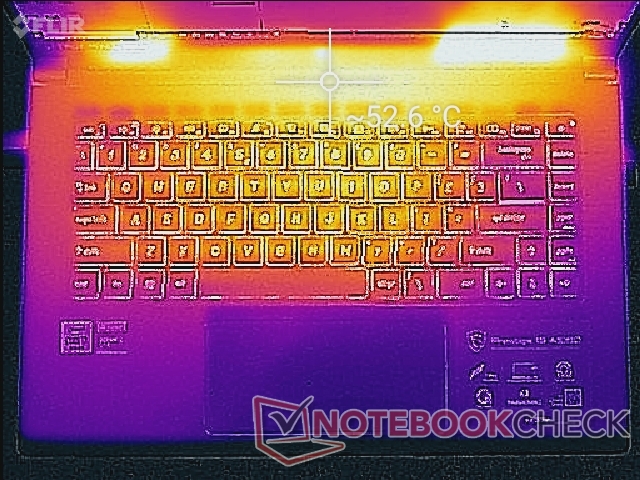
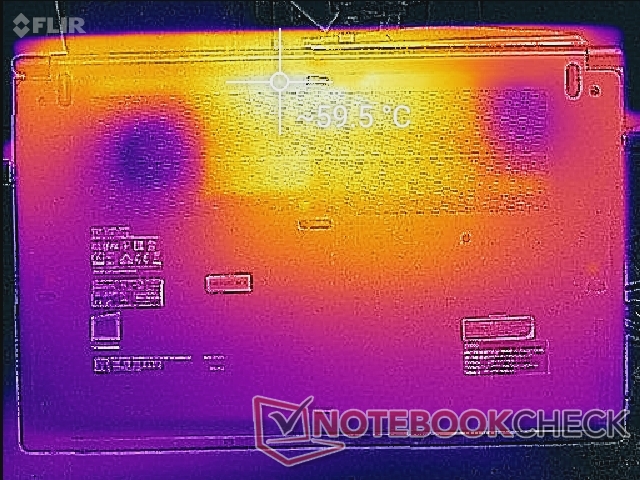
Temperature
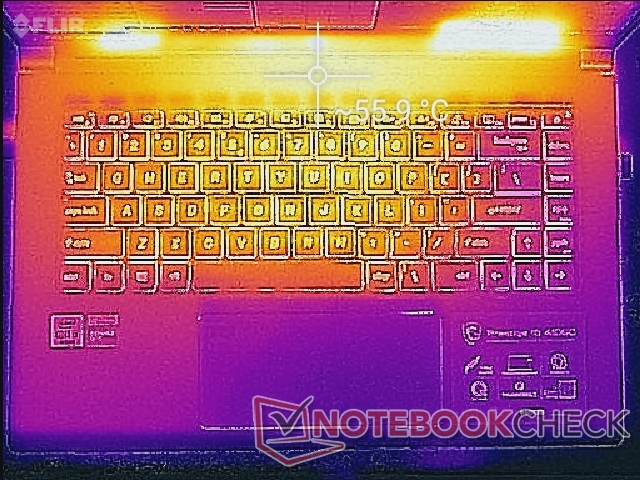
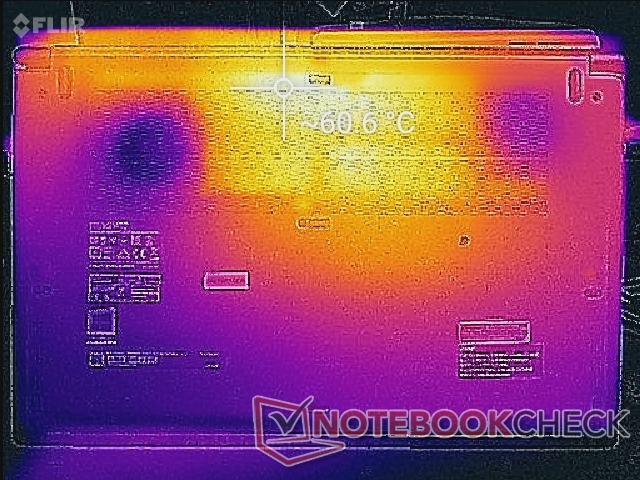
Surface temperatures peak at about 31 C toward the center of the laptop during low or idling loads. When gaming or running high loads, surfaces can become as warm as 55 C to 60 C as shown by our temperature maps below. These hot spots are thankfully above the first row of keyboard keys where users are unlikely to touch.
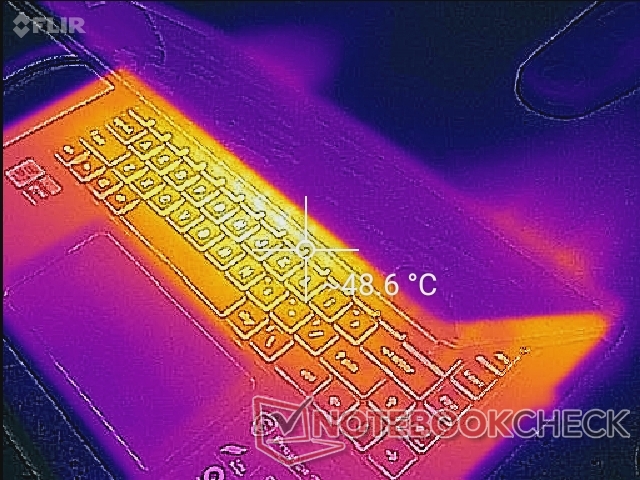
(-) The maximum temperature on the upper side is 56 °C / 133 F, compared to the average of 36.9 °C / 98 F, ranging from 21 to 71 °C for the class Multimedia.
(-) The bottom heats up to a maximum of 60.6 °C / 141 F, compared to the average of 39.1 °C / 102 F
(+) In idle usage, the average temperature for the upper side is 27.2 °C / 81 F, compared to the device average of 31.3 °C / 88 F.
(-) Playing The Witcher 3, the average temperature for the upper side is 39.4 °C / 103 F, compared to the device average of 31.3 °C / 88 F.
(+) The palmrests and touchpad are reaching skin temperature as a maximum (34.6 °C / 94.3 F) and are therefore not hot.
(-) The average temperature of the palmrest area of similar devices was 28.7 °C / 83.7 F (-5.9 °C / -10.6 F).
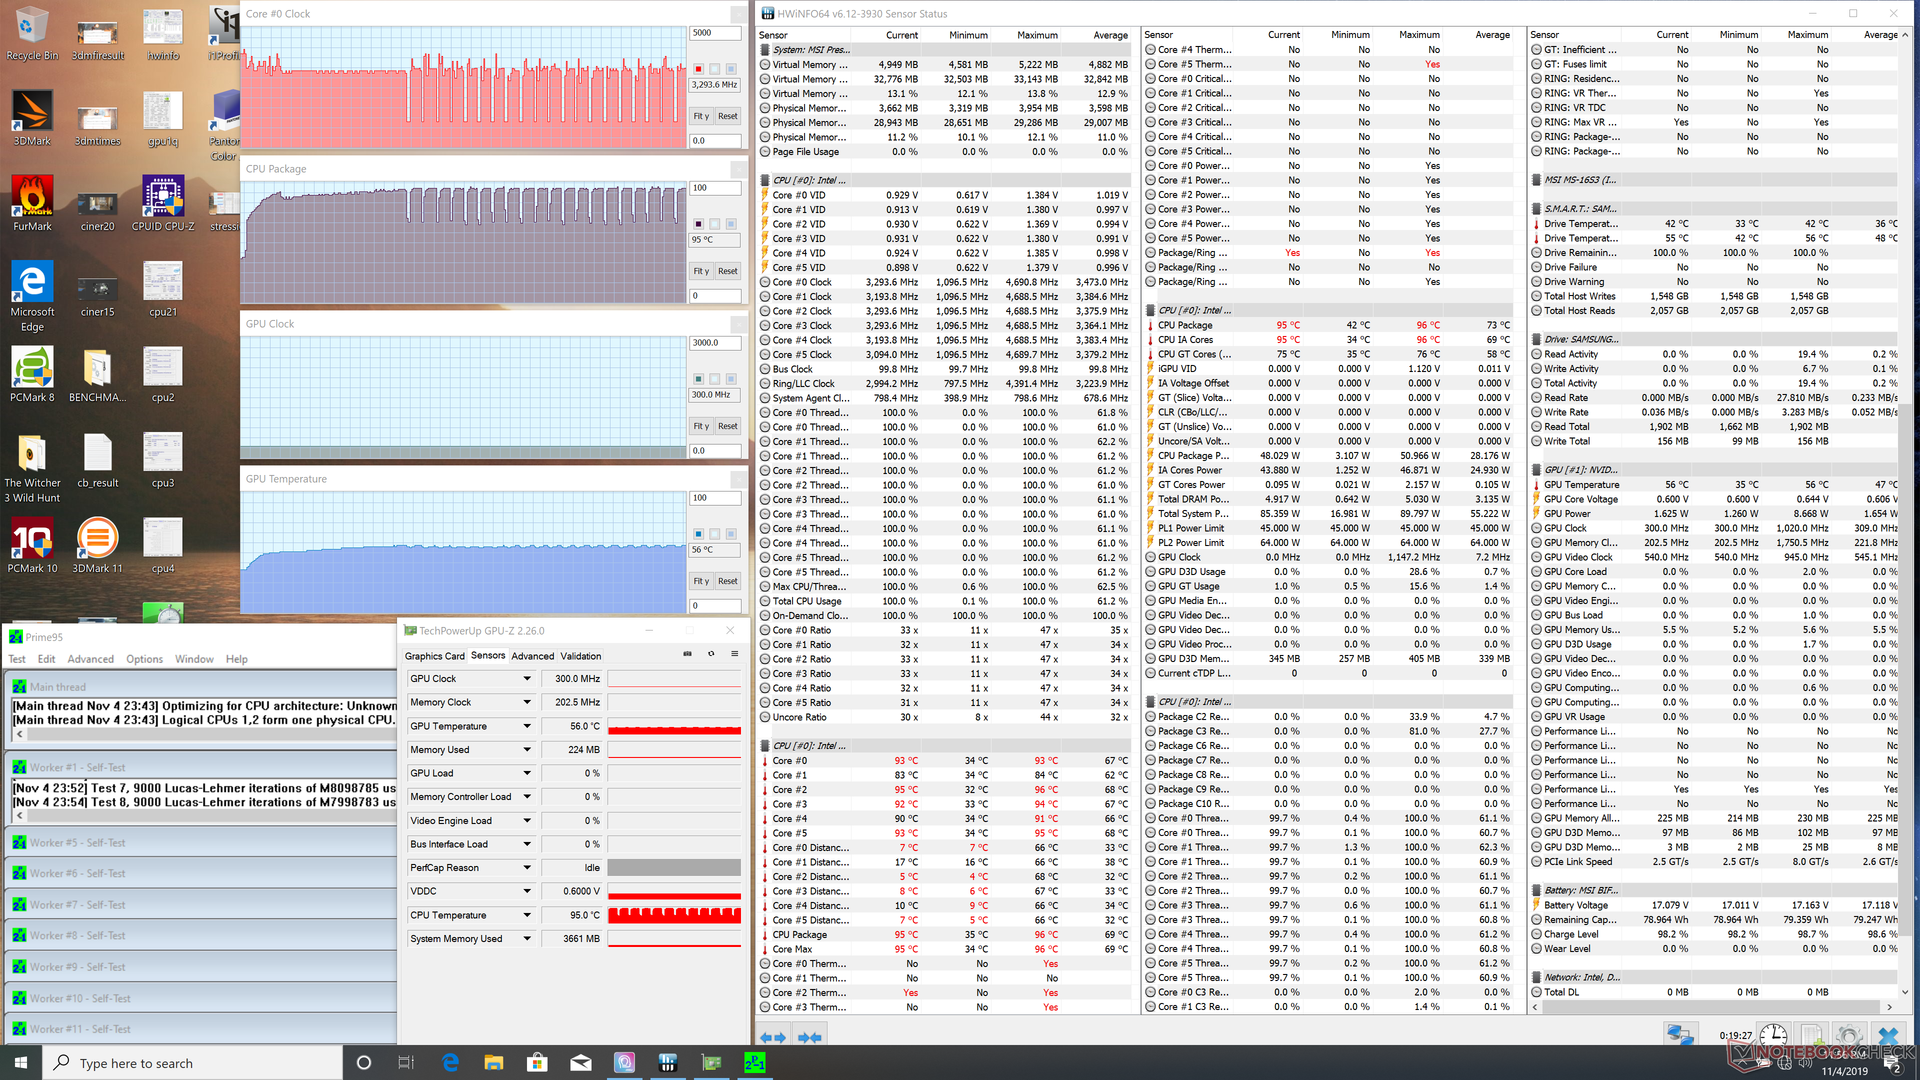
Stress Test - Strange Throttling Behavior
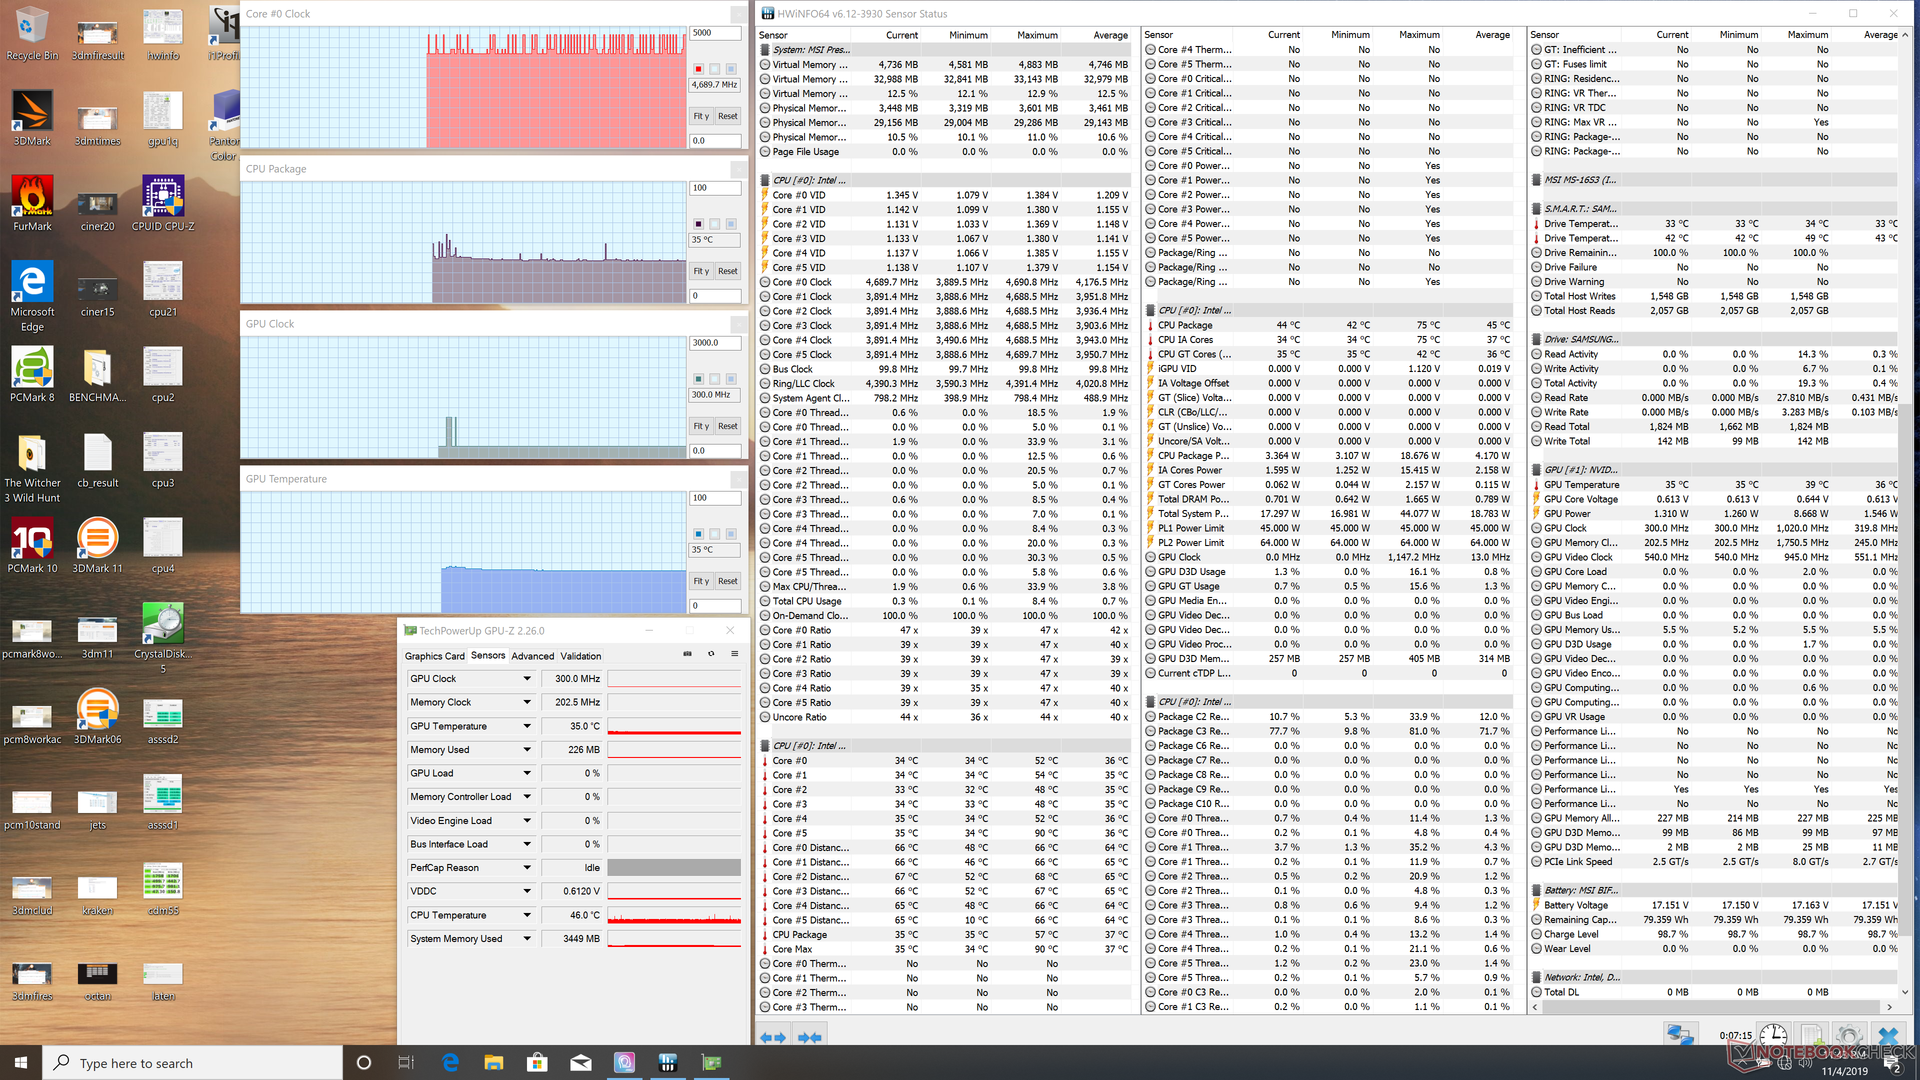
We stress the laptop to identify for any potential throttling or stability issues. When running Prime95, CPU clock rates can be observed running at up to 3.6 GHz for the first few seconds until core temperature reaches 92 C. Thereafter, clock rates drop to the 3.0 to 3.2 GHz range in order to maintain a core temperature in the 90 C to 95 C range. After about 4.5 minutes, however, clock rate and temperature will fluctuate between 0.8 and 3.3 GHz and 67 C and 95 C, respectively. This throttling behavior is strange because it does not occur during the CineBench stress test above and yet it occurs here on Prime95 even after repeat runs. We'll re-confirm our throttling observations with a second Prestige 15 unit soon.
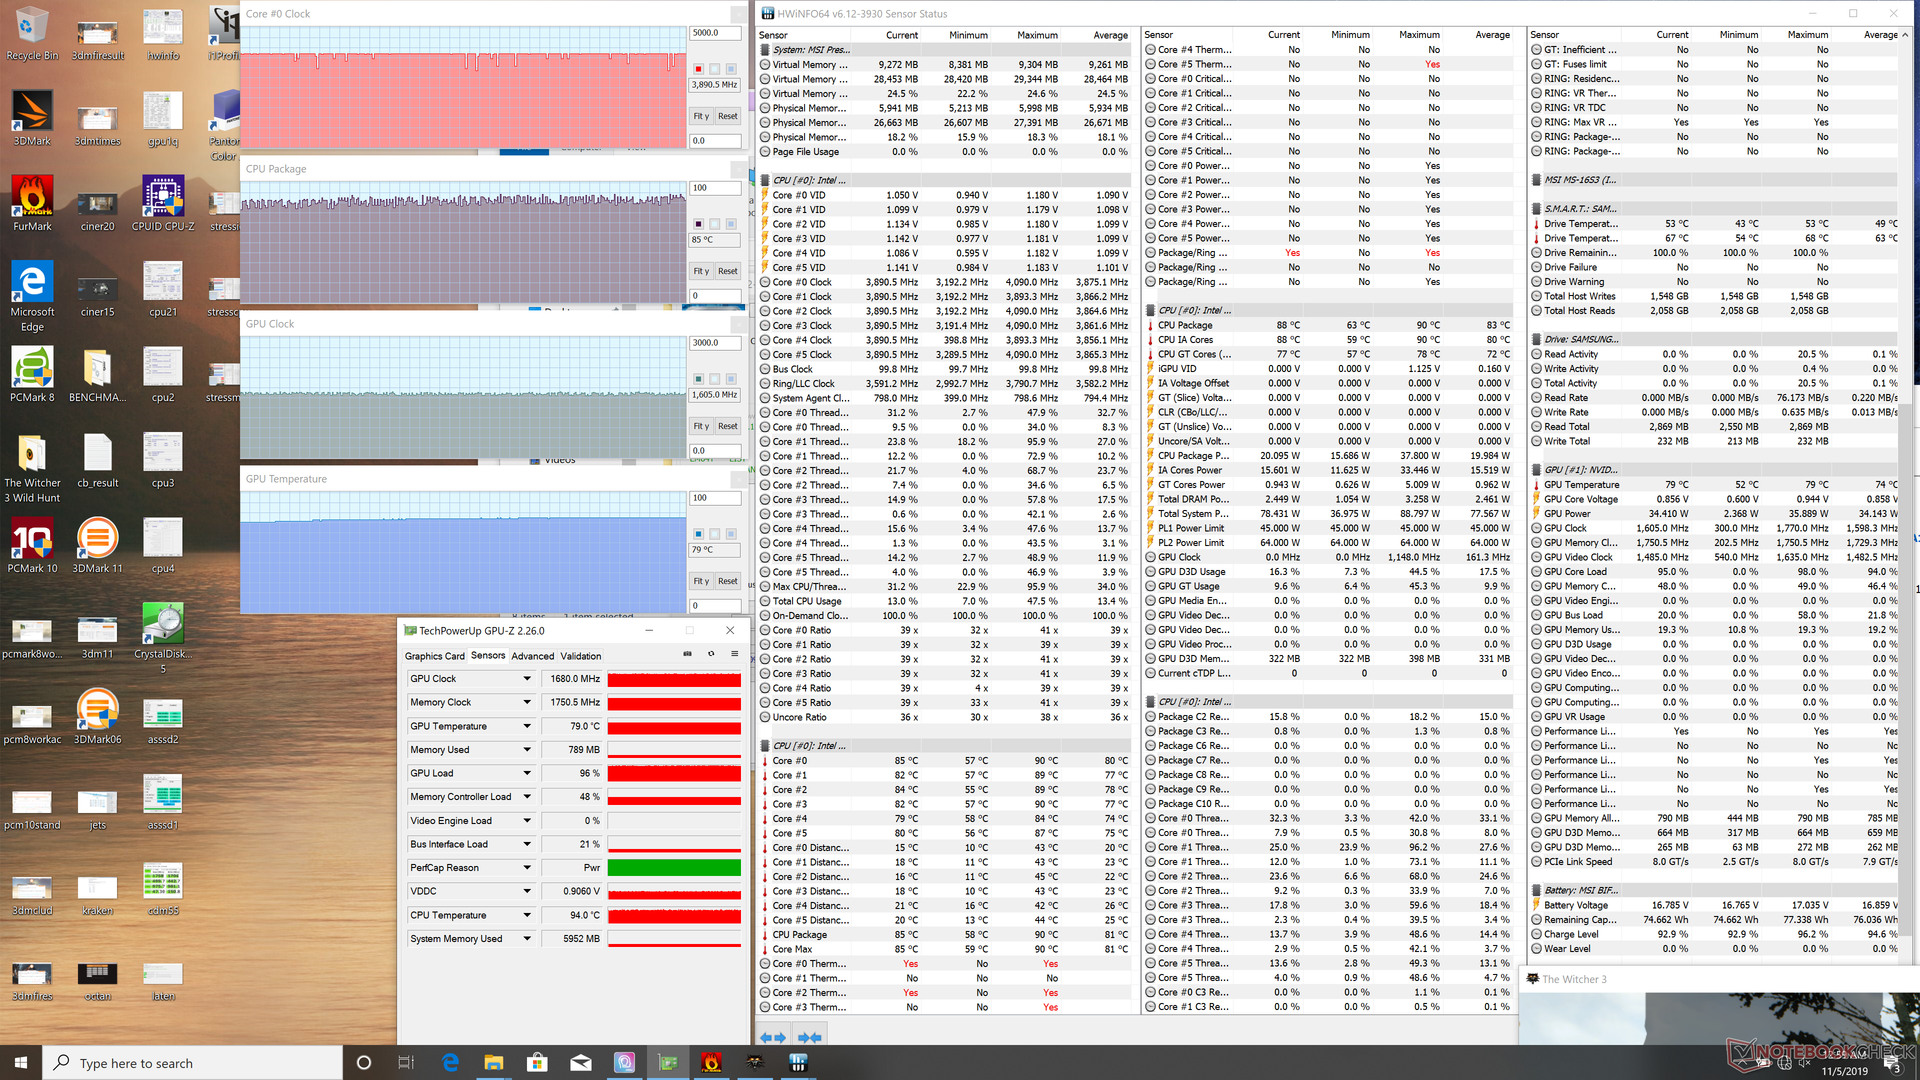
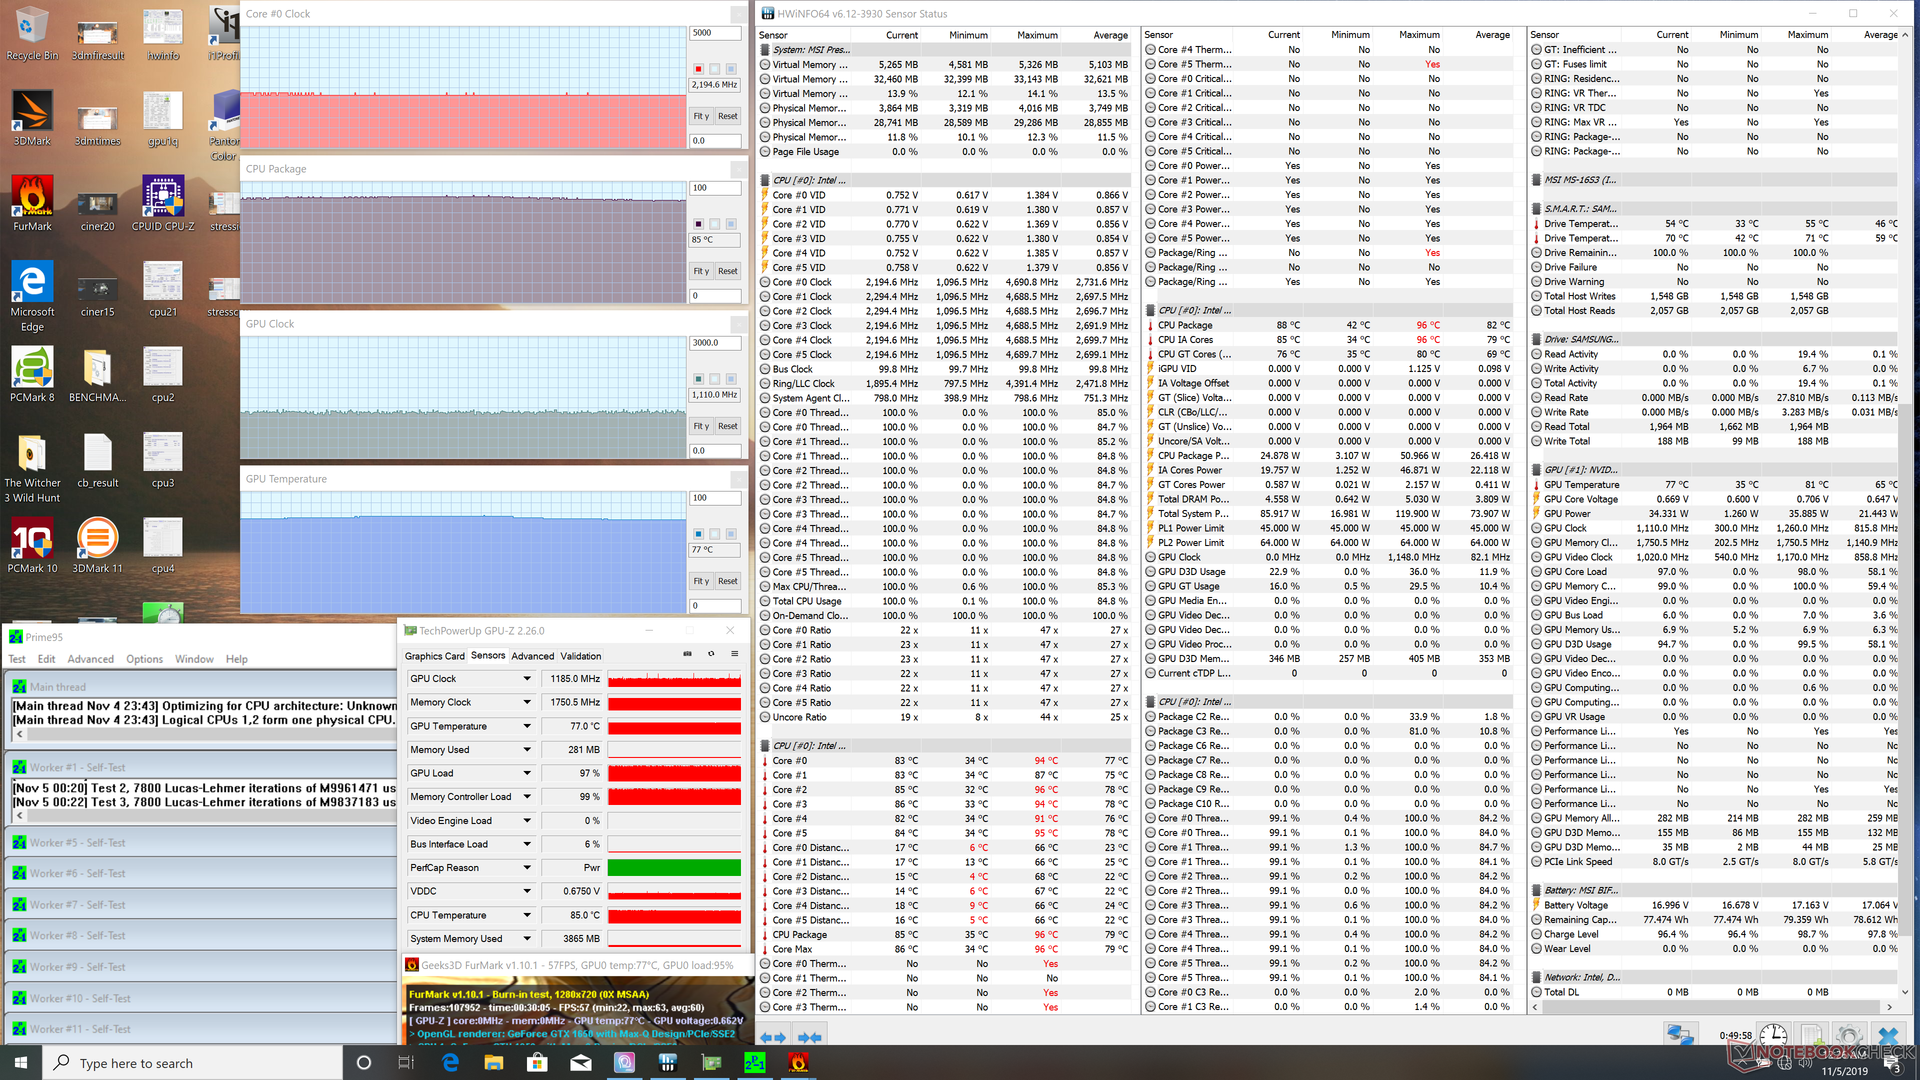
Running Witcher 3 results in stable CPU and GPU temperatures of 85 C and 80 C, respectively, which is warmer than what we observed on the more powerful XPS 15 7590 when under similar conditions. The CPU and GPU may be low-power processors, but their running temperatures are anything but.
Running on battery power will limit performance. A Fire Strike run on batteries returns Physics and Graphics scores of 8865 and 7323 points, respectively, compared to 15892 and 7774 points when on mains.
| CPU Clock (GHz) | GPU Clock (MHz) | Average CPU Temperature (°C) | Average GPU Temperature (°C) | |
| System Idle | -- | -- | 35 | 35 |
| Prime95 Stress | 0.8 - 3.3 | 67 - 95 | 56 | |
| Prime95 + FurMark Stress | 2.2 | 1185 | 85 | 77 |
| Witcher 3 Stress | 3.9 | 1680 | 85 | 80 |
Speakers
Audio quality is decent with just average bass reproduction to be good enough for conference calls but lacking for multimedia playback. Louder volume settings will cause the palm rests to vibrate slightly to the touch.


MSI Prestige 15 A10SC audio analysis
(±) | speaker loudness is average but good (80.1 dB)
Bass 100 - 315 Hz
(±) | reduced bass - on average 12.8% lower than median
(+) | bass is linear (6.4% delta to prev. frequency)
Mids 400 - 2000 Hz
(+) | balanced mids - only 4.6% away from median
(±) | linearity of mids is average (10% delta to prev. frequency)
Highs 2 - 16 kHz
(+) | balanced highs - only 2.4% away from median
(+) | highs are linear (6.4% delta to prev. frequency)
Overall 100 - 16.000 Hz
(±) | linearity of overall sound is average (20.2% difference to median)
Compared to same class
» 67% of all tested devices in this class were better, 8% similar, 25% worse
» The best had a delta of 5%, average was 17%, worst was 45%
Compared to all devices tested
» 52% of all tested devices were better, 8% similar, 40% worse
» The best had a delta of 4%, average was 24%, worst was 134%
Apple MacBook 12 (Early 2016) 1.1 GHz audio analysis
(+) | speakers can play relatively loud (83.6 dB)
Bass 100 - 315 Hz
(±) | reduced bass - on average 11.3% lower than median
(±) | linearity of bass is average (14.2% delta to prev. frequency)
Mids 400 - 2000 Hz
(+) | balanced mids - only 2.4% away from median
(+) | mids are linear (5.5% delta to prev. frequency)
Highs 2 - 16 kHz
(+) | balanced highs - only 2% away from median
(+) | highs are linear (4.5% delta to prev. frequency)
Overall 100 - 16.000 Hz
(+) | overall sound is linear (10.2% difference to median)
Compared to same class
» 7% of all tested devices in this class were better, 2% similar, 91% worse
» The best had a delta of 5%, average was 18%, worst was 53%
Compared to all devices tested
» 5% of all tested devices were better, 1% similar, 94% worse
» The best had a delta of 4%, average was 24%, worst was 134%
Energy Management
Power Consumption
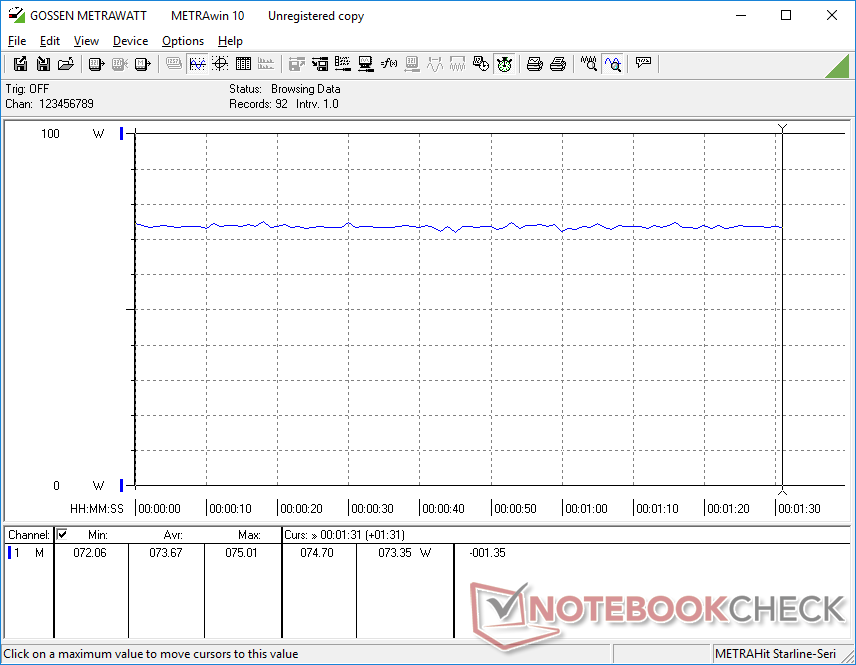
Idling on desktop will demand anywhere between 6 W and 20 W depending on the brightness level and power profile to be not unlike what we discovered on the P65 Creator. The more interesting results come when running higher loads like gaming. Idling on Witcher 3 consumes just 74 W compared to 94 W on the Dell G3 3590 gaming laptop with GTX 1650 graphics or 124 W on the Lenovo Legion Y7000 with GTX 1060 graphics. The performance-per-Watt is impressive for a laptop that pairs an ULV CPU with a Max-Q GPU.
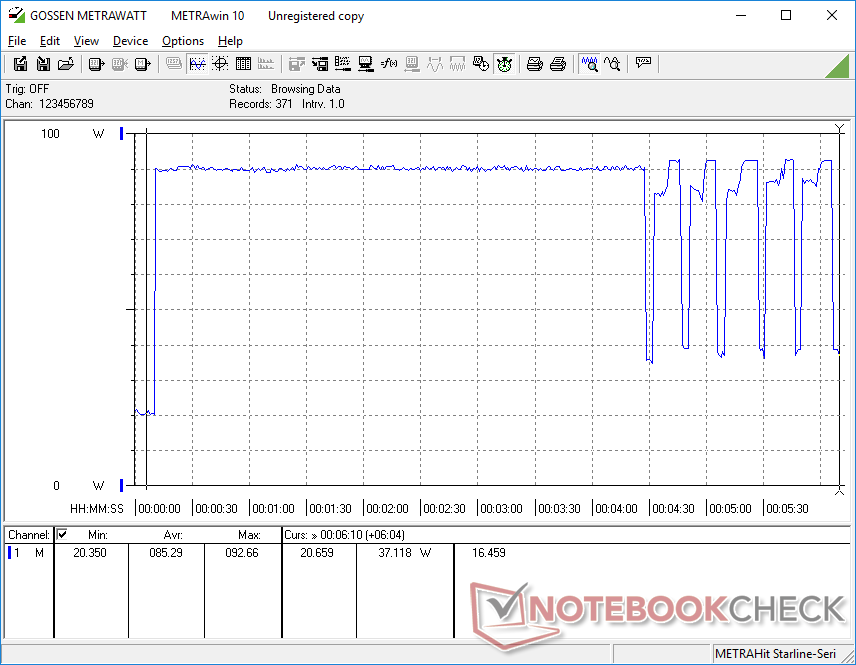
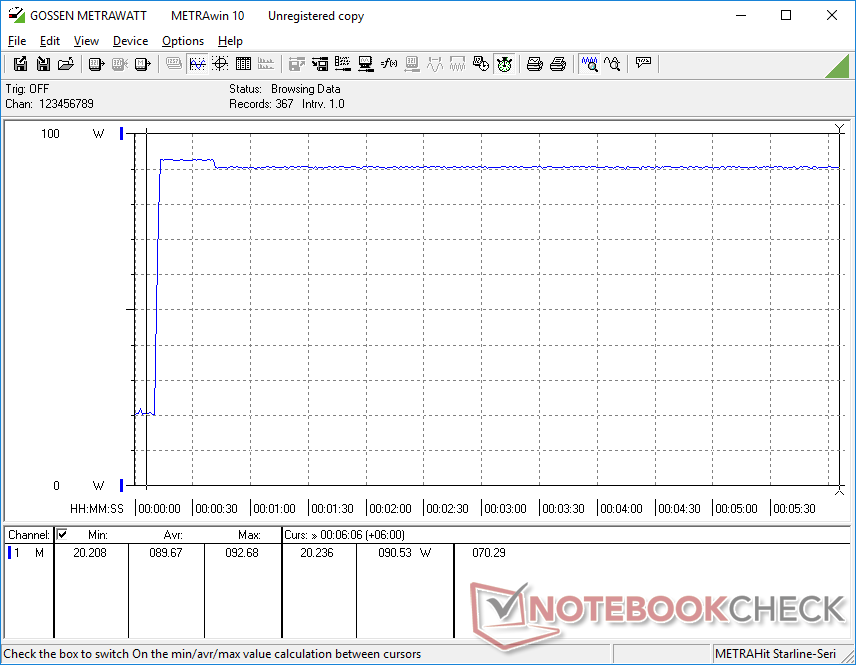
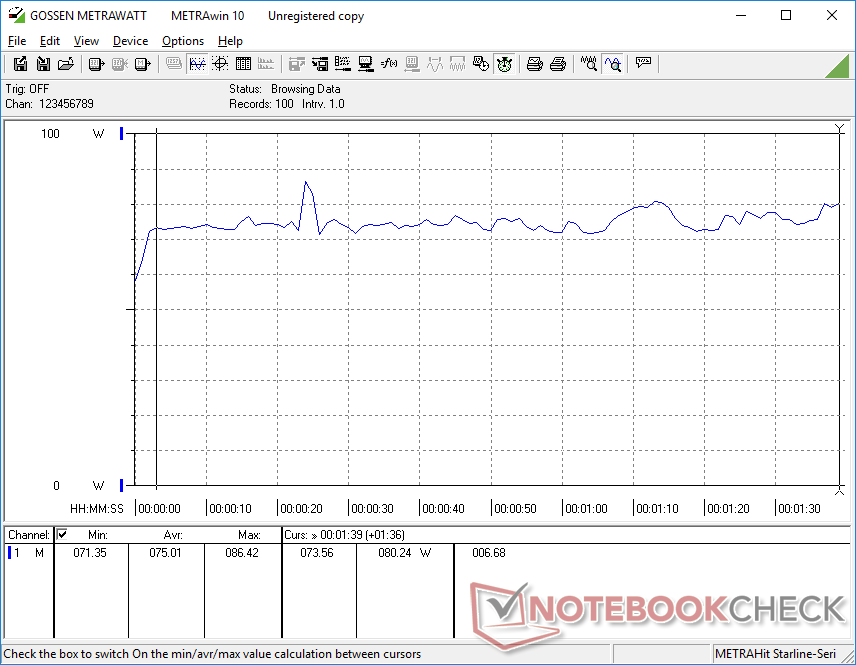
When running Prime95, consumption spikes to 90 W for the first few minutes as shown by our graph below. After a while, however, consumption would cycle between 40 W and 90 W instead of steadily decreasing like on most other laptops. This undesirable behavior matches our Prime95 Stress Test observations above where clock rates would cycle between 1.1 GHz and 3.3 GHz.
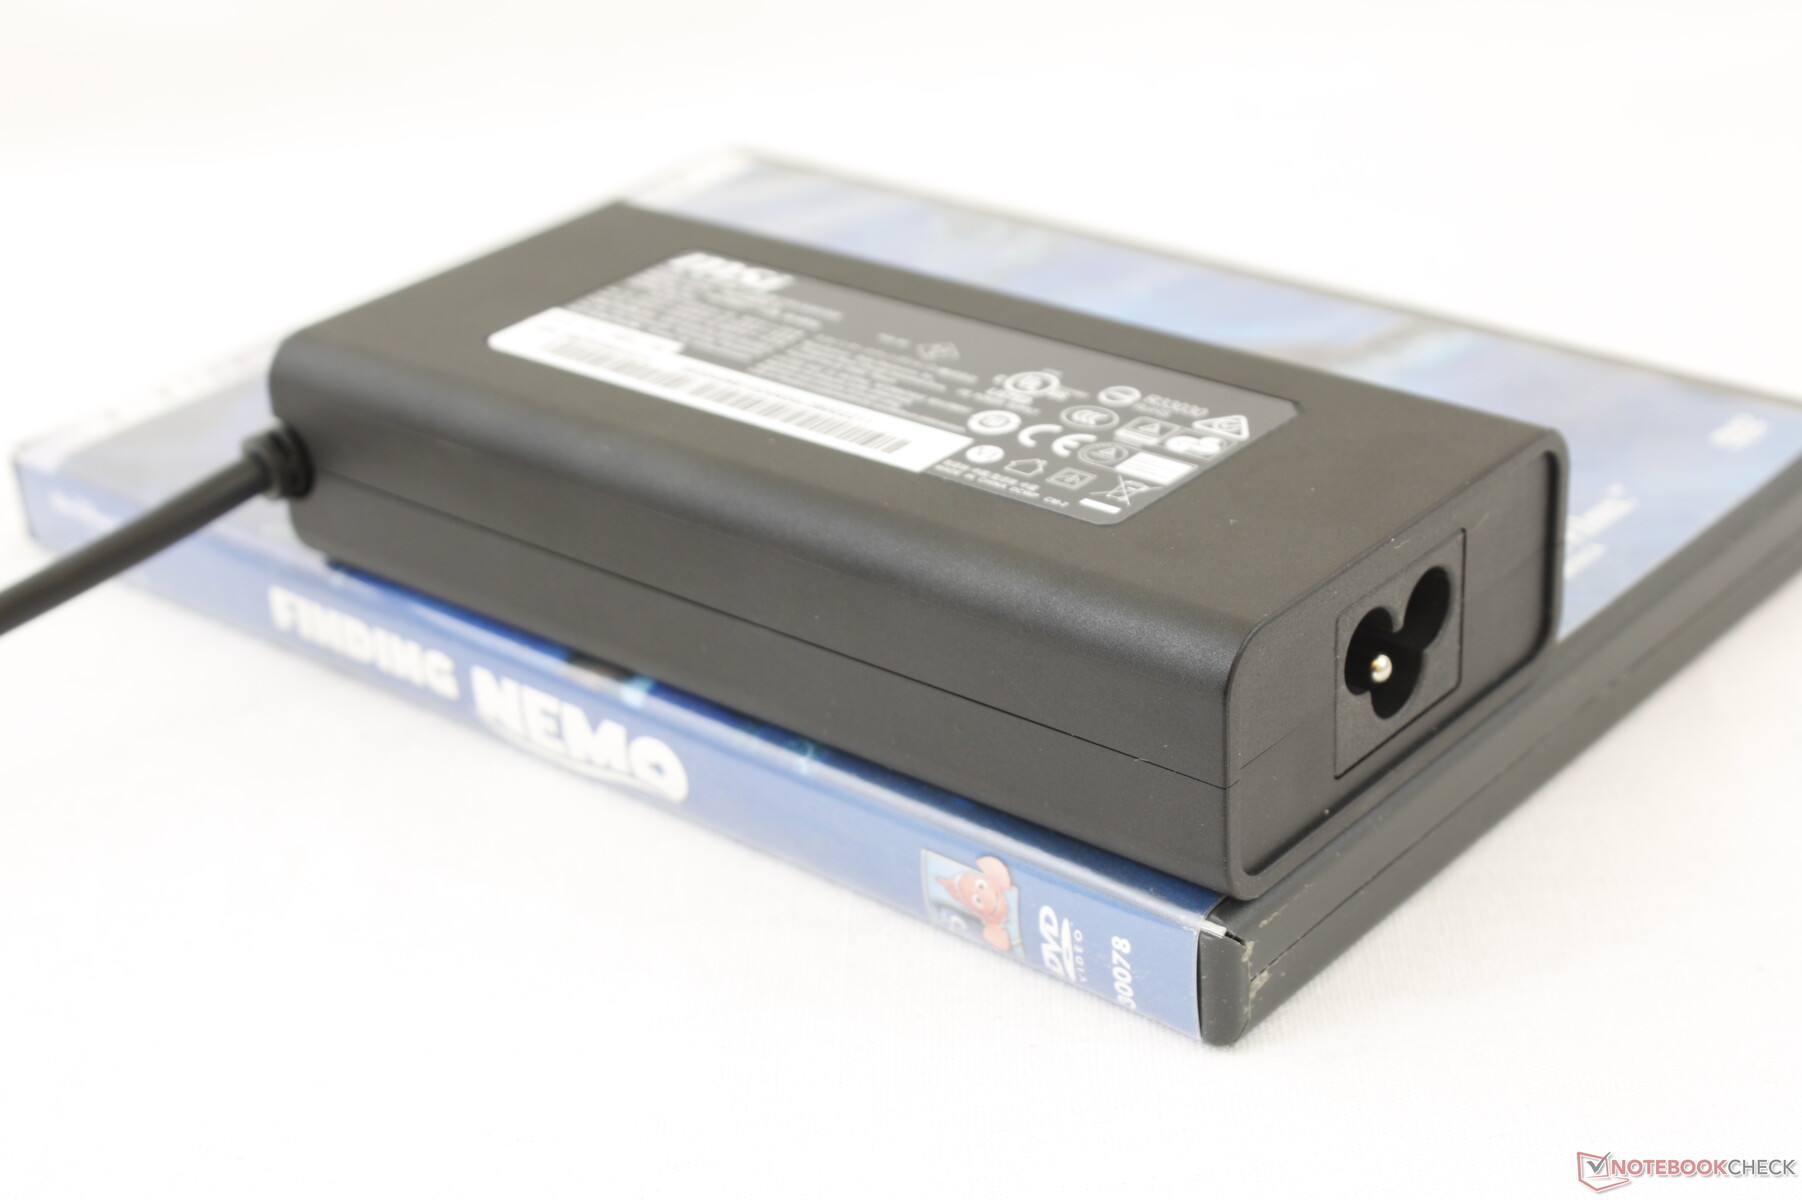
At most, we're able to record a consumption of 92 W when running both Prime95 and FurMark simultaneously from the small-medium (~13 x 6 x 2.8 cm) 90 W AC adapter. Keep in mind that recharging will grind to a halt when running high loads simultaneously.
| Off / Standby | |
| Idle | |
| Load |
|
Key:
min: | |
| MSI Prestige 15 A10SC i7-10710U, GeForce GTX 1650 Max-Q, Samsung SSD PM981 MZVLB1T0HALR, IPS, 3840x2160, 15.6" | Microsoft Surface Laptop 3 15 Ryzen 5 3580U R5 3580U, Vega 9, SK hynix BC501 HFM256GDGTNG, IPS, 2496x1664, 15" | Lenovo ThinkPad T590-20N4002VGE i7-8565U, GeForce MX250, Toshiba XG6 KXG60ZNV512G, aSi IPS LED, 1920x1080, 15.6" | Dell Latitude 5500 i7-8665U, UHD Graphics 620, Toshiba XG6 KXG60ZNV1T02, IPS, 1920x1080, 15.6" | HP EliteBook 755 G5 3UN79EA R7 2700U, Vega 10, Toshiba XG5 KXG50ZNV512G, IPS, 1920x1080, 15.6" | MSI P65 Creator 9SF-657 i9-9880H, GeForce RTX 2070 Max-Q, 2x Samsung SSD PM981 MZVLB512HAJQ (RAID 0), IPS, 3840x2160, 15.6" | Dell Precision 5530 Xeon E-2176M E-2176M, Quadro P2000, SK hynix PC400 512 GB, IGZO, 3840x2160, 15.6" | |
|---|---|---|---|---|---|---|---|
| Power Consumption | 46% | 29% | 40% | 33% | -53% | -24% | |
| Idle Minimum * (Watt) | 6.1 | 3.3 46% | 4.1 33% | 4.4 28% | 5 18% | 9.4 -54% | 9.8 -61% |
| Idle Average * (Watt) | 13.2 | 7.1 46% | 8.3 37% | 6.9 48% | 10.6 20% | 17.4 -32% | 16.8 -27% |
| Idle Maximum * (Watt) | 19.2 | 7.2 62% | 11.8 39% | 7.7 60% | 12.9 33% | 19.6 -2% | 16.9 12% |
| Load Average * (Watt) | 75 | 44.8 40% | 61.6 18% | 43.6 42% | 40.6 46% | 103 -37% | 102.3 -36% |
| Witcher 3 ultra * (Watt) | 74 | 45.1 39% | 54.4 26% | 76.5 -3% | |||
| Load Maximum * (Watt) | 89.7 | 53 41% | 69.4 23% | 69.1 23% | 46.6 48% | 216 -141% | 114.5 -28% |
* ... smaller is better
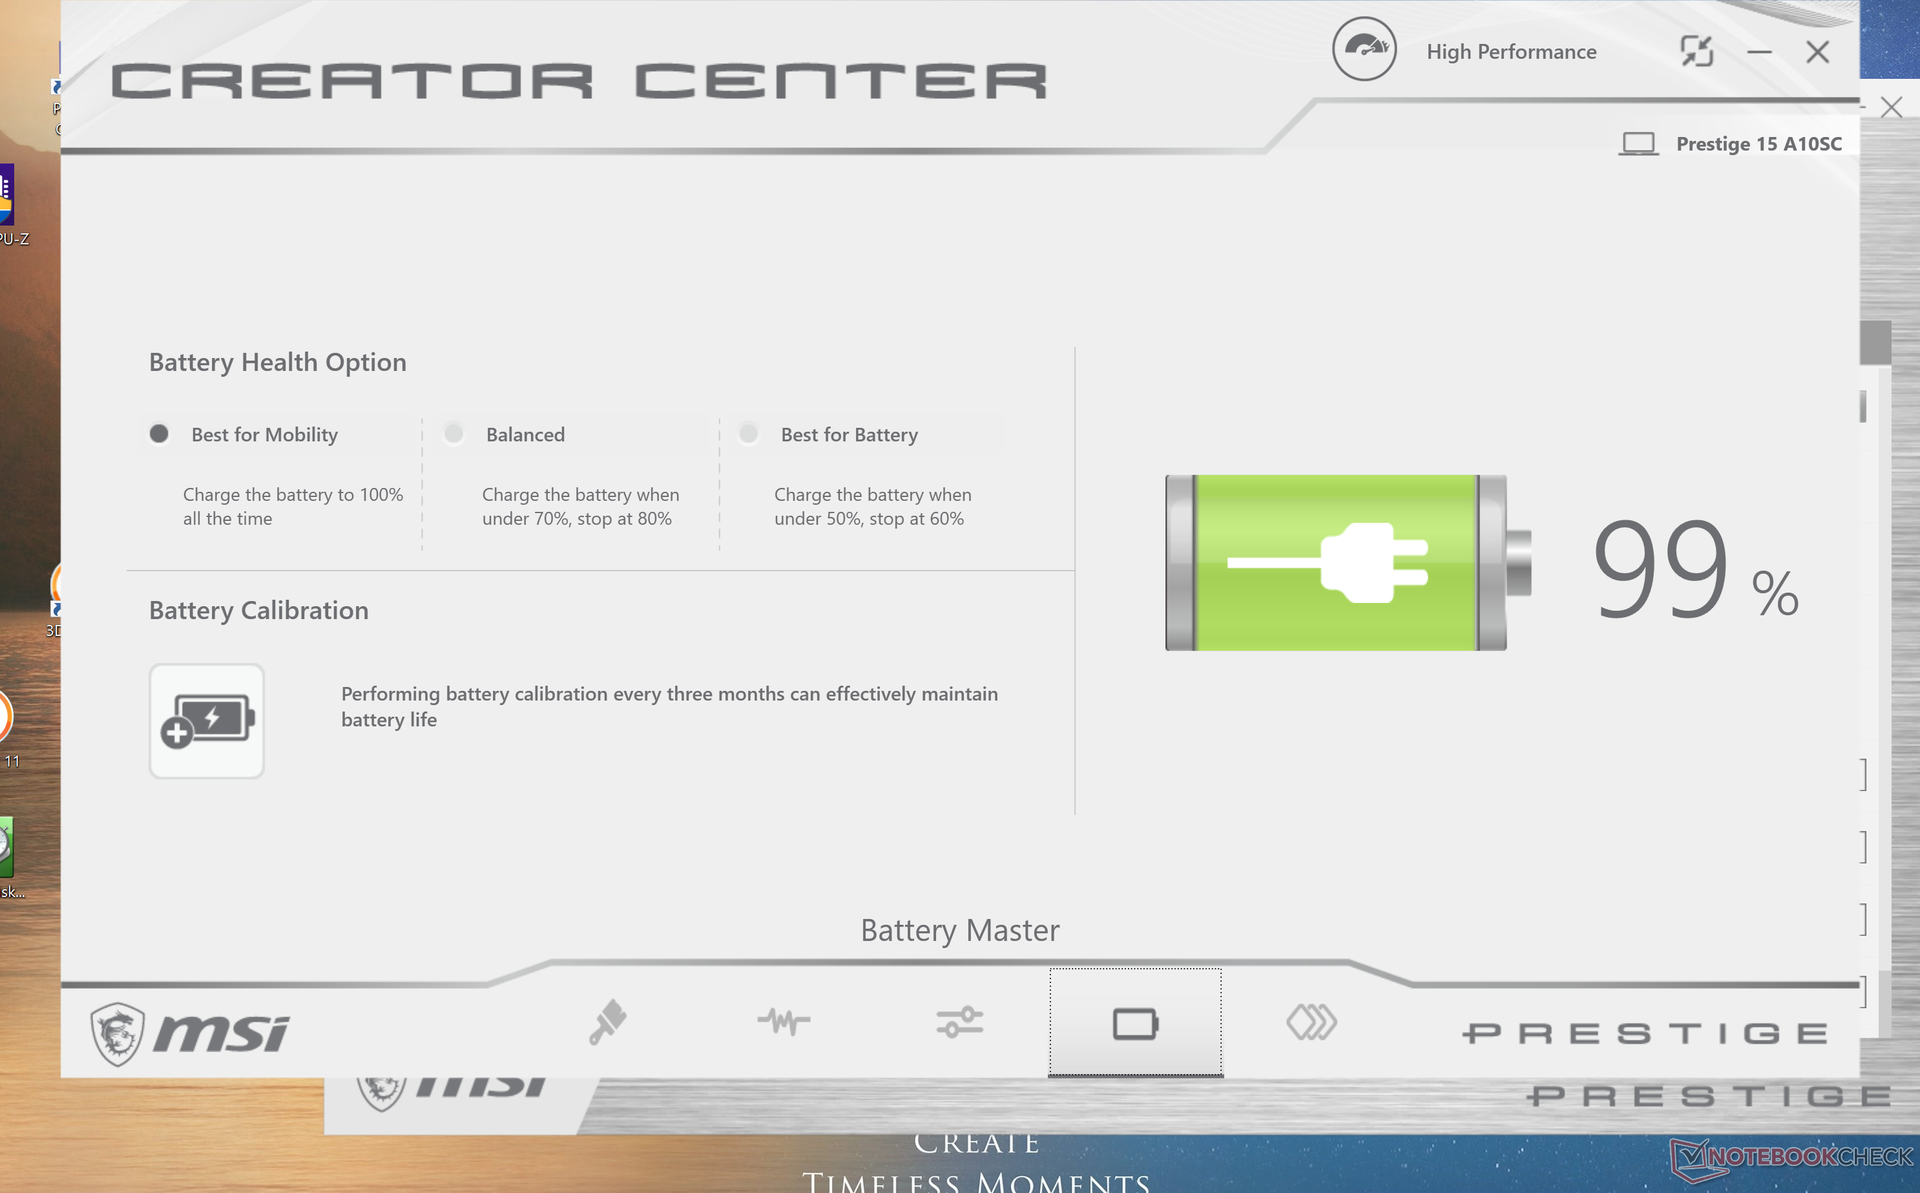
Battery Life - Versatile USB Type-C Charger
Battery capacity is identical to the P65 Creator at 82 Wh. Runtimes are longer than what we recorded on the P65 since the latter utilizes more powerful components. Users can expect about 7.5 hours of real-world WLAN use when running on battery power.
Recharging from empty to full capacity takes about 1.5 hours when under low or undemanding processing loads.
| MSI Prestige 15 A10SC i7-10710U, GeForce GTX 1650 Max-Q, 82 Wh | Microsoft Surface Laptop 3 15 Ryzen 5 3580U R5 3580U, Vega 9, 45 Wh | Lenovo ThinkPad T590-20N4002VGE i7-8565U, GeForce MX250, 57 Wh | Dell Latitude 5500 i7-8665U, UHD Graphics 620, 68 Wh | HP EliteBook 755 G5 3UN79EA R7 2700U, Vega 10, 56 Wh | MSI P65 Creator 9SF-657 i9-9880H, GeForce RTX 2070 Max-Q, 82 Wh | Dell Precision 5530 Xeon E-2176M E-2176M, Quadro P2000, 97 Wh | |
|---|---|---|---|---|---|---|---|
| Battery runtime | -0% | 53% | 62% | -16% | -40% | -6% | |
| Reader / Idle (h) | 19.1 | 18.7 -2% | 11.9 -38% | 9.6 -50% | 16.5 -14% | ||
| WiFi v1.3 (h) | 7.6 | 9.1 20% | 10.5 38% | 12.3 62% | 8.3 9% | 6 -21% | 8.4 11% |
| Load (h) | 2.1 | 1.7 -19% | 3.5 67% | 1.7 -19% | 1.1 -48% | 1.8 -14% |
Pros
Cons
Verdict - Awesome with a Few Nicks
(November 14, 2019 update: We're unable to reproduce the CPU throttling behavior on a second Prestige 15 unit. Clock rates and core temperature would stabilize at 2.8 GHz and 95 C, respectively, on the second unit. Core temperatures are nonetheless higher than we would like when under such high loads. We recommend keeping your system up to date through the MSI Drivers and App Center and keeping an eye on the CPU temperature if running it at 100 percent utilization.)
The Prestige 15 is proof that MSI can do more than just gaming products. It's arguably just as visually appealing as the XPS 15, ZenBook 15, or Spectre x360 15 while being lighter and generally more versatile for travel because of its USB Type-C charger. The hexa-core Comet Lake-U CPU works very well as an alternative to quad-core Coffee Lake-H provided that the programs you run can fully exploit the six physical cores available. Meanwhile, the 4K UHD display is brighter and more accurate out of the box than what most 15.6-inch Ultrabooks have to offer including the aforementioned Asus and HP. Fan noise is less likely to pulse during higher loads as well when compared to Ultrabooks with more demanding Intel H-series processors.
There's still a lot that MSI can do to make the Prestige 15 even better. The lack of both a Kensington Lock and IR camera, for example, are strange omissions on a high-end office laptop. The case could be made more rigid as it doesn't feel as strong as the flagships from Dell or HP. CPU throttling when under 100 percent utilization could be handled better. Even though the system uses both an ULV Intel CPU and Max-Q Nvidia GPU, core temperatures are still very warm when under load. keyboard and clickpad feedback in particular could be crisper and less spongy.
The MSI Prestige 15 strikes an excellent balance between weight, display quality, CPU performance, GPU performance, and port options. Chassis rigidity, keyboard and clickpad feedback, CPU throttling, and some missing security features could hopefully be addressed on future revisions.
MSI Prestige 15 A10SC
- 11/14/2019 v7 (old)
Allen Ngo
Price comparison
