Dell XPS 13 9300 Core i5 vs. Dell XPS 13 9300 Core i7: What's the Difference?
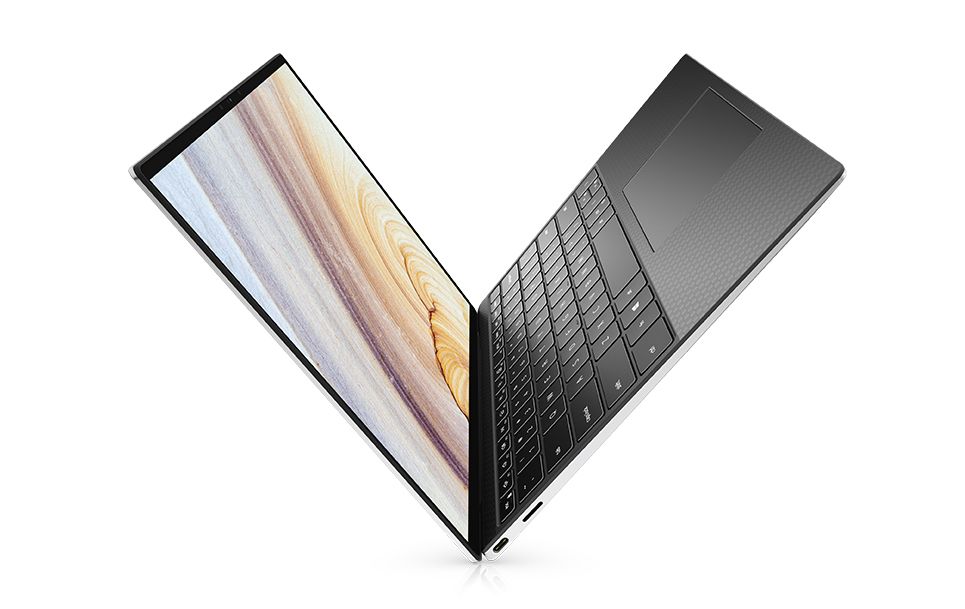
We recently reviewed two separate XPS 13 9300 SKUs: one equipped with the Core i5-1035G1 CPU and just 8 GB of RAM while the other came with the Core i7-1065G7 CPU and 16 GB of RAM. Dell charges an additional $400 to $500 for doubling the RAM, doubling the storage, and jumping from the Core i5 to the Core i7. If you're on a tight budget, our benchmarks below comparing the two SKUs should help decide if it's worth investing hundreds more on the pricier Core i7 version.
In short, users who know they can exploit the GPU advantages of the Core i7 should consider the Core i7 over the Core i5. Otherwise, the Core i5 version will offer similar runtimes, similar temperatures, similar power consumption rates, and the same excellent 1200p display. The biggest differentiator between the Core i5 and Core i7 lies in their graphics and not their processor performance; the Core i7 is about 70 percent faster in graphics while being only about 20 percent faster in multi-thread CPU performance.
If you occasionally edit photos or videos or play League of Legends, then the Core i7 and its integrated Iris Plus G7 will be of immediate benefit. If you mostly email, browse, and video stream, then save yourself a few hundred dollars by going with the Core i5. Our favorite aspect of the new XPS 13 9300 by far is its larger 16:10 13.4-inch display as it helps distinguish the Dell laptop from most other competing Ultrabooks available in the market.
| Cinebench R20 | |
| CPU (Multi Core) | |
| Dell XPS 13 9300 Core i7-1065G7 | |
| Dell XPS 13 9300 i5 FHD | |
| CPU (Single Core) | |
| Dell XPS 13 9300 Core i7-1065G7 | |
| Dell XPS 13 9300 i5 FHD | |
| Cinebench R15 | |
| CPU Single 64Bit | |
| Dell XPS 13 9300 Core i7-1065G7 | |
| Dell XPS 13 9300 i5 FHD | |
| CPU Multi 64Bit | |
| Dell XPS 13 9300 Core i7-1065G7 | |
| Dell XPS 13 9300 i5 FHD | |
| Dell XPS 13 9300 i5 FHD | |
| PCMark 10 | |
| Score | |
| Dell XPS 13 9300 Core i7-1065G7 | |
| Dell XPS 13 9300 i5 FHD | |
| Essentials | |
| Dell XPS 13 9300 Core i7-1065G7 | |
| Dell XPS 13 9300 i5 FHD | |
| Productivity | |
| Dell XPS 13 9300 i5 FHD | |
| Dell XPS 13 9300 Core i7-1065G7 | |
| Digital Content Creation | |
| Dell XPS 13 9300 Core i7-1065G7 | |
| Dell XPS 13 9300 i5 FHD | |
| PCMark 8 | |
| Home Score Accelerated v2 | |
| Dell XPS 13 9300 i5 FHD | |
| Dell XPS 13 9300 Core i7-1065G7 | |
| Work Score Accelerated v2 | |
| Dell XPS 13 9300 Core i7-1065G7 | |
| Dell XPS 13 9300 i5 FHD | |
| 3DMark | |
| 1280x720 Cloud Gate Standard Graphics | |
| Dell XPS 13 9300 Core i7-1065G7 | |
| Dell XPS 13 9300 i5 FHD | |
| 1920x1080 Fire Strike Graphics | |
| Dell XPS 13 9300 Core i7-1065G7 | |
| Dell XPS 13 9300 i5 FHD | |
| 2560x1440 Time Spy Graphics | |
| Dell XPS 13 9300 Core i7-1065G7 | |
| Dell XPS 13 9300 i5 FHD | |
| 1280x720 Ice Storm Standard Score | |
| Dell XPS 13 9300 Core i7-1065G7 | |
| Dell XPS 13 9300 i5 FHD | |
| 1280x720 offscreen Ice Storm Unlimited Graphics Score | |
| Dell XPS 13 9300 Core i7-1065G7 | |
| Dell XPS 13 9300 i5 FHD | |
| 3DMark 11 | |
| 1280x720 Performance GPU | |
| Dell XPS 13 9300 Core i7-1065G7 | |
| Dell XPS 13 9300 i5 FHD | |
| 1280x720 Performance Combined | |
| Dell XPS 13 9300 Core i7-1065G7 | |
| Dell XPS 13 9300 i5 FHD | |
| The Witcher 3 | |
| 1024x768 Low Graphics & Postprocessing | |
| Dell XPS 13 9300 Core i7-1065G7 | |
| Dell XPS 13 9300 i5 FHD | |
| 1366x768 Medium Graphics & Postprocessing | |
| Dell XPS 13 9300 Core i7-1065G7 | |
| Dell XPS 13 9300 i5 FHD | |
| BioShock Infinite | |
| 1280x720 Very Low Preset | |
| Dell XPS 13 9300 Core i7-1065G7 | |
| Dell XPS 13 9300 i5 FHD | |
| 1366x768 Medium Preset | |
| Dell XPS 13 9300 Core i7-1065G7 | |
| Dell XPS 13 9300 i5 FHD | |
| 1366x768 High Preset | |
| Dell XPS 13 9300 Core i7-1065G7 | |
| Dell XPS 13 9300 i5 FHD | |
| 1920x1080 Ultra Preset, DX11 (DDOF) | |
| Dell XPS 13 9300 Core i7-1065G7 | |
| Dell XPS 13 9300 i5 FHD | |
| Dell XPS 13 9300 Core i7-1065G7 Sharp LQ134N1, IPS, 13.4", 1920x1200 | Dell XPS 13 9300 i5 FHD SHP14CB, IPS, 13.4", 1920x1200 | |
|---|---|---|
| Display | ||
| Display P3 Coverage (%) | 66.3 | 71.5 |
| sRGB Coverage (%) | 97.3 | 99.4 |
| AdobeRGB 1998 Coverage (%) | 68.5 | 73.5 |
| Response Times | ||
| Response Time Grey 50% / Grey 80% * (ms) | 50 ? | 60 ? |
| Response Time Black / White * (ms) | 33.2 ? | 33.2 ? |
| PWM Frequency (Hz) | 2500 ? | 2500 ? |
| Screen | ||
| Brightness middle (cd/m²) | 607.6 | 619 |
| Brightness (cd/m²) | 595 | 591 |
| Brightness Distribution (%) | 96 | 91 |
| Black Level * (cd/m²) | 0.4 | 0.35 |
| Contrast (:1) | 1519 | 1769 |
| Colorchecker dE 2000 * | 3.23 | 3 |
| Colorchecker dE 2000 max. * | 8.67 | 8.2 |
| Colorchecker dE 2000 calibrated * | 1.01 | 1 |
| Greyscale dE 2000 * | 5.5 | 5.2 |
| Gamma | 2.12 104% | 2.14 103% |
| CCT | 6413 101% | 6340 103% |
| Color Space (Percent of AdobeRGB 1998) (%) | 63 | 66.9 |
| Color Space (Percent of sRGB) (%) | 97.5 | 99.3 |
| Total Average (Program / Settings) |
* ... smaller is better
| Dell XPS 13 9300 Core i7-1065G7 Intel SSDPEMKF512G8 NVMe SSD | Dell XPS 13 9300 i5 FHD Toshiba XG6 KXG60ZNV512G | |
|---|---|---|
| AS SSD | ||
| Seq Read (MB/s) | 1956 | 2328 |
| Seq Write (MB/s) | 1227 | 1137 |
| 4K Read (MB/s) | 63 | 48.07 |
| 4K Write (MB/s) | 156.6 | 120.6 |
| 4K-64 Read (MB/s) | 475.6 | 899 |
| 4K-64 Write (MB/s) | 539 | 1220 |
| Access Time Read * (ms) | 0.042 | 0.085 |
| Access Time Write * (ms) | 0.105 | 0.033 |
| Score Read (Points) | 734 | 1180 |
| Score Write (Points) | 818 | 1455 |
| Score Total (Points) | 1915 | 3189 |
| Copy ISO MB/s (MB/s) | 1022 | |
| Copy Program MB/s (MB/s) | 302.8 | |
| Copy Game MB/s (MB/s) | 491.4 | |
| CrystalDiskMark 5.2 / 6 | ||
| Write 4K (MB/s) | 186.8 | 121.9 |
| Read 4K (MB/s) | 71.4 | 50 |
| Write Seq (MB/s) | 1203 | 1497 |
| Read Seq (MB/s) | 2600 | 2111 |
| Write 4K Q32T1 (MB/s) | 514 | 365.9 |
| Read 4K Q32T1 (MB/s) | 570 | 384.6 |
| Write Seq Q32T1 (MB/s) | 786 | 2748 |
| Read Seq Q32T1 (MB/s) | 2947 | 3119 |
| Total Average (Program / Settings) |
* ... smaller is better
| Dell XPS 13 9300 Core i7-1065G7 Iris Plus Graphics G7 (Ice Lake 64 EU), i7-1065G7, Intel SSDPEMKF512G8 NVMe SSD | Dell XPS 13 9300 i5 FHD UHD Graphics G1 (Ice Lake 32 EU), i5-1035G1, Toshiba XG6 KXG60ZNV512G | |
|---|---|---|
| Noise | ||
| off / environment * (dB) | 28.3 | 29.3 |
| Idle Minimum * (dB) | 28.3 | 29.3 |
| Idle Average * (dB) | 28.3 | 29.3 |
| Idle Maximum * (dB) | 28.3 | 29.3 |
| Load Average * (dB) | 32.5 | 30 |
| Witcher 3 ultra * (dB) | 39.3 | |
| Load Maximum * (dB) | 39.3 | 32.4 |
* ... smaller is better
| Dell XPS 13 9300 Core i7-1065G7 i7-1065G7, Iris Plus Graphics G7 (Ice Lake 64 EU), Intel SSDPEMKF512G8 NVMe SSD, IPS, 1920x1200, 13.4" | Dell XPS 13 9300 i5 FHD i5-1035G1, UHD Graphics G1 (Ice Lake 32 EU), Toshiba XG6 KXG60ZNV512G, IPS, 1920x1200, 13.4" | |
|---|---|---|
| Power Consumption | ||
| Idle Minimum * (Watt) | 4.2 | 3.4 |
| Idle Average * (Watt) | 6.9 | 6 |
| Idle Maximum * (Watt) | 7.5 | 10.2 |
| Load Average * (Watt) | 33.3 | 36.6 |
| Witcher 3 ultra * (Watt) | 37.1 | |
| Load Maximum * (Watt) | 48.4 | 49.3 |
* ... smaller is better
| Dell XPS 13 9300 Core i7-1065G7 i7-1065G7, Iris Plus Graphics G7 (Ice Lake 64 EU), 52 Wh | Dell XPS 13 9300 i5 FHD i5-1035G1, UHD Graphics G1 (Ice Lake 32 EU), 52 Wh | |
|---|---|---|
| Battery runtime | ||
| WiFi v1.3 (h) | 12.7 | 11.7 |
| Load (h) | 3.4 |
