Dell XPS 13 9300 Core i7 Laptop Review: New Chassis Design is More Exciting than the New CPU
Dell launched the first Ice Lake laptop in 2019 with its XPS 13 7390 2-in-1. In the meantime, the clamshell XPS 13 7390 would go on to receive Comet Lake-U options to complement the new XPS 13 convertible. It wouldn't be until now that Dell would offer the same Ice Lake CPU options for its XPS 13 clamshell lineup as found on last year's XPS 13 convertible lineup.
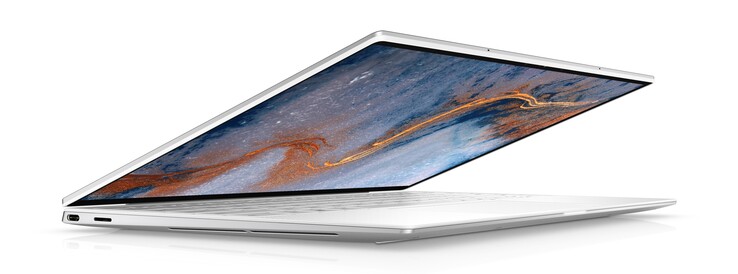
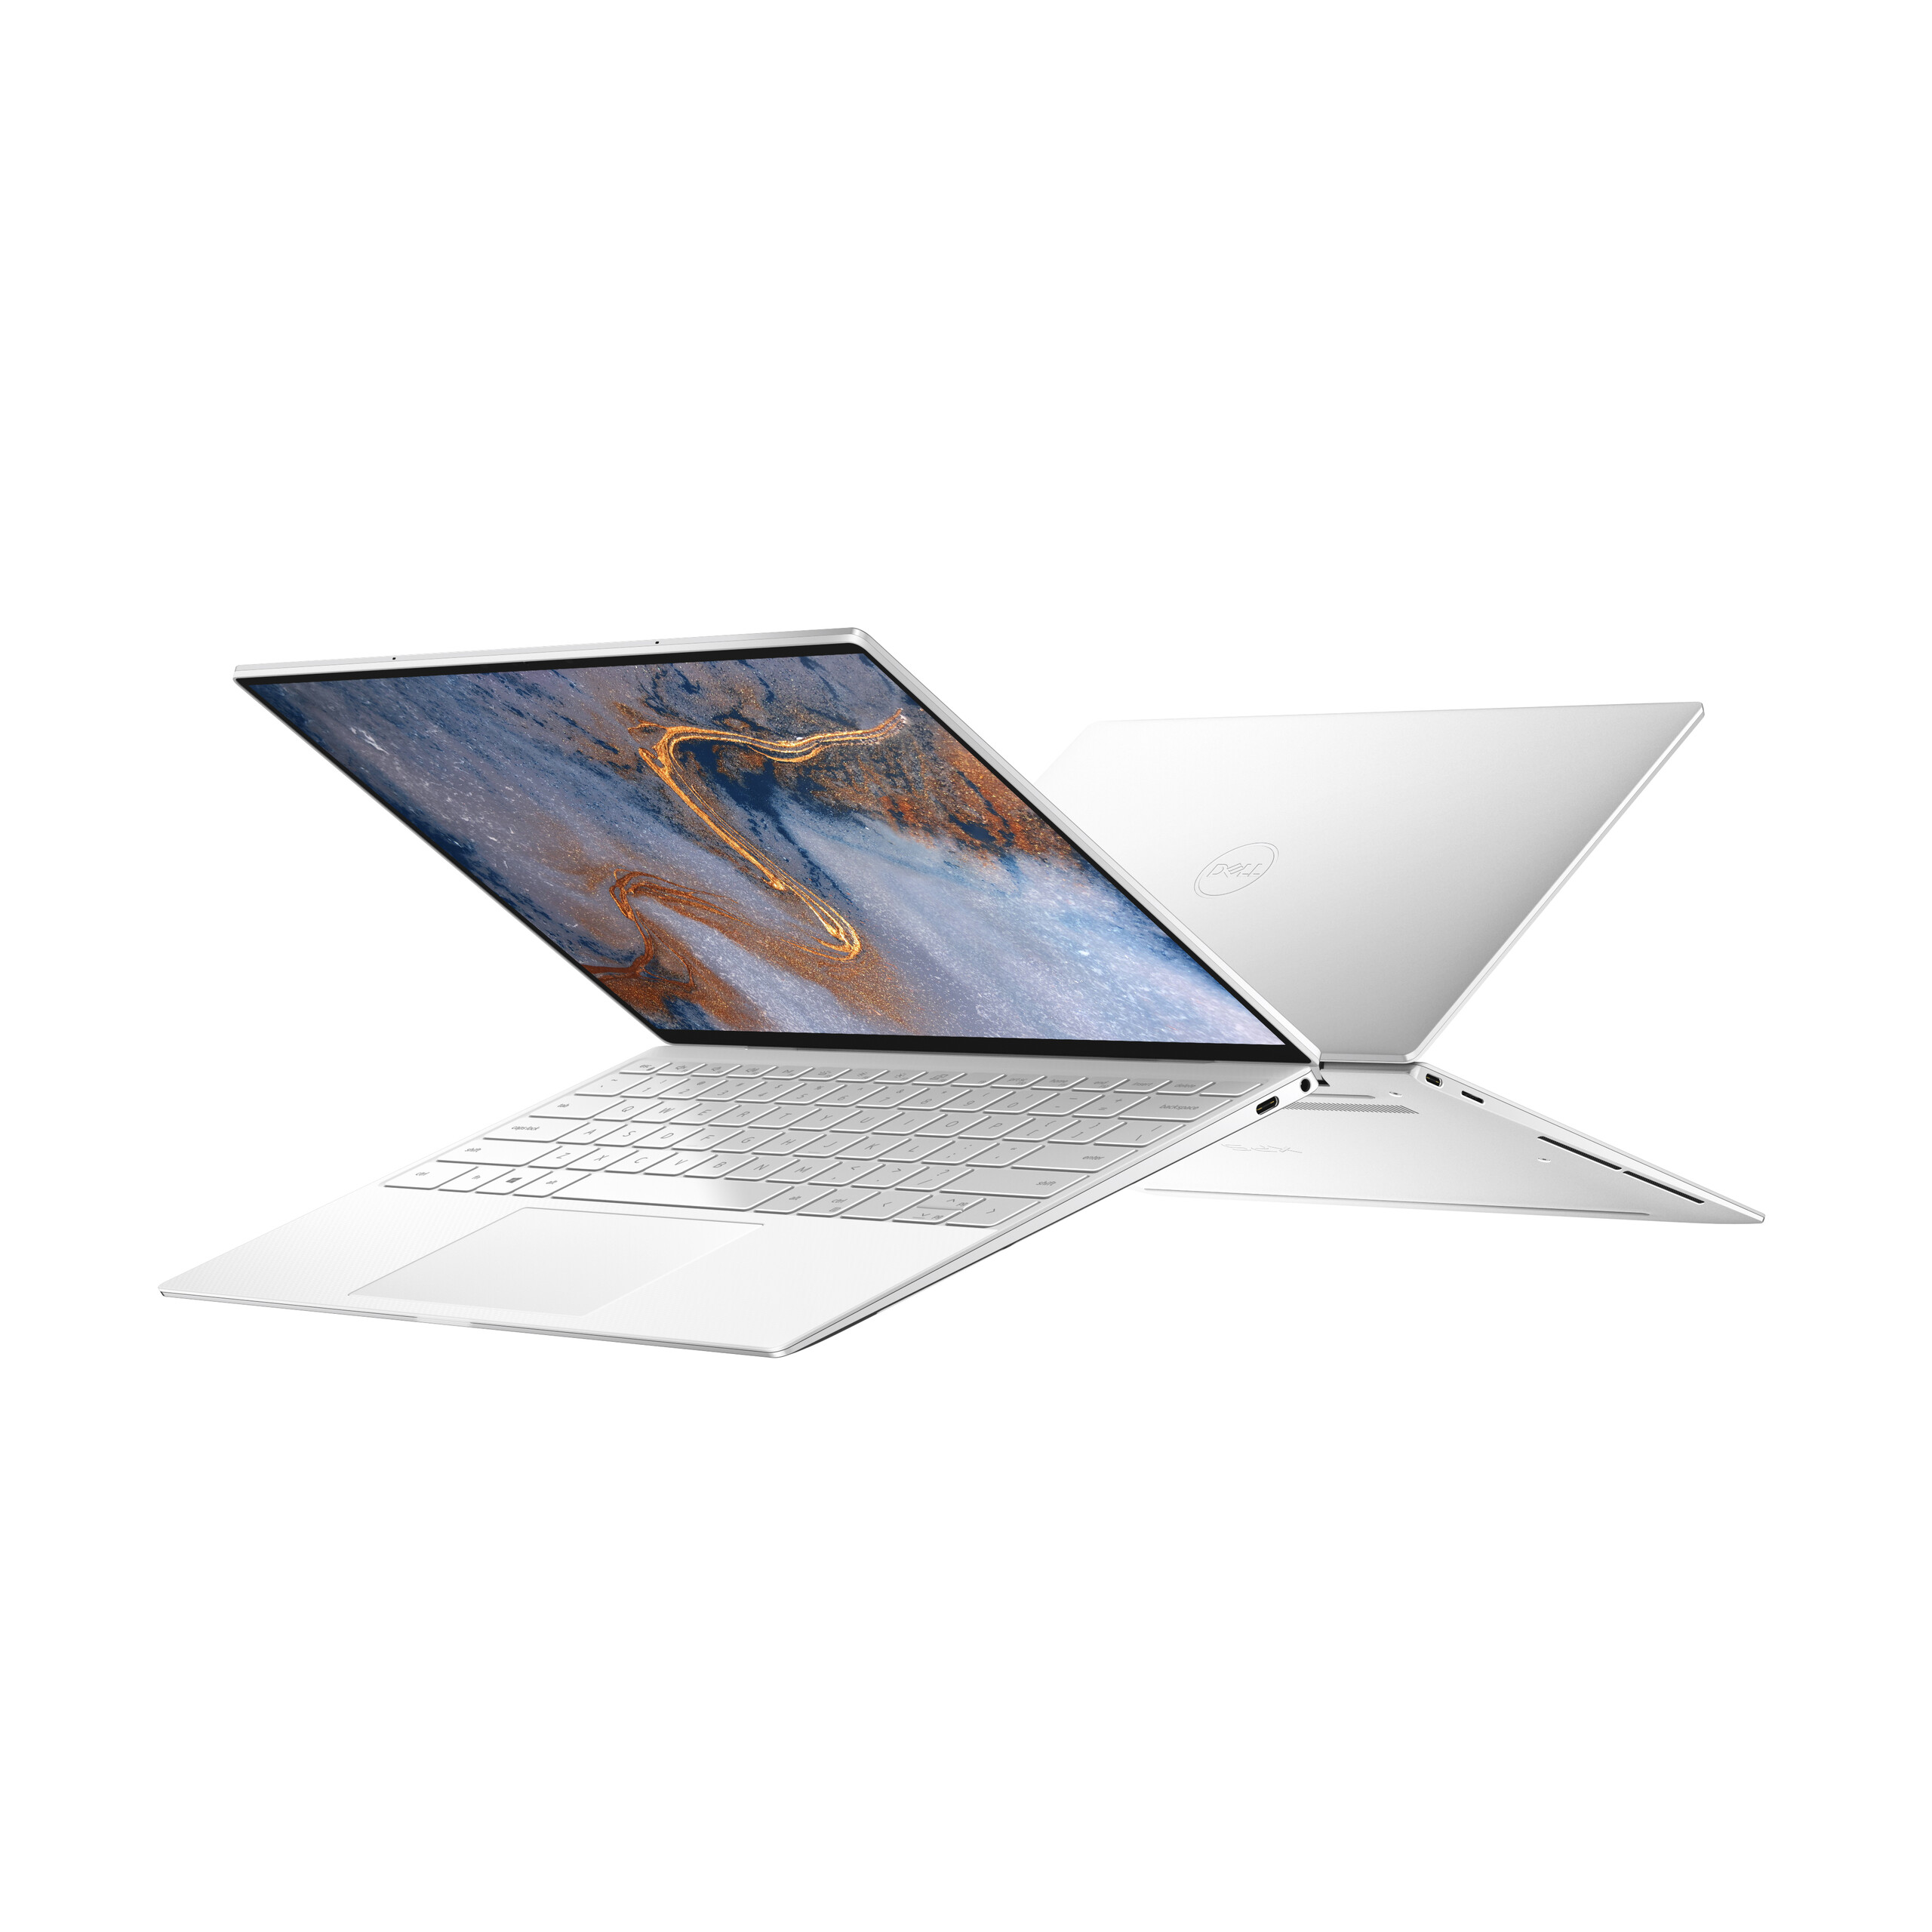
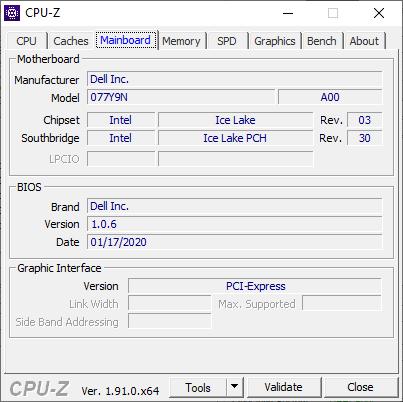
The latest XPS 13 9300 clamshell succeeds last year's XPS 13 7390 by introducing a refreshed chassis design that's even smaller than before while increasing the sizes of both the screen and clickpad. More details on the chassis and its features can be found on our existing XPS 13 9300 Core i5 review page here. Our test unit today is the XPS 13 9300 Core i7 version to see what kinds of benefits or drawbacks there may be between it and the lesser Core i5 SKU.
More Dell reviews:
Rating | Date | Model | Weight | Height | Size | Resolution | Price |
|---|---|---|---|---|---|---|---|
| 88.9 % v7 (old) | 03 / 2020 | Dell XPS 13 9300 Core i7-1065G7 i7-1065G7, Iris Plus Graphics G7 (Ice Lake 64 EU) | 1.2 kg | 14.8 mm | 13.40" | 1920x1200 | |
| 85.9 % v7 (old) | 11 / 2019 | Dell XPS 13 7390 Core i7-10710U i7-10710U, UHD Graphics 620 | 1.2 kg | 11.6 mm | 13.30" | 3840x2160 | |
| 86.3 % v7 (old) | 10 / 2019 | Dell XPS 13 7390 2-in-1 Core i7 i7-1065G7, Iris Plus Graphics G7 (Ice Lake 64 EU) | 1.3 kg | 13 mm | 13.40" | 1920x1200 | |
| 86.6 % v6 (old) | 05 / 2019 | Asus ZenBook S13 UX392FN i7-8565U, GeForce MX150 | 1.1 kg | 12.9 mm | 13.90" | 1920x1080 | |
| 84 % v7 (old) | 02 / 2020 | Microsoft Surface Laptop 3 13 Core i5-1035G7 i5-1035G7, Iris Plus Graphics G7 (Ice Lake 64 EU) | 1.3 kg | 14.5 mm | 13.50" | 2256x1504 |
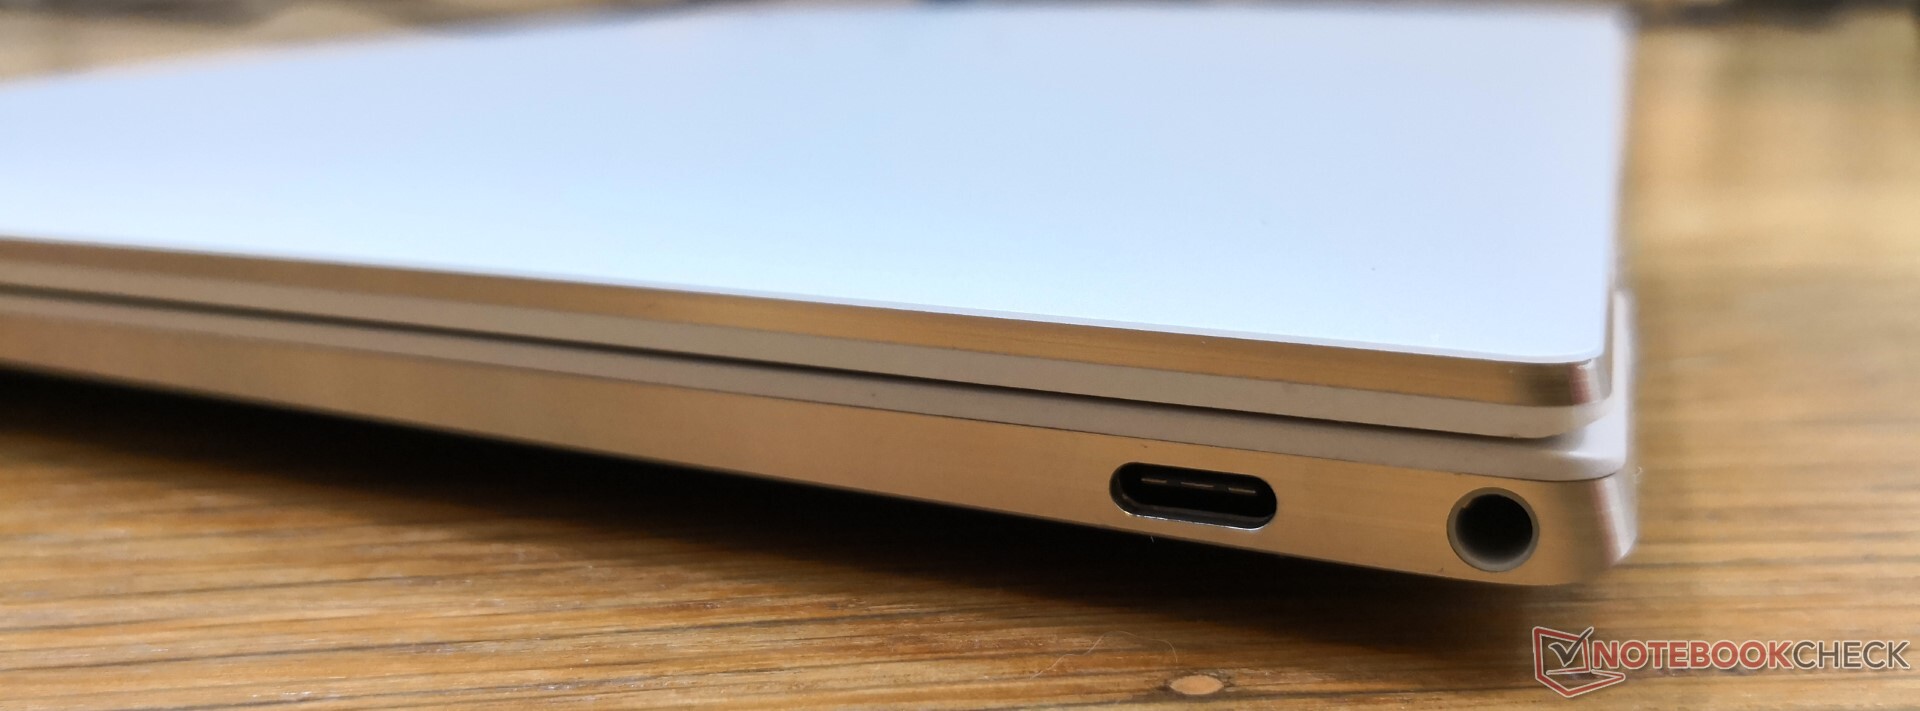
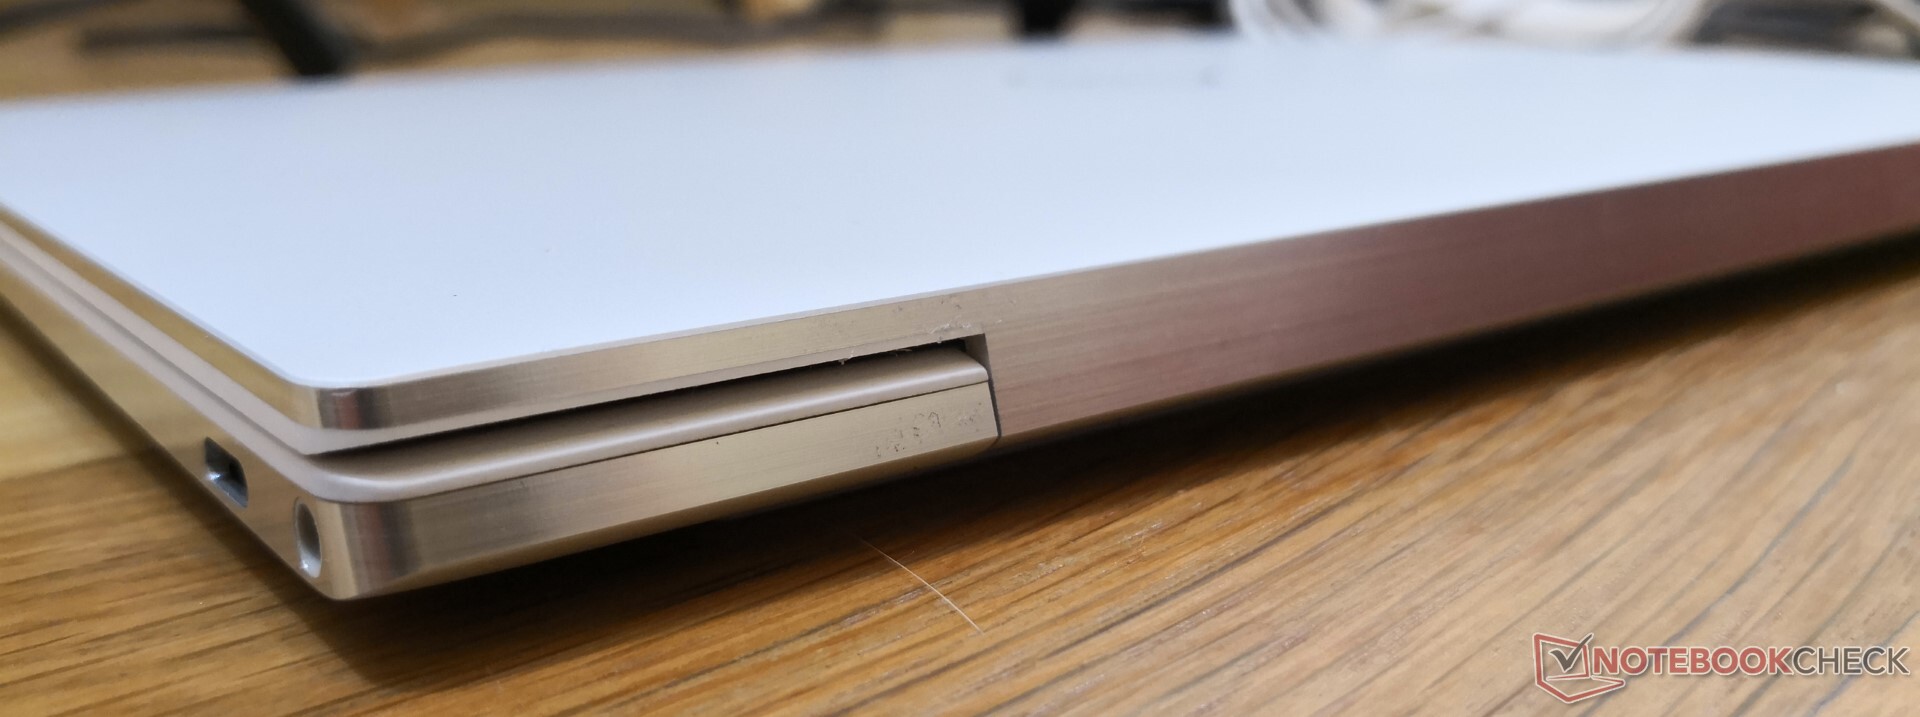
Case

Connectivity
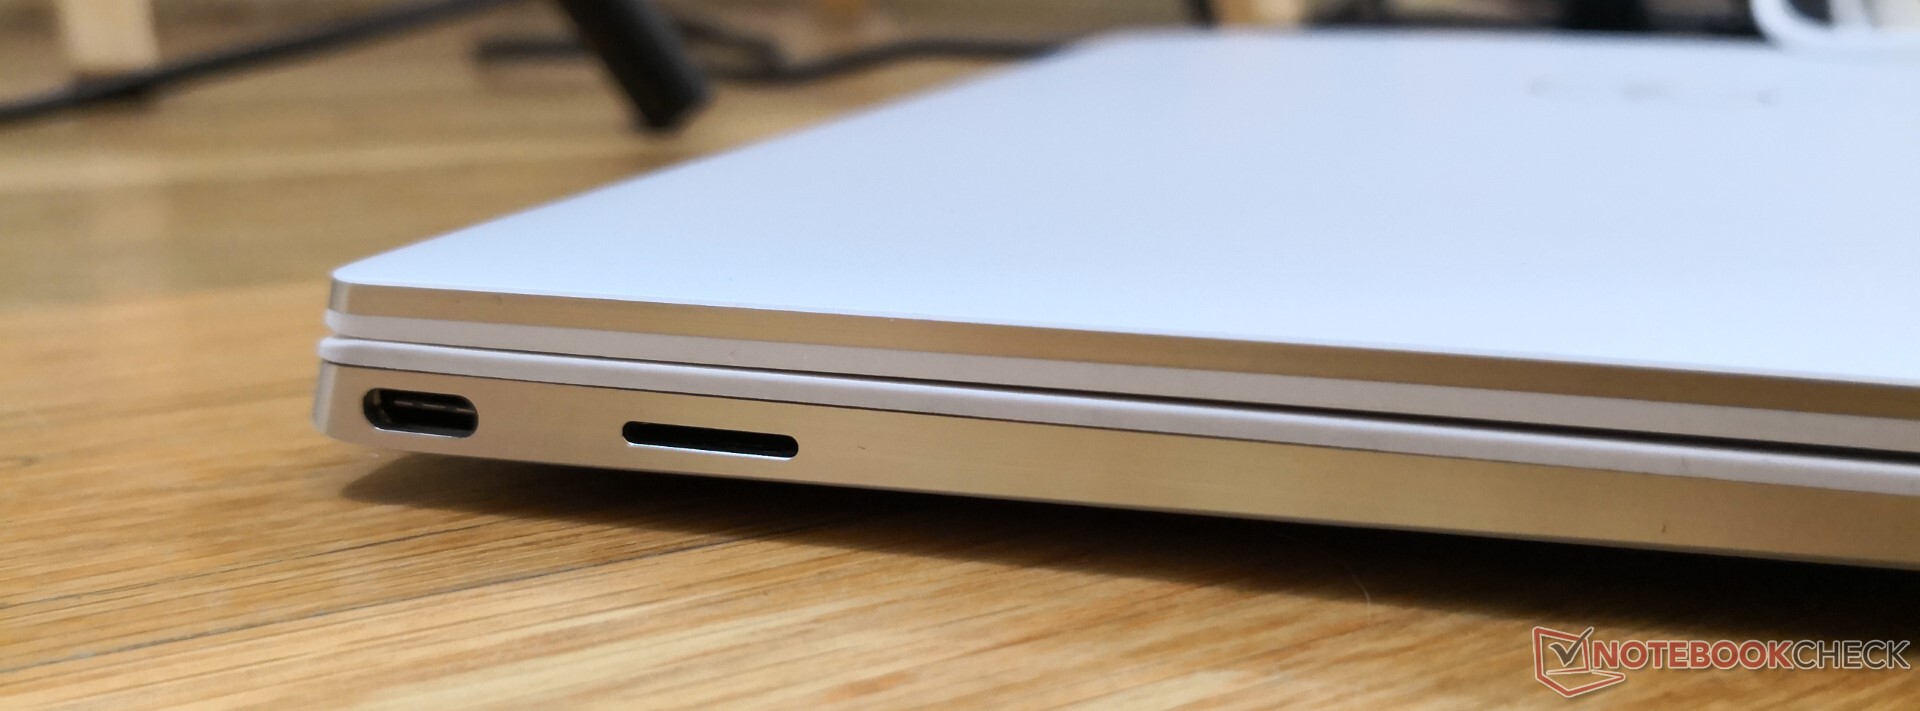
SD Card Reader
| SD Card Reader | |
| average JPG Copy Test (av. of 3 runs) | |
| Dell XPS 13 7390 Core i7-10710U (Toshiba Exceria Pro M501 64 GB UHS-II) | |
| Dell XPS 13 9300 Core i7-1065G7 (Toshiba Exceria Pro M501 64 GB UHS-II) | |
| Dell XPS 13 7390 2-in-1 Core i7 (Toshiba Exceria Pro M501 64 GB UHS-II) | |
| Asus ZenBook S13 UX392FN (Toshiba Exceria Pro M501 64 GB UHS-II) | |
| maximum AS SSD Seq Read Test (1GB) | |
| Dell XPS 13 7390 Core i7-10710U (Toshiba Exceria Pro M501 64 GB UHS-II) | |
| Dell XPS 13 7390 2-in-1 Core i7 (Toshiba Exceria Pro M501 64 GB UHS-II) | |
| Dell XPS 13 9300 Core i7-1065G7 (Toshiba Exceria Pro M501 64 GB UHS-II) | |
| Asus ZenBook S13 UX392FN (Toshiba Exceria Pro M501 64 GB UHS-II) | |
Communication
WLAN is provided by the Intel Killer 1650x which is essentially identical to the Intel AX200/201 but with additional Killer-specific software features. It's a bit overkill for an XPS system as Killer caters more towards advanced users like gamers on the Dell G series or Alienware series. We're able to record average transfer rates of 800 Mbps to 1400 Mbps when standing one meter away from our Wi-Fi 6-enabled Netgear RAX200 router. Transmit speeds could have been more stable as it dipped to as low as 232 Mbps even after a retest.
Webcam

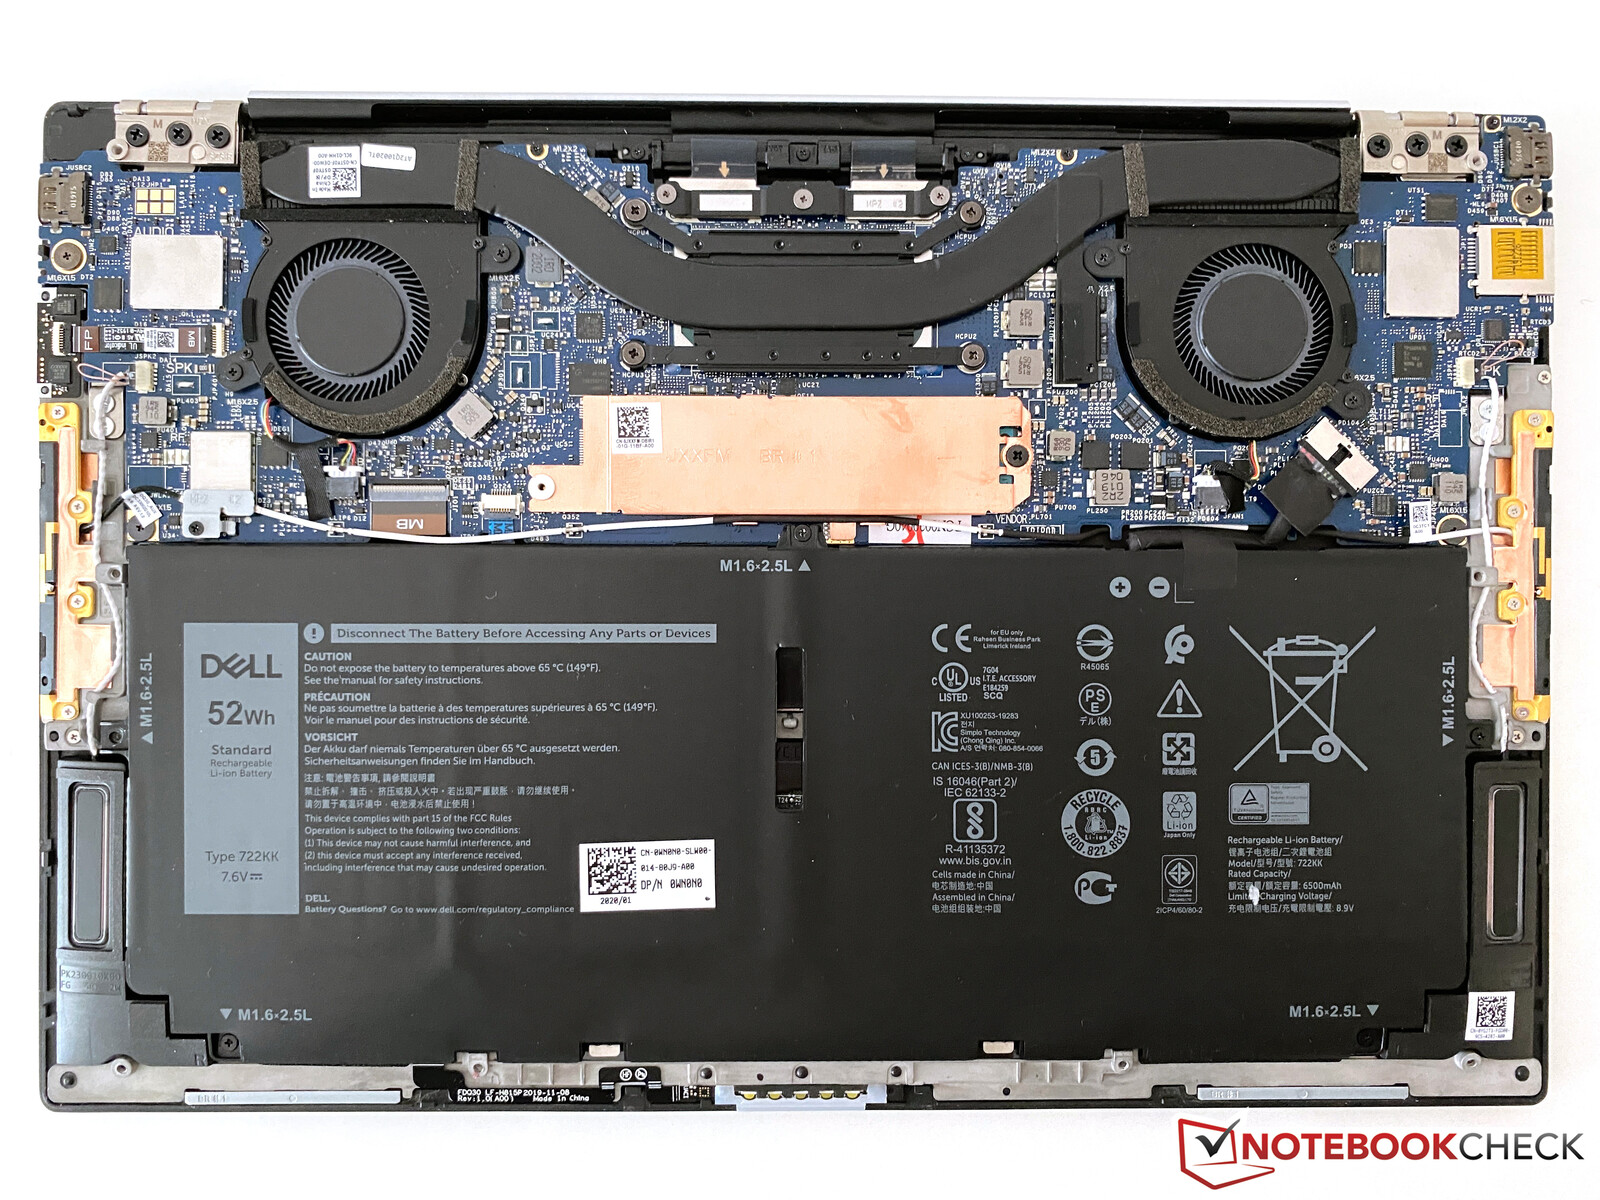
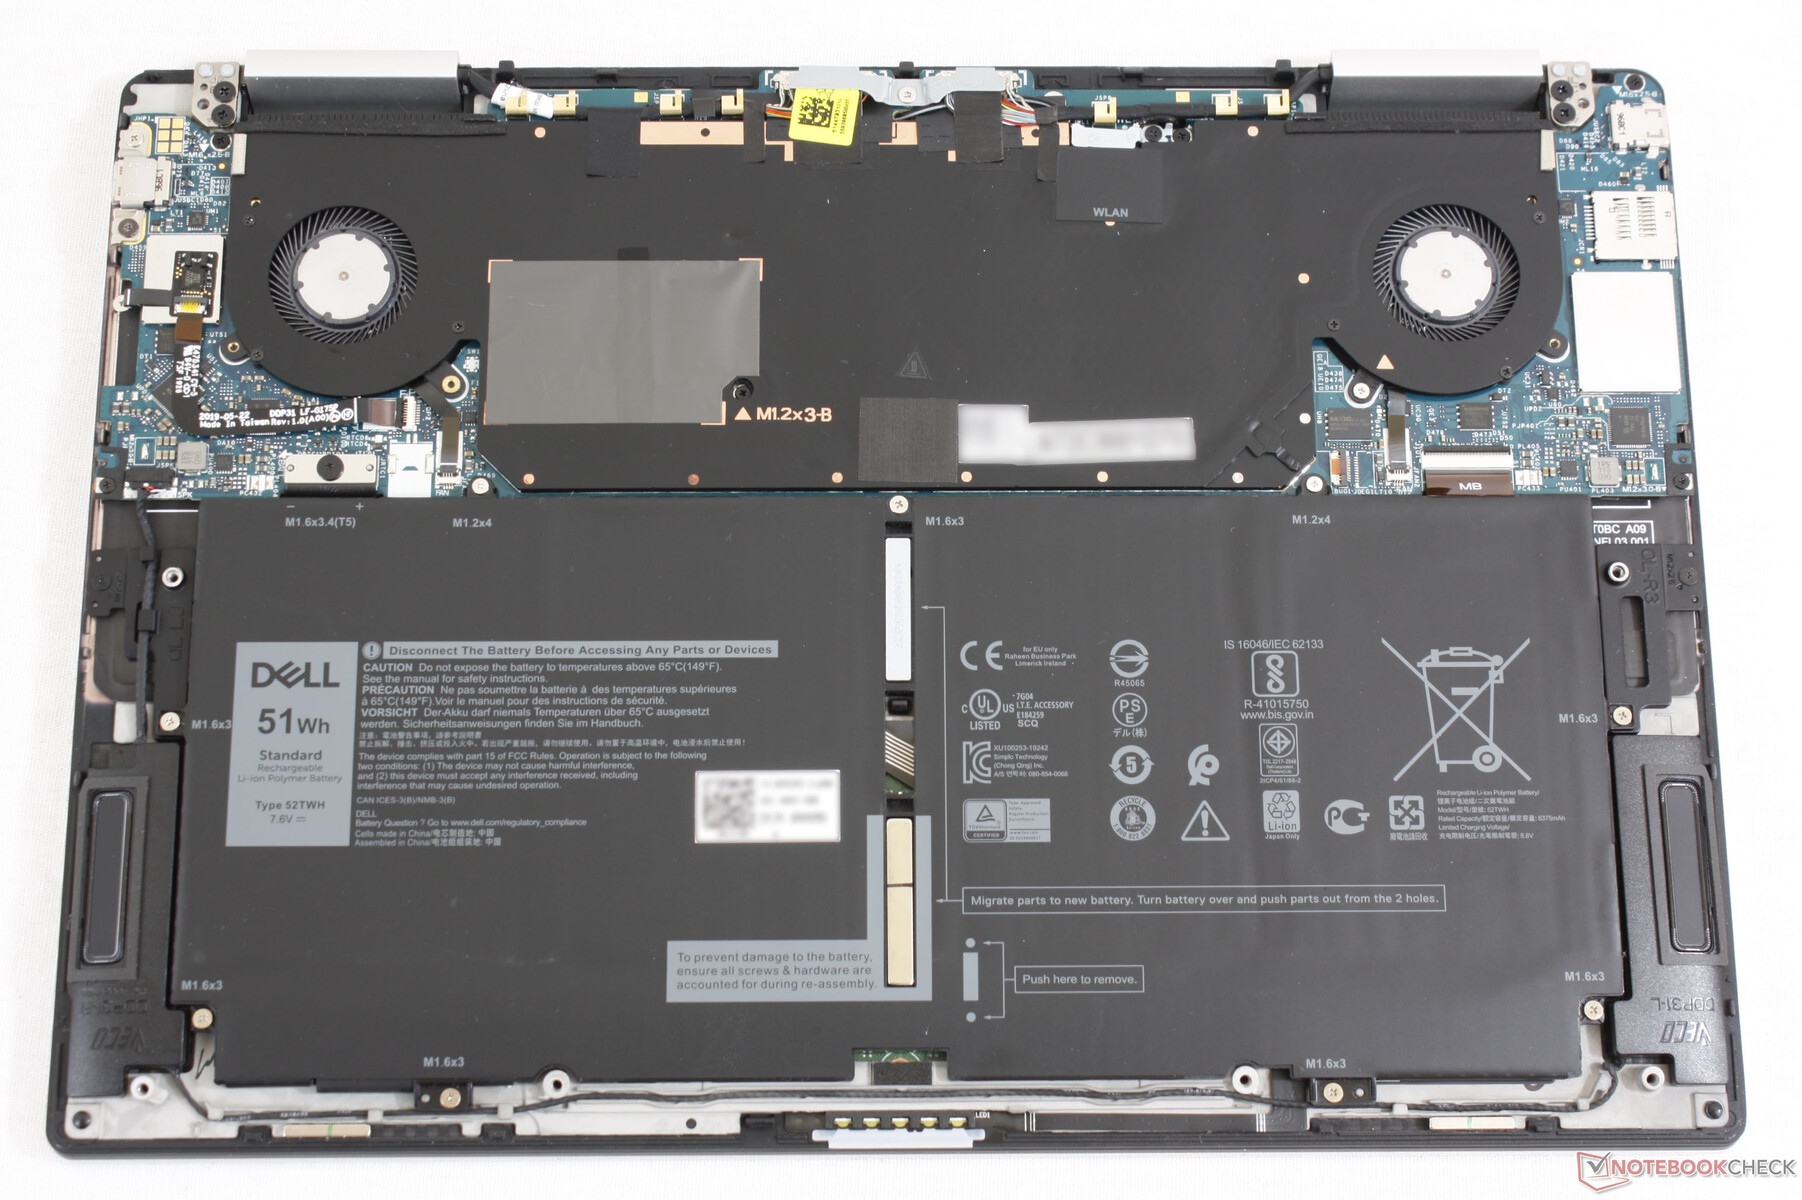
Maintenance
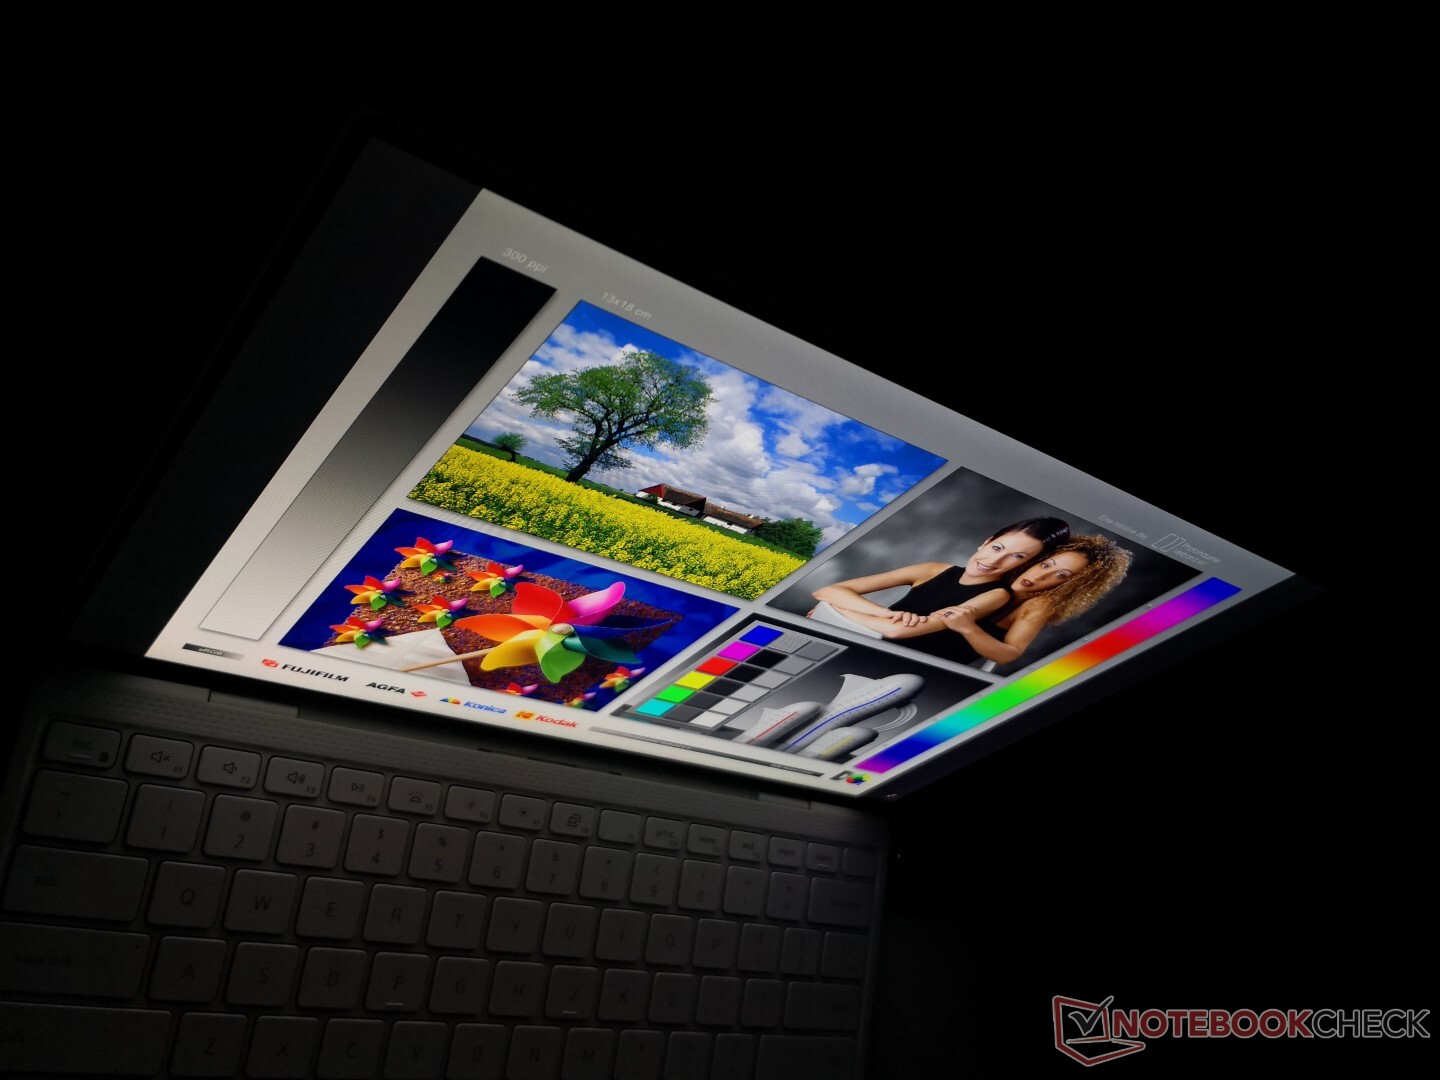
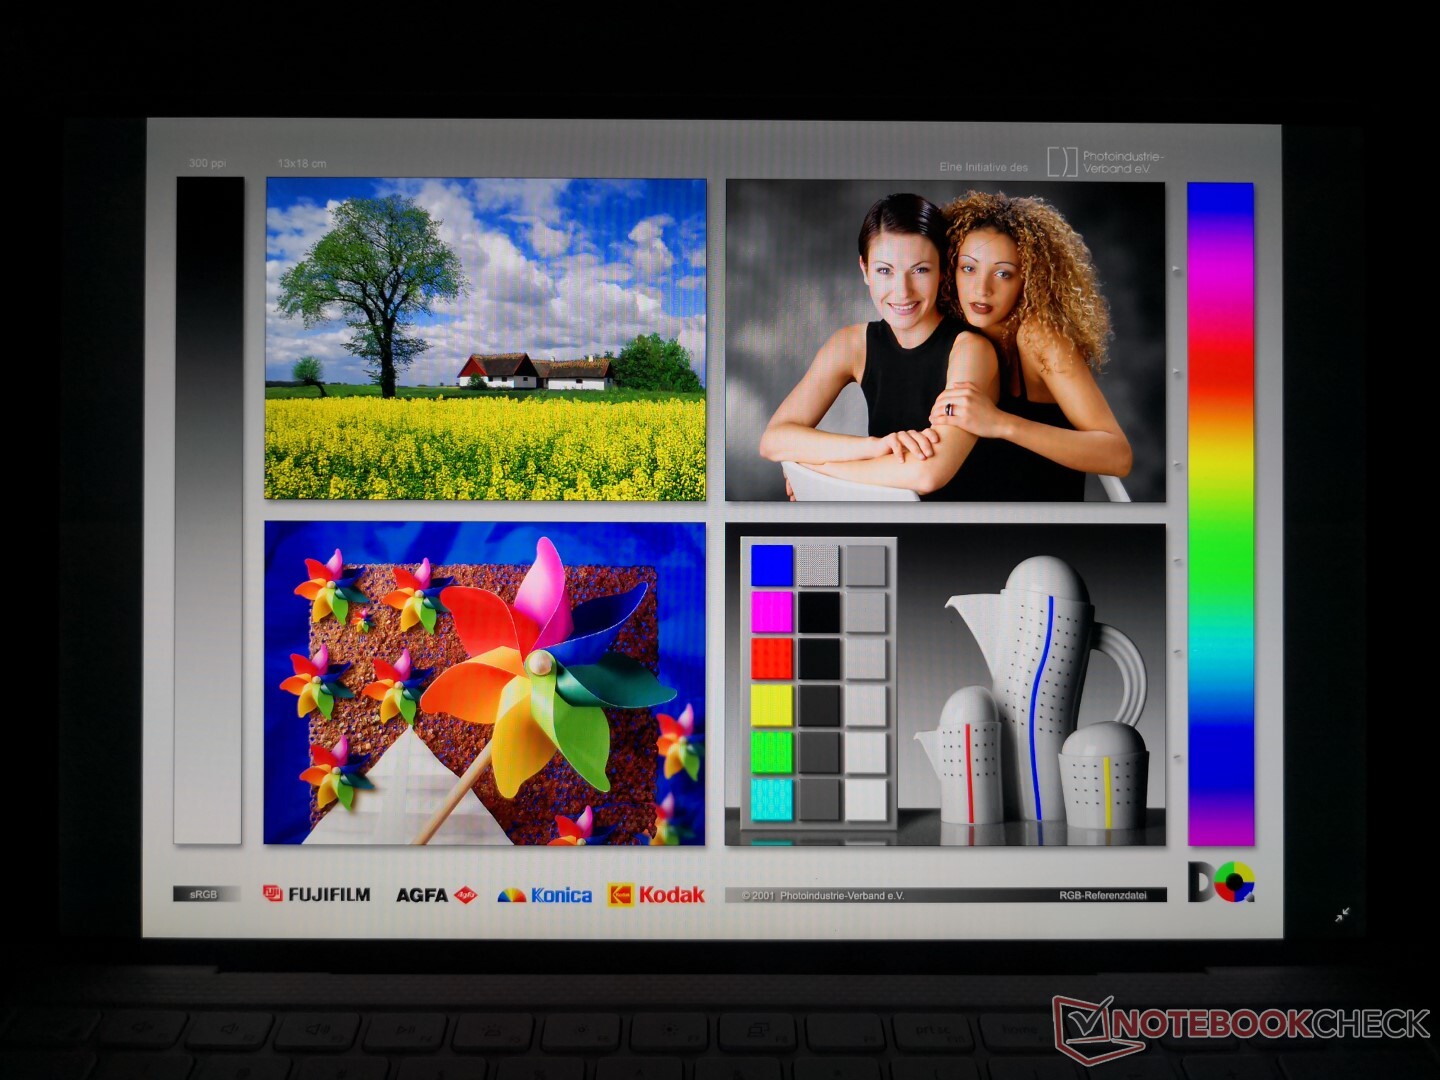
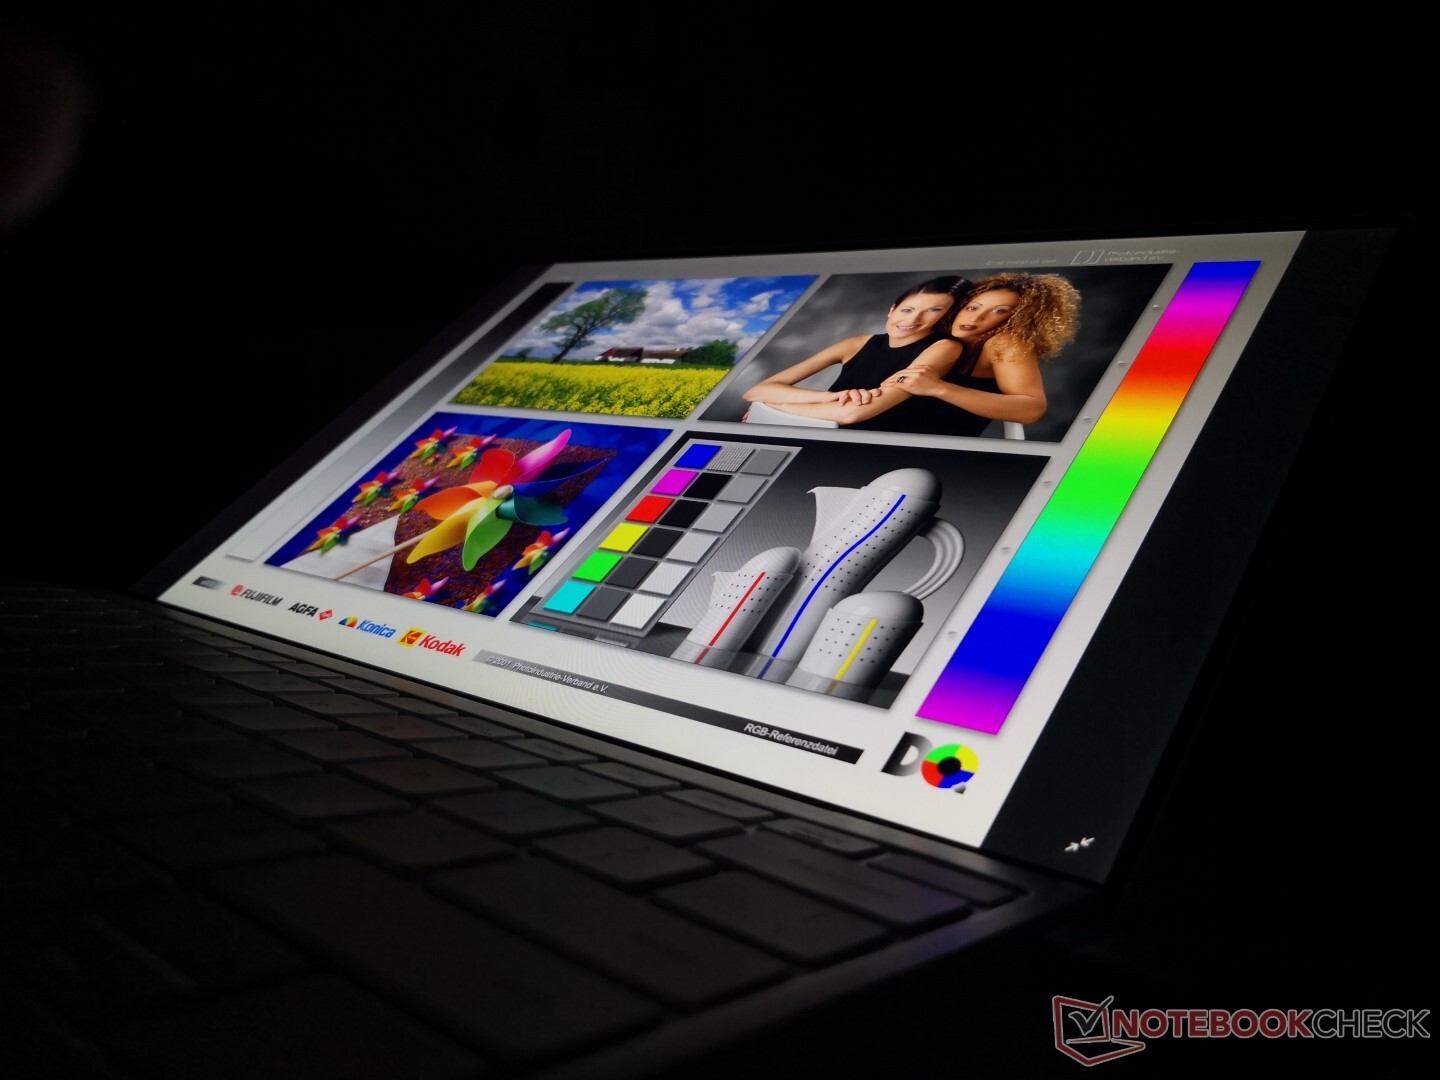
Display
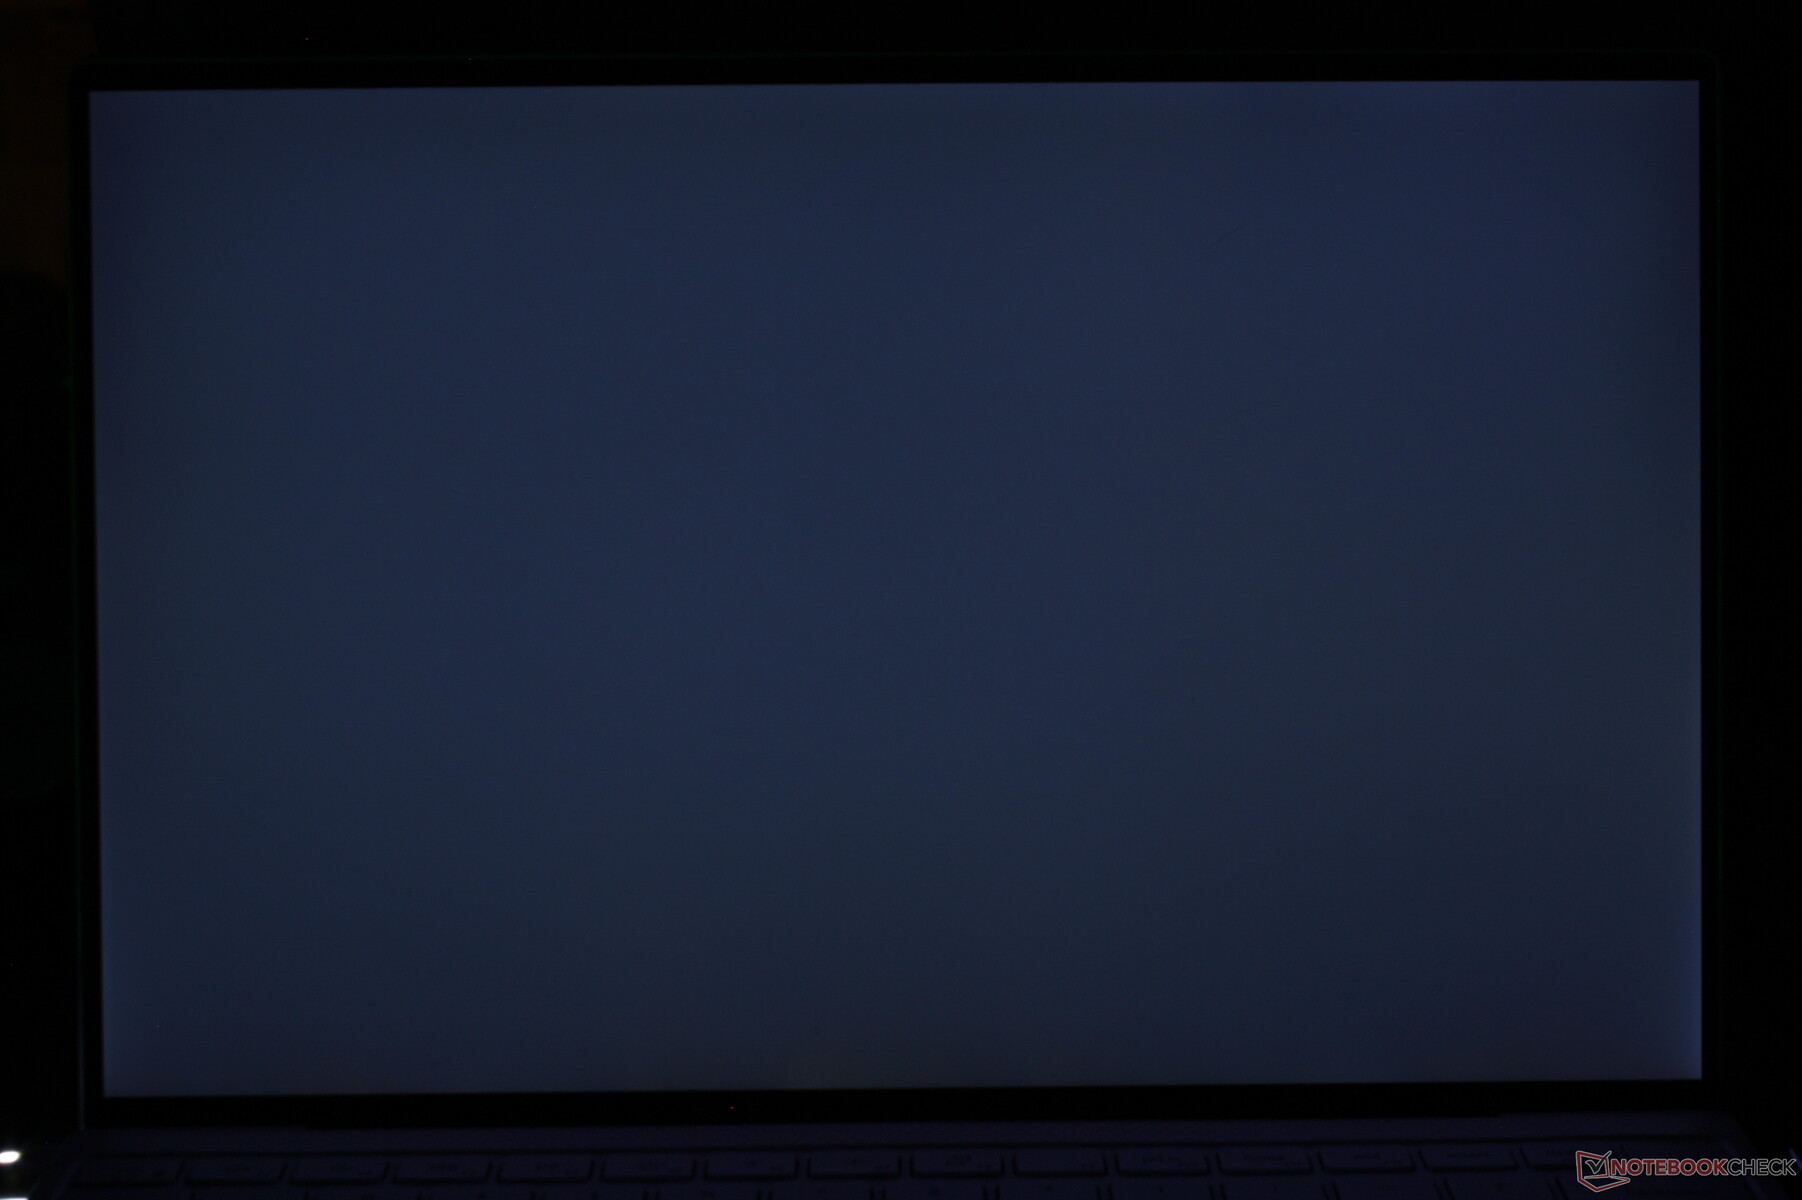
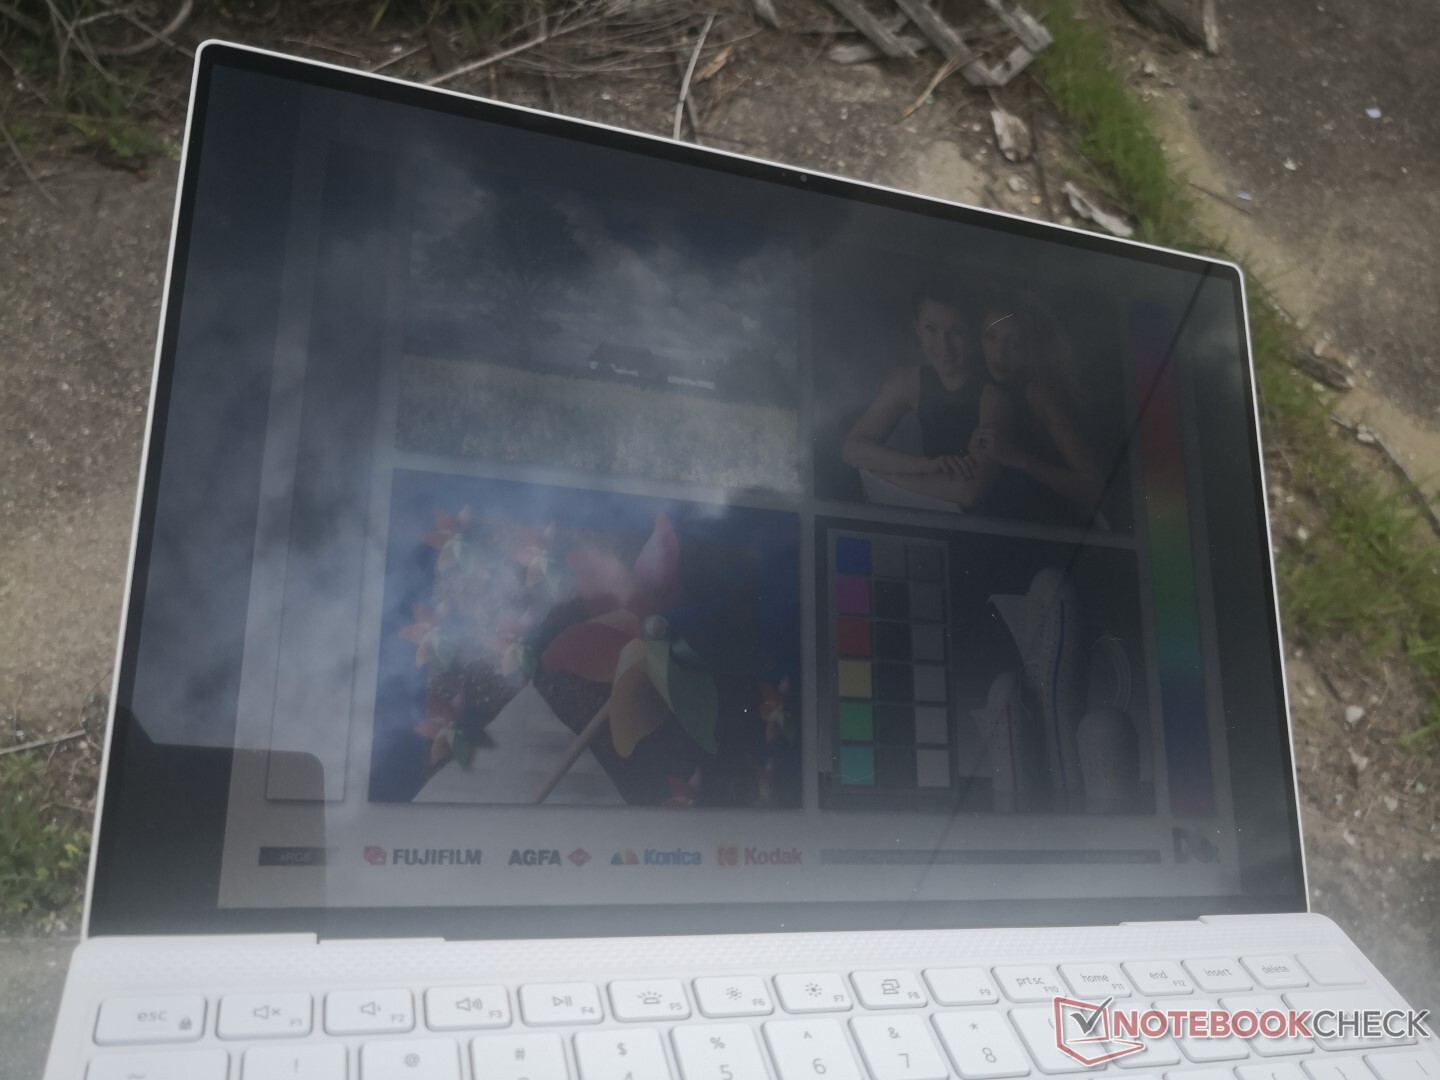
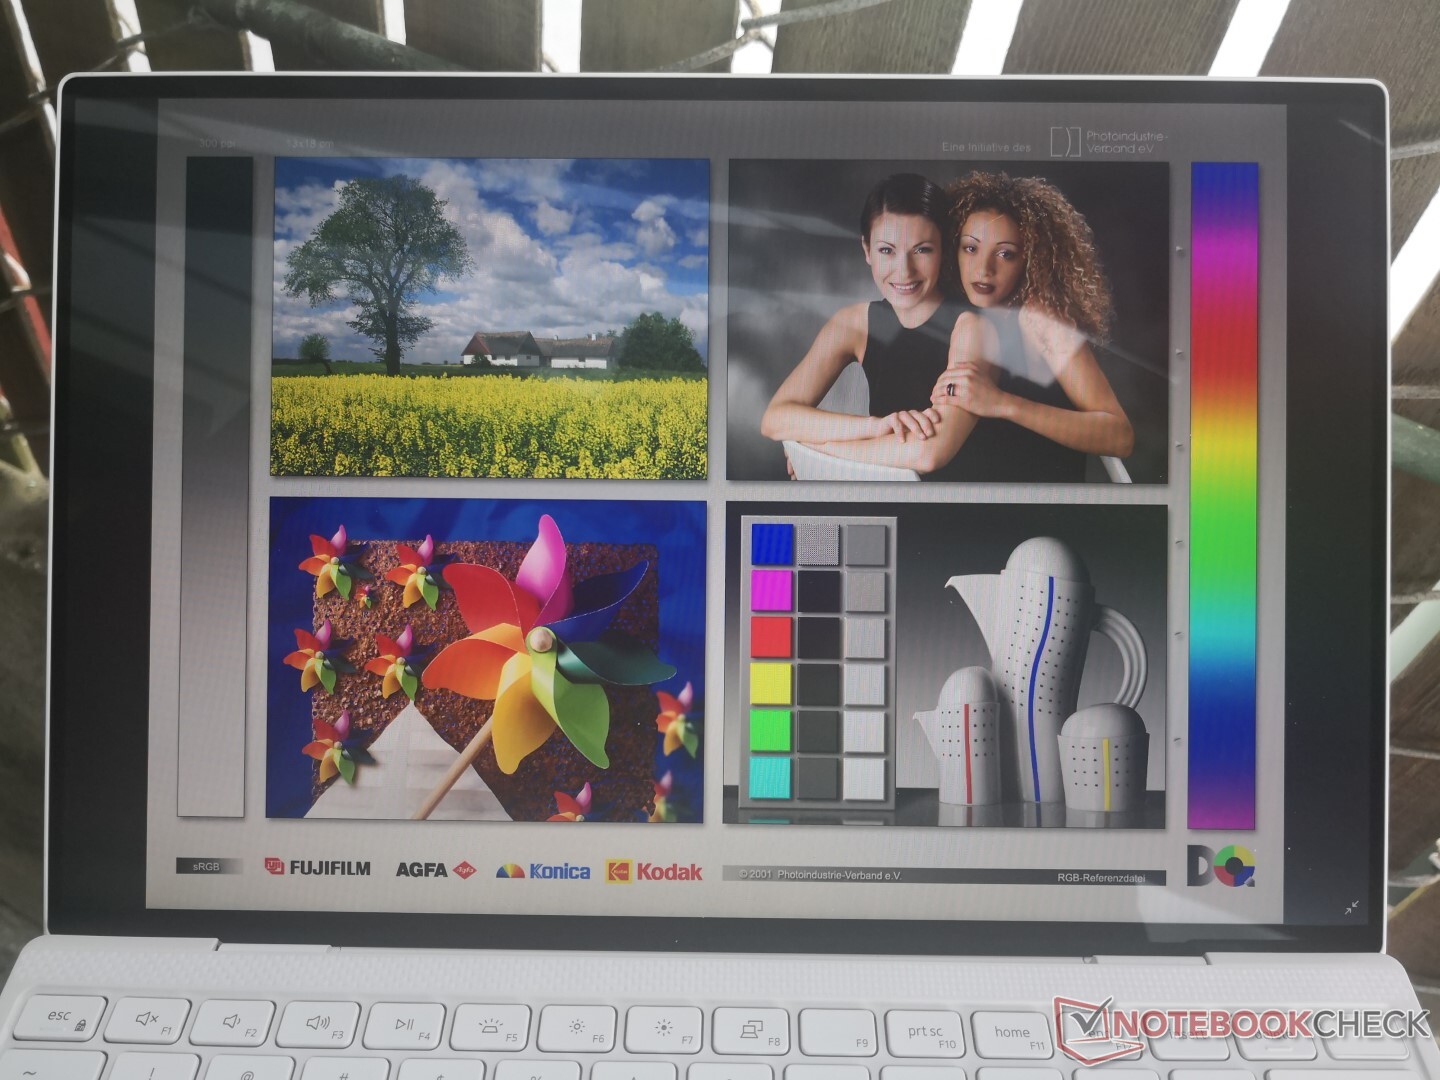
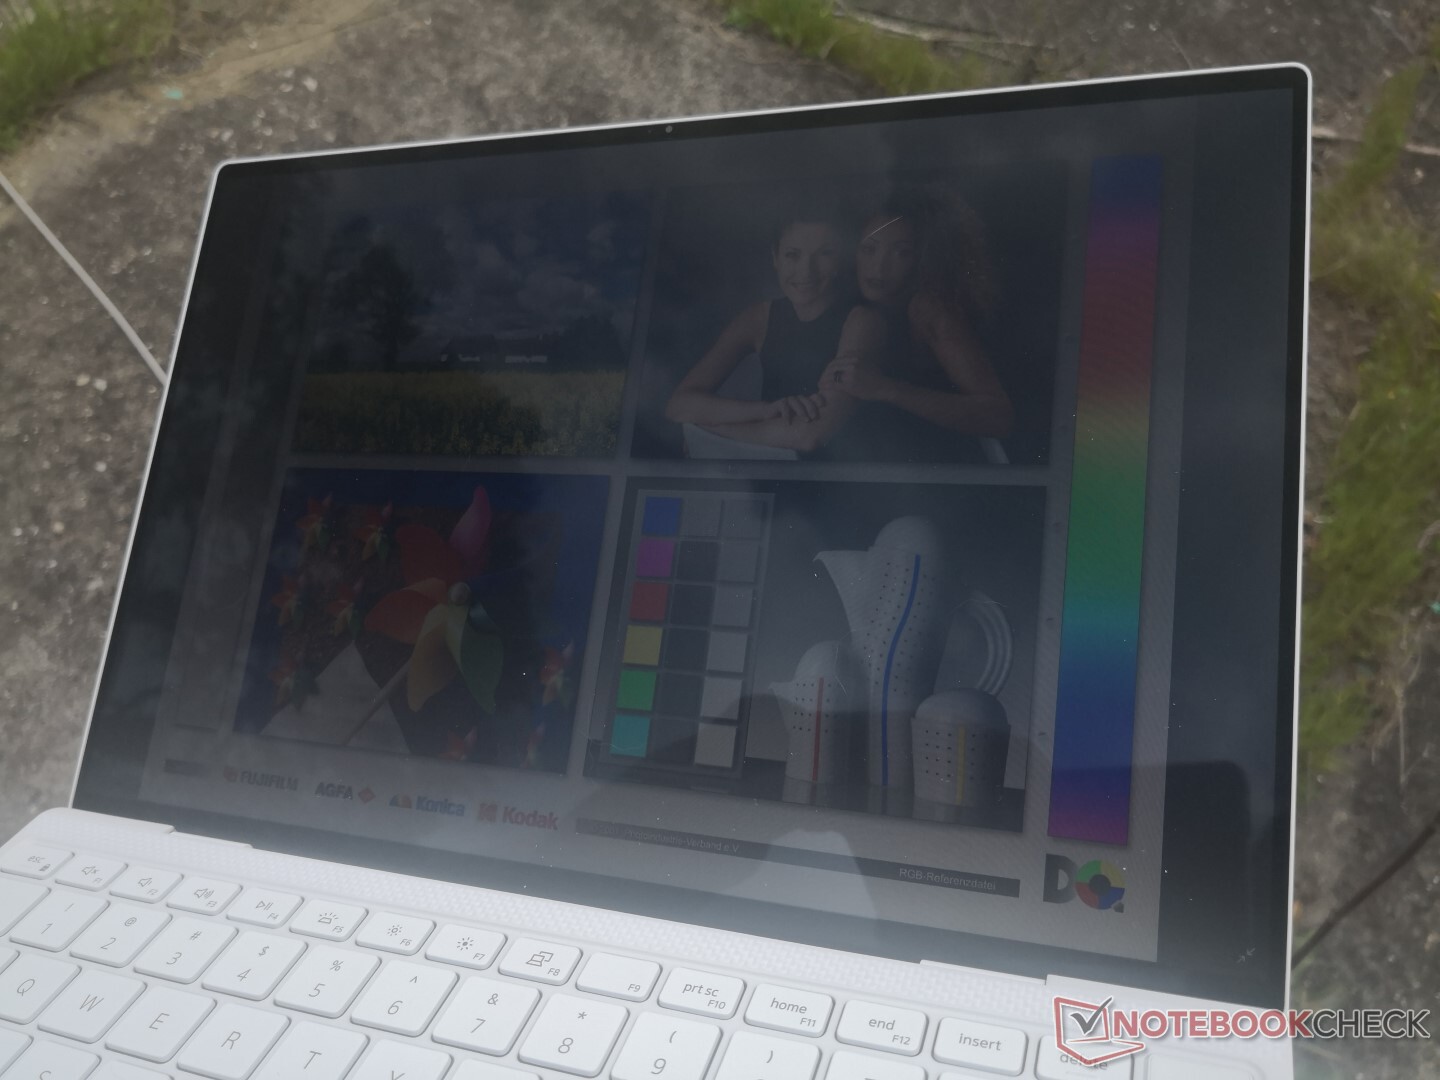
Dell advertises a brightness of 500 nits for its XPS 13 9300 FHD SKUs. Interestingly, we're able to measure a maximum brightness of 600 nits on two different FHD SKUs to be brighter than what Dell is advertising. We've discovered that the display will automatically dim to a maximum of 500 nits only when disconnected from the outlet and running on battery power.
Fortunately, it's possible to get the full 600 nits when running on battery power with a few clicks as detailed here. Users will have to disable adaptive brightness via Windows, then disable adaptive brightness again via the Intel Graphics Control Center software, enable Display Power Savings, and then disable Enhanced Power Saving in that order. It's a convoluted process involving multiple boxes when it should have been just one or two clicks at most.
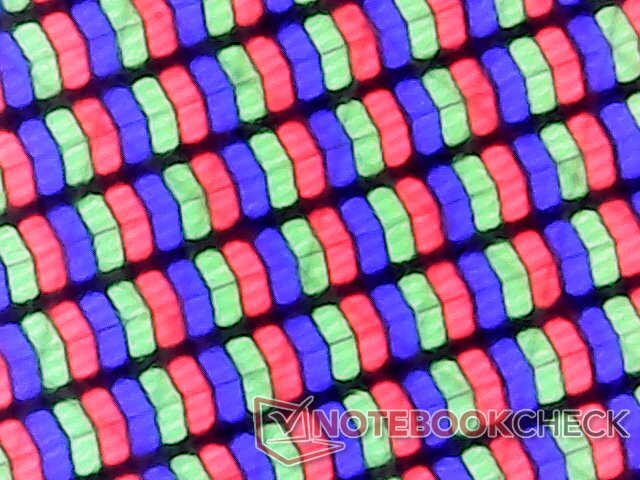
It's worth noting that the XPS 13 9300 uses the exact same 13.4-inch 16:10 Sharp LQ134N1 IPS panel as found on the XPS 13 7390 2-in-1 and so both systems share very similar characteristics. Even their pulse-width modulation frequencies are the same at 2500 Hz to suggest that they may share other similar components.
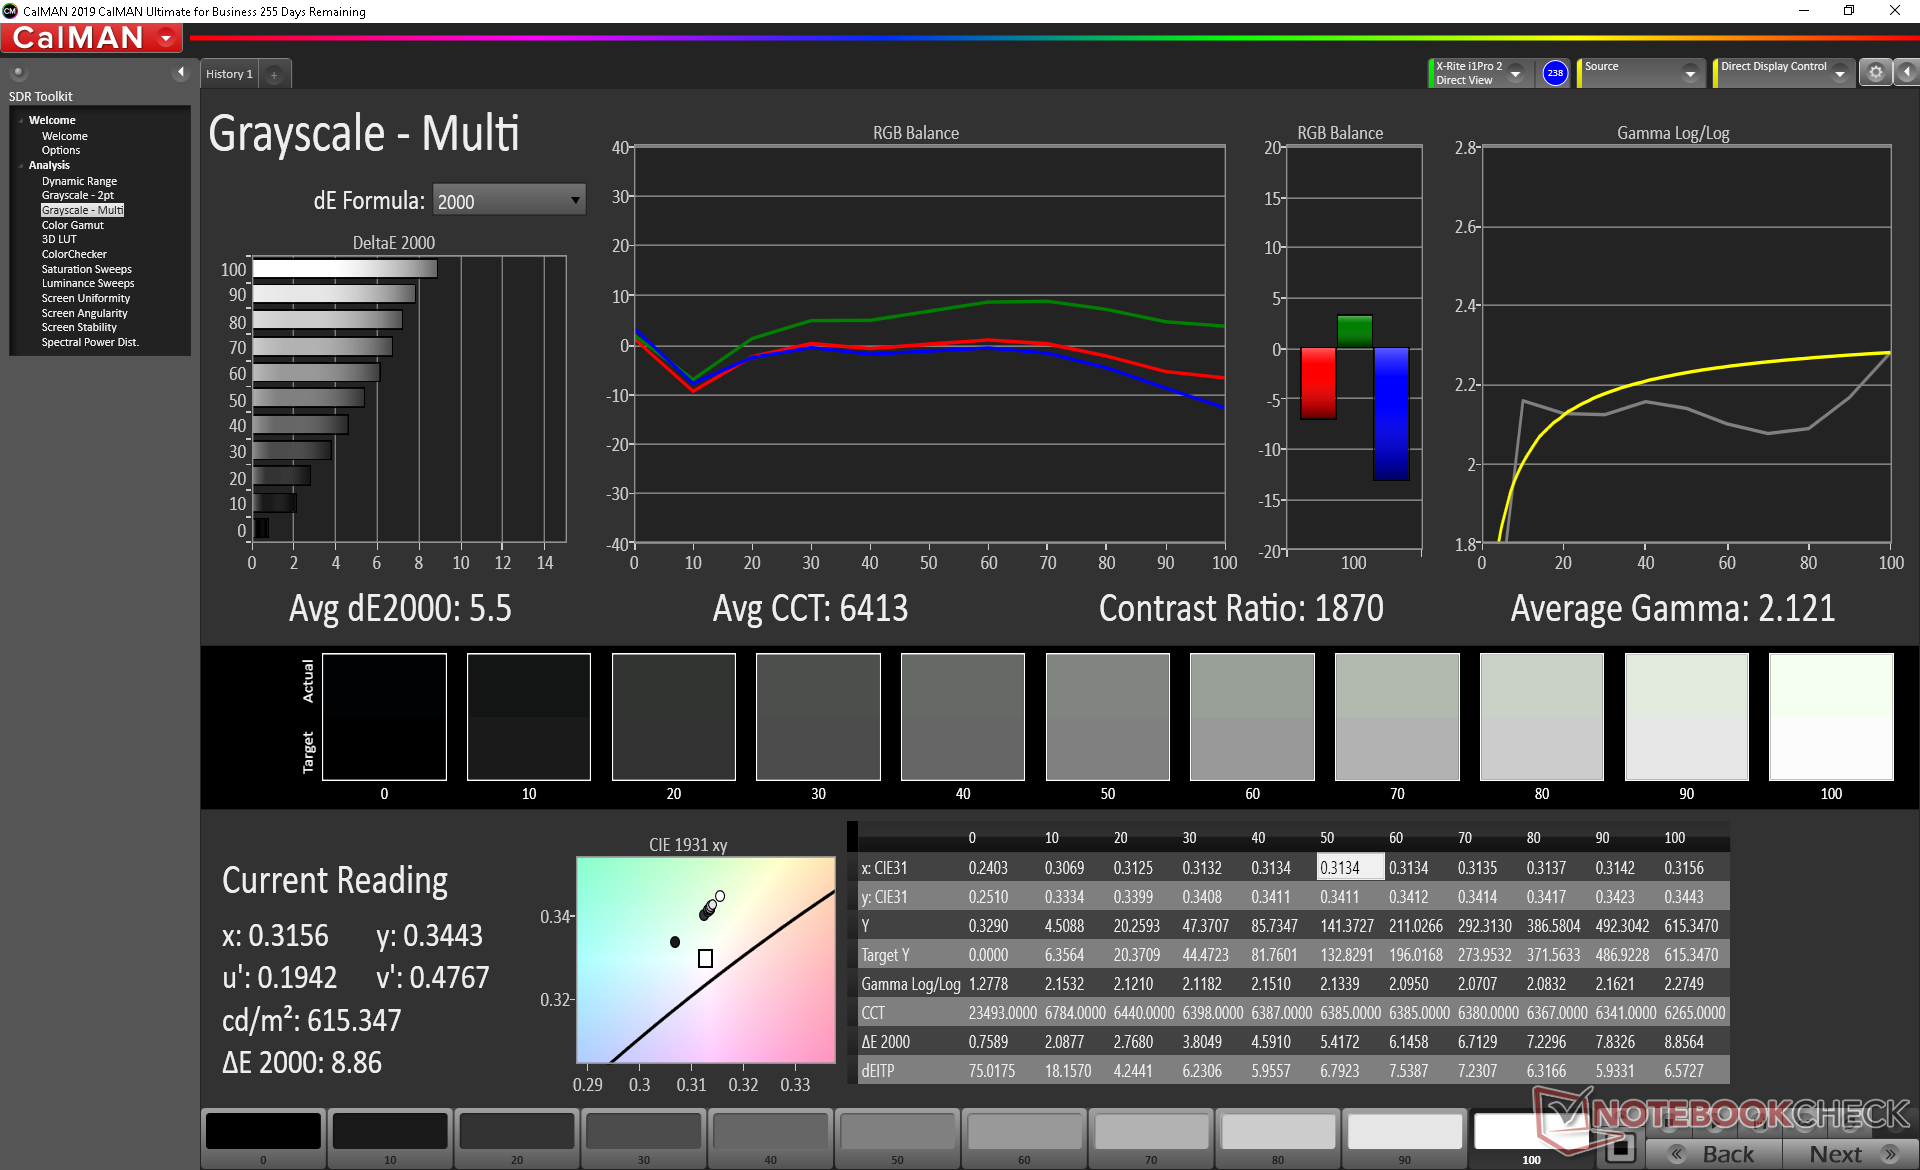
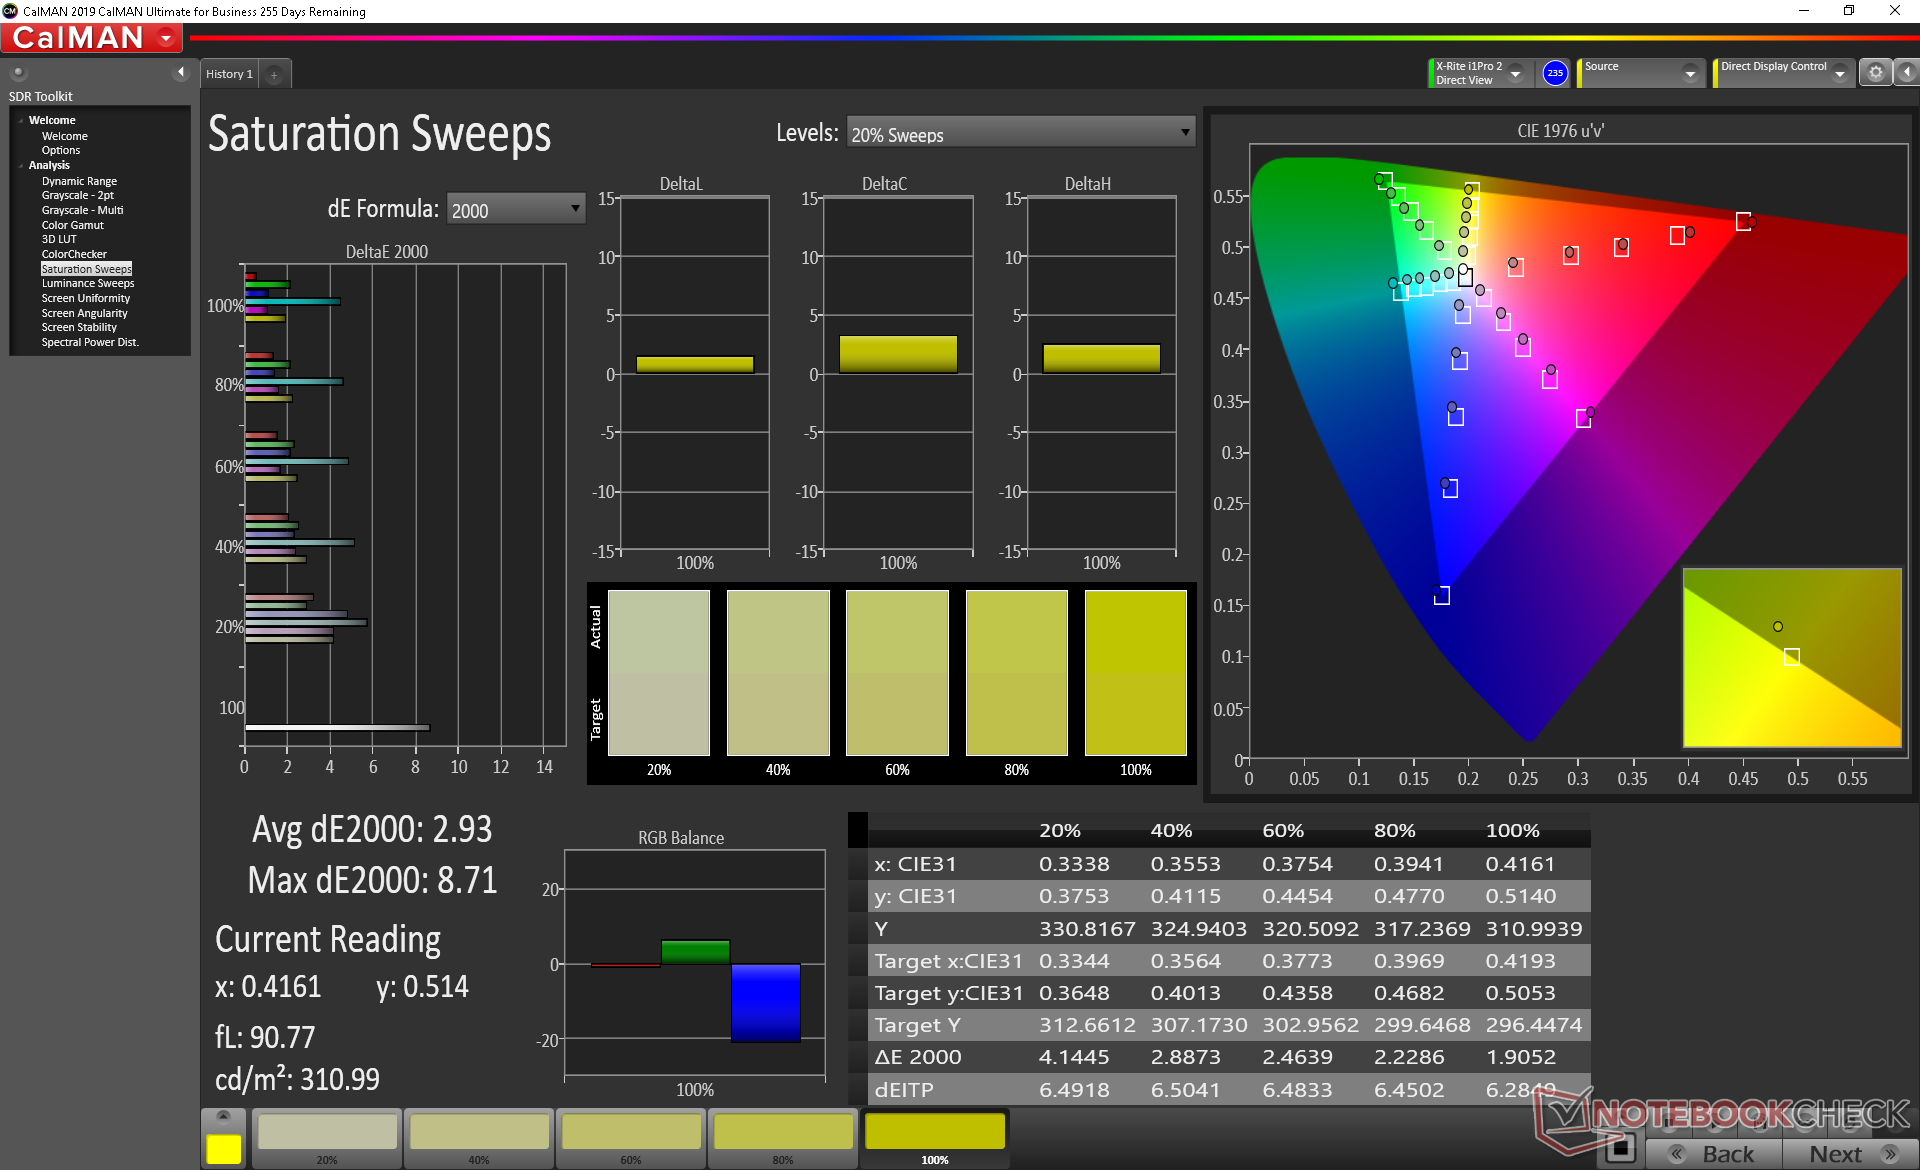
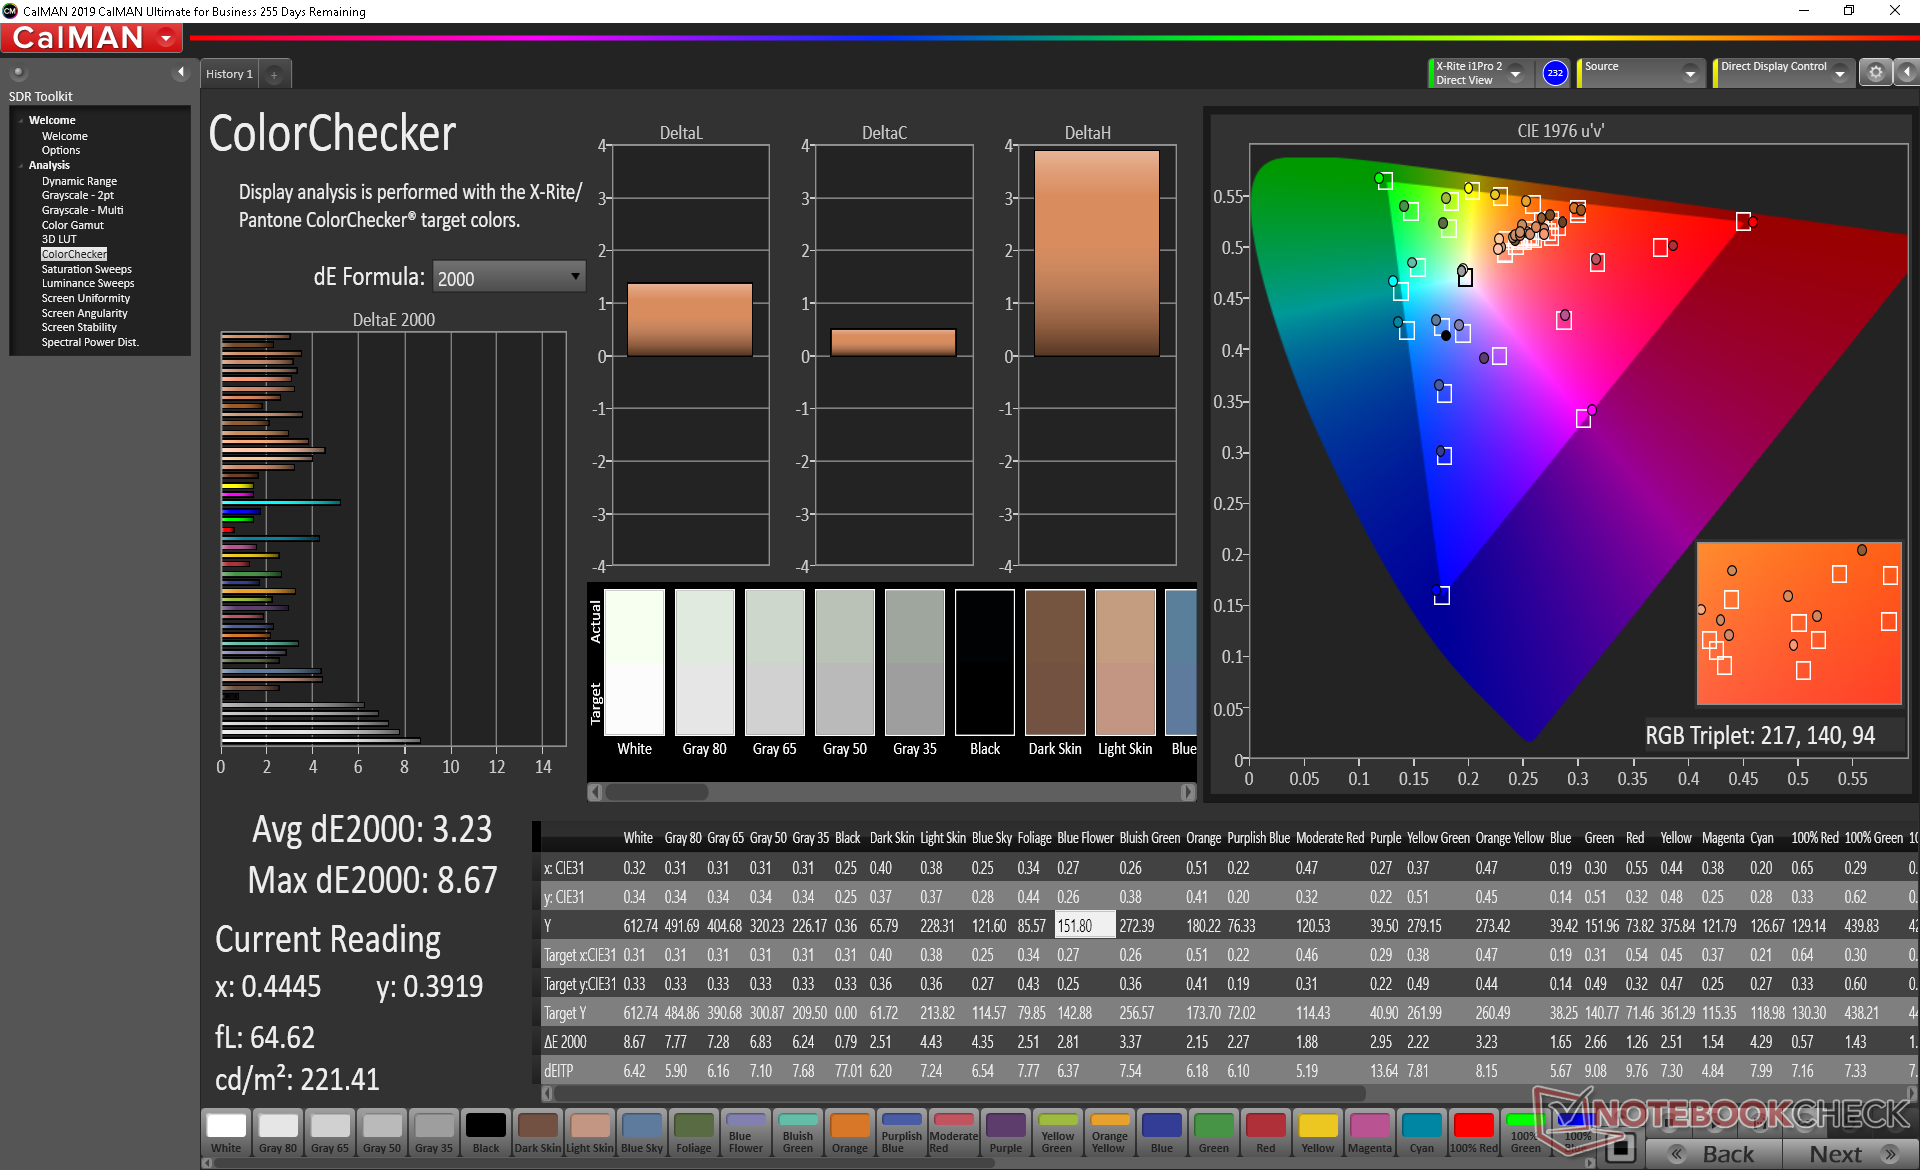
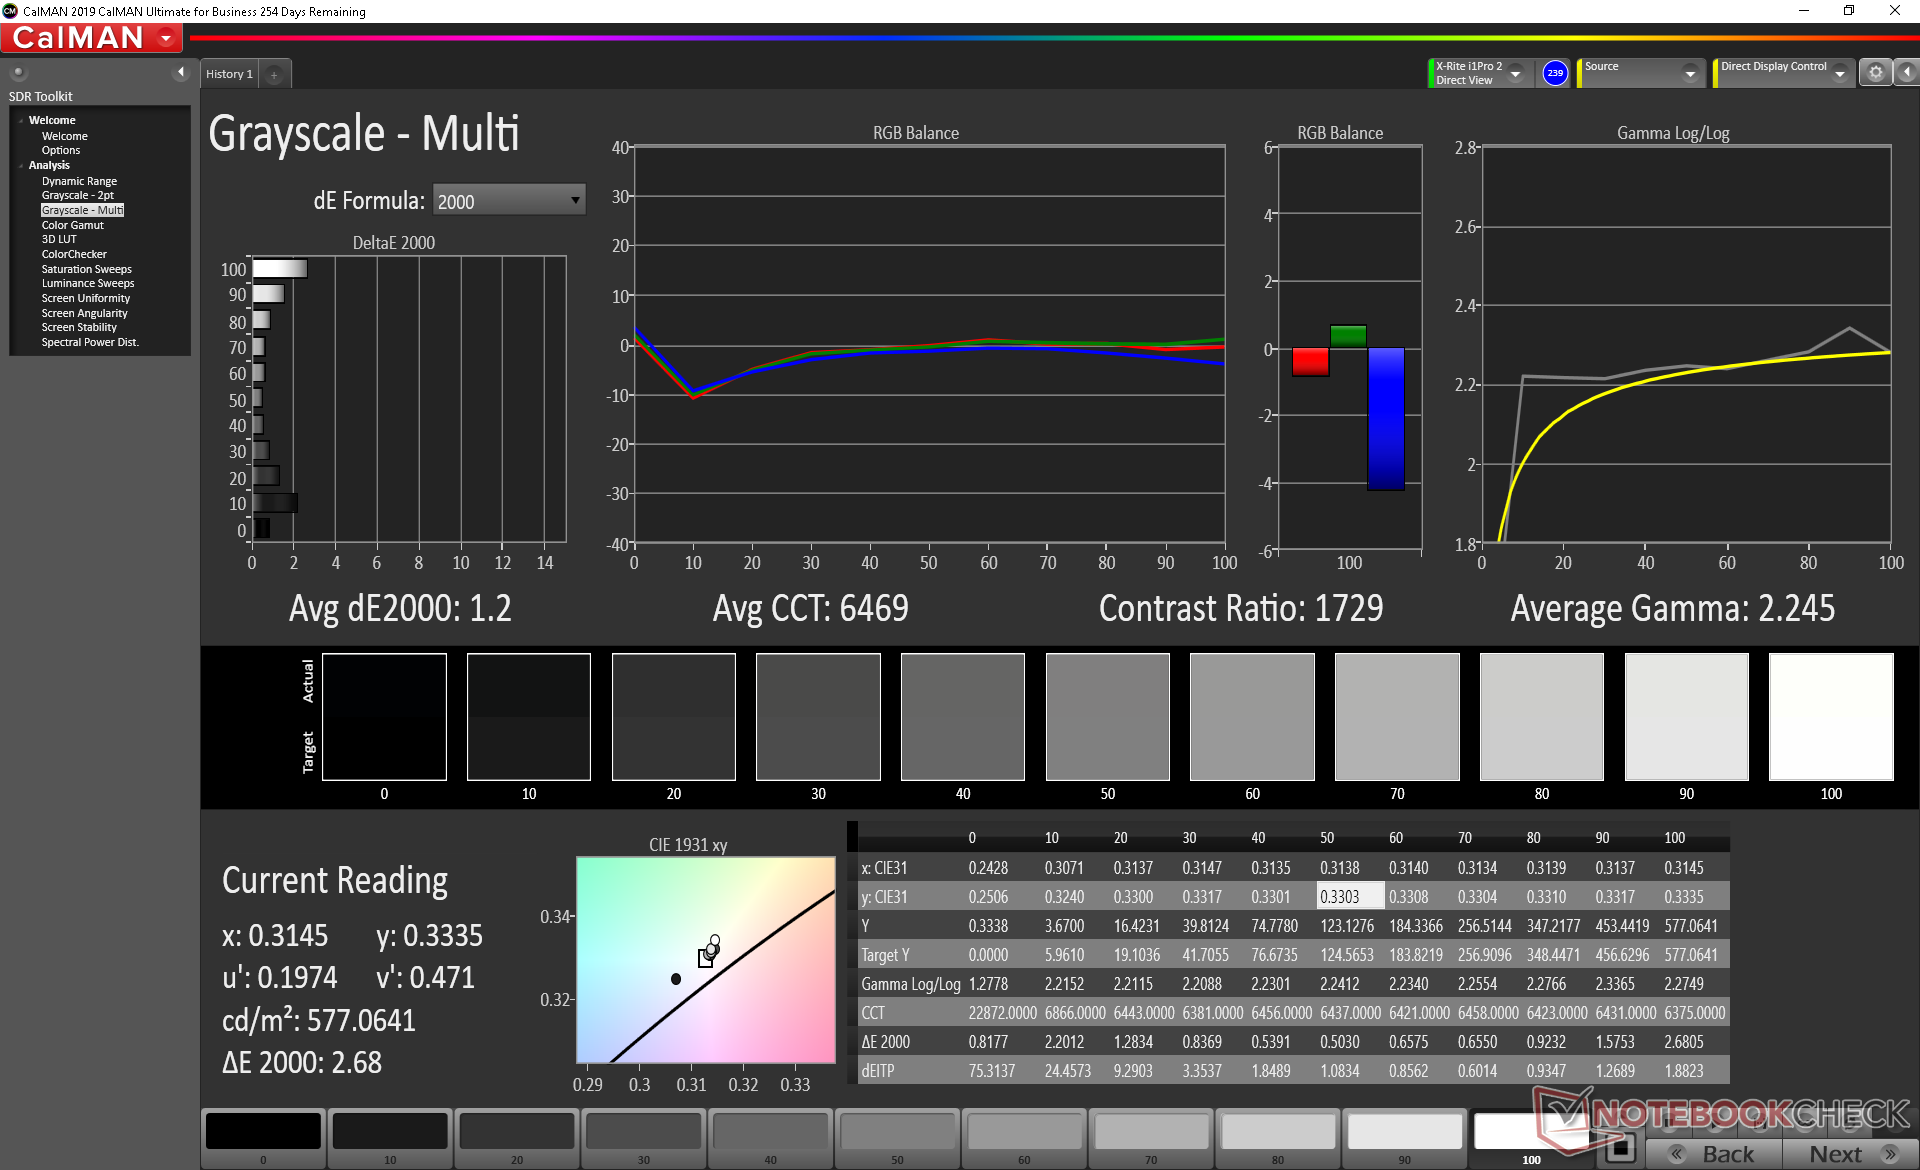
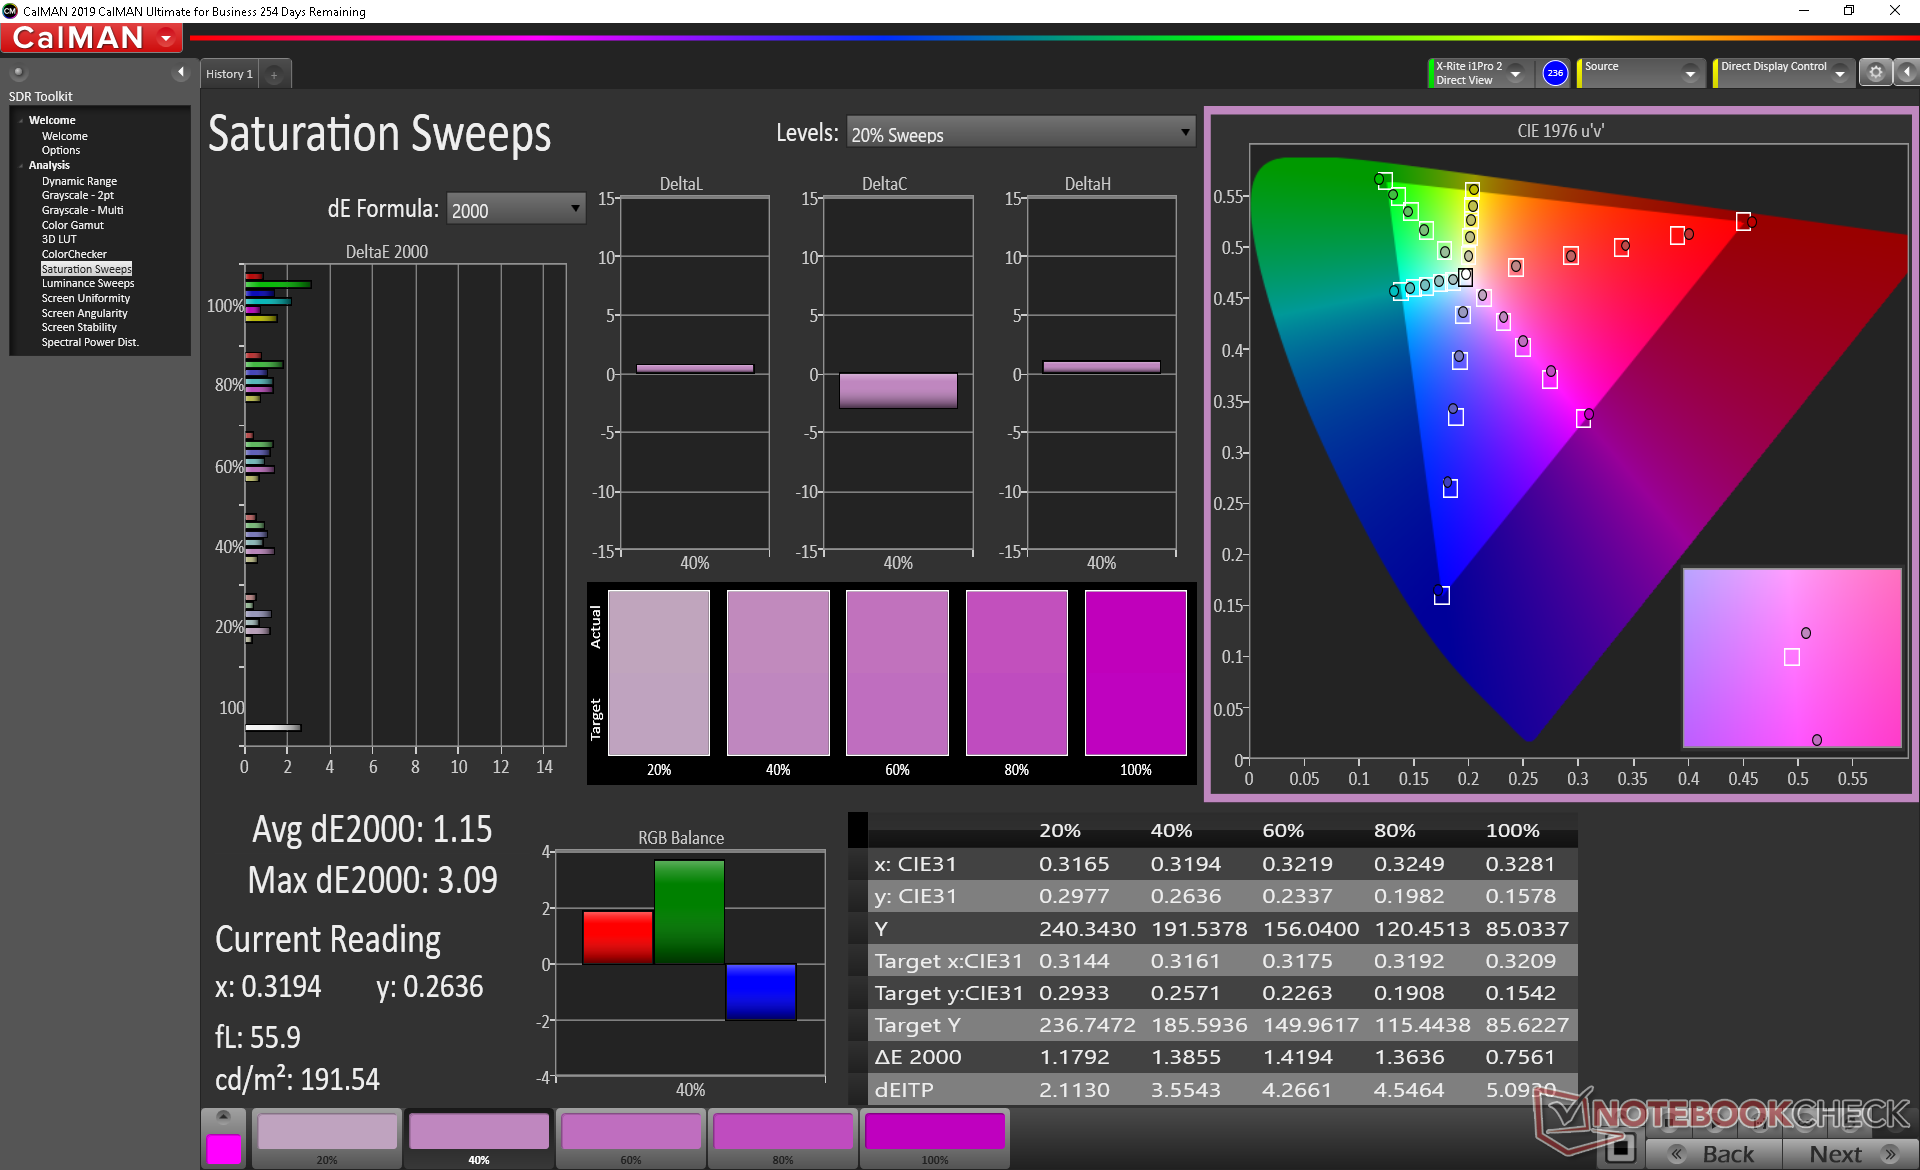
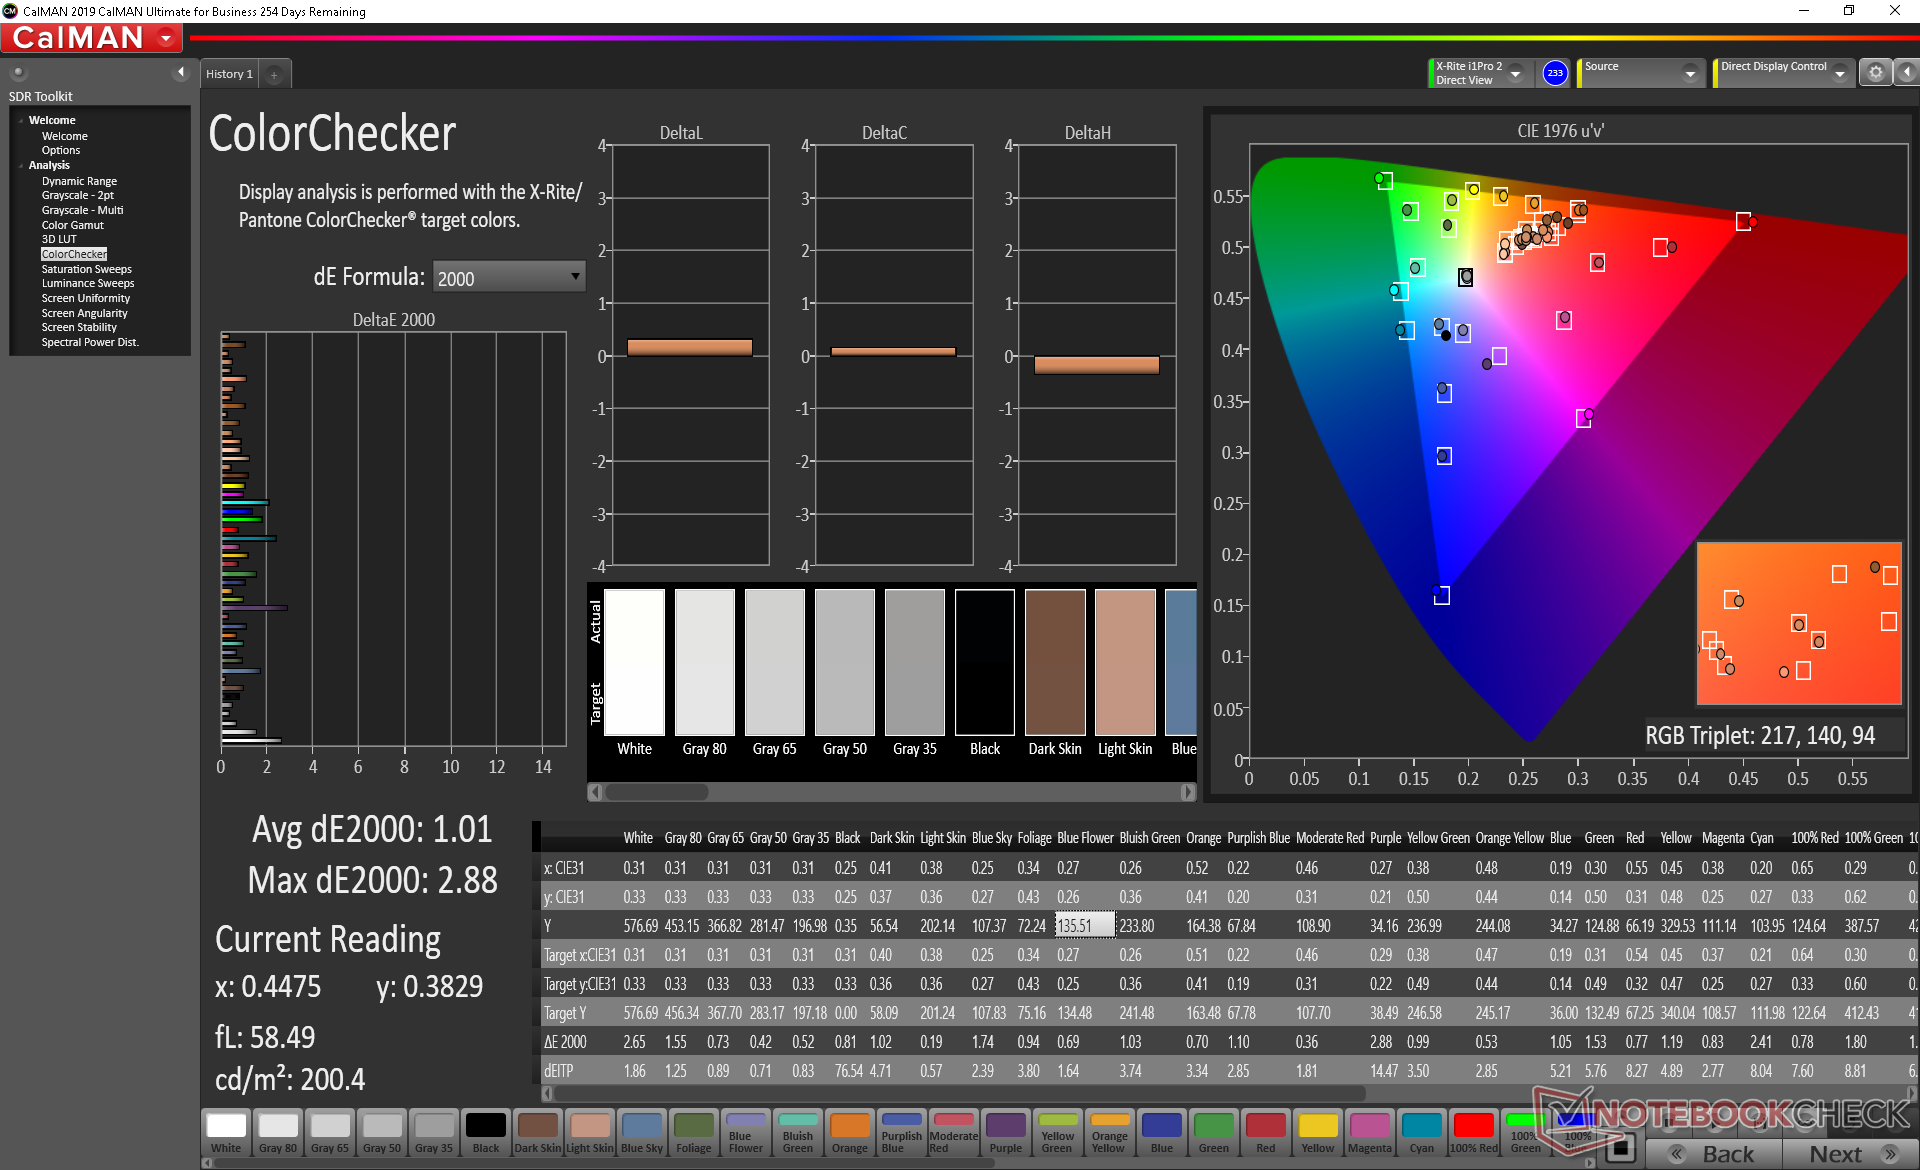
Eyesafe technology is included by default to reduce blue light emissions without impacting the color profile or accuracy of the display. Even so, our CalMAN measurements below show that the display could be even better calibrated than its default out-of-the-box settings.

| |||||||||||||||||||||||||
Brightness Distribution: 96 %
Center on Battery: 607.6 cd/m²
Contrast: 1519:1 (Black: 0.4 cd/m²)
ΔE ColorChecker Calman: 3.23 | ∀{0.5-29.43 Ø4.73}
calibrated: 1.01
ΔE Greyscale Calman: 5.5 | ∀{0.09-98 Ø4.97}
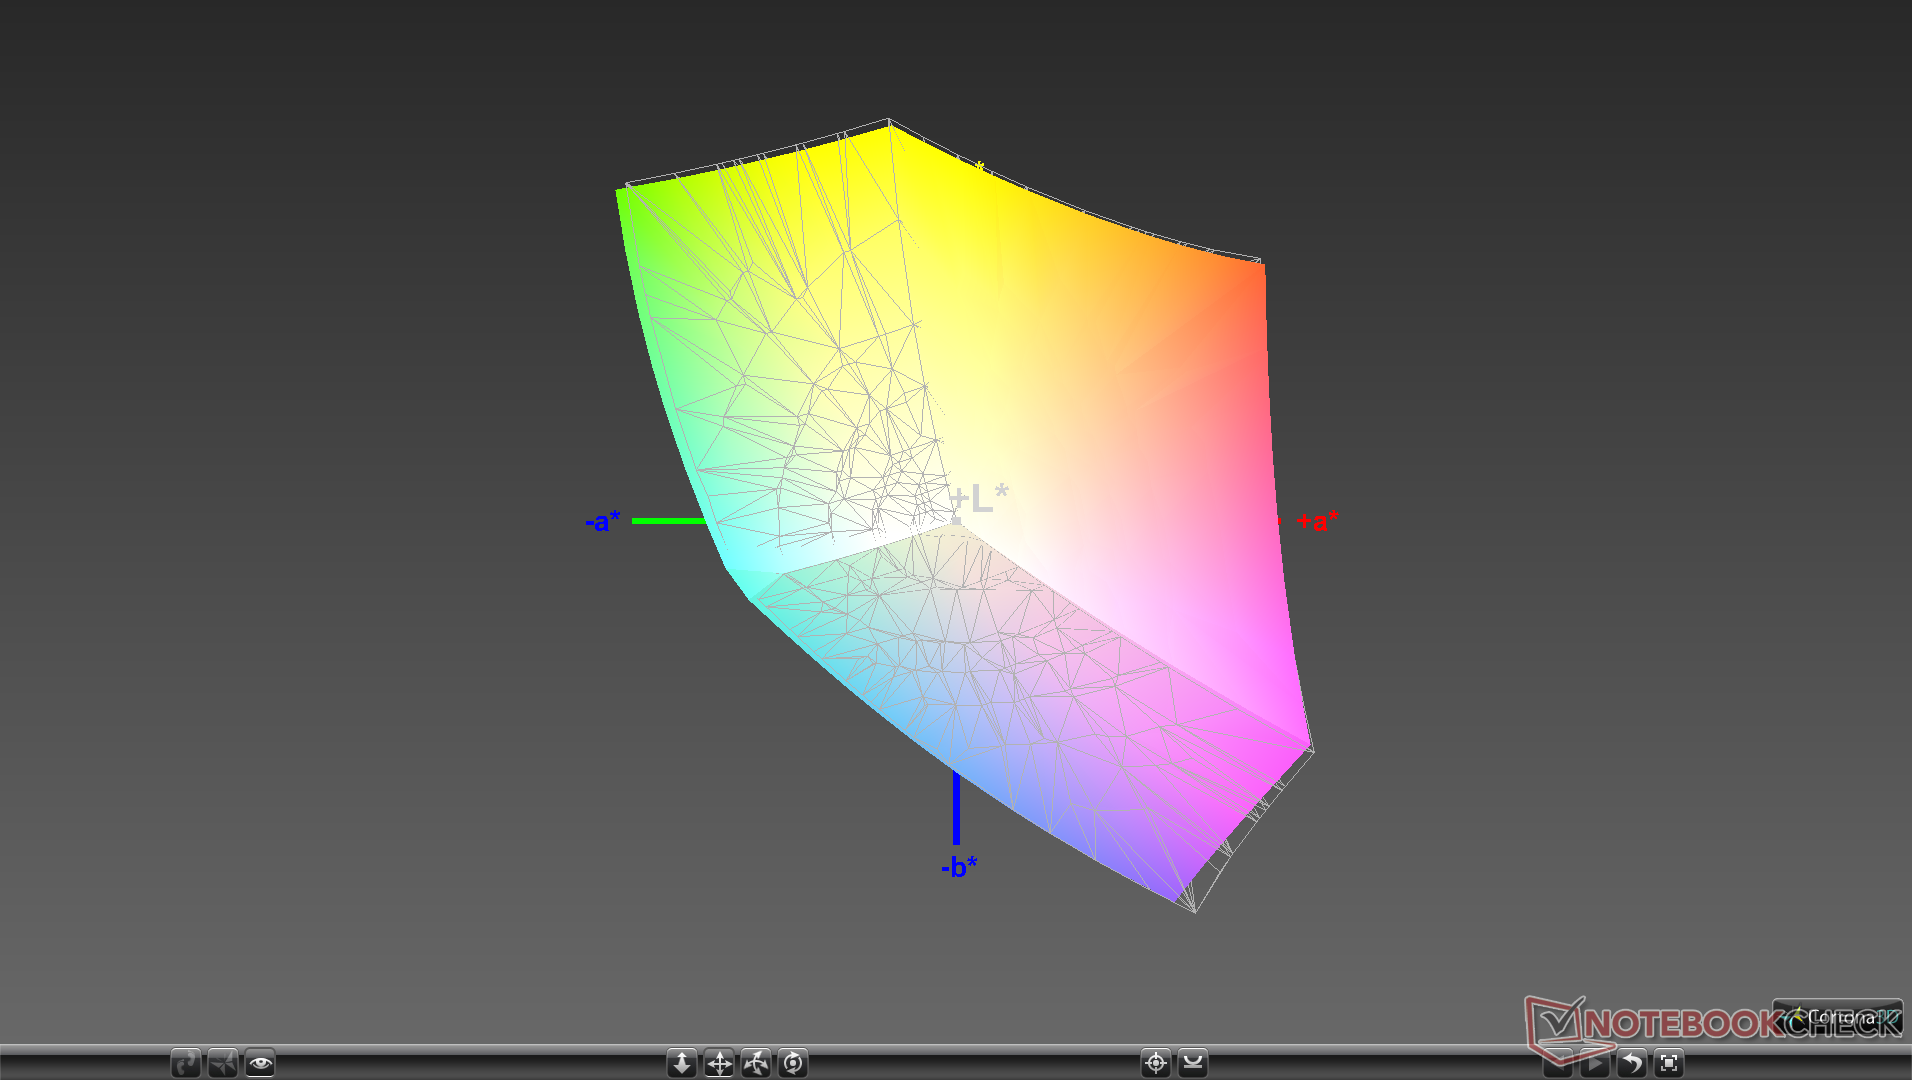
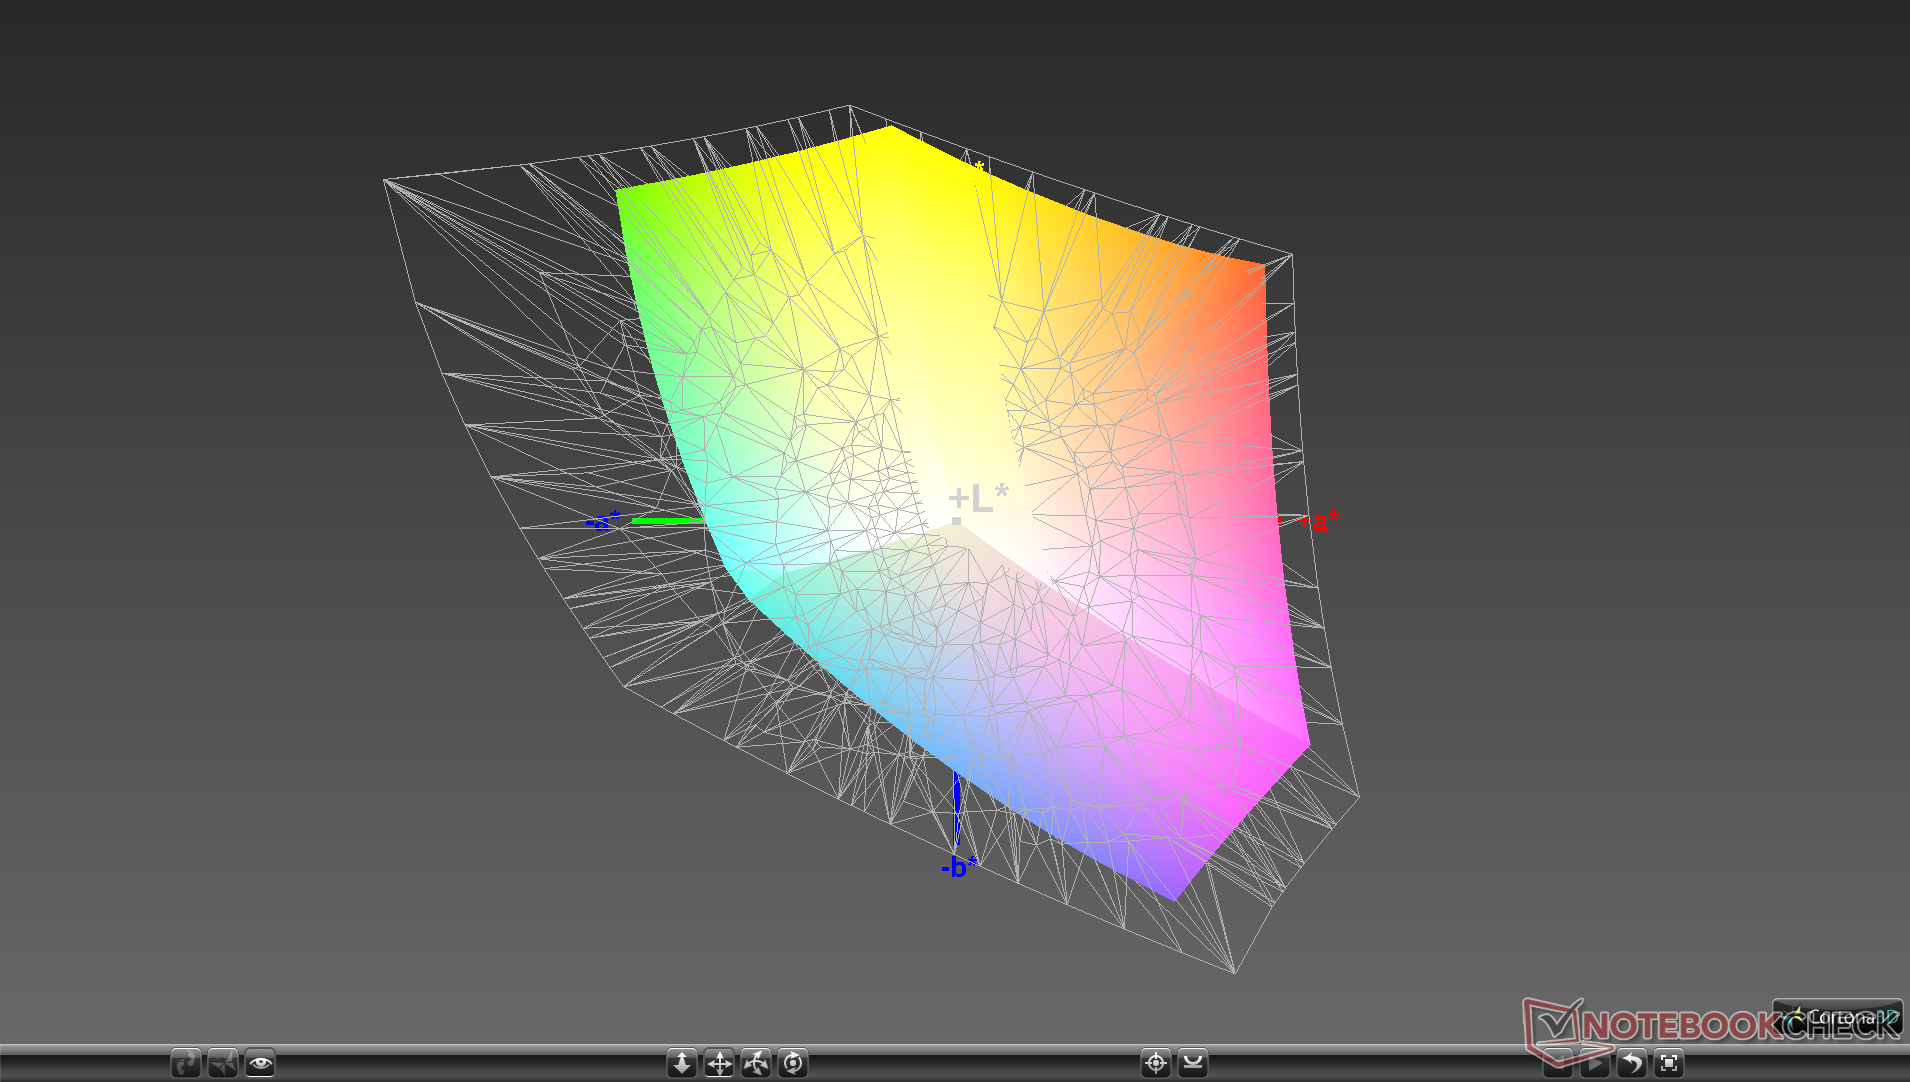
97.5% sRGB (Argyll 1.6.3 3D)
63% AdobeRGB 1998 (Argyll 1.6.3 3D)
68.5% AdobeRGB 1998 (Argyll 3D)
97.3% sRGB (Argyll 3D)
66.3% Display P3 (Argyll 3D)
Gamma: 2.12
CCT: 6413 K
| Dell XPS 13 9300 Core i7-1065G7 Sharp LQ134N1, IPS, 13.4", 1920x1200 | Dell XPS 13 7390 Core i7-10710U AU Optronics B133ZAN, Dell P/N: 90NTH, IPS, 13.3", 3840x2160 | Dell XPS 13 7390 2-in-1 Core i7 Sharp LQ134N1, IPS, 13.4", 1920x1200 | Huawei Matebook X Pro i5 Tianma XM, IPS, 13.9", 3000x2000 | Asus ZenBook S13 UX392FN Tianma XM, IPS, 13.9", 1920x1080 | Microsoft Surface Laptop 3 13 Core i5-1035G7 Sharp LQ135P1JX51, IPS, 13.5", 2256x1504 | |
|---|---|---|---|---|---|---|
| Display | -5% | 4% | -1% | 0% | -0% | |
| Display P3 Coverage (%) | 66.3 | 63.4 -4% | 69.9 5% | 65.9 -1% | 67.5 2% | 65.7 -1% |
| sRGB Coverage (%) | 97.3 | 93.7 -4% | 99.2 2% | 95.2 -2% | 95.8 -2% | 98.6 1% |
| AdobeRGB 1998 Coverage (%) | 68.5 | 64.3 -6% | 71.5 4% | 67.6 -1% | 69 1% | 67.8 -1% |
| Response Times | -2% | 9% | 21% | 16% | -22% | |
| Response Time Grey 50% / Grey 80% * (ms) | 50 ? | 51.6 ? -3% | 47.6 ? 5% | 40.4 ? 19% | 47.2 ? 6% | 59.2 ? -18% |
| Response Time Black / White * (ms) | 33.2 ? | 33.6 ? -1% | 29.2 ? 12% | 25.6 ? 23% | 24.8 ? 25% | 41.6 ? -25% |
| PWM Frequency (Hz) | 2500 ? | 2500 ? | 21740 ? | |||
| Screen | -30% | 7% | -8% | 2% | 13% | |
| Brightness middle (cd/m²) | 607.6 | 408.2 -33% | 549.8 -10% | 442.7 -27% | 466 -23% | 403.4 -34% |
| Brightness (cd/m²) | 595 | 399 -33% | 520 -13% | 428 -28% | 462 -22% | 397 -33% |
| Brightness Distribution (%) | 96 | 89 -7% | 86 -10% | 84 -12% | 90 -6% | 89 -7% |
| Black Level * (cd/m²) | 0.4 | 0.39 2% | 0.39 2% | 0.31 23% | 0.33 17% | 0.34 15% |
| Contrast (:1) | 1519 | 1047 -31% | 1410 -7% | 1428 -6% | 1412 -7% | 1186 -22% |
| Colorchecker dE 2000 * | 3.23 | 4.6 -42% | 2.12 34% | 2.24 31% | 1.93 40% | 0.94 71% |
| Colorchecker dE 2000 max. * | 8.67 | 11.84 -37% | 3.66 58% | 7.19 17% | 4.26 51% | 2.92 66% |
| Colorchecker dE 2000 calibrated * | 1.01 | 2.03 -101% | 1.37 -36% | 1.11 -10% | 1.99 -97% | 0.99 2% |
| Greyscale dE 2000 * | 5.5 | 7.5 -36% | 2.6 53% | 9.7 -76% | 1.7 69% | 0.9 84% |
| Gamma | 2.12 104% | 2.12 104% | 2.3 96% | 1.42 155% | 2.15 102% | 2.13 103% |
| CCT | 6413 101% | 7966 82% | 6884 94% | 6227 104% | 6382 102% | 6620 98% |
| Color Space (Percent of AdobeRGB 1998) (%) | 63 | 59.5 -6% | 65.4 4% | 61.6 -2% | 62.2 -1% | 62.3 -1% |
| Color Space (Percent of sRGB) (%) | 97.5 | 93.5 -4% | 99.7 2% | 95 -3% | 95.7 -2% | 98.7 1% |
| Total Average (Program / Settings) | -12% /
-22% | 7% /
7% | 4% /
-3% | 6% /
3% | -3% /
6% |
* ... smaller is better
Display Response Times
| ↔ Response Time Black to White | ||
|---|---|---|
| 33.2 ms ... rise ↗ and fall ↘ combined | ↗ 16 ms rise | 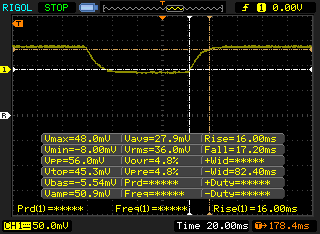 |
| ↘ 17.2 ms fall | ||
| The screen shows slow response rates in our tests and will be unsatisfactory for gamers. In comparison, all tested devices range from 0.1 (minimum) to 240 (maximum) ms. » 90 % of all devices are better. This means that the measured response time is worse than the average of all tested devices (19.9 ms). | ||
| ↔ Response Time 50% Grey to 80% Grey | ||
| 50 ms ... rise ↗ and fall ↘ combined | ↗ 22 ms rise | 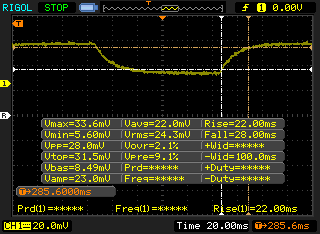 |
| ↘ 28 ms fall | ||
| The screen shows slow response rates in our tests and will be unsatisfactory for gamers. In comparison, all tested devices range from 0.165 (minimum) to 636 (maximum) ms. » 86 % of all devices are better. This means that the measured response time is worse than the average of all tested devices (31.1 ms). | ||
Screen Flickering / PWM (Pulse-Width Modulation)
| Screen flickering / PWM detected | 2500 Hz | ≤ 25 % brightness setting | 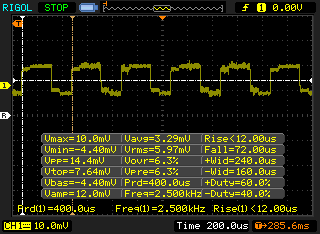 |
The display backlight flickers at 2500 Hz (worst case, e.g., utilizing PWM) Flickering detected at a brightness setting of 25 % and below. There should be no flickering or PWM above this brightness setting. The frequency of 2500 Hz is quite high, so most users sensitive to PWM should not notice any flickering. In comparison: 52 % of all tested devices do not use PWM to dim the display. If PWM was detected, an average of 7798 (minimum: 5 - maximum: 343500) Hz was measured. | |||
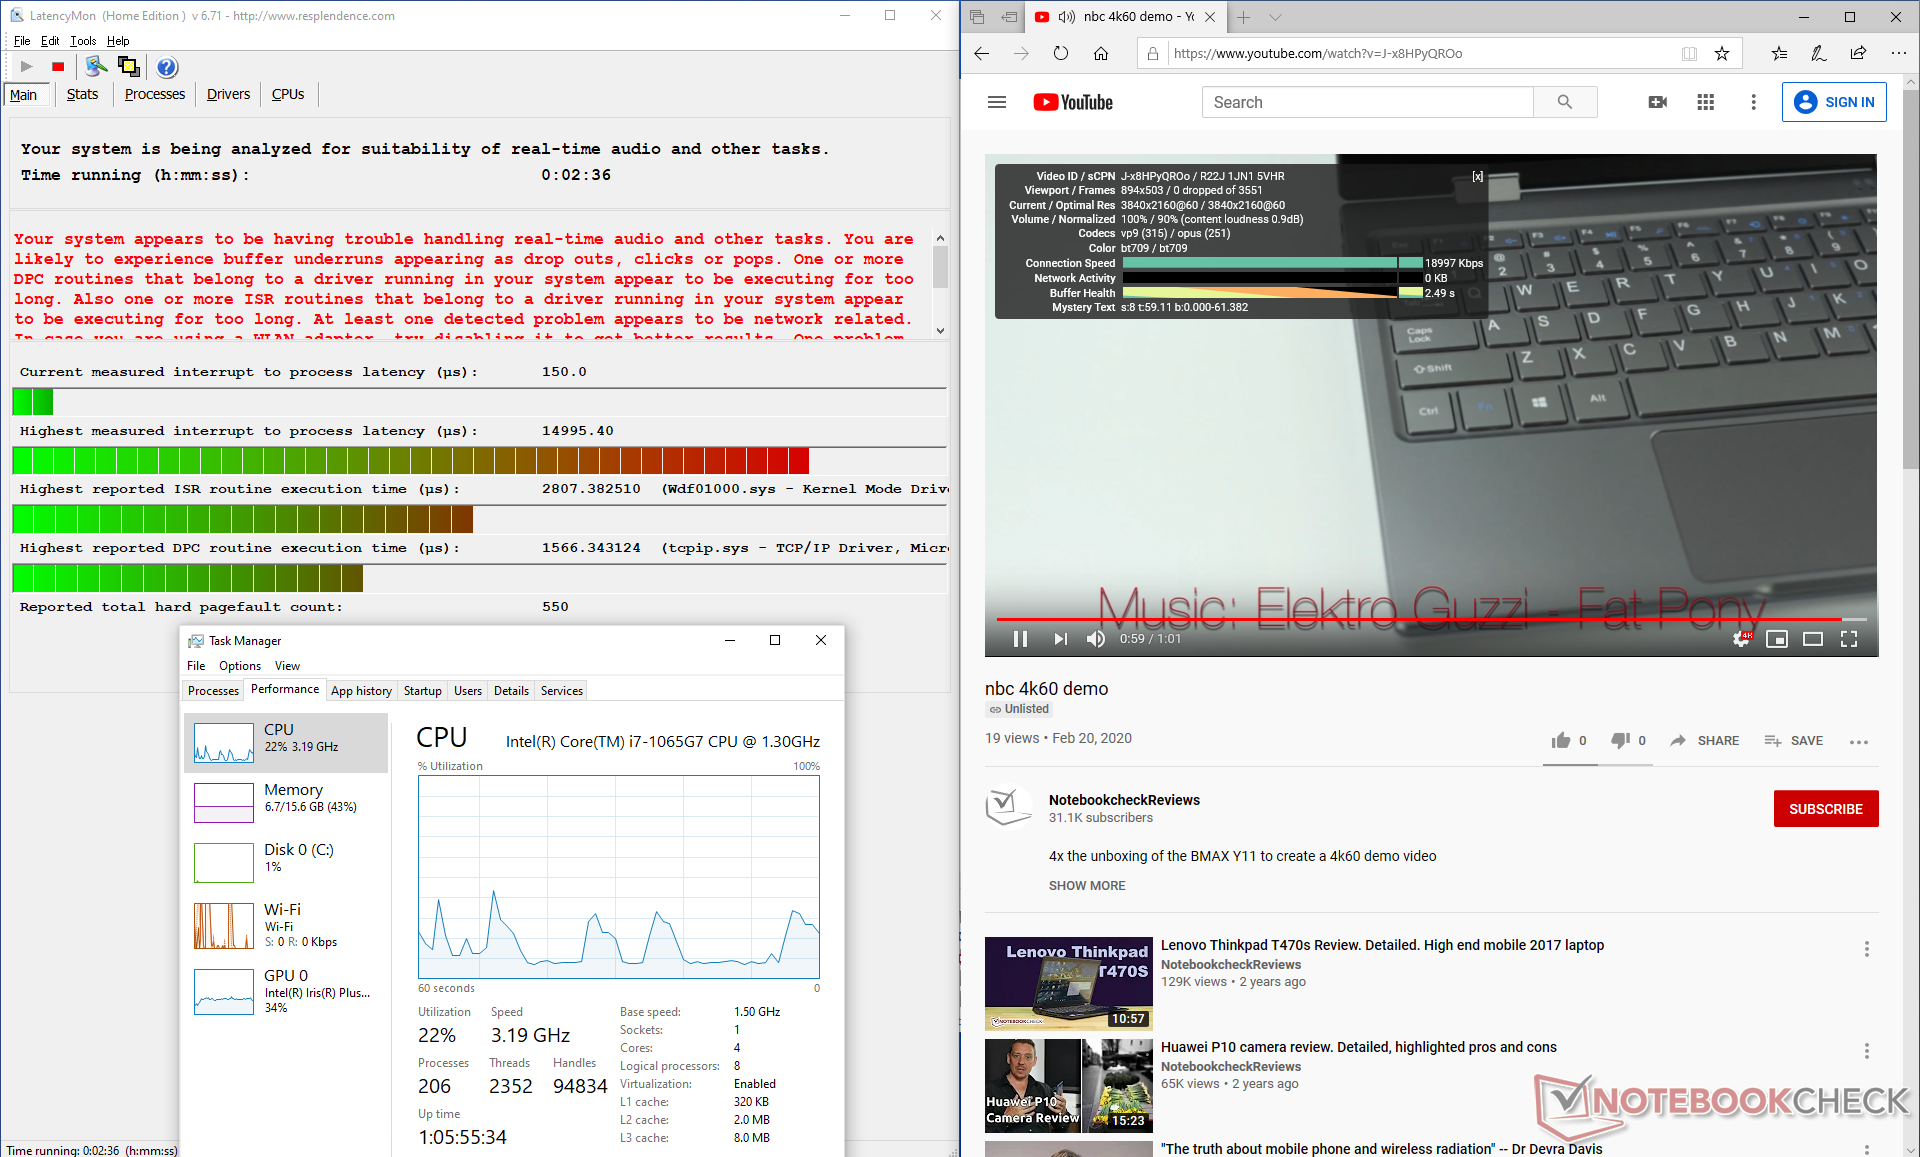
Performance
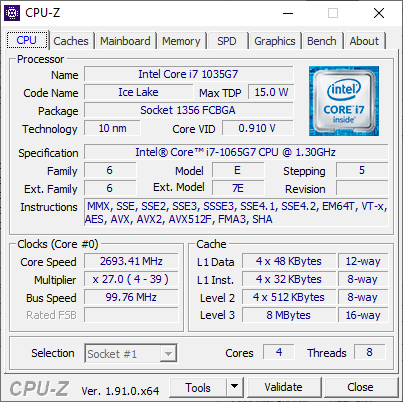
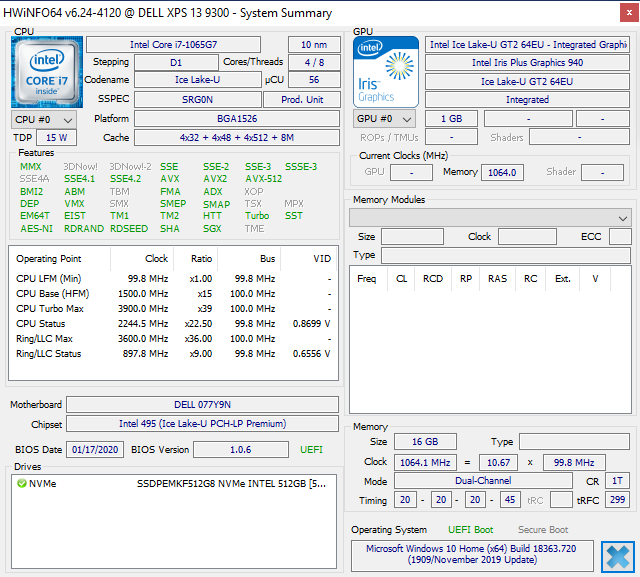
Currently, the XPS 13 9300 comes with either the Core i5-1035G1 or Core i7-1065G7 with no Core i3 or Comet Lake-U options. There are no discrete GPU options either meaning that users will be choosing between the integrated UHD Graphics G1 or the Iris Plus G7. RAM ranges from 8 GB to 16 GB of soldered 3733 MHz LPDDR4x.
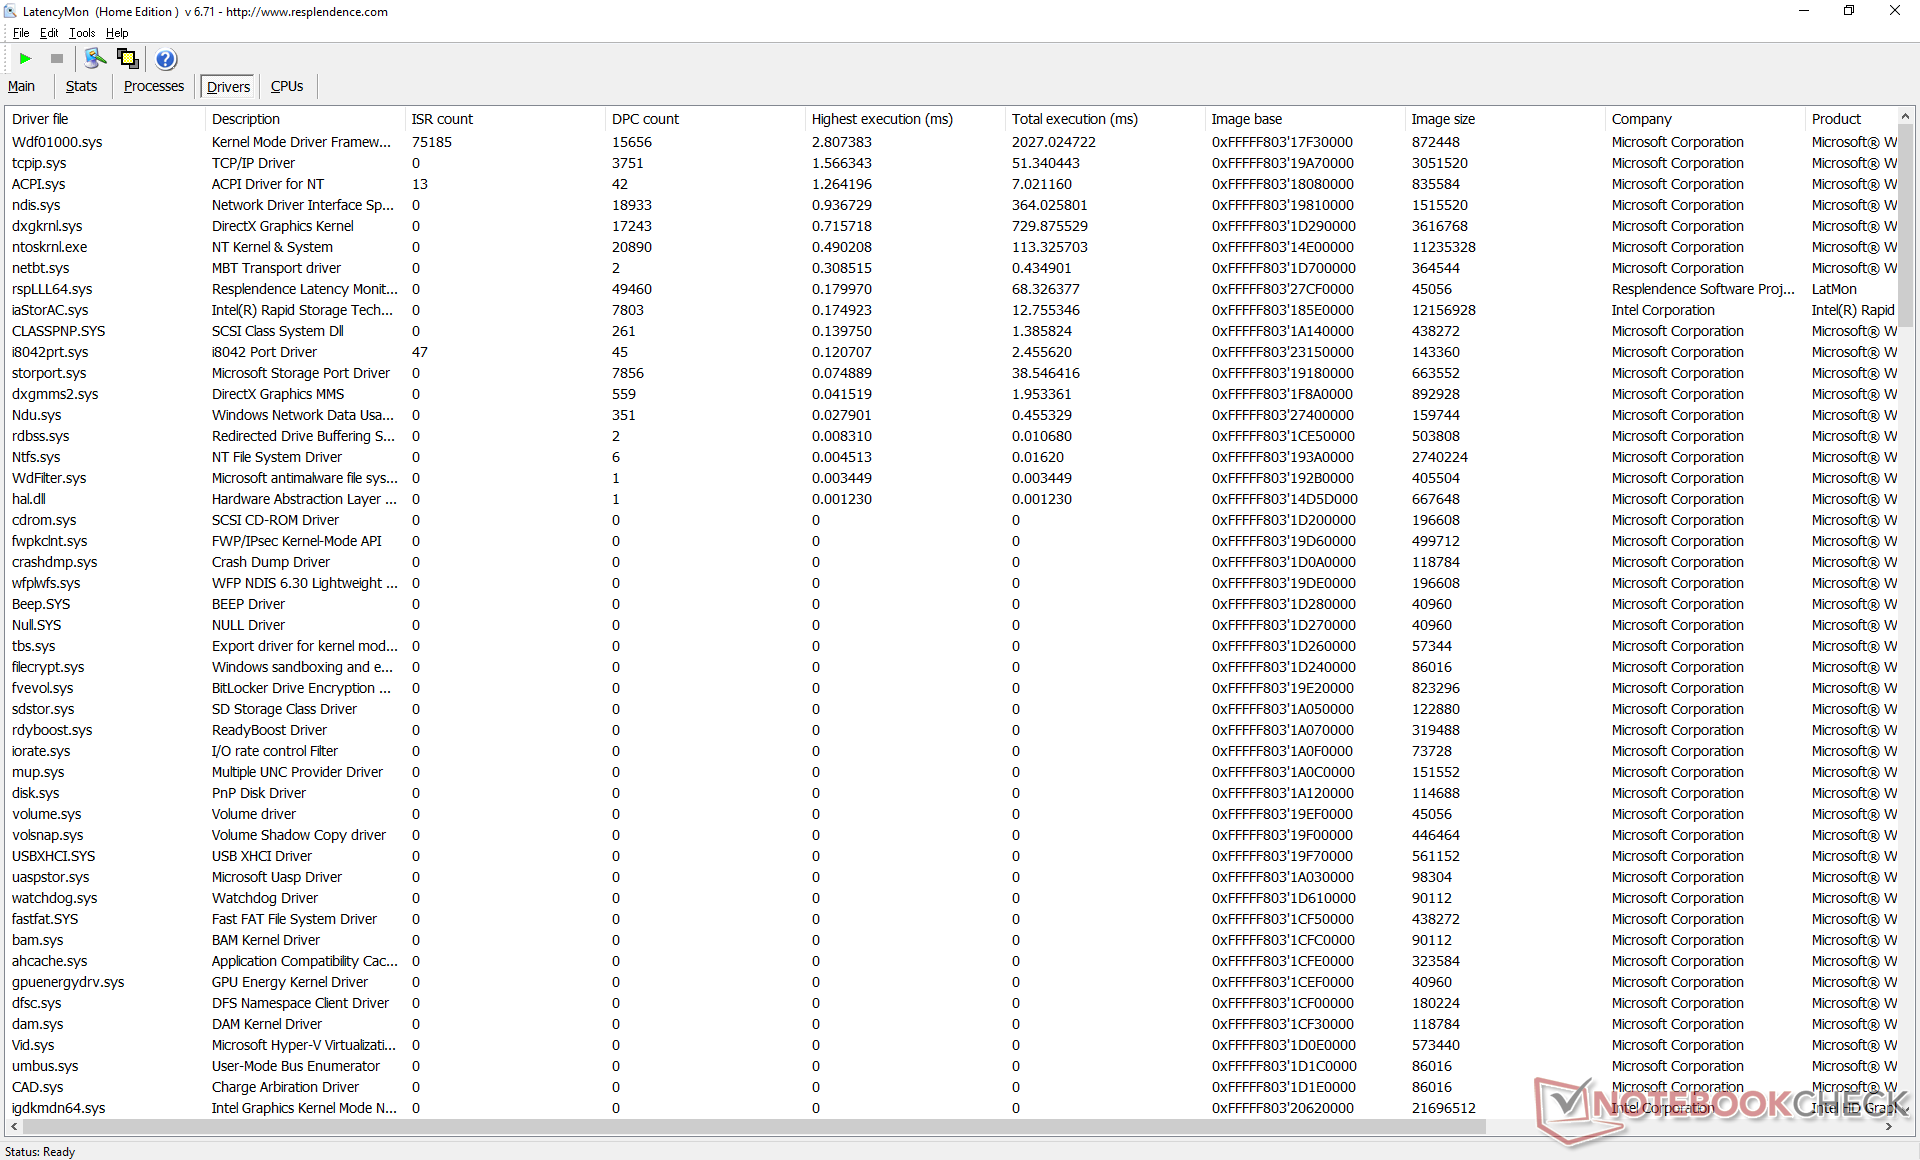
Our unit exhibits DPC latency issues when opening multiple browser tabs, running a 4K60 YouTube video, and running Prime95 in sequence.
Processor
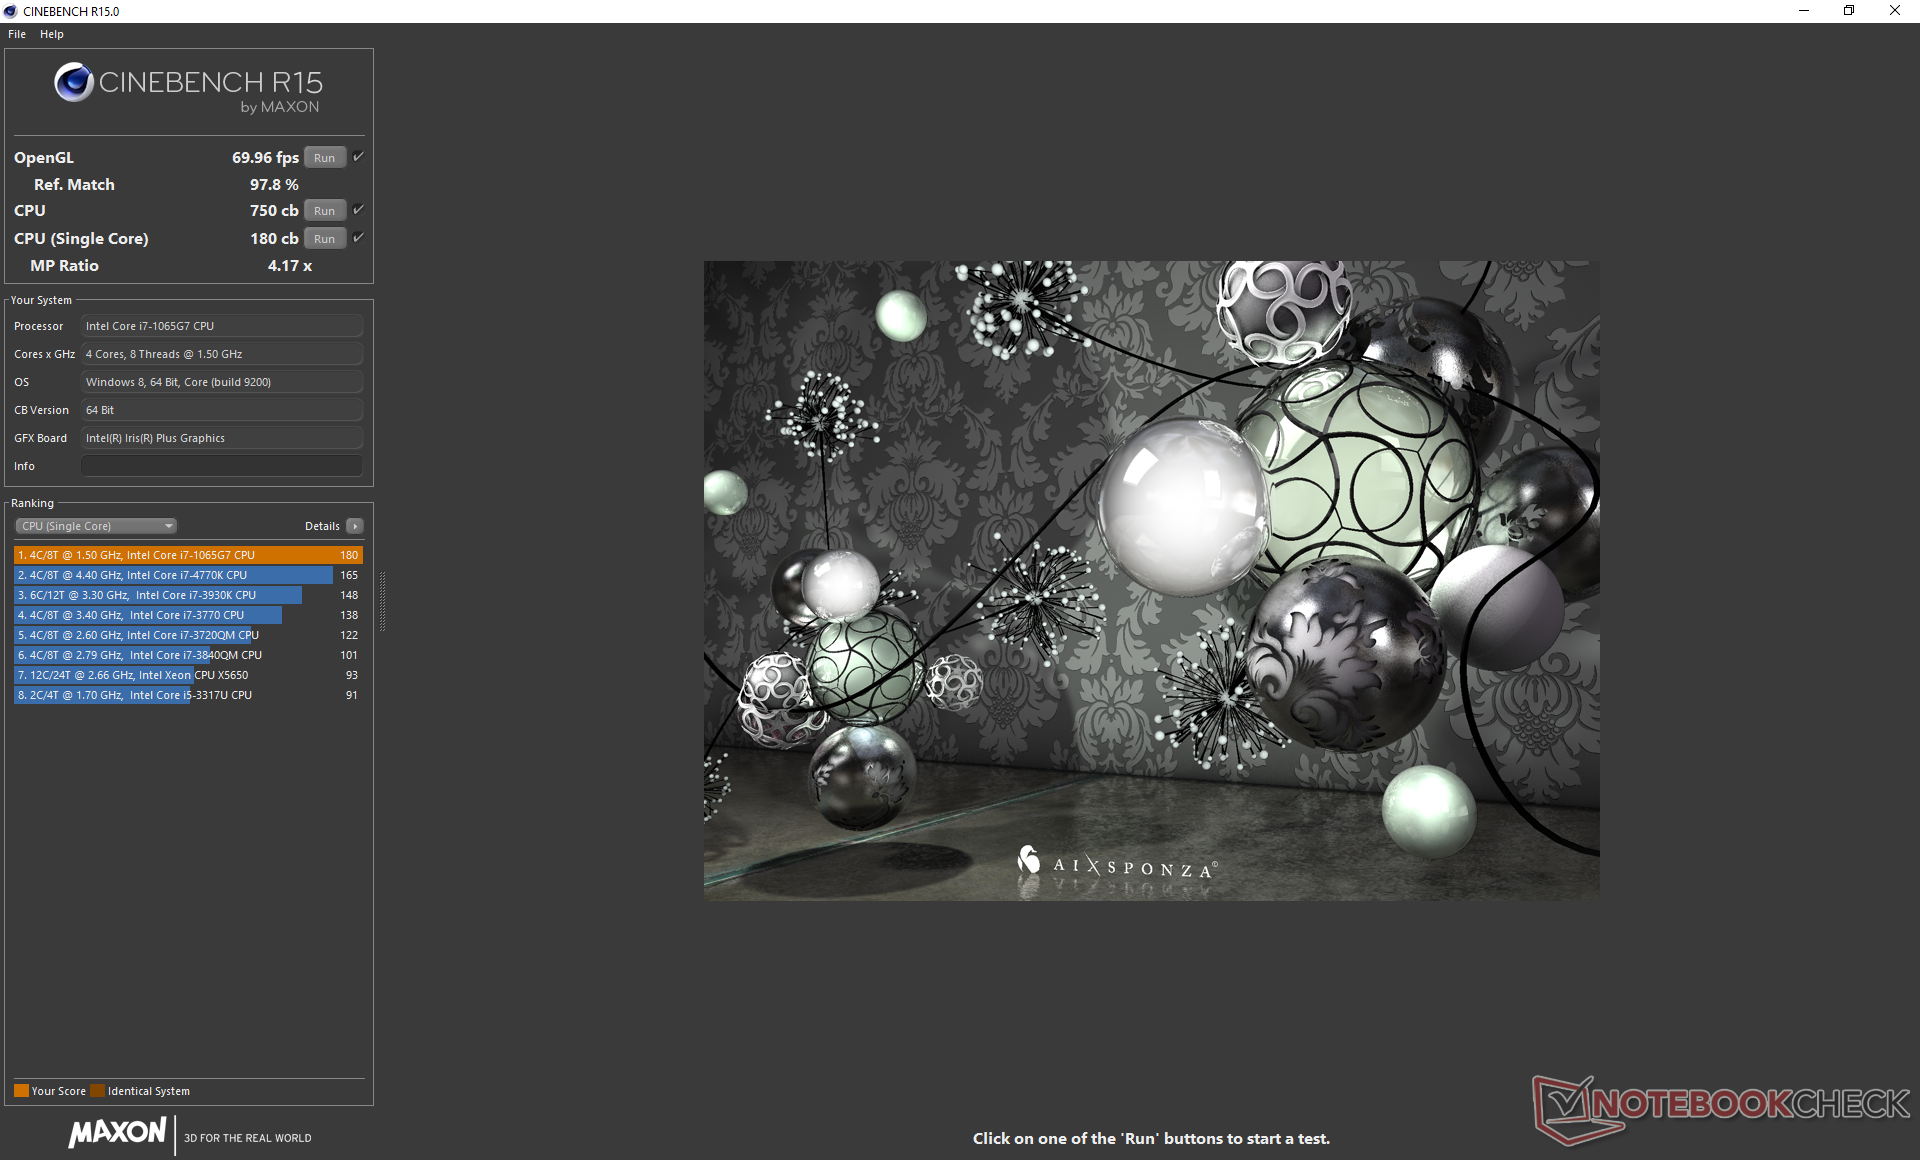
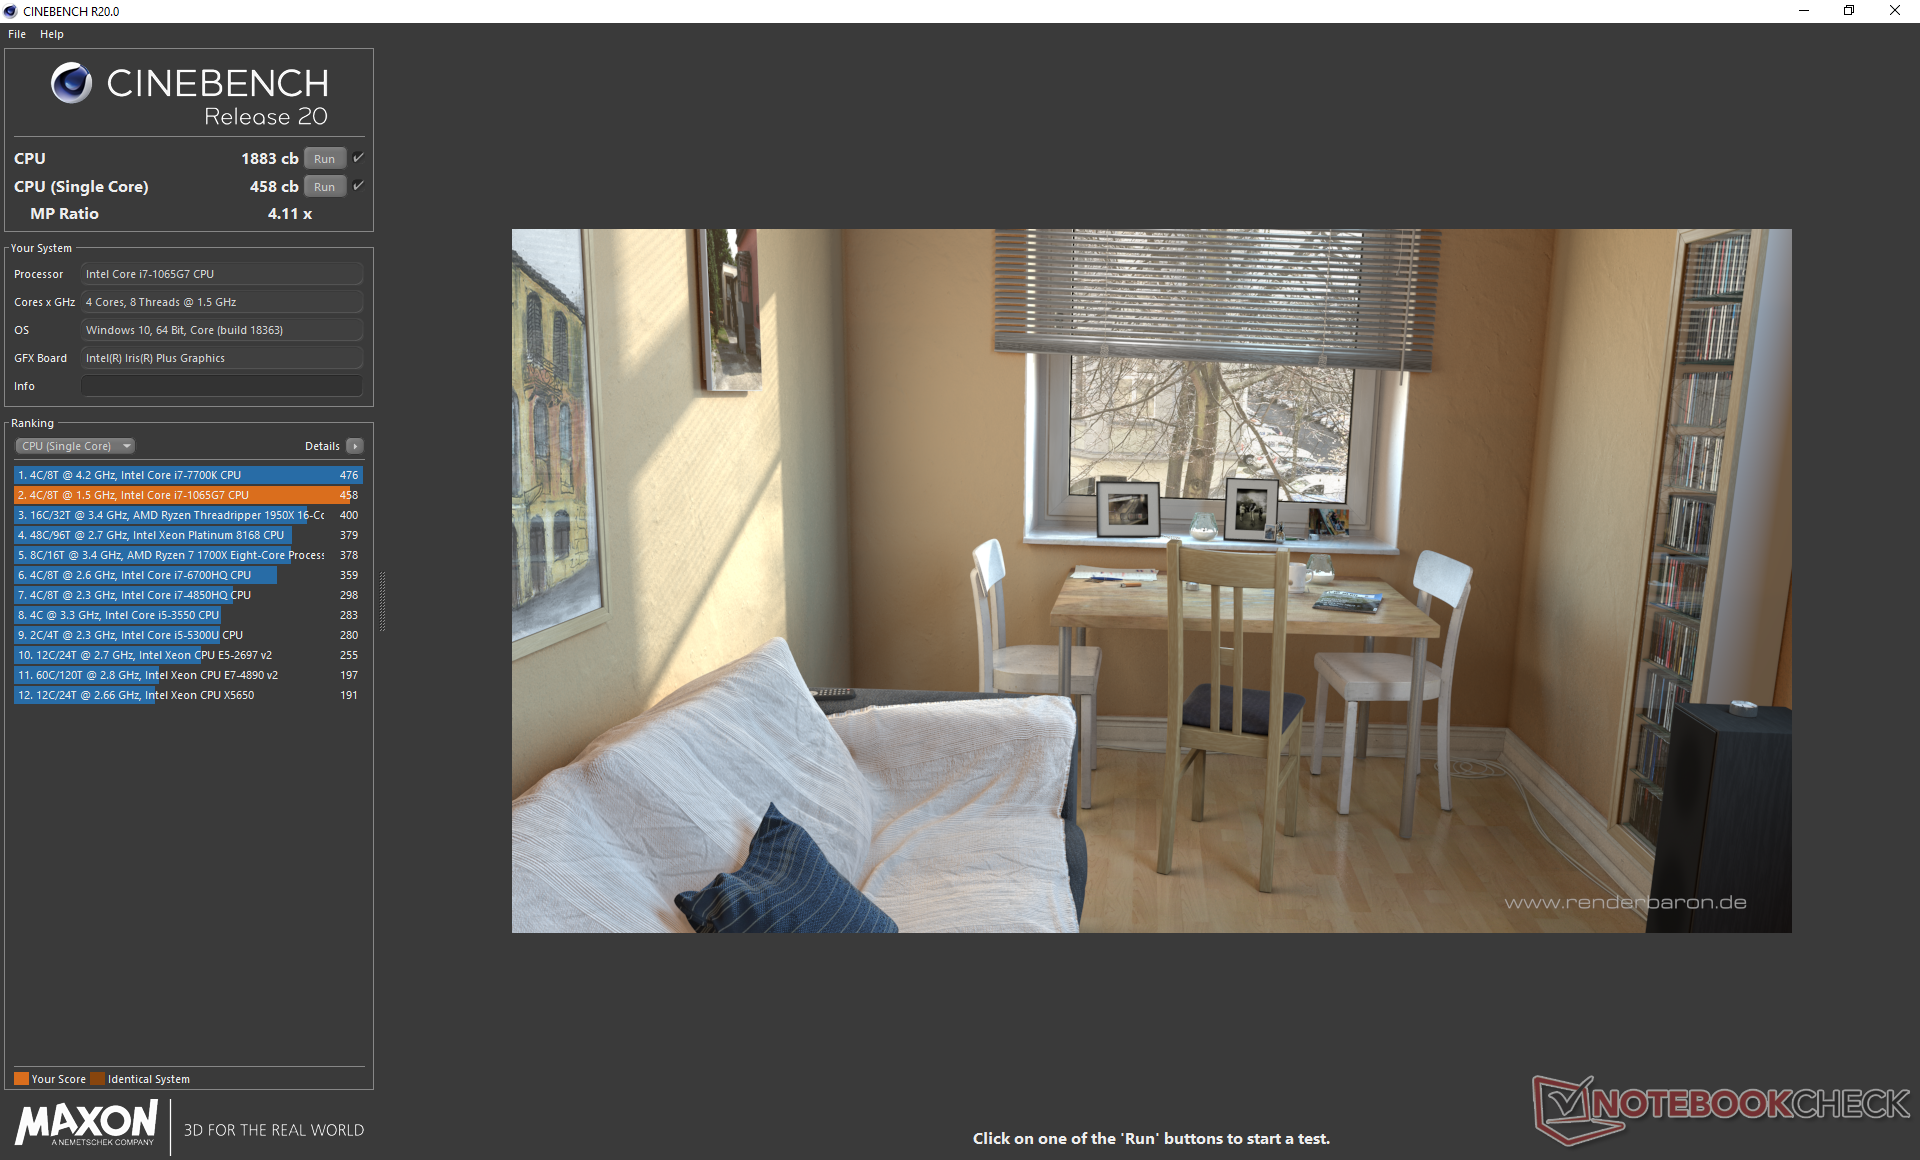
To ensure we are getting the fastest performance possible from our test unit, we had set the system to Ultra Performance via the pre-installed Dell Power Manager software before running any of the tests described below. CineBench results are approximately 9 to 17 percent faster than the average Core i7-1065G7 in our database taken from at least 13 other laptops. However, this doesn't tell the whole story as Ultrabooks tend to throttle performance over time when under continuous stress. To simulate this, we would run CineBench R15 Multi-Thread in a loop as shown by the graph below. The initial score of 811 points would drop over time to about 610 points on average to represent a 25 percent performance dip. Interestingly, the scores would fluctuate between ~560 points and ~660 points to imply cycling CPU clock rates when under such extreme processing conditions.
Overall CPU performance is generally better than the last generation Core i7-8565U especially when the processor is cool due to its faster Turbo Boost speeds. Its advantages begin to dwindle once the CPU reaches a certain temperature range where clock rates start cycling.
See our dedicated page on the Core i7-1065G7 for more technical information and benchmark comparisons. The hexa-core Core i7-10710U offers faster multi-thread performance but it is only available on the XPS 13 7390 for now.
| wPrime 2.10 - 1024m | |
| Dell XPS 13 7390 2-in-1 Core i3 | |
| Microsoft Surface Pro 7 Core i5-1035G4 | |
| Average Intel Core i7-1065G7 (233 - 354, n=3) | |
| Dell XPS 13 7390 Core i7-10710U | |
* ... smaller is better
System Performance
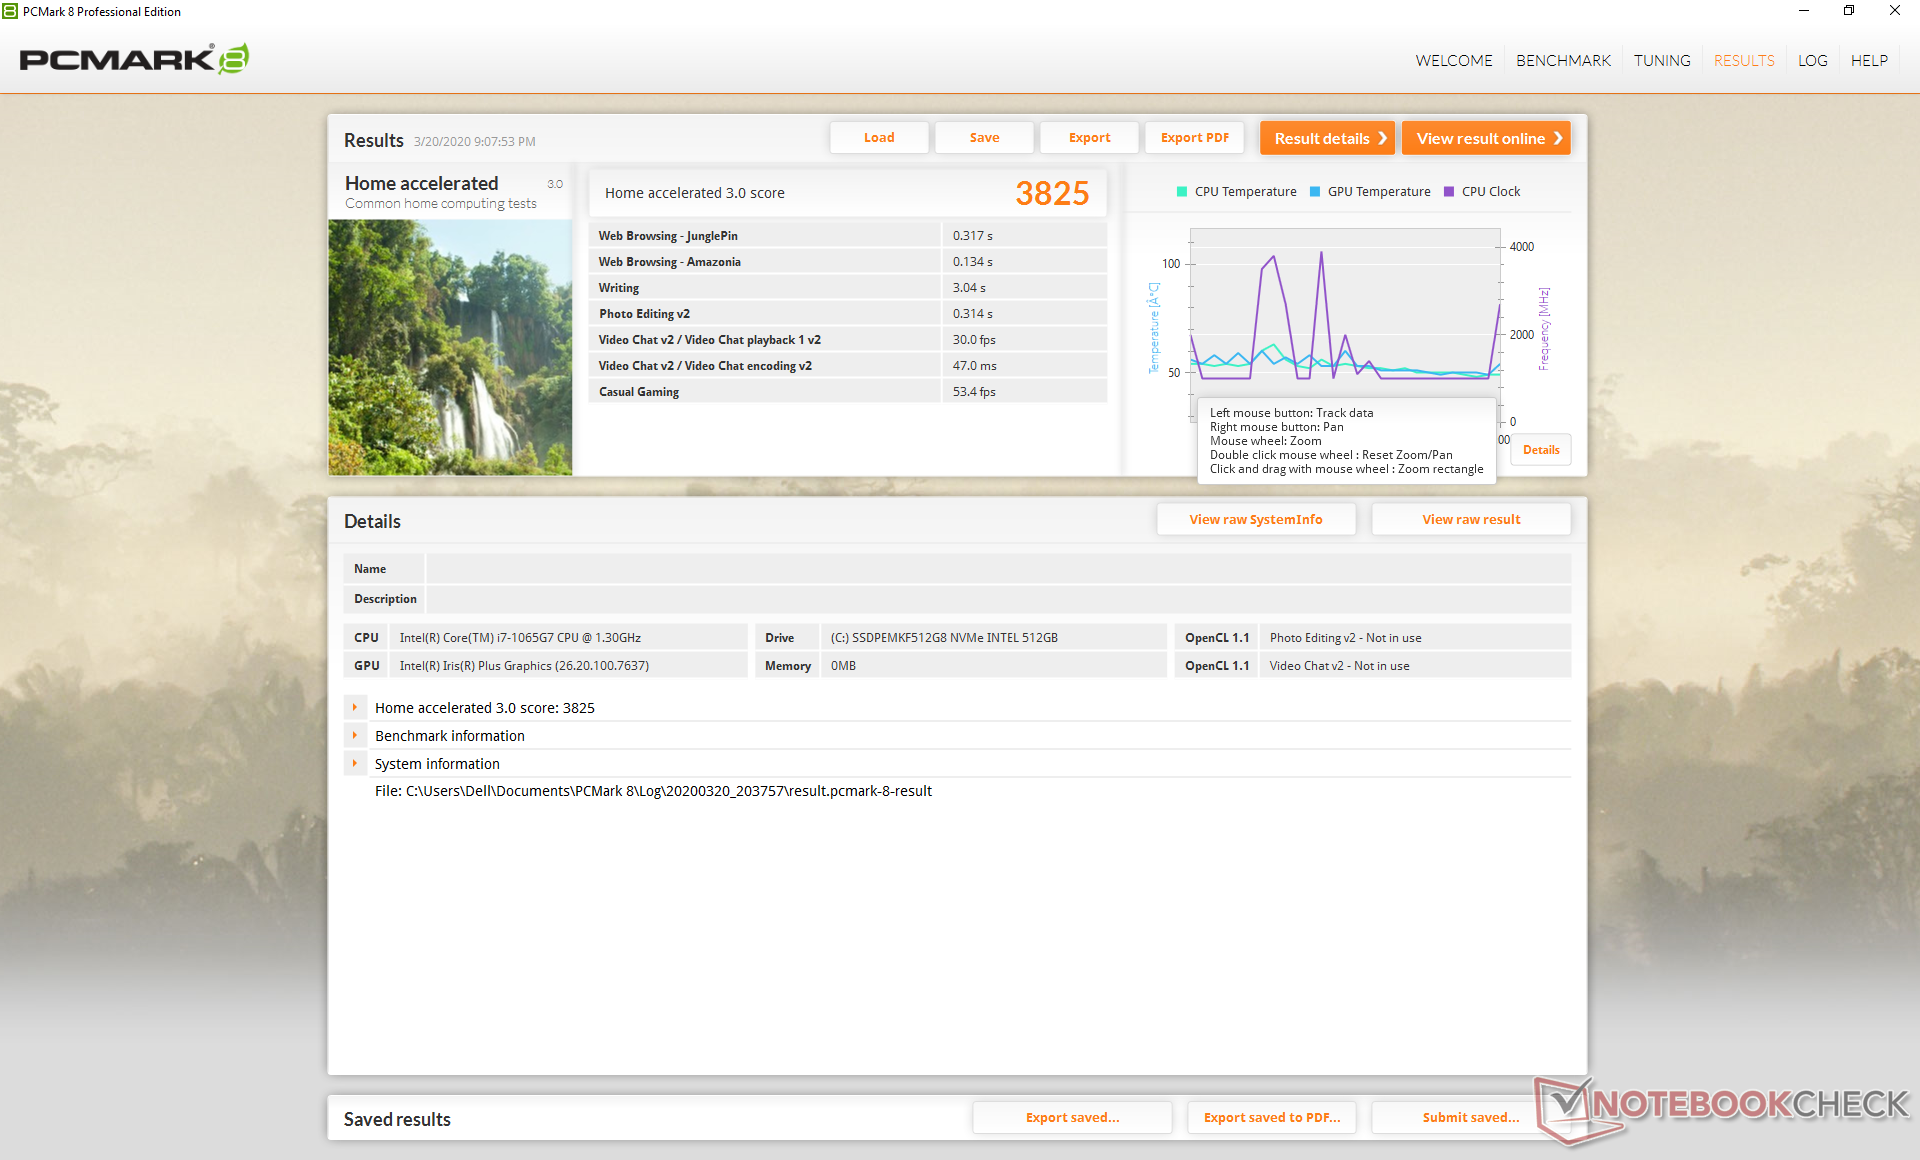
| PCMark 8 Home Score Accelerated v2 | 3825 points | |
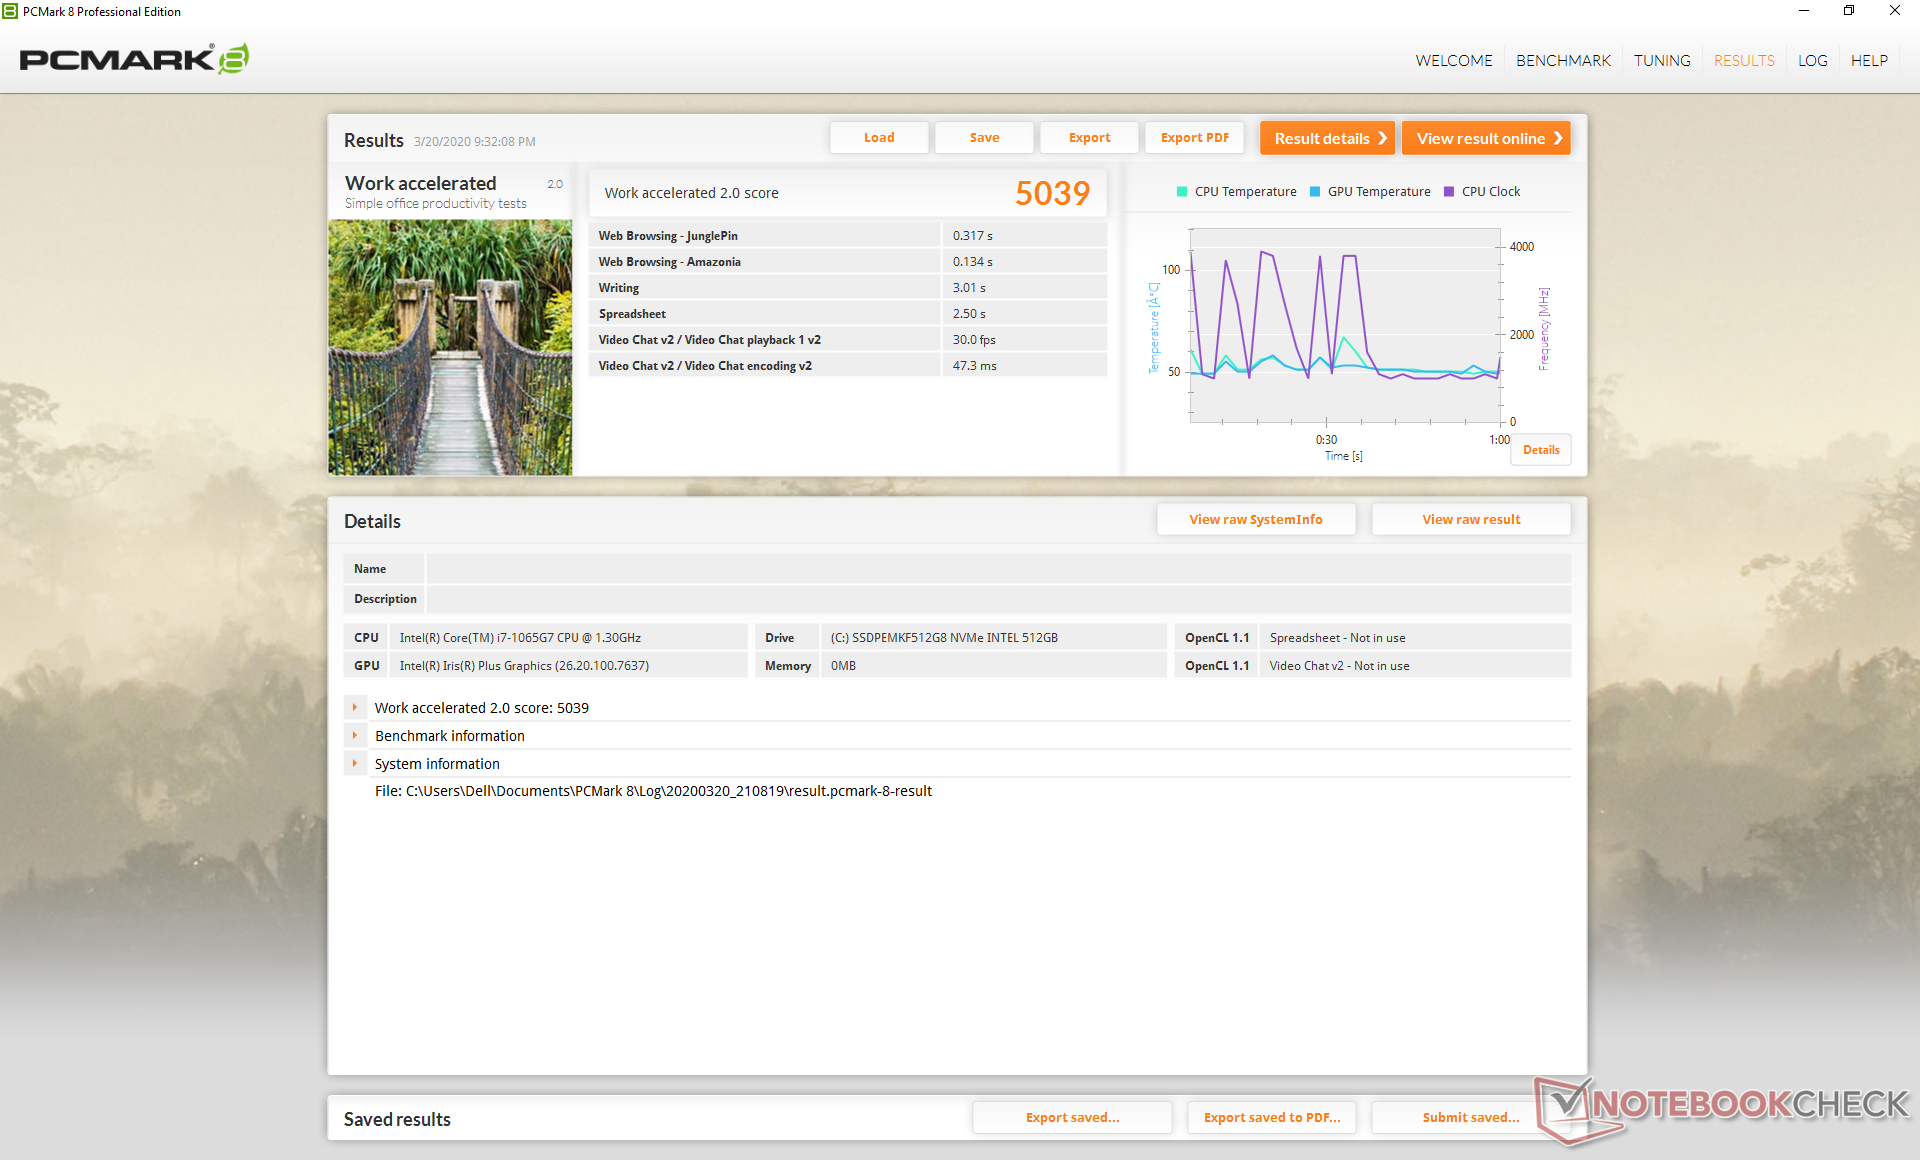
| PCMark 8 Work Score Accelerated v2 | 5039 points | |
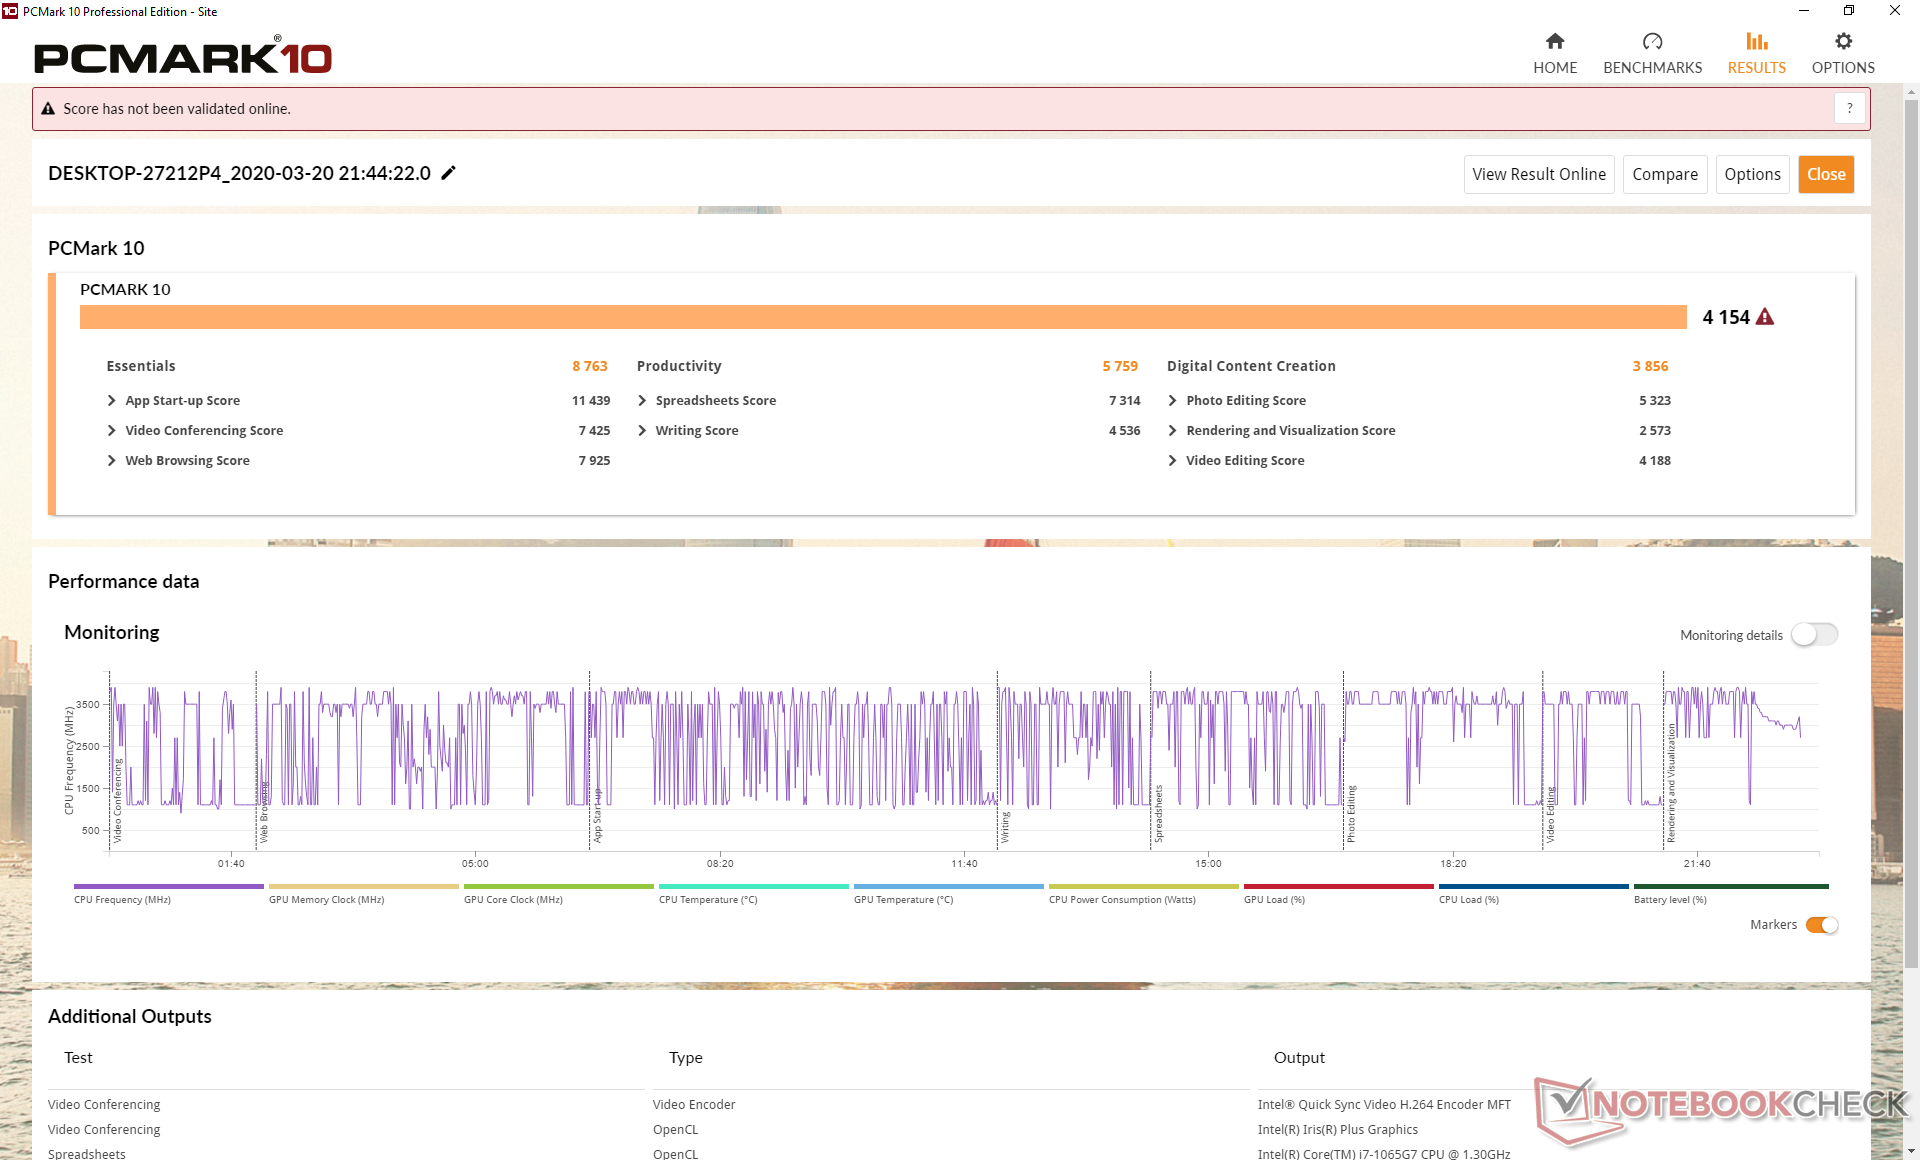
| PCMark 10 Score | 4154 points | |
Help | ||
Storage Devices
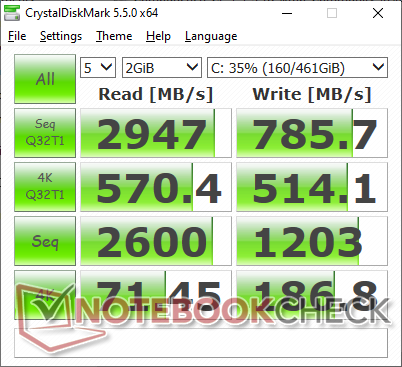
Unlike our first XPS 13 9300 Core i5 SKU and its 512 GB Toshiba SSD, the XPS 13 9300 Core i7 SKU comes with a 512 GB Intel SSD instead. Sequential read and write rates are similar between them according to both CrystalDiskMark and AS SSD, but the Toshiba SSD appears to be much faster when addressing higher queue depths.
See our table of SSDs and HDDs for more benchmark comparisons.

| Dell XPS 13 9300 Core i7-1065G7 Intel SSDPEMKF512G8 NVMe SSD | Dell XPS 13 7390 Core i7-10710U SK Hynix PC601 NVMe 512 GB | Dell XPS 13 7390 2-in-1 Core i7 Toshiba BG4 KBG40ZPZ512G | Microsoft Surface Laptop 3 13 Core i5-1035G7 SK hynix BC501 HFM256GDGTNG | Asus ZenBook S13 UX392FN WDC PC SN520 SDAPNUW-512G | |
|---|---|---|---|---|---|
| AS SSD | 30% | -20% | -23% | 39% | |
| Seq Read (MB/s) | 1956 | 1804 -8% | 1801 -8% | 1387 -29% | 1224 -37% |
| Seq Write (MB/s) | 1227 | 1000 -19% | 1125 -8% | 504 -59% | 907 -26% |
| 4K Read (MB/s) | 63 | 45.1 -28% | 39.7 -37% | 42.35 -33% | 41.46 -34% |
| 4K Write (MB/s) | 156.6 | 115 -27% | 67 -57% | 120 -23% | 126.2 -19% |
| 4K-64 Read (MB/s) | 475.6 | 893 88% | 1253 163% | 497.4 5% | 1021 115% |
| 4K-64 Write (MB/s) | 539 | 732 36% | 209 -61% | 354.9 -34% | 1251 132% |
| Access Time Read * (ms) | 0.042 | 0.044 -5% | 0.069 -64% | 0.055 -31% | 0.053 -26% |
| Access Time Write * (ms) | 0.105 | 0.095 10% | 0.625 -495% | 0.093 11% | 0.027 74% |
| Score Read (Points) | 734 | 1119 52% | 1472 101% | 678 -8% | 1185 61% |
| Score Write (Points) | 818 | 947 16% | 388 -53% | 525 -36% | 1468 79% |
| Score Total (Points) | 1915 | 2608 36% | 2583 35% | 1520 -21% | 3250 70% |
| Copy ISO MB/s (MB/s) | 1022 | 1515 48% | 1293 27% | 764 -25% | 1404 37% |
| Copy Program MB/s (MB/s) | 302.8 | 535 77% | 560 85% | 256.1 -15% | 402.4 33% |
| Copy Game MB/s (MB/s) | 491.4 | 1211 146% | 927 89% | 368.4 -25% | 902 84% |
| CrystalDiskMark 5.2 / 6 | 12% | -13% | -35% | -9% | |
| Write 4K (MB/s) | 186.8 | 134 -28% | 106.7 -43% | 112.3 -40% | 149.2 -20% |
| Read 4K (MB/s) | 71.4 | 42.91 -40% | 49.94 -30% | 42.13 -41% | 47.18 -34% |
| Write Seq (MB/s) | 1203 | 1841 53% | 1223 2% | 630 -48% | 750 -38% |
| Read Seq (MB/s) | 2600 | 1707 -34% | 1801 -31% | 1023 -61% | 1137 -56% |
| Write 4K Q32T1 (MB/s) | 514 | 394.7 -23% | 325.3 -37% | 336.6 -35% | 749 46% |
| Read 4K Q32T1 (MB/s) | 570 | 398.5 -30% | 551 -3% | 399.6 -30% | 478.7 -16% |
| Write Seq Q32T1 (MB/s) | 786 | 2250 186% | 1224 56% | 821 4% | 1453 85% |
| Read Seq Q32T1 (MB/s) | 2947 | 3265 11% | 2350 -20% | 2030 -31% | 1713 -42% |
| Total Average (Program / Settings) | 21% /
24% | -17% /
-18% | -29% /
-28% | 15% /
21% |
* ... smaller is better

GPU Performance
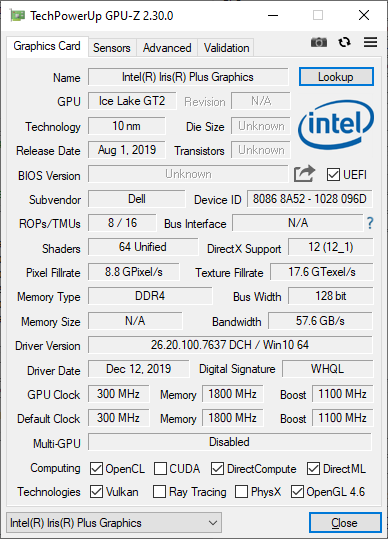
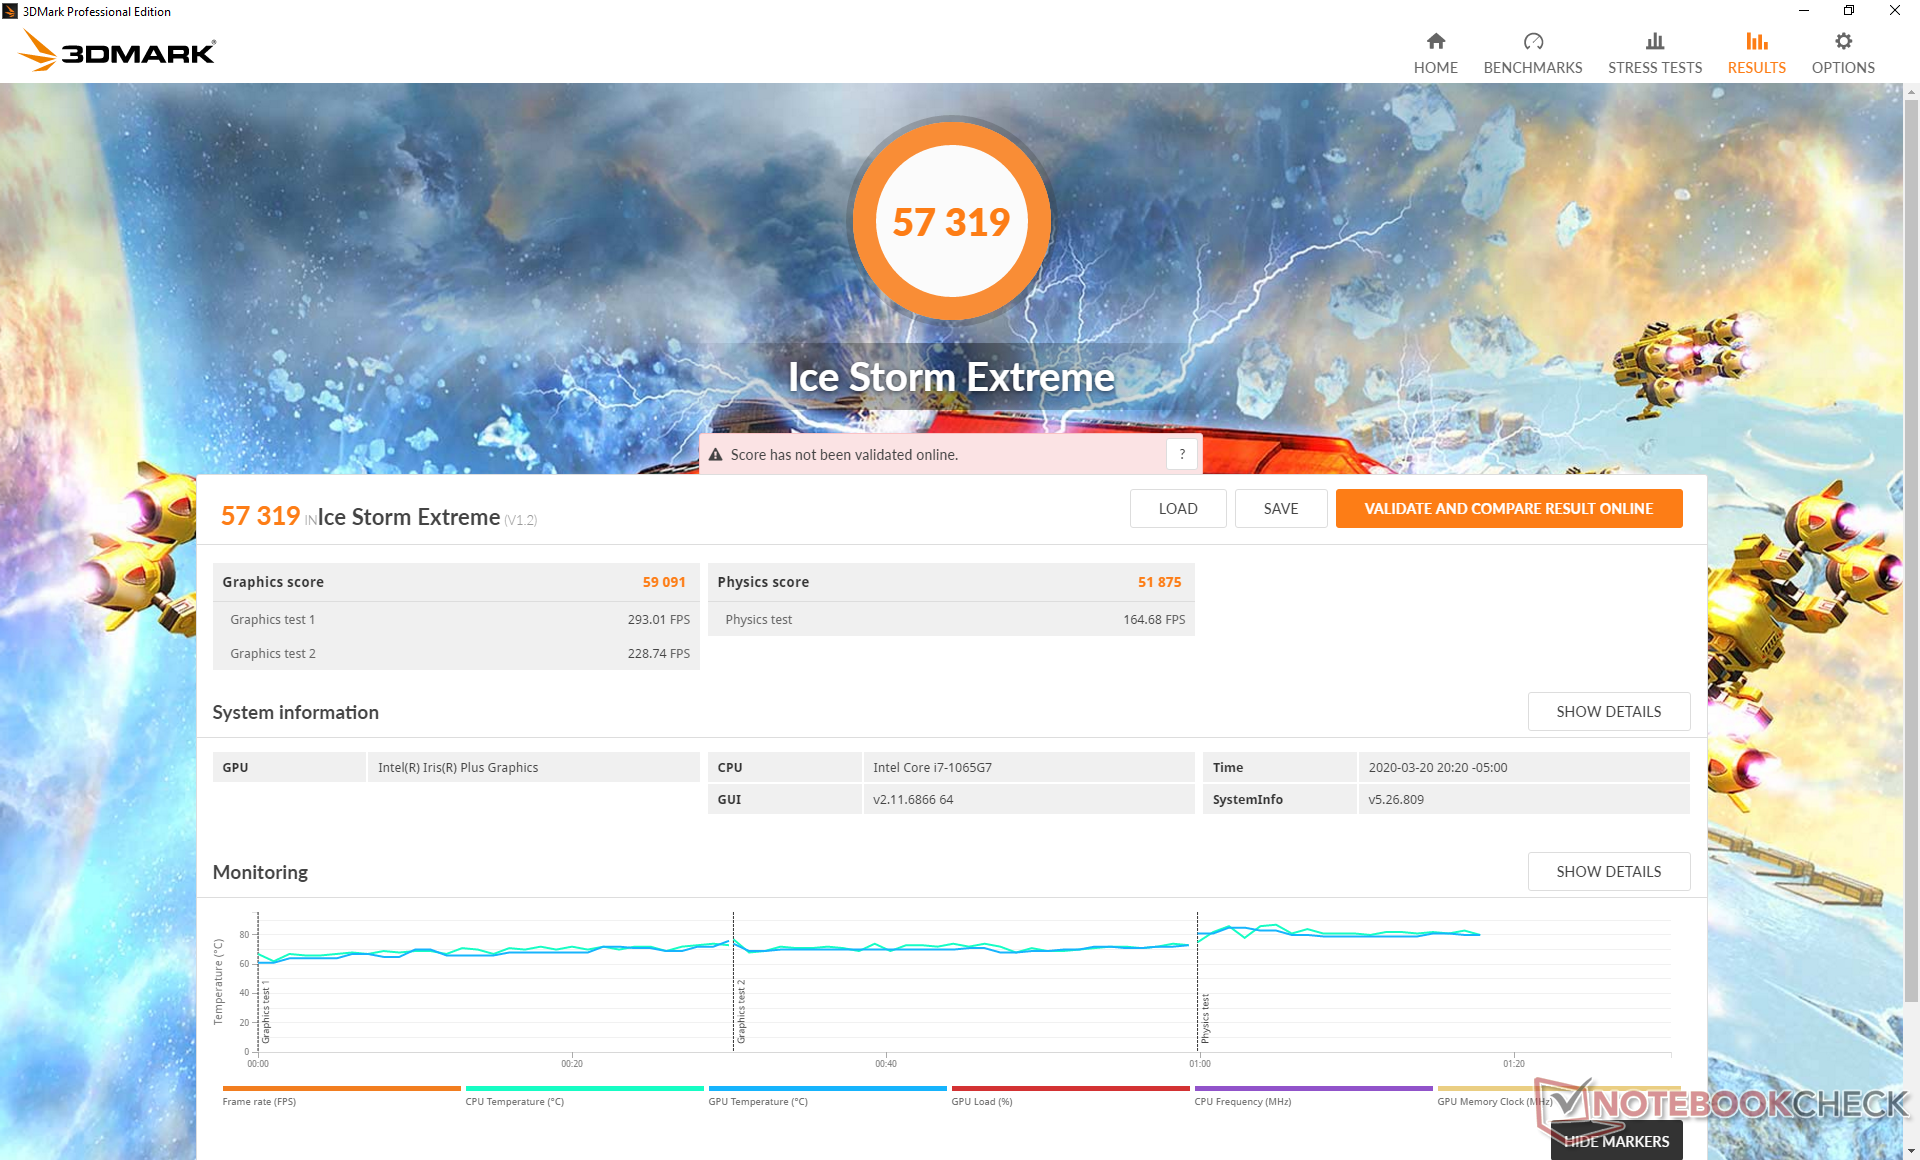
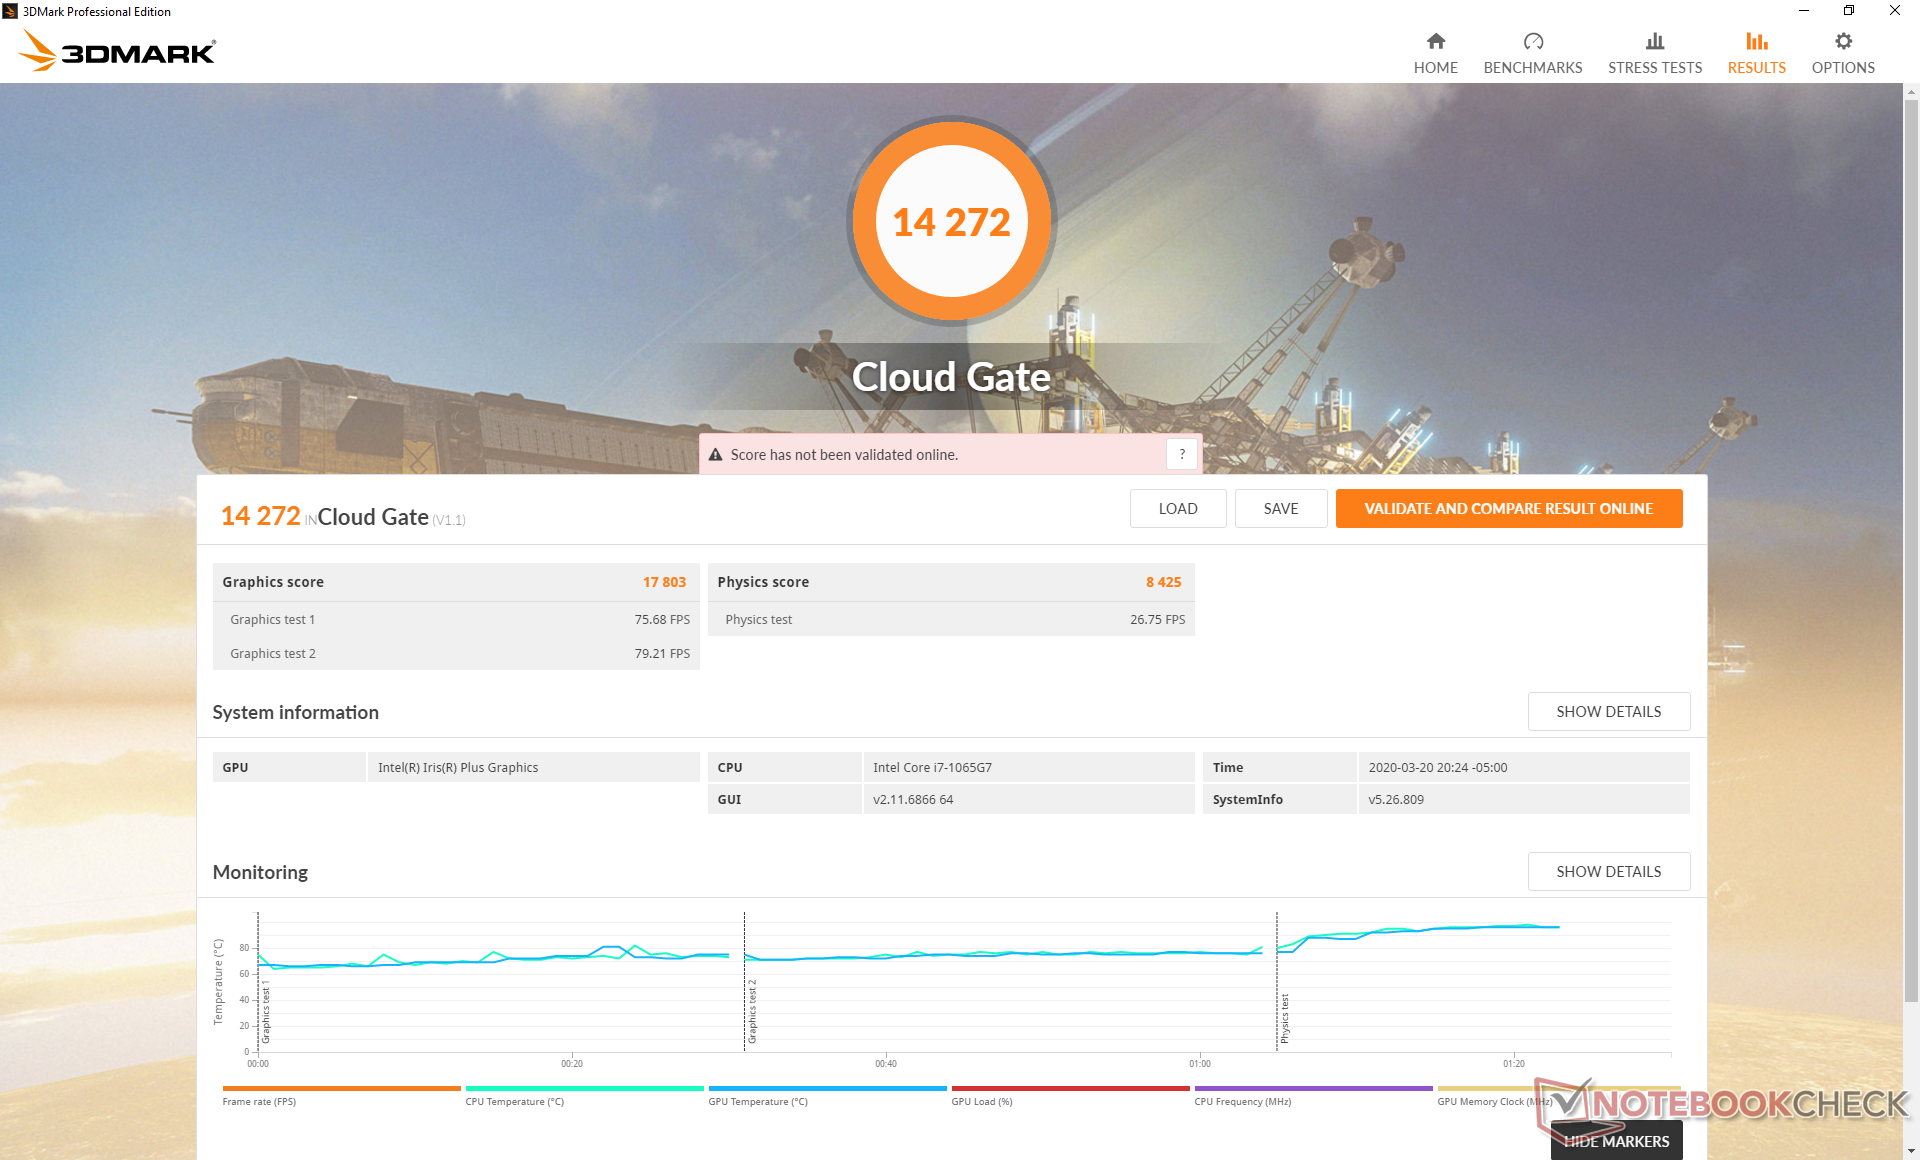
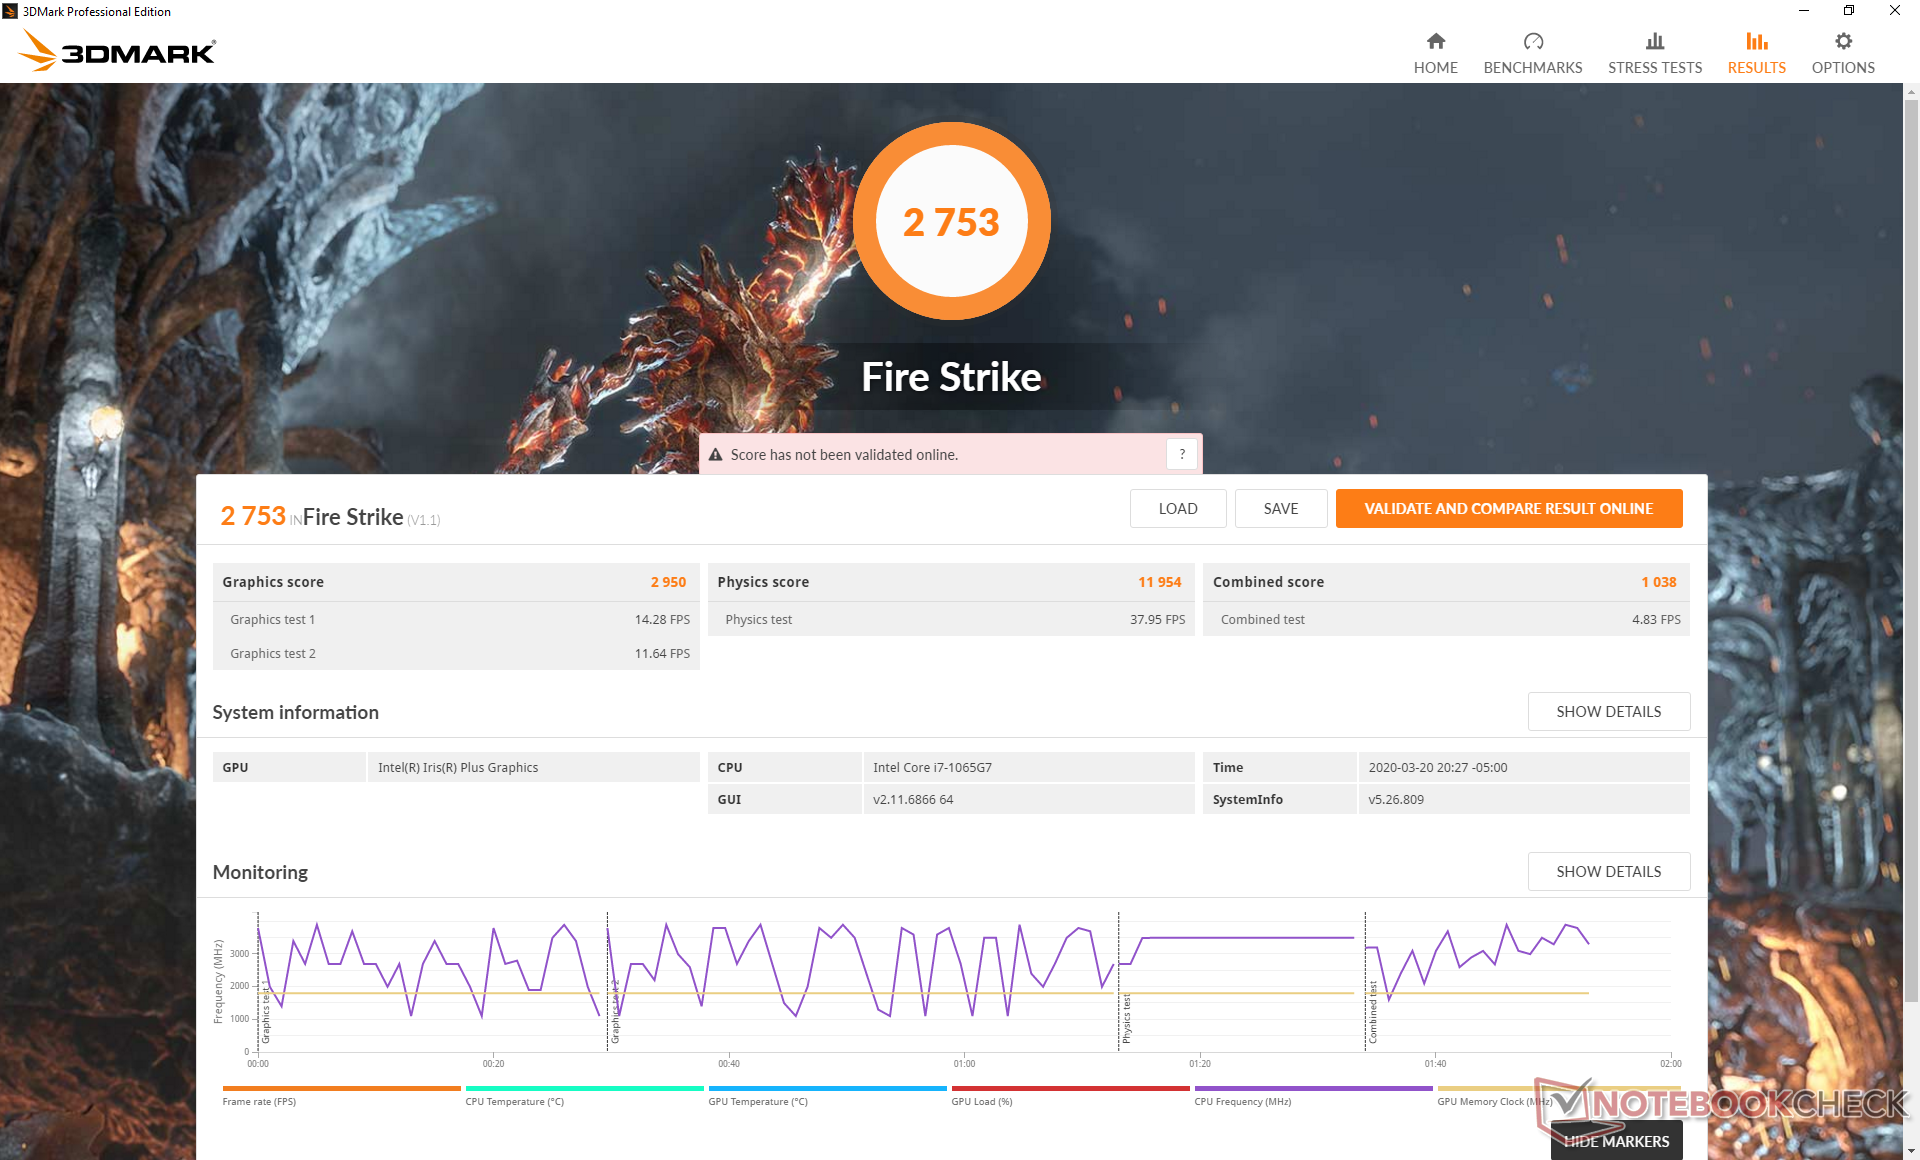
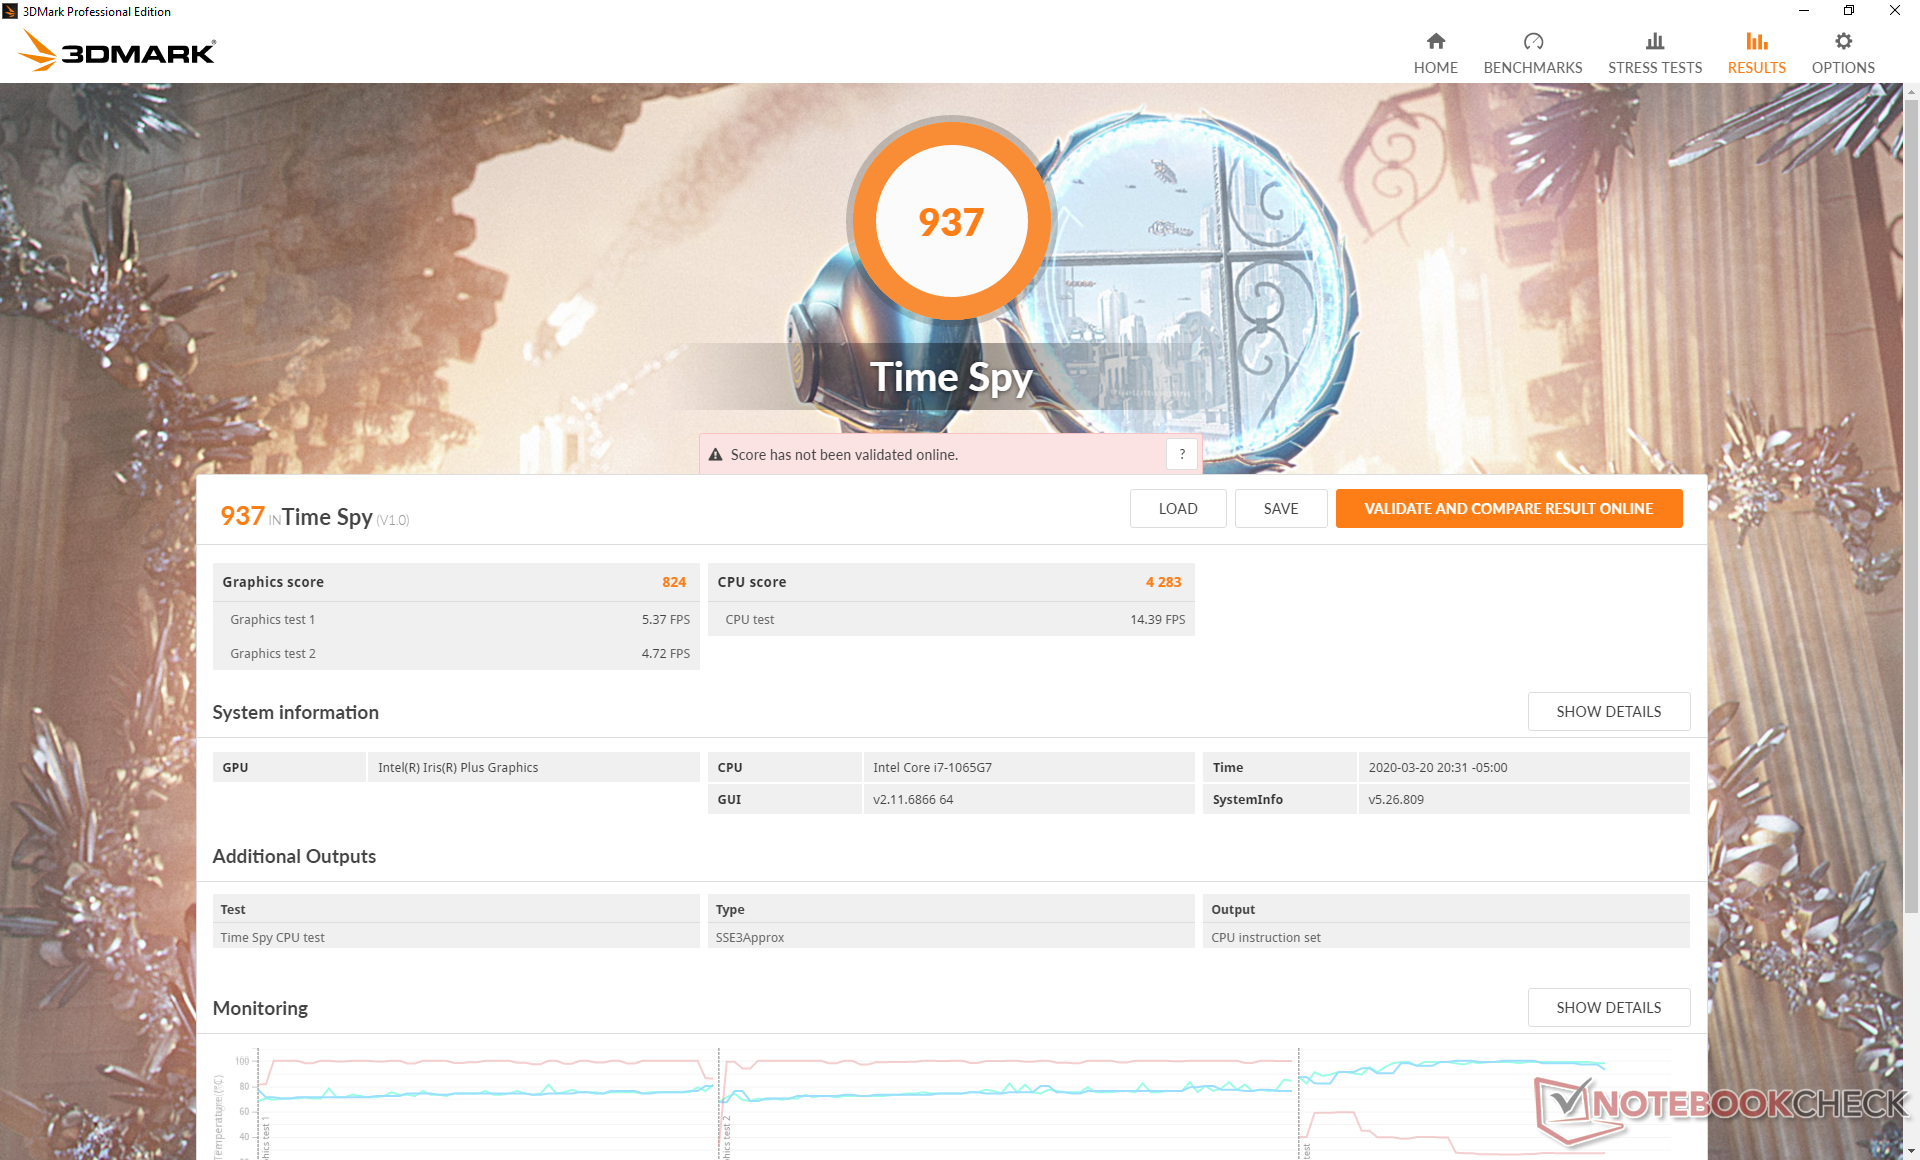
Performance in games is significantly better than the outdated UHD Graphics 620 but still disappointing overall when compared to the competing RX Vega 8 or Vega 10 series. Synthetic benchmarks like 3DMark suggest that the Iris Plus G7 is on par with the RX Vega 10, but real-world gaming benchmarks still show the AMD solution outperforming the newer Intel solution in certain games.
Perhaps more notably, the GPU performance jump between the XPS 13 Core i5-1035G1 and Core i7-1065G7 SKUs is quite significant at about 70 percent meaning that users may want to consider the Core i7 SKU if they intend to make the most of Intel Ice Lake.
See our dedicated page on the Iris Plus G7 for more benchmark comparisons.
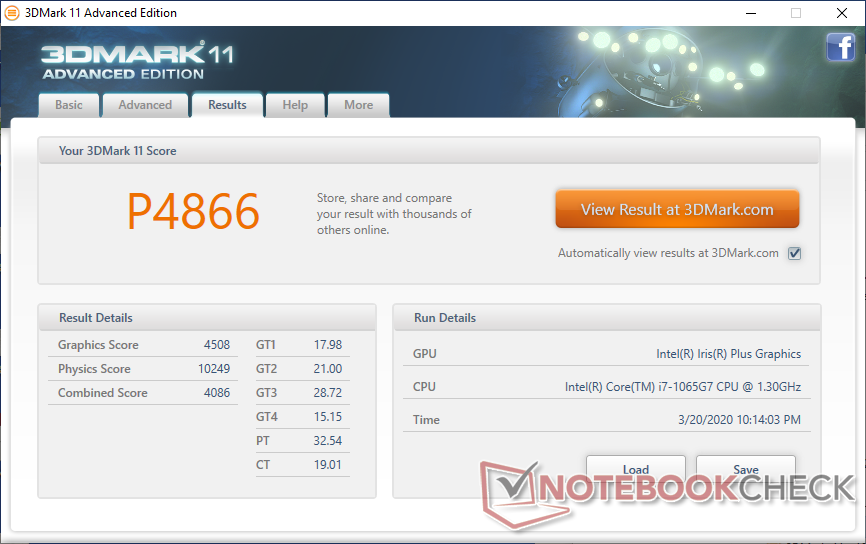

| 3DMark 11 Performance | 4866 points | |
| 3DMark Ice Storm Standard Score | 67829 points | |
| 3DMark Cloud Gate Standard Score | 14272 points | |
| 3DMark Fire Strike Score | 2753 points | |
| 3DMark Time Spy Score | 937 points | |
Help | ||
| Shadow of the Tomb Raider - 1280x720 Lowest Preset | |
| Desktop PC | |
| MSI Modern 15 A10RB | |
| Dell Inspiron 15 5000 5585 | |
| Dell XPS 13 9300 Core i7-1065G7 | |
| Average Intel Iris Plus Graphics G7 (Ice Lake 64 EU) (15.6 - 33, n=13) | |
| Dell XPS 13 7390 Core i7-10710U | |
| The Witcher 3 | |
| 1024x768 Low Graphics & Postprocessing | |
| Huawei MateBook 13 i7 | |
| MSI Modern 15 A10RB | |
| Dell Inspiron 15 5000 5585 | |
| Dell XPS 13 9300 Core i7-1065G7 | |
| Average Intel Iris Plus Graphics G7 (Ice Lake 64 EU) (28.2 - 58, n=20) | |
| Dell XPS 13 7390 Core i7-10710U | |
| HP Pavilion x360 15-dq0065cl | |
| 1366x768 Medium Graphics & Postprocessing | |
| MSI Modern 15 A10RB | |
| Huawei MateBook 13 i7 | |
| Dell XPS 13 9300 Core i7-1065G7 | |
| Average Intel Iris Plus Graphics G7 (Ice Lake 64 EU) (20.8 - 36.8, n=18) | |
| HP Pavilion x360 15-dq0065cl | |
| 1920x1080 High Graphics & Postprocessing (Nvidia HairWorks Off) | |
| HP Pavilion Gaming 15t-cx0000 | |
| MSI Modern 15 A10RB | |
| Huawei MateBook 13 i7 | |
| Dell Inspiron 15 5000 5585 | |
| Dell XPS 13 9300 Core i7-1065G7 | |
| Average Intel Iris Plus Graphics G7 (Ice Lake 64 EU) (10.9 - 20.1, n=18) | |
Idling on Witcher 3 for over an hour shows the inability of the system to maintain consistent frame rates. As shown by the graph below, frame rates would be stable at about 50 FPS during the first 15 minutes or so before they begin cycling between 40 and 60 FPS. In contrast, most other laptops would run at more stable frame rates from beginning to end. The cycling GPU clock rate that we will detail in the Stress Test section below is the likely culprit to this undesirable behavior when running games.
| low | med. | high | ultra | |
|---|---|---|---|---|
| BioShock Infinite (2013) | 104.2 | 66.8 | 56.7 | 21.1 |
| The Witcher 3 (2015) | 50.7 | 33.5 | 18.4 | 9.1 |
| Rocket League (2017) | 85.5 | 53.6 | 38.3 | |
| Shadow of the Tomb Raider (2018) | 28 |
Emissions
System Noise
Fan noise is almost non-existent during typical day-to-day workloads like browsing or video streaming. It even manages to remain quiet when running 3DMark 06 up until the very end of the first benchmark scene. At worst, expect a fan noise of just 32.5 dB(A) against a background of 28.3 dB(A) when multi-tasking for long periods.
If running very high loads like gaming, fan noise will jump and stabilize at 39.3 dB(A). The 40 dB(A) mark is common for Ultrabooks when under high processing stress so this is not unexpected. The high-pitched fan noise of the XPS 13 9300, however, makes it more noticeable than it should be.
We're able to notice slight electronic noise or coil whine from our test unit when placing an ear near the keyboard keys. It's thankfully not noticeable when sitting a normal distance away from the system.
| Dell XPS 13 9300 Core i7-1065G7 Iris Plus Graphics G7 (Ice Lake 64 EU), i7-1065G7, Intel SSDPEMKF512G8 NVMe SSD | Dell XPS 13 7390 Core i7-10710U UHD Graphics 620, i7-10710U, SK Hynix PC601 NVMe 512 GB | Dell XPS 13 7390 2-in-1 Core i7 Iris Plus Graphics G7 (Ice Lake 64 EU), i7-1065G7, Toshiba BG4 KBG40ZPZ512G | Huawei Matebook X Pro i5 GeForce MX150, i5-8250U, Samsung PM961 MZVLW256HEHP | Microsoft Surface Laptop 3 13 Core i5-1035G7 Iris Plus Graphics G7 (Ice Lake 64 EU), i5-1035G7, SK hynix BC501 HFM256GDGTNG | Dell XPS 13 9300 i5 FHD UHD Graphics G1 (Ice Lake 32 EU), i5-1035G1, Toshiba XG6 KXG60ZNV512G | |
|---|---|---|---|---|---|---|
| Noise | -3% | -2% | -5% | 0% | 2% | |
| off / environment * (dB) | 28.3 | 28 1% | 28.1 1% | 27.9 1% | 28.5 -1% | 29.3 -4% |
| Idle Minimum * (dB) | 28.3 | 28 1% | 28.1 1% | 27.9 1% | 28.5 -1% | 29.3 -4% |
| Idle Average * (dB) | 28.3 | 28 1% | 28.1 1% | 27.9 1% | 28.5 -1% | 29.3 -4% |
| Idle Maximum * (dB) | 28.3 | 28 1% | 28.1 1% | 27.9 1% | 28.5 -1% | 29.3 -4% |
| Load Average * (dB) | 32.5 | 33.7 -4% | 31.7 2% | 36.2 -11% | 28.5 12% | 30 8% |
| Witcher 3 ultra * (dB) | 39.3 | 43.4 -10% | 45 -15% | 40.4 -3% | ||
| Load Maximum * (dB) | 39.3 | 46.5 -18% | 43.4 -10% | 45.2 -15% | 40.4 -3% | 32.4 18% |
* ... smaller is better
Noise level
| Idle |
| 28.3 / 28.3 / 28.3 dB(A) |
| Load |
| 32.5 / 39.3 dB(A) |
 | ||
30 dB silent 40 dB(A) audible 50 dB(A) loud |
||
min: | ||
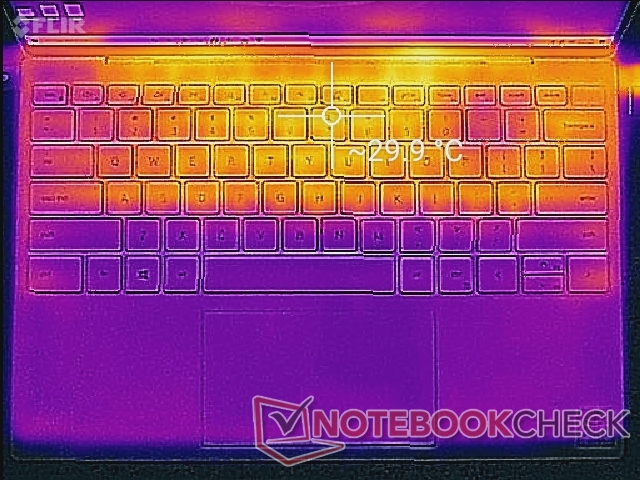
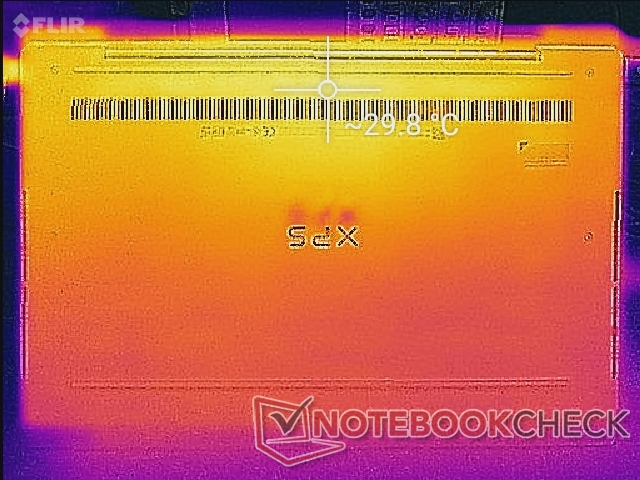
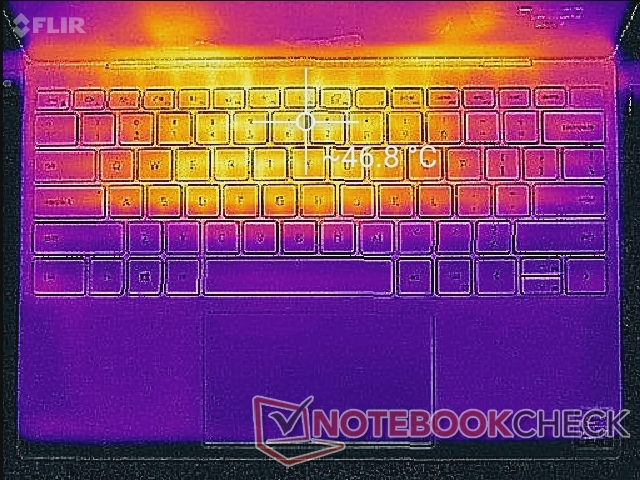
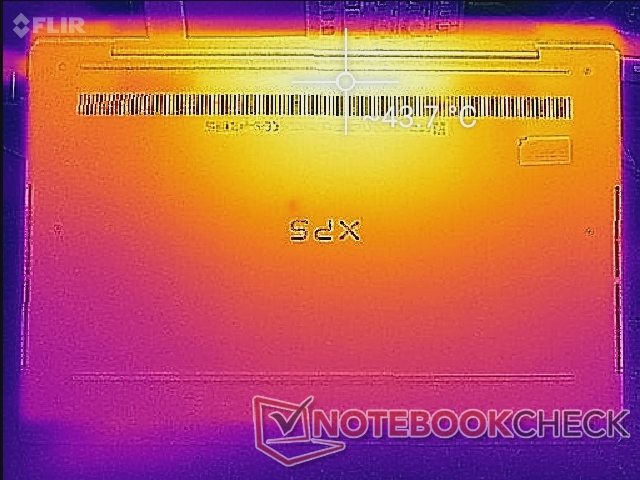
Temperature
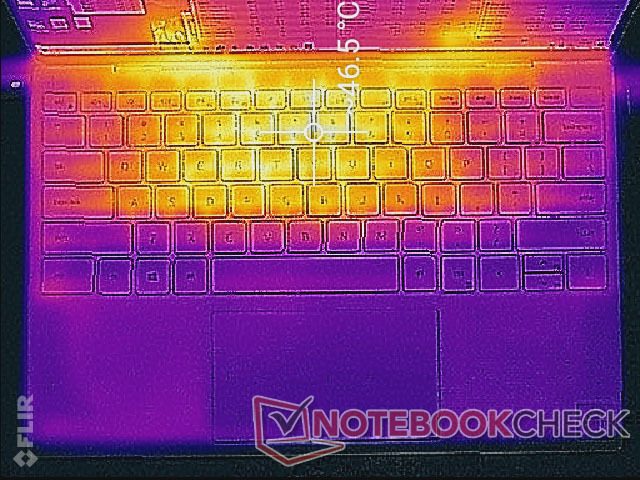
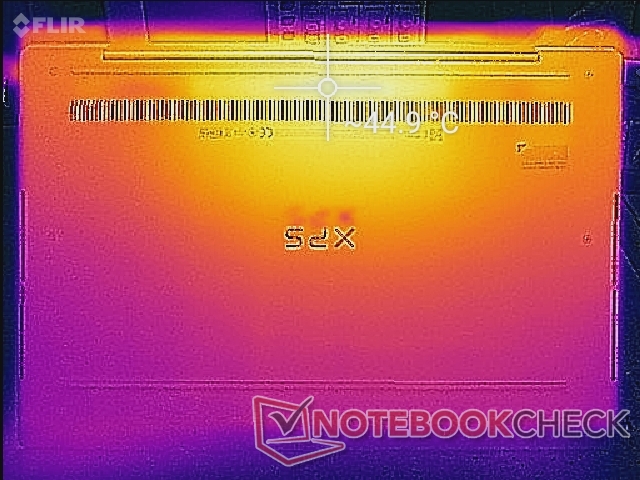
Surface temperatures when idling range from 26 C on the palm rests to 30 C on the hot spots near the rear. When under high loads, the same hot spots can become as warm as 47 C to be very close to what we recorded on the XPS 13 2-in-1 with the same Core i7 CPU.
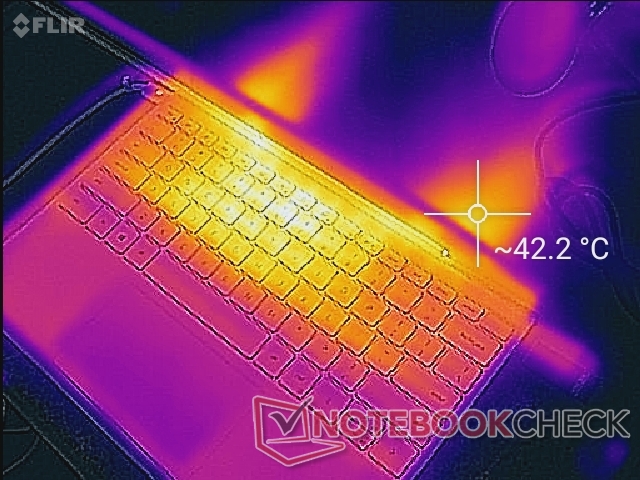
(-) The maximum temperature on the upper side is 46.6 °C / 116 F, compared to the average of 35.9 °C / 97 F, ranging from 21.4 to 59 °C for the class Subnotebook.
(±) The bottom heats up to a maximum of 44.8 °C / 113 F, compared to the average of 39.2 °C / 103 F
(+) In idle usage, the average temperature for the upper side is 27.4 °C / 81 F, compared to the device average of 30.8 °C / 87 F.
(±) Playing The Witcher 3, the average temperature for the upper side is 33.9 °C / 93 F, compared to the device average of 30.8 °C / 87 F.
(+) The palmrests and touchpad are cooler than skin temperature with a maximum of 29.8 °C / 85.6 F and are therefore cool to the touch.
(±) The average temperature of the palmrest area of similar devices was 28.2 °C / 82.8 F (-1.6 °C / -2.8 F).
Stress Test
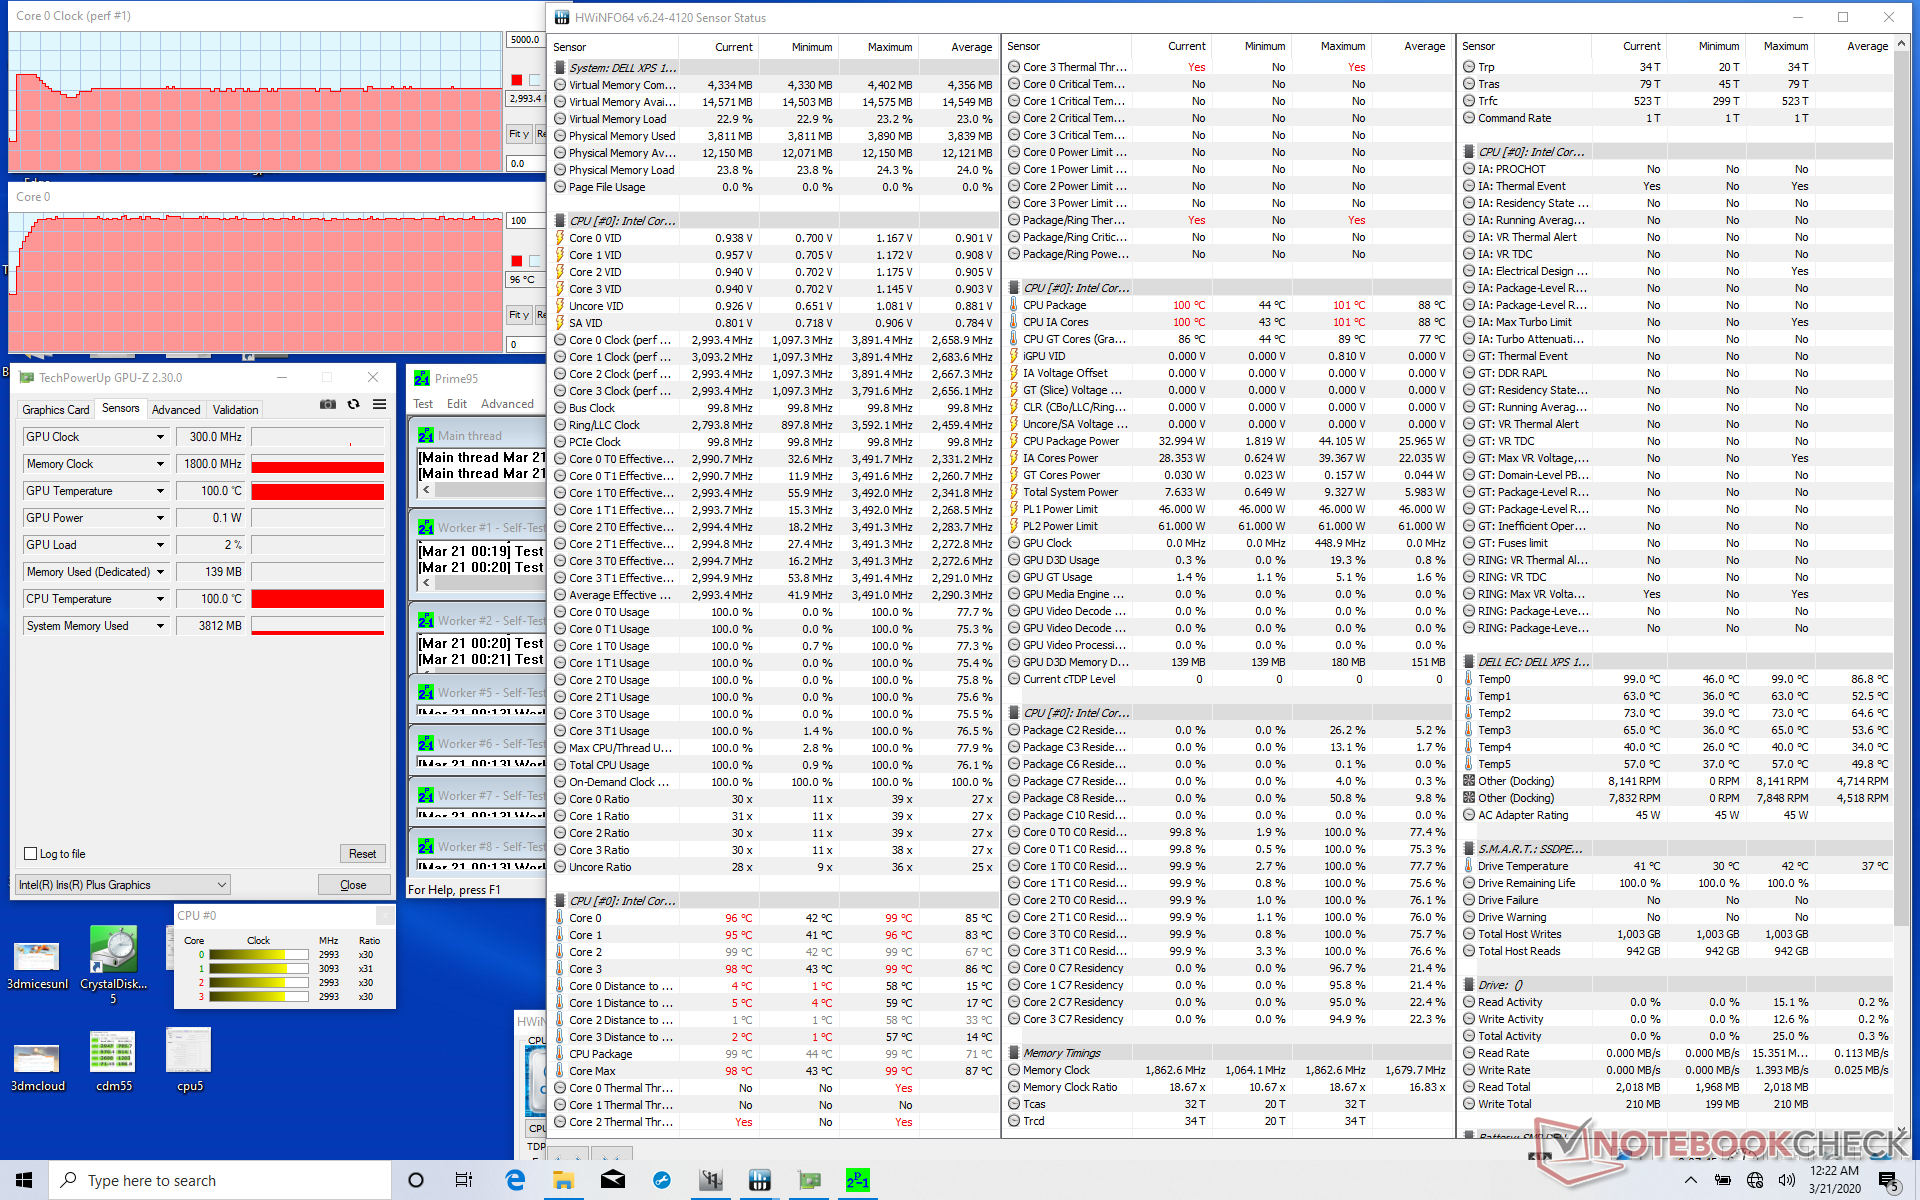
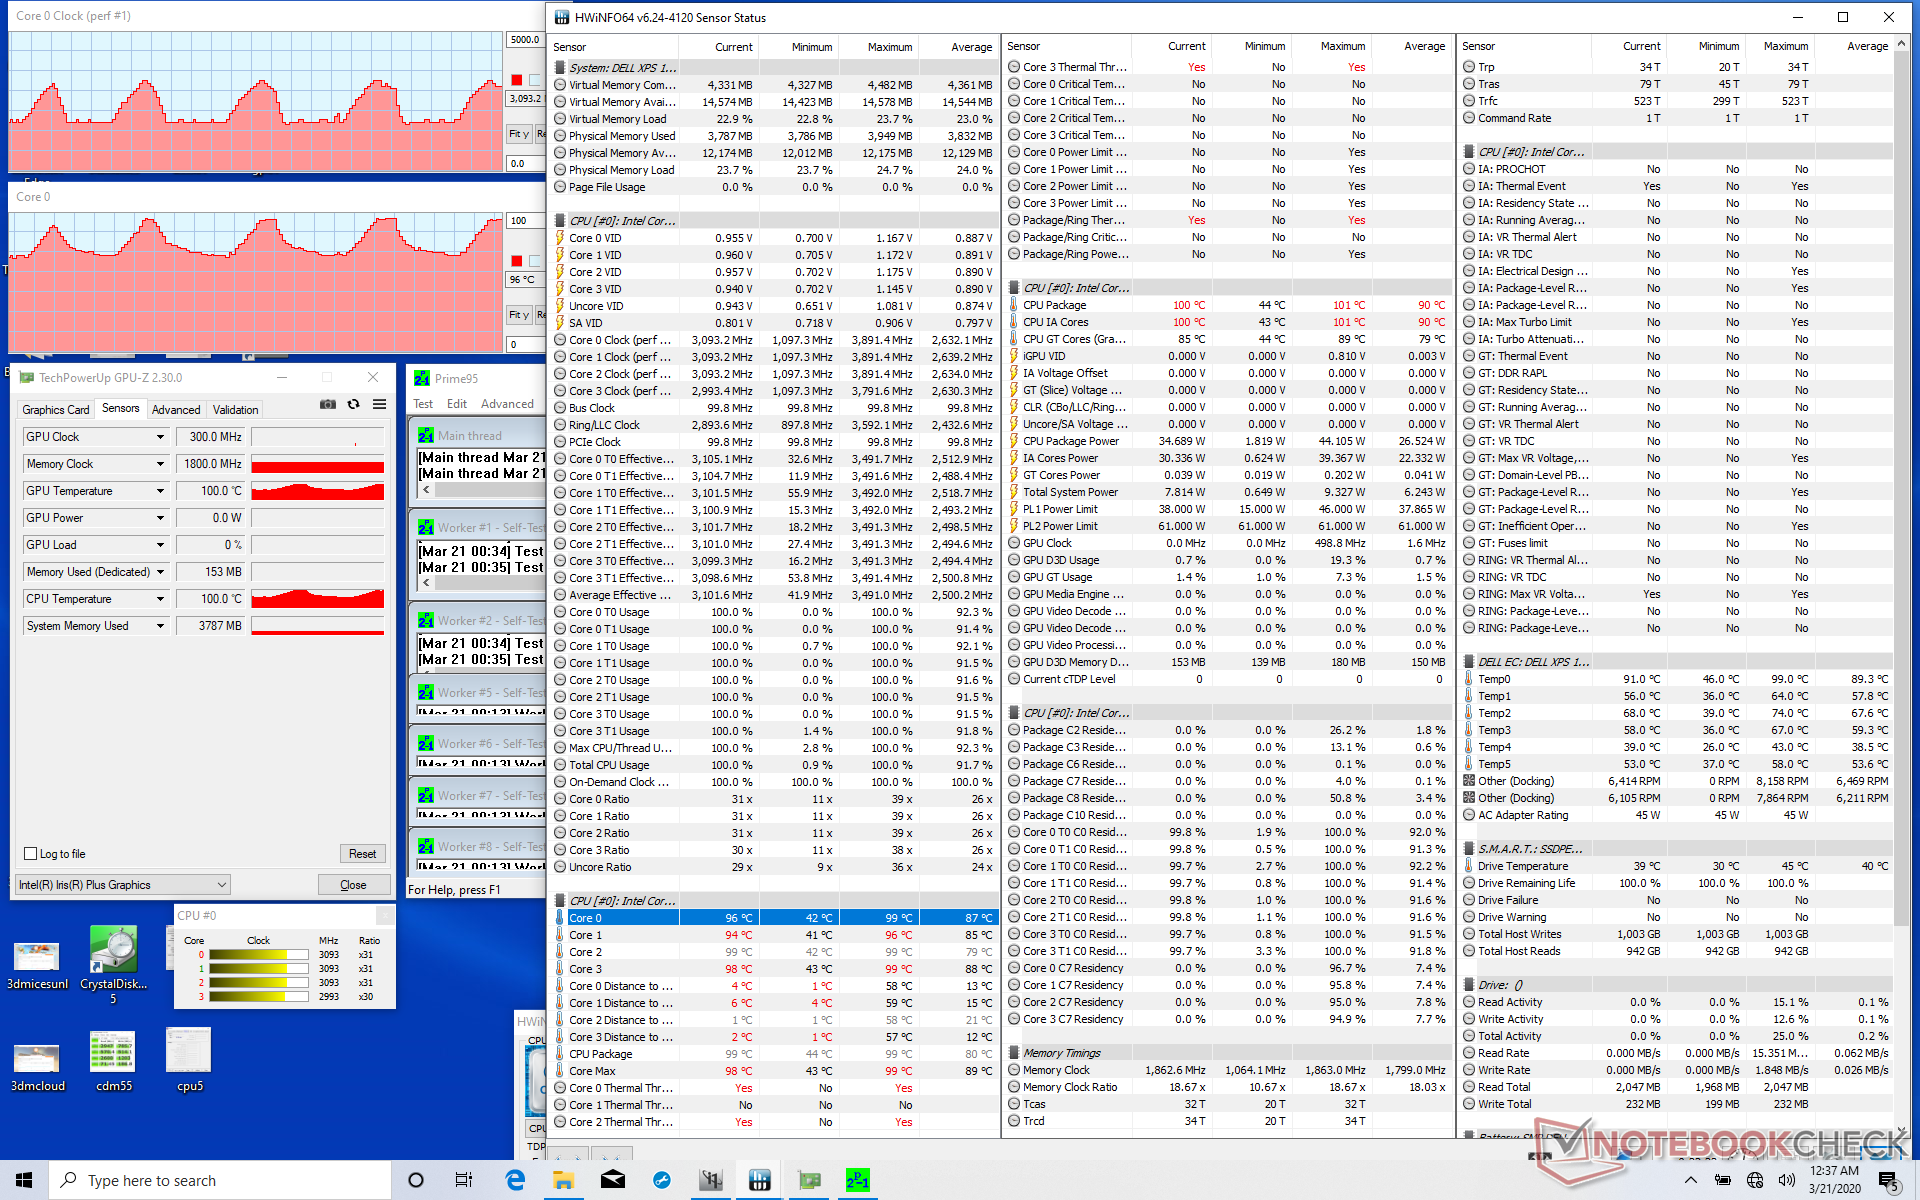
We stress the system with synthetic loads to identify for any potential throttling or stability issues. When running Prime95, the CPU would boost up to 3.5 GHz for the first 10 seconds or so until hitting a core temperature of 99 C. Thereafter, clock rates and temperature would immediately drop and stabilize at 3.0 GHz and ~96 C, respectively. After just a few minutes, however, clock rates and temperature will begin cycling from 1.8 GHz to 3.3 GHz and 70 C to 97 C, respectively, as shown by our screenshots below. This behavior ensures that core temperature will not run remain at >95 C at the cost of consistent clock rates. While the processor will not throttle below its base clock rate when running Prime95, it's unable to maintain a fixed Turbo Boost clock rate for extended periods, either.
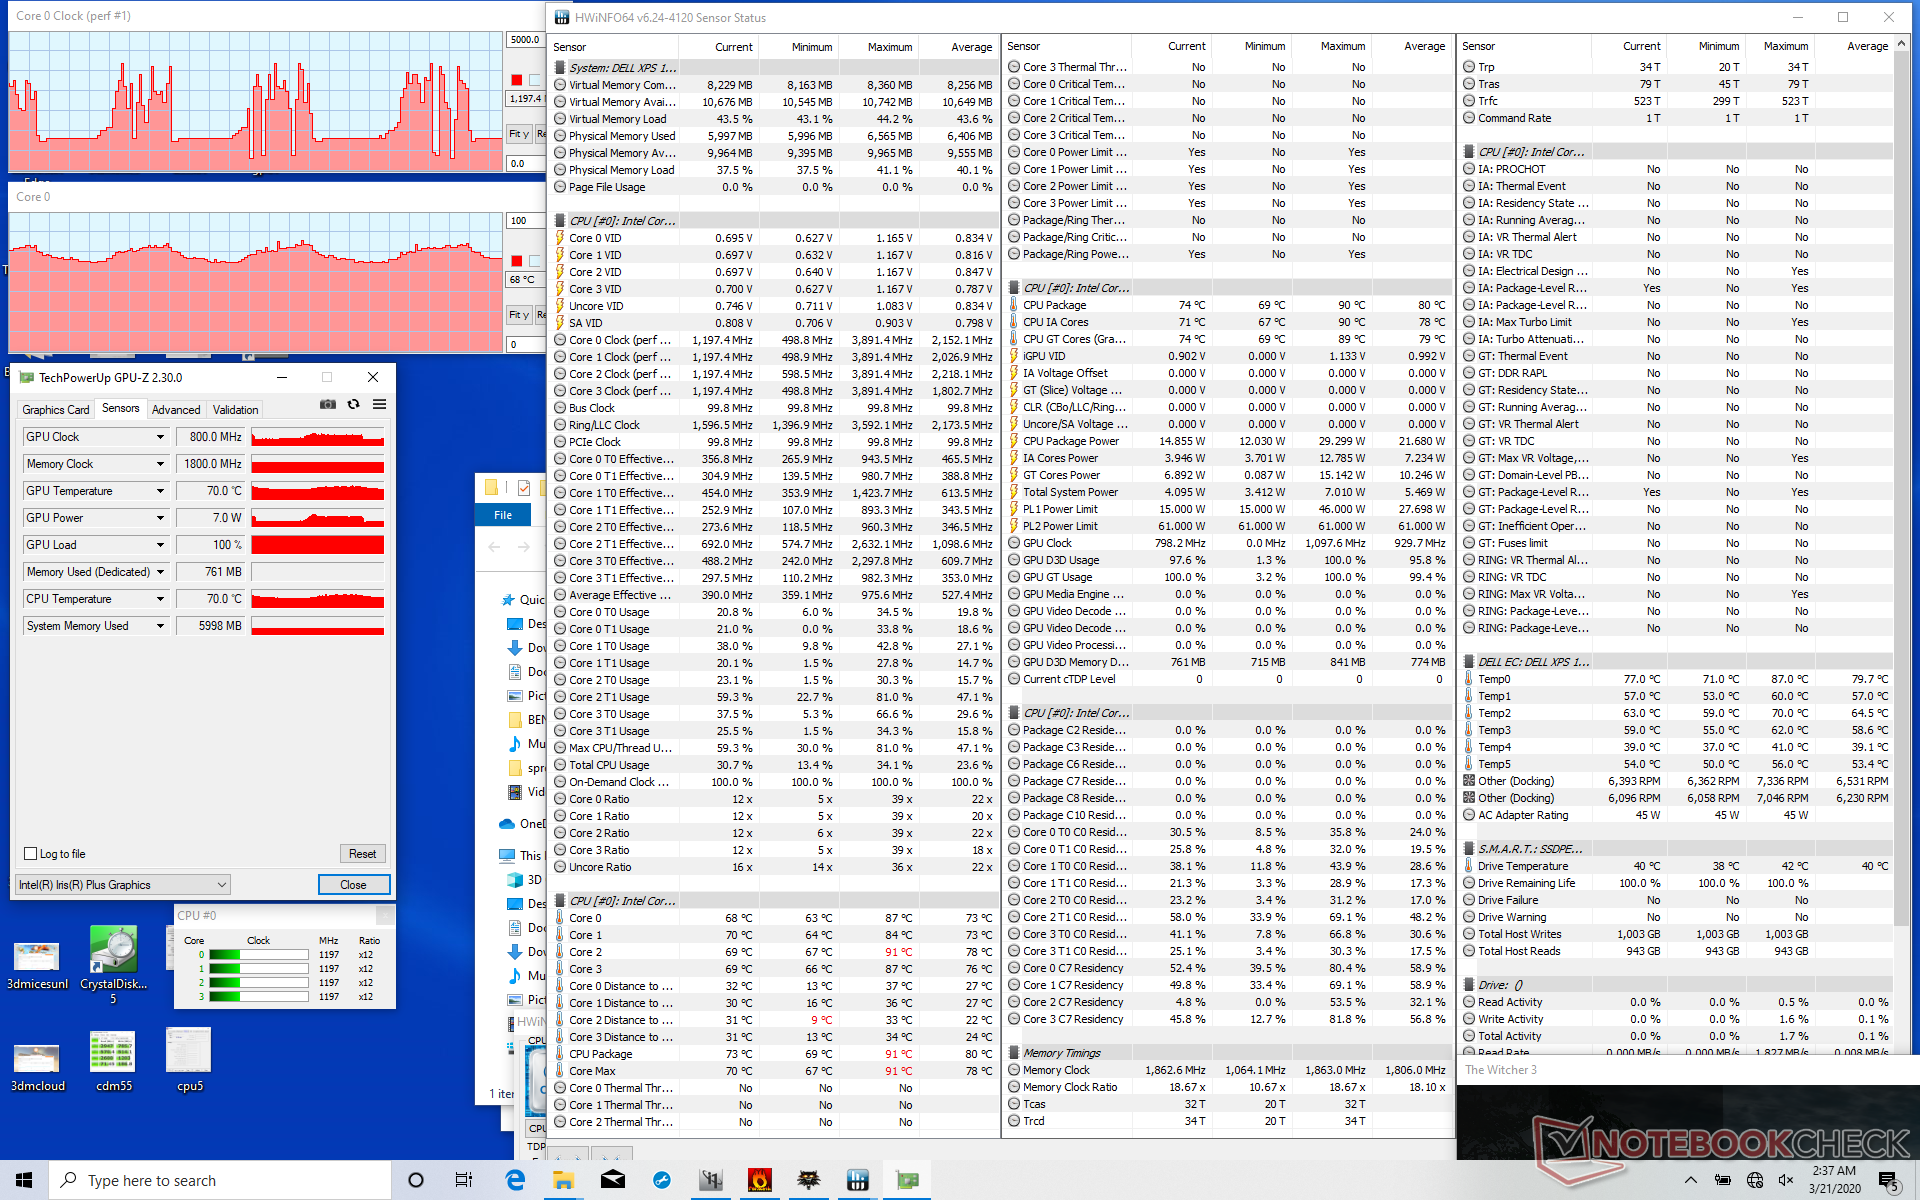
Running Witcher 3 is more representative of stressful real-world loads. When under such conditions, GPU clock rates will cycle between 750 and 1000 MHz which, unfortunately, leads to the cycling frame rates that we described above.
Running on battery will impact performance. A 3DMark 11 test on batteries returns Physics and Graphics scores of 4680 and 1675 points, respectively, compared to 10249 and 4508 points when on mains.
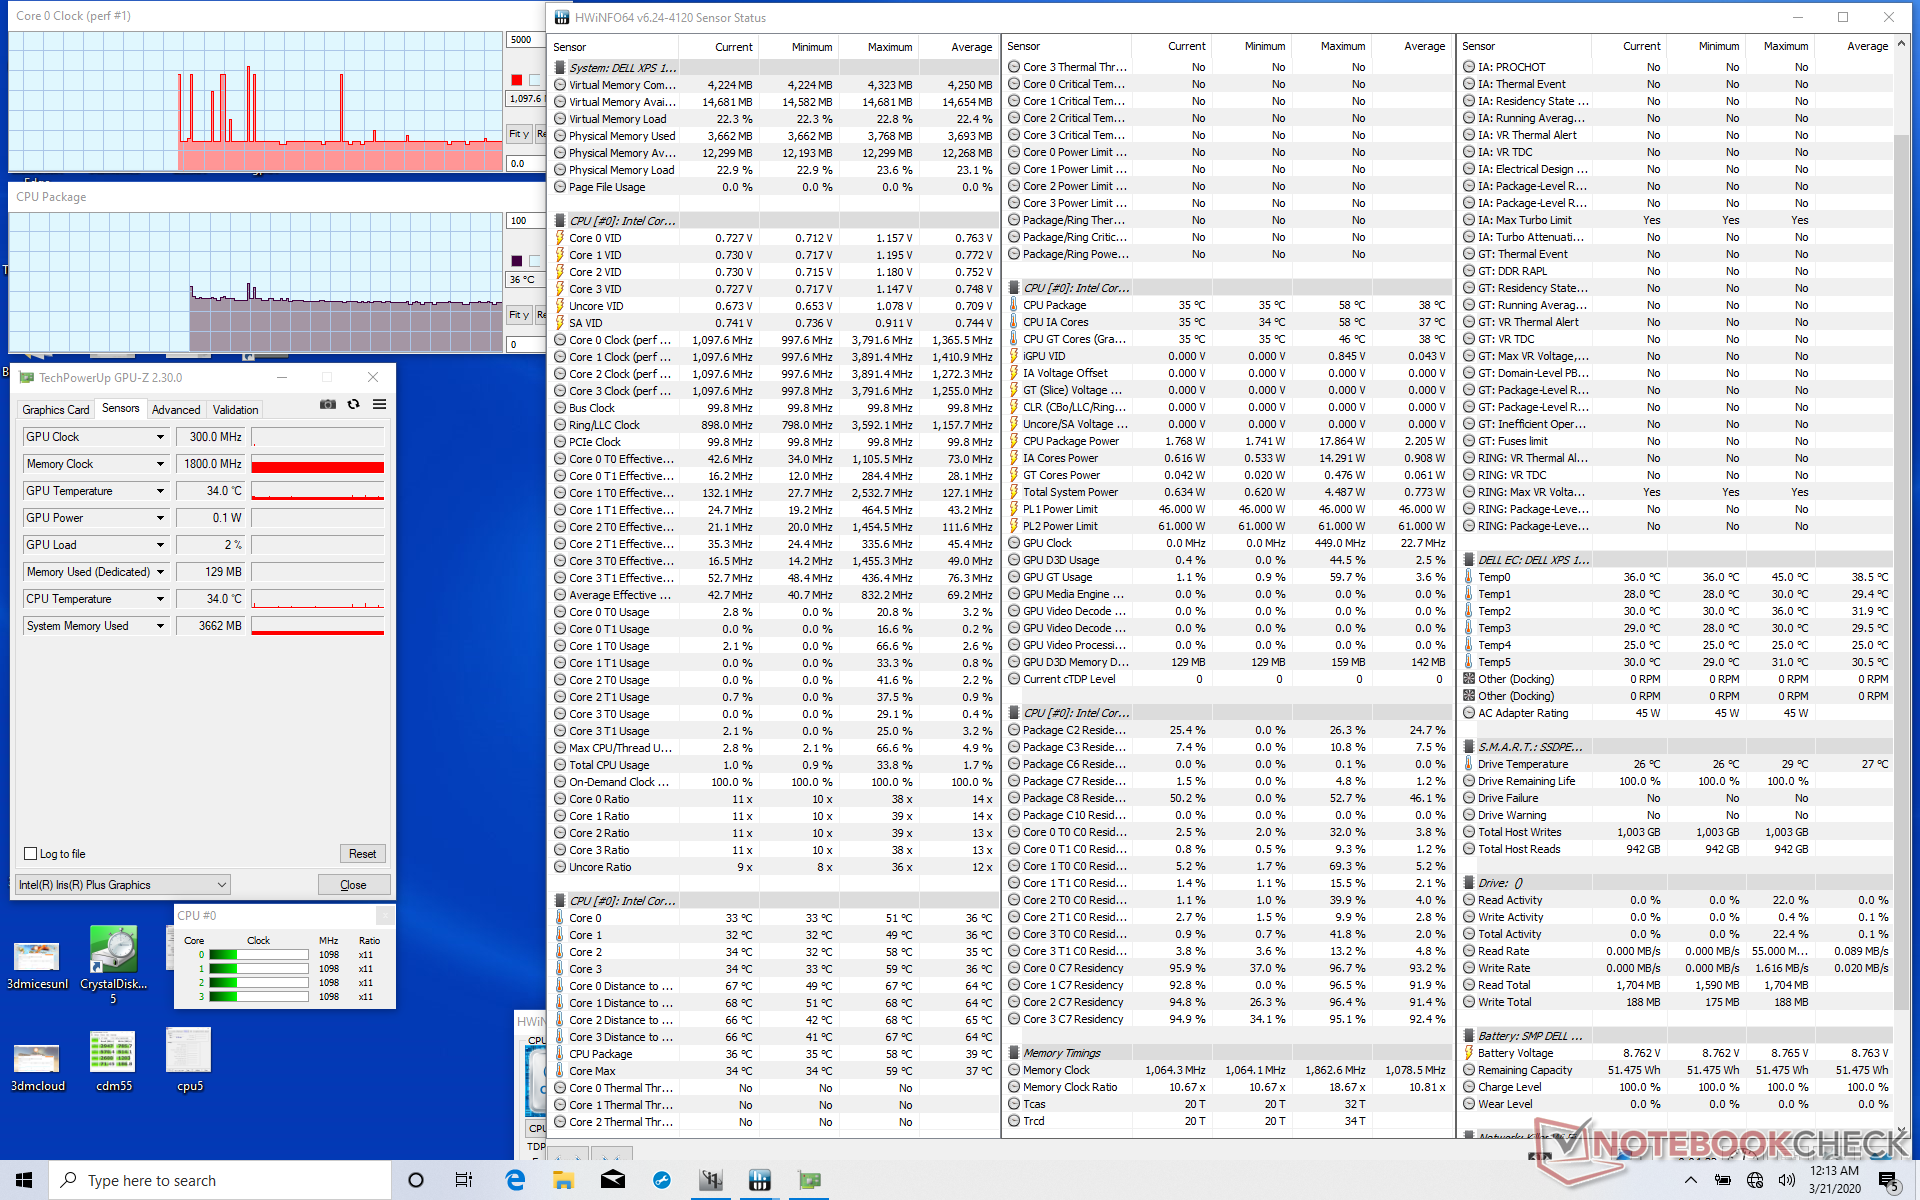
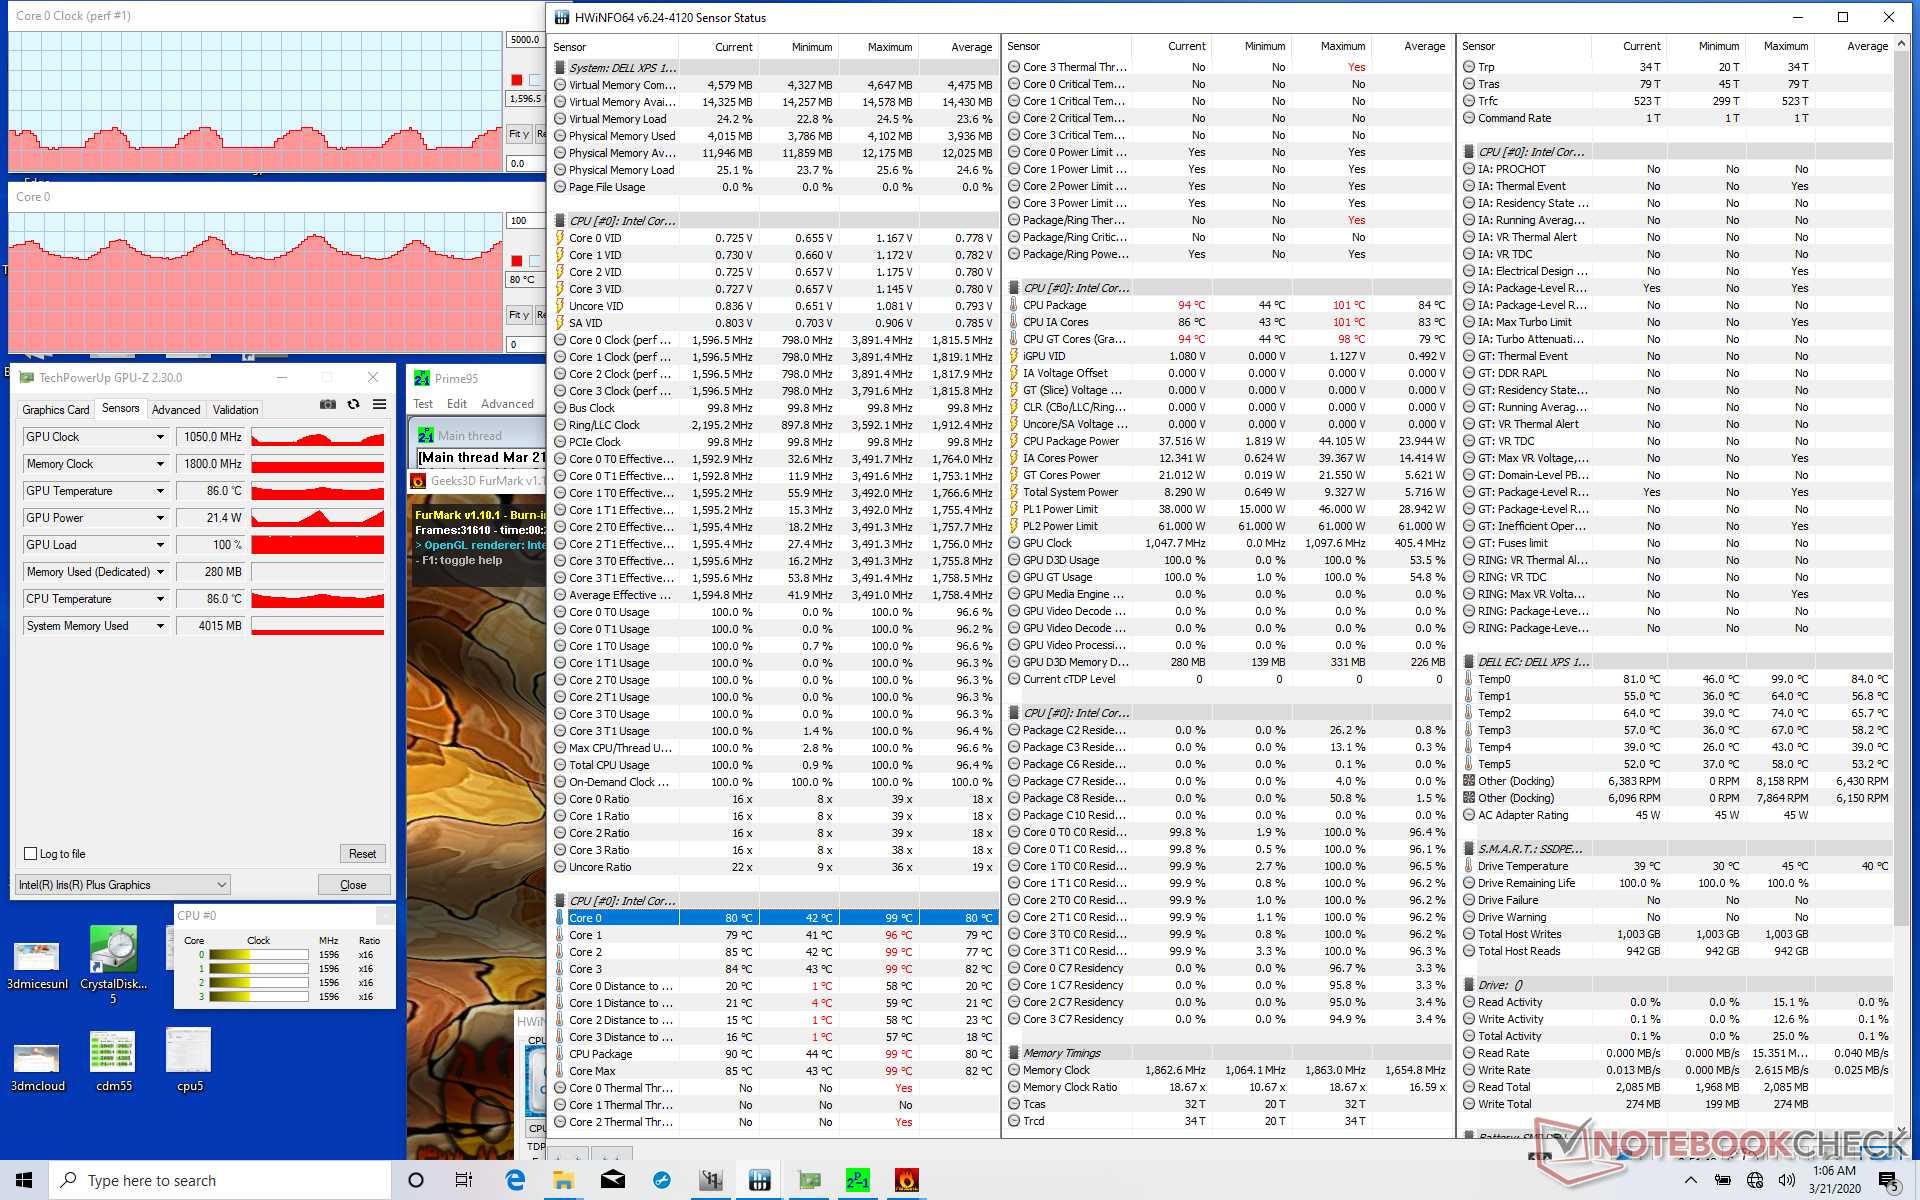
| CPU Clock (GHz) | GPU Clock (MHz) | Average CPU Temperature (°C) | |
| System Idle | -- | -- | 35 |
| Prime95 Stress | 1.8 - 3.3 | -- | 70 - 97 |
| Prime95 + FurMark Stress | 0.9 - 1.6 | 550 - 1050 | 67 - 81 |
| Witcher 3 Stress | 1.2 - 3.8 | 750 - 1000 | 65 - 77 |
Energy Management
Power Consumption
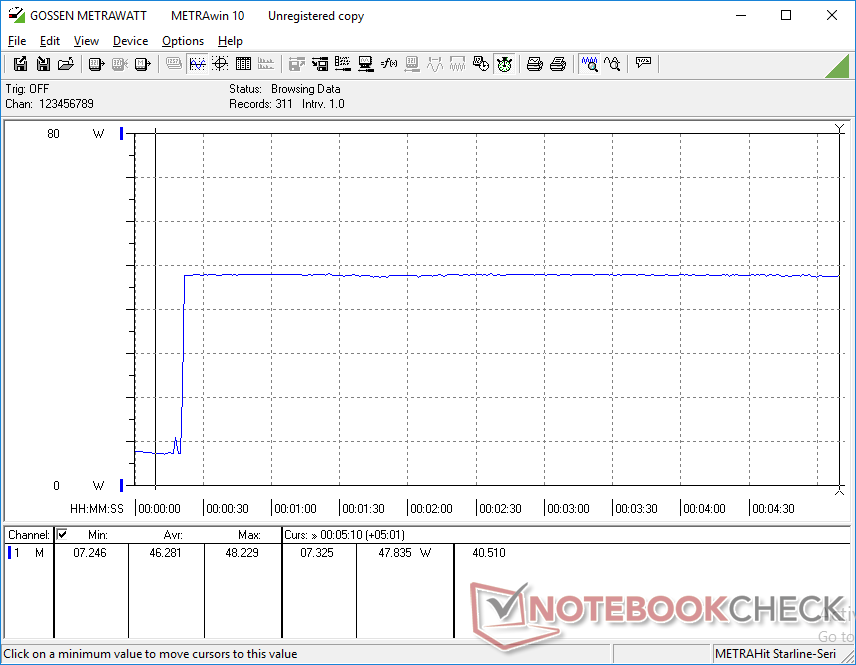
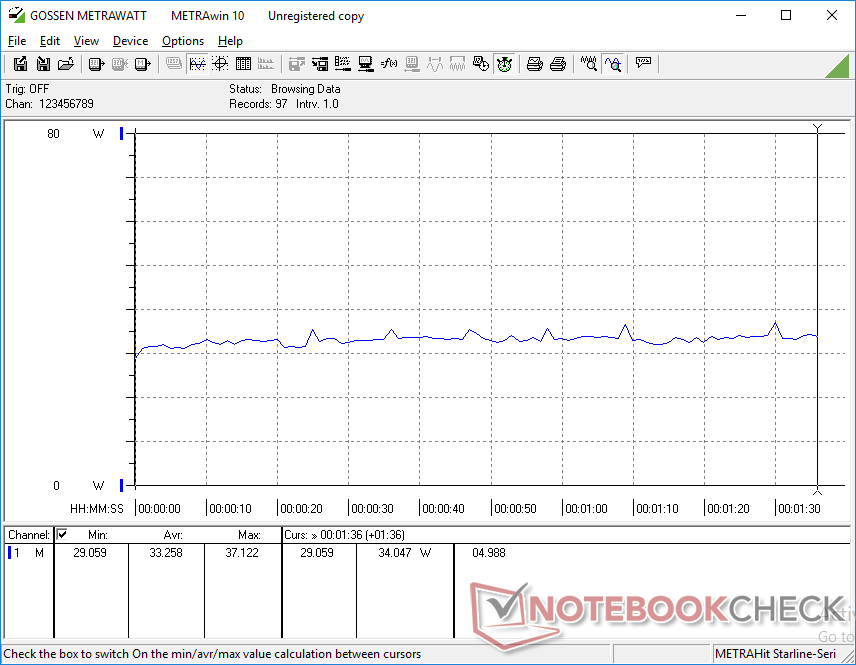
The system consumes between 4 W and 8 C when idling depending on the power profile and brightness setting. When running higher loads like gaming, consumption will range between 33 W to 37 W not unlike what we measured on the lower-end XPS 13 Core i5 SKU despite their significant GPU performance differences. Thus, the Core i7-1065G7 is able to offer much faster graphics performance than the Core i5 SKU without necessarily demanding more power from the outlet.
Ultrabooks with the GeForce MX150 or MX250 will consume just a few more Watts each than our Ice Lake system when gaming. Performance-per-Watt is still very much in Nvidia's favor as the MX150/MX250 will always outperform the Iris Plus G7 when gaming by noticeable margins.
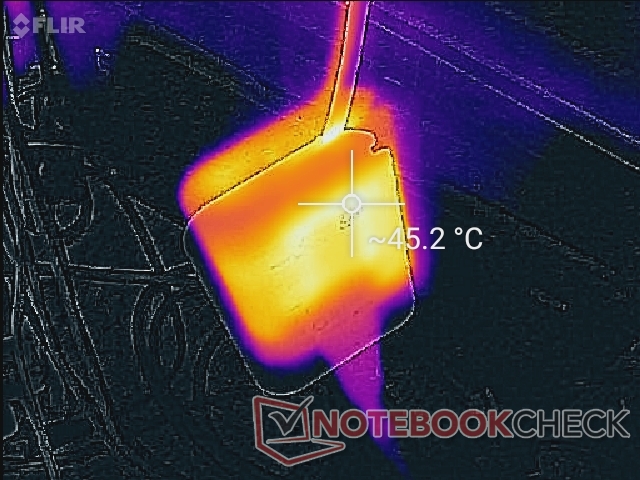
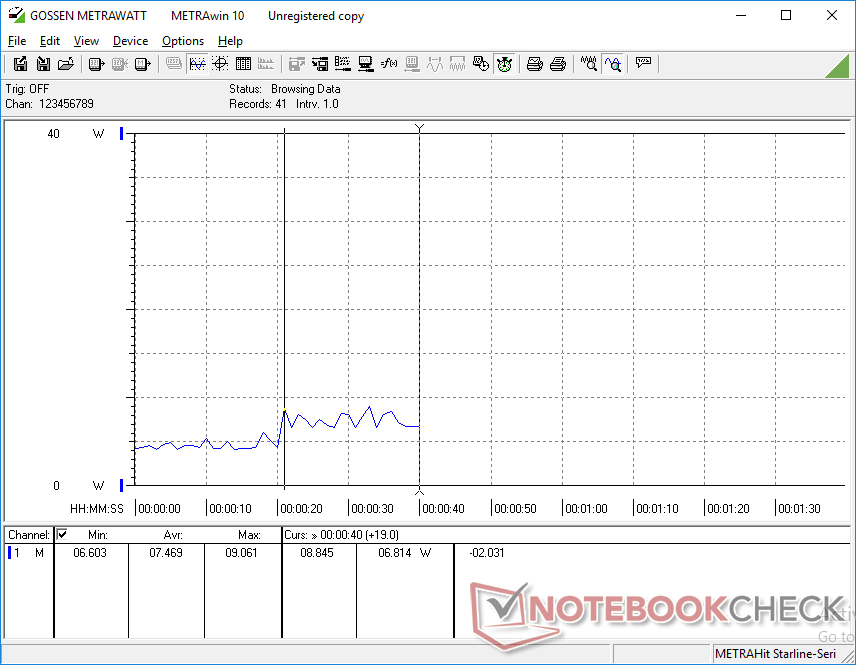
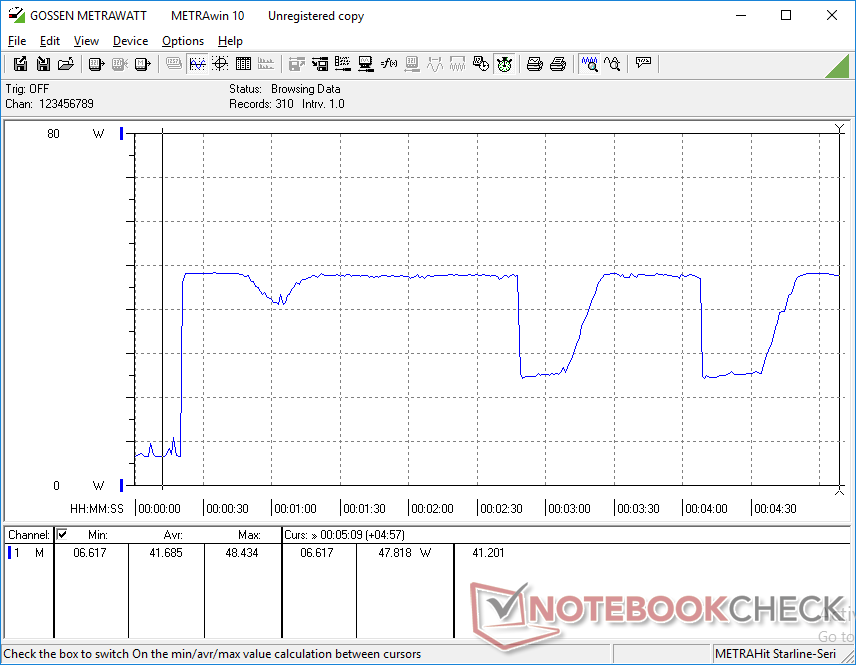
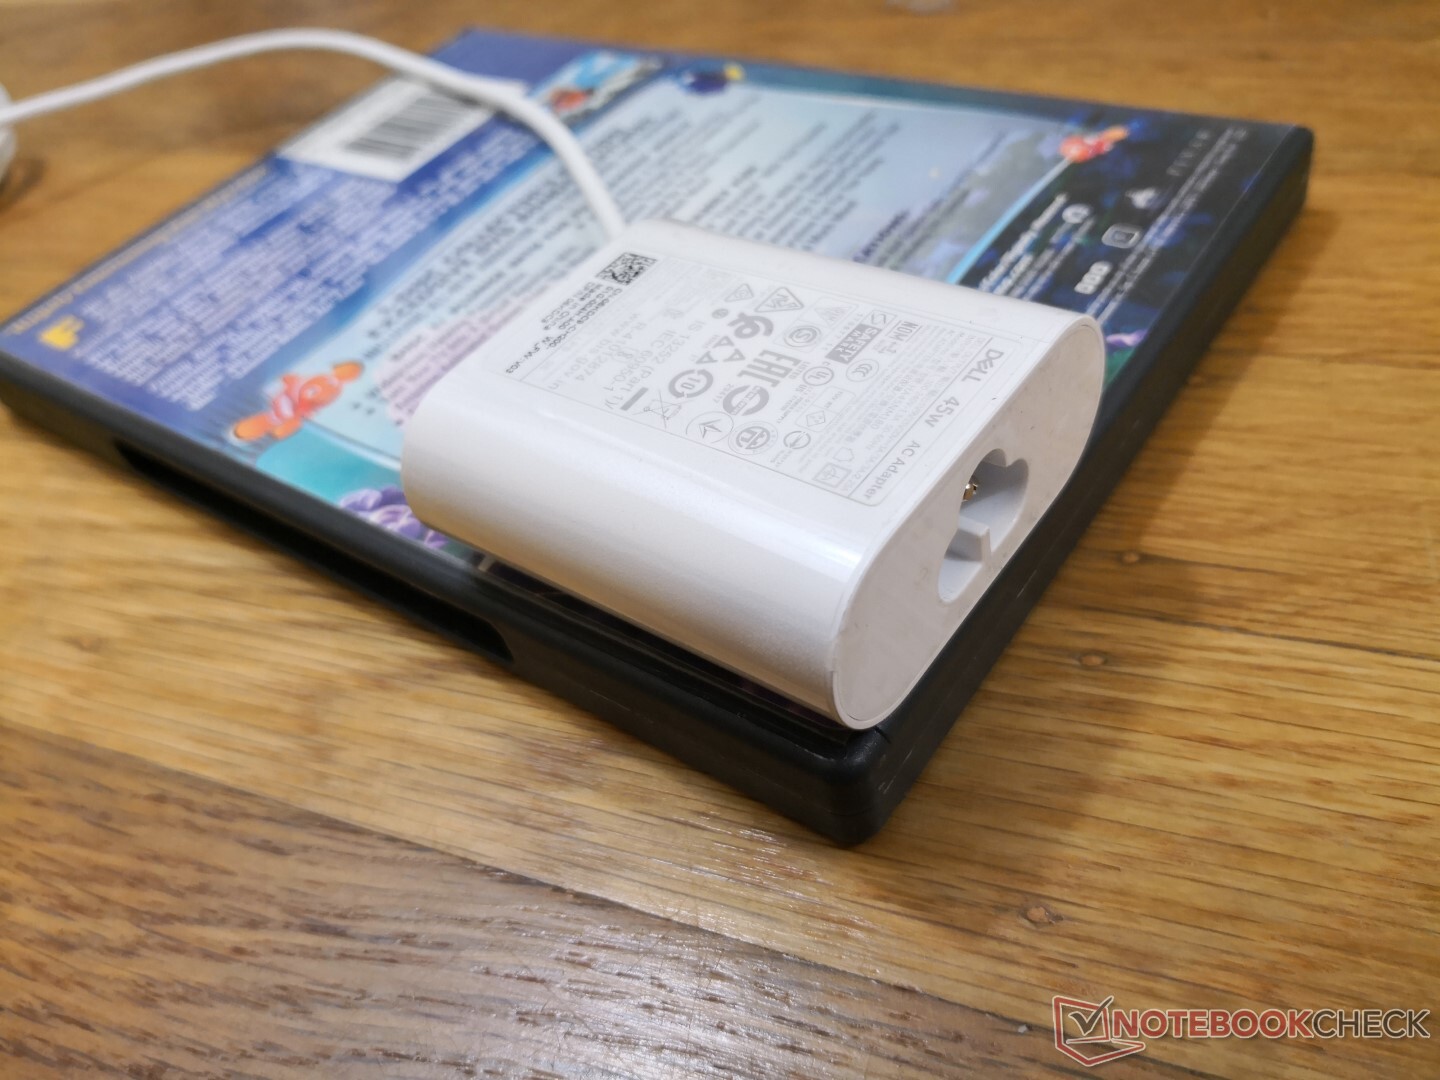
We're able to measure a maximum consumption of 48.4 W from the small (~6 x 5.5 x 3.2 cm) 45 W AC adapter. Power consumption may cycle during such extreme loads as shown by our graphs below which corroborates with the cycling clock rates and CineBench loop results above.
| Off / Standby | |
| Idle | |
| Load |
|
Key:
min: | |
| Dell XPS 13 9300 Core i7-1065G7 i7-1065G7, Iris Plus Graphics G7 (Ice Lake 64 EU), Intel SSDPEMKF512G8 NVMe SSD, IPS, 1920x1200, 13.4" | Dell XPS 13 7390 Core i7-10710U i7-10710U, UHD Graphics 620, SK Hynix PC601 NVMe 512 GB, IPS, 3840x2160, 13.3" | Dell XPS 13 7390 2-in-1 Core i7 i7-1065G7, Iris Plus Graphics G7 (Ice Lake 64 EU), Toshiba BG4 KBG40ZPZ512G, IPS, 1920x1200, 13.4" | Huawei Matebook X Pro i5 i5-8250U, GeForce MX150, Samsung PM961 MZVLW256HEHP, IPS, 3000x2000, 13.9" | Asus ZenBook S13 UX392FN i7-8565U, GeForce MX150, WDC PC SN520 SDAPNUW-512G, IPS, 1920x1080, 13.9" | Microsoft Surface Laptop 3 13 Core i5-1035G7 i5-1035G7, Iris Plus Graphics G7 (Ice Lake 64 EU), SK hynix BC501 HFM256GDGTNG, IPS, 2256x1504, 13.5" | Dell XPS 13 9300 i5 FHD i5-1035G1, UHD Graphics G1 (Ice Lake 32 EU), Toshiba XG6 KXG60ZNV512G, IPS, 1920x1200, 13.4" | |
|---|---|---|---|---|---|---|---|
| Power Consumption | -16% | 4% | -27% | -17% | -14% | -3% | |
| Idle Minimum * (Watt) | 4.2 | 4.7 -12% | 2.6 38% | 3.5 17% | 3.4 19% | 4.4 -5% | 3.4 19% |
| Idle Average * (Watt) | 6.9 | 8.3 -20% | 5.3 23% | 8.9 -29% | 6.3 9% | 7.5 -9% | 6 13% |
| Idle Maximum * (Watt) | 7.5 | 9 -20% | 7 7% | 12.3 -64% | 10.4 -39% | 7.8 -4% | 10.2 -36% |
| Load Average * (Watt) | 33.3 | 42 -26% | 43.1 -29% | 54.2 -63% | 51 -53% | 41.9 -26% | 36.6 -10% |
| Witcher 3 ultra * (Watt) | 37.1 | 43.1 -16% | 42.4 -14% | 39 -5% | 40.8 -10% | ||
| Load Maximum * (Watt) | 48.4 | 49 -1% | 49 -1% | 52.1 -8% | 62.7 -30% | 63.9 -32% | 49.3 -2% |
* ... smaller is better
Battery Life
Runtimes are similar to what we recorded on the XPS 13 9300 Core i5 SKU at 12 to 13 hours of real-world WLAN use. Results are longer than competing Ultrabooks including the HP Spectre x360 13 which uses the same Ice Lake CPU but with a larger 60 Wh battery.
Recharging from empty to full capacity takes about two hours. This same adapter can be used to recharge other USB Type-C devices including smartphones, tablets, and the Nintendo Switch.
| Dell XPS 13 9300 Core i7-1065G7 i7-1065G7, Iris Plus Graphics G7 (Ice Lake 64 EU), 52 Wh | Dell XPS 13 7390 Core i7-10710U i7-10710U, UHD Graphics 620, 52 Wh | Dell XPS 13 7390 2-in-1 Core i7 i7-1065G7, Iris Plus Graphics G7 (Ice Lake 64 EU), 51 Wh | Huawei Matebook X Pro i5 i5-8250U, GeForce MX150, 57.4 Wh | Asus ZenBook S13 UX392FN i7-8565U, GeForce MX150, 50 Wh | Microsoft Surface Laptop 3 13 Core i5-1035G7 i5-1035G7, Iris Plus Graphics G7 (Ice Lake 64 EU), 45 Wh | Dell XPS 13 9300 i5 FHD i5-1035G1, UHD Graphics G1 (Ice Lake 32 EU), 52 Wh | |
|---|---|---|---|---|---|---|---|
| Battery runtime | -34% | -29% | -27% | -34% | -35% | -8% | |
| WiFi v1.3 (h) | 12.7 | 8.4 -34% | 9 -29% | 9.3 -27% | 8.4 -34% | 8.3 -35% | 11.7 -8% |
| Reader / Idle (h) | 20.7 | 28.5 | 34.4 | ||||
| Load (h) | 2.2 | 1.7 | 1.9 | 3.4 |
Pros
Cons
Verdict
Jumping from the Core i5-1035G1 SKU to the Core i7-1065G7 SKU will bring approximately 23 percent faster CPU performance and 70 percent faster GPU performance at no additional power cost. Thus, the biggest reason for owning the Core i7 SKU over the Core i5 SKU would be for the graphics advantage in applications such as light photo editing or the occasional game of Rocket League or LoL. If your primary activities involve word processing, web browsing, or video streaming, however, then the Core i5 configuration will be more than sufficient. In fact, you may as well consider an older Whiskey Lake-U Core i5-8265U or Core i7-8565U model as the Core i5-1035G1 performs very similarly to these last generation CPUs.
CPU performance begins to buckle when running extreme loads for extended periods. This likely won't apply to the target subnotebook audience as any performance users should be considering more powerful laptops instead like the XPS 15 or Asus ZenBook Pro.
The more alluring aspect of the XPS 13 9300 is its larger 16:10 display which will have more obvious benefits to the user when compared to the relatively minor performance updates. This is probably one of the smarter moves from Dell if they wanted to attract more MacBook Air or MacBook Pro 13 users who have been enjoying 16:10 displays for years. We find the aspect ratio to be a good middle-ground between traditional 16:9 laptops and full-on 3:2 office laptops like the Huawei MateBook X Pro or the Microsoft Surface series.
The XPS 13 is becoming a better alternative to the MacBook every year. Its latest redesign adds a bigger 16:10 display and clickpad without sacrificing any major features of last year's model.
Dell XPS 13 9300 Core i7-1065G7
- 03/25/2020 v7 (old)
Allen Ngo
Price comparison
