Dell G3 15 3590 Laptop Review: Inexpensive with Easy Upgrades
Not to be confused with the business-centric Dell Latitude 3590, the Dell G3 3590 is an entry-level gaming laptop announced at Computex 2019 alongside the XPS 13 7390 2-in-1 and pricier Alienware m15/m17 R2 series. It directly replaces last year's G3 3579 with both a brand new chassis design and upgraded hardware for faster gaming performance.
Current SKUs range from the Core i5-9300H and GTX 1050 for $780 up to the Core i7-9750H and GTX 1660 Ti Max-Q for $1220 USD. Our test unit today is the mid-range option with the Core i5-9300H and GeForce GTX 1650 retailing for about $830 USD.
Direct competitors to the G3 3590 include other budget 15.6-inch gaming laptops like the Lenovo Legion Y540, Aorus 5 or Aorus 15, HP Pavilion 15 Gaming, MSI GL65, and Dell's own G5 series.
More Dell reviews:
Rating | Date | Model | Weight | Height | Size | Resolution | Price |
|---|---|---|---|---|---|---|---|
| 79.3 % v7 (old) | 10 / 2019 | Dell G3 3590 i5-9300H, GeForce GTX 1650 Mobile | 2.5 kg | 21.6 mm | 15.60" | 1920x1080 | |
| 85.5 % v6 (old) | 06 / 2019 | Aorus 15-SA i7-9750H, GeForce GTX 1660 Ti Mobile | 2.1 kg | 24.4 mm | 15.60" | 1920x1080 | |
| 83.9 % v7 (old) | 08 / 2019 | HP Gaming Pavilion 15-dk0009ng i7-9750H, GeForce GTX 1660 Ti Max-Q | 2.4 kg | 23.4 mm | 15.60" | 1920x1080 | |
| 83.3 % v6 (old) | 05 / 2019 | Asus ROG Zephyrus G15 GA502DU R7 3750H, GeForce GTX 1660 Ti Max-Q | 2.1 kg | 20.4 mm | 15.60" | 1920x1080 |
Case
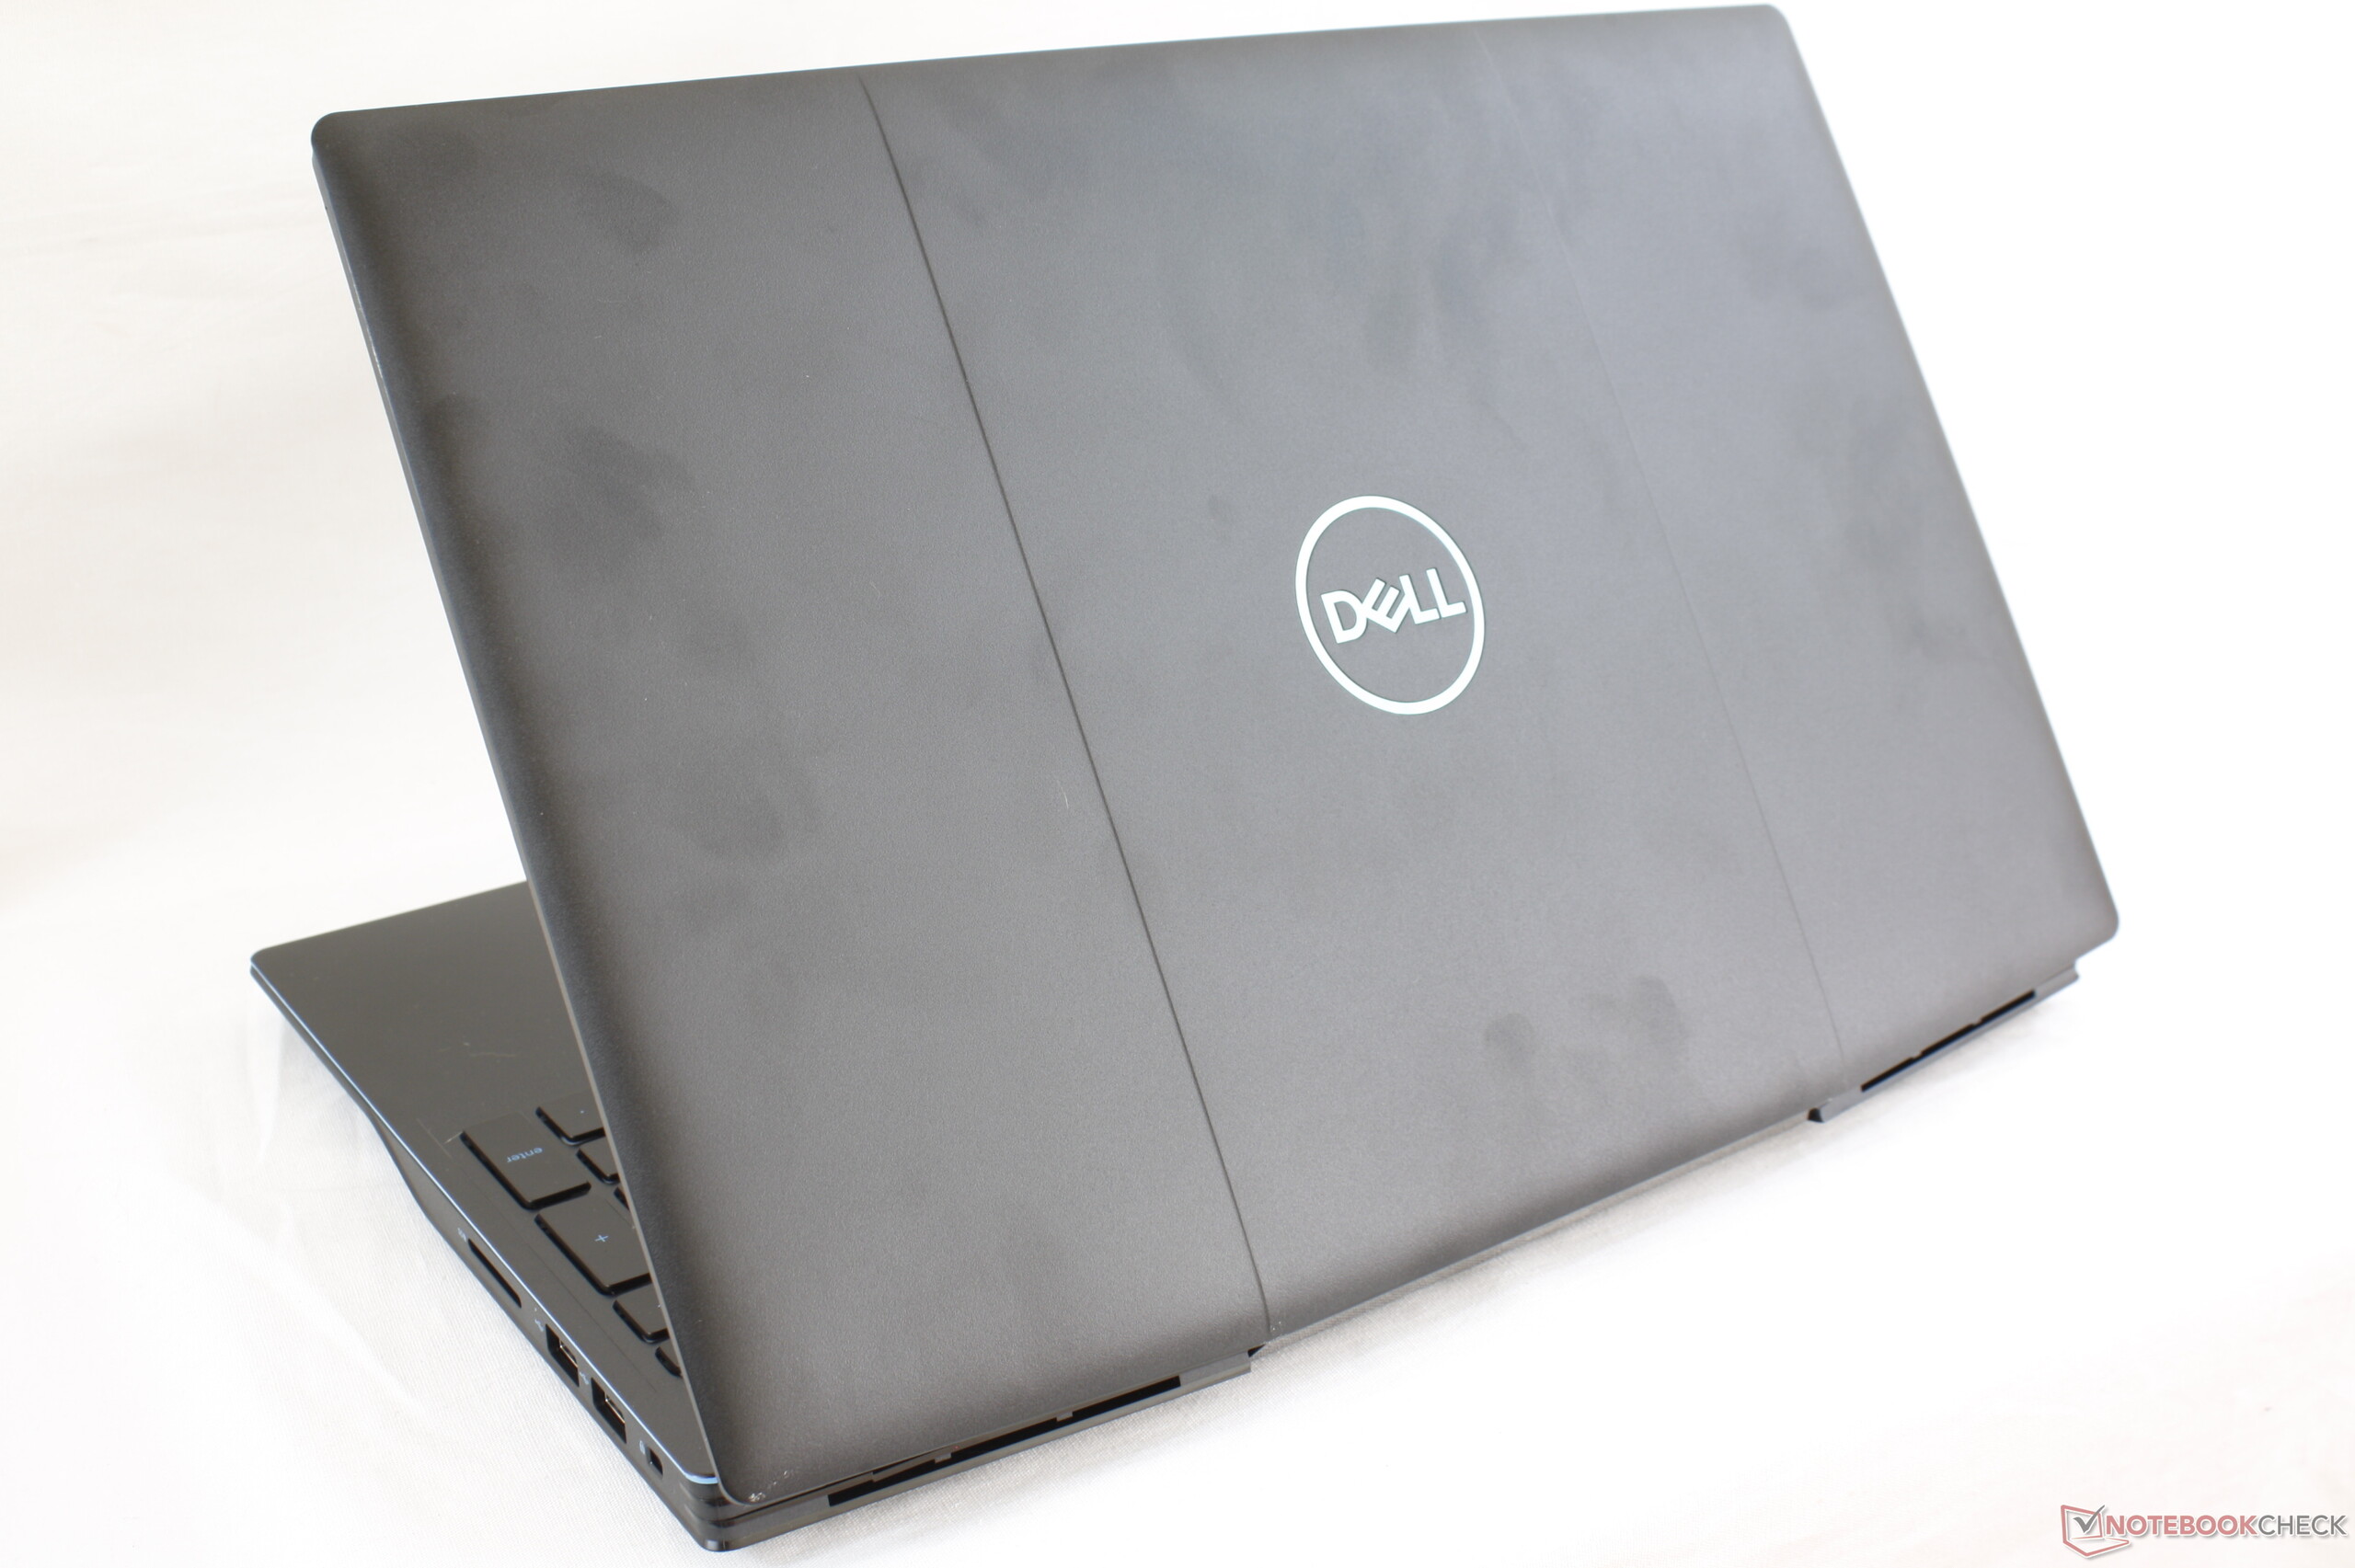
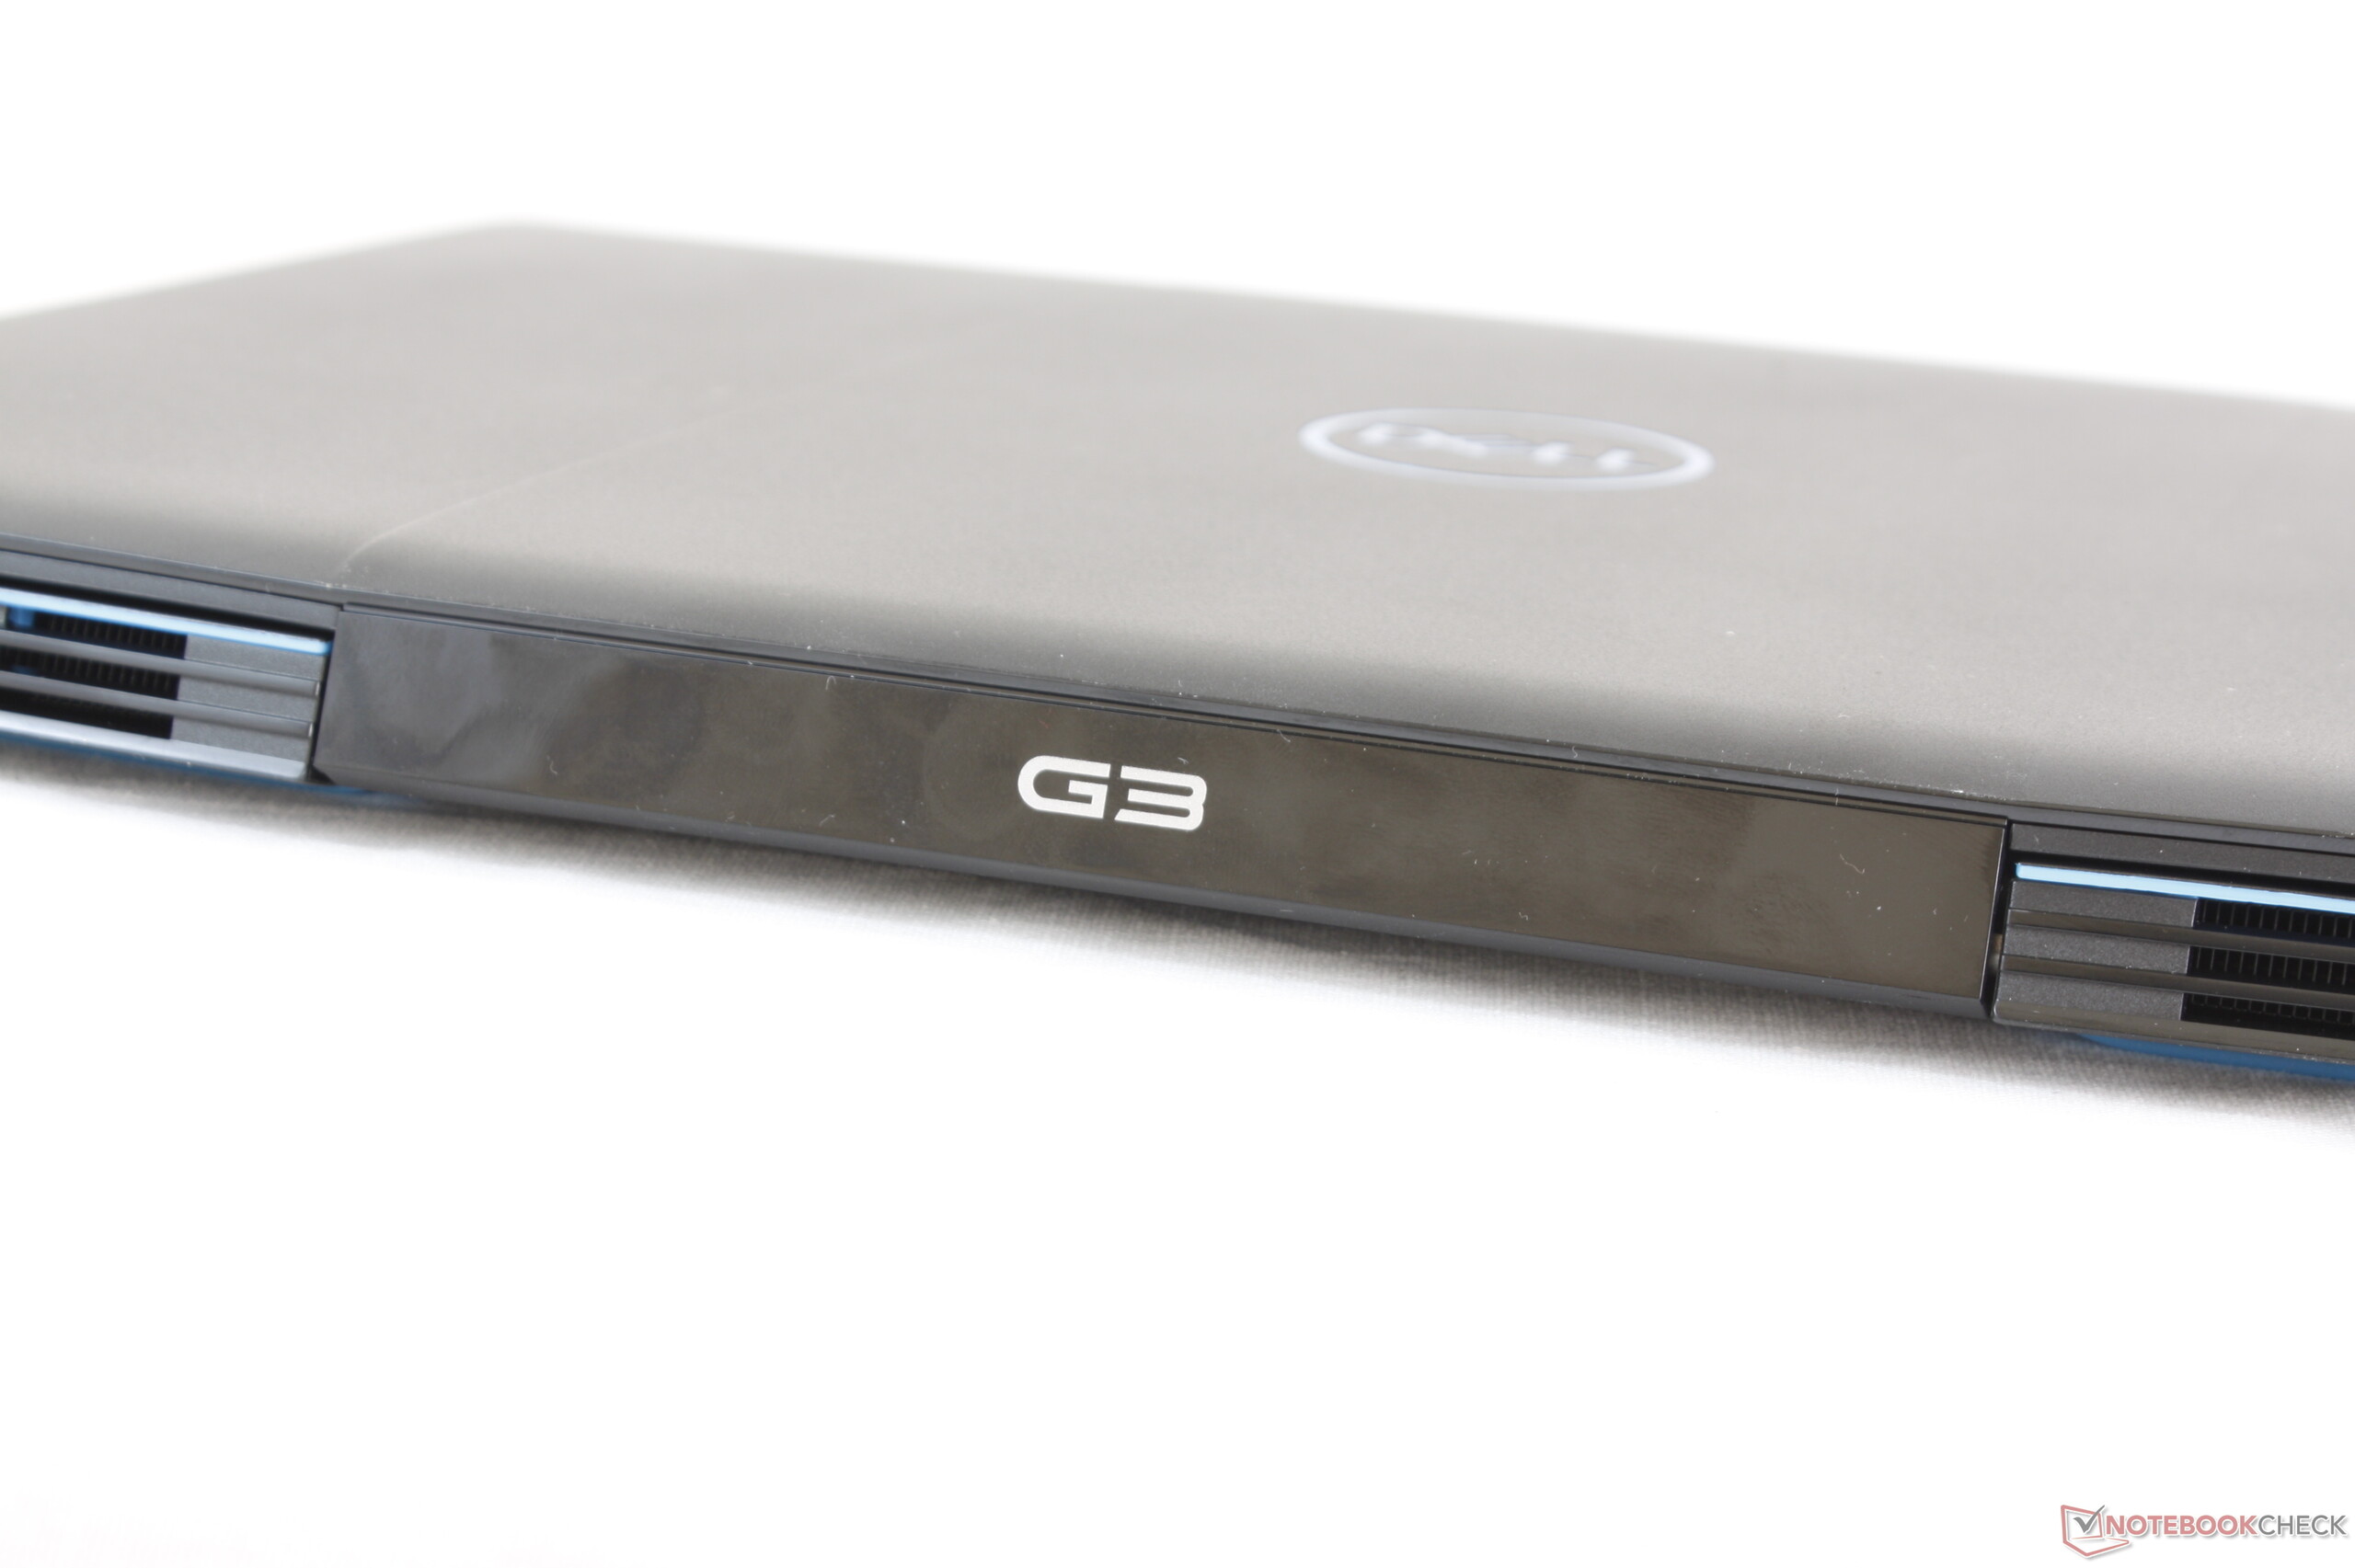
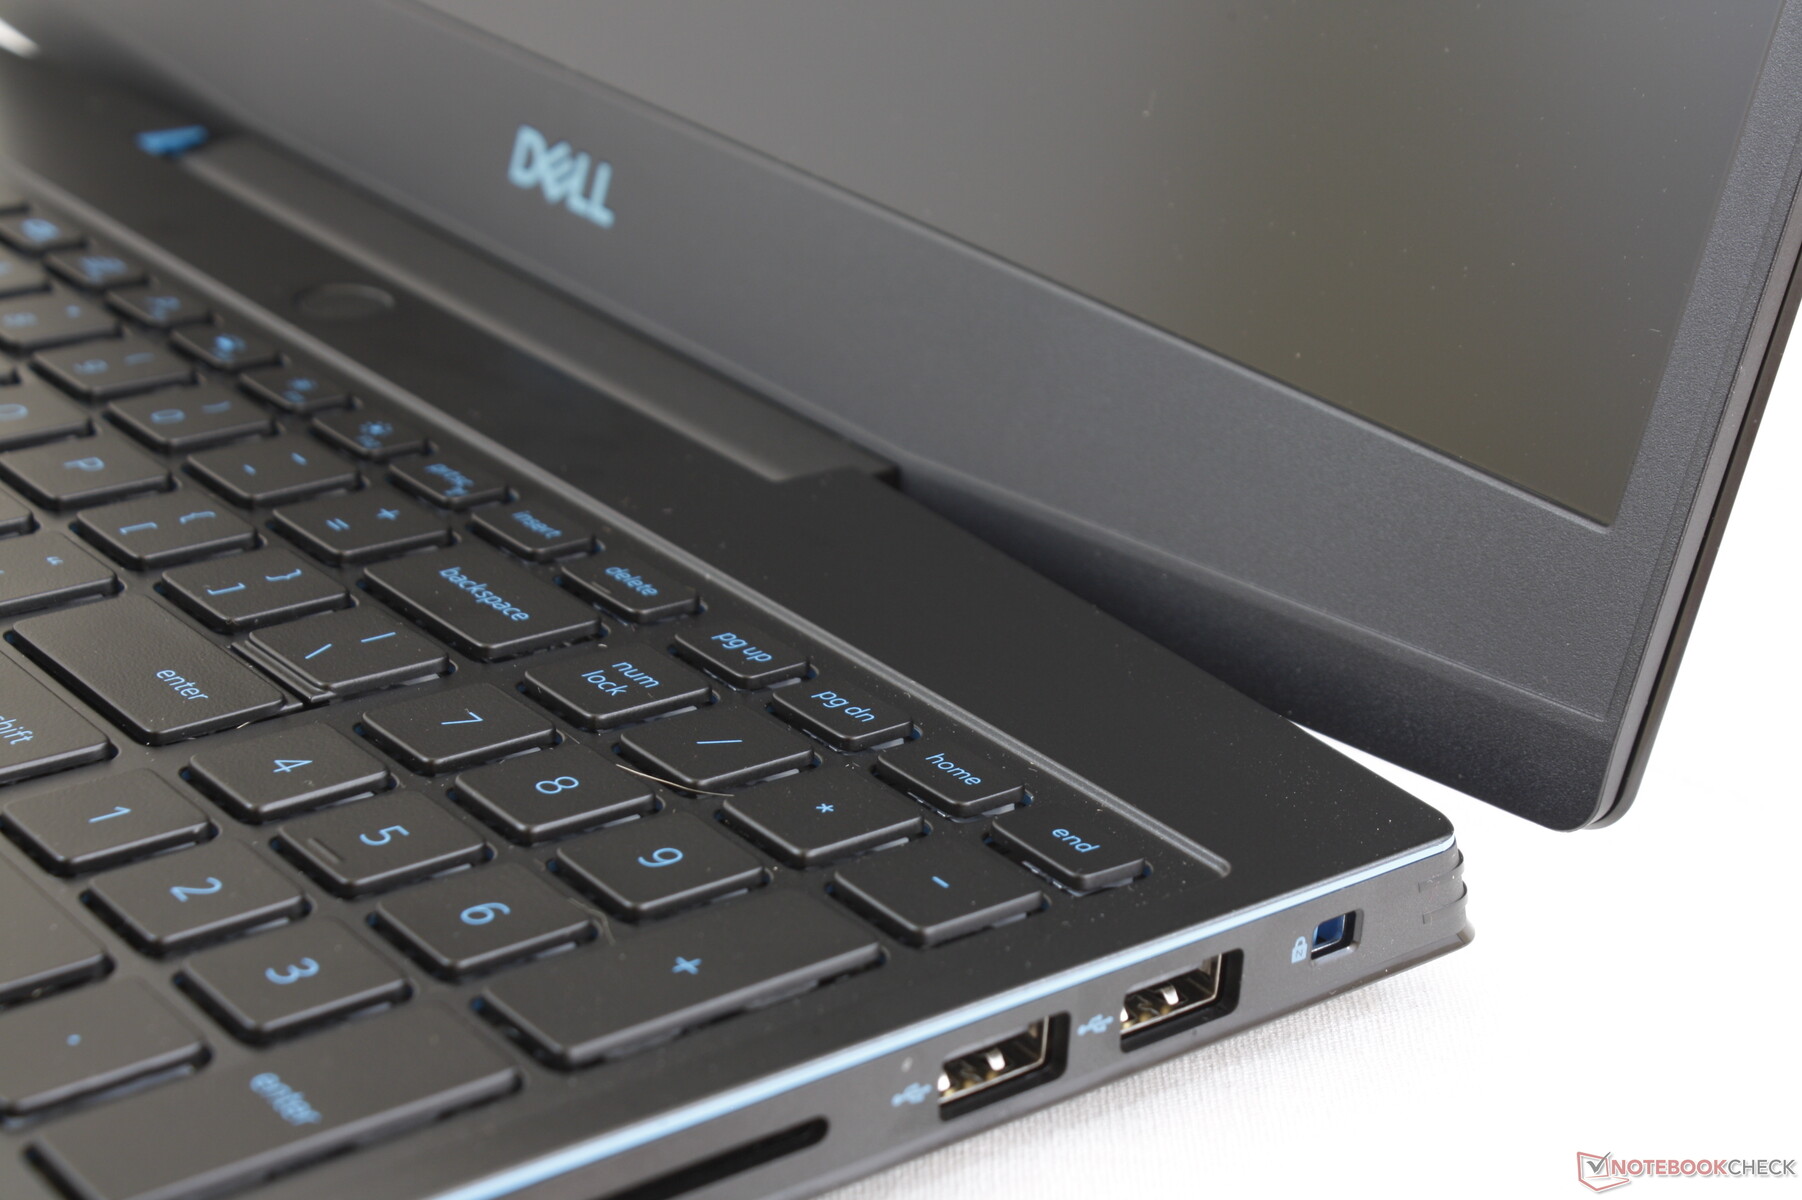
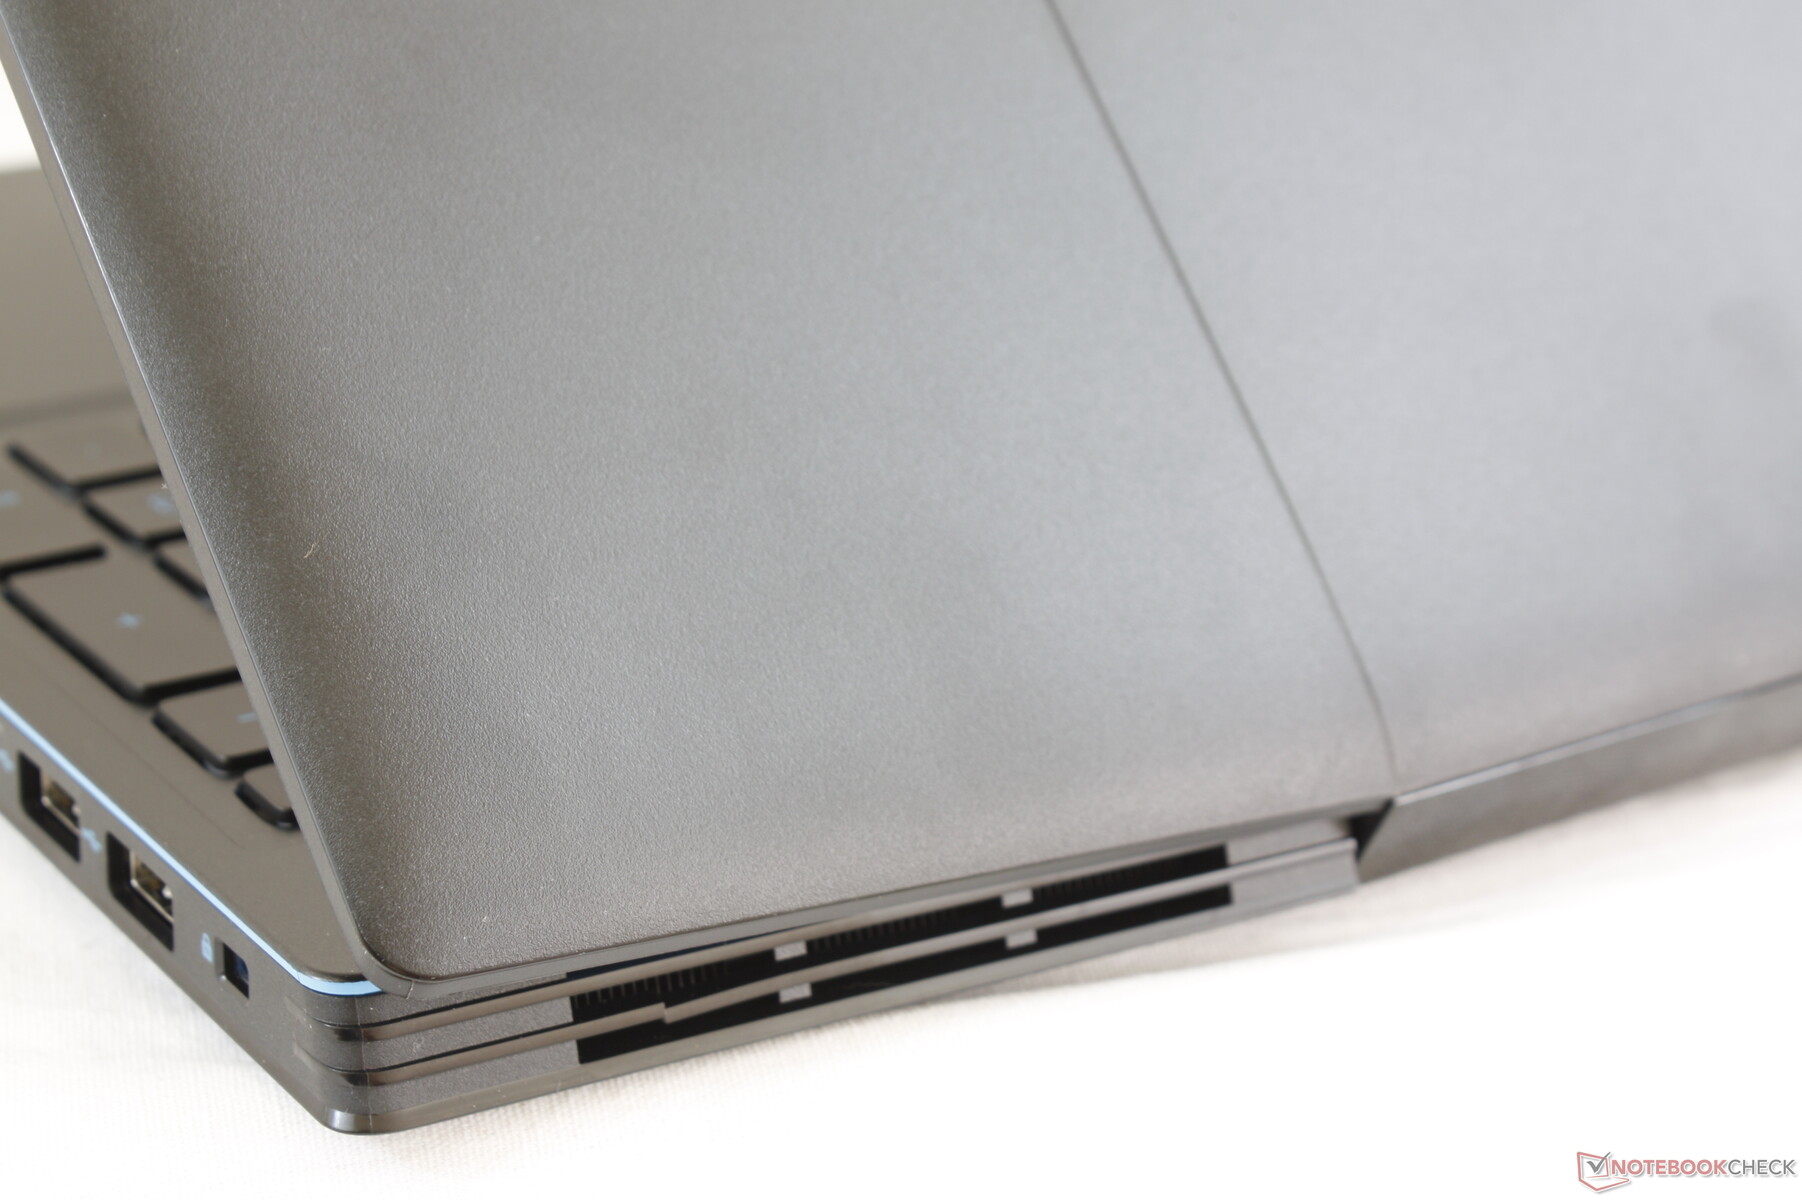
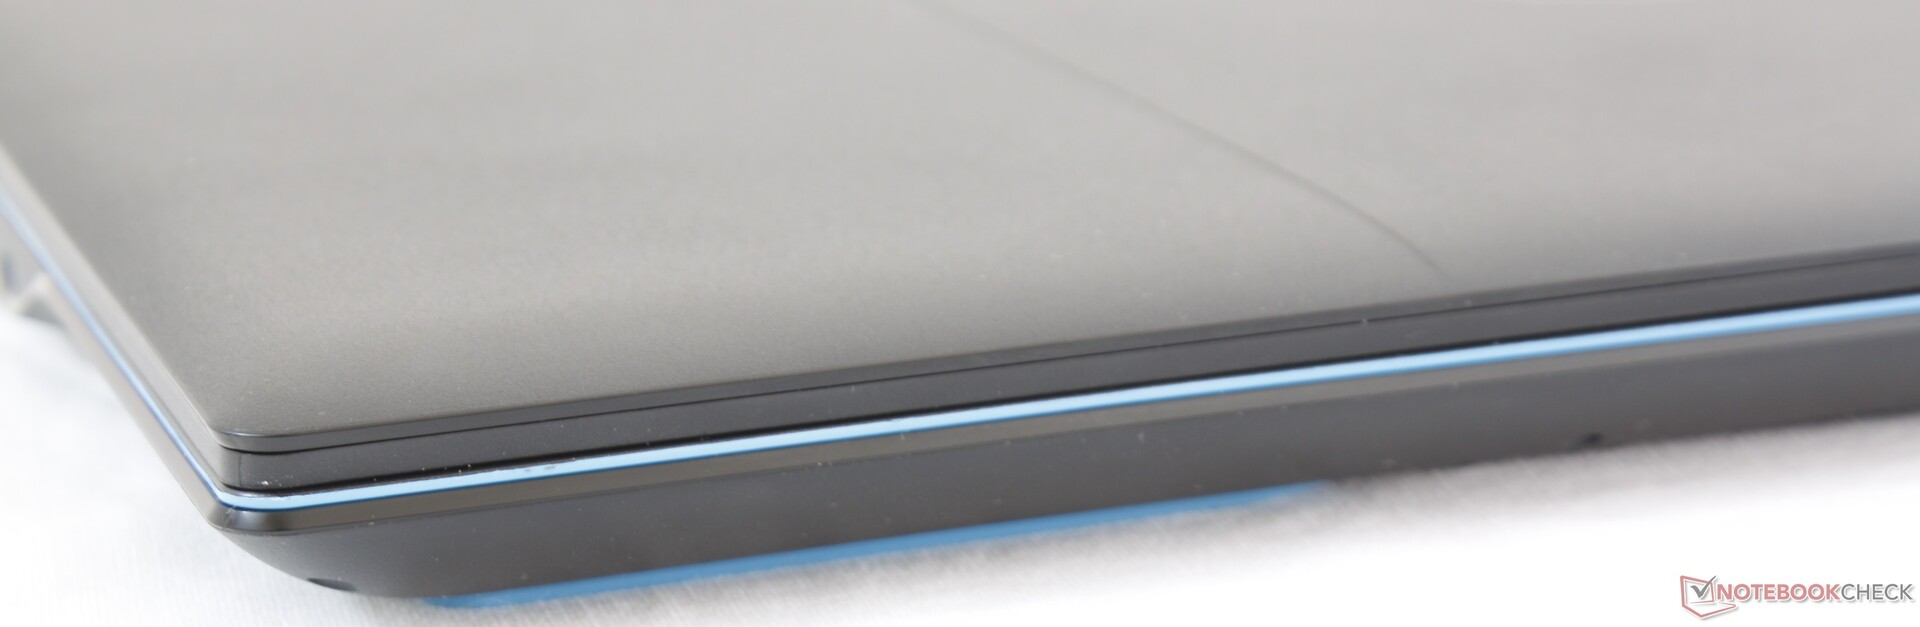
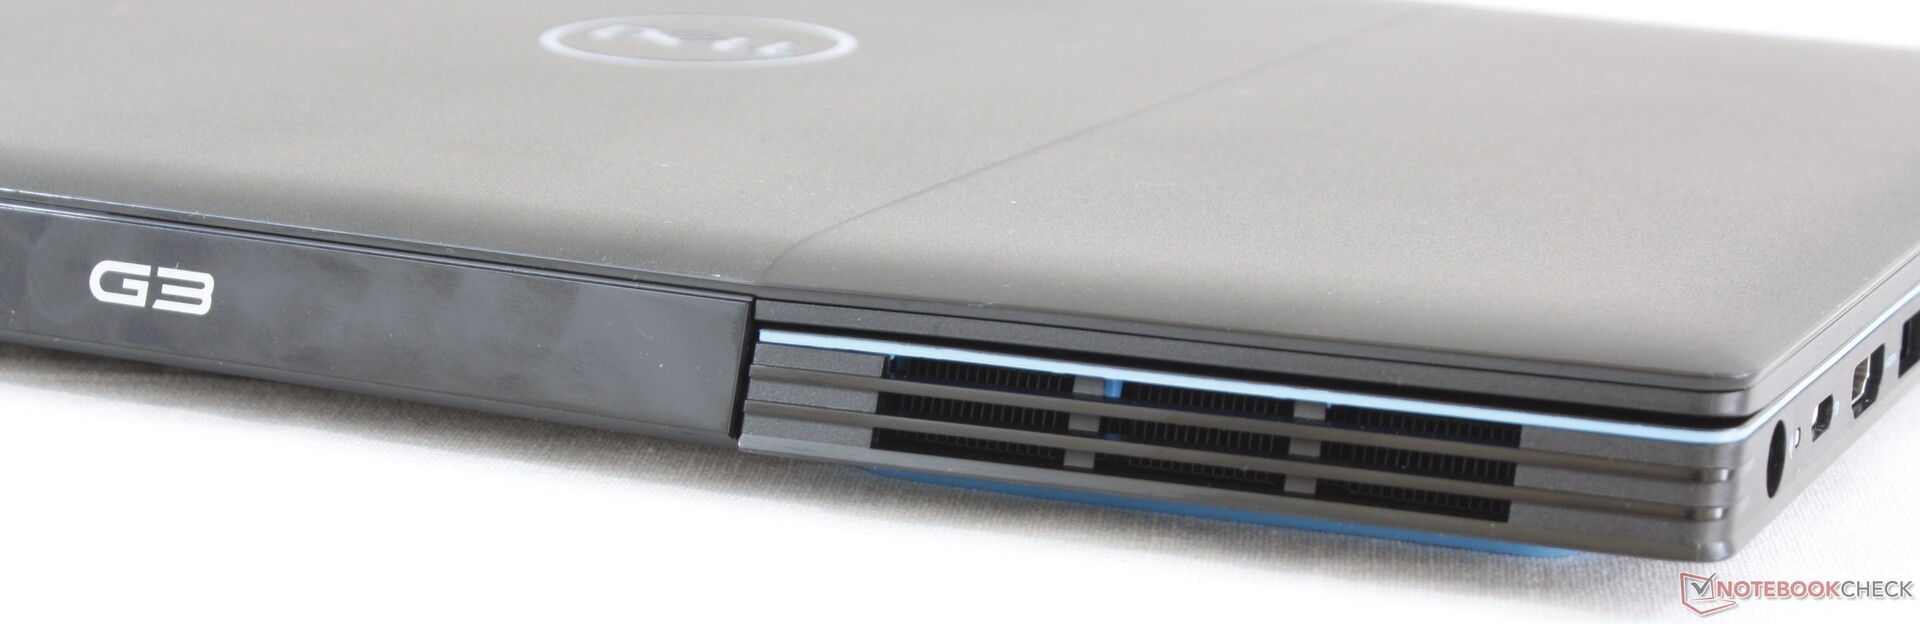
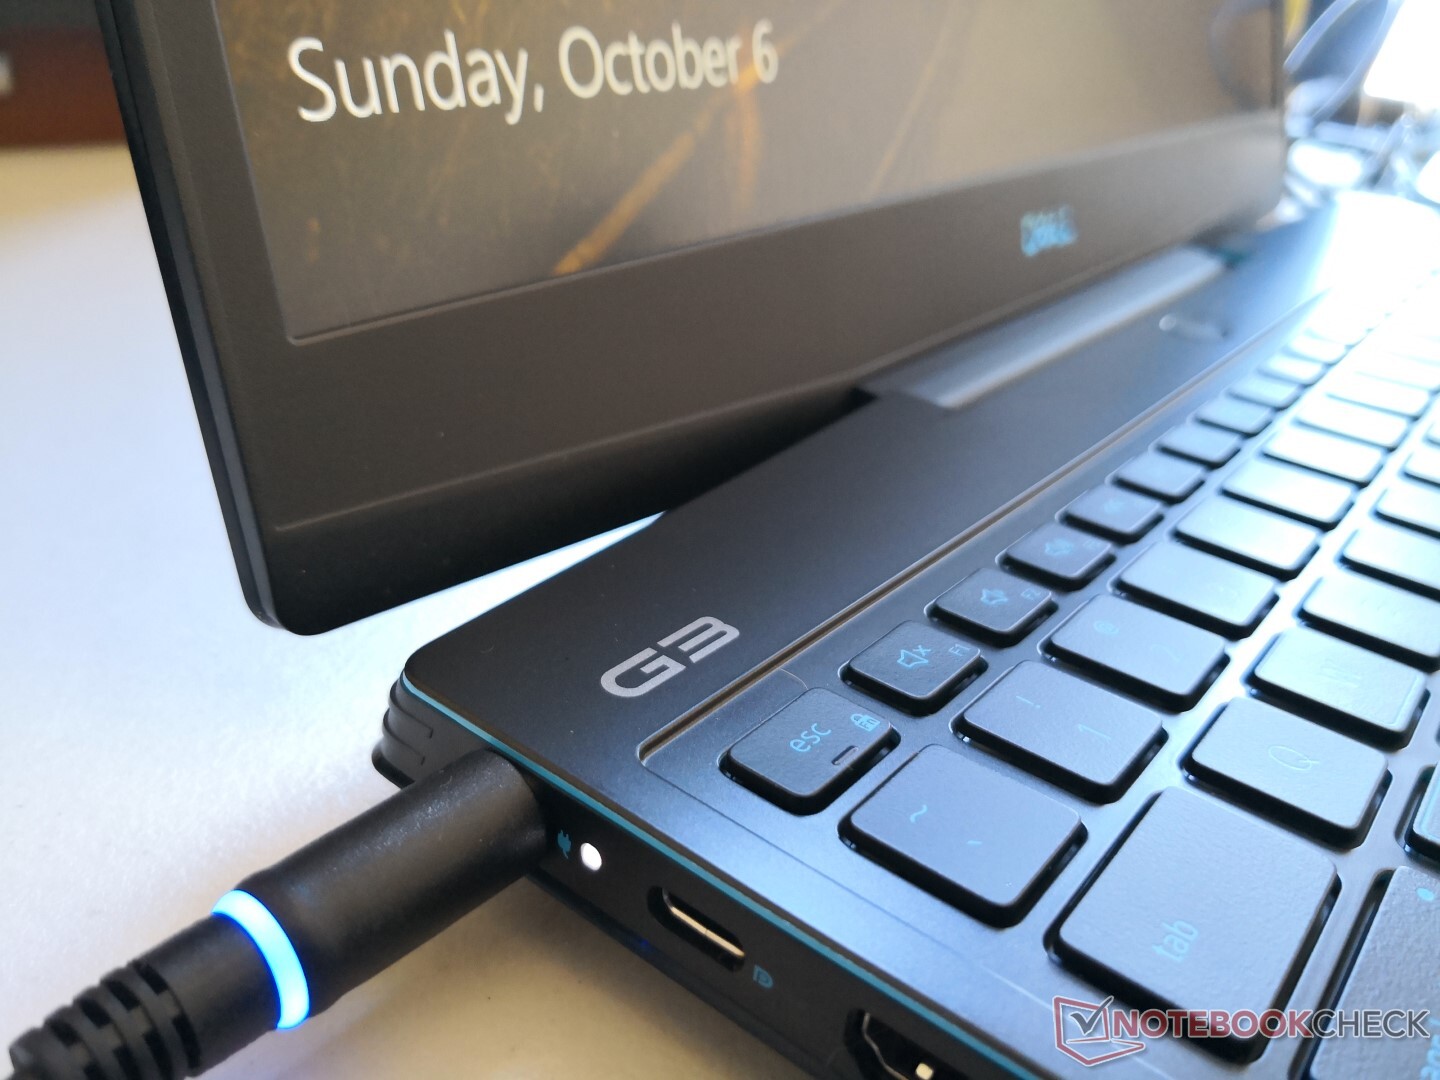
Entry-level gaming laptops tend to be mostly plastic with rounder edges and corners than their sleeker and costlier alternatives. The latest G3 laptop is no different with its smooth plastic palm rests, roughened matte plastic outer lid, and light blue accent marks all around to distinguish itself from the competition. The redesign is more "gamer-like" whereas the older G3 3579 looked too much like an HP Pavilion 15. On the other hand, characteristics like rigidity and build quality haven't changed much gen-to-gen for similar first impressions gen-to-gen.
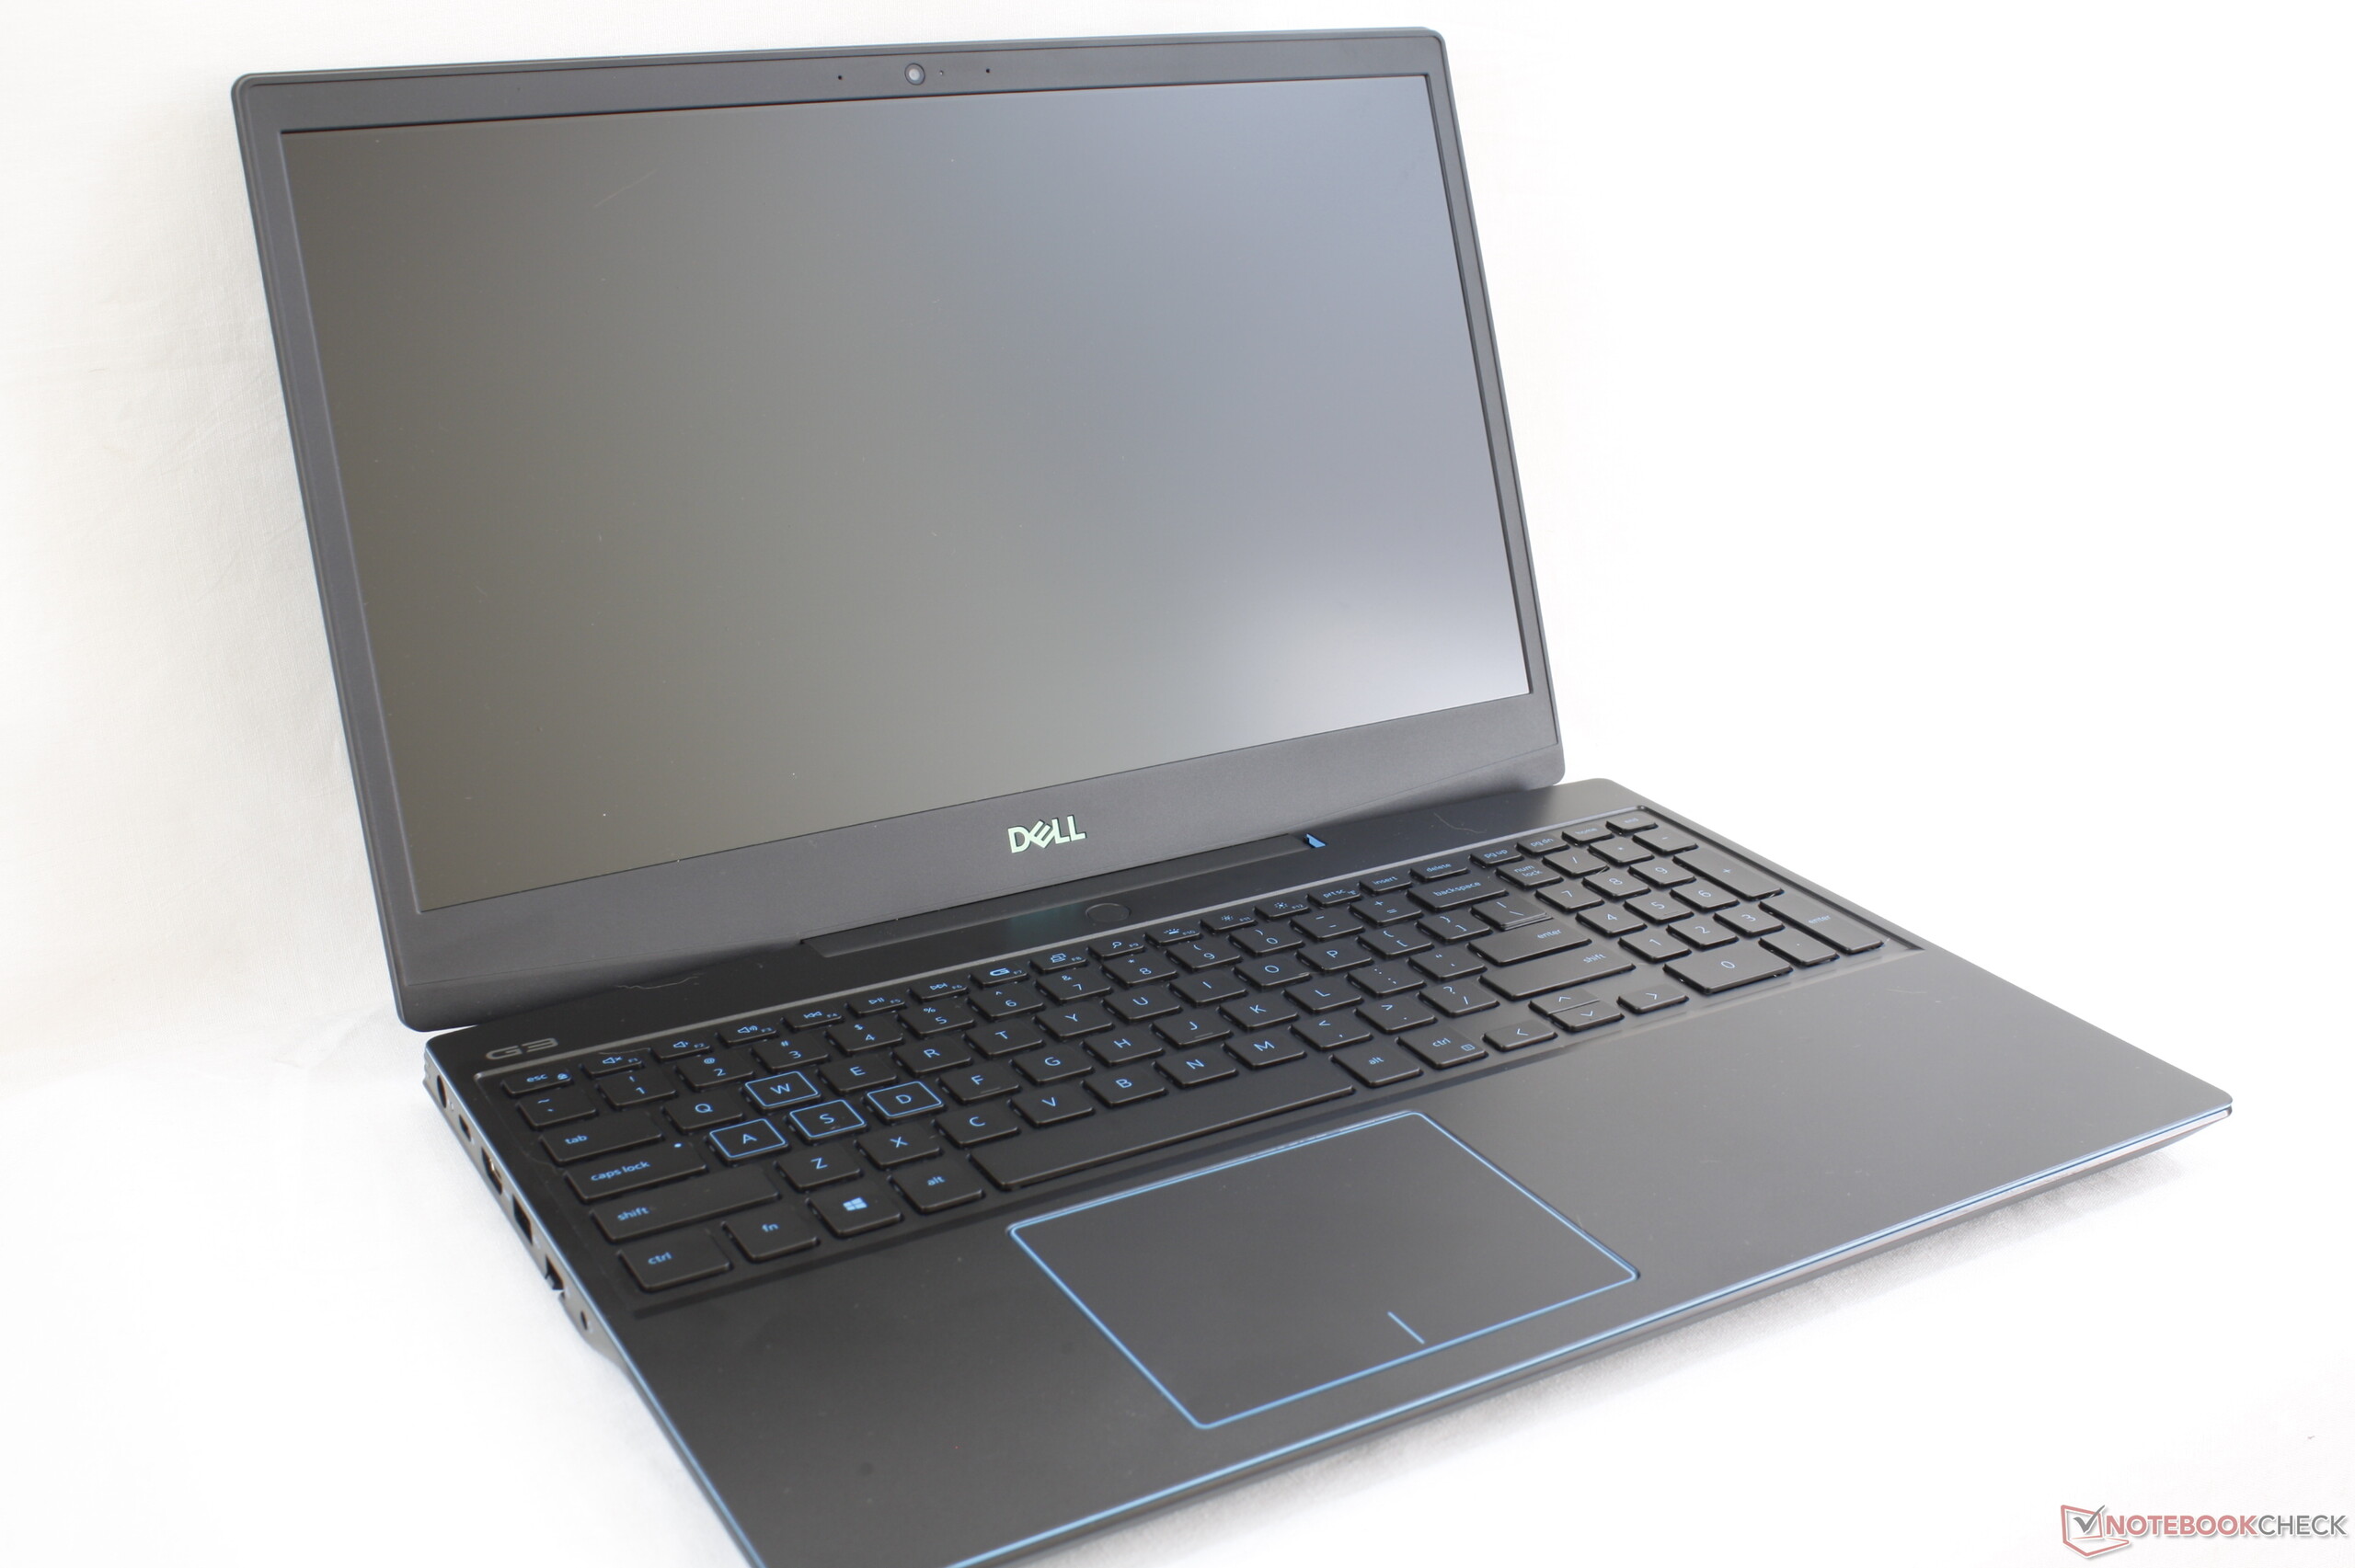
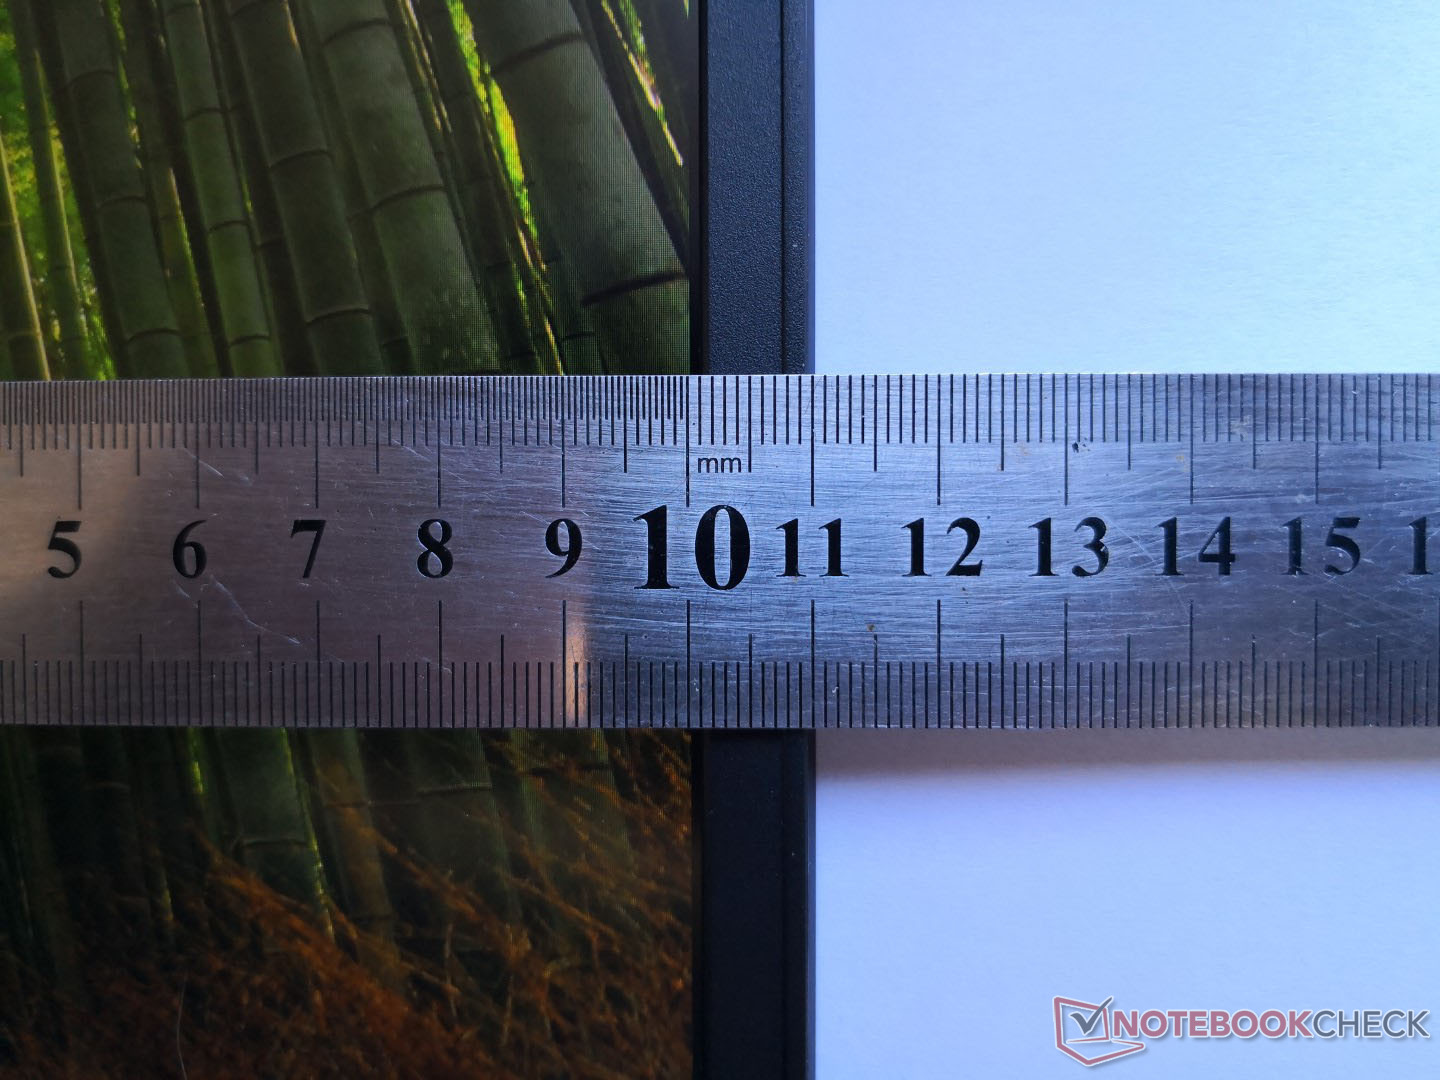
The narrower bezels of the G3 3590 when compared to the last generation G3 3579 have resulted in a smaller footprint. Even so, they still weigh about the same at roughly 2.5 kg each. Dimensions are similar to the HP Pavilion 15 Gaming, Aorus 15, and Lenovo Legion Y540 while being slightly heavier in the process.
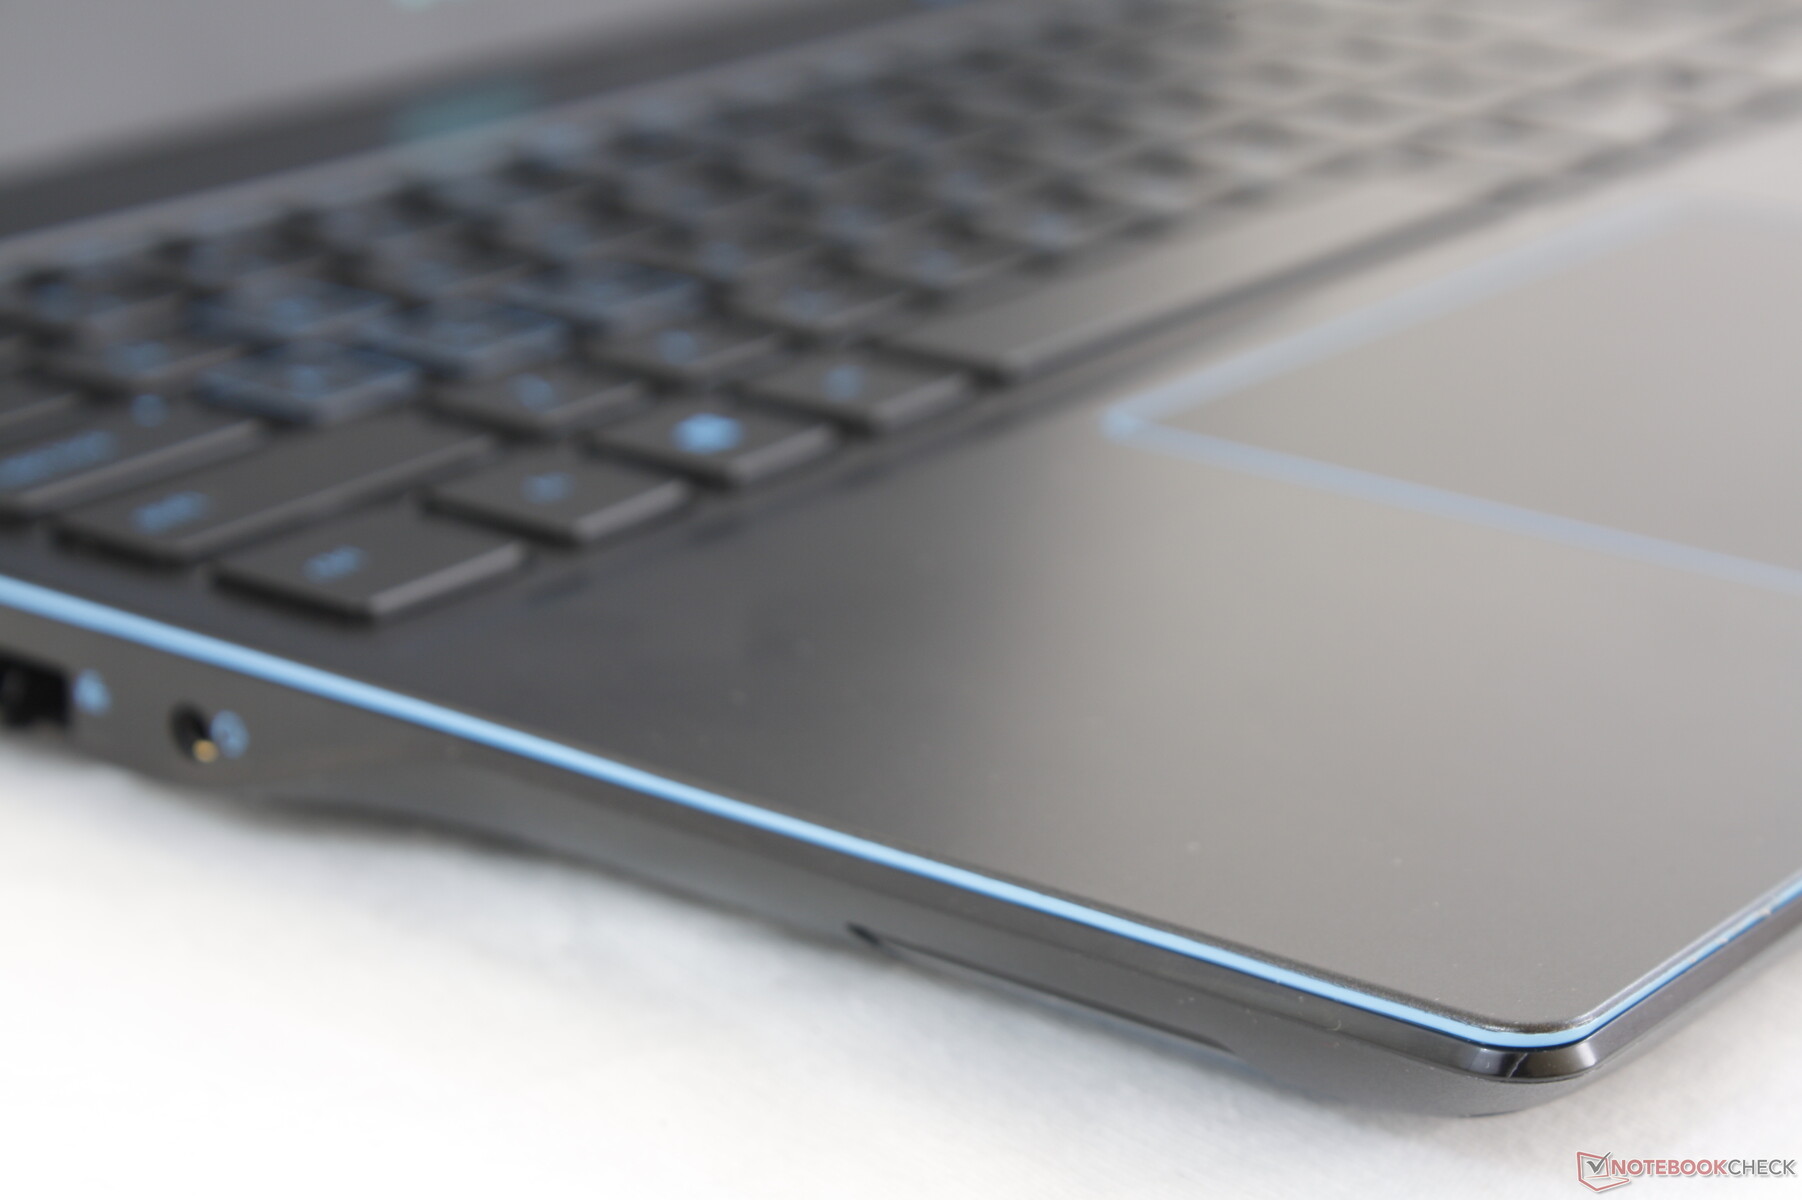
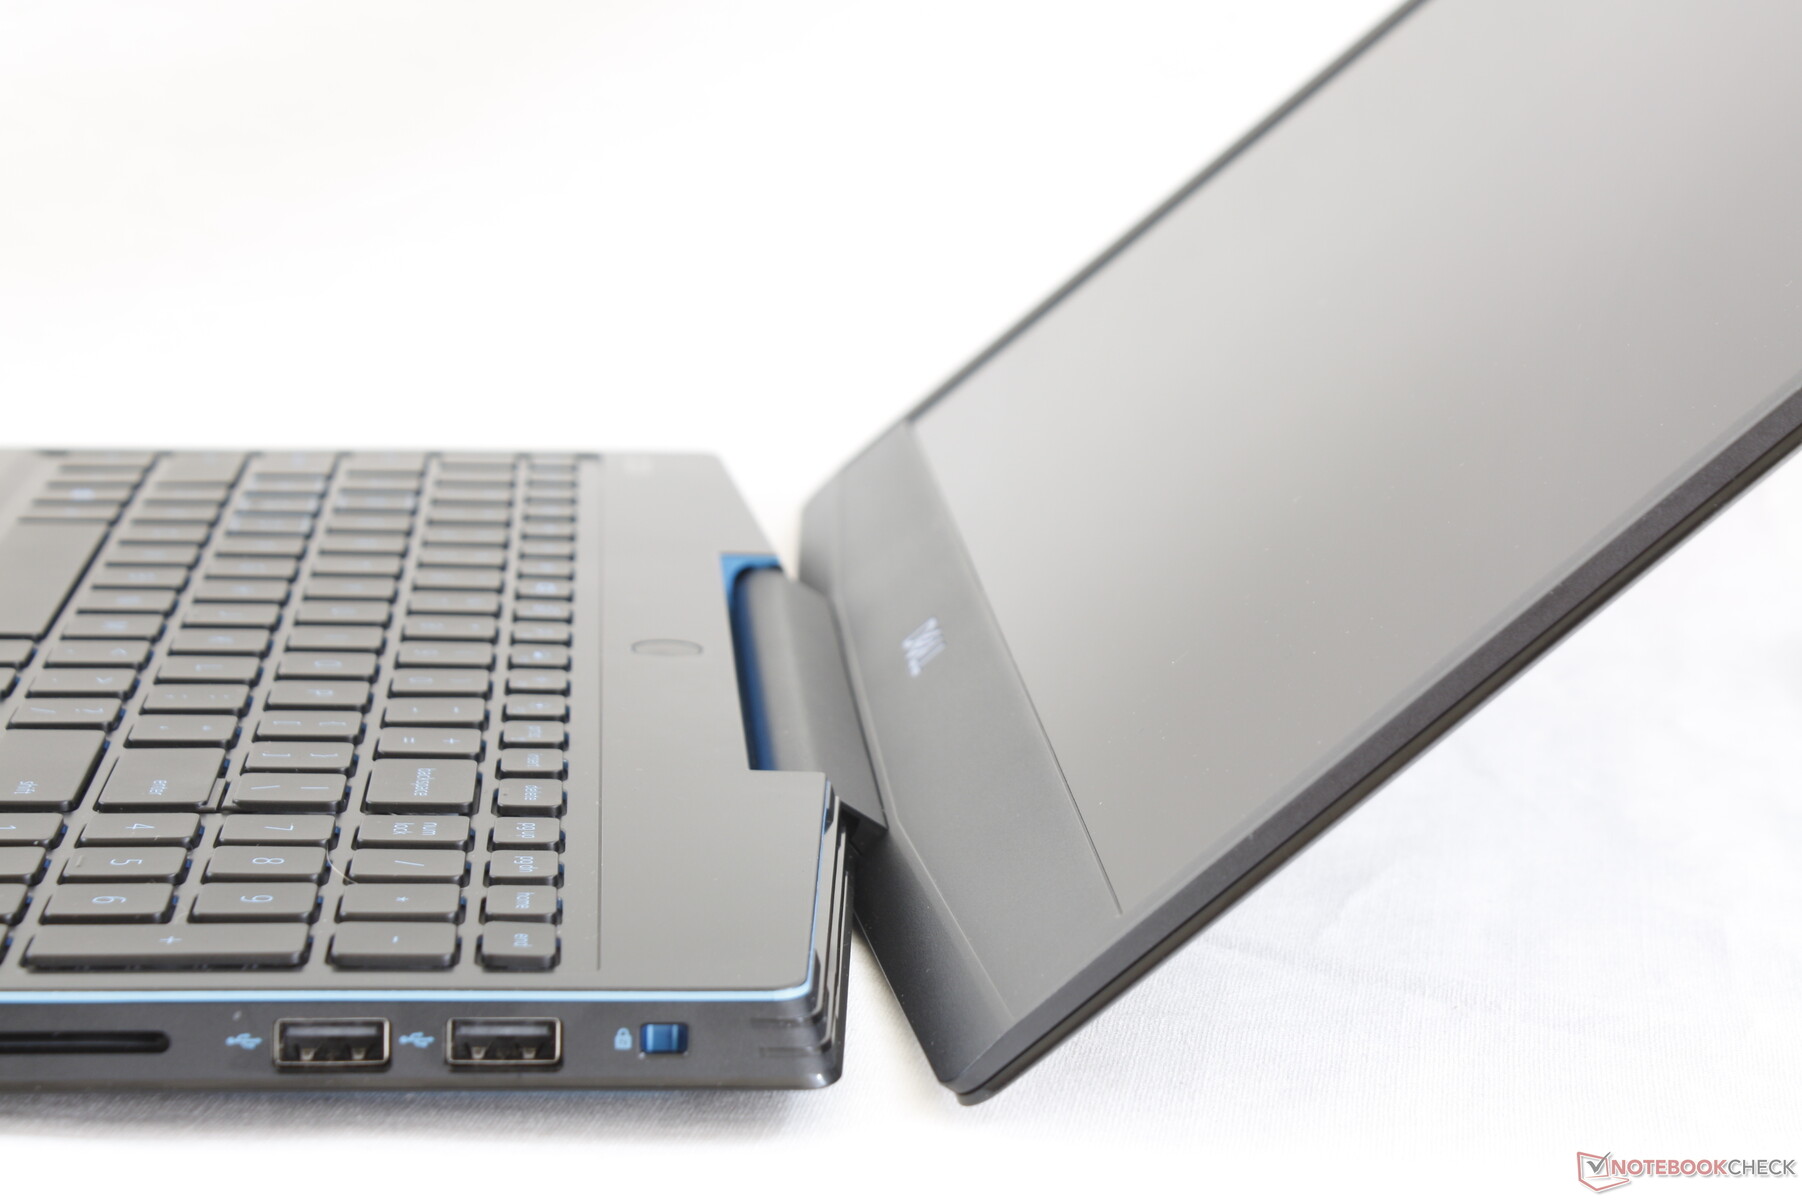
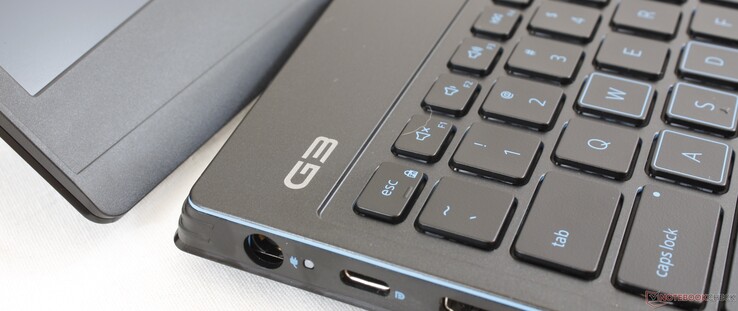
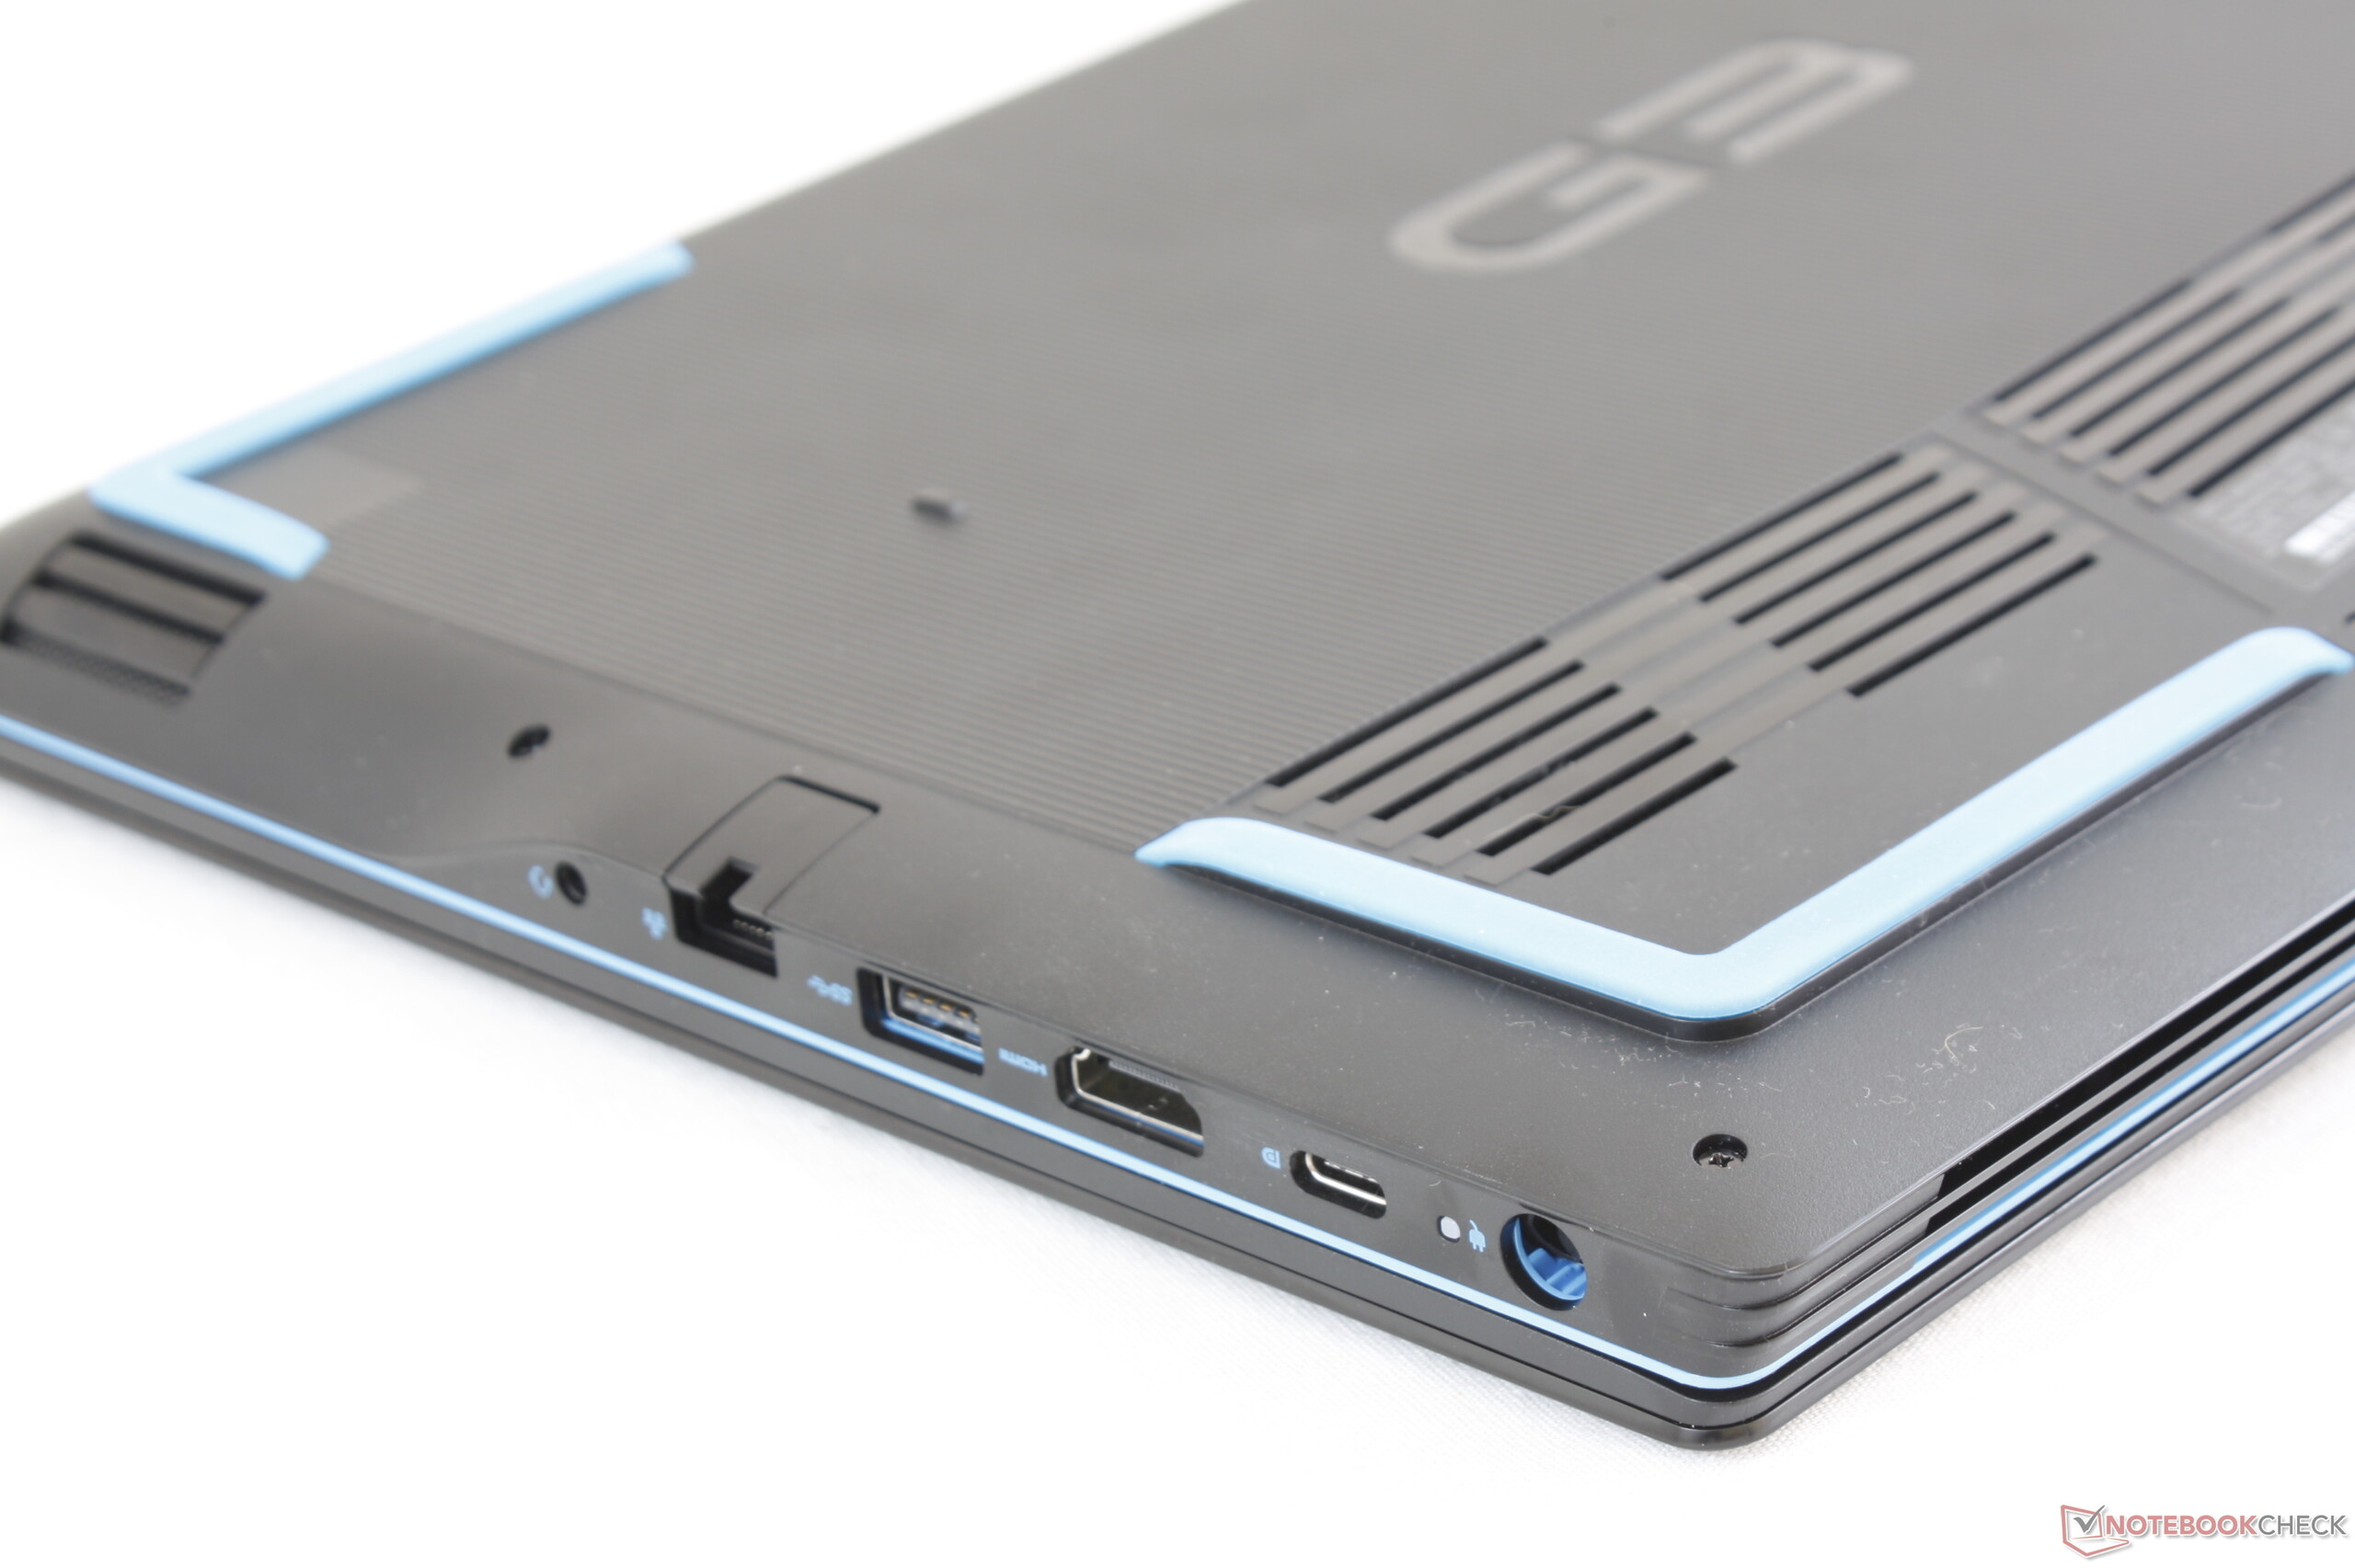
Connectivity
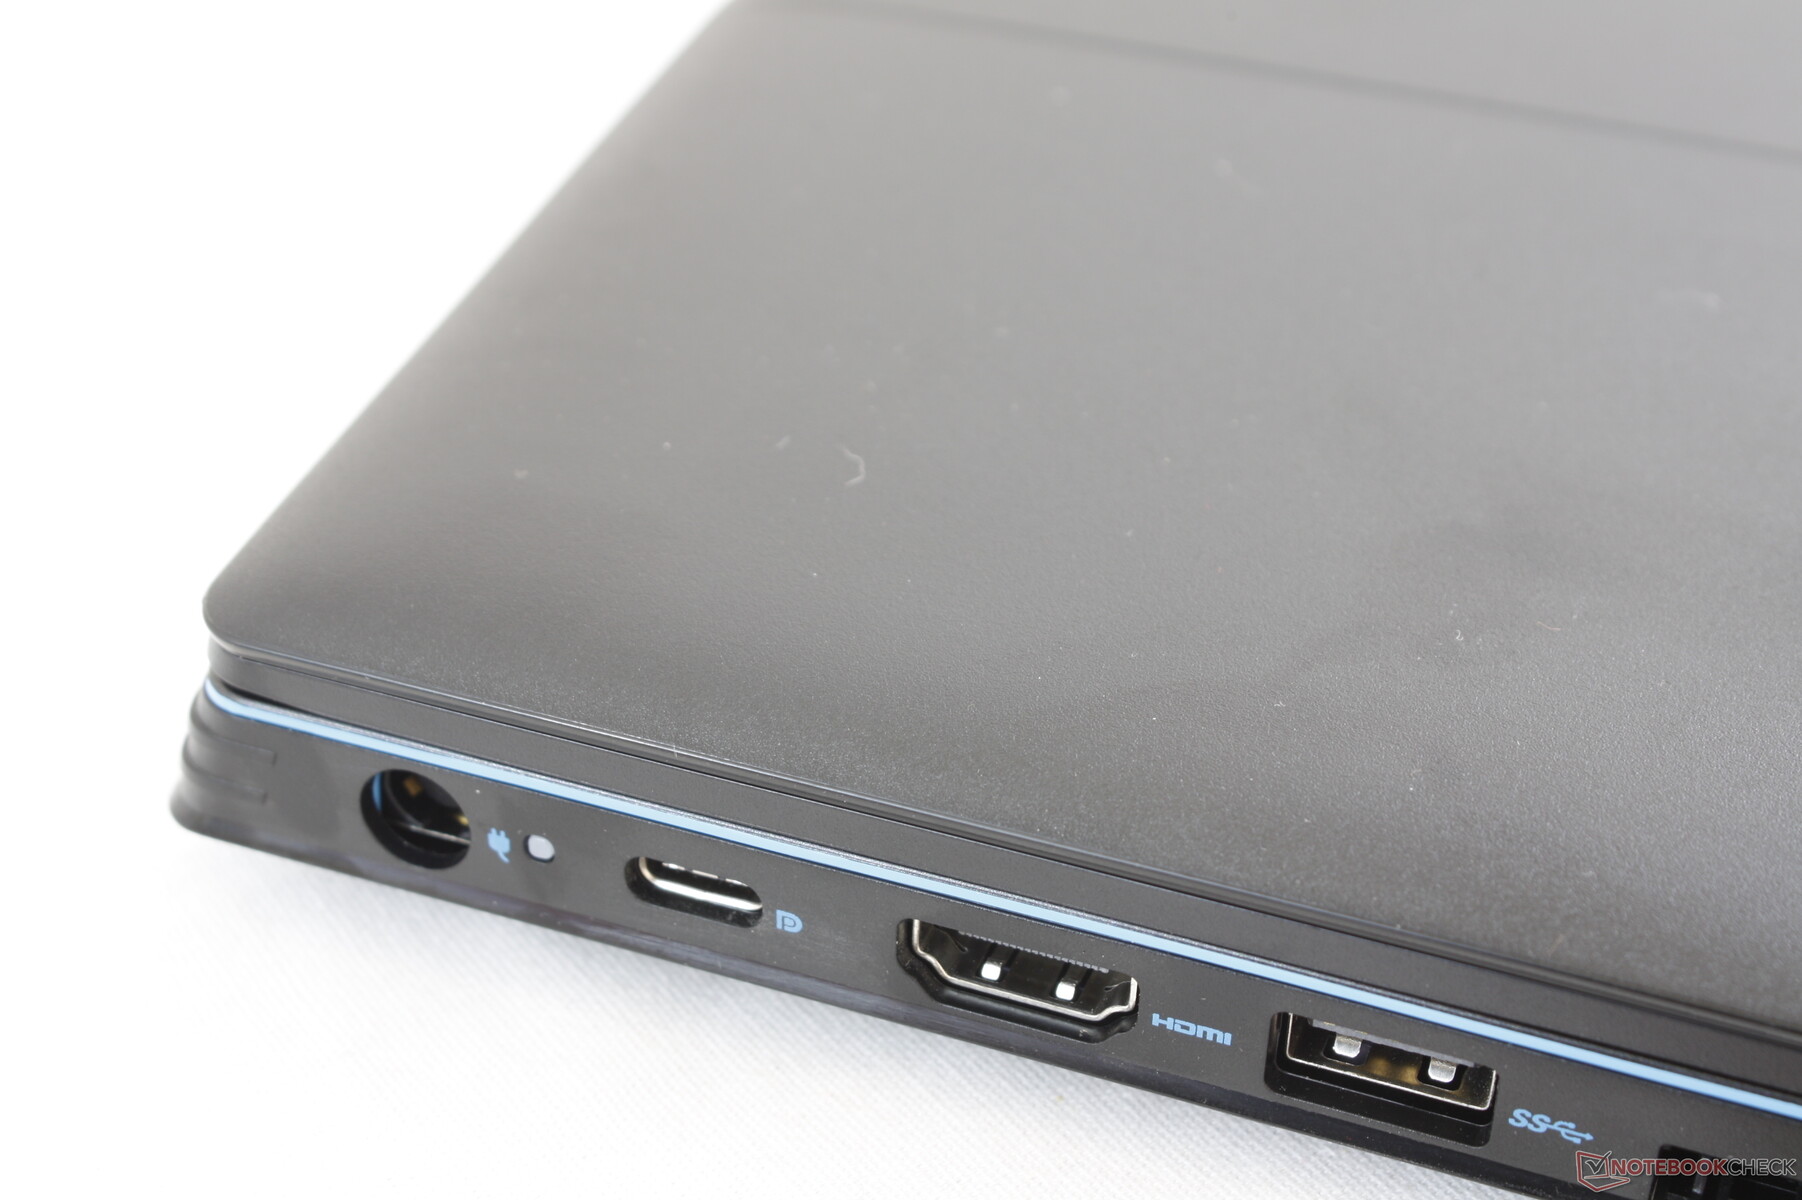
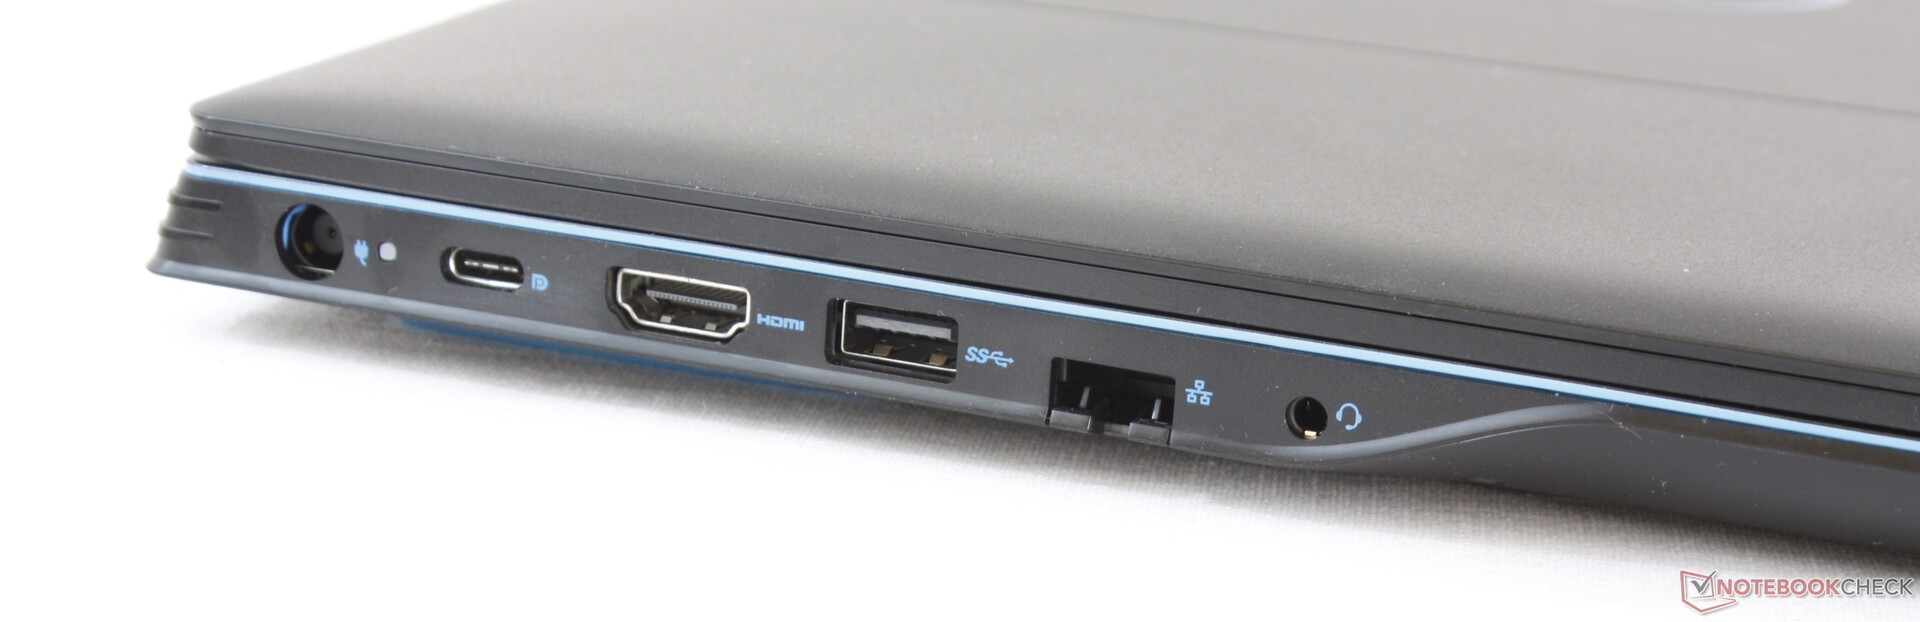
Port options include everything found on the G3 3579 but with an added USB Type-C port. Port positioning has changed slightly, but all ports remain easy to reach and evenly spaced.
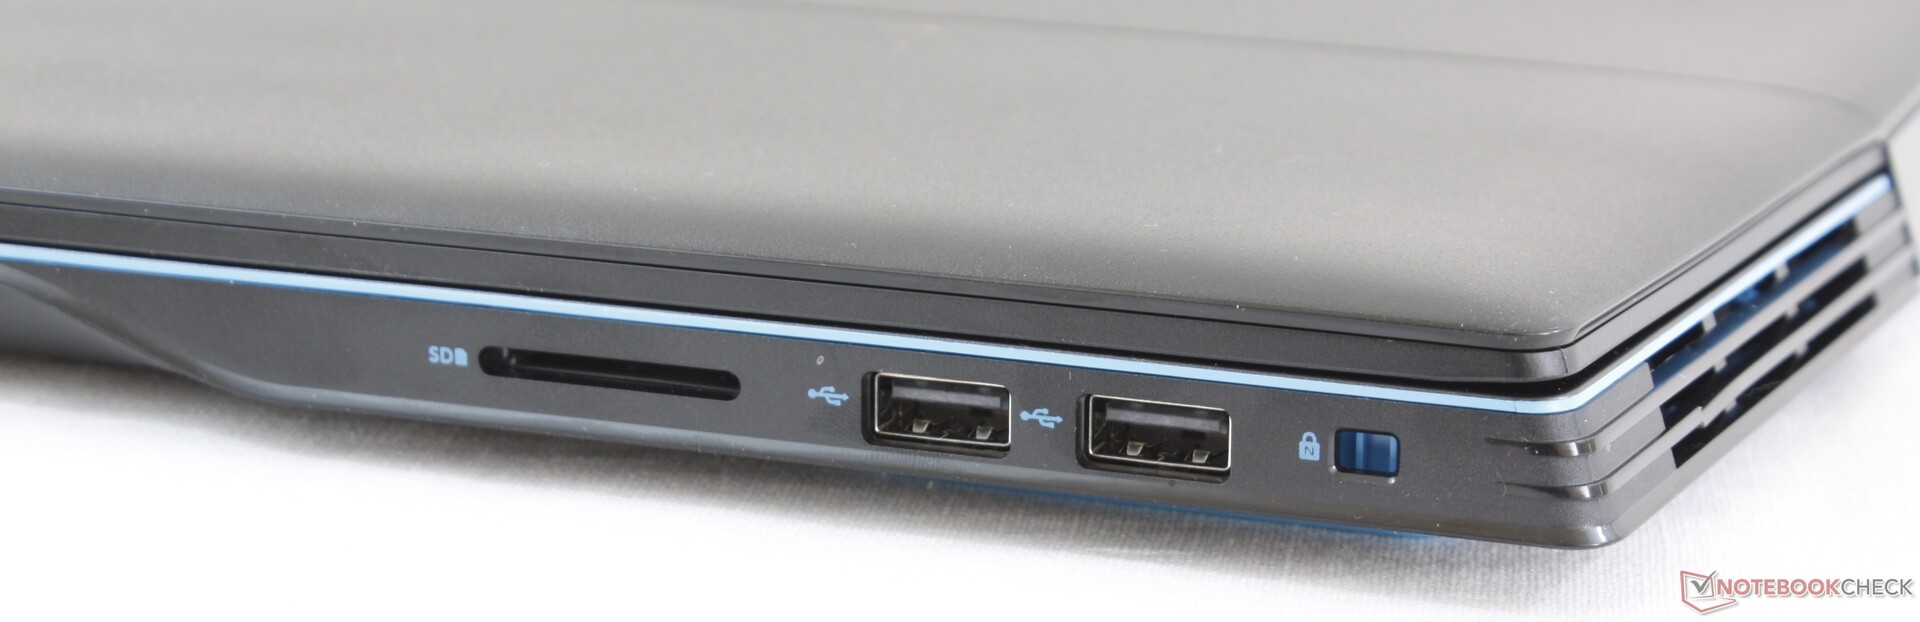
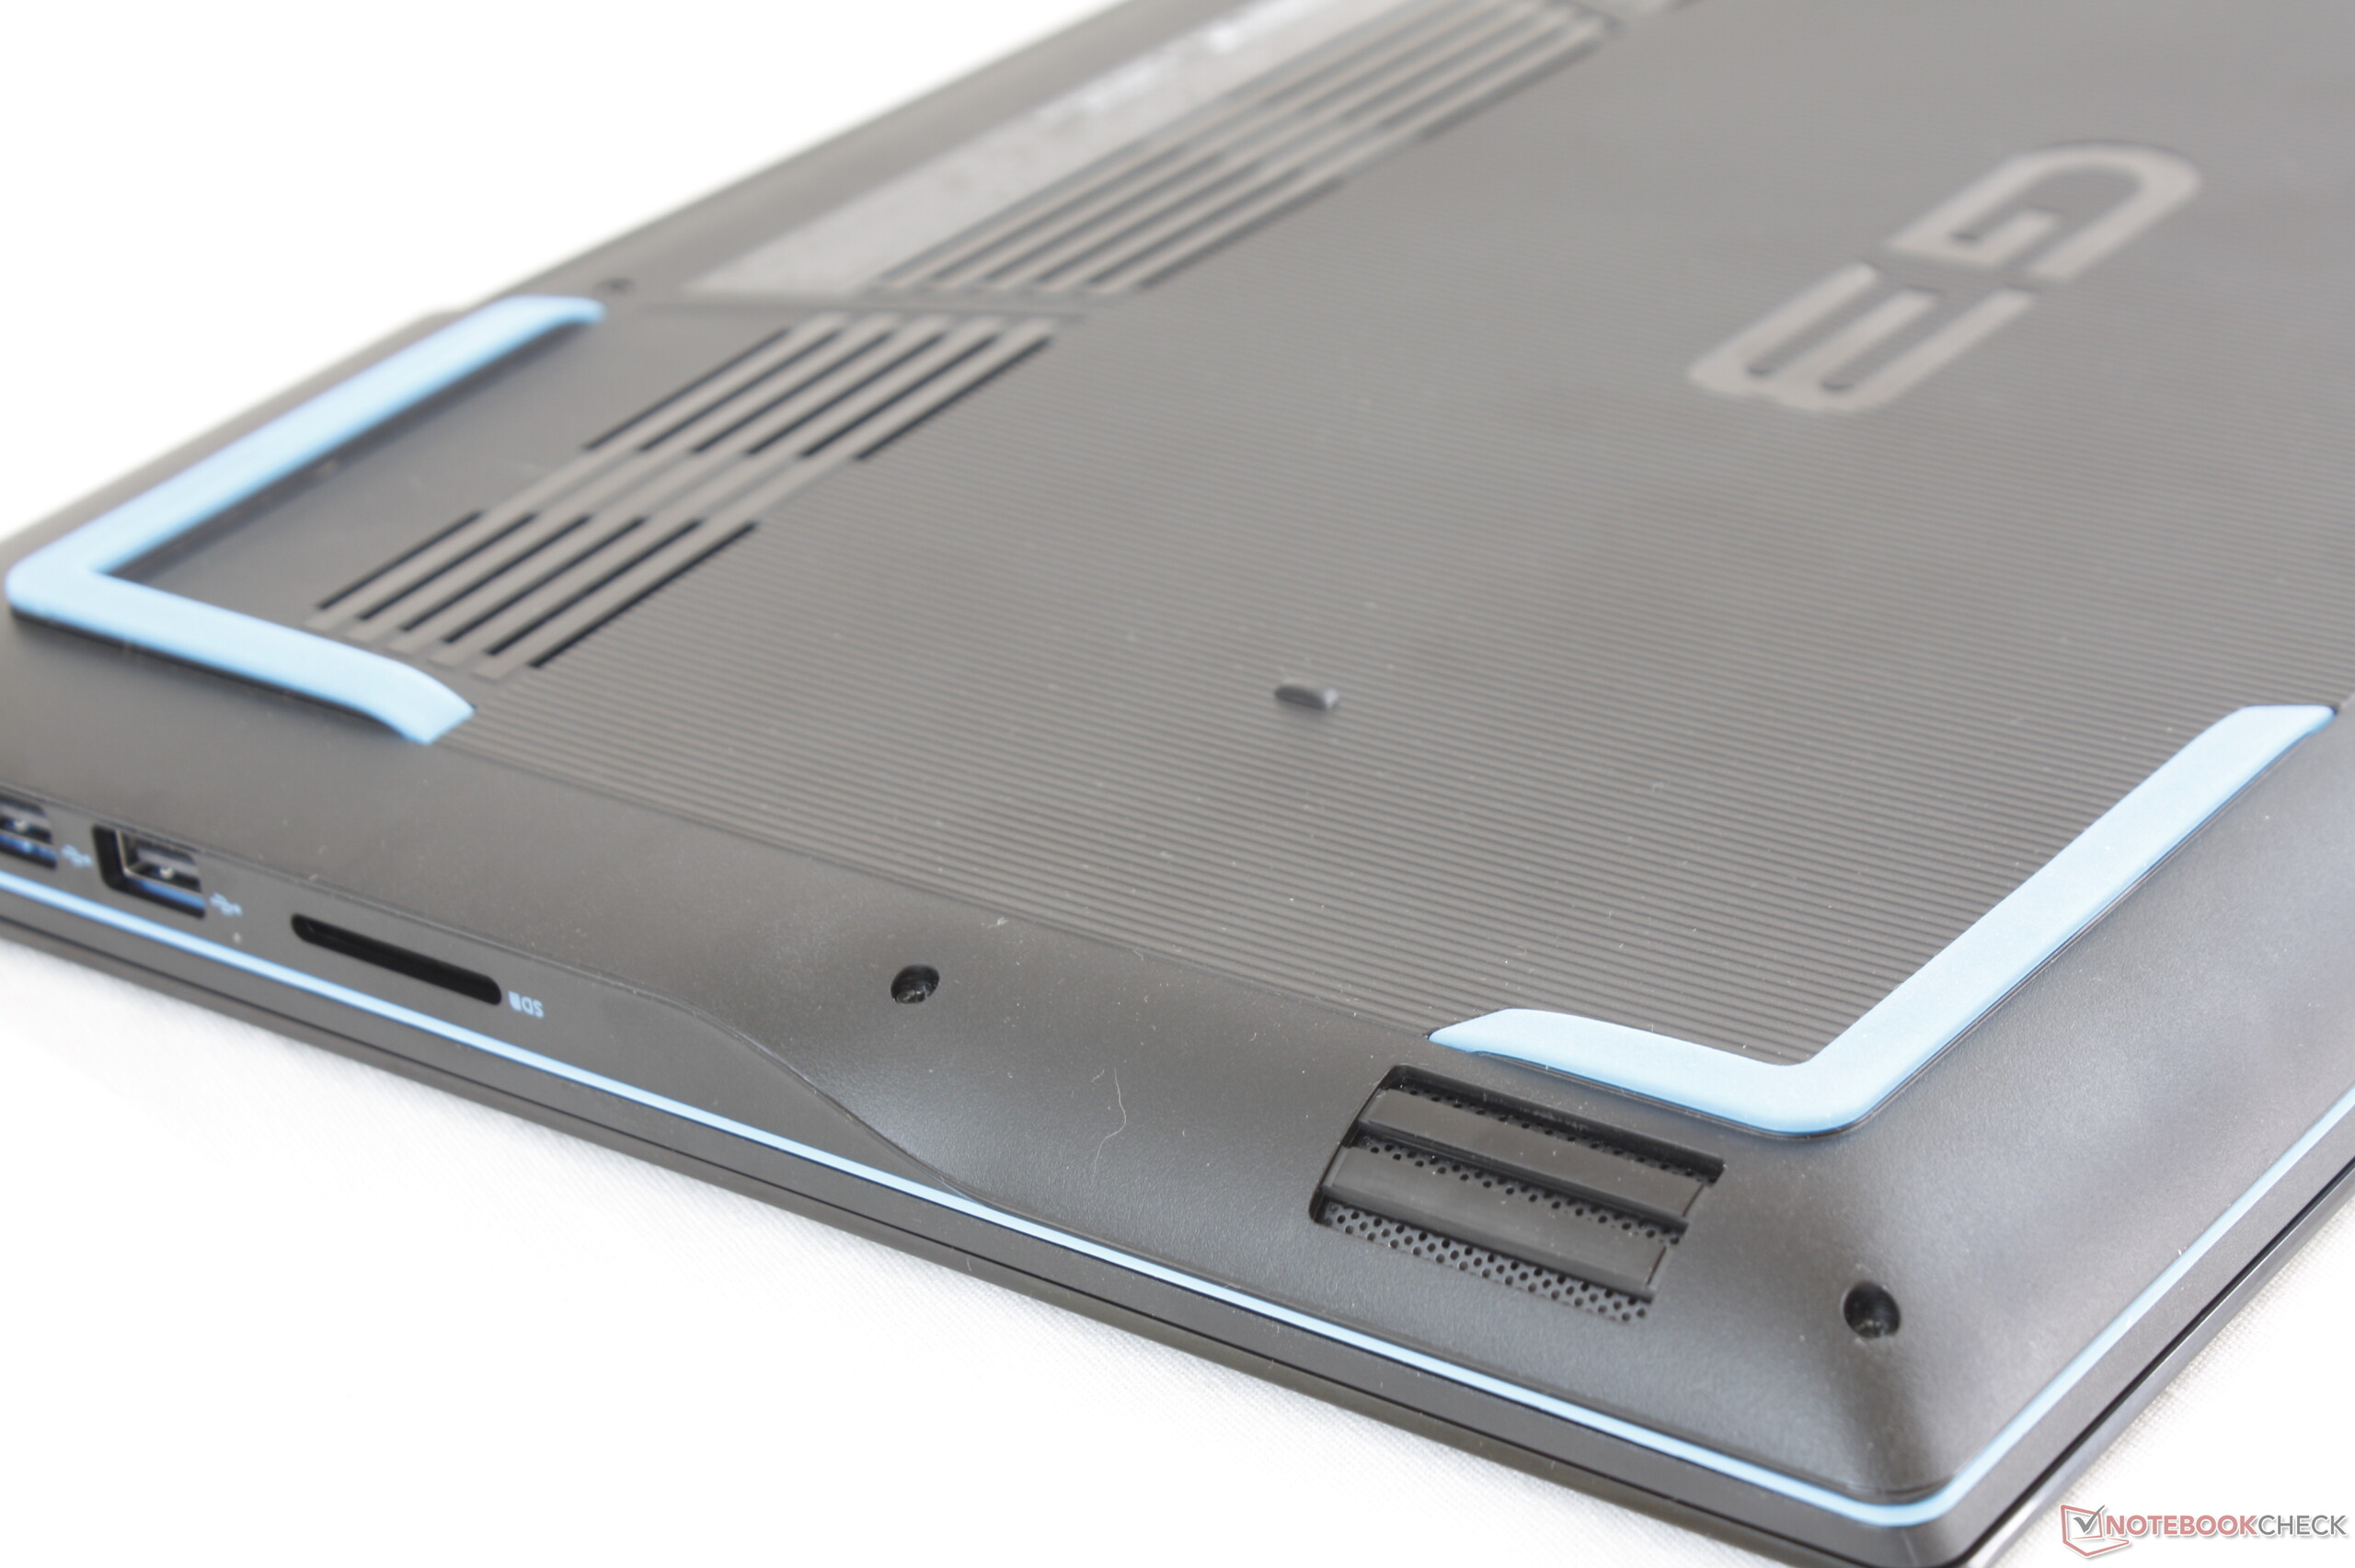
SD Card Reader
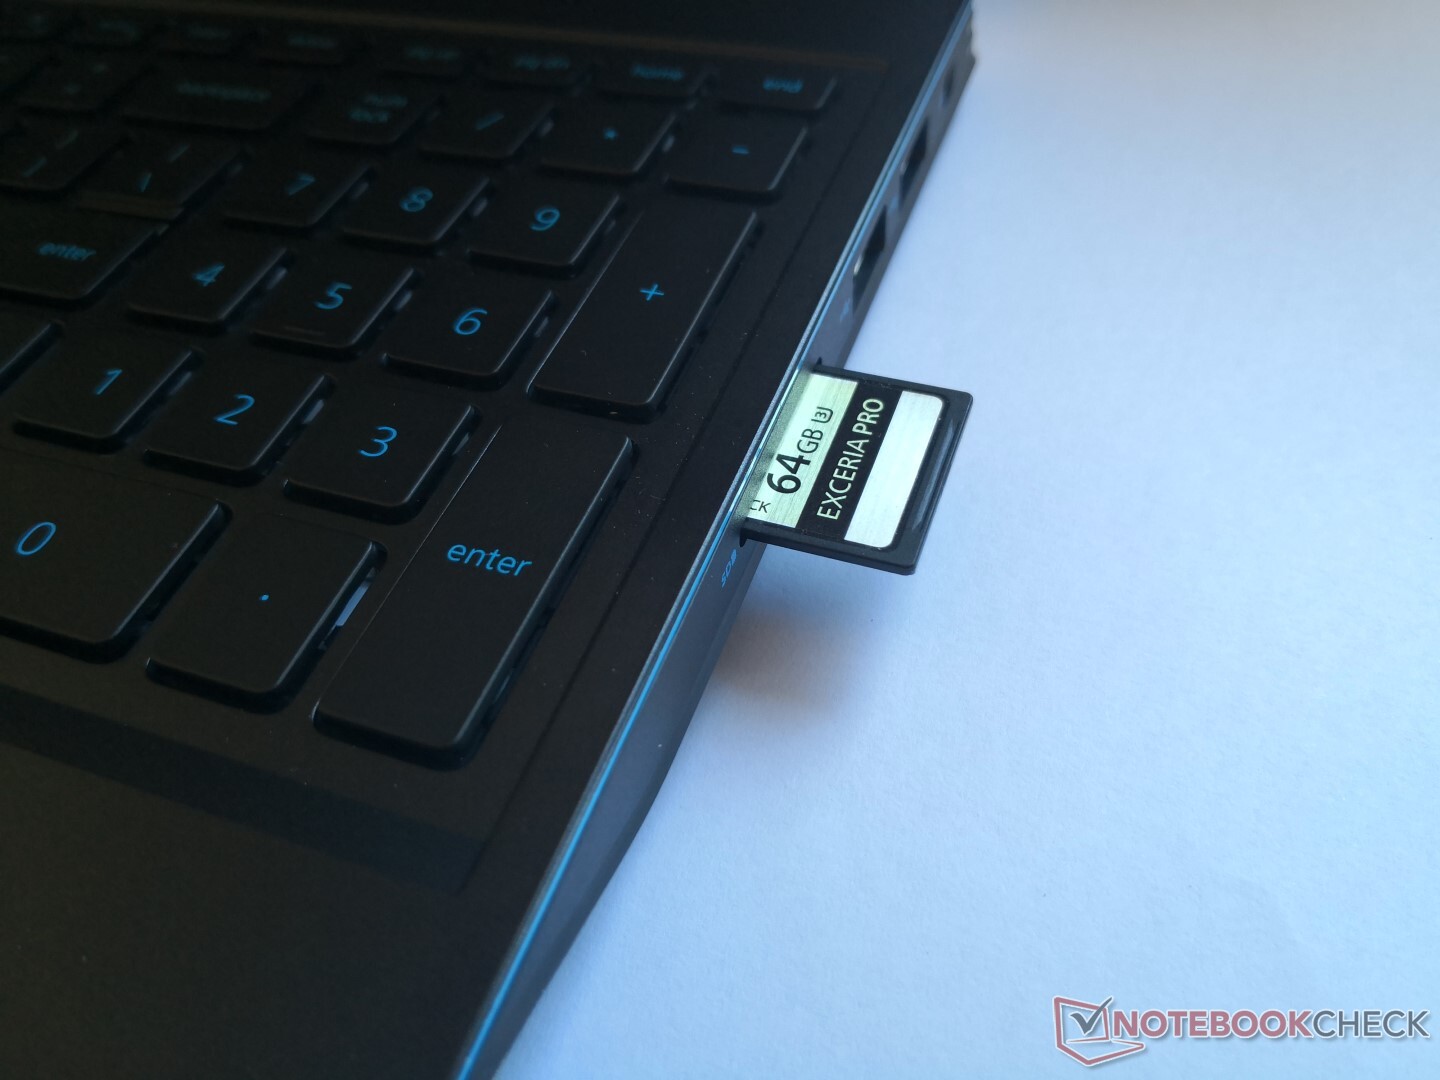
Transfer rates from the integrated SD reader have not improved over the G3 3579. Moving 1 GB worth of images from card to desktop takes about 50 seconds compared to just 6 to 7 seconds on the XPS 15. A fully inserted card will still protrude by over half its length for unsafe transporting.
| SD Card Reader | |
| average JPG Copy Test (av. of 3 runs) | |
| HP Gaming Pavilion 15-dk0009ng (Toshiba Exceria Pro SDXC 64 GB UHS-II) | |
| Dell G3 15 3579 (Toshiba Exceria Pro SDXC 64 GB UHS-II) | |
| Dell G3 3590 (Toshiba Exceria Pro SDXC 64 GB UHS-II) | |
| maximum AS SSD Seq Read Test (1GB) | |
| HP Gaming Pavilion 15-dk0009ng (Toshiba Exceria Pro SDXC 64 GB UHS-II) | |
| Dell G3 3590 (Toshiba Exceria Pro SDXC 64 GB UHS-II) | |
| Dell G3 15 3579 (Toshiba Exceria Pro SDXC 64 GB UHS-II) | |
Communication
The budget Qualcomm Atheros QCA9377 is a 1x1 802.11ac module with integrated Bluetooth 5. Thus, theoretical transfer rates are limited to just 433 Mbps compared to 1.73 Gbps or greater on most modern Ultrabooks likely to save on costs. We experienced no connectivity issues during our time with the system.
| Networking | |
| iperf3 transmit AX12 | |
| Aorus 15-SA | |
| Lenovo Legion Y540-15IRH-81SX00B2GE | |
| Alienware m15 R2 P87F | |
| Dell G3 15 3579 | |
| Dell G3 3590 | |
| iperf3 receive AX12 | |
| Aorus 15-SA | |
| Alienware m15 R2 P87F | |
| Lenovo Legion Y540-15IRH-81SX00B2GE | |
| Dell G3 3590 | |
| Dell G3 15 3579 | |
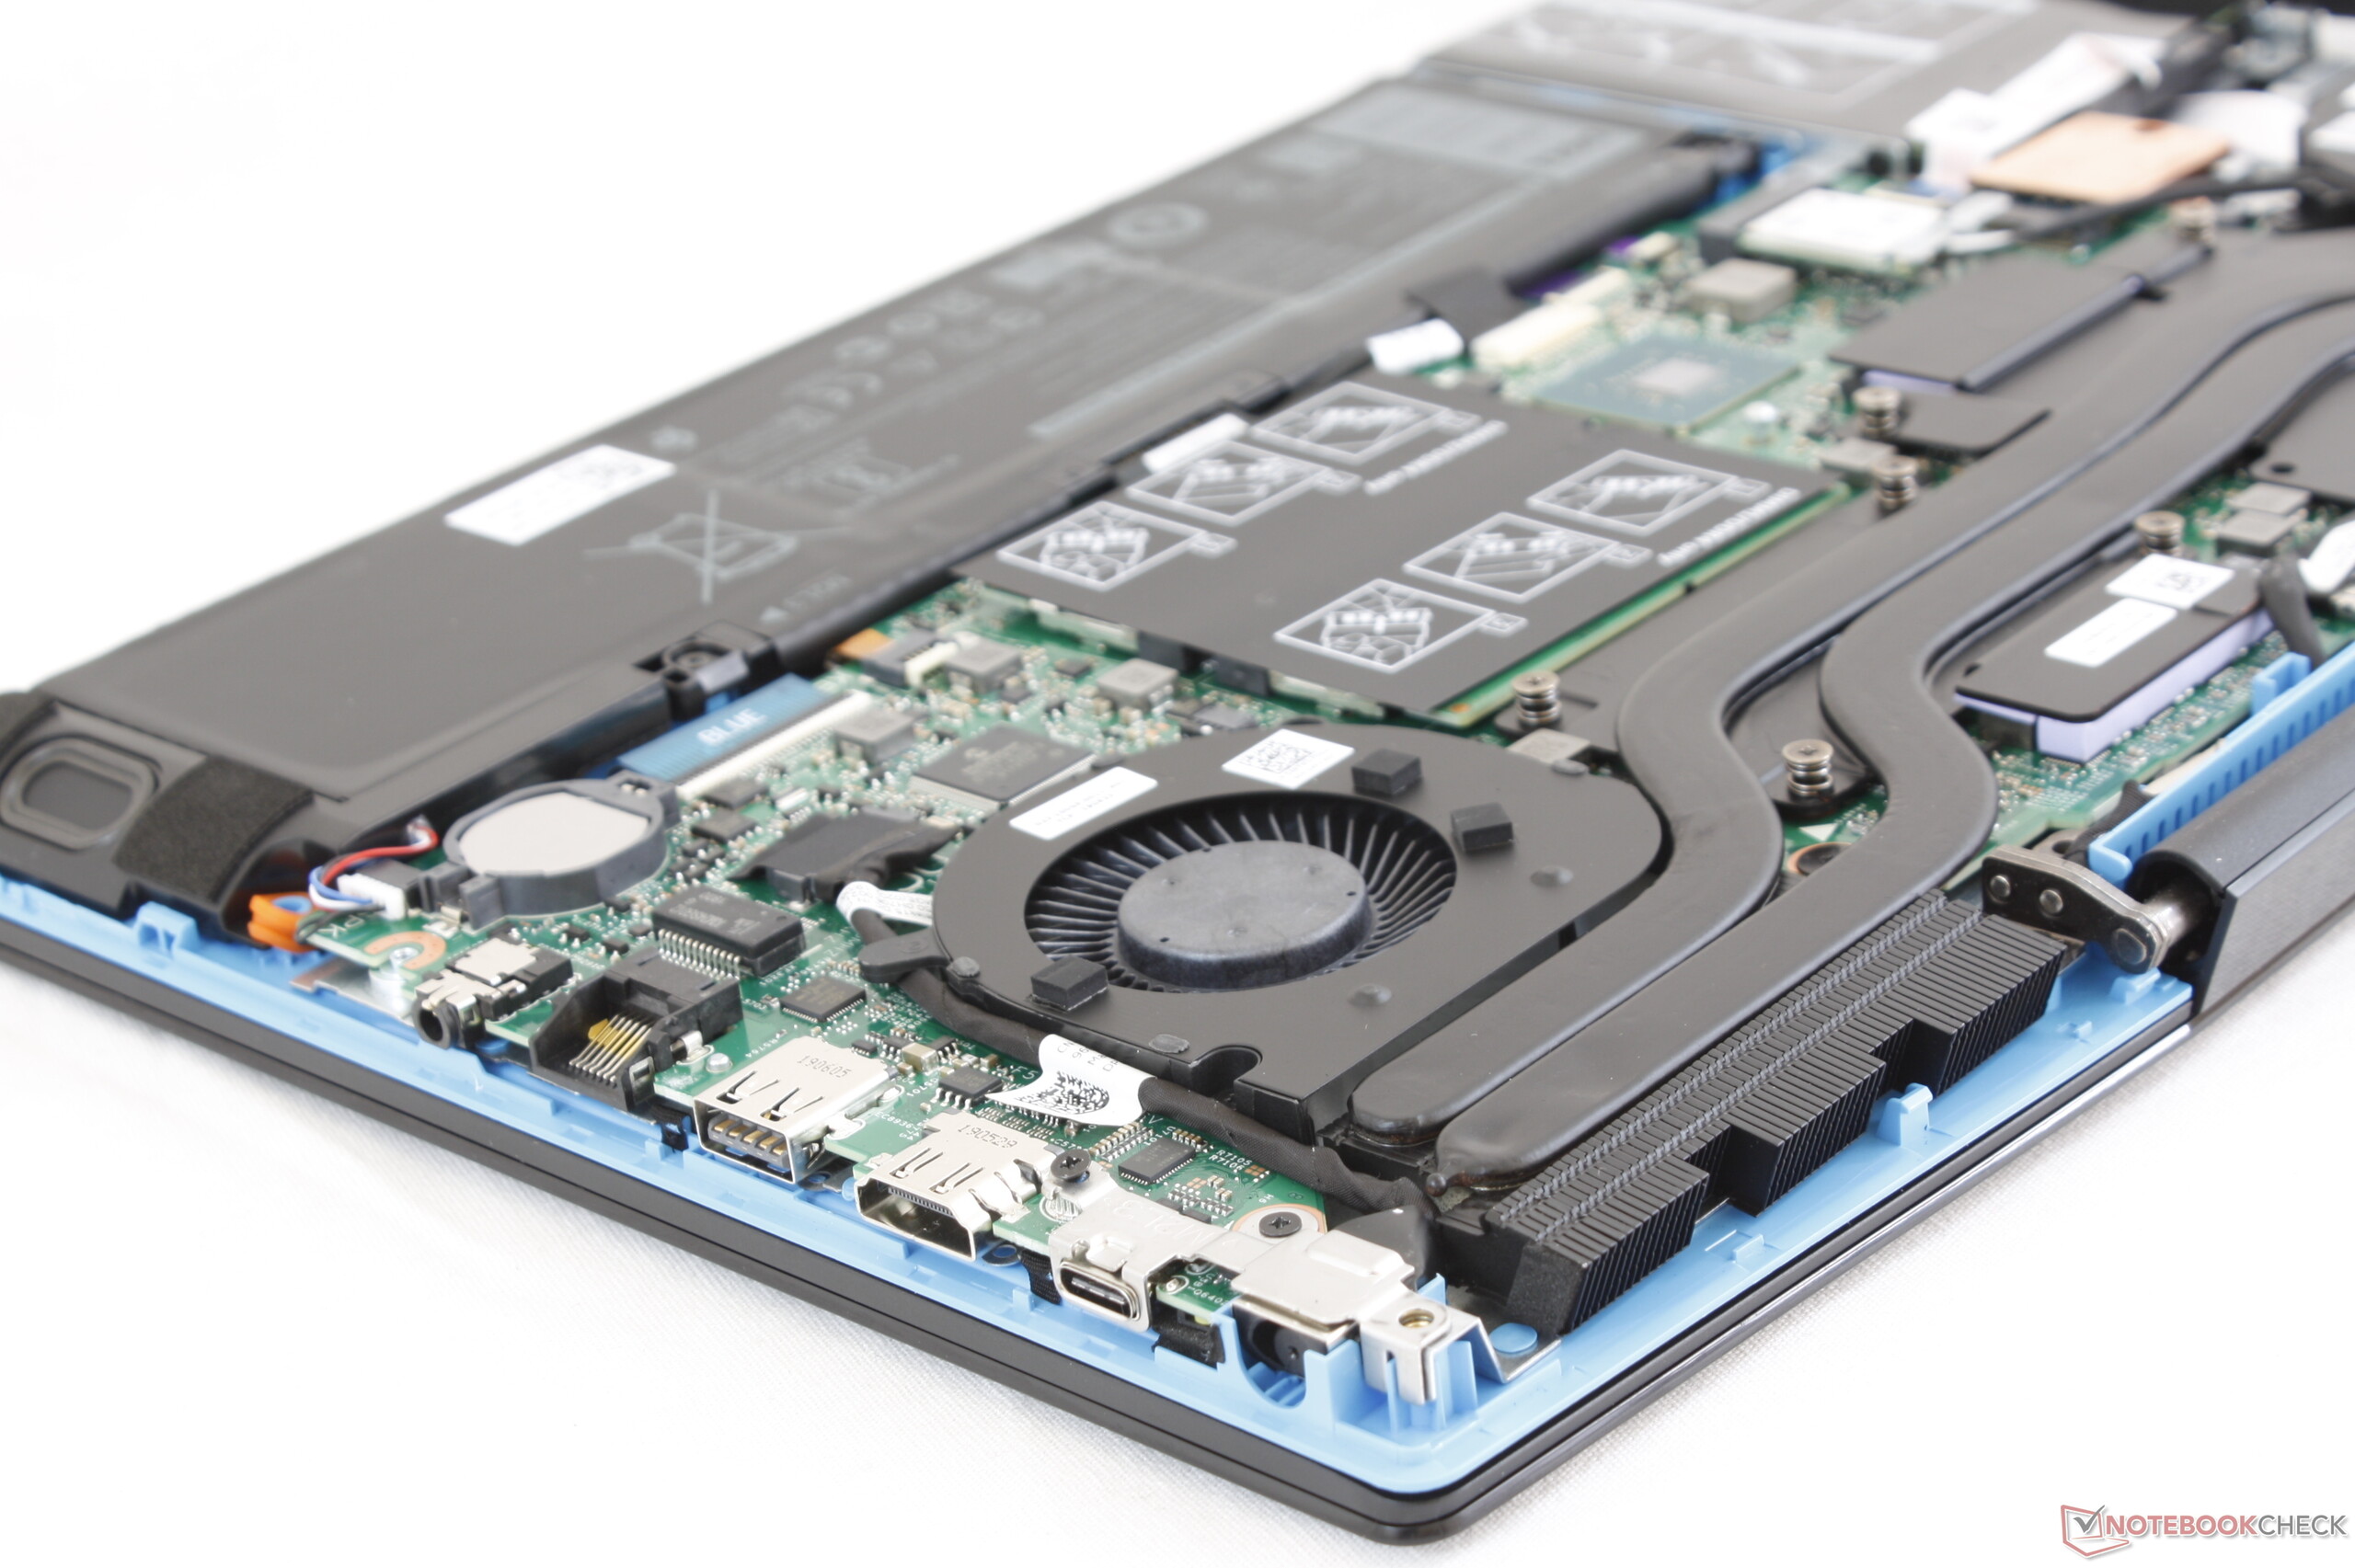
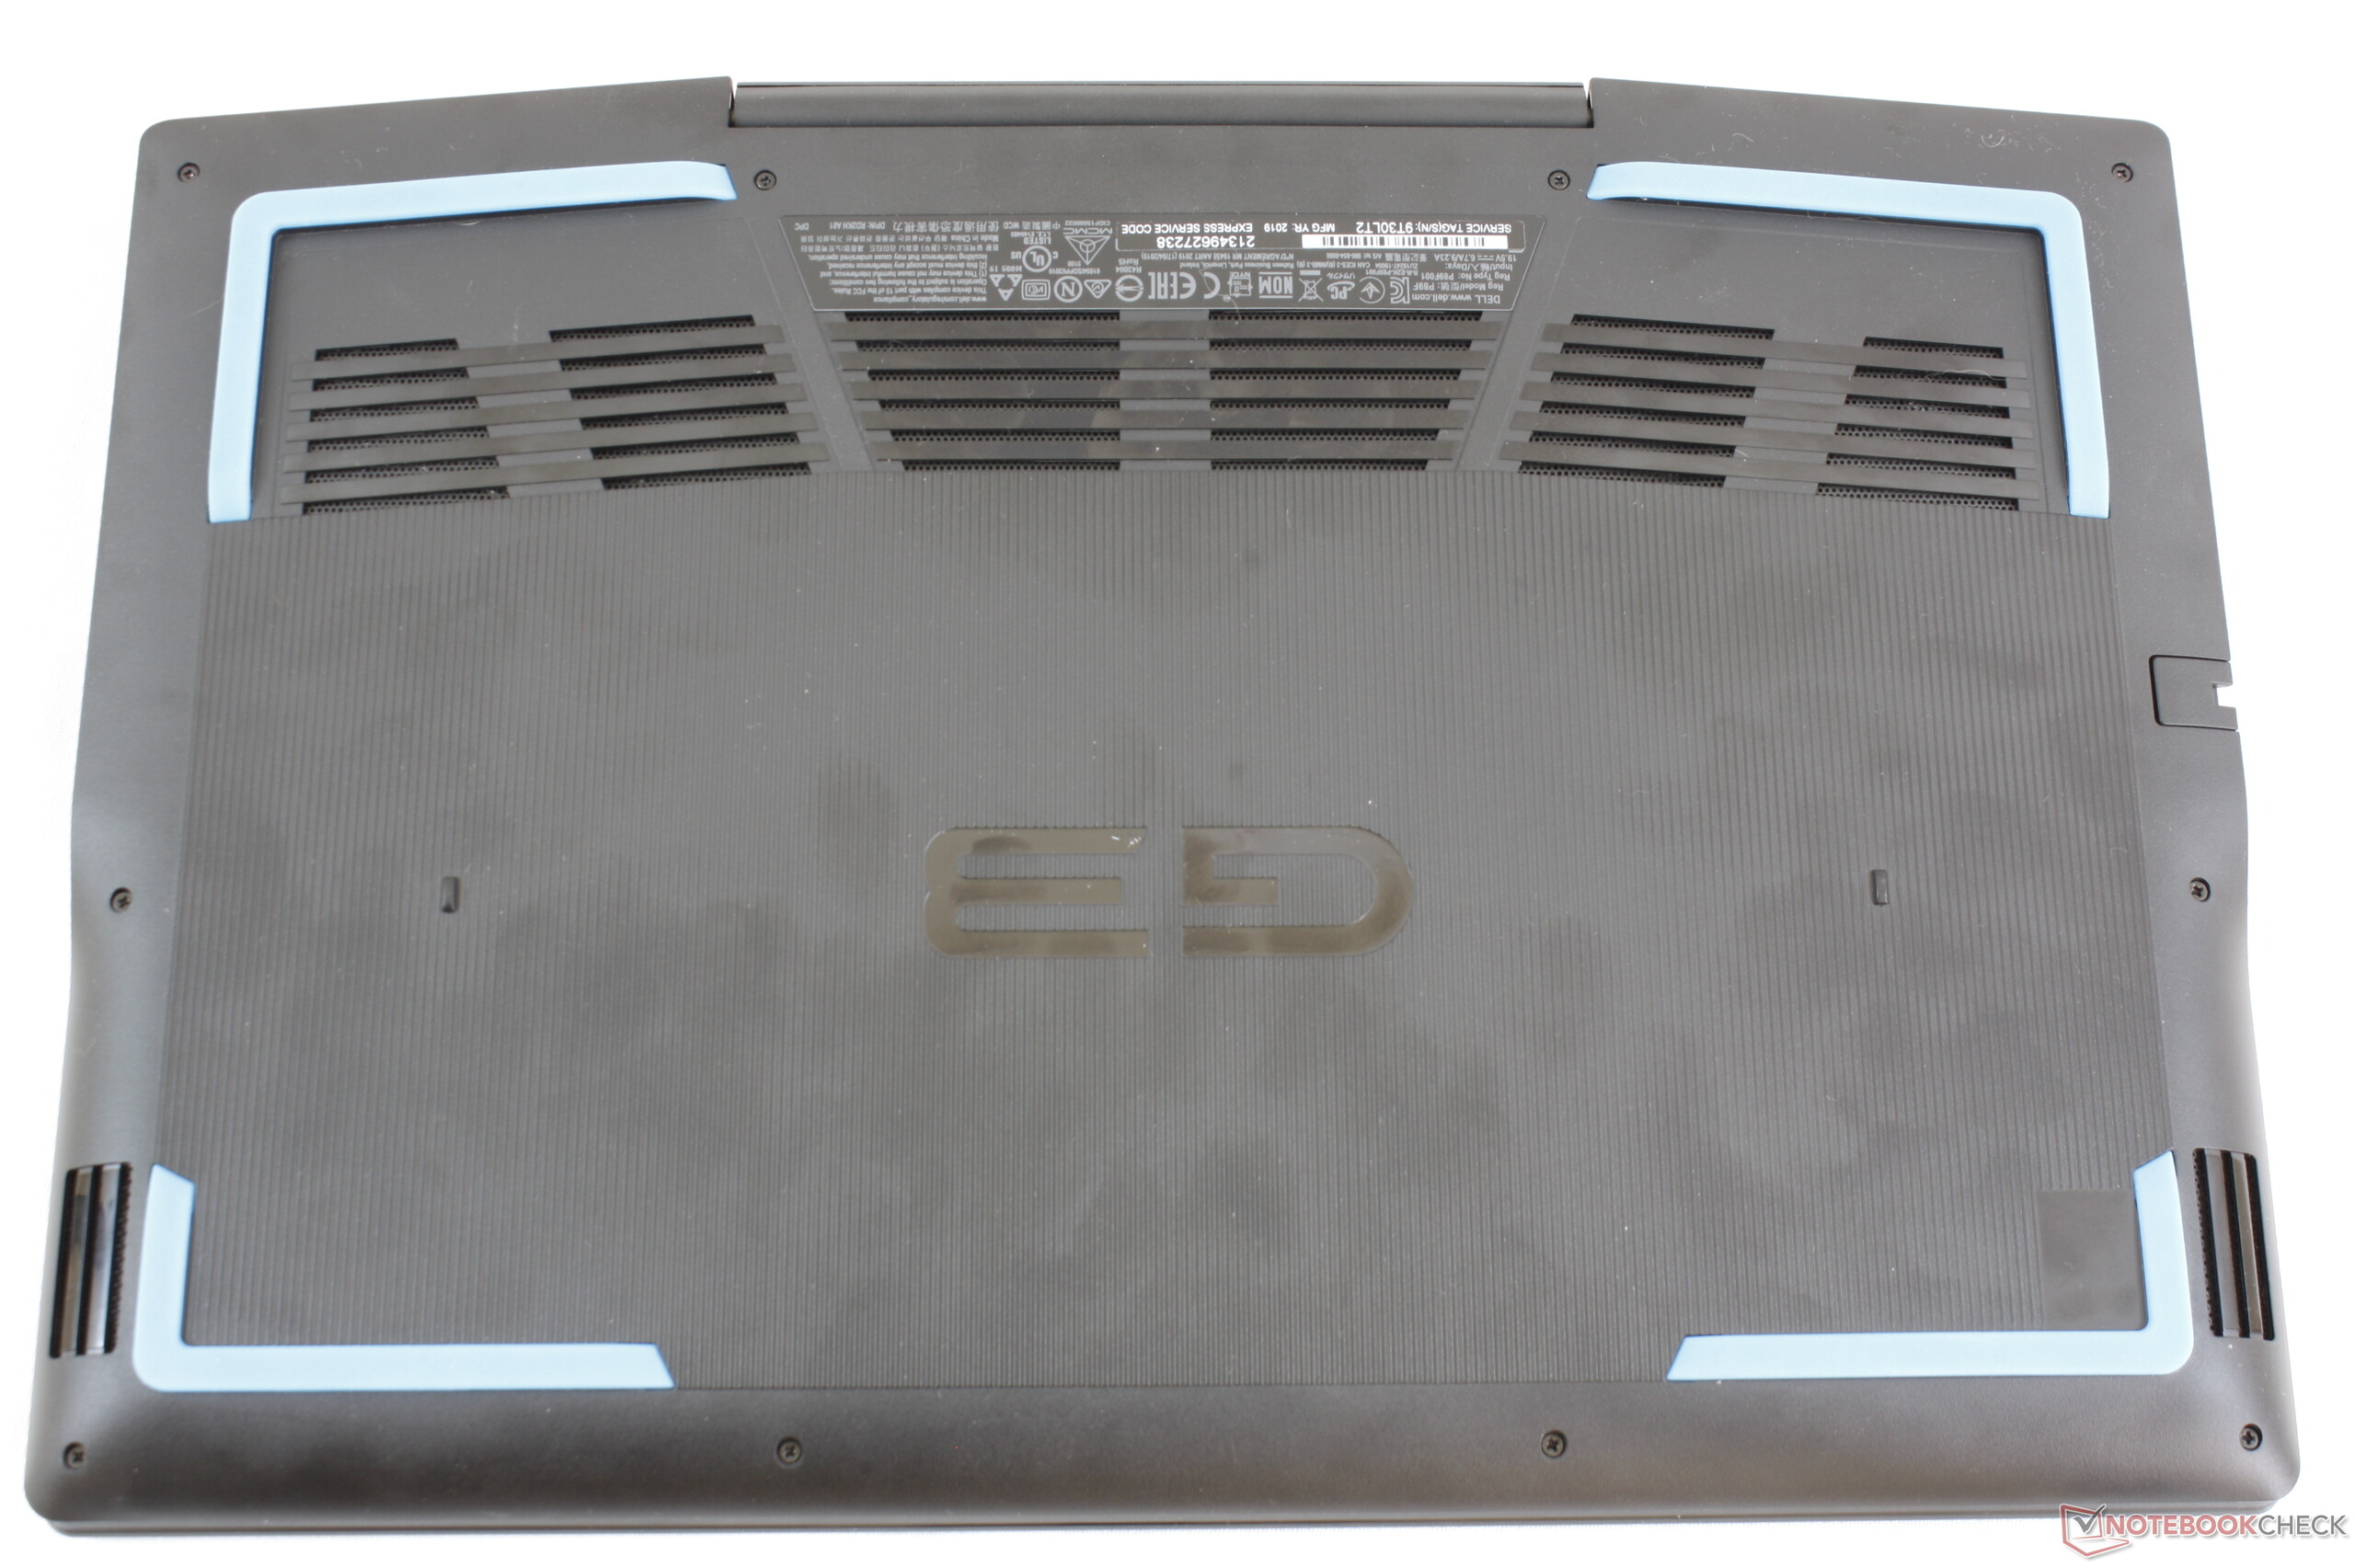
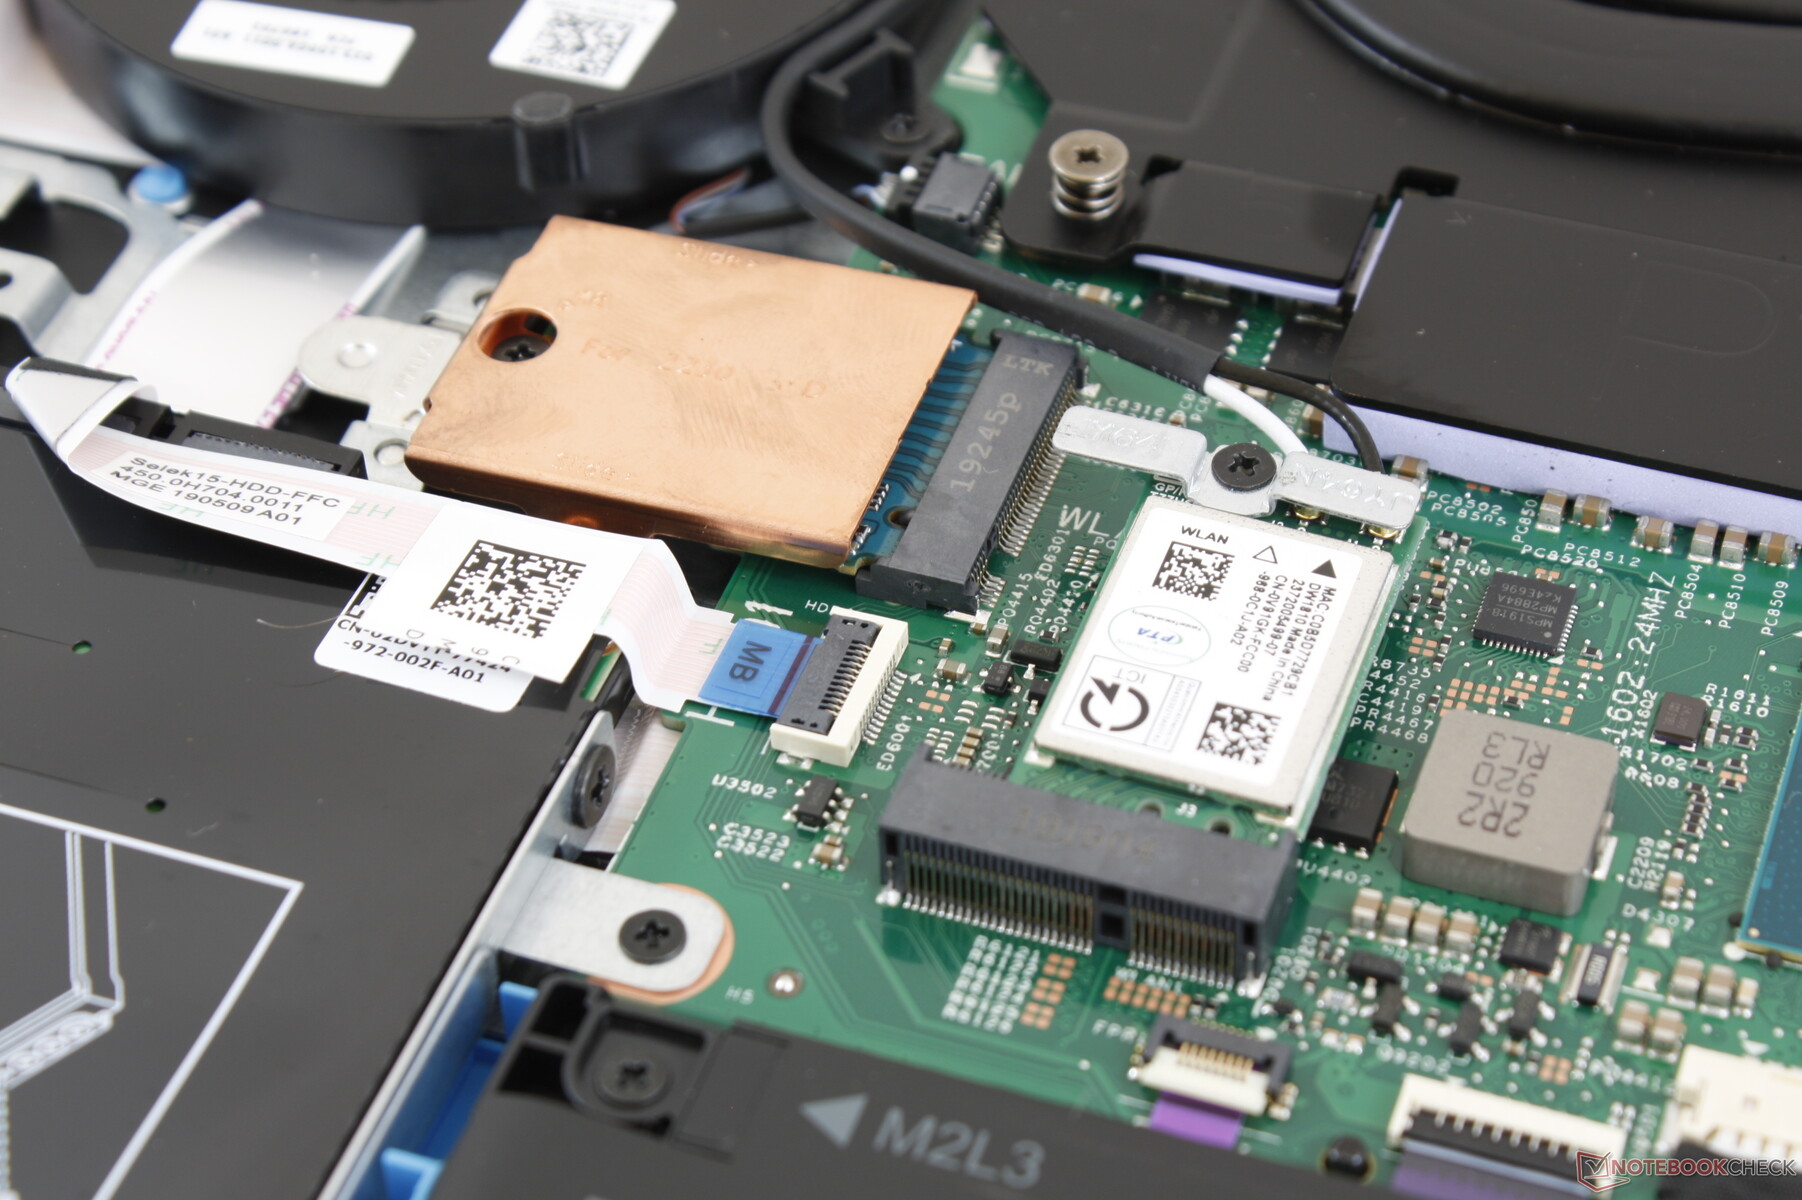
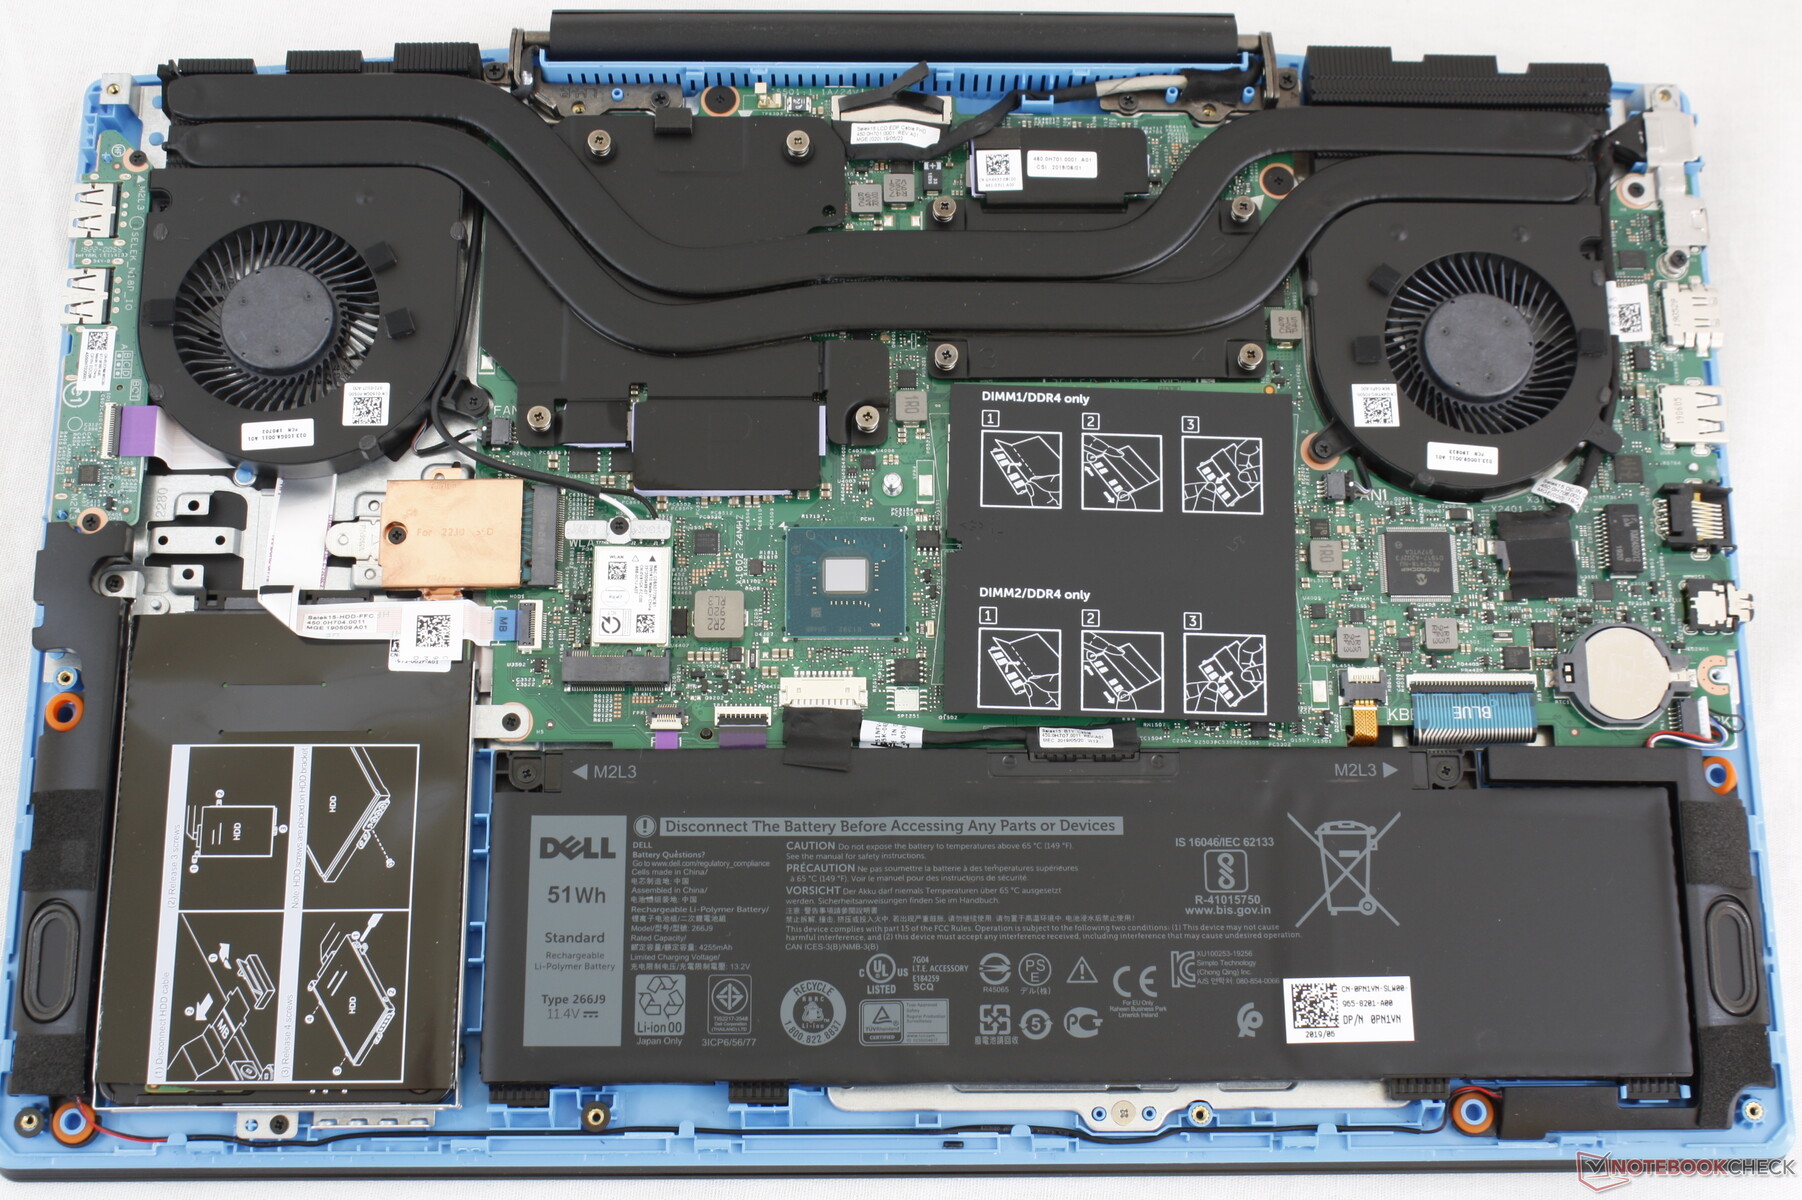
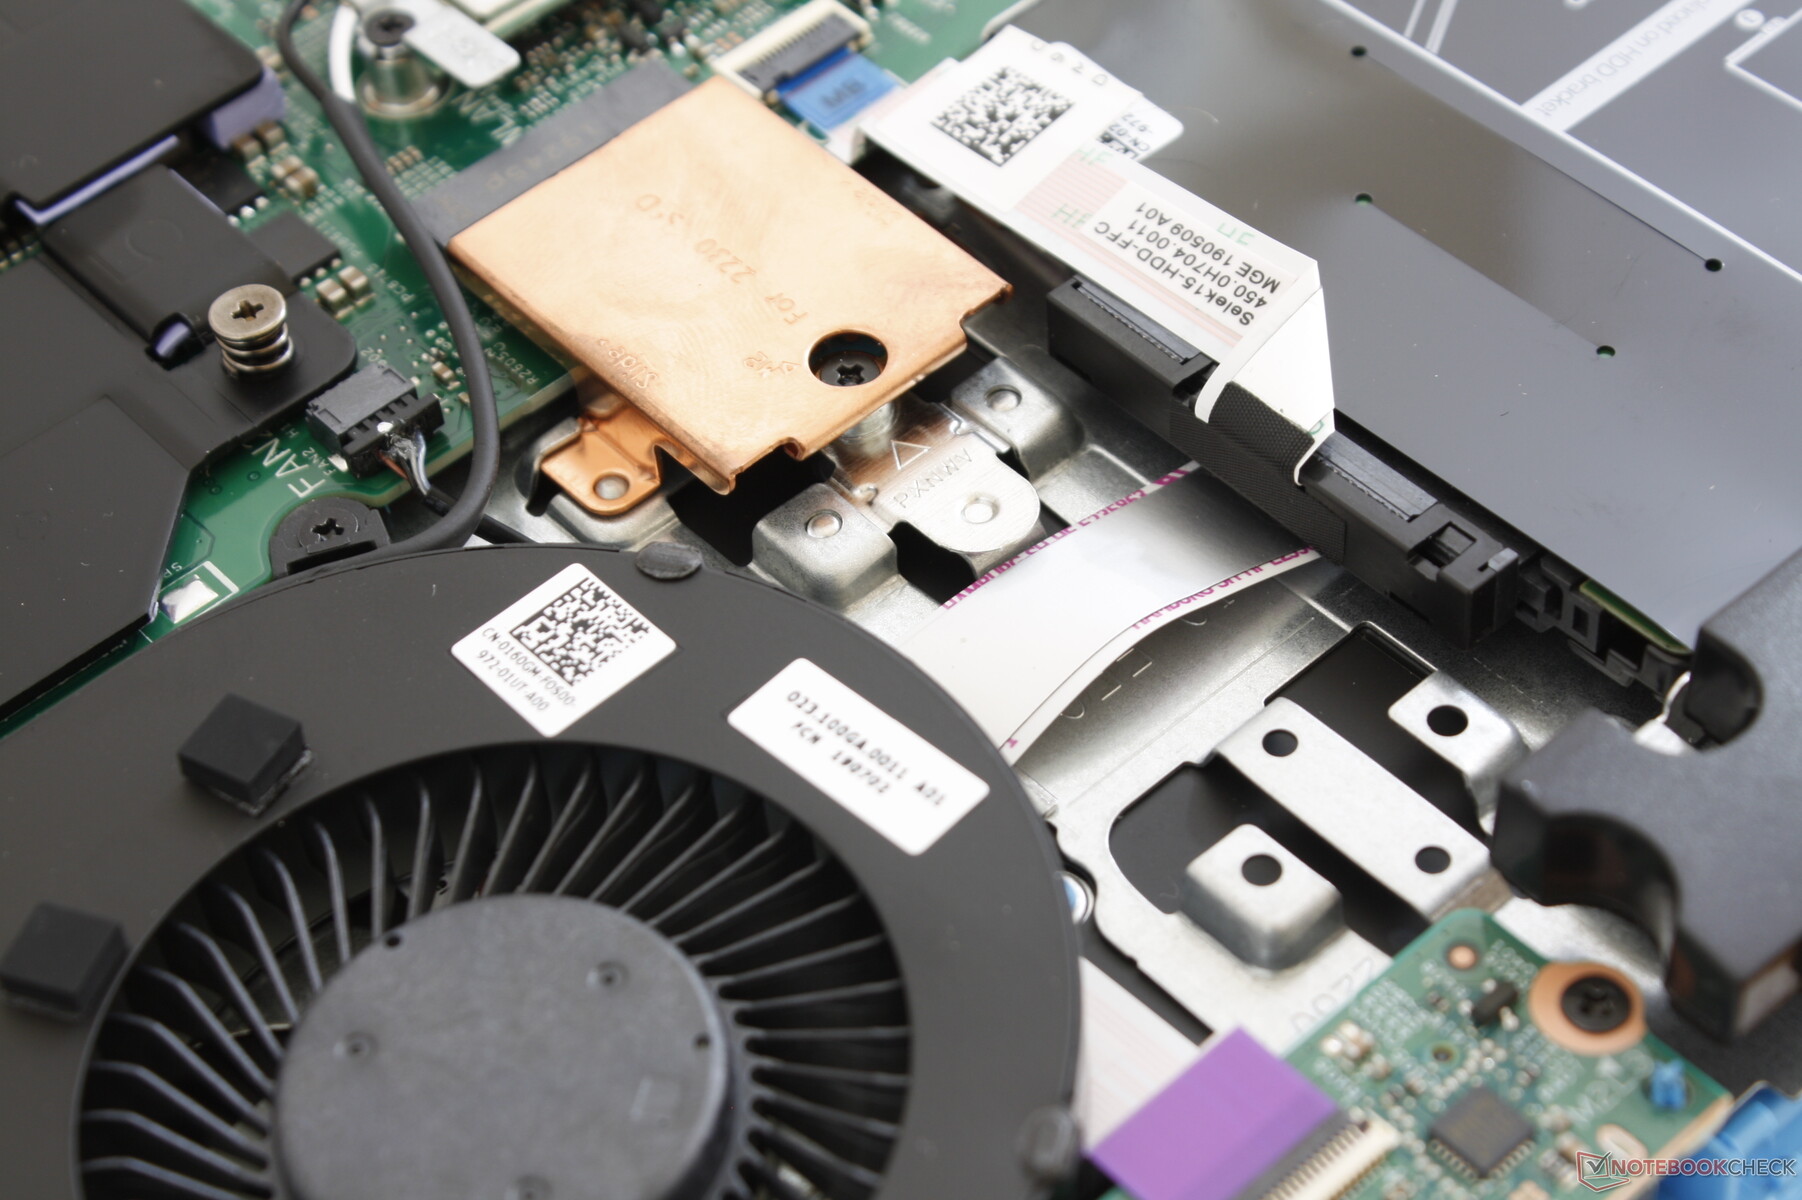
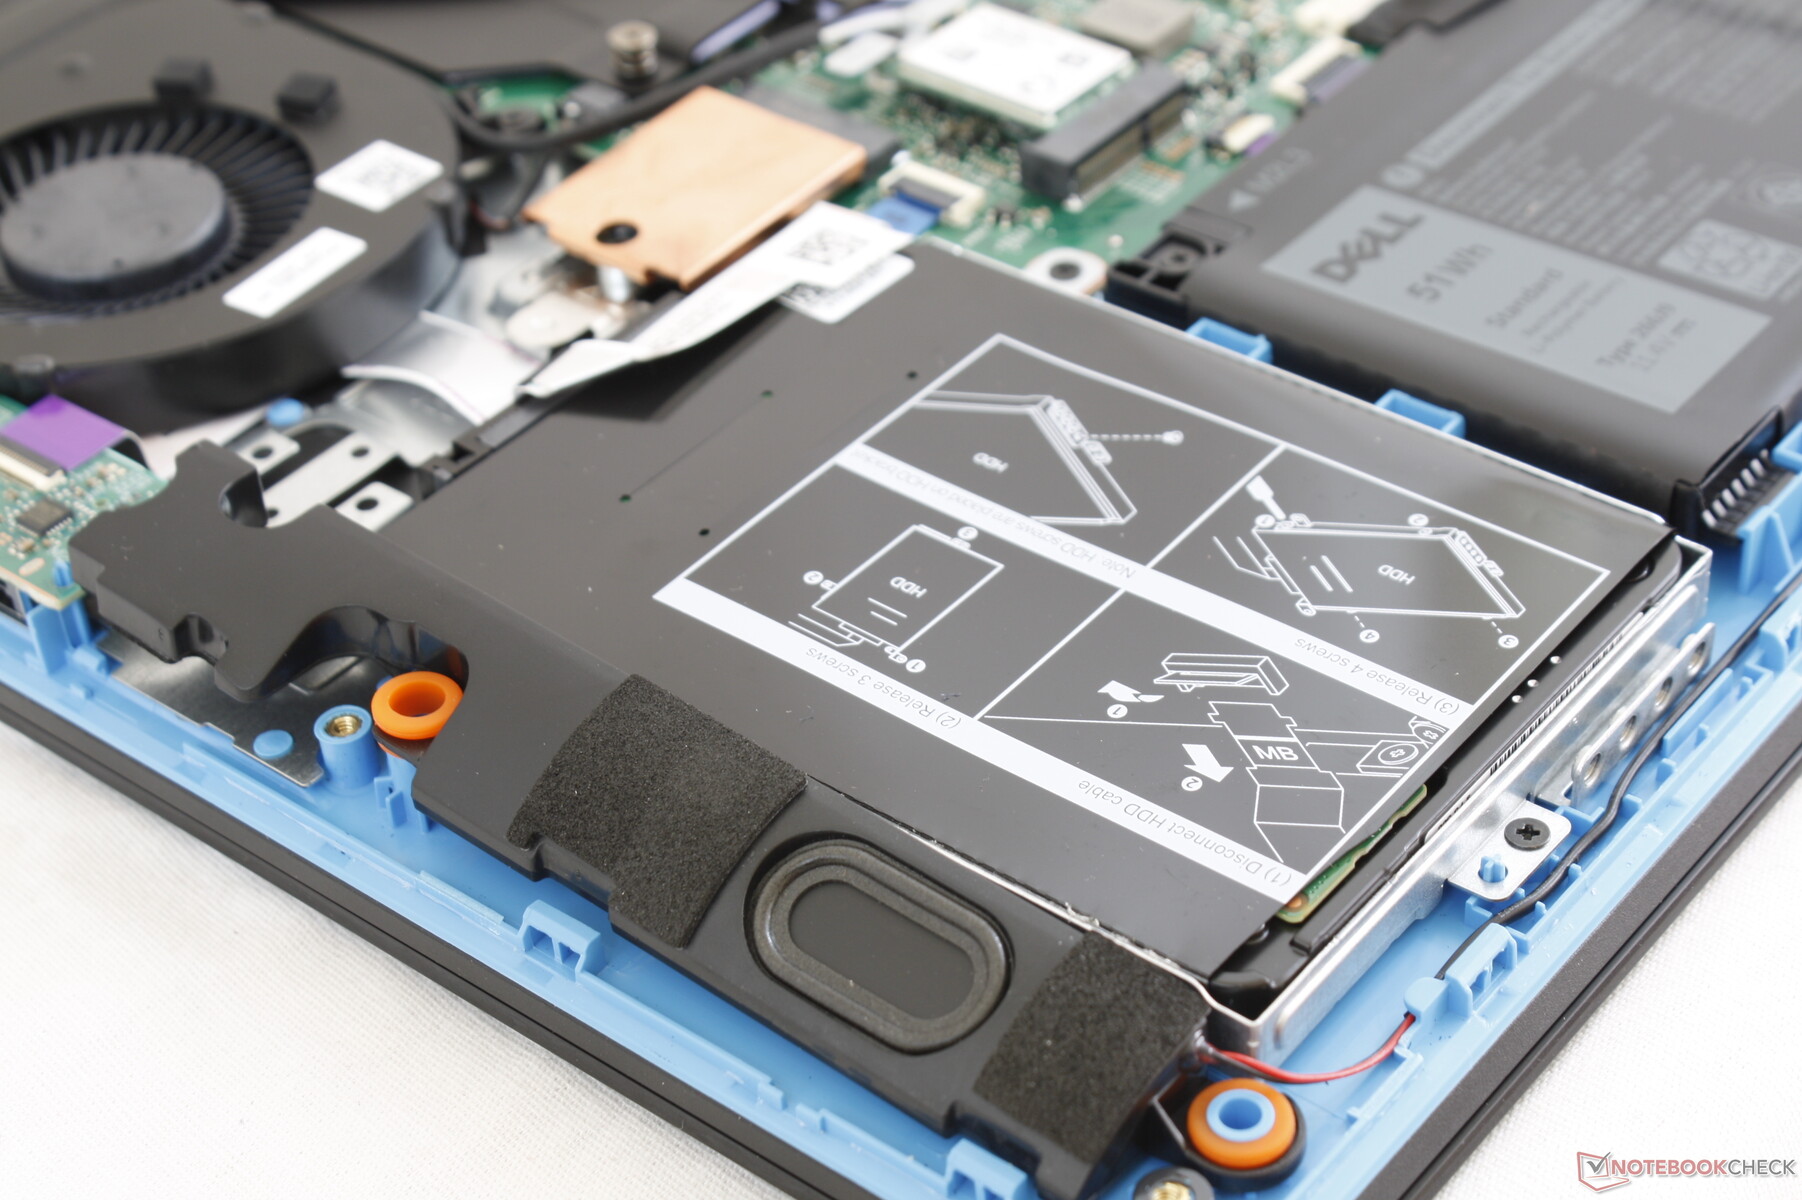
Maintenance
The bottom panel is secured by 10 Philips screws. Servicing will require a sharp edge because the bottom panel is latched tightly around the corners and edges.
Accessories and Warranty
There are no extras in the retail box other than the usual paper manuals. Warranty is the standard one-year limited protection with several extension options of up to four years.
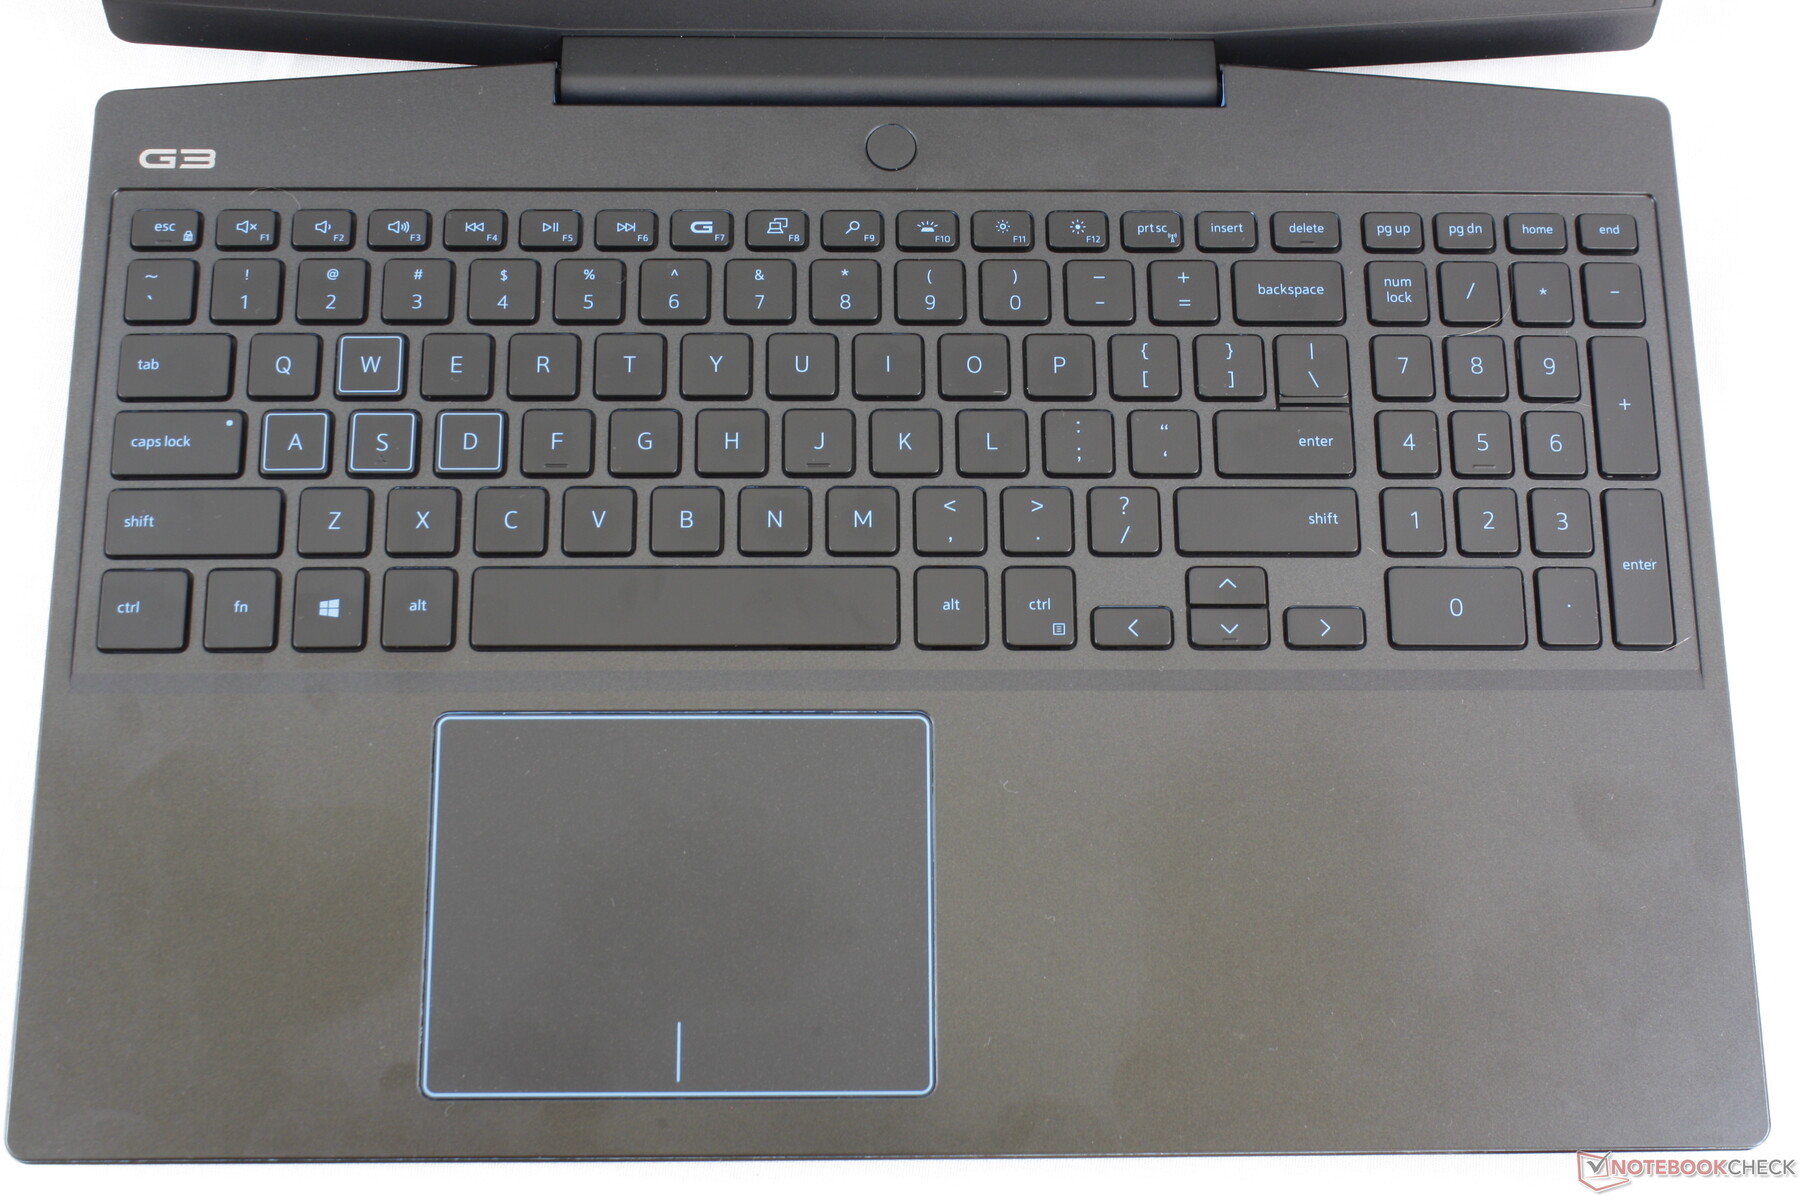
Input Devices
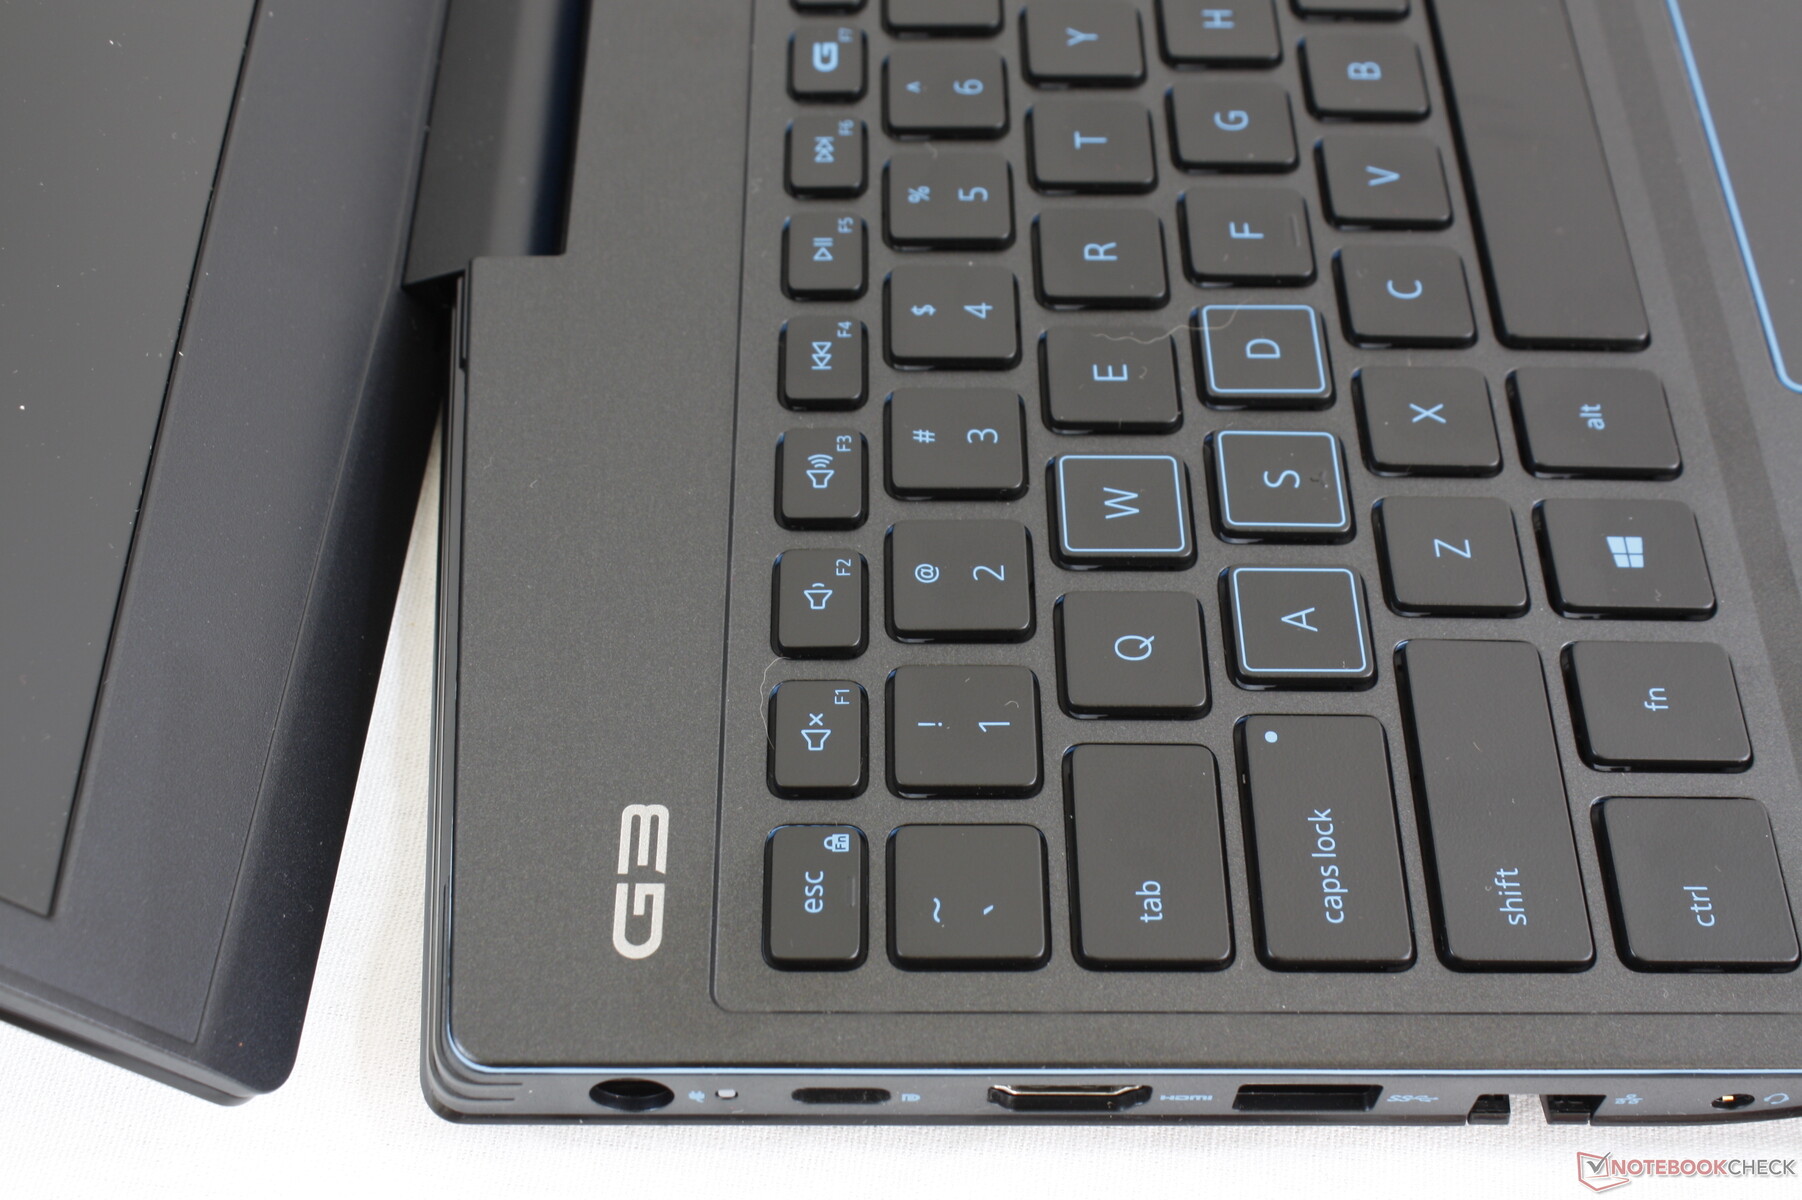
Keyboard
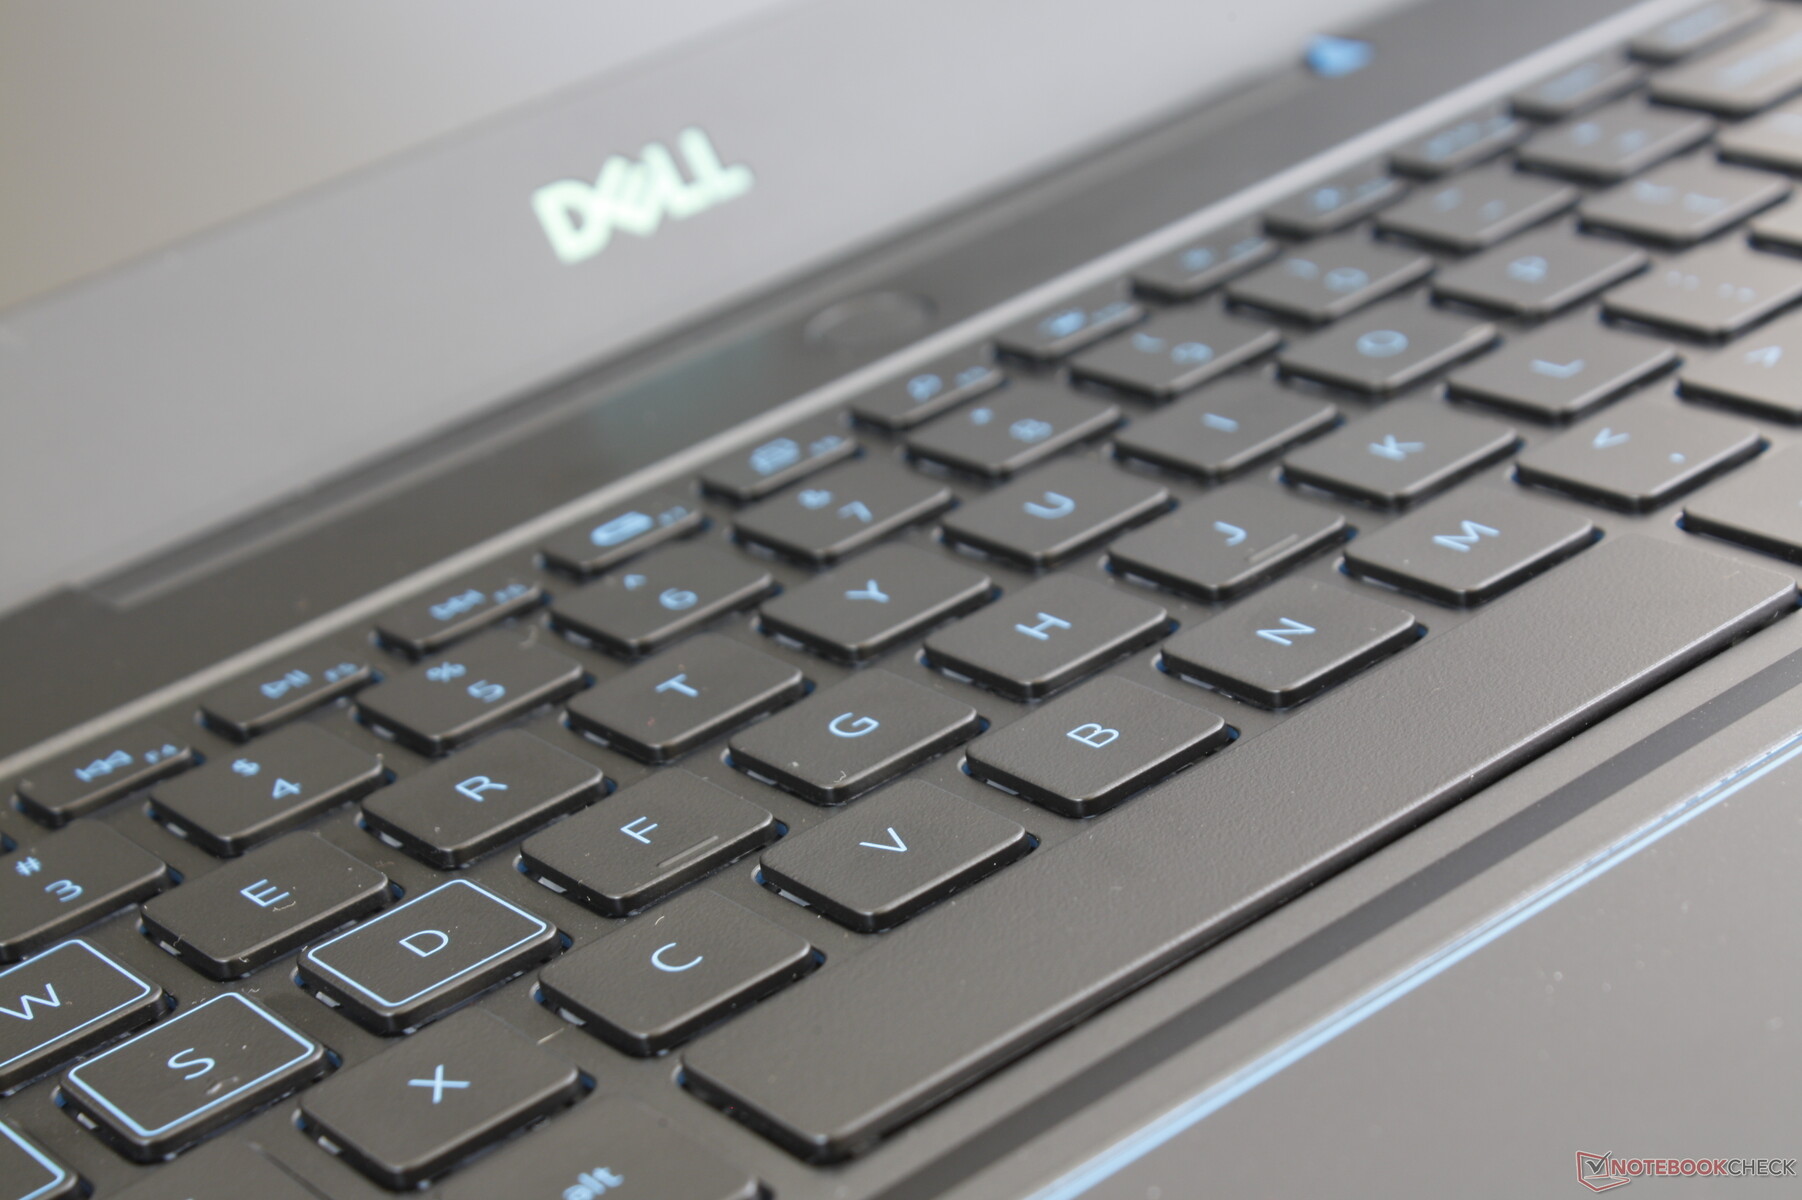
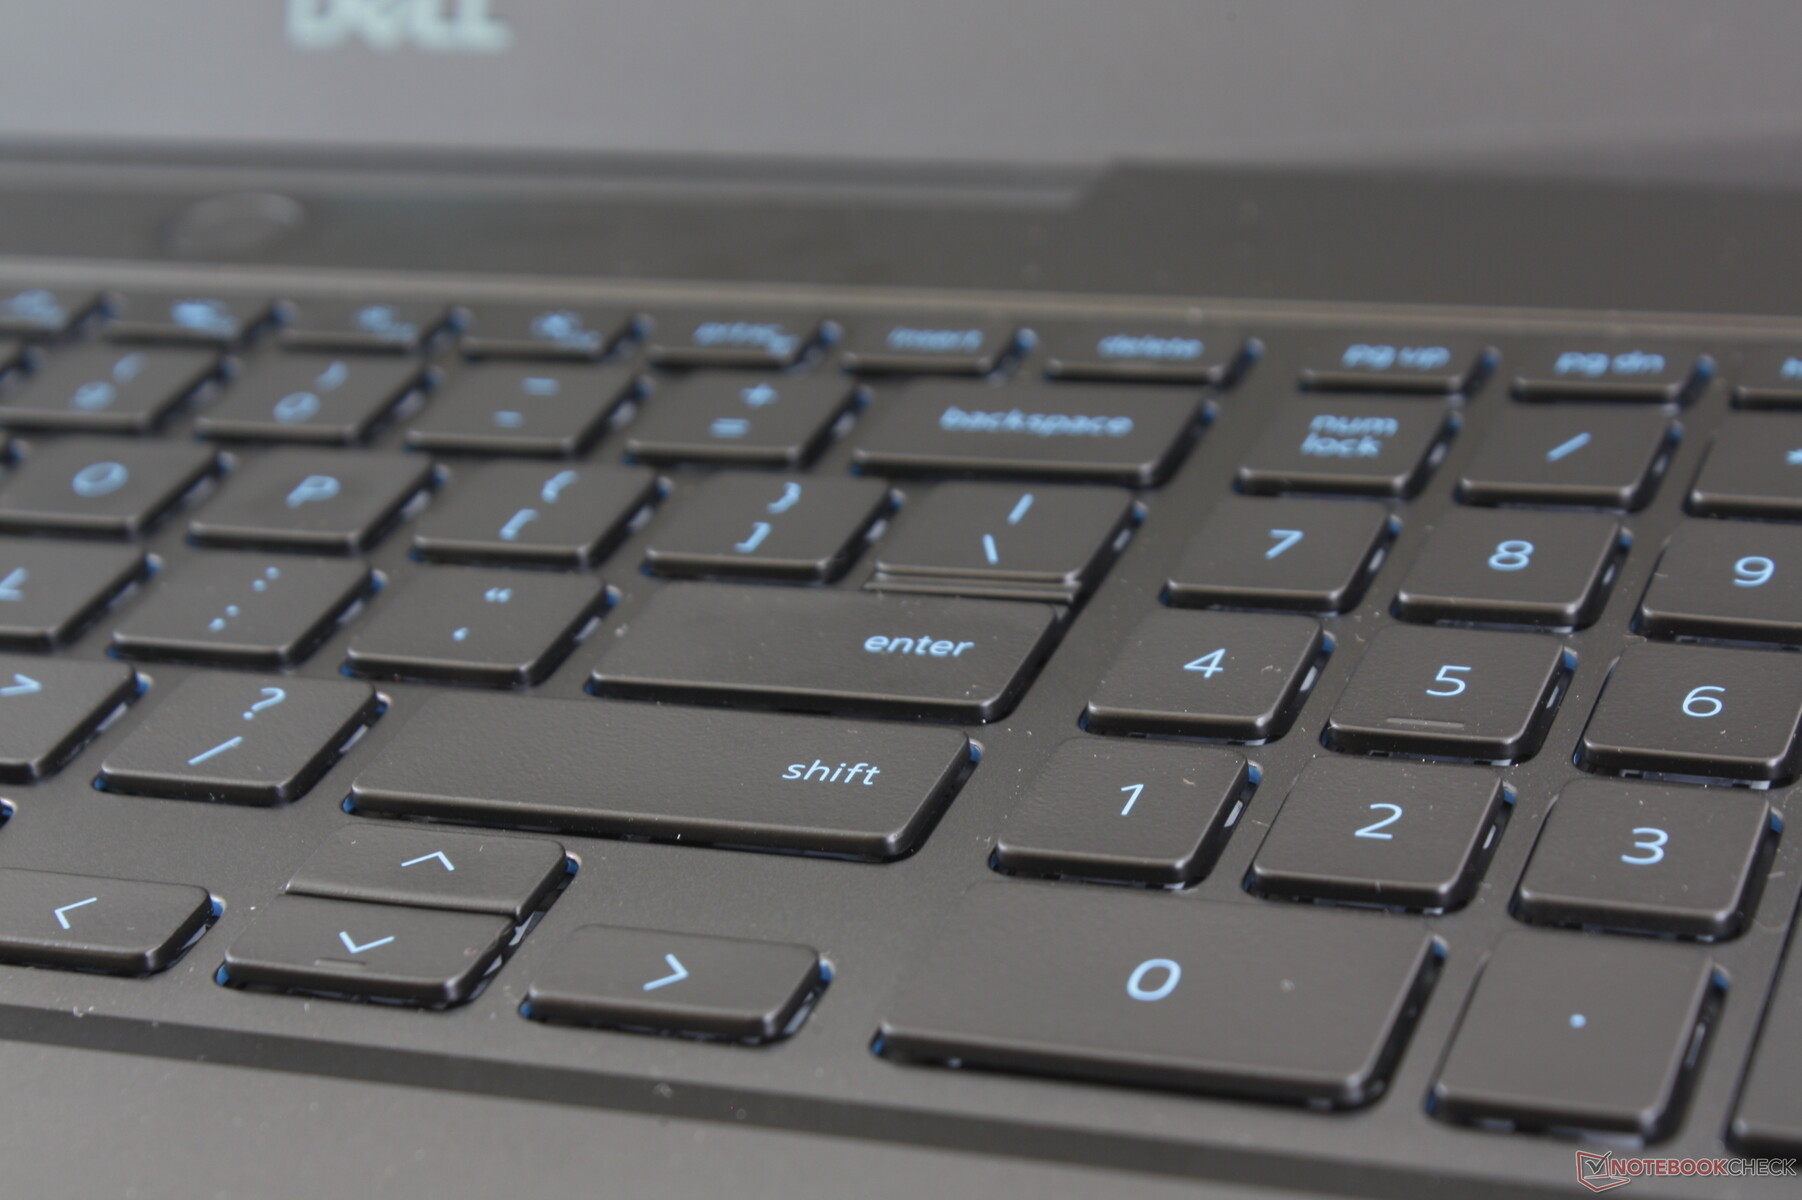
Keyboard layout and feedback have not changed gen-to-gen despite the upgraded chassis design. We find feedback to be satisfactory if not slightly on the soft side relative to the low clatter. Other pricier laptops like the MSI GT series, HP Spectre series, or even Dell's own G7 series have firmer keys.
The blue font doesn't contrast very well against the dark color scheme of the laptop when compared to the usual white font. This forces the user to toggle the blue backlight in order to more clearly see the lettering on each key.
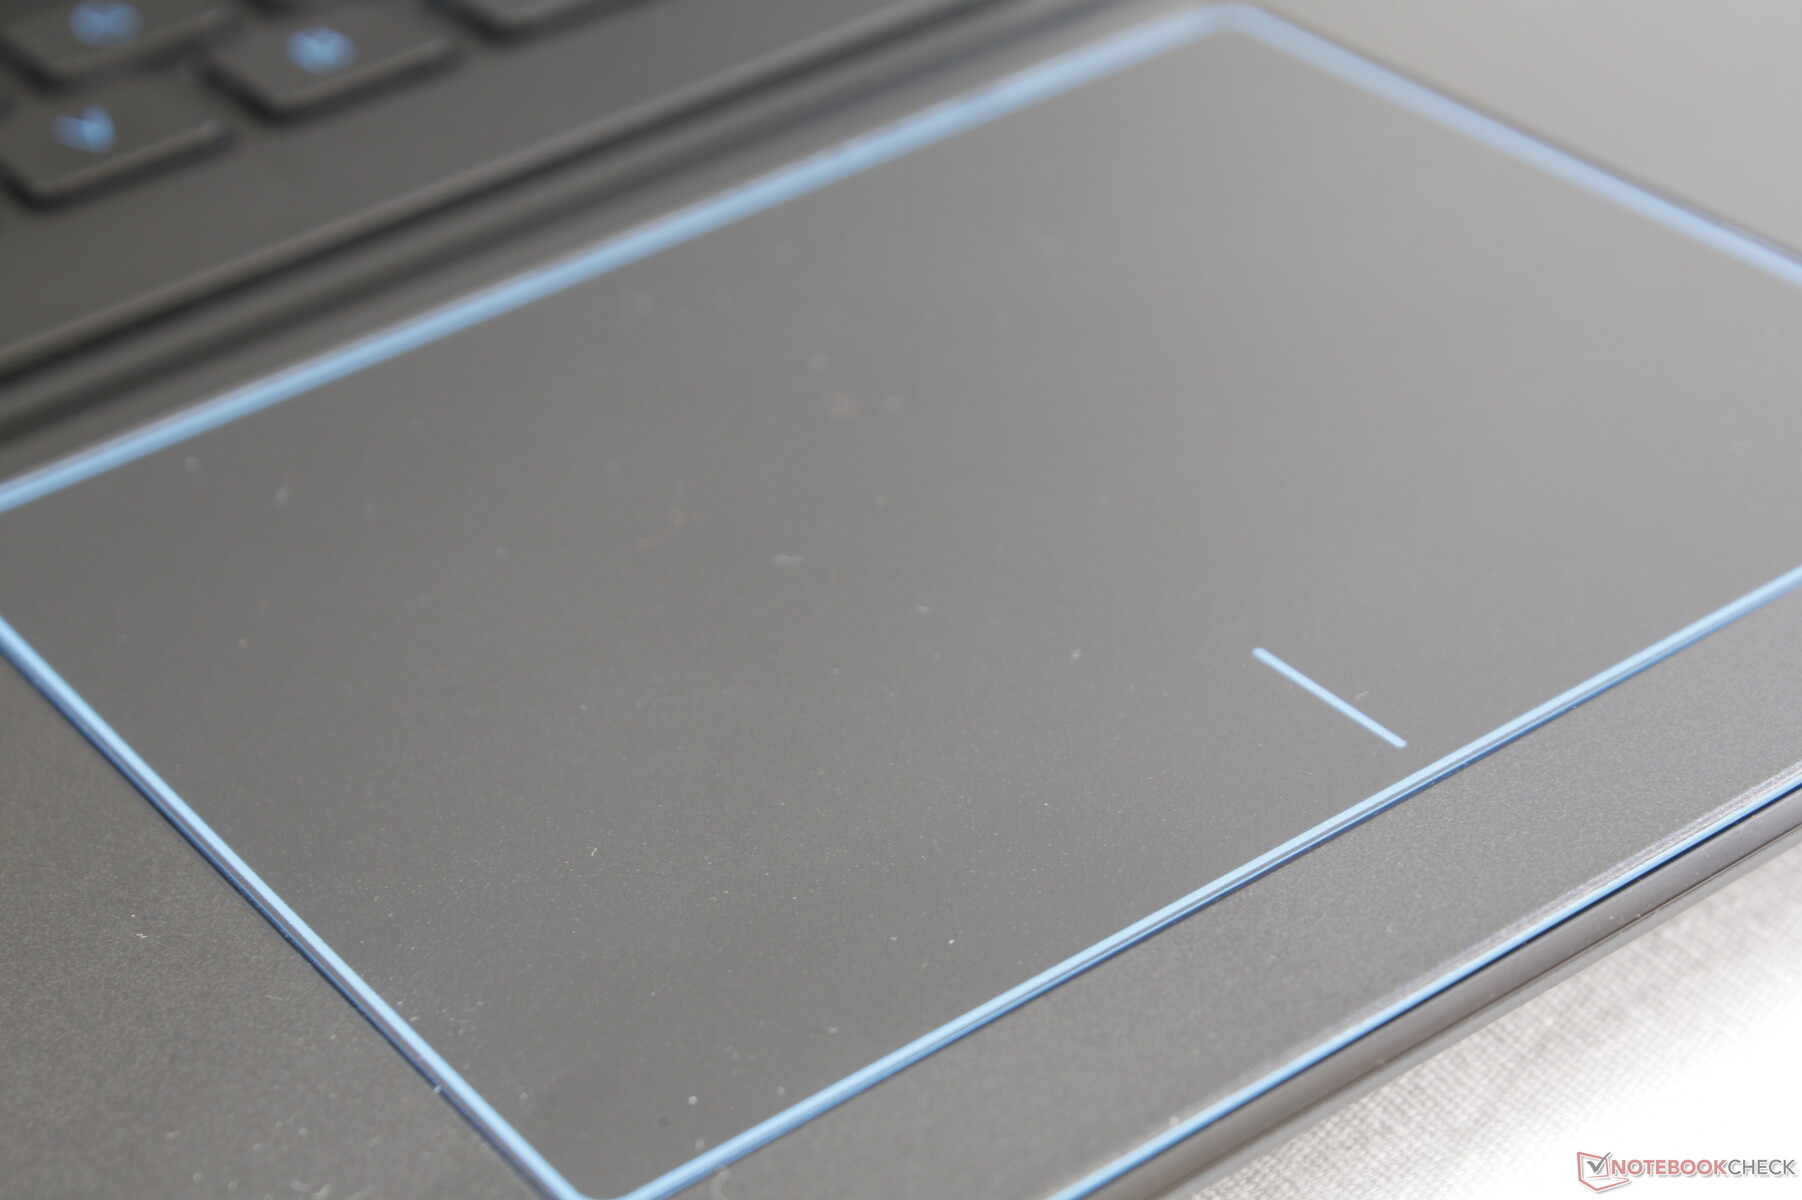
Touchpad
The clickpad is exactly the same size as it was on the G3 3579 (~10.5 x 8 cm). Perhaps unsurprisingly, they also feel identical from their slightly roughened surface texture and the moderately loud and spongy click when pressed. The strange cursor responsiveness behavior that we experienced on the G3 3579 is not present on the G3 3590.
Display
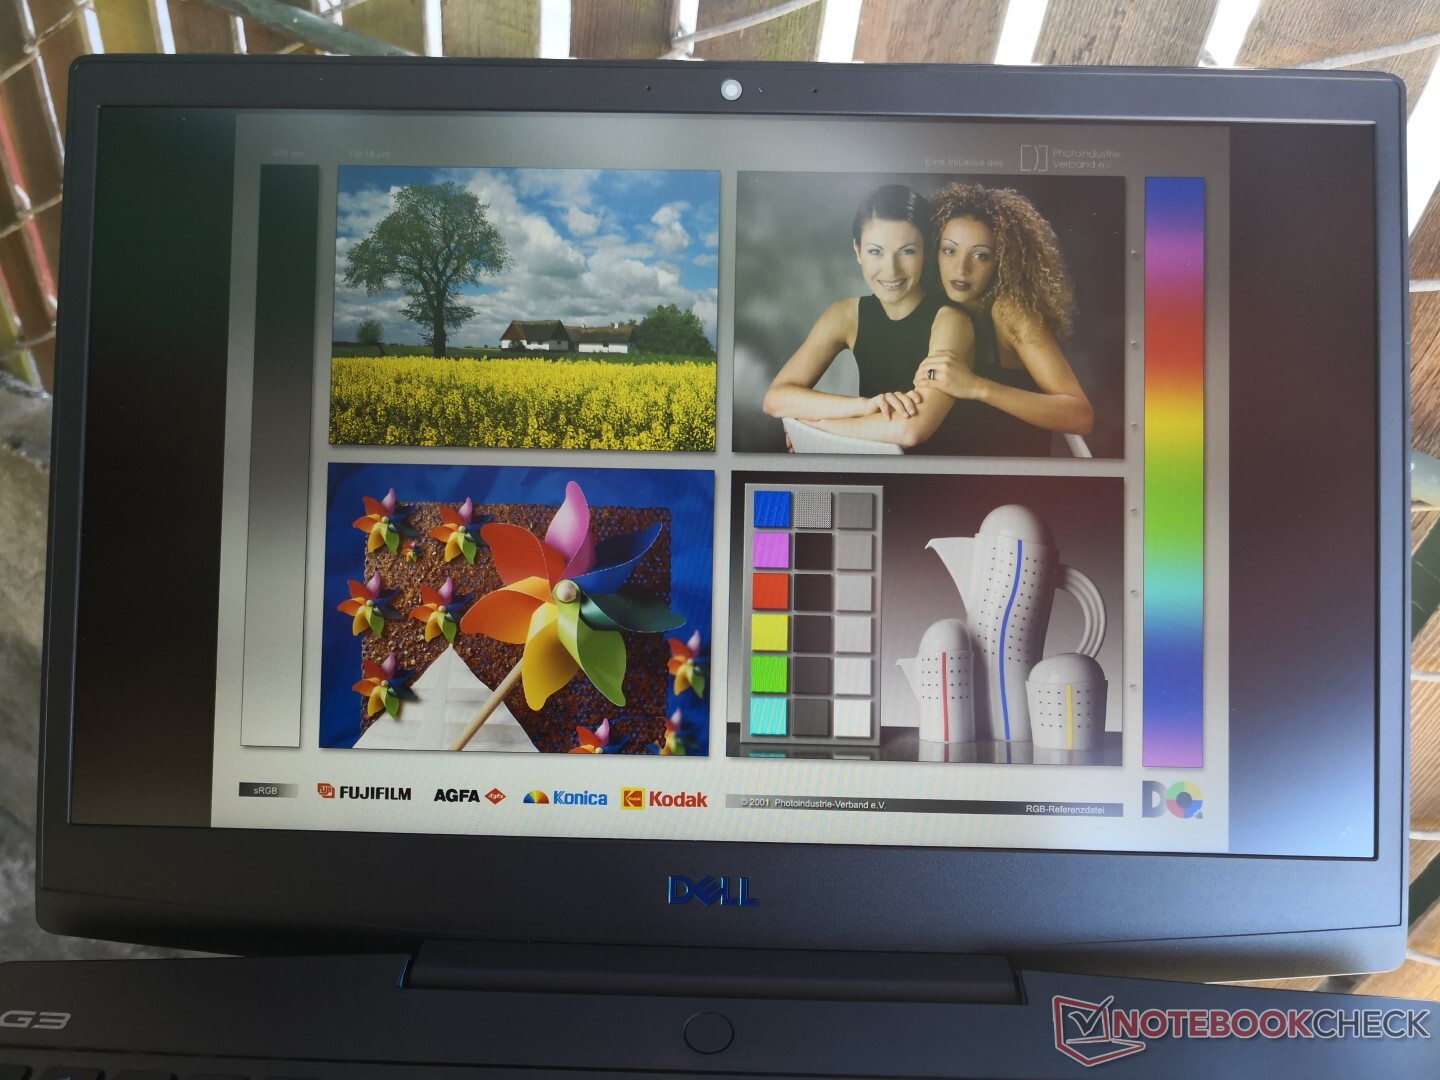
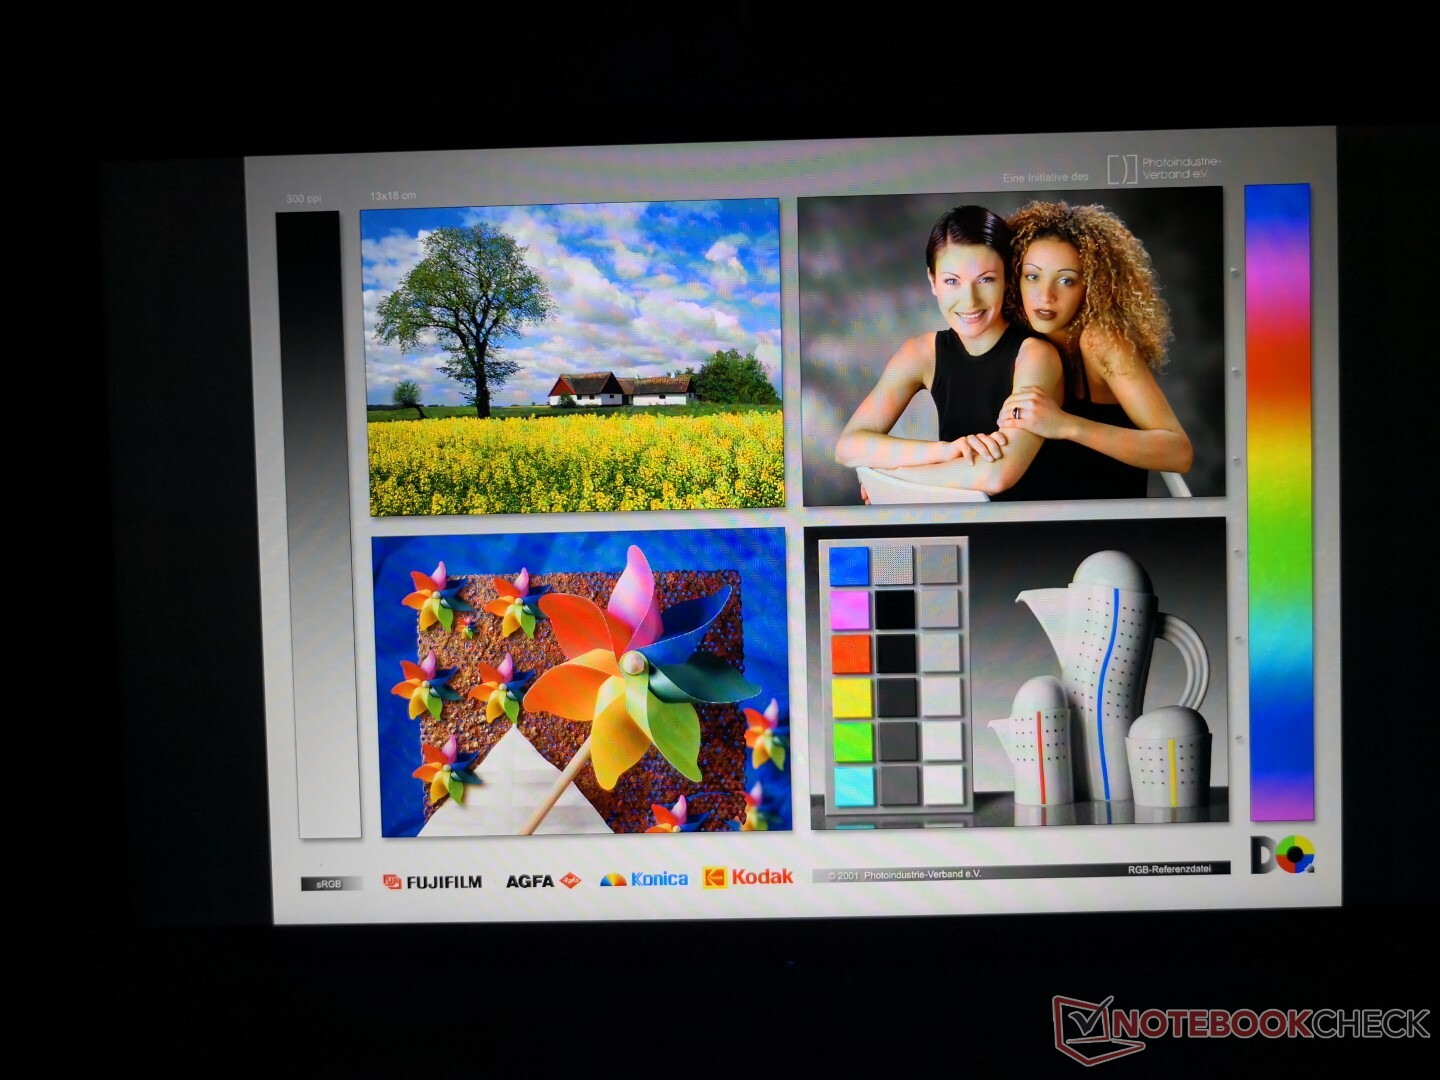
The 1080p BOE NV15N3D IPS panel can be found on no other laptop in our database whereas the older G3 3579 uses a panel from LG Philips. Our independent measurements reveal it to be a budget panel which is fitting for the budget G3 series. Response times are slow for noticeable ghosting and colors are shallow because of the limited gamut. On the flip side, black levels are excellent for a high contrast ratio of about 1100:1 and the display is brighter than on the older G3 3579 by about 33 percent.
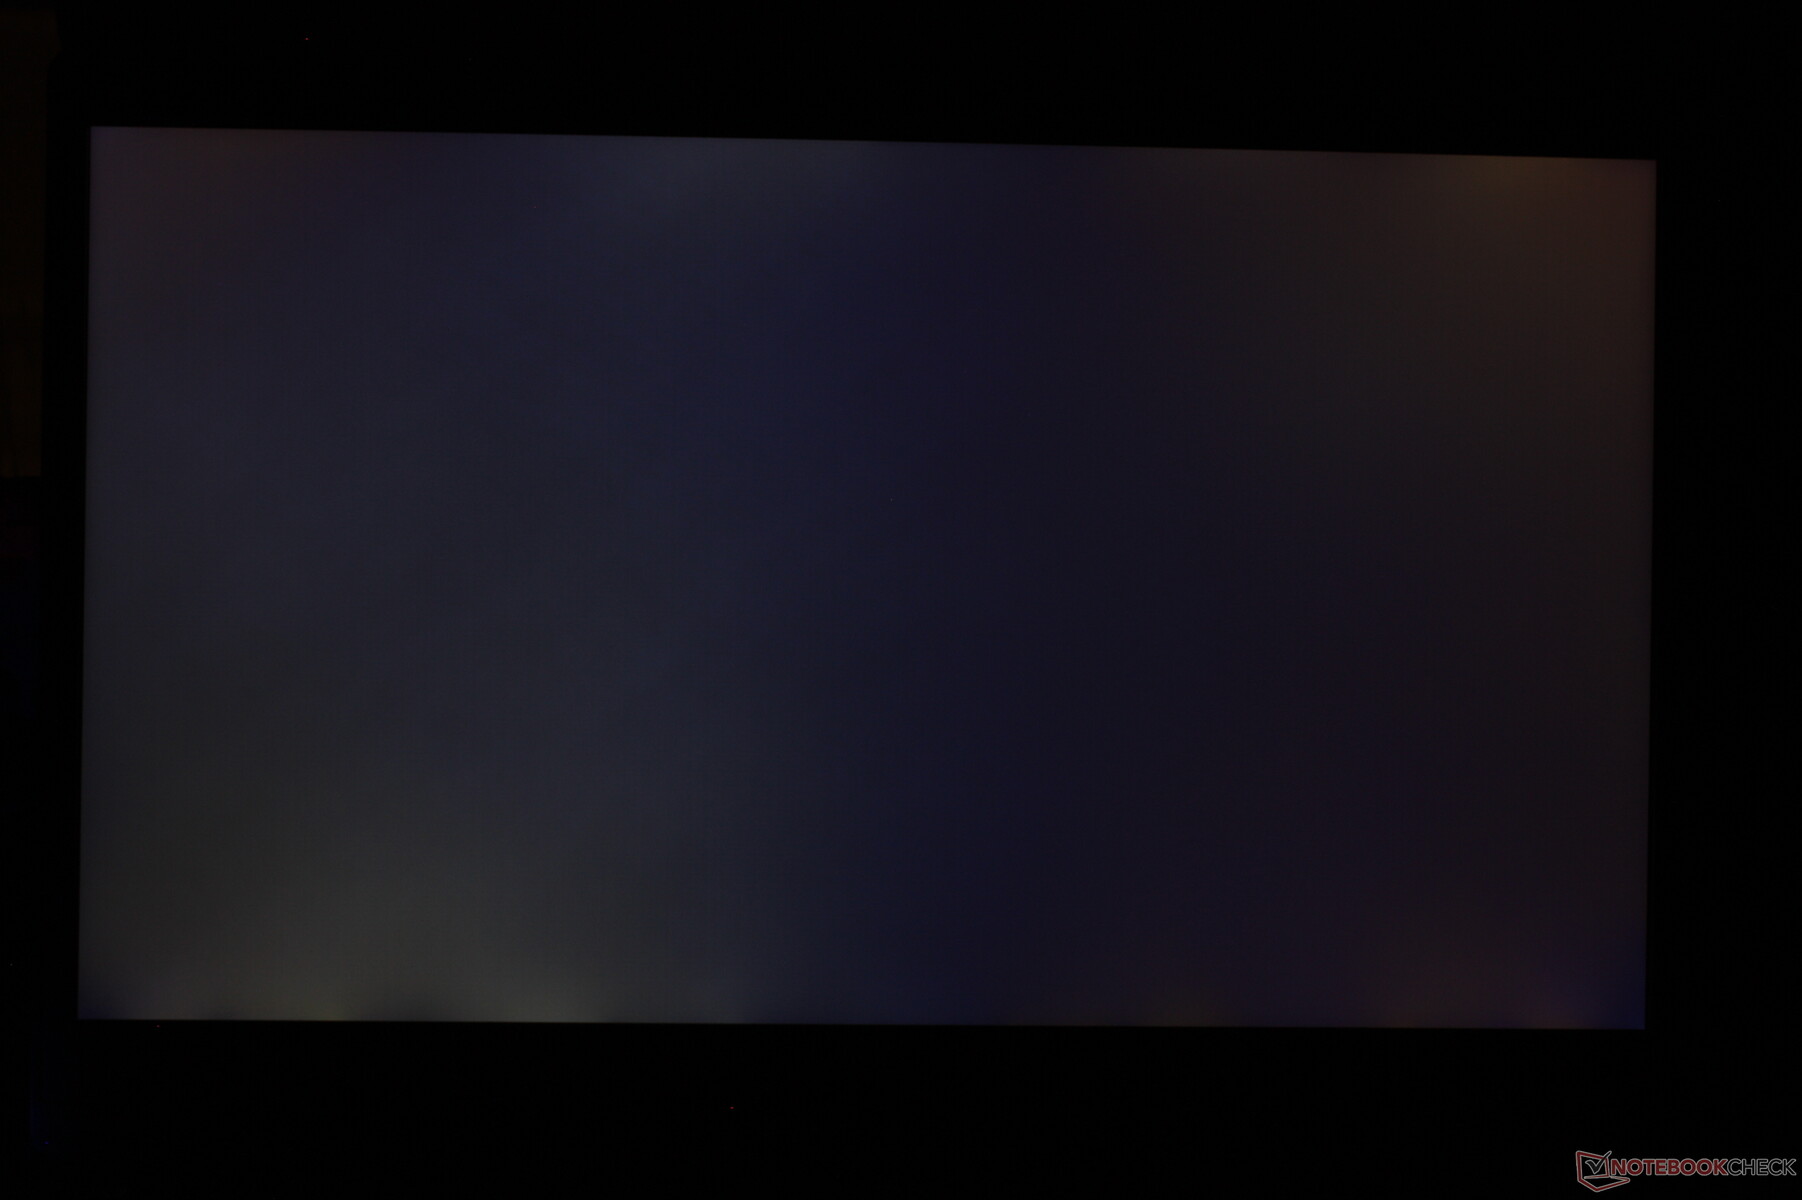
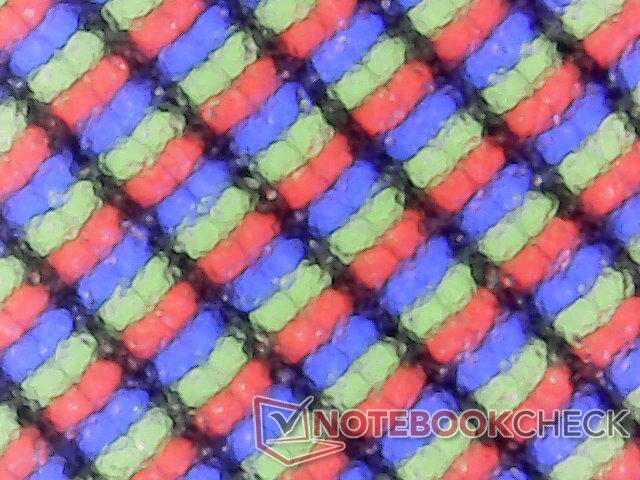
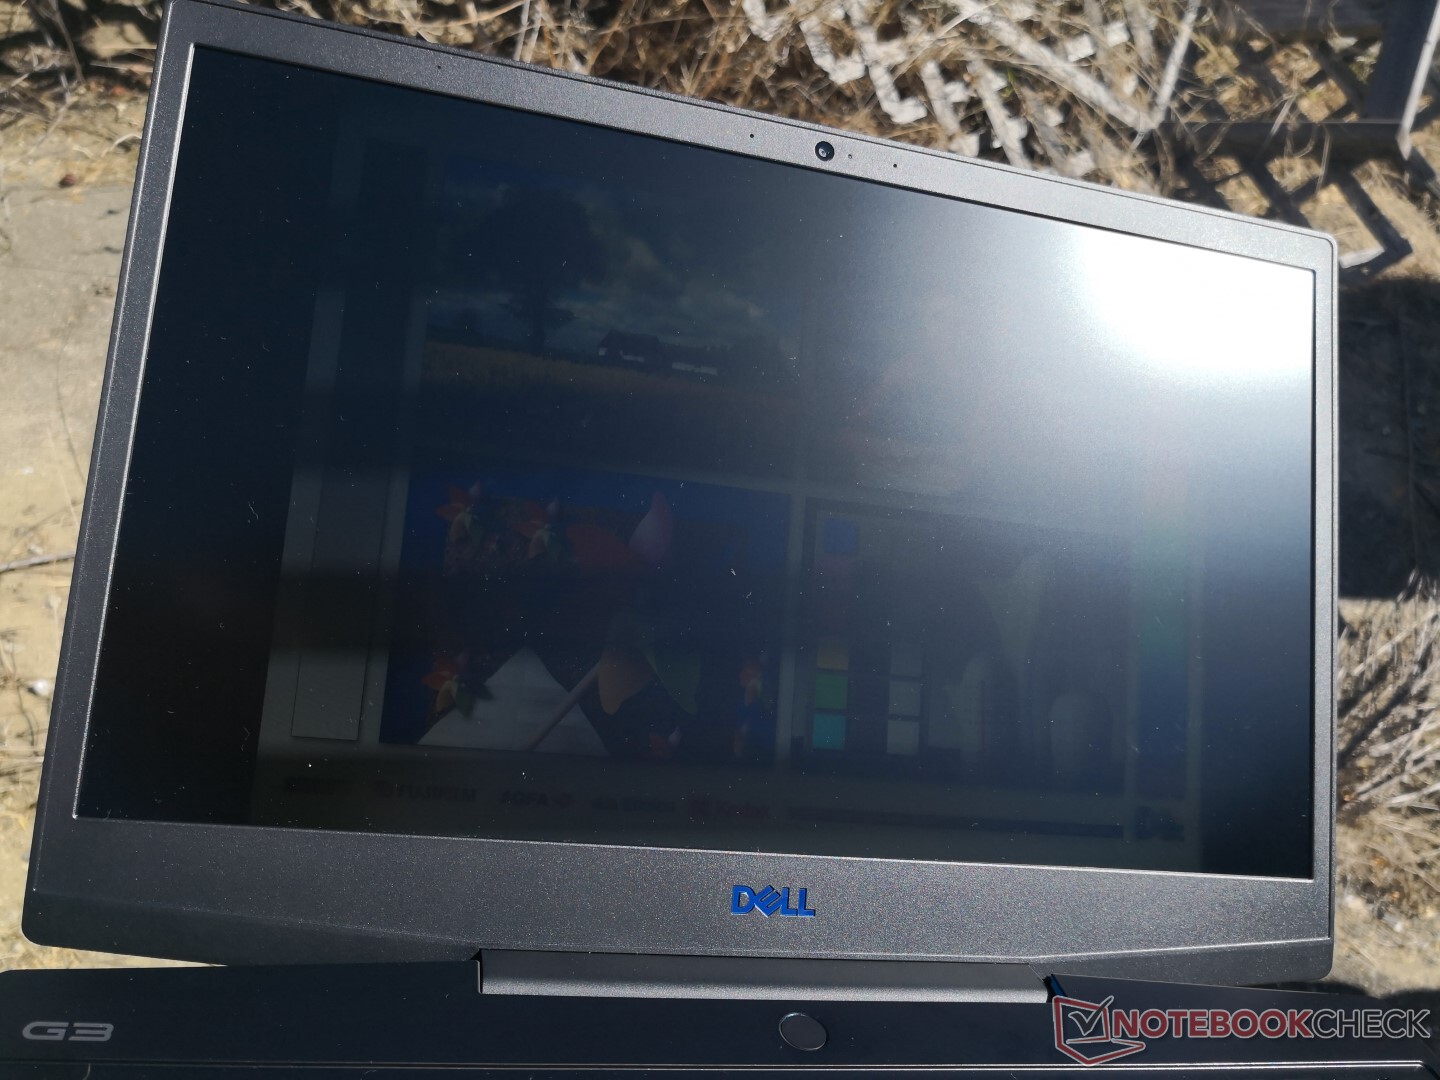
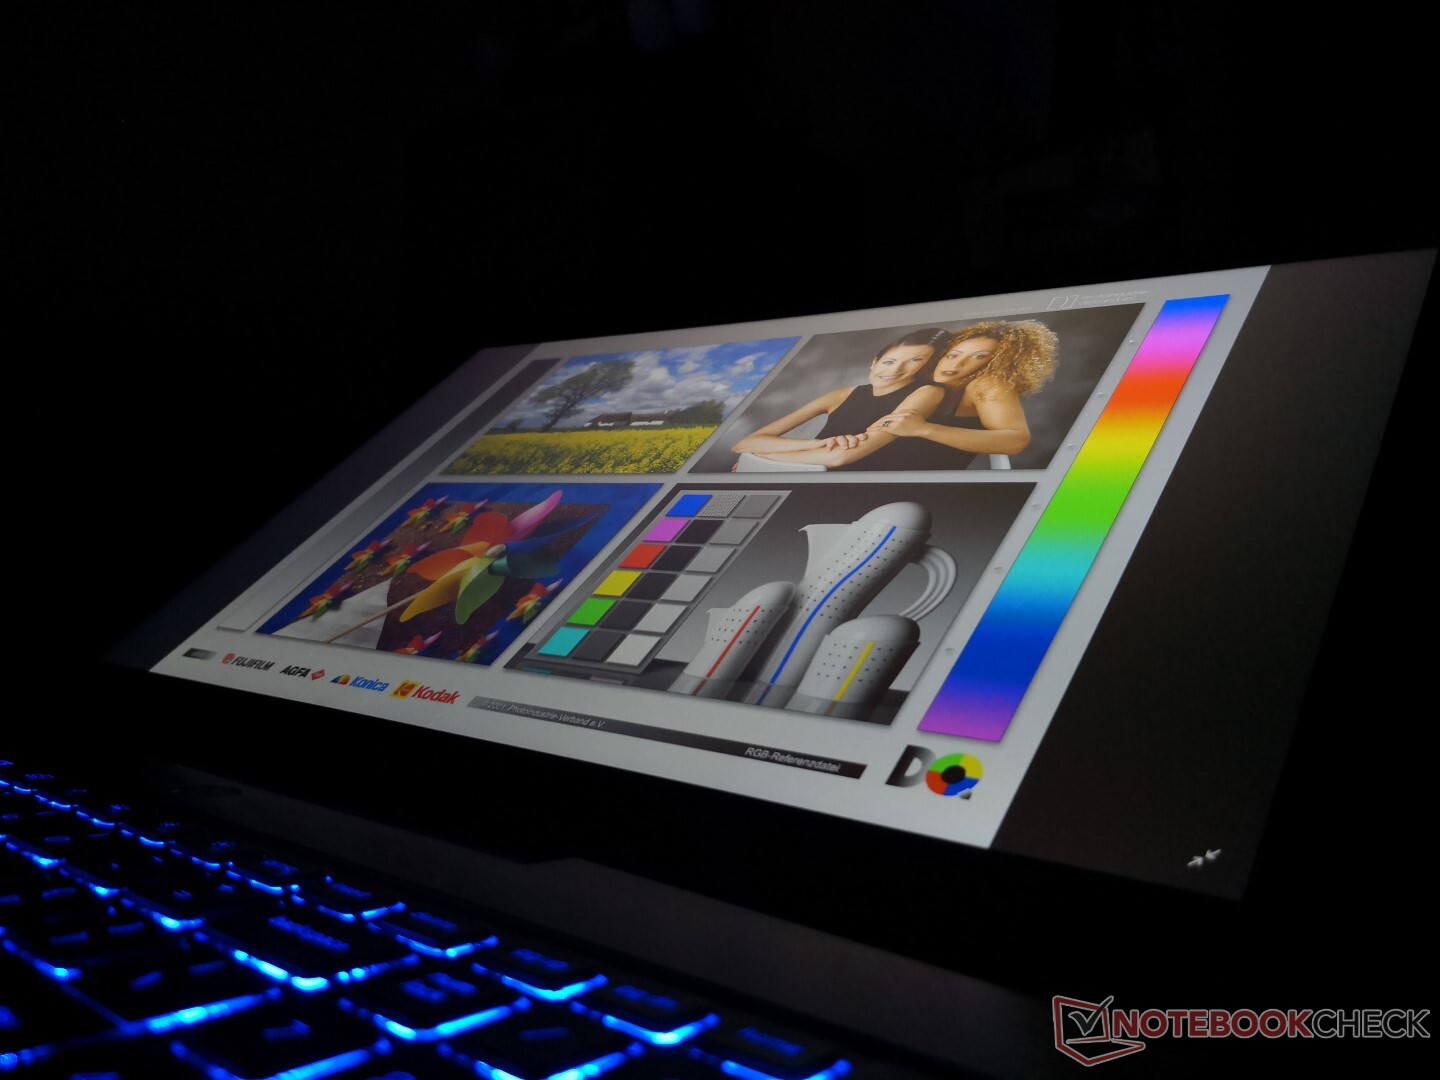
The matte display is slightly grainier than expected and not as sharp as a typical glossy panel. Combine this with the muted colors and you have a visual experience that's not as crisp or colorful as on the pricier XPS or Alienware series. Uneven backlight bleeding is heavy and noticeable during the initial bootup screen or when viewing videos with black borders.
| |||||||||||||||||||||||||
Brightness Distribution: 86 %
Center on Battery: 172 cd/m²
Contrast: 1151:1 (Black: 0.24 cd/m²)
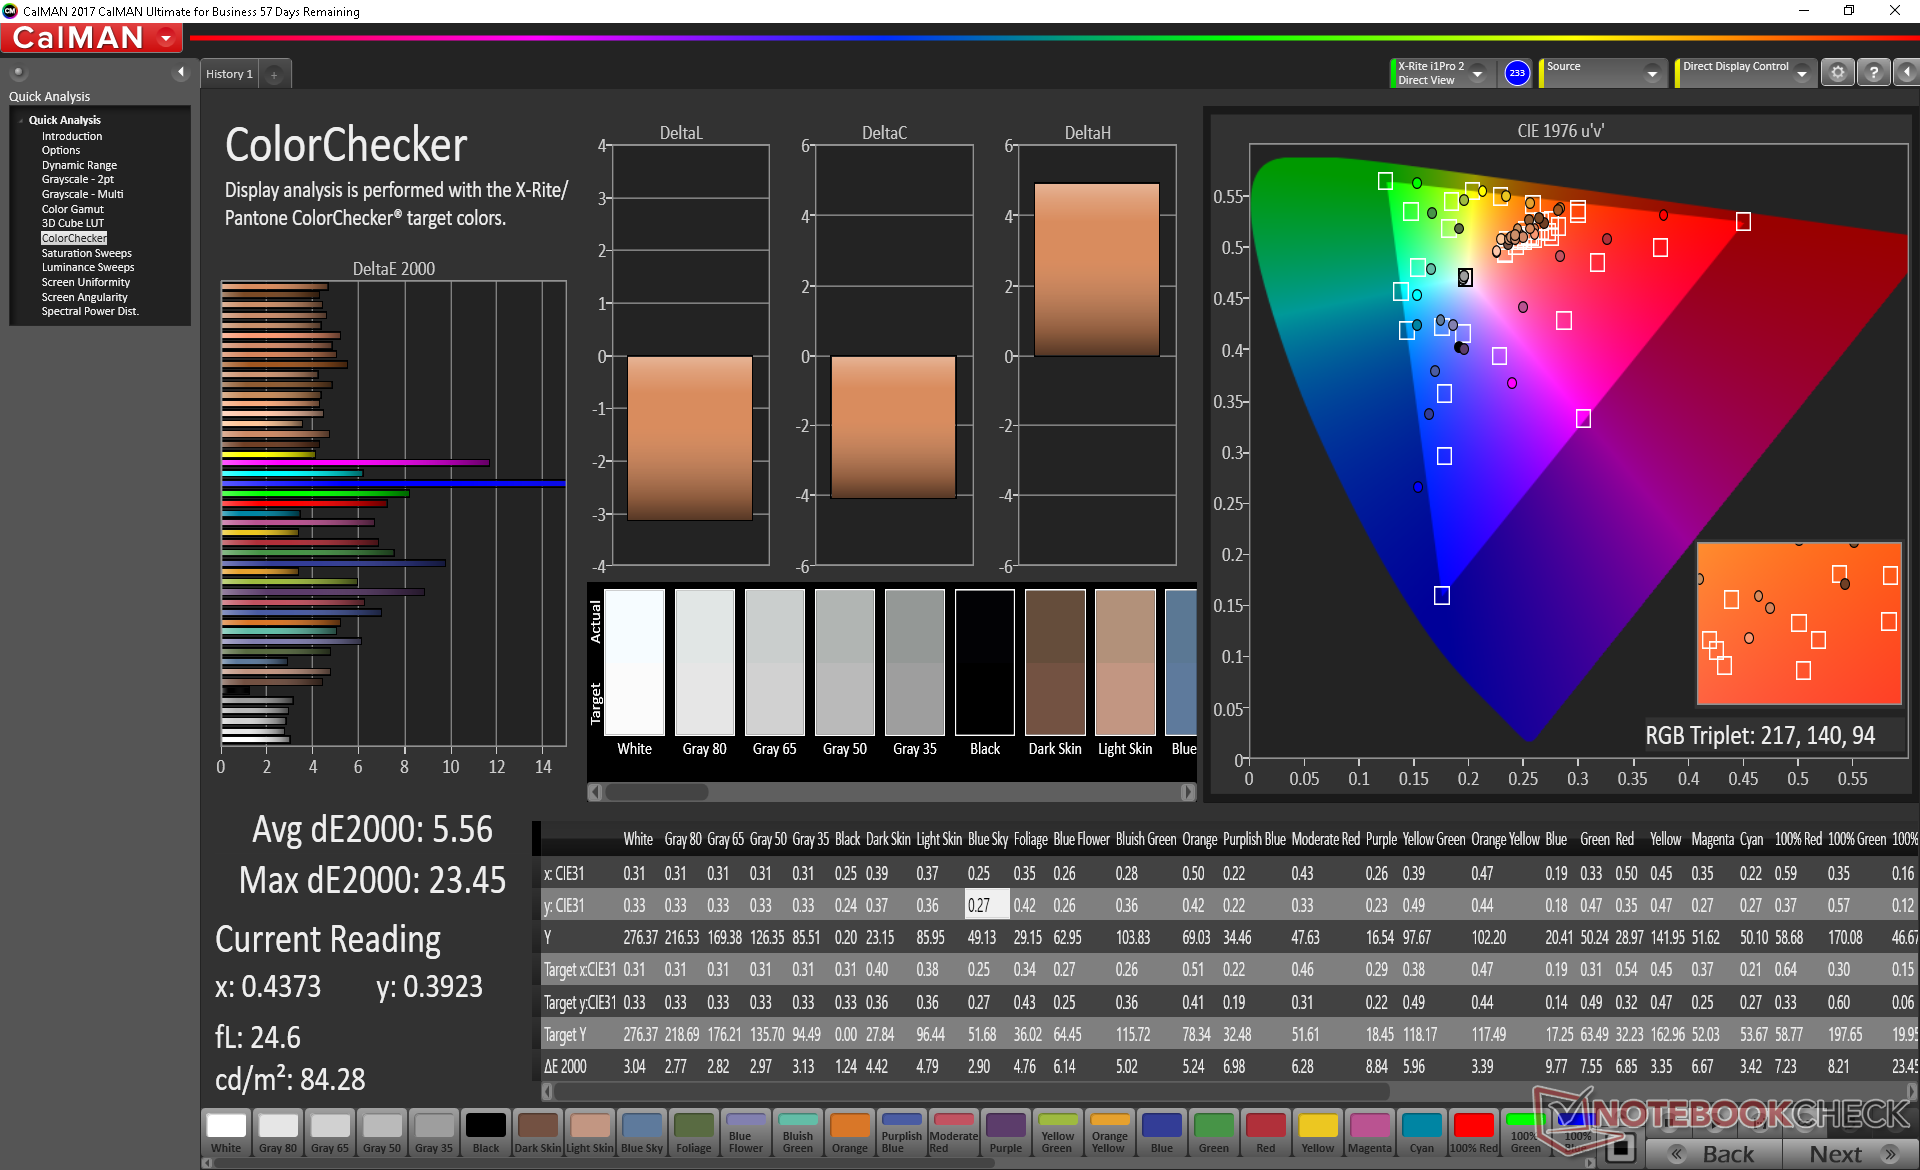
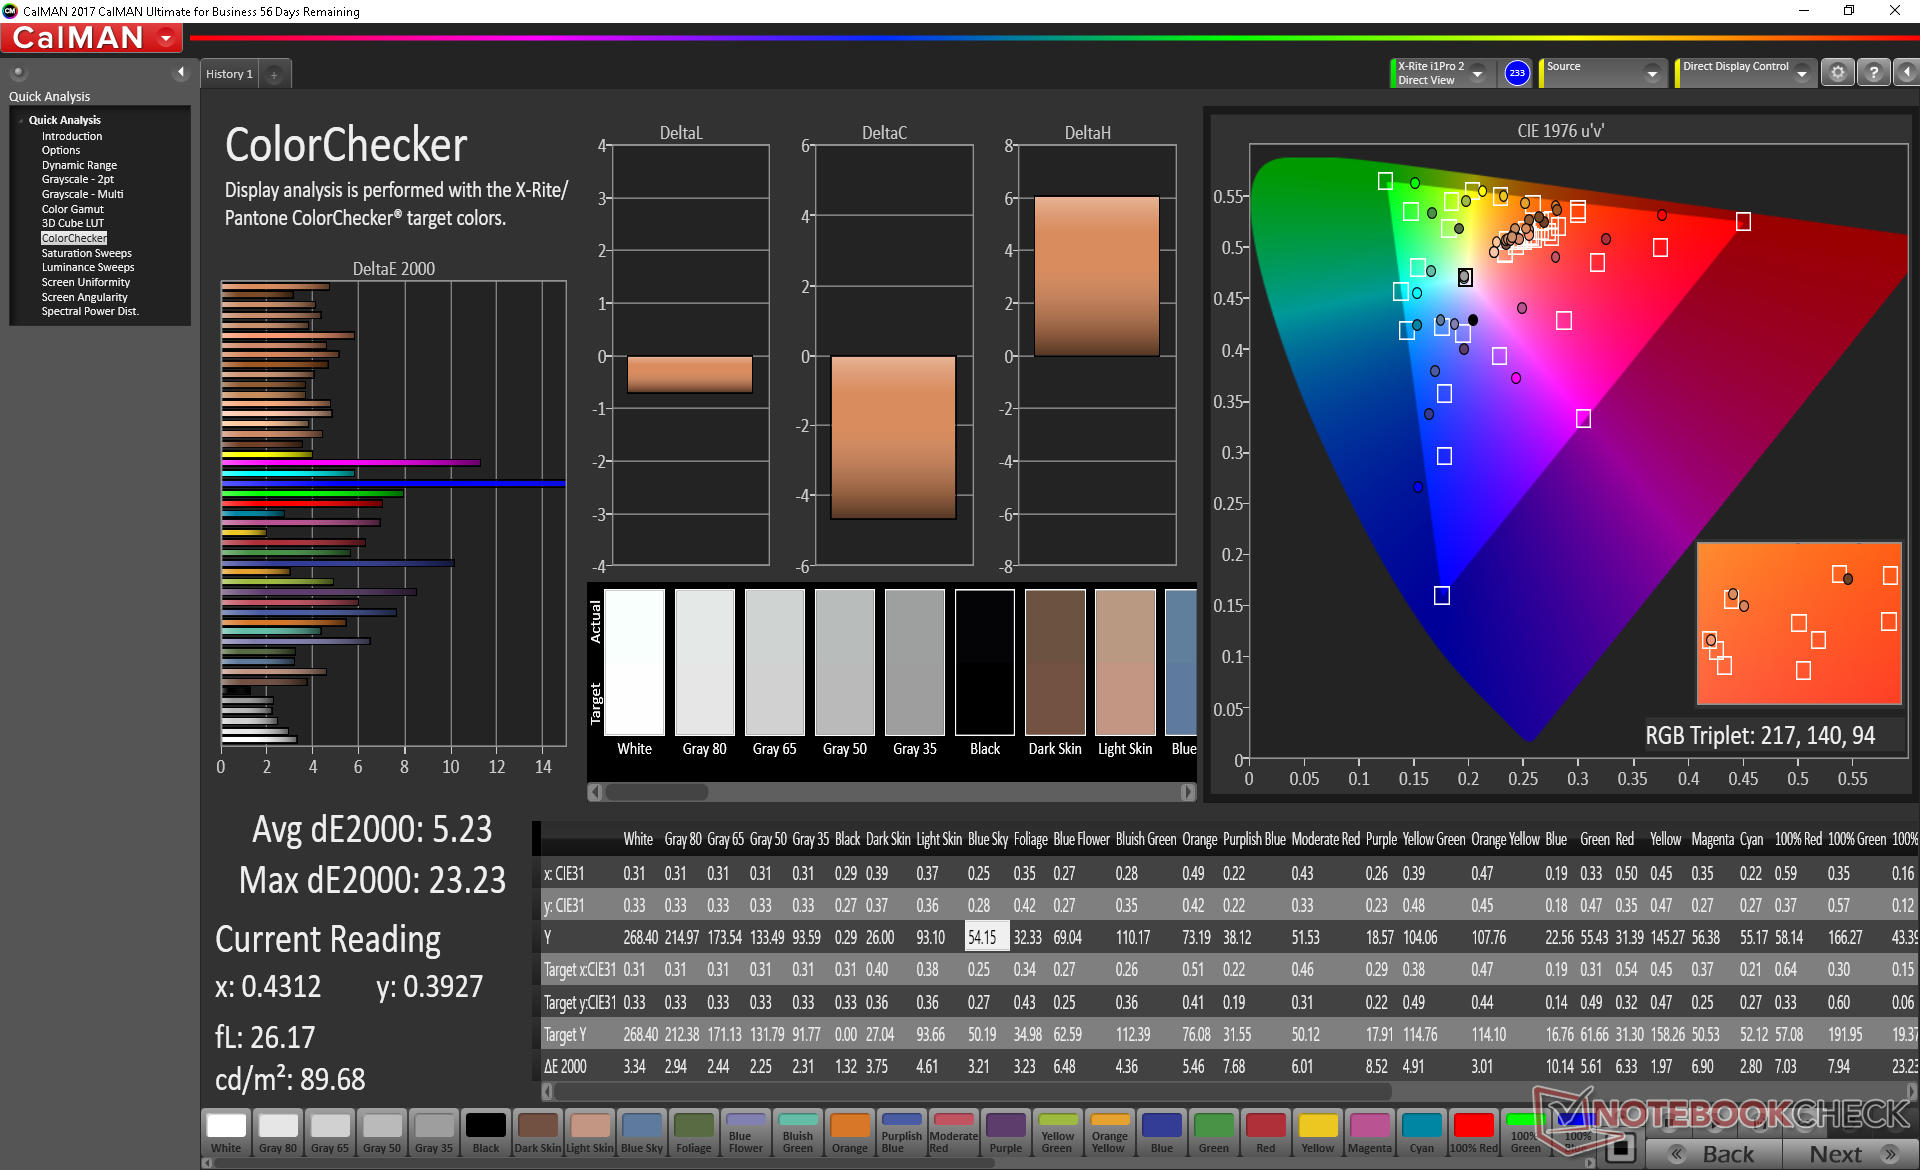
ΔE ColorChecker Calman: 5.56 | ∀{0.5-29.43 Ø4.73}
calibrated: 5.23
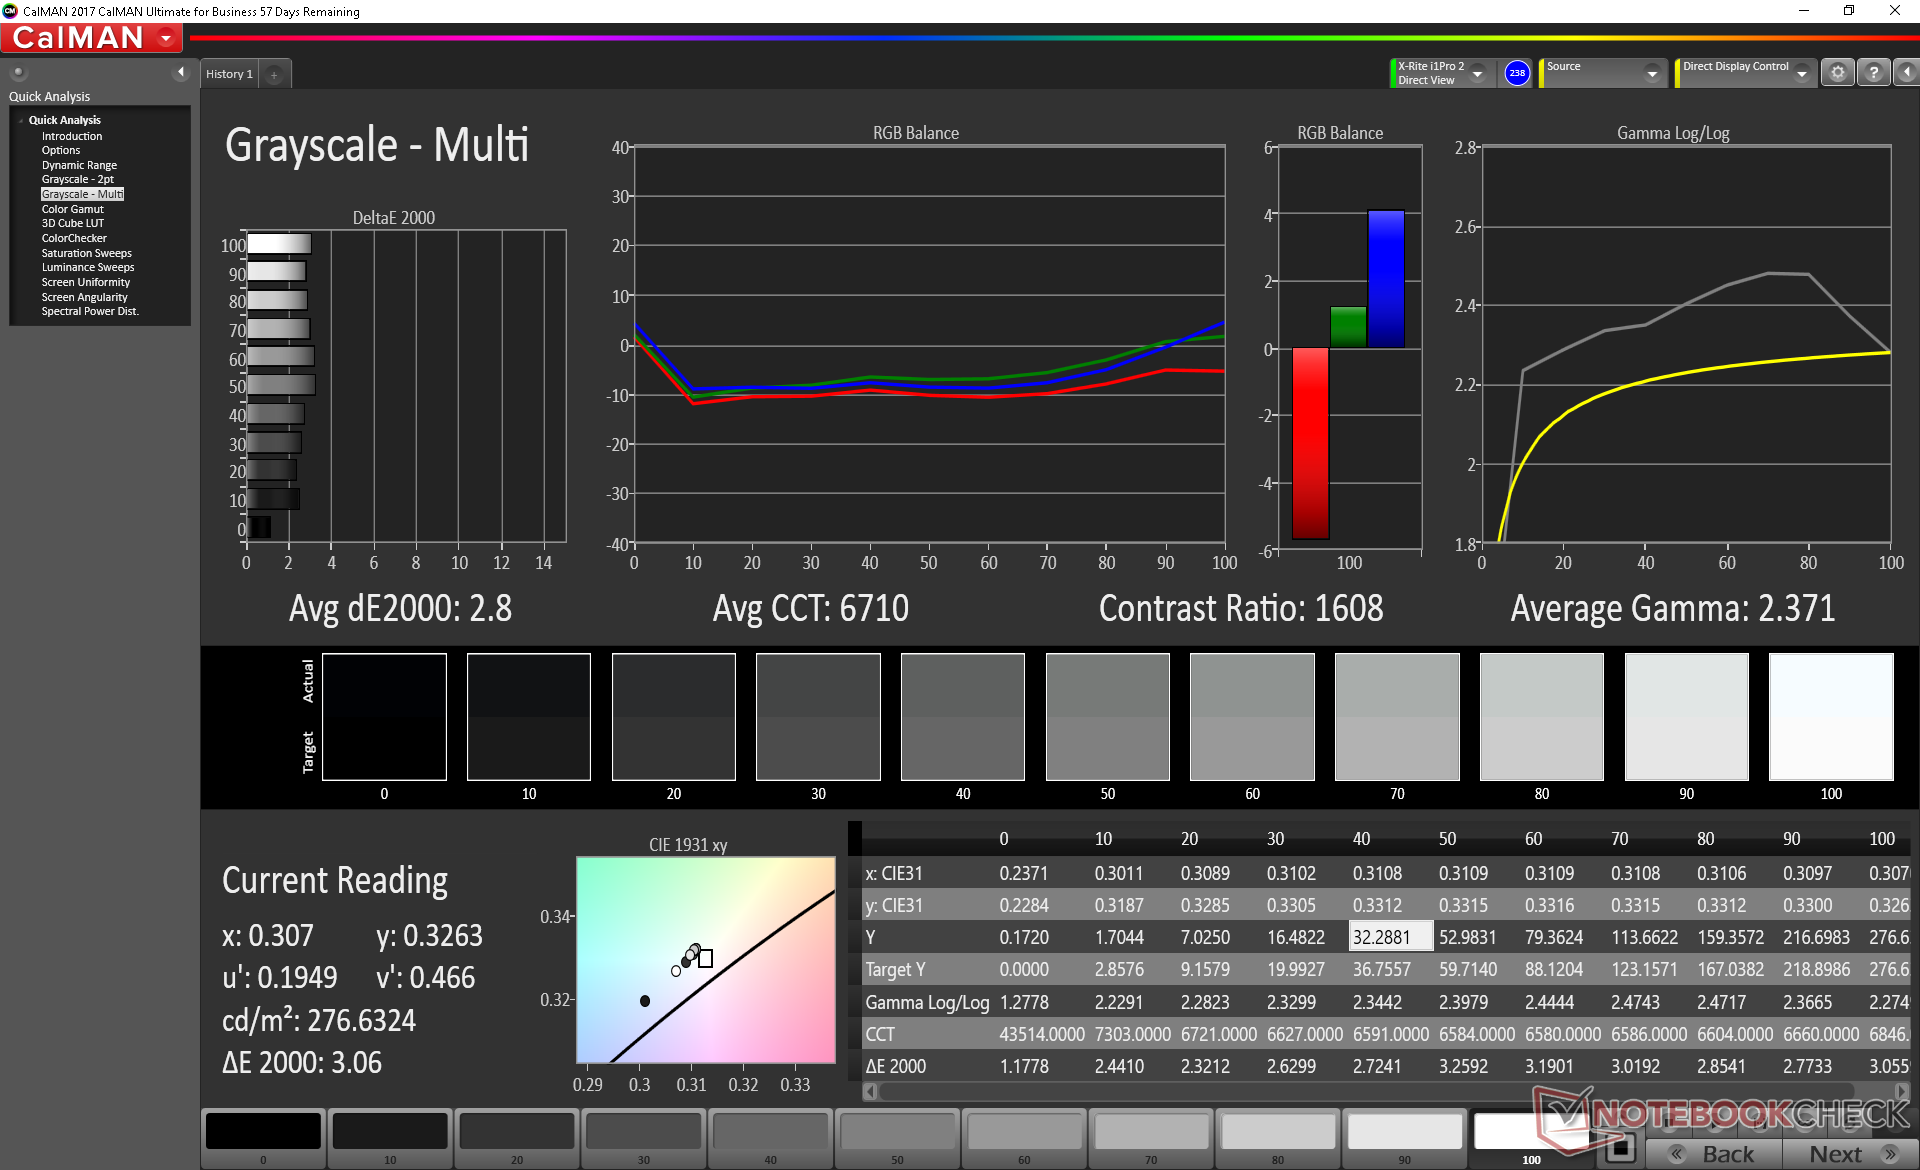
ΔE Greyscale Calman: 2.8 | ∀{0.09-98 Ø4.97}
59% sRGB (Argyll 1.6.3 3D)
37.8% AdobeRGB 1998 (Argyll 1.6.3 3D)
41.47% AdobeRGB 1998 (Argyll 3D)
59.8% sRGB (Argyll 3D)
40.13% Display P3 (Argyll 3D)
Gamma: 2.37
CCT: 6710 K
| Dell G3 3590 BOE NV15N3D, IPS, 15.6", 1920x1080 | Dell G3 15 3579 LG Philips LP156WF6, IPS, 15.6", 1920x1080 | Lenovo Legion Y540-15IRH-81SX00B2GE BOE 084D, IPS, 15.6", 1920x1080 | Aorus 15-SA LG Philips LP156WFG-SPB2 (LGD05E8), IPS, 15.6", 1920x1080 | Alienware m15 R2 P87F Sharp LQ156M1, IPS, 15.6", 1920x1080 | HP Gaming Pavilion 15-dk0009ng LG Philips LGD05FE, IPS, 15.6", 1920x1080 | |
|---|---|---|---|---|---|---|
| Display | -4% | 56% | 58% | 60% | 59% | |
| Display P3 Coverage (%) | 40.13 | 38.48 -4% | 63.6 58% | 64.3 60% | 65.3 63% | 64.2 60% |
| sRGB Coverage (%) | 59.8 | 57.9 -3% | 91.7 53% | 93.6 57% | 95.1 59% | 95.1 59% |
| AdobeRGB 1998 Coverage (%) | 41.47 | 39.75 -4% | 65.2 57% | 65.6 58% | 65.9 59% | 65.8 59% |
| Response Times | 29% | 72% | 63% | 69% | 66% | |
| Response Time Grey 50% / Grey 80% * (ms) | 46 ? | 32.4 ? 30% | 8.8 ? 81% | 15.6 ? 66% | 16.4 ? 64% | 16.4 ? 64% |
| Response Time Black / White * (ms) | 32.4 ? | 23.2 ? 28% | 12 ? 63% | 12.8 ? 60% | 8.8 ? 73% | 10.4 ? 68% |
| PWM Frequency (Hz) | 200 ? | 23810 ? | ||||
| Screen | -11% | 20% | 21% | 2% | 33% | |
| Brightness middle (cd/m²) | 276.2 | 208.2 -25% | 299 8% | 266 -4% | 324.2 17% | 345 25% |
| Brightness (cd/m²) | 261 | 203 -22% | 290 11% | 254 -3% | 304 16% | 324 24% |
| Brightness Distribution (%) | 86 | 81 -6% | 89 3% | 90 5% | 90 5% | 86 0% |
| Black Level * (cd/m²) | 0.24 | 0.34 -42% | 0.29 -21% | 0.28 -17% | 0.38 -58% | 0.42 -75% |
| Contrast (:1) | 1151 | 612 -47% | 1031 -10% | 950 -17% | 853 -26% | 821 -29% |
| Colorchecker dE 2000 * | 5.56 | 4.65 16% | 3.7 33% | 3.11 44% | 5.01 10% | 1.3 77% |
| Colorchecker dE 2000 max. * | 23.45 | 15.99 32% | 7 70% | 5.84 75% | 12.7 46% | 2.8 88% |
| Colorchecker dE 2000 calibrated * | 5.23 | 3.84 27% | 2 62% | 1.37 74% | 1.64 69% | 1.1 79% |
| Greyscale dE 2000 * | 2.8 | 4.1 -46% | 4.1 -46% | 3.94 -41% | 7.9 -182% | 1.2 57% |
| Gamma | 2.37 93% | 2.3 96% | 2.19 100% | 2.53 87% | 2.35 94% | 2.31 95% |
| CCT | 6710 97% | 7352 88% | 7166 91% | 6210 105% | 8455 77% | 6476 100% |
| Color Space (Percent of AdobeRGB 1998) (%) | 37.8 | 36.7 -3% | 59.3 57% | 60 59% | 60.8 61% | 60.5 60% |
| Color Space (Percent of sRGB) (%) | 59 | 57.9 -2% | 91.5 55% | 93 58% | 95.5 62% | 94.9 61% |
| Total Average (Program / Settings) | 5% /
-4% | 49% /
33% | 47% /
33% | 44% /
21% | 53% /
42% |
* ... smaller is better
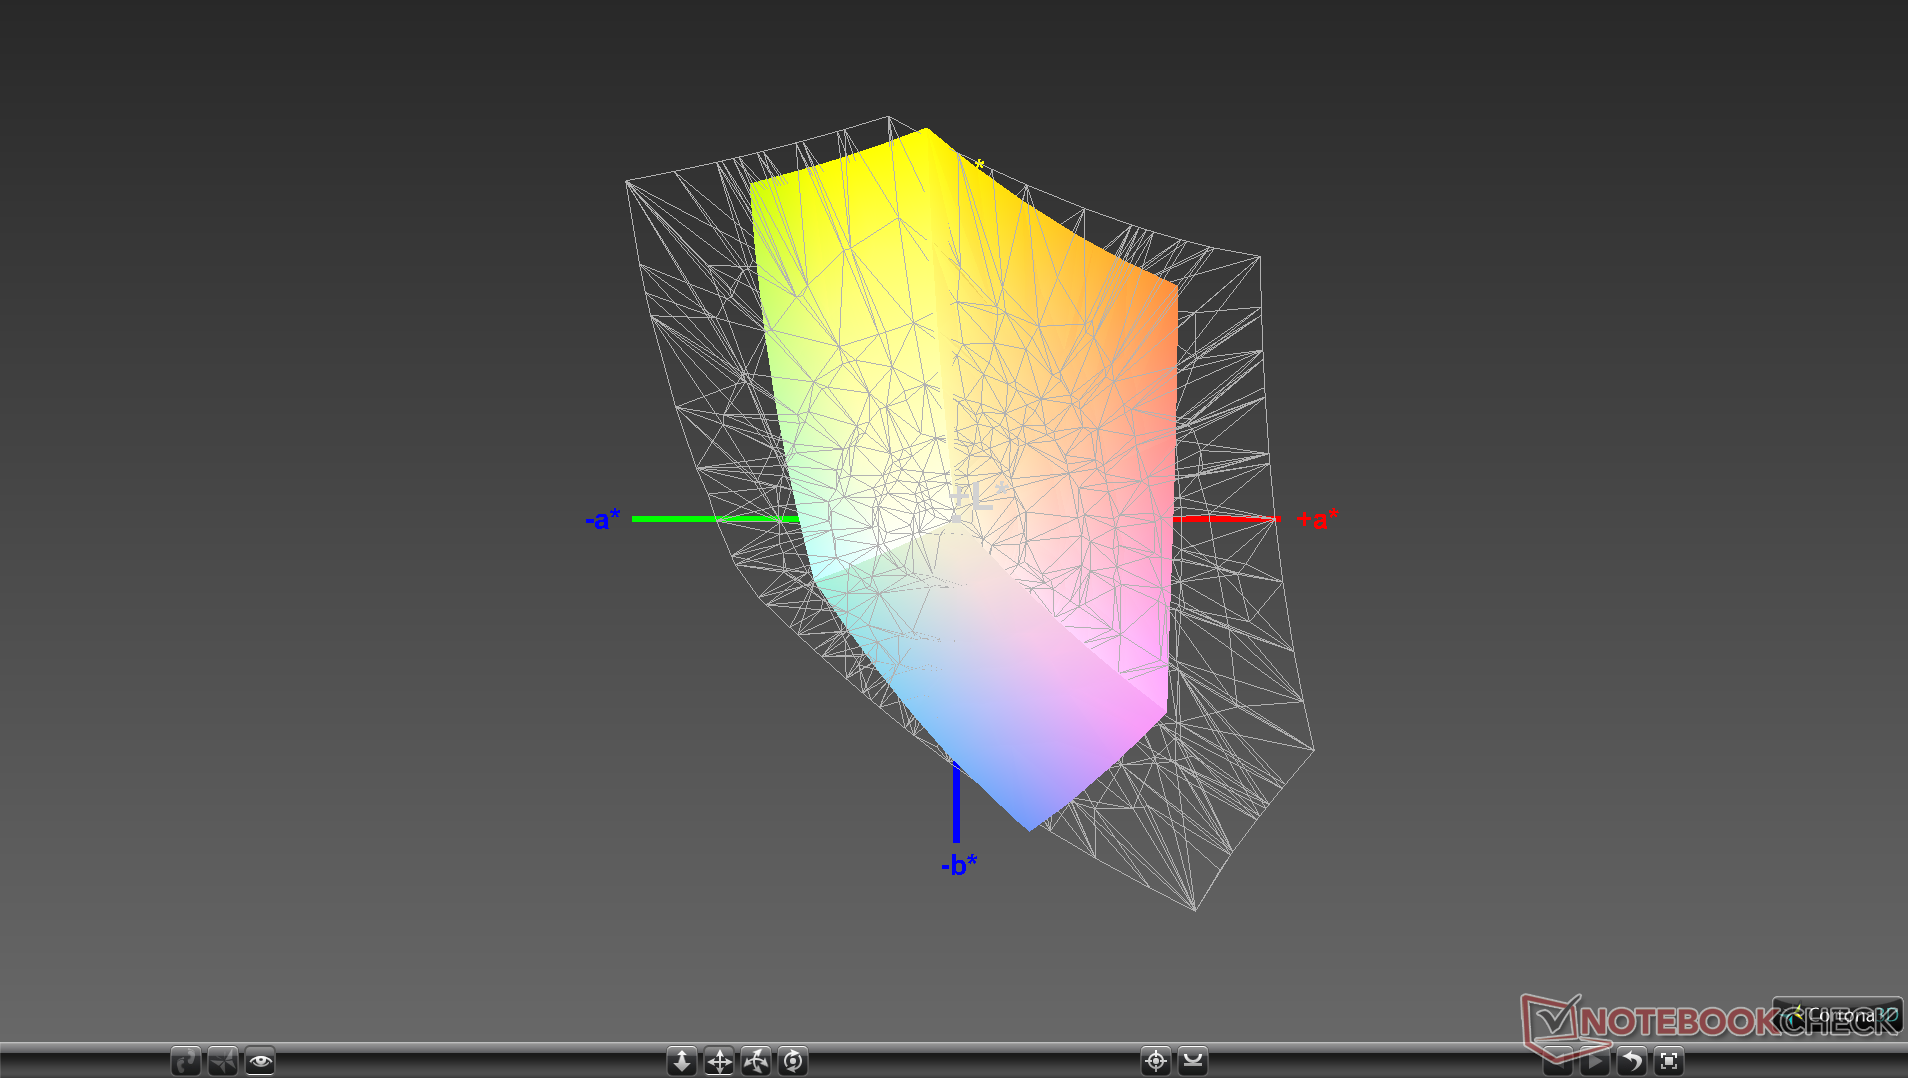
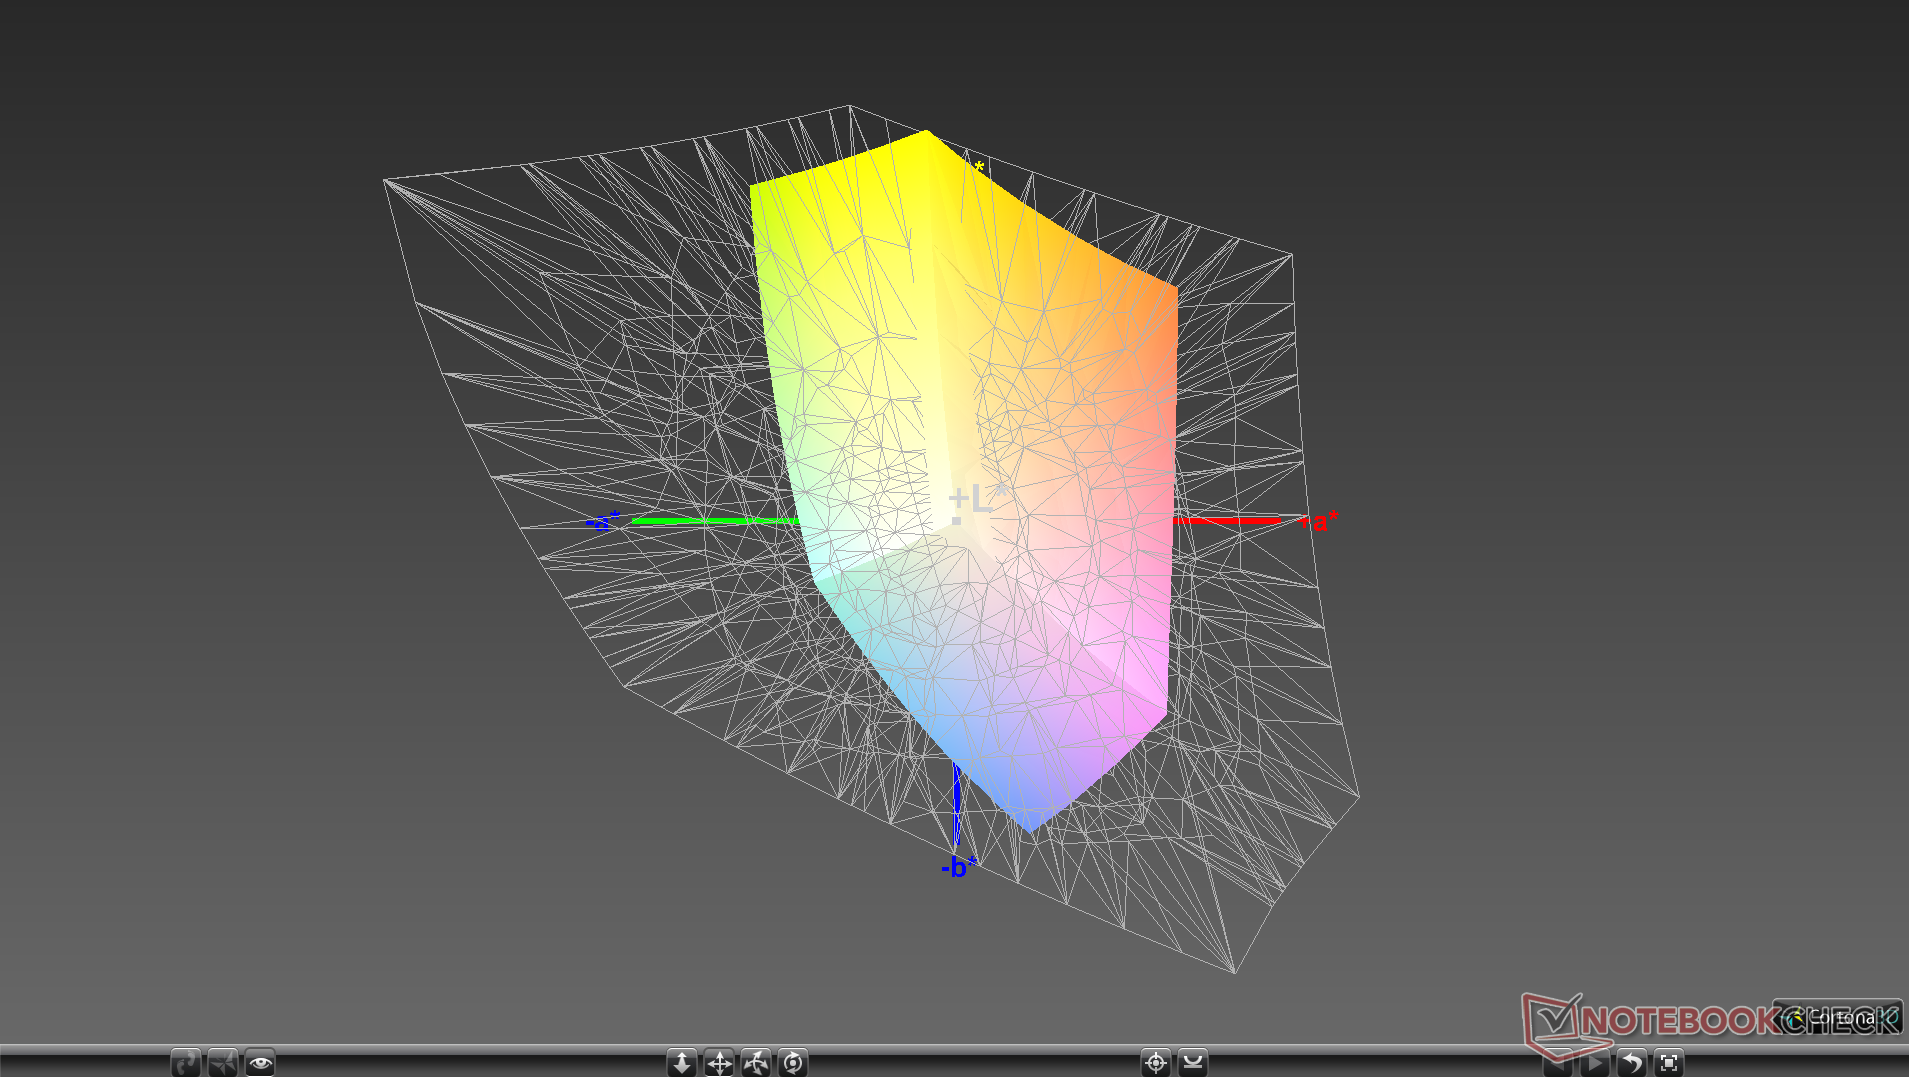
Color space is narrow at just 59 percent and 38 percent of sRGB and AdobeRGB, respectively. Users who want deeper and more accurate colors ought to look at Dell's higher-end XPS or Alienware families instead. The G3 3590 is definitely not suitable for digital graphics work where precise colors are paramount.
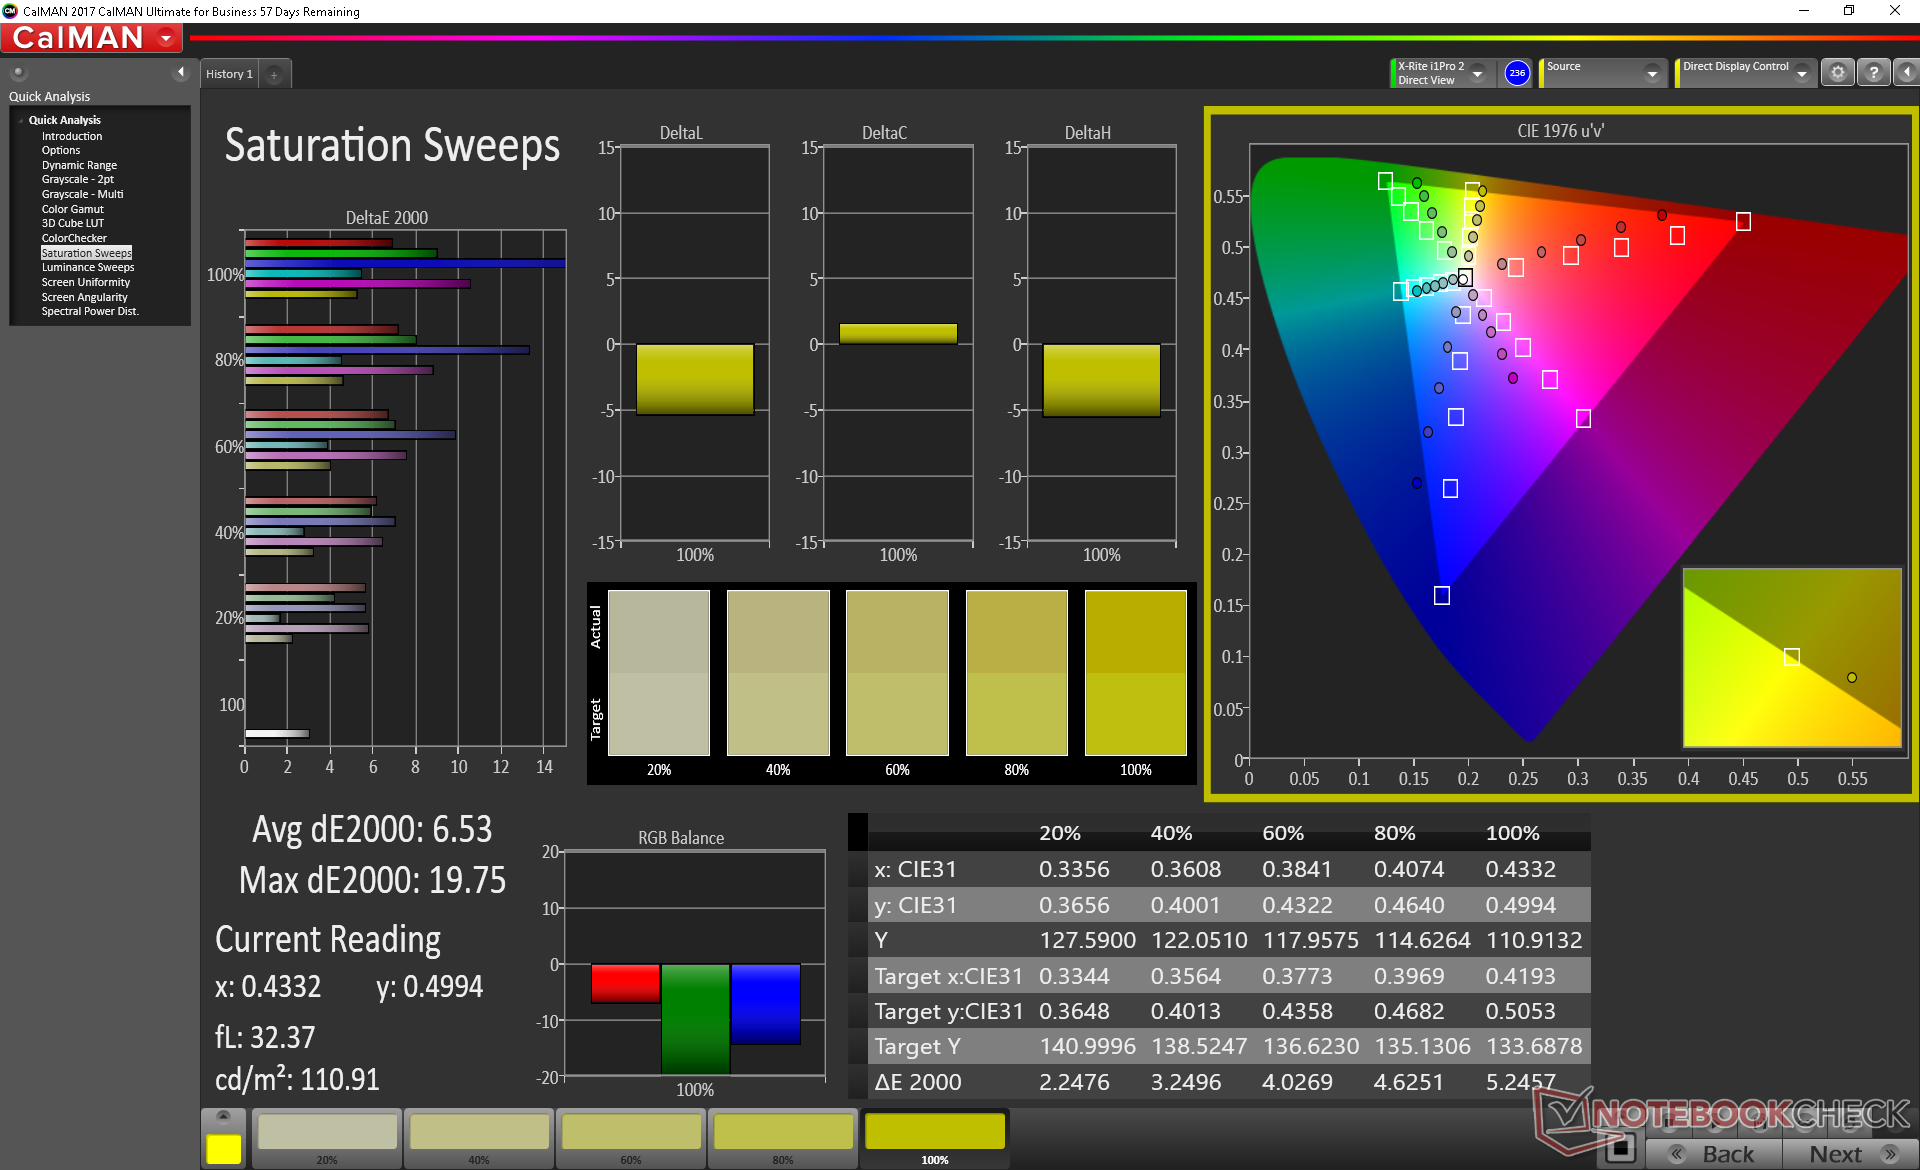
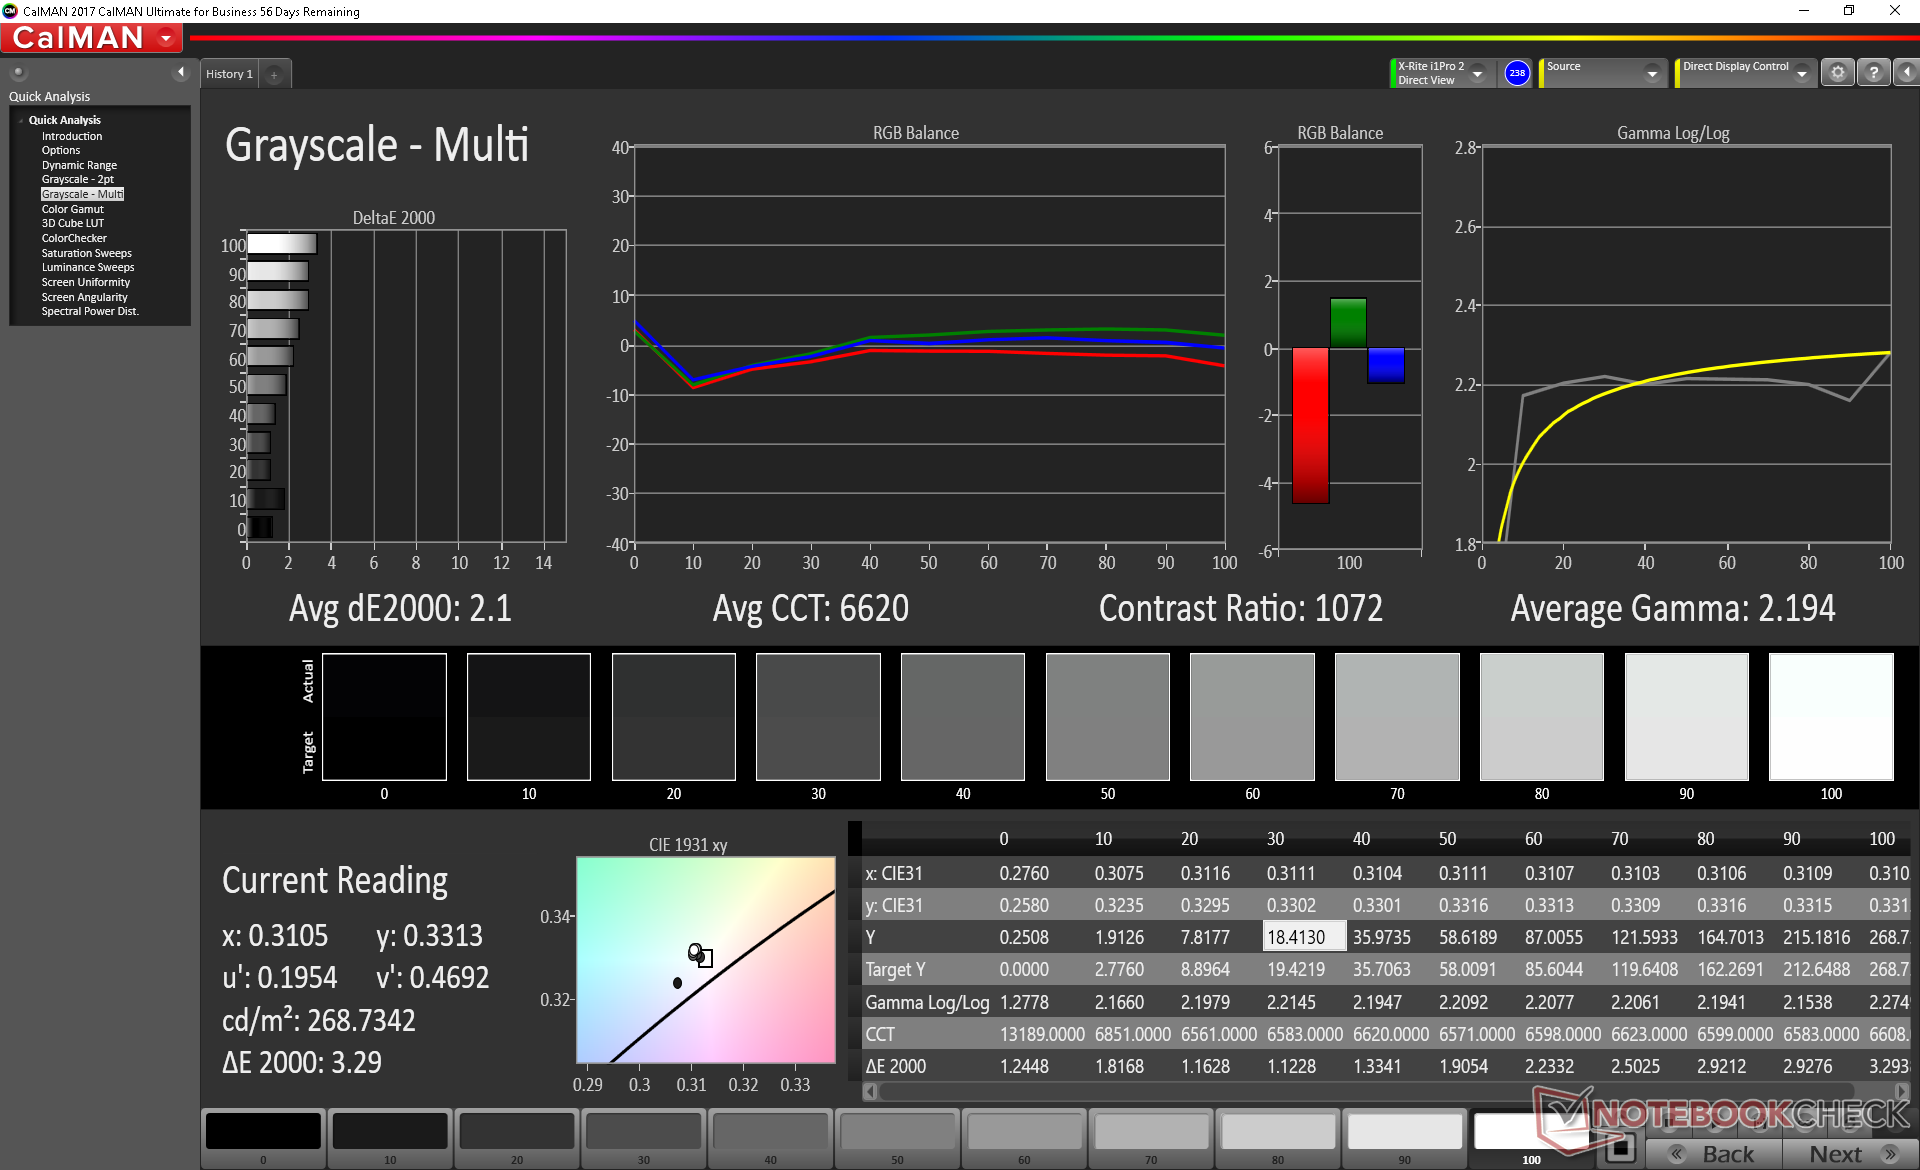
To our surprise, the display is well calibrated out of the box which is uncommon for a budget laptop. Grayscale and color temperature are excellent especially for an inexpensive panel where average DeltaE values are usually very high. The limited gamut of the panel means colors will still become increasingly inaccurate at higher saturation levels so matter how well calibrated the display may be.

Display Response Times
| ↔ Response Time Black to White | ||
|---|---|---|
| 32.4 ms ... rise ↗ and fall ↘ combined | ↗ 18.4 ms rise | 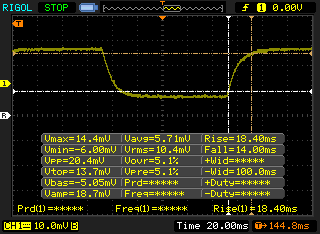 |
| ↘ 14 ms fall | ||
| The screen shows slow response rates in our tests and will be unsatisfactory for gamers. In comparison, all tested devices range from 0.1 (minimum) to 240 (maximum) ms. » 88 % of all devices are better. This means that the measured response time is worse than the average of all tested devices (19.9 ms). | ||
| ↔ Response Time 50% Grey to 80% Grey | ||
| 46 ms ... rise ↗ and fall ↘ combined | ↗ 22 ms rise | 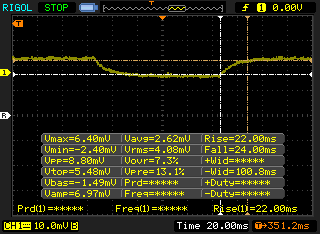 |
| ↘ 24 ms fall | ||
| The screen shows slow response rates in our tests and will be unsatisfactory for gamers. In comparison, all tested devices range from 0.165 (minimum) to 636 (maximum) ms. » 79 % of all devices are better. This means that the measured response time is worse than the average of all tested devices (31.1 ms). | ||
Screen Flickering / PWM (Pulse-Width Modulation)
| Screen flickering / PWM detected | 200 Hz | ≤ 98 % brightness setting | 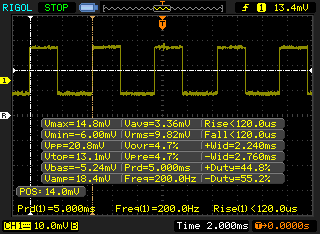 |
The display backlight flickers at 200 Hz (worst case, e.g., utilizing PWM) Flickering detected at a brightness setting of 98 % and below. There should be no flickering or PWM above this brightness setting. The frequency of 200 Hz is relatively low, so sensitive users will likely notice flickering and experience eyestrain at the stated brightness setting and below. In comparison: 52 % of all tested devices do not use PWM to dim the display. If PWM was detected, an average of 7794 (minimum: 5 - maximum: 343500) Hz was measured. | |||
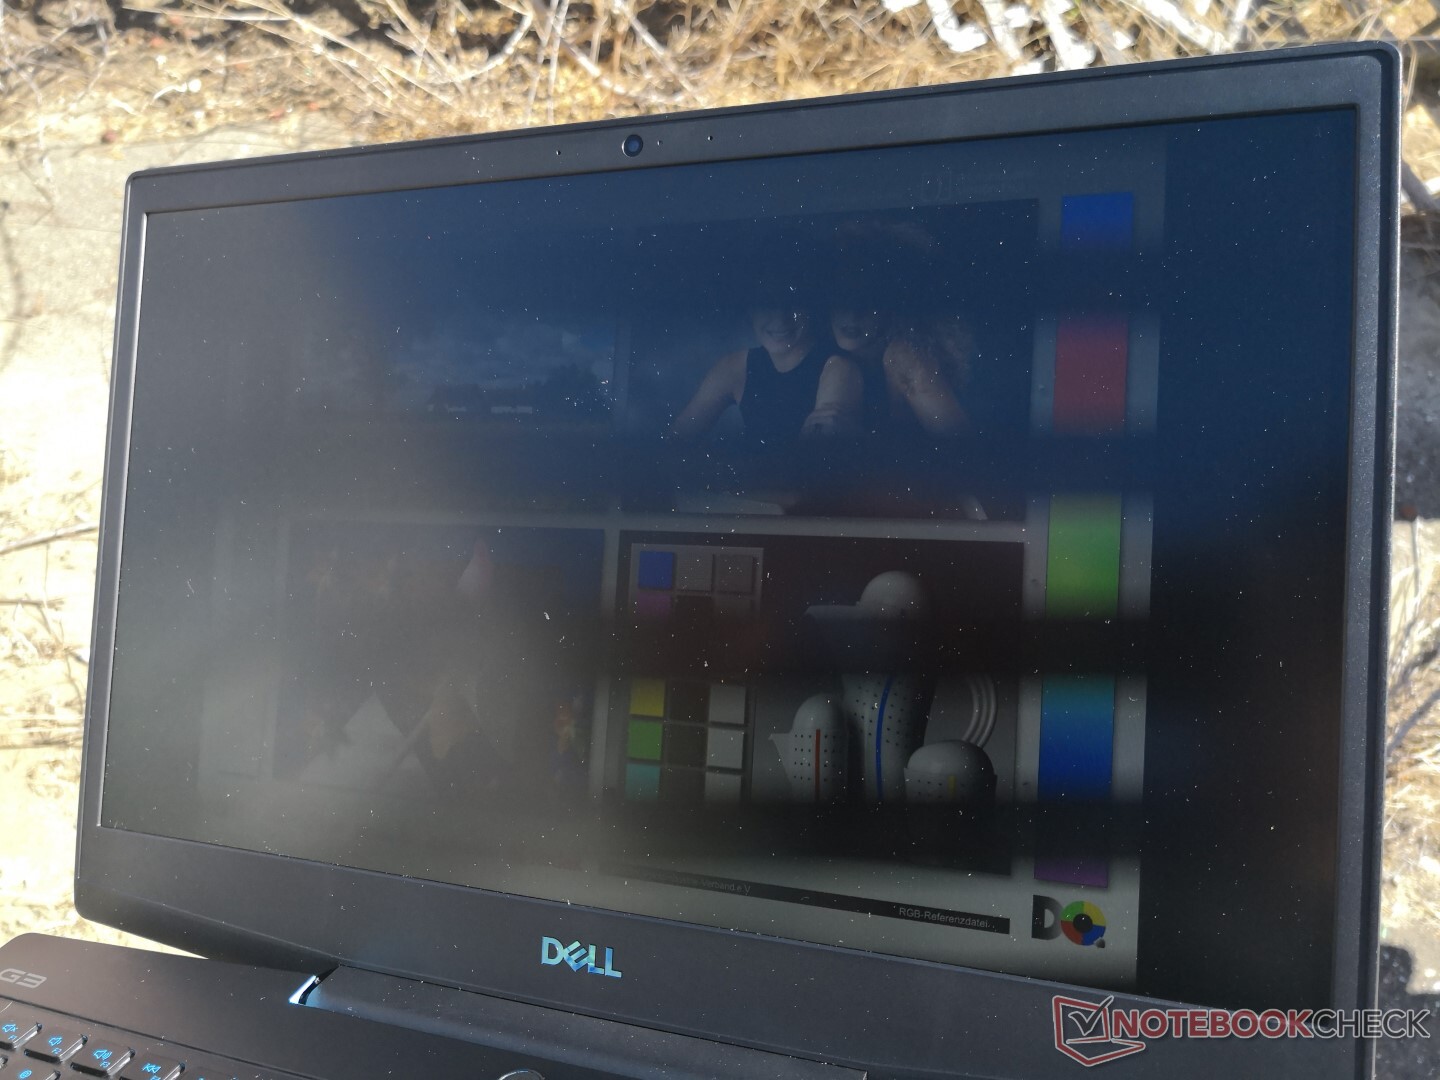
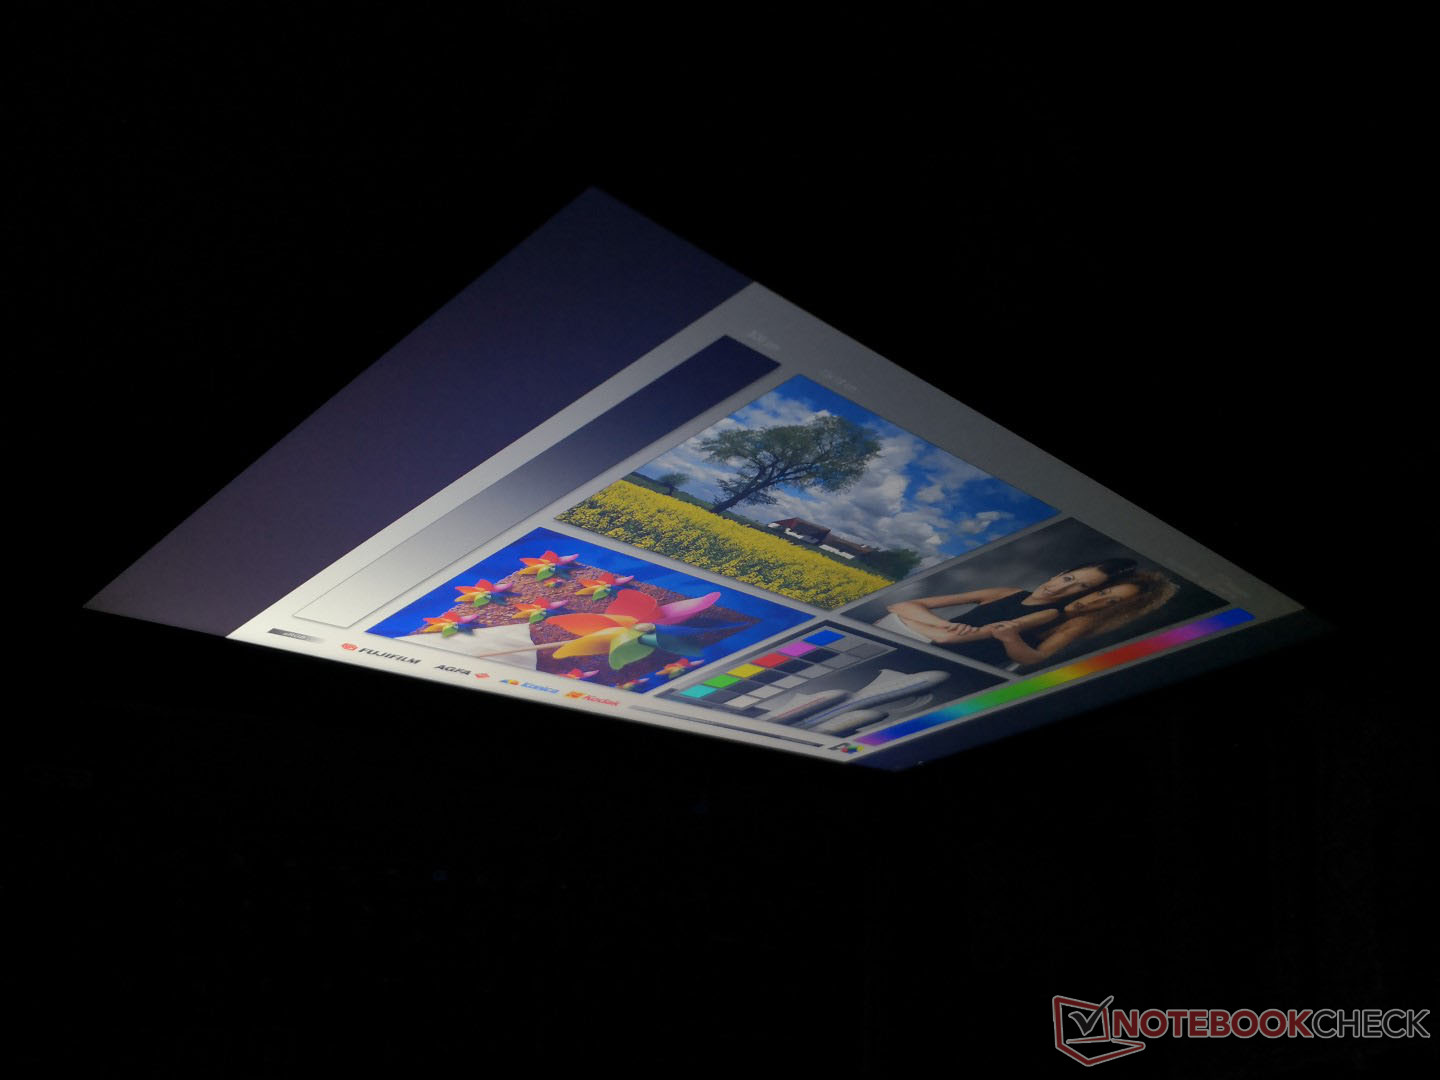
Outdoor visibility is very poor as the maximum brightness is reduced to just 171 nits from 276 nits when running on battery power. This is nearly 70 percent dimmer than the latest XPS 15 7590 FHD and most gaming laptops in general. Meanwhile, viewing angles are excellent as one would expect from an IPS panel, but apparent brightness decreases even further if viewing from obtuse angles.
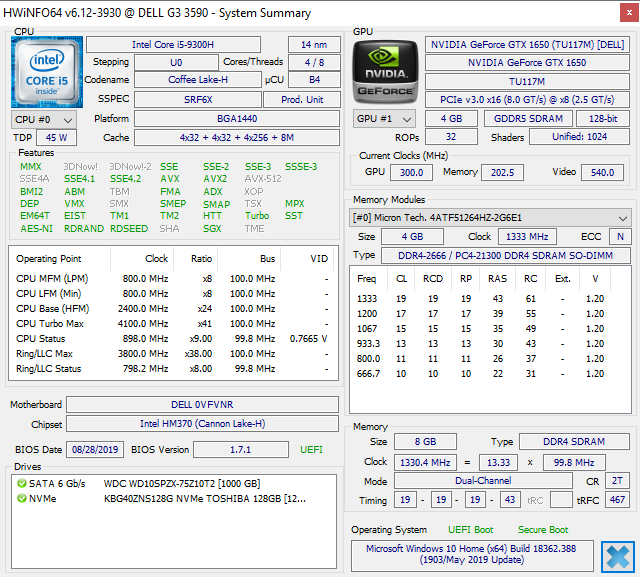
Performance
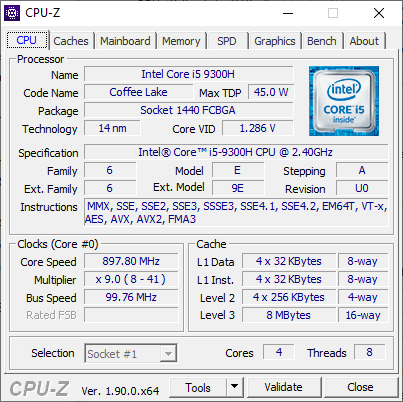
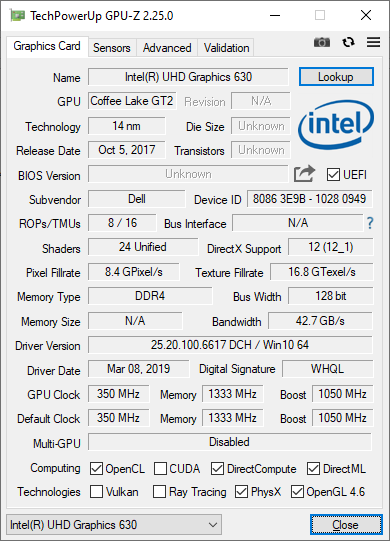
The Core i5-9300H CPU and GeForce GTX 1650 GPU are common on low-end gaming laptops of 2019. While CPU performance is only marginally better than the Core i5-8300H at best, the GTX 1650 is significantly faster than GTX 1050 it replaces.
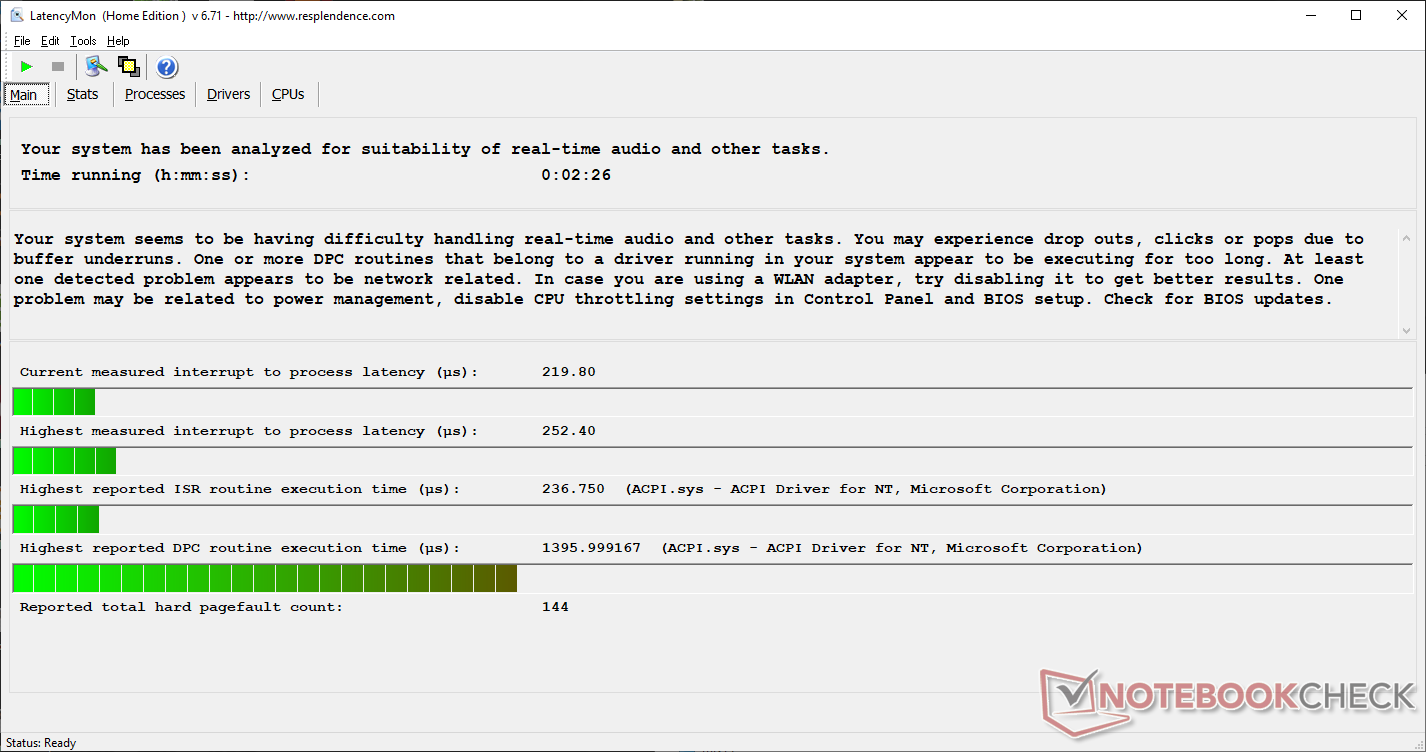
Nvidia Optimus comes standard across all SKUs to automatically exclude G-Sync. LatencyMon shows DPC latency issues even when the wireless is disabled.
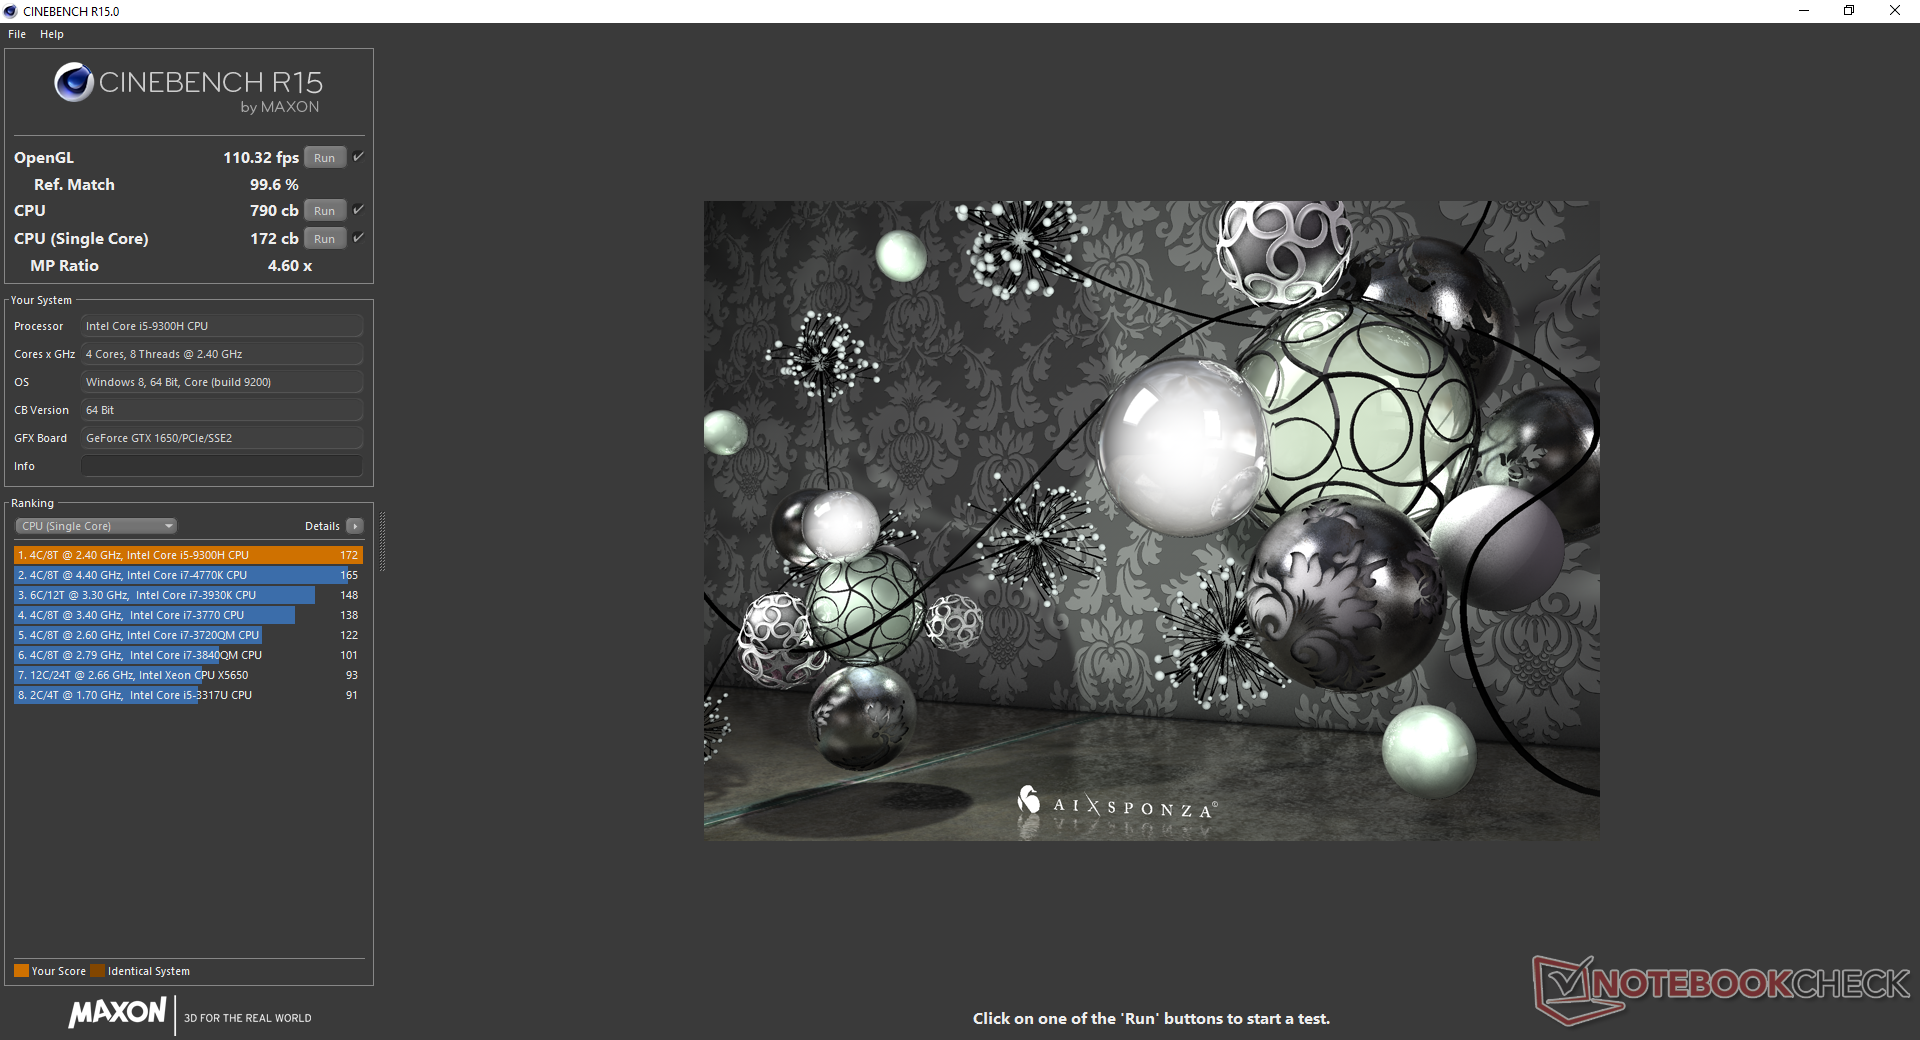
Processor
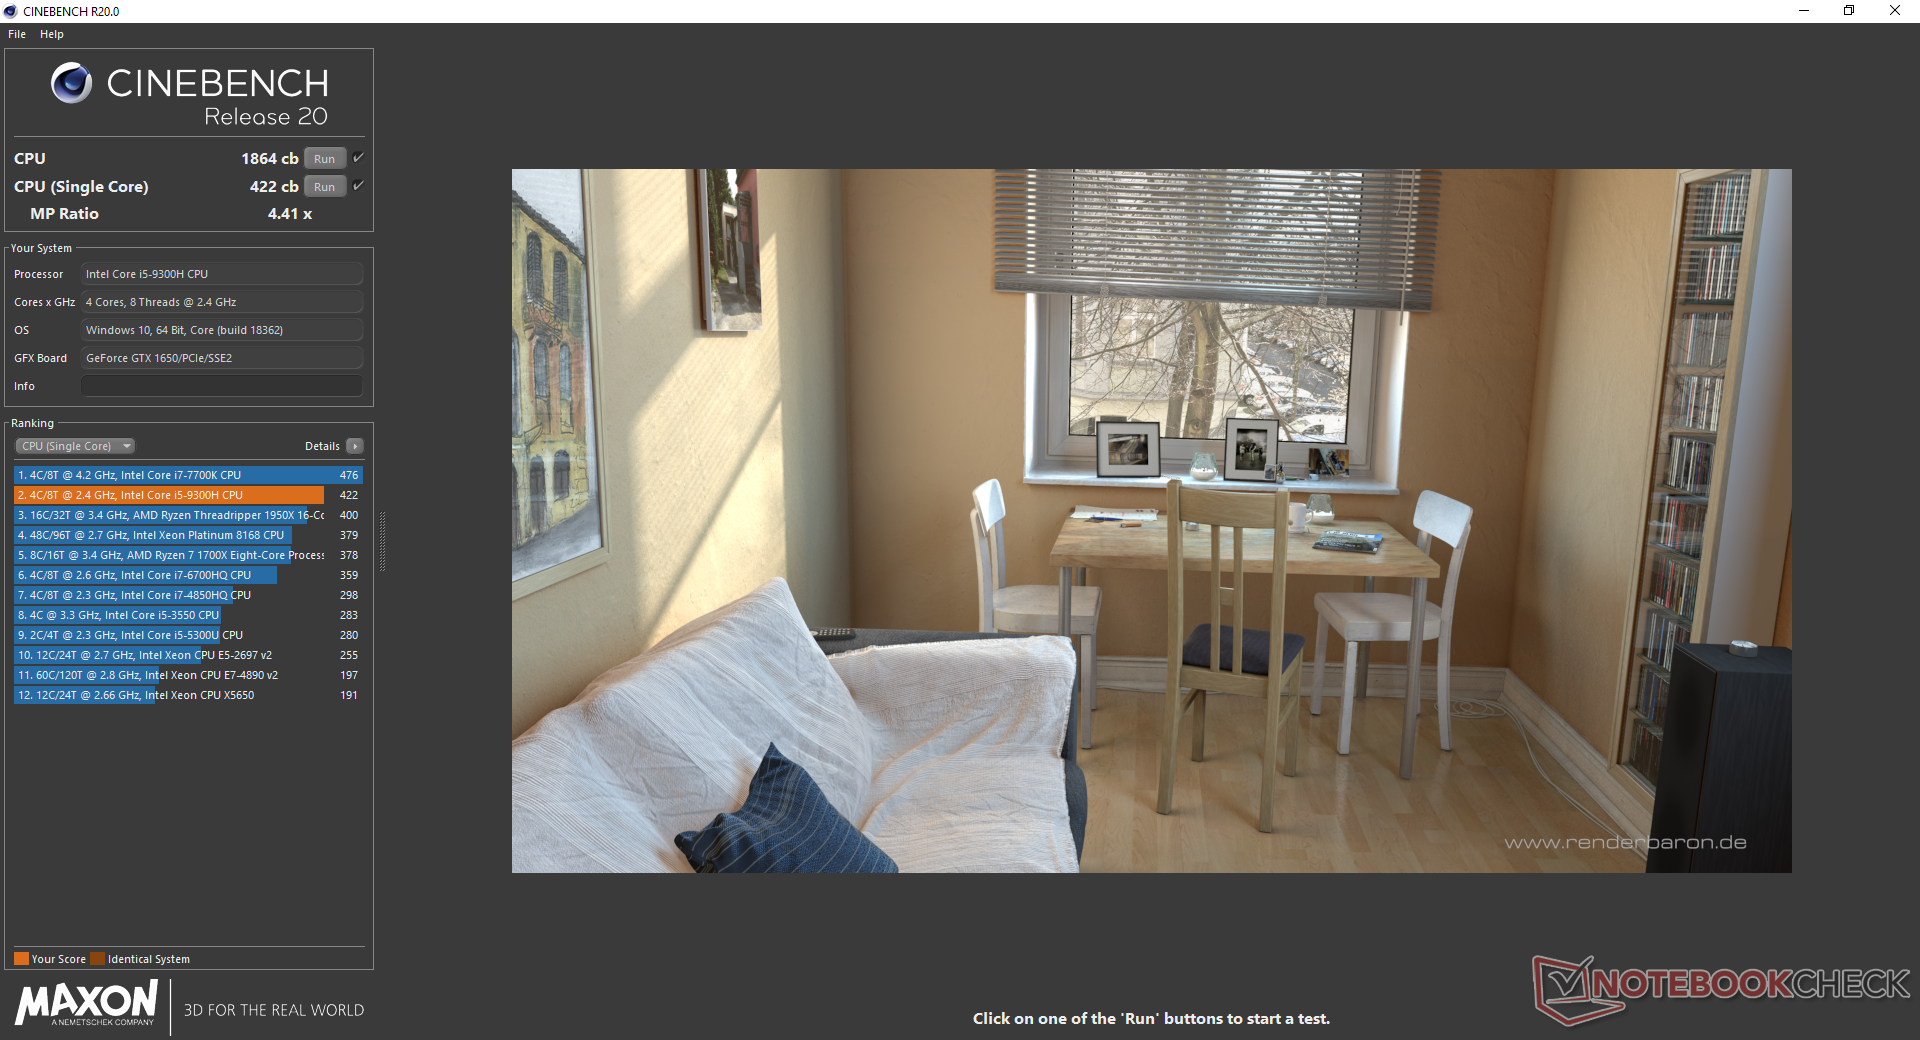
The Core i5 CPU is performing exactly where we expect it to be when compared to the average i5-9300H in our database with no major throttling issues. Opting for the pricier Core i7-9750H will net 30 to 40 percent faster multi-threaded performance.
See our dedicated page on the Core i5-9300H for more technical information and benchmark comparisons.
| Cinebench R11.5 | |
| CPU Single 64Bit | |
| Dell Inspiron 15 7000 7577 4K | |
| Asus ROG Zephyrus G15 GA502DU | |
| CPU Multi 64Bit | |
| Asus ROG Zephyrus G15 GA502DU | |
| Dell Inspiron 15 7000 7577 4K | |
| Cinebench R10 | |
| Rendering Multiple CPUs 32Bit | |
| Average Intel Core i5-9300H (21798 - 25656, n=5) | |
| Dell Inspiron 15 7000 7577 4K | |
| Asus ROG Zephyrus G15 GA502DU | |
| Rendering Single 32Bit | |
| Average Intel Core i5-9300H (6421 - 6677, n=5) | |
| Dell Inspiron 15 7000 7577 4K | |
| Asus ROG Zephyrus G15 GA502DU | |
| wPrime 2.10 - 1024m | |
| Dell Inspiron 15 7000 7577 4K | |
| Asus ROG Zephyrus G15 GA502DU | |
* ... smaller is better
System Performance
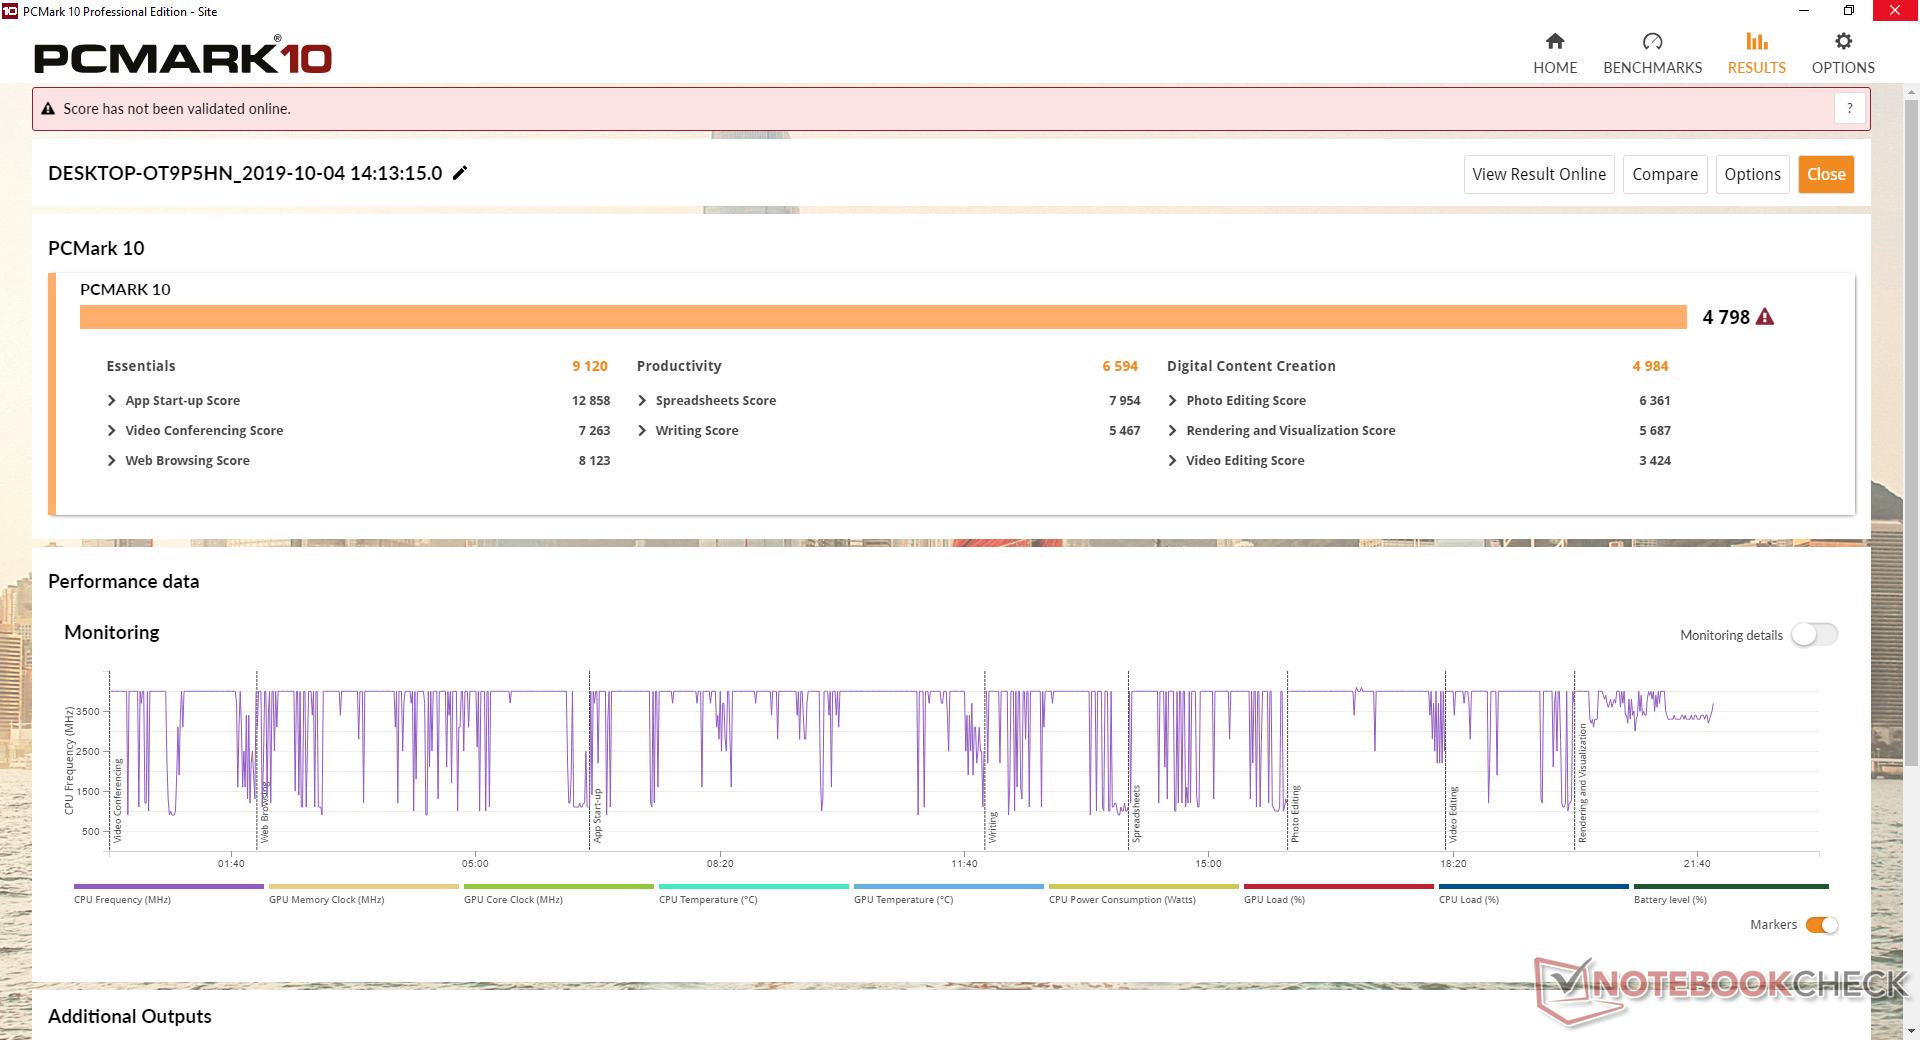
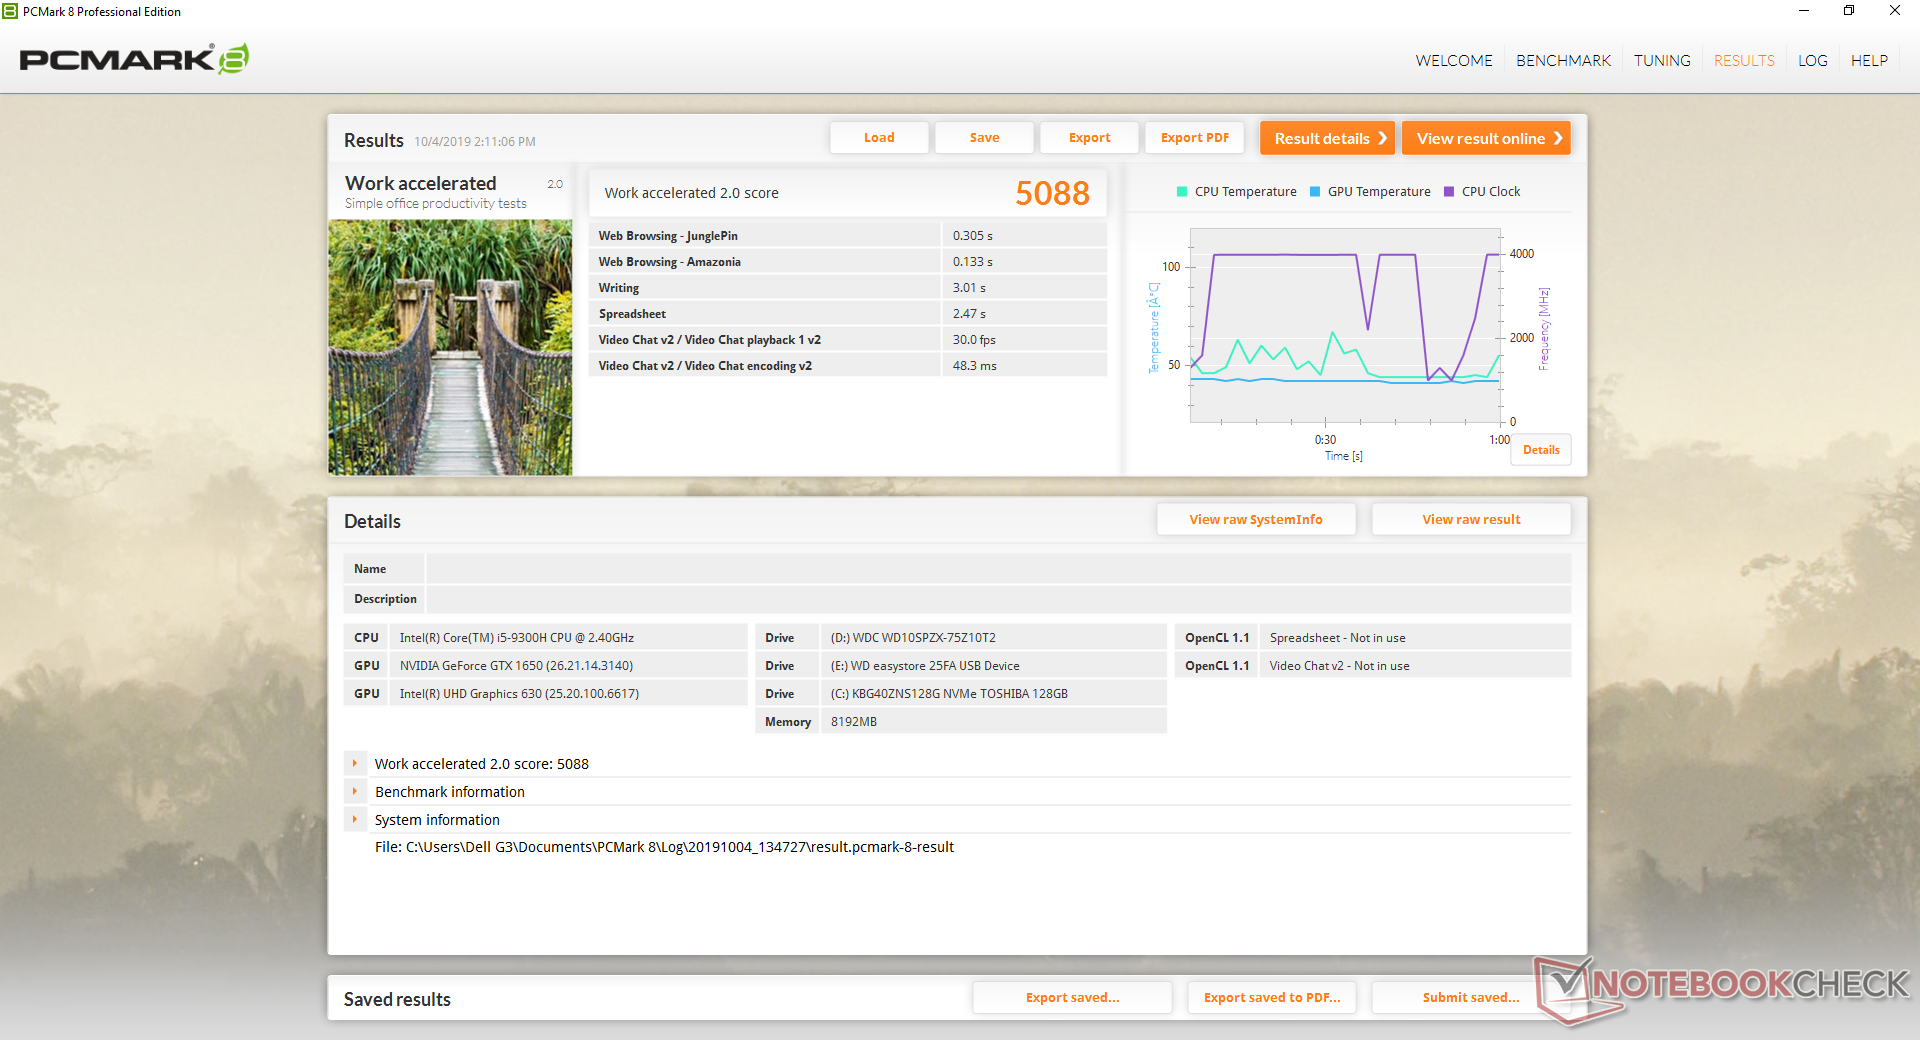
PCMark benchmarks are consistently higher than last year's G3 3579 largely due to the newer Turing GPU and primary SSD in contrast to the Pascal GPU and primary HDD of the predecessor. Overall scores are still below that of faster gaming laptops like the Alienware m15 R2 or HP Pavilion 15 Gaming.
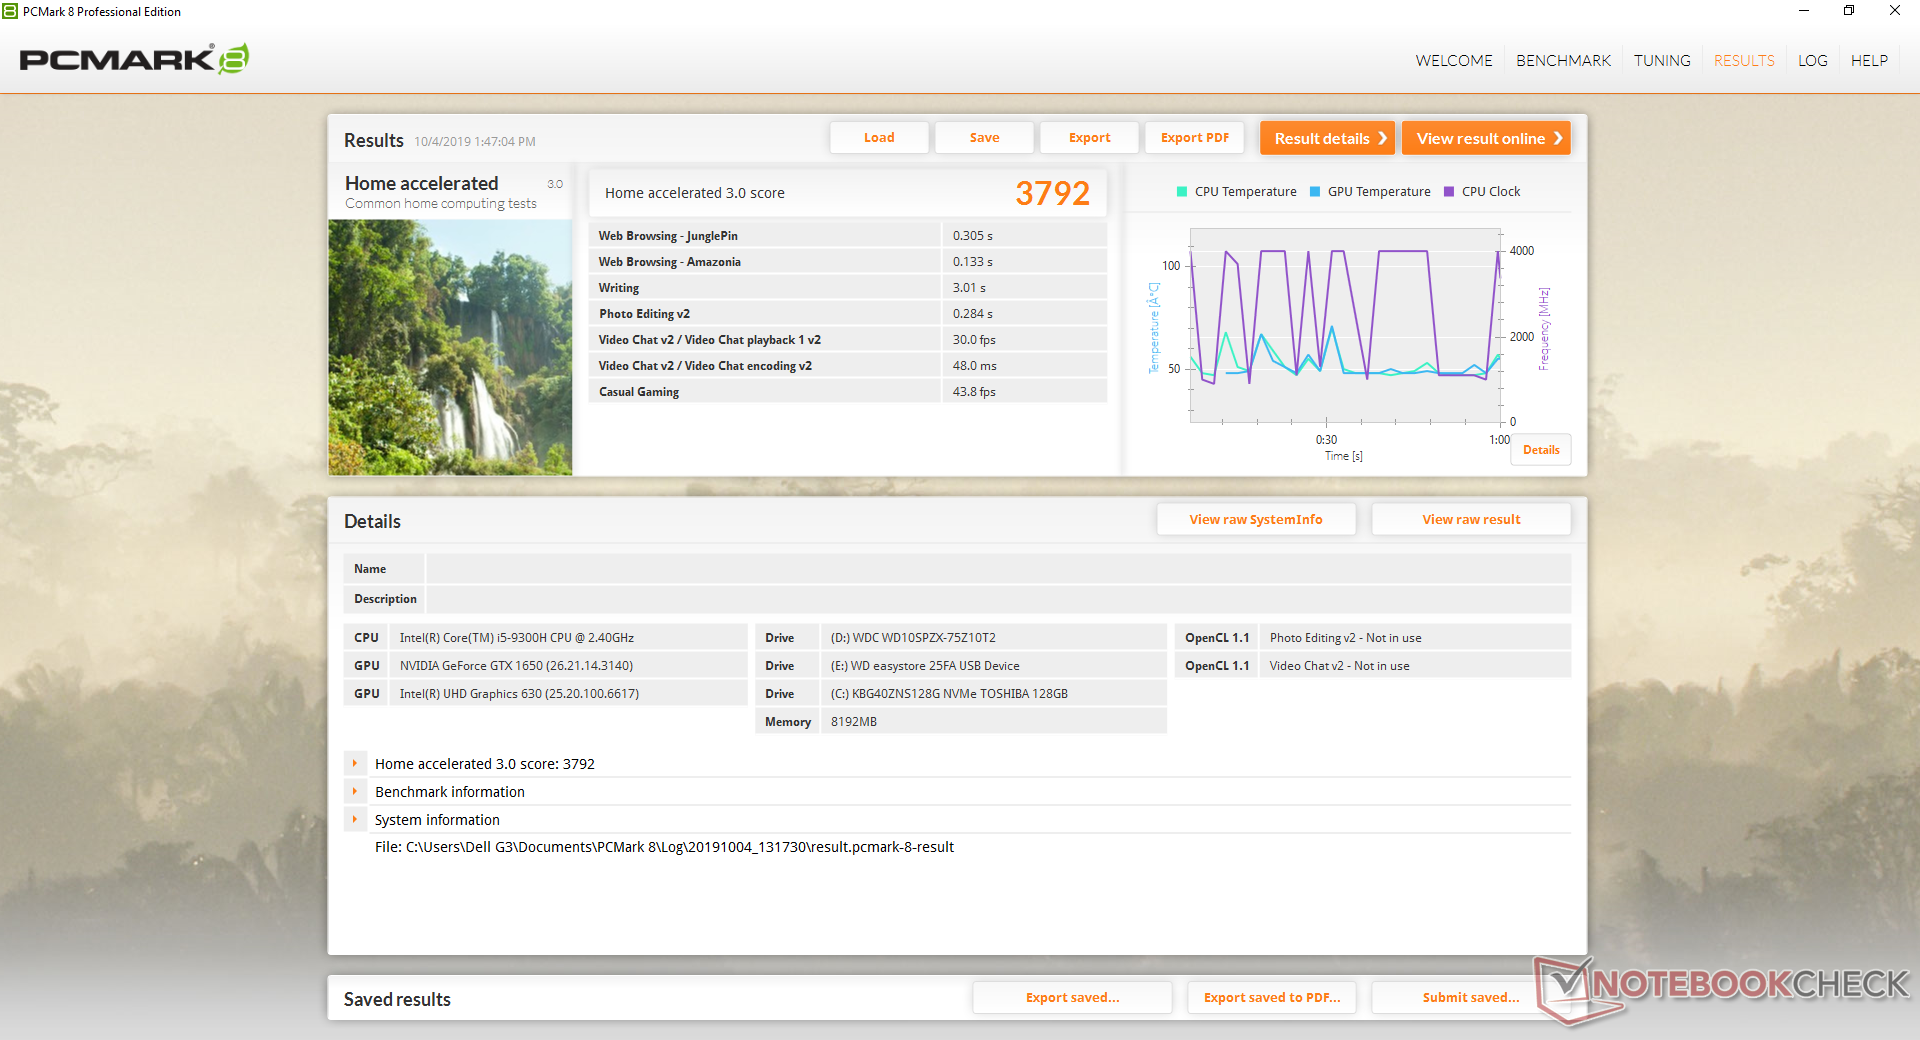
| PCMark 8 Home Score Accelerated v2 | 3792 points | |
| PCMark 8 Work Score Accelerated v2 | 5088 points | |
| PCMark 10 Score | 4798 points | |
Help | ||
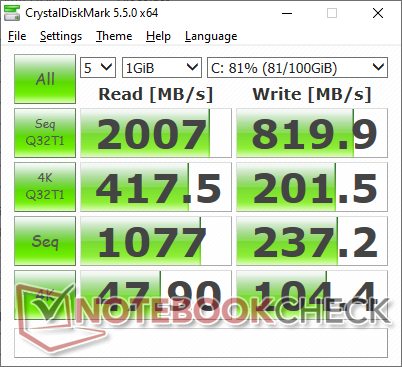
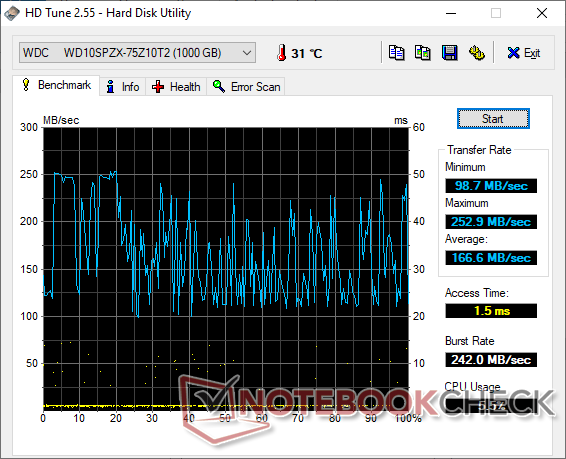
Storage Devices
Two internal storage bays are available (M.2 2280 NVMe + 2.5-inch SATA III bay). Our test unit comes equipped with a 128 GB primary Toshiba BG4 SSD and a secondary 1 TB WDC WD10SPZX HDD. While sequential read rates on the SSD are decent at about 1200 MB/s, sequential write rates are slower than even most SATA III SSDs at just under 200 MB/s. This is a budget drive after all with similar results to the Toshiba BG3 found on the Dell G7 17 7790.
See our table of HDDs and SSDs for more benchmark comparisons.
| Dell G3 3590 Toshiba BG4 KBG40ZNS128G | Dell G7 17 7790 Toshiba BG3 KBG30ZMS256G | Aorus 15-SA Intel SSD 760p SSDPEKKW512G8 | Razer Blade 15 GTX 1660 Ti Samsung SSD PM981 MZVLB256HAHQ | Dell XPS 15 7590 i5 iGPU FHD Toshiba XG6 KXG60ZNV512G | Asus ROG Zephyrus G15 GA502DU Intel SSD 660p SSDPEKNW512G8 | |
|---|---|---|---|---|---|---|
| AS SSD | 26% | 361% | 387% | 466% | 226% | |
| Seq Read (MB/s) | 1174 | 1033 -12% | 2601 122% | 1829 56% | 2357 101% | 907 -23% |
| Seq Write (MB/s) | 186 | 218.3 17% | 1507 710% | 1315 607% | 1235 564% | 926 398% |
| 4K Read (MB/s) | 34.01 | 24.12 -29% | 56.3 66% | 51.3 51% | 43.29 27% | 47.26 39% |
| 4K Write (MB/s) | 69.4 | 55 -21% | 110.3 59% | 106 53% | 99.7 44% | 98.7 42% |
| 4K-64 Read (MB/s) | 424 | 330.3 -22% | 877 107% | 917 116% | 1020 141% | 321.5 -24% |
| 4K-64 Write (MB/s) | 68.8 | 155.8 126% | 914 1228% | 1212 1662% | 1502 2083% | 736 970% |
| Access Time Read * (ms) | 0.168 | 0.18 -7% | 0.05 70% | 0.063 62% | 0.07 58% | 0.064 62% |
| Access Time Write * (ms) | 0.94 | 0.314 67% | 0.034 96% | 0.104 89% | 0.039 96% | 0.045 95% |
| Score Read (Points) | 575 | 458 -20% | 1193 107% | 1152 100% | 1299 126% | 459 -20% |
| Score Write (Points) | 157 | 233 48% | 1175 648% | 1450 824% | 1726 999% | 927 490% |
| Score Total (Points) | 987 | 891 -10% | 2938 198% | 3177 222% | 3640 269% | 1641 66% |
| Copy ISO MB/s (MB/s) | 215.7 | 382.9 78% | 2104 875% | 1539 613% | 2145 894% | 905 320% |
| Copy Program MB/s (MB/s) | 108.2 | 234.9 117% | 387.7 258% | 513 374% | 565 422% | 496.9 359% |
| Copy Game MB/s (MB/s) | 165.9 | 218.7 32% | 1021 515% | 1150 593% | 1320 696% | 819 394% |
* ... smaller is better

GPU Performance
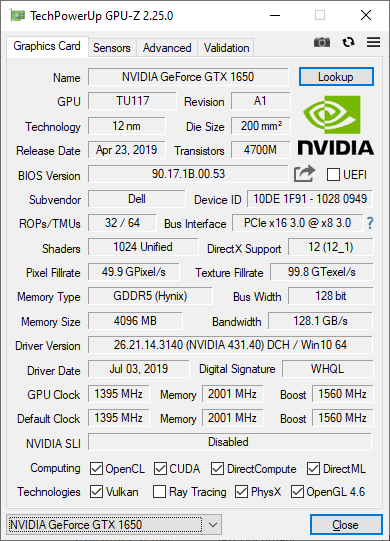
The mobile GTX 1650 performs nearly identically to the desktop GTX 1650. Users can expect 50 percent faster graphics performance than the GTX 1050 when on DX11 or 100 percent faster performance when on DX12 since Turing GPUs are optimized for DX12. Opting for the costlier GTX 1660 Ti Max-Q configuration will bring another 40 percent boost over the GTX 1650.
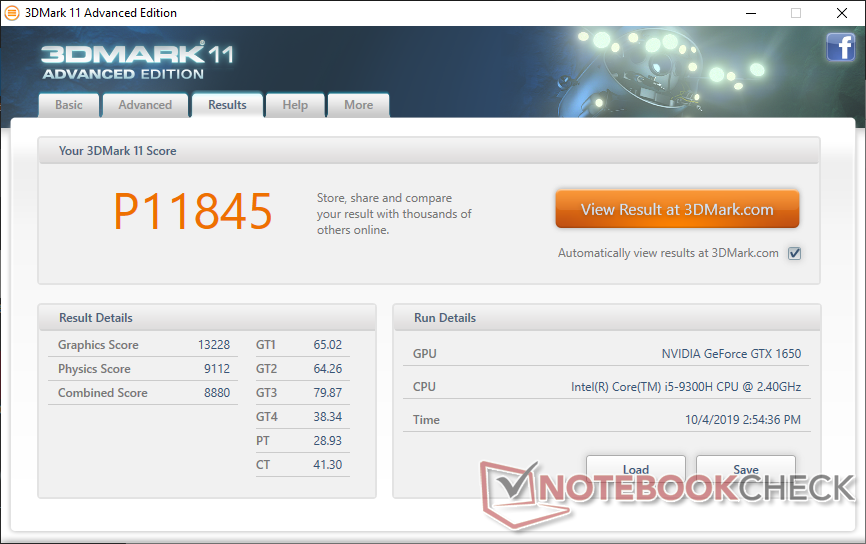
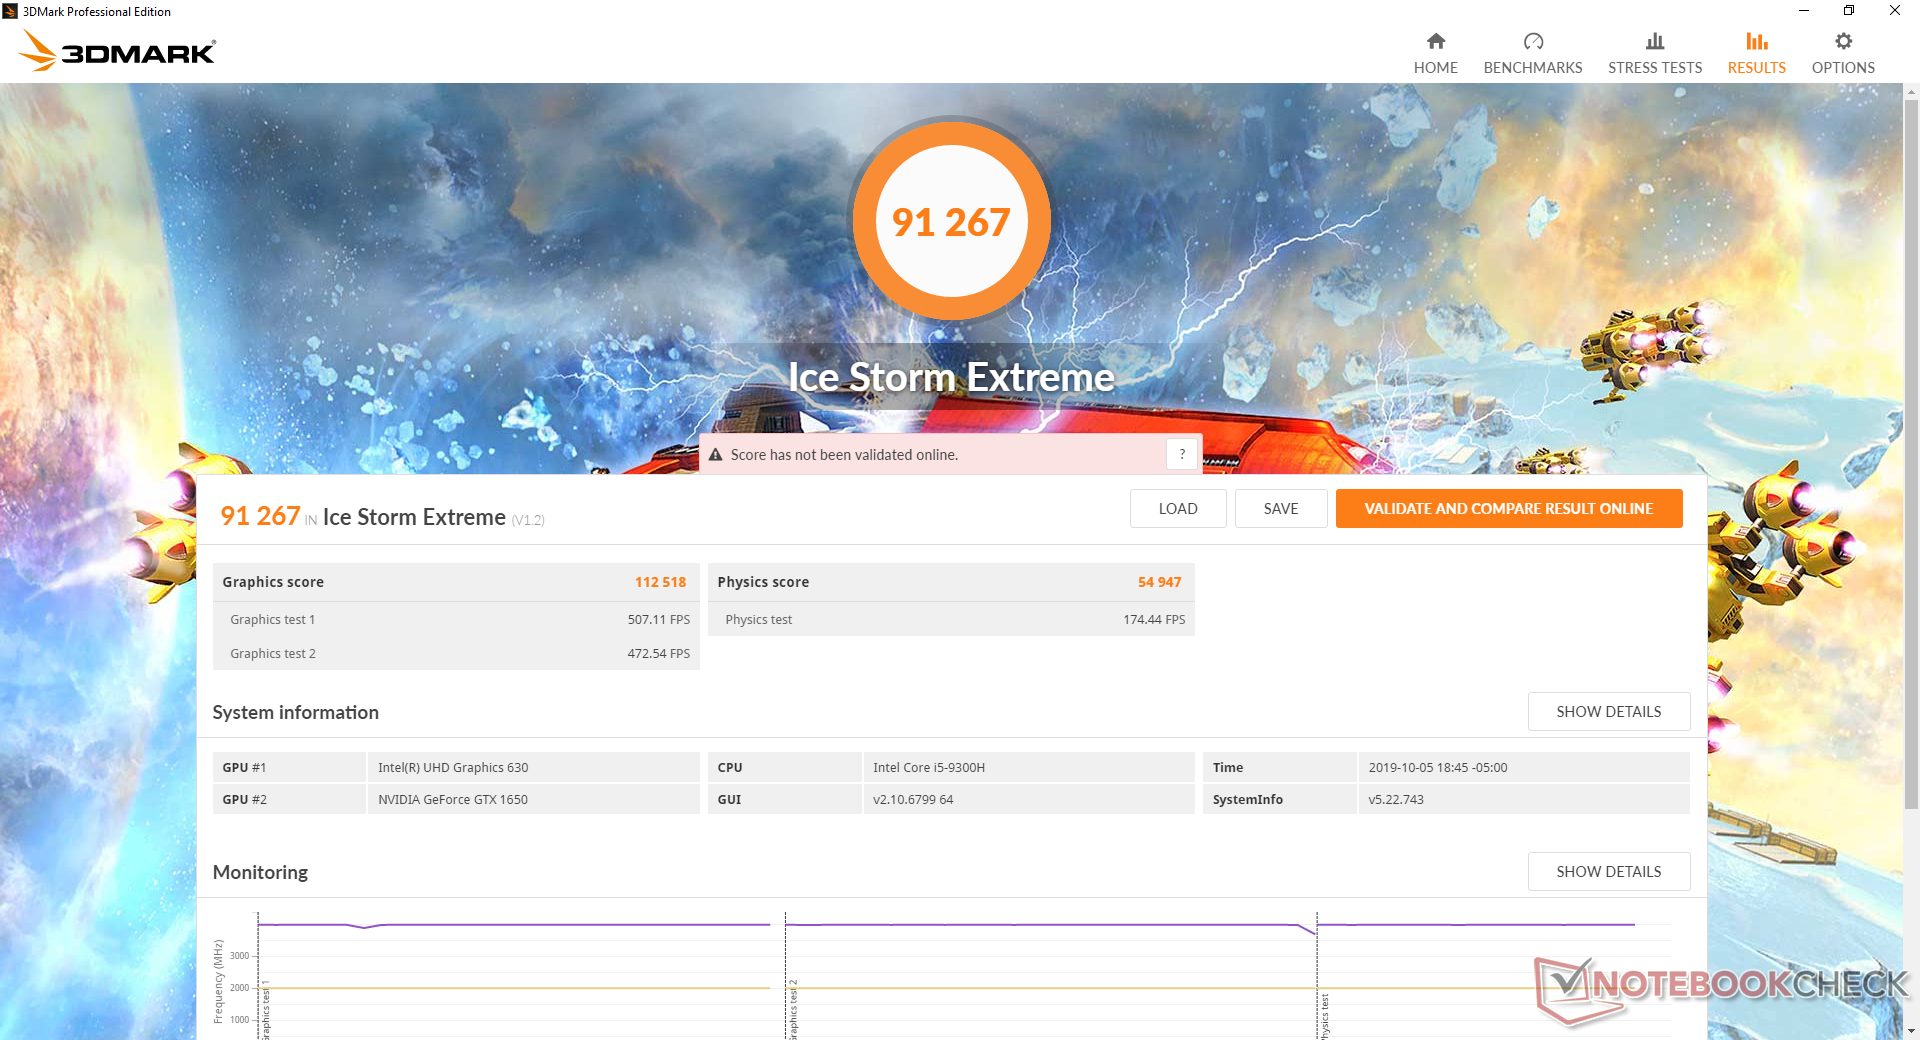
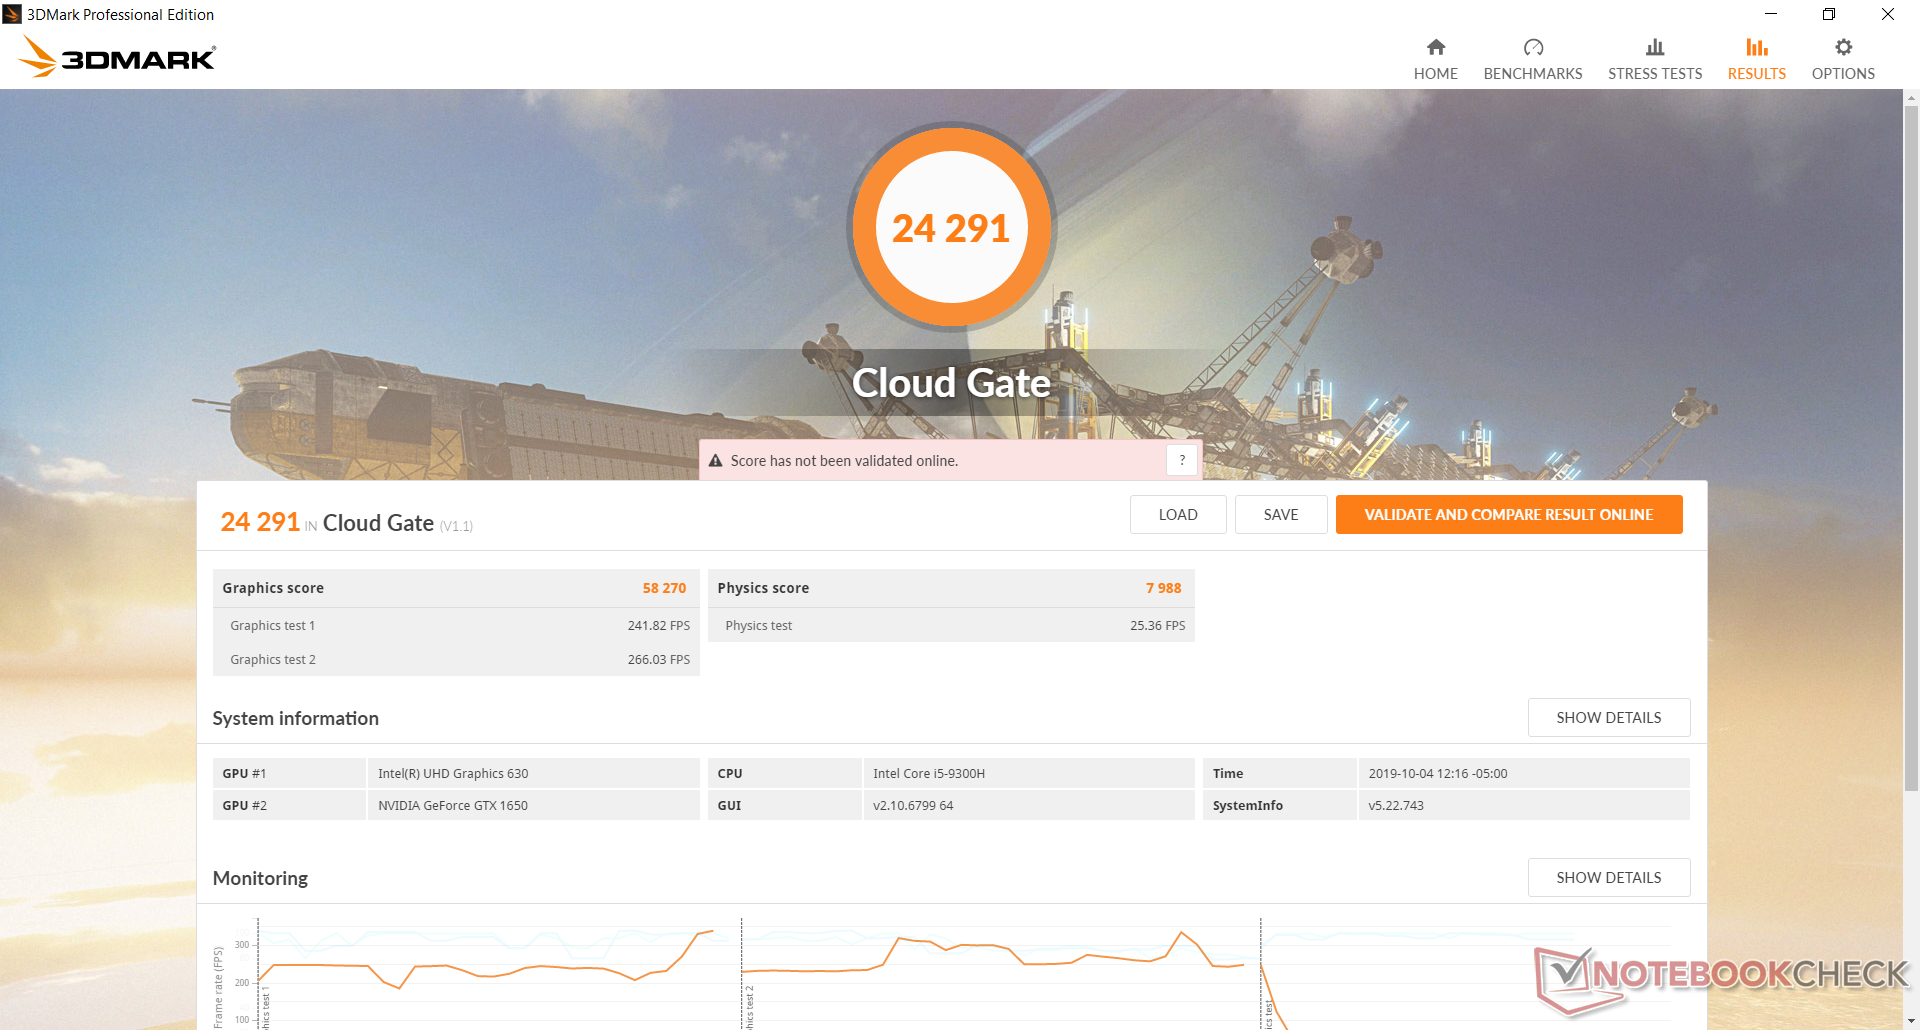
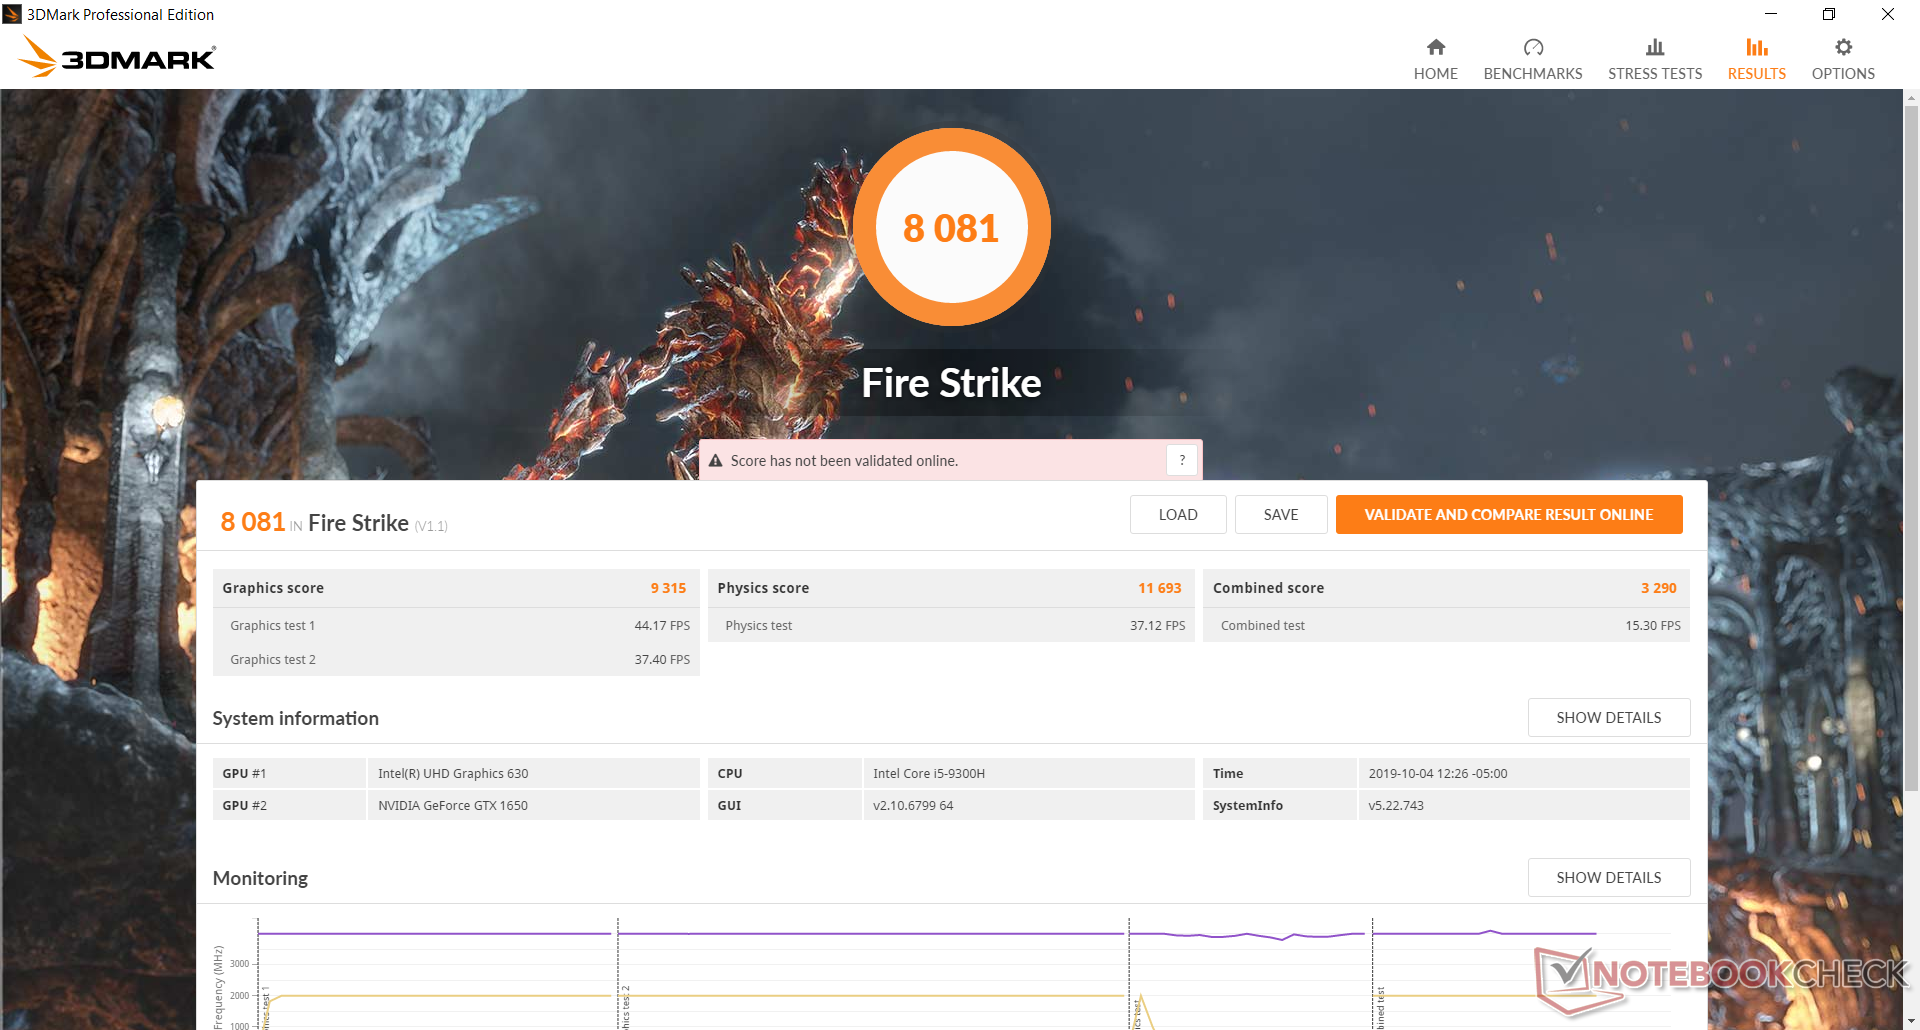
| 3DMark 11 Performance | 11845 points | |
| 3DMark Cloud Gate Standard Score | 24291 points | |
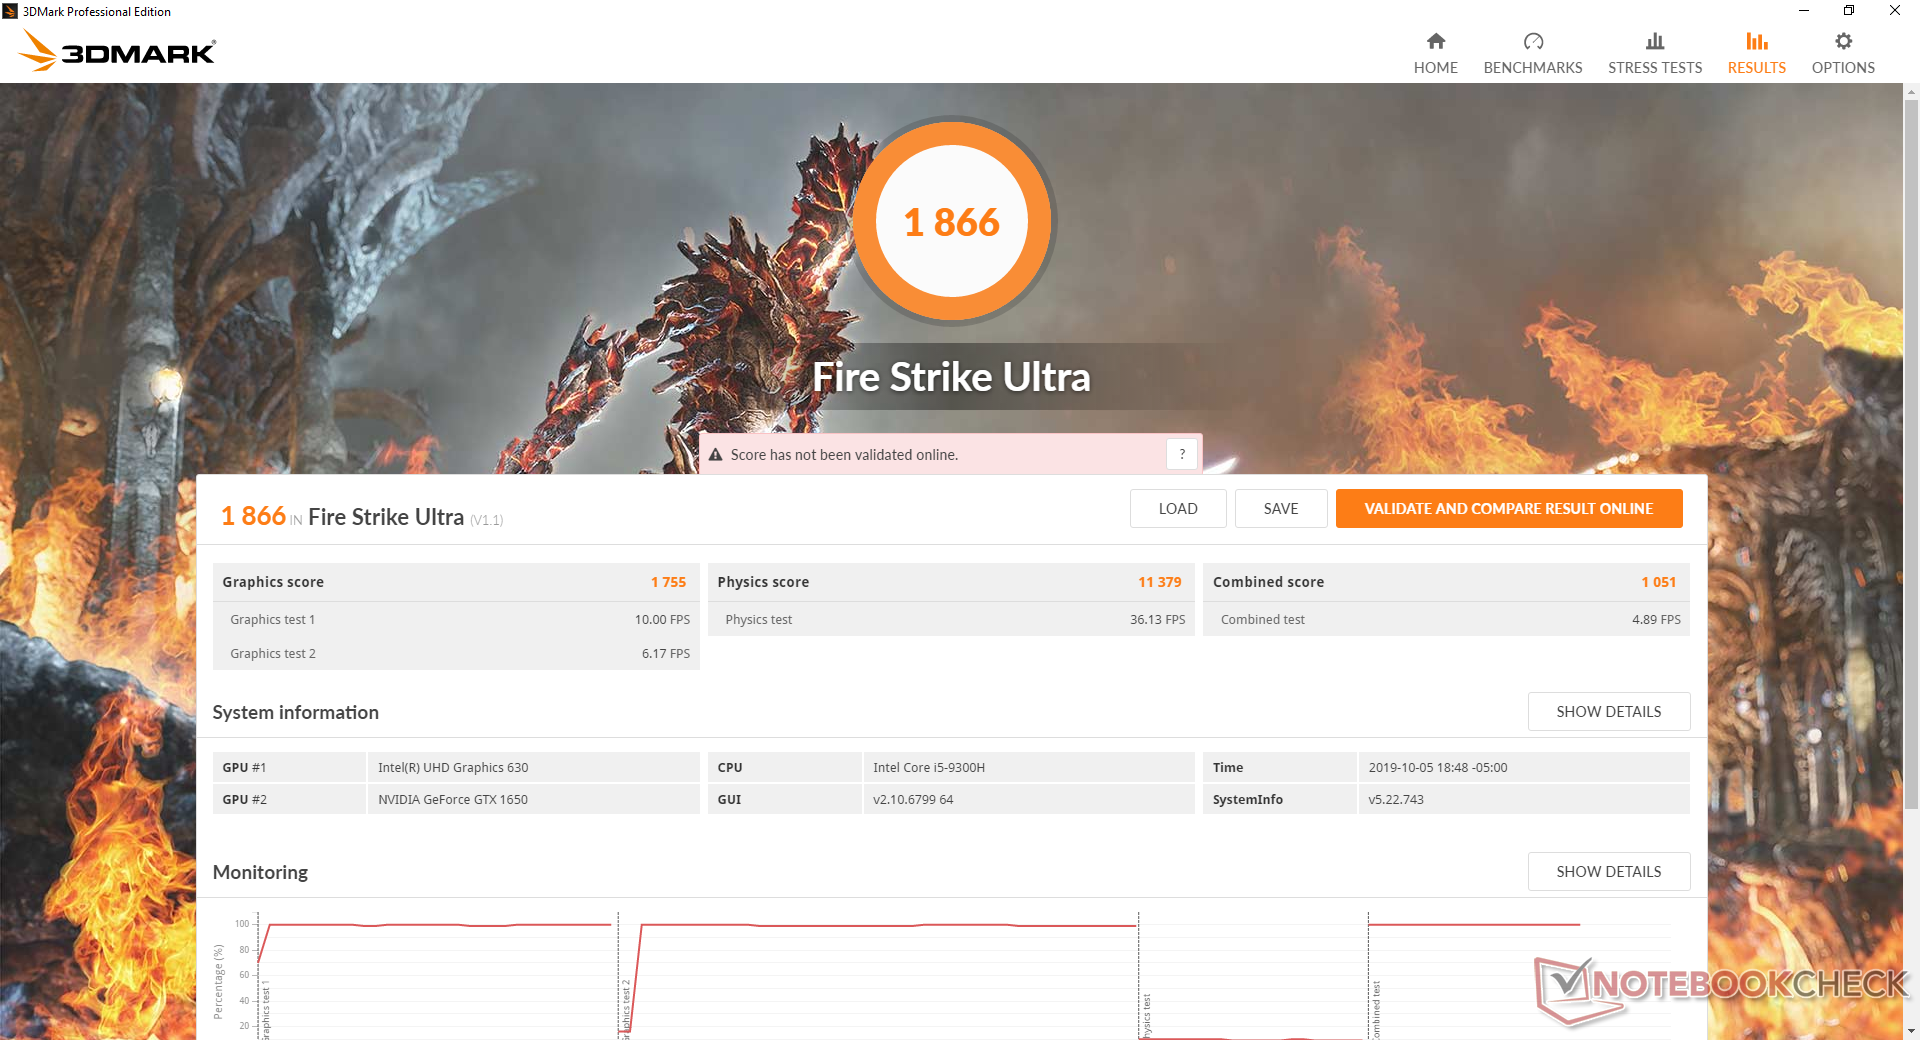
| 3DMark Fire Strike Score | 8081 points | |
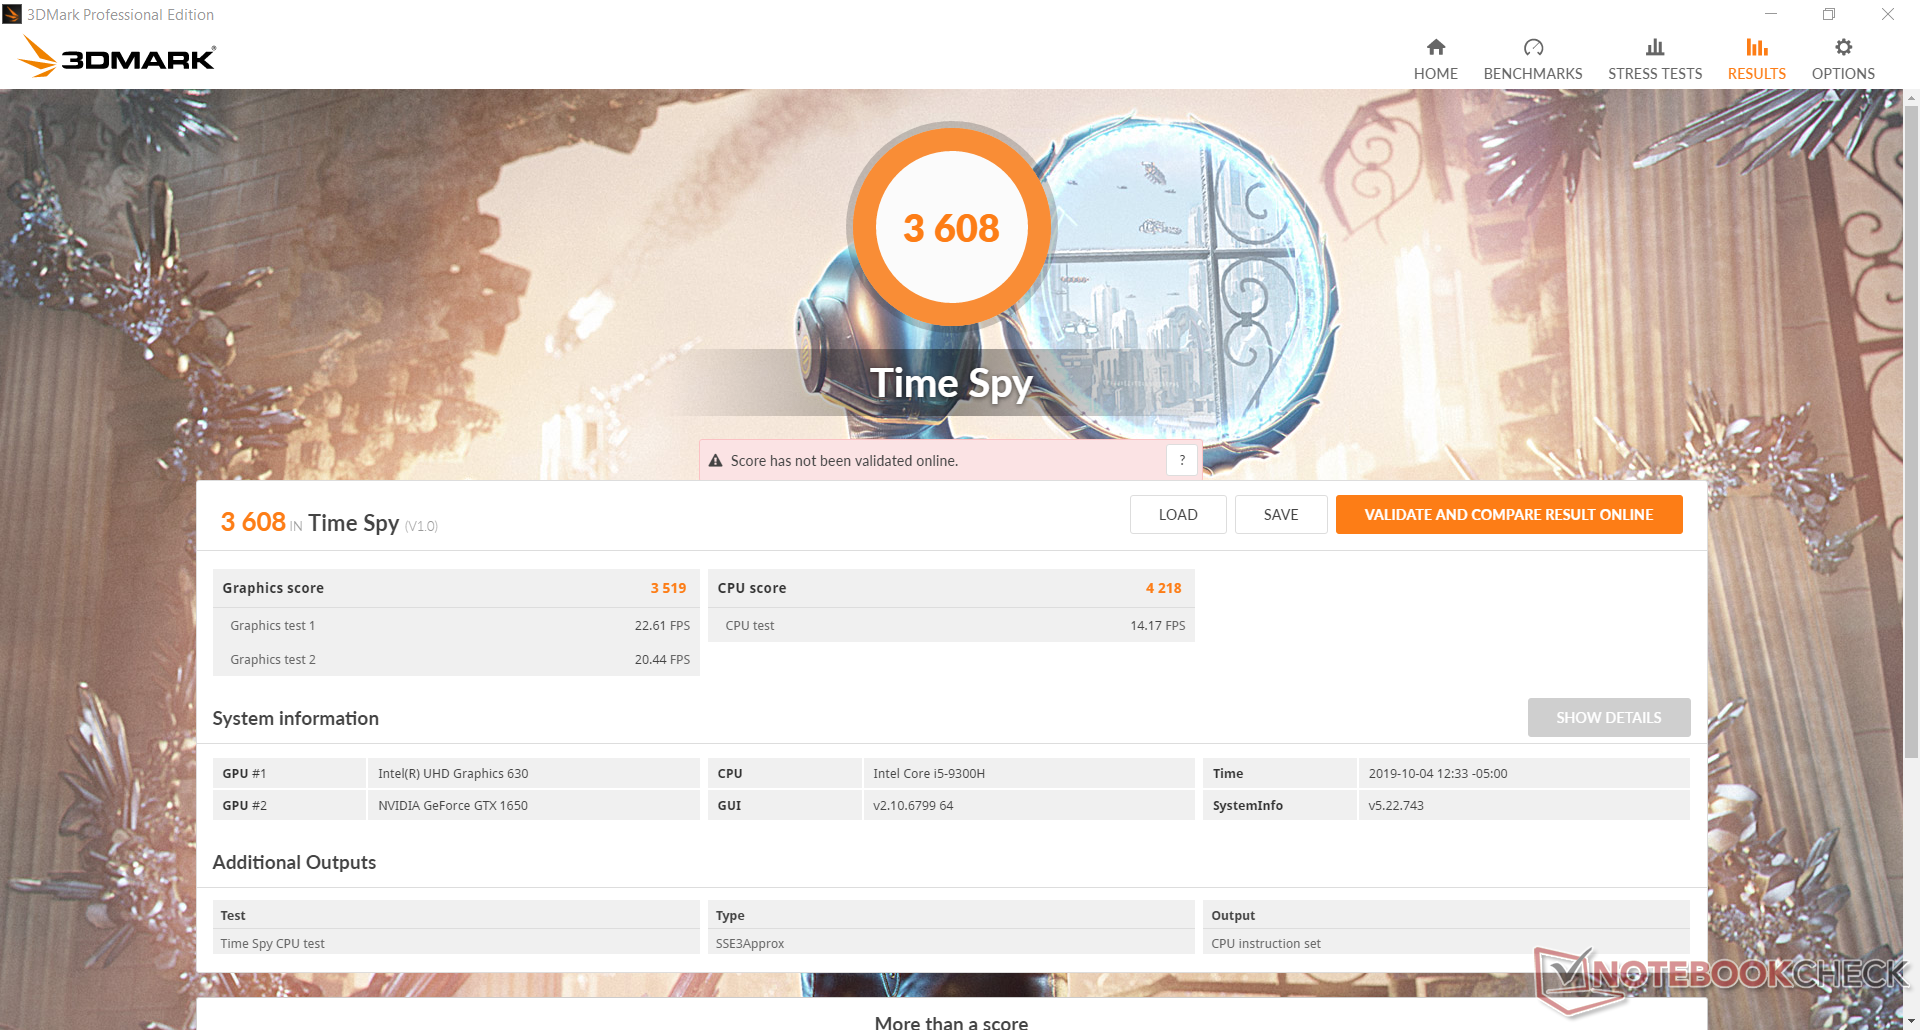
| 3DMark Time Spy Score | 3608 points | |
Help | ||
Gaming Performance
The GTX 1650 is powerful enough to play the latest titles at 1080p and at both reasonable frame rates and Medium settings. Frame rates are in the same ballpark as the older GTX 1060 while the higher-end GTX 1660 Ti Max-Q will be significantly faster as predicted by the 3DMark results above. Idling on Witcher 3 shows no frame dips to suggest no interrupting background activity when gaming.
See our dedicated page on the GTX 1650 for more technical information and benchmark comparisons.
| Shadow of the Tomb Raider - 1920x1080 High Preset AA:SM | |
| Alienware Area-51m i9-9900K RTX 2080 | |
| Alienware m15 R2 P87F | |
| Alienware m15 P79F | |
| Razer Blade 15 GTX 1660 Ti | |
| HP Pavilion Gaming 17-cd0085cl | |
| Asus TUF FX705GM | |
| Asus ROG Zephyrus G15 GA502DU | |
| MSI GF75 Thin 9SC | |
| Dell G3 3590 | |
| Gainward GeForce GTX 1650 4 GB | |
| Average NVIDIA GeForce GTX 1650 Mobile (38 - 53, n=15) | |
| Asus TUF FX705GE-EW096T | |
| Asus GL753VD | |
| low | med. | high | ultra | |
|---|---|---|---|---|
| BioShock Infinite (2013) | 259.9 | 221.8 | 193.6 | 85.6 |
| The Witcher 3 (2015) | 175.1 | 115.8 | 65.9 | 36.2 |
| Rocket League (2017) | 247 | 188.7 | 137.2 | |
| Shadow of the Tomb Raider (2018) | 102 | 61 | 51 |
Emissions
System Noise
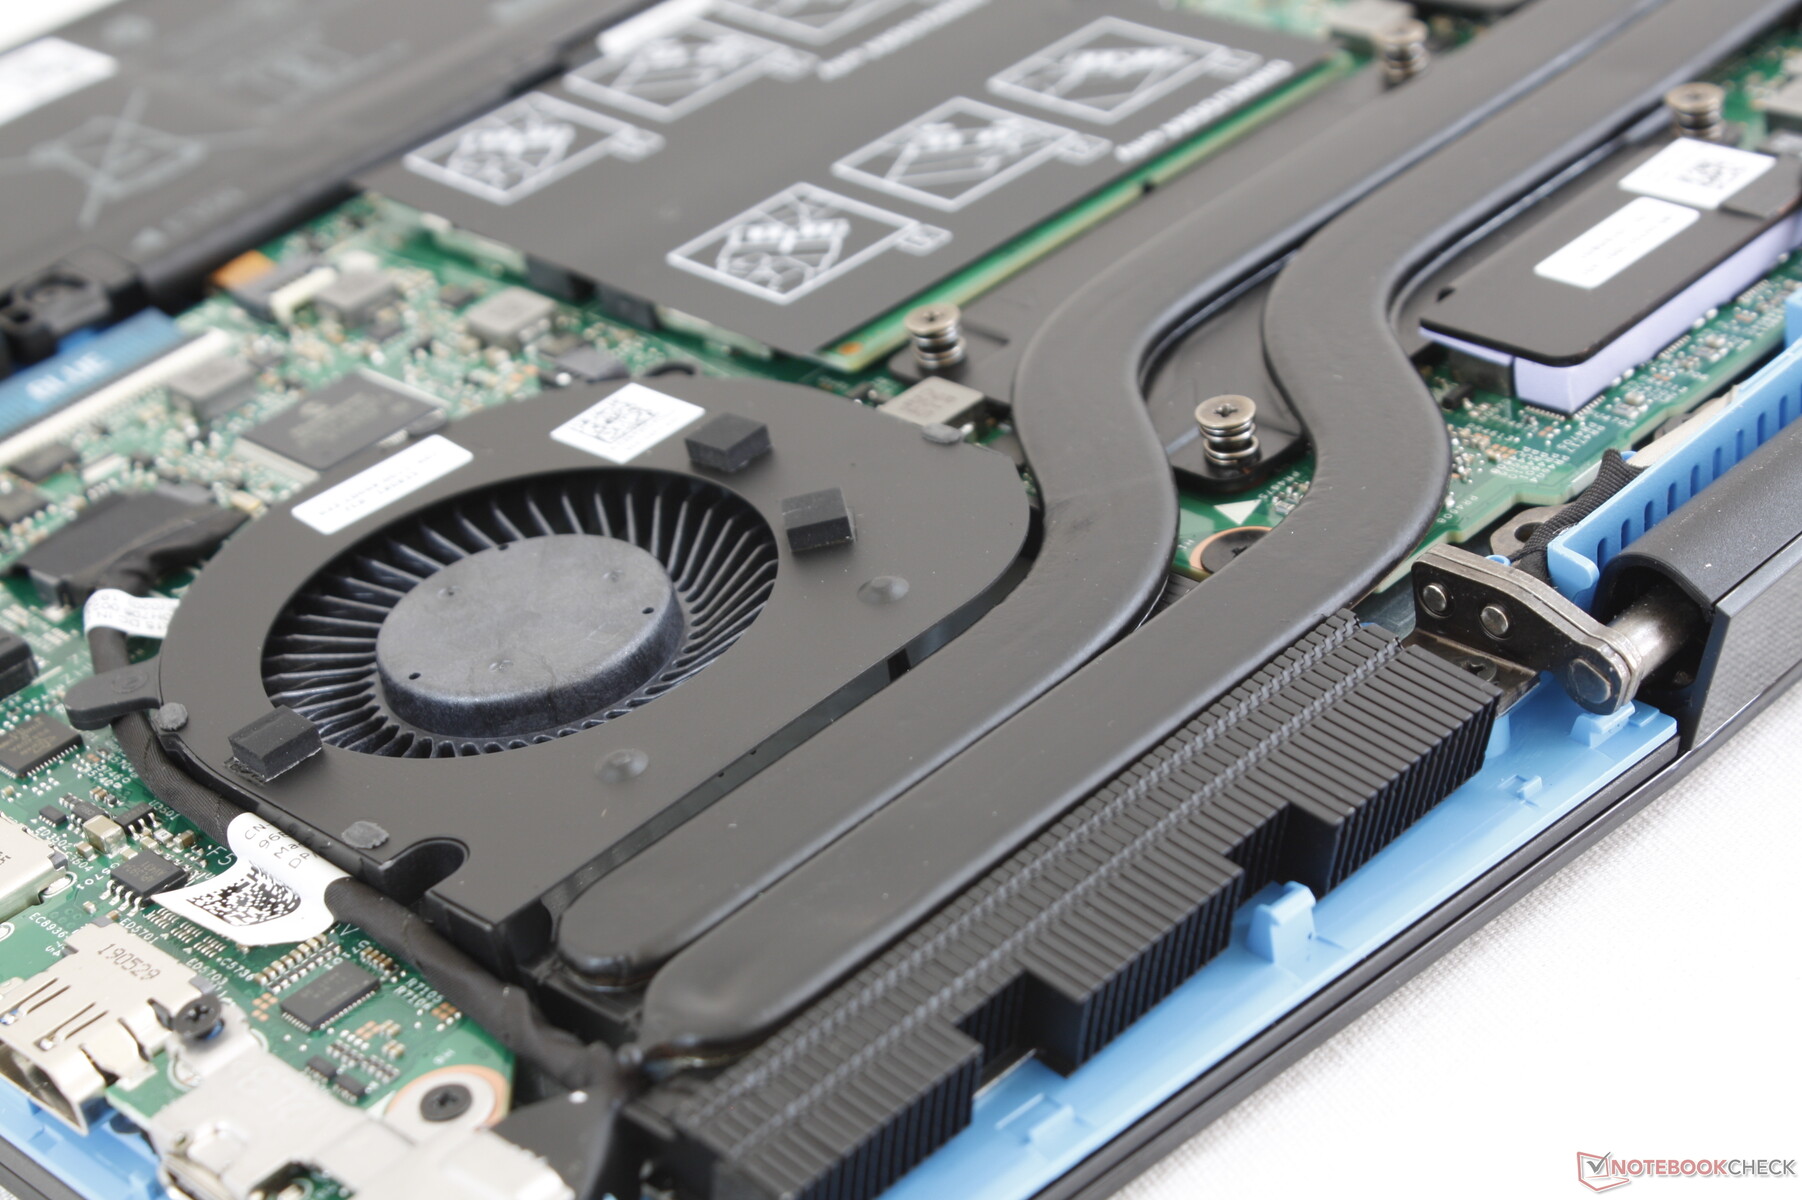
The cooling solution consists of twin ~50 mm fans and just two heat pipes between them. The fans are always active no matter the load at 29.4 dB(A) against a background of 28.4 dB(A) and so they are never completely silent. Common loads like browsing or video streaming can bump the fans up to 35 dB(A) temporarily before falling back down to 31 dB(A). In general, the fans are audible but not loud enough to be distracting.
Fan nose when gaming will induce a constant fan noise of 49.5 dB(A) to be louder than what we recorded on the G3 3579. Meanwhile, the HP Pavilion 15 Gaming with faster GTX 1660 Ti graphics runs significantly quieter when under similar conditions.
We recommend becoming familiar with the pre-installed Dell Power Manager software as it directly controls performance and fan behavior.

| Dell G3 3590 GeForce GTX 1650 Mobile, i5-9300H, Toshiba BG4 KBG40ZNS128G | Dell G3 15 3579 GeForce GTX 1050 Mobile, i5-8300H, Seagate Mobile HDD 1TB ST1000LX015-1U7172 | Lenovo Legion Y540-15IRH-81SX00B2GE GeForce GTX 1660 Ti Mobile, i7-9750H, WDC PC SN720 SDAPNTW-512G | Aorus 15-SA GeForce GTX 1660 Ti Mobile, i7-9750H, Intel SSD 760p SSDPEKKW512G8 | Alienware m15 R2 P87F GeForce RTX 2080 Max-Q, i7-9750H, 2x Toshiba XG6 KXG60ZNV512G (RAID 0) | HP Gaming Pavilion 15-dk0009ng GeForce GTX 1660 Ti Max-Q, i7-9750H, Samsung SSD PM981 MZVLB256HAHQ | |
|---|---|---|---|---|---|---|
| Noise | 0% | 3% | -18% | -14% | 9% | |
| off / environment * (dB) | 28.4 | 28 1% | 29.3 -3% | 29 -2% | 28.3 -0% | 28.2 1% |
| Idle Minimum * (dB) | 29.2 | 29.8 -2% | 29.3 -0% | 32 -10% | 28.5 2% | 29.3 -0% |
| Idle Average * (dB) | 29.4 | 29.8 -1% | 29.3 -0% | 35 -19% | 28.5 3% | 29.3 -0% |
| Idle Maximum * (dB) | 29.4 | 30 -2% | 29.3 -0% | 41 -39% | 49 -67% | 29.3 -0% |
| Load Average * (dB) | 39 | 38.6 1% | 35.7 8% | 54 -38% | 49 -26% | 32.3 17% |
| Witcher 3 ultra * (dB) | 49.5 | 46.9 5% | 44.2 11% | 52 -5% | 49 1% | 34 31% |
| Load Maximum * (dB) | 49.7 | 49.4 1% | 45.6 8% | 56 -13% | 55 -11% | 41.2 17% |
* ... smaller is better
Noise level
| Idle |
| 29.2 / 29.4 / 29.4 dB(A) |
| Load |
| 39 / 49.7 dB(A) |
 | ||
30 dB silent 40 dB(A) audible 50 dB(A) loud |
||
min: | ||
Temperature
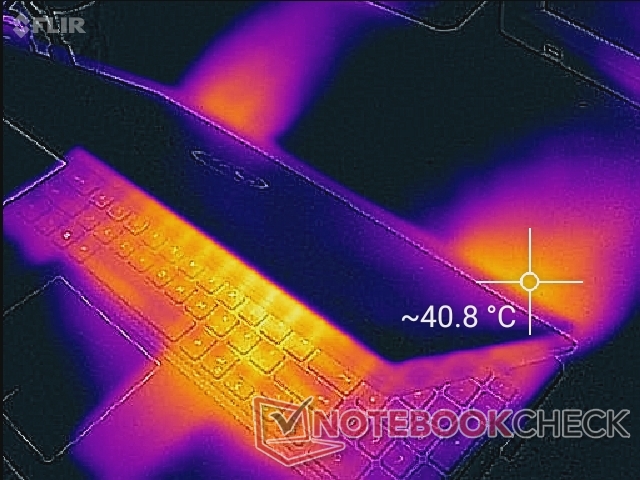
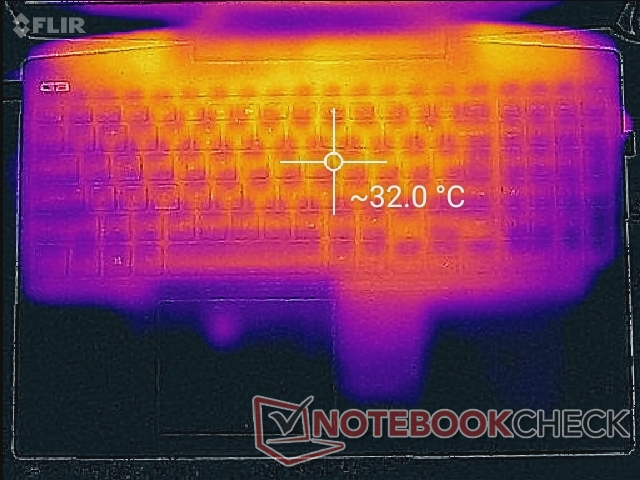
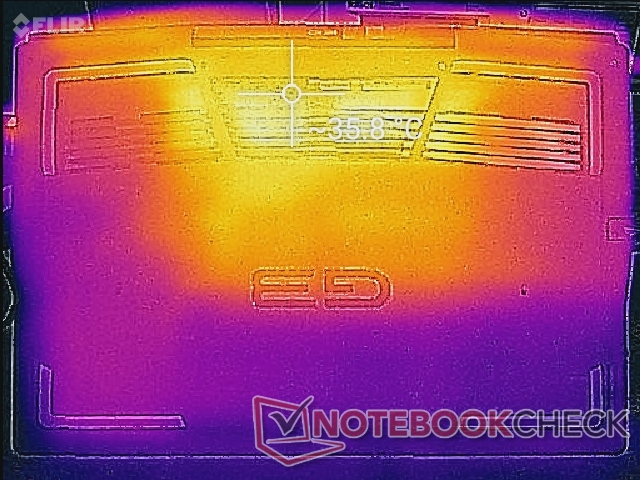
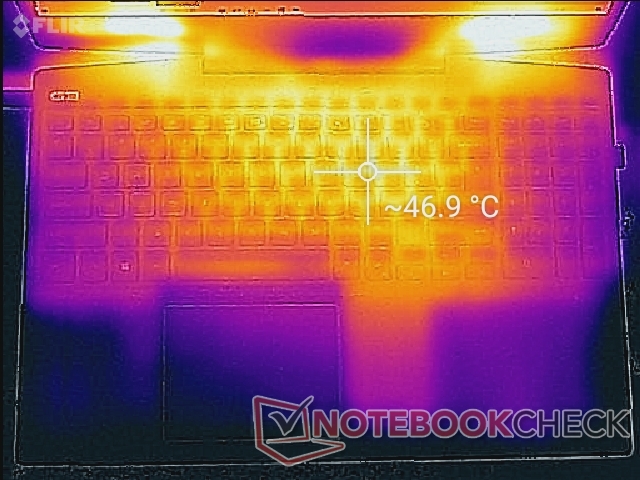
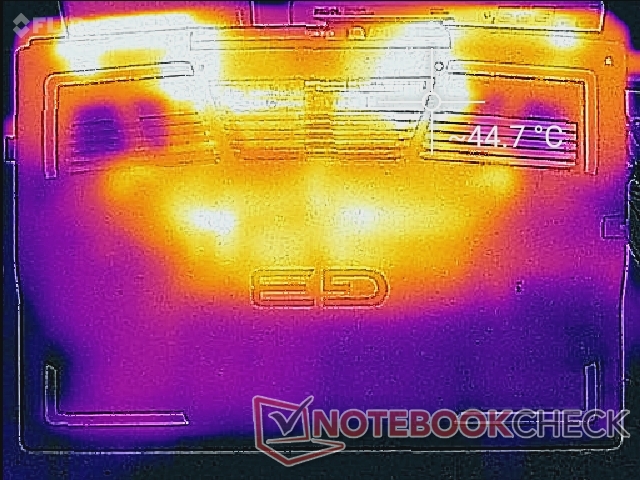
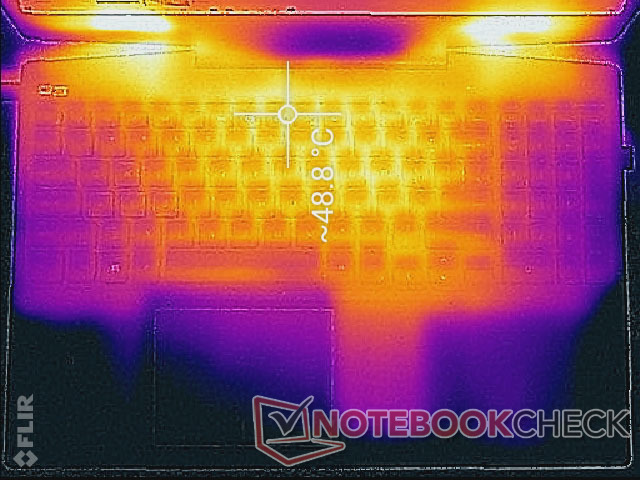
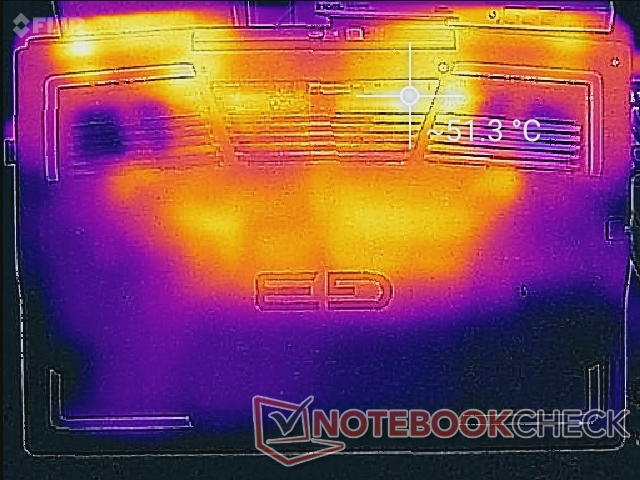
Surface temperatures are warmest towards the center of the keyboard ranging from 32 C when idling on desktop to as high as 49 C when gaming or under stressful conditions. Results are cooler than the older G3 3579 during low loads but they are otherwise very close when gaming. The WASD keys and palm rests remain relatively cool no matter the load for comfortable palms and fingers.
(-) The maximum temperature on the upper side is 49 °C / 120 F, compared to the average of 40.4 °C / 105 F, ranging from 21.2 to 68.8 °C for the class Gaming.
(-) The bottom heats up to a maximum of 49.8 °C / 122 F, compared to the average of 43.2 °C / 110 F
(+) In idle usage, the average temperature for the upper side is 28.8 °C / 84 F, compared to the device average of 33.9 °C / 93 F.
(±) Playing The Witcher 3, the average temperature for the upper side is 37.3 °C / 99 F, compared to the device average of 33.9 °C / 93 F.
(+) The palmrests and touchpad are cooler than skin temperature with a maximum of 31.2 °C / 88.2 F and are therefore cool to the touch.
(-) The average temperature of the palmrest area of similar devices was 28.8 °C / 83.8 F (-2.4 °C / -4.4 F).
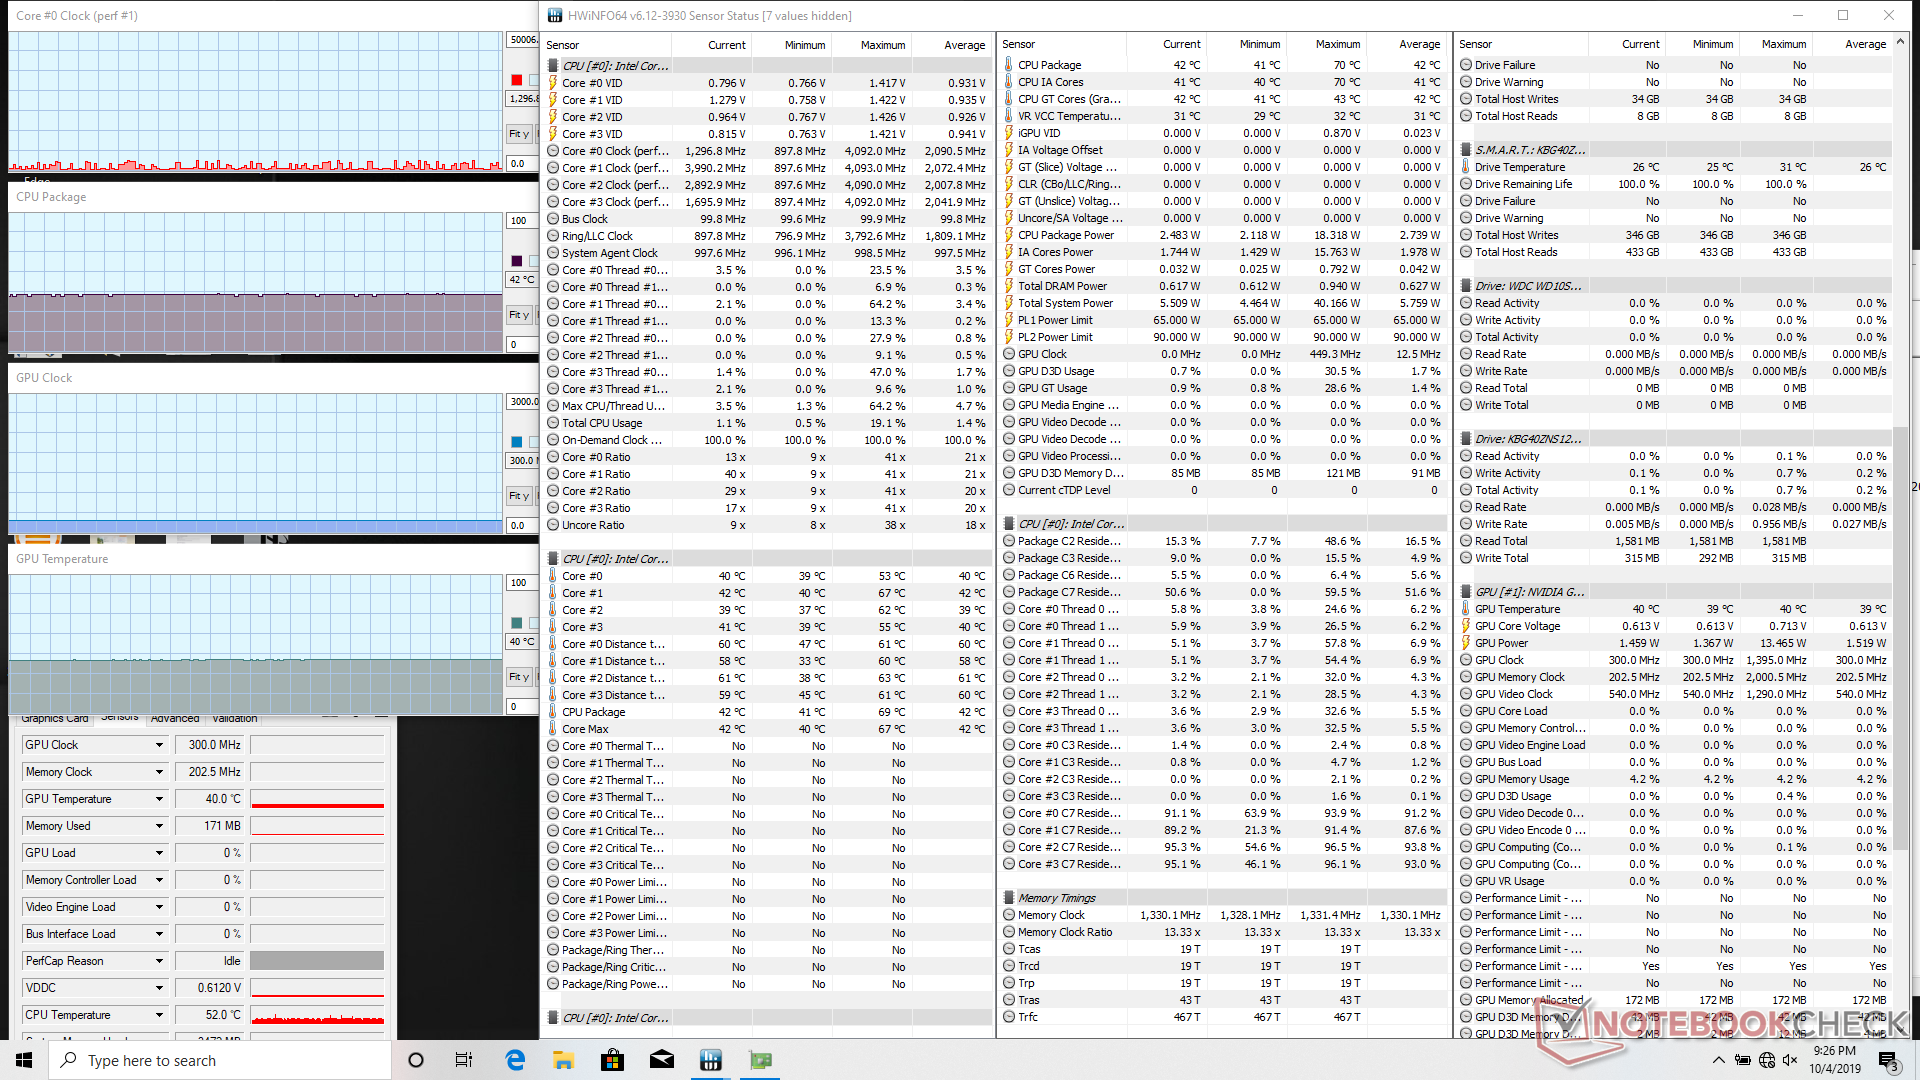
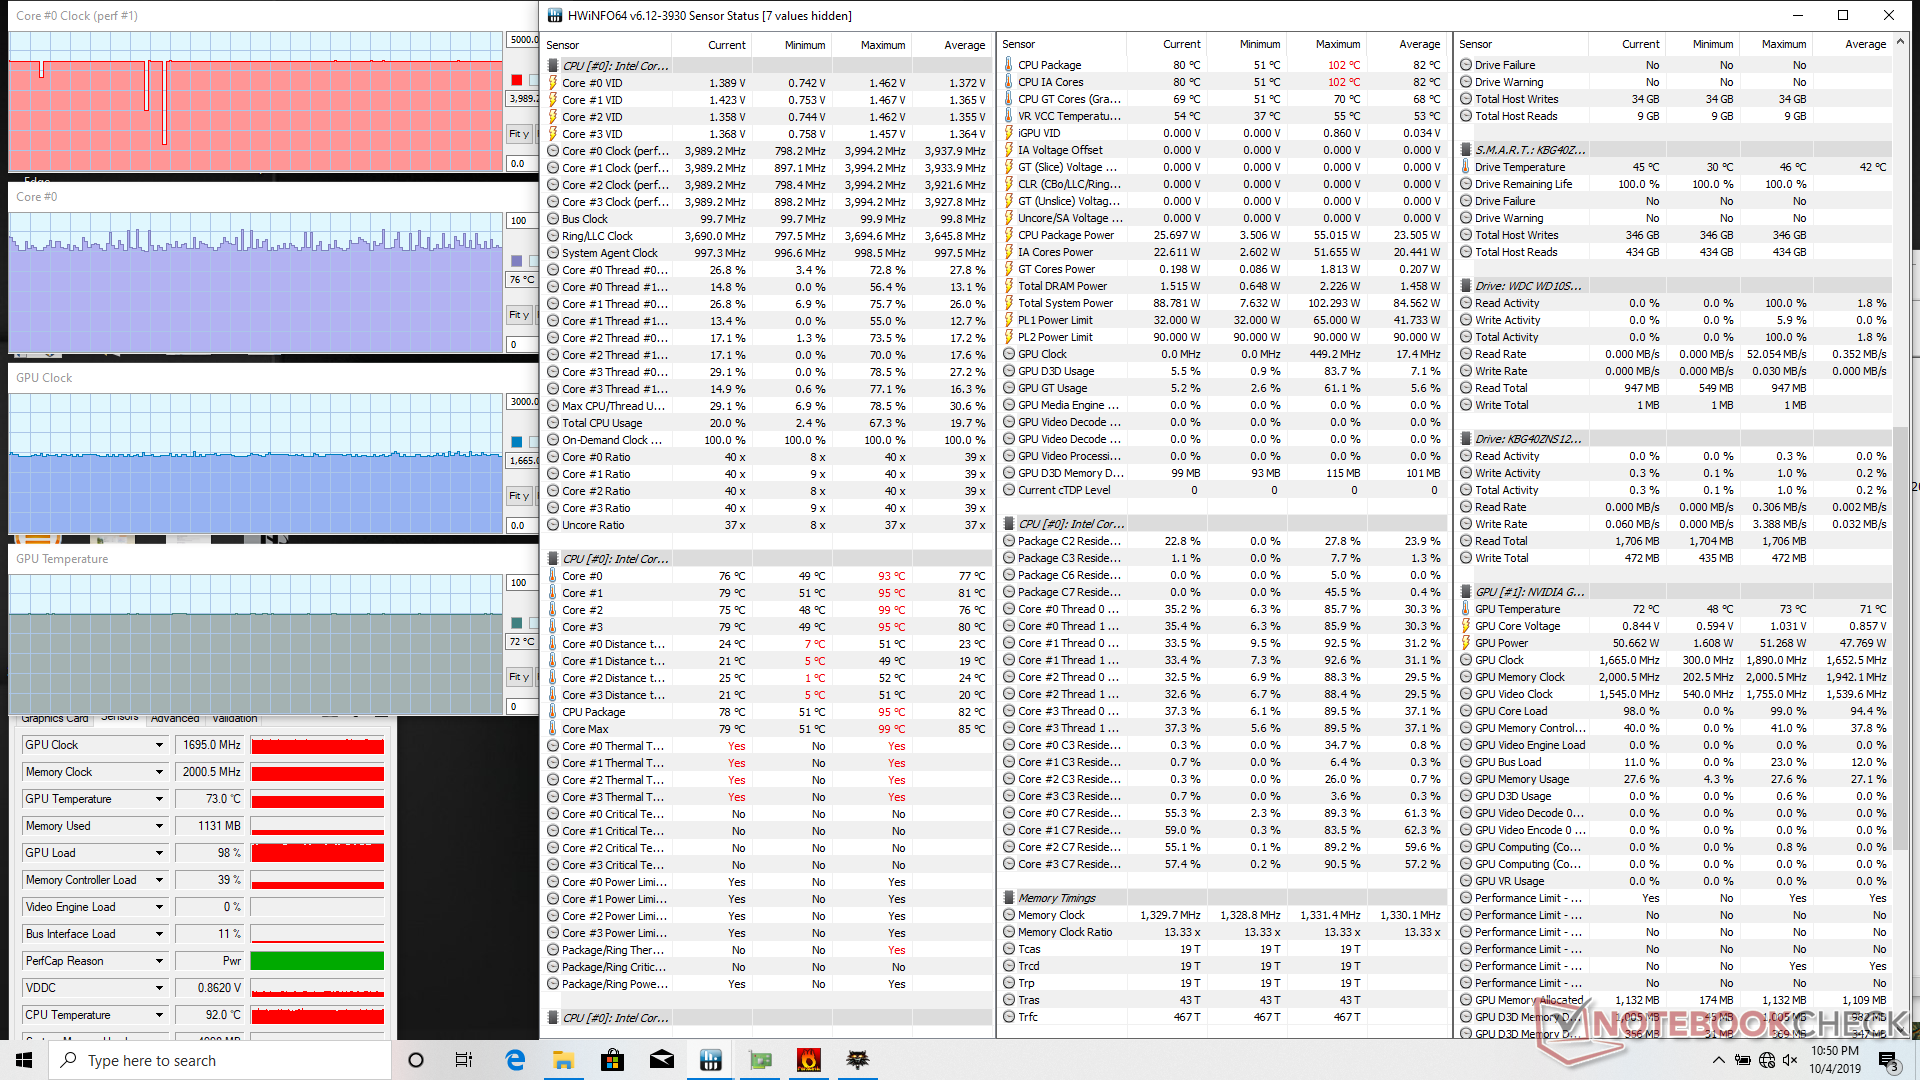
Stress Test
We stress the laptop with synthetic loads to identify for any potential throttling or stability issues. When running Prime95, clock rates would spike to 4 GHz until reaching a high core temperature of 96 C just a few seconds later. Thereafter, clock rates steadily fall until they stabilize at the 3.4 to 3.5 GHz range in order to maintain a relatively cooler core temperature of 88 C. Thus, the G3 3590 is able to maintain respectable Turbo Boost clock rates albeit at higher core temperatures than expected. CPU and GPU temperatures when gaming remain stable at 76 C and 72 C, respectively.
Running on battery power will limit performance. A Fire Strike run on batteries returns Physics and Graphics scores of 8555 and 7535 points, respectively, compared to 11693 and 9315 points when on mains.
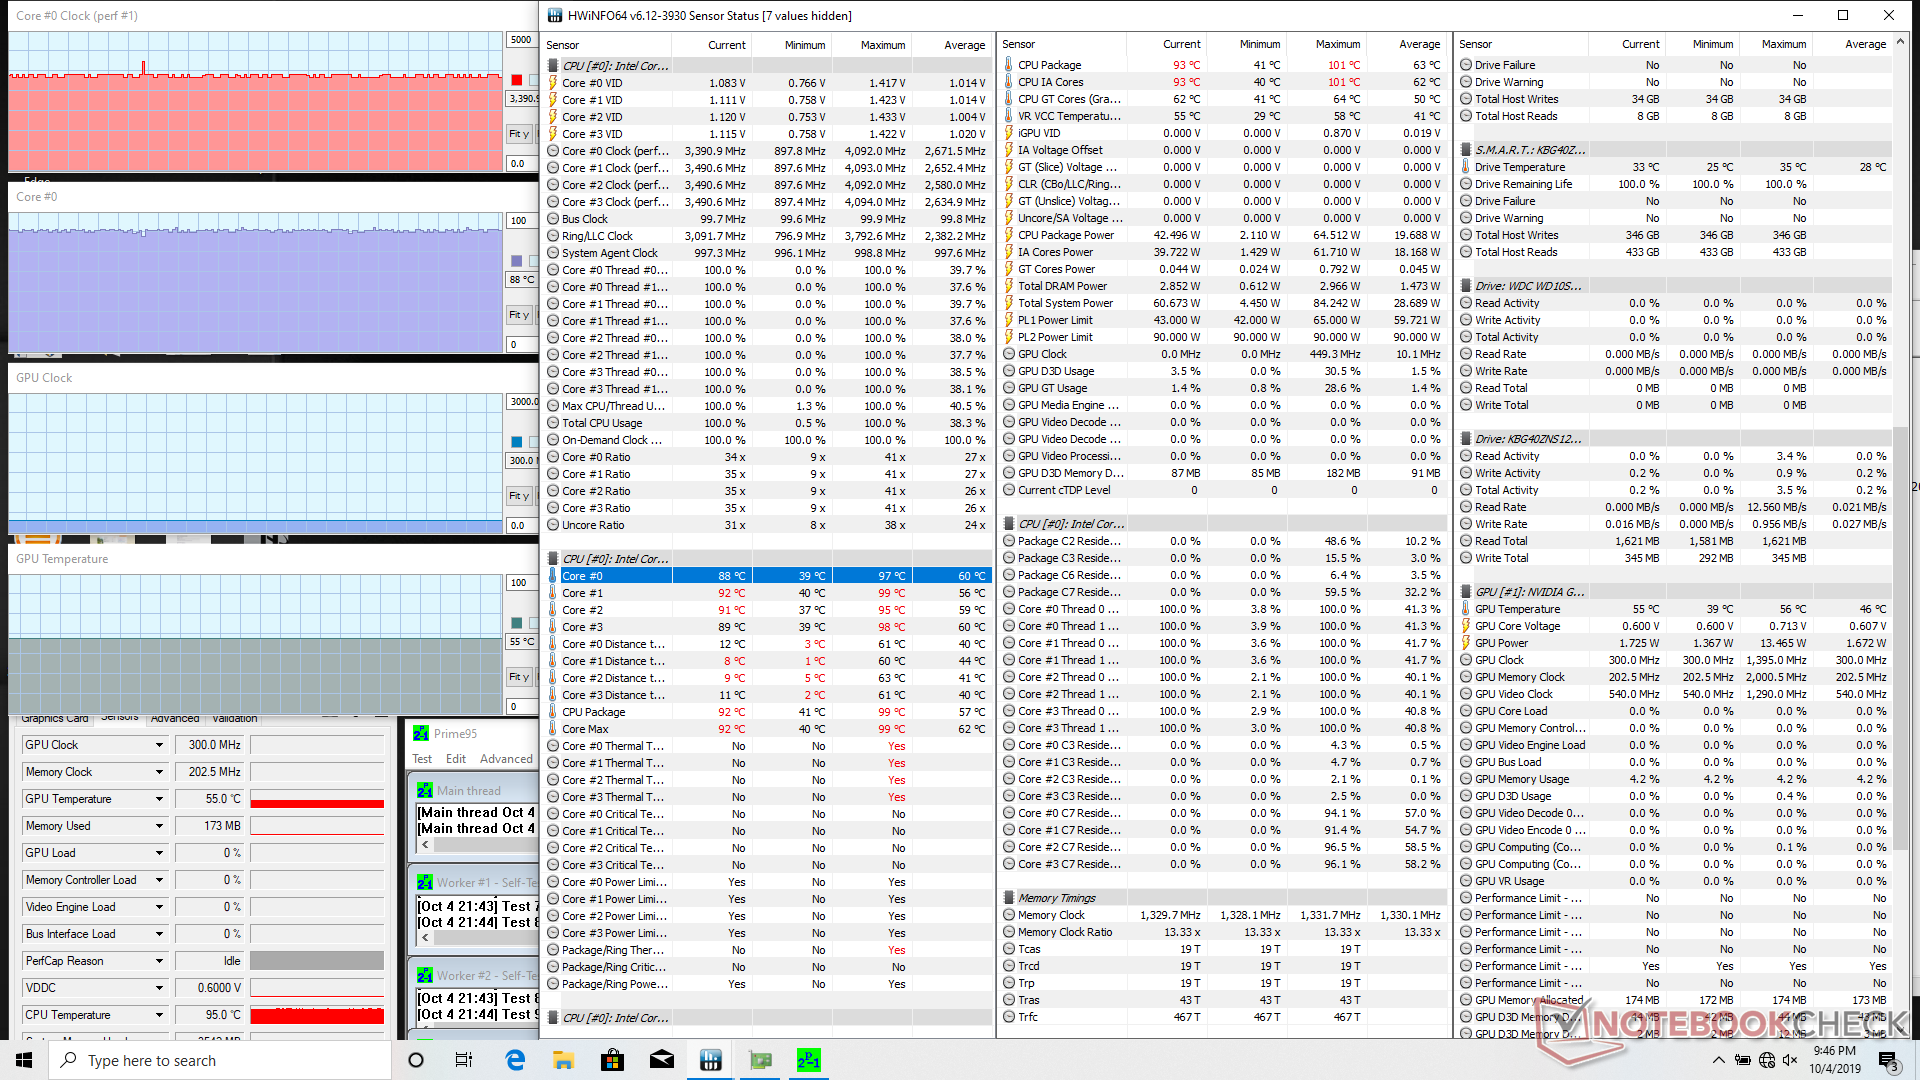
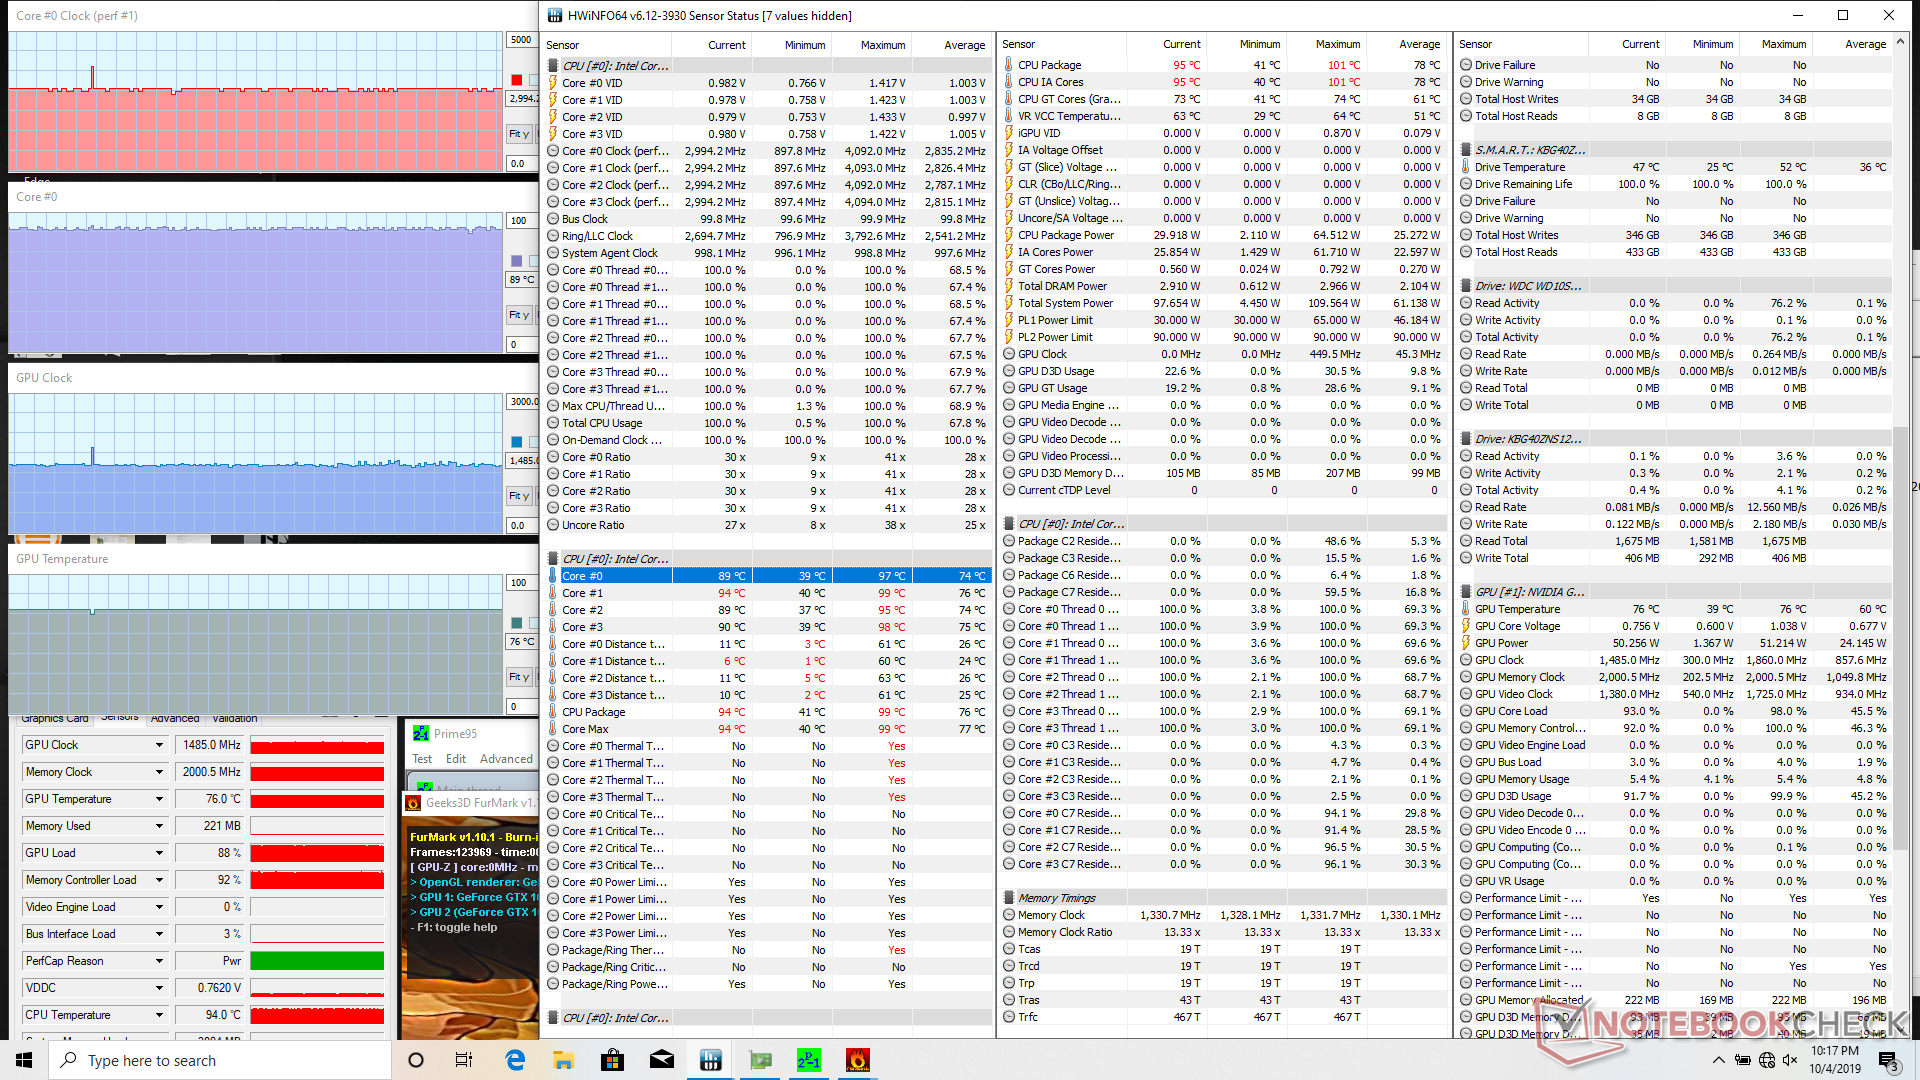
| CPU Clock (GHz) | GPU Clock (MHz) | Average CPU Temperature (°C) | Average GPU Temperature (°C) | |
| System Idle | -- | -- | 42 | 40 |
| Prime95 Stress | 3.4 - 3.5 | -- | 88 | 55 |
| Prime95 + FurMark Stress | 2.9 - 3.0 | 1485 | 89 | 76 |
| Witcher 3 Stress | 4.0 | 1695 | ~76 | 72 |
Speakers
Audio quality from the integrated speakers is lacking in bass as one might expect from an inexpensive gaming laptop. The maximum volume setting is decently loud at 84 dB(A) but the palm rests unfortunately vibrate slightly. Headphones are recommended for a better audio experience.


Dell G3 3590 audio analysis
(+) | speakers can play relatively loud (84.1 dB)
Bass 100 - 315 Hz
(-) | nearly no bass - on average 16.9% lower than median
(±) | linearity of bass is average (10.9% delta to prev. frequency)
Mids 400 - 2000 Hz
(±) | higher mids - on average 6.5% higher than median
(+) | mids are linear (5.9% delta to prev. frequency)
Highs 2 - 16 kHz
(+) | balanced highs - only 3.5% away from median
(±) | linearity of highs is average (9.4% delta to prev. frequency)
Overall 100 - 16.000 Hz
(±) | linearity of overall sound is average (22.8% difference to median)
Compared to same class
» 82% of all tested devices in this class were better, 5% similar, 13% worse
» The best had a delta of 6%, average was 18%, worst was 132%
Compared to all devices tested
» 67% of all tested devices were better, 6% similar, 27% worse
» The best had a delta of 4%, average was 24%, worst was 134%
Apple MacBook 12 (Early 2016) 1.1 GHz audio analysis
(+) | speakers can play relatively loud (83.6 dB)
Bass 100 - 315 Hz
(±) | reduced bass - on average 11.3% lower than median
(±) | linearity of bass is average (14.2% delta to prev. frequency)
Mids 400 - 2000 Hz
(+) | balanced mids - only 2.4% away from median
(+) | mids are linear (5.5% delta to prev. frequency)
Highs 2 - 16 kHz
(+) | balanced highs - only 2% away from median
(+) | highs are linear (4.5% delta to prev. frequency)
Overall 100 - 16.000 Hz
(+) | overall sound is linear (10.2% difference to median)
Compared to same class
» 7% of all tested devices in this class were better, 2% similar, 91% worse
» The best had a delta of 5%, average was 18%, worst was 53%
Compared to all devices tested
» 5% of all tested devices were better, 1% similar, 94% worse
» The best had a delta of 4%, average was 24%, worst was 134%
Energy Management
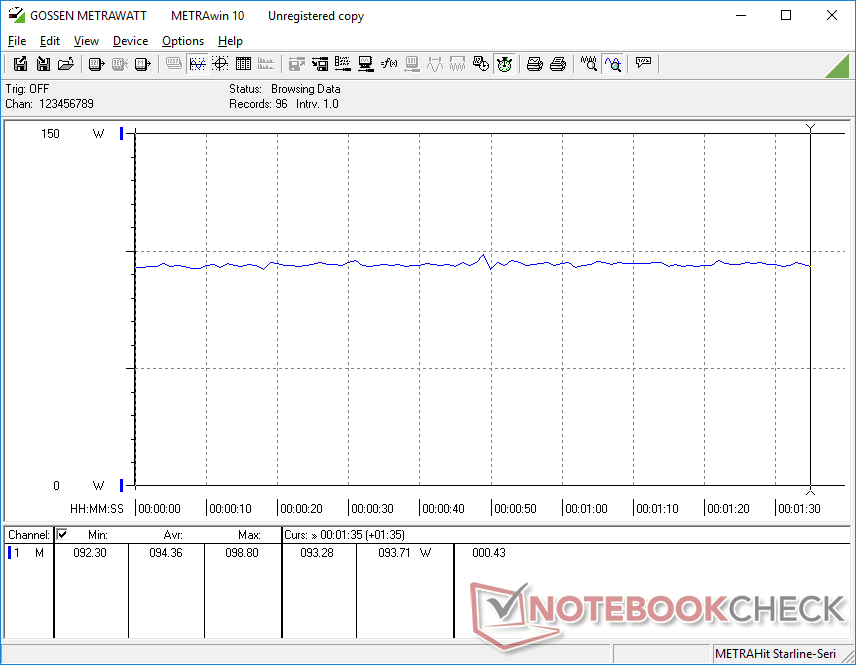
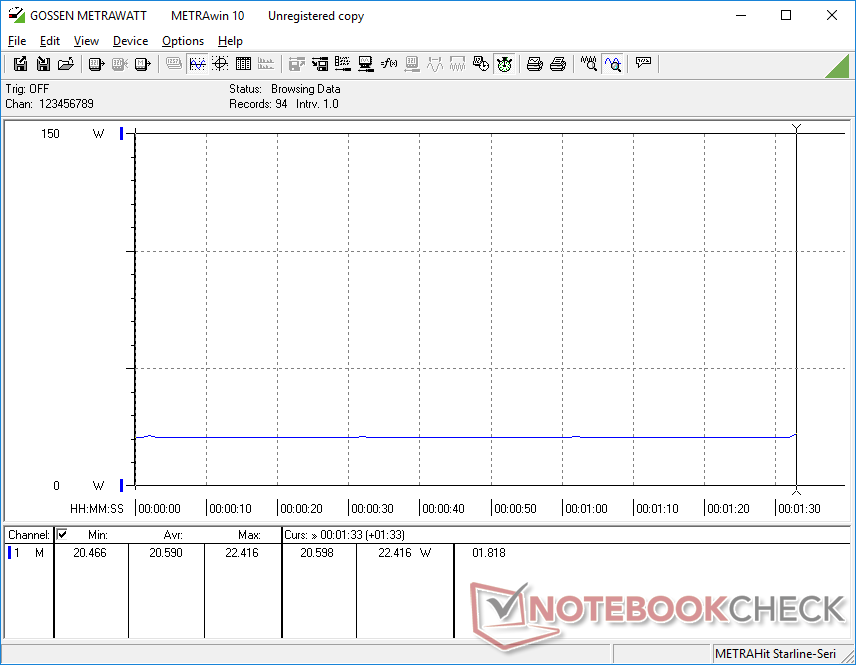
Power Consumption
The system draws between 6 W and 28 W when idling on desktop depending on the power profile and system brightness. When running Witcher 3, consumption becomes only 94 W compared to 101 W on the last generation G3 3579. In other words, the G3 3590 is able to offer up to 2x the graphics performance of its predecessor while consuming less power in the process. The GTX 1660 Ti Max-Q SKU is expected to be about 30 percent more demanding than our GTX 1650 SKU when gaming.
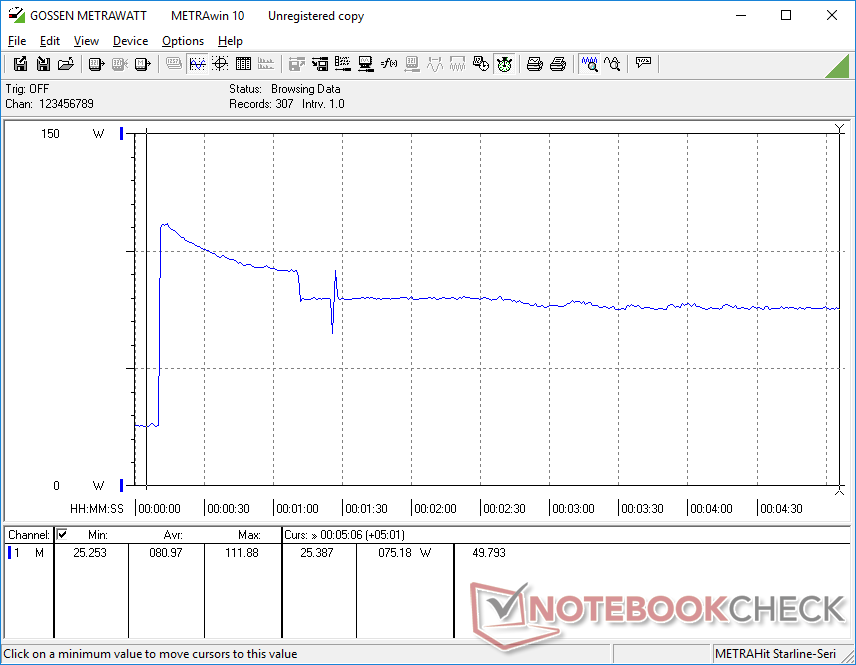
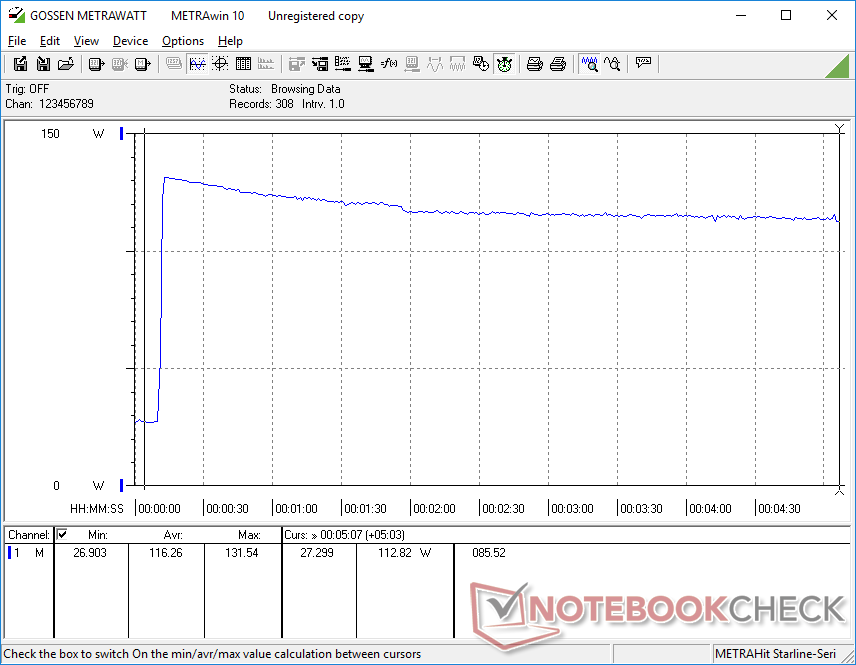
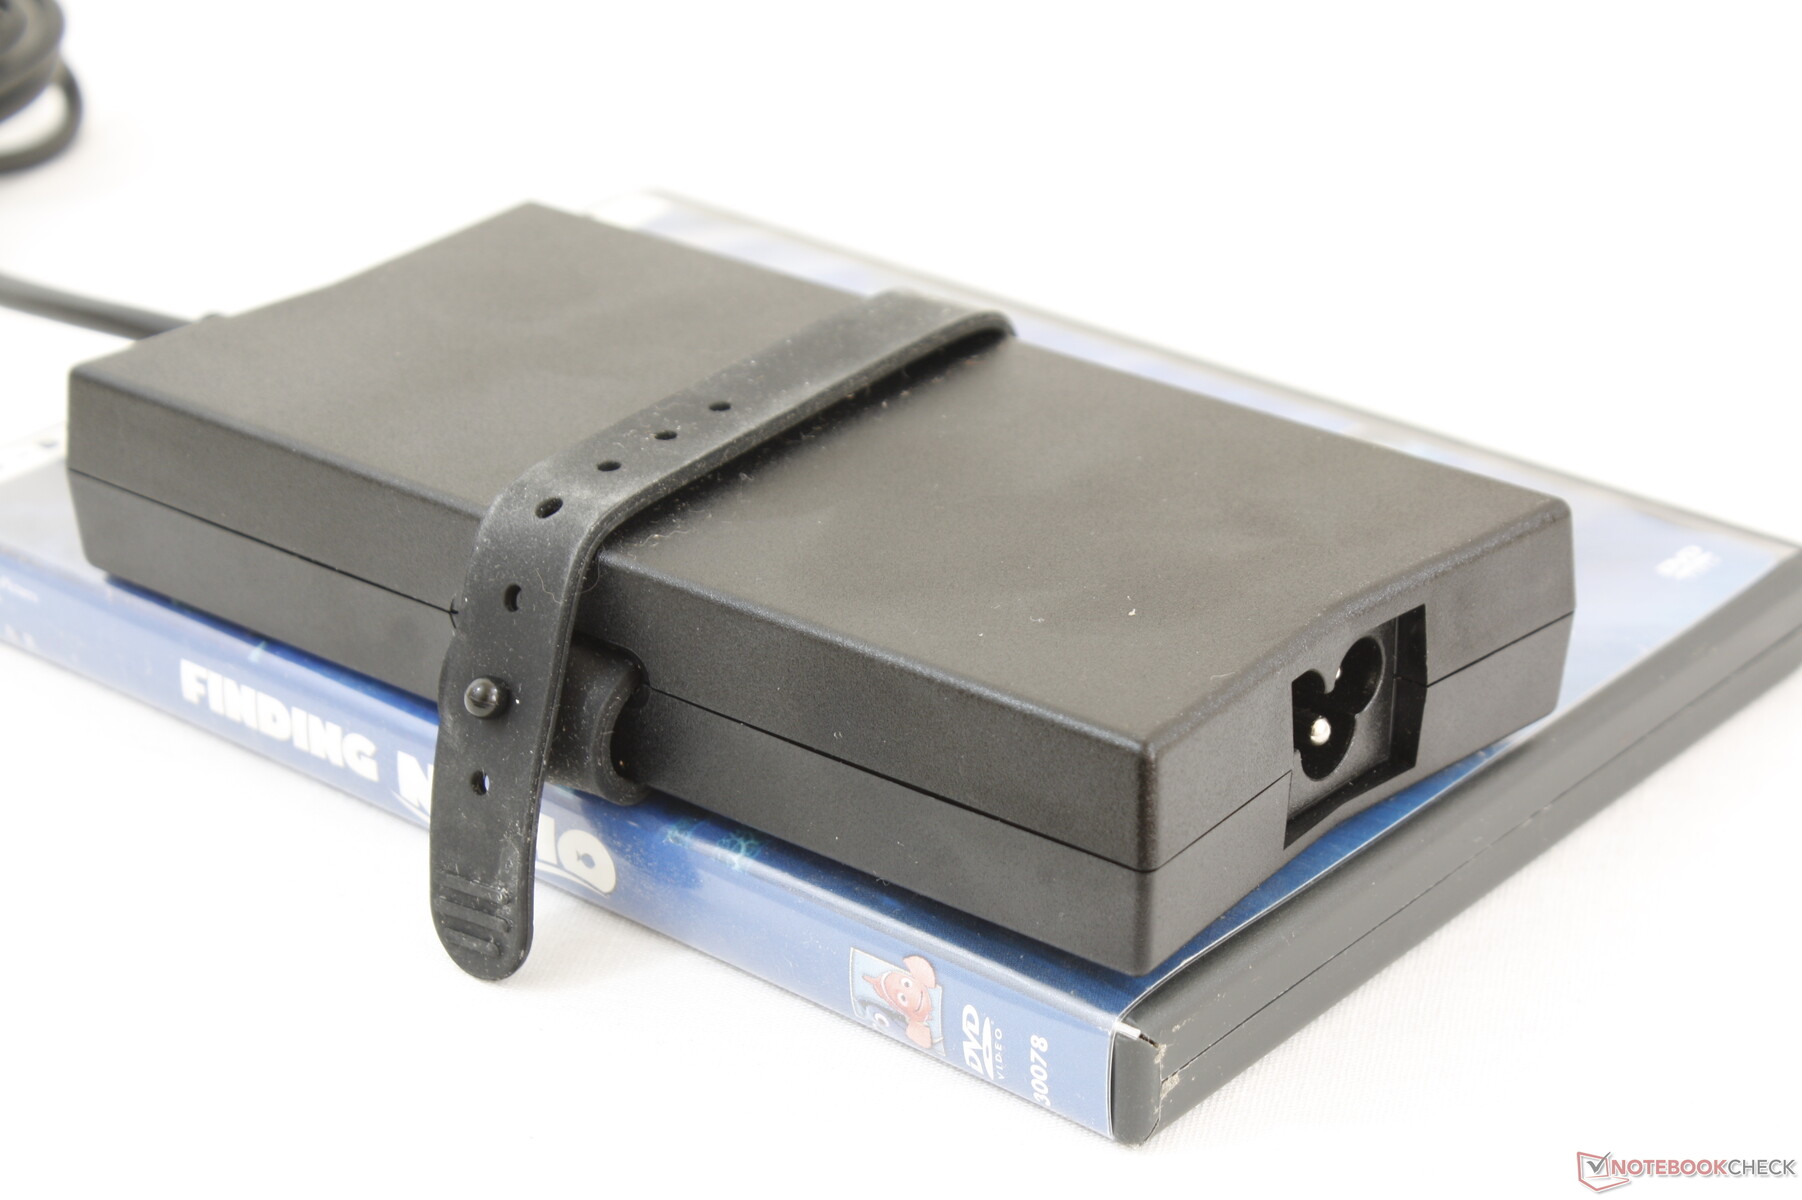
At most, we're able to measure a demand spike of 132 W from the medium-sized (~15 x 7.5 x 2.5 cm) 130 W AC adapter when running both Prime95 and FurMark simultaneously. This high of a consumption steadily drops over time before plateauing at about 113 W as shown by our graphs below.
There is a bug where the the system would not enter Sleep mode correctly seemingly at random. When this occurs, the system fans would continue to run and power consumption would be as high as 20 W. When everything is working as intended, consumption in Sleep mode would be just 0.68 W.
| Off / Standby | |
| Idle | |
| Load |
|
Key:
min: | |
| Dell G3 3590 i5-9300H, GeForce GTX 1650 Mobile, Toshiba BG4 KBG40ZNS128G, IPS, 1920x1080, 15.6" | Dell G3 15 3579 i5-8300H, GeForce GTX 1050 Mobile, Seagate Mobile HDD 1TB ST1000LX015-1U7172, IPS, 1920x1080, 15.6" | Aorus 15-SA i7-9750H, GeForce GTX 1660 Ti Mobile, Intel SSD 760p SSDPEKKW512G8, IPS, 1920x1080, 15.6" | Alienware m15 R2 P87F i7-9750H, GeForce RTX 2080 Max-Q, 2x Toshiba XG6 KXG60ZNV512G (RAID 0), IPS, 1920x1080, 15.6" | HP Gaming Pavilion 15-dk0009ng i7-9750H, GeForce GTX 1660 Ti Max-Q, Samsung SSD PM981 MZVLB256HAHQ, IPS, 1920x1080, 15.6" | MSI GS65 Stealth Thin 8RE-051US i7-8750H, GeForce GTX 1060 Mobile, Samsung SSD PM981 MZVLB256HAHQ, IPS, 1920x1080, 15.6" | |
|---|---|---|---|---|---|---|
| Power Consumption | 0% | -79% | -147% | -9% | -20% | |
| Idle Minimum * (Watt) | 6.2 | 7.9 -27% | 20 -223% | 19 -206% | 6.8 -10% | 8.7 -40% |
| Idle Average * (Watt) | 8.4 | 9.6 -14% | 23 -174% | 40.5 -382% | 10.7 -27% | 13 -55% |
| Idle Maximum * (Watt) | 27.7 | 13 53% | 29 -5% | 52 -88% | 12.5 55% | 14.3 48% |
| Load Average * (Watt) | 91 | 93 -2% | 87 4% | 132.3 -45% | 87.2 4% | 107.4 -18% |
| Witcher 3 ultra * (Watt) | 94.4 | 100.6 -7% | 136 -44% | 183.3 -94% | 121 -28% | 129 -37% |
| Load Maximum * (Watt) | 131.5 | 132.7 -1% | 173 -32% | 217.2 -65% | 191.4 -46% | 151.5 -15% |
* ... smaller is better
Battery Life
Battery capacity has dropped from 56 Wh on the older G3 3579 to 51 Wh on our G3 3590. Runtimes are otherwise very similar between them at approximately 6.5 hours of real-world WLAN use to be above average for a gaming laptop.
Charging from empty to full capacity takes about 2 hours with the included AC adapter. The system cannot be recharged via USB Type-C.
| Dell G3 3590 i5-9300H, GeForce GTX 1650 Mobile, 51 Wh | Dell G3 15 3579 i5-8300H, GeForce GTX 1050 Mobile, 56 Wh | Lenovo Legion Y540-15IRH-81SX00B2GE i7-9750H, GeForce GTX 1660 Ti Mobile, 57 Wh | Aorus 15-SA i7-9750H, GeForce GTX 1660 Ti Mobile, 62 Wh | Alienware m15 R2 P87F i7-9750H, GeForce RTX 2080 Max-Q, 76 Wh | HP Gaming Pavilion 15-dk0009ng i7-9750H, GeForce GTX 1660 Ti Max-Q, 52.5 Wh | |
|---|---|---|---|---|---|---|
| Battery runtime | 27% | -47% | -30% | -33% | -24% | |
| Reader / Idle (h) | 13.5 | 4 -70% | 3.5 -74% | 9.2 -32% | 8.7 -36% | |
| WiFi v1.3 (h) | 6.7 | 6.5 -3% | 2.4 -64% | 2.8 -58% | 5.5 -18% | 4.8 -28% |
| Load (h) | 1.4 | 2.2 57% | 1.3 -7% | 2 43% | 0.7 -50% | 1.3 -7% |
| Witcher 3 ultra (h) | 1 |
Pros
Cons
Verdict
The strongest aspect of the Dell G3 3590 is its serviceability. Unlike the HP Pavilion Gaming 15 or the MSI GP65, the Dell system is easier to upgrade and it doesn't require tearing any warranty seals. Performance is where we expect it to be considering the hardware and the low price of entry makes the system attractive to users who want a decently powerful no frills gaming machine.
The list of weaknesses is longer than we would like. The display in particular suffers from one too many cut corners including weak colors, moderate-heavy uneven backlight bleeding, slower response times, grainy matte overlay, and a dim backlight. While perfectly acceptable for most games, both the competing HP Gaming Pavilion 15 and Lenovo Legion Y540 offer much better panels that are more fit for fast-paced gameplay. You'll have to upgrade to the Dell G7 series or higher if you want a better visual experience as the G3 3590 offers no other panel options.
The rest of the system is typical of its price range. The plastic chassis, treble-heavy speakers, slow SD reader, 1x1 WLAN, and budget NVMe SSD are common on budget gaming laptops.
If you have $1000 to spend on a gaming laptop, you may want to consider the quieter HP Pavilion Gaming 15 or the sleeker AMD-powered Asus Zephyrus G GA502 series. The Dell G3 3590 may be slightly cheaper, but its louder fans and poorer display are tough to recommend.
Dell G3 3590
- 10/11/2019 v7 (old)
Allen Ngo
Price comparison
