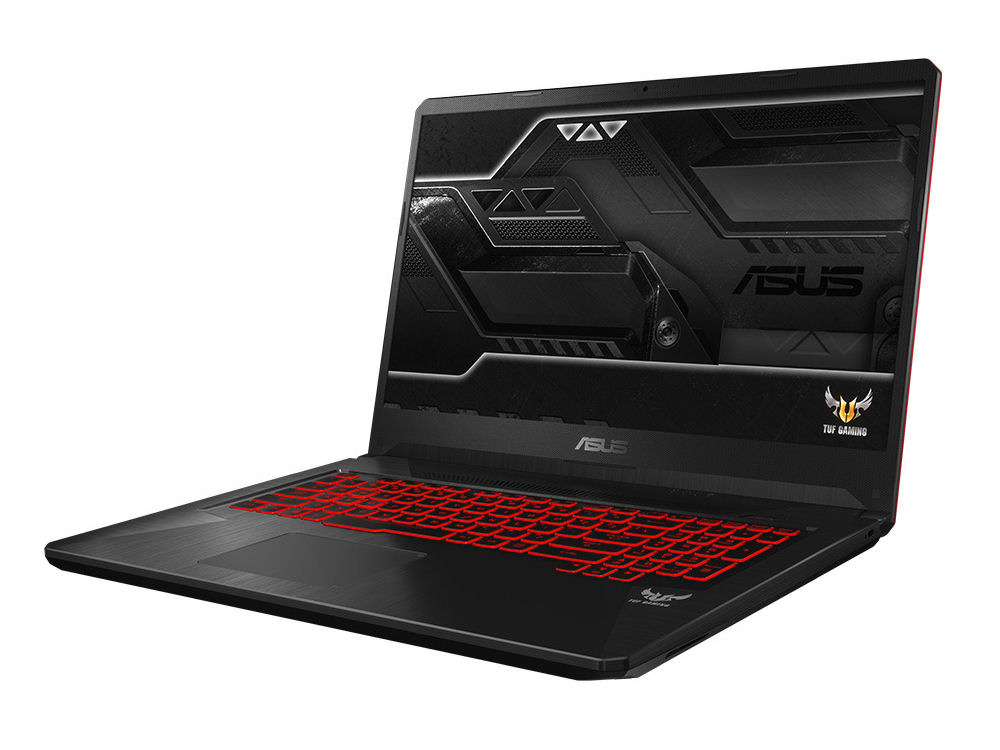
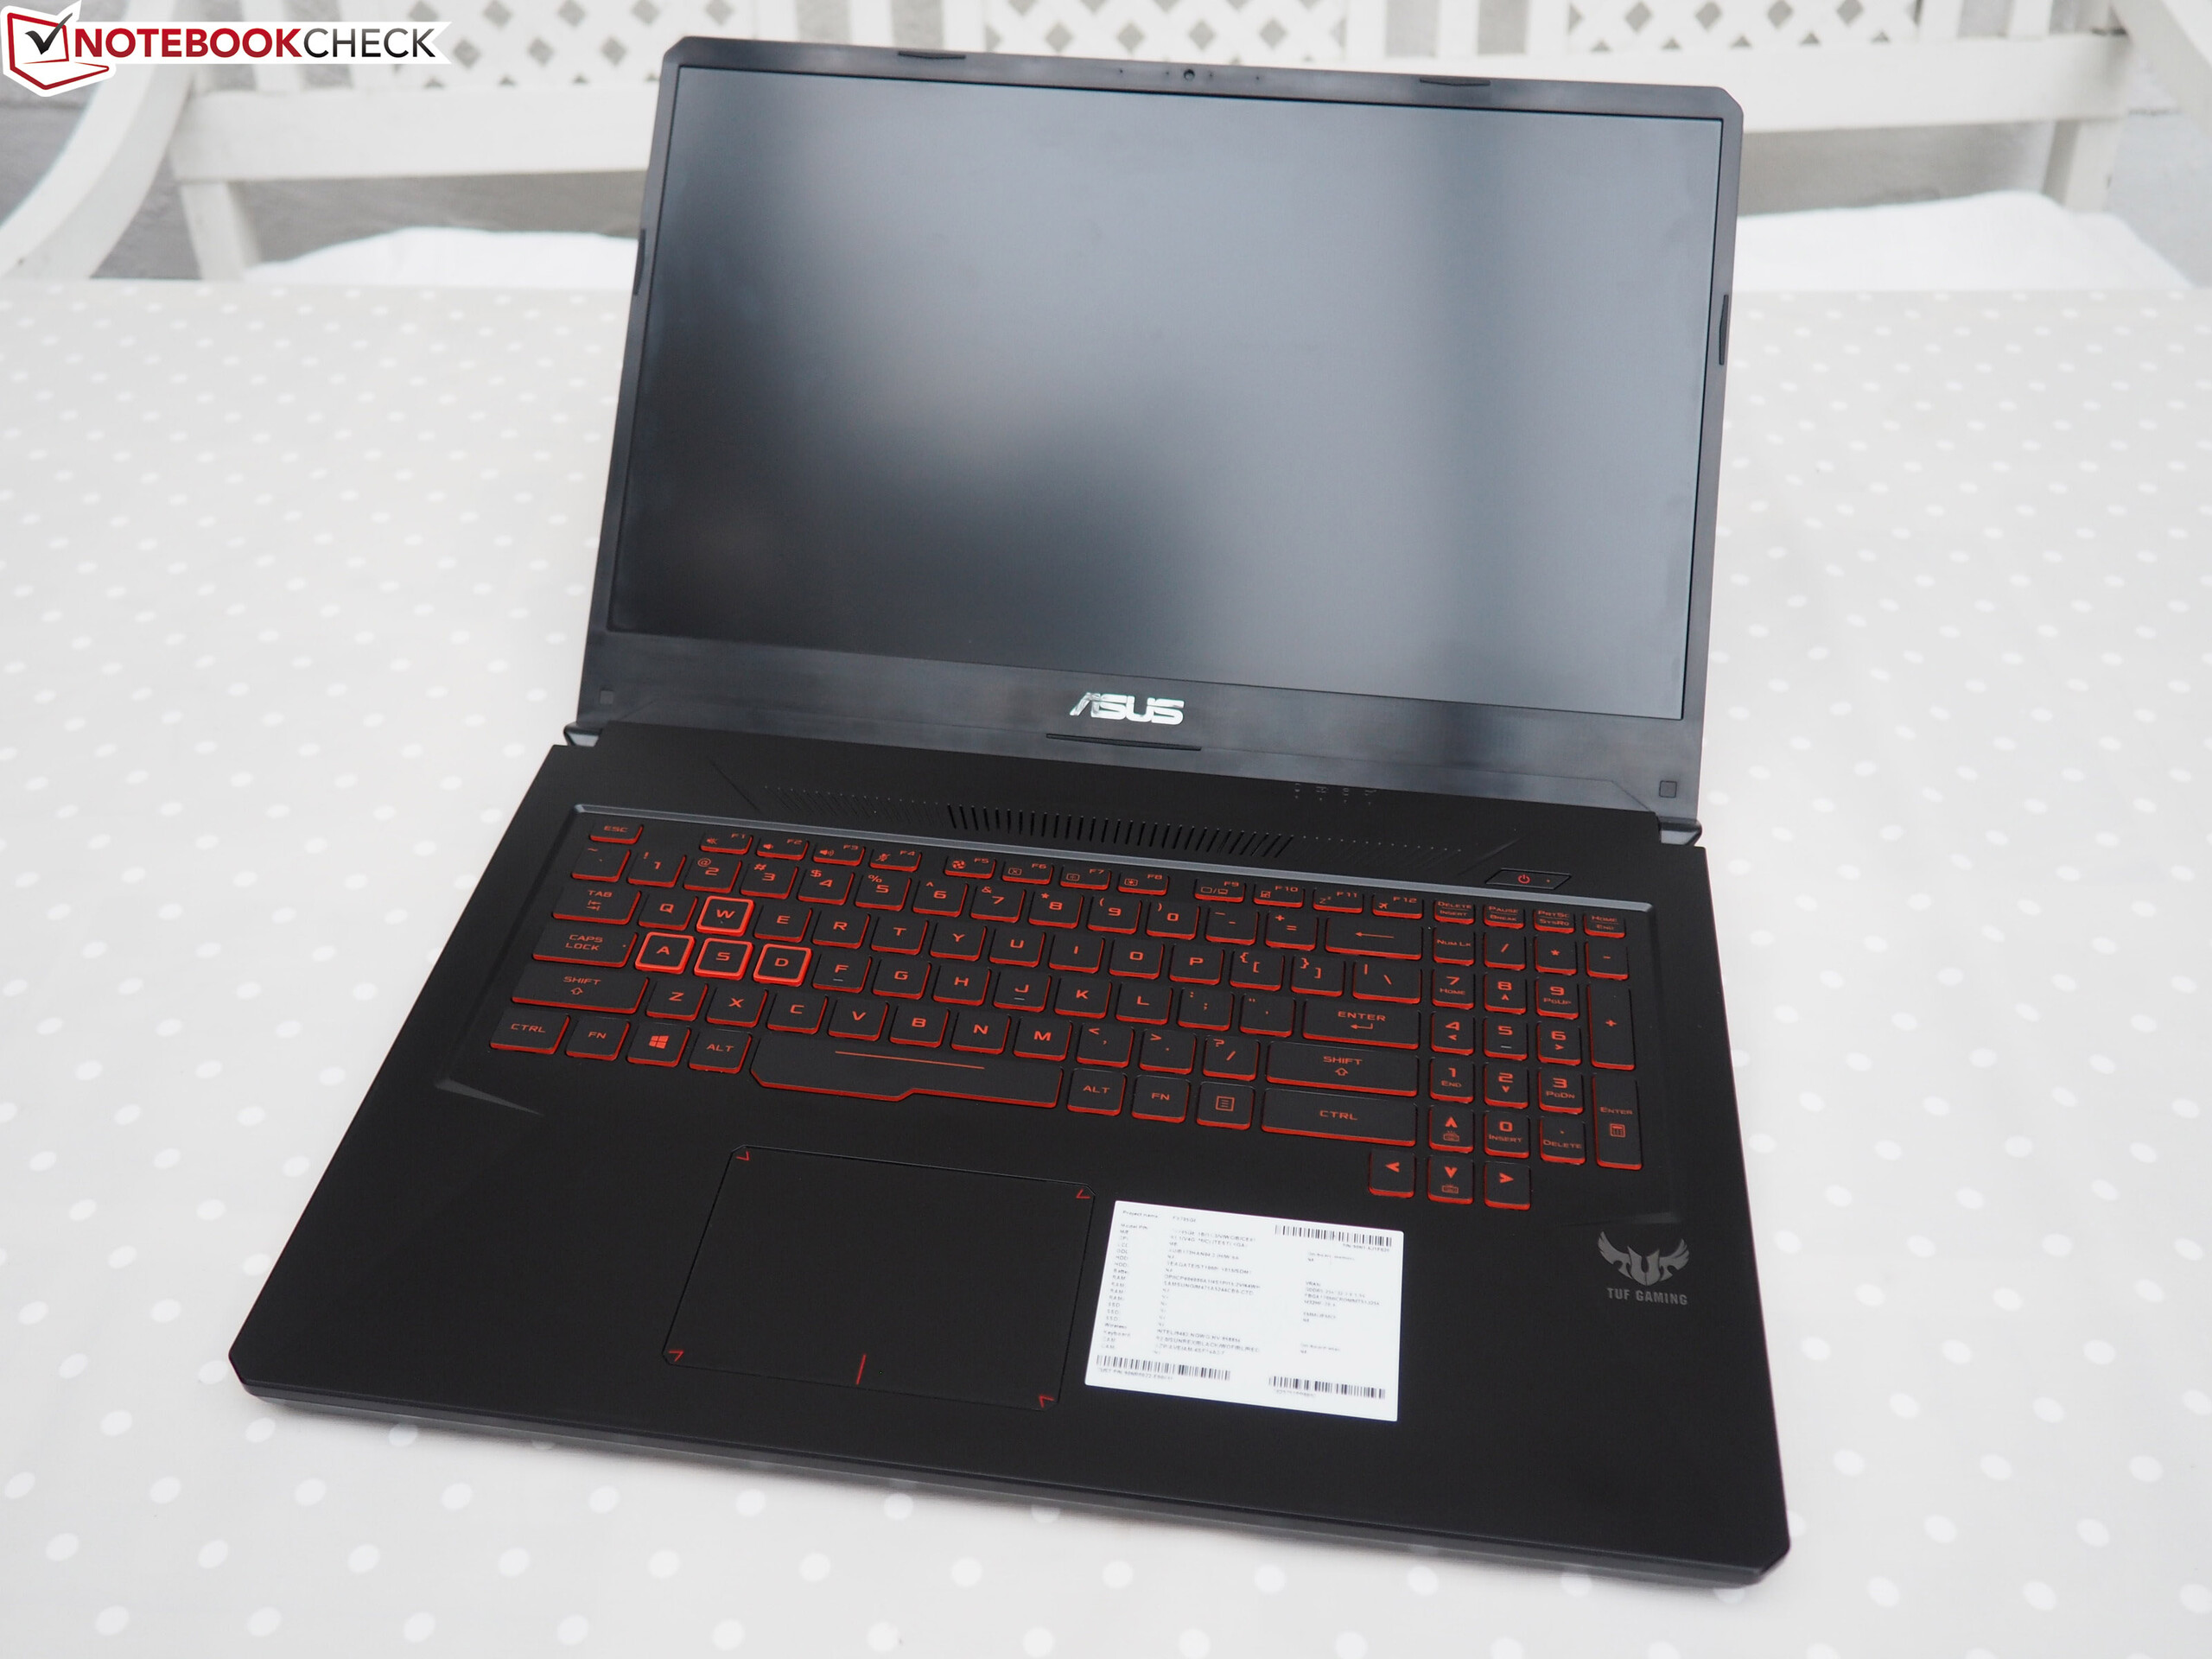
Asus TUF Gaming FX705GE (i7-8750H, GTX 1050 Ti, SSD, FHD) Laptop Review

“TUF” (The Ultimate Force) notebooks from Asus are intended for price-conscious buyers. In absolute terms, our review device that retails for 1200 Euros (~$1361) is not a very cheap notebook, but it finds its place right at the bottom of the gaming segment. This notebook is no stranger to us. We have already reviewed a sibling model known as the Asus TUF Gaming FX705GM. The competing devices include: the Acer Predator Helios 300 PH317-52, the Lenovo Legion Y730-17ICH and the Schenker XMG A707.
Because the FX705GE and the FX705GM are identically built, we shall skip the sections that deal with the case, connectivity, input devices and the speakers. Note: There are a few small differences. You can find all the appropriate information in the review of the Asus TUF Gaming FX705GM.
Differences to FX705GM
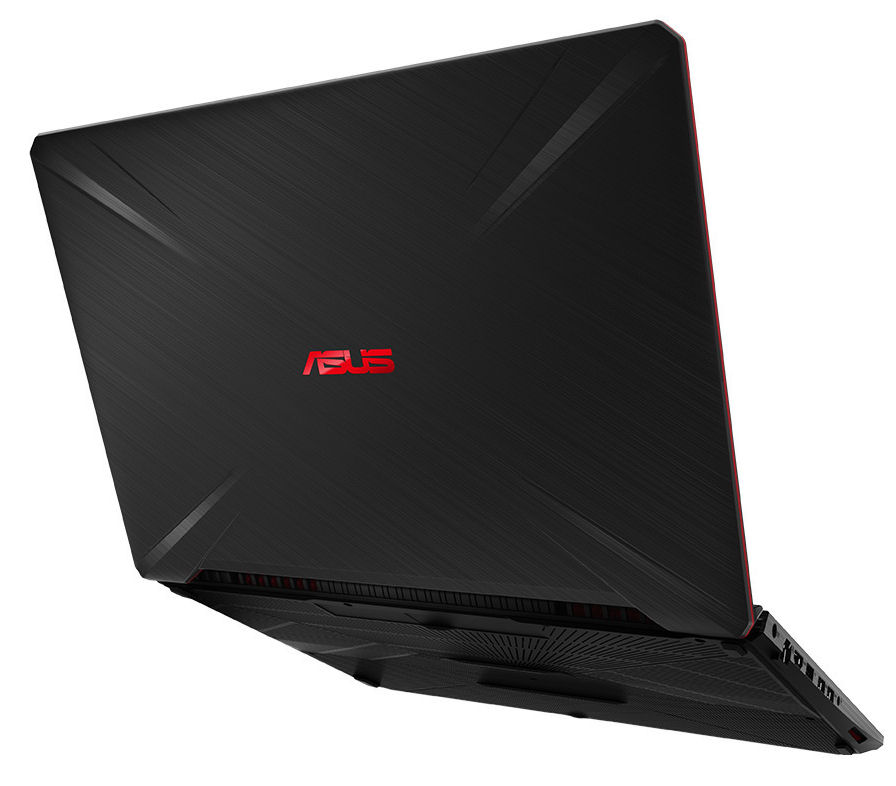
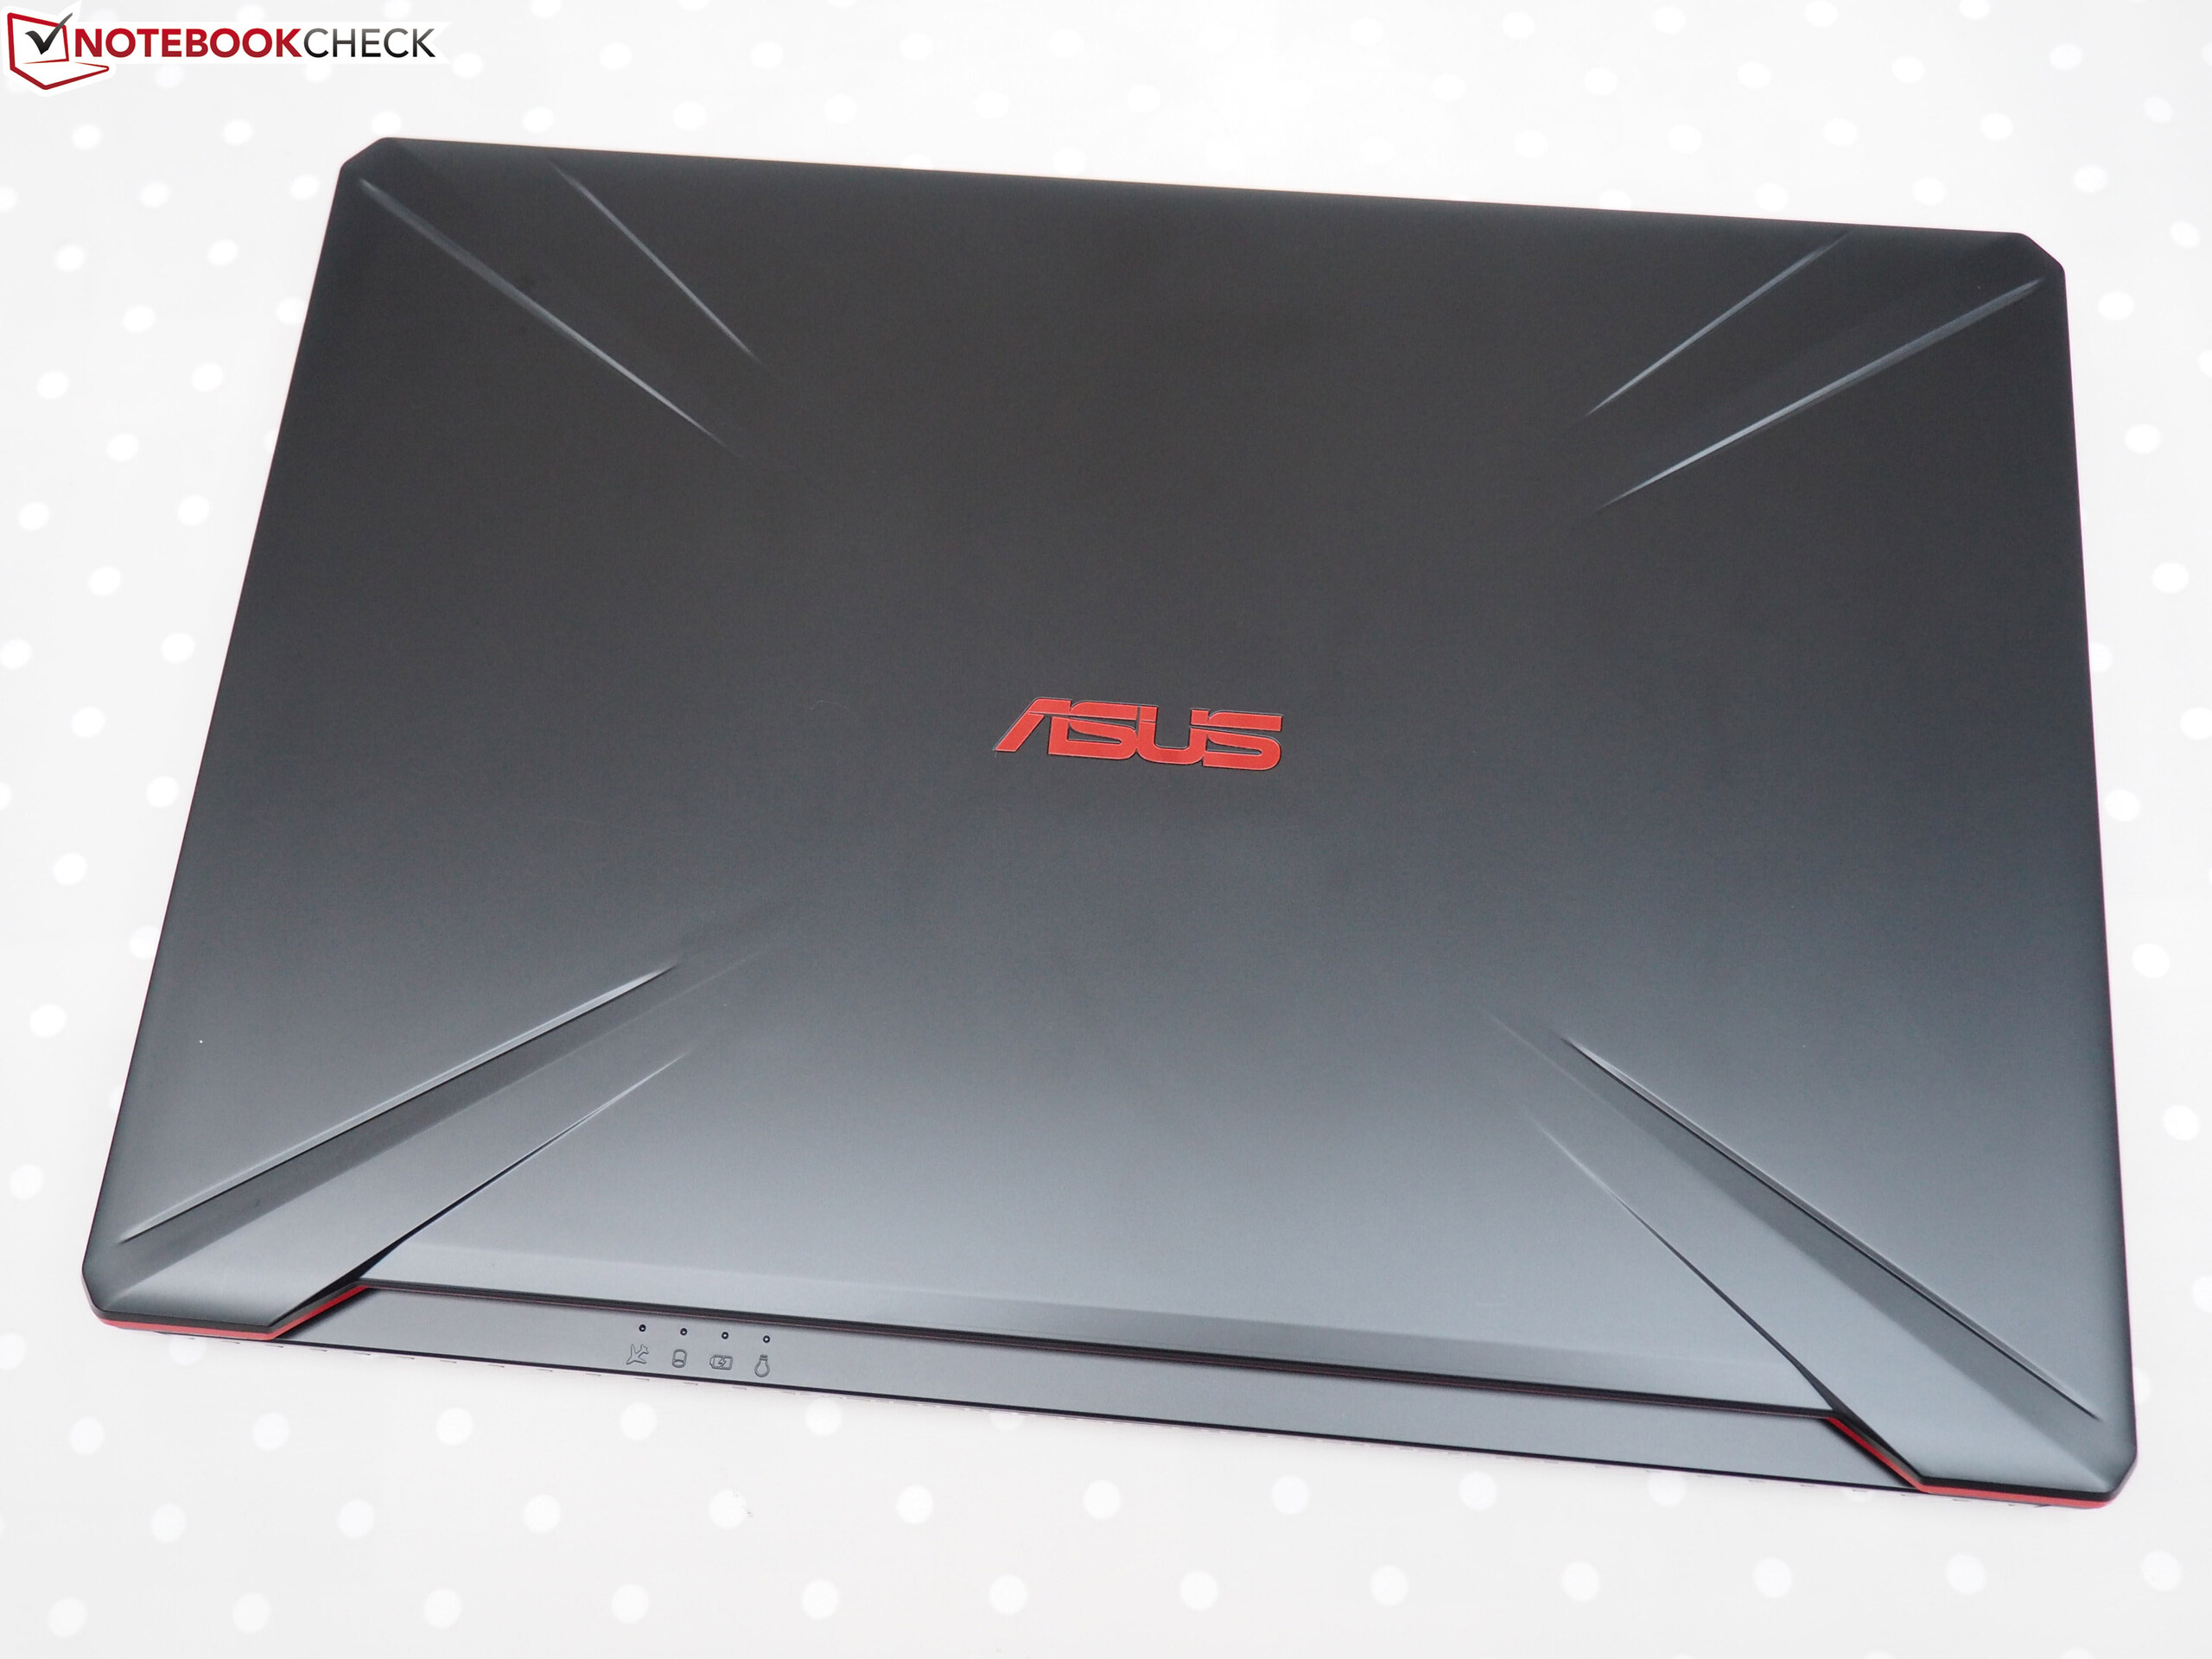
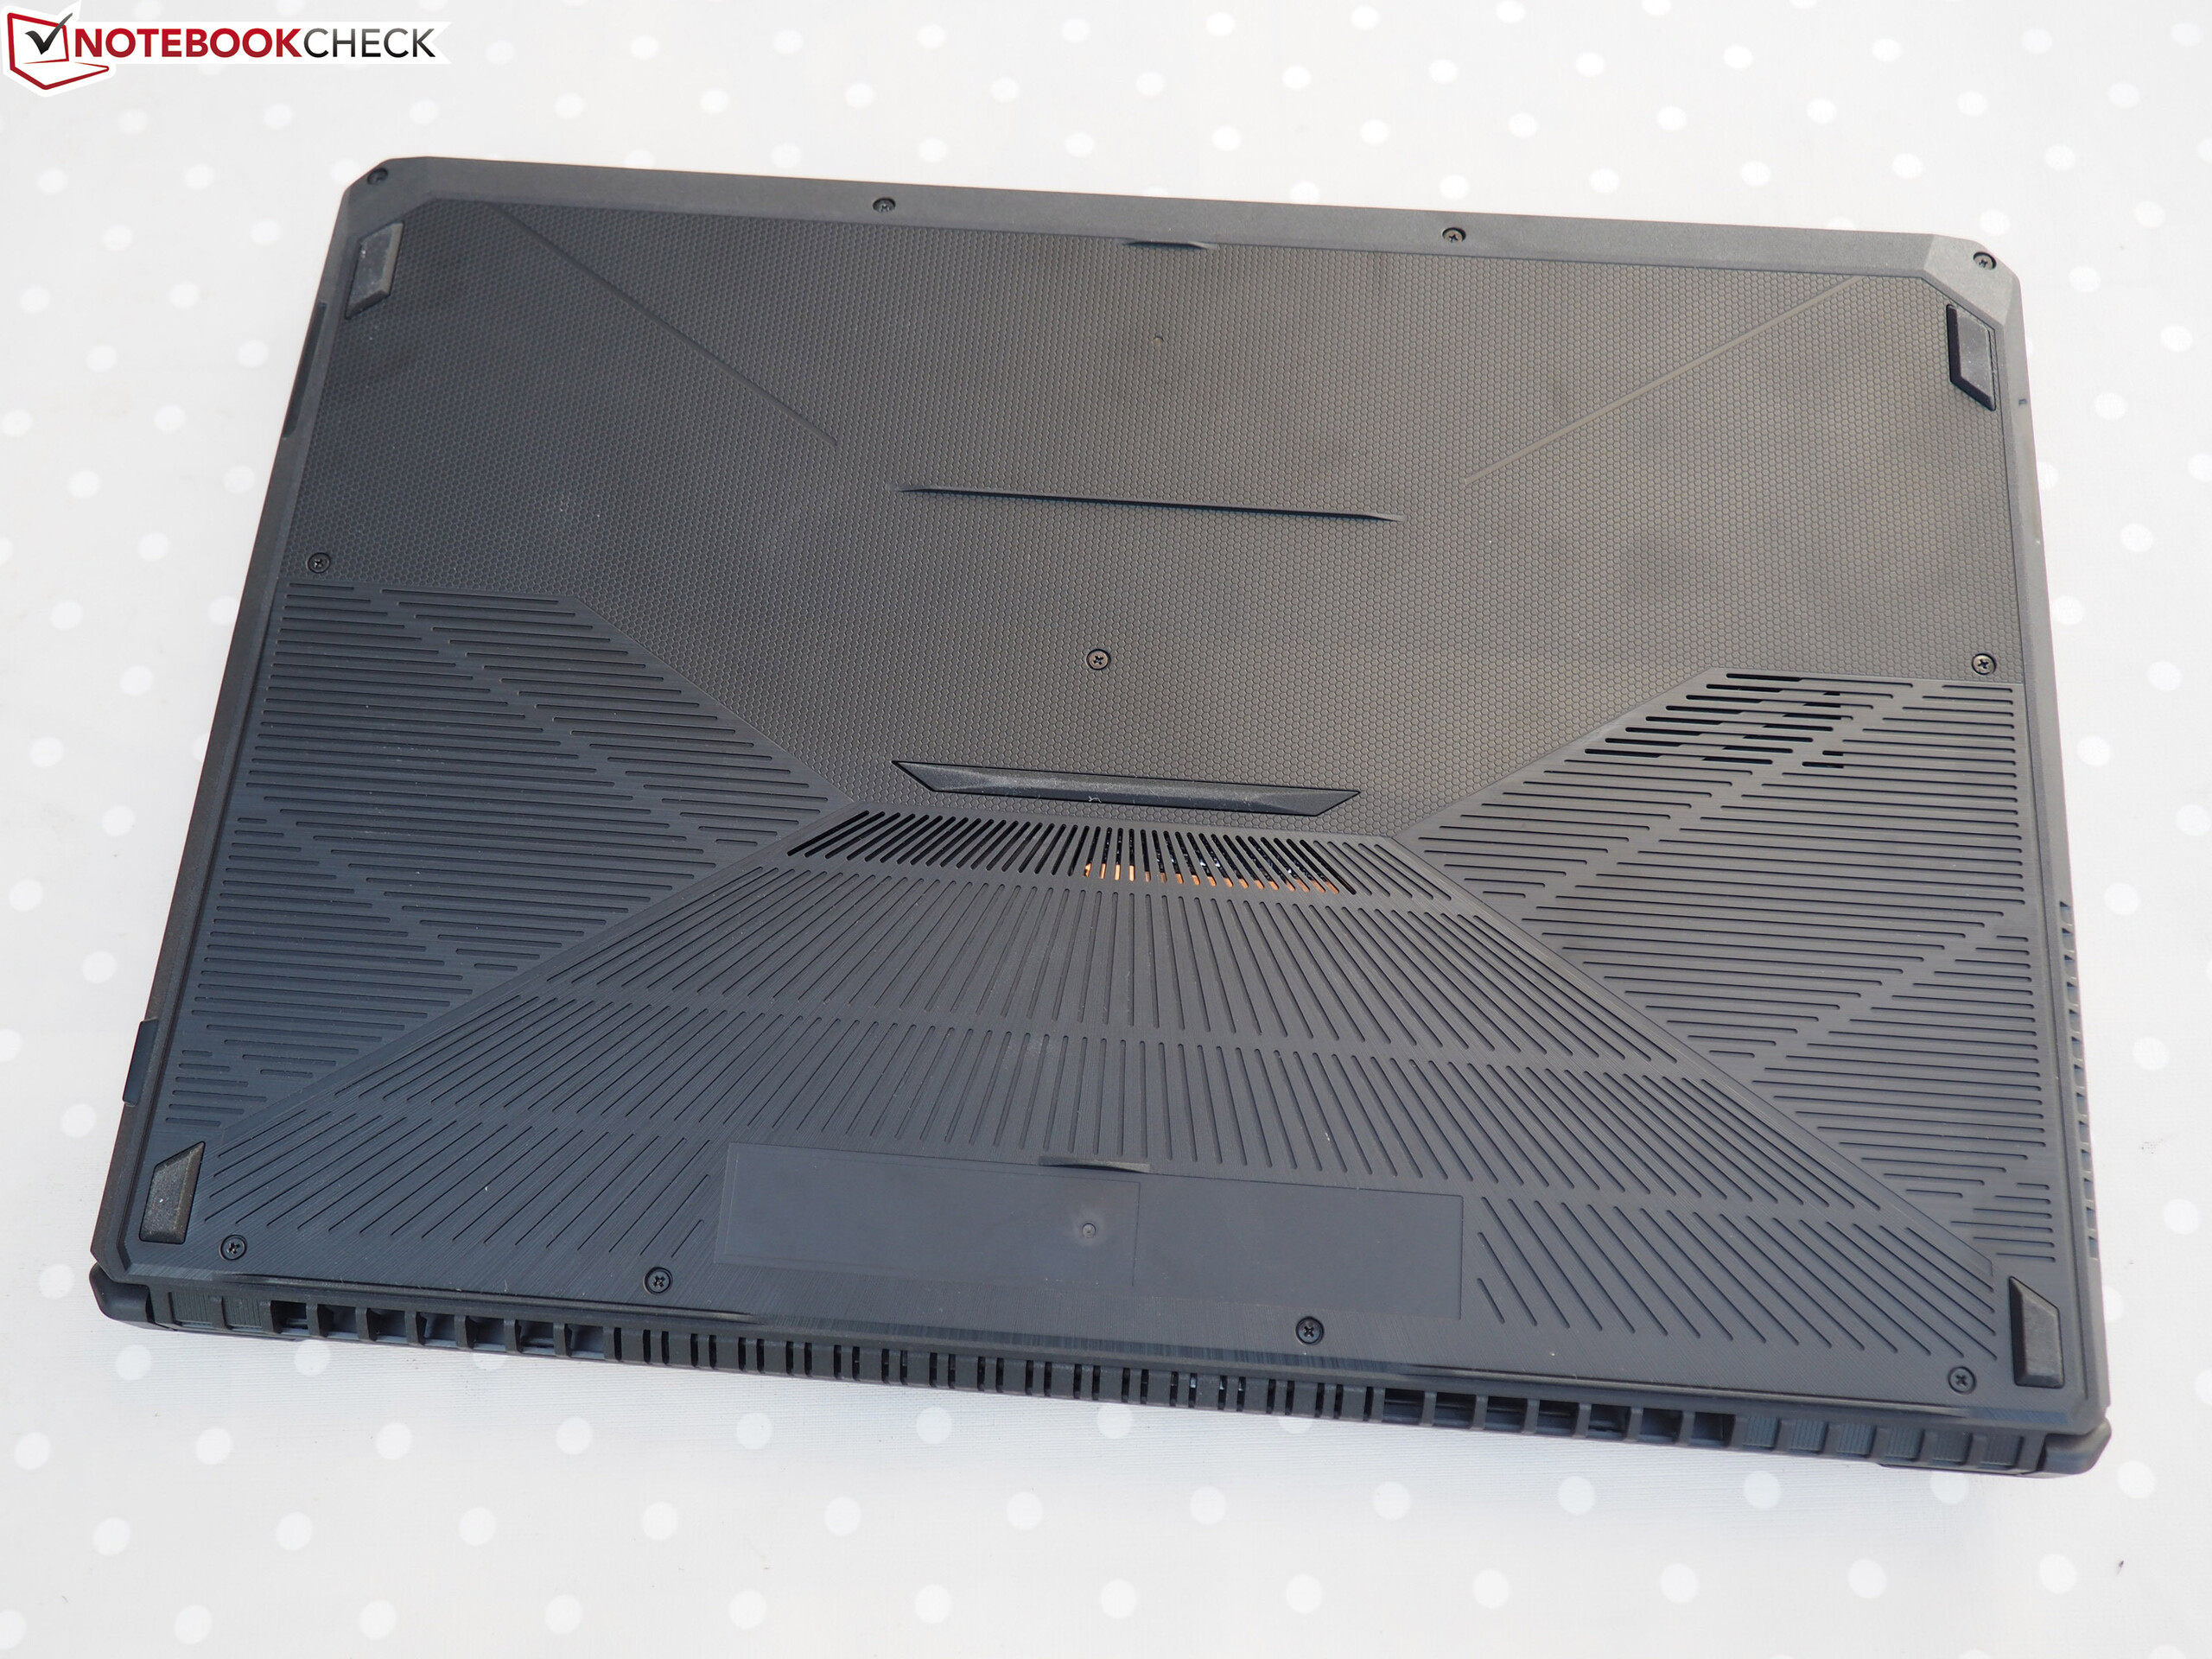
- While the FX705GM had a metal display lid, our current review device features a plastic display lid.
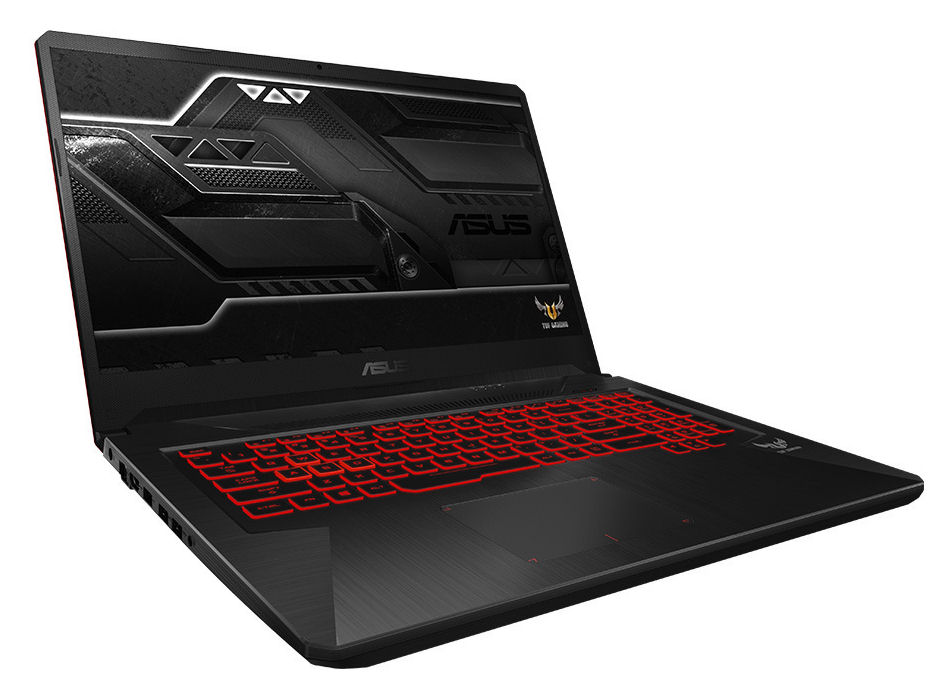
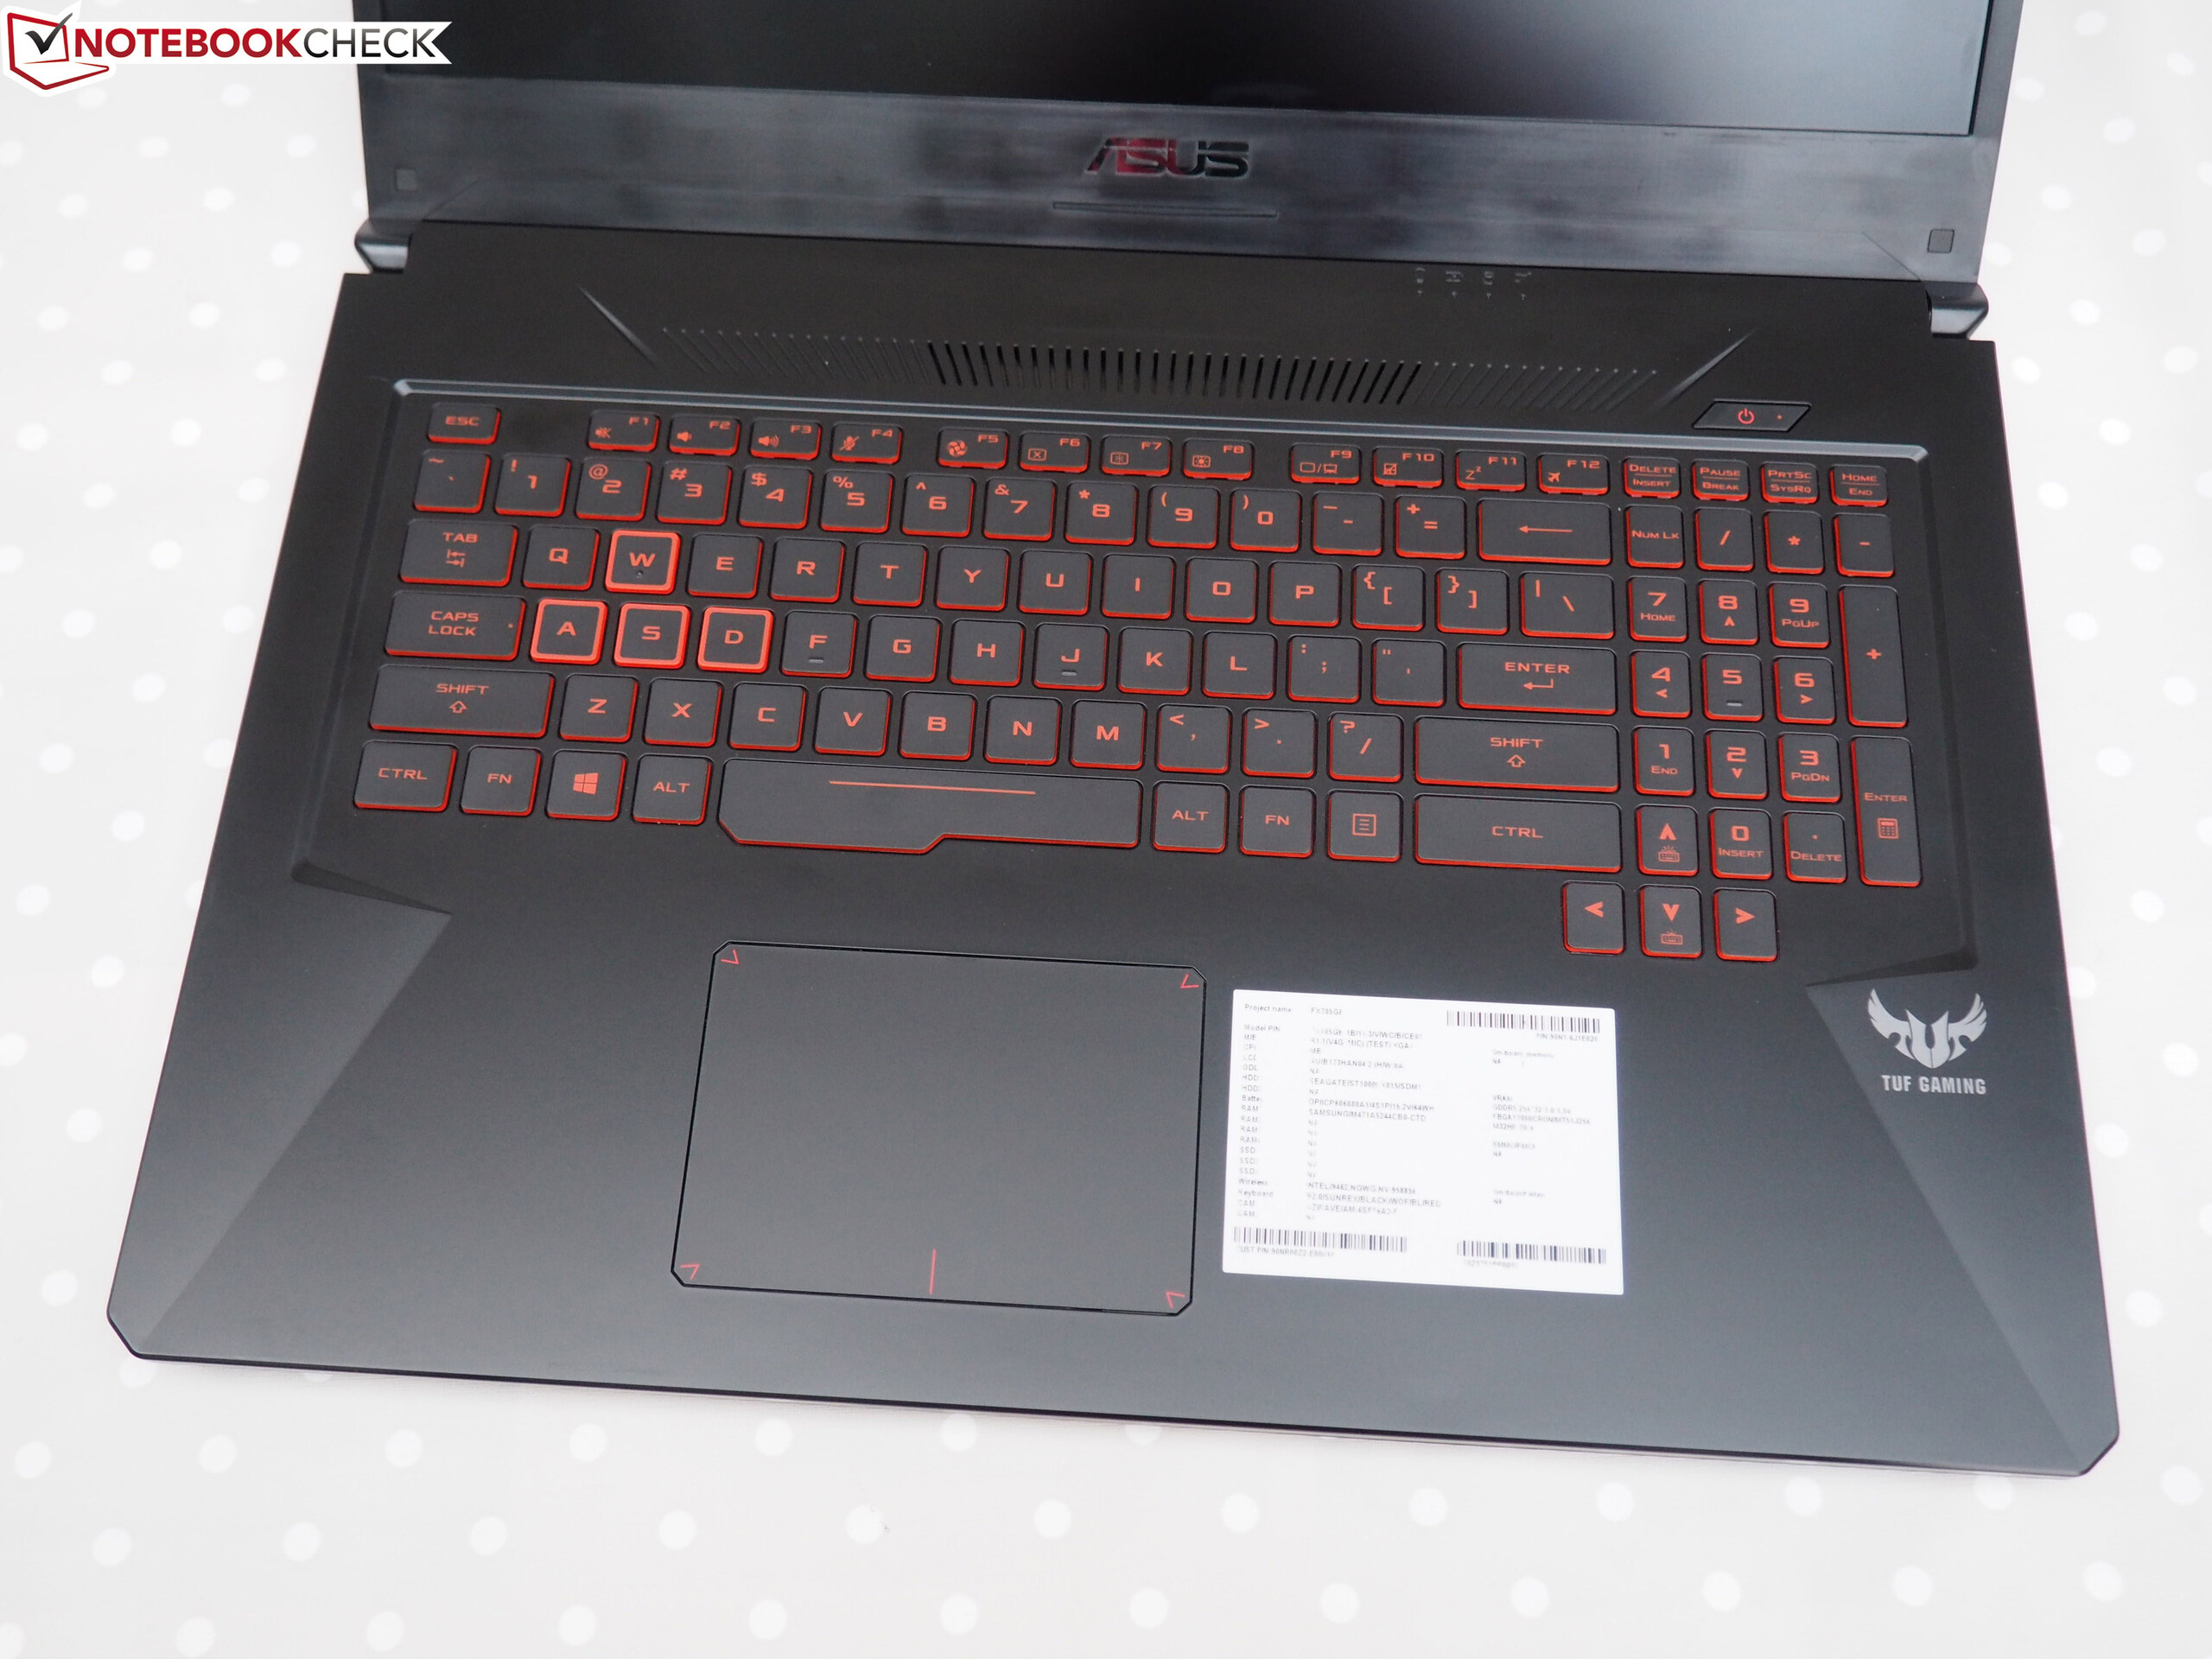
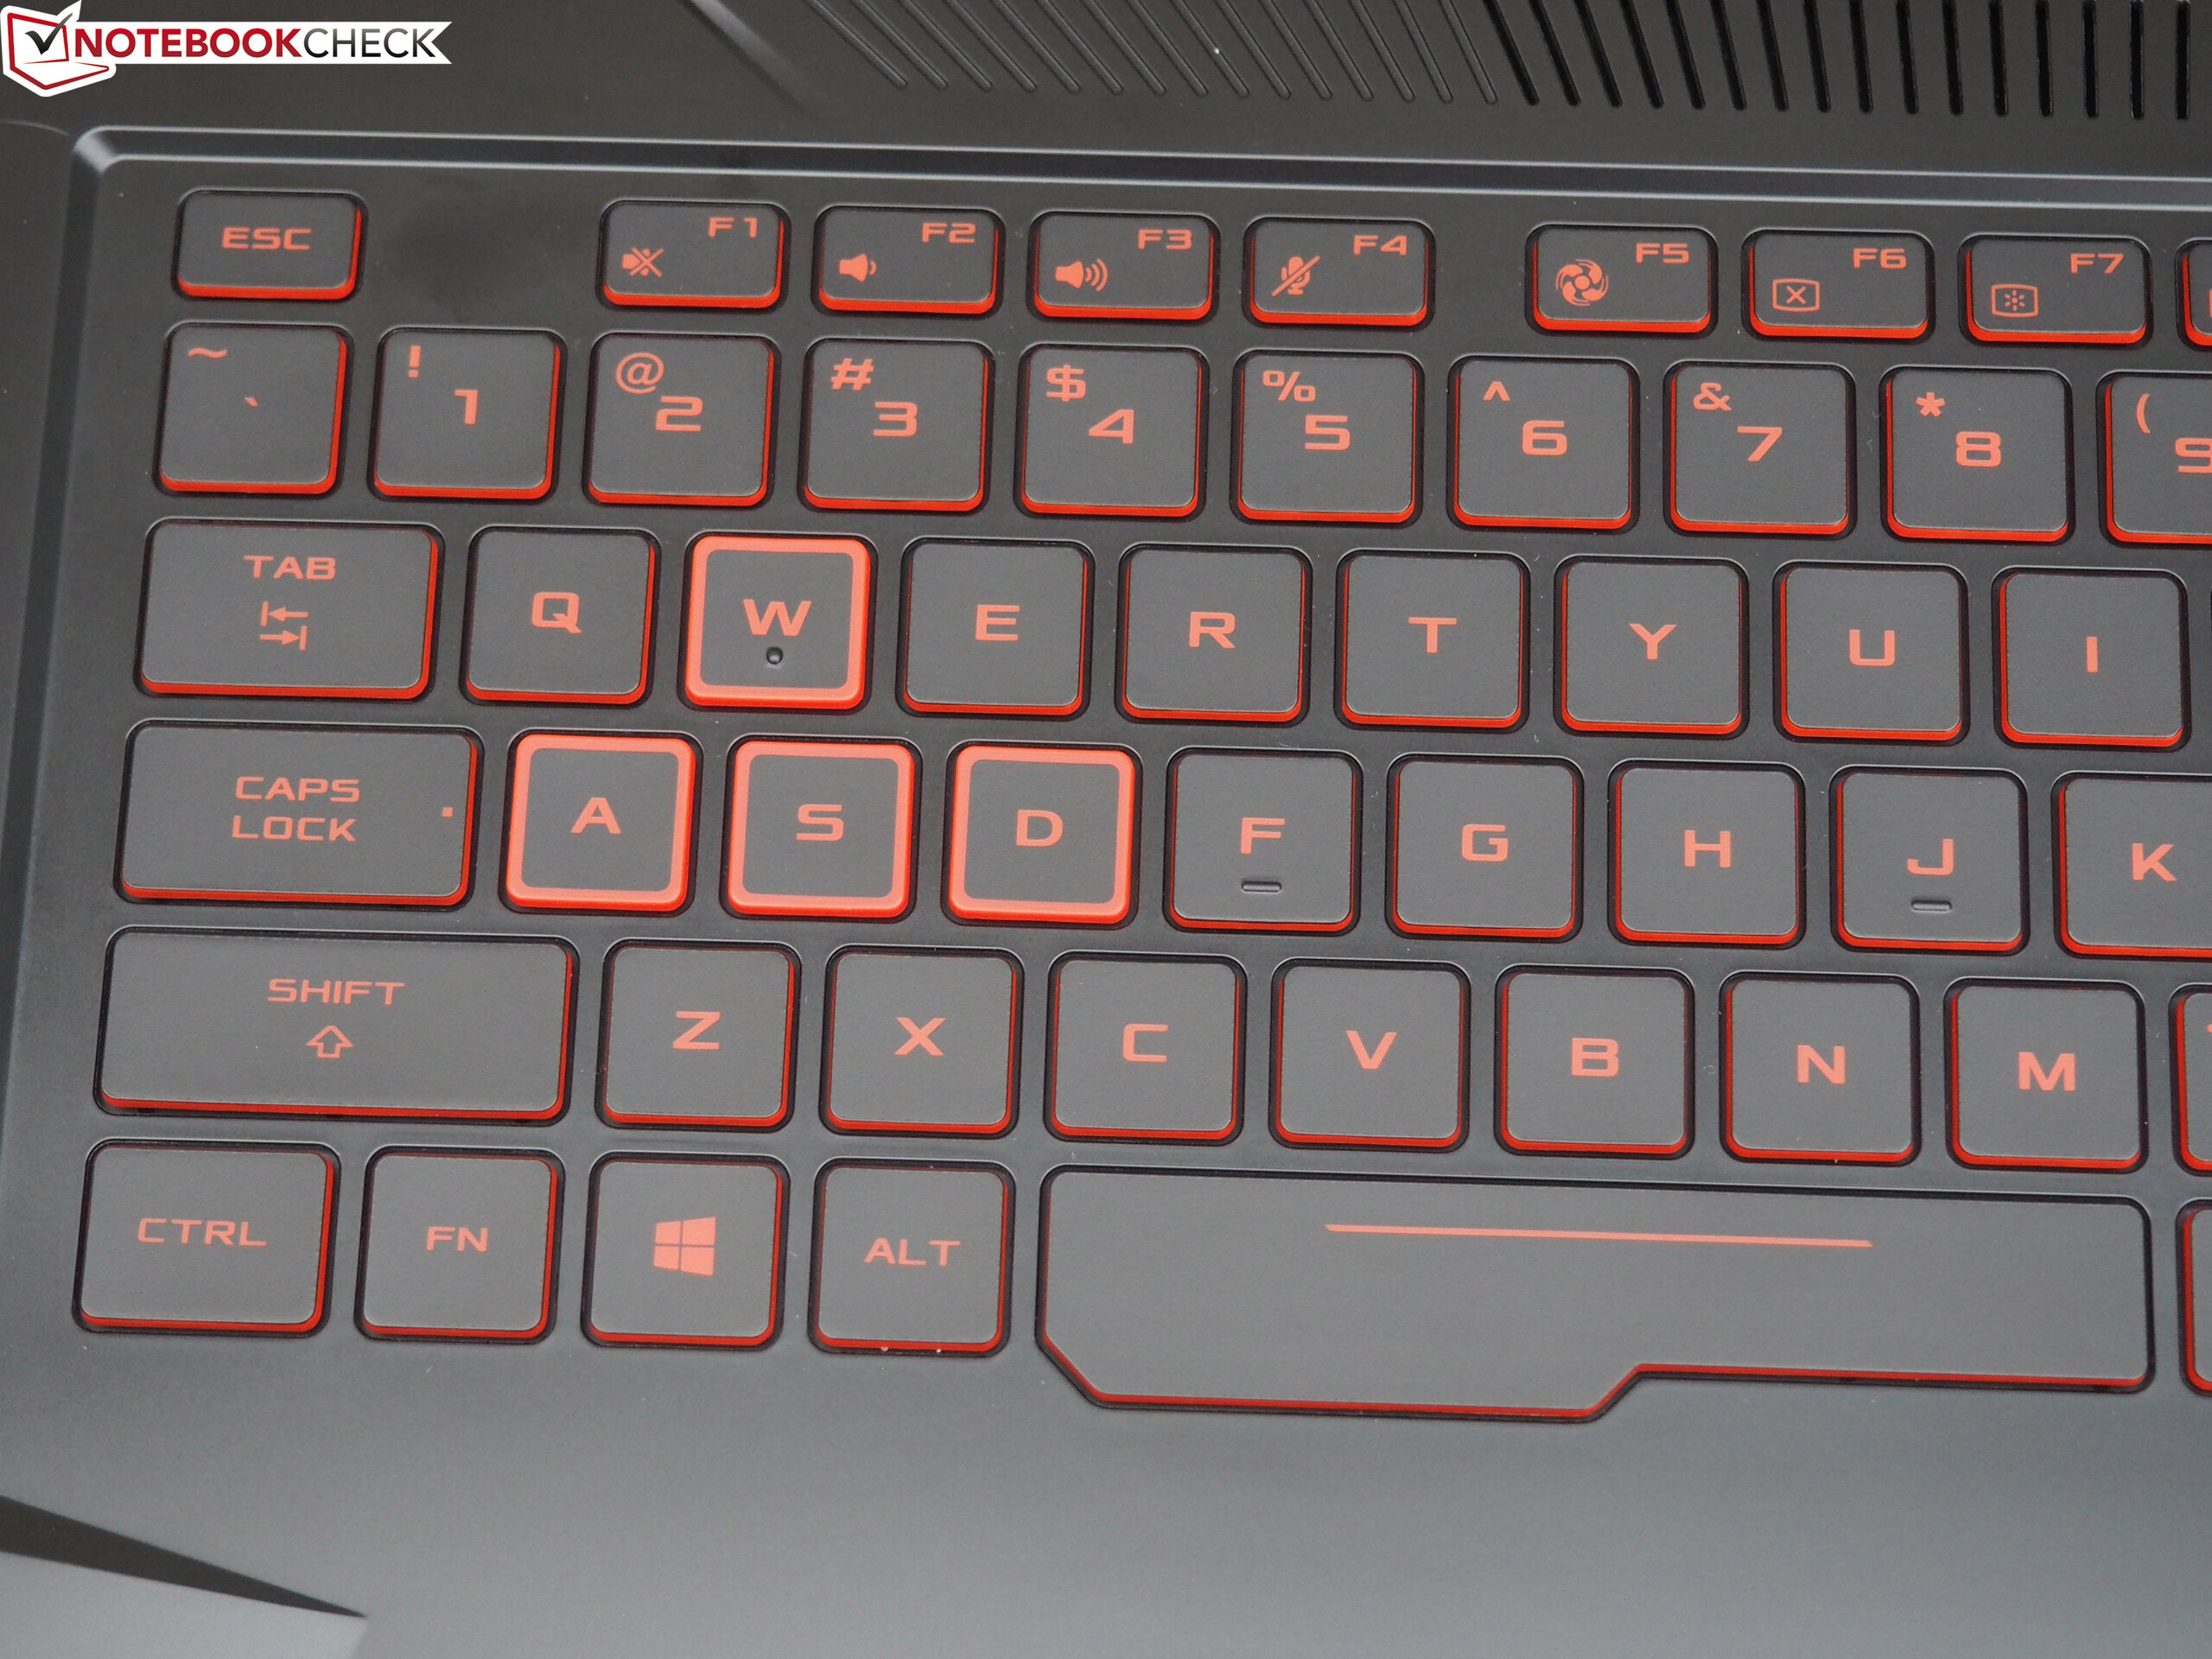
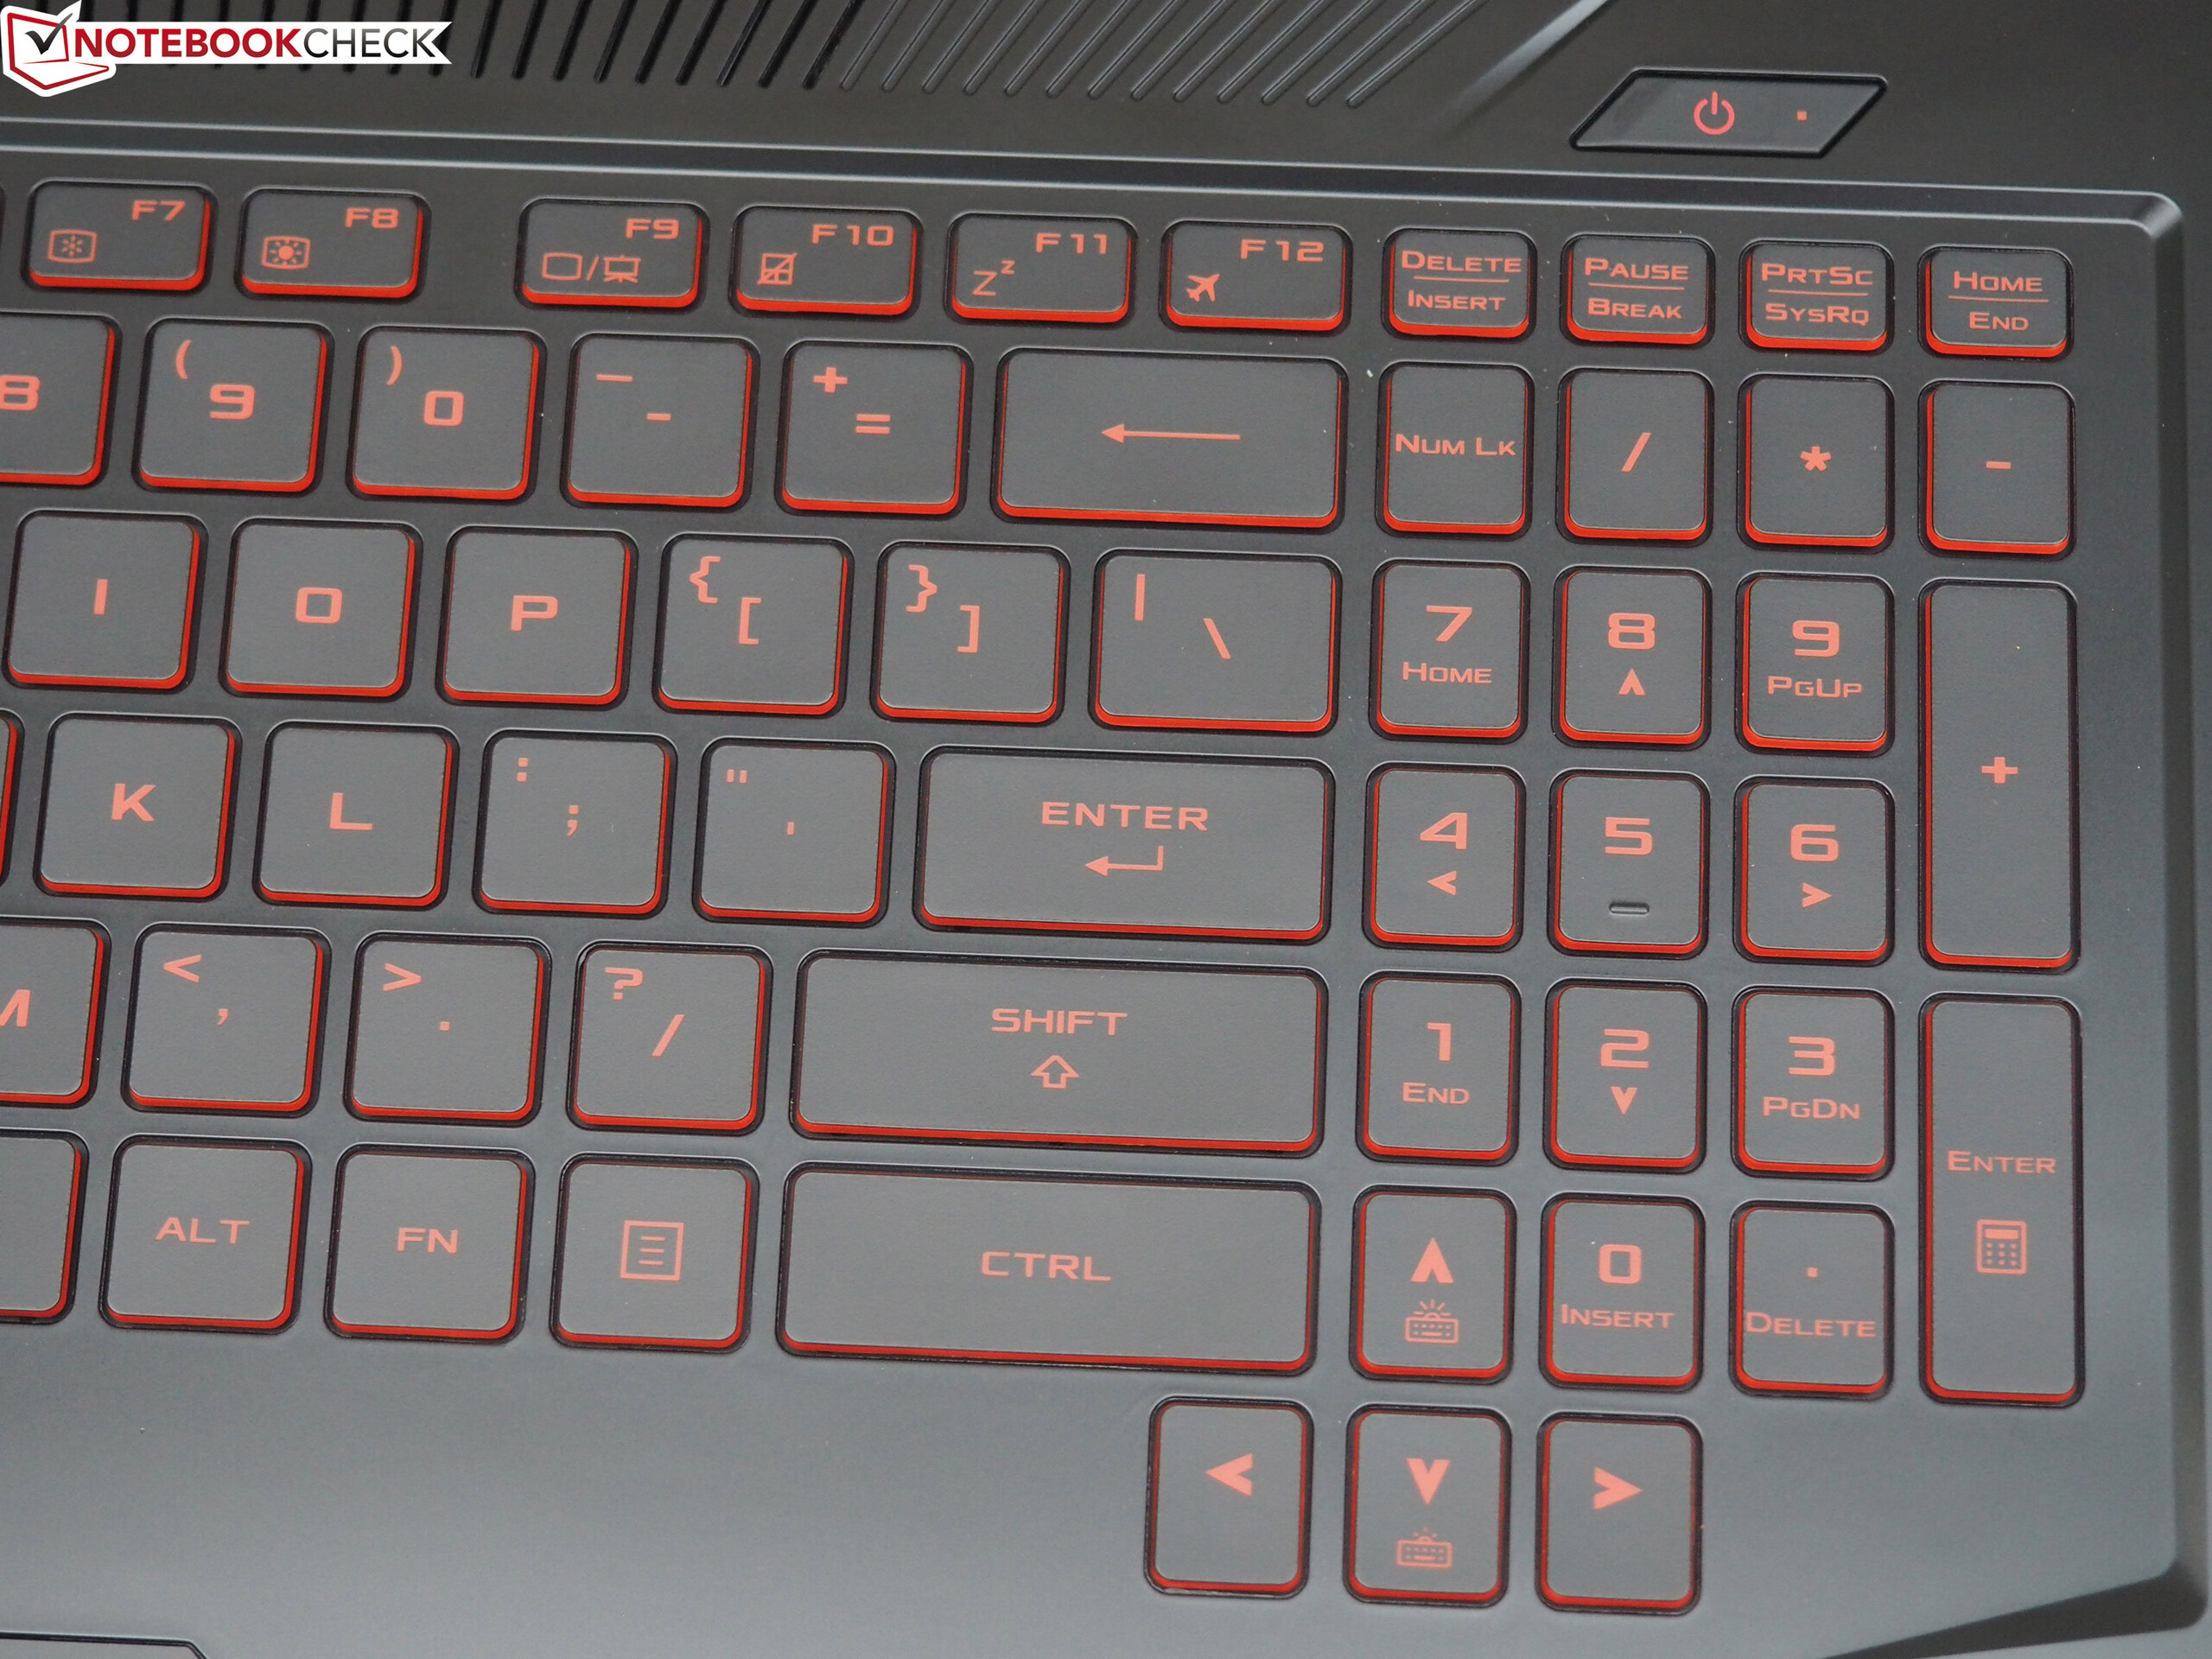
- The FX705GM had an RGB keyboard backlight. The FX705GE comes with a monochrome (red) keyboard backlight.
- The FX705GE has a smaller fan grill.

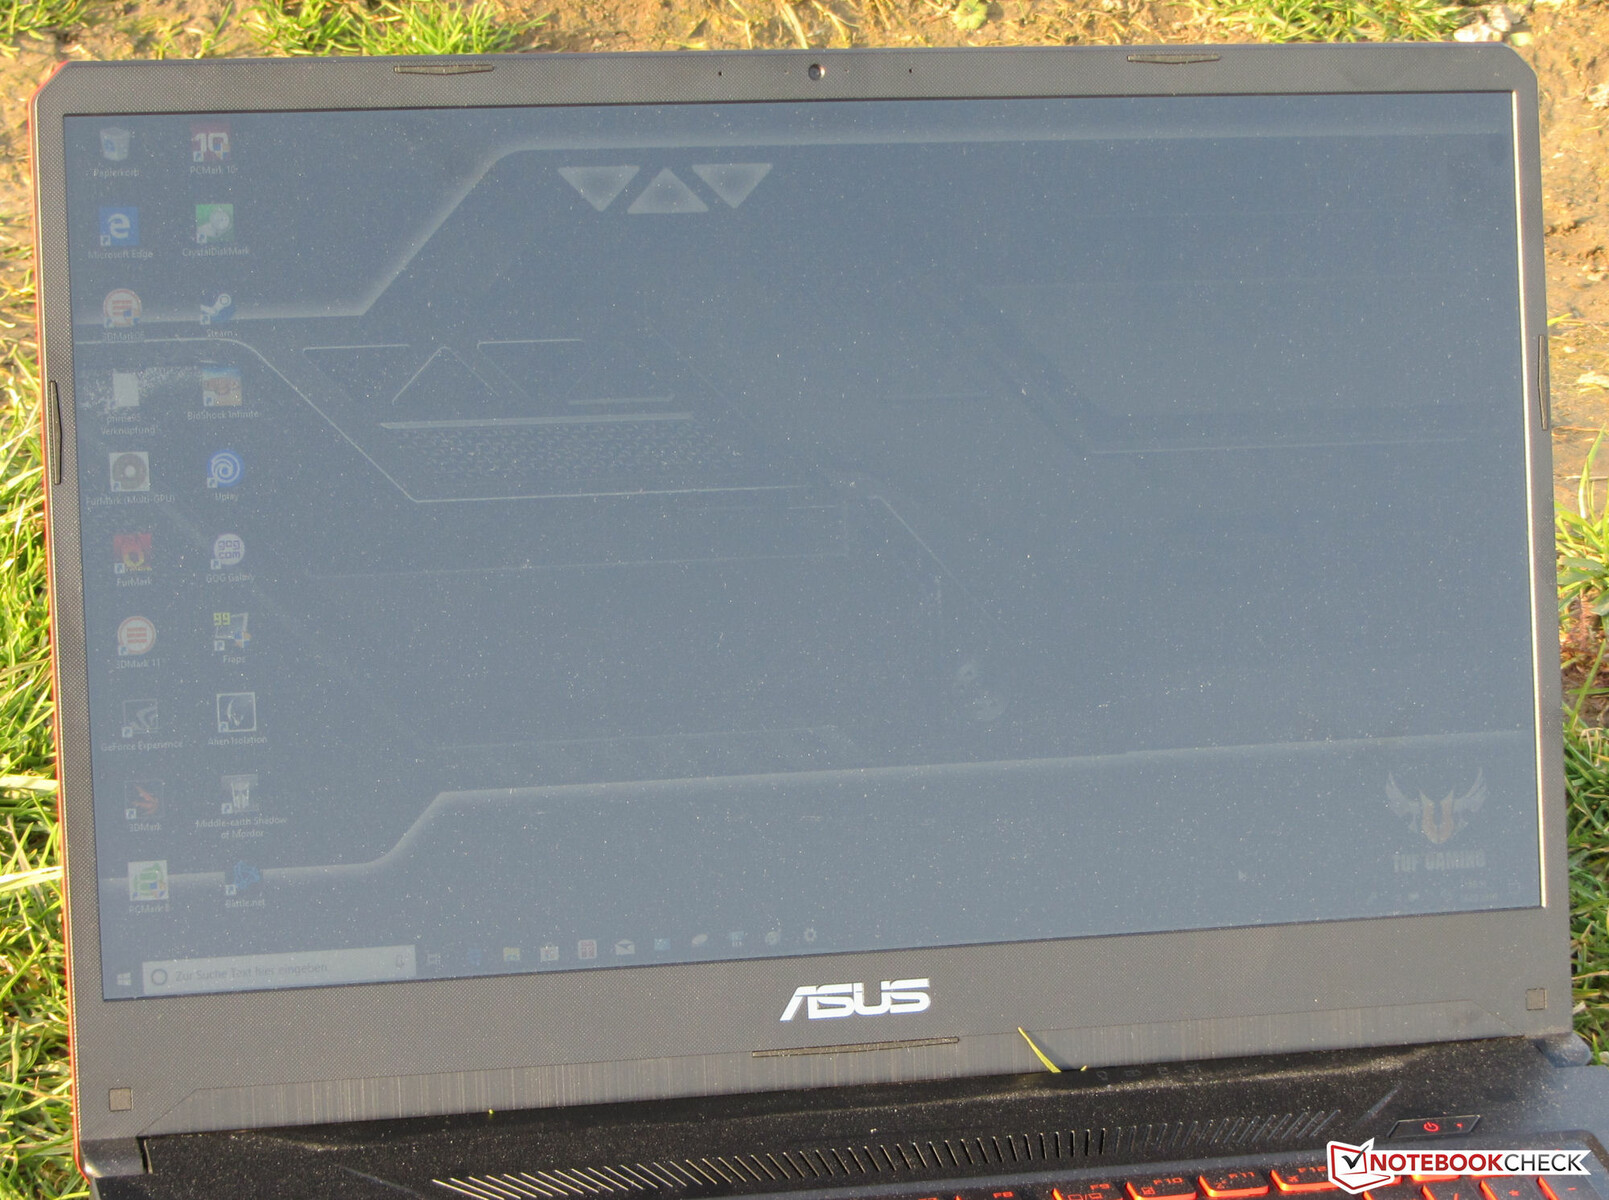
Display - FX705GE has an IPS screen

The matte 17.3-inch display of the FX705GE operates with a native resolution of 1920x1080. The contrast ratio (1068:1) is good. However, the display brightness (291.1 cd/m²) could have been a little higher. We see a contrast ratio of 1000:1 and a screen brightness of at least 300 cd/m² as good. The competitors have slightly brighter displays. Positive: The screen does not suffer from PWM flickering.
| |||||||||||||||||||||||||
Brightness Distribution: 90 %
Center on Battery: 301 cd/m²
Contrast: 1068:1 (Black: 0.28 cd/m²)
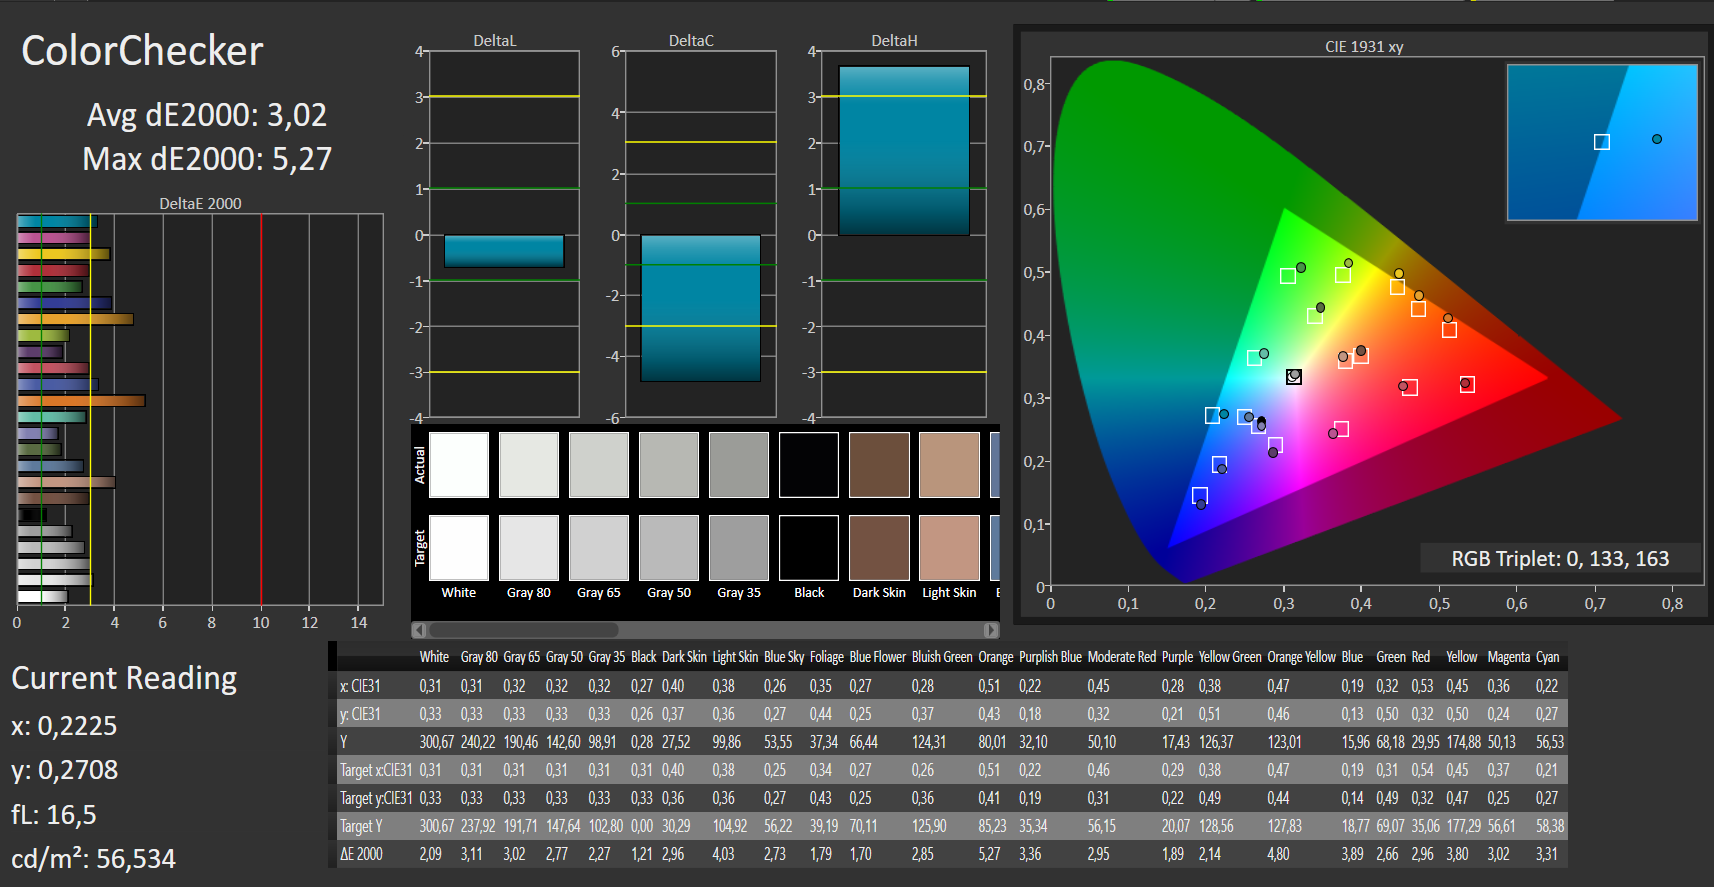
ΔE ColorChecker Calman: 3.02 | ∀{0.5-29.43 Ø4.73}
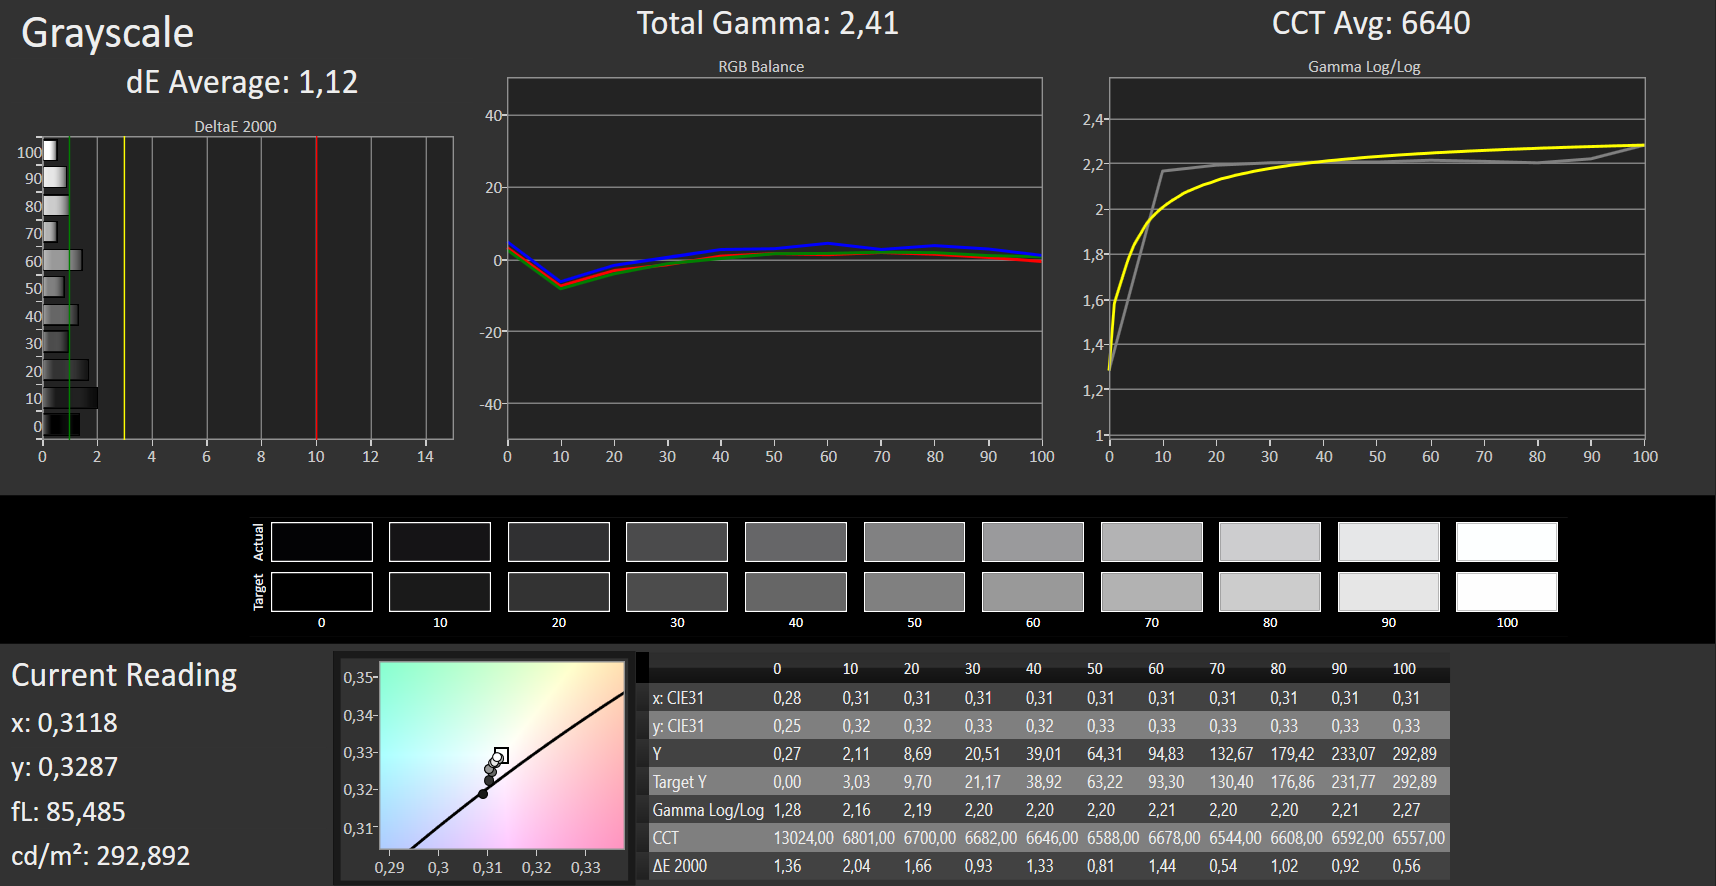
calibrated: 2.76
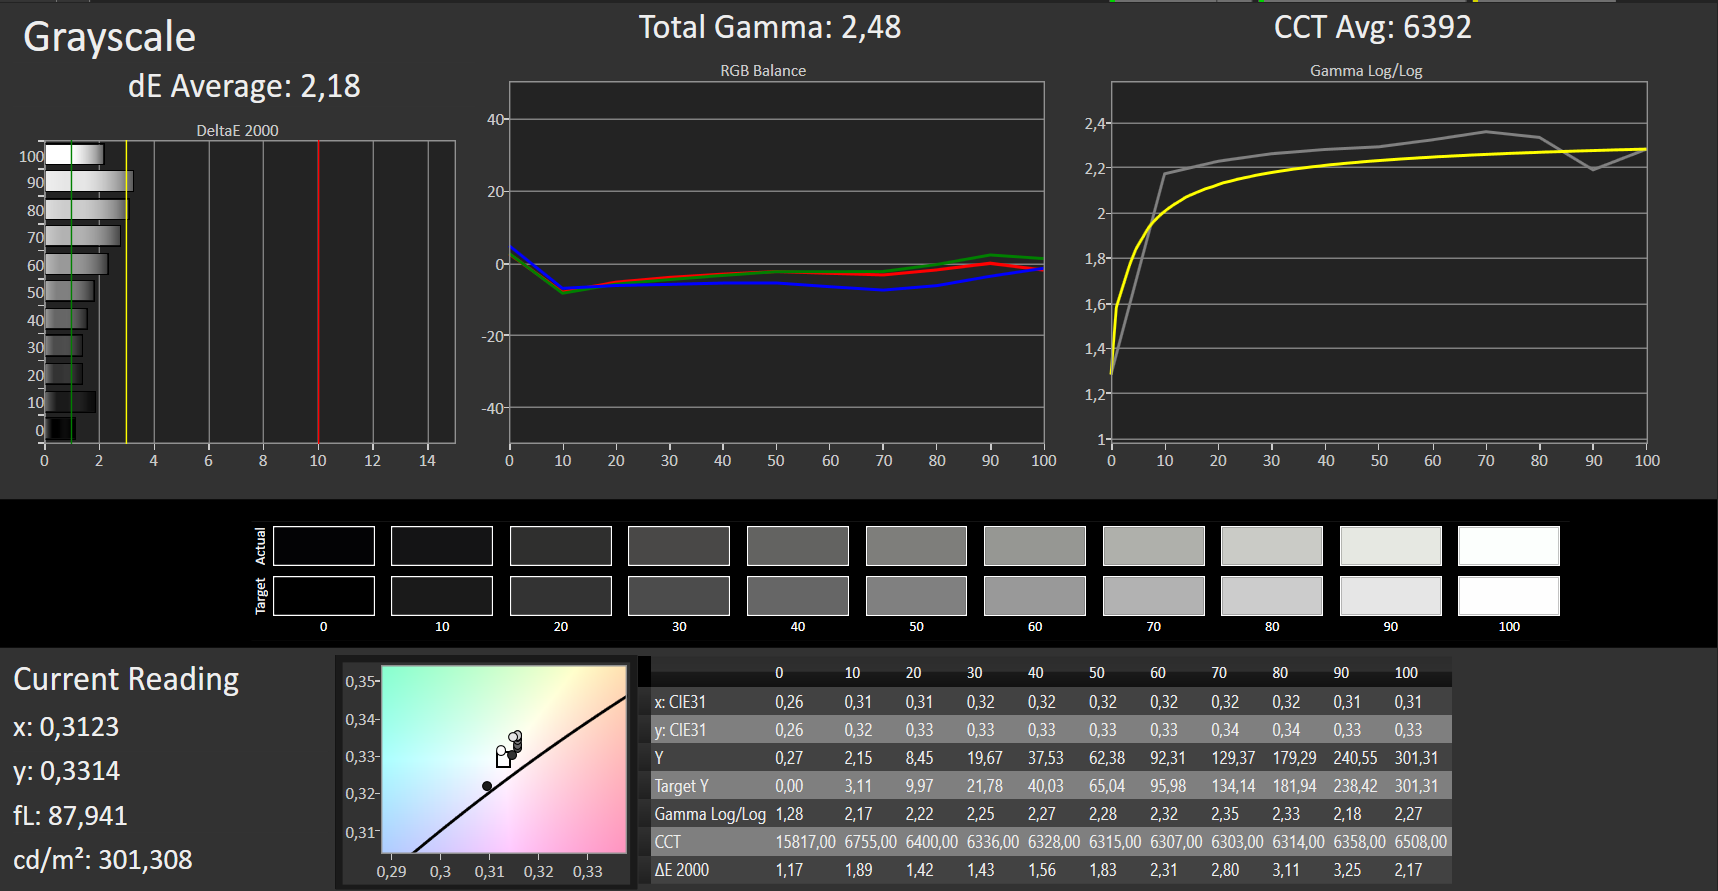
ΔE Greyscale Calman: 2.18 | ∀{0.09-98 Ø4.97}
87% sRGB (Argyll 1.6.3 3D)
57% AdobeRGB 1998 (Argyll 1.6.3 3D)
63.5% AdobeRGB 1998 (Argyll 3D)
86.8% sRGB (Argyll 3D)
63.1% Display P3 (Argyll 3D)
Gamma: 2.48
CCT: 6392 K
| Asus TUF FX705GE-EW096T IPS, 1920x1080, 17.3" | Lenovo Legion Y730-17ICH, i7-8750H IPS, 1920x1080, 17.3" | Schenker XMG A707 Coffee Lake IPS, 1920x1080, 17.3" | Acer Predator Helios 300 PH317-52-51M6 IPS, 1920x1080, 17.3" | Asus TUF FX705GM IPS, 1920x1080, 17.3" | |
|---|---|---|---|---|---|
| Display | 0% | -0% | 1% | 0% | |
| Display P3 Coverage (%) | 63.1 | 66.4 5% | 66.1 5% | 67.1 6% | 62.4 -1% |
| sRGB Coverage (%) | 86.8 | 84.9 -2% | 84.4 -3% | 86.1 -1% | 88.8 2% |
| AdobeRGB 1998 Coverage (%) | 63.5 | 62.1 -2% | 61.7 -3% | 63 -1% | 63.8 0% |
| Response Times | 10% | 8% | 15% | 73% | |
| Response Time Grey 50% / Grey 80% * (ms) | 39 ? | 36.8 ? 6% | 39.2 ? -1% | 36 ? 8% | 7.4 ? 81% |
| Response Time Black / White * (ms) | 28 ? | 24 ? 14% | 23.2 ? 17% | 22 ? 21% | 10 ? 64% |
| PWM Frequency (Hz) | 119000 ? | 122000 ? | |||
| Screen | -36% | -38% | -43% | 8% | |
| Brightness middle (cd/m²) | 299 | 328.7 10% | 362 21% | 365 22% | 234 -22% |
| Brightness (cd/m²) | 291 | 318 9% | 350 20% | 341 17% | 228 -22% |
| Brightness Distribution (%) | 90 | 91 1% | 91 1% | 89 -1% | 85 -6% |
| Black Level * (cd/m²) | 0.28 | 0.51 -82% | 0.29 -4% | 0.32 -14% | 0.2 29% |
| Contrast (:1) | 1068 | 645 -40% | 1248 17% | 1141 7% | 1170 10% |
| Colorchecker dE 2000 * | 3.02 | 4.91 -63% | 6.06 -101% | 6.51 -116% | 2.16 28% |
| Colorchecker dE 2000 max. * | 5.27 | 10.15 -93% | 11.6 -120% | 12.32 -134% | 3.39 36% |
| Colorchecker dE 2000 calibrated * | 2.76 | 4.27 -55% | 3.13 -13% | 2.9 -5% | 2.02 27% |
| Greyscale dE 2000 * | 2.18 | 3.9 -79% | 7.22 -231% | 7.65 -251% | 2 8% |
| Gamma | 2.48 89% | 2.13 103% | 2.51 88% | 2.64 83% | 2.46 89% |
| CCT | 6392 102% | 6911 94% | 7659 85% | 8066 81% | 6394 102% |
| Color Space (Percent of AdobeRGB 1998) (%) | 57 | 55.6 -2% | 55 -4% | 56 -2% | 58 2% |
| Color Space (Percent of sRGB) (%) | 87 | 84.7 -3% | 84 -3% | 86 -1% | 89 2% |
| Total Average (Program / Settings) | -9% /
-24% | -10% /
-25% | -9% /
-28% | 27% /
15% |
* ... smaller is better
Screen Flickering / PWM (Pulse-Width Modulation)
| Screen flickering / PWM not detected | 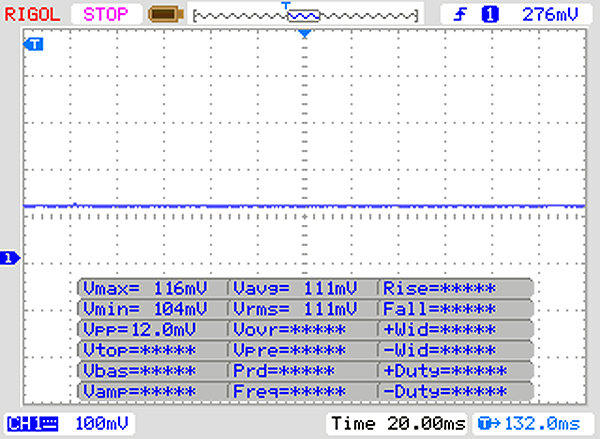 | ||
In comparison: 52 % of all tested devices do not use PWM to dim the display. If PWM was detected, an average of 7798 (minimum: 5 - maximum: 343500) Hz was measured. | |||
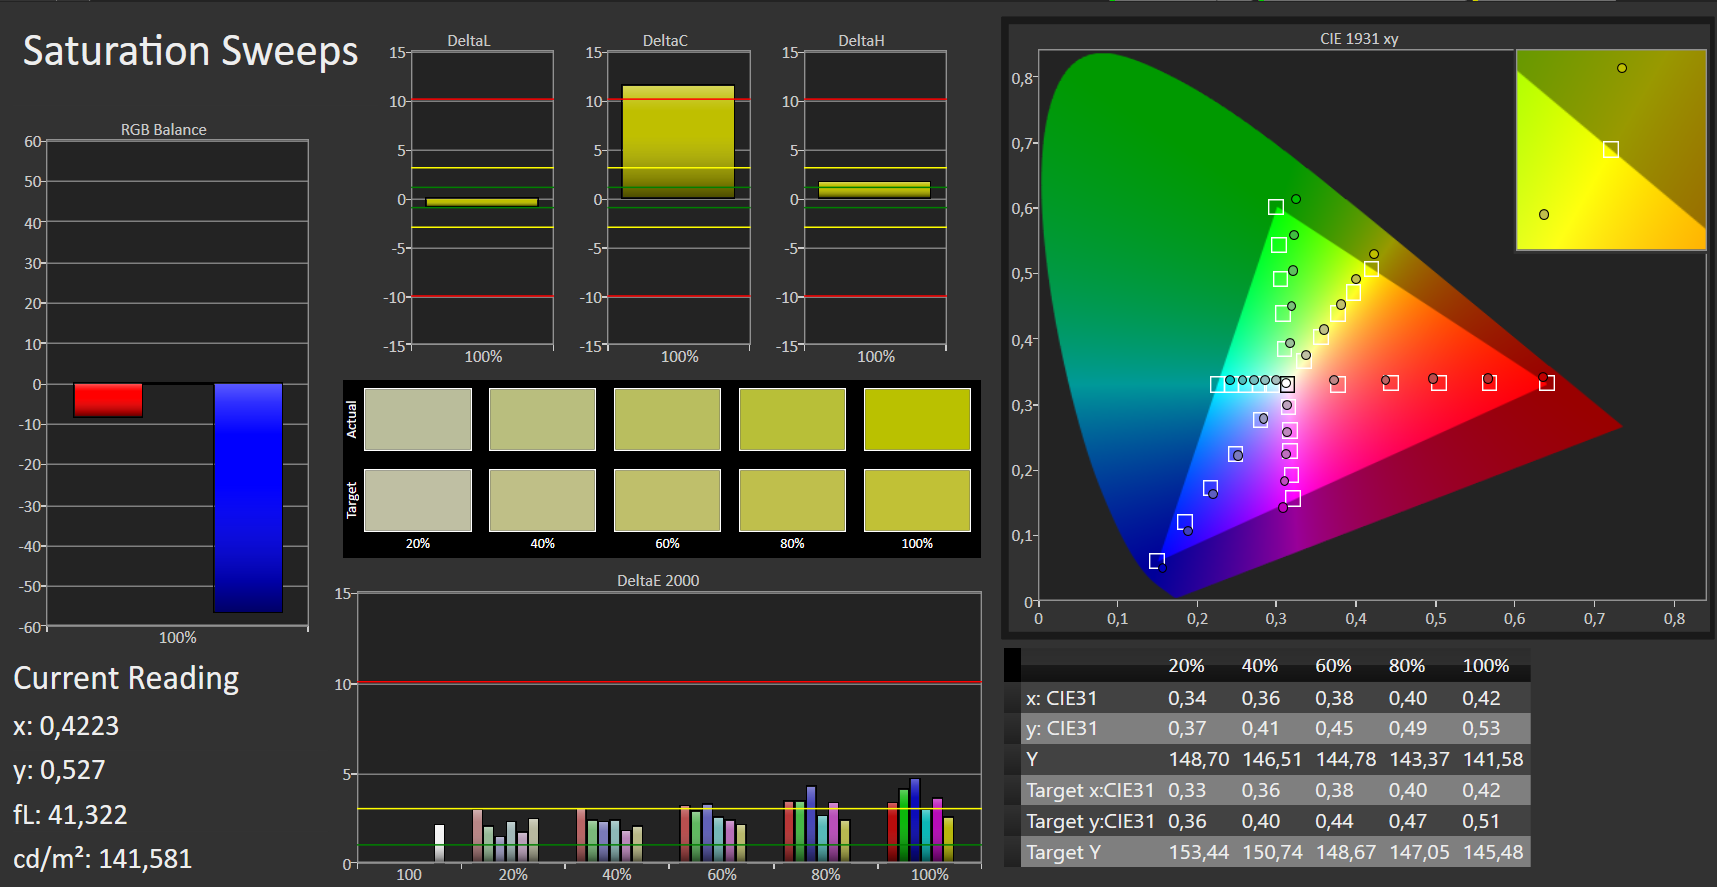
Right out of the box, the color reproduction of the display is quite good. The DeltaE 2000 color deviation of 3.02 misses the target value (Delta E less than 3) by a very small margin. The display does not suffer from a bluish cast. The color reproduction can be improved only minimally by way of calibration. After calibration, the DeltaE 2000 sinks to 2.76 and the grayscale looks significantly more balanced. The screen fails to cover both the sRGB (87%) and the Adobe RGB (57%) color spaces.
By means of our color profile, the color reproduction can be improved. However before downloading it, you should make sure that your laptop has the same display model (manufacturer + model number) as our review device, because otherwise our color profile can result in worse color reproduction. Displays from different manufacturers can often be found within notebooks from the same model range.


Display Response Times
| ↔ Response Time Black to White | ||
|---|---|---|
| 28 ms ... rise ↗ and fall ↘ combined | ↗ 16 ms rise | 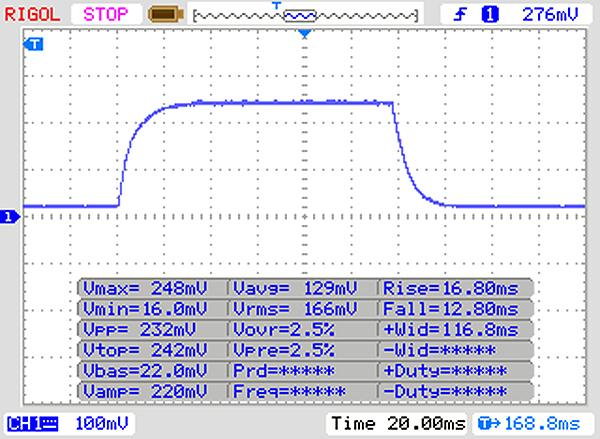 |
| ↘ 12 ms fall | ||
| The screen shows relatively slow response rates in our tests and may be too slow for gamers. In comparison, all tested devices range from 0.1 (minimum) to 240 (maximum) ms. » 71 % of all devices are better. This means that the measured response time is worse than the average of all tested devices (19.9 ms). | ||
| ↔ Response Time 50% Grey to 80% Grey | ||
| 39 ms ... rise ↗ and fall ↘ combined | ↗ 21 ms rise | 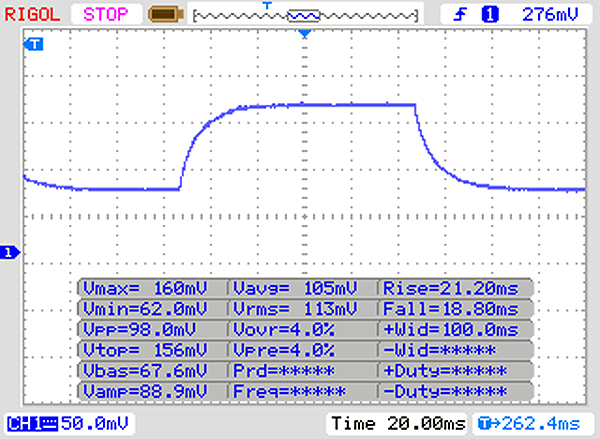 |
| ↘ 18 ms fall | ||
| The screen shows slow response rates in our tests and will be unsatisfactory for gamers. In comparison, all tested devices range from 0.165 (minimum) to 636 (maximum) ms. » 59 % of all devices are better. This means that the measured response time is worse than the average of all tested devices (31.1 ms). | ||
Asus has equipped the FX705GE with an IPS panel with stable viewing angles. Therefore, the screen content can be read from any position. The display brightness is only high enough for indoor use. Outside, the screen is readable only when the sun does not shine too brightly.
Performance - Plenty of power
The TUF Gaming FX705GE is a 17.3-inch gaming notebook that can run all the latest titles in Full HD. Our review device can be had for 1200 Euros (~$1361). Other hardware configurations are also available. The prices start at 900 Euros (~$1020).
Benchmarking Conditions
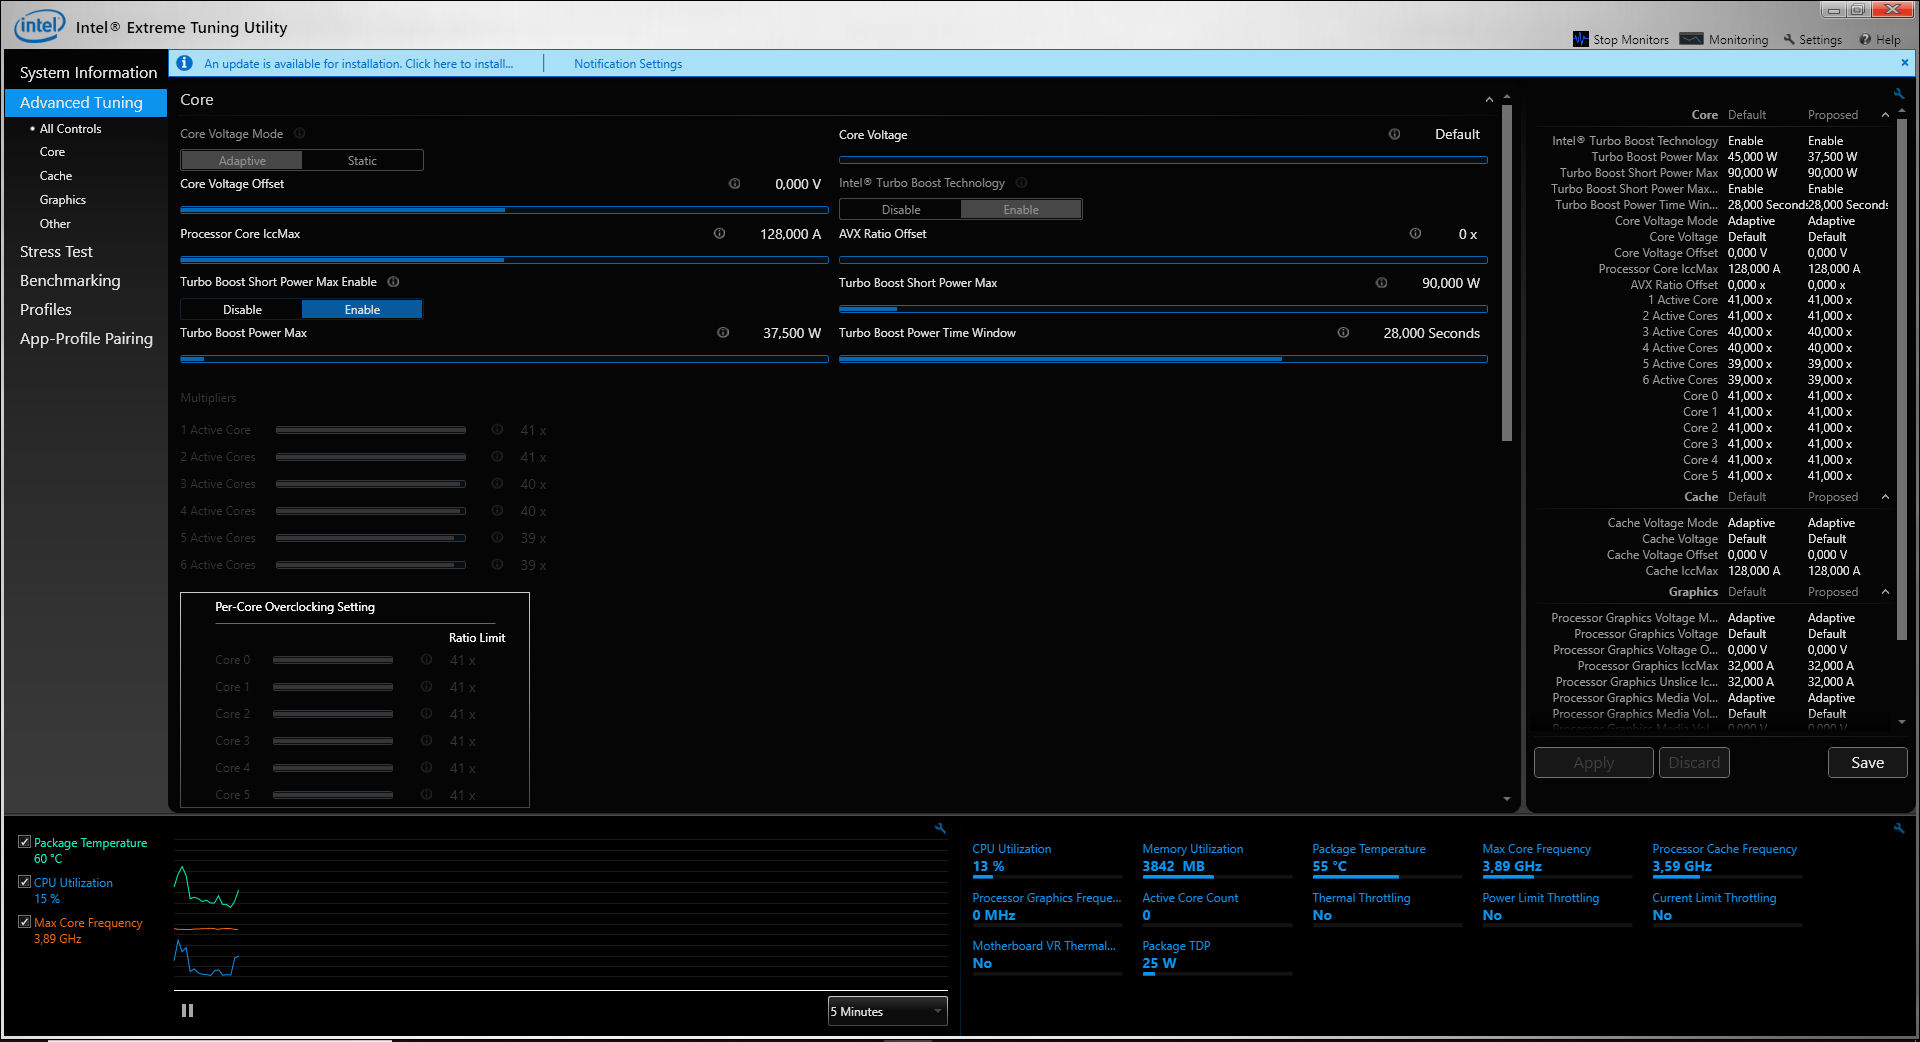
The FX705GE offers the three following fan modes: “Overboost”, “Balanced” and “Quiet”. These modes can be selected with the help of a function key. We used the “Balanced” mode for this review. However, we also conducted a few benchmarks in “Overboost” mode. There is not a lot of difference between the two modes in terms of performance. When we used the “Quiet” mode, the Turbo boost was utilized sparingly.
Processor
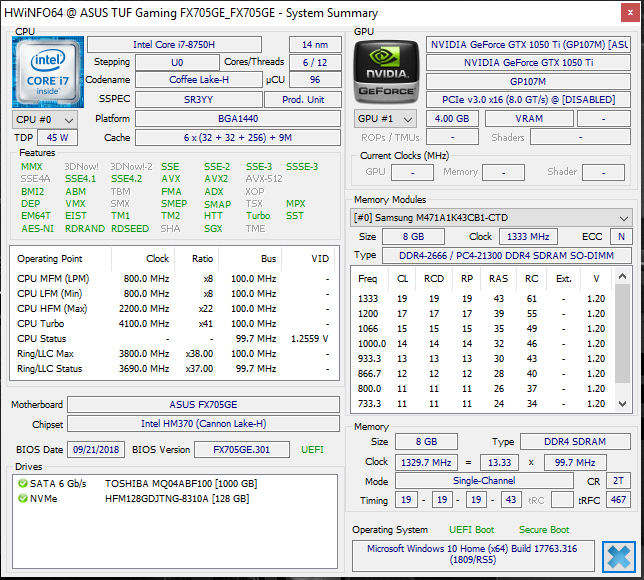
The FX705GE comes with a Core i7-8750H. It is a high-end, hexa-core (Coffee Lake) CPU from Intel with a TDP of 45 watts. The processor has a base clock of 2.2 GHz and a boost clock of 3.9 GHz for six cores, 4 GHz for four cores and 4.1 GHz for one/two cores.
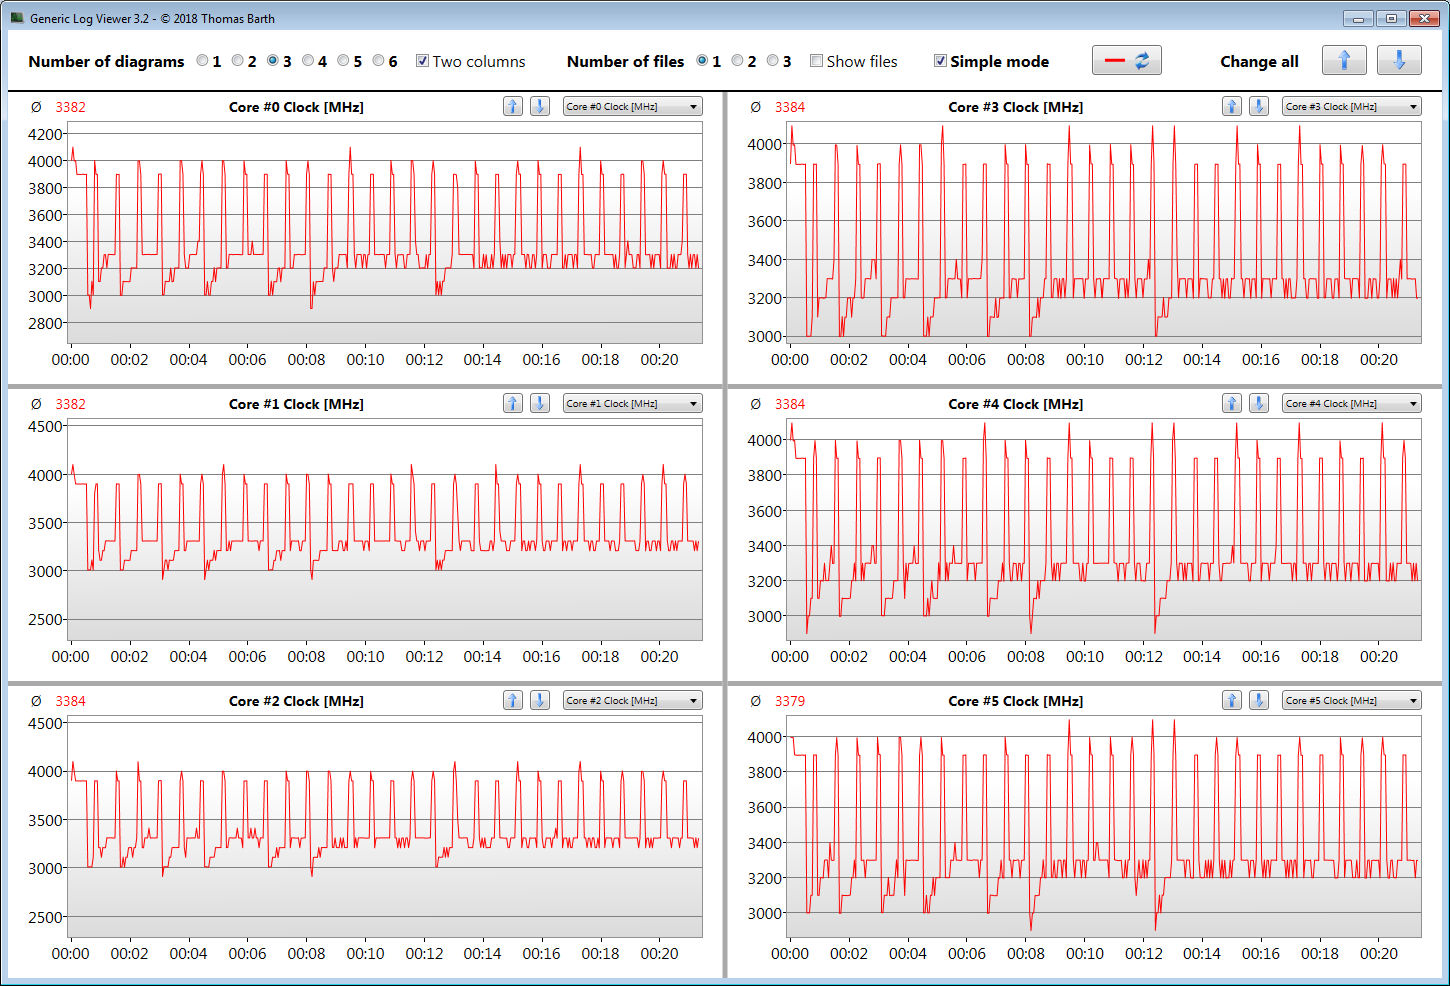
In the multi-core section of the Cinebench R15 benchmark, the processor runs at 3.9 GHz (the clock speed is the same in “Overboost” mode) for a few seconds. Then the clock rate sinks to 2.9 to 3.1 GHz (3 to 3.2 GHz in “Overboost” mode). In the single-core benchmark, the CPU operates at 3.9 to 4.1 GHz (clock speeds are identical in “Overboost” mode). When running on battery power, the processor consistently operates at 2.2 GHz.
We check if the Turbo boost can be used over an extended period of time by running the Cinebench R15 multi-core benchmark in a continuous loop for 30 minutes. The results fall after the first benchmark run. After that they keep fluctuating between 1000 and 1070 points. The Turbo boost is utilized.
Our review device achieves similar results when running in “Overboost” mode. However, when running in this mode, we observed fewer fluctuations. In “Quiet” mode, the results fluctuate between 770 and 820 points.
| Cinebench R10 | |
| Rendering Single 32Bit | |
| Average of class Gaming (7457 - 11779, n=8, last 2 years) | |
| Average Intel Core i7-8750H (6236 - 6645, n=25) | |
| Asus TUF FX705GE-EW096T | |
| Rendering Multiple CPUs 32Bit | |
| Average of class Gaming (42932 - 81339, n=8, last 2 years) | |
| Asus TUF FX705GE-EW096T | |
| Average Intel Core i7-8750H (29664 - 35307, n=25) | |
| Geekbench 3 | |
| 32 Bit Multi-Core Score | |
| Average Intel Core i7-8750H (20725 - 22665, n=13) | |
| Asus TUF FX705GE-EW096T | |
| 32 Bit Single-Core Score | |
| Average Intel Core i7-8750H (3734 - 4163, n=13) | |
| Asus TUF FX705GE-EW096T | |
| Geekbench 4.0 | |
| 64 Bit Multi-Core Score | |
| Average of class Gaming (40469 - 76142, n=4, last 2 years) | |
| Average Intel Core i7-8750H (17048 - 22006, n=8) | |
| Asus TUF FX705GE-EW096T | |
| 64 Bit Single-Core Score | |
| Average of class Gaming (7589 - 9053, n=4, last 2 years) | |
| Average Intel Core i7-8750H (4548 - 4997, n=8) | |
| Asus TUF FX705GE-EW096T | |
| Geekbench 4.4 | |
| 64 Bit Multi-Core Score | |
| Average of class Gaming (89200 - 97490, n=2, last 2 years) | |
| Average Intel Core i7-8750H (17709 - 23313, n=17) | |
| Asus TUF FX705GE-EW096T | |
| 64 Bit Single-Core Score | |
| Average of class Gaming (9335 - 9492, n=2, last 2 years) | |
| Average Intel Core i7-8750H (4669 - 5146, n=17) | |
| Asus TUF FX705GE-EW096T | |
| JetStream 1.1 - 1.1 Total | |
| Average of class Gaming (518 - 647, n=6, last 2 years) | |
| Asus TUF FX705GE-EW096T (Edge 44) | |
| Average Intel Core i7-8750H (205 - 299, n=49) | |
System Performance
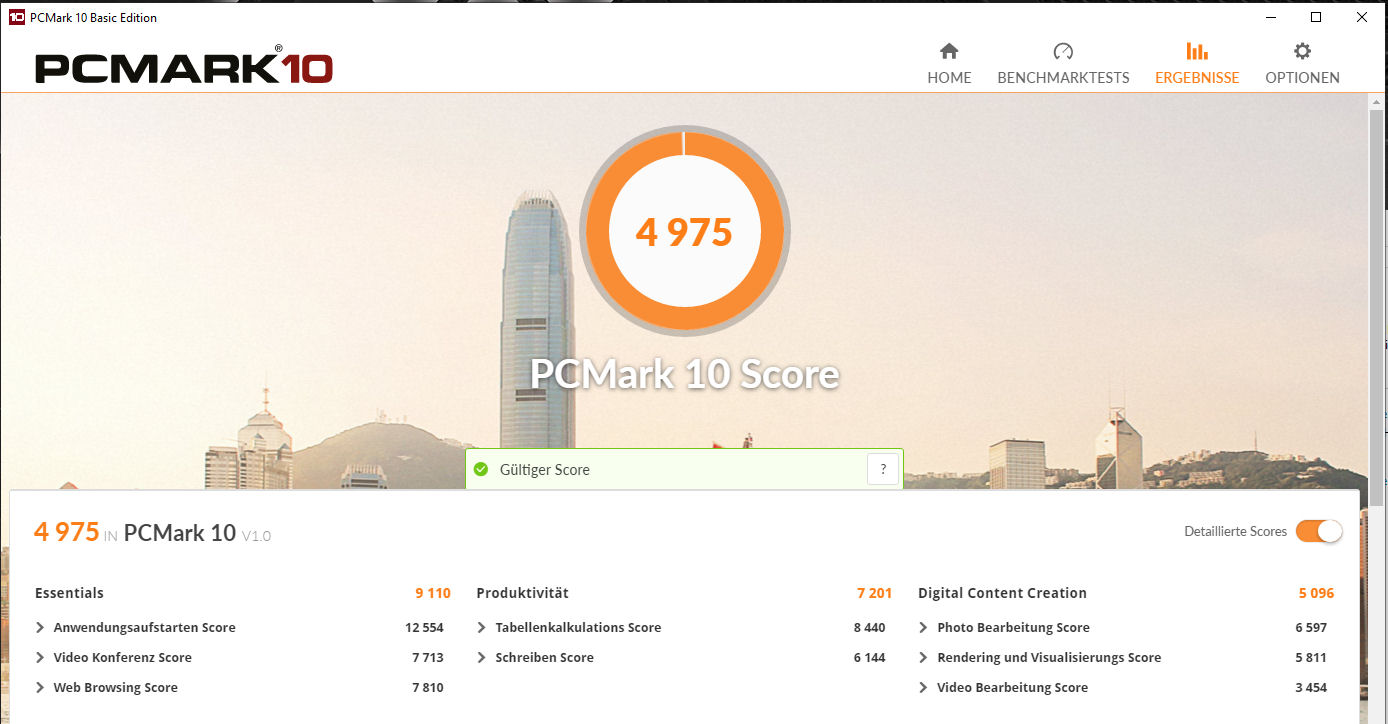
The laptop is very responsive. We did not encounter any problems. The 17.3-inch notebook revealed no issues related to system performance. The Intel Core i7-8750H is a hexa-core processor that offers more than enough computing power for applications that go far beyond gaming. It will not become obsolete for years. Thanks to the inclusion of a dedicated GPU, the Asus notebook can run video games. Our review device receives good results in the PCMark benchmarks. The system performance can be further increased by enabling dual-channel mode. Doing so will increase the performance by a few percentage points.
| PCMark 8 Home Score Accelerated v2 | 4230 points | |
| PCMark 8 Creative Score Accelerated v2 | 5038 points | |
| PCMark 8 Work Score Accelerated v2 | 5461 points | |
| PCMark 10 Score | 4975 points | |
Help | ||
Storage Devices
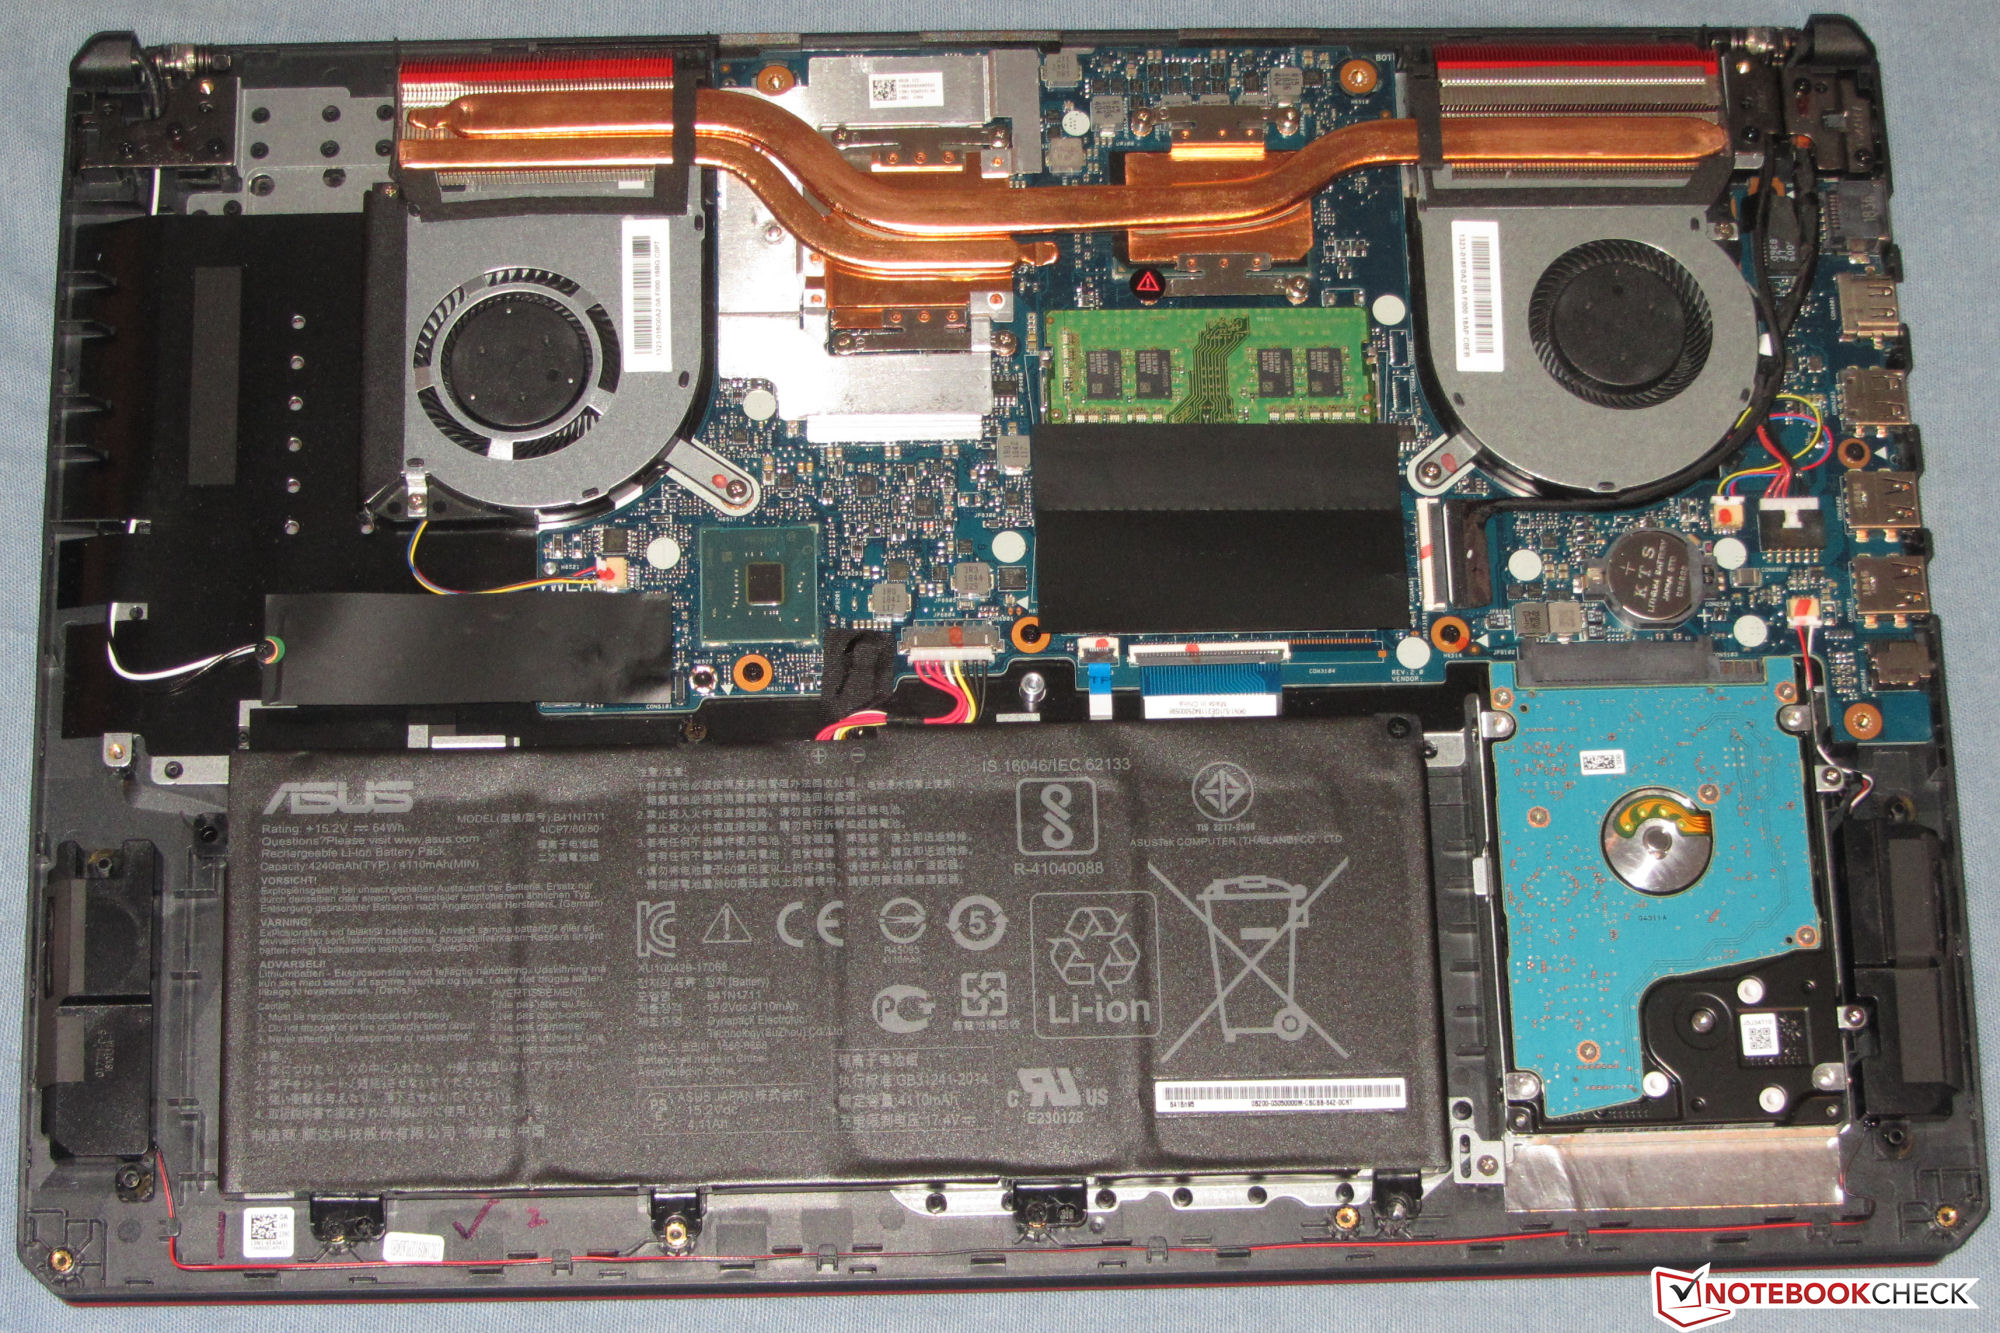
An NVMe SSD from SK Hynix serves as the system drive. It comes in the M.2-2280 form-factor and has a storage capacity of 128 GB. Straight out of the box, only 89 GB is available to the user. The rest of the storage space is occupied by the recovery partition and the Windows installation files. The transfer rates of the SSD are very good. NVMe SSDs achieve significantly faster transfer speeds than SATA-III models, because they are connected via PCI Express 3.0 x4.
The gaming notebook offers plenty of storage space. In addition to the SSD, Asus also put a 2.5-inch HDD (1 TB, 5400 rpm) inside the device.

| Asus TUF FX705GE-EW096T SK hynix BC501 HFM128GDJTNG-831 | Lenovo Legion Y730-17ICH, i7-8750H Toshiba KBG30ZMT128G | Schenker XMG A707 Coffee Lake Samsung SSD 970 EVO 250GB | Acer Predator Helios 300 PH317-52-51M6 Hynix HFS128G39TND | Asus TUF FX705GM WDC PC SN520 SDAPNUW-256G | Average SK hynix BC501 HFM128GDJTNG-831 | Average of class Gaming | |
|---|---|---|---|---|---|---|---|
| CrystalDiskMark 5.2 / 6 | -36% | 132% | -43% | 102% | 4% | 513% | |
| Write 4K (MB/s) | 90.3 | 71.4 -21% | 100.7 12% | 61.9 -31% | 104.2 15% | 108.2 ? 20% | 203 ? 125% |
| Read 4K (MB/s) | 37.03 | 29.98 -19% | 41.04 11% | 22.78 -38% | 41.46 12% | 39.3 ? 6% | 78.2 ? 111% |
| Write Seq (MB/s) | 320.3 | 129.6 -60% | 1420 343% | 136.1 -58% | 1295 304% | 284 ? -11% | 3724 ? 1063% |
| Read Seq (MB/s) | 1012 | 843 -17% | 1307 29% | 490.1 -52% | 1325 31% | 772 ? -24% | 3596 ? 255% |
| Write 4K Q32T1 (MB/s) | 196.8 | 88.9 -55% | 269.6 37% | 136.2 -31% | 282.8 44% | 239 ? 21% | 610 ? 210% |
| Read 4K Q32T1 (MB/s) | 271.5 | 196.4 -28% | 353.6 30% | 208.4 -23% | 321.3 18% | 279 ? 3% | 714 ? 163% |
| Write Seq Q32T1 (MB/s) | 268.8 | 130.5 -51% | 1533 470% | 136 -49% | 1301 384% | 303 ? 13% | 5210 ? 1838% |
| Read Seq Q32T1 (MB/s) | 1595 | 1037 -35% | 3554 123% | 553 -65% | 1704 7% | 1597 ? 0% | 6960 ? 336% |
Graphics Card
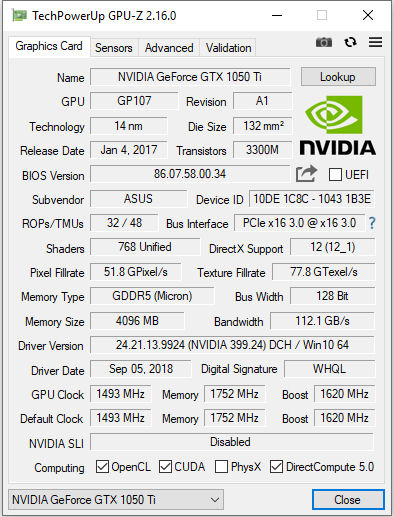
The Asus TUF FX705GE comes with Nvidia’s GeForce GTX 1050 Ti. It is a mid-range, Pascal-based GPU. It has 4 GB of GDDR5 memory, supports DirectX 12 and it runs at up to 1620 MHz. The results in the 3DMark benchmarks are on the normal level for this kind of GPU. The “Overboost” mode does not improve performance in any way.
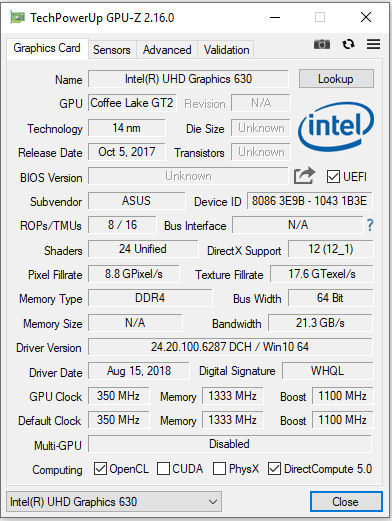
In addition to the GTX 1050 Ti, there is also Intel’s integrated UHD Graphics 630 on board. The laptop supports Nvidia’s Optimus technology (that enables automatic switching between a dedicated and an integrated graphics adapter). In day-to-day use and when running on battery power, Intel’s graphics unit is used. Nvidia’s GPU is utilized when playing video games and running other graphically demanding applications.
| 3DMark 11 Performance | 9298 points | |
| 3DMark Ice Storm Standard Score | 75191 points | |
| 3DMark Cloud Gate Standard Score | 26828 points | |
| 3DMark Fire Strike Score | 6989 points | |
| 3DMark Time Spy Score | 2571 points | |
Help | ||
Gaming Performance
The CPU-GPU combination of the Asus notebook can run all the latest games smoothly. Our review device can achieve playable frames in most titles at 1080p resolution (the screen resolution is also 1080p). In terms of graphics settings, you will have to stick to medium or high presets in most cases. There are only a few games that can run on the highest settings. Only titles that have low system requirements can be played at resolutions above 1080p (you will need an external monitor to achieve resolutions higher than 1080p).
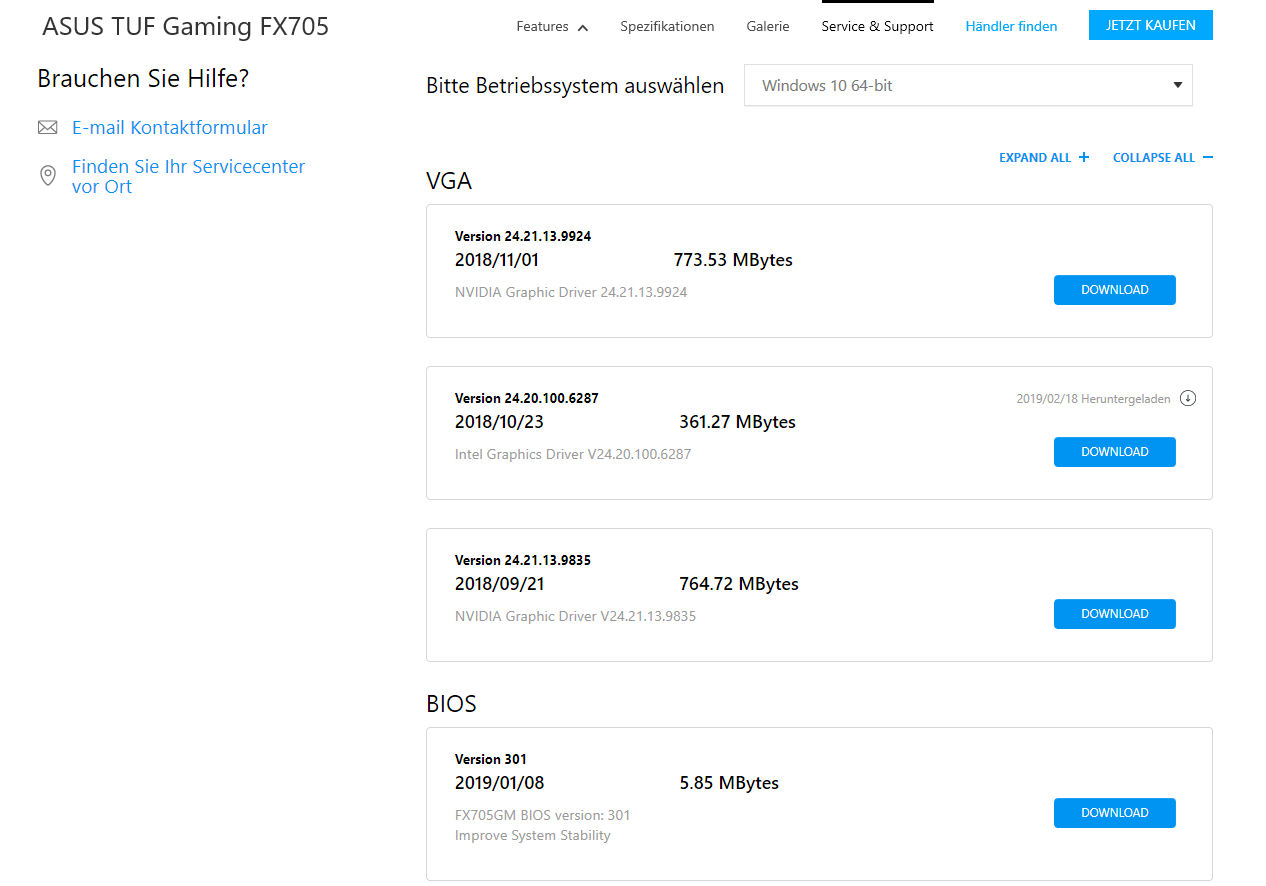
The FX705GE does not ship with the latest Nvidia drivers. Our review device features the Nvidia GeForce 399.24 WHQL drivers. You cannot download the latest driver package from Asus’s website. The Windows update function also does not offer any newer drivers. Unfortunately, the drivers downloaded directly from Nvidia’s website cannot be installed. It would appear as though only drivers that were customized by Asus can be used.

We ran the video game The Witcher 3 for one hour on the highest settings to see if the performance of the laptop falls during long gaming sessions. Over the entire run of gameplay, the player-controlled character stands still. We did not observe any frame-rate drops.
| low | med. | high | ultra | |
|---|---|---|---|---|
| StarCraft 2 (2010) | 388.5 | 178 | 168.6 | 125.5 |
| Diablo III (2012) | 228 | 196 | 190.5 | 165.6 |
| BioShock Infinite (2013) | 237.4 | 196.1 | 178.7 | 72.2 |
| Middle-earth: Shadow of Mordor (2014) | 128.5 | 123 | 117.5 | 89.2 |
| Alien: Isolation (2014) | 238.3 | 215.4 | 122.4 | 80.9 |
| The Witcher 3 (2015) | 132.7 | 82 | 46.1 | 25.8 |
| For Honor (2017) | 152.6 | 65.5 | 61.7 | 48.1 |
| Ghost Recon Wildlands (2017) | 90.4 | 45.5 | 41.7 | 22.6 |
| Far Cry 5 (2018) | 81 | 48 | 45 | 42 |
| Shadow of the Tomb Raider (2018) | 63 | 39 | 36 | 31 |
| Assassin´s Creed Odyssey (2018) | 57 | 44 | 40 | 27 |
| Darksiders III (2018) | 121 | 66.4 | 53 | 44.4 |
| The Witcher 3 - 1920x1080 High Graphics & Postprocessing (Nvidia HairWorks Off) | |
| Average of class Gaming (181 - 341, n=3, last 2 years) | |
| Asus TUF FX705GM | |
| Lenovo Legion Y730-17ICH, i7-8750H | |
| Acer Predator Helios 300 PH317-52-51M6 | |
| Asus TUF FX705GE-EW096T | |
| Average NVIDIA GeForce GTX 1050 Ti Mobile (21.3 - 51.9, n=26) | |
| Schenker XMG A707 Coffee Lake | |
| BioShock Infinite - 1920x1080 Ultra Preset, DX11 (DDOF) | |
| Lenovo Legion Y730-17ICH, i7-8750H | |
| Average NVIDIA GeForce GTX 1050 Ti Mobile (61 - 97, n=23) | |
| Asus TUF FX705GE-EW096T | |
| Shadow of the Tomb Raider - 1280x720 Lowest Preset | |
| Average NVIDIA GeForce GTX 1050 Ti Mobile (63 - 97, n=3) | |
| Asus TUF FX705GE-EW096T | |
| Far Cry 5 - 1920x1080 Medium Preset AA:T | |
| Average of class Gaming (84 - 173, n=10, last 2 years) | |
| Asus TUF FX705GE-EW096T | |
| Average NVIDIA GeForce GTX 1050 Ti Mobile (46 - 48, n=3) | |
Emissions and Energy Management - The TUF notebook lasts for a long time
System Noise
When idle, the fans often stand still, which leads to silent operation - except when the 2.5-inch hard drive is being accessed. Otherwise, the fans run at a low speed. However, under load, the fans really start to spin up. Here, we measured a sound pressure level of 48.1 dB(A). Under medium load, the system noise amounts to 43 dB(A). Those who want less noise should enable the “Quiet” mode. In this mode, the fans operate less frequently and at lower speeds, which is why the boost clocks of the CPU are considerably lower.
Unfortunately, our review device suffers from occasional coil whine.
Noise level
| Idle |
| 31.2 / 32.4 / 32.8 dB(A) |
| HDD |
| 31.4 dB(A) |
| Load |
| 43 / 48.1 dB(A) |
 | ||
30 dB silent 40 dB(A) audible 50 dB(A) loud |
||
min: | ||
Temperature
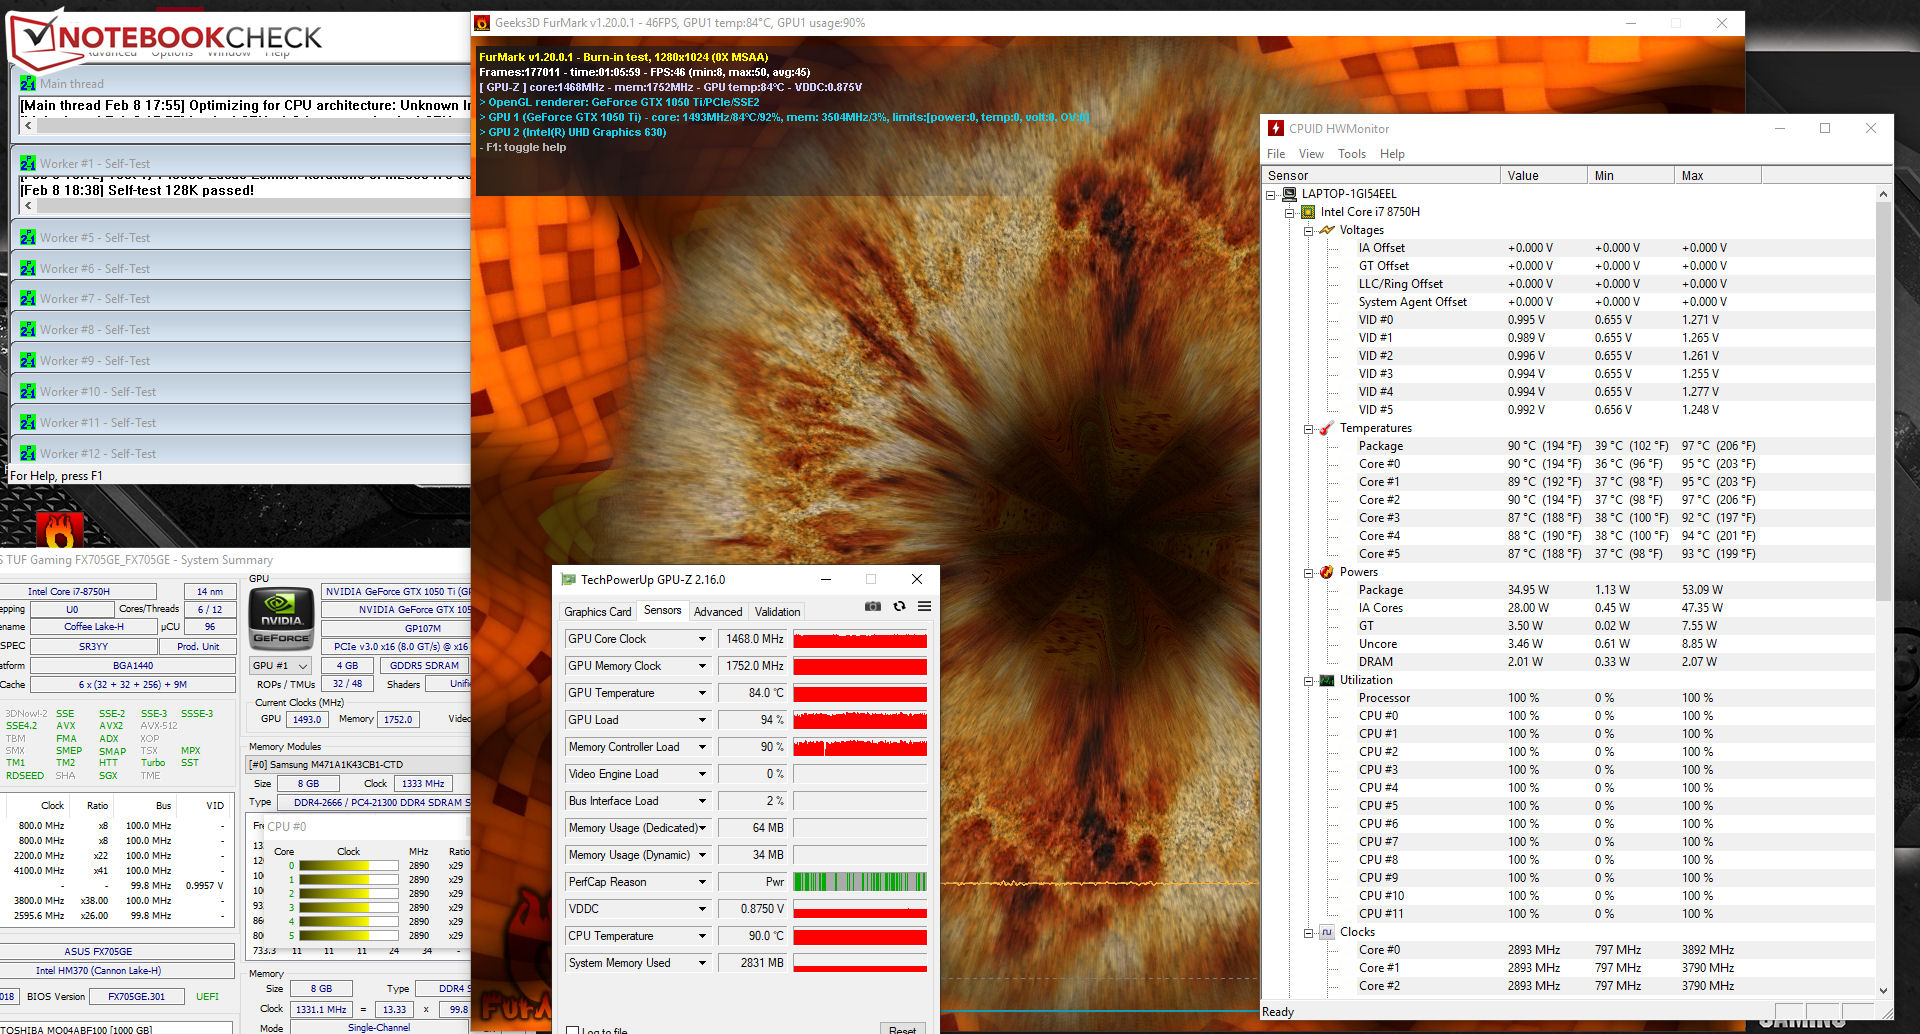
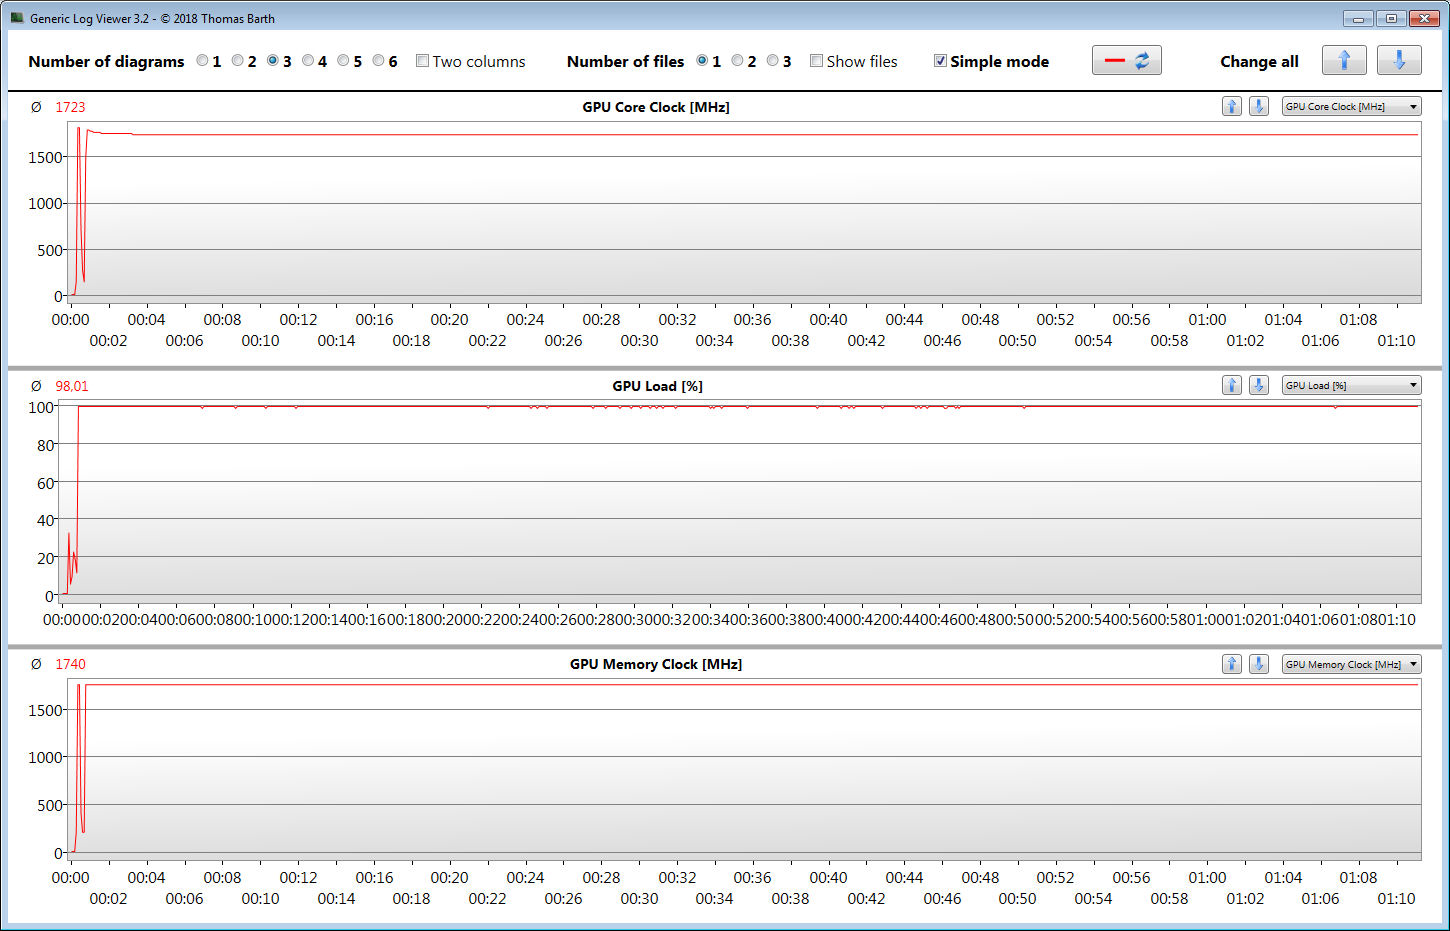
The FX705GE completes our stress test (Prime95 and FurMark running continuously for at least one hour) with different results. When plugged in, the CPU runs at 2.8 to 2.9 GHz and the GPU operates at 1500 to 1700 MHz. When running on battery power, the CPU is throttled down to 800 MHz and the core clock of the GPU fluctuates between 1000 and 1050 MHz.
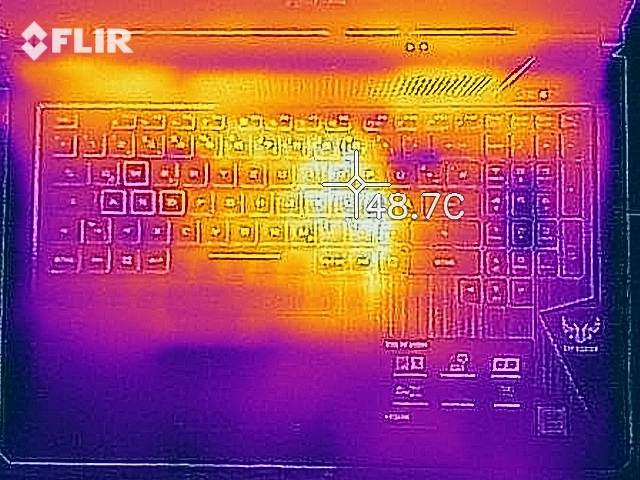
The notebook does not become excessively hot. During the stress test, the 50 °C (122 °F) mark is exceeded only at one measurement point. In everyday use, the temperatures always stay within reasonable bounds. The stress test is an extreme case scenario, which is very unlikely to occur in real life. We use it to test system stability.
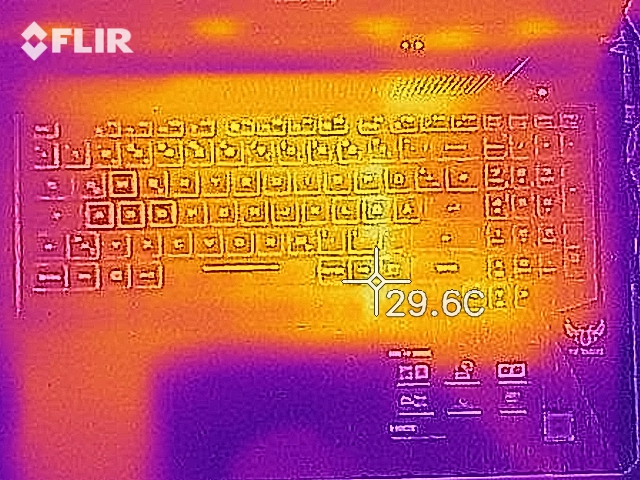
(-) The maximum temperature on the upper side is 53.3 °C / 128 F, compared to the average of 40.4 °C / 105 F, ranging from 21.2 to 68.8 °C for the class Gaming.
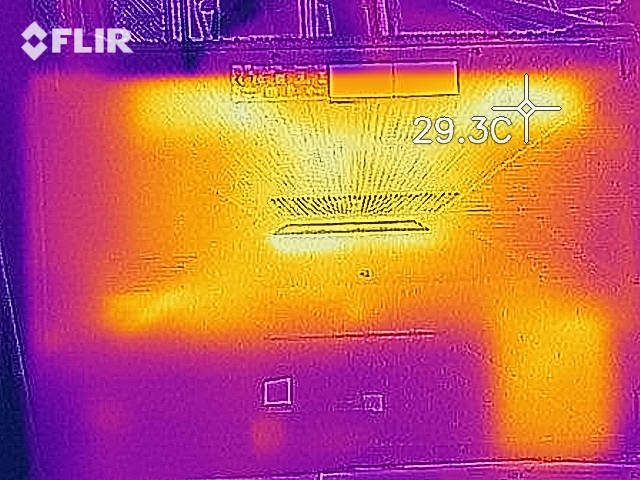
(±) The bottom heats up to a maximum of 44.7 °C / 112 F, compared to the average of 43.2 °C / 110 F
(+) In idle usage, the average temperature for the upper side is 25.4 °C / 78 F, compared to the device average of 33.9 °C / 93 F.
(+) The palmrests and touchpad are cooler than skin temperature with a maximum of 26.5 °C / 79.7 F and are therefore cool to the touch.
(+) The average temperature of the palmrest area of similar devices was 28.8 °C / 83.8 F (+2.3 °C / 4.1 F).

Speakers
Asus TUF FX705GE-EW096T audio analysis
(±) | speaker loudness is average but good (73.2 dB)
Bass 100 - 315 Hz
(-) | nearly no bass - on average 25% lower than median
(±) | linearity of bass is average (9.2% delta to prev. frequency)
Mids 400 - 2000 Hz
(±) | reduced mids - on average 6.4% lower than median
(±) | linearity of mids is average (11.9% delta to prev. frequency)
Highs 2 - 16 kHz
(±) | higher highs - on average 9.9% higher than median
(+) | highs are linear (6.9% delta to prev. frequency)
Overall 100 - 16.000 Hz
(-) | overall sound is not linear (31.6% difference to median)
Compared to same class
» 97% of all tested devices in this class were better, 1% similar, 2% worse
» The best had a delta of 6%, average was 18%, worst was 132%
Compared to all devices tested
» 90% of all tested devices were better, 2% similar, 8% worse
» The best had a delta of 4%, average was 24%, worst was 134%
Apple MacBook 12 (Early 2016) 1.1 GHz audio analysis
(+) | speakers can play relatively loud (83.6 dB)
Bass 100 - 315 Hz
(±) | reduced bass - on average 11.3% lower than median
(±) | linearity of bass is average (14.2% delta to prev. frequency)
Mids 400 - 2000 Hz
(+) | balanced mids - only 2.4% away from median
(+) | mids are linear (5.5% delta to prev. frequency)
Highs 2 - 16 kHz
(+) | balanced highs - only 2% away from median
(+) | highs are linear (4.5% delta to prev. frequency)
Overall 100 - 16.000 Hz
(+) | overall sound is linear (10.2% difference to median)
Compared to same class
» 7% of all tested devices in this class were better, 2% similar, 91% worse
» The best had a delta of 5%, average was 18%, worst was 53%
Compared to all devices tested
» 5% of all tested devices were better, 1% similar, 94% worse
» The best had a delta of 4%, average was 24%, worst was 134%
Energy Consumption
The power consumption is well within the normal range for this type of hardware. When idle, we measured a maximum power draw of 11.2 watts. During the stress test, the energy consumption peaked at 119.7 watts. The power output of the included AC adapter amounts to 120 watts.
Note: When idle, the 17.3-inch notebook consumes less than half the power that its sibling model consumed. In all likelihood, this can be attributed to the fact that Nvidia’s Optimus technology did not function correctly on the sibling model.
| Off / Standby | |
| Idle | |
| Load |
|
Key:
min: | |
Battery Life
Our practically oriented Wi-Fi test simulates loads that are consistent with surfing the web. The “balanced” power plan is selected, the display brightness is set to 150 cd/m² and the energy-saving functions are switched off. The Asus TUF FX705GE achieves a battery runtime of 8 h 33 m, which is a very good result. Many office notebooks have shorter battery life. Our current review device lasts twice as long as its sibling model. We already mentioned the reason for this: The sibling model consumes significantly more energy under low load.
Pros
Cons
Verdict
The Asus TUF Gaming FX705GE is an entry-level 17.3-inch gaming notebook. The combination of a Core i7-8750H and a GeForce GTX 1050 Ti can run all the games in our benchmark library smoothly. However, you will have to lower the resolution and graphics settings in some of the latest AAA titles in order to achieve playable frame rates.
The Asus TUF Gaming FX705GE is a true gaming laptop that also works well as a notebook for daily tasks. However, it does not feature a lot of ports.
An NVMe SSD helps create a very responsive system. Even though its capacity amounts only to 128 GB, there is no lack of storage space. The laptop features an additional 1 TB hard drive. Moreover, the notebook also comes with a usable, backlit keyboard. The FX705GE surprises when it comes to battery runtimes. In our Wi-Fi test, it lasts for 8 h 33 m, which is why it beats most office notebooks in terms of battery life.
The Full HD IPS screen has a matte surface, good contrast ratio and stable viewing angles. The brightness is okay. However, it could have been higher given the price tag of the device.
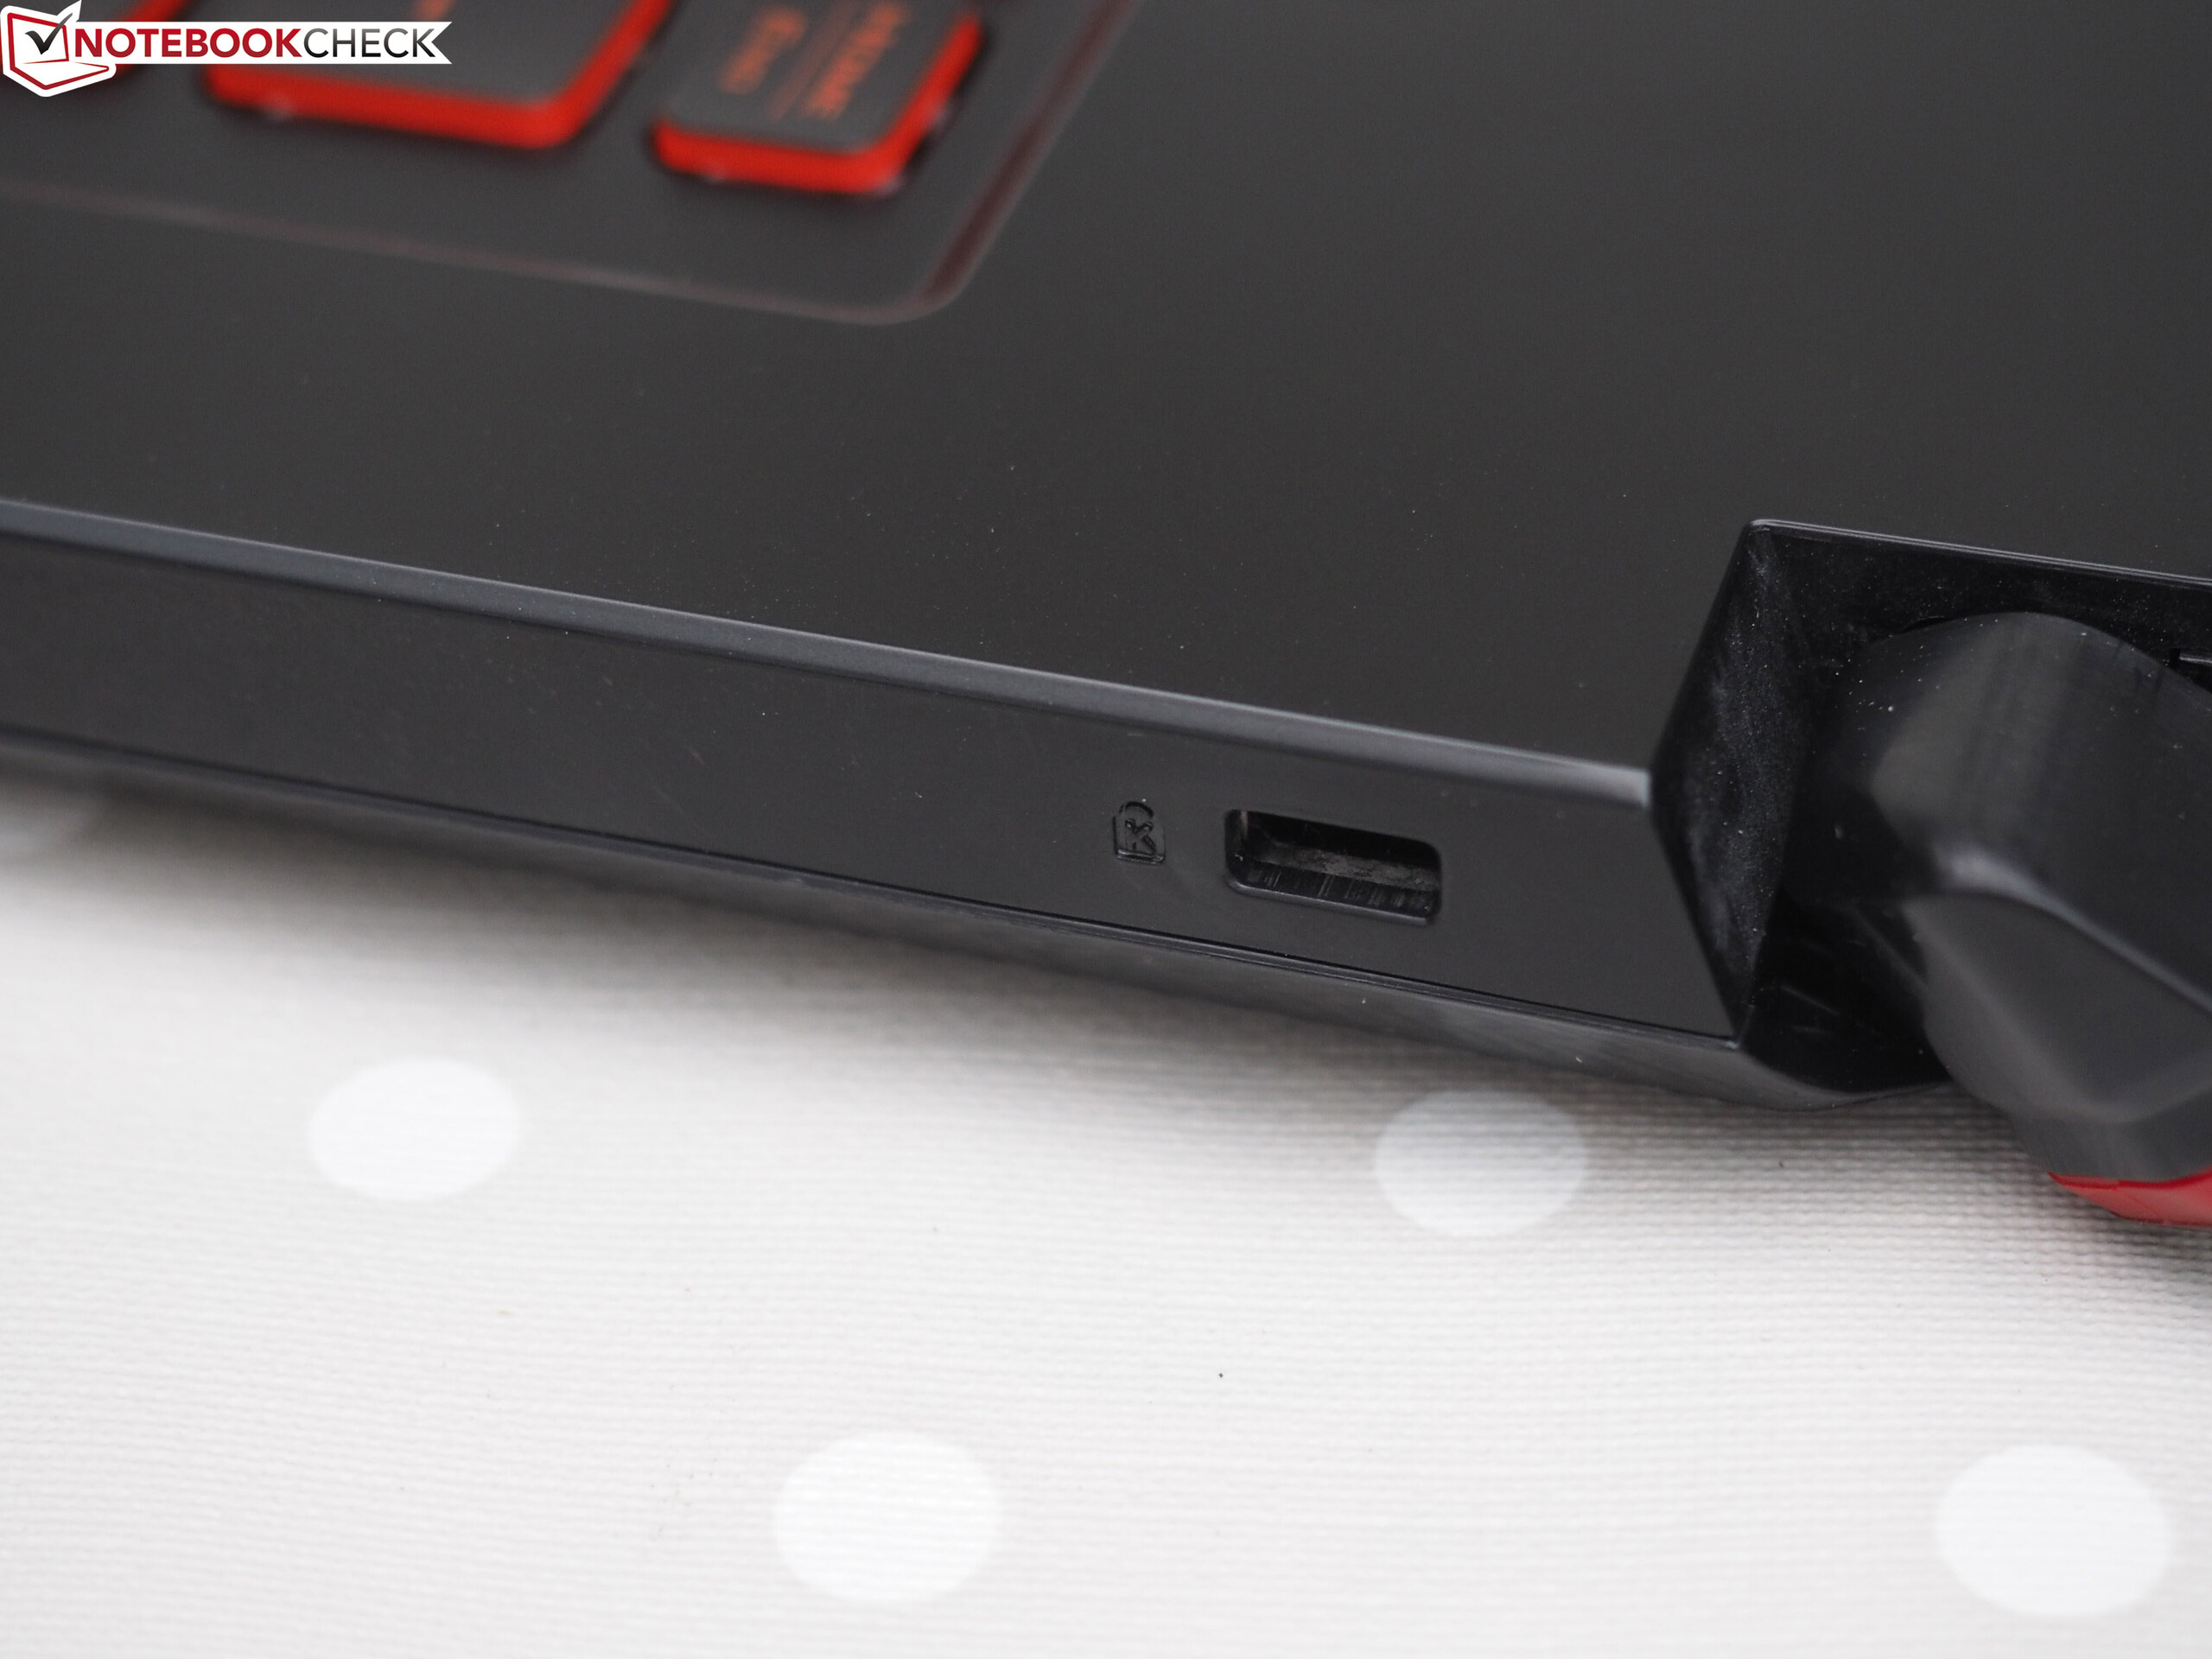
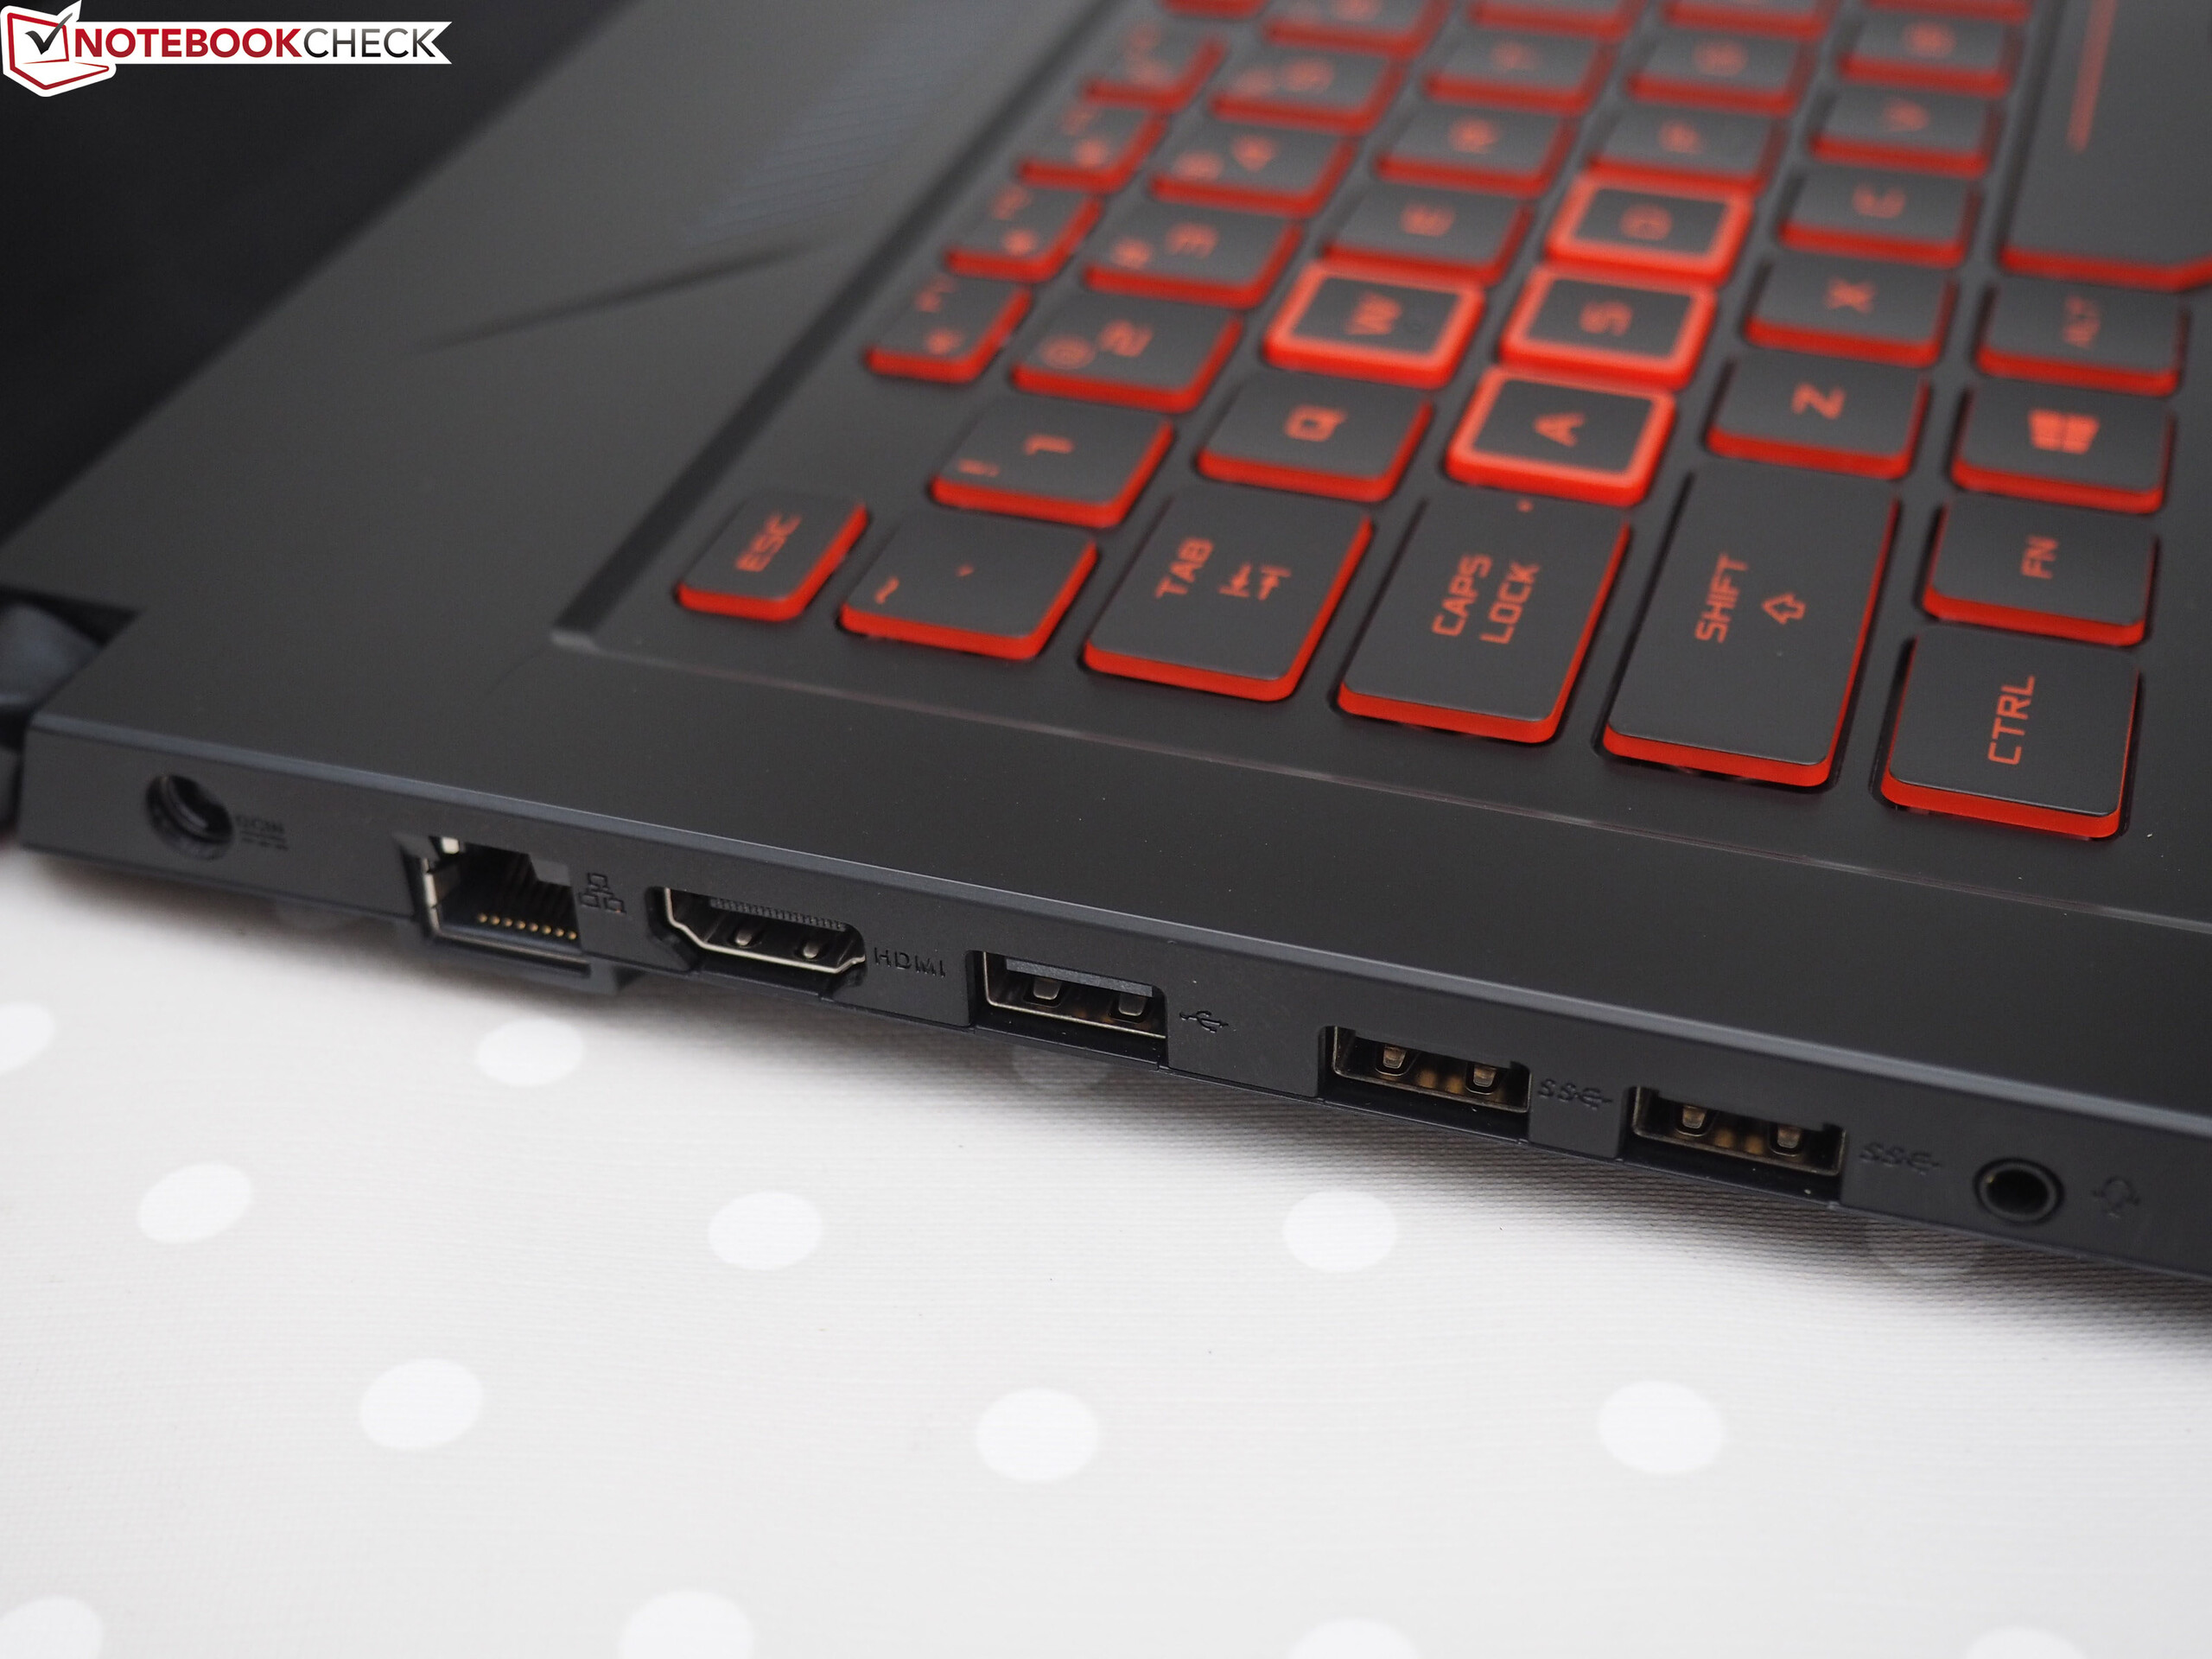
The FX705GE does not feature plenty of ports. Here, Asus chose to go the minimalist route to differentiate its more premium ROG gaming notebooks from cheaper TUF gaming laptops. The FX705GE has neither an SD card reader nor a USB Type-C port. Furthermore, it offers only one video output. Here, competitors with the same CPU-GPU combination such as the Schenker XMG A707 and the Lenovo Legion Y730-17ICH offer significantly more. The Lenovo notebook actually comes with a Thunderbolt 3 port.
Asus TUF FX705GE-EW096T
- 02/18/2019 v6 (old)
Sascha Mölck
Price comparison
