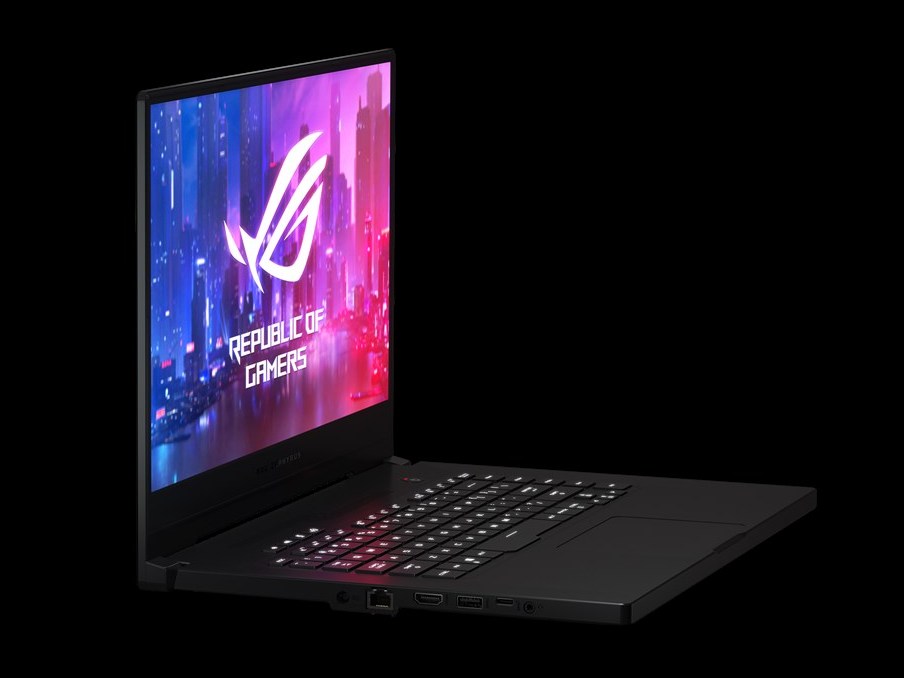
Asus ROG Zephyrus G GA502DU (Ryzen 7 3750H, GTX 1660 Ti Max-Q) Laptop Review

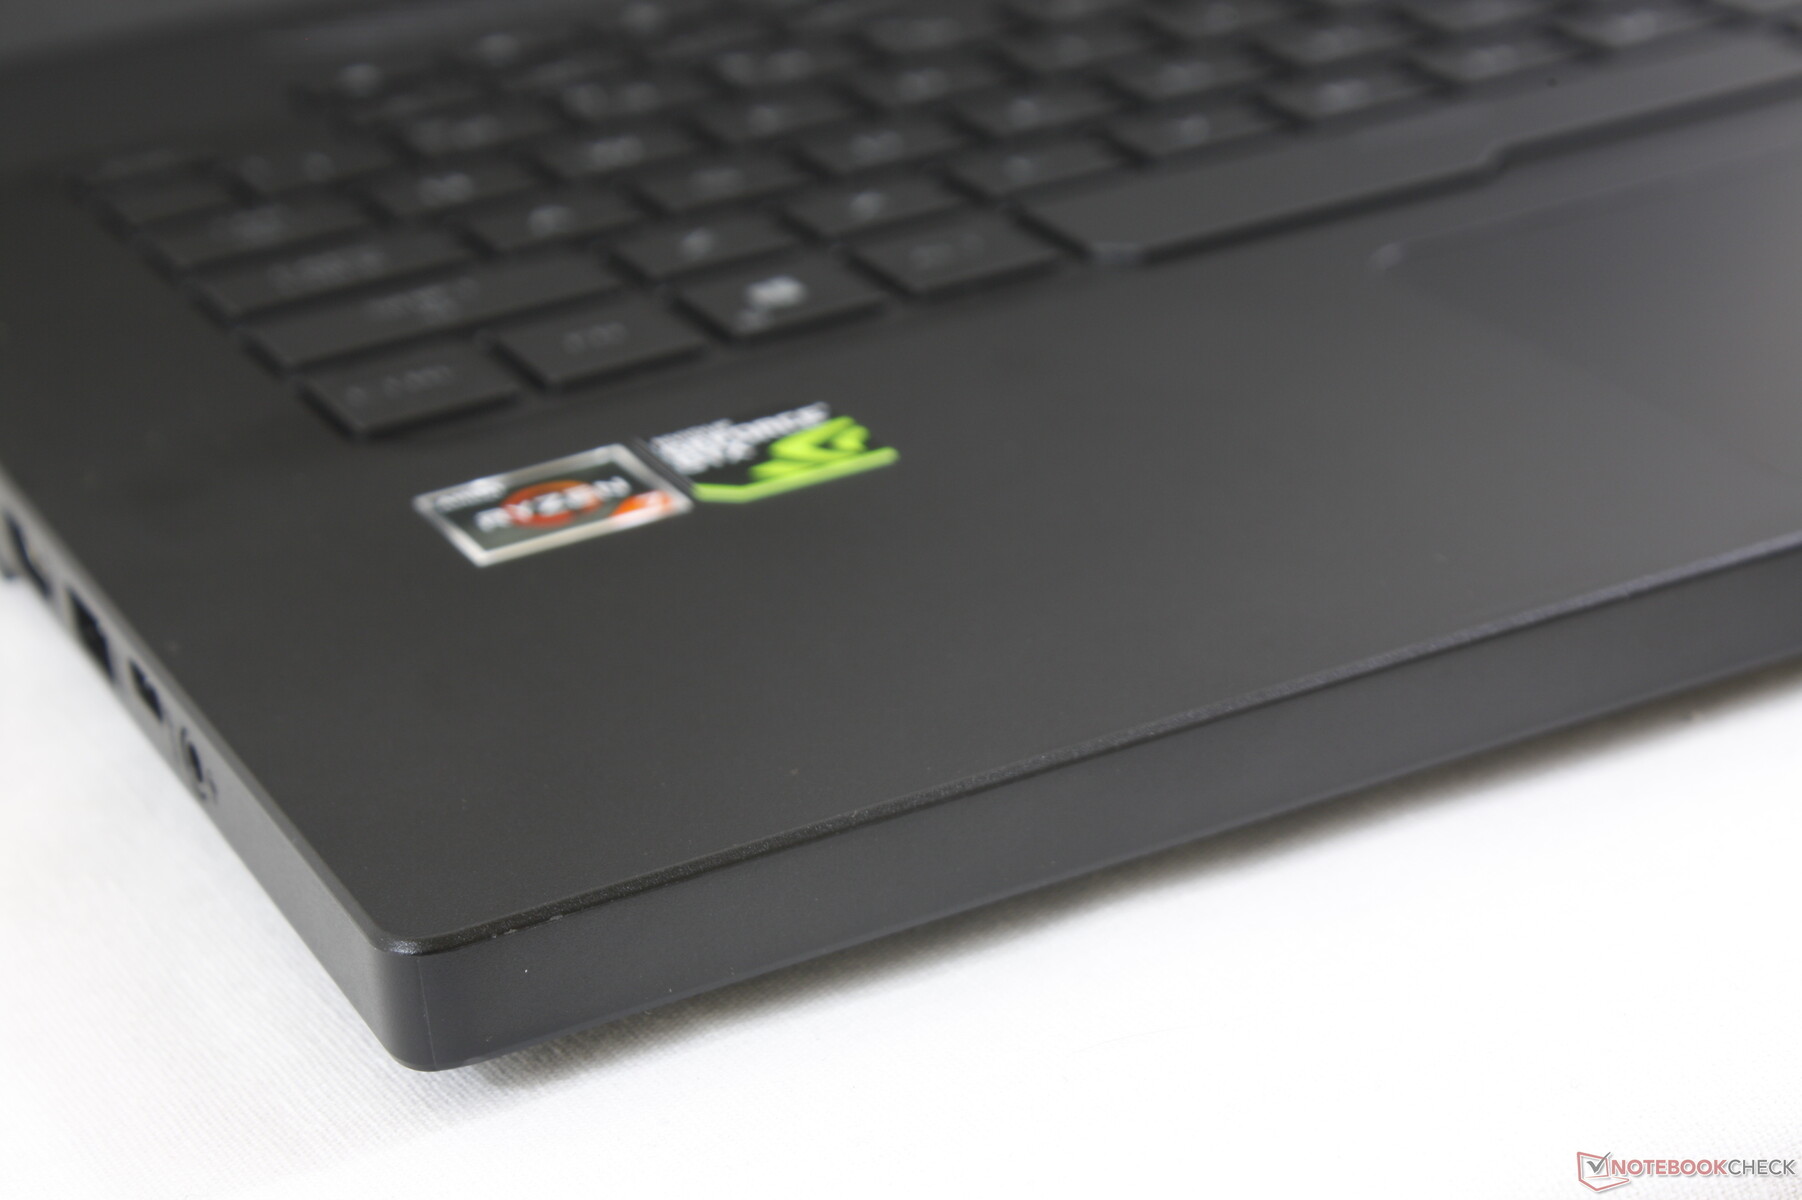
The Zephyrus series is Asus' flagship family of ultra-thin gaming laptops followed by the mid-range Strix/Hero series and the entry-level budget TUF series. The Zephyrus lineup itself has since expanded into additional subcategories including the super-slim Zephyrus S series, mid-range Zephyrus M series, and the more affordable Zephyrus G series. Our test unit today is the Zephyrus G GA502DU equipped with the uncommon AMD Ryzen 7 3750H CPU and Nvidia GeForce GTX 1660 Ti Max-Q GPU targeted at gamers on a budget who don't want to sacrifice the attractive designs of the latest ultra-thin laptops.
The most notable qualities of the GA502GU are its aforementioned Ryzen CPU and Nvidia GTX 16 Max-Q GPU as this is the first laptop to pair both of these specific processors together. No other CPU or GPU options are available for the GA502 series at the time of writing. Other features like the 1080p display (60 Hz or 120 Hz), RAM (8 GB single-channel to 32 GB dual-channel), and storage (256 GB to 512 GB) are fairly standard and configurable. Our specific test unit is a lower-end configuration retailing for about $1100 or $950 when on sale.
As a budget quad-core gaming laptop, direct competitors to the GA502GU can be any gaming laptop powered by a quad-core Intel Core i5-8300H or Core i5-9300H CPU with GTX 1050, 1050 Ti, 1650, or 1660 Ti graphics. Examples include the Acer Aspire Nitro 5, Lenovo Legion Y740, HP Omen 15, Gigabyte Sabre 15, Aorus 5, Acer Predator Helios 300, MSI GP63, or the Dell G7 series. The even cheaper Asus TUF FX505DY is also an alternative.
More Asus Zephyrus reviews:
Case
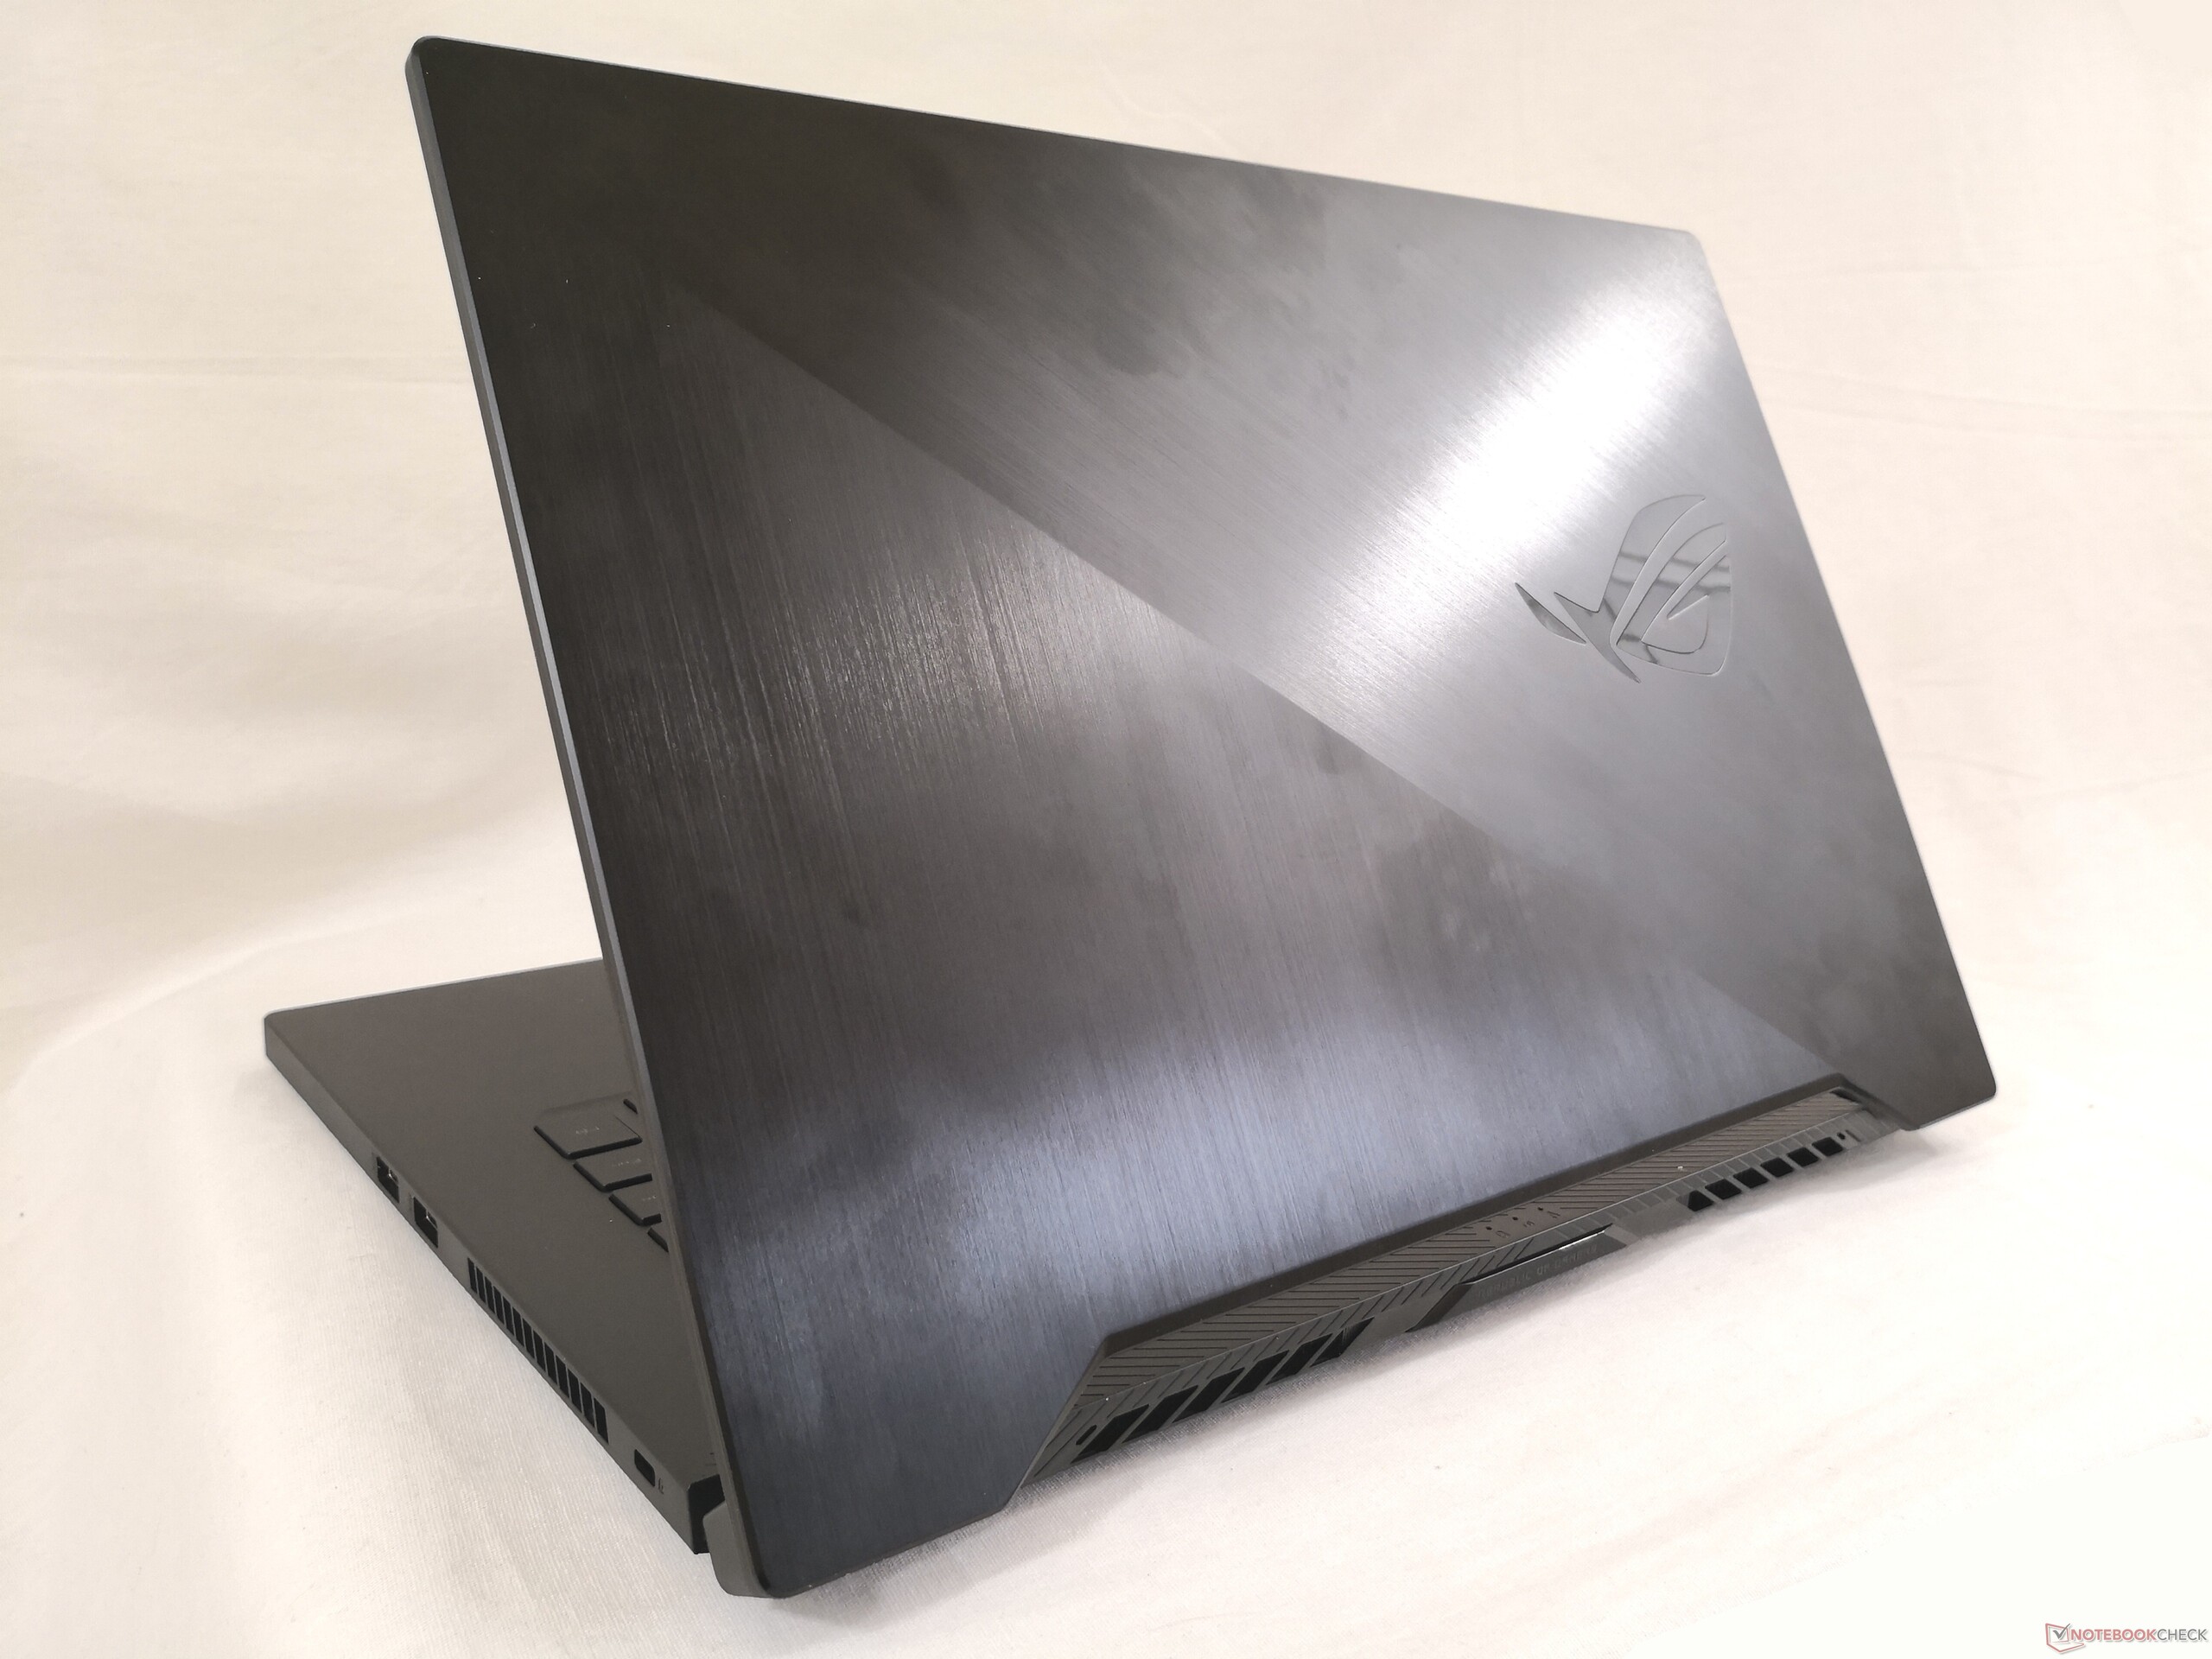
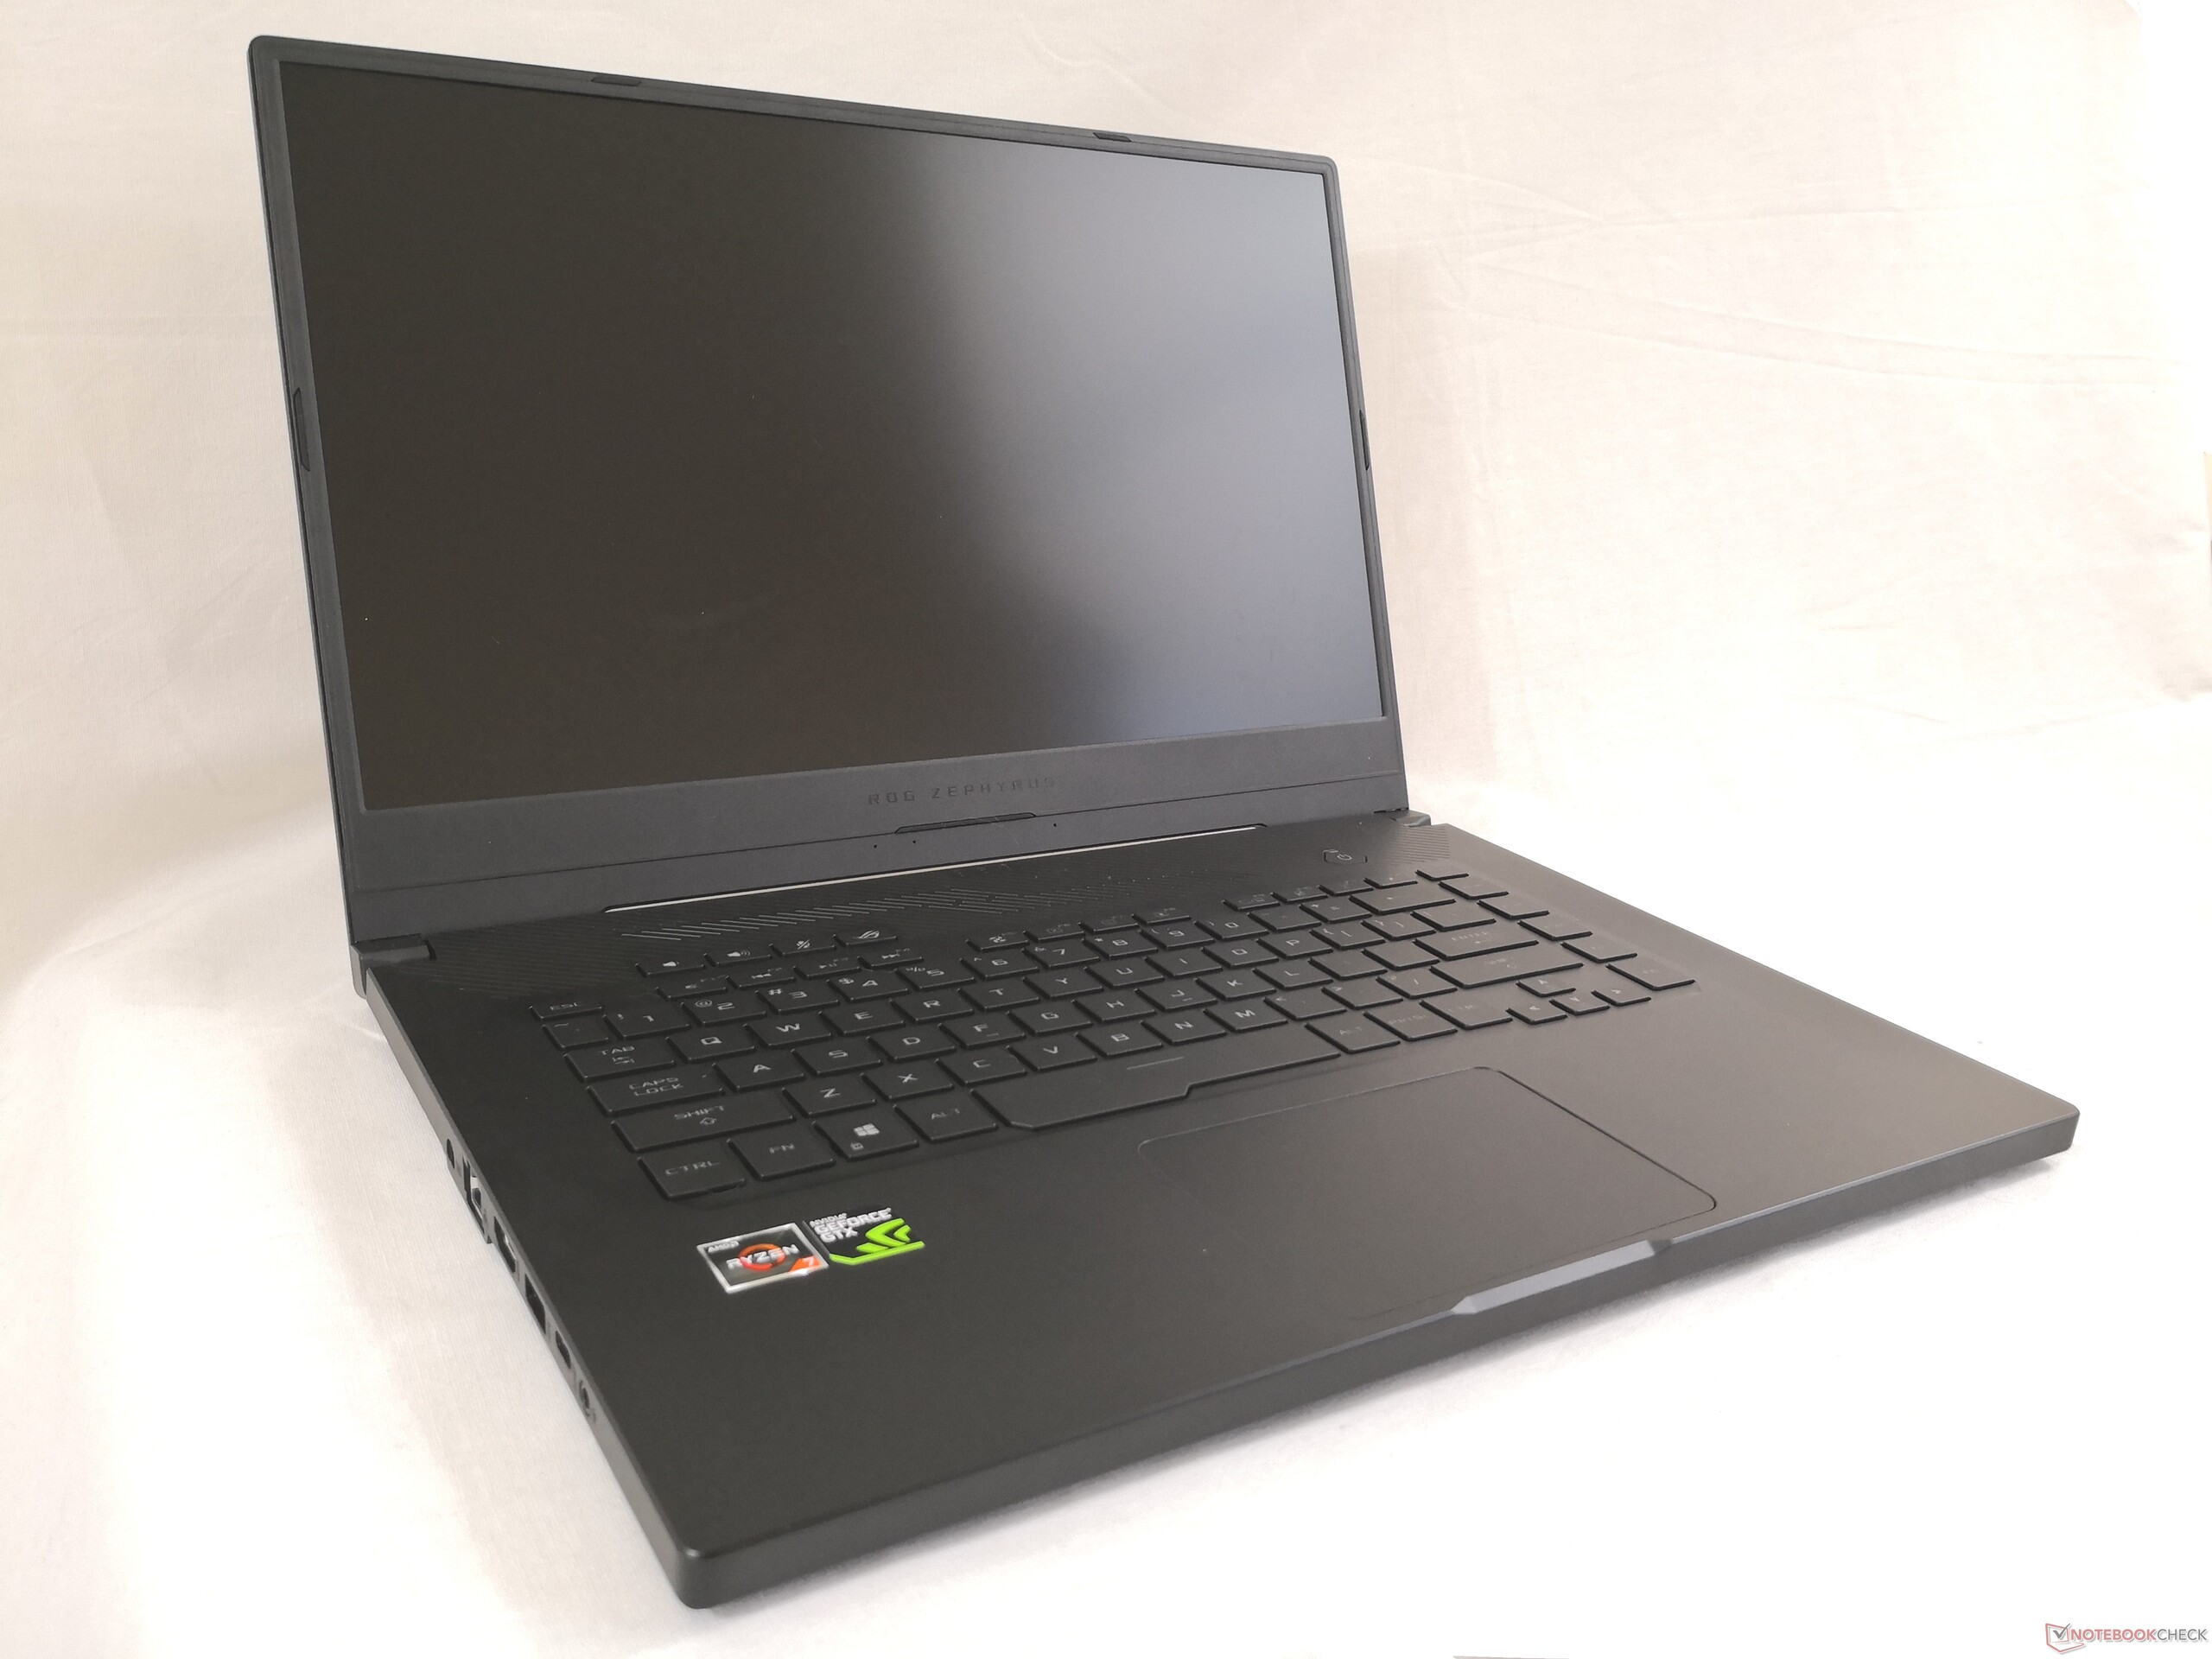
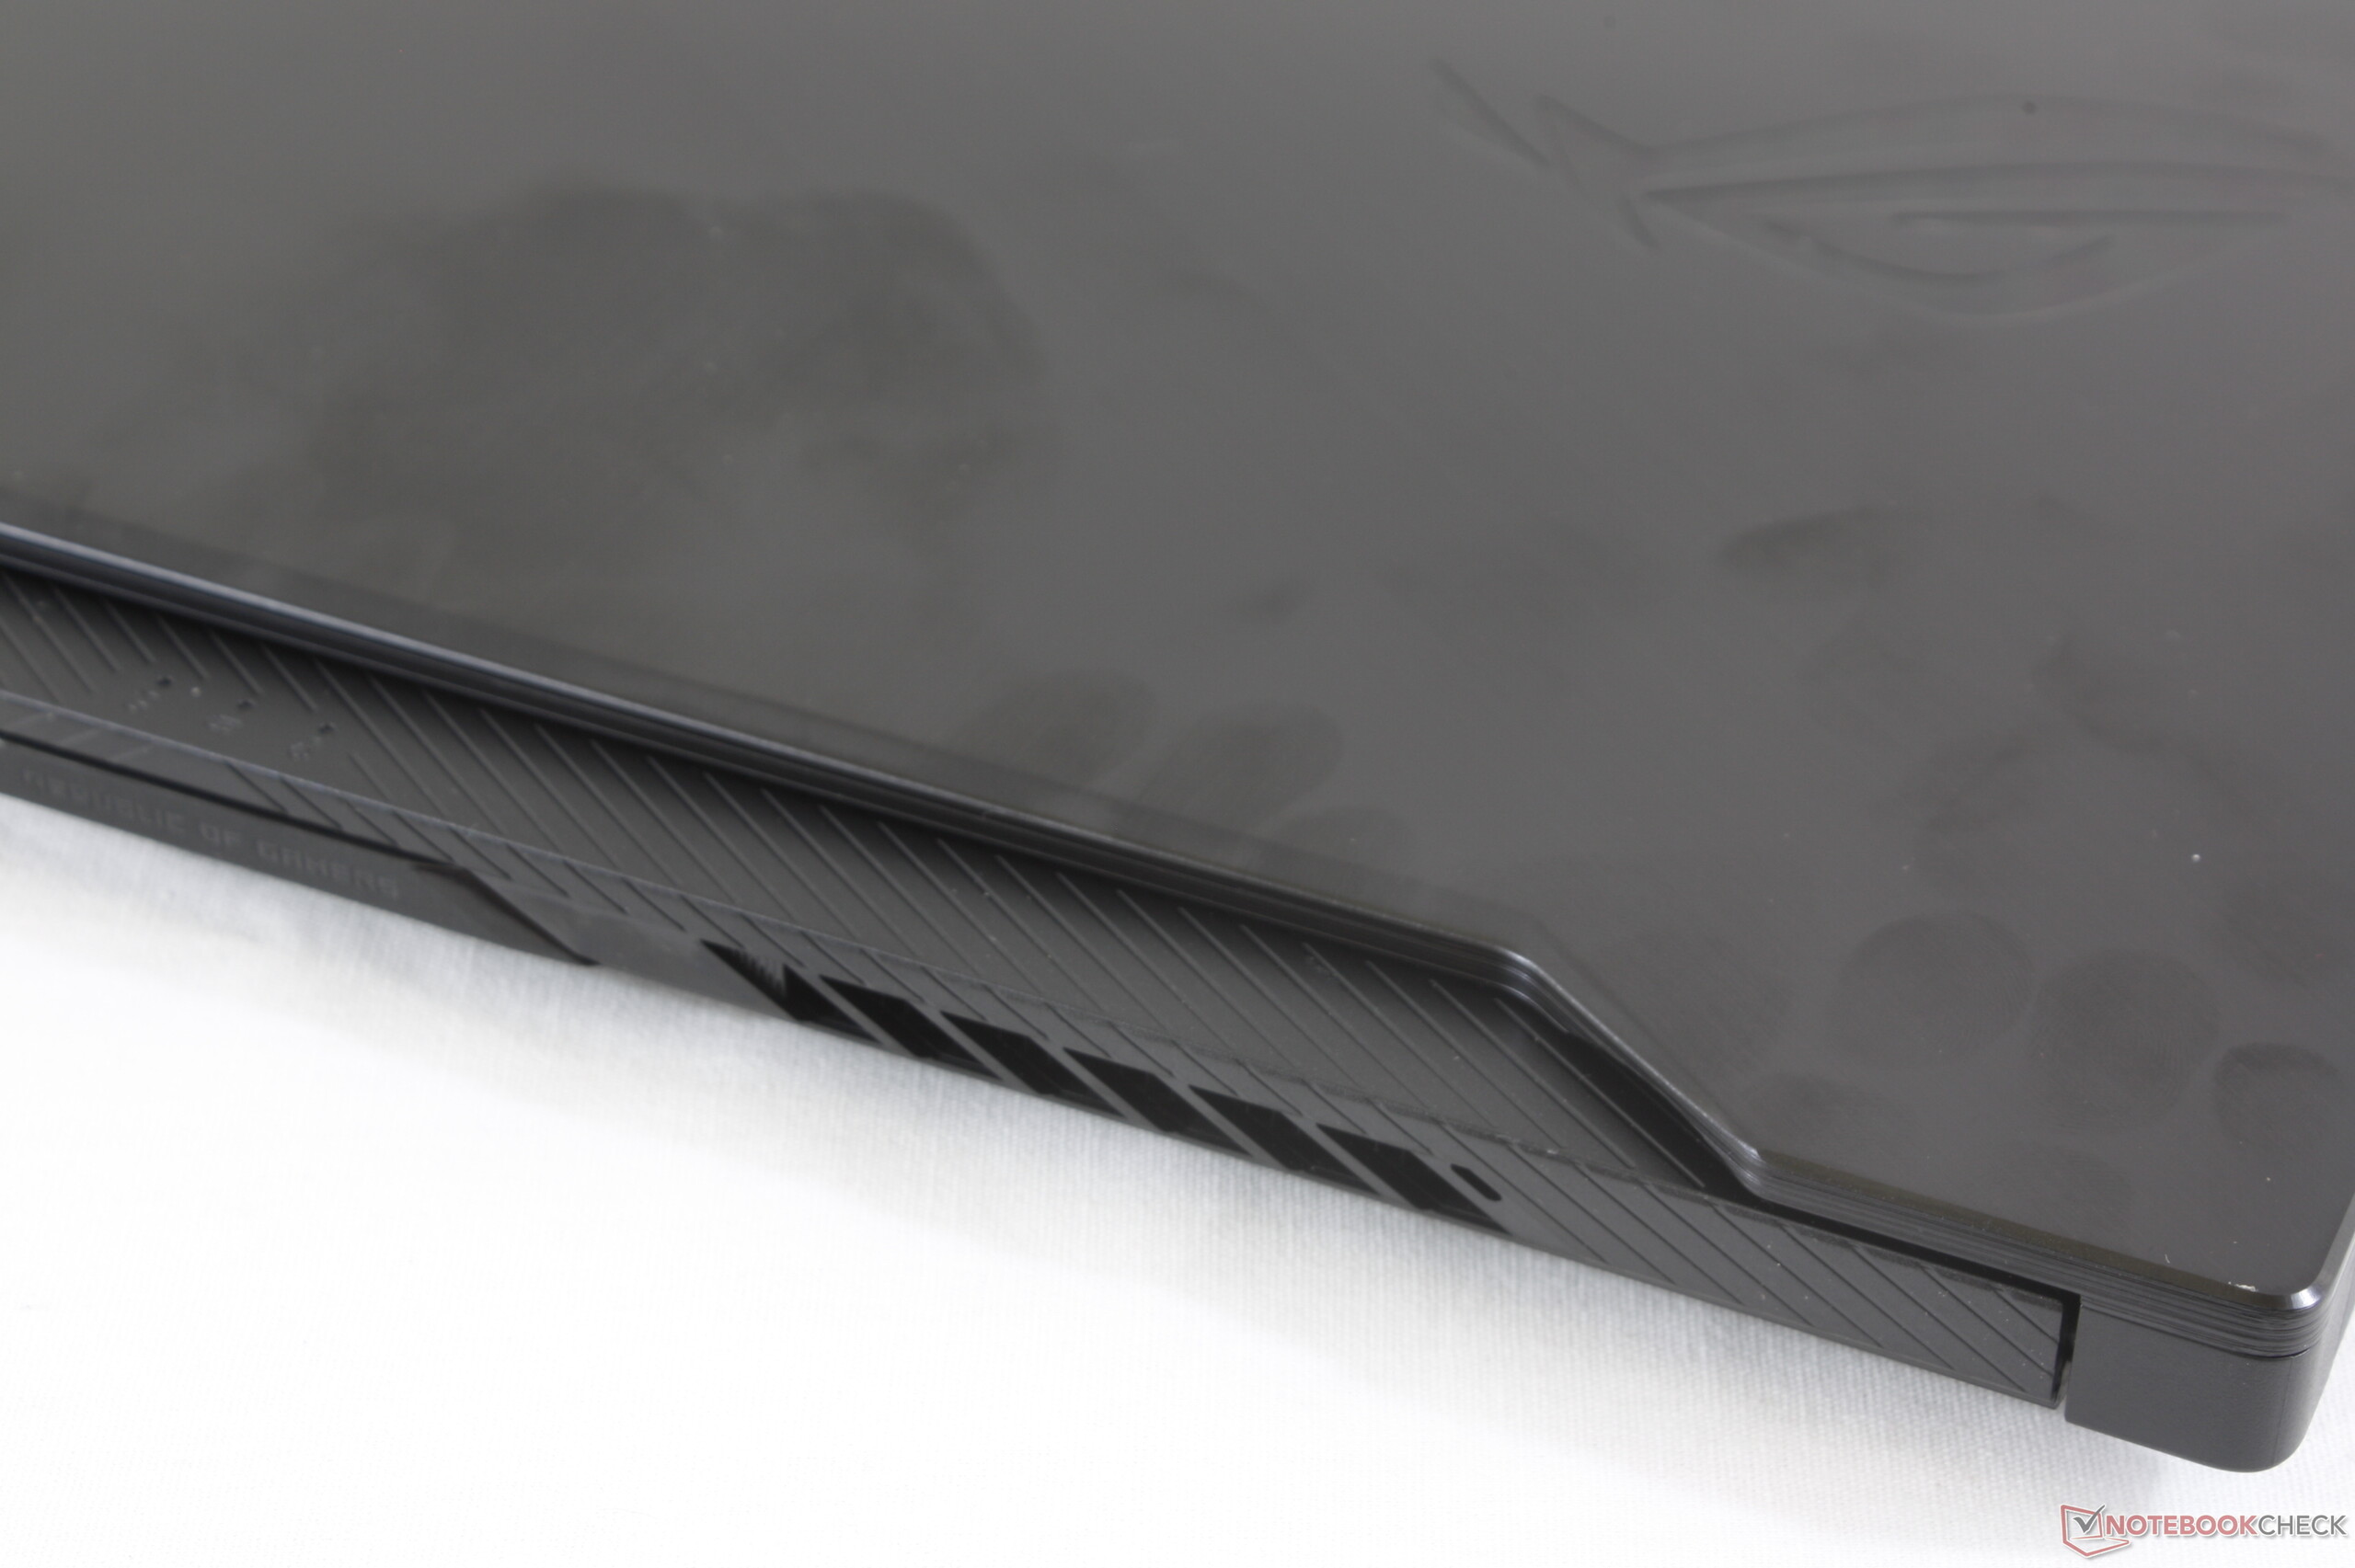
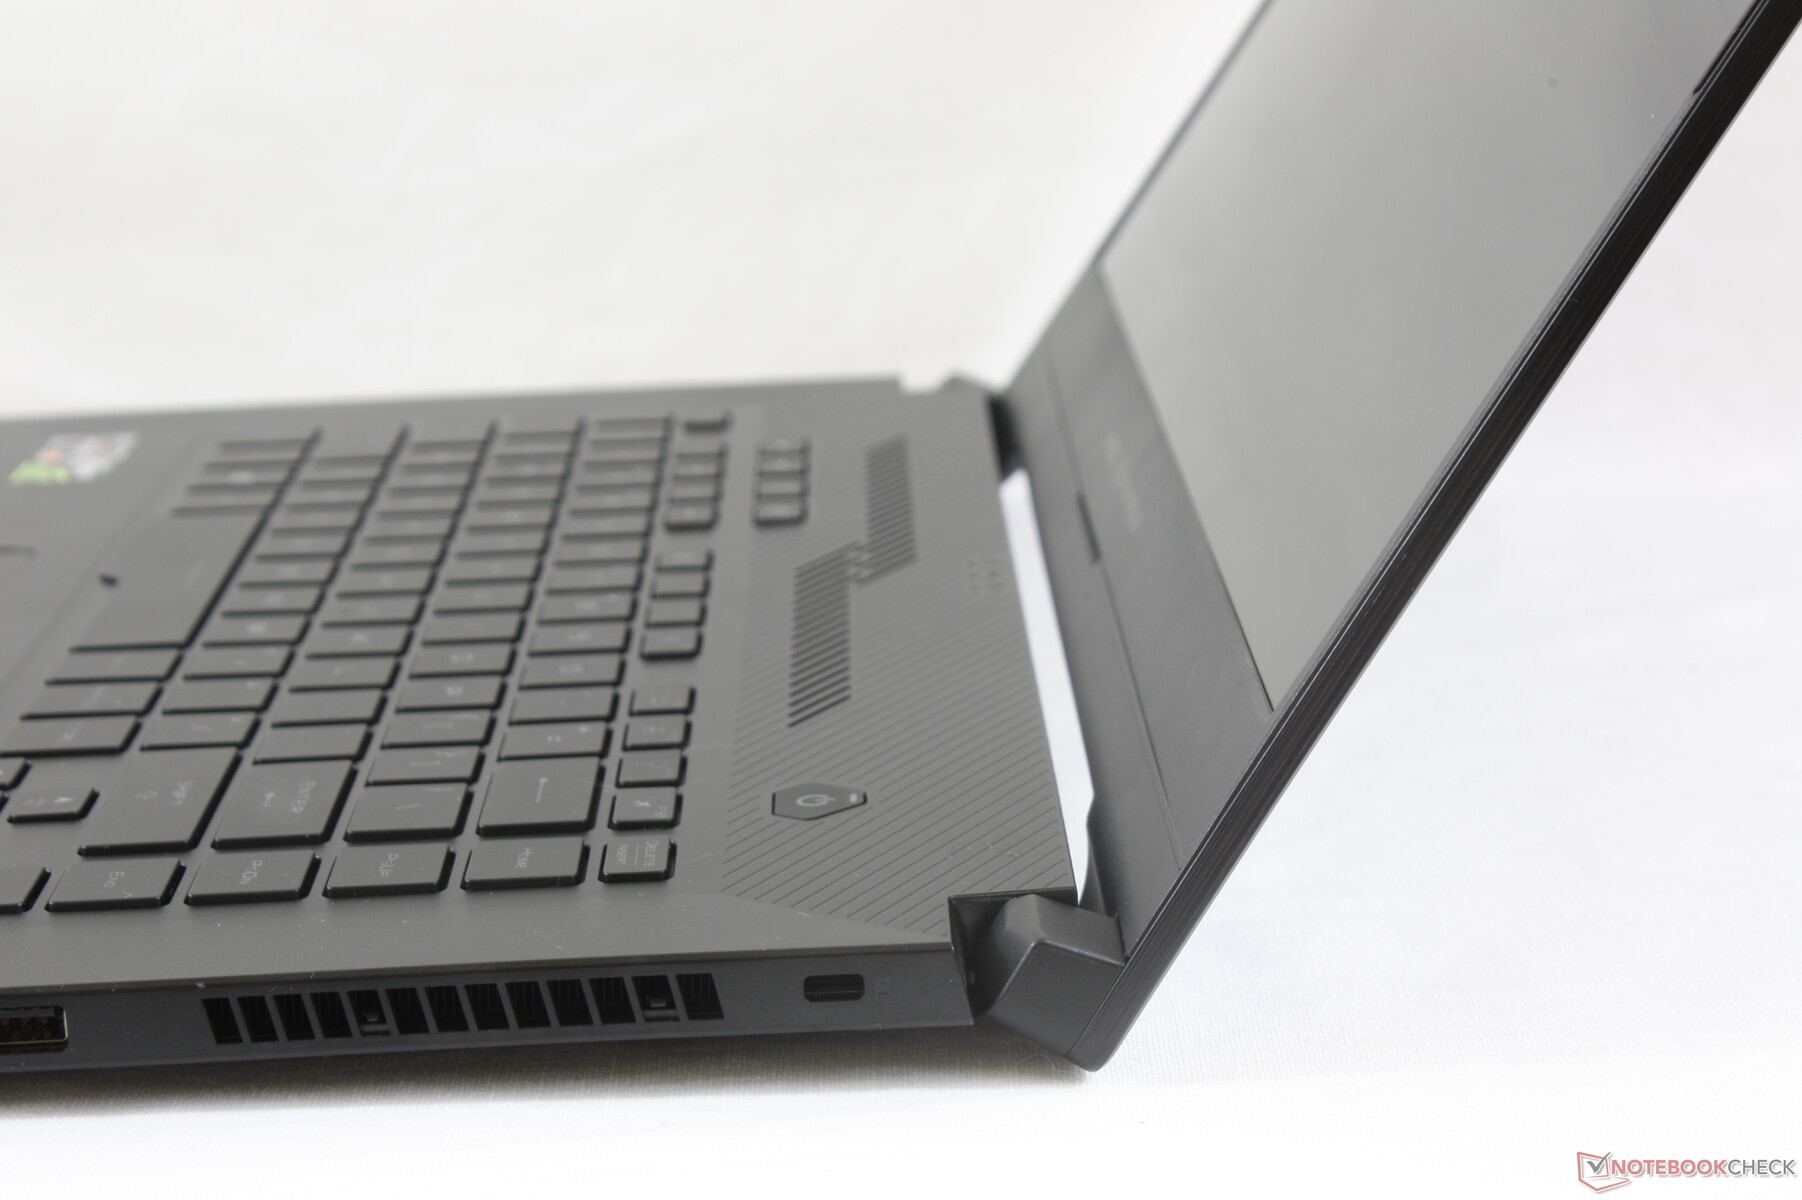
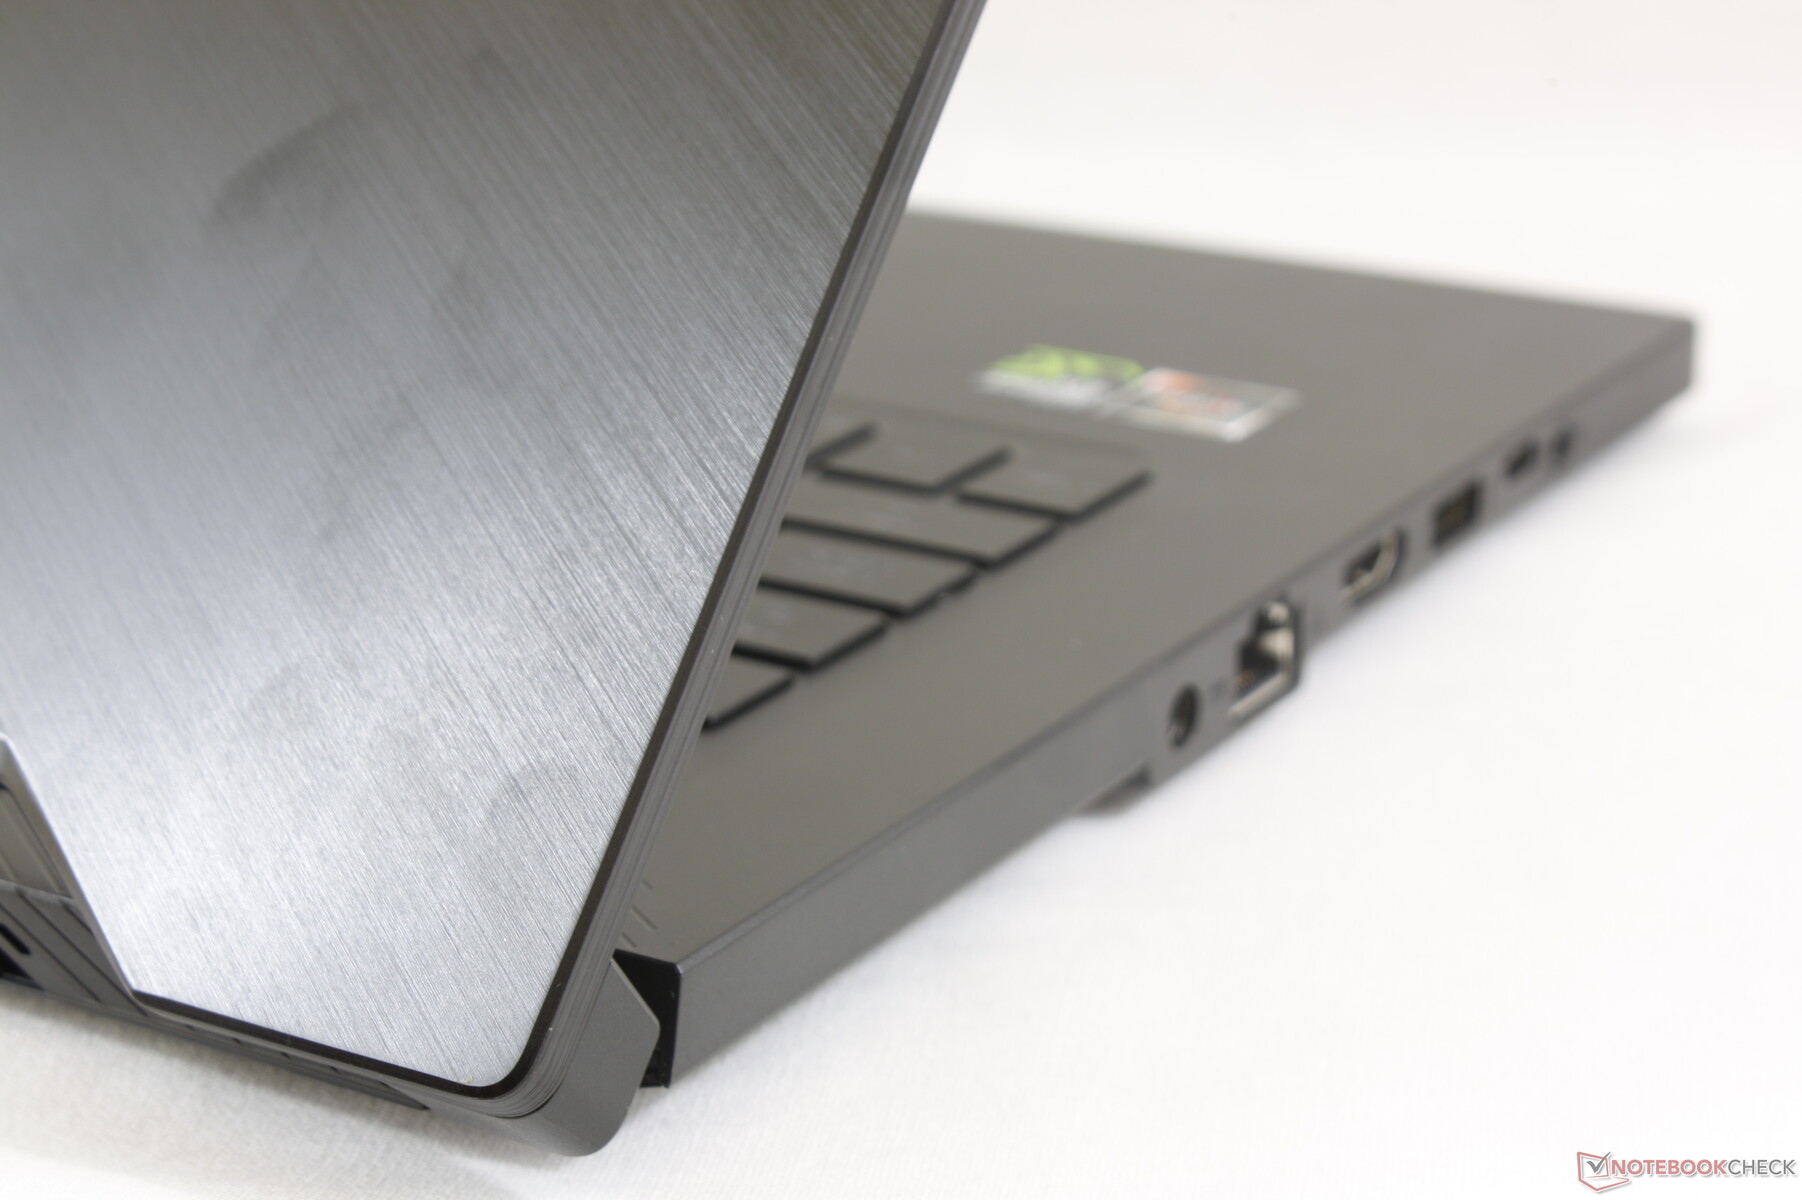
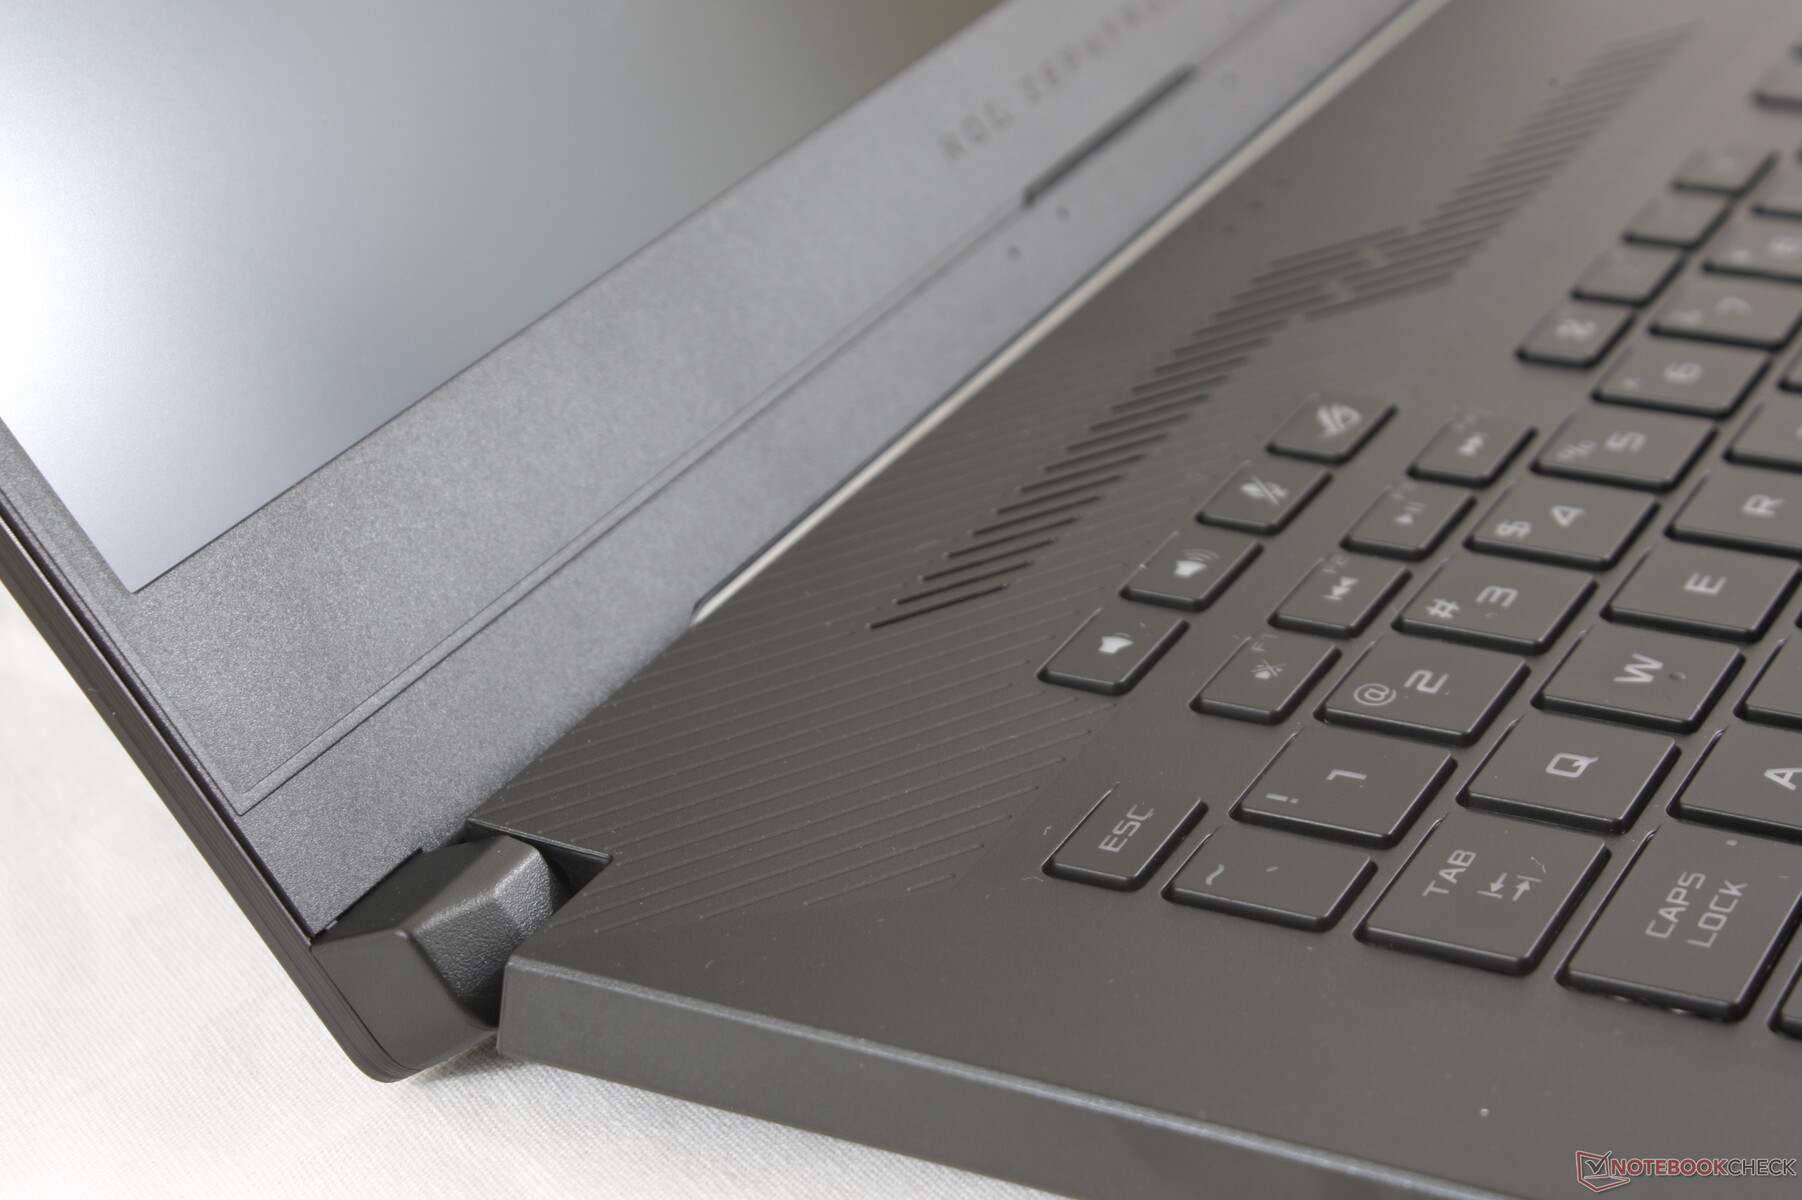
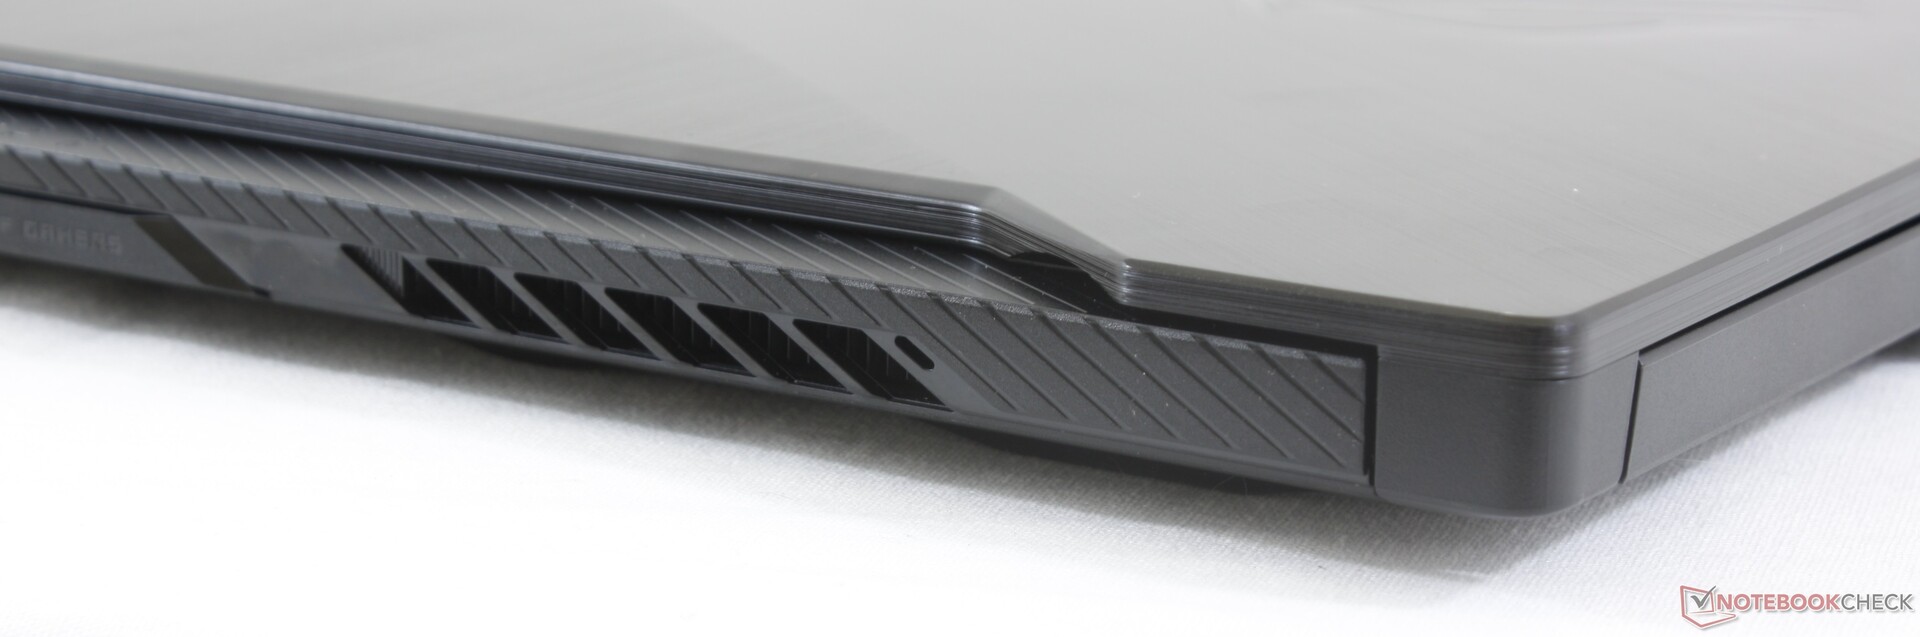
The Zephyrus G chassis is closely related to the Zephyrus S GX502. In fact, the chassis are essentially identical between them save for two key distinctions: the GA502 lacks the ErgoLift-style rear ventilation that was all the rage on the original Zephyrus design and it lacks the rubber-coated palm rest of the GX502. We suspect that the decision to omit these exotic features on the GA502 was likely down to cost and, in truth, we don't even miss the features at all. The bottom panel is now stiffer because of it while the rest of the plastic chassis feels and looks nearly the same as on the GX502. The cross-cut brushed aluminum outer lid, super-narrow three-sided bezels, and ultra-thin profile have all returned. You're essentially getting a flagship-like chassis for a laptop targeted at gamers on a budget.
Base rigidity is very good with only minimal creaking and warping when attempting to bend its edges or depress the center of the keyboard. We find it to be just slightly weaker than the Alienware m15 but definitely stronger and less rickety than what the MSI GS65 has to offer. The flexible lid continues to be the weakest link much like on the other Zephyrus laptops and its super-small hinges and narrow 130-degree lid angle haven't improved at all. Laptops with stiffer lids like the Razer Blade 15, XPS 15, and even Asus' own ROG Strix II GL504 all prove that the Zephyrus can do better in this regard.
Build quality is excellent on our unit with no noticeable gaps or crevices between materials including the edges of the inner display bezels. Nonetheless, be prepared for instant fingerprints especially around the outer lid, keyboard keys, and trackpad.
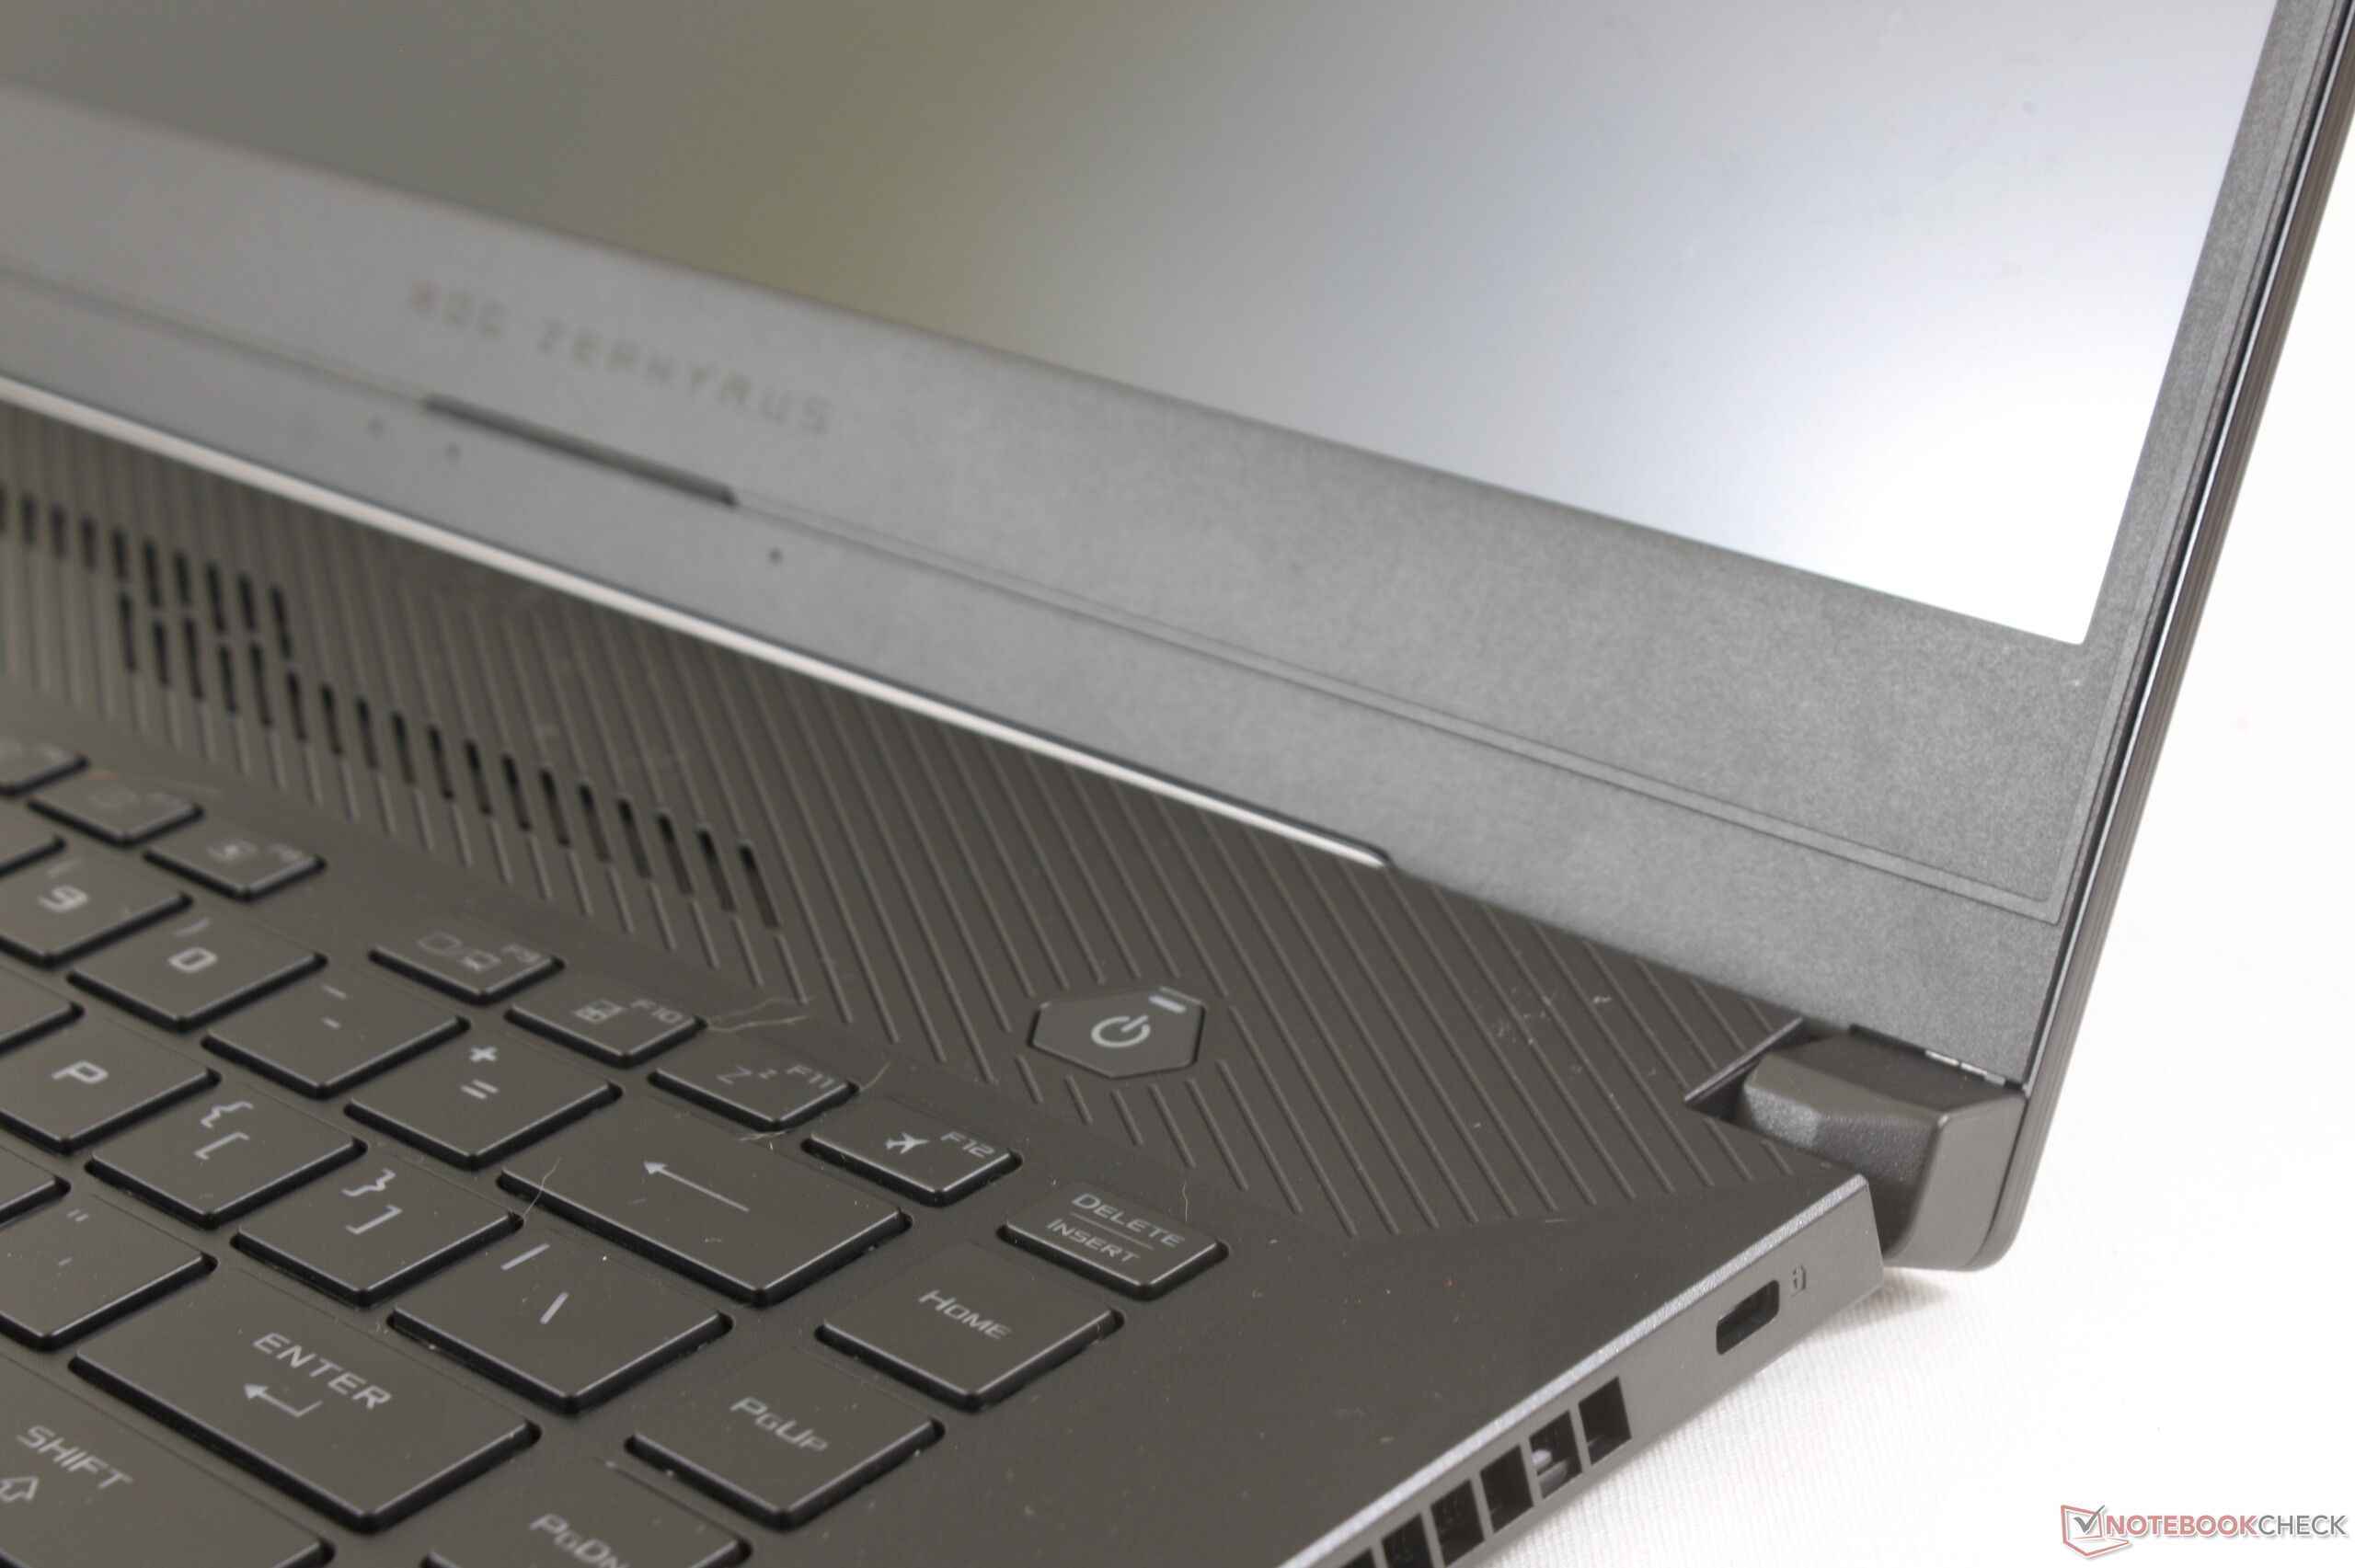
Note that the GA502 is one of the only laptops in its category with no integrated webcam. According to Asus, the target audience will rarely use the webcam and if they do, they tend to already have an external higher-quality webcam. Fortunately, the unit still integrates a microphone.
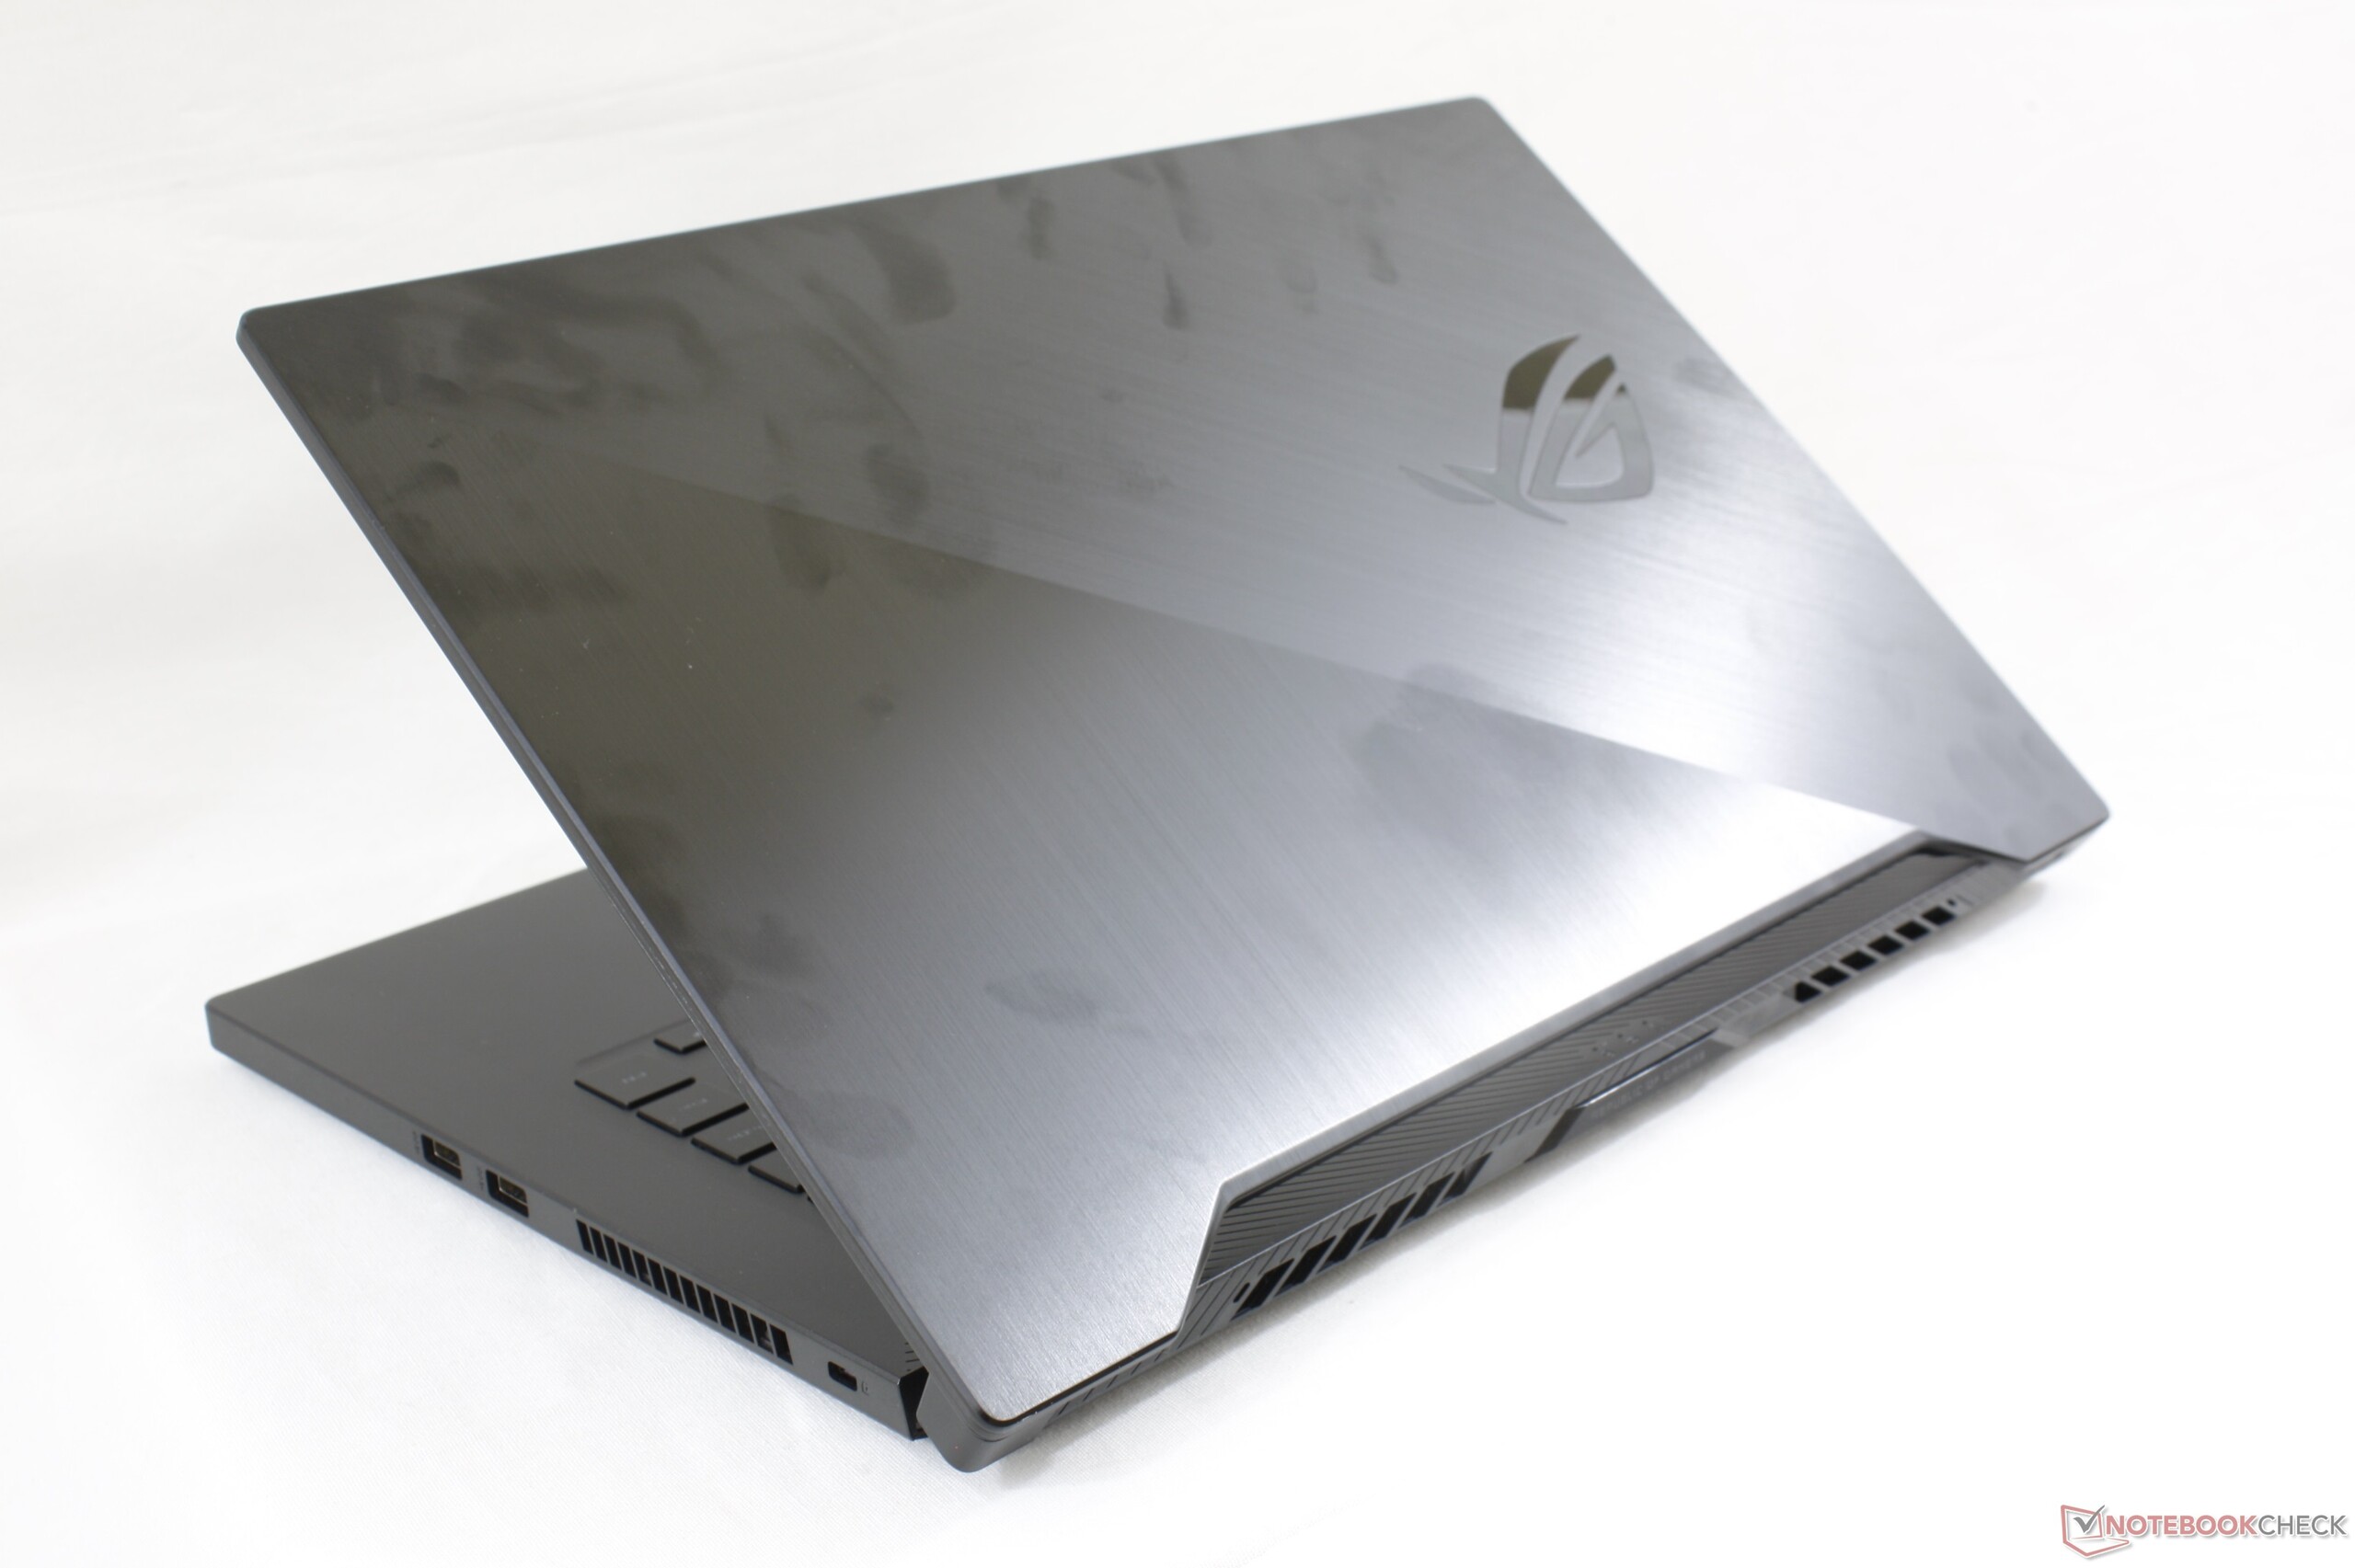
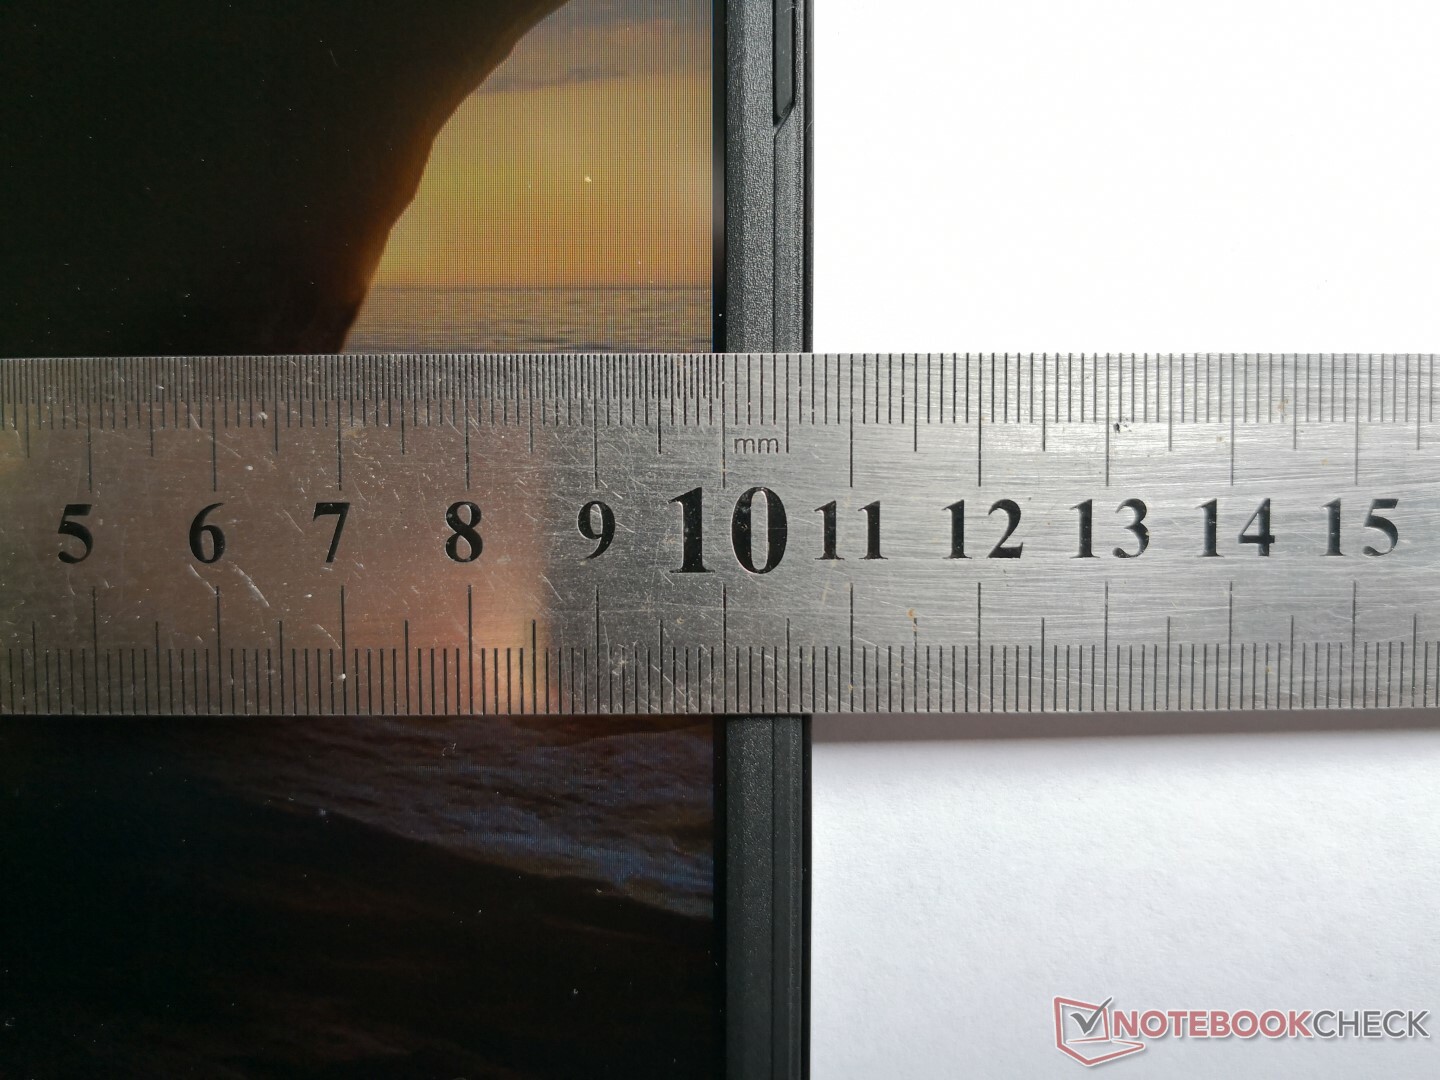
The Zephyrus G GA502 is slightly thicker than both the Zephyrus M GU501 and Zephyrus S GX531 while having a smaller footprint than the former and weighing about the same as the latter as illustrated by our size comparison below. To put simply, the GA502 is almost as small and compact as the pricier GX531 while costing significantly less. Other gaming laptops retailing for under $1000 like the Dell G7, MSI GF63, Acer Nitro 5, or even Asus' own TUF FX series are all thicker, larger, or heavier than the similarly priced GA502. It's definitely a highlight and major selling point of the GA502.
When compared to the GX502, both systems share the same footprint while the GA502 is about 1.5 mm thicker since the underside of the base lacks the ErgoLift feature.
Connectivity
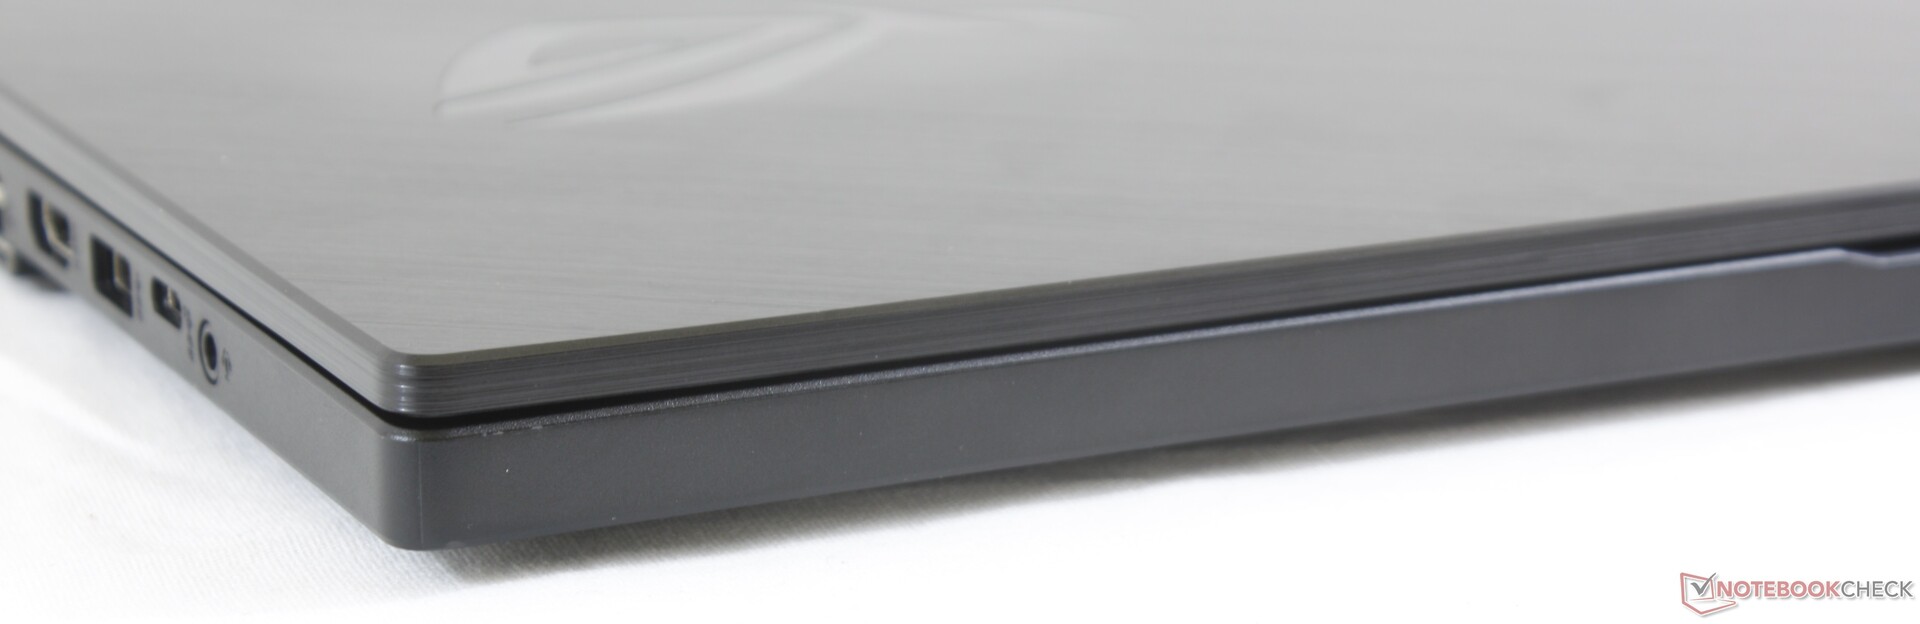
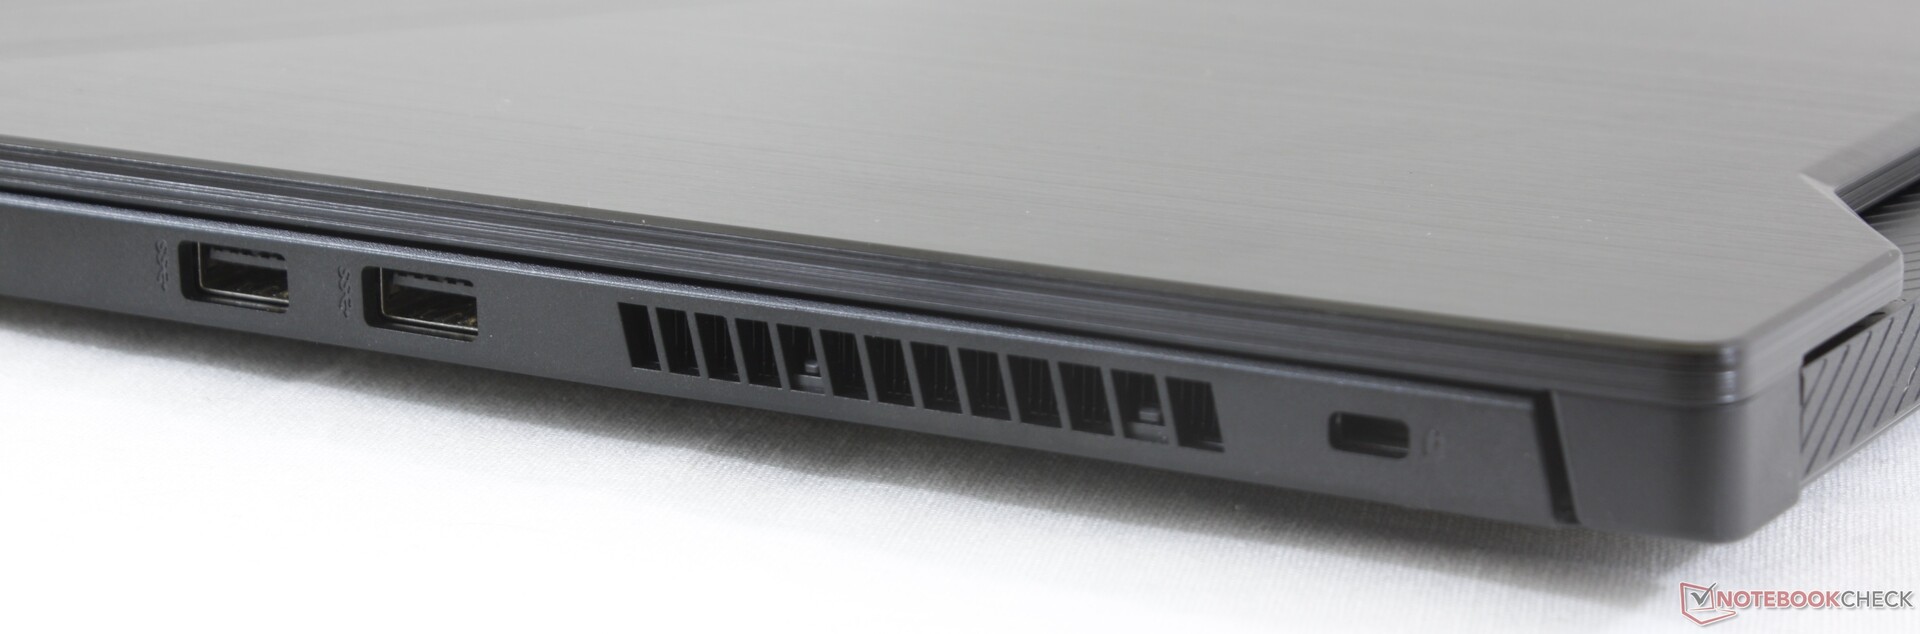
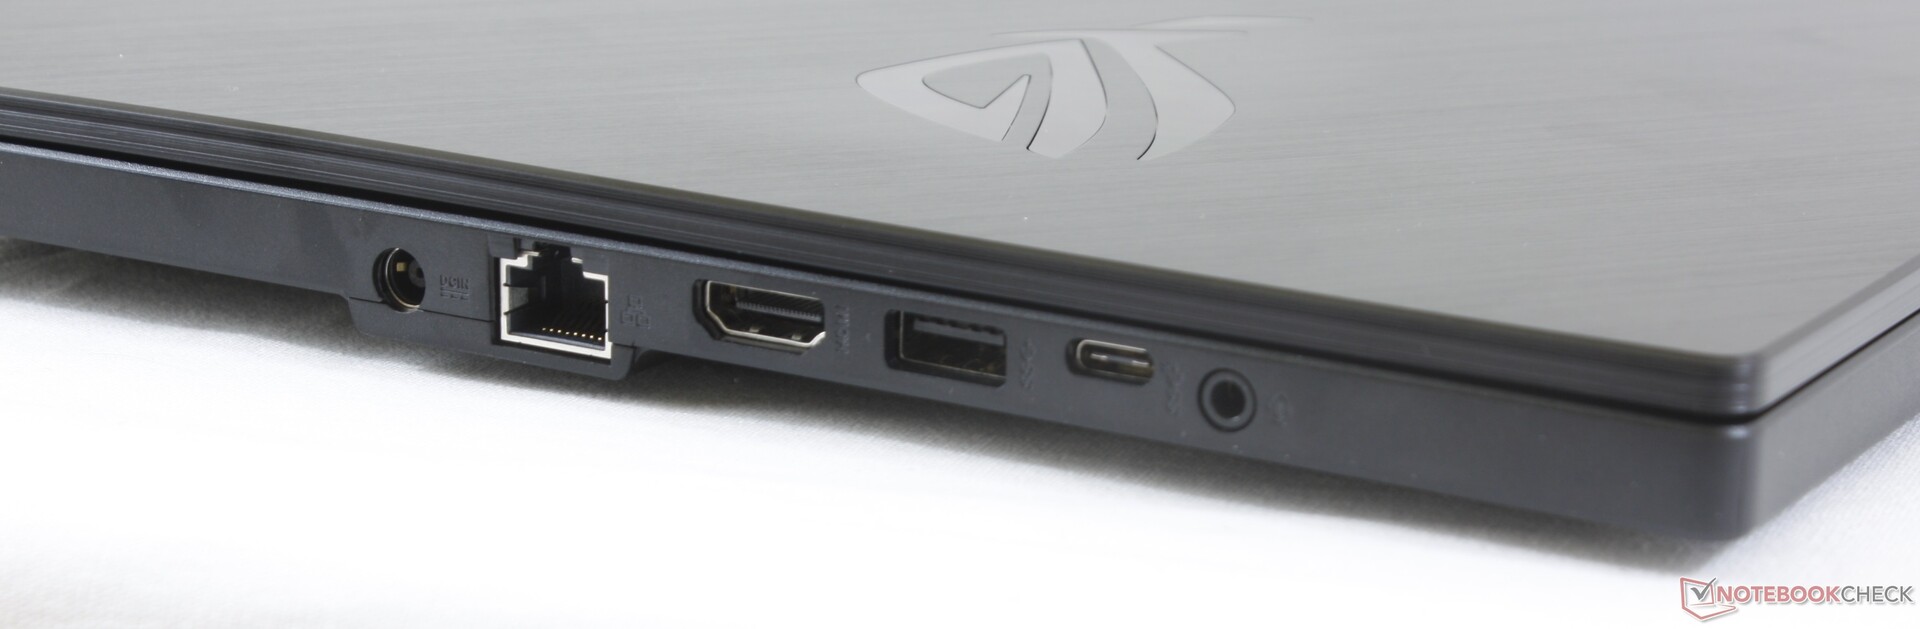
Available ports are identical to the Zephyrus GX502 albeit without the dedicated 3.5 mm microphone port and with slightly rearranged positioning. Even so, port positioning is still a mixed bag because the ports are very close up front instead of towards the rear. Cables will take up valuable desk space especially for left-handed users where the majority of ports are located.
Both Thunderbolt 3 and an SD card reader are not available. Users who must have these features can instead consider the costlier MSI GS65 or Lenovo Legion Y740.
Communication
Wireless is provided by a 1x1 Realtek 8821CE WLAN module with integrated Bluetooth 5.0. Maximum transfer rates are just a fraction of the higher-end Intel 9560 as found on the pricier Zephyrus S GX531 and the module carries no gaming-centric features as found on the Killer 1550 or 1535. It's a cut corner that casual gamers will likely not mind so long as connectivity is stable and reliable. We experienced no connectivity issues during our time with the test unit.
Maintenance
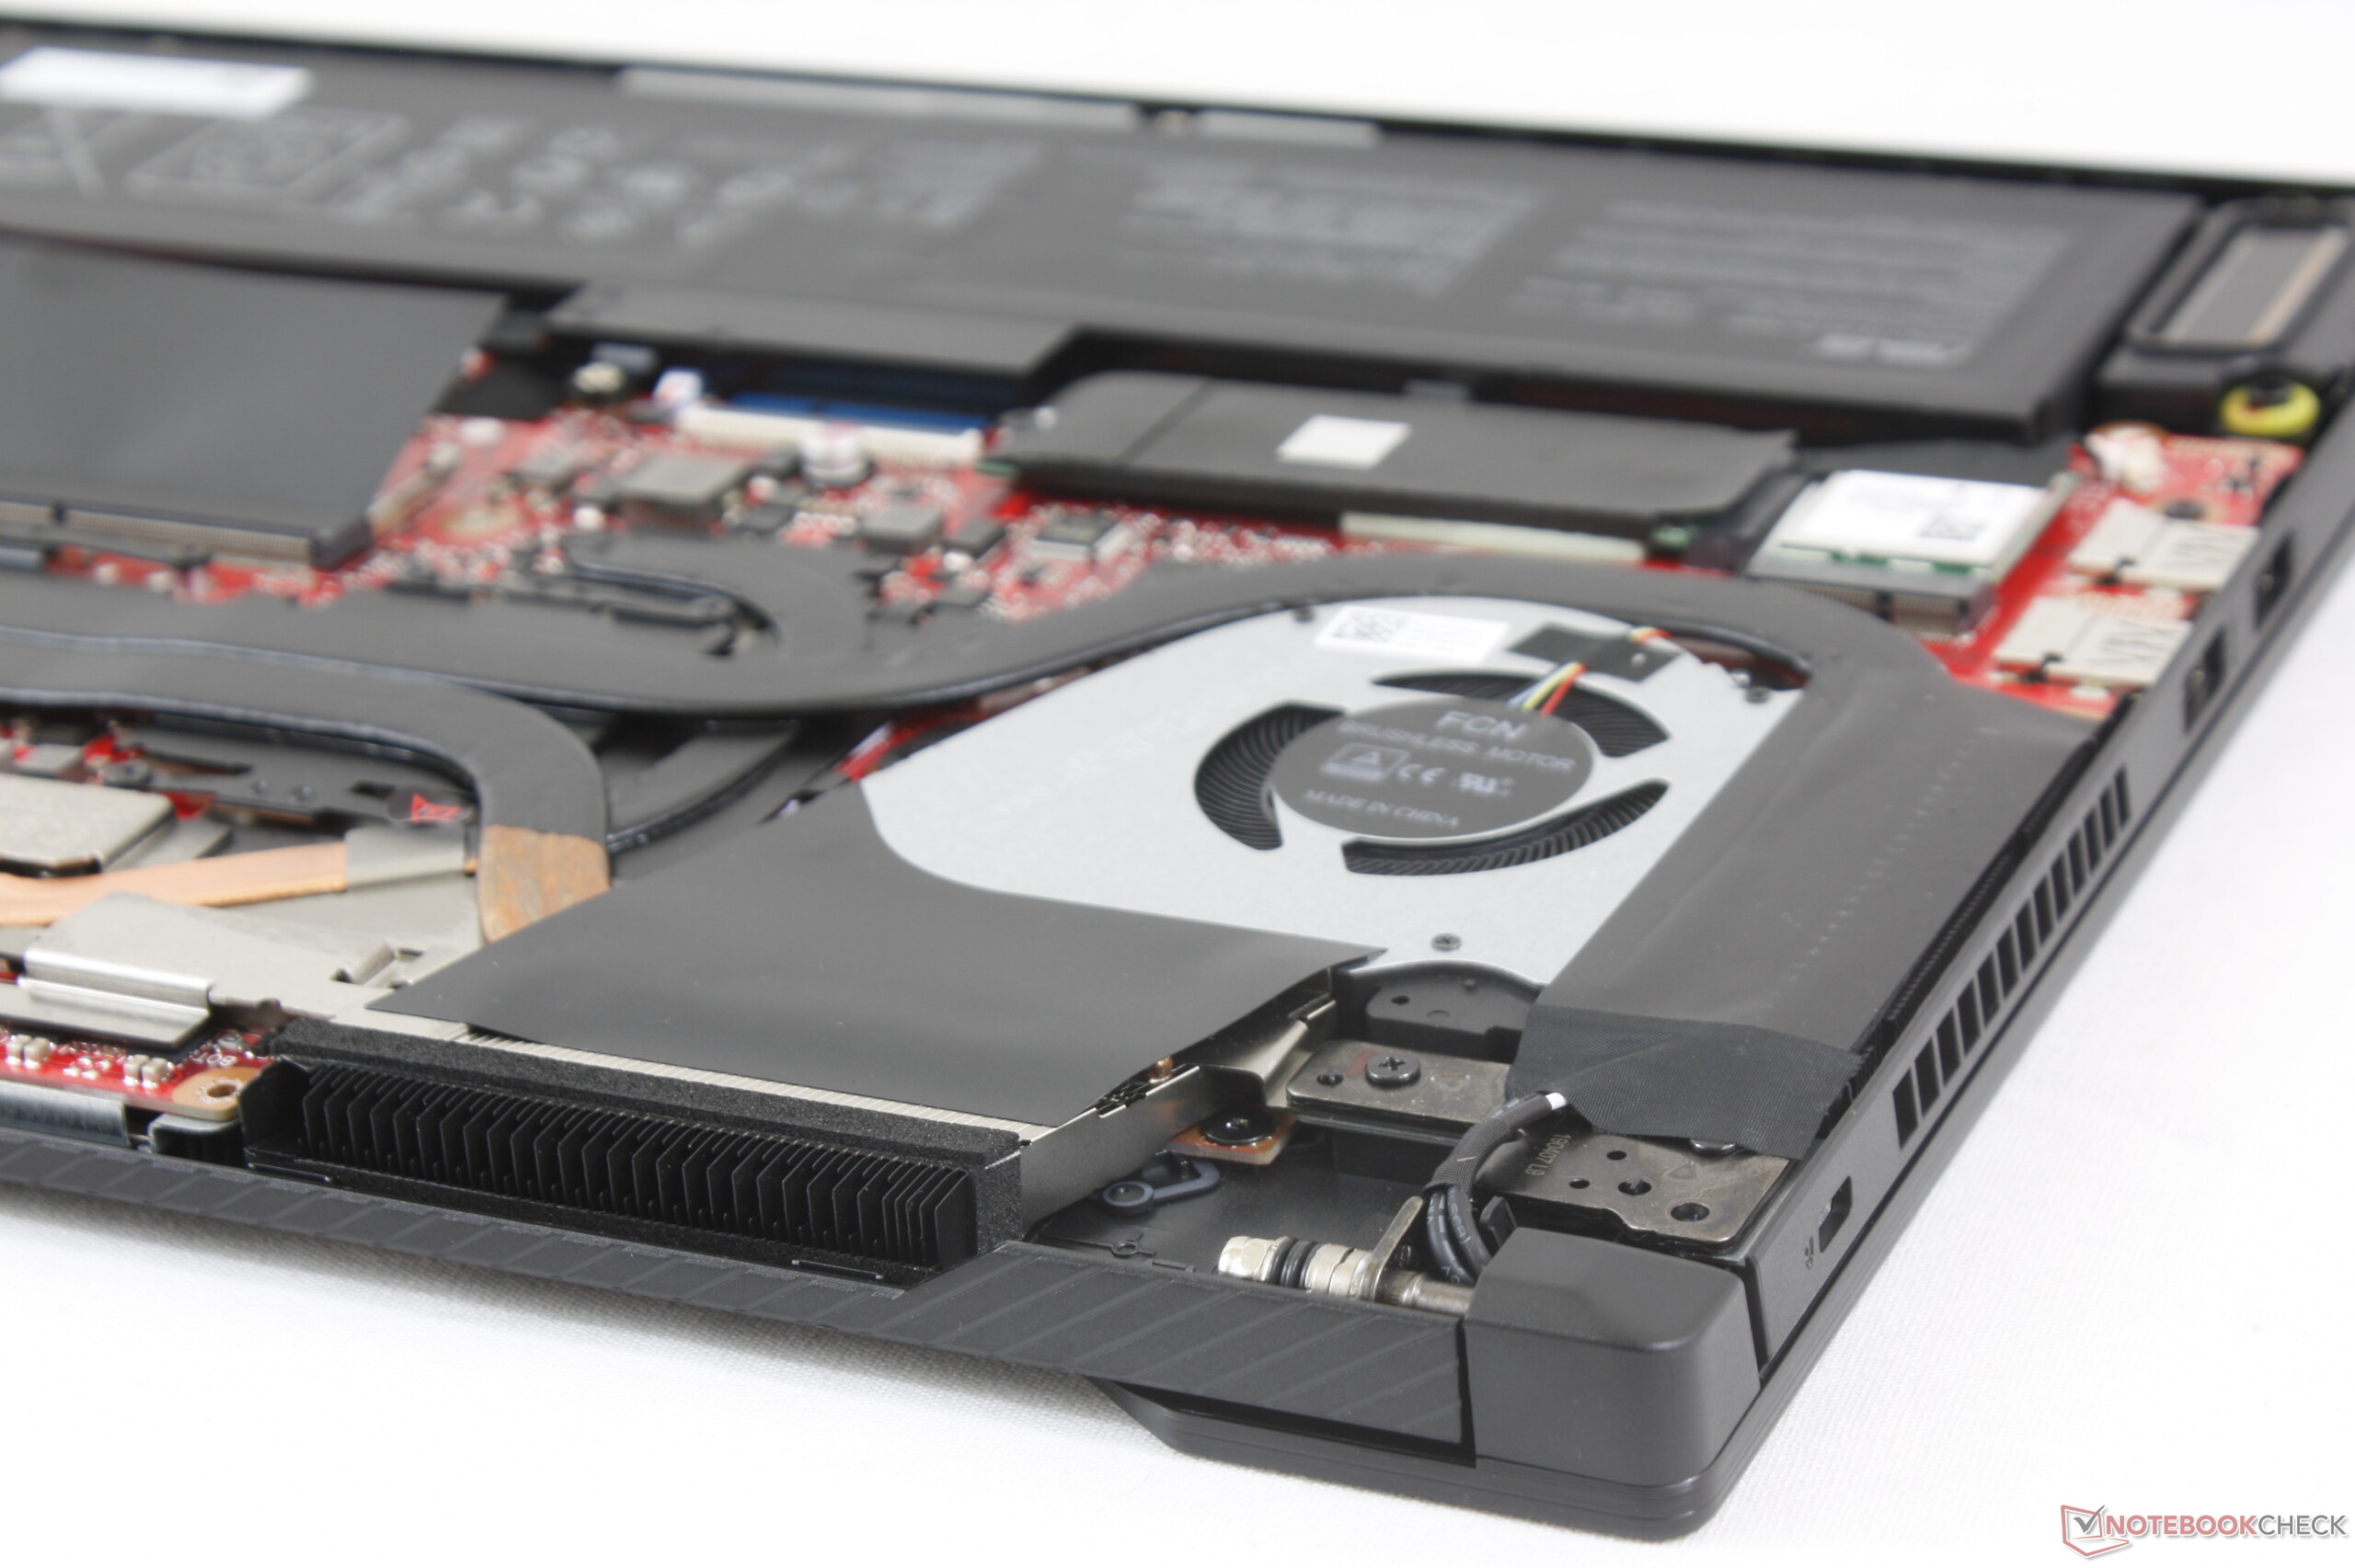
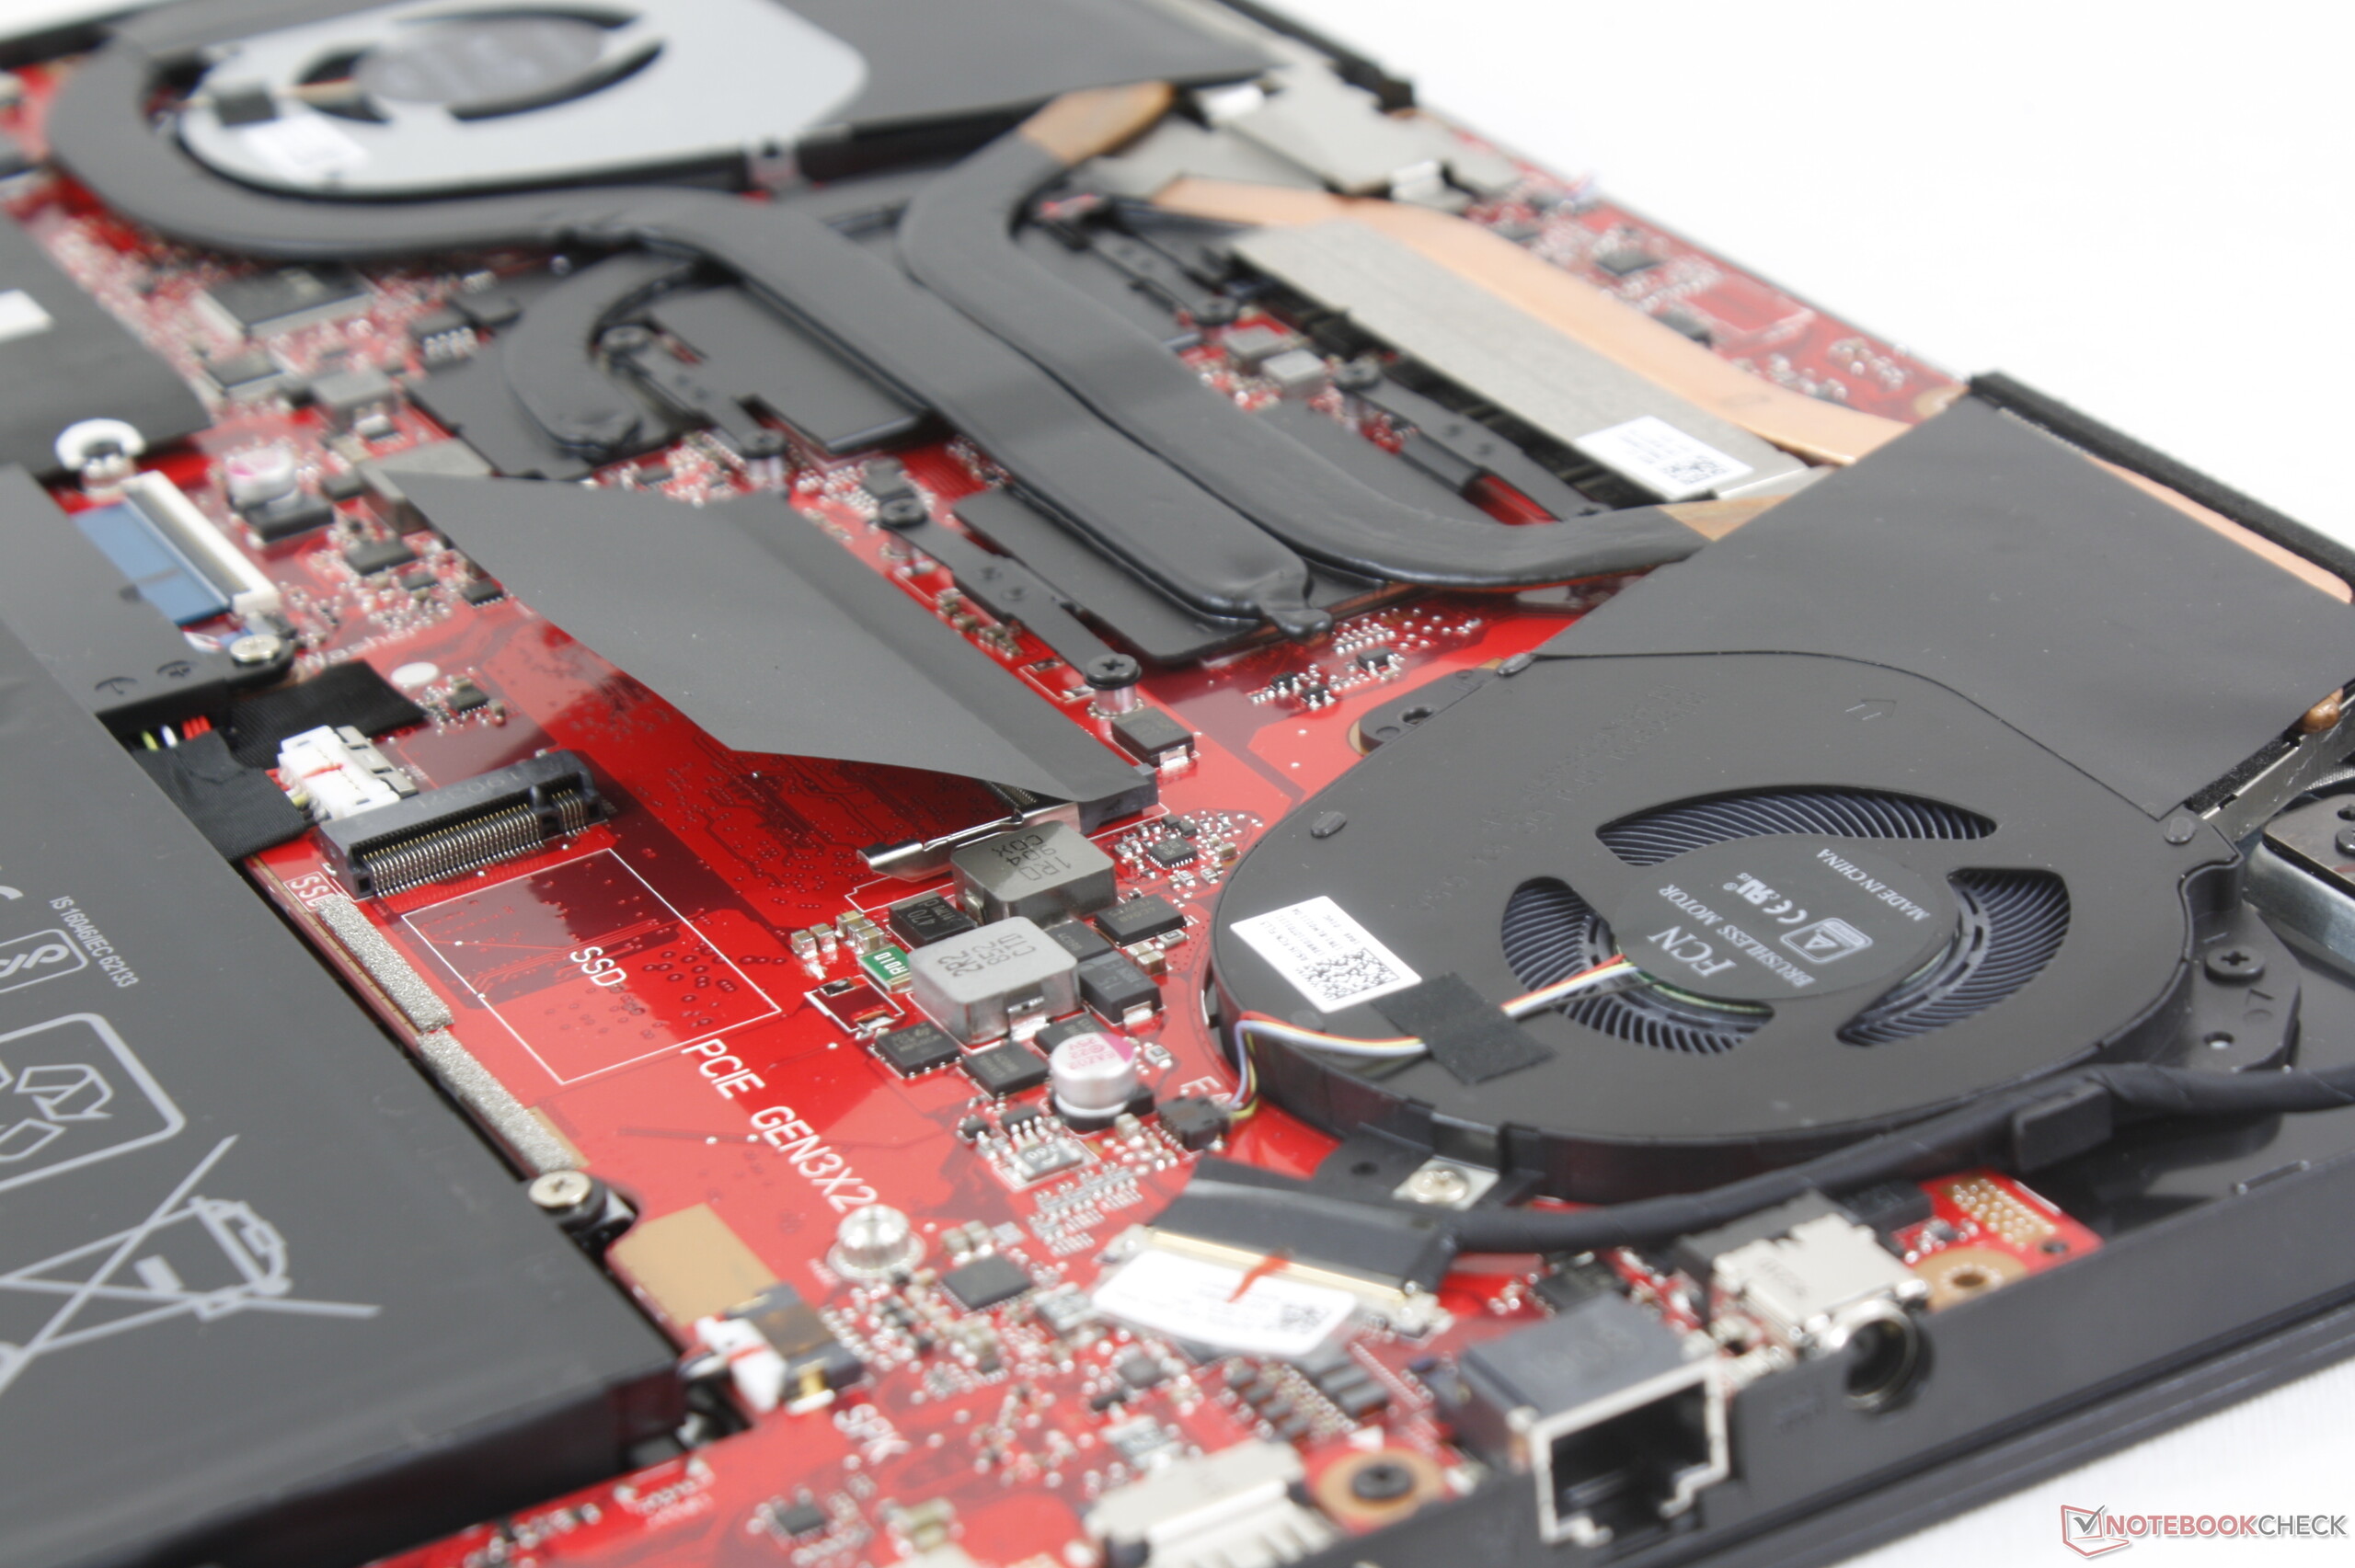
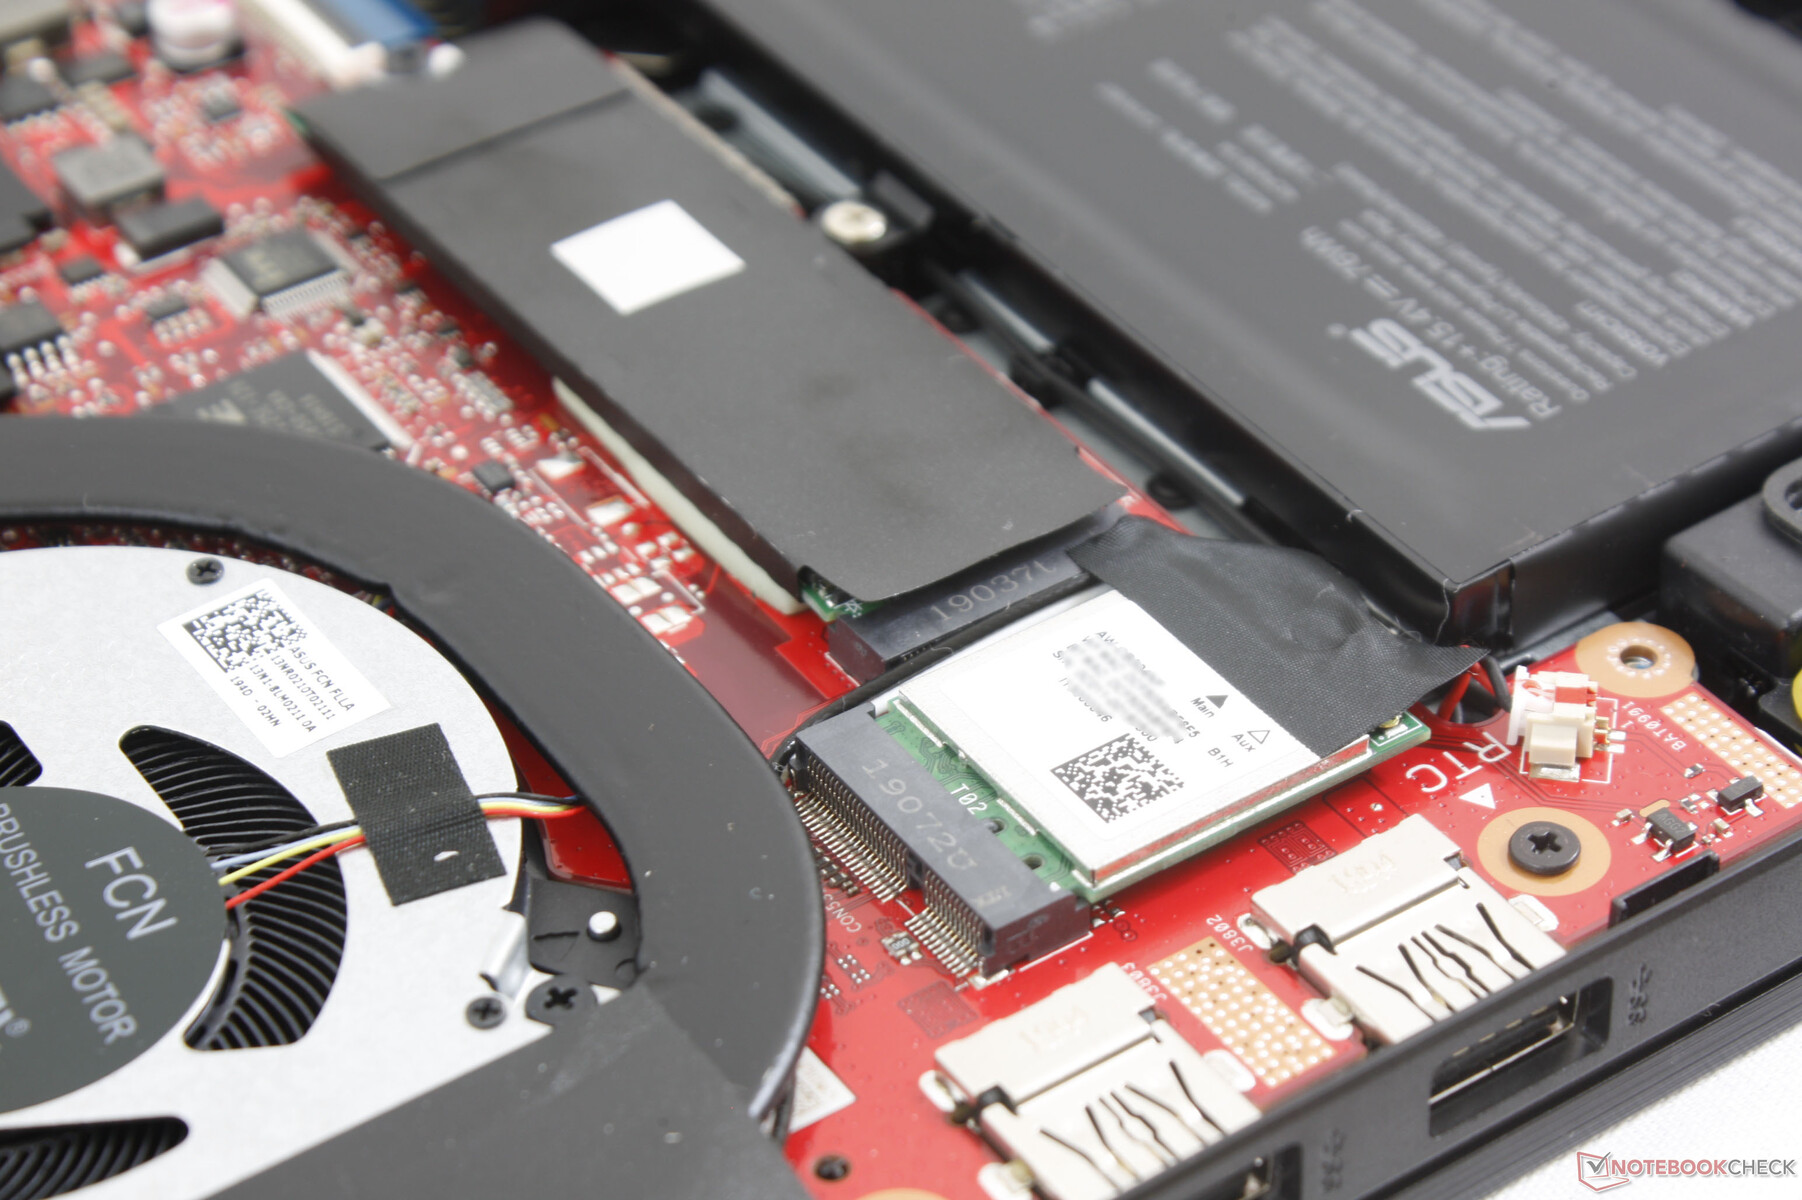
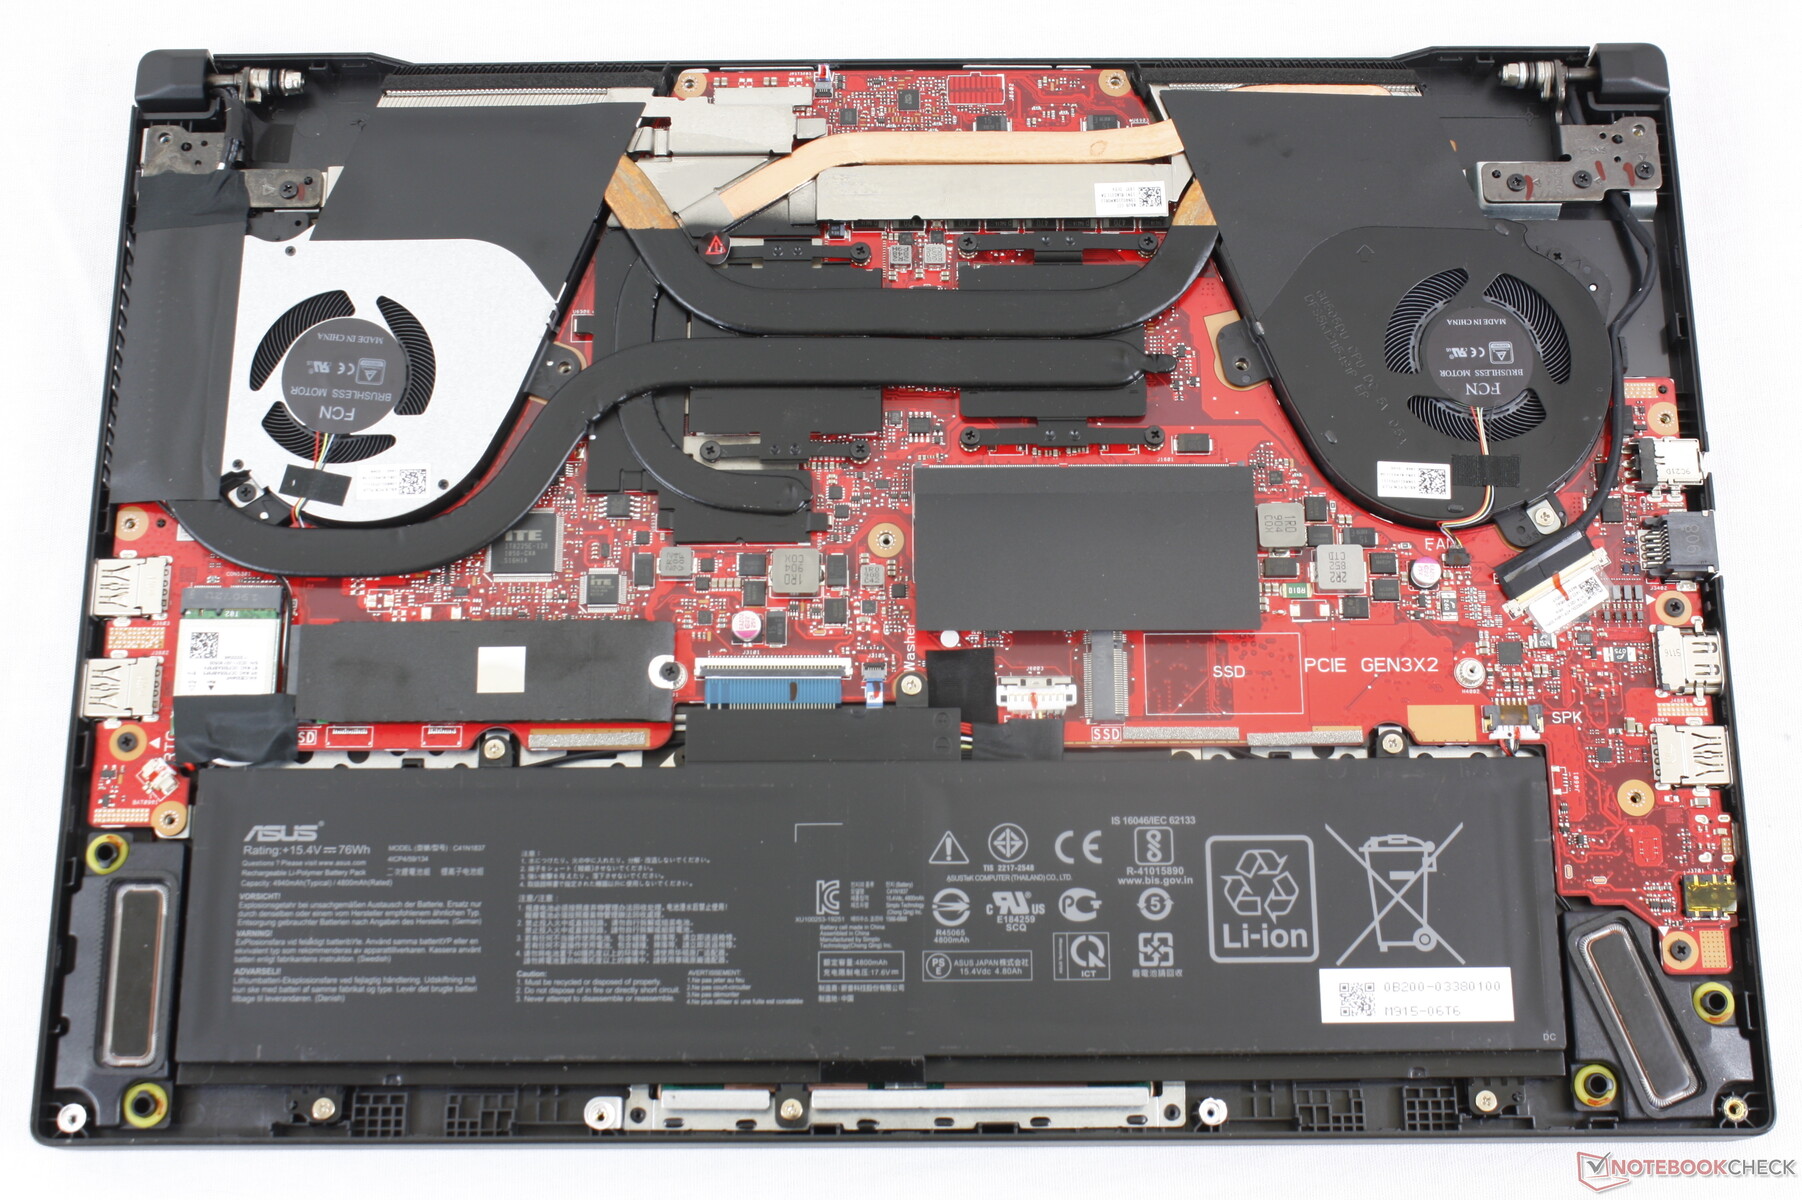
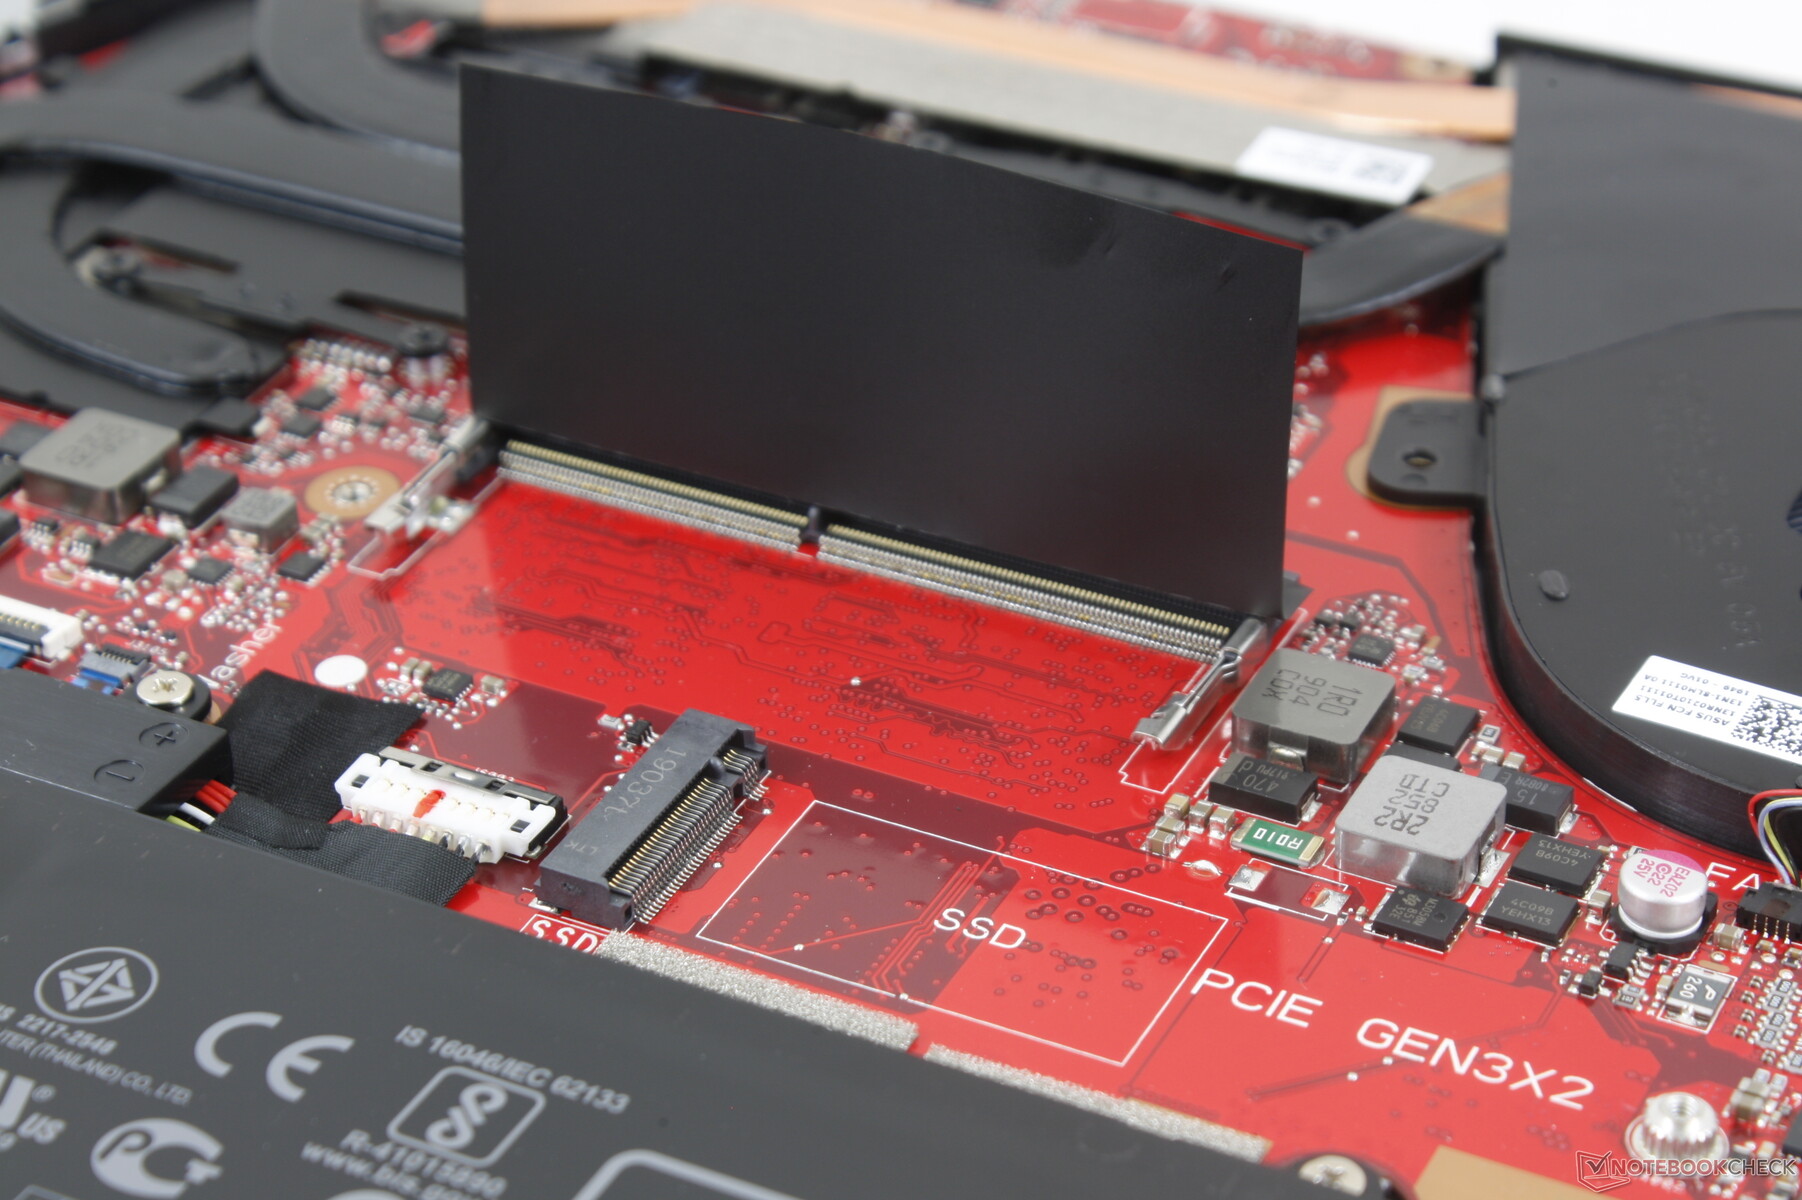
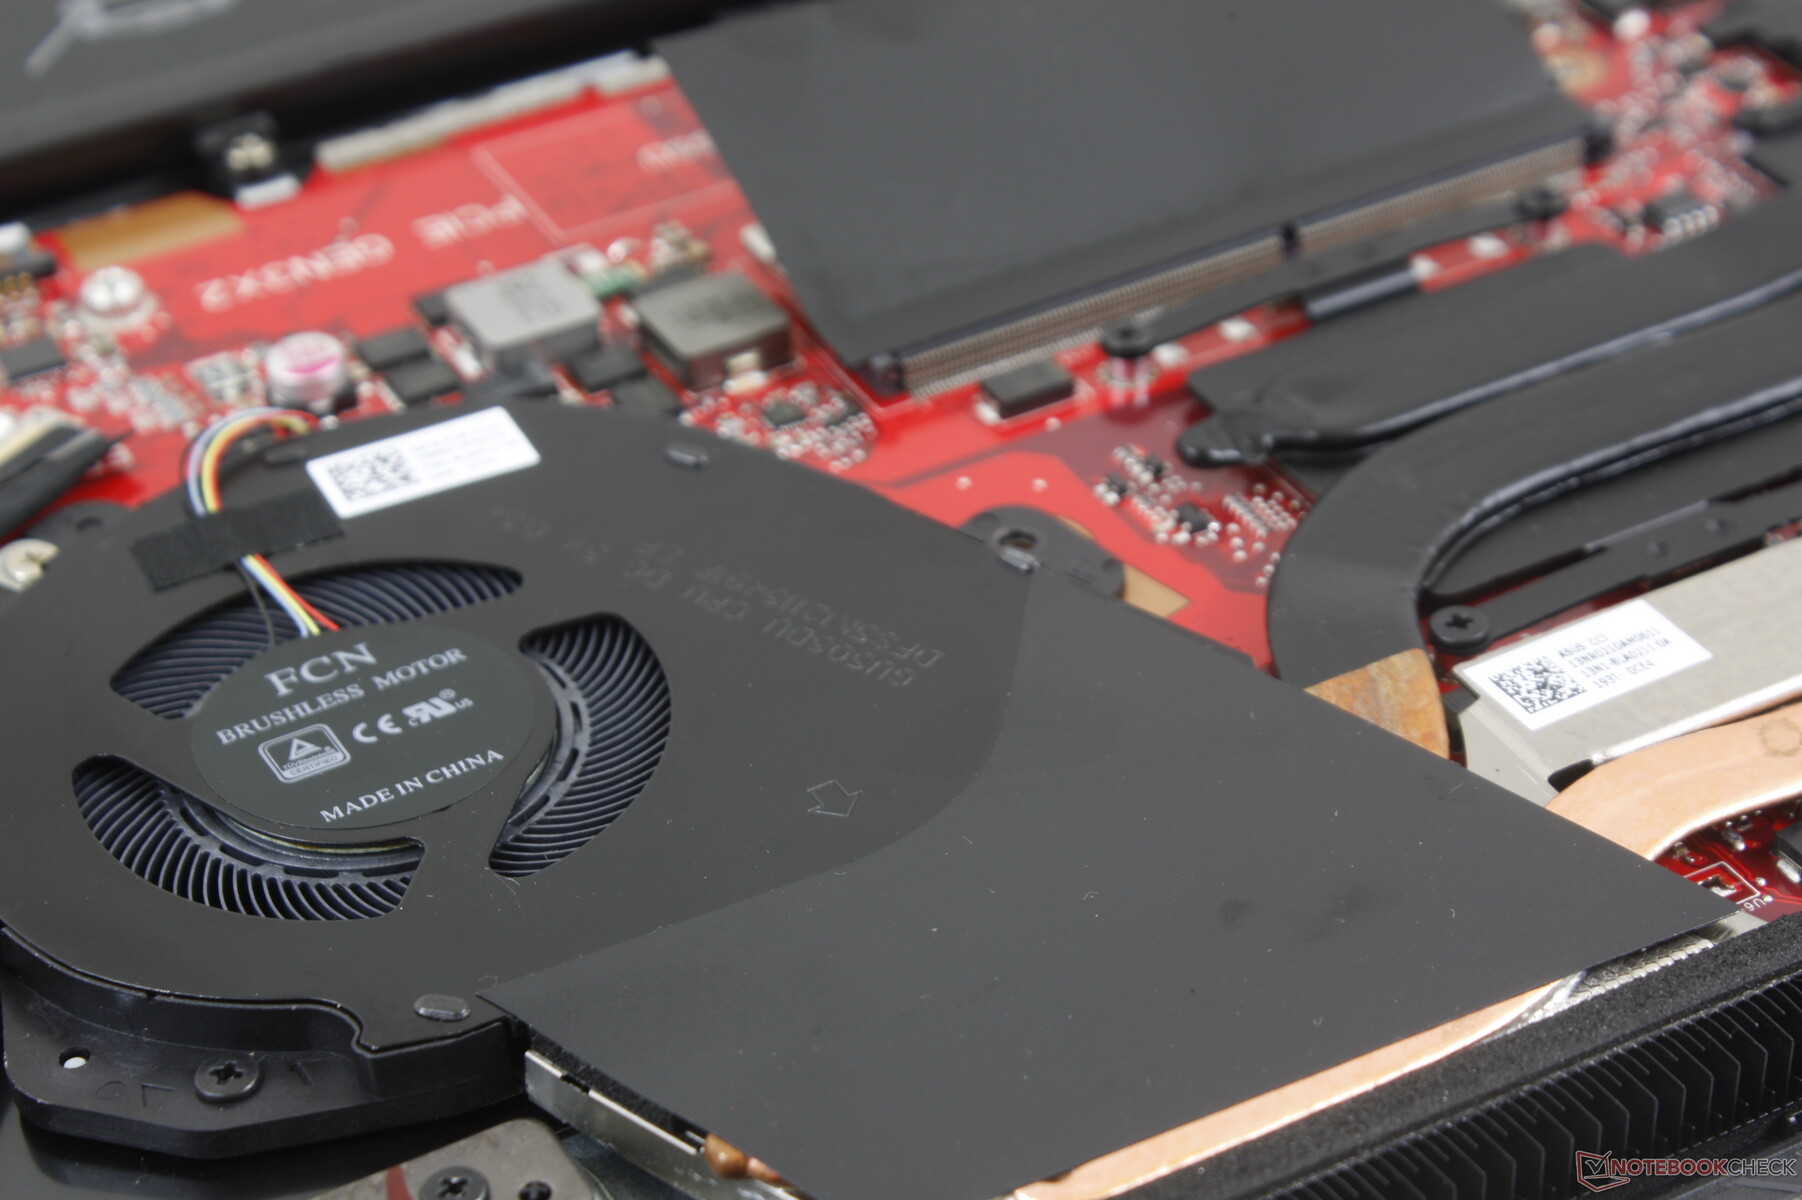
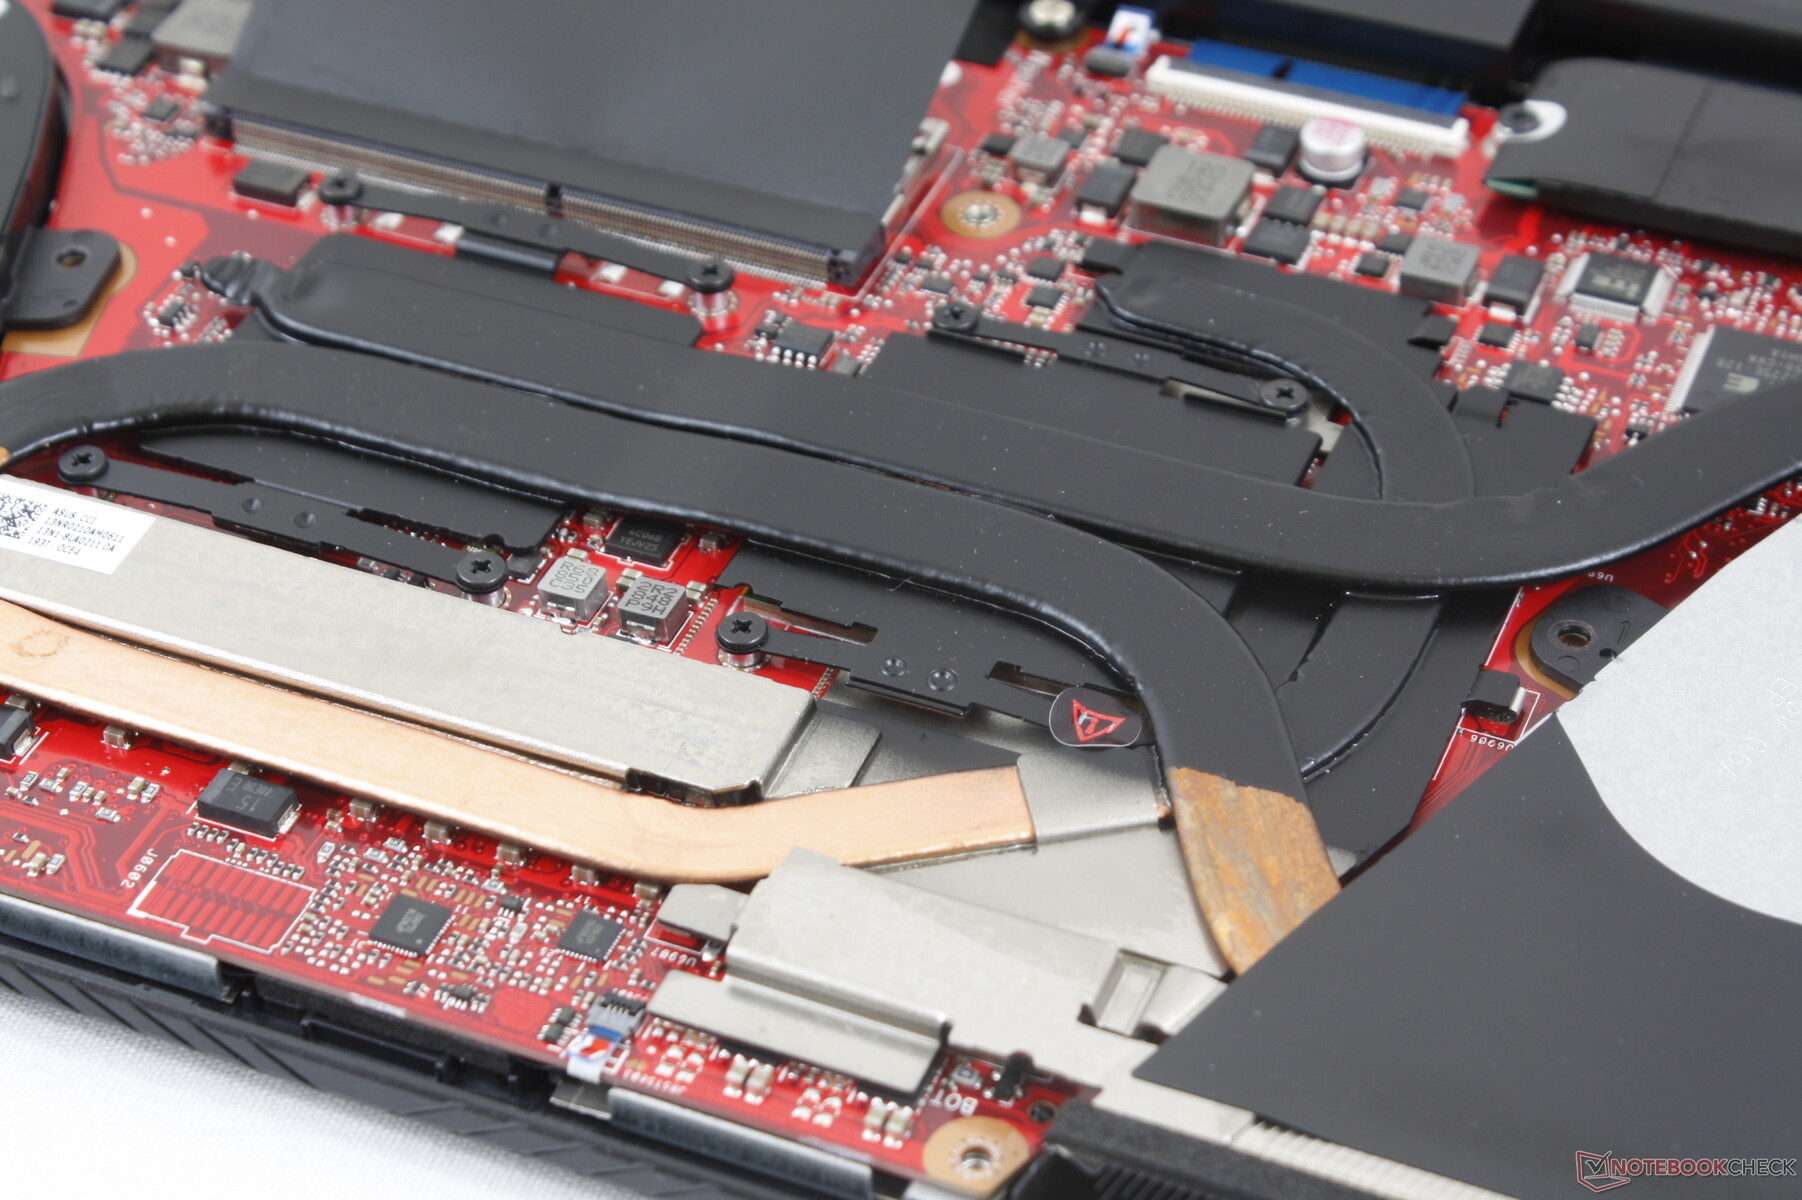
Since the GA series is lacking the ErgoLift feature of the GX series, the bottom panel is much easier to remove with just a Philips screwdriver for better serviceability. In other words, Asus' cheaper GA502 is easier to repair than its more expensive GX502. Users can upgrade the M.2 2242 WLAN, 2x M.2 2280 SSD, or single SODIMM slot. With 15 screws to remove, however, the process definitely takes a bit of patience.
It's worth noting that the bottom panel can be removed without needing to tear any anti-tamper stickers unlike on most MSI laptops.
Accessories and Warranty
There are no extras in the box other than the AC adapter and Quick Start guide which is understandable for a relatively inexpensive gaming laptop.
The standard one-year limited warranty applies. Owners can register their purchases to make the most of the manufacturer warranty.
Input Devices
Keyboard
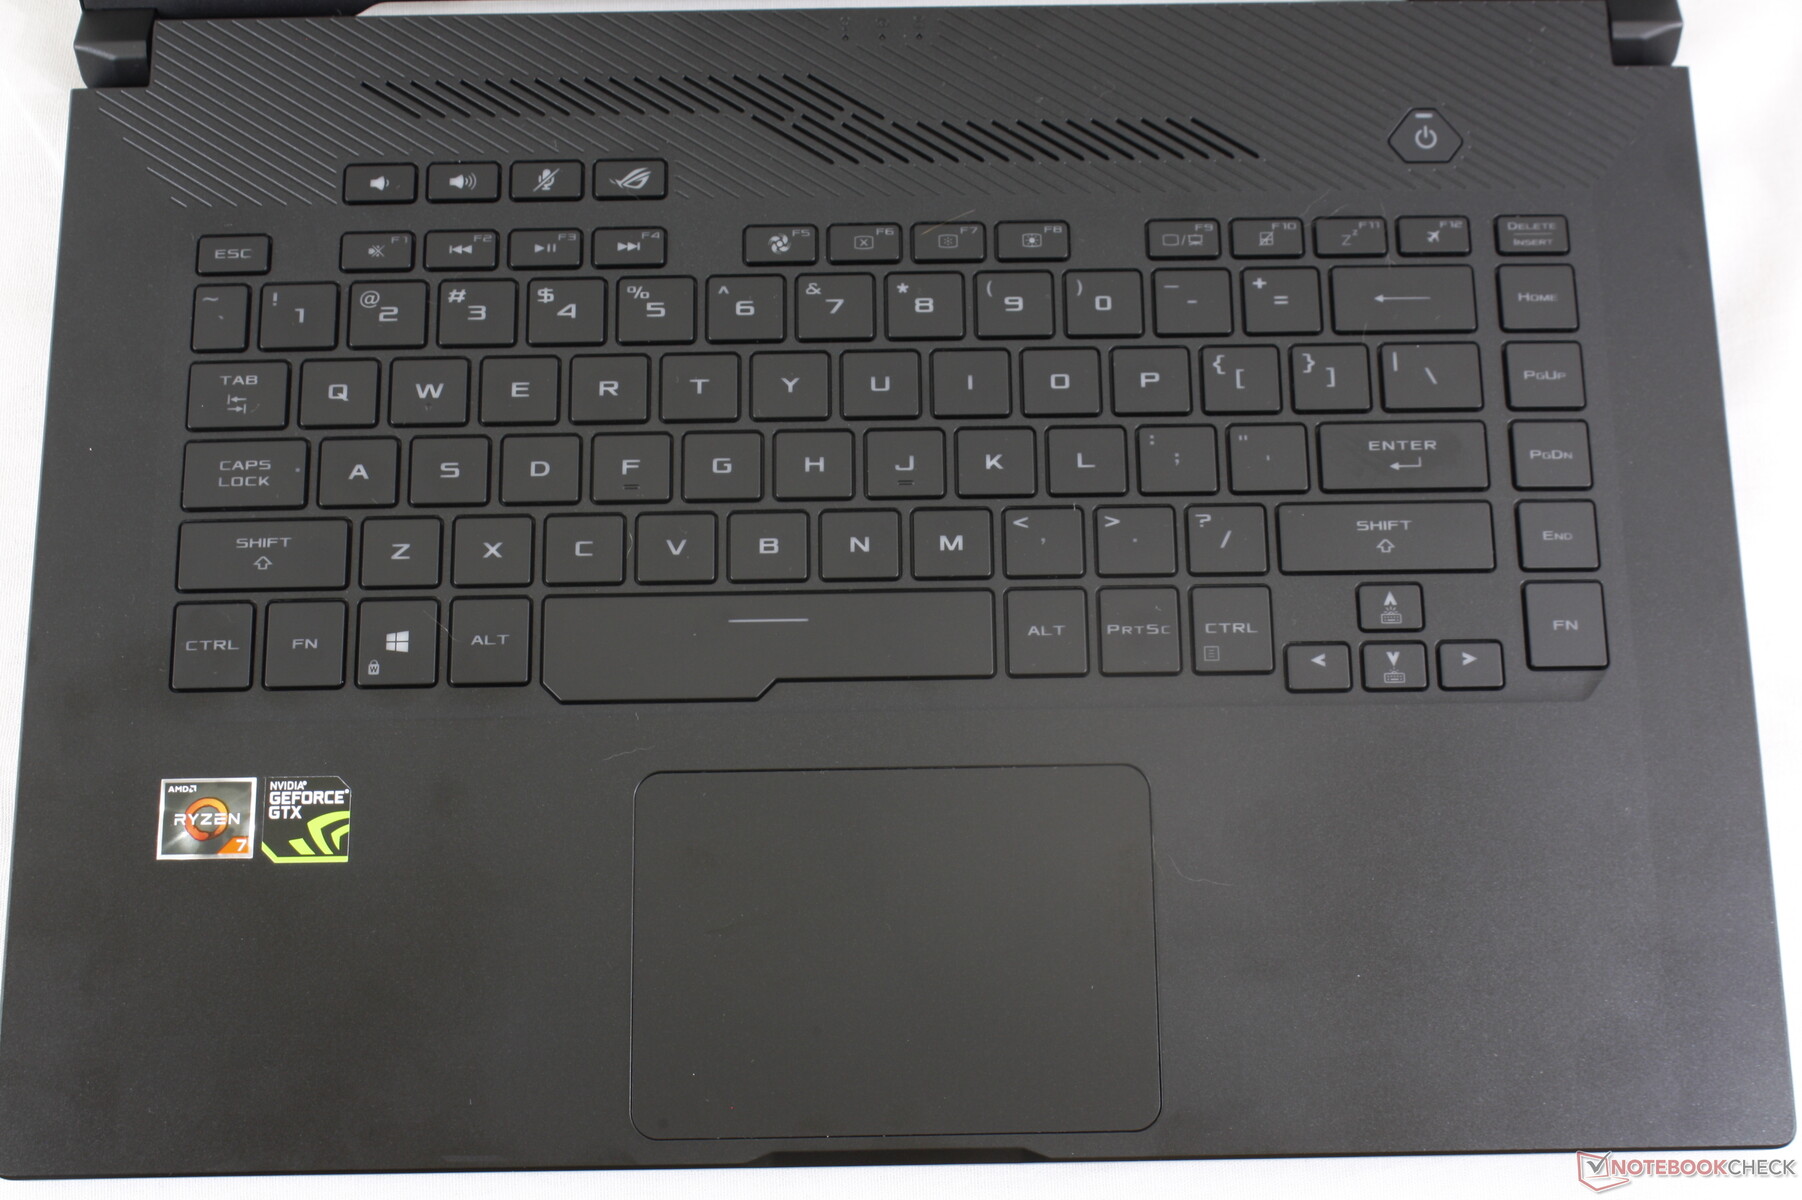
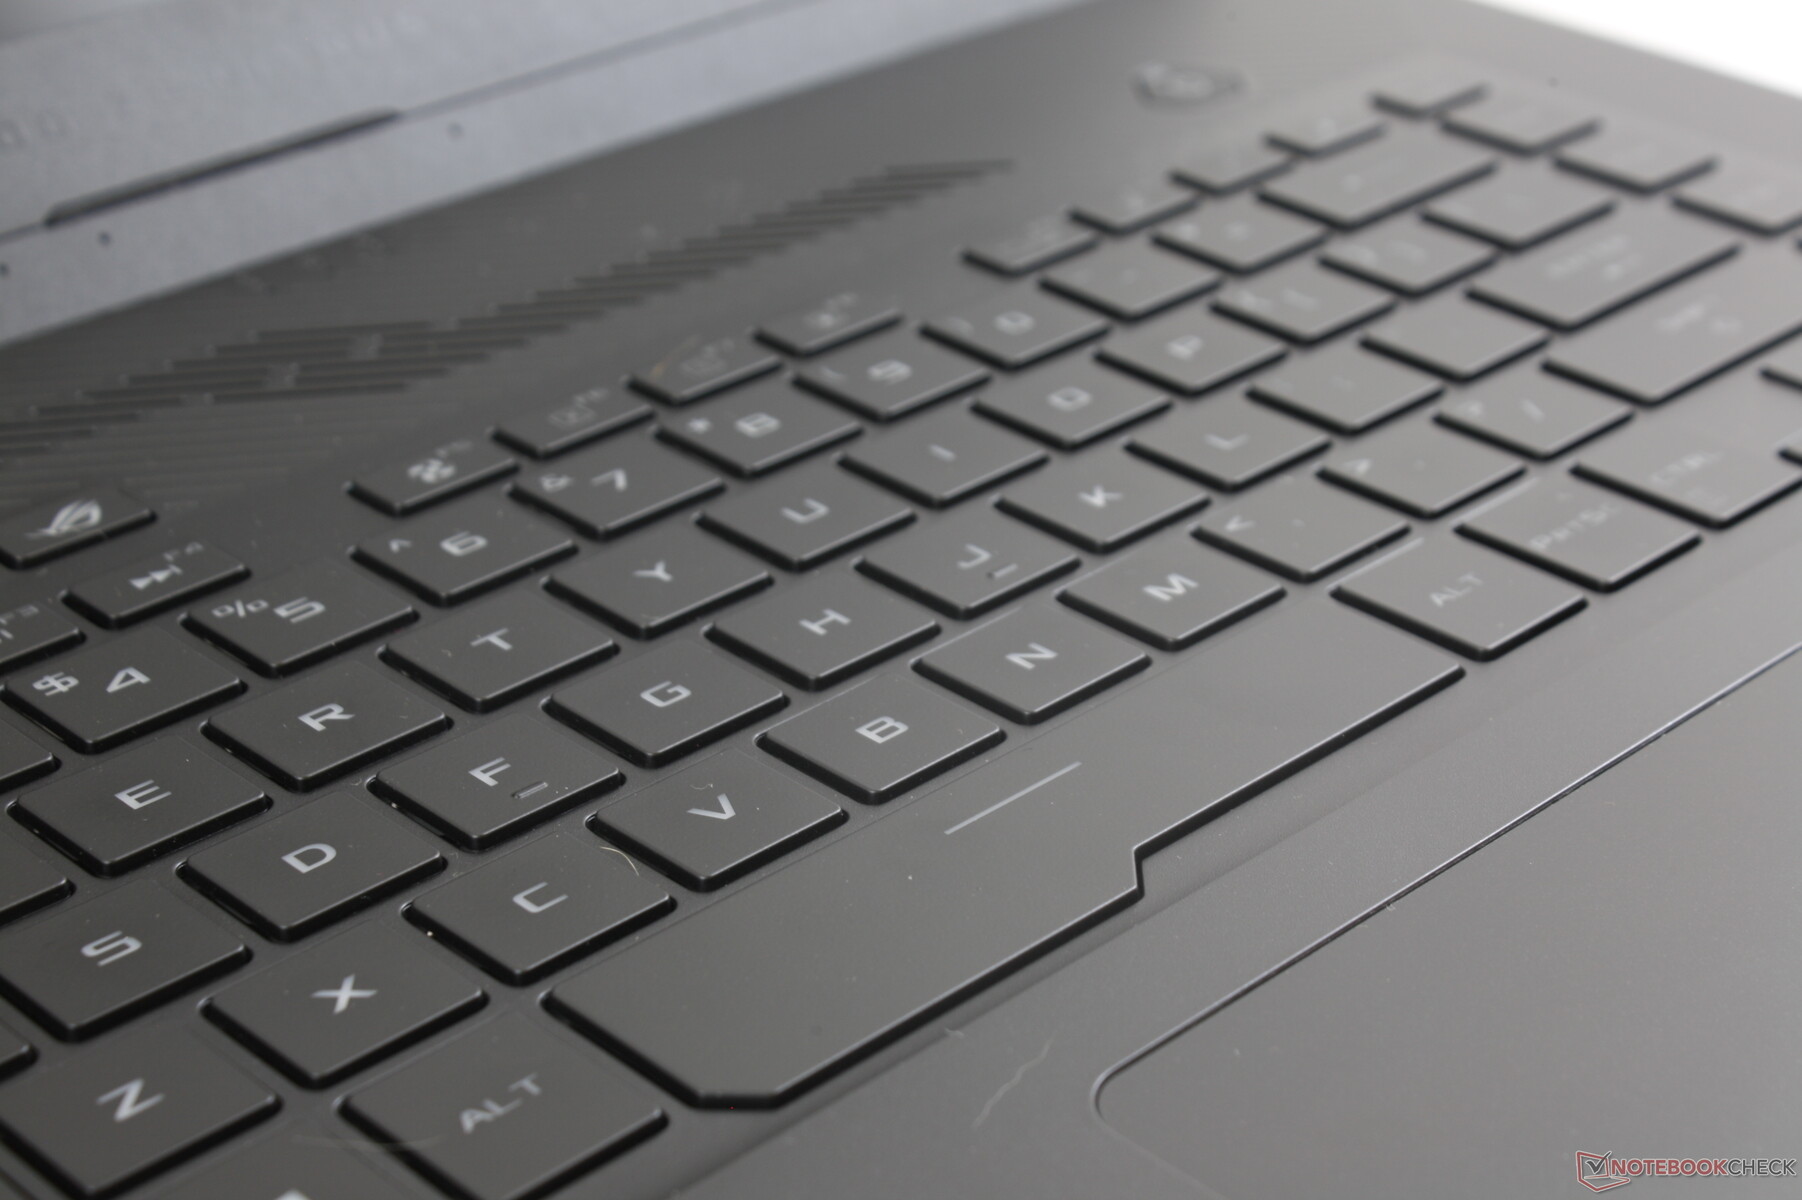
Take the GX501 keyboard, move it back to the more traditional position, and you have the GA501 keyboard. Everything from key feedback to layout and sizes are nearly identical between the GA501 and GX502 and so many of our existing comments still apply here for better or worse. Key feedback remains shallower and softer than what you will find on most other 15.6-inch laptops including the HP Spectre x360 15, MSI GS65, Alienware 15, and Asus' own TUF FX505 or Zephyrus G GU501. It takes some getting used to if you're a desktop gamer.
RGB lighting has been replaced by a single-zone white light likely to keep costs under control.
Touchpad
The medium-sized clickpad (10.5 x 7.5 cm) is slightly smaller than the trackpad on the XPS 15 (10.5 x 8.5 cm) while being much larger than the non-traditional trackpad on the older GX501 (6.0 x 7.8 cm). Glide is very smooth with no cursor jumping and only minimal sticking when moving at very slow speeds. Meanwhile, the integrated mouse keys are shallow in travel with soft and quiet feedback. We would have preferred a firmer feel or even dedicated mouse keys for more accurate clicks.
Perhaps the most irksome aspect of the clickpad is its tendency to attract and collect grease very quickly even after just a few minutes of use. Much like the keyboard keys above, we expect the trackpad to look old and unsightly much sooner than on most other laptops.
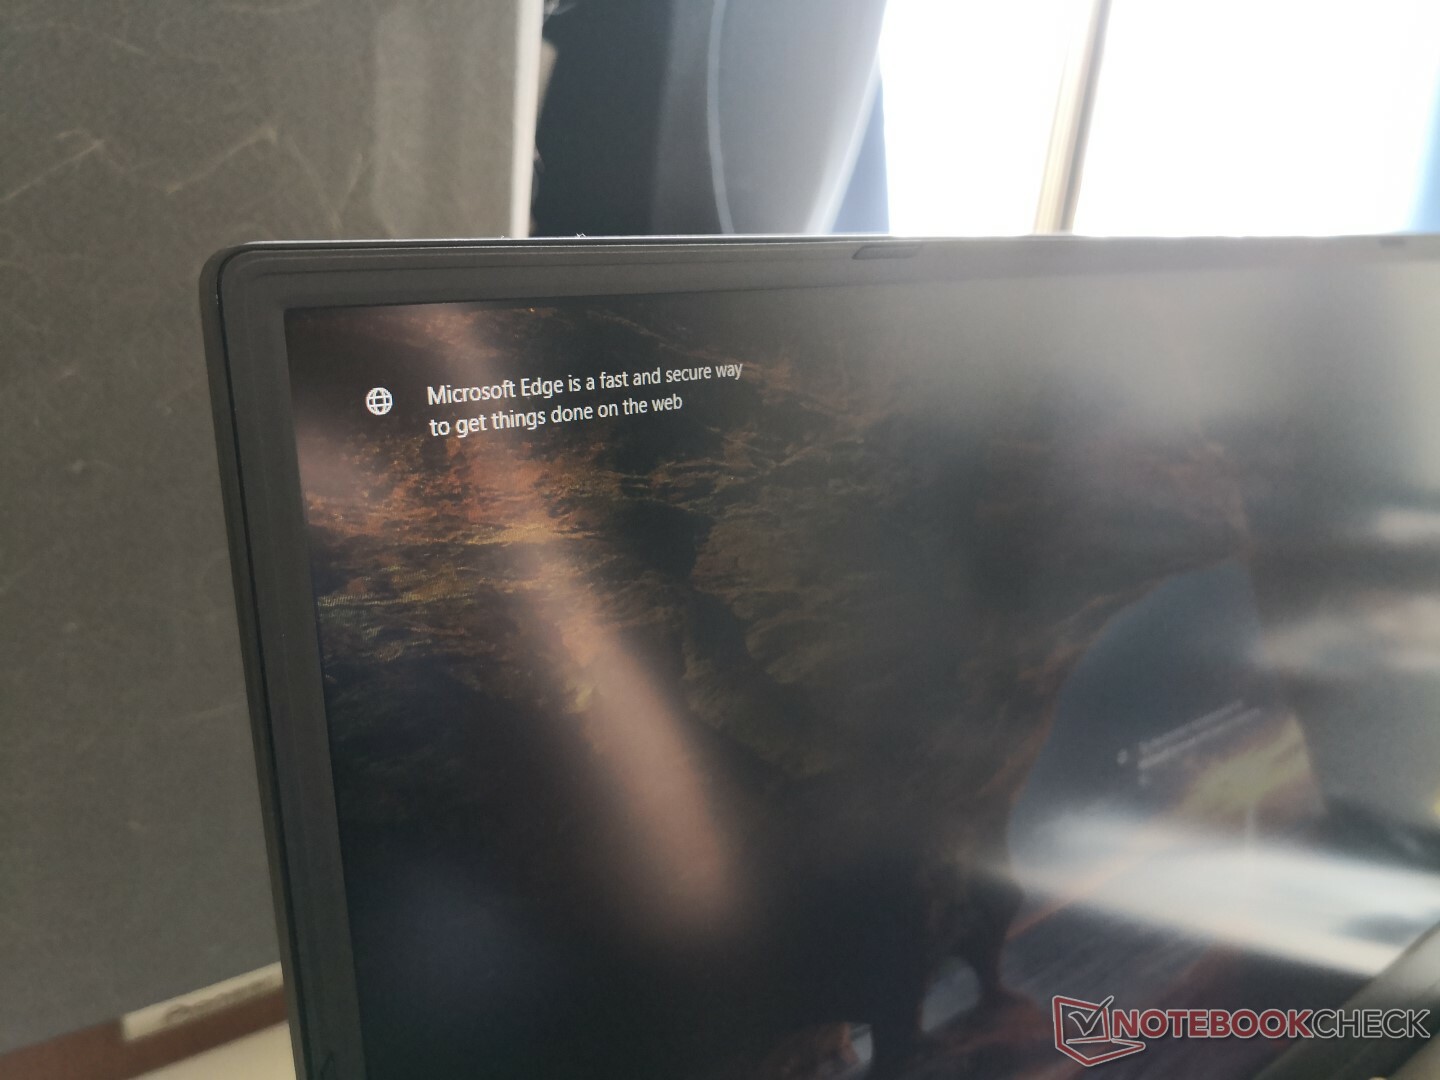
Display
Two "IPS-level" panel options are available: 1080p at 60 Hz or 1080p at 120 Hz. Our test unit is configured with the former and so all our measurements below reflect only the 1080p60 panel. We cannot speak for the 120 Hz option.
Asus uses the same Panda LM156LF-CL03 panel for both the ROG GA502GU and the less expensive TUF FX505DY. Thus, both of these laptops share similar characteristics including the good contrast ratio, average response times, and limited color space. It's somewhat disappointing to not see any 3 ms or 5 ms panel options to reduce ghosting as even the similarly-priced Lenovo Legion Y740 has this option. Display brightness could be brighter as well when compared to other gaming laptops or Ultrabooks where 300+ nits is commonplace.
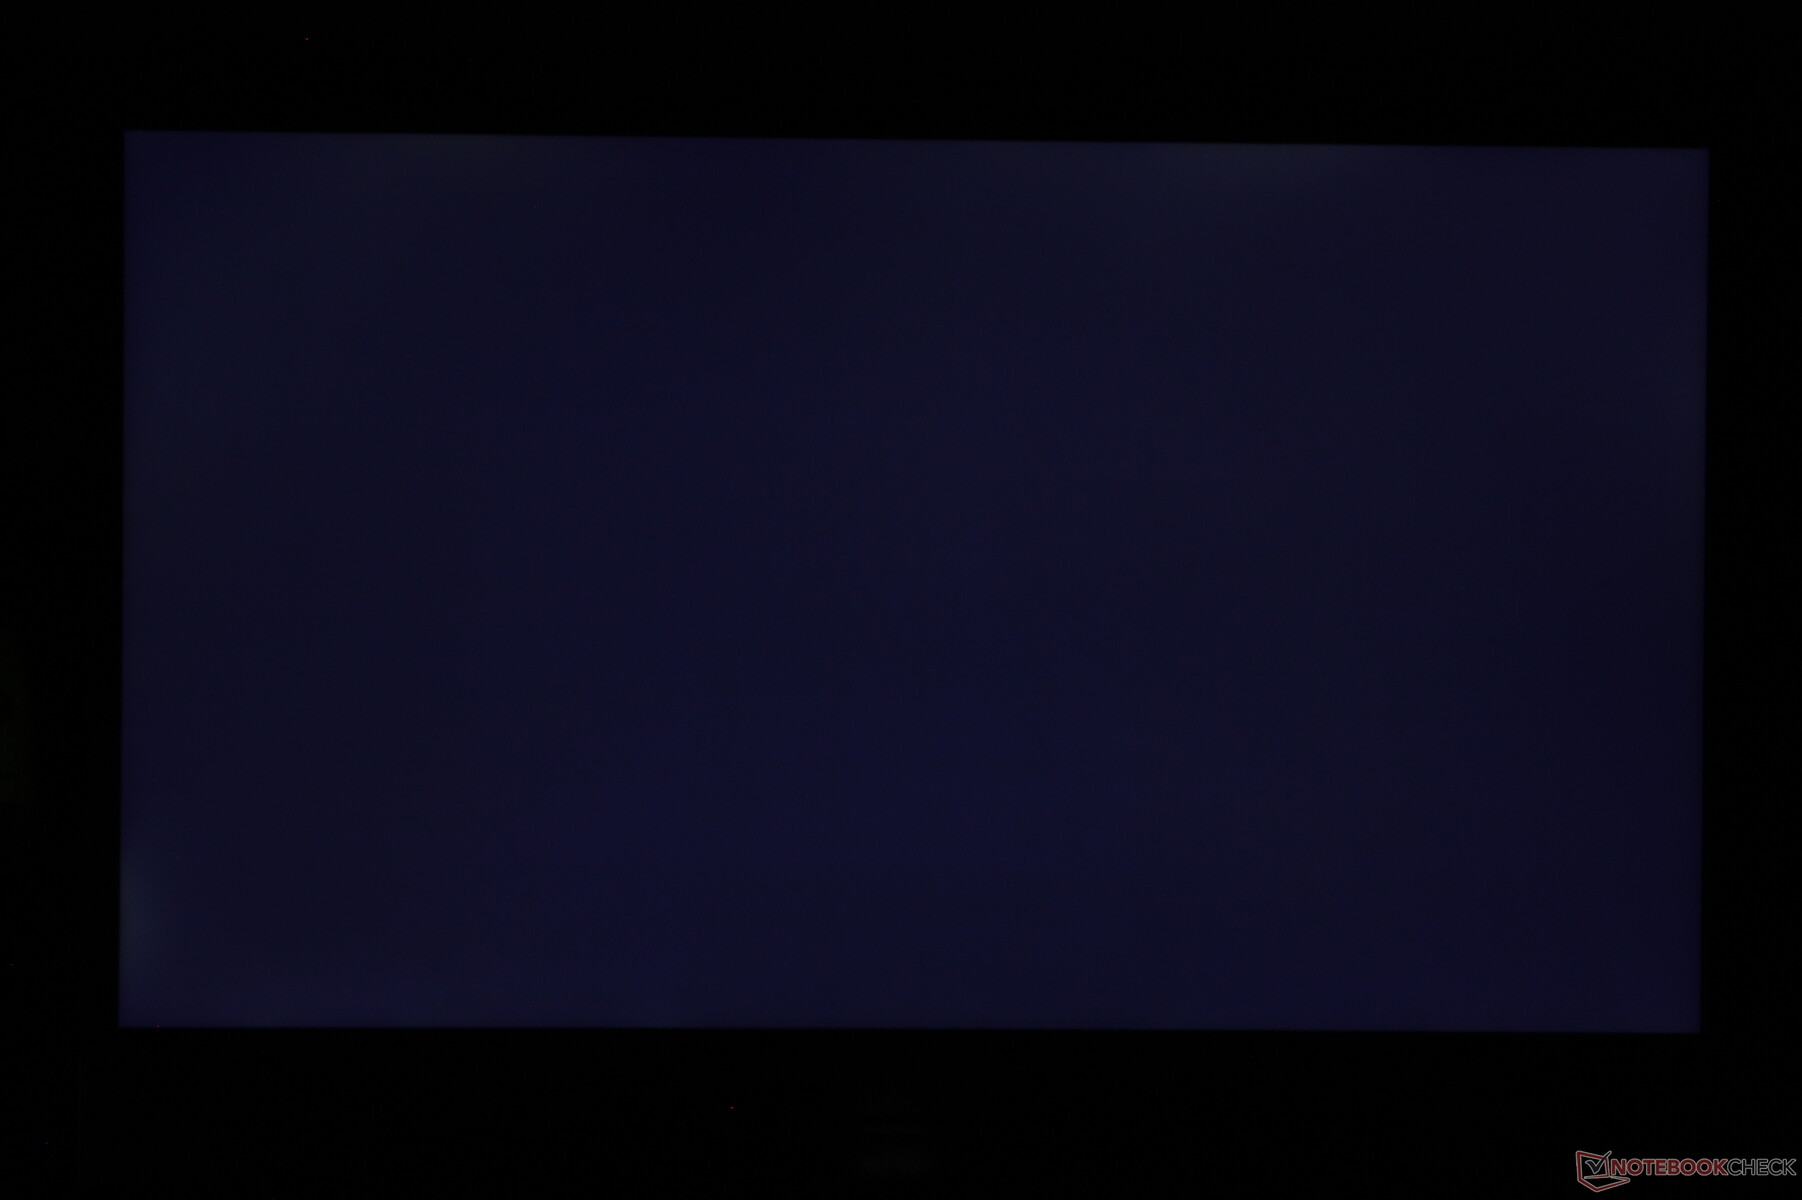
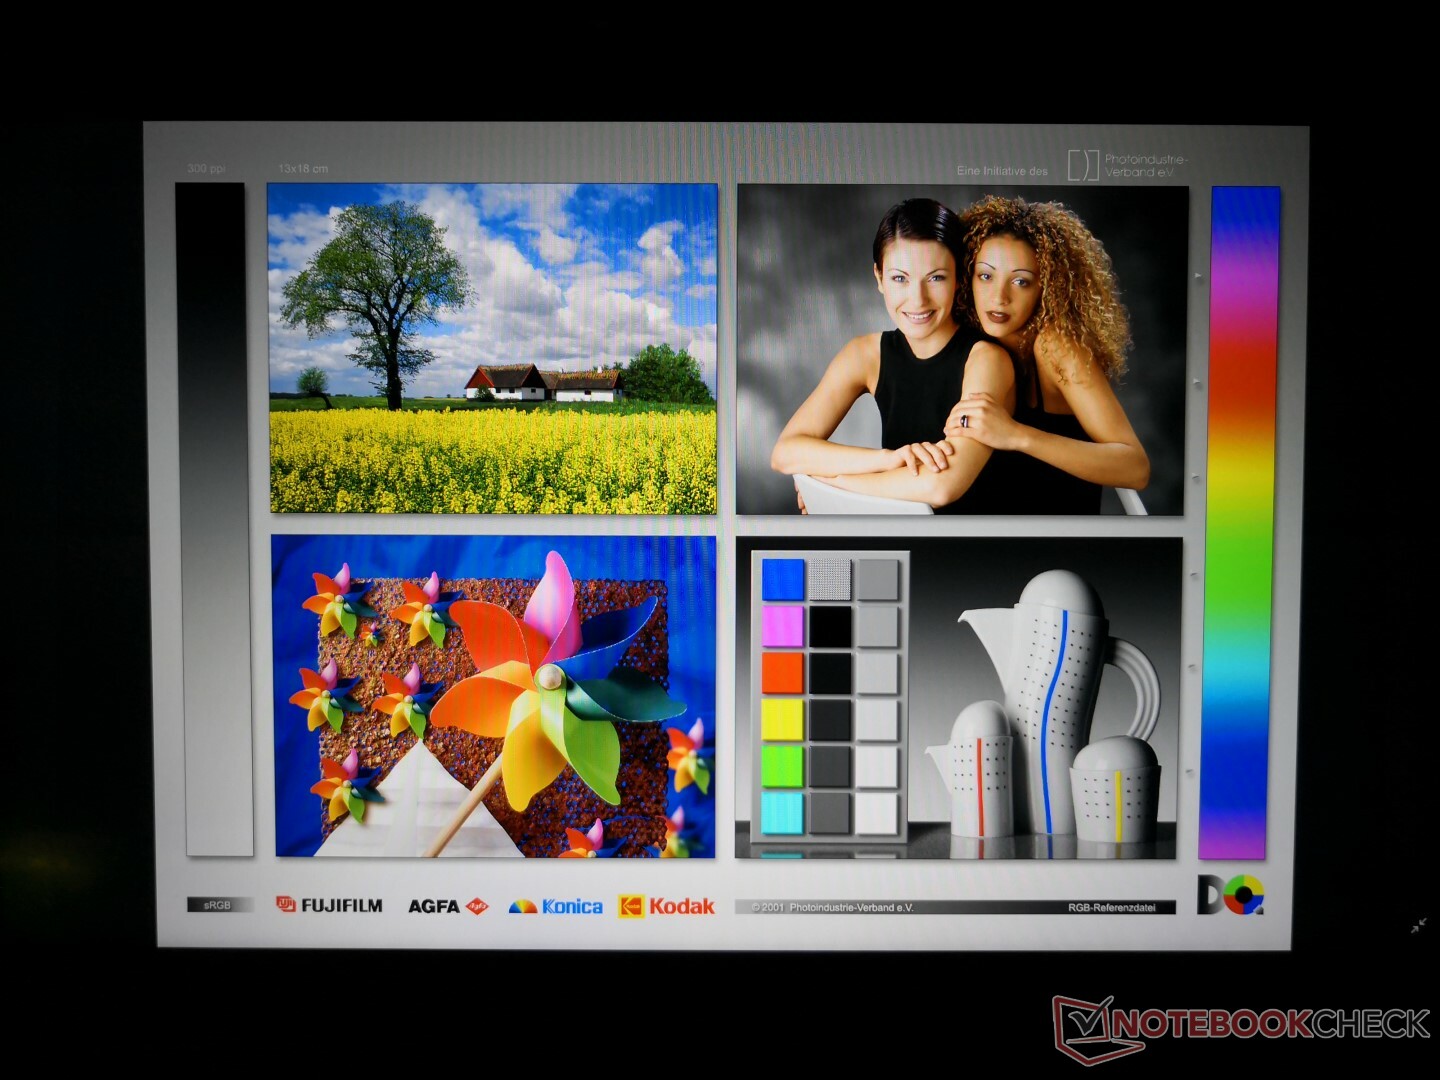
Graininess and uneven backlight bleeding are both non-issues which is impressive for a budget-midrange gaming laptop. The picture is just slightly less sharp than what you would get from a glossy panel.
| |||||||||||||||||||||||||
Brightness Distribution: 85 %
Center on Battery: 240.1 cd/m²
Contrast: 706:1 (Black: 0.34 cd/m²)
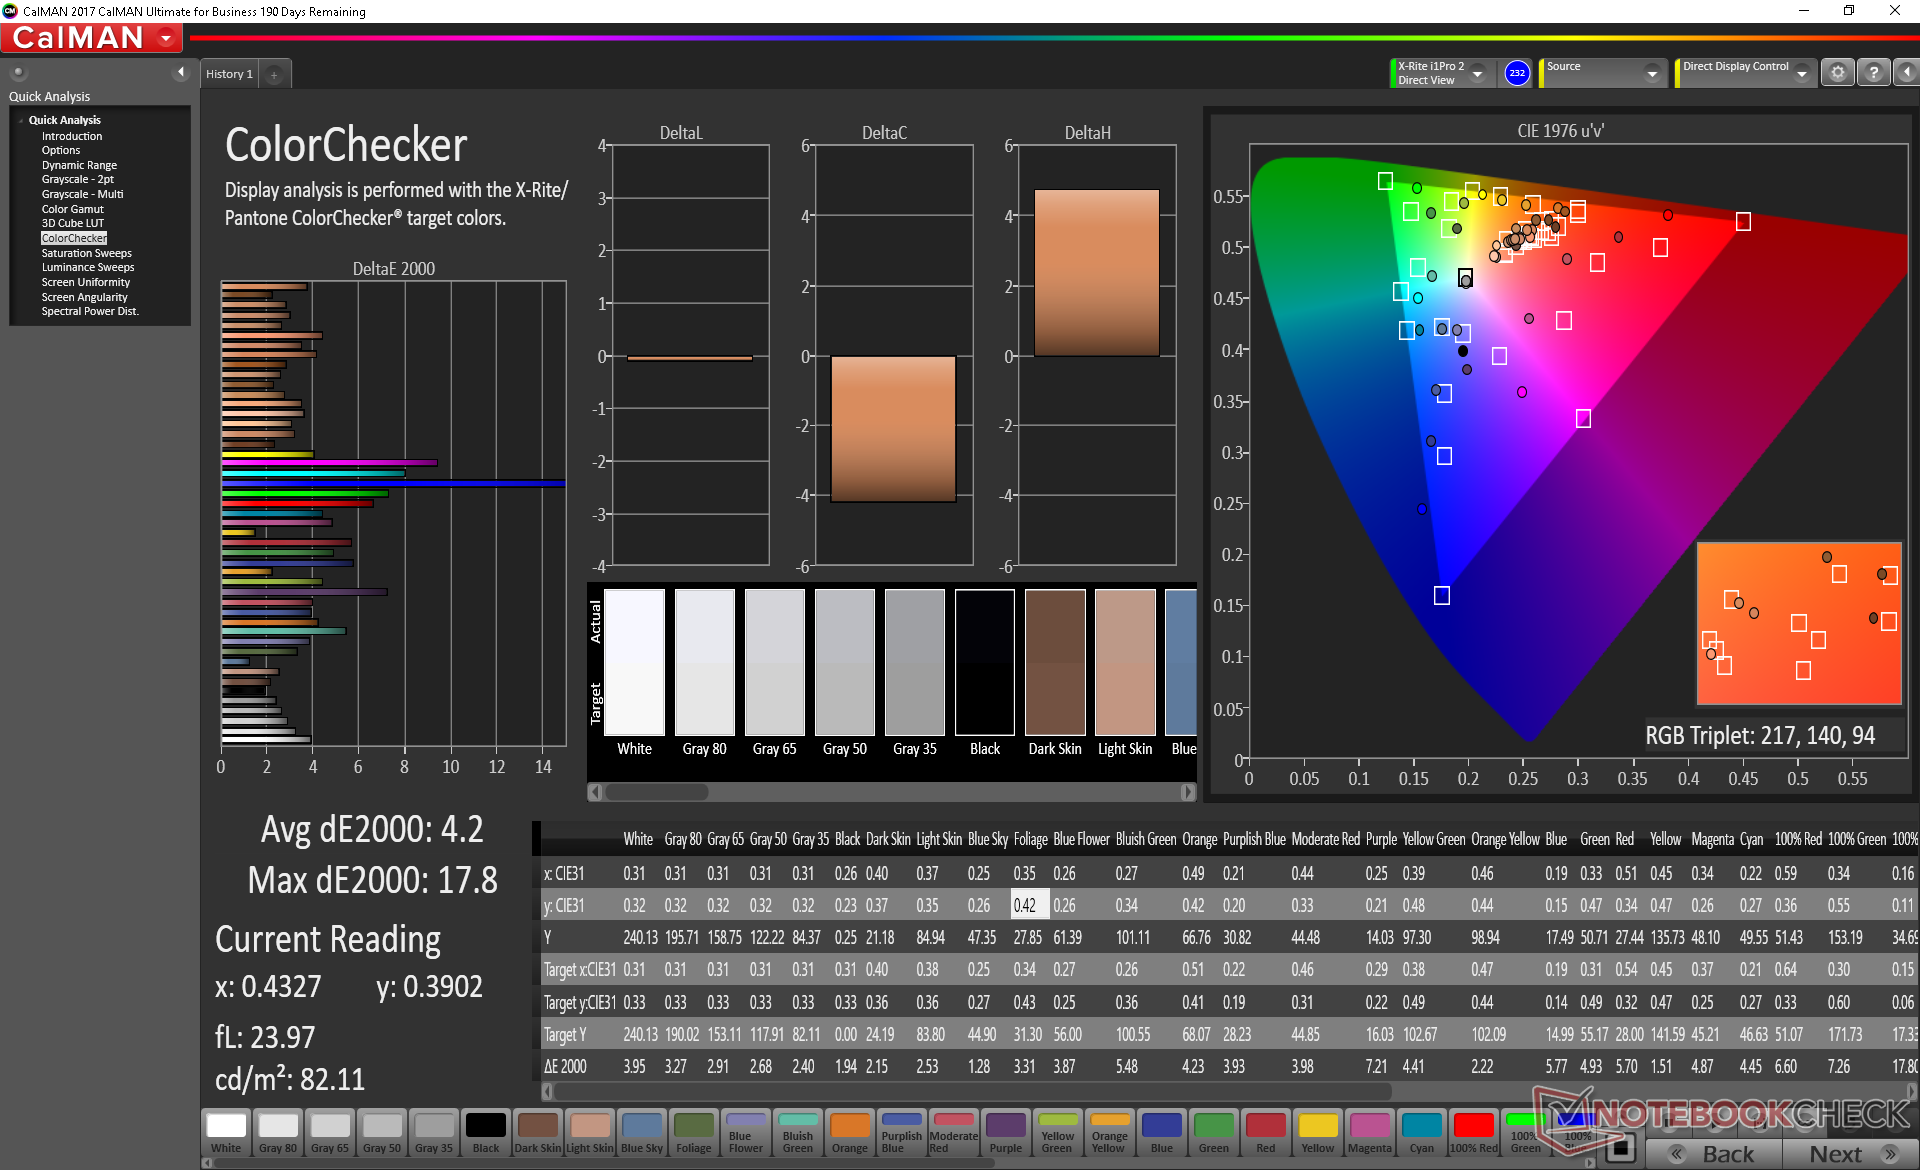
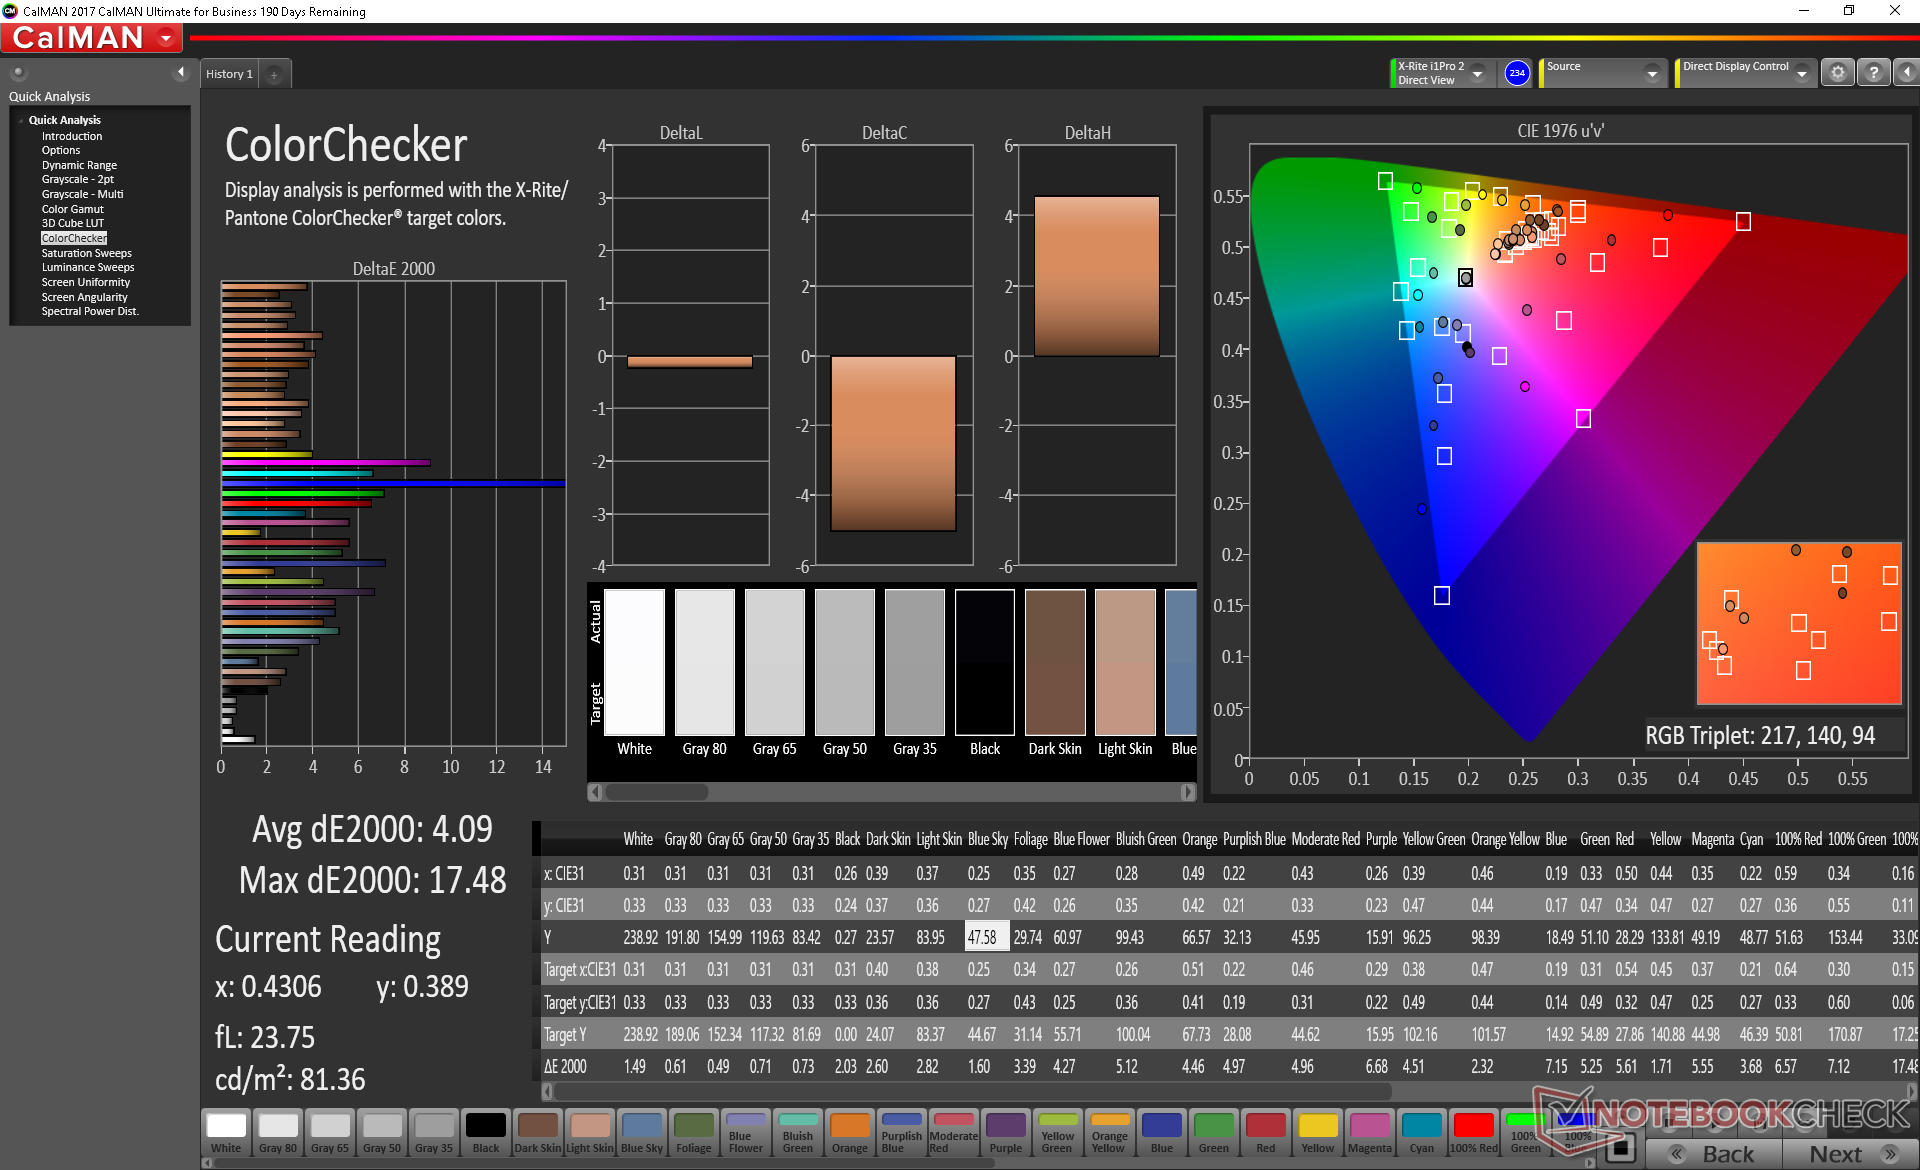
ΔE ColorChecker Calman: 4.2 | ∀{0.5-29.43 Ø4.73}
calibrated: 4.09
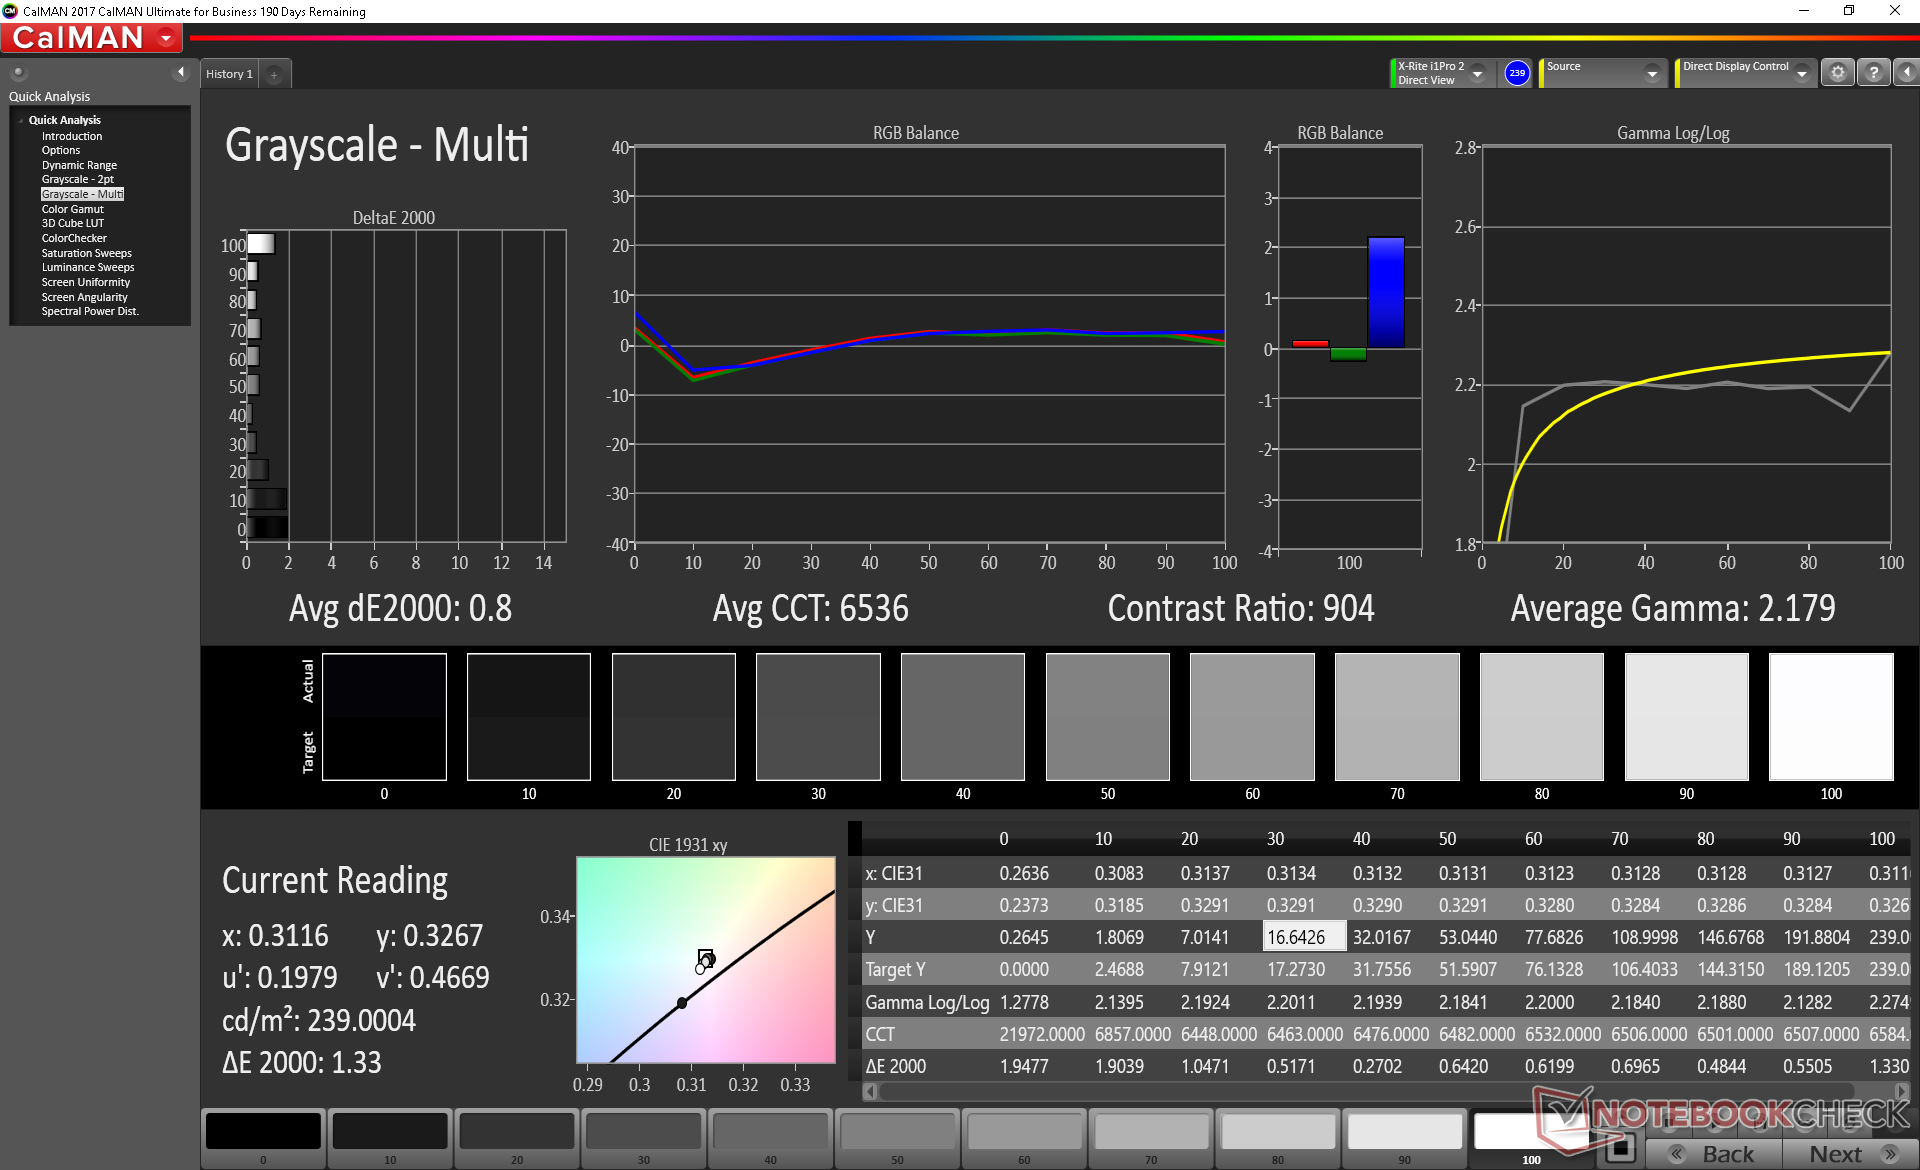
ΔE Greyscale Calman: 2.8 | ∀{0.09-98 Ø4.97}
60.4% sRGB (Argyll 1.6.3 3D)
38.4% AdobeRGB 1998 (Argyll 1.6.3 3D)
41.69% AdobeRGB 1998 (Argyll 3D)
60.6% sRGB (Argyll 3D)
40.33% Display P3 (Argyll 3D)
Gamma: 2.2
CCT: 6925 K
| Asus ROG Zephyrus G15 GA502DU Panda LM156LF-CL03, IPS, 15.6", 1920x1080 | Razer Blade 15 RTX 2070 Max-Q LG Philips LGD05C0, IPS, 15.6", 1920x1080 | Asus Zephyrus S GX531GX AU Optronics B156HAN08.2, IPS, 15.6", 1920x1080 | Asus ROG GU501GM-BI7N8 AU Optronics AUO45ED, IPS, 15.6", 1920x1080 | Lenovo Legion Y740-15ICHg LP156WFG-SPB2, IPS, 15.6", 1920x1080 | Gigabyte Aero 15 Classic-XA Sharp LQ156M1JW03 (SHP14C5), IGZO, 15.6", 1920x1080 | Asus Zephyrus S GX502GW AU Optronics B156HAN08.2 (AUO82ED), IPS, 15.6", 1920x1080 | |
|---|---|---|---|---|---|---|---|
| Display | 59% | 58% | 51% | 55% | 60% | 56% | |
| Display P3 Coverage (%) | 40.33 | 65.3 62% | 65.6 63% | 63.4 57% | 63.5 57% | 65.3 62% | 64.9 61% |
| sRGB Coverage (%) | 60.6 | 94.9 57% | 92.2 52% | 87.7 45% | 92.4 52% | 95.5 58% | 91 50% |
| AdobeRGB 1998 Coverage (%) | 41.69 | 66.3 59% | 66.9 60% | 64.7 55% | 66.5 60% | 65.9 58% | |
| Response Times | 55% | 73% | 5% | 49% | 58% | 74% | |
| Response Time Grey 50% / Grey 80% * (ms) | 34 ? | 16.8 ? 51% | 7 ? 79% | 30.8 ? 9% | 18.8 ? 45% | 15.2 ? 55% | 7.2 ? 79% |
| Response Time Black / White * (ms) | 28 ? | 11.6 ? 59% | 9.6 ? 66% | 27.6 ? 1% | 13.2 ? 53% | 11.2 ? 60% | 8.8 ? 69% |
| PWM Frequency (Hz) | 21280 ? | 23580 ? | |||||
| Screen | 31% | 34% | 20% | 23% | 30% | 31% | |
| Brightness middle (cd/m²) | 240.1 | 314.7 31% | 323.6 35% | 286.7 19% | 320.4 33% | 266 11% | 286 19% |
| Brightness (cd/m²) | 231 | 312 35% | 315 36% | 281 22% | 298 29% | 248 7% | 275 19% |
| Brightness Distribution (%) | 85 | 90 6% | 91 7% | 92 8% | 85 0% | 89 5% | 90 6% |
| Black Level * (cd/m²) | 0.34 | 0.38 -12% | 0.29 15% | 0.39 -15% | 0.42 -24% | 0.31 9% | 0.37 -9% |
| Contrast (:1) | 706 | 828 17% | 1116 58% | 735 4% | 763 8% | 858 22% | 773 9% |
| Colorchecker dE 2000 * | 4.2 | 2.56 39% | 3.31 21% | 4.17 1% | 3.21 24% | 2.78 34% | 2.19 48% |
| Colorchecker dE 2000 max. * | 17.8 | 4.89 73% | 5.74 68% | 7.22 59% | 5.54 69% | 5.96 67% | 4.4 75% |
| Colorchecker dE 2000 calibrated * | 4.09 | 1.71 58% | 2.73 33% | 2.36 42% | 0.91 78% | 2.27 44% | |
| Greyscale dE 2000 * | 2.8 | 3.4 -21% | 2.9 -4% | 2.5 11% | 3.6 -29% | 3.58 -28% | 2.2 21% |
| Gamma | 2.2 100% | 2.3 96% | 2.29 96% | 2.274 97% | 2.27 97% | 2.46 89% | 2.41 91% |
| CCT | 6925 94% | 6435 101% | 6765 96% | 6885 94% | 6503 100% | 7186 90% | 6405 101% |
| Color Space (Percent of AdobeRGB 1998) (%) | 38.4 | 60.7 58% | 59.7 55% | 57 48% | 59 54% | 62 61% | 59 54% |
| Color Space (Percent of sRGB) (%) | 60.4 | 94.6 57% | 91.8 52% | 87 44% | 92 52% | 96 59% | 91 51% |
| Total Average (Program / Settings) | 48% /
39% | 55% /
44% | 25% /
22% | 42% /
33% | 49% /
39% | 54% /
41% |
* ... smaller is better
Color space is limited to just 60 percent of sRGB to suggest a budget panel. Most mid-range to flagship Ultrabooks, for example, have >90 percent sRGB coverage for deeper and potentially more accurate colors including Asus' own ZenBook series. The AU Optronics panels on the Zephyrus S GX531 and GX501 each have a wider gamut than the Panda panel on this GA502.
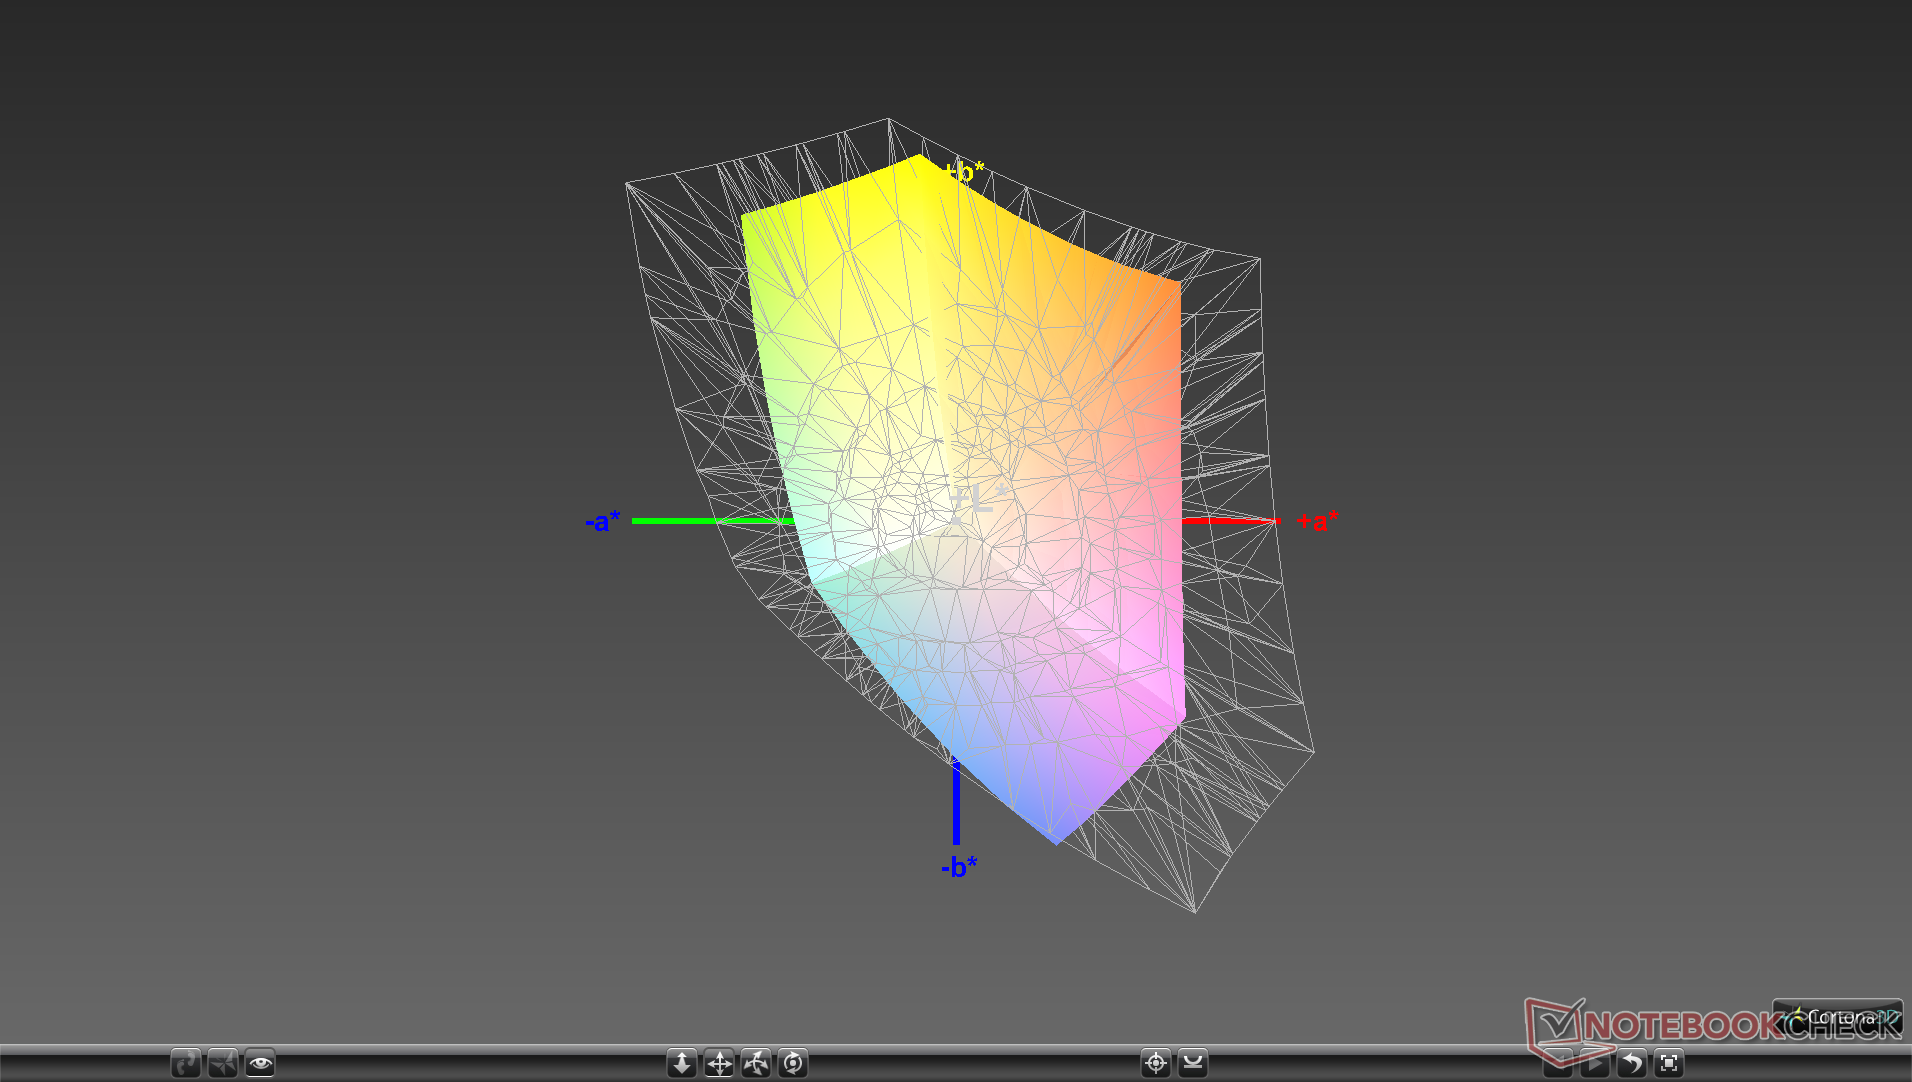
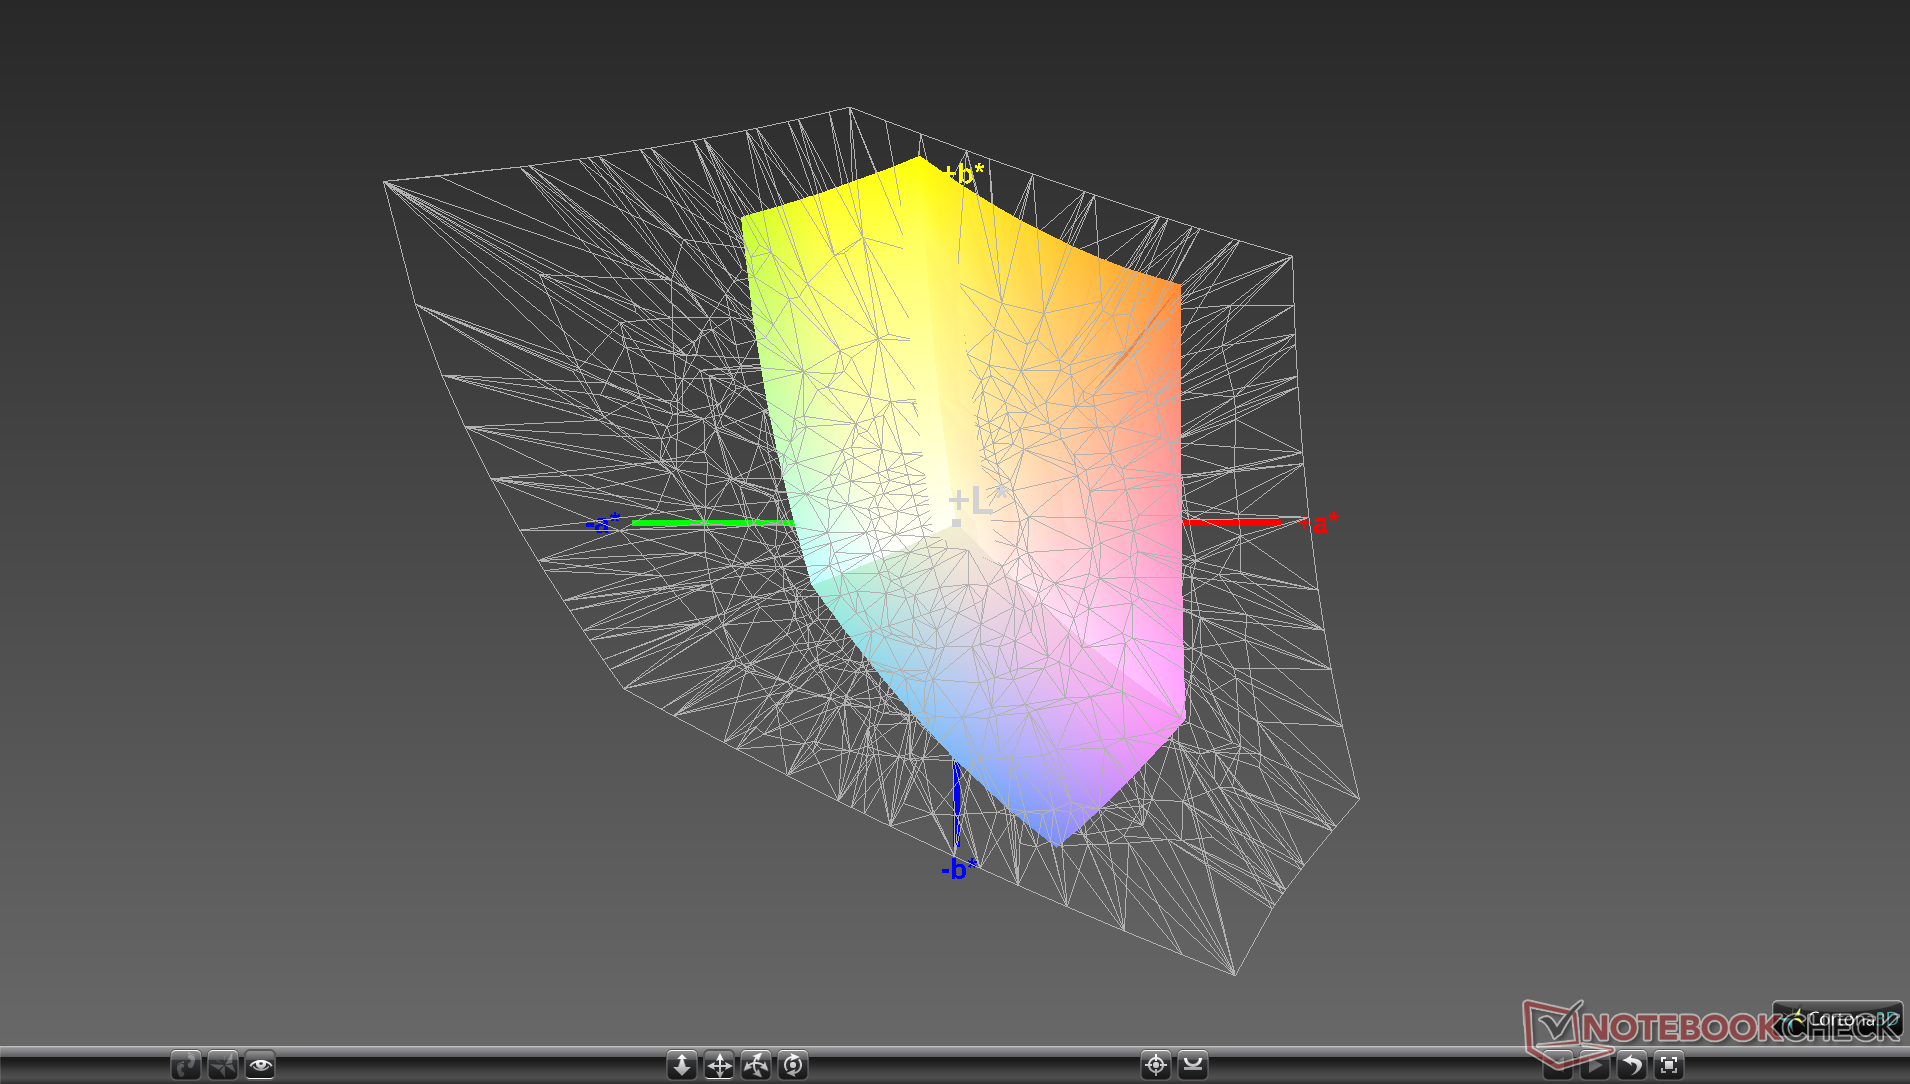
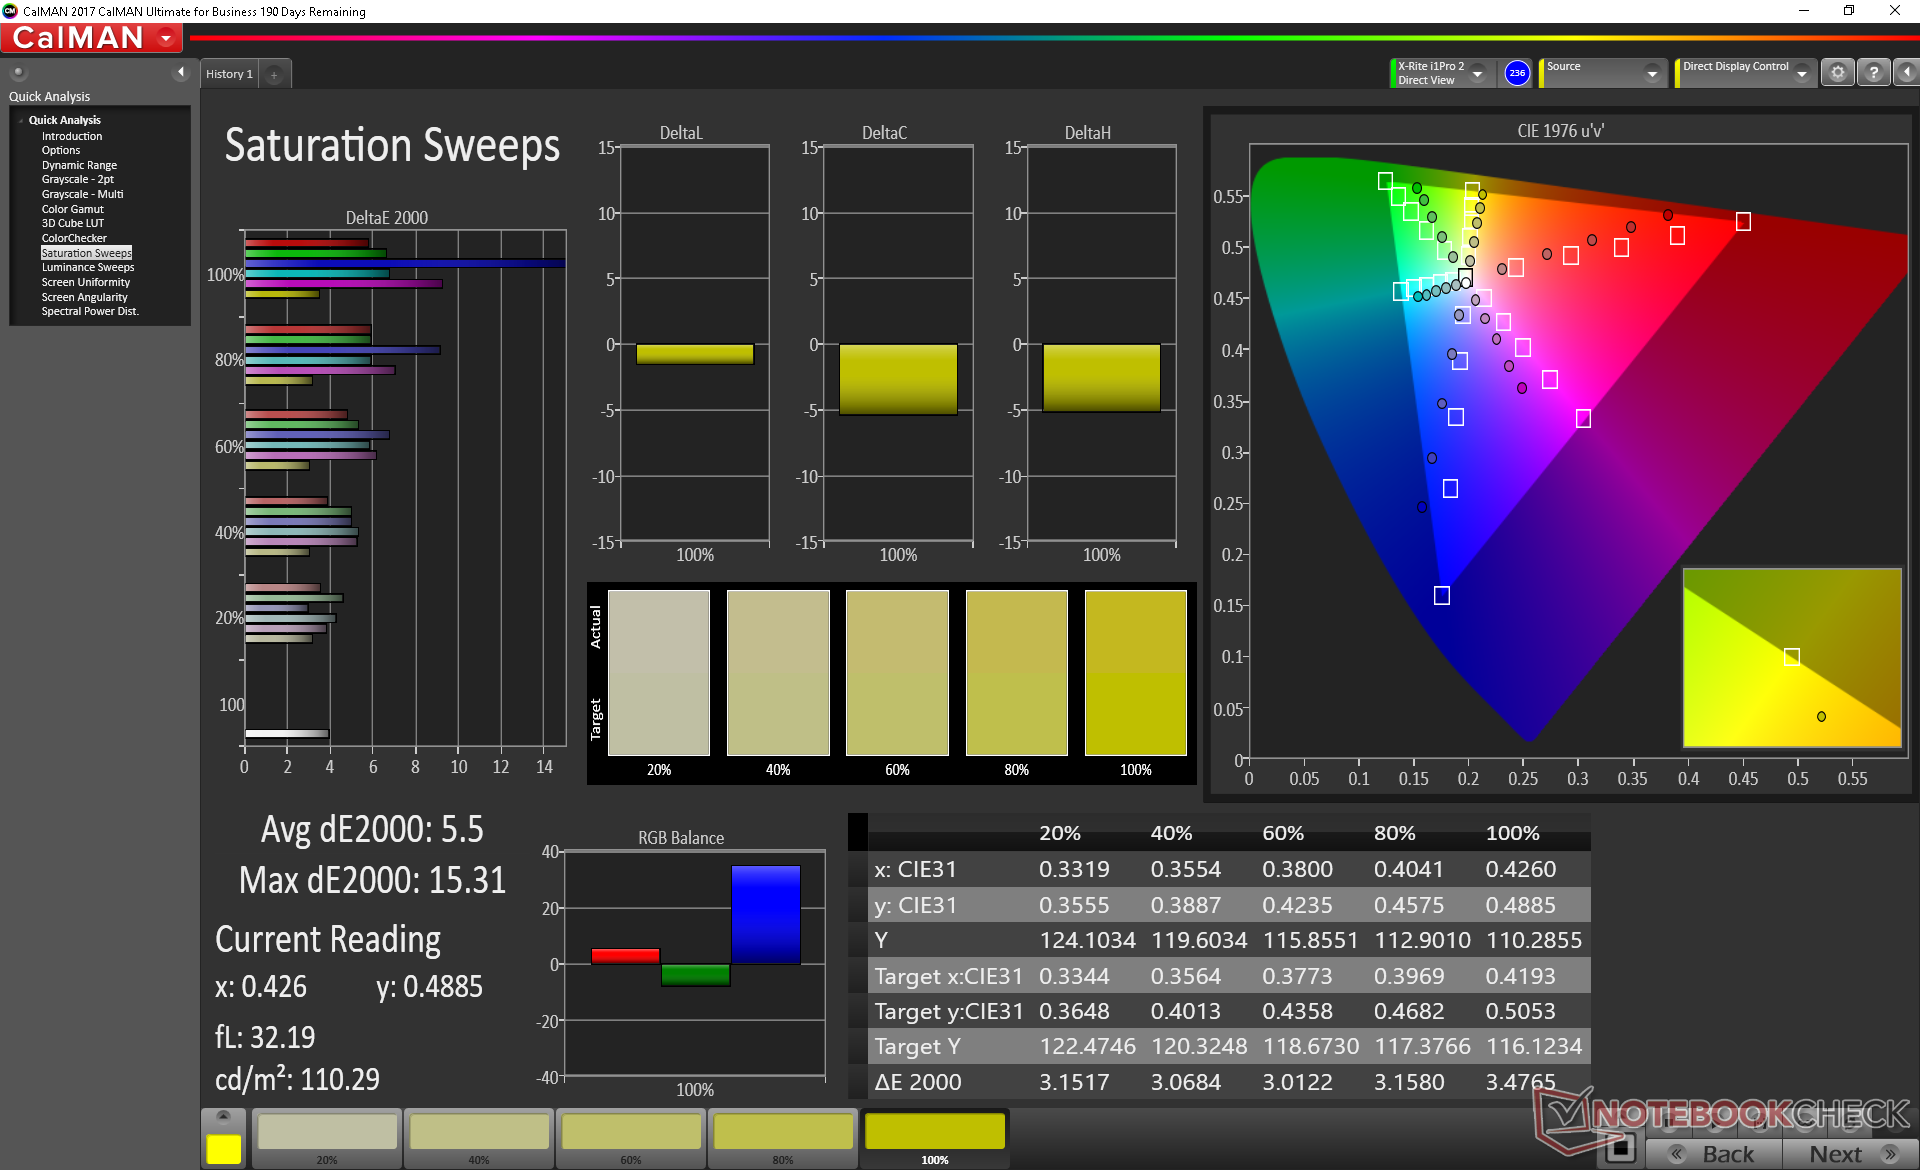
Further measurements with an X-Rite colorimeter reveal good grayscale, mediocre colors, and a cool color temperature. Our calibration attempts improve all aspects of the display especially in regard to grayscale. Unfortunately, colors still become increasingly inaccurate when at higher saturation levels due to the limited color space of the panel. Blue in particular is much more inaccurate than the other tested colors. While the average color reproduction doesn't detract from the gaming experience, graphic artists may want to consider the Zephyrus GX531 and GX501 instead where more of sRGB is represented.


Display Response Times
| ↔ Response Time Black to White | ||
|---|---|---|
| 28 ms ... rise ↗ and fall ↘ combined | ↗ 17.2 ms rise | 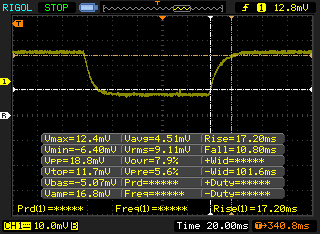 |
| ↘ 10.8 ms fall | ||
| The screen shows relatively slow response rates in our tests and may be too slow for gamers. In comparison, all tested devices range from 0.1 (minimum) to 240 (maximum) ms. » 71 % of all devices are better. This means that the measured response time is worse than the average of all tested devices (19.9 ms). | ||
| ↔ Response Time 50% Grey to 80% Grey | ||
| 34 ms ... rise ↗ and fall ↘ combined | ↗ 17.2 ms rise | 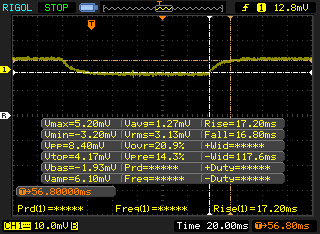 |
| ↘ 16.8 ms fall | ||
| The screen shows slow response rates in our tests and will be unsatisfactory for gamers. In comparison, all tested devices range from 0.165 (minimum) to 636 (maximum) ms. » 47 % of all devices are better. This means that the measured response time is similar to the average of all tested devices (31.1 ms). | ||
Screen Flickering / PWM (Pulse-Width Modulation)
| Screen flickering / PWM detected | 21280 Hz | ≤ 34 % brightness setting | 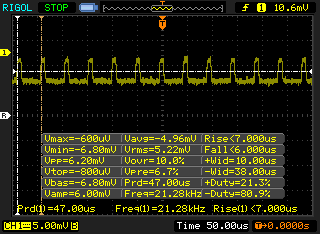 |
The display backlight flickers at 21280 Hz (worst case, e.g., utilizing PWM) Flickering detected at a brightness setting of 34 % and below. There should be no flickering or PWM above this brightness setting. The frequency of 21280 Hz is quite high, so most users sensitive to PWM should not notice any flickering. In comparison: 52 % of all tested devices do not use PWM to dim the display. If PWM was detected, an average of 7798 (minimum: 5 - maximum: 343500) Hz was measured. | |||
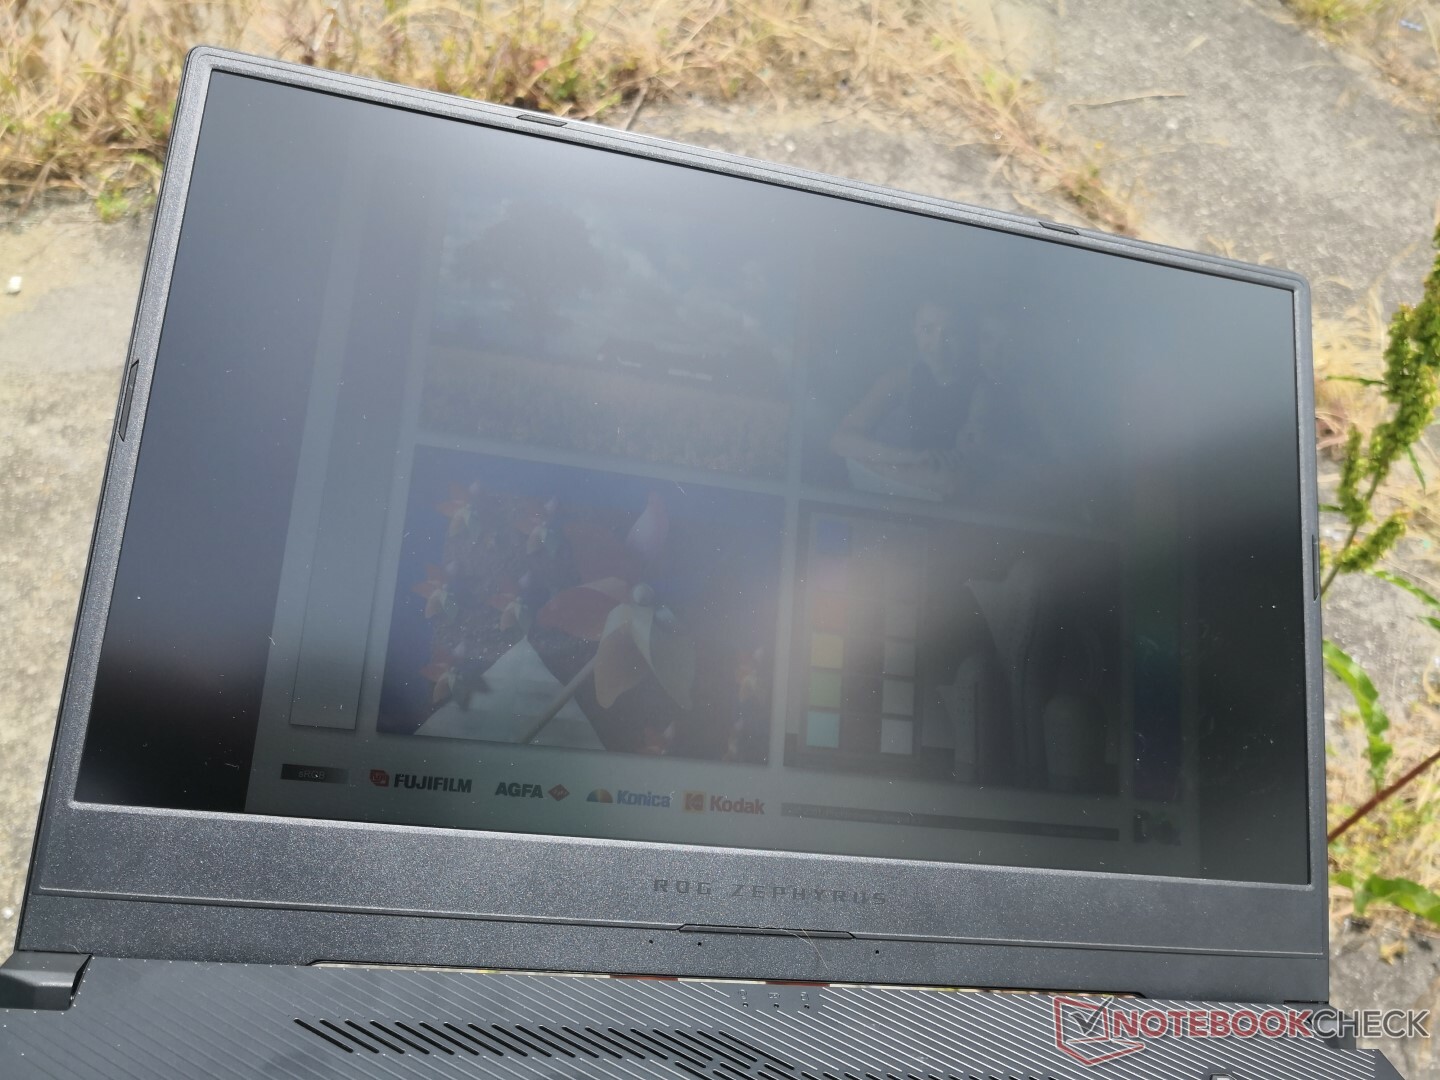
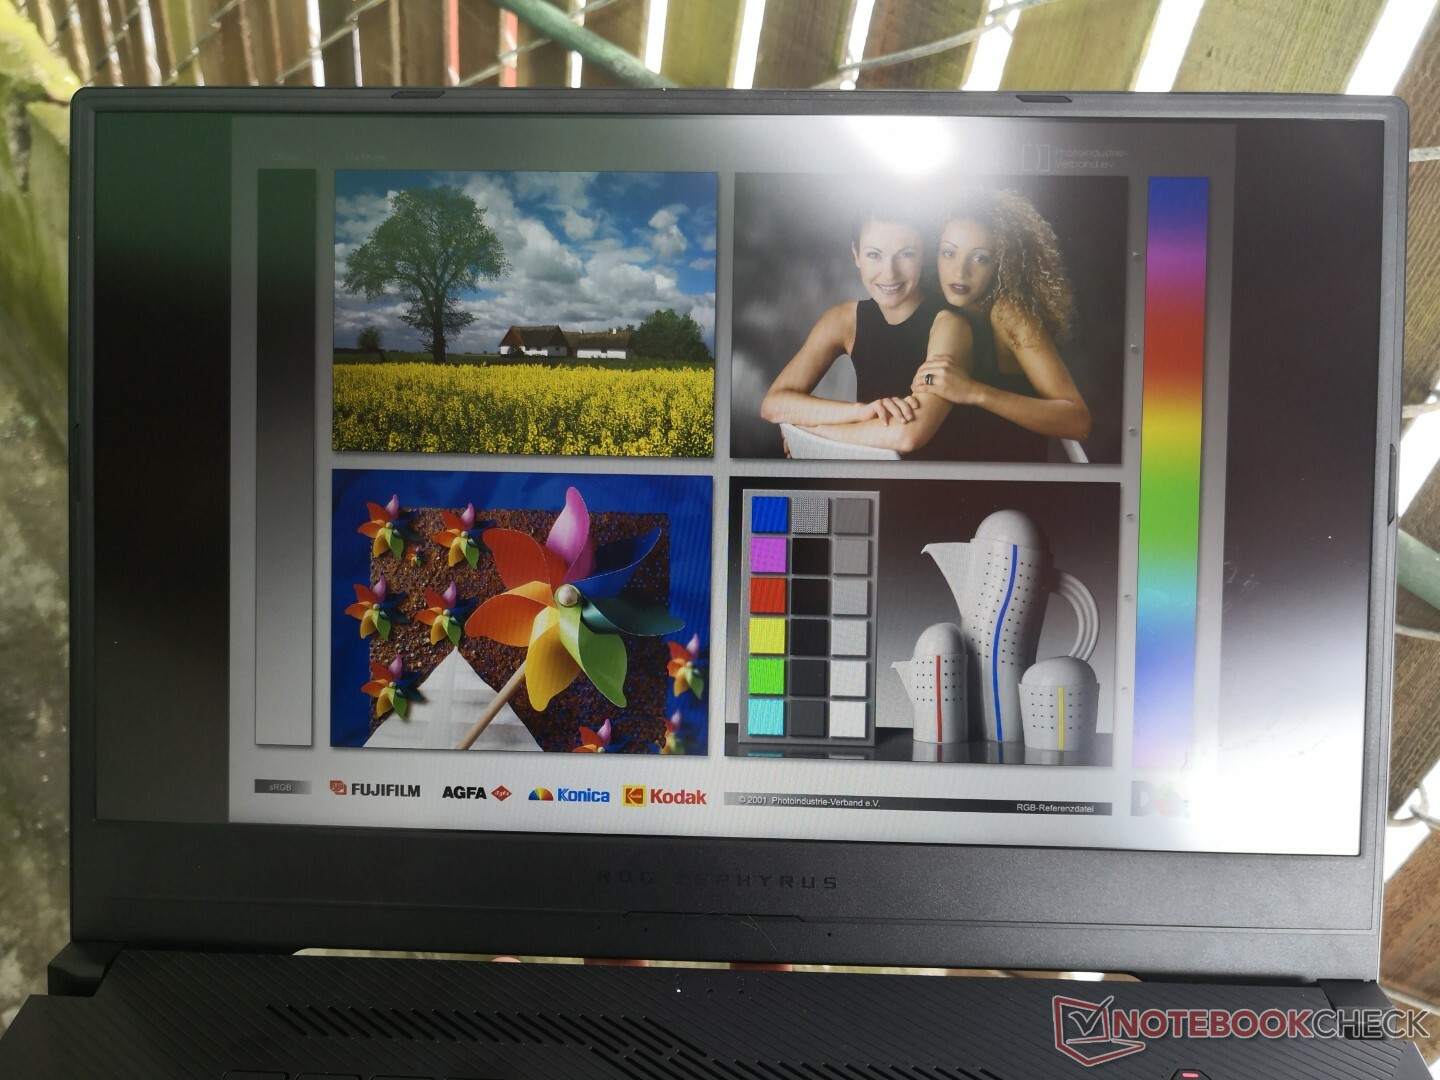
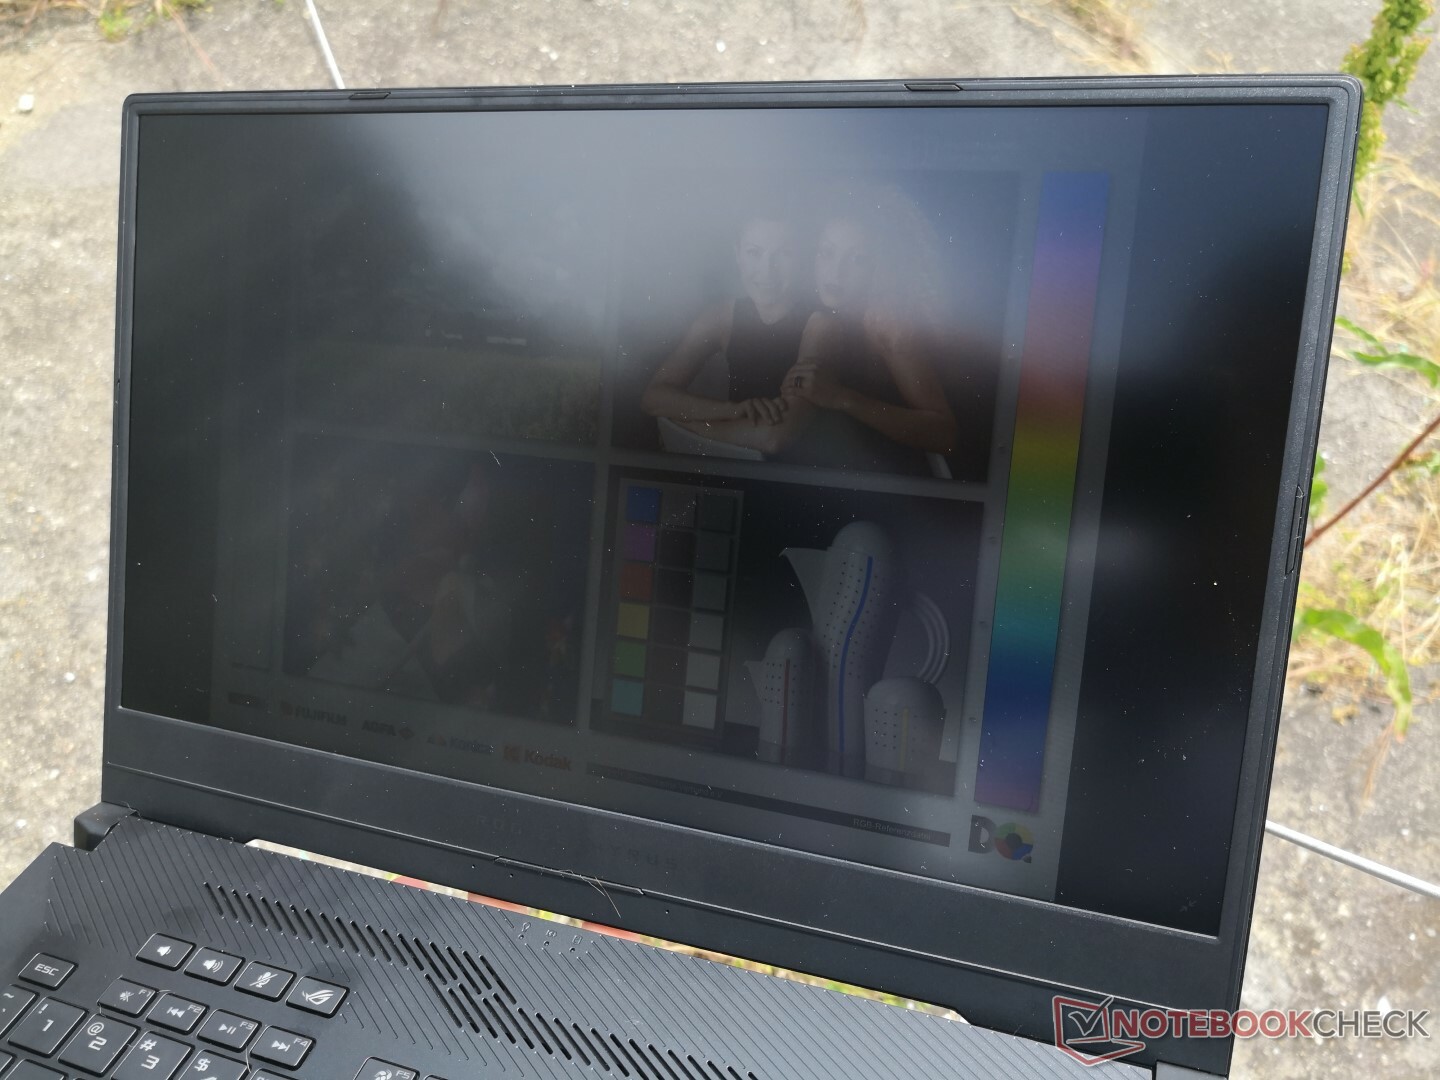
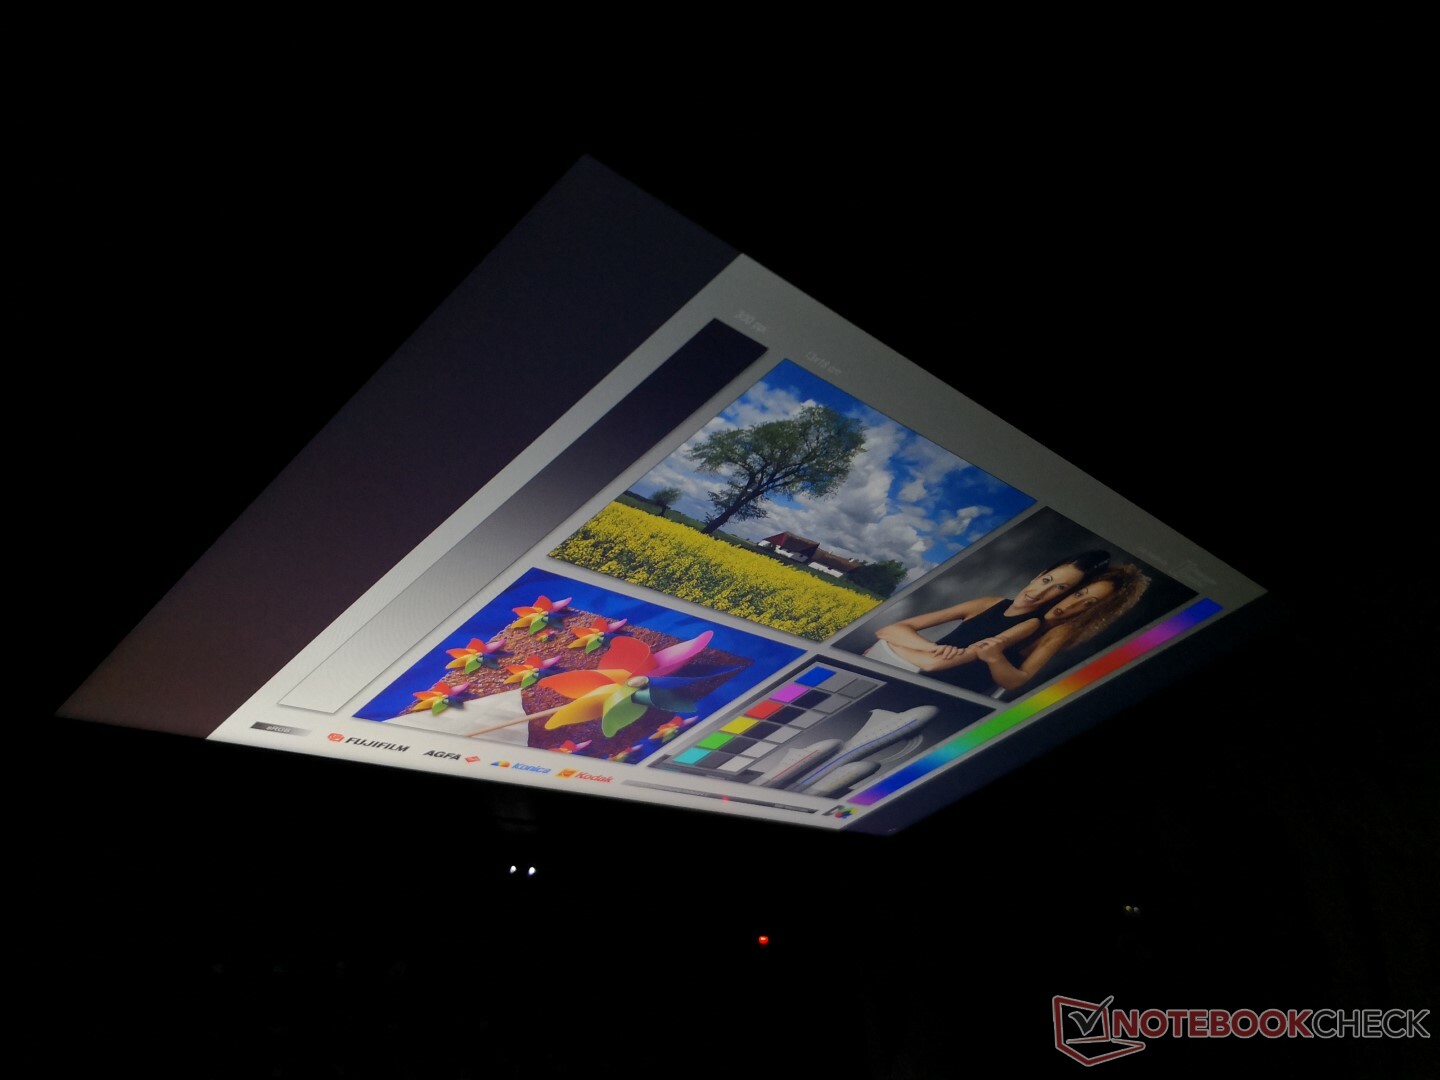
Outdoor visibility is poor despite the excellent portability, narrow bezels, and long battery life of the GA502. It all comes down to the dim display which is nowhere near bright enough to overcome ambient lighting on a cloudy day or worse. The wide IPS viewing angles help, but this can only go so far. Expect glare, washed out colors, and lots of squinting.
Performance
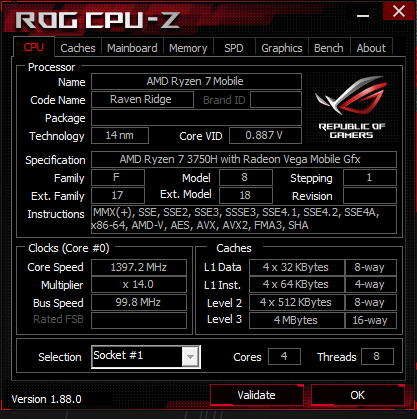
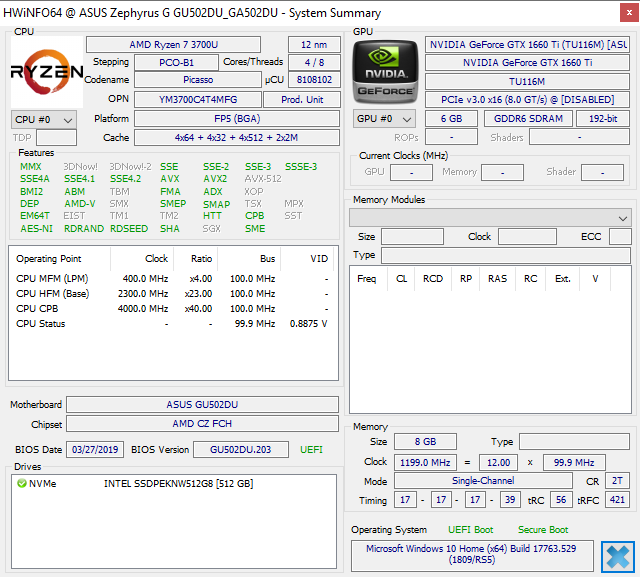
The quad-core AMD Ryzen 7 3750H CPU is designed to be an alternative to the quad-core Coffee Lake Intel 8th gen Core i7-8300H and 9th gen Core i7-9300H. It's manufactured on a smaller node compared to Intel (12 nm vs. 14 nm) and with a lower nominal TDP (35 W vs. 45 W) for improved efficiency on paper. The slightly slower Ryzen 5 3550H is currently not available on the GA502 series but can be found on the Asus TUF series.
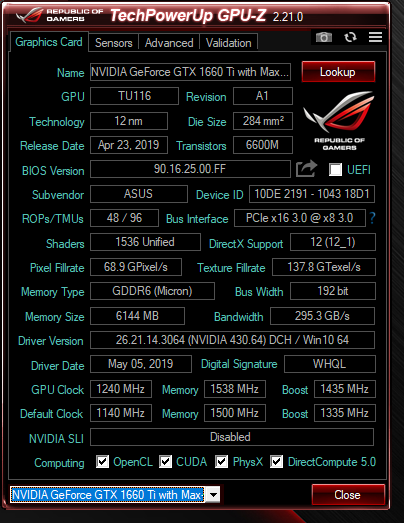
The Turing-based GTX 1660 Ti Max-Q GPU is a direct replacement of the uncommon Pascal-based GTX 1050 Ti Max-Q. It's one step down from the enthusiast RTX 2060 and it therefore lacks the AI acceleration and dedicated ray-tracing capabilities of the RTX series. Users who want RTX options may want to look at the Zephyrus M or Zephrus S instead.
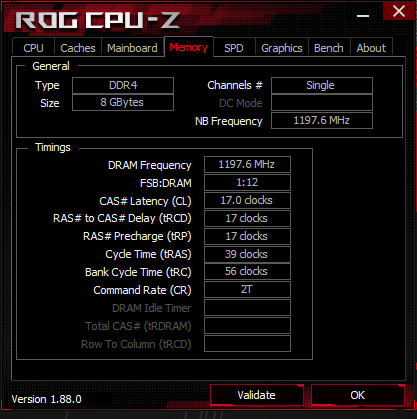
8 GB to 16 GB of single-channel DDR4 RAM at 1200 MHz is soldered onto the motherboard depending on the SKU. Users can add 16 GB more for a total of 32 GB in dual-channel configuration since there is one free SODIMM slot. Our test unit ships with the base 8 GB of single-channel RAM and so all our benchmarks below reflect this setup.
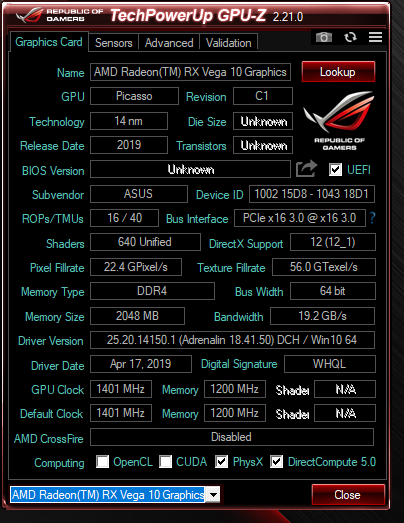
Nvidia Optimus comes standard for switching to the integrated RX Vega 10. There is no G-Sync option as a result.
Processor
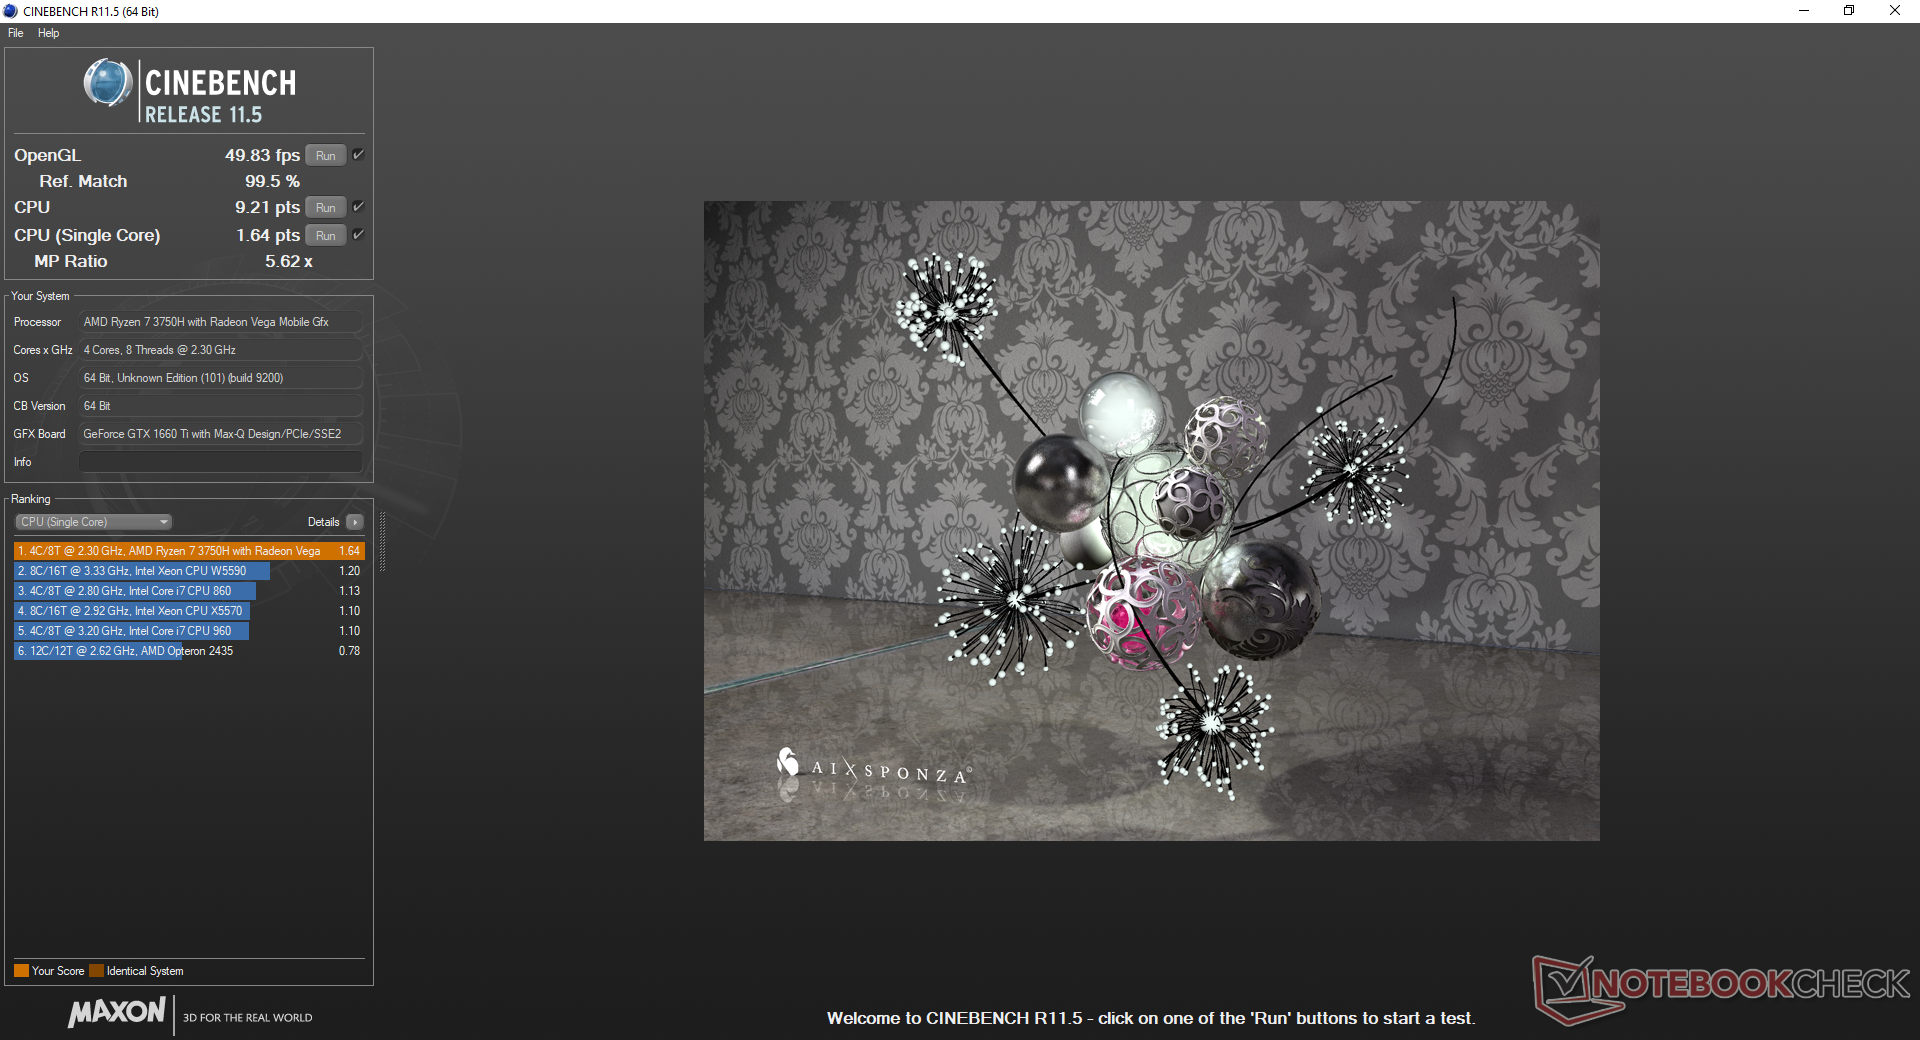
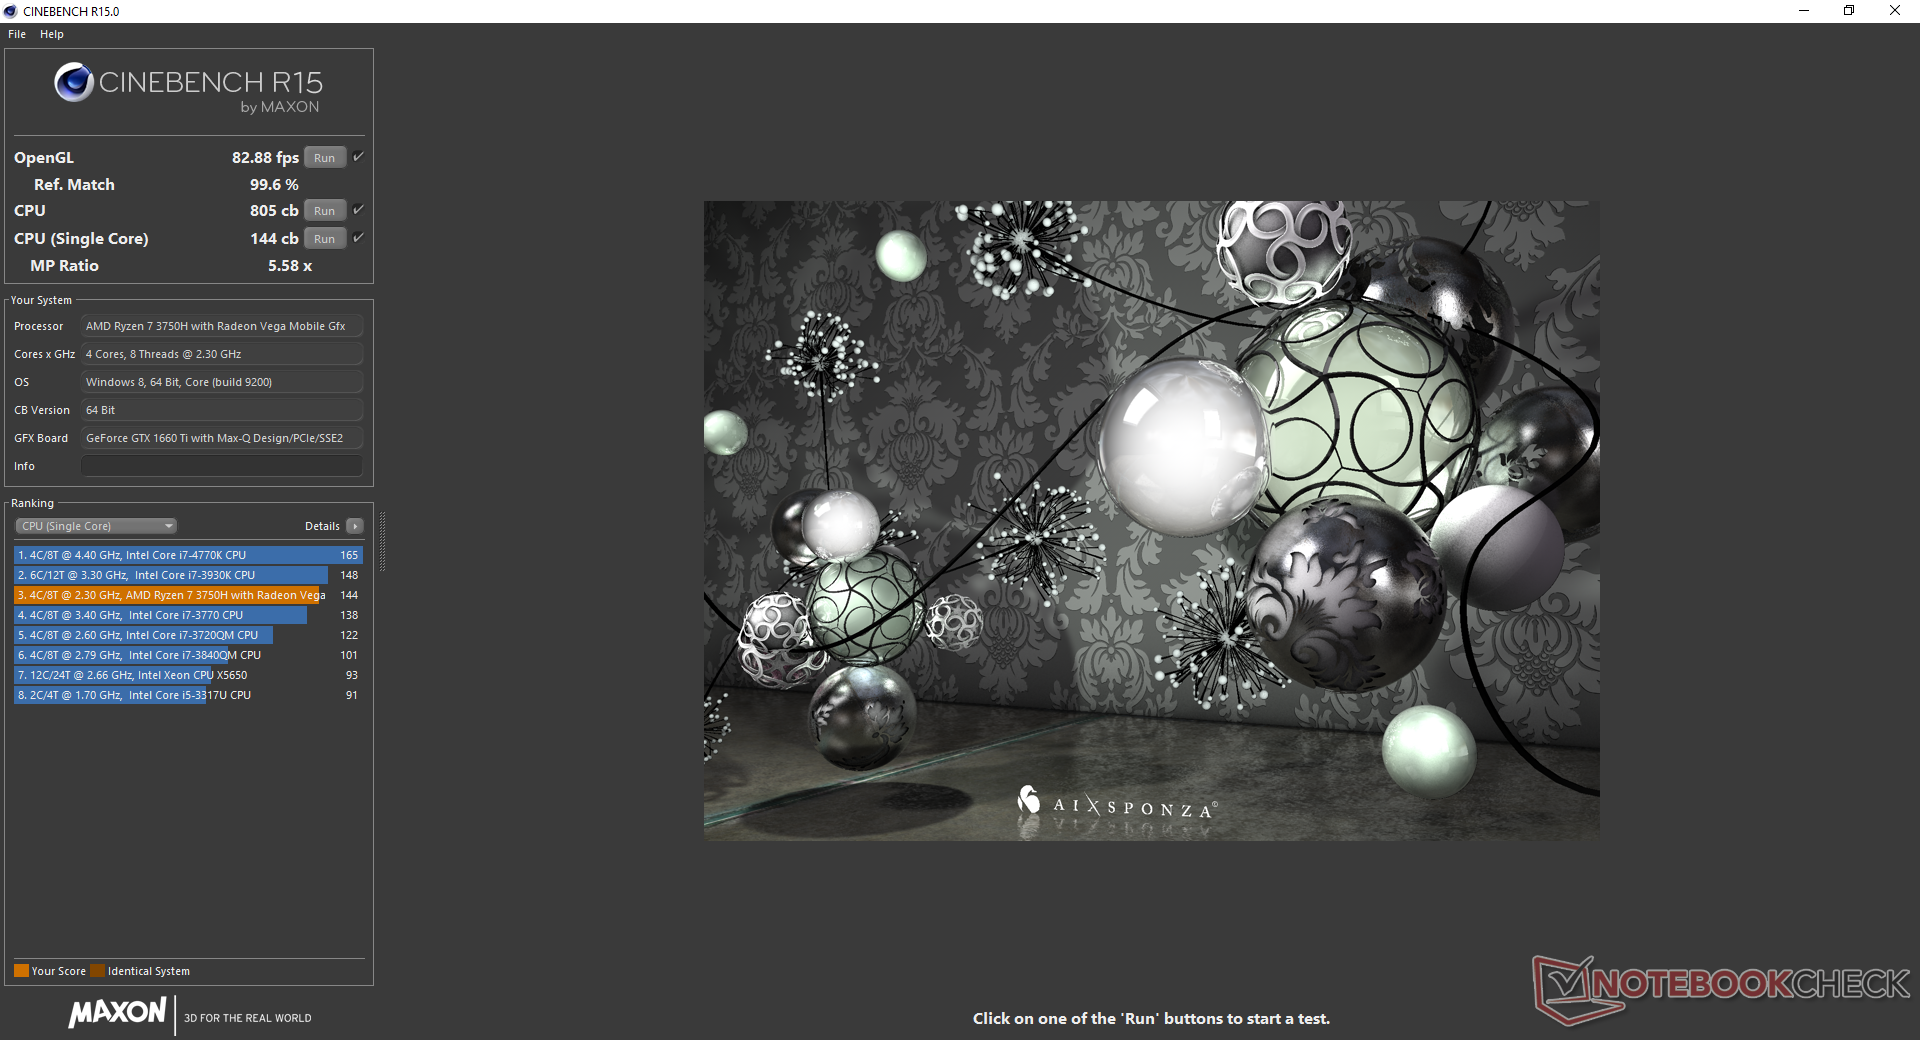
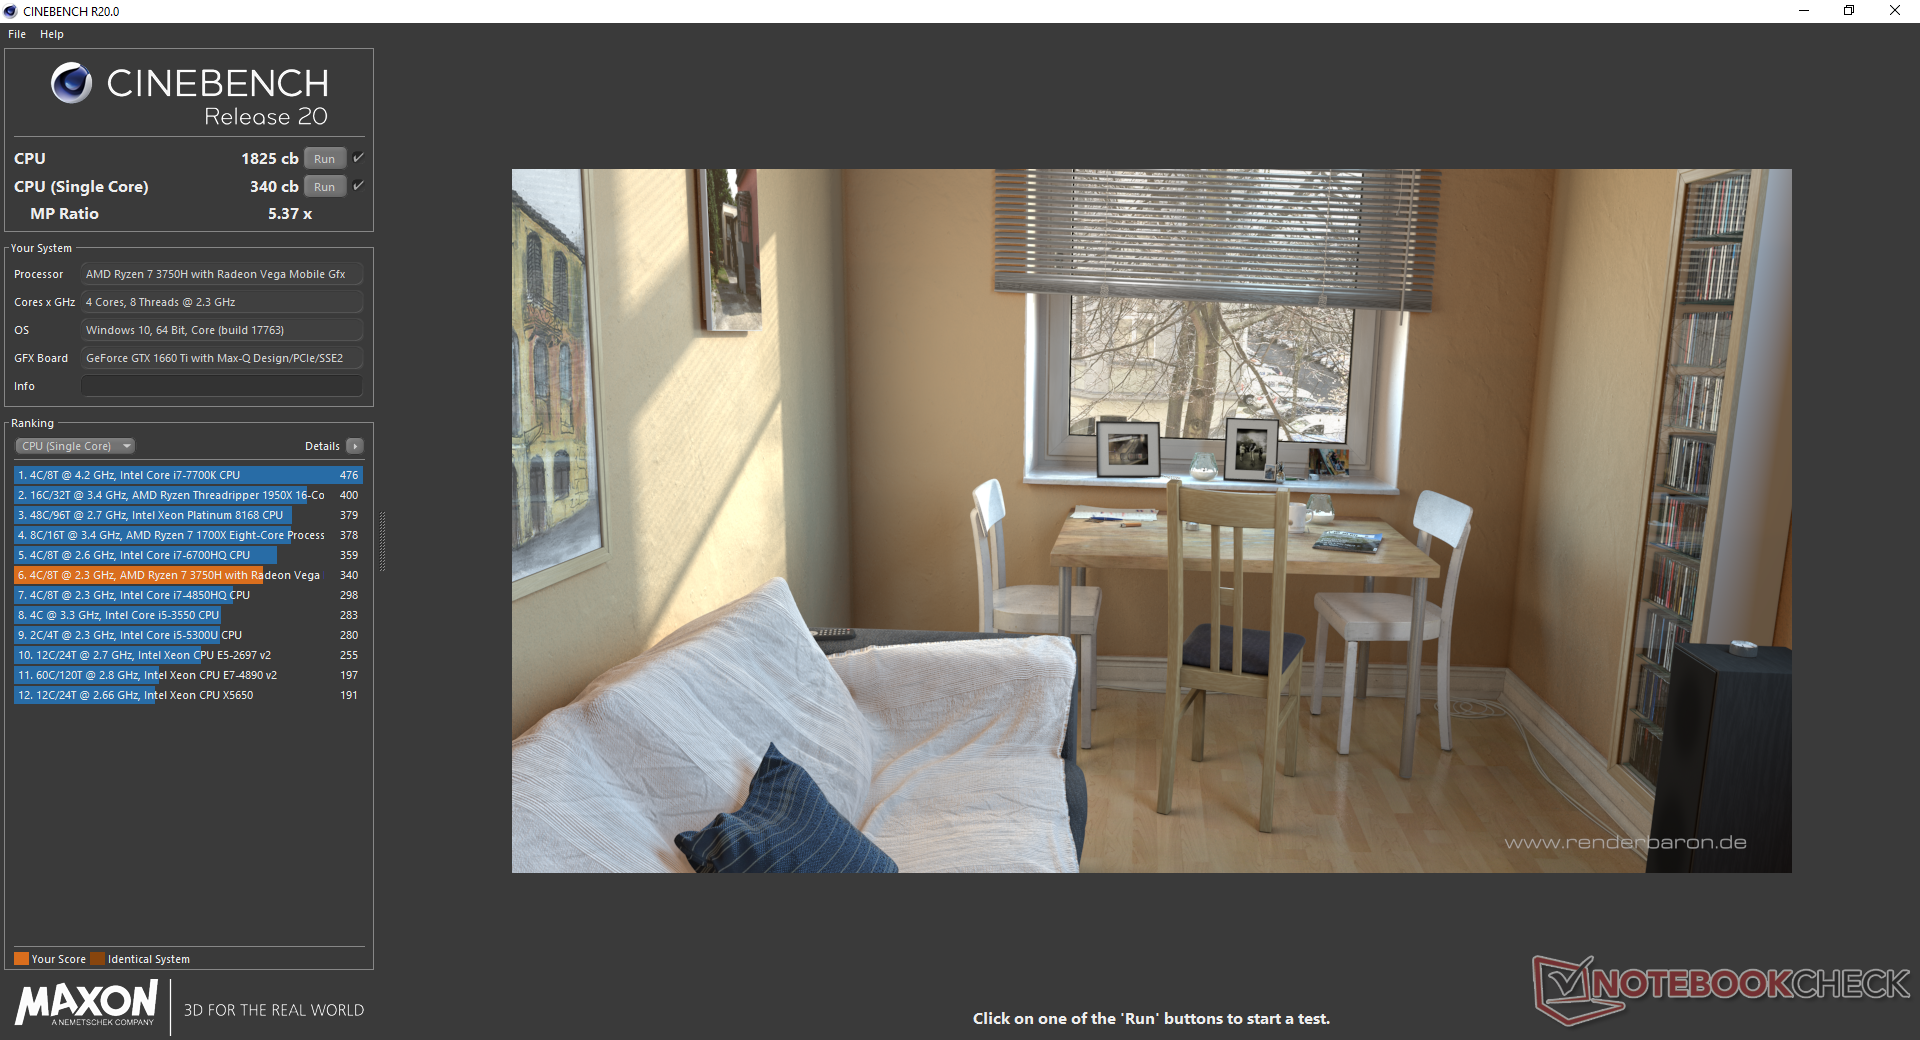
We called the Ryzen 7 3750H an excellent alternative to the Core i5-8300H and Core i5-9300H and this remains true here. CineBench R15 Multi-Thread ranks the AMD processor within 5 percent of both the i5-8300H and i5-9300H as found on the Lenovo Legion Y730 and Acer Nitro 5, respectively. Raw performance is merely 8 percent faster than the lower-end Ryzen 5 3550H which is smaller than we were expecting between the two SKUs. Pricier higher-end gaming laptops equipped with the hexa-core Core i7-8750H or i7-9750H will offer 40 to 50 percent faster CPU performance than our affordable Ryzen.
Single-thread performance is somewhat disappointing as it offers no significant boost over the ULV 15 W Ryzen 5 2500U or Ryzen 7 2700U. The aforementioned i5-8300H or i5-9300H are each about 15 percent faster than the Ryzen 7 3750H in this regard and so most applications will launch a bit faster on an Intel Core i5 system as a result.
Performance sustainability is excellent. When running CineBench R15 Multi-Thread in a loop, results remain consistent throughout the stress test to suggest no major throttling issues.
See our dedicated page on the Ryzen 7 3750H for more technical information and benchmark comparisons.
System Performance
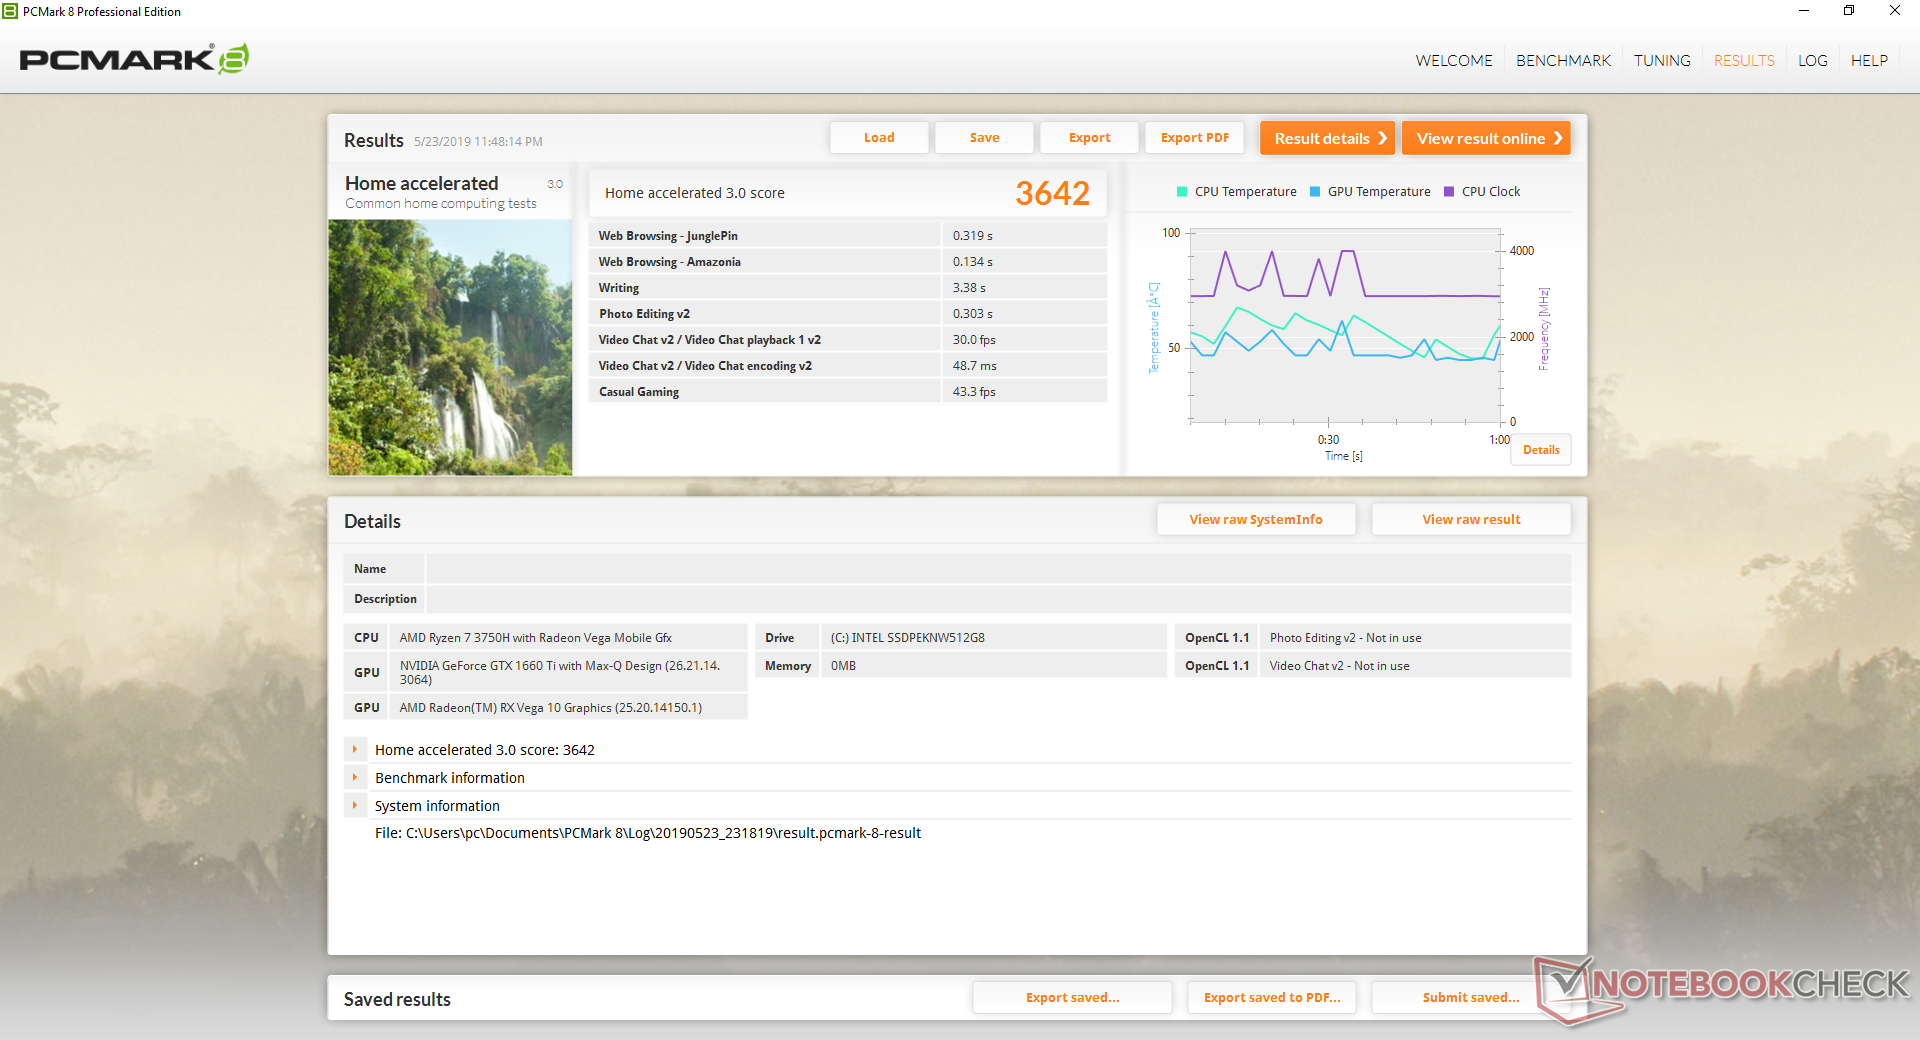
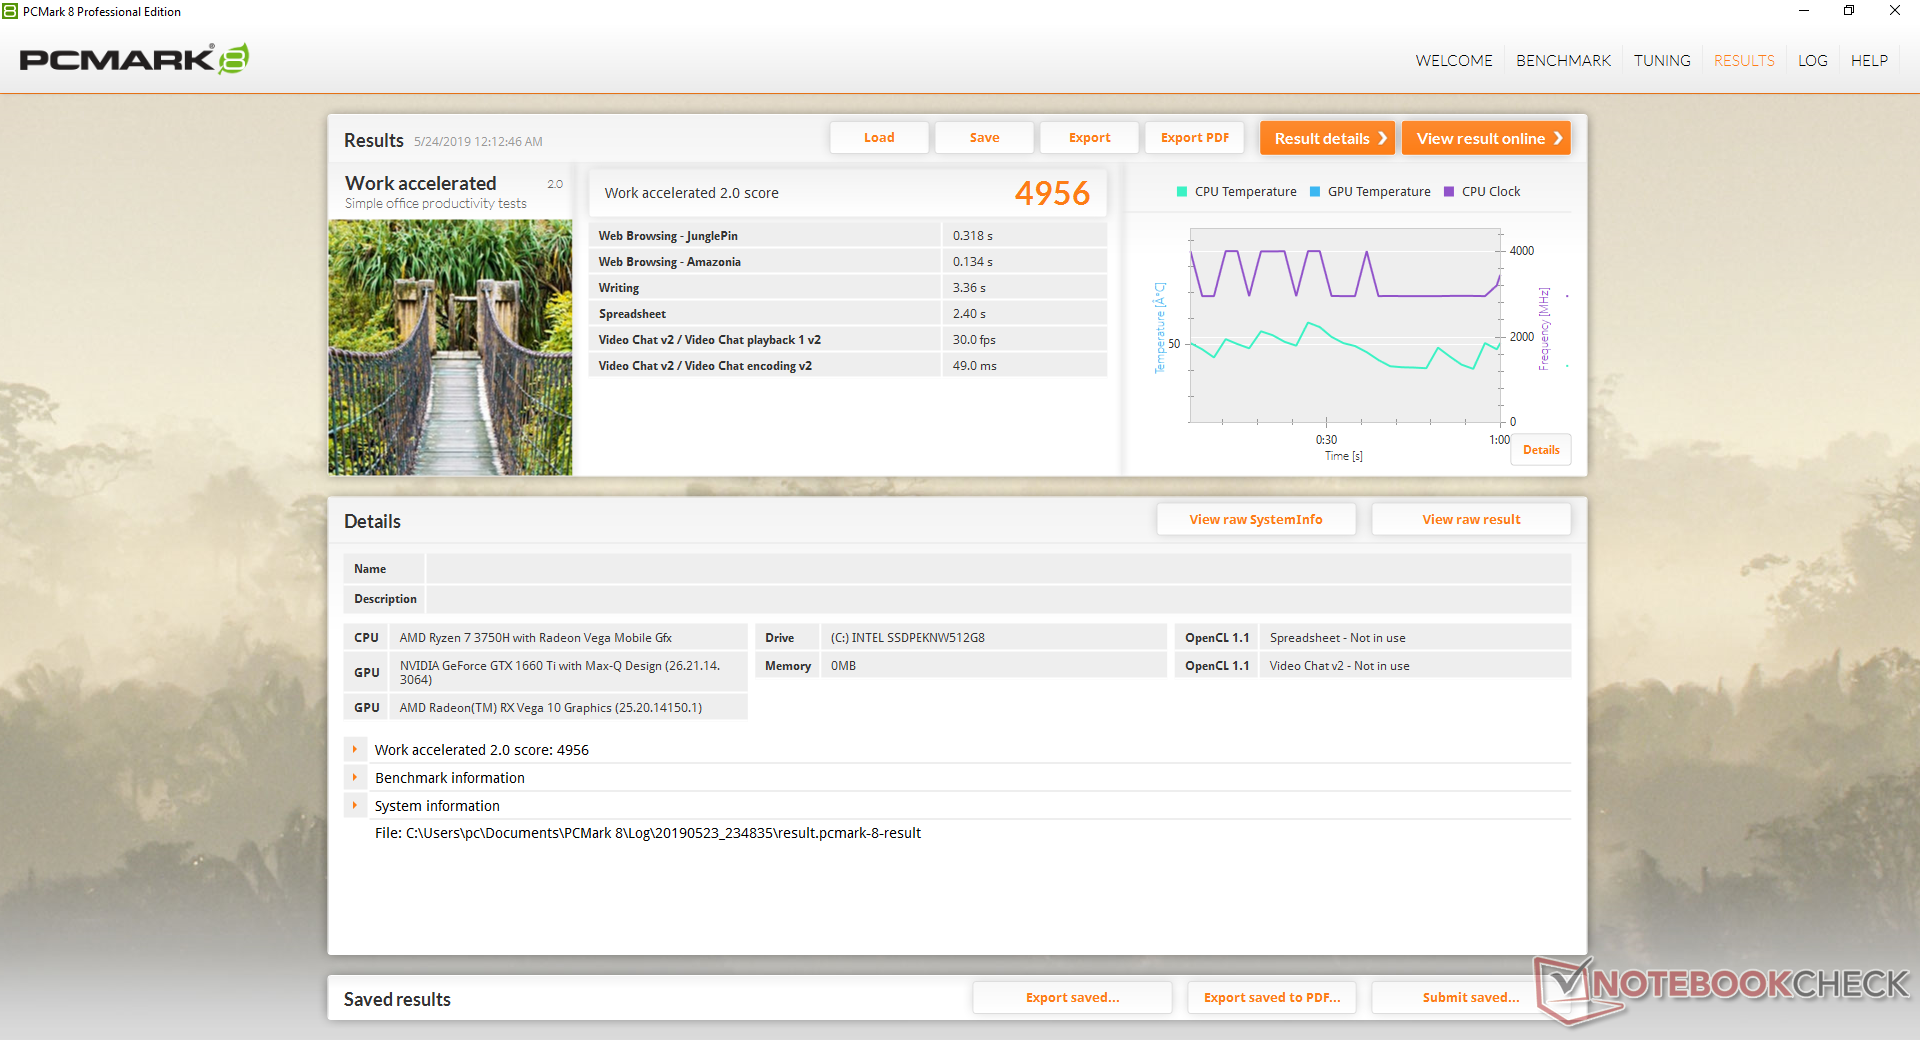
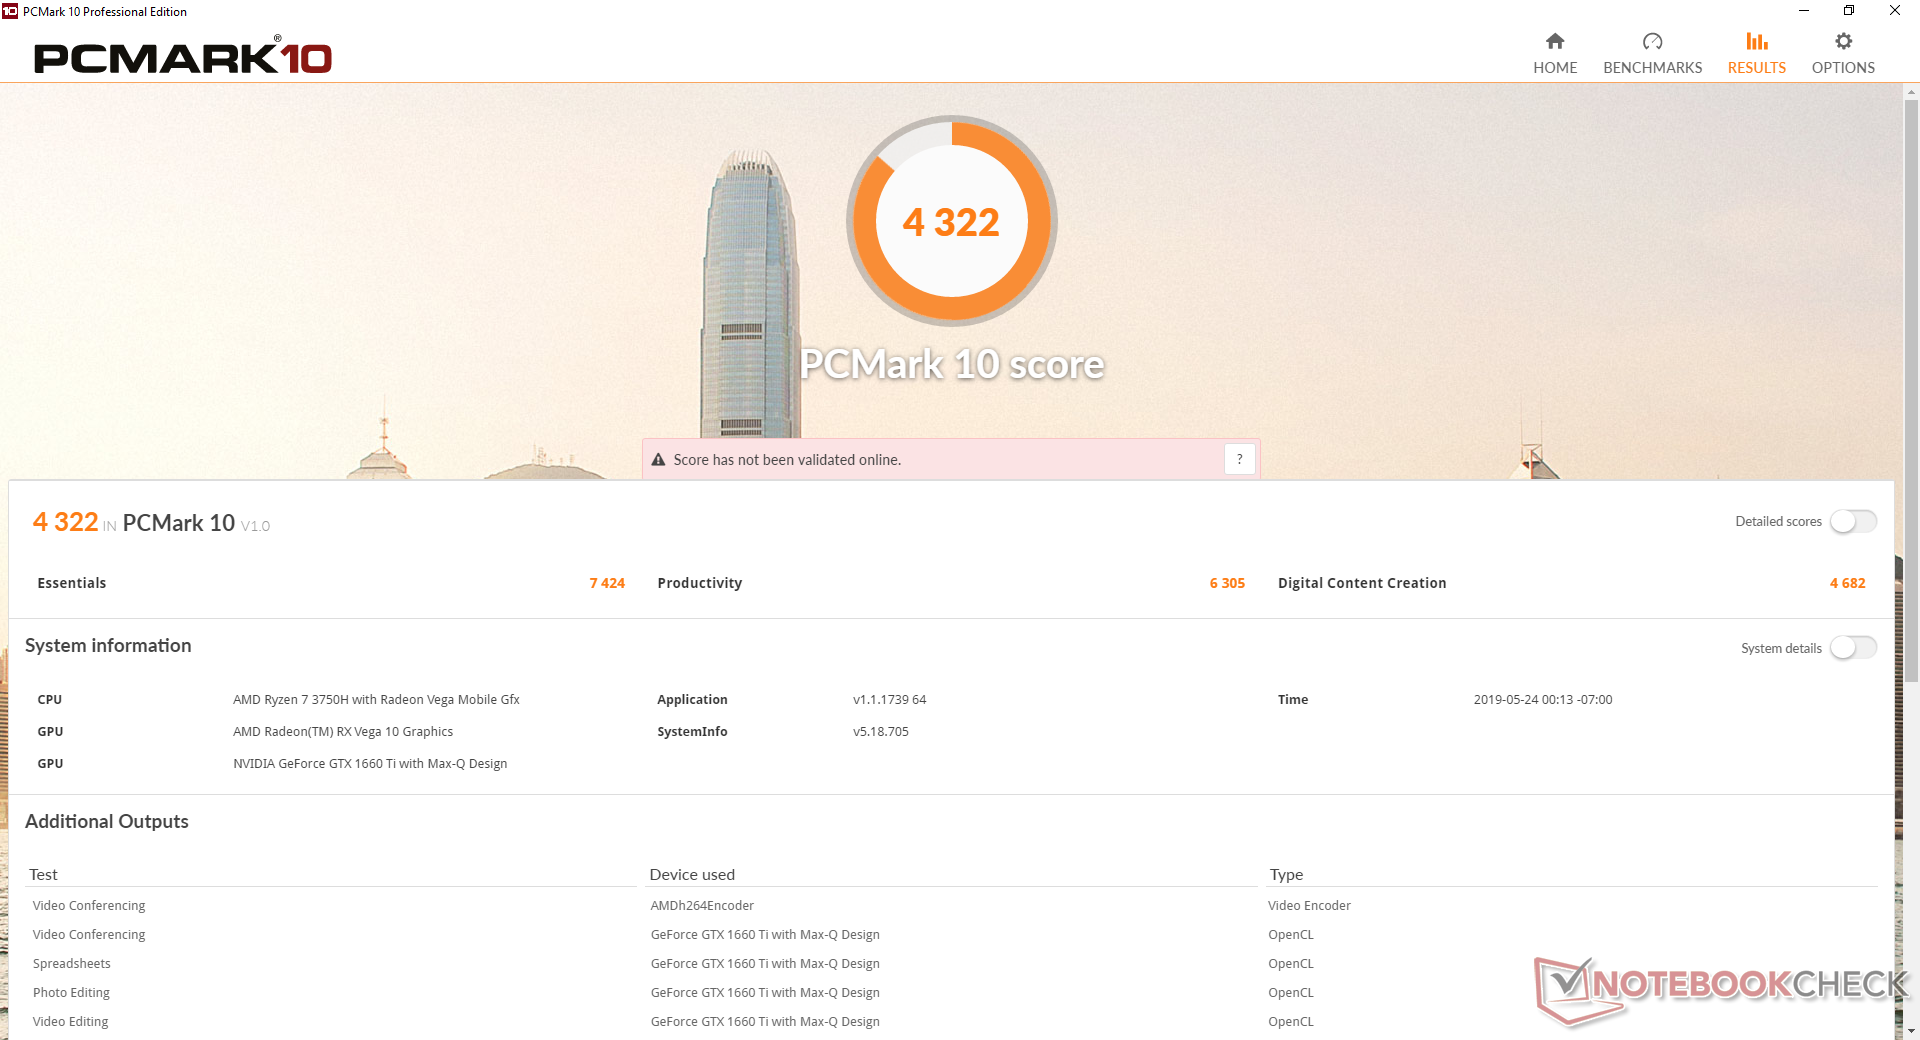
PCMark benchmarks rank our GA502 slightly lower than where we were expecting it to be: in between Intel Core i5-powered gaming laptops equipped with the GTX 1050 and GTX 1060. Results are very similar to the cheaper Asus TUF FX505DY that's also equipped with a Ryzen H-series CPU.
We experienced no software or hardware issues during our time with the test unit. The system is just a tad slower than the Intel Core i5 when launching or installing applications since the Ryzen H-series has a slower Turbo clock rate.
| PCMark 8 | |
| Home Score Accelerated v2 | |
| Asus TUF FX505DY | |
| Asus ROG GU501GM-BI7N8 | |
| Asus Zephyrus S GX531GX | |
| MSI GL63 8RC-069US | |
| Asus ROG Zephyrus G15 GA502DU | |
| Work Score Accelerated v2 | |
| Asus Zephyrus S GX531GX | |
| MSI GL63 8RC-069US | |
| Asus TUF FX505DY | |
| Asus ROG GU501GM-BI7N8 | |
| Asus ROG Zephyrus G15 GA502DU | |
| PCMark 8 Home Score Accelerated v2 | 3642 points | |
| PCMark 8 Work Score Accelerated v2 | 4956 points | |
| PCMark 10 Score | 4322 points | |
Help | ||
Storage Devices
Two internal storage options are available as M.2 2280 PCIe x2 slots. While PCIe x4 SSDs are supported, they may not be able to perform at their full potential due to the halved lanes. It's an understandable cut corner for a budget-midrange gaming laptop.
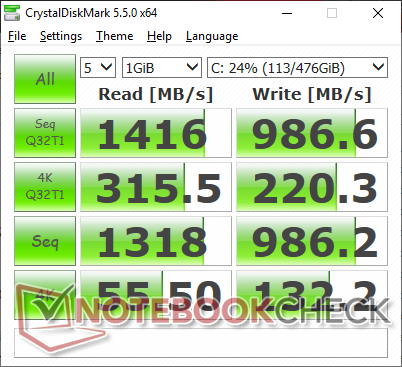
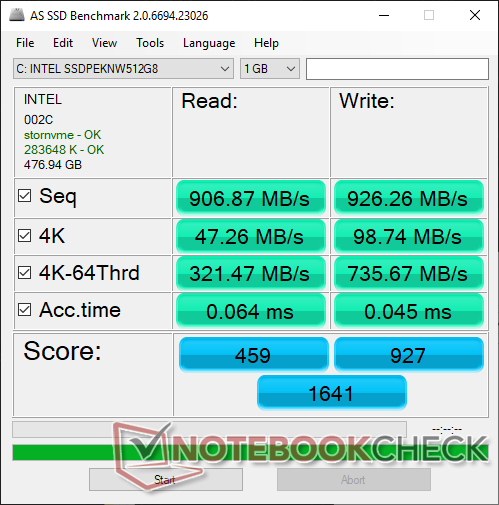
Our test unit comes equipped with a 512 GB Intel SSD 660p PCIe x4 NVMe SSD which advertises sequential read and write rates of up to 1500 MB/s and 1000 MB/s, respectively. We're able to reach close to these theoretical numbers with CrystalDiskMark while results are slightly slower on AS SSD. Asus ships this same SSD with its Zephyrus S GX531 series as well. The pricier Samsung PM981 series is able to outperform our budget Intel SSD by over two times.
See our table of HDDs and SSDs for more benchmark comparisons.
| Asus ROG Zephyrus G15 GA502DU Intel SSD 660p SSDPEKNW512G8 | Razer Blade 15 RTX 2070 Max-Q Samsung SSD PM981 MZVLB512HAJQ | Asus Zephyrus S GX531GX Intel SSD 660p SSDPEKNW512G8 | Asus ROG GU501GM-BI7N8 Kingston RBUSNS8154P3128GJ | Lenovo Legion Y740-15ICHg Samsung SSD PM981 MZVLB256HAHQ | Gigabyte Aero 15 Classic-XA Intel SSD 760p SSDPEKKW512G8 | |
|---|---|---|---|---|---|---|
| AS SSD | 92% | 7% | -59% | 59% | 60% | |
| Seq Read (MB/s) | 907 | 1840 103% | 1239 37% | 841 -7% | 1953 115% | 2517 178% |
| Seq Write (MB/s) | 926 | 1822 97% | 920 -1% | 404.7 -56% | 1629 76% | 924 0% |
| 4K Read (MB/s) | 47.26 | 52.3 11% | 45.74 -3% | 22.62 -52% | 33.2 -30% | 59.1 25% |
| 4K Write (MB/s) | 98.7 | 110.7 12% | 95.7 -3% | 67.1 -32% | 88.1 -11% | 126.5 28% |
| 4K-64 Read (MB/s) | 321.5 | 1126 250% | 322 0% | 270.3 -16% | 757 135% | 876 172% |
| 4K-64 Write (MB/s) | 736 | 1717 133% | 722 -2% | 237 -68% | 1501 104% | 922 25% |
| Access Time Read * (ms) | 0.064 | 0.047 27% | 0.073 -14% | 0.278 -334% | 0.077 -20% | 0.042 34% |
| Access Time Write * (ms) | 0.045 | 0.033 27% | 0.047 -4% | 0.058 -29% | 0.043 4% | 0.065 -44% |
| Score Read (Points) | 459 | 1362 197% | 492 7% | 377 -18% | 985 115% | 1186 158% |
| Score Write (Points) | 927 | 2010 117% | 910 -2% | 345 -63% | 1752 89% | 1141 23% |
| Score Total (Points) | 1641 | 4079 149% | 1654 1% | 900 -45% | 3230 97% | 2870 75% |
| Copy ISO MB/s (MB/s) | 905 | 1975 118% | 1236 37% | 773 -15% | 1872 107% | 2086 130% |
| Copy Program MB/s (MB/s) | 496.9 | 526 6% | 703 41% | 269.2 -46% | 478.2 -4% | 454.2 -9% |
| Copy Game MB/s (MB/s) | 819 | 1200 47% | 812 -1% | 419.3 -49% | 1165 42% | 1141 39% |
* ... smaller is better

GPU Performance
Nvidia Max-Q GPUs will always be slower than their equivalent non-Max-Q alternatives and the GTX 1660 Ti Max-Q is no different. GPU performance is about 6 to 10 percent slower than the standard GTX 1660 Ti for laptops and 15 to 21 percent slower than the GTX 1660 Ti for desktops. When compared to the Asus ROG GX531GM with the last generation GTX 1060, the new Turing card is about 18 to 34 percent faster. Running DX12 titles on Turing will generally see a larger boost in performance when compared to running DX11 on a Pascal card. In general, graphics performance sits comfortably between the GTX 1060 and GTX 1070.
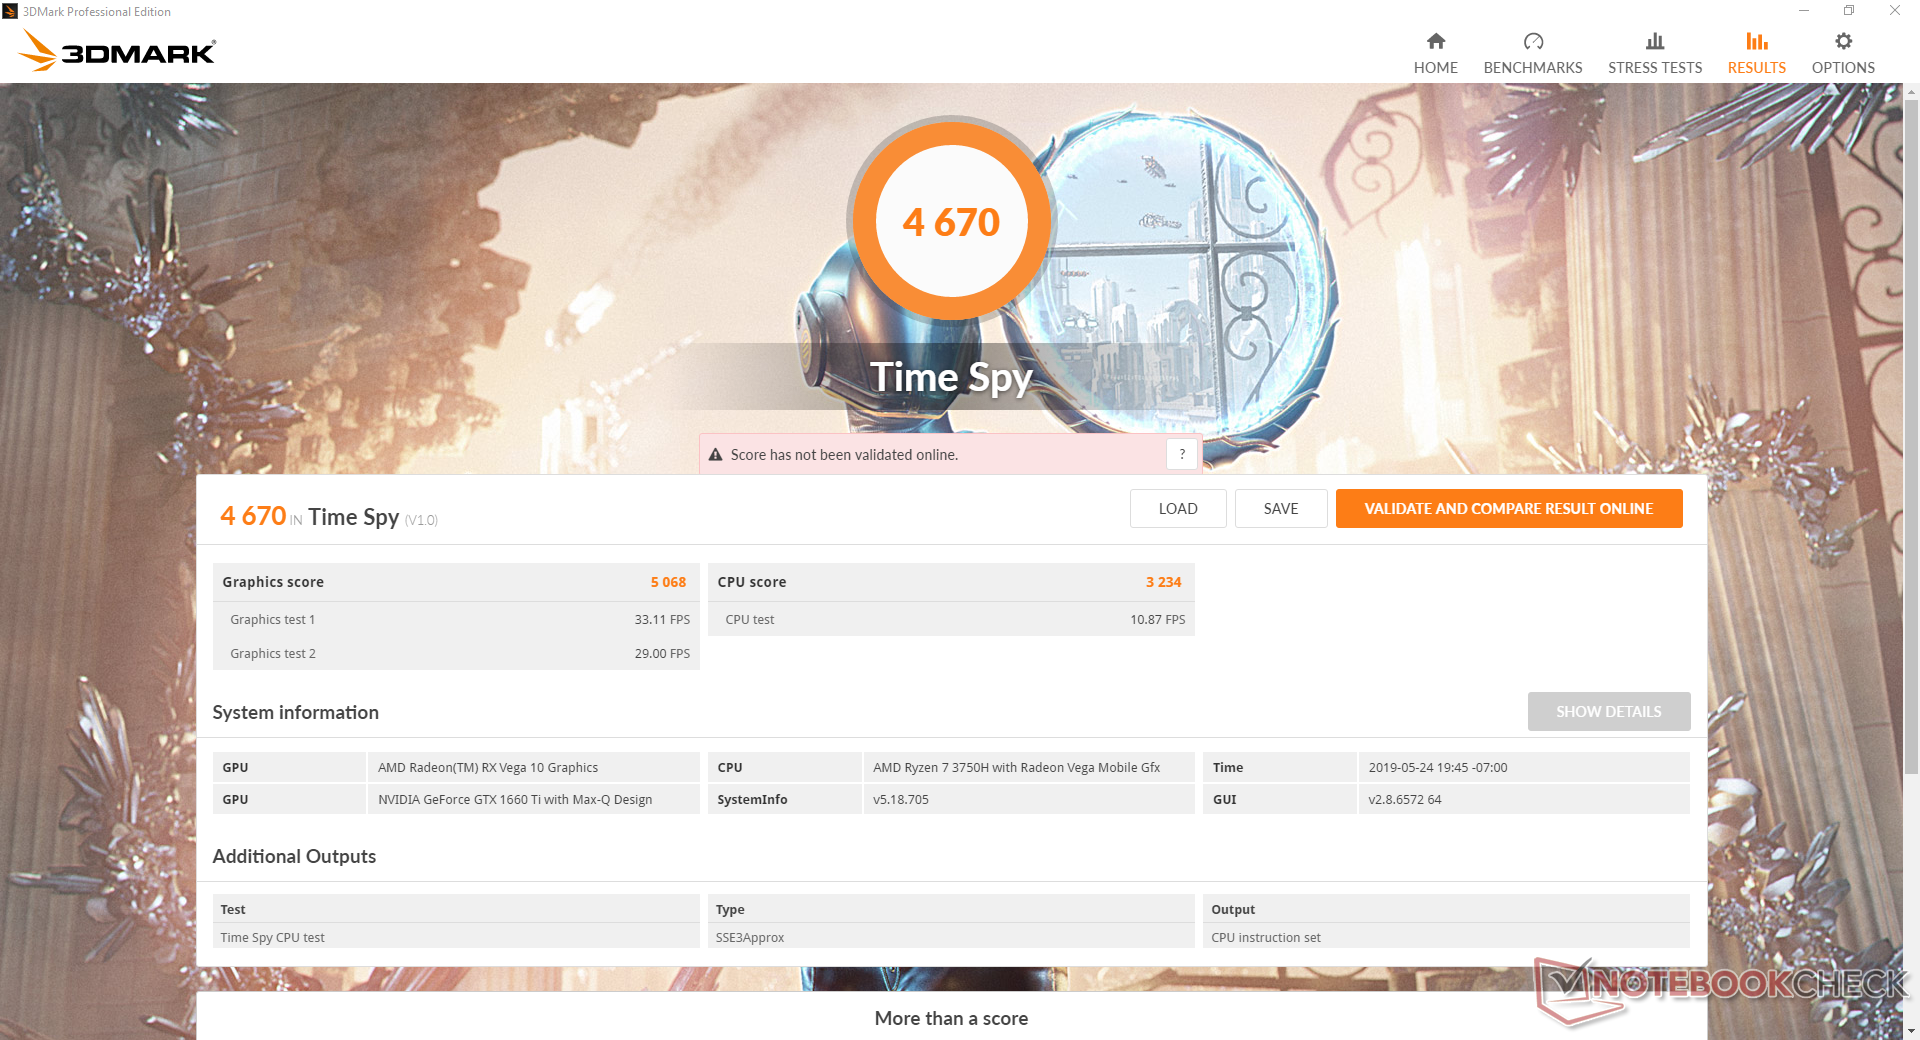
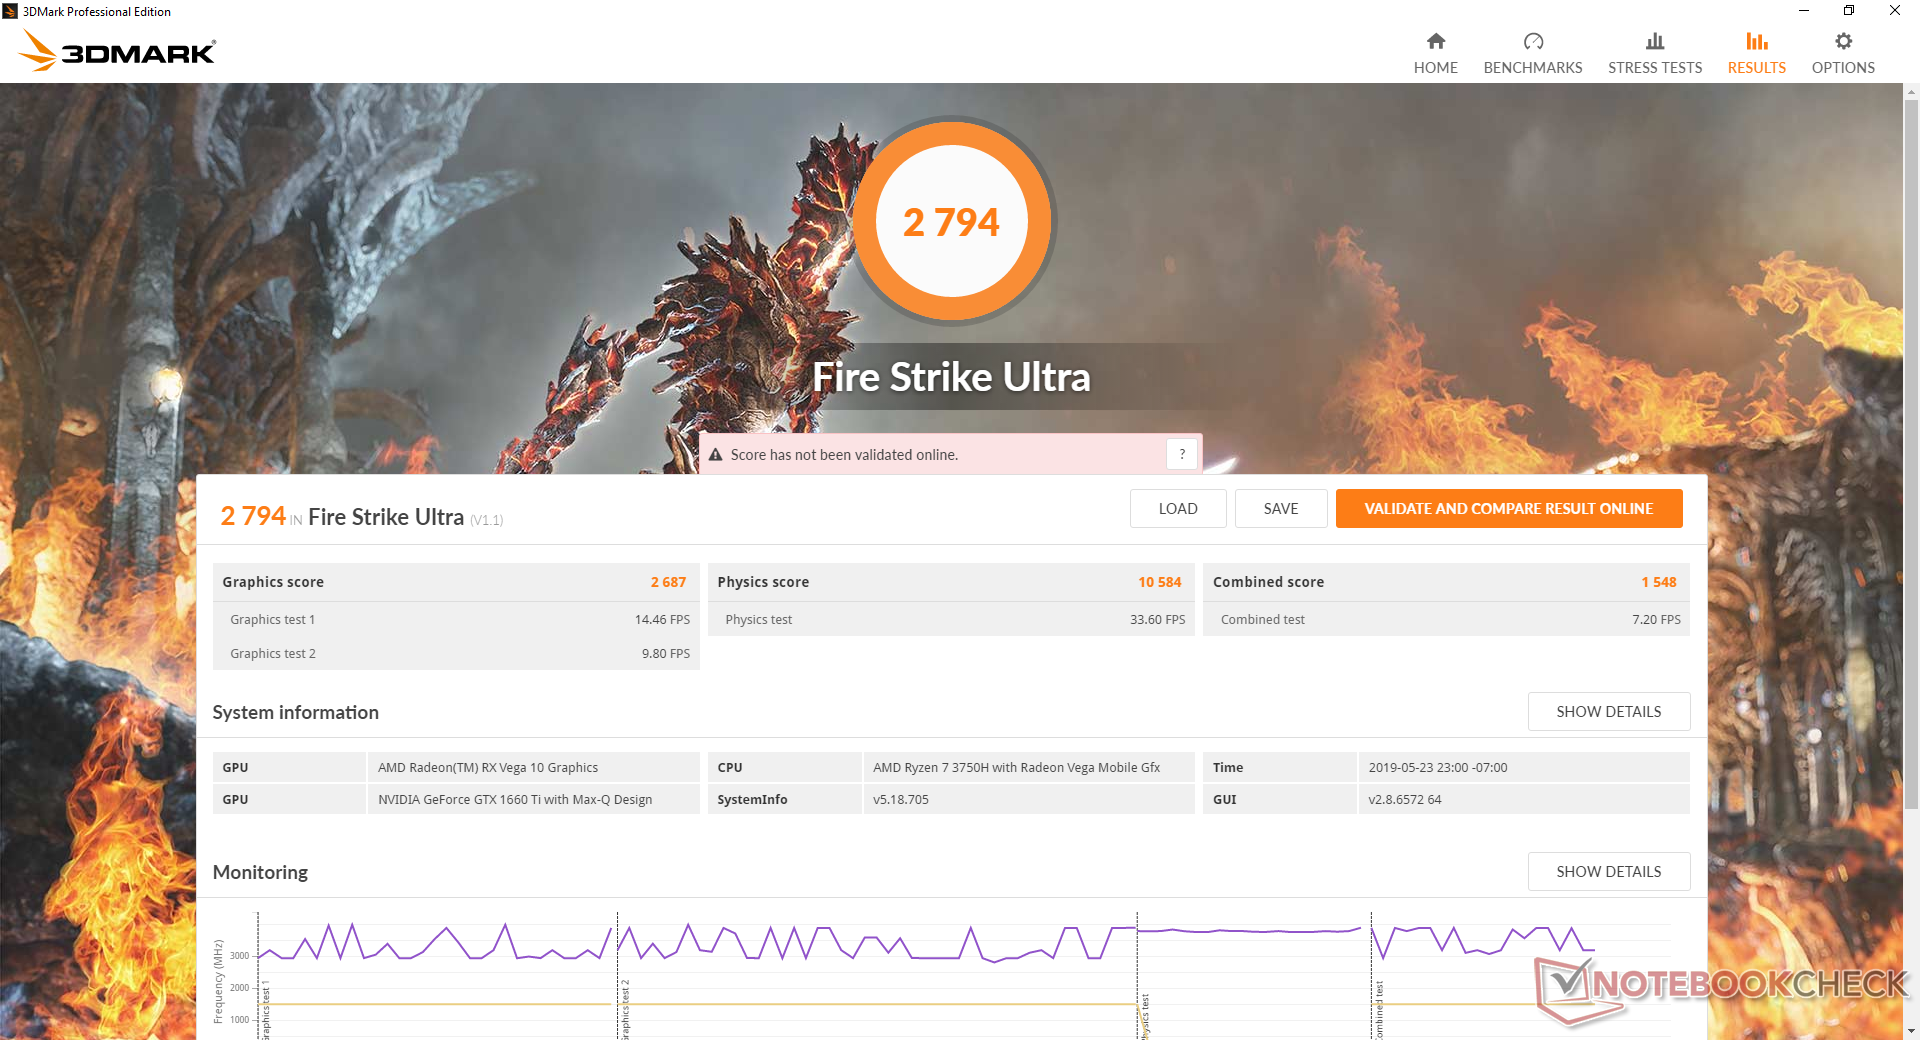
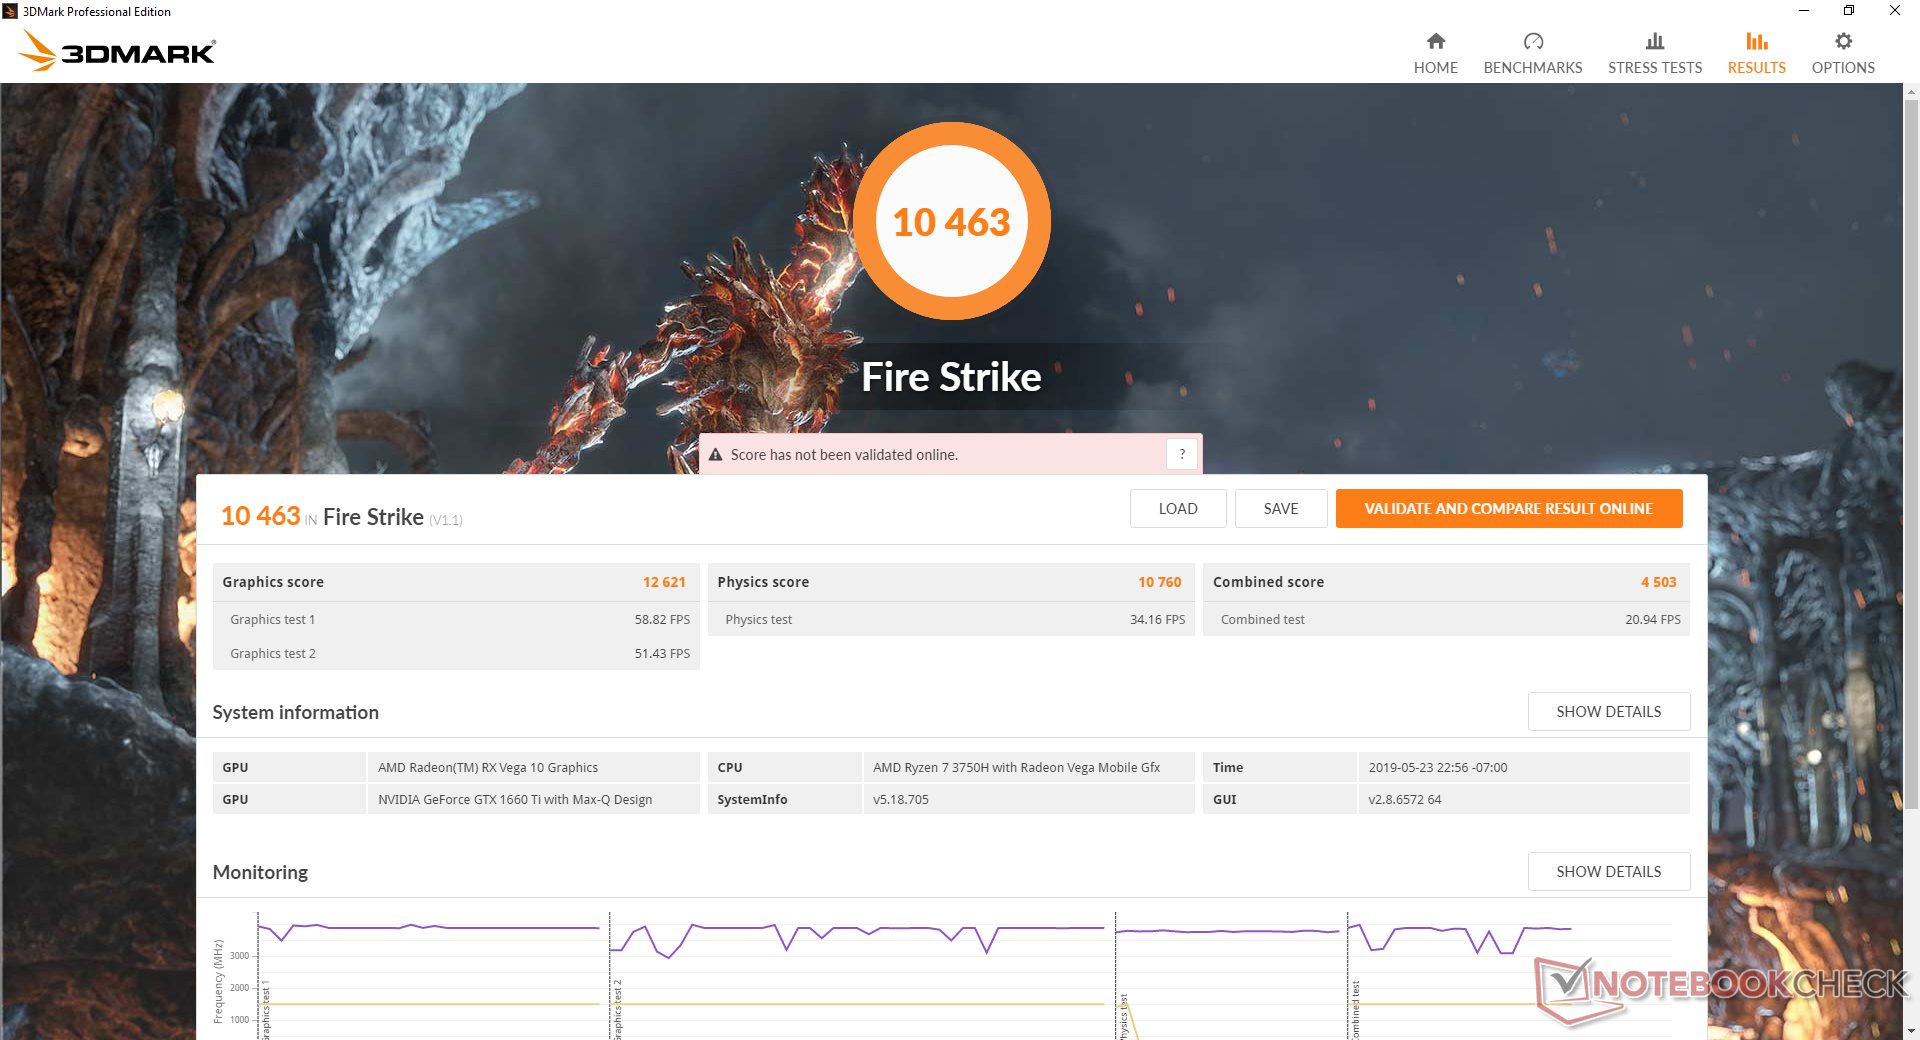
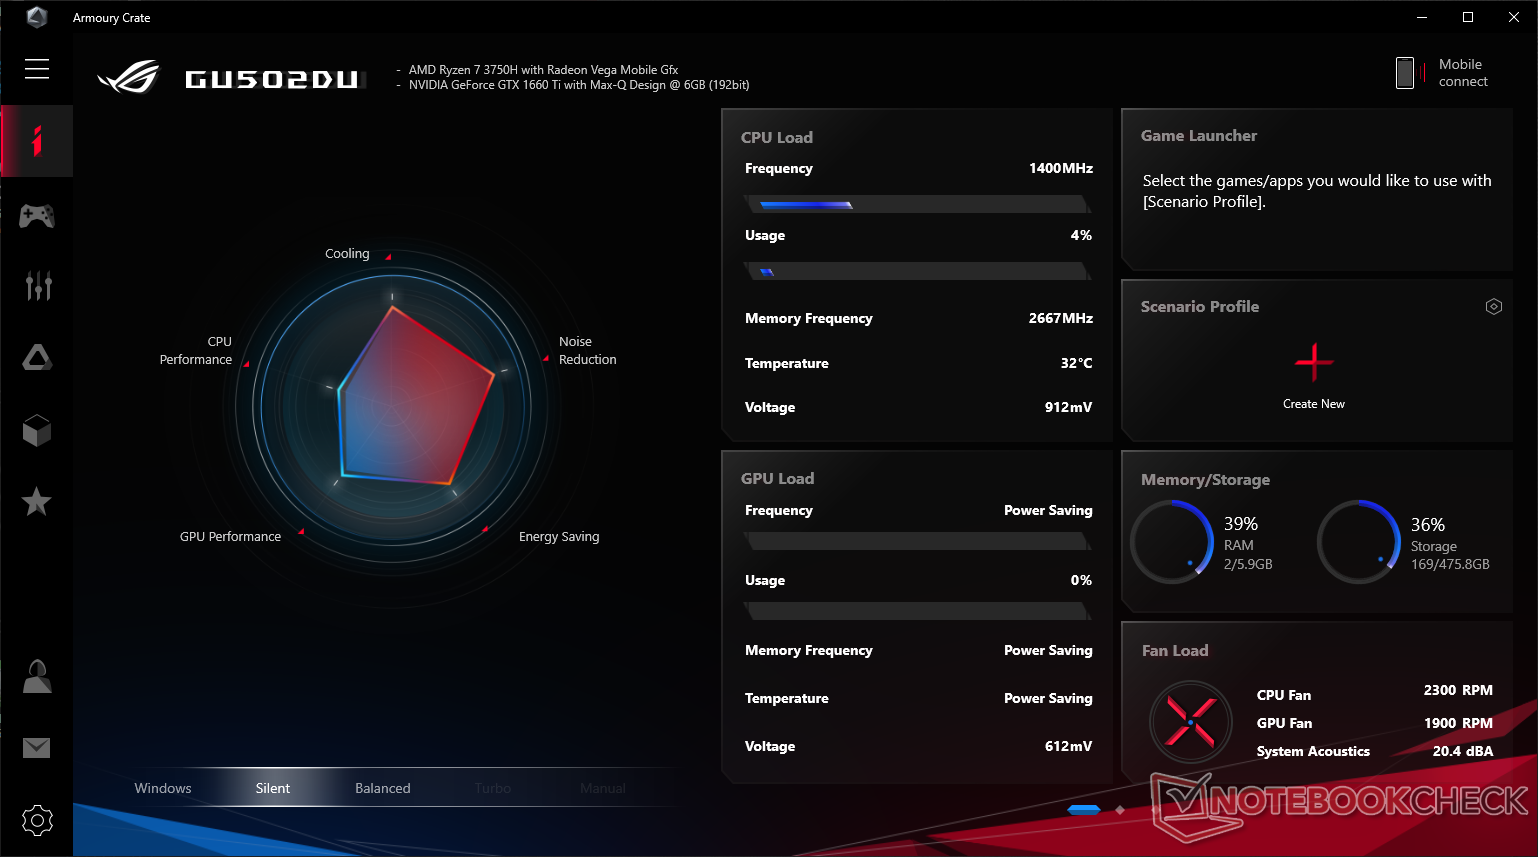
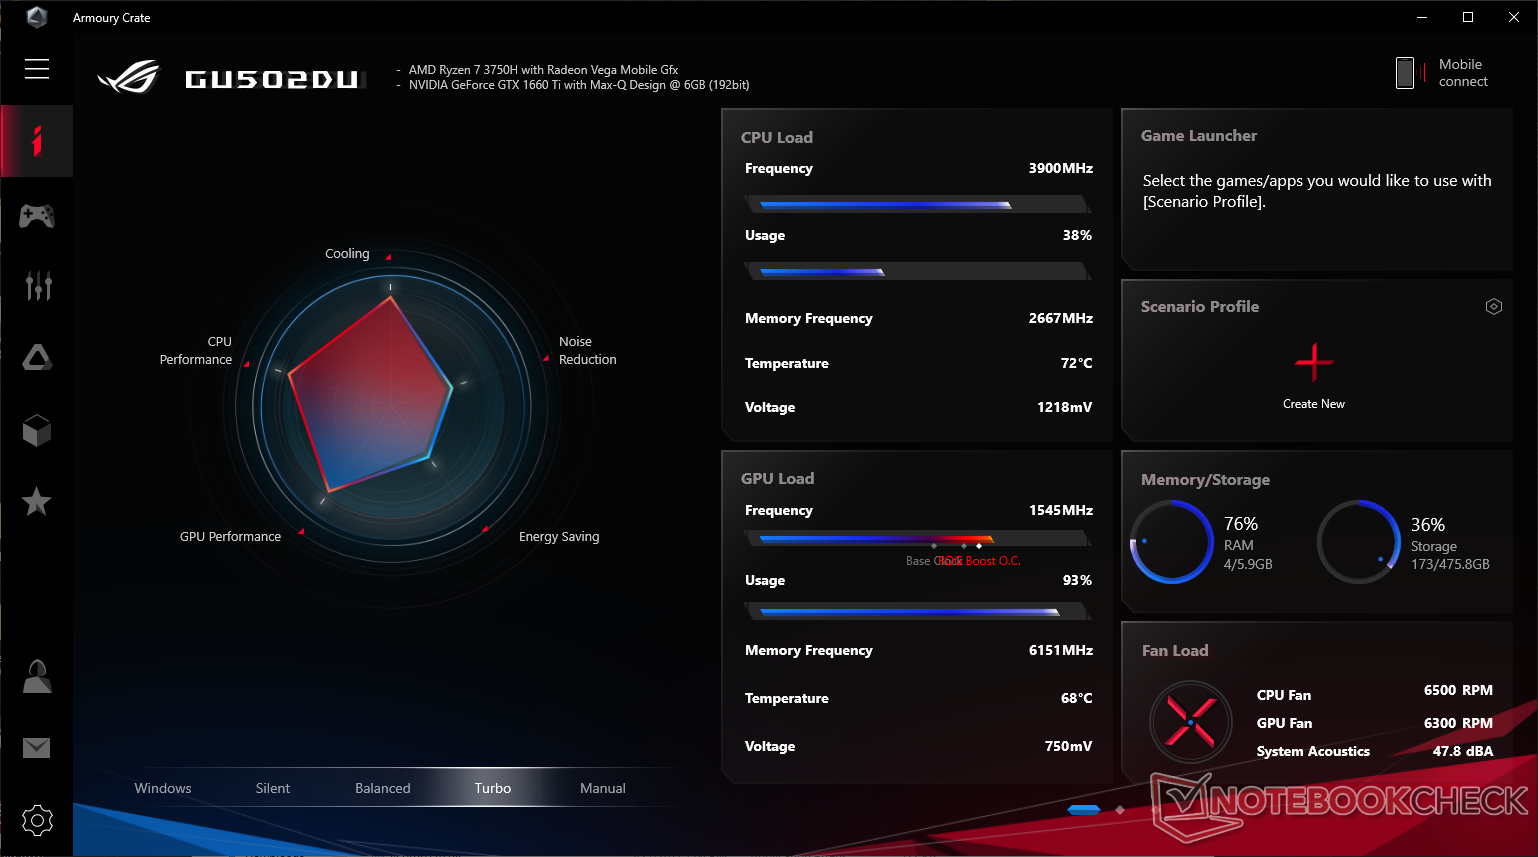
For maximum GPU performance, be sure to set the laptop to Turbo Mode through the Armoury Crate system application. Running Fire Strike and Time Spy on Turbo Mode returns Graphics scores of 13355 and 5068 points, respectively, compared to 12621 and 4867 points when on mains. These modes are annoyingly independent of the Windows power profiles.

| 3DMark | |
| 1920x1080 Fire Strike Graphics | |
| MSI GE75 9SG | |
| Asus Zephyrus S GX502GW | |
| Razer Blade 15 RTX 2070 Max-Q | |
| Alienware 17 R5 | |
| Schenker Compact 15 | |
| Asus ROG Zephyrus G15 GA502DU | |
| Asus Zephyrus S GX531GM | |
| Acer Nitro 5 | |
| Asus TUF FX705GE-EW096T | |
| Asus TUF FX705DY-AU072 | |
| Acer Swift 3 SF314-55G-768V | |
| 2560x1440 Time Spy Graphics | |
| MSI GE75 9SG | |
| Asus Zephyrus S GX502GW | |
| Razer Blade 15 RTX 2070 Max-Q | |
| Alienware 17 R5 | |
| Schenker Compact 15 | |
| Asus ROG Zephyrus G15 GA502DU | |
| Asus Zephyrus S GX531GM | |
| Acer Nitro 5 | |
| Asus TUF FX705GE-EW096T | |
| Asus TUF FX705DY-AU072 | |
| 3840x2160 Fire Strike Ultra Graphics | |
| MSI GE75 9SG | |
| Razer Blade 15 RTX 2070 Max-Q | |
| Asus ROG Zephyrus G15 GA502DU | |
| Asus Zephyrus S GX531GM | |
| Asus TUF FX705GE-EW096T | |
| Asus TUF FX705DY-AU072 | |
| 1920x1080 Fire Strike Score | |
| MSI GE75 9SG | |
| Asus Zephyrus S GX502GW | |
| Alienware 17 R5 | |
| Razer Blade 15 RTX 2070 Max-Q | |
| Schenker Compact 15 | |
| Asus ROG Zephyrus G15 GA502DU | |
| Asus Zephyrus S GX531GM | |
| Acer Nitro 5 | |
| Asus TUF FX705GE-EW096T | |
| Asus TUF FX705DY-AU072 | |
| Acer Swift 3 SF314-55G-768V | |
| 3DMark 11 | |
| 1280x720 Performance GPU | |
| MSI GE75 9SG | |
| Asus Zephyrus S GX502GW | |
| Alienware 17 R5 | |
| Razer Blade 15 RTX 2070 Max-Q | |
| Schenker Compact 15 | |
| Asus ROG Zephyrus G15 GA502DU | |
| Acer Nitro 5 | |
| Asus Zephyrus S GX531GM | |
| Asus TUF FX705GE-EW096T | |
| Asus TUF FX705DY-AU072 | |
| Acer Swift 3 SF314-55G-768V | |
| 1280x720 Performance Combined | |
| MSI GE75 9SG | |
| Schenker Compact 15 | |
| Alienware 17 R5 | |
| Asus Zephyrus S GX502GW | |
| Razer Blade 15 RTX 2070 Max-Q | |
| Acer Nitro 5 | |
| Asus TUF FX705GE-EW096T | |
| Asus Zephyrus S GX531GM | |
| Asus ROG Zephyrus G15 GA502DU | |
| Asus TUF FX705DY-AU072 | |
| Acer Swift 3 SF314-55G-768V | |
| 3DMark 06 Standard Score | 24029 points | |
| 3DMark Vantage P Result | 31845 points | |
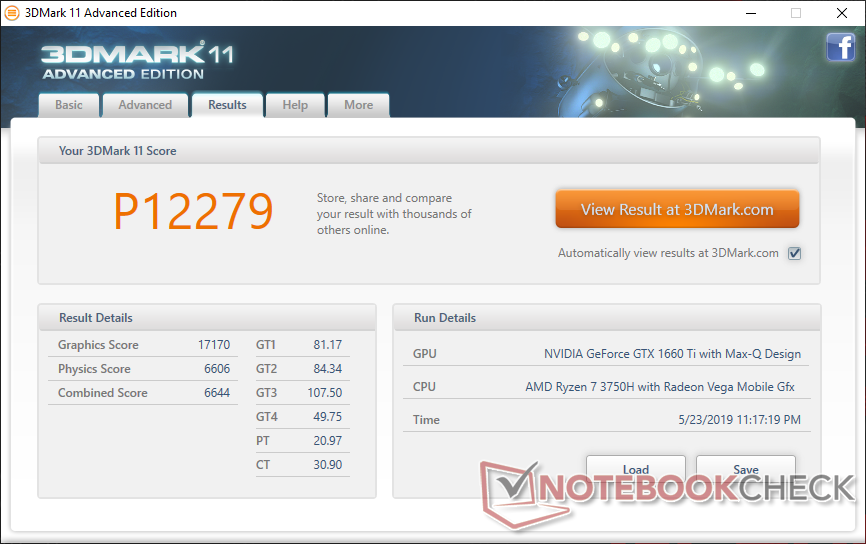
| 3DMark 11 Performance | 12279 points | |
| 3DMark Ice Storm Standard Score | 56479 points | |
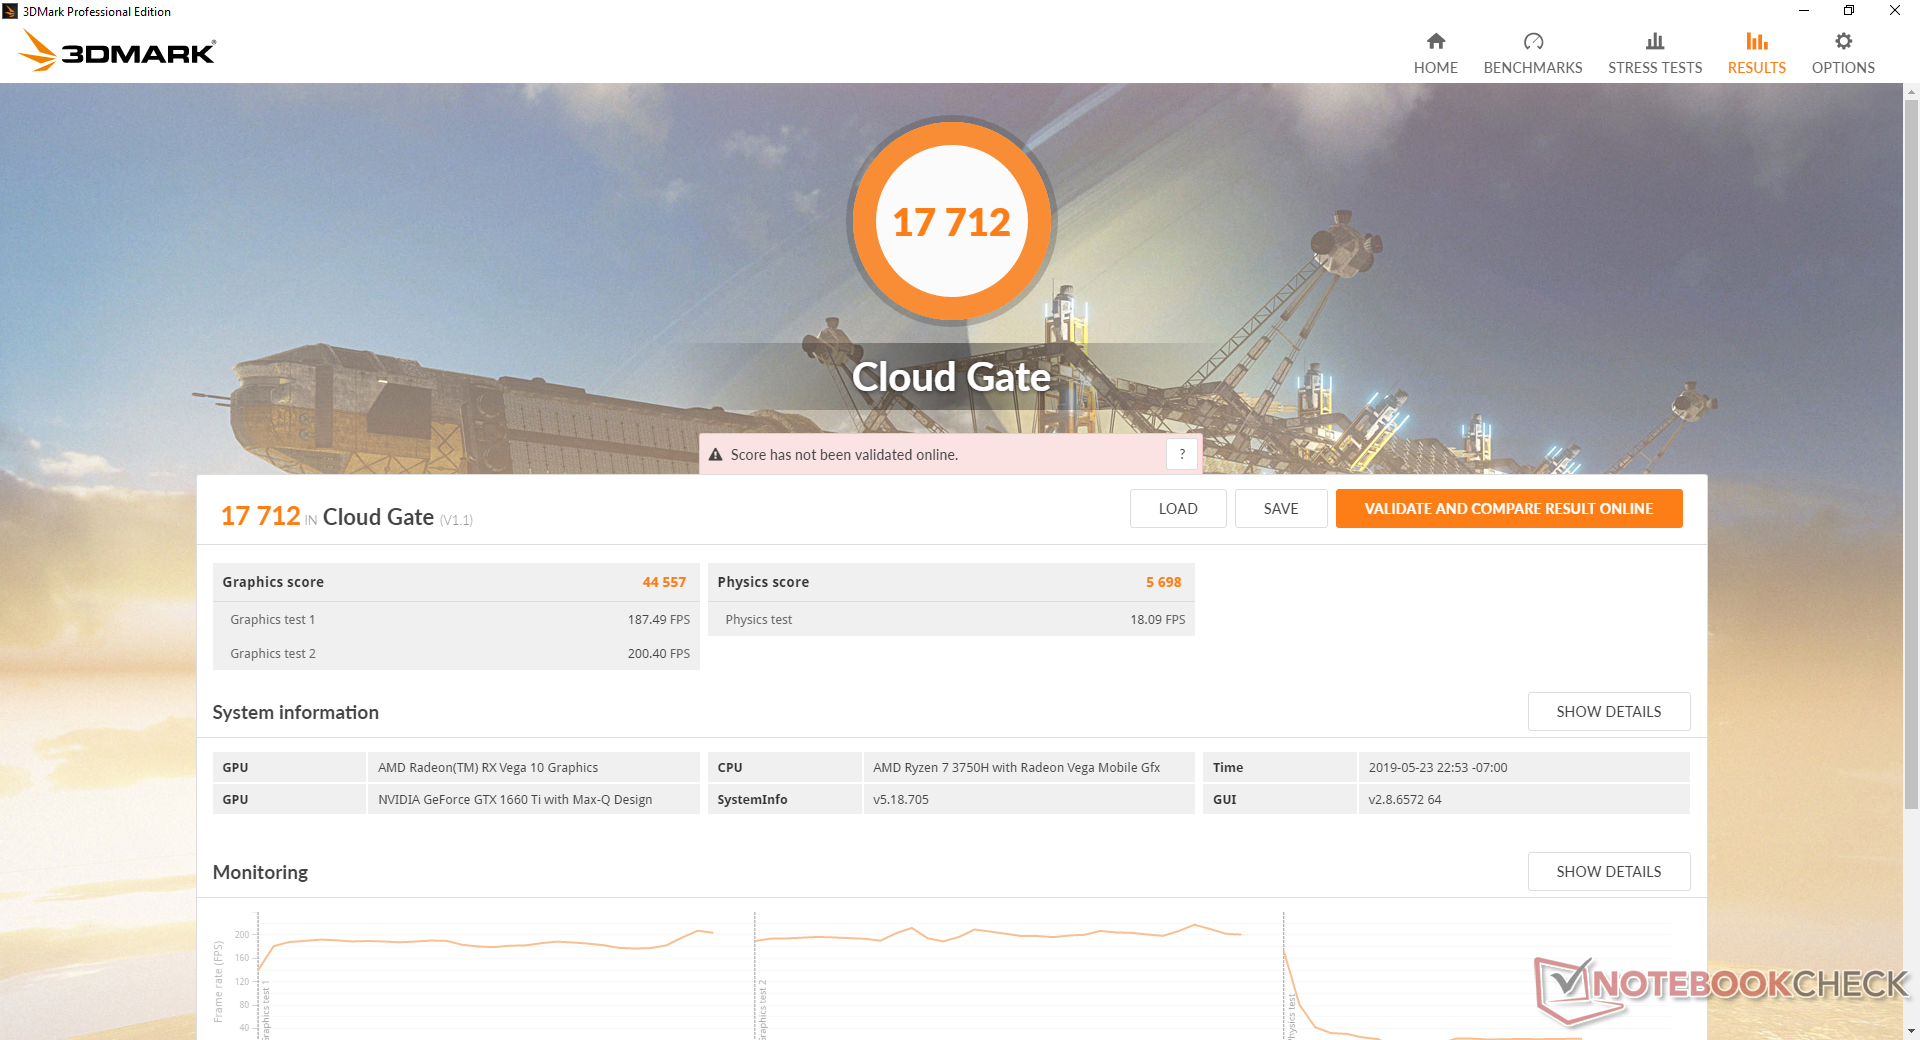
| 3DMark Cloud Gate Standard Score | 17712 points | |
| 3DMark Fire Strike Score | 10792 points | |
| 3DMark Time Spy Score | 4547 points | |
Help | ||
Gaming Performance
Real-world performance is slightly slower than expected. Average frame rates in Shadow of the Tomb Raider, for example, are about 25 percent slower than our Schenker laptop with standard GTX 1660 Ti graphics compared to only 10 percent as suggested by the synthetic Time Spy results above. Furthermore, running Assassin's Creed Odyssey on Low settings is similar to an old GTX 950M laptop while running the same game on Ultra settings is similar to a GTX 1060 laptop. This suggests a bottleneck related to the CPU and/or 8 GB of single-channel RAM.
Regardless of the above, however, all tested games run well at 1080p with the more demanding games averaging in the 40 FPS range. G-Sync would have been a perfect option in this regard. 1366 x 768 is an unsupported resolution on the system despite updating to the latest drivers and so our benchmark results for this setting are not included below.
See our dedicated page on the GeForce GTX 1660 Ti Max-Q for more technical information and benchmark comparisons.
| Shadow of the Tomb Raider - 1920x1080 Highest Preset AA:T | |
| Nvidia GeForce GTX 1080 Founders Edition | |
| Alienware m15 P79F | |
| Zotac GeForce GTX 1660 Ti 6 GB | |
| MSI GL73 8SE-010US | |
| Schenker Compact 15 | |
| HP Omen 15-dc0015ng | |
| Asus ROG Zephyrus G15 GA502DU | |
| Acer Nitro 5 | |
| Asus Zephyrus S GX531GM | |
| Asus TUF FX705GE-EW096T | |
| Lenovo ThinkPad X1 Extreme-20MF000XGE | |
| Acer Aspire 5 A515-52G-723L | |
| low | med. | high | ultra | |
|---|---|---|---|---|
| BioShock Infinite (2013) | 183.4 | 102.3 | ||
| The Witcher 3 (2015) | 138.4 | 83.9 | 48.8 | |
| Batman: Arkham Knight (2015) | 89 | 69 | 51 | |
| Metal Gear Solid V (2015) | 60 | 60 | 60 | |
| Rise of the Tomb Raider (2016) | 93.7 | 72.7 | 64.5 | |
| Ashes of the Singularity (2016) | 42.4 | 40.7 | ||
| Overwatch (2016) | 193.7 | 140.7 | 116 | |
| Rocket League (2017) | 206.7 | 160.8 | 141.7 | |
| Middle-earth: Shadow of War (2017) | 91 | 82 | 72 | 61 |
| Fortnite (2018) | 138 | 92.2 | 89.5 | 78.6 |
| Final Fantasy XV Benchmark (2018) | 78.4 | 60.3 | 44.9 | |
| Monster Hunter World (2018) | 66.9 | 59.3 | 59.5 | 50.8 |
| Shadow of the Tomb Raider (2018) | 62 | 57 | 53 | 49 |
| Assassin´s Creed Odyssey (2018) | 48 | 43 | 39 | 33 |
| Apex Legends (2019) | 144 | 105.3 | 90.1 | 89 |
| Metro Exodus (2019) | 96.6 | 53.9 | 46.6 | 35.1 |
Emissions
System Noise
The cooling solution consists of two identical fans with three heat pipes between them. Actual fan noise, however, depends highly on the preset Asus' power profiles. When set to Silent mode, fan noise tends to settle at the mostly inaudible 29 to 32 dB(A) range during low loads like browsing or video streaming. If set to Balanced mode, the fans will become more sensitive to onscreen loads and fan noise may alternate between 32 dB(A) and 35 dB(A) during the same browsing or streaming loads. Avoid using Turbo mode if not gaming because this sets the fans to 40 dB(A) at the minimum no matter the processing load.
As a gaming laptop, of course, users will likely want to game on Turbo mode to get the highest performance possible. In truth, however, fan noise between Balanced and Turbo modes are nearly identical when gaming. Running Witcher 3 on Balanced and Turbo mode induces a fan noise of 53.8 dB(A) and 54.8 dB(A), respectively. Thus, there's no reason to not game on Turbo mode as Balanced mode will not be all that much quieter.
On the flip side, the Asus system is still louder than expected even for a gaming laptop. At over 50 dB(A), fan noise becomes difficult to ignore without a pair of headphones. The Razer Blade 15 with RTX 2070 Max-Q and Acer Aspire Nitro 5 with GTX 1650 are each noticeably quieter when gaming.
We can notice no coil whine on our test unit.
| Asus ROG Zephyrus G15 GA502DU GeForce GTX 1660 Ti Max-Q, R7 3750H, Intel SSD 660p SSDPEKNW512G8 | Razer Blade 15 RTX 2070 Max-Q GeForce RTX 2070 Max-Q, i7-8750H, Samsung SSD PM981 MZVLB512HAJQ | Asus Zephyrus S GX531GX GeForce RTX 2080 Max-Q, i7-8750H, Intel SSD 660p SSDPEKNW512G8 | Asus ROG GU501GM-BI7N8 GeForce GTX 1060 Mobile, i7-8750H, Kingston RBUSNS8154P3128GJ | Asus Zephyrus S GX502GW GeForce RTX 2070 Mobile, i7-9750H, 2x Intel SSD 660p SSDPEKNW512G8 (RAID 0) | Acer Aspire Nitro 5 AN515-54-53Z2 GeForce GTX 1650 Mobile, i5-9300H, WDC PC SN520 SDAPNUW-512G | |
|---|---|---|---|---|---|---|
| Noise | 10% | -3% | -0% | -7% | 1% | |
| off / environment * (dB) | 28 | 28.8 -3% | 28.7 -2% | 28.6 -2% | 30 -7% | 30 -7% |
| Idle Minimum * (dB) | 29.4 | 28.8 2% | 29.8 -1% | 31.4 -7% | 31 -5% | 30 -2% |
| Idle Average * (dB) | 31.9 | 28.8 10% | 32.4 -2% | 31.4 2% | 33 -3% | 31 3% |
| Idle Maximum * (dB) | 33 | 29.4 11% | 38 -15% | 34.2 -4% | 38 -15% | 33 -0% |
| Load Average * (dB) | 41.2 | 35.7 13% | 38.2 7% | 42.8 -4% | 50 -21% | 46 -12% |
| Witcher 3 ultra * (dB) | 53.8 | 42.5 21% | 56.6 -5% | 50.9 5% | 53 1% | 46 14% |
| Load Maximum * (dB) | 55.7 | 45 19% | 56.6 -2% | 50.9 9% | 56 -1% | 49 12% |
* ... smaller is better
Noise level
| Idle |
| 29.4 / 31.9 / 33 dB(A) |
| Load |
| 41.2 / 55.7 dB(A) |
 | ||
30 dB silent 40 dB(A) audible 50 dB(A) loud |
||
min: | ||
Temperature
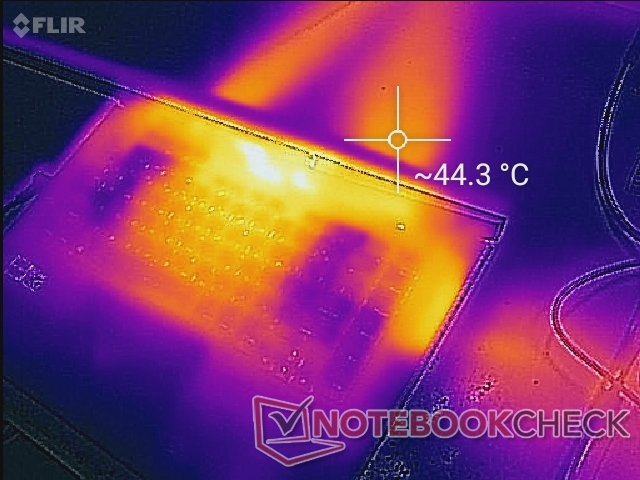
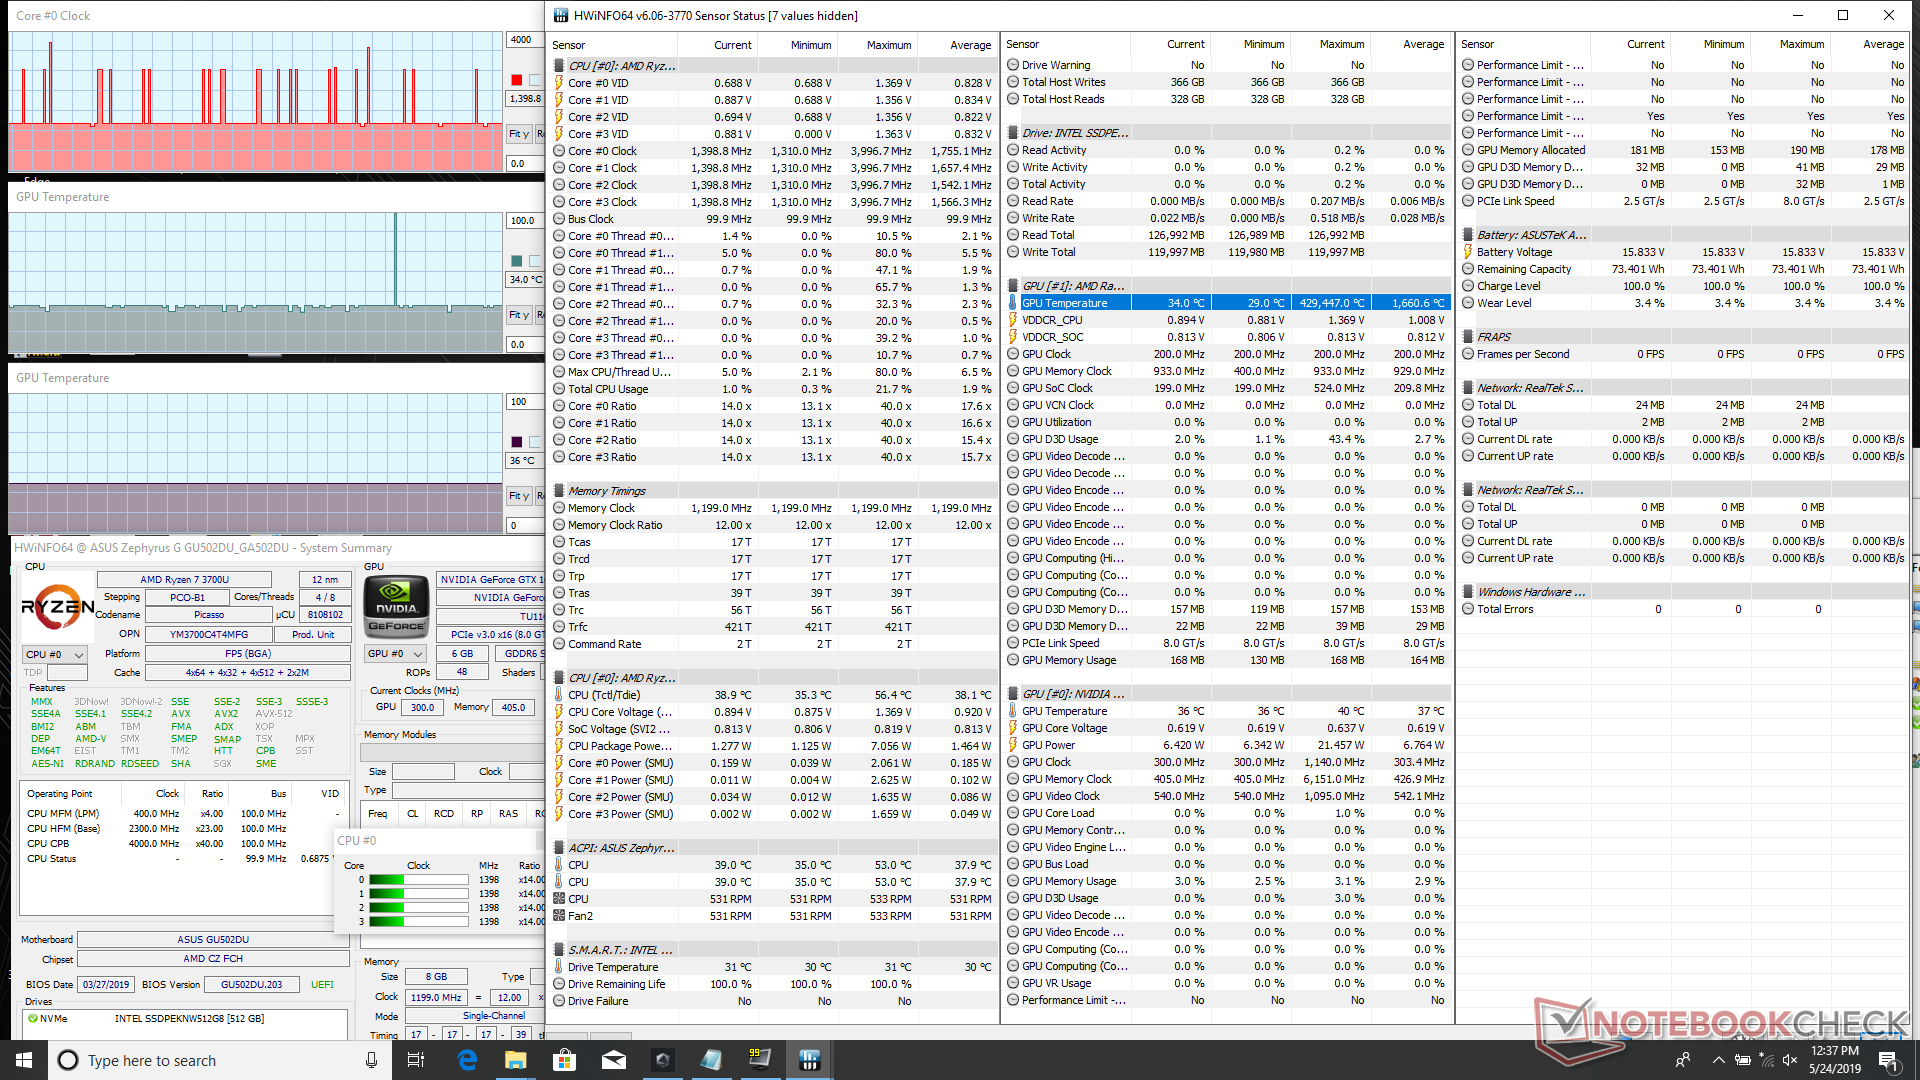
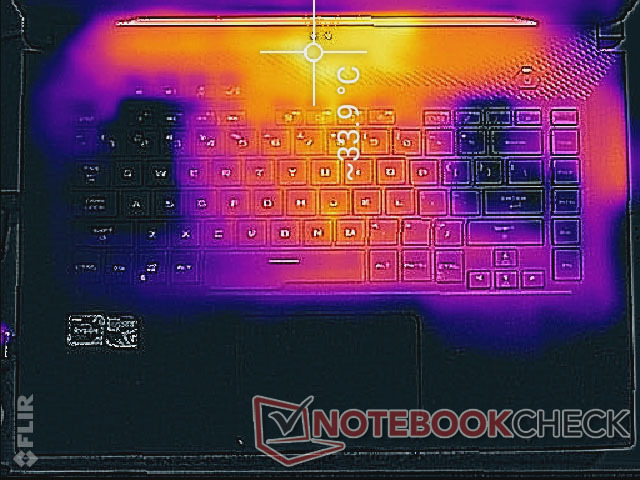
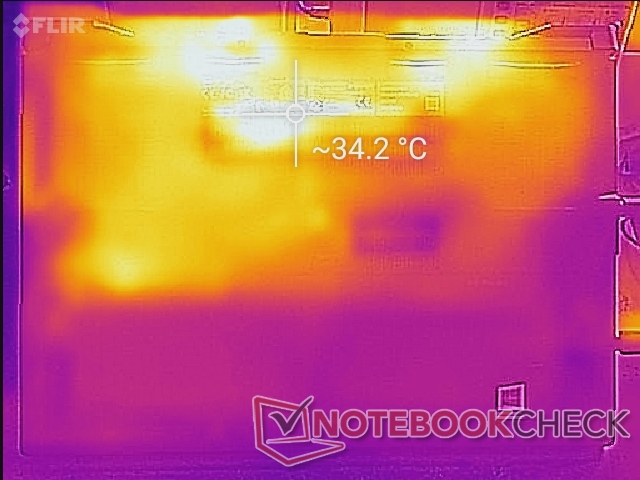
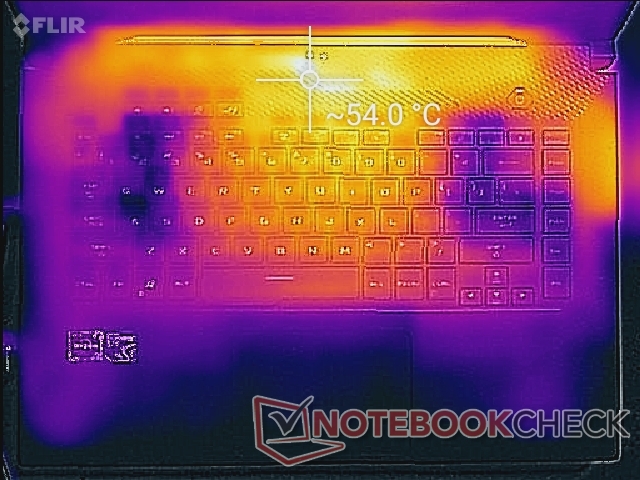
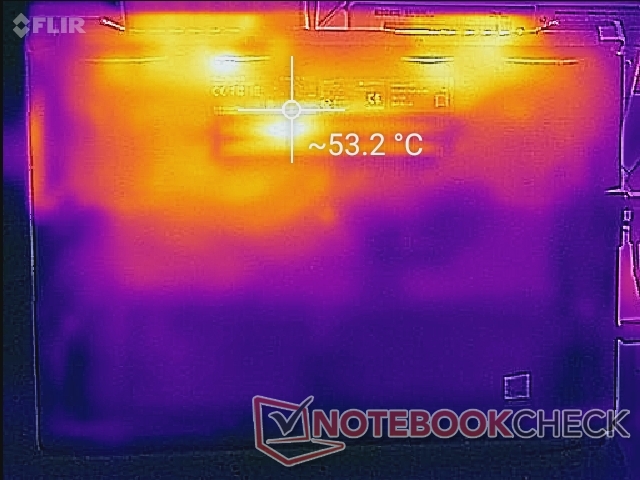
Surface temperatures are almost symmetrical due to the underlying cooling solution. When idling or during low loads, the palm rests and keyboard keys remain cool while any hot spots are toward the rear of the unit where users are unlikely to touch.
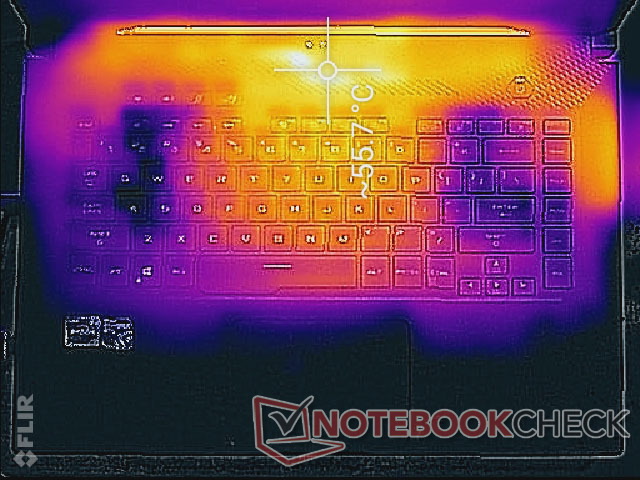
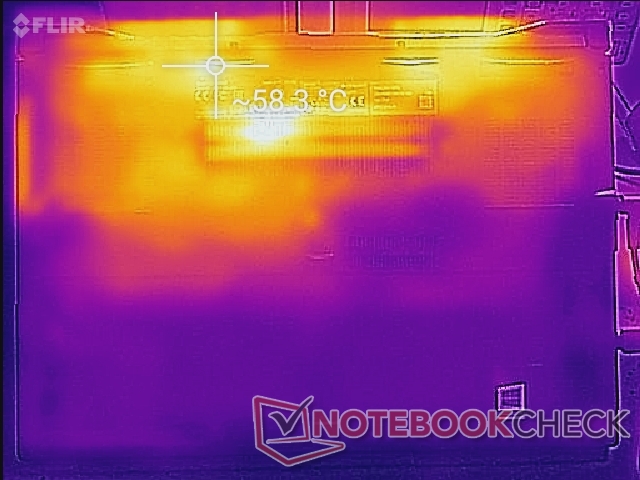
When gaming, hot spots can become as warm as 56 C not unlike what we discovered on the more powerful GX502GW with its fancy ErgoLift cooling feature. Fans draw fresh air from the WASD keys to keep this area cool for gamers in a similar manner to the Razer Blade 15. Unlike the magnesium-clad Razer, however, the plastic palm rests on the Asus are generally cooler and thus more comfortable. We never found the system to be uncomfortably warm no matter the onscreen load.
Stress Test
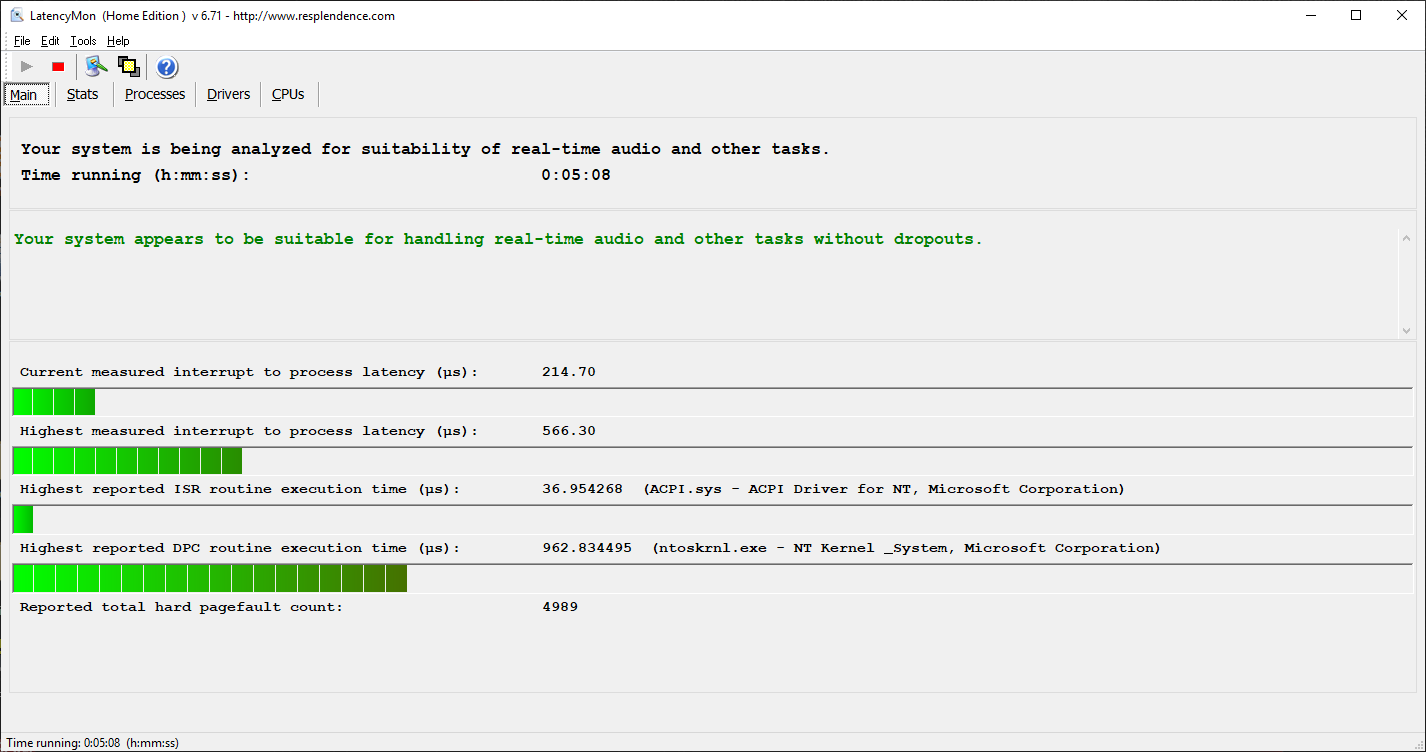
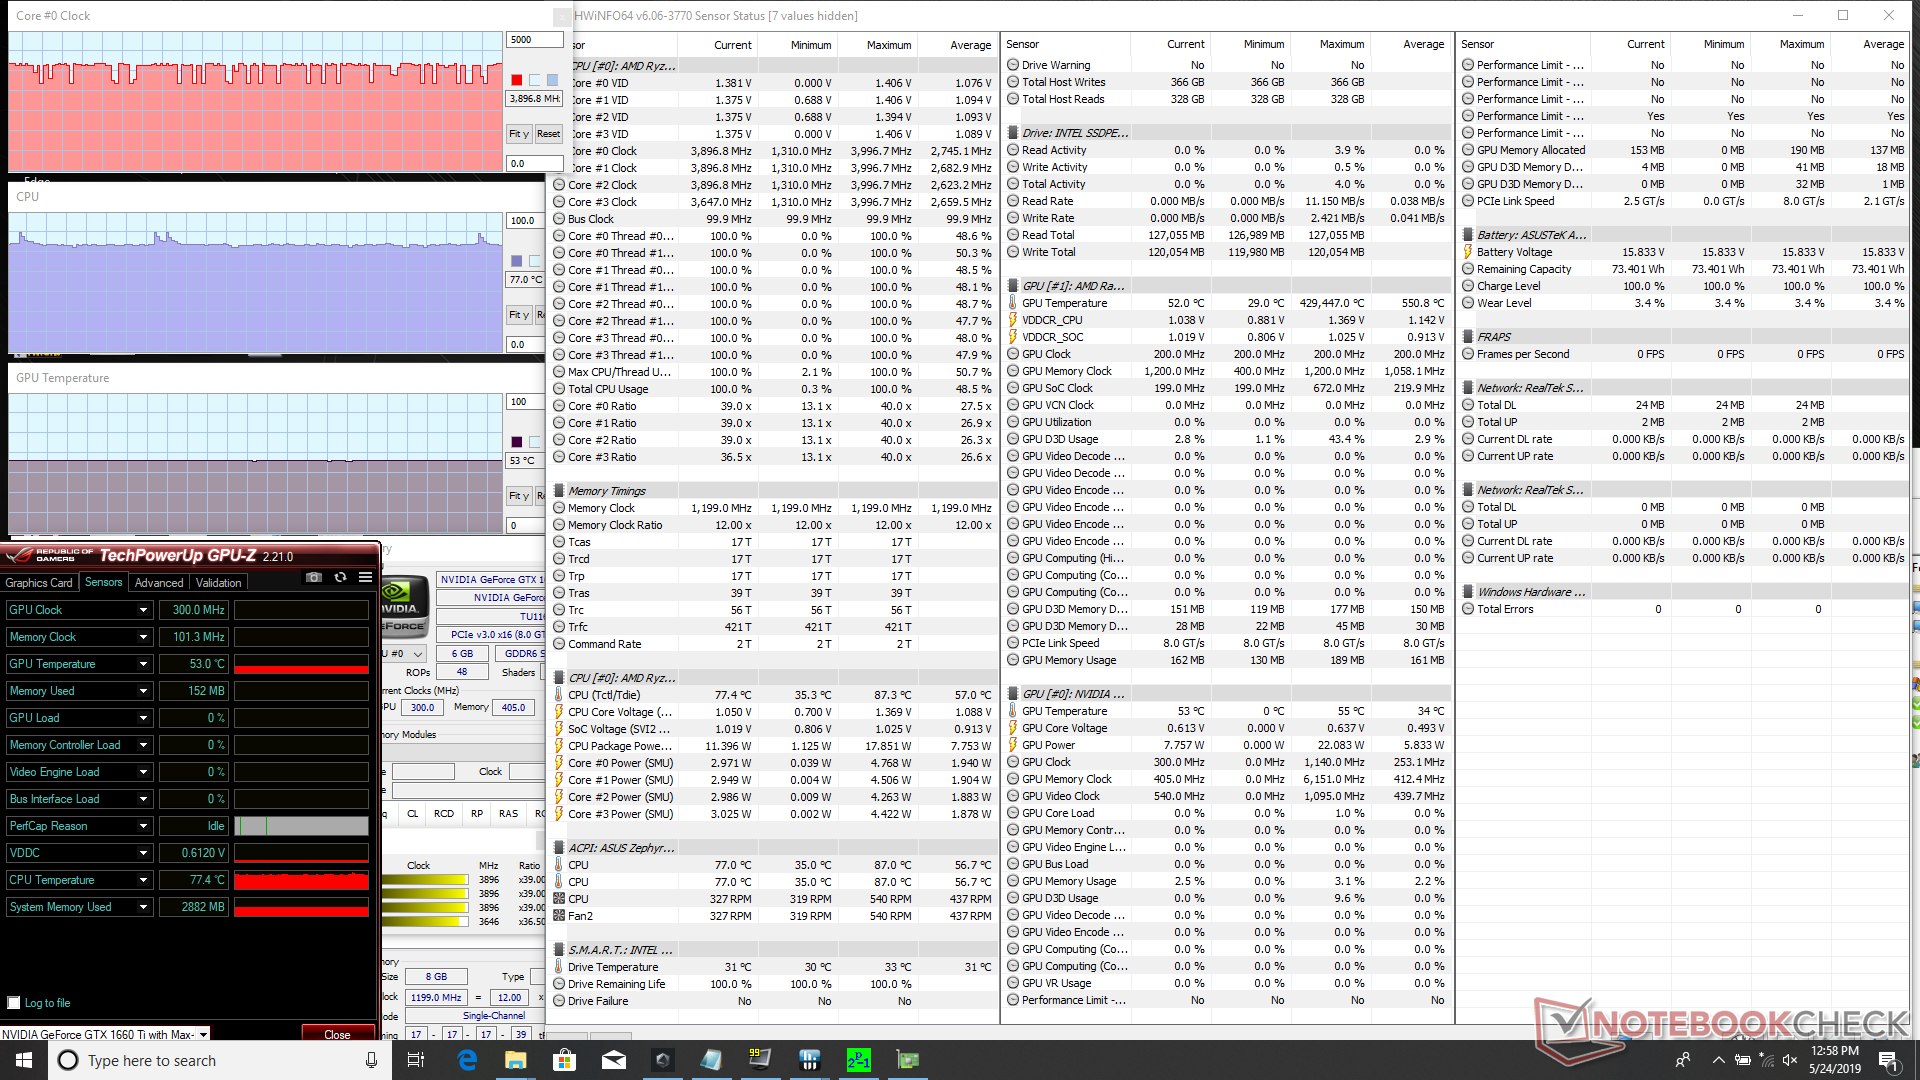
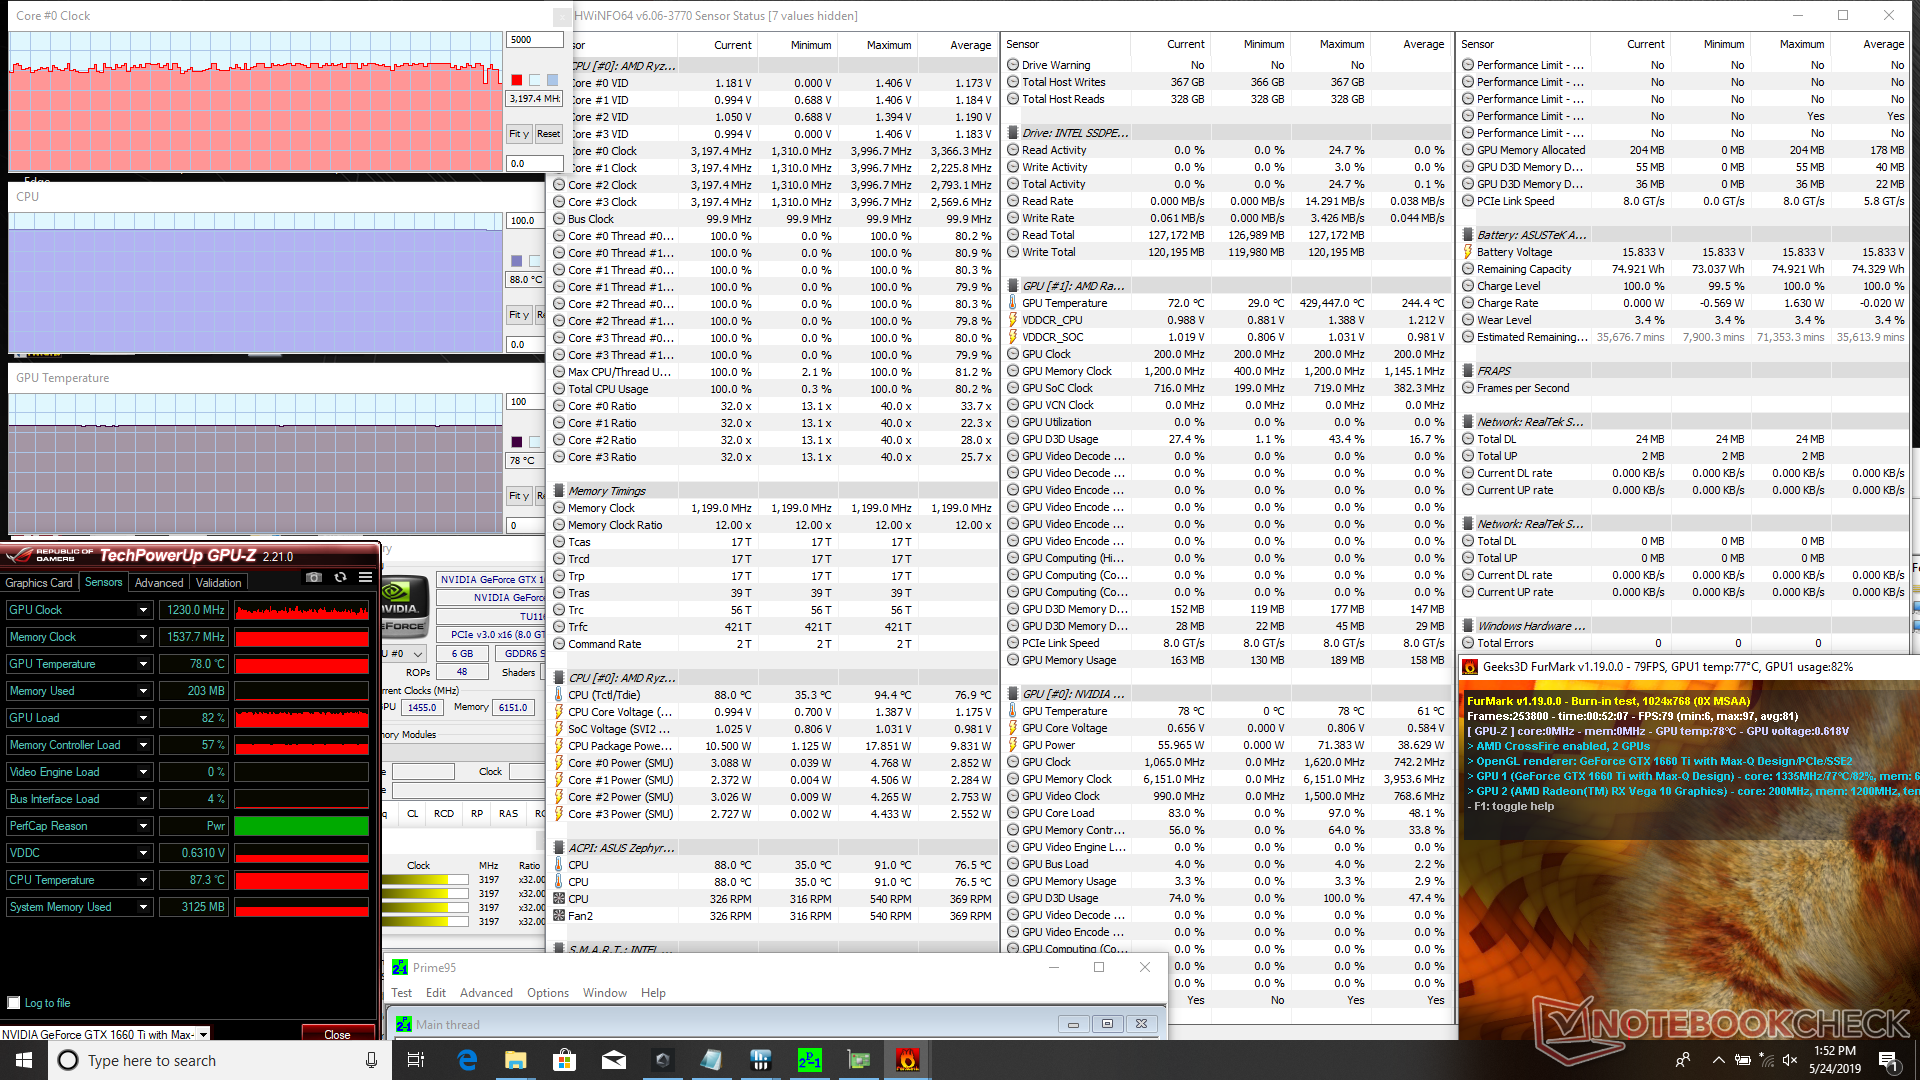
We stress the laptop with synthetic loads to identify for any potential throttling or stability issues. When running Prime95 to stress the CPU, we can observe clock rates boost to 4.0 GHz before dropping by just 100 MHz to a generally stable 3.9 GHz. We say "generally" because clock rates will occasionally dip to 3.2 GHz for a split second before jumping back up to 3.9 GHz as shown by our screenshot below. Fortunately, this behavior does not impact CPU performance or gaming performance as shown by our CineBench loop test and Witcher 3 test above. If running Prime95 and FurMark simultaneously, CPU and GPU temperatures will stabilize at 88 C and 78 C, respectively, which is not unlike what we observed on the more powerful GX502GW.
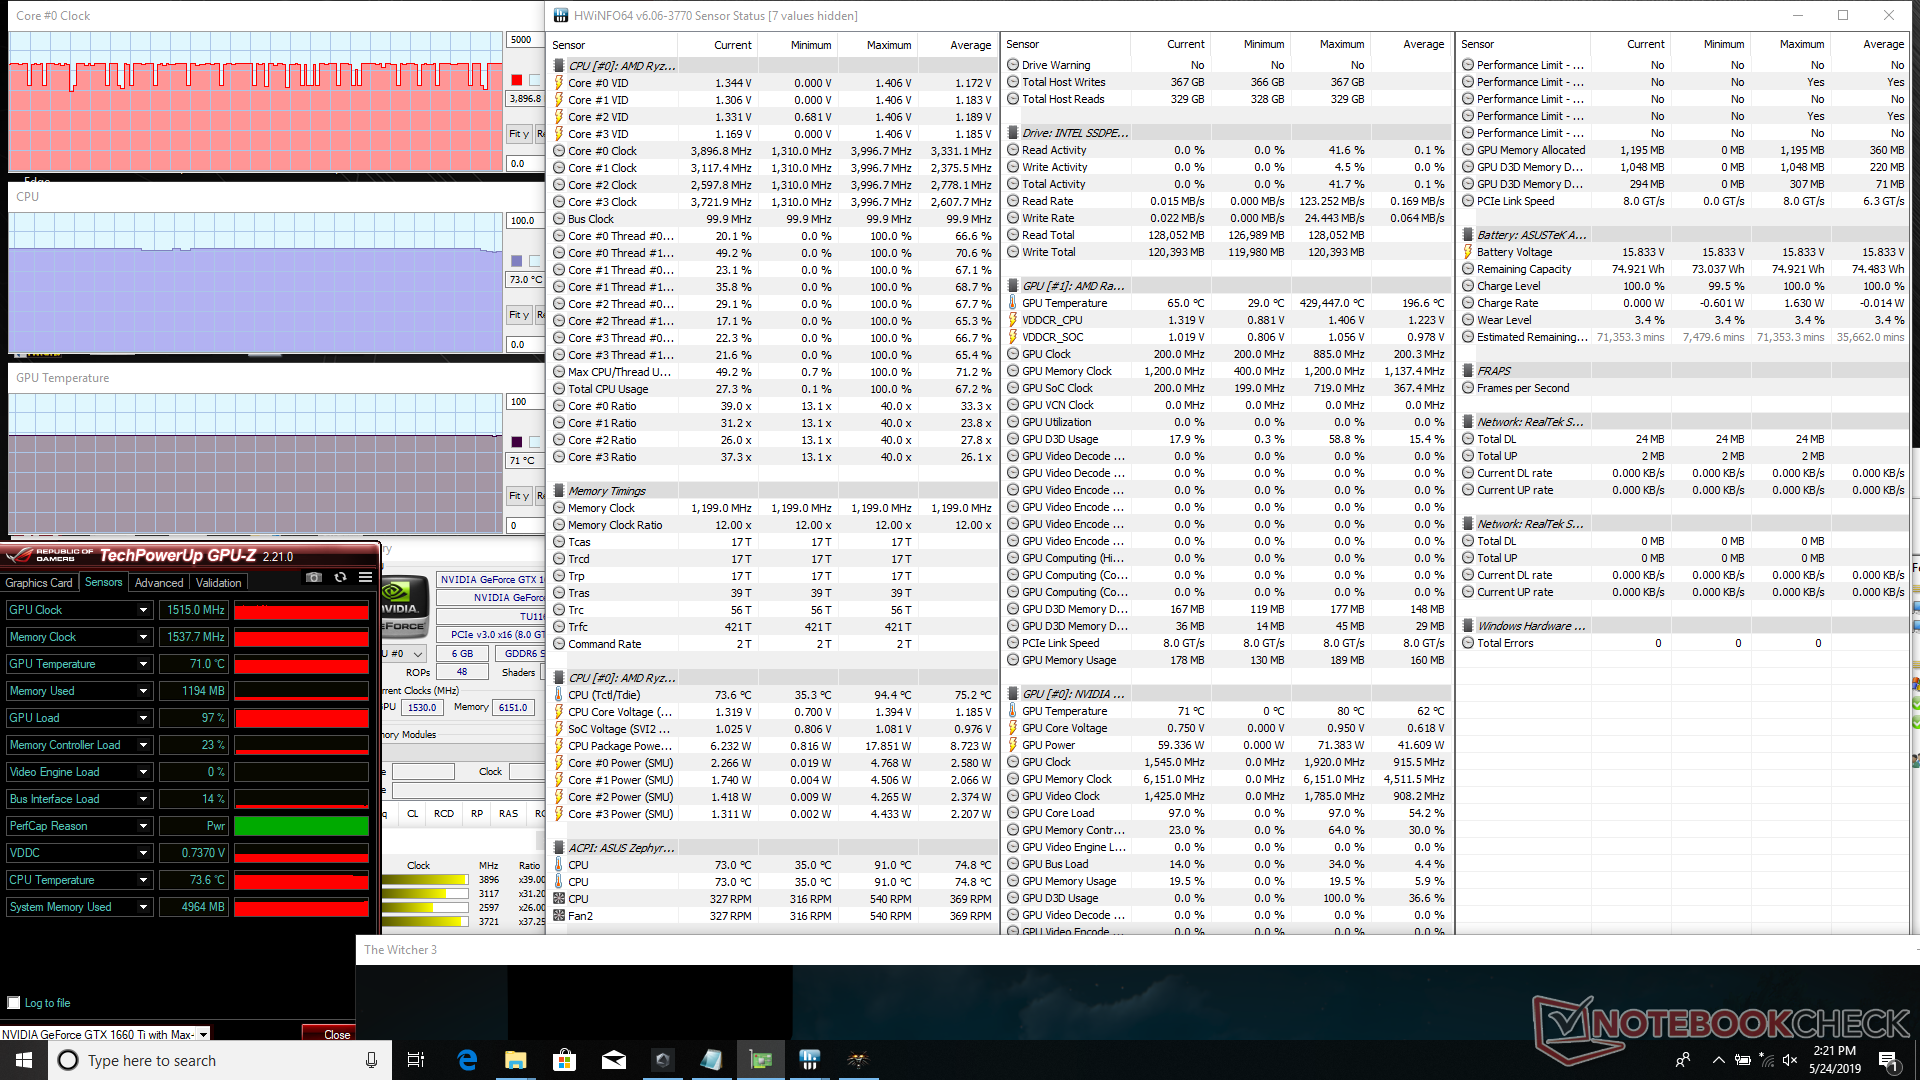
If running Witcher 3, CPU and GPU temperatures will stabilize at just 74 C and 71 C, respectively, compared to 77 C and 79 C on the less powerful Razer Blade 15 GTX 1060 Max-Q.
GPU performance will be reduced when running on batteries. A Fire Strike run on batteries returns Physics and Graphics scores of 10145 and 4130 points, respectively, compared to 10737 and 13355 points when on mains.
| CPU Clock (GHz) | GPU Clock (MHz) | Average CPU Temperature (°C) | Average GPU Temperature (°C) | |
| System Idle | -- | -- | 39 | 36 |
| Prime95 Stress | 3.2 - 3.9 | -- | 77 | 53 |
| Prime95 + FurMark Stress | ~3.6 | 1230 | 88 | 78 |
| Witcher 3 Stress | 3.2 - 3.9 | 1515 | 74 | 71 |
(-) The maximum temperature on the upper side is 55.8 °C / 132 F, compared to the average of 40.4 °C / 105 F, ranging from 21.2 to 68.8 °C for the class Gaming.
(-) The bottom heats up to a maximum of 58.2 °C / 137 F, compared to the average of 43.2 °C / 110 F
(+) In idle usage, the average temperature for the upper side is 27 °C / 81 F, compared to the device average of 33.9 °C / 93 F.
(±) Playing The Witcher 3, the average temperature for the upper side is 35.7 °C / 96 F, compared to the device average of 33.9 °C / 93 F.
(+) The palmrests and touchpad are cooler than skin temperature with a maximum of 27.6 °C / 81.7 F and are therefore cool to the touch.
(±) The average temperature of the palmrest area of similar devices was 28.8 °C / 83.8 F (+1.2 °C / 2.1 F).
Speakers
The 1 W stereo speakers offer decent audio quality with shallow bass reproduction not unlike on cheap multimedia laptops. Our main gripe with the speakers is that reverberation is high meaning you can feel the palm rests vibrating strongly when placing your palms on the surface. This would occur even when the volume is set to just 25 percent. While some users may not be bothered by it at all, we find it hard to ignore when listening to music, watching video, or playing games. Maximum volume is otherwise sufficiently loud with no static.


Asus ROG Zephyrus G15 GA502DU audio analysis
(+) | speakers can play relatively loud (88.8 dB)
Bass 100 - 315 Hz
(±) | reduced bass - on average 12.5% lower than median
(±) | linearity of bass is average (12.5% delta to prev. frequency)
Mids 400 - 2000 Hz
(±) | higher mids - on average 6.2% higher than median
(±) | linearity of mids is average (7.7% delta to prev. frequency)
Highs 2 - 16 kHz
(+) | balanced highs - only 3.5% away from median
(±) | linearity of highs is average (9.2% delta to prev. frequency)
Overall 100 - 16.000 Hz
(±) | linearity of overall sound is average (17.2% difference to median)
Compared to same class
» 46% of all tested devices in this class were better, 11% similar, 42% worse
» The best had a delta of 6%, average was 18%, worst was 132%
Compared to all devices tested
» 32% of all tested devices were better, 8% similar, 60% worse
» The best had a delta of 4%, average was 24%, worst was 134%
Apple MacBook 12 (Early 2016) 1.1 GHz audio analysis
(+) | speakers can play relatively loud (83.6 dB)
Bass 100 - 315 Hz
(±) | reduced bass - on average 11.3% lower than median
(±) | linearity of bass is average (14.2% delta to prev. frequency)
Mids 400 - 2000 Hz
(+) | balanced mids - only 2.4% away from median
(+) | mids are linear (5.5% delta to prev. frequency)
Highs 2 - 16 kHz
(+) | balanced highs - only 2% away from median
(+) | highs are linear (4.5% delta to prev. frequency)
Overall 100 - 16.000 Hz
(+) | overall sound is linear (10.2% difference to median)
Compared to same class
» 7% of all tested devices in this class were better, 2% similar, 91% worse
» The best had a delta of 5%, average was 18%, worst was 53%
Compared to all devices tested
» 5% of all tested devices were better, 1% similar, 94% worse
» The best had a delta of 4%, average was 24%, worst was 134%
Energy Management
Power Consumption
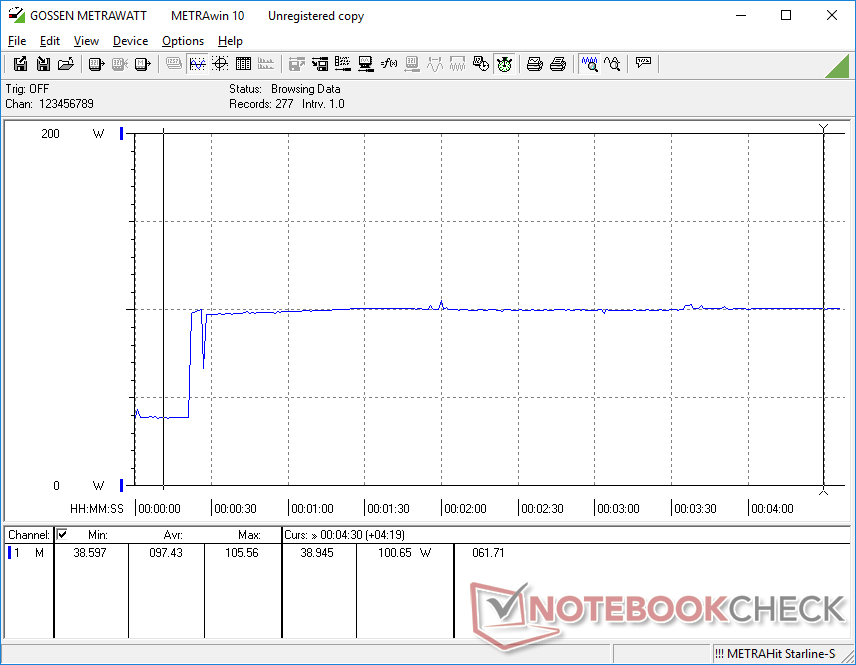
Idling on desktop will demand anywhere between 7 W and 39 W depending on the power profile. Enabling the discrete GPU or running the laptop in Turbo mode will bump power consumption towards the higher-end of this spectrum. Thus, we recommend setting the system to Balanced mode or lower with the integrated GPU active for quieter fans and longer battery life if simply browsing or streaming video.
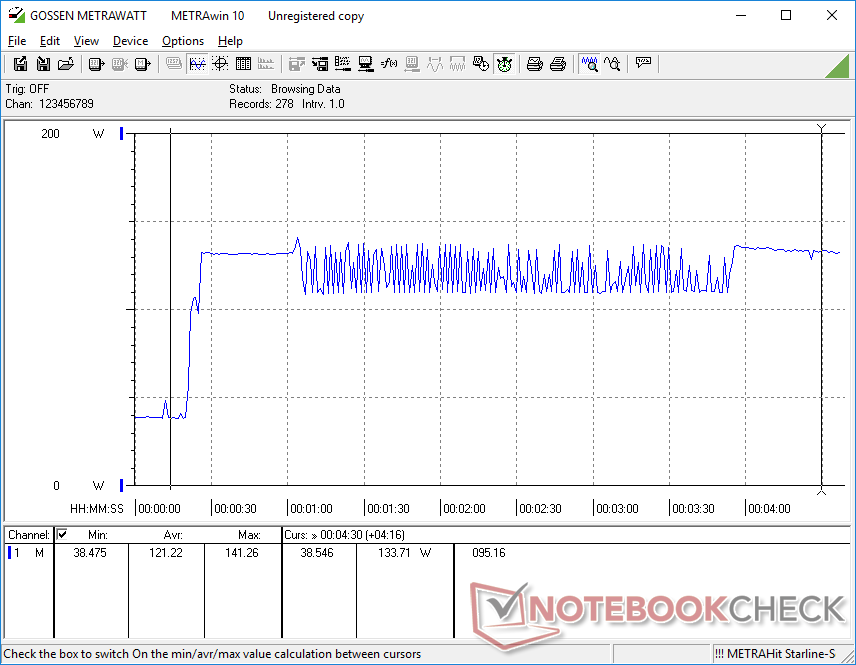
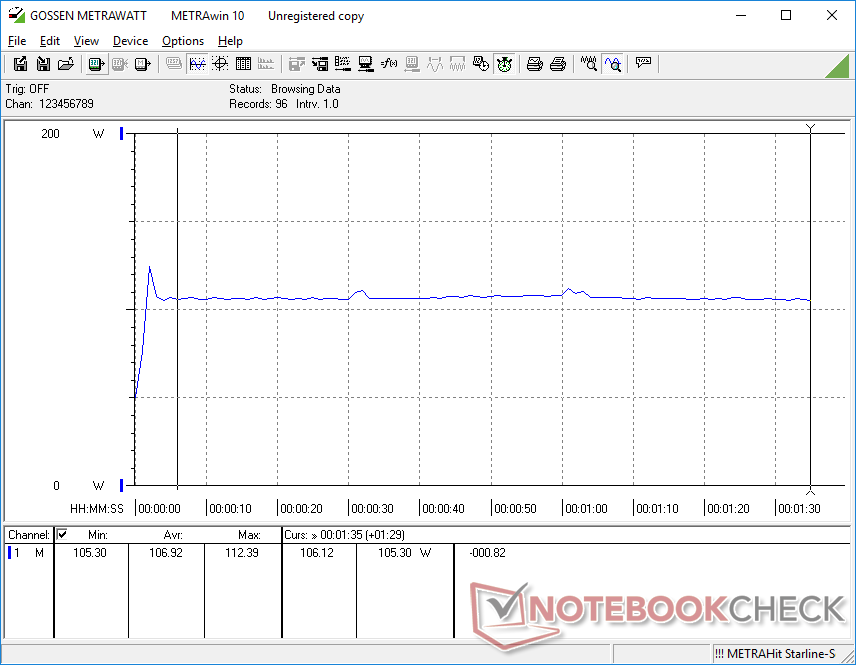
When running Witcher 3 to represent gaming loads, power consumption becomes stable at 107 W to be nearly identical to the Lenovo Legion Y730 and about 20 W more than the HP Pavilion Power 15 each equipped with the GTX 1050 Ti GPU. When considering that the GTX 1660 Ti Max-Q is able to offer 50 to 90 percent faster graphics performance than the GTX 1050 Ti according to the 3DMark results above, the performance-per-Watt of the new Turing Max-Q GPU is quite impressive. The system even consumes less power than the Zephyrus M GU501 with GTX 1060 graphics while performing up to 35 percent faster in DX12-enabled titles.
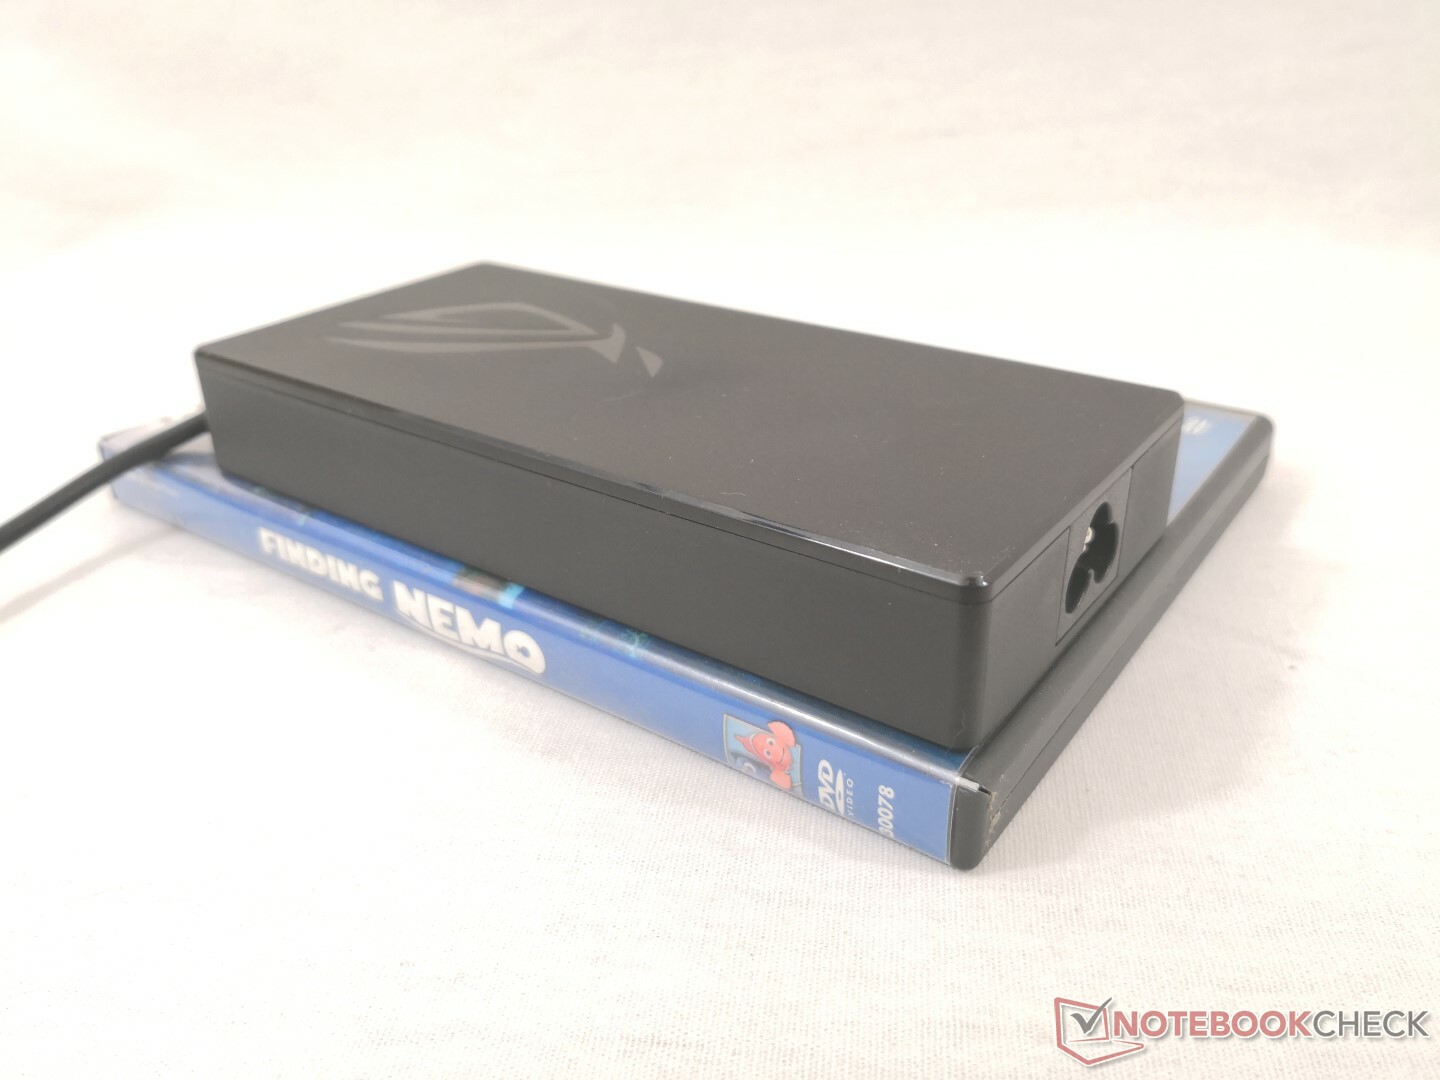
We're able to record a maximum draw of 141.3 W from the surprisingly compact (~15 x 7.4 x 2.4 cm) 180 W AC adapter when running both Prime95 and FurMark. The ample overhead means users can game and recharge the battery at the normal rate simultaneously.
| Off / Standby | |
| Idle | |
| Load |
|
Key:
min: | |
| Asus ROG Zephyrus G15 GA502DU R7 3750H, GeForce GTX 1660 Ti Max-Q, Intel SSD 660p SSDPEKNW512G8, IPS, 1920x1080, 15.6" | Razer Blade 15 RTX 2070 Max-Q i7-8750H, GeForce RTX 2070 Max-Q, Samsung SSD PM981 MZVLB512HAJQ, IPS, 1920x1080, 15.6" | Asus Zephyrus S GX531GX i7-8750H, GeForce RTX 2080 Max-Q, Intel SSD 660p SSDPEKNW512G8, IPS, 1920x1080, 15.6" | Asus ROG GU501GM-BI7N8 i7-8750H, GeForce GTX 1060 Mobile, Kingston RBUSNS8154P3128GJ, IPS, 1920x1080, 15.6" | Acer Aspire Nitro 5 AN515-54-53Z2 i5-9300H, GeForce GTX 1650 Mobile, WDC PC SN520 SDAPNUW-512G, IPS, 1920x1080, 15.6" | Lenovo Legion Y730-15ICH i5-8300H i5-8300H, GeForce GTX 1050 Ti Mobile, Intel Optane 16 GB MEMPEK1J016GAL + HGST ST1000LM049 1 TB HDD, IPS, 1920x1080, 15.6" | |
|---|---|---|---|---|---|---|
| Power Consumption | -27% | -64% | -39% | 19% | -2% | |
| Idle Minimum * (Watt) | 7.4 | 10.4 -41% | 16.1 -118% | 12.35 -67% | 5 32% | 8 -8% |
| Idle Average * (Watt) | 8.6 | 14.6 -70% | 20.9 -143% | 19.98 -132% | 7 19% | 11.8 -37% |
| Idle Maximum * (Watt) | 39.1 | 16.3 58% | 27 31% | 25.44 35% | 11 72% | 13.1 66% |
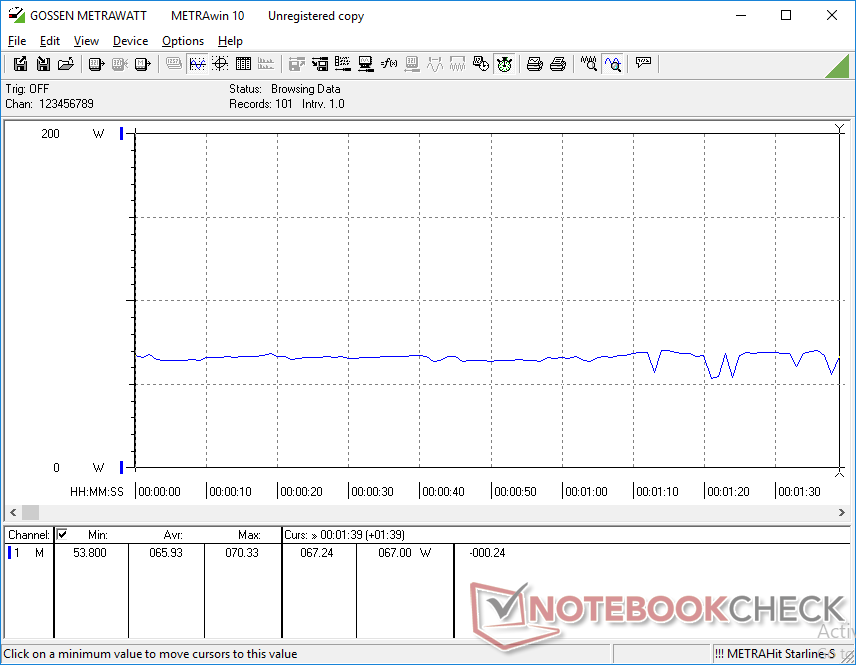
| Load Average * (Watt) | 65.9 | 88.5 -34% | 93.4 -42% | 94.28 -43% | 89 -35% | 90.2 -37% |
| Witcher 3 ultra * (Watt) | 106.9 | 155.4 -45% | 168.2 -57% | 132.9 -24% | 90 16% | 107.8 -1% |
| Load Maximum * (Watt) | 141.3 | 182.4 -29% | 215.3 -52% | 140.63 -0% | 132 7% | 136.2 4% |
* ... smaller is better
Battery Life
In an unexpected twist, the GA502 houses a larger 76 Wh battery than the GU501 (55 Wh) and the more expensive GX531GX (50 Wh). Combine this with the less demanding CPU and GPU and you have respectable runtimes from this machine. We're able to record 8 full hours of real-world WLAN use when set to the Balanced profile with Optimus set to the integrated GPU. Results are several hours better than what we've recorded on the aforementioned Zephyrus alternatives and on par with the Acer Aspire Nitro 5.
Recharging is slow at about 2.5 hours with the included AC adapter. Many gaming laptops like the MSI GS65 take less than two hours to fully charge.
| Asus ROG Zephyrus G15 GA502DU R7 3750H, GeForce GTX 1660 Ti Max-Q, 76 Wh | Razer Blade 15 RTX 2070 Max-Q i7-8750H, GeForce RTX 2070 Max-Q, 80 Wh | Asus Zephyrus S GX531GX i7-8750H, GeForce RTX 2080 Max-Q, 50 Wh | Asus ROG GU501GM-BI7N8 i7-8750H, GeForce GTX 1060 Mobile, 55 Wh | Lenovo Legion Y740-15ICHg i7-8750H, GeForce RTX 2070 Max-Q, 57 Wh | Acer Aspire Nitro 5 AN515-54-53Z2 i5-9300H, GeForce GTX 1650 Mobile, 57 Wh | |
|---|---|---|---|---|---|---|
| Battery runtime | -24% | -62% | -61% | -67% | -5% | |
| Reader / Idle (h) | 15.3 | 11.4 -25% | 4.5 -71% | 3.9 -75% | 17.4 14% | |
| WiFi v1.3 (h) | 8 | 6.5 -19% | 3 -62% | 4 -50% | 2.8 -65% | 8.1 1% |
| Load (h) | 2.1 | 1.5 -29% | 0.8 -62% | 0.8 -62% | 1.5 -29% |
Pros
Cons
Verdict
Budget gaming laptops are notorious for their dull looks, cheap plastics, and thicker profiles. It's generally the price to pay for having faster CPU and GPU options when compared to Ultrabooks. To some budget gamers, the boring design may not matter to them so long as performance is reliable enough to play the latest titles. What if, however, we told you that there exists an inexpensive laptop with both the looks of a pricey super-thin system and the performance of the GTX 1060 or better?
The Asus Zephyrus G GA502GU has been finely tuned to balance gaming performance with appearance perhaps better than any other gaming laptop before it at this price range. The $1000 mark is filled with entry-level gaming systems like the Acer Nitro 5, MSI GF/GP series, Dell G5, Walmart Overpowered 15, and the HP Pavilion Gaming equipped with GTX 1050 Ti, GTX 1060, or GTX 1650 graphics. The GA502GU can outperform these alternatives with its more capable GTX 1660 Ti Max-Q GPU all while sporting a thinner, more power efficient, and more luxurious design for nearly the same price.
Some corners had to be cut in order to offer both top notch looks and performance at an affordable level: The display is dimmer than most, color space is narrow, ghosting is more noticeable, both M.2 2280 NVMe slots are half-speed, there is no integrated webcam or G-Sync, and the base SKU includes just 8 GB of single-channel RAM only. At worst, these limitations detract only little from the core 1080p gaming experience and RAM is fortunately easy to expand if desired. Hopefully, future revisions will address the fan noise to be quieter when gaming.
Flagship looks with mid-range gaming performance at a budget price point. With the help of Ryzen, Asus has upped the ante on how an inexpensive gaming laptop should look, feel, and perform when compared to the sea of cheap Intel Core i5 gaming laptops in the market.
Asus ROG Zephyrus G15 GA502DU
- 05/30/2019 v6 (old)
Allen Ngo
Price comparison
